Embed Size (px)
Citation preview

arX
iv:0
812.
2517
v4 [
hep-
ex]
13
Mar
200
9
DESY–08–132
December 2008
A measurement of the Q2, W and t
dependences of deeply virtual Compton
scattering at HERA
ZEUS Collaboration
Abstract
Deeply virtual Compton scattering, γ∗p → γp, has been measured in e+p col-
lisions at HERA with the ZEUS detector using an integrated luminosity of
61.1 pb−1. Cross sections are presented as a function of the photon virtual-
ity, Q2, and photon-proton centre-of-mass energy, W , for a wide region of the
phase space, Q2 > 1.5 GeV2 and 40 < W < 170 GeV. A subsample of events
in which the scattered proton is measured in the leading proton spectrometer,
corresponding to an integrated luminosity of 31.3 pb−1, is used for the first direct
measurement of the differential cross section as a function of t, where t is the
square of the four-momentum transfer at the proton vertex.
The ZEUS Collaboration
S. Chekanov, M. Derrick, S. Magill, B. Musgrave, D. Nicholass1, J. Repond, R. Yoshida
Argonne National Laboratory, Argonne, Illinois 60439-4815, USA n
M.C.K. Mattingly
Andrews University, Berrien Springs, Michigan 49104-0380, USA
P. Antonioli, G. Bari, L. Bellagamba, D. Boscherini, A. Bruni, G. Bruni, G. Cara Romeo
F. Cindolo, M. Corradi, G. Iacobucci, A. Margotti, T. Massam, R. Nania, A. Polini
INFN Bologna, Bologna, Italy e
S. Antonelli, M. Basile, M. Bindi, L. Cifarelli, A. Contin, F. Palmonari, S. De Pasquale2,
G. Sartorelli, A. Zichichi
University and INFN Bologna, Bologna, Italy e
D. Bartsch, I. Brock, H. Hartmann, E. Hilger, H.-P. Jakob, M. Jungst, A.E. Nuncio-Quiroz,
E. Paul, U. Samson, V. Schonberg, R. Shehzadi, M. Wlasenko
Physikalisches Institut der Universitat Bonn, Bonn, Germany b
N.H. Brook, G.P. Heath, J.D. Morris
H.H. Wills Physics Laboratory, University of Bristol, Bristol, United Kingdom m
M. Kaur, P. Kaur3, I. Singh3
Panjab University, Department of Physics, Chandigarh, India
M. Capua, S. Fazio, A. Mastroberardino, M. Schioppa, G. Susinno, E. Tassi
Calabria University, Physics Department and INFN, Cosenza, Italy e
J.Y. Kim
Chonnam National University, Kwangju, South Korea
Z.A. Ibrahim, F. Mohamad Idris, B. Kamaluddin, W.A.T. Wan Abdullah
Jabatan Fizik, Universiti Malaya, 50603 Kuala Lumpur, Malaysia r
Y. Ning, Z. Ren, F. Sciulli
Nevis Laboratories, Columbia University, Irvington on Hudson, New York 10027 o
J. Chwastowski, A. Eskreys, J. Figiel, A. Galas, K. Olkiewicz, B. Pawlik, P. Stopa,
L. Zawiejski
The Henryk Niewodniczanski Institute of Nuclear Physics, Polish Academy of Sciences,
Cracow, Poland i
L. Adamczyk, T. Bo ld, I. Grabowska-Bo ld, D. Kisielewska, J. Lukasik4, M. Przybycien,
L. Suszycki
Faculty of Physics and Applied Computer Science, AGH-University of Science and Technology,
Cracow, Poland p
I
A. Kotanski5, W. S lominski6
Department of Physics, Jagellonian University, Cracow, Poland
O. Behnke, U. Behrens, C. Blohm, A. Bonato, K. Borras, D. Bot, R. Ciesielski, N. Cop-
pola, S. Fang, J. Fourletova7, A. Geiser, P. Gottlicher8, J. Grebenyuk, I. Gregor, T. Haas,
W. Hain, A. Huttmann, F. Januschek, B. Kahle, I.I. Katkov9, U. Klein10, U. Kotz,
H. Kowalski, M. Lisovyi, E. Lobodzinska, B. Lohr, R. Mankel11, I.-A. Melzer-Pellmann,
S. Miglioranzi12, A. Montanari, T. Namsoo, D. Notz11, A. Parenti, L. Rinaldi13, P. Roloff,
I. Rubinsky, U. Schneekloth, A. Spiridonov14, D. Szuba15, J. Szuba16, T. Theedt, J. Ukleja17,
G. Wolf, K. Wrona, A.G. Yagues Molina, C. Youngman, W. Zeuner11
Deutsches Elektronen-Synchrotron DESY, Hamburg, Germany
V. Drugakov, W. Lohmann, S. Schlenstedt
Deutsches Elektronen-Synchrotron DESY, Zeuthen, Germany
G. Barbagli, E. Gallo
INFN Florence, Florence, Italy e
P. G. Pelfer
University and INFN Florence, Florence, Italy e
A. Bamberger, D. Dobur, F. Karstens, N.N. Vlasov18
Fakultat fur Physik der Universitat Freiburg i.Br., Freiburg i.Br., Germany b
P.J. Bussey19, A.T. Doyle, W. Dunne, M. Forrest, M. Rosin, D.H. Saxon, I.O. Skillicorn
Department of Physics and Astronomy, University of Glasgow, Glasgow, United Kingdom m
I. Gialas20, K. Papageorgiu
Department of Engineering in Management and Finance, Univ. of Aegean, Greece
U. Holm, R. Klanner, E. Lohrmann, H. Perrey, P. Schleper, T. Schorner-Sadenius, J. Sz-
tuk, H. Stadie, M. Turcato
Hamburg University, Institute of Exp. Physics, Hamburg, Germany b
C. Foudas, C. Fry, K.R. Long, A.D. Tapper
Imperial College London, High Energy Nuclear Physics Group, London, United Kingdom m
T. Matsumoto, K. Nagano, K. Tokushuku21, S. Yamada, Y. Yamazaki22
Institute of Particle and Nuclear Studies, KEK, Tsukuba, Japan f
A.N. Barakbaev, E.G. Boos, N.S. Pokrovskiy, B.O. Zhautykov
Institute of Physics and Technology of Ministry of Education and Science of Kazakhstan,
Almaty, Kazakhstan
II
V. Aushev23, O. Bachynska, M. Borodin, I. Kadenko, A. Kozulia, V. Libov, D. Lon-
tkovskyi, I. Makarenko, Iu. Sorokin, A. Verbytskyi, O. Volynets
Institute for Nuclear Research, National Academy of Sciences, Kiev and Kiev National
University, Kiev, Ukraine
D. Son
Kyungpook National University, Center for High Energy Physics, Daegu, South Korea g
J. de Favereau, K. Piotrzkowski
Institut de Physique Nucleaire, Universite Catholique de Louvain, Louvain-la-Neuve, Belgium q
F. Barreiro, C. Glasman, M. Jimenez, L. Labarga, J. del Peso, E. Ron, M. Soares,
J. Terron, C. Uribe-Estrada, M. Zambrana
Departamento de Fısica Teorica, Universidad Autonoma de Madrid, Madrid, Spain l
F. Corriveau, C. Liu, J. Schwartz, R. Walsh, C. Zhou
Department of Physics, McGill University, Montreal, Quebec, Canada H3A 2T8 a
T. Tsurugai
Meiji Gakuin University, Faculty of General Education, Yokohama, Japan f
A. Antonov, B.A. Dolgoshein, D. Gladkov, V. Sosnovtsev, A. Stifutkin, S. Suchkov
Moscow Engineering Physics Institute, Moscow, Russia j
R.K. Dementiev, P.F. Ermolov †, L.K. Gladilin, Yu.A. Golubkov, L.A. Khein, I.A. Korzhavina,
V.A. Kuzmin, B.B. Levchenko24, O.Yu. Lukina, A.S. Proskuryakov, L.M. Shcheglova,
D.S. Zotkin
Moscow State University, Institute of Nuclear Physics, Moscow, Russia k
I. Abt, A. Caldwell, D. Kollar, B. Reisert, W.B. Schmidke
Max-Planck-Institut fur Physik, Munchen, Germany
G. Grigorescu, A. Keramidas, E. Koffeman, P. Kooijman, A. Pellegrino, H. Tiecke,
M. Vazquez12, L. Wiggers
NIKHEF and University of Amsterdam, Amsterdam, Netherlands h
N. Brummer, B. Bylsma, L.S. Durkin, A. Lee, T.Y. Ling
Physics Department, Ohio State University, Columbus, Ohio 43210 n
P.D. Allfrey, M.A. Bell, A.M. Cooper-Sarkar, R.C.E. Devenish, J. Ferrando, B. Foster,
C. Gwenlan25, K. Horton26, K. Oliver, A. Robertson, R. Walczak
Department of Physics, University of Oxford, Oxford United Kingdom m
A. Bertolin, F. Dal Corso, S. Dusini, A. Longhin, L. Stanco
INFN Padova, Padova, Italy e
III
P. Bellan, R. Brugnera, R. Carlin, A. Garfagnini, S. Limentani
Dipartimento di Fisica dell’ Universita and INFN, Padova, Italy e
B.Y. Oh, A. Raval, J.J. Whitmore27
Department of Physics, Pennsylvania State University, University Park, Pennsylvania
16802 o
Y. Iga
Polytechnic University, Sagamihara, Japan f
G. D’Agostini, G. Marini, A. Nigro
Dipartimento di Fisica, Universita ’La Sapienza’ and INFN, Rome, Italy e
J.E. Cole28, J.C. Hart
Rutherford Appleton Laboratory, Chilton, Didcot, Oxon, United Kingdom m
C. Heusch, H. Sadrozinski, A. Seiden, R. Wichmann29, D.C. Williams
University of California, Santa Cruz, California 95064, USA n
H. Abramowicz30, R. Ingbir, S. Kananov, A. Levy, A. Stern
Raymond and Beverly Sackler Faculty of Exact Sciences, School of Physics, Tel Aviv
University, Tel Aviv, Israel d
M. Kuze, J. Maeda
Department of Physics, Tokyo Institute of Technology, Tokyo, Japan f
R. Hori, S. Kagawa31, N. Okazaki, S. Shimizu, T. Tawara
Department of Physics, University of Tokyo, Tokyo, Japan f
R. Hamatsu, H. Kaji32, S. Kitamura33, O. Ota34, Y.D. Ri
Tokyo Metropolitan University, Department of Physics, Tokyo, Japan f
R. Cirio, M. Costa, M.I. Ferrero, V. Monaco, C. Peroni, R. Sacchi, V. Sola, A. Solano
Universita di Torino and INFN, Torino, Italy e
N. Cartiglia, S. Maselli, A. Staiano
INFN Torino, Torino, Italy e
M. Arneodo, M. Ruspa
Universita del Piemonte Orientale, Novara, and INFN, Torino, Italy e
S. Fourletov7, J.F. Martin, T.P. Stewart
Department of Physics, University of Toronto, Toronto, Ontario, Canada M5S 1A7 a
S.K. Boutle20, J.M. Butterworth, T.W. Jones, J.H. Loizides, M. Wing35
Physics and Astronomy Department, University College London, London, United Kingdom m
IV
B. Brzozowska, J. Ciborowski36, G. Grzelak, P. Kulinski, P. Luzniak37, J. Malka37, R.J. Nowak,
J.M. Pawlak, W. Perlanski37, T. Tymieniecka38, A.F. Zarnecki
Warsaw University, Institute of Experimental Physics, Warsaw, Poland
M. Adamus, P. Plucinski39, A. Ukleja
Institute for Nuclear Studies, Warsaw, Poland
Y. Eisenberg, D. Hochman, U. Karshon
Department of Particle Physics, Weizmann Institute, Rehovot, Israel c
E. Brownson, D.D. Reeder, A.A. Savin, W.H. Smith, H. Wolfe
Department of Physics, University of Wisconsin, Madison, Wisconsin 53706, USA n
S. Bhadra, C.D. Catterall, Y. Cui, G. Hartner, S. Menary, U. Noor, J. Standage, J. Whyte
Department of Physics, York University, Ontario, Canada M3J 1P3 a
V
1 also affiliated with University College London, United Kingdom2 now at University of Salerno, Italy3 also working at Max Planck Institute, Munich, Germany4 now at Institute of Aviation, Warsaw, Poland5 supported by the research grant no. 1 P03B 04529 (2005-2008)6 This work was supported in part by the Marie Curie Actions Transfer of Knowledge
project COCOS (contract MTKD-CT-2004-517186)7 now at University of Bonn, Germany8 now at DESY, group FEB, Hamburg, Germany9 also at Moscow State University, Russia
10 now at University of Liverpool, UK11 on leave of absence at CERN, Geneva, Switzerland12 now at CERN, Geneva, Switzerland13 now at Bologna University, Bologna, Italy14 also at Institut of Theoretical and Experimental Physics, Moscow, Russia15 also at INP, Cracow, Poland16 also at FPACS, AGH-UST, Cracow, Poland17 partially supported by Warsaw University, Poland18 partly supported by Moscow State University, Russia19 Royal Society of Edinburgh, Scottish Executive Support Research Fellow20 also affiliated with DESY, Germany21 also at University of Tokyo, Japan22 now at Kobe University, Japan23 supported by DESY, Germany24 partly supported by Russian Foundation for Basic Research grant no. 05-02-39028-
NSFC-a25 STFC Advanced Fellow26 nee Korcsak-Gorzo27 This material was based on work supported by the National Science Foundation, while
working at the Foundation.28 now at University of Kansas, Lawrence, USA29 now at DESY, group MPY, Hamburg, Germany30 also at Max Planck Institute, Munich, Germany, Alexander von Humboldt Research
Award31 now at KEK, Tsukuba, Japan32 now at Nagoya University, Japan33 member of Department of Radiological Science, Tokyo Metropolitan University, Japan34 now at SunMelx Co. Ltd., Tokyo, Japan35 also at Hamburg University, Inst. of Exp. Physics, Alexander von Humboldt Research
Award and partially supported by DESY, Hamburg, Germany
VI
36 also at Lodz University, Poland37 member of Lodz University, Poland38 also at University of Podlasie, Siedlce, Poland39 now at Lund Universtiy, Lund, Sweden† deceased
VII

a supported by the Natural Sciences and Engineering Research Council of
Canada (NSERC)b supported by the German Federal Ministry for Education and Research
(BMBF), under contract numbers 05 HZ6PDA, 05 HZ6GUA, 05 HZ6VFA
and 05 HZ4KHAc supported in part by the MINERVA Gesellschaft fur Forschung GmbH, the Is-
rael Science Foundation (grant no. 293/02-11.2) and the U.S.-Israel Binational
Science Foundationd supported by the Israel Science Foundatione supported by the Italian National Institute for Nuclear Physics (INFN)f supported by the Japanese Ministry of Education, Culture, Sports, Science
and Technology (MEXT) and its grants for Scientific Researchg supported by the Korean Ministry of Education and Korea Science and Engi-
neering Foundationh supported by the Netherlands Foundation for Research on Matter (FOM)i supported by the Polish State Committee for Scientific Research, project no.
DESY/256/2006 - 154/DES/2006/03j partially supported by the German Federal Ministry for Education and Re-
search (BMBF)k supported by RF Presidential grant N 1456.2008.2 for the leading scientific
schools and by the Russian Ministry of Education and Science through its
grant for Scientific Research on High Energy Physicsl supported by the Spanish Ministry of Education and Science through funds
provided by CICYTm supported by the Science and Technology Facilities Council, UKn supported by the US Department of Energyo supported by the US National Science Foundation. Any opinion, findings
and conclusions or recommendations expressed in this material are those of
the authors and do not necessarily reflect the views of the National Science
Foundation.p supported by the Polish Ministry of Science and Higher Education as a scien-
tific project (2006-2008)q supported by FNRS and its associated funds (IISN and FRIA) and by an
Inter-University Attraction Poles Programme subsidised by the Belgian Federal
Science Policy Officer supported by an FRGS grant from the Malaysian government
VIII
1 Introduction
This paper presents cross-section measurements for the exclusive production of a real
photon in diffractive e+p1 interactions, ep → eγp, a process known as deeply virtual
Compton scattering (DVCS). In perturbative QCD, this process is described by the ex-
change of two partons, with different longitudinal and transverse momenta in a colourless
configuration. At the γ∗p centre-of-mass energies, W , available for ep collisions at the
HERA collider, for large momentum-transfer squared at the lepton vertex, Q2, the DVCS
process is dominated by two-gluon exchange. Measurements of the DVCS cross section
provide constraints on the generalised parton distributions (GPDs) [1–5], which carry
information about the wave function of the proton) [2]. The transverse distribution of
partons in the proton, which is not accessible via the F2 proton structure function, is
accounted for in the dependence of the GPDs on the four-momentum transfer squared
at the proton vertex, t. The initial and final states of the DVCS process are identical to
those of the purely electromagnetic Bethe-Heitler (BH) process. The interference between
these two processes in principle provides information about the real and imaginary parts
of the QCD scattering amplitude [6–8]. However, the interference is expected to be small
in the kinematic region studied in this paper [6, 7].
The simplicity of the final state and the absence of complications due to hadronisation
mean that the QCD predictions for DVCS are expected to be more reliable than for
exclusive vector meson production which has been extensively studied in ep collisions at
HERA [9–16]. Several measurements of DVCS at high W are available [17–20]. The
analysis presented here is based on data in the kinematic range of 1.5 < Q2 < 100 GeV2
and 40 < W < 170 GeV, an extension compared to the previous ZEUS measurement [18].
A subsample of the data in which the scattered proton is measured in the ZEUS leading
proton spectrometer (LPS) [21] is used for the direct measurement of the t dependence of
the DVCS cross section.
2 Experimental set-up
The data used for this measurement were taken with the ZEUS detector at the HERA ep
collider in the years 1999 and 2000, when HERA collided positrons of energy 27.5 GeV
with protons of energy 920 GeV, and correspond to an integrated luminosity of 61.1 pb−1.
The subsample used to measure the t distribution was collected in 2000 and corresponds
to an integrated luminosity of 31.3 pb−1.
1 Hereafter, the positron is referred to with the same symbol, e, as the electron.
1
A detailed description of the ZEUS detector can be found elsewhere [23, 24]. A brief
outline of the components most relevant for this analysis is given below.
Charged particles were tracked in the CTD [25]. The CTD operated in a magnetic field
of 1.43 T provided by a thin solenoid. It consisted of 72 cylindrical drift-chamber layers,
organised in nine superlayers covering the polar-angle 2 region 15◦ < θ < 164◦. The
transverse-momentum resolution for full-length tracks was σ(pT )/pT = 0.0058pT⊕0.0065⊕0.0014/pT , with pT in GeV.
The uranium–scintillator calorimeter (CAL) [26] covered 99.7% of the total solid angle and
consisted of three parts: the forward (FCAL), the barrel (BCAL) and the rear (RCAL)
calorimeters. Each part was subdivided transversely into towers and longitudinally into
one electromagnetic section (EMC) and either one (in RCAL) or two (in BCAL and
FCAL) hadronic sections (HAC). The CAL energy resolutions, as measured under test-
beam conditions, were σ(E)/E = 0.18/√E for positrons and σ(E)/E = 0.35/
√E for
hadrons, with E in GeV.
The position of positrons scattered at small angles to the positron-beam direction was de-
termined combining the information from the CAL, the small-angle rear tracking detector
(SRTD) and the hadron-electron separator (HES) [27, 28].
The FPC [29] was used to measure the energy of particles in the pseudorapidity range
η ≈ 4.0 − 5.0. It consisted of a lead–scintillator sandwich calorimeter installed in the
20×20 cm2 beam hole of the FCAL. The energy resolution for electrons as measured in a
test beam, was σ(E)/E = (0.41± 0.02)/√E ⊕ 0.062± 0.002, with E in GeV. The energy
resolution for pions was σ(E)/E = (0.65± 0.02)/√E ⊕ 0.06± 0.01, with E in GeV, after
having combined the information from FPC and FCAL. The e/h ratio was close to unity.
The LPS [21] detected positively charged particles scattered at small angles and carrying
a substantial fraction, xL, of the incoming proton momentum; these particles remained
in the beam-pipe and their trajectory was measured by a system of silicon microstrip
detectors that was inserted very close (typically within a distance of a few mm) to the
proton beam. The detectors were grouped in six stations, S1 to S6, placed along the beam-
line in the direction of the proton beam, between 23.8 m and 90.0 m from the interaction
point. The particle deflections induced by the magnets of the proton beam-line allowed a
momentum analysis of the scattered proton. For the present measurements, only stations
S4, S5 and S6 were used. The resolutions were about 0.5% on the longitudinal momentum
fraction and about 5 MeV on the transverse momentum. The LPS acceptance [22] was
2 The ZEUS coordinate system is a right-handed Cartesian system, with the Z axis pointing in the proton
direction, referred to as the “forward direction”, and the X axis pointing left towards the centre of
HERA. The coordinate origin is at the nominal interaction point. The pseudorapidity is defined as
η = − ln (tan θ
2), where the polar angle θ is measured with respect to the proton beam direction.
2
approximately 2% and xL-independent for xL∼>0.98; it increased smoothly to about 10%
as xL decreased to 0.9.
The luminosity was measured from the rate of the bremsstrahlung process ep → eγp,
where the photon was measured in a lead–scintillator calorimeter [30] placed in the HERA
tunnel at Z = −107 m.
3 Monte Carlo simulations
The acceptance and the detector response were determined using Monte Carlo (MC) simu-
lations. The detector was simulated in detail using a program based on Geant 3.13 [31].
All of the simulated events were processed through the same reconstruction and analysis
chain as the data.
A MC generator, GenDVCS [32], based on a model by Frankfurt, Freund and Strikman
(FFS) [33], was used to simulate the elastic DVCS process as described in [18]. The
ALLM97 [34] parameterisation of the F2 proton structure function of the proton was used
as input. The t dependence was assumed to be exponential with a slope parameter b set
to 4.5 GeV−2, independent of W and Q2.
The elastic, ep → eγp, and quasi-elastic ep → eγY BH processes, where Y is a low-
mass state, and the exclusive dilepton production, ep → ee+e−p, were simulated using
the Grape-Compton3 [35] and the Grape-Dilepton [35] generators. These two MC
programs are based on the automatic system Grace [36] for calculating Feynman dia-
grams. A possible contribution from vector meson electroproduction was simulated with
the Zeusvm generator [37]. To account for electroweak radiative effects, all the generators
were interfaced to Heracles 4.6 [38].
4 Kinematic variables and event selection
The process ep→ eγp is parametrised by the following variables:
• Q2 = −q2 = −(k − k′)2, the negative four-momentum squared of the virtual photon,
where k (k′) is the four-momentum of the incident (scattered) positron;
• W 2 = (q+ p)2, the squared centre-of-mass energy of the photon-proton system, where
p is the four-momentum of the incident proton;
3 Hereafter, the Grape-Compton generator is referred to as Grape.
3

• x = Q2/(2P · q), the fraction of the proton momentum carried by the quark struck by
the virtual photon in the infinite-momentum frame (the Bjorken variable);
• xL = p′·kp·k
, the fractional momentum of the outgoing proton, where p′ is the four-
momentum of the scattered proton;
• t = (p− p′)2, the squared four-momentum transfer at the proton vertex.
For the Q2 range of this analysis, Q2 > 1.5 GeV2, and at small values of t, the signature
of elastic DVCS and BH events consists of a scattered positron, a photon and a scattered
proton. The scattered proton remains in the beam-pipe where, for a subsample of events,
it is detected in the LPS (LPS sample).
The events were selected online via a three-level trigger system [23, 39]. The trigger
required events with two isolated electromagnetic (EM) clusters with energy greater than
2 GeV. The trigger efficiency was studied as a function of the lowest energy cluster, it was
found to increase from 80% to 100% for increasing cluster energy and the Monte Carlo
was reweighed according.
The offline selection followed the strategy described in [18]. Two EM clusters were found
by a dedicated, neural-network based, positron finder [40]. They were ordered in polar-
angle and are in the following denoted as EM1 and EM2, with θ1 > θ2. The first cluster
was required to be in the RCAL with energy E1 > 10 GeV; the second cluster had to
have a polar angle θ2 < 2.85 rad and was required to be either in the RCAL, with energy
E2 > 3 GeV, or in the BCAL, with energy E2 > 2.5 GeV. The angular range of the second
cluster corresponds to the region of high reconstruction efficiency for tracks in the CTD.
The association of a track discriminates between positron and photon induced clusters.
For events with one track, a match was required between the track and one of the two EM
clusters. Events with more than one track were rejected. To ensure full containement of
the electromagnetic shower, the impact position of each EM cluster on the face of RCAL
was required to be outside a rectangular area of 26 × 16 cm2 around the beam-pipe.
The condition 40 < E − PZ < 70 GeV was imposed, with E = E1 + E2 and PZ =
E1 cos θ1 + E2 cos θ2. This requirement rejected photoproduction events and also events
in which a hard photon was radiated from the incoming positron.
Events with CAL energy deposits not associated with the two EM clusters were rejected
if their energy was above the noise level in the CAL [41]. In addition, the total energies
measured in the FPC and in the FCAL were each required to be below 1 GeV [10, 41].
These elasticity requirements also suppressed DVCS events and inelastic BH events in
which the proton dissociates into a high-mass hadronic system. The sample was still
contaminated by events in which a forward, low-mass hadronic system was not visible
in the main detector. Alternatively, a clean sample of elastic DVCS and BH events was
obtained by additionally requiring the proton to be detected in the LPS.
4
The LPS event was rejected if, at any point, the distance of the proton track candidate to
the beam-pipe was less than 0.04 cm. It was also rejected if the X position of the track
impact point at station S4 was smaller than −3.3 cm. These cuts reduced the sensitivity
of the acceptance on the uncertainty in the position of the beam-pipe apertures. To
suppress background from overlays of ep collisions with protons originating from the beam-
halo, it was required that (E + PZ) + 2pLPSZ < 1865 GeV, where pLPS
Z is the longitudinal
momentum of the scattered proton. The variable xL was required to be within the range
0.96 < xL < 1.02 to exclude non-elastic events [42, 43]. The variable t was required to
be in the range 0.08 < |t| < 0.53 GeV2 where the LPS acceptance was high and slowly
changing.
The kinematic region was 40 < W < 170 GeV and 1.5 < Q2 < 100 GeV2. For the purposes
of this analysis, the values of Q2 and W were determined for each event, independently of
its topology, under the assumption that the EM1 cluster is the scattered positron. This
assumption is always valid for DVCS events for the Q2 range considered here. The electron
method [44] was used to determine Q2 and the double-angle method [44] to determine W .
5 Background study and signal extraction
The selected events were subdivided into three samples,
• γ sample: EM2, with no track pointing to it, is taken to be the photon and EM1 is
assumed to be the scattered positron. Both BH and DVCS processes contribute to this
topology. The sample consisted of 7618 events and 55 events after the LPS selection.
• e sample: EM2, with a positive-charge track pointing to it, is assumed to be the
scattered positron and EM1 is the photon. The sample is dominated by BH events.
The number of DVCS events is predicted to be negligible due to the large Q2 implied
by the large positron scattering angle. This sample consisted of 11988 events and 33
events after the LPS selection.
• negative-charge-e sample: EM2, with a negative-charge track pointing to it, may have
originated from an e+e− final state accompanying the scattered positron, where one
of the positrons escaped detection. This sample is dominated by non-resonant e+e−
production and by J/ψ production with subsequent decay into e+e− and was used to
study these background sources. It consisted of 764 events and only one event after
the LPS selection.The diffractive electroproduction of ρ, ω and φ mesons was found
to be negligible [18].
In the kinematic region of this analysis, the contribution of the interference term between
the DVCS and BH amplitudes is very small when the cross section is integrated over the
5

angle between the positron and proton scattering planes [6,7]. Thus the cross section for
exclusive production of real photons was treated as a simple sum over the contributions
from the DVCS and BH processes. The DVCS cross section was determined by subtracting
the latter.
The size of the BH contribution to be subtracted was determined using the e sample
which consists of elastic and inelastic BH events and a small fraction of exclusive e+e−
production. The exclusive e+e− contribution was estimated with the negative-charge-e
sample to be (6.4 ± 0.2)% and subtracted from the e sample.
The inelastic fraction of the BH events was estimated from the difference in the azimuthal
angles, ∆φ, between the two electromagnetic clusters in the e sample. It was determined
to be (16 ± 1)% and was negligible in the LPS tagged subsample [45].
The measured cross section of the BH process was (4±1)% smaller than the expectations
of the Grape program (a detailed discussion can be found elsewhere [45,46]). The Grape
cross section was modified accordingly.
The BH contribution to the γ sample was determined by Grape and found to be (56±1)%
for the untagged and (21±3)% for the LPS tagged sample. The BH-subtracted γ sample
was further scaled by (1 − fp−diss), where fp−diss is the fraction of DVCS events in which
the proton dissociated into a low-mass state. Its value was taken, as in [18], from previous
publication [47], fp−diss = 17.5 ± 1.3+3.7−3.2%.
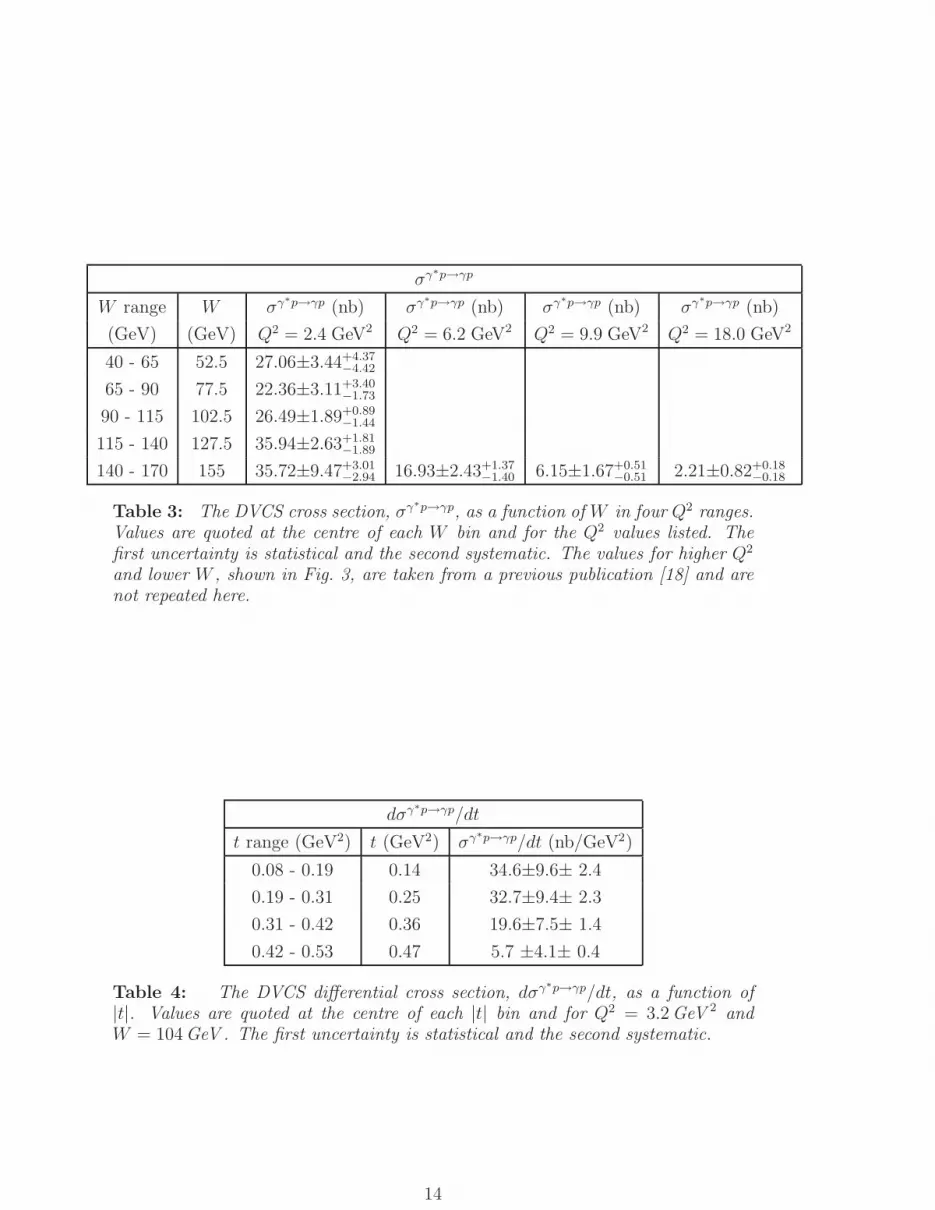
The W and Q2 distributions in the untagged sample (inclusive sample) and the xL and t
distributions in the LPS sample, separately for the e sample, for the γ sample and for the
γ sample after BH and proton dissociation background subtraction, are shown in Fig. 1.
Also shown in the figure are MC expectations which describe the data well.
6 Systematic uncertainties
The uncertainties due to the reconstruction of the scattered positron and to the back-
ground subtraction were evaluated by varying the selection criteria as follows:
• varying the electromagnetic energy scale by ±2%;
• restricting the E − PZ cut to 45 < E − PZ < 65 GeV;
• shifting the reconstructed position of the positron with respect to the MC by ±1mm;
• changing the elasticity requirements by ±30 MeV in the EMC and ±50 MeV in the
HAC sections;
• changing the photon candidate energy by ±10%;
6
• varying the inelastic BH fraction by ±1%.
Each individual systematic uncertainty affects single bins in Q2 and W typically by less
than 5% and by less than 10% in all cases bar the highest Q2 bin where statistical fluc-
tuations dominate.
To evaluate the uncertainties due to the reconstruction of the final-state proton,
• the cut on the minimum distance to the beam-pipe was increased to 0.1 cm;
• the t range was tightened to 0.1 < |t| < 0.5 GeV2;
• the kinematic limit of the beam-halo background cut was lowered to 1855 GeV;
• the x position of the track impact point at station S4 was restricted to −32 mm.
The total systematic uncertainty was obtained by adding in quadrature the individual
contributions. It was found to be ±8% on average which is smaller than the statistical
uncertainties.
For the inclusive sample the uncertainty in the determination of the integrated luminosity
of ±2.25% and on the proton-dissociative background of +3.9−3.5% are not included in the
figures and in the tables.
For the LPS data, there is an overall uncertainty of ±7% which originates mostly from
the uncertainty on the simulation of the proton-beam optics. It can be treated as a
normalisation uncertainty as it is largely independent of the kinematic variables and is
not included in the figures and in the tables. It also includes the uncertainty on the
integrated luminosity for the LPS sample of ±2.25%.
7 Cross section determination and results
The γ∗p cross section of the DVCS process was evaluated as a function of W , Q2 using
the expression
σγ∗p→γp(Wi, Q2i ) =
(Nobsi −NBH
i ) · (1 − fp−diss)
NMCi
· σFFS(γ∗p→γp)(Wi, Q2i ),
where Nobsi is the total number of data events in the γ sample in bin i of W and Q2, NBH
i
denotes the number of elastic and inelastic BH events in the γ sample in the bin, and NMCi
is the number of events expected in the γ sample from GenDVCS for the luminosity of
the data. The cross section as predicted by the FFS model is denoted σFFS(γ∗p → γp)
and was evaluated at the centre (Wi, Q2i ) of each Q2 and W bin. The differential cross
section as a function of t was calculated from the LPS tagged sample for which fp−diss is
zero. All the results are listed in Tables 1 – 4.
7
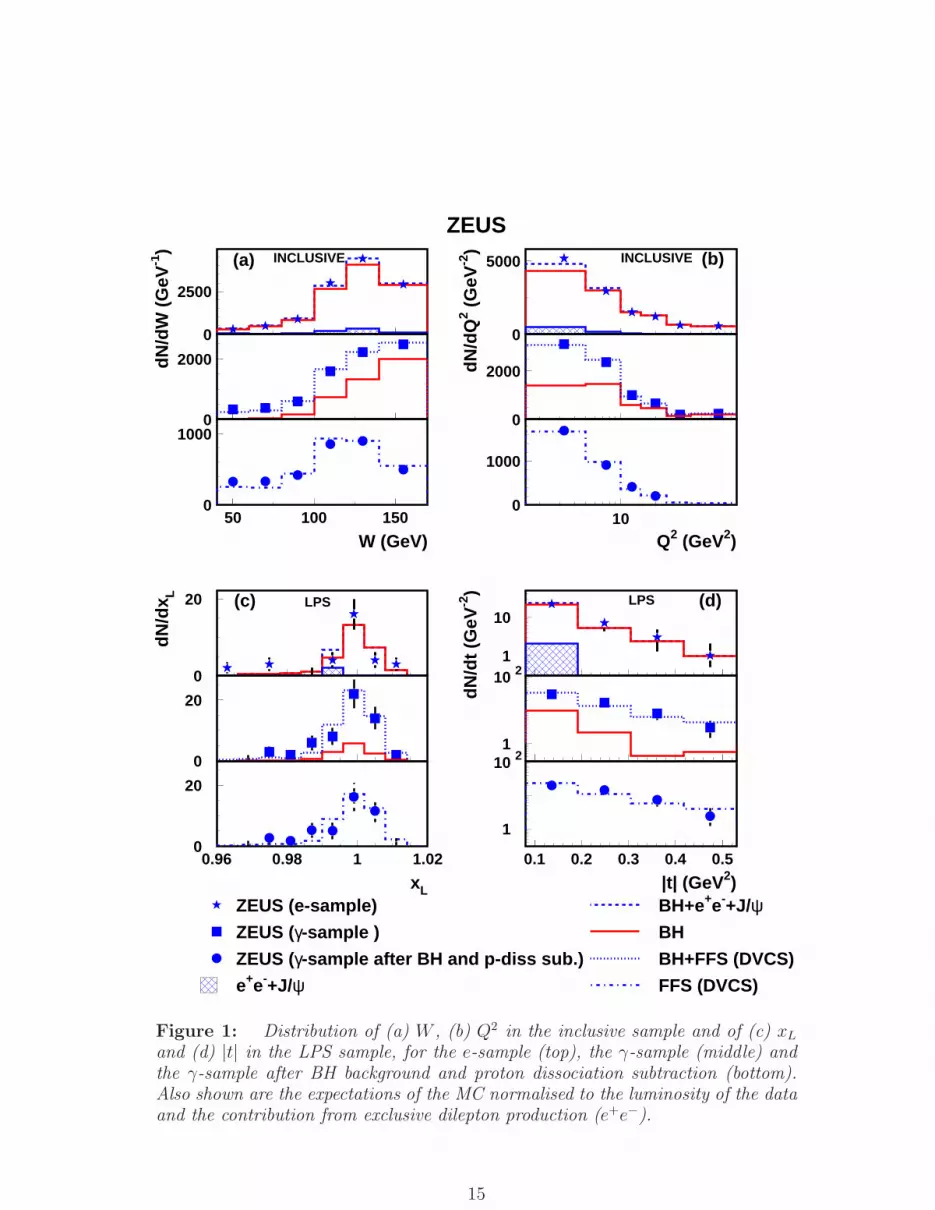
The γ∗p DVCS cross section, σγ∗p→γp, is presented in Fig. 2 as a function of Q2 at
W = 104 GeV and as a function of W at Q2 = 3.2 GeV2. The cross section shows
a fast decrease with Q2. A fit to the Q2 dependence of the cross section, assuming
the functional form σγ∗p→γp(Q2) ∼ Q−2n, was performed for W = 104 GeV yielding
n = 1.54 ± 0.05(stat.), smaller than expected for a pure propagator term [33]. The re-
sult is in agreement with other DVCS measurements at HERA at lower W [17–20]. As
expected for DVCS [33], the decrease of the cross section with Q2 is slower than for
exclusive vector meson production [12–16, 48]. The cross section increases with W . In
pQCD-based models, this behaviour is related to the increase of the gluon content of the
proton with decreasing Bjorken-x. A fit to the W dependence of the cross section, as-
suming a functional form σγ∗p→γp(W ) ∼W δ, was performed for Q2 = 3.2 GeV2, yielding
δ = 0.52±0.09(stat.). This result is in agreement with the previous measurements [17–20]
performed in a restricted range of W and at higher Q2. A second fit restricted to the region
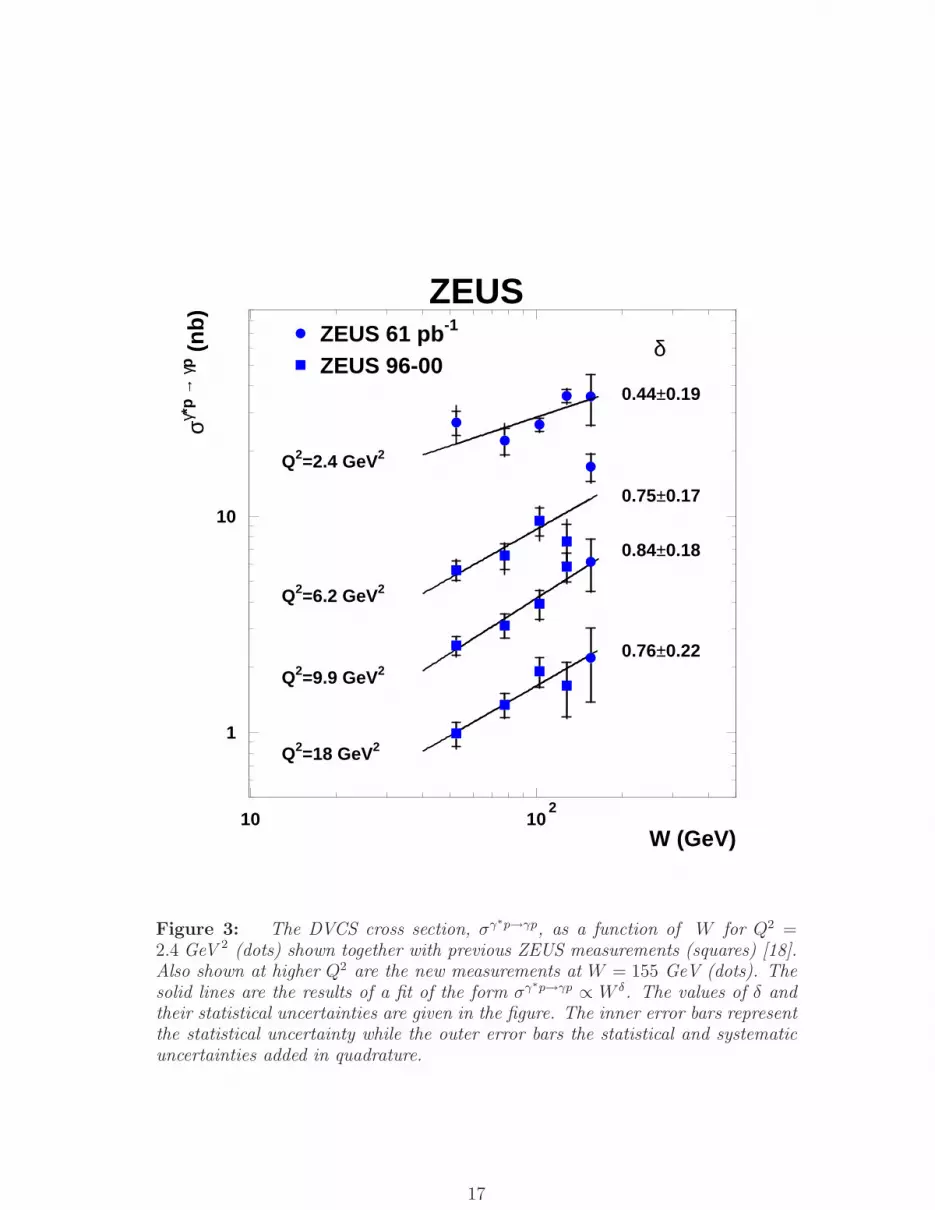
1.5 < Q2 < 5 GeV2 at Q2 = 2.4 GeV2, was also performed giving δ = 0.44 ± 0.19(stat.).
The fit is presented in Fig. 3. Also shown in the figure are previous ZEUS measurements at
different values of Q2 [18] and the extension to higher W values from the present analysis.
For each Q2 the corresponding δ values fitted in the extended W range are given. Within
the present accuracy the results do not show evidence for a Q2 dependence of δ. This
result is similar to that obtained for the exclusive production of J/ψ mesons [12–14,47].
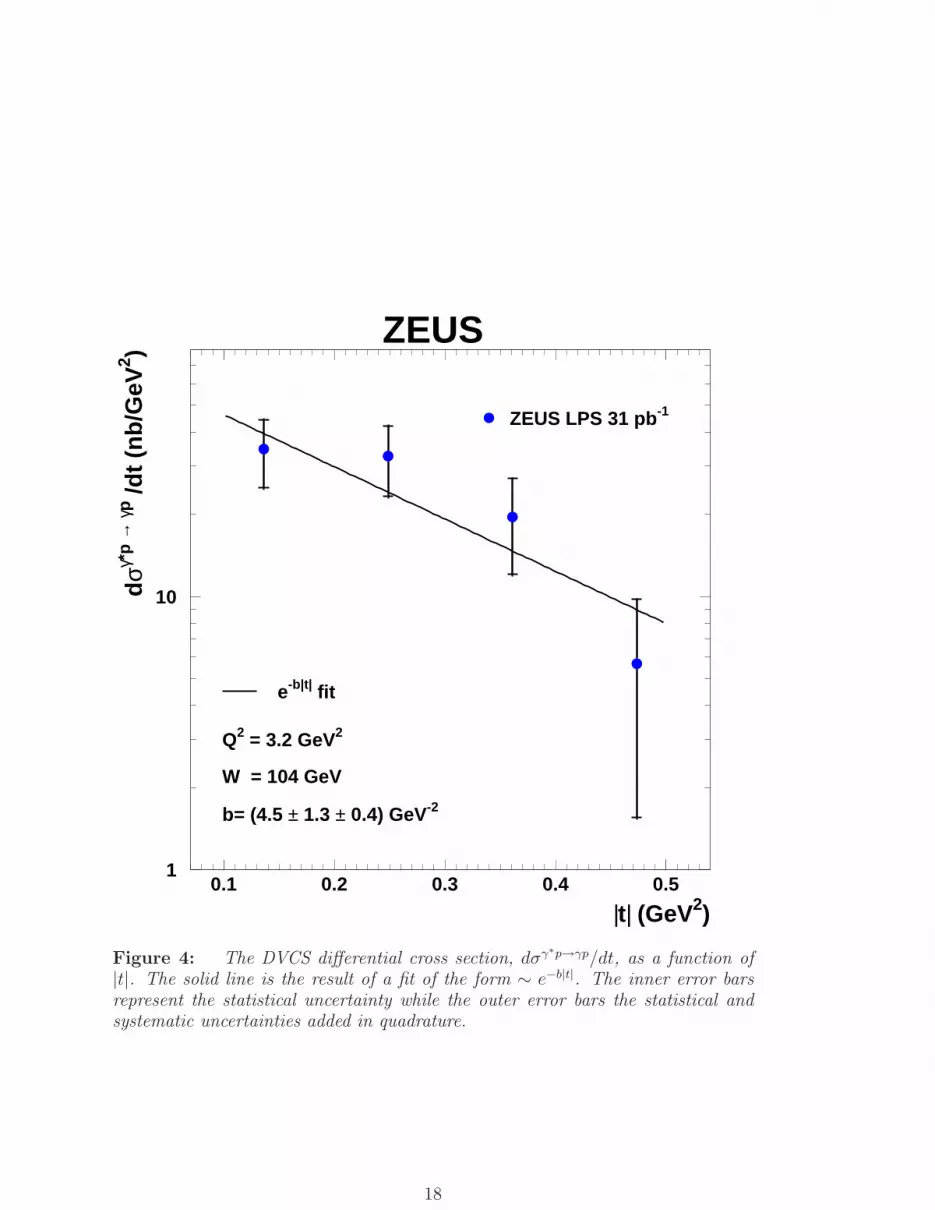
The first direct measurement of the differential cross section dσγ∗p→γp/dt, extracted from
the LPS-tagged events at Q2 = 3.2 GeV2 and at W = 104 GeV, is shown in Fig. 4. The
value of the slope parameter b extracted from an exponential fit to the differential cross
section, dσγ∗p→γp/dt ∝ e−b|t|, is b = 4.5 ± 1.3(stat.) ± 0.4(syst.) GeV−2 (χ2/ndf = 0.90).
This value is consistent with the results obtained by H1 [20] b = 5.45 ± 0.19(stat.) ±0.34(syst.) GeV−2 at Q2 = 8 GeV2 and W = 82 GeV, from the transverse-momentum
distribution of the photon candidate.
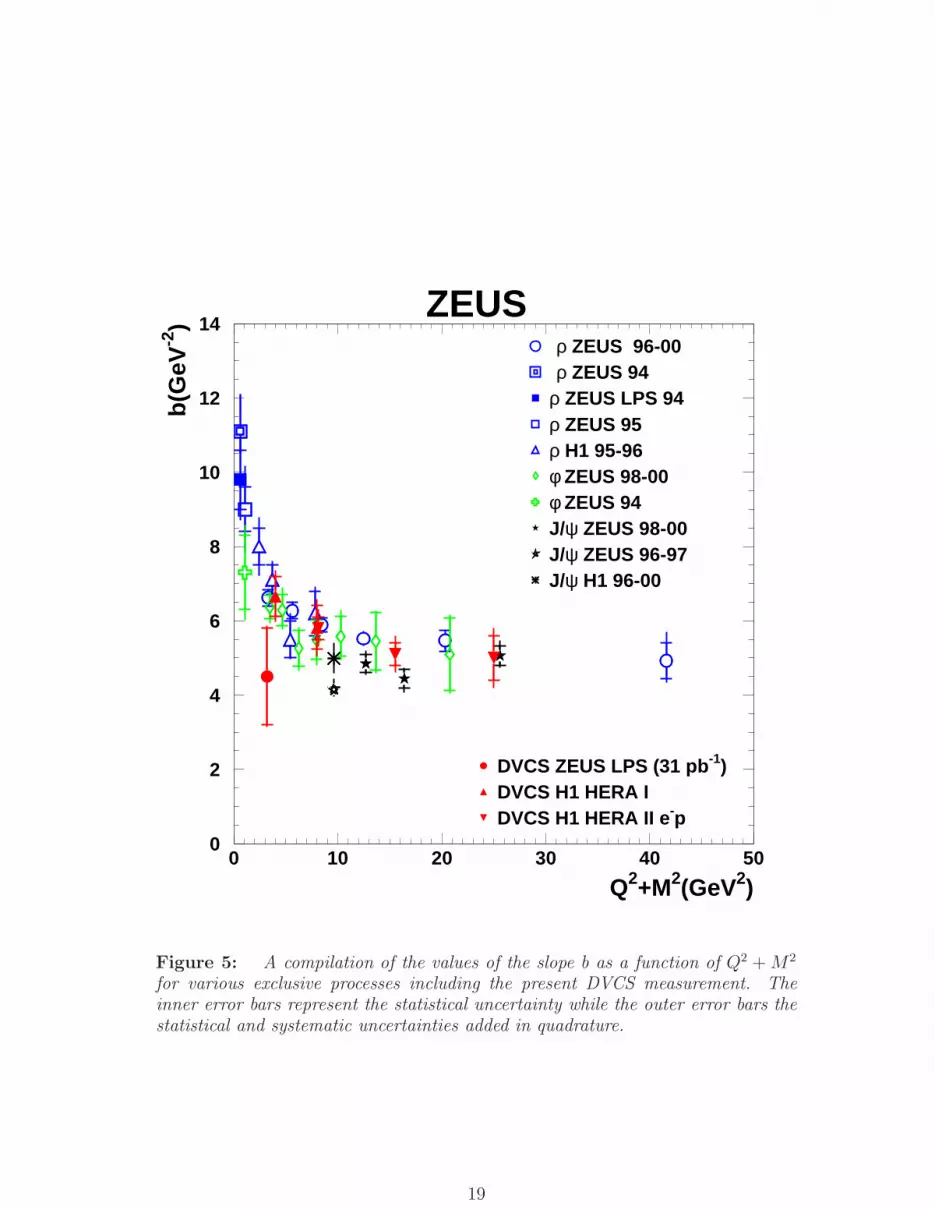
A compilation of b values as measured for various exclusive processes [14, 21], including
the result of this paper, is shown in Fig. 5 as a function of Q2 +M2, where M is the mass
of the exclusive final state. The b value presented here is lower but consistent with the
corresponding vector mesons and H1 DVCS values at similar scales. The fast rise of the
DVCS cross section with W at Q2 = 2.4 GeV2 and the low value of b at Q2 = 3.2 GeV2
indicate that the DVCS process is a hard process even at low Q2 values.
8 Summary
The DVCS cross section has been measured as a function of Q2 and W in the region
1.5 < Q2 < 100 GeV2 and 40 < W < 170 GeV. The measured cross section decreases
8
steeply with Q2, showing a dependence Q−2n, with n = 1.54 ± 0.05(stat.). The W cross
section rises with increasing W following a functional form W δ, with δ = 0.52±0.09(stat.)
and has little dependence on Q2.
For the first time, the DVCS differential cross section as a function of t was measured by
directly tagging the scattered proton. An exponential behaviour was assumed, the slope
parameter b = 4.5 ± 1.3(stat.) ± 0.4(syst.) GeV−2 was obtained from a fit to the data at
Q2 = 3.2 GeV2 and W = 104 GeV. These findings indicate that the DVCS process is a
hard process even at low Q2.
Acknowledgements
We thank the DESY Directorate for their support and encouragement. We are grateful
for the support of the DESY computing and network services. We are specially grate-
ful to the HERA machine group: collaboration with them was crucial to the successful
installation and operation of the leading proton spectrometer. The design, construction
and installation of the ZEUS detector were made possible by the ingenuity and effort of
many people who are not listed as authors.
9
References
[1] M. Diehl, T. Gousset, B. Pire and J. Ralston, Phys. Lett. B 411, 193 (1997).
[2] M. Burkardt, Int. J. Mod. Phys. A 18, 173 (2003).
[3] M. Diehl, Eur. Phys. J. C 25, 223 (2002).
[4] V. Guzey and T. Teckentrup, Phys. Rev. D 74, 54027 (2006).
[5] K. Kumericki, D. Mueller and K. Passek-Kumericki, Nucl. Phys. B 794, 244 (2008).
[6] L. Frankfurt, A. Freund and M. Strikman, Phys. Lett. B 460, 417 (1999).
[7] A.V. Belitsky, D. Muller and A. Kirchner, Nucl. Phys. B 629, 323 (2002).
[8] A. Freund and M. McDermott, Phys. Rev. D 65, 091901 (2002).
[9] ZEUS Coll., J. Breitweg et al., Phys. Lett. B 487, 273 (2000).
[10] ZEUS Coll., S. Chekanov et al., Nucl. Phys. B 718, 2 (2005).
[11] ZEUS Coll., S. Chekanov et al., Nucl. Phys. B 695, 3 (2004).
[12] ZEUS Coll., J. Breitweg et al., Eur. Phys. J. C 14, 213 (2000).
[13] H1 Coll., C. Adloff et al., Phys. Lett. B 483, 360 (2000).
[14] ZEUS Coll., S. Chekanov et al., PMC Phys. A 1, 6 (2007).
[15] H1 Coll., A. Aktas et al., Eur. Phys. J. C 46, 585 (2006).
[16] H1 Coll., C. Adloff et al., Eur. Phys. J. C 13, 371 (2000).
[17] H1 Coll., C. Adloff et al., Phys. Lett. B 517, 47 (2001).
[18] ZEUS Coll., S. Chekanov et al., Phys. Lett. B 573, 46 (2003).
[19] H1 Coll., A. Aktas et al., Eur. Phys. J. C 44, 1 (2005).
[20] H1 Coll., F.D. Aktas et al., Phys. Lett. B 659, 796 (2008).
[21] ZEUS Coll., M. Derrick et al., Z. Phys. C 73, 253 (1997).
[22] ZEUS Coll., S. Chekanov et al., Eur. Phys. J. C 38, 43 (2004).
[23] ZEUS Coll., U. Holm (ed.), The ZEUS Detector. Status Report (unpublished), DESY
(1993), available on http://www-zeus.desy.de/bluebook/bluebook.html.
[24] ZEUS Coll., M. Derrick et al., Phys. Lett. B 293, 465 (1992).
[25] N. Harnew et al., Nucl. Inst. Meth. A 279, 290 (1989);
B. Foster et al., Nucl. Phys. Proc. Suppl. B 32, 181 (1993);
B. Foster et al., Nucl. Inst. Meth. A 338, 254 (1994).
10
[26] M. Derrick et al., Nucl. Inst. Meth. A 309, 77 (1991);
A. Andresen et al., Nucl. Inst. Meth. A 309, 101 (1991);
A. Caldwell et al., Nucl. Inst. Meth. A 321, 356 (1992);
A. Bernstein et al., Nucl. Inst. Meth. A 336, 23 (1993).
[27] A. Bamberger et al., Nucl. Inst. Meth. A 401, 63 (1997).
[28] A. Dwurazny et al., Nucl. Inst. Meth. A 277, 176 (1989).
[29] ZEUS Coll., FPC group, A. Bamberger et al., Nucl. Inst. Meth. A 450, 235 (2000).
[30] J. Andruszkow et al., Preprint DESY-92-066, DESY, 1992;
ZEUS Coll., M. Derrick et al., Z. Phys. C 63, 391 (1994);
J. Andruszkow et al., Acta Phys. Pol. B 32, 2025 (2001).
[31] R. Brun et al., GEANT3. Technical Report CERN-DD/EE/84-1,CERN, 1987.
[32] P.R.B. Saull, A Monte Carlo Generator for Deeply Virtual Compton Scattering at
HERA, 1999, available on http://www-zeus.desy.de/physics/diff/pub/MC.
[33] L.L. Frankfurt, A. Freund and M. Strikman, Phys. Rev. D 58, 114001 (1998).
Erratum-ibid D 59 (1999) 119901.
[34] H. Abramowicz and A. Levy, Preprint DESY-97-251 (hep-ph/9712415), DESY, 1997.
[35] T. Abe, Comp. Phys. Comm. 136, 126 (2001).
[36] T. Ishikawa et al., GRACE manual: Automatic generation of tree amplitudes in
Standard Models: Version 1.0. KEK Report 92-19, 1993.
[37] K. Muchorowski, Ph.D. Thesis, Warsaw University, 1998 (unpublished).
[38] H. Spiesberger, An Event Generator for ep Interactions at HERA
Including Radiative Processes (Version 4.6), 1996, available on
http://www.desy.de/~hspiesb/heracles.html.
[39] W.H. Smith, K. Tokushuku and L.W. Wiggers, Proc. Computing in High-Energy
Physics (CHEP), Annecy, France, Sept. 1992, C. Verkerk and W. Wojcik (eds.),
p. 222, CERN, Geneva, Switzerland (1992). Also in preprint DESY 92-150B.
[40] H. Abramowicz, A. Caldwell and R. Sinkus, Nucl. Inst. Meth. A 365, 508 (1995);
R. Sinkus and T. Voss, Nucl. Inst. Meth. A 391, 360 (1997).
[41] R. Ciesielski, Exclusive J/Psi Production in Deep Inelastic ep Scattering in the ZEUS
exeriment at HERA. Ph.D. Thesis, Warsaw University, Warsaw, Poland, 2004.
[42] ZEUS Coll., S. Chekanov et al., Preprint DESY-08-176, DESY, 2008.
[43] ZEUS Coll., S. Chekanov et al., PMC Phys. A 1, 6 (2007).
11

[44] S. Bentvelsen, J. Engelen and P. Kooijman, Proc. Workshop on Physics at HERA,
W. Buchmuller and G. Ingelman (eds.), Vol. 1, p. 23, Hamburg, Germany, DESY
(1992);
K.C. Hoger, ibid, p.43.
[45] S. Fazio, Measurement of Deeply Virtual Compton Scattering cross sec-
tions at HERA and a new model for the DVCS amplitude. Ph.D. The-
sis, Calabria University, Rende (Cosenza), Italy, 2007, available on
http://www-zeus.desy.de/physics/diff/pub/theses.html.
[46] I. Grabowska-Bo ld, Measurement of Deeply Virtual Compton Scattering Using the
ZEUS Detector at HERA. Ph.D. Thesis, University of Mining and Metallurgy, Cra-
cow, Poland, Report DESY-THESIS-2004-034, 2003.
[47] ZEUS Coll., S. Chekanov et al., Eur. Phys. J. C 24, 345 (2002).
[48] ZEUS Coll., J. Breitweg et al., Eur. Phys. J. C 6, 603 (1999).
12
σγ∗p→γp
Q2 range (GeV2) Q2 (GeV2) σγ∗p→γp (nb)
1.5 - 5 3.25 21.28±0.92+1.02−1.34
5 - 10 7.5 5.87 ±0.42+0.14−0.30
10 - 15 12.5 3.27 ±0.33+0.07−0.16
15 - 25 20.0 1.23 ±0.21+0.05−0.08
25 - 40 32.5 0.55 ±0.18+0.04−0.04
40 - 100 70.0 0.16 ±0.07+0.02−0.02
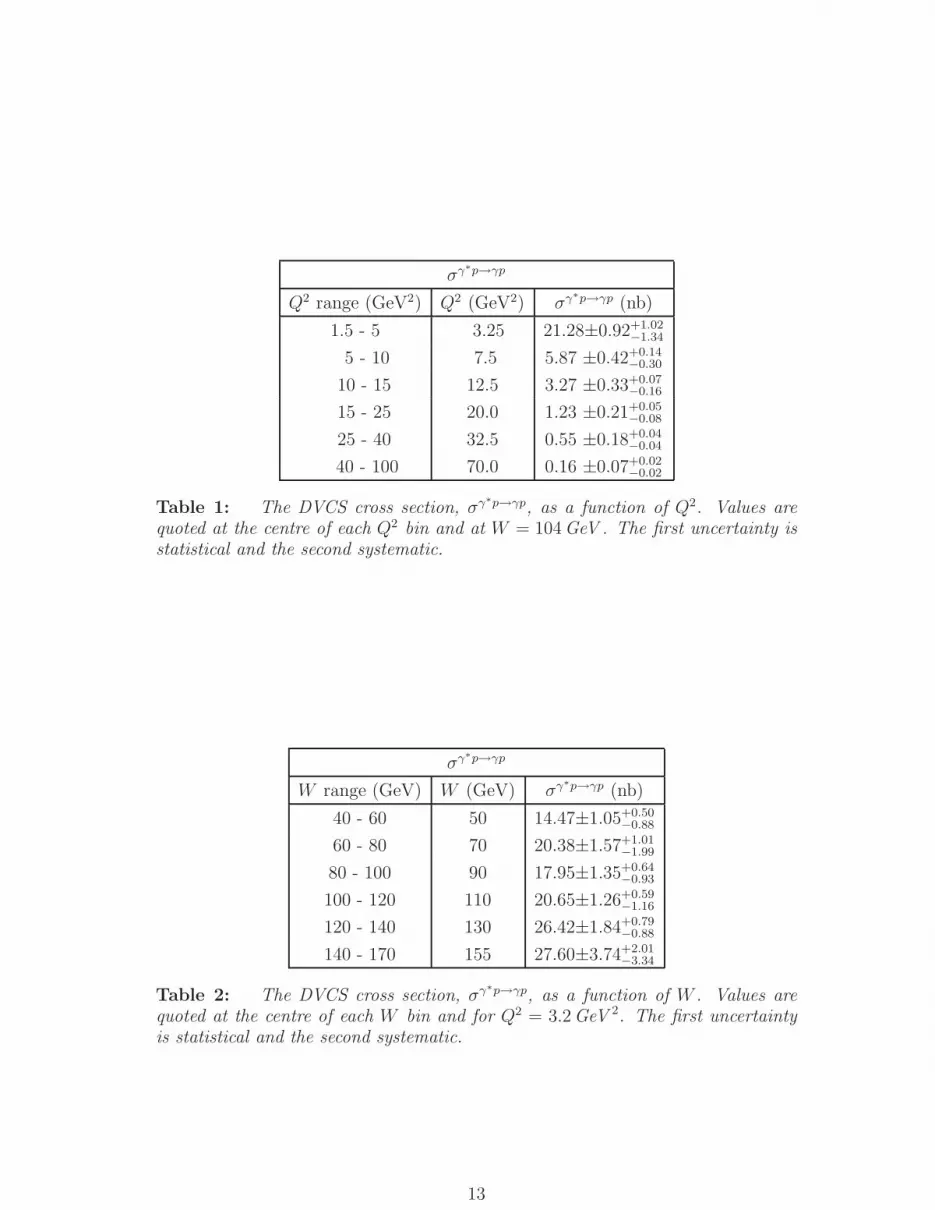
Table 1: The DVCS cross section, σγ∗p→γp, as a function of Q2. Values arequoted at the centre of each Q2 bin and at W = 104 GeV . The first uncertainty isstatistical and the second systematic.
σγ∗p→γp
W range (GeV) W (GeV) σγ∗p→γp (nb)
40 - 60 50 14.47±1.05+0.50−0.88
60 - 80 70 20.38±1.57+1.01−1.99
80 - 100 90 17.95±1.35+0.64−0.93
100 - 120 110 20.65±1.26+0.59−1.16
120 - 140 130 26.42±1.84+0.79−0.88
140 - 170 155 27.60±3.74+2.01−3.34
Table 2: The DVCS cross section, σγ∗p→γp, as a function of W . Values arequoted at the centre of each W bin and for Q2 = 3.2 GeV 2. The first uncertaintyis statistical and the second systematic.
13
σγ∗p→γp
W range W σγ∗p→γp (nb) σγ∗p→γp (nb) σγ∗p→γp (nb) σγ∗p→γp (nb)
(GeV) (GeV) Q2 = 2.4 GeV2 Q2 = 6.2 GeV2 Q2 = 9.9 GeV2 Q2 = 18.0 GeV2
40 - 65 52.5 27.06±3.44+4.37−4.42
65 - 90 77.5 22.36±3.11+3.40−1.73
90 - 115 102.5 26.49±1.89+0.89−1.44
115 - 140 127.5 35.94±2.63+1.81−1.89
140 - 170 155 35.72±9.47+3.01−2.94 16.93±2.43+1.37
−1.40 6.15±1.67+0.51−0.51 2.21±0.82+0.18
−0.18
Table 3: The DVCS cross section, σγ∗p→γp, as a function of W in four Q2 ranges.Values are quoted at the centre of each W bin and for the Q2 values listed. Thefirst uncertainty is statistical and the second systematic. The values for higher Q2
and lower W , shown in Fig. 3, are taken from a previous publication [18] and arenot repeated here.
dσγ∗p→γp/dt
t range (GeV2) t (GeV2) σγ∗p→γp/dt (nb/GeV2)
0.08 - 0.19 0.14 34.6±9.6± 2.4
0.19 - 0.31 0.25 32.7±9.4± 2.3
0.31 - 0.42 0.36 19.6±7.5± 1.4
0.42 - 0.53 0.47 5.7 ±4.1± 0.4
Table 4: The DVCS differential cross section, dσγ∗p→γp/dt, as a function of|t|. Values are quoted at the centre of each |t| bin and for Q2 = 3.2 GeV 2 andW = 104 GeV . The first uncertainty is statistical and the second systematic.
14
ZEUS
0
2500
dN
/dW
(G
eV-1
)
(a) INCLUSIVE
0
5000
dN
/dQ
2 (G
eV-2
) (b)INCLUSIVE
0
2000
0
2000
0
1000
50 100 150
W (GeV)
0
1000
10
Q2 (GeV2)
0
20
dN
/dx L (c) LPS
1
10
dN
/dt
(GeV
-2) (d)LPS
0
20
1
10 2
0
20
0.96 0.98 1 1.02
xL
1
10 2
0.1 0.2 0.3 0.4 0.5
|t| (GeV2)ZEUS (e-sample)
ZEUS (γ-sample )
ZEUS (γ-sample after BH and p-diss sub.)
e+e-+J/ψ
BH+e+e-+J/ψBH
BH+FFS (DVCS)
FFS (DVCS)
Figure 1: Distribution of (a) W , (b) Q2 in the inclusive sample and of (c) xL
and (d) |t| in the LPS sample, for the e-sample (top), the γ-sample (middle) andthe γ-sample after BH background and proton dissociation subtraction (bottom).Also shown are the expectations of the MC normalised to the luminosity of the dataand the contribution from exclusive dilepton production (e+e−).
15
ZEUS
10-1
1
10
0 20 40 60 80 100
(a)ZEUS 61 pb-1
W = 104 GeV
n = 1.53±0.05
Q-2n fit
Q2 (GeV2)
σγ*p
→ γ
p (
nb
)
510152025303540
45
40 60 80 100 120 140 160
W (GeV)
σγ*p
→ γ
p (
nb
)
Q2 = 3.2 GeV2(b)
W (GeV)
σγ*p
→ γ
p (
nb
)
δ = 0.52±0.09
Wδ fitZEUS 61 pb-1
Figure 2: (a) The DVCS cross section, σγ∗p→γp, as a function of Q2. The solidline is the result of a fit of the form ∼ Q−2n. (b) The DVCS cross section, σγ∗p→γp,as a function of W . The solid line is the result of a fit of the form ∼ W δ. Theinner error bars represent the statistical uncertainty while the outer error bars thestatistical and systematic uncertainties added in quadrature.
16
ZEUS
1
10
10 102
ZEUS 61 pb-1
ZEUS 96-00δ
0.44±0.19
0.75±0.17
0.84±0.18
0.76±0.22
Q2=2.4 GeV2
Q2=6.2 GeV2
Q2=9.9 GeV2
Q2=18 GeV2
W (GeV)
σγ*p
→ γ
p (
nb
)
Figure 3: The DVCS cross section, σγ∗p→γp, as a function of W for Q2 =2.4 GeV 2 (dots) shown together with previous ZEUS measurements (squares) [18].Also shown at higher Q2 are the new measurements at W = 155 GeV (dots). Thesolid lines are the results of a fit of the form σγ∗p→γp ∝ W δ. The values of δ andtheir statistical uncertainties are given in the figure. The inner error bars representthe statistical uncertainty while the outer error bars the statistical and systematicuncertainties added in quadrature.
17
ZEUS
|t| (GeV2)
dσγ*
p →
γp /d
t (n
b/G
eV2 )
e-b|t| fit
ZEUS LPS 31 pb-1
Q2 = 3.2 GeV2
W = 104 GeV
b= (4.5 ± 1.3 ± 0.4) GeV-2
1
10
0.1 0.2 0.3 0.4 0.5
Figure 4: The DVCS differential cross section, dσγ∗p→γp/dt, as a function of|t|. The solid line is the result of a fit of the form ∼ e−b|t|. The inner error barsrepresent the statistical uncertainty while the outer error bars the statistical andsystematic uncertainties added in quadrature.
18
ZEUSρ ZEUS 96-00ρ ZEUS 94
ρ ZEUS LPS 94ρ ZEUS 95ρ H1 95-96φ ZEUS 98-00φ ZEUS 94J/ψ ZEUS 98-00J/ψ ZEUS 96-97J/ψ H1 96-00
DVCS H1 HERA IDVCS H1 HERA II e-p
DVCS ZEUS LPS (31 pb-1)
Q2+M2(GeV2)
b(G
eV-2
)
0
2
4
6
8
10
12
14
0 10 20 30 40 50
Figure 5: A compilation of the values of the slope b as a function of Q2 + M2
for various exclusive processes including the present DVCS measurement. Theinner error bars represent the statistical uncertainty while the outer error bars thestatistical and systematic uncertainties added in quadrature.
19


