Embed Size (px)
Citation preview
International Journal of Psychophysiology 75 (2010) 249–257
Contents lists available at ScienceDirect
International Journal of Psychophysiology
j ourna l homepage: www.e lsev ie r.com/ locate / i jpsycho
Decreased P300 current source density in drug-naive first episode schizophrenicsrevealed by high density recording
Jijun Wang a, Yunxiang Tang b,⁎, Chunbo Li a,⁎, Axel Mecklinger c, Zeping Xiao a, Mingdao Zhang a,Yoshio Hirayasu d, Hiroto Hokama e, Hui Li a
a Shanghai Mental Health Center, Shanghai Jiaotong University School of Medicine, Shanghai 200030, Chinab Department of Psychology, Faculty of Health Service, Second Military Medical University, Shanghai 200433, Chinac Experimental Neuropsychology Unit Postfach 151150, D-66041 Saarbrücken, Germanyd Department of Psychiatry, Yokohama City University School of Medicine, Yokohama, Japane Department of Psychiatry, the University of Ryukyus, Okinawa, Japan
⁎ Corresponding authors. Tang is to be contacted aFaculty of Health Service, Second Military Medical UniveLi, Department of Biological Psychiatry, Shanghai MeJiaotong University School of Medicine, Shanghai 20007250 3065; fax: +86 21 6438 7986.
E-mail addresses: [email protected], [email protected] (C. Li).
0167-8760/$ – see front matter. Crown Copyright © 20doi:10.1016/j.ijpsycho.2009.12.005
a b s t r a c t
a r t i c l e i n f oArticle history:Received 16 May 2009Received in revised form 25 November 2009Accepted 3 December 2009Available online 24 December 2009
Keywords:First episode schizophreniaP300Low resolution of electromagnetic tomography(LORETA)
Decreased P300 amplitude has been reported in schizophrenics during their first episode. The brain sourcesthat contribute to this abnormality have not yet been well documented, and were investigated in the presentstudy using high density EEG recordings. Nineteen drug-naive first episode schizophrenics were compared to25 normal controls. Auditory P300 was elicited using an oddball paradigm. The brain sources of P300 ERPwere reconstructed by performing low resolution of electromagnetic tomography (LORETA) analysis. Nogroup difference in P300 latency was found. P300 amplitude was smaller for schizophrenics than forcontrols. Topographical analysis revealed that P300 amplitude reduction in schizophrenics was significantover left and medial regions of interest (ROIs). LORETA analysis of the P300 peak revealed that, the brainsources of P300 were symmetrically distributed over left and right hemispheres among the normal controls,but were asymmetrically distributed among the patients, with a reduction predominantly over the lefttemporal area. Statistical non-Parametric Mapping analysis identified 29 voxels of a significant groupdifference, which focused on left insula, left superior temporal gyrus (STG) and left postcentral gyrus (PCG).In addition, the mean P300 current source density over left insula, left STG and left PCG correlated inverselywith the patients' Positive and Negative Syndrome Scale scores. The neural substrates that contributed to thedecreased P300 amplitude in drug-naive first episode schizophrenia relatively focused on left STG and itsnearby areas. These areas are probably involved in the pathogenesis of schizophrenia, and possiblemechanisms for pathology need to be further clarified.
Crown Copyright © 2009 Published by Elsevier B.V. All rights reserved.
1. Introduction
Schizophrenia is a complex disorder, and its pathophysiology is bestunderstood through the findings from first episode schizophreniapatients,mainly because confounding factors such as chronicmorbidity,neuroleptic medication and/or hospitalization among chronic patients,and are difficult to disentangle from the disease process.
Cognitive deficits are one of the core features of schizophrenia andhave been investigated using P300 of auditory event-related poten-tials (ERPs) for several decades. However, the history of P300 study of
t Department of Psychology,rsity, Shanghai 200433, China.ntal Health Center, Shanghai30, China. Tel.: +86 21 6438
[email protected] (Y. Tang),
09 Published by Elsevier B.V. All rig
first episode schizophrenia is only about 10 years old. The character-istics of P300 abnormalities in first episode schizophrenia are similarto, but not identical to, those previously reported among patients witha more chronic course. Almost all studies have found P300 amplitudereduction among first episode schizophrenia patients (Hirayasu et al.,1998; Salisbury et al., 1998; McCarley et al., 2002; Brown et al., 2002;Demiralp et al., 2002; Wang et al., 2003b, 2005; van der Stelt et al.,2005; Renoult et al., 2007; Ozgürdal et al., 2008). Decreased P300amplitude was also found among individuals clinically at risk forpsychosis (Frommann et al., 2008; Ozgürdal et al., 2008). RegardingP300 latency, while Demiralp et al. (2002) reported P300 latencyprolongation in first episode patients, Wang et al. (2003b) found anincreased rate of P300 latency prolongation with age in drug-naivefirst episode schizophrenia. These results support the idea thatauditory P300 abnormalities in schizophrenia might reflect a primarypathophysiological feature of the illness.
In first episode schizophrenia patients, smaller P300 amplitude overthe left temporal area has been associated with smaller left superior
hts reserved.

Table 1Demographic and clinical characteristics of schizophrenia patients and controls(means±SD).
Schizophrenia patients Normal controls
Cases 19 25Gender (male/female) 12/7 12/13Age (years) 28.63±12.33 32.88±9.39Age range 16–57 17–52Onset age (years) 27.99±12.57Illness duration (months) 7.68±7.43
PANSSTotal score 62.0±10.4Positive score 16.7±5.8Negative score 16.2±6.9General psychopathological score 29.1±6.3
PANSS: Positive and Negative Syndrome Scale.
250 J. Wang et al. / International Journal of Psychophysiology 75 (2010) 249–257
temporal gyrus (STG) gray matter volume on magnetic resonanceimaging (MRI) (McCarley et al., 2002). To better understand the P300abnormalities in first episode schizophrenia it is important toinvestigate its neural substrates.
Topographical studies have revealed two components of P300,P3a and P3b (Soltani and Knight, 2000). The P3b, elicited by targetstimuli and recorded in most clinical settings, often shows itstopographical distribution with a maximum over the parietalregions (Katayama and Polich, 1998). It reflects the match betweenthe incoming stimulus and the voluntarily maintained attentionaltrace of the task relevant stimulus. The P3a, elicited by rare non-target stimuli, demonstrates its topographical distribution with amore anterior distribution than the P3b. The P3a is thought torepresent the automatic attentional switch to deviant stimuli ordistractors with respect to the ongoing task (Goldstein et al., 2002).Intracranial investigations have shown that the P3a generators arelocated in the anterior cingulate and fronto-parietal cortex and theP3b generators in superior temporal, posterior parietal, hippocam-pal, cingulate and frontal structures (Halgren et al., 1995a,b, 1998).However, the intracranial recordings are not suitable for investiga-tions involving healthy volunteers or psychiatric patients. Recently,the neural basis of P300 has been investigated using non-invasivefunctional magnetic resonance imaging (fMRI) by several studies,which confirmed the involvement of the frontal, parietal, temporaland cingulate areas in the genesis of P300 ERP (Mulert et al.,2004; Stevens et al., 2006). One limitation of fMRI technique inthe identification of brain generators of P300 is its relatively poortemporal resolution.
Electrophysiological techniques have a far better temporalresolution, and a newmethod of low resolution brain electromagnetictomography (LORETA) has been developed for reconstructing thecurrent source for a given scalp electrical distribution in recent years(Pascual-Marqui et al., 1994). LORETA does not require the assump-tion of a specific number of sources, and only assumes thatneighboring neurons are simultaneously and synchronously activatedand approximates the current density distribution throughout thebrain (Pascual-Marqui et al., 1994). Validation of LORETA has beenmade by comparing its findings with those by intracranial recordings(Lantz et al., 1997). Consistency between LORETA and neuroimagingstudies has been reported. Strik et al. (1998) used LORETA to identifyfrontal activation as the electrical generators of the P300 producedduring a cued continuous performance test, which is consistent withthe findings by previous positron emission tomography studies. Theelectrical sources of ictal EEG discharges revealed by LORETA wereconsistent with the results from well-defined symptomatic MRIlesions (Worrell et al., 2000). The time-course of activationscorresponding to P300 ERP has been investigated using both LORETAand fMRI (Mulert et al., 2004), and the LORETA findings were wellconsistent with those provided by fMRI. Through use of LORETA, P300sources were estimated to occur over bilateral prefrontal cortex, thetemporal lobe, the cingulum, the parieto-occipital junction, theinferior parietal cortex and the superior parietal cortex (Andereret al., 1998; Winterer et al., 2001; Wang et al., 2003a; Volpe et al.,2007). It is suggested that the main regions consistently attributed togenerating P300 related brain activation include the temporal–parietal junction, medial–temporal complex, and the lateral prefron-tal cortex (Soltani and Knight, 2000; Volpe et al., 2007).
Several studies had performed LORETA analysis to estimate theP300 neural sources among schizophrenia patients (Winterer et al.,2001; Wang et al., 2003a; Pae et al., 2003; Sumiyoshi et al., 2006;Kawasaki et al., 2007; Higuchi et al., 2008). Most of these studiesconsistently demonstrated that the affected P300 neural sources weremainly over the left hemisphere. The P300 current source density(CSD) over the left superior temporal gyrus (STG) had been correlatedwith the Positive subscale score of the brief psychiatric rating scale(BPRS) (including item hallucinatory behavior, hostility, unusual
thought content) and with the Negative subscale score of BPRS(including item blunted affect, emotional withdrawal, motor retar-dation) by Kawasaki et al. (2007). Higuchi et al. (2008) also found thata six-month treatment with olanzapine significantly increased P300source density in the left STG, which correlated with improvements ofnegative symptoms and verbal learning memory. However, none ofthese studies used the first episode patients, with the exception of thestudy by Kleinlogel et al. (2007), in which the NoGo-P300 to theNoGo-stimuli during a visual Continuous Performance Test (CPT) wasthe main focus. Therefore, the neural sources of auditory P300 havenot yet been investigated among first episode schizophrenia patientsusing LORETA.
The main purpose of the present study was to investigate auditoryP300 neural sources among first episode schizophrenia patients.Because a short history of antipsychotic medication possibly influ-ences the P300 ERP, only drug-naive patients were recruited. Inaddition, because both simulation and experimental studies clearlyindicate that at least 60 equally distributed electrodes are needed tocorrectly sample the scalp electric field that is submitted to the sourcelocalization procedure (Michel et al., 2004), a high density recordingof 60 channels was applied to record auditory P300 in the presentstudy.
2. Methods
2.1. Subjects
All subjects participating in the study signed an informed consentfor a protocol approved by the Institutional Review Board (IRB) ofShanghai Mental Health Center, Shanghai Jiaotong University. Thepatients were recruited from among those who first came to ShanghaiMental Health Center, Shanghai Jiaotong University, who met ICD-10diagnostic criteria for schizophrenia (F20), and who had no history ofantipsychotic medication use. Diagnosis verification was made by asenior psychiatrist at the rank of associate professor within twoweeks. Nineteen drug-naive first episode schizophrenia patients wereincluded in the present study. Clinical symptoms were evaluatedusing the Positive and Negative Syndrome Scale (PANSS) (Kay et al.,1987). The control subjects were 25 healthy subjects, none of whomhad a history of psychiatric illnesses. All the subjects, both the patientsand healthy controls, were free of neurological disease, mentalretardation, alcohol or substance abuse, and any physical illness thatmight affect cognitive function or produce hearing loss. Groupcharacteristics are shown in Table 1. All subjects were right-handedas revealed by Edinburgh Handedness Inventory (Oldfield andCarolus, 1971). No difference was found in age or in gendercomposition between two subject groups (PN0.05).
251J. Wang et al. / International Journal of Psychophysiology 75 (2010) 249–257
2.2. ERP recording procedure
The EEG was acquired using a 64 channel quick-cap (Neuroscan),in which 60 scalp electrodes (FP1, F7, FP2, F3, FC3, FT7, T7, F8, F4, Fz,FCz, C3, TP7, FT8, FC4, Cz, CPz, CP3, P3, P7, T8, TP8, C4, P8, CP4, P4, Pz,Oz, O1, O2, FPz, AF3, AF7, F5, AF8, AF4, F1, FC5, F6, F2, FC1, C5, FC6, FC2,C2, C1, CP1, CP5, P5, PO7, PO8, C6, CP6, P6, CP2, PO4, P2, POz, P1, PO3)were positioned according to the international 10–10 system. Thereference electrode was placed on the tip of nose. VEOG was obtainedfrom two electrodes positioned above and below the left eye, andHEOG was obtained from two electrodes placed at the outer canthi ofboth eyes. The EEG was sampled continuously at a rate of 1000 Hzwith a bandpass between 0.05 and 200 Hz. All impedances were keptbelow 10 kΩ.
Auditory ERPs were obtained using an oddball paradigm. Infre-quent (P=0.20) target tones (1500 Hz, 80 dB SPL) were presentedwith frequent (P=0.80) standard tones (1000 Hz, 80 dB SPL). Thetone duration was 50 ms with a rise and fall time of 10 ms. Auditorystimuli were delivered binaurally through headphones with variableinter-stimulus intervals ranging from 1.5 s to 2.5 s. There were 50target tones and 200 non-target tones. Subjects were asked to press a
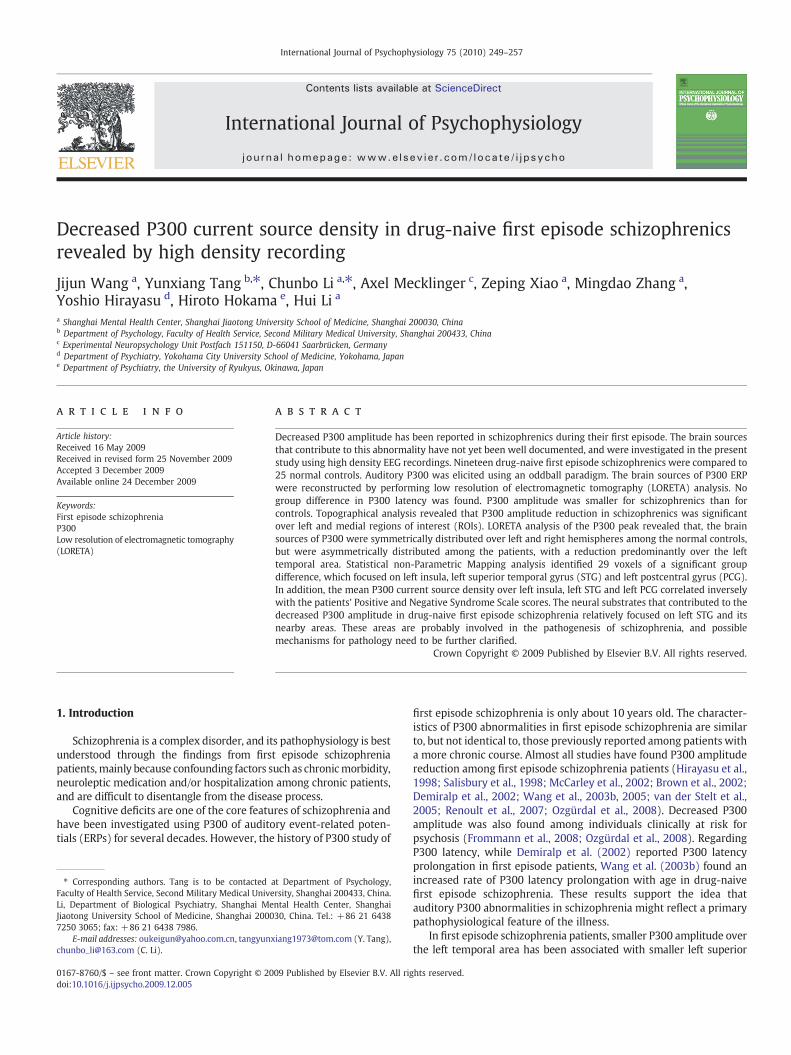
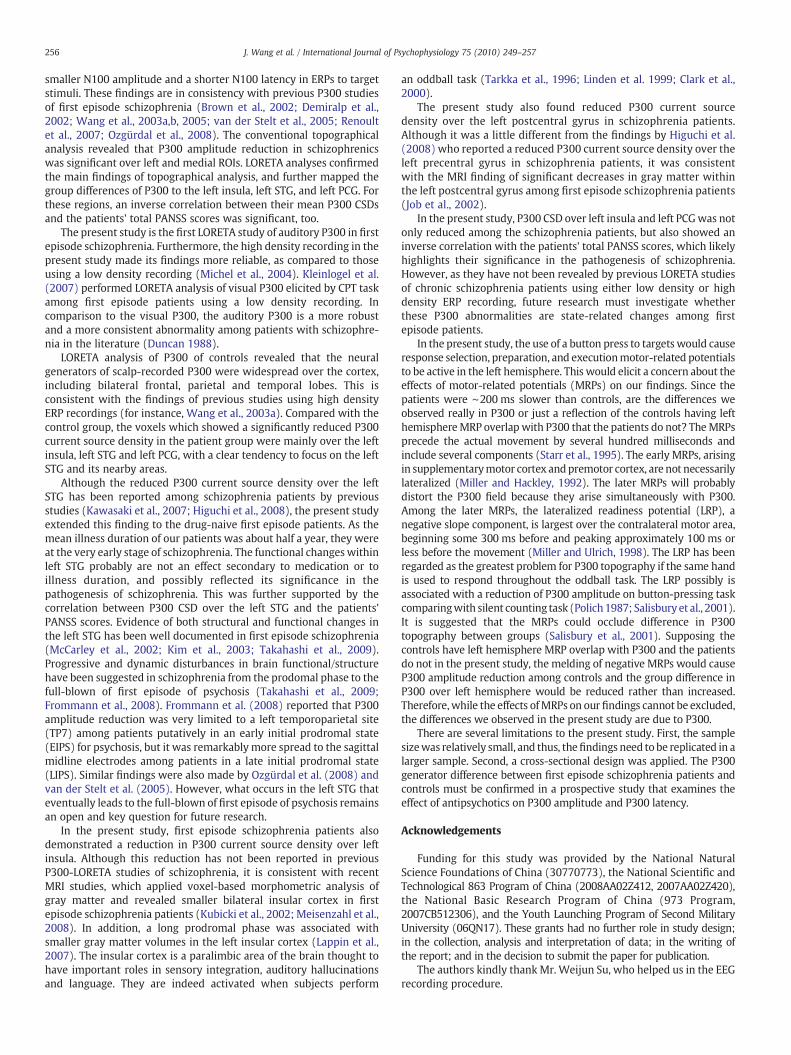
Fig. 1. The grand averaged ERP waveforms at F7, FT7, T7, TP7, P7, Fz, FCz, Cz, CPz, Pz, F8, FT8,group. Right side, the scalp distribution of P300 ERP at 347 ms after stimulus onset. The scalppredominantly over the left hemisphere.
button promptly and accurately in response to infrequent targettones. Averaging of ERP waves and related procedures was performedoffline using Brain Vision Analyzer software (1.05, Brain ProductsCompany, Germany).
Epoch lengthwas 700 ms, including a 100-ms pre-stimulus baseline.EEG trials with incorrect responses were excluded. Ocular correctionwas done offlinewith the algorithm of Gratton and Coles (Gratton et al.,1983). For artifact rejection, trials were excluded if their voltageexceeded ±70 μV. The mean averaged EEG responses to target toneswas34.3±6.7 trials for thepatients, 37.2±5.2 trials for the controls; thegroup difference was not significant (F=2.64, PN0.05).
2.3. Data analysis
Before peak identification, EEG was filtered with a 0.5 Hz high passfilter and with a 15 Hz low pass filter. Both P300 amplitude and P300latency were measured at all 60 recording sites as the most positivevoltage sampled in the latency range of 280∼450 ms after the stimulusonset. N100wasmeasured from the ERPs to both target and non-targetstimuli as the most negative peak between 50 and 150 ms at Fz.
T8, TP8 and P8, elicited by target stimuli. Black line, the control group; red line, patienttopographic images demonstrated that P300 amplitude reduction among patients was

Table 2Mean (±SD) of P300 amplitude and P300 latency at electrodes of ROIs.
ROI P300 amplitudes (μV) P300 latency (ms)
Controls Patients Controls Patients
Left-anteriorF7 5.48 (5.83) 3.39 (4.80) 338.5 (32.0) 337.9 (40.7)F5 6.09 (5.87) 3.31 (4.28) 339.9 (31.3) 333.1 (42.2)F3 6.64 (5.63) 2.37 (3.97) 340.5 (27.2) 347.6 (37.2)FT7 6.61 (6.14) 3.77 (4.31) 339.8 (29.0) 344.4 (40.0)FC5 6.86 (5.82) 3.35 (4.44) 340.5 (30.0) 342.2 (41.3)FC3 6.89 (4.92) 3.97 (4.52) 341.8 (29.1) 337.0 (38.4)
Left-posteriorP7 7.60 (4.10) 5.73 (4.09) 352.6 (27.4) 347.3 (42.0)P5 7.55 (4.08) 5.84 (4.02) 350.7 (29.7) 343.1 (41.1)P3 7.85 (4.25) 5.53 (4.12) 346.6 (28.5) 342.7 (46.4)TP7 7.27 (4.46) 5.30 (4.09) 351.3 (25.2) 346.8 (41.7)CP5 7.78 (4.25) 5.52 (3.70) 349.6 (26.6) 347.6 (38.8)CP3 9.08 (5.42) 5.90 (3.94) 348.5 (28.9) 341.6 (38.1)
Medial–anteriorF1 6.63 (6.08) 2.54 (4.63) 337.2 (29.7) 339.7 (38.0)Fz 6.62 (6.66) 2.65 (4.78) 337.8 (30.2) 341.2 (34.5)F2 6.03 (6.25) 2.58 (4.57) 337.6 (30.1) 341.2 (34.4)FC1 7.61 (6.20) 3.77 (4.60) 342.4 (30.9) 334.5 (38.4)FCz 7.47 (6.26) 3.79 (5.27) 341.3 (32.4) 338.4 (38.8)FC2 6.95 (5.97) 4.06 (4.76) 336.3 (30.1) 338.9 (36.0)
Medial–posteriorP1 9.30 (4.71) 6.39 (3.93) 350.7 (29.1) 350.5 (38.8)Pz 10.52 (5.50) 6.25 (3.90) 349.0 (29.8) 342.3 (41.4)P2 10.01 (5.53) 7.35 (3.72) 350.2 (31.6) 349.8 (39.0)CP1 9.88 (5.47) 5.82 (4.14) 347.9 (28.1) 343.3 (40.5)CPz 11.89 (6.28) 7.25 (4.99) 344.2 (29.5) 343.2 (41.4)CP2 10.81 (5.52) 6.83 (4.73) 350.0 (31.1) 342.2 (39.2)
Right-anteriorF8 5.90 (5.22) 4.20 (5.82) 342.3 (30.8) 336.3 (38.9)F6 5.71 (5.33) 3.85 (5.65) 342.3 (30.4) 338.6 (41.0)F4 6.02 (5.74) 4.15 (6.42) 340.2 (28.2) 338.2 (40.4)FT8 6.60 (4.46) 4.89 (5.05) 342.1 (29.5) 335.7 (37.8)FC6 5.87 (5.21) 3.83 (3.76) 341.2 (31.1) 334.3 (36.0)FC4 6.00 (4.41) 3.32 (3.22) 339.8 (28.9) 341.4 (32.7)
Right-posteriorP8 8.25 (5.85) 6.08 (3.96) 351.9 (36.7) 351.7 (42.9)P6 8.81 (5.35) 6.73 (4.25) 348.0 (34.7) 350.1 (40.1)P4 8.81 (5.30) 5.59 (5.18) 350.3 (34.3) 352.2 (40.7)TP8 7.23 (4.36) 5.92 (4.14) 348.4 (35.2) 349.6 (36.5)CP6 8.77 (4.98) 6.01 (3.88) 352.8 (30.2) 355.2 (38.5)CP4 10.46 (5.41) 6.95 (4.49) 350.4 (31.2) 342.0 (42.9)
252 J. Wang et al. / International Journal of Psychophysiology 75 (2010) 249–257
The group and topographical differences in P300 amplitude andP300 latency were evaluated using a repeated measures analysis ofvariance (ANOVA). The between subject factor of the omnibus ANOVAwas Group (2 levels: patients and controls). In order to explore thetopographical P300 differences between patients and controls, therecording sites were integrated into 6 regions of interest (ROIs)including both the left-to-right hemispheric dimension (3 levels:left, medial and right, LMR) and the anterior–posterior dimension(2 levels: anterior and posterior, AP). For each ROI, 6 recording siteswere included into the ANOVA as following: left-anterior (F7, F5, F3,FT7, FC5, FC3), left-posterior (TP7, CP5, CP3, P7, P5, P3), medial–anterior (F1, Fz, F2, FC1, FCz, FC2), medial–posterior (CP1, CPz, CP2,P1, Pz, P2), right-anterior (F8, F6, F4, FT8, FC6, FC4) and right-posterior (TP8, CP6, CP4, P8, P6, P4). Therefore, the overall ANOVA hadthree within-subject factors of LMR (3 levels: left, medial and right),AP (2 levels: anterior and posterior) and electrode (6 levels: 6different recording sites). Any significant interaction of group×LMR,group×AP or group×LMR×APwere further parsed in twoways: first,by examining the effect of LMR, AP or LMR×AP in each participantgroup, and second, by examining the effect of Group for each level ofLMR, AP or LMR×AP. When the Mauchly's sphericity assumptionabout the repeated measure factor was violated, the Greenhouse–Geisser correction of degrees of freedom was applied, with only thecorrected probability values reported. Post hoc assessment of multiplecomparisons employed Tukey's test.
LORETA images were obtained by estimating the current sourcedensity distribution for epochs of brain electric activity on a densegrid of 2394 voxels at 7-mm spatial resolution, which is establishedby Pascual-Marqui (1999) according to the digitized Talairachhuman brain altas (Pascual-Marqui, 1999). LORETA made use ofthe three-shell spherical head model registered to the Talairach atlasavailable as a digitized MRI from the Brain Imaging Centre, MontrealNeurologic Institute. Registration between spherical and realistichead geometry used EEG electrode coordinates reported by Towleet al. (1993). The solution space was restricted to cortical graymatter and the hippocampus, as determined by the correspondingdigitized Probability Atlas, which is also available from the BrainImaging Centre.
LORETA images were calculated for each subject using one digitalbin of the peak P300 at Pz in the time frame 280∼450 ms post-stimulus. The P300 LORETA images of the controls and of the patientswere obtained by separately averaging individual P300 LORETAresults for each group. The localization of the differences in P300current source density between the two groups was assessed byvoxel-by-voxel t-tests of the LORETA images of the log transformedcomputed current density power. In the resulting statistical three-dimensional images, cortical voxels that were significantly differentwere identified by a nonparametric approach using a randomizationstrategy (Nichols and Holmes, 2002) that determined the criticalprobability threshold values for the actual observed t-values withcorrection for multiple testing.
Relationships between P300 CSD values at voxels which show agroup difference and psychopathological assessments were evaluatedby performing Pearson's correlation test. If the voxels of groupdifference focus on some regions of interest (ROIs), exploratorycorrelational analyses will be performed for the mean P300 CSD valuesof all voxels within these ROIs and clinical measures. The significancelevel for all statistical tests was set at Pb0.05 (two-tailed).
3. Results
3.1. Behavioral performance and ERP waveforms
The button press accuracywas 90.78%±4.11% among schizophreniapatients, and98.79%±1.52% amongnormal controls. Themean reactiontime was 711.7±65.8 ms for the patients and 510.1±126.4 ms for the
controls. Overall, the patients responded less accurately (F=81.0,Pb0.001) and more slowly (F=39.9, Pb0.001) than the controls.
Fig. 1 shows ERP waveforms at F7, FT7, T7, TP7, P7, Fz, FCz, Cz, CPz,Pz, F8, FT8, T8, TP8 and P8, elicited by target stimuli. Visual inspectionrevealed that the P300 was remarkably smaller in the patients groupthan in the control group. The scalp topographic images demonstratedthat P300 amplitude reduction among patients was predominantlyover the left hemisphere.
3.2. Topographical comparison of P300 amplitude and P300 latencybetween patients and controls
The means of P300 amplitude and P300 latency at electrodes ofROIs are presented in Table 2. Overall, P300 amplitude was smaller forschizophrenia patients than for control subjects (F=4.40, df=1,42,P=0.042). The repeated measure ANOVA revealed a significant effectof LMR on P300 amplitude (F=9.11, df=2,84, P=0.001), suggestinga higher P300 amplitude over medial ROIs than over left or right ROIs.However, the factor of LMR demonstrated a significant interactionwith group (F=5.50, df=2,84, P=0.010). Follow-up ANOVAs foundthat, the effect of LMR was only significant for the control group

253J. Wang et al. / International Journal of Psychophysiology 75 (2010) 249–257
(F=16.50, df=2,48, Pb0.001) but insignificant for the patient group(F=1.53, df=2,36, P=0.233), the effect of group was significant forleft ROIs (F=4.11, df=1,42, P=0.049) and for medial ROIs (F=6.09,df=1,42, P=0.018), but insignificant for right ROIs (F=2.73,df=1,42, P=0.106). The overall ANOVA also detected a significanteffect of AP on P300 amplitude (F=35.90, df=1,42, Pb0.001),suggesting a higher P300 amplitude over posterior ROIs than overanterior ROIs. It showed no interaction with group (F=0.01,df=1,42, P=0.937). The interaction of LMR×AP was significant(F=10.81, df=1,42, Pb0.001), suggesting a more remarkable effectof LMR on P300 amplitude over posterior ROIs than over anteriorROIs. However, its interaction with group was insignificant (F=1.98,df=1,42, P=0.147).
P300 latency showed no significant group difference betweenschizophrenia patients and normal controls (F=0.06, df=1,42,P=0.812). The effect of LMR on P300 latency was insignificant(F=0.53, df=2,84, P=0.545), and without any significant interactionwith group (F=0.02, df=2,84, P=0.953). The effect of AP on P300latency was significant (F=5.58, df=1,42, P=0.023), suggesting alongerP300 latencyoverposteriorROIs thanover anteriorROIs, however,it showed no interaction with group (F=0.05, df=1,42, P=0.818). ForP300 latency, neither the interaction of LMR×AP nor the interaction ofgroup×LMR×AP was significant (for LMR×AP: F=0.97, df=2,84,P=0.370; for group×LMR×AP: F=1.47, df=2,84, P=0.237).
For the target ERPs at Fz, N100 amplitude was reduced significantlyamong patients (patients,−5.92±3.60 µV, controls,−8.86±4.20 µV;
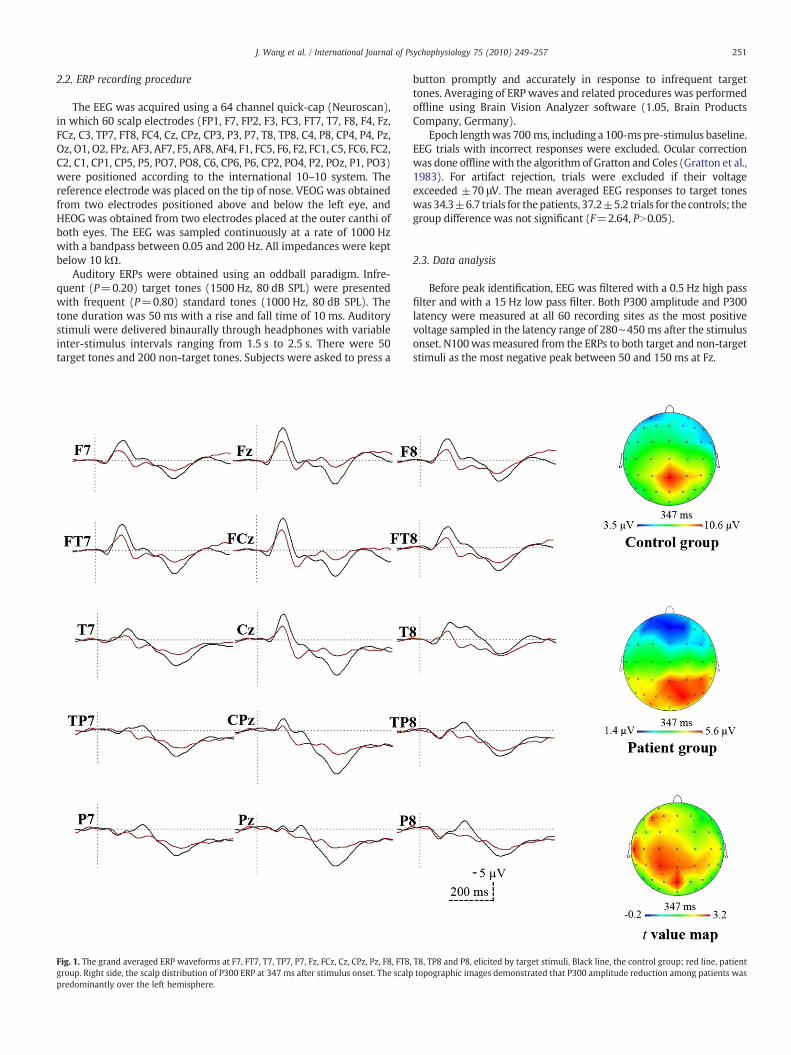
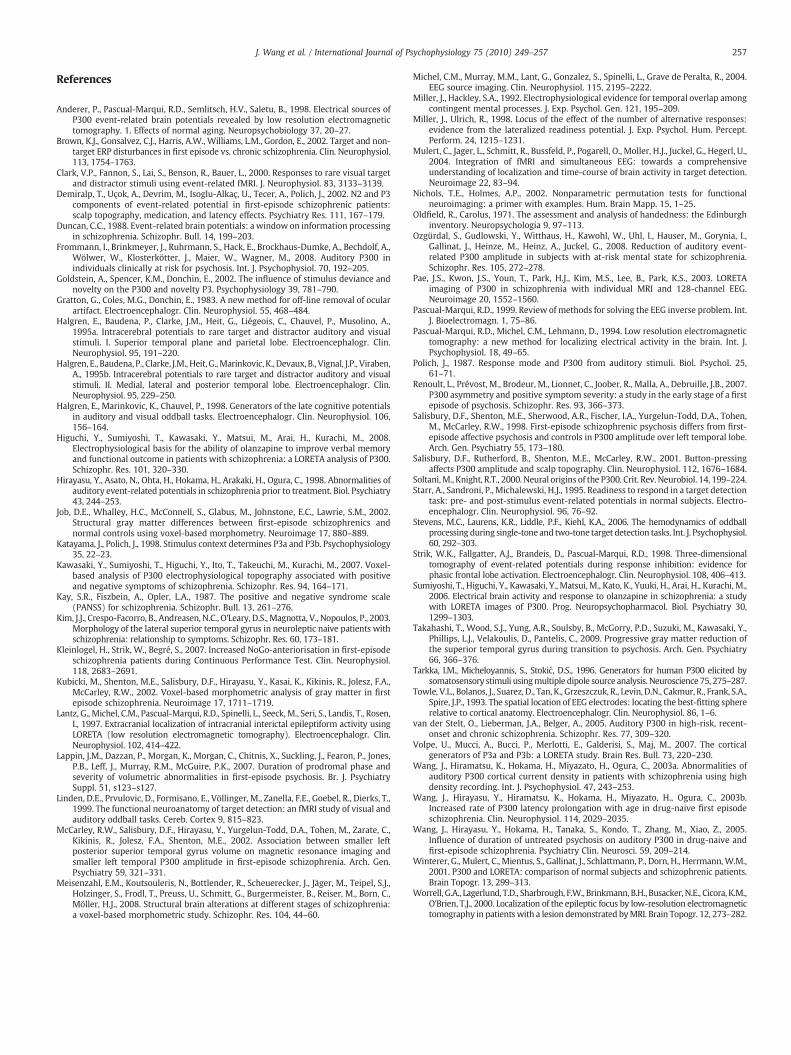
Fig. 2. The grand averaged LORETA images of P300 ERP and the maps showing
F=5.97, df=1,42, P=0.019), and N100 latency was shorter forschizophrenia patients than for controls (patients, 103.2±11.3 ms,controls, 111.5±4.7 ms; F=11.23, df=1,42, P=0.002). For the non-target ERPs at Fz, the reduction of N100 amplitude among schizo-phrenicswas approachinga significant level (patients,−5.36±3.33 µV,controls,−6.92±2.69 µV; F=2.97, df=1,42, P=0.092), but no groupdifference was found for N100 latency (patients, 102.2±11.9 ms,controls,106.6±9.1 ms; F=1.96, df=1,42, P=0.169).
3.3. Comparisons between healthy controls and schizophrenia patientson LORETA images
Individual P300 current density was averaged for each groupand the results are shown in Fig. 2. P300 current density in normalcontrols was symmetrically distributed over bilateral frontal lobes(medial frontal gyrus, paracentral lobule, superior frontal gyrus),bilateral parietal lobes (inferior parietal lobule, postcentral gyrus,precuneus, superior parietal lobule) and bilateral temporal lobes(superior temporal gyrus, middle temporal gyrus, inferior temporalgyrus and fusiform gyrus).
Schizophrenia patients showed P300 current density mainly overbilateral frontal lobe (medial frontal gyrus, middle frontal gyrus,paracentral lobule, superior frontal gyrus) and bilateral parietal lobes(inferior parietal lobule, postcentral gyrus, precuneus, superiorparietal lobule). Unlike the control group, it was not very strongover the temporal lobes, specifically over the left temporal lobe. In
the significant difference between the control group and the patient group.
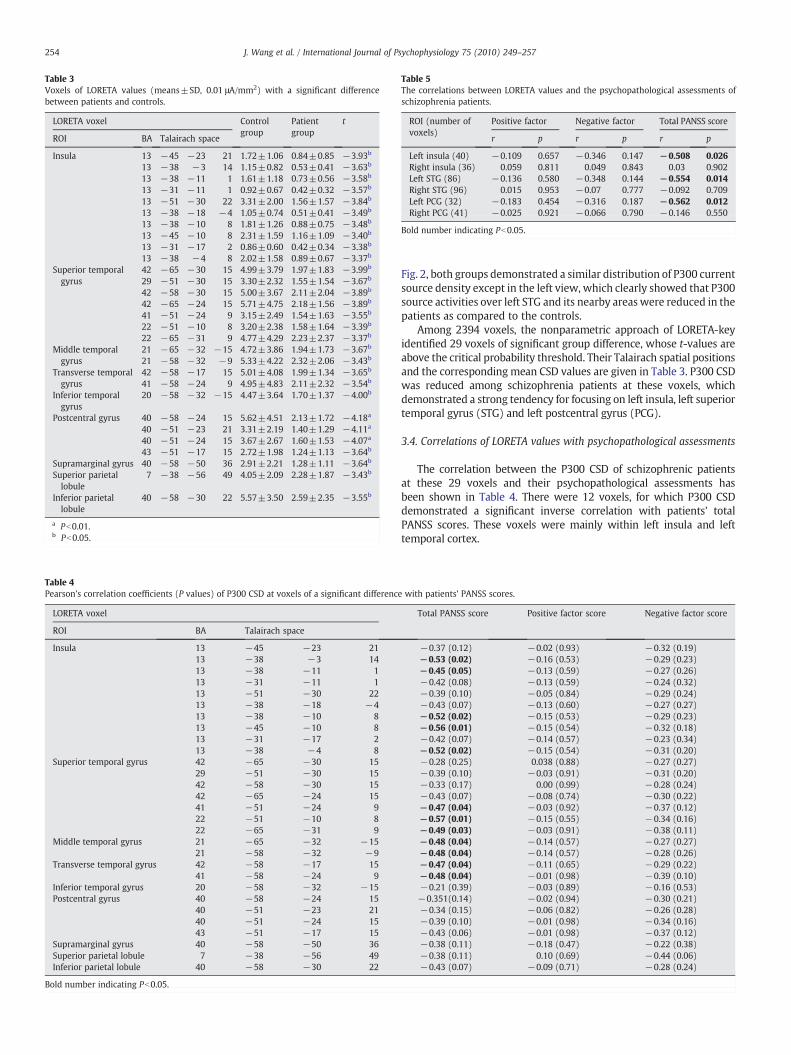
Table 3Voxels of LORETA values (means±SD, 0.01 μA/mm2) with a significant differencebetween patients and controls.
LORETA voxel Controlgroup
Patientgroup
t
ROI BA Talairach space
Insula 13 −45 −23 21 1.72±1.06 0.84±0.85 −3.93b
13 −38 −3 14 1.15±0.82 0.53±0.41 −3.63b
13 −38 −11 1 1.61±1.18 0.73±0.56 −3.58b
13 −31 −11 1 0.92±0.67 0.42±0.32 −3.57b
13 −51 −30 22 3.31±2.00 1.56±1.57 −3.84b
13 −38 −18 −4 1.05±0.74 0.51±0.41 −3.49b
13 −38 −10 8 1.81±1.26 0.88±0.75 −3.48b
13 −45 −10 8 2.31±1.59 1.16±1.09 −3.40b
13 −31 −17 2 0.86±0.60 0.42±0.34 −3.38b
13 −38 −4 8 2.02±1.58 0.89±0.67 −3.37b
Superior temporalgyrus
42 −65 −30 15 4.99±3.79 1.97±1.83 −3.99b
29 −51 −30 15 3.30±2.32 1.55±1.54 −3.67b
42 −58 −30 15 5.00±3.67 2.11±2.04 −3.89b
42 −65 −24 15 5.71±4.75 2.18±1.56 −3.89b
41 −51 −24 9 3.15±2.49 1.54±1.63 −3.55b
22 −51 −10 8 3.20±2.38 1.58±1.64 −3.39b
22 −65 −31 9 4.77±4.29 2.23±2.37 −3.37b
Middle temporalgyrus
21 −65 −32 −15 4.72±3.86 1.94±1.73 −3.67b
21 −58 −32 −9 5.33±4.22 2.32±2.06 −3.43b
Transverse temporalgyrus
42 −58 −17 15 5.01±4.08 1.99±1.34 −3.65b
41 −58 −24 9 4.95±4.83 2.11±2.32 −3.54b
Inferior temporalgyrus
20 −58 −32 −15 4.47±3.64 1.70±1.37 −4.00b
Postcentral gyrus 40 −58 −24 15 5.62±4.51 2.13±1.72 −4.18a
40 −51 −23 21 3.31±2.19 1.40±1.29 −4.11a
40 −51 −24 15 3.67±2.67 1.60±1.53 −4.07a
43 −51 −17 15 2.72±1.98 1.24±1.13 −3.64b
Supramarginal gyrus 40 −58 −50 36 2.91±2.21 1.28±1.11 −3.64b
Superior parietallobule
7 −38 −56 49 4.05±2.09 2.28±1.87 −3.43b
Inferior parietallobule
40 −58 −30 22 5.57±3.50 2.59±2.35 −3.55b
a Pb0.01.b Pb0.05.
Table 4Pearson's correlation coefficients (P values) of P300 CSD at voxels of a significant differenc
LORETA voxel
ROI BA Talairach space
Insula 13 −45 −23 2113 −38 −3 1413 −38 −11 113 −31 −11 113 −51 −30 2213 −38 −18 −413 −38 −10 813 −45 −10 813 −31 −17 213 −38 −4 8
Superior temporal gyrus 42 −65 −30 1529 −51 −30 1542 −58 −30 1542 −65 −24 1541 −51 −24 922 −51 −10 822 −65 −31 9
Middle temporal gyrus 21 −65 −32 −1521 −58 −32 −9
Transverse temporal gyrus 42 −58 −17 1541 −58 −24 9
Inferior temporal gyrus 20 −58 −32 −15Postcentral gyrus 40 −58 −24 15
40 −51 −23 2140 −51 −24 1543 −51 −17 15
Supramarginal gyrus 40 −58 −50 36Superior parietal lobule 7 −38 −56 49Inferior parietal lobule 40 −58 −30 22
Bold number indicating Pb0.05.
Table 5The correlations between LORETA values and the psychopathological assessments ofschizophrenia patients.
ROI (number ofvoxels)
Positive factor Negative factor Total PANSS score
r p r p r p
Left insula (40) −0.109 0.657 −0.346 0.147 −0.508 0.026Right insula (36) 0.059 0.811 0.049 0.843 0.03 0.902Left STG (86) −0.136 0.580 −0.348 0.144 −0.554 0.014Right STG (96) 0.015 0.953 −0.07 0.777 −0.092 0.709Left PCG (32) −0.183 0.454 −0.316 0.187 −0.562 0.012Right PCG (41) −0.025 0.921 −0.066 0.790 −0.146 0.550
Bold number indicating Pb0.05.
254 J. Wang et al. / International Journal of Psychophysiology 75 (2010) 249–257
Fig. 2, both groups demonstrated a similar distribution of P300 currentsource density except in the left view, which clearly showed that P300source activities over left STG and its nearby areas were reduced in thepatients as compared to the controls.
Among 2394 voxels, the nonparametric approach of LORETA-keyidentified 29 voxels of significant group difference, whose t-values areabove the critical probability threshold. Their Talairach spatial positionsand the corresponding mean CSD values are given in Table 3. P300 CSDwas reduced among schizophrenia patients at these voxels, whichdemonstrated a strong tendency for focusing on left insula, left superiortemporal gyrus (STG) and left postcentral gyrus (PCG).
3.4. Correlations of LORETA values with psychopathological assessments
The correlation between the P300 CSD of schizophrenic patientsat these 29 voxels and their psychopathological assessments hasbeen shown in Table 4. There were 12 voxels, for which P300 CSDdemonstrated a significant inverse correlation with patients' totalPANSS scores. These voxels were mainly within left insula and lefttemporal cortex.
e with patients' PANSS scores.
Total PANSS score Positive factor score Negative factor score
−0.37 (0.12) −0.02 (0.93) −0.32 (0.19)−0.53 (0.02) −0.16 (0.53) −0.29 (0.23)−0.45 (0.05) −0.13 (0.59) −0.27 (0.26)−0.42 (0.08) −0.13 (0.59) −0.24 (0.32)−0.39 (0.10) −0.05 (0.84) −0.29 (0.24)−0.43 (0.07) −0.13 (0.60) −0.27 (0.27)−0.52 (0.02) −0.15 (0.53) −0.29 (0.23)−0.56 (0.01) −0.15 (0.54) −0.32 (0.18)−0.42 (0.07) −0.14 (0.57) −0.23 (0.34)−0.52 (0.02) −0.15 (0.54) −0.31 (0.20)−0.28 (0.25) 0.038 (0.88) −0.27 (0.27)−0.39 (0.10) −0.03 (0.91) −0.31 (0.20)−0.33 (0.17) 0.00 (0.99) −0.28 (0.24)−0.43 (0.07) −0.08 (0.74) −0.30 (0.22)−0.47 (0.04) −0.03 (0.92) −0.37 (0.12)−0.57 (0.01) −0.15 (0.55) −0.34 (0.16)−0.49 (0.03) −0.03 (0.91) −0.38 (0.11)−0.48 (0.04) −0.14 (0.57) −0.27 (0.27)−0.48 (0.04) −0.14 (0.57) −0.28 (0.26)−0.47 (0.04) −0.11 (0.65) −0.29 (0.22)−0.48 (0.04) −0.01 (0.98) −0.39 (0.10)−0.21 (0.39) −0.03 (0.89) −0.16 (0.53)−0.351(0.14) −0.02 (0.94) −0.30 (0.21)−0.34 (0.15) −0.06 (0.82) −0.26 (0.28)−0.39 (0.10) −0.01 (0.98) −0.34 (0.16)−0.43 (0.06) −0.01 (0.98) −0.37 (0.12)−0.38 (0.11) −0.18 (0.47) −0.22 (0.38)−0.38 (0.11) 0.10 (0.69) −0.44 (0.06)−0.43 (0.07) −0.09 (0.71) −0.28 (0.24)
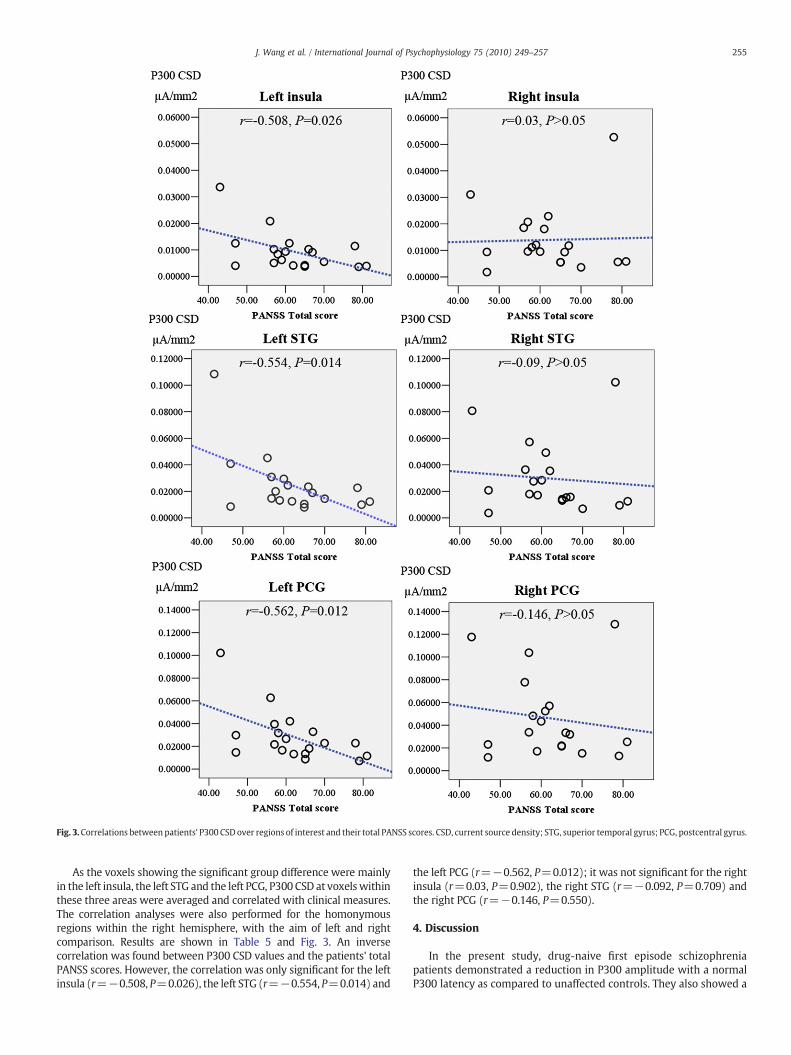
Fig. 3.Correlations between patients' P300 CSD over regions of interest and their total PANSS scores. CSD, current source density; STG, superior temporal gyrus; PCG, postcentral gyrus.
255J. Wang et al. / International Journal of Psychophysiology 75 (2010) 249–257
As the voxels showing the significant group difference were mainlyin the left insula, the left STG and the left PCG, P300 CSD at voxelswithinthese three areas were averaged and correlated with clinical measures.The correlation analyses were also performed for the homonymousregions within the right hemisphere, with the aim of left and rightcomparison. Results are shown in Table 5 and Fig. 3. An inversecorrelation was found between P300 CSD values and the patients' totalPANSS scores. However, the correlation was only significant for the leftinsula (r=−0.508, P=0.026), the left STG (r=−0.554, P=0.014) and
the left PCG (r=−0.562, P=0.012); it was not significant for the rightinsula (r=0.03, P=0.902), the right STG (r=−0.092, P=0.709) andthe right PCG (r=−0.146, P=0.550).
4. Discussion
In the present study, drug-naive first episode schizophreniapatients demonstrated a reduction in P300 amplitude with a normalP300 latency as compared to unaffected controls. They also showed a
256 J. Wang et al. / International Journal of Psychophysiology 75 (2010) 249–257
smaller N100 amplitude and a shorter N100 latency in ERPs to targetstimuli. These findings are in consistency with previous P300 studiesof first episode schizophrenia (Brown et al., 2002; Demiralp et al.,2002; Wang et al., 2003a,b, 2005; van der Stelt et al., 2005; Renoultet al., 2007; Ozgürdal et al., 2008). The conventional topographicalanalysis revealed that P300 amplitude reduction in schizophrenicswas significant over left and medial ROIs. LORETA analyses confirmedthe main findings of topographical analysis, and further mapped thegroup differences of P300 to the left insula, left STG, and left PCG. Forthese regions, an inverse correlation between their mean P300 CSDsand the patients' total PANSS scores was significant, too.
The present study is the first LORETA study of auditory P300 in firstepisode schizophrenia. Furthermore, the high density recording in thepresent study made its findings more reliable, as compared to thoseusing a low density recording (Michel et al., 2004). Kleinlogel et al.(2007) performed LORETA analysis of visual P300 elicited by CPT taskamong first episode patients using a low density recording. Incomparison to the visual P300, the auditory P300 is a more robustand a more consistent abnormality among patients with schizophre-nia in the literature (Duncan 1988).
LORETA analysis of P300 of controls revealed that the neuralgenerators of scalp-recorded P300 were widespread over the cortex,including bilateral frontal, parietal and temporal lobes. This isconsistent with the findings of previous studies using high densityERP recordings (for instance, Wang et al., 2003a). Compared with thecontrol group, the voxels which showed a significantly reduced P300current source density in the patient group were mainly over the leftinsula, left STG and left PCG, with a clear tendency to focus on the leftSTG and its nearby areas.
Although the reduced P300 current source density over the leftSTG has been reported among schizophrenia patients by previousstudies (Kawasaki et al., 2007; Higuchi et al., 2008), the present studyextended this finding to the drug-naive first episode patients. As themean illness duration of our patients was about half a year, they wereat the very early stage of schizophrenia. The functional changeswithinleft STG probably are not an effect secondary to medication or toillness duration, and possibly reflected its significance in thepathogenesis of schizophrenia. This was further supported by thecorrelation between P300 CSD over the left STG and the patients'PANSS scores. Evidence of both structural and functional changes inthe left STG has been well documented in first episode schizophrenia(McCarley et al., 2002; Kim et al., 2003; Takahashi et al., 2009).Progressive and dynamic disturbances in brain functional/structurehave been suggested in schizophrenia from the prodomal phase to thefull-blown of first episode of psychosis (Takahashi et al., 2009;Frommann et al., 2008). Frommann et al. (2008) reported that P300amplitude reduction was very limited to a left temporoparietal site(TP7) among patients putatively in an early initial prodromal state(EIPS) for psychosis, but it was remarkably more spread to the sagittalmidline electrodes among patients in a late initial prodromal state(LIPS). Similar findings were also made by Ozgürdal et al. (2008) andvan der Stelt et al. (2005). However, what occurs in the left STG thateventually leads to the full-blown of first episode of psychosis remainsan open and key question for future research.
In the present study, first episode schizophrenia patients alsodemonstrated a reduction in P300 current source density over leftinsula. Although this reduction has not been reported in previousP300-LORETA studies of schizophrenia, it is consistent with recentMRI studies, which applied voxel-based morphometric analysis ofgray matter and revealed smaller bilateral insular cortex in firstepisode schizophrenia patients (Kubicki et al., 2002; Meisenzahl et al.,2008). In addition, a long prodromal phase was associated withsmaller gray matter volumes in the left insular cortex (Lappin et al.,2007). The insular cortex is a paralimbic area of the brain thought tohave important roles in sensory integration, auditory hallucinationsand language. They are indeed activated when subjects perform
an oddball task (Tarkka et al., 1996; Linden et al. 1999; Clark et al.,2000).
The present study also found reduced P300 current sourcedensity over the left postcentral gyrus in schizophrenia patients.Although it was a little different from the findings by Higuchi et al.(2008) who reported a reduced P300 current source density over theleft precentral gyrus in schizophrenia patients, it was consistentwith the MRI finding of significant decreases in gray matter withinthe left postcentral gyrus among first episode schizophrenia patients(Job et al., 2002).
In the present study, P300 CSD over left insula and left PCGwas notonly reduced among the schizophrenia patients, but also showed aninverse correlation with the patients' total PANSS scores, which likelyhighlights their significance in the pathogenesis of schizophrenia.However, as they have not been revealed by previous LORETA studiesof chronic schizophrenia patients using either low density or highdensity ERP recording, future research must investigate whetherthese P300 abnormalities are state-related changes among firstepisode patients.
In the present study, the use of a button press to targets would causeresponse selection, preparation, and executionmotor-related potentialsto be active in the left hemisphere. This would elicit a concern about theeffects of motor-related potentials (MRPs) on our findings. Since thepatients were ∼200 ms slower than controls, are the differences weobserved really in P300 or just a reflection of the controls having lefthemisphereMRP overlapwith P300 that the patients do not? TheMRPsprecede the actual movement by several hundred milliseconds andinclude several components (Starr et al., 1995). The early MRPs, arisingin supplementarymotor cortex andpremotor cortex, are not necessarilylateralized (Miller and Hackley, 1992). The later MRPs will probablydistort the P300 field because they arise simultaneously with P300.Among the later MRPs, the lateralized readiness potential (LRP), anegative slope component, is largest over the contralateral motor area,beginning some 300 ms before and peaking approximately 100 ms orless before the movement (Miller and Ulrich, 1998). The LRP has beenregarded as the greatest problem for P300 topography if the same handis used to respond throughout the oddball task. The LRP possibly isassociated with a reduction of P300 amplitude on button-pressing taskcomparingwith silent counting task (Polich1987; Salisbury et al., 2001).It is suggested that the MRPs could occlude difference in P300topography between groups (Salisbury et al., 2001). Supposing thecontrols have left hemisphere MRP overlap with P300 and the patientsdo not in the present study, the melding of negative MRPs would causeP300 amplitude reduction among controls and the group difference inP300 over left hemisphere would be reduced rather than increased.Therefore,while the effects ofMRPs on our findings cannot be excluded,the differences we observed in the present study are due to P300.
There are several limitations to the present study. First, the samplesizewas relatively small, and thus, thefindings need tobe replicated in alarger sample. Second, a cross-sectional design was applied. The P300generator difference between first episode schizophrenia patients andcontrols must be confirmed in a prospective study that examines theeffect of antipsychotics on P300 amplitude and P300 latency.
Acknowledgements
Funding for this study was provided by the National NaturalScience Foundations of China (30770773), the National Scientific andTechnological 863 Program of China (2008AA02Z412, 2007AA02Z420),the National Basic Research Program of China (973 Program,2007CB512306), and the Youth Launching Program of Second MilitaryUniversity (06QN17). These grants had no further role in study design;in the collection, analysis and interpretation of data; in the writing ofthe report; and in the decision to submit the paper for publication.
The authors kindly thank Mr. Weijun Su, who helped us in the EEGrecording procedure.
257J. Wang et al. / International Journal of Psychophysiology 75 (2010) 249–257
References
Anderer, P., Pascual-Marqui, R.D., Semlitsch, H.V., Saletu, B., 1998. Electrical sources ofP300 event-related brain potentials revealed by low resolution electromagnetictomography. 1. Effects of normal aging. Neuropsychobiology 37, 20–27.
Brown, K.J., Gonsalvez, C.J., Harris, A.W., Williams, L.M., Gordon, E., 2002. Target and non-target ERP disturbances in first episode vs. chronic schizophrenia. Clin. Neurophysiol.113, 1754–1763.
Clark, V.P., Fannon, S., Lai, S., Benson, R., Bauer, L., 2000. Responses to rare visual targetand distractor stimuli using event-related fMRI. J. Neurophysiol. 83, 3133–3139.
Demiralp, T., Uçok, A., Devrim, M., Isoglu-Alkaç, U., Tecer, A., Polich, J., 2002. N2 and P3components of event-related potential in first-episode schizophrenic patients:scalp topography, medication, and latency effects. Psychiatry Res. 111, 167–179.
Duncan, C.C., 1988. Event-related brain potentials: a window on information processingin schizophrenia. Schizophr. Bull. 14, 199–203.
Frommann, I., Brinkmeyer, J., Ruhrmann, S., Hack, E., Brockhaus-Dumke, A., Bechdolf, A.,Wölwer, W., Klosterkötter, J., Maier, W., Wagner, M., 2008. Auditory P300 inindividuals clinically at risk for psychosis. Int. J. Psychophysiol. 70, 192–205.
Goldstein, A., Spencer, K.M., Donchin, E., 2002. The influence of stimulus deviance andnovelty on the P300 and novelty P3. Psychophysiology 39, 781–790.
Gratton, G., Coles, M.G., Donchin, E., 1983. A new method for off-line removal of ocularartifact. Electroencephalogr. Clin. Neurophysiol. 55, 468–484.
Halgren, E., Baudena, P., Clarke, J.M., Heit, G., Liégeois, C., Chauvel, P., Musolino, A.,1995a. Intracerebral potentials to rare target and distractor auditory and visualstimuli. I. Superior temporal plane and parietal lobe. Electroencephalogr. Clin.Neurophysiol. 95, 191–220.
Halgren, E., Baudena, P., Clarke, J.M., Heit, G.,Marinkovic, K., Devaux, B., Vignal, J.P., Viraben,A., 1995b. Intracerebral potentials to rare target and distractor auditory and visualstimuli. II. Medial, lateral and posterior temporal lobe. Electroencephalogr. Clin.Neurophysiol. 95, 229–250.
Halgren, E., Marinkovic, K., Chauvel, P., 1998. Generators of the late cognitive potentialsin auditory and visual oddball tasks. Electroencephalogr. Clin. Neurophysiol. 106,156–164.
Higuchi, Y., Sumiyoshi, T., Kawasaki, Y., Matsui, M., Arai, H., Kurachi, M., 2008.Electrophysiological basis for the ability of olanzapine to improve verbal memoryand functional outcome in patients with schizophrenia: a LORETA analysis of P300.Schizophr. Res. 101, 320–330.
Hirayasu, Y., Asato, N., Ohta, H., Hokama, H., Arakaki, H., Ogura, C., 1998. Abnormalities ofauditory event-related potentials in schizophrenia prior to treatment. Biol. Psychiatry43, 244–253.
Job, D.E., Whalley, H.C., McConnell, S., Glabus, M., Johnstone, E.C., Lawrie, S.M., 2002.Structural gray matter differences between first-episode schizophrenics andnormal controls using voxel-based morphometry. Neuroimage 17, 880–889.
Katayama, J., Polich, J., 1998. Stimulus context determines P3a and P3b. Psychophysiology35, 22–23.
Kawasaki, Y., Sumiyoshi, T., Higuchi, Y., Ito, T., Takeuchi, M., Kurachi, M., 2007. Voxel-based analysis of P300 electrophysiological topography associated with positiveand negative symptoms of schizophrenia. Schizophr. Res. 94, 164–171.
Kay, S.R., Fiszbein, A., Opler, L.A., 1987. The positive and negative syndrome scale(PANSS) for schizophrenia. Schizophr. Bull. 13, 261–276.
Kim, J.J., Crespo-Facorro, B., Andreasen, N.C., O'Leary, D.S., Magnotta, V., Nopoulos, P., 2003.Morphology of the lateral superior temporal gyrus in neuroleptic naive patients withschizophrenia: relationship to symptoms. Schizophr. Res. 60, 173–181.
Kleinlogel, H., Strik, W., Begré, S., 2007. Increased NoGo-anteriorisation in first-episodeschizophrenia patients during Continuous Performance Test. Clin. Neurophysiol.118, 2683–2691.
Kubicki, M., Shenton, M.E., Salisbury, D.F., Hirayasu, Y., Kasai, K., Kikinis, R., Jolesz, F.A.,McCarley, R.W., 2002. Voxel-based morphometric analysis of gray matter in firstepisode schizophrenia. Neuroimage 17, 1711–1719.
Lantz, G., Michel, C.M., Pascual-Marqui, R.D., Spinelli, L., Seeck,M., Seri, S., Landis, T., Rosen,I., 1997. Extracranial localization of intracranial interictal epileptiform activity usingLORETA (low resolution electromagnetic tomography). Electroencephalogr. Clin.Neurophysiol. 102, 414–422.
Lappin, J.M., Dazzan, P., Morgan, K., Morgan, C., Chitnis, X., Suckling, J., Fearon, P., Jones,P.B., Leff, J., Murray, R.M., McGuire, P.K., 2007. Duration of prodromal phase andseverity of volumetric abnormalities in first-episode psychosis. Br. J. PsychiatrySuppl. 51, s123–s127.
Linden, D.E., Prvulovic, D., Formisano, E., Völlinger, M., Zanella, F.E., Goebel, R., Dierks, T.,1999. The functional neuroanatomy of target detection: an fMRI study of visual andauditory oddball tasks. Cereb. Cortex 9, 815–823.
McCarley, R.W., Salisbury, D.F., Hirayasu, Y., Yurgelun-Todd, D.A., Tohen, M., Zarate, C.,Kikinis, R., Jolesz, F.A., Shenton, M.E., 2002. Association between smaller leftposterior superior temporal gyrus volume on magnetic resonance imaging andsmaller left temporal P300 amplitude in first-episode schizophrenia. Arch. Gen.Psychiatry 59, 321–331.
Meisenzahl, E.M., Koutsouleris, N., Bottlender, R., Scheuerecker, J., Jäger, M., Teipel, S.J.,Holzinger, S., Frodl, T., Preuss, U., Schmitt, G., Burgermeister, B., Reiser, M., Born, C.,Möller, H.J., 2008. Structural brain alterations at different stages of schizophrenia:a voxel-based morphometric study. Schizophr. Res. 104, 44–60.
Michel, C.M., Murray, M.M., Lant, G., Gonzalez, S., Spinelli, L., Grave de Peralta, R., 2004.EEG source imaging. Clin. Neurophysiol. 115, 2195–2222.
Miller, J., Hackley, S.A., 1992. Electrophysiological evidence for temporal overlap amongcontingent mental processes. J. Exp. Psychol. Gen. 121, 195–209.
Miller, J., Ulrich, R., 1998. Locus of the effect of the number of alternative responses:evidence from the lateralized readiness potential. J. Exp. Psychol. Hum. Percept.Perform. 24, 1215–1231.
Mulert, C., Jager, L., Schmitt, R., Bussfeld, P., Pogarell, O., Moller, H.J., Juckel, G., Hegerl, U.,2004. Integration of fMRI and simultaneous EEG: towards a comprehensiveunderstanding of localization and time-course of brain activity in target detection.Neuroimage 22, 83–94.
Nichols, T.E., Holmes, A.P., 2002. Nonparametric permutation tests for functionalneuroimaging: a primer with examples. Hum. Brain Mapp. 15, 1–25.
Oldfield, R., Carolus, 1971. The assessment and analysis of handedness: the Edinburghinventory. Neuropsychologia 9, 97–113.
Ozgürdal, S., Gudlowski, Y., Witthaus, H., Kawohl, W., Uhl, I., Hauser, M., Gorynia, I.,Gallinat, J., Heinze, M., Heinz, A., Juckel, G., 2008. Reduction of auditory event-related P300 amplitude in subjects with at-risk mental state for schizophrenia.Schizophr. Res. 105, 272–278.
Pae, J.S., Kwon, J.S., Youn, T., Park, H.J., Kim, M.S., Lee, B., Park, K.S., 2003. LORETAimaging of P300 in schizophrenia with individual MRI and 128-channel EEG.Neuroimage 20, 1552–1560.
Pascual-Marqui, R.D., 1999. Review of methods for solving the EEG inverse problem. Int.J. Bioelectromagn. 1, 75–86.
Pascual-Marqui, R.D., Michel, C.M., Lehmann, D., 1994. Low resolution electromagnetictomography: a new method for localizing electrical activity in the brain. Int. J.Psychophysiol. 18, 49–65.
Polich, J., 1987. Response mode and P300 from auditory stimuli. Biol. Psychol. 25,61–71.
Renoult, L., Prévost, M., Brodeur, M., Lionnet, C., Joober, R., Malla, A., Debruille, J.B., 2007.P300 asymmetry and positive symptom severity: a study in the early stage of a firstepisode of psychosis. Schizophr. Res. 93, 366–373.
Salisbury, D.F., Shenton, M.E., Sherwood, A.R., Fischer, I.A., Yurgelun-Todd, D.A., Tohen,M., McCarley, R.W., 1998. First-episode schizophrenic psychosis differs from first-episode affective psychosis and controls in P300 amplitude over left temporal lobe.Arch. Gen. Psychiatry 55, 173–180.
Salisbury, D.F., Rutherford, B., Shenton, M.E., McCarley, R.W., 2001. Button-pressingaffects P300 amplitude and scalp topography. Clin. Neurophysiol. 112, 1676–1684.
Soltani,M., Knight, R.T., 2000. Neural origins of the P300. Crit. Rev. Neurobiol. 14, 199–224.Starr, A., Sandroni, P., Michalewski, H.J., 1995. Readiness to respond in a target detection
task: pre- and post-stimulus event-related potentials in normal subjects. Electro-encephalogr. Clin. Neurophysiol. 96, 76–92.
Stevens, M.C., Laurens, K.R., Liddle, P.F., Kiehl, K.A., 2006. The hemodynamics of oddballprocessing during single-tone and two-tone target detection tasks. Int. J. Psychophysiol.60, 292–303.
Strik, W.K., Fallgatter, A.J., Brandeis, D., Pascual-Marqui, R.D., 1998. Three-dimensionaltomography of event-related potentials during response inhibition: evidence forphasic frontal lobe activation. Electroencephalogr. Clin. Neurophysiol. 108, 406–413.
Sumiyoshi, T., Higuchi, Y., Kawasaki, Y., Matsui, M., Kato, K., Yuuki, H., Arai, H., Kurachi, M.,2006. Electrical brain activity and response to olanzapine in schizophrenia: a studywith LORETA images of P300. Prog. Neuropsychopharmacol. Biol. Psychiatry 30,1299–1303.
Takahashi, T., Wood, S.J., Yung, A.R., Soulsby, B., McGorry, P.D., Suzuki, M., Kawasaki, Y.,Phillips, L.J., Velakoulis, D., Pantelis, C., 2009. Progressive gray matter reduction ofthe superior temporal gyrus during transition to psychosis. Arch. Gen. Psychiatry66, 366–376.
Tarkka, I.M., Micheloyannis, S., Stokić, D.S., 1996. Generators for human P300 elicited bysomatosensory stimuli usingmultiple dipole source analysis. Neuroscience 75, 275–287.
Towle, V.L., Bolanos, J., Suarez, D., Tan, K., Grzeszczuk, R., Levin, D.N., Cakmur, R., Frank, S.A.,Spire, J.P., 1993. The spatial location of EEG electrodes: locating the best-fitting sphererelative to cortical anatomy. Electroencephalogr. Clin. Neurophysiol. 86, 1–6.
van der Stelt, O., Lieberman, J.A., Belger, A., 2005. Auditory P300 in high-risk, recent-onset and chronic schizophrenia. Schizophr. Res. 77, 309–320.
Volpe, U., Mucci, A., Bucci, P., Merlotti, E., Galderisi, S., Maj, M., 2007. The corticalgenerators of P3a and P3b: a LORETA study. Brain Res. Bull. 73, 220–230.
Wang, J., Hiramatsu, K., Hokama, H., Miyazato, H., Ogura, C., 2003a. Abnormalities ofauditory P300 cortical current density in patients with schizophrenia using highdensity recording. Int. J. Psychophysiol. 47, 243–253.
Wang, J., Hirayasu, Y., Hiramatsu, K., Hokama, H., Miyazato, H., Ogura, C., 2003b.Increased rate of P300 latency prolongation with age in drug-naive first episodeschizophrenia. Clin. Neurophysiol. 114, 2029–2035.
Wang, J., Hirayasu, Y., Hokama, H., Tanaka, S., Kondo, T., Zhang, M., Xiao, Z., 2005.Influence of duration of untreated psychosis on auditory P300 in drug-naive andfirst-episode schizophrenia. Psychiatry Clin. Neurosci. 59, 209–214.
Winterer, G., Mulert, C., Mientus, S., Gallinat, J., Schlattmann, P., Dorn, H., Herrmann,W.M.,2001. P300 and LORETA: comparison of normal subjects and schizophrenic patients.Brain Topogr. 13, 299–313.
Worrell, G.A., Lagerlund, T.D., Sharbrough, F.W., Brinkmann,B.H., Busacker, N.E., Cicora, K.M.,O'Brien, T.J., 2000. Localization of the epileptic focus by low-resolution electromagnetictomography in patients with a lesion demonstrated byMRI. Brain Topogr. 12, 273–282.


