Embed Size (px)
Citation preview

This article was downloaded by: [University of Bath]On: 16 February 2012, At: 03:07Publisher: RoutledgeInforma Ltd Registered in England and Wales Registered Number: 1072954 Registeredoffice: Mortimer House, 37-41 Mortimer Street, London W1T 3JH, UK
Oxford Development StudiesPublication details, including instructions for authors andsubscription information:http://www.tandfonline.com/loi/cods20
Decomposing the Ethnic Gap in RuralVietnam, 1993–2004Bob Baulch, Hung T. Pham & Barry Reilly
Available online: 15 Feb 2012
To cite this article: Bob Baulch, Hung T. Pham & Barry Reilly (2012): Decomposing the Ethnic Gap inRural Vietnam, 1993–2004, Oxford Development Studies, 40:1, 87-117
To link to this article: http://dx.doi.org/10.1080/13600818.2011.646441
PLEASE SCROLL DOWN FOR ARTICLE
Full terms and conditions of use: http://www.tandfonline.com/page/terms-and-conditions
This article may be used for research, teaching, and private study purposes. Anysubstantial or systematic reproduction, redistribution, reselling, loan, sub-licensing,systematic supply, or distribution in any form to anyone is expressly forbidden.
The publisher does not give any warranty express or implied or make any representationthat the contents will be complete or accurate or up to date. The accuracy of anyinstructions, formulae, and drug doses should be independently verified with primarysources. The publisher shall not be liable for any loss, actions, claims, proceedings,demand, or costs or damages whatsoever or howsoever caused arising directly orindirectly in connection with or arising out of the use of this material.

Decomposing the Ethnic Gap in RuralVietnam, 1993–2004
BOB BAULCH, HUNG T. PHAM & BARRY REILLY
ABSTRACT This paper examines and decomposes the gap in per capita expenditures betweenmajorityand minority ethnic groups in rural Vietnam between 1993 and 2004. Over this period, the realexpenditure gap between rural Kinh and Chinese-headed households and those headed by ethnicminorities increasedby14.6%.Approximately two-fifths of themeangap is found to be due todifferencesin household endowments (in particular demographic structure and education), and at least half due todifferences in returns to these endowments. Geographic variables explain less than one-fifth of the gap.Over half of the increase in themean gap is linked to temporal changes in unobservable factors, and lessthan a quarter to the majority’s endowments improving more rapidly than those of the minorities.Broadly similar findings are detected using quantile regression analysis. These findings raise importantquestions concerning the drivers of the disadvantage faced by Vietnam’s ethnic minorities.
JEL Classification: I32, J15
1. Introduction
The rapid economic growth experienced in Vietnam during the 1990s and the early 2000s
resulted in unprecedented poverty reduction. However, the ethnic groups within
Vietnam’s diverse society have not shared equally in the benefits of this growth. Poverty is
high, while life expectancy, nutritional status and other living standard measures remain
low among the ethnic minority groups despite numerous policies introduced to assist them
(Swinkels & Turk, 2006). Indeed, some recent studies (World Bank, 2009; Baulch et al.,
2010) suggest that horizontal (group-wise) inequalities within Vietnam are on the rise.1
A set of recent studies for Vietnam (Van de Walle & Gunewardena, 2001; Baulch et al.,
2004; Hoang et al., 2007), using per capita household expenditure as a welfare measure,
have investigated the average gap in living standards between the majority Kinh and Hoa
(ethnic Chinese) and the other 52 minority groups, assigning the differences to treatment and
endowment components using standard Blinder (1973) and Oaxaca (1973) decomposition
methods. Both components were found statistically to favour the Kinh and Hoa majority.
ISSN 1360-0818 print/ISSN 1469-9966 online/12/010087-31
q 2012 Oxford Department of International Development
http://dx.doi.org/10.1080/13600818.2011.646441
This research was funded by the UK Economic and Social Research Council and Department for International
Development under their Joint Research Scheme (Award Number RES-167-25-0157).
Bob Baulch, School of Business and Economics, Tan Tao University, Long An, Vietnam, and Social
Development Research Initiative, 4 Victoria Place, Bath BA2 5EY, UK. Email: [email protected]. Hung T.
Pham, National Economics University, Hanoi Indochina Research and Consulting, Hanoi, Vietnam. Barry Reilly,
Department of Economics, University of Sussex, Brighton BN1 9RF, UK.
Oxford Development Studies,Vol. 40, No. 1, 87–117, March 2012
Dow
nloa
ded
by [
Uni
vers
ity o
f B
ath]
at 0
3:07
16
Febr
uary
201
2
The poor endowment levels of the ethnic minority groups are sometimes linked to the fact
that most minorities reside in remote and mountainous areas, although this is only a partial
explanation. Baulch et al. (2004, p. 274) noted that “ . . . [e]ven if ethnic minority households
had the same endowments as the Kinh and Hoa (Kinh majority and the Chinese), this would
close no more than a third of the gap in their living standards”. This suggests that the ethnic
minorities secure considerably lower returns to their endowments than the majority.
The existing evidence, while reporting a sizeable ethnic minority disadvantage within
Vietnam, provides no insights on either the magnitude of the gap at different points of the
household expenditure distribution or the evolution of horizontal inequalities over time. The
primary motivation for the current paper is therefore to address these issues by investigating
the factors that drive the level and temporal evolution of the ethnic household welfare gap
using both mean and quantile regression analysis. The decomposition analyses undertaken
attempt to identify the relative contributions of household demographics, education,
landholdings and community characteristics in explaining total treatment and endowment
effects and their change over time.
The structure of the paper is as follows. The next section provides the context for our
empirical analysis through a review of recent economic events in Vietnam. It also details
the nature of Vietnam’s ethnic diversity. This is followed by sections outlining the data
sources and the econometric methodology used, and a section discussing the empirical
results. A final section outlines policy implications and offers some concluding remarks.
2. Background
The Doi Moi (economic renovation) reforms of the late 1980s have stimulated rapid
economic growth in Vietnam over the last two decades, and this has affected greatly poverty
and welfare at the household level. Between 1993 and 2004, Vietnam’s national poverty
headcount fell from 58.1 to 19.5%, while educational enrolments, life expectancy and other
measures of human development increased dramatically (Vietnam Academy of Social
Sciences (VASS), 2007). Though the different groups within Vietnam’s ethnically diverse
society have reaped rewards from such growth, horizontal inequalities have risen because
the benefits have generally not been shared equally. For instance, despite numerous policies
and programmes designed to assist minority groups, the poverty headcount rate among
Vietnam’s broadly defined ethnic minorities fell only from 86.4 to 60.7% between 1993 and
2004 (VASS, 2007). Despite comprising just over one-tenth of the national population, the
minorities accounted for about 40% of the poor in 2004 (VASS, 2007). School enrolments,
nutritional indicators and life expectancy also remain low among the minorities.
Vietnam has 54 officially recognized ethnic groups, of which the Kinh (the Vie_t or
mainstream Vietnamese) accounted for 86.7% in 1999 (Dang et al., 2000). Traditionally,
the Kinh have inhabited lowland and coastal areas in and around Vietnam’s two densely
populated deltas (the Red River Delta and the Mekong River Delta). With the exception of
the Hoa (who tend to live in urban areas and account for 1.1% of the population), the Khmer
(who are concentrated in the Mekong Delta with a 1.2% population share) and the Cham
(representing 0.1% of the population, located along the southern coast), most other ethnic
groups are scattered across Vietnam’s upland and highland areas. Within the upland and
highland areas, some ethnic groups (in particular, the Tay, Thai, , Nung—each of
which has a population of close to one million) specialize in wet-rice cultivation and usually
live in the flatter, lower areas along the valley bottoms (the “midlands”). Other less populous
88 B. Baulch et al.
Dow
nloa
ded
by [
Uni
vers
ity o
f B
ath]
at 0
3:07
16
Febr
uary
201
2
groups (such as the Hmong, Dao and Kho-mu in the Northern Uplands and the Ede, Bana
and Hre in the Central Highlands) tend to live in higher, more mountainous areas where
often rice cannot be grown. There are also 17 ethnic groups with populations of less than
10 000, some of which are likely to disappear in the absence of dedicated measures to protect
them (Committee for Ethnic Minorities (CEM), 2009). All ethnic groups have their
individual identities that embody diverse and unique cultures, with groups in the Central
Highlands being more likely to follow matrilineal (uxorial) inheritance practices and, as
with the Hmong, the Christian religion.
Poverty among the different ethnic groups varies considerably, with the poverty
headcount and poverty gaps for the Kinh in 2004 being 13.8 and 2.7%, respectively,
compared with a headcount of 72.3% and a poverty gap above 25% for the Central
Highlands and other northern minorities.2 While poverty has fallen more quickly among
the majority than the minority groups (VASS, 2007), inequality is relatively stable within
the majority group but rising among the minorities.3 Since 1998, a plethora of government
policies and programmes, most focused on improving infrastructure and endowments in
mountainous areas, have been implemented in an attempt to reverse these disparities
(Nguyen & Baulch, 2007). However, as the last independent evaluation of the two main
programmes concluded, while their scale and breadth is clear, their impact on poverty
reduction is less obvious (MOLISA & UNDP, 2004).
Previous studies investigating ethnic minority issues in Vietnam (Van de Walle &
Gunewardena, 2001; Baulch et al., 2004; Hoang et al., 2007) have used the household
surveys conducted in 1993, 1998 and 2004, and have relied on a simple dichotomy
between the Kinh-Hoa and all other ethnic minority groups. The findings reported for these
studies suggest that between one-half and two-thirds of the ethnic gap in household
expenditures is due to differences in returns, with differences in household endowments
and community characteristics accounting for the remainder.
Qualitative studies emphasize the fact that the minorities vary considerably in terms of
their levels of economic and social assimilation, and that the targeting of assistance to the
poorer communes and households reaches only some of the minority groups (World Bank,
2009). Furthermore, despite the many educational benefits that ethnic minority pupils and
students enjoy, their lower educational attainments can be traced back to kindergarten (pre-
school), while the preferential treatment they receive at the post-secondary level may
provide employers with a rationale to prefer Kinh graduates (Vasavakul, 2003; Nguyen &
Baulch, 2007).4 Similarly, many land tenure and agricultural extension policies seem more
appropriate to the needs of Kinh-dominated lowland agriculture than to the diverse and
fragile ecologies of the uplands, where about 70% of Vietnam’s ethnic minorities reside
(Jamieson et al., 1998; Hoang et al., 2004; Vuong, 2007). Finally, policymakers rarely
understand ethnic minority customs and culture, and negative stereotyping and informal
discrimination characterize much government discourse (World Bank, 2009). As a
consequence of these overlapping disadvantages, many ethnic minority groups are poorly
positioned to benefit from the rapid economic growth experienced by the urban and coastal
areas of Vietnam, and constitute a growing share of the country’s poor.
3. Data
This paper uses data drawn from household-level surveys conducted for Vietnam in
1993, 1998 and 2004. The Vietnam Living Standards Surveys (VLSSs) of 1993 and 1998
Decomposing the Ethnic Gap in Rural Vietnam 89
Dow
nloa
ded
by [
Uni
vers
ity o
f B
ath]
at 0
3:07
16
Febr
uary
201
2

are multi-topic surveys patterned after the World Bank’s Living Standard Measurement
Surveys with nationally representative samples of 4800 and 6000 households,
respectively (see Annex to Glewwe et al., 2004). A biennial household survey
programme known as the Vietnam Household Living Standards Survey (VHLSS) was
introduced in 2002, which adopted a rotating core-and-module designed with an
expanded sample size intended to provide more representative statistics at the provincial
level (Phung & Nguyen, 2006). However, given the potential presence of large non-
sampling errors in the VHLSS 2002, the VHLSS 2004, which surveyed a total of 9189
households, is the one used in this study. Though the content of the survey
questionnaires has evolved over time, the main modules contained within these three
surveys are comparable and provide a rich set of variables that can be used to model
household welfare. Following the approach adopted in the existing literature, we use per
capita expenditure as the metric to examine ethnic differences in household welfare in rural
Vietnam.5 Although per capita expenditures are an incomplete measure of welfare, there is
considerable evidence to suggest that many of the more commonly used non-monetary
measures of well-being are highly correlated with expenditures in Vietnam (see Glewwe et al.,
2004). We restrict our sample to rural areas both because this is where the vast majority of
Vietnam’s ethnic minorities reside and because of well-documented problems with the urban
sampling frame for the 1998 and 2004 surveys (Poverty Working Group, 1999; Pincus &
Sender, 2006; VASS, 2007).
As our primary purpose is to investigate empirically the household welfare gap between
the majority and the minority ethnic groups, the ethnic group definitions used in previous
studies on Vietnam (Van de Walle & Gunewardena, 2001; Baulch et al., 2004; Swinkels &
Turk, 2006) are adhered to in the current paper. Thus, we treat households headed by either
Kinh or Hoa (ethnic Chinese) as comprising the majority group, and households headed by
those of all other ethnic origins as affiliated to a broadly defined minority group. The
motivation for merging the Chinese with the Kinh to form the majority group relates to the
fact that Chinese-headed households are widely recognized as being relatively well-off
and economically integrated in Vietnam. Approximately 14% of Vietnamese households
were headed by ethnic minorities in 1993, with that figure rising to 17% by 2004.
Table A1 of the Appendix provides a description of the variables used and selected
summary statistics. Using the estimates reported in that table, the average annual growth
rate in real per capita household expenditure for the majority group in rural Vietnam
between 1993 and 2004 is estimated at 4.4%, compared with 3.2% for the minority group.
Over this period, the national poverty headcount fell sharply from 54 to 14% for the
majority group, while declining from 86 to 61% for the minority group.
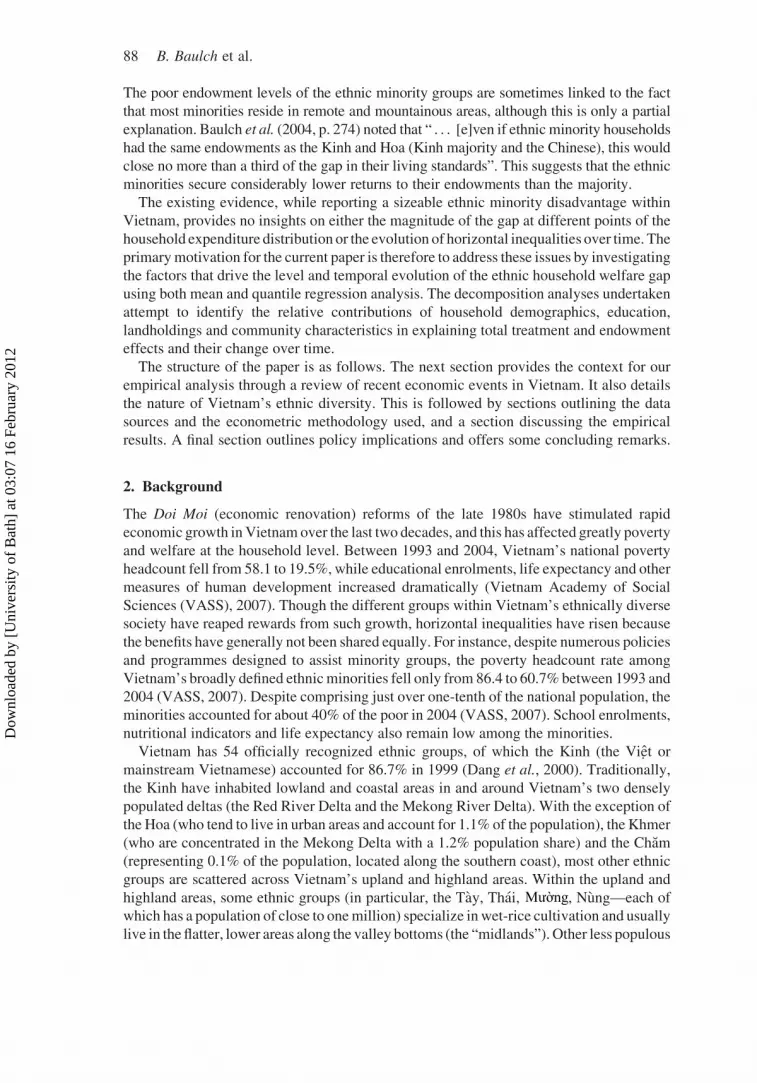
Further insights on the changes in poverty and welfare over time are obtained by
plotting the kernel densities for per capita household expenditure for majority and
minority groups (Figure 1). The poverty line, using the GSO and World Bank criterion, is
also superimposed on these densities.6 The unbroken plot represents the Kinh and Chinese
and the broken plot that of the other ethnic minority groups. In general, the densities for the
majority group are strongly right-skewed compared with the minority group. The contrasts
between the reduction in headcount poverty between 1993 and 2004 for the two groups can
be largely explained by the mode of the majority group’s distribution having crossed the
poverty line, while the mode for the minorities remains below it.
Finally, Figure 2 depicts the evolution of the mean per capita expenditure gap
between the majority and the minority groups by percentile and survey year. It is
90 B. Baulch et al.
Dow
nloa
ded
by [
Uni
vers
ity o
f B
ath]
at 0
3:07
16
Febr
uary
201
2
Den
sity
0 2500
0.0008
0.0006
0.0004
0.0002
0
Den
sity
0.0005
0.0004
0.0002
0.0003
0.0001
0
Den
sity
0.0006
0.0004
0.0002
0
5000 7500 10000 12500 15000Real expenditure per capita (VND thousand) in 1993
0 2500 5000 7500 10000 12500 15000Real expenditure per capita (VND thousand) in 1998
0 2500 5000 7500 10000 12500 15000Real expenditure per capita (VND thousand) in 2004
Figure 1. Kernel density plots of the majority/minority per capita expenditures, 1993–2004.Note: Expenditures per capita are given in January 2004 prices; the solid line represents the kerneldensity of the per capita household expenditures for the Kinh and Chinese; the dashed line representsthat of the other ethnic minority groups. Source:Drawn from VLSS 1993 and 1998, and VHLSS 2004.
Decomposing the Ethnic Gap in Rural Vietnam 91
Dow
nloa
ded
by [
Uni
vers
ity o
f B
ath]
at 0
3:07
16
Febr
uary
201
2

evident that the gaps in household living standards have widened considerably over
time at almost all the non-extreme percentiles of the distribution and that the largest
part of the increase occurred between 1998 and 2004. The mean per capita expenditure
among the majority group was 47% higher than that of the minority in 1993, and
increased to 69% by 2004. Our calculations also suggest that the average minority
group’s household expenditure has steadily fallen down the rankings within the
majority household’s actual expenditure distribution (from the 21st percentile in 1993
to the 13th by 2004).
4. Methodology
Separate equations describing the determination of log per capita household expenditure
are specified for the majority (Kinh-Hoa) and minority groups as follows:
ym ¼ xm0bm þ um ð1Þ
ye ¼ xe0be þ ue; ð2Þ
where yj denotes the per capita household expenditure measure expressed in natural
logarithms for the jth ethnic group (where j ¼ m or e, denoting the majority and minority
groups, respectively); x j is a (k £ n) matrix of household characteristics (e.g. household
structure, education of members, household landholding) and community characteristics
(e.g. infrastructure conditions); b is a (k £ 1) vector of unknown parameters capturing the
effects of the relevant covariates on log per capita expenditure; uj is an (n £ 1) vector of
random error terms for which the standard assumptions apply for estimation by ordinary
least squares (OLS). 7
40
60
80
100
120
% d
iffer
ence
in p
c ex
pend
iture
s
0 20 40 60 80 100
Percentiles of expenditure distribution
1993 1998 2004
Figure 2. The majority–minority gap in per capita expenditures in rural areas, 1993–2004.Source: Drawn from VLSS 1993 and 1998, and VHLSS 2004.
92 B. Baulch et al.
Dow
nloa
ded
by [
Uni
vers
ity o
f B
ath]
at 0
3:07
16
Febr
uary
201
2

Using the standard decomposition approach (Blinder, 1973; Oaxaca, 1973), the
estimated mean ethnic difference in log per capita household expenditure can be
expressed as:
ym 2 ye ¼ ðxm 2 xeÞ0bm þ xe
0ðbm 2 beÞ; ð3Þ
where the overbar represents mean values, the hat denotes OLS coefficient estimates,
and the subscripts “m” and “e” represent the majority and ethnic minority groups. This
allows the overall average differential in per capita household expenditure between
the two ethnic groups to be decomposed into a part attributable to differences in
characteristics (the endowment component) and a part attributable to differences in the
estimated returns to characteristics between majority and minority households
(the treatment component). The final part of expression (3) is sometimes taken to
reflect the degree of unequal treatment experienced by ethnic minorities. This approach
assumes that in the absence of unequal treatment, the majority group’s coefficient
structure would prevail.8 The overall treatment and endowment components can be
decomposed further into sets of characteristics and coefficient differences to identify
the key factors driving the overall components. In this study, the variables are classified
according to household structure (e.g. household size and the age structure composition
of the household), household education levels, landholding characteristics (e.g.
household’s access to different types of land) and commune characteristics (such as
access to electricity, markets, post offices, roads and schools plus the geographic region
within which the communes are located).9
The decomposition described in equation (3) is cast entirely within the mean regression
framework. An exclusive focus on the mean, however, provides an incomplete account of
the nature of ethnic welfare disadvantage in rural Vietnam. The estimation of a set of
conditional quantile functions allows for a more detailed portrait of the relationship
between the household welfare measure and selected covariates than that provided by
mean regression analysis (Koenker & Bassett, 1978; Deaton, 1997; Koenker, 2005). The
quantile functions are then estimated conditional on a given specification for various
percentiles of the residuals (e.g. 10th, 25th, 50th, 75th or 90th) by minimizing the sum of
absolute deviations of the residuals from the conditional specification (see Chamberlain,
1994). The sampling variances for the quantile regression estimates are obtained using
bootstrapping with 200 replications.10
In the current application, the quantile regression for the majority (m) and minority (e)
subsamples can be defined as:
ym ¼ xm0bum þ uum ð4Þ
ye ¼ xe0bu e þ uu e: ð5Þ
If Qu(·) is taken to denote the conditional uth quantile operator, then Qu ðwjjxjÞ ¼ xj0bu j,
where bujis the unknown parameter vector for the uth quantile, with u representing the
selected quantile of interest (i.e. 0.1, 0.25, 0.5, 0.75 and 0.9 in the current context); uu jdenotes the error term, the distribution of which is left unspecified but for which
QuðmujjxjÞ ¼ 0 is assumed; and subscript j denotes either the majority or the minority
group.
Decomposing the Ethnic Gap in Rural Vietnam 93
Dow
nloa
ded
by [
Uni
vers
ity o
f B
ath]
at 0
3:07
16
Febr
uary
201
2
Using equations (4) and (5), the conditional uth quantile functions for the two groups are
expressed as:
QuðymÞ ¼ Eðxmjym ¼ QuðymÞÞ0bum þ Eðmumjym ¼ QuðymÞÞ ð6Þ
QuðyeÞ ¼ Eðxejye ¼ QuðyeÞÞ0bue þ Eðmuejye ¼ QuðyeÞÞ; ð7Þ
where the hats now denote quantile regression estimates and E(·) denotes the expectations
operator. In expressions (6) and (7), the characteristics are evaluated conditionally at the
quantile values for the log household per capita expenditure and not unconditionally as in
the mean regression case. The terms Eðmujjwj ¼ QuðwjÞÞ are thus non-zero. However,
these terms tend to be small and can be conveniently ignored if we decompose the ethnic
household welfare gap in terms of the predicted rather than actual log household
expenditures at selected quantiles. Thus,
D^
u ¼ DVu0bum þVue
0Dbu; ð8Þ
where D^
u denotes the differences in predicted expenditures at the uth quantile; Dbu ¼
ðbum 2 bueÞ; and DVu ¼ Vum 2Vue with Vum ¼ Eðxmjwm ¼ QuðwmÞÞ and Vue ¼
Eðxejwe ¼ QuðweÞÞ. The first and second expressions on the right-hand side of equation
(8) are the quantile regression analogues, respectively, to the differences in characteristics
and differences in returns components reported for the conventional mean-based
decomposition described in equation (3) earlier.
In the computation of expression (8) it is necessary to use realizations of characteristics
that accurately reflect the relevant points on the conditional per capita household
expenditure distribution. In order to address this issue, we use an approach originally
suggested by Machado & Mata (2005) to derive the realizations for the relevant
characteristics at different quantiles of the conditional household expenditure distribution.
The procedure involves drawing 100 observations at random and with replacement from
each of the majority and minority subsamples. Each observation once ranked comprises a
percentile point on the log per capita household expenditure distribution. The full set of
household-level and other characteristics for the observation at the uth expenditure quantile
is then retrieved. This process is then replicated 500 times to obtain 500 observations at the
selected uth quantile. The mean characteristics of these observations at each quantile are
then used to construct the realizations for VumandVueused in expression (8).
We also investigate the temporal evolution of the mean ethnic welfare gap using a
framework developed by Juhn et al. (1991). This framework allows the decomposition of
the change in the average gap across two points in time. Following Reilly (1999), the
procedure used here requires only the OLS estimation of the majority group’s household
expenditure equation for each year of interest. If we denote the mean difference in the
ethnic household welfare gap in year t as dt, the differential in the average ethnic welfare
gap between any two years (labelled with subscripts 1 and 0) can then be decomposed as:
d1 2 d0 ¼ ½Dx1 2 Dx0�0bm1 þ Dx0
0½bm1 2 bm0� þ sm1½Dmm1 2 Dmm0�
þ Dmm0½sm1 2 sm0�; ð9Þ
where smt is the residual (or regression) standard error from the majority group’s
household expenditure equations at time t (t ¼ 0, 1 where 1 is the most recent year), and
94 B. Baulch et al.
Dow
nloa
ded
by [
Uni
vers
ity o
f B
ath]
at 0
3:07
16
Febr
uary
201
2

mmt is the standardized residual, which has a mean of zero and a standard deviation of unity
for the majority group; Dmmt is computed as Dmmt ¼ 2½yet 2 xet0bmt�=smt, while Dxt ¼
ðxmt 2 xetÞ:The first term on the right-hand side of equation (4) captures the effect of changes in
differences in (observable) characteristics between the majority and minority groups over
time on the ethnic gap in household welfare. The second term captures the effect of
changes in returns to characteristics for the majority group. The third term captures the
“gap effect”, which measures the impact of changes in the relative position of the average
ethnic minority households within the majority group’s residual household expenditure
distribution. The fourth term reflects changes in residual dispersion of living standards of
the majority group. This term can be taken to reflect the role of temporal changes in the
unobservable coefficient structure. Note that the first and third terms measure ethnic-
specific factors, while the second and fourth capture the effects, respectively, of changing
coefficient structures.
In the context of the quantile regression approach, the most appropriate method to
decompose gaps over time is not entirely transparent. There are a number of different ways
that the temporal change in the predicted gap at selected quantiles can be decomposed. The
approach adopted here requires separate estimation of both majority and minority
regression models at the selected quantiles. This decomposition approach is relatively easy
to estimate, and yields four components that are amenable to straightforward
interpretation. Using this approach, the predicted ethnic welfare gap at selected quantiles
between year 1 and year 0 can be expressed as follows:
D^
u;1 2 D^
u;0 ¼ ðDVu;1 2 DVu;0Þ0bum;1 þ ðVue;1 2Vue;0Þ
0Dbu;1 þ DVu;00ðbum;1
2 bum;0Þ þVue;00ðDbu;1 2 Dbu;0Þ: ð10Þ
Thus, the overall change in the ethnic gap in living standards between two years at the uth
quantile can be decomposed into four parts. The first part is attributable to the change over
time in the (observable) characteristics between the majority and minority groups at the
uth quantile of the conditional expenditure distribution, evaluated using the majority
group’s coefficients. The second part is attributable to the change over time in the
(observable) characteristics of the minority group at the uth quantile of the conditional
distribution. The third part is attributable to the temporal change in the majority group’s
returns to characteristics at the uth quantile. The fourth term is attributable to the change
over time in differences in returns between the majority and minority groups at the uth
quantile of the conditional distribution. The final term offers the potential for insight into
the role of temporally changing ethnically motivated unequal treatment.11
5. Empirical Results
The raw mean ethnic gap in per capita household expenditures rose by 14.6% (0.137 log
points) between 1993 and 2004. As can be seen from Figure 2, most of this increase occurred
over the shorter time period between 1998 and 2004, during which time the ethnic gap
increased by 12% (0.113 log points). The decomposition estimates reported in Table 1 use
the standard Blinder–Oaxaca decomposition of expression (3), and assume the majority
coefficient structure prevails in the absence of unequal treatment.12 The estimated effects
Decomposing the Ethnic Gap in Rural Vietnam 95
Dow
nloa
ded
by [
Uni
vers
ity o
f B
ath]
at 0
3:07
16
Febr
uary
201
2

Table
1.
Dec
om
po
siti
on
of
the
eth
nic
dif
fere
nti
alin
ho
use
ho
ldex
pen
dit
ure
sat
the
mea
n,
19
93
–2
00
4
(1)
Wit
hco
mm
un
eco
ntr
ols
(2)
Wit
hd
istr
ict
effe
cts
19
93
19
98
20
04
19
93
19
98
20
04
Totaldifferential
0.3876
**
*0.4112
**
*0.5241
**
*0.3876
**
*0.4112
**
*0.5241
**
*(0.025)
(0.029)
(0.016)
(0.025)
(0.001)
(0.016)
Dueto
differencesin
characteristics
0.1651
**
*0.1585
**
*0.187
**
*0.1909
**
*0.2126
**
*0.2705
**
*ofwhich:
(0.026)
(0.035)
(0.023)
(0.03)
(0.008)
(0.064)
Ho
use
ho
ldst
ruct
ure
0.0
67
5*
**
0.0
67
1*
**
0.1
02
9*
**
0.0
74
4*
**
0.0
69
5*
**
0.1
17
9*
**
(0.0
14
)(0
.00
5)
(0.0
07
)(0
.01
6)
(0.0
03
)(0
.00
6)
Ed
uca
tio
n0
.06
54
**
*0
.07
2*
**
0.0
76
2*
**
0.0
79
6*
**
0.0
82
7*
**
0.0
92
5*
**
(0.0
10
)(0
.00
6)
(0.0
04
)(0
.01
1)
(0.0
05
)(0
.00
4)
Lan
dh
old
ing
20
.02
63
**
20
.03
98
**
*2
0.0
34
**
*2
0.0
10
62
0.0
27
**
*2
0.0
31
1*
**
(0.0
12
)(0
.01
1)
(0.0
08
)(0
.01
)(0
.00
7)
(0.0
08
)C
om
mu
ne
or
dis
tric
tef
fect
s0
.05
85
**
*0
.05
92
*0
.04
19
*0
.04
75
*0
.08
73
**
*0
.09
11
(0.0
20
)(0
.03
2)
(0.0
24
)(0
.02
7)
(0.0
06
)(0
.06
3)
Dueto
differencesin
returns
0.2224
**
*0.2527
**
*0.3371
**
*0.1967
**
*0.1986
**
*0.2555
**
*ofwhich:
(0.033)
(0.045)
(0.028)
(0.034)
(0.008)
(0.064)
Ho
use
ho
ldst
ruct
ure
0.1
11
20
.22
96
0.3
92
3*
*2
0.0
37
90
.04
65
0.1
93
9(0
.26
6)
(0.2
26
)(0
.20
2)
(0.2
49
)(0
.22
8)
(0.1
8)
Ed
uca
tio
n0
.04
40
0.0
01
92
0.0
21
70
.07
28
**
0.0
60
8*
**
0.0
10
8(0
.03
0)
(0.0
31
)(0
.02
0)
(0.0
29
)(0
.02
4)
(0.0
16
)L
and
ho
ldin
g2
0.0
18
02
0.0
36
52
0.0
13
02
0.0
66
9*
20
.07
29
**
20
.05
97
**
*(0
.04
2)
(0.0
31
)(0
.02
0)
(0.0
37
)(0
.03
)(0
.01
7)
Co
mm
un
eo
rd
istr
ict
effe
cts
0.1
96
0*
*0
.30
90
**
0.1
22
00
.18
38
**
0.1
26
3*
**
0.0
40
8(0
.07
9)
(0.1
38
)(0
.12
1)
(0.0
88
)(0
.02
3)
(0.0
99
)C
on
stan
tte
rmef
fect
20
.11
08
20
.25
13
20
.14
26
0.0
44
90
.03
80
.06
96
(0.2
81
)(0
.26
8)
(0.2
4)
(0.2
66
)(0
.23
2)
(0.2
35
)
Notes:
Th
ed
eco
mp
osi
tio
nin
this
tab
leu
ses
the
seto
fm
ajo
rity
coef
fici
ents
asth
ere
fere
nce
gro
up
for
un
equ
altr
eatm
ent;
see
equ
atio
n(3
).F
or
(1),
the
log
of
per
cap
ita
ho
use
ho
ldex
pen
dit
ure
isre
gre
ssed
on
ase
to
fh
ou
seh
old
char
acte
rist
ics
and
ase
to
fco
mm
un
ech
arac
teri
stic
s(i
ncl
ud
ing
geo
gra
ph
ical
typ
eo
fco
mm
un
e,ac
cess
toro
ad,p
ub
lic
tran
spo
rt,p
ost
offi
ce,d
aily
mar
ket
,el
ectr
icit
yan
dh
avin
gfa
cto
ries
loca
ted
wit
hin
10
km
).F
or
(2),
the
set
of
com
mu
ne
char
acte
rist
ics
in(1
)is
rep
lace
db
ya
seto
fd
istr
ictd
um
mie
s.T
he
nu
mb
ero
fd
istr
ictef
fect
sin
clu
ded
was
12
0,1
50
and
57
4in
19
93
,19
98
and
20
04
,res
pec
tiv
ely
.Sta
nd
ard
erro
rsar
ere
po
rted
inp
aren
thes
es.
Th
esu
rvey
des
ign
effe
cts
of
clu
ster
ing
and
stra
tifi
cati
on
are
tak
enin
toac
cou
nt
inth
eco
mp
uta
tio
no
fth
ese
stan
dar
der
rors
.*
**
,*
*,
*S
tati
stic
ally
sig
nifi
can
tat
the
0.0
1,
0.0
5an
d0
.1le
vel
s,re
spec
tiv
ely
.
96 B. Baulch et al.
Dow
nloa
ded
by [
Uni
vers
ity o
f B
ath]
at 0
3:07
16
Febr
uary
201
2

for the regressions for the majority and minority groups are generally signed in accordance
with priors and have plausible magnitudes, and are reported in Table A2 of the Appendix.
Using the specification containing commune characteristics (see note “For (1)” under
Table 1), approximately two-fifths of the gap in all three years is attributable to endowment
differentials. This is consistent with the findings reported in the existing literature. There is
no statistical evidence that the differences in endowments have widened over time, with the
absolute t-ratio for a test of the difference between the initial and terminal years computed at
a statistically insignificant 0.63.
Unlike previous studies, Table 1 attempts to isolate the relative contributions of
demographic factors, education, landholding patterns and community characteristics to the
ethnic expenditure gap. The contributions of differentials in household demographic
structure and education levels to the overall endowment effect are broadly similar, while
differences in community characteristics account for a smaller portion of the ethnic gap
and decline over time. However, different landholding patterns between the majority and
minority groups are found to narrow the endowment differential. The negative signs on the
landholding variables for the mean decompositions possibly reflect the greater experience
and knowledge that ethnic minority peoples have in farming upland areas.
The part of the gap due to differences in returns reported in Table 1 widened by a
statistically significant amount over time. The overall gap due to differences in returns rose
by 0.11 log points between the initial and terminal years, with the estimated absolute
t-ratio computed at 2.6. Thus, almost two-thirds of the household welfare gap was
attributable to differential treatment effects by 2004. The key drivers responsible for the
treatment differentials are less transparent than was the case with regard to the endowment
differentials. However, in both 1993 and 1998 commune characteristics accounted for a
sizeable proportion of the treatment differential in total per capita expenditures.13 By
2004, a sizeable role for the differential treatment effects associated with the set of
demographic structure variables was detected.
If we use the richer set of district-level controls rather than the commune controls, the
interpretational narrative detailed above is not materially altered. The overall endowment
effects are magnified slightly and the treatment differentials attenuated. Indeed, the
estimated difference in these effects between 1993 and 2004 is now statistically
indistinguishable from zero at a conventional level (jtj ¼ 0.81). However, even allowing
for the introduction of a large array of district controls, a sizeable treatment effect,
comprising about one-half of the raw difference, remains for each year. This suggests that
the disadvantaged position of Vietnam’s rural ethnic minority groups cannot be attributed
exclusively to the role of geography and the concentration of ethnic minorities within the
more remote parts of the country.
We now turn to a discussion of the decompositions computed at selected points of the
conditional expenditure distribution using equation (8).14 The estimates for this exercise
are reported for the three years in Tables 2–4. In all cases, the point estimates for the raw
ethnic gap in household welfare exhibit an increase between the 10th and 90th percentiles,
though the evolution of the increase is not monotonic for any of the three years. The
portion of the mean gap accounted for by endowment differences is fairly stable across the
selected percentiles and comprises between one-fifth and two-fifths of the relevant total
raw gap in each of the three years. The roles played by household demographic structure,
education and commune characteristics in determining the overall endowment effects are
similar to the findings obtained using the mean regression analysis for all years. In a direct
Decomposing the Ethnic Gap in Rural Vietnam 97
Dow
nloa
ded
by [
Uni
vers
ity o
f B
ath]
at 0
3:07
16
Febr
uary
201
2

Table
2.
Dec
om
po
siti
on
of
the
eth
nic
dif
fere
nti
alin
ho
use
ho
ldex
pen
dit
ure
atse
lect
edq
uan
tile
s,1
99
3
10
th2
5th
50
th7
5th
90
th
Totaldifferential
0.3767***
0.3085***
0.2949***
0.4113***
0.4716***
(0.035)
(0.036)
(0.029)
(0.028)
(0.042)
Dueto
differencesin
characteristics
0.1336***
0.0834**
0.1484***
0.1576***
0.1975***
ofwhich:
(0.047)
(0.036)
(0.025)
(0.027)
(0.051)
Ho
use
ho
ldst
ruct
ure
0.0
48
5*
**
0.0
38
8*
**
0.0
56
2*
**
0.0
85
9*
**
0.0
66
5*
**
(0.0
1)
(0.0
06
)(0
.00
8)
(0.0
06
)(0
.00
9)
Ed
uca
tio
n0
.05
09
**
*0
.03
70
**
*0
.06
69
**
*0
.05
38
**
*0
.11
90
**
*(0
.01
1)
(0.0
07
)(0
.00
9)
(0.0
08
)(0
.02
7)
Lan
dh
old
ing
20
.01
82
0.0
48
42
0.0
26
8*
**
20
.04
59
**
*2
0.0
38
9*
**
(0.0
25
)(0
.03
2)
(0.0
11
)(0
.00
9)
(0.0
14
)C
om
mu
ne
char
acte
rist
ics
0.0
52
30
.05
60
**
0.0
52
1*
**
0.0
63
7*
*0
.05
09
(0.0
42
)(0
.02
4)
(0.0
19
)(0
.02
8)
(0.0
44
)
Dueto
differencesin
returns
0.2431***
0.2251***
0.1465***
0.2538***
0.2742***
ofwhich:
(0.061)
(0.051)
(0.039)
(0.038)
(0.061)
Ho
use
ho
ldst
ruct
ure
20
.23
49
0.3
28
20
.66
67
*0
.48
58
20
.05
16
(0.4
38
)(0
.41
1)
(0.3
67
)(0
.36
5)
(0.3
76
)E
du
cati
on
0.0
09
10
.03
71
0.0
45
30
.01
41
0.0
29
9(0
.06
2)
(0.0
43
)(0
.03
5)
(0.0
38
)(0
.07
1)
Lan
dh
old
ing
20
.00
35
20
.00
01
20
.06
6*
0.0
11
62
0.0
35
8(0
.05
8)
(0.0
57
)(0
.03
7)
(0.0
45
)(0
.05
6)
Co
mm
un
ech
arac
teri
stic
s0
.16
23
0.2
95
30
.17
91
*0
.11
18
0.0
42
5(0
.18
7)
(0.1
46
)(0
.11
5)
(0.1
02
)(0
.12
4)
Co
nst
ant
term
effe
ct0
.31
02
20
.43
54
20
.67
85
*2
0.3
69
50
.28
91
(0.4
69
)(0
.44
9)
(0.3
93
)(0
.36
4)
(0.4
13
)
Notes:
Th
ed
eco
mp
osi
tio
nin
this
tab
leu
ses
the
set
of
maj
ori
tyco
effi
cien
tsas
the
refe
ren
ceg
rou
pfo
ru
neq
ual
trea
tmen
t;se
eeq
uat
ion
(8)
inth
ete
xt.
Th
elo
gp
erca
pit
ah
ou
seh
old
exp
end
itu
reis
reg
ress
edo
na
set
of
ho
use
ho
ldch
arac
teri
stic
san
da
set
of
com
mu
ne
char
acte
rist
ics
(in
clu
din
gg
eog
rap
hic
alty
pes
of
com
mu
nes
,ac
cess
toro
ad,
pu
bli
ctr
ansp
ort
,p
ost
offi
ce,
dai
lym
ark
et,
elec
tric
ity
and
hav
ing
fact
ori
eslo
cate
dw
ith
in1
0k
m).
Sta
nd
ard
erro
rsar
ere
po
rted
inp
aren
thes
esan
dar
eb
ased
on
bo
ots
trap
pin
gw
ith
20
0re
pli
cati
on
s.*
**
,*
*,
*S
tati
stic
ally
sig
nifi
can
tat
the
0.0
1,
0.0
5an
d0
.1le
vel
s,re
spec
tiv
ely
.
98 B. Baulch et al.
Dow
nloa
ded
by [
Uni
vers
ity o
f B
ath]
at 0
3:07
16
Febr
uary
201
2

Table
3.
Dec
om
po
siti
on
of
the
eth
nic
dif
fere
nti
alin
ho
use
ho
ldex
pen
dit
ure
atse
lect
edq
uan
tile
s,1
99
8
10
th2
5th
50
th7
5th
90
th
Totaldifferential
0.4049
**
*0.4773
**
*0.4084*
**
0.5367
**
*0.6151
**
*(0.031)
(0.024)
(0.024)
(0.026)
(0.043)
Dueto
differencesin
characteristics
0.1713
**
*0.1991
**
*0.1807*
**
0.1909
**
*0.2152
**
*ofwhich:
(0.025)
(0.028)
(0.029)
(0.029)
(0.063)
Ho
use
ho
ldst
ruct
ure
s0
.11
46
**
*0
.06
62
**
*0
.08
79*
**
0.0
62
**
*0
.11
34
**
*(0
.01
)(0
.00
5)
(0.0
05
)(0
.00
6)
(0.0
13
)E
du
cati
on
0.0
53
6*
**
0.0
74
9*
**
0.0
57
7*
**
0.1
03
8*
**
0.0
73
4*
**
(0.0
08
)(0
.01
6)
(0.0
04
)(0
.01
)(0
.01
2)
Lan
dh
old
ing
20
.02
78
**
20
.02
31
**
20
.08
84*
**
20
.02
71
20
.05
5(0
.01
2)
(0.0
11
)(0
.02
3)
(0.0
18
)(0
.04
8)
Co
mm
un
ech
arac
teri
stic
s0
.03
1*
*0
.08
11
**
*0
.12
35*
**
0.0
52
20
.08
34
**
(0.0
16
)(0
.02
)(0
.02
5)
(0.0
21
)(0
.04
)
Dueto
differencesin
returns
0.2336
**
*0.2782
**
*0.2277*
**
0.3458
**
*0.3998
**
*ofwhich:
(0.037)
(0.035)
(0.041)
(0.037)
(0.08)
Ho
use
ho
ldst
ruct
ure
s0
.00
05
0.2
26
50
.46
96*
0.6
98
7*
*0
.12
85
(0.3
56
)(0
.29
4)
(0.2
63
)(0
.32
8)
(0.4
)E
du
cati
on
20
.03
08
20
.02
43
20
.01
91
20
.00
69
20
.01
96
(0.0
45
)(0
.03
7)
(0.0
35
)(0
.03
5)
(0.0
44
)L
and
ho
ldin
g2
0.0
86
4*
*2
0.0
53
1*
20
.01
08
20
.01
97
20
.05
12
(0.0
44
)(0
.03
4)
(0.0
5)
(0.0
43
)(0
.06
9)
Co
mm
un
ech
arac
teri
stic
s0
.12
05
0.2
86
4*
*0
.29
68*
*0
.40
97
**
*0
.45
88
**
*(0
.14
3)
(0.1
19
)(0
.10
8)
(0.1
17
)(0
.14
4)
Co
nst
ant
term
effe
ct0
.22
98
20
.15
72
20
.50
88*
20
.73
61
**
20
.11
68
(0.3
53
)(0
.31
4)
(0.2
83
)(0
.33
6)
(0.4
01
)
Notes:
See
no
tes
toT
able
2.
Decomposing the Ethnic Gap in Rural Vietnam 99
Dow
nloa
ded
by [
Uni
vers
ity o
f B
ath]
at 0
3:07
16
Febr
uary
201
2

Table
4.
Dec
om
po
siti
on
of
the
eth
nic
dif
fere
nti
alin
ho
use
ho
ldex
pen
dit
ure
atse
lect
edq
uan
tile
s,2
00
4
10
th2
5th
50
th7
5th
90
th
Totaldifferential
0.482
**
*0.5865
**
*0.5941*
**
0.5524
**
*0.5485
**
*(0.024)
(0.019)
(0.022)
(0.026)
(0.024)
Dueto
differencesin
characteristics
0.207
**
*0.2438
**
*0.2471*
**
0.1973
**
*0.200
**
*ofwhich:
(0.026)
(0.027)
(0.024)
(0.027)
(0.039)
Ho
use
ho
ldst
ruct
ure
s0
.07
06
**
*0
.13
09
**
*0
.11
66*
**
0.1
08
3*
**
0.1
41
7*
**
(0.0
08
)(0
.01
)(0
.00
7)
(0.0
09
)(0
.01
2)
Ed
uca
tio
n0
.07
66
**
*0
.08
17
**
*0
.11
36*
**
0.0
87
9*
**
0.0
48
6*
**
(0.0
06
)(0
.00
6)
(0.0
06
)(0
.00
6)
(0.0
04
)L
and
ho
ldin
g2
0.0
30
8*
**
20
.04
12
**
*2
0.0
59
7*
**
20
.03*
**
20
.02
36
(0.0
11
)(0
.01
)(0
.00
8)
(0.0
1)
(0.0
22
)C
om
mu
ne
char
acte
rist
ics
0.0
90
7*
**
0.0
72
4*
**
0.0
76
6*
**
0.0
31
20
.03
34
(0.0
23
)(0
.02
4)
(0.0
23
)(0
.02
4)
(0.0
32
)
Dueto
differencesin
returns
0.275
**
*0.3427
**
*0.347*
**
0.3551
**
*0.3485
**
*ofwhich:
(0.038)
(0.033)
(0.032)
(0.033)
(0.047)
Ho
use
ho
ldst
ruct
ure
s0
.41
79
0.4
02
40
.30
05
0.3
26
40
.02
19
(0.3
01
)(0
.27
2)
(0.2
2)
(0.2
5)
(0.4
29
)E
du
cati
on
20
.01
09
20
.00
75
20
.01
06
20
.01
57
20
.09
88
**
*(0
.02
7)
(0.0
23
)(0
.02
8)
(0.0
3)
(0.0
34
)L
and
ho
ldin
g0
.01
03
0.0
03
32
0.0
06
82
0.0
32
32
0.0
24
8(0
.03
1)
(0.0
26
)(0
.02
3)
(0.0
24
)(0
.03
2)
Co
mm
un
ech
arac
teri
stic
s0
.13
58
0.2
56
9*
**
0.1
88
7*
0.0
44
32
0.0
22
6(0
.17
7)
(0.1
44
)(0
.11
5)
(0.1
22
)(0
.17
5)
Co
nst
ant
term
effe
ct2
0.2
78
12
0.3
12
52
0.1
24
90
.03
24
0.4
72
8(0
.35
9)
(0.2
99
)(0
.24
8)
(0.2
81
)(0
.47
5)
Notes:
See
no
tes
toT
able
2.
100 B. Baulch et al.
Dow
nloa
ded
by [
Uni
vers
ity o
f B
ath]
at 0
3:07
16
Febr
uary
201
2
comparison between 1993 and 2004, the estimated differences in the magnitudes of the
endowment and treatment effects were found to be statistically significant only in a couple
of cases for each of the two component parts. The estimated endowment effect rose by a
statistically significant 0.16 log points at the 25th percentile (jtj ¼ 3.57) and by 0.097 log
points at the median (jtj ¼ 2.86). The treatment component rose by 0.20 log points at the
median (jtj ¼ 3.98) and by 0.10 log points at the 75th percentile (jtj ¼ 2.01).15
The Juhn, Murphy and Pierce (1991) decomposition is now exploited to investigate the
evolution of the mean gap in per capita expenditures between the majority and minority
groups over time. The analysis is undertaken separately for 1993 and 2004 and for 1998
and 2004.16 The results are reported in Tables 5 and 6, which decompose the changes in
the ethnic gap into the four component parts described in equation (9).
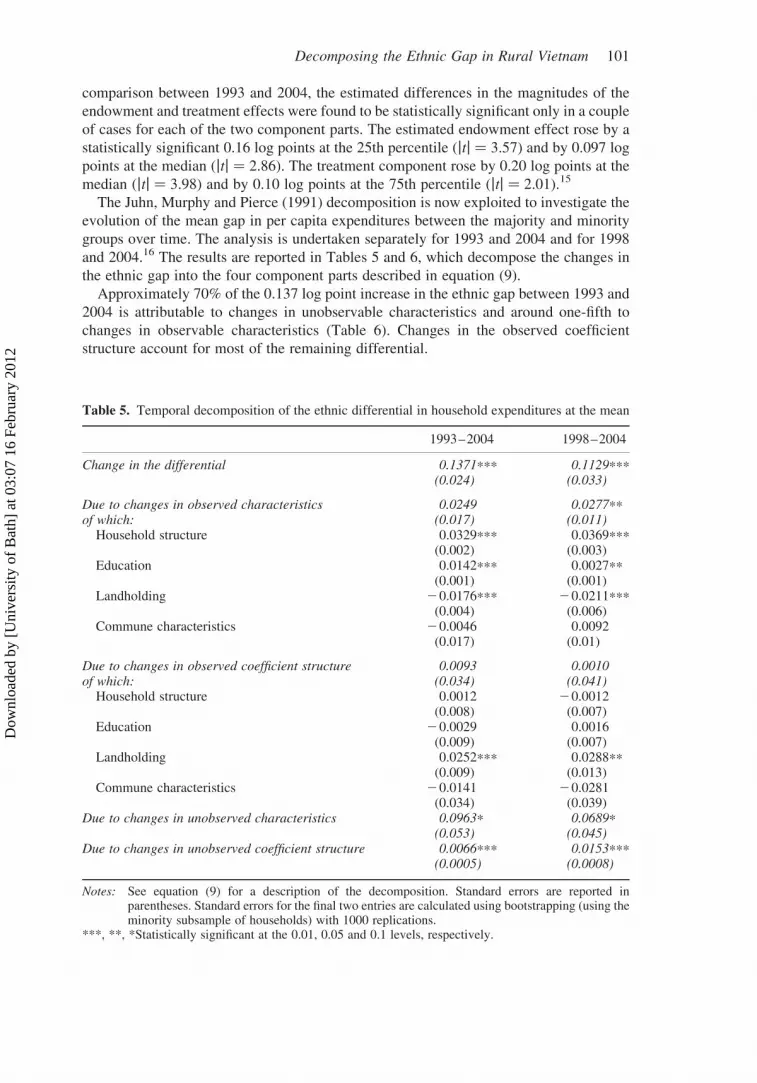
Approximately 70% of the 0.137 log point increase in the ethnic gap between 1993 and
2004 is attributable to changes in unobservable characteristics and around one-fifth to
changes in observable characteristics (Table 6). Changes in the observed coefficient
structure account for most of the remaining differential.
Table 5. Temporal decomposition of the ethnic differential in household expenditures at the mean
1993–2004 1998–2004
Change in the differential 0.1371*** 0.1129***(0.024) (0.033)
Due to changes in observed characteristics 0.0249 0.0277**of which: (0.017) (0.011)
Household structure 0.0329*** 0.0369***(0.002) (0.003)
Education 0.0142*** 0.0027**(0.001) (0.001)
Landholding 20.0176*** 20.0211***(0.004) (0.006)
Commune characteristics 20.0046 0.0092(0.017) (0.01)
Due to changes in observed coefficient structure 0.0093 0.0010of which: (0.034) (0.041)
Household structure 0.0012 20.0012(0.008) (0.007)
Education 20.0029 0.0016(0.009) (0.007)
Landholding 0.0252*** 0.0288**(0.009) (0.013)
Commune characteristics 20.0141 20.0281(0.034) (0.039)
Due to changes in unobserved characteristics 0.0963* 0.0689*(0.053) (0.045)
Due to changes in unobserved coefficient structure 0.0066*** 0.0153***(0.0005) (0.0008)
Notes: See equation (9) for a description of the decomposition. Standard errors are reported inparentheses. Standard errors for the final two entries are calculated using bootstrapping (using theminority subsample of households) with 1000 replications.
***, **, *Statistically significant at the 0.01, 0.05 and 0.1 levels, respectively.
Decomposing the Ethnic Gap in Rural Vietnam 101
Dow
nloa
ded
by [
Uni
vers
ity o
f B
ath]
at 0
3:07
16
Febr
uary
201
2

Table
6.
Tem
po
ral
dec
om
po
siti
on
of
the
eth
nic
gap
inh
ou
seh
old
exp
end
itu
res
atse
lect
edq
uan
tile
s,1
99
3–
20
04
10
th2
5th
Med
ian
75
th9
0th
Changein
totaldifferential
0.1053
**
0.2779
**
*0.2992
**
*0.1411
**
*0.0769
*(0.049)
(0.038)
(0.039)
(0.036)
(0.047)
Changein
observable
characteristics
0.0249
20.0472
0.05
0.0362
0.0017
(betweenmajority
andminority
groups)
(0.089)
(0.064)
(0.072)
(0.066)
(0.116)
ofwhich:
Ho
use
ho
ldst
ruct
ure
20
.00
53
0.0
19
20
.01
93
20
.00
03
20
.01
9(0
.01
8)
(0.0
15
)(0
.01
8)
(0.0
19
)(0
.03
3)
Ed
uca
tio
n0
.01
73
0.0
26
1*
*0
.01
54
0.0
13
0.0
01
(0.0
14
)(0
.01
1)
(0.0
1)
(0.0
11
)(0
.01
1)
Lan
dh
old
ing
20
.01
62
0.0
24
3*
20
.00
05
20
.00
86
0.0
00
9(0
.02
2)
(0.0
15
)(0
.01
4)
(0.0
16
)(0
.01
8)
Co
mm
un
ech
arac
teri
stic
s0
.02
89
20
.06
80
.05
44
0.0
32
10
.01
88
(0.0
84
)(0
.05
7)
(0.0
65
)(0
.06
1)
(0.1
09
)
Changein
observable
ethnic
differences
0.0285
0.1969
**
*0.1011
**
*2
0.0254
20.0071
oftheminority
group
(0.036)
(0.026)
(0.02)
(0.024)
(0.046)
ofwhich:
Ho
use
ho
ldst
ruct
ure
0.0
21
4*
**
0.1
11
3*
**
0.0
74
3*
**
0.0
08
60
.06
99
**
*(0
.00
7)
(0.0
08
)(0
.00
5)
(0.0
06
)(0
.01
2)
Ed
uca
tio
n0
.02
89
**
*0
.05
97
**
*0
.05
36
**
*0
.03
79
**
*2
0.0
37
7*
**
(0.0
03
)(0
.00
4)
(0.0
05
)(0
.00
4)
(0.0
1)
Lan
dh
old
ing
20
.00
78
0.0
07
72
0.0
43
8*
**
20
.01
81
**
*2
0.0
07
4(0
.01
1)
(0.0
1)
(0.0
07
)(0
.00
7)
(0.0
14
)C
om
mu
ne
char
acte
rist
ics
20
.01
40
.01
82
0.0
16
92
0.0
53
7*
*2
0.0
31
9(0
.03
4)
(0.0
2)
(0.0
2)
(0.0
22
)(0
.04
)
Changein
themajority
group’s
returnsto
characteristics
0.0449
20.0366
20.0023
0.0652
0.0096
ofwhich:
(0.067)
(0.046)
(0.038)
(0.044)
(0.079)
Ho
use
ho
ldst
ruct
ure
0.0
00
72
0.0
19
3*
*2
0.0
13
90
.01
38
*0
.00
53
(0.0
13
)(0
.01
)(0
.01
)(0
.00
9)
(0.0
12
)E
du
cati
on
20
.00
32
20
.01
51
**
20
.00
72
0.0
03
82
0.0
32
7(0
.01
3)
(0.0
08
)(0
.00
9)
(0.0
1)
(0.0
34
)
102 B. Baulch et al.
Dow
nloa
ded
by [
Uni
vers
ity o
f B
ath]
at 0
3:07
16
Febr
uary
201
2

Lan
dh
old
ing
20
.00
52
0.0
00
50
.01
09
0.0
34
**
*0
.02
26
(0.0
25
)(0
.03
)(0
.01
1)
(0.0
1)
(0.0
15
)C
om
mu
ne
char
acte
rist
ics
0.0
52
32
0.0
01
70
.00
76
0.0
21
20
.01
44
(0.0
63
)(0
.03
7)
(0.0
37
)(0
.04
4)
(0.0
73
)
Changein
differencesin
returns
0.007
0.1647
**
0.1505
*0.0651
0.0727
(betweenmajority
andminority
groups)
(0.118)
(0.084)
(0.086)
(0.085)
(0.137)
ofwhich:
Ho
use
ho
ldst
ruct
ure
0.6
58
0.0
55
22
0.3
46
82
0.1
59
10
.09
26
(0.5
82
)(0
.49
2)
(0.4
)(0
.4)
(0.5
25
)E
du
cati
on
20
.03
71
20
.07
06
20
.07
13
*2
0.0
42
72
0.1
29
8*
(0.0
73
)(0
.05
2)
(0.0
45
)(0
.04
3)
(0.0
82
)L
and
ho
ldin
g0
.02
98
0.0
27
80
.05
97
20
.03
53
0.0
10
1(0
.06
3)
(0.0
63
)(0
.04
2)
(0.0
41
)(0
.05
9)
Co
mm
un
ech
arac
teri
stic
s2
0.0
55
50
.02
95
20
.04
48
20
.09
96
20
.08
39
(0.2
75
)(0
.21
6)
(0.1
49
)(0
.14
8)
(0.1
82
)C
on
stan
tte
rmef
fect
20
.58
82
0.1
22
90
.55
37
0.4
01
90
.18
36
(0.6
16
)(0
.51
3)
(0.4
44
)(0
.41
9)
(0.5
98
)
Notes:
See
equ
atio
n(1
0).
Sta
nd
ard
erro
rsar
ere
po
rted
inp
aren
thes
es.
**
*,
**
,*
Sta
tist
ical
lysi
gn
ifica
nt
atth
e0
.01
,0
.05
and
0.1
lev
els,
resp
ecti
vel
y.
Decomposing the Ethnic Gap in Rural Vietnam 103
Dow
nloa
ded
by [
Uni
vers
ity o
f B
ath]
at 0
3:07
16
Febr
uary
201
2

The first component of the Juhn, Murphy and Pierce decomposition captures the
contribution of changes in observed characteristics in explaining the changes in the
ethnic gap. This component accounts for one-fifth of the overall change in the ethnic gap
between 1983 and 2004, and one-quarter for the shorter period between 1998 and 2004.
As shown in Table 5, the most important subset of characteristics relates to ethnic
differentials in household demographic structure variables followed by changes in ethnic
differences in education. By contrast, changes in ethnic differences with respect to
landholdings serve to narrow the temporal change in the household welfare gap. The
second component of the decomposition, which shows temporal changes in the majority
group’s coefficient structure, accounts for a modest part of the rise in the ethnic gap.
Moreover, the estimated effect is not found to be significant at a conventional level.17
The third component is the most important: about 70% of the overall temporal change is
accounted for by changes in unobservable household and community characteristics.
This component reflects the sharp decline in the percentile rankings of the average
minority household within the majority group’s residual welfare distribution. Just over
60% of this change occurred between 1998 and 2004. The final component of the
decomposition reveals that changes in the residual dispersion of the welfare measure
account for little of the rising ethnic welfare gap.
Overall, the ethnic-specific factors relating to observable and unobservable
characteristics account for over 80% of the increase in the ethnic expenditure gap.
There appears to be a negligible role for changes in coefficient structure, whether observed
(i.e. changes in the estimated coefficients over time) or unobserved (i.e. changes in the
residual expenditure dispersion over time). That around two-thirds of the increase in the
ethnic gap between these two years is attributable to unobserved factors is noteworthy and
could be linked to either greater unobserved heterogeneity and/or an increasingly unequal
treatment of the ethnic minorities within Vietnam in recent times (see Section 6).
Finally, an analysis of the temporal changes in the ethnic gaps at selected quantiles is
implemented using expression (10). The results of this exercise are reported in Tables 6
and 7, and are again based on comparisons conducted between 1993 and 2004, and 1998
and 2004, respectively. For the period 1993–2004 (Table 6), the differentials in the
temporal change in the overall predicted raw gaps were found to be statistically significant
at all the selected quantiles, with the lowest gaps at the two extreme percentile points used
in our analysis. At the median, the predicted gap rose by approximately 0.30 log points
between 1993 and 2004. About one-third of this change is attributable to changes over
time in the characteristics of the minority group, with changes in household structure and
educational levels being the most important subset of variables. Approximately one-half
of the increase in the ethnic disadvantage at the median is attributable to a widening of the
gap between majority and minority returns to included characteristics.18
The results reported in Table 7 for 1998–2004 are broadly congruent with the findings
of Table 6. However, the share of the change in the ethnic gap accounted for by changes in
the difference in returns at the median rose to almost three-fifths, while that accounted for
by changes in observable ethnic differentials declined to one-twentieth; but none of the
subsets of variables was found to be statistically significantly from zero in this case,
underlining the need for further interrogation of the two unobserved components of the
decomposition within the most recent 6-year period. By contrast, the subsets of variables
for household structure, education and landholdings explain most of the changes in
observable ethnic differences that occurred over the same period.
104 B. Baulch et al.
Dow
nloa
ded
by [
Uni
vers
ity o
f B
ath]
at 0
3:07
16
Febr
uary
201
2

Table
7.
Tem
po
ral
dec
om
po
siti
on
of
the
eth
nic
gap
inh
ou
seh
old
exp
end
itu
res
atse
lect
edq
uan
tile
s,1
99
8–
20
04
10
th2
5th
Med
ian
75
th9
0th
Changein
totaldifferential
0.0771
**
0.1092*
**
0.1853
**
*0.0157
20.0666
(0.038)
(0.031)
(0.033)
(0.033)
(0.051)
Changein
observable
characteristics
0.0103
20.0269
0.0099
0.0101
20.0805
(betweenmajority
andminority
groups)
(0.045)
(0.05)
(0.041)
(0.03)
(0.061)
ofwhich:
Ho
use
ho
ldst
ruct
ure
20
.01
45
0.0
12
42
0.0
22
72
0.0
25
3*
*2
0.0
25
2(0
.01
9)
(0.0
13
)(0
.01
5)
(0.0
11
)(0
.02
)E
du
cati
on
0.0
14
90
.01
42
0.0
29
5*
*0
.01
85
*0
.00
32
(0.0
11
)(0
.01
1)
(0.0
12
)(0
.01
)(0
.01
2)
Lan
dh
old
ing
20
.01
81
20
.03
8*
*2
0.0
18
82
0.0
28*
*2
0.0
41
6*
(0.0
17
)(0
.01
7)
(0.0
13
)(0
.01
3)
(0.0
26
)C
om
mu
ne
char
acte
rist
ics
0.0
27
92
0.0
15
50
.02
19
0.0
45*
**
20
.01
7(0
.03
5)
(0.0
4)
(0.0
31
)(0
.01
7)
(0.0
43
)
Changein
observable
ethnic
differences
20.0123
0.0608*
**
0.044
**
0.0044
0.0121
oftheminority
group
(0.028)
(0.02)
(0.019)
(0.011)
(0.04)
ofwhich:
Ho
use
ho
ldst
ruct
ure
20
.03
76
**
*0
.07
12*
**
0.0
26
8*
**
0.0
43
5*
**
20
.00
52
(0.0
08
)(0
.00
7)
(0.0
07
)(0
.00
6)
(0.0
09
)E
du
cati
on
0.0
09
6*
**
20
.00
19
0.0
56
1*
**
20
.00
36
20
.00
34
(0.0
02
)(0
.00
5)
(0.0
05
)(0
.00
3)
(0.0
06
)L
and
ho
ldin
g0
.01
51
20
.00
72
0.0
20
7*
**
20
.02
5*
**
0.0
19
2(0
.01
2)
(0.0
1)
(0.0
07
)(0
.00
6)
(0.0
2)
Co
mm
un
ech
arac
teri
stic
s0
.00
07
20
.00
16
20
.01
82
20
.01
05
*0
.00
15
(0.0
25
)(0
.01
4)
(0.0
17
)(0
.00
6)
(0.0
3)
Changein
themajority
group’s
returnsto
characteristics
0.0479
20.0161
0.0219
0.0021
20.0273
ofwhich:
(0.044)
(0.042)
(0.04)
(0.037)
(0.072)
Ho
use
ho
ldst
ruct
ure
20
.00
64
20
.00
66
0.0
01
60
.00
28
0.0
33
4*
*(0
.01
4)
(0.0
06
)(0
.00
8)
(0.0
1)
(0.0
17
)E
du
cati
on
0.0
13
40
.00
87
20
.00
04
20
.01
23
20
.02
14
(Continued
)
Decomposing the Ethnic Gap in Rural Vietnam 105
Dow
nloa
ded
by [
Uni
vers
ity o
f B
ath]
at 0
3:07
16
Febr
uary
201
2

Table
7.Continued
10
th2
5th
Med
ian
75
th9
0th
(0.0
1)
(0.0
15
)(0
.00
5)
(0.0
12
)(0
.01
6)
Lan
dh
old
ing
20
.01
81
20
.01
10
.04
94
**
0.0
22
20
.01
22
(0.0
16
)(0
.01
2)
(0.0
23
)(0
.01
7)
(0.0
42
)C
om
mu
ne
char
acte
rist
ics
0.0
59
20
.00
71
20
.02
87
20
.01
06
20
.05
16
(0.0
41
)(0
.03
5)
(0.0
36
)(0
.03
)(0
.05
8)
Changein
differencesin
returns
0.0312
0.0914
0.1095
**
20.0009
0.0292
(betweenmajority
andminority
groups)
(0.067)
(0.07)
(0.057)
(0.053)
(0.1)
ofwhich:
Ho
use
ho
ldst
ruct
ure
0.4
31
80
.16
35
20
.14
21
20
.34
72
0.0
81
4(0
.47
4)
(0.3
99
)(0
.35
5)
(0.4
13
)(0
.51
5)
Ed
uca
tio
n0
.00
50
.00
26
20
.02
06
20
.02
73
20
.08
25
*(0
.06
)(0
.04
5)
(0.0
41
)(0
.04
5)
(0.0
52
)L
and
ho
ldin
g0
.11
48
**
0.0
94
4*
*0
.02
28
0.0
15
30
.06
8(0
.05
)(0
.04
3)
(0.0
5)
(0.0
46
)(0
.06
6)
Co
mm
un
ech
arac
teri
stic
s2
0.0
12
62
0.0
14
20
.13
20
.41
04
**
*2
0.4
64
5*
*(0
.20
2)
(0.1
79
)(0
.13
9)
(0.1
62
)(0
.22
3)
Co
nst
ant
term
effe
ct2
0.5
07
82
0.1
55
30
.37
93
0.7
68
4*
0.5
89
6(0
.49
8)
(0.4
48
)(0
.38
)(0
.43
7)
(0.5
56
)
Notes:
See
no
tes
toT
able
6.
106 B. Baulch et al.
Dow
nloa
ded
by [
Uni
vers
ity o
f B
ath]
at 0
3:07
16
Febr
uary
201
2

6. Summary and Conclusions
In 1946, Ho Chi Minh famously asserted that:
As people born from the same womb, whether Kinh or Tho, Muong or Man, Gia Rai or
Ede, Xedang or Bana, or any other ethnic minority, all of us are the children of Vietnam,
all of us are brothers and sisters. We live and die together, share happiness and sorrow
together, [and] whether hungry or full, we help each other. (Dao et al., 2000, p. 545)
It is now over 30 years since the reunification of Vietnam and around 20 since the Doi Moi
economic reforms were first initiated. The rapid economic growth experienced since the
early 1990s has certainly been of central importance in poverty reduction and improving
the well-being of the Vietnamese people across a broad range of dimensions. However, on
the basis of the empirical analysis reported in this paper, it is clear that the ethnic
minorities have not benefited from this process to the same extent as the Kinh-Hoa
majority. Indeed, economic horizontal inequalities are substantial and rising, with the
ethnic gap in per capita expenditures in rural Vietnam widening considerably since 1998.
The increase in the ethnic expenditure gap in rural areas has, however, been relatively
constant across the conditional expenditure distribution, with little evidence that it has
widened more among either the richer or the poorer households.
In line with the existing literature, this study found that the larger portion of the ethnic
gap in household welfare levels is attributable to differences in returns to endowments
(treatment effects) rather than the differences in the endowments themselves. Previous
studies using mean regression analysis have found this to be a persistent feature over time
in the mean expenditure gap, but we have shown it is also the case at selected quantiles of
the conditional household expenditure distribution. The factors underlying the overall
treatment differentials are difficult to unpick, although the estimated differences in returns
due to household demographic structure were found to be important in both mean and
median regression analysis. The characteristics driving the endowment differentials were
more clear-cut and comprised, in order of importance, ethnic differences in household
demographic structure, education levels and commune characteristics.
As ethnic minorities in Vietnam tend to live in higher, more mountainous and more
remote areas than the majority, a failure to control for spatial heterogeneity may bias, among
other things, the estimated treatment effects. We therefore introduced controls for a large
number of districts. An important finding of the current study is that, even allowing for the
introduction of such a large array of district effects, a sizeable treatment effect remains in all
years. This finding supports the view that the horizontal inequalities between ethnic
minority groups in rural Vietnam cannot be ascribed entirely to the role of geography and the
concentration of ethnic minorities within the more remote parts of the country.
1The widening of the mean ethnic expenditure gap over the 11-year interval we analysed
was dramatic and mostly concentrated in the second half of this period. The rise was not
restricted to the mean but occurred at most points of the conditional household expenditure
distribution. Our temporal decomposition analysis shows that at least half of the increase in
the ethnic expenditure gap is attributable to changes in unobservable characteristics, with
less than a quarter due to changes in the observable ethnic differences in characteristics.
Changes over time in coefficient structure, whether observed or unobserved, accounted for a
negligible part of the increase. This finding appears to be invariant to the use of mean or
quantile regression analysis.
Decomposing the Ethnic Gap in Rural Vietnam 107
Dow
nloa
ded
by [
Uni
vers
ity o
f B
ath]
at 0
3:07
16
Febr
uary
201
2
In an additional piece of research undertaken in this study, following an approach
suggested in Pham & Reilly (2009), we used auxiliary regression analysis in an attempt to
uncover the role of cultural, geographic and language variables in explaining the variation in
the estimated treatment effects across the minority groups. The point estimates obtained
suggest that membership of the Central Highlands minorities, lack of ability in the
Vietnamese language, and distance to the commune and district centres amplified the
treatment effects, while membership of the Khmer and Cham ethnic groups or being a
Christian diminished them. However, these estimated effects were generally not found to be
well-determined across all three survey years, and any inferences must be treated with a
great deal of interpretational caution. We are thus left to conjecture that the source of these
unexplained differences may be partially rooted in: negative stereotyping and poor
understanding of ethnic minority customs and cultures; and unobserved variations in
household-level endowments (e.g. education, distance from the commune centre and land
quality). Unfortunately, the data available to us do not permit us to distinguish empirically
between these two probably reinforcing and complementary explanations.
This paper’s empirical results do suggest that the geographically targeted and infrastructure-
focused interventions that have been implemented in Vietnam’s ethnic minority areas since
1998 have not been able to counteract the widening gap in majority–minority living standards.
Policies and programmes are also required to enhance the lower returns that the ethnic
minorities obtain from their endowments.19 These and other measures that reduce and
dismantle the multiple barriers that restrict most ethnic minorities fromparticipating fully in the
growth process are urgently required. By doing this, Ho Chi Minh’s vision of equality and
mutual interdependence among all Vietnam’s ethnic groups can be furthered.
Notes
1 Horizontal inequality is not a term that is in common use in Vietnam, although group-wise inequality is
clearly of concern to national policymakers. For a useful overview of the horizontal inequality
literature, see Stewart et al. (2005).2 These estimates are based on the authors’ own calculations using the VHLSS 2004.3 The estimated Gini coefficient for the Kinh and Hoa majority located in rural areas, based on the per
capita household expenditure measure, is approximately 0.27 for both 1993 and 2004. By contrast,
household expenditures within the minority groups have become more unequal, with Gini rising from
0.24 in 1993 to 0.29 in 2004. The differential in the Gini point estimates for the minority group across
these two years is statistically significant at a conventional level.4 Ethnic minority students can attend college or university without taking the normal entrance
examinations if they are nominated by their provincial authorities, or can attend one of three pre-
universities if their examination score grades do not qualify them for immediate admission to college
or university. Some colleges and universities also have special classes for ethnic minority students,
although such classes are now less common than in the past (Nguyen & Baulch, 2007).5 Our chosen measure is defined as real household per capita expenditure computed on the basis of total
household food and non-food consumption over the past 12 months. The living standard variable is
expressed in real terms at January 2004 prices.6 There are two poverty lines in common use within Vietnam: the GSO-World Bank poverty line (which is
based on a standard “cost-of-basic-needs” methodology and estimated from the V(H)LSS) and the
MOLISA poverty lines (which are used for targeting social assistance as well as monitoring the number of
poor households at the commune level). The “international” $1.25 and $2 a day poverty lines are rarely
used for poverty analysis within Vietnam owing to issues relating to Purchasing Power Parity conversion.7 In the mean regression analysis, the effects of clustering and stratification are taken into account in the
mean estimation of the per capita log expenditure equation by exploiting each of the relevant survey’s
sample design features.
108 B. Baulch et al.
Dow
nloa
ded
by [
Uni
vers
ity o
f B
ath]
at 0
3:07
16
Febr
uary
201
2

8 The minority coefficient structure could also be assumed to prevail in the absence of unequal treatment.
This will yield numerically different values for the component parts of equation (3) given the well-
known index number problem.9 Coastal, delta, midlands, low mountains and high mountains are the geographic types of commune that
are distinguished in the VLSS and VHLSS.10 It should be noted that the quantile approach used here does not incorporate survey design features in
the construction of the sampling variances as there are several communes (the primary sampling unit
for the VLSS and VHLSS) with only one ethnic minority household in the sample. This problem is
especially severe in the VHLSS 2004 in which expenditure data were collected only for three
households per commune. So while it is possible to account for the survey design in quantile
regressions for the majority group, it is not possible to do so in quantile regressions for the minority
group. We thank an anonymous referee for helping us clarify this point.11 It is acknowledged that this approach is also subject to the conventional index number problem.12 We also decomposed the ethnic per capita household expenditure gaps under the assumption that the
minority coefficients prevailed in the absence of unequal treatment. The results, which are available
from the corresponding author on request, suggest relatively modest evidence of an “index number”
problem. Furthermore, as the Kinh and Hoa majority group accounts for about 85% of the total sample,
it is reasonable to assume the majority coefficient structure is the relevant benchmark in the absence of
unequal treatment. We therefore focus on the decomposition results using equation (3) in this paper.13 The declining importance of commune characteristics in accounting for both endowment and treatment
differentials between 1998 and 2004 may reflect the impact of the geographically targeted
infrastructure investments, which focused on commune roads, clean water and irrigation systems,
markets, schools and health centres, and electricity supply under Programmes 133 and 135 in ethnic
minority areas. See Nguyen & Baulch (2007) for further details of these and other ethnic minority
policies and programmes in Vietnam.14 For brevity, the full set of quantile regression estimates is not reported here but is available from the
corresponding author on request. Note that, in contrast to the mean linear regressions reported in
Table A2, a large number of commune or district fixed effects cannot be introduced into the quantile
regressions because of a programming constraint (the group demeaning approach to estimating fixed
effects cannot be used in the quantile regression context).15 Note that the median estimate of the raw differential is materially different from the mean estimate in
only the first year of our analysis, suggesting a large role for outliers in this particular year. This has
implications for the mean estimate of the treatment effect, which is over 50% higher than the median-
based effect. The mean decompositions thus appear to understate by a magnitude of about one-half the
increase in the ethnic disadvantage for a median household between 1993 and 2004.16 In order to ensure that the temporal comparisons are comparable to the quantile regressions, only the
expenditure equations with commune controls are used in this exercise.17 Note that temporal differences in the estimated landholding effects in the majority equations are
statistically significant from zero, and exert a widening effect on the observed change on the per capita
household welfare gap.18 This finding is not detected at the extremes of the distribution where the estimated change in treatment
effects is found to be poorly determined. The imprecisely estimated effect at the 90th percentile, for
example, may be due to the low density of data points in the minority equations at this particular
quantile.19 The priority areas that are likely to achieve this include, inter alia, improving agricultural extension,
marketing services and the quality of education in mountainous areas, improved access to wage
employment, and the improvement of Vietnamese language skills among some ethnic minority groups.
References
Baulch, B., Truong, C., Haughton, D. & Haughton, J. (2004) Ethnic minority development in Vietnam: a
socio-economic perspective, in: P. Glewwe, N. Agrawal & D. Dollar (Eds) Economic Growth, Poverty and
Household Welfare in Vietnam (Washington, DC: World Bank Regional and Sectoral Studies, World Bank).
Baulch, B., Nguyen, H. T. M., Nguyen, P. T. T. & Pham, H. T. (2010) Ethnic minority poverty in Vietnam, CPRC
Working Paper No. 169 (Manchester: Chronic Poverty Research Centre).
Decomposing the Ethnic Gap in Rural Vietnam 109
Dow
nloa
ded
by [
Uni
vers
ity o
f B
ath]
at 0
3:07
16
Febr
uary
201
2
Blinder, A. (1973) Wage discrimination: reduced form and structural variables, Journal of Human Resources,
8(4), pp. 436–455.
Chamberlain, G. (1994) Quantile regression, censoring and the structure of wages, in: C. Sims (Ed.) Advances in
Econometrics (Cambridge: Cambridge University Press).
Committee for Ethnic Minorities (CEM) (2009) Annual Report (Hanoi: Committee for Ethnic Minorities).
Dang, N. V., Chu, T. S. & Lu, H. (2000) Ethnic Minorities in Vietnam (Hanoi: The Gioi Publishers).
Ðao, D. T., Nguyen, Ð. B., Ha, Ð., Ðang, X. K., Tran, T. T., Nguyen, D. Q., Ðo, N. P., Hoang, M. T. & Tran, N.
(Eds) (2000) Ho Chı Minh: Toan Tap 4, 1945–1946 (Ha Noi: Nha Xuat Chınh Tri Quoc Gia).
Deaton, A. (1997) The Analysis of Household Surveys: A Microeconometric Approach to Policy (Baltimore:
Johns Hopkins University Press).
Glewwe, P., Agrawal, N. & Dollar, D. (Eds) (2004) Economic Growth, Poverty and Household Welfare in
Vietnam (Washington, DC: World Bank Regional and Sectoral Studies).
Hoang, T. T. H., Pham, H. G., Tran, B. M. & Hansen, H. (2007) Ethnicity and poverty reduction, in: T. Nguyen &
H. Hansen (Eds) Markets, Policy and Poverty Reduction in Vietnam (Hanoi: Vietnam Academy of Social
Sciences/National Political Publishing House).
Hoang, X. T., Le, T. Q. & Ngo, V. H. (2004) Ethnic minorities and gender issues in agricultural extension,
Agricultural Extension Services for the Poor Series No. 2 (Hanoi: Sub-group on Agricultural Extension
Services for the Poor, VUFU-NGO Resource Centre).
Jamieson, H., Cuc, L. T. & Rambo, T. (1998) The Development Crisis in Viet Nam’s Mountains (Honolulu: East
West Centre).
Juhn, C., Murphy, K. & Pierce, B. (1991) Accounting for the slowdown in black–white wage convergence, in:
M. Kosters (Ed.) Workers and Their Wages (Washington, DC: American Enterprise Institute Press).
Koenker, R. (2005) Quantile regression, Econometric SocietyMonographs (Cambridge: Cambridge University Press).
Koenker, R. & Bassett, G. (1978) Regression quantiles, Econometrica, 46(1), pp. 33–50.
Machado, J. & Mata, J. (2005) Counterfactual decomposition of changes in wage distributions using quantile
regression models, Journal of Applied Econometrics, 20, pp. 445–465.
MOLISA & UNDP (2004) Taking Stock, Planning Ahead: Evaluation of the National Targeted Programme on
Hunger Eradication and Poverty Reduction and Programme 135 (Hanoi: Ministry of Labour Invalids and
Social Affairs and United Nations Development Programme).
Nguyen, P. & Baulch, B. (2007) A review of ethnic minority programmes and policies in Vietnam, Mimeo,
Centre for Analysis and Forecasting, Vietnam Academy of Social Sciences, Hanoi.
Oaxaca, R. (1973) Male–female wage differentials in urban labour markets, International Economic Review,
9(3), pp. 693–709.
Pham, T. H. & Reilly, R. (2009) Ethnic wage inequality in Vietnam, International Journal of Manpower, 30(3, 4),
pp. 119–192.
Phung, D. T. & Nguyen, P. (2006) Vietnam Household Living Standards Survey (VHLSS) 2002 and 2004, in:
H. Hansen & T. Nguyen (Eds) Market, Policy and Poverty Reduction in Vietnam (Hanoi: Vietnam Culture
and Information Publishing House).
Pincus, J. & Sender, J. (2006) Quantifying poverty in Viet Nam: who counts? Mimeo, United Nations
Development Programme, Hanoi.
Poverty Working Group (1999) Vietnam Attacking Poverty (Hanoi: World Bank).
Reilly, B. (1999) The gender pay gap in Russia during the transition (1992–1996), The Economics of Transition,
7(1), pp. 245–264.
Stewart, F., Brown, G. & Mancini, L. (2005) Why horizontal inequality? Issues of application and measurement,
CRISE Working Paper No. 19 (Oxford: Centre for Research on Inequality, Human Security and Ethnicity).
Swinkels, R. & Turk, C. (2006) Explaining ethnic minority poverty in Vietnam: a summary of recent trends and
current challenges, Background paper for CEM-MPI Meeting on Ethnic Minority Poverty, World Bank,
Hanoi.
Van de Walle, D. & Gunewardena, D. (2001) Sources of ethnic inequality in Viet Nam, Journal of Development
Economics, 65, pp. 177–207.
Vasavakul, T. (2003) Language policy and ethnic relations in Vietnam, in: M. E. Brown & S. Ganguly (Eds)
Fighting Words: Language Policy and Ethnic Relations in Asia (Cambridge, MA: MIT Press), pp. 211–238.
Vietnam Academy of Social Sciences (VASS) (2007) Vietnam Poverty Update Report: Poverty and Poverty
Reduction in Vietnam, 1993–2004 (Hanoi: National Political Publishing House).
110 B. Baulch et al.
Dow
nloa
ded
by [
Uni
vers
ity o
f B
ath]
at 0
3:07
16
Febr
uary
201
2
Vuong, X. T. (2007) Land tenure and poverty reduction for ethnic minorities in Vietnam’s mountainous areas,
Paper for World Bank Country Social Assessment for Vietnam, Institute of Anthropology, Vietnam
Academy of Social Sciences, Hanoi.
World Bank (2009) Country Social Assessment: Ethnicity and Development in Vietnam (Washington, DC: World
Bank).
Decomposing the Ethnic Gap in Rural Vietnam 111
Dow
nloa
ded
by [
Uni
vers
ity o
f B
ath]
at 0
3:07
16
Febr
uary
201
2

Appendix
Table
A1.
Des
crip
tio
no
fv
aria
ble
san
dsu
mm
ary
stat
isti
cs
19
93
19
98
20
04
Bri
efd
escr
ipti
on
of
var
iab
les
(1)
(2)
(1)
(2)
(1)
(2)
Rea
lp
erca
pit
aex
pen
dit
ure
in2
00
4p
rice
(VN
D’0
00
s)1
87
01
26
92
40
11
59
13
14
91
86
1(1
30
9)
(67
4)
(14
90
)(7
86
)(2
13
0)
(13
39
)H
ou
seh
old
size
5.7
89
46
.63
03
5.4
42
36
.10
65
4.8
58
96
.02
08
(2.1
41
)(3
.24
5)
(1.8
71
)(1
.98
)(1
.64
8)
(2.3
07
)P
rop
ort
ion
of
chil
dre
nag
ed6
yea
rsan
dle
ss0
.17
29
0.2
15
20
.12
00
0.1
54
60
.08
57
0.1
21
8(0
.17
6)
(0.1
77
)(0
.15
4)
(0.1
54
)(0
.13
3)
(0.1
47
)P
rop
ort
ion
of
chil
dre
nag
edfr
om
7to
16
yea
rs0
.26
21
0.2
59
00
.27
27
0.2
91
70
.23
74
0.2
74
1(0
.20
5)
(0.1
96
)(0
.20
6)
(0.2
03
)(0
.20
2)
(0.1
9)
Pro
po
rtio
no
fm
ale
adu
lts
0.2
61
60
.25
11
0.2
84
80
.26
40
0.3
28
60
.29
78
(0.1
44
)(0
.12
6)
(0.1
51
)(0
.13
8)
(0.1
68
)(0
.14
)P
rop
ort
ion
of
fem
ale
adu
lts
0.3
03
30
.27
48
0.3
22
50
.28
98
0.3
48
30
.30
63
(0.1
54
)(0
.13
3)
(0.1
59
)(0
.13
5)
(0.1
58
)(0
.13
)H
ou
seh
old
typ
e1
:h
ead
or
hea
dan
dsp
ou
se0
.02
13
0.0
07
90
.03
02
0.0
10
50
.03
76
0.0
09
3H
ou
seh
old
typ
e2
:p
aren
tsan
do
ne
chil
d0
.06
87
0.0
50
70
.05
51
0.0
25
60
.09
02
0.0
49
0H
ou
seh
old
typ
e3
:p
aren
tsan
dtw
och
ild
ren
0.1
39
40
.08
86
0.1
67
00
.11
92
0.2
54
70
.16
87
Ho
use
ho
ldty
pe
4:
par
ents
wit
h.
thre
ech
ild
ren
0.4
55
90
.45
07
0.4
31
90
.41
53
0.3
20
60
.37
36
Ho
use
ho
ldty
pe
5:
thre
e-g
ener
atio
nh
ou
seh
old
0.0
62
30
.06
39
0.0
66
70
.09
47
0.1
57
00
.18
60
Ho
use
ho
ldty
pe
6:
oth
erh
ou
seh
old
stru
ctu
res
0.2
52
30
.33
81
0.2
49
00
.33
47
0.1
39
90
.21
34
Ag
eo
fh
ou
seh
old
hea
d(y
ears
)4
5.2
32
42
.51
24
6.7
27
44
.04
84
8.9
86
44
.83
7(1
3.7
)(1
3.9
2)
(12
.87
)(1
2.3
5)
(13
.61
)(1
2.6
2)
Sq
uar
edag
eo
fh
ou
seh
old
hea
d(d
ivid
edb
y1
00
)2
2.3
35
20
.00
82
3.4
89
20
.92
62
5.8
48
21
.69
5(1
3.5
2)
(13
.19
)(1
3.1
1)
(12
.04
)(1
4.8
4)
(12
.7)
Ho
use
ho
ldh
ead
isfe
mal
e0
.18
98
0.1
31
10
.17
49
0.1
39
10
.17
59
0.0
88
1M
ost
edu
cate
dm
emb
er:
no
sch
oo
lin
g0
.01
04
0.1
02
10
.00
70
0.0
52
90
.05
70
0.1
47
9M
ost
edu
cate
dm
emb
er:
pri
mar
yed
uca
tio
n0
.16
84
0.3
18
30
.12
62
0.3
04
60
.22
24
0.3
52
5M
ost
edu
cate
dm
emb
er:
low
erse
con
dar
y0
.49
17
0.3
72
00
.47
24
0.4
26
80
.35
34
0.2
93
1M
ost
edu
cate
dm
emb
er:
up
per
seco
nd
ary
0.2
01
60
.10
31
0.2
63
10
.16
61
0.1
88
50
.10
11
Mo
sted
uca
ted
mem
ber
:v
oca
tio
nal
/tec
hn
ical
0.1
03
30
.09
32
0.0
83
80
.03
63
0.1
29
60
.08
76
112 B. Baulch et al.
Dow
nloa
ded
by [
Uni
vers
ity o
f B
ath]
at 0
3:07
16
Febr
uary
201
2
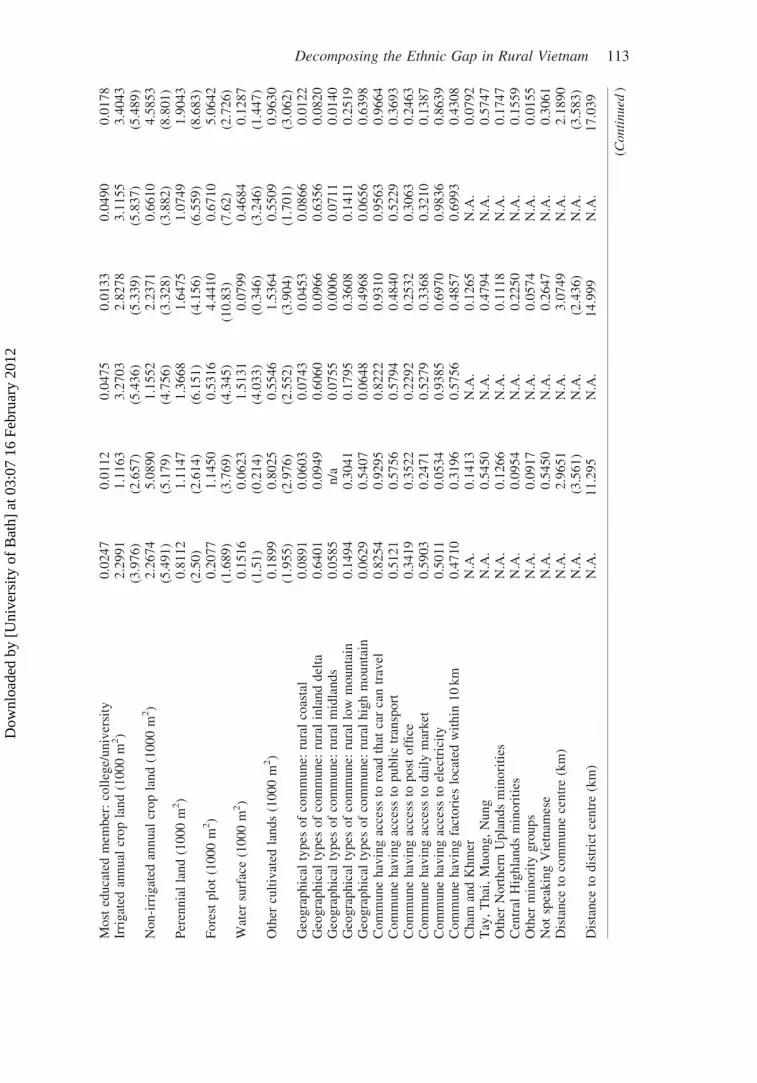
Mo
sted
uca
ted
mem
ber
:co
lleg
e/u
niv
ersi
ty0
.02
47
0.0
11
20
.04
75
0.0
13
30
.04
90
0.0
17
8Ir
rig
ated
ann
ual
cro
pla
nd
(10
00
m2)
2.2
99
11
.11
63
3.2
70
32
.82
78
3.1
15
53
.40
43
(3.9
76
)(2
.65
7)
(5.4
36
)(5
.33
9)
(5.8
37
)(5
.48
9)
No
n-i
rrig
ated
ann
ual
cro
pla
nd
(10
00
m2)
2.2
67
45
.08
90
1.1
55
22
.23
71
0.6
61
04
.58
53
(5.4
91
)(5
.17
9)
(4.7
56
)(3
.32
8)
(3.8
82
)(8
.80
1)
Per
enn
ial
lan
d(1
00
0m
2)
0.8
11
21
.11
47
1.3
66
81
.64
75
1.0
74
91
.90
43
(2.5
0)
(2.6
14
)(6
.15
1)
(4.1
56
)(6
.55
9)
(8.6
83
)F
ore
stp
lot
(10
00
m2)
0.2
07
71
.14
50
0.5
31
64
.44
10
0.6
71
05
.06
42
(1.6
89
)(3
.76
9)
(4.3
45
)(1
0.8
3)
(7.6
2)
(2.7
26
)W
ater
surf
ace
(10
00
m2)
0.1
51
60
.06
23
1.5
13
10
.07
99
0.4
68
40
.12
87
(1.5
1)
(0.2
14
)(4
.03
3)
(0.3
46
)(3
.24
6)
(1.4
47
)O
ther
cult
ivat
edla
nd
s(1
00
0m
2)
0.1
89
90
.80
25
0.5
54
61
.53
64
0.5
50
90
.96
30
(1.9
55
)(2
.97
6)
(2.5
52
)(3
.90
4)
(1.7
01
)(3
.06
2)
Geo
gra
ph
ical
typ
eso
fco
mm
un
e:ru
ral
coas
tal
0.0
89
10
.06
03
0.0
74
30
.04
53
0.0
86
60
.01
22
Geo
gra
ph
ical
typ
eso
fco
mm
un
e:ru
ral
inla
nd
del
ta0
.64
01
0.0
94
90
.60
60
0.0
96
60
.63
56
0.0
82
0G
eog
rap
hic
alty
pes
of
com
mu
ne:
rura
lm
idla
nd
s0
.05
85
n/a
0.0
75
50
.00
06
0.0
71
10
.01
40
Geo
gra
ph
ical
typ
eso
fco
mm
un
e:ru
ral
low
mo
un
tain
0.1
49
40
.30
41
0.1
79
50
.36
08
0.1
41
10
.25
19
Geo
gra
ph
ical
typ
eso
fco
mm
un
e:ru
ral
hig
hm
ou
nta
in0
.06
29
0.5
40
70
.06
48
0.4
96
80
.06
56
0.6
39
8C
om
mu
ne
hav
ing
acce
ssto
road
that
car
can
trav
el0
.82
54
0.9
29
50
.82
22
0.9
31
00
.95
63
0.9
66
4C
om
mu
ne
hav
ing
acce
ssto
pu
bli
ctr
ansp
ort
0.5
12
10
.57
56
0.5
79
40
.48
40
0.5
22
90
.36
93
Co
mm
un
eh
avin
gac
cess
top
ost
offi
ce0
.34
19
0.3
52
20
.22
92
0.2
53
20
.30
63
0.2
46
3C
om
mu
ne
hav
ing
acce
ssto
dai
lym
ark
et0
.59
03
0.2
47
10
.52
79
0.3
36
80
.32
10
0.1
38
7C
om
mu
ne
hav
ing
acce
ssto
elec
tric
ity
0.5
01
10
.05
34
0.9
38
50
.69
70
0.9
83
60
.86
39
Co
mm
un
eh
avin
gfa
cto
ries
loca
ted
wit
hin
10
km
0.4
71
00
.31
96
0.5
75
60
.48
57
0.6
99
30
.43
08
Ch
aman
dK
hm
erN
.A.
0.1
41
3N
.A.
0.1
26
5N
.A.
0.0
79
2T
ay,
Th
ai,
Mu
on
g,
Nu
ng
N.A
.0
.54
50
N.A
.0
.47
94
N.A
.0
.57
47
Oth
erN
ort
her
nU
pla
nd
sm
ino
riti
esN
.A.
0.1
26
6N
.A.
0.1
11
8N
.A.
0.1
74
7C
entr
alH
igh
lan
ds
min
ori
ties
N.A
.0
.09
54
N.A
.0
.22
50
N.A
.0
.15
59
Oth
erm
ino
rity
gro
up
sN
.A.
0.0
91
7N
.A.
0.0
57
4N
.A.
0.0
15
5N
ot
spea
kin
gV
ietn
ames
eN
.A.
0.5
45
0N
.A.
0.2
64
7N
.A.
0.3
06
1D
ista
nce
toco
mm
un
ece
ntr
e(k
m)
N.A
.2
.96
51
N.A
.3
.07
49
N.A
.2
.18
90
N.A
.(3
.56
1)
N.A
.(2
.43
6)
N.A
.(3
.58
3)
Dis
tan
ceto
dis
tric
tce
ntr
e(k
m)
N.A
.1
1.2
95
N.A
.1
4.9
99
N.A
.1
7.0
39
(Continued
)
Decomposing the Ethnic Gap in Rural Vietnam 113
Dow
nloa
ded
by [
Uni
vers
ity o
f B
ath]
at 0
3:07
16
Febr
uary
201
2

Table
A1.Continued
19
93
19
98
20
04
Bri
efd
escr
ipti
on
of
var
iab
les
(1)
(2)
(1)
(2)
(1)
(2)
N.A
.(7
.73
5)
N.A
.(1
2.9
3)
N.A
.(1
5.8
2)
Dis
tan
ceto
maj
or
citi
es(k
m)
N.A
.n
/aN
.A.
n/a
N.A
.2
25
.91
N.A
.N
.A.
N.A
.(1
87
.0)
Mat
rili
nea
lp
ract
ice
N.A
.n
/aN
.A.
0.0
63
2N
.A.
0.0
86
5M
ino
rity
-on
lyco
mm
un
eN
.A.
0.2
93
6N
.A.
0.2
76
5N
.A.
n/a
No
reli
gio
nN
.A.
0.6
86
2N
.A.
0.7
30
9N
.A.
n/a
Nu
mb
ero
fo
bse
rvat
ion
s3
29
45
45
35
90
68
05
53
11
18
1
Notes:
(1)
and
(2)
rep
rese
nt
the
sam
ple
aver
age
val
ues
for
the
char
acte
rist
ics
of
the
maj
ori
tyan
dm
ino
rity
gro
up
s,re
spec
tiv
ely
.n
/a:
no
tav
aila
ble
;N
.A.:
no
tap
pli
cab
leas
thes
ev
aria
ble
sar
eo
nly
con
stru
cted
for
the
aux
ilia
ryre
gre
ssio
ns
for
the
min
ori
tyh
ou
seh
old
s.S
tan
dar
dd
evia
tio
ns
of
the
con
tin
uo
us
var
iab
les
are
rep
ort
edin
par
enth
eses
.Sources:
VL
SS
19
92
/93
,V
LS
S1
99
7/9
8an
dV
HL
SS
20
04
.
114 B. Baulch et al.
Dow
nloa
ded
by [
Uni
vers
ity o
f B
ath]
at 0
3:07
16
Febr
uary
201
2
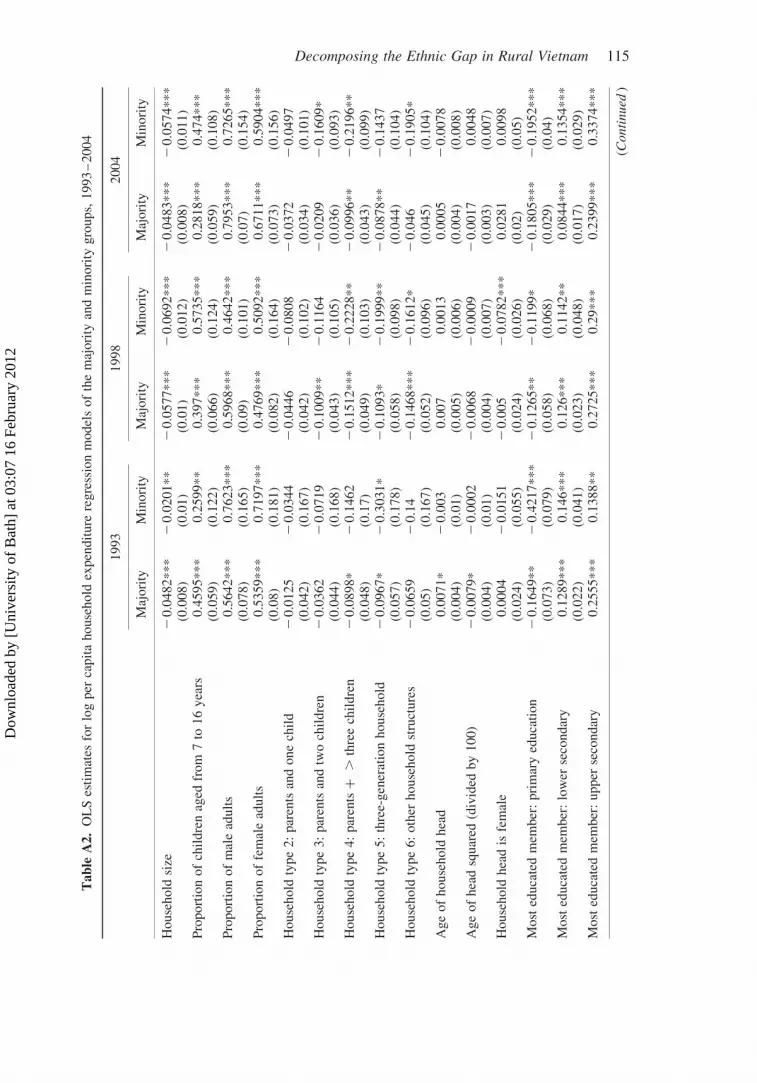
Table
A2.
OL
Ses
tim
ates
for
log
per
cap
ita
ho
use
ho
ldex
pen
dit
ure
reg
ress
ion
mo
del
so
fth
em
ajo
rity
and
min
ori
tyg
rou
ps,
19
93
–2
00
4
19
93
19
98
20
04
Maj
ori
tyM
ino
rity
Maj
ori
tyM
ino
rity
Maj
ori
tyM
ino
rity
Ho
use
ho
ldsi
ze2
0.0
48
2*
**
20
.02
01
**
20
.05
77
**
*2
0.0
69
2*
**
20
.04
83
**
*2
0.0
57
4*
**
(0.0
08
)(0
.01
)(0
.01
)(0
.01
2)
(0.0
08
)(0
.01
1)
Pro
po
rtio
no
fch
ild
ren
aged
fro
m7
to1
6y
ears
0.4
59
5*
**
0.2
59
9*
*0
.39
7*
**
0.5
73
5*
**
0.2
81
8*
**
0.4
74
**
*(0
.05
9)
(0.1
22
)(0
.06
6)
(0.1
24
)(0
.05
9)
(0.1
08
)P
rop
ort
ion
of
mal
ead
ult
s0
.56
42
**
*0
.76
23
**
*0
.59
68
**
*0
.46
42
**
*0
.79
53
**
*0
.72
65
**
*(0
.07
8)
(0.1
65
)(0
.09
)(0
.10
1)
(0.0
7)
(0.1
54
)P
rop
ort
ion
of
fem
ale
adu
lts
0.5
35
9*
**
0.7
19
7*
**
0.4
76
9*
**
0.5
09
2*
**
0.6
71
1*
**
0.5
90
4*
**
(0.0
8)
(0.1
81
)(0
.08
2)
(0.1
64
)(0
.07
3)
(0.1
56
)H
ou
seh
old
typ
e2
:p
aren
tsan
do
ne
chil
d2
0.0
12
52
0.0
34
42
0.0
44
62
0.0
80
82
0.0
37
22
0.0
49
7(0
.04
2)
(0.1
67
)(0
.04
2)
(0.1
02
)(0
.03
4)
(0.1
01
)H
ou
seh
old
typ
e3
:p
aren
tsan
dtw
och
ild
ren
20
.03
62
20
.07
19
20
.10
09
**
20
.11
64
20
.02
09
20
.16
09
*(0
.04
4)
(0.1
68
)(0
.04
3)
(0.1
05
)(0
.03
6)
(0.0
93
)H
ou
seh
old
typ
e4
:p
aren
tsþ
.th
ree
chil
dre
n2
0.0
89
8*
20
.14
62
20
.15
12
**
*2
0.2
22
8*
*2
0.0
99
6*
*2
0.2
19
6*
*(0
.04
8)
(0.1
7)
(0.0
49
)(0
.10
3)
(0.0
43
)(0
.09
9)
Ho
use
ho
ldty
pe
5:
thre
e-g
ener
atio
nh
ou
seh
old
20
.09
67
*2
0.3
03
1*
20
.10
93
*2
0.1
99
9*
*2
0.0
87
8*
*2
0.1
43
7(0
.05
7)
(0.1
78
)(0
.05
8)
(0.0
98
)(0
.04
4)
(0.1
04
)H
ou
seh
old
typ
e6
:o
ther
ho
use
ho
ldst
ruct
ure
s2
0.0
65
92
0.1
42
0.1
46
8*
**
20
.16
12
*2
0.0
46
20
.19
05
*(0
.05
)(0
.16
7)
(0.0
52
)(0
.09
6)
(0.0
45
)(0
.10
4)
Ag
eo
fh
ou
seh
old
hea
d0
.00
71
*2
0.0
03
0.0
07
0.0
01
30
.00
05
20
.00
78
(0.0
04
)(0
.01
)(0
.00
5)
(0.0
06
)(0
.00
4)
(0.0
08
)A
ge
of
hea
dsq
uar
ed(d
ivid
edb
y1
00
)2
0.0
07
9*
20
.00
02
20
.00
68
20
.00
09
20
.00
17
0.0
04
8(0
.00
4)
(0.0
1)
(0.0
04
)(0
.00
7)
(0.0
03
)(0
.00
7)
Ho
use
ho
ldh
ead
isfe
mal
e0
.00
04
20
.01
51
20
.00
52
0.0
78
2*
**
0.0
28
10
.00
98
(0.0
24
)(0
.05
5)
(0.0
24
)(0
.02
6)
(0.0
2)
(0.0
5)
Mo
sted
uca
ted
mem
ber
:p
rim
ary
edu
cati
on
20
.16
49
**
20
.42
17
**
*2
0.1
26
5*
*2
0.1
19
9*
20
.18
05
**
*2
0.1
95
2*
**
(0.0
73
)(0
.07
9)
(0.0
58
)(0
.06
8)
(0.0
29
)(0
.04
)M
ost
edu
cate
dm
ember
:lo
wer
seco
nd
ary
0.1
28
9*
**
0.1
46
**
*0
.12
6*
**
0.1
14
2*
*0
.08
44
**
*0
.13
54
**
*(0
.02
2)
(0.0
41
)(0
.02
3)
(0.0
48
)(0
.01
7)
(0.0
29
)M
ost
edu
cate
dm
ember
:u
pp
erse
con
dar
y0
.25
55
**
*0
.13
88
**
0.2
72
5*
**
0.2
9*
**
0.2
39
9*
**
0.3
37
4*
**
(Continued
)
Decomposing the Ethnic Gap in Rural Vietnam 115
Dow
nloa
ded
by [
Uni
vers
ity o
f B
ath]
at 0
3:07
16
Febr
uary
201
2
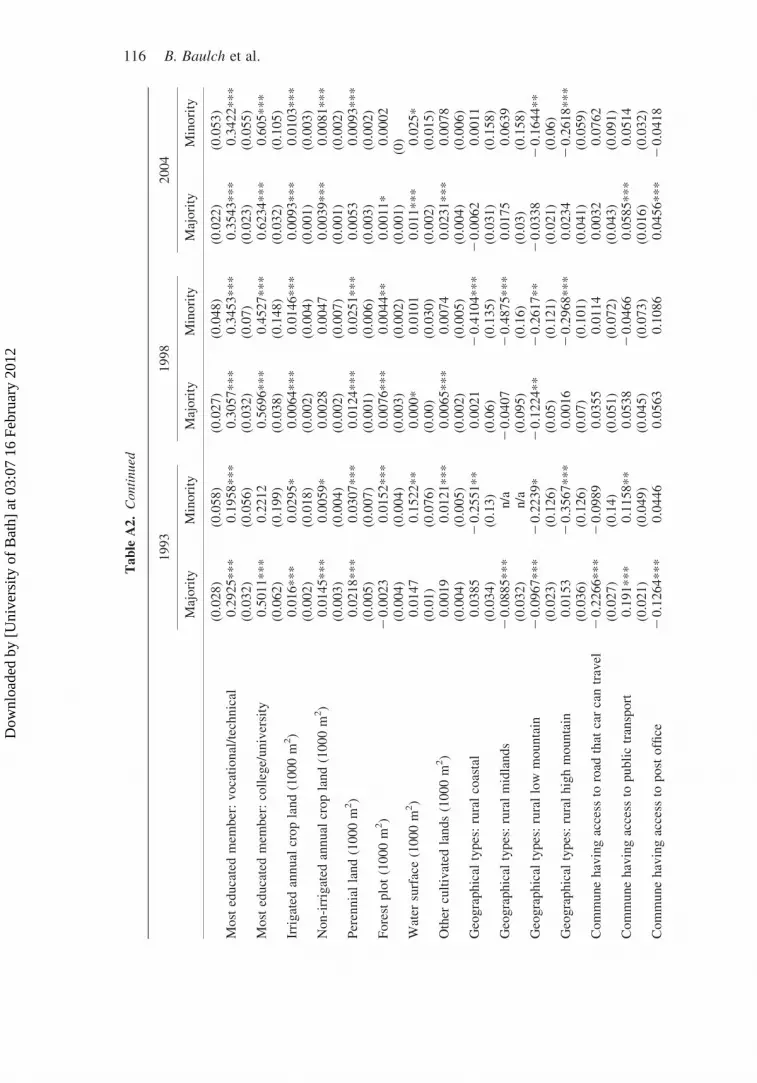
Table
A2.Continued
19
93
19
98
20
04
Maj
ori
tyM
ino
rity
Maj
ori
tyM
ino
rity
Maj
ori
tyM
ino
rity
(0.0
28
)(0
.05
8)
(0.0
27
)(0
.04
8)
(0.0
22
)(0
.05
3)
Mo
sted
uca
ted
mem
ber
:v
oca
tio
nal
/tec
hn
ical
0.2
92
5*
**
0.1
95
8*
**
0.3
05
7*
**
0.3
45
3*
**
0.3
54
3*
**
0.3
42
2*
**
(0.0
32
)(0
.05
6)
(0.0
32
)(0
.07
)(0
.02
3)
(0.0
55
)M
ost
edu
cate
dm
emb
er:
coll
ege/
un
iver
sity
0.5
01
1*
**
0.2
21
20
.56
96
**
*0
.45
27*
**
0.6
23
4*
**
0.6
05
**
*(0
.06
2)
(0.1
99
)(0
.03
8)
(0.1
48
)(0
.03
2)
(0.1
05
)Ir
rig
ated
ann
ual
cro
pla
nd
(10
00
m2)
0.0
16*
**
0.0
29
5*
0.0
06
4*
**
0.0
14
6*
**
0.0
09
3*
**
0.0
10
3*
**
(0.0
02
)(0
.01
8)
(0.0
02
)(0
.00
4)
(0.0
01
)(0
.00
3)
No
n-i
rrig
ated
ann
ual
cro
pla
nd
(10
00
m2)
0.0
14
5*
**
0.0
05
9*
0.0
02
80
.00
47
0.0
03
9*
**
0.0
08
1*
**
(0.0
03
)(0
.00
4)
(0.0
02
)(0
.00
7)
(0.0
01
)(0
.00
2)
Per
enn
ial
lan
d(1
00
0m
2)
0.0
21
8*
**
0.0
30
7*
**
0.0
12
4*
**
0.0
25
1*
**
0.0
05
30
.00
93
**
*(0
.00
5)
(0.0
07
)(0
.00
1)
(0.0
06
)(0
.00
3)
(0.0
02
)F
ore
stp
lot
(10
00
m2)
20
.00
23
0.0
15
2*
**
0.0
07
6*
**
0.0
04
4*
*0
.00
11
*0
.00
02
(0.0
04
)(0
.00
4)
(0.0
03
)(0
.00
2)
(0.0
01
)(0
)W
ater
surf
ace
(10
00
m2)
0.0
14
70
.15
22
**
0.0
00
*0
.01
01
0.0
11
**
*0
.02
5*
(0.0
1)
(0.0
76
)(0
.00
)(0
.03
0)
(0.0
02
)(0
.01
5)
Oth
ercu
ltiv
ated
lan
ds
(10
00
m2)
0.0
01
90
.01
21
**
*0
.00
65
**
*0
.00
74
0.0
23
1*
**
0.0
07
8(0
.00
4)
(0.0
05
)(0
.00
2)
(0.0
05
)(0
.00
4)
(0.0
06
)G
eog
rap
hic
alty
pes
:ru
ral
coas
tal
0.0
38
52
0.2
55
1*
*0
.00
21
20
.41
04*
**
20
.00
62
0.0
01
1(0
.03
4)
(0.1
3)
(0.0
6)
(0.1
35
)(0
.03
1)
(0.1
58
)G
eog
rap
hic
alty
pes
:ru
ral
mid
lan
ds
20
.08
85*
**
n/a
20
.04
07
20
.48
75*
**
0.0
17
50
.06
39
(0.0
32
)n
/a(0
.09
5)
(0.1
6)
(0.0
3)
(0.1
58
)G
eog
rap
hic
alty
pes
:ru
ral
low
mo
un
tain
20
.09
67*
**
20
.22
39
*2
0.1
22
4*
*2
0.2
61
7*
*2
0.0
33
82
0.1
64
4*
*(0
.02
3)
(0.1
26
)(0
.05
)(0
.12
1)
(0.0
21
)(0
.06
)G
eog
rap
hic
alty
pes
:ru
ral
hig
hm
ou
nta
in0
.01
53
20
.35
67
**
*0
.00
16
20
.29
68*
**
0.0
23
42
0.2
61
8*
**
(0.0
36
)(0
.12
6)
(0.0
7)
(0.1
01
)(0
.04
1)
(0.0
59
)C
om
mu
ne
hav
ing
acce
ssto
road
that
car
can
trav
el2
0.2
26
6*
**
20
.09
89
0.0
35
50
.01
14
0.0
03
20
.07
62
(0.0
27
)(0
.14
)(0
.05
1)
(0.0
72
)(0
.04
3)
(0.0
91
)C
om
mu
ne
hav
ing
acce
ssto
pu
bli
ctr
ansp
ort
0.1
91*
**
0.1
15
8*
*0
.05
38
20
.04
66
0.0
58
5*
**
0.0
51
4(0
.02
1)
(0.0
49
)(0
.04
5)
(0.0
73
)(0
.01
6)
(0.0
32
)C
om
mu
ne
hav
ing
acce
ssto
po
sto
ffice
20
.12
64*
**
0.0
44
60
.05
63
0.1
08
60
.04
56
**
*2
0.0
41
8
116 B. Baulch et al.
Dow
nloa
ded
by [
Uni
vers
ity o
f B
ath]
at 0
3:07
16
Febr
uary
201
2

(0.0
2)
(0.0
57
)(0
.04
5)
(0.0
94
)(0
.01
8)
(0.0
35
)C
om
mu
ne
hav
ing
acce
ssto
dai
lym
ark
et0
.12
19
**
*2
0.0
93
40
.08
49*
*2
0.0
26
90
.09
88
**
*0
.15
72*
**
(0.0
18
)(0
.06
6)
(0.0
37
)(0
.09
8)
(0.0
17
)(0
.04
8)
Co
mm
un
eh
avin
gac
cess
toel
ectr
icit
y2
0.0
43
5*
*0
.47
61
**
*0
.08
06
0.1
66
*0
.02
65
0.0
58
4(0
.01
9)
(0.1
05
)(0
.07
9)
(0.0
99
)(0
.04
4)
(0.0
47
)C
om
mu
ne
hav
ing
fact
ori
eslo
cate
dw
ith
in1
0k
m0
.13
06
**
*2
0.0
21
80
.05
72
0.0
57
50
.06
76
**
*0
.09
21*
**
(0.0
17
)(0
.04
7)
(0.0
4)
(0.0
74
)(0
.01
6)
(0.0
33
)C
on
stan
tte
rm6
.51
47
**
*6
.62
55
**
*7
.04
35*
**
7.2
94
8*
**
7.4
54
**
*7
.59
66*
**
(0.0
93
)(0
.26
5)
(0.1
51
)(0
.22
2)
(0.1
08
)(0
.21
5)
R2
0.4
04
90
.36
14
0.3
16
20
.47
26
0.3
12
20
.44
68
Nu
mb
ero
fo
bse
rvat
ion
s3
29
45
45
35
90
68
05
53
11
18
1
Note:
n/a
isn
ot
avai
lab
leas
ther
ew
ere
no
eth
nic
min
ori
tyh
ou
seh
old
slo
cate
din
rura
lm
idla
nd
sin
the
VL
SS
19
92
/93
.
**
*,
**,
*S
tati
stic
ally
sig
nifi
can
tat
0.0
1,
0.0
5an
d0
.1le
vel
s,re
spec
tiv
ely
.
Decomposing the Ethnic Gap in Rural Vietnam 117
Dow
nloa
ded
by [
Uni
vers
ity o
f B
ath]
at 0
3:07
16
Febr
uary
201
2


