Embed Size (px)
Citation preview
Data guilt: Should you be analysing yourqualitative survey information?
Paper presented at the Australasian Association forInstitutional Researchers Conference, Rockhampton, 2001.
The bulk of institutional research activities are largely composed of the seemingly cold inevitability of highly aggregated figures and facts. In this context it is not surprising that that the rich and comparatively detailed insights contained in qualitative information are proving tobe increasingly enticing. Overall, while quantitative research tends to be oriented towards explanation, control and causes, qualitative investigation focuses on understanding complex relationships relating to events and people (Stake, 1995). Given that many of the questions asked of institutional researchers involve multifarious interactions between individuals and systems it is logical that qualitative data could provide further insights into patterns and trends apparent in the quantitative information. Or can it? Should you really go to all the bother of analysing your qualitative survey data?To make this discussion more concrete and accessible some ofthe conceptual and methodological points have been illustrated with practical examples from the Course Experience Questionnaire (CEQ).
The analysis of open ended responses
‘Qualitative survey data’From the perspective of qualitative research, or even multi method investigations, the phrase ‘qualitative survey data’ is a contradiction in terms. At a fundamental level, qualitative research attempts to explore complex meanings and situations, usually in real time where the investigator is an observer or active participant. As such, it is
1
unlikely that meaningful data could be captured from a retrospective, cross sectional view that cannot accommodate multiple realities and experiential understanding. Furthermore, item orders in questionnaires tend to follow a format where open questions are preceded by banks of queriesrequiring a fixed response. To some extent this makes a researcher’s task easier as participants tend to helpfully use phrases contained in the closed questions to frame their‘free responses’. While this precoding almost guarantees that most of the data lends itself to categorisation it cannot be regarded as providing an unadulterated insight into the individual’s experience or opinion.In addition, qualitative survey information suffers from thesame ecological validity problems as quantitative survey data. Difficulties associated with poor response rates, inadequate sampling procedures and irrelevant questions are magnified when attempts are made to examine free responses. Not everyone has the time, inclination or skills to be able to write comments on a survey form so, for example, a response rate of 50 per cent to quantitative sections can easily be halved when written responses are examined. Annoyingly, the respondents who fail to comment are often the ones who could potentially provide the most interesting feedback.The quantitative sections of surveys also naturally make assumptions about which issues are relevant and important. How then should a student who has studied externally interpret a questionnaire that fails to address matters relating to distance education and instead requests information that they cannot provide such as their opinion of the campus facilities? It is also likely that once the researcher’s expectations have been communicated to the respondent about what is of interest that the subsequent qualitative responses are impoverished by the change in focus. Cognitive psychologists have long suggested that ease of recall of an event, usually facilitated by recency effects, substantially influences response accuracy (eg Tversky & Kahneman, 1974).
2
Lastly, the fact that the process of creating categories of responses to open ended questions essentially reduces the qualitative information to quantitative data is often overlooked. Grouping, counting and cross tabulating these comments seems somewhat strange if the point of the exercisewas to communicate the richness and diversity of the writtenresponses.These theoretical and methodological considerations can seriously call into question the usefulness of analysing free responses to qualitative survey questions. In additionthere are also a number of practical issues that need to be taken into account when dealing with qualitative data.
Practical considerations“They [open-ended responses] are also costly anddifficult to code, often self-contradictory, incomprehensible or irrelevant and defy categorisation.” (Conner & Waterman, 1996: 44)
Assuming that it has been possible to reconcile the methodological murkiness that surrounds open-ended survey responses there are also a number of practical issues that need to be addressed. Most obviously, when applied to real world or existing situations qualitative methods “…have the potential to produce very large amounts of data which may very well be interesting, but extremely difficult to reduce to manageable levels and make any sense of…”(Raynard & Williamson, 1996). Organising the overwhelming volume of data that can result from asking qualitative questions is labour intensive, time consuming and frequently frustrating.Prior to undertaking a content analysis, decisions have to be made regarding the manner in which the resulting categories will be organised for further examination. To restrict the amount of data that is coded, it is possible toonly allow one comment per respondent, arguing that in the case of multiple responses, the initial comment is the most salient or important. As such, it is likely that a substantial proportion of the data will be ignored. Alternatively, categories can be dummy coded to
3
dichotomously reflect the presence or absence of a comment (de Vaus, 1995). This can be somewhat misleading as the assumption made be made that a ‘no’ is indicative of a negative response rather than the absence of a comment in that particular category. A more common approach allows individuals to make multiple responses to qualitative questions with the creation of a number of variables with identical value labels. This can create difficulties when some respondents are particularly verbose (the inclusion of two A4 pages with the survey is not unusual) or the number of responses is far greater than the number of respondents. All of the approaches outlined above require substantial effort.A thorough content analysis usually requires more than one researcher to group the responses into meaningful categories. The researchers then compare categories to determine the extent to which they overlap, discuss responses that have been coded differently and then reach agreement in areas where coding differs. Due to the subjective nature of this task this process of coding, checking and agreeing is difficult to automate and extremelytime consuming.
Why bother?“Qualitative data are sexy”. (Miles & Huberman, 1994: 1)
Given the myriad difficulties and hurdles associated with collecting and analysing open ended survey questions should you bother? For many people, qualitative data is more interesting, easier to understand and, for want of a better term, sexier than numerical information. This view often leads to extensive ‘eyeballing’ of survey comments but rarely results in any systematic investigation of the information. One of the major benefits of analysing qualitative data of this sort is to identify and define categories that have been missed in the quantitative sections so that they can beincluded in subsequent instruments (Conner & Waterman,
4
1996). Such an approach assumes that the questionnaire is dynamic and responsive and that the inclusion of additional issues that are deemed to be important by respondents is a useful exercise. In many cases, however, the survey instrument is aimed at measuring or evaluating certain aspects of a program or intervention usually to demonstrate that certain performance or accountability standards have been met. In this instance, the open ended responses are oflittle consequence and are usually included on the survey toplacate respondents who feel that they wish to communicate more of their personal story in a relatively impersonal forum. Determining the intended purpose of an instrument isextremely important when attempting to ascertain the extent to which it would be a useful exercise to analyse the qualitative information.
Background to the Course Experience QuestionnaireSince its inception as a national survey for 1993 graduates,the CEQ has undergone a number of changes and alterations. As part of the fourth CEQ Symposium held in 1998, representatives from universities, the public service and a range of allied and interested organisations discussed the origins, development and future directions of the instrumentfor the higher education sector. Speakers at the symposium presented their views on the purpose of the CEQ and while they are undeniably linked and related, the change in focus from improved teaching to quality, performance, and outcomesis revealing. The following list provides some views on thepurpose of the CEQ.
“…a system wide instrument for measuring student perceptions of teaching” (Karmel, 1999)
“While it does provide a broad view of student and graduate satisfaction…It is a proxy measure for the quantity and quality of student learning outcomes” (Ramsden, 1999)
“The responses provide valuable feedback to universities, and their staff and current students. …[and] provide information for prospective students to
5
assist them in making informed course and career decisions, and careers advisers can integrate the survey results into their counselling practices”. (Guthrie, 1999)
“…yields valuable information which can help institutions to make judgments about their teaching andlearning performance”. (Trembath, 1999)
“…it is now becoming part of the overall programme for determining performance in universities”. (Niland, 1999)
“It is used…to gather graduate perceptions of teaching and course quality”. (Waugh, 1999)
Obviously the ambit of the CEQ has extended far beyond the original intentions of providing basic feedback that could be used to enhance teaching practice. By 2001, the CEQ was serving an ever increasing number of masters and had come tobe regarded as
“…a valuable instrument for the purpose of improving the quality of teaching in universities and also for informing student choice, managing institutional performance and promoting accountability of the higher educationsector”. (Mc Innes, Griffen, James and Coates, 2001 )
Notably absent is the concept that the instrument could be used to gather information about the students actual experience of the course that they had studied. This issue was addressed, in part, by a recent review suggesting the addition of five new scales to the questionnaire that would capture some aspects of the actual course experience from the perspective of the student (Mc Innes et al, 2001).The scales offered for inclusion aim to address issues relating to student support, learning resources, learning community, intellectual motivation and graduate qualities (Mc Innes et al, 2001). While the authors maintain that theinclusion of the new items does not affect the integrity of
6
the instrument, their scale development process is entirely divergent from the core of the CEQ.
CQU and the CEQ
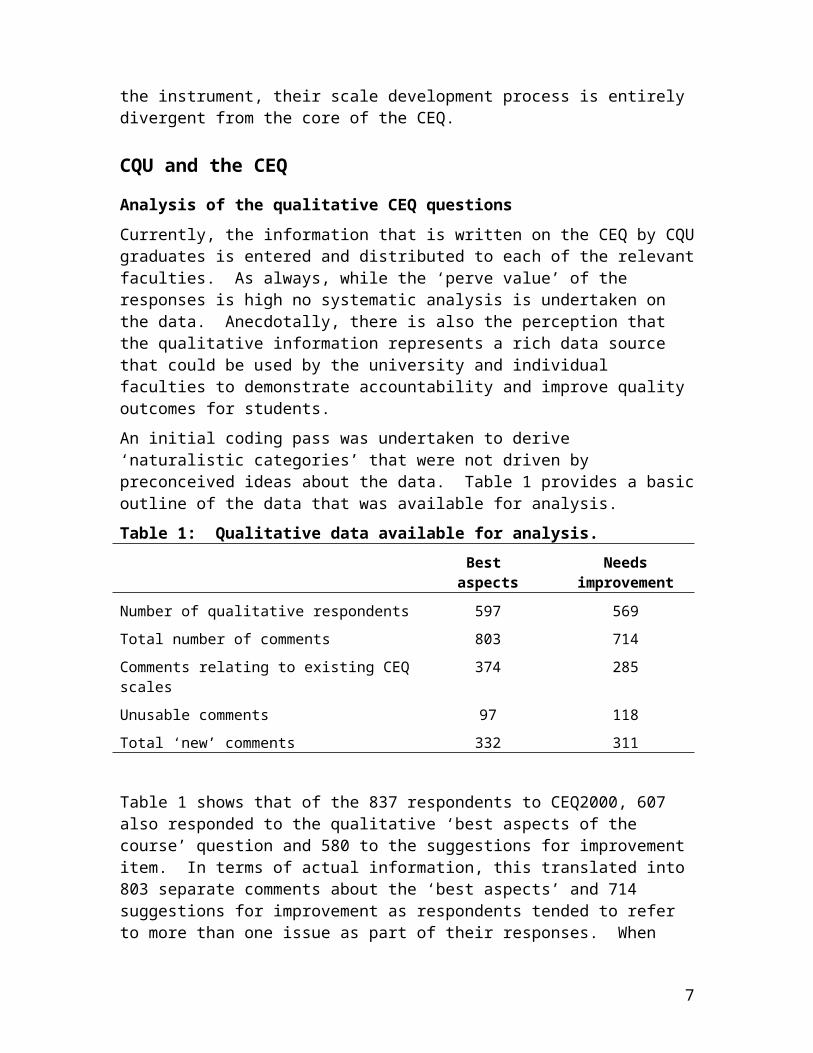
Analysis of the qualitative CEQ questionsCurrently, the information that is written on the CEQ by CQUgraduates is entered and distributed to each of the relevantfaculties. As always, while the ‘perve value’ of the responses is high no systematic analysis is undertaken on the data. Anecdotally, there is also the perception that the qualitative information represents a rich data source that could be used by the university and individual faculties to demonstrate accountability and improve quality outcomes for students.An initial coding pass was undertaken to derive ‘naturalistic categories’ that were not driven by preconceived ideas about the data. Table 1 provides a basicoutline of the data that was available for analysis.Table 1: Qualitative data available for analysis.
Best aspects
Needsimprovement
Number of qualitative respondents 597 569Total number of comments 803 714Comments relating to existing CEQscales
374 285
Unusable comments 97 118Total ‘new’ comments 332 311
Table 1 shows that of the 837 respondents to CEQ2000, 607 also responded to the qualitative ‘best aspects of the course’ question and 580 to the suggestions for improvement item. In terms of actual information, this translated into 803 separate comments about the ‘best aspects’ and 714 suggestions for improvement as respondents tended to refer to more than one issue as part of their responses. When
7
these comments were further examined, approximately 47 per cent of the ‘best aspects’ comments and 40 per cent of the ‘needs improvement’ suggestions strongly related to CEQ scales that had already been rated as part of the quantitative questions. In many cases, respondents used similar terms, and in some instances, the exact wording of the quantitative items. Unusable comments were those that defied categorisation because there were unintelligible, didnot refer to the question that had been asked or were an isolated comment. In the case of the suggestions for improvement, a number of responses indicated satisfaction with all aspects of the course further decreasing the numberof usable comments for this section.Some respondents seemed to be answering a question that was unrelated to the best aspects of the course, usually providing an insight into their more negative experiences while at university. The fourth largest category contained responses that, despite our best efforts, defied coding. Comments included in this category were responses such as:
It would have been nice for large envelopes and postageto be provided.
Creativity. That it was short. The small no of people helped to relieve competition
status. Not enough room to list.
The categories that emerged and the frequency of responses are contained in Tables 2 and 3. Fourteen main categories were apparent in the data with two of these grouping representing problematic responses. When responding to the question asking about the best aspects of the course, the greatest number of responses weremade in relation to staff and teaching. Fewer comments related to the practical and relevant nature of the course and skills and knowledge acquired during studies. It shouldbe noted that while the largest category includes approximately 21 per cent of the total responses to the
8
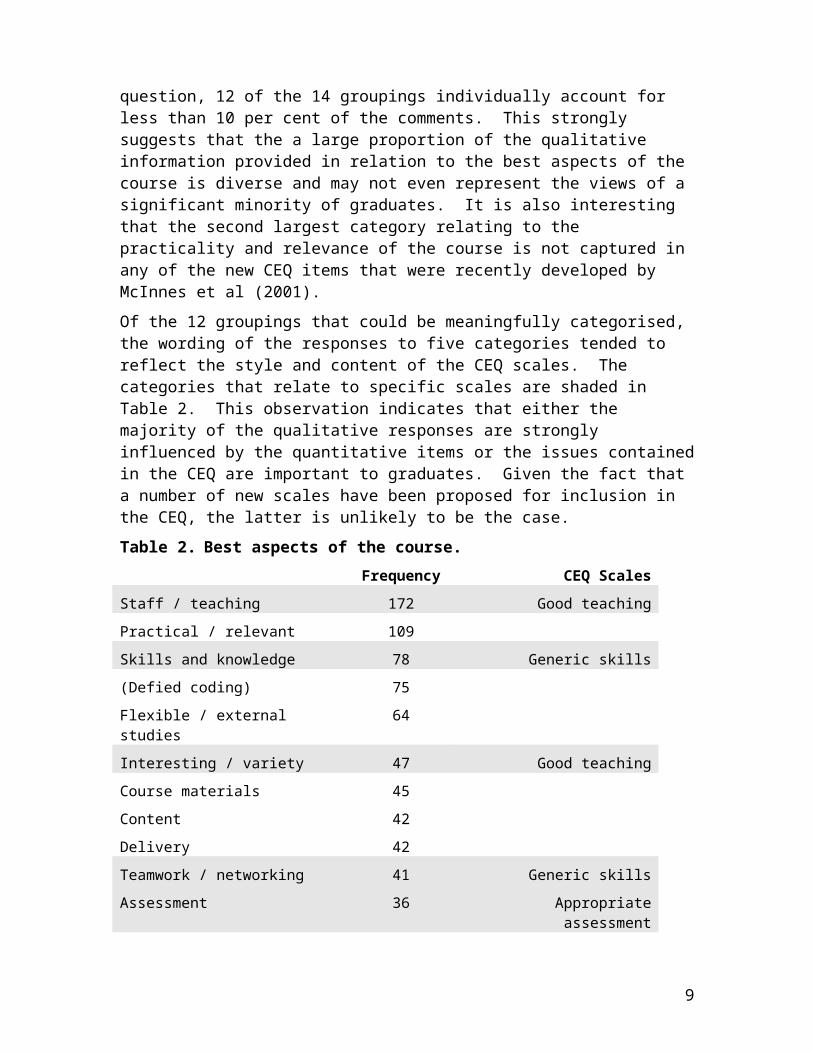
question, 12 of the 14 groupings individually account for less than 10 per cent of the comments. This strongly suggests that the a large proportion of the qualitative information provided in relation to the best aspects of the course is diverse and may not even represent the views of a significant minority of graduates. It is also interesting that the second largest category relating to the practicality and relevance of the course is not captured in any of the new CEQ items that were recently developed by McInnes et al (2001).Of the 12 groupings that could be meaningfully categorised, the wording of the responses to five categories tended to reflect the style and content of the CEQ scales. The categories that relate to specific scales are shaded in Table 2. This observation indicates that either the majority of the qualitative responses are strongly influenced by the quantitative items or the issues containedin the CEQ are important to graduates. Given the fact that a number of new scales have been proposed for inclusion in the CEQ, the latter is unlikely to be the case.Table 2. Best aspects of the course.
Frequency CEQ ScalesStaff / teaching 172 Good teachingPractical / relevant 109Skills and knowledge 78 Generic skills(Defied coding) 75Flexible / external studies
64
Interesting / variety 47 Good teachingCourse materials 45Content 42Delivery 42Teamwork / networking 41 Generic skillsAssessment 36 Appropriate
assessment
9
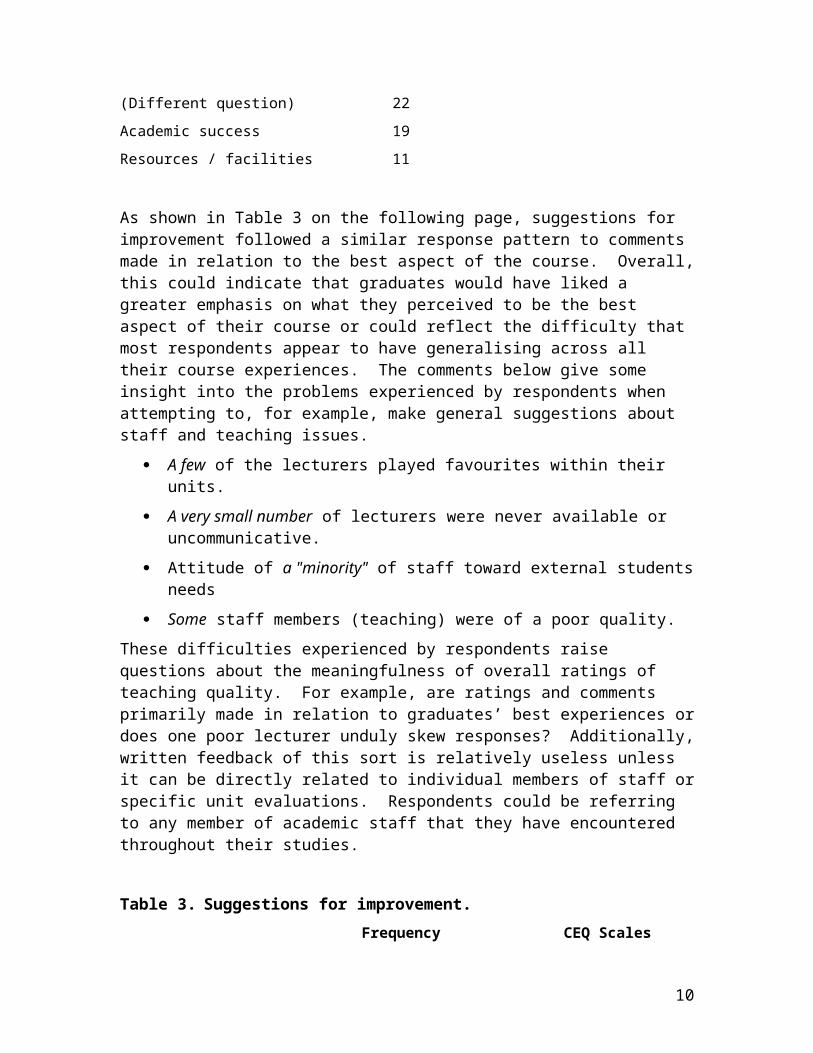
(Different question) 22Academic success 19Resources / facilities 11
As shown in Table 3 on the following page, suggestions for improvement followed a similar response pattern to comments made in relation to the best aspect of the course. Overall,this could indicate that graduates would have liked a greater emphasis on what they perceived to be the best aspect of their course or could reflect the difficulty that most respondents appear to have generalising across all their course experiences. The comments below give some insight into the problems experienced by respondents when attempting to, for example, make general suggestions about staff and teaching issues.
A few of the lecturers played favourites within their units.
A very small number of lecturers were never available or uncommunicative.
Attitude of a "minority" of staff toward external studentsneeds
Some staff members (teaching) were of a poor quality.These difficulties experienced by respondents raise questions about the meaningfulness of overall ratings of teaching quality. For example, are ratings and comments primarily made in relation to graduates’ best experiences ordoes one poor lecturer unduly skew responses? Additionally,written feedback of this sort is relatively useless unless it can be directly related to individual members of staff orspecific unit evaluations. Respondents could be referring to any member of academic staff that they have encountered throughout their studies.
Table 3. Suggestions for improvement.Frequency CEQ Scales
10
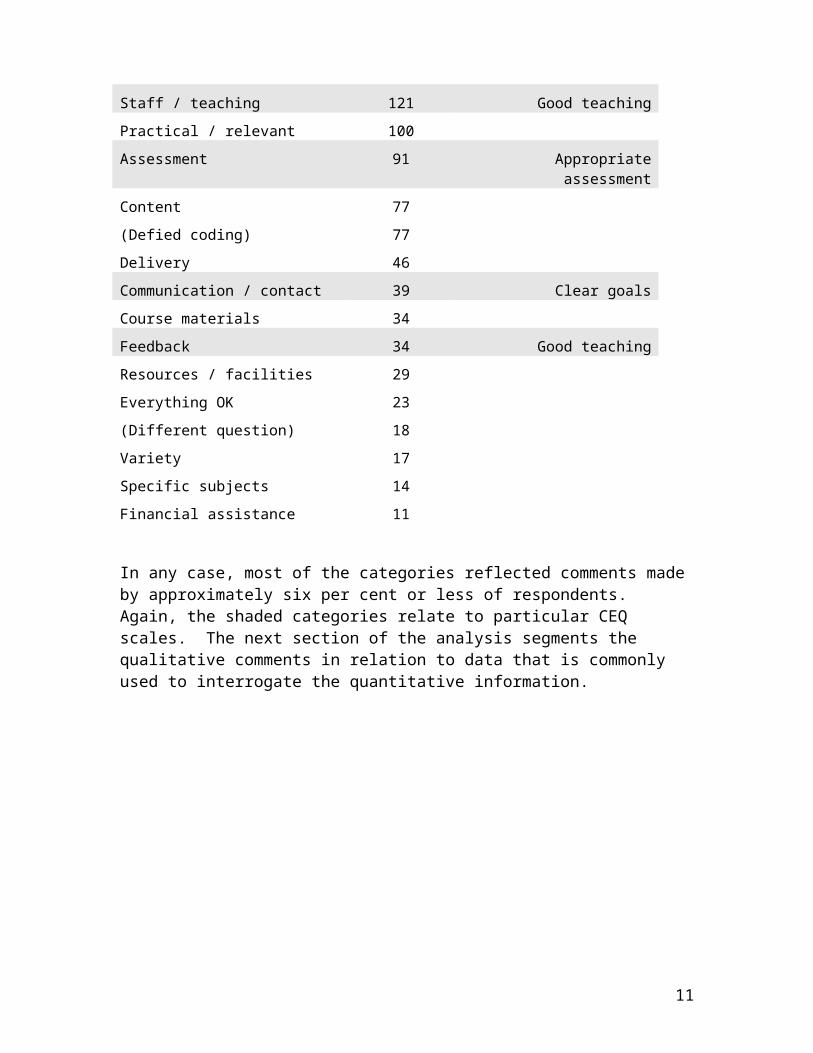
Staff / teaching 121 Good teachingPractical / relevant 100Assessment 91 Appropriate
assessmentContent 77(Defied coding) 77Delivery 46Communication / contact 39 Clear goalsCourse materials 34Feedback 34 Good teachingResources / facilities 29Everything OK 23(Different question) 18Variety 17Specific subjects 14Financial assistance 11
In any case, most of the categories reflected comments made by approximately six per cent or less of respondents. Again, the shaded categories relate to particular CEQ scales. The next section of the analysis segments the qualitative comments in relation to data that is commonly used to interrogate the quantitative information.
11
Comparison of qualitative responses using other data elementsMany analyses of the CEQ data involve comparisons of ratingsby field of study, attendance mode or level of course. Due to the artificial nature of the categorisation of qualitative survey information and the provision for multiple comments by individuals, such comparisons tend to be less useful than for quantitative data. It is also tempting, but distinctly inappropriate, to perform any one of a number of statistical tests. As such, while it is impossible to determine the extent to which differences are significant or meaningful, the data can be used to provide some suggestions for further investigation. To provide an indication as to whether there may be any substantial differences in the qualitative information the quantitative scales were compared by field of student, attendance mode and level of course. Given the size of the sample, the criterion was set at p<.001 and no significant differences were for any of the variables were found. This is not unexpected as the mean responses for all groups to all scales was neutral usually ranging from means of 2.8 to 3.2. With this pattern of results from the quantitative data, is would not be surprising if there were few differences between groups in relation to the qualitative comments.
Field of studyTable 4 shows that there appears to be only a few differences relating to the number of comments made by graduates in each field of study on the best aspect of the course. Those who had studied science made fewer comments on staff and teaching practices than graduates in other fields of study. In terms of the practical and relevant features being the best aspect of the course, it is not surprising that education graduates, who undertook substantial practicum component, were more likely to commenton this aspect that those who had studied business subjects.
12
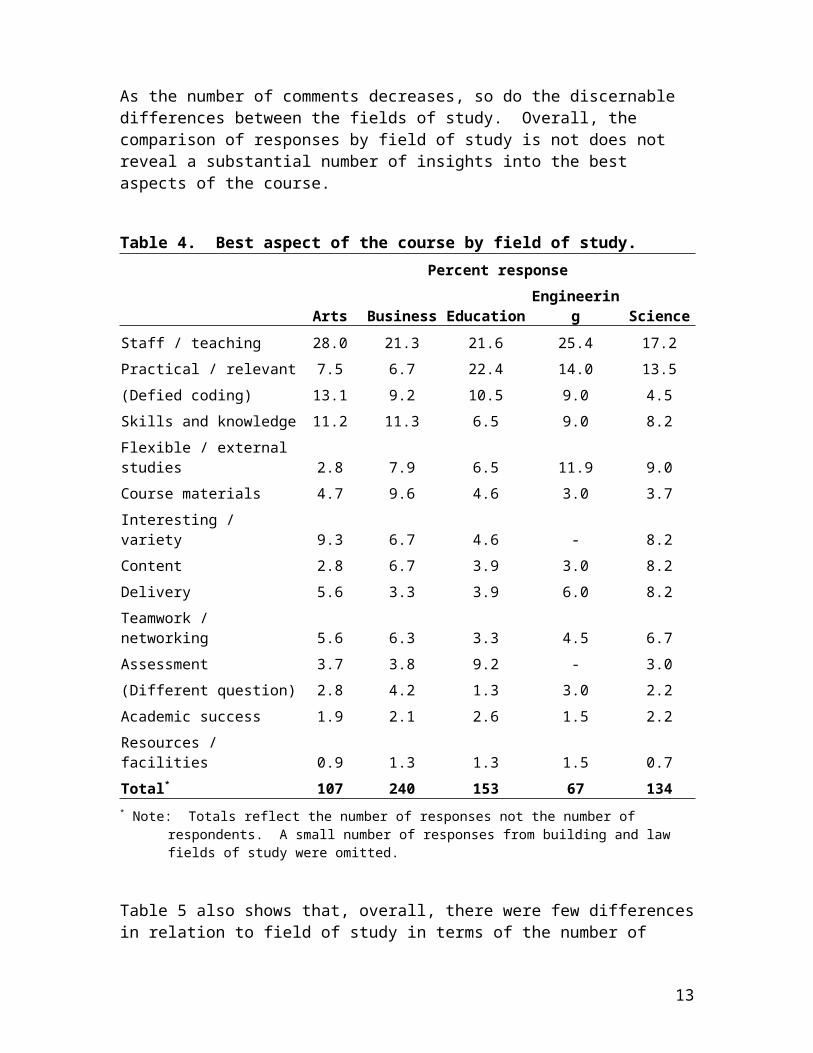
As the number of comments decreases, so do the discernable differences between the fields of study. Overall, the comparison of responses by field of study is not does not reveal a substantial number of insights into the best aspects of the course.
Table 4. Best aspect of the course by field of study.Percent response
Arts Business EducationEngineerin
g ScienceStaff / teaching 28.0 21.3 21.6 25.4 17.2Practical / relevant 7.5 6.7 22.4 14.0 13.5(Defied coding) 13.1 9.2 10.5 9.0 4.5Skills and knowledge 11.2 11.3 6.5 9.0 8.2Flexible / external studies 2.8 7.9 6.5 11.9 9.0Course materials 4.7 9.6 4.6 3.0 3.7Interesting / variety 9.3 6.7 4.6 - 8.2Content 2.8 6.7 3.9 3.0 8.2Delivery 5.6 3.3 3.9 6.0 8.2Teamwork / networking 5.6 6.3 3.3 4.5 6.7Assessment 3.7 3.8 9.2 - 3.0(Different question) 2.8 4.2 1.3 3.0 2.2Academic success 1.9 2.1 2.6 1.5 2.2Resources / facilities 0.9 1.3 1.3 1.5 0.7Total* 107 240 153 67 134* Note: Totals reflect the number of responses not the number of
respondents. A small number of responses from building and law fields of study were omitted.
Table 5 also shows that, overall, there were few differencesin relation to field of study in terms of the number of
13
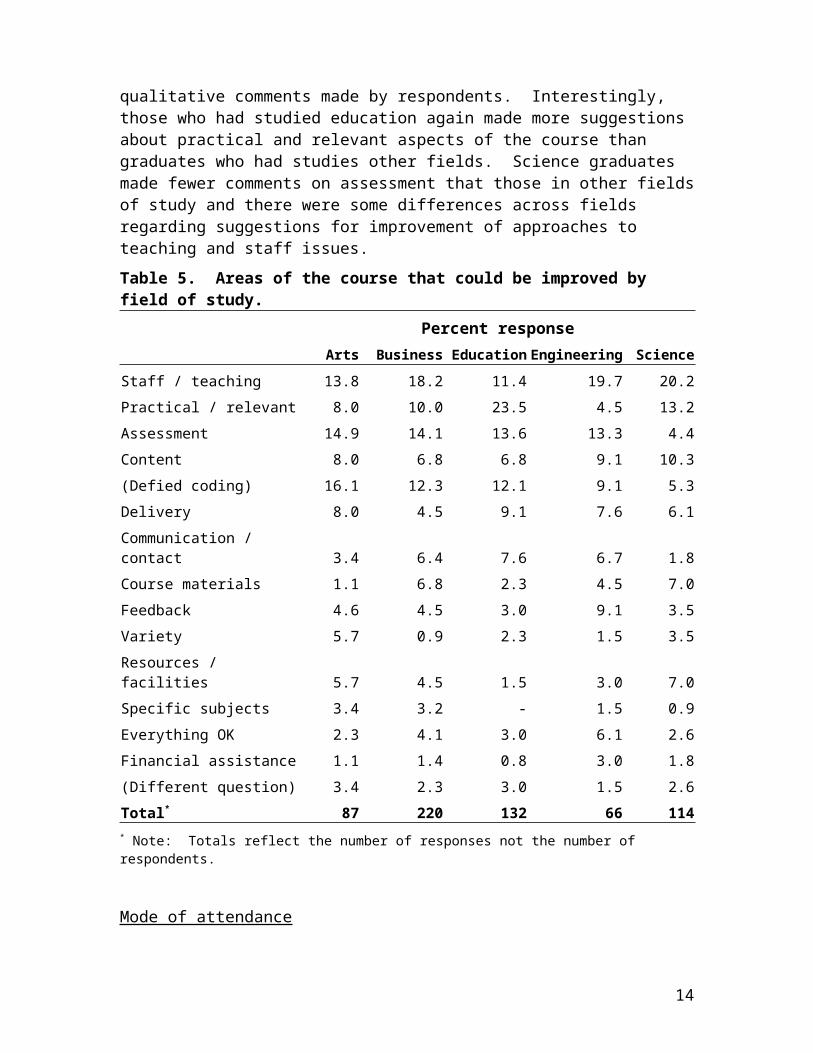
qualitative comments made by respondents. Interestingly, those who had studied education again made more suggestions about practical and relevant aspects of the course than graduates who had studies other fields. Science graduates made fewer comments on assessment that those in other fieldsof study and there were some differences across fields regarding suggestions for improvement of approaches to teaching and staff issues.Table 5. Areas of the course that could be improved by field of study.
Percent responseArts Business Education Engineering Science
Staff / teaching 13.8 18.2 11.4 19.7 20.2Practical / relevant 8.0 10.0 23.5 4.5 13.2Assessment 14.9 14.1 13.6 13.3 4.4Content 8.0 6.8 6.8 9.1 10.3(Defied coding) 16.1 12.3 12.1 9.1 5.3Delivery 8.0 4.5 9.1 7.6 6.1Communication / contact 3.4 6.4 7.6 6.7 1.8Course materials 1.1 6.8 2.3 4.5 7.0Feedback 4.6 4.5 3.0 9.1 3.5Variety 5.7 0.9 2.3 1.5 3.5Resources / facilities 5.7 4.5 1.5 3.0 7.0Specific subjects 3.4 3.2 - 1.5 0.9Everything OK 2.3 4.1 3.0 6.1 2.6Financial assistance 1.1 1.4 0.8 3.0 1.8(Different question) 3.4 2.3 3.0 1.5 2.6Total* 87 220 132 66 114* Note: Totals reflect the number of responses not the number of respondents.
Mode of attendance
14
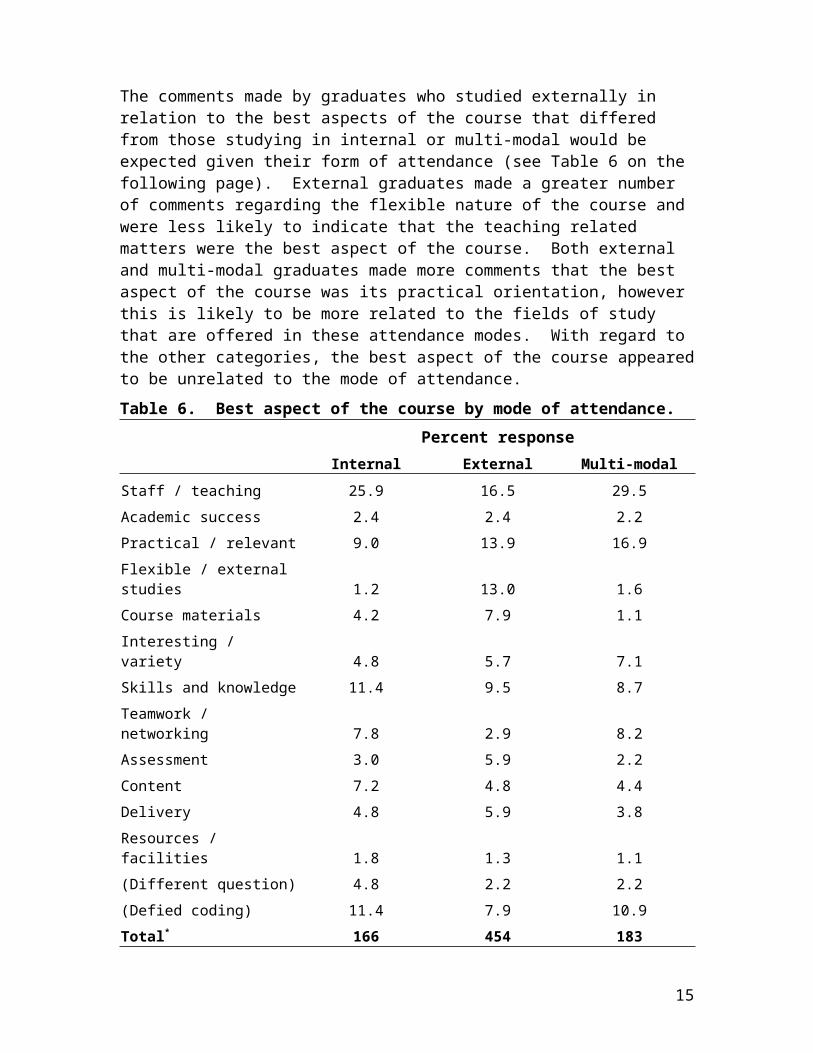
The comments made by graduates who studied externally in relation to the best aspects of the course that differed from those studying in internal or multi-modal would be expected given their form of attendance (see Table 6 on the following page). External graduates made a greater number of comments regarding the flexible nature of the course and were less likely to indicate that the teaching related matters were the best aspect of the course. Both external and multi-modal graduates made more comments that the best aspect of the course was its practical orientation, however this is likely to be more related to the fields of study that are offered in these attendance modes. With regard to the other categories, the best aspect of the course appearedto be unrelated to the mode of attendance.Table 6. Best aspect of the course by mode of attendance.
Percent responseInternal External Multi-modal
Staff / teaching 25.9 16.5 29.5Academic success 2.4 2.4 2.2Practical / relevant 9.0 13.9 16.9Flexible / external studies 1.2 13.0 1.6Course materials 4.2 7.9 1.1Interesting / variety 4.8 5.7 7.1Skills and knowledge 11.4 9.5 8.7Teamwork / networking 7.8 2.9 8.2Assessment 3.0 5.9 2.2Content 7.2 4.8 4.4Delivery 4.8 5.9 3.8Resources / facilities 1.8 1.3 1.1(Different question) 4.8 2.2 2.2(Defied coding) 11.4 7.9 10.9Total* 166 454 183
15
* Note: Totals reflect the number of responses not the number of respondents.
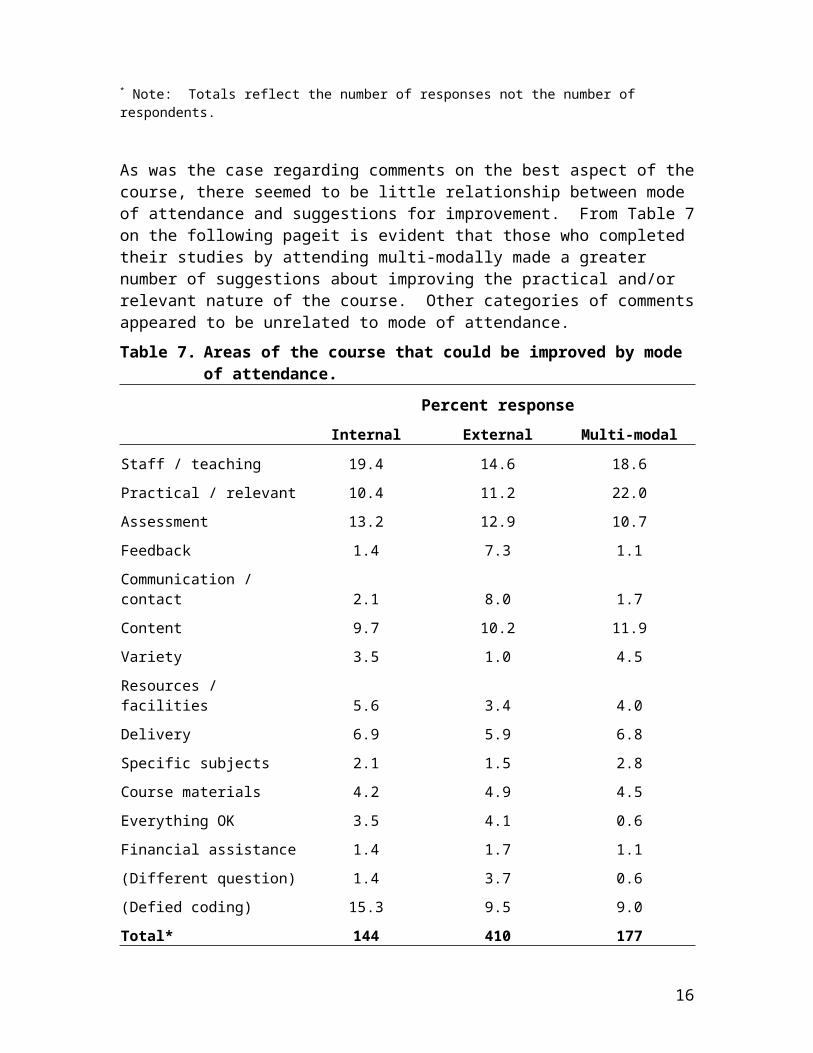
As was the case regarding comments on the best aspect of thecourse, there seemed to be little relationship between mode of attendance and suggestions for improvement. From Table 7on the following pageit is evident that those who completed their studies by attending multi-modally made a greater number of suggestions about improving the practical and/or relevant nature of the course. Other categories of commentsappeared to be unrelated to mode of attendance.Table 7. Areas of the course that could be improved by mode
of attendance.Percent response
Internal External Multi-modalStaff / teaching 19.4 14.6 18.6Practical / relevant 10.4 11.2 22.0Assessment 13.2 12.9 10.7Feedback 1.4 7.3 1.1Communication / contact 2.1 8.0 1.7Content 9.7 10.2 11.9Variety 3.5 1.0 4.5Resources / facilities 5.6 3.4 4.0Delivery 6.9 5.9 6.8Specific subjects 2.1 1.5 2.8Course materials 4.2 4.9 4.5Everything OK 3.5 4.1 0.6Financial assistance 1.4 1.7 1.1(Different question) 1.4 3.7 0.6(Defied coding) 15.3 9.5 9.0Total* 144 410 177
16

* Note: Totals reflect the number of responses not the number of respondents.
17
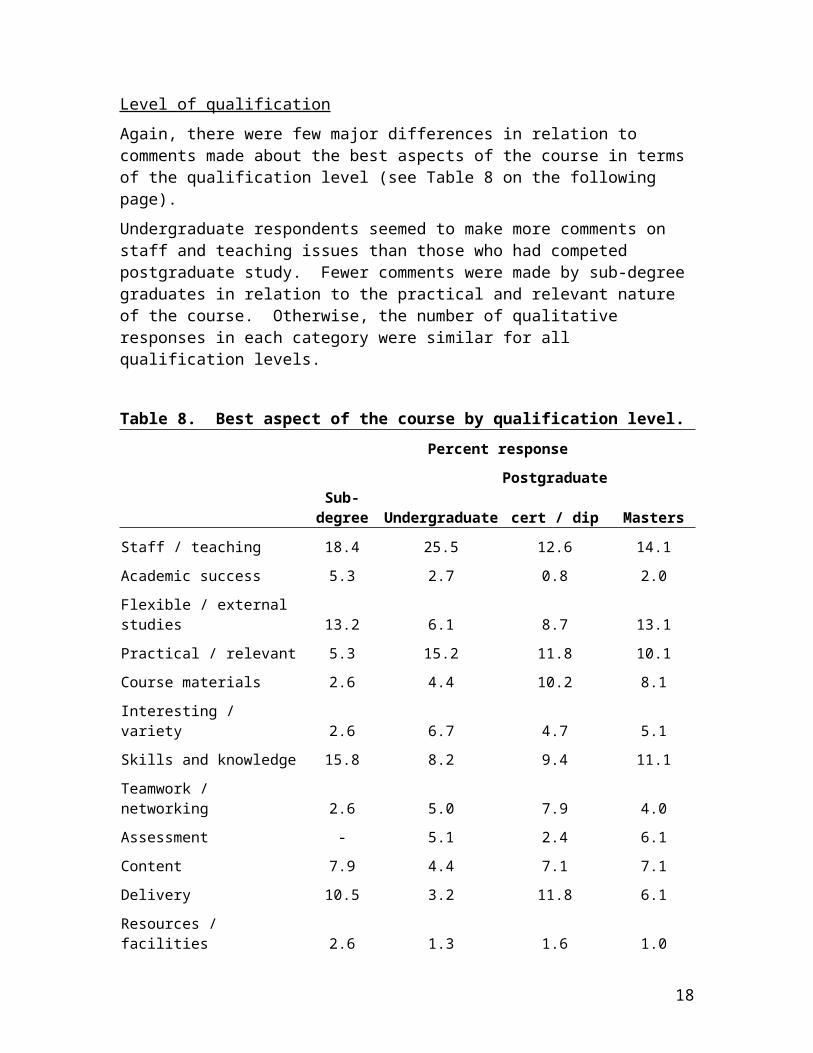
Level of qualificationAgain, there were few major differences in relation to comments made about the best aspects of the course in terms of the qualification level (see Table 8 on the following page). Undergraduate respondents seemed to make more comments on staff and teaching issues than those who had competed postgraduate study. Fewer comments were made by sub-degree graduates in relation to the practical and relevant nature of the course. Otherwise, the number of qualitative responses in each category were similar for all qualification levels.
Table 8. Best aspect of the course by qualification level.Percent response
Sub-degree Undergraduate
Postgraduate
cert / dip MastersStaff / teaching 18.4 25.5 12.6 14.1Academic success 5.3 2.7 0.8 2.0Flexible / external studies 13.2 6.1 8.7 13.1Practical / relevant 5.3 15.2 11.8 10.1Course materials 2.6 4.4 10.2 8.1Interesting / variety 2.6 6.7 4.7 5.1Skills and knowledge 15.8 8.2 9.4 11.1Teamwork / networking 2.6 5.0 7.9 4.0Assessment - 5.1 2.4 6.1Content 7.9 4.4 7.1 7.1Delivery 10.5 3.2 11.8 6.1Resources / facilities 2.6 1.3 1.6 1.0
18
(Different question) - 2.7 3.9 2.0(Defied coding) 13.2 9.5 7.1 10.0Total* 38 525 127 99* Note: Totals reflect the number of responses not the number of
respondents. A small number of graduates completing PhD studies were omitted.
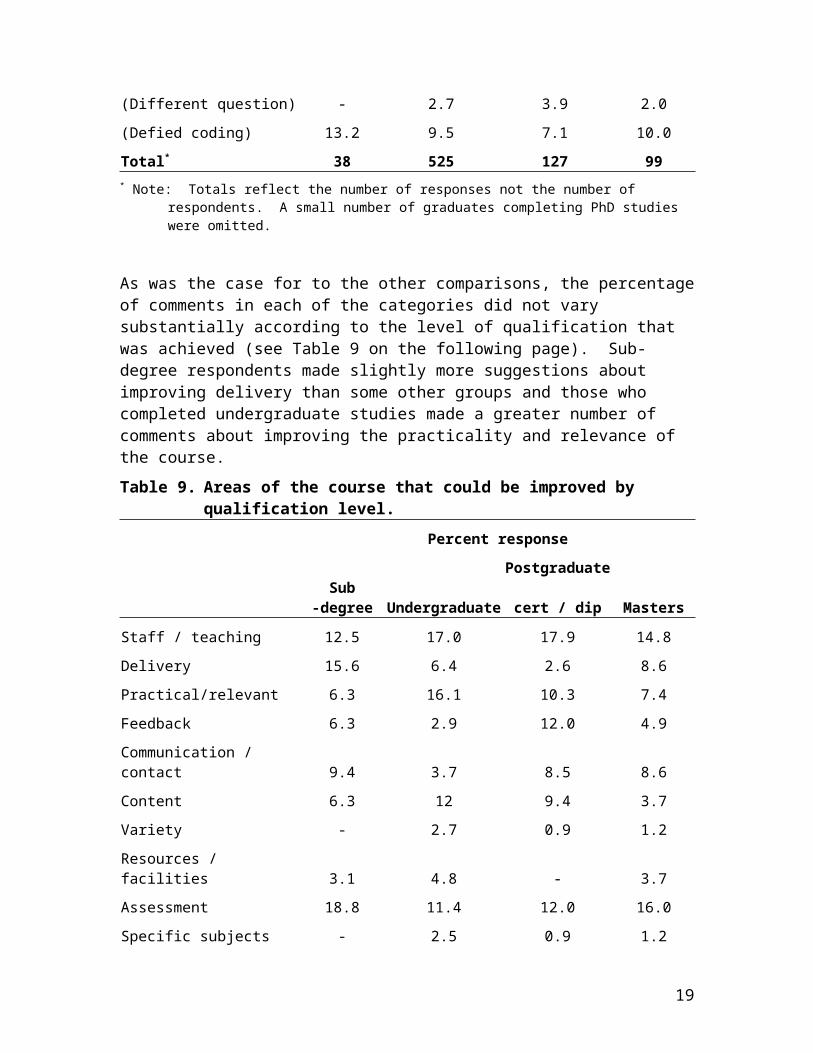
As was the case for to the other comparisons, the percentageof comments in each of the categories did not vary substantially according to the level of qualification that was achieved (see Table 9 on the following page). Sub-degree respondents made slightly more suggestions about improving delivery than some other groups and those who completed undergraduate studies made a greater number of comments about improving the practicality and relevance of the course.Table 9. Areas of the course that could be improved by
qualification level.Percent response
Sub-degree Undergraduate
Postgraduate
cert / dip MastersStaff / teaching 12.5 17.0 17.9 14.8Delivery 15.6 6.4 2.6 8.6Practical/relevant 6.3 16.1 10.3 7.4Feedback 6.3 2.9 12.0 4.9Communication / contact 9.4 3.7 8.5 8.6Content 6.3 12 9.4 3.7Variety - 2.7 0.9 1.2Resources / facilities 3.1 4.8 - 3.7Assessment 18.8 11.4 12.0 16.0Specific subjects - 2.5 0.9 1.2
19
Course materials 3.1 4.6 4.3 6.2Everything OK - 3.1 2.6 4.9Financial assistance - 1.2 4.3 -(Different question) 9.4 2.1 2.6 2.5(Defied coding) 9.4 9.5 12 16Total* 32 483 117 81* Note: Totals reflect the number of responses not the number of
respondents. A small number of graduates completing PhD studies were omitted.
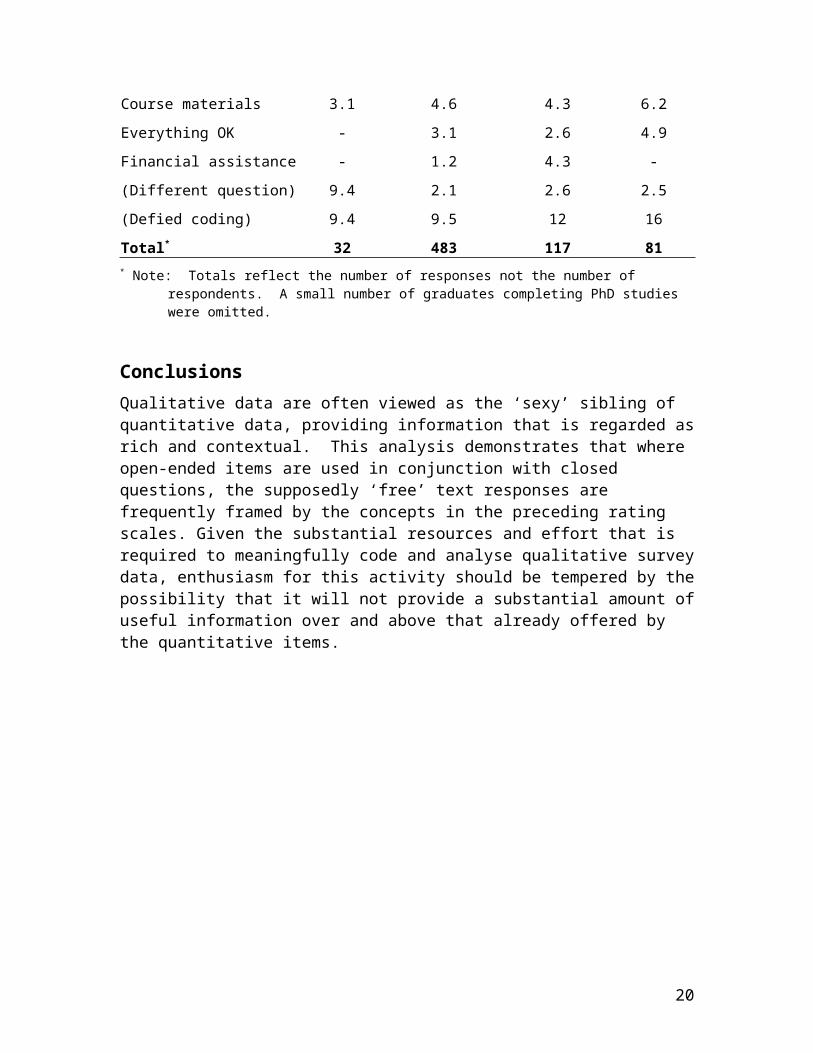
Conclusions Qualitative data are often viewed as the ‘sexy’ sibling of quantitative data, providing information that is regarded asrich and contextual. This analysis demonstrates that where open-ended items are used in conjunction with closed questions, the supposedly ‘free’ text responses are frequently framed by the concepts in the preceding rating scales. Given the substantial resources and effort that is required to meaningfully code and analyse qualitative surveydata, enthusiasm for this activity should be tempered by thepossibility that it will not provide a substantial amount ofuseful information over and above that already offered by the quantitative items.
20
ReferencesConner, M. & Waterman, M. (1996). Questionnaire measures of
health relevant cognitions and behaviours in J. Haworthed, Psychological Research: Innovative Methods and Strategies. London: Routledge
de Vaus, D.A. (1995). Surveys in Social Research. Australia: Allen & Unwin.
Guthrie, B. (1999). Recommended methodology for the GDS andCEQ, in T.Hand and K.Trembath eds, The Course Experience Questionnaire Symposium 1998. Canberra: AGPS.
Karmel, T. (1999) ,in T.Hand and K.Trembath eds, The Course Experience Questionnaire Symposium 1998. Canberra: AGPS.
Mc Innes, C. Griffen, P. James, R. and Coates, H. (2001). Development of the Course Experience Questionnaire (CEQ). Canberra: AGPS.
Miles, M. & Huberman, A.M. (1994). Qualitative data analysis: an expanded sourcebook. USA: Sage Publications.
Niland, J. (1999). The CEQ and accountability, in T.Hand and K.Trembath eds, The Course Experience Questionnaire Symposium 1998. Canberra: AGPS.
Ramsden, P. (1999) The CEQ: looking back and forward, in T.Hand and K.Trembath eds, The Course Experience Questionnaire Symposium 1998. Canberra: AGPS.
Raynard, R. & Williamson, J. (1996). Qualitative research methods in cognitive psychology: illustrations from decision process research and environmental cognition, in J. Haworth ed, Psychological Research: Innovative Methods and Strategies. London: Routledge.
Stake, R. (1995) The Art of Case Study Research. USA: Sage Publications.
Trembath, K. (1999). Enhancing and customising the analysisof the CEQ, in T.Hand and K.Trembath eds, The Course Experience Questionnaire Symposium 1998. Canberra: AGPS.
21

Tversky, A. & Kahneman, D. (1974). Judgement under uncertainty: Heuristics and biases. Science, 185, 1124-1131.
Waugh, R. (1999). A revised CEQ for student evaluation of university courses, in T.Hand and K.Trembath eds, The Course Experience Questionnaire Symposium 1998. Canberra: AGPS.
22


