Embed Size (px)
Citation preview
Cycle to Cycle Task Variations in Mixed-Model Assembly Lines and
Their Effects on Worker Posture, Joint Loads, and Recovery Time
by
Vernnaliz Carrasquillo
A dissertation submitted in partial fulfillment of the requirements for the degree of
Doctor of Philosophy (Industrial and Operations Engineering)
in the University of Michigan 2016
Doctoral Committee:
Professor Thomas J. Armstrong, Co-Chair Professor S. Jack Hu, Co-Chair Assistant Professor Clive R. D’Souza Associate Professor Theodor Freiheit, University of Calgary Associate Professor Kathleen H. Sienko

© Vernnaliz Carrasquillo
2016
ii
To Edgardo, Patricia, Amanda, Mami, and titi Lilli
iii
ACKNOWLEDGEMENT
This dissertation was completed thanks to the help and support of many people. First of
all, I want to thank my advisors Dr. Thomas J. Armstrong and Dr. S. Jack Hu for all their support
and guidance all these years. I really appreciate all the time both of you spent helping me grow
as a researcher and teacher. I would also like to thank the members of my dissertation
committee, Dr. Clive D’Souza, Dr. Kathleen Sienko, and Dr. Theo Freiheit. All of your
suggestions and recommendations further improved this work. I am also very grateful for the
managers who allowed me to come to their workplace to conduct my studies, Brenda Myers,
Ann McLean, Sara Williams, Diane Knibbs, Jeff Weiss, Uryna Gerber, and Michelle Dedo. I
truly appreciate all the time you allowed me to spend at your facilities. I also want to thank
Katie Grosteffon for developing the code to conduct the laboratory simulation and Aldan Brown,
Nicholas Cobane, Bisma Haque, and Naina Singh for their help analyzing data.
There are many other great people in the department who provided immense help. First
of all, Eyvind Claxton who spent countless days in the lab with me trying to get the equipment to
work and who always had a helping hand when needed. The same goes for Chuck Woolley,
Chris Konrad, and Olof (Mint) Minto for their technical support. Many thanks also to the staff
of the Center for Ergonomics, Amy Warhaft, Sheryl Ulin, and Rick Krause, and to all the other
staff in IOE, Tina Sroka, Wanda Dobberstein, Matt Irelan, Candy Ellis, Gwen Brown, Liz Fisher,
and Rod Capps for happily providing so much assistance when I needed it.
To my fellow PhD students and labmates, Sara and Robert Riggs, Maggie Brown,
Kathryn Schumacher, Denny Yu, Christopher and Katharina Best, Fred Feng, Neal
Wiggermanm, Tom Ferris, Justin Young, Nadine Moacdieh, Brandon Pitts, Huiyang Li, Julie
Prinet, Yuzhi Wan, Rosemarie Figueroa, Yadrianna Acosta, thank you so much for making this
journey a very pleasant one with all your support and guidance.
Finally, my personal support and cheerleaders, my dear husband, Edgardo Reyes, without
you these years would have been much harder. My amazing friend Sheila Morales, the first
person to take time off her busy life to help make sure the laboratory experiment would run

iv
smoothly with other participants and for watching my girls when I needed to do work and
couldn’t take them to daycare. To my girls, Patricia and Amanda, for being the inspiration for all
my hard work. And to my mom and my aunt who sacrificed so much to help me get here. I’ll be
eternally grateful.
v
TABLE OF CONTENTS DEDICATION ii
ACKNOWLEDGEMENT iii
LIST OF TABLES vii
LIST OF FIGURES viii
ABSTRACT xii
CHAPTER 1: INTRODUCTION 1
1.1 Overview 1 1.2 Background 1 1.3 Aims 7 1.4 Postulated Model 7 1.5 Dissertation Organization 15 1.6 References 16
CHAPTER 2: WORK VARIATIONS AND MUSCULOSKELETAL STRESSES IN PACED PRODUCTION OPERATIONS
19
2.1 Introduction 19 2.2 Observation Study 21 2.3 Simulation Study 36 2.4 Conclusion 42 2.5 References 42
CHAPTER 3: EFFECT OF CYCLE TO CYCLE TASK VARIATIONS IN MIXED-MODEL ASSEMBLY LINES ON WORKERS’ UPPER BODY EXERTIONS AND RECOVERY TIME: A SIMULATED ASSEMBLY STUDY
44
3.1 Introduction 44 3.2 Methods 46 3.3 Results 56 3.4 Discussion 69 3.5 Conclusion 72 3.6 References 72
vi
CHAPTER 4: WORKER POSTURE AND RECOVERY TIME IN A MADE TO ORDER, MIXED-MODEL, SELF-PACED ASSEMBLY LINE: AN OBSERVATION STUDY
75
4.1 Introduction 75 4.2 Methods 77 4.3 Results 85 4.4 Discussion 105 4.5 Conclusion 116 4.6 References 117
CHAPTER5: DISCUSSION AND CONCLUSSIONS 119
5.1 Summary of aims 119 5.2 Postulated model 119 5.3 Summary of findings 122 5.4 Discussion 124 5.5 Conclusion 130 5.6 Significance and broader impact 131 5.7 Future work 134 5.8 References 135
vii
LIST OF TABLES
Table 2-1: Workstation descriptions………………………………………………………… 22 Table 2-2: Summary of statistics for observed stations…………………………………...... 26 Table 2-3: Frequency of orders and time to reach, get, move, and put on tray for the different food categories at station 4 and station 6………………………………………....... 33 Table 2-4: Tasks conducted by the worker on station 4 and the occurrences………………. 34 Table 2-5: Observed data collected from videos utilized to develop simulation…………… 37 Table 2-6: Promodel parameters used to simulate assembly line workstations, workers, characteristics, and events…………………………………………………………………… 38
Table 3-1: Product specifications……………………………………………………………. 48 Table 3-2: Conveyor and product mix and sequence specifications used for each treatment……………………………………………………………………………………... 50 Table 3-3: Summary of results for work time per cycle, location of work object, and observed recovery time……………………………………………………………………… 57 Table 3-4: Summary of 3DSSPP results for joint forces, joint moments, and %MVC for all conveyor/mix combinations. The table shows the average and standard deviation ( ±s) and the 95th %-tile. The %MVC is shown for a person of average strength……………….. 58
Table 4-1: Demand and work in progress during each observed period…………………….. 90 Table 4-2: Workers gender, age, height, and body mass for each workstation and each meal demand period……………………………………………………………………………….. 92 Table 4-3: Percent maximum voluntary contractions exerted by the kitchen workers when performing frequent tasks in all workstations. (P95 represents the 95%tile of the %MVC exerted by the workers)………………………………………………………….................... 101Table 4-4: Percent maximum voluntary contractions exerted by the kitchen workers in station 1 when performing frequent tasks…………………………………………………… 102Table 4-5: Percent maximum voluntary contractions exerted by the kitchen workers in station 2 when performing frequent tasks…………………………………………………… 103Table 4-6: Percent maximum voluntary contractions exerted by the cooks when performing frequent tasks……………………………………………………………………. 104Table 4-7: %MVC for workers conducting tasks under current and proposed workplace layout and the difference between them…………………………………………………....... 115 Table 5-1: Summary of each of the observed assembly line characteristics……………….. 133
viii
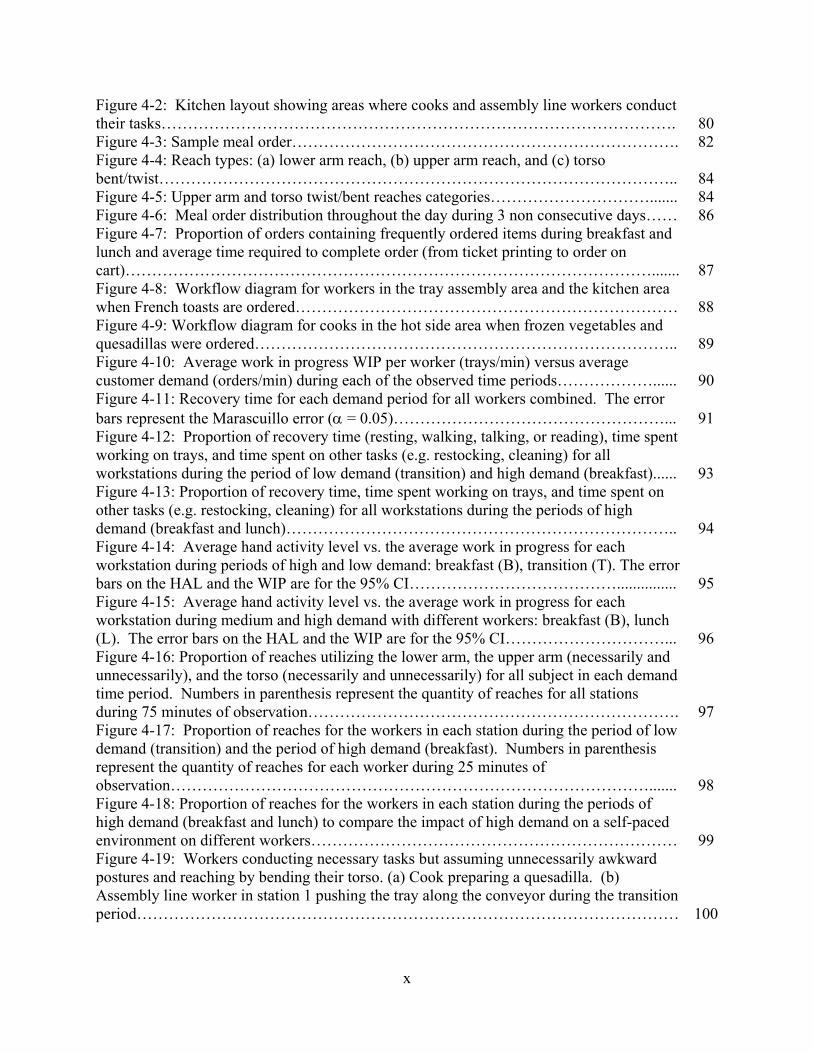
LIST OF FIGURES Figure 1-1: Postulated model in which the allocated time for paced work is based on the standard time. Deviations from the standard method and conditions affect work speed, available recovery time, and reach. In self-paced work, recovery time is affected by the establishment of a minimum work time…………………………………………………....... 9 Figure 1-2: The width (2*dx) of the reach envelope for a standing worker using one hand (a) is a function of the elbow height (he) and forearm length (la) of the worker, the height of the work object (hw), the size of the target area of the work object wt, and the angle at which the worker can abduct and adduct the arm without having to stretch the arm to reach the work object (). If the worker uses both hands to do the work (b), then the width of the reach envelope also depends on the shoulder width ws, 2*dx + ws. Male and female statures are for males and females age 20 and over. (CDC, 2012; Drillis, Contini, 1966)……………………………………………………………………………..................... 10 Figure 1-3: Worker reaching work object on conveyor outside the reach envelope. Torso is twisted and flexed……………………………………………………………………………. 12 Figure 1-4: Description of work object movement through one workstation in 3 different conveyor configurations: (a) continuous moving, (b) synchronous indexing, (c) asynchronous indexing. The horizontal sections represent the reach zones of a 5%-tile female worker. The green zone is defined as the section of the conveyor where the work object is within the worker’s reach envelope. When the work object is in the yellow zone, it is still within the reach envelope but the elbow is rotated more than 30º and the upper arm may be stretched out. The red zone indicates the area outside the reach envelope. The widths of the work object lines represent the width of the target area of the work object, wt…………………………………………………………………………………………….. 14
Figure 2-1: Floor plan of food tray assembly line…………………………………………... 21 Figure 2-2: Food tray layout………………………………………………………………... 22 Figure 2-3: Tray reaching zones for 5%-tile female at main course station………………… 23 Figure 2-4: Percentage of trays that stopped the conveyor by cause of stoppage………...... 27 Figure 2-5: Average duration of each time the conveyor stopped by cause of stoppage…... 28 Figure 2-6: Proportion of reaches in the Front zone versus the number of variations in the food serving stations (stations 2, 4, 5, 6, and 7). The number of variations is the total number of possible jobs a worker was responsible for……………………………………… 29 Figure 2-7: Idle time percent versus the number of variations in the food serving stations (stations 2, 4, 5, 6, and 7)……………………………………………………………………. 30 Figure 2-8: Percentage of times worker at station 4 (low variation) and 6 (high variation) reached each zone…………………………………………………………………………… 31 Figure 2-9: Diagram of time available to work on tray vs. time actually spent…………….. 32
ix
Figure 2-10: Graphic representation of simulation model………………………………….. 36 Figure 2-11: Proportion of reaches that occurred in each reach zone in the observed workstation and the simulation……………………………………………………………… 41
Figure 3-1: Plan view of experiment setup showing steps to complete the simulated assembly tasks. Step 1: Observe the incoming work piece on the TV screen and reach toward part storage screen (Zone A). Step 2: Click on corresponding part on the computer screen and press down on force plate to “get” part (Zone A). Step 3: Move towards TV screen showing simulated conveyor and put click on moving work piece (Zone B). When this step is completed, the value of x is recorded and classified according to the reach zone………………………………………………………………………………………….. 48 Figure 3-2: Hand location map for all subjects in the continuous, single assembly line. (a) Full cycle, (b) Step 1 - Reach, (c) Step 2 - Get, and (d) Step 3 – Move and Put, are shown separately. Reach zones are identified by yellow and green dashed lines, from left to right: Behind 2, Behind 1, Front, Ahead 1, Ahead2. Hand location samples at 50 Hz……………………………………………………………………………………………. 53 Figure 3-3: Back and wrist locations during move motion of step 3- The squares represent the range of motion of the hand during the move motion. The ‘X’ marks represent the location of the wrist and L5/S1 during the put motion of step 3- The ‘X’ marks over the blue squares are the wrist, the ‘X’ marks over the white area are for the back. Blue ‘Xs’ correspond to reaches in Behind 1 zones, green ‘Xs’ correspond to reaches in Front zone, and red ‘Xs’ correspond to reaches in Ahead 1 and Ahead 2 zones. The vertical yellow and green lines divide the work space by reach zones………………………………………. 54 Figure 3-4: Data transformation process from marker location coordinates to %MVC, joint forces and moments…………………………………………………………………………. 55 Figure 3-5: Location of work object at the moment the assembly task was completed (end of step 3) for all conveyor types and mix and sequence combinations: single (S), fixed sequence (F), and random sequence (R). The green area represents the Front reach zone, the yellow areas represent the Behind 1 and Ahead 1 reach zones, and the red areas represent the Behind 2 and Ahead 2 reach zones (Figure 3-1)……………………………… 61 Figure 3-6: Proportion of work pieces that were not completed or completed incorrectly in each experimental treatment (a) and pooled by conveyor and product sequence type (b)……………………………………………………………………………………………. 64 Figure 3-7: Example of the different postures a subject may assume when reaching the Behind 2, Behind 1, Front, Ahead1, and Ahead…………………………………………….. 65 Figure 3-8: Shoulder abduction/adduction %MVC in each of the reach zones for each conveyor and product mix/sequence type. N – number of subjects who reach each zone in each of the different configurations…………………………………………………………. 67 Figure 3-9: Torso flexion %MVC in each of the reach zones for each conveyor and product mix/sequence type………………………………………………………………....... 68 Figure 3-10: Shoulder abduction/adduction and torso flexion %MVC in each of the reach zones grouped by conveyor type and by product mix and sequence………………………... 69
Figure 4-1: Kitchen layout………………………………………………………………...... 79
x
Figure 4-2: Kitchen layout showing areas where cooks and assembly line workers conduct their tasks…………………………………………………………………………………….
80
Figure 4-3: Sample meal order………………………………………………………………. 82 Figure 4-4: Reach types: (a) lower arm reach, (b) upper arm reach, and (c) torso bent/twist…………………………………………………………………………………….. 84 Figure 4-5: Upper arm and torso twist/bent reaches categories…………………………....... 84 Figure 4-6: Meal order distribution throughout the day during 3 non consecutive days…… 86 Figure 4-7: Proportion of orders containing frequently ordered items during breakfast and lunch and average time required to complete order (from ticket printing to order on cart)………………………………………………………………………………………....... 87 Figure 4-8: Workflow diagram for workers in the tray assembly area and the kitchen area when French toasts are ordered……………………………………………………………… 88 Figure 4-9: Workflow diagram for cooks in the hot side area when frozen vegetables and quesadillas were ordered…………………………………………………………………….. 89 Figure 4-10: Average work in progress WIP per worker (trays/min) versus average customer demand (orders/min) during each of the observed time periods………………...... 90 Figure 4-11: Recovery time for each demand period for all workers combined. The error bars represent the Marascuillo error ( = 0.05)……………………………………………... 91 Figure 4-12: Proportion of recovery time (resting, walking, talking, or reading), time spent working on trays, and time spent on other tasks (e.g. restocking, cleaning) for all workstations during the period of low demand (transition) and high demand (breakfast)...... 93 Figure 4-13: Proportion of recovery time, time spent working on trays, and time spent on other tasks (e.g. restocking, cleaning) for all workstations during the periods of high demand (breakfast and lunch)……………………………………………………………….. 94 Figure 4-14: Average hand activity level vs. the average work in progress for each workstation during periods of high and low demand: breakfast (B), transition (T). The error bars on the HAL and the WIP are for the 95% CI…………………………………............... 95 Figure 4-15: Average hand activity level vs. the average work in progress for each workstation during medium and high demand with different workers: breakfast (B), lunch (L). The error bars on the HAL and the WIP are for the 95% CI…………………………... 96 Figure 4-16: Proportion of reaches utilizing the lower arm, the upper arm (necessarily and unnecessarily), and the torso (necessarily and unnecessarily) for all subject in each demand time period. Numbers in parenthesis represent the quantity of reaches for all stations during 75 minutes of observation……………………………………………………………. 97 Figure 4-17: Proportion of reaches for the workers in each station during the period of low demand (transition) and the period of high demand (breakfast). Numbers in parenthesis represent the quantity of reaches for each worker during 25 minutes of observation………………………………………………………………………………....... 98 Figure 4-18: Proportion of reaches for the workers in each station during the periods of high demand (breakfast and lunch) to compare the impact of high demand on a self-paced environment on different workers…………………………………………………………… 99 Figure 4-19: Workers conducting necessary tasks but assuming unnecessarily awkward postures and reaching by bending their torso. (a) Cook preparing a quesadilla. (b) Assembly line worker in station 1 pushing the tray along the conveyor during the transition period………………………………………………………………………………………… 100
xi
Figure 4-20: Location of ingredients for lunch meals requiring upper arm and torso reach………………………………………………………………………………………….
108
Figure 4-21: Assembly line worker in station 2 throwing order ticket in trash bin under conveyor…………………………………………………………………………………....... 110Figure 4-22: Recommended location of soup bowls……………………………………....... 111Figure 4-23: Reach envelope of 95%tile female getting soup bowls in current and proposed locations……………………………………………………………………………………... 111Figure 4-24: Recommended location of clarified butter container………………………...... 112Figure 4-25: Reach envelope of 95%tile female reaching clarified butter container in current and proposed locations………………………………………………………………. 112Figure 4-26: Toaster oven location and proposed change…………………………………… 113Figure 4-27: Reach envelope of 95%tile female reaching toaster oven in current and proposed locations……..…………………………………………………………………….. 113
Figure 5-1: Concept model………………………………………………………………....... 121Figure 5-2: Continuous moving assembly line observation – worker reaching Ahead +75 bending her torso…………………………………………………………………….............. 126Figure 5-3: Asynchronous indexing laboratory simulation – subject reaching Ahead 1 using her upper arm………………………………………………………………………….. 126Figure 5-4: Self-paced assembly line observation - worker reaching bending her torso…… 127Figure 5-5: Proportion of worker/subject reaching using the lower arm, and unnecessarily reaching using the upper arm and the torso in a continuous moving conveyor, an asynchronous indexing conveyor, and a self-paced manual conveyor……............................ 128Figure 5-6: Proportion of time available for recovery time in a continuous moving conveyor, an asynchronous indexing conveyor, and a self-paced manual conveyor……....... 129
xii
ABSTRACT
Assembly work frequently requires workers to move their hands, arms and body
repeatedly, sometimes assuming poor postures while exerting high forces and with little time to
rest. These movements and posture conditions are causal factors of work related musculoskeletal
disorders. This dissertation develops and provides supporting evidence for a conceptual model
that describes the conditions under which workers of mixed-model assembly lines (MMALs)
with cycle to cycle task variations are exposed to awkward postures and insufficient recovery
time.
To evaluate the effect of variations on worker posture and recovery time, an observation
study was conducted. It found that the workstation with the most variations had 89% less
recovery time and 57% more reaching outside the normal reach ranges than the workstation with
the least. A discrete event simulation model of this system was created to predict work time and
frequency of worker reaching upstream/downstream to complete the assigned tasks for a longer
period of time. It may also be used to evaluate the changes in the assembly line parameters.
A second study was conducted in the laboratory. In it, subjects’ recovery time and
frequency of reaching outside the normal reach ranges were tested under 3 conveyor types and 3
product mix/sequence configurations. It found that the asynchronous indexing conveyor reduced
reaching the most (19% vs. 63%) but none of the configurations provided sufficient recovery
time (<5%).
Third, a field study was conducted to evaluate worker posture and recovery time as
customer demand fluctuated in a made to order, manual conveyor MMAL. This study found that
increases in demand did not result in increased reach but it reduced recovery time by 15%.
Recovery time exceeded 10% in all cases because workers were required to wait for processing
time to complete the tasks.
Finally, recommendations are provided to reduce the impact of cycle-to-cycle variations
on workers’ exposure to reaching and insufficient recovery time. Providing workers with the
opportunity to complete the work at their own pace, but with controls in the system to prevent

xiii
them from working continuously, allows them to reduce reaching and provides time for recovery
time.
1
CHAPTER 1
INTRODUCTION
1.1 Overview
Manual assembly tasks frequently require workers to move their hands, arms, and bodies
repeatedly, sometimes assuming poor postures while exerting high forces and with little time to
rest. These movements, forces, and postures vary as assembly tasks change from one product to
the next and have been determined to be causal factors of work related musculoskeletal disorders
(WMSDs). This thesis develops and provides supporting evidence for a conceptual model that
describes the conditions under which workers of mixed-model assembly lines (MMALs) with
cycle to cycle task variations are exposed to awkward postures and low recovery time.
1.2 Background
1.2.1 Motivation
In 2014, the rate of manufacturing workers with injuries related to overexertion and
repetitive motions serious enough to require a median of 10 days away from work was 17.6 cases
per 10,000 full-time workers (Bureau of Labor and Statistics, 2015). Workers use their hands to
manipulate tools and/or other equipment to place, join, or form components that become part of a
final product, frequently exposing them to risk factors of musculoskeletal disorders: repetition,
force exertion, poor posture, and insufficient recovery time (Bernard, 1997; NRC, 1998, 2001).
The exposures to these risk factors can be influenced by the tools, equipment, and pacing of the
assembly lines.
2
1.2.2 Assembly Lines
Many consumer products are manufactured in assembly lines. In these lines
subcomponents are assembled in a sequential order determined by product design and line
balancing requirements. Design requirements determine the precedence constraints, i.e., which
steps need to be completed before others can be performed. Balancing the workload among
workstations is performed so that all of the resources are maximally utilized according to some
pre-determined objectives. Assembly lines can take many shapes (e.g. circular, U-shape, etc.),
can be paced by different methods (e.g. continuously moving, asynchronous indexing, one piece
flow, etc.), and can require a combination of manual labor and machines.
Earlier assembly lines were developed to manufacture a single product type which
required the same tasks to be continuously performed by line workers. These lines are capable
of producing large quantities of the same product. Increasingly, MMALs are used to produce
customized versions of one product or multiple products. They enable companies to use
resources more efficiently and respond quicker to shifts in customer demand.
Workers in assembly lines must be able to determine when a work object is arriving at a
workstation and what specific tasks they must perform to complete the job correctly. Work
objects arriving represent a signal for the worker to start working on the assigned tasks.
Detection of a signal depends on the sensitivity in vigilance, which is reduced when tasks occur
successively with high event rates (Wickens and Hollands, 2000; Parasuraman, 1979). This is
particularly important for the single product assembly lines where the same task is repeated
continuously. A decrease in vigilance during this task, may prevent workers from detecting the
signal and may lead to the workers reaching behind to complete the task or to quality problems.
Upon detection of the signal, the worker must decide when to start the work. There is a
choice the workers must make, should they respond to the signal immediately, and complete the
job as quickly as possible, even if it requires them to reach ahead? Or, should they wait for the
part to be closer, and complete the task while the work object is within the reach envelope, and
risk not being able to complete the task in time, thus reaching behind to complete it? Human’s
ability to correctly respond to a signal depends on their response bias – in this case, how likely
are they to respond immediately versus waiting. Deciding to wait, may result in falling behind
occasionally. Choosing whether to act depends on the subjective value the workers may place on
reaching ahead or behind and the probability of either of those happening (Wickens and
3
Hollands, 2000). And because ‘people tend to overestimate the probability of rare events and
underestimate that of frequent events’ (Wickens and Hollands, 2000; Peterson and Beach, 1967;
Sheridan and Ferrell, 1974), they may be more likely to respond to the signal immediately to
avoid falling behind.
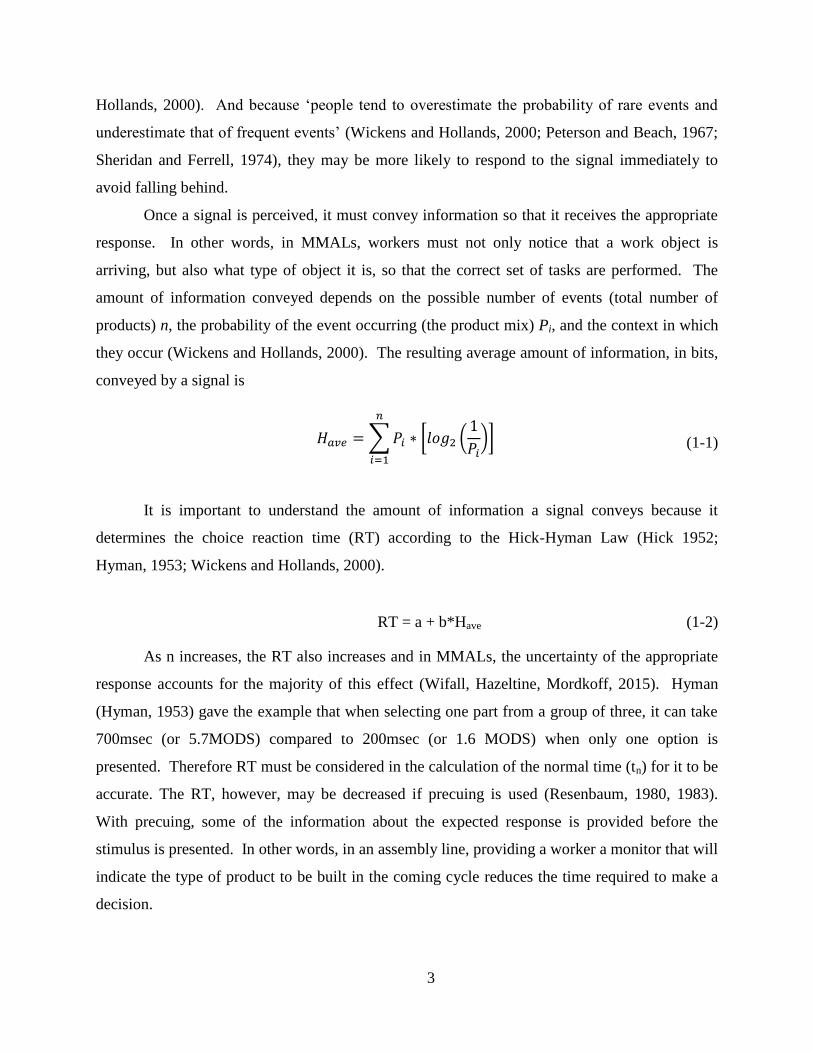
Once a signal is perceived, it must convey information so that it receives the appropriate
response. In other words, in MMALs, workers must not only notice that a work object is
arriving, but also what type of object it is, so that the correct set of tasks are performed. The
amount of information conveyed depends on the possible number of events (total number of
products) n, the probability of the event occurring (the product mix) Pi, and the context in which
they occur (Wickens and Hollands, 2000). The resulting average amount of information, in bits,
conveyed by a signal is
𝐻𝑎𝑣𝑒 =∑𝑃𝑖 ∗ [𝑙𝑜𝑔2 (1
𝑃𝑖)]
𝑛
𝑖=1
(1-1)
It is important to understand the amount of information a signal conveys because it
determines the choice reaction time (RT) according to the Hick-Hyman Law (Hick 1952;
Hyman, 1953; Wickens and Hollands, 2000).
RT = a + b*Have (1-2)
As n increases, the RT also increases and in MMALs, the uncertainty of the appropriate
response accounts for the majority of this effect (Wifall, Hazeltine, Mordkoff, 2015). Hyman
(Hyman, 1953) gave the example that when selecting one part from a group of three, it can take
700msec (or 5.7MODS) compared to 200msec (or 1.6 MODS) when only one option is
presented. Therefore RT must be considered in the calculation of the normal time (tn) for it to be
accurate. The RT, however, may be decreased if precuing is used (Resenbaum, 1980, 1983).
With precuing, some of the information about the expected response is provided before the
stimulus is presented. In other words, in an assembly line, providing a worker a monitor that will
indicate the type of product to be built in the coming cycle reduces the time required to make a
decision.
4
1.2.3 Pacing of Assembly Lines
The pacing of the assembly lines needs to be considered carefully to achieve productivity
targets and allow the worker to have sufficient time to complete the tasks mandated by the
standard method and to have enough recovery time. The standard method specifies which
motions need to be performed and in which sequence so that the tasks are completed in the same
manner every time. The time required to reach for and move parts is related to the distance
between the part storage and the location of the following task. Based on MODAPTS (The
International MODAPTS Association Inc., Jonesboro, Arkansas) data, the reach and move time
increases approximately 0.005 sec for every mm of movement. A product that requires a part
that is located 20 cm from where it is assembled might require 0.26 sec for a simple get and
place. While another one that requires two parts might require 0.59 sec – more than double the
previous amount. Knowledge of all the motions and actions required to complete every task is
required to correctly balance a production line.
How pacing affects worker fatigue and force exertion is not well understood. Although
some research suggests that workers performing a task at a high work pace do not have “direct
negative physiological effects” when compared to a low work pace (Bosh, Mathiassen, Visser,
de Looze, van Dieën, 2011), this effect was studied on a simple repetitive task without the
introduction of cycle-to-cycle variation introduced by product variety. Additionally, a simulated
meat cutting experiment (McGorry, Dempsey, O’Brien, 2004) showed that work pace (self vs.
production) caused the largest difference in grip force among subjects, with an increase in grip
force when working at the production pace.
1.2.4 Recent Research in MMALs
In the case of mixed-model assembly lines, the complexity of dealing with multiple
materials, tools, and/or methods, can present additional concerns in the development of the
standard time and pacing of the line. According to Johnson (2005), it is important for
manufacturers to understand the effects of the cycle-to-cycle task variation on the workers to
achieve the desired productivity and quality targets. Therefore, most of the research conducted
on MMALs focuses on developing methods to achieve these targets. Algorithms for determining
the best sequence of assembly steps (precedence graphs), and throughput analysis models have
been created to improve the efficiency of MMAL and improve quality and productivity (Hyun,
5
Kim, Kim, 1998; Boysen, Fliedner, Scholl, 2009). Zhu, Hu, and Koren (2008) proposed an
operator choice complexity model. It provides guidelines for managing the complexity of a
MMAL by quantifying the probability of the operator choosing the correct materials, tools, and
process given a number of possible choices. This study was expanded by Wang and Hu (2010).
They included in the complexity model a reliability measure that is impacted by worker physical
and mental fatigue. However, the assumption was that worker’s exertion would not exceed
17%MVC and therefore physical fatigue could be ignored. In reality, fatigue can occur at all
levels of %MVC. Endurance depends on the muscle groups being activated (Chaffin, Anderson,
Martin, 2006). Fisher and Ittner (1999) conducted a field study that examined the impact of
product variety on worker performance. They found that, as product variety increased, worker
performance decreased; additional work time for repairs was needed, and as a result, production
downtime increased. These studies address productivity and work quality but do not address
workers’ exposures to risk factors of WMSDs, which demonstrates that the ergonomics
requirements associated with this type of assembly line have not been clearly determined.
Several tools and methods to understand and manage the demands that production line
workers experience have been developed due to the need to reduce ergonomic stresses and
maintain productivity. The Operational Complexity Coefficient, proposed by ElMaraghy and
Urbanic (2004) integrates manufacturing requirements with human needs and capabilities. It
provides a single measure of the complexity of the system by scoring the physical and cognitive
demands of each task according to a relative effort scale where 0 represents low effort and 1
represents high effort. This method allows for a comparison of the effort required at different
workstations or before and after changes at an individual workstation. Line balancing algorithms
and heuristics that incorporate the magnitude and frequency of exertion in the calculation of the
amount of time required by each workstation with the purpose of reducing ergonomic risks have
been described by Otto and Scholl (2011), and Carnahan, Norman, and Redfern (2001). The
Threshold Limit Value (TLV) for hand activity level (HAL) and vibration defined by the
American Conference of Governmental Industrial Hygienists (ACGIH) were incorporated into a
mixed-integer program by Xu, Ko, Cochran, and Jung (2012). It aimed to minimize the number
of workstations including assembly balancing requirements and the TLVs for HAL and vibration
as constraints on the model. Battini, Faccio, Persona, and Sgarbossa (2001) proposed a
framework that considers worker stresses (both physical and psychosocial) and safety, market
6
demand, assembly processes, availability of space, and others into the assembly line design.
These studies do not consider the effect of cycle-to-cycle task variations on workers exposure to
WMSD risk factors and what assembly line parameters can be manipulated to reduce adverse
effects.
1.2.5 Hospital Kitchen Research
The concerns that affect traditional manufacturing plants also affect commercial kitchens.
Workers can be exposed to poor posture, high repetition, and extreme temperatures. To integrate
manufacturing efficiency methodology with occupational health and safety standards in the
design layout of a hospital kitchen, Moatari-Kazerouni, A., Chinniah, Y., and Agard, B. (2015)
developed a risk estimation method. The method was shown to improve efficiency and reduce
workers’ exposure to heat and noise in the kitchen of a hospital. Other studies have investigated
the effect of equipment size (Cocci, S.J., Namasivayam, K., Bordi, P., 2005) and physical and
environmental workloads before and after interventions on the productivity and health of kitchen
workers (Matsuzuki, H., Haruyama, Y., Muto, T., Aikawa, K., Ito, A., Katamoto, S., 2013;
Medeiros da Luz, C., Pacheco da Costa Proença, R., Rodríguez Ortiz de Salazar, B., do
Nascimento Galego, G., 2013; Haukka., E., Ojajärvi, A., Takala, E., Viikari-Juntura, E., Leino-
Arjas, P., 2012). While cooks and other kitchen workers do not typically have standardized
work cycles, the work in a hospital kitchen resembles the cyclic nature of manufacturing plants.
In this environment, workers prepare food to be placed in trays moving along conveyors that are
then transported to the hospital patients. The assembly lines where trays are put together can be
considered MMALs given the large number of food options patients can select. Just like in
traditional manufacturing environment, studies are needed to determine the effect of cycle-to-
cycle task variations on worker posture and recovery time.
7
1.3 Aims
The aim of this research is to develop and provide supporting evidence for a conceptual
model that describes the relationship between cycle-to-cycle task variations in mixed-model
assembly lines (MMALs) and worker exposure to upper limb work related musculoskeletal
disorders (WMSDs) and fatigue risk factors.
The research will specifically test the following hypotheses:
1. Cycle-to-cycle task variations require different work times in assembly lines which
increase stressful postures and reduce recovery time.
2. Conveyor type and product mix and sequence affect worker posture by requiring them to
reach outside the normal reach range envelope and lead to reduced recovery time.
3. Increased customer demand increases the frequency of workers reaching outside the
normal reach ranges and the recovery time in a made to order, mixed-model, self-paced
assembly line.
The results of this study will provide employers with additional tools to achieve the
flexibility of MMAL while reducing workers’ exposure to risk factors of WMSDs by:
1. Determining assembly line parameters that increase workers’ exposure to awkward
postures and insufficient recovery time.
2. Recommending assembly line parameters to manage work variations and reduce worker’s
exposure to awkward postures and insufficient recovery time.
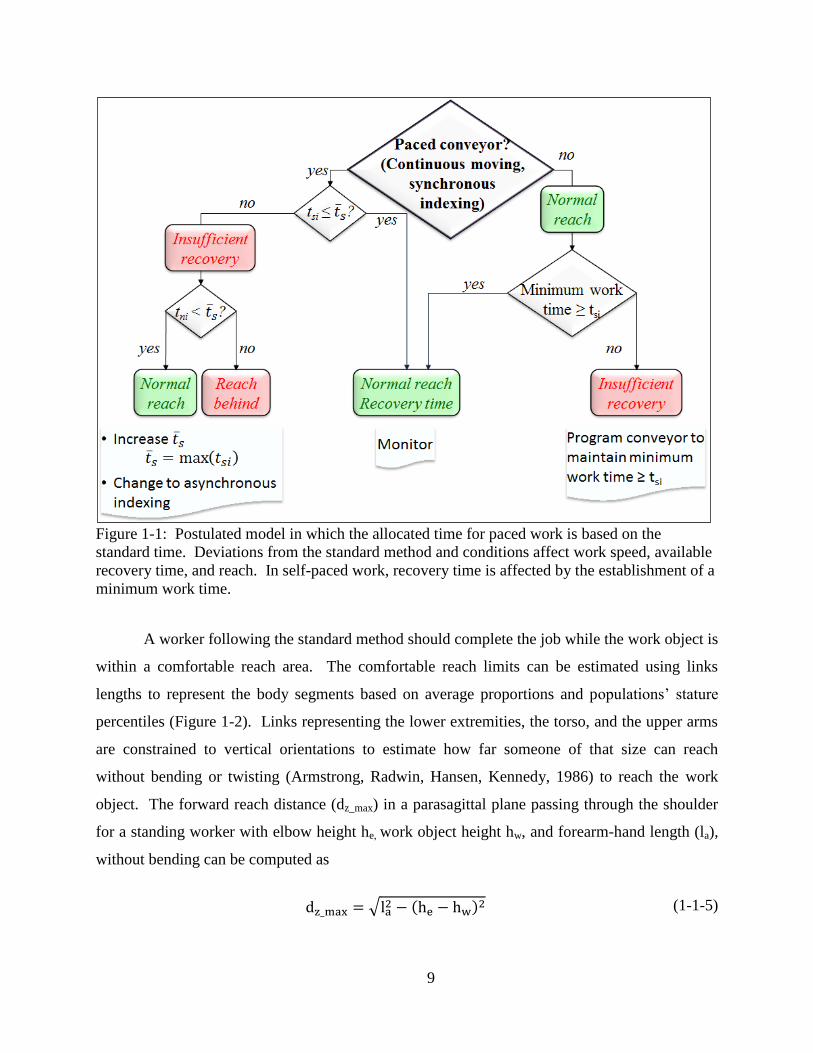
1.4 Postulated Model
This section discusses the development of a model that describes the relationship between
worker reach location and recovery time with respect to task variation from cycle to cycle and
assembly line pacing. Figure 1-1 shows a graphic representation of the model where worker
reach location and recovery time depend on the difference between the time required to complete
the assigned tasks and the actual time allocated to complete a work cycle (i.e. the standard time).
Assembly line balancing methods are used to distribute the total work required to
manufacture a product throughout various workstations according to certain balancing criteria.
8
The work is divided so that each worker has time to do the assigned tasks and still have adequate
recovery time. Line balancing is accomplished by estimating the time required to complete
assigned tasks using a standard method (SM). The SM specifies the sequence of all the motions
or actions, known as work elements (e), required to complete a job, such that
SM: e1 + e2 + … + en (1-1-3).
The time required to do each element, the elemental time (te), is estimated using
predetermined motion time systems, such as MODAPTS (The International MODAPTS
Association Inc., Jonesboro, Arkansas) or MTM (MTM Association for Standards and Research,
Des Plaines, Illinois). These systems provide estimates of the time required to complete a
movement or action based on distance and force requirements. The sum of all the te is known as
the normal time (tn). It represents the time required for most (90% - 95%) qualified and trained
workers to complete the task, following the SM under normal conditions.
tn = te1 + te2 + … + ten (1-1-4a)
The tn for a group of elements or movements can also be estimated using time study (Niebel,
Freivalds, 2003). A time allowance (ta) may be added to the tn to account for: work activities not
included in the SM, e.g. housekeeping, restocking, etc.; and personal needs, e.g. recovery time to
prevent fatigue or WMSDs. The combined tn and ta are referred to as the standard time, ts.
ts = tn + ta (1-1-4a)
9
Figure 1-1: Postulated model in which the allocated time for paced work is based on the
standard time. Deviations from the standard method and conditions affect work speed, available
recovery time, and reach. In self-paced work, recovery time is affected by the establishment of a
minimum work time.
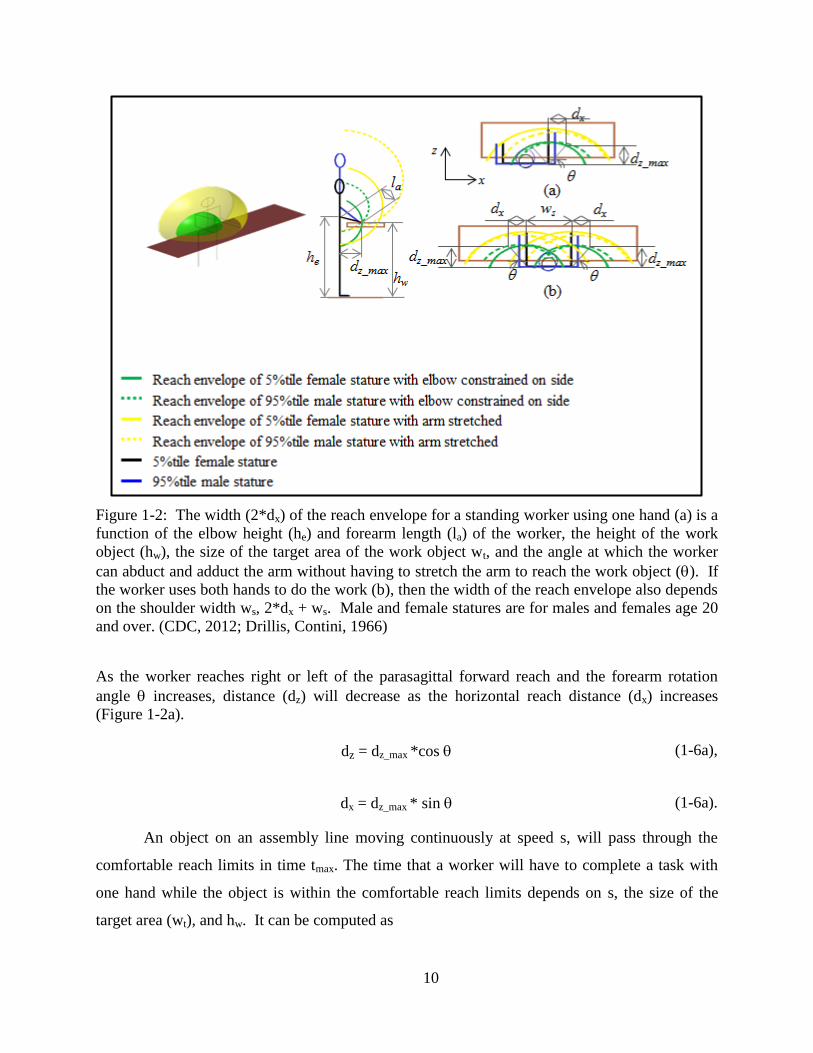
A worker following the standard method should complete the job while the work object is
within a comfortable reach area. The comfortable reach limits can be estimated using links
lengths to represent the body segments based on average proportions and populations’ stature
percentiles (Figure 1-2). Links representing the lower extremities, the torso, and the upper arms
are constrained to vertical orientations to estimate how far someone of that size can reach
without bending or twisting (Armstrong, Radwin, Hansen, Kennedy, 1986) to reach the work
object. The forward reach distance (dz_max) in a parasagittal plane passing through the shoulder
for a standing worker with elbow height he, work object height hw, and forearm-hand length (la),
without bending can be computed as
dz_max = √la2 − (he − hw)2 (1-1-5)
10
Figure 1-2: The width (2*dx) of the reach envelope for a standing worker using one hand (a) is a
function of the elbow height (he) and forearm length (la) of the worker, the height of the work
object (hw), the size of the target area of the work object wt, and the angle at which the worker
can abduct and adduct the arm without having to stretch the arm to reach the work object (). If
the worker uses both hands to do the work (b), then the width of the reach envelope also depends
on the shoulder width ws, 2*dx + ws. Male and female statures are for males and females age 20
and over. (CDC, 2012; Drillis, Contini, 1966)
As the worker reaches right or left of the parasagittal forward reach and the forearm rotation
angle increases, distance (dz) will decrease as the horizontal reach distance (dx) increases
(Figure 1-2a).
dz = dz_max *cos (1-6a),
dx = dz_max * sin (1-6a).
An object on an assembly line moving continuously at speed s, will pass through the
comfortable reach limits in time tmax. The time that a worker will have to complete a task with
one hand while the object is within the comfortable reach limits depends on s, the size of the
target area (wt), and hw. It can be computed as
11
tmax =
(2dx +wt)s⁄
(1-7a).
when the work is performed with only one hand. If the work can be done with either hand
(Figure 1-2b), then tmax also depends on the shoulder width (ws) and is given by:
tmax =(2dx +wt +ws)
s⁄ (1-7b).
If the work must be performed by both hands working simultaneously on the same area, then,
tmax =wt
s⁄ (1-7c).
The tmax can be further increased if the worker is able to step side-to-side to follow the moving
part. If this is allowed, then the tn must include time to move back to the starting location. The
pace of the production line, the takt time (ttakt), is set to approximate customer demand. The
speed of the line must be chosen so that
tmax = tn < ts ttakt (1-8).
in order to satisfy customer demand and provide the worker sufficient time to complete the job
within the reach envelope and have recovery time. An assembly line is a serial process. Unless
there are duplicate parallel workstations, all of the ts along an assembly line must be less than the
ttakt to meet production demand. The ts for all workers along an assembly line should be equal. If
the ts is greater for some workers, they may have to work harder to keep up or they would slow
down the entire line. An assembly line containing n workstations has
ts = ts_1 = ts_2 = … = ts_n ttakt (1-9).
Achieving a balanced line is particularly difficult on a MMAL. In a MMAL, each work cycle
may require more/less motions or actions due to different processes, tools, or materials, leading
to different normal times. In this case, the average standard time (ts) is based on the mix (i.e. the
total number of products and the demand for each of the products). It is computed using the
relative frequencies (fi) and the ts for each of the products assembled in a workstation (tsi) where
tsi depends on the normal time (tni) and the allowance (tai) for each specific product.
12
tsi = tni + tai (1-10)
ts = f1 ∗ ts1 + f2 ∗ ts2 +⋯+ fn ∗ tsn ≤ ttakt (1-11).
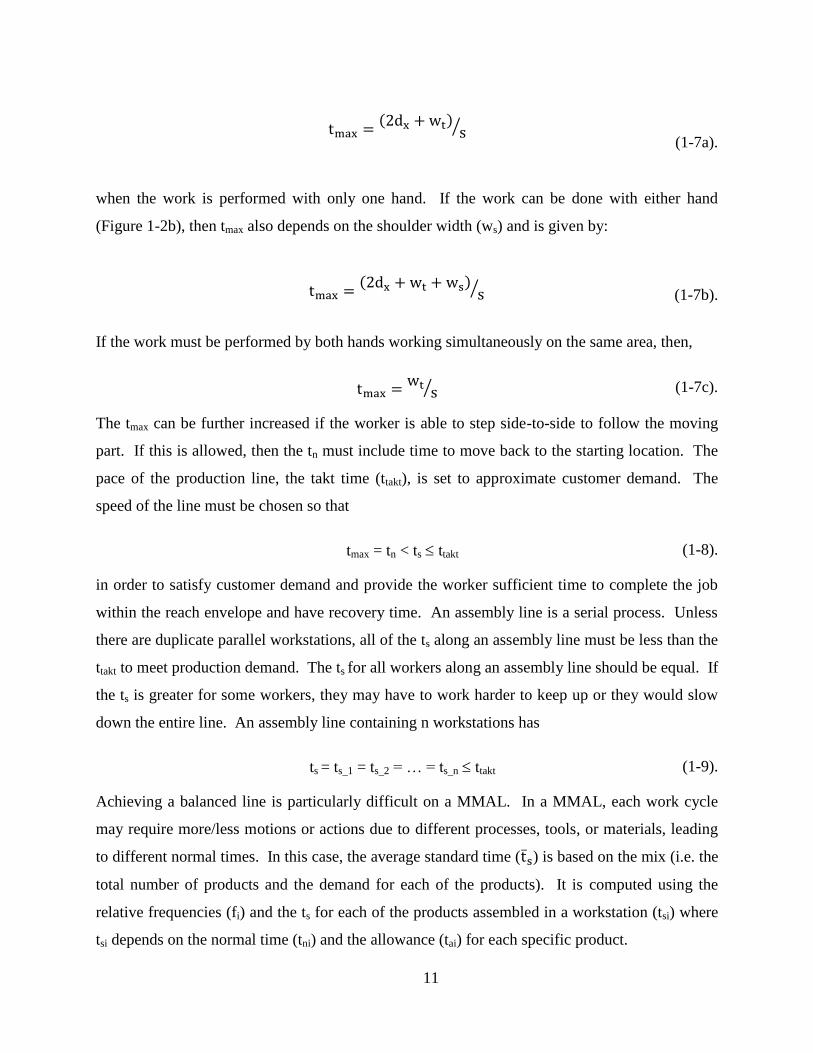
Assembly tasks that vary from one cycle to the next, determined by the product mix and
sequence (i.e. order in which they arrive), may increase the exposure to risk factors of WMSDs.
When sequential work cycles require different ts, workers may not be able to complete their work
within the ts. Equation (1-11) shows that the ts assigned to the station will be a time somewhere
in the middle of the ts for all the possible products. In work cycles that require the larger tsi, the
worker may be required to reach outside the reach envelope or work faster to complete the job
(Figure 1-3).
Figure 1-3: Worker reaching work object on conveyor outside the reach envelope. Torso is
twisted and flexed.
If the total required time exceeds the ts, the ta on one or more subsequent work cycles may be
utilized to catch up. It is also possible that, when presented with a cycle requiring a smaller tsi,
the worker may start to work ahead in anticipation for the next cycle or may become distracted,
fail to notice incoming work and thus, not start the tasks with sufficient time to finish the work
within the ts. Figure 1-1 summarizes the relationship between tsi and location of work object at
the end of the cycle.
Cycle-to-cycle variations are also caused by the inherent variance of the process, the fact
that no two parts or processes will ever be identical. Slight differences among parts may result in
workers making small adjustments to their movements, which vary from one cycle to the next.
13
These are small changes that the ta accommodates in addition to providing time for rest to reduce
the risk of fatigue and WMSDs. Occasionally, the work object may arrive at the workstation
presenting quality issues, such as: misassembled subcomponents, out of tolerance, or missing
subcomponents. When this occurs, a deviation from the standard method is required, possibly
leading to an increase in the number of work elements, e’i which, in turn, require additional time
t’ei. The time (t’n) required to perform the job will be:
t’n = tn + t’e1 + t
’e2 + t
’e3 … (1-12).
In this case, ta will be reduced by the sum of the t’ei and t’n will exceed tmax, and the worker will
have to reach behind (Figure 1-3). The work will then overflow into the subsequent cycles.
The posture and recovery time will be affected by how the assembly line moves. In
addition to the continuously moving conveyors, synchronous and asynchronous indexing
conveyors are commonly used to transfer products. The synchronous conveyor transports
objects between workstations with speed s and stops at each workstation for a specified time (tw).
Synchronous indexing lines may be setup so that the work object stops in the center of the reach
envelope. Like the continuously moving conveyors, the synchronous indexing conveyors are
paced. The cycle time is the same for all workstations, thus the work object remains in the reach
envelope for tmax (Figure 1-4(a) and Figure 1-4(b)). If the worker uses only one hand to
complete the job,
tmax =(2dx +wt)
s⁄ + tw (1-13).
14
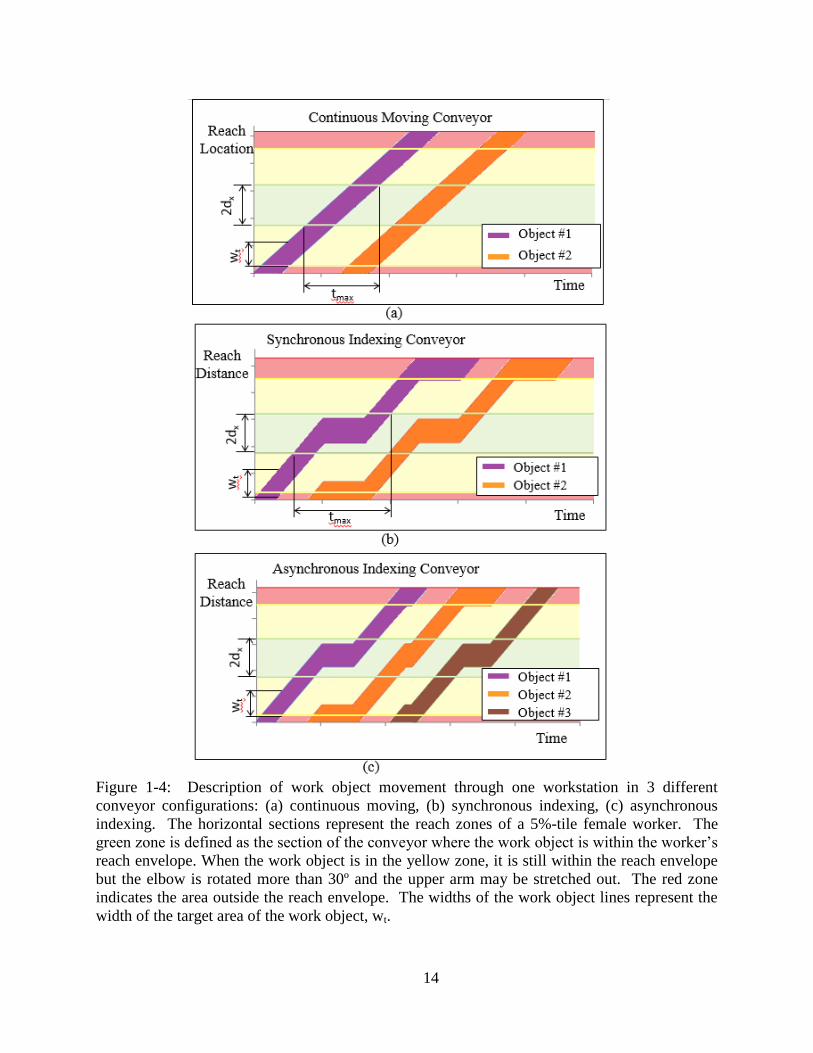
Figure 1-4: Description of work object movement through one workstation in 3 different
conveyor configurations: (a) continuous moving, (b) synchronous indexing, (c) asynchronous
indexing. The horizontal sections represent the reach zones of a 5%-tile female worker. The
green zone is defined as the section of the conveyor where the work object is within the worker’s
reach envelope. When the work object is in the yellow zone, it is still within the reach envelope
but the elbow is rotated more than 30º and the upper arm may be stretched out. The red zone
indicates the area outside the reach envelope. The widths of the work object lines represent the
width of the target area of the work object, wt.
15
The synchronous indexing conveyor has the advantage that the work object stops in front
of the worker which may increase tmax (Figure 1-4a and Figure 1-4b), if the s and tw are adjusted
accordingly, and allows the worker to manipulate the work object more easily. However, a
MMAL with a synchronous indexing conveyor has the same predicament as the continuously
moving conveyor. It is possible that the tsi will differ from the ts leading the worker to reach
behind if work is not completed before the work object starts moving or to reach ahead in
anticipation for the next cycle. The asynchronous indexing conveyor (Figure 1-4c) overcomes
this problem. The work object remains for an indefinite time within the reach envelope, but it is
no longer a one piece flow because parts move from ‘station to station on an as needed basis, as
they become ready for the next operation’ and have buffers between stations (Dattatray, Kavade,
2013). This means the asynchronous indexing conveyor line has more work in progress (WIP)
and requires more physical space for buffers and additional hardware (e.g., stop/release
mechanisms).
We hypothesize that cycle-to-cycle task variations in MMALs will increase workers’
exposure to risk factors of WMSDs, specifically reaching outside the reach envelope and reduced
recovery time. This will occur when workers are required to reach behind to complete a task
whose ts > tmax. We also hypothesize that the frequency of this scenario occurring can be
affected by the type of conveyor utilized in the assembly line. The conveyor type and pacing
determines the tmax. It may also be affected by the product mix and sequence because they
determine the frequency of work objects requiring tsi > ts or tsi < ts and the order in which they
appear.
1.5 Dissertation Organization
The remainder of the dissertation has four additional chapters. Chapter 2 consisted of a
field study designed to evaluate whether greater work variations affected workers’ frequency of
reaching and reduced their recovery time and the development of a computer simulation program
that modeled the studied site and evaluated reaching and recovery time over a longer period of
time. Chapter 3 presents a laboratory simulation study in which 9 configurations of conveyor
types and product mix and sequence were tested and subjects’ recovery time, posture, joint loads,
and work quality were evaluated. Chapter 4 presents a field study that evaluated worker posture
and recovery time during different customer demand periods in a made to order, manual
16
conveyor MMAL. Finally, Chapter 5 presents a summary of the findings, discussion, and
conclusions of the studies conducted and how they support the concept model postulated in
Chapter 1.
1.6 References
Armstrong, T.J., Radwin, R.G., Hansen, D.J., Kennedy, K.W. (1986). Repetitive trauma
disorders: job evaluation and design. Human Factors 28(3): 325-336.
Battini, D., Faccio, M., Persona, A., Sgarbossa, F. (2001). New methodological framework to
improve productivity and ergonomics in assembly system design. International Journal of
Industrial Ergonomics, 41, 30-42.
Bernard, B. A. Critical Review of Epidemiologic Evidence for Work-related Musculoskeletal
Disorders of the Neck, Upper Extremity, and Low Back. NIOSH Publication No. 97-141:
Musculoskeletal Disorders and Workplace Factors. 1997.
Bosch, T., Mathiassen, S.E., Visser, B., Looze, M.P. de and Dieën, J.H. van (2001). The effect of
work pace on workload, motor variability and fatigue during simulated light assembly work.
Ergonomics, 54(2), 154 - 168.
Bosch, T., Mathiassen, S.E., Visser, B., Looze, M.P. de and Dieën, J.H. van (2011). The effect of
work pace on workload, motor variability and fatigue during simulated light assembly work.
Ergonomics, 54(2), 154 - 168.
Boysen, N., Fliedner, M., Scholl, A. (2009). Assembly line balancing: Joint precedence graphs
under high product variety. IIE Transactions, 41, 183-193
Bureau of Labor and Statistics. Nonfatal Occupational Injuries and Illnesses Requiring Days
Away From Work, 2014. USDL-15-2205. Released 11/19/2015.
http://www.bls.gov/news.release/pdf/osh2.pdf
Carnahan, B.J., Norman, B.A., Redfern, M.S. (2001) Incorporating physical demand criteria into
assembly line balancing. IIE Transactions, 33, 875-887.
CDC. (2012). Anthropometric reference data for children and adults: United States 2007 – 2010.
US Department of Health and Human Services, 14.
Chaffin, D.B., Andersson, G.B.J., Martin, B.J. Occupational Biomechanics. Hoboken, NJ: John
Wiley & Sons, 2006. 25-27
Cocci, S., Namasivayam, K., Bordi, P. (2005). An investigation of ergonomic design and
productivity improvements in foodservice production tables. Foodservice Research
International, 16, 53-59.
Dattatray, A. A., Kavade, M. V. (2013). Compressor assembly line changes for integration with
application of lean manufacturing tool. International Journal of Advanced Engineering
Technology, 4 (2), 10-13.
17
Drillis, R. and R. Contini (1966). Body Segment Parameters. New York, New York Office of
Vocational Rehabilitation. Report No 1166-03.
ElMaraghy, W.H., Urbanic, R.J. (2004). Assessment of manufacturing operational complexity.
CIRP Annals – Manufacturing Technology, 53(1), 401-406.
Fisher, M. L., Ittner, C. D. (1999). The impact of product variety on automobile assembly
operations: Empirical evidence and simulation. Management Science, 45(6), 771-786.
Haukka, E., Ojajärvi, A., Takala, E., Viikari-Juntura, E., Leino-Arjas, P. (2002). Physical
workload, leisure-time physical activity, obesity and smoking as predictors of multisite
musculoskeletal pain. A 2-year prospective study of kitchen workers. Occupational and
Environmental Medicine. 69, 485 – 492.
Hick W.E. (1952). On the rate of gain of information. Quarterly Journal of Experimental
Psychology, 4, 11–26.
Hyman R (1953) Stimulus information as a determinant of reaction time. Journal of
Experimental Psychology, 45,188–196.
Hyun, C., Kim, Y., Kim, Y. (1998). A genetic algorithm for multiple objective sequencing
problems in mixed model assembly lines. Journal of Computers and Operations Research, 25
(7-8) 675-690
Johnson, D. J. (2005). Converting assembly lines to assembly cells at sheet metal products:
Insights on performance improvements. International Journal of Production Research, 43(7),
1483 – 1509.
Matsuzuki, H., Haruyama, Y., Muto, T., Aikawa, K., Ito, A., Katamoto, S. (2013). Workers’ load
and job-related stress after a reform and work system change in a hospital kitchen in Japan.
Environmental Health and Preventive Medicine. 18, 171-176.
McGorry, R.W., Dempsey, P.G., O'Brien, N.V. (2004). The effect of workstation and task
variables on forces applied during simulated meat cutting. Ergonomics, 47(15), 1640-1656.
Medeiros da Luz, C., Pacheco da Costa Proença, R., Rodríguez Ortiz de Salazar, B., do
Nascimento Galego, G. (2013). Working conditions at hospital food service and the development
of venous disease of lower limbs. International Journal of Environmental Health Research. 23
(6), 520-530.
Moatari-Kazerouni, A., Chinniah, Y., Agard, B. (2015). Integration of occupational health and
safety in the facility layout planning, part II: Design of the kitchen of a hospital. International
Journal of Production Research. 53(11), 3228 – 3242.
National Research Council. Work-related musculoskeletal disorders: A review of evidence.
Washington DC: National Academy Press, 1998.
National Research Council. The Institute of Medicine. Musculoskeletal disorders and the
workplace: Low back and upper extremities. Washington, DC: National Academy Press, 2001.
18
Niebel, B., Freivalds, A. Methods, Standards, and Work Design. New York, NY: Mc Graw Hill,
2003. 373-403
Otto, A., Scholl, A. (2011). Incorporating ergonomic risks into assembly line balancing.
European Journal of Operational Research, 212, 277 – 286.
Parasuraman, R. (1979). Memory load and event rate control sensitivity decrements in sustained
attention. Science, 205 – 925-927.
Peterson, C.R., Beach, L.R. (1967). Man as an intuitive statistician. Psychological Bulletin. 68-
29-46.
Rosenbaum, D.A. (1980). Human Movement Initiation: Specification of Arm, Direction, and
Extent. Journal of Experimental Psychology: General. 109 (4): 444-474.
Rosenbaum, D.A. (1983). The movement precuing technique: assumptions, applications, and
extensions. Advances in Psychology. 12: 231-274.
Sheridan, T.B., Ferrell, WA. (1974). Man-machine systems: Information, control, and decision
models of human performance. Cambridge, MA: MIT Press.
Wang, H., Hu, S.J. (2010). Manufacturing complexity in assembly systems with hybrid
configurations and its impact on throughput. CIRP Annals - Manufacturing Technology, 59 (1),
53-56.
Wickens, C. D., Holland, J., G. Engineering Psychology and Human Performance. Upper Saddle
River, NJ. 2000. P 24, 37, 46, 314, 342
Wifall, T., Hazeltine, E., Mordkoff, J.T. (2015). The roles of stimulus and response uncertainty
in forced-choice performance: an amendment to Hick/Hyman Law. Psychological Research, 1-
11.
Xu, Z., Ko, J., Cochran, D.J., Jung, M. (2012). Design of assembly lines with the concurrent
consideration of productivity and upper extremity musculoskeletal disorders using linear models.
Computers and Industrial Engineering, 62: 431-441.
Zhu, X., Hu, S. J., Koren, Y. (2008). Modeling of manufacturing complexity in mixed-model
assembly lines. Journal of Manufacturing Science and Engineering, 130(051013), 1-10.
19 Parts of this paper were presented in HFES and PREMUS conferences.
Carrasquillo, V., Armstrong, T.J., Hu, S.J. Process variations and work-related musculoskeletal disorder, WMSD, risk factors. Prevention of Work-Related Musculoskeletal Disorders PREMUS, Angers, France, August, 2010
Carrasquillo, V., Armstrong, T.J., Hu, S.J. Work variations and musculoskeletal stresses in paced production operations. HFES Annual Conference. September, 2011
CHAPTER 2
WORK VARIATIONS AND MUSCULOSKELETAL STRESSES IN PACED
PRODUCTION OPERATIONS
2.1 Introduction
2.1.1 Aims This research investigated the relationship between work variations and ergonomic
stresses associated with upper limb musculoskeletal disorders (MSDs) in paced production work.
Specifically, it tested the hypotheses that variations in assembly work increase reaching and
posture stresses while decreasing recovery time.
A field observation study was conducted to test the proposed hypotheses. It consisted of
direct observations of a mixed-model assembly line with a continuous moving conveyor to
identify work variations and examine their relationship to work performed outside the reach
envelope and recovery time. Furthermore, this work developed a discrete event computer
simulation of the observed site. The simulation can be used to evaluate exposure over longer
periods of time and to predict the effects of changes in the system on reaching and recovery time.
2.1.2 Motivation Manual labor continues to be an important part of our manufacturing economy.
Approximately 12 million people in the US perform this kind of work (Bureau of Labor and
Statistics, 2015). Hand intensive work is often associated with increased risk of MSDs, which are
20
a significant cause of worker disability. In 2014, the rate of manufacturing workers with injuries
related to overexertion and repetitive motions serious enough to require a median of 10 days
away from work was 17.6 cases per 10,000 full-time workers (Bureau of Labor and Statistics,
2015). Research shows that there is sufficient or strong evidence that certain work-related
factors, such as repetition, force, posture, or a combination of such factors, can have a causal
effect on workers’ MSDs (Bernard, 1997; McAtammney, 1993; NRC, 1998, 2001; Punnett et a,
2004). Additionally, these ergonomic risk factors have been related to quality errors in
manufacturing (Falck, Ӧrtengren, Högberg, 2010, Oğuzhan, Yeow, 2011).
2.1.2.1 Work variations and ergonomic stresses in paced work.
Most modern production facilities use standardized work to ensure production volumes
can be attained while safeguarding the quality of the product and the safety of the employees.
Standardized work makes it possible to predict the time required to perform a given job under
specified conditions and helps minimize errors (Niebel, 2003). Chapter 1 (Section 1.4) shows
that in standardized work, the time allocated to perform a given job, called the standard time (ts),
can be decomposed into normal time (tn) and allowance (ta). The normal time is based on the
time required for a trained and qualified worker to perform a given job using specified methods
and tools. The method dictates the sequence of required work elements (e) and the time required
to complete each work elements, te. The allowance adds time for recovery to prevent fatigue and
for material or process variations that do not follow a predictable time pattern (Chapter 1 -
Equation 1.2b).
In mixed-model assembly lines (MMALs) variations can occur from one cycle to the
next. These types of assembly lines manufacture different versions of similar products in the
same line. For the workers, the work elements (e) required to complete the task may vary from
cycle to cycle and therefore have a different tn (Chapter 1 – Equation 1.2a). If, in addition to the
variations caused by multiple products being assembled, a work piece arrives at a workstation
out of position, or has poor quality, additional motions and therefore, time, may be required to
complete the job, resulting in t’ei. When the difference between the time required to complete
the job and the maximum time available, tmax (Chapter 1 – 1.5c) exceeds the tn or the takt time
(ttakt), workers may be forced to reach outside their reach envelope (Figure 1.2), use their
recovery time to complete the task, and possibly use part of the time allotted to the next work
object. This time will have to be made up in successive work cycles. In a MMAL, a series of
21
products with a long cycle time can result in reduced recovery time and demand the worker to
move faster to keep-up. If the variations, and their effects, occur frequently, workers may start
working in anticipation of the work object’s arrival to the zone within the reach envelope and
reach ahead to avoid falling behind.
We hypothesize that increased work variations:
1. reduce recovery time
2. increase reaching outside the reach envelope
2.2 Observation Study
2.2.1 Methods
2.2.1.1 Study site
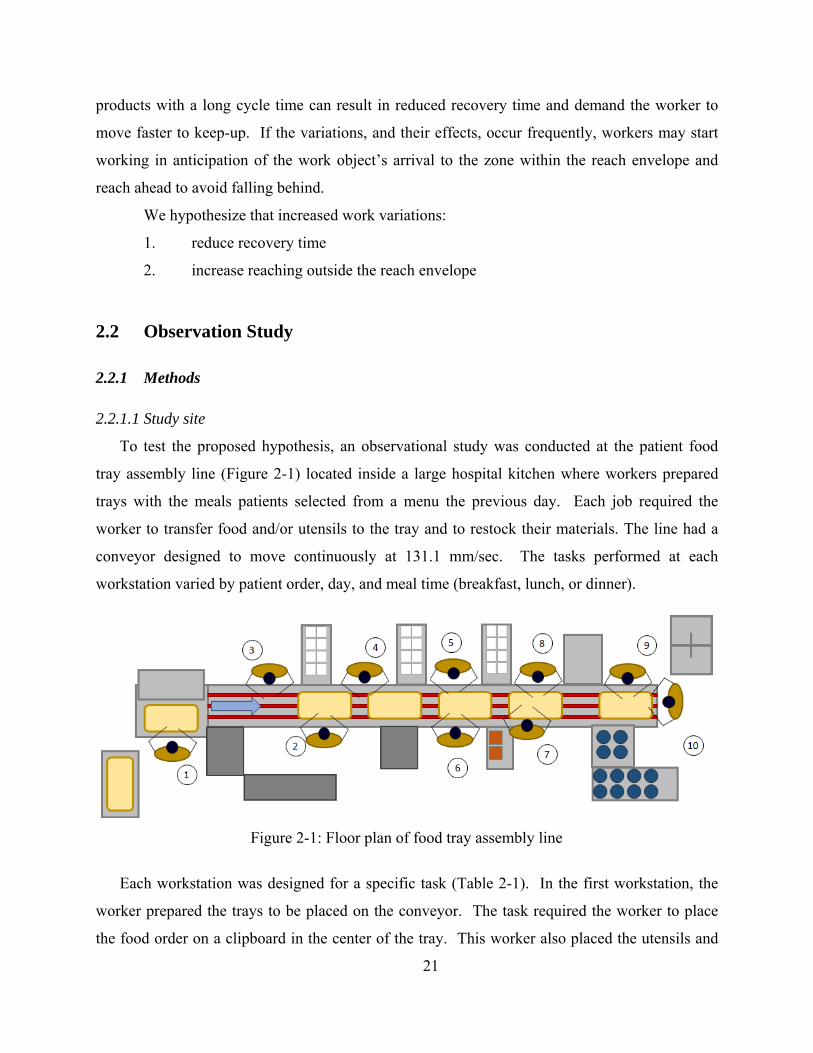
To test the proposed hypothesis, an observational study was conducted at the patient food
tray assembly line (Figure 2-1) located inside a large hospital kitchen where workers prepared
trays with the meals patients selected from a menu the previous day. Each job required the
worker to transfer food and/or utensils to the tray and to restock their materials. The line had a
conveyor designed to move continuously at 131.1 mm/sec. The tasks performed at each
workstation varied by patient order, day, and meal time (breakfast, lunch, or dinner).
Each workstation was designed for a specific task (Table 2-1). In the first workstation, the
worker prepared the trays to be placed on the conveyor. The task required the worker to place
the food order on a clipboard in the center of the tray. This worker also placed the utensils and
Figure 2-1: Floor plan of food tray assembly line
22
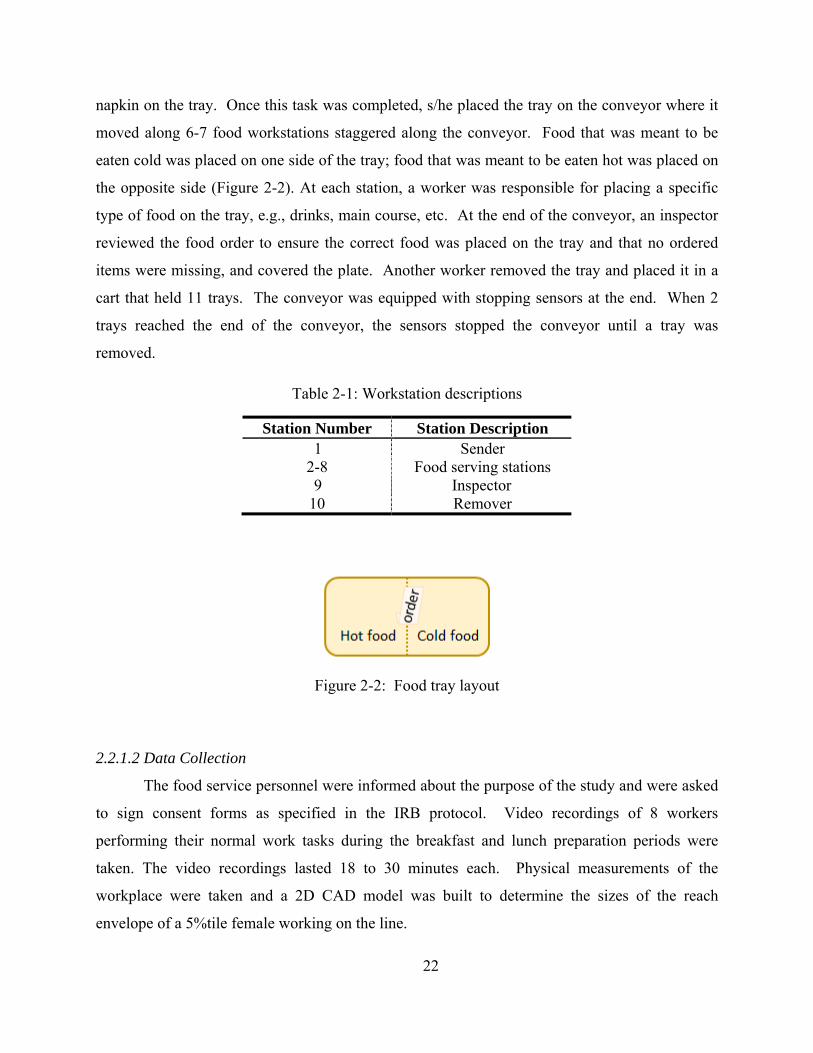
napkin on the tray. Once this task was completed, s/he placed the tray on the conveyor where it
moved along 6-7 food workstations staggered along the conveyor. Food that was meant to be
eaten cold was placed on one side of the tray; food that was meant to be eaten hot was placed on
the opposite side (Figure 2-2). At each station, a worker was responsible for placing a specific
type of food on the tray, e.g., drinks, main course, etc. At the end of the conveyor, an inspector
reviewed the food order to ensure the correct food was placed on the tray and that no ordered
items were missing, and covered the plate. Another worker removed the tray and placed it in a
cart that held 11 trays. The conveyor was equipped with stopping sensors at the end. When 2
trays reached the end of the conveyor, the sensors stopped the conveyor until a tray was
removed.
Table 2-1: Workstation descriptions
Station Number Station Description 1 Sender
2-8 Food serving stations 9 Inspector
10 Remover
Figure 2-2: Food tray layout
2.2.1.2 Data Collection
The food service personnel were informed about the purpose of the study and were asked
to sign consent forms as specified in the IRB protocol. Video recordings of 8 workers
performing their normal work tasks during the breakfast and lunch preparation periods were
taken. The video recordings lasted 18 to 30 minutes each. Physical measurements of the
workplace were taken and a 2D CAD model was built to determine the sizes of the reach
envelope of a 5%tile female working on the line.
23
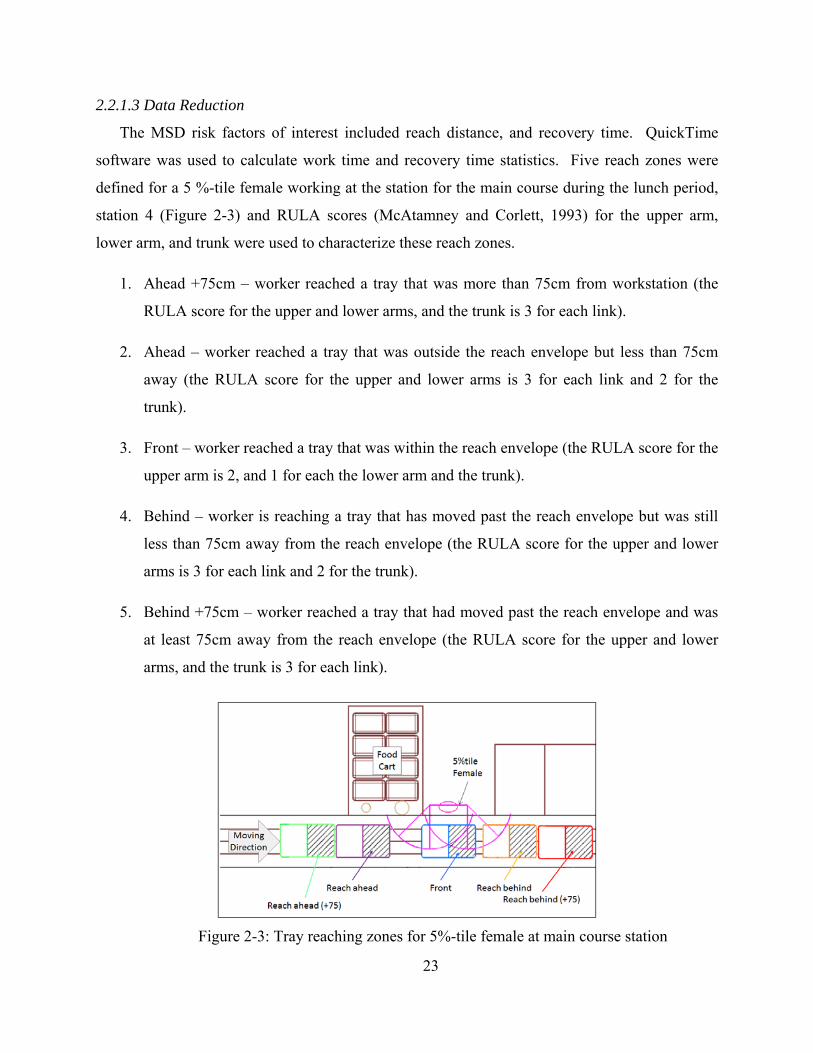
2.2.1.3 Data Reduction
The MSD risk factors of interest included reach distance, and recovery time. QuickTime
software was used to calculate work time and recovery time statistics. Five reach zones were
defined for a 5 %-tile female working at the station for the main course during the lunch period,
station 4 (Figure 2-3) and RULA scores (McAtamney and Corlett, 1993) for the upper arm,
lower arm, and trunk were used to characterize these reach zones.
1. Ahead +75cm – worker reached a tray that was more than 75cm from workstation (the
RULA score for the upper and lower arms, and the trunk is 3 for each link).
2. Ahead – worker reached a tray that was outside the reach envelope but less than 75cm
away (the RULA score for the upper and lower arms is 3 for each link and 2 for the
trunk).
3. Front – worker reached a tray that was within the reach envelope (the RULA score for the
upper arm is 2, and 1 for each the lower arm and the trunk).
4. Behind – worker is reaching a tray that has moved past the reach envelope but was still
less than 75cm away from the reach envelope (the RULA score for the upper and lower
arms is 3 for each link and 2 for the trunk).
5. Behind +75cm – worker reached a tray that had moved past the reach envelope and was
at least 75cm away from the reach envelope (the RULA score for the upper and lower
arms, and the trunk is 3 for each link).
Figure 2-3: Tray reaching zones for 5%-tile female at main course station
24
2.2.1.4 Data Analysis
The workstations with the greatest and fewest observed task variations were used to test
the null hypothesis that cycle-to-cycle work variations do not affect worker postures or recovery
time. The null hypothesis was tested using a 2 population proportion test for a large sample for
the frequency of reaching the Front zone (Figure 2-3). A similar test was conducted for the
proportion of idle time.
H0 = p1 - p2 = 0 (2-1)
Ha = p1 - p2 ≤ 0 (2-2)
Where p1 is the proportion of reaching in the Front zone for the station with the greatest task
variation and p2 is the proportion of reaching in the Front zone for the station with the least task
variations.
2.2.2 Results
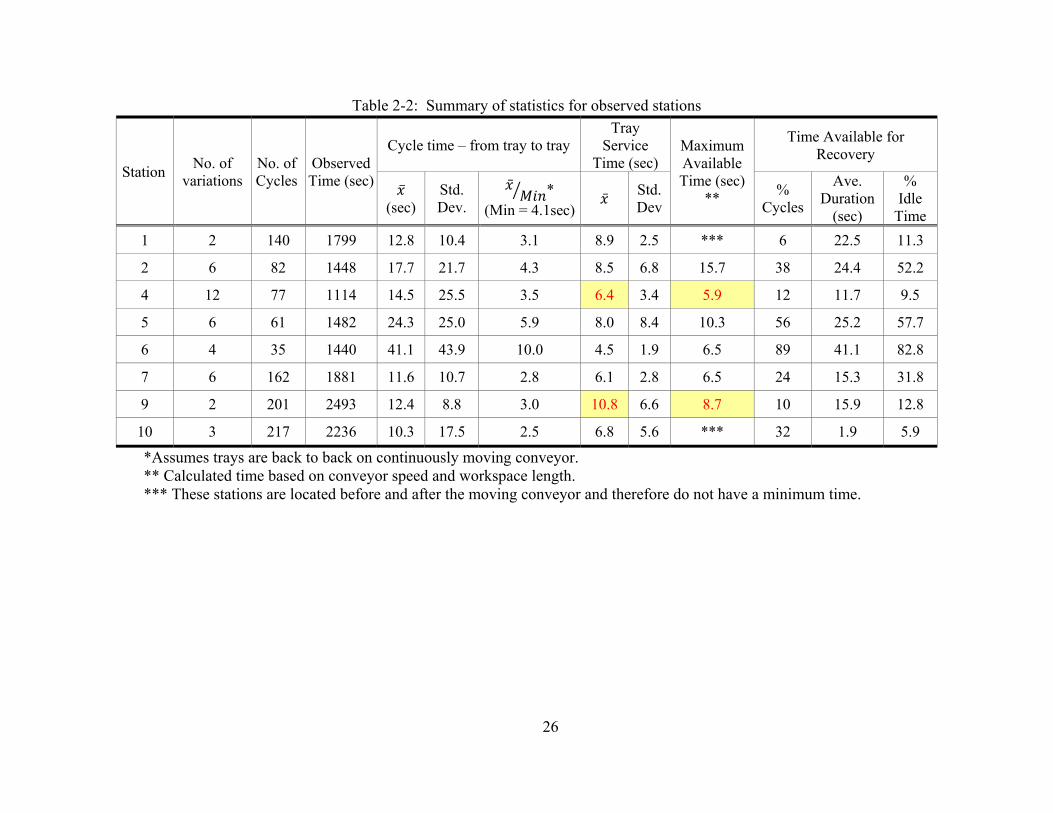
Workstations were observed for 35 to 217 work cycles (Table 2-2). Results for the
following were collected for 8 stations:
Average Cycle time the average time between start of work on one tray and start of
work on the next. It may include time waiting and/or time spent on other tasks. The
average ranged from 10.3 sec ± 17.5 sec (station10) to 41.1 sec ± 43.9 sec (station 6). The
theoretical minimum inter-arrival time based on a continuous moving conveyor with each
tray adjacent to the next was 4.1 sec (tray length/conveyor speed). The ratio of the
average cycle time to the theoretical minimum inter-arrival time shows the average
spacing between the trays, it ranged from 2.5 (station 10) to 10 (station 6). This shows
that the assembly line was running at 10% - 40% capacity.
Tray service cycle the average time spent working on each tray (excluding time to
restock and perform housekeeping tasks). It ranged from 4.8 sec (station 6) to 10.8 sec
(station 9), which are 17.1% to 163.4% more than the theoretical inter-arrival time.
Maximum available time the time available for tray at a workstation based on the
length of the workstation and the speed of the conveyor (without stopping). It varied
from 5.9 sec (station 4) to 15.7 sec (station 2) because some stations had access to a
longer section of the conveyor than others allowing the workers to walk and reach a tray.
25
The actual time differed due to conveyor stops, or workers manually moving the trays
forward or rearward along the conveyor.
Time available for recovery the time the worker spent waiting for a tray (due to large
spacing between trays or conveyor stops). It ranged from 6% (station 1) to 89% (station
6) occurrences with average duration per occurrence ranging from 1.9 sec (station 10) to
41.1 sec (station 6). The percentage of time the worker was idle during the observed time
ranged from 5.9% to 88.5%.
26
Table 2-2: Summary of statistics for observed stations
Station No. of
variations No. of Cycles
Observed Time (sec)
Cycle time – from tray to tray Tray
Service Time (sec)
Maximum Available Time (sec)
**
Time Available for Recovery
(sec)
Std. Dev.
* (Min = 4.1sec)
Std. Dev
% Cycles
Ave. Duration
(sec)
% Idle
Time
1 2 140 1799 12.8 10.4 3.1 8.9 2.5 *** 6 22.5 11.3
2 6 82 1448 17.7 21.7 4.3 8.5 6.8 15.7 38 24.4 52.2
4 12 77 1114 14.5 25.5 3.5 6.4 3.4 5.9 12 11.7 9.5
5 6 61 1482 24.3 25.0 5.9 8.0 8.4 10.3 56 25.2 57.7
6 4 35 1440 41.1 43.9 10.0 4.5 1.9 6.5 89 41.1 82.8
7 6 162 1881 11.6 10.7 2.8 6.1 2.8 6.5 24 15.3 31.8
9 2 201 2493 12.4 8.8 3.0 10.8 6.6 8.7 10 15.9 12.8
10 3 217 2236 10.3 17.5 2.5 6.8 5.6 *** 32 1.9 5.9
*Assumes trays are back to back on continuously moving conveyor. ** Calculated time based on conveyor speed and workspace length. *** These stations are located before and after the moving conveyor and therefore do not have a minimum time.
27
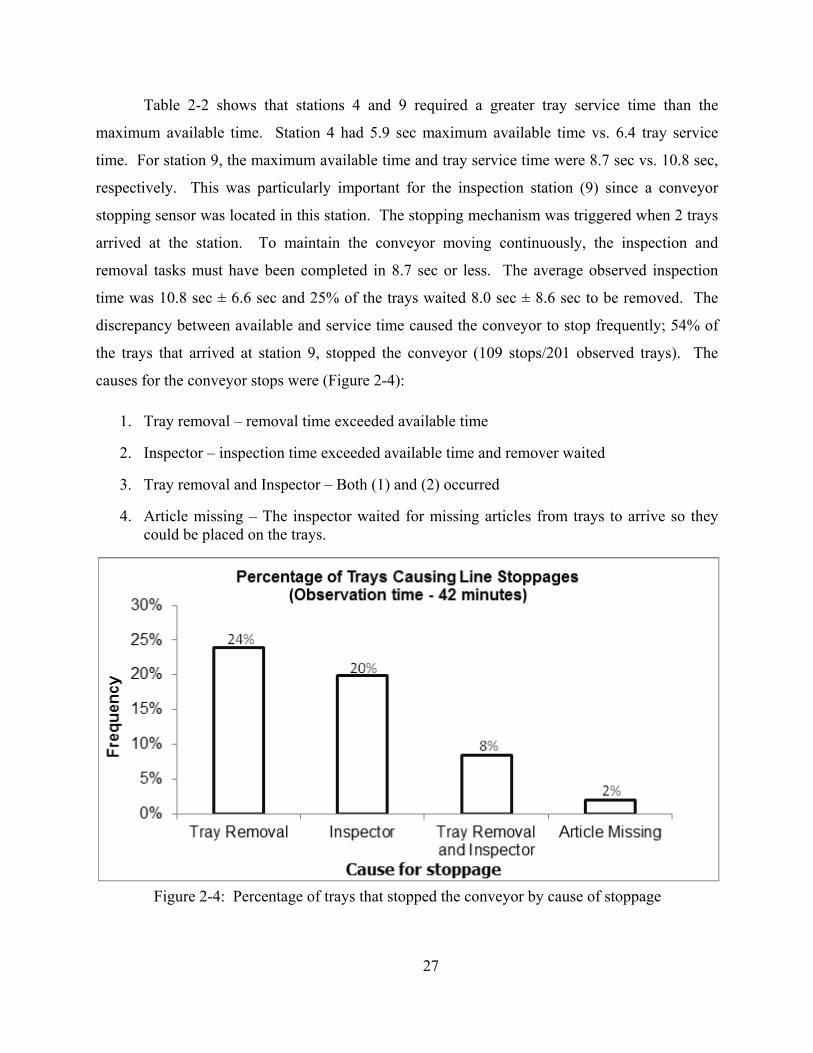
Table 2-2 shows that stations 4 and 9 required a greater tray service time than the
maximum available time. Station 4 had 5.9 sec maximum available time vs. 6.4 tray service
time. For station 9, the maximum available time and tray service time were 8.7 sec vs. 10.8 sec,
respectively. This was particularly important for the inspection station (9) since a conveyor
stopping sensor was located in this station. The stopping mechanism was triggered when 2 trays
arrived at the station. To maintain the conveyor moving continuously, the inspection and
removal tasks must have been completed in 8.7 sec or less. The average observed inspection
time was 10.8 sec ± 6.6 sec and 25% of the trays waited 8.0 sec ± 8.6 sec to be removed. The
discrepancy between available and service time caused the conveyor to stop frequently; 54% of
the trays that arrived at station 9, stopped the conveyor (109 stops/201 observed trays). The
causes for the conveyor stops were (Figure 2-4):
1. Tray removal – removal time exceeded available time
2. Inspector – inspection time exceeded available time and remover waited
3. Tray removal and Inspector – Both (1) and (2) occurred
4. Article missing – The inspector waited for missing articles from trays to arrive so they could be placed on the trays.
Figure 2-4: Percentage of trays that stopped the conveyor by cause of stoppage
28
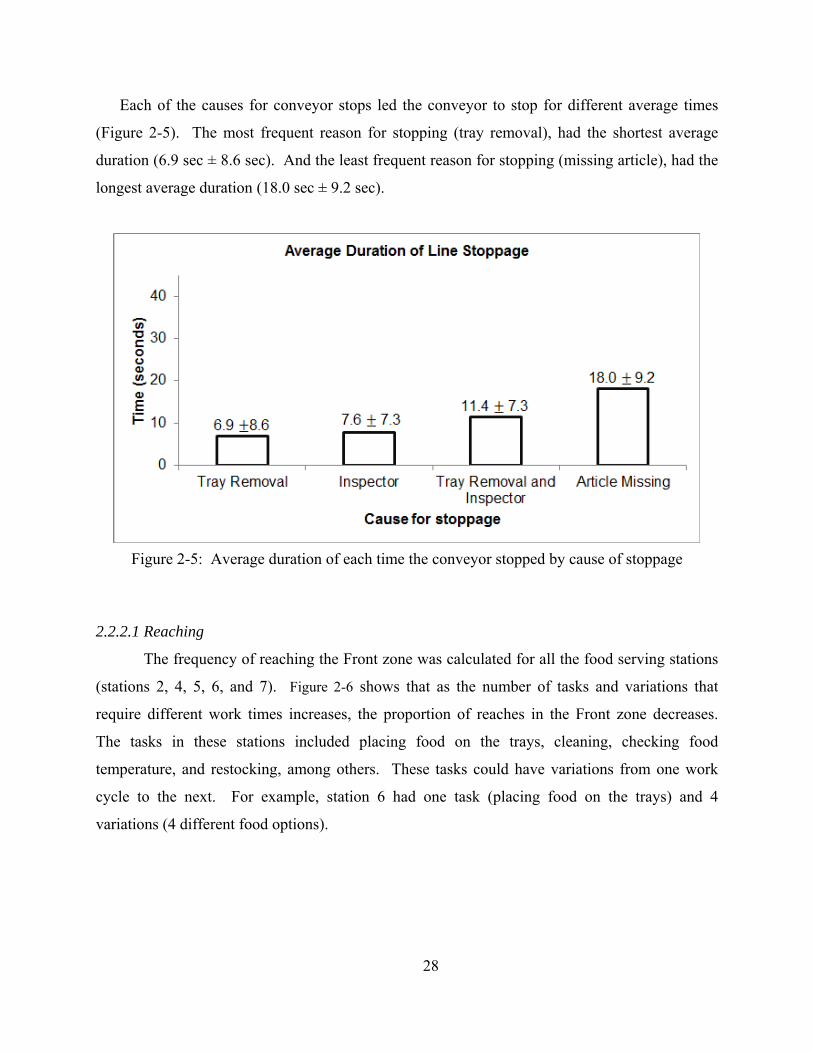
Each of the causes for conveyor stops led the conveyor to stop for different average times
(Figure 2-5). The most frequent reason for stopping (tray removal), had the shortest average
duration (6.9 sec ± 8.6 sec). And the least frequent reason for stopping (missing article), had the
longest average duration (18.0 sec ± 9.2 sec).
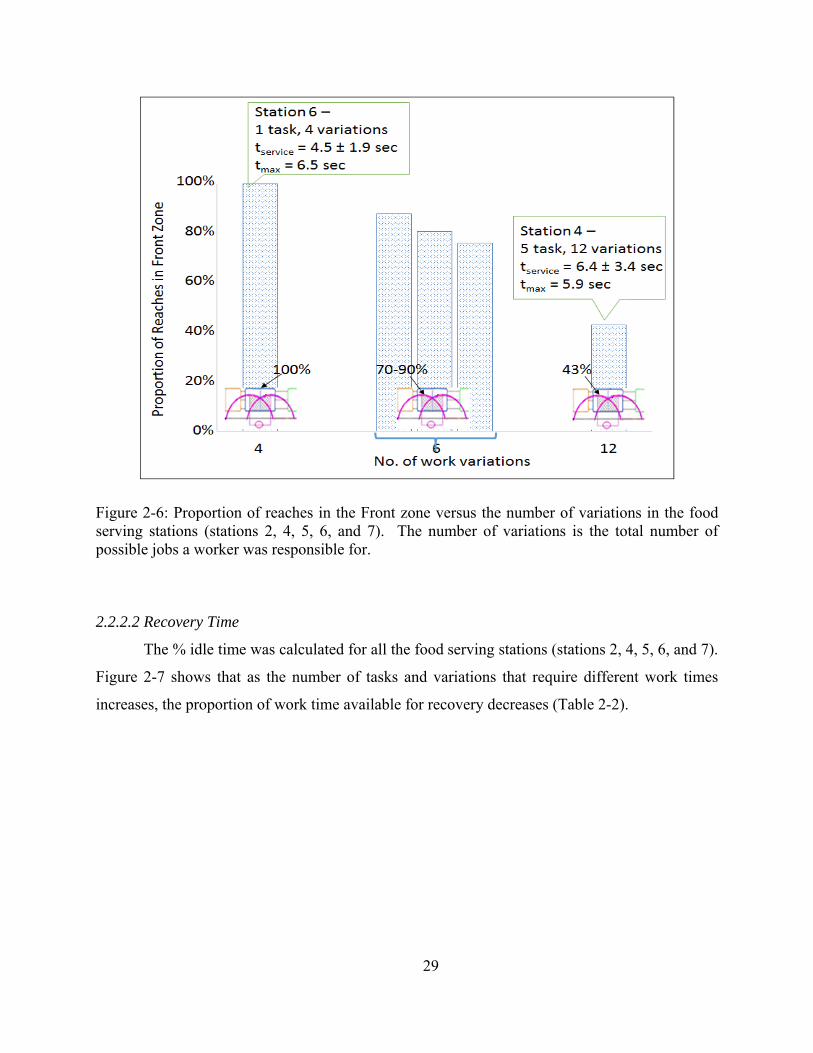
2.2.2.1 Reaching
The frequency of reaching the Front zone was calculated for all the food serving stations
(stations 2, 4, 5, 6, and 7). Figure 2-6 shows that as the number of tasks and variations that
require different work times increases, the proportion of reaches in the Front zone decreases.
The tasks in these stations included placing food on the trays, cleaning, checking food
temperature, and restocking, among others. These tasks could have variations from one work
cycle to the next. For example, station 6 had one task (placing food on the trays) and 4
variations (4 different food options).
Figure 2-5: Average duration of each time the conveyor stopped by cause of stoppage
29
Figure 2-6: Proportion of reaches in the Front zone versus the number of variations in the food serving stations (stations 2, 4, 5, 6, and 7). The number of variations is the total number of possible jobs a worker was responsible for.
2.2.2.2 Recovery Time
The % idle time was calculated for all the food serving stations (stations 2, 4, 5, 6, and 7).
Figure 2-7 shows that as the number of tasks and variations that require different work times
increases, the proportion of work time available for recovery decreases (Table 2-2).
30
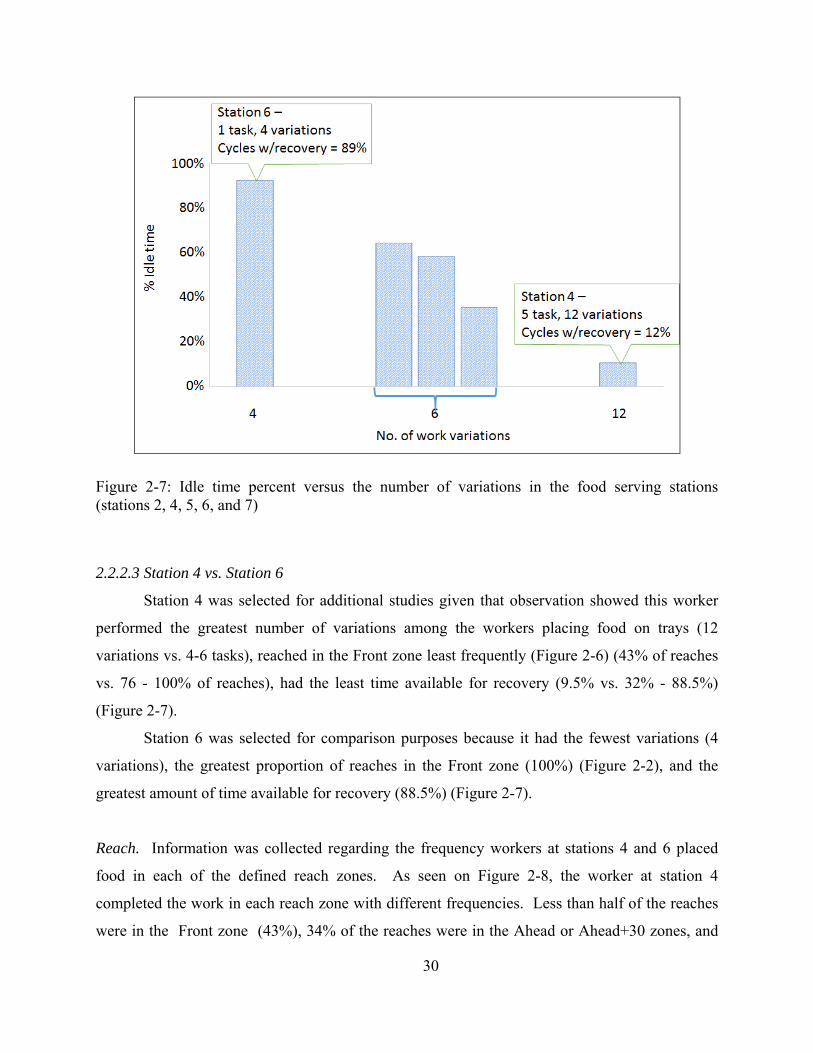
Figure 2-7: Idle time percent versus the number of variations in the food serving stations (stations 2, 4, 5, 6, and 7)
2.2.2.3 Station 4 vs. Station 6
Station 4 was selected for additional studies given that observation showed this worker
performed the greatest number of variations among the workers placing food on trays (12
variations vs. 4-6 tasks), reached in the Front zone least frequently (Figure 2-6) (43% of reaches
vs. 76 - 100% of reaches), had the least time available for recovery (9.5% vs. 32% - 88.5%)
(Figure 2-7).
Station 6 was selected for comparison purposes because it had the fewest variations (4
variations), the greatest proportion of reaches in the Front zone (100%) (Figure 2-2), and the
greatest amount of time available for recovery (88.5%) (Figure 2-7).
Reach. Information was collected regarding the frequency workers at stations 4 and 6 placed
food in each of the defined reach zones. As seen on Figure 2-8, the worker at station 4
completed the work in each reach zone with different frequencies. Less than half of the reaches
were in the Front zone (43%), 34% of the reaches were in the Ahead or Ahead+30 zones, and
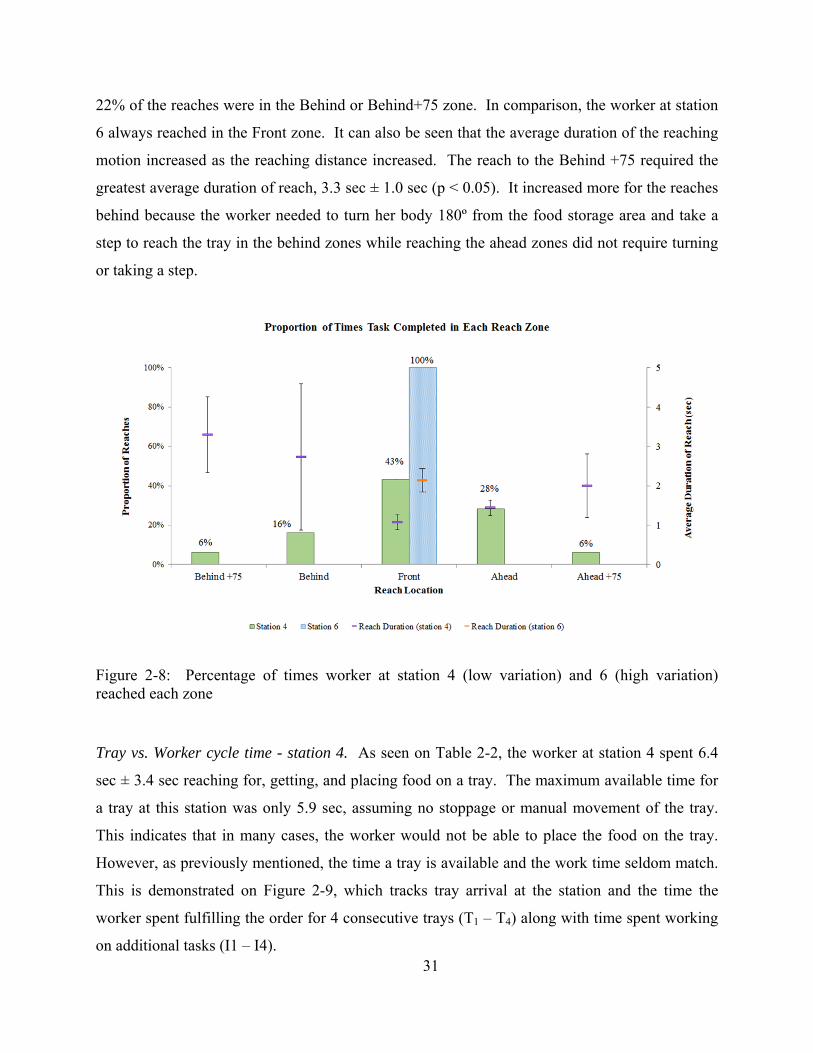
31
22% of the reaches were in the Behind or Behind+75 zone. In comparison, the worker at station
6 always reached in the Front zone. It can also be seen that the average duration of the reaching
motion increased as the reaching distance increased. The reach to the Behind +75 required the
greatest average duration of reach, 3.3 sec ± 1.0 sec (p < 0.05). It increased more for the reaches
behind because the worker needed to turn her body 180º from the food storage area and take a
step to reach the tray in the behind zones while reaching the ahead zones did not require turning
or taking a step.
Figure 2-8: Percentage of times worker at station 4 (low variation) and 6 (high variation) reached each zone
Tray vs. Worker cycle time - station 4. As seen on Table 2-2, the worker at station 4 spent 6.4
sec ± 3.4 sec reaching for, getting, and placing food on a tray. The maximum available time for
a tray at this station was only 5.9 sec, assuming no stoppage or manual movement of the tray.
This indicates that in many cases, the worker would not be able to place the food on the tray.
However, as previously mentioned, the time a tray is available and the work time seldom match.
This is demonstrated on Figure 2-9, which tracks tray arrival at the station and the time the
worker spent fulfilling the order for 4 consecutive trays (T1 – T4) along with time spent working
on additional tasks (I1 – I4).
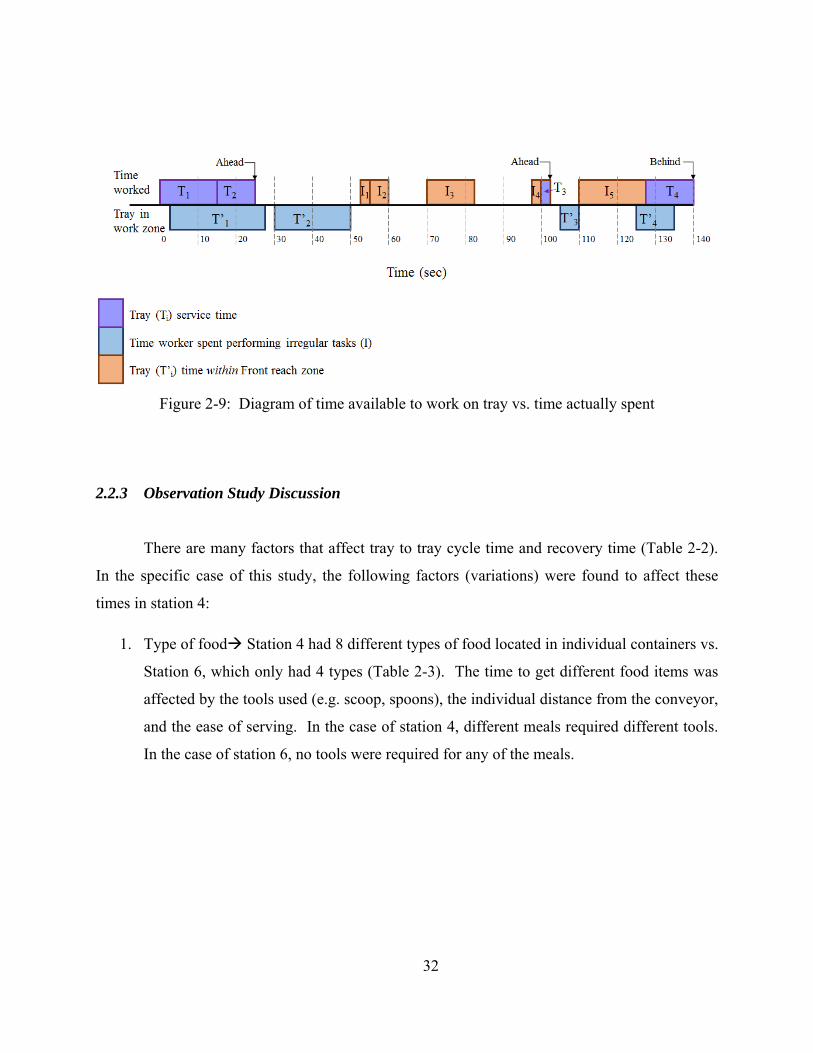
32
Figure 2-9: Diagram of time available to work on tray vs. time actually spent
2.2.3 Observation Study Discussion
There are many factors that affect tray to tray cycle time and recovery time (Table 2-2).
In the specific case of this study, the following factors (variations) were found to affect these
times in station 4:
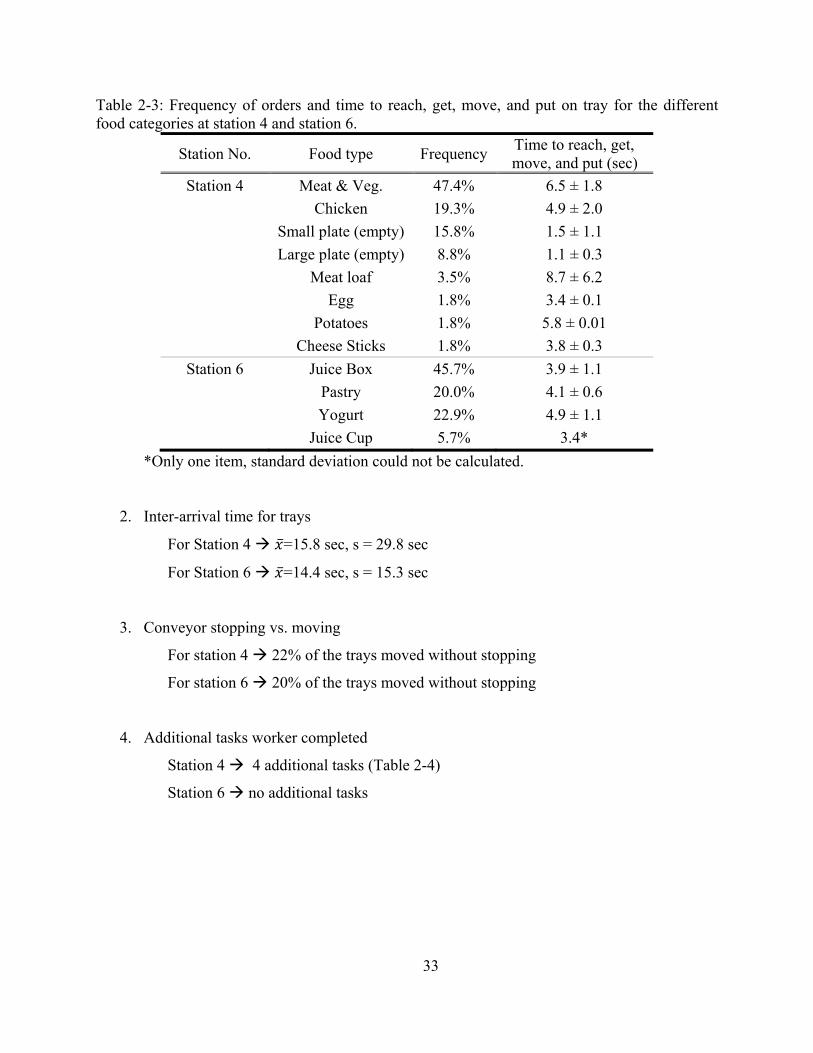
1. Type of food Station 4 had 8 different types of food located in individual containers vs.
Station 6, which only had 4 types (Table 2-3). The time to get different food items was
affected by the tools used (e.g. scoop, spoons), the individual distance from the conveyor,
and the ease of serving. In the case of station 4, different meals required different tools.
In the case of station 6, no tools were required for any of the meals.
33
Table 2-3: Frequency of orders and time to reach, get, move, and put on tray for the different food categories at station 4 and station 6.
Station No. Food type Frequency Time to reach, get, move, and put (sec)
Station 4 Meat & Veg. 47.4% 6.5 ± 1.8
Chicken 19.3% 4.9 ± 2.0
Small plate (empty) 15.8% 1.5 ± 1.1
Large plate (empty) 8.8% 1.1 ± 0.3
Meat loaf 3.5% 8.7 ± 6.2
Egg 1.8% 3.4 ± 0.1
Potatoes 1.8% 5.8 ± 0.01
Cheese Sticks 1.8% 3.8 ± 0.3
Station 6 Juice Box 45.7% 3.9 ± 1.1
Pastry 20.0% 4.1 ± 0.6
Yogurt 22.9% 4.9 ± 1.1
Juice Cup 5.7% 3.4*
*Only one item, standard deviation could not be calculated.
2. Inter-arrival time for trays
For Station 4 =15.8 sec, s = 29.8 sec
For Station 6 =14.4 sec, s = 15.3 sec
3. Conveyor stopping vs. moving
For station 4 22% of the trays moved without stopping
For station 6 20% of the trays moved without stopping
4. Additional tasks worker completed
Station 4 4 additional tasks (Table 2-4)
Station 6 no additional tasks
34
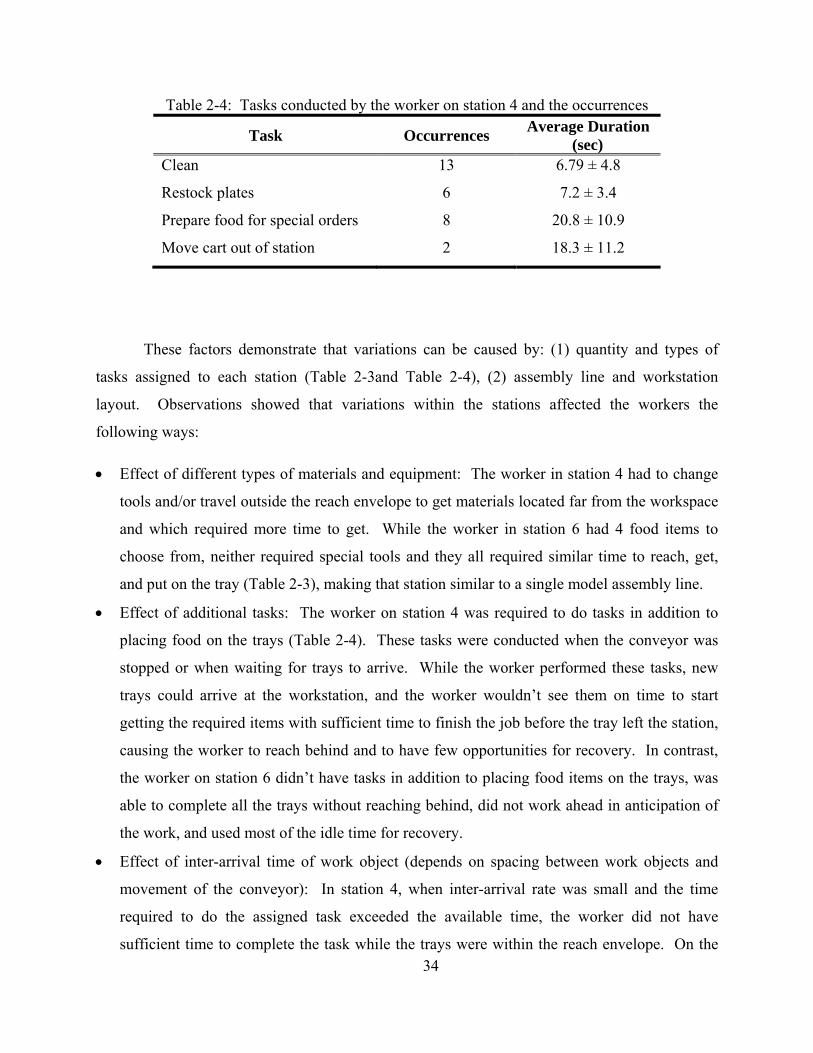
Table 2-4: Tasks conducted by the worker on station 4 and the occurrences
Task Occurrences Average Duration
(sec) Clean 13 6.79 ± 4.8
Restock plates 6 7.2 ± 3.4
Prepare food for special orders 8 20.8 ± 10.9
Move cart out of station 2 18.3 ± 11.2
These factors demonstrate that variations can be caused by: (1) quantity and types of
tasks assigned to each station (Table 2-3and Table 2-4), (2) assembly line and workstation
layout. Observations showed that variations within the stations affected the workers the
following ways:
Effect of different types of materials and equipment: The worker in station 4 had to change
tools and/or travel outside the reach envelope to get materials located far from the workspace
and which required more time to get. While the worker in station 6 had 4 food items to
choose from, neither required special tools and they all required similar time to reach, get,
and put on the tray (Table 2-3), making that station similar to a single model assembly line.
Effect of additional tasks: The worker on station 4 was required to do tasks in addition to
placing food on the trays (Table 2-4). These tasks were conducted when the conveyor was
stopped or when waiting for trays to arrive. While the worker performed these tasks, new
trays could arrive at the workstation, and the worker wouldn’t see them on time to start
getting the required items with sufficient time to finish the job before the tray left the station,
causing the worker to reach behind and to have few opportunities for recovery. In contrast,
the worker on station 6 didn’t have tasks in addition to placing food items on the trays, was
able to complete all the trays without reaching behind, did not work ahead in anticipation of
the work, and used most of the idle time for recovery.
Effect of inter-arrival time of work object (depends on spacing between work objects and
movement of the conveyor): In station 4, when inter-arrival rate was small and the time
required to do the assigned task exceeded the available time, the worker did not have
sufficient time to complete the task while the trays were within the reach envelope. On the
35
opposite side, when the inter-arrival time was large, the worker conducted other tasks and
paid less attention to the conveyor, also requiring the worker to reach behind. This did not
affect the worker on station 6 in the same way because the maximum available time was 2
seconds greater than the average tray service time. This means that even if the inter-arrival
time was small, the worker had sufficient time to complete the job. In the cases when the
inter-arrival time was large, this worker was not affected because she didn’t have other tasks
to complete while waiting and therefore, was always able to see the incoming trays.
The proposed model (Figure 1.3) is supported by these results because it shows that when
variations in the time for completing a work element (t’ei) occur, and they exceed the available
time (ta), the worker may have to work faster and/or have less recovery time. Also, if the tpi < ,
the worker can decide to perform other tasks, work ahead or use the extra time for recovery
(Figure 2-9).
When time for recovery is not allocated, or it occurs sporadically, and reaching out of the
reach envelope is frequent, workers are increasing the exposure to risk factors for WMSDs of the
back, neck, and upper extremities (NRC 1998, 2001). This suggests that work should be paced
in such a way that recovery time is allowed after every work cycle, which highlights the
importance of clearly defining a standard method. The standard method must account for each
possible variation and the frequency of occurrence so that variations can be accommodated
without requiring workers to perform additional exertions, forces, or movements and time is
allocated for recovery after every cycle.
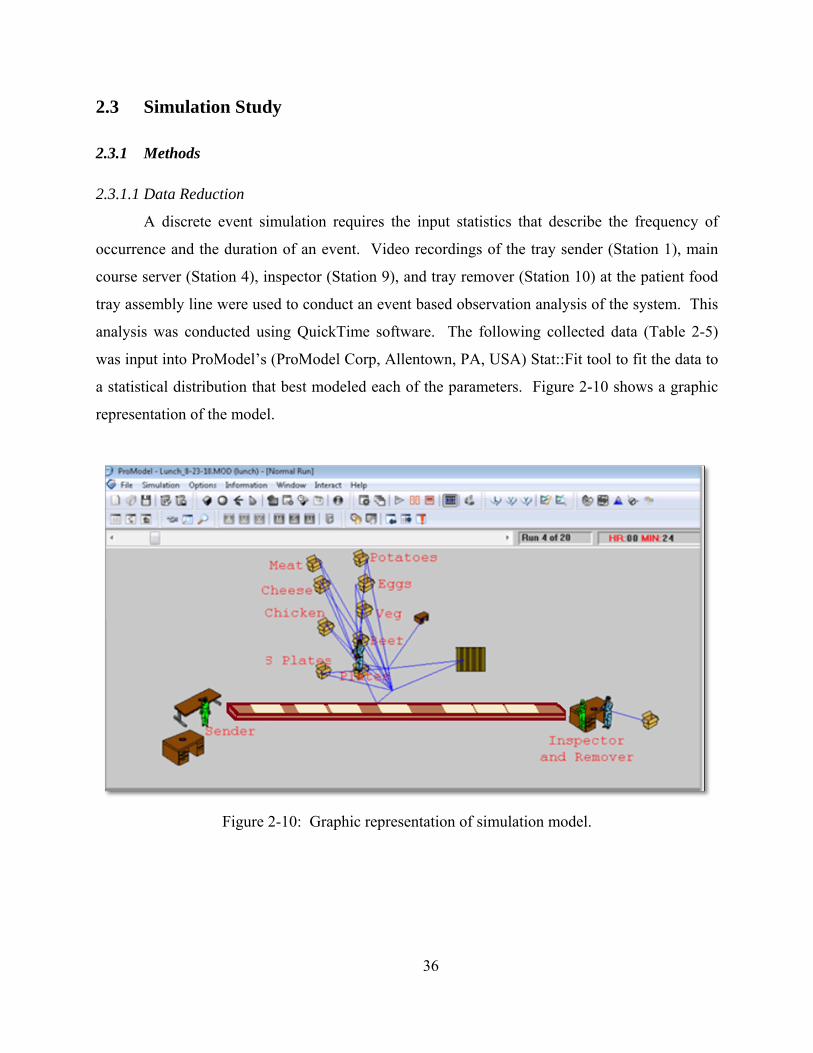
36
2.3 Simulation Study
2.3.1 Methods
2.3.1.1 Data Reduction
A discrete event simulation requires the input statistics that describe the frequency of
occurrence and the duration of an event. Video recordings of the tray sender (Station 1), main
course server (Station 4), inspector (Station 9), and tray remover (Station 10) at the patient food
tray assembly line were used to conduct an event based observation analysis of the system. This
analysis was conducted using QuickTime software. The following collected data (Table 2-5)
was input into ProModel’s (ProModel Corp, Allentown, PA, USA) Stat::Fit tool to fit the data to
a statistical distribution that best modeled each of the parameters. Figure 2-10 shows a graphic
representation of the model.
Figure 2-10: Graphic representation of simulation model.
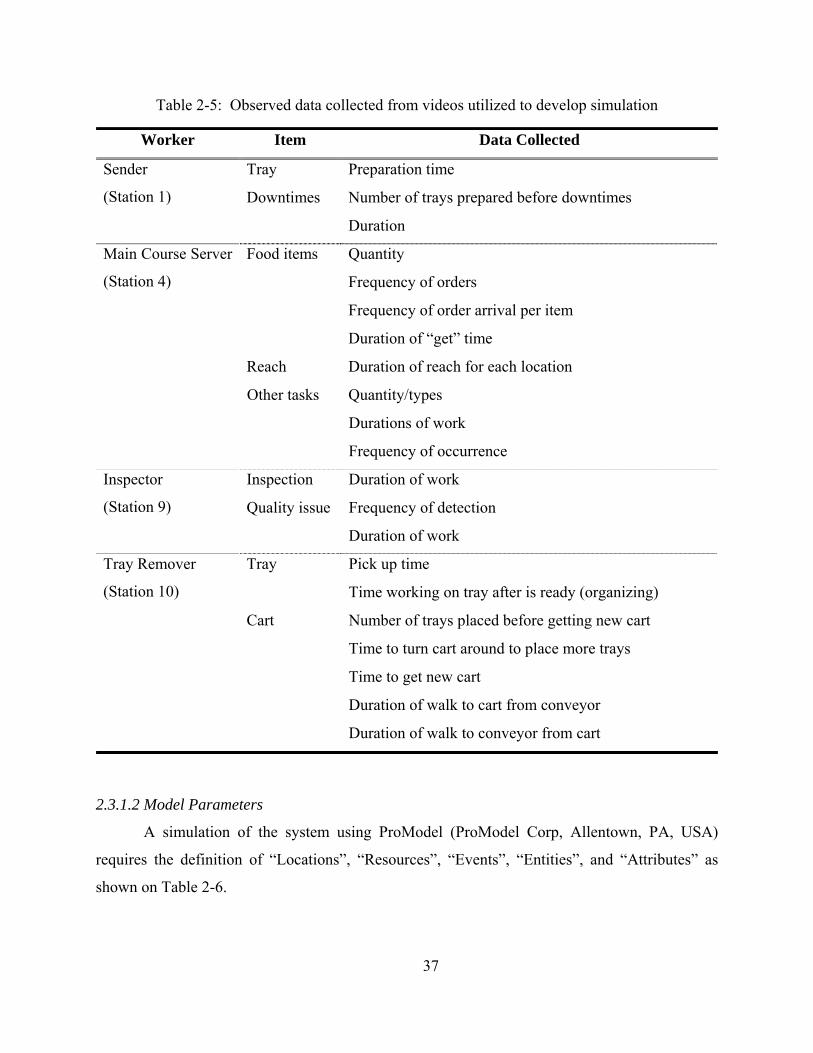
37
Table 2-5: Observed data collected from videos utilized to develop simulation
Worker Item Data Collected
Sender
(Station 1)
Tray Preparation time
Downtimes Number of trays prepared before downtimes
Duration
Main Course Server
(Station 4)
Food items Quantity
Frequency of orders
Frequency of order arrival per item
Duration of “get” time
Reach Duration of reach for each location
Other tasks Quantity/types
Durations of work
Frequency of occurrence
Inspector
(Station 9)
Inspection Duration of work
Quality issue Frequency of detection
Duration of work
Tray Remover
(Station 10)
Tray Pick up time
Time working on tray after is ready (organizing)
Cart Number of trays placed before getting new cart
Time to turn cart around to place more trays
Time to get new cart
Duration of walk to cart from conveyor
Duration of walk to conveyor from cart
2.3.1.2 Model Parameters
A simulation of the system using ProModel (ProModel Corp, Allentown, PA, USA)
requires the definition of “Locations”, “Resources”, “Events”, “Entities”, and “Attributes” as
shown on Table 2-6.
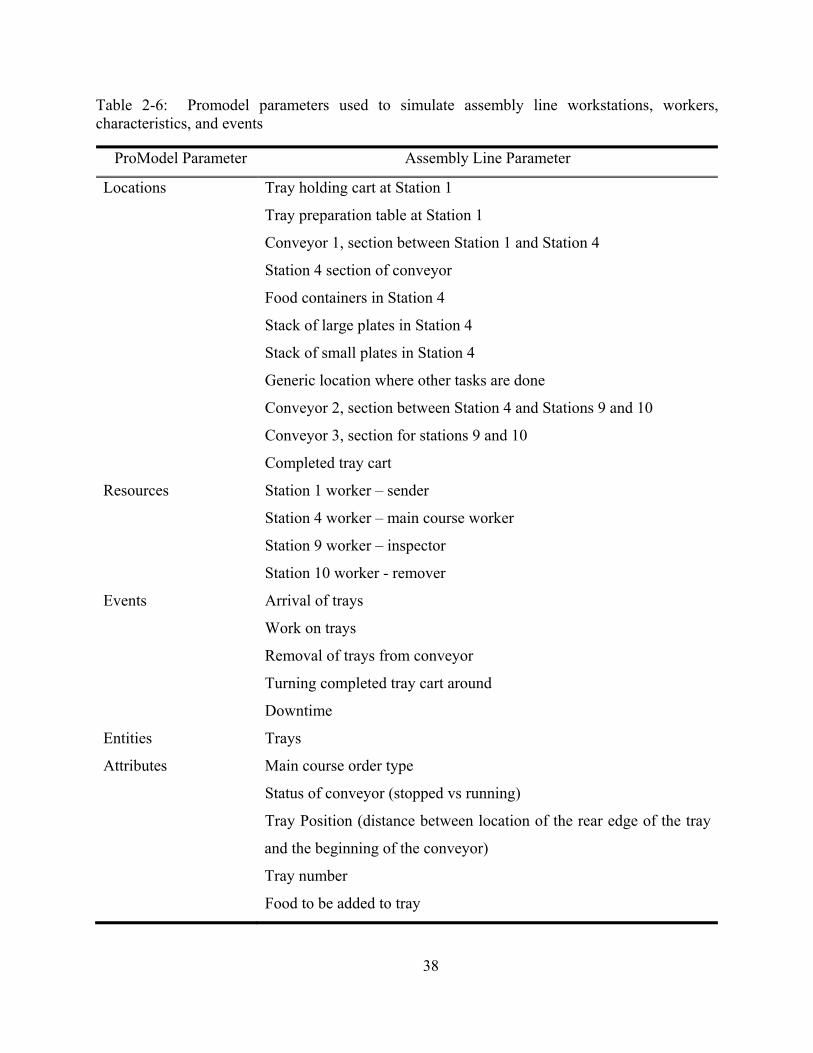
38
Table 2-6: Promodel parameters used to simulate assembly line workstations, workers, characteristics, and events
ProModel Parameter Assembly Line Parameter
Locations Tray holding cart at Station 1
Tray preparation table at Station 1
Conveyor 1, section between Station 1 and Station 4
Station 4 section of conveyor
Food containers in Station 4
Stack of large plates in Station 4
Stack of small plates in Station 4
Generic location where other tasks are done
Conveyor 2, section between Station 4 and Stations 9 and 10
Conveyor 3, section for stations 9 and 10
Completed tray cart
Resources Station 1 worker – sender
Station 4 worker – main course worker
Station 9 worker – inspector
Station 10 worker - remover
Events Arrival of trays
Work on trays
Removal of trays from conveyor
Turning completed tray cart around
Downtime
Entities Trays
Attributes Main course order type
Status of conveyor (stopped vs running)
Tray Position (distance between location of the rear edge of the tray
and the beginning of the conveyor)
Tray number
Food to be added to tray
39
2.3.1.3 Process Description
The simulation model used the tools described on Table 2-6 to describe the processing of
450 trays during a lunch period and gathered data regarding the work time of the main course
worker and the location along the conveyor of a tray when the “put” motion was completed. The
steps of the process were:
1. Trays were removed from the holding cart by the sender and placed on the tray
preparation table. Where the sender used them for a time with distribution Pearson 5 (
= 9.95, = 1.38).
2. Trays were placed on Conveyor 1 and moved 0.31mm every 0.001 min unless the
conveyor was stopped.
3. Tray arrived at Conveyor 2. Worker read order to determine what kind of food was
requested, reached a small or large plate depending on the food type, moved to the given
food container, got the food, and moved back to place the plate on the tray. Tray
continued to move on the conveyor at the same pace as in Conveyor 1. The time required
to reach for the food depended on the location along the conveyor where the previous
tray was completed and the location of the specific food on the cart. The time required to
move the food to the tray depended on the given food location on the cart and on the
location of the tray on the conveyor as the worker moved toward Conveyor 2.
4. Tray continued on Conveyor 2 until it reached the end of Conveyor 2.
5. Tray arrived at Conveyor 3 where it continued to move at the same pace unless the
conveyor was stopped.
6. Tray arrived at the inspector station. Inspector used the tray for a time with distribution
Pearson 5 ( = 4.99, = 1.04) when the tray was assembled correctly and Pearson 5 ( =
3.43, = 0.46) when there was a quality problem with it.
7. Tray remover used the tray for a time with distribution Beta ( = 1.33, = 8.95, lower
boundary = 0, upper boundary = 0.474) to remove the tray from the conveyor and placing
it on the tray cart. However, 50.6% of the time, the food items on the tray needed to be
organized. In those situations, the tray remover worked for an additional time with
distribution Gamma ( = 5.01, = 0.00365).
40
2.3.1.4 Validation
The simulation program was run for 450 trays and 20 replications. The number of
replications was chosen in order to have a confidence interval for the average work time with a
width of 0.01 min. A t-test was calculated to validate the average work time for the worker in 20
replications of the simulation vs. the total work time of the worker in the recorded video.
Additionally 2 population proportion tests were conducted to compare the frequency of
completing the work in each reach zone.
2.3.2 Results
2.3.2.1 Reach zones
The proportion of completing the work in each of the reach zones for the worker on
station 4 was calculated in the simulation (Figure 2-11). Validation results show the proportions
of completing the work in each of the reach zones were not statistically different (p > 0.01)
between the worker in the simulation and the observed worker (Behind +30 p = 0.93, Behind
p = 0.92, Front p = 0.58, Ahead 0.03, Ahead +30 p = 0.94).
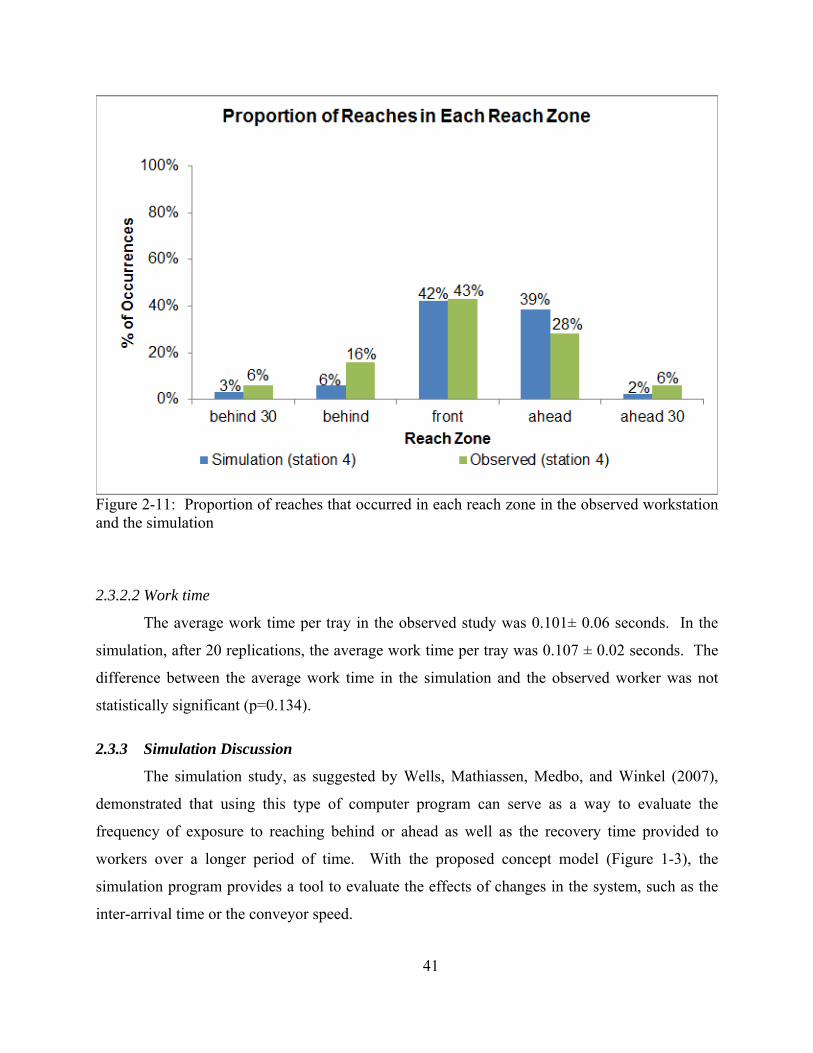
41
Figure 2-11: Proportion of reaches that occurred in each reach zone in the observed workstation and the simulation
2.3.2.2 Work time
The average work time per tray in the observed study was 0.101± 0.06 seconds. In the
simulation, after 20 replications, the average work time per tray was 0.107 ± 0.02 seconds. The
difference between the average work time in the simulation and the observed worker was not
statistically significant (p=0.134).
2.3.3 Simulation Discussion
The simulation study, as suggested by Wells, Mathiassen, Medbo, and Winkel (2007),
demonstrated that using this type of computer program can serve as a way to evaluate the
frequency of exposure to reaching behind or ahead as well as the recovery time provided to
workers over a longer period of time. With the proposed concept model (Figure 1-3), the
simulation program provides a tool to evaluate the effects of changes in the system, such as the
inter-arrival time or the conveyor speed.
42
2.4 Conclusion
In conclusion, the null hypothesis that work variations in assembly operations do not
affect the exposure to risk factors for musculoskeletal disorders can be rejected. The workstation
with the greatest amount of variation (8 products and 4 housekeeping tasks) had 89% less
recovery time and 57% greater reaching outside the reach envelope than the workstation with the
fewest variations (4 products, no additional tasks). Of the reaches outside the reach envelope,
21% were in the extreme reach zones and required the worker to bend and twist her torso. This
information can aid in the development of interventions to reduce worker’s exposure to
ergonomic stresses. It shows the importance of providing sufficient time for each job variation
and for all workers to complete their job every time to reduce reaching and provide time for
recovery. In this particular case, providing sufficient time for all workers in every cycle would
allow the workers in the inspection and removal station (stations 9 and 10, respectively) to
complete their jobs without the conveyor stopping, which in turn allows for a more constant
inter-arrival rate of the trays. Allowing sufficient time for the worker in station 4 to complete all
the assigned tasks and having a constant inter-arrival time would, in turn, reduce reaching and
provide recovery time during each work cycle. However, when the time allowed for a given task
is larger than the time needed and the worker is allowed to reach ahead, the benefits of reduced
reaching and improved recovery may be lost if the workers chooses to reach ahead instead of
waiting.
The discrete event simulation program created proved to be a good tool to model
exposure to risk factors of WMSDs such as reaching and recovery time. It may serve as a tool
for testing new assembly line parameters or for evaluating changes to the existing system.
2.5 References
Bernard, B. A Critical Review of Epidemiologic Evidence for Work-related Musculoskeletal Disorders of the Neck, Upper Extremity, and Low Back. NIOSH Publication No. 97-141: Musculoskeletal Disorders and Workplace Factors. 1997.
Bureau of Labor and Statistics. The Employment Situation – November 2015. USDL-15-2292. Released 12/4/2015. http://www.bls.gov/news.release/pdf/empsit.pdf
Bureau of Labor and Statistics. Nonfatal Occupational Injuries and Illnesses Requiring Days Away From Work, 2014. USDL-15-2205. Released 11/19/2015. http://www.bls.gov/news.release/pdf/osh2.pdf
43
Falck, A., Ӧrtengren, R., Högberg, D. (2010). The impact of poor assembly ergonomics on product quality: A cost-benefit analysis in car manufacturing. Human Factors and Ergonomics in Manufacturing and Service Industries, 20 (1), 24–41.
McAtammney, L., Corlett, E. (1983). RULA: a survey method for the investigation of work-related upper limb disorders. Applied Ergonomics. 24 (2), 91-99
National Research Council. Work-related musculoskeletal disorders: A review of evidence. National Academy Press, Washington D. C. 1998.
National Research Council, The Institute of Medicine. Musculoskeletal disorders and the workplace: Low back and upper extremities. National Academy Press, Washington, DC. 2001.
Niebel, B., Freivalds, A. Methods, Standards, and Work Design. Mc Graw Hill. 11th edition. 2003: 373-403.
Oğuzhan, E., Yeow, P. (2011). Proving external validity of ergonomics and quality relationship through review of real-world case studies. International Journal of Production Research. 49 (4), 949-962
Punnett, L., Wegman, D. Work-related musculoskeletal disorders: the epidemiologic evidence and the debate. Journal of Electromyography and Kinesiology. No. 14. 2004: 13-23.
Wells, R., Mathiassen, S., Medbo, L., Winkel, J. (2007). Time – A key issue for musculoskeletal health and manufacturing. Applied Ergonomics. 38, 733-744
44 This chapter was submitted for publication to Ergonomics in January 28, 2016.
CHAPTER 3
EFFECT OF CYCLE TO CYCLE TASK VARIATIONS IN MIXED-
MODEL ASSEMBLY LINES ON WORKERS’ UPPER BODY EXERTIONS
AND RECOVERY TIME: A SIMULATED ASSEMBLY STUDY
3.1 Introduction
3.1.1 Aims
The aim of this study is to develop knowledge about how task variations associated with
mixed-model assembly lines (MMAL) affect workers and tools for conveyor design and
production sequencing. Such knowledge will be of direct benefit to manufacturers and workers.
Towards this end, we tested the hypothesis that conveyor type and product mix and sequence
affect the loads on the upper extremity and lower back joints by requiring workers to assume
awkward postures and lead to reduced recovery time. Presumably, this work enables employers
to achieve the flexibility of MMAL without overloading the workers.
3.1.2 Background
In 2012, there were more than 22,000 reported cases of manufacturing workers with
injuries related to overexertion and repetitive motions serious enough to require a median of 9
days away from work (Bureau of Labor and Statistics, 2013). Using their hands to manipulate
tools and/or other equipment to place, join, or form components that become part of a final
product frequently exposes them to risk factors of musculoskeletal disorders: repetition, force
exertion, poor posture, and insufficient recovery time (Bernard, 1997; NRC, 1998, 2001). The
exposures to these risk factors can be influenced by the tools, equipment, and pacing of the
assembly lines.
45
MMAL are used to produce customized versions of one product or even different
products. They enable companies to use resources more efficiently and respond quicker to shifts
in customer demand. It is important for manufacturers to understand the effects of the cycle to
cycle variation on the workers to achieve the desired productivity and quality targets (Johnson,
2005) so most of the past research focuses on developing methods to achieve these targets.
Algorithms for determining the best sequence of assembly steps (precedence graphs), and
throughput analysis models have been created to improve the efficiency of MMAL and improve
quality and productivity (Hyun, Kim, Kim, 1998; Boysen, Fliedner, Scholl, 2009; Wang, Hu,
2001). Zhu, Hu, and Koren (2008) proposed an operator choice complexity model. It provides
guidelines for managing the complexity of a MMAL by quantifying the probability of the
operator choosing the correct materials, tools, and process given a number of possible choices.
These studies address productivity and work quality but do not address workers’ exposures to
risk factors of WMSDs.
The Operational Complexity Coefficient, proposed by ElMaraghy, Urbanic, 2004,
integrates manufacturing requirements with human needs and capabilities. It provides a single
measure of the complexity of the system by scoring the physical and cognitive demands of each
task according to a relative effort scale where 0 represents low effort and 1 represents high effort.
This method allows for a comparison of the effort required at different workstations or before
and after changes at an individual workstation. Line balancing algorithms and heuristics that
incorporate the magnitude and frequency of exertion in the calculation to determine the amount
of time required by each workstation with the purpose of reducing ergonomic risks have been
described by Otto, Scholl, 2011; Carnahan, Norman, Redfern, 2001. Battini, Faccio, Persona,
and Sgarbossa (2001) proposed a framework that considers worker stresses (both physical and
psychosocial) and safety, market demand, assembly processes, availability of space, and others
into the assembly line design. These studies do not consider the effect of cycle to cycle task
variations on workers exposure to WMSD risk factors and what assembly line parameters can be
manipulated to reduced adverse effects.
In Chapter 2, the effect of task variations on a MMAL on work cycle time, worker
recovery time, and reaching was examined. A workstation with a mix of 8 products arriving in
random sequence plus 4 housekeeping tasks were found to require greater average cycle time
(6.4 sec, s.d. 3.4 sec) to get and transport materials than one with only 3 products and no
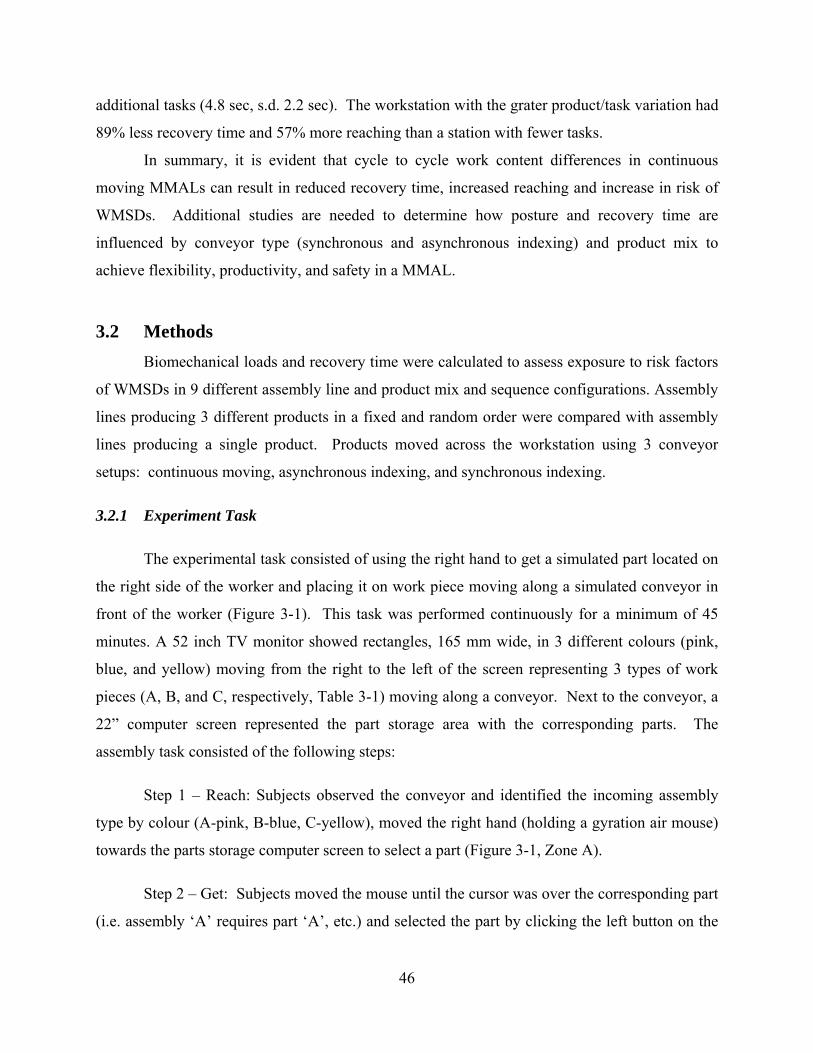
46
additional tasks (4.8 sec, s.d. 2.2 sec). The workstation with the grater product/task variation had
89% less recovery time and 57% more reaching than a station with fewer tasks.
In summary, it is evident that cycle to cycle work content differences in continuous
moving MMALs can result in reduced recovery time, increased reaching and increase in risk of
WMSDs. Additional studies are needed to determine how posture and recovery time are
influenced by conveyor type (synchronous and asynchronous indexing) and product mix to
achieve flexibility, productivity, and safety in a MMAL.
3.2 Methods
Biomechanical loads and recovery time were calculated to assess exposure to risk factors
of WMSDs in 9 different assembly line and product mix and sequence configurations. Assembly
lines producing 3 different products in a fixed and random order were compared with assembly
lines producing a single product. Products moved across the workstation using 3 conveyor
setups: continuous moving, asynchronous indexing, and synchronous indexing.
3.2.1 Experiment Task
The experimental task consisted of using the right hand to get a simulated part located on
the right side of the worker and placing it on work piece moving along a simulated conveyor in
front of the worker (Figure 3-1). This task was performed continuously for a minimum of 45
minutes. A 52 inch TV monitor showed rectangles, 165 mm wide, in 3 different colours (pink,
blue, and yellow) moving from the right to the left of the screen representing 3 types of work
pieces (A, B, and C, respectively, Table 3-1) moving along a conveyor. Next to the conveyor, a
22” computer screen represented the part storage area with the corresponding parts. The
assembly task consisted of the following steps:
Step 1 – Reach: Subjects observed the conveyor and identified the incoming assembly
type by colour (A-pink, B-blue, C-yellow), moved the right hand (holding a gyration air mouse)
towards the parts storage computer screen to select a part (Figure 3-1, Zone A).
Step 2 – Get: Subjects moved the mouse until the cursor was over the corresponding part
(i.e. assembly ‘A’ requires part ‘A’, etc.) and selected the part by clicking the left button on the
47
mouse. To complete the get step, subjects pressed a force plate down with their fingers until the
gauge on the computer screen was in the green zone (indicating the correct amount of force was
exerted to gain control of the part, Table 3-1) while the part button displayed a ‘Hold’ message.
The force was exerted until the display message changed to ‘OK’. This concluded the get task.
This step was conducted in Zone A on Figure 3-1.
Step 3 – Move and Put: This step required the subject to move the right hand, holding a
gyration air mouse, towards the assembly line and click the left button on the mouse when the
cursor was above the desired assembly (on any part of the rectangle). At that point, the assembly
task was completed. For this step, the hand had to be positioned along Zone B on Figure 3-1.
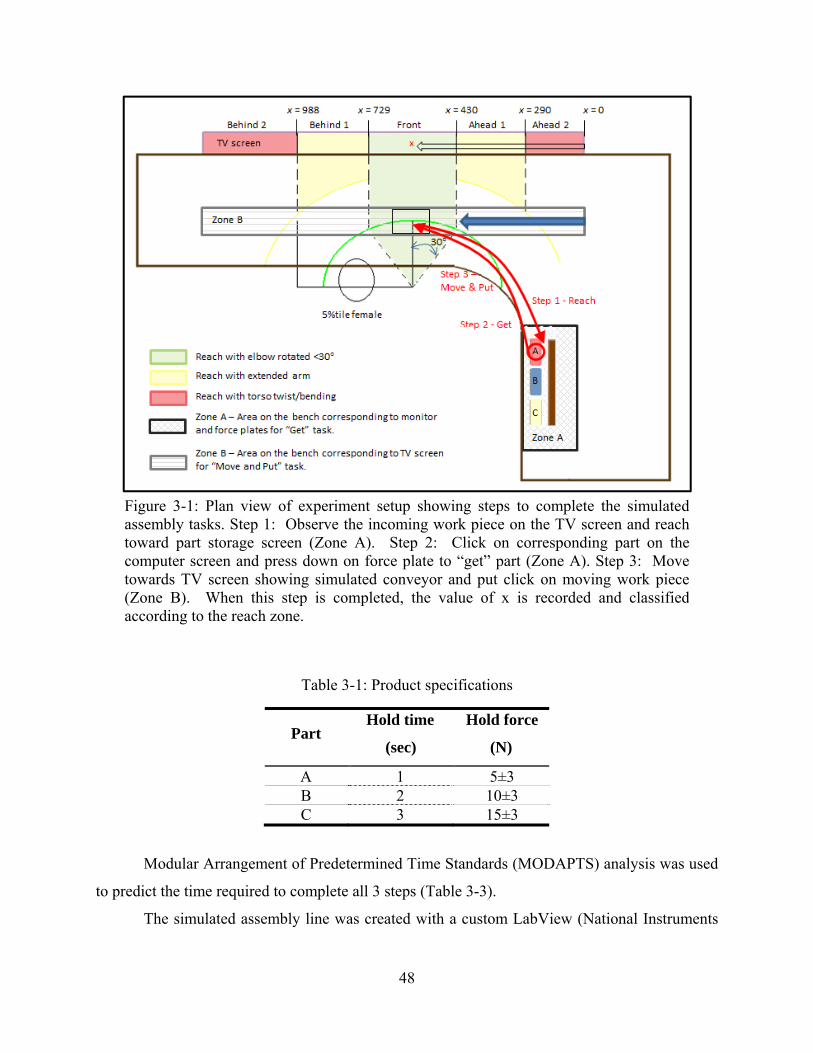
48
Table 3-1: Product specifications
Part Hold time
(sec)
Hold force
(N)
A 1 5±3 B 2 10±3 C 3 15±3
Modular Arrangement of Predetermined Time Standards (MODAPTS) analysis was used
to predict the time required to complete all 3 steps (Table 3-3).
The simulated assembly line was created with a custom LabView (National Instruments
Figure 3-1: Plan view of experiment setup showing steps to complete the simulatedassembly tasks. Step 1: Observe the incoming work piece on the TV screen and reachtoward part storage screen (Zone A). Step 2: Click on corresponding part on thecomputer screen and press down on force plate to “get” part (Zone A). Step 3: Movetowards TV screen showing simulated conveyor and put click on moving work piece(Zone B). When this step is completed, the value of x is recorded and classifiedaccording to the reach zone.
49
2010, Austin, TX, USA) script that displayed the conveyor and part storage in two separate
monitors (Figure 3-1). It also included a force transducer where the subject pressed down to
exert the specified force. A Gyration Air Mouse Elite was used by the subject to click on the
screens when performing the simulated assembly tasks. The mouse was fitted with a reflecting
ball that was tracked by a Logitec Pro-9000 Webcam (model V-U0009, resolution 640x360)
connected to the computer using the same script that ran the conveyor. The webcam was
mounted overhead to provide a viewing field of the entire workstation. Using a camera to track
the mouse allowed the cursor to move on the screens at a 1:1 ratio with the hand (e.g. if the hand
moved 1cm to the right, the cursor on the screen moved 1cm to the right).
3.2.2 Experiment Design
3.2.2.1 Participants
The protocol was approved by the Institutional Review Board of the University of
Michigan. A total of 12 subjects participated (5 females and 7 males) in this study. The mean age
was 22.4 yrs (s.d.=2.6 yrs), mean height 174.5 cm (s.d.=5.9 cm), and mean mass 71.0 kg
(s.d.=11.4 kg). Subjects were asked to sign consent forms agreeing to voluntarily participate in
the study and to be video recorded while performing the tasks. No history of MSDs of the right
arm, neck, or back was reported by the subjects.
3.2.2.2 Independent variables
A 2-way layout experiment (treatments: conveyor type, product mix/sequence) with 3 levels was
conducted. The details of conveyor and product settings are shown on Table 2. In the case of a
mixed-model assembly line (i.e. assembly line with multiple products to be assembled), the
product mix was held constant (50% part A, 30% part B, and 20% part C) and the sequence
varied, either fixed or random.
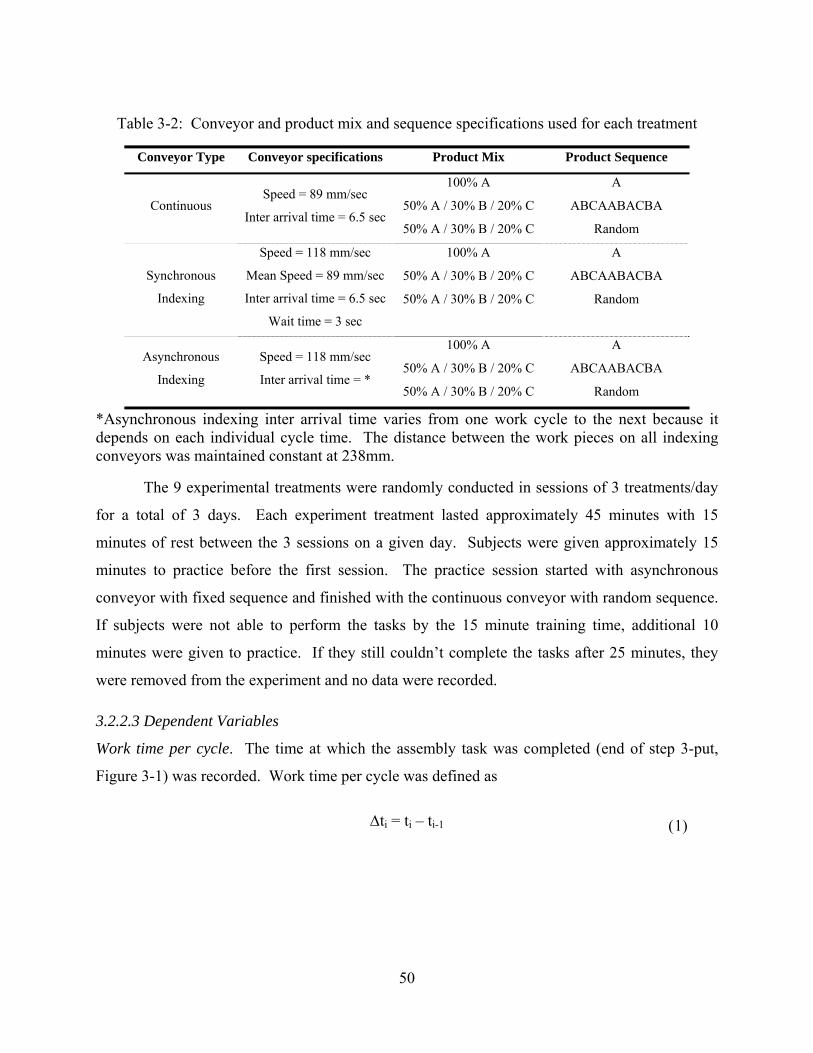
50
Table 3-2: Conveyor and product mix and sequence specifications used for each treatment
Conveyor Type Conveyor specifications Product Mix Product Sequence
Continuous Speed = 89 mm/sec
Inter arrival time = 6.5 sec
100% A A
50% A / 30% B / 20% C ABCAABACBA
50% A / 30% B / 20% C Random
Synchronous
Indexing
Speed = 118 mm/sec
Mean Speed = 89 mm/sec
Inter arrival time = 6.5 sec
Wait time = 3 sec
100% A A
50% A / 30% B / 20% C ABCAABACBA
50% A / 30% B / 20% C Random
Asynchronous
Indexing
Speed = 118 mm/sec
Inter arrival time = *
100% A A
50% A / 30% B / 20% C ABCAABACBA
50% A / 30% B / 20% C Random
*Asynchronous indexing inter arrival time varies from one work cycle to the next because it depends on each individual cycle time. The distance between the work pieces on all indexing conveyors was maintained constant at 238mm.
The 9 experimental treatments were randomly conducted in sessions of 3 treatments/day
for a total of 3 days. Each experiment treatment lasted approximately 45 minutes with 15
minutes of rest between the 3 sessions on a given day. Subjects were given approximately 15
minutes to practice before the first session. The practice session started with asynchronous
conveyor with fixed sequence and finished with the continuous conveyor with random sequence.
If subjects were not able to perform the tasks by the 15 minute training time, additional 10
minutes were given to practice. If they still couldn’t complete the tasks after 25 minutes, they
were removed from the experiment and no data were recorded.
3.2.2.3 Dependent Variables
Work time per cycle. The time at which the assembly task was completed (end of step 3-put,
Figure 3-1) was recorded. Work time per cycle was defined as
ti = ti – ti-1 1
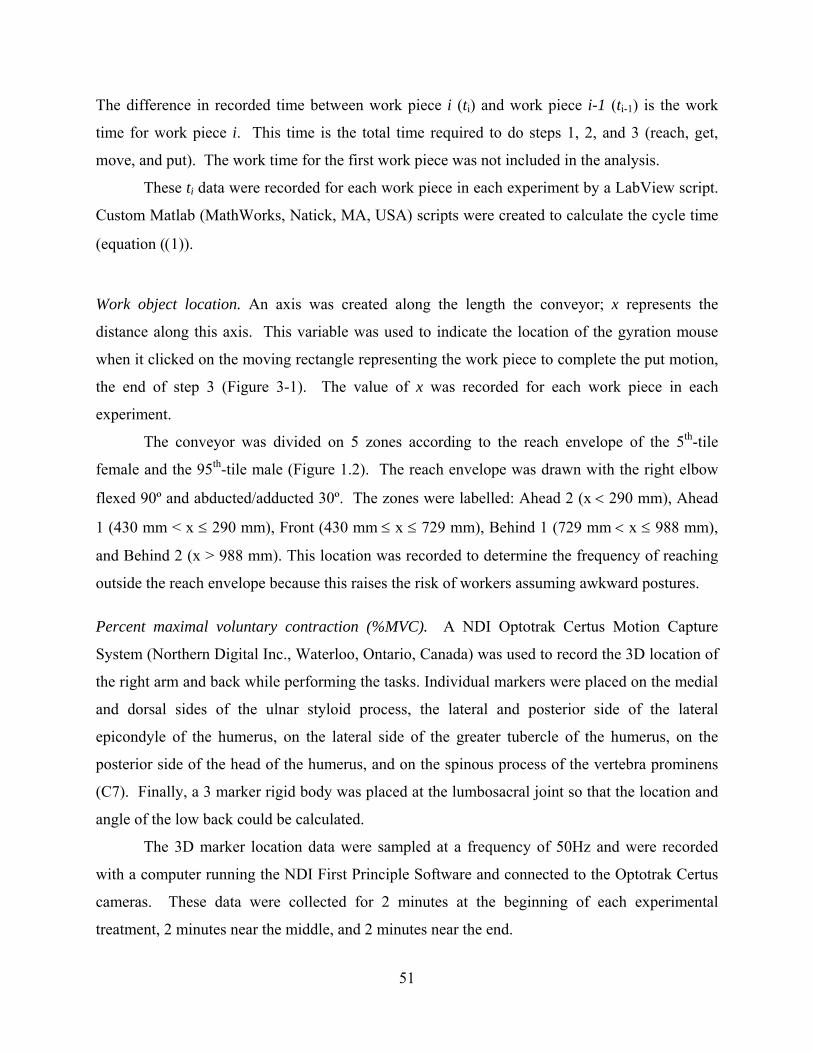
51
The difference in recorded time between work piece i (ti) and work piece i-1 (ti-1) is the work
time for work piece i. This time is the total time required to do steps 1, 2, and 3 (reach, get,
move, and put). The work time for the first work piece was not included in the analysis.
These ti data were recorded for each work piece in each experiment by a LabView script.
Custom Matlab (MathWorks, Natick, MA, USA) scripts were created to calculate the cycle time
(equation (1)).
Work object location. An axis was created along the length the conveyor; x represents the
distance along this axis. This variable was used to indicate the location of the gyration mouse
when it clicked on the moving rectangle representing the work piece to complete the put motion,
the end of step 3 (Figure 3-1). The value of x was recorded for each work piece in each
experiment.
The conveyor was divided on 5 zones according to the reach envelope of the 5th-tile
female and the 95th-tile male (Figure 1.2). The reach envelope was drawn with the right elbow
flexed 90º and abducted/adducted 30º. The zones were labelled: Ahead 2 (x 290 mm), Ahead
1 (430 mm < x 290 mm), Front (430 mm x 729 mm), Behind 1 (729 mm x 988 mm),
and Behind 2 (x > 988 mm). This location was recorded to determine the frequency of reaching
outside the reach envelope because this raises the risk of workers assuming awkward postures.
Percent maximal voluntary contraction (%MVC). A NDI Optotrak Certus Motion Capture
System (Northern Digital Inc., Waterloo, Ontario, Canada) was used to record the 3D location of
the right arm and back while performing the tasks. Individual markers were placed on the medial
and dorsal sides of the ulnar styloid process, the lateral and posterior side of the lateral
epicondyle of the humerus, on the lateral side of the greater tubercle of the humerus, on the
posterior side of the head of the humerus, and on the spinous process of the vertebra prominens
(C7). Finally, a 3 marker rigid body was placed at the lumbosacral joint so that the location and
angle of the low back could be calculated.
The 3D marker location data were sampled at a frequency of 50Hz and were recorded
with a computer running the NDI First Principle Software and connected to the Optotrak Certus
cameras. These data were collected for 2 minutes at the beginning of each experimental
treatment, 2 minutes near the middle, and 2 minutes near the end.
52
Two markers were used assuming there was no relative motion between them so that,
when data for one marker were missing, the joint location data could be estimated using the data
for the other marker. In cases where data for both markers were missing, splines were created
and used for interpolation to estimate the missing data. Recordings were eliminated from the
analysis of more than 0.5 seconds were missing for both markers at a joint.
Custom Matlab scripts were used to determine the angles to describe the posture of the
right arm and the back. The angular speed was calculated by taking the derivative of the splines
describing the change of the joint angles for the lower arm and upper arm with respect to time.
The 3D motion tracking system recorded the marker location data for an average of 54
work cycles per subject per assembly line configuration. These data were used to create a hand
location map for the full work cycles and for each of the steps. Figure 3-2 shows the hand
location map created for the continuous moving single assembly line. The location of the hand
during the put motion, the end of step 3, was determined using the 3D location data of the wrist
based on the instantaneous speed, location on the conveyor, and direction of movement. These
locations are shown in the hand location maps in Figure 3-3. The put motions are marked as ‘x’
over the maps. The ‘x’ marks over the white background indicate the location of the L5/S1 joint
corresponding to the hand ‘x’ marks.
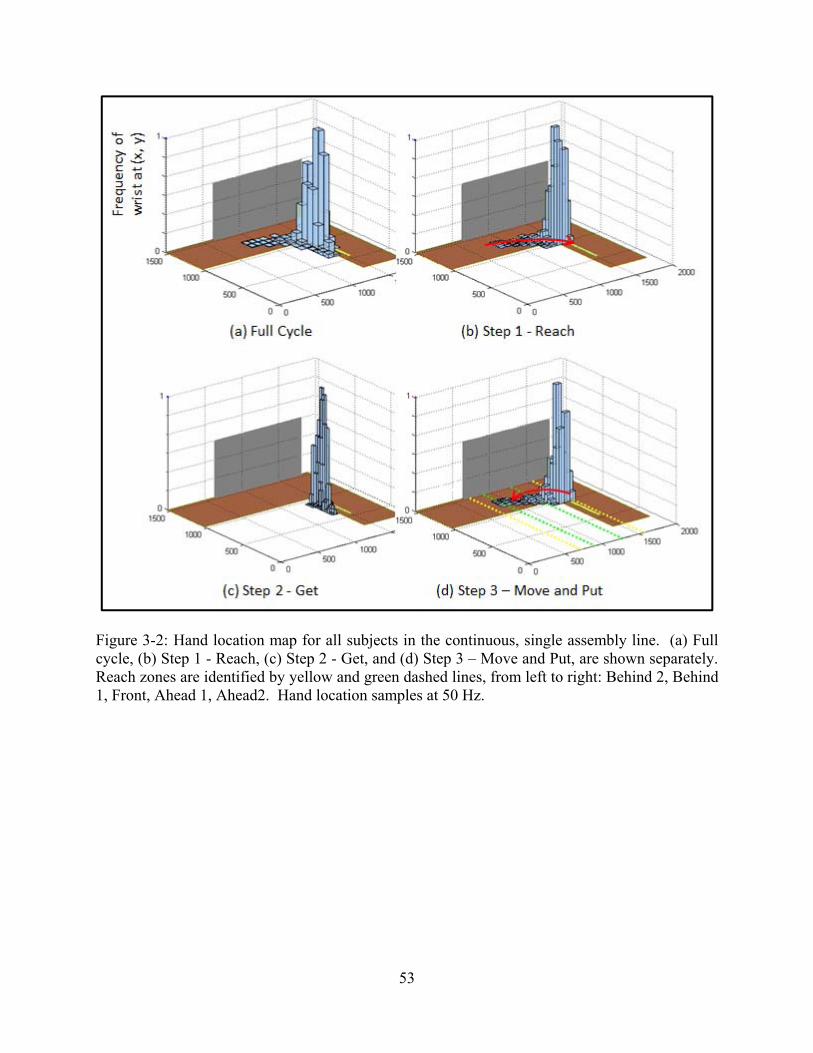
53
Figure 3-2: Hand location map for all subjects in the continuous, single assembly line. (a) Full cycle, (b) Step 1 - Reach, (c) Step 2 - Get, and (d) Step 3 – Move and Put, are shown separately. Reach zones are identified by yellow and green dashed lines, from left to right: Behind 2, Behind 1, Front, Ahead 1, Ahead2. Hand location samples at 50 Hz.
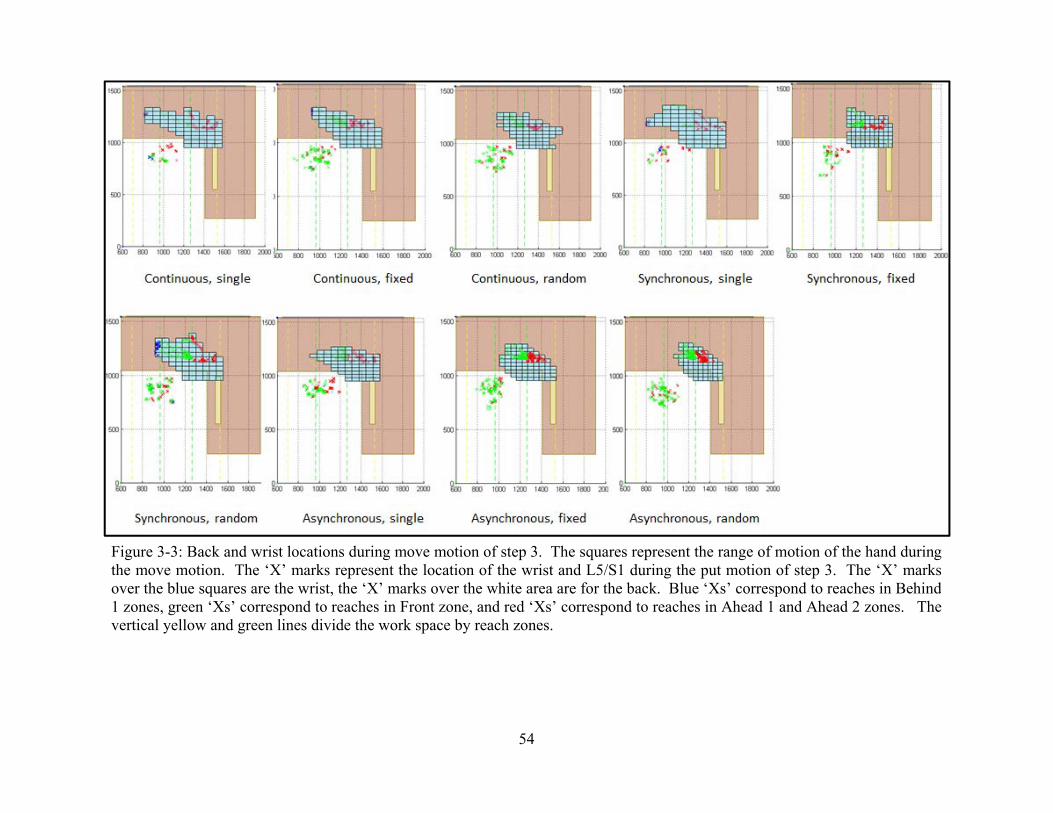
54
Figure 3-3: Back and wrist locations during move motion of step 3. The squares represent the range of motion of the hand duringthe move motion. The ‘X’ marks represent the location of the wrist and L5/S1 during the put motion of step 3. The ‘X’ marksover the blue squares are the wrist, the ‘X’ marks over the white area are for the back. Blue ‘Xs’ correspond to reaches in Behind1 zones, green ‘Xs’ correspond to reaches in Front zone, and red ‘Xs’ correspond to reaches in Ahead 1 and Ahead 2 zones. Thevertical yellow and green lines divide the work space by reach zones.
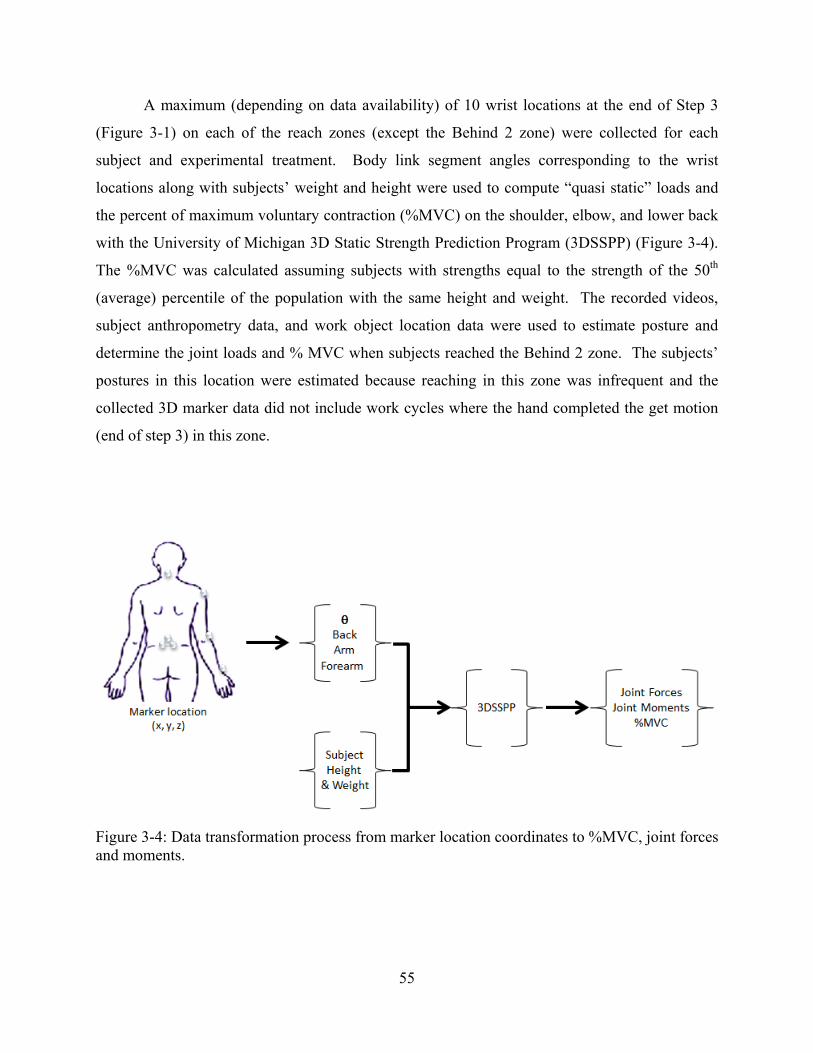
55
A maximum (depending on data availability) of 10 wrist locations at the end of Step 3
(Figure 3-1) on each of the reach zones (except the Behind 2 zone) were collected for each
subject and experimental treatment. Body link segment angles corresponding to the wrist
locations along with subjects’ weight and height were used to compute “quasi static” loads and
the percent of maximum voluntary contraction (%MVC) on the shoulder, elbow, and lower back
with the University of Michigan 3D Static Strength Prediction Program (3DSSPP) (Figure 3-4).
The %MVC was calculated assuming subjects with strengths equal to the strength of the 50th
(average) percentile of the population with the same height and weight. The recorded videos,
subject anthropometry data, and work object location data were used to estimate posture and
determine the joint loads and % MVC when subjects reached the Behind 2 zone. The subjects’
postures in this location were estimated because reaching in this zone was infrequent and the
collected 3D marker data did not include work cycles where the hand completed the get motion
(end of step 3) in this zone.
Figure 3-4: Data transformation process from marker location coordinates to %MVC, joint forcesand moments.
56
Recovery Time. Two types of recovery types were calculated: observed recovery time, and idle
time. The observed recovery time was defined as the percentage of time subjects’ wrists,
elbows, and shoulders were at rest and the hand was placed at the top of the table. This time was
determined using the recorded marker location data. The calculation used the time the wrist was
stationary (i.e. angular speed less than 1º/sec (Szeto, Cheng, Poon, Ting, Tsang, Ho, 2012;
Arvidsson, Hansson, Mathiassen, Skerfving, 2008)) and the wrist coordinates were less than 50
mm above the top of the table and away from the force plates (zone A, Figure 3-1).
The idle time was time available for recovery while subjects waited for the work pieces
but not necessarily used for recovery. It was calculated by conducting a time study with the
video recordings of the subjects. Random video segments of 2 minutes per participant were
analysed to determine the amount of idle time. It was defined as time when the hands were
moving but not actively doing a reach or move motion or being held in a position waiting for the
work piece to arrive on that location.
3.2.3 Statistical Analysis
The significant effect of conveyor type and product mix/sequence on cycle time was
evaluated using a 2 way layout analysis of variance (ANOVA). The significant effect of the
different conveyor and product configurations on the %MVC utilized and the work object
location were evaluated using Bonferroni confidence intervals. These were calculated for the
multi-level comparisons of these variables. Significance was determined based on = 0.05.
Confidence intervals for the proportion difference of 2 populations were constructed to do multi-
level comparisons of the recovery time and idle time.
3.3 Results
The following results are for all 9 conveyor and product mix/sequence configurations.
The observed work time per cycle, the work object location, the idle time, and the recovery time
are shown on Figure 3-3. The joint markers and 3DSSPP were used to calculate the %MVC,
they are shown on Figure 3-4.
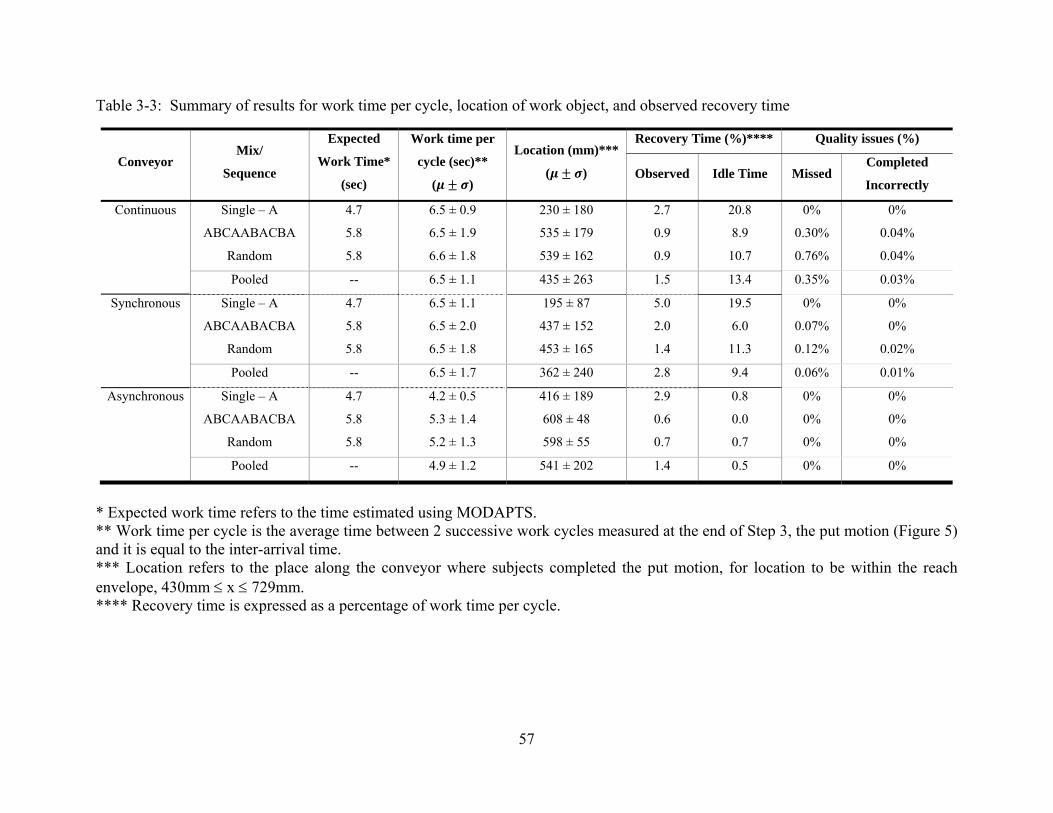
57
Table 3-3: Summary of results for work time per cycle, location of work object, and observed recovery time
Conveyor Mix/
Sequence
Expected
Work Time*
(sec)
Work time per
cycle (sec)**
( )
Location (mm)***
( )
Recovery Time (%)**** Quality issues (%)
Observed Idle Time Missed Completed
Incorrectly
Continuous Single – A 4.7 6.5 ± 0.9 230 ± 180 2.7 20.8 0% 0%
ABCAABACBA 5.8 6.5 ± 1.9 535 ± 179 0.9 8.9 0.30% 0.04%
Random 5.8 6.6 ± 1.8 539 ± 162 0.9 10.7 0.76% 0.04%
Pooled -- 6.5 ± 1.1 435 ± 263 1.5 13.4 0.35% 0.03%
Synchronous Single – A 4.7 6.5 ± 1.1 195 ± 87 5.0 19.5 0% 0%
ABCAABACBA 5.8 6.5 ± 2.0 437 ± 152 2.0 6.0 0.07% 0%
Random 5.8 6.5 ± 1.8 453 ± 165 1.4 11.3 0.12% 0.02%
Pooled -- 6.5 ± 1.7 362 ± 240 2.8 9.4 0.06% 0.01%
Asynchronous Single – A 4.7 4.2 ± 0.5 416 ± 189 2.9 0.8 0% 0%
ABCAABACBA 5.8 5.3 ± 1.4 608 ± 48 0.6 0.0 0% 0%
Random 5.8 5.2 ± 1.3 598 ± 55 0.7 0.7 0% 0%
Pooled -- 4.9 ± 1.2 541 ± 202 1.4 0.5 0% 0%
* Expected work time refers to the time estimated using MODAPTS. ** Work time per cycle is the average time between 2 successive work cycles measured at the end of Step 3, the put motion (Figure 5) and it is equal to the inter-arrival time. *** Location refers to the place along the conveyor where subjects completed the put motion, for location to be within the reach envelope, 430mm x 729mm. **** Recovery time is expressed as a percentage of work time per cycle.
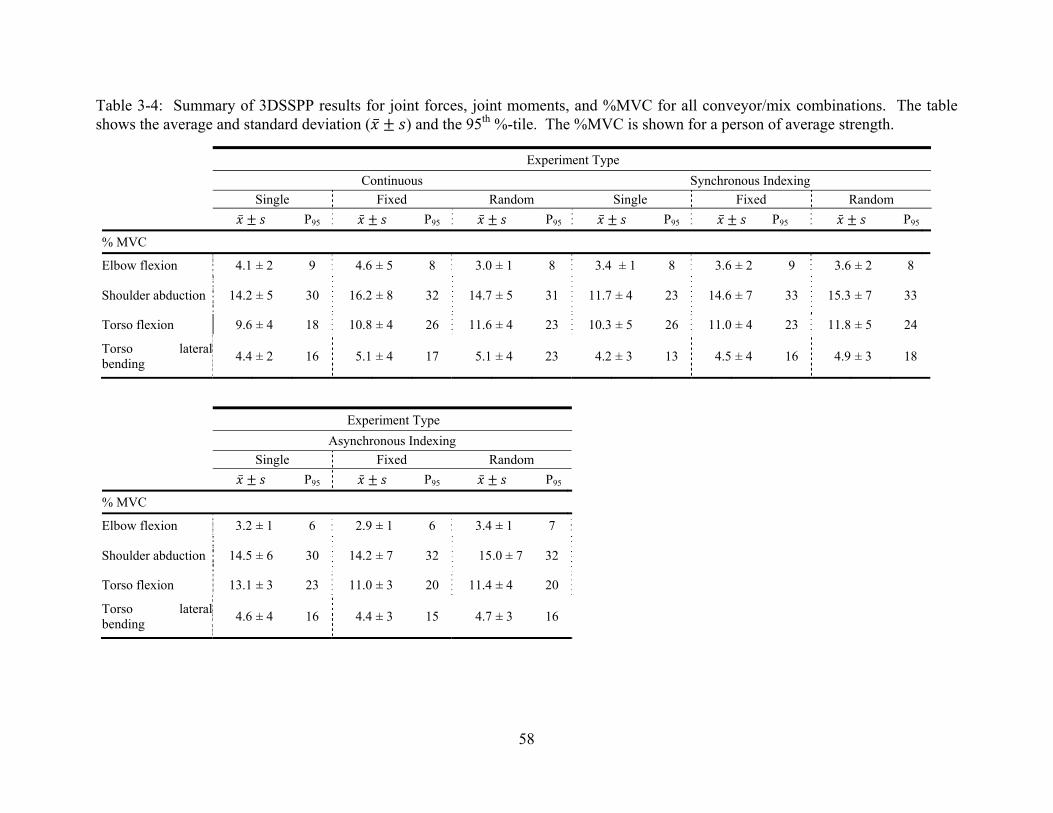
58
Table 3-4: Summary of 3DSSPP results for joint forces, joint moments, and %MVC for all conveyor/mix combinations. The table shows the average and standard deviation ( ) and the 95th %-tile. The %MVC is shown for a person of average strength.
Experiment Type Continuous Synchronous Indexing
Single Fixed Random Single Fixed Random P95 P95 P95 P95 P95 P95
% MVC
Elbow flexion 4.1 ± 2 9 4.6 ± 5 8 3.0 ± 1 8 3.4 ± 1 8 3.6 ± 2 9 3.6 ± 2 8
Shoulder abduction 14.2 ± 5 30 16.2 ± 8 32 14.7 ± 5 31 11.7 ± 4 23 14.6 ± 7 33 15.3 ± 7 33
Torso flexion 9.6 ± 4 18 10.8 ± 4 26 11.6 ± 4 23 10.3 ± 5 26 11.0 ± 4 23 11.8 ± 5 24
Torso lateral bending 4.4 ± 2 16 5.1 ± 4 17 5.1 ± 4 23 4.2 ± 3 13 4.5 ± 4 16 4.9 ± 3 18
Experiment Type Asynchronous Indexing
Single Fixed Random P95 P95 P95
% MVC
Elbow flexion 3.2 ± 1 6 2.9 ± 1 6 3.4 ± 1 7
Shoulder abduction 14.5 ± 6 30 14.2 ± 7 32 15.0 ± 7 32
Torso flexion 13.1 ± 3 23 11.0 ± 3 20 11.4 ± 4 20
Torso lateral bending 4.6 ± 4 16 4.4 ± 3 15 4.7 ± 3 16
59
3.3.1 Work time per cycle.
The average observed work time per cycle for all the paced conveyors, except the
continuous moving MMAL with random sequence, was 6.5 seconds, the same as the inter-arrival
time (Table 3-3). The average observed work time per cycle for the continuous moving
assembly line was 6.6 sec ± 1.8 sec. This conveyor had a higher average work time per cycle
than the inter-arrival time because it had the highest percentage of missed work pieces (0.7%).
Occasionally, subjects were not able to complete the assembly task before the part left the
conveyor. When that occurred, they had to return to Zone A (Figure 3-1) to get the next part and
continue working. The work time for that cycle was measured from the time the previous
assembly task was completed, resulting in a higher work time for that cycle.
The average cycle time per cycle was the least in the single model asynchronous indexing
conveyor (4.2 sec ± 0.5 sec) (Table 3-3). Using MODAPTS, the expected cycle time of a single
model assembly line was 4.8 sec. The mean work time per cycle in the asynchronous indexing
assembly line was significantly different between the single line (4.2 sec ± 1.3 sec) and the
MMALs (synchronous indexing - 5.3sec ± 1.4sec, asynchronous indexing - 5.2 sec ± 1.3 sec) (p
< 0.01). No significant difference was found between the fixed sequence and random sequence
asynchronous indexing assembly lines (p > 0.01).
3.3.2 Recovery Time – Observed and Idle Time
The synchronous indexing single product assembly line had the greatest amount of
observed recovery time (5.0%), Table 3-3. The continuous moving and asynchronous moving
MMAL (both fixed and random sequence) had the least amount of observed recovery time,
between 0.6% and 0.9% and were statistically different from each other (p <0.01).
The observed work time (Table 3-3) in the paced assembly lines, 6.5 seconds, is greater
than the expected work time per cycle, 4.7 seconds for the single lines and 5.8 seconds for the
MMALs. This difference should have provided time for recovery in each work cycle but much
less recovery time was observed, an average of 1.9% for all conditions. Subjects frequently had
idle time that could have been used for recovery. However, instead of resting their hands, they
held their hands up in waiting position or moved them around the screen while they waited for
60
the next work piece to appear on the screen. The continuous moving and the synchronous
indexing single assembly lines had the most idle time, 20.8% and 19.5%, respectively and were
not statistically different from each other (p=0.4). The least amount of idle time was found in the
asynchronous indexing lines. It was 0.8%, 0.0%, and 0.7% for the single line, MMAL with fixed
sequence, and MMAL with random sequence, respectively. The synchronous indexing with
fixed sequence was statistically different to the synchronous indexing single model and random
sequence lines (p>0.01).
3.3.3 Work Object Location
Subjects performing the assembly of a single product reached the Ahead 2 zone to
complete the task most frequently. Work cycles were completed in the Ahead 2 zone 34%, 38%,
and 17% of the time on the continuous moving, synchronous indexing, and asynchronous
indexing, respectively (Figure 3-5). When comparing the pooled results for each conveyor type,
the paced conveyors (continuous and synchronous indexing) had the greatest reaches to the
Ahead 2 zone, 12% each. The work was completed in this zone less frequently when the
subjects were doing the task in MMAL. Subjects reached the Ahead 2 zone 2% and 0.1% of the
time on the fixed and random sequence continuous moving conveyors, respectively. On the
synchronous indexing MMAL, subjects reached this zone 0.1% and 0.02% of the time in the
fixed and random sequence, respectively. The Ahead 2 zone was not reached on the
asynchronous indexing MMALs.
The Ahead 1 zone (Figure 3-5) was reached the most frequently when subjects were
working on single model paced lines. They reached the Ahead 1 zone 61% and 60% of the time
in the continuous moving and synchronous indexing conveyors, respectively. On the
asynchronous indexing conveyor, the single model line also had the highest proportion of
reaches in the Ahead 1 zone (31%) but this was lesser than proportion of reaches in the paced
lines. Subjects working on MMALs reached the Ahead 1 zone 26% and 28% on the fixed and
random sequence continuous conveyor, respectively; they reached this zone 50% of the time on
both the fixed and random sequence synchronous indexing conveyor, respectively; and they
reached this zone 0.2% and 2% of the time on the fixed and random sequence asynchronous
indexing conveyor, respectively. Pooling the results by conveyor type, subjects working on the
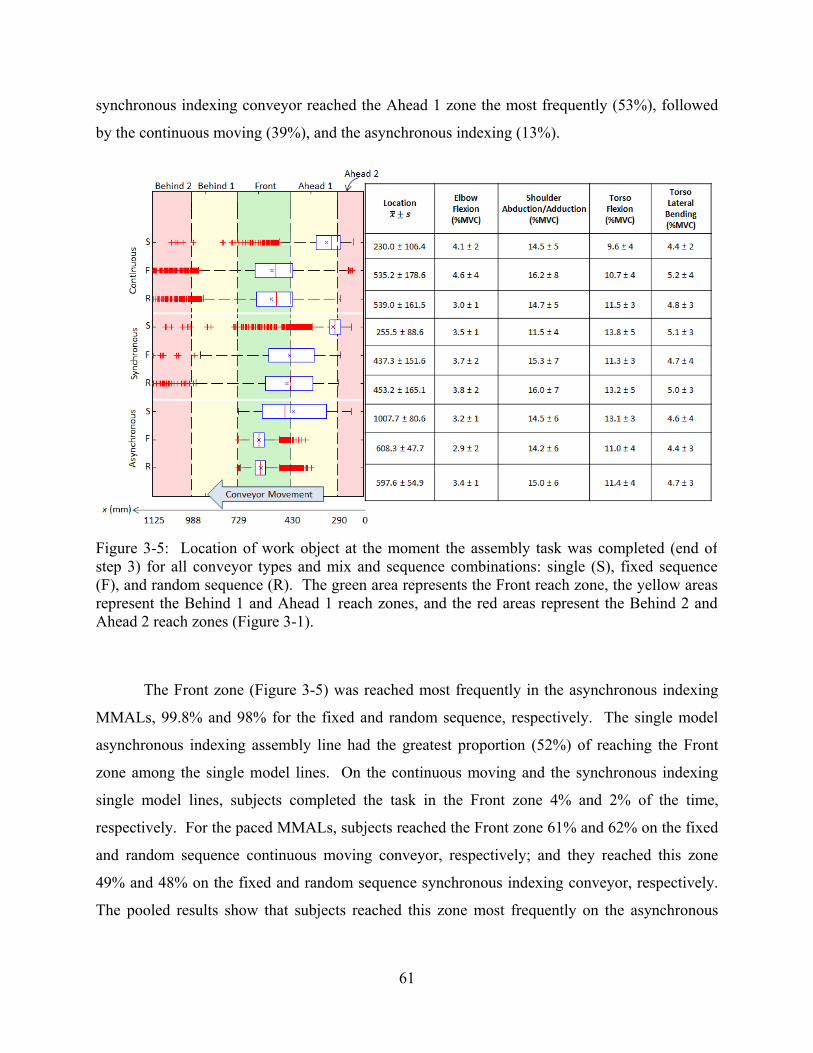
61
synchronous indexing conveyor reached the Ahead 1 zone the most frequently (53%), followed
by the continuous moving (39%), and the asynchronous indexing (13%).
The Front zone (Figure 3-5) was reached most frequently in the asynchronous indexing
MMALs, 99.8% and 98% for the fixed and random sequence, respectively. The single model
asynchronous indexing assembly line had the greatest proportion (52%) of reaching the Front
zone among the single model lines. On the continuous moving and the synchronous indexing
single model lines, subjects completed the task in the Front zone 4% and 2% of the time,
respectively. For the paced MMALs, subjects reached the Front zone 61% and 62% on the fixed
and random sequence continuous moving conveyor, respectively; and they reached this zone
49% and 48% on the fixed and random sequence synchronous indexing conveyor, respectively.
The pooled results show that subjects reached this zone most frequently on the asynchronous
Figure 3-5: Location of work object at the moment the assembly task was completed (end ofstep 3) for all conveyor types and mix and sequence combinations: single (S), fixed sequence(F), and random sequence (R). The green area represents the Front reach zone, the yellow areasrepresent the Behind 1 and Ahead 1 reach zones, and the red areas represent the Behind 2 andAhead 2 reach zones (Figure 3-1).
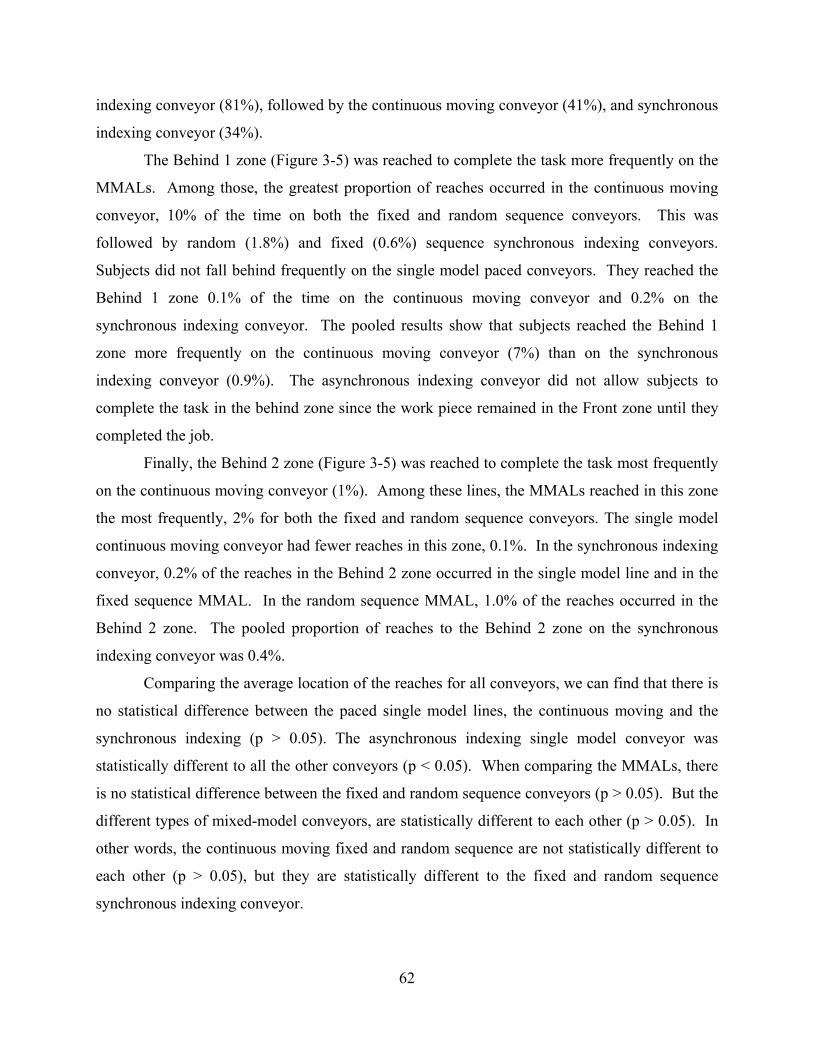
62
indexing conveyor (81%), followed by the continuous moving conveyor (41%), and synchronous
indexing conveyor (34%).
The Behind 1 zone (Figure 3-5) was reached to complete the task more frequently on the
MMALs. Among those, the greatest proportion of reaches occurred in the continuous moving
conveyor, 10% of the time on both the fixed and random sequence conveyors. This was
followed by random (1.8%) and fixed (0.6%) sequence synchronous indexing conveyors.
Subjects did not fall behind frequently on the single model paced conveyors. They reached the
Behind 1 zone 0.1% of the time on the continuous moving conveyor and 0.2% on the
synchronous indexing conveyor. The pooled results show that subjects reached the Behind 1
zone more frequently on the continuous moving conveyor (7%) than on the synchronous
indexing conveyor (0.9%). The asynchronous indexing conveyor did not allow subjects to
complete the task in the behind zone since the work piece remained in the Front zone until they
completed the job.
Finally, the Behind 2 zone (Figure 3-5) was reached to complete the task most frequently
on the continuous moving conveyor (1%). Among these lines, the MMALs reached in this zone
the most frequently, 2% for both the fixed and random sequence conveyors. The single model
continuous moving conveyor had fewer reaches in this zone, 0.1%. In the synchronous indexing
conveyor, 0.2% of the reaches in the Behind 2 zone occurred in the single model line and in the
fixed sequence MMAL. In the random sequence MMAL, 1.0% of the reaches occurred in the
Behind 2 zone. The pooled proportion of reaches to the Behind 2 zone on the synchronous
indexing conveyor was 0.4%.
Comparing the average location of the reaches for all conveyors, we can find that there is
no statistical difference between the paced single model lines, the continuous moving and the
synchronous indexing (p > 0.05). The asynchronous indexing single model conveyor was
statistically different to all the other conveyors (p < 0.05). When comparing the MMALs, there
is no statistical difference between the fixed and random sequence conveyors (p > 0.05). But the
different types of mixed-model conveyors, are statistically different to each other (p > 0.05). In
other words, the continuous moving fixed and random sequence are not statistically different to
each other (p > 0.05), but they are statistically different to the fixed and random sequence
synchronous indexing conveyor.
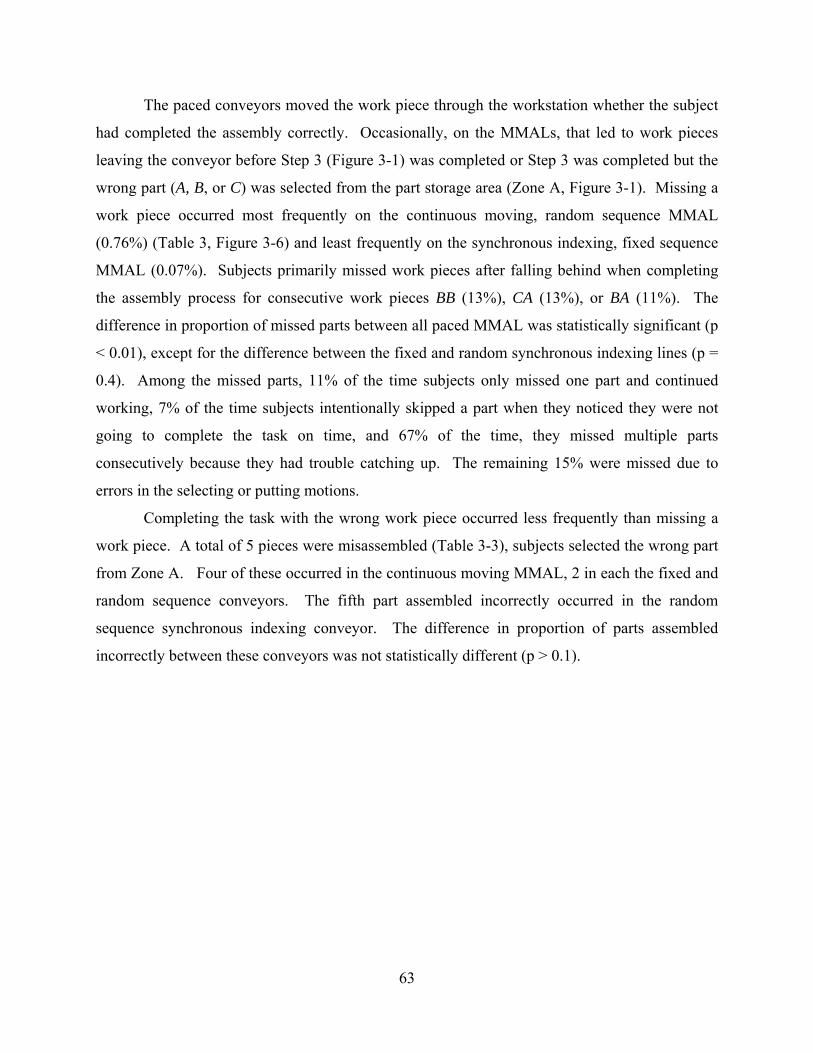
63
The paced conveyors moved the work piece through the workstation whether the subject
had completed the assembly correctly. Occasionally, on the MMALs, that led to work pieces
leaving the conveyor before Step 3 (Figure 3-1) was completed or Step 3 was completed but the
wrong part (A, B, or C) was selected from the part storage area (Zone A, Figure 3-1). Missing a
work piece occurred most frequently on the continuous moving, random sequence MMAL
(0.76%) (Table 3, Figure 3-6) and least frequently on the synchronous indexing, fixed sequence
MMAL (0.07%). Subjects primarily missed work pieces after falling behind when completing
the assembly process for consecutive work pieces BB (13%), CA (13%), or BA (11%). The
difference in proportion of missed parts between all paced MMAL was statistically significant (p
< 0.01), except for the difference between the fixed and random synchronous indexing lines (p =
0.4). Among the missed parts, 11% of the time subjects only missed one part and continued
working, 7% of the time subjects intentionally skipped a part when they noticed they were not
going to complete the task on time, and 67% of the time, they missed multiple parts
consecutively because they had trouble catching up. The remaining 15% were missed due to
errors in the selecting or putting motions.
Completing the task with the wrong work piece occurred less frequently than missing a
work piece. A total of 5 pieces were misassembled (Table 3-3), subjects selected the wrong part
from Zone A. Four of these occurred in the continuous moving MMAL, 2 in each the fixed and
random sequence conveyors. The fifth part assembled incorrectly occurred in the random
sequence synchronous indexing conveyor. The difference in proportion of parts assembled
incorrectly between these conveyors was not statistically different (p > 0.1).
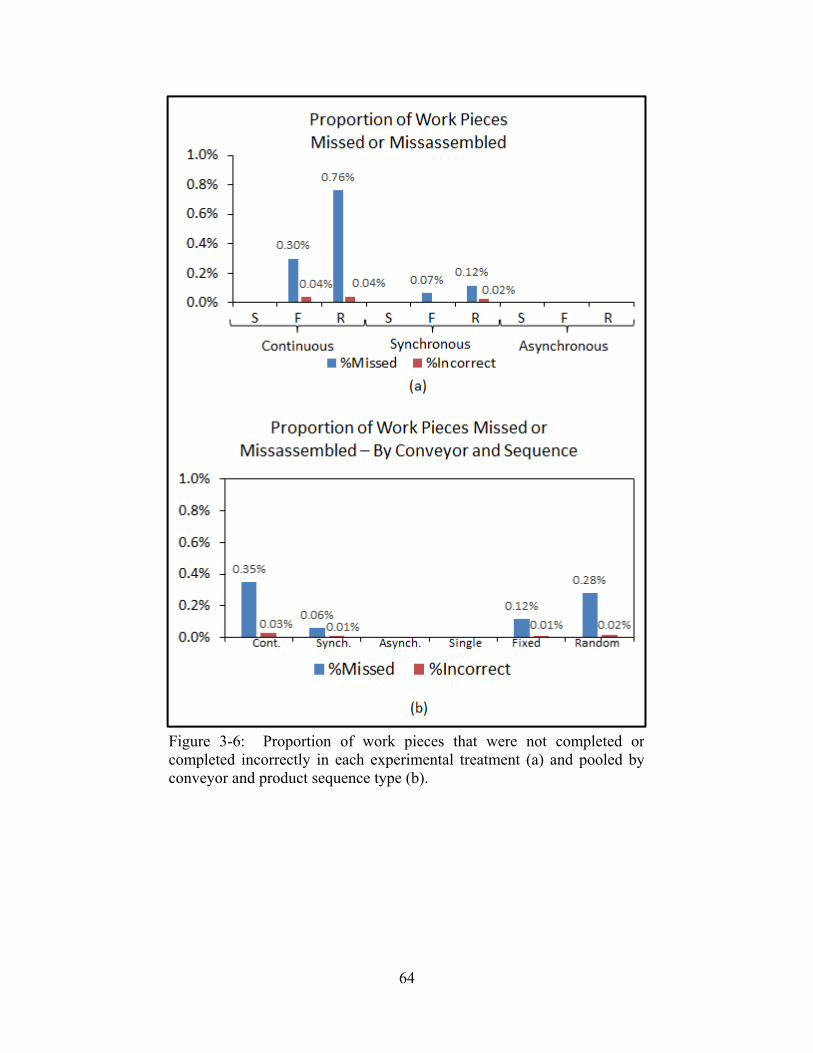
64
Figure 3-6: Proportion of work pieces that were not completed orcompleted incorrectly in each experimental treatment (a) and pooled byconveyor and product sequence type (b).
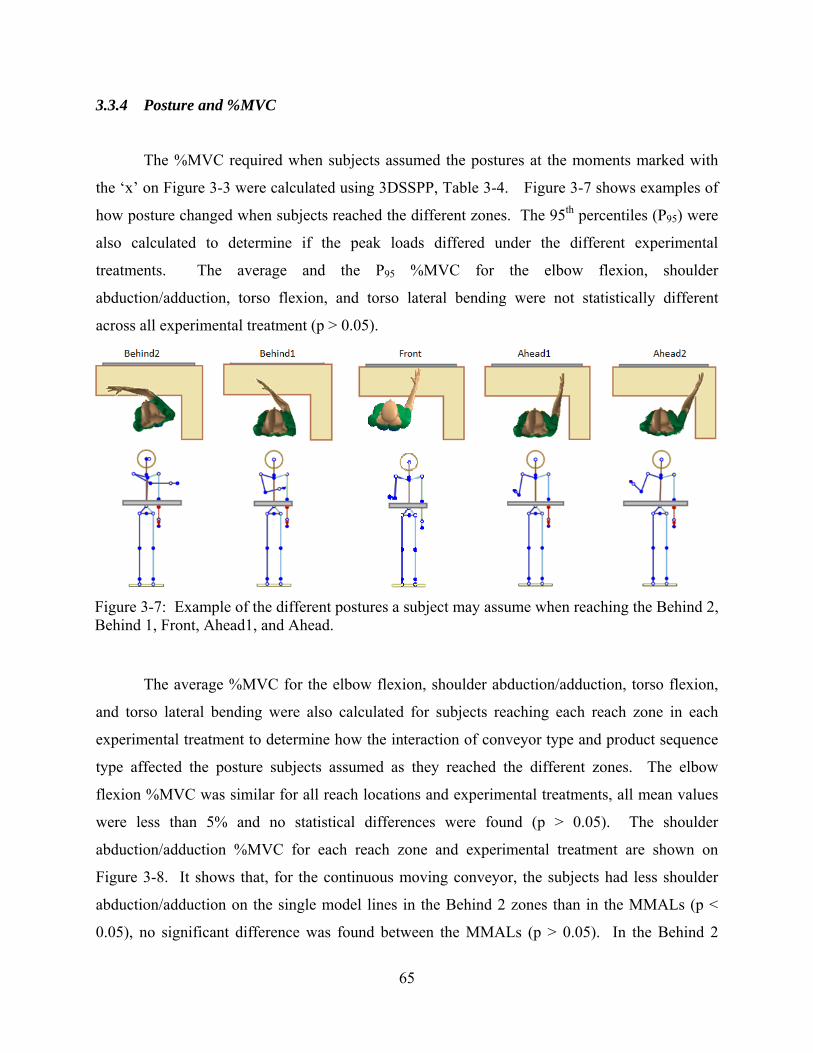
65
3.3.4 Posture and %MVC
The %MVC required when subjects assumed the postures at the moments marked with
the ‘x’ on Figure 3-3 were calculated using 3DSSPP, Table 3-4. Figure 3-7 shows examples of
how posture changed when subjects reached the different zones. The 95th percentiles (P95) were
also calculated to determine if the peak loads differed under the different experimental
treatments. The average and the P95 %MVC for the elbow flexion, shoulder
abduction/adduction, torso flexion, and torso lateral bending were not statistically different
across all experimental treatment (p > 0.05).
The average %MVC for the elbow flexion, shoulder abduction/adduction, torso flexion,
and torso lateral bending were also calculated for subjects reaching each reach zone in each
experimental treatment to determine how the interaction of conveyor type and product sequence
type affected the posture subjects assumed as they reached the different zones. The elbow
flexion %MVC was similar for all reach locations and experimental treatments, all mean values
were less than 5% and no statistical differences were found (p > 0.05). The shoulder
abduction/adduction %MVC for each reach zone and experimental treatment are shown on
Figure 3-8. It shows that, for the continuous moving conveyor, the subjects had less shoulder
abduction/adduction on the single model lines in the Behind 2 zones than in the MMALs (p <
0.05), no significant difference was found between the MMALs (p > 0.05). In the Behind 2
Figure 3-7: Example of the different postures a subject may assume when reaching the Behind 2,Behind 1, Front, Ahead1, and Ahead.
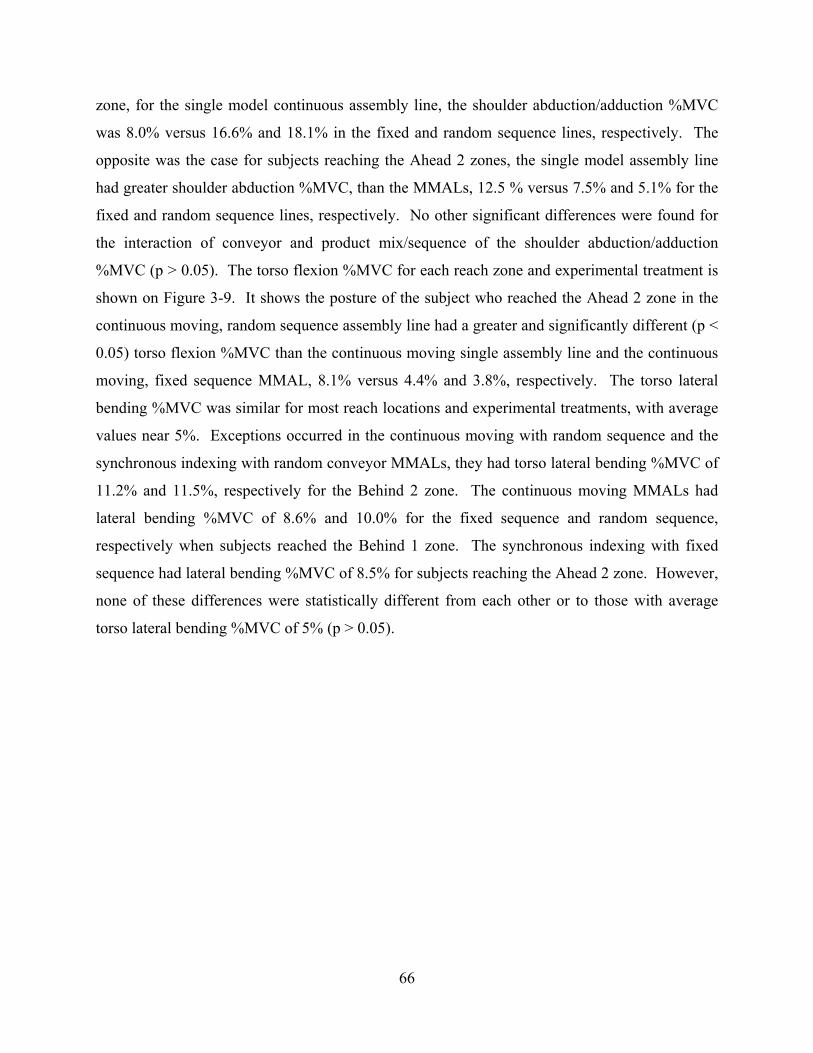
66
zone, for the single model continuous assembly line, the shoulder abduction/adduction %MVC
was 8.0% versus 16.6% and 18.1% in the fixed and random sequence lines, respectively. The
opposite was the case for subjects reaching the Ahead 2 zones, the single model assembly line
had greater shoulder abduction %MVC, than the MMALs, 12.5 % versus 7.5% and 5.1% for the
fixed and random sequence lines, respectively. No other significant differences were found for
the interaction of conveyor and product mix/sequence of the shoulder abduction/adduction
%MVC (p > 0.05). The torso flexion %MVC for each reach zone and experimental treatment is
shown on Figure 3-9. It shows the posture of the subject who reached the Ahead 2 zone in the
continuous moving, random sequence assembly line had a greater and significantly different (p <
0.05) torso flexion %MVC than the continuous moving single assembly line and the continuous
moving, fixed sequence MMAL, 8.1% versus 4.4% and 3.8%, respectively. The torso lateral
bending %MVC was similar for most reach locations and experimental treatments, with average
values near 5%. Exceptions occurred in the continuous moving with random sequence and the
synchronous indexing with random conveyor MMALs, they had torso lateral bending %MVC of
11.2% and 11.5%, respectively for the Behind 2 zone. The continuous moving MMALs had
lateral bending %MVC of 8.6% and 10.0% for the fixed sequence and random sequence,
respectively when subjects reached the Behind 1 zone. The synchronous indexing with fixed
sequence had lateral bending %MVC of 8.5% for subjects reaching the Ahead 2 zone. However,
none of these differences were statistically different from each other or to those with average
torso lateral bending %MVC of 5% (p > 0.05).
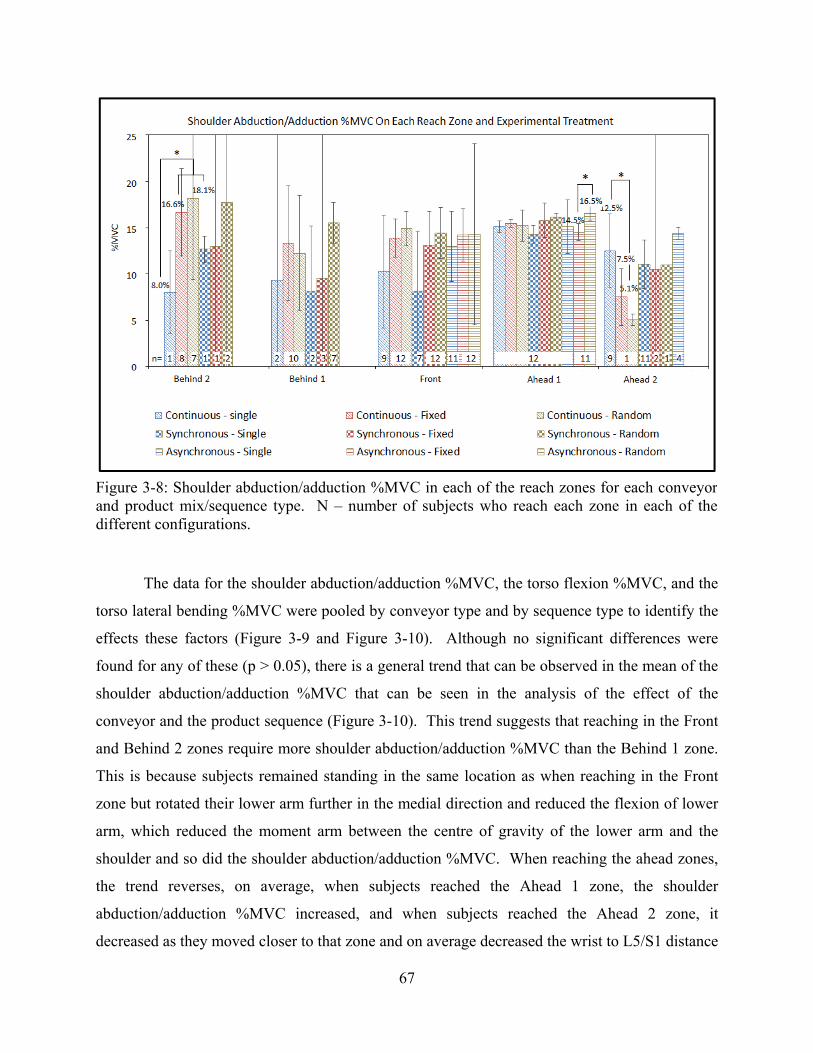
67
The data for the shoulder abduction/adduction %MVC, the torso flexion %MVC, and the
torso lateral bending %MVC were pooled by conveyor type and by sequence type to identify the
effects these factors (Figure 3-9 and Figure 3-10). Although no significant differences were
found for any of these (p > 0.05), there is a general trend that can be observed in the mean of the
shoulder abduction/adduction %MVC that can be seen in the analysis of the effect of the
conveyor and the product sequence (Figure 3-10). This trend suggests that reaching in the Front
and Behind 2 zones require more shoulder abduction/adduction %MVC than the Behind 1 zone.
This is because subjects remained standing in the same location as when reaching in the Front
zone but rotated their lower arm further in the medial direction and reduced the flexion of lower
arm, which reduced the moment arm between the centre of gravity of the lower arm and the
shoulder and so did the shoulder abduction/adduction %MVC. When reaching the ahead zones,
the trend reverses, on average, when subjects reached the Ahead 1 zone, the shoulder
abduction/adduction %MVC increased, and when subjects reached the Ahead 2 zone, it
decreased as they moved closer to that zone and on average decreased the wrist to L5/S1 distance
Figure 3-8: Shoulder abduction/adduction %MVC in each of the reach zones for each conveyorand product mix/sequence type. N – number of subjects who reach each zone in each of thedifferent configurations.
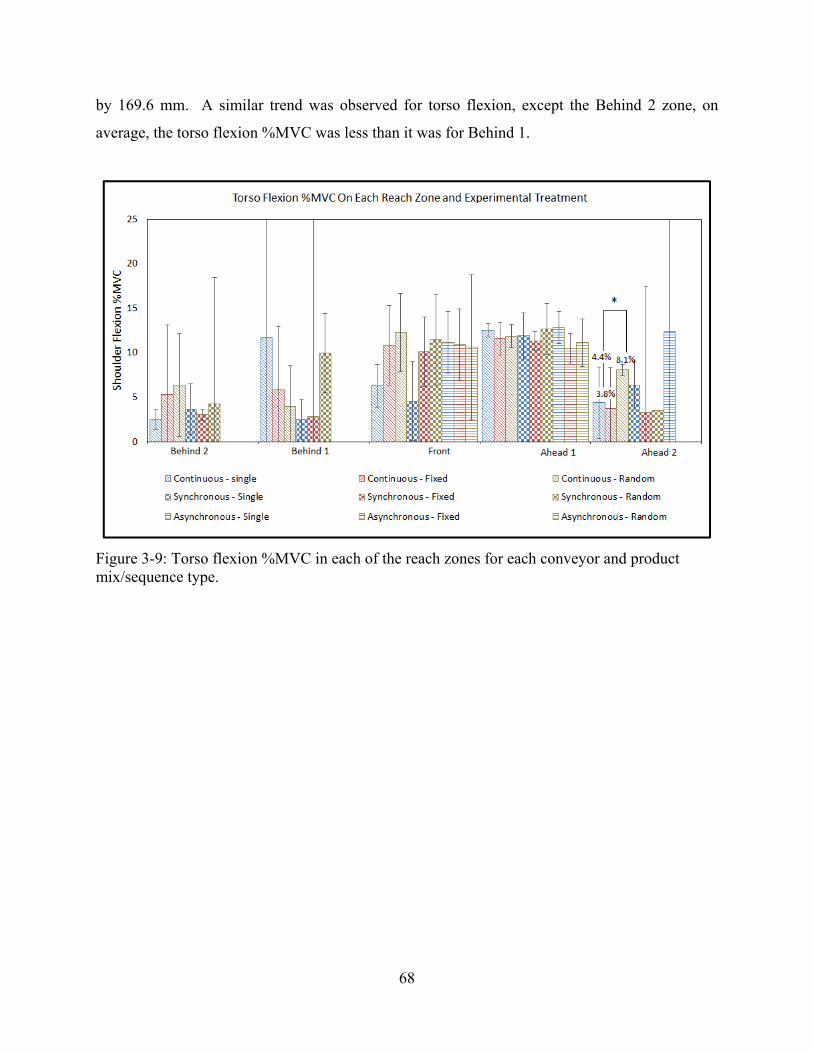
68
by 169.6 mm. A similar trend was observed for torso flexion, except the Behind 2 zone, on
average, the torso flexion %MVC was less than it was for Behind 1.
Figure 3-9: Torso flexion %MVC in each of the reach zones for each conveyor and product mix/sequence type.
69
Figure 3-10: Shoulder abduction/adduction and torso flexion %MVC in each of the reach zones grouped by conveyor type and by product mix and sequence.
3.4 Discussion
Results show that cycle to cycle task variations had significant effects on reach distance
and recovery times. The location of the work object at the end of each work cycle, the recovery
and idle times, and the quality problems were found to be significantly different between the
single product and the mixed-model assembly lines (MMALs) (Table 3). The magnitude of the
effects were influenced by the conveyor type.
The asynchronous indexing conveyor was found to have work location, recovery time,
and quality that were significantly different to those of the paced conveyors (continuous moving
and synchronous indexing). In the single product assembly line, subjects reached ahead more
frequently (95% and 98% for the continuous moving and synchronous indexing conveyors,
respectively versus 48% on the self-paced conveyor) (Figure 9). In the MMALs, subjects were
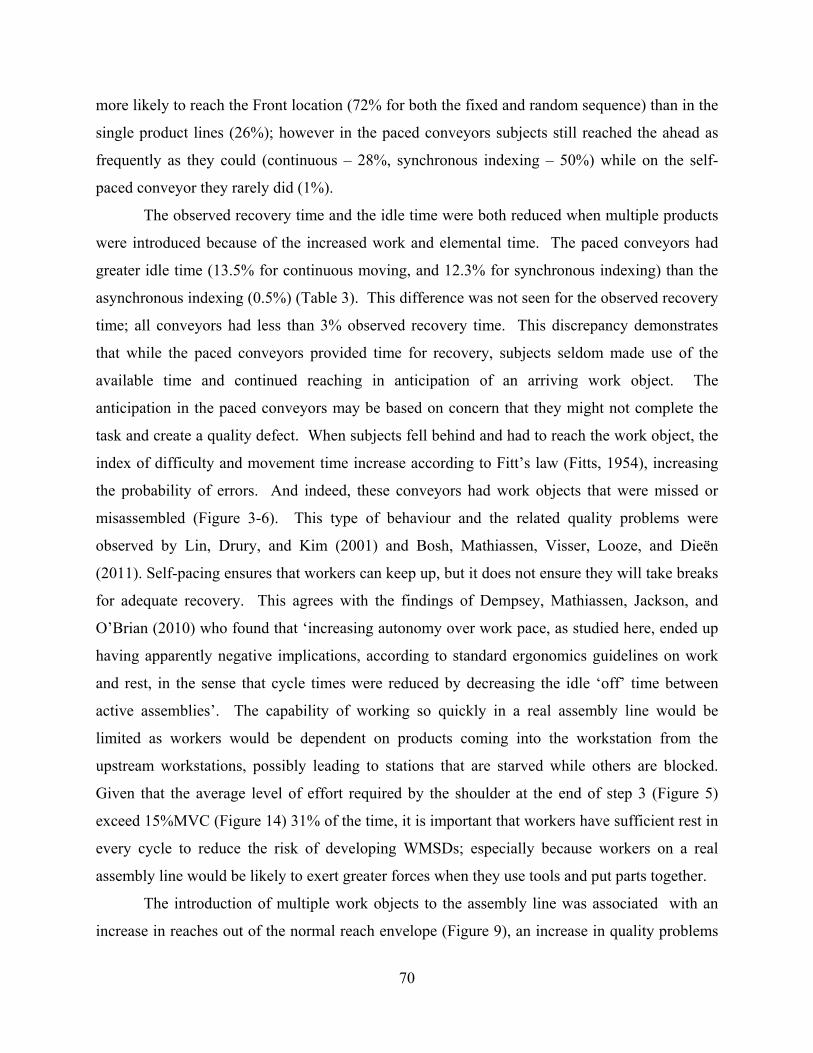
70
more likely to reach the Front location (72% for both the fixed and random sequence) than in the
single product lines (26%); however in the paced conveyors subjects still reached the ahead as
frequently as they could (continuous – 28%, synchronous indexing – 50%) while on the self-
paced conveyor they rarely did (1%).
The observed recovery time and the idle time were both reduced when multiple products
were introduced because of the increased work and elemental time. The paced conveyors had
greater idle time (13.5% for continuous moving, and 12.3% for synchronous indexing) than the
asynchronous indexing (0.5%) (Table 3). This difference was not seen for the observed recovery
time; all conveyors had less than 3% observed recovery time. This discrepancy demonstrates
that while the paced conveyors provided time for recovery, subjects seldom made use of the
available time and continued reaching in anticipation of an arriving work object. The
anticipation in the paced conveyors may be based on concern that they might not complete the
task and create a quality defect. When subjects fell behind and had to reach the work object, the
index of difficulty and movement time increase according to Fitt’s law (Fitts, 1954), increasing
the probability of errors. And indeed, these conveyors had work objects that were missed or
misassembled (Figure 3-6). This type of behaviour and the related quality problems were
observed by Lin, Drury, and Kim (2001) and Bosh, Mathiassen, Visser, Looze, and Dieën
(2011). Self-pacing ensures that workers can keep up, but it does not ensure they will take breaks
for adequate recovery. This agrees with the findings of Dempsey, Mathiassen, Jackson, and
O’Brian (2010) who found that ‘increasing autonomy over work pace, as studied here, ended up
having apparently negative implications, according to standard ergonomics guidelines on work
and rest, in the sense that cycle times were reduced by decreasing the idle ‘off’ time between
active assemblies’. The capability of working so quickly in a real assembly line would be
limited as workers would be dependent on products coming into the workstation from the
upstream workstations, possibly leading to stations that are starved while others are blocked.
Given that the average level of effort required by the shoulder at the end of step 3 (Figure 5)
exceed 15%MVC (Figure 14) 31% of the time, it is important that workers have sufficient rest in
every cycle to reduce the risk of developing WMSDs; especially because workers on a real
assembly line would be likely to exert greater forces when they use tools and put parts together.
The introduction of multiple work objects to the assembly line was associated with an
increase in reaches out of the normal reach envelope (Figure 9), an increase in quality problems
71
(Figure 3-6, Table 3), and a reduction in idle time (Table 3). No differences were found between
a random sequence and a fixed sequence. Although selecting a product sequence in a MMAL is
very important to avoid starving or blocking a workstation, in this case, the selected fixed
sequence did not have any significant differences to the random sequence for the same product
mix (Table 2). These results could potentially be different if a different sequence had been
selected, such as batch processing (AAAAABBBCC), or if some tasks required more work
elements (e) than the simple pick and place task performed in this simulation.
It was expected that the amount of physical effort exerted by subjects when reaching the
different reach zones in each of the experimental treatments would be different, especially
between the paced and the self-paced conveyors (Figures 12-14). However, generally, subjects
shifted their positions leading to no significant differences. An important observation is that, on
average, on the paced conveyors, subjects moved closer to the Ahead 2 zone when reaching that
zone. This indicates an attempt to get closer to the part storage (zone A, Figure 5) when they
were concerned with completing the task within the allotted time. This was not observed in the
asynchronous indexing conveyor.
There are some limitations to this study. The simulated assembly task was representative
of the jobs performed in assembly lines but it was not an exact reproduction of a known
assembly process. It is very likely that in actual assembly lines workers would have larger
amount of tasks with higher exertion requirements assigned to each cycle, which could impact
the differences in %MVC for the shoulder and the torso and cause differences not seen in this
study. Another limitation is the age and number of the participants of the experiments. The
participants were typical college students whose ages were on their late teen to mid-20s. A
manufacturing plant may also have older workers with a wider range of capabilities. Although
results may not be generalized to any assembly line, they provide useful information for
assembly line designers and serve as a starting point for further research in this area.
72
3.5 Conclusion
In conclusion, a hybrid synchronous/asynchronous indexing conveyor, i.e. one that has a
minimum work time established but workers can keep the work object in the station longer if
needed (without completely stopping the line), has the greatest potential to reduce workers’
reach and provide sufficient time for recovery in every cycle. It can do so because:
When work objects stop directly in front of the workers and they have control over how
much time they spend completing the tasks (e.g. asynchronous indexing line), there is
less reaching and fewer defects versus conveyors that move continuously or where
workers do not have control over the time the work object spends in front of them (e.g.
continuous moving and synchronous indexing).
Workers in neither the self-paced nor the paced assembly lines took advantage of the time
available for recovery. In self-paced assembly lines, workers work continuously with
little rest between cycles. In paced assembly lines, workers often start reaching for work
before the work object reaches the ideal work zone.
3.6 References
Armstrong, T.J., Radwin, R.G., Hansen, D.J., Kennedy, K.W. (1986). Repetitive trauma disorders: job evaluation and design. Human Factors 28(3): 325-336.
Arvidsson, I., Hansson, G., Mathiassen, S., Skerfving, S. (2008). Neck postures in air traffic controllers with and without neck/shoulder disorders. Applied Ergonomics, 39, 255-260.
Battini, D., Faccio, M., Persona, A., Sgarbossa, F. (2011). New methodological framework to improve productivity and ergonomics in assembly system design. International Journal of Industrial Ergonomics, 41, 30-42.
Bernard, B. A. (1997). Critical review of epidemiologic evidence for work-related musculoskeletal disorders of the neck, upper extremity, and low back. NIOSH Publication: Musculoskeletal Disorders and Workplace Factors, 97-141.
73
Bosch, T., Mathiassen, S.E., Visser, B., Looze, M.P. de and Dieën, J.H. van (2001). The effect of work pace on workload, motor variability and fatigue during simulated light assembly work. Ergonomics, 54(2), 154 - 168.
Boysen, N., Fliedner, M., Scholl, A. (2009). Assembly line balancing: Joint precedence graphs under high product variety. IIE Transactions, 41, 183-193
Bukchin, J., Dar-El, E., Rubinovitz, J. (2002). Mixed model assembly line design in a make-to-order environment. Journal of Computers and Industrial Engineering. 41 (4), 405-421.
Bureau of Labor and Statistics. Employment Statistics Highlights, January 2014. Release date 2/2014. http://www.bls.gov/web/empsit/ceshighlights.pdf
Bureau of Labor and Statistics. Nonfatal Occupational Injuries and Illnesses Requiring Days Away From Work, 2012. USDL-13-2257. Released 11/26/2013. http://www.bls.gov/news.release/pdf/osh2.pdf
Byström, S., Fransson-Hall, C. (1994). Acceptability of intermittent handgrip contractions based on physiological response. Human Factors: The Journal of the Human Factors and Ergonomics Society. 36 (1), 158 – 171.
Carnahan, B.J., Norman, B.A., Redfern, M.S. (2001). Incorporating physical demand criteria into assembly line balancing. IIE Transactions, 33, 875-887.
Carrasquillo, V., Armstrong, T.J., Hu, S.J. (2011). Work variations and musculoskeletal stresses in paced production operations. HFES Annual Conference, 55, 1012-1016
CDC. (2012). Anthropometric reference data for children and adults: United States 2007 – 2010. US Department of Health and Human Services, 14.
Chaffin, D.B., Andersson, G.B.J., Martin, B.J. (2006). Occupational biomechanics (4th ed., 99.25-27). Hoboken, NJ: Wiley - Interscience.
Dempsey, P.G., Mathiassen, S.E., Jackson, J.A., O’Brien, N.V. (2010). Influence of three principles of pacing on the temporal organisation of work dring cyclic assembly and disassembly tasks. Ergonomics, 53 (11), 1347-1358.
Dattatray, A. A., Kavade, M. V. (2013). Compressor assembly line changes for integration with application of lean manufacturing tool. International Journal of Advanced Engineering Technology, 4 (2), 10-13.
Dolgui, A., Guschinsky, N., Levin, G., A. (2006). Special case of transfer lines balancing by graph approach. European Journal of Operational Research, 168, 732-746.
Drillis, R. and R. Contini (1966). Body Segment Parameters. New York, New York Office of Vocational Rehabilitation. Report No 1166-03.
74
ElMaraghy, W.H., Urbanic, R.J. (2004). Assessment of manufacturing operational complexity. CIRP Annals – Manufacturing Technology, 53(1), 401-406.
Fitts, P.M. (1954). The information capacity of the human motor system in controlling the amplitude of movement. Journal of Experimental Psychology, 47, 381-391.
Genikomsakis, K. N., Tourassis, V. D., A. (2008). A simulation-based assessment of alternative assembly line configurations. IEEE International Conference on Systems, Man and Cybernetic, 1626-1631.
Hyun, C., Kim, Y., Kim, Y. (1998). A genetic algorithm for multiple objective sequencing problems in mixed model assembly lines. Journal of Computers and Operations Research, 25 (7-8) 675-690
Johnson, D. J. (2005). Converting assembly lines to assembly cells at sheet metal products: Insights on performance improvements. International Journal of Production Research, 43(7), 1483 – 1509.
Lin, L., Drury, C.G., Kim, S.W. (2001). Ergonomics and quality in paced assembly lines. Human Factors and Ergonomics in Manufacturing, 11 (4), 377-382.
National Institute for Occupational Safety and Health. Work practices guide for manual lifting. Technical report number: 81 – 122, US Department of Health and Human Services (NIOSH), Cincinnati, OH, 1981
National Research Council. (1998). Work-related musculoskeletal disorders: A review of evidence. National Academy Press, Washington D. C.
National Research Council, The Institute of Medicine. (2001). Musculoskeletal disorders and the workplace: Low back and upper extremities. National Academy Press, Washington, DC.
Niebel, B.W., Freivalds, A. (2002). Methods, standards, and work design (11th ed., pp. 373-403). Dubuque: McGraw-Hill.
Otto, A., Scholl, A. (2011). Incorporating ergonomic risks into assembly line balancing. European Journal of Operational Research, 212, 277 – 286.
Punnett, L. (2000). Commentary on the scientific basis of the proposed occupational safety and health administration ergonomics program standard. Journal of Occupational and Environmental Medicine, 42 (10), 970-981.
Punnett, L., Wegman, D. (2004). Work-related musculoskeletal disorders: The epidemiologic evidence and the debate. Journal of Electromyography and Kinesiology, 14, 13-23.
Szeto, G., Cheng, S., Poon, J., Ting, A., Tsang, R., Ho, P. (2012). Surgeons’ static posture and movement repetitions in open and laparoscopic surgery. Journal of Surgical Research, 172, 19-31.
75
Wang, H., Hu, S.J. (2001). Manufacturing complexity in assembly systems with hybrid configurations and its impact on throughput. CIRP Annals - Manufacturing Technology, 59 (1), 53-56.
Zhu, X., Hu, S. J., Koren, Y. (2008). Modeling of manufacturing complexity in mixed-model assembly lines. Journal of Manufacturing Science and Engineering, 130(051013), 1-10.
75
CHAPTER 4
WORKER POSTURE AND RECOVERY TIME IN A MADE TO ORDER,
MIXED-MODEL, SELF-PACED ASSEMBLY LINE: AN OBSERVATION
STUDY
4.1 Introduction
4.1.1 Aims
The aim of this study is to investigate the relationship between customer demand
fluctuations in self-paced assembly operations with cycle to cycle task variations and workers’
exposure to risk factors of work related musculoskeletal disorders (WMSDs). Specifically, this
work tested the hypothesis that, as customer demand increases in a mixed-model, self-paced
assembly line, workers will reach outside their reach envelope more frequently and will increase
their hand motions and efforts. As a result, time for recovery will be reduced.
Towards this end, a field observation study was conducted. The study consisted of direct
observations of workers completing tasks on a manual conveyor, mixed-model assembly line
during different customer demand time periods. The frequency and duration of reaching outside
the reach envelope, the hand activity level, and the proportion of recovery time were evaluated
based on the observations.
4.1.2 Motivation
In 2014, more than 3 million people in the US worked on commercial kitchens preparing
and serving food to customers (Bureau of Labor Statistics, 2014(a)). Of these, approximately
76
220,000 were employed by hospitals to provide meals to patients (Bureau of Labor Statistics,
2014(b)). Worker posture and recovery time are as important in this industry as it is in
manufacturing. Musculoskeletal injuries caused by repetitive motion and overexertion ranked as
the greatest source of reported injuries requiring a median of 6 days away from work in this
industry(Bureau of Labor Statistics, 2014(c)). The incidence rate was 57.3 cases per 10,000 full-
time workers. The workers in commercial kitchens continually use their hands to reach and
transport food items, prepare food, move heavy food containers, and move completed plates and
trays from the kitchen to the location for distribution to the customer. Unsteady customer
demand leads to periods of time when the workers are continuously busy with little time
available for recovery. These working conditions lead to high joint loads and to insufficient
recovery time, known causes of work-related musculoskeletal disorders (WMSDs) (Bernard,
1997; NRC, 1998, 2001; da Costa, Ramos Vieira, 2010).
The high incidence rate of WMSDs due to overexertion and repetition (18.3 per 100
person-years) in hospital kitchens has been reported by Alamgir, Swinkels, Yu, and Yassi,
(2007). Medeiros da Luz, Pacheco da Costa Proença, Rodríguez Ortiz de Salazar, and do
Nascimento Galego (2013) reported that overexertion has also been associated with the
development of circulatory disorders of the lower limbs among the kitchen staff in healthcare
facilities. Despite overexertion and repetition being major causes of injuries, research in the
health of commercial kitchens and hospital kitchens has focused on other risk factors.
Matsuzuki, Haruyama, Muto, Aikawa, Ito, and Katamoto (2012) investigated whether a new
hospital kitchen layout had any effect on the workload and job-related stresses of its staff.
However, their study focused on measuring workload and stresses using fluid loss, heat rate, and
metabolic equivalents of tasks and did not look at how the facility changes affected posture and
recovery time.
The work in hospital kitchens can be analogous to the work in a manufacturing plant due
to the cyclic nature of some of the tasks conducted. These repetitive tasks include getting meal
orders, setting up a tray, placing food on a tray that is transported between stations via a
conveyor, and removing the tray from the conveyor and placing it on a cart. Utilizing concepts
traditionally used for manufacturing plants, Moatari-Kazerouni, Chinniah, and Agard (2014a)
developed a risk estimation method aimed at integrating occupational health and safety
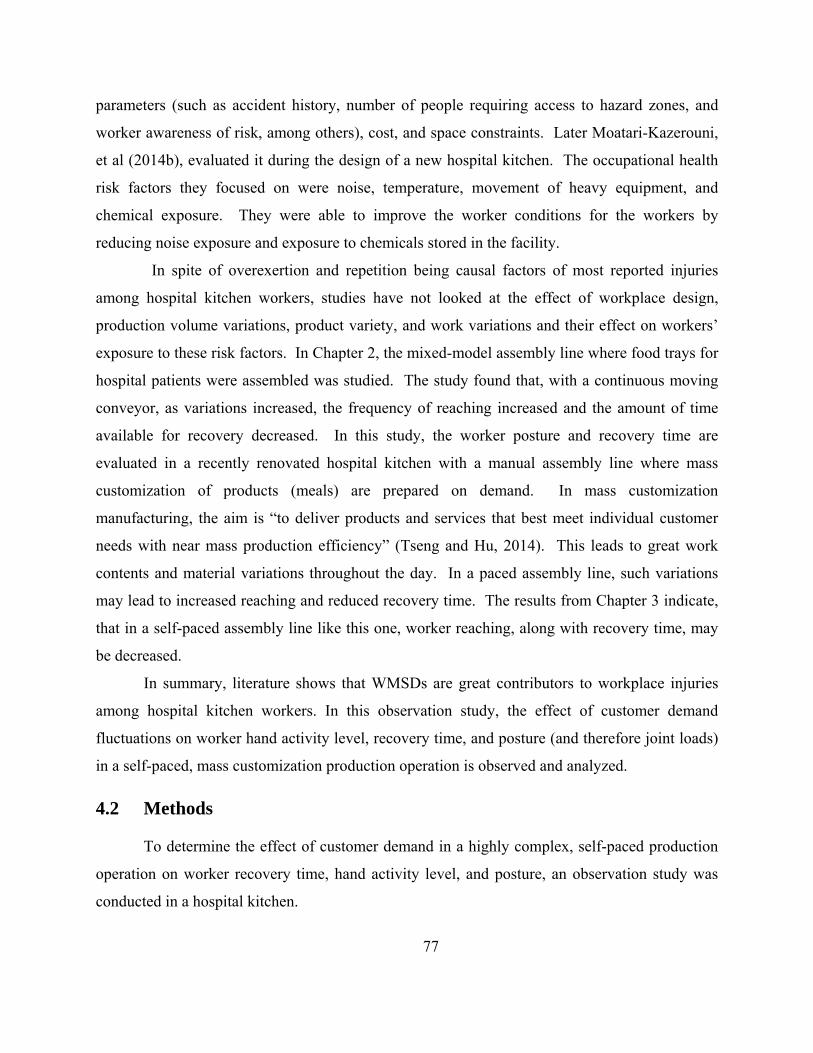
77
parameters (such as accident history, number of people requiring access to hazard zones, and
worker awareness of risk, among others), cost, and space constraints. Later Moatari-Kazerouni,
et al (2014b), evaluated it during the design of a new hospital kitchen. The occupational health
risk factors they focused on were noise, temperature, movement of heavy equipment, and
chemical exposure. They were able to improve the worker conditions for the workers by
reducing noise exposure and exposure to chemicals stored in the facility.
In spite of overexertion and repetition being causal factors of most reported injuries
among hospital kitchen workers, studies have not looked at the effect of workplace design,
production volume variations, product variety, and work variations and their effect on workers’
exposure to these risk factors. In Chapter 2, the mixed-model assembly line where food trays for
hospital patients were assembled was studied. The study found that, with a continuous moving
conveyor, as variations increased, the frequency of reaching increased and the amount of time
available for recovery decreased. In this study, the worker posture and recovery time are
evaluated in a recently renovated hospital kitchen with a manual assembly line where mass
customization of products (meals) are prepared on demand. In mass customization
manufacturing, the aim is “to deliver products and services that best meet individual customer
needs with near mass production efficiency” (Tseng and Hu, 2014). This leads to great work
contents and material variations throughout the day. In a paced assembly line, such variations
may lead to increased reaching and reduced recovery time. The results from Chapter 3 indicate,
that in a self-paced assembly line like this one, worker reaching, along with recovery time, may
be decreased.
In summary, literature shows that WMSDs are great contributors to workplace injuries
among hospital kitchen workers. In this observation study, the effect of customer demand
fluctuations on worker hand activity level, recovery time, and posture (and therefore joint loads)
in a self-paced, mass customization production operation is observed and analyzed.
4.2 Methods To determine the effect of customer demand in a highly complex, self-paced production
operation on worker recovery time, hand activity level, and posture, an observation study was
conducted in a hospital kitchen.
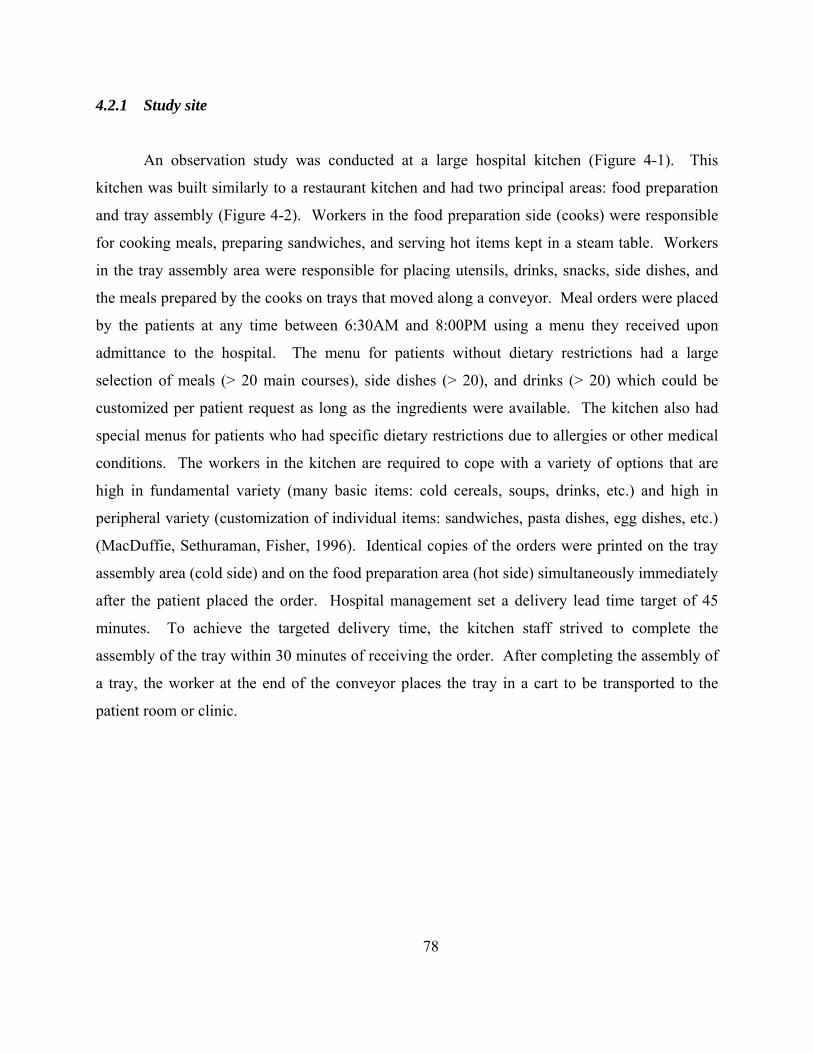
78
4.2.1 Study site
An observation study was conducted at a large hospital kitchen (Figure 4-1). This
kitchen was built similarly to a restaurant kitchen and had two principal areas: food preparation
and tray assembly (Figure 4-2). Workers in the food preparation side (cooks) were responsible
for cooking meals, preparing sandwiches, and serving hot items kept in a steam table. Workers
in the tray assembly area were responsible for placing utensils, drinks, snacks, side dishes, and
the meals prepared by the cooks on trays that moved along a conveyor. Meal orders were placed
by the patients at any time between 6:30AM and 8:00PM using a menu they received upon
admittance to the hospital. The menu for patients without dietary restrictions had a large
selection of meals (> 20 main courses), side dishes (> 20), and drinks (> 20) which could be
customized per patient request as long as the ingredients were available. The kitchen also had
special menus for patients who had specific dietary restrictions due to allergies or other medical
conditions. The workers in the kitchen are required to cope with a variety of options that are
high in fundamental variety (many basic items: cold cereals, soups, drinks, etc.) and high in
peripheral variety (customization of individual items: sandwiches, pasta dishes, egg dishes, etc.)
(MacDuffie, Sethuraman, Fisher, 1996). Identical copies of the orders were printed on the tray
assembly area (cold side) and on the food preparation area (hot side) simultaneously immediately
after the patient placed the order. Hospital management set a delivery lead time target of 45
minutes. To achieve the targeted delivery time, the kitchen staff strived to complete the
assembly of the tray within 30 minutes of receiving the order. After completing the assembly of
a tray, the worker at the end of the conveyor places the tray in a cart to be transported to the
patient room or clinic.
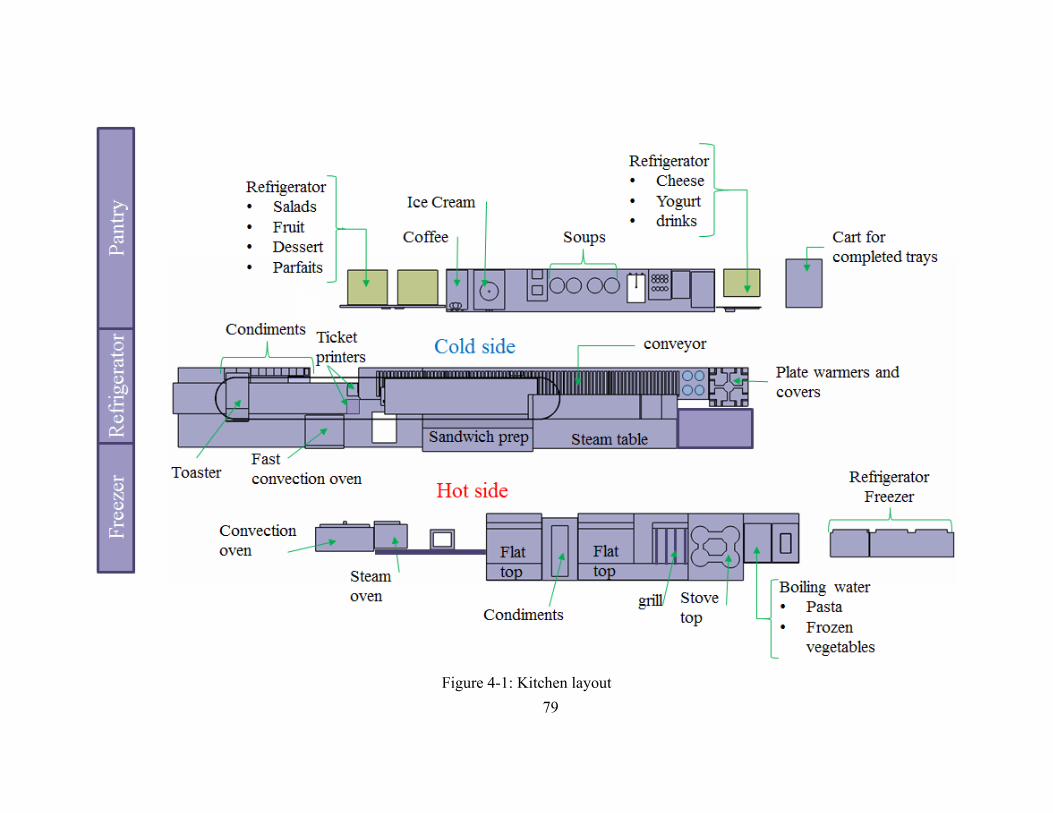
79
Figure 4-1: Kitchen layout
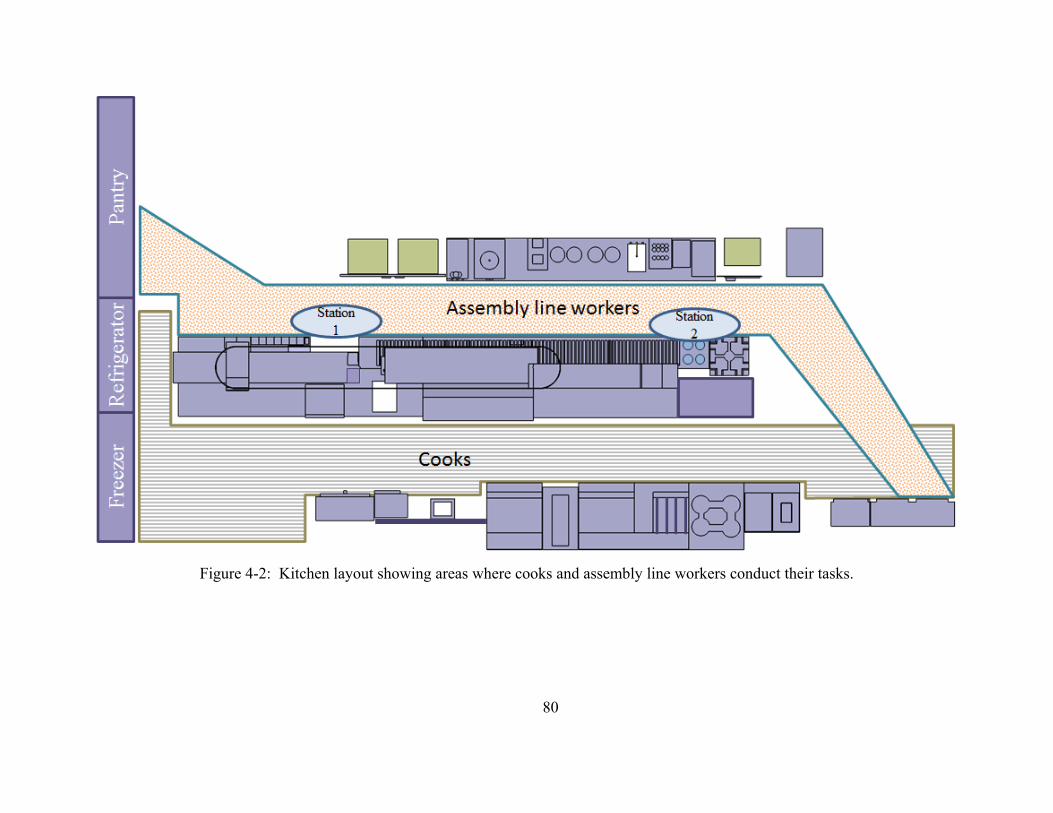
80
Figure 4-2: Kitchen layout showing areas where cooks and assembly line workers conduct their tasks.
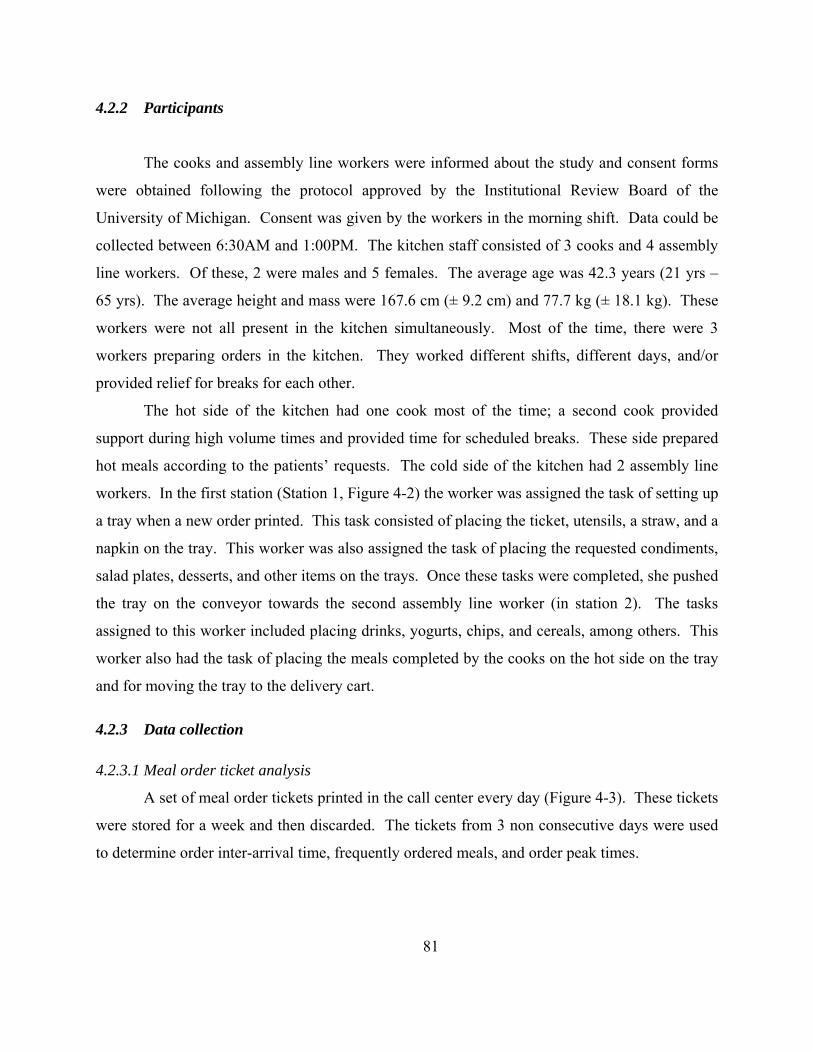
81
4.2.2 Participants
The cooks and assembly line workers were informed about the study and consent forms
were obtained following the protocol approved by the Institutional Review Board of the
University of Michigan. Consent was given by the workers in the morning shift. Data could be
collected between 6:30AM and 1:00PM. The kitchen staff consisted of 3 cooks and 4 assembly
line workers. Of these, 2 were males and 5 females. The average age was 42.3 years (21 yrs –
65 yrs). The average height and mass were 167.6 cm (± 9.2 cm) and 77.7 kg (± 18.1 kg). These
workers were not all present in the kitchen simultaneously. Most of the time, there were 3
workers preparing orders in the kitchen. They worked different shifts, different days, and/or
provided relief for breaks for each other.
The hot side of the kitchen had one cook most of the time; a second cook provided
support during high volume times and provided time for scheduled breaks. These side prepared
hot meals according to the patients’ requests. The cold side of the kitchen had 2 assembly line
workers. In the first station (Station 1, Figure 4-2) the worker was assigned the task of setting up
a tray when a new order printed. This task consisted of placing the ticket, utensils, a straw, and a
napkin on the tray. This worker was also assigned the task of placing the requested condiments,
salad plates, desserts, and other items on the trays. Once these tasks were completed, she pushed
the tray on the conveyor towards the second assembly line worker (in station 2). The tasks
assigned to this worker included placing drinks, yogurts, chips, and cereals, among others. This
worker also had the task of placing the meals completed by the cooks on the hot side on the tray
and for moving the tray to the delivery cart.
4.2.3 Data collection
4.2.3.1 Meal order ticket analysis
A set of meal order tickets printed in the call center every day (Figure 4-3). These tickets
were stored for a week and then discarded. The tickets from 3 non consecutive days were used
to determine order inter-arrival time, frequently ordered meals, and order peak times.
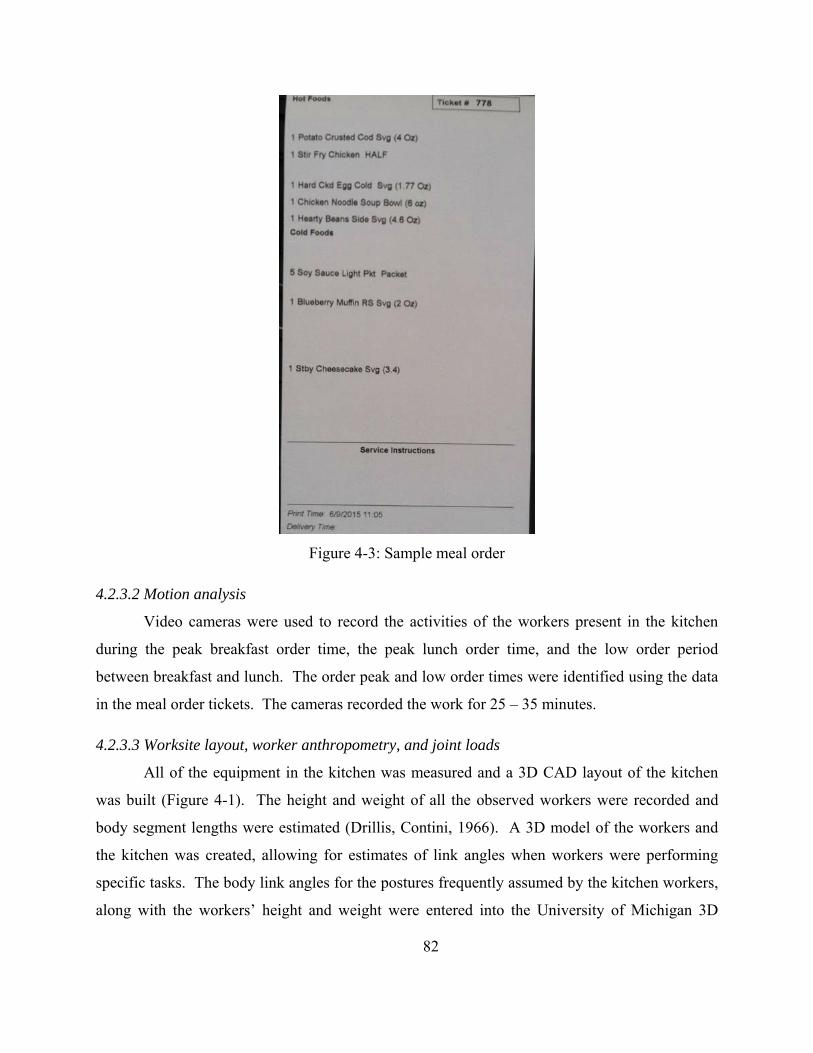
82
Figure 4-3: Sample meal order
4.2.3.2 Motion analysis
Video cameras were used to record the activities of the workers present in the kitchen
during the peak breakfast order time, the peak lunch order time, and the low order period
between breakfast and lunch. The order peak and low order times were identified using the data
in the meal order tickets. The cameras recorded the work for 25 – 35 minutes.
4.2.3.3 Worksite layout, worker anthropometry, and joint loads
All of the equipment in the kitchen was measured and a 3D CAD layout of the kitchen
was built (Figure 4-1). The height and weight of all the observed workers were recorded and
body segment lengths were estimated (Drillis, Contini, 1966). A 3D model of the workers and
the kitchen was created, allowing for estimates of link angles when workers were performing
specific tasks. The body link angles for the postures frequently assumed by the kitchen workers,
along with the workers’ height and weight were entered into the University of Michigan 3D
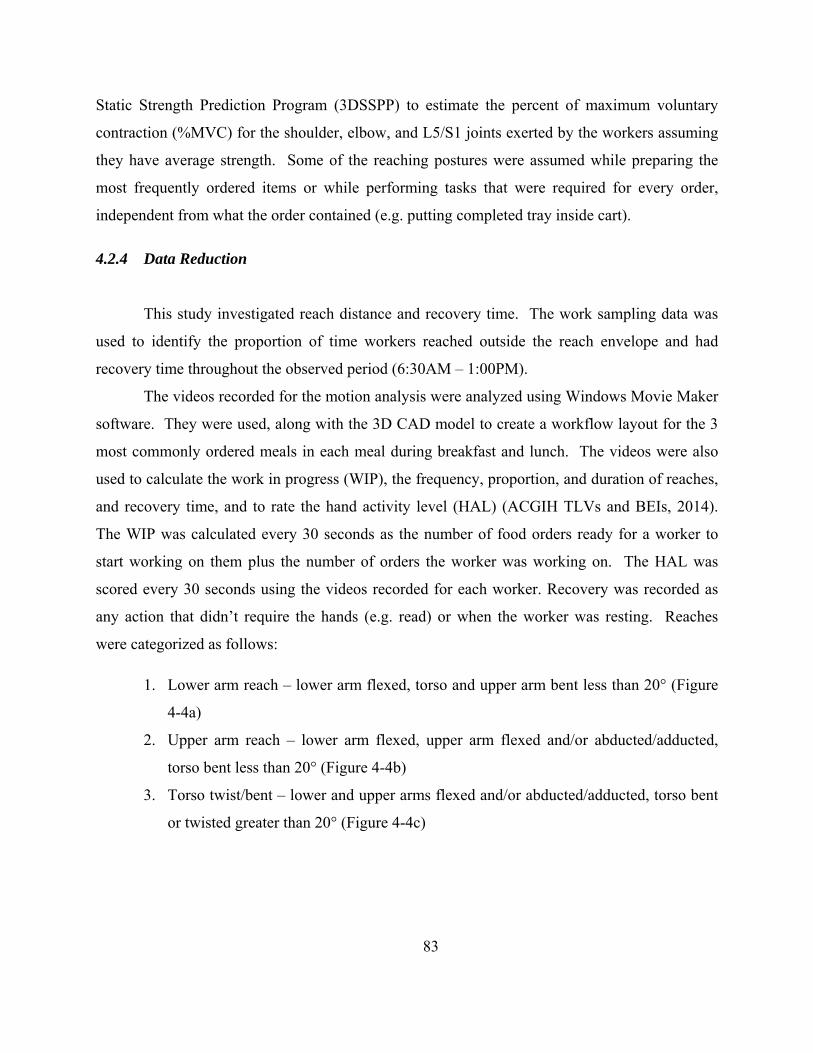
83
Static Strength Prediction Program (3DSSPP) to estimate the percent of maximum voluntary
contraction (%MVC) for the shoulder, elbow, and L5/S1 joints exerted by the workers assuming
they have average strength. Some of the reaching postures were assumed while preparing the
most frequently ordered items or while performing tasks that were required for every order,
independent from what the order contained (e.g. putting completed tray inside cart).
4.2.4 Data Reduction
This study investigated reach distance and recovery time. The work sampling data was
used to identify the proportion of time workers reached outside the reach envelope and had
recovery time throughout the observed period (6:30AM – 1:00PM).
The videos recorded for the motion analysis were analyzed using Windows Movie Maker
software. They were used, along with the 3D CAD model to create a workflow layout for the 3
most commonly ordered meals in each meal during breakfast and lunch. The videos were also
used to calculate the work in progress (WIP), the frequency, proportion, and duration of reaches,
and recovery time, and to rate the hand activity level (HAL) (ACGIH TLVs and BEIs, 2014).
The WIP was calculated every 30 seconds as the number of food orders ready for a worker to
start working on them plus the number of orders the worker was working on. The HAL was
scored every 30 seconds using the videos recorded for each worker. Recovery was recorded as
any action that didn’t require the hands (e.g. read) or when the worker was resting. Reaches
were categorized as follows:
1. Lower arm reach – lower arm flexed, torso and upper arm bent less than 20° (Figure
4-4a)
2. Upper arm reach – lower arm flexed, upper arm flexed and/or abducted/adducted,
torso bent less than 20° (Figure 4-4b)
3. Torso twist/bent – lower and upper arms flexed and/or abducted/adducted, torso bent
or twisted greater than 20° (Figure 4-4c)
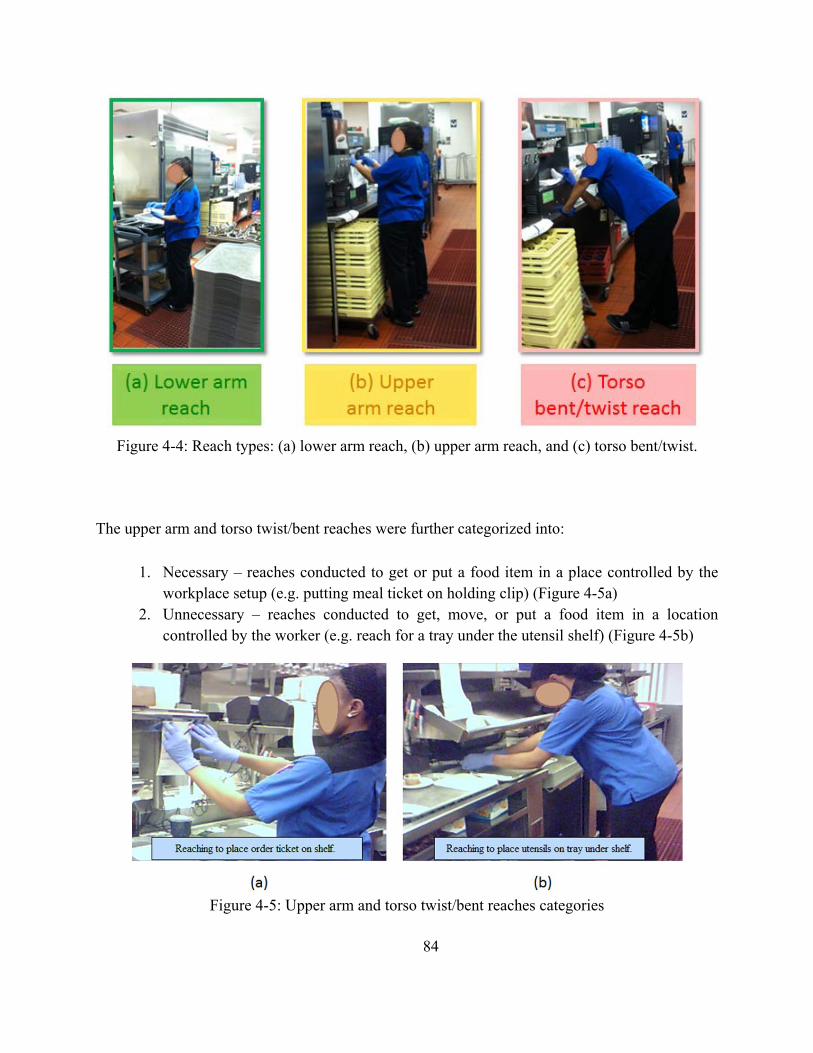
84
Figure 4-4: Reach types: (a) lower arm reach, (b) upper arm reach, and (c) torso bent/twist.
The upper arm and torso twist/bent reaches were further categorized into:
1. Necessary – reaches conducted to get or put a food item in a place controlled by the workplace setup (e.g. putting meal ticket on holding clip) (Figure 4-5a)
2. Unnecessary – reaches conducted to get, move, or put a food item in a location controlled by the worker (e.g. reach for a tray under the utensil shelf) (Figure 4-5b)
Figure 4-5: Upper arm and torso twist/bent reaches categories
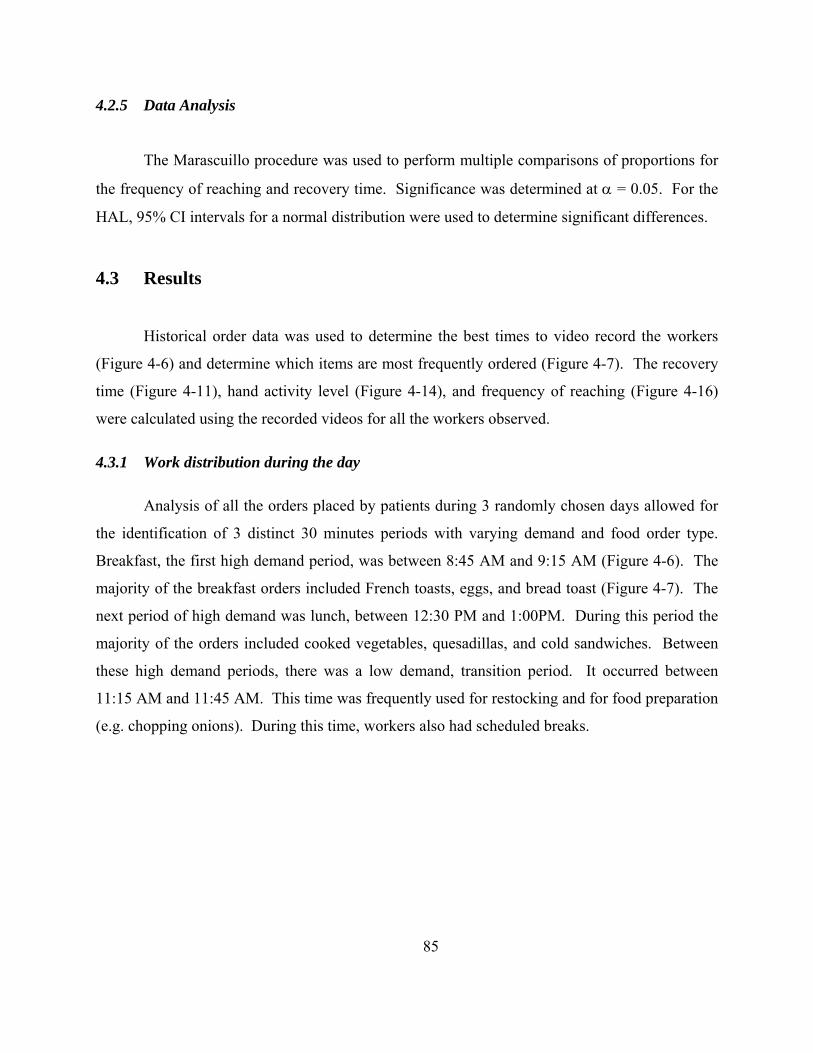
85
4.2.5 Data Analysis
The Marascuillo procedure was used to perform multiple comparisons of proportions for
the frequency of reaching and recovery time. Significance was determined at = 0.05. For the
HAL, 95% CI intervals for a normal distribution were used to determine significant differences.
4.3 Results
Historical order data was used to determine the best times to video record the workers
(Figure 4-6) and determine which items are most frequently ordered (Figure 4-7). The recovery
time (Figure 4-11), hand activity level (Figure 4-14), and frequency of reaching (Figure 4-16)
were calculated using the recorded videos for all the workers observed.
4.3.1 Work distribution during the day
Analysis of all the orders placed by patients during 3 randomly chosen days allowed for
the identification of 3 distinct 30 minutes periods with varying demand and food order type.
Breakfast, the first high demand period, was between 8:45 AM and 9:15 AM (Figure 4-6). The
majority of the breakfast orders included French toasts, eggs, and bread toast (Figure 4-7). The
next period of high demand was lunch, between 12:30 PM and 1:00PM. During this period the
majority of the orders included cooked vegetables, quesadillas, and cold sandwiches. Between
these high demand periods, there was a low demand, transition period. It occurred between
11:15 AM and 11:45 AM. This time was frequently used for restocking and for food preparation
(e.g. chopping onions). During this time, workers also had scheduled breaks.
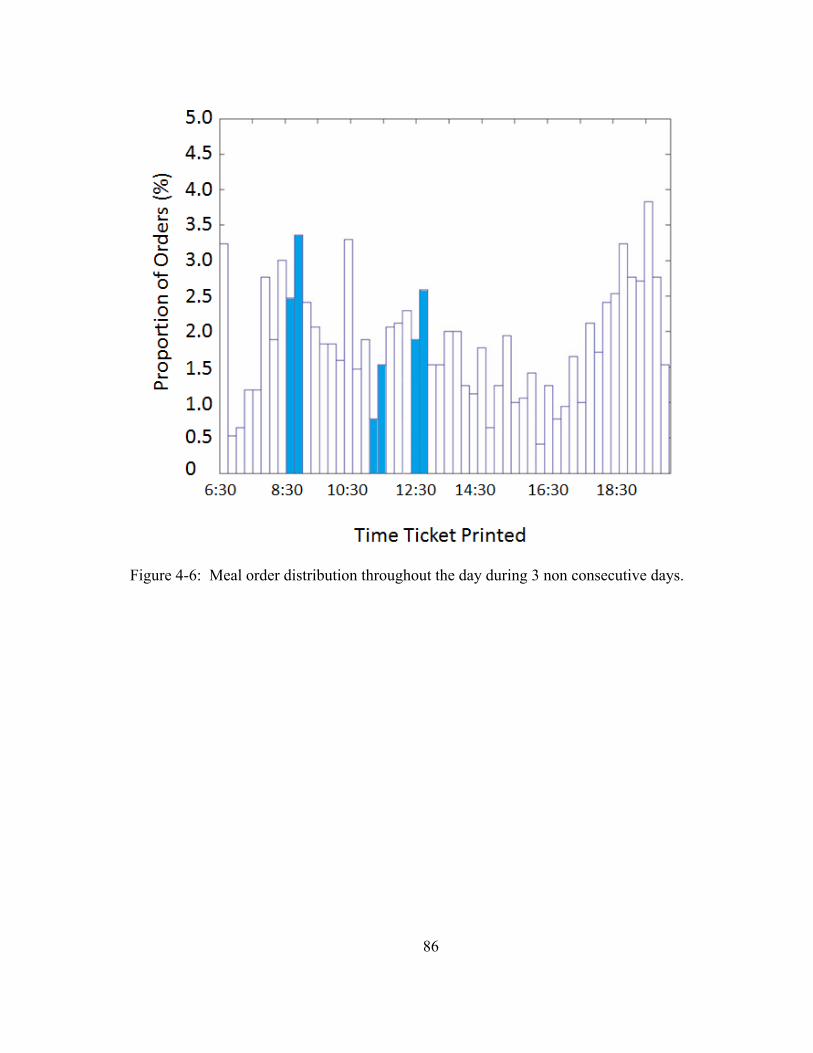
86
Figure 4-6: Meal order distribution throughout the day during 3 non consecutive days.
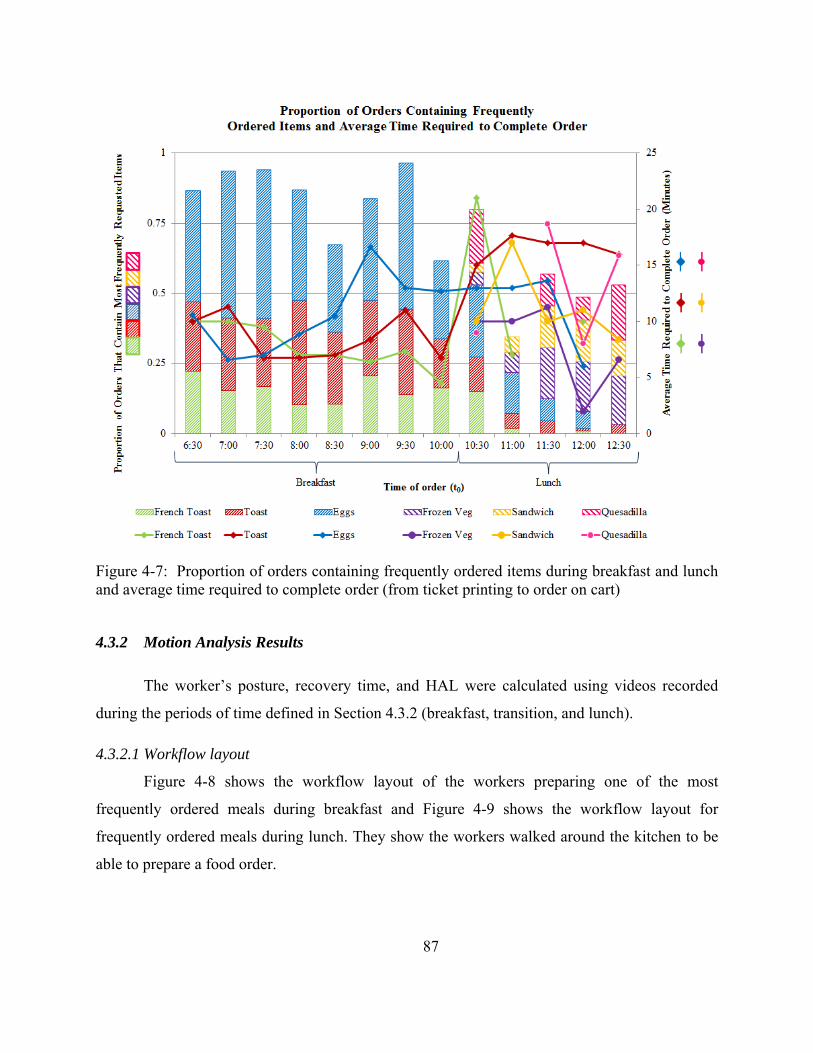
87
Figure 4-7: Proportion of orders containing frequently ordered items during breakfast and lunch and average time required to complete order (from ticket printing to order on cart)
4.3.2 Motion Analysis Results
The worker’s posture, recovery time, and HAL were calculated using videos recorded
during the periods of time defined in Section 4.3.2 (breakfast, transition, and lunch).
4.3.2.1 Workflow layout
Figure 4-8 shows the workflow layout of the workers preparing one of the most
frequently ordered meals during breakfast and Figure 4-9 shows the workflow layout for
frequently ordered meals during lunch. They show the workers walked around the kitchen to be
able to prepare a food order.
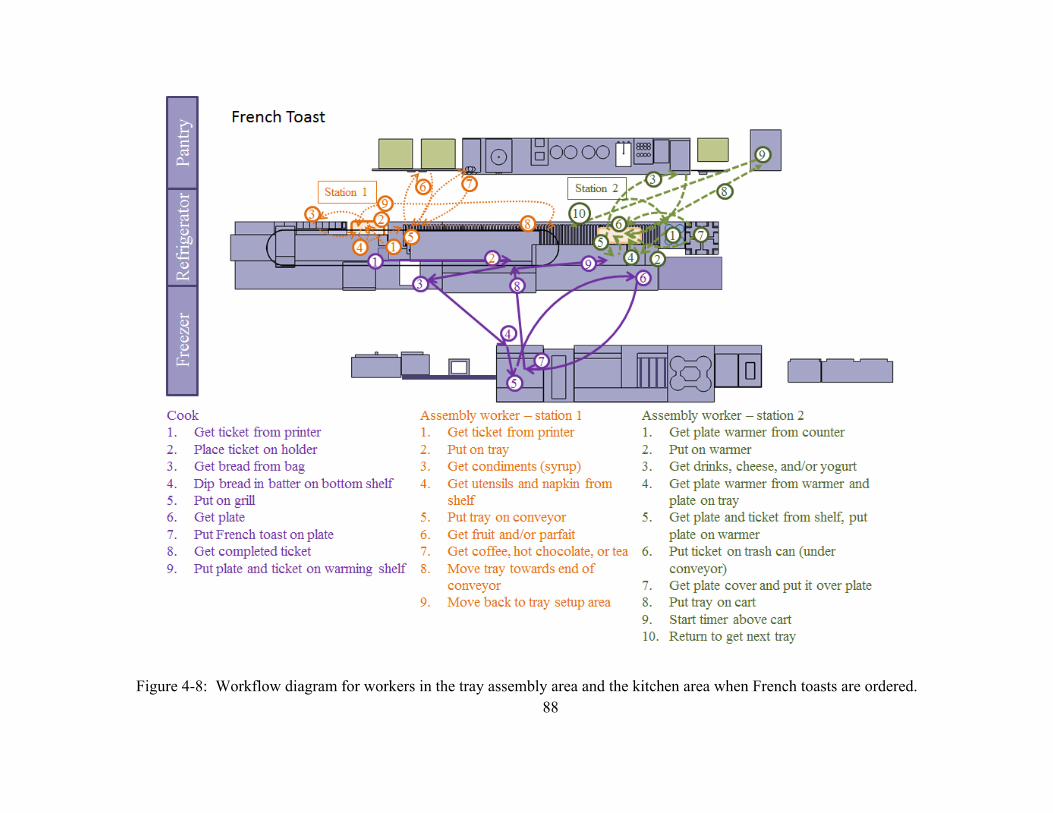
88
Figure 4-8: Workflow diagram for workers in the tray assembly area and the kitchen area when French toasts are ordered.
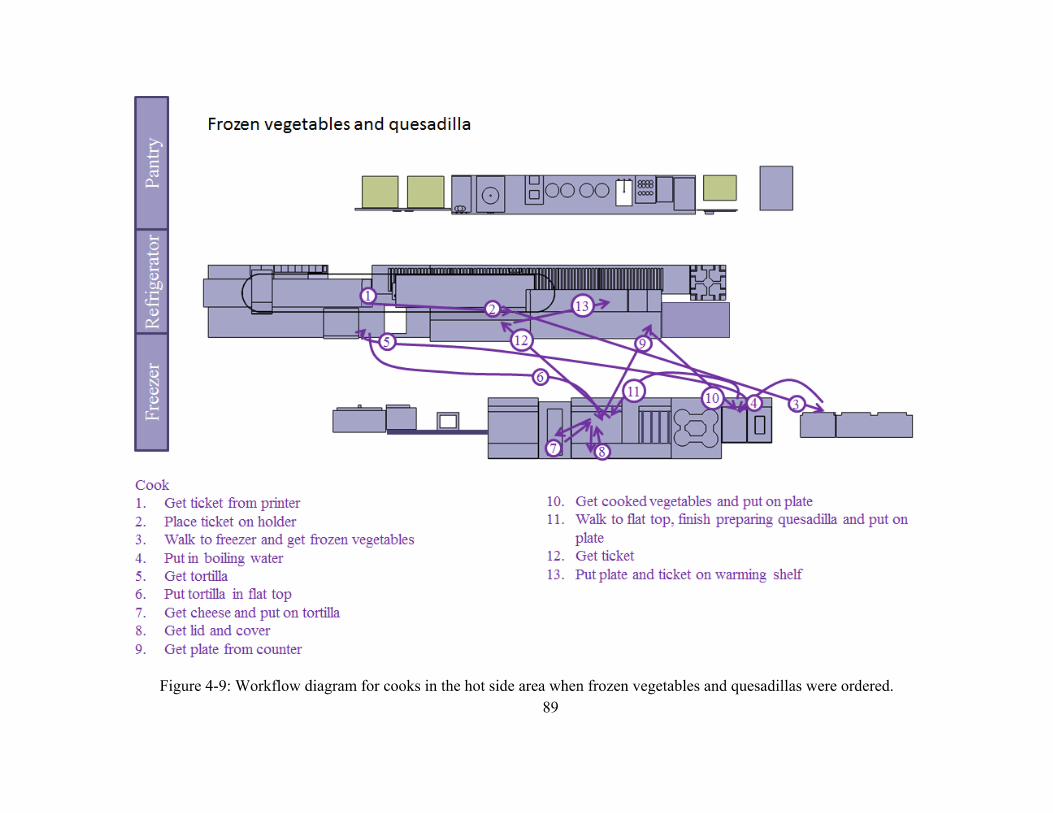
89
Figure 4-9: Workflow diagram for cooks in the hot side area when frozen vegetables and quesadillas were ordered.
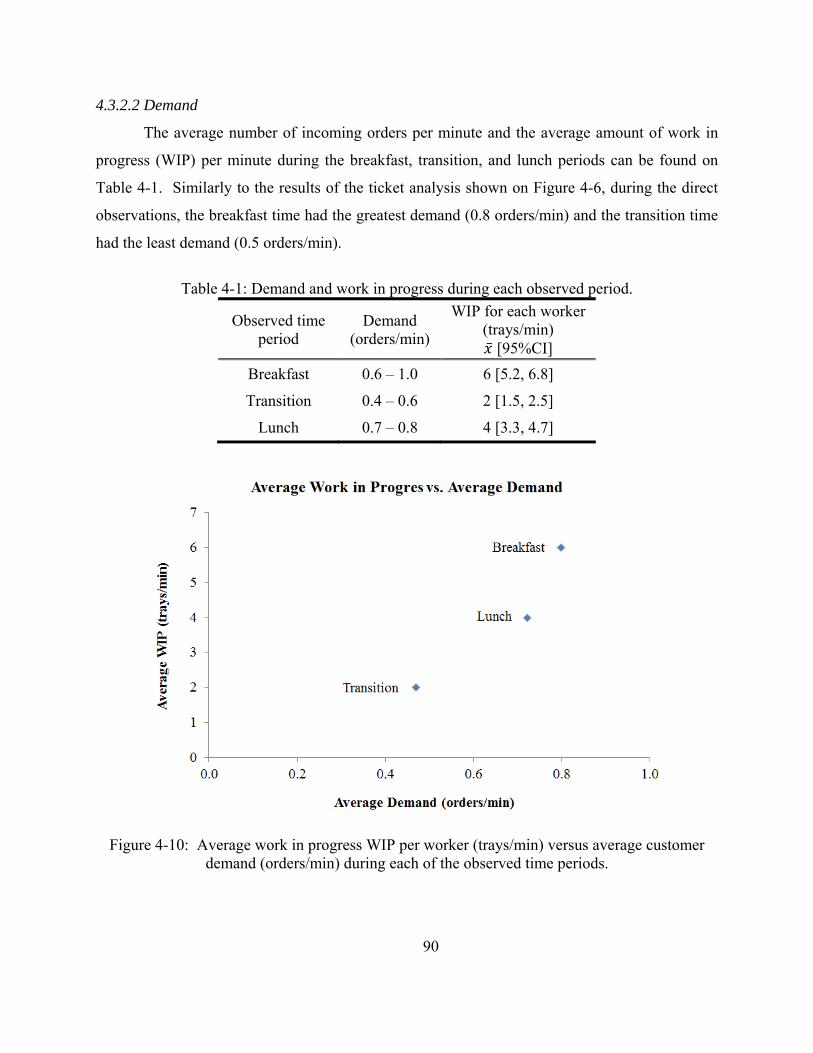
90
4.3.2.2 Demand
The average number of incoming orders per minute and the average amount of work in
progress (WIP) per minute during the breakfast, transition, and lunch periods can be found on
Table 4-1. Similarly to the results of the ticket analysis shown on Figure 4-6, during the direct
observations, the breakfast time had the greatest demand (0.8 orders/min) and the transition time
had the least demand (0.5 orders/min).
Table 4-1: Demand and work in progress during each observed period.
Observed time period
Demand (orders/min)
WIP for each worker (trays/min) [95%CI]
Breakfast 0.6 – 1.0 6 [5.2, 6.8]
Transition 0.4 – 0.6 2 [1.5, 2.5]
Lunch 0.7 – 0.8 4 [3.3, 4.7]
Figure 4-10: Average work in progress WIP per worker (trays/min) versus average customer
demand (orders/min) during each of the observed time periods.
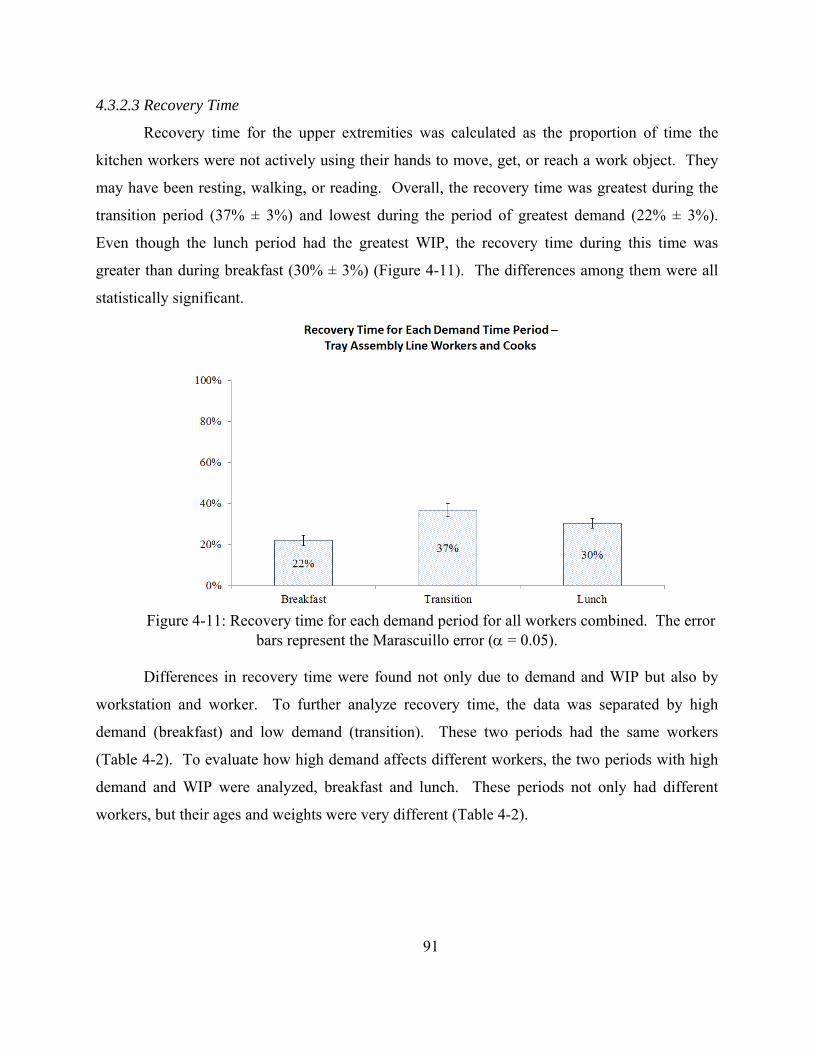
91
4.3.2.3 Recovery Time
Recovery time for the upper extremities was calculated as the proportion of time the
kitchen workers were not actively using their hands to move, get, or reach a work object. They
may have been resting, walking, or reading. Overall, the recovery time was greatest during the
transition period (37% ± 3%) and lowest during the period of greatest demand (22% ± 3%).
Even though the lunch period had the greatest WIP, the recovery time during this time was
greater than during breakfast (30% ± 3%) (Figure 4-11). The differences among them were all
statistically significant.
Figure 4-11: Recovery time for each demand period for all workers combined. The error
bars represent the Marascuillo error ( = 0.05).
Differences in recovery time were found not only due to demand and WIP but also by
workstation and worker. To further analyze recovery time, the data was separated by high
demand (breakfast) and low demand (transition). These two periods had the same workers
(Table 4-2). To evaluate how high demand affects different workers, the two periods with high
demand and WIP were analyzed, breakfast and lunch. These periods not only had different
workers, but their ages and weights were very different (Table 4-2).
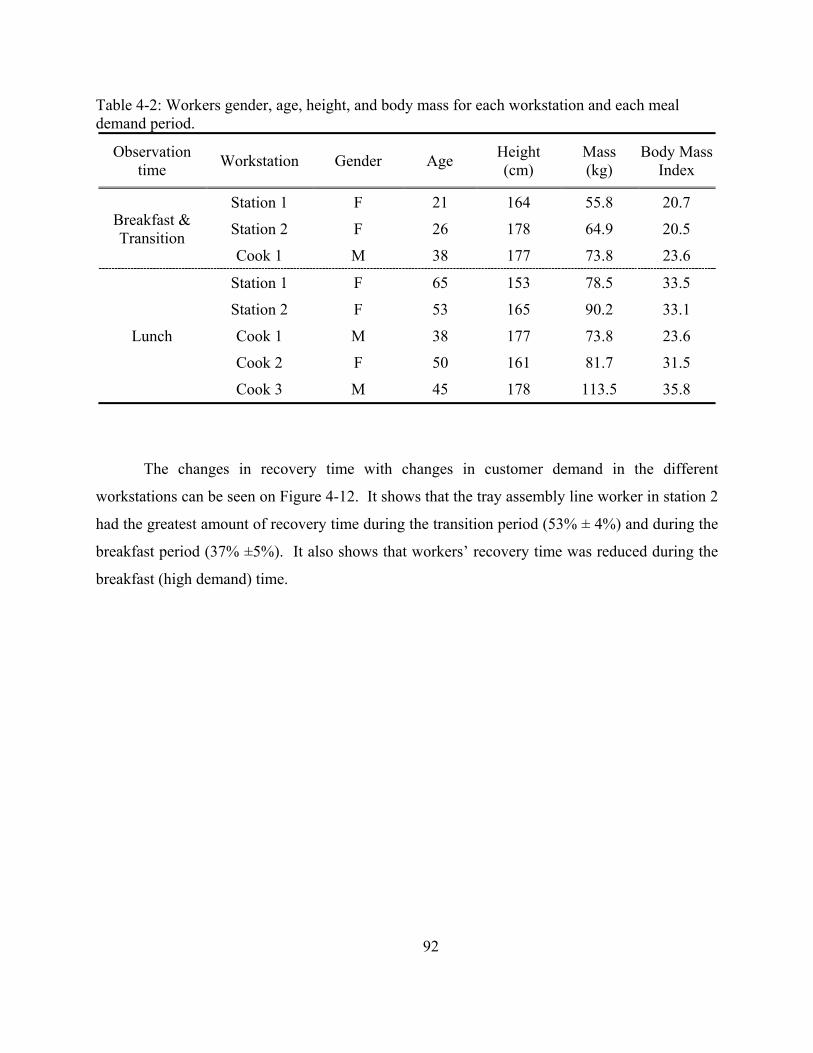
92
Table 4-2: Workers gender, age, height, and body mass for each workstation and each meal demand period.
Observation time Workstation Gender Age Height
(cm) Mass (kg)
Body Mass Index
Breakfast & Transition
Station 1 F 21 164 55.8 20.7
Station 2 F 26 178 64.9 20.5
Cook 1 M 38 177 73.8 23.6
Lunch
Station 1 F 65 153 78.5 33.5
Station 2 F 53 165 90.2 33.1
Cook 1 M 38 177 73.8 23.6
Cook 2 F 50 161 81.7 31.5
Cook 3 M 45 178 113.5 35.8
The changes in recovery time with changes in customer demand in the different
workstations can be seen on Figure 4-12. It shows that the tray assembly line worker in station 2
had the greatest amount of recovery time during the transition period (53% ± 4%) and during the
breakfast period (37% ±5%). It also shows that workers’ recovery time was reduced during the
breakfast (high demand) time.
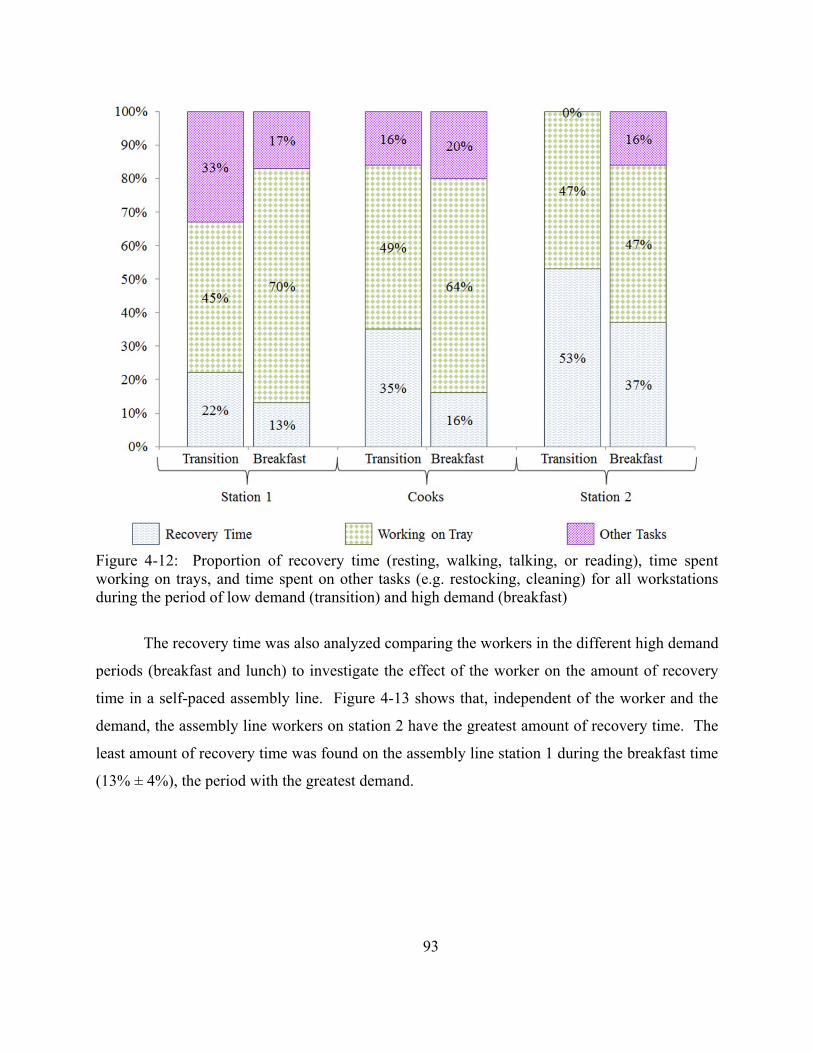
93
Figure 4-12: Proportion of recovery time (resting, walking, talking, or reading), time spent working on trays, and time spent on other tasks (e.g. restocking, cleaning) for all workstations during the period of low demand (transition) and high demand (breakfast)
The recovery time was also analyzed comparing the workers in the different high demand
periods (breakfast and lunch) to investigate the effect of the worker on the amount of recovery
time in a self-paced assembly line. Figure 4-13 shows that, independent of the worker and the
demand, the assembly line workers on station 2 have the greatest amount of recovery time. The
least amount of recovery time was found on the assembly line station 1 during the breakfast time
(13% ± 4%), the period with the greatest demand.
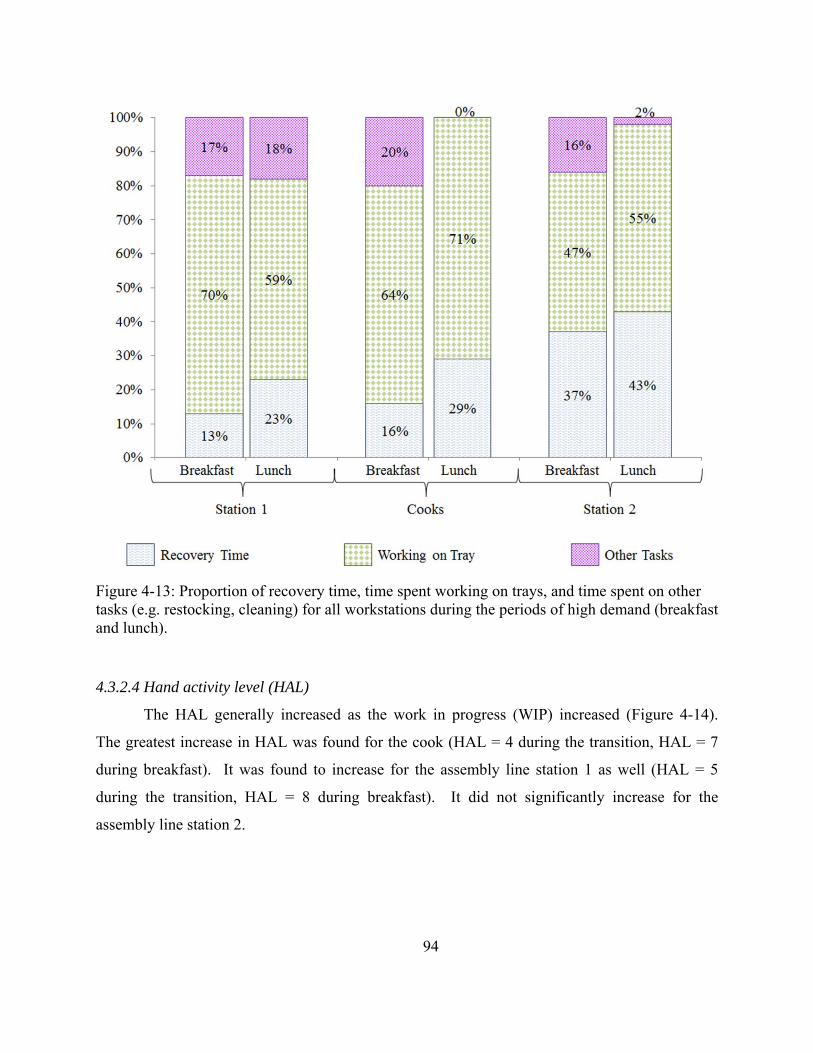
94
Figure 4-13: Proportion of recovery time, time spent working on trays, and time spent on other tasks (e.g. restocking, cleaning) for all workstations during the periods of high demand (breakfast and lunch).
4.3.2.4 Hand activity level (HAL)
The HAL generally increased as the work in progress (WIP) increased (Figure 4-14).
The greatest increase in HAL was found for the cook (HAL = 4 during the transition, HAL = 7
during breakfast). It was found to increase for the assembly line station 1 as well (HAL = 5
during the transition, HAL = 8 during breakfast). It did not significantly increase for the
assembly line station 2.
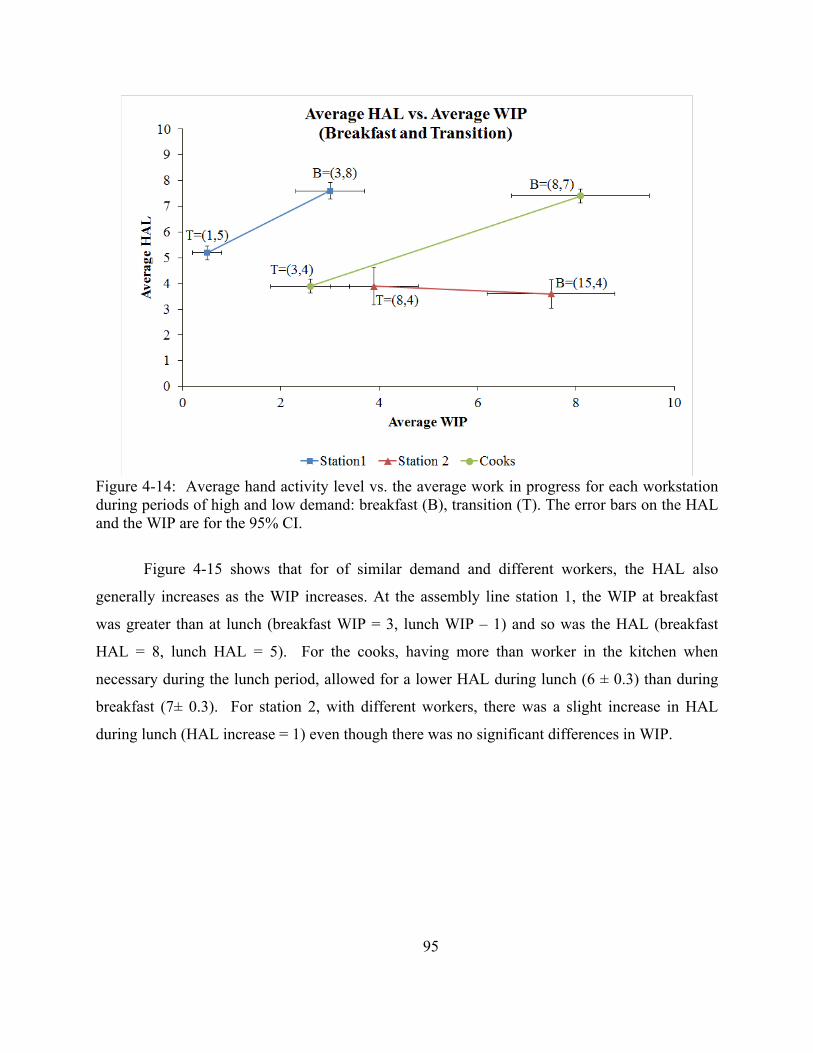
95
Figure 4-14: Average hand activity level vs. the average work in progress for each workstation during periods of high and low demand: breakfast (B), transition (T). The error bars on the HAL and the WIP are for the 95% CI.
Figure 4-15 shows that for of similar demand and different workers, the HAL also
generally increases as the WIP increases. At the assembly line station 1, the WIP at breakfast
was greater than at lunch (breakfast WIP = 3, lunch WIP – 1) and so was the HAL (breakfast
HAL = 8, lunch HAL = 5). For the cooks, having more than worker in the kitchen when
necessary during the lunch period, allowed for a lower HAL during lunch (6 ± 0.3) than during
breakfast (7± 0.3). For station 2, with different workers, there was a slight increase in HAL
during lunch (HAL increase = 1) even though there was no significant differences in WIP.
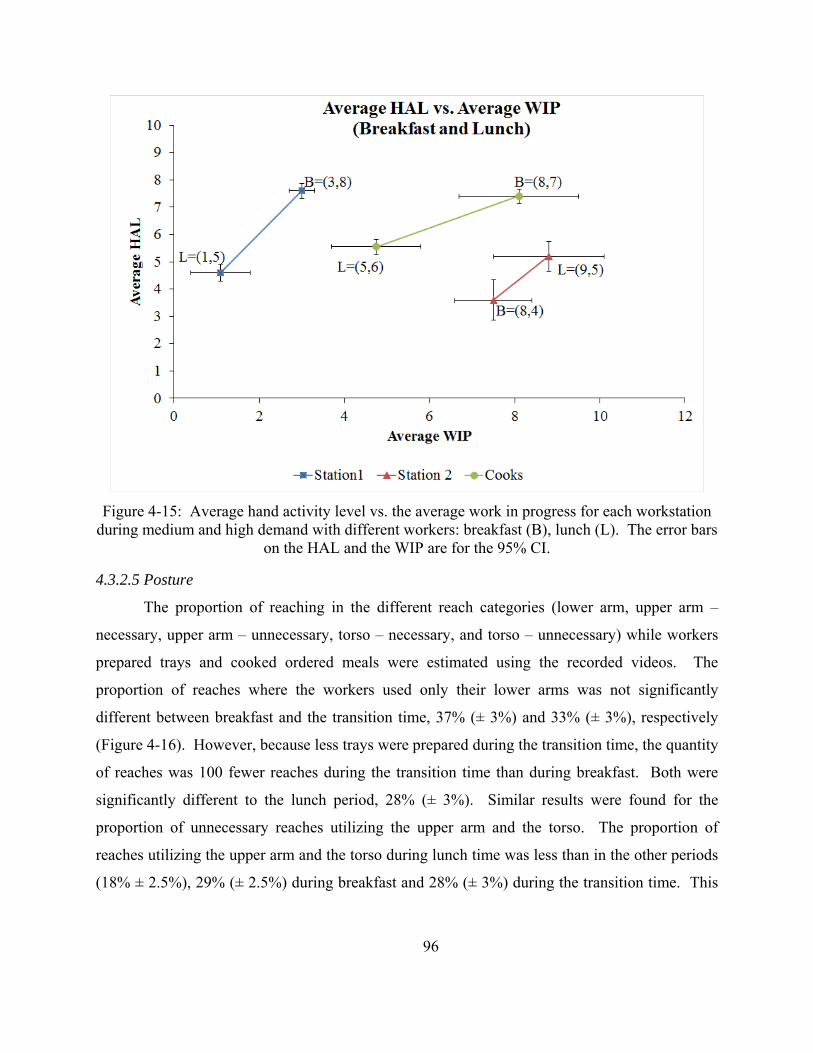
96
Figure 4-15: Average hand activity level vs. the average work in progress for each workstation
during medium and high demand with different workers: breakfast (B), lunch (L). The error bars on the HAL and the WIP are for the 95% CI.
4.3.2.5 Posture
The proportion of reaching in the different reach categories (lower arm, upper arm –
necessary, upper arm – unnecessary, torso – necessary, and torso – unnecessary) while workers
prepared trays and cooked ordered meals were estimated using the recorded videos. The
proportion of reaches where the workers used only their lower arms was not significantly
different between breakfast and the transition time, 37% (± 3%) and 33% (± 3%), respectively
(Figure 4-16). However, because less trays were prepared during the transition time, the quantity
of reaches was 100 fewer reaches during the transition time than during breakfast. Both were
significantly different to the lunch period, 28% (± 3%). Similar results were found for the
proportion of unnecessary reaches utilizing the upper arm and the torso. The proportion of
reaches utilizing the upper arm and the torso during lunch time was less than in the other periods
(18% ± 2.5%), 29% (± 2.5%) during breakfast and 28% (± 3%) during the transition time. This
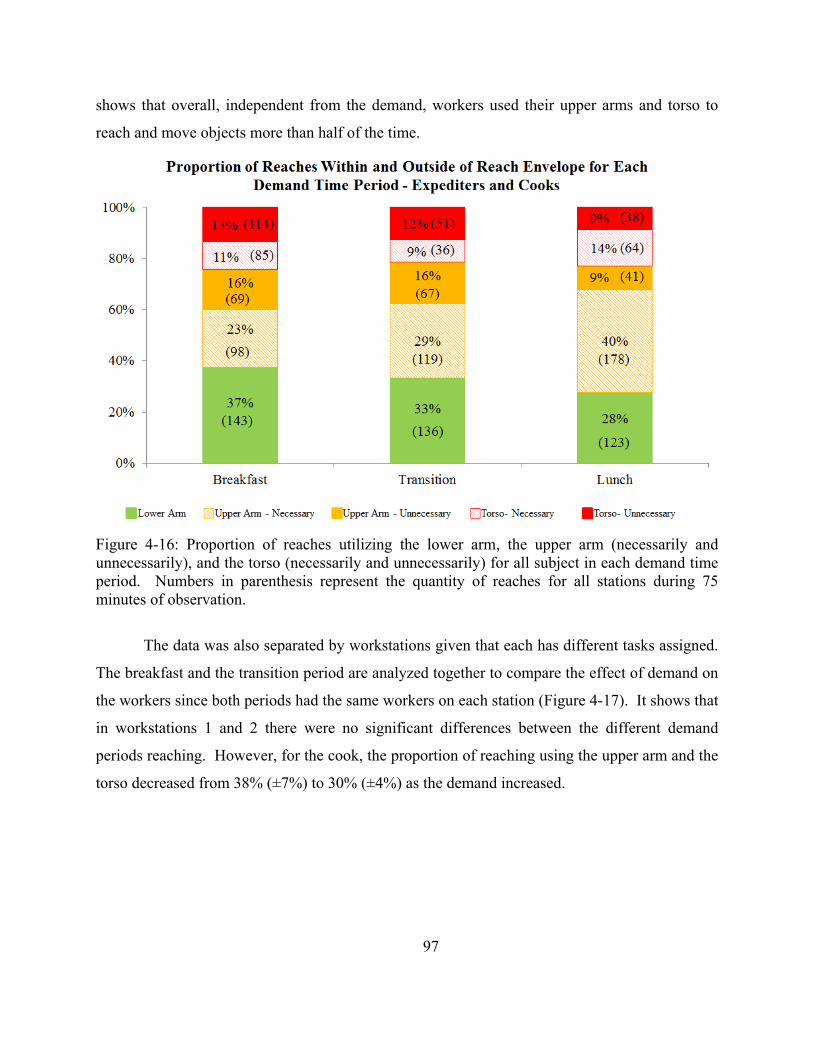
97
shows that overall, independent from the demand, workers used their upper arms and torso to
reach and move objects more than half of the time.
Figure 4-16: Proportion of reaches utilizing the lower arm, the upper arm (necessarily and unnecessarily), and the torso (necessarily and unnecessarily) for all subject in each demand time period. Numbers in parenthesis represent the quantity of reaches for all stations during 75 minutes of observation.
The data was also separated by workstations given that each has different tasks assigned.
The breakfast and the transition period are analyzed together to compare the effect of demand on
the workers since both periods had the same workers on each station (Figure 4-17). It shows that
in workstations 1 and 2 there were no significant differences between the different demand
periods reaching. However, for the cook, the proportion of reaching using the upper arm and the
torso decreased from 38% (±7%) to 30% (±4%) as the demand increased.
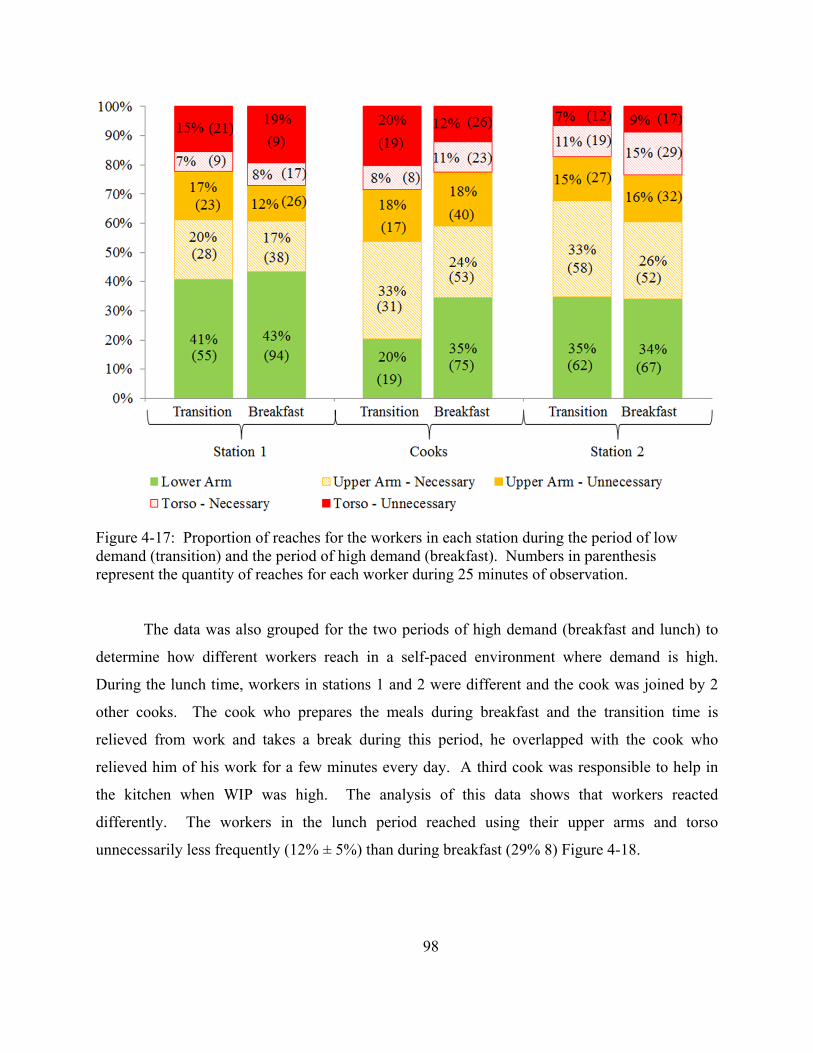
98
Figure 4-17: Proportion of reaches for the workers in each station during the period of low demand (transition) and the period of high demand (breakfast). Numbers in parenthesis represent the quantity of reaches for each worker during 25 minutes of observation.
The data was also grouped for the two periods of high demand (breakfast and lunch) to
determine how different workers reach in a self-paced environment where demand is high.
During the lunch time, workers in stations 1 and 2 were different and the cook was joined by 2
other cooks. The cook who prepares the meals during breakfast and the transition time is
relieved from work and takes a break during this period, he overlapped with the cook who
relieved him of his work for a few minutes every day. A third cook was responsible to help in
the kitchen when WIP was high. The analysis of this data shows that workers reacted
differently. The workers in the lunch period reached using their upper arms and torso
unnecessarily less frequently (12% ± 5%) than during breakfast (29% 8) Figure 4-18.
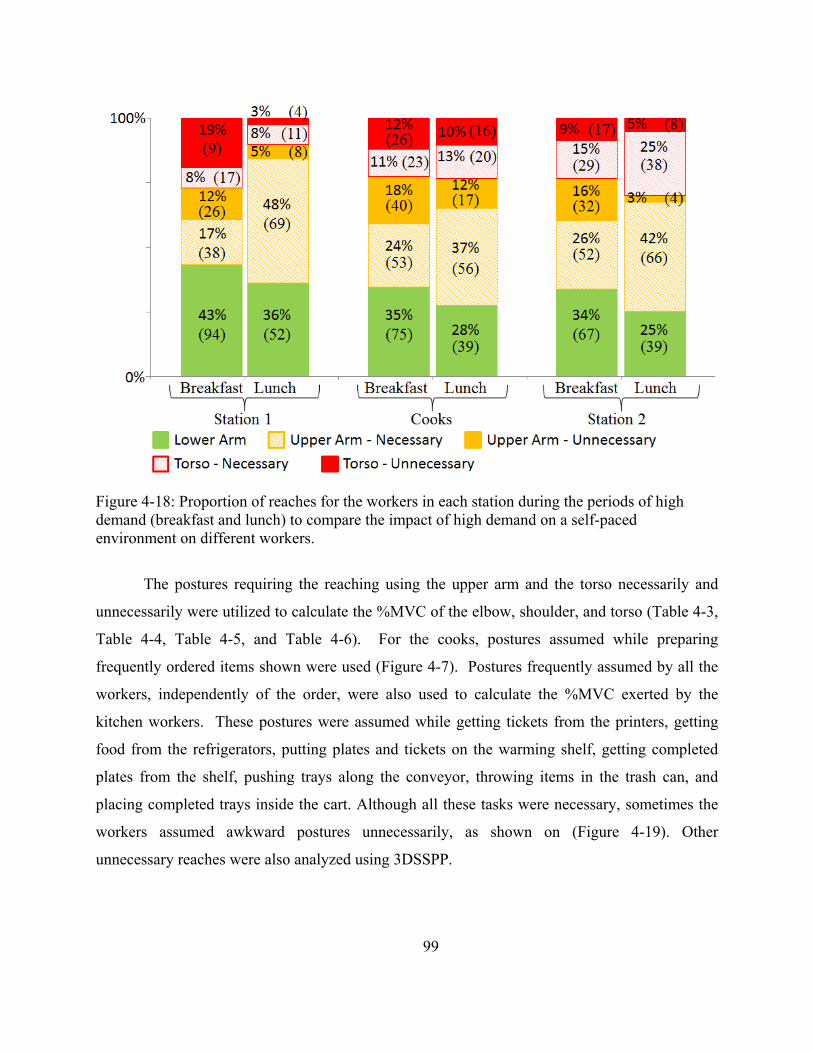
99
Figure 4-18: Proportion of reaches for the workers in each station during the periods of high demand (breakfast and lunch) to compare the impact of high demand on a self-paced environment on different workers.
The postures requiring the reaching using the upper arm and the torso necessarily and
unnecessarily were utilized to calculate the %MVC of the elbow, shoulder, and torso (Table 4-3,
Table 4-4, Table 4-5, and Table 4-6). For the cooks, postures assumed while preparing
frequently ordered items shown were used (Figure 4-7). Postures frequently assumed by all the
workers, independently of the order, were also used to calculate the %MVC exerted by the
kitchen workers. These postures were assumed while getting tickets from the printers, getting
food from the refrigerators, putting plates and tickets on the warming shelf, getting completed
plates from the shelf, pushing trays along the conveyor, throwing items in the trash can, and
placing completed trays inside the cart. Although all these tasks were necessary, sometimes the
workers assumed awkward postures unnecessarily, as shown on (Figure 4-19). Other
unnecessary reaches were also analyzed using 3DSSPP.
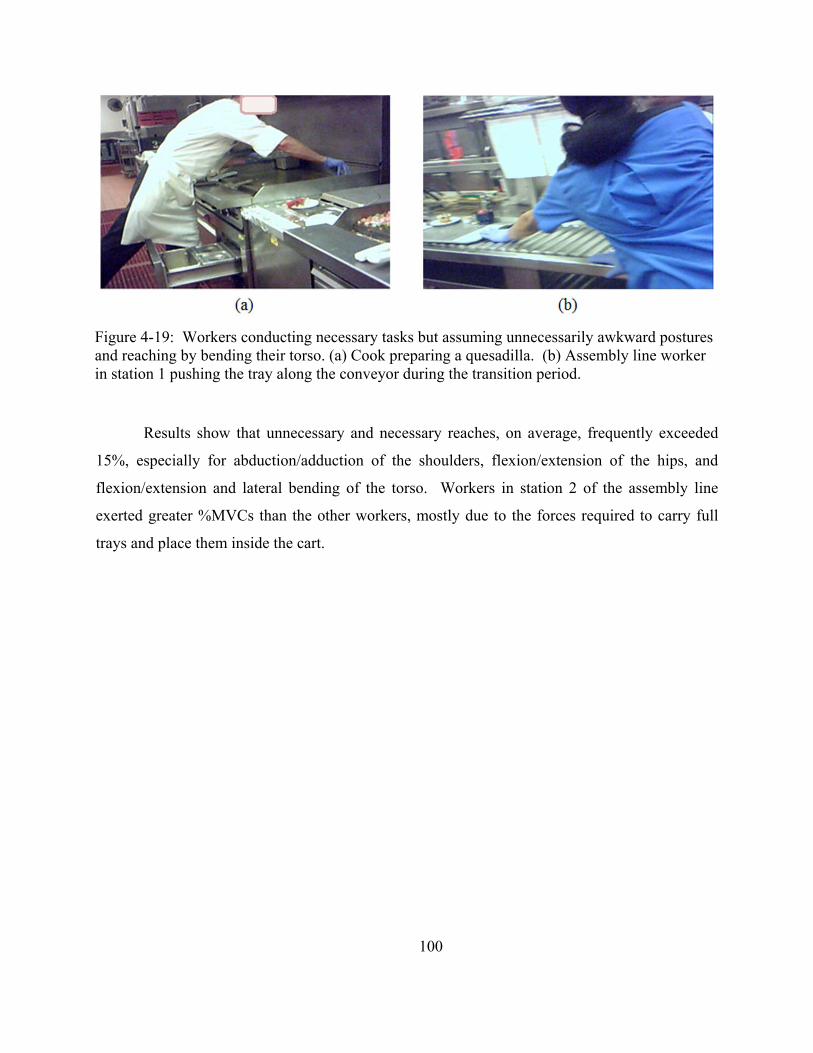
100
Results show that unnecessary and necessary reaches, on average, frequently exceeded
15%, especially for abduction/adduction of the shoulders, flexion/extension of the hips, and
flexion/extension and lateral bending of the torso. Workers in station 2 of the assembly line
exerted greater %MVCs than the other workers, mostly due to the forces required to carry full
trays and place them inside the cart.
Figure 4-19: Workers conducting necessary tasks but assuming unnecessarily awkward postures and reaching by bending their torso. (a) Cook preparing a quesadilla. (b) Assembly line worker in station 1 pushing the tray along the conveyor during the transition period.
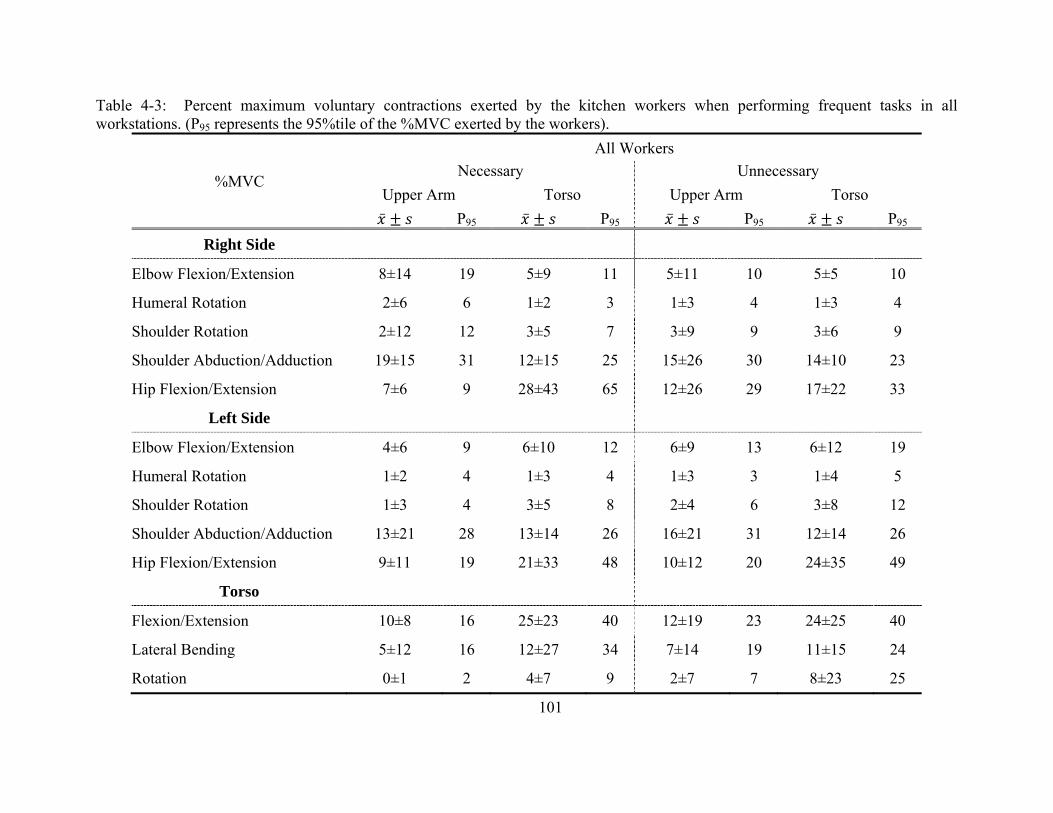
101
Table 4-3: Percent maximum voluntary contractions exerted by the kitchen workers when performing frequent tasks in all workstations. (P95 represents the 95%tile of the %MVC exerted by the workers).
%MVC
All Workers Necessary Unnecessary
Upper Arm Torso Upper Arm Torso P95 P95 P95 P95
Right Side
Elbow Flexion/Extension 8±14 19 5±9 11 5±11 10 5±5 10
Humeral Rotation 2±6 6 1±2 3 1±3 4 1±3 4
Shoulder Rotation 2±12 12 3±5 7 3±9 9 3±6 9
Shoulder Abduction/Adduction 19±15 31 12±15 25 15±26 30 14±10 23
Hip Flexion/Extension 7±6 9 28±43 65 12±26 29 17±22 33
Left Side
Elbow Flexion/Extension 4±6 9 6±10 12 6±9 13 6±12 19
Humeral Rotation 1±2 4 1±3 4 1±3 3 1±4 5
Shoulder Rotation 1±3 4 3±5 8 2±4 6 3±8 12
Shoulder Abduction/Adduction 13±21 28 13±14 26 16±21 31 12±14 26
Hip Flexion/Extension 9±11 19 21±33 48 10±12 20 24±35 49
Torso
Flexion/Extension 10±8 16 25±23 40 12±19 23 24±25 40
Lateral Bending 5±12 16 12±27 34 7±14 19 11±15 24
Rotation 0±1 2 4±7 9 2±7 7 8±23 25
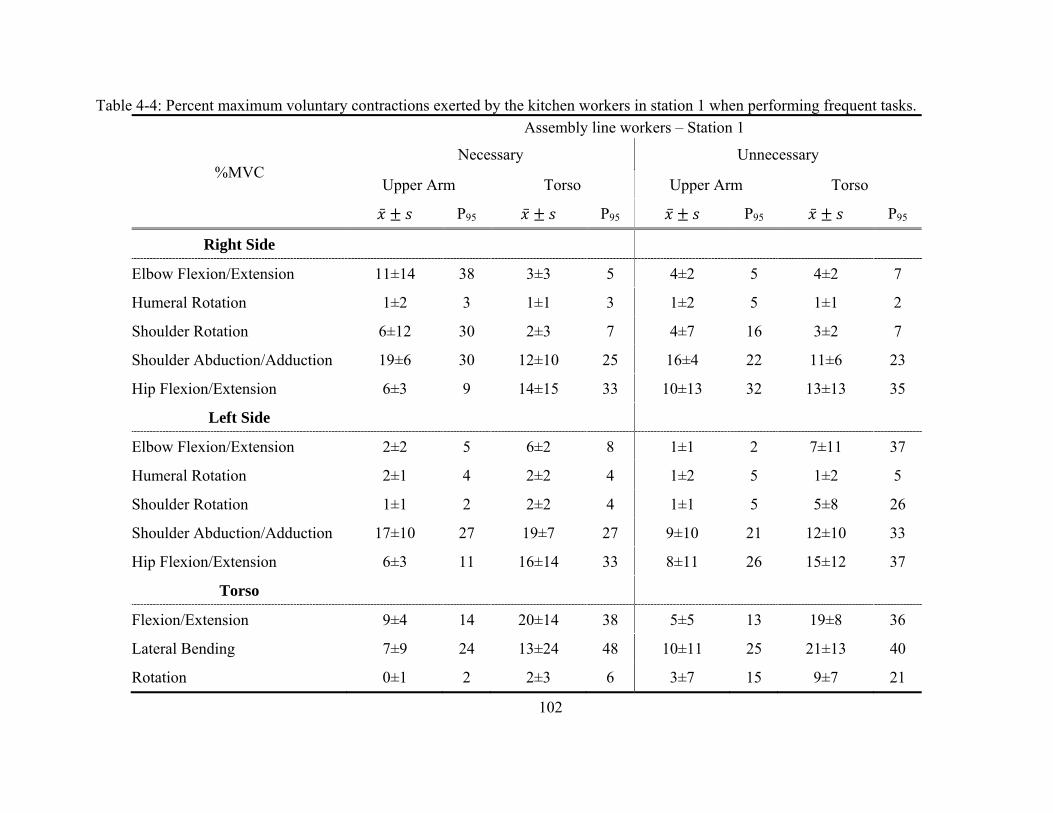
102
Table 4-4: Percent maximum voluntary contractions exerted by the kitchen workers in station 1 when performing frequent tasks.
%MVC
Assembly line workers – Station 1
Necessary Unnecessary
Upper Arm Torso Upper Arm Torso
P95 P95 P95 P95
Right Side
Elbow Flexion/Extension 11±14 38 3±3 5 4±2 5 4±2 7
Humeral Rotation 1±2 3 1±1 3 1±2 5 1±1 2
Shoulder Rotation 6±12 30 2±3 7 4±7 16 3±2 7
Shoulder Abduction/Adduction 19±6 30 12±10 25 16±4 22 11±6 23
Hip Flexion/Extension 6±3 9 14±15 33 10±13 32 13±13 35
Left Side
Elbow Flexion/Extension 2±2 5 6±2 8 1±1 2 7±11 37
Humeral Rotation 2±1 4 2±2 4 1±2 5 1±2 5
Shoulder Rotation 1±1 2 2±2 4 1±1 5 5±8 26
Shoulder Abduction/Adduction 17±10 27 19±7 27 9±10 21 12±10 33
Hip Flexion/Extension 6±3 11 16±14 33 8±11 26 15±12 37
Torso
Flexion/Extension 9±4 14 20±14 38 5±5 13 19±8 36
Lateral Bending 7±9 24 13±24 48 10±11 25 21±13 40
Rotation 0±1 2 2±3 6 3±7 15 9±7 21
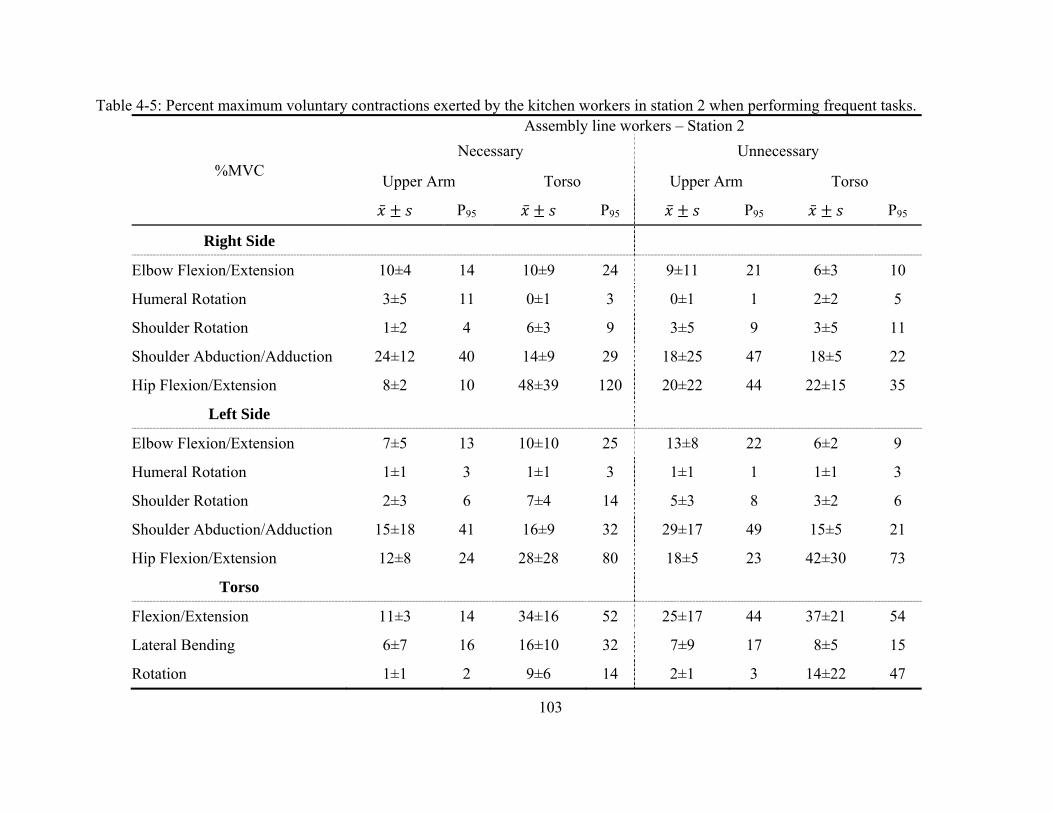
103
Table 4-5: Percent maximum voluntary contractions exerted by the kitchen workers in station 2 when performing frequent tasks.
%MVC
Assembly line workers – Station 2 Necessary Unnecessary
Upper Arm Torso Upper Arm Torso
P95 P95 P95 P95
Right Side
Elbow Flexion/Extension 10±4 14 10±9 24 9±11 21 6±3 10
Humeral Rotation 3±5 11 0±1 3 0±1 1 2±2 5
Shoulder Rotation 1±2 4 6±3 9 3±5 9 3±5 11
Shoulder Abduction/Adduction 24±12 40 14±9 29 18±25 47 18±5 22
Hip Flexion/Extension 8±2 10 48±39 120 20±22 44 22±15 35
Left Side
Elbow Flexion/Extension 7±5 13 10±10 25 13±8 22 6±2 9
Humeral Rotation 1±1 3 1±1 3 1±1 1 1±1 3
Shoulder Rotation 2±3 6 7±4 14 5±3 8 3±2 6
Shoulder Abduction/Adduction 15±18 41 16±9 32 29±17 49 15±5 21
Hip Flexion/Extension 12±8 24 28±28 80 18±5 23 42±30 73
Torso
Flexion/Extension 11±3 14 34±16 52 25±17 44 37±21 54
Lateral Bending 6±7 16 16±10 32 7±9 17 8±5 15
Rotation 1±1 2 9±6 14 2±1 3 14±22 47
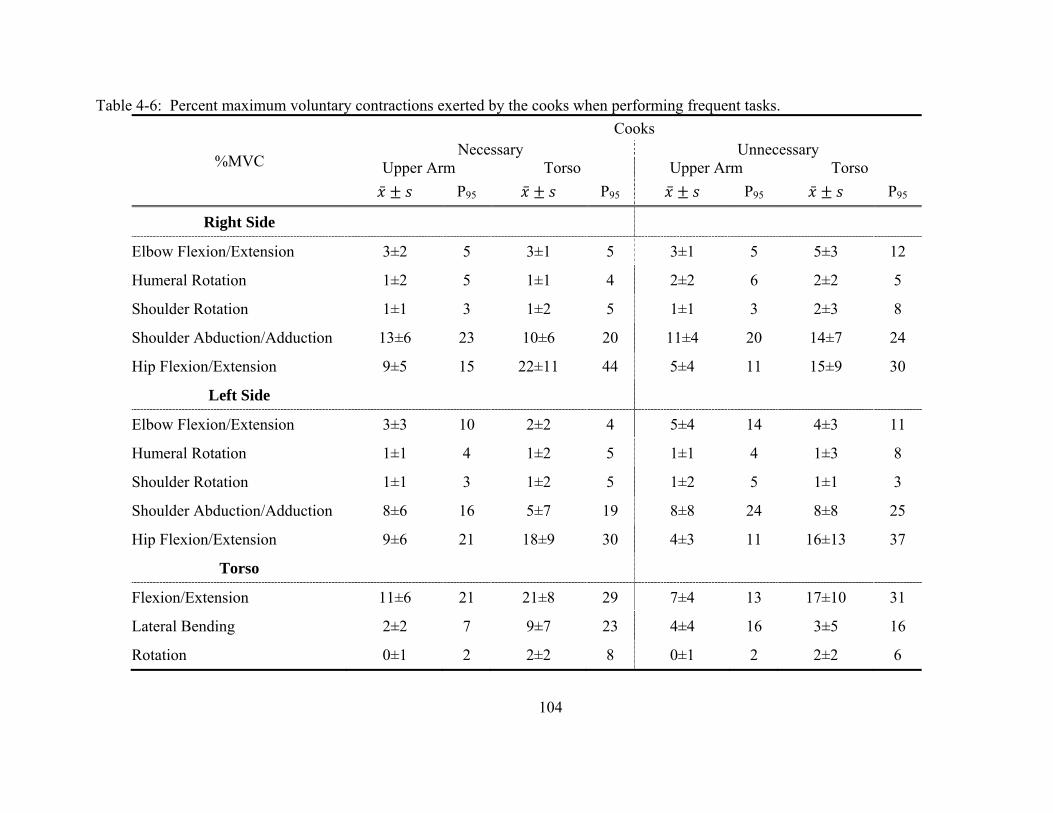
104
Table 4-6: Percent maximum voluntary contractions exerted by the cooks when performing frequent tasks.
%MVC
Cooks Necessary Unnecessary
Upper Arm Torso Upper Arm Torso P95 P95 P95 P95
Right Side
Elbow Flexion/Extension 3±2 5 3±1 5 3±1 5 5±3 12
Humeral Rotation 1±2 5 1±1 4 2±2 6 2±2 5
Shoulder Rotation 1±1 3 1±2 5 1±1 3 2±3 8
Shoulder Abduction/Adduction 13±6 23 10±6 20 11±4 20 14±7 24
Hip Flexion/Extension 9±5 15 22±11 44 5±4 11 15±9 30
Left Side
Elbow Flexion/Extension 3±3 10 2±2 4 5±4 14 4±3 11
Humeral Rotation 1±1 4 1±2 5 1±1 4 1±3 8
Shoulder Rotation 1±1 3 1±2 5 1±2 5 1±1 3
Shoulder Abduction/Adduction 8±6 16 5±7 19 8±8 24 8±8 25
Hip Flexion/Extension 9±6 21 18±9 30 4±3 11 16±13 37
Torso
Flexion/Extension 11±6 21 21±8 29 7±4 13 17±10 31
Lateral Bending 2±2 7 9±7 23 4±4 16 3±5 16
Rotation 0±1 2 2±2 8 0±1 2 2±2 6
105
4.4 Discussion
Results show there are significant differences in recovery time (Figure 4-11, Figure 4-12,
and Figure 4-13) and hand activity level (HAL) (Figure 4-14, Figure 4-15) when customer
demand is low versus high. Changes in posture (unnecessary reaches) were more related to
worker preference than with demand (Figure 4-16, Figure 4-17, and Figure 4-18).
4.4.1 Recovery time
As seen on Figure 4-12, worker recovery time decreased with an increase in customer
demand and work in progress (WIP). In Figure 4-12 and Figure 4-13, it can be seen that
workstation 2 on the cold side of the kitchen had the greatest amount of recovery time during all
work periods, independent of the worker (breakfast = 37%, transition = 53%, lunch = 43%).
This workstation is afforded greater recovery time because 94% of the trays include an item
prepared by the cooks, leaving this station starved of materials to complete the job.
For the workers in station 1, breakfast time had the least amount of recovery time (13%).
The tasks these workers had to complete did not differ greatly in type or quantity by meal time,
and because these workers did not have to wait for the cooks, as long as the conveyor was not
full, they were able to complete their jobs quickly and maintain a low WIP (3 tray during
breakfast, 1 trays during lunch) even if the demand was similar (breakfast = 0.6 orders/min,
lunch 0.7 orders/min). The recovery time was not significantly different between the transition
time (22% ± 6%) and the lunch time (23% ± 6%). It may be possible that the increase in
recovery time during lunch was due to worker preference and capabilities. The worker during
breakfast was younger (21 vs 65), less heavy (546.8N vs 769.3N), and was observed moving at a
quicker pace (lunch average HAL = 5.2 ± 0.5 vs breakfast average HAL = 7.6 ± 0.3). The lower
pace provided the worker during the lunch period with more frequent and short breaks.
In the hot side of the kitchen, adding a cook during lunch allowed the cooks to have time
to recover while the meals are cooking, even when the conveyor on the cold side was full (WIP
>10) and the proportion of work time (Figure 4-13) increased. The proportion of work increased
for the cooks (lunch – 71%, breakfast – 20%) due to an increase in peripheral and fundamental
106
variety of the meals offered at that time of the day. More types of meal increased time spent
moving ingredients from different parts of the kitchen to the cooking equipment (ovens, flat tops,
grill, etc.) (Figure 4-8 and Figure 4-9). The time spent walking to get these ingredients and tools
(12% during lunch, 10% during breakfast) also served as recovery time for the hands.
An increase in tray work time was also observed in station 2 (47% during breakfast, 55%
during lunch) (Figure 4-13). The time spent working on trays increased due to this worker
completing her job ahead of time. She placed the required items on all trays in the conveyor
even if they were still near workstation 1. Choosing to do so required her to walk along the line
with objects in her hands. She also had, on average, 1 more item to place on the trays during
lunch than during breakfast.
This shows that even though self-pacing has been found to reduce recovery time (Chapter
3; Depsey, Mathiasen, Jackson, O’Brien, 2010), as long as sufficient workers are available to
cope with increases on customer demand and workers have to wait for process time (cooking),
workers may be able to have recovery time even if it decreases during periods of high demand.
4.4.2 Hand Activity Level
There was an overall change in hand activity level with each meal period (Figure 4-14) as
the WIP increased (Figure 4-15). It significantly decreased for the worker in station 1 and the
cooks between breakfast and the transition time (station 1 HAL decrease = 3, cook HAL
decrease = 3). Similar decreases in HAL were also observed in these two workstations between
the medium demand time (lunch) and the greatest demand time (breakfast) (station 1 HAL
decrease = 3, cook HAL decrease = 1) even though the workers during the lunch period were
different than the workers during breakfast. The worker in station 2 was not observed to
decrease her HAL even when the WIP decreased between breakfast and the transition time
because this worker still needed to wait for the meals to be prepared by the cooks and did not
need to increase her speed to complete her assigned tasks during breakfast. The HAL slightly
increased in this station during lunch (lunch = 5, breakfast and transition = 4) for the same reason
that the amount of time spent on a tray increased, this worker moved along the conveyor
completing the tasks ahead of time and had less breaks). Therefore, the HAL generally increased
as the WIP increased, but the effect varied greatly by worker preference.
107
4.4.3 Reaching
The proportion of reaching out of the reach envelope, necessarily and unnecessarily, did
not change significantly as the demand and WIP changed between breakfast and the transition
period (Figure 4-16) but it significantly increased during lunch time. The decrease in demand
during the transition time did not decrease the proportion of reaching out of the reach envelope
(although it decreased the total quantity by 222 reaches) for the workers in the tray assembly line
(Figure 4-17). However, the cook had an inverse response to the decrease in demand during the
transition time. His proportion of unnecessary torso reaches increased during the transition time
(breakfast – 12%, transition – 20%). During this time, the cook had a large amount of recovery
time (35%), most of it (70%) was rest (instead of walking), compared to breakfast when he had
16% recovery time, but only 12% of it was rest, the remaining time was spent walking. A
possible explanation for this behavior is that the worker, having the chance to rest his legs and
walk less, he preferred to increase his proportion of unnecessary reaches using his torso to reach
by 8%, especially because there were fewer reaches (217 reaches during breakfast and 94 during
the transition time).
During the periods of high demand, breakfast and lunch, a significant difference can be
seen between the two different groups of workers (Figure 4-18). The workers in the afternoon,
reached using their upper arm and torso unnecessarily less frequently than the workers who
prepared trays during breakfast. Because there were multiple cooks in the kitchen during lunch,
the quantity of reaches per worker was less than for the cook who prepared breakfast (lunch –
122, breakfast – 185). Although the proportion of unnecessary upper arm and torso reaches
during lunch was less than during breakfast, the proportion of necessary upper arm and torso
reaches increased. During lunch, the quantity of meals offered in the menu increased by 40
items that could be customized per patients’ request. The large variety of meals offered
increased the complexity in the kitchen. The layout must accommodate a large number of
ingredients, equipment, and tools in a small space to minimize non value add motions and time
required to complete the orders. This leads to products being located below the waistline
(requiring bending) and above the shoulder (requiring overhead work) and an increase in the
proportion of necessary reaches when working on fulfilling meal orders (Figure 4-20). For the
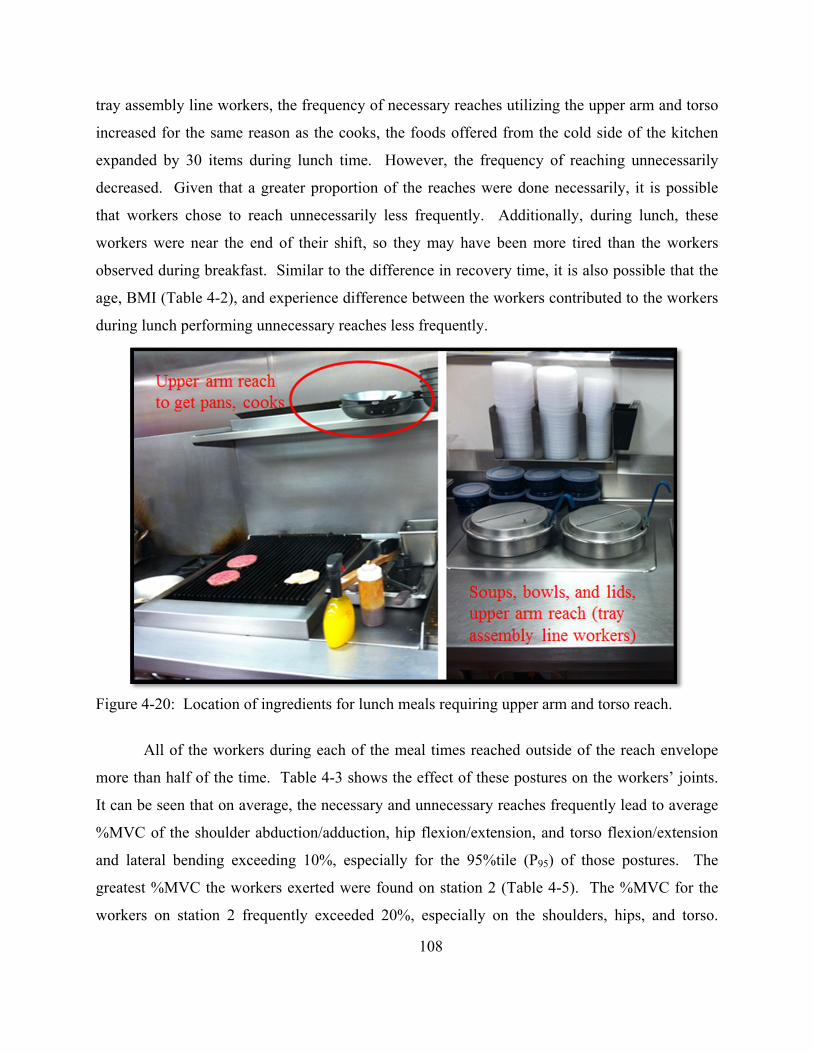
108
tray assembly line workers, the frequency of necessary reaches utilizing the upper arm and torso
increased for the same reason as the cooks, the foods offered from the cold side of the kitchen
expanded by 30 items during lunch time. However, the frequency of reaching unnecessarily
decreased. Given that a greater proportion of the reaches were done necessarily, it is possible
that workers chose to reach unnecessarily less frequently. Additionally, during lunch, these
workers were near the end of their shift, so they may have been more tired than the workers
observed during breakfast. Similar to the difference in recovery time, it is also possible that the
age, BMI (Table 4-2), and experience difference between the workers contributed to the workers
during lunch performing unnecessary reaches less frequently.
Figure 4-20: Location of ingredients for lunch meals requiring upper arm and torso reach.
All of the workers during each of the meal times reached outside of the reach envelope
more than half of the time. Table 4-3 shows the effect of these postures on the workers’ joints.
It can be seen that on average, the necessary and unnecessary reaches frequently lead to average
%MVC of the shoulder abduction/adduction, hip flexion/extension, and torso flexion/extension
and lateral bending exceeding 10%, especially for the 95%tile (P95) of those postures. The
greatest %MVC the workers exerted were found on station 2 (Table 4-5). The %MVC for the
workers on station 2 frequently exceeded 20%, especially on the shoulders, hips, and torso.
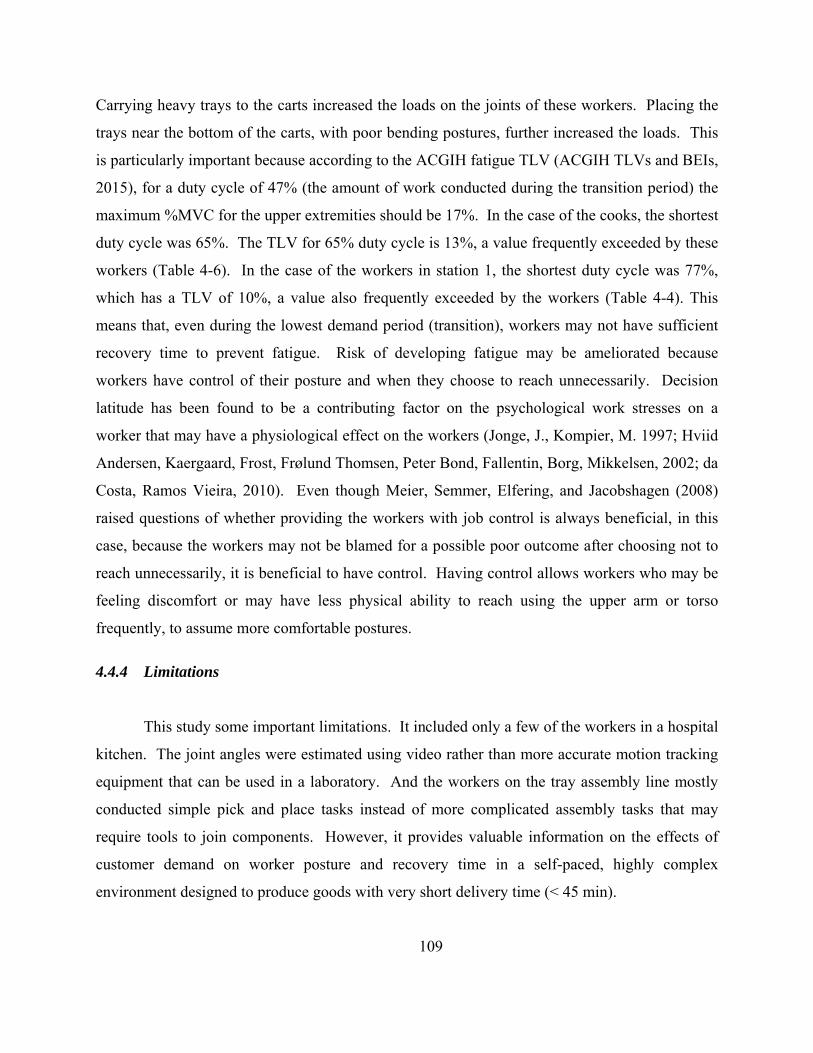
109
Carrying heavy trays to the carts increased the loads on the joints of these workers. Placing the
trays near the bottom of the carts, with poor bending postures, further increased the loads. This
is particularly important because according to the ACGIH fatigue TLV (ACGIH TLVs and BEIs,
2015), for a duty cycle of 47% (the amount of work conducted during the transition period) the
maximum %MVC for the upper extremities should be 17%. In the case of the cooks, the shortest
duty cycle was 65%. The TLV for 65% duty cycle is 13%, a value frequently exceeded by these
workers (Table 4-6). In the case of the workers in station 1, the shortest duty cycle was 77%,
which has a TLV of 10%, a value also frequently exceeded by the workers (Table 4-4). This
means that, even during the lowest demand period (transition), workers may not have sufficient
recovery time to prevent fatigue. Risk of developing fatigue may be ameliorated because
workers have control of their posture and when they choose to reach unnecessarily. Decision
latitude has been found to be a contributing factor on the psychological work stresses on a
worker that may have a physiological effect on the workers (Jonge, J., Kompier, M. 1997; Hviid
Andersen, Kaergaard, Frost, Frølund Thomsen, Peter Bond, Fallentin, Borg, Mikkelsen, 2002; da
Costa, Ramos Vieira, 2010). Even though Meier, Semmer, Elfering, and Jacobshagen (2008)
raised questions of whether providing the workers with job control is always beneficial, in this
case, because the workers may not be blamed for a possible poor outcome after choosing not to
reach unnecessarily, it is beneficial to have control. Having control allows workers who may be
feeling discomfort or may have less physical ability to reach using the upper arm or torso
frequently, to assume more comfortable postures.
4.4.4 Limitations
This study some important limitations. It included only a few of the workers in a hospital
kitchen. The joint angles were estimated using video rather than more accurate motion tracking
equipment that can be used in a laboratory. And the workers on the tray assembly line mostly
conducted simple pick and place tasks instead of more complicated assembly tasks that may
require tools to join components. However, it provides valuable information on the effects of
customer demand on worker posture and recovery time in a self-paced, highly complex
environment designed to produce goods with very short delivery time (< 45 min).
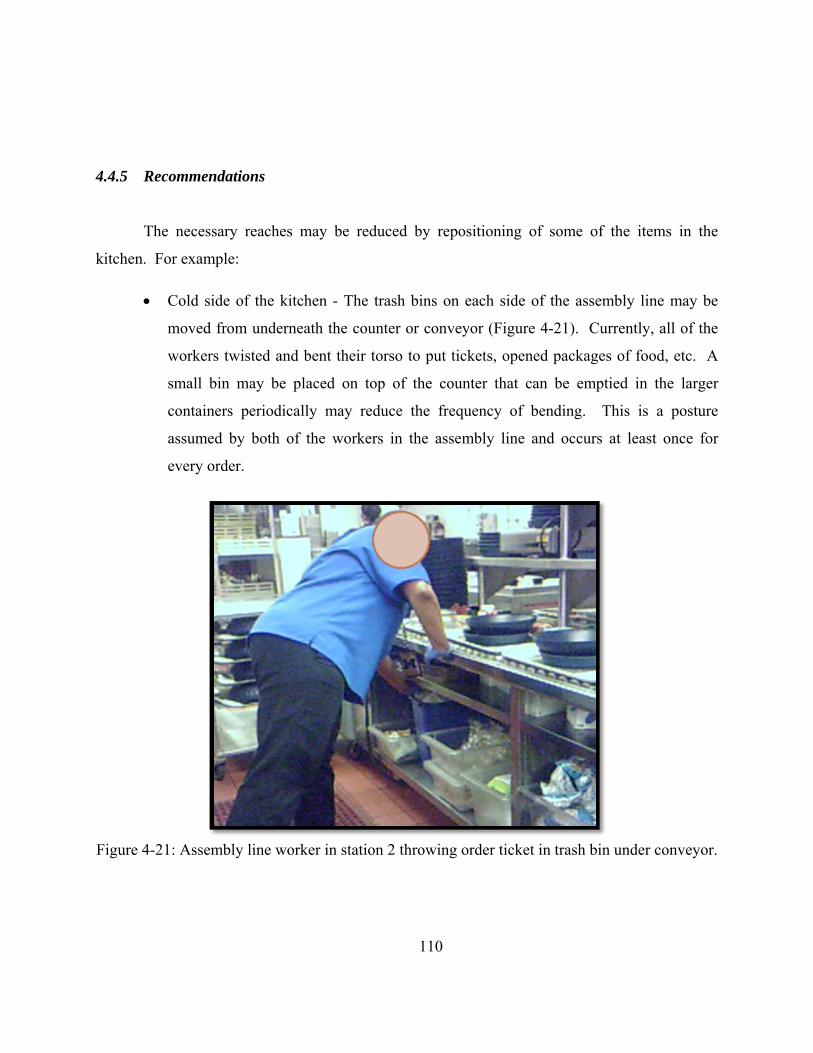
110
4.4.5 Recommendations
The necessary reaches may be reduced by repositioning of some of the items in the
kitchen. For example:
Cold side of the kitchen - The trash bins on each side of the assembly line may be
moved from underneath the counter or conveyor (Figure 4-21). Currently, all of the
workers twisted and bent their torso to put tickets, opened packages of food, etc. A
small bin may be placed on top of the counter that can be emptied in the larger
containers periodically may reduce the frequency of bending. This is a posture
assumed by both of the workers in the assembly line and occurs at least once for
every order.
Figure 4-21: Assembly line worker in station 2 throwing order ticket in trash bin under conveyor.
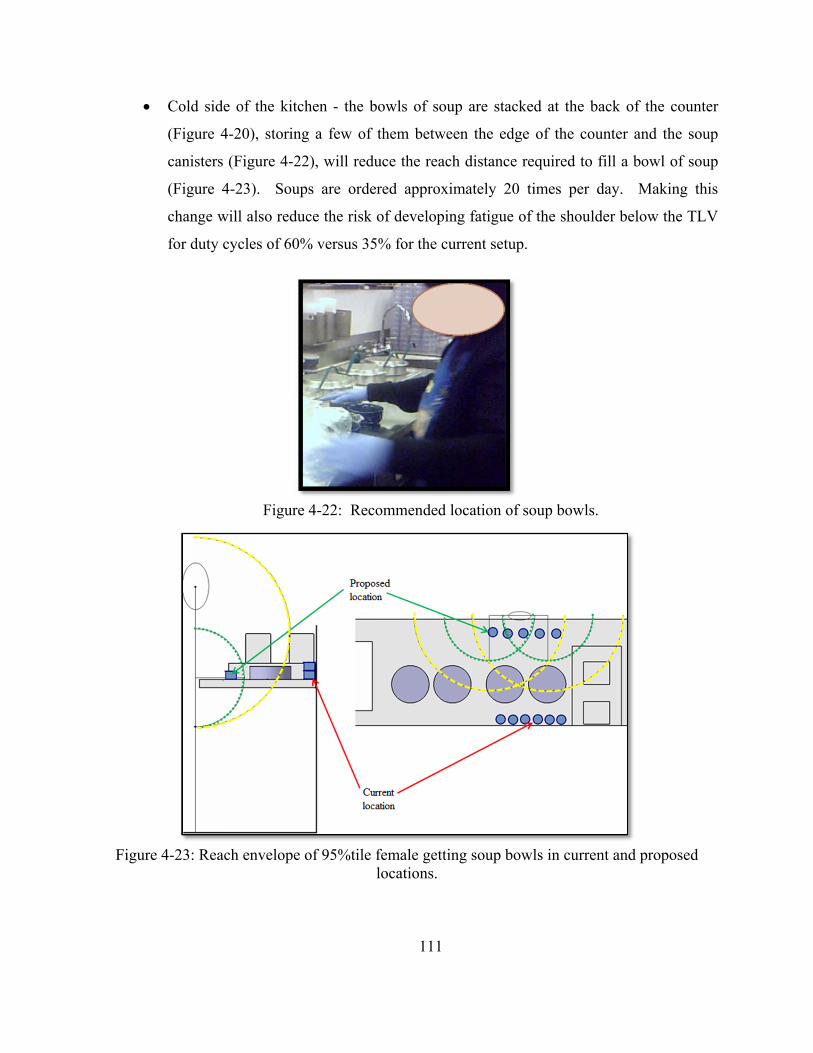
111
Cold side of the kitchen - the bowls of soup are stacked at the back of the counter
(Figure 4-20), storing a few of them between the edge of the counter and the soup
canisters (Figure 4-22), will reduce the reach distance required to fill a bowl of soup
(Figure 4-23). Soups are ordered approximately 20 times per day. Making this
change will also reduce the risk of developing fatigue of the shoulder below the TLV
for duty cycles of 60% versus 35% for the current setup.
Figure 4-22: Recommended location of soup bowls.
Figure 4-23: Reach envelope of 95%tile female getting soup bowls in current and proposed
locations.
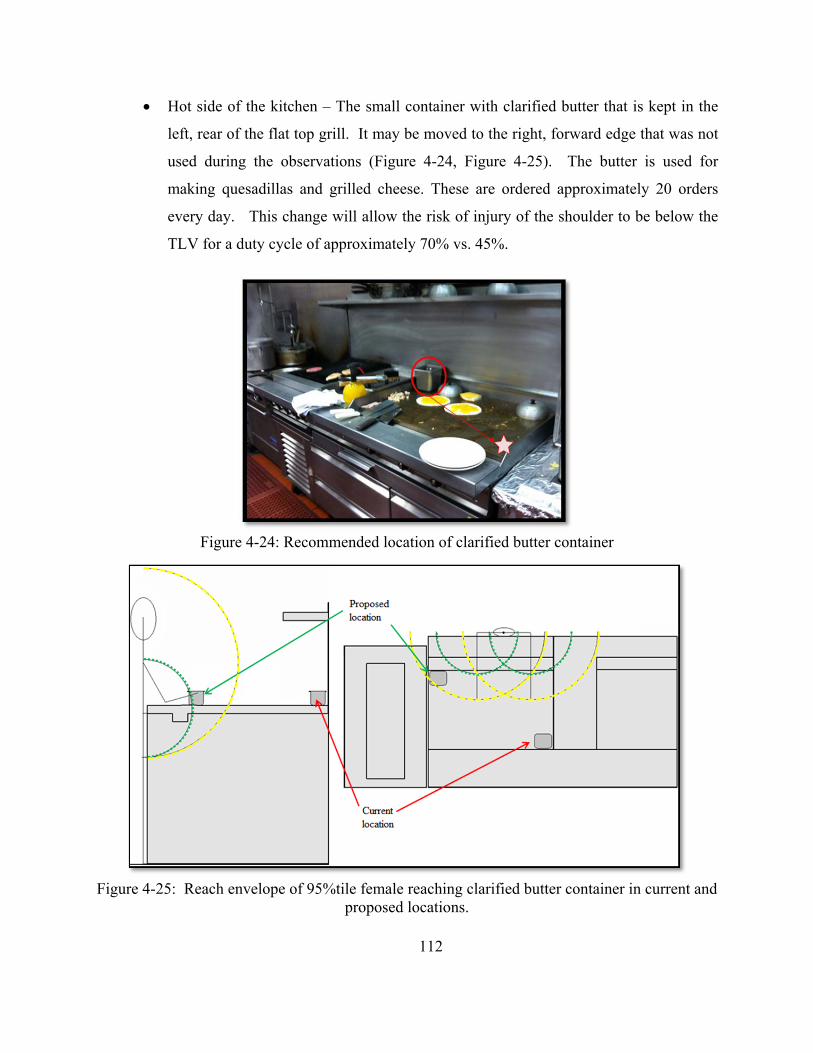
112
Hot side of the kitchen – The small container with clarified butter that is kept in the
left, rear of the flat top grill. It may be moved to the right, forward edge that was not
used during the observations (Figure 4-24, Figure 4-25). The butter is used for
making quesadillas and grilled cheese. These are ordered approximately 20 orders
every day. This change will allow the risk of injury of the shoulder to be below the
TLV for a duty cycle of approximately 70% vs. 45%.
Figure 4-24: Recommended location of clarified butter container
Figure 4-25: Reach envelope of 95%tile female reaching clarified butter container in current and
proposed locations.
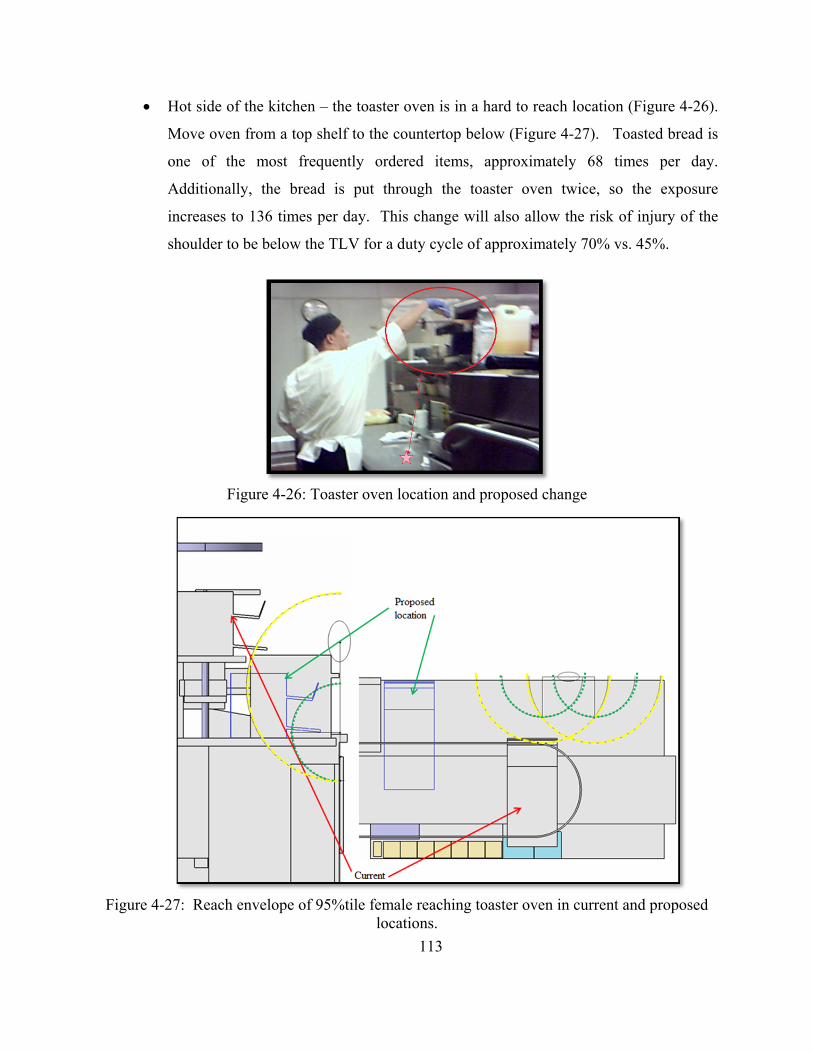
113
Hot side of the kitchen – the toaster oven is in a hard to reach location (Figure 4-26).
Move oven from a top shelf to the countertop below (Figure 4-27). Toasted bread is
one of the most frequently ordered items, approximately 68 times per day.
Additionally, the bread is put through the toaster oven twice, so the exposure
increases to 136 times per day. This change will also allow the risk of injury of the
shoulder to be below the TLV for a duty cycle of approximately 70% vs. 45%.
Figure 4-26: Toaster oven location and proposed change
Figure 4-27: Reach envelope of 95%tile female reaching toaster oven in current and proposed
locations.
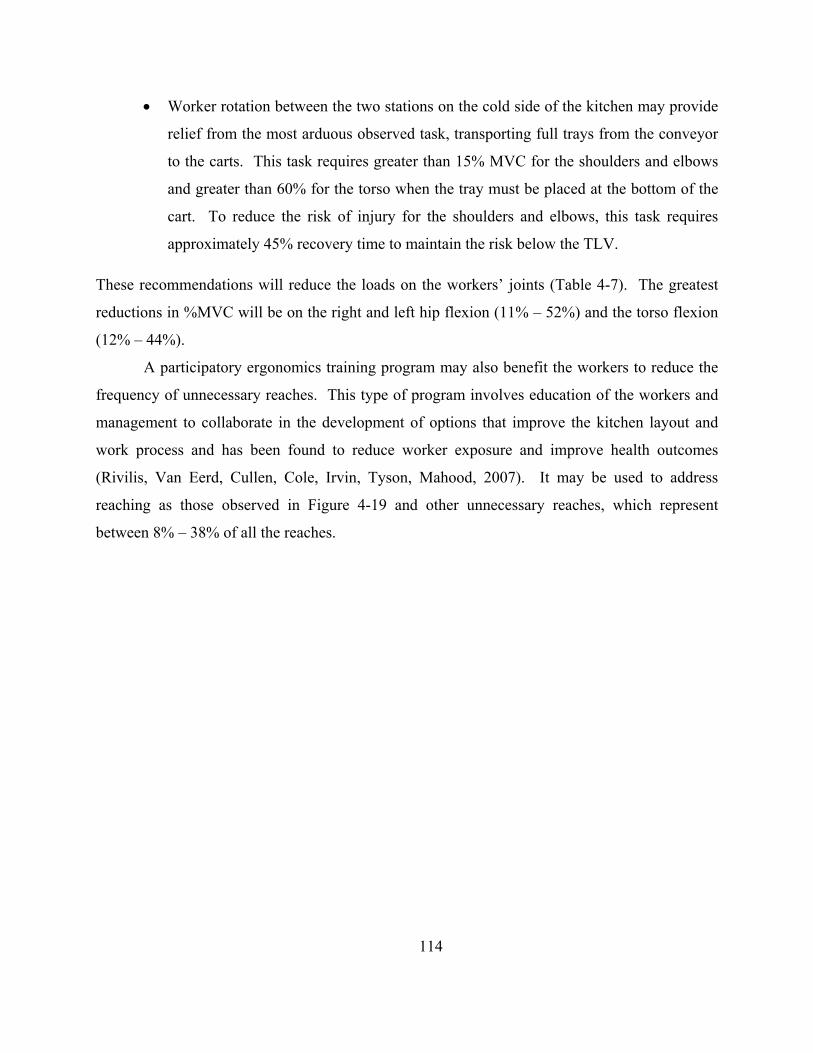
114
Worker rotation between the two stations on the cold side of the kitchen may provide
relief from the most arduous observed task, transporting full trays from the conveyor
to the carts. This task requires greater than 15% MVC for the shoulders and elbows
and greater than 60% for the torso when the tray must be placed at the bottom of the
cart. To reduce the risk of injury for the shoulders and elbows, this task requires
approximately 45% recovery time to maintain the risk below the TLV.
These recommendations will reduce the loads on the workers’ joints (Table 4-7). The greatest
reductions in %MVC will be on the right and left hip flexion (11% – 52%) and the torso flexion
(12% – 44%).
A participatory ergonomics training program may also benefit the workers to reduce the
frequency of unnecessary reaches. This type of program involves education of the workers and
management to collaborate in the development of options that improve the kitchen layout and
work process and has been found to reduce worker exposure and improve health outcomes
(Rivilis, Van Eerd, Cullen, Cole, Irvin, Tyson, Mahood, 2007). It may be used to address
reaching as those observed in Figure 4-19 and other unnecessary reaches, which represent
between 8% – 38% of all the reaches.
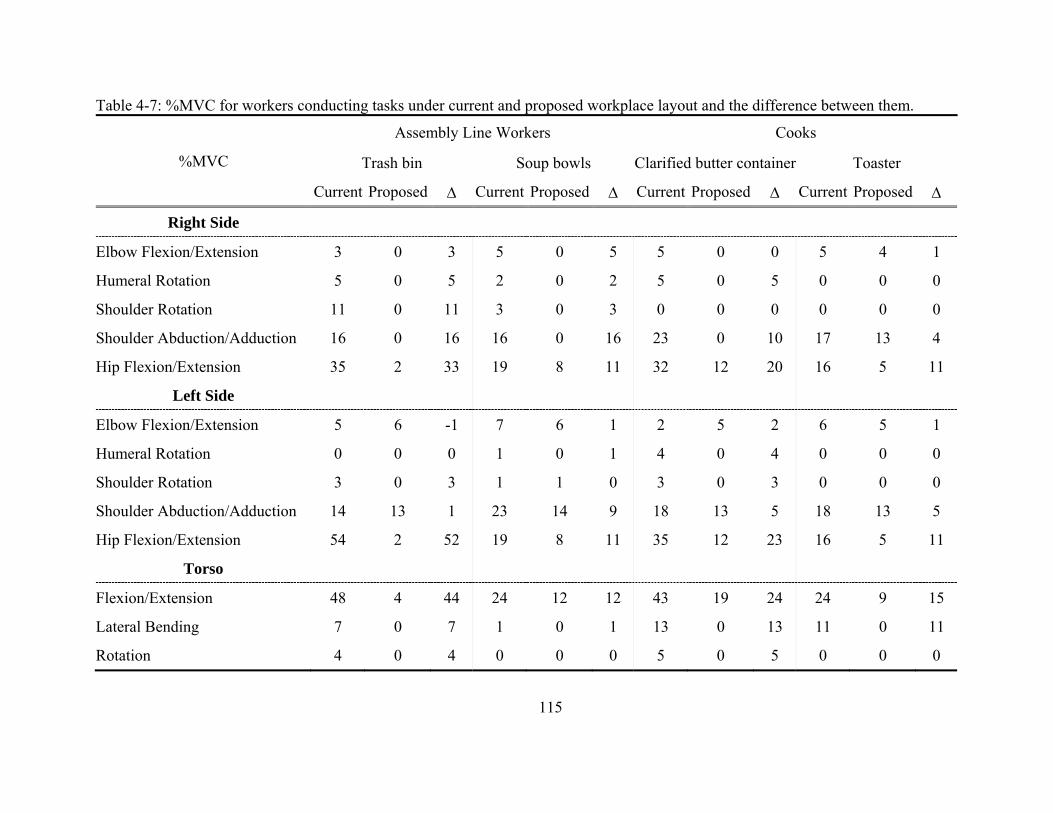
115
Table 4-7: %MVC for workers conducting tasks under current and proposed workplace layout and the difference between them.
%MVC
Assembly Line Workers Cooks
Trash bin Soup bowls Clarified butter container Toaster
Current Proposed Current Proposed Current Proposed Current Proposed
Right Side
Elbow Flexion/Extension 3 0 3 5 0 5 5 0 0 5 4 1
Humeral Rotation 5 0 5 2 0 2 5 0 5 0 0 0
Shoulder Rotation 11 0 11 3 0 3 0 0 0 0 0 0
Shoulder Abduction/Adduction 16 0 16 16 0 16 23 0 10 17 13 4
Hip Flexion/Extension 35 2 33 19 8 11 32 12 20 16 5 11
Left Side
Elbow Flexion/Extension 5 6 -1 7 6 1 2 5 2 6 5 1
Humeral Rotation 0 0 0 1 0 1 4 0 4 0 0 0
Shoulder Rotation 3 0 3 1 1 0 3 0 3 0 0 0
Shoulder Abduction/Adduction 14 13 1 23 14 9 18 13 5 18 13 5
Hip Flexion/Extension 54 2 52 19 8 11 35 12 23 16 5 11
Torso
Flexion/Extension 48 4 44 24 12 12 43 19 24 24 9 15
Lateral Bending 7 0 7 1 0 1 13 0 13 11 0 11
Rotation 4 0 4 0 0 0 5 0 5 0 0 0
116
4.5 Conclusion
The benefits and drawbacks of self-pacing assembly lines have been debated for many
years (Conrad, 1954, 1955; Davis, 1966; Lin, Drury, Kim, 2001; McGorry, Dempsey, O’Brien,
2004; Mathiassen, Visser, Looze, Dieën, 2011; Bosh, Mathiassen, Visser, de Looze, van Dieën,
2011) and the study in Chapter 3 suggested that it may reduce reaching but also recovery time.
In this study, a self-paced, mass customization assembly line, reaching unnecessarily still
occurred and workers had recovery time. Reaching was not significantly influenced by customer
demand or work in progress, but rather by worker preference. This demonstrates that while the
workers may complete their tasks more quickly (with a greater HAL) when demand increases,
they still have some control of their postures and may choose to reach unnecessarily if they feel
comfortable doing them. This provides them with control over some of their actions. The
workers, however, do not have decision latitude when conducting the necessary reaches.
Workers were also found to have time for recovery. Even though it decreased as
customer demand increased, all workers had greater than 10% recovery time during all observed
periods, partly due to the fact that process time (cooking) required them to wait. The loads
acting on their joints when assuming postures required for frequently done tasks have %MVCs
that may require greater amount of recovery time than what the workers had. Given that the
%MVC required for those reaches frequently exceed 10%, and the lack of control over some of
the reaches, changes to the kitchen layout that move frequently used items closer to the workers
(e.g. trash bins, toaster) may allow workers to reach outside the reach envelope less frequently.
In conclusion, customer demand in a self-paced, mass customization assembly line
affected the recovery time and the HAL, but not the worker posture. Workers’ frequency of
unnecessarily reaching outside of the reach envelope was associated with worker preference
instead. The process time to complete the orders (cooking) provided workers with time for
recovery throughout the day. However, because all workers reached using their upper arms and
their torsos more than half of the time, and the %MVC of the shoulders, hips, and torso required
for such postures were greater than 10%, the recovery time may not be sufficient.
117
4.6 References
Alagmir, H., Swinkels, H., Yu, S., Yassi, A. (2007). Occupational injury among cooks and food service workers in the healthcare sector. American Journal of Industrial Medicine. 50, 528 – 535. American Conference of Governmental Industrial Hygienists. (2014). TLVs and BEIs. 182. Bosch, T., Mathiassen, S.E., Visser, B., Looze, M.P. de and Dieën, J.H. van (2001) The effect of work pace on workload, motor variability and fatigue during simulated light assembly work. Ergonomics, 54(2), 154 - 168. Bureau of Labor Statistics. Occupational Employment and Wages, May 2014. 35-3021 Combined food preparation and serving workers, including fast food. Accessed 2/1/2016. Bureau of Labor Statistics. May 2014 National Industry – Specific Occupational Employment and Wage Estimates. NAICS 622000 – Hospitals (including private, state, and local government hospitals). Accessed 2/1/2016 Bureau of Labor and Statistics. Nonfatal Occupational Injuries and Illnesses Requiring Days Away From Work, 2014. USDL-15-2205. Released 11/19/2015. http://www.bls.gov/news.release/pdf/osh2.pdf Conrad, R. (1954). The rate of paced man-machine systems. Journal of the Institution of Production Engineers. 33(10): 562 Conrad, R. (1955). Comparison of paced and unpaced performance at a packing task. Occupational Psychology. 29: 15-28 Conrad, R. (1955). Setting the pace. The Manager (London). 23: 664-667. da Costa, B.R., Ramos Vieira, E. (2010). Risk factors for work-related musculoskeletal disorders: a systematic review of recent longitudinal studies. American Journal of Industrial Medicine. 53: 285-323. Davis, L.E. (1966). Pacing effects on manned assembly lines. The International Journal of Production Research. 4(3), 171-184 De Jonge, J., Kompier, M.A.J. (1997). A critical examination of the demand-control-support model from a work psychological perspective. International Journal of Stress Management. 4(4), 235 – 258. Dempsey, P.G., Mathiassen, S.E., Jackson, J.A., O’Brien, N.V. (2010). Influence of three principles of pacing on the temporal organisation of work dring cyclic assembly and disassembly tasks. Ergonomics, 53 (11), 1347-1358. Hviid Andersen, J., Kaergaard, A., Frost, P., Frølund Thomsen, J., Peter Bond, J., Fallentin, N., Borg, V., Mikkelsen, S. (2002). Physical, psychosocial, and individual risk factors for
118
neck/shoulder pain with pressure tenderness in the muscles among workers performing monotonous, repetitive work. Occupational Health and Ergonomics. 27(6), 660-667. de Jonge, J., Kompier, A.J. (1997). A critical examination of the demand-control-support model from a work psychological perspective. International Journal of Stress Management. 4(4):235 – 258) Lin, L, Drury, C.G., Kim, S.W. (2001). Ergonomics and Quality in Paced Assembly Lines. Human Factors and Ergonomics in Manufacturing. 11(4):377-382. MacDuffie, J.P., Sethuraman, K., Fisher, M.L. (1996). Product variety and manufacturing performance: Evidence from the international automative assembly plant study. Management Science. 42 (3), 350-369. McGorry, R.W., Dempsey, P.G., O'Brien, N.V. (2004). The effect of workstation and task variables on forces applied during simulated meat cutting. Ergonomics. 47(15), 1640-1656. Matsuzuki, H., Haruyama, Y., Muto, T., Aikawa, K., Ito, A., Katamoto, S. (2013). Workers’ load and job-related stress after a reform and work system change in a hospital kitchen in Japan. Environmental Health and Preventive Medicine. 18, 171-176. Moatari-Kazerouni, A., Chinniah, Y., Agard, B. (2015). A proposed occupational health and safety risk estimation tool for manufacturing systems. International Journal of Production Research. 53(15), 4459 – 4475. Moatari-Kazerouni, A., Chinniah, Y., Agard, B. (2015). Integration of occupational health and safety in the facility layout planning, part II: Design of the kitchen of a hospital. International Journal of Production Research. 53(11), 3228 – 3242. Medeiros da Luz, C., Pacheco da Costa Proença, R., Rodríguez Ortiz de Salazar, B., do Nascimento Galego, G. (2013). Working conditions at hospital food service and the development of venous disease of lower limbs. International Journal of Environmental Health Research. 23 (6), 520-530. Meier, L.L., Semmer, N.K., Elfering, A., Jacobshagen, N. (2008). The double meaning f control: three-way interactions between internal resources, job control, and stressors at work. Journal of Occupational Health Psychology. 13(3): 244-258. National Research Council. The Institute of Medicine. Musculoskeletal disorders and the workplace: Low back and upper extremities. Washington, DC: National Academy Press, 2001. National Research Council. Work-related musculoskeletal disorders: A review of evidence. Washington DC: National Academy Press, 1998. Rivilis, I., Van Eerd, D., Cullen, K., Cole, D.C., Irvin, E., Tyson, J., Mahood, Q. (2007). Effectiveness of participatory ergonomic interventions on health outcomes: A systematic review. Applied Ergonomics. 39: 342-358 Tseng, M.M., Hu, S.J. (2014).CIRP Encyclopedia of Production Engineering. The International Academy of Production Engineering. 836 – 837.
119
CHAPTER 5
DISCUSSION AND CONCLUSIONS
5.1 Summary of aims
The aim of this research is to develop and provide supporting evidence for a conceptual
model that describes the relationship between cycle-to-cycle task variations in mixed-model
assembly lines (MMALs) and worker exposure to upper limb work related musculoskeletal
disorders (WMSDs) and fatigue risk factors.
The research will specifically test the following hypotheses:
1. Cycle-to-cycle task variations that require different work times in assembly lines increase
stressful postures and reduce recovery time.
2. Conveyor type and product mix and sequence affect worker posture by requiring them to
reach outside the normal reach range envelope and lead to reduced recovery time.
3. Increased customer demand increases the frequency of workers reaching outside the
normal reach ranges and the recovery time in a made-to-order, mixed-model, self-paced
assembly line.
This chapter summarizes the findings of the studies conducted and discusses how they
support the proposed concept model. These findings provide assembly line design
recommendations to enable employers to achieve the flexibility of MMAL without overloading
the workers.
5.2 Postulated model
Workers of assembly lines move their hands repeatedly, sometimes assuming awkward
postures when reaching and transporting work objects. In single model assembly lines, workers
120
are assigned specific tasks that must be performed according to the standard method within the
normal time (Equation 1.2a). The standard time includes the normal time required to complete
the tasks plus a time allowance that provides recovery time (Equation 1.2b). In a moving
assembly line, the conveyor speed must be selected in such a way that the work objects remain
within the workers’ reach envelope during the normal time to reduce reaching and allow time for
recovery.
In mixed model assembly lines, the tasks assigned to workers may change from one cycle
to the next. These different tasks may require different motions, tools, forces, or materials,
resulting in different normal times from one cycle to the next. An average standard time is
defined according to the frequencies of each possible variation (Equation 1.8) and the same
amount of time is given to the workers to complete all the different tasks. This results in some
work cycles where more time than what is required is available and others where workers do not
have sufficient time.
In Chapter 1 a concept model (Figure 5-1) was postulated to describe the relationship
between the time provided to the workers, the average standard time ( ), and time required by
the workers (tsi) to complete each assigned task in different conveyor configurations of a mixed-
model assembly line and how they affect worker posture and recovery time. This model
demonstrates the importance of providing sufficient work time in the paced (continuous and
synchronous indexing) conveyors to reduce workers’ need to reach behind and to provide
sufficient recovery time in every work cycle. It also demonstrates that allowing workers to
control the pace of the conveyor (asynchronous indexing, manual) provides workers with
sufficient time to complete the job within the normal reach range every time. However, it is
necessary to establish a minimum work time with every cycle so that in addition to the time
required to complete the task, workers have sufficient time for recovery. Otherwise, workers
may work continuously instead of using the time available for recovery. This minimum work
time may be programmed into the conveyor or may be provided during the processing time of
the work object.
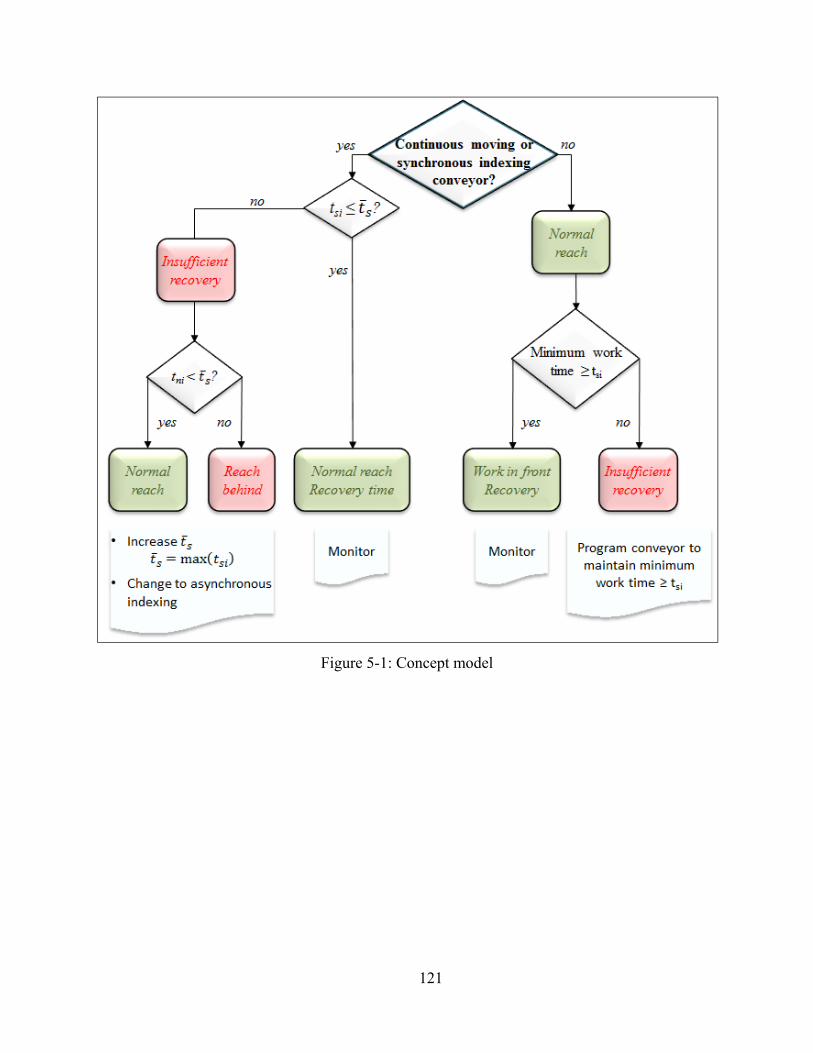
121
Figure 5-1: Concept model
122
5.3 Summary of findings
The findings of the studies in Chapter 2 and 3 support and validate the concept model for
a paced assembly line. The findings of Chapter 3 indicate that a self –paced conveyor may
reduce reaching but also recovery time. The study in Chapter 4 evaluates how worker posture
and recovery time are affected by fluctuations in customer demand in a highly complex, self-
paced assembly line where products are made to order.
5.3.1 Work variations and musculoskeletal stresses in paced production operations
Chapter 2 consisted of direct observations of a mixed-model assembly line with a
continuous moving conveyor in a hospital kitchen and the creation of a discrete event simulation
program that modeled the observed site. The observation study found that an increase in work
variations led to an increase in reaching and a reduction in time available for recovery:
The workstation with the greatest amount of variations had 89% less recovery time and
57% greater reaching outside the reach envelope than the workstation with the fewest
variations.
Of the reaches outside the reach envelope, 21% were in the extreme reach zones and
required the worker to bend and twist her torso.
The discrete event simulation program was created using ProModel (ProModel Corp,
Allentown, PA, USA). It used the concept model as a foundation and simulated the actions of
the worker and predicted the frequency of reaching and recovery time of the worker in the
observed assembly line. This model predicted exposure to reaching and low recovery time
accurately and was validated using the data collected during the observation. It may serve as a
tool for testing new assembly line parameters or for evaluating changes to the existing system as
proposed by Wells, Mathiassen, Medbo, and Winkel (2007).
123
5.3.2 Effect of cycle to cycle task variations in mixed-model assembly lines on workers’
upper body exertions and recovery time: A simulated assembly study
Chapter 3 tested the hypothesis that conveyor type and product mix and sequence affect
worker postures and recovery time. It found that:
When work objects stop directly in front of the workers and they have control over how
much time they spend completing the tasks (e.g. asynchronous indexing line), there is
less reaching (99% less) and fewer defects (0%) versus conveyors that move
continuously or where workers do not have control over the time the work object spends
in front of them (e.g. continuous moving and synchronous indexing).
Workers in neither the self-paced nor the paced assembly lines took advantage of the time
available for recovery. In self-paced assembly lines, workers moved their hands
continuously with little rest between cycles (1.4%). In paced assembly lines, workers
often start reaching for work before the work object reaches the ideal work zone.
These findings suggest that none of the conveyor types completely reduced the frequency
of reaching while providing sufficient recovery time. A hybrid synchronous/asynchronous
indexing conveyor, i.e. one that has a minimum work time established but workers can keep the
work object in the station longer if needed (without completely stopping the line), may have the
greatest potential to reduce workers’ reach and provide sufficient time for recovery in every
cycle. It also found that product sequence did not have an effect on either posture or recovery
time.
5.3.3 Worker posture and recovery time in a made to order, mixed-model, self-paced
assembly line: an observation study
Chapter 4 consisted of direct observations in a mixed-model, self-paced assembly line in
a hospital kitchen where meals were prepared to order. It investigated the relationship between
customer demand fluctuations and workers’ reach and recovery time. Specifically, this work
tested the hypothesis that, as customer demand increases in a mixed-model, self-paced assembly
124
line, workers will reach outside their reach envelope more frequently and time for recovery will
be reduced. This study found that as customer demand increased:
The frequency of reaching unnecessarily did not change significantly. The changes in
reaching were associated with worker preference instead.
Recovery time decreased as demand increased but all workers had greater than 10%
recovery time, even during periods of high demand.
The percent of maximum voluntary contractions for the shoulders, hips, and torso
frequently exceeded 10% due to the reaching that occurred throughout the day and hand
activity level (HAL), for most workers, increased with demand. These two factors
indicate that recovery time may not be sufficient to recover and prevent fatigue during
periods of high demand.
5.4 Discussion
Studies suggesting how to manage cycle-to-cycle variations were conducted long before
mixed-model assembly lines were introduced. In the mid 1900’s Conrad (1954, 1955a, 1955b)
and Davis (1965) proposed the use of self-paced assembly lines to improve productivity and
quality while reducing waste (idle time) in the presence of process time and worker variability.
Today, however, most modern manufacturing lines are paced by a continuously moving
conveyor. With the advent of mixed-model assembly lines, cycle-to-cycle variability increased
and tools to manage the variability and their effect on the workers were needed. This research
evaluated how the variations in mixed-model assembly lines affect worker posture and recovery
time and how different assembly line pacing configurations may impact the level of workers’
exposure to these risk factors of WMSDs.
The field observation study in Chapter 2 demonstrated that, in a continuous moving
conveyor, increases in variations (12 vs. 4 – 6) increased the frequency of workers reaching
outside the reach envelope (57% vs. 0% – 30%, Figure 2.6) and reduced recovery time (9.5% vs.
31.8% – 88.5%, Table 2.2 and Figure 2.7). In Chapter 3, the self-paced, asynchronous indexing
mixed-model assembly line (3 variations) was the most effective configuration in reducing the
frequency of reaching unnecessarily to complete the job. Self-pacing has been proposed as a
method to improve productivity (Conrad 1954, 1955a, 1955b; Davis 1965) and quality (Lin,
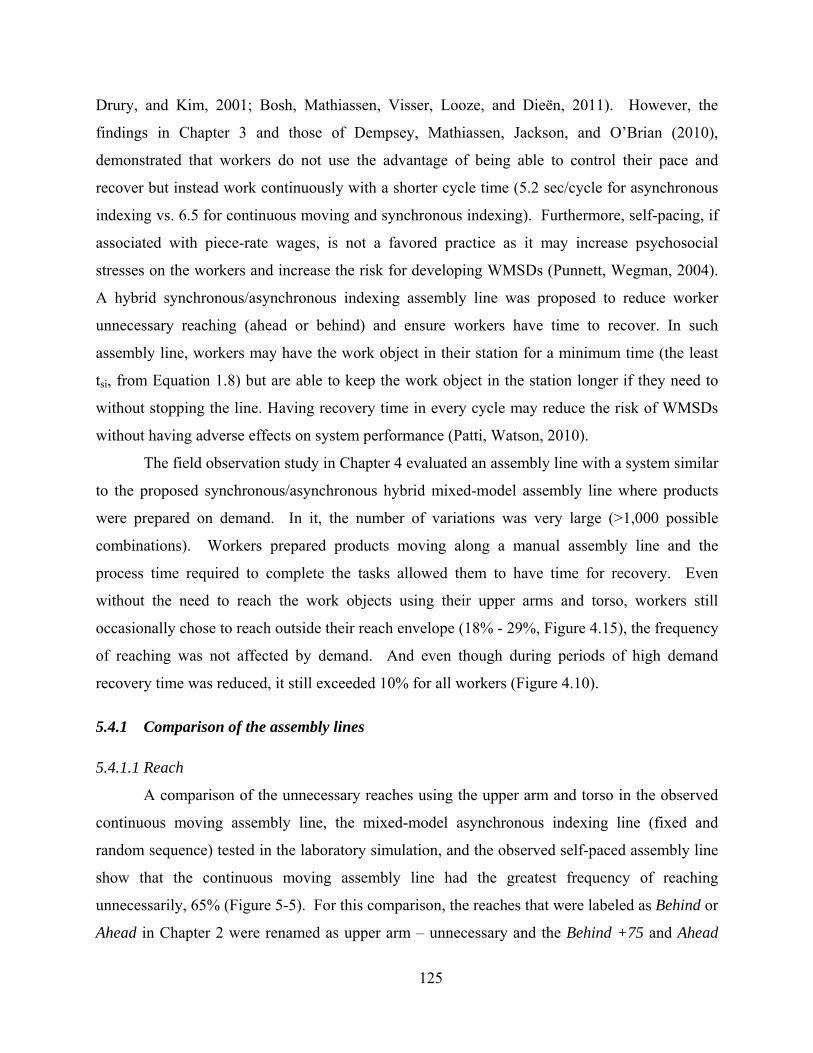
125
Drury, and Kim, 2001; Bosh, Mathiassen, Visser, Looze, and Dieën, 2011). However, the
findings in Chapter 3 and those of Dempsey, Mathiassen, Jackson, and O’Brian (2010),
demonstrated that workers do not use the advantage of being able to control their pace and
recover but instead work continuously with a shorter cycle time (5.2 sec/cycle for asynchronous
indexing vs. 6.5 for continuous moving and synchronous indexing). Furthermore, self-pacing, if
associated with piece-rate wages, is not a favored practice as it may increase psychosocial
stresses on the workers and increase the risk for developing WMSDs (Punnett, Wegman, 2004).
A hybrid synchronous/asynchronous indexing assembly line was proposed to reduce worker
unnecessary reaching (ahead or behind) and ensure workers have time to recover. In such
assembly line, workers may have the work object in their station for a minimum time (the least
tsi, from Equation 1.8) but are able to keep the work object in the station longer if they need to
without stopping the line. Having recovery time in every cycle may reduce the risk of WMSDs
without having adverse effects on system performance (Patti, Watson, 2010).
The field observation study in Chapter 4 evaluated an assembly line with a system similar
to the proposed synchronous/asynchronous hybrid mixed-model assembly line where products
were prepared on demand. In it, the number of variations was very large (>1,000 possible
combinations). Workers prepared products moving along a manual assembly line and the
process time required to complete the tasks allowed them to have time for recovery. Even
without the need to reach the work objects using their upper arms and torso, workers still
occasionally chose to reach outside their reach envelope (18% - 29%, Figure 4.15), the frequency
of reaching was not affected by demand. And even though during periods of high demand
recovery time was reduced, it still exceeded 10% for all workers (Figure 4.10).
5.4.1 Comparison of the assembly lines
5.4.1.1 Reach
A comparison of the unnecessary reaches using the upper arm and torso in the observed
continuous moving assembly line, the mixed-model asynchronous indexing line (fixed and
random sequence) tested in the laboratory simulation, and the observed self-paced assembly line
show that the continuous moving assembly line had the greatest frequency of reaching
unnecessarily, 65% (Figure 5-5). For this comparison, the reaches that were labeled as Behind or
Ahead in Chapter 2 were renamed as upper arm – unnecessary and the Behind +75 and Ahead
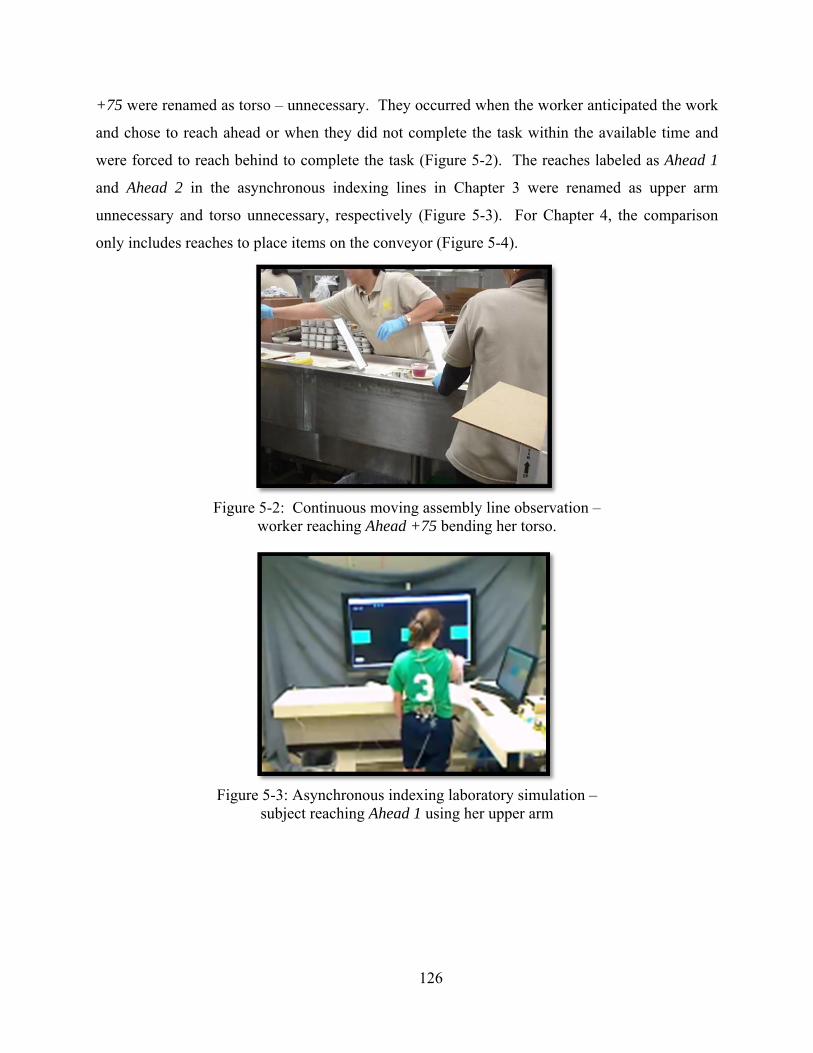
126
+75 were renamed as torso – unnecessary. They occurred when the worker anticipated the work
and chose to reach ahead or when they did not complete the task within the available time and
were forced to reach behind to complete the task (Figure 5-2). The reaches labeled as Ahead 1
and Ahead 2 in the asynchronous indexing lines in Chapter 3 were renamed as upper arm
unnecessary and torso unnecessary, respectively (Figure 5-3). For Chapter 4, the comparison
only includes reaches to place items on the conveyor (Figure 5-4).
Figure 5-2: Continuous moving assembly line observation –
worker reaching Ahead +75 bending her torso.
Figure 5-3: Asynchronous indexing laboratory simulation –
subject reaching Ahead 1 using her upper arm
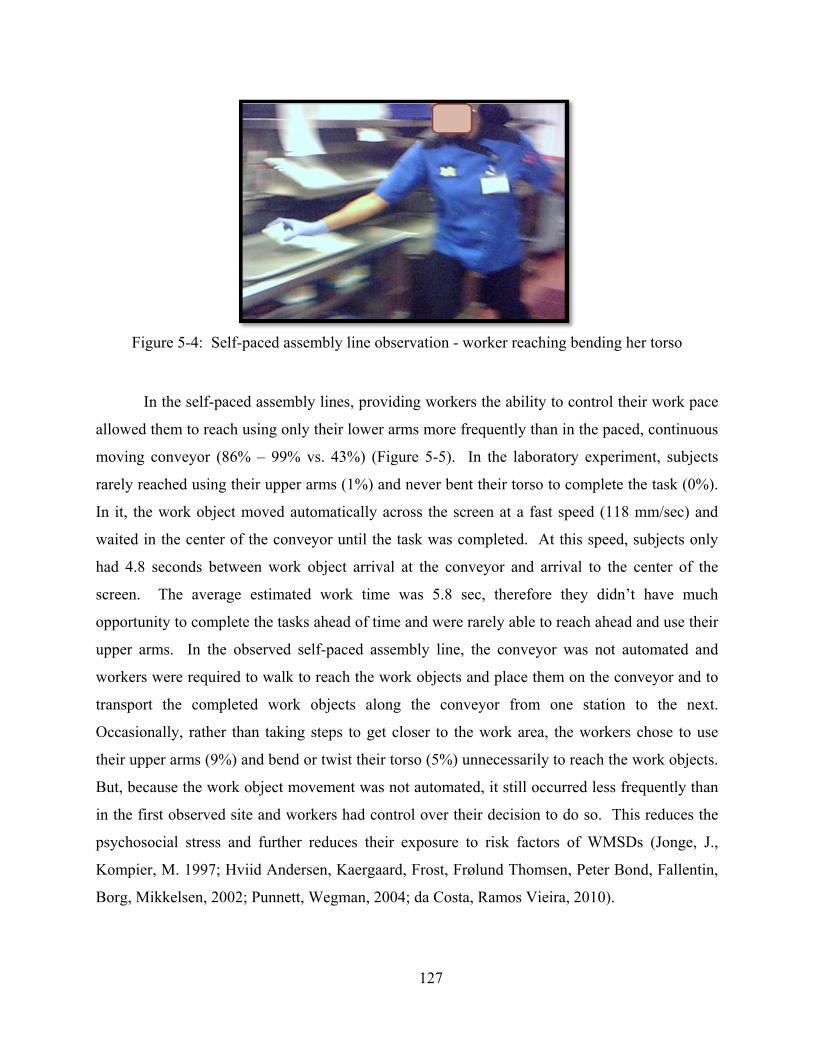
127
Figure 5-4: Self-paced assembly line observation - worker reaching bending her torso
In the self-paced assembly lines, providing workers the ability to control their work pace
allowed them to reach using only their lower arms more frequently than in the paced, continuous
moving conveyor (86% – 99% vs. 43%) (Figure 5-5). In the laboratory experiment, subjects
rarely reached using their upper arms (1%) and never bent their torso to complete the task (0%).
In it, the work object moved automatically across the screen at a fast speed (118 mm/sec) and
waited in the center of the conveyor until the task was completed. At this speed, subjects only
had 4.8 seconds between work object arrival at the conveyor and arrival to the center of the
screen. The average estimated work time was 5.8 sec, therefore they didn’t have much
opportunity to complete the tasks ahead of time and were rarely able to reach ahead and use their
upper arms. In the observed self-paced assembly line, the conveyor was not automated and
workers were required to walk to reach the work objects and place them on the conveyor and to
transport the completed work objects along the conveyor from one station to the next.
Occasionally, rather than taking steps to get closer to the work area, the workers chose to use
their upper arms (9%) and bend or twist their torso (5%) unnecessarily to reach the work objects.
But, because the work object movement was not automated, it still occurred less frequently than
in the first observed site and workers had control over their decision to do so. This reduces the
psychosocial stress and further reduces their exposure to risk factors of WMSDs (Jonge, J.,
Kompier, M. 1997; Hviid Andersen, Kaergaard, Frost, Frølund Thomsen, Peter Bond, Fallentin,
Borg, Mikkelsen, 2002; Punnett, Wegman, 2004; da Costa, Ramos Vieira, 2010).
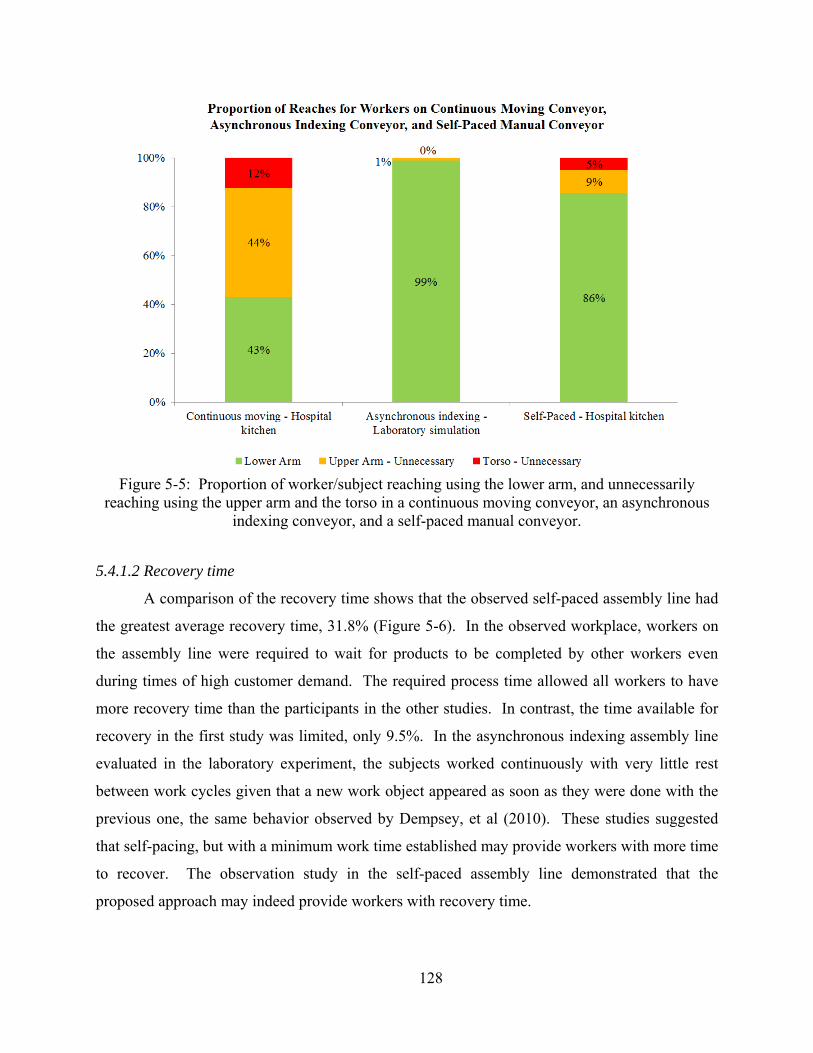
128
Figure 5-5: Proportion of worker/subject reaching using the lower arm, and unnecessarily
reaching using the upper arm and the torso in a continuous moving conveyor, an asynchronous indexing conveyor, and a self-paced manual conveyor.
5.4.1.2 Recovery time
A comparison of the recovery time shows that the observed self-paced assembly line had
the greatest average recovery time, 31.8% (Figure 5-6). In the observed workplace, workers on
the assembly line were required to wait for products to be completed by other workers even
during times of high customer demand. The required process time allowed all workers to have
more recovery time than the participants in the other studies. In contrast, the time available for
recovery in the first study was limited, only 9.5%. In the asynchronous indexing assembly line
evaluated in the laboratory experiment, the subjects worked continuously with very little rest
between work cycles given that a new work object appeared as soon as they were done with the
previous one, the same behavior observed by Dempsey, et al (2010). These studies suggested
that self-pacing, but with a minimum work time established may provide workers with more time
to recover. The observation study in the self-paced assembly line demonstrated that the
proposed approach may indeed provide workers with recovery time.
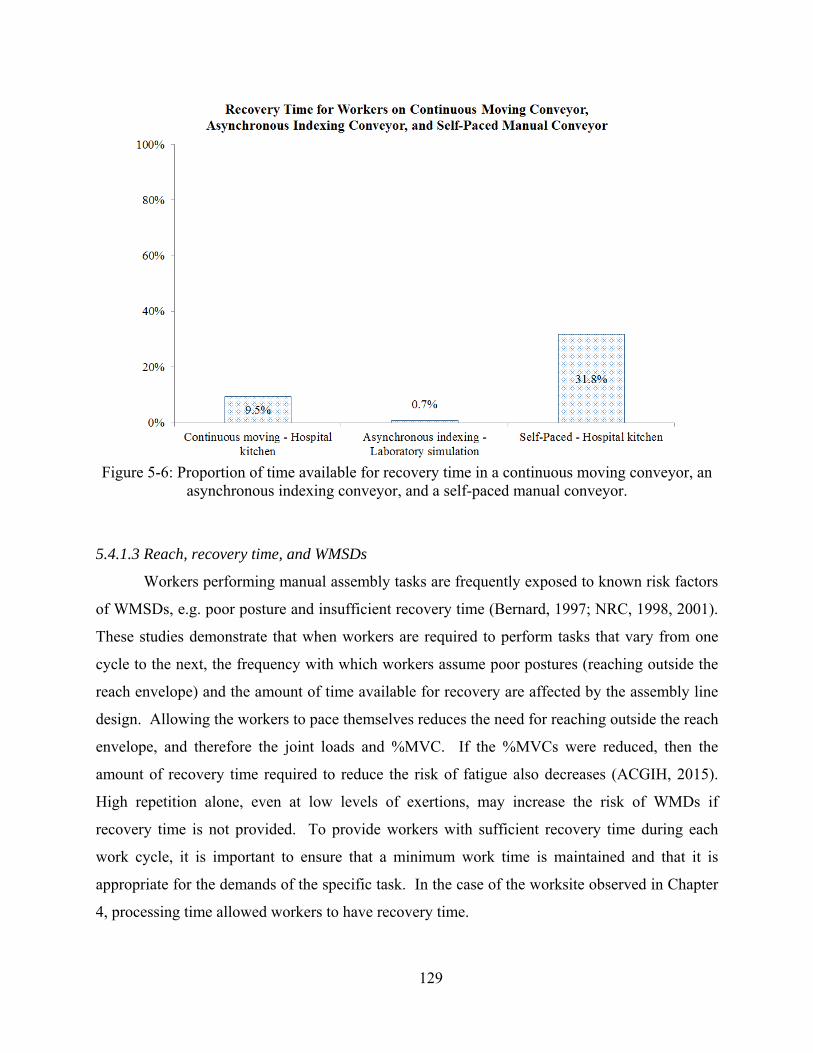
129
Figure 5-6: Proportion of time available for recovery time in a continuous moving conveyor, an
asynchronous indexing conveyor, and a self-paced manual conveyor.
5.4.1.3 Reach, recovery time, and WMSDs
Workers performing manual assembly tasks are frequently exposed to known risk factors
of WMSDs, e.g. poor posture and insufficient recovery time (Bernard, 1997; NRC, 1998, 2001).
These studies demonstrate that when workers are required to perform tasks that vary from one
cycle to the next, the frequency with which workers assume poor postures (reaching outside the
reach envelope) and the amount of time available for recovery are affected by the assembly line
design. Allowing the workers to pace themselves reduces the need for reaching outside the reach
envelope, and therefore the joint loads and %MVC. If the %MVCs were reduced, then the
amount of recovery time required to reduce the risk of fatigue also decreases (ACGIH, 2015).
High repetition alone, even at low levels of exertions, may increase the risk of WMDs if
recovery time is not provided. To provide workers with sufficient recovery time during each
work cycle, it is important to ensure that a minimum work time is maintained and that it is
appropriate for the demands of the specific task. In the case of the worksite observed in Chapter
4, processing time allowed workers to have recovery time.
130
5.4.2 Limitations
The results presented are based on observations of a few workers (<10 in each study) and
12 experimental subjects. It is possible that, in paced assembly lines, other workers may choose
to rest more frequently instead of reaching ahead when encountered with large variety of tasks
that require different work times. However, reaching behind or working faster to complete the
work that requires more time than what is provided when an assembly line is paced will occur
even if more workers are observed, unless workers are willing to let defective products continue
moving along the line. Another limitation is that the jobs observed mostly consisted of simple
pick and place tasks. These jobs didn’t require complex motions or high precision of movements
and positioning. As the actions conducted on the assembly line get more complex, the ability to
complete the job accurately may decrease if workers are reaching ahead or behind, making it
more important to control the pacing. Allowing workers to self-pace, as shown in these studies,
may be effective in reducing reach regardless of the number of workers observed or the
complexity of the task. Finally, this work does not address what factors (e.g. psychosocial,
worker capability) influence workers’ decision to reach ahead versus waiting for the work object
to reach the workspace. The data show that different workers/subjects were more willing than
others to reach ahead but do not provide root cause information for that behavior. Further work
in this area is needed to improve the model so that it can include these factors.
5.5 Conclusion
These findings support the postulated concept model that describes workers’ exposure to
reach and insufficient recovery time in mixed-model assembly lines. It demonstrates that as
work variations that require different normal times increase, so does the frequency of reaching
(57%) while the recovery time is reduced (89%) when the assembly work is conducted on a
continuously moving conveyor. To reduce the impact of variations, it was found that allowing
workers to self-pace, either in an asynchronous indexing conveyor, or on a manual conveyor,
allowed workers to reach less in order to complete the task (asynchronous indexing – 1%,
manual conveyor – 14% versus continuous moving – 56% ). Although self-pacing eliminated
the need of reaching behind in order to complete the job, it reduced but did not eliminate the
131
reaches ahead. In all the studies workers/subjects chose to reach ahead and complete the
assigned tasks before the work objects were within the reach envelope. To reduce the frequency
of workers reaching ahead, the normal time to reach for, grasp, and move the work objects to the
conveyor must be greater than the time it takes for the work object on the conveyor to reach the
center of the workspace, as it was in the asynchronous indexing conveyor. This propensity to
reach ahead unnecessarily, however, was not impacted by customer demand but mostly by
worker preference in a self-paced environment. Further work is necessary to identify which
factors influence workers’ decision to reach ahead.
While self-pacing proved to an effective tool in reducing reaching, it alone was not
sufficient to provide workers with needed recovery time. Workers instead moved continuously
(asynchronous indexing recovery time – 0.7%) and completed the job quicker (cycle time 5.3 sec
vs 5.6 sec in paced conveyors). Ensuring that a minimum work time is maintained for each
product type is essential to providing workers with sufficient time for recovery. This can be in
the form of process time (as in the observed study) or by programming the conveyor so that it
doesn’t move out of the workspace until the minimum work time for each product variation has
passed.
5.6 Significance and broader impact
The results from these studies may apply to assembly lines with conveyors designed with
different parameters. In the case of the paced conveyors, if the speed were to be increased, tmax
(Equations 1.7 and 1.13) would be reduced, and therefore less time would be available to
complete the job, leading to an increase in the reaches outside the reach envelope and a decrease
in recovery time. For example, for a 5%tile female, whose reach envelope width is 2dx =
300mm, working with an object of width wt = 20mm, if the conveyor speed increases from 10
mm/sec to 20mm/sec, according to Equation 1.7a, tmax decreases from 32 sec to 16 sec. A
decrease in speed, on the other hand, would result in a greater tmax, allowing workers to reach
within the reach envelope more frequently and providing recovery time, although they may
choose to work ahead rather than wait. According to the previous example, decreasing the speed
to 5 mm/sec would increase tmax to 64 sec.
132
The effect of the inter-arrival time on the frequency of reaching and the recovery time
will depend on the conveyor speed and whether it may lead to work objects arriving at the
workspace while the worker is performing tasks on the previous work object. If it does, then the
worker may not have sufficient time to complete the task and will fall behind.
As the range of standard times for each type of products increases, the greater the
discrepancy between the and each tsi. In a paced conveyor, this would result in greater
frequency of reaching and reduced recovery time, due to insufficient time to complete the tasks.
In the laboratory simulation and the observed assembly lines, the workers were assigned
a pick and place task where great accuracy in the place motion was not required (Table 5-1).
Workers were only required to place the items in a tray without any physical constraints limiting
the location, other than the edges of the tray. In other types of assembly lines, this would most
likely be different. Components must be attached together using screws, clips, connectors, etc.
and there are greater constraints on how one part is located with respect to the other. According
to Fitt’s Law (Fitts, 1954), this would lead to a decrease in the target size, an increase in the
index of difficulty, and therefore to an increase in the time required to complete the motion. This
time must be accounted for in the calculation of the standard times.
In assembly lines of small goods, where the conveyors function in a similar manner to
those observed in these studies, the increase in precision of the task may result in fewer reaches
ahead given that the workers may not be able to see or reach the work object well enough to do
the job correctly. However, when the tsi exceeds the , the result will be greater number of
motions per unit of time to be able to complete the job before it leaves the workstation and
insufficient recovery time. In other words, HAL and duty cycle will increase, and thus the risk
of exceeding the TLV to prevent fatigue. In the assembly of larger goods (e.g. vehicles), the
conditions are slightly different but the results may be similar. In these assembly lines, the work
objects move on a conveyor directly on the floor. Workers move into and out of the conveyor to
complete the assigned tasks, which also require accuracy. Such configuration makes it unlikely
that reaching may be affected. When confronted with task variations, these workers may
increase the HAL, walk faster when stepping out of the conveyor to start working on the next
work object, and/or may attempt to walk ahead of their workstation. All of these may also
reduce the recovery time and increase the risk of developing fatigue.
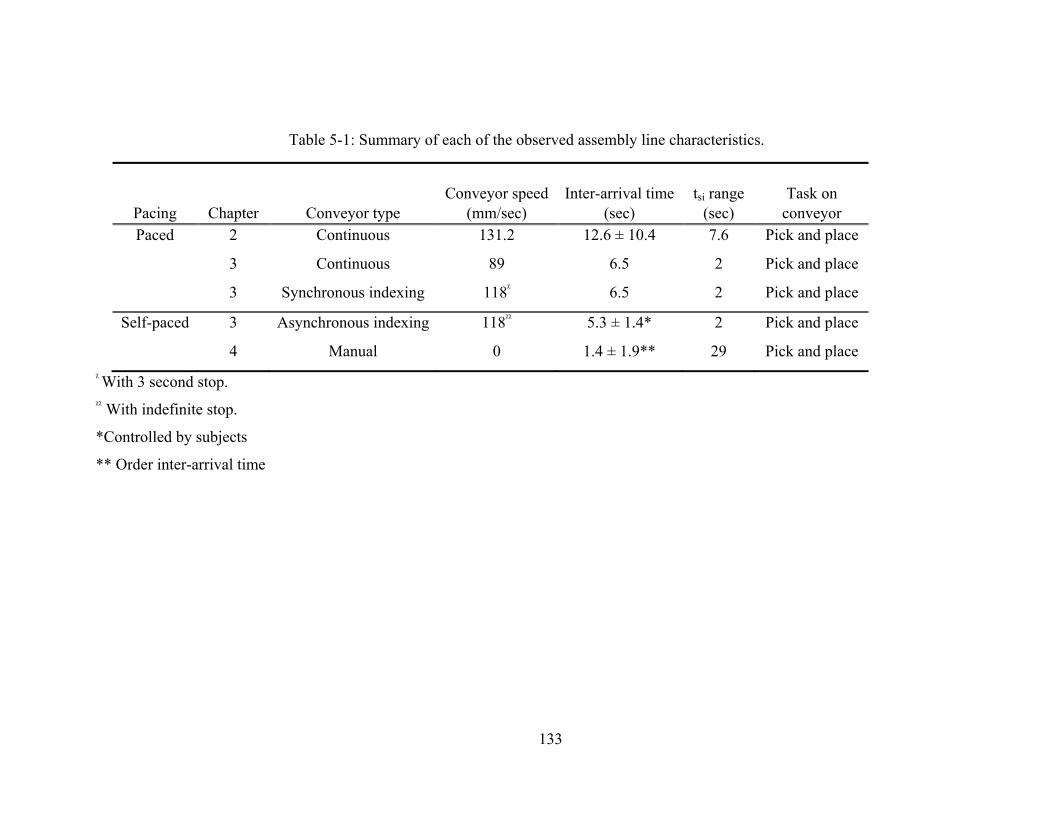
133
Table 5-1: Summary of each of the observed assembly line characteristics.
Pacing
Chapter Conveyor type Conveyor speed
(mm/sec) Inter-arrival time
(sec) tsi range
(sec) Task on
conveyor Paced 2 Continuous 131.2 12.6 ± 10.4 7.6 Pick and place
3 Continuous 89 6.5 2 Pick and place
3 Synchronous indexing 118ᵡ 6.5 2 Pick and place
Self-paced 3 Asynchronous indexing 118ᵡᵡ 5.3 ± 1.4* 2 Pick and place
4 Manual 0 1.4 ± 1.9** 29 Pick and place
ᵡ With 3 second stop. ᵡᵡ With indefinite stop.
*Controlled by subjects
** Order inter-arrival time
134
Allowing workers to self-pace, whether on a simple pick and place task, or on a more
difficult task, eliminates workers’ need to reach outside the reach envelope or to increase the
HAL. It also increases product quality (Figure 3.6; Lin, et al, 2001; Bosh, et al, 2011).
However, to ensure recovery time is provided to the worker, the conveyor must be programmed
to ensure a minimum work time. This requirement is based on the observations presented in this
study (Table 3.3), along with other studies (Conrad, 1954, 1955a, 1955b; Davis, 1965; Dempsey,
et al, 2010) that demonstrate that when workers are allowed to self-pace, they tend to work
continuously without breaks. Not having a minimum work time allows for the response-stimulus
interval (RSI) to be almost zero, which leads to an increase in the speed stress, and in turn lead
the worker to make the decision to take action, i.e. start working in the following work object
(Wickens and Hollands, 2000; Welford, 1968, 1976; Drury and Coury, 1981; Knight and
Salvendy, 1981; Waganaar and Stakenberg, 1975, Wickens, 1984).
Finally, the main contribution of this work is that it expands the knowledge of the effects
of cycle-to-cycle variations associated with mixed-model-assembly lines on workers’ exposure
to risk factors of WMDS. It provides specific information that enables assembly line designers
to manage these variations in such a way that workers’ reaching decreases and sufficient time for
recovery is provided. It shows that allowing the workers to control the pace of the work reduces
the frequency of reaching outside the reach envelope unnecessarily. At the same time, it is
important to control the process so that a minimum work time that includes allowance time is
maintained for each variation to ensure workers are provided with time for recovery.
5.7 Future work
This research provided important information that can be used in the process of designing
assembly lines. To expand on this research, it is necessary to address one of its limitations.
Specifically, it is necessary to conduct an experiment to determine how assembly line pacing
affects posture and recovery time when subjects are asked to conduct tasks that require additional
and more complex motions, e.g. construct different shapes using building blocks. This would be
followed with observation studies in a paced assembly line where workers are also assigned tasks
that require joining components to determine how the frequency of awkward postures and/or
insufficient recovery time lead to quality defects. It will also be important to identify factors that
135
increase the probability of workers’ reaching ahead to complete the assigned tasks. Physical
factors such as age and health condition may have an impact. Other possible factors to
investigate may be worker experience and psychosocial factors.
Later, it is important to expand this research into the design process. Problems related to
ergonomics can be encountered in the assembly plants when joining components. It is of interest
to identify design characteristics of attachments (e.g. clips) that can successfully reduce worker
pushing efforts when variations in components’ dimensions and tolerance stack up make it
difficult to align the attachments with the mating holes. Another area of interest in design is to
identify characteristics of the design of connectors (e.g. wire harness) that reduce the need for
awkward postures during blind connections.
5.8 References
Bernard, B. A. Critical Review of Epidemiologic Evidence for Work-related Musculoskeletal Disorders of the Neck, Upper Extremity, and Low Back. NIOSH Publication No. 97-141: Musculoskeletal Disorders and Workplace Factors. 1997.
Bosch, T., Mathiassen, S.E., Visser, B., Looze, M.P. de and Dieën, J.H. van (2001). The effect of work pace on workload, motor variability and fatigue during simulated light assembly work. Ergonomics, 54(2), 154 - 168.
Conrad, R. (1954). The rate of paced man-machine systems. Journal of the Institution of Production Engineers. 33(10): 562
Conrad, R. (1955). Comparison of paced and unpaced performance at a packing task. Occupational Psychology. 29: 15-28
Conrad, R. (1955). Setting the pace. The Manager (London). 23: 664-667.
da Costa, B.R., Ramos Vieira, E. (2010). Risk factors for work-related musculoskeletal disorders: a systematic review of recent longitudinal studies. American Journal of Industrial Medicine. 53: 285-323.
Davis, L.E. (1966). Pacing effects on manned assembly lines. The International Journal of Production Research. 4(3), 171-184
Hviid Andersen, J., Kaergaard, A., Frost, P., Frølund Thomsen, J., Peter Bond, J., Fallentin, N., Borg, V., Mikkelsen, S. (2002). Physical, psychosocial, and individual risk factors for neck/shoulder pain with pressure tenderness in the muscles among workers performing monotonous, repetitive work. Occupational Health and Ergonomics. 27(6), 660-667.
136
de Jonge, J., Kompier, A.J. (1997). A critical examination of the demand-control-support model from a work psychological perspective. International Journal of Stress Management. 4(4):235 – 258)
Dempsey, P.G., Mathiassen, S.E., Jackson, J.A., O’Brien, N.V. (2010). Influence of three principles of pacing on the temporal organisation of work during cyclic assembly and disassembly tasks. Ergonomics, 53 (11), 1347-1358.
Fitts, P.M. (1954) The information capacity of the human motor system in controlling the amplitude of movement. Journal of Experimental Psychology, 47, 381-391.
Lin, L., Drury, C.G., Kim, S.W. (2001). Ergonomics and quality in paced assembly lines. Human Factors and Ergonomics in Manufacturing, 11 (4), 377-382.
National Research Council. Work-related musculoskeletal disorders: A review of evidence. Washington DC: National Academy Press, 1998.
National Research Council. The Institute of Medicine. Musculoskeletal disorders and the workplace: Low back and upper extremities. Washington, DC: National Academy Press, 2001.
Patti, A.L., Watson, K.J. (2010). Downtime variability: the impact of duration-frequency on the performance of serial production systems. International Journal of Production Research. 48(19):5834-5841.
Punnett, L., Wegman, D.H. (2004). Work-related musculoskeletal disorders: the epidemiologic evidence and the debate. Journal of Electromyography and Kinesiology 14:13-23.
Waganaar, W.A., Stakenberg, H. (1975). Paced and self-paced continuous reaction time. Quarterly Journal of Experimental Psychology, 27, 559-563.
Welford, A.T. (1968).Fundamentals of skill. London: Methuen.
Welford, A.T. (1976). Skilled performance: Perceptual and motor skills. Glenview, IL: Scott, Foresman.
Wells, R., Mathiassen, S., Medbo, L., Winkel, J. (2007). Time – A key issue for musculoskeletal health and manufacturing. Applied Ergonomics. 38, 733-744
Wickens, C.D. (1984). Processing resources in attention. In R. Parasuraman and R. Davies (Eds.), Varieties of attention (p63-101). New York: Academic Press.
Wickens, C. D., Holland, J., G. Engineering Psychology and Human Performance. Upper Saddle River, NJ. 2000. P 24, 37, 46, 314, 342