Embed Size (px)
Citation preview
CSI Communications | July 2012 | ACSSSSSI II CCCCCoCoCoCoCCCC mmmmmmmmmmmmmmmununununnnnnunnnnuunniicicatioonsnsnsnsnssssss |||||||||| July 2222222222000001001000 222222222222 ||| AAAww
w.c
si-in
dia.
org
ISSN
097
0-64
7X |
Vol
ume
No.
36
| Is
sue
No.
4 |
Jul
y 2
012
` 50
/-
Cover StoryAn Algebraic Method for Super Resolution Image Reconstruction 5
Research FrontAccurate Pupil and Iris Localization using Reverse Function 16
ArticleImage and Video ProcessingToolbox in Scilab 20
ArticleImportance of Shifting Focus in Solving Problems 23
Technical TrendsApplications of Image Processing in Industries 8Research FrontSome Upcoming Challenges in Bioimage Informatics 12

CSI Communications | July 2012 | 1
ContentsVolume No. 36 • Issue No. 4 • July 2012
CSI Communications
Editorial Board
Chief EditorDr. R M Sonar
EditorsDr. Debasish JanaDr. Achuthsankar Nair
Resident EditorMrs. Jayshree Dhere
AdvisorsDr. T V GopalMr. H R Mohan
Published byExecutive Secretary Mr. Suchit GogwekarFor Computer Society of India
Design, Print and Dispatch byCyberMedia Services Limited
Please note:CSI Communications is published by Computer Society of India, a non-profi t organization. Views and opinions expressed in the CSI Communications are those of individual authors, contributors and advertisers and they may diff er from policies and offi cial statements of CSI. These should not be construed as legal or professional advice. The CSI, the publisher, the editors and the contributors are not responsible for any decisions taken by readers on the basis of these views and opinions.Although every care is being taken to ensure genuineness of the writings in this publication, CSI Communications does not attest to the originality of the respective authors’ content. © 2012 CSI. All rights reserved.Instructors are permitted to photocopy isolated articles for non-commercial classroom use without fee. For any other copying, reprint or republication, permission must be obtained in writing from the Society. Copying for other than personal use or internal reference, or of articles or columns not owned by the Society without explicit permission of the Society or the copyright owner is strictly prohibited.
Published by Suchit Gogwekar for Computer Society of India at Unit No. 3, 4th Floor, Samruddhi Venture Park, MIDC, Andheri (E), Mumbai-400 093.Tel. : 022-2926 1700 • Fax : 022-2830 2133 • Email : [email protected] Printed at GP Off set Pvt. Ltd., Mumbai 400 059.
Cover Sto ry
5 An Algebraic Method for Super Resolution Image ReconstructionBhabatosh Chanda
Technical Trends
8 Applications of Image Processing in Industries
Dr. Tanushyam Chattopadhyay, Brojeshwar Bhowmick, and Aniruddha Sinha
Research Front
12 Some Upcoming Challenges in Bioimage Informatics
Saurav Basu
16 Accurate Pupil and Iris Localization using Reverse Function
R P Ramkumar and Dr. S Arumugam
Articles
20 Image and Video Processing Toolbox in Scilab Hema Ramachandran
23 Importance of Shifting Focus in Solving Problems
Dr. Pramod Koparkar
25 Distance Units in CSS3 Hareesh N Nampoothiri
Practitioner Workbench
28 Programming.Tips() »
Multidimensional Plots in Matlab for Data Analysis Baisa L Gunjal and Dr. Suresh N Mali
29 Programming.Learn (“Python”) »
Read and Write Using Python Umesh P
Security Corner
30 Information Security »
Privacy & Responsibility Adv. Prashant Mali
IT Act 2000 »
31 Prof. IT Law in Conversation with Mr. IT Executive: Issue No. 4 Mr. Subramaniam Vutha
ICT@ Society
32 Upload India, Upload … Achuthsankar S Nair
PLUSBrain TeaserDr. Debasish Jana
33
Ask an ExpertDr. Debasish Jana
34
Happenings@ICT: ICT News Briefs in June 2012H R Mohan
35
CSI Report Dr. Dharm Singh
36
CSI News 37
CSI Communications | July 2012 | 2 www.csi-india.org
* Access is for CSI members only.
Important Contact Details »For queries, correspondence regarding Membership, contact [email protected]
Know Your CSIExecutive Committee (2012-13/14) »
President Vice-President Hon. SecretaryMr. Satish Babu Prof. S V Raghavan Mr. S [email protected] [email protected] [email protected]
Hon. Treasurer Immd. Past PresidentMr. V L Mehta Mr. M D [email protected] [email protected]
Nomination Committee (2012-2013)Dr. D D Sarma Mr. Bipin V Mehta Mr. Subimal Kundu
Regional Vice-PresidentsRegion - I Region - II Region - III Region - IVMr. R K Vyas Prof. Dipti Prasad Mukherjee Mr. Anil Srivastava Mr. Sanjeev Kumar Delhi, Punjab, Haryana, Himachal Assam, Bihar, West Bengal, Gujarat, Madhya Pradesh, Jharkhand, Chattisgarh, Pradesh, Jammu & Kashmir, North Eastern States Rajasthan and other areas Orissa and other areas inUttar Pradesh, Uttaranchal and and other areas in in Western India Central & Southother areas in Northern India. East & North East India [email protected] Eastern [email protected] [email protected] [email protected]
Region - V Region - VI Region - VII Region - VIIIProf. D B V Sarma Mr. C G Sahasrabudhe Mr. Ramasamy S Mr. Pramit MakodayKarnataka and Andhra Pradesh Maharashtra and Goa Tamil Nadu, Pondicherry, International [email protected] [email protected] Andaman and Nicobar, [email protected] Kerala, Lakshadweep [email protected]
Division Chairpersons, National Student Coordinator & Publication Committee ChairmanDivision-I : Hardware (2011-13) Division-II : Software (2012-14) Division-III : Applications (2011-13) National Student CoordinatorDr. C R Chakravarthy Dr. T V Gopal Dr. Debesh Das Mr. Ranga Raj [email protected] [email protected] [email protected]
Division-IV : Communications Division-V : Education and Research Publication Committee (2012-14) (2011-13) ChairmanMr. Sanjay Mohapatra Chairman Division V Prof. R K Shyamsundar [email protected] To be announced [email protected]
Important links on CSI website »Structure & Organisation http://www.csi-india.org/web/csi/structureNational, Regional & http://www.csi-india.org/web/csi/structure/nsc State Students CoordinatorsStatutory Committees http://www.csi-india.org/web/csi/statutory-committees Collaborations http://www.csi-india.org/web/csi/collaborations Join Now - http://www.csi-india.org/web/csi/joinRenew Membership http://www.csi-india.org/web/csi/renewMember Eligibility http://www.csi-india.org/web/csi/eligibilityMember Benefi ts http://www.csi-india.org/web/csi/benifi tsSubscription Fees http://www.csi-india.org/web/csi/subscription-feesForms Download http://www.csi-india.org/web/csi/forms-downloadBABA Scheme http://www.csi-india.org/web/csi/baba-schemePublications http://www.csi-india.org/web/csi/publicationsCSI Communications* http://www.csi-india.org/web/csi/info-center/communicationsAdhyayan* http://www.csi-india.org/web/csi/adhyayanR & D Projects http://csi-india.org/web/csi/1204Technical Papers http://csi-india.org/web/csi/technical-papersTutorials http://csi-india.org/web/csi/tutorialsCourse Curriculum http://csi-india.org/web/csi/course-curriculumTraining Program http://csi-india.org/web/csi/training-programs(CSI Education Products)Travel support for International http://csi-india.org/web/csi/travel-supportConferenceeNewsletter* http://www.csi-india.org/web/csi/enewsletterCurrent Issue http://www.csi-india.org/web/csi/current-issueArchives http://www.csi-india.org/web/csi/archivesPolicy Guidelines http://www.csi-india.org/web/csi/helpdeskEvents http://www.csi-india.org/web/csi/events1President’s Desk http://www.csi-india.org/web/csi/infocenter/president-s-desk
ExecCom Transacts http://www.csi-india.org/web/csi/execcom-transacts1News & Announcements archive http://www.csi-india.org/web/csi/announcementsCSI Divisions and their respective web linksDivision-Hardware http://www.csi-india.org/web/csi/division1Division Software http://www.csi-india.org/web/csi/division2Division Application http://www.csi-india.org/web/csi/division3Division Communications http://www.csi-india.org/web/csi/division4Division Education and Research http://www.csi-india.org/web/csi/division5List of SIGs and their respective web linksSIG-Artifi cial Intelligence http://www.csi-india.org/web/csi/csi-sig-aiSIG-eGovernance http://www.csi-india.org/web/csi/csi-sig-egovSIG-FOSS http://www.csi-india.org/web/csi/csi-sig-fossSIG-Software Engineering http://www.csi-india.org/web/csi/csi-sig-seSIG-DATA http://www.csi-india.org/web/csi/csi-sigdataSIG-Distributed Systems http://www.csi-india.org/web/csi/csi-sig-dsSIG-Humane Computing http://www.csi-india.org/web/csi/csi-sig-humaneSIG-Information Security http://www.csi-india.org/web/csi/csi-sig-isSIG-Web 2.0 and SNS http://www.csi-india.org/web/csi/sig-web-2.0SIG-BVIT http://www.csi-india.org/web/csi/sig-bvitSIG-WNs http://www.csi-india.org/web/csi/sig-fwnsSIG-Green IT http://www.csi-india.org/web/csi/sig-green-itSIG-HPC http://www.csi-india.org/web/csi/sig-hpcSIG-TSSR http://www.csi-india.org/web/csi/sig-tssrOther Links -Forums http://www.csi-india.org/web/csi/discuss-share/forumsBlogs http://www.csi-india.org/web/csi/discuss-share/blogsCommunities* http://www.csi-india.org/web/csi/discuss-share/communitiesCSI Chapters http://www.csi-india.org/web/csi/chaptersCalendar of Events http://www.csi-india.org/web/csi/csi-eventcalendar
CSI Communications | July 2012 | 3
The ExeCom of CSI met on 30th June, 2012 and reviewed the activities and plans of CSI. Based on the recommendations of the Nominations Committee, the ExeCom also fi lled an interim vacancy of Chair, Division V, with Prof. RP Soni, an eminent professional from Ahmedabad. I would like to welcome Prof. Soni to the CSI ExeCom on behalf of all of us.
International ActivitiesOne of the major areas of discussion during the June ExeCom was international activities and linkages of CSI. These constitute an important role of CSI in fulfi llment of its position as a national society. I would like to update you briefl y on these.
IFIPIFIP and SEARCC are two international agencies that CSI, as a national society, are directly involved with. CSI is a member of IFIP, which was founded under the auspices of UNESCO in 1960, with national societies as members. Interestingly, one of the earliest contributions of IFIP was defi ning the ALGOL 60 programming language, which proved to be, in turn, the foundation for several other imperative languages such as C and Pascal. CSI represents India in the IFIP General Assembly, and the Immediate Past President, Mr. M D Agrawal will represent CSI in the forthcoming meeting of the GA.
SEARCCSouth East Asian Regional Computer Confederation (SEARCC) is a regional association of the national societies of Asia Pacifi c, founded in 1978 at an IFIP meeting at Singapore. The CSI President is also the President of SEARCC for 2012, and I will be representing CSI in the activities of SEARCC. At this time, a priority for SEARCC is to increase its membership as it is limited to about 6 countries. SEARCC also is seeking to organize funds for its operations.
IEEE Computer Society and ACMCSI has been negotiating with IEEE and IEEE Computer Society for the renewal of existing MoUs with them, and with ACM for a new MoU. While the process of fi nalization of the MoU with ACM is continuing, the June ExeCom approved the signing of the MoU with IEEE Computer Society. This MoU, the details of which will be available on the CSI Website as soon as it is formally signed within about a month, has a number of innovative features that will benefi t CSI members, especially students and researchers. We hope to start its implementation from August 2012.BASISFrom 2009, CSI has been a member of Business Action to Support the Information Society (BASIS), which is a body of the International Chamber of Commerce, set up after the 2003/2005 World Summit on the Information Society (WSIS) at Geneva/Tunis. BASIS contributes signifi cantly to Internet Governance through its presence at the Internet Governance Forum (IGF) and other similar UN and international processes. BASIS off ers opportunities for CSI to articulate the civil society perspective at the IGF. In the June ExeCom, CSI decided to renew its membership in BASIS.
Theme: Digital Image ProcessingThis month's theme for CSIC is Digital Image Processing. Image Processing has been one of the relatively recent computational fi elds, emerging towards the last decade of the twentieth century. It has grown rapidly on account of the explosive growth in its applications. In essence, Digital Image Processing is an instance of digital signal processing, the signal in this case being any image source such as a video frame, photograph, photomicrograph, or satellite imagery. Today, Digital Image Processing is employed in a wide variety of applications. In medicine, image processing is extensively used in diagnostics and pathology, and is an integral component of such popular techniques as radiology, nuclear medicine, endoscopy, and microscopy. In Remote Sensing, image processing provides an extensive set of algorithms for the analysis of satellite imagery, which could be
multi/super/hyperspectral for military applications as well as for precision agriculture, natural resource management, and coastal zone management. In our day-to-day lives, Digital Image Processing has been applied to solve interesting problems. Face recognition and biometrics is popularly available, including as a built-in option in some laptops and tablet computers. In transportation security, face recognition is now capable of seeing through disguises and can isolate the underlying physiognomy of individuals. Advanced scanners are able to provide three-dimensional images of individuals in some airports for security scanning. Video-based VOIP conferencing is a popular feature on Smart Devices such as mobiles and pad computers. Automatic number plate recognition is being used in many parts of the world, including India, to identify vehicles involved in traffi c violations. Driverless cars, now being piloted by several companies employ advanced forms of real-time image processing. Among all its applications, it is perhaps military applications that are most advanced in the digital computing domain. Many fi ghter cockpits employ Head-Up Displays which project all fl ight parameters on to the normal outside view surface instead of pilots having to look downwards at their fl ight instruments. Another important use of digital image processing is in Unmanned Aerial Vehicles (UAVs) which are formidable weapons in today's wars. Since the command-and-control centers for UAVs are remotely operated, the entire video captured by the UAV has to be processed and transmitted in real time. UAVs are also used in peacetime applications, for instance in surveillance after natural disasters. Given the nature of the terrain, lack of line-of-sight tracks, and limited satellite bandwidth, video transmission in UAVs require the use of highly effi cient algorithms. Finally, the entertainment industry is another major user of image and video processing technologies. Most feature fi lms are now shot and edited using digital technologies. 3-D modeling and animation technologies have been used side-by-side with image processing technologies for fi lms. Commercial broadcasting and cable TV also make extensive use of digital image processing, especially with 3-D television. Given one or two cameras in most mobile phones, and a million pictures being uploaded daily to some of the social networking sites, it is clear that digital storage, processing, distribution, and use of images will continue to increase. Digital Image Processing, once the domain of a few select research applications, is now a ubiquitous technology, touching everyone's lives.
With greetings
Satish BabuPresident
President’s Message Satish Babu
From : [email protected] : President’s DeskDate : 1st July, 2012
Dear Members
CSI Communications | July 2012 | 4 www.csi-india.org
Editorial Rajendra M Sonar, Achuthsankar S Nair, Debasish Jana and Jayshree DhereEditors
We are happy to release special issue on image processing covering articles from distinguished experts in the arena. When we talk about image processing, we usually mean digital image processing, but analog and optical image processing also emerge. Image can be enhanced in quality with increased contrast, compressed in size with minimum deterioration, restored with reduced blurring and also can be used for extraction of useful features and characteristics so that machines can visualize. Computer vision, biomedical imaging, pattern recognition, astronomical and geospatial imaging, content based image search are all in the platter. Image processing algorithms apply point, local, global operations on a digital image like detection of edges, elimination of high frequency noise, contrast stretching.
Image can be enhanced in quality with increased contrast, compressed in size with minimum deterioration, restored with reduced blurring and also can be used for extraction of useful features and characteristics so that machines can visualize
The issue starts with Cover Story titled “An Algebraic Method for Super Resolution Image Reconstruction” by Prof. Bhabatosh Chanda of Indian Statistical Institute, Kolkata. In his article, Prof. Chanda presents a technique of image reconstruction of super resolution images as an unconstrained optimization problem. Technical Trends section is enriched with an article on “Applications of Image Processing in Industries” by Dr. Tanushyam Chattopadhyay, Brojeshwar Bhowmick and Aniruddha Sinha of TCS Innovation Labs, Kolkata.
In Research Front section, Dr. Saurav Basu of Carnegie Mellon University has articulated his thoughts on “Some Upcoming Challenges in Bioimage Informatics” on the backdrop of the conceptual ecosystem of a dedicated image analysis/computer vision framework. R P Ramkumar of Mahendra Institute of Technology and Dr. S Arumugam of Nandha Educational Institutions have presented biometric identifi cation through iris in their article on “Accurate Pupil and Iris Localization using Reverse Function”.
In Article section, Hema Ramachandran of College of Engineering, Trivandrum has presented write-up on “Image and Video Processing Toolbox in Scilab – an eff ective
alternative to Matlab”. In another article titled “Importance of Shifting Focus in Solving Problems”, Dr. Pramod Koparkar has shown interesting application of image synthesis technique in geometric modelling. Another article authored by Hareesh N Nampoothiri of University of Kerala has covered “Distance Units in CSS3”, new standard for cascading style sheets recommended by W3C.
Practitioner Workbench column has a section titled Programming.Tips() and it provides an interesting write-up on “Multidimensional Plots in Matlab for Data Analysis” by Baisa L Gunjal of Amrutvahini College of Engineering Sangamner and Dr. Suresh N Mali of Singhgad Institute of Technology and Science, Maharastra. The other section called Programming.Learn("Python") under Practitioner Workbench covers guidelines on how to read from text fi le and how to write results to a fi le using Python.
… “Challenges in Bioimage Informatics” on the backdrop of the conceptual ecosystem of a dedicated image analysis/computer vision framework.
Information Security section of the Security Corner feature has an interesting article on Security and Privacy, which throws light on privacy concerns in the age of social networking. Another section called IT Act 2000 under Security Corner comes with a write-up by Mr. Subramaniam Vutha, wherein he explains the concepts of ‘off er’ and its ‘acceptance’ in the context of online shopping through a dialogue between a legal expert and an IT executive. This time we are dropping CIO Perspective and HR column but next time you will surely have them.
As usual there are other regular features such as Brain Teaser, Ask an Expert, ICT@Society and Happenings@ICT. CSI Reports and CSI News section provide event details of various regions, SIGs, chapters and student branches.
Please note that we welcome your feedback, contributions and suggestions at [email protected].
With warm regards,Rajendra M Sonar, Achuthsankar S Nair,Debasish Jana, and Jayshree DhereEditors
Dear Fellow CSI Members,
Cover Story
Bhabatosh ChandaElectronics and Communication Sciences Unit, Indian Statistical Institute, Kolkata 700108
IntroductionWhenever we capture images with a camera our intention is almost always to have high-resolution (HR) images as these are good for both viewing as well as computer processing. However, to have the desired HR image is not always possible and the major bottleneck is the hardware limitations. A direct method for increasing pixel resolution would be by dense sensor manufacturing technique. However, increasing chip size or packing more sensors in a single chip leads to increase in capacitance, which makes it difficult to speed up the charge transfer rate. Thus, using image restoration technique to obtain a HR image from the observed low-resolution (LR) image(s) has become a promising solution to the problem. This is simply a method of increasing pixel resolution synthetically[1,5] and is called super resolution image reconstruction or super resolution imaging. The topic remains an area of active research because of its many interesting applications including synthetic zooming of region of interest in forensic, surveillance, remote sensing, and conversion from NTSC video signal to HDTV signal. The SR methods can be broadly categorized into two groups:
(i) generating HR image from multiple LR frames known as multi-frame SR, and (ii) generating HR image from a single LR image known as single-frame SR. Here we will focus only on multi-frame SR using an algebraic technique.
Generating LR ImageBefore developing the algorithm for generating HR image from LR images, let us mention again that the SR imaging means the enhancement of the spatial resolution only and not of gray level or color. Moreover, the enhancement in image quality by SR methods is possible if and only if LR images were sampled at a rate lower than the Nyquist rate. Second, the multi-frame SR methodology
An Algebraic Method for Super Resolution Image Reconstruction
CSI Communications | July 2012 | 5
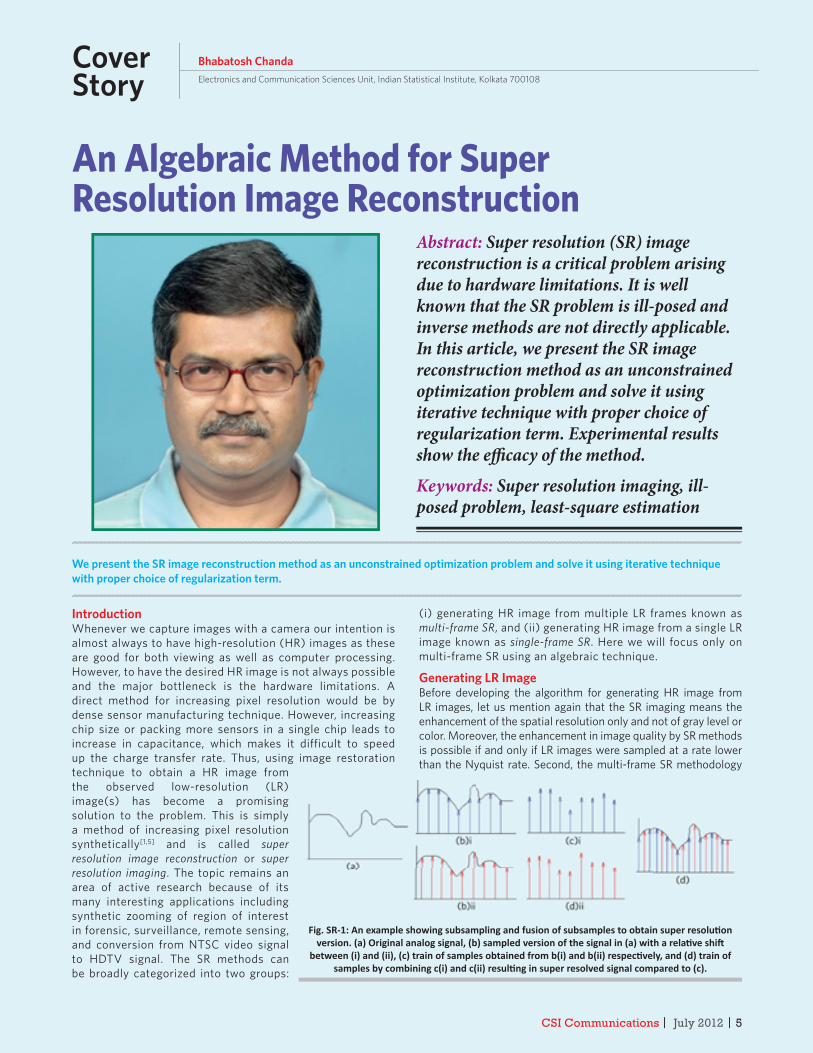
Fig. SR-1: An example showing subsampling and fusion of subsamples to obtain super resoluti on version. (a) Original analog signal, (b) sampled version of the signal in (a) with a relati ve shift
between (i) and (ii), (c) train of samples obtained from b(i) and b(ii) respecti vely, and (d) train of samples by combining c(i) and c(ii) resulti ng in super resolved signal compared to (c).
Abstract: Super resolution (SR) image reconstruction is a critical problem arising due to hardware limitations. It is well known that the SR problem is ill-posed and inverse methods are not directly applicable. In this article, we present the SR image reconstruction method as an unconstrained optimization problem and solve it using iterative technique with proper choice of regularization term. Experimental results show the effi cacy of the method.Keywords: Super resolution imaging, ill-posed problem, least-square estimation
We present the SR image reconstruction method as an unconstrained optimization problem and solve it using iterative technique with proper choice of regularization term.
CSI Communications | July 2012 | 6 www.csi-india.org
works only when we have suffi cient number of LR images of the same scene that are diff erent from one another because of motion or blurring or any other physical reason.
Let us fi rst consider an example of a one-dimensional signal as shown in
Fig. SR-1(a). Two diff erent sampling instances of this signal at the same sampling rate but with a little off set are shown in Figs. SR-1(b)i and SR-1(b)ii. Thus, we get two LR-sampled signals [Figs. SR-1(c)i and SR-1(c)ii]. Given these two signals, the objective of SR technique is to reconstruct the HR-sampled signal as shown in Fig. SR-1(d). It is obvious that the reconstruction of HR signal from the LR signals needs mutual registration of the latter ones. For mutual registration of the sampled signals [Figs. SR-1(c)i and SR-1(c)ii] they have to be mutually correlated, which is not apparent if (shifted) delta functions are used for sampling as described in the fi gure. However, according to digital image acquisition technology, a sample value is not really an instantaneous value of the signal, but approximately the average intensity over the sampling interval as revealed in Fig. SR-2(a), where the sample value fi may be defi ned as:
fi =
1(
Δxf x d x
xi −Δx/ 2
xi +Δx/ 2
∫ )
where �x is the sampling interval. If we consider the samples of Fig. SR-1(d) as the HR version of the signal and denote them by fi(i = 0, 1, 2, ...), then the LR samples [see Fig. SR-1(c)] may be obtained by down sampling fi as
g j
1 =12
(f2j+f
2j+1) and
g j
2 =12
(f2j+1
+f2j+2
) assuming that the
resolution of gj is half of that of fi and the relative shift is one sample. Similarly, in two-dimension, one of the LR images g(r,c) may be obtained by averaging the corresponding 2x2 pixels of HR image, i.e.
g(r,c) =
14
(f(2r,2c) +f(2r,2c + 1)+f(2r + 1,2c)+f(2r + 1,2c + 1)
This is illustrated in Fig. SR-2(b). Thus, g(r,c) is the downsampled image of f(r,c), where downsampling factor is 2. With this understanding let us state the super resolution imaging problem as follows.
Problem Defi nitionSuppose a two-dimensional array of M X N CCD sensors cover the entire LR image plane resulting in observed images of M rows and N columns. Corresponding HR image is of size sM X sN, where s is the downsampling factor. A column vector g
of size MN is generated from the given LR image matrix {g(r,c)} by raster scan of the matrix. A column vector f of size s2MN
corresponding to the HR image may be obtained in a similar way. Suppose we have n such LR images gi(i = 1, 2, 3, ..., n), and then assuming that each LR image is corrupted by signal independent additive noise we can represent the i-th observed LR image as:
gi = SBiViF + ηi for i = 1, 2, 3, ..., n (sr-1)
where Vi is a transformation matrix of size s2MN X s2MN representing motion of the objects observed in i-th LR image, Bi is a s2MN X s2MN matrix representing blurring including defocusing and atmospheric eff ect, and fi nally S is the MN X s2MN
decimation matrix that describes the downsampling process such as:
g(r,c) =
1s2 f(x,y)
y=sc
s(c+1)−1
∑x=sr
s(r+1)−1
∑
(sr-2)
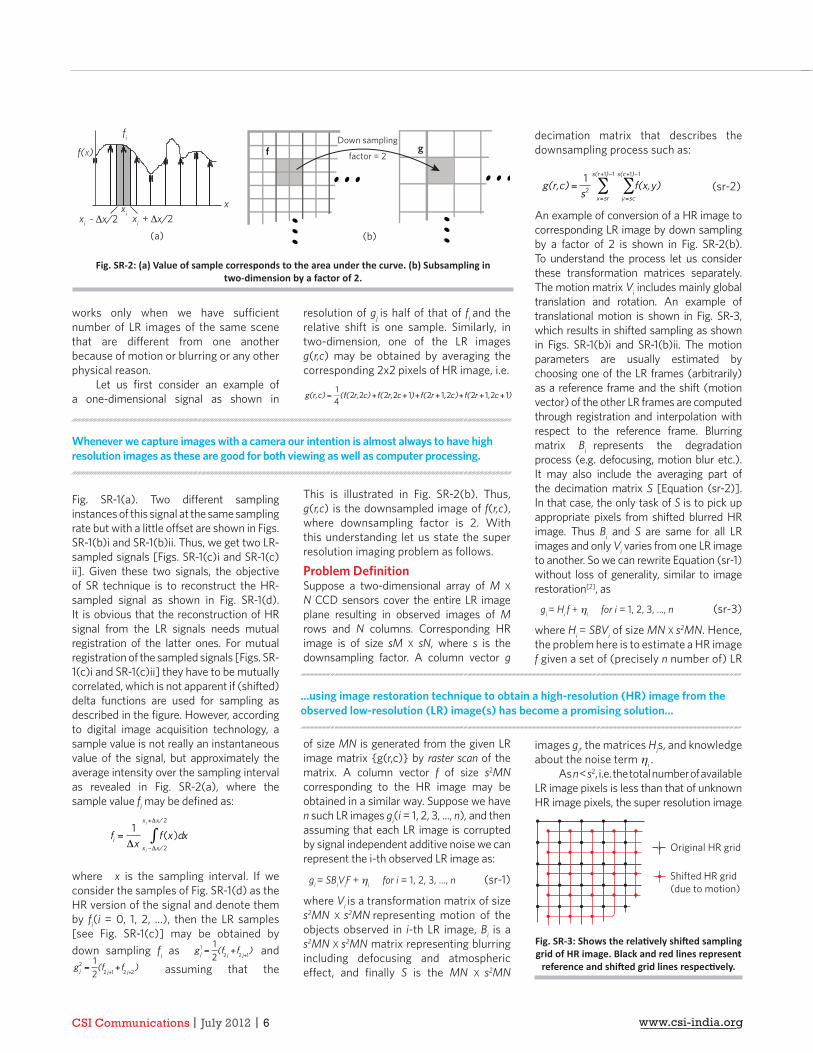
An example of conversion of a HR image to corresponding LR image by down sampling by a factor of 2 is shown in Fig. SR-2(b). To understand the process let us consider these transformation matrices separately. The motion matrix Vi includes mainly global translation and rotation. An example of translational motion is shown in Fig. SR-3, which results in shifted sampling as shown in Figs. SR-1(b)i and SR-1(b)ii. The motion parameters are usually estimated by choosing one of the LR frames (arbitrarily) as a reference frame and the shift (motion vector) of the other LR frames are computed through registration and interpolation with respect to the reference frame. Blurring matrix Bi represents the degradation process (e.g. defocusing, motion blur etc.). It may also include the averaging part of the decimation matrix S [Equation (sr-2)]. In that case, the only task of S is to pick up appropriate pixels from shifted blurred HR image. Thus Bi and S are same for all LR images and only Vi varies from one LR image to another. So we can rewrite Equation (sr-1) without loss of generality, similar to image restoration[2], as
gi = Hi f + ηi for i = 1, 2, 3, ..., n (sr-3)
where Hi = SBVi of size MN X s2MN. Hence, the problem here is to estimate a HR image f given a set of (precisely n number of) LR
images gi, the matrices His, and knowledge about the noise term ηi .
As n < s2, i.e. the total number of available LR image pixels is less than that of unknown HR image pixels, the super resolution image
Whenever we capture images with a camera our intention is almost always to have high resolution images as these are good for both viewing as well as computer processing.
...using image restoration technique to obtain a high-resolution (HR) image from the observed low-resolution (LR) image(s) has become a promising solution...
Original HR grid
Shifted HR grid(due to motion)
Fig. SR-2: (a) Value of sample corresponds to the area under the curve. (b) Subsampling in two-dimension by a factor of 2.
Fig. SR-3: Shows the relati vely shift ed sampling grid of HR image. Black and red lines represent
reference and shift ed grid lines respecti vely.
fi
f(X)
- Δx/2 + Δx/2xi
xxi
xi
f gDown sampling
factor = 2
(a) (b)
CSI Communications | July 2012 | 7
reconstruction, in general, is an ill-posed problem. That means Equation (sr-3) has infi nitely many solutions. Second, since size of Hi is extremely large, direct inverse methods are computationally infeasible. There are many diff erent approaches to solve this problem. Here we discuss an algebraic method, namely constrained least-square estimation.
Constrained Least-Square EstimationSuppose we have the reconstructed HR image f
(
. This would be a good estimate if the diff erence between the observed LR images and the redegraded downsampled estimated image f
(
be zero. Because of the ill-conditioned nature of the solution, a number of f
(
may be available that would satisfy this criterion. From among these f
(
, we need to select a particular one. For this purpose we may employ a
selection criterion, which can obtain a particular f
(
that satisfy some criterion of goodness or quality measure of image
f
(
Q2 subject to the constraint that total
residual norm between the LR images and the redegraded down sampled estimated image be minimum. In other words, we try to obtain a solution f
(
as
minimize f
(
Q2 such that
gi−
i 1
n
∑ Hif ̂ 2 − η
i
2 < ε=
The quality measure operator Q could be fi rst or second order derivative operator. In that case, quality measure f
(
Q2 emphasizes
on the smoothness in the HR image, and the data error term gi −
i 1
n
∑ Hi2 − ηi
2f ̂ =should be less than a predefi ned tolerable
error. Since obtaining solution to a constraint minimization problem is a nontrivial task, we reformulate the above problem as an
unconstrained minimization problem as
J( ) = Q2+λ( gi −
i 1
n
∑ Hi
2− ηi
2)f ̂ f ̂ f ̂
= (sr-4)
where λ is the Lagrange multiplier, commonly known as the regularization parameter in the super-resolution literature, which maintains a trade-off between the regularization term
f (
Q2
and the error in estimation. J(f ̂ ) of equation (sr-4) is a quadratic and convex function of the estimated image f
(
, so the f
(
for which J(f ̂ ) is minimum may be obtained by diff erentiating J(f ̂ ) and equating the result to zero. Hence, we can write
HT
i 1
n
∑ Hi +γQTQ) = HT gii 1
n
∑f ̂ (== (sr-5)
that leads to an iterative solution for f
(
as[3]
k+1= k +α HiT gi −Hi
k −γQTQ k
i 1
n
∑f
(
f
(
f ̂ f ̂ ]
]
=
)
) (sr-6)
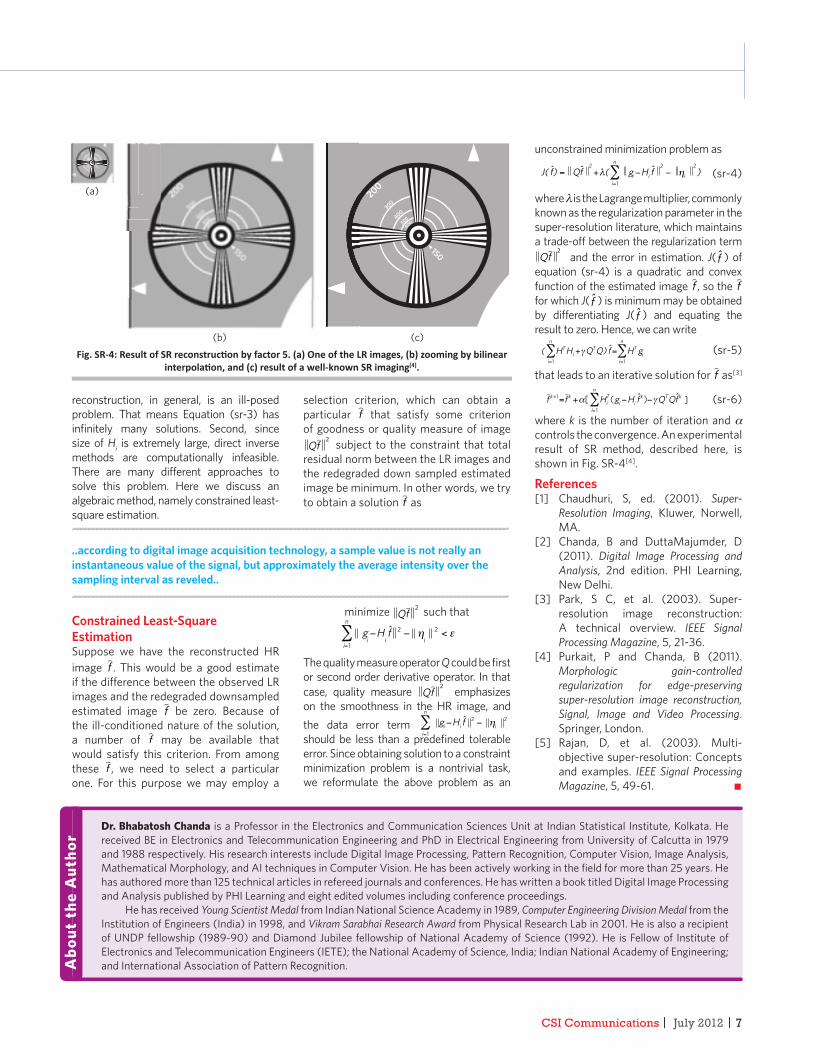
where k is the number of iteration and αcontrols the convergence. An experimental result of SR method, described here, is shown in Fig. SR-4[4].
References [1] Chaudhuri, S, ed. (2001). Super-
Resolution Imaging, Kluwer, Norwell, MA.
[2] Chanda, B and DuttaMajumder, D (2011). Digital Image Processing and Analysis, 2nd edition. PHI Learning, New Delhi.
[3] Park, S C, et al. (2003). Super-resolution image reconstruction: A technical overview. IEEE Signal Processing Magazine, 5, 21-36.
[4] Purkait, P and Chanda, B (2011). Morphologic gain-controlled regularization for edge-preserving super-resolution image reconstruction, Signal, Image and Video Processing. Springer, London.
[5] Rajan, D, et al. (2003). Multi-objective super-resolution: Concepts and examples. IEEE Signal Processing Magazine, 5, 49-61. n
Dr. Bhabatosh Chanda is a Professor in the Electronics and Communication Sciences Unit at Indian Statistical Institute, Kolkata. He received BE in Electronics and Telecommunication Engineering and PhD in Electrical Engineering from University of Calcutta in 1979 and 1988 respectively. His research interests include Digital Image Processing, Pattern Recognition, Computer Vision, Image Analysis, Mathematical Morphology, and AI techniques in Computer Vision. He has been actively working in the fi eld for more than 25 years. He has authored more than 125 technical articles in refereed journals and conferences. He has written a book titled Digital Image Processing and Analysis published by PHI Learning and eight edited volumes including conference proceedings.
He has received Young Scientist Medal from Indian National Science Academy in 1989, Computer Engineering Division Medal from the Institution of Engineers (India) in 1998, and Vikram Sarabhai Research Award from Physical Research Lab in 2001. He is also a recipient of UNDP fellowship (1989-90) and Diamond Jubilee fellowship of National Academy of Science (1992). He is Fellow of Institute of Electronics and Telecommunication Engineers (IETE); the National Academy of Science, India; Indian National Academy of Engineering; and International Association of Pattern Recognition.A
bout
the
Aut
hor
..according to digital image acquisition technology, a sample value is not really an instantaneous value of the signal, but approximately the average intensity over the sampling interval as reveled..
200
150
300
400
500
600
(a)
(b) (c)Fig. SR-4: Result of SR reconstructi on by factor 5. (a) One of the LR images, (b) zooming by bilinear
interpolati on, and (c) result of a well-known SR imaging[4].
CSI Communications | July 2012 | 8 www.csi-india.org
Image processing (IP) is used in diversifi ed application areas in the industries. In this article, we shall describe three diff erent perspectives of industrial applications of image processing: computer vision, video technologies, and 3-D reconstruction. We shall also describe some industry-specifi c IP applications based on our experiences as a part of service industry.
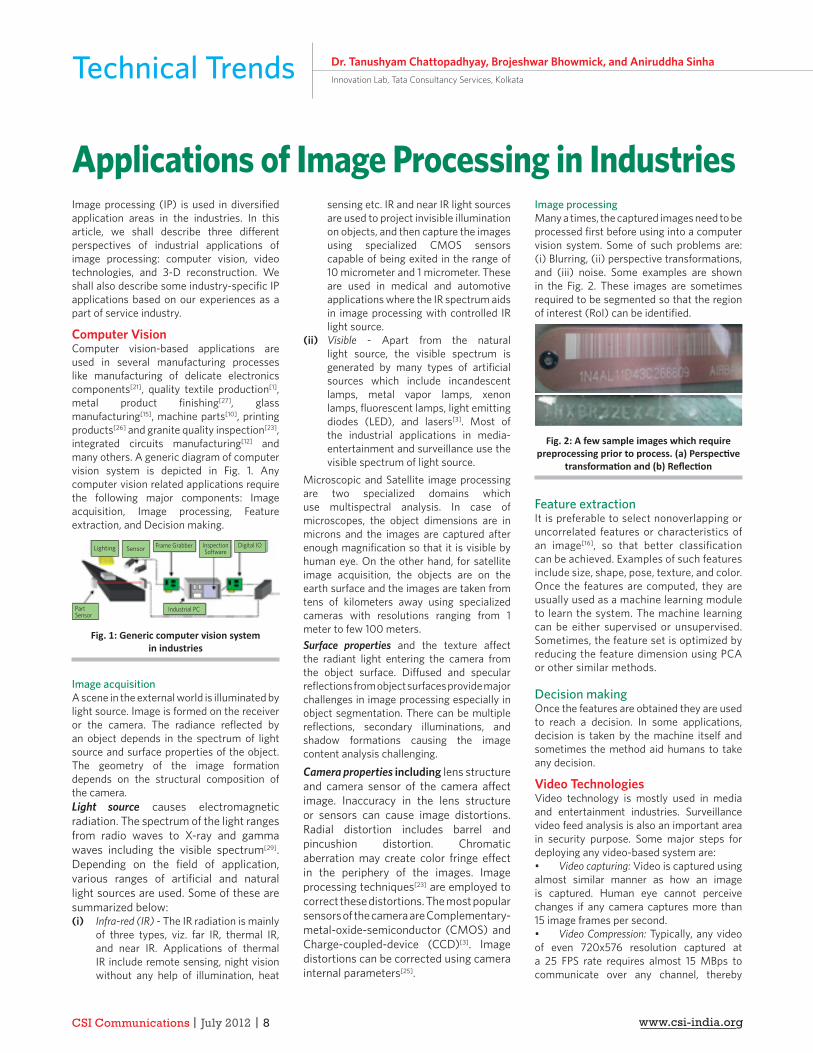
Computer VisionComputer vision-based applications are used in several manufacturing processes like manufacturing of delicate electronics components[21], quality textile production[1], metal product fi nishing[27], glass manufacturing[15], machine parts[10], printing products[26] and granite quality inspection[23], integrated circuits manufacturing[12] and many others. A generic diagram of computer vision system is depicted in Fig. 1. Any computer vision related applications require the following major components: Image acquisition, Image processing, Feature extraction, and Decision making.
Lighting Sensor Frame Grabber InspectionSoftware
Digital IO
Part Sensor
Industrial PC
Fig. 1: Generic computer vision system in industries
Image acquisitionA scene in the external world is illuminated by light source. Image is formed on the receiver or the camera. The radiance refl ected by an object depends in the spectrum of light source and surface properties of the object. The geometry of the image formation depends on the structural composition of the camera. Light source causes electromagnetic radiation. The spectrum of the light ranges from radio waves to X-ray and gamma waves including the visible spectrum[29]. Depending on the fi eld of application, various ranges of artifi cial and natural light sources are used. Some of these are summarized below:(i) Infra-red (IR) - The IR radiation is mainly
of three types, viz. far IR, thermal IR, and near IR. Applications of thermal IR include remote sensing, night vision without any help of illumination, heat
sensing etc. IR and near IR light sources are used to project invisible illumination on objects, and then capture the images using specialized CMOS sensors capable of being exited in the range of 10 micrometer and 1 micrometer. These are used in medical and automotive applications where the IR spectrum aids in image processing with controlled IR light source.
(ii) Visible - Apart from the natural light source, the visible spectrum is generated by many types of artifi cial sources which include incandescent lamps, metal vapor lamps, xenon lamps, fl uorescent lamps, light emitting diodes (LED), and lasers[3]. Most of the industrial applications in media-entertainment and surveillance use the visible spectrum of light source.
Microscopic and Satellite image processing are two specialized domains which use multispectral analysis. In case of microscopes, the object dimensions are in microns and the images are captured after enough magnifi cation so that it is visible by human eye. On the other hand, for satellite image acquisition, the objects are on the earth surface and the images are taken from tens of kilometers away using specialized cameras with resolutions ranging from 1 meter to few 100 meters.Surface properties and the texture aff ect the radiant light entering the camera from the object surface. Diff used and specular refl ections from object surfaces provide major challenges in image processing especially in object segmentation. There can be multiple refl ections, secondary illuminations, and shadow formations causing the image content analysis challenging.
Camera properties including lens structure and camera sensor of the camera aff ect image. Inaccuracy in the lens structure or sensors can cause image distortions. Radial distortion includes barrel and pincushion distortion. Chromatic aberration may create color fringe eff ect in the periphery of the images. Image processing techniques[23] are employed to correct these distortions. The most popular sensors of the camera are Complementary-metal-oxide-semiconductor (CMOS) and Charge-coupled-device (CCD)[3]. Image distortions can be corrected using camera internal parameters[25].
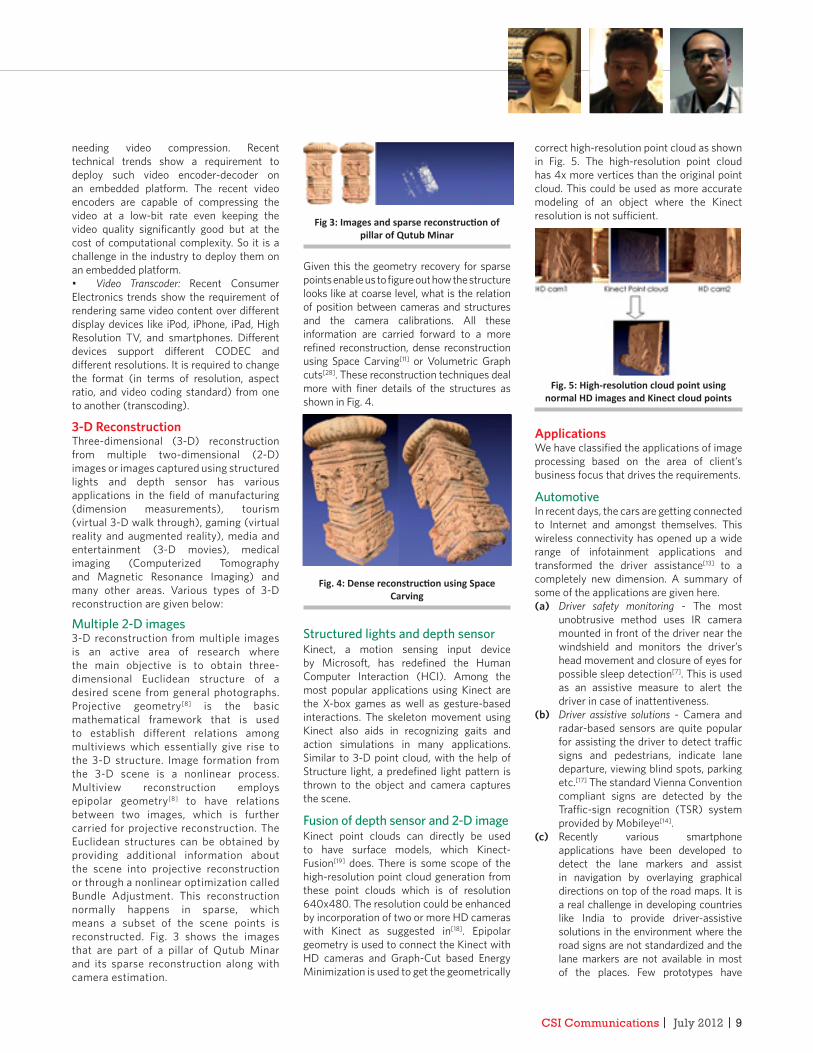
Image processingMany a times, the captured images need to be processed fi rst before using into a computer vision system. Some of such problems are: (i) Blurring, (ii) perspective transformations, and (iii) noise. Some examples are shown in the Fig. 2. These images are sometimes required to be segmented so that the region of interest (RoI) can be identifi ed.
Fig. 2: A few sample images which require preprocessing prior to process. (a) Perspecti ve
transformati on and (b) Refl ecti on
Feature extractionIt is preferable to select nonoverlapping or uncorrelated features or characteristics of an image[16], so that better classifi cation can be achieved. Examples of such features include size, shape, pose, texture, and color. Once the features are computed, they are usually used as a machine learning module to learn the system. The machine learning can be either supervised or unsupervised. Sometimes, the feature set is optimized by reducing the feature dimension using PCA or other similar methods.
Decision makingOnce the features are obtained they are used to reach a decision. In some applications, decision is taken by the machine itself and sometimes the method aid humans to take any decision.
Video TechnologiesVideo technology is mostly used in media and entertainment industries. Surveillance video feed analysis is also an important area in security purpose. Some major steps for deploying any video-based system are:• Video capturing: Video is captured using almost similar manner as how an image is captured. Human eye cannot perceive changes if any camera captures more than 15 image frames per second.• Video Compression: Typically, any video of even 720x576 resolution captured at a 25 FPS rate requires almost 15 MBps to communicate over any channel, thereby
Technical Trends
Applications of Image Processing in Industries
Dr. Tanushyam Chattopadhyay, Brojeshwar Bhowmick, and Aniruddha SinhaInnovation Lab, Tata Consultancy Services, Kolkata
CSI Communications | July 2012 | 9
needing video compression. Recent technical trends show a requirement to deploy such video encoder-decoder on an embedded platform. The recent video encoders are capable of compressing the video at a low-bit rate even keeping the video quality signifi cantly good but at the cost of computational complexity. So it is a challenge in the industry to deploy them on an embedded platform.• Video Transcoder: Recent Consumer Electronics trends show the requirement of rendering same video content over diff erent display devices like iPod, iPhone, iPad, High Resolution TV, and smartphones. Diff erent devices support diff erent CODEC and diff erent resolutions. It is required to change the format (in terms of resolution, aspect ratio, and video coding standard) from one to another (transcoding).
3-D ReconstructionThree-dimensional (3-D) reconstruction from multiple two-dimensional (2-D) images or images captured using structured lights and depth sensor has various applications in the fi eld of manufacturing (dimension measurements), tourism (virtual 3-D walk through), gaming (virtual reality and augmented reality), media and entertainment (3-D movies), medical imaging (Computerized Tomography and Magnetic Resonance Imaging) and many other areas. Various types of 3-D reconstruction are given below:
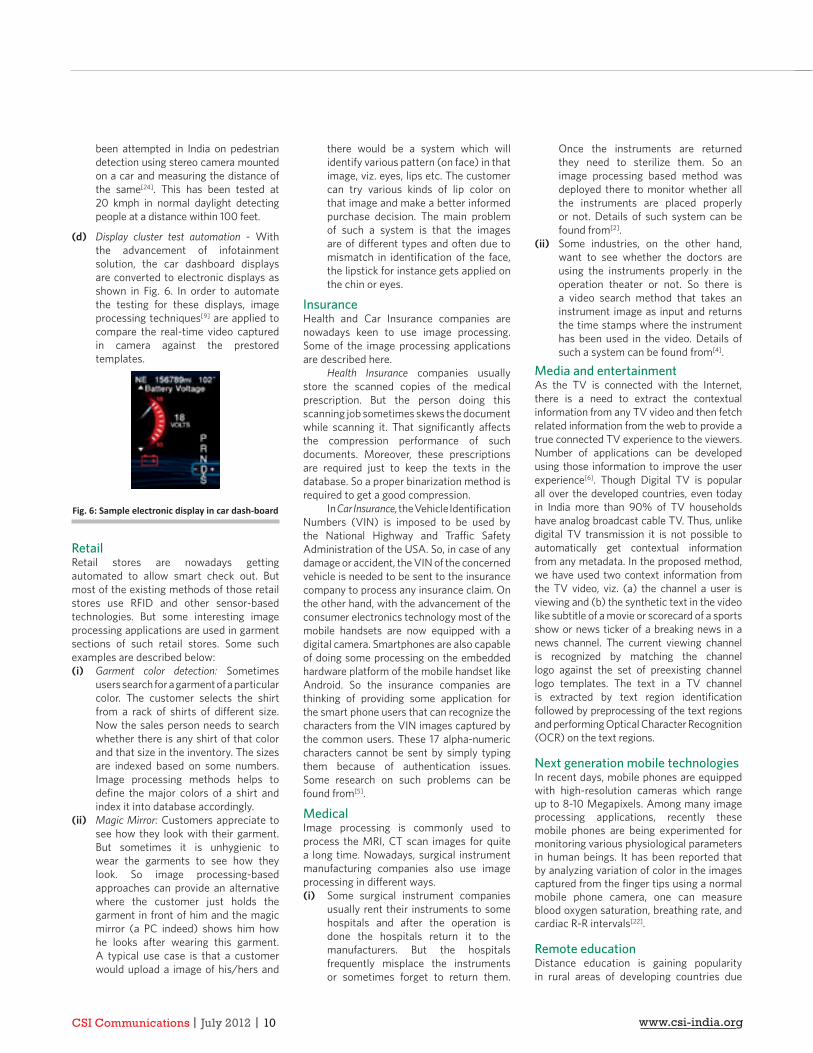
Multiple 2-D images3-D reconstruction from multiple images is an active area of research where the main objective is to obtain three-dimensional Euclidean structure of a desired scene from general photographs. Projective geometry[8] is the basic mathematical framework that is used to establish different relations among multiviews which essentially give rise to the 3-D structure. Image formation from the 3-D scene is a nonlinear process. Multiview reconstruction employs epipolar geometry[8] to have relations between two images, which is further carried for projective reconstruction. The Euclidean structures can be obtained by providing additional information about the scene into projective reconstruction or through a nonlinear optimization called Bundle Adjustment. This reconstruction normally happens in sparse, which means a subset of the scene points is reconstructed. Fig. 3 shows the images that are part of a pillar of Qutub Minar and its sparse reconstruction along with camera estimation.
Fig 3: Images and sparse reconstructi on of pillar of Qutub Minar
Given this the geometry recovery for sparse points enable us to fi gure out how the structure looks like at coarse level, what is the relation of position between cameras and structures and the camera calibrations. All these information are carried forward to a more refi ned reconstruction, dense reconstruction using Space Carving[11] or Volumetric Graph cuts[28]. These reconstruction techniques deal more with fi ner details of the structures as shown in Fig. 4.
Fig. 4: Dense reconstructi on using Space Carving
Structured lights and depth sensorKinect, a motion sensing input device by Microsoft, has redefi ned the Human Computer Interaction (HCI). Among the most popular applications using Kinect are the X-box games as well as gesture-based interactions. The skeleton movement using Kinect also aids in recognizing gaits and action simulations in many applications. Similar to 3-D point cloud, with the help of Structure light, a predefi ned light pattern is thrown to the object and camera captures the scene.
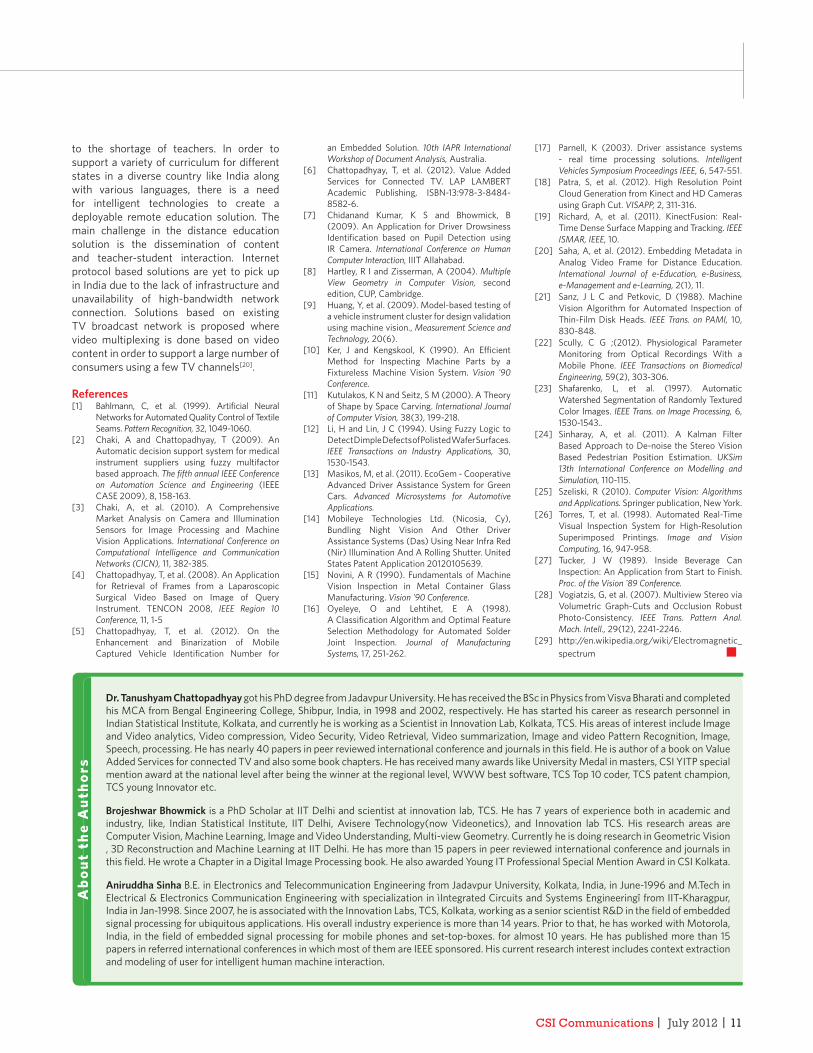
Fusion of depth sensor and 2-D imageKinect point clouds can directly be used to have surface models, which Kinect-Fusion[19] does. There is some scope of the high-resolution point cloud generation from these point clouds which is of resolution 640x480. The resolution could be enhanced by incorporation of two or more HD cameras with Kinect as suggested in[18]. Epipolar geometry is used to connect the Kinect with HD cameras and Graph-Cut based Energy Minimization is used to get the geometrically
correct high-resolution point cloud as shown in Fig. 5. The high-resolution point cloud has 4x more vertices than the original point cloud. This could be used as more accurate modeling of an object where the Kinect resolution is not suffi cient.
Fig. 5: High-resoluti on cloud point using normal HD images and Kinect cloud points
ApplicationsWe have classifi ed the applications of image processing based on the area of client’s business focus that drives the requirements.
AutomotiveIn recent days, the cars are getting connected to Internet and amongst themselves. This wireless connectivity has opened up a wide range of infotainment applications and transformed the driver assistance[13] to a completely new dimension. A summary of some of the applications are given here.(a) Driver safety monitoring - The most
unobtrusive method uses IR camera mounted in front of the driver near the windshield and monitors the driver’s head movement and closure of eyes for possible sleep detection[7]. This is used as an assistive measure to alert the driver in case of inattentiveness.
(b) Driver assistive solutions - Camera and radar-based sensors are quite popular for assisting the driver to detect traffi c signs and pedestrians, indicate lane departure, viewing blind spots, parking etc.[17] The standard Vienna Convention compliant signs are detected by the Traffi c-sign recognition (TSR) system provided by Mobileye[14].
(c) Recently various smartphone applications have been developed to detect the lane markers and assist in navigation by overlaying graphical directions on top of the road maps. It is a real challenge in developing countries like India to provide driver-assistive solutions in the environment where the road signs are not standardized and the lane markers are not available in most of the places. Few prototypes have
CSI Communications | July 2012 | 10 www.csi-india.org
been attempted in India on pedestrian detection using stereo camera mounted on a car and measuring the distance of the same[24]. This has been tested at 20 kmph in normal daylight detecting people at a distance within 100 feet.
(d) Display cluster test automation - With the advancement of infotainment solution, the car dashboard displays are converted to electronic displays as shown in Fig. 6. In order to automate the testing for these displays, image processing techniques[9] are applied to compare the real-time video captured in camera against the prestored templates.
Fig. 6: Sample electronic display in car dash-board
RetailRetail stores are nowadays getting automated to allow smart check out. But most of the existing methods of those retail stores use RFID and other sensor-based technologies. But some interesting image processing applications are used in garment sections of such retail stores. Some such examples are described below:(i) Garment color detection: Sometimes
users search for a garment of a particular color. The customer selects the shirt from a rack of shirts of diff erent size. Now the sales person needs to search whether there is any shirt of that color and that size in the inventory. The sizes are indexed based on some numbers. Image processing methods helps to defi ne the major colors of a shirt and index it into database accordingly.
(ii) Magic Mirror: Customers appreciate to see how they look with their garment. But sometimes it is unhygienic to wear the garments to see how they look. So image processing-based approaches can provide an alternative where the customer just holds the garment in front of him and the magic mirror (a PC indeed) shows him how he looks after wearing this garment. A typical use case is that a customer would upload a image of his/hers and
there would be a system which will identify various pattern (on face) in that image, viz. eyes, lips etc. The customer can try various kinds of lip color on that image and make a better informed purchase decision. The main problem of such a system is that the images are of diff erent types and often due to mismatch in identifi cation of the face, the lipstick for instance gets applied on the chin or eyes.
InsuranceHealth and Car Insurance companies are nowadays keen to use image processing. Some of the image processing applications are described here.
Health Insurance companies usually store the scanned copies of the medical prescription. But the person doing this scanning job sometimes skews the document while scanning it. That signifi cantly aff ects the compression performance of such documents. Moreover, these prescriptions are required just to keep the texts in the database. So a proper binarization method is required to get a good compression.
In Car Insurance, the Vehicle Identifi cation Numbers (VIN) is imposed to be used by the National Highway and Traffi c Safety Administration of the USA. So, in case of any damage or accident, the VIN of the concerned vehicle is needed to be sent to the insurance company to process any insurance claim. On the other hand, with the advancement of the consumer electronics technology most of the mobile handsets are now equipped with a digital camera. Smartphones are also capable of doing some processing on the embedded hardware platform of the mobile handset like Android. So the insurance companies are thinking of providing some application for the smart phone users that can recognize the characters from the VIN images captured by the common users. These 17 alpha-numeric characters cannot be sent by simply typing them because of authentication issues. Some research on such problems can be found from[5].
MedicalImage processing is commonly used to process the MRI, CT scan images for quite a long time. Nowadays, surgical instrument manufacturing companies also use image processing in diff erent ways.(i) Some surgical instrument companies
usually rent their instruments to some hospitals and after the operation is done the hospitals return it to the manufacturers. But the hospitals frequently misplace the instruments or sometimes forget to return them.
Once the instruments are returned they need to sterilize them. So an image processing based method was deployed there to monitor whether all the instruments are placed properly or not. Details of such system can be found from[2].
(ii) Some industries, on the other hand, want to see whether the doctors are using the instruments properly in the operation theater or not. So there is a video search method that takes an instrument image as input and returns the time stamps where the instrument has been used in the video. Details of such a system can be found from[4].
Media and entertainmentAs the TV is connected with the Internet, there is a need to extract the contextual information from any TV video and then fetch related information from the web to provide a true connected TV experience to the viewers. Number of applications can be developed using those information to improve the user experience[6]. Though Digital TV is popular all over the developed countries, even today in India more than 90% of TV households have analog broadcast cable TV. Thus, unlike digital TV transmission it is not possible to automatically get contextual information from any metadata. In the proposed method, we have used two context information from the TV video, viz. (a) the channel a user is viewing and (b) the synthetic text in the video like subtitle of a movie or scorecard of a sports show or news ticker of a breaking news in a news channel. The current viewing channel is recognized by matching the channel logo against the set of preexisting channel logo templates. The text in a TV channel is extracted by text region identifi cation followed by preprocessing of the text regions and performing Optical Character Recognition (OCR) on the text regions.
Next generation mobile technologiesIn recent days, mobile phones are equipped with high-resolution cameras which range up to 8-10 Megapixels. Among many image processing applications, recently these mobile phones are being experimented for monitoring various physiological parameters in human beings. It has been reported that by analyzing variation of color in the images captured from the fi nger tips using a normal mobile phone camera, one can measure blood oxygen saturation, breathing rate, and cardiac R-R intervals[22].
Remote educationDistance education is gaining popularity in rural areas of developing countries due
CSI Communications | July 2012 | 11
to the shortage of teachers. In order to support a variety of curriculum for diff erent states in a diverse country like India along with various languages, there is a need for intelligent technologies to create a deployable remote education solution. The main challenge in the distance education solution is the dissemination of content and teacher-student interaction. Internet protocol based solutions are yet to pick up in India due to the lack of infrastructure and unavailability of high-bandwidth network connection. Solutions based on existing TV broadcast network is proposed where video multiplexing is done based on video content in order to support a large number of consumers using a few TV channels[20].
References[1] Bahlmann, C, et al. (1999). Artifi cial Neural
Networks for Automated Quality Control of Textile Seams. Pattern Recognition, 32, 1049-1060.
[2] Chaki, A and Chattopadhyay, T (2009). An Automatic decision support system for medical instrument suppliers using fuzzy multifactor based approach. The fi fth annual IEEE Conference on Automation Science and Engineering (IEEE CASE 2009), 8, 158-163.
[3] Chaki, A, et al. (2010). A Comprehensive Market Analysis on Camera and Illumination Sensors for Image Processing and Machine Vision Applications. International Conference on Computational Intelligence and Communication Networks (CICN), 11, 382-385.
[4] Chattopadhyay, T, et al. (2008). An Application for Retrieval of Frames from a Laparoscopic Surgical Video Based on Image of Query Instrument. TENCON 2008, IEEE Region 10 Conference, 11, 1-5
[5] Chattopadhyay, T, et al. (2012). On the Enhancement and Binarization of Mobile Captured Vehicle Identifi cation Number for
an Embedded Solution. 10th IAPR International Workshop of Document Analysis, Australia.
[6] Chattopadhyay, T, et al. (2012). Value Added Services for Connected TV. LAP LAMBERT Academic Publishing, ISBN-13:978-3-8484-8582-6.
[7] Chidanand Kumar, K S and Bhowmick, B (2009). An Application for Driver Drowsiness Identifi cation based on Pupil Detection using IR Camera. International Conference on Human Computer Interaction, IIIT Allahabad.
[8] Hartley, R I and Zisserman, A (2004). Multiple View Geometry in Computer Vision, second edition, CUP, Cambridge.
[9] Huang, Y, et al. (2009). Model-based testing of a vehicle instrument cluster for design validation using machine vision., Measurement Science and Technology, 20(6).
[10] Ker, J and Kengskool, K (1990). An Effi cient Method for Inspecting Machine Parts by a Fixtureless Machine Vision System. Vision '90 Conference.
[11] Kutulakos, K N and Seitz, S M (2000). A Theory of Shape by Space Carving. International Journal of Computer Vision, 38(3), 199-218.
[12] Li, H and Lin, J C (1994). Using Fuzzy Logic to Detect Dimple Defects of Polisted Wafer Surfaces. IEEE Transactions on Industry Applications, 30, 1530-1543.
[13] Masikos, M, et al. (2011). EcoGem - Cooperative Advanced Driver Assistance System for Green Cars. Advanced Microsystems for Automotive Applications.
[14] Mobileye Technologies Ltd. (Nicosia, Cy), Bundling Night Vision And Other Driver Assistance Systems (Das) Using Near Infra Red (Nir) Illumination And A Rolling Shutter. United States Patent Application 20120105639.
[15] Novini, A R (1990). Fundamentals of Machine Vision Inspection in Metal Container Glass Manufacturing. Vision '90 Conference.
[16] Oyeleye, O and Lehtihet, E A (1998). A Classifi cation Algorithm and Optimal Feature Selection Methodology for Automated Solder Joint Inspection. Journal of Manufacturing Systems, 17, 251-262.
[17] Parnell, K (2003). Driver assistance systems - real time processing solutions. Intelligent Vehicles Symposium Proceedings IEEE, 6, 547-551.
[18] Patra, S, et al. (2012). High Resolution Point Cloud Generation from Kinect and HD Cameras using Graph Cut. VISAPP, 2, 311-316.
[19] Richard, A, et al. (2011). KinectFusion: Real-Time Dense Surface Mapping and Tracking. IEEE ISMAR, IEEE, 10.
[20] Saha, A, et al. (2012). Embedding Metadata in Analog Video Frame for Distance Education. International Journal of e-Education, e-Business, e-Management and e-Learning, 2(1), 11.
[21] Sanz, J L C and Petkovic, D (1988). Machine Vision Algorithm for Automated Inspection of Thin-Film Disk Heads. IEEE Trans. on PAMI, 10, 830-848.
[22] Scully, C G ;(2012). Physiological Parameter Monitoring from Optical Recordings With a Mobile Phone. IEEE Transactions on Biomedical Engineering, 59(2), 303-306.
[23] Shafarenko, L, et al. (1997). Automatic Watershed Segmentation of Randomly Textured Color Images. IEEE Trans. on Image Processing, 6, 1530-1543..
[24] Sinharay, A, et al. (2011). A Kalman Filter Based Approach to De-noise the Stereo Vision Based Pedestrian Position Estimation. UKSim 13th International Conference on Modelling and Simulation, 110-115.
[25] Szeliski, R (2010). Computer Vision: Algorithms and Applications. Springer publication, New York.
[26] Torres, T, et al. (1998). Automated Real-Time Visual Inspection System for High-Resolution Superimposed Printings. Image and Vision Computing, 16, 947-958.
[27] Tucker, J W (1989). Inside Beverage Can Inspection: An Application from Start to Finish. Proc. of the Vision '89 Conference.
[28] Vogiatzis, G, et al. (2007). Multiview Stereo via Volumetric Graph-Cuts and Occlusion Robust Photo-Consistency. IEEE Trans. Pattern Anal. Mach. Intell., 29(12), 2241-2246.
[29] http://en.wikipedia.org/wiki/Electromagnetic_spectrum n
Dr. Tanushyam Chattopadhyay got his PhD degree from Jadavpur University. He has received the BSc in Physics from Visva Bharati and completed his MCA from Bengal Engineering College, Shibpur, India, in 1998 and 2002, respectively. He has started his career as research personnel in Indian Statistical Institute, Kolkata, and currently he is working as a Scientist in Innovation Lab, Kolkata, TCS. His areas of interest include Image and Video analytics, Video compression, Video Security, Video Retrieval, Video summarization, Image and video Pattern Recognition, Image, Speech, processing. He has nearly 40 papers in peer reviewed international conference and journals in this fi eld. He is author of a book on Value Added Services for connected TV and also some book chapters. He has received many awards like University Medal in masters, CSI YITP special mention award at the national level after being the winner at the regional level, WWW best software, TCS Top 10 coder, TCS patent champion, TCS young Innovator etc.
Brojeshwar Bhowmick is a PhD Scholar at IIT Delhi and scientist at innovation lab, TCS. He has 7 years of experience both in academic and industry, like, Indian Statistical Institute, IIT Delhi, Avisere Technology(now Videonetics), and Innovation lab TCS. His research areas are Computer Vision, Machine Learning, Image and Video Understanding, Multi-view Geometry. Currently he is doing research in Geometric Vision , 3D Reconstruction and Machine Learning at IIT Delhi. He has more than 15 papers in peer reviewed international conference and journals in this fi eld. He wrote a Chapter in a Digital Image Processing book. He also awarded Young IT Professional Special Mention Award in CSI Kolkata.
Aniruddha Sinha B.E. in Electronics and Telecommunication Engineering from Jadavpur University, Kolkata, India, in June-1996 and M.Tech in Electrical & Electronics Communication Engineering with specialization in ìIntegrated Circuits and Systems Engineeringî from IIT-Kharagpur, India in Jan-1998. Since 2007, he is associated with the Innovation Labs, TCS, Kolkata, working as a senior scientist R&D in the fi eld of embedded signal processing for ubiquitous applications. His overall industry experience is more than 14 years. Prior to that, he has worked with Motorola, India, in the fi eld of embedded signal processing for mobile phones and set-top-boxes. for almost 10 years. He has published more than 15 papers in referred international conferences in which most of them are IEEE sponsored. His current research interest includes context extraction and modeling of user for intelligent human machine interaction.
Abo
ut t
he A
utho
rs
CSI Communications | July 2012 | 12 www.csi-india.org
ResearchFront
Saurav BasuCenter for Bioimage Informatics, Carnegie Mellon UniversityPittsburgh, United States 15213
It has been around half a century since the establishment of image processing and computer vision as disciplines fi rmly rooted in mathematical principles and focused at automatically analyzing visual information in the digital age. The
entry into the fi eld of visual automation was both exciting and challenging; problems requiring automation grew exponentially, and so did the gap between arcane mathematical formulae and practical algorithms. It would not be an exaggeration to state that artifi cial intelligence, machine learning, signal processing, and their direct descendant in the form of computer vision has been instrumental in developing the area of practical and practicable numerical algorithms - mathematics is now a means of livelihood for the computer scientist.
Since its inception, there have been numerous directions in which computer vision has taken interesting turns. With the barrage of relevant journals, conferences and workshops, image processing and computer vision has gradually matured into a well-grounded subject that is not merely a collection of ad-hoc solutions for solving academic toy problems, but having the foundation and depth to create a new world of digital assistants. Today, automated algorithms are an integral part in all labor-intensive and observer bias-prone areas such as video surveillance, satellite image analysis, video broadcasting, biological image segmentation, and medical image diagnostics. With the establishment of the indispensability of computer vision algorithms in the age of digital automation
and the exponential growth in both the quantity and variability of information, challenges that are unique to this age have emerged which require a long-term evaluation of the future of computer vision.
Application of computer vision algorithms to the gamut of exploratory and diagnostic data in the fi elds of biology and medicine holds the potential to be one of the greatest success stories in health care and fundamental sciences. Quantitative measurement, computation and informatics from bioimage data, such as brightfi eld microscopy, confocal microscopy, MRI, CT, and Ultrasound, to name a few, has miles to catch up with the
pace of advancement of these modalities. Measurement from biomedical images such as MRI and Ultrasound are fast becoming the primary noninvasive ways for diagnosing abnormalities in patients. Numerical algorithms for segmenting and tracking 3D organ volumes in these images, despite background clutter and modality specifi c aberration, are the need of the hour for medical diagnostics. The fi eld of microscopy is still a predominantly subjective exercise where qualitative evaluations of the diff erence between control and experimental groups are the only ways to assess eff ect of drugs or discover fundamental biological functions - quantitative algorithms that can produce accurate measurements has the potential to advance microscopy in unimaginable ways. Lastly and most importantly, the pace of generation of bioimage data and the availability of physicians and biologists actively participating with the computer vision community means that powerful machine learning algorithms can be
Some Upcoming Challenges in Bioimage Informatics
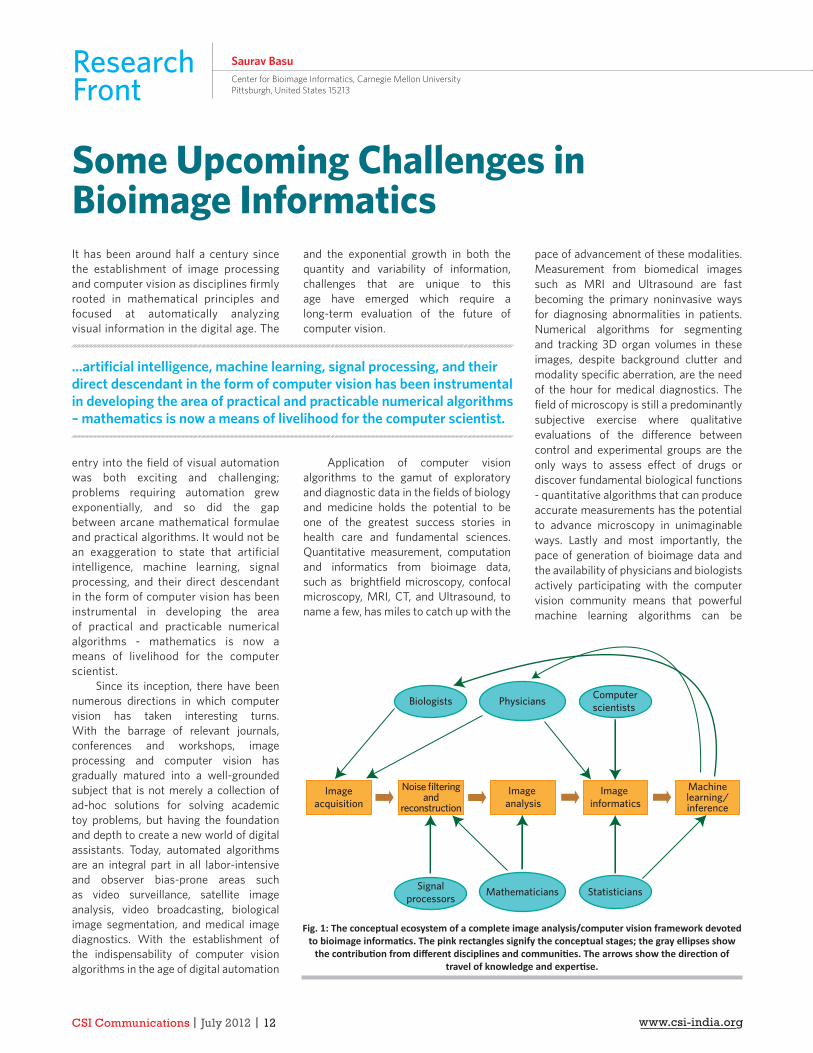
Fig. 1: The conceptual ecosystem of a complete image analysis/computer vision framework devoted to bioimage informati cs. The pink rectangles signify the conceptual stages; the gray ellipses show
the contributi on from diff erent disciplines and communiti es. The arrows show the directi on of travel of knowledge and experti se.
...artifi cial intelligence, machine learning, signal processing, and their direct descendant in the form of computer vision has been instrumental in developing the area of practical and practicable numerical algorithms – mathematics is now a means of livelihood for the computer scientist.
Imageacquisition
Image analysis
Image informatics
Machinelearning/inference
Noise filteringand
reconstruction
Signalprocessors Mathematicians Statisticians
Physicians ComputerscientistsBiologists
CSI Communications | July 2012 | 13
devised to incorporate human experience into a statistical setting in a systematic manner. Fig. 1 shows a version of the current conceptual pipeline of a bioimage informatics system.
Here I outline fi ve major areas that I consider to be future challenges that will shape the discipline of automated bioimage informatics in the next age.
Open Access to Biological/Biomedical DataOne of the most critical impediments to a computer vision scientist developing specialized algorithms to analyze a particular bioimage segmentation and/or
analysis problem is the current disinterest of the biomedical imaging community in establishing an open database of images. Algorithms, often custom-made to solve a particular problem at hand, share a considerable similarity in methodology with other algorithms that might be applied to a diff erent data. As an example, a neuron-tracing algorithm might have the same underlying methodology of matched fi ltering and background suppression as an actin network measurement algorithm for animal cells.
The lack of suffi cient open access databases where algorithms can be tested and results reported have led to considerable reinvention of basic methodologies. Diff erent research groups, privy to the data of their own collaborators are often unaware and unsure of the existence of useful algorithms that can already be altered in a minor way to solve their own analysis problems. Moreover, even if a careful study of results reported by diff erent groups in diff erent journals and conferences might lead to an acknowledgement of existing techniques, the lack of open access to the reported datasets is often the reason for the abandonment of those particular methodologies. There is often no way to
compare and analyze success of another methodology within the experimental confi nes of one’s own laboratory.
Moreover, circumstantial affi nity to a distinguished group of biological imagers often puts many computer vision scientists at an advantage compared to equally talented scientists who are not in close collaboration with any facility that can acquire images relevant to the current state of the art. Algorithm developers with lesser resources at hand are often constrained to develop newer algorithms that can only be tested on very generic data that off er no variability or validation for their new algorithms.
Therefore, there needs to be a concerted eff ort by the biological and the biomedical imaging community to develop forums and alliances that can develop open access databases of state-of-the-art images that are in desperate need of quantitative information extraction. Uniform storage, retrieval, and metadata standards need to be decided. There is an immediate need for proactive and useful participation from well-equipped radiology departments of hospitals as well as well funded microscopy laboratories to off er their
data to the general computer vision community. It is understandable that privacy and technical concerns will hinder the speedy publishing of data, and in some cases make it perhaps impossible; but for the most part, any disclosure of declassifi ed image data to the general computer vision community will
tremendously enhance the streamlined development of the state of the art.
Verifi cation and Validation of AlgorithmsIt is undeniable that the numbers of conferences and journals that report current research on bioimage informatics have grown exponentially in the last decade, and so has the reporting of fantastic results. The high frequency of these events has put immense pressure on researchers and reviewers. Several expected incremental improvements over a short period of time naturally have led to the assumption by the reviewers that a huge improvement in the state of the art is a necessity for any consideration for publication.
This has naturally resulted in an extremely competitive and claustrophobic atmosphere where there are fewer and fewer incentives for reporting genuine and reasonable results and higher and higher temptations for cherry picking experimental datasets. It is almost next to impossible to reproduce the results reported in a variety of journals without in-depth familiarity with the specifi c datasets and extensive tuning of free parameters. Methods and numerical analysis often hold for very narrow assumptions and the incentive for the community invariably gravitates towards constructing over complicated and fancy details rather than develop robust, well-rounded, and complete solutions. It is perhaps not uncommon to any of us in the community how a lack of astonishing
results often have confi ned graduate students and lead investigators inside their laboratories for days at end, in search for the ‘magical’ data or inventing ways to ‘defend’ comments from reviewers.
It is therefore with genuine urgency that the computer vision community, especially those who are engaged in the
There is an immediate need for proactive and useful participation from well-equipped radiology departments of hospitals as well as well funded microscopy laboratories to off er their data to the general computer vision community.
Quantitative measurement, computation and informatics from bioimage data such as brightfi eld microscopy, confocal microscopy, MRI, CT, and Ultrasound, to name a few, has miles to catch up with the pace of advancement of these modalities.
CSI Communications | July 2012 | 14 www.csi-india.org
fi eld of bioimage informatics, needs to reevaluate and recalibrate the success criteria for the whole community. A more transparent and reproducible model for research needs to be embraced, where the emphasis is less on stellar results and more on the wide applicability, robustness, and reproducibility of research. Higher percentage of numerical and/or qualitative validation metrics needs to be developed,
and the focus should shift from vast advancement conditioned on assumptions and constrained data towards robust incremental advancement. A reasonable way to achieve this goal might be for journals to require at least a pseudocode, if not the entire implementation of one’s algorithms, with the specifi cation of the exact tuning parameters. Expectations for stellar achievements from the side of the reviewers should be curtailed, and the emphasis should be on usefulness and robustness.
This is really the need of the hour - any lack of dedication towards reproducible and incremental but robust results will ultimately lead to a scientifi c literature that itself generates unhealthy mistrust inside the community.
Taking Advantage of the Explosion in Data AcquisitionOne big change that perhaps sets the current stage apart from the early days of bioimage informatics as well as computer vision is the availability of huge amounts of data generated by experts which stands on the frontier of current human knowledge. High throughput experiments for large biological assays are regular features in the drug research community today. Terabytes of images are generated every day in the pathology research labs for the analysis of cancerous tissues and stockpiling medical evidence of diseases. High-resolution imaging of the neural circuits of Drosophila and the cytoskeletal structure of muscle tissue are carried out
routinely throughout universities in the United States that generate gigabytes of information about cellular structure. In short, image data is being generated at a much faster pace than the speed with which computer vision scientists are coming up with tailor-made algorithms that automate specifi c problems pertaining to each of these datasets.
It is therefore quite imperative
that the process of development of automation algorithms take advantage of this information explosion and modify themselves to be data driven rather than imagination driven. In other words, it would be quite impossible for computer vision scientists to anticipate the physics behind the image generation and then come up with arbitrary and rule-based schemes that work on a wide variation of the images in a particular set. For example, guessing and formulating an effi cient stopping force in the case of active contours that segment a large Ultrasound dataset of murine hearts would quite frankly be infeasible - several ad-hoc adjustments need to be carried out to tune and perfect arbitrary and complicated edge stopping formulae.
The need of the hour is perhaps to take
advantage of the immense advancements in the discipline of machine learning and the availability of suffi ciently large and annotated datasets by experts in the specifi c biological problem at hand. In a data-driven atmosphere and with suffi cient computing resources, statistical learning models are possibly the best alternatives to learn the intrinsic variability of data. Instead of formulating and anticipating every numerical formula in every algorithm, generic functional forms can be assumed and the corresponding functions learnt as a regression or a classifi cation problem. This learning approach can often lead to very robust and useful solutions in practice that can be easily adapted by practicing biologists and research physicians to actually advance health care and medical diagnostics. Reinforcement learning and online learning models can be easily incorporated in a rapidly functioning image generation laboratory that can quickly adapt to new annotated data. With the current capabilities in computing speed and power for most computer vision groups, and availability of collaboration between the medical and the vision communities, incorporating human knowledge and driving the solution process through the data is the most natural choice in today’s world.
Dissemination of Diagnostic Data for the End UserA very reasonable and valid impetus for the continued relevance and usefulness of the computer vision community in the fi eld of bioimage informatics is the
A more transparent and reproducible model for research needs to be embraced, where the emphasis is less on stellar results and more on the wide applicability, robustness and reproducibility of research.
Group 2Group 1
Restricted knowledge sharingRestricted knowledge sharing
Restricted knowledge sharing
(B)(A)Open access image
database
Data-driven algorithm generation
Standardized and reasonablevalidation methodologies
Provide fast diagnostic software to end-user
Choose imagedatabase
Designempiricalalgorithm
Tune algorithmparameters
Choose imagedatabase
Designempiricalalgorithm
Tune algorithmparameters
Group 1
Group 3
Group 1
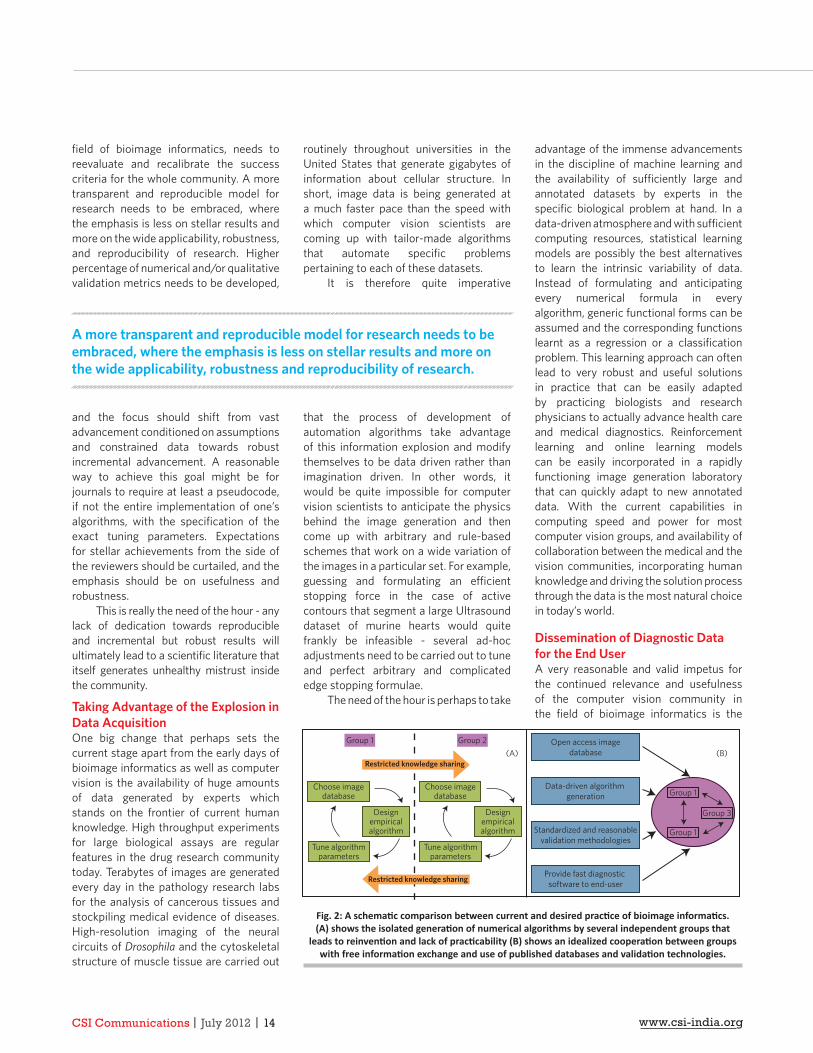
Fig. 2: A schemati c comparison between current and desired practi ce of bioimage informati cs. (A) shows the isolated generati on of numerical algorithms by several independent groups that
leads to reinventi on and lack of practi cability (B) shows an idealized cooperati on between groups with free informati on exchange and use of published databases and validati on technologies.
CSI Communications | July 2012 | 15
A focused curriculum on bioimage analysis and informatics needs to be developed that can enable the undergraduate student to bridge the daunting gap between engineering and biology.
ultimate utilization of fast diagnostic algorithms by the end user. Although part of the importance of the community is discovering important facts in the fi elds of clinical research and fundamental science, yet, the biggest service and impact will indeed come from making vision algorithms operate under limited resources inside the house of the common man. Quick and accurate medical diagnosis must be performed on
handheld medical devices such as a heart Ultrasound device and remedial measures advised on the fl y.
This goal can only be achieved if simple, fast, and accurate algorithms are developed that can run on limited resources and computing power. The huge array of statistical models and trained examples can be suitably accessed in a client server model where the client only performs a regression, classifi cation, or computation task and the bulk of the expertise is transferred through the server which has the benefi ts of high computational power and accumulation of expertise in specialized laboratories. In short, in addition to developing data-intensive and mathematically complete algorithms that can solve complicated problems in a high-tech environment, low-tech versions of the same algorithms need to be developed that disseminate the same fruits of success to the ultimate end user and can be run via accessing the
information pool through the Internet. This would ensure that the science of computer vision makes the greatest impact on everyday life. Fig. 2 contrasts the way in which the aforementioned four points are implemented in the current scenario versus an idealized way the algorithm generation community might work in order to reduce reinvention and increase practicability of academic inventions.
Education and Training of the Modern Generation of Biomedical Image AnalystsI come to the last and most frequently overlooked aspect of the recipe to success of bioimage informatics as a discipline. Education and hands-on training of the modern generation of computer vision scientists with a specifi c focus on bioimage informatics is in a state of confusion and disarray. Biomedical engineering is in most universities a newly formed discipline at the undergraduate level. A subject-specifi c curriculum and philosophy has still not permeated the classrooms from the highly specialized laboratories that perform cutting edge research on bioimage informatics.
Successful research in vision algorithms applied to biomedical images have frequently taken years of study for most investigators in various disciplines ranging from mathematics, signal
processing, and biology - this fi rmly establishes the credentials of bioimage informatics as a multidisciplinary subject that not only requires perspective from diff erent angles and disciplines, but a need to develop an attitude for collaboration and special understanding for cross-discipline communication. Often, the demands from the biology community seem imprecise and overcomplicated to the computer vision community, and the mathematical jargon and computations supplied by the computer vision community seem unnecessary and impractical to the biology community. The need to develop a language that can enable eff ective and free communication is therefore paramount. And it is only natural that experts in bioimage informatics need to take the initiative to develop this language and disseminate this perspective through undergraduate education.
Undergraduate curriculums in bioimage analysis and informatics not only need to teach the systems perspective of signal processing and abstraction of real medical imaging devices as systems, but also need to entrench the student in strong mathematical principles of algebra and analysis. Moreover, a systems-oriented biology syllabi and current understanding of biological and medical imaging research that can lead to fundamental discoveries is also a unique requirement to this fi eld. Simply put, one cannot depend on years of practical research experience to develop a bioimage informatics expert - a focused curriculum on bioimage analysis and informatics needs to be developed that can enable the undergraduate student to bridge the daunting gap between engineering and biology. n
Saurav Basu is currently engaged in developing bioimage informatics retrieval systems in the Center for Bioimage Informatics, Carnegie Mellon University, USA. He was conferred a PhD in Image Analysis by the University of Virginia, USA, in 2011, where he worked with Prof. Scott T. Acton to develop mathematical algorithms for image recognition that leveraged techniques in diff erential geometry. He has been actively involved in the image analysis community as a researcher and reviewer for distinguished journals and conferences. His research interests include application of diff erential geometry, graph methods, machine learning, and PDEs to problems in biomedical image registration, distance metric calculation, and generative modeling of biological data.A
bout
the
Aut
hor
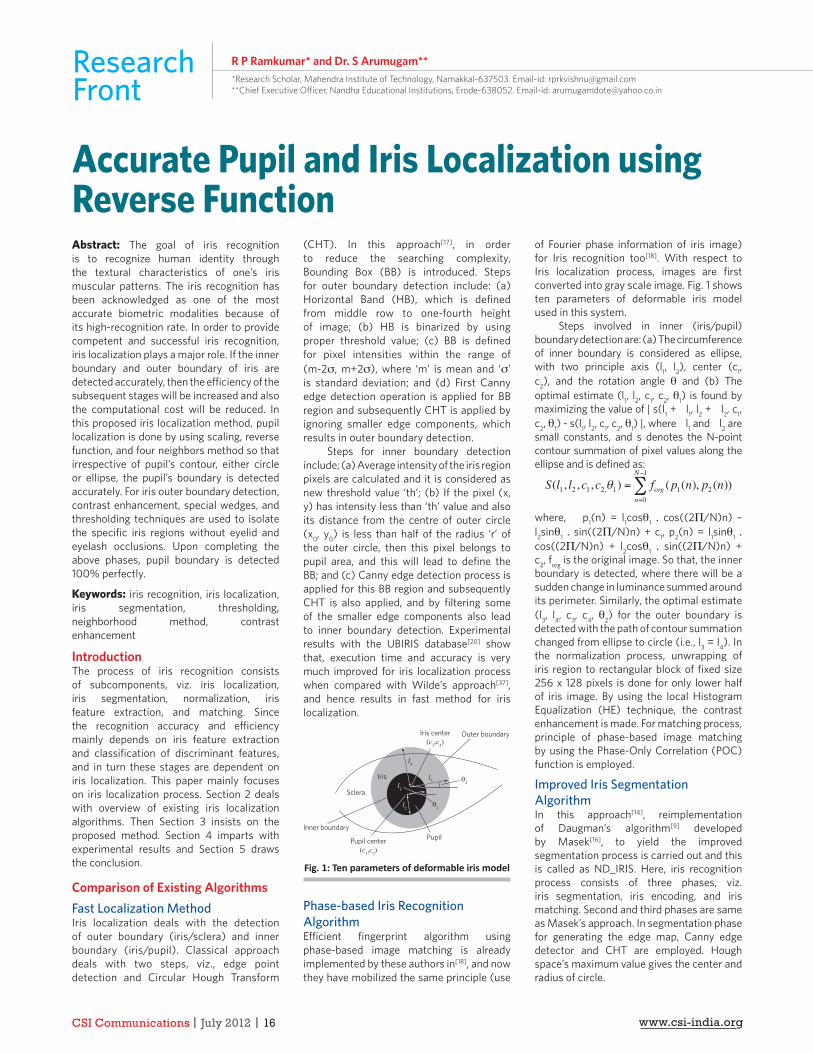
CSI Communications | July 2012 | 16 www.csi-india.org
ResearchFront
R P Ramkumar* and Dr. S Arumugam***Research Scholar, Mahendra Institute of Technology, Namakkal-637503. Email-id: [email protected]**Chief Executive Offi cer, Nandha Educational Institutions, Erode-638052. Email-id: [email protected]
Abstract: The goal of iris recognition is to recognize human identity through the textural characteristics of one’s iris muscular patterns. The iris recognition has been acknowledged as one of the most accurate biometric modalities because of its high-recognition rate. In order to provide competent and successful iris recognition, iris localization plays a major role. If the inner boundary and outer boundary of iris are detected accurately, then the effi ciency of the subsequent stages will be increased and also the computational cost will be reduced. In this proposed iris localization method, pupil localization is done by using scaling, reverse function, and four neighbors method so that irrespective of pupil’s contour, either circle or ellipse, the pupil’s boundary is detected accurately. For iris outer boundary detection, contrast enhancement, special wedges, and thresholding techniques are used to isolate the specifi c iris regions without eyelid and eyelash occlusions. Upon completing the above phases, pupil boundary is detected 100% perfectly.
Keywords: iris recognition, iris localization, iris segmentation, thresholding, neighborhood method, contrast enhancement
IntroductionThe process of iris recognition consists of subcomponents, viz. iris localization, iris segmentation, normalization, iris feature extraction, and matching. Since the recognition accuracy and effi ciency mainly depends on iris feature extraction and classifi cation of discriminant features, and in turn these stages are dependent on iris localization. This paper mainly focuses on iris localization process. Section 2 deals with overview of existing iris localization algorithms. Then Section 3 insists on the proposed method. Section 4 imparts with experimental results and Section 5 draws the conclusion.
Comparison of Existing AlgorithmsFast Localization MethodIris localization deals with the detection of outer boundary (iris/sclera) and inner boundary (iris/pupil). Classical approach deals with two steps, viz., edge point detection and Circular Hough Transform
(CHT). In this approach[17], in order to reduce the searching complexity, Bounding Box (BB) is introduced. Steps for outer boundary detection include: (a) Horizontal Band (HB), which is defi ned from middle row to one-fourth height of image; (b) HB is binarized by using proper threshold value; (c) BB is defi ned for pixel intensities within the range of (m-2σ, m+2σ), where ‘m’ is mean and ‘σ’ is standard deviation; and (d) First Canny edge detection operation is applied for BB region and subsequently CHT is applied by ignoring smaller edge components, which results in outer boundary detection.
Steps for inner boundary detection include; (a) Average intensity of the iris region pixels are calculated and it is considered as new threshold value ‘th’; (b) If the pixel (x, y) has intensity less than ‘th’ value and also its distance from the centre of outer circle (x0, y0) is less than half of the radius ‘r’ of the outer circle, then this pixel belongs to pupil area, and this will lead to defi ne the BB; and (c) Canny edge detection process is applied for this BB region and subsequently CHT is also applied, and by fi ltering some of the smaller edge components also lead to inner boundary detection. Experimental results with the UBIRIS database[20] show that, execution time and accuracy is very much improved for iris localization process when compared with Wilde’s approach[37], and hence results in fast method for iris localization.
Outer boundaryIris center(c
3,c
4)
Sclera
Iris
PupilInner boundary
Pupil center(c
1,c
2)
l3 θ
2
θ1
l4
l1
l2
Fig. 1: Ten parameters of deformable iris model
Phase-based Iris Recognition AlgorithmEffi cient fi ngerprint algorithm using phase-based image matching is already implemented by these authors in[18], and now they have mobilized the same principle (use
of Fourier phase information of iris image) for Iris recognition too[18]. With respect to Iris localization process, images are fi rst converted into gray scale image. Fig. 1 shows ten parameters of deformable iris model used in this system.
Steps involved in inner (iris/pupil) boundary detection are: (a) The circumference of inner boundary is considered as ellipse, with two principle axis (l1, l2), center (c1, c2), and the rotation angle θ and (b) The optimal estimate (l1, l2, c1, c2, θ1) is found by maximizing the value of | s(l1 + �l1, l2 + �l2, c1, c2, θ1) - s(l1, l2, c1, c2, θ1) |, where �l1 and �l2 are small constants, and s denotes the N-point contour summation of pixel values along the ellipse and is defi ned as:
where, p1(n) = l1cosθ1 . cos((2Π/N)n) – l2sinθ1 . sin((2Π/N)n) + c1, p2(n) = l1sinθ1 . cos((2Π/N)n) + l2cosθ1 . sin((2Π/N)n) + c2, forg is the original image. So that, the inner boundary is detected, where there will be a sudden change in luminance summed around its perimeter. Similarly, the optimal estimate (l3, l4, c3, c4, θ2) for the outer boundary is detected with the path of contour summation changed from ellipse to circle (i.e., l3 = l4). In the normalization process, unwrapping of iris region to rectangular block of fi xed size 256 x 128 pixels is done for only lower half of iris image. By using the local Histogram Equalization (HE) technique, the contrast enhancement is made. For matching process, principle of phase-based image matching by using the Phase-Only Correlation (POC) function is employed.
Improved Iris Segmentation Algorithm In this approach[14], reimplementation of Daugman’s algorithm[9] developed by Masek[16], to yield the improved segmentation process is carried out and this is called as ND_IRIS. Here, iris recognition process consists of three phases, viz. iris segmentation, iris encoding, and iris matching. Second and third phases are same as Masek’s approach. In segmentation phase for generating the edge map, Canny edge detector and CHT are employed. Hough space’s maximum value gives the center and radius of circle.
Accurate Pupil and Iris Localization using Reverse Function
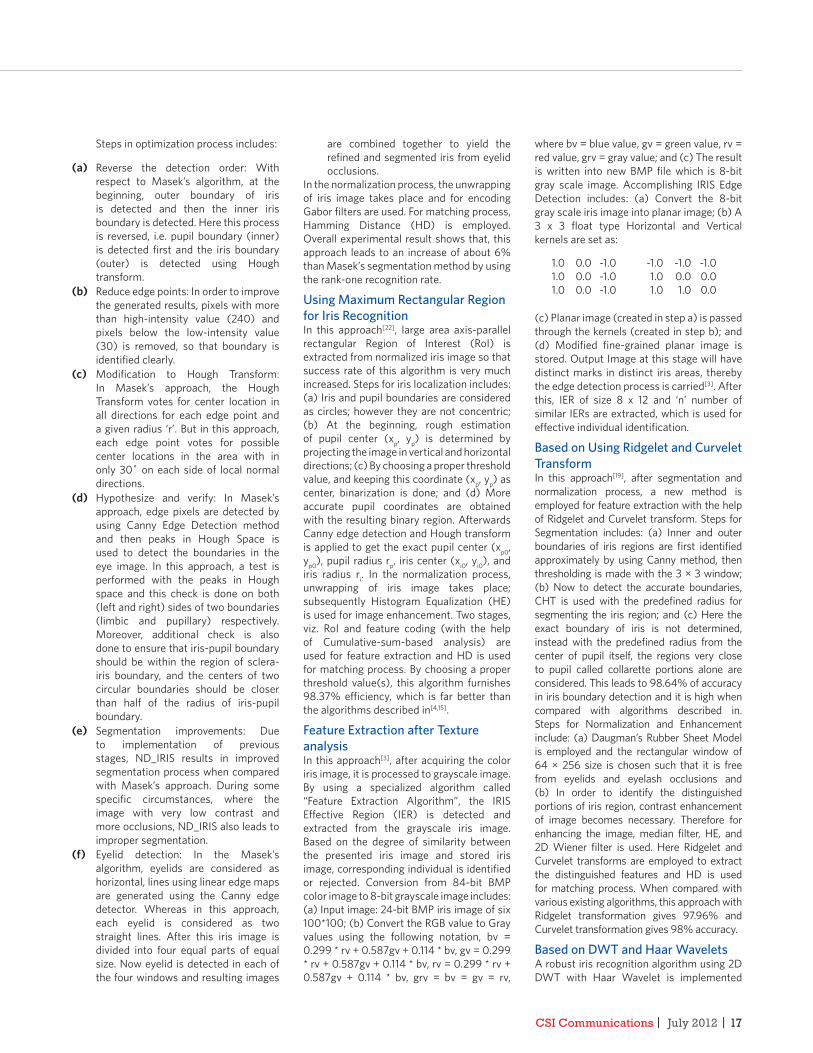
CSI Communications | July 2012 | 17
Steps in optimization process includes:
(a) Reverse the detection order: With respect to Masek’s algorithm, at the beginning, outer boundary of iris is detected and then the inner iris boundary is detected. Here this process is reversed, i.e. pupil boundary (inner) is detected fi rst and the iris boundary (outer) is detected using Hough transform.
(b) Reduce edge points: In order to improve the generated results, pixels with more than high-intensity value (240) and pixels below the low-intensity value (30) is removed, so that boundary is identifi ed clearly.
(c) Modifi cation to Hough Transform: In Masek’s approach, the Hough Transform votes for center location in all directions for each edge point and a given radius ‘r’. But in this approach, each edge point votes for possible center locations in the area with in only 30˚ on each side of local normal directions.
(d) Hypothesize and verify: In Masek’s approach, edge pixels are detected by using Canny Edge Detection method and then peaks in Hough Space is used to detect the boundaries in the eye image. In this approach, a test is performed with the peaks in Hough space and this check is done on both (left and right) sides of two boundaries (limbic and pupillary) respectively. Moreover, additional check is also done to ensure that iris-pupil boundary should be within the region of sclera-iris boundary, and the centers of two circular boundaries should be closer than half of the radius of iris-pupil boundary.
(e) Segmentation improvements: Due to implementation of previous stages, ND_IRIS results in improved segmentation process when compared with Masek’s approach. During some specifi c circumstances, where the image with very low contrast and more occlusions, ND_IRIS also leads to improper segmentation.
(f) Eyelid detection: In the Masek’s algorithm, eyelids are considered as horizontal, lines using linear edge maps are generated using the Canny edge detector. Whereas in this approach, each eyelid is considered as two straight lines. After this iris image is divided into four equal parts of equal size. Now eyelid is detected in each of the four windows and resulting images
are combined together to yield the refi ned and segmented iris from eyelid occlusions.
In the normalization process, the unwrapping of iris image takes place and for encoding Gabor fi lters are used. For matching process, Hamming Distance (HD) is employed. Overall experimental result shows that, this approach leads to an increase of about 6% than Masek’s segmentation method by using the rank-one recognition rate.
Using Maximum Rectangular Region for Iris RecognitionIn this approach[22], large area axis-parallel rectangular Region of Interest (RoI) is extracted from normalized iris image so that success rate of this algorithm is very much increased. Steps for iris localization includes: (a) Iris and pupil boundaries are considered as circles; however they are not concentric; (b) At the beginning, rough estimation of pupil center (xp, yp) is determined by projecting the image in vertical and horizontal directions; (c) By choosing a proper threshold value, and keeping this coordinate (xp, yp) as center, binarization is done; and (d) More accurate pupil coordinates are obtained with the resulting binary region. Afterwards Canny edge detection and Hough transform is applied to get the exact pupil center (xp0, yp0), pupil radius rp, iris center (xi0, yi0), and iris radius ri. In the normalization process, unwrapping of iris image takes place; subsequently Histogram Equalization (HE) is used for image enhancement. Two stages, viz. RoI and feature coding (with the help of Cumulative-sum-based analysis) are used for feature extraction and HD is used for matching process. By choosing a proper threshold value(s), this algorithm furnishes 98.37% effi ciency, which is far better than the algorithms described in[4,15].
Feature Extraction after Texture analysisIn this approach[3], after acquiring the color iris image, it is processed to grayscale image. By using a specialized algorithm called “Feature Extraction Algorithm”, the IRIS Eff ective Region (IER) is detected and extracted from the grayscale iris image. Based on the degree of similarity between the presented iris image and stored iris image, corresponding individual is identifi ed or rejected. Conversion from 84-bit BMP color image to 8-bit grayscale image includes: (a) Input image: 24-bit BMP iris image of six 100*100; (b) Convert the RGB value to Gray values using the following notation, bv = 0.299 * rv + 0.587gv + 0.114 * bv, gv = 0.299 * rv + 0.587gv + 0.114 * bv, rv = 0.299 * rv + 0.587gv + 0.114 * bv, grv = bv = gv = rv,
where bv = blue value, gv = green value, rv = red value, grv = gray value; and (c) The result is written into new BMP fi le which is 8-bit gray scale image. Accomplishing IRIS Edge Detection includes: (a) Convert the 8-bit gray scale iris image into planar image; (b) A 3 x 3 fl oat type Horizontal and Vertical kernels are set as:
1.0 0.0 -1.0 -1.0 -1.0 -1.01.0 0.0 -1.0 1.0 0.0 0.01.0 0.0 -1.0 1.0 1.0 0.0
(c) Planar image (created in step a) is passed through the kernels (created in step b); and (d) Modifi ed fi ne-grained planar image is stored. Output Image at this stage will have distinct marks in distinct iris areas, thereby the edge detection process is carried[3]. After this, IER of size 8 x 12 and ‘n’ number of similar IERs are extracted, which is used for eff ective individual identifi cation.
Based on Using Ridgelet and Curvelet TransformIn this approach[19], after segmentation and normalization process, a new method is employed for feature extraction with the help of Ridgelet and Curvelet transform. Steps for Segmentation includes: (a) Inner and outer boundaries of iris regions are fi rst identifi ed approximately by using Canny method, then thresholding is made with the 3 × 3 window; (b) Now to detect the accurate boundaries, CHT is used with the predefi ned radius for segmenting the iris region; and (c) Here the exact boundary of iris is not determined, instead with the predefi ned radius from the center of pupil itself, the regions very close to pupil called collarette portions alone are considered. This leads to 98.64% of accuracy in iris boundary detection and it is high when compared with algorithms described in. Steps for Normalization and Enhancement include: (a) Daugman’s Rubber Sheet Model is employed and the rectangular window of 64 × 256 size is chosen such that it is free from eyelids and eyelash occlusions and (b) In order to identify the distinguished portions of iris region, contrast enhancement of image becomes necessary. Therefore for enhancing the image, median fi lter, HE, and 2D Wiener fi lter is used. Here Ridgelet and Curvelet transforms are employed to extract the distinguished features and HD is used for matching process. When compared with various existing algorithms, this approach with Ridgelet transformation gives 97.96% and Curvelet transformation gives 98% accuracy.
Based on DWT and Haar Wavelets A robust iris recognition algorithm using 2D DWT with Haar Wavelet is implemented
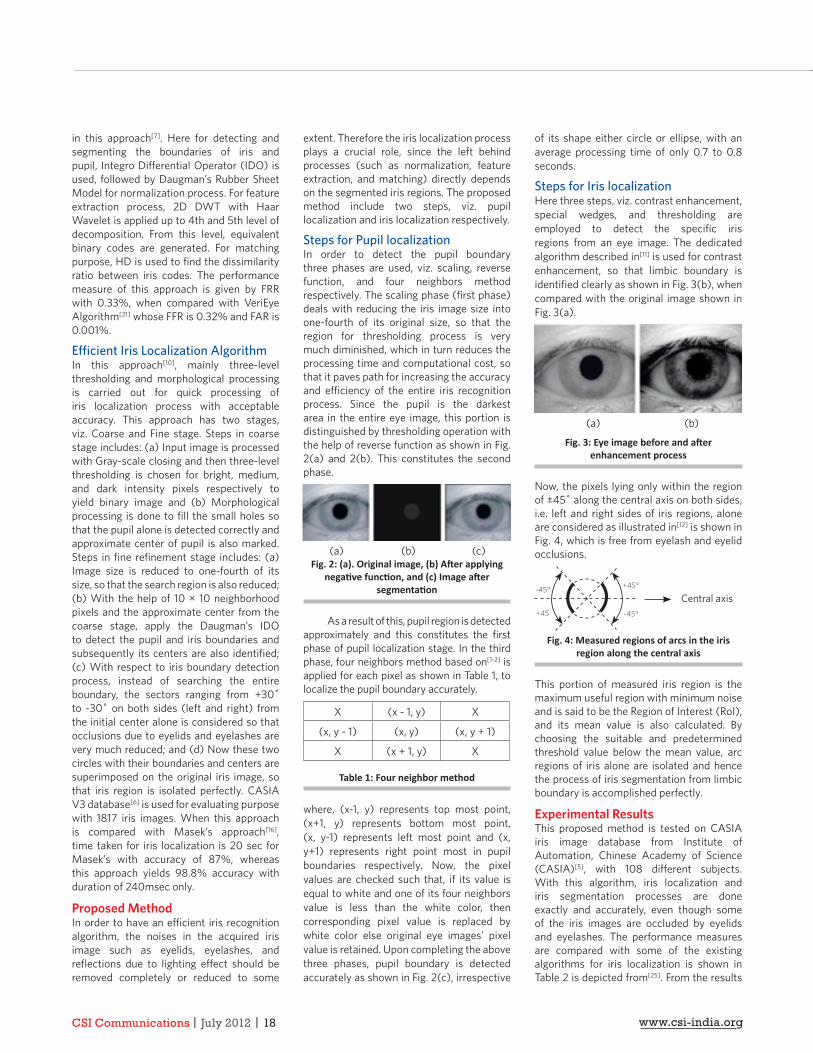
CSI Communications | July 2012 | 18 www.csi-india.org
in this approach[7]. Here for detecting and segmenting the boundaries of iris and pupil, Integro Diff erential Operator (IDO) is used, followed by Daugman’s Rubber Sheet Model for normalization process. For feature extraction process, 2D DWT with Haar Wavelet is applied up to 4th and 5th level of decomposition. From this level, equivalent binary codes are generated. For matching purpose, HD is used to fi nd the dissimilarity ratio between iris codes. The performance measure of this approach is given by FRR with 0.33%, when compared with VeriEye Algorithm[21] whose FFR is 0.32% and FAR is 0.001%.
Effi cient Iris Localization AlgorithmIn this approach[10], mainly three-level thresholding and morphological processing is carried out for quick processing of iris localization process with acceptable accuracy. This approach has two stages, viz. Coarse and Fine stage. Steps in coarse stage includes: (a) Input image is processed with Gray-scale closing and then three-level thresholding is chosen for bright, medium, and dark intensity pixels respectively to yield binary image and (b) Morphological processing is done to fi ll the small holes so that the pupil alone is detected correctly and approximate center of pupil is also marked. Steps in fi ne refi nement stage includes: (a) Image size is reduced to one-fourth of its size, so that the search region is also reduced; (b) With the help of 10 × 10 neighborhood pixels and the approximate center from the coarse stage, apply the Daugman’s IDO to detect the pupil and iris boundaries and subsequently its centers are also identifi ed; (c) With respect to iris boundary detection process, instead of searching the entire boundary, the sectors ranging from +30˚ to -30˚ on both sides (left and right) from the initial center alone is considered so that occlusions due to eyelids and eyelashes are very much reduced; and (d) Now these two circles with their boundaries and centers are superimposed on the original iris image, so that iris region is isolated perfectly. CASIA V3 database[6] is used for evaluating purpose with 1817 iris images. When this approach is compared with Masek’s approach[16], time taken for iris localization is 20 sec for Masek’s with accuracy of 87%, whereas this approach yields 98.8% accuracy with duration of 240msec only.
Proposed MethodIn order to have an effi cient iris recognition algorithm, the noises in the acquired iris image such as eyelids, eyelashes, and refl ections due to lighting eff ect should be removed completely or reduced to some
extent. Therefore the iris localization process plays a crucial role, since the left behind processes (such as normalization, feature extraction, and matching) directly depends on the segmented iris regions. The proposed method include two steps, viz. pupil localization and iris localization respectively.
Steps for Pupil localizationIn order to detect the pupil boundary three phases are used, viz. scaling, reverse function, and four neighbors method respectively. The scaling phase (fi rst phase) deals with reducing the iris image size into one-fourth of its original size, so that the region for thresholding process is very much diminished, which in turn reduces the processing time and computational cost, so that it paves path for increasing the accuracy and effi ciency of the entire iris recognition process. Since the pupil is the darkest area in the entire eye image, this portion is distinguished by thresholding operation with the help of reverse function as shown in Fig. 2(a) and 2(b). This constitutes the second phase.
(a) (b) (c)Fig. 2: (a). Original image, (b) Aft er applying
negati ve functi on, and (c) Image aft er segmentati on
As a result of this, pupil region is detected approximately and this constitutes the fi rst phase of pupil localization stage. In the third phase, four neighbors method based on[1-2] is applied for each pixel as shown in Table 1, to localize the pupil boundary accurately.
X (x - 1, y) X
(x, y - 1) (x, y) (x, y + 1)
X (x + 1, y) X
Table 1: Four neighbor method
where, (x-1, y) represents top most point, (x+1, y) represents bottom most point, (x, y-1) represents left most point and (x, y+1) represents right point most in pupil boundaries respectively. Now, the pixel values are checked such that, if its value is equal to white and one of its four neighbors value is less than the white color, then corresponding pixel value is replaced by white color else original eye images’ pixel value is retained. Upon completing the above three phases, pupil boundary is detected accurately as shown in Fig. 2(c), irrespective
of its shape either circle or ellipse, with an average processing time of only 0.7 to 0.8 seconds.
Steps for Iris localizationHere three steps, viz. contrast enhancement, special wedges, and thresholding are employed to detect the specifi c iris regions from an eye image. The dedicated algorithm described in[11] is used for contrast enhancement, so that limbic boundary is identifi ed clearly as shown in Fig. 3(b), when compared with the original image shown in Fig. 3(a).
(a) (b)
Fig. 3: Eye image before and aft er enhancement process
Now, the pixels lying only within the region of ±45˚ along the central axis on both sides, i.e. left and right sides of iris regions, alone are considered as illustrated in[12] is shown in Fig. 4, which is free from eyelash and eyelid occlusions.
-45°
-45°+45
+45°
Fig. 4: Measured regions of arcs in the iris region along the central axis
This portion of measured iris region is the maximum useful region with minimum noise and is said to be the Region of Interest (RoI), and its mean value is also calculated. By choosing the suitable and predetermined threshold value below the mean value, arc regions of iris alone are isolated and hence the process of iris segmentation from limbic boundary is accomplished perfectly.
Experimental ResultsThis proposed method is tested on CASIA iris image database from Institute of Automation, Chinese Academy of Science (CASIA)[5], with 108 diff erent subjects. With this algorithm, iris localization and iris segmentation processes are done exactly and accurately, even though some of the iris images are occluded by eyelids and eyelashes. The performance measures are compared with some of the existing algorithms for iris localization is shown in Table 2 is depicted from[25]. From the results
Central axis
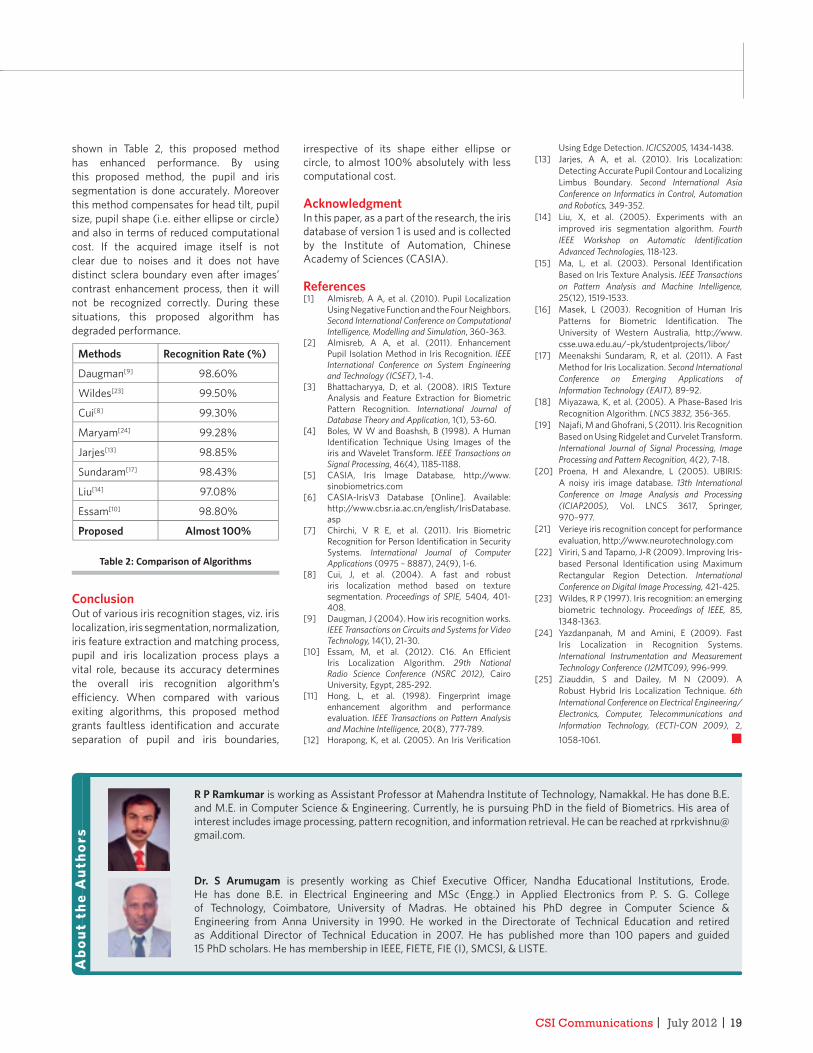
CSI Communications | July 2012 | 19
R P Ramkumar is working as Assistant Professor at Mahendra Institute of Technology, Namakkal. He has done B.E. and M.E. in Computer Science & Engineering. Currently, he is pursuing PhD in the fi eld of Biometrics. His area of interest includes image processing, pattern recognition, and information retrieval. He can be reached at [email protected].
Dr. S Arumugam is presently working as Chief Executive Offi cer, Nandha Educational Institutions, Erode. He has done B.E. in Electrical Engineering and MSc (Engg.) in Applied Electronics from P. S. G. College of Technology, Coimbatore, University of Madras. He obtained his PhD degree in Computer Science & Engineering from Anna University in 1990. He worked in the Directorate of Technical Education and retired as Additional Director of Technical Education in 2007. He has published more than 100 papers and guided 15 PhD scholars. He has membership in IEEE, FIETE, FIE (I), SMCSI, & LISTE.
Abo
ut t
he A
utho
rs
shown in Table 2, this proposed method has enhanced performance. By using this proposed method, the pupil and iris segmentation is done accurately. Moreover this method compensates for head tilt, pupil size, pupil shape (i.e. either ellipse or circle) and also in terms of reduced computational cost. If the acquired image itself is not clear due to noises and it does not have distinct sclera boundary even after images’ contrast enhancement process, then it will not be recognized correctly. During these situations, this proposed algorithm has degraded performance.
Methods Recognition Rate (%)
Daugman[9] 98.60%
Wildes[23] 99.50%
Cui[8] 99.30%
Maryam[24] 99.28%
Jarjes[13] 98.85%
Sundaram[17] 98.43%
Liu[14] 97.08%
Essam[10] 98.80%
Proposed Almost 100%
Table 2: Comparison of Algorithms
ConclusionOut of various iris recognition stages, viz. iris localization, iris segmentation, normalization, iris feature extraction and matching process, pupil and iris localization process plays a vital role, because its accuracy determines the overall iris recognition algorithm’s effi ciency. When compared with various exiting algorithms, this proposed method grants faultless identifi cation and accurate separation of pupil and iris boundaries,
irrespective of its shape either ellipse or circle, to almost 100% absolutely with less computational cost.
AcknowledgmentIn this paper, as a part of the research, the iris database of version 1 is used and is collected by the Institute of Automation, Chinese Academy of Sciences (CASIA).
References[1] Almisreb, A A, et al. (2010). Pupil Localization
Using Negative Function and the Four Neighbors. Second International Conference on Computational Intelligence, Modelling and Simulation, 360-363.
[2] Almisreb, A A, et al. (2011). Enhancement Pupil Isolation Method in Iris Recognition. IEEE International Conference on System Engineering and Technology (ICSET), 1-4.
[3] Bhattacharyya, D, et al. (2008). IRIS Texture Analysis and Feature Extraction for Biometric Pattern Recognition. International Journal of Database Theory and Application, 1(1), 53-60.
[4] Boles, W W and Boashsh, B (1998). A Human Identifi cation Technique Using Images of the iris and Wavelet Transform. IEEE Transactions on Signal Processing, 46(4), 1185-1188.
[5] CASIA, Iris Image Database, http://www.sinobiometrics.com
[6] CASIA-IrisV3 Database [Online]. Available: http://www.cbsr.ia.ac.cn/english/IrisDatabase.asp
[7] Chirchi, V R E, et al. (2011). Iris Biometric Recognition for Person Identifi cation in Security Systems. International Journal of Computer Applications (0975 – 8887), 24(9), 1-6.
[8] Cui, J, et al. (2004). A fast and robust iris localization method based on texture segmentation. Proceedings of SPIE, 5404, 401-408.
[9] Daugman, J (2004). How iris recognition works. IEEE Transactions on Circuits and Systems for Video Technology, 14(1), 21-30.
[10] Essam, M, et al. (2012). C16. An Effi cient Iris Localization Algorithm. 29th National Radio Science Conference (NSRC 2012), Cairo University, Egypt, 285-292.
[11] Hong, L, et al. (1998). Fingerprint image enhancement algorithm and performance evaluation. IEEE Transactions on Pattern Analysis and Machine Intelligence, 20(8), 777-789.
[12] Horapong, K, et al. (2005). An Iris Verifi cation
Using Edge Detection. ICICS2005, 1434-1438.[13] Jarjes, A A, et al. (2010). Iris Localization:
Detecting Accurate Pupil Contour and Localizing Limbus Boundary. Second International Asia Conference on Informatics in Control, Automation and Robotics, 349-352.
[14] Liu, X, et al. (2005). Experiments with an improved iris segmentation algorithm. Fourth IEEE Workshop on Automatic Identifi cation Advanced Technologies, 118-123.
[15] Ma, L, et al. (2003). Personal Identifi cation Based on Iris Texture Analysis. IEEE Transactions on Pattern Analysis and Machine Intelligence, 25(12), 1519-1533.
[16] Masek, L (2003). Recognition of Human Iris Patterns for Biometric Identifi cation. The University of Western Australia, http://www.csse.uwa.edu.au/~pk/studentprojects/libor/
[17] Meenakshi Sundaram, R, et al. (2011). A Fast Method for Iris Localization. Second International Conference on Emerging Applications of Information Technology (EAIT), 89-92.
[18] Miyazawa, K, et al. (2005). A Phase-Based Iris Recognition Algorithm. LNCS 3832, 356-365.
[19] Najafi , M and Ghofrani, S (2011). Iris Recognition Based on Using Ridgelet and Curvelet Transform. International Journal of Signal Processing, Image Processing and Pattern Recognition, 4(2), 7-18.
[20] Proena, H and Alexandre, L (2005). UBIRIS: A noisy iris image database. 13th International Conference on Image Analysis and Processing (ICIAP2005), Vol. LNCS 3617, Springer, 970–977.
[21] Verieye iris recognition concept for performance evaluation, http://www.neurotechnology.com
[22] Viriri, S and Tapamo, J-R (2009). Improving Iris-based Personal Identifi cation using Maximum Rectangular Region Detection. International Conference on Digital Image Processing, 421-425.
[23] Wildes, R P (1997). Iris recognition: an emerging biometric technology. Proceedings of IEEE, 85, 1348-1363.
[24] Yazdanpanah, M and Amini, E (2009). Fast Iris Localization in Recognition Systems. International Instrumentation and Measurement Technology Conference (I2MTC09), 996-999.
[25] Ziauddin, S and Dailey, M N (2009). A Robust Hybrid Iris Localization Technique. 6th International Conference on Electrical Engineering/Electronics, Computer, Telecommunications and Information Technology, (ECTI-CON 2009), 2, 1058-1061. n
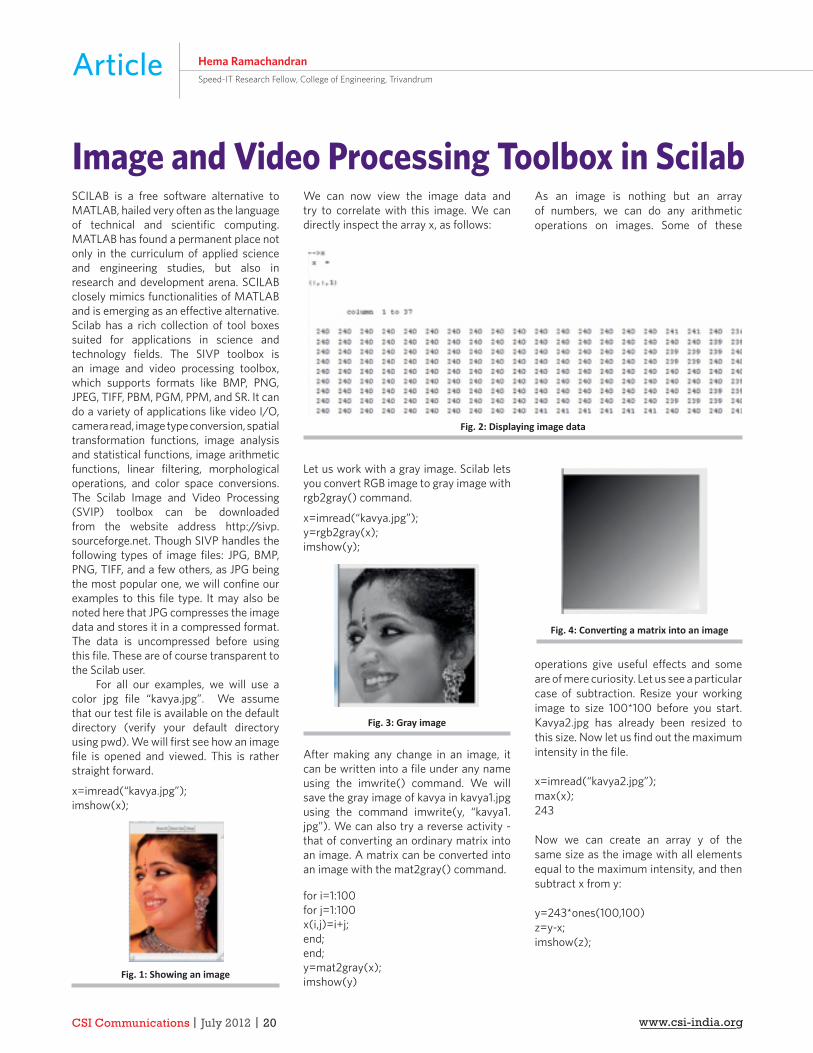
CSI Communications | July 2012 | 20 www.csi-india.org
Article Hema RamachandranSpeed-IT Research Fellow, College of Engineering, Trivandrum
SCILAB is a free software alternative to MATLAB, hailed very often as the language of technical and scientifi c computing. MATLAB has found a permanent place not only in the curriculum of applied science and engineering studies, but also in research and development arena. SCILAB closely mimics functionalities of MATLAB and is emerging as an eff ective alternative. Scilab has a rich collection of tool boxes suited for applications in science and technology fi elds. The SIVP toolbox is an image and video processing toolbox, which supports formats like BMP, PNG, JPEG, TIFF, PBM, PGM, PPM, and SR. It can do a variety of applications like video I/O, camera read, image type conversion, spatial transformation functions, image analysis and statistical functions, image arithmetic functions, linear fi ltering, morphological operations, and color space conversions. The Scilab Image and Video Processing (SVIP) toolbox can be downloaded from the website address http://sivp.sourceforge.net. Though SIVP handles the following types of image fi les: JPG, BMP, PNG, TIFF, and a few others, as JPG being the most popular one, we will confi ne our examples to this fi le type. It may also be noted here that JPG compresses the image data and stores it in a compressed format. The data is uncompressed before using this fi le. These are of course transparent to the Scilab user.
For all our examples, we will use a color jpg fi le “kavya.jpg”. We assume that our test fi le is available on the default directory (verify your default directory using pwd). We will fi rst see how an image fi le is opened and viewed. This is rather straight forward.
x=imread(“kavya.jpg”);imshow(x);
Fig. 1: Showing an image
We can now view the image data and try to correlate with this image. We can directly inspect the array x, as follows:
Let us work with a gray image. Scilab lets you convert RGB image to gray image with rgb2gray() command.
x=imread(“kavya.jpg”);y=rgb2gray(x);imshow(y);
Fig. 3: Gray image
After making any change in an image, it can be written into a fi le under any name using the imwrite() command. We will save the gray image of kavya in kavya1.jpg using the command imwrite(y, “kavya1.jpg”). We can also try a reverse activity - that of converting an ordinary matrix into an image. A matrix can be converted into an image with the mat2gray() command.
for i=1:100for j=1:100x(i,j)=i+j;end;end;y=mat2gray(x);imshow(y)
As an image is nothing but an array of numbers, we can do any arithmetic operations on images. Some of these
operations give useful eff ects and some are of mere curiosity. Let us see a particular case of subtraction. Resize your working image to size 100*100 before you start. Kavya2.jpg has already been resized to this size. Now let us fi nd out the maximum intensity in the fi le.
x=imread(“kavya2.jpg”);max(x);243
Now we can create an array y of the same size as the image with all elements equal to the maximum intensity, and then subtract x from y:
y=243*ones(100,100)z=y-x;imshow(z);
Image and Video Processing Toolbox in Scilab
Fig. 2: Displaying image data
Fig. 4: Converti ng a matrix into an image
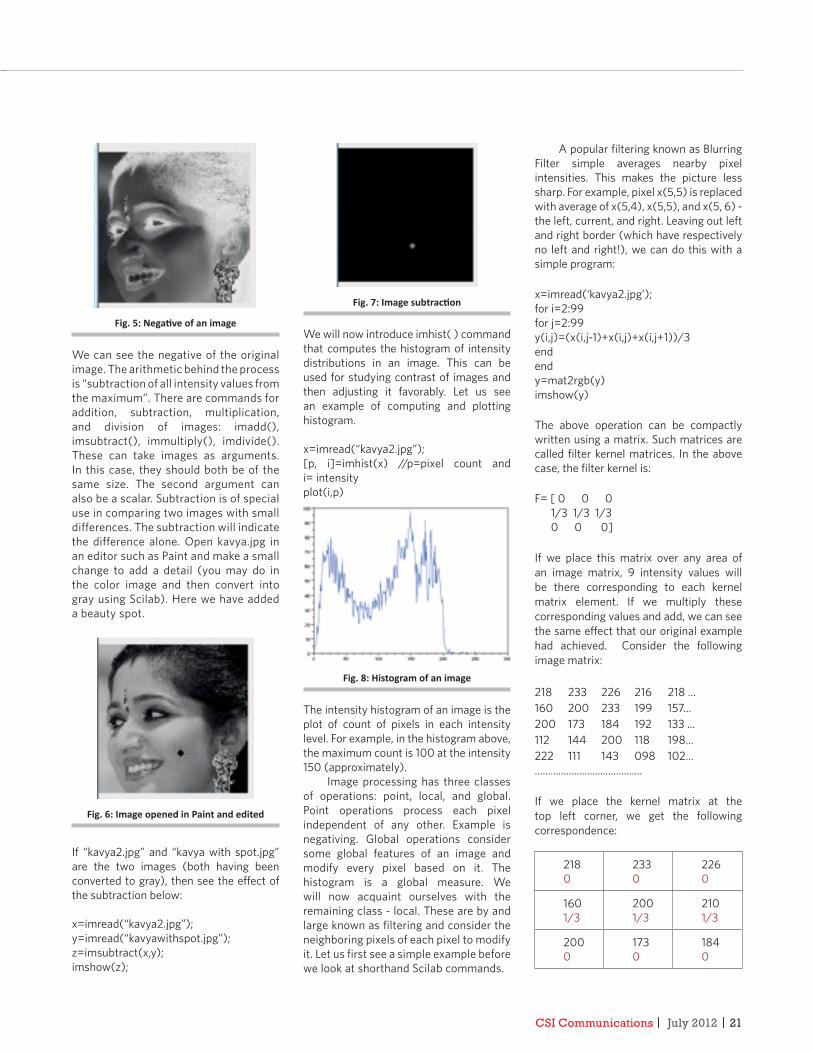
CSI Communications | July 2012 | 21
Fig. 5: Negati ve of an image
We can see the negative of the original image. The arithmetic behind the process is “subtraction of all intensity values from the maximum”. There are commands for addition, subtraction, multiplication, and division of images: imadd(), imsubtract(), immultiply(), imdivide(). These can take images as arguments. In this case, they should both be of the same size. The second argument can also be a scalar. Subtraction is of special use in comparing two images with small differences. The subtraction will indicate the difference alone. Open kavya.jpg in an editor such as Paint and make a small change to add a detail (you may do in the color image and then convert into gray using Scilab). Here we have added a beauty spot.
Fig. 6: Image opened in Paint and edited
If “kavya2.jpg” and “kavya with spot.jpg” are the two images (both having been converted to gray), then see the eff ect of the subtraction below:
x=imread(“kavya2.jpg”);y=imread(“kavyawithspot.jpg”);z=imsubtract(x,y);imshow(z);
Fig. 7: Image subtracti on
We will now introduce imhist( ) command that computes the histogram of intensity distributions in an image. This can be used for studying contrast of images and then adjusting it favorably. Let us see an example of computing and plotting histogram.
x=imread(“kavya2.jpg”);[p, i]=imhist(x) //p=pixel count and i= intensityplot(i,p)
Fig. 8: Histogram of an image
The intensity histogram of an image is the plot of count of pixels in each intensity level. For example, in the histogram above, the maximum count is 100 at the intensity 150 (approximately).
Image processing has three classes of operations: point, local, and global. Point operations process each pixel independent of any other. Example is negativing. Global operations consider some global features of an image and modify every pixel based on it. The histogram is a global measure. We will now acquaint ourselves with the remaining class - local. These are by and large known as fi ltering and consider the neighboring pixels of each pixel to modify it. Let us fi rst see a simple example before we look at shorthand Scilab commands.
A popular fi ltering known as Blurring Filter simple averages nearby pixel intensities. This makes the picture less sharp. For example, pixel x(5,5) is replaced with average of x(5,4), x(5,5), and x(5, 6) - the left, current, and right. Leaving out left and right border (which have respectively no left and right!), we can do this with a simple program:
x=imread(‘kavya2.jpg’);for i=2:99for j=2:99y(i,j)=(x(i,j-1)+x(i,j)+x(i,j+1))/3endendy=mat2rgb(y)imshow(y)
The above operation can be compactly written using a matrix. Such matrices are called fi lter kernel matrices. In the above case, the fi lter kernel is:
F= [ 0 0 0 1/3 1/3 1/3 0 0 0]
If we place this matrix over any area of an image matrix, 9 intensity values will be there corresponding to each kernel matrix element. If we multiply these corresponding values and add, we can see the same eff ect that our original example had achieved. Consider the following image matrix:
218 233 226 216 218 ...160 200 233 199 157...200 173 184 192 133 ...112 144 200 118 198...222 111 143 098 102............................................
If we place the kernel matrix at the top left corner, we get the following correspondence:
218 0
2330
2260
1601/3
2001/3
2101/3
2000
1730
1840
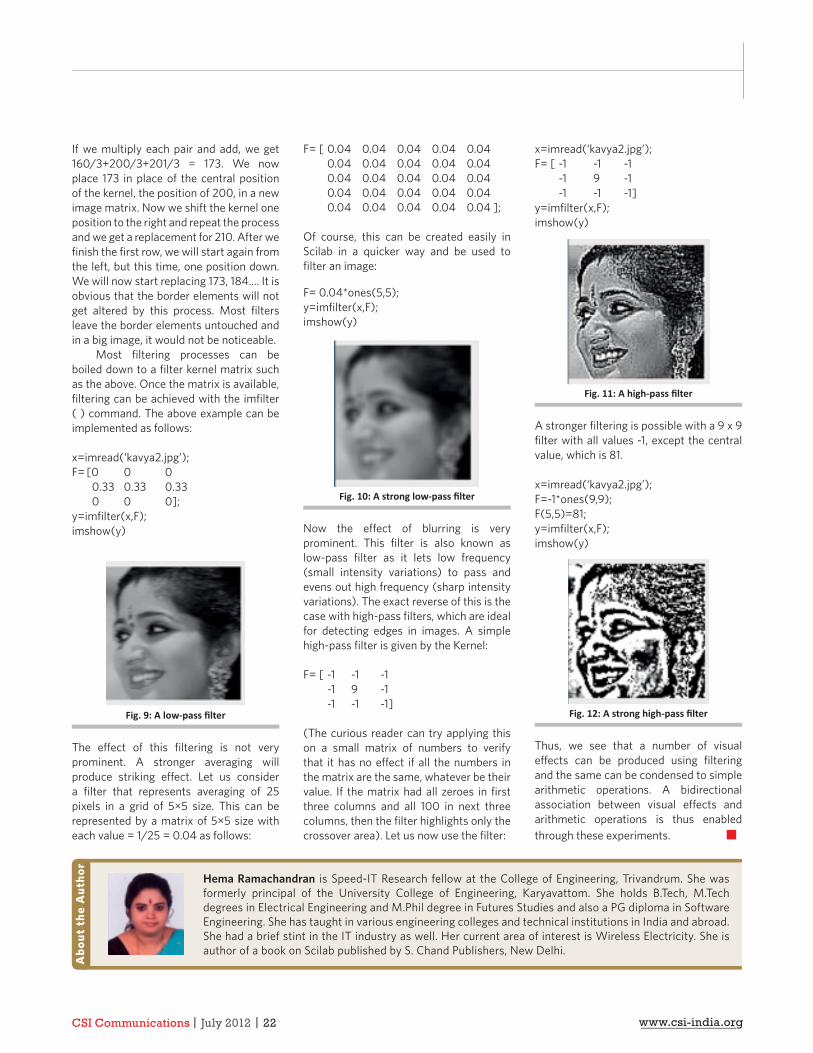
CSI Communications | July 2012 | 22 www.csi-india.org
If we multiply each pair and add, we get 160/3+200/3+201/3 = 173. We now place 173 in place of the central position of the kernel, the position of 200, in a new image matrix. Now we shift the kernel one position to the right and repeat the process and we get a replacement for 210. After we fi nish the fi rst row, we will start again from the left, but this time, one position down. We will now start replacing 173, 184.... It is obvious that the border elements will not get altered by this process. Most fi lters leave the border elements untouched and in a big image, it would not be noticeable.
Most fi ltering processes can be boiled down to a fi lter kernel matrix such as the above. Once the matrix is available, fi ltering can be achieved with the imfi lter( ) command. The above example can be implemented as follows:
x=imread(‘kavya2.jpg’);F= [0 0 0 0.33 0.33 0.33 0 0 0];y=imfi lter(x,F);imshow(y)
Fig. 9: A low-pass fi lter
The eff ect of this fi ltering is not very prominent. A stronger averaging will produce striking eff ect. Let us consider a fi lter that represents averaging of 25 pixels in a grid of 5×5 size. This can be represented by a matrix of 5×5 size with each value = 1/25 = 0.04 as follows:
F= [ 0.04 0.04 0.04 0.04 0.04 0.04 0.04 0.04 0.04 0.04 0.04 0.04 0.04 0.04 0.04 0.04 0.04 0.04 0.04 0.04 0.04 0.04 0.04 0.04 0.04 ];
Of course, this can be created easily in Scilab in a quicker way and be used to fi lter an image:
F= 0.04*ones(5,5);y=imfi lter(x,F);imshow(y)
Fig. 10: A strong low-pass fi lter
Now the eff ect of blurring is very prominent. This fi lter is also known as low-pass fi lter as it lets low frequency (small intensity variations) to pass and evens out high frequency (sharp intensity variations). The exact reverse of this is the case with high-pass fi lters, which are ideal for detecting edges in images. A simple high-pass fi lter is given by the Kernel:
F= [ -1 -1 -1 -1 9 -1 -1 -1 -1]
(The curious reader can try applying this on a small matrix of numbers to verify that it has no eff ect if all the numbers in the matrix are the same, whatever be their value. If the matrix had all zeroes in fi rst three columns and all 100 in next three columns, then the fi lter highlights only the crossover area). Let us now use the fi lter:
x=imread(‘kavya2.jpg’);F= [ -1 -1 -1 -1 9 -1 -1 -1 -1]y=imfi lter(x,F);imshow(y)
Fig. 11: A high-pass fi lter
A stronger fi ltering is possible with a 9 x 9 fi lter with all values -1, except the central value, which is 81.
x=imread(‘kavya2.jpg’);F=-1*ones(9,9);F(5,5)=81;y=imfi lter(x,F);imshow(y)
Fig. 12: A strong high-pass fi lter
Thus, we see that a number of visual eff ects can be produced using fi ltering and the same can be condensed to simple arithmetic operations. A bidirectional association between visual eff ects and arithmetic operations is thus enabled through these experiments. n
Hema Ramachandran is Speed-IT Research fellow at the College of Engineering, Trivandrum. She was formerly principal of the University College of Engineering, Karyavattom. She holds B.Tech, M.Tech degrees in Electrical Engineering and M.Phil degree in Futures Studies and also a PG diploma in Software Engineering. She has taught in various engineering colleges and technical institutions in India and abroad. She had a brief stint in the IT industry as well. Her current area of interest is Wireless Electricity. She is author of a book on Scilab published by S. Chand Publishers, New Delhi.
Abo
ut t
he A
utho
r
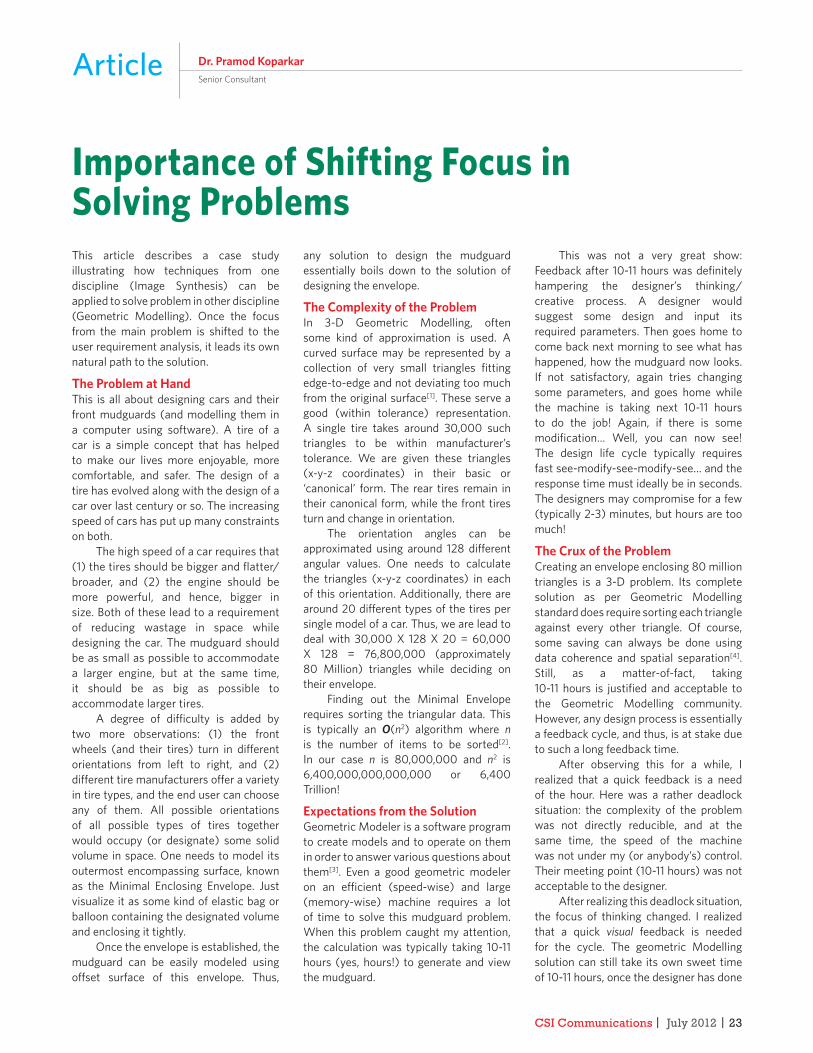
CSI Communications | July 2012 | 23
Article Dr. Pramod KoparkarSenior Consultant
This article describes a case study illustrating how techniques from one discipline (Image Synthesis) can be applied to solve problem in other discipline (Geometric Modelling). Once the focus from the main problem is shifted to the user requirement analysis, it leads its own natural path to the solution.
The Problem at HandThis is all about designing cars and their front mudguards (and modelling them in a computer using software). A tire of a car is a simple concept that has helped to make our lives more enjoyable, more comfortable, and safer. The design of a tire has evolved along with the design of a car over last century or so. The increasing speed of cars has put up many constraints on both.
The high speed of a car requires that (1) the tires should be bigger and fl atter/broader, and (2) the engine should be more powerful, and hence, bigger in size. Both of these lead to a requirement of reducing wastage in space while designing the car. The mudguard should be as small as possible to accommodate a larger engine, but at the same time, it should be as big as possible to accommodate larger tires.
A degree of diffi culty is added by two more observations: (1) the front wheels (and their tires) turn in diff erent orientations from left to right, and (2) diff erent tire manufacturers off er a variety in tire types, and the end user can choose any of them. All possible orientations of all possible types of tires together would occupy (or designate) some solid volume in space. One needs to model its outermost encompassing surface, known as the Minimal Enclosing Envelope. Just visualize it as some kind of elastic bag or balloon containing the designated volume and enclosing it tightly.
Once the envelope is established, the mudguard can be easily modeled using off set surface of this envelope. Thus,
any solution to design the mudguard essentially boils down to the solution of designing the envelope.
The Complexity of the ProblemIn 3-D Geometric Modelling, often some kind of approximation is used. A curved surface may be represented by a collection of very small triangles fi tting edge-to-edge and not deviating too much from the original surface[1]. These serve a good (within tolerance) representation. A single tire takes around 30,000 such triangles to be within manufacturer’s tolerance. We are given these triangles (x-y-z coordinates) in their basic or ‘canonical’ form. The rear tires remain in their canonical form, while the front tires turn and change in orientation.
The orientation angles can be approximated using around 128 diff erent angular values. One needs to calculate the triangles (x-y-z coordinates) in each of this orientation. Additionally, there are around 20 diff erent types of the tires per single model of a car. Thus, we are lead to deal with 30,000 X 128 X 20 = 60,000 X 128 = 76,800,000 (approximately 80 Million) triangles while deciding on their envelope.
Finding out the Minimal Envelope requires sorting the triangular data. This is typically an O(n2) algorithm where n is the number of items to be sorted[2]. In our case n is 80,000,000 and n2 is 6,400,000,000,000,000 or 6,400 Trillion!
Expectations from the SolutionGeometric Modeler is a software program to create models and to operate on them in order to answer various questions about them[3]. Even a good geometric modeler on an effi cient (speed-wise) and large (memory-wise) machine requires a lot of time to solve this mudguard problem. When this problem caught my attention, the calculation was typically taking 10-11 hours (yes, hours!) to generate and view the mudguard.
This was not a very great show: Feedback after 10-11 hours was defi nitely hampering the designer’s thinking/creative process. A designer would suggest some design and input its required parameters. Then goes home to come back next morning to see what has happened, how the mudguard now looks. If not satisfactory, again tries changing some parameters, and goes home while the machine is taking next 10-11 hours to do the job! Again, if there is some modifi cation… Well, you can now see! The design life cycle typically requires fast see-modify-see-modify-see… and the response time must ideally be in seconds. The designers may compromise for a few (typically 2-3) minutes, but hours are too much!
The Crux of the ProblemCreating an envelope enclosing 80 million triangles is a 3-D problem. Its complete solution as per Geometric Modelling standard does require sorting each triangle against every other triangle. Of course, some saving can always be done using data coherence and spatial separation[4]. Still, as a matter-of-fact, taking 10-11 hours is justifi ed and acceptable to the Geometric Modelling community. However, any design process is essentially a feedback cycle, and thus, is at stake due to such a long feedback time.
After observing this for a while, I realized that a quick feedback is a need of the hour. Here was a rather deadlock situation: the complexity of the problem was not directly reducible, and at the same time, the speed of the machine was not under my (or anybody’s) control. Their meeting point (10-11 hours) was not acceptable to the designer.
After realizing this deadlock situation, the focus of thinking changed. I realized that a quick visual feedback is needed for the cycle. The geometric Modelling solution can still take its own sweet time of 10-11 hours, once the designer has done
Importance of Shifting Focus in Solving Problems
CSI Communications | July 2012 | 24 www.csi-india.org
all the necessary modifi cations using quick visual feedbacks in the cycle.
The SolutionThe problem is now relatively easy: Create an image of the lump of 80 million triangles from one point of view quickly and show it to the designer. If it can be done in a minute or so, nothing is like that. If required, the designer may create one or two more views from diff erent angles to see how it looks.
Here the focus changed from Geometric Modelling to Image Synthesis. I started looking for Image Rendering techniques that handle very large data of scenes. Computer Games Design is a typical application dealing with such requirements.
The tool I found to create the required image is called the z-buff er[5]. It accepts model data in the form of triangles, and applies high-end imagery techniques of ray tracing[6], scan-conversion[4], and occlusion culling[7] to them. The calculations are done by hard-wired implementation of the algorithms. The resulting image is directly accumulated in a huge fast-access memory buff er.
The main advantage of using hardware implementation of z-buffer is speed. Another advantage is that it accepts any kind of collection of triangles without demanding any particular structural relation on them. The z-buffer typically has the capacity to handle one triangle in an average time of one millisecond. So for our 80 million triangles, it takes just 80 seconds – slightly more than a minute. A designer may want to see from multiple directions, to get a better idea about how it looks. For more views,
say three from x, y, and z directions, it takes 4 minutes. This gives a reasonable timing for the designer’s feedback cycle.
AddendumI did not stop at just that. The original problem of creating envelope was still there taking 10-11 hours, even though the feedback cycle was fast.
What I observed is that the envelope contains roughly the same number of triangles (30,000) like a single tire in canonical form. This is no surprise. It any way is just a surface, although it encloses a volume containing very large number (80,000,000) of triangles.
The z-buff er was giving only one view of the envelope seen from some particular point and direction, and not the complete geometric model from all sides. However, at the same time this view was taking just 80 seconds.
The solution now is to generate six views (or more if required) from six sides (say top, bottom, left, right, back, and front) Each view has roughly 30,000 triangles (total 180, 000). These of course overlap. One needs to develop appropriate software to (1) detect and remove repeated triangles from the collection, and (2) to ‘stitch’ the six vies together so that the topology of the envelop is developed and its complete Geometric Model (as a Triangular Mesh) is established[1].
Such software for ‘stitching’ was developed. It was taking roughly 8-10 minutes to do the stitching. This is 10 times more than the time required for rendering one view, but that is not exorbitantly large beyond expectations.
The time mainly reduced because (1) the number of triangles have reduced from 80 million to 180,000, (2) a lot of
coherence and spatial relations (structure) exists[4], and (3) more importantly, the time complexity[2] of stitching operation is not O(n2) but between O(n) and O(n log n).
This surely was not that bad—from 10-11 hours to 8-10 minutes! All this was achieved by changing focus and then applying techniques from one discipline (Image Synthesis) to solve problem in other discipline (Geometric Modelling).
AcknowledgementsThe author is thankful to Dr. S. P. Mudur for many fruitful technical discussions and inputs to the topics discussed in this article.
References[1] Hoppe, H: Progressive Meshes,
SIGGRAPH 96, p99-108, 1996.[2] Aho/Hopcroft/Ullman: The Design
and Analysis of Computer Algorithms, Addison-Wesley, 1974.
[3] Mortensen M.E.: Geometric Modelling, Wiley & Sons, 1985.
[4] Newmann/Sproull: Principles of Interactive Computer Graphics, McGraw- Hill, 1979.
[5] Wand, M. et.al.: The Randomized z-Buff er Algorithm: Interactive Rendering of Highly Complex Scenes, www.mpi-inf.mpg.de/~mwand/papers/siggraph01.pdf
[6] Ellis et.al. : The Ray Casting Engine and Ray Representations, Int. J. Comput. Geometry Appl.'91, , 1991.
[7] Zhang, Hansong: Eff ective Occlusion Culling for Interactive Display of Arbitrary Models, Ph.D. Thesis, Dept. of Computer Science, University of North Carolina at Chapel Hill, 1998. n
Dr. Koparkar has a Ph.D. in Computer Science, in 1985. Since then he has published over 20 Research Papers in the prestigious International Journals and Conferences, mainly in the areas of Geometric Modelling, Image Synthesis, and Geometric Shape Processing in 2-D and 3-D. He has been on the International Journal Editorial Board and International Conference Program Committee. He has visited several organizations in diff erent countries for delivering lectures, developing software and presenting research papers.
He has been on various Academic Advisory Committees at the University and Government levels in India. He had worked in Research Institutes like TIFR and NCST, and in Corporations like Citicorp, Computer Vision, ADAC Laboratories (USA), and 3-dPLM/GSSL (India).
He has written four Books: Unix for You, Pascal for You, Java for You, and C-DAC Entrance Guide. At present, he off ers consultancy to corporate clients about various latest technologiesA
bout
the
Aut
hor
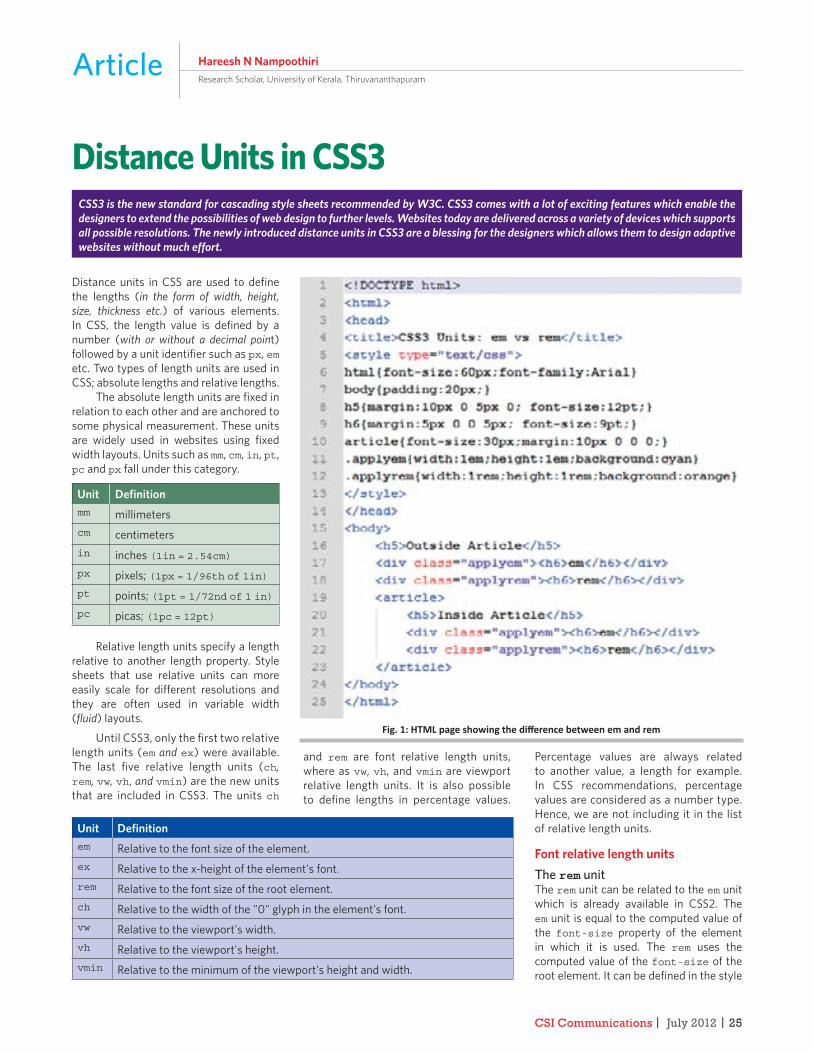
CSI Communications | July 2012 | 25
Article Hareesh N NampoothiriResearch Scholar, University of Kerala, Thiruvananthapuram
Distance units in CSS are used to defi ne the lengths (in the form of width, height, size, thickness etc.) of various elements. In CSS, the length value is defi ned by a number (with or without a decimal point) followed by a unit identifi er such as px, em etc. Two types of length units are used in CSS; absolute lengths and relative lengths.
The absolute length units are fi xed in relation to each other and are anchored to some physical measurement. These units are widely used in websites using fi xed width layouts. Units such as mm, cm, in, pt, pc and px fall under this category.
Unit Defi nitionmm millimeterscm centimetersin inches (1in = 2.54cm)px pixels; (1px = 1/96th of 1in)pt points; (1pt = 1/72nd of 1 in)pc picas; (1pc = 12pt)
Relative length units specify a length relative to another length property. Style sheets that use relative units can more easily scale for diff erent resolutions and they are often used in variable width (fl uid) layouts.
Until CSS3, only the fi rst two relative length units (em and ex) were available. The last fi ve relative length units (ch, rem, vw, vh, and vmin) are the new units that are included in CSS3. The units ch
and rem are font relative length units, where as vw, vh, and vmin are viewport relative length units. It is also possible to defi ne lengths in percentage values.
Percentage values are always related to another value, a length for example. In CSS recommendations, percentage values are considered as a number type. Hence, we are not including it in the list of relative length units.
Font relative length unitsThe rem unitThe rem unit can be related to the em unit which is already available in CSS2. The em unit is equal to the computed value of the font-size property of the element in which it is used. The rem uses the computed value of the font-size of the root element. It can be defi ned in the style
Distance Units in CSS3CSS3 is the new standard for cascading style sheets recommended by W3C. CSS3 comes with a lot of exciting features which enable the designers to extend the possibilities of web design to further levels. Websites today are delivered across a variety of devices which supports all possible resolutions. The newly introduced distance units in CSS3 are a blessing for the designers which allows them to design adaptive websites without much effort.
Fig. 1: HTML page showing the diff erence between em and rem
Unit Defi nitionem Relative to the font size of the element.ex Relative to the x-height of the element's font.rem Relative to the font size of the root element.ch Relative to the width of the "0" glyph in the element's font.vw Relative to the viewport's width.vh Relative to the viewport's height.vmin Relative to the minimum of the viewport's height and width.
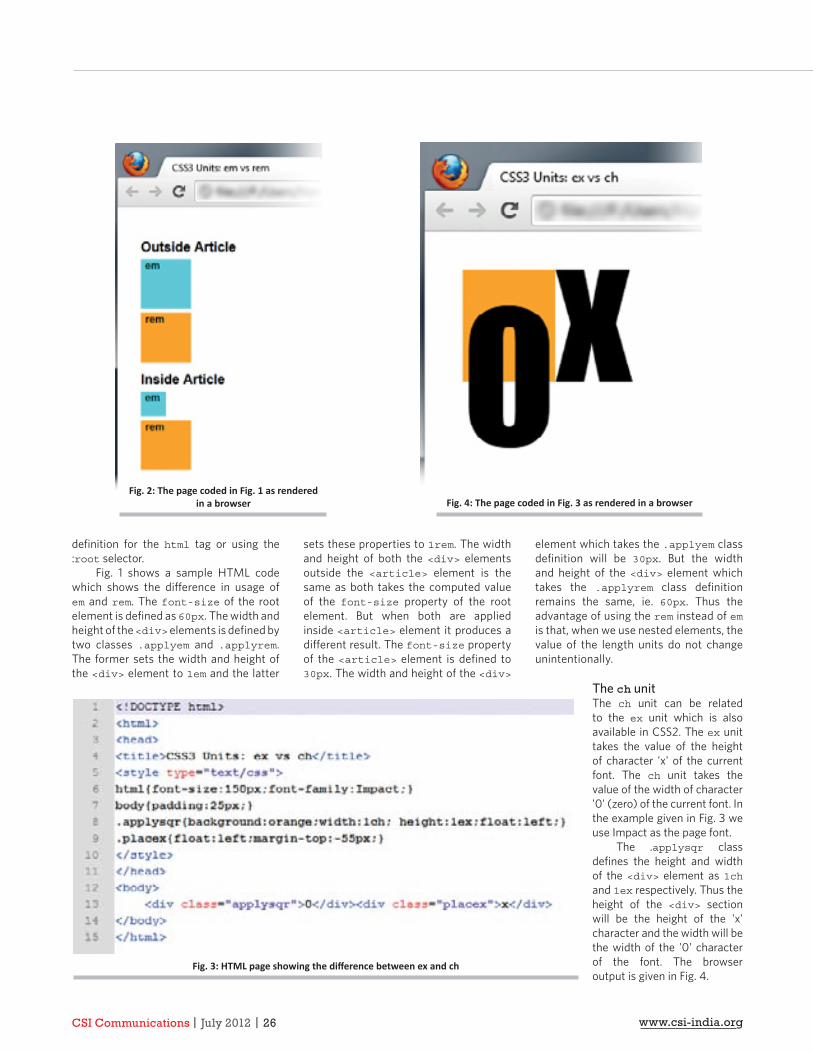
CSI Communications | July 2012 | 26 www.csi-india.org
defi nition for the html tag or using the :root selector.
Fig. 1 shows a sample HTML code which shows the diff erence in usage of em and rem. The font-size of the root element is defi ned as 60px. The width and height of the <div> elements is defi ned by two classes .applyem and .applyrem. The former sets the width and height of the <div> element to 1em and the latter
sets these properties to 1rem. The width and height of both the <div> elements outside the <article> element is the same as both takes the computed value of the font-size property of the root element. But when both are applied inside <article> element it produces a diff erent result. The font-size property of the <article> element is defi ned to 30px. The width and height of the <div>
element which takes the .applyem class defi nition will be 30px. But the width and height of the <div> element which takes the .applyrem class defi nition remains the same, ie. 60px. Thus the advantage of using the rem instead of em is that, when we use nested elements, the value of the length units do not change unintentionally.
The ch unitThe ch unit can be related to the ex unit which is also available in CSS2. The ex unit takes the value of the height of character 'x' of the current font. The ch unit takes the value of the width of character '0' (zero) of the current font. In the example given in Fig. 3 we use Impact as the page font.
The .applysqr class defi nes the height and width of the <div> element as 1ch and 1ex respectively. Thus the height of the <div> section will be the height of the 'x' character and the width will be the width of the '0' character of the font. The browser output is given in Fig. 4.
Fig. 3: HTML page showing the diff erence between ex and ch
Fig. 2: The page coded in Fig. 1 as rendered in a browser Fig. 4: The page coded in Fig. 3 as rendered in a browser
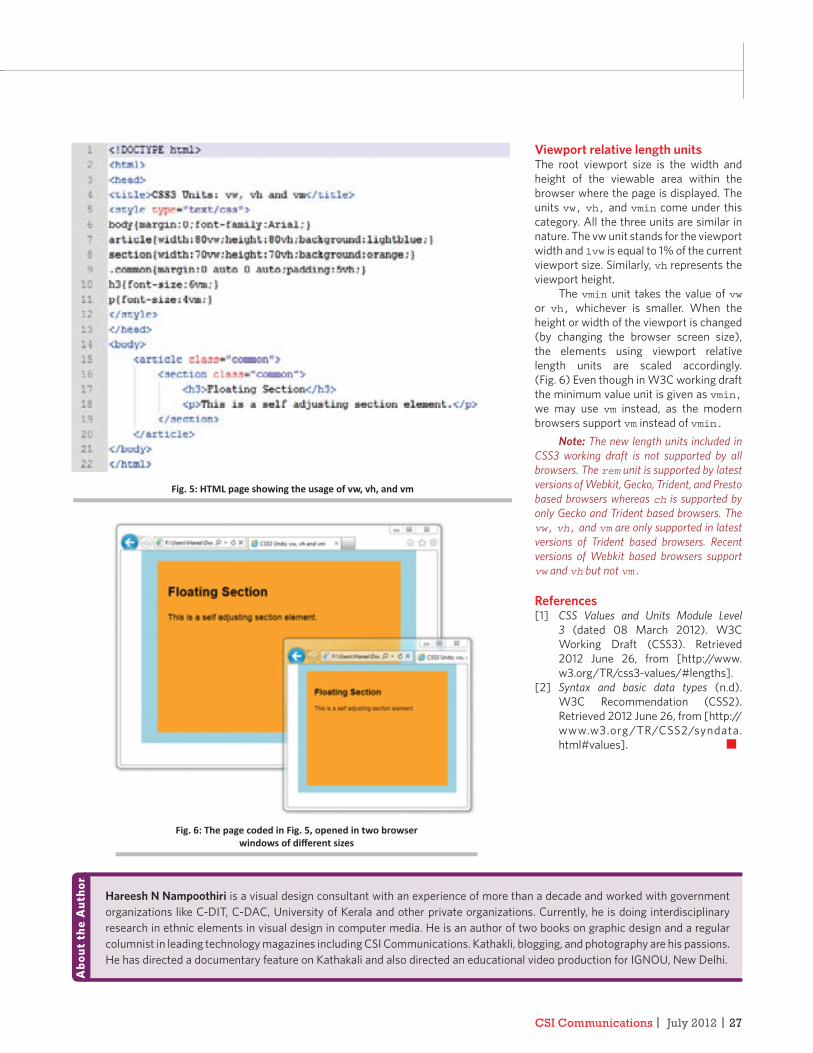
CSI Communications | July 2012 | 27
Viewport relative length unitsThe root viewport size is the width and height of the viewable area within the browser where the page is displayed. The units vw, vh, and vmin come under this category. All the three units are similar in nature. The vw unit stands for the viewport width and 1vw is equal to 1% of the current viewport size. Similarly, vh represents the viewport height.
The vmin unit takes the value of vwor vh, whichever is smaller. When the height or width of the viewport is changed (by changing the browser screen size), the elements using viewport relative length units are scaled accordingly. (Fig. 6) Even though in W3C working draft the minimum value unit is given as vmin,we may use vm instead, as the modern browsers support vm instead of vmin.
Note: The new length units included in CSS3 working draft is not supported by all browsers. The rem unit is supported by latest versions of Webkit, Gecko, Trident, and Presto based browsers whereas ch is supported by only Gecko and Trident based browsers. The vw, vh, and vm are only supported in latest versions of Trident based browsers. Recent versions of Webkit based browsers support vw and vh but not vm.
References[1] CSS Values and Units Module Level
3 (dated 08 March 2012). W3C Working Draft (CSS3). Retrieved 2012 June 26, from [http://www.w3.org/TR/css3-values/#lengths].
[2] Syntax and basic data types (n.d). W3C Recommendation (CSS2). Retrieved 2012 June 26, from [http://www.w3.org /TR/CSS2/syndata.html#values]. n
Fig. 5: HTML page showing the usage of vw, vh, and vm
Fig. 6: The page coded in Fig. 5, opened in two browser windows of diff erent sizes
Hareesh N Nampoothiri is a visual design consultant with an experience of more than a decade and worked with government organizations like C-DIT, C-DAC, University of Kerala and other private organizations. Currently, he is doing interdisciplinary research in ethnic elements in visual design in computer media. He is an author of two books on graphic design and a regular columnist in leading technology magazines including CSI Communications. Kathakli, blogging, and photography are his passions. He has directed a documentary feature on Kathakali and also directed an educational video production for IGNOU, New Delhi.
Abo
ut t
he A
utho
r
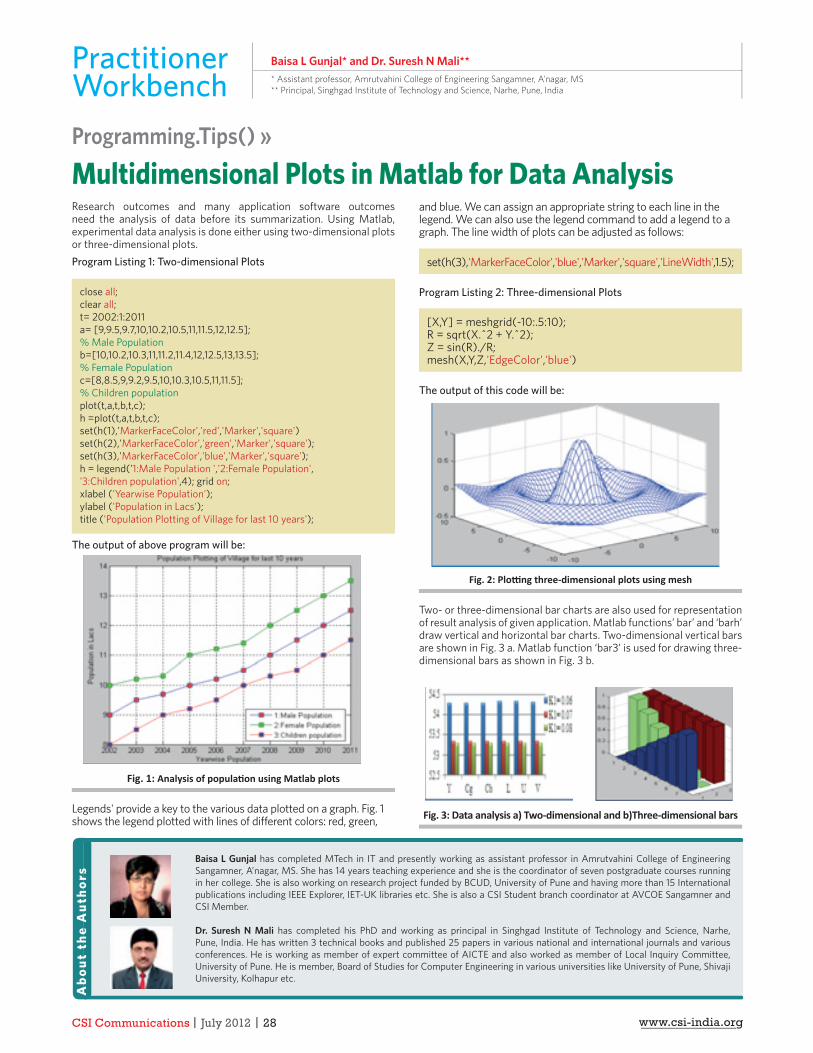
CSI Communications | July 2012 | 28 www.csi-india.org
Programming.Tips() »
Multidimensional Plots in Matlab for Data Analysis
Practitioner Workbench
Baisa L Gunjal* and Dr. Suresh N Mali*** Assistant professor, Amrutvahini College of Engineering Sangamner, A’nagar, MS** Principal, Singhgad Institute of Technology and Science, Narhe, Pune, India
Research outcomes and many application software outcomes need the analysis of data before its summarization. Using Matlab, experimental data analysis is done either using two-dimensional plots or three-dimensional plots.Program Listing 1: Two-dimensional Plots
close all;clear all;t= 2002:1:2011a= [9,9.5,9.7,10,10.2,10.5,11,11.5,12,12.5];% Male Populationb=[10,10.2,10.3,11,11.2,11.4,12,12.5,13,13.5]; % Female Populationc=[8,8.5,9,9.2,9.5,10,10.3,10.5,11,11.5];% Children population plot(t,a,t,b,t,c);h =plot(t,a,t,b,t,c);set(h(1),'MarkerFaceColor','red','Marker','square')set(h(2),'MarkerFaceColor','green','Marker','square');set(h(3),'MarkerFaceColor','blue','Marker','square');h = legend('1:Male Population ','2:Female Population','3:Children population',4); grid on;xlabel ('Yearwise Population');ylabel ('Population in Lacs');title ('Population Plotting of Village for last 10 years');
The output of above program will be:
Fig. 1: Analysis of populati on using Matlab plots
Legends' provide a key to the various data plotted on a graph. Fig. 1 shows the legend plotted with lines of diff erent colors: red, green,
and blue. We can assign an appropriate string to each line in the legend. We can also use the legend command to add a legend to a graph. The line width of plots can be adjusted as follows:
set(h(3),'MarkerFaceColor','blue','Marker','square','LineWidth',1.5);
Program Listing 2: Three-dimensional Plots
[X,Y] = meshgrid(-10:.5:10); R = sqrt(X.^2 + Y.^2);Z = sin(R)./R;mesh(X,Y,Z,'EdgeColor','blue')
The output of this code will be:
Fig. 2: Plotti ng three-dimensional plots using mesh
Two- or three-dimensional bar charts are also used for representation of result analysis of given application. Matlab functions’ bar’ and ‘barh’ draw vertical and horizontal bar charts. Two-dimensional vertical bars are shown in Fig. 3 a. Matlab function ‘bar3’ is used for drawing three-dimensional bars as shown in Fig. 3 b.
Fig. 3: Data analysis a) Two-dimensional and b)Three-dimensional bars
Baisa L Gunjal has completed MTech in IT and presently working as assistant professor in Amrutvahini College of Engineering Sangamner, A’nagar, MS. She has 14 years teaching experience and she is the coordinator of seven postgraduate courses running in her college. She is also working on research project funded by BCUD, University of Pune and having more than 15 International publications including IEEE Explorer, IET-UK libraries etc. She is also a CSI Student branch coordinator at AVCOE Sangamner and CSI Member.
Dr. Suresh N Mali has completed his PhD and working as principal in Singhgad Institute of Technology and Science, Narhe, Pune, India. He has written 3 technical books and published 25 papers in various national and international journals and various conferences. He is working as member of expert committee of AICTE and also worked as member of Local Inquiry Committee, University of Pune. He is member, Board of Studies for Computer Engineering in various universities like University of Pune, Shivaji University, Kolhapur etc.
Abo
ut t
he A
utho
rs
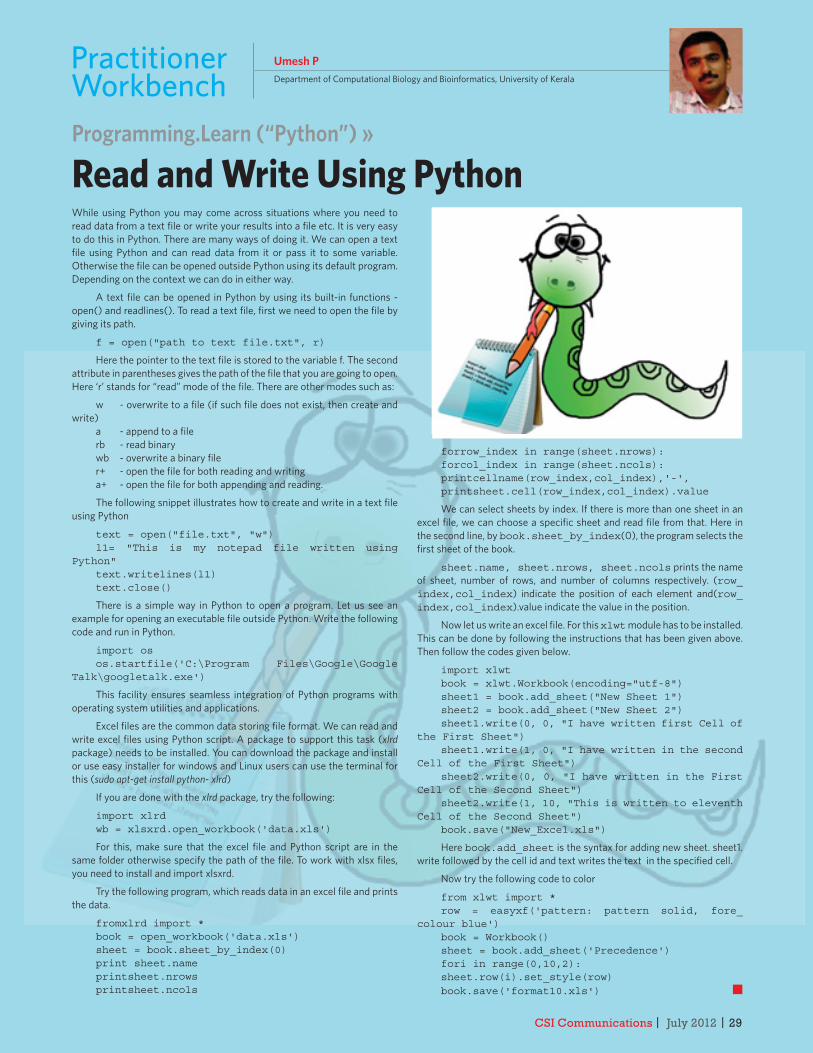
CSI Communications | July 2012 | 29
While using Python you may come across situations where you need to read data from a text fi le or write your results into a fi le etc. It is very easy to do this in Python. There are many ways of doing it. We can open a text fi le using Python and can read data from it or pass it to some variable. Otherwise the fi le can be opened outside Python using its default program. Depending on the context we can do in either way.
A text fi le can be opened in Python by using its built-in functions - open() and readlines(). To read a text fi le, fi rst we need to open the fi le by giving its path.
f = open("path to text file.txt", r)
Here the pointer to the text fi le is stored to the variable f. The second attribute in parentheses gives the path of the fi le that you are going to open. Here ‘r’ stands for “read” mode of the fi le. There are other modes such as:
w - overwrite to a fi le (if such fi le does not exist, then create and write)
a - append to a fi lerb - read binarywb - overwrite a binary fi le r+ - open the fi le for both reading and writinga+ - open the fi le for both appending and reading.
The following snippet illustrates how to create and write in a text fi le using Python
text = open("file.txt", "w")l1= "This is my notepad file written using
Python"text.writelines(l1)text.close()
There is a simple way in Python to open a program. Let us see an example for opening an executable fi le outside Python. Write the following code and run in Python.
import osos.startfile('C:\Program Files\Google\Google
Talk\googletalk.exe')
This facility ensures seamless integration of Python programs with operating system utilities and applications.
Excel fi les are the common data storing fi le format. We can read and write excel fi les using Python script. A package to support this task (xlrd package) needs to be installed. You can download the package and install or use easy installer for windows and Linux users can use the terminal for this (sudo apt-get install python- xlrd)
If you are done with the xlrd package, try the following:
import xlrdwb = xlsxrd.open_workbook('data.xls')
For this, make sure that the excel fi le and Python script are in the same folder otherwise specify the path of the fi le. To work with xlsx fi les, you need to install and import xlsxrd.
Try the following program, which reads data in an excel fi le and prints the data.
fromxlrd import *book = open_workbook('data.xls')sheet = book.sheet_by_index(0)print sheet.nameprintsheet.nrowsprintsheet.ncols
forrow_index in range(sheet.nrows):forcol_index in range(sheet.ncols):printcellname(row_index,col_index),'-',printsheet.cell(row_index,col_index).value
We can select sheets by index. If there is more than one sheet in an excel fi le, we can choose a specifi c sheet and read fi le from that. Here in the second line, by book.sheet_by_index(0), the program selects the fi rst sheet of the book.
sheet.name, sheet.nrows, sheet.ncols prints the name of sheet, number of rows, and number of columns respectively. (row_index,col_index) indicate the position of each element and(row_index,col_index).value indicate the value in the position.
Now let us write an excel fi le. For this xlwt module has to be installed. This can be done by following the instructions that has been given above. Then follow the codes given below.
import xlwtbook = xlwt.Workbook(encoding="utf-8")sheet1 = book.add_sheet("New Sheet 1") sheet2 = book.add_sheet("New Sheet 2") sheet1.write(0, 0, "I have written first Cell of
the First Sheet")sheet1.write(1, 0, "I have written in the second
Cell of the First Sheet")sheet2.write(0, 0, "I have written in the First
Cell of the Second Sheet") sheet2.write(1, 10, "This is written to eleventh
Cell of the Second Sheet") book.save("New_Excel.xls")
Here book.add_sheet is the syntax for adding new sheet. sheet1.write followed by the cell id and text writes the text in the specifi ed cell.
Now try the following code to color
from xlwt import *row = easyxf('pattern: pattern solid, fore_
colour blue')book = Workbook()sheet = book.add_sheet('Precedence')fori in range(0,10,2):sheet.row(i).set_style(row)book.save('format10.xls') n
Practitioner Workbench
Umesh PDepartment of Computational Biology and Bioinformatics, University of Kerala
Programming.Learn (“Python”) »
Read and Write Using Python
CSI Communications | July 2012 | 30 www.csi-india.org
As a Panelist I am attending the “India Security Meet 2012” to be held on 29th July in New Delhi. Thus, I thought of penning about the most talked topic of privacy. As the use of mobile phones and social networking, as well as resulting attacks, proliferate users’ personal information is
subjected to more and more risk. Adding to that risk is the increasing connection between the cyber and physical worlds.
As the college-going users of Facebook and Twitter grow older, they will still want the social networking capabilities they are used to, but will also be more concerned about privacy. There are companies out there developing and testing both secure social networking sites and privacy technologies to run on top of existing sites. For now, users should pay close attention to the kind of information the applications they use are sharing about them with others. Permissions granted knowingly or unknowingly.
When speaking of physical systems, it is easy to recognize privacy concerns within the BFSI Segment as malware captures client information and sends it out across the Internet, or as busy managers carry vital data around on USB drives, DVDs, or on attachments. However, it is important to note that privacy concerns also come into play with the compromise of utility networks. A recent set of smart grid cyber security guidelines published by the National Institute of Standards and Technology (NIST) includes an evaluation of privacy issues at residences based on new smart grid technologies.
According to IEEE Security & Privacy, “Electricity use patterns could lead to disclosure of not only how much energy customers use but also when they’re at home, at work, or traveling”. When at home, it might even be possible to deduce information about specifi c activities (e.g. sleeping versus watching television). The
data DTH users reveal to DTH operators or the easily manageable and accessible data in Call Data Records present with Mobile Operators.
So who is responsible for all of this? Who is responsible for protecting users’ privacy and for halting the compromise
of computers, mobile phones, and other devices? Who is responsible for stopping the spread of malware and preventing the damage it could cause to our nation’s critical infrastructure?
It is very clear that the cyber security problem cannot be solved by a single group of people. Users, government, technology vendors, and security researchers all have a role to play in this fi ght, but each group alone can only go so far. We can’t make the users responsible. Within an enterprise, the CSO has to be aware of what the real threats are and be dictating policies for the employees.
Users have to be extra vigilant. Because so much of the initial infection today is driven by carefully crafted social engineering, botnet operators are successful even against computers that have practically every protection technology known to man. Having said
that, those layers of defense should not be neglected - at the very least they limit the scope of attack.
The solution is not just technology-based or policy-based, but requires a more holistic approach to obtaining a deeper understanding of the threats through the collaboration of users, government, academia, and industry.
The name of the game today is to know what you don’t know. Staying plugged into external environments and the overall ‘threat Vector’ is a key for being prepared for when attacks really do emerge. Today, security has gotten so complex that there is no way a single person can even know everything about one aspect of cyber defense. It is therefore critical for leaders in the security industry to share information with one another. Government and industry collaboration is the key when it comes to protecting physical systems from cyber attack. When you consider how much of our critical infrastructure is owned and operated by the private sector, it becomes clear that there is a need for greater public/private partnership when it comes to mitigating risk. Moving forward, government organizations that possess classifi ed information about potential threats will need to regularly share this actionable intelligence with the private sector in a more timely and structured manner to eff ectively defend our nation against attacks.
The threat is now so big that the old style of developing a separate remedy for every threat simply does not scale, so a community-based defense approach is the need of the hour. A cultural revolution towards Cyber Security and Privacy is must, and this can be brought out through larger cooperation and awareness amongst stake holders.
The threat related to loss of privacy in this cyber insecure village relates to all. It is therefore up to all of us to educate ourselves on the various cyber security risks and do our part to stop enabling and spreading malicious cyber activity aff ecting our privacy. n
Information Security »
Privacy & Responsibility
Security Corner Adv. Prashant Mali [BSc (Physics), MSc (Comp Science), LLB]
Cyber Law ExpertEmail: [email protected]
Electricity use patterns could lead to disclosure of not only how much energy customers use but also when they’re at home, at work, or traveling
Moving forward, government organizations that possess classifi ed information about potential threats will need to regularly share this actionable intelligence with the private sector in a more timely and structured manner to eff ectively defend our nation against attacks.
CSI Communications | July 2012 | 31
IT Executive: Hi Prof. IT Law! The last time we met, you showed me how I often enter into electronic contracts without even realizing that I have done so especially on websites.
Prof. IT Law: Yes, the law of contracts is broad enough to permit two parties to bind themselves to a contract orally, in writing, or even by actions that convey their intent. As for example, when you pick up a newspaper from a vendor and give him Rs. 5 for it.
IT Executive: What happens in “real world” situations? Are the same “contract” principles applicable to web-based contracts?
Prof. IT Law: Yes, the principles of contract formation are the same whether you get into contracts in the “real world” or in the “virtual” web-based world. But the web poses some special challenges to contract formation.
IT Executive: For example?
Prof. IT Law: You remember that I told you that all it takes to form a contract in real life is for one person to make an off er and for another to accept it?
IT Executive: Yes I do.
Prof. IT Law: So let us consider what happens when you enter a shop. The shop has many items on display, and each item has a price tag on it. When you pick up an item and pay for it you have a classic case of an ‘off er’ and an ‘acceptance’ of that ‘off er’ made orally. Often without even a word being spoken!
IT Executive: I see. But in this case who makes the off er and who accepts the off er?
Prof. IT Law: Good question. And the answer is crucial for web-based contracts too. The law says that when you enter a shop and see items with price tags, it is you who makes the “off er”
to the shopkeeper when you pick up an item and off er cash.
IT Executive: And the shopkeeper “accepts” my “off er” by accepting my cash?
Prof. IT Law: Yes and a contract is formed. It is as simple as that. But now consider what happens if the shopkeeper refuses to sell you the item. For example, by refusing to take the cash you off ered, or your credit card.
IT Executive: I guess he can do that because I am making an off er to buy the chosen item, and he can either accept or refuse the off er.
Prof. IT Law: You are right. And so is the reason given by you. If it was the other way around, i.e. if the shopkeeper makes an “off er” to you by displaying items with price tags that you could “accept” then, in that case, the shopkeeper would not be in a position to refuse to sell you the item. And the shopkeeper would be bound by that contract.
IT Executive: I see. But how is this crucial in web-based contracts?
Prof. IT Law: As in shops, the question of who makes the “off er” is crucial even on websites. For example, if you make an off er on your website and it is accepted by a visitor to your site, you would have a contract that binds you.
IT Executive: That is ok I guess.
Prof. IT Law: Not always. You may not want to ship products to someone who accepts your website-based off er because he lives in another state or country. Or you may have run out of stock. Or you may have found it necessary to revise your prices, and so on.
IT Executive: So what is the solution?
Prof. IT Law: Here it is. Your website is like a shop. And you display goods on it
with price tags. But the off er is made by the visitor to your site. That is what legal scholars say. So you can refuse the “off er” made by the visitor to your site. Just like the shopkeeper.
IT Executive: That is good for those who sell goods on websites.
Prof. IT Law: Yes, the principle is the same whether it is a shop or a website. But you must be careful not to say anything on your website that reverses these principles. For example, if your website “screams” in large bold fonts that your “off er” closes at 5 p.m. on 30th June, 2012, it may be diffi cult for you to say later that you were simply inviting “off ers” from visitors to your site.
IT Executive: Can you tell me more?
Prof. IT Law: To make sure that your website makes “invitations” to people to make off ers to you for the items you are selling, you will need to design your website accordingly. For example, if your website repeatedly uses the words “OFFER, OFFER, OFFER” or “OFFER closes by 5 p.m. on Sunday, 24th June, 2012”, it may be diffi cult to then contend that you were not making an off er that visitors to your site can accept.
IT Executive: And how about an “ I agree” button rather than an “I accept” button for those who wish to buy the items displayed?
Prof. IT Law: Yes, that is a good idea too. In sum, you should have your lawyer apply his or her mind to the design of your website to avoid problems with transactions on your site.
IT Executive: Ah, that is good to know. Thank you. I look forward to meeting you again soon.
Prof. IT Law: Yes, I enjoy the sessions with you too. See you soon. n
IT Act 2000 »
Prof. IT Law in Conversation with Mr. IT Executive: Issue No. 4
Security Corner Mr. Subramaniam VuthaAdvocateEmail: [email protected]
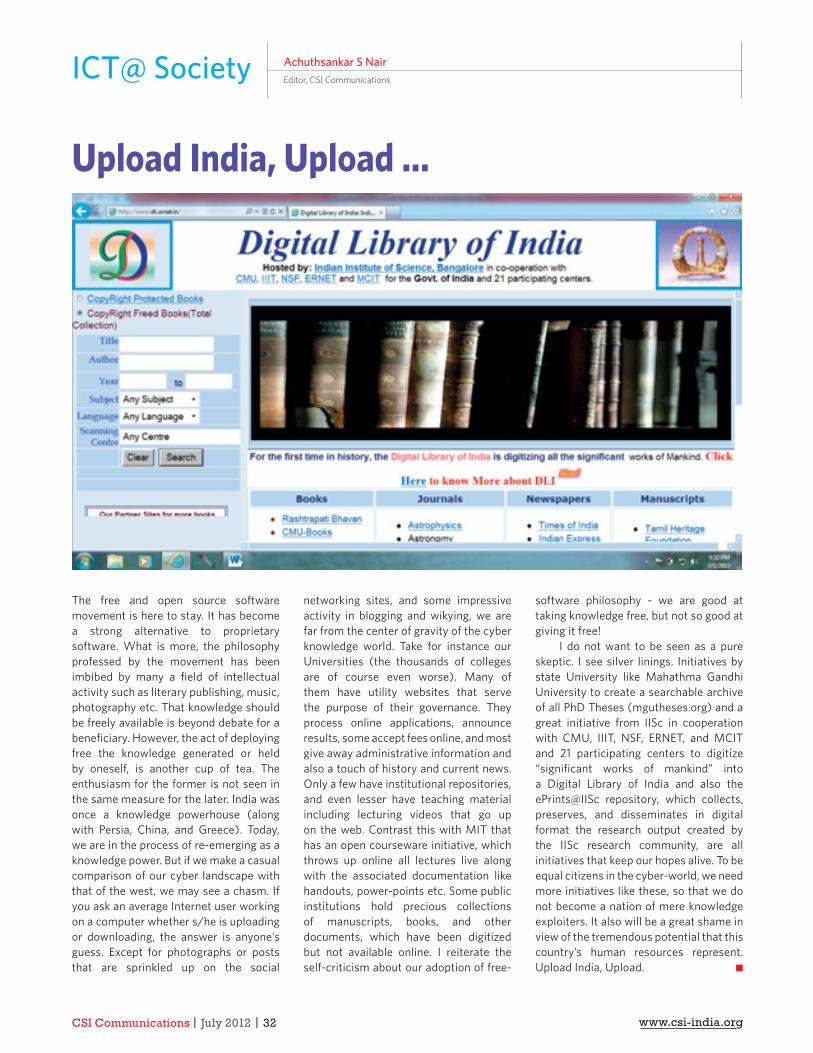
CSI Communications | July 2012 | 32 www.csi-india.org
ICT@ Society Achuthsankar S NairEditor, CSI Communications
The free and open source software movement is here to stay. It has become a strong alternative to proprietary software. What is more, the philosophy professed by the movement has been imbibed by many a fi eld of intellectual activity such as literary publishing, music, photography etc. That knowledge should be freely available is beyond debate for a benefi ciary. However, the act of deploying free the knowledge generated or held by oneself, is another cup of tea. The enthusiasm for the former is not seen in the same measure for the later. India was once a knowledge powerhouse (along with Persia, China, and Greece). Today, we are in the process of re-emerging as a knowledge power. But if we make a casual comparison of our cyber landscape with that of the west, we may see a chasm. If you ask an average Internet user working on a computer whether s/he is uploading or downloading, the answer is anyone’s guess. Except for photographs or posts that are sprinkled up on the social
networking sites, and some impressive activity in blogging and wikying, we are far from the center of gravity of the cyber knowledge world. Take for instance our Universities (the thousands of colleges are of course even worse). Many of them have utility websites that serve the purpose of their governance. They process online applications, announce results, some accept fees online, and most give away administrative information and also a touch of history and current news. Only a few have institutional repositories, and even lesser have teaching material including lecturing videos that go up on the web. Contrast this with MIT that has an open courseware initiative, which throws up online all lectures live along with the associated documentation like handouts, power-points etc. Some public institutions hold precious collections of manuscripts, books, and other documents, which have been digitized but not available online. I reiterate the self-criticism about our adoption of free-
software philosophy - we are good at taking knowledge free, but not so good at giving it free!
I do not want to be seen as a pure skeptic. I see silver linings. Initiatives by state University like Mahathma Gandhi University to create a searchable archive of all PhD Theses (mgutheses.org) and a great initiative from IISc in cooperation with CMU, IIIT, NSF, ERNET, and MCIT and 21 participating centers to digitize “signifi cant works of mankind” into a Digital Library of India and also the ePrints@IISc repository, which collects, preserves, and disseminates in digital format the research output created by the IISc research community, are all initiatives that keep our hopes alive. To be equal citizens in the cyber-world, we need more initiatives like these, so that we do not become a nation of mere knowledge exploiters. It also will be a great shame in view of the tremendous potential that this country’s human resources represent. Upload India, Upload. n
Upload India, Upload …
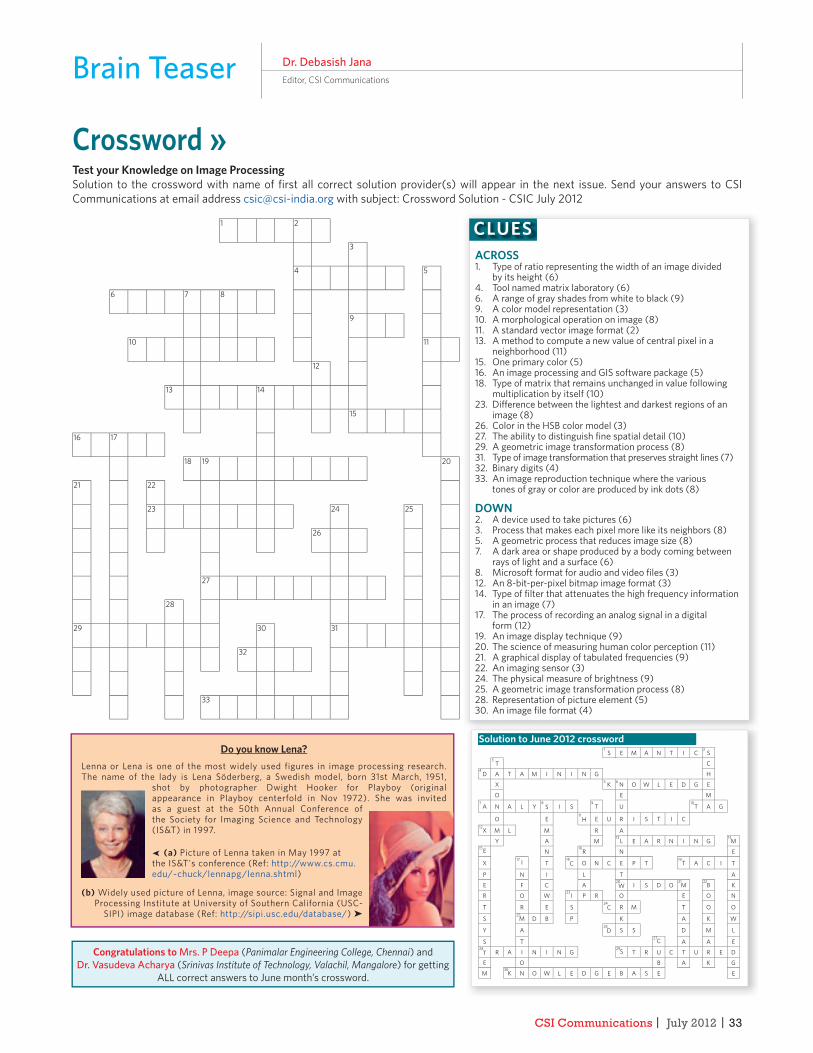
CSI Communications | July 2012 | 33
CLUES
Brain Teaser Dr. Debasish JanaEditor, CSI Communications
Crossword »Test your Knowledge on Image ProcessingSolution to the crossword with name of fi rst all correct solution provider(s) will appear in the next issue. Send your answers to CSI Communications at email address [email protected] with subject: Crossword Solution - CSIC July 2012
ACROSS1. Type of ratio representing the width of an image divided
by its height (6)4. Tool named matrix laboratory (6) 6. A range of gray shades from white to black (9)9. A color model representation (3)10. A morphological operation on image (8)11. A standard vector image format (2)13. A method to compute a new value of central pixel in a
neighborhood (11)15. One primary color (5)16. An image processing and GIS software package (5)18. Type of matrix that remains unchanged in value following
multiplication by itself (10)23. Diff erence between the lightest and darkest regions of an
image (8)26. Color in the HSB color model (3) 27. The ability to distinguish fi ne spatial detail (10)29. A geometric image transformation process (8)31. Type of image transformation that preserves straight lines (7)32. Binary digits (4)33. An image reproduction technique where the various
tones of gray or color are produced by ink dots (8)
DOWN2. A device used to take pictures (6)3. Process that makes each pixel more like its neighbors (8)5. A geometric process that reduces image size (8)7. A dark area or shape produced by a body coming between
rays of light and a surface (6)8. Microsoft format for audio and video fi les (3)12. An 8-bit-per-pixel bitmap image format (3)14. Type of fi lter that attenuates the high frequency information
in an image (7)17. The process of recording an analog signal in a digital
form (12)19. An image display technique (9)20. The science of measuring human color perception (11)21. A graphical display of tabulated frequencies (9)22. An imaging sensor (3)24. The physical measure of brightness (9)25. A geometric image transformation process (8)28. Representation of picture element (5)30. An image fi le format (4)
Solution to June 2012 crossword
Congratulations to Mrs. P Deepa (Panimalar Engineering College, Chennai) and Dr. Vasudeva Acharya (Srinivas Institute of Technology, Valachil, Mangalore) for getting
ALL correct answers to June month’s crossword.
Do you know Lena?Lenna or Lena is one of the most widely used figures in image processing research. The name of the lady is Lena Söderberg, a Swedish model, born 31st March, 1951,
shot by photographer Dwight Hooker for Playboy (original appearance in Playboy centerfold in Nov 1972). She was invited as a guest at the 50th Annual Conference of the Society for Imaging Science and Technology (IS&T) in 1997.
(a) Picture of Lenna taken in May 1997 at the IS&T's conference (Ref: http://www.cs.cmu.edu/~chuck/lennapg/lenna.shtml)
(b) Widely used picture of Lenna, image source: Signal and Image Processing Institute at University of Southern California (USC-
SIPI) image database (Ref: http://sipi.usc.edu/database/) ➤
1 2
3
4 5
6 7 8
9
10 11
12
13 14
15
16 17
18 19 20
21 22
23 24 25
26
27
28
29 30 31
32
33
1S E M A N T I C
2S
3T C
4D A T A M I N I N G H
X 5 K 6 N O W L E D G E
O E M7
A N A L Y8
S I S9
T U10
T A G
O E11
H E U R I S T I C12
X M L M R A
Y A M13
L E A R N I N G14M
15E N16
R N E
X17 I T
18C O N C E P T
19T A C I T
P N I L T A
E F C A20W I S D O
21M
22B K
R O W23
I P R O E O N
T R E S24
C R M T O O
S25M D B P K A K W
Y A26
D S S D M L
S T27C A A E
28T R A I N I N G
29S T R U C T U R E D
E O B A K G
M30
K N O W L E D G E B A S E E
➤
CSI Communications | July 2012 | 34 www.csi-india.org
Ask an Expert Dr. Debasish JanaEditor, CSI Communications
Your Question, Our Answer“A computer would deserve to be called intelligent if it could deceive a human into believing that it was human.”
~ Alan Turing
Subject: PHP arrays
What are the diff erent types of arrays in PHP and provide few examples for illustration of their use.
Thanks.AnonymousA In general, an array can store one or more values and
referred in a single variable name. Each element in the array can be assigned its own identifi er (we call index or key) so that the corresponding element stored can be easily accessed through the key, for example:
$array[key] = value;
In PHP, arrays can be three types:• Numeric Array• Associative Array• Multidimensional ArrayA numeric array stores each element associated with a numeric key value (like array index in C/C++/Java). We can defi ne the numeric array like below:
(a) $anames = array("Amar","Akbar","Anthony");
Or
(b) $anames[0] = "Amar"; $anames[1] = "Akbar"; $anames[2] = "Anthony";The array and array elements can be used in a PHP script, for example:<?php$anames[0] = "Amar";$anames[1] = "Akbar";$anames[2] = "Anthony";echo $anames[1] . " and " . $anames[2] . " are ". $anames[0] . "'s friends";?>
The output would be displayed as:
Akbar and Anthony are Amar's friends
In an associative array, each key is associated with a value, could be numeric or nonnumeric. We can use the some values as keys and assign some other values to them.Using an associative array we can assign number of chocolates belonging to a person now:
$chocolates = array(”Amar"=>4, ”Akbar"=>5, "Anthony”=>6);
Or,
$chocolates [’Amar '] = ”4";
$chocolates [’Akbar '] = ”5";$chocolates ['Anthony'] = ”6";
The associative array and array elements can be used in a PHP script, for example:
<?php$chocolates [’Amar '] = “4";$chocolates [’Akbar '] = “5";$chocolates ['Anthony'] = “6";
echo “Akbar has ” . $chocolates [‘Akbar’] . "chocolates.";?>
The output would be displayed as:
Akbar has 5 chocolates.
In a multidimensional array, array may contain another array and can be nested to any level. Each element in the main array can also be an array. And each element in the sub-array can be an array, and so on. For example:
$friends = array( "FA"=>array ( "Amar", "Akbar", "Anthony" ), "FB"=>array ( "Raja" ));echo $friends ['FA'][1]
The output would be: Akbar
Accessing Arrays can be done in many ways. One may use direct access to obtain the item. For sequential access, the foreach loop was designed to work with arrays. This iterates through the items in two diff erent ways:
foreach ($array_element as $key => $value)
It would provide both the key and value at each iteration
foreach ($arrayvar as $value)
Provides just the next value at each iteration.Ex: Using each to iterate:The each function returns a pair with each call, (a) a key fi eld for the current key and (b) a value fi eld for the current value. It returns the next (key,value) pair, then moves forward
while ($x = each($array)): $key = $x ["key"]; $val = $x["value"]; echo "key is $key and value is $val<BR>\n";endwhile; n
Send your questions to CSI Communications with subject line ‘Ask an Expert’ at email address [email protected]
CSI Communications | July 2012 | 35
Happenings@ICT H R MohanAVP (Systems), The Hindu, ChennaiEmail: [email protected]
ICT News Briefs in June 2012The following are the ICT news and headlines of interest in June 2012. They have been compiled from various news & Internet sources including the fi nancial dailies - The Hindu, Business Line, Economic Times.
Voices & Views• ‘London 2012 Olympics will be biggest
smartgame ever'. There will be real-time information and results to the world's broadcast media in less than 0.3 seconds to broadcasters globally.
• The cloud computing market is expected to grow to $241 billion in 2020, against $40.7 in 2010 -Mr. B Suresh Babu, Additional Commissioner at Commissionerate of Industries, AP.
• As many as 604 universities and 35,000 colleges will be brought under the national knowledge network (NKN) in the next six months - Mr. Kapil Sibal.
• Apple accounted for 11.8 million (68%) of the 17.4 million tablets that were shipped in 2011 - IDC.
• Income from fi nancial services, telecom segments of IT fi rms takes a beating.
• Airtel, Idea, Vodafone face Rs 1-lakh crore outgo on re-farming.
• 50% car buyers do online research - study by Neilsen.
• IT spend in fi nancial services to touch Rs. 38K crore - Gartner.
• IT, ITES fi rms in AP clock Rs. 50,000-crore biz.
• Nasscom maintains growth forecast of 11-14% for IT industry.
• Cyber security must be top priority for CEOs - Deloitte.
• Over 85% enterprises to deploy tablets this year - Gartner.
• Smartphones seeing malware explosion - Software security companies.
• India among worst aff ected by malware. Malware detected on 13.8 of every 1,000 computers scanned in India as against the global average of 7.1 - Microsoft.
• Top PC makers logging out of netbooks as sales drop.
• Global R&D spending rises 8.2% in FY11 - Zinnov.
• Phishing attacks on .in domain rising - Symantec.
• In 2011, 7% of consumer content was stored in cloud, but this will grow to 36% in 2016 - Gartner.
• Worldwide consumer digital storage needs will grow from 329 exabytes in 2011 to 4.1 zettabytes in 2016. Average storage per household to grow from 464 GB in 2011 to 3.3 TB in 2016 - Gartner.
• Over half (53%) of children in India have been bullied online - Global Youth Online
Behavior Survey by Microsoft.• Enterprise social software market size
is growing and will touch $6.4 billion in 2016 - IDC.
• IT sector feels the Obama heat and slows in 2009-12.
Telecom, Govt., Policy, Compliance• Spectrum: GoM to decide on TRAI, DoT
panel pricing formula.• Airtel, Hughes unable to zero-in on users,
says Intelligence Bureau.• 90% cable TVs yet to go digital in Kolkata
while it is hardly one month to go for the digitization deadline.
• JPC on 2G to submit report in six months.• Govt. to remove multilevel TDS on
software from 1st July, 2012.• DoT to fi nalize auctioneer for spectrum
auction by July 10.• Specifi cations for Aakash 2 revised
version to be fi nalized by June.• TRAI has hauled up mobile companies
for failing to comply with its order on seeking consumer's consent before activating VAS.
• Hardware makers ask Govt. for cover against forex volatility.
• 2G Scam: JPC may decide against summoning politicians.
• TN Govt. wants BPOs to open units in village panchayats. Capital subsidy of 20% to be provided.
• India ready to move to new Internet protocol IPv6.
• Satyam case: 44 properties of promoter's family attached.
• Raja asserts his innocence on 2G charge.• Bharti Airtel to pay Rs. 700 crore for
customs duty evasion case.• AP to extend e-governance initiative
“Mee Seva” to all districts.• All panchayats to have fi ber optic
connectivity in three years - Sachin Pilot.
IT Manpower, Staffi ng & Top Moves• IT Industry witness 29% decline in hiring
- Mr. Rajesh Kumar, CEO, MyHiringClub.com
• Fashion and You to hire 400 people by this fi scal end.
• Only 1 out of 7 opts for Nokia Siemens' voluntary retirement scheme at Kolkata unit.
• PayPal zooms in on IITs for ‘hi-tech' hires. Has hired 80 graduates at Rs. 7 lakh a year.
• Forbes describes Mr. Sridhar Vembu, founder and CEO of Zoho, as the ‘Smartest Unknown Indian Entrepreneur'.
• Zensar to hire 1200 engineers in Karnataka this fi scal.
• Over 17,000 foreign nationals on rolls in TCS.
• Majority of Indian employees approve personal use of social media at work.
• USCIS reaches cap on H-1B visas.• Nokia to cut 10,000 jobs.• Subex grants ESOPs to employees.• Microsoft launches Wi-Fi bus service for
employees.• IT fi rms have made over 1 lakh job off ers so
far this year - Nasscom President.• Bangalore IT fi rms caught by hunger pangs
due to a curtailed ‘11 p.m.’ dinner time.• Som Mittal to continue as President of
Nasccom for another two years.• RIM to cut about 5,000 jobs.
Company News: Tie-ups, Joint Ventures, New Initiatives• Google tips China searchers to hot-
button terms that evidently prompt censors to derail queries.
• Microsoft releases fi nal test version of Windows 8.
• Intel unveils new chip for faster computing devices.
• Dell introduces laptop battery recycling program.
• Infosys has been identifi ed as one of the top 25 performers in Caring for Climate Initiative by the UN Global Compact and UN Environment Program.
• Mahindra Satyam, Tech Mahindra shareholders okay merger.
• Allied Computers to launch laptops at Rs. 4,999.
• Agiliq Info Solutions announces a tool that converts the blog into an app.
• Wipro AppLife Contest for engineering students open from June 19, 2012 to December 18, 2012.
• Microsoft unveils Surface tablet running Windows RT and Windows 8 Pro.
• Bharti Airtel launches ‘Behtar Zindagi’, a mobile-based service for farming.
• Duke University, UK, develops gigapixel camera.
• ‘Printer virus’ hits BPO, health care, manufacturing cos.
• HP to pay Rs. 1.17 lakh for selling defective laptop.
• Intel launches future scientist program in Karnataka. To train 500 teachers and 5,000 students.
• Microsoft off ers Offi ce 365 at no cost to educational institutes.
• TCS(China) Co. Ltd., has been recognized as ‘2012 Top 10 Global Service Providers in China’.
• Google unveils Nexus 7 tablet designed to challenge Apple’s iPad.
• Beware of email off ers this Olympics season! - Mr Amit Nath, Trend Micro. n
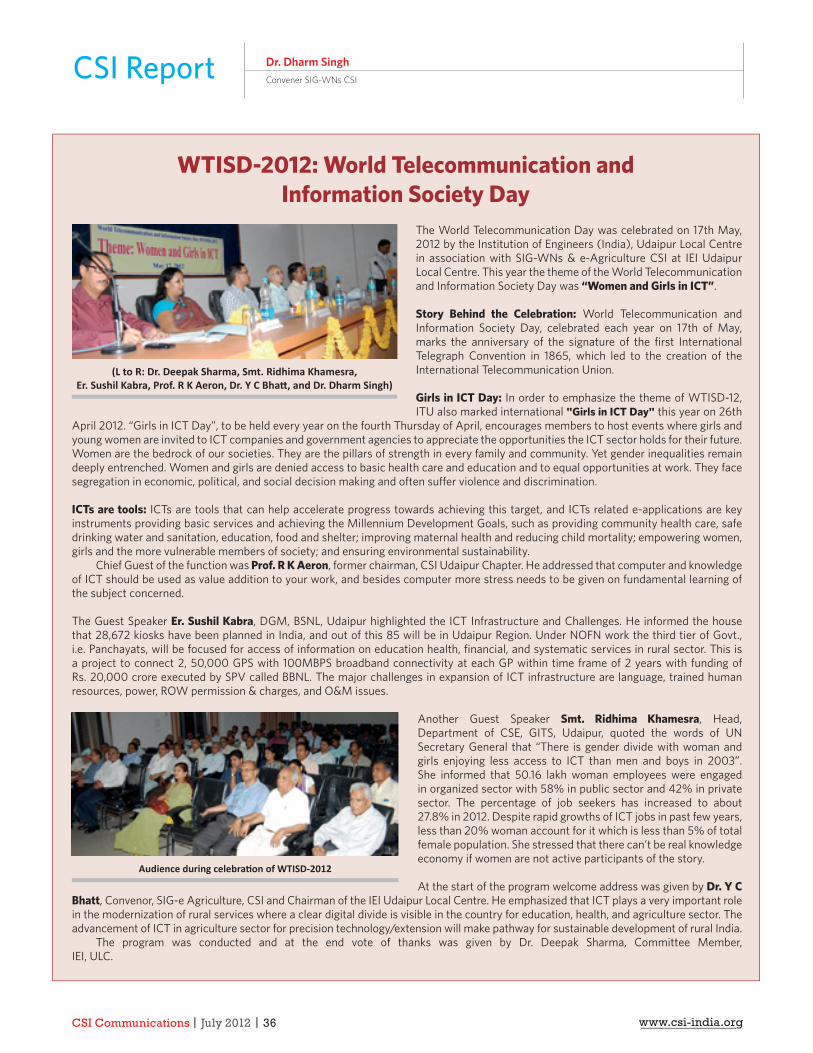
CSI Communications | July 2012 | 36 www.csi-india.org
CSI Report Dr. Dharm SinghConvener SIG-WNs CSI
WTISD-2012: World Telecommunication and Information Society Day
(L to R: Dr. Deepak Sharma, Smt. Ridhima Khamesra, Er. Sushil Kabra, Prof. R K Aeron, Dr. Y C Bhatt , and Dr. Dharm Singh)
The World Telecommunication Day was celebrated on 17th May, 2012 by the Institution of Engineers (India), Udaipur Local Centre in association with SIG-WNs & e-Agriculture CSI at IEI Udaipur Local Centre. This year the theme of the World Telecommunication and Information Society Day was “Women and Girls in ICT”.
Story Behind the Celebration: World Telecommunication and Information Society Day, celebrated each year on 17th of May, marks the anniversary of the signature of the fi rst International Telegraph Convention in 1865, which led to the creation of the International Telecommunication Union.
Girls in ICT Day: In order to emphasize the theme of WTISD-12, ITU also marked international "Girls in ICT Day" this year on 26th
April 2012. “Girls in ICT Day”, to be held every year on the fourth Thursday of April, encourages members to host events where girls and young women are invited to ICT companies and government agencies to appreciate the opportunities the ICT sector holds for their future. Women are the bedrock of our societies. They are the pillars of strength in every family and community. Yet gender inequalities remain deeply entrenched. Women and girls are denied access to basic health care and education and to equal opportunities at work. They face segregation in economic, political, and social decision making and often suff er violence and discrimination.
ICTs are tools: ICTs are tools that can help accelerate progress towards achieving this target, and ICTs related e-applications are key instruments providing basic services and achieving the Millennium Development Goals, such as providing community health care, safe drinking water and sanitation, education, food and shelter; improving maternal health and reducing child mortality; empowering women, girls and the more vulnerable members of society; and ensuring environmental sustainability.
Chief Guest of the function was Prof. R K Aeron, former chairman, CSI Udaipur Chapter. He addressed that computer and knowledge of ICT should be used as value addition to your work, and besides computer more stress needs to be given on fundamental learning of the subject concerned.
The Guest Speaker Er. Sushil Kabra, DGM, BSNL, Udaipur highlighted the ICT Infrastructure and Challenges. He informed the house that 28,672 kiosks have been planned in India, and out of this 85 will be in Udaipur Region. Under NOFN work the third tier of Govt., i.e. Panchayats, will be focused for access of information on education health, fi nancial, and systematic services in rural sector. This is a project to connect 2, 50,000 GPS with 100MBPS broadband connectivity at each GP within time frame of 2 years with funding of Rs. 20,000 crore executed by SPV called BBNL. The major challenges in expansion of ICT infrastructure are language, trained human resources, power, ROW permission & charges, and O&M issues.
Another Guest Speaker Smt. Ridhima Khamesra, Head, Department of CSE, GITS, Udaipur, quoted the words of UN Secretary General that “There is gender divide with woman and girls enjoying less access to ICT than men and boys in 2003”. She informed that 50.16 lakh woman employees were engaged in organized sector with 58% in public sector and 42% in private sector. The percentage of job seekers has increased to about 27.8% in 2012. Despite rapid growths of ICT jobs in past few years, less than 20% woman account for it which is less than 5% of total female population. She stressed that there can’t be real knowledge economy if women are not active participants of the story.
At the start of the program welcome address was given by Dr. Y C Bhatt, Convenor, SIG-e Agriculture, CSI and Chairman of the IEI Udaipur Local Centre. He emphasized that ICT plays a very important role in the modernization of rural services where a clear digital divide is visible in the country for education, health, and agriculture sector. The advancement of ICT in agriculture sector for precision technology/extension will make pathway for sustainable development of rural India.
The program was conducted and at the end vote of thanks was given by Dr. Deepak Sharma, Committee Member, IEI, ULC.
Audience during celebrati on of WTISD-2012
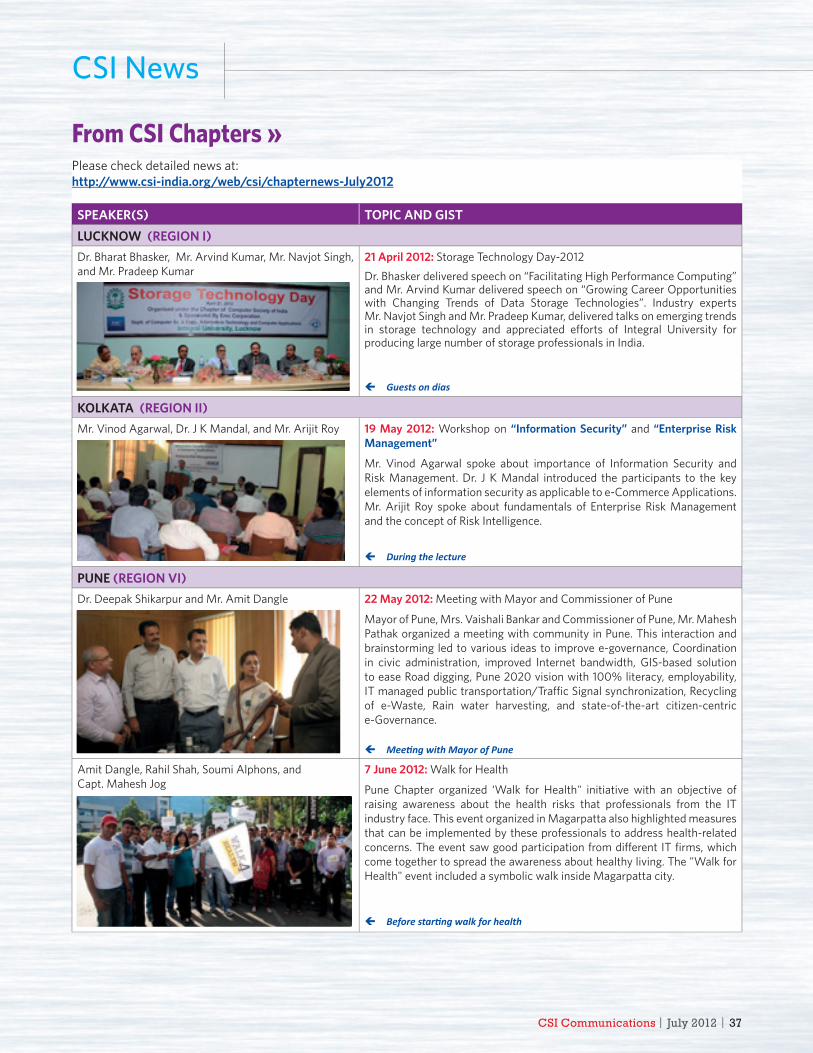
CSI Communications | July 2012 | 37CSCSSI I I CoCoC mmmmmmunununiciccatata ioionsns ||| JuJuJulylyly 202020121212 ||| 373737
CSI News
From CSI Chapters »Please check detailed news at: http://www.csi-india.org/web/csi/chapternews-July2012
SPEAKER(S) TOPIC AND GISTLUCKNOW (REGION I)Dr. Bharat Bhasker, Mr. Arvind Kumar, Mr. Navjot Singh, and Mr. Pradeep Kumar
21 April 2012: Storage Technology Day-2012
Dr. Bhasker delivered speech on “Facilitating High Performance Computing” and Mr. Arvind Kumar delivered speech on “Growing Career Opportunities with Changing Trends of Data Storage Technologies”. Industry experts Mr. Navjot Singh and Mr. Pradeep Kumar, delivered talks on emerging trends in storage technology and appreciated eff orts of Integral University for producing large number of storage professionals in India.
Guests on dias
KOLKATA (REGION II)Mr. Vinod Agarwal, Dr. J K Mandal, and Mr. Arijit Roy 19 May 2012: Workshop on “Information Security” and “Enterprise Risk
Management”
Mr. Vinod Agarwal spoke about importance of Information Security and Risk Management. Dr. J K Mandal introduced the participants to the key elements of information security as applicable to e-Commerce Applications. Mr. Arijit Roy spoke about fundamentals of Enterprise Risk Management and the concept of Risk Intelligence.
During the lecture
PUNE (REGION VI)Dr. Deepak Shikarpur and Mr. Amit Dangle 22 May 2012: Meeting with Mayor and Commissioner of Pune
Mayor of Pune, Mrs. Vaishali Bankar and Commissioner of Pune, Mr. Mahesh Pathak organized a meeting with community in Pune. This interaction and brainstorming led to various ideas to improve e-governance, Coordination in civic administration, improved Internet bandwidth, GIS-based solution to ease Road digging, Pune 2020 vision with 100% literacy, employability, IT managed public transportation/Traffi c Signal synchronization, Recycling of e-Waste, Rain water harvesting, and state-of-the-art citizen-centric e-Governance.
Meeti ng with Mayor of Pune
Amit Dangle, Rahil Shah, Soumi Alphons, and Capt. Mahesh Jog
7 June 2012: Walk for Health
Pune Chapter organized ‘Walk for Health" initiative with an objective of raising awareness about the health risks that professionals from the IT industry face. This event organized in Magarpatta also highlighted measures that can be implemented by these professionals to address health-related concerns. The event saw good participation from diff erent IT fi rms, which come together to spread the awareness about healthy living. The "Walk for Health" event included a symbolic walk inside Magarpatta city.
Before starti ng walk for health
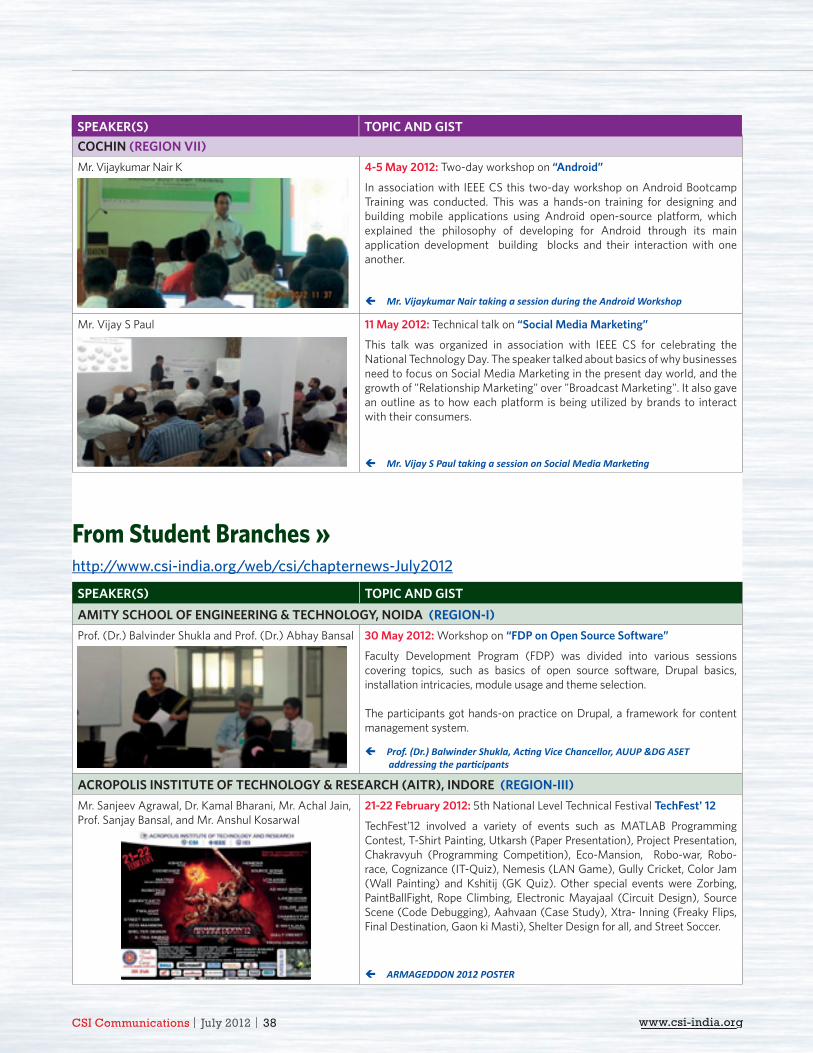
CSI Communications | July 2012 | 38 www.csi-india.orgCSCSCSI I I CoCoCommmmmmunununiciccattatioionsnss ||| JuJuulylyy 2 201010 22 || 3838 wwwwwww.w.w.cscscsi-ii-ininindididiaa.a.orororggggg
COCHIN (REGION VII)Mr. Vijaykumar Nair K 4-5 May 2012: Two-day workshop on “Android”
In association with IEEE CS this two-day workshop on Android Bootcamp Training was conducted. This was a hands-on training for designing and building mobile applications using Android open-source platform, which explained the philosophy of developing for Android through its main application development building blocks and their interaction with one another.
Mr. Vijaykumar Nair taking a session during the Android Workshop
Mr. Vijay S Paul 11 May 2012: Technical talk on “Social Media Marketing”
This talk was organized in association with IEEE CS for celebrating the National Technology Day. The speaker talked about basics of why businesses need to focus on Social Media Marketing in the present day world, and the growth of "Relationship Marketing" over "Broadcast Marketing". It also gave an outline as to how each platform is being utilized by brands to interact with their consumers.
Mr. Vijay S Paul taking a session on Social Media Marketi ng
From Student Branches »http://www.csi-india.org/web/csi/chapternews-July2012
SPEAKER(S) TOPIC AND GISTAMITY SCHOOL OF ENGINEERING & TECHNOLOGY, NOIDA (REGION-I)Prof. (Dr.) Balvinder Shukla and Prof. (Dr.) Abhay Bansal 30 May 2012: Workshop on “FDP on Open Source Software”
Faculty Development Program (FDP) was divided into various sessions covering topics, such as basics of open source software, Drupal basics, installation intricacies, module usage and theme selection.
The participants got hands-on practice on Drupal, a framework for content management system.
Prof. (Dr.) Balwinder Shukla, Acti ng Vice Chancellor, AUUP &DG ASET addressing the parti cipants
ACROPOLIS INSTITUTE OF TECHNOLOGY & RESEARCH (AITR), INDORE (REGION-III)Mr. Sanjeev Agrawal, Dr. Kamal Bharani, Mr. Achal Jain, Prof. Sanjay Bansal, and Mr. Anshul Kosarwal
21-22 February 2012: 5th National Level Technical Festival TechFest' 12
TechFest’12 involved a variety of events such as MATLAB Programming Contest, T-Shirt Painting, Utkarsh (Paper Presentation), Project Presentation, Chakravyuh (Programming Competition), Eco-Mansion, Robo-war, Robo-race, Cognizance (IT-Quiz), Nemesis (LAN Game), Gully Cricket, Color Jam (Wall Painting) and Kshitij (GK Quiz). Other special events were Zorbing, PaintBallFight, Rope Climbing, Electronic Mayajaal (Circuit Design), Source Scene (Code Debugging), Aahvaan (Case Study), Xtra- Inning (Freaky Flips, Final Destination, Gaon ki Masti), Shelter Design for all, and Street Soccer.
ARMAGEDDON 2012 POSTER
SPEAKER(S) TOPIC AND GIST
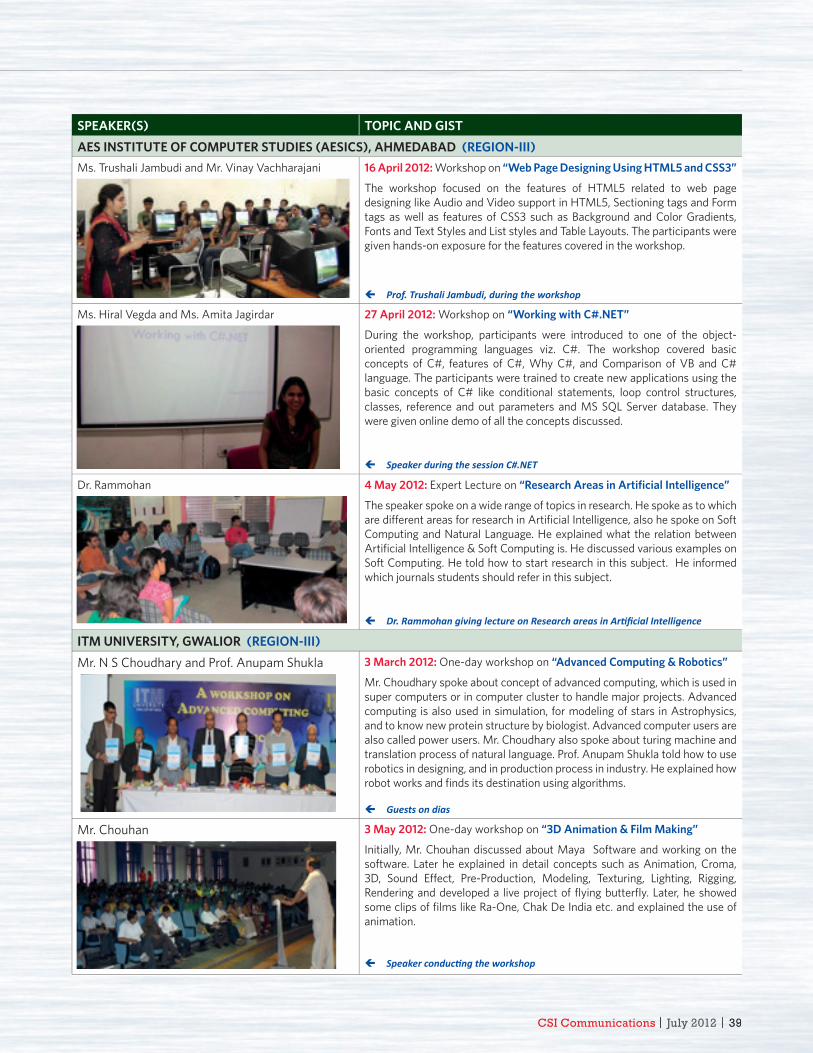
CSI Communications | July 2012 | 39CSCSSI I I CoCoC mmmmmmunununiciccatata ioionsns || JuJuJulylyly 202020121212 ||| 393939
SPEAKER(S) TOPIC AND GISTAES INSTITUTE OF COMPUTER STUDIES (AESICS), AHMEDABAD (REGION-III)Ms. Trushali Jambudi and Mr. Vinay Vachharajani 16 April 2012: Workshop on “Web Page Designing Using HTML5 and CSS3”
The workshop focused on the features of HTML5 related to web page designing like Audio and Video support in HTML5, Sectioning tags and Form tags as well as features of CSS3 such as Background and Color Gradients, Fonts and Text Styles and List styles and Table Layouts. The participants were given hands-on exposure for the features covered in the workshop.
Prof. Trushali Jambudi, during the workshop
Ms. Hiral Vegda and Ms. Amita Jagirdar 27 April 2012: Workshop on “Working with C#.NET”
During the workshop, participants were introduced to one of the object-oriented programming languages viz. C#. The workshop covered basic concepts of C#, features of C#, Why C#, and Comparison of VB and C# language. The participants were trained to create new applications using the basic concepts of C# like conditional statements, loop control structures, classes, reference and out parameters and MS SQL Server database. They were given online demo of all the concepts discussed.
Speaker during the session C#.NET
Dr. Rammohan 4 May 2012: Expert Lecture on “Research Areas in Artifi cial Intelligence”
The speaker spoke on a wide range of topics in research. He spoke as to which are diff erent areas for research in Artifi cial Intelligence, also he spoke on Soft Computing and Natural Language. He explained what the relation between Artifi cial Intelligence & Soft Computing is. He discussed various examples on Soft Computing. He told how to start research in this subject. He informed which journals students should refer in this subject.
Dr. Rammohan giving lecture on Research areas in Arti fi cial Intelligence
ITM UNIVERSITY, GWALIOR (REGION-III)Mr. N S Choudhary and Prof. Anupam Shukla 3 March 2012: One-day workshop on “Advanced Computing & Robotics”
Mr. Choudhary spoke about concept of advanced computing, which is used in super computers or in computer cluster to handle major projects. Advanced computing is also used in simulation, for modeling of stars in Astrophysics, and to know new protein structure by biologist. Advanced computer users are also called power users. Mr. Choudhary also spoke about turing machine and translation process of natural language. Prof. Anupam Shukla told how to use robotics in designing, and in production process in industry. He explained how robot works and fi nds its destination using algorithms.
Guests on dias
Mr. Chouhan 3 May 2012: One-day workshop on “3D Animation & Film Making”
Initially, Mr. Chouhan discussed about Maya Software and working on the software. Later he explained in detail concepts such as Animation, Croma, 3D, Sound Eff ect, Pre-Production, Modeling, Texturing, Lighting, Rigging, Rendering and developed a live project of fl ying butterfl y. Later, he showed some clips of fi lms like Ra-One, Chak De India etc. and explained the use of animation.
Speaker conducti ng the workshop
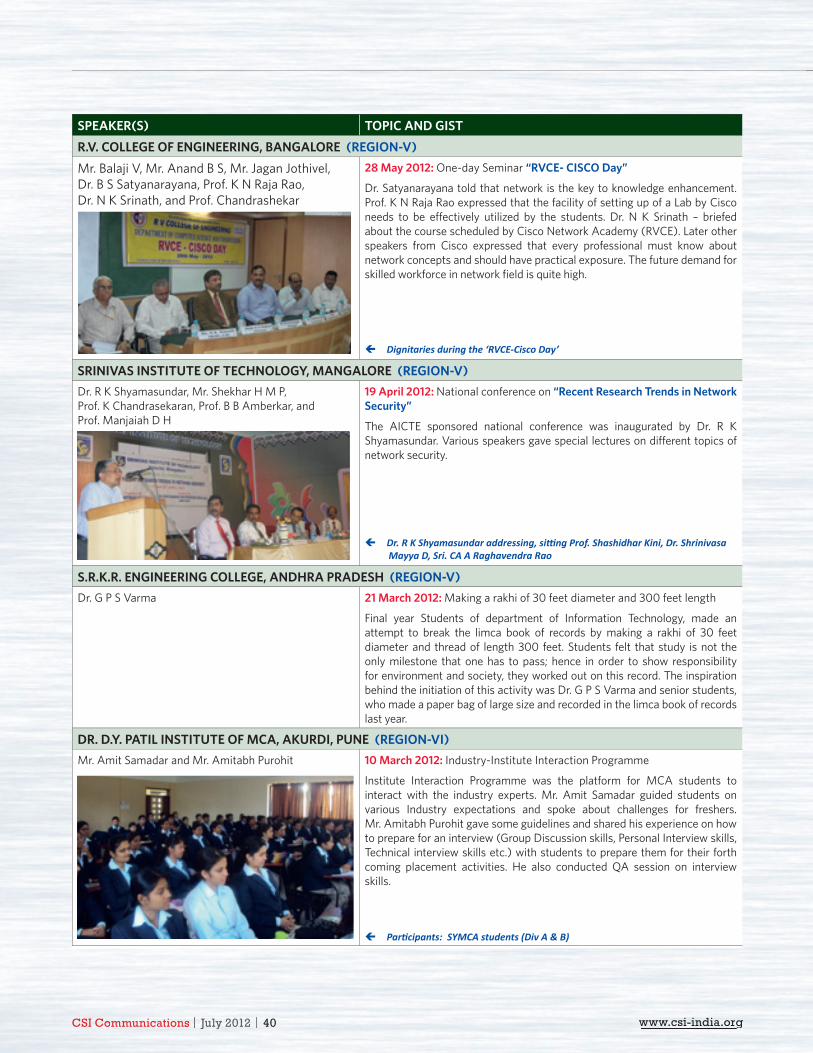
CSI Communications | July 2012 | 40 www.csi-india.orgCSCSCSI I I CoCoCommmmmmunununiciccattatioionsnss ||| JuJuulylyy 2 201010 22 || 4040 wwwwwww.w.w.cscscsi-ii-ininindididiaa.a.orororggggg
SPEAKER(S) TOPIC AND GISTR.V. COLLEGE OF ENGINEERING, BANGALORE (REGION-V)Mr. Balaji V, Mr. Anand B S, Mr. Jagan Jothivel, Dr. B S Satyanarayana, Prof. K N Raja Rao, Dr. N K Srinath, and Prof. Chandrashekar
28 May 2012: One-day Seminar “RVCE- CISCO Day”
Dr. Satyanarayana told that network is the key to knowledge enhancement. Prof. K N Raja Rao expressed that the facility of setting up of a Lab by Cisco needs to be eff ectively utilized by the students. Dr. N K Srinath – briefed about the course scheduled by Cisco Network Academy (RVCE). Later other speakers from Cisco expressed that every professional must know about network concepts and should have practical exposure. The future demand for skilled workforce in network fi eld is quite high.
Dignitaries during the ‘RVCE-Cisco Day’
SRINIVAS INSTITUTE OF TECHNOLOGY, MANGALORE (REGION-V)Dr. R K Shyamasundar, Mr. Shekhar H M P, Prof. K Chandrasekaran, Prof. B B Amberkar, and Prof. Manjaiah D H
19 April 2012: National conference on “Recent Research Trends in Network Security”
The AICTE sponsored national conference was inaugurated by Dr. R K Shyamasundar. Various speakers gave special lectures on diff erent topics of network security.
Dr. R K Shyamasundar addressing, sitti ng Prof. Shashidhar Kini, Dr. Shrinivasa Mayya D, Sri. CA A Raghavendra Rao
S.R.K.R. ENGINEERING COLLEGE, ANDHRA PRADESH (REGION-V)Dr. G P S Varma 21 March 2012: Making a rakhi of 30 feet diameter and 300 feet length
Final year Students of department of Information Technology, made an attempt to break the limca book of records by making a rakhi of 30 feet diameter and thread of length 300 feet. Students felt that study is not the only milestone that one has to pass; hence in order to show responsibility for environment and society, they worked out on this record. The inspiration behind the initiation of this activity was Dr. G P S Varma and senior students, who made a paper bag of large size and recorded in the limca book of records last year.
DR. D.Y. PATIL INSTITUTE OF MCA, AKURDI, PUNE (REGION-VI) Mr. Amit Samadar and Mr. Amitabh Purohit 10 March 2012: Industry-Institute Interaction Programme
Institute Interaction Programme was the platform for MCA students to interact with the industry experts. Mr. Amit Samadar guided students on various Industry expectations and spoke about challenges for freshers. Mr. Amitabh Purohit gave some guidelines and shared his experience on how to prepare for an interview (Group Discussion skills, Personal Interview skills, Technical interview skills etc.) with students to prepare them for their forth coming placement activities. He also conducted QA session on interview skills.
Parti cipants: SYMCA students (Div A & B)
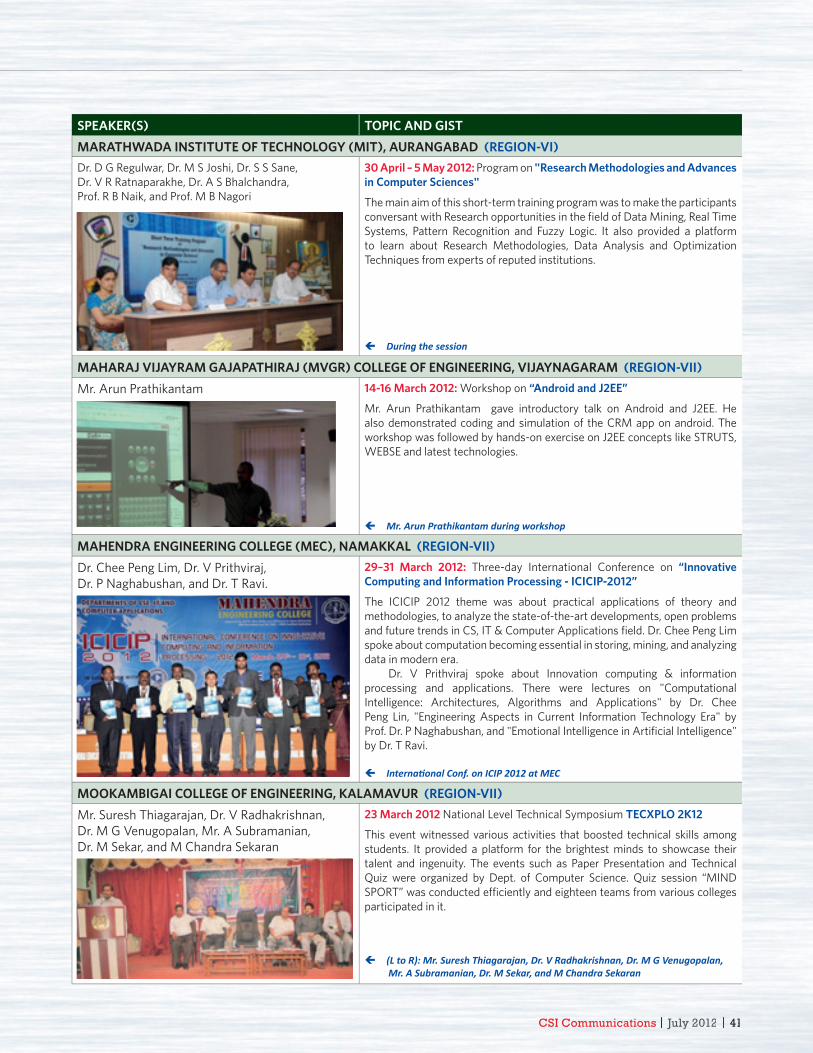
CSI Communications | July 2012 | 41CSCSSI I I CoCoC mmmmmmunununiciccatata ioionsns ||| JuJuJulylyly 202020121212 ||| 414141
SPEAKER(S) TOPIC AND GISTMARATHWADA INSTITUTE OF TECHNOLOGY (MIT), AURANGABAD (REGION-VI)Dr. D G Regulwar, Dr. M S Joshi, Dr. S S Sane, Dr. V R Ratnaparakhe, Dr. A S Bhalchandra, Prof. R B Naik, and Prof. M B Nagori
30 April – 5 May 2012: Program on "Research Methodologies and Advances in Computer Sciences"
The main aim of this short-term training program was to make the participants conversant with Research opportunities in the fi eld of Data Mining, Real Time Systems, Pattern Recognition and Fuzzy Logic. It also provided a platform to learn about Research Methodologies, Data Analysis and Optimization Techniques from experts of reputed institutions.
During the session
MAHARAJ VIJAYRAM GAJAPATHIRAJ (MVGR) COLLEGE OF ENGINEERING, VIJAYNAGARAM (REGION-VII)Mr. Arun Prathikantam 14-16 March 2012: Workshop on “Android and J2EE”
Mr. Arun Prathikantam gave introductory talk on Android and J2EE. He also demonstrated coding and simulation of the CRM app on android. The workshop was followed by hands-on exercise on J2EE concepts like STRUTS, WEBSE and latest technologies.
Mr. Arun Prathikantam during workshop
MAHENDRA ENGINEERING COLLEGE (MEC), NAMAKKAL (REGION-VII)Dr. Chee Peng Lim, Dr. V Prithviraj, Dr. P Naghabushan, and Dr. T Ravi.
29–31 March 2012: Three-day International Conference on “Innovative Computing and Information Processing - ICICIP-2012”
The ICICIP 2012 theme was about practical applications of theory and methodologies, to analyze the state-of-the-art developments, open problems and future trends in CS, IT & Computer Applications fi eld. Dr. Chee Peng Lim spoke about computation becoming essential in storing, mining, and analyzing data in modern era.
Dr. V Prithviraj spoke about Innovation computing & information processing and applications. There were lectures on "Computational Intelligence: Architectures, Algorithms and Applications" by Dr. Chee Peng Lin, "Engineering Aspects in Current Information Technology Era" by Prof. Dr. P Naghabushan, and "Emotional Intelligence in Artifi cial Intelligence" by Dr. T Ravi.
Internati onal Conf. on ICIP 2012 at MEC
MOOKAMBIGAI COLLEGE OF ENGINEERING, KALAMAVUR (REGION-VII)Mr. Suresh Thiagarajan, Dr. V Radhakrishnan, Dr. M G Venugopalan, Mr. A Subramanian, Dr. M Sekar, and M Chandra Sekaran
23 March 2012 National Level Technical Symposium TECXPLO 2K12
This event witnessed various activities that boosted technical skills among students. It provided a platform for the brightest minds to showcase their talent and ingenuity. The events such as Paper Presentation and Technical Quiz were organized by Dept. of Computer Science. Quiz session “MIND SPORT” was conducted effi ciently and eighteen teams from various colleges participated in it.
(L to R): Mr. Suresh Thiagarajan, Dr. V Radhakrishnan, Dr. M G Venugopalan, Mr. A Subramanian, Dr. M Sekar, and M Chandra Sekaran
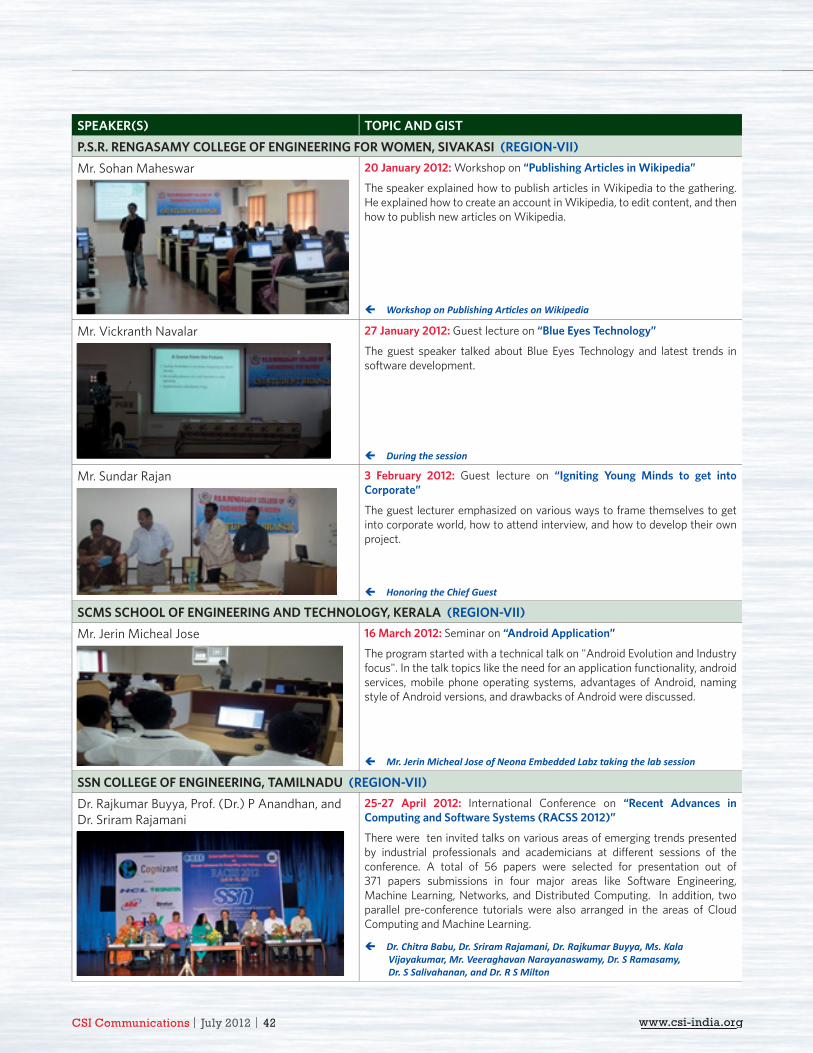
CSI Communications | July 2012 | 42 www.csi-india.orgCSCSCSI I I CoCoCommmmmmunununiciccattatioionsnss ||| JuJuulylyy 2 201010 22 || 4242 wwwwwww.w.w.cscscsi-ii-ininindididiaa.a.orororggggg
SPEAKER(S) TOPIC AND GISTP.S.R. RENGASAMY COLLEGE OF ENGINEERING FOR WOMEN, SIVAKASI (REGION-VII)Mr. Sohan Maheswar 20 January 2012: Workshop on “Publishing Articles in Wikipedia”
The speaker explained how to publish articles in Wikipedia to the gathering. He explained how to create an account in Wikipedia, to edit content, and then how to publish new articles on Wikipedia.
Workshop on Publishing Arti cles on Wikipedia
Mr. Vickranth Navalar 27 January 2012: Guest lecture on “Blue Eyes Technology”
The guest speaker talked about Blue Eyes Technology and latest trends in software development.
During the session
Mr. Sundar Rajan 3 February 2012: Guest lecture on “Igniting Young Minds to get into Corporate”
The guest lecturer emphasized on various ways to frame themselves to get into corporate world, how to attend interview, and how to develop their own project.
Honoring the Chief Guest
SCMS SCHOOL OF ENGINEERING AND TECHNOLOGY, KERALA (REGION-VII)Mr. Jerin Micheal Jose 16 March 2012: Seminar on “Android Application”
The program started with a technical talk on "Android Evolution and Industry focus". In the talk topics like the need for an application functionality, android services, mobile phone operating systems, advantages of Android, naming style of Android versions, and drawbacks of Android were discussed.
Mr. Jerin Micheal Jose of Neona Embedded Labz taking the lab session
SSN COLLEGE OF ENGINEERING, TAMILNADU (REGION-VII)Dr. Rajkumar Buyya, Prof. (Dr.) P Anandhan, and Dr. Sriram Rajamani
25-27 April 2012: International Conference on “Recent Advances in Computing and Software Systems (RACSS 2012)”
There were ten invited talks on various areas of emerging trends presented by industrial professionals and academicians at diff erent sessions of the conference. A total of 56 papers were selected for presentation out of 371 papers submissions in four major areas like Software Engineering, Machine Learning, Networks, and Distributed Computing. In addition, two parallel pre-conference tutorials were also arranged in the areas of Cloud Computing and Machine Learning.
Dr. Chitra Babu, Dr. Sriram Rajamani, Dr. Rajkumar Buyya, Ms. Kala Vijayakumar, Mr. Veeraghavan Narayanaswamy, Dr. S Ramasamy, Dr. S Salivahanan, and Dr. R S Milton
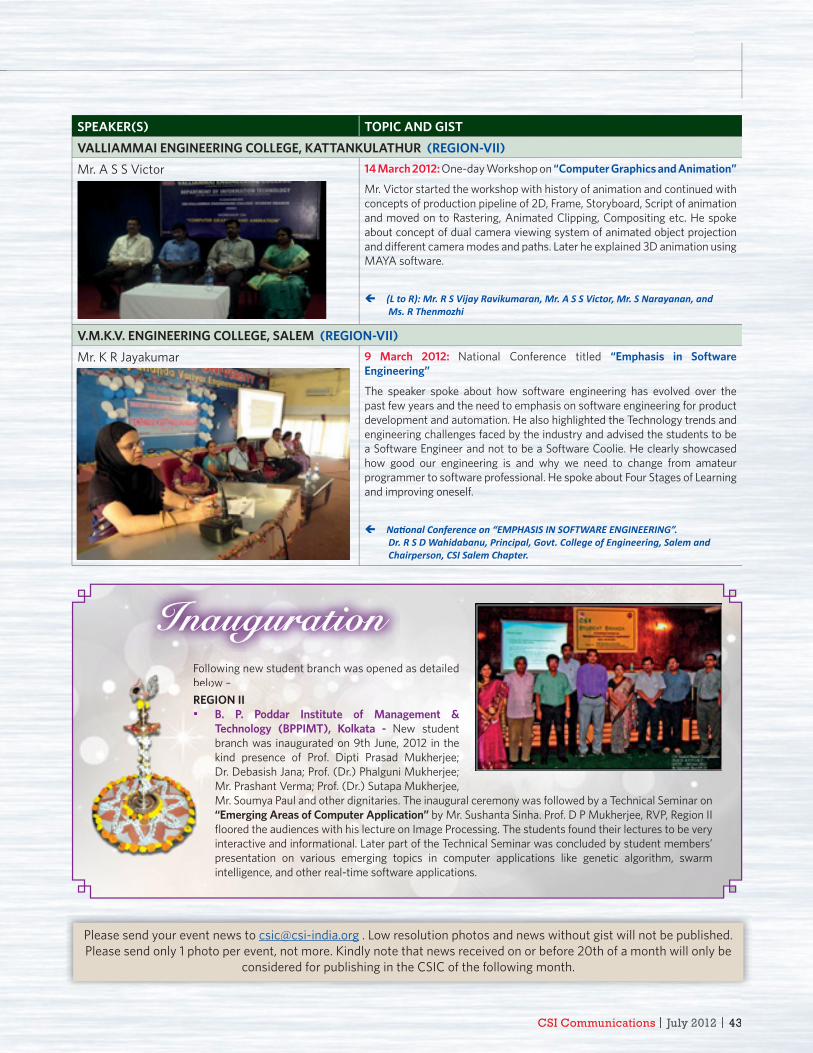
CSI Communications | July 2012 | 43CSCSSI I I CoCoC mmmmmmunununiciccatata ioionsns || JuJuJulylyly 202020121212 ||| 434343
SPEAKER(S) TOPIC AND GISTVALLIAMMAI ENGINEERING COLLEGE, KATTANKULATHUR (REGION-VII)Mr. A S S Victor 14 March 2012: One-day Workshop on “Computer Graphics and Animation”
Mr. Victor started the workshop with history of animation and continued with concepts of production pipeline of 2D, Frame, Storyboard, Script of animation and moved on to Rastering, Animated Clipping, Compositing etc. He spoke about concept of dual camera viewing system of animated object projection and diff erent camera modes and paths. Later he explained 3D animation using MAYA software.
(L to R): Mr. R S Vijay Ravikumaran, Mr. A S S Victor, Mr. S Narayanan, and Ms. R Thenmozhi
V.M.K.V. ENGINEERING COLLEGE, SALEM (REGION-VII)Mr. K R Jayakumar 9 March 2012: National Conference titled “Emphasis in Software
Engineering”
The speaker spoke about how software engineering has evolved over the past few years and the need to emphasis on software engineering for product development and automation. He also highlighted the Technology trends and engineering challenges faced by the industry and advised the students to be a Software Engineer and not to be a Software Coolie. He clearly showcased how good our engineering is and why we need to change from amateur programmer to software professional. He spoke about Four Stages of Learning and improving oneself.
Nati onal Conference on “EMPHASIS IN SOFTWARE ENGINEERING”. Dr. R S D Wahidabanu, Principal, Govt. College of Engineering, Salem and Chairperson, CSI Salem Chapter.
Following new student branch was opened as detailed below –REGION II
B. P. Poddar Institute of Management & Technology (BPPIMT), Kolkata - New student branch was inaugurated on 9th June, 2012 in the kind presence of Prof. Dipti Prasad Mukherjee; Dr. Debasish Jana; Prof. (Dr.) Phalguni Mukherjee; Mr. Prashant Verma; Prof. (Dr.) Sutapa Mukherjee, Mr. Soumya Paul and other dignitaries. The inaugural ceremony was followed by a Technical Seminar on “Emerging Areas of Computer Application” by Mr. Sushanta Sinha. Prof. D P Mukherjee, RVP, Region II fl oored the audiences with his lecture on Image Processing. The students found their lectures to be very interactive and informational. Later part of the Technical Seminar was concluded by student members’ presentation on various emerging topics in computer applications like genetic algorithm, swarm intelligence, and other real-time software applications.
FFFoFooFoFoFoolllllbbebebellololoREREREEREGGGGG
Please send your event news to [email protected] . Low resolution photos and news without gist will not be published. Please send only 1 photo per event, not more. Kindly note that news received on or before 20th of a month will only be
considered for publishing in the CSIC of the following month.

CSI Communications | July 2012 | 44 www.csi-india.org
Th e next iss ue (August 2012) of the CSI
Communications is on the theme: Hist ory of IT in
India and will att empt to rec reate a feel of the past
few dec ades wh ich saw tremendous emergence of IT in
India. Articles /Phot os are invited fr om all members towards
enriching this iss ue. Th e following are most welcome:
InInInInInddddd
fefefefefefefef w w w w w w decdecdecdecddec a a a a a
InInInInInInInInInIndidididididididia.a.a.a.a.a.a.a A A A AA A AArtrtrtrtrtrtrtrttiiiiiiii
eneneneneneneneneneneenriririririririririrr chchchchchchchchchchhininininininininininingggggggggg thththththththhththhhisisisisisisisisisiii iiiiiiiiissssssssssssssssssssueueueueueueueuu
Articles
invited on the
theme: History of
IT in India
Brief write up on Computer Centres of 1960-1980s (R&D institutions, Universities , Institutes , Colleges et c)
Phot ographs of early computers and peripherals
Interes ting anec dot es on early computerisation
Interes ting computer-related Advertisemnts fr om media
Th e story of IBM in India (and its ex it in late 1970s)
Hist ory of ECIL
Railway and Bank Computerisation
Early e-Governance eff orts
Profi le of early ex perts, leaders and res earchers in IT with phot os and
rec ollect ions if available
CSI Membership = 360° Knowledge
Your membership in CSI provides instant access to key career / business building resources - Knowledge, Networking, Opportunities.
CSI provides you with 360° coverage for your Technology goals
Learn more at www.csi-india.org
WE INVITE YOU TO JOINComputer Society of India
India's largest technical professional associationJoin us
andbecome a member
I am interested in the work of CSI . Please send me information on how to become an individual/institutional* memberName ______________________________________ Position held_______________________ Address______________________________________________________________________ ______________________________________________________________________City ____________Postal Code _____________Telephone: _______________ Mobile:_______________ Fax:_______________ Email:_______________________ *[Delete whichever is not applicable]
Interested in joining CSI? Please send your details in the above format on the following email address. [email protected]
Date Event Details & Organizers Contact Information
July 2012 Events
20 July 2012 Hands on workshop on Advanced Excel 2007CSI Mumbai Chapter
Mr. Abraham [email protected]
20-21 July 2012 Hands on workshop on Web Application SecurityCSI Mumbai Chapter
Mr. Abraham [email protected]
21 July 2012 Workshop on Developing & Writing Structured Use CasesCSI Mumbai Chapter
Mr. Abraham [email protected]
21-22 July 2012 Hands on workshop on Microsoft SQL Server reporting Services (SSRS)CSI Mumbai Chapter
Mr. Abraham [email protected]
26-28 July 2012 International Conference on Advances in Cloud Computing (ACC-2012)CSI, Bangalore Chapter and CSI Division I
Dr. Anirban Basu, [email protected]. C R Chakravarthy, [email protected]
27 July 2012 Workshop on Group Dynamics and Team BuildingCSI Mumbai Chapter
Mr. Abraham [email protected]
27-29 July 2012 Hands on workshop on e-Crime & Computer ForensicsCSI Mumbai Chapter
Mr. Abraham [email protected]
28 July 2012 Workshop on Bidding I.T. Projects; A Successful ApproachCSI Mumbai Chapter
Mr. Abraham [email protected]
August 2012 Events
3-4 August 2012 2nd AP State Student Convention Dadi Institute of Engineering & Technology, Vizag, A.P
Prof. G Satyanarayana, [email protected]. K Rajashekhara Rao, [email protected]
9-10 August 2012
Regional Student Convention – Region 5 G. Pulla Reddy Engineering College, Kurnool, A.P
Prof. I K Ishthaq Ahamed, [email protected] Sabapathy, [email protected]
24-25 August 2012
6th Tamilnadu State Student Convention R.V.S College of Engineering, Dindigul, T.N
Dr. C G Ravichandran, [email protected]. M Sundaresan, [email protected]
31 Aug-1 Sep 2012
3rd International Conference on Transforming Healthcare with IT CSI Division II ( Software), Hyderabad
Dr. T V Gopal, [email protected]
September 2012 Events
5-7 September 2012
International Conference on Software Engineering (CONSEG 2012)CSI Division II ( Software), Indore
Dr. T V Gopal, [email protected]
13-14 September 2012
Global Science and Technology Forum Business Intelligent Summit and AwardsCSI Division II ( Software), Singapore
Dr. T V Gopal, [email protected]/bi-summit
19-20 September 2012
4th e-Governance Knowledge Sharing Summit (KSS2012)Govt. of Chhattisgarh, In association with CSI-SIG-eGOV at Hotel V W Canyon Raipur
Mr. A M Parial, [email protected] Maj. Gen. (Retd) Dr. R K [email protected]
October 2012 Events
20 Oct. 2012 Communication Technologies & its impact on Next Generation Computing (CTNGC-2012)I.T.S – Management & IT Institute Mohan Nagar, Ghaziabad, U.P
Prof. Umang, [email protected]. Ashish Seth, [email protected]. Alka Agrawal, [email protected]
November 2012 Events
29 Nov- 1 Dec 2012
Third International Conference on Emerging Applications of Information Technology (EAIT 2012)CSI Kolkata Chapter Event at Kolkata URL: https://sites.google.com/site/csieait2012/
D P Mukherjee/Debasish Jana/Pinakpani Pal/R T [email protected]
December 2012 Events
1-2 December 2012
47th Annual National Convention of CSI (CSI 2012)CSI Kolkata Chapter Event at Kolkata, URL: http://csi-2012.org/
D P Mukherjee/Debasish Jana/Pinakpani Pal/R T Goswami, [email protected]
6-8 December 2012
Second IEEE International Conference on PDG Computing [PDGC 2012] , TechnicallyCSI Special Interest Group on Cyber Forensics at Jaypee University of information Technology, Waknaghat- Solan (HP)
Dr. Nitin, [email protected]. Vipin Tyagi, [email protected] http://www.juit.ac.in/pdgc-2012/index1.php
14-16 December 2012
International Conference on Management of Data (COMAD-2012) SIGDATA, CSI, Pune Chapter and CSI Division II
Mr. C G Sahasrabudhe [email protected]
CSI Calendar 2012
Prof. S V RaghavanVice President & Chair, Conference Committee, CSI
Registered with Registrar of News Papers for India - RNI 31668/78 If undelivered return to : Regd. No. MH/MR/N/222/MBI/12-14 Samruddhi Venture Park, Unit No.3, Posting Date: 10&11 every month. Posted at Patrika Channel Mumbai-I 4th fl oor, MIDC, Andheri (E). Mumbai-400 093


