Embed Size (px)
Citation preview
A
too©
K
1
tL(a[asTlt
tamiPmiobo
0d
Materials Science and Engineering A 460–461 (2007) 227–232
Crystallography of the bcc/hcp transformation in a Mg–8Li alloy
M.V. Kral a,∗, B.C. Muddle b, J.F. Nie b
a Department of Mechanical Engineering, University of Canterbury, P.O. Box 4800, Christchurch, New Zealandb ARC Centre of Excellence for Design in Light Metals, Department of Materials Engineering,
Monash University, Clayton, Victoria 3800, Australia
Received 25 October 2006; received in revised form 9 January 2007; accepted 28 January 2007
bstract
A magnesium–8 wt% lithium alloy was prepared to give a microstructure of hcp (�) and bcc (�) phases, with the � phase appearing as plates inhe � matrix. A near Burgers OR was observed between the two phases, i.e., [0 0 0 1]�//[0 1 1]�, (1 1 0 0)�//(2 1 1)�. An additional ∼0.5◦ rotationf the bcc lattice around [0 0 0 1]�//[0 1 1]� axis, as well as the �/� interface orientation, were both predicted by a moire plane approach andbserved experimentally. 2007 Elsevier B.V. All rights reserved.
elect
t(Awer
fapi5t[oiti
ii
eywords: Mg–Li; Crystallography; Edge-to-edge; Moire plane; Transmission
. Introduction
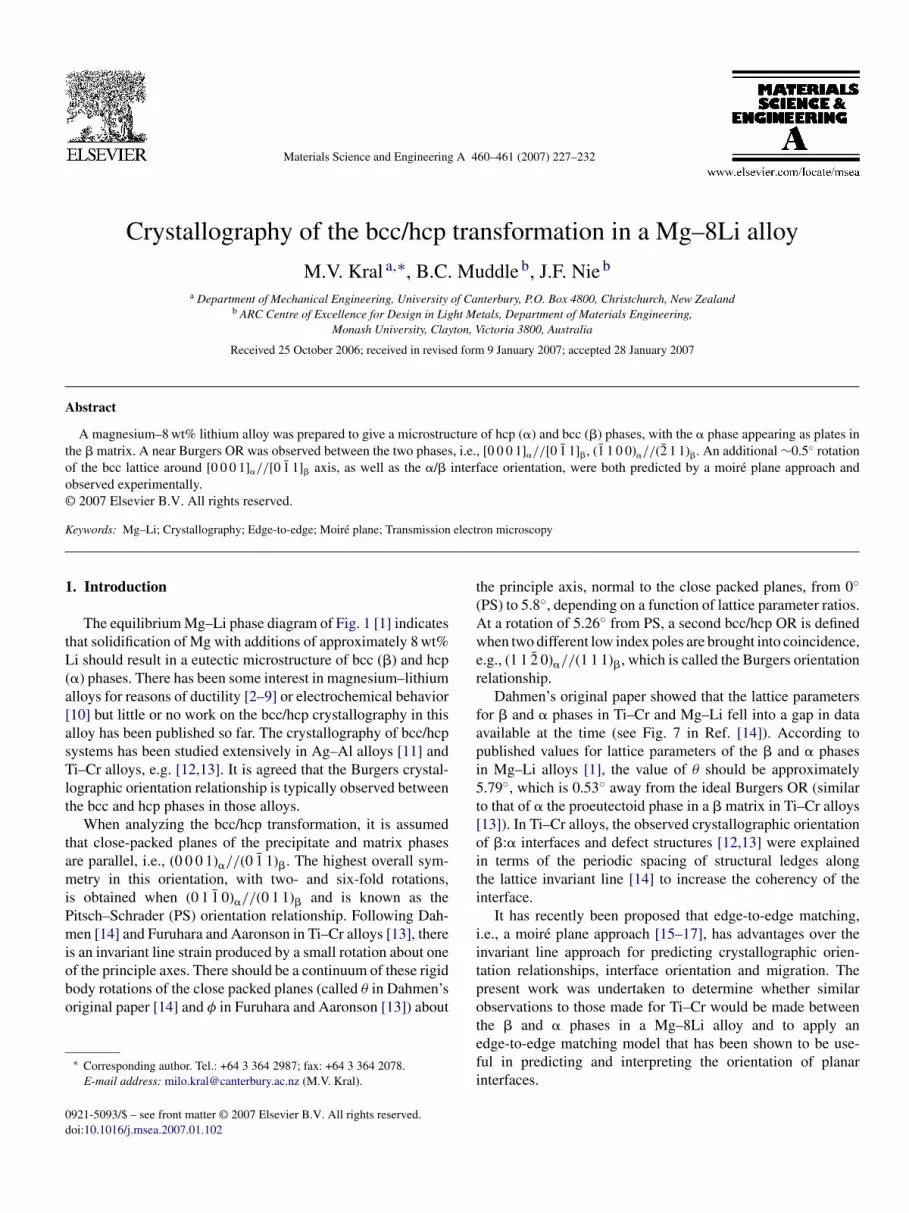
The equilibrium Mg–Li phase diagram of Fig. 1 [1] indicateshat solidification of Mg with additions of approximately 8 wt%i should result in a eutectic microstructure of bcc (�) and hcp
�) phases. There has been some interest in magnesium–lithiumlloys for reasons of ductility [2–9] or electrochemical behavior10] but little or no work on the bcc/hcp crystallography in thislloy has been published so far. The crystallography of bcc/hcpystems has been studied extensively in Ag–Al alloys [11] andi–Cr alloys, e.g. [12,13]. It is agreed that the Burgers crystal-
ographic orientation relationship is typically observed betweenhe bcc and hcp phases in those alloys.
When analyzing the bcc/hcp transformation, it is assumedhat close-packed planes of the precipitate and matrix phasesre parallel, i.e., (0 0 0 1)�//(0 1 1)�. The highest overall sym-etry in this orientation, with two- and six-fold rotations,
s obtained when (0 1 1 0)�//(0 1 1)� and is known as theitsch–Schrader (PS) orientation relationship. Following Dah-en [14] and Furuhara and Aaronson in Ti–Cr alloys [13], there
s an invariant line strain produced by a small rotation about one
f the principle axes. There should be a continuum of these rigidody rotations of the close packed planes (called θ in Dahmen’sriginal paper [14] and φ in Furuhara and Aaronson [13]) about∗ Corresponding author. Tel.: +64 3 364 2987; fax: +64 3 364 2078.E-mail address: [email protected] (M.V. Kral).
tpotefi
921-5093/$ – see front matter © 2007 Elsevier B.V. All rights reserved.oi:10.1016/j.msea.2007.01.102
ron microscopy
he principle axis, normal to the close packed planes, from 0◦PS) to 5.8◦, depending on a function of lattice parameter ratios.t a rotation of 5.26◦ from PS, a second bcc/hcp OR is definedhen two different low index poles are brought into coincidence,
.g., (1 1 2 0)�//(1 1 1)�, which is called the Burgers orientationelationship.
Dahmen’s original paper showed that the lattice parametersor � and � phases in Ti–Cr and Mg–Li fell into a gap in datavailable at the time (see Fig. 7 in Ref. [14]). According toublished values for lattice parameters of the � and � phasesn Mg–Li alloys [1], the value of θ should be approximately.79◦, which is 0.53◦ away from the ideal Burgers OR (similaro that of � the proeutectoid phase in a � matrix in Ti–Cr alloys13]). In Ti–Cr alloys, the observed crystallographic orientationf �:� interfaces and defect structures [12,13] were explainedn terms of the periodic spacing of structural ledges alonghe lattice invariant line [14] to increase the coherency of thenterface.
It has recently been proposed that edge-to-edge matching,.e., a moire plane approach [15–17], has advantages over thenvariant line approach for predicting crystallographic orien-ation relationships, interface orientation and migration. Theresent work was undertaken to determine whether similarbservations to those made for Ti–Cr would be made between
he � and � phases in a Mg–8Li alloy and to apply andge-to-edge matching model that has been shown to be use-ul in predicting and interpreting the orientation of planarnterfaces.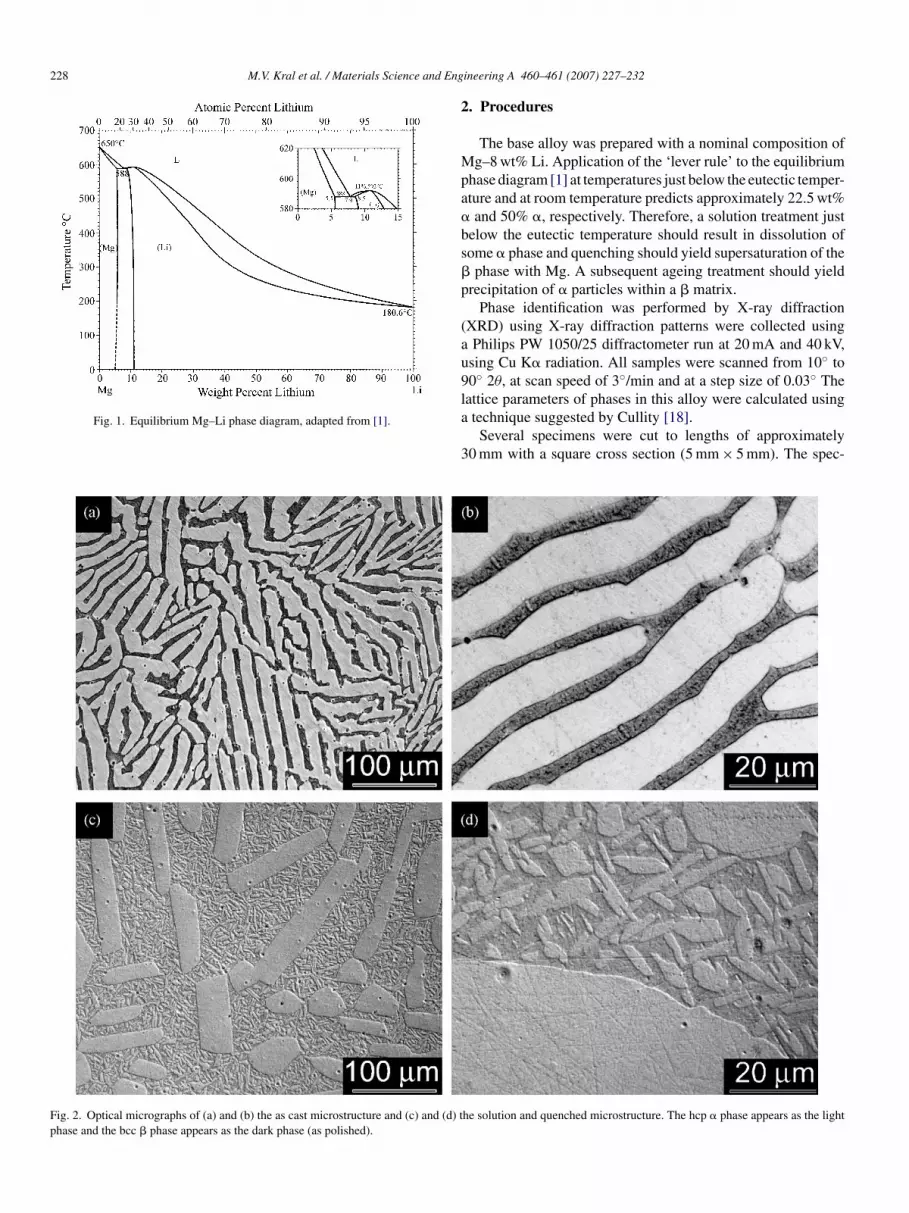
228 M.V. Kral et al. / Materials Science and Eng
Fp
2
Mpa�bs�p
(au9
Fig. 1. Equilibrium Mg–Li phase diagram, adapted from [1].
ig. 2. Optical micrographs of (a) and (b) the as cast microstructure and (c) and (d) thase and the bcc � phase appears as the dark phase (as polished).
la
3
ineering A 460–461 (2007) 227–232
. Procedures
The base alloy was prepared with a nominal composition ofg–8 wt% Li. Application of the ‘lever rule’ to the equilibrium
hase diagram [1] at temperatures just below the eutectic temper-ture and at room temperature predicts approximately 22.5 wt%and 50% �, respectively. Therefore, a solution treatment just
elow the eutectic temperature should result in dissolution ofome � phase and quenching should yield supersaturation of the
phase with Mg. A subsequent ageing treatment should yieldrecipitation of � particles within a � matrix.
Phase identification was performed by X-ray diffractionXRD) using X-ray diffraction patterns were collected usingPhilips PW 1050/25 diffractometer run at 20 mA and 40 kV,
sing Cu K� radiation. All samples were scanned from 10◦ to0◦ 2θ, at scan speed of 3◦/min and at a step size of 0.03◦ The
he solution and quenched microstructure. The hcp � phase appears as the light
attice parameters of phases in this alloy were calculated usingtechnique suggested by Cullity [18].
Several specimens were cut to lengths of approximately0 mm with a square cross section (5 mm × 5 mm). The spec-

and E
ieanwf
S3OoicsNp
itfuApawtacmaz
3
3
lpfcatsb�opiba(ipcafs
o
F(
M.V. Kral et al. / Materials Science
mens were encapsulated in Pyrex tubes that were repeatedlyvacuated to approximately 1 × 10⁻⁵ Torr and back-filled withrgon. Next, the encapsulated specimens were placed in a fur-ace at 575 ◦C (±5) for 2 h followed by an immediate quench inater. Finally, the specimens were aged in an oil bath at 200 ◦C
or 2 or 24 h.Metallographic preparation consisted of grinding to 600 grit
iC (wet), 9 �m water-based diamond suspension, followed byand 1 �m steps, with a final polish with 0.05 �m alumina.ptical microscopy was carried out using a Leica DM-IRMptical microscope with differential interference contrast andmages were digitally captured using a Zeiss Axiocam digitalamera. Specimens were examined using a JEOL JSM 6100canning electron microscope (SEM) equipped with an HKLordlys II EBSD Detector and Channel 5 system software forhase identification.
TEM specimens were prepared using standard electropol-shing techniques. Disks of 3 mm diameter were punched fromhe material and ground to approximately 100 �m thicknessor thinning using a Struers Tenupol twin-jet electropolishingnit. The specimens were polished in an electrolyte of 750 mlR grade methanol, 150 ml butoxyethanol, 16.74 g magnesiumerchlorate and 7.95 g lithium chloride at −45 to −55 ◦C andcurrent of 12–14 mA. Subsequent to perforation, specimensere immediately washed in AR grade ethanol and placed in
he TEM. Alternatively, TEM specimens were prepared usingGatan Model 656 Dimple Grinder and Gatan Model 691 Pre-
ision Ion Polishing System (PIPS). TEM observations were
ade with a Philips CM20 microscope operated at 200 kV anddouble-tilt holder. Selected area diffraction was used to obtainone axis patterns.dme
ig. 3. Bright field TEM images of the solution, quenched, aged Mg–8Li alloy micrb) a higher magnification image of the approximately planar interface between the la
ngineering A 460–461 (2007) 227–232 229
. Results and discussion
.1. Microstructural characterization
The presence of the hcp � and the bcc � phases were estab-ished in a bulk specimen using X-ray diffraction, and latticearameters were found to be a = 0.3194 nm and c = 0.5126 nmor � and a = 0.3514 nm for �. Fig. 2a and b shows that the asast microstructure is a simple eutectic, with the hcp � phaseppearing as the light grey interconnected lamellar phase andhe bcc � phase appears as the dark grey phase. After theolution and quench treatment (Fig. 2c and d), a bimodal distri-ution of lath or plate-shaped � particles was observed. The
phase was identified as the plate-shaped phase via EBSDn a polished specimen. The � phase did not exhibit EBSDatterns that could be indexed, probably due to oxide contam-nation. The microstructure of the heat-treated materials cane explained by a partial dissolution of the original � phaset the solution temperature followed by precipitation of newsmaller laths in Fig. 2c and d) � phase particles upon cool-ng. It is these smaller � precipitates that are the focus of theresent study. Some of the original � phase remains but it hasoarsened and possesses a more faceted appearance than in thes cast microstructure. There was no optically apparent dif-erence between the solution–quench microstructures and theolution–quench–age microstructures.
TEM revealed the microstructure that was expected afterptical microscopy (Fig. 3). Although it had been hoped to
evelop an even more refined distribution of � phase in theicrostructure, the quench rate actually obtained was appar-ntly inadequate to achieve this goal. Nevertheless, the nature
ostructure showing (a) an example of a smaller � lath strongly diffracting andth shown in (a) and the � matrix.

2 d Engineering A 460–461 (2007) 227–232
ons
3
ptB[
[
c[figtastl
F(atooolewsbttsta
i[fiTici
Fig. 4. (a) Experimental SAD pattern across the �/� interface shown in Fig. 3wwb
30 M.V. Kral et al. / Materials Science an
f the �/� interface was revealed to be approximately pla-ar over distances of several hundred nanometers in crossection.
.2. Electron diffraction
Selected area diffraction patterns taken with an SAD aperturelaced across a planar interface between the smaller � precipi-ates and the � matrix, such as the one in Fig. 3, show that theurgers orientation relationship is confirmed as shown in Fig. 4
19]:
0 0 0 1]�//[0 1 1]�, (1 1 0 0)�//(2 1 1)�
It was not possible to obtain a SAD pattern that was wellentered for both phases simultaneously, indicating that the0 0 0 1]� and [0 1 1]� directions are not exactly parallel. There-ore, in Fig. 4a, the [0 1 1]� is centered and thus the [0 0 0 1]�
s slightly off-axis. The simulated pattern shown in Fig. 4b wasenerated with Desktop Microscopist, using the orientation rela-ionship expressed above and lattice parameters a = 0.3194 nmnd c = 0.5126 nm for � and a = 0.3514 nm for �. Note thatome ‘extra’ spots appeared in all SAD patterns, probably dueo oxide contamination such as that observed especially in theithium-rich � phase (see Fig. 3b).
Fig. 4c is an enlarged view of the diffraction pattern ofig. 4a, showing the transmitted beam spot and angle between2 2 0 0)� and (2 1 1)�. Although a rotation is clearly observ-ble, it is difficult to estimate closer than 0.6 ± 0.1◦. Recallhat an invariant line analysis using the present experimentallybtained lattice parameters also predicted a similar rotationf approximately 0.53◦ away for the ideal Burgers OR. Inrder to quantify this misorientation, convergent beam Kikuchiine diffraction patterns were obtained from both phases onither side of an �/� interface. Kikuchi lines from the �-phaseere not as distinct as from the �-phase so it was not pos-
ible to measure the angle between (1 1 0 0)�//(2 1 1)� anyetter than from the selected area patterns. However, the pat-ern centers for the [0 0 0 1]� and [0 1 1]� zones were foundo be slightly (approximately 0.5◦) rotated toward (0 1 1)�. Inummary, the presently observed OR (ignoring the slight rota-ion between [0 0 0 1]� and [0 1 1]�) can be expressed explicitlys
[0 0 0 1]�//[0 1 1]�,
(1 1 0 0)�//(2 1 1)� + approximately 0.5◦ CW rotation of the
bcc lattice around [0 1 1]�
The specimen was oriented such that the �/� interfaces viewed ‘edge-on’ when the incident beam is parallel to0 0 0 1]�//[0 1 1]�, such as has been observed in bcc/hcp inter-aces in Ti–Cr alloys [12]. When the SAD pattern expressing thedeal orientation relationship is superimposed with a bright field
EM image from the same area (employing a rotation calibrationf necessary) as shown in Fig. 5a, the �/� interface orientationan be conveniently illustrated. The interface is shown schemat-cally in Fig. 5b. Similar to the Ti–Cr alloys [12], the broad face
(fpi
ith [0 0 0 1]�//[0 1 1]�, (b) superimposed by an indexed simulated SAD patternith � (hcp) (©) and � (bcc) (♦) and (c) an enlarged view of the transmittedeam spot and angle between (2 2 0 0)� and (2 1 1)�.
terrace plane) of the � plate is rotated approximately 13.7◦ away
rom (1 1 0 0)� and (2 1 1)�, which is not close to any low indexlane or direction in either phase and thus could be consideredrrational.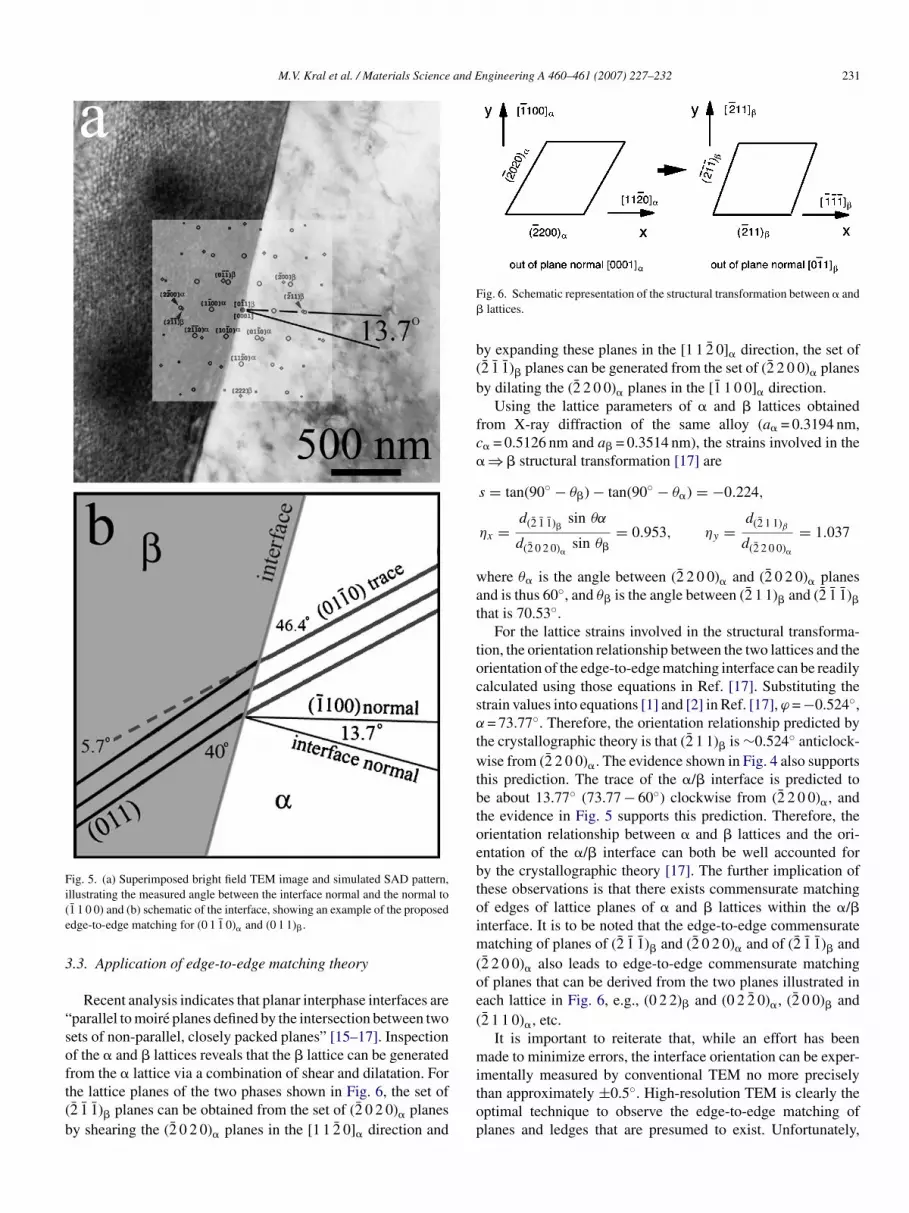
M.V. Kral et al. / Materials Science and Engineering A 460–461 (2007) 227–232 231
Fig. 5. (a) Superimposed bright field TEM image and simulated SAD pattern,i(e
3
“soft(b
F�
b(b
fc�
wat
tocsα
twtbtoebtoim(oe(
m
llustrating the measured angle between the interface normal and the normal to1 1 0 0) and (b) schematic of the interface, showing an example of the proposeddge-to-edge matching for (0 1 1 0)� and (0 1 1)�.
.3. Application of edge-to-edge matching theory
Recent analysis indicates that planar interphase interfaces areparallel to moire planes defined by the intersection between twoets of non-parallel, closely packed planes” [15–17]. Inspectionf the � and � lattices reveals that the � lattice can be generated
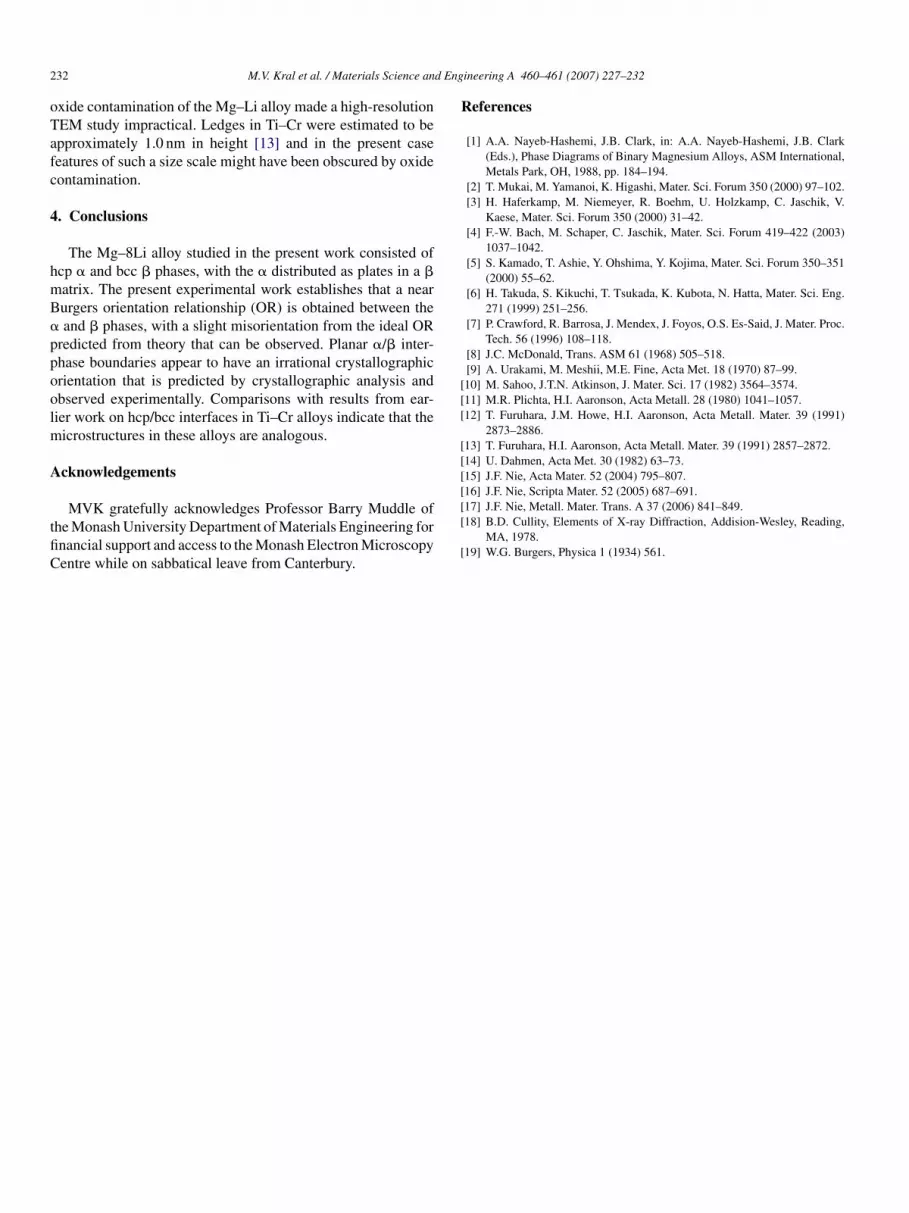
rom the � lattice via a combination of shear and dilatation. Forhe lattice planes of the two phases shown in Fig. 6, the set of2 1 1)� planes can be obtained from the set of (2 0 2 0)� planesy shearing the (2 0 2 0)� planes in the [1 1 2 0]� direction anditop
ig. 6. Schematic representation of the structural transformation between � andlattices.
y expanding these planes in the [1 1 2 0]� direction, the set of2 1 1)� planes can be generated from the set of (2 2 0 0)� planesy dilating the (2 2 0 0)� planes in the [1 1 0 0]� direction.
Using the lattice parameters of � and � lattices obtainedrom X-ray diffraction of the same alloy (a� = 0.3194 nm,� = 0.5126 nm and a� = 0.3514 nm), the strains involved in the⇒ � structural transformation [17] are
s = tan(90◦ − θ�) − tan(90◦ − θ�) = −0.224,
ηx =d(2 1 1)�
sin θα
d(2 0 2 0)�sin θ�
= 0.953, ηy =d(2 1 1)β
d(2 2 0 0)�
= 1.037
here θ� is the angle between (2 2 0 0)� and (2 0 2 0)� planesnd is thus 60◦, and θ� is the angle between (2 1 1)� and (2 1 1)�
hat is 70.53◦.For the lattice strains involved in the structural transforma-
ion, the orientation relationship between the two lattices and therientation of the edge-to-edge matching interface can be readilyalculated using those equations in Ref. [17]. Substituting thetrain values into equations [1] and [2] in Ref. [17], ϕ = −0.524◦,= 73.77◦. Therefore, the orientation relationship predicted by
he crystallographic theory is that (2 1 1)� is ∼0.524◦ anticlock-ise from (2 2 0 0)�. The evidence shown in Fig. 4 also supports
his prediction. The trace of the �/� interface is predicted toe about 13.77◦ (73.77 − 60◦) clockwise from (2 2 0 0)�, andhe evidence in Fig. 5 supports this prediction. Therefore, therientation relationship between � and � lattices and the ori-ntation of the �/� interface can both be well accounted fory the crystallographic theory [17]. The further implication ofhese observations is that there exists commensurate matchingf edges of lattice planes of � and � lattices within the �/�nterface. It is to be noted that the edge-to-edge commensurate
atching of planes of (2 1 1)� and (2 0 2 0)� and of (2 1 1)� and2 2 0 0)� also leads to edge-to-edge commensurate matchingf planes that can be derived from the two planes illustrated inach lattice in Fig. 6, e.g., (0 2 2)� and (0 2 2 0)�, (2 0 0)� and2 1 1 0)�, etc.
It is important to reiterate that, while an effort has beenade to minimize errors, the interface orientation can be exper-
mentally measured by conventional TEM no more preciselyhan approximately ±0.5◦. High-resolution TEM is clearly theptimal technique to observe the edge-to-edge matching oflanes and ledges that are presumed to exist. Unfortunately,
2 d Eng
oTafc
4
hmB�ppoolm
A
tfiC
R
[[[
[[[[16] J.F. Nie, Scripta Mater. 52 (2005) 687–691.
32 M.V. Kral et al. / Materials Science an
xide contamination of the Mg–Li alloy made a high-resolutionEM study impractical. Ledges in Ti–Cr were estimated to bepproximately 1.0 nm in height [13] and in the present caseeatures of such a size scale might have been obscured by oxideontamination.
. Conclusions
The Mg–8Li alloy studied in the present work consisted ofcp � and bcc � phases, with the � distributed as plates in a �atrix. The present experimental work establishes that a nearurgers orientation relationship (OR) is obtained between theand � phases, with a slight misorientation from the ideal OR
redicted from theory that can be observed. Planar �/� inter-hase boundaries appear to have an irrational crystallographicrientation that is predicted by crystallographic analysis andbserved experimentally. Comparisons with results from ear-ier work on hcp/bcc interfaces in Ti–Cr alloys indicate that the
icrostructures in these alloys are analogous.
cknowledgements
MVK gratefully acknowledges Professor Barry Muddle ofhe Monash University Department of Materials Engineering fornancial support and access to the Monash Electron Microscopyentre while on sabbatical leave from Canterbury.
[[
[
ineering A 460–461 (2007) 227–232
eferences
[1] A.A. Nayeb-Hashemi, J.B. Clark, in: A.A. Nayeb-Hashemi, J.B. Clark(Eds.), Phase Diagrams of Binary Magnesium Alloys, ASM International,Metals Park, OH, 1988, pp. 184–194.
[2] T. Mukai, M. Yamanoi, K. Higashi, Mater. Sci. Forum 350 (2000) 97–102.[3] H. Haferkamp, M. Niemeyer, R. Boehm, U. Holzkamp, C. Jaschik, V.
Kaese, Mater. Sci. Forum 350 (2000) 31–42.[4] F.-W. Bach, M. Schaper, C. Jaschik, Mater. Sci. Forum 419–422 (2003)
1037–1042.[5] S. Kamado, T. Ashie, Y. Ohshima, Y. Kojima, Mater. Sci. Forum 350–351
(2000) 55–62.[6] H. Takuda, S. Kikuchi, T. Tsukada, K. Kubota, N. Hatta, Mater. Sci. Eng.
271 (1999) 251–256.[7] P. Crawford, R. Barrosa, J. Mendex, J. Foyos, O.S. Es-Said, J. Mater. Proc.
Tech. 56 (1996) 108–118.[8] J.C. McDonald, Trans. ASM 61 (1968) 505–518.[9] A. Urakami, M. Meshii, M.E. Fine, Acta Met. 18 (1970) 87–99.10] M. Sahoo, J.T.N. Atkinson, J. Mater. Sci. 17 (1982) 3564–3574.11] M.R. Plichta, H.I. Aaronson, Acta Metall. 28 (1980) 1041–1057.12] T. Furuhara, J.M. Howe, H.I. Aaronson, Acta Metall. Mater. 39 (1991)
2873–2886.13] T. Furuhara, H.I. Aaronson, Acta Metall. Mater. 39 (1991) 2857–2872.14] U. Dahmen, Acta Met. 30 (1982) 63–73.15] J.F. Nie, Acta Mater. 52 (2004) 795–807.
17] J.F. Nie, Metall. Mater. Trans. A 37 (2006) 841–849.18] B.D. Cullity, Elements of X-ray Diffraction, Addision-Wesley, Reading,
MA, 1978.19] W.G. Burgers, Physica 1 (1934) 561.


