Embed Size (px)
Citation preview

Release Date Friday May 1st , 2009
by the Louisiana Uniform Crime Reporting Program
A Joint Project Of
The Louisiana Commission on Law Enforcement
And the Administration of Criminal Justice And
The Louisiana Sheriffs' Association
Crime In
Louisiana 2007


LOUISIANA UNIFORM CRIME REPORTING PROGRAM
CRIME IN LOUISIANA 2007
A REPORT ON THE NUMBER OF OFFENSES REPORTED TO POLICE
AND THE ARRESTS MADE BY LOUISIANA’S LAW ENFORCEMENT AGENCIES
May 2009 LOUISIANA SHERIFFS’ ASSOCIATION LOUISIANA COMMISSION ON LAW LOUISIANA UNIFORM CRIME REPORTING PROGRAM ENFORCEMENT AND ADMINISTRATION 1213 NICHOLSON DRIVE SUITE B OF CRIMINAL JUSTICE BATON ROUGE, LOUISIANA 70802 1885 WOODDALE BOULEVARD, ROOM 1230 BATON ROUGE, LOUISIANA 70806

LOUISIANA UNIFORM CRIME REPORTING PROGRAM
Louisiana Sheriffs’ Association
Sheriff Larry Cox
President
Louisiana Commission on Law Enforcement and Administration of Criminal Justice
Sheriff Jeff Wiley
Chairman This public document was published at a cost of $ *,***.**. * copies of this public document were published in the first printing at a cost of $*,***.**. This document was published by the Louisiana Commission on Law Enforcement Uniform Crime Reporting Section, to inform the public of the number of offenses and arrests made in Louisiana under authority of Title 15:1204.2, Louisiana Revised Statutes. This material was printed in accordance with provisions of Title 43 of the Louisiana Revised Statutes. Funding was provided by the Sub-Grant Number from the United States Department of Justice, Bureau of Justice Assistance, through the Louisiana Commission on Law Enforcement.
ii

iii
TABLE OF CONTENTS Statement of Purpose ..............................................................................1 Crime in Louisiana—The Publication ........................................................2 The FBI’s Uniform Crime Reporting Program............................................3 Louisiana’s Uniform Crime Reporting Program ........................................4 Louisiana Law Enforcement Information Management System .................7 Reporting Agencies .................................................................................9 2007 Louisiana Part 1 Offenses ..............................................................12 Total Index Crimes in Louisiana..............................................................19 Percent Change in Index Crime 2006-2007 .............................................30 Index Crime Totals for Cities Comparable in Size to New Orleans ...........33 Louisiana’s National Ranking in Index Crime Categories ........................35 Louisiana’s Index Crime Trend over Ten Years.......................................46 Louisiana Arrest Data 2006-2007 ...........................................................54 Louisiana’s Drug Arrests by Drug Type - 2007........................................62 Weapons Used in Murder, Robbery and Aggravated Assault ..................64 Homicides Reported by Selected Agencies in Louisiana 2007 ................70 Law Enforcement Officers Feloniously Killed..........................................72 Criminal Justice Records Improvement Program ...................................73 Full Time Law Enforcement Officers.......................................................75 Glossary of Terms..................................................................................80 Contact Information ...............................................................................88
Crime in Louisiana 2007
STATEMENT OF PURPOSE
The purpose of Crime in Louisiana is to provide the reader with the most current information available regarding the number of offenses reported and the number of arrests made by Louisiana law enforcement agencies as recorded in the Summary Uniform Crime Reporting System (UCR). The information is designed to increase public awareness and understanding of such issues. The crime summary points out changes in crime rates between the years of 2006 and 2007. For the agencies that reported the entire 12-month reporting period, some individual statistics have been added for their particular areas. Crime trends covering the years of 1998 through 2007 are also included in the report. This year there are several new charts with information on regional breakdowns by cities, metropolitan & Non -metropolitan parishes, colleges & universities and other law enforcement entities with offenses on pages 13-17 and more data on law enforcement officers on pages 75-79.
1
Crime in Louisiana 2007

CRIME IN LOUISIANA - THE PUBLICATION
Crime in Louisiana, 2007 Edition, is presented in large part in the form of tables and charts. The number of offenses and arrests in the State of Louisiana is more clearly illustrated in this manner. This year we have added charts that give information for those cities, parishes, universities and colleges and other law enforcement entities that have reported 12 months of UCR data to the FBI. There are also charts that show the full-time law enforcement employees. Many tables and charts throughout the publication contain state totals while some tables and charts contain information specific to certain jurisdictions. Because not all law enforcement agencies provide data at this time and some possibly not for complete reporting periods, offense estimations are sometimes used. Information was obtained from the national publication Crime in the United States (2007) published by the FBI. Additional information was obtained from the Louisi-ana Drug Strategy and Program Application - FY 2008. As the state program pro-gresses, more data will be obtained from it and less from the FBI. Data will also be available more quickly; therefore subsequent editions of this publication will contain more current data. It is important to remember when reviewing crime data that the volume of crime in a given area is related to certain factors. There are some factors which, by their na-ture, affect crime that occurs from place to place. Some of these factors are: com-position of the population with reference particularly to age, sex and race; economic status, including job availability in the population; climate, including seasonal weather conditions; cultural conditions, such as educational, recreational and reli-gious characteristics and crime reporting practices of the citizens. Throughout the publication, references are made to “crime rates”. A “crime rate” is the number of offenses reported in a given jurisdiction per 100,000 population. In other words, it is a way to express the volume of crime so that jurisdictions can be compared more fairly. It should be noted, however, that the crime rate based on population does not incorporate any of the other elements which may contribute to the amount of crime in a given community. The effect of population composition and other crime related factors should be kept in mind when attempting to make comparisons of crime rates. All crime rates in this publication are per 100,000 popu-lation. Crime rates are calculated by dividing the number of offenses by the popula-tion and multiplying the result times 100,000. The reader is cautioned against comparing statistical data in individual juris-dictions solely on the basis of their population. Data should not be used to calculate the effectiveness of law enforcement agencies in Louisiana.
2
Crime in Louisiana 2007

UNIFORM CRIME REPORTING
THE FBI's UNIFORM CRIME REPORTING PROGRAM (UCR) Prior to 1929, there was no comprehensive system of crime information on a national scale. This was primarily due to the fact that the terminology defining criminal behavior in criminal statutes varied greatly from state to state. Addressing this problem between 1927 and 1929, the International Association of Chiefs of Police (IACP) conceived, developed and implemented the UCR Program. They designed the program to serve as an operational, administrative, and management tool for law enforcement. Through Congressional action, the Attorney General was authorized to gather the crime data. The responsibility was placed on the FBI, which has acted as the national clearinghouse for statistical information on crime and as administrator of the program since 1930. To provide a picture of the changes in crime across the parish and also to provide useful data to police agencies, it was incumbent upon the IACP to limit the statistics to be gathered. Recognizing the problem, among others, of coping with volume, they decided that only those criminal acts deemed most serious, most pervasive across the country, most likely to be reported and most frequently committed would be counted. Furthermore, it was decided to include only criminal acts brought to the attention of police, whether or not there was an arrest. As a result, seven crimes were chosen and standardized definitions were created to assure uniformity. Those seven offenses were murder, rape, robbery, aggravated assault, burglary, larceny theft, and motor vehicle theft. The original publication was a complete manual for police records and statistics. Over the years, the program was expanded to include data on persons arrested, law enforcement officers killed and supplemental information on homicides. To promote participation by sheriffs, in 1966 the National Sheriffs’ Association formed the Committee on Uniform Crime Reporting. Later, data on officers assaulted, arson, and bias-motivated crimes were added to the information gathered. For over seventy years, the FBI’s Uniform Crime Reporting Program has been collecting crime data from participating states, either from the individual agencies within the states or directly from state programs. Crime data is made available to the public in the FBI’s annual publications, Crime in the United States, Law Enforcement Officers Killed and Assaulted, and Hate Crime Statistics. These statistics are also available at www.fbi.gov/ucr/ucr.htm. Agencies are expected to count all offenses reported to them using the national definitions, disregarding state or local statutes. Because these statistics are meant to assist law enforcement in identifying the crime problem, the decision of a prosecutor, or the findings of a court, coroner, or jury are not taken into consideration in counting offenses. Previously reported criminal offenses that have been determined through investigation to be unfounded or false are eliminated from an agency’s count. The number of actual offenses known (the final figure used for statistical purposes) counts all offenses regardless if anyone is arrested for the crime, stolen property is recovered, or prosecution is undertaken.
3
Crime in Louisiana 2007

In addition, the Summary UCR Program uses the Hierarchy Rule. In this system, the eight Part 1 offenses are ranked in a specific order. In multiple-offense situations, the rule requires counting only the highest offense on the list of Part I offenses and ignoring all other offenses. Justifiable homicide, motor vehicle theft, and arson are exceptions to the rule. Data is collected on arrests for all crimes with the exception of traffic violations. The age, race and sex of offenders are recorded for both adults and juveniles. Because identities of individuals are not involved, confidentiality laws pertaining to juveniles do not preclude their inclusion in the statistical count. Jurisdictional guidelines were developed to prevent duplication in reporting and to accurately depict the nature and volume of crime in a community. They were not intended to indicate which agency claims or takes credit for an investigation or arrest. The guidelines, simplified, state that police report offenses within their city jurisdiction and sheriffs report those offenses outside the city jurisdiction. Agencies count arrests for offenses committed and recovery of property for items reported stolen within their jurisdiction.
LOUISIANA’S UNIFORM CRIME REPORTING PROGRAM (LUCR) In the legislative session of 1991, House Bill 1176 passed both the House and the Senate to become Act 509 creating Louisiana Revised Statute 15:1204.2. This law created and allows for the establishment of a uniform crime reporting system in Louisiana. The Summary Uniform Crime Reporting System was the first of three components to be established. Following it, development of the Louisiana Incident Based Reporting System and the Louisiana Law Enforcement Management Information System began.
SUMMARY UCR SYSTEM The Louisiana Uniform Crime Reporting Program staff began working toward the establishment of a Summary UCR program in 1991. Then, in 1992, the staff began developing and conducting classes to encourage local law enforcement agencies to fully participate in the national Summary UCR program operated by the FBI. At the time, the necessary infrastructure was created for the program to become recognized. In September 1993, a formal request for certification was made to the FBI. In order to become a certified program certain conditions had to be met. These conditions are:
1. The program must conform to national UCR Program standards, definitions and information requirements.
2. The program must be statewide, proven, and effective and must have instituted acceptable quality control procedures.
4
Crime in Louisiana 2007

3. Coverage within the state by the program must be, at least, equal to that
attained by the national program through direct reporting.
4. The program must have adequate field staff assigned to conduct audits and to assist contributing agencies in record-keeping practices and crime reporting procedures.
5. The program must furnish to the FBI all of the detailed data regularly collected by the FBI in the form of duplicate returns, computer printouts, and/or magnetic tapes.
6. The program must have the proven capability (tested over a period of time) to supply all the statistical data required in time to meet national UCR Program publication deadlines.
In October 1993, the FBI certified the Louisiana Summary UCR program. The Louisiana Uniform Crime Reporting (LUCR) staff began collecting Summary UCR reports in December 1993. The first reports were due by December 15, 1993, and included data from the month of November. The state’s law enforcement agencies proved their support by overwhelming response. In 2007, 144 law enforcement agencies statewide reported all 12 months of UCR data to the FBI. Special effort has been placed on obtaining data from the state’s Standard Metropolitan Statistical Areas (SMSA’s). Currently, the majority of the agencies within the state’s SMSA’s are reporting. The LUCR staff continues to fulfill its responsibilities in connection with the program by editing and reviewing individual agency reports monthly for both completeness and quality. Each report submitted is examined thoroughly for arithmetical accuracy and for deviations, which may indicate errors. To ensure quality, the field staff maintains constant contact with the individual contributors. Minor errors are corrected by telephone between the field agent and the agency. Site visits are conducted regularly and the field staff is “on call” at any time to give technical assistance to agencies in need. The personal contacts are invaluable to the accuracy and quality of reporting and are a vital link between the Summary UCR program and the contributors. Periodic seminars are conducted in key areas of the state as an effort to ensure data quality and to encourage reporting. Seminar instruction includes basic information necessary to begin reporting such as classifying and scoring crimes using UCR crime definitions and preparing all the forms. Master Classes have been developed for seasoned UCR contributors to address issues raised by the FBI. In addition to seminars, “one-on-one” training sessions are conducted by field staff as needed.
UCR ONLINE UCR Online is a web-based system that was built to securely and accurately manage Louisiana’s crime statistics. The system collects all UCR report information
4 5
Crime in Louisiana 2007

from participating agencies from across the state and compiles it into one secure database. The program can be accessed from any computer with Internet access and is compatible with Internet Explorer and Mozilla Firefox. The flow of the system begins with the agency users. Agency users can add and submit new reports online, save a report-in-progress to complete later, view the status of a submitted report, edit previously submitted reports and re-submit them to LCLE. After LCLE receives the submitted UCR report, they have the ability to approve the report and forward the information to the FBI, or reject the report. If a report is rejected, it is sent back to the agency user to review, edit, and re-submit. There are security measures built into the UCR Online system. Each user will be given a user name, an encrypted password in order to access their account and will only see data from their authorized agencies. The web site has a SSL certificate giving the user a secure session. This ensures that data leaving one machine is encrypted until it reaches the server. Furthermore, the database server is isolated from the application server and is protected with a firewall. This means that there is no Internet access to the database server where all crime data is stored. The database server is located in a national hosting site where the physical environment is closely monitored to ensure the protection of the server and all of its information.
LOUISIANA’S INCIDENT-BASED REPORTING SYSTEM (LIBRS) In addition to the ongoing and implementing efforts of the Summary Uniform Crime Reporting Program, the state has been developing the Louisiana Incident-Based Reporting System (LIBRS). Just as the FBI is phasing in an incident-based reporting system for all of the states in the nation, our state is phasing incident-based reporting into our law enforcement agencies. It is important to distinguish between the Louisiana program, LIBRS, and the national program, NIBRS, since the two acronyms are so similar. Incident-Based Reporting (IBR), the more generic term used here, is a more detailed form of reporting. It is the result of a study done by law enforcement agencies in our nation in the 1980's to find the needs of law enforcement as it drew to the 21st century. Incident-Based Reporting will enhance the quantity, quality and timeliness of statistical data collected by the law enforcement community. It will also improve the methodology used for compiling, analyzing, auditing, and publishing collected crime data.
Incident-Based Reporting is a system that collects information on an incident-by-incident basis. It provides us with all the crimes that occur during a criminal incident, unlike the Summary UCR System that follows the “Hierarchy Rule”. The IBR system includes a new category called “Crimes Against Society” which produces data on crimes such as drug and narcotic offenses. Another important feature of IBR is the expansion of victim-to-offender relationships. The system will also have increased “circumstances” reporting, where more information will be collected in the area of circumstances involved in the offense.
6
Crime in Louisiana 2007

There will be more correlation between offenses, property, victims, offenders and arrestees, all pertinent information necessary in crime analysis. In addition, a new area of social concern, hate crimes, has been included in Incident-Based Reporting. Hate crimes are crimes that show prejudice and bias toward a group of people or an individual member of a group. Federal law includes the areas of race, ethnicity, sexual orientation and religion in its definition of hate crime. Louisiana has passed hate crime legislation as well. LIBRS, the state’s incident-based reporting system, is intended to serve several functions. It is intended to replace Summary UCR as the base statistical system for crime data in the state. Second, it is intended to provide the additional statistical information necessary to properly plan modifications to the state criminal justice system. Examples of this include determining the need for additional state prison or local jail space, and the need for additional law enforcement officers. In addition, it will help determine the impact of proposed changes in terms of both cost and programmatic effect. LIBRS is also part of a larger effort to improve criminal justice records at the local level where it serves to both standardize the information collected at point of incident and point of arrest, and to create standards for the electronic transfer of law enforcement data statewide. It is through its role in the improvement of criminal justice records at the local level that LIBRS provides the basis for the state level Criminal Justice Records Improvement Program. The reader will find information regarding the Criminal Justice Records Improvement Program later in this publication. In March 2003 the LIBRS program received FBI (NIBRS) certification. LIBRS is available to law enforcement agencies, and there are now 36 certified LIBRS agencies in Louisiana. Please refer to pages 9-11 for a list of LIBRS certified agencies. LOUISIANA LAW ENFORCEMENT MANAGEMENT INFORMATION SYSTEMS
There are numerous law enforcement agencies in the state that do not have computerized law enforcement management software. Because of this, the Louisiana Sheriffs’ Association and the Louisiana Commission on Law Enforcement joined efforts in developing a software package for law enforcement agencies. The first package of software was called LA-LEMIS (Louisiana Law Enforcement Management Information System) and was developed in dBase. In order to provide a more versatile and expandable software package, a newer version called LA-LEMIS 2000 was developed using Oracle for its database engine and it was created to be compatible with the LIBRS 2.0 specifications. LA-LEMIS 2000 automates the operational and record keeping functions of field reporting, inmate bookings, case management, prisoner tracking and administrative and statistical reporting. It also automates functions such as calls for service; incident and arrest reporting; ticket, citation and warrant tracking; property control;
7
Crime in Louisiana 2007
8
and personnel. In addition, it features several jail management modules that together make up what is known as LOCKDOWN 2000. LOCKDOWN 2000 automates the collection, storage and maintenance of inmate bookings. This includes logs, medical data, housing classification, agency and inmate billings and inmate releases. LOCKDOWN 2000 assigns a unique inmate booking number for the current booking event but the number will be tied to any other bookings that the inmate may have. LCLE also provides the Computer Aided Dispatch 2000 (CAD) software for law enforcement agencies to use in their local territories to dispatch officers to calls and emergencies. LA-LEMIS 2000, which includes CAD 2000 and LOCKDOWN 2000, was developed utilizing Oracle Developer 6 as the graphical interface and Oracle 8 relational database. Recognizing the need to improve upon the Oracle based LA-LEMIS 2000, the Louisiana Sheriffs’ Association and the Louisiana Commission on Law Enforcement began the development of LEMIS IBR. LEMIS IBR, Version 2.0, is a client/server-based record management system for law enforcement agencies currently undergoing beta testing. Once fully tested and accepted LEMIS IBR Version 2.0 will serve as a replacement for LEMIS 2000. The Louisiana Commission on Law Enforcement and Louisiana Sheriffs’ Association will provide LEMIS IBR Version 2.0 application support free of charge to all Louisiana law enforcement agencies. There is no software license required and no database software to purchase. LEMIS IBR Version 2.0 runs on Microsoft operating systems which includes Server 2003, Windows XP and Windows 2000 Pro. LEMIS IBR Version 2.0 will have jail management and CAD systems. The major functions of LEMIS IBR Version 2.0 include the following: • Record Management System (RMS) that handles; complaints, incidents,
warrants, citations, tickets and vehicle data • Simplified installation • Backup utility • LIBRS/NIBRS reporting which eliminates agencies filling out Summary UCR
reports for the FBI • Improved Security • Enhanced User Access control While not ready for statewide distribution, LEMIS IBR represents the future of crime reporting coupled with records management capabilities in Louisiana. The software packages described in this section give Louisiana law enforcement a complete statewide records management system that coordinates their efforts from the initial contact until the inmate is release or their case has been resolved.
Crime in Louisiana 2007

REPORTING AGENCIES - 2007 ACKNOWLEDGMENTS
Although Uniform Crime Reporting is mandated by Louisiana Revised Statute 15:1204.2 the following agencies’ participation in reporting crime data to the State of Louisiana is greatly appreciated. We realize that it is their willingness to support the program and their dedication that make the program a success. We would like to acknowledge the following law enforcement agencies for their participation in Summary Uniform Crime Reporting. Totals for some of the Police Departments listed below were reported on the UCR reports submitted by their parish Sheriff’s Office. Some of the participating agencies listed below did not report all 12 months of UCR statistics for 2007 as required by the FBI to be included in the Crime in the US for 2007 and thus were included in the report totals listed in this publication. * Denotes LIBRS Certified Agency.
9
CATAHOULA PARISH Catahoula Parish S.O. Harrisonburg P.D. Jonesville P.D. Sicily Island P.D. CLAIBORNE PARISH Claiborne Parish S.O. Haynesville P.D. Homer P.D. CONCORDIA PARISH Concordia Parish S.O. Clayton P.D. Ferriday P.D. Vidalia P.D. DeSOTO PARISH DeSoto Parish S.O. Mansfield P.D. Stonewall P.D. EAST BATON ROUGE PARISH East Baton Rouge Parish S.O. Baker P.D.* Baton Rouge P.D. LA Dept of Public Safety LSU A&M College C.P. Southern Univ. Baton Rouge C.P. Zachary P.D. EAST CARROLL PARISH East Carroll Parish S.O.* Lake Providence P.D.
BOSSIER PARISH Bossier Parish S.O.* Bossier City P.D.* Haughton P.D. CADDO PARISH Caddo Parish S.O. Blanchard P.D. LSU Health Sciences P.D. LSU – Shreveport C.P. Shreveport P.D. Southern Univ.- Shreveport C.P. Vivian P.D. CALCASIEU PARISH Calcasieu Parish S.O. DeQunicy P.D.* Iowa P.D. Lake Charles P.D. Maplewood P.D. McNeese C.P.* Sulphur P.D. Vinton P.D* Westlake P.D.* CALDWELL PARISH Caldwell Parish S.O. CAMERON PARISH Cameron Parish S.O.*
ACADIA PARISH Acadia Parish S.O.* Church Pointe P.D. Crowley P.D. Rayne P.D. ALLEN PARISH Kinder P.D. ASCENSION PARISH Ascension Parish S.O* Donaldsonville P.D. Gonzales P.D. Sorrento P.D. ASSUMPTION PARISH Assumption Parish S.O. Napoleonville P.D. AVOYELLES PARISH Bunkie P.D. Cottonport P.D. Marksville P.D. Moreauville P.D. Simmsport P.D. BEAUREGARD PARISH Beauregard S.O. DeRidder P.D. Merryville P.D. BIENVILLE PARISH Bienville S.O.
Crime in Louisiana 2007

10
MOREHOUSE PARISH Morehouse Parish S.O.* Bastrop P.D. Bonita P.D. Collingston P.D. Oak Ridge P.D. NATCHITOCHES PARISH Natchitoches Parish S.O. Clarence P.D. Natchitoches P.D. UL at Natchitoches C.P. ORLEANS PARISH Delgado Community College C.P. LSU Medical Center C.P. New Orleans P.D. Southern Univ –NO C.P. UNO C.P. Tulane C.P. OUACHITA PARISH Monroe P.D. Ouachita Parish S.O. Richwood P.D. Sterlington P.D.* Tensas Basin Levee P.D UL – Monroe C.P. West Monroe P.D. PLAQUEMINES PARISH Plaquemines Parish S.O.* POINTE COUPEE PARISH Pointe Coupee Parish S.O.* New Roads P.D. RAPIDES PARISH Rapides Parish S.O.* Alexandria P.D. Ball P.D. Chaneyville P.D. Glenmora P.D. LeCompte P.D. McNary P.D. Pineville P.D. Woodworth P.D.
JEFFERSON DAVIS PARISH Jefferson Davis Parish S.O. Elton P.D. Jennings P.D. Lake Arthur P.D.* Welsh P.D. LAFAYETTE PARISH Lafayette Parish S.O. Broussard P.D. Duson P.D. Lafayette P.D. Scott P.D. Youngsville P.D. UL-Lafayette C.P. LAFOURCHE PARISH Lafourche Parish S.O. Golden Meadow P.D. Lockport P.D. Nicholls State Univ. C.P. Thibodaux P.D. LaSALLE PARISH LaSalle Parish S.O. Jena P.D. Olla P.D.* LINCOLN PARISH Lincoln Parish S.O. Dubach P.D. Grambling P.D. Grambling State Univ C.P. Louisiana Tech Univ C.P. Ruston P.D. LIVINGSTON PARISH Livingston Parish S.O Denham Springs P.D. French Settlement P.D. Port Vincent P.D. MADISON PARISH Madison Parish S.O.* Tallulah P.D.*
EAST FELICIANA PARISH Clinton P.D. Jackson PD. EVANGELINE PARISH Evangeline Parish S.O. * Basile P.D. * Mamou P.D.* Ville Platte P.D. FRANKLIN PARISH Franklin Parish S.O. Baskin P.D. Winnsboro P.D. GRANT PARISH Grant Parish S.O. Pollock P.D. IBERIA PARISH Iberia Parish S.O. Jeanerette P.D. Loreauville P.D. IBERVILLE PARISH Iberville Parish S.O. Maringouin P.D. Plaquemine P.D. Grosse Tete P.D. Rosedale P.D. St. Gabriel P.D. White Castle P.D. JACKSON PARISH Jackson Parish S.O. Jonesboro P.D. JEFFERSON PARISH Jefferson Parish S.O. Grande Isle P.D. Gretna P.D. Kenner P.D. Westwego P.D.
* Denotes LIBRS Certified Agency.
Crime in Louisiana 2007

11
VERMILION PARISH Vermilion Parish S.O. Abbeville P.D. Delcambre P.D. Erath P.D. Gueydan P.D Kaplan City P.D. VERNON PARISH Vernon Parish S.O. Leesville P.D. New Llano P.D. WASHINGTON PARISH Washington Parish S.O. Bogalusa P.D. Franklinton P.D. WEBSTER PARISH Webster Parish S.O. Cullen P.D. Dixie Inn P.D. Minden P.D. Springhill P.D. WEST BATON ROUGE PARISH West Baton Rouge Parish S.O. Addis P.D. Port Allen P.D.* WEST CARROLL PARISH West Carroll Parish S.O. Oak Grove P.D. WEST FELICIANA PARISH West Feliciana Parish S.O. * St. Francisville P.D. WINN PARISH Winn Parish S.O. Winnfield P.D.
ST. MARTIN PARISH St. Martin S.O. Breaux Bridge P.D. Parks P.D. St. Martinville P.D. ST. MARY PARISH St. Mary Parish S.O. Baldwin P.D. Berwick P.D. Franklin P.D. Morgan City P.D. Patterson P.D. ST. TAMMANY PARISH St. Tammany Parish S.O. Abita Springs P.D. Covington P.D. Mandeville P.D. Pearl River P.D, Slidell PD. TANGIPAHOA PARISH Tangipahoa Parish S.O. Hammond P.D. Independence P.D. Kentwood P.D.* Ponchatoula P.D. Southeastern University C.P.* Tickfaw P.D. TENSAS PARISH Tensas Parish S.O. Newellton P.D. St. Joseph P.D. Waterproof P.D. TERREBONNE PARISH Terrebonne Parish S.O. Houma P.D. UNION PARISH Union Parish S.O. Bernice P.D.* Farmerville P.D.
RED RIVER PARISH Red River Parish S.O. Coushatta P.D. RICHLAND PARISH Richland Parish S.O. Delhi P.D. Mangham P.D. Rayville P.D. SABINE PARISH Sabine Parish S.O. Many P.D. Zwolle P.D. ST. BERNARD PARISH St. Bernard Parish S.O. ST. CHARLES PARISH St. Charles Parish S.O. ST. HELENA PARISH St. Helena Parish S.O. ST. JAMES PARISH St. James Parish S.O.* Gramercy P.D. Lutcher P.D. ST. JOHN THE BAPTIST PARISH St. John the Baptist Parish S.O. ST. LANDRY PARISH St. Landry Parish S.O. Arnaudville P.D. Eunice P.D. Krotz Springs P.D. LSU Eunice C.P. Opelousas P.D. Port Barre P.D. Sunset P.D. Washington P.D.
* Denotes LIBRS Certified Agency.
Crime in Louisiana 2007

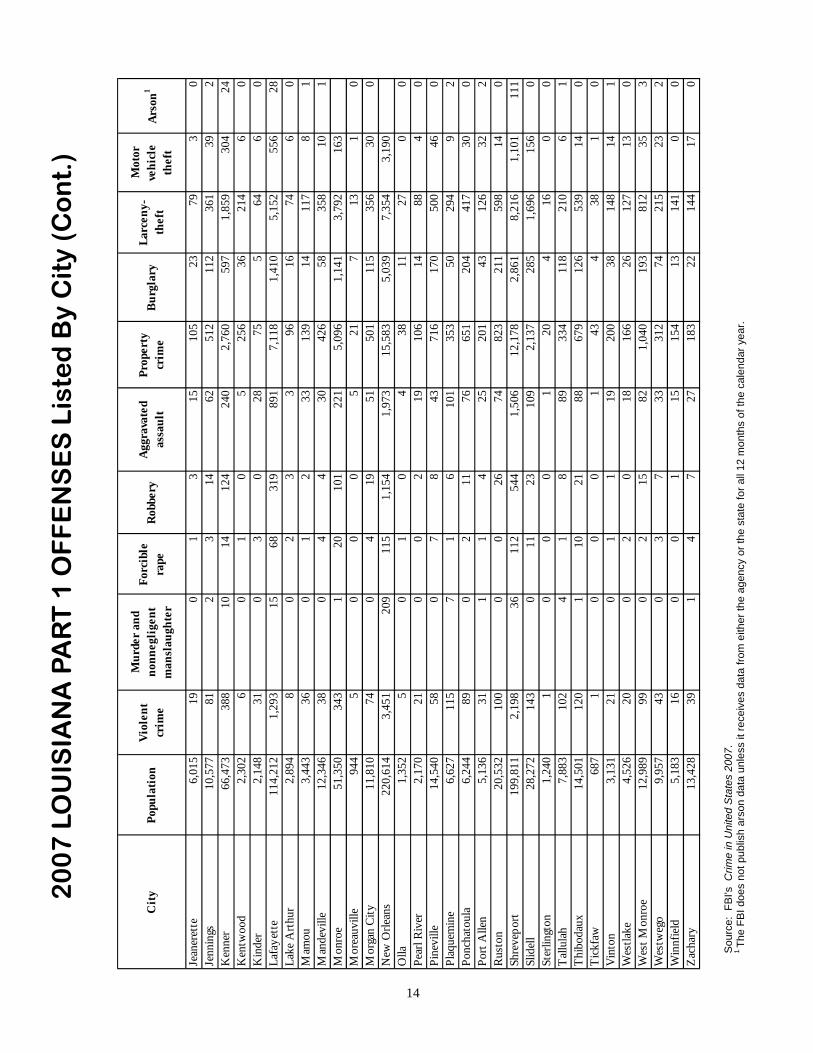
2007 LOUISIANA PART 1 OFFENSES This section lists the eight Part 1 Crimes. The violent crimes are murder and non-negligent manslaughter, forcible rape, robbery and aggravated assault. The non-violent Part 1 Crimes included burglary, larceny-theft, motor vehicle theft and arson. The tables that follow show numbers of offenses in cities, parishes and metropolitan versus non-metropolitan areas of Louisiana in 2007. The tables capture a snapshot of the eight Part 1 Crimes.
12

13
20
07
LO
UIS
IAN
A P
AR
T 1
OF
FE
NS
ES
Lis
ted
By
Cit
y
Sou
rce:
FB
I's 2
007
Crim
e in
Uni
ted
Sta
tes.
1 Th
e FB
I doe
s no
t pub
lish
arso
n da
ta u
nles
s it
rece
ives
dat
a fro
m e
ither
the
agen
cy o
r the
sta
te fo
r all
12 m
onth
s of
the
cale
ndar
yea
r.
City
Popu
latio
nV
iole
nt
crim
e
Mur
der
and
nonn
eglig
ent
man
slau
ghte
r
Forc
ible
ra
peR
obbe
ryA
ggra
vate
d as
saul
tPr
oper
ty
crim
eB
urgl
ary
Larc
eny-
thef
t
Mot
or
vehi
cle
thef
tA
rson
1
Add
is3,
145
90
00
95
04
10
Ale
xand
ria45
,720
1,06
58
1617
586
64,
246
1,09
92,
966
181
0Ba
ker
13,6
0051
24
1233
729
151
535
433
Basi
le2,
392
40
00
415
312
00
Bato
n Ro
uge
228,
446
2,61
571
721,
015
1,45
713
,643
3,84
78,
617
1,17
921
0Be
rnic
e1,
677
71
00
615
510
00
Berw
ick
4,31
230
00
030
3715
202
0Bo
galu
sa12
,927
201
311
3515
288
825
955
079
4Bo
ssie
r City
61,9
931,
146
234
881,
022
2,69
242
62,
068
198
15Br
eaux
Brid
ge8,
047
320
23
2731
1514
20
Clin
ton
1,90
732
10
031
7218
477
0Co
usha
tta2,
166
120
01
1184
2257
50
Covi
ngto
n9,
745
670
113
5332
069
232
191
Crow
ley
13,9
9286
08
969
680
270
392
180
Den
ham
Spr
ings
10,5
5214
50
529
111
1,08
522
683
227
0D
e Q
uinc
y3,
192
110
10
1015
240
107
51
De
Ridd
er10
,143
260
11
2417
248
123
10
Elto
n1,
252
110
12
860
2535
01
Euni
ce11
,621
470
19
3769
711
354
836
0Fa
rmer
ville
3,56
742
03
138
188
6012
80
1Fr
ankl
in7,
794
960
29
8552
660
453
132
Fran
klin
ton
3,72
348
02
838
293
5222
912
0Fr
ench
Set
tlem
ent
1,10
02
10
01
70
70
0Go
lden
Mea
dow
2,15
82
00
02
101
81
1Go
nzal
es9,
067
541
312
3837
631
315
300
Gram
ercy
6,94
633
02
229
133
1411
36
2Gr
etna
16,2
4016
54
1052
9986
821
554
311
00
Har
ahan
9,21
221
00
417
187
3713
812
13H
augh
ton
2,99
722
00
022
40
40
0H
oum
a32
,597
340
416
6525
51,
489
235
1,18
272
7Io
wa
2,56
515
00
114
124
2888
80
Jack
son
3,71
431
00
031
7311
611
0
14
Sou
rce:
FB
I's C
rime
in U
nite
d S
tate
s 20
07.
1 Th
e FB
I doe
s no
t pub
lish
arso
n da
ta u
nles
s it
rece
ives
dat
a fro
m e
ither
the
agen
cy o
r the
sta
te fo
r all
12 m
onth
s of
the
cale
ndar
yea
r.
20
07
LO
UIS
IAN
A P
AR
T 1
OF
FE
NS
ES
Lis
ted
By
Cit
y (C
on
t.)
Cit
yPo
pula
tion
Viol
ent
crim
e
Mur
der
and
nonn
egli
gent
m
ansl
augh
ter
Forc
ible
ra
peR
obbe
ryA
ggra
vate
d as
saul
tPr
oper
ty
crim
eB
urgl
ary
Larc
eny-
thef
t
Mot
or
vehi
cle
thef
tAr
son1
Jean
eret
te6,
015
190
13
1510
523
793
0Je
nnin
gs10
,577
812
314
6251
211
236
139
2K
enne
r66
,473
388
1014
124
240
2,76
059
71,
859
304
24K
entw
ood
2,30
26
01
05
256
3621
46
0K
inde
r2,
148
310
30
2875
564
60
Lafa
yett
e11
4,21
21,
293
1568
319
891
7,11
81,
410
5,15
255
628
Lake
Art
hur
2,89
48
02
33
9616
746
0M
amou
3,44
336
01
233
139
1411
78
1M
ande
ville
12,3
4638
04
430
426
5835
810
1M
onro
e51
,350
343
120
101
221
5,09
61,
141
3,79
216
3M
orea
uvill
e94
45
00
05
217
131
0M
orga
n C
ity11
,810
740
419
5150
111
535
630
0N
ew O
rlean
s22
0,61
43,
451
209
115
1,15
41,
973
15,5
835,
039
7,35
43,
190
Olla
1,35
25
01
04
3811
270
0Pe
arl R
iver
2,17
021
00
219
106
1488
40
Pine
ville
14,5
4058
07
843
716
170
500
460
Plaq
uem
ine
6,62
711
57
16
101
353
5029
49
2Po
ncha
toul
a6,
244
890
211
7665
120
441
730
0Po
rt A
llen
5,13
631
11
425
201
4312
632
2R
usto
n20
,532
100
00
2674
823
211
598
140
Shre
vepo
rt19
9,81
12,
198
3611
254
41,
506
12,1
782,
861
8,21
61,
101
111
Slid
ell
28,2
7214
30
1123
109
2,13
728
51,
696
156
0St
erlin
gton
1,24
01
00
01
204
160
0T
allu
lah
7,88
310
24
18
8933
411
821
06
1T
hibo
daux
14,5
0112
01
1021
8867
912
653
914
0T
ickf
aw68
71
00
01
434
381
0V
into
n3,
131
210
11
1920
038
148
141
Wes
tlake
4,52
620
02
018
166
2612
713
0W
est M
onro
e12
,989
990
215
821,
040
193
812
353
Wes
tweg
o9,
957
430
37
3331
274
215
232
Win
nfie
ld5,
183
160
01
1515
413
141
00
Zac
hary
13,4
2839
14
727
183
2214
417
0

Met
ropo
litan
/ No
nmet
ropo
litan
Pa
rishe
sPa
rishe
sVi
olen
t cr
ime
Mur
der a
nd
nonn
eglig
ent
man
slau
ghte
rFo
rcib
le
rape
Robb
ery
Aggr
avat
ed
assa
ult
Prop
erty
cr
ime
Burg
lary
Larc
eny-
thef
t
Mot
or
vehi
cle
thef
tAr
son1
Asce
nsio
n40
76
2837
336
2,89
060
52,
018
267
7Bo
ssie
r25
41
43
246
538
5743
942
2Ca
ddo
202
322
1416
399
321
066
811
55
Calc
asie
u28
02
8887
103
3,64
089
92,
480
261
10Ca
mer
on71
13
067
187
2914
513
1Ea
st B
aton
Rou
ge92
520
2918
968
78,
927
1,99
56,
425
507
50Ib
ervil
le14
16
55
125
460
9035
020
2Je
ffers
on2,
616
4474
634
1,86
415
,090
3,63
29,
596
1,86
217
7La
faye
tte42
84
1441
369
1,55
345
989
819
622
Lafo
urch
e14
20
77
128
1,83
612
91,
631
760
Livin
gsto
n49
08
1426
442
1,55
159
380
015
80
Plaq
uem
ines
562
24
4860
013
640
955
4Po
inte
Cou
pee
744
04
6637
710
525
220
2Ra
pide
s18
91
189
161
1,04
229
759
614
91
St. B
erna
rd11
01
415
901,
706
496
1,01
819
21
St. C
harle
s17
02
1143
114
1,33
846
077
410
420
St. J
ohn
the
Bapt
ist
194
79
9385
1,73
143
41,
109
188
1St
. Mar
tin80
215
1251
488
114
369
5St
. Tam
man
y41
110
3129
341
2,86
179
01,
762
309
24Te
rrebo
nne
387
732
4130
73,
054
543
2,27
423
713
Wes
t Bat
on R
ouge
932
518
6849
153
398
400
Wes
t Fel
icia
na72
22
464
140
2310
611
2
7,79
213
541
71,
315
5,92
551
,493
12,1
4934
,517
4,82
734
4
Met
ropo
litan
Par
ishes
2007
LO
UISI
ANA
PART
1 O
FFEN
SES
MET
ROPO
LITA
N AN
D NO
N-M
ETRO
POLI
TAN
PARI
SHES
[The
dat
a sh
own
in th
is ta
ble
do n
ot re
flect
par
ish
tota
ls b
ut a
re th
e nu
mbe
r of o
ffens
es re
port
ed b
y th
e sh
eriff
's o
ffice
or p
olic
e de
part
men
t.]
Sour
ce:
FBI's
Crim
e in
the
Unite
d St
ates
200
7.
Tabl
e To
tals
2
2 The
tabl
e on
ly in
clud
es 4
2 of
the
64 P
aris
hes
in th
e St
ate
of L
ouis
iana
.
1 The
FBI
doe
s no
t pub
lish
arso
n da
ta u
nles
s it
rece
ives
data
from
eith
er th
e ag
ency
or t
he s
tate
for a
ll 12
mon
ths
of th
e ca
lend
ar y
ear.
15

Met
ropo
litan
/ No
nmet
ropo
litan
Pa
rishe
sPa
rishe
sVi
olen
t cr
ime
Mur
der a
nd
nonn
eglig
ent
man
slau
ghte
rFo
rcib
le
rape
Robb
ery
Aggr
avat
ed
assa
ult
Prop
erty
cr
ime
Burg
lary
Larc
eny-
thef
t
Mot
or
vehi
cle
thef
tAr
son1
Acad
ia16
01
114
406
8127
847
0As
sum
ptio
n12
10
54
112
400
7729
033
0Av
oyel
les
160
10
1521
117
215
240
Beau
rega
rd36
38
124
429
161
232
363
East
Car
roll
200
16
1332
1022
00
Evan
gelin
e66
19
452
440
127
269
44Fr
ankl
in15
00
015
203
6512
513
3Je
ffers
on D
avis
542
65
4141
764
316
372
Linc
oln
395
35
2624
784
149
140
Mad
ison
612
34
5218
079
8912
1M
oreh
ouse
321
12
2843
893
334
111
Nat
chito
ches
990
55
8945
616
324
449
0St
. Jam
es20
33
615
179
697
199
451
472
St. L
andr
y16
41
818
137
1,12
732
569
710
56
St. M
ary
193
27
5213
21,
027
226
756
450
Tang
ipah
oa88
411
4159
773
3,68
41,
515
2,02
714
23
Verm
ilion
401
17
039
321
833
184
1Ve
rnon
233
16
522
163
813
647
230
8W
ashi
ngto
n18
53
2412
146
774
151
534
890
Wes
t Car
roll
290
00
2927
983
179
171
2,86
736
142
198
2,49
112
,303
3,84
47,
663
796
30
Sour
ce:
FBI's
Crim
e in
the
Uni
ted
Stat
es 2
007
.
Tabl
e To
tals
2
2 The
tabl
e on
ly in
clud
es 4
2 of
the
64 P
aris
hes
in th
e St
ate
of L
ouis
iana
.
1 The
FBI
doe
s no
t pub
lish
arso
n da
ta u
nles
s it
rece
ives
data
from
eith
er th
e ag
ency
or t
he s
tate
for a
ll 12
mon
ths
of th
e ca
lend
ar ye
ar.
Nonm
etro
polit
an
Paris
hes
2007
LO
UISI
ANA
PART
1 O
FFEN
SES
MET
ROPO
LITA
N AN
D N
ON-
MET
ROPO
LITA
N PA
RISH
ES[T
he d
ata
show
n in
this
tabl
e do
not
refle
ct p
aris
h to
tals
but
are
the
num
ber o
f offe
nses
repo
rted
by
the
sher
iff's
offi
ce o
r pol
ice
depa
rtm
ent.]
16

Uni
vers
ity/C
olle
ge
Cam
pus
Stu
dent
en
rollm
ent1
Vio
lent
cr
ime
Mur
der
and
nonn
eglig
ent
man
slau
ghte
r
Forc
ible
ra
peR
obbe
ryA
ggra
vate
d as
saul
tP
rope
rty
crim
eB
urgl
ary
Larc
eny-
thef
t
Del
gado
Com
mun
ity C
olle
ge
11,9
163
00
12
271
25
Gra
mbl
ing
Sta
te U
nive
rsity
5,06
58
01
16
173
9969
Loui
sian
a S
tate
Uni
vers
ityB
aton
Rou
ge2
192
09
845
655
382
McN
eese
Sta
te U
nive
rsity
8,
327
20
00
291
980
Nic
holls
Sta
te U
nive
rsity
6,
804
60
10
536
332
Sou
thea
ster
n Lo
uisi
ana
Uni
vers
ity15
,106
70
11
517
229
139
Bat
on R
ouge
8,62
49
02
34
179
1316
1N
ew O
rlean
s2,
197
00
00
011
011
Tula
ne U
nive
rsity
10,2
3724
018
24
232
6915
6La
faye
tte16
,302
20
10
113
913
123
Mon
roe
8,57
67
00
25
153
1713
2U
nive
rsity
of N
ew O
rlean
s
11,7
4712
00
111
873
79U
nive
rsity
/Col
lege
Tot
als
104,
901
992
2420
531,
756
311
1,38
9
Sou
ther
n U
nive
rsity
and
A&
M
Col
lege
:
Uni
vers
ity o
f Lou
isia
na:2
00
7 L
OU
ISIA
NA
PA
RT
1 O
FF
EN
SE
S L
iste
d B
y
Un
ive
rsit
y a
nd
Co
lleg
e
Sou
rce:
FB
I's 2
007
Crim
e in
Uni
ted
Sta
tes.
1 Th
e st
uden
t enr
ollm
ent f
igur
es p
rovi
ded
by th
e U
nite
d S
tate
s D
epar
tmen
t of E
duca
tion
are
for t
he 2
006
scho
ol y
ear,
the
mos
t rec
ent a
vaila
ble.
The
enr
ollm
ent f
igur
es in
clud
e fu
ll-tim
e an
d pa
rt-tim
e st
uden
ts.
2 S
tude
nt e
nrol
lmen
t fig
ures
wer
e no
t ava
ilabl
e.
NO
TE:
Per
the
FBI,
caut
ion
shou
ld b
e ex
erci
sed
in m
akin
g an
y in
terc
ampu
s co
mpa
rison
s or
rank
ing
scho
ols
beca
use
univ
ersi
ty/c
olle
ge c
rime
stat
istic
s ar
e af
fect
ed b
y a
varie
ty o
f fa
ctor
s. T
hese
incl
ude
dem
ogra
phic
cha
ract
eris
tics
of th
e su
rrou
ndin
g co
mm
unity
, rat
io o
f mal
e to
fem
ale
stud
ents
, num
ber o
f on-
cam
pus
resi
dent
s, a
cces
sibi
lity
of th
e ca
mpu
s to
ou
tsid
e vi
sito
rs, s
ize
of e
nrol
lmen
t, et
c.
17

20
07
LO
UIS
IAN
A P
AR
T 1
OF
FE
NS
ES
Lis
ted
By
Sta
te
an
d O
the
r A
ge
nc
ies
Sou
rce:
FB
I's C
rime
in U
nite
d S
tate
s 20
07.
1 The
FB
I doe
s no
t pub
lish
arso
n da
ta u
nles
s it
rece
ives
dat
a fro
m e
ither
the
agen
cy o
r the
sta
te fo
r all
12 m
onth
s of
the
cale
ndar
yea
r.
Sta
te A
genc
ies/
Oth
er
Age
ncie
sV
iole
nt
Cri
me
Mur
der
and
Non
negl
igen
t M
ansl
augh
ter
Forc
ible
R
ape
Rob
bery
Agg
rava
ted
Ass
ault
Pro
pert
y C
rim
eB
urgl
ary
Larc
eny-
Thef
t
Mot
or
Veh
icle
Th
eft
Ars
on1
Sta
te A
genc
ies
30
01
234
033
11
Dep
artm
ent o
f Pub
lic
Saf
ety
- Sta
te C
apita
l D
etai
l
Age
ncy
18

TOTAL INDEX CRIMES IN LOUISIANA
The Part One Crime Index Total is composed of the crimes of murder and non-negligent manslaughter, forcible rape, robbery, aggravated assault, burglary, larceny theft and motor vehicle theft. The tables and charts that follow show numbers of offenses and crime rates in our state in 2007 as well as a comparison of 2005, 2006 and 2007. Trends are included for the years 1998 through 2007 and percentages of violent crime compared to non-violent (property) crime.
19
Crime in Louisiana 2007

2007 LOUISIANA INDEX CRIMES
STATE TOTALS BY NUMBER OF OFFENSES
2007 LOUISIANA INDEX CRIMES STATE TOTALS BY CRIME RATE
OFFENSE 2006 2007
MURDER and NON-NEGLIGENT MANSLAUGHTER
530 608
FORCIBLE RAPE 1,562 1,393
ROBBERY 5,729 6,083
AGGRAVATED ASSAULT 22,098 23,233 BURGLARY 44,986 44,602 LARCENY-THEFT 110,613 115,209 MOTOR VEHICLE THEFT 15,640 15,180 CRIME INDEX OFFENSE TOTAL 201,158 206,308
2006 Population: 4,287,768 2007: Population: 4,293,204
20
OFFENSE 2006 2007
MURDER and NON-NEGLIGENT MANSLAUGHTER
12.4 14.2
FORCIBLE RAPE 36.4 32.4
ROBBERY 133.6 141.7
AGGRAVATED ASSAULT 515.4 541.2 BURGLARY 1,049.2 1,038.9 LARCENY-THEFT 2,579.7 2,683.5 MOTOR VEHICLE THEFT 364.8 353.6 CRIME INDEX OFFENSE TOTAL 4,691.5 4,805.5
Crime in Louisiana 2007

Robbery2.9%
Forcible Rape0.7%
Aggravated Assault11.3%
Burglary21.6%
Murder andNon-Negligent Manslaughter
0.3%
Motor Vehicle Theft7.4%
Larceny-Theft55.8%
Louisiana Index Crimes 2007
21
Crime in Louisiana 2007

LOUISIANA INDEX CRIMES - VIOLENT CRIME
BY NUMBER OF OFFENSES 2006 and 2007
LOUISIANA INDEX CRIMES - VIOLENT CRIME BY CRIME RATE
RATE PER 100,000 2006 and 2007
OFFENSE 2006 2007
MURDER and NON-NEGLIGENT MANSLAUGHTER 12.4 14.2
FORCIBLE RAPE 36.4 32.4
ROBBERY 133.6 141.7
AGGRAVATED ASSAULT 515.4 541.2
VIOLENT CRIME RATE TOTAL 697.8 729.5
OFFENSE 2006 2007
MURDER and NON-NEGLIGENT MANSLAUGHTER 530 608
FORCIBLE RAPE 1,562 1,393
ROBBERY 5,729 6,083
AGGRAVATED ASSAULT 22,098 23,233
VIOLENT CRIME OFFENSE TOTAL 29,919 31,317
22
2006 Population: 4,287,768 2007: Population: 4,293,204
Crime in Louisiana 2007

530 608
1,562 1,393
5,729 6,083
22,098
23,233
0
5000
10000
15000
20000
25000
MURDER AND NON-NEGLIGENT
MANSLAUGHTER
FORCIBLE RAPE ROBBERY AGGRAVATEDASSAULT
2006 2007
Violent Crimes By Number of Offenses 2006 and 2007
23
Crime in Louisiana 2007

2 0 0 7
A gg rava ted A s s au lt74 .2%
R obbe ry19 .4%
F orc ib le R ape4 .4%
M urde r & N on -N eg ligen t
M ans laugh te r1 .6%
Violent Crimes by Number of Offenses
24
Crime in Louisiana 2007
2006
A ggravated A ssault73.9%
Robbery19.1%
Forc ible Rape5.2%
M urder & Non-Negligent
M ans laughter1.6%

LOUISIANA INDEX CRIMES - NON-VIOLENT CRIME
BY NUMBER OF OFFENSES 2006 and 2007
LOUISIANA INDEX CRIMES - NON-VIOLENT CRIME BY CRIME RATE
RATE PER 100,000 2006 and 2007
OFFENSE 2006 2007
BURGLARY 44,986 44,602
LARCENY-THEFT 110,613 115,209
MOTOR VEHICLE THEFT 15,640 15,180
NONVIOLENT CRIME OFFENSE TOTAL 171,239 174,991
OFFENSE 2006 2007
BURGLARY 1,049.2 1,038.9
LARCENY-THEFT 2,579.7 2,683.5
MOTOR VEHICLE THEFT 364.8 353.6
NONVIOLENT CRIME RATE TOTAL 3,993.7 4,076.0
25
2006 Population: 4,287,768 2007: Population: 4,293,204
Crime in Louisiana 2007

Non-Violent Crimes by Number of Offenses 2006 - 2007
26
BURGLARY
LARCENY-THEFT
MOTOR VEHICLE THEFT
44,986 44,602
110,613115,209
15,640 15,180
0
20,000
40,000
60,000
80,000
100,000
120,000
2006
2007
Crime in Louisiana 2007
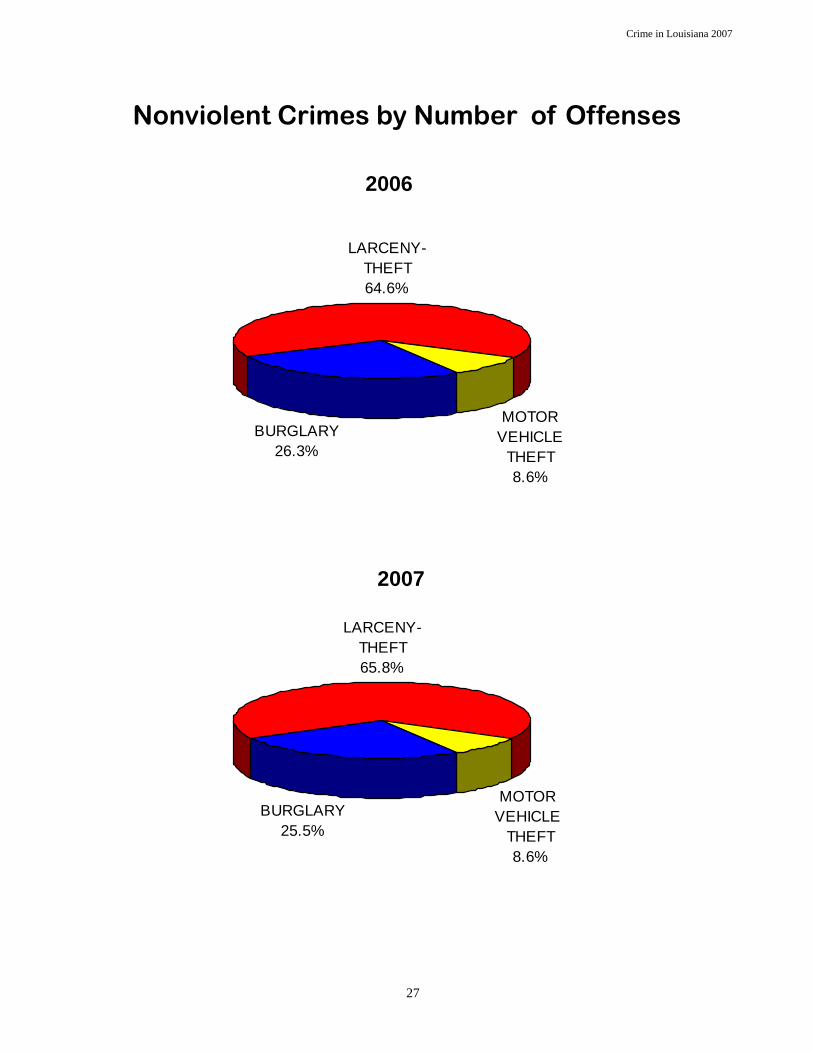
Nonviolent Crimes by Number of Offenses
27
BURGLARY25.5%
LARCENY-THEFT65.8%
MOTOR VEHICLE
THEFT8.6%
2007
Crime in Louisiana 2007
BURGLARY26.3%
LARCENY-THEFT64.6%
MOTOR VEHICLE
THEFT8.6%
2006

Violent and Property Crime Trends Number of Offenses
2003 –2007
28
2003 2004 2005 2006 2007 Violent
Property
020,00040,00060,00080,000
100,000120,000140,000160,000180,000200,000
Crime in Louisiana 2007
Violent and Property Crime Percentage
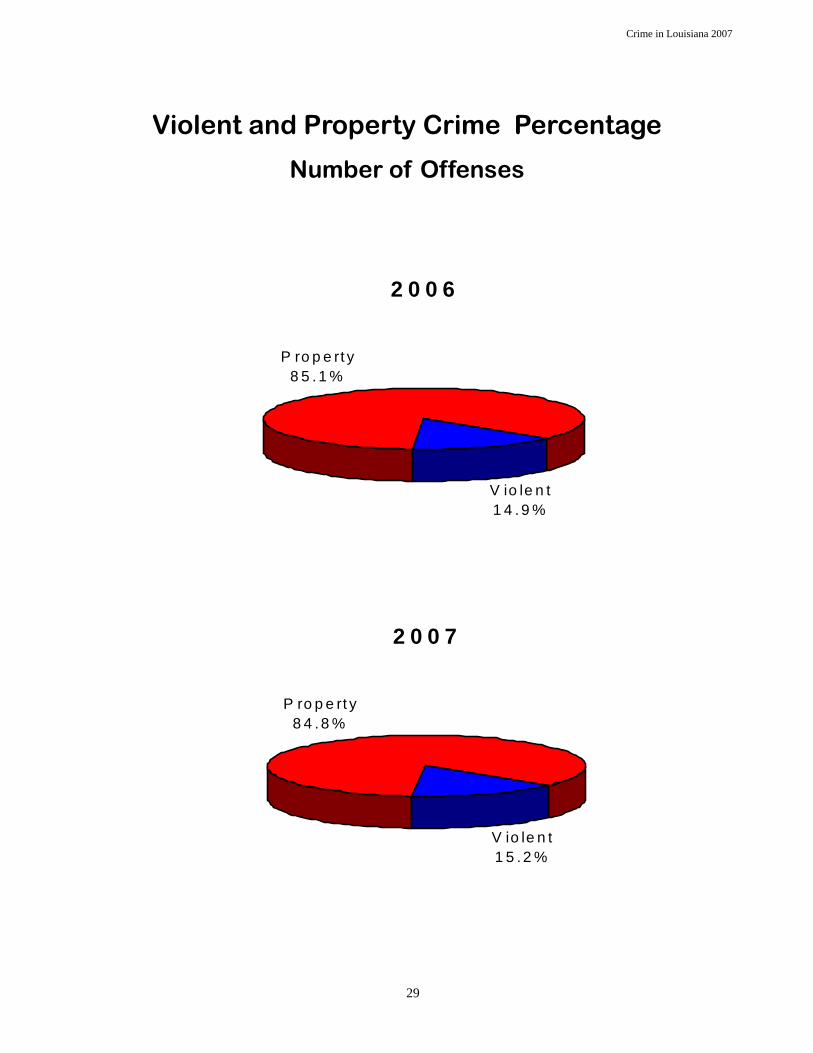
Number of Offenses
29
Crime in Louisiana 2007
2 0 0 6
V io le n t1 4 . 9 %
P ro p e rt y8 5 . 1 %
2 0 0 7
V io le n t1 5 .2 %
P ro p e rt y8 4 .8 %

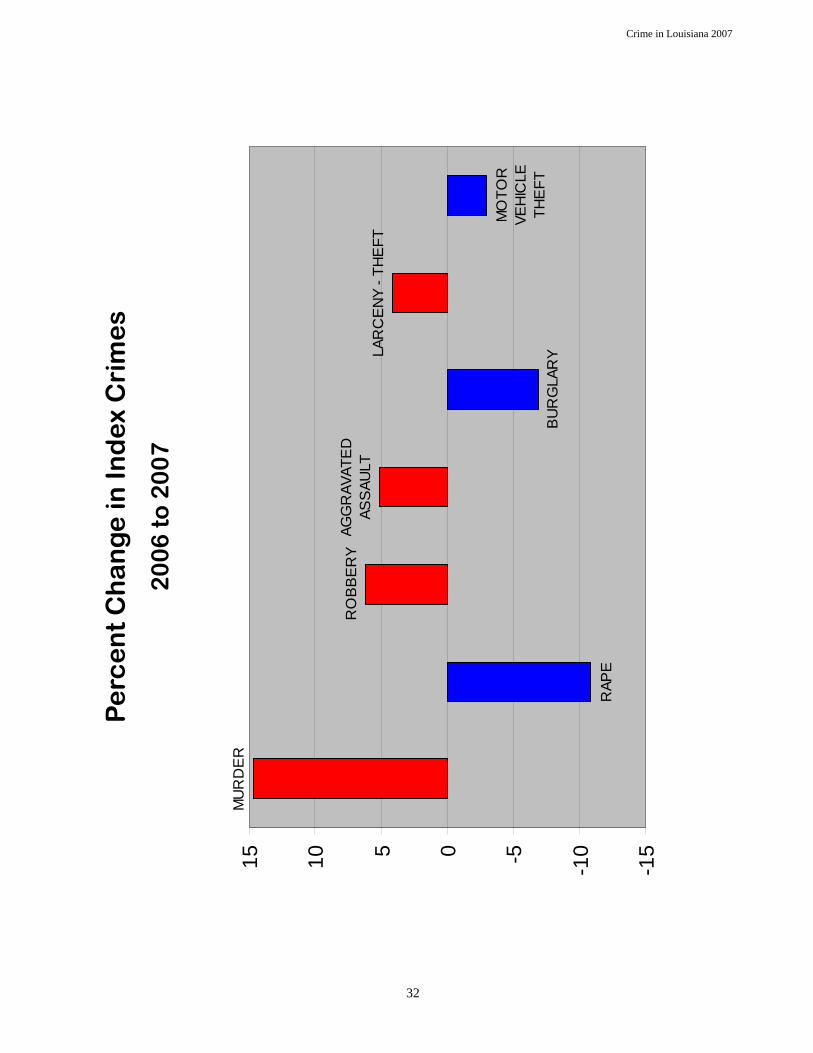
PERCENT CHANGE IN INDEX CRIME 2006 TO 2007
The tables and charts that follow show the percent change in index crime from 2006 to 2007.
30
Crime in Louisiana 2007

LOUISIANA INDEX CRIMES PERCENT CHANGE BY NUMBER OF OFFENSES
LOUISIANA INDEX CRIMES PERCENT CHANGE BY RATE PER 100,000
OFFENSE 2006 2007 % Change
MURDER 530 608 14.72
RAPE 1,562 1,393 -10.82
ROBBERY 5,729 6,083 6.18
AGGRAVATED ASSAULT 22,098 23,233 5.14
VIOLENT CRIME TOTAL 29,919 31,317 4.67
BURGLARY 44,986 44,602 -0.85
LARCENY-THEFT 110,613 115,209 4.16
MOTOR VEHICLE THEFT 15,640 15,180 -2.94 NONVIOLENT CRIME TOTAL 171,239 174,991 2.19
OFFENSE 2006 2007 % Change
MURDER 12.4 14.2 14.52
RAPE 36.4 32.4 -10.99
ROBBERY 133.6 141.7 6.06
AGGRAVATED ASSAULT 515.4 541.2 5.01
VIOLENT CRIME TOTAL 697.8 729.5 4.54
BURGLARY 1,049.2 1,038.9 -0.98
LARCENY-THEFT 2,579.7 2,683.5 4.02
MOTOR VEHICLE THEFT 364.8 353.6 -3.07 NONVIOLENT CRIME TOTAL 3,993.7 4,076.0 2.06
2006 Population: 4,287,768 2007: Population: 4,293,204
Crime in Louisiana 2007
31
Pe
rce
nt
Ch
an
ge
in In
de
x C
rim
es
20
06
to
20
07
32
BU
RG
LAR
YLAR
CE
NY
- TH
EFT
RAP
E
MU
RD
ER
AGG
RAV
ATE
D
ASS
AULT
RO
BB
ER
Y
MO
TOR
VE
HIC
LE
THE
FT
-15
-10-5051015
Crime in Louisiana 2007

INDEX CRIME TOTALS AND RATES FOR CITIES COMPARABLE IN SIZE TO NEW ORLEANS, 2007
The following table shows the number of index crimes and rate of crime for cities comparable in size to New Orleans.
33
Crime in Louisiana 2007

Ind
ex
Cri
me
To
tals
an
d R
ate
s Fo
r C
itie
s S
imila
r In
Siz
e T
o N
ew
Orl
ea
ns,
20
07
Prio
r to
hurr
ican
es K
atrin
a an
d R
ita, N
ew O
rlean
s riv
aled
oth
er U
.S. c
ities
that
are
400
,000
or m
ore
in p
opul
atio
n. T
he c
ities
that
wer
e pr
evi-
ousl
y co
mpa
red
to N
ew O
rlean
s wer
e K
ansa
s City
, Mis
sour
i, A
lbuq
uerq
ue, N
ew M
exic
o, C
leve
land
, Ohi
o, O
kala
hom
a C
ity, O
klah
oma,
Fr
esno
, Cal
iforn
ia, T
ucso
n, A
rizon
a, P
ortla
nd, O
rego
n, a
nd A
tlant
a, G
eorg
ia.
The
estim
ates
pre
dict
that
it w
ill ta
ke m
ore
than
ten
year
s for
N
ew O
rlean
s to
retu
rn to
its f
orm
er p
opul
atio
n.
34
OFF
ENSE
N
ew O
rlea
ns,
LA
B
aton
Rou
ge,
LA
Sh
reve
port
, LA
A
kron
, OH
B
irm
ingh
am,
AL
B
oise
, ID
Ir
ving
, TX
G
reen
sbor
o,
NC
M
odes
to,
CA
POPU
LATI
ON
22
0,61
4 22
8,44
6 19
9,81
1 20
8,70
1 22
7,68
6 19
9,10
4 19
6,67
6 23
8,12
2 20
8,06
7
Mur
der &
N
on- N
eglig
ent
Man
slau
ghte
r 20
9 71
36
22
86
10
9
40
11
Forc
ible
Rap
e 11
5 72
11
2 17
4 22
9 12
2 30
94
65
Rob
bery
1,
154
1,01
5 54
4 73
0 1,
609
68
240
942
452
Agg
rava
ted
Ass
ault
1,97
3 1,
457
1,50
6 64
1 1,
396
448
450
1,23
6 96
2
Bur
glar
y 5,
039
3,84
7 2,
861
3,31
9 4,
864
1,01
8 1,
730
4,70
4 2,
216
Larc
eny-
Thef
t 7,
354
8,61
7 8,
216
5,97
3 12
,528
4,
778
6,30
6 8,
943
7,85
0
Mot
or V
ehic
le
The
ft 3,
190
1,17
9 1,
101
1,20
2 2,
246
379
994
1,13
1 1,
964
Crim
e In
dex
Tota
l 19
,034
16
,258
14
,376
12
,061
22
,958
6,
823
9,75
9 17
,090
13
,520
Rat
e pe
r 100
,000
8,
627.
74
7,11
6.78
7,
194.
80
5,77
9.08
10
,083
.18
3,42
6.85
4,
961.
97
7,17
6.99
6,
497.
91
Crime in Louisiana 2007

LOUISIANA’S NATIONAL RANKING IN INDEX CRIME CATEGORIES
The tables that follow show where Louisiana ranks compared to the rest of the states in the nation in the individual index offenses. Rankings are also given for the total violent crimes of murder, rape, robbery, and aggravated assault and the nonviolent crimes of burglary, larceny-theft and motor vehicle theft.
35
Offense 2006 Rank 2007 Rank Murder and Non-Negligent Manslaughter 1st 1st Forcible Rape 15th 24th Robbery 19th 18th Aggravated Assault 4th 2nd
Violent Crime Ranking 5th 4th Burglary 4th 3rd Larceny-Theft 14th 8th Motor Vehicle Theft 19th 17th
Non-Violent Crime Ranking 9th 8th Total Index Crime Ranking 7th 6th
Crime in Louisiana 2007
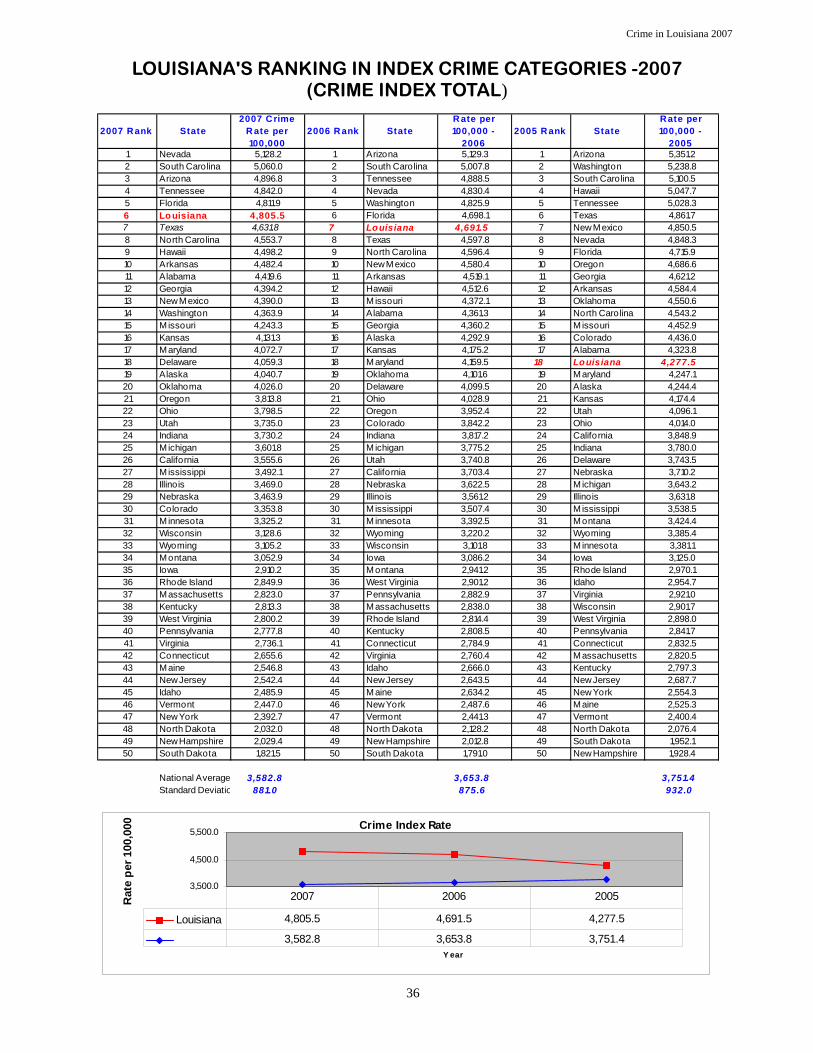
2007 Rank State2007 C rime
R ate per 100,000
2006 R ank StateR ate per 100,000 -
20062005 R ank State
Rate per 100,000 -
20051 Nevada 5,128.2 1 Arizona 5,129.3 1 Arizona 5,351.22 South Carolina 5,060.0 2 South Carolina 5,007.8 2 Washington 5,238.83 Arizona 4,896.8 3 Tennessee 4,888.5 3 South Carolina 5,100.54 Tennessee 4,842.0 4 Nevada 4,830.4 4 Hawaii 5,047.75 Florida 4,811.9 5 Washington 4,825.9 5 Tennessee 5,028.36 Lo uisiana 4,805.5 6 Florida 4,698.1 6 Texas 4,861.77 Texas 4,631.8 7 Louisiana 4,691.5 7 New Mexico 4,850.58 North Carolina 4,553.7 8 Texas 4,597.8 8 Nevada 4,848.39 Hawaii 4,498.2 9 North Carolina 4,596.4 9 Florida 4,715.910 Arkansas 4,482.4 10 New M exico 4,580.4 10 Oregon 4,686.611 Alabama 4,419.6 11 Arkansas 4,519.1 11 Georgia 4,621.212 Georgia 4,394.2 12 Hawaii 4,512.6 12 Arkansas 4,584.413 New Mexico 4,390.0 13 M issouri 4,372.1 13 Oklahoma 4,550.614 Washington 4,363.9 14 Alabama 4,361.3 14 North Carolina 4,543.215 Missouri 4,243.3 15 Georgia 4,360.2 15 Missouri 4,452.916 Kansas 4,131.3 16 Alaska 4,292.9 16 Colorado 4,436.017 Maryland 4,072.7 17 Kansas 4,175.2 17 Alabama 4,323.818 Delaware 4,059.3 18 M aryland 4,159.5 18 Louisiana 4,277.519 Alaska 4,040.7 19 Oklahoma 4,101.6 19 Maryland 4,247.120 Oklahoma 4,026.0 20 Delaware 4,099.5 20 Alaska 4,244.421 Oregon 3,813.8 21 Ohio 4,028.9 21 Kansas 4,174.422 Ohio 3,798.5 22 Oregon 3,952.4 22 Utah 4,096.123 Utah 3,735.0 23 Colorado 3,842.2 23 Ohio 4,014.024 Indiana 3,730.2 24 Indiana 3,817.2 24 California 3,848.925 Michigan 3,601.8 25 M ichigan 3,775.2 25 Indiana 3,780.026 California 3,555.6 26 Utah 3,740.8 26 Delaware 3,743.527 Mississippi 3,492.1 27 California 3,703.4 27 Nebraska 3,710.228 Illinois 3,469.0 28 Nebraska 3,622.5 28 Michigan 3,643.229 Nebraska 3,463.9 29 Illinois 3,561.2 29 Illinois 3,631.830 Colorado 3,353.8 30 M ississippi 3,507.4 30 Mississippi 3,538.531 Minnesota 3,325.2 31 M innesota 3,392.5 31 Montana 3,424.432 Wisconsin 3,128.6 32 Wyoming 3,220.2 32 Wyoming 3,385.433 Wyoming 3,105.2 33 Wisconsin 3,101.8 33 Minnesota 3,381.134 Montana 3,052.9 34 Iowa 3,086.2 34 Iowa 3,125.035 Iowa 2,910.2 35 M ontana 2,941.2 35 Rhode Island 2,970.136 Rhode Island 2,849.9 36 West Virginia 2,901.2 36 Idaho 2,954.737 Massachusetts 2,823.0 37 Pennsylvania 2,882.9 37 Virginia 2,921.038 Kentucky 2,813.3 38 M assachusetts 2,838.0 38 Wisconsin 2,901.739 West Virginia 2,800.2 39 Rhode Island 2,814.4 39 West Virginia 2,898.040 Pennsylvania 2,777.8 40 Kentucky 2,808.5 40 Pennsylvania 2,841.741 Virginia 2,736.1 41 Connecticut 2,784.9 41 Connecticut 2,832.542 Connecticut 2,655.6 42 Virginia 2,760.4 42 Massachusetts 2,820.543 Maine 2,546.8 43 Idaho 2,666.0 43 Kentucky 2,797.344 New Jersey 2,542.4 44 New Jersey 2,643.5 44 New Jersey 2,687.745 Idaho 2,485.9 45 M aine 2,634.2 45 New York 2,554.346 Vermont 2,447.0 46 New York 2,487.6 46 Maine 2,525.347 New York 2,392.7 47 Vermont 2,441.3 47 Vermont 2,400.448 North Dakota 2,032.0 48 North Dakota 2,128.2 48 North Dakota 2,076.449 New Hampshire 2,029.4 49 New Hampshire 2,012.8 49 South Dakota 1,952.150 South Dakota 1,821.5 50 South Dakota 1,791.0 50 New Hampshire 1,928.4
National Average 3,582.8 3,653.8 3,751.4Standard Deviatio 881.0 875.6 932.0
Crime Index Rate
3,500.0
4,500.0
5,500.0
Y ear
Rat
e pe
r 100
,000
Louisiana 4,805.5 4,691.5 4,277.5
3,582.8 3,653.8 3,751.4
2007 2006 2005
36
LOUISIANA'S RANKING IN INDEX CRIME CATEGORIES -2007 (CRIME INDEX TOTAL)
Crime in Louisiana 2007

2007 Rank State 2007 Rate per 100,000 2006 Rank State
Rate per 100,000 -
20062005 Rank State
Rate per 100,000 -
20051 South Carolina 788.3 1 South Carolina 765.5 1 South Carolina 761.12 Tennessee 753.3 2 Tennessee 760.2 2 Tennessee 752.83 Nevada 750.6 3 Nevada 741.6 3 Florida 708.0
4 Louisiana 729.5 4 Florida 712.0 4 Maryland 703.05 Florida 722.6 5 Louisiana 697.8 5 New Mexico 702.26 Delaware 689.2 6 Alaska 688.0 6 Delaware 632.17 New Mexico 664.2 7 Delaware 681.6 7 Alaska 631.98 Alaska 661.2 8 Maryland 678.6 8 Nevada 606.89 Maryland 641.9 9 New Mexico 643.2 9 Louisiana 594.410 Michigan 536.0 10 Michigan 562.4 10 Michigan 552.111 Illinois 533.2 11 Arkansas 551.6 11 Illinois 551.512 Arkansas 529.4 12 Missouri 545.6 12 Texas 529.713 California 522.6 13 Illinois 541.6 13 Arkansas 527.514 Texas 510.6 14 California 532.5 14 California 526.315 Missouri 504.9 15 Texas 516.3 15 Missouri 525.416 Oklahoma 499.6 16 Arizona 501.4 16 Arizona 513.217 Georgia 493.2 17 Oklahoma 497.4 17 Oklahoma 508.618 Arizona 482.7 18 North Carolina 475.6 18 North Carolina 468.119 North Carolina 466.4 19 Georgia 471.0 19 Massachusetts 456.920 Kansas 452.7 20 Massachusetts 447.0 20 Georgia 448.921 Alabama 448.0 21 Pennsylvania 439.4 21 New York 445.822 Massachusetts 431.5 22 New York 434.9 22 Alabama 431.723 Pennsylvania 416.5 23 Alabama 425.2 23 Pennsylvania 424.524 New York 414.1 24 Kansas 425.0 24 Colorado 396.525 Colorado 347.8 25 Colorado 391.6 25 Kansas 387.426 Ohio 343.2 26 New Jersey 351.6 26 New Jersey 354.7
27 Indiana 333.6 27 Ohio 350.3 27 Ohio 351.328 Washington 333.1 28 Washington 345.9 28 Washington 345.829 New Jersey 329.3 29 Indiana 314.8 29 Indiana 323.730 Nebraska 302.4 30 Minnesota 312.0 30 Minnesota 297.031 Kentucky 295.0 31 Mississippi 298.6 31 Iowa 291.332 Iowa 294.7 32 Wisconsin 284.0 32 Nebraska 287.033 Mississippi 291.3 33 Iowa 283.5 33 Oregon 286.834 Wisconsin 290.9 34 Virginia 282.2 34 Virginia 282.835 Minnesota 288.7 35 Nebraska 281.8 35 Montana 281.536 Oregon 287.6 36 Hawaii 281.2 36 Mississippi 278.437 Montana 287.5 37 Connecticut 280.8 37 Connecticut 274.538 West Virginia 275.2 38 Oregon 280.3 38 West Virginia 272.839 Hawaii 272.8 39 West Virginia 279.7 39 Kentucky 266.840 Virginia 269.7 40 Kentucky 263.0 40 Idaho 256.841 Connecticut 256.0 41 Montana 253.7 41 Hawaii 255.142 Idaho 239.4 42 Idaho 247.2 42 Rhode Island 251.243 Wyoming 239.3 43 Wyoming 239.6 43 Wisconsin 241.544 Utah 234.8 44 Rhode Island 227.5 44 Wyoming 230.145 Rhode Island 227.3 45 Utah 224.4 45 Utah 227.246 South Dakota 169.2 46 South Dakota 171.4 46 South Dakota 175.747 North Dakota 142.4 47 New Hampshire 138.7 47 New Hampshire 132.048 New Hampshire 137.3 48 Vermont 136.6 48 Vermont 119.749 Vermont 124.3 49 North Dakota 127.9 49 Maine 112.250 Maine 118.0 50 Maine 115.5 50 North Dakota 98.2
National Average 407.5 410.0 401.6Standard Deviation 181.7 182.1 175.8
Violent Crime Index
300.0450.0600.0750.0
Year
Rat
e pe
r 100
,000
Louisiana 729.5 697.8 594.4
National Average 407.5 410.0 401.6
2007 2006 2005
37
LOUISIANA'S RANKING IN INDEX CRIME CATEGORIES - 2007 (VIOLENT)
Crime in Louisiana 2007
38
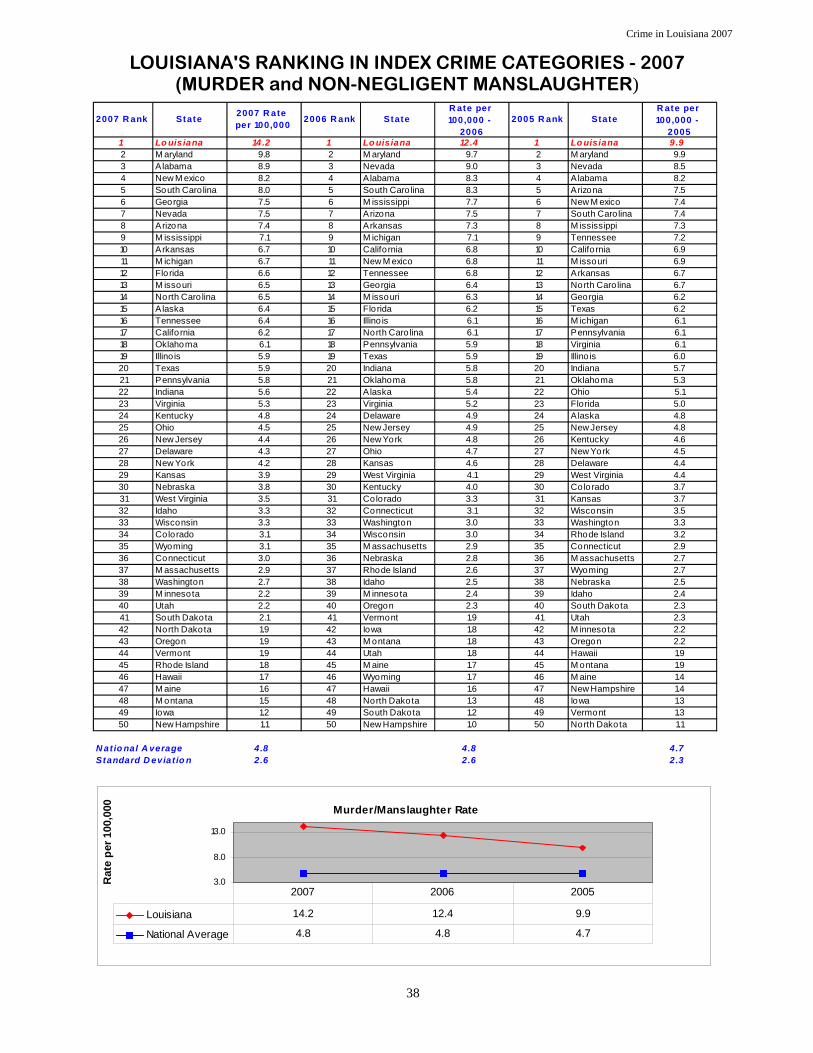
LOUISIANA'S RANKING IN INDEX CRIME CATEGORIES - 2007 (MURDER and NON-NEGLIGENT MANSLAUGHTER)
Crime in Louisiana 2007
2007 R ank State 2007 R ate per 100,000 2006 R ank State
R ate per 100,000 -
20062005 R ank State
R ate per 100,000 -
20051 Lo uisiana 14.2 1 Lo uisiana 12.4 1 Lo uisiana 9.92 M aryland 9.8 2 M aryland 9.7 2 M aryland 9.93 Alabama 8.9 3 Nevada 9.0 3 Nevada 8.54 New M exico 8.2 4 Alabama 8.3 4 Alabama 8.25 South Carolina 8.0 5 South Carolina 8.3 5 Arizona 7.56 Georgia 7.5 6 M ississippi 7.7 6 New M exico 7.47 Nevada 7.5 7 Arizona 7.5 7 South Carolina 7.48 Arizona 7.4 8 Arkansas 7.3 8 M ississippi 7.39 M ississippi 7.1 9 M ichigan 7.1 9 Tennessee 7.210 Arkansas 6.7 10 California 6.8 10 California 6.911 M ichigan 6.7 11 New M exico 6.8 11 M issouri 6.912 Florida 6.6 12 Tennessee 6.8 12 Arkansas 6.713 M issouri 6.5 13 Georgia 6.4 13 North Carolina 6.714 North Caro lina 6.5 14 M issouri 6.3 14 Georgia 6.215 Alaska 6.4 15 Florida 6.2 15 Texas 6.216 Tennessee 6.4 16 Illino is 6.1 16 M ichigan 6.117 Califo rnia 6.2 17 North Caro lina 6.1 17 Pennsylvania 6.118 Oklahoma 6.1 18 Pennsylvania 5.9 18 Virginia 6.119 Illino is 5.9 19 Texas 5.9 19 Illino is 6.020 Texas 5.9 20 Indiana 5.8 20 Indiana 5.721 Pennsylvania 5.8 21 Oklahoma 5.8 21 Oklahoma 5.322 Indiana 5.6 22 Alaska 5.4 22 Ohio 5.123 Virginia 5.3 23 Virginia 5.2 23 Florida 5.024 Kentucky 4.8 24 Delaware 4.9 24 Alaska 4.825 Ohio 4.5 25 New Jersey 4.9 25 New Jersey 4.826 New Jersey 4.4 26 New York 4.8 26 Kentucky 4.627 Delaware 4.3 27 Ohio 4.7 27 New York 4.528 New York 4.2 28 Kansas 4.6 28 Delaware 4.429 Kansas 3.9 29 West Virginia 4.1 29 West Virginia 4.430 Nebraska 3.8 30 Kentucky 4.0 30 Colorado 3.731 West Virginia 3.5 31 Colorado 3.3 31 Kansas 3.732 Idaho 3.3 32 Connecticut 3.1 32 Wisconsin 3.533 Wisconsin 3.3 33 Washington 3.0 33 Washington 3.334 Colorado 3.1 34 Wisconsin 3.0 34 Rhode Island 3.235 Wyoming 3.1 35 M assachusetts 2.9 35 Connecticut 2.936 Connecticut 3.0 36 Nebraska 2.8 36 M assachusetts 2.737 M assachusetts 2.9 37 Rhode Island 2.6 37 Wyoming 2.738 Washington 2.7 38 Idaho 2.5 38 Nebraska 2.539 M innesota 2.2 39 M innesota 2.4 39 Idaho 2.440 Utah 2.2 40 Oregon 2.3 40 South Dakota 2.341 South Dakota 2.1 41 Vermont 1.9 41 Utah 2.342 North Dakota 1.9 42 Iowa 1.8 42 M innesota 2.243 Oregon 1.9 43 M ontana 1.8 43 Oregon 2.244 Vermont 1.9 44 Utah 1.8 44 Hawaii 1.945 Rhode Island 1.8 45 M aine 1.7 45 M ontana 1.946 Hawaii 1.7 46 Wyoming 1.7 46 M aine 1.447 M aine 1.6 47 Hawaii 1.6 47 New Hampshire 1.448 M ontana 1.5 48 North Dakota 1.3 48 Iowa 1.349 Iowa 1.2 49 South Dakota 1.2 49 Vermont 1.350 New Hampshire 1.1 50 New Hampshire 1.0 50 North Dakota 1.1
N atio nal A verage 4.8 4.8 4.7Standard D eviat io n 2.6 2.6 2.3
Murder/Manslaughter Rate
3.0
8.0
13.0
Rat
e pe
r 100
,000
Louisiana 14.2 12.4 9.9
National Average 4.8 4.8 4.7
2007 2006 2005

39
LOUISIANA'S RANKING IN INDEX CRIME CATEGORIES - 2007 (FORCIBLE RAPE)
Crime in Louisiana 2007
2007 R ank State 2007 R ate per 100,000 2006 R ank State
R ate per 100,000 -
20062005 R ank State
R ate per 100,000 -
20051 Alaska 77.4 1 Alaska 76.0 1 Alaska 81.12 New M exico 52.4 2 New M exico 56.0 2 New M exico 54.13 M ichigan 45.5 3 M ichigan 52.2 3 M ichigan 51.34 Arkansas 44.7 4 Delaware 46.9 4 South Dakota 46.75 Kansas 44.3 5 Arkansas 46.5 5 Delaware 44.76 Oklahoma 43.1 6 Kansas 44.8 6 Washington 44.77 Nevada 42.7 7 Colorado 43.7 7 M innesota 44.08 Colorado 41.1 8 Nevada 43.2 8 Colorado 43.49 Washington 40.6 9 South Dakota 43.0 9 Arkansas 42.910 South Carolina 39.5 10 Washington 42.9 10 South Carolina 42.511 Delaware 38.9 11 Oklahoma 41.6 11 Nevada 42.112 Ohio 38.8 12 South Carolina 40.8 12 Oklahoma 41.713 South Dakota 38.7 13 Idaho 40.0 13 Idaho 40.414 Idaho 38.5 14 Ohio 39.6 14 Ohio 39.815 M innesota 36.0 15 Lo uisiana 36.4 15 M ississippi 39.316 M ississippi 35.6 16 Alabama 35.9 16 Kansas 38.417 Tennessee 35.3 17 Florida 35.8 17 Utah 37.318 Texas 35.3 18 Texas 35.6 18 Texas 37.219 Utah 34.3 19 Tennessee 35.5 19 Florida 37.120 Florida 33.7 20 M ississippi 34.4 20 Tennessee 36.421 Oregon 33.5 21 Utah 34.1 21 Oregon 34.822 Alabama 33.4 22 Oregon 32.3 22 Alabama 34.323 Kentucky 32.6 23 Illino is 31.8 23 Kentucky 34.0
24 Lo uisiana 32.4 24 M innesota 31.8 24 Arizona 33.825 North Dakota 32.4 25 Arizona 31.5 25 Illino is 33.726 Illino is 31.9 26 Nebraska 31.0 26 Nebraska 32.927 Wyoming 30.6 27 Kentucky 30.8 27 M ontana 32.228 Iowa 30.3 28 North Dakota 30.4 28 Lo uisiana 31.429 M ontana 30.3 29 M issouri 30.2 29 New Hampshire 30.930 M aine 29.7 30 Indiana 29.1 30 Rhode Island 29.831 Nebraska 29.7 31 M ontana 28.5 31 Indiana 29.632 Arizona 29.3 32 North Carolina 28.2 32 Pennsylvania 28.933 M issouri 29.2 33 Iowa 27.8 33 M issouri 28.034 Pennsylvania 27.7 34 Hawaii 27.6 34 Iowa 27.935 Indiana 27.5 35 Pennsylvania 27.3 35 M assachusetts 27.136 North Carolina 26.3 36 Wyoming 27.2 36 Hawaii 26.937 Hawaii 25.4 37 M assachusetts 27.1 37 North Carolina 26.538 M assachusetts 25.3 38 Rhode Island 26.7 38 California 26.039 New Hampshire 25.3 39 New Hampshire 26.2 39 M aine 24.740 California 24.7 40 M aine 25.7 40 North Dakota 24.241 Rhode Island 24.2 41 California 25.3 41 Wyoming 24.042 Georgia 22.8 42 Vermont 24.0 42 Georgia 23.643 Virginia 22.6 43 Virginia 23.4 43 Vermont 23.344 Wisconsin 21.8 44 Georgia 23.2 44 Virginia 22.745 M aryland 21.0 45 West Virginia 21.4 45 M aryland 22.646 West Virginia 20.4 46 M aryland 21.0 46 Wisconsin 20.647 Vermont 19.8 47 Wisconsin 20.4 47 Connecticut 20.048 Connecticut 18.8 48 Connecticut 18.1 48 New York 18.949 New York 15.2 49 New York 16.4 49 West Virginia 17.750 New Jersey 12.1 50 New Jersey 14.2 50 New Jersey 13.9
N atio nal A verage 32.5 33.3 33.8Standard D eviat io n 10.5 10.9 11.3
Forcible Rape Index
31.033.035.037.0
Year
Rat
e pe
r 100
,000
Louisiana 32.4 36.4 34.0
National Average 32.5 33.3 33.8
2007 2006 2005

40
LOUISIANA'S RANKING IN INDEX CRIME CATEGORIES - 2007 (ROBBERY)
Crime in Louisiana 2007
2007 R ank State 2007 R ate per 100,000 2006 R ank State
R ate per 100,000 -
20062005 R ank State
R ate per 100,000 -
20051 Nevada 270.2 1 Nevada 281.6 1 M aryland 256.72 M aryland 236.0 2 M aryland 256.0 2 Nevada 194.73 Florida 209.1 3 Delaware 203.3 3 New York 182.74 Delaware 197.3 4 California 194.7 4 Illino is 181.75 California 193.0 5 Florida 188.8 5 California 176.16 Georgia 181.7 6 Illino is 185.3 6 Florida 169.47 Illinois 179.7 7 Tennessee 184.3 7 Tennessee 167.38 Tennessee 179.0 8 New York 178.6 8 Ohio 163.19 Texas 162.2 9 Pennsylvania 168.6 9 Texas 156.610 New York 161.1 10 Ohio 166.8 10 Delaware 154.811 Alabama 159.9 11 Georgia 165.6 11 Georgia 154.812 Ohio 159.2 12 Texas 158.5 12 Pennsylvania 154.613 Pennsylvania 156.5 13 Alabama 153.5 13 New Jersey 151.614 Arizona 151.7 14 New Jersey 153.1 14 North Carolina 145.515 North Carolina 149.5 15 North Carolina 152.2 15 Arizona 144.4
16 New Jersey 144.5 16 Arizona 149.6 16 Alabama 141.117 South Carolina 144.0 17 M ichigan 140.7 17 South Carolina 132.1
18 Lo uisiana 141.7 18 South Carolina 136.5 18 M ichigan 131.819 M ichigan 133.2 19 Lo uisiana 133.6 19 M issouri 124.120 Indiana 124.1 20 M issouri 129.9 20 M assachusetts 119.021 M issouri 121.9 21 M assachusetts 125.0 21 Lo uisiana 118.022 New M exico 117.8 22 Connecticut 121.0 22 Connecticut 113.023 M assachusetts 108.6 23 Indiana 114.7 23 Indiana 108.624 Arkansas 106.7 24 New M exico 107.7 24 Virginia 99.225 Connecticut 103.0 25 M ississippi 107.1 25 New M exico 98.726 Virginia 99.2 26 M innesota 105.1 26 Washington 92.127 M ississippi 98.2 27 Virginia 101.4 27 M innesota 92.028 Wisconsin 97.7 28 Wisconsin 100.2 28 Arkansas 91.129 Kentucky 95.9 29 Washington 100.1 29 Oklahoma 91.030 Washington 93.6 30 Arkansas 98.4 30 Kentucky 88.431 Oklahoma 93.2 31 Alaska 90.3 31 Colorado 84.632 M innesota 91.8 32 Hawaii 88.9 32 M ississippi 82.333 Hawaii 86.1 33 Oklahoma 87.5 33 Wisconsin 82.234 Alaska 85.3 34 Kentucky 86.2 34 Alaska 80.935 Oregon 76.4 35 Colorado 80.7 35 Hawaii 78.536 Kansas 72.6 36 Oregon 72.7 36 Rhode Island 72.137 Colorado 71.0 37 Rhode Island 68.8 37 Oregon 68.138 Rhode Island 71.0 38 Kansas 67.9 38 Kansas 65.339 Nebraska 62.4 39 Nebraska 63.8 39 Nebraska 59.140 Utah 53.7 40 Utah 48.8 40 West Virginia 44.641 West Virginia 47.0 41 West Virginia 46.9 41 Utah 44.342 Iowa 43.9 42 Iowa 43.5 42 Iowa 38.943 New Hampshire 32.8 43 New Hampshire 32.2 43 New Hampshire 27.444 M aine 26.5 44 M aine 29.1 44 M aine 24.445 M ontana 19.9 45 Idaho 20.5 45 M ontana 18.946 Wyoming 16.1 46 Vermont 17.6 46 Idaho 18.647 Idaho 15.5 47 M ontana 17.4 47 South Dakota 18.648 South Dakota 14.1 48 South Dakota 15.2 48 Wyoming 15.349 Vermont 12.9 49 Wyoming 14.0 49 Vermont 11.750 North Dakota 10.9 50 North Dakota 11.3 50 North Dakota 7.4
N atio nal A verage 109.6 111.3 102.7Standard D eviat io n 61.6 63.1 56.7
Robbery Index
75.0
100.0
125.0
150.0
Year
Rat
e pe
r 100
,000
Louisiana 141.7 133.6 118.0
National Average 109.6 111.3 102.7
2007 2006 2005

41
LOUISIANA'S RANKING IN INDEX CRIME CATEGORIES - 2007 (AGGRAVATED ASSAULT)
Crime in Louisiana 2007
2007 R ank State 2007 R ate per 1000,000 2006 R ank State
R ate per 100,000 -
20062005 R ank State
R ate per 100,000 -
20051 South Carolina 596.9 1 South Carolina 579.9 1 South Carolina 579.0
2 Lo uisiana 541.2 2 Tennessee 533.7 2 New M exico 541.93 Tennessee 532.5 3 Alaska 516.4 3 Tennessee 541.94 Alaska 492.0 4 Lo uisiana 515.4 4 Florida 496.65 New M exico 485.8 5 Florida 481.2 5 Alaska 465.16 Florida 473.2 6 New M exico 472.8 6 Lo uisiana 435.17 Delaware 448.8 7 Delaware 426.5 7 Delaware 428.28 Nevada 430.2 8 Nevada 407.8 8 M aryland 413.89 M aryland 375.1 9 Arkansas 399.4 9 Arkansas 386.810 Arkansas 371.2 10 M aryland 392.0 10 Oklahoma 370.511 Oklahoma 357.1 11 M issouri 379.3 11 M issouri 366.412 M ichigan 350.7 12 Oklahoma 362.5 12 M ichigan 362.913 M issouri 347.3 13 M ichigan 362.4 13 Nevada 361.514 Kansas 331.8 14 Illinois 318.4 14 Illino is 330.215 Illino is 315.7 15 Texas 316.4 15 Texas 329.816 Texas 307.2 16 Arizona 312.7 16 Arizona 327.417 California 298.8 17 Kansas 307.7 17 California 317.318 M assachusetts 294.7 18 California 305.7 18 M assachusetts 308.119 Arizona 294.3 19 M assachusetts 292.1 19 North Carolina 289.420 North Carolina 284.1 20 North Carolina 289.1 20 Kansas 280.021 Georgia 281.2 21 Georgia 275.8 21 Colorado 264.722 Alabama 245.8 22 Colorado 264.0 22 Georgia 264.323 M ontana 235.8 23 Pennsylvania 237.6 23 Alabama 247.824 New York 233.7 24 New York 235.1 24 New York 239.725 Colorado 232.5 25 Alabama 227.6 25 Pennsylvania 235.026 Pennsylvania 226.4 26 Iowa 210.4 26 M ontana 228.527 Iowa 219.2 27 West Virginia 207.3 27 Iowa 223.328 Nebraska 206.5 28 M ontana 206.1 28 West Virginia 206.129 West Virginia 204.3 29 Washington 199.8 29 Washington 205.830 Washington 196.2 30 Wyoming 196.7 30 Idaho 195.431 Wyoming 189.5 31 Idaho 184.2 31 Nebraska 192.532 Idaho 182.0 32 Nebraska 184.1 32 Wyoming 188.133 Indiana 176.4 33 New Jersey 179.4 33 New Jersey 184.434 Oregon 175.8 34 Oregon 173.0 34 Oregon 181.835 New Jersey 168.3 35 M innesota 172.6 35 Indiana 179.936 Wisconsin 168.1 36 Indiana 165.2 36 M innesota 158.737 Kentucky 161.7 37 Hawaii 163.0 37 Virginia 154.838 Hawaii 159.6 38 Wisconsin 160.6 38 M ississippi 149.439 M innesota 158.6 39 Virginia 152.1 39 Hawaii 147.840 M ississippi 150.3 40 M ississippi 149.5 40 Rhode Island 146.141 Utah 144.6 41 Kentucky 142.0 41 Ohio 143.442 Virginia 142.6 42 Utah 139.7 42 Utah 143.443 Ohio 140.7 43 Ohio 139.2 43 Kentucky 139.844 Connecticut 131.2 44 Connecticut 138.6 44 Connecticut 138.645 Rhode Island 130.3 45 Rhode Island 129.4 45 Wisconsin 135.246 South Dakota 114.3 46 South Dakota 112.0 46 South Dakota 108.147 North Dakota 97.2 47 Vermont 93.0 47 Vermont 83.548 Vermont 89.7 48 North Dakota 84.9 48 New Hampshire 72.349 New Hampshire 78.0 49 New Hampshire 79.4 49 North Dakota 65.550 M aine 60.2 50 M aine 59.0 50 M aine 61.7
N at io nal A verage 260.6 260.7 260.4Standard D eviat io n 132.0 132.0 131.3
Aggravated Assault Index
225.0
325.0
425.0
525.0
Year
Rat
e pe
r 100
,000
Louisiana 541.2 515.4 435.1
National Average 260.6 260.7 260.4
2007 2006 2005

42
LOUISIANA'S RANKING IN INDEX CRIME CATEGORIES - 2007 (PROPERTY CRIME)
Crime in Louisiana 2007
2007 R ank State2007 C rime
R ate per 100,000
2006 R ank StateC rime R ate
per 100,000 - 2006
2005 R ank StateR ate per 100,000 -
20051 Arizona 4,414.0 1 Arizona 4,627.9 1 Washington 4,893.02 South Carolina 4,271.7 2 Washington 4,480.0 2 Arizona 4,838.03 Hawaii 4,225.4 3 South Carolina 4,242.3 3 Hawaii 4,792.64 Texas 4,121.2 4 Hawaii 4,230.4 4 Oregon 4,399.85 Florida 4,089.3 5 Tennessee 4,128.3 5 South Carolina 4,339.46 Tennessee 4,088.6 6 North Carolina 4,120.8 6 Texas 4,332.07 North Carolina 4,087.3 7 Nevada 4,088.8 7 Tennessee 4,275.5
8 Lo uisiana 4,076.0 8 Texas 4,081.5 8 Nevada 4,241.59 Washington 4,030.8 9 Lo uisiana 3,993.7 9 Georgia 4,172.310 Alabama 3,971.6 10 Florida 3,986.1 10 New M exico 4,148.311 Arkansas 3,953.1 11 Arkansas 3,967.5 11 North Carolina 4,075.112 Georgia 3,901.0 12 New M exico 3,937.2 12 Arkansas 4,057.913 Nevada 3,777.8 13 Alabama 3,936.1 13 Oklahoma 4,042.014 M issouri 3,738.4 14 Georgia 3,889.2 14 Colorado 4,039.515 New M exico 3,725.7 15 M issouri 3,826.5 15 Florida 4,007.916 Kansas 3,678.7 16 Kansas 3,750.2 16 M issouri 3,927.517 Oregon 3,562.2 17 Ohio 3,678.6 17 Alabama 3,892.118 Oklahoma 3,526.4 18 Oregon 3,672.1 18 Utah 3,868.919 Utah 3,500.3 19 Alaska 3,604.9 19 Kansas 3,787.020 Ohio 3,455.2 20 Oklahoma 3,604.2 20 Lo uisiana 3,683.121 M aryland 3,431.5 21 Utah 3,516.4 21 Ohio 3,662.722 Indiana 3,396.6 22 Indiana 3,502.4 22 Alaska 3,612.523 Alaska 3,379.5 23 M aryland 3,480.9 23 M aryland 3,544.124 Delaware 3,370.1 24 Colorado 3,451.3 24 Indiana 3,456.325 M ississippi 3,200.8 25 Delaware 3,417.9 25 Nebraska 3,423.226 Nebraska 3,161.4 26 Nebraska 3,340.7 26 California 3,322.627 M ichigan 3,065.7 27 M ichigan 3,212.8 27 M ississippi 3,260.128 M innesota 3,036.6 28 M ississippi 3,208.8 28 Wyoming 3,155.329 California 3,033.0 29 California 3,170.9 29 M ontana 3,142.930 Colorado 3,006.1 30 M innesota 3,079.5 30 Delaware 3,111.431 Illinois 2,935.8 31 Illinois 3,019.6 31 M ichigan 3,091.132 Wyoming 2,865.9 32 Wyoming 2,980.6 32 M innesota 3,084.133 Wisconsin 2,837.7 33 Wisconsin 2,817.8 33 Illinois 3,080.334 M ontana 2,765.4 34 Iowa 2,802.7 34 Iowa 2,833.735 Rhode Island 2,622.6 35 M ontana 2,687.5 35 Rhode Island 2,718.936 Iowa 2,615.6 36 West Virginia 2,621.5 36 Idaho 2,697.937 West Virginia 2,525.0 37 Rhode Island 2,586.9 37 Wisconsin 2,660.238 Kentucky 2,518.3 38 Kentucky 2,544.5 38 Virginia 2,638.239 Virginia 2,466.4 39 M aine 2,518.7 39 West Virginia 2,625.240 M aine 2,428.8 40 Connecticut 2,504.1 40 Connecticut 2,558.041 Connecticut 2,399.9 41 Virginia 2,478.2 41 Kentucky 2,530.542 M assachusetts 2,391.5 42 Pennsylvania 2,443.5 42 Pennsylvania 2,417.243 Pennsylvania 2,361.3 43 Idaho 2,418.8 43 M aine 2,413.144 Vermont 2,322.7 44 M assachusetts 2,391.0 44 M assachusetts 2,363.645 Idaho 2,246.6 45 Vermont 2,304.7 45 New Jersey 2,333.046 New Jersey 2,213.1 46 New Jersey 2,291.9 46 Vermont 2,280.747 New York 1,978.6 47 New York 2,052.7 47 New York 2,108.548 New Hampshire 1,892.0 48 North Dakota 2,000.3 48 North Dakota 1,978.249 North Dakota 1,889.6 49 New Hampshire 1,874.1 49 New Hampshire 1,796.450 South Dakota 1,652.3 50 South Dakota 1,619.6 50 South Dakota 1,776.4
N atio nal A verage 3,164.1 3,243.7 3,349.8Standard D eviatio n 733.7 748.7 824.4
Property Crime Index
3,000.0
3,500.0
4,000.0
4,500.0
Year
Rat
e pe
r 100
,000
Louisiana 4,076.0 3,993.7 3,683.1
National Average 3,164.1 3,243.7 3,349.8
2007 2006 2005

LOUISIANA'S RANKING IN INDEX CRIME CATEGORIES - 2007 (BURGLARY)
43
Crime in Louisiana 2007
2007 R ank State 2007 Rate per 100,000 2006 R ank State
R ate per 100,000 -
20062005 R ank State
R ate per 100,000 -
20051 North Carolina 1,200.7 1 North Carolina 1,212.7 1 North Carolina 1,201.12 Arkansas 1,131.4 2 Arkansas 1,139.9 2 New M exico 1,093.9
3 Lo uisiana 1,038.9 3 New M exico 1,069.7 3 Arkansas 1,084.64 South Carolina 1,025.8 4 Lo uisiana 1,049.2 4 Tennessee 1,026.95 Tennessee 1,002.4 5 Tennessee 1,040.9 5 Oklahoma 1,006.06 Florida 996.3 6 Nevada 994.6 6 South Carolina 1,000.97 Alabama 979.5 7 South Carolina 989.8 7 Nevada 972.48 Nevada 968.3 8 Alabama 969.1 8 Texas 961.69 New M exico 964.1 9 Oklahoma 960.5 9 Washington 959.710 M ississippi 957.9 10 Florida 944.6 10 Alabama 953.811 Texas 955.1 11 M ississippi 935.9 11 Arizona 948.412 Georgia 950.2 12 Arizona 925.3 12 Georgia 931.013 Oklahoma 943.3 13 Texas 917.3 13 Florida 926.314 Arizona 912.2 14 Washington 911.6 14 M ississippi 919.715 Ohio 859.1 15 Ohio 909.8 15 Ohio 872.816 Washington 814.8 16 Georgia 909.0 16 Lo uisiana 870.617 M ichigan 748.9 17 M issouri 764.1 17 Hawaii 767.918 Indiana 739.4 18 M ichigan 753.9 18 Oregon 758.619 M issouri 739.1 19 Indiana 731.3 19 Colorado 744.820 Delaware 733.3 20 Delaware 725.2 20 M issouri 738.321 Kansas 729.9 21 Kansas 723.3 21 Indiana 697.622 Hawaii 708.8 22 Colorado 682.1 22 M ichigan 696.823 M aryland 660.2 23 Hawaii 677.5 23 California 693.324 Kentucky 652.7 24 California 676.0 24 Kansas 689.225 California 648.4 25 M aryland 667.0 25 Delaware 688.926 Oregon 609.0 26 Oregon 645.2 26 M aryland 641.427 West Virginia 596.8 27 Kentucky 644.8 27 Kentucky 634.028 Colorado 591.4 28 West Virginia 634.1 28 Alaska 622.529 Illinois 587.6 29 Alaska 617.3 29 West Virginia 621.230 Utah 587.5 30 Iowa 604.2 30 Illinois 606.931 M innesota 570.8 31 Illinois 602.1 31 Iowa 606.432 Iowa 567.0 32 M innesota 583.9 32 Utah 606.233 M assachusetts 552.9 33 Utah 576.5 33 M innesota 578.934 Alaska 538.7 34 M assachusetts 546.5 34 Idaho 564.435 Nebraska 509.8 35 Nebraska 534.5 35 M assachusetts 541.136 M aine 506.8 36 Vermont 528.9 36 Nebraska 532.437 Vermont 500.0 37 Idaho 513.2 37 Rhode Island 494.238 Wisconsin 497.0 38 M aine 512.9 38 Vermont 491.839 Rhode Island 495.0 39 Rhode Island 507.2 39 M aine 478.540 Idaho 465.3 40 Wisconsin 485.8 40 Wyoming 476.341 Pennsylvania 450.6 41 Pennsylvania 463.2 41 Pennsylvania 451.642 Wyoming 449.1 42 New Jersey 452.0 42 New Jersey 447.143 Connecticut 432.9 43 Wyoming 450.5 43 Wisconsin 440.844 New Jersey 431.5 44 Connecticut 419.3 44 Connecticut 437.145 Virginia 410.9 45 Virginia 417.6 45 Virginia 392.146 New Hampshire 378.9 46 North Dakota 376.3 46 M ontana 389.247 North Dakota 338.3 47 New York 355.1 47 New Hampshire 371.048 New York 336.1 48 South Dakota 338.9 48 New York 353.349 M ontana 316.0 49 New Hampshire 331.4 49 South Dakota 324.450 South Dakota 298.7 50 M ontana 310.7 50 North Dakota 311.9
N atio nal Average 681.6 694.6 692.4Standard D eviat io n 237.0 235.6 232.1
Burglary Index
500.0
700.0
900.0
1,100.0
Year
Rat
e pe
r 100
,000
Louisiana 1,038.9 1,049.2 870.6
National Average 681.6 694.6 692.4
2007 2006 2005

LOUISIANA'S RANKING IN INDEX CRIME CATEGORIES - 2007 (LARCENY-THEFT)
44
Crime in Louisiana 2007
2007 R ank State 2007 R ate per 100,000 2006 Rank State
R ate per 100,000 -
20062005 R ank State
R ate per 100,000 -
20051 Hawaii 2,993.3 1 Hawaii 2,949.1 1 Hawaii 3,308.42 South Carolina 2,859.6 2 South Carolina 2,873.0 2 Washington 3,149.53 Texas 2,773.3 3 Washington 2,850.7 3 Oregon 3,112.24 Arizona 2,738.4 4 Arizona 2,813.1 4 Arizona 2,965.25 Tennessee 2,734.4 5 Texas 2,758.2 5 Texas 2,961.76 Florida 2,689.4 6 Tennessee 2,713.2 6 South Carolina 2,954.17 Alabama 2,684.6 7 Kansas 2,712.0 7 Utah 2,918.8
8 Lo uisiana 2,683.5 8 Alabama 2,644.3 8 Tennessee 2,828.19 Kansas 2,640.2 9 Oregon 2,636.1 9 Kansas 2,758.110 Washington 2,634.4 10 M issouri 2,627.0 10 Georgia 2,751.111 M issouri 2,594.7 11 Florida 2,619.0 11 M issouri 2,746.212 Utah 2,579.7 12 Utah 2,614.5 12 Colorado 2,735.213 North Carolina 2,577.9 13 Alaska 2,610.2 13 Arkansas 2,711.214 Arkansas 2,574.4 14 Lo uisiana 2,579.7 14 Florida 2,658.315 Oregon 2,529.0 15 North Carolina 2,567.9 15 Alabama 2,650.016 Georgia 2,504.6 16 Arkansas 2,562.1 16 Oklahoma 2,644.217 Alaska 2,487.0 17 Nebraska 2,521.3 17 New M exico 2,639.918 Delaware 2,369.0 18 Georgia 2,519.3 18 Alaska 2,599.119 Nebraska 2,358.6 19 Ohio 2,442.8 19 Nebraska 2,574.320 Indiana 2,349.0 20 Indiana 2,424.8 20 North Carolina 2,546.221 New M exico 2,307.9 21 New M exico 2,395.5 21 M ontana 2,543.022 Ohio 2,301.6 22 Wyoming 2,379.4 22 Wyoming 2,533.923 M ontana 2,266.2 23 Colorado 2,331.8 23 Lo uisiana 2,494.524 M aryland 2,265.9 24 Oklahoma 2,270.5 24 Ohio 2,429.025 Wyoming 2,264.6 25 M aryland 2,270.4 25 Indiana 2,412.026 M innesota 2,224.7 26 M innesota 2,236.6 26 M aryland 2,294.327 Oklahoma 2,211.1 27 M ontana 2,191.8 27 M innesota 2,226.928 Wisconsin 2,100.9 28 Illinois 2,124.2 28 Illinois 2,164.829 Illinois 2,084.5 29 Wisconsin 2,079.5 29 Nevada 2,153.930 Colorado 2,069.3 30 Iowa 2,030.7 30 Delaware 2,144.031 M ississippi 1,990.0 31 Nevada 2,013.8 31 M ississippi 2,083.932 Nevada 1,939.1 32 M ississippi 1,986.1 32 Iowa 2,042.733 M ichigan 1,898.3 33 M ichigan 1,963.5 33 Virginia 2,035.034 Iowa 1,885.1 34 M aine 1,904.3 34 Wisconsin 1,992.835 Virginia 1,873.3 35 Virginia 1,866.8 35 Idaho 1,931.736 M aine 1,826.4 36 California 1,829.1 36 M ichigan 1,917.837 Rhode Island 1,822.7 37 Connecticut 1,788.4 37 California 1,916.538 California 1,784.4 38 West Virginia 1,771.8 38 M aine 1,832.639 West Virginia 1,735.5 39 Rhode Island 1,744.2 39 Connecticut 1,824.140 Vermont 1,719.6 40 Pennsylvania 1,742.9 40 Rhode Island 1,816.041 Connecticut 1,705.2 41 Idaho 1,740.0 41 West Virginia 1,794.042 Pennsylvania 1,697.9 42 Vermont 1,681.8 42 Pennsylvania 1,729.143 Kentucky 1,661.1 43 Kentucky 1,679.9 43 Vermont 1,686.144 Idaho 1,632.8 44 M assachusetts 1,565.4 44 Kentucky 1,685.845 M assachusetts 1,606.1 45 New Jersey 1,556.5 45 New York 1,569.646 New Jersey 1,528.8 46 New York 1,531.1 46 New Jersey 1,568.447 New York 1,497.2 47 North Dakota 1,464.8 47 M assachusetts 1,527.448 New Hampshire 1,414.4 48 New Hampshire 1,434.5 48 North Dakota 1,500.349 North Dakota 1,408.4 49 Delaware 1,362.8 48 New Hampshire 1,377.350 South Dakota 1,261.3 50 South Dakota 1,188.9 50 South Dakota 1,343.7
N atio nal Average 2,166.8 2,183.3 2,295.7Standard D eviat io n 444.2 462.6 511.7
Larceny Theft Index
2,000.0
2,500.0
3,000.0
Year
Rat
e pe
r 100
,000
Louisiana 2,683.5 2,579.7 2,494.5
National Average 2,166.8 2,183.3 2,295.7
2007 2006 2005

45
LOUISIANA'S RANKING IN INDEX CRIME CATEGORIES - 2007 (MOTOR VEHICLE THEFT)
Crime in Louisiana 2007
2007 Rank State 2007 Rate per 100,000 2006 Rank State
Rate per 100,000 -
20062005 Rank State
Rate per 100,000 -
20051 Nevada 870.5 1 Nevada 1,080.4 1 Nevada 1,115.22 Arizona 763.4 2 Arizona 889.5 2 Arizona 924.43 California 600.2 3 Washington 717.6 3 Washington 783.94 Washington 581.6 4 California 665.7 4 Hawaii 716.45 Hawaii 523.2 5 Hawaii 603.9 5 California 712.86 Maryland 505.4 6 Maryland 543.5 6 Maryland 608.47 New Mexico 453.8 7 Michigan 495.4 7 Colorado 559.58 Georgia 446.3 8 New Mexico 472.0 8 Oregon 529.09 Michigan 418.5 9 Georgia 460.9 9 Georgia 490.210 Missouri 404.6 10 Colorado 437.5 10 Michigan 476.511 Florida 403.6 11 Missouri 435.3 11 Missouri 443.112 Texas 392.8 12 Florida 422.5 12 Florida 423.313 Oregon 388.2 13 Texas 405.9 13 Tennessee 420.614 South Carolina 386.3 14 Oregon 390.7 14 New Mexico 414.515 Oklahoma 372.1 15 South Carolina 379.6 15 Rhode Island 408.716 Alaska 353.8 16 Alaska 377.4 16 Texas 408.7
17 Lo uisiana 353.6 17 Tennessee 374.1 17 Oklahoma 391.818 Tennessee 351.8 18 Oklahoma 373.2 18 Alaska 391.019 Colorado 345.4 19 Lo uisiana 364.8 19 South Carolina 384.420 Utah 333.1 20 Indiana 346.3 20 Ohio 360.921 North Carolina 308.6 21 North Carolina 340.2 21 Indiana 346.722 Kansas 308.5 22 Rhode Island 335.5 22 Utah 343.923 Indiana 308.2 23 Delaware 329.9 23 Kansas 339.624 Alabama 307.5 24 Ohio 326.1 24 North Carolina 327.825 Rhode Island 305.0 25 Utah 325.4 25 Lo uisiana 318.126 Ohio 294.6 26 Alabama 322.7 26 New Jersey 317.527 Nebraska 293.1 27 Kansas 314.9 27 Nebraska 316.528 Delaware 267.8 28 Connecticut 296.4 28 Illinois 308.629 Illinois 263.7 29 Illinois 293.3 29 Connecticut 296.830 Connecticut 261.7 30 Mississippi 286.8 30 Massachusetts 295.131 Mississippi 252.9 31 Nebraska 284.9 31 Alabama 288.332 New Jersey 252.7 32 New Jersey 283.4 32 Delaware 278.533 Arkansas 247.3 33 Massachusetts 279.0 33 Minnesota 278.234 Minnesota 241.0 34 Arkansas 265.5 34 Arkansas 262.135 Wisconsin 239.8 35 Minnesota 258.9 35 Mississippi 256.536 Massachusetts 232.4 36 Wisconsin 252.5 36 Pennsylvania 236.537 Pennsylvania 212.8 37 Pennsylvania 237.4 37 Wisconsin 226.638 Kentucky 204.5 38 Kentucky 219.8 38 Virginia 211.139 West Virginia 192.7 39 West Virginia 215.6 39 Kentucky 210.840 Montana 183.2 40 Virginia 193.8 40 Montana 210.741 Virginia 182.2 41 Montana 185.0 41 West Virginia 210.042 Iowa 163.5 42 Iowa 167.9 42 Idaho 201.843 Wyoming 152.2 43 New York 166.4 43 New York 185.644 Idaho 148.5 44 Idaho 165.6 44 Iowa 184.645 New York 145.3 45 North Dakota 159.2 45 North Dakota 166.046 North Dakota 142.9 46 Wyoming 150.7 46 Wyoming 145.147 Vermont 103.2 47 New Hampshire 108.1 47 South Dakota 108.448 New Hampshire 98.7 48 Maine 101.4 48 Vermont 102.949 Maine 95.6 49 Vermont 93.9 48 New Hampshire 102.150 South Dakota 92.3 50 South Dakota 91.8 50 Maine 102.0
Natio nal Average 315.0 345.8 362.8Standard D eviatio n 159.2 190.7 205.8
Motor Vehicle Theft Rate
300.0
320.0
340.0
360.0
380.0
Year
Rat
e pe
r 100
,000
Louisiana 353.6 364.8 318.1
National Average 315.0 345.8 362.8
2007 2006 2005
LOUISIANA’S INDEX CRIME TREND OVER TEN YEARS
The following tables and charts show trends in index crime in Louisiana over the years of 1998 through 2007. Tables and charts including both numbers of index crimes and crime rates are included and are followed by tables and charts showing trends in violent and nonviolent crimes.
46
Crime in Louisiana 2007

LOUISIANA INDEX CRIME TREND OVER 10 YEARS
1998 – 2007 .
YEAR POPULATION OFFENSES CRIME RATE
1998 4,369,000 266,435 6,098.3
1999 4,372,000 251,252 5,746.8
2000 4,468,976 242,344 5,422.8
2001 4,465,430 238,371 5,338.1
2002 4,465,430 228,528 5,098.1
2003 4,496,334 224,631 4,995.9
2004 4,515,770 227,997 5,048.9
2005 4,523,628 193,500 4,277.5
2006 4,287,768 201,158 4,691.4
2007 4,293,204 206,308 4,805.5
47
Crime in Louisiana 2007

Offense Trend of Index Crimes Over 10 Years
48
150000
170000
190000
210000
230000
250000
270000
290000
1998 1999 2000 2001 2002 2003 2004 2005 2006 2007
Crime in Louisiana 2007
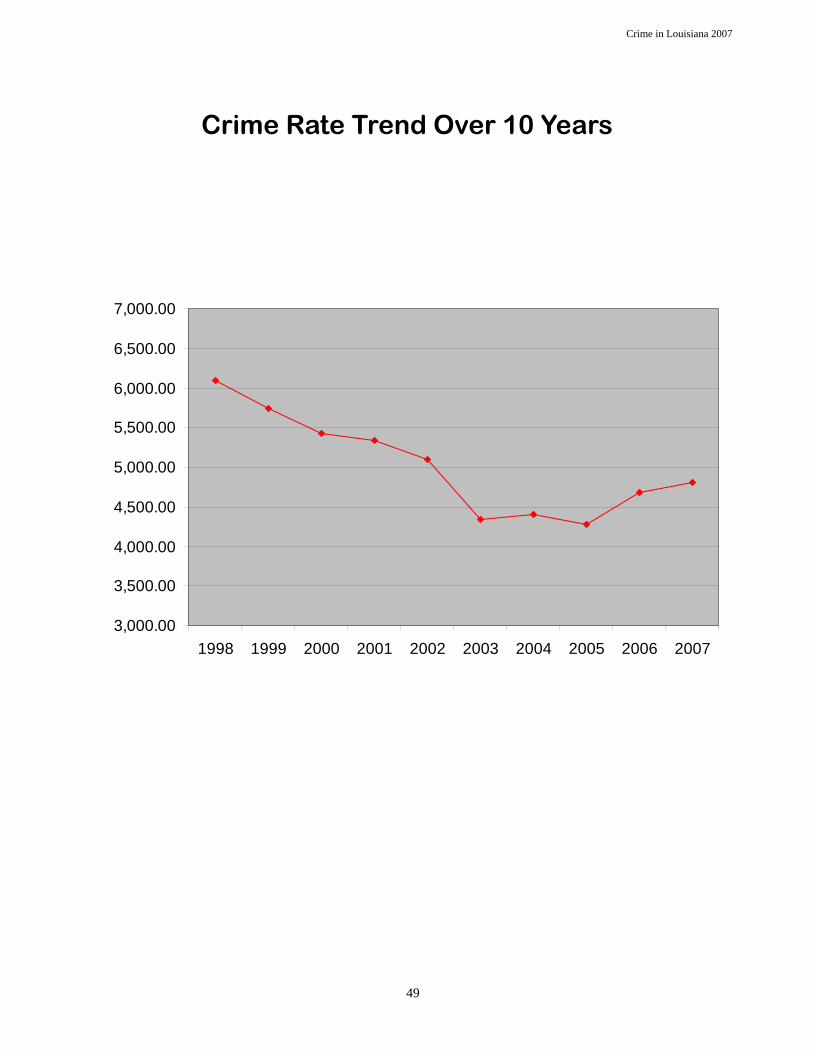
Crime Rate Trend Over 10 Years
3,000.00
3,500.00
4,000.00
4,500.00
5,000.00
5,500.00
6,000.00
6,500.00
7,000.00
1998 1999 2000 2001 2002 2003 2004 2005 2006 2007
49
Crime in Louisiana 2007

LOUISIANA VIOLENT CRIME BASED ON NUMBER OF OFFENSES
1998 - 2007
YEAR OFFENSES TOTAL
Murder/Non-
Negligent Manslaughter
Forcible Rape Robbery Aggravated
Assault
Violent Crime
Offenses
1998 560 1,609 8,651 23,237 34,057
1999 468 1,448 7,591 22,526 32,033
2000 560 1,497 7,532 20,851 30,440
2001 501 1,403 7,864 20,910 30,678
2002 593 1,529 7,123 20,445 29,690
2003 586 1,849 7,069 19,558 29,062
2004 574 1,616 6,564 20,090 28,844
2005 450 1,421 5,337 19,681 26,889
2006 530 1,562 5,729 22,098 29,919
2007 608 1,393 6,083 23,233 31,317
50
Crime in Louisiana 2007
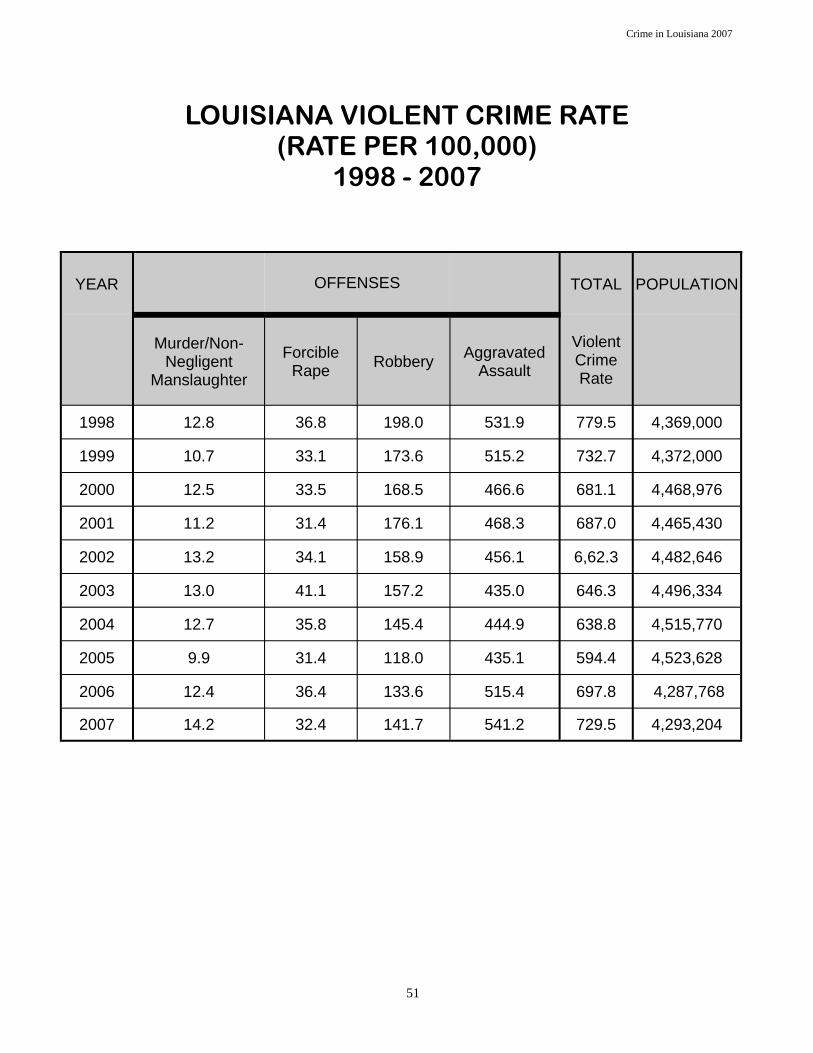
LOUISIANA VIOLENT CRIME RATE (RATE PER 100,000)
1998 - 2007
YEAR OFFENSES TOTAL
Murder/Non-
Negligent Manslaughter
Forcible Rape Robbery Aggravated
Assault
Violent Crime Rate
1998 12.8 36.8 198.0 531.9 779.5
1999 10.7 33.1 173.6 515.2 732.7
2000 12.5 33.5 168.5 466.6 681.1
2001 11.2 31.4 176.1 468.3 687.0
2002 13.2 34.1 158.9 456.1 6,62.3
2003 13.0 41.1 157.2 435.0 646.3
2004 12.7 35.8 145.4 444.9 638.8
2005 9.9 31.4 118.0 435.1 594.4
2006 12.4 36.4 133.6 515.4 697.8
2007 14.2 32.4 141.7 541.2 729.5
POPULATION
4,369,000
4,372,000
4,468,976
4,465,430
4,482,646
4,496,334
4,515,770
4,523,628
4,287,768
4,293,204
51
Crime in Louisiana 2007

LOUISIANA NON-VIOLENT CRIME BASED ON NUMBER OF OFFENSES
1998 - 2007
YEAR OFFENSES TOTAL
Burglary Larceny-Theft Motor Vehicle Theft
Nonviolent Crime
Offenses
1998 51,210 157,507 23,661 232,378
1999 47,775 149,749 21,695 219,219
2000 46,289 144,345 21,270 211,904
2001 46,451 139,555 21,687 207,693
2002 45,350 133,302 20,186 198,838
2003 44,877 130,810 19,882 195,569
2004 45,359 134,080 19,714 199,153
2005 39,382 112,840 14,389 166,611
2006 44,986 110,613 15,640 171,239
2007 44,602 115,209 15,180 174,991
52
Crime in Louisiana 2007

LOUISIANA NON-VIOLENT CRIME RATE (RATE PER 100,000)
1998 - 2007
YEAR OFFENSES TOTAL
POPULATION
Burglary Larceny-Theft Motor
Vehicle Theft
Nonviolent Crime Rate
1998 1,172.1 3,605.1 541.6 5,318.8 4,369,000
1999 1,092.7 3,425.2 496.2 5,014.2 4,372,000
2000 1,035.8 3,229.9 475.9 4,741.7 4,468,976
2001 1,040.2 3,125.2 485.7 4,651.1 4,465,430
2002 1,011.7 2,973.7 450.3 4,435.7 4,482,646
2003 998.1 2,909.3 442.2 4,349.5 4,496,334
2004 1,004.5 2969.2 436.6 4,410.3 4,515,770
2005 870.6 2,494.5 318.1 3,683.2 4,523,628
2006 1,049.2 2,579.7 364.8 3,993.7 4,287,768
2007 1,038.9 2,683.5 353.6 4,076.0 4,293,204
53
Crime in Louisiana 2007
LOUISIANA ARREST DATA 2006 – 2007 The tables and charts that follow show arrests in Louisiana for 2006 and 2007. Figures are given for adult and juvenile arrests as well as total arrests. Charts are also included to show arrests for violent and non-violent crime.
54
Crime in Louisiana 2007

LOUISIANA ARREST DATA* 2006 - 2007
TOTAL ARRESTS
*When comparing offenses and arrest data, it should be understood that crimes relate to events and arrests relate to persons. A single crime may involve several criminals, several offenders and several victims. This arrest information is not complete; some agencies reported all twelve months of data, some only partial data and some agencies do not report any arrest data. Each year the number of agencies participating in the Uniform Crime Reporting Program changes. Due to the number of agencies reporting, comparing current data to prior years is not advisable.
OFFENSE 2006 2007
Murder and Non-Negligent Manslaughter 292 242
Forcible Rape 306 324
Robbery 953 1,119
Aggravated Assault 5,697 6,329
Burglary 3,819 5,103
Larceny-Theft 12,081 16,555
Motor Vehicle Theft 1,078 1,143
GRAND TOTAL 24,226 30,815
55
Crime in Louisiana 2007
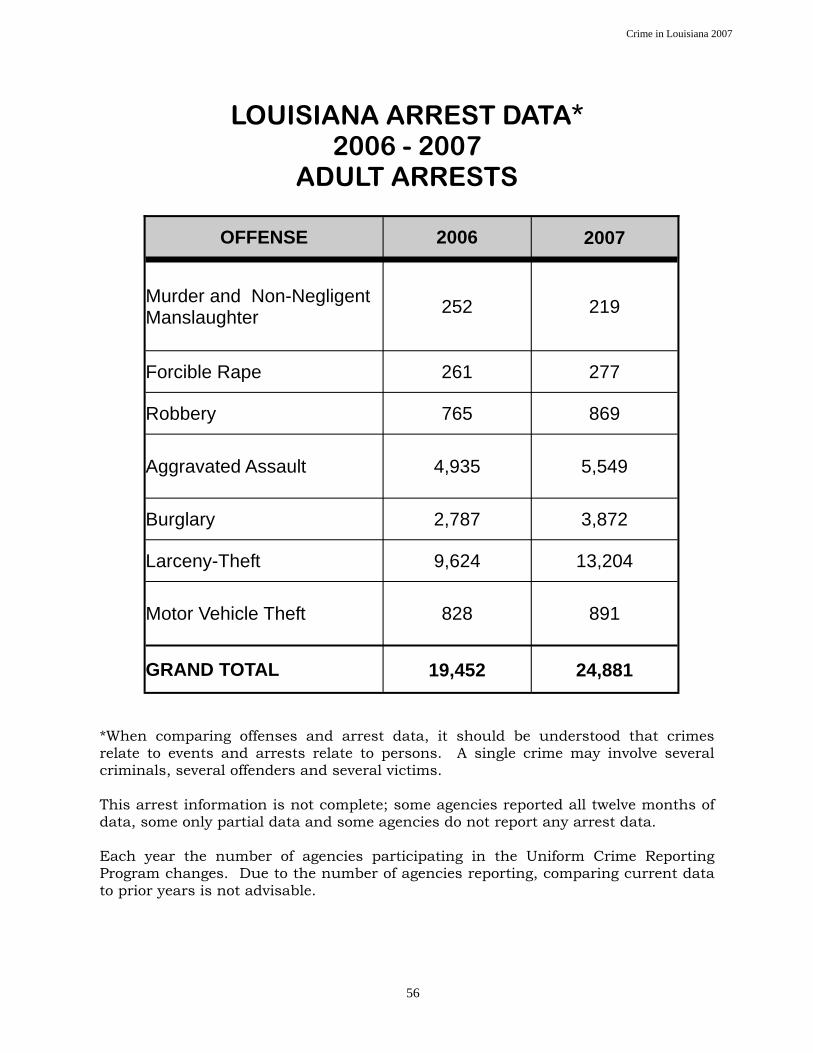
LOUISIANA ARREST DATA* 2006 - 2007
ADULT ARRESTS *When comparing offenses and arrest data, it should be understood that crimes relate to events and arrests relate to persons. A single crime may involve several criminals, several offenders and several victims. This arrest information is not complete; some agencies reported all twelve months of data, some only partial data and some agencies do not report any arrest data. Each year the number of agencies participating in the Uniform Crime Reporting Program changes. Due to the number of agencies reporting, comparing current data to prior years is not advisable.
OFFENSE 2006 2007
Murder and Non-Negligent Manslaughter 252 219
Forcible Rape 261 277
Robbery 765 869
Aggravated Assault 4,935 5,549
Burglary 2,787 3,872
Larceny-Theft 9,624 13,204
Motor Vehicle Theft 828 891
GRAND TOTAL 19,452 24,881
56
Crime in Louisiana 2007

LOUISIANA ARREST DATA* 2006 - 2007
JUVENILE ARRESTS
*When comparing offenses and arrest data, it should be understood that crimes relate to events and arrests relate to persons. A single crime may involve several criminals, several offenders and several victims. This arrest information is not complete; some agencies reported all twelve months of data, some only partial data and some agencies do not report any arrest data. Each year the number of agencies participating in the Uniform Crime Reporting Program changes. Due to the number of agencies reporting, comparing current data to prior years is not advisable.
OFFENSE 2006 2007
Murder and Non-Negligent Manslaughter 40 23
Forcible Rape 45 47
Robbery 188 250
Aggravated Assault 762 780
Burglary 1,032 1,231
Larceny-Theft 2,457 3,351
Motor Vehicle Theft 250 252
GRAND TOTAL 4,774 5,934
57
Crime in Louisiana 2007
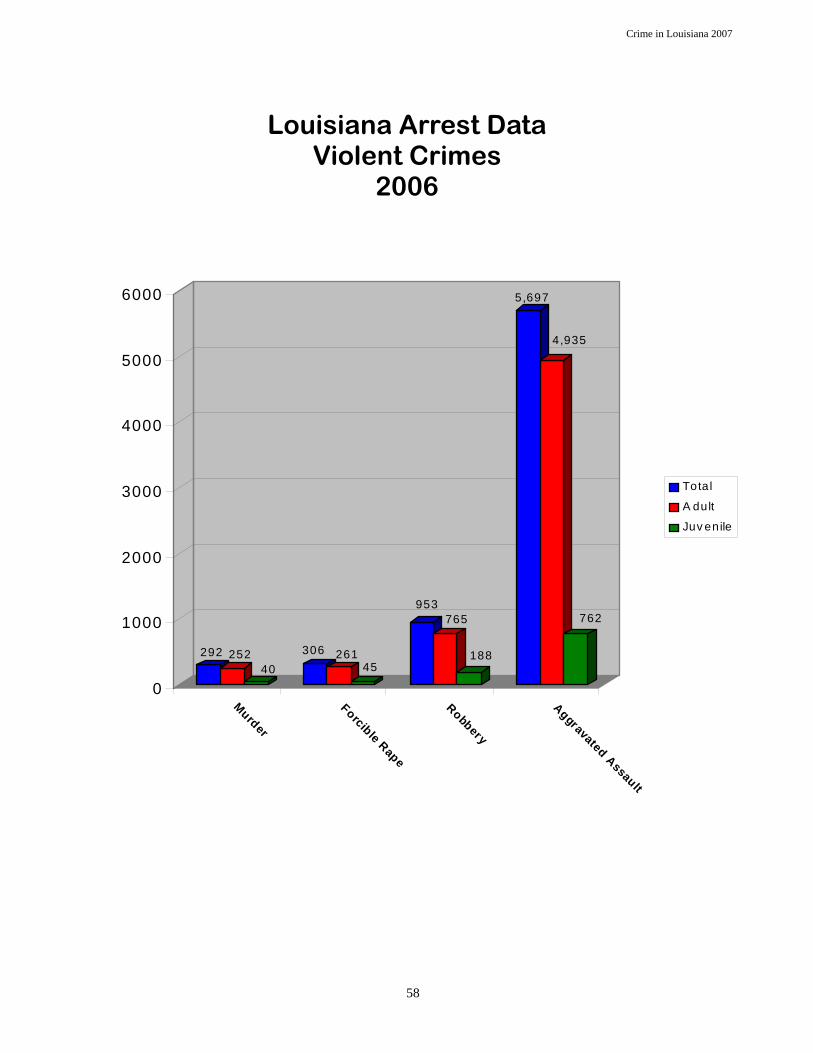
Louisiana Arrest Data Violent Crimes
2006
58
Crime in Louisiana 2007
292 25240
306 26145
953765
188
5,697
4,935
762
0
1000
2000
3000
4000
5000
6000
Murder
Forcible Rape
Robbery
Aggravated Assault
Total
A dult
Juv enile
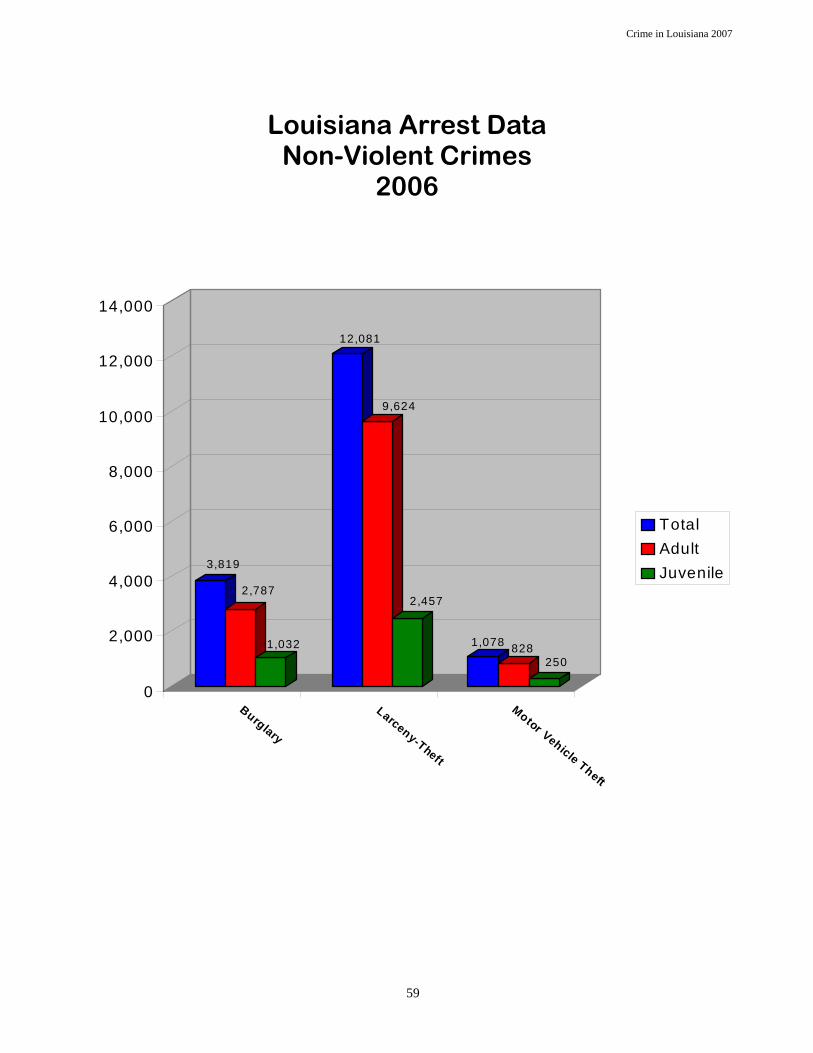
Louisiana Arrest Data Non-Violent Crimes
2006
59
Crime in Louisiana 2007
3,819
2,787
1,032
12,081
9,624
2,457
1,078 828250
0
2,000
4,000
6,000
8,000
10,000
12,000
14,000
Burglary
Larceny-Theft
Motor Vehicle Theft
TotalAdultJuvenile
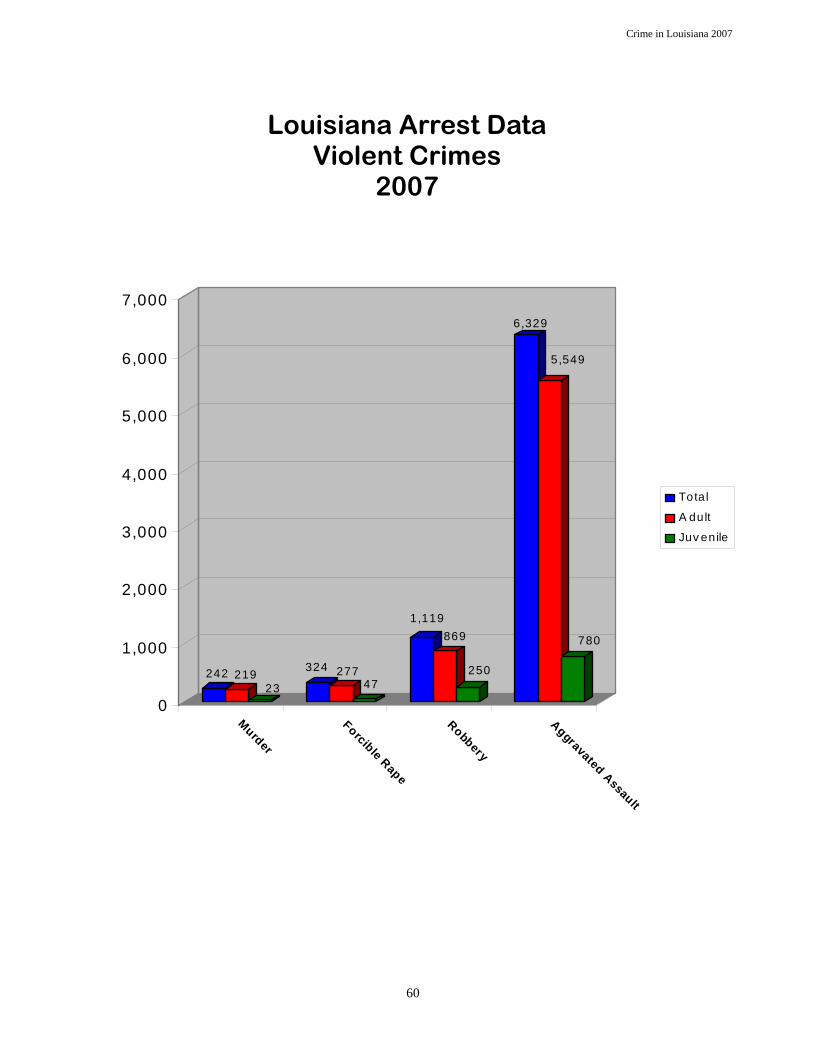
Louisiana Arrest Data Violent Crimes
2007
60
242 21923
324 27747
1,119869
250
6,329
5,549
780
0
1,000
2,000
3,000
4,000
5,000
6,000
7,000
Murder
Forcible Rape
Robbery
Aggravated Assault
Total
A dult
Juv enile
Crime in Louisiana 2007

Louisiana Arrest Data Non-Violent Crimes
2007
5,103
3,872
1,231
16,555
13,204
3,351
1,143 891252
0
2,000
4,000
6,000
8,000
10,000
12,000
14,000
16,000
18,000
Burglary
Larceny-Theft
Motor Vehicle Theft
TotalAdultJuvenile
61
Crime in Louisiana 2007

LOUISIANA DRUG ARRESTS BY TYPE – 2007
The following table shows drug arrests made in Louisiana in 2007 by drug type. This data was obtained from the Louisiana Drug Strategy and Program Application- Fiscal Year 2008. The data is collected through surveys sent to law enforcement agencies in Louisiana.
62
Crime in Louisiana 2007

LOU
ISIA
NA
DR
UG
AR
RE
ST
S B
Y D
RU
G T
YP
E -
20
07
Dru
g C
rime
Arr
est T
ype
Coc
aine
Opi
ates
C
anna
bis
Hal
luci
no-
gens
St
imul
ants
D
epre
s-sa
nts
Unk
now
n O
ther
SUB
TOTA
L w
ithou
t Met
h D
rugs
Poss
essi
on
10,8
13
1,40
1 14
,437
23
3 95
3 1,
015
2,08
4 30
,936
Poss
essi
on
with
Inte
nt &
D
istr
ibut
ion
3,24
7 1,
109
3,16
7 10
0 15
2 33
4 17
5 8,
284
Oth
er O
ffens
e Ty
pes
293
0 15
0 21
21
47
60
0 1,
132
Tota
l 14
,353
2,
510
17,7
54
354
1,12
6 1,
396
2,85
9 40
,352
Met
h D
rugs
Met
h
Prec
urso
rs
Met
h La
bs
TOTA
L
All
drug
s
802
9 16
31
,763
174
0 1
8,45
9
23
0 2
1,15
7
999
9 19
41
,379
63
Crime in Louisiana 2007
Sour
ce:
Loui
sian
a D
rug
Stra
tegy
and
Pro
gram
App
licat
ion
- Fis
cal Y
ear 2
008
Type Of Weapon Used Murder, Robbery And Aggravated Assault
2006 - 2007 The tables and charts that follow show weapons used for the offenses of murder, robbery and aggravated assault. The homicide data in some cases does not include weapons used for all homicides reported. The data for robberies and aggravated assaults includes only the offenses for which breakdowns were received for twelve months.
64
Crime in Louisiana 2007

LOUISIANA OFFENSE DATA
MURDER, TYPE OF WEAPON 2006 and 2007
1Total number of murders for which supplemental homicide data was received. 2Pushed is included in hands, fists, feet, etc.
WEAPONS 2006 2007
Total Murders1 488 577
Total Firearms 396 455
Handguns 335 339
Rifles 29 31
Shotguns 7 15
Firearms Unknown 25 70
Knives/Cutting Instruments 35 45
Other Weapons 37 55
Hands, Fists, Feet, etc.2 20 22
65
Crime in Louisiana 2007

Type of Weapon Used in Murder Louisiana Offense Data
2007
Type of Firearm Used in Murder Louisiana Offense Data
2007
KNIVES/CUTTING
INSTRUMENTS8.3%
OTHER WEAPONS
9.5% HANDS, FISTS,
FEET, ETC.3.8%
TOTAL FIREARMS
78.9%
RIFLES6.8%
FIREA RMS/UNKNOWN
2.3%
SHOTGUNS3.3%
HA NDGUNS74.5%
66
Crime in Louisiana 2007

LOUISIANA OFFENSE DATA ROBBERY, TYPE OF WEAPON
2006 and 2007 *Total number of robberies for which breakdowns were received for the twelve months
of 2006 and 2007.
WEAPONS 2006 2007
TOTAL ROBBERIES* 5,103 5,410
FIREARMS 2,642 2,980
KNIVES/CUTTING INSTRUMENTS 328 269
OTHER WEAPONS 400 311
STRONG-ARMED 1,733 1,850
67
OTHER WEAPONS
5.7%
KNIVES/CUTTING
INSTRUMENTS7.1%
FIREARMS55.1%
STRONG-ARMED34.2%
Type of Weapon Used in Robberies 2007
Crime in Louisiana 2007

LOUISIANA OFFENSE DATA AGGRAVATED ASSAULT, TYPE OF WEAPON
2006 and 2007
*Total number of aggravated assaults for which breakdowns were received for the twelve months of 2006 and 2007.
WEAPONS 2006 2007
TOTAL AGGRAVATED ASSAULTS* 17,373 18,850
FIREARMS 4,797 4,760
KNIVES/CUTTING INSTRUMENTS 3,127 3,047
OTHER WEAPONS 4,654 4,753
PERSONAL WEAPONS 4,795 6,290
68
OTHER W EAPONS
25.2%
PERSONAL W EAPONS
33.4%
FIREARMS25.3%
KNIVES/CUTTING INSTRUMENTS
16.2%
Type Of Weapon Used In Aggravated Assaults 2007
Crime in Louisiana 2007

MURDERS, ROBBERIES AND AGGRAVATED ASSAULTS
Percentage of Firearms Used
2003–2007
69
20%
30%
40%
50%
60%
70%
80%
90%
2003 2004 2005 2006 2007
Hun
dred
s
MURDER
ROBBERY
AGGRAVATEDASSAULT
Crime in Louisiana 2007

HOMICIDES IN LOUISIANA 2007 The following tables show homicides (murder and non-negligent manslaughter) in Louisiana for the year of 2007. It is important to note the definition of homicide when reviewing these tables. Homicide (murder and non-negligent manslaughter) is the willful (non-negligent) killing of one human being by another. The classification of this offense is based solely on police investigation as opposed to the determination of a court, medical examiner, coroner, jury or other judicial body. Not included in the count for this offense classification are deaths caused by negligence, suicide, accident, justifiable homicides, and attempts to murder or assault to murder, which are scored as aggravated assaults.
70
Crime in Louisiana 2007

HOMICIDES REPORTED BY SELECTED AGENCIES IN LOUISIANA
January 1, 2007 - December 31, 2007
The homicide figures above include only the willful (non-negligent) killing of one human being by another. This includes the crimes of murder and non-negligent manslaughter. Excluded are attempts to kill, suicides, accidental deaths, justifiable homicides and manslaughter by negligence. In addition, it is possible that some homicide investigations are still in progress and this could effect these figures. *Note: Lake Charles Police Department and Ouachita Parish Sheriff's Office did not report all 12 months of UCR statistics for 2007 as required by the FBI to be included in the Crime in the United States 2007. Consequently, their data is missing from this chart.
Agency Police Department or
Sheriff’s Office Number of Homicides
Alexandria PD 8
Baton Rouge PD 71
Caddo SO 3
Calcasieu SO 2
East Baton Rouge SO 20
Jefferson SO 44
Lafayette PD 15
Lafayette SO 4
Lake Charles PD* 0
Monroe PD 1
New Orleans PD 209
Ouachita SO* 0
Rapides SO 1
Shreveport PD 36
Grand Total 414
71
Crime in Louisiana 2007

STATE OF LOUISIANA LAW ENFORCEMENT OFFICERS FELONIOUSLY
KILLED 1998 - 2007
Since 1961, the FBI has maintained and published statistics concerning Law Enforcement Officers Killed and Assaulted with the intent of providing law enforcement data which can be used to enhance training and protect the lives of the officer on the street. The table above shows the number of felonious deaths that occurred in our state each year from 1998-2007. Notification of duty-related deaths is sent to the FBI's Uniform Crime Reporting Program. Once notification of an officer's death is received, inquiries to obtain additional details concerning the circumstances surrounding the incident are directed to the victim officer's employing agency. Information concerning two Federal programs which provide benefits to survivors is furnished to the agency. Pertinent criminal history data of the individuals identified in connection with felonious killings are kept on file at the FBI. As the Louisiana Uniform Crime Reporting Program phases in incident based reporting (LIBRS mentioned previously in publication), the data will give more insight into the circumstances involving felonious killings of law enforcement officers. Careful consideration of this information will aid in protecting the lives of those who protect us.
YEAR OFFICERS KILLED
1998 0
1999 0
2000 3
2001 0
2002 2
2003 3
2004 6
2005 2
2006 2
2007 5
72
Crime in Louisiana 2007

CRIMINAL JUSTICE
RECORDS IMPROVEMENT PROGRAM Since the inception of the Crime Control Act of 1990, the Louisiana Commission on Law Enforcement has undertaken several initiatives to improve Louisiana’s criminal justice records. The LCLE has worked continuously in collaboration with the Louisiana Supreme Court, the Louisiana Department of Public Safety and Corrections, the Louisiana Sheriffs’ Association, the Louisiana Association of Chiefs of Police, and the Louisiana District Attorneys’ Association to design and develop an Integrated Criminal Justice Information System (ICJIS) for the State of Louisiana. The primary goal of the ICJIS is to create a criminal justice information system that will provide timely and accurate information to criminal justice decision makers at the crucial time it is needed, a system that would not only benefit the entire criminal justice community but the citizens of Louisiana as well. In order to begin development of a Louisiana ICJIS, it was necessary that an advisory board be created that would bring all the participating agencies together. In the 1999 Regular Legislative session, the ICJIS Policy Board was established. The Board consists of thirteen members from all different areas of the criminal justice community. Representatives from each of the following make up the ICJIS Policy Board: Louisiana Supreme Court, Louisiana Senate, Louisiana House of Representatives, Governor’s Designee, Louisiana Commission on Law Enforcement, Attorney General Designee, Department of Public Safety and Corrections, Office of Public Safety Services, Louisiana Association of Chiefs of Police, Louisiana Sheriffs’ Association, Louisiana District Attorneys’ Association, Louisiana District Court Judges Association and the Louisiana Association of Clerks of Court. The purpose of the Board “is to assist the agencies involved in the operations of the individual systems by facilitating the development of the Integrated Criminal Justice Information System (ICJIS), providing for common standards which ensure communications among systems, and providing a common forum for the discussion of issues affecting the agencies involved.” Some of their specific duties include: (1) the coordination of the design, development, maintenance, and use of an ICJIS serving the criminal justice agencies in Louisiana; (2) the development and maintenance of a strategic plan for the design, development, maintenance and overall ICJIS; (3) the development and maintenance of a criminal justice data dictionary for use by all criminal justice agencies in their activities relative to the ICJIS so as to facilitate communication among agencies on the system; (4) the development and maintenance of communication hardware and software standards to be used by all criminal justice agencies desiring to participate in the ICJIS; (5) the development of policy coordinating the development, maintenance, and utilization of the ICJIS and the state level criminal justice information systems in their capacity as components of the ICJIS; and (6) the coordination of developmental plans prepared by specific agencies charged with the responsibility of operating state level criminal justice information systems only in their capacity as components of the ICJIS so as to ensure that individual development plans are in accord with the overall system development effort.
73
Crime in Louisiana 2007

74
The ICJIS is a collective effort among the agencies and associations listed above to provide access to appropriate information contained in the following systems: the Automated Fingerprint Identification System (AFIS), the Computerized Criminal History (CCH), the Louisiana Incident Based Reporting System (LIBRS) from law enforcement; the Case Management Information System (CMIS) and the Statewide Protective Order Repository (SPOR) from the courts; the Prosecutors’ Information Management System (PIMS) from the Louisiana District Attorneys’ Association, the Corrections and Justice Unified Network (CAJUN) and the Juvenile Institution Records Management System (JIRMS) from corrections, and the Louisiana Automated Victim Notification System (LAVNS) administered by the LCLE. A major advancement in the ICJIS effort was the Board’s decision to direct funding received from the federal COPS Technology Program to the development and implementation of the Louisiana Civil and Criminal Information Exchange (LACCIE) system. LACCIE was developed by the Jefferson Davis Parish Sheriff’s Office, through a sub grant from LCLE, and is currently administered by the Louisiana Sheriffs’ Association (LSA). LACCIE is available to Louisiana criminal justice agencies on a 7 day per week, 24 hour per day, 365 days per year basis. Major state and local databases are linked to LACCIE, thereby providing cross database analytical capabilities to participating agencies. This connectivity is seen as a major gain for criminal justice information systems statewide. The LCLE continues to coordinate and monitor the LACCIE project, in partnership with the LSA, in order to insure that local efforts remain in line with the goals and objectives of the ICJIS.

Source: FBI's Crime in United States 2007. 1 This is not an exhaustive listing of cities in Louisiana, only those that report UCR statistics to the FBI.
Total Law Total LawEnforcement Total Total Enforcement Total Total
City Population Employees Officers Civilians City Population Employees Officers CiviliansAbbeville 11797 41 33 8 Kinder 2148 18 12 6Addis 3145 9 8 1 Krotz Springs 1268 5 3 2Alexandria 45720 195 162 33 Lafayette 114212 291 225 66Amite 4278 28 28 0 Lake Arthur 2894 10 6 4Baker 13600 36 34 2 Lake Charles 69966 181 174 7Baldw in 2618 8 7 1 Leesville 5763 34 29 5Ball 3727 6 5 1 Mandeville 12346 52 37 15Basile 2392 12 7 5 Mansfield 5466 17 13 4Bastrop 12249 38 36 2 Many 2777 11 9 2Baton Rouge 228446 909 632 277 Marksville 5787 22 17 5Berw ick 4312 11 11 0 McNary 199 2 1 1Blanchard 2468 6 5 1 Minden 13238 30 29 1Bogalusa 12927 59 37 22 Monroe 51350 220 175 45Bossier City 61993 237 196 41 Moreauville 944 2 2 0Breaux Bridge 8047 18 14 4 Morgan City 11810 52 34 18Broussard 7466 24 21 3 Napoleonville 685 2 1 1Brusly 2130 7 6 1 Natchitoches 17680 64 48 16Church Point 4734 14 13 1 New llano 2031 11 6 5Clarence 493 2 2 0 New Orleans 220614 1666 1416 250Clinton 1907 6 5 1 Oakdale 7997 17 17 0Coushatta 2166 6 6 0 Olla 1352 4 4 0Covington 9745 47 36 11 Opelousas 23223 65 50 15Crow ley 13992 39 32 7 Patterson 5223 19 19 0Delhi 3013 11 7 4 Pearl River 2170 16 10 6Denham Springs 10552 39 32 7 Pineville 14540 64 56 8De Quincy 3192 14 14 0 Plaquemine 6627 30 25 5De Ridder 10143 28 22 6 Ponchatoula 6244 25 20 5Dixie Inn 348 3 3 0 Port Allen 5136 24 20 4Elton 1252 11 7 4 Port Barre 2353 15 8 7Erath 2205 14 10 4 Port Vincent 552 2 2 0Eunice 11621 41 30 11 Rayne 8628 23 23 0Farmerville 3567 13 13 0 Richw ood 2090 20 13 7Ferriday 3588 20 13 7 Ruston 20532 48 39 9Franklin 7794 25 23 2 Scott 8091 22 21 1Franklinton 3723 22 16 6 Shreveport 199811 679 595 84French Settleme 1100 2 2 0 Simmesport 2228 10 10 0Golden Meadow 2158 3 3 0 Slidell 28272 114 88 26Gonzales 9067 36 36 0 Sorrento 1443 6 5 1Grambling 4474 14 9 5 Sterlington 1240 9 9 0Gramercy 6946 5 5 0 St. Gabriel 5592 13 8 5Gretna 16240 114 89 25 St. Martinville 7012 18 13 5Hammond 19190 99 75 24 Stonew all 1927 2 2 0Harahan 9212 27 22 5 Sulphur 19362 63 42 21Haughton 2997 9 7 2 Sunset 2580 12 12 0Haynesville 2492 7 7 0 Thibodaux 14501 47 38 9Homer 3472 12 11 1 Tickfaw 687 8 8 0Houma 32597 83 68 15 Vidalia 4189 26 20 6Independence 1826 16 16 0 Vinton 3131 13 11 2Iow a 2565 15 10 5 Washington 1064 7 7 0Jackson 3714 5 5 0 Westlake 4526 23 13 10Jeanerette 6015 11 11 0 West Monroe 12989 81 77 4Jena 2850 7 6 1 Westw ego 9957 44 41 3Jennings 10577 36 34 2 Winnfield 5183 23 14 9Kaplan 5192 21 15 6 Youngsville 6189 9 7 2Kenner 66473 225 171 54 Zachary 13428 45 42 3Kentw ood 2302 10 9 1
75
2007 Louisiana Full Time Law Enforcement Employees Listed by City1

76
2007 Louisiana Full Time Law Enforcement Employees Listed by Metropolitan Parishes1
Source: FBI's Crime in United States 2007. 1 This is not an exhaustive listing of all the Metropolitan Parishes in Louisiana, only those that report UCR statistics to the FBI.
TotalLaw Enforcement Total Total
Parish Employees Officers Civilians Ascension 250 216 34Bossier 346 288 58Caddo 640 432 208Calcasieu 793 417 376Cameron 68 44 24East Baton Rouge 803 688 115East Feliciana 65 19 46Grant 65 23 42Iberville 131 77 54Jefferson 1,393 900 493Lafourche 316 255 61Livingston 207 207 0Ouachita 358 358 0Plaquemines 185 102 83Pointe Coupee 84 36 48Rapides 476 363 113St. Bernard 219 194 25St. Charles 352 253 99St. Helena 47 15 32St. John the Baptist 216 185 31St. Martin 231 114 117St. Tammany 667 265 402Terrebonne 295 108 187Union 45 31 14West Baton Rouge 165 122 43West Feliciana 105 81 24

77
2007 Louisiana Full Time Law Enforcement Employees Listed by Non-Metropolitan Parishes1
Source: FBI's Crime in United States 2007. 1 This is not an exhaustive listing of all the Non-Metropolitan Parishes in Louisiana, only those that report UCR statistics to the FBI.
TotalLaw Enforcement Total Total
Parish Employees Officers Civilians Acadia 111 111 0Assumption 76 45 31Beauregard 70 49 21Bienville 54 45 9Caldwell 35 35 0Catahoula 112 16 96Claiborne 37 37 0Concordia 250 239 11East Carroll 215 18 197Evangeline 53 17 36Jackson 92 26 66Jefferson Davis 48 37 11La Salle 39 22 17Lincoln 61 40 21Morehouse 158 37 121Natchitoches 78 58 20Red River 39 30 9Sabine 71 71 0St. James 92 68 24St. Landry 218 152 66St. Mary 185 165 20Tangipahoa 262 198 64Tensas 141 31 110Vermilion 124 67 57Vernon 140 105 35Washington 137 137 0Webster 145 50 95West Carroll 20 20 0Winn 40 16 24
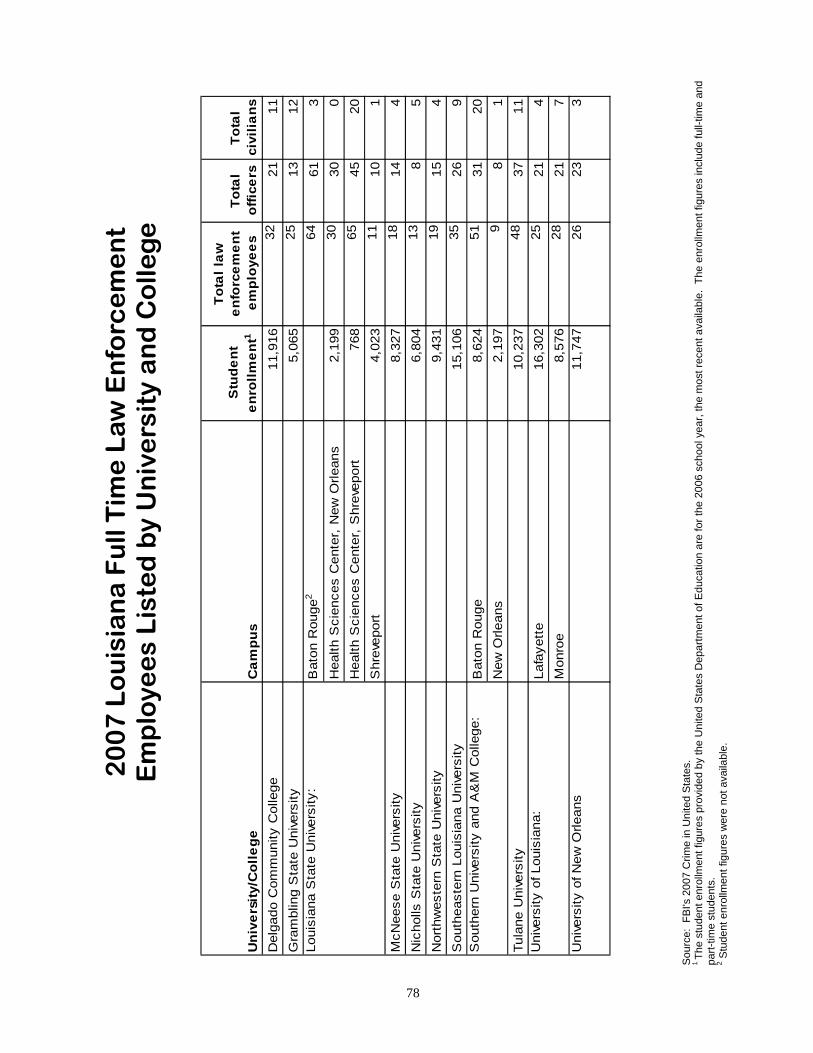
78
20
07
Lo
uis
ian
a F
ull
Tim
e L
aw E
nfo
rce
me
nt
E
mp
loye
es
Lis
ted
by
Un
ive
rsit
y a
nd
Co
lleg
e
Sou
rce:
FB
I's 2
007
Crim
e in
Uni
ted
Sta
tes.
1 Th
e st
uden
t enr
ollm
ent f
igur
es p
rovi
ded
by th
e U
nite
d S
tate
s D
epar
tmen
t of E
duca
tion
are
for t
he 2
006
scho
ol y
ear,
the
mos
t rec
ent a
vaila
ble.
The
enr
ollm
ent f
igur
es in
clud
e fu
ll-tim
e an
d pa
rt-tim
e st
uden
ts.
2 S
tude
nt e
nrol
lmen
t fig
ures
wer
e no
t ava
ilabl
e.
Uni
vers
ity/C
olle
ge
Cam
pus
Stu
dent
en
rollm
ent1
Tota
l law
en
forc
emen
t em
ploy
ees
Tota
l of
ficer
sTo
tal
civi
lians
Del
gado
Com
mun
ity C
olle
ge11
,916
3221
11G
ram
blin
g S
tate
Uni
vers
ity5,
065
2513
12B
aton
Rou
ge2
6461
3H
ealth
Sci
ence
s C
ente
r, N
ew O
rlean
s2,
199
3030
0H
ealth
Sci
ence
s C
ente
r, S
hrev
epor
t76
865
4520
Shr
evep
ort
4,02
311
101
McN
eese
Sta
te U
nive
rsity
8,
327
1814
4N
icho
lls S
tate
Uni
vers
ity6,
804
138
5N
orth
wes
tern
Sta
te U
nive
rsity
9,43
119
154
Sou
thea
ster
n Lo
uisi
ana
Uni
vers
ity15
,106
3526
9B
aton
Rou
ge8,
624
5131
20N
ew O
rlean
s2,
197
98
1Tu
lane
Uni
vers
ity10
,237
4837
11La
faye
tte
16,3
0225
214
Mon
roe
8,57
628
217
Uni
vers
ity o
f New
Orle
ans
11,7
4726
233
Loui
sian
a S
tate
Uni
vers
ity:
Sou
ther
n U
nive
rsity
and
A&
M C
olle
ge:
Uni
vers
ity o
f Lou
isia
na:

79
2007 Louisiana Full Time Law Enforcement Employees Listed by State Agency and
Other Agencies
Source: FBI's Crime in United States 2007.
State/Other Agency Unit/Office
Total law enforcement employees
Total officers
Total civilians
Department of Public Safety State Capitol Detail 51 41 10Tensas Basin Levee District 6 5 1
GLOSSARY OF TERMS
Arrest - Arrest is the taking of a person into custody by law enforcement with the intention of seeking charges and recording the detention. All persons who are served a citation or a summons for committing an offense are counted as arrested. Juveniles taken into custody, counseled and released without being charged are counted in UCR as arrested. UCR arrest data does not include traffic offenses with the exception of DWI. Crime Rate - The number of Index Offenses reported within a specific geographic area and divided by the population of the area, produces a crime rate per capita statistic. This is then scaled to represent some standard population unit, such as the factor 100,000 utilized by the FBI in scaling their national and regional crime statistics. Thus, “Crime Rate Per Capita” multiplied by 100,000 produces the statistic commonly referred to as “Crime Per 100,000 Population”, or more frequently, simply, “Crime Rate.” Single and multi-jurisdictional areas can then be compared to each other, without regard to population variation. Index Crime - A term devised by the International Association of Chiefs of Police for use in their Uniform Crime Reporting Program. Recognizing the problem, among others, of coping with volume, they decided that only those criminal acts deemed most serious, most pervasive across the country, most likely to be reported and most frequently committed would be counted. Furthermore, they decided to include only criminal acts brought to the attention of police, whether or not there was an arrest. As a result, seven crimes were chosen and standardized definitions were created to assure uniformity. Those seven offenses were murder, rape, robbery, aggravated assault, burglary, larceny theft, and motor vehicle theft. Many years later the crime of arson was added. LUCR - Louisiana Uniform Crime Reporting Program. The LUCR program is comprised of the Summary UCR Unit, Louisiana Incident Based Reporting System (LIBRS) and the Louisiana Law Enforcement Management Information System (LA-LEMIS). UCR – Uniform Crime Reporting. The Summary UCR unit is responsible for collecting crime statistics and performing quality assurance functions prior to forwarding the statistics to the FBI. Early stages of development for the Summary UCR program began in 1991, and by 1993 Louisiana’s Program was certified by the Federal Bureau of Investigation.
80
Crime in Louisiana 2007
LA-LEMIS – Louisiana Law Enforcement Management Information System. This is the RMS (Record Management System) software that Louisiana developed for agencies to use. LA-LEMIS 2000 is LIBRS compliant and currently we have more agencies certified with this RMS software than any others. LEMIS-IBR 2.0 is in beta testing and till ultimately replace LA-LEMIS 2000. LIBRS - Louisiana Incident Based Reporting System. LIBRS certified agencies are no longer required to generate and submit UCR paper reports. Their monthly LIBRS data submissions are converted to NIBRS specifications by the LIBRS computer system and submitted to the FBI electronically. LIBRS was certified by the FBI as NIBRS compliant in March, 2003. NIBRS - National Incident Based Reporting System. A redesign of UCR, NIBRS is the FBI’s incident-based reporting system. It is an electronic data collection system modernizing crime information. A more detailed form of crime reporting, it incorporates information not captured by UCR regarding the circumstances involved in incidents. It includes more correlation between offenses, property, victims, offenders and arrestees and expands the crimes included to 22 categories. In order to submit NIBRS data, an agency’s records management system must be compliant with LIBRS and agencies must complete a certification process with LSA and LCLE personnel. Nonviolent Crime – In UCR the crimes of burglary, larceny-theft, motor vehicle theft, and arson are referred to as Property Crimes. For this publication, they are referred to as non-violent crimes. Offenses Reported - Sometimes referred to as a crime occurrence, this term refers to actual offenses reported or made known to law enforcement agencies. Offenses reported, but later determined to be “unfounded,” are excluded from the final tabulation of crime statistics used by the FBI for publication in Crime in the United States. The final figures used are referred to as “Actual Offenses.” Violent Crime - The crimes of murder and non-negligent manslaughter, forcible rape, robbery and aggravated assault. According to UCR definitions, violent crimes involve force or threat of force. Comparisons of Definitions Offenses in incident-based reporting were defined differently from those in UCR. To help the reader make comparisons between the traditional UCR and new NIBRS definitions, both are listed on the following pages.
81
Crime in Louisiana 2007

SUMMARY UCR DEFINITION Murder and non-negligent manslaugh-ter: the willful (non-negligent) killing of one human being by another. Manslaughter by negligence: the killing of another person through gross negligence. Justifiable homicide: the killing of a felon by a peace officer in the line of duty, or the killing (during the commis-sion of a felony) of a felon by a private citizen (counted as homicide, then un-founded). Forcible rape: the carnal knowledge of a female forcibly and against her will. (Includes attempts.) Robbery: the taking or attempting to take anything of value from the care, custody, or control of a person or per-sons by force or threat of force or vio-lence and/or by putting the victim in fear. Assault: an unlawful attack by one per-son upon another.
LIBRS/NIBRS DEFINITION Murder and non-negligent manslaugh-ter: the willful (non-negligent) killing of one human being by another. Negligent manslaughter: the killing of another person through negligence. Justifiable homicide: the killing of a perpetrator of a serious criminal offense by a peace officer in the line of duty; or the killing, during the commission of a serious criminal offense, of a perpetrator by a private individual (kept apart from homicide counts from the outset). Forcible rape: the carnal knowledge of a person, forcibly and/or against that person’s will where the victim is incapable of giving consent because of his/her temporary or permanent mental or physical incapacity (or because of his/her youth). Robbery: the taking, or attempting to take, anything of value under confronta-tional circumstances from the control, custody, or care of another person by force or threat of force or violence and/or putting the victim in fear of immediate harm. Assault: an unlawful attack by one per-son upon another.
82
Crime in Louisiana 2007

SUMMARY UCR DEFINITION (continued)
Aggravated Assault: an unlawful at-tack by one person upon another for the purpose of inflicting severe or aggravated bodily injury; this type of assault usually is accompanied by the use of a weapon or by means likely to produce death or great bodily harm. a) Firearm b) Knife c) Other Dangerous Weapon d) Hands, Fists, Feet, etc. (Aggravated Injury) Simple Assault: all assaults and attempted assaults which are not of an aggravated nature and do not result in serious injury to the victim. (NOT included in the tabulation of index crimes.) e) Other Assaults - Simple, Not Aggravated: unlawful physical attack where neither the offender displays a weapon, nor the victim suffers obvious severe or aggravated bodily injury involving apparent broken bones, loss of teeth, possible internal injury, severe laceration, or loss of consciousness. To unlawfully place another person in reasonable fear of bodily harm through the use of threatening words and/or other conduct, but without displaying a weapon or subjecting the victim to ac tua l phys i ca l a t tack ( e . g . , intimidation). Examples: Simple Assault Stalking Minor Assault Intimidation Assault & Battery Coercion Resisting an Officer Hazing Injury by culpable negligence Attempts to commit any of the above
LIBRS/NIBRS DEFINITION (continued)
Aggravated Assault: an unlawful at-tack by one person upon another wherein the offender uses a weapon or displays it in a threatening manner, or the victim suffers obvious severe or ag-gravated bodily injury involving appar-ent broken bones, loss of teeth, possi-ble internal injury, severe laceration, or loss of consciousness.
Simple Assault: an unlawful physical attack by one person upon another where neither the offender displays a weapon, nor the victim suffers obvious severe or aggravated bodily injury in-volving apparent broken bones, loss of teeth, possible internal injury, severe laceration or loss of consciousness. Intimidation: to unlawfully place an-other person in reasonable fear of bod-ily harm through the use of threatening words and/or other conduct, but without displaying a weapon or subjecting the victim to actual physical attack.
83
Crime in Louisiana 2007

SUMMARY UCR DEFINITION (continued)
Burglary: the unlawful entry of a structure to commit a felony or a theft. (Includes attempts.) Excludes tents, trailers and other mobile units used for recreational purposes. Applies “Hotel Rule”. Larceny: the unlawful taking, carrying, leading, or riding away of property from the possession, or constructive possession, of another. (Includes attempts.) Categories: a) Pocket-picking: the theft of articles from a person by stealth where the victim usually does not become immediately aware of the theft. b) Purse-snatching: the grabbing or snatching of a purse, handbag, etc. from the custody of an individual. c) Shoplifting: the theft by a person (other than an employee) of goods or merchandise exposed for sale.
LIBRS/NIBRS DEFINITION (continued)
Burglary: the unlawful entry into a building or other structure with the in-tent to commit a felony or a theft (excludes tents, trailers and other mo-bile units used for recreational pur-poses) Applies expanded “Hotel Rule” to in-clude temporary storage facility Because burglary is defined in terms of theft, only the burglary is to be re-ported. Larceny: the unlawful taking, carrying, leading, or riding away of property from the possession, or constructive possession, of another person. Categories: a) Pocket-picking: the theft of articles from another person’s physical posses-sion by stealth where the victim usually does not become immediately aware of the theft. b) Purse-snatching: the grabbing or snatching of a purse, handbag, etc., from the physical possession of another person. c) Shoplifting: the theft, by someone other than an employee of the victim, of goods or merchandise exposed for sale.
84
Crime in Louisiana 2007

SUMMARY UCR DEFINITION (continued)
d) Theft from motor vehicles: (except theft of motor vehicle parts and acces-sories) the theft of articles from a motor vehicle, whether locked or unlocked. e) Theft of motor vehicle parts and ac-cessories: the theft of any part or ac-cessory attached to the interior or exte-rior of a motor vehicle in a manner which would make the part an attach-ment to the vehicle or necessary for the operation of the vehicle. f) Theft of bicycles: the unlawful taking of any bicycle, tandem bicycle, unicycle, etc. g) Theft from building: a theft from within a building that is open to the general public and where the offender has legal access. h) Theft from coin-operated device or machine: the theft from a device or ma-chine that is operated or activated by the use of a coin. i) All other larceny - theft not specifi-cally classified: all thefts that do not fit the definition of the specific categories of larceny listed above. Motor vehicle theft: the theft or at-tempted theft of a motor vehicle. A motor vehicle is defined for UCR purposes as a self-propelled vehicle that runs on land surface and not on rails. Excluded are farm equipment, bulldozers, construction equipment, airplanes, and watercraft.
LIBRS/NIBRS DEFINITION (continued)
d) Theft from motor vehicle: the theft of articles from a motor vehicle, whether locked or unlocked. e) Theft of motor vehicle parts or ac-cessories: the theft of any part or ac-cessory affixed to the interior or exterior of a motor vehicle in a manner which would make the item an attachment of the vehicle or necessary for its operation. f) Theft of bicycles: classified according to the location from which the bicycle was taken. g) Theft from building: a theft from within a building that is either open to the general public or where the offender has legal access. h) Theft from coin-operated machine or device: a theft from a machine or de-vice that is operated or activated by the use of coins. i) All other larceny: all thefts that do not fit any of the definitions of the spe-cific subcategories of Larceny/Theft listed above. Motor vehicle theft: the theft of a mo-tor vehicle. A “motor vehicle” is defined for UCR purposes as a self-propelled vehicle that runs on land surface and not on rails and which fits one of the following property descriptions:
85
Crime in Louisiana 2007

SUMMARY UCR DEFINITION (continued)
a) Autos: all sedans, station wagons, coupes, convertibles, and other similar motor vehicles which serve the primary purpose of transporting people from one place to another; also include automobiles used as taxis. Includes SUV’s. b) Trucks and Buses: vehicles specifi-cally designed (but not necessarily used) to commercially transport people and cargo; include pickup trucks and cargo vans regardless of their use and self-propelled motor homes. c) Other vehicles: all other vehicles that meet the UCR definition, such as snowmobiles, motorcycles, motor scooters, trail bikes, mopeds, golf carts, all-terrain vehicles, and motorized wheelchairs.
LIBRS/NIBRS DEFINITION (continued)
a) Automobiles: sedans, coupes, station wagons, convertibles, taxicabs, or other similar motor vehicles which serve the primary purpose of transporting people.
b) Trucks: motor vehicles which are specif ically designed (but not necessarily used) to transport cargo on a commercial basis. c) Buses: motor vehicles which are spe-cifically designed (but not necessarily used) to transport groups of people on a commercial basis. d) Recreational vehicles: motor vehicles which are specifically designed (but not necessarily used) to transport people and also to provide them temporary lodging for recreational purposes. e) Other motor vehicles: any other motor vehicles, e.g., motorcycles, motor scooters, trail bikes, mopeds, snowmo-biles, golf carts, whose primary purpose is to transport people.
86
Crime in Louisiana 2007

Standard Metropolitan Statistical Area (SMSA) - The U.S. Bureau of Census defines Standard Metropolitan Statistical Area as a county (parish) or group of contiguous counties (parishes) that contain at least one central city of 50,000 or more inhabitants or “twin cities” with a combined population of at least 50,000 or more. In addition to the par-ish or parishes containing such a city or cities, contiguous parishes are included in a Standard Metropolitan Statistical Area if, according to certain criteria, they are essentially metropolitan in character and are socially and economically integrated with the central city. The following parishes and central cities are classified as major metropolitan areas: SMSA PARISH CENTRAL CITY Alexandria / Pineville Grant Alexandria Rapides Baton Rouge Ascension Baton Rouge
East Baton Rouge Livingston West Baton Rouge Bossier City Bossier Bossier City Webster Houma Lafourche Houma
Terrebonne Thibodaux Lafayette Acadia Lafayette
Lafayette St. Landry St. Martin Lake Charles Calcasieu Lake Charles Cameron Monroe Ouachita Monroe Union New Orleans Jefferson New Orleans
Orleans Kenner Plaquemines Metairie St. Bernard St. Charles St. John the Baptist St.Tammany Shreveport Caddo Shreveport
87
Crime in Louisiana 2007

LOUISIANA UNIFORM CRIME REPORTING PROGRAM CONTACT INFORMATION
LOUISIANA SHERIFFS’ ASSOCIATION
LIBRS Program (225) 383-8342
LOUISIANA COMMISSION ON LAW ENFORCEMENT
Crime Victims Reparations 1-888-6-VICTIM 1-888-684-2846 LAVNS (Victims Notification System) 1-866-LAVNS-4-U 1-866-528-6748 LAVNS Administrative Line (225) 925-4440 LEMIS Program (225) 925-7475 LIBRS Program (225) 922-2921 POST (225) 925-4942 (Peace Officers Standards Training) Policy Planning (225) 925-4440 Statistical Analysis Center (SAC) (225) 925-7464 SUMMARY UCR PROGRAM (225) 922-2921 North Region (225) 925-7470 Southwest Region (225) 925-4440 Southeast Region (225) 925-7467
88
Crime in Louisiana 2007


