Embed Size (px)
Citation preview
DOCUMENT RESUME
ED 230 450 SO 014 578
AUTHOR Andreasen, Alan R.; Belk, Russell W.TITLE Consumer Response to Arts Offerings: A Study of
Theater and Symphony in Four Southern Cities.INSTITUTION Illinois Univ., Urbana. Dept. of Business
Administration.SPONS AGENCY National Endowment for the Arts, Washington, D.C.PUB DATE Sep 78CONTRACT RQO-22-6NNOTE 170p.; Some pages may be marginally legible due to
broken print type.PUB TYPE Reports - Research/Technical (143)
EDRS PRICE MF01/PC07 Plus Postage.DESCRIPTORS *Audiences; *Citizen Participation; *Concerts;
Interviews; Life Style; Social Attitudes; SocialScience Research; Socioeconomic Influences; *TheaterArts
IDENTIFIERS Georgia (Atlanta); Louisiana (Baton Rouge); SouthCarolina (Columbia); Tennessee (Memphis); *UnitedStates (South)
ABSTRACTIn an effort to broaden the audience for the
performing arts, attitudinal, life-style, and socioeconomic data onmarginal and regular attenders of theater and symphony concerts in
Atlanta (Georgia), Baton Rouge (Louisiana), Columbia.(SouthCarolina), and Memphis (Tennessee) were collected. Telephoneinterviews were conducted with 1491 respondents 14 years of age orolder randomly selected from households with telephones in 4 cities.Four major factors were found to predict attendance at both theaterand symphony: attitudes toward attendance, attendance in the pastyear, interest in the art form as a child, and membership in theCulture Patron life-style group. For both theater and symphony, thetwo highest impact strategies were to offer second tickets at halfprice from time to time and to include famous performers in theproduction. The report concludes with recommendations of interest toarts managers who would like to translate the study results intoconcrete actions and with methodological conclusions of interest tothose doing further audience studies. Appendices contain statisticaltables, a note on factor analysis, and the survey questionnaire.(RM)
************************************************************************ Reproductions supplied by EDRS are the best that can be made *
* from the original document. *
***********************************************************************
c:Lr..\
C:)teN(NJ CONSUMER RESPONSE TO ARTS OFFERINGS:
LLJ A STUDY OF THEATER AND SYMPFONY
IN FOUR SOUTHERN CITIES
Alan R. AndreasenProfessor of Business Administration
Research Professor, Survey Research Laboratory
Russell W. BelkAssociate Professor of Business Administration
University of Illinois at Urbana-Champaign
September 1978
U.S. DEPARTMENT OF EDUCATION
NATIONAL INSTITUTE OF EDUCATION
EDUCATIONAL RESOURCESINFORMATION
CENTER (ERIC/
)( This document has beenreproduced as
received from the person or organization
originating it.Minor changes have
been made to improve
reproduction quality.
Points of view or opinionsstated in this docu-
ment do not necessarilyrepresent official NIE
position or policy.
Prepared for the Research Division of the National Endowment for the
Arts under Contract No. RQ0-22-6N.
TABLE OF CONTENTS
Page
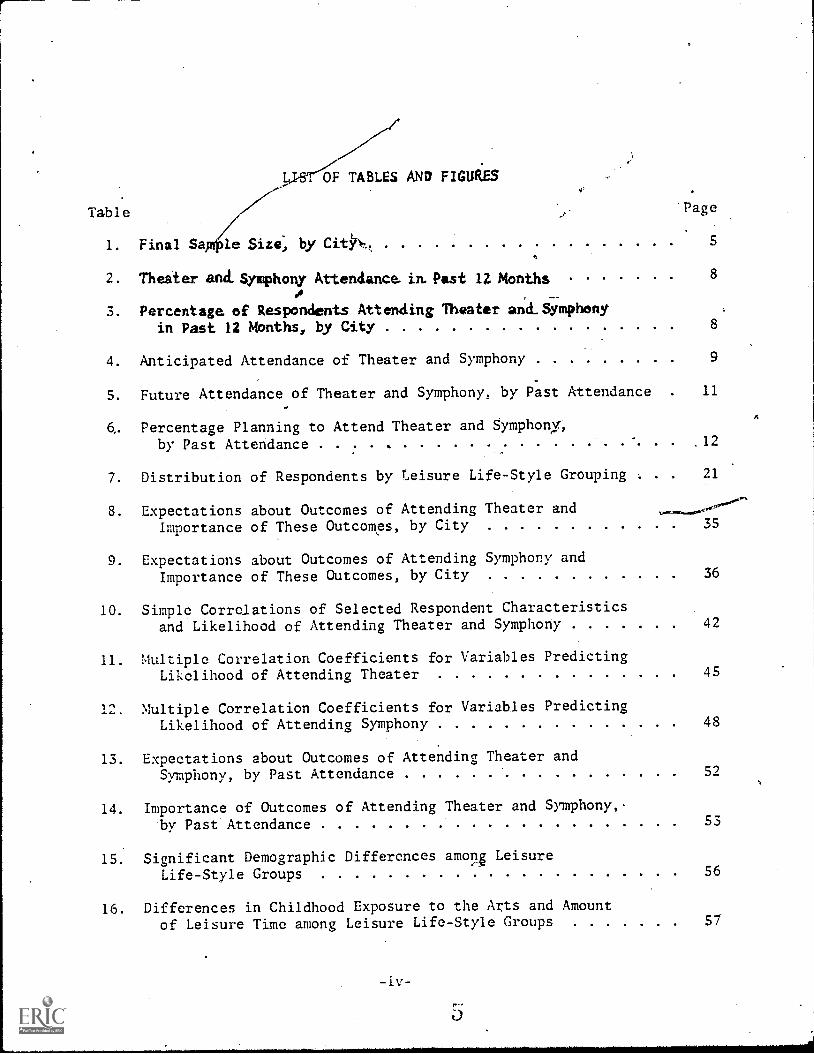
LIST OF TABLES AND FIGURES iv
ACKNOWLEDGMENTS
SUMARY
vii
ix
I.
II.
INTRODUCTION
METHODOLOGY 3
A. Sample Selection 3
B. Characteristics of the Sample 6
C. The Questionnaire 6
III. FINDINGS 7
A. Past and Future Attendance 7
1. Past Attendance 7
2. Future Attendance: General Findings 9
B. Determinants of Future Attendance 13
1. Past Findings 14
2. Life Style 18
a. Leisure Life-Style Characteristics 20
b. General Life-Style Characteristics 30
3. Attitudes toward Theater and Symphony ,32
4. Family Life Cycle 39
5. Regression Results 41
a. Theater 44
b. Symphony 47
c. Nonuseful Potential Predictors 49
6. Implications of the Associational Approach 50
a, Attitudes 50
b. Leisure Life-Style Groups SS
c. Interest in the Arts as a Child 61
7. Deficiencies of the Associational Approach 62
C. The Manipulations Approach 63
1. The Manipulations 64
2, Results 72
a. New Offerings 72
b. Price and Series Strategies 73
c. Broadening the Audience 78
d. Responses to Manipulations across Life-Sty1e Groups 81
e. Responses to Manipulations within Life-Style Groups 85
TABLE OF CONTtNTS--Coatinueot
PAga.
IV. CONCLUSIONS AND RECOMMENDATIONS 88
A. Managerial Conclusions and Recommendations 88
B. Analytical ,Conclusions and Recommendations 94
APPENDICES
A. Detailea Statistical Tables 96
B. Technical Note on Factor Analysis 98
C. Survey Questionnaire with Frequency Counts 110
REFERENCES 138
OF TABLES AND FIGUliES
Table Page
1. Final Sa, .le Size, by cith, 5
2. Theater andSymphony Attendanoe. im Past 12 Months 8
I.3. Percentage of Respondents Attending Theater and_Symphony
in Past 12 Months, by City 8
4. Anticipated Attendance of Theater and Symphony 9
5. Future Attendance of Theater and Symphony, by Past Attendance 11
Percentage Planning to Attend Theater and Symphoniy;
by Past Attendance ,12
7. Distribution of Respondents by Leisure Life-Style Grouping , . 21
8. Expectations about Outcomes of Attending Theater andImportance of These Outcomes, by City 35
9. Expectations about Outcomes of Attending Symphony andImportance of These Outcomes, by City 36
10. Simple Correlations of Selected Respondent Characteristicsand Likelihood of Attending Theater and Symphony 42
11. Multiple Correlation Coefficients for Variables PredictingLikelihood of Attending Theater 45
12. Multiple Correlation Coefficients for Variables PredictingLikelihood of Attending Symphony 48
13. Expectations about Outcomes of Attending Theater andSymphony, by Past Attendance 52
14. Importance of Outcomes of Attending Theater and Symphony,,.by Past Attendance 53
15. Significant Demographic Differences among LeisureLife-Style Groups 56
16. Differences in Childhood Exposure to the Arts and Amount57of Leisure Time among Leisure Life-Style Groups
-iv-
-V-
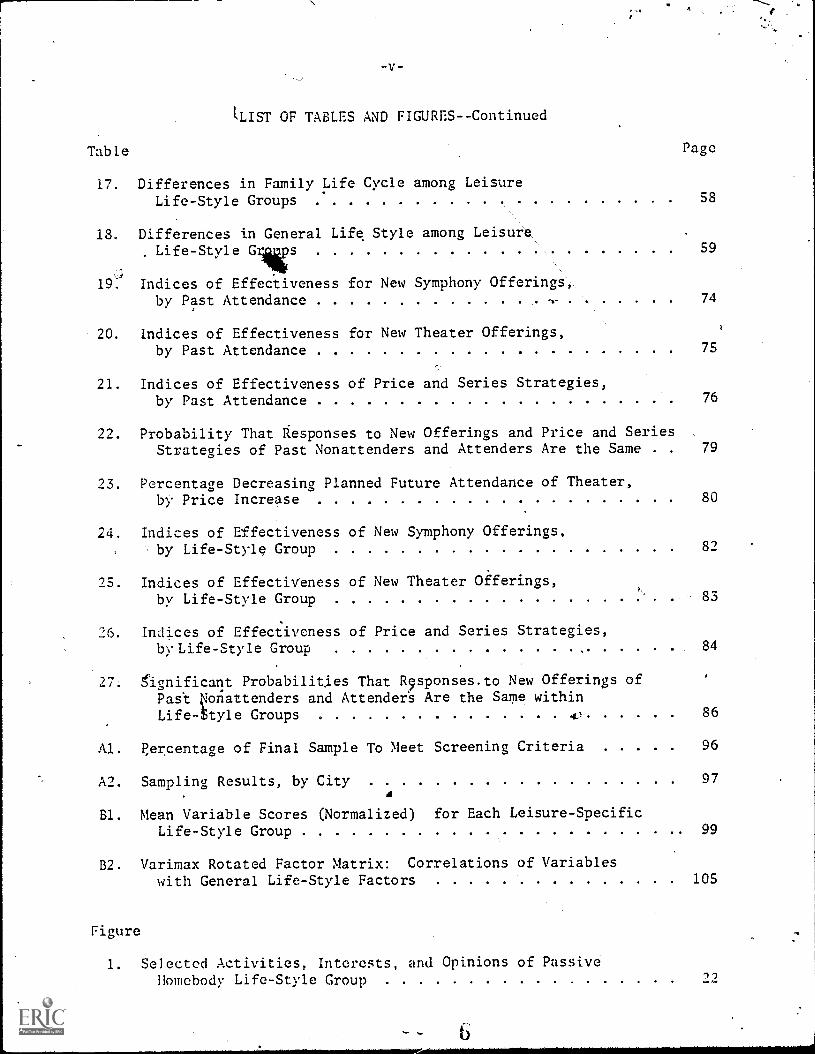
(LIST OF TABLES AND FIGURES--Continued
Table
17. Differences in Family Life Cycle among LeisureLife-Style Groups
Page
58
18. Differences in General Life Style among Leisure. Life-Style Grigs 59
19: Indices of Effectiveness for New Symphony Offerings,.by Past Attendance 74
20. Indices of Effectiveness for New Theater Offerings,by Past Attendance 75
21. Indices of Effectiveness of Price and Series Strategies,by Past Attendance 76
22. Probability That liesponses to New Offerings and Price and SeriesStrategies of Past Nonattenders and Attenders Are the Same 79
23. Percentage Decreasing Planned Future Attendahce of Theater,by Price Increase 80
24. Indices of Effectiveness of New Symphony Offerings,by Life-Style Group 82
25. Indices of Effectiveness of New Theater Offerings,by Life-Style Group 83
26. Ind.i.ces of Effectiveness of Price and Series Strategies,by Life-Style Group 84
)-./. Significant Probabilities That R'sponses.to New Offerings ofPas't Vonattenders and Attenders Are the Same withinLife-ltyle Groups 4:1 86
Al. P,ercentage of Final Sample To Meet Screening Criteria 96
A2. Sampling Results, by City 97
81. Mean Variable Scores (Normalized) for Each Leisure-SpecificLife-Style Group . 99
B2. Varimax Rotated Factor Matrix: Correlations of Variableswith General Life-Style Factors 105
Figure
1. Selected Activities, Interests, and Opinions of PassiveHomebody Life-Style Group 22
-vi-
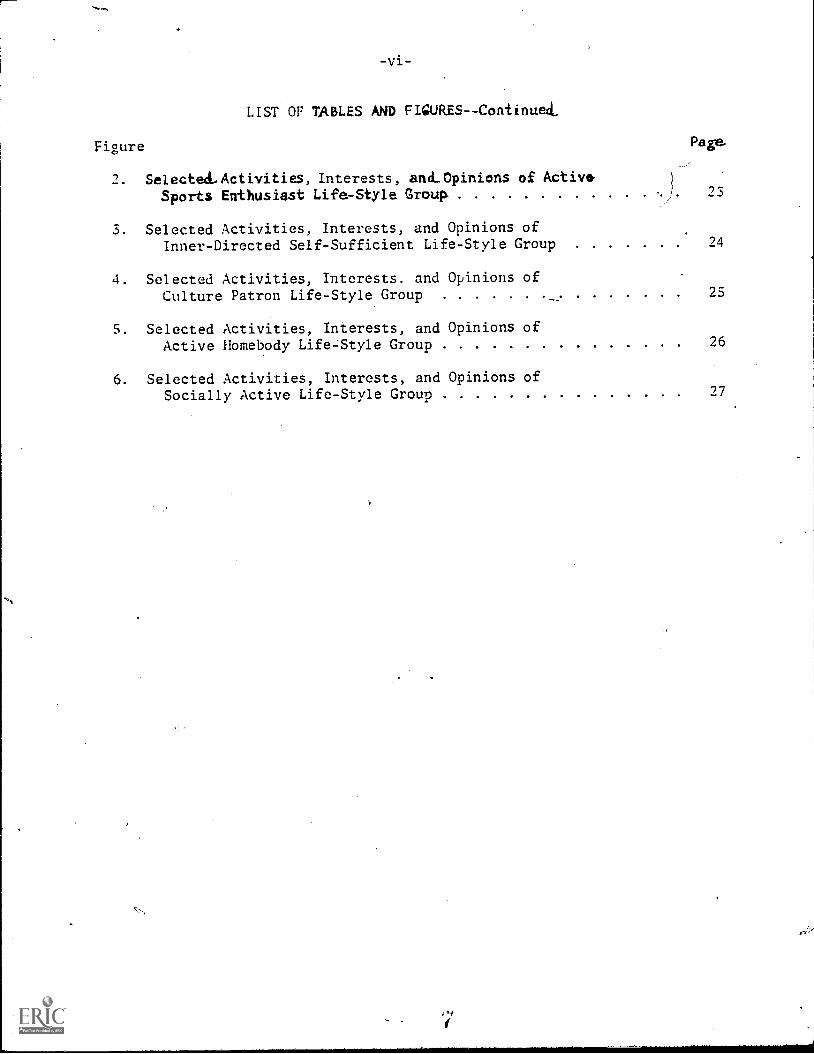
LIST OF TABLES AND FICURES--Continue4,
Figure Page.
2. Selected.Activities, Interests, and.Opinions of ActiveSports Enthusiast Life-Style Group 23
3. Selected Activities, Interests, and Opinions ofInner-Directed Self-Sufficient Life-Style Group 24
4. Selected Activities, Interests. and Opinions ofCulture Patron Life-Style Group 25
5. Selected Activities, Interests, and Opinions ofActive Homebody LifeStyle Group 26
6. Selected Activities, Interests, and Opinions ofSocially Active Life-Style Group 27
ACKNOWLEDGMENTS\
This study was ma& possible through. the assistance.of a great many,,.
specialists in the. performing arts and in survey research. Insightful
suggestions for questions and manipulations to be presented to our survey
respondents were offered by Michael Hardy of the Krannert Center for the
Performing Arts at the University of Illinois, Harold Horowitz of the
National Endowment for the Arts, Hugh Southern of the Theater Development
Fund, and Michael Useem of the Center for Study of Public Policy. Assis-
tance with pretesting was provided by Michael Hardy and by Juana H. Naoy
of the Memphis Arts Council, Inc. William D. Wells of Needham, Harper.
and Steers aided in constructing our pool of life-style items. Technical
assistance on the survey design and analysis was given generously by
Seymour Sudman of the Survey Research Laboratory of the University of
Illinois. The latter organization was responsible for managing the field
work and_for coding and reducing the data for analysis. This work was
conducted under the competent supervision of Nati Frankel, Jutta Sebestik,
and Dorothy Nemanich of SRL. Field work was carried out by Joyner-Hutcheson
Research, Inc., of Atlanta, Georgia. Computation of Q-factor groupings was
carried out by Market Facts, Inc., Chicago, under the supervision of
John Freehling. Harold Horowitz, Paul DiMaggio, and several anonymous
reviewers in the arts community made useful comments on an earlier draft
of this report.
Finally, we wish.to thank our tireless research assistants, Tony
Schellink, Gregory Upah, and Ganesan Visvabharathy for their willingness

to carry out sometimes, dull assignments and their ability to give us
insithts and perspectives on the anatyses they were helping produce.
SUMMARY
This study applies recent advances from the field, of marketing to
attitude measurement, life-style analysis, market segmentation, and
multivariate statistics to audience development research. Data were
collected from a sample of 1,491 respondents 14 years of age or older in
four southern cities (Atlanta, Georgia; Memphis, Tennessee; Columbia,
South Carolina; and Baton Rouge, Louisiana). Our focus was on attracting
marginal attenders rather thanbuilding subscription sales among present
attenders. For this reason, potential respondents judged to have zero
probabilities of attending resident theater or symphony in the future
Were eliminated from the study and present heavy users were undersampled.
Somewhat less than half the sample claimed to have attended the
theater in the previous 12 months; about the same proportion said that
they woultLatteann the next year or two. Ay contrast, 14 percent
attended a symphony concert in the past year, but double- that number
said they were likely to attend in the next year or two. A substantial
proportion of those whoiAlanned to go to both theater and symphony
events in the future had never been in the past.4
two approaches to the problem of broadening the audience for
theater and symphony were then explored. The first approach, called
the "associational" approach, considered which characteristics best
predicted whether respondents anticipated attending theater and symphony
in the future. The second "manipulations" approach explored the responses
of potential audiences to new theater and symphony offerings.
a
To
-x-
d the best set of predictors of future attendance, the
"associational" ap h employed stepwise regression analysis using a
battery of individual traits including demographic characteristics,
prior experience with theater or symphony, a specially developed leisure
life-style characterization, measures of general life-style traits,
measures of attitudes toward theater or symphony, and a measure of the
respondent's stage in the family life cycle. The best predictors of
anticipated future attendance for both theater and symphony were found
to be attitudes toward attending these events, prior experiences with
the cultural arts (including childhood interests), and belonging to a
leisure life-style group characterized in this report as "Culture Patrons."
In addition, for theater the absence of two general life-style traits
referred to here as "traditionalism" and "self-confidence/opinion leadership"
increased the level of anticipated future attendance beyond that suggested
by the predictor variables shared with the symphony analysis.
These findings, although associational, are interpreted to suggest
that leisure life styles are a valuable means for characterizing pro-
spective theater and symphony attenders (i.e., for segmenting the market).
In addition it appears that early Childhood socialization in the arts is
critical and that greater likelihood of attendance is reflected in
more detailed attitudes toward theater and symphony attendance. Finally,
in contrast to most other past studies, purely demographic or family life-
cycle characteristics were not found to be the best predictors of attendance.
In particular, we did not find significant differences across cities.
The other significant group of analyses conducted, the "manipulations"
approach, examined reported changes in the likelihood of future theater
and symphony attendance if certain changes t,:cre made in thcsc offerings
,-,
or in the controllable conditions surrounding them.
fince the overa111
1
objective was to assess the potential for attractingincw patrons rather,
than siAply increasing the attendance of current pairons, these analysei./
//compared the responses of current attenders and urrent nonattenders
at each cultural event.
II)Over a dozeil different difications were considered in four basic
areas: Cl) changes in the event (type of performance, quality of perfor-
mance, formality, and extent of learning appp,rtunities); (2) price
changes; (3) changes in the event's locatio ; and (4) changes of price
in combination with changes in the event or its location.
The analysis of these manipulations clearly pinpointed two strat-
egies that appear to have very high impact on present nonattenders, although
in both cases the impact on present attenders is just as great. One Can
attract more nonattenders by offering second tickets at half price,
a strategy that strikingly appears likely to generate more revenues from
nomittenders than does offering ticket or series discounts of "Larger
amounts. A second high impact strategy is one that is not surprising
to arts managers--including More famous-performers in the event. The next
most important overall strategies for attracting symphony attenders were
offering tickets at half off on the day of the program and having a
:,hort introductory talk before the concert. However, both of the latter
strategies appear to have lower overall impact on theater nonattenders,
who seem more responsive to program Changes, especially the offering of
more musical comedies.
Several of the proposed strategies also had an impact on past at-
tenders. Investigation of strategies that selectively broadened audiences
(i.e., attracted past nonattenders but not past attenders) found none
Eor theater and, onIy one for syftphony--offering choral music Subsequent
anabiis within lifestyle groups showea that choral music was nainly
effective on nonattenders among a life-sfyle group described here as
"Passive Homebodies." However, increasing the use of choral music is
probably not effective because 4.t affects only one life-style group
and, more importantAx, because it has the lowest overall impact score
among nonattenders.
Given the lack of a great number of significant selective strategies
for increasing attendance at symphony and theater ,events, the obvious
implication from this analysis for managers is that the major short-term
strategy for broadening the audiende is to use high-impact strategies
such as occasionally offering second tickets at half off or scheduling
more famous performers, recognizing that these strategies will also
increase patronage among present attenders. Data from the associa-
tional analysis would also encourage the use of the second ticket at
half off to stimulate interpersonal influence processes, thus getting
present attenders to invite nonattenders at the reduced rate.
I. INTRODUCTION
This study responds to three specific objectives of the arts
community. A first long-run objective is to broaden the audience for
the performing arts. Presently there is a great deal of interest among
arts managers in increasing subscription sales to current attenders as
a means of stabilizing revenues (18). This is not our focus here. The
present research follows from the mandate of the National Endowment
for the Arts to "make arts and cultural activities more widely available
to millions of Americans" (16, p. 11). To achieve this, the arts must
attract greater patronage from current light attenders and, particularly, .
from nonattenders. However, at this time we know little about why some
people become arts attenders and others do not. We know even less about
What, if anything, can be done to make light or nonattenders attend more
often.
The traditional approach to this problem has been to look at
relationships between standard socioeconomic characteristics and arts
attendance one at a time (e.g., 13, 17, 30). The present study
advances this approach by adding complex life-style.and attitudinal
measurements to the standard set of predictors and by simultaneously
analyzing the relationships between planned arts attendance and aLi
the predictor variables.
However, as we shall discuss below, a problem with this "associa-
tional" approach is that association does not imply causation. Inferences
about the effects that changes in arts offerings might have on future
-1-
-2-
attendance are subject to very strong, often fatal, quanfications.
Efforts by researchers to look directly at-the effects of given changes
on attendance have been rare. One such attempt is found in the work
of Eric Marder (13).
Marder developed a model of respondents' attitudes toward seven
performing arts. Re then, in effect, asked the model what would happen
if selected beliefs about these arts were changed, deriving estimktet
of likely gains and losses to each art form. Three limitations exist
in Marder's pioneering work, however. First, respondents were not asked
directly what their responses'-to the changes would be. Second, relative
choices were forced; a gain for one art form always meant a loss for
another. Finally, no assessment was reported of who changed. Thus, one
cannot tell whether the changes simply attracted more present attenders
or, in fact, broadened the arts audience.
To extend Marder's work, the present study asked potential theater
and symphony attenders what their responses would be to proposed changes
in the offerings of those institutions. Many means of increasing
attendance have been tried or suggested-in various parts of the country,
inCluding price discounts, touring programs, and special promotions
(e.g., 2). A major objective of this study is to explore several such
changes in order to provide insight into what will and will not broaden
the arts audience.
The second broad objective to which this study is directed is the
need to apply the sophisticated tools of marketing and business manage-
ment to the problems of generating demand for the arts. This study
introduces several recent marketing approaches to demand analysis in an
attempt to give new insights into arts audiences and their development.
-3-
In particular, the study makes considerable use of recent advances in
attitude measurement, life-style analysis, market segmentation, and
multivariate statistics to develop strategies for arts managers.
A final objective is to develop information that can be used by
arts administrators in the South, where research (e.g.,*17) has shown
that demand for the performing arts is particularly weak.
II. METHODOLOGY
In order to achieve the three objectives outlined above, this
study develops basic attitudinal, life-style, and socioeconomic data
on marginal and regulaa' attenders of two of the performing arts--
theater and symphony concerts. The study was carried out in four southern
cities (Atlanta, Georgia; Baton Rouge, Louisiana; Columbia, South
Carolina; and Memphis, Tennessee) and assesses responses to 12 different
manipulations in the offerings of both resident symphony and resident
theater. The four cities were chosen from among a list of several dozen
southern cities with both a symphony and regular theater presentations.
A. Sample Selection
Data for the analysis were gathered by means of telephone interviews
conducted with respondents 14 years of age or older randomly selected from
households with telephones in the four cities. At the outset, it was
decided that a major focus of the study would be on marginal attenders--
those--who do not now go frequently to theater or symphony but who might
be enticed to do so. For-this reason, those whom we judged'to have virtually
zero probability of attending theater or symphony were screened out. At
the same time, those who are already heavy atienders were intentionally
-4-
undersampltd, since our concern was not with appealing to audiences already
heavily involved in the arts. The undersampling was accomplished by inter-
viewing only one-half of those who had attended three or more theater or
symphony performances in the previous year.
Screening questions defined potential users as the following:
a) Those who did one of the following in the last 12 months:
(1) Went to live popular or rock concerts;
(2) Listened at least ten times to classical music on radio>,
television, records, or tapes;
(3) Visited an art gallery or museum;
(4) Went to a live classical music performance other than a
symphony concert;
(5) Saw a ballet either live or on television;
(6) Saw one or two plays;
(7) Went to a symphony orchestra concert once or twice.
b) And/or those who met one of the following qualifications:
(1) Plays a musical instrument;
(2) Ever worked for a theater, music, or dance production;
(3) Attended three or more live plays sometime in their lives
but not in the past year;
(4) Attended three or more symphony orchestra concerts'sometime
in their lives but not in the past year.
A total of 3,956 residential telephone numbers were selected for
screening. Cf these, 44 percent/ere not screened because the numbers
were no longer in service, the residents were not at home after five
callbacks, or they refused to participate. Of those screened, 15 percent
1 7
-5 7
were heavy offenders; by sample design, one-half of them were dropped. from
the main sample.1 Only 14 percent of those reached were dropped because
their probability of attending was deemed to be zero according to the
criteria discussed above. (Percentages of the final sample who met each
screening criterion are reported in Appendix A, Table Al.) After screen-
ing, a total of 1,733 households were designated for complete interviews.
A systematic selection table (see Appendix C) was used to determine the
household member to be interviewed. Of the remaining respondents, an
additional 14 percent were unavailable or refused to participate in the
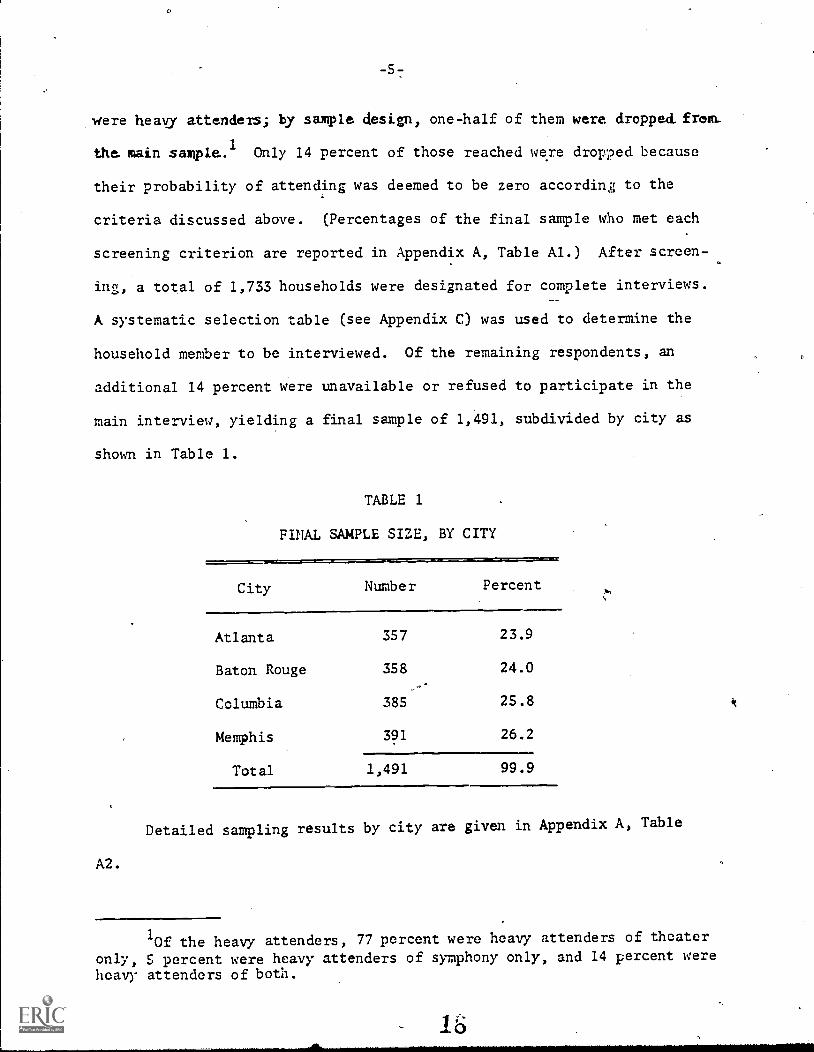
main interview, yielding a final sample of 1,491, subdivided by city as
shown in Table 1.
TABLE 1
FINAL SAMPLE SIZE, BY CITY
City Number Percent
Atlanta 357 23.9
Baton Rouge 358 24.0
Columbia 385 25.8
Memphis 391 26.2
Total 1,491 99.9
Detailed sampling results by city are given in Appendix A, Table
A2.
10f the heavy attenders, 77 percent were heavy attenders of theater
only, S percent were heavy attenders of symphony only, and 14 percent wereheavy attenders of both.
-6-
B. Characteristics of the Sample
The study's methodology attempted to develop a sample of individuals
over 14 years of age in the four metropolitan areas. Comparisons of study
characteristics with available census data suggest that the sample popula-
tion is younger, better educated, from a higher income level, and substan-
tially more often female than the general population of the four areas.
These differences are consistent with those found in other studies using
telephone interviewing and are also consistent with our procedure for
screening out those with zero probability of attending arts events.
C. The Questionnaire
Respondents in the study were asked extensive questions about their
attitudes and behavior toward theater and symphony, aspects of their lei-
sure and general life styles, and their socioeconomic characteristics.
The questions were developed from other research studies, from introspec-
tion, and from several focus-group interviews with heavy and light arts
attenders. The questionnaire was pretested with a sample of 30 respondents
in Memphis. Because of the length of the questionnaire, one-third of the
main sanple in each city was asked about their attitudes toward attending
the theater, another third was asked about their attitudes toward attending
symphony concerts, and the final third was asked neither set of attitude
questions. The questionnaire reproduced in Appendix C includes basic
frequency counts or mean responses for each question.
-7-
III. FINDINGS
As indicated in the Introduction, this study is concerned with.
building future audiences. It is designed to offer guidance on hOw to
make both past nonattenders and attenders become future attenders. The
study utilizes two broad analytical approaches: (1) analyzing associations
with planned future attendance (the "associational" approach), and
(2) analyzing responses to proposed changes in arts offerings (the-
"manipulations" approach). Sections B and C of this part of the report
///
are devoted to these analyses. First, however, we shall begin in. Section
with a background description of the sample's ast and planned'future
patronage behavior.
. Past and Future Attendance
1. Past Attendance
About 42 percent of all respondents in the study claimed that they
had attended the theater in the past 12 months (and an addit.,onal 46 per-
cent had not attended theater in the past year but had attended at least
three times'in their lives). By contrast, only 14 percent had attended
a symphony concert in the past 12 months (and 19 percent had at sOme
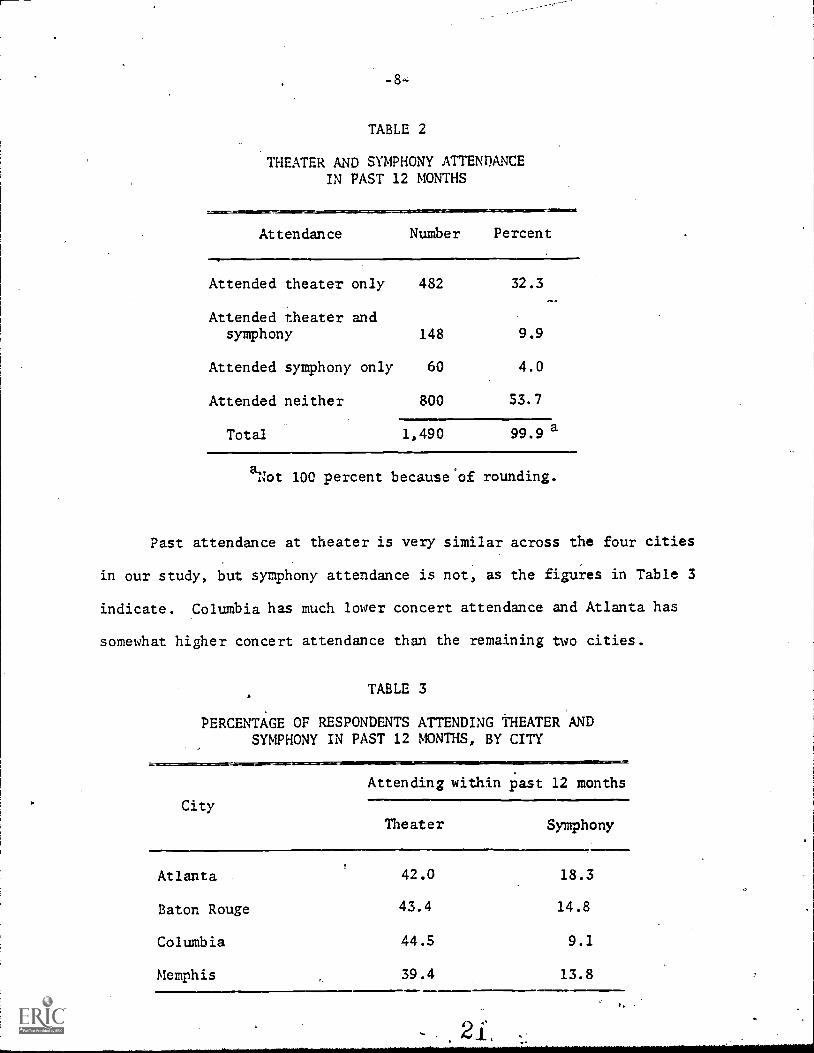
previous time). Some 10 percent of the respondents had attended both
symphony and theater, and some 54 percent had attended neither in the
past 12 months, as the figures in Table 2 indicate. Clearly those Who
are concertgoers only are a small, unique group; concert attendance is
more likely to be combined with theater attendance. Cluite the opposite
is true of theater attendance.
-8=
TABLE 2
THEATER AND SYMPHONY ATTENDANCEIN PAST 12 MONTHS
Attendance Number Percent
Attended theater only 482 32.3
Attended theater andsymphony 148 9.9
Attended symphony only 60 4.0
Attended neither 800 53.7
Total 1,490 99.9 a
EL,ivOt 100 percent because*of rounding.
Past attendance at theater is very similar across the four cities
in our study, but symphony attendance is not, as the figures in Table 3
indicate. Columbia has much lower concert attendance and Atlanta has
somewhat higher concert attendance than the remaining two cities.
TABLE 3
PERCENTAGE OF RESPONDENTS ATTENDING THEATER ANDSYMPHONY IN PAST 12 MONTHS, BY CITY
City
Attending within Past 12 months
Theater Symphony
Atlanta
Baton Rouge
Columbia
Memphis
42.0
43.4
44.5
39.4
18.3
14.8
9.1
13.8
-9-
Whether these differences are due to differences in the kinds of peopleA
in each of these cities or to other factors in their respective cultural
environments (e.g., quality and relative availability of performances)
is an issue to which we shall return in later multivariate analyses.
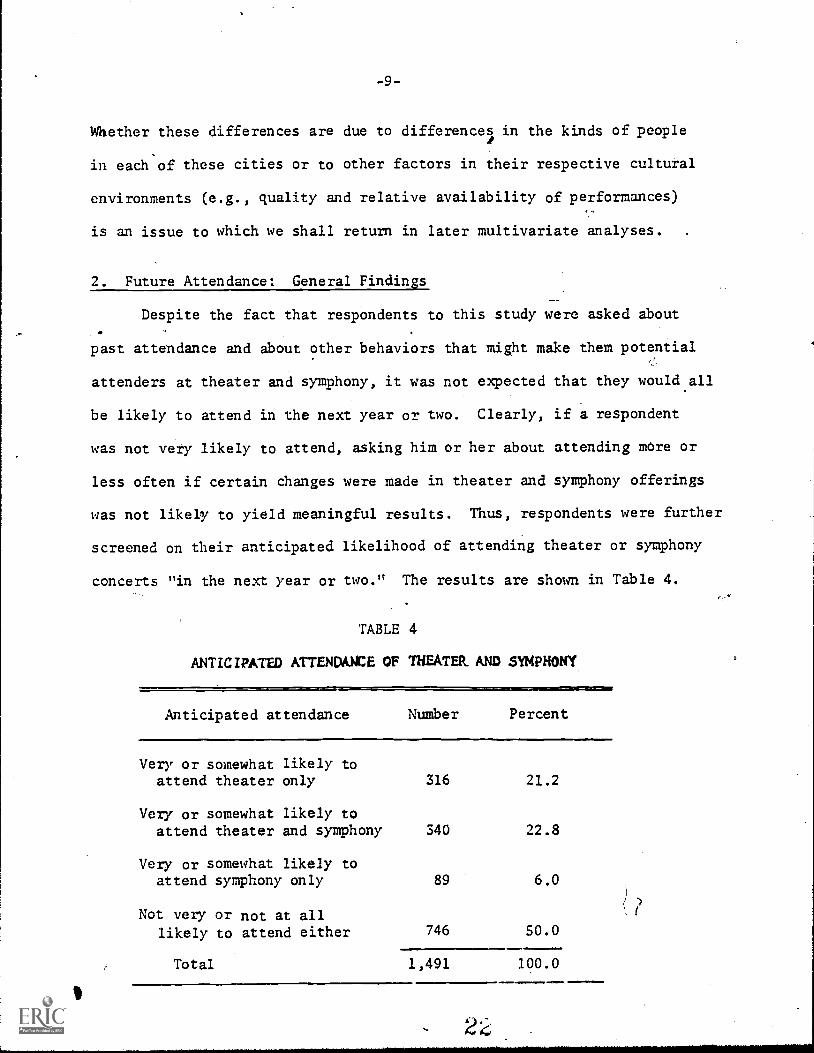
2. Future Attendance: General Findings
Despite the fact that respondents to this study were asked about
past attendance and about other behaviors that might make them potential
attenders at theater and symphony, it was not expected that they would.all
be likely to attend in the next year or two. Clearly, if a respondent
was not very likely to attend, asking him or her about attending more or
less often if certain changes were made in theater and symphony offerings
was not likely to yield meaningful results. Thus, respondents were further
screened on their anticipated likelihood of attending theater or symphony
concerts "in the next year or two." The results are shown in Table 4.
TABLE 4
ANTICIPATED ATTENDANCE OF THEATER. AND SYMPHONY
Anticipated attendance Number Percent
Very or somewhat likely toattend theater only 316 21.2
Very or somewhat likely toattend theater and symphony 340 22.8
Very or somewhat likely toattend symphony only 89 6.0
Not very or not at alllikely to attend either 746 50.0
Total 1,491 100.0
-10-
Comparison ofthese data with those on past attendance indicates
that about the same proportion anticipate attending symphony only or
neither symphony nor theater in the future as in the past. There is a
marked shift, however, from 'theater only" to joint theater and symphony
attendance.v.,_Althdt gh this shift does not affect the number who are
planning to attend theater, it has marked effects on the number who are
planning to attend symphony concerts in the next year or so.
To see where this shift is coming from, past andi planned future
attendance is contrasted in Table S. Here we can see that the most
stable groups are those who go either to both art forms or to neither;
in each case, about two-thirds say that they will continue their past
patterns. The remaining categories have a great deal of volatility.
Only 18 percent of the symphony-only patrons and 34 percent of the
theater-only patrons claim that they will continue exactly the same
arts attendance patterns. Half of the symphony goers say that they will
add theater attendance and a quarter of the theater attenders will add
symphony. By contrast, one-quarter of the symphony-only attenders and
over one-third of the theater-only attenders will drop out of the market
altogether.
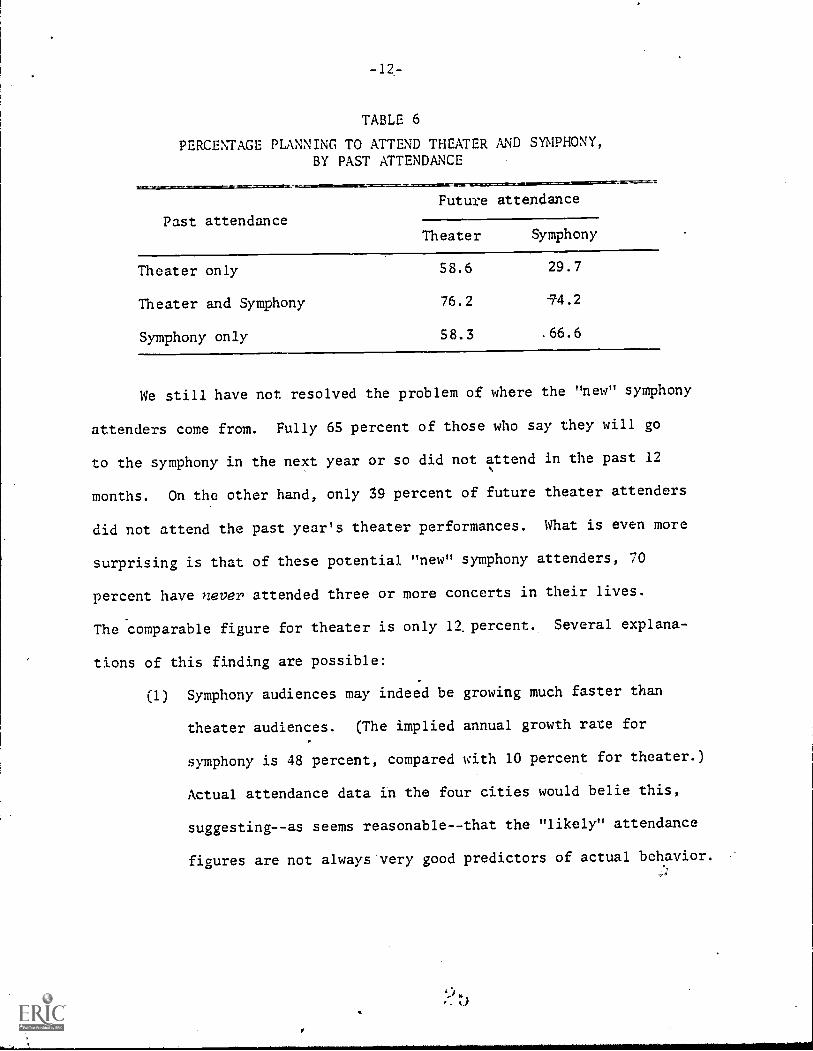
Put another way, those who attended both theater and symphony
appear more likely to remain loyal to each performing art than those
who attended only one of the art forms, as the figures in Table 6 show.
This high likelihood of future attendance on the part of those with
interest in more than one cultural art is a finding that we shall see
reflected in later analyses. It will, undoubtedly, not come as a
surprise to arts researchers or administrators.
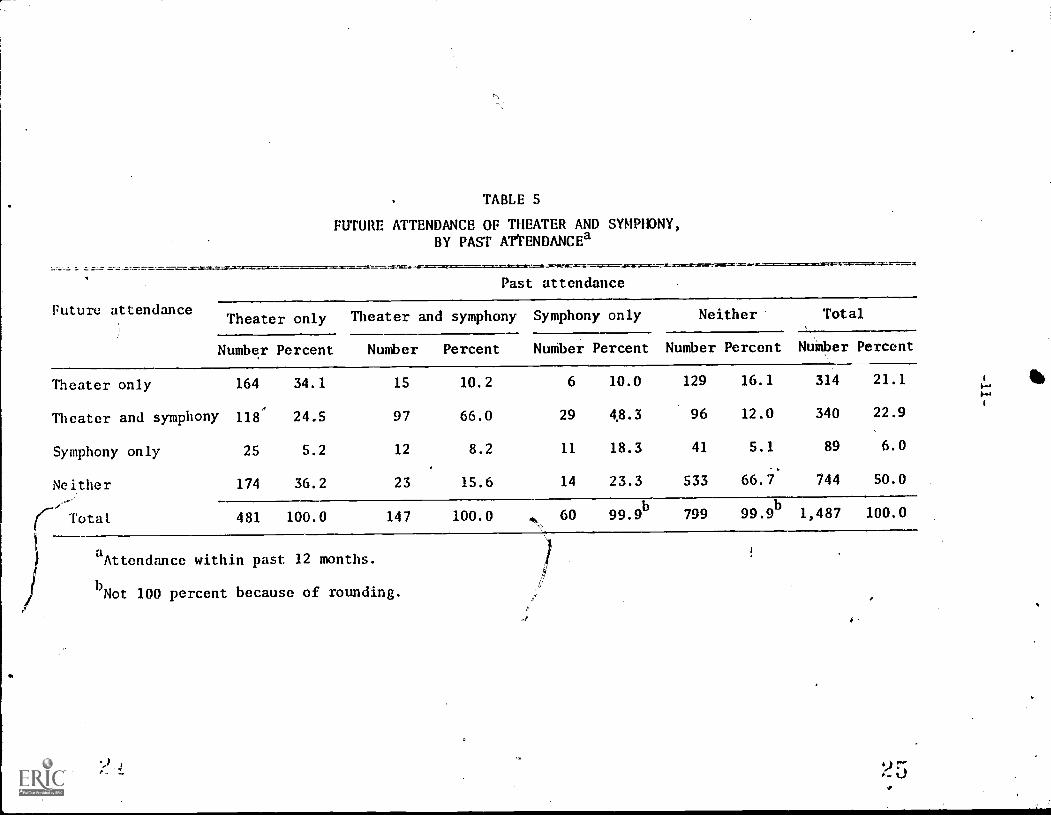
TABLE 5
FUTURE ATTENDANCE OF THEATER AND SYMPHONY,BY PAST ATTENDANCEa
Future attendance
Past attendance
Theater only Theater and symphony Symphony only Neither Total
Number Percent Number Percent NuMber Percent Number Percent NuMber Percent
Theater only
Theater and symphony
Symphony only
Neither,r Total
164
118
25
174
34.1
24.5
5.2
36.2
15
97
12
23
10.2
66.0
8.2
15.6
6
29
11
14
10.0
48.3
18.3
23.3
129
96
41
533
16.1
12.0
5.1
66.7
314
340
89
744
21.1
22.9
6.0
50.0
1-11
Illio
481 100.0 147 100.0 ...60 99. 9
b799 99.9
b1,487 100.0
'.
i
awithin past 12 months. 1
#
!
./
Not 100 percent because of rounding.
1
-12-
TABLE 6
PERCENTAGE PLANNING TO ATTEND THEATER AND SYMPHONY,BY PAST ATTENDANCE
Future attendance
Past attendanceTheater Symphony
Theater only 58.6 29.7
Theater and Symphony 76.2 -74.2
Symphony only 58.3 .66.6
We still have not resolved the problem of where the "new" symphony
attenders come from. Fully 65 percent of those who say they will go
to the symphony in the next year or so did not attend in the past 12
months. On the other hand, only 59 percent of future theater attenders
did not attend the past year's theater performances. What is even more
surprising is that of these potential "new" symphony attenders, 70
percent have never attended three or more concerts in their lives.
The comparable figure for theater is only 12 percent. Several explana-
tions of this finding are possible:
(1) Symphony audiences may indeed be growing much faster than
theater audiences. (The implied annual growth rate for
symphony is 48 percent, compared with 10 percent for theater.)
Actual attendance data in the four cities would belie this,
suggesting--as seems reasonable--that the "likely" attendance
figures are not always very good predictors of actual behavior.
- 13-
(2) Symphony attendance is seen as more prestigious than theater
attendance, so that more respondents tried to impress our
interviewers by saying that they planned to attend in the
future. Undoubtedly, some of this response bias is present.
in our data, but to suggest that it applies to 1S-19 percent
of the sample seems unlikely.
(3) The potential audience for symphony is much larger than past
attendance figures would suggest. By saying that they plan
to go in the future, past nonattenders may be merely sig-
naling their interest in attending if the circumstances are
right. Such a possibility would predict that this group
might be particularly responsive to new offerings a pre-
diction that we shall see has some support.
B. Determinants of Future Attendance
It is future attendance that arts marketers wish to influence.
One approach to developing strategies to that end, as we have note4,
ta ascertain what characteristics arg associated with planned attendance.
The assumption, then, is that if one knows that some members of a
particular population segment have a high probability of attendance,
one should focus one's marketing efforts on that segment with the ex-
pectation that nonattenders or light attenders in the segment are more
likely to be,fayorably predisposed to take the action that one wants
than are those in other segments. Marketing dollars would therefore
be more productively spent with such a sequential strategy (7, 25).
-14-
1. Past Findings
There have, of course, been a large and growing number of audience
studies conducted in the United States in the last ten years, a great
many of which are unpublished.
A detailed analysis of 270 studies of audiences for museums and the
performing arts has recently been completed by DiMaggio, Useem, and
Brown (5). Through extensive efforts at standardizing the results across
these diverse studies, these researcheri concluded the following:
Gender: "The percentage of men and women in the audiences
surveyed varied, but did not differ greatly from
the population at large" (5, p. ii).
"On the average, arts audiences exhibited age
profiles similar to that of the entire population,
but specific audiences frequently diverged greatly
from this central tendency" (5, p. 32).
Educationalattainment: "Although audiences varied considerably, median
educational attainment was in most cases very
high relative to the population at large" (5, p. iii).
Occupation: "Among the most striking findings were the high
median percentages of professionals in the audiences
surveyed relative to their share of the employed
civilian work force and the rarity of blue collar
workers among attenders surveyed in art museums
and the performing arts" (5, p. iii).
Income:
- 15-
"The median income for performing arts audiences
was approximately $19,000 [in mid-1976 dollars],
or about $4,000 more than the United States'
average" (5, p. iv).
Race andethnicity: "Minorities participated in the relatively few
audiences for which data were avallable at rates
consistently lower than their share of relevant
metropolitan populations" (5, p. iv).
In addition to these findings, the authors also reached the follow-
ing conclusions:
(1) There seem to be no significant changes in audiences over time,
although there are relatively few pre-1970 studies.
(2) Heavy attenders reported higher education levels and incomes
than did light attenders but they had the same gender and
age patterns.
(3) Heavy attenders at one live performing art (except theater)
tended to be heavy attenders at other live performing arts.
These findingNin the main, are not very surprising, and in
their conclusions, the authors point to the need for further advances
in research to try to improve the quality of audience research. They
urge four specific advances of relevance to the present study:
(1) They ask, "Is there one arts audience or many? For example,
do major arts centers like New York have multiple publics
while smaller cities have a single cultural public?" (5, p. 177).
-16-
Much of the past research on arts audiences has tended to
contrast attenders and nonattenders and has not looked to
see if there are meaningful subsegments within either group.
A major contribution of the present study is that it
divides the population in advance into subsegments based
on their leisure-time use patterns and then observes,their
likelihood of future attendance and their responsiveness
to new arts offerings. In addition to developing these
leisure life-style groupings, this study also develops a
rich array of data on respondents' general life-style
tendencies.
(2) DiMaggio, Useem, and Brown state: "Another issue about which
little is known and much curiosity exists is the 1-rocess of
socialization into arts attendance: how early does it begin,
how important is the family, and how important is the school?"
(5, p. 178). The present study for the first time adds to
the standard set of socioeconomic vaaables two new sets
of questions asking about (a) the extent to which respondents
were interested in classical music or live theater when they
were growing up and (b) the extent to which their parents
were interested in the same performing arts. In addition
to these new questions, the analysis also takes conventional
data on age, marital status, and the presence or absence
of children to construct a measure'of the respondent's stage
in the family life cycle to see whether receptivity to the
performing arts is higher or lower as one moves through a set
of typical life stages.
-17-
(3) DiMaggio, Useem, and Brown indicate a critical need for more
information on why people do or do not att . For example,
they ask, "Do individuals fail to attend museums and the live
performing arts because of disinterest, antipathy, inconven-
ience, prices or discomfort?" (5, p. 176). Clearly, to answer
this question one must know the extent to which potential
attenders' expectations affect their attendance. To this
end, our study has included a substantial battery of questions
about consumer attitudes (e.g., their expectations) when
attending theater and symphony and on the importance of those
A
expectations to them.
(4) Finally, DiMaggio, Useem, and Brown urge researchers to employ
more sophisticated analytic techniques to the crata that they
collect and particularly to look at the interactions among
variables. Although they focus on the need for greater use
of the relatively simple technique of cross-tabulation
analysis, the present study suggests the much higher payoff
that is possible from the use of more sophisticated techniques
now relatively commonplace in marketing research, namely,
analysis of variance, factor analysis, and multiple regression.
These techniques permit examinations of the entire set of
predictor variables simultaneously to learn which are most
important in explaining the variability in planned attendance.
Thus, in summary, what we have sought to achieve in the present
study is to use more advanced analytic techniques and to introduce
several new audience measures in the expectation that these innovations
-.18-
will yield better predictions of future attendance and better explanations
of responses to changes in arts offerings. Before proceeding to the
analysis of future attendance, it will be.desirable to describe in more
detail three of the new sets of variables introduced here--life styles,
attitudes, and family life cycle--since they are relatively complex
and possibly are new to some readers of this report. We begin with the
concept of life style, which occupies a central position in the analysis.
2. Life Style
In the field of marketing, the -study of consumettlife styles,
or "psychographic" profiles, has emerged in the past decade as a major
part of an effort to provide detailed insight into consumer decision
patterns. A description of a consumer's life style typically notes
the activities in which the consumer commonly participates (e.g., going
to church, camping), the interests of the consumer (e.g., liking to eat,
liking to travel), and the opinions of the consumer (e.g., most men
would cheat on their wives if given the chance; there should be a gun
in every home). For this reason, life-style data are often called
activity, interest, and opinion (AIO) data. By constructing a broad-
based life-style profile, the researcher's intent is to show how the
consumption of a particular product or service fits into the context
of the consumer's chosen way of life.
Besides the expanded perspective on consumption provided by life-
style analysis, these descriptions often provide profiles of consumer
purchases that are greater in depth and clarity than those provided
-19-
by simpler demographic information about the consumer. Among the product
and service choices that have benefited from life-style analysis are
bank charge cards (21), department stores (14), television programs (22),
shotgun ammunition (27), and clothing (4). A number of further studies
have shown that the predictive ower of such psychographic profiles
can be superior to that o c demographic characteristics (e.g., 3,
.8, 10, 20, 29). Thus, life-style atalysis can be a practical tool
for understanding consumer choice. It can also be subjectively in-
sightful, as we shall suggest below.
The methods used in obtaining psychographic profiles are somewhat
varied, but they usually involve having a large number of people
(often over 1,000) respond to a large number of scaled activity, interest,
and opinion questions (often over 100). The questions may involve either
general life style--in which case they are often drawn from a pool of
more or less standard items--or a life style specific to the consumption
area under study (e.g., cooking). In,the latter case the items must
be specially developed.
Consumer responses to the AIO questions may be analyzed in several
ways. The most direct way is to simply profile the responses of users
versus nonusers of a product or service (for example, those with and
without bank charge cards). More typically, however, life-style
dimensions are developed through R procedure such as factor analysis
in order to combine AIO items into underlying dimensions. It is
also common to use a cluster analysis or Q-type factor analysis to
group respondents into life-style categories. (The present study
-20-
employs both procedures, as described in Appendix B.) In either case,
the reduced life-style dimensions or groups are then related to the
choice or preference behavior of interest in order to examine the im-
pact of life style on these consumption responses.
To the marketing practitioner, analysis of consumer life styles
offers a means for probing into reasons for consumer choice more deeply
than is allowed by standard demographic variables such as age, income,
and family size. This deeper awareness of how consumer purchases
facilitate or reflect individual life styles can offer major insights
for programs designed to communicate more effectively with these con-
sumers.
In the present study, consumer life style was measured at two
different levels. The first level was the individual's use of leisure
time, or what may be called "going-out behavior". The second level
was the individual's more general activities, interests, and opinions
in which the leisure activities are imbedded.
a. Leisure Life-Style Characteristics
The first type of life style analyzed was based on responses to
a set of SO questions about leisure-time activities, interests, and
opinions. These data were then used to group respondents into leisure-
specific life-style categories. Unlike the analysis of the general
life-style characteristics to be discussed later, for the leisure
life styles so-called Q-type factor analysis was performed on the answers
to these SO questions in order to group respondents into unique leisure-
time use categories, recognizing that this procedure does some disservice
-21-
to those respondents with mixed life styles (see Appendix 2). The
objective of this analysis was to find types of life styles (i.e., people)
rather than types of life-style characteristics (i.e., traits).
In developing the leisure life-style groups, a number of differ-
ent possible groupings from the Q-type factor analysis were examined, -
and these solutions were tested for stability between two randomly
chbsen halves of the respondents. A solution was selected that par-
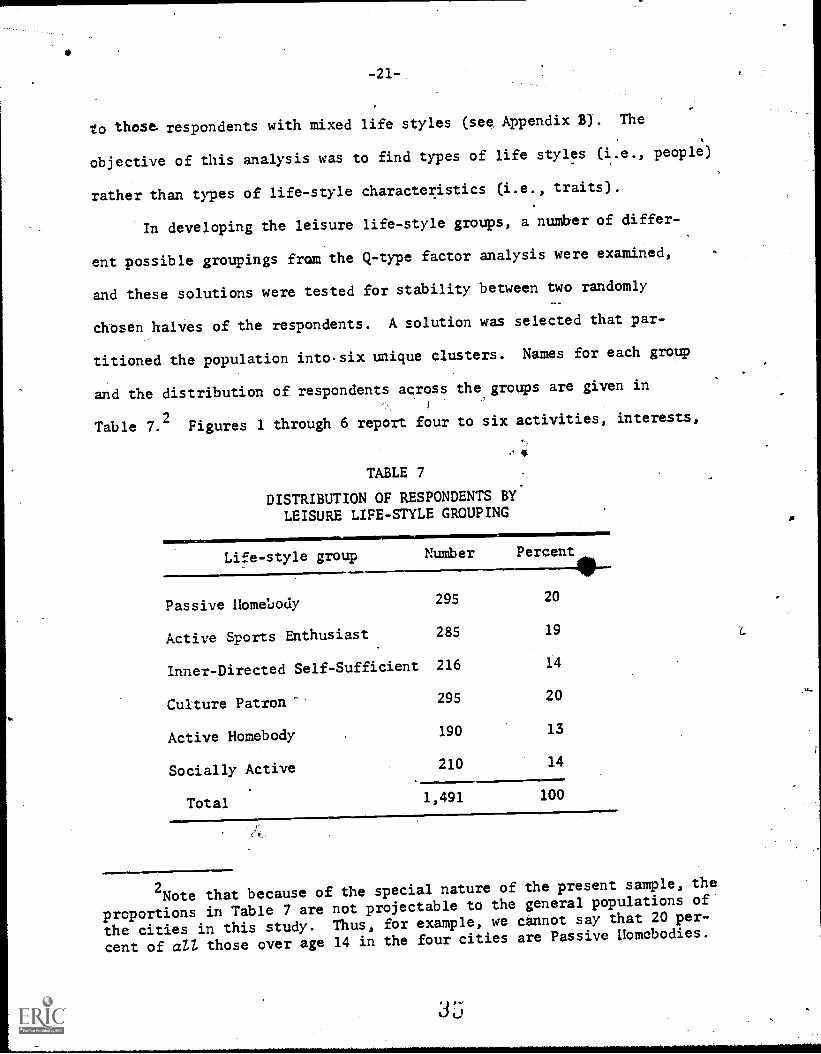
titioned the population into.six unique clusters. Nanes for each group
and the distribution of respondents across the groups are given in
Table 7.2 Figures 1 through 6 report four to six activities, interests,
TABLE 7
DISTRIBUTION OF RESPONDENTS BY.
LEISURE LIFE-STYLE GROUPING
Life-style group Number Percent
41111Passive Homebody 295 20
Active Sports Enthusiast 285 19
Inner-Directed Self-Sufficient 216 14
Culture Patron- 295 20
Active Homebody 190 13
Socially Active 210 14
Total 1,491 100
2Note that because of the special nature of the present sample, the
proportions in Table 7 are not projectable to the general populations of
the cities in this study. Thus, for example, we cannot say that 20 per-
cent of an those over age 14 in the four cities are Passive Homebodies.

-22-
FIGURE I
SELECTED ACTIVITIES, INTERESTS, ANDOPINIONS OF PASSIVE HCMEBODY
LIFE-STYLE GROUP
They do or agree with the following:
1. Television is my primary source of entertainment (interest).
2. I am a homebody (interest).
3. I watch TV in order to quietly relax (interest).
4. I would rather spend a quiet,evening at home than go to a party interest).
5. My days-seem to follow a definite routine (interest).
They do not do or disagree with the followinu
1. See a movie in a movie theater (activity).
2. Go bowling (activity).
3. Go to a sports event (activity).
4. *irk on ah arts or crafts project of your own (activity).
5. Go out to dinner at a restaurant (activity).
6. Play tennis (activity).
Number in group = 295 (20% of sample)
411,
36
-23-
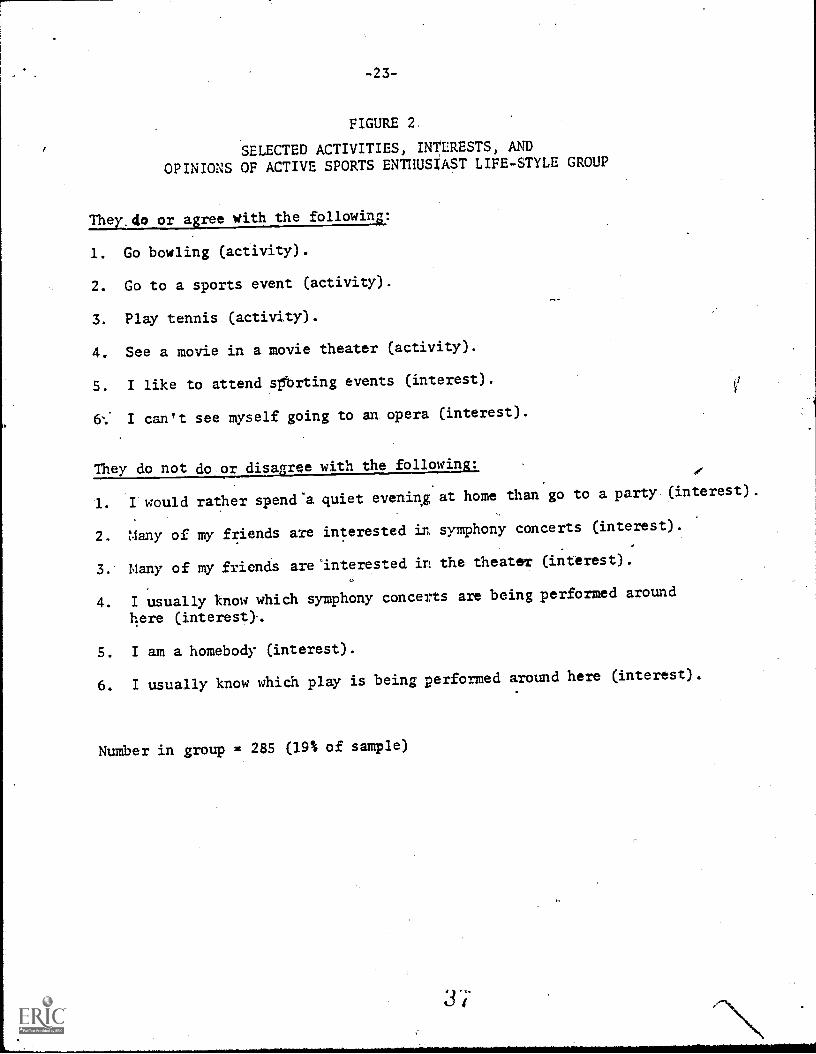
FIGURE 2.
SELECTED ACTIVITIES, INTERESTS, AND
OPINIONS OF ACTIVE SPORTS ENTHUSIAST LIFE-STYLE GROUP
najtaragree with the followinv
1. Go bowling (activity).
2. Go to a sports event (activity).
3. Play tennis (activity).
4. See a movie in a movie theater (activity).
5. I like to attend spanting events (interest).
I can't see myself going to an opera (interest).
They do not do or disaaree with the followin :
1. I would rather spend'a quiet evening at home than go to a party (interest).
2. Many of my friends are interested in symphony concerts (interest).
3. Many of my friends are'interested it the theater (interest).
4. I usually know which symphony concerts are being performed around
here (interest).
5. I am a homebody (interest).
6. I usually know which play is being performed around here (interest).
Number in group = 285 (19% of sample)

-24-.,
FIGURE,3
SELECTED ACTIVITIES, INTERESTS, AND OPINIONS OFINNER-DIRECTED SELF-SUFFICIENT LIFE-STYLE GROUP
2Tey_dooragree with the following:
1. Do yard work or gardening outdoors (activity).
2. Read a book for pleasure (activity).
3. I'd rather read a good book than a newspaper (interest).
4. Work on an arts or crafts project of your own (activity).
S. Go on a picnic (activity).
The do not do or disa ree with the followin :
1. I enjoy many foreign filns (interest).
2. I do more things socially than most of my friends do (interest).
3. I usually know which synphony concerts are being performed around
here (interest).
4. Many of my friends are interested in symphony concerts (interest).
Number in group = 216 (14% of sample)
6:0
-25-
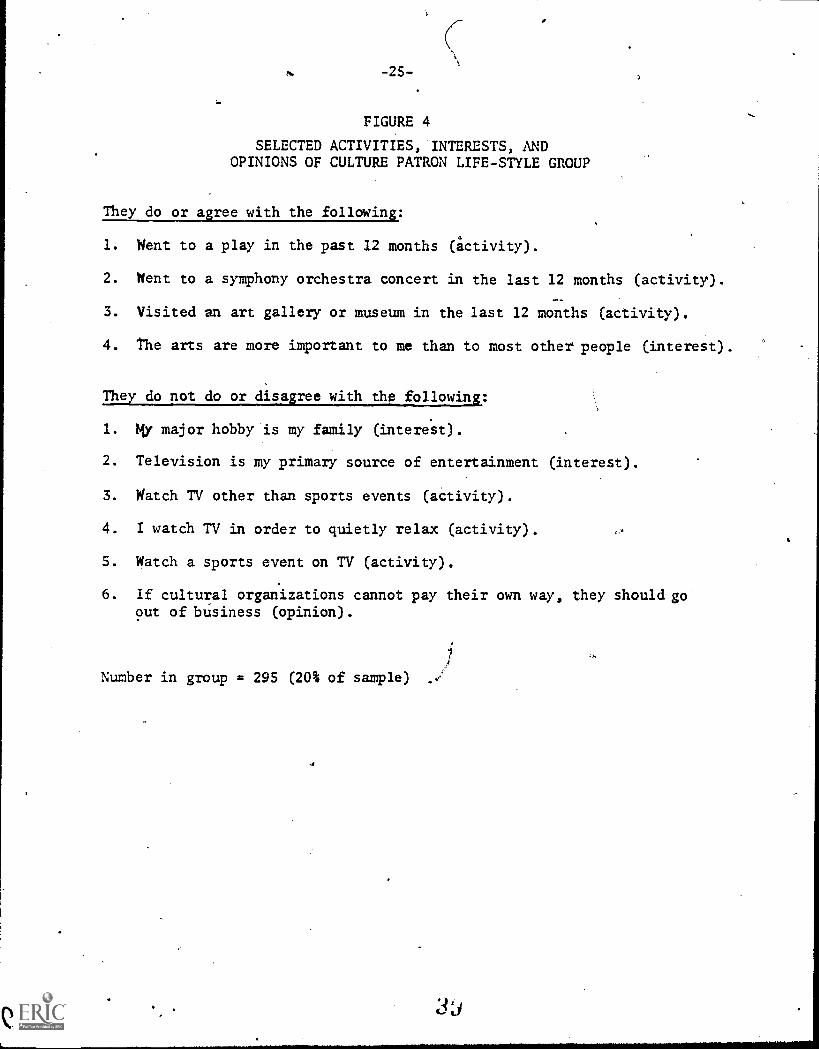
FIGURE 4
SELECTED ACTIVITIES, INTERESTS, ANDOPINIONS OF CULTURE PATRON LIFE-STYLE GROUP
They do or agree with the following:
1. Went to a play in the past 12 months (activity).
2. Went to a symphony orchestra concert in the last 12 months (activity).
3. Visited an art gallery or museum in the last 12 months (activity).
4. The arts are more important to me than to most other people (interest).
The do not do or disa ree with the followin :
1. My major hobby is my family (intere.st).
2. Television is my primary source of entertainment (interest).
3. Watch TV other than sports events (activity).
4. I watch TV in order to quietly relax (activity).
5. Watch a sports event on TV (activity).
6. If cultural organizations cannot pay their own way, they should go9ut of business (opinion).
Number in group = 295 (20% of sample)
31,1
-26-
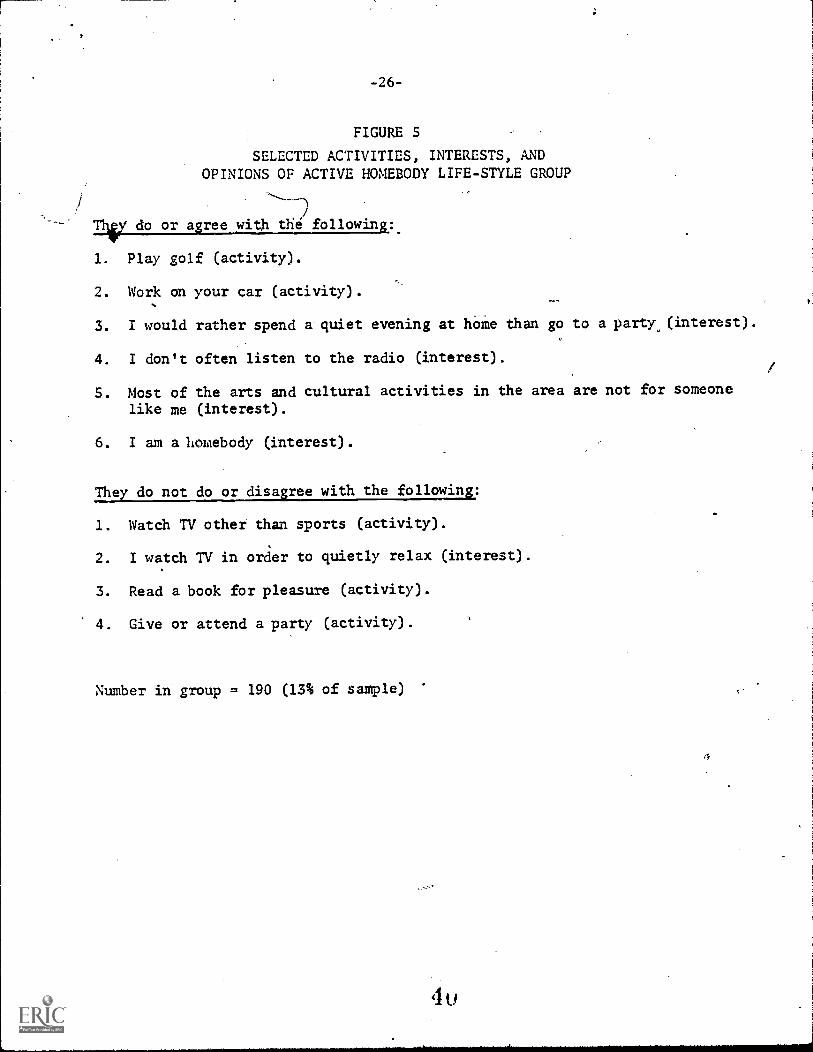
FIGURE 5
SELECTED ACTIVITIES, INTERESTS, ANDOPINIONS OF ACTIVE HOMEBODY LIFE-STYLE GROUP
1. Play golf (activity).
2. Work on your car (activity).
3. I would rather spend a quiet evening at hbie than go to a partyjinterest).
4. I don't often listen to the radio (interest).
S. Most of the arts and cultural activities in the area are not for someonelike me (interest).
6. I am a homebody (interest).
y_u_Ltcloor.limirts_Thedorwith the following:
1. Watch TV other than sports (activity).
2. I watch TV in order to quietly relax (interest).
3. Read a book for pleasure (activity).
4. Give or attend a party (activity).
Number in group = 190 (13% of sanple)
u
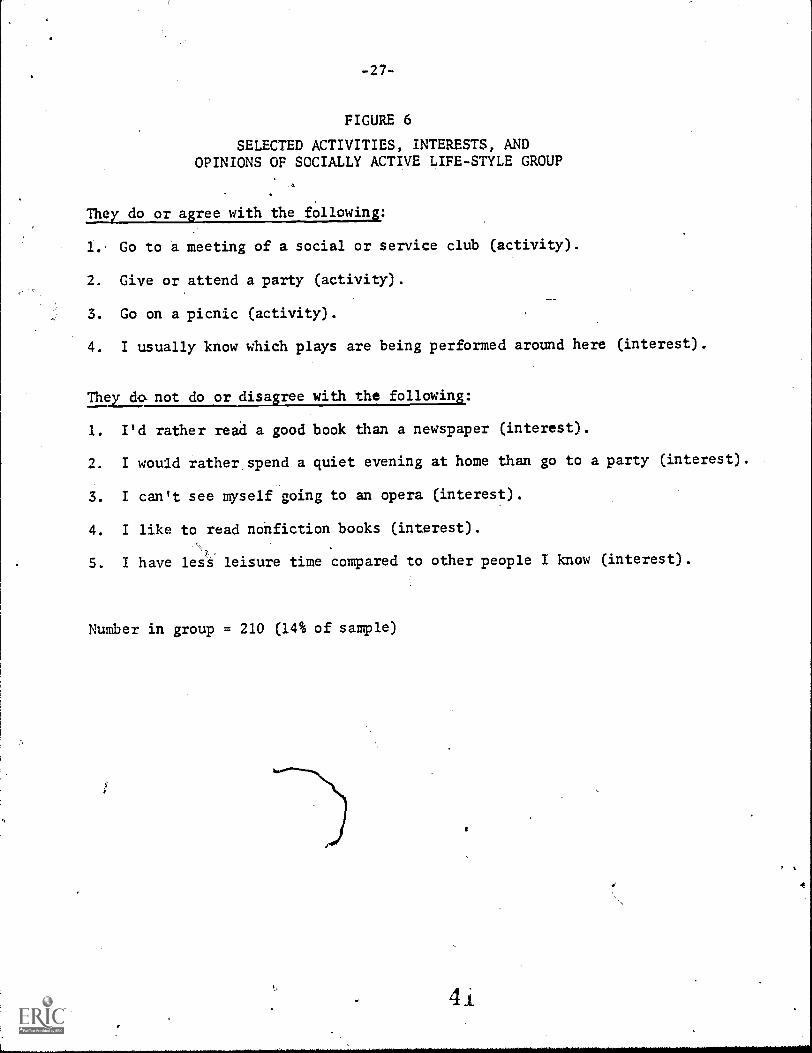
-27-
FIGURE 6
SELECTED ACTIVITIES, INTERESTS, ANDOPINIONS OF SOCIALLY ACTIVE LIFE-STYLE GROUP
They do or agree with the following.:
1. Go to a meeting of a social or service club (activity).
2. Give or attend a party (activity).
3. Go on a picnic (activity).
4. I usually know which plays are being performed around here (interest).
They do. not do or disagree with the following.:
1. I'd rather read a good book than a newspaper (interest).
2. I would rather spend a quiet evening at home than go to a party (interest).
3. I can't see myself going to an opera (interest).
4. I like to read nonfiction books (interest).
5. I have lesi leisure time compared to other people I know (interest).
Number in group = 210 (14% of sample)
II
A
4
-28-
and opinions that most typify each group and four to six that least
typi4Y it. Table Ill in Appendix B provides a more detailed summary of
the mean scores of each group on each of the SO variables used to con-
struct the typologies. The answers to the questions have been "standardized"
so that the average score, across an groups, is zero and the group
scores range between 4-1 and -1.
The six leisure life-style groups may be characterized as follows:
The Passive Homebody.--This group prefers family- and home-oriented
activities. Its members are heavy watchers of television, have essentially
negative attitudes toward cultural organizations and activities, and,
in fact, tend to avoid nearly any activity outside the home, su.ch as
bowling, eating out, or seeing a movie. These people recognize.that
their days are routine and filled with unused leisure time.
The Active Sports Enthusiast.--In many ways this group is the antith-
esis of the previous group. They take part in many active sports, such
as tennis and bowling, and engage in other outgoing activities, such
as movies, parties, and spectator sports. They strongly disagree that
they are homebodies or like to spend a quiet evening at home. On the
other hand, they are like the homebodies, but more extreme, in their
negative attitudes toward theater, symphony, and other cultural activities.
The Inner-Directed Self-Sufficient.--Members of this group are
best characterized by their participation in a number of industrious home-
oriented activities, such as gardening, reading, and craftprojects.
They are family-oriented and prone to undertake outdoor activities such
as hiking and picnics. They are inactive and uninformed when it comes to
4 '4
,-29-
cultural activities, although they are not negative toward these activ-
ities as are the Passive Homebody and Active Sports Enthusiast groups.
They are not overburdened with leisure time as is the Passive Homebody.
Instead, it appears that their leisure interests keep them busy, either
alone or with their family.
The Culture Patron.--This group would be expected to be the best
market for theater and symphony, since they report that they are now
involved with these activities. This is a reflection of their general
cultural orientation, with favorable attitudes toward and*partronage
of the arts in general. They lack the orientation toward home and family
of the Passive Homebody and the Inner-Directed Self-Sufficient and the sports
orientation of the Active Sports Enthusiast. They rely very little on
television for entertainment or relaxation.
The Active Homebody.--Members of this group resemble the Passive
Homebody group in their home- and family-orientation, but replacethat
group's nonactive TV-watching with such activities as golf, working on
the car, and gardening. They have a generally negative attitude toward
the arts and do little reading, partying, or radio listening. In other
words, they are not very socially active or media-oriented, but fill
their time with what might be called productive "tinkering" activities.
lieSocii2.11.--This last group is also active, but in a
more social vein. They give and attend parties, eat out often, and
pprticipate in clubs and other meetings. They areaware of theater
and symphony offerings and have friends who are interested in these
activities. Nevertheless, their own patronage is presently not great.
They are busy.and cannot abide leisurely pursuits such as golf, reading,
or spending a quiet evening at'home.
-30-
In the present context, then, the Culture Patron -and Socially
Active groups havd leisure life styles that appear to be conducive to
attending the performing arts. On the other hand, the Passive Homebody,
Active Homebody, and Active Sports Enthusiast groups would appear tO be
negatively predisposed toward attendance. Finally, the Inner-Directed
Self-Sufficent group appears generally uninformed, and possibly neutral,
about the arts. It may be expected that these differences will prove
instructive in the analyses of future behavior response to our manipu-
lations in the sections to follow.
b. General Life-Style Chracteristics
Differences in leisure life styles are likely to be associated
with both socioeconomic characteristics and other, more general activities,
interests, and opinions. Descriptions of general life styles were
developed through 43 questions asked in the study. These questions were
then factor analyzed to yield underlying dimensions along which our six
groups might be expected to vary. The methodology used to accomplish
this was an R-type factor analysis, which develops a small number of
independent dimensions (in this case, six) that are highly correlated
with subsets Of the original 43 variables. It is a grouping of char-
acteristics, not of people. The correlation coefficients measuring the
degree of relationship between the original variables and.the six new
dimensions (factors) are shown in Table B2 of Appendix B, which also
presents a more detailed description of the analytical procedures.
The larger coefficients for each dimension may be used in labeling the
factors. For instance, the first factor has high positive correlations
-31-
(over .30) with church-going, old-fashioned tastes, and wishing for the
good old days. These and other high correlations point to variables
that the factor most closely resembles (or in the case of negative
correlations, resembles the opposite of); they thus aid in naming the
factor.3
The six general life-style dimensions developed in this study are
the following:
Traditionalism.--As noted, this characteristic is associated with
church-going, old-fasht6fted tastes, a feeling that things are moving too
fast, and a wish 'far the god-eld days, rt is also related to preferences
for a traditional child- andfamily-centered home where the man is in
charge and the woman is home-oriented. Finally, it includes a preference
for security and an unwillingness to take chances.
Hedonism/Optimism.--This characteristicinvolves wanting to look
attractive and perhaps a little different, wanting to travel around
the world or live in London or Paris for a year, and liking to eat.
It is associated with the positive view that one's greatest achieve-
ments lie ahead.
Defeatism.--This dharacteristic is marked by a depressed outlook
due to a belief that things have not turned out so well. One's present
life is thought undesirable; if given the chance, one woulp do things4
differently. It is also associated with wishing for the good old days,
thinking things are dhanging too fast, spending for today, and dreading
the future.
3It may be noted that a small nunber of items from the leisUre
life-style analysis are used in the general analysis.
-32-
§_sLfzconSlcience/Oini_p_2r_ILeadershik.--Two tharacteristics seem best
to describe this dimension--a feeling of self-confidence and liking to
be considered a leader.
Urbanism.--This factor involves a preference for big cities and
support for Women's Liberation.
Outdoorsiness.--This dimension involves going on picnics and hiking.
3. Attitudes toward.21211termilimplam
The life-style approach to explaining arts behavior is a general
7 one; examines how various arts behaviors fit into more general life
patterns. Attitude researchers focus instead on predicting behavior
by understanding the nature and value of the various outcomes that an
individual expects from engaging in a behavior (e.g., attending
theater or symphony).4 Behaviors that yield positive outcomes on im-
portant dimensions will be adopted; those that do not yield positive
outcomes or that yield positive outcomes only on unimportant dimensions
will not be adopted. This approach, following the work of Fishbein
and Ajzen (6), Rosenberg (23), and others (e.g., 9), has proved useful -
/T
to marketers in predicting purchase intentions, ac ual purchases of
such products as children's clothing (26), and TV program selection (12).
In the present investigation, subsamples of consumers were asked
about their attitudes toward attending the two performing arts under study.
As indicated earlier; because of the length of the overall questionnaire,
4 .
iIt rs mportant to note that it is attitude toward an action
(e.g., buying a Rolls Royce) rather than attitude toward an object
or event (e.g., a Rolls Royce) that generally is found to predict
behavior best.
-33-
attitudes about theater attendance were only asked of one-third of the
sample and attitudes about symphony attendance were only asked of another
third. Each participating respondent was asked two questions, the first
of which asked the following:
If you were to go to a live, professional play (symphony concert)in the next month or two, how likely would it be that you wouldexperience the following:
a. You could get exactly the seats you wanted?
b. It would not take a long time to get from your home into thetheater (concert hall)?
c. You would feel comfortable with the audience?
d. You would not find the play (concert) too long?
e. You would feel personally involved with what was going.on atthe performance?
f. You would find your friends there?
g. You would feel pleased that you were going long before theperformance day?
h. You would find the tickets inexpensive?
i. You would not feel that it was too formal an occasion?
j. You would find the performers excellent?
k. You would not feel you'd spent too much for the occasion, thatis, for tickets, travel, food and the like?
1. You would like the play (program)?
m. You would feel you understood what was going on?
n. You would find that those you were with were having a good time?
o. You would learn a lot?
You would not feel you were wasting your time?
q. You wouJd feel stimulated?
-34-
Respondents were asked whether it would be "very likely," "somewhat likely,"
"somewhat unlikely," or "very unlikely" that each would be experienced.
The next question read as follows:
We've just talked about how likely it would be to experiencecertain things when going to a live play (symphony concert).If you were to go to a live, professional play (symphonyconcert) in the next month or two, how important would it bethat-you would experience these same things?
Respondents were then given the same 17 itens as in the preceding question
and asked whether each outcome would be "very important," "somewhat
important," "somewhat unlmportant," or "very unimportant."
Specific beliefs and importance scores on each of the 17 attributes
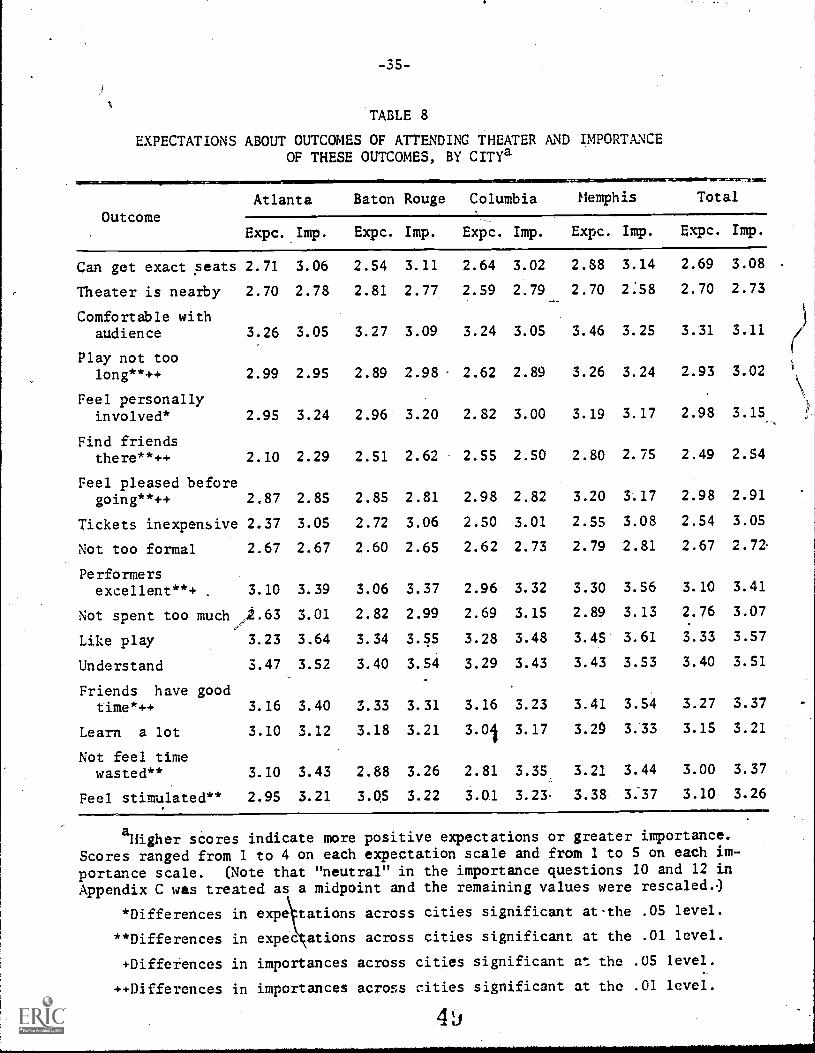
for each of the four study cities/are given in Tables 8 and 9.
The data in Table 8 show that, when thinking of attending theater,
respondents give highest importance weightings to the play and perfor-
mance characteristics and to understanding what is going on. Finding
friends there, having the occasion informal, and having the theater
nearby appear to be least important.
There are differences across the four cities with respect to
expectations about attending the theater.5
These differences appear to
be greatest for Memphis. Respondents there are more likely to expect
plays to be
(1) Not too long
(2) Personally involving
(3) Performed well
5Differences across cities were tested at the .05 level underone-way analysis of variance.
-35-
TABLE 8
EXPECTATIONS ABOUT OUTCOMES OF ATTENDING THEATER AND IMPORTANCEOF THESE OUTCOMES, BY CITYa.
AtlantaOutcome
Baton Rouge Columbia Memphis Total
Expc. Imp. Expc. Imp. Expc. Imp. Expc. Imp. Expc. Imp.
Can get exact seats 2.71 3.06 2.54 3.11 2.64 3.02 2.88 3.14 2.69 3.08 .
Theater is nearby 2.70 2.78 2.81 2.77 2.59 2.79 2.70 2:58 2.70 2.73
Comfortable withaudience 3.26 3.05 3.27 3.09 3.24 3.05 3.46 3.25 3.31 3.11 i)
Play not toolong**++ 2.99 2.95 2.89 2.98 2.62 2.89 3.26 3.24 2.93 3.02
Feel personallyinvolved* 2.95 3.24 2.96 3.20 2.82 3.00 3.19 3.17 2.98 3.15
Find friendsthere**++ 2.10 2.29 2.51 2.62 2.55 2.50 2.80 2.75 2.49 2.54
Feel pleased beforegoing**++ 2.87 2.85 2.85 2.81 2.98 2.82 3.20 3.17 2.98 2.91
Tickets inexpensive 2.37 3.05 2.72 3.06 2.50 3.01 2.55 3.08 2.54 3.05
Not too formal 2.67 2.67 2.60 2.65 2.62 2.73 2.79 2.81 2.67 2.72-
Performersexcellent**+ 3.10 3.39 3.06 3.37 2.96 3.32 3.30 3.56 3.10 3.41
Not spent too much ).63 3.01 2.82 2.99 2.69 3.15 2.89 3.13 2.76 3.07
Like play 3.23 3.64 3.34 3.5 3.28 3.48 3.45 3.61 3.33 3.57
Understand 3.47 3.52 3.40 3.54 3.29 3.43 3.43 3.53 3.40 3.51
Friends have goodtime*++ 3.16 3.40 3.33 3.31 3.16 3.23 3.41 3.54 3.27 3.37
Learn a lot 3.10 3.12 3.18 3.21 3.0i 3.17 3.20 3.33 3.15 3.21
Not feel timewasted** 3.10 3.43 2.88 3.26 2.81 3.35 3.21 3.44 3.00 3.37
Feel stimulated** 2.95 3.21 3.05 3.22 3.01 3.23- 3.38 3.37 3.10 3.26
aHigher scores indicate more positive expectations or greater importance.Scores ranged from 1 to 4 on each expectation scale and from 1 to 5 on each im-
portance scale. (Note that "neutral" in the importance questions 10 and 12 inAppendix C was treated as a midpoint and the remaining values were resealed.)
*Differences in expe tations across cities significant at.the .05 level.
**Differences in expec ations across cities significant at the .01 level.
+Differences in importances across cities significant at the .05 level.
++Differences in importances across cities significant at the .01 level.
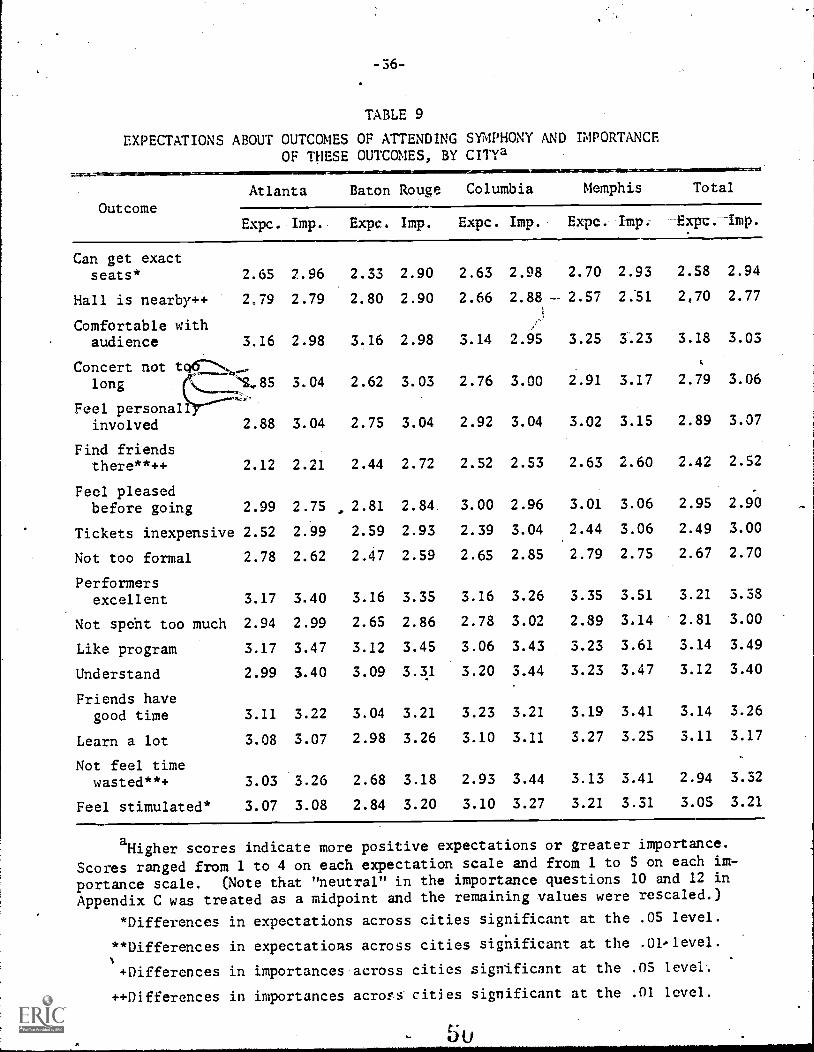
- 36-
TABLE 9
EXPECTATIONS ABOUT OUTCOMES OF ATTENDING SYMPHONY AND IMPORTANCEOF THESE OUTCOMES, BY CITYa
OutcomeAtlanta Baton Rouge
MENSONE.
Columbia Memphis Total
Expc. Imp. Expc. Imp. Expc. Imp. Expc. Imp. Expc: Imp.
Can get exactseats* 2.65 2.96 2.33 2.90 2.63 2.98 2.70 2.93 2.58 2.94
Hall is nearby++ 2.79 2.79 2.80 2.90 2.66 2.88 -- 2.57 2.51 2,70 2.77
Comfortable withaudience 3.16 2.98 3.16 2.98 3.14 2.95 3.25 3.23 3.18 3.03
Concert notlong 3.04 2.62 3.03 2.76 3.00 2.91 3.17 2.79 3.06
Feel personallinvolved 2.88 3.04 2.75 3.04 2.92 3.04 3.02 3.15 2.89 3.07
Find friendstherP**++ 2.12 2.21 2.44 2.72 2.52 2.53 2.63 2.60 2.42 2.52
Feel pleasedbefore going 2.99 2.75 2.81 2.84. 3.00 2.96 3.01 3.06 2.95 2.9.0
Tickets inexpensive 2.52 2.99 2.59 2.93 2.39 3.04 2.44 3.06 2.49 3.00
Not too formal 2.78 2.62 2.47 2.59 2.65 2.85 2.79 2.75 2.67 2.70
Performersexcellent 3.17 3.40 3.16 3.35 3.16 3.26 3.35 3.51 3.21 3.38
Not speht too much 2.94 2.99 2.65 2.86 2.78 3.02 2.89 3.14 2.81 3.00
Like program 3.17 3.47 3.12 3.45 3.06 3.43 3.23 3.61 3.14 3.49
Understand 2.99 3.40 3.09 3.31 3.20 3.44 3.23 3.47 3.12 3.40
Friends havegood time 3.11 3.22 3.04 3.21 3.23 3.21 3.19 3.41 3.14 3.26
Learn a lot 3.08 3.07 2.98 3.26 3.10 3.11 3.27 3.25 3.11 3.17
Not feel timewasted**+ 3.03 3.26 2.68 3.18 2.93 3.44 3.13 3.41 2.94 3.32
Feel stimulated* 3.07 3.08 2.84 3.20 3.10 3.27 3.21 3.31 3.05 3.21
aHigher scores indicate more positive expectations or greater importance.
Scores ranged from 1 to 4 on each expectation scale and from 1 to 5 on each im-
portance scale. (Note that "neutral" in the importance questions 10 and 12 in
Appendix C was treated as a midpoint and the remaining values were resealed.)
*Differences in expectations across cities significant at the .05 level.
**Differences in expectations across cities sighificant at the .01.1evel.
+Differences in importances across cities significant at the .05 level.
++Differences in importances across cities significant at the .01 level.
-37-
(4) Anticipated with pleasure
(5) Pleasing'to those going with them
(6) Stimulating
(7) Not wasteful of one's time
Memphis respondents are also likely to indicate that several of these
attributes are more important to them. Atlantans less often expect
to find their friends at the theater, and more respondents in Columbia
than in other cities expect to find the plays long. In Baton Rouge,
respondents expect those going with them to have a good time.
With respect to symphony concerts (Table 9), the respondents
again indicate that the performers, the program, and their understand-
ing of what is going on are most important factors, while finding
friends there, having the occasion informal, and having the hall near-
by are least important.
There are fewer differences across the four cities for symphony
than for theater. Table 9, however, does indicate some significant
differences. Thus, among respondents in the four cities, those in
Baton Rouge believe that it is harder to get the exact seats one wants
and that one is more likely to waste one's time at the symphony and less
likely to feel stimulated. On the other hand, Memphis and Atlanta
respondents are less likely to expect to waste time by attending the
symphony. Atlanta respondents are also less likely to expect.to find
their friends at the symphony, but they seem to think that this is
less important. Memphis respondents place less importance on having
the hall nearby.
-38-
4
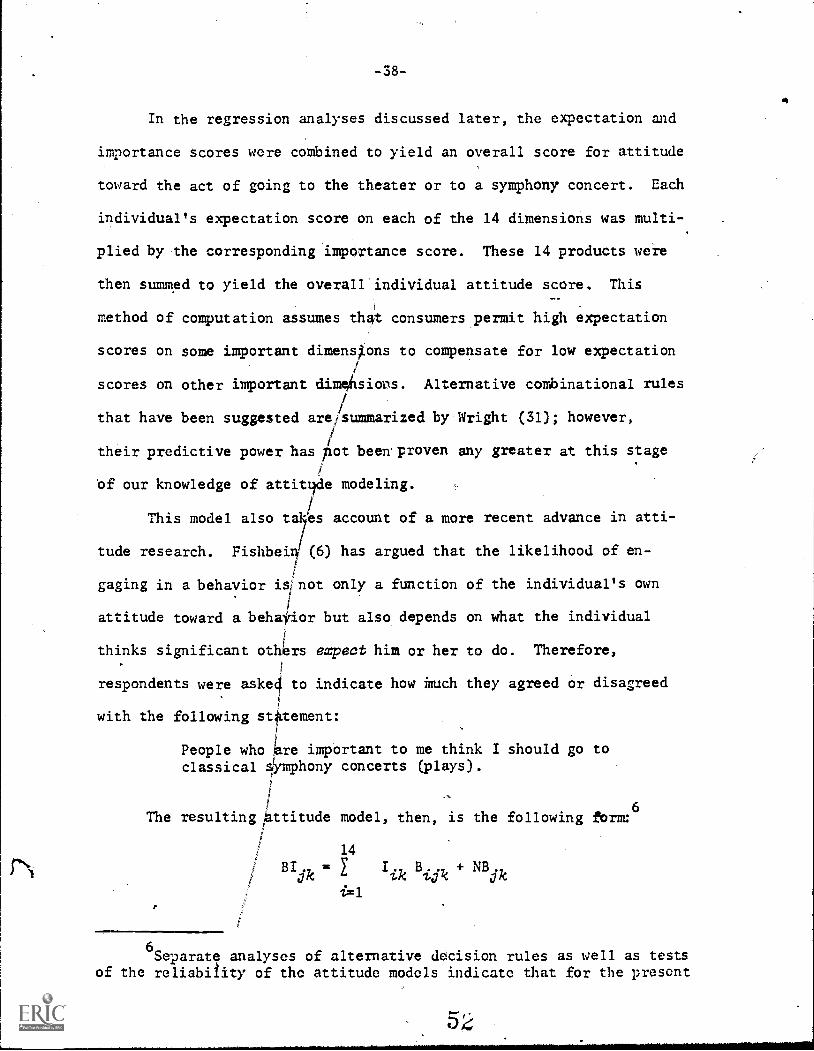
In the regression analyses discussed later, the expectation and
importance scores were combined to yield an overall score for attitude
toward the act of going to the theater or to a symphony concert. Each
individual's expectation score on each of the 14 dimensions was multi-
plied by the corresponding importance score. These 14 products were
then summed to yield the overall individual attitude score. This
method of computation assumes that consumers permit high expectation
scores on
scores on
that have
some important dimensions to compensate for low expectation
other important dimeftsions. Alternative combinational rules
been suggested are,summarized by Wright (31); however,
their predictive power has)4ot been.proven any greater at this stage
1
of our knowledge of attivide modeling.
/This model also t -es account of a more recent advance in atti-
tude research. Fishbei (6) has argued that the likelihood of en-
gaging in a behavior is/not only a function of the individual's own
?
attitude toward a behavior but also depends on what the individual
thinks significant otlIrs expect him or her to do. Therefore,
respondents were aske4 to indicate how Much they agreed or disagreed
with the following statement:
People who "are important to me think I should go toclassical s/ymphony concerts (plays).
The resulting ,attitude model, then, is the following form:6
14
BIjk
I. B.. + NB.-Lk 1.0k ok
i=1
6Separate analyses of alternative decision rules as well as tests
of the reliabifity of the attitude models indicate that for the present
52
-39-
where BI = likelihood of respondent k attending performing art j;
Iik = the importance weight given to consequence i by respondent k;
Bijk = the respondent k's belief about the extent to which attendingperforming art j will result in consequence i; and
N B = normative belief--the extent to which respondent k perceivesthat significant others believe he or she should attendperforming art j.
4. Family Life Cycle
A major alternative to the approach oflife-style and attitude.
theorists is the more mundane approach of social demographers. These
researchers argue that behaviors can be predicted by socioeconomic
characteristics (such as education), which predispose one to engage in
the behavior or which (as with income) remove constraints that bar
the carrying out of existing predispositions. These socioeconomic
characteristics can be seen, then, as potential determinants of life
styles or attitudes, which may then determine behavior or perhaps as
1
codeterminants (with life styles or attitudes) of behavior.
The present study includes a wide range of socioeconomic measures.
One combined index developed from several of these measures is a Family
Life Cycle (FLC) Index, which is based on the notion that many patterns
of behavior are affected by where chronologically, a person is in his
data (1) the "extended model" does well relative to alternative formu-
lations and (2) correlations of all measures with future attendance
at symphony and theater vary considerably across independently drawn
samples. The latter suggests instability in the attitude models. On
the other hand, the overall attitude component did turn out to be a
significant predictor of behavior in the multiple regression analysis
described later.
-40-
or her life cycle. Age itself only approximates this chronology; a
better measure is one that accounts for the fact that there are signif-
icant points of change in a traditional life cyc2e that radically
alter one's values and life style (11, 28). These points of change and
the life cycle that they imply are the following:
Young single.--This is the first stage of the traditional pattern.
The individual is under 40 years of age and has never been married.
Young married.--The first important change in one's life (and life-
style) is marriage. The individual is under 40, married, and has no
children.
Children under six.--The next major event is the arrival of young
children. In this stage the individual is married and has one or more
children under six. This stage can last a considerable period of time.
Children six or over.--The next important event is when the children
are all old enough to be in school and both spouses can be free for more
activities outside the home.
Empty nest.--Eventually the children leave home and the older
married couple is again alone.7
Widowed.--The final stage arrives when one of the partners dies.
It was expected that families in the middle stages of the family
life cycle would be significantly less likely to be arts attenders
owing to the inhibiting presence of children and the accompanying lack
of time and money.
7 In our analysis, this classiZication also includes married couples
over 40 who never had children.
-41-
5. Regression Results
The question that we consider now is whether these new variables
are important predictors in multlple regression analyses of likely future
symphony and theater attendance. (It should be kept in mind, however,
that we shall be returning to the deficiencies in this approach, partic-
ularly emphasizing that the correlations we find do not necessarily
mean causation.) In these analyses, variables were used to predict the
likelihood of theater and symphony attendance. Table 10 reports simple
correlations between the 56 variables and the likelihoods of attending
theater and symphony. Simple correlations greater than t.045 can be
considered statistically significant given the sample size.
From the point of view of a total prediction from these correla-
tions, one problem is that many of the variables are related. For
example, as income increases so does the likelihood.that the spouse is
employed (r = .36) and the number of cars in the family (r = .46).
Me problem then is to conduct an analysis that enables us to assess
the. importance of several variables in explaining the likelihood of
attendance while taking account of these variables' interrelationships.
Cne useful technique for doing this is stepwise regression.8 In this
technique, predictors are selected one at a time, starting with the
single best predictor and adding the one variable at each "step" that
increases predictive accuracy tfie, most. This continues until the beft
remaining predictor that could be added produces no significant improve-
ment in overall predictive accuracy.
susing Version 7 of SPSS (19).
5 b
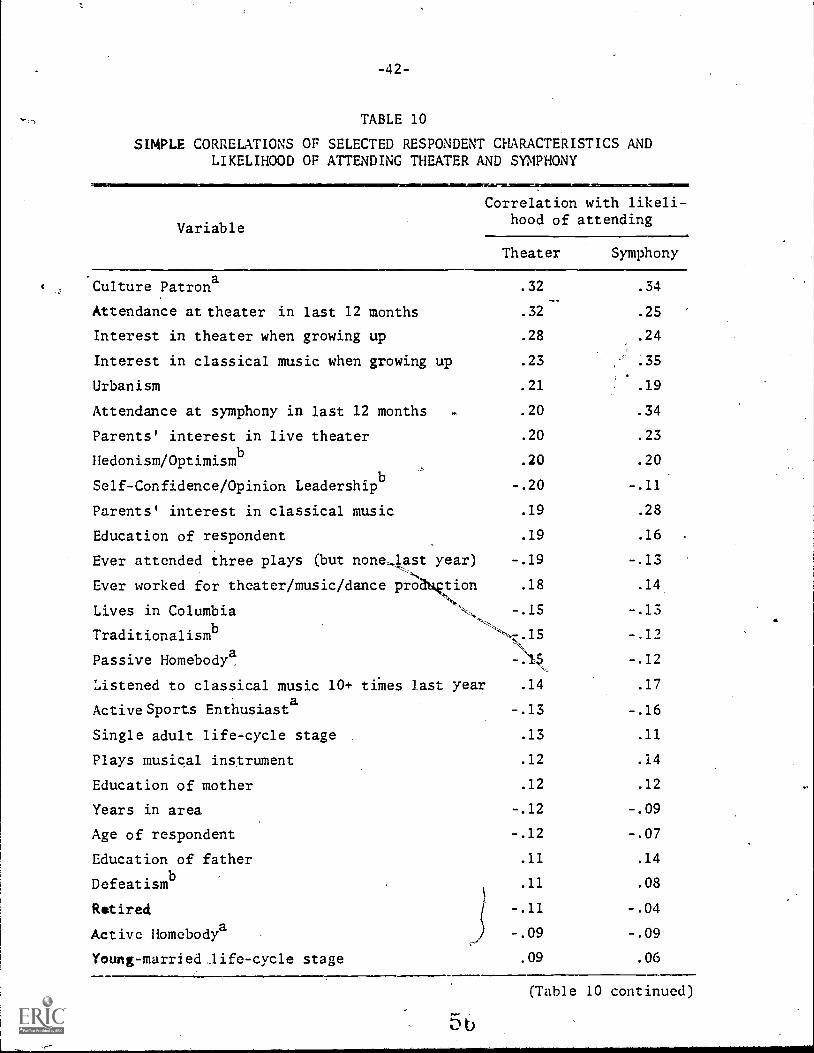
=IMO,
-42-
TABLE 10
SIMPLE CORRELATIONS OF SELECTED RESPONDENT CHARACTERISTICS ANDLIKELIHOOD OF ATTENDING THEATER AND SYMPHONY
Variable
Correlation with likeli-hood of attending
Theater Symphony
'Culture patrona
Attendance at theater in last 12 months
.32 .34
.32 .25
Interest in theater when growing up .28 .24
Interest in classical music when growing up .23 .35
Urbanism .21 .19
Attendance at symphony in last 12 months .20 .34
Parents' interest in live theater .20 .23
Hedonism/Optimismb .20 .20,
Self-Confidence/Opinion Leadershipb .20 -.11
Parents' interest in classical music .19 .28
Education of respondent .19 .16
Ever attended three plays (but none4ast year) .19 -.13
Ever worked for theater/music/dance pro tion .18 .14
Lives in Columbia -.IS -.13
Traditionalismb -,..-.15 -.12
Passive Homebodya -.12
Listened to classical music 10+ tiMes last year .14 .17
ActiveSports Enthusiasta
-.13 -.16
Single adult life-cycle stage .13 .11
Plays musical instrument .12 .14
Education of mother .12 .12
Years in area -.12 -.09
Age of respondent -.12 -.07
Education of father .11 .14
Defeatismb
.11 .08
i-.09
-.11 -.04
-.09
.09 .06
Retired
Active Homebodya
Young-married life-cycle stage
(Table 10 continued)
56
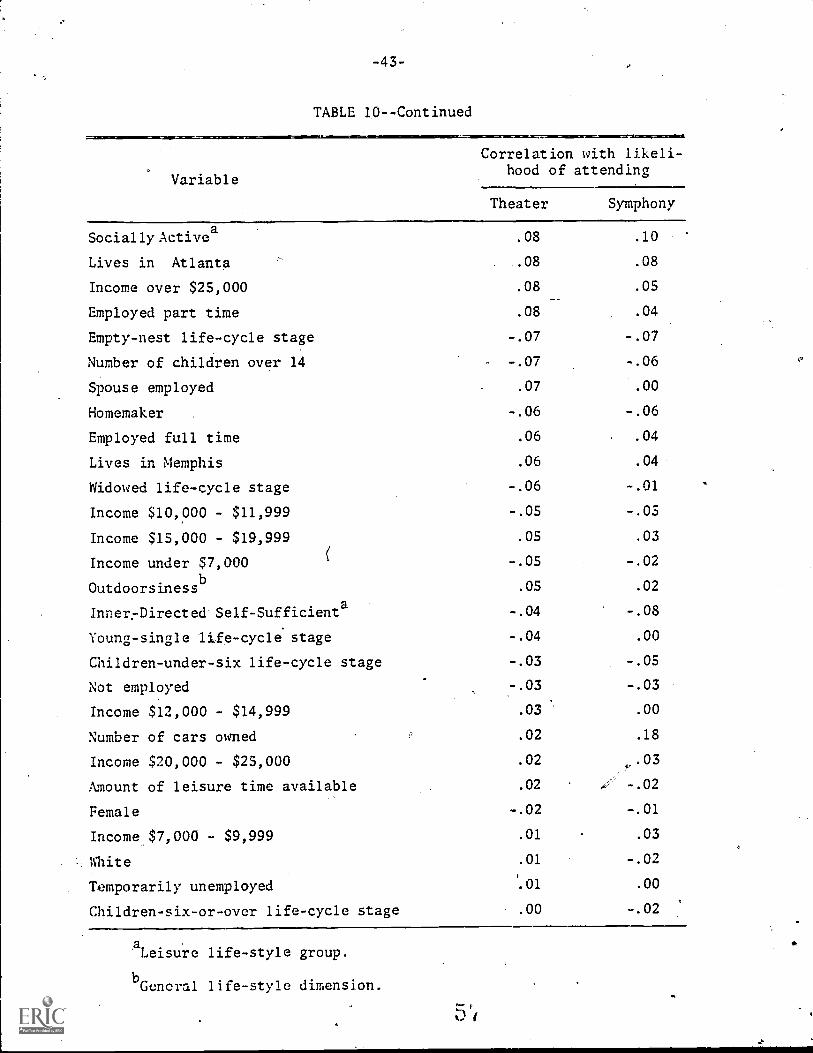
,
-43-
TABLE IO-Continued
Variable
Correlation with likeli-hood of attending
Theater Symphony
SociallyActivea .08 .10
Lives in Atlanta .08 .08
Income over $25,000 .08 .05
Employed part time .08 .04
Empty-nest life-cycle stage -.07 -.07
Number of children over 14 -.07 -.06
Spouse employed .07 .00
Homemaker -.06 -.06
Employed full time .06 .04
Lives in Memphis .06 .04
Widowed life-cycle stage -.06 -.01
Income $10,000 - $11,999 -.05 -.03
Income $15,000 - $19,999 .05 .03
Income under $7,000 ( -.OS -.02
. bOutdoorsiness .05 .02
Inner.-Directed Self-Sufficienta -.04 -.08
Young-single life-cycle stage -.04 .00
Children-under-six life-cycle stage -.03 -.05
Not employed -.03 -.03
Income $12,000 - $14,999 .03 .00
Number of cars owned .02 .18
Income $20,000 - $25,000 .02 v.03
Amount of leisure time available .02 -.02
Female -.02 -.01
Income $7,000 - $9,999 .01 .03
White .01 -.02
Temporarily unemployed .01 .000
Children-six-or-over life-cycle stage .00 -.02
aLeisure life-style group.
bGeneral life-style dimension.
ki
-44-
a. Theater
Of the 56 variables examined, six were found to add to the pre-
diction of theater attendance likelihood at the .05 level of signifi-
cance. These six predictors were jointly able to predict 28 percent of
the variability in the reported likelihoods of theater attendance.
Although this leaves the majority of the variability in these likelihoods
"unexplained" (and potentially related to factors not examined in the
study), over one-quarter of the variability of theater attendance like-
lihoods can be accounted for by these factors. This is a relatively
high level of predictive power for a marketing study.
The variables that aided this prediction are shown in descending
order of usefulness in Table 11. The beta weights in this table may
be interpreted as an indication of the relative importance of each
predictor variable; the larger the weight,-the more useful the variable
was found to be. These results may be compared to the simple correla-
tions between each variable and likelihood of attendance. The reason
that the importances of variables in the multiple regression are differ-
ent from those in the simple correlatiohs is that, in the full predic-*
tion, the information supplied by variables introduced at one point
in the analysis can be highly related to the information supplied by
variables entering the analysis at other points, so that the other
variables do not appear as important as they would have alone.
Table 11,shows that by quite a substantial margin, the best pre-
dictor of the likelihood of future attendance is attitude toward going
to the theater. Not surprisingly, the more favorable one thinks the
outcomes of attendance will be, the more important these outcomes dre;
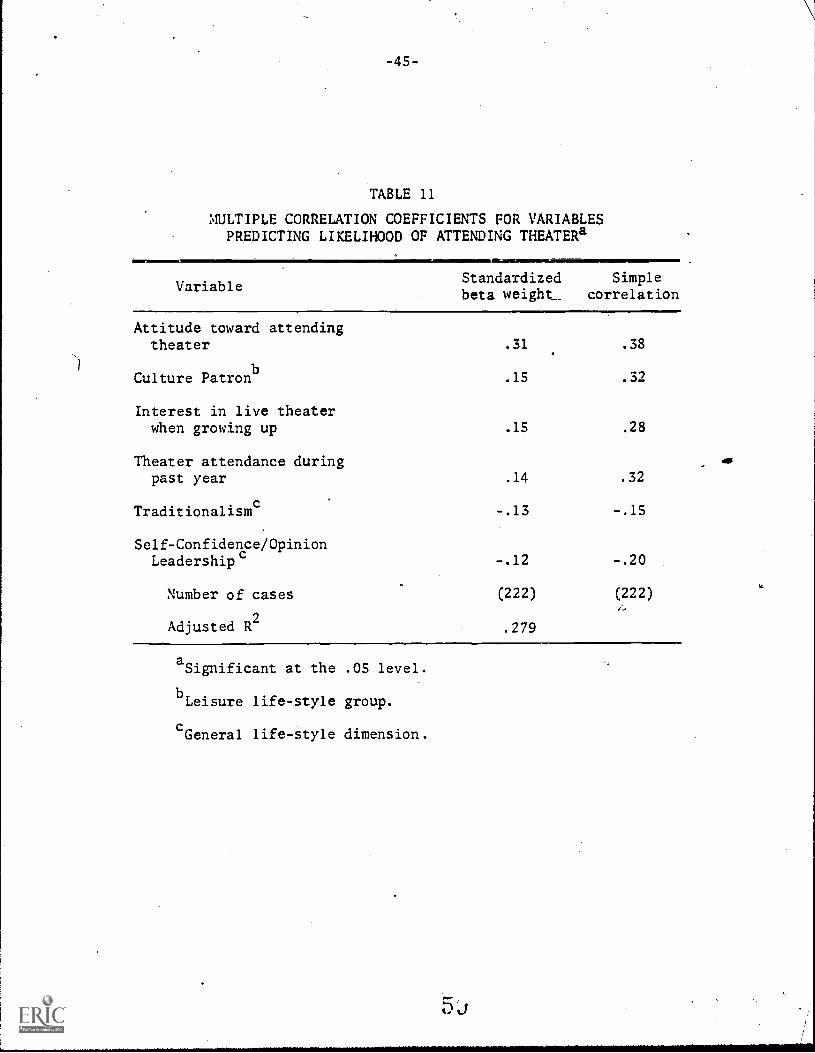
TABLE 11
MULTIPLE CORRELATION COEFFICIENTS FOR VARIABLESPREDICTING LIKELIHOOD OF ATTENDING THEATERa
VariableStandardizedbeta weight.
Simplecorrelation
Attitude toward attendingtheater .31 .38
Culture Patronb
.15 .32
Interest in live theaterwhen growing up .15 .28
Theater attendance duringpast year .14 .32
Traditionalismc -.13 -.15
Self-Confidence/OpinionLeadership c -.12 -.20
Number of cases (222) (222)
Adjusted R2
.279
aSignificant at the .05 level.
bLeisure life-style group.
cGeneral life-style dimension.
-46-
the more that significant others are seen as favoring attendande, the
more one will report likely future attendance. Three variables of
approximately equal importance are the next best predictors. All three
are measures of positive past experiences with the arts. One variable
is interest in live theater when growing up. Favorable socialization
to the theater as a child seems to have a strong and lasting effect on
future attendance independent of whether one presently has favorable
attitudes toward attendance. Also in this predictor group is theater
attendance during the past year. As we discussed in an earlier section,
past behavior is a good predictor of likely future behavior. However,
as we also saw, it is not a perfect predictor, A great deal of varia-
tion remains to be explained by the other variables in this equation.
One factor that is important is leisure life style--particularly whether
one is classified in the Culture Patron leisure life-style group. Here
we see that past attendance at not only theater but also at several arts
institutions--as well as having other interests and opinions reflecting
an arts-centered leisure life style--makes a significant contribution
to our knowledge beyond the fact that a given target consumer merely
attended the specific art form in the past year or has a fayorable atti-
tude toward such attendance in the future. This lends support to our
contention that performing arts attendante can profitably be seen from
its perspective within particular life styles. It also supports the
contention of DiMaggio, Useem, and Brown that "aficionados of one
arts form also attend others" (5, p. 176).
-47-
Following the three experience variables at a slightly reduced
level of importance are two generaZ life-style dimensions. Both of these
are negatively related to future attendance.
Traditionalism is negatively associated with likely attendance,
indicating that those with old-fashioned tastes, a traditional family
role structure, and a preference for a slow-moving life are not likely
to attenththe theater. This suggests that overcoming the inertia of
traditional patterns may be a major task of future promoters anxious
to broaden theater audience.
The Self-Crnfidence/Opinion Leadershipdimension is also neg-
atively correlated with likely attendance. This suggests that theater
attendance may be seen as distracting from the self-esteem of a signif-
icant number of respondents. This is a puzzling finding that bears
more investigation. (lane speculation is that arts attendance is asso-
ciated with elitism in many people's minds, and joining such a group
may be perceived as putting distance between a self-confident leader
and those he or she wishes to lead.)
b. Symphony
Table 12 reports beta weights and simple correlations for the five
variables that explain about 29 percent of the variance in likely atten-
dance at symphony concerts. Most striking is the fact that although
this is an entirely dileerent sample than in the theater analysis, the
first four variables--those with the most weight in this equation--
are the same four variables that are the most important in the theater
analysis. Again, attitudes are a significant factor, although not the
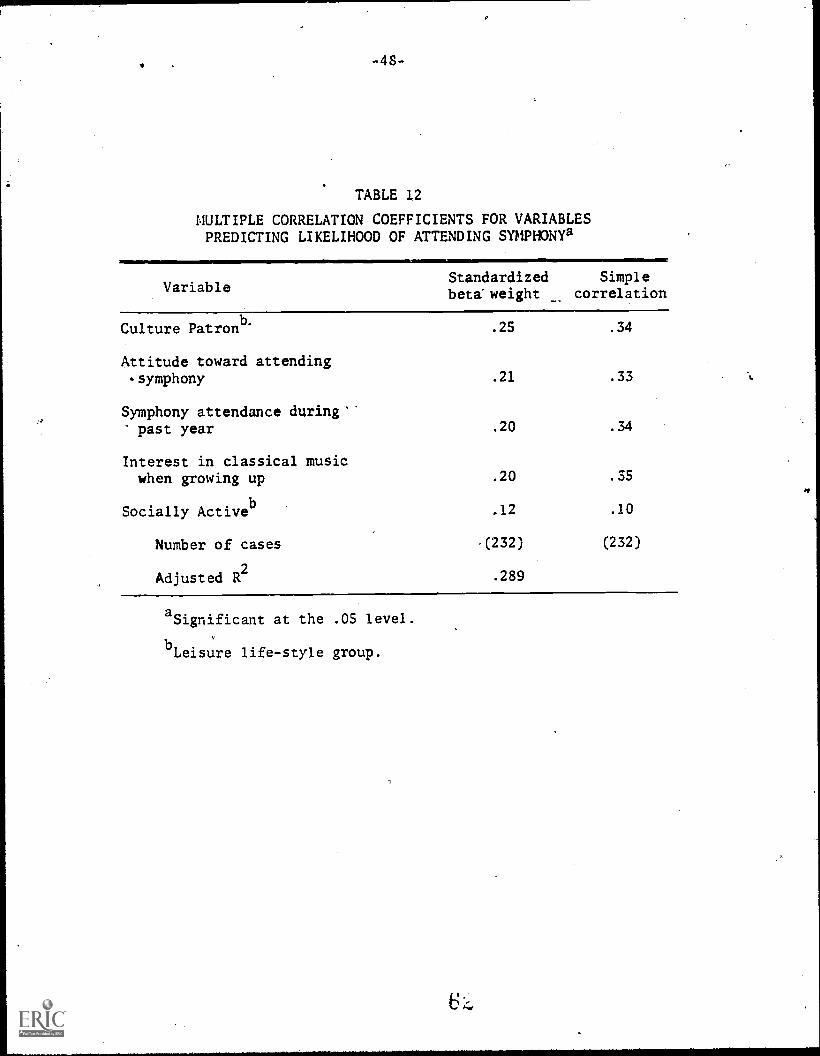
-48-
TABLE 12
MULTIPLE CORRELATION COEFFICIENTS FOR VARIABLESPREDICTING LIKELIHOOD OF ATTENDING SYMPHONYa
VariableStandardizedbeta-weight
Simplecorrelation
Culture Patronb .25 .34
Attitude toward attending'symphony .21 .33
Symphony attendance during'past year .20 .34
Interest in classical musicwhen growing up .20 .35
Socially Activeb .12 .10
Number of cases ,(232) (232)
Adjusted R2 .289
aSignificant at the .05 level.
bLeislire life-style group.
-49-
most important variableias in the theater equation. Also, the three
experience dimensions--past attendance, interest in the art form when
growing up, and membership in the Culture Patron life-style group--
are again the remaining variables in this set of most important predictors.
The single new variable in this equation is membership in the
Socially Active leisure life-style group. It will be recalled that
this was the second group with a life style positively; pTedisposed
toward the arts. This finding may lend credence to the suspicion:
that symphony attendance for some patrons serves social needs beyond
any cultural needs it may fulfill.
c. Nonuseful Potential Predictors
The fact'that a particular set of variables entered the equations
in the preceding two regression analyses does not mean that those which.
/did not enter do not have substantial simple correlations with likely
attendance. Table 10 attests to this. What the equations do is capture
the best linear combinations of predictors. Given this task, it is
interesting to consider which variables did not enter the equations.
First, all the standard socioeconomic variables used in other
studies--education, sex, income, occupation, and so forthL-do not turn
out to be significant predictors of likely attendance when the.atti-
tude and general and specific life-style factors that we have included
here are entered into the analysis. This would strongly suggest that
where these standard socibeconomic variables are found to be significant
in other studies, it is only because the 'richer set of variables added
here are not included.
-50-
The second factor that does not show up in our analysis is variation
across pities. We did find Columbia generally less'responsive to the
performing arts at the time of our study, bufthe analysis determined
that eventhis apparent difference is not sufficiently strong to pro-
duce a significant effect on likely attendance. This gives us some
confidence that the results reported here are generalizable across cities
of different sizes and different cultural opportunitiii--at least those
in the South.
6. Implications of the Associational Approach
The associational approach to segmentation has rather clear impli-
cations for building arts audiences. It says that one should take the
factors noW leading to likely attendance and use them to identify tar-
get audiences; where there is some opportunity to modify these charac-
teristics, one should use them in programs to motivate attendance by
present nonattenders. In the present analysis, three factors show
through in both analyses, and these three should be the starting point
for any marketing approach based ori this analysis.
a. Attitudes
How positive one expects the outcome to be clearly affects whether
one will attend theater or symphony. It will be recalled that these
attitude measures had three components:
(1) Expectations regarding the likelihood of obtaining particular
benefits;
(2) The importance of those benefits; and
(3) The perception of whether others expect one to attend.
6
-51-
Thus, one can deduce that future attendance may be increased and arts
audiences broadened by one of the following three approaches:
(1) Improving expectations abouit important outcomes;
(2) Increasing the importance weights for outcomes where expectationsare highly positive; or
(3) Increasing the perceived pressure brought by significant .
others to attend.
Improving expectations.--Table 13 indicates that there are 12
expectation dimensions on which nonattenders are significantly less
positive than attenders about outcomes from going to the theater;
there are nine such dimensions for symphony. Table 14 further indicates
that there are seven.attributes with average importance scores
(above 3.15) for nonattenders for both theater and symphony. If we
look at the intersection of these two groups--those attributes where
expectations are significantly low while the importance weight is high--
we find four dimensions for theater and five for symphony that merit
attention. Improved attendance for both theater and symphony may result
if nonattenders become more positive about the following:
(1) The likelihood that they would like the particular program
(the effect of changing programs is discussed further below);
(2) The likelihood that they would understand what is going on;
(3) The likelihood that those with whom they attend would have
a good time; and
(4) The 1ike4hood that the evening would prove stimulating.
In addition, theater attendance might be enhanced if nonattenders
felt that the performers were better than we believe to be the case at
6t)
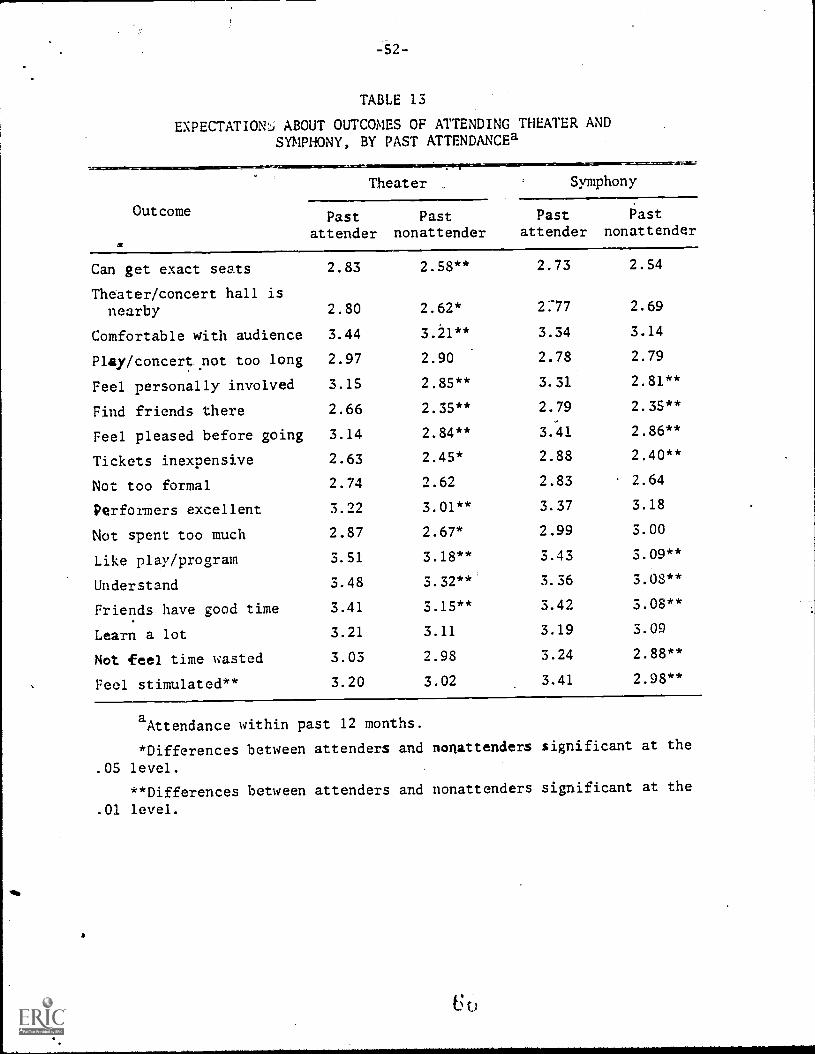
-52-
TABLE 13
EXPECTATION'S ABOUT OUTCOMES OF ATTENDING THEATER ANDSYMPHONY, BY PAST ATTENDANCEa
Outcome
amilmorspowsue-.
Theater Symphony
Pastattender
Pastnonattender
Pastattender
Pastnonattender
Can get exact seats 2.83 2.58** 2.73 2.54
Theater/concert hall isnearby 2.80 2.62* 277 2.69
Comfortable with audience 3.44 3.2l** 3.34 3.14
Play/concert .not too long 2.97 2.90 2.78 2.79
Feel personally involved 3.15 2.85** 3.31 2.81**
Find friends there 2.66 2.35** 2.79 2.35**
Feel pleased before going 3.14 2.84** 3.41 2.86**
Tickets inexpensive 2.63 2.45* 2.88 2.40**
Not too formal 2.74 2.62 2.83 2.64
Performers excellent 3.22 3.01** 3.37 3.18
Not spent too much 2.87 2.67* 2.99 3.00
Like play/program 3.51 3.18** 3.43 3.09**
Understand 3.48 3.32** 3.36 3.08**
Friends have good time 3.41 3.15** 3.42
Learn a lot 3.21 3.11 3.19 3.09
Not feel time wasted 3.03 2.98 3.24 2.88**
Feel stimulated** 3.20 3.02 3.41 2.98**
aAttendance within past 12 months.
*Differences between attenders and nonattenders significant at the
.05 level.
**Differences between attenders and nonattenders significant at the
.01 level.
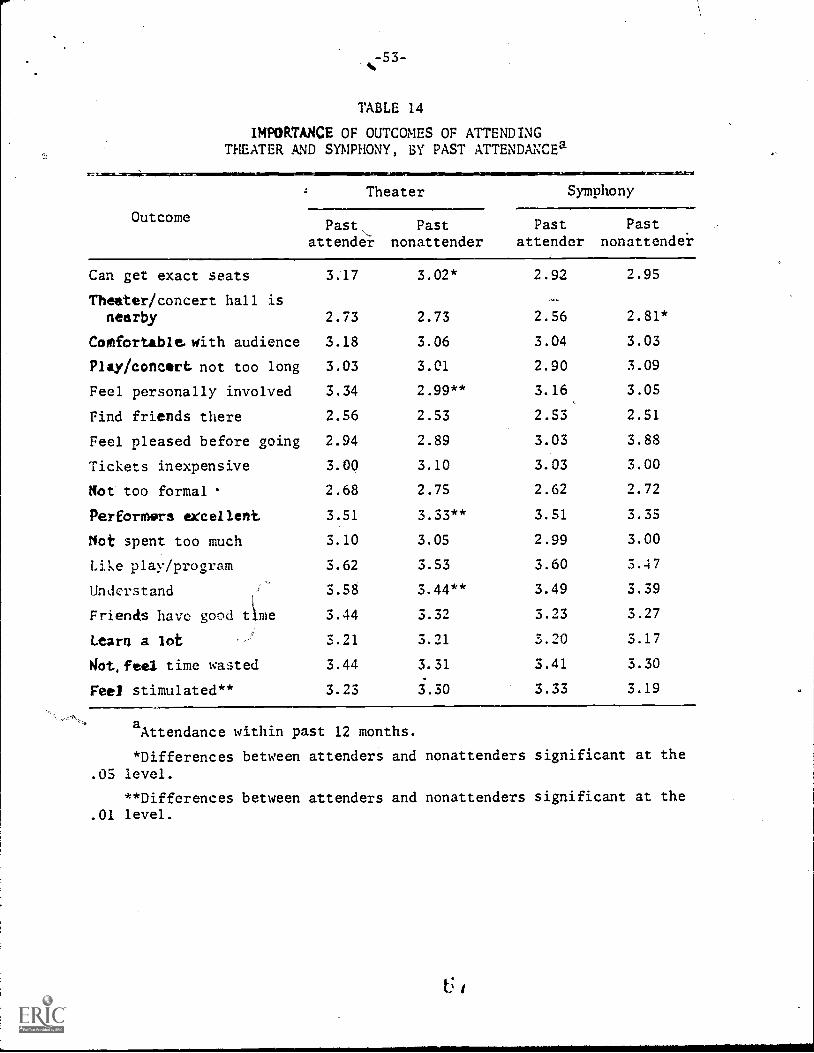
s753-
TABLE 14
IMPORTANCE OF OUTCOMES OF ATTENDINGTHEATER AND SYMPHONY, BY PAST ATTENDANCEa
Theater Symphony
OutcomePast
attende'r
Pastnonattender
Pastattender
Pastnonattender
Can get exact seats 3.17 3.02* 2.92 2.95
Theater/concert hall isnearby 2.73 2.73 2.56 2.81*
Comfortable. with audience 3.18 3.06 3.04 3.03
Play/concert not too long 3.03 3.01 2.90 3.09
Feel personally involved 3.34 2.99** 3.16 3.05
Find friends there 2.56 2.53 2.53 2.51
Feel pleased before going 2.94 2.89 3.03 3.88
Tickets inexpensive 3.00 3.10 3.03 3.00
Not too formal 2.68 2.75 2.62 2.72
Performers excellent 3.51 333** 3.51 3.35
Not spent too much 3.10 3.05 2.99 3.00
Like play/program 3.62 3.53 3.60 3.47
Understand 3.58 3.44** 3.49 3.39
Friends have good .6.me 3.44 3.32 3.23 3.27
Learn a lot 3.21 3.21 3.20 3.17
Not,feel time wasted 3.44 3.31 3.41 3.30
Feel stimulated** 3.23 3.30 3.33 3.19
aAttendance within past 12 months.
*Differences between attenders and nonattenders significant at the.05 level.
**Differences between attenders and nonattenders significant at the.01 level.
-54-
present, and symphony attendance might be increased if nonattenders would
come to believe that they were not going to waste their time.
Increasing importances.--Increasing importance weights is a much
more difficult task than changing perceptions in marketing in general.
and often takes many years. The anllysis here suggests that the problem
in the arts is even more difficult because there are only two cases
where there are significantly lower importances reported by nonattenders
than by attenders and expectations are also relatively high (i.e., average
scores over 3.00). Both of these cases are for theater: One is under-
standing what was going on; the other is feeling that those with whom
you were attending we* having a good time. The fact that these are
both dimensions where expectations are also significantly lower for non-
attenders suggests that they may be areas particularly ripe for promo-4
tional focus, although the task of changing both dimensions is.admittedly
much more difficult.
Increasing the impact of significant others.--Attenders are sub-
stantially more likely than nonattenders to agree that significant others
expdlt them to attend theater and symphony. The scores for the two groups
are as follows:
Attenders
Nonattenders
Theater Symphony
2.29 2.54
1..99 2.04
This factor may potentially be used to induce more attendance through
promotions aimed at stimulating personal influence. This may be accomplished
-55-
by showing the different types of present attenders in promotions or
by encouraging present attenders to bring nonattenders to performances.
The.latter Is a suggestion that we shall discuss more fully later.
As any arts marketer knows, Culture Patrons are excellent prospects
for attendance at arts events. The use of mailing liSts, programs, and
billboards for one performing art to encourage attendance at another
should be commonplace in the arts, although reluctance to share mailing
lists seems surprisingly high among administrators in this field. What
is new and intriguing is the indication that likely attendance at sym-
phony concerts is high among ,the Socially Active group. This finding
would.suggest that promotions emphasizing the social dimensions of sym-
phony attendance may bear considerable fruit among this group.
If one is to focus a strategy on members of a specifiá leisure
life-style group, such as the Socially Active, it is qdite useful to
Lnow their socioeconomic characteristics, media habits, general life-
style tendencies, and so forth. Unfortunately we did not find signif-
icaLt differences across the six groups in media habits. Tables 15-18,
however, do report those factors that were significantly different across
the six leisure life-style groups. These differences yield the following
additional insights:
The Passive Homebodies tend to be older, with a high prOportion
being retired and/or widowed. They are less educated and lower in
socioeconomic status than other groups. Slightly over one-fourth'of them
ego
are nonwhite. They are highly traditional and see themselves as opinion
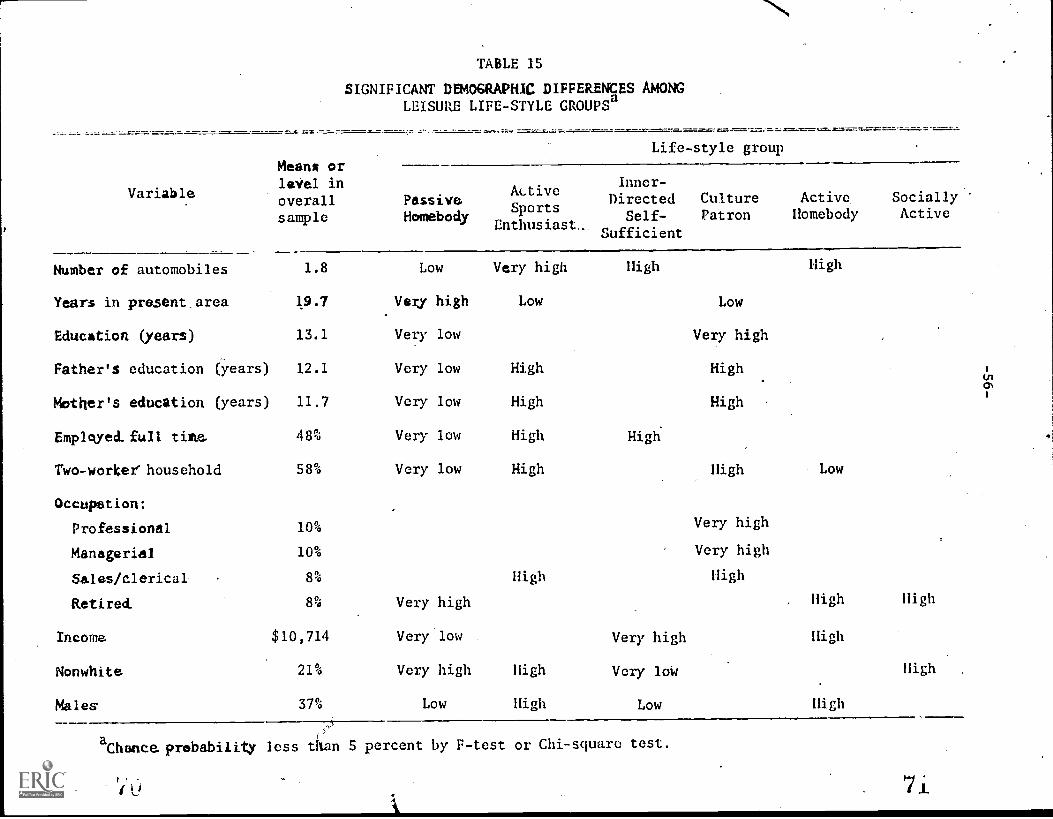
TABLE 15
SIGNIFICANT DEMOGRAPHIC DIFFERENCES AMONGLEISURE LIFE-STYLE GROUPSa
Variable
Meana orlevel inoverallsample
Life-style group
Inner-iwtive
Passive Directed Culture Active Sociallyorts
HomebodySp
Self- Patron Homebody ActiveEnthusiast_
Sufficient
Number of automobiles 1.8 Low Very high High High
Years in present,area 19.7 VeKy high Low Low
Education (years) 13.1 Very low Very high
Father's education (years) 12.1 Very low High High 1
tri
c:IN
Mother's education (years) 11.7 Very low High High1
Employed.full time. 48% Very low High High .
Two-worker' household 58% Very low High High Low
Occupation:
Professional 10% Very high
Managerial 10% Very high
Sales/clerical. 8% High High
Retired. 8% Very high , High High
Income $10,714 Very low Very high High
Nonwhite 21% Very high High Very loW High
Miles 37% Low High Low High
aChance. probability less than 5 percent by F-test or Chi-square test.
7.i
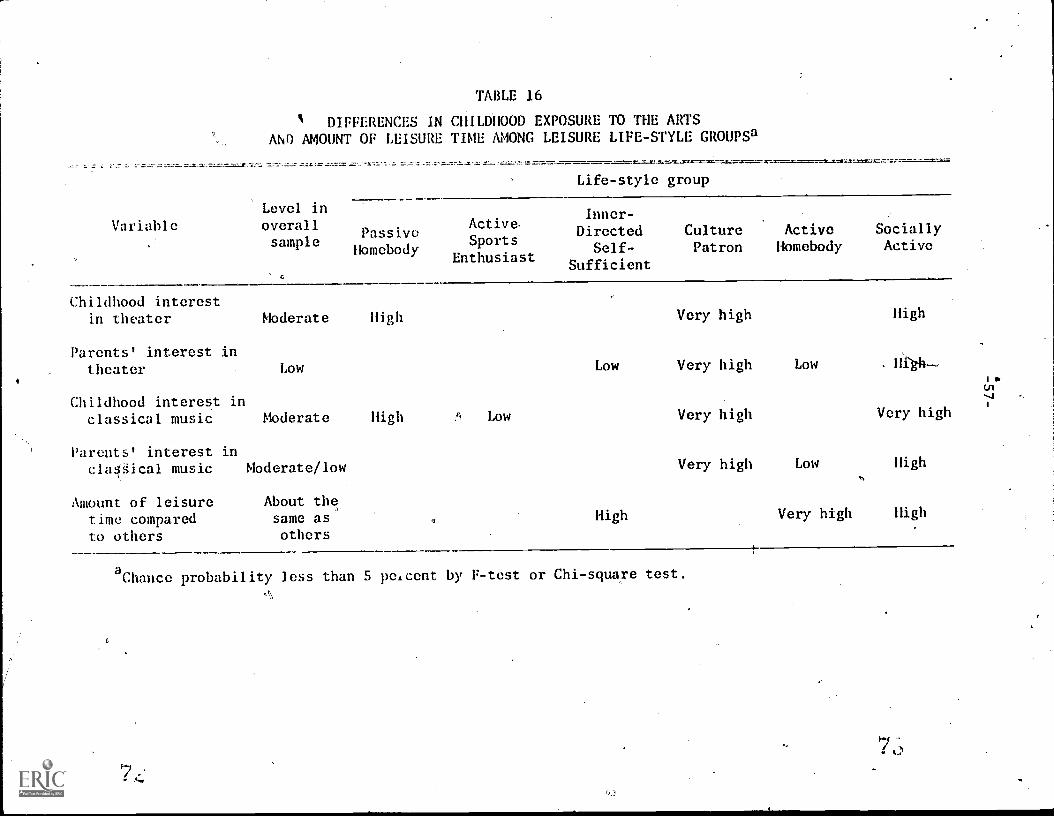
Variable
Childhood interestin theater Moderate High Very high High
TABLE 16
1 DIFFERENCES IN CHILDHOOD EXPOSURE TO THE ARTSAND AMOUNT OF LEISURE TIME AMONG LEISURE LIFE-STYLE GROUPSa
Level inoverallsample
Life-style group
PassiveHomebody
Active,
SportsEnthusiast
Inner-Directed Culture Active Socially
Self- Patron Homebody Active
Sufficient
Parents' interest intheater Low Low Very high Low . High
Childhood interest inclassical music Moderate High Low Very high Very high
Parents' interest incla4Sical music Moderate/low Very high Low High
Amount of leisure About the
time compared same as High Very high High,
to others others
aChance probability less than 5 peicent by F-test or Chi-square test.
7 7.,
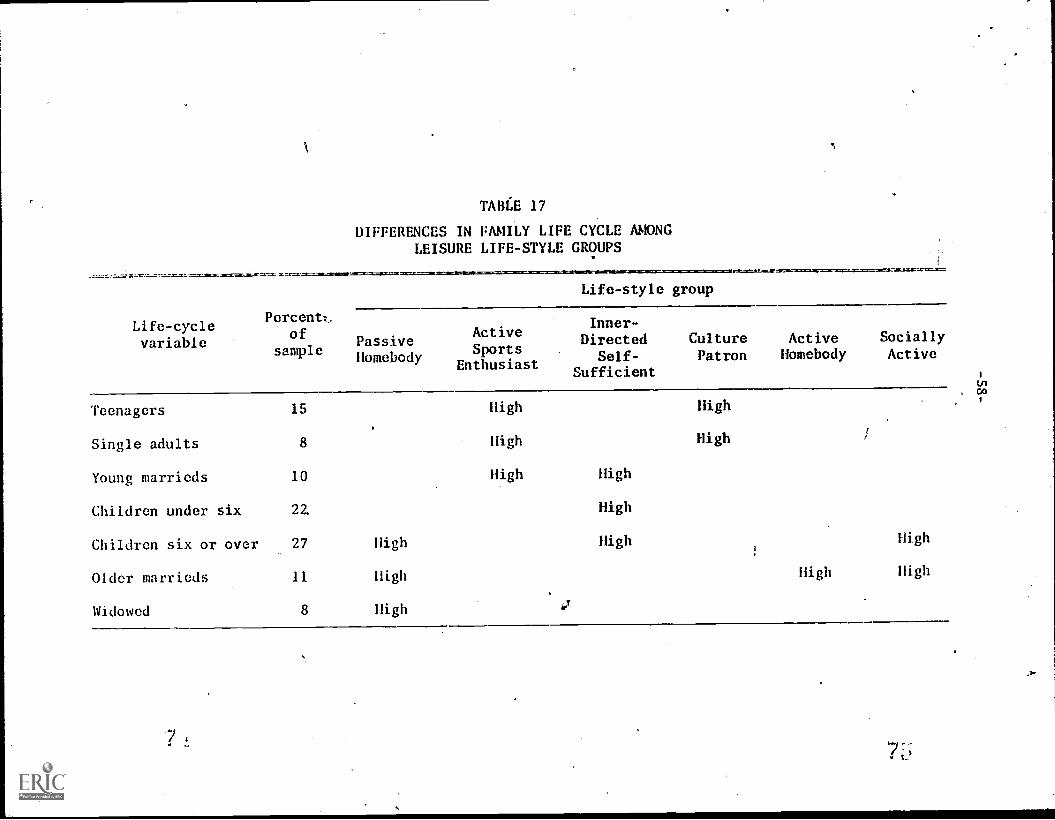
TABU 17
DIFFERENCES IN FAMILY LIFE CYCLE AMONGLEISURE LIFE-STYLE GROUPS
Life-cyclevariable
Percentz,
ofsample
Life-style group
trl
PassiveHomebody
ActiveSports
Enthusiast
Inner-Directed
Self-Sufficient
CulturePatron
ActiveHomebody
SociallyActive
, Go
Teenagers 15 High lligh
Single adults 8 High High
Young marrieds 10 High High
Children under six 22 High
Children six or over 27 High High thigh
Older marrieds 11 High High High
Widowed 8 High 2
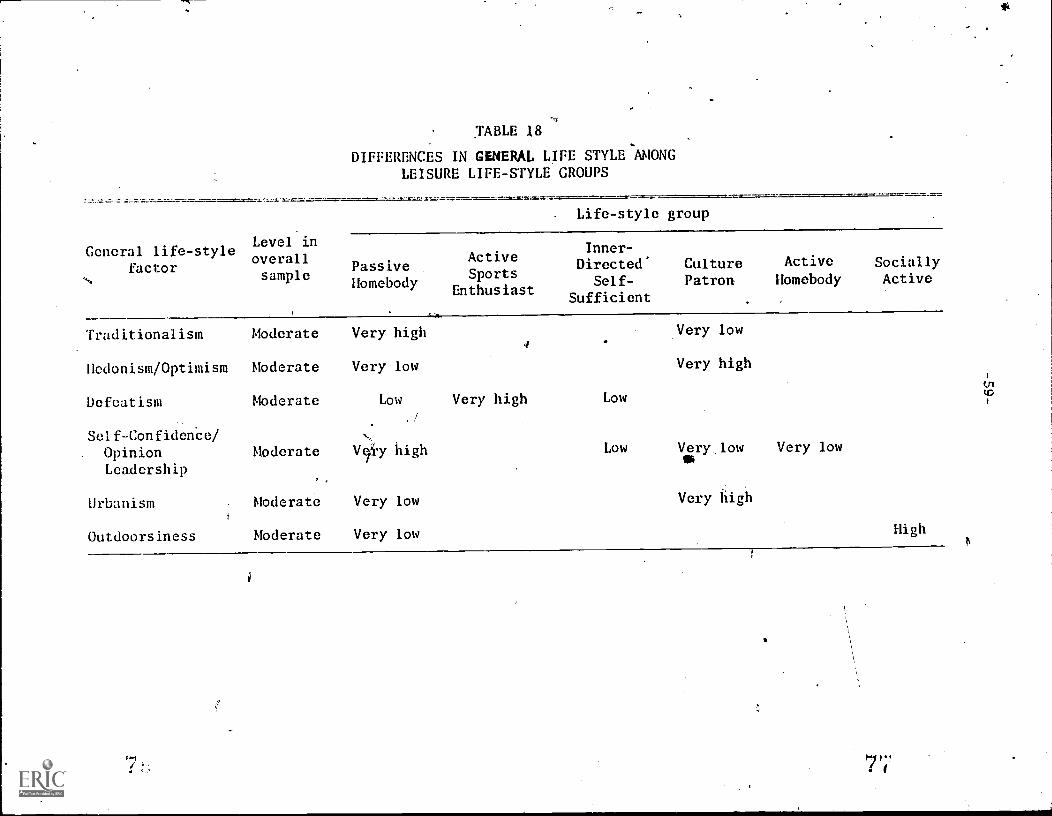
TABLE 18
DIFFERENCES IN GENERAL LIFE STYLE 'AMONG
LEISURE LIFE-STYLE CROUPS
General life-stylefactor
Level inoverallsample
Life-style group
PassiveHomebody
ActiveSports
Enthusiast
Inner-Directed' Culture Active Socially
Self- Patron Homebody Active
Sufficient
Traditionalism Moderate Very high Very low4
Hedonism/Optimism Moderate Very low Very high
Defeatism Moderate Low Very high Low
./
Self-ConfidenCe/ ,Opinion Moderate V9icy high Low Very,low Very low
sLeadership
Urbanism Moderate Very low Very fiigh
Outdoorsiness Moderate Very low High
f.,11
to
-60-
leaders. They have had some exposure to theater and classical music
as children.
The Active Sports Ehthueiasts tend more often to be teenagers or
single adults of highly educated parents. They are slightly more likely
than the overall sample to be nonwhite, to constitute a high proportion
of two-worker houSeholds, and to work full time at moderate status jobs.
They feel more defeated in life and have more automobiles than the sample
average.
The Inner-DirectsaSelf-Sufficients tend to be married, to have
young children, to have the highest incomelevel of all six groups, and
to be the lowest percent nonWhite of the groups. They tend not to feel
defeated or to see themselves as, opinion leaders but are outdoors people.
The Culture Patrons are members of a highly distinctive group
heavily represented in the earlier life-cycle stages. They are optimis-
tic, city-oriented, and highly educated, with high-status occupations
but moderate incomes.
The Active Homebodies tend to be older married couples, a rela-
tively high proportion of whom are retifred. Despite this and the re-
sulting fact that they represent a low proportion of two-worker house-
holds, they tend to be high-income families. These characteristics,
however, explain why they often report that they have more leisure
time.
The Socially ActiVs tend to have older children who may have
left the household. Socially Actives are also more likely to be retired
and nonwhite. They have more leisure time than the rest of'the sample
and much more often have had exposure to classical music and theater
as children.fa4
-61-
These profiles suggest that if symphony marketers wish to promote
to Socially Active respondents, they should aim their messages toward
older, retired people who are active in giving and going to dinners
and parties, possibly portraying a visit to the symphony with other
mature, socially active people as a natural complement to their active,
social life style. The fact that we have discovered that this group
has more leisure time and apparently fewer family responsibilities than
other groups leads to the speculation that they may be good workers
as well as attenders at the symphony, if working on a fund drive or a
related activity can be seen as carried out in the company of other
mature adults and as part of an active social life style.
c. Interest in the Arts as a Child
It seems clear that early exposure is a major determinant of arts
attendance, as it is of many other leisure behaviors. It appears
reasonable to suggest, therefore, that if they have not already done so,'
both theater and symphony organizations shoulld develop active youth
programs, young people's concerts or plays, in-school programs, youth
discounts, and the like. Bradley Morison, a"marketing consultant to
many arts organizations, recently stated his belief that the develop-
ment of an active ch)Idren's theate l. prograM at the Guthrie Theater in
Minneapolis was largely responsible for a.drop of five years in the
average age of attenders at the Guthrie between 1963 and 1973.9
,
This infusion of youthfurl attendees is, Morison argues, a source of
continuing vitality to such established organizations. Constant
9Comments made at a Conference on Planning for the Arts, University
of Illinois, Urbana, January 17, 1918.
-62-
measurement of the effects of youth programs seems necessary, pref-
erably through panel studies. It should also be commonplace for
these organizations to develop mailing lists of participants in school
or youth programs if this early exposure is to be turned into active
adult patronage of symphony and theater. It may also be useful to
consider longer-term series discount programs (perhaps billed as
"learners' discounts" to encourage adult patronage.
7. Deficiencies of the Associational Approach
The associational approach suffers from three major defect's.
First, it measures association, not causation. The implications drawn
above assume causation, but it is entirely possible that the causation
may beA.n the other direction or due to some third variable. Attendance
at theater and symphony now may, for example, lead to favorable attitudes
and not the other way around. This is not an implausible explanation.
Further, attendance at theater or symphony may have led to attendance
at other cultural institutions, not the reverse. This is somewhat
less plausible, but as Ryans and Weinberg (24) point out, we know very
little about how people "learn" to attend arts events over time. It is
even possible, although much less plausible, that childhood interest
in the arts and likely future patronage have a causal structure opposite
to reasonable expectations if present involvement causes people more
often to remember childhood involvements. The problem with this
"causation/assOciation" deficiency is that we do not know if a particular
change in marketing strategy will cause the desired result just because
it is associated with the desired result.
-63-
A second deficiency is that the associational approach is based-
on a measure of-likely future attendance that may lack external reliability
and validity (i.e., it may predict actual future behavior poorly).
A third deficiency with this approach is tha7E it seldom directly
relates to the marketing mix elements tii`ct. an arts administrator can
manipulate. It does not show that if, say, one varied price, a partic-
ular result would be likely to occur. We have said, for example, that
if specific attitude elements were changed, a general increase in arts
attendance could occur; but we did not say how to make such changes.
As a consequence, we cannot say that a particular message strategy devel-
oped by an administrator or his or her communications specialists would
lead to the desired changes in the attitude elements and hence to the
desired behavior change. In that sense, our associational findings
are one step removed from specifying managerial action outcomes.
In order to be in a better position to suggest such outcomes,
we now turn to the "manipulations" approach.
C. The ManipulationsyApproach
A principal concern in this study was to assess the responsive-
ness of the present sample to changes in the offerings made by the per-
forming arts in the communities under study. To do this, we constructed
a series of "what if" statements embodying new offerings that had been
tried in other communities (and in a few cases, in the communities
studied10) or had been proposed elselthere and that could be explained to our
10Telephone and credit card purchases are possible in Atlanta, and
all four cities offer season tickets.
-64-
respondents in telephone interviews.11 It is essential to point out
at this juncture that "what if" questions are biased,predictors of
actual short-run behavior. Respondents are speculating on their future
behavior with respect to hypothetical alternatives. The likelihood
of their carrying through their speculation in the event the alternative
was introduced is low. For this reason, the absolute responses reported
in the following discussion should not be considered very good predictors
of absolute levels of response. That is, to siy that X percent of
respondents in the study will respond to offer Y is not to say that the
result of actually offering Y will be X. It is our belief that our
responses in general overestimated the true responses.
Then why ask about hypothetical offers? The answer is that we
are willing to assume that whatever bias is found in the answers is
constant across the hypothetical offers. That is, if the response to
offer Y is "really" too.high, then the response to offer Z is also likely
to be too high. This reasonable assumption permits gs to compare simi-
larly biased offerings. This is, indeed, our objective: To discover
which offerings are relatively more effective in broadening the audience
for the performing arts.
1. The Manipulations
The marketing strategies of major business organizations revolve
around manipulations of what one author has called "the four P's" (15):
Product: What products and services are offered
11This criterion restricted us from asking about several of the
voucher plans in practice or planned around the country.
-65-
Price: What the level and conditions of retail cost are
Place: Where and how the products and services are offered
Promotion: Where and how one communicans information andattitude change messages about the offerings
In the context of telephone interviews, it was not possible to mani-
pulate the "promotion" element of the mix of marketing variables. However,
the following variables were manipulated:
a) Product variables
(1) Type of performance (play or concert)
(2) Quality of performance
(3) Formality of atmosphere
(4) Extent of learning opportunities
(5) Quality of seating
b) (Price
(1) Price of individual tickets for single performances
(2) Price of multiple tickets for single performances
(3) Price of individual tickets for multiple performances(season tickcs)
(4) Cost and effort of securing tickets at regular price's
(5) Other special reduced ticket prices
c) Place: Location of performance
Some of the variables were offered individually; some were introduced
in combinations either to assess interactions or to make particular
offerings more realistic. The offerings were the following:
a) Product variables
(1) Type of performance
It has been argued that a major vehicle for broadening
-66-
audiences is to offer programs that would better
meet the needs of lighv attenders or nonattenders. Thus,
in this study, respondents were asked whether they would
go "much more often," "somewhat more often," "as often,"
or "less often" if more of the following kinds of programs
were offered:
(a) Symphony
i) 4ymphonies by clasfsical composers such as Kozart
and Beethoven
ii) Symphonies by romantic composers such as Brahms
and Tchaikovsky
iii) Music by contemporary composers such as Stravinsky
iv) Concertos with soloists-
v) Choral music
(b) Theater
i) Musical comedies such as "South Pacific" or
"Showboat"
ii) Classical plays such as "Hamlet" or "Macbeth"
iii) Well-known American dramas such as "Death of
a Salesman" or Streetcar Named Desire"
iv) Modern comedies such as "The Sunshine Boys"
v) Original plays that have never been done before
(2) Quality of performance
Again, it has been argued that new audibnces can be
attracted by the appearance of well-known performers.1,
12 .
is recognized that fa-le of the performer and quality of the
performaiilvaye not perfectly correlated.
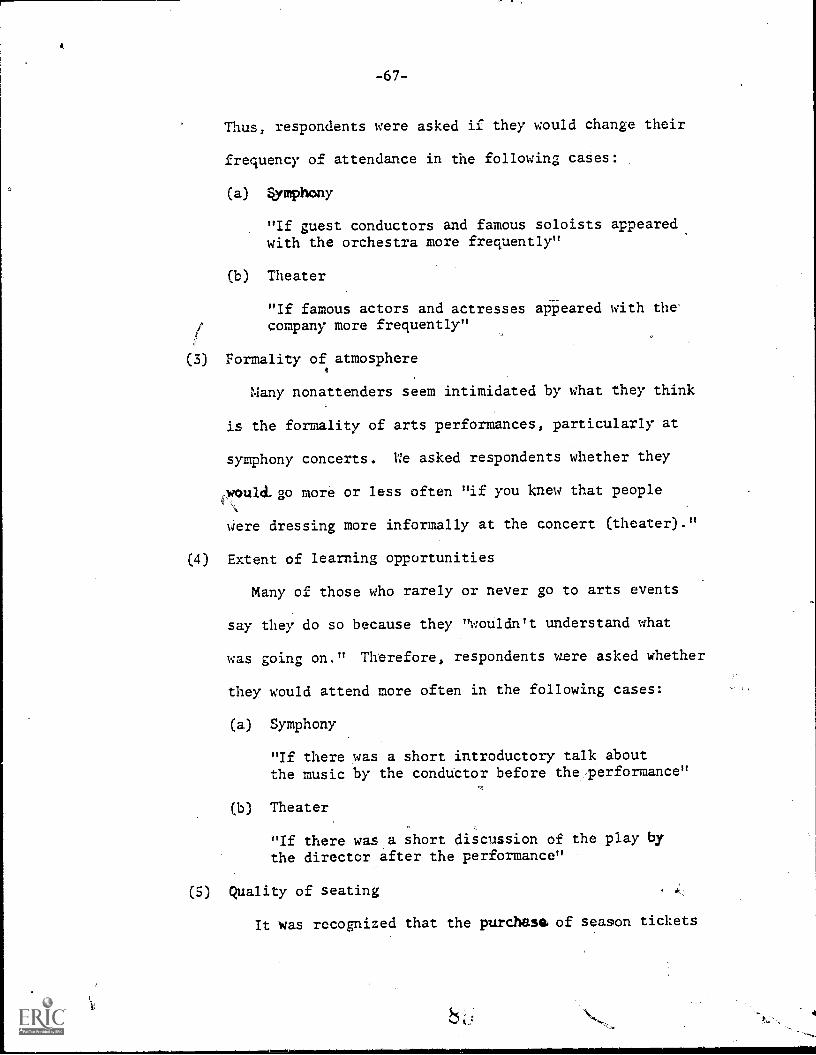
4
-67-
Thus, respondents were asked if they would change their
frequency of attendance in the following cases:
(a) qymphouy
"If guest conductors and famous soloists appearedwith the orchestra more frequently"
(b) Theater
"If famous actors and actresses aliPeared with thecompany more frequently"
(3) Formality of atmosphere
Many nonattenders seem intimidated by what they think
is the formality of arts performances, particularly at
symphony concerts. We asked respondents whether they
would-go more or less often "if you knew that people
were dressing more informally at the concert (theater)."
(4) Extent of learning opportunities
Many of those who rarely or never go to arts events
say they do so because they "wouldn't understand what
was going on." Therefore, respondents were asked whether
they would attend more often in the following cases:
(a) Symphony
"If there was a short introductory talk aboutthe music by the conductor before the performance"
(b) Theater
"If there was a short discussion of the play bythe director after the performance"
(5) Quality of seating
It was recognized that the purchase, of season tickets
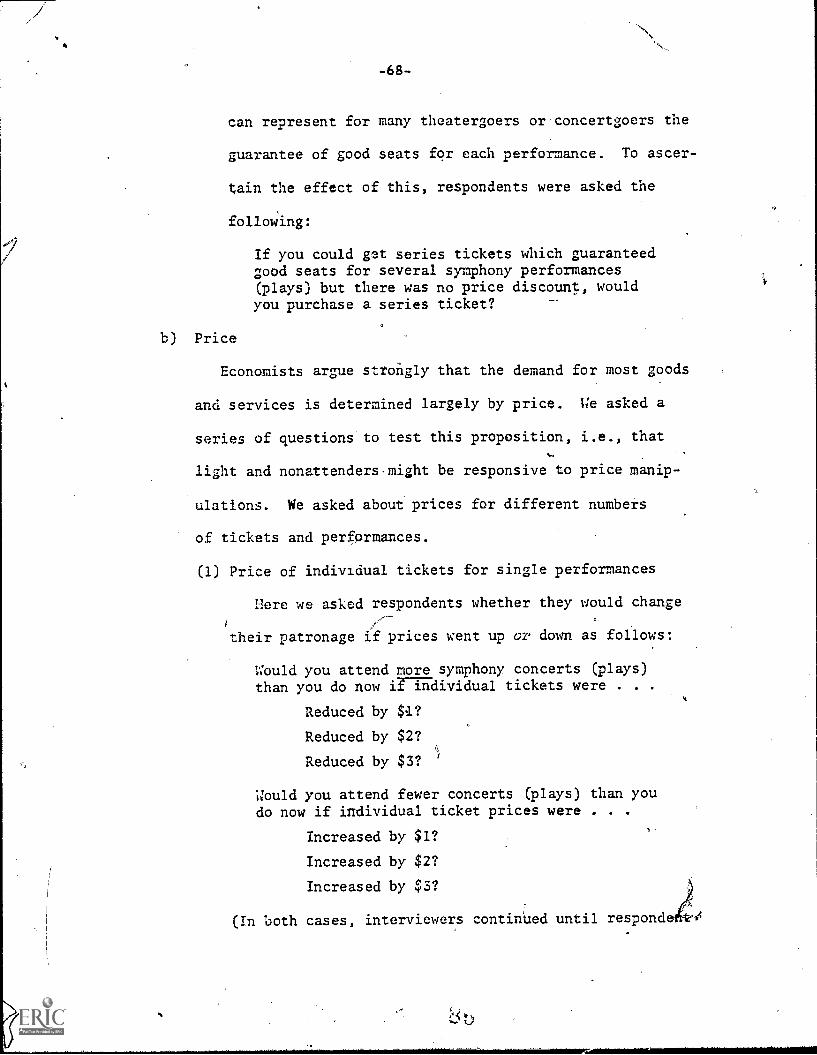
-68-
can represent for many theatergoers or concertgoers the
guarantee of good seats for each performance. To ascer-
tain the effect of this, respondents were asked the
following:
If you could get series tickets which guaranteedgood seats for several symphony performances(plays) but there was no price discount, wouldyou purchase a series ticket?
b) Price
Economists argue strongly that the demand for most goods
and services is determined largely by price. We asked a
series of questions to test this proposition, i.e., that
light and nonattenders-might be responsive to price manip-
ulations. We asked about prices for different numbers
of tickets and performances.
(1) Price of individual tickets for single performances
Here we asked respondents whether they would change
their patronage if prices went up or down as follows:
Would you attend more symphony concerts (plays)than you do now ilEaividual tickets were . . .
Reduced by $1?
Reduced by $2?
Reduced by $3? '/
Uould you attend fewer concerts (plays) than youdo now if individual ticket prices were . . .
Increased by $1?
Increased by $2?
Increased by $3?
(In both cases, interviewers continued until responde
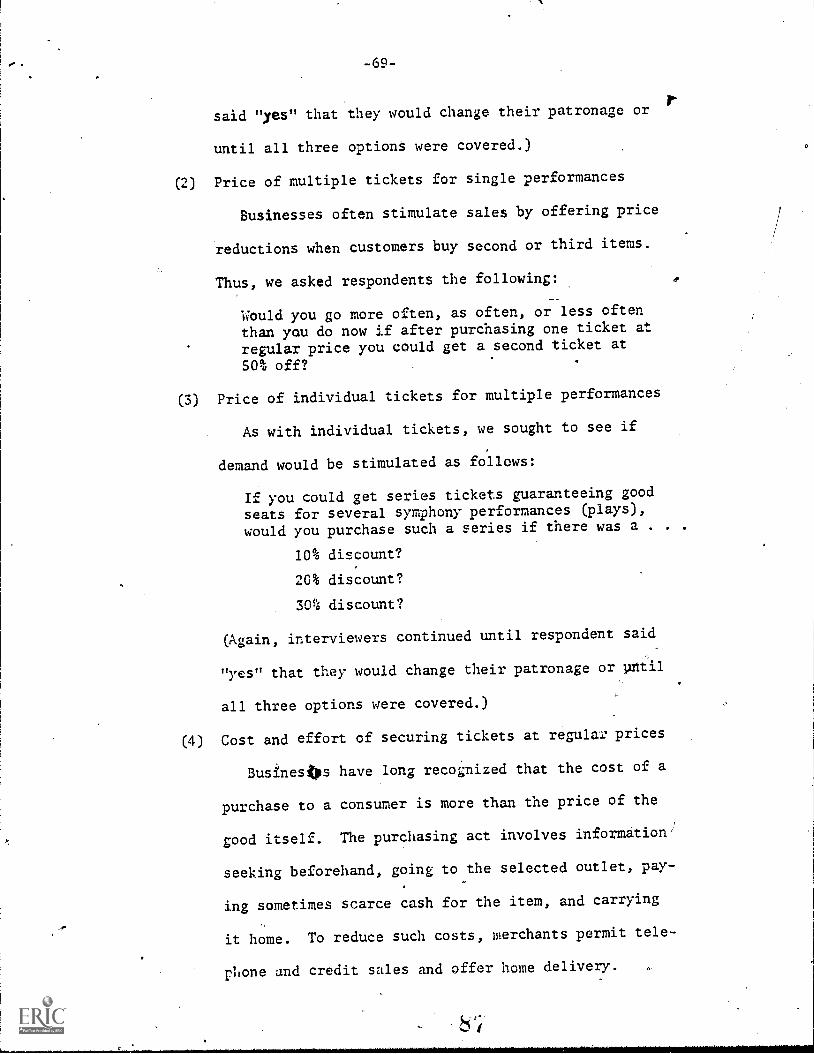
-69-
said "yes" that they would change their patronage or
until all three options were covered.)
(2) Price of multiple tickets for single performances
Businesses often stimulate sales by offering price
reductions when customers buy second or third items.
Thus, we asked respondents the following:
Would you go more often, as often, or less often
than you do now if after purchasing one ticket at
regular price you could get a second ticket at
50% off?
(3) Price of individual tickets for multiple performances
As with individual tickets, we sought to see if
demand would be stimulated as follows:
If you could get series tickets guaranteeing good
seats for several symphony performances (plays),
would you purchase such a series if there was a . .
10% discount?
20% discount?
30% discount?
(Again, interviewers continued until respondent said
"yes" that they would change their patronage or until
all three options were covered.)
(4) Cost and effort of securing tickets at regular prices
Businestps have long recognized that the cost of a
purchase to a consumer is more than the price of the
good itself. The purchasing act involves information/
seeking beforehand, going to the selected outlet, pay-
ing sometimes scarce cash for the item, and carrying
it home. To reduce such costs, merchants permit tele-
phone and credit sales and offer home delivery.
8';
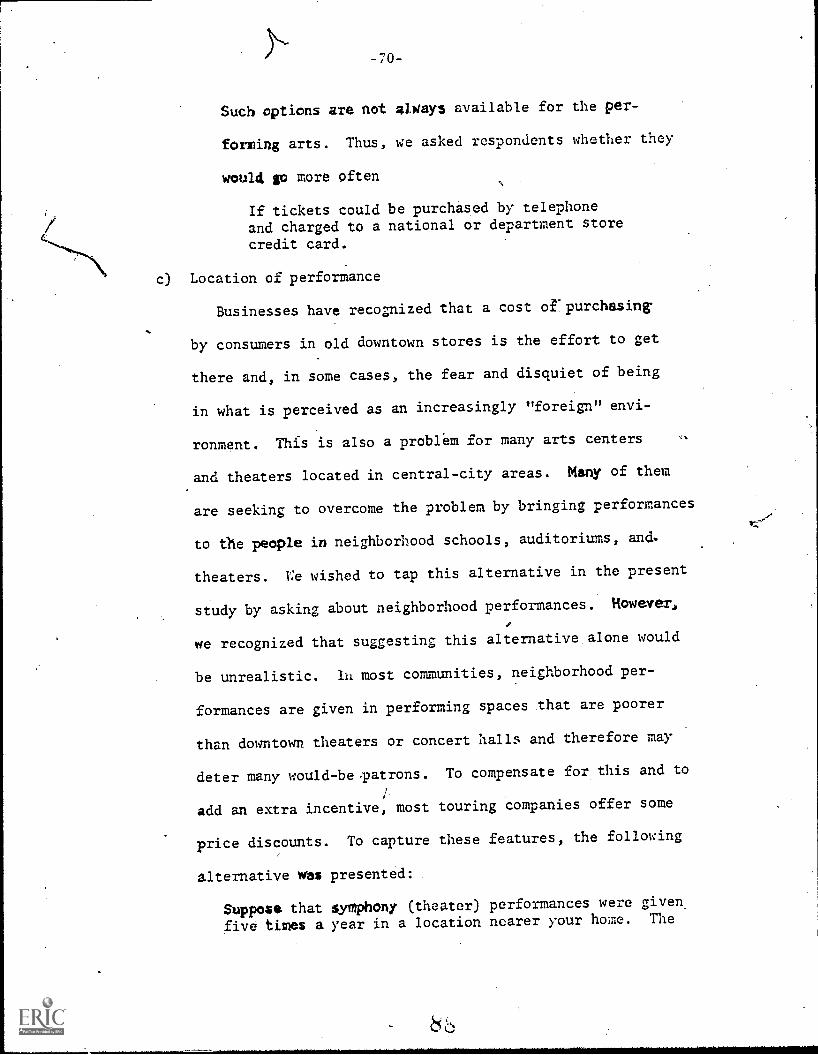
Such options are not always available for the per-
forming arts. Thus, we asked respondents whether they
would go more often
If tickets could be purchased by telephone
and charged to a national or department store
credit card.
c) Location of performance
Businesses have recognized that a cost or purchasing.
by consumers in old downtown stores is the effort to get
there and, in some cases, the fear and disquiet of being
in what is perceived as an increasingly "foreign" envi-
ronment. This is also a problem for many arts centers
and theaters located in central-city areas. Many of them
are seeking to overcome the problem by bringing performances
to the people in neighborhood schools, auditoriums, and.
theaters. L'e wished to tap this alternative in the present
study by asking about neighborhood performances. However,
we recognized that suggesting this alternative alone would
be unrealistic. 1.11 most communities, neighborhood per-
formances are given in performing spaces that are poorer
than downtown theaters or concert halls and therefore may
deter many would-be patrons. To compensate for this and to
add an extra incentive, most touring Companies offer some
price discounts. To capture these features, the following
alternative vots presented:
Suppose that symphony (theater) performances were given
five times a year in a location nearer your home. The
-71-
performing space wouldn't be. as nice as (name of isajor
theater or concert hall in city) but the prices would
be 20% lower. Would you go much more often, somewhatmore often, as often, or less often than you do now?
d) Combinations
(1) A combination of price, seat quality, and purchase.
effort
Several major cities are experimenting with discounts
for tickets unsold. on the day of the performance. While
this represents a price saving for consumers, it usually
involves poorer seating and added efforts to go to a
central location and stand in line to get the desired
disCount. To capture these complicated feat4resL,, respon-
)'
dents were asked about their likely patrontge under the
following circumstances:
Suppose that next year unsold tickets for performances
of the (name of symphony or theater) could be obtained
at regular ticket outlets for 50% off on,the day of
the performance. The seats usually would not be as'
good as those bought in advance. Would you go much
more often, somewhat more often, as often, or less
often than you do now?
(2) A. combination of type of performance and price
In marketing, product improvements are often accom-
panied by price increases. We, therefore, sought to learn
whether the respondent would pay more if more of his or
her favorite music or plays were offered. This could yield
us a feeling for the interaction between product charac-
teristics and price. After asking respondents what their
-72-
favorite type of music or play was, the following
question was asked:,
Let's suppose that your favorite kind of music
(play) were presented more often during the year,
but ticket prices were raised. Would you go to the
symphony (theater) less frequently than you do now
if tiz:ket prices were . .
Increased by $1?
Increased by $2?
Increased by $3?
(Interviewers continued A.intil respondent said "yes"
that they would change their patronage or until all three
,opticns were covered.)
2. Results
The manipulations, described in detail above, are of two general types.
First, there was a diverse set of offerings in response to which the respon-
dents could say that they would go (1) much more often, (2) somewhat more
often, (3) as often, or (4) less often. Then, there was a set of questions
about series tickets and/or price changes that would indicate at what price
the respondent would change behavior. since they involved different types
of responses, the two sets, to be referred to as "new offerings" and "price
and series strategies," will be analyzed separately in the subsections
to follow.
a. New Offerings
All those who indicated some likelihood of attending theater or
symphony in the next year or two were asked whether their attendance
would change if several changeis
were made in the offerings of these
-73-
performing arts. TwO questions sre of interest here.: (1) Are some changes
in offerings more effective-than others in increasing arts attendance;
(2) Are some changes more effective than others in broadening the audience
The answer to the first question is clearly "yes." Indices of rel-
ative etfectiveness were computed for 12 new offerings for symphony ana
12 for theater as follows:
(1) Respondents saying they would go "much more often" as a
result of a new offering were counted as two additional
attendances; respondents going only "more often" were
counted as one. Respondents claiming they would go "less
often" were counted as one fewer future attendance.
(2) The resulting number of net new attendances was divided by
the number of respondents responding to the new offering
to yield an effectiveness score for the offering.
(3) Each effectiveness score was divided by the average effec-
tiveness score for all 12 new offerings and multiplied by
100 to yield the indices reported below.
These calculations make what we believe are reasonable and conser-
vative-assumptions in order to allow comparisons of the relative effec-
tiveness of each manipulated offering. The resulting indices calculated
for all likely future attenders broken down separately for those who did
and did not attend in the past year are reported in Tables 19 and 20.
The indices for nonattenders show two obviously superior strategies for
drawing more members of this group to the theater and symphony: intro-
ducing more "star" performers and offering second tickets for half price.
Equally as powerful for nonattending theatergoers is presenting more
musical comedies. Of somewhat lesser effect for nonattending concert-
goers is offering tickets at one-half off on the day of the performance
or presenting a short discussion of the work before the performance.
j). Price and Series Strategies
Teble 21 reports indices for price and series ,strategi'es for past
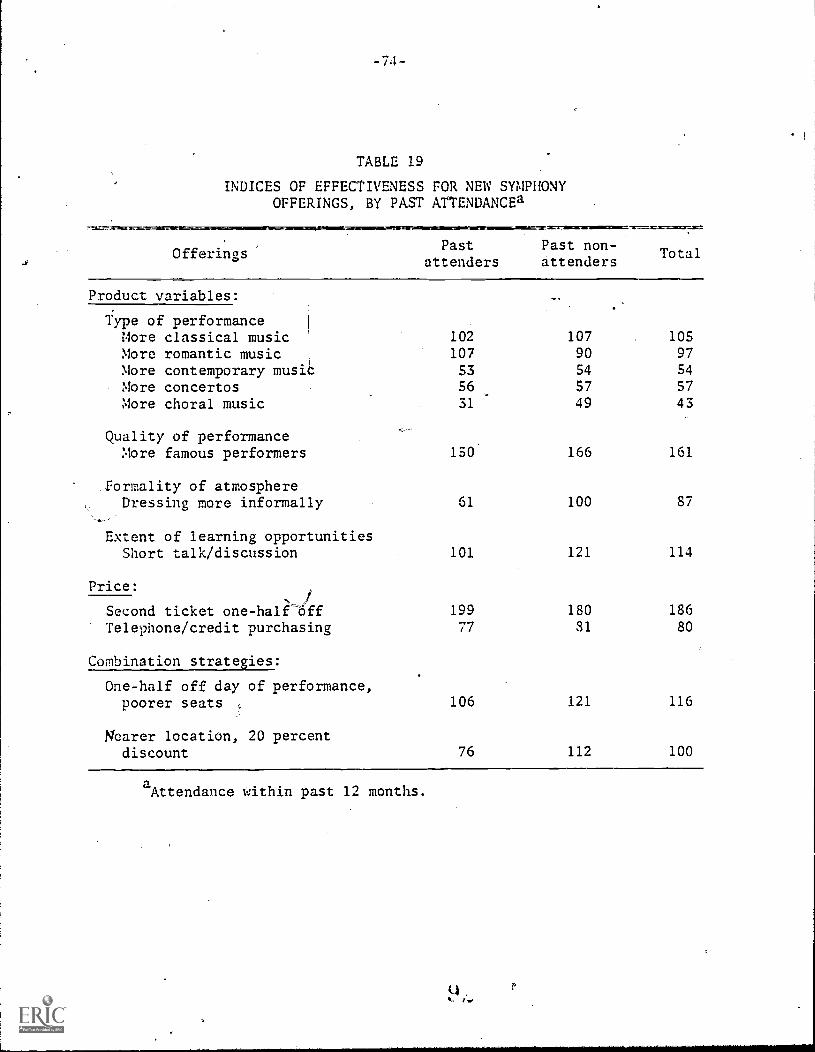
-74-
TABLE 19
INDICES OF EFFECTIVENESS FOR NEW SYMPHONYOFFERINGS, BY PAST ATTENDANCEa
Offerings
Product variables:
Type of performanceMore classical music 1
More romantic music 1
More contemporary musit, More concertosMore choral music
Quality of performanceMore famous performers
Formality of atmosphereDressing more informally
Extent of learning opportunitiesShort talk/discussion
Price:.'4----)
Second ticket one-haltOffTelephone/credit purchasing
Combination strategies:
One-half off day of performance,poorer seats ,
Wearer location, 20 percentdiscount
Pastattenders
Past non-attenders
Total
102 107 105
107 90 97
53 54 54
56 57 57
31 49 43
150 166 161
61 100 87
101 121 114
199 180 186
77 31 80
106 121 116
76 112 100
aAttendance within past 12 months.
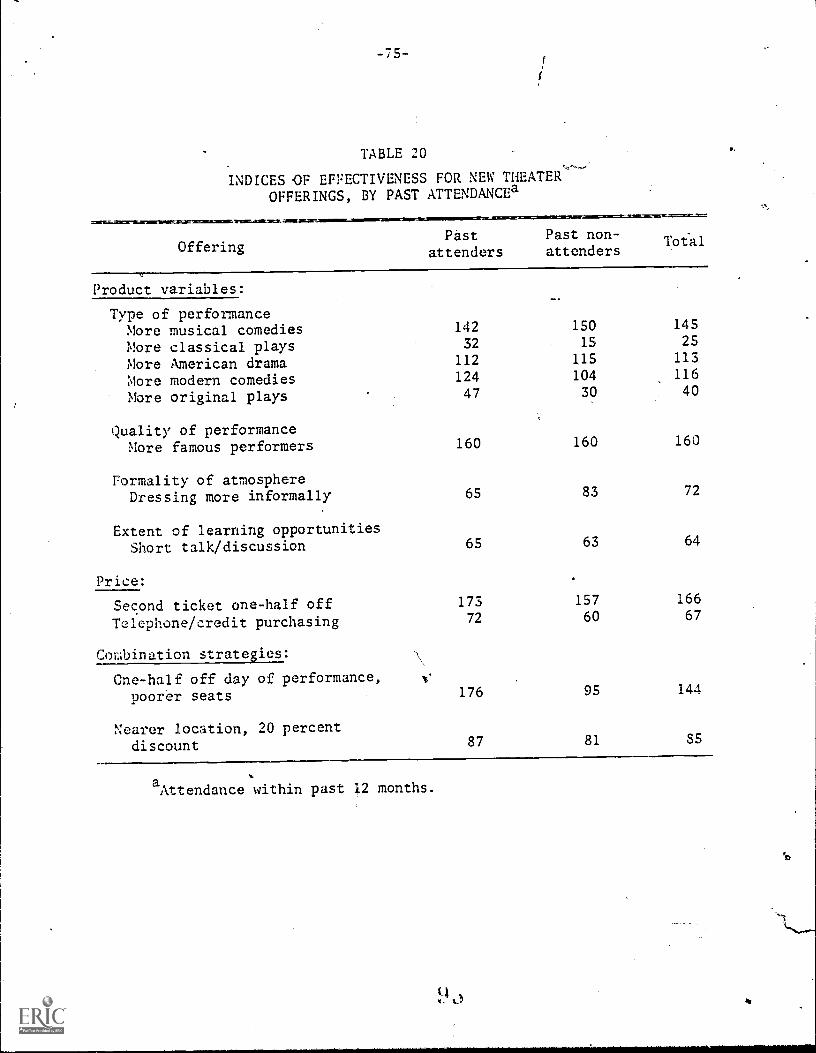
-75-
TABLE 20
INDICES CP EFFECTIVENESS FOR NEW THEATER/OFFERINGS, BY PAST ATTENDANCEa
-m--=-=21121C..111C =OIL MIIIKALII,
OfferingPast
attenders
7[71.1113r
Past non-attenders
Tot'al
Product variables:
Type of performanceMore musical comedies 142 150 145
More classical plays 32 15 25
More American drama 112 115 113
More modern comedies 124 104 116
More original plays 47 30 40
Quality of performanceMore famous performers 160 160 160
Formality of atmosphereDressing more informally 65 83 72
Extent of learning opportunitiesShort talk/discussion 65 63 64
Price:
Second ticket one-half off 173 157 166
Telephone/credit purchasing 72 60 67
Combination strategies:
One-half off day of performance,poorer seats 176 95 144
Nearer location, 20 percentdiscount 87 81 85
aAttendance within past 12 months.
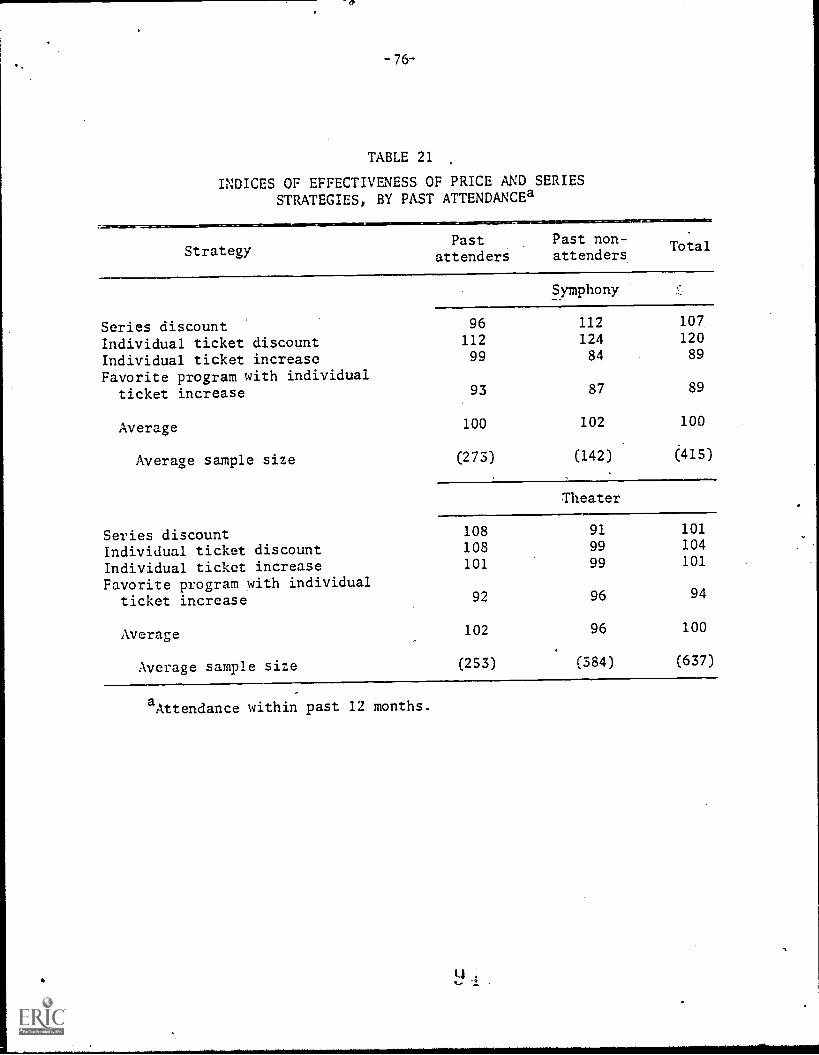
76-
TABLE 21
INDICES OF EFFECTIVENESS OF PRICE AND SERIESSTRATEGIES, BY PAST ATTENDANCEa
StrategyPast
attenders
Past non-attenders
Total
Symphony
Series discount 96 112 107
Individual ticket discount 112 124 120
Individual ticket increase 99 84 89
Favorite program with individualticket increase 93 87 89
Average 100 102 100
Average sample size (273) (142) 415)
Theater
Series discount 108 91 101
Individual ticket discount 108 99 104
Individual ticket increase 101 99 101
Favorite program with individualticket increase 92 96 94
Average 102 96 100
Average sample size (253) (384) (637)
aAttendance within past 12 months.
-77-
offenders and. nonattenders.13
Among this set of strategies, for symphony
by far the best for increasing revenues from nonattenders is to decrease
individual ticket prices. Not surprisingly, this appears substantially
better than increasing prices. For theater, price discounts are also
somewhat higher in their relative effectiveness, but the variation across
all manipulations here is minimal. This is, however, primarily a function
of the smaller sample size for symphony manipulations, to which the indices
are quite sensitive.
It should be noted, however, that comparing the various price re-
duction strategies reported in Table 21 with the strategy of offering a
second ticket for half off (Tables 19 and 20) indicates that the latter
is a substantially better strategy for increasing revenues.14
That is
to say, these data suggest that more customers wiZZ be brought in by
offering second tickets at hatfprice than by giving series discounts
<es high as 30 percent:or indVvidUalacket discounts of up to $3. It
may well be that the expression "half off" is the key to this manipula-
tion's success. Alternatively, it may be that it is the "second ticket"
aspect of the offer that is crucial, given the importance of interpersonal
influences that we have pointed out elsewhere in the study.
13 Indices were computed by calculating the proportion of respondents
who responded positively to each alternative (e.g., would buy series tickets,would go more if prices were decreased, or would not go less often if priceswere increased) and then comparing the score for the responses of each group
for each manipulation to the average responsiveness across all groups forall manipulations within symphony or within theater.
14 .This conclusion was drawn by comparing the proportion of peoplegoing more often or much more often in response to a second ticket atone-half price to the proportion of respondents who would go more oftenwith any of the individual or series price discounts offered.
-78-
c. Broadenins the Audience
The above strategies broaden the audience in the sense that they
have high impact on nonattenders, but many also have high impact OR
attenders.. To ascertain whether some of the strategies just discussed
have different effects on each group, direct comparisons were made of
responses of those who attended symphony or theater in the past year
and those who did not. Table 22 shows that there were four strategies
by which symphony nonattenders were more positively affected than
attenders:15
(1) Offering choral music.
(2) Knowing that people were dressing more informally.
(3) Offering symphony performances five times a year nearer home,with a performing space not as nice but prices 20 percent lower.
(4) More famous performers.
There are two problems with these findings. First, it should be
noted that according to Table 19, offering choral musicAlad the lowest
iotca effectiveness of all the strategies and nearer locations and greater
informality drew only average responses among past nonattenders. A second,
more critical problem is that it is not clear whether the differences
found are,because past nonattenders responded positively or because past
attenders responded negatively. Indeed, more detailed analyses of re-
sponses within life-style groups to be reported later do indicate that
the latter may be the case, at least for the "dressing informally" ma-
nipulation. The fact that of these four manipulations only "more famous
15Probability of attanders and nonattenders being the.same .05.
Mote that the significance-levels may not be reflected in the indicesreported,earlier becauve the latter used a weighting scheme that thesignificaneetests ignore&
LJ
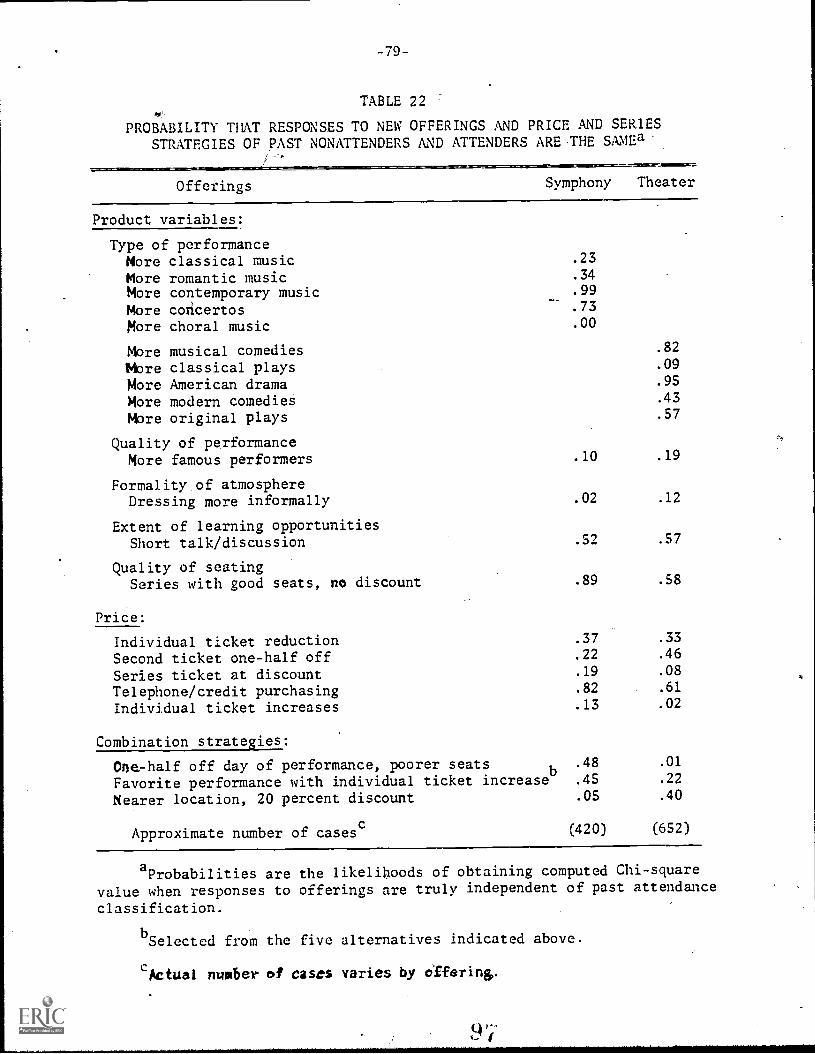
-79-
TABLE 22
PROBABILITY THAT RESPONSES TO NEW OFFERINGS AND PRICE AND SERIESSTRATEGIES OF pAST NONATTENDERS AND ATTENDERS ARE ,THE SAMEa'
.11.MOIMIESZCOMMIS
Offerings Symphony Theater
Product variables:
Type of performanceMore classical music .23
More romantic music .34
More contemporary music .99
More concertos_-
.73
More choral music .00
Mbre musical comedies .82
Mlore classical plays .09
More American drama .95
More modern comedies .43
Mbre original plays .57
Quality of performanceMore famous performers .10 .19
Formality of atmosphereDressing more informally .02 .12
Extent of learning opportunitiesShort talk/discussion .52 .57
Quality of seatingSeries with good seats, no discount .89 .58
Price:
Individual ticket reduction .37 .33
Second ticket one-half off .22 .46
Series ticket at discount .19 .08
Telephone/credit purchasing .82 .61
Individual ticket increases .13 .02
Combination strategies:
One-half off day of performance, poorer seats b.48 .01
Favorite performance with individual ticket increase .45 .22
Nearer location, 20 percent discount .05 .40
Approximate number of casesc (420) (652)
aProbabilities are the likelihoods of obtaining computed Chi-square
value when responses to offerings are truly independent of past attendance
classification.
bSelected from the five alternatives indicated above.
("Actual number of cases varies by Offering.
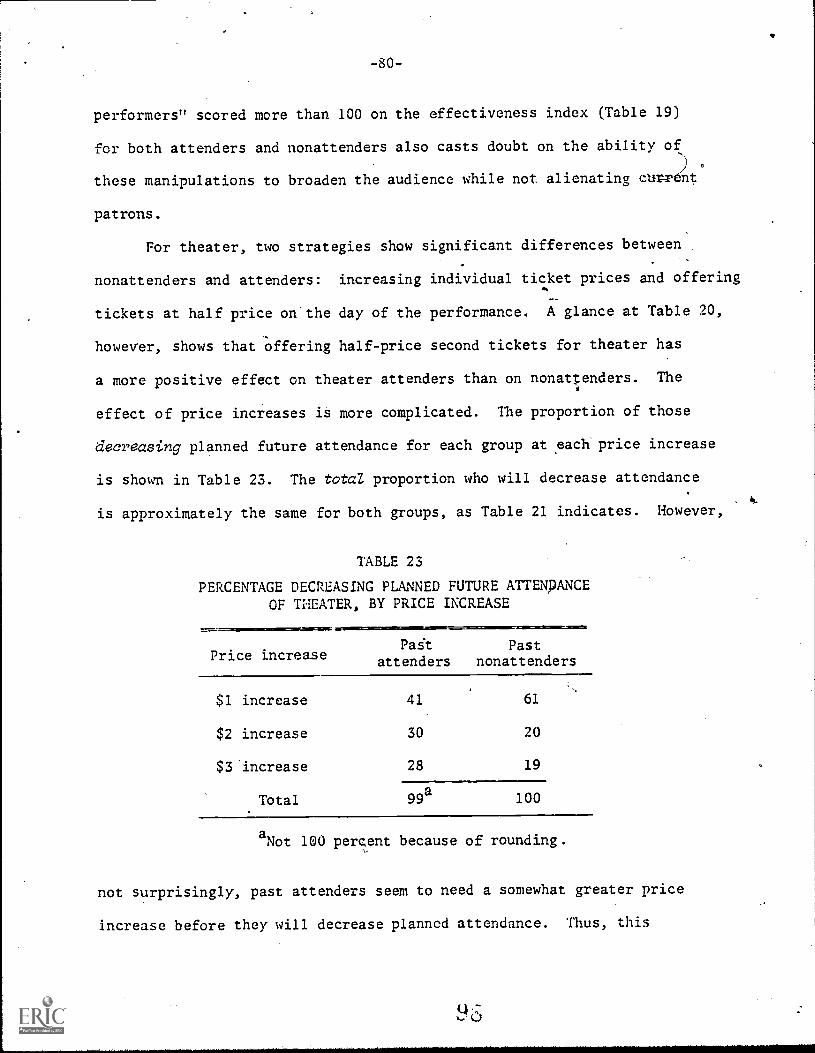
performers" scored more than 100 on the effectiveness index (Table 19)
for both attenders and nonattenders also casts doubt on the ability of,
these manipulations to broaden the audience while not alienating curr nt
patrons.
For theater, two strategies show significant differences between
nonattenders and attenders: increasing individual ticket prices and offering
tickets at half price on the day of the performance. A glance at Table 20,
however, shows that Offering half-price second tickets for theater has
a more positive effect on theater attenders than on nonatpenders. The
effect of price increases is more complicated. The proportion of those
decreasing planned future attendance for each group at seach price increase
is shown in Table 23. The total proportion who will decrease attendance
is approximately the same for both groups, as Table 21 indicates. However,
TABLE 23
PERCENTAGE DECREASING PLANNED FUTURE ATTENpANCEOF THEATER, BY PRICE INCREASE
Price increaseFait
attendersPast
nonattenders
$1 increase 41 61
$2 increase 30 20
$3 increase 28 19
Totala
99 100
aNot 100 percent because of rounding.
not surprisingly, past attenders seem to need a somewhat greater price
increase before they will decrease planned attendance. Thus, this
-81-
strategy is also ineffective for broadening the audience, since low and
derate price increases keep the nonattenders away more whereas higher
increases have equal effects on aiteriders and nonattenders.
d. Ileiponses to Manipulations across Life-Style Groups
As we have emphasized throughout this analysis, a key to under-
standing people's responses to arts opportunities is an_understanding
of their leisure life styles. Since these life styles reflect general
orientations toward leisure, one might expect that responsiveness to the
manipulations employed will also vary by life-style group. And, indeed,
as Tables 24, 25, and 26 indicate, there is substantial variation in this
responsiveness across life-style groups.16
In two cases for symphony
and four for theater, the differences across these groups in response
to the manipulations are significant. For symphony, the only significant
+
differences were in the effects of introducing more choral music and of
moving the performance nearer to the respondent's home combined with
offering a 20-percent ticket discount. More choral music was most attrac-
tive to Active Homebodies and least attractive to Culture Pati.ons. A near-
er location appealed to Active Sports Enthusiasts but not to Passive
Homebodies.
For theater, four manipulations had differential effects across
lifeTstyle groups. Both having more famous performers and dressing more
informally are most attractive to Passive Homebodies and least attractive
o
to Culture Patrons. Culture Patrons are most responsive to individual
ticket discounts and Active Sports Enthusiasts least responsive. On the
16The indices in these tables were computed in tho same manneras those for Tables 19-21.
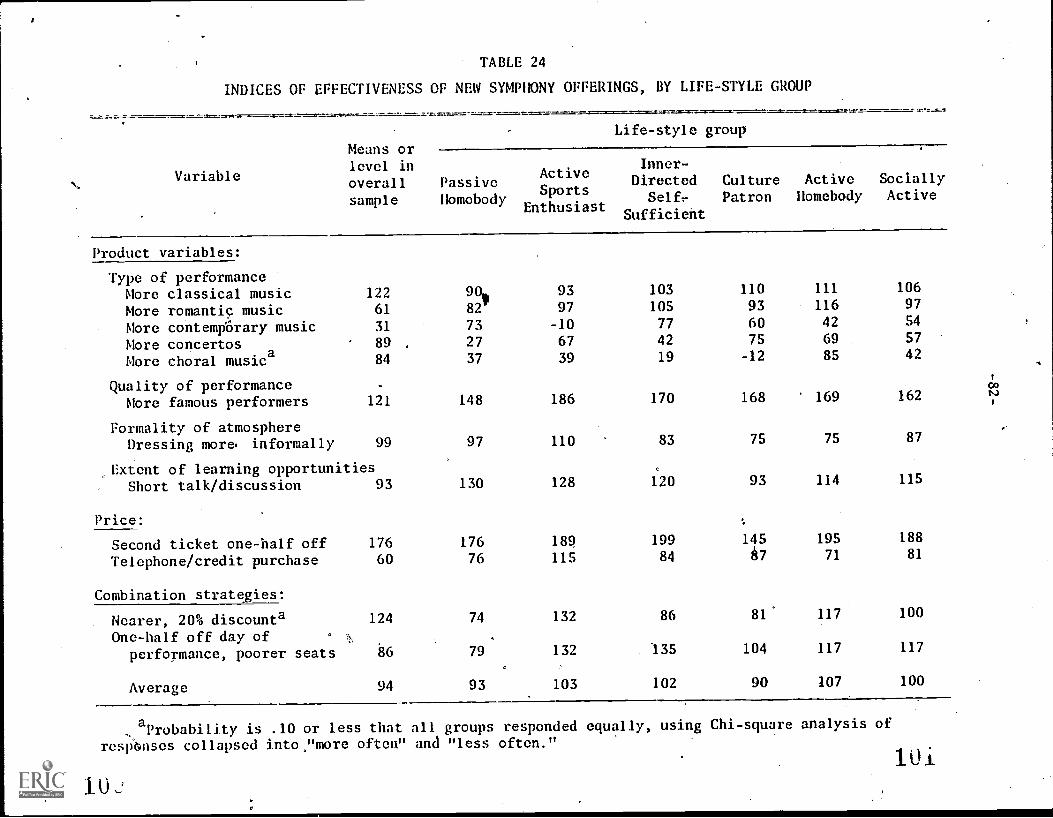
TABLE 24
INDICES OF EFFECTIVENESS OF NEW SYMPHONY OFFERINGS, BY LIFE-STYLE GROUP
Variable
Means orlevel inoverallsample
PassiveHomebody
ActiveSports
Enthusiast
Product variables:
Type of performanceMore classical music 122 90, 93
More romantic music 61 82 97
More contempbrary music 31 73 -10
More concertos 89 . 27 67
More choral music 84 37 39
Quality of performance .
More famous performers 121 148 186
Formality of atmosphereDressing more. informally 99 97 110
,Extent of learning opportunities
Short talk/discussion 93 130 128
Price:
Second ticket one-half off 176 176 189
Telephone/credit purchase 60 76 115
Combination strategies:
Nearer, 20% discounta 124 74 132
One-half off day of .
performance, poorer seats 86 79 132
Average 94 93 103
Life-style group
Inner-Directed
Self,-
Sufficient
103
105
77
42
19
170
83
120
199
84
86
435
102
CulturePatron
ActiveHomebody
SociallyActive
110936075-12
111
11642
69
85
106
97
54
5742
168 169 162
75 75 87
93 114 115
145 195 188
7 71 81
81 117 100
104 117 117
90 107 100
aProbability is .10 or less that all groups responded equally, using Chi-square analysis of
resp&nscs collapsed into,"more often" and "less often."101
10
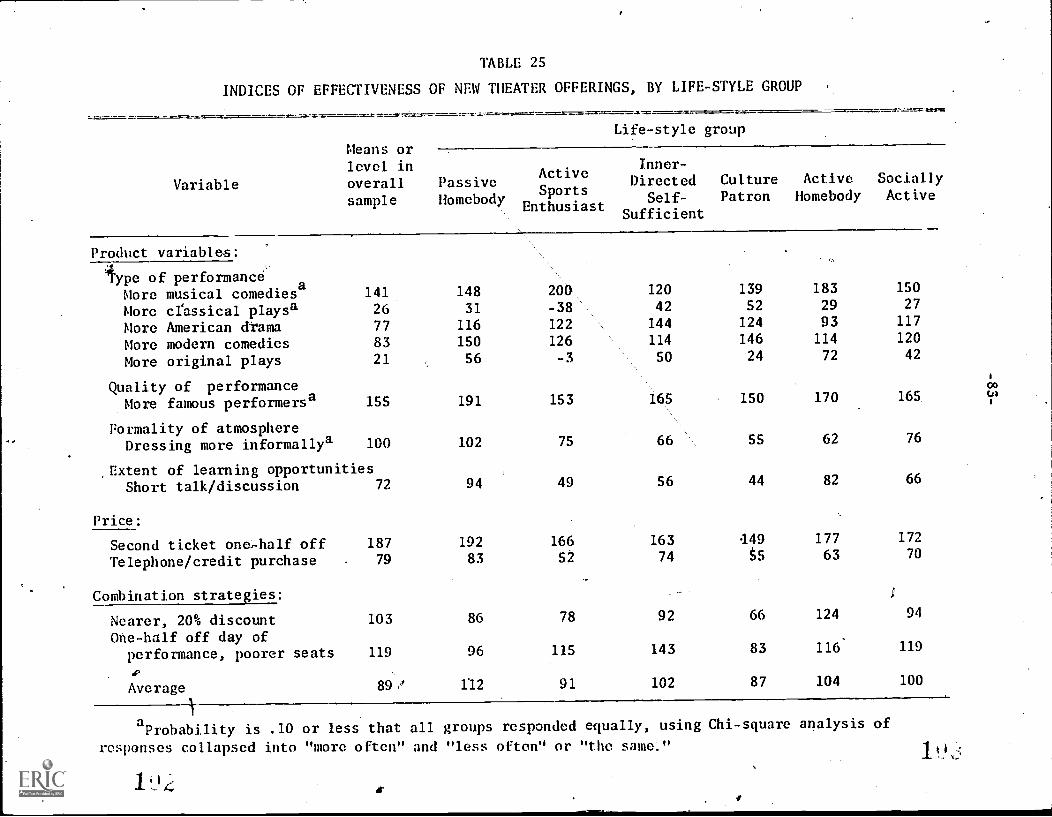
TABLE 25
INDICES OF EFFECTIVENESS OF NEW THEATER OFFERINGS, BY LIFE-STYLE GROUP
Life-style group
Means orlevel in
Variable overallsample
PassiveHomebodv
g
ActiveSports
Enthusiast
Inner-Directed
Self-
Sufficient
CulturePatron
ActiveHomebody
SociallyActive
Product variables:
iype of performanceMore mUsical comedies
a141 148 206, 120 139 183 150
More crassical playsa 26 31 -38 42 52 29 27
More American drama 77 116 122 144 124 93 117
More modern comedies 83 150 126 114 146 114 120
More original plays 21 56 -3 50 24 72 42
Quality of performanceMore famous performersa 155 191 153 165 150 170 165
Formality of atmosphereDressing more informallya 100 102 75 66 55 62 76
,Extent of learning opportunitiesShort talk/discussion 72 94 49 56 44 82 66
Price:
Second ticket one,half off 187 192 166 163 449 177 172
Telephone/credit purchase 79 83 52 74 tS 63 70
Combination strate ies: ;
Nearer, 20% discount 103 86 78 92 66 124 94
One-half off day ofperformance, poorer seats 119 96 115 143 83 116 119
.p
Average 89,,' 112 91 102 87 104 100
a Probability is .10 or less that all groups responded equally, using Chi-square analysis o
responses collapsed into "more often" and "less often" or "the same."
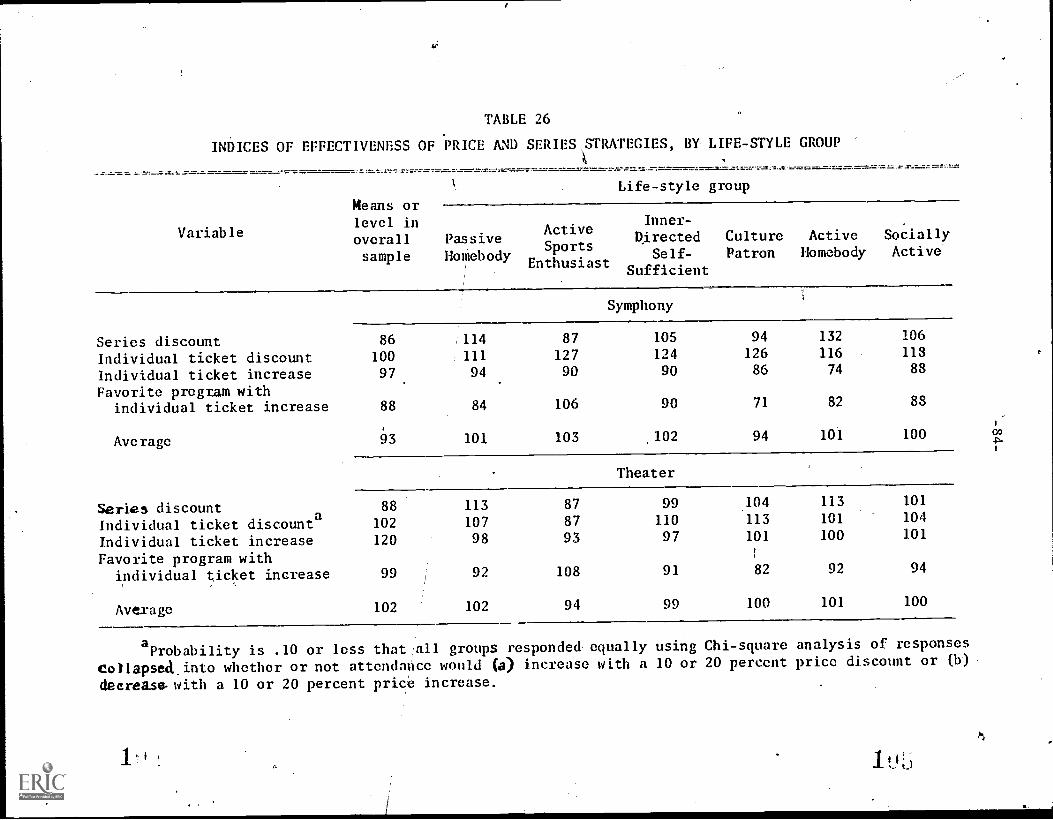
TABLE 26
INDICES OF EFFECTIVENESS OF PRICE AND SERIES STRATEGIES, BY LIFE-STYLE GROUP
Life-style group
Variable
Means orlevel in Inner-
Activeoverall Passive Directed Culture Active Socially
sample HomebodySports
Self- Patron Homebody ActiveEnthusiast
Sufficient
Symphony
Series discount 86 ,114 87 105 94 132 106
Individual ticket discount 100 111 127 124 126 116 118
Individual ticket increase 97 94 90 90 86 74 88
Favorite program withindividual ticket increase 88 84 106 90 71 82 88
Average 63 101 103 .102 94 101 100
Theater
Series discount 88 113 87 99 104 113 101
Individual ticket discounta
102 107 87 110 113 101 104
Individual ticket increase 120 98 93 97 101 100 101
Favorite program with I
individual ticket increase 99 92 108 91 82 92 94
Average 102 102 94 99 100 101 100
aProbability is .10 or less that all groups responded equally using Chi-square analysis of responses
co)lapsea.into whether or not attendance would (a) increase with a 10 or 20 percent price discount or (b)
decrease. with a 10 or 20 percent price increase.
other hand, more Active Sports Enthusiasts said they would pay more for
.Ththeir favorite type of theater presenta ion than Culture Patrons.
e. Responses to Manipulations within Life-Style Groups
Of critical interest to the issue of broadening the audience is
whether there are also differential effects on attenders and nonattenders
in each life-style group. To investigate this questioa; a series of
cross tabulations was constructed comparing the responses of past attenders
and past nonattenders to the new offerings,\price manipulations, and series
ticket offers within each life-style group:4 7 In four cases each, theater
and symphony manipulations yielded different effects'for attenders than
for nonattenders within specific life-style groups.18
These data are
reported in Table 27.
Symphony.--For symphony, each of the four manipulations had mere
positive effects on nonattenders than on attenders. However, closer
examcnation of the data in Table 27 allows us to assess whether these
differences are due to the nonattenders being "turned on" by the mani-
pulation or to the attenders being "turned off." Such an assessment
is possible by comparing the responses of attenders and nonattenders
within each of the significant life-style groups listed with the average
responses of the remaining sample responding to the manipulation.
This analysis revealed that for three of the four manipulations the
significant effects are due to the attenders having a'beiow average response
17 Because of the sample sizes, the full range of responses to thenew offering's was collapsed into two categories: (1) will go more often
and (2) will not go more often.
1 8.
Significant at .10 level, Ch;.-square test.
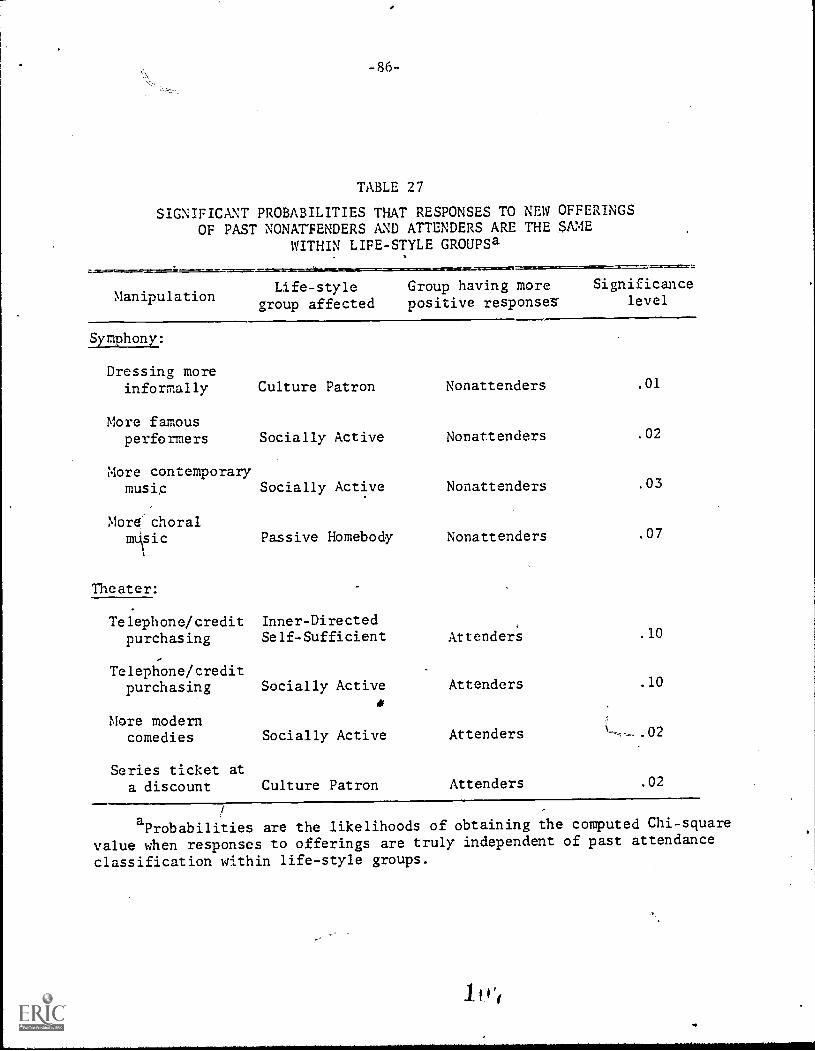
-86-
TABLE 27
SIGNIFICANT PROBABILITIES THAT RESPONSES TO NEW OFFERINGSOF PAST NONATTENDERS AND ATTENDERS ARE THE SAME
WITHIN LIFE-STYLE GROUPSa
ManipulationLife-style
group affected
Group having morepositive responses
Significancelevel
Symphony:
Dressing moreinformally Culture Patron Nonattenders .01
More famousperformers Socially Active Nonattenders .02
More contemporarymusic Socially Active Nonattenders .03
More' choralPassive Homebody Nonattenders .07
Theater:
Telephone/credit Inner-Directedpurchasing Self-Sufficient Attender's .10
Telephone/creditpurchasing Socially Active Attenders .10
More moderncomedies Socially Active Attenders
Series ticket ata discount Culture Patron Attenders .02
aProbabilities are the likelihoods of obtaining the computed Chi-square
value when responses to offerings are truly independent of past attendance
classification within life-style groups.
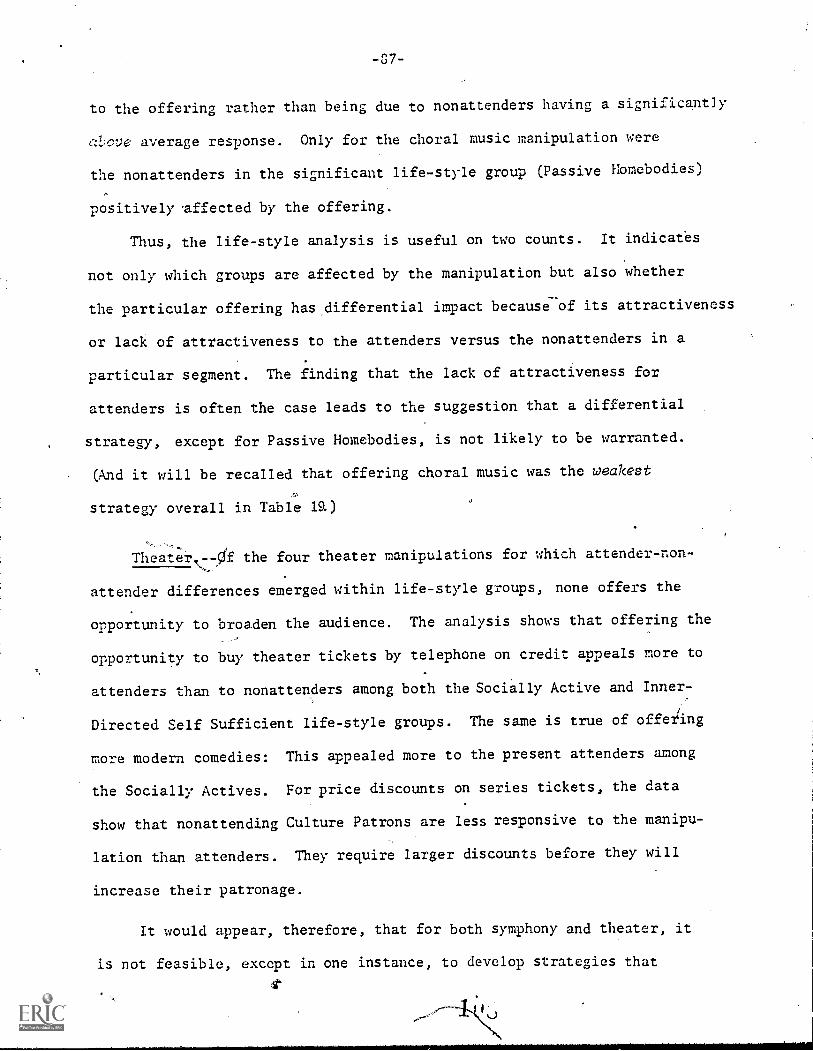
to the offering rather than being due to nonattenders having a significantly
aZ)cve average response. Only for the choral music manipulation were
the nonattenders in the significant life-style group (Passive Homebodies)
positively 'affected by the offering.
Thus, the life-style analysis is useful on two counts. It indicates
not only which groups are affected by the manipulation but also whether
the particular offering has,differential impact becauseof its attractiveness
or lack of atttactiveness to the attenders versus the nonattenders in a
particular segment. The finding that the lack of attractiveness for
attenders is often the case leads to the suggestion that a differential
strategy, except for Passive Homebodies, is not likely to be warranted.
(And it will be recalled that offering choral music was the weakest
strategy overall in Table IR)
Theate r.- the four theater manipulations for which attender-non--,,
attender differences emerged within life-style groups, none offers the
opportunity to broaden the audience. The analysis shows that offering the
opportunity to buy theater tickets by telephone on credit appeals more to
attenders than to nonattenders among both the Socially Active and Inner-
Directed Self Sufficient life-style groups. The same is true of offetlng
more modern comedies: This appealed more to the present attenders among
the Socially Actives. For price discounts on series tickets, the data
show that nonattending Culture Patrons are less responsive to the manipu-
lation than attenders. They require larger discounts before they will
increase their patronage.
It would appear, therefore, that for both symphony and theater, it
is not feasible, except in one instance, to develop strategies that
selectively broaden the audience, i.e., strategies that positively affect
nonattenders while not turning off attenders. The preferred strategy for
bringing in more paSt nonattenders is clearly to offer alternatives, such
as second tickets at half price, that have' a high impact on that group.while
also attracting more patronage from past attenders.
IV. CONCLUSIONS AND RECOMENDATIONS
The conclusions to be drawn from this study fall into two broad
categories, practical and analytical. The former are the findings of
interest to arts managers who would like to translate the study results
into concrete actions. The latter are methodological conclusions of
interest to those doing further audience studies. We shall discuss
each in turn and then close with a brief reminder of some of the
limitations of the study.
A. Managerial Conclusions and Recommendations
This study has developed two broad approaches to the issues of
whether and how one can broaden the audience for the arts. The first ,
approach, it will be recalled, was to seek out correlates of future
attendance intentions. There the findings were rather striking, since the
four major factors that predicted symphony attendance were also the four
major predictors of theater attendance (attitudes toward attendance,
attendance in the past year, interest in the art form as a child, a
membership in the Culture Patron life-style group). On the other hand,
it was pointed out that the results were based on association, nOt causation,
and hinged on a dependent measure of future behavior that.might be rela-
tively weak.
-89-
The second approach, the manipulations analysis, was useful in t,he sense
that for both theater and symphony, it pointed clearly to the need to
focus on high-impact strategies rather than on selective strategies.
And, in this analysis, the two highest impact strategies were the same for
theater and symphony (i.e., offering second tickets at half price from time
to time and including more famous performers in the production). Here
again, the analyses had their limits, particularly because the evaluations
concerned future behavior and were in response to possible offerings
that may have been hard to visualize.
On which set of conclusions should the practicing manager rely?
If the associational analysis is to be relied on, and if one ignores
cost, the recommended actions would include the following:
(1) Improve nonattender symphony/theater expectations about the
likelihood that
(a) They would like the program;
(b) They would understand what was going on;
(c) Those with whom they were attending wotild have a good
time;
(d) The evening would prove stimulating;
(e) They would find the performers better (theater only);
(f) They would feel they weren't wasting their time
(symphony only).
(2) Increase the importance in leisure-time decisions of
(a) Understanding what was going on (theater only);
(b) The feeling that those with you were having a good time
(theaterionly).
(3) Stimulate personal influence of attenders on nonattenders.
-90-
(4) Market actively to two life-style groups:
(a) Culture Patrons through promotions developed throughother art forms. (Theater patrons may be a particu-.larly good source of symphony patrons.)
(b) Socially Actives (symphony only) through promotions designedto emphasize the positive social benefits of symphonyattendance.
(5) Strengthen young people's programs and develop strategies to
convert early socialization to the arts into active adulto
patronage, possibly through improved mailing lists of young
people or "learners' discounts."
On the other hand, if tee manipulations analysis is to be relied on,
as we have already noted the emphasis (again ignoring cost) would be pn
(1) Offering second tickets at half price from time to time
(although obviously not on a routine basis);
(2) Including famous performers more often in programs;
(5)- Including more musical comedies in theater offerings;
.(4) Offering more choral music to Passive Homebodies;
(5) Possibly offering symphony tickets at one-half off on the day
of the performance or presenting a short discussicin before
the performance.
(6) Otherwise concentrating on the Inner-Directed Self-Sufficients,
Active Sports Enthusiasts, Passive Homebodies, and possibly
Socially Actives.
It is hard io selectively motivate Culture Patrons' beyond their
present level of high attendance, and Active Homebodies are generally
unresponsive. More generally, the manipulations analysis suggests that
it may be difficult or impossible to devise marketing strategies that will
111
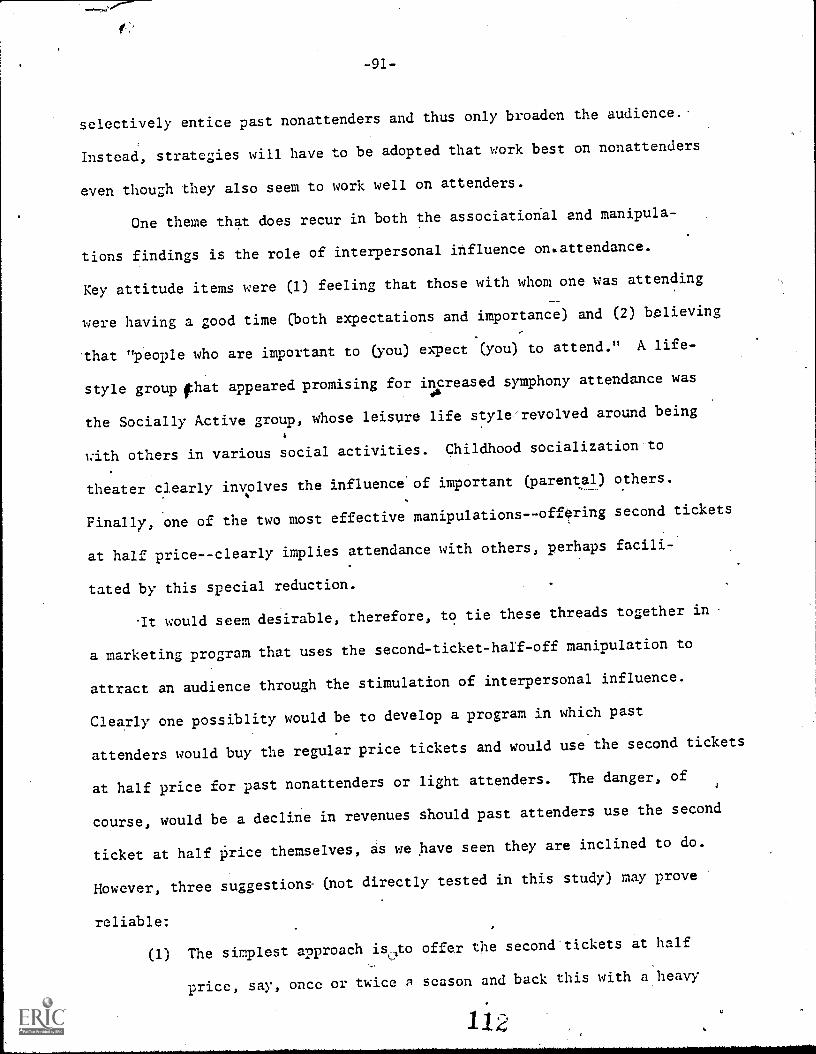
fT
-91-
selectively entice past nonattenders and thus only broaden the audience..
Instead, strategies will have to be adopted that work best on nonattenders
even though they also seem to work well on attenders.
One theme that does recur in both the associational and manipula-
tions findings is the role of interpersonal influence on.attendance.
Key attitude items were (1) feeling that those with whom one was attending
were having a good time (both expectations and importance) and (2) believing
that "people who are important to (you) expect (you) to attend." A life-
style group fhat appeared promising for increased symphony attendance was
the Socially Active group, whose leisure life style'revolved around being
with others in various social activities. Childhood socialization to
theater c.learly involves the influence of important (parental) others.
Finally, one of the two most effective manipulationsoffering second tickets
at half price--clearly implies attendance with others, perhaps facili-
tated by this special reduction.
-It would seem desirable, therefore, to tie these threads together in
a marketing program that uses the second-ticket-haif-off manipulation to
attract an audience through the stimulation of interpersonal influence.
Clearly one possiblity would be to develop a program in which past
attenders would buy the regular price tickets and would use the second tickets
at half price for past nonattenders or light attenders. The danger, of
course, would be a decline in revenues should past attenders use the second
ticket at half iirice themselves, as we have seen they are inclined to do.
However, three suggestions- (not directly tested in this study) may prove
reliable:
(1) The simplest approach is to offer the second tickets at half
price, say, once or twice a season and back this with a heavy
112
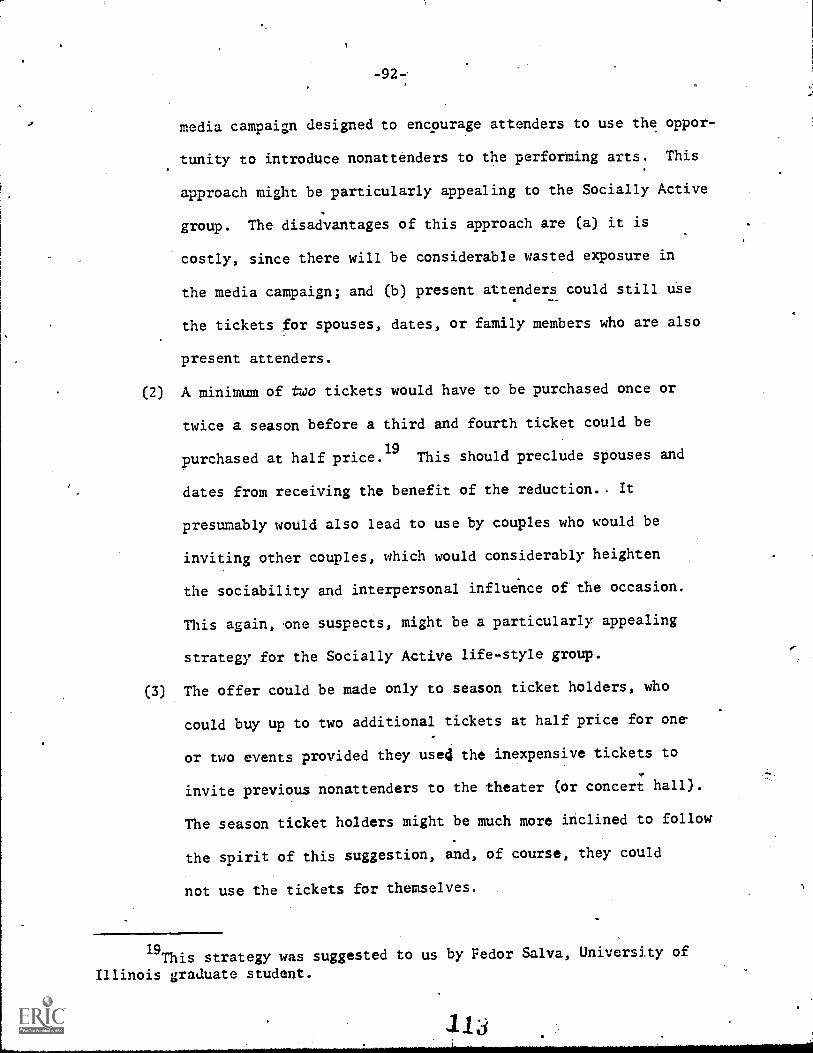
-92
media campaign designed to encourage attenders to use the oppor-
tunity to introduce nonattenders to the performing arts. This
approach might be particularly appealing to the Socially Active
group. The disadvantages of this approach are (a) it is
costly, since there will be considerable wasted exposure in
the media campaign; and (b) present attenders could still use
the tickets for spouses, dates, or family members who are also
present attenders.
(2) A minimum of two tickets would have to be purchased once or
twice a season before a third and fourth ticket could be
purchased at half price.19 This should preclude spouses and
dates from receiving the benefit of the reduction.. It
presumably would also lead to use by couples who would be
inviting other couples, which would considerably heighten
the sociability and interpersonal influence of the occasion.
This again, -one suspects, might be a particularly appealing
strategy for the Socially Active life-style group.
(3) The offer could be made only to season ticket holders, who
could buy up to two additional tickets at half price for one.
or two events provided they use4 the inexpensive tickets to
invite previous nonattenders to the theater (or concert hall).
The season ticket holders might be much more inclined to follow
the spirit of this suggestion, and, of course, they could
not use the tickets for themselves.
19This strategy was suggested to us by Fedor Salva, University of
Illinois graduate student.
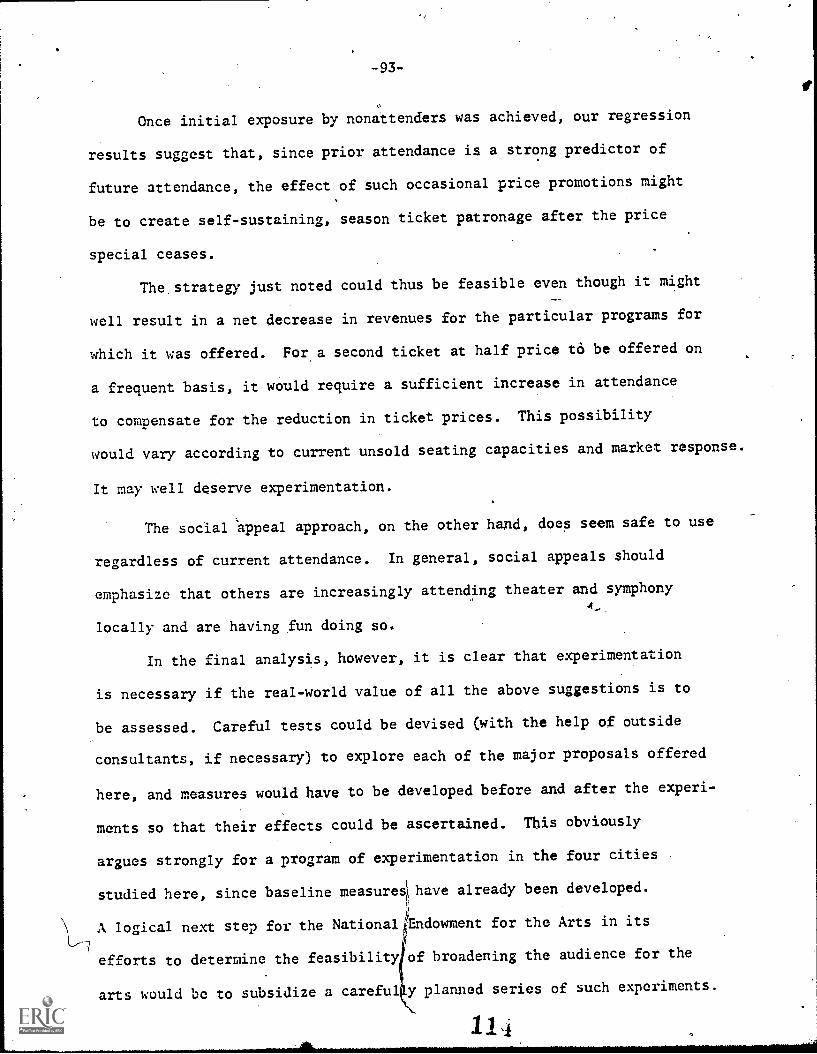
-93-
Once initial exposure by nonattenders was achieved, our regression
results suggest that, since prior attendance is a strong predictor of
future attendance, the effect of such occasional price promotions might
be to create self-sustaining, season ticket patronage after the price
special ceases.
The strategy just noted could thus be feasible even though it might
well result in a net decrease in revenues for the particular programs for
which it was offered. For a second ticket at half price tO be offered on
a frequent basis, it would require a sufficient increase in attendance
to compensate for the reduction in ticket prices. This possibility
would vary according to current unsold seating capacities and market response.
It may well deserve experimentation.
The social appeal approach, on the other hand, does seem safe to use
regardless of current attendance. In general, social appeals should
emphasize that others are increasingly attending theater and symphony4-
locally and are having fun doing so.
In the final analysis, however, it is clear that experimentation
is necessary if the real-world value of all the above suggestions is to
be assessed. Careful tests could be devised (with the help of outside
consultants, if necessary) to explore each of the major proposals offered
here, and measures would have to be developed before and after the experi-
ments so that their effects could be ascertained. This obviously
argues strongly for a program of experimentation in the four cities
studied here, since baseline measures have already been developed.
A logical next step for the Nationa4ndowment for the Arts in its
efforts to determine the feasibility of broadening the audience for the
arts would be to subsidize a careful y planned series of such experiments.
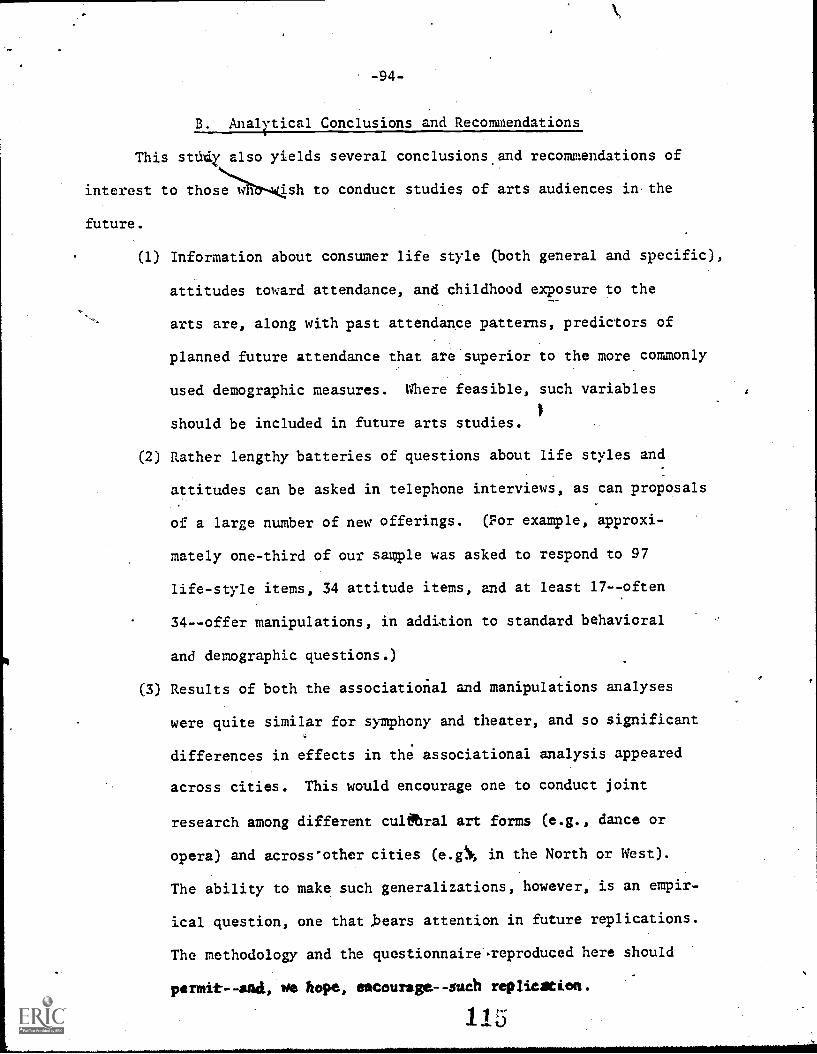
-94-
B. Analrtical Conclusions and Recommendations
This stuiz also yields several conclusions.and recommendations of
interest to those wl ish to conduct studies of arts audiences in.the
future.
(1) Information about consumer life style (both general and specific
attitudes toward attendance, and childhood exposure to the
arts are, along with past attendance patterns, predictors of
planned future attendance that wrie superior to the more commonly
used demographic measures. Where feasible, such variables
should be included in future arts studies.
(2) Rather lengthy batteries of questions about life styles and
attitudes can be asked in telephone interviews, as can proposals
of a large number of new offerings. (For example, approxi-
mately one-third of our sample was asked to respond to 97
life-style items, 34 attitude items, and at least 17--often
34--offer manipulations, in addition to standard behavioral
and demographic questions.)
(3) Results of both the associational and manipulations analyses
were quite similar for symphony and theater, and so significant
differences in effects in the associational analysis appeared
across cities. This would encourage one to conduct joint
research among different culftmal art forms (e.g., dance or
opera) and across-other cities (e.g4.% in the North or West).
The ability to make such generalizations, however, is an empir-
ical question, one that bears attention in future replications.
The methodology and the questionnaire*.reproduced here should
permitand, We hope, encouragesuch replication.
113
-95-
^
(4) Although past attendance is an important predictor of future
attendance, there is a good deal of volatility between time
periods, especially among those who attend only one art form.
A useful direction for future research would be to develop
panel data on arts attendance over a relatively long period of
time. This is an approach now used by most major product
marketers. Panel data can provide not only better descriptions
of behavioral patterns (e.g., how one "learns" to become
a patron) but also insights into the effectiveness of specific
marketing programs (e.g., precisely who changed behavior when
second tickets to a production were introduced). The possi-
bilities using such data are substantial (see 1).
(5) The attitude model developed in the associational analysis,
although quite useful, exhibited soil instability. Further
analysis of the present data is clearly warranted to improve the
attitude instrument for future research.
(6) A final limitation of the present study was that both analy-
tical approaches relied on respondents' indications of intended
future behavior. If future studiei are to rely on such planning
information, it is important to learn the extent to which such
plans are actually carried out. A follow-up to the present
study could evaluate that critical question.
116

APPENDIX A
DETAILED STATISTICAL TABLES
TABLE Al
PERCENTAGE OF FINAL SAMPLE TOMEET SCREENING CRITERIA
Screening criterion Percent
Went to one or more popular or rock concert 35.3
Listened to classical music ten times or more 46.1
Visited art gallery or museum 44.3
Saw ballet live or on television 43.0
Attended one or more plays 42.3
Attended one or more symphony concerts 14.0
Plays a musical instrument 35.7
Worked in theater/music/dance production 12.3
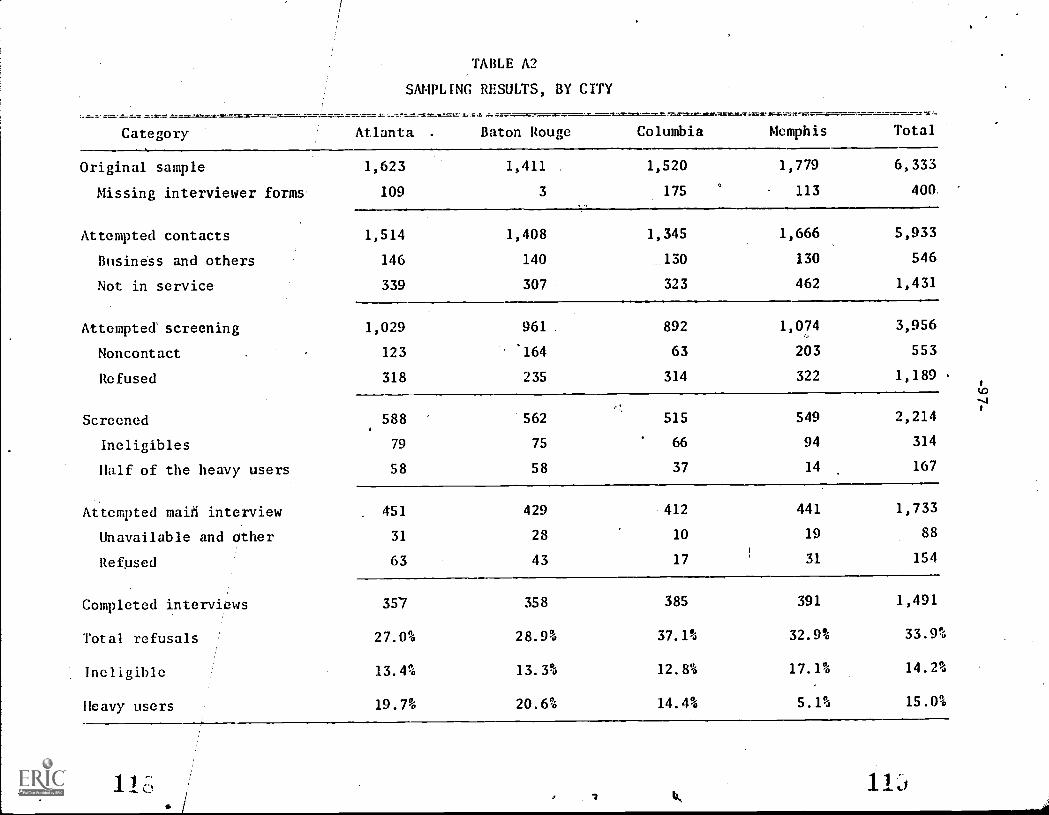
,TABLE A2
SAMPLING RESULTS, BY CITY
Category Atlanta . Baton Rouge Columbia Memphis Total
Original sample 1,623 1,411 1,520 1,779 6,333
Missing interviewer forms 109 3 175 113 400,
Attempted contacts 1,514 1,408 1,345 1,666 5,933
BusinOss and others 146 140 130 130 546
Not in service 339 307 323 462 1,431
Attempted'screening 1,029 961 . 892 1,074 3,956
Noncontact 123.
164 63 203 553
Refused 318 235 314 322 1,189
Screened 588 562 515 549 2,214
Ineligibles 79 75 66 94 314
Half of the heavy users 58 58 37 14 167
Attempted maili interview . 451 429 412 441 1,733
Unavailable and other 31 23 10 19 88
Refused 63 43 17 31 154
Completed interviews 357 358 385 391 1,491
Total refusals 27.0% 28.9% 37.1% 32.9% 33.9%
Ineligible 13.4% 13.3% 12.8% 17.1% 14.2%
Heavy users 19.7% 20.6% 14.4% 5.1% 15.0%
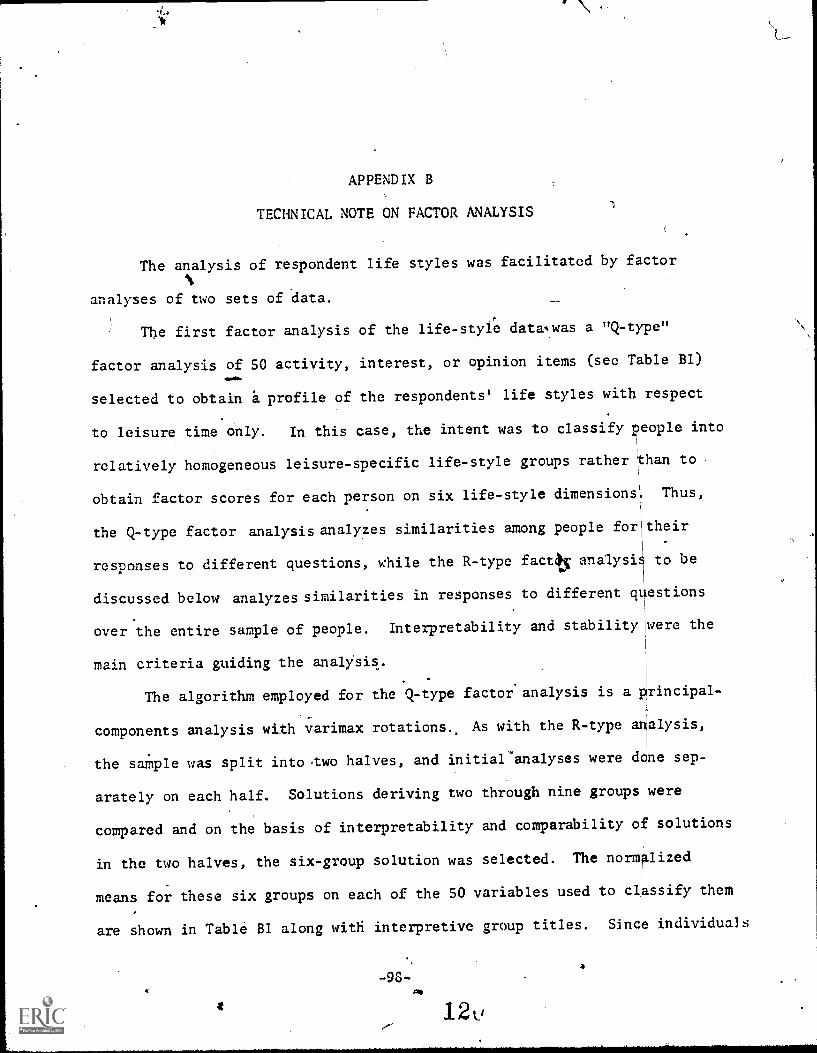
APPENDIX B
TECHNICAL NOTE ON FACTOR ANALYSIS
The analysis of respondent life styles was facilitated by factor
analyses of two sets of data.
The first factor analysis of the life-style dataiwas a "Q-type"
factor analysis of 50 activity, interest, or opinion items (see Table Bl)amer.
selected to obtain a profile of the respondents' life styles with respect
to leisure time only. In this case, the intent was to classify people into
relatively homogeneous leisure-specific life-style groups rather than to .
obtain factor scores for each person on six life-style dimensions', Thus,
the Q-type factor analysis analyzes similarities among people for
responses to different questions, while the R-type factIN analysz
their
to be
discussed below analyzes similarities in responses to different q estions
over the entire sample of people. Interpretability and stability were the
main criteria guiding the analysis.
The algorithm employed for the Q-type factor analysis is a principal-,
components analysis with varimax rotations. As with the R-type analysis,
the saiTle was split into <two halves, and initial'analyses were done sep-
arately on each half. Solutions deriving two through nine groups were
compared and on the basis of interpretability and comparability of solutions
in the two halves, the six-group solution was selected. The normalized
means for these six groups on each of the 50 variables used to classify them
are shown in Table Bl along with interpretive group titles. SinCe individuals
-93-mit
12e
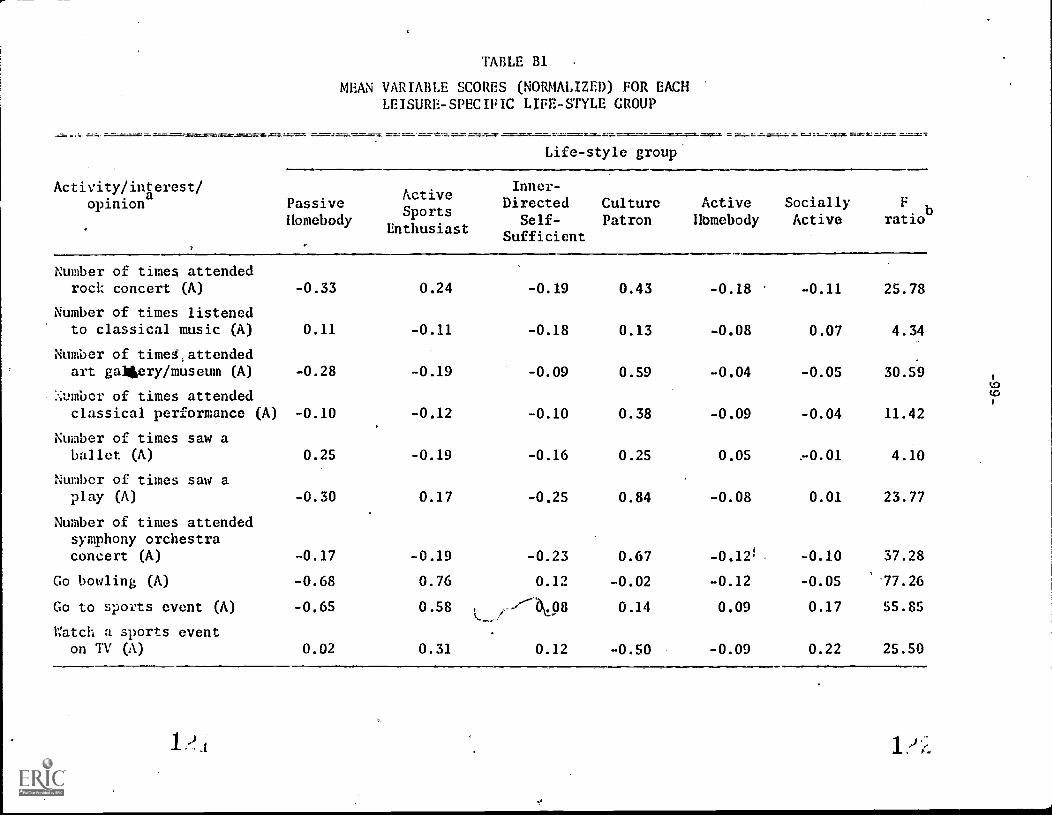
TABLE 81
MEAN VARIABLE SCORES (NORMALIZED) FOR EACHLEISURE-SPECIFIC LIFE-STYLE GROUP
Life-style group
Activity/iqerest/opinion Passive
Homebody
ActiveSports
Enthusiast
Inner-Directed
Self-Sufficient
CulturePatron
ActiveHomebody
SociallyActive
Fb
ratio
Number of times attendedroclz concert (A) -0.33 0.24 -0.19 0.43 -0.18 -0.11 25.78
Number of times listenedto classical music (A) 0.11 -0.11 -0.18 0.13 -0.08 0.07 4.34
Number of time$-,attendedart gaMiery/museum (A) -0.28 -0.19 -0.09 0.59 -0.04 -0.05 30.59
'.mber of times attendedclassical performance (A) -0.10 -0.12 -0.10 0.38 -0.09 -0.04 11.42
Number of times saw aballet (A) 0.25 -0.19 -0.16 0.25 0.05 4.10
Number of times saw aplay (A) -0.30 0.17 -0.25 0.84 -0.08 0.01 23.77
Number of times attendedsymphony orchestraconcert (A) -0.17 -0.19 -0.23 0.67 -0.121 -0.10 37.28
Go bowling (A) -0.68 0.76 0.12 -0.02 -0.12 -0.05 77.26
Go to sports event (A) -0.65 0.58 0.14 0.09 0.17 55.85
Watch a sports eventon TV (A) 0.02 0.31 0.12 -0.50 -0.09 0.22 25.50
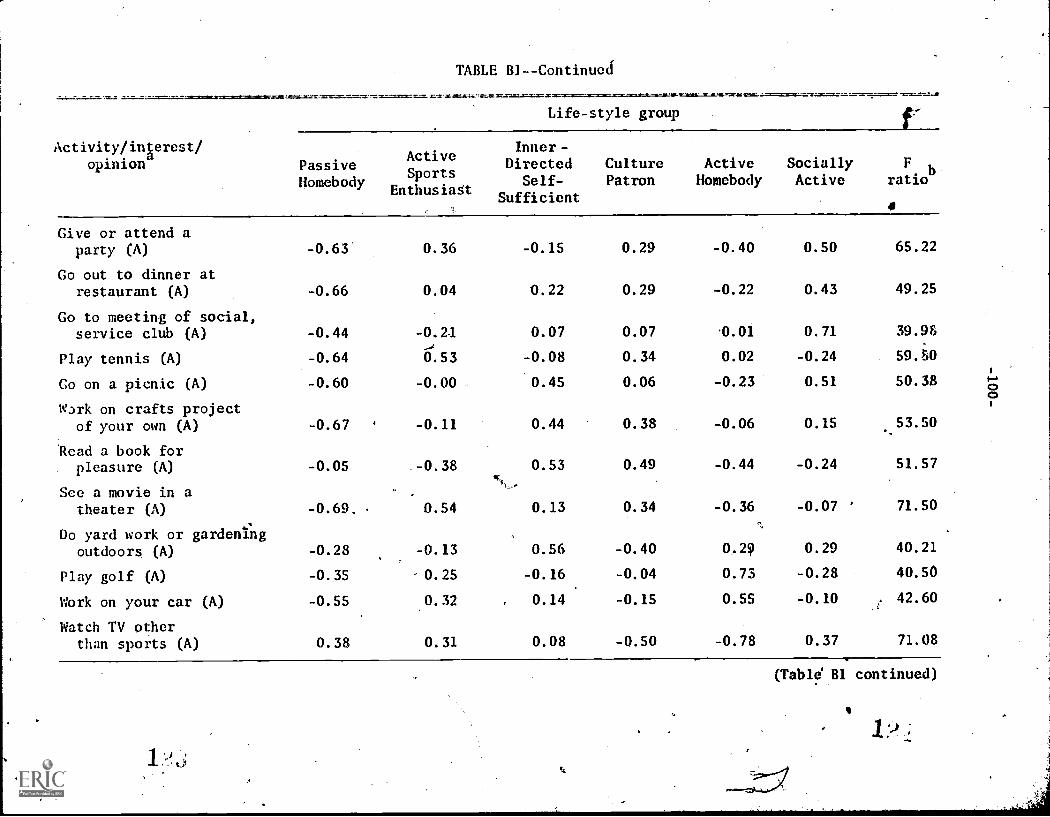
TABLE IN--Continued
Life-style group
Activity/inIerest/opinion Passive
Homebody
ActiveSports
Enthusiat
Inner -
DirectedSelf-
Sufficient
CulturePatron
ActiveHomebody
SociallyActive
Fb
ratio
Give or attend aparty (A) -0.63 0.36 -0.15 0.29 -0.40 0.50 65.22
Go out to dinner atrestaurant (A) -0.66 0.04 0.22 0.29 -0.22 0.43 49.25
Go to meeting of social,service club (A) -0.44 -0.21 0.07 0.07 0.01 0.71 39.9&
Play tennis (A) -0.64 0.53 -0.08 0.34 0.02 -0.24 59.6
Co on a picnic (A)
wark on crafts projectof your own (A)
-0.60
-0.67
-0.00
-0.11
0.45
0.44
0.06
0.38
-0.23
-0.06
0.51
0.15
50.38
53.50
Read a book forpleasure (A) -0.05 -0.38 0.53 0.49 -0.44 -0.24 51.57
Sce a movie in atheater (A) -0.69, 0.54 0.13 0.34 -0.36 -0.07 ' 71.50
Do yard work or gardeningoutdoors (A) -0.28 -0.13 0.56 -0.40 0.4 0.29 40.21
Play golf (A) -0.35 ,0.25 -0.16 -0.04 0.73 -0.28 40.50
Work on your car (A) -0.55 0.32 , 0.14 -0.15 0.55 -0.10 42.60
Watch TV otherthan sports (A) 0.38 0.31 0.08 -0.50 -0.78 0.37 71.08
(Table B1 continued)
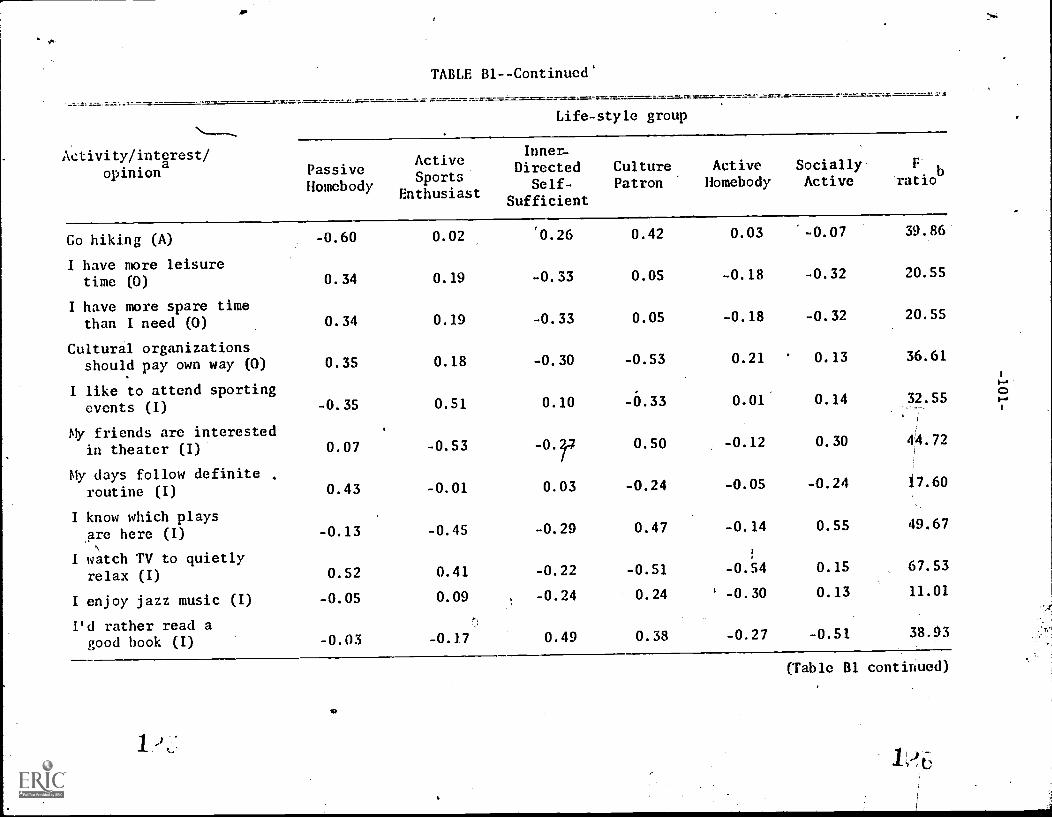
TABLE B1--Continued'
Life-style group
Activity/intarest/opinion Passive
Homebody
ActiveSports
Enthusiast
Inner-
DirectedSelf-
Sufficient
CulturePatron
ActiveHomebody
SociallyActive
Fb
ratio
Go hiking (A) -0.60 0.02 0.26 0.42 0.03 -0.07 39.86
I have more leisuretime (D) 0.34 0.19 -0.33 0.05 -0.18 -0.32 20.55
I have more spare timethan I need (0) 0.34 0.19 -0.33 0.05 -0.18 -0.32 20.55
Cultural organizationsshould pay own way (0) 0.35 0.18 -0.30 -0.53 0.21 0.13 36.61
I like to attend sportingevents (I) -0.35 0.51 0.10 -0.33 0.01 0.14 32.55
My friends are interestedin theater (I) 0.07 -0.53 -0q4 0.50 -0.12 0.30 44.72
My days follow definite .
routine (I) 0.43 -0.01 0.03 -0.24 -0.05 -0.24 17.60
I know which playsAre here (I) -0.13 -0.45 -0.29 0.47 -0.14 0.55 49,67
I watch TV to quietly 1
relax (I) 0.52 0.41 -0.22 -0.51 -0.54 0.15 67.53
I enjoy jazz music (I) -0.05 0.09 -0.24 0.24 ' -0.30 0.13 11.01
I'd rather read agood book (I) -0.03
,
-0.17 0.49 0.38 -0.27 -0.51 38.03
(Table B1 continued)
1 )
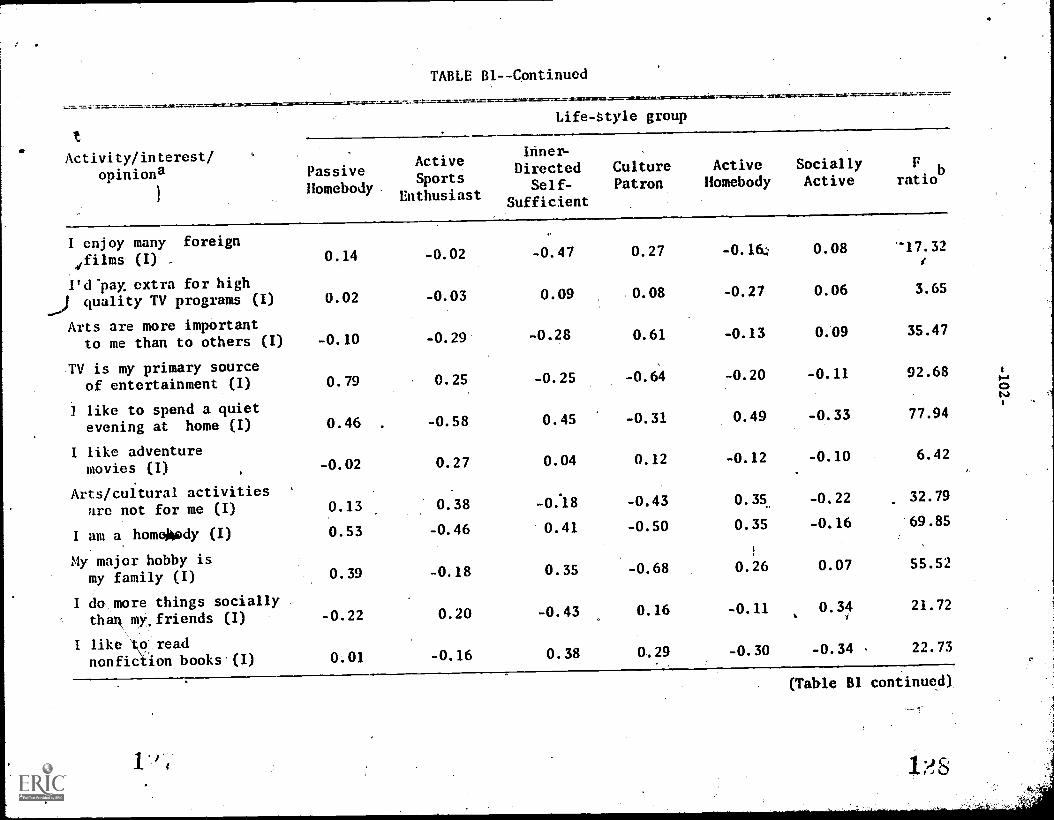
TABLE 81-Continued
Life-Style group
Activity/interest/opiniona Passive
1
Homebody
ActiveSports
Enthusiast
Ifineri-
Directed Culture Active Socially Fb
Self- Patron Homebody Active ratio
Sufficient
I enjoy many foreign
wfilms (I) . 0.14 -0.02 -0.47 0.27 -0.16. 0.08 -17.32,i
I'd-pay, extra for high
...) quality TV programs (I) 0.02 -0.03 0.09 0.08 -0.27 0.06 3.65
Arts are more importantto me than to others (I) -0.10 -0.29 -0.28 0.61 -0.13 0.09 35.47
TV is my primary sourceof entertainment (I)
i like to spend a quietevening at home (I)
0.79
0.46 .
0.25
-0.58
-0.25
0.45
-0.64
-0.31
-0.20
0.49
-0.11
-0.33
92.68
77.94
I like adventuremovies (1) -0.02 0.27 0.04 0.12 -0.12 -0.10 6.42
Arts/cultural activitiesarc not for me (I) 0.13 0.38 -0.18 -0.43 0.35, -0.22 . 32.79
I am a. homoArody (I) 0.53 -0.46 0.41 -0.50 0.35 -0.16 -69.85
My major hobby isI
my family (I) 0.39 -0.18 0.35 -0.68 0.26 0.07 55.52
I do more things sociallythaa my,friends (I) -0.22 0.20 -0.43 0.16 -0.11 0.34
f
21.72
I like 'co', read
nonficiion books (I) 0.01 -0.16 0.38 0.29 -0.30 -0.34 . 22.73
(Table B1 continued)
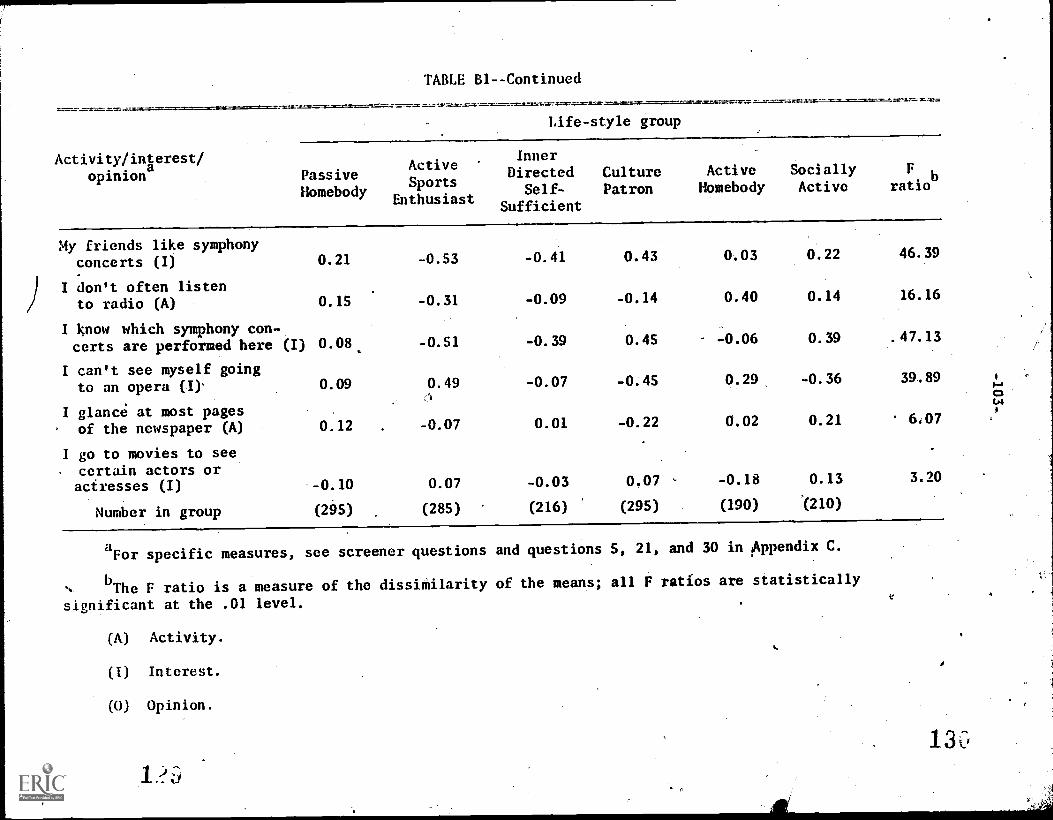
TABLE B1--Continued
Life-style group
Activity/illerest/opinion Passive
Homebody
ActiveSports
Enthusiast
InnerDirected
Self-Sufficient
CulturePatron
ActiveHomebody
SociallyActive
Fb
ratio
My friends like symphonyconcerts (I) 0.21 -0.53 -0.41 0.43 0.03 0.22 46.39
I don't often listento radio (A) 0.15 -0.31 -0.09 -0.14 0.40 0.14 16.16
I know which symphony con-certs are performed here (I) 0.08., -0.51 -0.39 0.45 -0.06 0.39 .47.13
I can't see myself goingto an opera (I)' 0.09 0.49 -0.07 -0.45 0.29 -0.36 39.89
I glance at most pagesof the newspaper (A) 0.12 -0.07 0.01 -0.22 0.02 0.21 . 6,07
I go to movies to see. certain actors oractresses (I) -0.10 0.07 -0.03 0.07 - -0.18 0.13 3.20
Number in group (295) (285) (216) (295) (190) '(210)
aFor specific measures, see screener questions and questions 5, 21, and 30 in !Appendix C.
bThe F ratio is a measure of the dissiMilarity of the means; all F ratios are statistically
significant at the .01 level.
(A) Activity.
(I) Interest.
(0) Opinion.
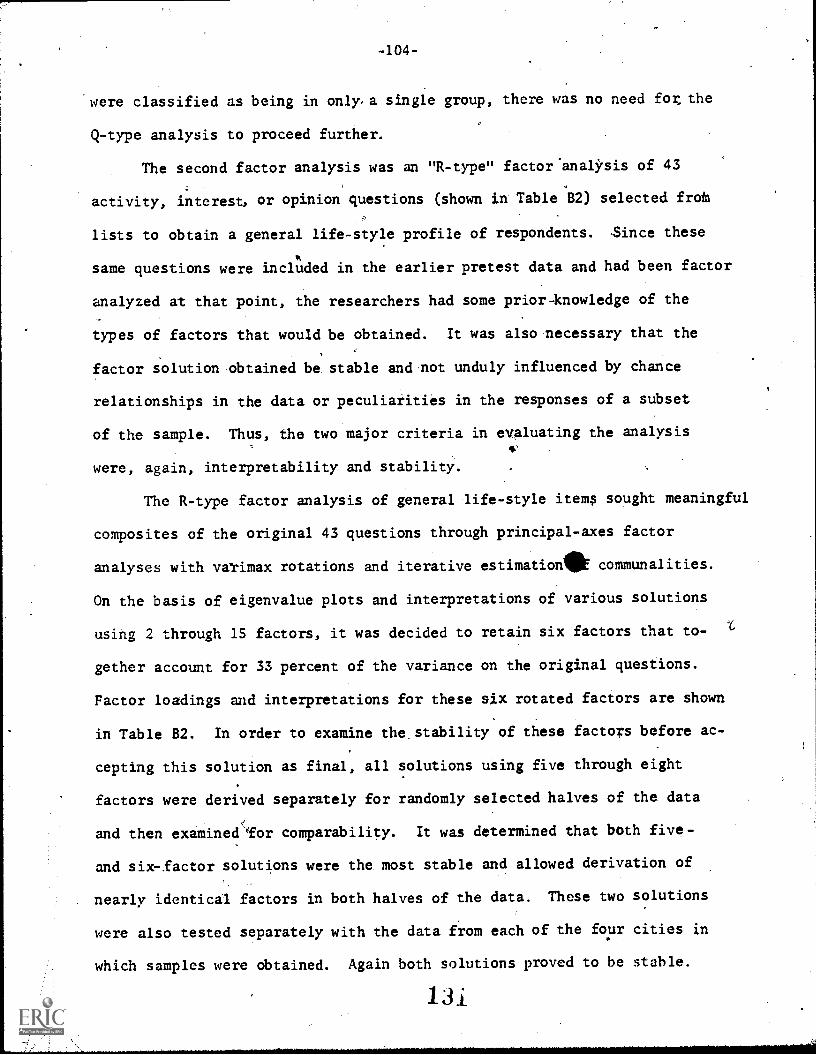
-104-
were classified as being in only, a single group, there was no need for, the
Q-type analysis to proceed further.
The second factor analysis was an "R-type" factor'analksis of 43
activity, interest, or opinion questions (shown in Table B2) selected frot
lists to obtain a general life-style profile of respondents. Since these
same questions were included in the earlier pretest data and had been factor
analyzed at that point, the researchers had some prior-knowledge of the
types of factors that would be obtained. It was also necessary that the
factor solution obtained be stable and not unduly influenced by chance
relationships in the data or peculiarities in the responses of a subset
of the sample. Thus, the two major criteria in evaluating the analysis
were, again, interpretability and stability.
The R-type factor analysis of general life-style items sought meaningful
composites of the original 43 questions through principal-axes factor
analyses with vatimax rotations and iterative estimatiolk communalities.
On the basis of eigenvalue plots and interpretations of various solutions
using 2 through IS factors, it was decided to retain six factors that to-
gether account for 33 percent of the variance on the original questions.
Factor loadings and interpretations for these six rotated factors are shown
in Table B2. In order to examine the stability of these factors before ac-
cepting this solution as final, all solutions using five through eight
factors were derived separately for randomly selected halves of the data
and then examined for comparability. It was determined that both five-
and six-factor solutions were the most stable and allowed derivation of
nearly identical factors in both halves of the data. These two solutions
were also tested separately with the data from each of the four cities in
which samples were obtained. Again both solutions proved to be stable.
131
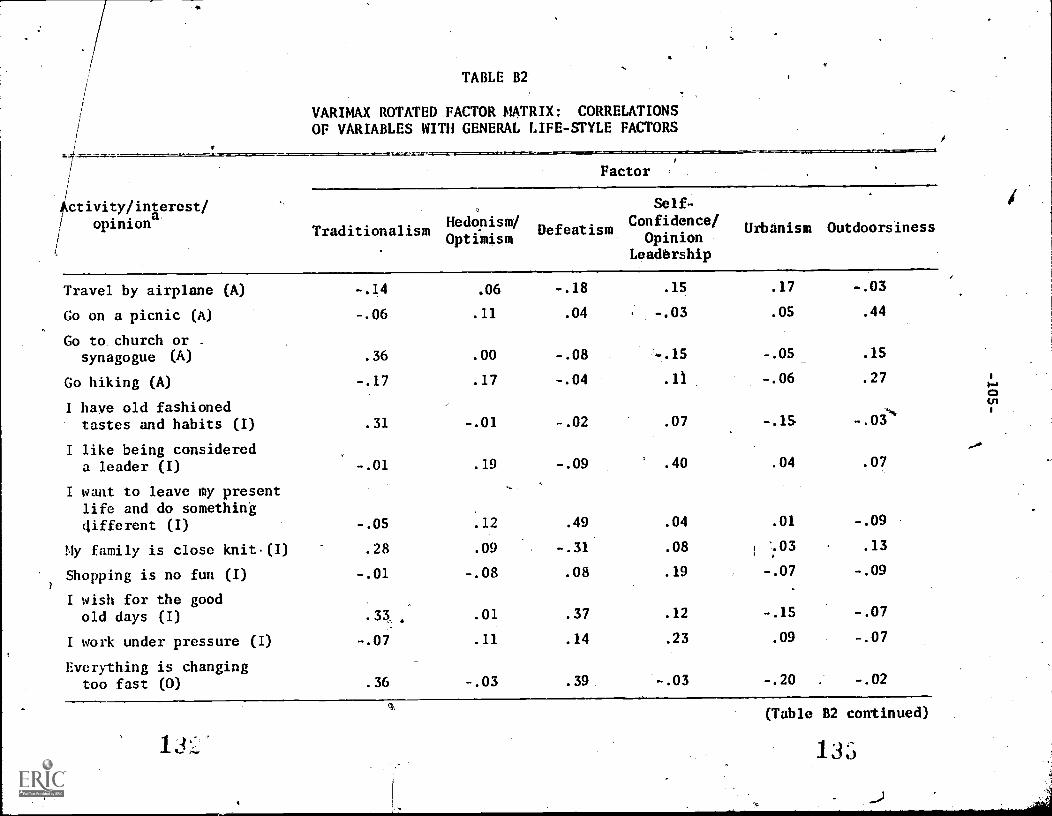
TABLE B2
VARIMAX ROTATED FACTOR MATRIX: CORRELATIONSOF VARIABLES WITH GENERAL LIFE-STYLE FACTORS
Factor ,
ctivity/inherest/opinion
TraditionalismHedonism/Optimism
Defeatism
Self-
Confidence/Opinion
Leadership
Urbanism Outdoorsiness
Travel by airplane (A) -.14 .06 -.18 .15 .17 -.03
Go on a picnic (A) -.06 .11 .04 -.03 .05 .44
Go to. church or .
synagogue (A) .36 .00 -.08 ..15 -.05 .15
Go hiking (A) -.17 .17 -.04 .11 -.06 .27
I have old fashionedtastes and habits (I) .31 -.01 -.02 .07 -.15 -.03%
I like being considereda leader (I) .19 -.09 .40 .04 .07
I want to leave my presentlife and do somethingdifferent (I) -.05 .12 .49 .04 .01 -.09
My family is close knits(I) .28 .09 -.31 .08 1 ':03 .13
Shopping is no fun (I) -.01 -.08 .08 .19 -.07 -.09
I wish for the goodold days (I) .01 .37 .12 -.15 -.07
I work under pressure (I) -.07 .11 .14 .23 .09 -.07
Everything is changingtoo fast (0) .36 -.03 .39 -.03 -.20 . -.02
(Table 82 continued)
133
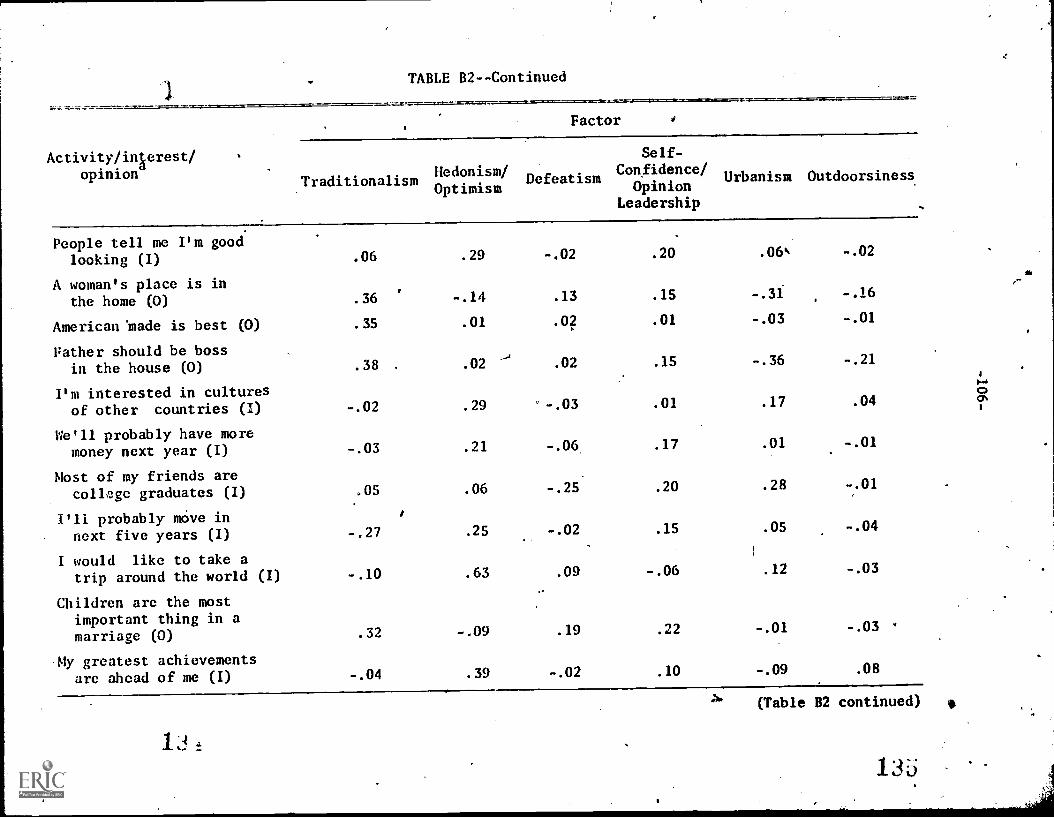
TABLE 82--Continued
Factor
Activity/inprest/opinion Traditionalism
Hedonism/Optimism
Defeatism
Self-Confidence/
OpinionLeadership
Urbanism Outdoorsiness
People tell me I'm goodlooking (I) .06 .29 -.02 .20 .06% -.02
A woman's place is inthe home (0) .36 -.14 .13 .15 -.31 -.16
American 'made is best (0) .35 .01 .02 .01 -.03 -.01
Father should be bossin the house (0) .38 . .02 -4 .02 .15 -.36 -.21
I'm interested in culturesof other countries (I) -.02 .29 -.03 .01 .17 .04
We'll probably have moremoney next year (I) -.03 .21 -.06 .17 .01 -.01
Most of my friends arecollge graduates (I)
I'll probably move in
.05
r
.06 -.25 .20 .28 -.01
next five years (I) -.27 .25 -.02 .15 .05 -.04
I would like to take atrip around the world (I) -.10 .63 .09 -.06 .12 -.03
Children are the mostimportant thing in amarriage (0) .32 -.09 .19 .22 -.01 -.03 *
My greatest achievementsare ahead of me (I) -.04 .39 -.02 .10 -.09 .08
(Table 82 continued)
13i3
a
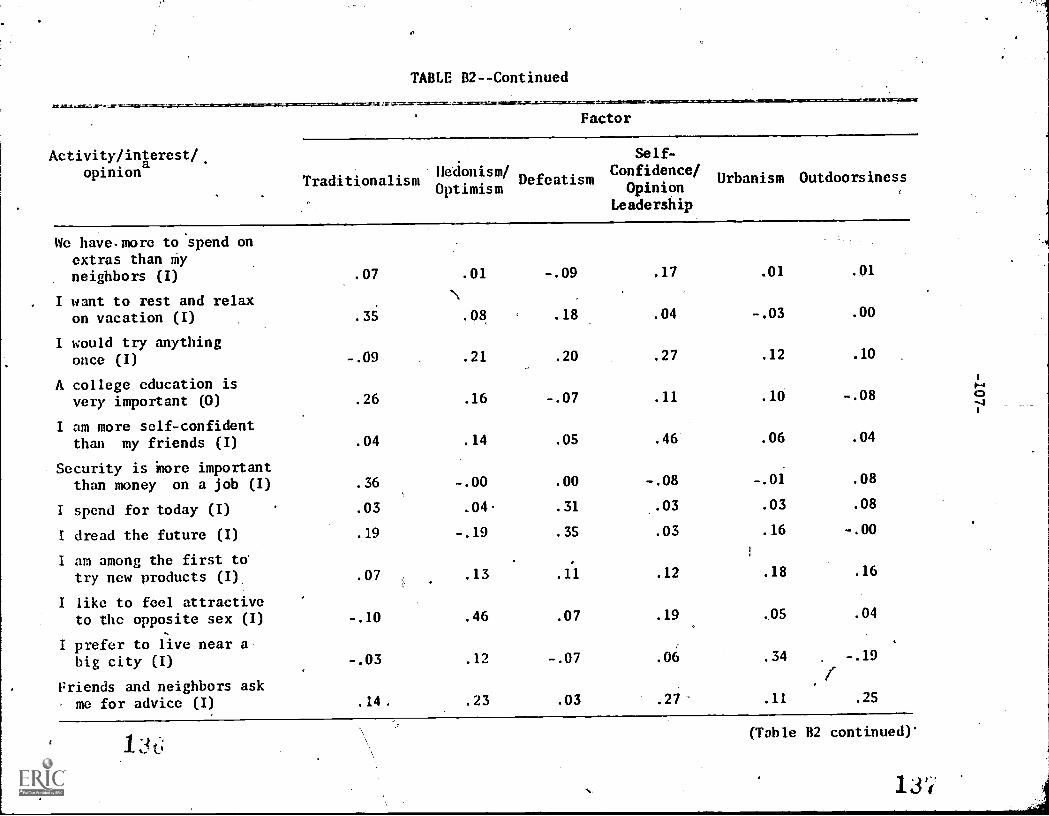
Activity/inierest/.opinion
TABLE B2--Continued
Factor
Self-
Hedonism/ Confidence/Traditionalism
OptimismDefeatism Urbanism Outdoorsiness
OpinionLeadership
We have,,more to spend onextras than myneighbors (I) .07 .01 -.09 .17 .01 .01
I want to rest and relax `\
on vacation (I) .3 .08 .18 .04 -.03 .00
I would try anythingonce (I) -.09 .21 .20 .27 .12 .10
A college education is1
-,
very important (0) .26 .16 -.07 .11 .16 -.08 c)1i
I am more self-confidentthan my friends (I) .04 .14 .05 .46 .06 .04
Security is 'more importantthan money on a job (I) .36 -.00 .00 -.08 -.01 .08
I spend for today (I) .03 .04- .31 .03 .03 .08
I dread the future (I) .19 -.19 .35 .03 .16 -.00
I am among the first to'try new products (I) .07 .13 .11 .12 .18 .16
I like to feel attractiveto the opposite sex (I) -.10 .46 .07 .19 ,05 .04
I prefer to live near abig city (I) -.03 .12 -.07 .06 .34 -.19
Friends and neighbors ask- me for advice (I) .14 .23 .03 .27 .11 .25
136(Table 132 continued)'
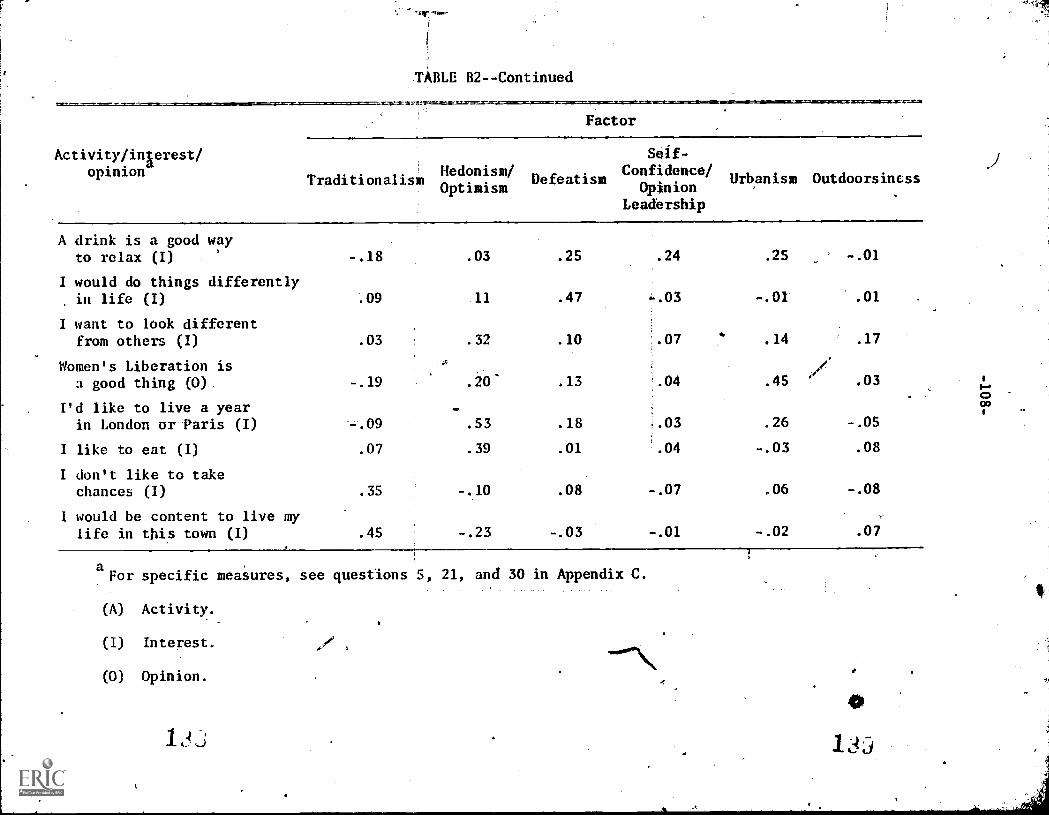
TABLE 82--Continued
Factor
Activity/inprest/opinion
TraditionalismHedonism/Optimism
Defeatism
Seif-Confidence/
OpinionLeadership
Urbanism Outdoorsincss
A drink is a good wayto relax (I) -.18 .03 .25 .24 .25 -.01
I would do things differentlyin life (I) 11 .47 4..03 -.01 .01
I want to look differentfrom others (I) .03 .32 .10 .07 .14 .17
Women's Liberation isa good thing (0) -.19 .20' .13 .04 .45 .03
I'd like to live a yearin London or Paris (I) -.09 .53 .18 .03 .26 -.OS
I like to eat (I) .07 .39 .01 .04 -.03 .08
I don't like to takechances (I) .35 -.10 .08 -.07 .06 -.08
I would be content to live mylife in this town (I) .45 -.23 -.03 -.01 -.02 .07
aFor specific measures, see questions 5, 21, and 30 in Appendix C.
(A) Activity.
(I) Interest.
(0) Opinion.
013d

-109-
On the basis of its superior interpretability, the six-factor solution
was selected.
The final step in the R-type factor analysis of general life styles
was to develop a set of factor scores for each individual that represented
this person s score on each of the six composite life-style dimensions.'
These factor scores were developed by least-squares regression estimates
and served as the representation of the amount of each general life-style
dimensioq possessed by each individual in further analyses.

APPENDIX C
SURVEY QUESTIONNAIRE WITH FREQUENCY COUNTS
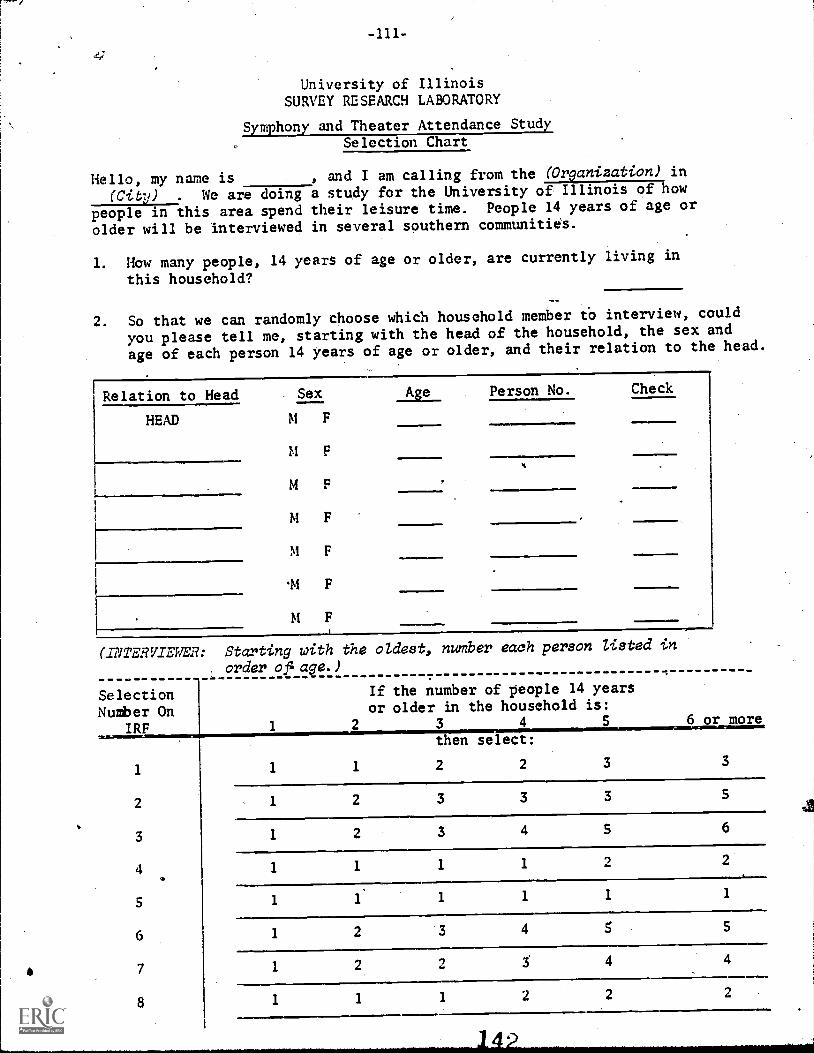
University of IllinoisSURVEY RESEARCH LABORATORY
Symphony and Theater Attendance Study
. Selection Chart
Hello, my name is , and I am calling from the (Organization) in
(Cit-i) .We are doing a study for the University of Illinois of how
people in this area spend their leisure time. People 14 years of age or
older will be interviewed in several southern communitis.
1. How many people, 14 years of age or older, are currently living in
this household?
2. So that we can randomly choose which household member ft) interview, could
you please tell me, starting with the head of the household, the sex and
age of each person 14 years of age or older, and their relation to the head.
Relation to Head Sex Age Person No. Check
HEAD M F
M F
M F
M F
M F
F
M F
(INTERVIEWER: Starting with the oldest, number each person Zisted in
order oflage.)
SelectionNumber On
IRF
1
2
3
4
5
1
2
1
1
If the number of people 14 yearsor older in the household is:
3 4 5 6ormorethen select:
2 2 3 3
3 3 3 5
3 4 5 6
1 1 2 2
1 1 1 1
3 4 5 5
2 5 4 4
2 2 2
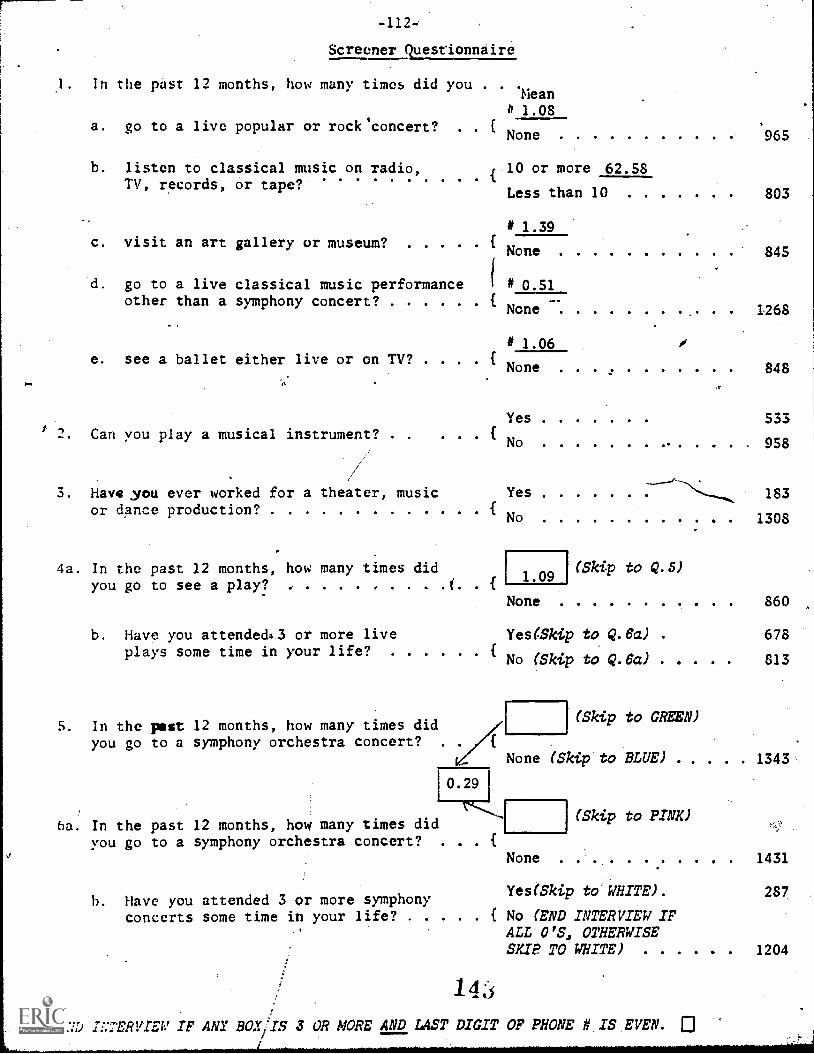
-112-
I.
_.
3.
4a.
Screener Questionnaire
62.58
In the past 12 months, how many times did you
a. go to a live popular or rock'concert? . .
b. listen to classical music on radio,TV, records, or tape?
c. visit an art gallery or museum'
d. go to a live classical music performanceother than a symphony concert'
e. see a ballet either live or on TV'
Can you play a musical instrument? .
Have you ever worked for a theater, musicor 4nce production'
In the past 12 months, how many times didyou go to see a play? .
. .
(
(
(
(
{
.
Mean# 1.08
None
10 or more
Less than
# 1.39
10 . .
(Skip to Q.5)
None
# 0.51
None
# 1.06
None
Yes
No
Yes
No
1.09
b. Have you attendedz3 or more liveplays some time in your life?
5. In the past 12 months, how many times didyou go to a symphony orchestra concert? .
None
965
..... 803
845
1268
848
533
958
183
1308
860
Yes(Skip to Q.6a) . 678
No (Skip to Q.6a) 813
10.29 1
6a. In the past 12 months, how many times didyou go to a symphony orchestra concert? . . .
None
(Skip to GREEN)
None (Skip to BLUE) 1343
b. Have you attended 3 or more symphonyconcerts some time in your life' No (END INTERVIEW IF
ALL O'S, OTHERWISESKIP TO WHITE)
(Skip to PINK)
Yes(Skip to WHITE).
14;4
IL.TERVIEW IF ANY BOX/IS 3 OR MORE AND LAST DIGIT OF PHONE if IS EVEN. 0
1431
287
1204
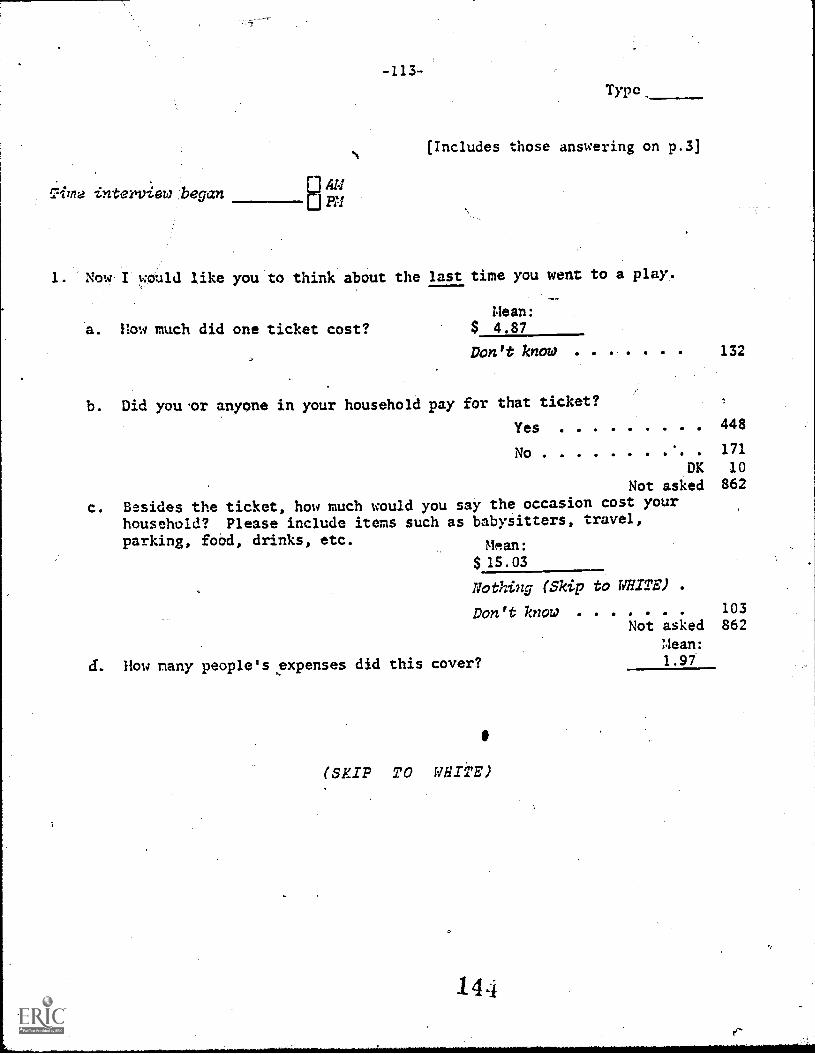
gime interew began
-113-
Type
[Includes those answering on p.3]
1. Now I would like you to think about the last time you went to a play.
a. How much did one ticket cost?Mean:
$ 4.87
Don't know . . . . . 132
b. Did you .or anyone in your household pay for that ticket?
Yes 448
No 171
DK 10
Not asked 862
c. Besides the ticket, how much would you say the occasion cost your
household? Please include items such as babysitters, travel,parking, food, drinks, etc. Mean:
$15.03
Nothing (Skip to WHITE)
Don't know 103Not asked 862
d. How many people's expenses did this cover?
(SKIP TO WEIE)
Mean:1.97
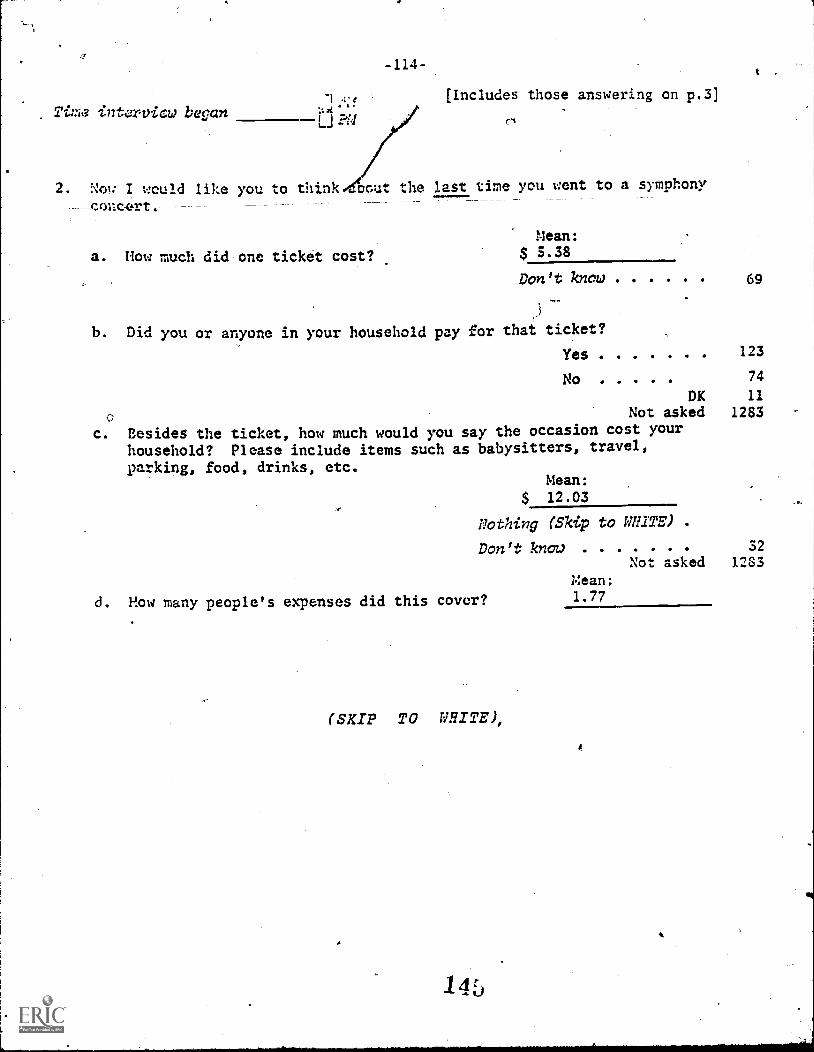
Time intcevicw began
-114-
[Includes those answering on p.3]
2. Now I would like you to thjnk4bout the last time you went to a symphony
a. How much did one ticket cost?
Mean:$ 5.38
Don't know 69
b. Did you or anyone in your household pay for that ticket?
Yes 123
No 74
DK 11
0 Not asked 1283
c. Besides the ticket, how much would you say the occasion cost yourhousehold? Please include items such as babysitters, travel,parking, food, drinks, etc.
Mean:
$ 12.03
nothing (Skip to WHITE)
Don't know
d. How many people's expenses did this cover?
(SKIP TO WHITE),
Mean:1.77mm...,111
32
Not asked 1283
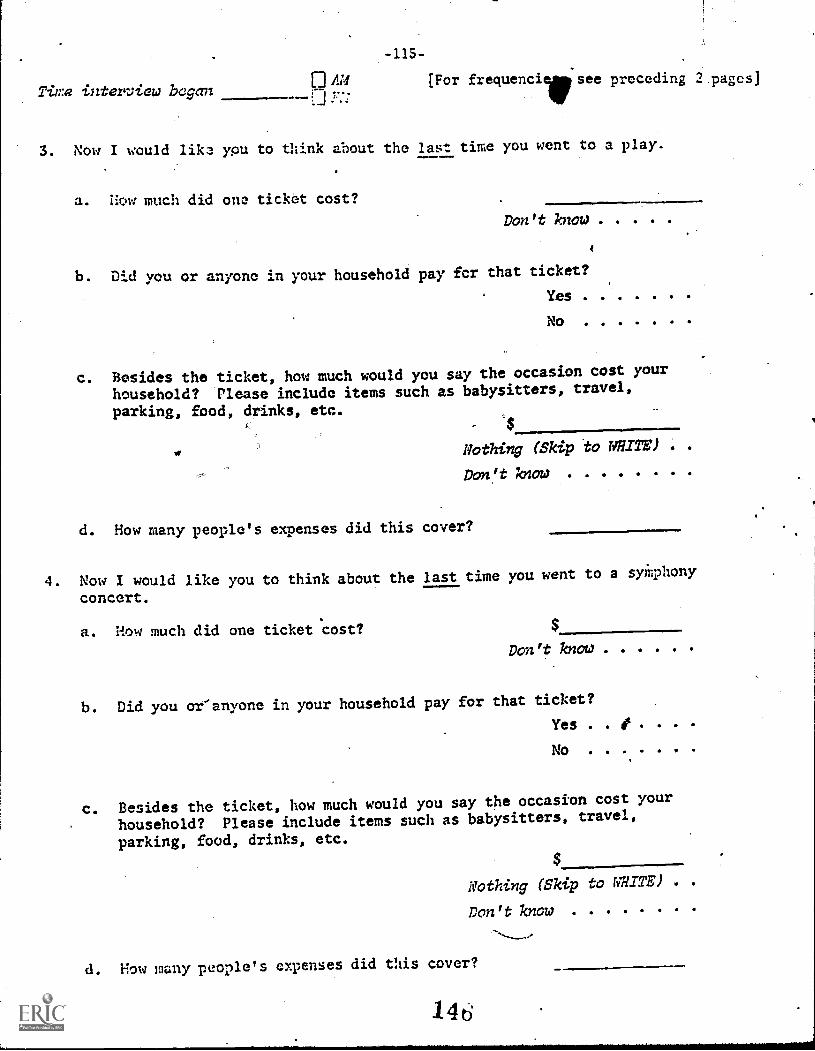
Time interview began
-115-
[For frequenci preceding 2_pages]
3. Now I would like you to think about the last time you went to a play.
a. How much did one ticket cost?
Don't know
4
b. Did you or anyone in your household pay for that ticket?
Yes
No
c. Besides the ticket, how much would you say the occasion cost your
household? Please include items such as babysitters, travel,
parking, food, drinks, etc.$
Nothing (Skip to NNITU) .
Don't know
d. How many people's expenses did this cover?
4. Now I would like you to think about the last time you went to a syiphony
concert.
a. How much did one ticket cost?
Don't know
b. Did you or'anyone in your household pay for that ticket?
Yes . . 0
No
c. Besides the ticket, how much would you say the occasion cost your
household? Please include items such as babysitters, travel,
parking, food, drinks, etc.
Nothing (Skip to WHITE)
Don't know
d. How many people's expenses did this cover?
14 6
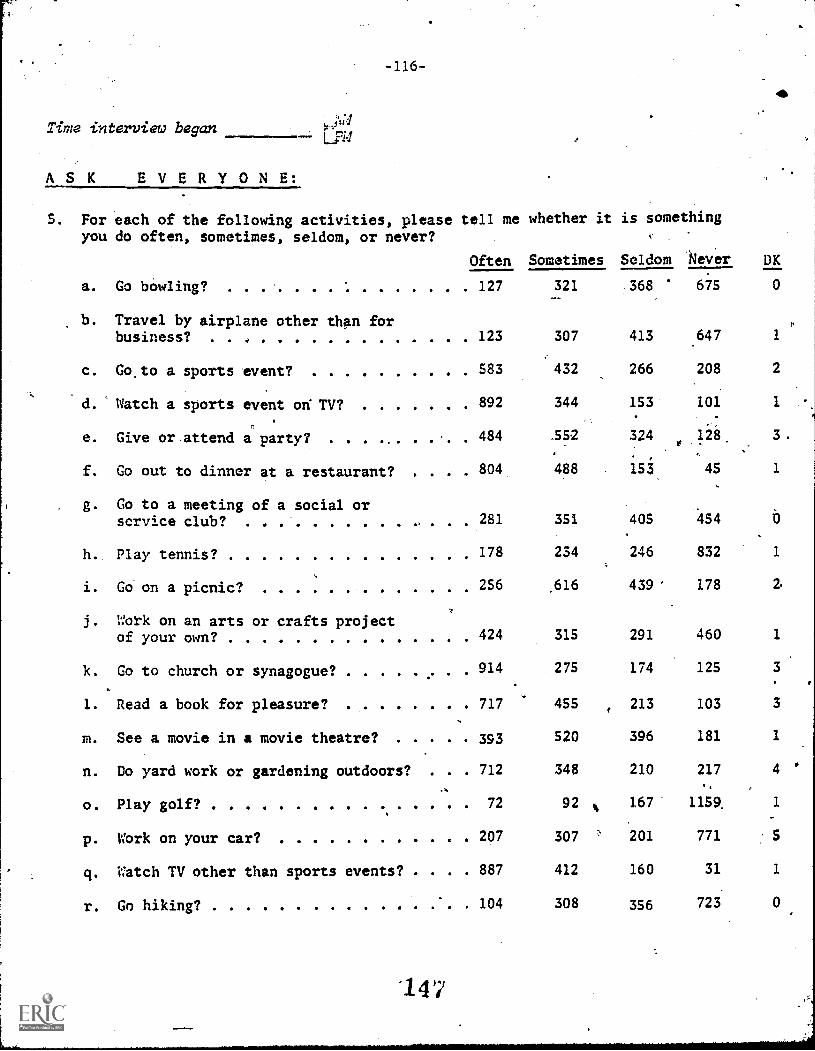
Tiwe interview began
ASK EVERYON E:
LF1,1
-116-
5. For each of the following activities, please tell me whether ityou do often, sometimes, seldom, or never?
is something
Often Sometimes Seldom Never DK
a. Go bowling?
b. Travel by airplane other than forbusiness? . . .
127
123
321
307
368
413
675
647
0
1
c. Go,to a sports event? 583 432 266 208 2
d. Watch a sports event on TV? 892 344 153 101 1
e. Give or attend al party? . . . .. ... .. 484 352 324/
128.
3
f Go out to dinner at a restaurant? .
g. Go to a meeting of a social orservice club?
. 804
281
488
351
i5
405
45
454
1
h. Play tennis? 178 234 246 832 1
,
i. Go on a picnic?
j. Work on an arts or crafts projectof your own?
256
424
,616
315
439'
291
178
460 1
k. Go to church or synagogue? 914 275 174 125 3
1. Read a book for pleasure?
m. See a movie in a movie theatre?
,
717
393
455
520
213
396
103
181
3
1
n. Do yard work or gardening outdoors? . . . 712 348 210 217 4..
o. Play golf? 72 92 % 167 1159. 1
p. Work on your car? 207 307 201 771 s
q. Watch TV other than sports events? . . . . 887 412 160 31 1
r. Go hiking? 104 308 356 723 0
14
.
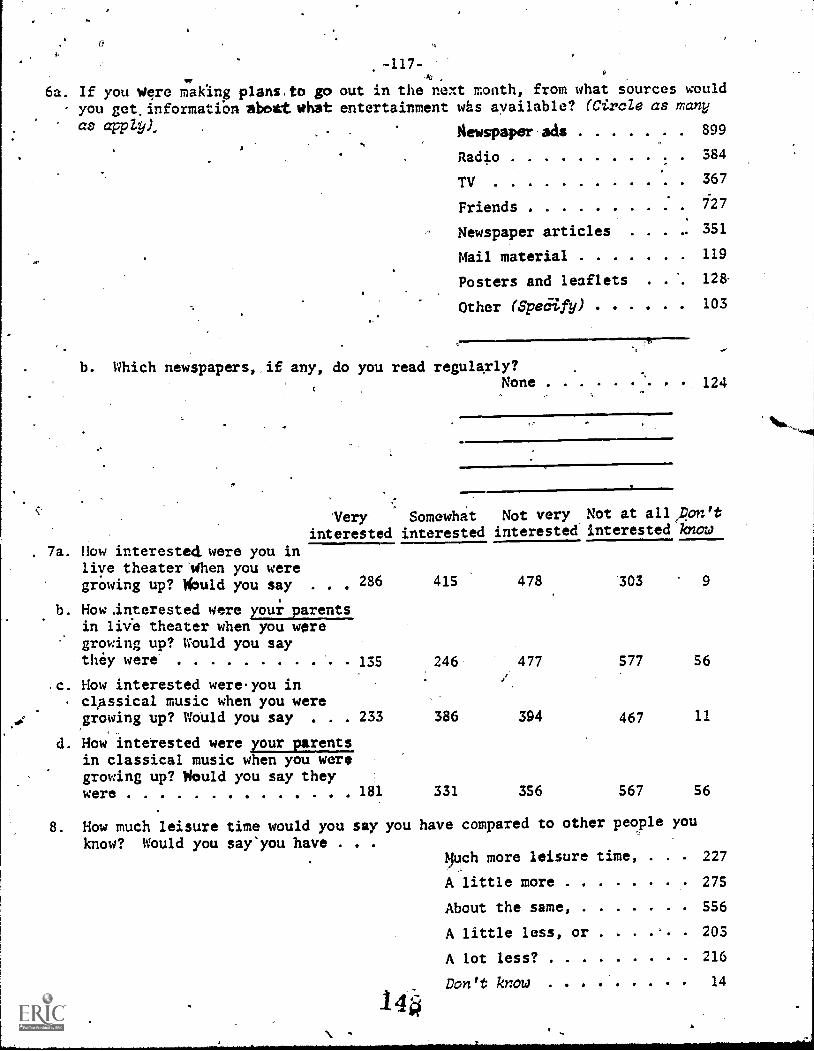
6a. If you Were making plans,to goyou get.information abolawhatas appl9).
-117-
out in the next month, from what sources wouldentertainment was available? (Circle as many
Aewspaper-ads 899
Radio 384
TV 367
Friends 727
Newspaper articles . . . 351
Mail material 119
Posters and leaflets . . 128-
Other (Spedify) 103
b. Which newspapers, if any, do you read regularly?None 124
Very Somewhat Not very Not at all/pan't
interested interested interested interested know
. 7a. How interested, were you inliye theater When you weregrowing up? Would you say 286 415 478 303 9
b. How .interested were you i. parentsin live theater when you weregrowing up? Would you saythey were 135 577 56
c. How interested were.you incl,assical music when you weregrowing up? Would you say . . . 233 467 11
,
d. How interested were your parentsin classical music when you weregrowing up? Would you say theywere 101 567 56
246 477
386 394
331 356
8. How much leisure time would you say you have compared to other people you
know? Would you say'you have . . .
14:4
Much more leisure time, . . 227
A little more 275
About the same, 556
A little less, or 203
A lot less? 216
Don't know 14
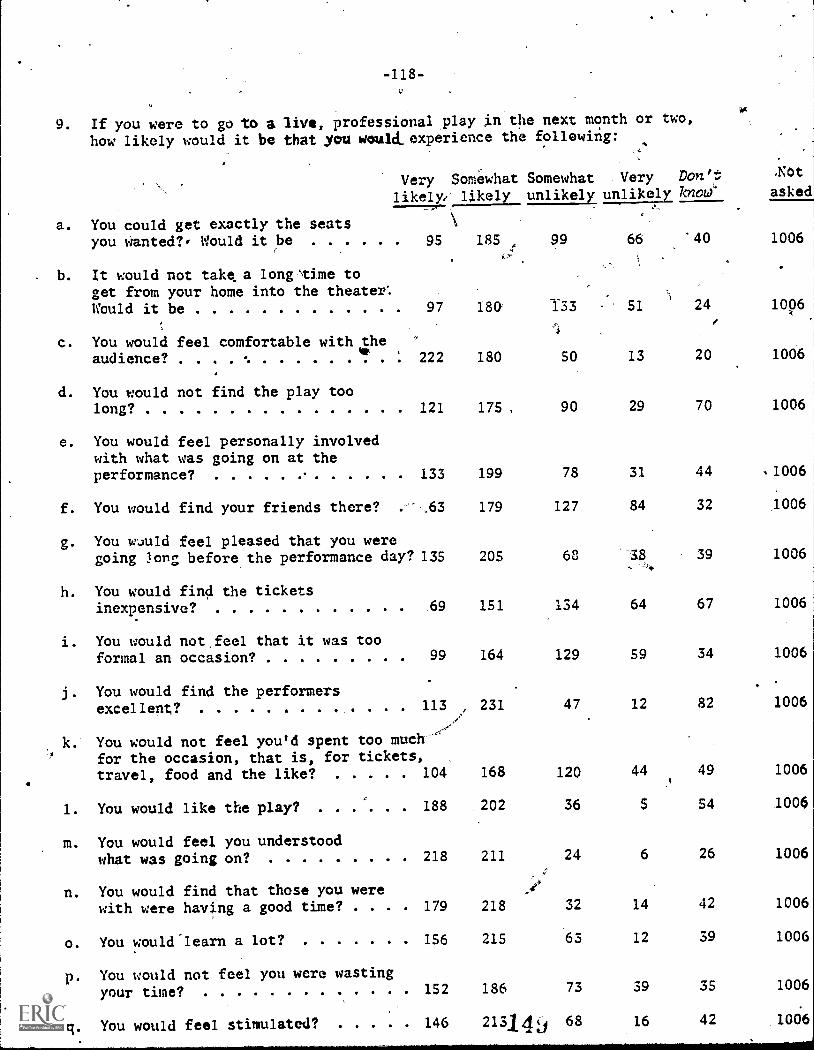
-118-
9. If you were to go to a 1ive, professional play in the next month or two,
how likely would it be that you would_experience the following:
a. You could get exactly the seatsyou wanted?, Would it be
Very Somewhat Somewhat Very Don't
likely, likely unlikely unlikely know'
b. It would not take a long`time toget from your home into the theater'.Would it be 97
c. You would feel comfortable with theaudience?
to ,
222
95
d. You would not find the play toolong? 121
e. You would feel personally involvedwith what was going on at theperformance? 133
f. You would find your friends there? . .63
g. You wuuld feel pleased that you weregoing 3ong before the performance day? 135
h. You would find the ticketsinexpensive? 69
i. You would not,feel that it was tooformal an occasion? 99
You would find the performersexce11ent? 113
You would not feel you'd spent too muchfor the occasion, that is, for tickets,travel, food and the like? 104
1. You would like the play? 188
m. You would feel you understoodwhat was going on? 218
n. You would find that those you werewith were having a good time? 179
o. You would'learn a lot?
p You would not feel you were wastingyour time?
You would feel stimulated?
156
152
146
.Not
asked
185 99 66 *40 1006
180 133 51 24 1096.
180 50 13 20 1006
175 , 90 29 70 1006
199 78 31 44 '1006
179 127 84 32 1006
205 68,3418
39 1006
151 134 64 67 1006
164 129 59 34 1006
.
231 47 12 82 1006
168 120 44 49 1006
202 36 54 1006
211 24 6 26 1006
218 32 14 42 1006
215 63 12 39 1006
186 73 39 35 1006
2131 tlij 68 16 42 1006
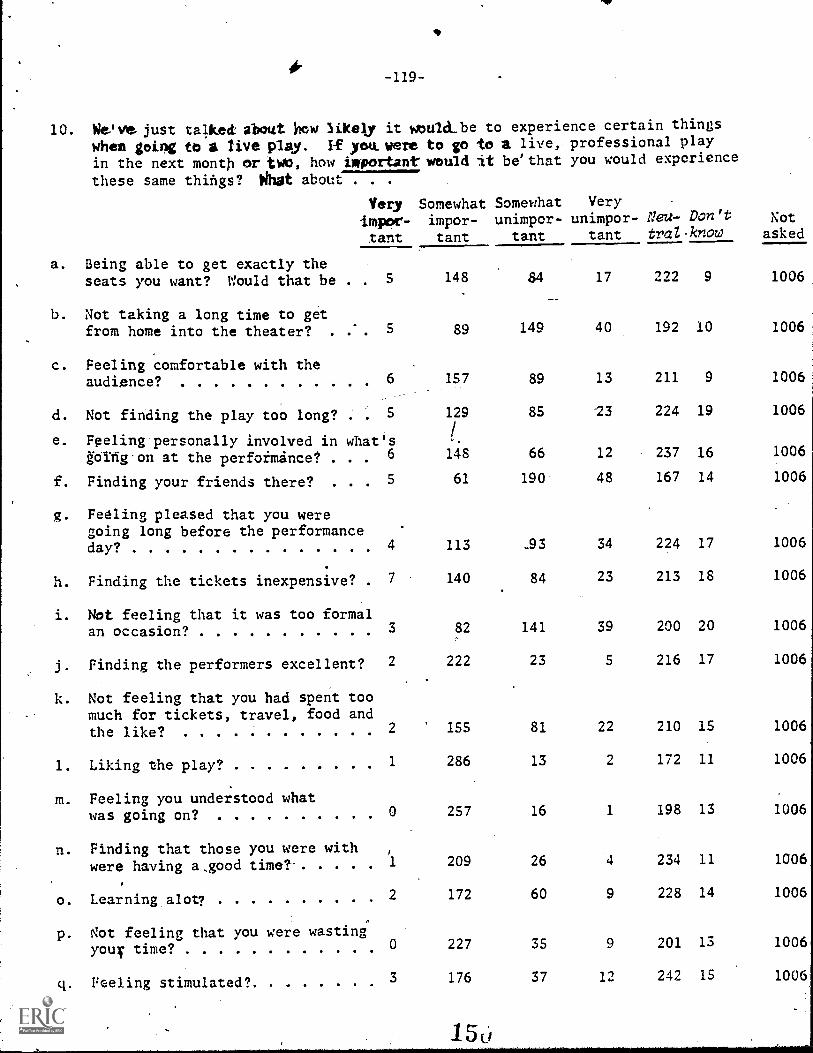
-119-
10. We've just talked aboat hew 5ikely it woula.be to experience certain things
when going to a rive play. If youwere to go to a live, professional play
in the next month or tut), how important would lt be'that you would experience
these same things? What about:7. .
Very Somewhat Somewhat Very
impor- impor- unimpor- unimpor- Neu- Don't Not
tant tant tant tant tral-know asked
a.
b.
c.
d.
Being able to get exactly theseats you want? Would that be . 5
Not taking a long time to getfrom home into the theater? . . . 5
Feeling comfortable with theaudience? 6
Not finding the play too long? 5
148
89
157
129
e. Feeling personally involved in what s 1
f.
m.
n.
o.
p.
q.
§ofrig-on at the performince? 6 18
Finding your friends there? . . . 5 61
Feeling pleased that you weregoing long before the performanceday9 4 113
Finding the tickets inexpensive? 7 140
Not feeling that it was too formalan occasion? 3 82
Finding the performers excellent? 2 222
Not feeling that you had spent toomuch for tickets, travel, food andthe like? 2 155
Liking the play? 1 286
Feeling you understood whatwas going on? 0 257
Finding that those you were withwere having a.good time 1 209
-
Learning alot? 2 172
Not feeling that you were wasting'
your time? 0 227
Feeling stimulated? 3 176
84 17 222 9 1006
149 40 192 10 1006
89 13 211 9 1006
85 23 224 19 1006
66 12 237 16 1006
190 48 167 14 1006
.93 34 224 17 1006
84 23 213 18 1006
141 39 200 20 1006
23 5 216 17 1006
81 22 210 15 1006
13 2 172 11 1006
16 1 198 13 1006
26 4 234 11 1006
60 9 228 14 1006
35 9 201 13 1006
37 12 242 15 1006'
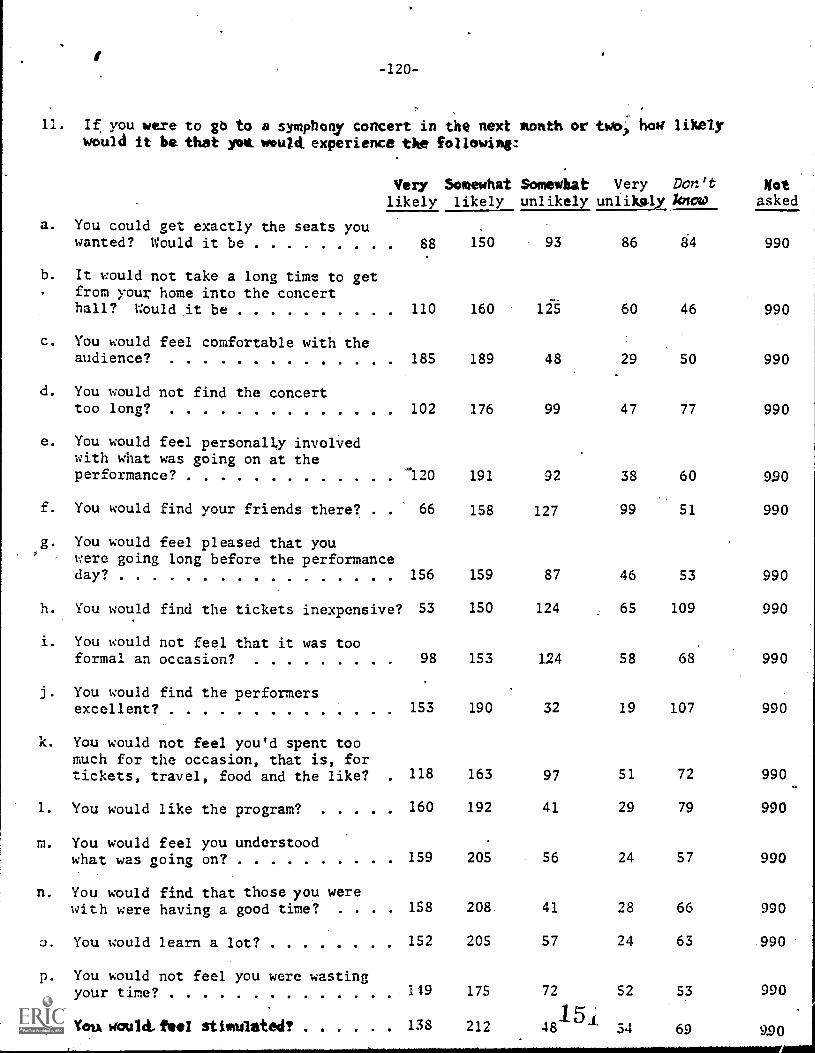
-120-
11. If you were to gb to a symphony concert in the next month or twb; how likelywould it be that yolt wouft experience tke following:
a. You could get exactly the seats youwanted? Would it be
b. It would not take a long time to getfrom your home into the concerthall? Would it be
c. You would feel comfortable with theaudience?
d. You would not find the concerttoo long?
Very Somewhat Somewhat Very Don't Notlikely likely unlikely unlikply know asked
e. You would feel personall,y involvedwith what was going on at theperformance?
f. You would find your friends there? . .
g. You would feel pleased that youwere going long before the performanceday9
h. You would find the tickets inexpensive?
i. You would not feel that it was tooformal an occasion?
j. You would find the performersexcellent?
k. You would not feel you'd spent toomuch for the occasion, that is, fortickets, travel, food and the like?
1. You would like the program?
m. You would feel you understoodwhat was going on?
n. You would find that those you werewith were having a good time? . . . .
a. You would learn a lot?
p. You would not feel you were wastingyour ti e?
q. You would- fool stimulated'
88 150 93 86 84 990
110 160 lit 60 46 990
185 189 48 29 50 990
102 176 99 47 77 990
'1120 191 92 38 60 990
66 158 127 99 51 990
156 159 87 46 53 990
53 150 124 65 109 990
98 153 124 58 68 990
153 190 32 19 107 990
118 163 97 51 72 990
160 192 41 29 79 990
159 205 56 24 57 990
158 208 41 28 66 990
152 205 57 24 63 990
119 175 72 52 53 990
138 212 4815i 34 69 990
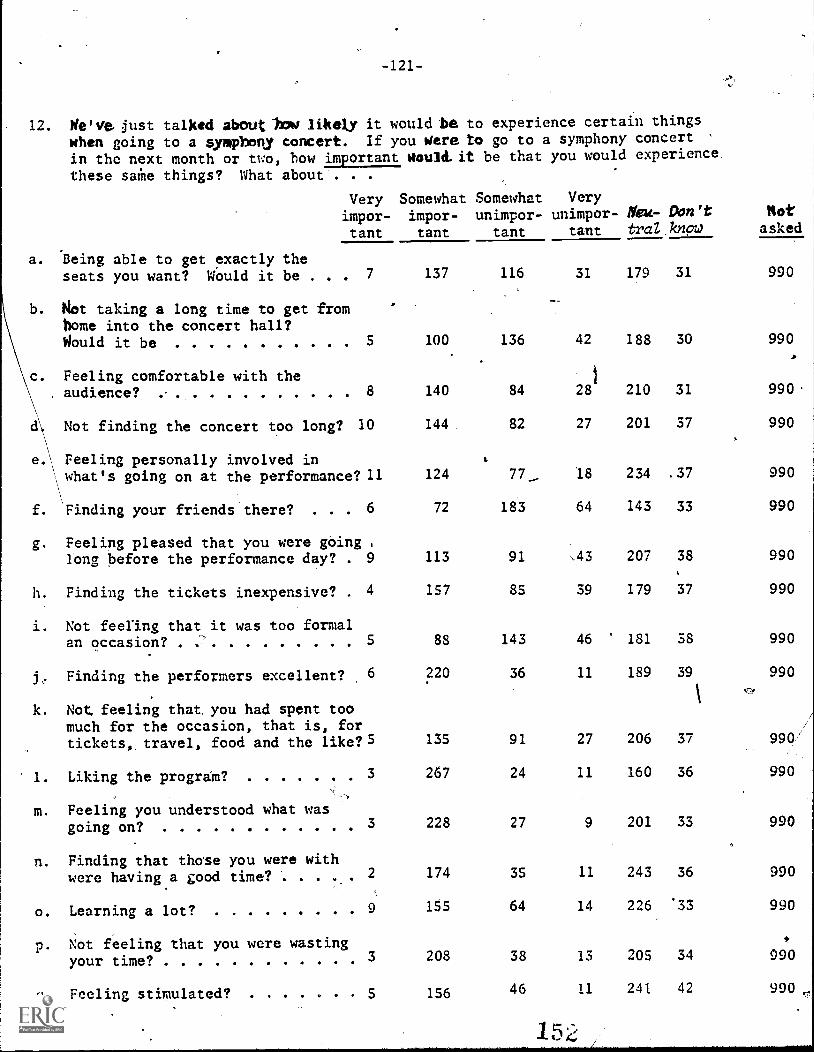
-121-
12. We've:just talked about-bow likely it would bewhen going to a symphony concert. If you Werein the next month or two, bow important Would-it
to experience certain thingsto go to a symphony concert
be that you would experience
Somewhat Veryunimpor- unimpor- Neu- Alon't
tant tant trca knpwNotasked
these same things? What about . . .
Very Somewhatimpor- impor-tant tant
a. Being able to get exactly theseats you want? Would it be . 7 137 116 31 179 31 990
b. got taking a long time to get from .
home into the concert hall?
c,
Would it be 5 100 136 42 188 30 990..
\
c. Feeling comfortable with the. audience? 8
\
d\ Not finding the concert too long? 10
e.\ Feeling personally involved in
140
144
t
84
82
28
27
210
201
31
37
990'
990
\what's going on at the performance? 11 124 77_, 18 234 .37 990
\
f. Finding your friends there? . . . 6
g. Feeling pleased that you were going i
72 183 64 143 33 990
Jong before the performance day? . 9 113 91 ,43 207 38 990
h. Finding the tickets inexpensive? . 4
i. Not feering that it was too formalan occasion? 5
157
88
85
143
39
46
179
181
37
38
990
990
j, Finding the performers excellent? 6
k. Not, feeling that you had spent toomuch for the occasion, that is, for
220 36 11 189 39 990
/
tickets, travel, food and the like? 5 135 91 27 206 37 990
1. Liking the program? 3
m. Feeling you understood what wasgoing on? 3
n. Finding that those you were withwere having a good time? 2
267
228
174
24
27
35
11
9
11
160
201
243
36
33
36
990
990
990
o. Learning a lot? 9
p. Not feeling that you were wastingyour time? 3
155
208
64
38
14
13
226
205
33
34
990
990
q. Feeling stimulated? 5 156 46 11 241 42 990 ,
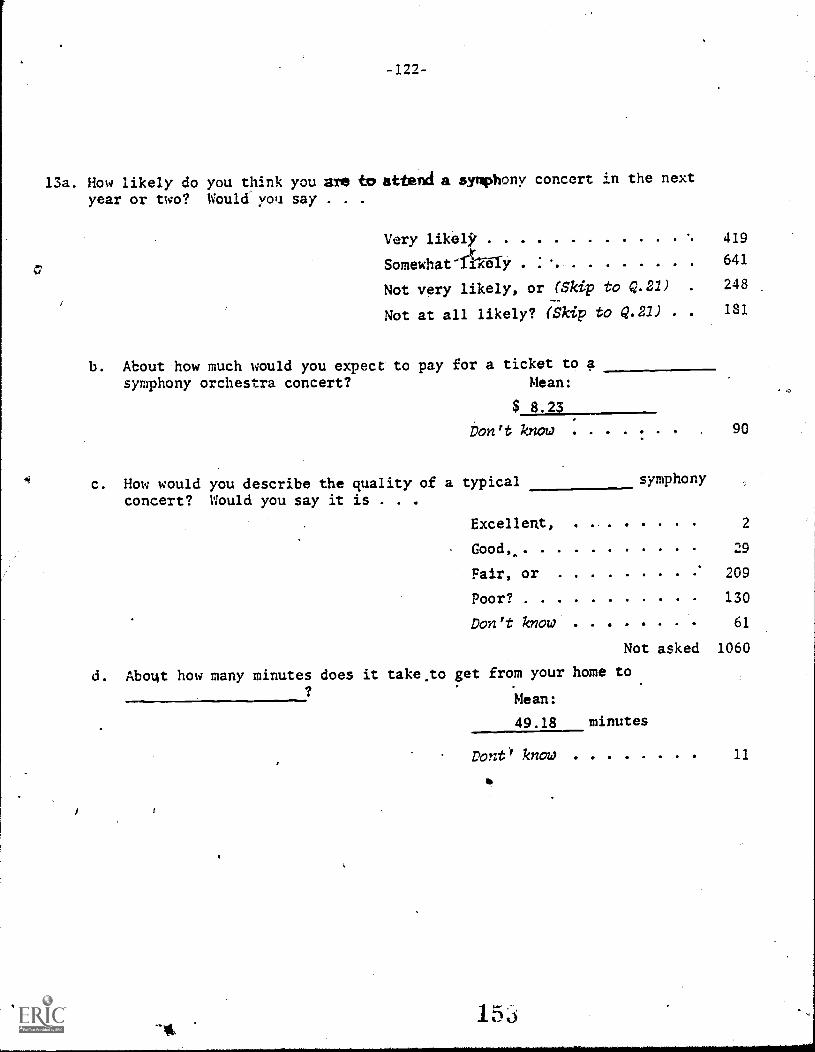
-122-
13a. How likely do you think you are to attend a symphony concert in the next
year or two? Would'you say . . .
Very likel? 419
Somewhat-fiRWly 641
Not very likely, or (Skip to Q.21) 248
Not at all likely? (Skip to Q.21) . 181
b. About how much would you expect to pay for a ticket tosymphony orchestra concert? Mean:
$ 8.23
bon't know 90
c. How would you describe the quality of a typical symphony
concert? Would you say it is . . .
Excellent, ...... 2
Good,, 29
Fair, or 209
Poor'? 130
Don't know 61
Not asked 1060
d. Abollt how many minutes does it take,to get from your home to
Mean:
49.18 minutes
Dont.' know 11
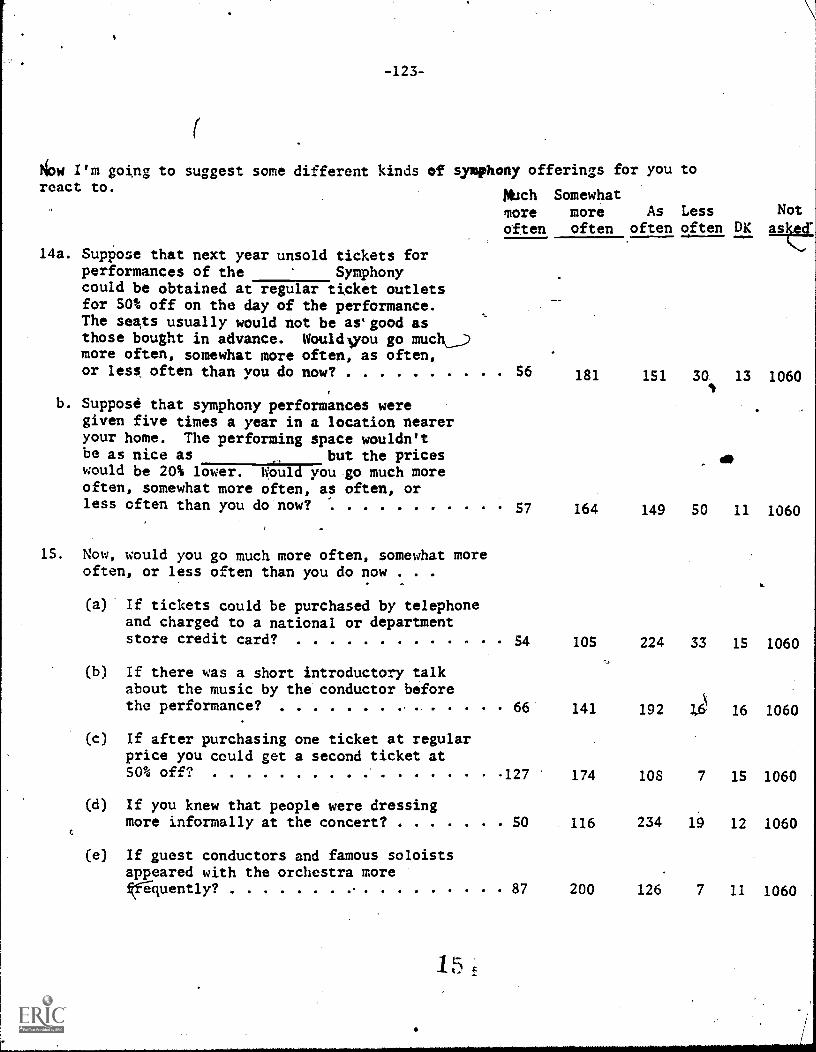
-123-
f*I0W I'm going to suggest some different kinds of symphony offerings for you toreact to.
ftich Somewhatmore more As Less Not
often often often often DK asc,1"
14a. Suppose that next year unsold tickets forperformances of the Symphonycould be obtained at regular ticket outletsfor SO% off on the day of the performance.The seats usually would not be as'good asthose bought in advance. Wouldvou go much,..._)more often, somewhat more often, as often,or less often than you do now'
b. Suppose that symphony performances weregiven five times a year in a location neareryour home. The performing space wouldn'tbe as nice as but the priceswould be 20% lower. Would you go much moreoften, somewhat more often, as often, orless often than you do now?
15. Now, would you go much more often, somewhat moreoften, or less often than you do now . . .
(a) If tickets could be purchased by telephoneand charged to a national or departmentstore credit card?
(b) If there was a short introductory talkabout the music by the conductor beforethe performance?
(c) If after purchasing one ticket at regularprice you could get a second ticket at50% offv.'
(d) If you knew that people were dressingmore informally at the concert?
(e) If guest conductors and famous soloistsappeared with the orchestra more
4
56 181 151 30 13 1060
57 164 149 50 11 1060
54 105 224 33 15 1060
66 141 192 16 16 1060
127 174 108 7 15 1060
50 116 234 19 12 1060
87 200 126 7 11 1060
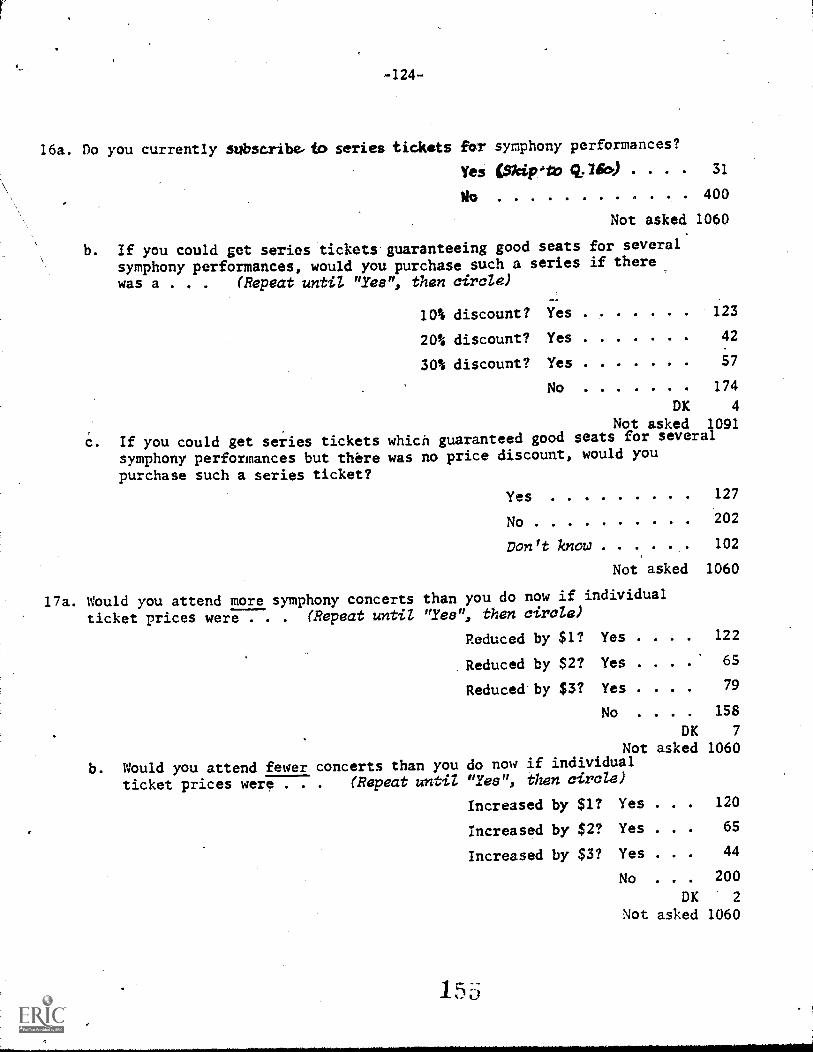
-124-
I6a. Do you currently subscribe-to series tickets for symphony performances?
Yes Warty uso) . . . 31
No 400
Not asked 1060
b. If you could get series tickets guaranteeing good seats for several
symphony performances, would you purchase such a series if there
was a . . . (Repeat untiZ "Yes", then circle)
10% discount? Yes
20% discount? Yes 42
30% discount? Yes
No
123
57
174
DK 4
Not asked 1091
C. If you could get series tickets which guaranteed good seats for several
symphony performances but there was no price discount, would you
purchase such a series ticket?
Yes 127
No 202
Don't know 102
Not asked 1060
17a. Would you attend more symphony concerts than you do now if individual
ticket prices were . . . (Repeat until "Yes", then circle)
Reduced by $1? Yes . . . . 122
Reduced by $2? Yes . . . . 65
Reduced by $3? Yes . . . . 79
No . . . . 158
DK 7
Not asked 1060
b. Would you attend fewer concerts than you do now if individual
ticket prices were . . . (Repeat until "Yes", then circle)
Increased by $1? Yes . . . 120
Increased by $2? Yes . . . 65
Increased by $3? Yes . . . 44
No . . 200
DK 2
Not asked 1060
15
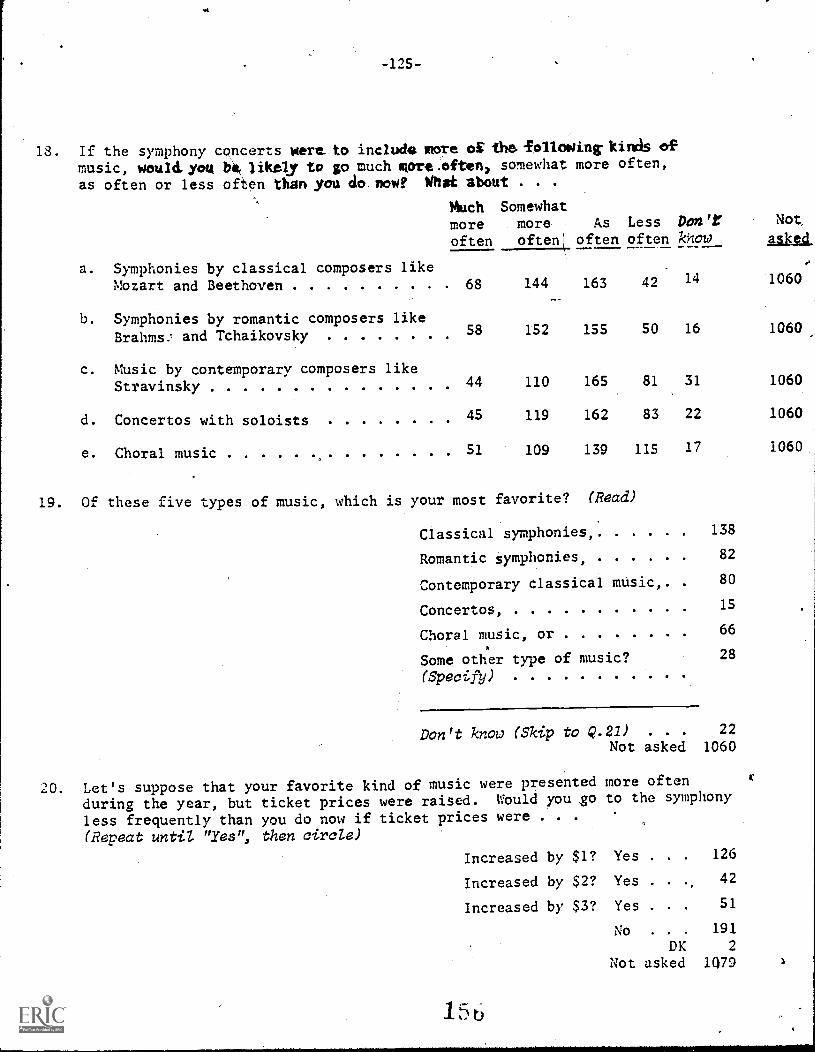
-125-
18. If the symphony concerts were. to include more of the following- kinds of
music, woulityou be likely to go much more.eften, somewhat more often,
as often or less often than you do, now! What about . . .
a. Symphonies by classical composers like
MUchmoreoften
Somewhatmoreoften
As
oftenLessoften
DenTkkow
Not,
asked
b.
Mozart and Beethoven
Symphonies by romantic composers like
68 144 163 42 14 1060
c.
Brahms: and Tchaikovsky
Music by contemporary composers like
58 152 155 50 16 1060
Stravinsky 44 110 165 81 31 1060
d. Concertos with soloists 45 119 162 83 22 1060
e. Choral music 51 109 139 115 17 1060
19. Of these five types of music, which is your most favorite? (Read)
Classical symphonies, 138
Romantic symphonies, 82
Contemporary classical music,. 80
Concertos, 15
Choral music, or 66
Some other type of music? 28
(Specify)
Don't know (Skip to Q.21) . . . 22Not asked 1060
20. Let's suppose that your favorite kind of music were presented more often
during the year, but ticket prices were raised. Would you go to the symphony
less frequently than you do now if ticket prices were . . .
(Repeat until "Yes", then circle)
Increased by $1? Yes . . . 126
Increased by $2? Yes . . , 42
Increased by $3? Yes . . . 51
No . . . 191
DK 2
Not asked 1079
15b
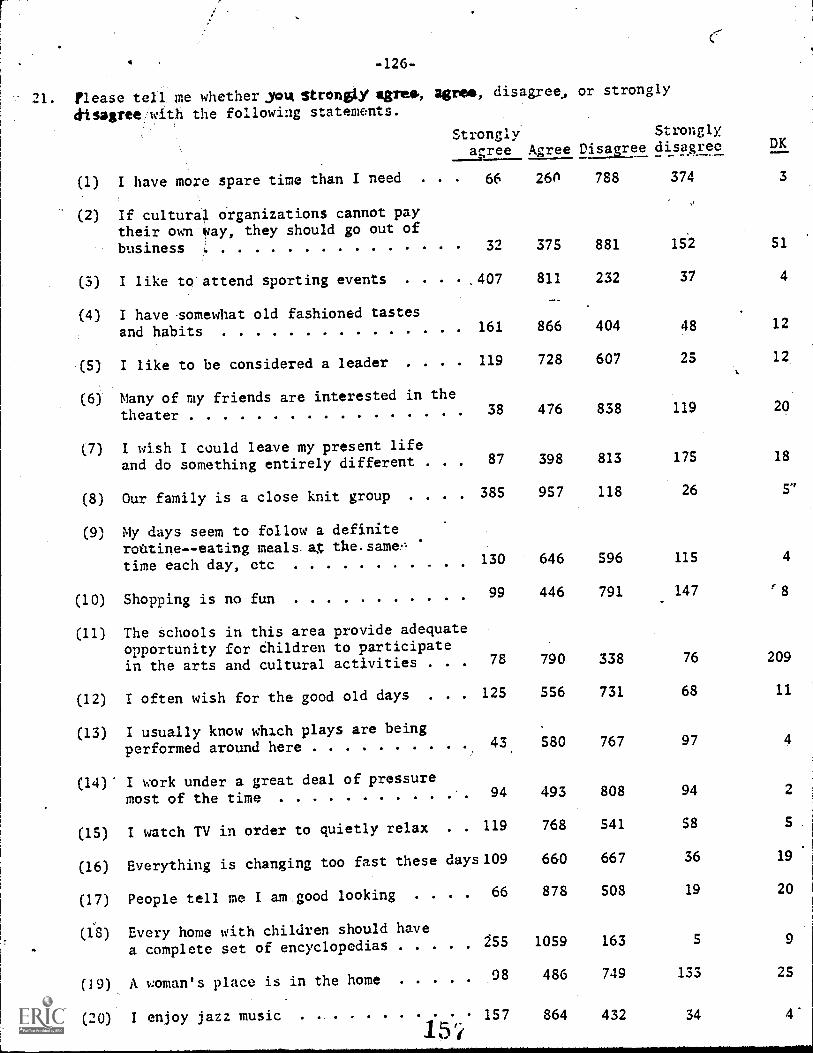
-126-
?lease tell me whether you, strongly Agreo, Agree, disagree, or strongly
disasree with the following statements.
Strongly Strongly
agree Agree Disagree disagree DK
(1) I have more spare time than I need 66
(2) If cultura1 organizations cannot paytheir oum way, they should go out ofbusiness i.
32
(3) I like to attend sporting events . .407
(4) I have somewhat old fashioned tastesand habits 161
(5) I like to be considered a leader . . 119
(6) Many of my friends are interested in the
theater 38
(7) I wish I could leave my present life
and do something entirely different . 87
(8) Our family is a close knit group . . . . 385
(9) My days seem to follow a definiteroatineeating meals. ag the.sametime each day, etc 130
(10) Shopping is no fun 99
(11) The schools in this area provide adequateopportunity for children to participatein the arts and cultural activities . 78
(12) I often wish for the good old days . . 125
(13) I usually know which plays are being
performed around here 43
(14) I work under a great deal of pressuremost of the time 94
(15) I watch TV in order to quietly relax . 119
(16) Everything is changing too fast these days109
(17)
(1'8)
(19)
(20)
People tell me I am good looking 66
Every home with children should have
a complete set of encyclopedias 255
A woman's place is in the home 98
I enjoy jazz music 157
26n 788 374 3
375 881 152 51
811 232 37 4
866 404 48 12
728 607 25 12
476 838 119 20
398 813 175 18
957 118 26 5'
646 596 115 4
446 791 147
790 338 76 209
556 731 68 11
580 767 97
493 808 94 2
768 541 58 s
660 667 36 19
878 508 19 20
1059 163 5 9
486 749 133 25
864 432 34 4'
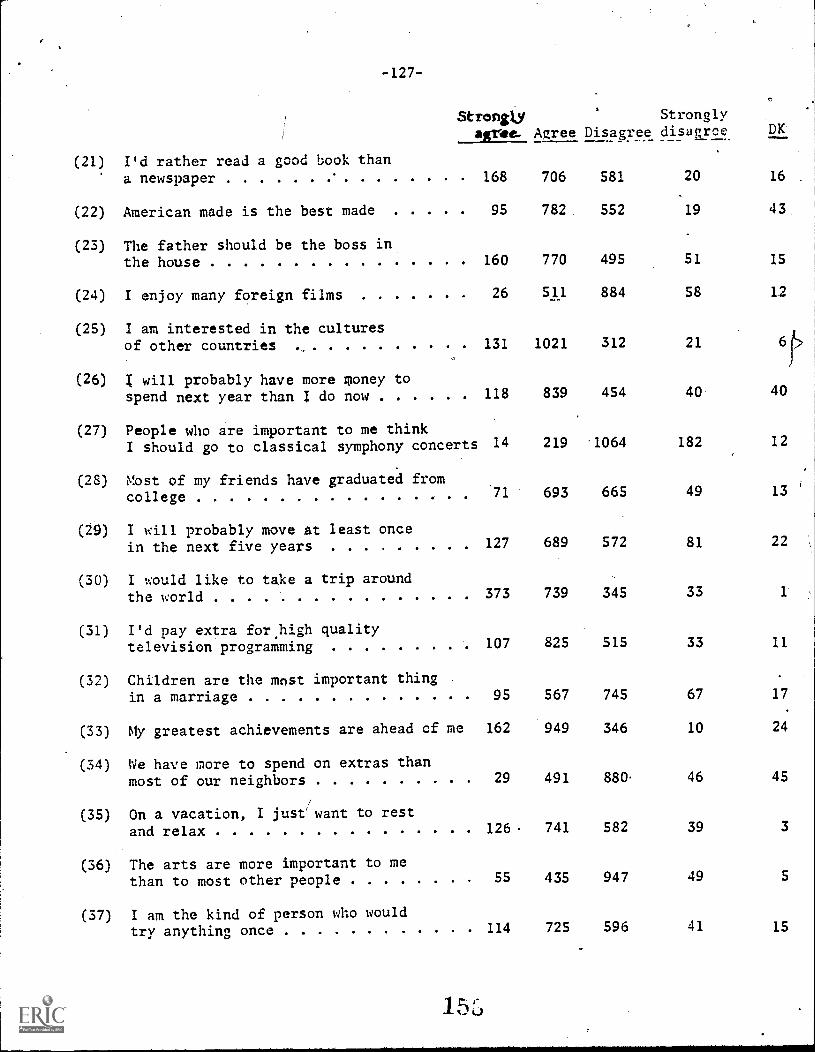
-127-
(21) I'd rather read a good book thana newspaper
(22) American made is the best made
(23) The father should be the boss inthe house
(24) I enjoy many foreign films
(25) I am interested in the culturesof other countries
Strongly Stronglyagnm Agree Disagree disagree. DK
(26) I will probably have more money tospend next year than I do now
(27) People who are important to me thinkI should go to classical symphony concerts
(28) Most of my friends have graduated fromcollege
(29) I will probably move at least oncein the next five years
(30) I ould like to take a trip aroundthe world
(31) I'd pay extra for.high qualitytelevision programming
(32) Children are the most important thingin a marriage
(33) My greatest achievements are ahead of me
(34) We have more to spend on extras thanmost of our neighbors
/
(35) On a vacation, I justwant to restand relax
(36) The arts are more important to methan to most other people
(37) I am the kind of person who wouldtry anything once
168 706 581 20 16
95 782 552 19 43
160 770 495 51 15
26 511 884 58 12
131 1021 312 21 6
t>
118 839 454 40 40
14 219 -1064 182 12
71 693 665 49 13 '
127 689 572 81 22
373 739 345 33 1
107 825 515 33 11
95 567 745 67 17
162 949 346 10 24
29 491 880. 46 45
126. 741 582 39 3
55 435 947 49 5
114 725 596 41 15
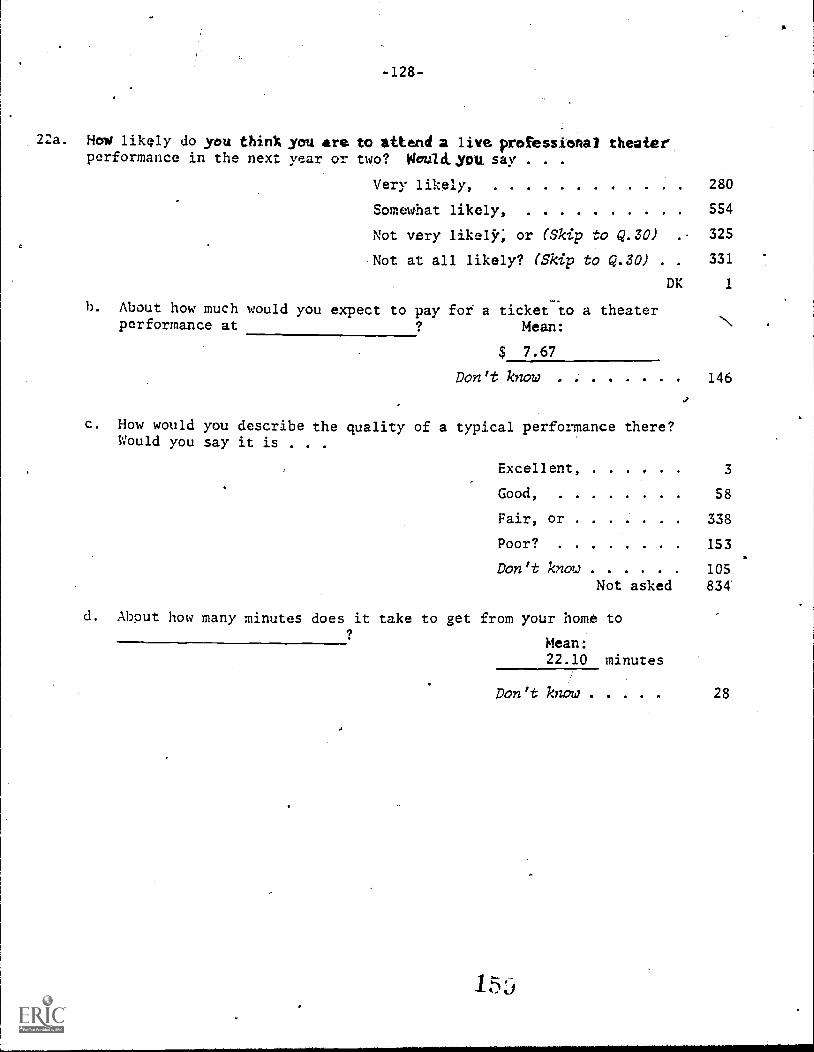
-128-
22a. How likely do you think you are to attend 2 live professional theaterperformance in the next year or two? Woultlyou say . . .
Very likely, 280
Somewhat likely, 554
Not very likelk; or (Skip to Q.30) .. 325
Not at all likely? (Skip to Q.30) . . 331
DK 1
b. About how much would you expect to pay for a ticket to a theaterperformance at Mean:
$ 7.67
Don't know 146
c. How would you describe the quality of a typical performance there?Would you say it is . . .
Excellent, . 3
Good, 58
Fair, or 338
Poor? 153
Don't know 105
Not asked 834
d. Abput how many minutes does it take to get from your home to
Mean:22.10 minutes
Don't know 28
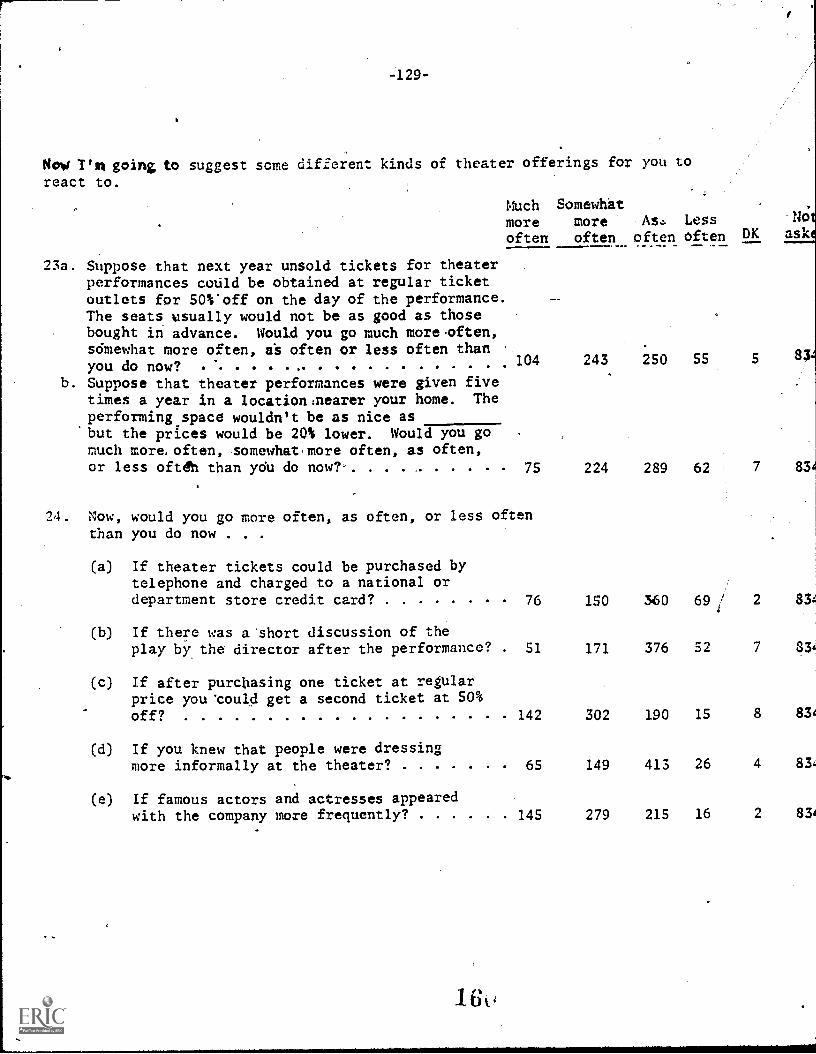
-129-
NeW 1'n going to suggest some different kinds of theater offerings for you toreact to.
Much Somewhatmore more As.:. Less
often often often Often DK ask-No
23a. Suppose that next year unsold tickets for theaterperformances could be obtained at regular ticketoutlets for 50%'off on the day of the performance.The seats usually would not be as good as thosebought in advance. Would you go much more.often,sdmewhat more often, aa often or less often than
104 243you do now?b. Suppose that theater performances were given five
times a year in a location:nearer your home. The
performing.space wouldn't be as nice as'but the prices would be 20% lower. Would you gomuch more,often, somewhat,more often, as often,or less oft& than ydu do now?' 75 224
24. Now, would you go more often, as often, or less oftenthan you do now . . .
(a) If theater tickets could be purchased bytelephone and charged to a national ordepartment store credit card? 76 150
(b) If there was a short discussion of theplay by the director after the performance? 51 171
(c) If after purchasing one ticket at regularprice yolcbauld get a second ticket at 50%off? 142 302
(d) If you knew that people were dressingmore informally at the theater? 65 149
(e) If famous actors and actresses appearedwith the company more frequently? 145 279
250 55
289 62
360 69 /
376 52
190 15
413 26
215 16
5 83
7 83
2 83
7 83
8 83
4 83
2 83
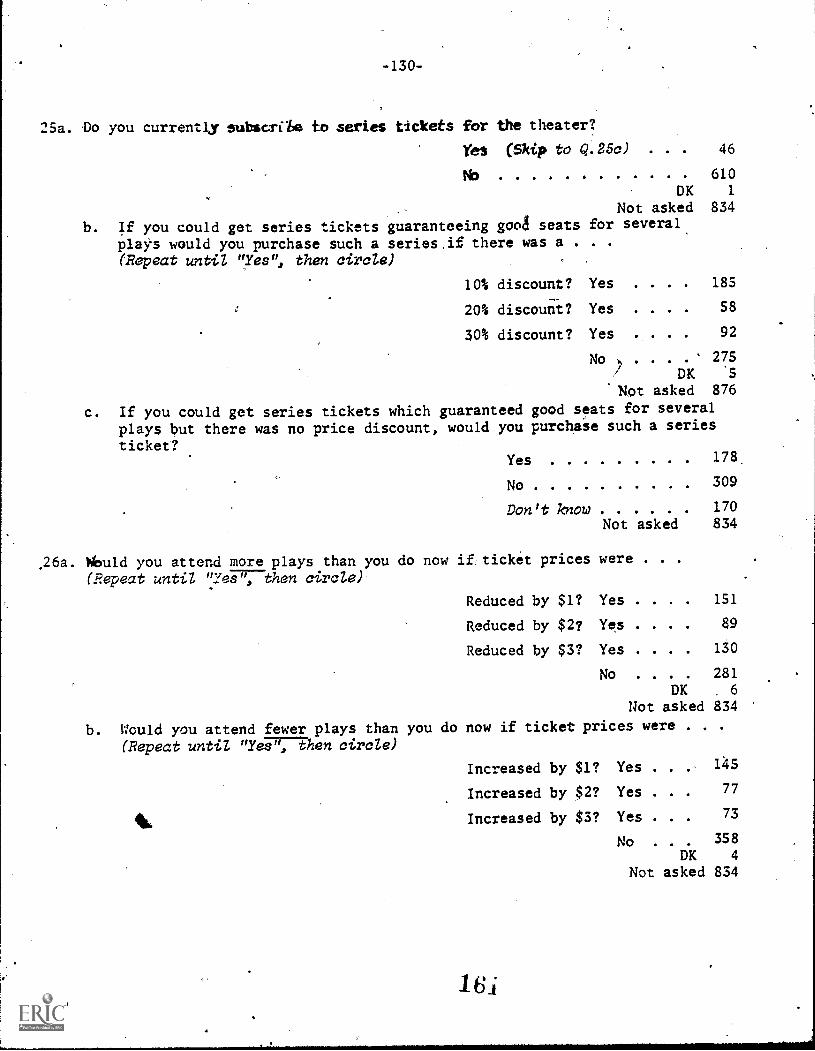
-130-
25a. Do you currently subscribe to series tickets for the theater?
Yes (Skip to Q.25c) . 46
NO 610DK 1
Not asked 834
b. If you could get series tickets guaranteeing good seats for several
plays would you purchase such a series if there was a . . .
(Repeat until "Yes", then circle)
10% discount? Yes . . . . 185
20% discount? Yes . . . . 58
30% discount? Yes . . 92
No . . . . 275
DK '5
'Not asked 876
c. If you could get series tickets which guaranteed good seats for severalplays but there was no price discount, would you purchase such a series
ticket?Yes 178
No 309
Don't know 170
Not asked 834
26a. Wuld you attend more plays than you do now ifticket prices were . .
(-Repeat untiZ "yes", then circle)
Reduced by $1? Yes . . . . 151
Reduced by $2? Yes . . . . 89
Reduced by $3? Yes . . . . 130
No . . . . 281
DK 6
Not asked 834
b. Would you attend fewer plays than you do now if ticket prices were . . .
(Repeat untiZ "YeTITTEhen circle)
Increased by $1? Yes . .
Increased by $2? Yes . .
Increased by $3? Yes . .
1. 6 i
145
77
73
No 358DK 4
Not asked 834
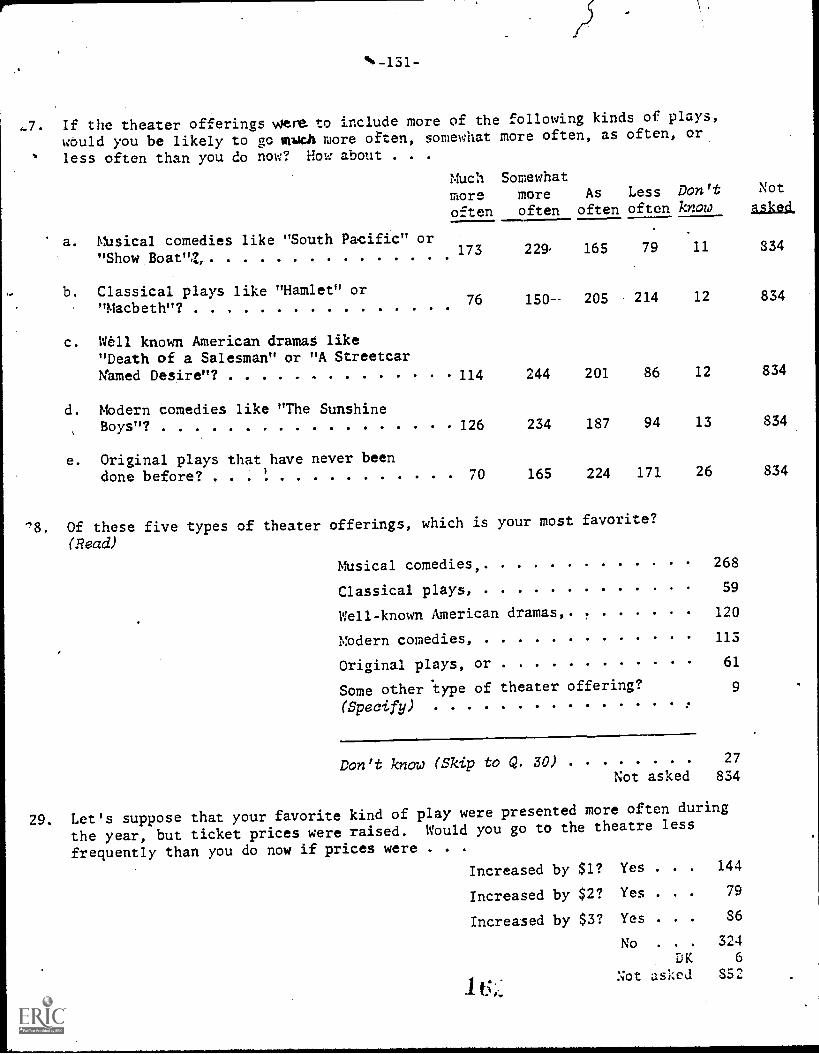
%-131-
,7. If the theater offerings ~a to include more of the following kinds of plays,
would you be likely to go much more often, somewhat more often, as often, or
less often than you do now? How about . . .
a. Musical comedies like "South Pacific" or
Muchmoreoften
Somewhatmoreoften
As Less Don'toften often know
Not
asked
b.
"Show Boat",t
Classical plays like "Hamlet" or
173 229, 165 79 11 834
c.
"Macbeth"?
Well known American dramaS like
76 150-- 205 214 12 834
"Death of a Salesman" or "A Streetcar
d.
Named Desire"?
Modern comedies like "The Sunshine
114 244 201 86 12 834
e.
Boys"?
Original plays that have never been
126 234 187 94 13 834
done before? 70 165 224 171 26 834
8. Of these five types of theater offerings, which is your most favorite?
(Read)
MUsical comedies,
Classical plays,
Well-known American dramas,
Modern comedies,
Original plays, or
Some other lype of theater offering?
(Specify)
268
59
120
113
61
9
Don't know (Skip to Q. 30) 27
Not asked 834
29. Let's suppose that your favorite kind of play were presented more often during
the year, but ticket prices were raised. Would you go to the theatre less
frequently than you do now if prices were . .
Increased by $1? Yes . . . 144
Increased by $2? Yes . . . 79
Increased by $3? Yes . . . 86
No . . . 324DK 6
1Not asked 352
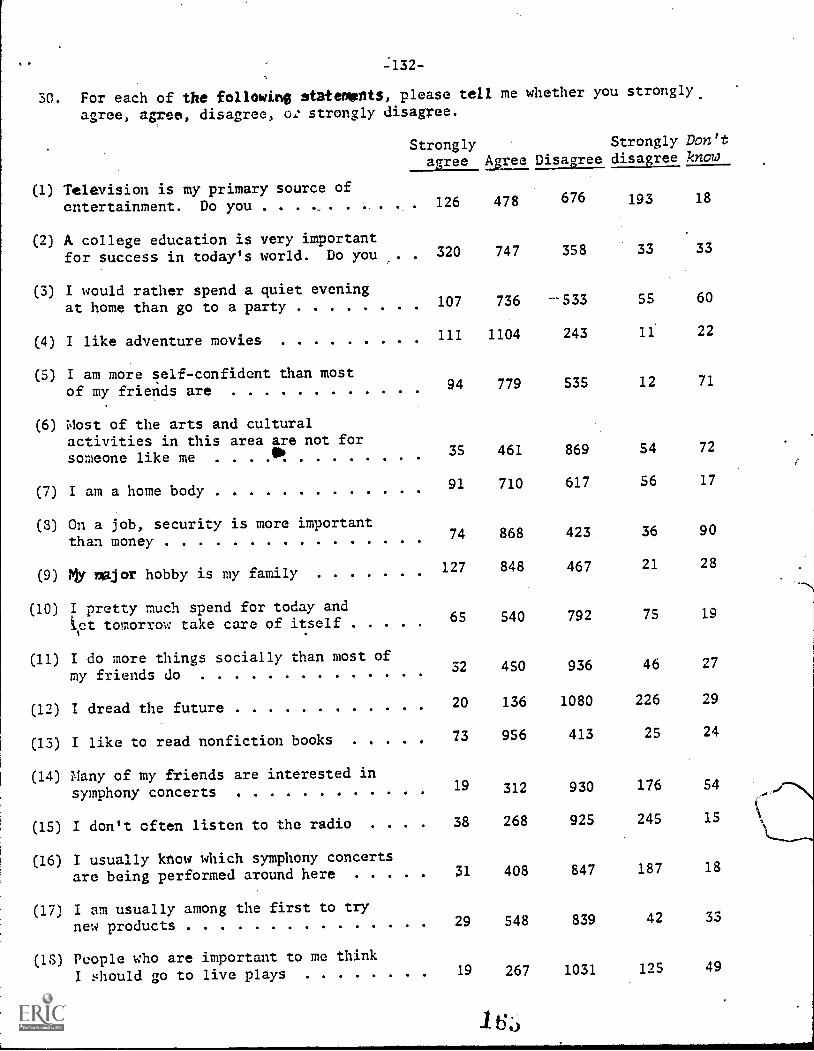
30. For each of the following statemints, please tell me whether you strongly
agree, agree, disagree, o: strongly disagree.
Strongly Strongly Don't
agree Agree Disagree disagree know
(1) Television is my primary source ofentertainment. Do you . . . .., .. .
(2) A college education is very importantfor success in today's world. Do you
(3) I would rather spend a quiet eveningat home than go to a party
(4) I like adventure movies
(5) I am more self-confident than mostof my friends are
(6) Most of the arts and culturalactivities in this area are not forsomeone like me 40
(7) I am a home body
(3) On a job, security is more importantthan money
(9) my moor hobby is my family
(10) I pretty much spend for today andi,ct tomorrow take care of itself
(11) I do more things socially than most ofmy friends do
(12) I dread the future
(13) I like to read nonfiction books
(14) Many of my friends are interested insymphony concerts
(15) I don't often listen to the radio .
(16) I usually know which symphony concertsare being performed around here
(17) I am usually among the first to trynew products
(18) People who are important to me think
I should go to live plays
126 478 676 193 18
. 320 747 358 33 33
107 736 --533 55 60
111 1104 243 11 22
94 779 535 12 71
35 461 869 54 72
91 710 617 56 17
74 868 423 36 90
127 848 467 21 28
65 540 792 75 19
52 450 936 46 27
20 136 1080 226 29
73 956 413 25 24
19 312 930 176 54
38 268 925 245 15
31 408 847 187 18
29 548 839 42 33
19 267 1031 125 49
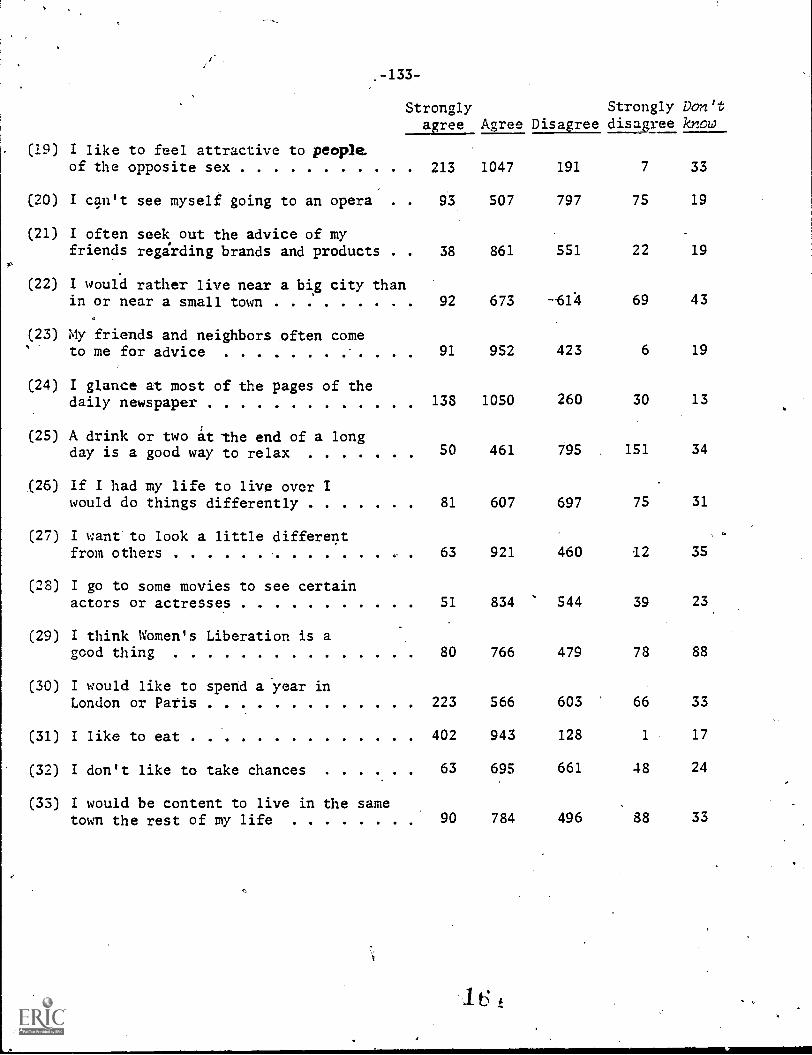
.-133-
Strongly Strongly Don't
agree Agree Disagree disagree know
(19) I like to feel attractive to peopleof the opposite sex 213 1047 191 7 33
(20) I can't see myselP going to an opera . . 93 507 797 75 19
(21) I often seek out the advice of myfriends regarding brands and products . 38 861 551 22 19
(22) I would rather live near a big city thanin or near a small town 92 673 614 69 43
(23) My friends and neighbors often come' to me for advice 91 952 423 6 19
(24) I glance at most of the pages of thedaily newspaper 138 1050 260 30 13
(25) A drink or two t the end of a longday is a good way to relax 50 461 795 151 34
(26) If I had my life to live over Iwould do things differently 81 607 697 75 31
(27) I want to look a little differentfrom others 63 921 460 12 35
(28) I go to some movies to see certainactors or actresses 51 834 544 39 23
(29) I think Women's Liberation is agood thing 80 766 479 78 88
(30) I ould like to spend a year inLondon or Paris 223 566 603 66 33
(31) I like to eat 402 943 128 1 17
(32) I don't like to take chances 63 695 661 48 24
(33) I would be content to live in the sametown the rest of my life 90 784 496 88 33
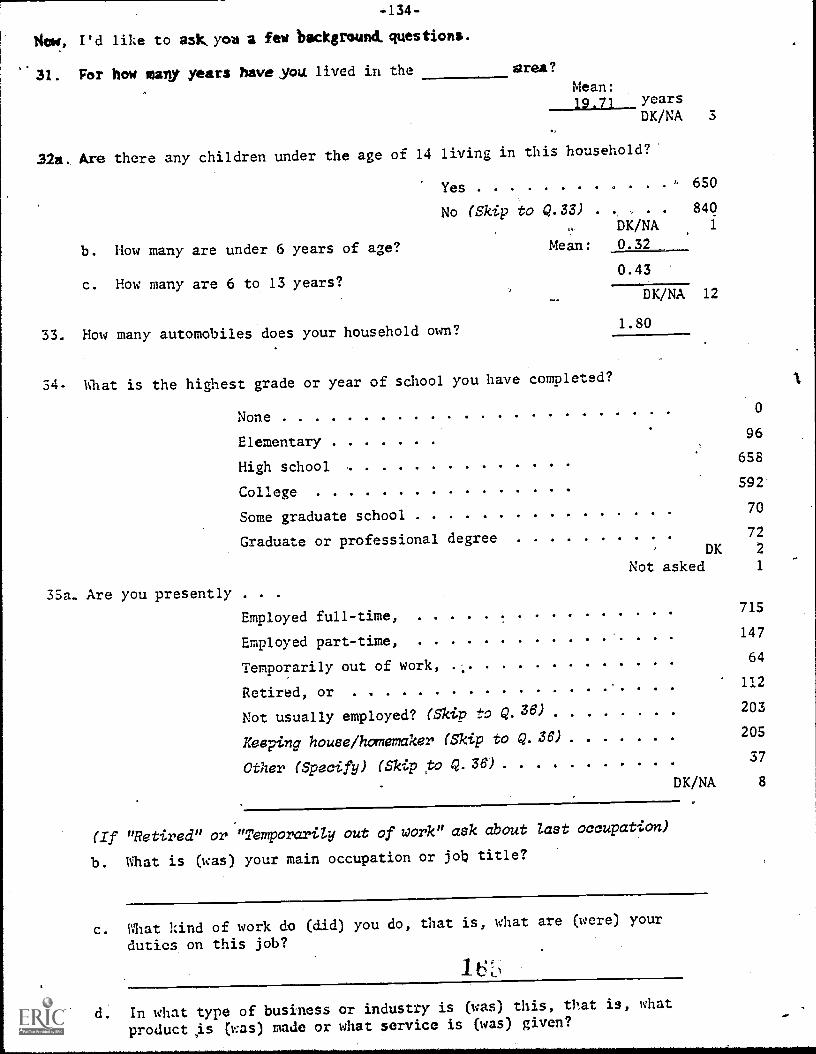
-134-
Womi, I'd like to aok,you a few backgrowAvestions.
31. For how mary years have you lived in the area?
Mean:19.71 years
DK/NA 3
32s. Are there any children under the age of 14 living in this household?
Yes - 650
No (Skip to Q.33) 840
cA DK/NA 1
b. How many are under 6 years of age? Mean: 0.32
0.43c. How many are 6 to 13 years?
33. How many automobiles does your household own?
34- What is the highest grade or year of school you have completed?
DK/NA 12
1.80
None0
Elementary96
High school658
College592
Some graduate school70
Graduate or professional degree
35a. Are you presently . . .
72
DK I
Not asked 1
Employed full-time,715
Employed part-time,147
Temporarily out of work,64
Retired, or112
Not usually employed? (Skip to Q.36) 203
Keeping house/homemaker (Skip to Q.36) 205
Other (Specify) (Skip to Q.36) 37
DK/NA 8
(I.f "Retired" or "Temporarily out of work" ask about last occupation)
b. What is (was) your main occupation or job title?
c. What kind of work do (did) you do, that is, what are (were) your
duties on this job?
16L1
d. In what type of business or industry is (was) this, that is, what
product is (was) made or what service is (was) given?
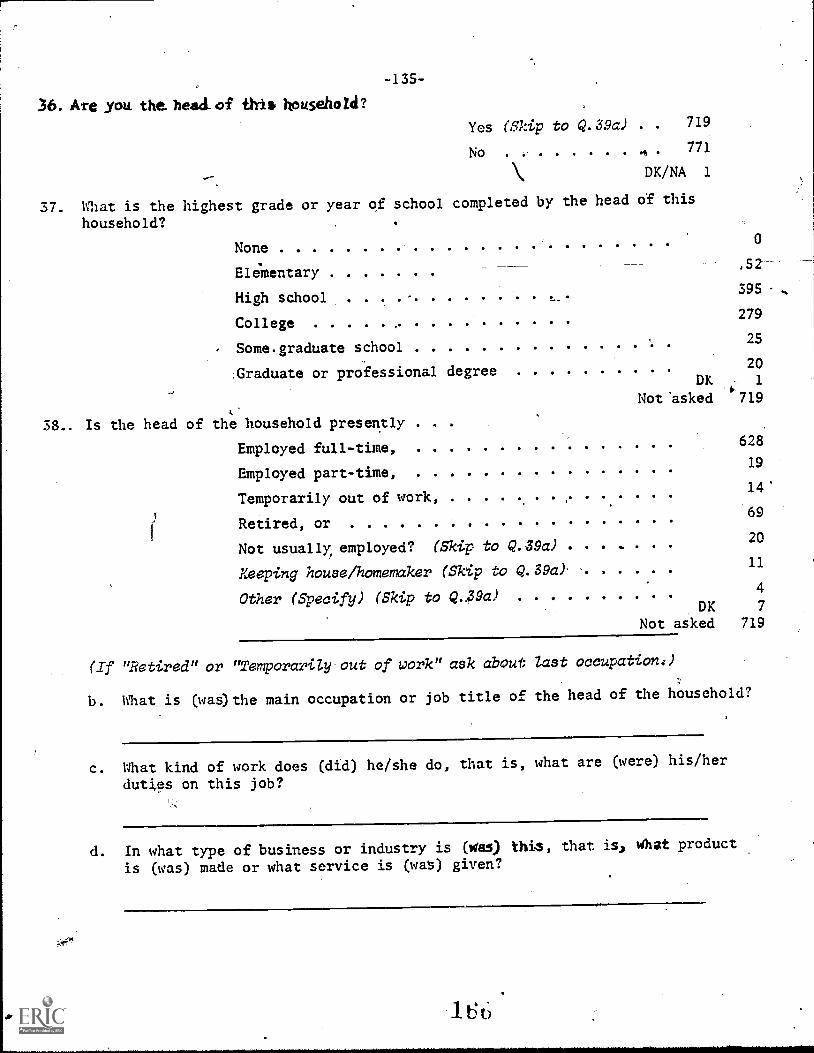
-135-
36. Are you. the. head_ of this household?Yes (Skip to Q.39a) . . 719
No .t771
DK/NA 1
37. What is the highest grade or year of school completed by the head of this
household?
None0
,52
279
EleMentary
High school
College
Some.graduate school25
,Graduate or professional degree20
DK 1
Not 'asked 719
38.. Is the head of the household presently .
Employed full-time,628
Employed part-time,19
Temporarily out of work,14
Retired, or69
Not usually, employed? (Skip to Q.39a) . . .20
Reeping house/homem aker (Skip to Q.39a)11
Other (Specify) (Skip to Q-39a)4
DK 7
Not asked 719
(Tf "Retired" or "Temporarily out of work" ask about last occupation...)
b. What is (was)the main occupation or job title of the head of the household?
c. What kind of work does (did) he/she do, that is, what are (were) his/her
duties on this job?
d. In what type of business or industry is (Wes) this, that is, What product
is (was) made or what service is (was) given?

-136-
39a. Vkat is the highest grade or jear of school your father- complate4?I
..
gono t 12
Elesienrry '254
High school .
429
College 247
Same graduate school 16
Graduate or professional degree 63
Rather is head 118
Don't know 325
Not appZicable27
b. What is the highest grade or year of school your mother completed?
None
Elementary
High school
College
Some graduate school
Graduate or professional degree
Mother is hedd
Don't know
Not dpplicable
40a. What is your marital status? Are you . .
b. Is your spouse employed?
10
208
648
16
26
29
272
25
Married, 859
Separated, (Skip to Q.41) . . 45
Divorced, (Skip to Q.41) gg
Widowed, or (Skip to Q.41). 124
Never married? (Skip to Q.41) . 374
DK/NA 1
Yes . . . . 620
No . . . , 234DK/NA 5
Not asked 632'
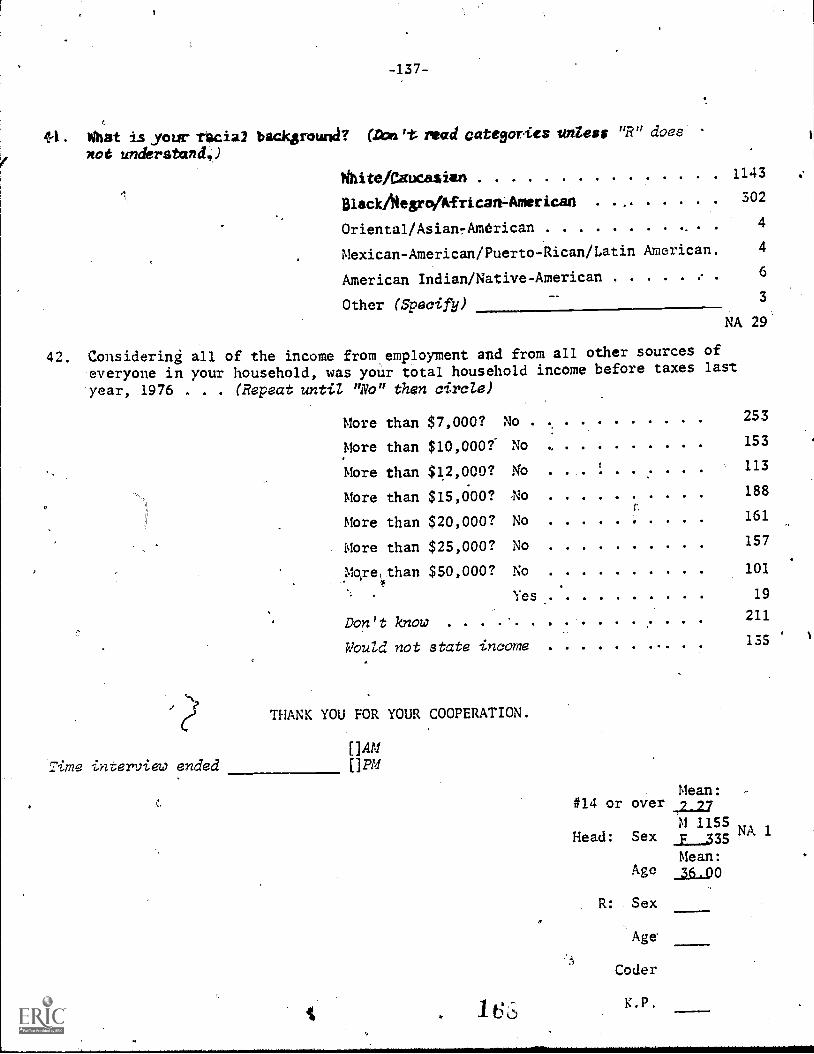
-137-
L. valet is your racia2 background? (Am 't read categories unless "R" does
not understandy)White/Caucasian 1143
Black/NegroAfricanAmerican302
Oriental/Asian7American 4
Mexican-American/Puerto-Rican/Latin American 4
American Indian/Native-American6
Other (Specify) 3
NA 29
42. Considering all of the income from.employment and from all other sources of
everyone in your household, was your total household income before taxes last
year, 1976 (Repeat until "Ro" then circle)
More than $7,000? No 253
More than $10,000?- No 153
More than $12,000? NO 113
More than $15,000? No 188
More than $20,000? No 161
More than $25,000? No 157
J.lo,rejhan $50,000? No 101
Yes_ 19
Don't know 211
Would not state income 135
THANK YOU FOR YOUR COOPERATION.
U411'Time interview ended OPM
Mean:#I4 or over 2.77
Head: Sex
Age
R: Sex
Age
Coder
M 1155N
1_335A 1
Mean:36.00
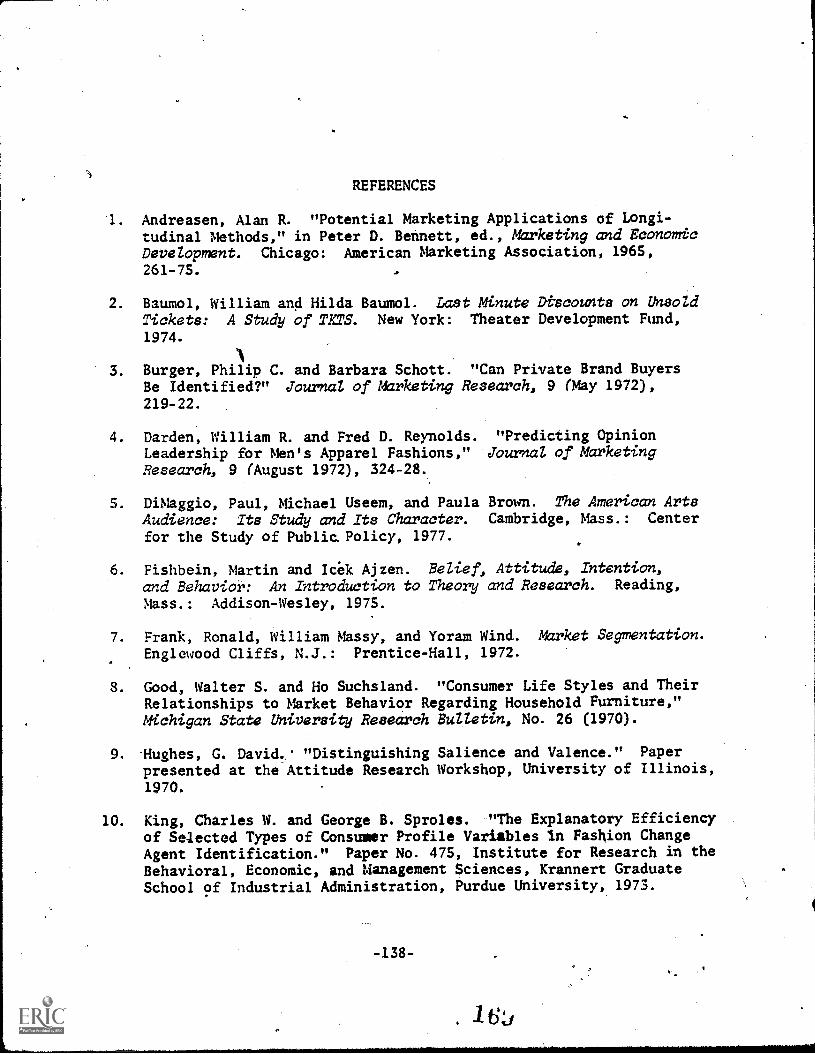
REFERENCES
1. Andreasen, Alan R. "Potential Marketing Applications of Longi-tudinal Methods," in Peter D. Bennett, ed., Mdrketing and EconomicDevelopment. Chicago: American Marketing Association, 1965,261-75.
2. Baumol, William and Hilda Baumol. Last Minute Dtscounts on UnsoldTickets: A Study of MTS. New York: Theater Development Fund,1974.
13. Burger, Philip C. and Barbara Schott. "Can Private Brand Buyers
Be Identified?" Journal of MUrketing Research, 9 (May 1972),219-22.
4. Darden, William R. and Fred D. Reynolds. "Predicting OpinionLeadership for Men's Apparel Fashions," Journal of MdrketingResearch, 9 (August 1972), 324-28.
5. DiMaggio, Paul, Michael Useem, and Paula Brown. The American Arts
Audience: Its Study and Its Character. Cambridge, Mass.: Center
for the Study of Public. Policy, 1977.
Fishbein, Martin and Icek Ajzen. BeUef, Attitu& Intention,and Behavior: An Introduction to Theory and Research. Reading,
Mass.: Addison-Wesley, 1975.
7. Frank, Ronald, William Massy, and Yoram Wind. &Met Segmentation.Englewood Cliffs, N.J.: Prentice-Hall, 1972.
S. Good, Walter S. and Ho Suchsland. "Consumer Life Styles and TheirRelationships to Market Behavior Regarding Household Furniture,"Michigan State University Research Bulletin, No. 26 (1970).
9. Hughes, G. David. "Distinguishing Salience and Valence." Paper
presented at the Attitude Research Workshop, University of Illinois,1970.
10. King, Charles W. and George B. Sproles. "The Explanatory Efficiencyof Selected Types of Consumer Profile Variables In Fashion ChangeAgent Identification." Paper No. 475, Institute for Research in theBehavioral, Economic, and Management Sciences, Krannert GraduateSchool of Industrial Administration, Purdue University, 1973.
-138-
-139-
11. Lansing, John B. and LesLie Kish. "Family Life Cycle as an Inde-
pendent Variable'," American Sociological Review, 22 (October 1957),
512-19.
12. Lehmann, Donald K. "Television Show Preference: Application of a
Choice Model," Journal of Marketing Research, 8 (February 1971),
47-55.
13. Eric Marder Associates, Inc. The Finances of the Performing Arts.
New York: Ford Foundation, 1974.
14. May, Eleanor G. "Psychographics in Department Store Imagery."Working paper P-65, Marketing Science,Institute, Cambridge, Mass.,1971.
,
15. McCarthy, E. Jerome. Basic Marketing: A Managerial Approach.
(4th ed.) Homewood, Ill.: Irwin, 1971
16. National Endowment for the Arts. ReSearch Division Program Solici-
tation, February 4, 1976.
17. National Research Center of the Arts, Inc. Americans and the Arts.
New York: National Committee for Cultural Resources, 1976.
18. Newman, Danny. Subscribe Now! New York: Theater Communications
Group, 1977.
19. Nie, Norman et al. SPSS: Statistical Package for the Social Sciences7
(2nd ed.) New York: McGraw-Hill, 1975.
20. Pessemier, Edgar A. and Douglas J. Tigert. "A Taxonomy of Magazine
Readership Applied to Problems in Marketing Strategy and Media Se-
lection." Institute Paper No. 195, Institute for Research in the
Behavioral, Economic, and Management Sciences, Krannert Graduate
School of Industrial Administration, Purdue University, 1967.
21. Plummer, Joseph T. "Life Style Patterns and Commercial Bank Credit
Card Usage," Journal of Marketing, 3,5 (April 1971), 35-41.
22. . "Life Style Patterns: A New Constraint for Mass Communi-
cation Research," JournaZ ofBroadcasting, 16 (Winter 1971-72),
79-89.
23. Rosenberg, Milton J. "Cognitive Structure and Attitudinal Affect,"
journal of Abnormal and Social Psychology, 53 (November 1956),
367-72.