Embed Size (px)
Citation preview

S W I S S G E R M A N U N I V E R S I T Y
CENTRAL RESEARCH FUND
FINAL REPORT
ROLE of SOCIAL MEDIA toward
POLITICAL PARTICIPATION of EARLY VOTERS In ELECTION 2014
Loina L.K. Perangin-angin, S.Sos., MSiAlva Erwin, ST., MSc., MTi
Research Center for Novel and Creative Solutions in Businessand Technology

Academic Research and Community Service (ARCS)Department
2014

3
A. Title Page
Title of Proposal : Role of Social Media towardPolitical participation
of Early Voters in Election 2014
Name of Team Leader : Loina L.K. Perangin-angin.,S.Sos., MSi
Research Center : Research Center for Novel andCreative Solutions
in Business and Technology
E-mail : [email protected]
Mobile phone : 0817 - 149171
Duration of CR Program : 8 months; from April to November2014
Proposed Budget : Rp. 48,468,000
Budget from Other Source : Rp. (please attach thevalidity proof)
EduTown, BSDCity, Tangerang
Date: 28 Januari 2014
Team Leader HeadResearch Center for Noveland Creative Solutions inBusiness and Technology
Signature Signature

4
Name : Loina L. K. Perangin-angin., MSi
Name
NIK 11111225 NIK
SUMMARY
ROLE OF SOCIAL MEDIA toward POLITICAL PARTICIPATION OF EARLYVOTERS
in ELECTION 2014
Loina Lalolo Krina Perangin-angin, S.Sos., MSi
Alva Erwin, ST., MSc., MTI
vii + 43 pages + 19 tables + 5 attachments + bibl 43 (1976-2013)
This research is conducted (1) to identify the contentand the usage of social media for early voters to interactpolitically, (2) to identify the political participation earlyvoters took part in Election 2014, and (3) to identify therole of social media for increasing the politicalparticipation of early voters in Election 2014.
This research used quantitative approach. Surveys wereconducted in 6 big cities in Indonesia; Jakarta, Serang,Bandung, Surabaya, Jogja, and Solo. Data was collected bydistributing a questionnaire to senior high school students,especially students in Grade 12, from private and state

5
schools in those cities. 1027 samples were drawn by usingrandom sampling. Data was analyzed descriptively. Forcorrelation analysis, the Pearson formula was used.
The research results show young voters moderately usesocial media for interacting and networking in Election 2014,however, they have low political participation. Facebook andTwitter were the two most popular and longer social medianetwork used by early voters, however the voters tend toconnect more on newer social media network such as Line, Pathand Instagram. Clicking a like sign on information, news, orcomments is an easier way to participate online in politics.Offline, young voters only share information about politicalevents and voting for the president. There is a slightly weakcorrelation between social media usage and politicalparticipation with coefficient of correlation is 0.423 ormoderate. It means that only 42.3% of the politicalparticipation can be influenced by social media usage, therest is influenced by other factors.
it is strongly recommended to have further research forstudying the other factors which influence the role of socialmedia toward political participation. Since the politicalparticipation of early voters in Election 2014 is very low,for the Election in the future, it is strongly recommended forevery parties involved with political issue to empower thesocial media for attracting youth to participate more byprovide them with attractive message about politics.
FOREWORD
We would like to thanks Swiss German University,
especially our colleagues in ARCS and Rector Office, for
facilitating and giving a supportive funding to conduct this
research.

6
Especially, I would like to thank Prof. Dr (phil) Martin
Loffelholz for his support and supervision toward this
research project.
We would like to thank Dean and colleagues of Faculty of
Business Administration and Humanities for supporting this
research.
We would like to thank every parties involved with this
research; the Principals of Senior High School in Jakarta,
Serang, Bandung, Surabaya, Jogja and Solo, the students, the
surveyor, and else.
Jakarta, January 2015
Researcher

7
TABLE OF CONTENT
Approval Page iiSummary iiiForeword ivTable of Content vList of Table viList of Attachment vii
CHAPTER I INTRODUCTION 1CHAPTER II LITERATURE STUDY 6CHAPTER III RESEARCH PROBLEM, OBJECTIVE, AND OUTCOMES 15
3.1. Research Problem 153.2. Research Objectives and Outcomes 16
CHAPTER IV RESEARCH METHOD 18CHAPTER V RESULTS ACHIEVED 21
5.1. Media Social Usage 235.2. Political Participation 295.3. Correlation Between Social Media Usage
and Political
Participation
33
CHAPTER VI PLAN FOR NEXT STAGE OF RESEARCH 37CHAPTER VII CONCLUSION AND RECOMMENDATION 38
7.1. Conclusion 387.2. Recommendation 38REFERENCES 40ATTACHMENTS 441. QUESTIONNAIRE

8
2. LOG-BOOK3. CODING SHEET
4. STATISTICAL RESULTS
5. CONTRACT AGREEMENT
6. CURICULLUM VITAE
LIST OF TABLES
Page
Tabel
2.1.
The Spread of the Internet 7
4.1.
Location and Number of Respondents 19
5.1.
Religion 21
5.2.
Gender 21
5.3.
Money for Phone Credit per Month 22
5.4 Money Pocket per Month 22
5.5 Social Media Account Ownership 23
5.6 Length of Ownership (Years) 24
5.7.
Frequency of Accessing the Account 25
5.8 Activity Doing After Being Exposed To Social 26

9
. Media Content
5.9 Category of Social Media Usage 27
5.10
Content in Social Media 28
5.11
Online Participation 30
5.12
Category of Online Participation 31
5.13
Offline Participation 31
5.14
Category of Offline Participation 32
5.15
Category of Political Participation 32
5.16
Reliability Test 33
5.17
Correlation Test 36
CHAPTER I
INTRODUCTION
The development of communication technology has offered
the world to experience a radical shift in the way of
communicating occur among people and societies. The digital

10
revolution resolved, triggered by the connectedness of a
computer-driven and electronic based system which allows the
Internet and the World Wide Web. These advancements change
some aspects of the communication processes. Walther (2011)
explain these aspects as a state of individuated mass media,
the potential for simultaneous communication via computers of
both conceptually mass and interpersonal channels; one can
watch movies on one’s computer, at the same time of examining
detik.com while chatting about its content with a friend via
Instant Messenger, other can draw political news from a
blogger, and post an individual reaction on that blog as a
comment. In just the last few years, Web sites like Facebook,
MySpace, YouTube, and Flickr have become commonly used by
hundreds of millions of people. Services like Twitter, RSS
feeds, blogs and LinkedIn connect us in real time to the
thoughts and lives of thousands of people at once so that we
can assemble rivers of information in ways we simply never had
before.
More specifically, new communication technologies are
changing the manner of reception by which individual acquire
information from institutional, Interpersonal, and peer
information sources. The network society allowed individuals
for true interactivity whereby people could communicate more
easily across boundaries and other barriers than ever before.
Everyone would be connected to a network of interactive
communication in which everyone can be a communicator whom
capable of originating, retrieving, storing, and disseminating
messages. Technology changes the temporal and adjoining

11
presentations of these sources, and may in fact change the
information processing and social influence dynamics among
these sources. New communication technology has made
incredibly salient another information source, virtual
communities and other forms of peer-generated information,
which is accessible at a previously impossible level. This
addition may further affect the balance of sources of social
influence in several settings.
Dennis and DeFleur (2010) explain about how the role of
media in a society dominated by digital influence. The
technology driving so much of today does not operate in
vacuum, nor is it the only profound influence. Instead,
technology is part of an amalgam of forces –cultural, social,
political, and economic- that shape and influence all aspect
of communication. The capacity for interactivity and precise
targeting of new recruits for one’s personal communication
space, or community, offered by many digital media can provide
the mechanism to move from personal to intermediate
communication. Intermediate communication uses technology to
create communities for like-minded people with similar
interests or the same political or social views. These
communities can be closed systems, such as a kind of virtual
“private club” with an encoded website or a specific network
in MySpace. Alternatively, they can be open systems,
accessible to anyone who cares to connect with them, such as a
political movement that uses new technologies to reach its
followers and affords them a communicative role.

12
The consequence of being “networked” is more than
interaction with other users of the system and exchange
information. The decision on how to use the new interactivity
technologies are much more complex than simply deciding on
whether to operate the on-off button on our telephone set. We
are making highly individual personalized choices to become
not only the receivers of communication but also the senders
and the gatekeepers. As these new technologies make an
increasing impact on our lives, Bittner (2010) alert us on how
to “mass” media change, but also to how we use these “new”
media. Cathcart and Gumpert’s (1986) initially give termed the
“new typology” as “mediated interpersonal communication” which
defined as “any person-to-person interaction where a medium has been
interposed to transcend the limitation of time and space”. They argued that
new analytical are needed for such forms since the
interposition of media changes the quality and quantity of
information exchanged, influences personal behaviors and
attitudes, and shapes an individual’s self image.
Whatever its effects on information might be, it is
likely that the Internet has consequences on politics.
Irwansyah (2012) explain that for first the Internet enables
the creation and recreation of “spaces” where discussion and
deliberation on issues of common interest is possible. Next,
the use of the Internet enables traditional participation
activities to be undertaken more easily (such as contacting a
politician, signing a petition, making a donation, and others)
and reduces the costs of organizing and coordinating
collective action. Further, the Internet is an interactive

13
medium which increases contact options extremely efficiently
in terms of time investment and creates a communication-
intensive. Talking about politics and public affairs helps
citizens overcome uncertainty as they filter and make sense of
the macro-level political environment. Political talk also
enhances the value of mass-mediated news and information. Much
of the work on political work before has assumed it takes
place in a face-to-face context, however, with the uptake of
new media; scholars have begun to examine the links between
political discourse online and its relationship to
participation offline. Recent studies of mobile communication
report a positive association between using the technology to
discuss politics and public affairs (with anyone) and offline
participation. Democracy nowadays is so different since the
virtual public sphere gives us more open, tolerant, dynamic,
and flexible world to discuss.
In the context of Indonesia, since the Reformation Order
on 1998, Indonesians have enjoyed better freedom of press and
freedom of voice compare with previously New Order (1966-
1998). Indonesians became politically better informed; more
educated and had more choices. But since the Reformation Era,
direct election has been perceived as a celebration only for
the “haves” due to high-cost of campaigning. Existence of
Jokowi as governor candidate in Jakarta has changed the
phenomenon. Jokowi once was social media savvy. The
Awesometrics reputation monitoring tool reported that he was
the first candidate who effectively communicated through
social media. All campaign materials were uploaded to YouTube
14
and other social media channels. His campaign teams
successfully managed various campaign issues through social
media and built strong electability. An Awesometrics report
clearly showed that with the lowest budget, he successfully
climbed to be the most endorsed, credible and loved. Yoze
Rizal (2013), founder and director of Political Wave and Media
Wave counted that on the respective election, there are
562,000 tweets mention Jokowi compare to 395,000 tweets
mention to Fauzi Bowo, his rivalry. Those digital natives
created a theme song of Jokowi-Ahok and Flashmob to be
distributed in virtual space. All activity in social media was
initiated and funded personally.
Enda Nasution, the godfather of Indonesian bloggers,
declare that social media is Indonesia’s Fifth Estate, where
civil society can challenge well-established powers. Wasesa
(2013) appointed that in 2013, Indonesia has about 75 million
of the Internet users. For the Election 2014, 63% of the
voters are live in Java Island and 57% of them are young
people who familiar with media usage (media literacy). The
possibility of winning is bigger for the political candidates
who focus their campaign through social media.
By late February 2012, the number of Facebook users in
Indonesia has surpassed 43 million, third behind United States
and India. Indonesia is also among the most active Twitter
users in the world, making the country among the top five
globally. Still, this number does not guarantee the
increasing of political participation, even though Luengo
(2006) found out that general use of Internet is profoundly

15
connected to political activism and in a positive way. Hamid
(2013) from Change.org predict that political interest and
participation of netizen will divide unto 2 group, on one hand
a group of netizen who active politically in social media that
will participate actively in the election. In the other hand,
there is a group of active netizen in social media who
actively participated in other form of political activity. The
second group may hold their participation in the election due
to their mistrust of the current politicians. As an activist
and practitioner of social media, Usman Hamid observed that
they who actively participated, especially for politics, in
social media generally act differently when facing the real
politics due to their bad perception of politics as dirty and
corrupt. Political participation is the citizen’s activity for
influencing decision making process politically, based on the
position as a citizen, not as a politician or a public
servant. It should be done voluntarily, not be mobilized by
other individual or organization such as the ruling party.
Citizen’s political participation then depends on the
willingness of the person to involve politically.
The competition for presidency at the time will become an
interesting one to explore more. The incumbent cannot be
elected anymore, but it seems that Indonesia nowadays lack of
prospective candidate for presidency. Research results by some
research centers show that electability still dispersed
between previous candidates, such as Megawati, Prabowo.
Wiranto, and other. Jokowi’s name now smoothly is coming up,
but the rest comes from older generation. Younger generations

16
seem to be alienated from the political stage, nevertheless in
reality the older politicians show bad reputation according to
corruption and domination of capital oligarchy.
A study by Forrester Research found that the youth
incorporate digital media into their lives at a more rapidly
rate than any other generation (Irwansyah, 2012). All
generations adopt devices and Internet technologies, but
younger consumers are Net Natives. Therefore, while politics
comes to the Internet, new media and social media, the younger
generation have engaged in politics in interactive media and
developed digital democracy. For Indonesia case, this
generation born after the New Order collapsed, so their
behavior toward politics rather different than the older
generation; they are open, dynamic, and spontaneous, but
sometime very critical.

17
CHAPTER II
LITERATURE STUDY
The basic purpose of communication is the transfer of
meaning. During the entire life, individual is preoccupied
with the necessity of making himself or herself understood and
of attempting to understand others. Indeed, the character and
nature of individual’s personality, the attitudes he develops,
the opinions he expresses, and his success or failure in life
probably depend upon his mastery of the art of communication.
Individuals must effectively convey not only facts, ideas, and
ideals but also his or her emotions, hopes, fears, anxieties,
loves, achievements, and frustrations. He or her must evaluate

18
and represent both the mental and physical environments in
which he lives, and he must accurately describe, explain,
appreciate, and capitalize upon his life experiences. Failure
to effect at least a minimal orientation to life through the
communication process will probably result not only in failure
to establish a proper social adjustment but possibly also in a
breakdown in personality.
The development of the media for mass communication has
opened all possibilities for the transmission of information
(and mis-information) and the conveyance of influence
throughout the polity. In a political sense the elite at the
fulcrum of the decision-making process may speak to the mid-
elite, and the mid-elite to the public as a whole, on matter
of public policy. Not only has the potential for leadership
been greatly enhanced, but the relationship between candidate
and voter in the campaign process has also been permanently
altered.
The role the media play in the political system has been
steadily growing during the twentieth century. Also increasing
through the century has been the effective and controversial
use of political advertising in the media. Although television
has emerged as one of the most powerful political tools in
electronic campaigns, it has been by no means the only one. By
the 1990s, three forms of media were being used effectively by
political consultants; vote videos, direct mail and TV ads.
All three of these approaches are extremely expensive and have
driven the cost of political campaigns sky high. Vote videos
are professionally produced videotapes glorifying candidates.

19
The tapes can be shown at political convention or on cable TV
as infomercial and are often distributed to campaign workers
and voters. Direct mails are a letter from the candidate to
the voters.
The Internet brought more developments, especially in its
evolving with remarkable speed on delivering and sharing the
information and communication. The growing popularity of
social-networking systems like YouTube, Twitter and Facebook
just do make it easier for people everywhere to receive
information on their computers and cell phones, they also let
users broadcast information and communicate with friends or
strangers, be it text, still photographs, audio, or video.
The social media are tools that facilitate networking. As
tools, their emergence has been one example of something going
viral. Facebook was launched in February 2004, and as of
January 2011, the number of users has grown from zero to more
than 600 million persons. YouTube was founded in February
2005, and in May 2010, it was reported that YouTube was
serving more than two billion videos a day. Table below shows
the spread of the Internet and the Facebook penetration along
the total population of some countries, including Indonesia.
Table 2.1.The Spread of the Internet
(Percentage of totalpopulation) Internet
penetration
Cell phonepenetratio
n
Facebookpenetrat
ionChina 33.6% 62.8% 0.1% Egypt 24.3% 76.8% 6.5% Hong Kong 69.4% 150.5% 52.4% India 5.1% 63.2% 1.8%

20
Indonesia 8.7% 73.1% 14.2% Japan 78.0% 90.0% 1.7% Malaysia 55.9% 106.0% 38.5% Philippines 9.0% 73.6% 22.3% Singapore 68.3% 74.5% 47.1% South Korea 81.6% 97.2% 7.8% Taiwan 69.9% 110.6% 51.1% Thailand 25.8% 81.0% 11.8% USA 78.0% 91.0% 48.0% Vietnam 26.6% 38.8% 2.1%
(Source : Asean Intelligence, 2011)
Social media can be defined as “a way to transmit, or share
information with a broad audience, while social networking is an act of
engagement”(Hartshorn, 2010). For social media, all we really
need is an internet connection, a tool for delivering the
message. In social networking, we have to be grouped and tied
by the same likeness or common interest, communication is two-
way with the conversation and discussion as the core of
networking.
Wigmore (2012) define social media as “the collective of online
communications channels dedicated to community-based input, interaction,
content-sharing and collaborations. Websites and applications dedicated to
forums, microblogging, social networking, social bookmarking,
social curation, and wikis are among the different types of
social media.” Social media can be characterized by some
characteristics below :
1. ParticipationSocial media encourages the contribution and feedback frominterested participant. No one can blockade other for beinga participant in social media. Everyone can participate bytheir own intention.

21
2. OpennessSocial media services are open to feedback andparticipation, it encourages voting, comments or sharing ofinformation. There are rarely any barriers for accessing andmaking use the content.
3. ConversationRegarding of the content transmitted of distributed to anaudience, social media is better seen as a two wayconversation.
4. CommunitySocial media allows communities to form quickly andcommunicate effectively to share common interests inrelation with occupation, ethnic, education, profession orothers.
5. ConnectednessSocial media thrive on their connectedness, making use oflinks to other sites, resources and people. (Mayfield, 2008).
Research has provided some insights into the possible
effects of online discussions about both political races and
public service announcements (PSAs). Price and Cappella (2002)
found that online political discussion promoted civic
engagement; 60 groups of citizens engaged monthly in real-time
CMC discussions about issues facing the country and the
ongoing 2000 presidential campaign. Price and Cappella found
that discussion participants recalled more pro and con
arguments over issues than they had held before the
discussions. This change correlated with increases in
participants’ political knowledge. As a result of
participants’ online discussions, attitudes and behaviors were
altered: Those who had engaged in online political discussion

22
were more likely to vote and perform civic duties than
individuals who did not participate in the discussions.
Whether these effects are due in any way to CMC rather than
discussion per se was not addressed (in Walther, et.al., 2011,
p. 24).
What does the term community mean? Conventionally, it
refers to a group of people who live close enough to one
another to interact on a regular basis. More and more people
in our era belong to virtual communities. In traditional
communities, people lived together and had to make compromises
and accommodations to get along. In contrast, we can visit our
virtual communities no matter where we are. We can also tap
out of these communities with a few clicks. We are free to
join communities when we want to and to leave when it is
suits. We need not accommodate people and topics that don’t
interest us. Virtual communities may offer many of the
benefits of community without most of the responsibilities
that go along with belonging to a physical community –
responsibility to adapt to and accommodate others and, most of
all, to remain part of the community.
Cyberspace is a unique environment that affect how and
what we communicate. states that “many people feel they have
more freedom to express themselves on the Internet. It allows
people to say what they want without being easily
identifiable. John Suler (1999) in Julia T. Wood (2008) states
that “on line, people are free to express aspects of
themselves that they wouldn’t in other kinds of encounters.”
Electronic communities have potential to promote narrow-

23
mindedness, because people may join communities that share
their values and views. People who visit only sites, blogs,
and chat rooms that support the perspectives they already have
risk never learning about other perspectives and encountering
useful questioning about their own views. Members of many
virtual communities maintain and police community norms and
ignore or oust anyone whose ideas or style transgress those
norms.
Irwansyah (2012) noted that political leaders send
thousands of messages, called tweets, to millions of people,
who choose to follow them on Twitter. The messages that are
tweeted give a glimpse of how Twitter is influencing
campaigns, governance, and the relationship between political
leaders and the public. Some politicians direct followers to
timely police information, while other politicians interact
with followers to improve government services or share
personal thoughts.
Internet usage has generated a widespread and
controversial debate on its effects on political
participation. The Internet is an interactive medium which
increases contact options extremely efficiently in terms of
time investment and creates a communication-intensive
environment. In addition, the Internet enables the creation
and recreation of “spaces” where discussion and deliberation
of issues of common interest is possible (Karakaya, in
Irwansyah, 2012). Finally, the use of the Internet enables
traditional participation activities, such as signing a
petition or making a donation, to be undertaken more easily

24
and cost-reduced of organizing and coordinating collective
action (Bonchek, in Irwansyah, 2012).
According to the usage of social media for politics, in
2012, 17% of all adults posted links to political stories or
articles on social networking sites, and 19% posted other
types of political content. That is a six-fold increase from
the 3% of adults who posted political stories or links on
these sites in 2008. In 2012, 12% of all adults followed or
make friend a political candidate or other political figure on
a social networking site, and 12% belonged to a group on a
social networking site involved in advancing a political or
social issue. That is a four-fold increase from the 3% of
adults who took part in these behaviors in 2008.1
There is no doubt that social media had a huge impact on
the recent elections. In 2008, there were about 1.5 million
election-related tweets. In 2012, there were 31 million. The
population of people using social media has changed since that
time as well. In 2008, much of social media was dominated by
younger demographics. Now it reflects the population as a
whole. More than half this population engaged in some sort of
election-related social media behavior2. Narnia Bohler-Muller
and Charl van der Merwe (March 2011) report that the 2010/2011
revolutions in Tunisia and Egypt were largely organized,
supported, and driven through the use of social media-based
tools, such as Facebook and Twitter. Social media was used for1 http://elections.firedoglake.com/2013/04/25/is-the-growth-of-social-media-in-politics-driving-issues-like-marriage-and-marijuana/ accessed 11th May 2013.
2 http://thesocialmediamonthly.com/how-social-media-has-changed-politics-its-not-just-tactics/ accessed 11th May 2013.

25
allowing extensive political expression. Calls for socio-
political transformation, then, heard on the streets of Tunis
and Cairo, and echoed around the glob, gaining much
sympathetic support internationally (in Irwansayh, 2012).
Social action depends upon the flow of influence among
individuals and groups in the community through the process of
communication. It is through discussion, criticism,
negotiation, debate, compromise, and special pleading that
opinions are expressed (and decisions made) that will
eventually be marshaled into purposeful public policy.
Individuals also have choices among media channels. What
people seek to gain from a medium may affect how they use that
channel and its message. Jay Blumler and Elihu Katz (1974)
describe the “uses and gratifications” of media to explain why
the same message may affect people differently. People go to
the media with different expectations and demands. One person
may be seeking an explanation for the latest presidential
action, whereas another individual may be searching for some
light comedy to ease the tension of a busy day. A television
news story detailing the president’s activities may provide
useful information to the one viewer, while the other may be
amused or bored, depending on the nature of story. Whether or
not is gratified depends on the uses one expects to make of
the media experience.
Political cognition has taken the study of communication
process a step further, focusing on the active role of
individuals in making sense of political messages. D.A.
Graber, for example, suggests that people process information
26
based on schema for various concepts and objects which they
develop over time and out of their own individual experiences
(Graber, 1988). The more developed the schema, the more likely
the individual is to be able to process complex information on
the topic. Samuel Popkin further argues that people utilize
heuristic “shortcuts” to reason about politics and that even
when people do not remember specific information, they may
have used that information to modify their thinking about
candidate (Popkin, 1991). Both authors show how individual
cognitive activity “tames the information tide”.
Studies of what people learn from political communication
show that the audience’s interest in the topic makes a
difference. W. Russell Neuman, Marion Just and Ann Crigler
(1992) find that people are better informed about issue
accessible to them in their daily lives and are able to learn
more about issues with which they are already familiar. People
who interested in most topics can learn as much as those who
are more cognitively skilled but not as interested.
Other researchers emphasized that individual’s political
ideologies, interests, and sophistication affect what they
comprehend about politics (Neuman 1986, Converse 1964). Neuman
points out that many people are unaware of the political world
in spite of the plenitude of information channels. He argues
that the public can be differentiated based on their level of
sophistication in politics. Shawn Rosenberg also
differentiates individuals, but he does so according to their
level of psychological development. Rosenberg shows that
people at higher levels think about politics in more and more

27
complex ways than people at lower levels (Rosenberg 1988).
Clearly, these differences in the sophistication and
psychological development of individuals affect the meaning
they give to political message.
Although political preference probably does change for
some people during the period of campaign, and some of these
changes may be directly linked to the mass media, it is
possible to argue that long term social, political and
economic change between elections is more significant for
predicting the election result (Negrine, 1994).
The major form of political behavior is political
participation. Political participation can be defines as “the
extent to which citizens use their rights, such as the right to protest, the right of free
speech, the right to vote, to influence or to get involved in political activity”
(Munroe, 2002). Other definition states political
participation as “any activity that shapes, affects, or involves the political
sphere. Political participation ranges from voting to attending a rally to committing
an act of terrorism to sending a letter to a representative.”3
Herbert McClosky defined political participation as:
Those voluntary activities by which members of a societyshare in the selection of rulers and, directly orindirectly, in the formation of public policy. The term“apathy” will refer to a state of withdrawal from, orindifference to, such activities. These activitiestypically include voting, seeking information, discussingand proselytizing, attending meetings, contributingfinancially, and communicating with representatives. Themore “active” forms of participation include formalenrollment in a party, canvassing and registering voters,
3 http://www.sparknotes.com/us-government-and-politics/political-science/political-culture-and-public-opinion/section4.rhtml as accessed by May 11th, 2013
28
speech writing and speechmaking, working in campaigns,and competing for public and party office. We shallexclude from this discussion such involuntary activitiesas paying taxes, serving in the armed forces, andperforming jury duty 4
From the definitions above, political participation can
be sum up as the activities conducted by individual or group
for participating actively in politics hence directly or
indirectly influence the policy. Activity may range from
passively just watching the political debate on television
show to actively vote for a candidate on the Election Day.
Political participation should be done as voluntary
activity, pull up by the motives for doing something for their
environment. It should be done without any pressure from
other, even the ruling party who will act only as facilitator
for the people participation. As to Michael Bratton (2009),
individual’s democratic commitments are linked to various
aspects of political participation. Political behavior seems
to drive political attitudes. Some participation in politics
may range from interest in politics, discuss politics, belong
to voluntary organization, voted in last election, contacted
government official, to protested or demonstrated. The
interest in politics likely relate with the openness of
society interacts with the intensity of political grievances
in determining actual levels of political interest, which in
turn bring the people to engage in political discourse and
discussion, and finally to other activities.
4 http://www.encyclopedia.com/topic/Political_Participation.aspx as accessed by August 30th, 2013

29
Furthermore, Munroe (2002) emphasize that political
participation can be subdivided into two (2) categories, the
conventional political participation and second, the
unconventional political participation. Conventional political
participation takes place within the norms and traditions of a
particular country; therefore, we say it is as a normal,
conventional, and customary activity. Usually it is the less
aggressive of the two, activities that we expect as good
citizens. The best example is the act of voting that occurs
every few years at election time. Others include attending a
political meeting, being a member of a political group or a
political party, volunteering for a political campaign, making
a campaign donation, belongs to activist group, and serving in
public office. People strongly committed to politics are more
likely to participate on a regular basis.
Second, unconventional political participation tends to
move outside the norms, move outside the traditional, and be
more aggressive, more assertive, and may even break the law.
Activities that are legal but often considered inappropriate.
It is also more radical. The best examples are protests and
staging demonstrations that are confrontational rather than
peaceful. Other activities include signing petitions,
supporting boycotts. Young people, students, and those with
grave concerns about a regime’s policies are most likely to
engage in unconventional participation.
Other mentions another type of political participation,
the illegal participation. This type includes the activities
that break the law. Most of the time, people resort to illegal
30
participation only when legal means have failed to create
significant political change. Some examples of illegal
political participation include political assassination,
terrorism, and sabotaging an opponent’s campaign through theft
or vandalism.
Political participation may be influenced by several
factors. Discussion networks characteristics, namely size and
heterogeneity, may have significant impact on political
participation. With regard to size, research consistently
shows that members of larger discussion network tend to more
politically engaged. Frequency of political discourse, number
of network ties, and the extent to which those ties are
likeminded can all affect political participation (Campbell &
Kwak, 2011). The openness of society interacts with the
intensity of political grievances in determining actual levels
of political interest (Bratton, 2009). Interest in politics
usually prompts people to engage in political discourse.
Further this will pull the person to participate actively in
politics.
Nevertheless, the present study examines the influence of
exposure to media on political participation shows that
negative media content leads to political disaffection,
further to political in-activism. Other study also shows that
exposure to political media content –regardless of its tone-
leads to informed and mobilized citizens (Luengo, 2006).

31
CHAPTER III
RESEARCH PROBLEM, OBJECTIVE & OUTCOMES
3.1. Research Problem
In many countries, young people participate less than
older citizens in most formal political process. In Indonesia
case, the number of non-voters, which are dominated by young
people, is increasing from election to another election, 10,21
% in Election 1999, to 23,34 % in Election 2004, and the last
39,10 % in Election 2009 (Sodikin, Amir and Nina Susilo. (2013).
This trend arise a great concern that the number of non-voters
for Election 2014 will be increasing, especially for the
younger generations. For young people, politics seem to be too
formal for involving; some even are trying to refuse of
talking about politics.
Traditionally, mass communication processes have been
conceptualized as one-way-message-transmission from one source
to a large, relatively undifferentiated and anonymous

32
audience. In other side, interpersonal communication processes
involve smaller numbers of participants who exchange messages
designed for, and directed toward, particular others.
Interpersonal communication has been considered as two-way
message exchange between two or more individuals in which
communication strategies are shaped by the instrumental and
relational goals of the individuals involved, and knowledge
about one another’s particular preferences. Katz & Lazarfeld
(1955) state that the manner in which most people form and
change opinions of politics, style, and other cultural issues
is well-known to involve mass media messages and interpersonal
discussions. This face-to-face interaction is less flexible
than social media in that it is place-based even more so
considering individuals must occupy shared space. Individuals
must either make prior arrangements to talk in person or rely
on the chance encounter.
But, social media blogs and other online tools can give
educated young citizens a voice for political activism, an
open channel for direct feedback between government officials
and youth. Social media has enjoyed an exponential increase in
popularity around teenager and young people. Social media has
become a place where the teenager and young people can express
their opinion and feeling overtly. Internet usage has
generated a widespread and controversial debate on its effects
on political participation. Early research (Campbell & Kwak,
2011) suggest that political communication on social
networking sites relate with political participation; a
significant moderating effect for like-mindedness of strong

33
ties, but not for weak ones, on associations between online
and offline political participation. Social media afford
heightened flexibility for discussing politics and public
affairs by allowing users to connect virtually anytime-
anywhere.
Social media afford heightened flexibility for discussing
politics and public affairs by allowing users to connect
virtually anytime-anywhere. Bucy, D’Angelo & Newhagen (in
Mustaqim, et.al., 2006) found that media usage, including the
Internet, encourage political participation rather than
political alienation. Of course, “promoting active citizenship
is a social, not a technological activity”; making aspects of
which one is connected with as important as the medium itself.
A research reported a significant moderating effect for like-
mindedness of strong ties, but not for weak ones, on
associations between online and offline political
participation (Campbell, et al., 2011).
In the past years, social media has enjoyed an
exponential increase in popularity in teenager and young
people. Social media has become a place where the teenager and
young people can express their opinion and feeling overtly.
Early research suggests that political communication on social
networking sites has a relationship with political
participation. The youth incorporated digital media into their
lives at a faster rate than any other generation. All
generation adopt devices and Internet technology, but younger
consumers are Net Natives (Brown, in Irwansyah, 2012).
According to National Census, there will be 19,7 million of

34
early voters for Election 2014, aged between 17-21 years old
(Sodikin, et.al., 2013). They are digital natives. As the
sovereign of social media; they fill the public sphere with
scorching, high-speed, and hasty comment for every attractive
issue; just a moment before moving to other issue abruptly.
Hence, while politics comes to the Internet, new media, and
social media, younger generation have engaged in politics in
interactive media and developed digital democracy (Montgomery,
Nold, in Irwansyah, 2012). It is interesting then to study the
usage of social media by the teenager and young people for
politics.
3.2. Research Objectives & Outcomes
This research is conducted especially to achieve some
purposes, mainly as follow :
a. To identify the content and the usage of social media,
based on pattern of ties and network size for early voter
in interacting for politics.
b. To identify the type of participation that early voters
take apart in politics
c. To identify the role of social medua usage toward political
participation of early voters, especially in Election 2014.
Academically, this research will show the role of social
media as medium for interaction between teenager and young
people in Indonesia. Further, the study will reveal kind of
political activities of teenager and young people when they
take participation politically. The result will enrich
theories and concepts in political communication field.

35
Practically, this research will support the usage of
social media by political candidates and activists in order to
maximize the dissemination of their idea and opinion. Further,
the candidate and activist can increase the empowerment of
social media in maintaining their relationship with their
supporters.
CHAPTER IV
RESEARCH METHOD

36
Based on research problem above, research questions of
this study can be summarized as follow:
1. What kind of social media content and usage the early voters
do in social media, especially for discussing politics?
2. What kind of participation the early voters do for politics?
3. What and how is the relationship between social interaction
through social media and political participation of early
voters?
Considering that question Number 1 and 2 are descriptive,
the research hypothesis for question number 3 for can be
derived as follow:
“Social media usage have a positively relationship toward political participation of
early voters in Election 2014”
H1 : There is a correlation between social media usage
and the political participation of
early voters in election 2014
H0 : There is no correlation between social media usage
and the political participation of
early voters inn election 2014
To answer the previously-stated research questions, there
will be two (2) methods used in this research as follow:
1. To answer the social media content, especially Twitter, data
mining will be used by exploring all the tweets and
discussions in the Twitter. Data mining will be conducted

37
for every month starting from April 2014 until October 2014
(7 months).
2. To answer the social media usage and kind of participation
of early voters, a survey will be conducted. Survey is “a
structured questionnaire given to a sample of a population and designed to elicit
specific information from respondents”5 Survey has been conducted in
6 provinces, based on the total number of voters. The
provinces which have highest total number of voters for
Election 2014 are (1) Jawa Barat, (2) Jawa Timur, and (3)
Jawa Tengah. Combine with 2 other provinces in region, DKI
Jakarta and Banten, there will be 5 provinces as the
location of research. Thus, the cities that will be chosen
are (1) Jakarta, (2) Serang, (3) Bandung, (4) Surabaya, (5)
Di Jogjakarta, and (6) Solo. For each city, questionnaires
have been distributed to third grade (kelas 3) of senior
high school students, both for public and private school.
Number of respondents can be read on the table 4.1.
Table 4.1.Location and Number of Respondents
Frequency
Percent ValidPercent
CumulativePercent
Valid
Bandung 237 23.1 23.1 23.1Jogjakarta
127 12.4 12.4 35.4
Solo 80 7.8 7.8 43.2Serang 79 7.7 7.7 50.9Surabaya
227 22.1 22.1 73.0
Jakarta 277 27.0 27.0 100.0Total 1027 100.0 100.0
5 Malhotra, ibid. p. 179

38
Unit analysis for this research is individual. Usage of
social media will be explained by four-item index; number of
social media account and duration of ownership. Their
frequency in accessing the social media, and activities the do
while they are accessing it. Scaling techniques that will be
used for measuring the social interaction is interval scale.
Political activity will be explained by a two-item index;
online and offline participation. Respondent were asked
whether they had voted in the past presidential election, had
contributed money to a political organizations or candidate,
had worked for a campaign, or had attended a political rally
or meeting (Iyengar, 1991). Interest in politics was tapped with
three questions. Respondents indicated how often they
discussed “politics and public affairs” with people they knew,
how often they “follow what’s going on in government” and how
much attention they “usually give” to news about government
and politics. Political information was defined in issue-
specific terms. That is in any particular experiments,
participant’s information scores reflect information about the
issues.
4 types of involvement in traditional forms of political
participation are (1) attending a political meeting, rally, or
speech, (2) working for a candidate or a party, (3) contacting
a public official or a political party, (4) contributing money
to a candidate or a political party, and (5) voting. Scaling
techniques that will be used for measuring is interval scales.

39
For data analysis, this research will use formula Pearson
to measure the correlation.

40
CHAPTER V
RESULTS ACHIEVED
As discussed before, this study explored the role of
social media toward political participation of early voters in
Election 2014. Thus, the research result will be divided into
three sub-chapter in explaining (1) The social media usage of
early voters in Election 2014, (2) the type of participation
they take apart in politics, and (3) Role of social media
usage toward political participation of early voters in
Election 2014.
As an introduction, there are below tables of
respondents’ profile of religion, gender, monthly pocket money
and money they spent for buying phone credit per month.
Table 5.1.Religion
Frequency
Percent
ValidPercent
CumulativePercent
Valid
No answer
4 .4 .4 .4
Moslem 700 68.2 68.2 68.5Christian
241 23.5 23.5 92.0
Catholic 82 8.0 8.0 100.0Total 1027 100.0 100.0
41
Just to reflect the composition largely, majorly the respondents are Moslem, followed by Christian and Catholic.
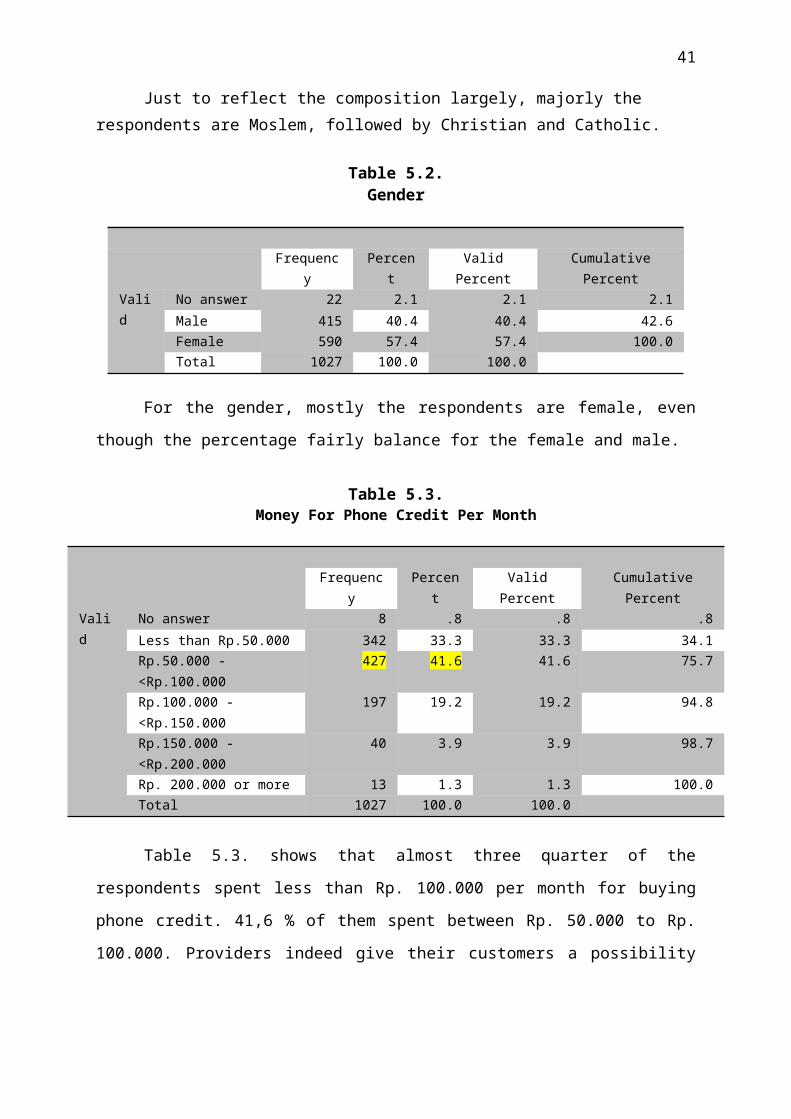
Table 5.2.Gender
Frequency
Percent
ValidPercent
CumulativePercent
Valid
No answer 22 2.1 2.1 2.1Male 415 40.4 40.4 42.6Female 590 57.4 57.4 100.0Total 1027 100.0 100.0
For the gender, mostly the respondents are female, even
though the percentage fairly balance for the female and male.
Table 5.3.Money For Phone Credit Per Month
Frequency
Percent
ValidPercent
CumulativePercent
Valid
No answer 8 .8 .8 .8Less than Rp.50.000 342 33.3 33.3 34.1Rp.50.000 - <Rp.100.000
427 41.6 41.6 75.7
Rp.100.000 - <Rp.150.000
197 19.2 19.2 94.8
Rp.150.000 - <Rp.200.000
40 3.9 3.9 98.7
Rp. 200.000 or more 13 1.3 1.3 100.0Total 1027 100.0 100.0
Table 5.3. shows that almost three quarter of the
respondents spent less than Rp. 100.000 per month for buying
phone credit. 41,6 % of them spent between Rp. 50.000 to Rp.
100.000. Providers indeed give their customers a possibility

42
to enjoy social networking through social media by buying a
credit package as their customers preference; daily, weekly,
or monthly. Respondent then can choose suitable package that
do not harm their monthly money pocket.
Table 5.4.Money Pocket Per Month
Frequency
Percent
ValidPercent
CumulativePercent
Valid
No answer 12 1.2 1.2 1.2less than Rp.250.000 185 18.0 18.0 19.2Rp.250.000 - <Rp.500.000
404 39.3 39.3 58.5
Rp.500.000 - <Rp750.000
220 21.4 21.4 79.9
Rp.750.000 - < Rp.1.000.000
108 10.5 10.5 90.5
Rp.1.000.000 or more 98 9.5 9.5 100.0Total 1027 100.0 100.0
Table 5.4. shows that respondents mostly (39,3%) got Rp.
250.000 – Rp. 500.000 per month for their monthly pocket.
Considering of daily needs, it can be stated that most of the
respondents got adequate money for their daily living.
5.1. Media Social Usage
The first objective of this research is to identify the
content and the usage of social media, based on pattern of
ties and network size for early voter in interacting for
politics. The social media usage will be measured by the

43
number of social media account owned by respondents, duration
of owning, frequency in accessing the account and kind of
activities respondents do while they connected with the social
media.
Table 5.5.Social Media Account Ownership
SocialMedia
Yes No NoAnswer
Total
Account f % f % f % f %Facebook 980 95.
415 1.5 32 3.1 1027 100
Twitter 909 88.5
29 2.8 89 8.7 1027 100
LinkedIn 98 9.5 320 31.2
609 59.3
1027 100
Line 834 81.2
33 3.2 160 15.6
1027 100
YouTube 720 70.1
51 9.0 256 24.9
1027 100
Path 657 64.0
99 9.6 271 26.4
1027 100
Instagram 735 71.6
84 8.2 208 20.3
1027 100
Blog 309 30.1
256 24.9
462 45.0
1027 100
MailingList
108 10.5
300 29.2
619 60.3
1027 100
Others 89 8.7 63 6.1 875 85.2
1027 100
Table 5.5. shows the most owned social media account is
Facebook (95,4%), followed by Twitter (88,5%). As launched in

44
Februari 2004, the number of Facebook account has reached
about more than 600 million person in 2011 (Asean
Intelligence, 2011) and appointed in first position on social
media networking. Compare with Table 2.1. of The Spread of the
Internet, Indonesia have 14,2 % of Facebook penetration. As
with Twitter itself has become a popular social media, too, in
Indonesia.
Other relative newer social media; Line, Path, Instagram,
are getting their roots, too along the youth. Each social
media have its own unique attributes, hence users usually have
several social media account to accommodate their needs and
wants in social networking. Even though respondents’ ownership
on these three social media network relatively less than
Facebook and Twitter, but all media work well together for
facilitating the networking between youth.
The other social media network, Line and MailingList
attracted less users due to its uniqueness as one for
accommodating work and professional relationships. Respondents
have not considered to have an account on both network, yet
around 10% of them considered to starting early in their
professional networking.
Table 5.6.Length of Ownership (Years)
SocialMedia
1 2 3 4 < 4 NoAnswer
Total
Account f % f % f % f % f % f % f %

45
12 1.2
51 5.0
110
10.7
142
13.8
651
63.4
61 5.9
1027
100
Twitter 50 4.9
153
14.9
224
21.8
254
24.7
220
21.4
126
12.3
1027
100
45 4.4
25 2.4
11 1.1
- - - - 946
92.1
1027
100
Line 319
31.1
354
34.5
107
10.4
24 2.3
10 1.0
213
20.7
1027
100
YouTube 102
9.9
140
13.6
83 8.1
55 5.4
78 7.6
569
55.4
1027
100
Path 371
36.1
175
17.0
36 3.5
12 1.2
7 0.7
426
41.5
1027
100
Instagran
374
36.4
206
20.1
72 7.0
17 1.7
12 1.2
346
33.7
1027
100
Blog 66 6.4
56 5.5
40 3.9
50 4.9
92 9.0
723
70.4
1027
100
MailingList
10 1.0
11 1.1
8 0.8
8 0.8
71 6.9
919
89.5
1027
100
Others 40 3.9
22 2.1
8 0.8
7 0.7
12 1.2
938
91.3
1027
100
Table 5.6. shows that most respondents (63.4%) own
Facebook longer than other social media. For Twitter, the
duration of ownership rather varied from 3 years, 4 years and
more than 4 years. Due to the late launching, newer social
media are owned less than the other two, only 1 or 2 years
before. Most of the respondents give no answer for the
duration since they might not aware of the time when they
engaged with the social media network.

46
Table 5.7.Frequency of Accessing the Account
Frequencyto Access
Never VeryRarely
Sometimes
AlmostEveryda
y
Everyday
Regularly
NoAnswer
Total
TheAccount
f % f % f % f % f % f % f %
Facebook 95 9.3 - - 794 77.3
69 6.7 40 3.9 29 2.8 1027
100
Twitter 64 6.2 231
22.5
485 47.2
130
12.7
56 5.5 61 5.9 1027
100
LinkedIn 339
33.0
23 2.2 8 0.8 - - 1 0.1 656
63.9
1027
100
Line 42 4.1 76 7.4 218 21.2
164
16.0
331
32.2
196
19.1
1027
100
YouTube 62 6.0 102
9.9 362 35.2
174
16.9
45 4.4 282
27.5
1027
100
Path 118
11.5
59 5.7 188 18.3
195
19.0
186
18.1
281
27.4
1027
100
Instagran 101
9.8 70 6.8 191 18.6
232
22.6
221
21.5
212
20.6
1027
100
Blog 253
24.6
160
15.6
114 11.1
14 1.4 12 1.2 474
46.2
1027
100
MailingList
10 1.0 11 1.1 8 0.8 8 0.8 71 6.9 919
89.5
1027
100
Others 51 5.0 4 0.4 23 2.2 25 2.4 63 6.1 861
83.8
1027
100

47
For accessing the social media network, the highest
percentage (77,3%) goes to Facebook, but only sometime> for
everyday accessing, most respondents (32,2%) use Line. For
other social media network, the frequency of accessing rather
varied.

48
Table 5.8.Activity Doing After Being Exposed to Social Media Content
No.
Never VeryRarely
Sometimes
AlmostEveryday
Everyday
Regularly
NoAnswer
Total
f % f % f % f % f % f % f %1 If it is news sharing, I
will look for officialsource online
109
10.6
163
15.9
476
46.3
185
18.0
66 6.4
28
2.7
1027
100
2 Looking for deeperexplanation in printedand electronic media
61 5.9
119
11.6
521
50.7
239
23.3
60 5.8
27
2.6
1027
100
3 I always follow then share political news through my account
250
24.3
339
33.0
337
32.8
57 5.6
17 1.7
27
2.6
1027
100
4 I only look for an interesting news and discussion of politics
95 9.3
125
12.2
468
45.6
239
23.3
73 7.1
27
2.6
1027
100
5 I discuss the political news with my friends andfollowers
342
33.3
329
32.0
261
25.4
52 5.1
16 1.6
27
2.6
1027
100
6 I always follow the political comments sharing by the experts
336
32.7
295
28.7
283
27.6
68 6.6
18 1.8
27
2.6
1027
100

49
7 I consider the expert comment for decision making
256
24.9
251
24.4
355
34.6
107
10.4
28 2.7
30
2.9
1027
100
8 I discuss with my familyin decision making, ex. Vote for president
129
12.6
154
15.0
448
43.6
201
19.6
66 6.4
29
2.8
1027
100
9 I debate the other for their opposite opinion
153
14.9
212
20.6
436
42.5
166
16.2
33 3.2
27
2.6
1027
100
10 I discuss with my friends in decision making, ex. Vote for president
164
16.0
206
20.1
436
42.5
148
14.4
46 4.5
27
2.6
1027
100

50
Table 5.8 shows the activities done by respondents while
they connected with social media. When be exposed by a
political news, only 50.7 % respondent claimed for looking
deeper explanation in other media, both printed and
electronic. Less than half, 46,3% looked for an official
source and only 32,8% shared the information with their
friends or followers.
Less than half of the respondents, 45.6 % only look for
interesting political news or discussion. They do not discuss
the political news with their friends and followers. They do
not follow any expert comment shared by others.
The favorable activities respondents sometimes do discuss
with their family (43.6%) and their friends (42.5 %) when they
have to make a decision toward politics. Sometimes they do
debate whenever others have opposite opinion.
Respondents’ answer to 20 questions then are added for
calculating the score of respondents’ social media usage. The
highest expected value is 100. The observed value then be
categorized unto 3 category; Low - Moderate – High with the
score of each category is as follow :
Less than 45 = Low
46 – less than 74 = Moderate
74 – 100 = High
The scale then converted from Interval to Ordinal, Low =
1, Moderate = 2, High = 3. The category can be read in the
table 5.9.

51
Table 5.9.Category of Social Media Usage
Frequency
Percent
ValidPercent
CumulativePercent
Valid
Low 253 24.6 24.6 24.6Moderate
600 58.4 58.4 83.1
High 174 16.9 16.9 100.0Total 1027 100.0 100.0
Table 5.9 shows that respondent’s social media usages
are on Moderate category, means they have been connected with
the social media but only use it moderately or whenever they
available to access it.
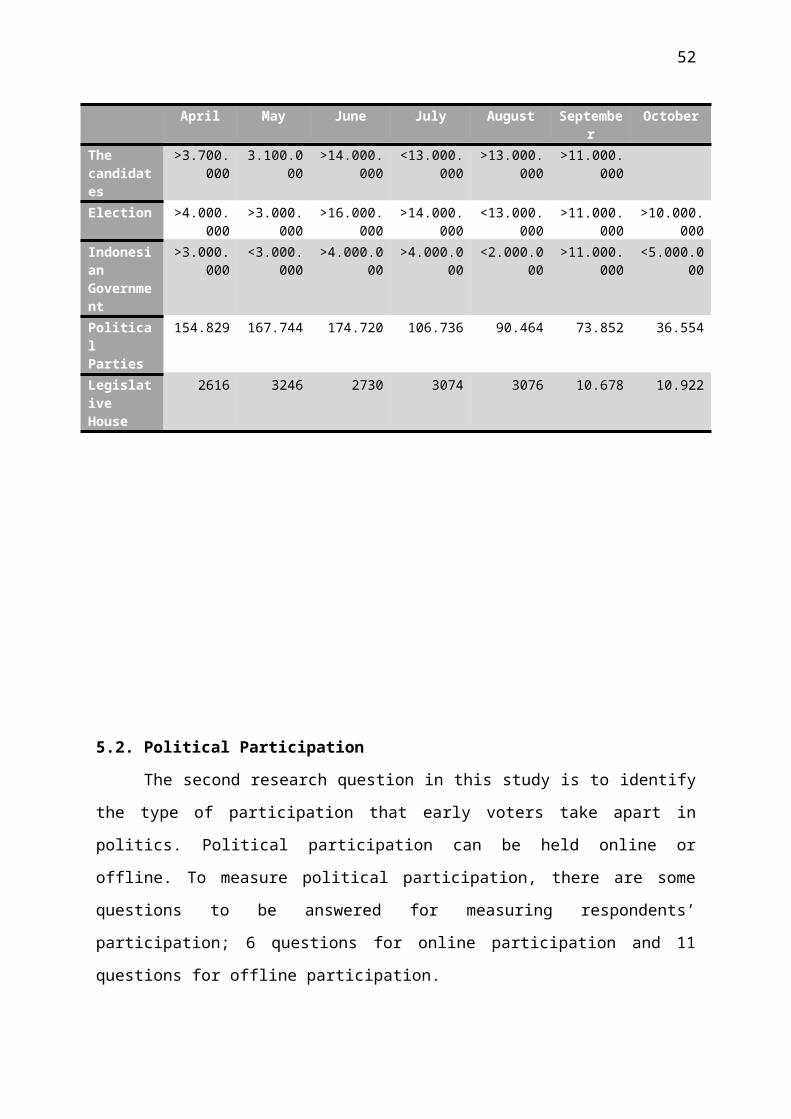
Second research question in this research is to identify
the content that respondents read or are exposed mostly in
social media. Due to some difficulties to explore the content
in closed network, this research will explore the contents
that are broadcasted in open social media, such as Twitter.
Data mining was conducted for 7 months, from April – October
2014 when Indonesia has 2 times of election; Legislative
election in April and Presidency election in July. The
trending topics pooled on some issue, the mostly commented and
shared are tweets on the candidate (Prabowo and Jokowi), the
election process, Indonesian government, political parties,
and legislative house. Total data can be read in the table
5.10.
Table 5.10.Content in Social Media
52
April May June July August September
October
The candidates
>3.700.000
3.100.000
>14.000.000
<13.000.000
>13.000.000
>11.000.000
Election >4.000.000
>3.000.000
>16.000.000
>14.000.000
<13.000.000
>11.000.000
>10.000.000
Indonesian Government
>3.000.000
<3.000.000
>4.000.000
>4.000.000
<2.000.000
>11.000.000
<5.000.000
Political Parties
154.829 167.744 174.720 106.736 90.464 73.852 36.554
Legislative House
2616 3246 2730 3074 3076 10.678 10.922
5.2. Political Participation
The second research question in this study is to identify
the type of participation that early voters take apart in
politics. Political participation can be held online or
offline. To measure political participation, there are some
questions to be answered for measuring respondents’
participation; 6 questions for online participation and 11
questions for offline participation.

53
Table 5.11 shows data regarding of the online activities
done by respondents while connected with social media in
Election 2014. In social media, people usually do kinds of
activities, such as mentioning, forwarding, liking, or
donating online for candidate or political party activity.
For 6 activities stated in Table 5.11, the highest
percentage (39.3 %) goes to “give a like sign to political
information or news”, followed by (35.6 %) for “liking a
political comment”. Giving a like sign to information, news or
comments become an easier way for respondents to do their
participation in politics.
Other activities such as mentioning an information from
expert, forwarding the news and information to group or
friends’ account, commenting a political information and news,
or donating electronically to political events do not become a
participation for most respondents, since their highest
responses to the question are never (around 40% or more).
Respondents’ answer to 6 questions then are added for
calculating the score of respondents’ online political
participation. The highest expected value is 30. The observed
value then be categorized unto 3 category; Low - Moderate –
High with the score of each category is as follow :
Less than 14 = Low
15 – less than 23 = Moderate
23 – 30 = High
The scale then converted from Interval to Ordinal, Low =
1, Moderate = 2, High = 3. The category can be read in table
5.12.

54

55
Table 5.11.Online Participation
No.
Online Participation Never VeryRarely
Sometimes
AlmostEveryda
y
Everyday
Regularly
NoAnswer
Total
f % f % f % f % f % f % f %1 Mentioning an information from expert 40
639.5
263
25.6
267 26.0
39 3.8 15 1.5 37
3.6
1027
100
2 Forwarding the news and information to group or friends’ account
373
36.3
272
26.5
288 28.0
50 4.9 9 0.9 35
3.4
1027
100
3 Liking a political information or news 219
21.3
208
20.3
404 39.3
122
11.9
39 3.8 35
3.4
1027
100
4 Commenting a political information or news in website,group or account
379
36.9
259
25.2
288 28.0
48 4.7 14 1.4 39
3.8
1027
100
5 Liking a political comment from friends 270
26.3
248
24.1
366 35.6
78 7.6 31 3.0 34
3.3
1027
100
6 Donating online to candidate or political partyactivity
617
60.1
185
18.0
157 15.3
20 1.9 10 1.0 38
3.7
1027
100

56

Table 5.12.Online Participation
Frequency
Percent
ValidPercent
CumulativePercent
Valid
Low 704 68.5 68.5 68.5Moderate 301 29.3 29.3 97.9High 22 2.1 2.1 100.0Total 1027 100.0 100.0
Table 5.12 shows that for online political participation,
the category is low (68.5%), means that respondent have not
put their political action as needed for become a good
citizen.
Table 5.13.Offline Participation
No.
Yes Never NoAnswer
Total
f % f % f % f %1 Being a volunteer in campaign - - 46 4.5 98
195.5 102
7100
2 Being a member of success team 34 3.3 827
80.5
166
16.2 1027
100
3 Attending a political meeting 12 1.2 843
82.1
172
16.7 1027
100
4 Participating in campaign 74 7.2 789
76.8
164
16.0 1027
100
5 Being a member of political party or organization
15 1.5 840
81.8
172
16.7 1027
100
6 Donating to a candidate 24 2.3 836
81.4
167
16.3 1027
100
7 Donating for political party 28 2.7 835
81.3
164
16.0 1027
100
8 Sharing information about political events
498
48.5
397
38.7
132
12.9 1027
100
9 Voting for legislative member (DPR, DPRD, DPD)
276
26.9
614
59.8
137
13.3 1027
100
10 Voting for president 45 44. 45 44. 11 11.5 102 10

6 4 3 1 8 7 011 Put the sticker of candidate or party
at house or car159
15.5
734
71.5
134
13.0 1027
100
Respondents only do sharing information about political
events (48.5%) and voting for the president (44.4%). Other
activities in offline political participation, such as being a
volunteer in campaign, being a member of success team,
attending a political meeting or even became political member,
are not conducted by the respondents. Few respondents (15.5%)
do a little action by putting the sticker of candidate or
party at house or car.
Respondents’ answer to 11 questions then are added for
calculating the score of respondents’ offline political
participation. The highest expected value is 33. The observed
value then be categorized unto 3 category; Low - Moderate –
High with the score of each category is as follow :
Less than 18 = Low
19 – less than 27 = Moderate
27 – 33 = High
The scale then converted from Interval to Ordinal, Low =
1, Moderate = 2, High = 3. The category can be read in the
table 5.14.
Table 5.14.Category of Offline Participation
Frequency
Percent ValidPercent
Cumulative Percent
Valid
Low 983 95.7 95.7 95.7Moderate 39 3.8 3.8 99.5

High 5 .5 .5 100.0Total 1027 100.0 100.0
For offline political participation, the category is low
(95.7%), means that respondents took less active action in
politics.
Respondents’ answer to all 17 questions for political
participation then are added for calculating the score of
respondents’ political participation. The highest expected
value is 63. The observed value then be categorized unto 3
category; Low - Moderate – High with the score of each
category is as follow :
Less than 33 = Low
33 – less than 49 = Moderate
49 – 63 = High
The scale then converted from Interval to Ordinal, Low =
1, Moderate = 2, High = 3. The category can be read in the
table 5.15.
Table 5.15.Category of Political Participation
Frequency Percent ValidPercent
CumulativePercent
Valid Low 905 88.1 88.1 88.1Moderate
114 11.1 11.1 99.2
High 8 .8 .8 100.0Total 1027 100.0 100.0
Overall, the political participation of early voters in
Election 2014 can be categorized as low (88.1%). It means that
most of the respondents do not take apart in politics.

5.3. Correlation between Social Media Usage and Political
Participation
This research aims to measure the correlation between
social media usage and political participation. Hypothesis for
question number 3 for can be derived as follow:
“Social media usage have a positively relationship toward political participation of
early voters in Election 2014”
H1 : There is a correlation between social media usage
and the political participation of
early voters in election 2014
H0 : There is no correlation between social media usage
and the political participation of
early voters inn election 2014
Before measure the correlation, the reliability of data
should be analyzed first by using formula alpha from Cronbach.
The results are presented on Table 5.16.
Table 5.16.Reliability Test
Cronbach'sAlpha
N ofItems
.907 57
Scale StatisticsMean Variance Std.
DeviationN ofItems
92.68 598.484 24.464 57
Case Processing SummaryN %
Cases Valid 1026 99.9

Excludeda 1 .1Total 1027 100.0
a. Listwise deletion based on all variables in the procedure.
Item-Total StatisticsScale Meanif ItemDeleted
ScaleVariance ifItem Deleted
CorrectedItem-TotalCorrelation
Cronbach'sAlpha if
Item DeletedSocial Media Account - Facebook
90.76 594.795 .199 .906
Years of Ownership - Facebook
88.53 577.605 .280 .906
Frequency of Accessing - Facebook
90.58 593.652 .091 .907
Social Media Account - Twitter
90.88 587.239 .389 .905
Years of Ownership - Twitter
89.62 560.493 .468 .904
Frequency of Accessing - Twitter
89.98 581.801 .283 .906
Social Media Account - LinkedIn
92.18 588.884 .284 .906
Years of Ownership - LinkedIn
92.56 594.842 .149 .906
Frequency of Accessing - LinkedIn
92.28 588.709 .327 .906
Social Media Account - Line
91.03 584.735 .372 .905
Years of Ownership - Line
91.23 577.913 .380 .905
Frequency of Accessing - Line
89.61 563.982 .355 .906
Social Media Account - YouTube
91.23 579.968 .427 .905
Years of Ownership - YouTube
91.47 566.058 .383 .905

Frequency of Accessing - YouTube
90.47 564.216 .419 .905
Social Media Account - Path
91.31 577.189 .489 .904
Years of Ownership - Path
91.80 574.322 .503 .904
Frequency of Accessing - Path
90.24 553.836 .460 .904
Social Media Account - Instagram
91.17 579.541 .469 .904
Years of Ownership - Instagram
91.58 574.456 .446 .904
Frequency of Accessing - Instagram
89.91 559.807 .407 .905
Social Media Account - Blog
91.83 578.588 .467 .904
Years of Ownership - Blog
91.75 564.791 .390 .905
Frequency of Accessing - Blog
91.68 573.744 .416 .904
Social Media Account - MailingList
92.18 586.139 .361 .905
Years of Ownership - MailingList
92.25 580.555 .250 .906
Frequency of Accessing - MailingList
91.96 578.368 .337 .905
Social Media Account - Others
92.45 592.587 .191 .906
Years of Ownership - Others
92.49 590.406 .207 .906
Frerquency of Accessing - Others
92.15 584.197 .185 .907
Activity-1 89.83 568.910 .532 .903Activity-2 89.65 571.846 .520 .903Activity-3 90.49 574.110 .485 .904Activity-4 89.69 571.936 .474 .904Activity-5 90.67 573.110 .499 .904Activity-6 90.60 573.676 .466 .904Activity-7 90.36 571.872 .471 .904Activity-8 89.85 570.359 .486 .904Activity-9 90.04 573.669 .450 .904Activity-10 90.05 571.069 .486 .904

Online Participation - 1
90.77 571.000 .532 .903
Online Participation - 2
90.71 571.390 .530 .903
Online Participation - 3
90.22 568.375 .520 .903
Online Participation - 4
90.71 570.948 .524 .903
Online Participation - 5
90.41 569.150 .525 .903
Online Participation - 6
91.14 580.233 .389 .905
Offline Participation- 1
92.64 597.166 .126 .907
Offline Participation- 2
91.78 589.404 .339 .906
Offline Participation- 3
91.83 590.951 .343 .906
Offline Participation- 4
91.70 590.078 .245 .906
Offline Participation- 5
91.82 590.549 .349 .906
Offline Participation- 6
91.80 591.021 .301 .906
Offline Participation- 7
91.79 590.838 .299 .906
Offline Participation- 8
90.84 578.310 .335 .905
Offline Participation- 9
91.28 584.641 .259 .906
Offline Participation- 10
90.91 584.297 .234 .906
Offline Participation- 11
91.50 589.762 .194 .906
For reliability test, only 57 out of 62 questions be
analyzed due to the significance of the question for the study
itself. The analysis shows that all 57 questions have score
above 0.9, means that all question reliable and can be used
for measuring the correlation.

Table 5.17Correlation Test
SocialMediaUsage
PoliticalParticipat
ionSocial Media Usage
Pearson Correlation
1 .423**
Sig. (2-tailed) .000N 1027 1027
Political Participation
Pearson Correlation
.423** 1
Sig. (2-tailed) .000N 1027 1027
**. Correlation is significant at the 0.01 level (2-tailed).
This research use formula Pearson for measuring the
correlation since the data used is interval. Table above
shows that with total sample 1027, alpha score is o.ooo means
significant at the 0.01 level (2-tailed). Correlation can be
accepted with coefficient of correlation is 0.423 or moderate.
It means that only 42.3% of the political participation can be
influenced by social media usage, the rest is influenced by
other factors.

CHAPTER VI
PLAN FOR NEXT STAGE OF RESEARCH
Based on current results and progress, there are two (2)
ways of action needed for following up this research. There
are:
1. In the case of social media usage variable, the dimension
can be extended to the way of respondents connected with
social media, in term of hardware and its utility.
2. In the term of data analysis techniques, it will be good for
next stage to analysis it by using Path Analysis for
Sequential Equation Model, thus a modeling of social media
networking can be developed.

CHAPTER VII
CONCLUSION AND RECOMMENDATION
7.1. Conclusion
Based on this research accomplishment, there are some
conclusions that can be noted as follow :
1. The social media usages are on Moderate category, means they
have been connected with the social media but only use it
moderately or whenever they available to access it. Facebook
and Twitter become two most popular and longer social media
network owned by early voters, however they tend to connect
more on newer social media network such as Line, Path and
Instagram. Most of the respondents have more than one
account to accommodate their needs in maintaining their
relationship and networking. While they are connecting with
a social media and be exposed by political information, only
half of them are doing something actively, such as looking
deeper explanation in other source or going to the official

source. Mostly do not discuss the political news with their
friends and followers. They do not follow any expert comment
shared by others. However, half of them admit for having
discussion with their family and/or friends when they have
to make a decision toward politics.
2. The political participation of early voters in Election 2014
can be categorized as low. It means that most of the
respondents do not take apart in politics, online and
offline. Giving a like sign on information, news, or
comments become an easier way to participate online-ly in
politics. Offline, young voters only do sharing information
about political events and voting for the president.
3. Research results show that there is a slightly weak
correlation between social media usage and political
participation. Correlation can be accepted with coefficient
of correlation is 0.423 or moderate. It means that only
42.3% of the political participation can be influenced by
social media usage, the rest is influenced by other factors.
7.2. Recommendations
Based on this research results, there are some
recommendations can be noted as follow :
1. it is strongly recommended to have further research for
studying the other factors which influence the role of
social media toward political participation.
2. Since the political participation of early voters in
Election 2014 is very low, for the Election in the future,
it is strongly recommended for every parties involved with
political issue to empower the social media for attracting

youth to participate more by provide them with attractive
message about politics.
REFERENCES

Abidin, Indira. (2013). “A New Style of PoliticalCommunication; Engaging With the People of Indonesia”,http://www.ipra.org/itl/03/2013/a-new-style-of-political-communications-engaging-with-the-people-of-indonesia
Alexander, Alison & Jarice Hanson, (2001), Taking Sides;Clashing Views on Controversial Issues in Mass Media andSociety, sixth edition, USA : McGraw-Hill.
Arifin, Anwar. (2003). Tujuan Komunikasi Politik. Jakarta :Lembaga Pendidikan Kader (LPK) DPP Partai Golkar.
Bittner, John R. Mass Communication; an Introduction. 5th
edition. USA : Prentice Hall.
Bratton, Michael. (2009). “Democratic Attitudes and PoliticalParticipation: an Exploratory Comparison across WorldRegions”. Paper prepared for the Congress of theInternational Political Science Association, Santiago,Chile.
Budiardjo, Miriam. (1998). Dasar-Dasar Ilmu Politik. Jakarta :PT. Gramedia Pustaka Utama.
Budiharsono, Suyuti. (2003). Politik Komunikasi. Jakarta : PT.Grasindo.
Campbell, Scott W. & Nojin Kwak. (2011). “Political Involvement in‘Mobilized’ Society: The Interactive Relationships among MobileCommunication, Network Characteristics, and Political Participation”, inJournal of Communication 61 (2011) 1005-1024 @2011International Communication Association.
Chebib, Nadine Kassem & Rabia Minatullah Sohail (2011). “TheReasons Social Media Contributed to the 2011 Egyptian Revolution”.International Journal of Business Research and Management(IJBRM). Volume (2) : Issue (3), 2011.
Crigler, Ann N. editor. (1998). The Psychology of PoliticalCommunication. USA : University of Michigan Press.

Denis, Everette E. & Melvin DeFleur. (2010). UnderstandingMedia in the Digital Age. USA : Pearson Education. Inc.
Graber, Doris A. “Whiter Research on the Psychology of PoliticalCommunication?”. In Crigler, Ann N. editor. (1998). ThePsychology of Political Communication. USA : Universityof Michigan Press.
Hamid, Usman. (2013). “Minat Politik Terbelah: PartisipasiPolitik Anak Muda Berpotensi Lewat Media Sosial”,http://m.facebook.com/notes/changeorg/minat-politik-terbelah-partisipasi-partisipasi-politik-nak-muda-berpotensi-lewat-media-sosial, August 5th, 2013, asaccessed by August 23rd, 2013.
Hartshorn, Sarah. (2010). 5 Differences Between Social Mediaand Social Networking.http://socialmediatoday.com/SMC/194754, as accessed bySept 17th, 2013.
Irwansyah. (2012). “Social Media and Political Participation: Youth Activists’Perspective” in Communicare: Journal of CommunicationStudies. Vol. 5 No. 2 July – December 2012.
Iyengar, Shanto. (1991). Is Anyone Responsible ? HowTelevision Frames Political issues. USA : The Universityof Chicago Press.
Johnston, Larry. (2009). Politics: an Introduction to theModern Democratic State. Canada : University of TorontoPress.
Joseph B. Walther, et.al. (2011), “Interaction of Interpersonal, Peer,and Media Influence Source Online: A research Agenda for TechnologicalConvergence”, in A Networked Self: Identity, Community andCulture on Social Network Sites, edited by ZiziPapacharissi. New York : Routledge.
Just, Marion, et.al. “Cognitive and Affective Dimensions of PoliticalConceptualization”, in Crigler, Ann N. editor. (1998). ThePsychology of Political Communication. USA : Universityof Michigan Press.

Lim, Merlyna. (2012). “Social Media and Political Mobilization” in TheIndonesia Journal of Leadership. Policy and World AffairsStrategic Review. April-June 2012/Volume 2/Number 2, p.52-60.
Luengo, Oscar Garefa. (2006). “E-activism: New Media &Political Participation in Europe”. Journal CONfines 2/4Agosto-Diciembre 2006, ISSN : 1870 – 3569.http://web2.mty.itesm.mx/temporal/confines/articulos4/OLuengo.pdf, as accessed by October 31th, 2013.
Mayfield, Antony. (2008). What is Social Media. E-book fromICrossing.co.uk as accessed by October 4th, 2013.
Malhotra, Naresh K. (1999). Marketing Research; an AppliedOrientation. New Jersey : Prentice Hall.
McNair, Brian. (2007). An Introduction to PoliticalCommunication, fourth edition. London : Routledge.
Munroe, Trevor. (2002). An Introduction to Politics: Lecturesfor First Year Students. Jamaica : Stephenson’s LithoPress.
Mustaqim, Asrul, et.al. (2006). “Hubungan Penggunaan Mediadan Partisipasi Politik” in Jurnal IISIP, Juli 2006,Jakarta, p. 89-106.
Negrine, Ralph. (1994). Politics and the Mass Media inBritain. Second edition. London : Routledge.
Nimmo, Dan. (2000). Komunikasi Politik : Khalayak dan Efek,translated by Tjun Surjaman. Bandung : PT. RemajaRosdakarya.
Parmalee, John H. & Shannon L. Bichard, (2012). Politics andthe Twitter Revolution; How Tweets Influence theRelationship Between Political Leaders and the Public.United Kingdom : Lexington Books.
Reinard, John C. (2008). Introduction to CommunicationResearch, fourth edition. New York : McGraw-Hill HigherEducation.

Rizal, Yose. (2013). Aktor Politik Wajib Manfaatkan MediaSosial, http://ugm.ac.id/id/berita/7884-aktor.politik.wajib.manfatkan.media.sosial. June 7th,2013, as accessed by August 23rd, 2013.
Rodee, Carlton Clymer , et.al., (1976). Introduction toPolitical Science, third edition. USA: McGraw Hill BookCompany.
Silverblatt, Art. (1995). Media Literacy: Keys to InterpretingMedia Messages. USA: Greenwood Publishing Group.
Sodikin, Amir and Wisnu Nugroho (2013). “Demokrasi Era Digital:Mengejar Generasi Pedas, Lekas, dan Bergegas”, in Kompas Daily,edition Friday, October 25th, 2013, p. 54.
Stokes, Jane. (2003), How to do Media and Cultural Studies,London : Sage Publications.
Wasesa, Silih Agung. (2013). “Aktor Politik Wajib ManfaatkanMedia Sosial”. http://ugm.ac.id/id/berita/7884-aktor.politik.wajib.manfatkan.media.sosial. June 7th,2013, as accessed by August 23rd, 2013.
Wigmore, Ivy. (2012). “What is Social Media?”,http://whatis.techtarget.com/definition/social-media, asaccessed on September 12th, 2013.
Wilson, Stan Le Roy, (1995). Mass Media/Mass Culture; anIntroduction, third edition, USA : McGraw-Hill.
Wood, Julia T., (2008). Communication Mosaics; an Introductionto the Field of Communication, USA : Thomson Wadsworth.
Other References
http://elections.firedoglake.com/2013/04/25/is-the-growth-of-social-media-in-politics-driving-issues-like-marriage-and-marijuana/ as accessed 11th May 2013.
http://thesocialmediamonthly.com/how-social-media-has-changed-politics-its-not-just-tactics/ as accessed 11th May 2013.

http://www.sparknotes.com/us-government-and-politics/political-science/political-culture-and-public-opinion/section4.rhtml as accessed by May 11th, 2013
“KPU Diminta Edukasi Pemilih Pemula”, http://nasional.kompas.com/read/2013/05/31/07221049/twitter.com May 31, 2013 as accessed June 3, 2013

ATTACHMENT 1 – QUESTIONNAIRE
RESEARCH QUESTIONNAIRES
Regards,Right now we just conducting a research, funding by
Central Research Fund – Swiss German University. The title ofthis research is “Role of Social Media Usage toward PoliticalParticipation of Early Voters in Election 2014.”
Questionnaires will be distributed in 6 cities inIndonesia, especially for SMU students as early voters inElection 2014. There is no right or wrong answers in thisquestionnaire, hence I expect you to give the answertruthfully and represent your own opinion. All answers only beanalyzed for the objectives of this research only. Thank youfor participating.
Jakarta, Juni 2014Loina Lalolo Krina Perangin-angin, S.Sos., M.Si
Ketua Jurusan Departemen Ilmu Komunikasi – Swiss GermanUniversity
EduTown BSDCity, Tangerang 15339
Guideliness :Please answer all questions. For open questions, fill in theavailable blank space. Others, please give (x) at theappointed letter that represent your opinion.
Provinces ............................................ City ......................................
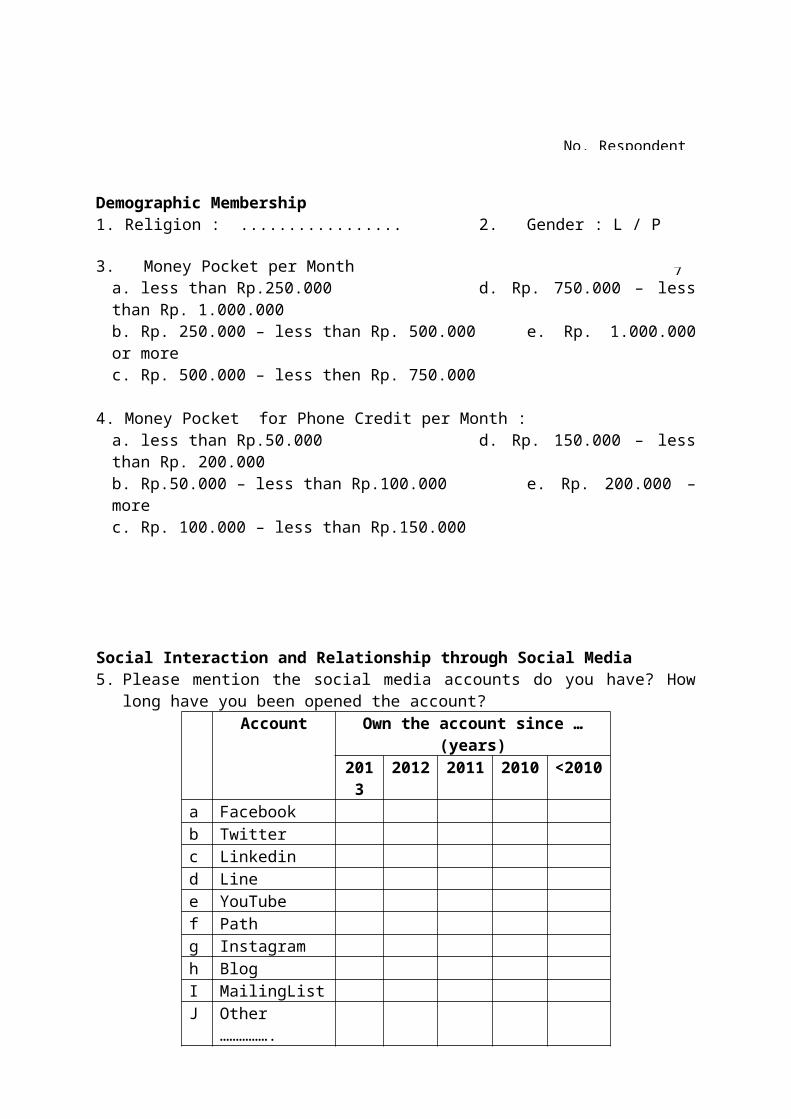
7
Demographic Membership1. Religion : ................. 2. Gender : L / P
3. Money Pocket per Montha. less than Rp.250.000 d. Rp. 750.000 – lessthan Rp. 1.000.000b. Rp. 250.000 – less than Rp. 500.000 e. Rp. 1.000.000or morec. Rp. 500.000 – less then Rp. 750.000
4. Money Pocket for Phone Credit per Month :a. less than Rp.50.000 d. Rp. 150.000 – lessthan Rp. 200.000b. Rp.50.000 – less than Rp.100.000 e. Rp. 200.000 –morec. Rp. 100.000 – less than Rp.150.000
Social Interaction and Relationship through Social Media5. Please mention the social media accounts do you have? How
long have you been opened the account? Account Own the account since …
(years)2013
2012 2011 2010 <2010
a Facebook b Twitterc Linkedind Linee YouTubef Pathg Instagramh BlogI MailingListJ Other
…………….
No. Respondent

6. How frequent are you accessing the account ? Account Frequency of Accessing
Never VeryRarely
Sometimes
AlmostEveryday
Everyday Regularly
a Facebook b Twitterc Linkedind Linee YouTubef Pathg Instagramh BlogI MailingLi
stJ Other
…………
7.. What do you do after reading a political issue di social media ?
Never
VeryRarel
y
Sometimes
AlmostEveryd
ay
Everyday Regularly
a If it is news sharing, I will lookfor official source online
b Looking for deeper explanation inprinted and electronic media
c I always follow then share political news through my account
d I only look for an interesting newsand discussion of politics
e I discuss the political news with my friends and followers
f I always follow the political comments sharing by the experts
g I consider the expert comment for decision making
h I discuss with my family in decision making, ex. Vote for president
i I discuss with my friends in decision making, ex. Vote for president

Online Participation8. From activities below, which one do you do with social
media in Election 2014?
Online PoliticalParticipation
Never VeryRarely
Sometimes
AlmostEveryda
y
Everyday Regularly
a Mentioning an information from expert
b Forwarding the news and information to group or friends’ account
c Liking a political information or news
d Commenting a politicalinformation or news inwebsite, group or account
e Liking a political commentf Donating for a politicalevent or candidate
Offline Participation9. From activities below, which one do you do in Election 2014?
Offline Political participation Yes Doubt Noa Being a volunteer in campaignb Being a member of success teamc Attending a political meetingd Participating in campaigne Being a member of political party or organization
f Donating to a candidateg Donating for political partyh Sharing information about political eventsi Voting for legislative member (DPR, DPRD, DPD)
j Voting for presidentk Put the sticker of candidate or party at house or car

Attachment 2 – Log Book
DATE TIME PLACE ACTIVITY PERSON HOURSAPRIL
18 13-15 SGU First Meeting - Coordinationand job description
LoinaAlvaAndrew
222
15-17 SGU Questionnaire drafting Loina 225 13-17 SGU Questionnaire developing Loina
Andrew44
28 13-17 SGU Finishing the questionnaire LoinaAndrew
22
MAY2 Fund Transfer from SGU Loina7 16-18 SGU Constructing the code for
data miningLoinaAlva
22
9 10-16 SMAN 58 Jak-Tim
Pre-Testing the questionnaire
LoinaAndrew
66
14 16-18 SGU Constructing the code for data mining
LoinaAlva
22
16 09-17 SGU Data input for Pre-testing the questionnaire
LoinaAndrew
88
21 16-18 SGU Constructing the process of data mining from Twitter
LoinaAlva
22
23 09-17 SGU Processing and Analyzing Result for Pre-test
LoinaAndrew
88
28 16-18 SGU Constructing the process of data mining from Twitter
LoinaAlva
22
30 09-17 SGU Coding Book Developing LoinaAndrew
88
JUNE4 16-18 SGU Finishing the code Loina 2

construction for data mining Alva 25 07-10 SMAN 14 -
JaktimMeeting with the Principal for distribution permission and mechanism of the questionnaire
Loina 5
6 07-10 SMAN 88 Jak-Tim
Meeting with the Principal for distribution permission and mechanism of the questionnaire
Loina 5
13 07-17 SMAN 2 Serang
Meeting with the Principal for distribution permission and mechanism of the questionnaire
Loina 10
22 9-17 SGU Contacting Principal of someSchools in SurabayaFinishing the questionnaire
Loina 8
23-24 9-17 Alva’s Data Mining for April - May Alva 1626 7-17 SMUN 3 &
SMUN 5, SMK YahyaBandung
Meeting with the Principal for distribution permission and mechanism of the questionnaire
10
27 7-17 SMK Taruna Bakti & SMA Aloysius Bandung
Meeting with the Principal for distribution permission and mechanism of the questionnaire
10
30 9-17 SGU Contacting Principal of someSchools in Jogja
Loina 8
JULY 18 9-17 SGU Contacting Principal of some
Schools in SemarangLoina 8
25 9-17 SGU Contacting Principal of someSchools in Semarang
Loina 8
AUGUST22 7-17 SMU 3 & 5
BandungQuestionnaire distribution Loina 10
26 7-10 SMU 14 Jakarta
Questionnaire distribution Loina 6
27 7-10 SMU 88 Jakarta
Questionnaire distribution Loina 6
28-30 9-17 SGU Data input to SPSS Andrew 2430-31 9-17 Alva’s Data Mining for June-July Alva 16
SEPTEMBER5 7-17 SMK
Yahya, Taruna Bakti - Bandung
Questionnaire distribution Loina 10
12 7-17 SMUN 2 Serang
Questionnaire distribution Loina 10

15-17 9-17 SGU Data input to SPSS Andrew 2418 7-10 SMU 58
JakartaQuestionnaire distribution Loina 6
19 7-10 SMK Slamet Riyadi - Jakarta
Questionnaire distribution Loina 6
22-24 9-17 SGU Data input to SPSS Andrew 24OCTOBER11-12 9-17 Alva’s Data mining for August-
SeptemberAlva 16
20 7-21 Jogja Questionnaire distribution Loina 1421 7-21 Solo Questionnaire distribution Loina 14
22-24 9-17 SGU Data input to SPSS Andrew 24NOVEMBER25-26 7-21 Surabaya Questionnaire distribution Loina 2829-30 9-17 Alva’s Data mining for October-
NovemberAlva 16
DECEMBER1-3 9-17 SGU Data input to SPSS Andrew 244-5 9-17 SGU Data editing Loina 168-12 15-17 SGU Data processing Loina 1015-19 15-17 SGU Data analysis Loina 10
JANUARY’15
Report draftingReport writing


![Nietzsche - Revision [Full]](https://img.dokumen.tips/doc/110x75/63618ee01b0df99ce1022aa0/nietzsche-revision-full.jpg)


