Embed Size (px)
Citation preview

Environmental Modelling & Software 22 (2007) 449e463www.elsevier.com/locate/envsoft
CREDOS: A Conservation Reserve EvaluationAnd Design Optimisation System
Neville D. Crossman a,b,*, Lyall M. Perry a, Brett A. Bryan b, Bertram Ostendorf a
a School of Earth and Environmental Sciences, University of Adelaide, Waite Campus, PMB 1, Glen Osmond, South Australia 5064, Australiab Policy and Economic Research Unit, CSIRO Land and Water, PMB 2, Glen Osmond, South Australia 5064, Australia
Received 19 December 2004; received in revised form 2 December 2005; accepted 9 December 2005
Available online 21 February 2006
Abstract
A number of spatial decision support systems (SDSSs) are already available for the systematic planning of conservation reserves. These ex-isting systems offer varying levels of integration and interactivity. However, these systems generate solutions that are sub-optimal. Integer pro-gramming (IP) optimisation techniques guarantee optimal solutions but have been criticised for excessively long or intractable solution times.Modern IP software has addressed this criticism by finding solutions in quick time. The aim in using IP techniques in this paper is to designconservation reserves that are of the minimum possible area to satisfy defined conservation targets, thereby producing reserve systems of greatestefficiency. The Conservation Reserve Evaluation and Design Optimisation System (CREDOS) is a fully integrated SDSS that calls on a third-party optimiser to generate solutions. We attempt to provide a foundation for a viable alternative to existing systems by tightly coupling CRE-DOS with a proprietary geographic information system (GIS) and IP analytical software by means of an interactive interface. It providesconservation planners with a fully featured planning system for both terrestrial and marine conservation reserves that is easy to use, offershigh levels of interactivity and flexibility, and produces practical and efficient solutions that can be used to support their experience and judge-ment. This paper describes the methodology used in the design and construction of CREDOS, and discusses the effectiveness of the systemin facilitating the planning of conservation reserves. The functionality of CREDOS is assessed in the context of designing Marine ProtectedAreas (MPAs). The results are maximally efficient, practical, and manageable arrangements of potential MPA sites that satisfy conservationtargets.� 2006 Elsevier Ltd. All rights reserved.
Keywords: Spatial decision support systems; Integer programming; Optimisation; GIS; Conservation reserves
Software availability
Name of Software: CREDOSDeveloper Contact Address: Lyall Perry, C/- Room M03,
Davies Building, University of Adelaide, PMB 1,Glen Osmond, SA, 5064, Australia.
Hardware required: Windows 2000 or betterSoftware required: ESRI ArcView 8.x, ESRI Spatial Analyst
8.x, ILOG CPLEX 9.0, ILOG OPL Studio 3.6
* Corresponding author. School of Earth and Environmental Sciences, Uni-
versity of Adelaide, Waite Campus, PMB 1, Glen Osmond, South Australia
5064, Australia. Tel.: þ61 8 8303 8663; fax: þ61 8 8303 8582.
E-mail address: [email protected] (N.D. Crossman).
1364-8152/$ - see front matter � 2006 Elsevier Ltd. All rights reserved.
doi:10.1016/j.envsoft.2005.12.006
Program language: Microsoft Visual Basic 6.0Program size: 145 KBAvailability: Free of charge, contact corresponding author
1. Introduction
1.1. Conservation reserves
The purpose of conservation reserves is to protect areas ofscenic beauty, valuable flora and fauna, popular recreationalpursuits, and/or sensitive ecosystems. International efforts byorganisations such as the World Commission on ProtectedAreas have attempted to permanently protect such areas for

450 N.D. Crossman et al. / Environmental Modelling & Software 22 (2007) 449e463
the benefit of present and future generations (e.g. InternationalUnion for the Conservation of Nature, 1994). Many govern-ments are committing to the development of nation-wide sys-tems of reserves to protect biodiversity. However, in manyinstances the locations for these reserves have been selectedwithout explicit consideration toward conservation and oftenfor short-term social, economic or political reasons (Pressey,1994; Bryan, 2002). While the reserves may in some casesbe representative of biodiversity, they tend to be superfluousto commercial activities and therefore least in need of protec-tion. This practice has led to new reserves being located in re-gions that do not provide the best contribution to therepresentation of biodiversity (Margules and Pressey, 2000).There has been a recent move towards adopting a more sys-tematic approach to reserve selection. Systematic conservationplanning (SCP; Margules and Pressey, 2000) provides a foun-dation for a structured approach to the selection of areas andenvironments for reservation, with the aim of maximisingthe chances that biodiversity will be conserved.
1.2. Systematic conservation planning
Decisions about conservation, whether through reserves orhabitat restoration, should be guided by explicit goals, theidentification of priorities at differing regional scales, and dis-tinct choices between potential conservation areas and alterna-tive means of habitat management (Margules and Pressey,2000). Reserves must sample the full variety of biodiversity(Austin and Margules, 1986). Reserves must also encouragethe long-term survival of species within them by maintainingnatural processes and viable population levels, and by exclud-ing threats to their existence (Soule, 1987).
Efficiency is one of the important characteristics of a re-serve selection process (Nicholls and Margules, 1993; Presseyet al., 1993; Williams, 1998). An approach used by several re-searchers (Church and ReVelle, 1974; Church et al., 1996) isto represent the maximum amount of species diversity forthe minimum cost, with cost measured in terms of area. Thisis known as the maximal covering location problem. The alter-nate approach is to minimise cost subject to a set of constraints(e.g. representing each species n times). This approach istermed the location set covering problem.
An SCP approach provides a foundation for meeting theseand other objectives, such as comprehensiveness, adequacy,irreplaceability, and complementarity. SCP has six stages(Margules and Pressey, 2000), with the aim of selecting areasfor reservation that maximise biodiversity across a region.Stage one selects features that can serve as surrogates forbiodiversity. Stage two identifies quantitative conservation tar-gets. Stage three measures the extent to which these conserva-tion targets have been met by existing reserve systems. Stagefour identifies preliminary arrangements of new reserve areasthat complement existing reserve systems and meet the conser-vation targets. Stage five determines the most feasible meansof implementing the conservation action. Finally, stage six de-velops mechanisms for maintaining optimal conditions withinindividual conservation areas. The technical challenges can be
alleviated with spatial decision support systems that automateimportant stages in the SCP process. The potential then existsfor reserve design to be supported by SCP principles. How-ever, SCP is a process that is difficult to achieve (Marguleset al., 2002) because of the complex social, institutional andoperational aspects of planning (e.g. Cowling et al., 2004).
Whilst SCP principles could be implemented as a series ofmanual processes, contemporary computer systems providethe opportunity to develop decision support tools that producesignificantly faster, more efficient, real-time design solutionsbased upon quantitative scientific analyses of large spatial da-tabases. Those systems employed in a spatial context are oftentermed spatial decision support systems (SDSS), and can usemathematical algorithms to solve complex spatial problems.They have the potential to provide conservation plannerswith baseline arrangements of sites that satisfy conservationtargets. The SDSS can be used to modify or extend the spatialarrangement of sites to aid decision-makers with their finalselection.
1.3. Selection algorithms
Many mathematical algorithms have been used in reservesite selection, but they are broadly delineated into two cate-gories separated by whether they produce optimal or sub-optimal solutions. There exist several comparative reviews(e.g. Underhill, 1994; Csuti et al., 1997; Possingham et al.,2000; McDonnell et al., 2002; Moore et al., 2003) concludingthat heuristics (approximate methods), including greedy(Kirkpatrick, 1983) and rarity (Margules et al., 1988) basedalgorithms, and simulated annealing (Possingham et al., 2000)may not find an optimal, maximally efficient solution to siteselection. These sub-optimal techniques have been favouredbecause they produce fast solutions with large data sets ofmany thousands of sites and features (e.g. Cowling et al.,2003; Rodrigues et al., 2004) and can deal with complexnon-linear problems, although only with smaller data sets(Westphal et al., 2003). On the other hand, guaranteed optimalsolutions can be found by the application of integer program-ming (IP) algorithms developed in operations research (seeKingsland, 2002), such as linear programming based branch-and-bound algorithms (Csuti et al., 1997). Pressey et al.(1997) demonstrate that solutions from heuristics were within5e20% of the optimal.
Pressey et al. (1996) and Onal (2003) suggest that optimi-sation is desirable over heuristic approaches because of theadvantage of solution efficiency in the former, and Rodriguesand Gaston (2002) demonstrate that IP optimisation can solveproblems typical in systematic, interactive reserve design.Although recent debate questions these claims (Sarkar et al.,2004), we employ IP because it is a fast and establishedtechnique with no uncertainty regarding the optimality ofoutcomes, as is evidenced by its application in many recentstudies (e.g. Onal and Briers, 2002, 2003; Arthur et al.,2004; Snyder et al., 2004; Haight et al., 2005). Furthermore,our applications of IP to terrestrial landscape planning studies

451N.D. Crossman et al. / Environmental Modelling & Software 22 (2007) 449e463
(Crossman and Bryan, 2006; Crossman et al., in press) havefound solutions to problems with large data sets (22,000 sites).
Whilst IP methods have been used in terrestrial reserve se-lection studies for some time and have recently increased inpopularity (Cocks and Baird, 1989; Camm et al., 1996; Churchet al., 1996; Williams and ReVelle, 1996, 1998; Pressey et al.,1999; Haight et al., 2000; ReVelle et al., 2002; Rodrigues andGaston, 2002; Onal and Briers, 2002, 2003; Arthur et al.,2004; Snyder et al., 2004; Haight et al., 2005; Crossman andBryan, in press), only recently have these methods been ap-plied to marine reserve design (Gerner and Bryan, 2003).Gerner and Bryan (2003) identified the potential for automat-ing the manual task of data preparation and manipulation, aswell as the transfer of solutions between a GIS and the IPanalytical module.
1.4. GIS customisations
Contemporary GIS applications often include tools to de-velop customisations that extend the capabilities of the system,thereby presenting the opportunity to link a GIS with evenmore powerful analytical modules that may not have been pre-viously used for spatial analyses. Such customisations addconsiderable value to geographic data (Bivand, 1996). A cou-pling between a GIS and a separate analytical module can beimplemented either manually or programmatically by meansof third-party software. Gerner and Bryan (2003) used themanual approach when integrating IP with a GIS. They per-formed the analysis in a number of stages (Fig. 1a), first ex-porting the data from the GIS to a text file, and then usingthe text file in conjunction with a model definition file as inputfor the analytical software. The results of the analysis were ex-ported to another text file and then manually processed beforeloading into the GIS for display and assessment. This manualprocess is labour intensive and not conducive to performingthe various analyses normally expected of an SDSS.
Many recent decision support systems that extend and in-crease functionality of GIS have been reported in the literature(e.g. Adenso-Dıaz et al., 2005; Chu et al., 2005; Lim et al.,2005; Naoum et al., 2005; Roetter et al., 2005; Schluteret al., 2005; Shen et al., 2005). For example, Shen et al.(2005) developed a stand-alone windows-based watershedmodelling system that integrates GIS tools, data managementcapabilities, a postprocessor and a dynamic watershed model.
Their module simplifies the management of relationshipsbetween multiple spatial data layers, and in the case study,watershed hydrology and stream flow are efficiently simulated.Related to flow is the optimal water allocation GIS-based sim-ulation tool developed by Schluter et al. (2005). This tool as-sists with evaluation of ecological effects of flow reductionunder alternative water management and allocation strategiesby simulating temporal water use requirements and optimal al-locations. A third example is that of Adenso-Dıaz et al. (2005),who developed an Environmental Decision Support System(EDSS; Rizzoli and Young, 1997) embedded within a GISand therefore able to draw on the full functionality of theGIS. The Adenso-Dıaz et al. (2005) EDSS is used to aidlocation and design decisions surrounding new wastewatertreatment systems in rural areas, and considers economiccost, social cost and environmental quality. As with the previ-ous examples, the decision support system increases the speedof data management and analysis to improve decision-making.
We propose a process that seamlessly links the GIS andanalytical module, automating the transfer of parameters anddata, and graphically displaying the analysis results in theGIS without requiring further action (Fig. 1b). Ideally this pro-cess should be performed with speed so that results can be as-sessed quickly and either accepted or rejected (Pressey et al.,1995). This automated process also saves time and removesthe margin for error intrinsic to any manual process. It alsoencourages sensitivity analyses to assess the impact of subtlechanges to analysis parameters.
1.5. Existing reserve selection tools
In the last decade a number of decision support systemshave been developed in response to the need for improved in-formation systems to efficiently manage biodiversity (Daviset al., 1990). These tools (e.g. WORLDMAP (Williams,1999), MARXAN (Possingham et al., 2000), and C-Plan(Pressey et al., 1995; Ferrier et al., 2000)) provide varyinglevels of interactivity and integration, and all use heuristicmodels. None use IP optimisation as the analytical model,so they cannot guarantee optimal solutions. For example,MARXAN (Possingham et al., 2000) uses simulated annealingto aid aquatic reserve design (Airame et al., 2003; Leslie et al.,2003) and has gained considerable popularity for fast solutiontimes and powerful edge minimisation algorithms. However,
GIS
Ana
lytic
alm
odul
e
Ana
lytic
alm
odul
e
Data
Result
1 2
34
Data
Result
GIS
1
1
1
1
a) b)
Fig. 1. (a) The manual processes performed by Gerner and Bryan (2003), and; (b) the automated process used in this study. Numbers indicate stages within the
analysis process.
452 N.D. Crossman et al. / Environmental Modelling & Software 22 (2007) 449e463
the input data pre-processing requirements of MARXAN andits limited interactivity with a GIS reduce the functionalityof the program. The WORLDMAP system (Williams, 1999)uses simple automated routines for biodiversity summationand spatial mapping. WORLDMAP has inbuilt data visualisa-tion capabilities, and whilst data can be exported to a GIS foranalysis, there is no integration with a GIS. C-Plan (Presseyet al., 1995; Ferrier et al., 2000) was developed to support con-servation planning decisions. It is tightly coupled to a proprie-tary GIS (ESRI ArcView) and therefore provides a high levelof interactivity. Its analytical model is based upon the conceptof irreplaceability, a measure which reflects the importance ofan area in achieving regional conservation targets (C-Plan,2001). Sites can be selected for reservation or exclusion usinga GIS. Though C-Plan contains greater levels of functionalitythan others, it still uses sub-optimal methods to find solutions.
1.6. Purpose of this paper
Both national and international efforts towards the conser-vation of marine environments have identified the need fora network of Marine Protected Areas (MPA; InternationalUnion for the Conservation of Nature, 1994; Australian andNew Zealand Environment and Conservation Council TaskForce on Marine Protected Areas, 1999). In response, theSouth Australian Government is committed to implementinga representative system of 19 MPAs within the State’s coastalwaters (Department for Environment and Heritage, 2004).
This paper details the development and application of theConservation Reserve Evaluation and Design OptimisationSystem (CREDOS) that will be adopted by the South Austra-lian Government. We present a fully featured SDSS that pro-vides higher levels of integration, interactivity, flexibility andgreater ease of use than is found in existing reserve selectiontools. The ability to use IP optimisation for conservation re-serve selection will be made more accessible to non-technicalprofessionals, thereby producing optimal, more efficient con-servation reserve systems at less cost than has previouslybeen possible. The South Australian Government will useCREDOS as a tool for decision-making in its efforts to estab-lish a representative system of MPAs in the State’s coastal wa-ters. CREDOS is the first fully integrated SDSS to combinehigh levels of interactivity with spatial IP optimisationmethods.
2. Methods
2.1. Software
The SDSS (CREDOS) comprises three components. Thecomponent most obvious to the user is the proprietary GIS.The least obvious component is the proprietary IP analyticalsoftware. Linking these two components is the third compo-nent, the CREDOS interface, which initially appears asa toolbar on the GIS interface. The proprietary GIS chosenfor this project is ArcMap 8.3 (ESRI, 2002). The ArcGIS Spa-tial Analyst extension must be installed and enabled. The
proprietary IP analytical software is CPLEX 9.0 (ILOG,2003), which has been proven in a conservation setting of be-ing capable of solving large-scale linear programs and variousclasses of integer programs (Ando et al., 1998; Church et al.,1996; Rodrigues and Gaston, 2002). The optimisation modelsand data files are written in OPL (Optimisation ProgrammingLanguage) Script created using OPL Studio 3.6 (ILOG, 2003).
Customised third-party software was developed to interactwith ESRI’s ArcMap GIS and ILOG’s OPL Studio andCPLEX using the COM (Microsoft Component Object Model )compliant development language Microsoft Visual Basic (VB).The software calls ArcObjects (ESRI, 2002) to perform thespatial functionality and the ILOG Component Libraries toperform the optimisation. The software was developed as anActiveX Dynamic Link Library (DLL) project in VB to interactwith ArcMap. The DLL is an executable COM enabled filethat runs in the same memory space as the calling application.In this form the software is easily portable between ArcMapsessions, and is not tied to a particular map document ortemplate.
2.2. IP algorithm
The location set covering problem IP model is used in thisstudy to identify the minimum number of sites required tomeet the areal and proportional conservation targets. The loca-tion set covering problem model is described below (adaptedfrom Possingham et al., 2000).
An m� n matrix A, where m is the number of sites and n isthe total number of classes of data (describing habitats and/orspecies) is created whose elements aij are attributed a binaryvalue according to the presence or absence of a class at eachsite (Table 1). Sites are given a value of one if it is within a par-ticular class, zero otherwise such that:
aij ¼1 if site i occurs in class j
0 otherwisefor i¼ 1.m and j ¼ 1.n:
�
Next, a variable is defined that reflects whether or not a siteis selected for reservation, as the vector X with dimension mand elements xi, given by:
xi ¼1 if site i is selected for reservation
0 otherwisefor i¼ 1.m:
�
In words, the location set covering problem strives to min-imise the number of sites to be reserved subject to areal
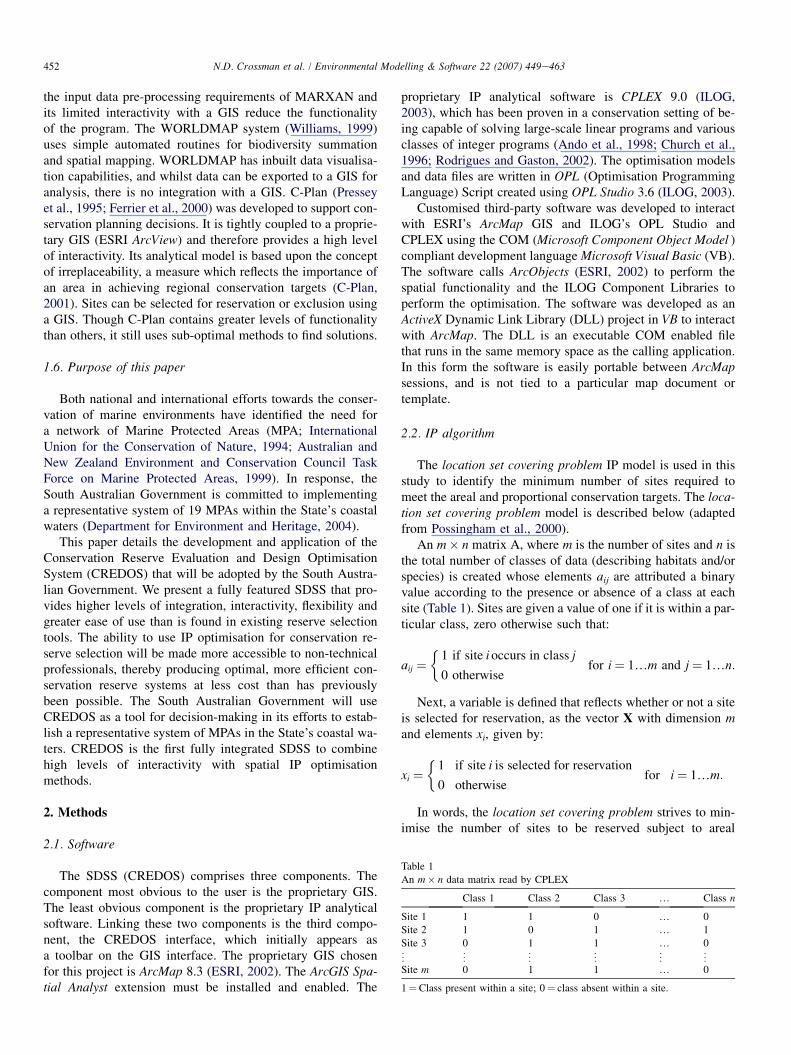
Table 1
An m� n data matrix read by CPLEX
Class 1 Class 2 Class 3 . Class n
Site 1 1 1 0 . 0
Site 2 1 0 1 . 1
Site 3 0 1 1 . 0
« « « « « «Site m 0 1 1 . 0
1¼Class present within a site; 0¼ class absent within a site.

453N.D. Crossman et al. / Environmental Modelling & Software 22 (2007) 449e463
constraints for each class (cj). Areal constraints are a functionof the area of the data class, the proportional target ( p, theminimum percentage of each class to be reserved), and theminimum area target (t, the minimum number of sites ineach class to be reserved). For each class of data, the arealconstraint is equal to the proportional target multiplied bythe number of sites in the class if this value is greater thanor equal to the minimum area target. Otherwise, the areal con-straint for the class equals the lesser of either the total numberof sites in the class or the specified minimum area target. Theproportional and areal target constraints work in conjunctionwith each other, each safeguarding the other against under-representation of certain classes, particularly those of asmall total area. Mathematically, the optimisation techniquesattempts to (adapted from Possingham et al., 2000):
minimiseXm
i¼1
xi ð1Þ
subject toXm
i¼1
aijxi � cj for j ¼ 1.n ð2Þ
where
aij; xi˛f0;1g; Aj ¼Xm
i¼1
aij and cj ¼pAj if pAj � tmin
�Aj; t�
otherwise:
�
ð3Þ
A second constraint was implemented in the models to takeinto account the presence of existing reserved sites. These sitesare given a value of 1 for xi. Thus, the aim of the models is toselect non-reserved sites that, together with existing reserves,meet conservation targets most efficiently.
2.3. Spatial constraints
Optimal solutions, while meeting the two constraints above,do not explicitly consider geographical location and could behighly fragmented and impossible to implement. This is a typ-ical problem in conservation planning exercises, but severalsuccessful efforts have overcome this problem by introducingcompactness and contiguity algorithms into the objective func-tion. For example, Ball and colleagues (Ball, 2000; Possi-ngham et al., 2000; McDonnell et al., 2002) introduceobjective functions that minimise total perimeter length andtotal area of selected sites, and Onal and Briers (2002) andNalle et al. (2002) cluster sites by minimising the sum of dis-tances between all pairs of selected sites. In these cases addi-tional objective functions were implemented to considerlocation and therefore produce spatially meaningful solutions.However, the problem often encountered with these ap-proaches is the complexity, potential non-linearity and intrac-tability of the mathematical problem when dealing with manythousands of sites.
We introduce a novel approach to the problem of compact-ness and continuity by introducing a parameter into the objec-tive function that forces the selection of sites for reservation
following user-defined priorities. The aim is to represent spa-tial conservation priorities within IP, thereby impeding themodel from selecting low priority sites. The new objectivefunction becomes:
minimiseXm
i¼1
xili ð4Þ
where li is an impedance layer value for i¼ 1.m. The sameareal and proportional constraints apply as described inEqs. (2) and (3). The impedance layer (L) is a functionof n number of impedance surfaces that represent spatialpriorities, and is calculated using an n-component mixturemodel:
L¼ p1f ð1Þ þ/þ pn f ðnÞ ð5Þ
where f(1).f(n) are impedance surfaces and p1.pn areweighting coefficients that are determined by the user. Theweighting coefficients can be adjusted to reflect the prioritiesof the decision maker, but must sum to 1. The application ex-ample described in Section 2.7 demonstrates the form imped-ance surfaces can take, but in general they would be Euclideandistances to/from features of priority such as existing marinereserves.
2.4. Data requirements
CREDOS expects that a number of spatial data sets areavailable in the ESRI’s ArcMap map document for selectionas analysis parameters (Fig. 2, Process a). All data sets mustbe in raster format. There must be a ‘zone layer’ representingthe geographic locations of all potential reserve sites (Fig. 2,Process b). There must also be at least one ‘value layer’ de-scribing features of the environment and/or species on whichsite selection is based (Fig. 2, Process c). Data representingspecies presence/absence can be used. Surrogate data that cap-tures the full range of ecosystem types is recommended asa supplement or alternative because all species in a regioncan never be fully quantified (Bedward et al., 1992; Belbin,1993; Wessels et al., 1999). The paucity of individual speciesdata and the reliance on surrogates is an even more likely sce-nario in marine environments (Ward et al., 1999). The valuelayers must be classified into categorical data, with each classof data representing the presence of a species or surrogate. Theuser also has the option of including a single impedance(‘weighting layer’) into the model (Fig. 2, Process d). For ex-ample, sites of lower economic productivity or higher recrea-tional value, or sites close to existing marine and terrestrialreserves are a higher priority for reserve selection. Hence,these sites provide less impedance to their inclusion in the re-serve system and are preferentially selected over sites of sim-ilar conservation value but higher impedance. A singleimpedance layer is developed from one or more impedancesurfaces (Eq. (5)). MPA site selection then aims to identifya compact and contiguous set of sites that meet a user-definedlevel of representation for all species and surrogates.

454 N.D. Crossman et al. / Environmental Modelling & Software 22 (2007) 449e463
2.5. Implementation
The four modules that comprise the CREDOS interface areavailable on a toolbar (Fig. 3) available in the ArcMap applica-tion window. The four modules function independently of eachother but are arranged in a logical usage sequence from left toright. They are called the ‘Sites’ module, the ‘Parameters’module, the ‘Analysis’ module, and the ‘Statistics’ module.
The ‘Sites’ module (Fig. 3) appears on the toolbar asa drop-down menu. It allows a number of sites to be interac-tively selected and saved as a site set by the user (Fig. 2,
a) open ArcGIS
b) add layer of potential reserve sites (Zone Layer)
c) add species/habitat layer (Value Layer)
d) add impedance surface (Weighting Layer)
e) create included/excluded site set
f) define targets/save parameter set
g) execute analysis for x iterations
h) review solutions/summed irreplaceability
more end
continue
more end
continue
more end
continue
more end
continue
more
end
end
Fig. 2. Flow diagram of CREDOS analyses.
Process e). A site set can either be saved as an included siteset or an excluded site set. These included and excluded sitesare added to the OPL model as constraints to the optimisationso that the optimisation process will always select the sites inan included site set whereas it will never select the sites in anexcluded site set. The ‘Parameters’ module (Fig. 4) allows theparameters selected for an analysis to be specified and savedas a parameter set and reloaded for ease in repeating certainanalyses (Fig. 2, Process f). A parameter set can be recalledat any time and modified and saved as required. The parameterentry form is divided into four frames, the ‘Options’ frame, the‘Zone Layer’ frame, the ‘Value Layers’ frame, and the‘Weighting Layers’ frame (Fig. 4).
The controls in the ‘Options’ frame (Fig. 4) define settingsused in an analysis. The ‘Output Format’ control allows theuser to specify whether the results of the analysis will be pre-sented as a raster layer (‘Layer’) added to the map, as a statis-tical report (‘Statistics’), or as both formats (‘Both’). The‘Optimisation Model Iterations’ control allows the numberof iterations performed by the model to be specified. Model it-erations have been included for four reasons: to provide flex-ibility in reserve system design; to avoid the peculiarities ofsingle-solution optimisation; to enable sensitivity analysis ofthe results; and to provide an indicator of summed irreplace-ability (sensu McDonnell et al., 2002; Leslie et al., 2003) asa planning tool. These reasons are explained in more detailin the next section.
The ‘Site Inclusion Sets’ and ‘Site Exclusion Sets’ controls(Fig. 4) allow saved site sets to be included in, or excludedfrom, a solution. The ‘Optimisation Model File’ control(Fig. 4) requires the user to specify the location of the optimi-sation algorithm used for the analysis. Different optimisationalgorithms can be used for an analysis without changing theCREDOS code. The ‘Report Lookup File’ control (Fig. 4) al-lows the path name of the statistics report lookup file to bespecified. The lookup file is a text file containing descriptivelabels for each value layer and each class of data used bythe analysis. The ‘Zone Layer’, ‘Value Layers’ and ‘WeightingLayers’ frames (Fig. 4) provide drop-down lists of raster layers
Sitesmodule
Analysismodule
Parametersmodule
Statisticsmodule
Fig. 3. The CREDOS toolbar available in an ArcGIS map document.

455N.D. Crossman et al. / Environmental Modelling & Software 22 (2007) 449e463
Fig. 4. The CREDOS ‘Parameters’ module form.
available for selection in the ESRI ArcMap map document.The ‘zone’ (all sites in the study area), ‘value’ (classes ofdata representing species and/or surrogate distribution) and‘weighting’ (impedances) layers must all be loaded into themap document. The option to specify different proportionaland areal targets for each value layer is available in the ‘ValueLayers’ selection frame.
The ‘Analysis’ module (Fig. 3) executes the analysis basedupon the parameters in the last saved parameter set (Fig. 2,Process g). An information window displays the phase of theanalysis being performed at any particular moment. The firststep towards finding a solution is the pre-processing of thevalue layers containing data classes into an m� n matrix(Table 1), where m is the total number of sites (from the zonelayer) and n is the total number of classes (from the valuelayers). The TabulateAreas ArcObjects command is used todevelop this matrix. TabulateAreas is also used to populatea matrix of m� l (impedance layer value at a site). This matrixis appended to the data file read by CPLEX. The data file thatcontains the matrices must have as a header the total numberof sites (m) and classes (n), as well as the proportional andareal targets for each class. Statistics are created at the conclu-sion of an analysis, and a solution layer representing theanalysis results is added to the active map document (Fig. 2,Process h). The layer may be classified to display an optimal
solution from any one of the model iterations, or it may be clas-sified to display summed irreplaceability scores.
The ‘Statistics’ module (Fig. 3) is used to display a statisticsreport of the optimal solution generated by any iteration of anyanalysis. The report displays statistics for each class of data ineach value layer and the associated proportional and areal tar-gets. The statistics are the total number of sites per class, thenumber of those sites that have been selected for reservation,and the percentage of the total number of sites selected for res-ervation. The report can be saved or printed. The summed ir-replaceability score is included in the attribute table if morethan one iteration was performed. The statistics from each so-lution are stored for display as a solution report (Table 2).
2.6. Model iterations
Flexibility in reserve design is important. There are manypotential reserve system designs that are capable of satisfyingconservation goals. Establishing one particular or single opti-mal (most efficient) reserve system is rarely possible becauseof the social, economic and political environments in whichreserve selection decisions are made. Therefore, calculatingmany different optimal solutions provides options and flexibil-ity generally not possible with a single optimal solution. Thehigh level of interactivity also ensures that conservation

456 N.D. Crossman et al. / Environmental Modelling & Software 22 (2007) 449e463
Table 2
Sample of a statistics report produced by CREDOS
planners can force certain areas to be included or excluded.CREDOS can be re-run with new constraints and another setof options can be explored for the most efficient designs.
Experimentation suggests that the order in which the valuelayers are processed in the optimisation analytical module canhave a significant impact on the solution. Hence, if an optimi-sation is only performed once, the solution is a peculiarity ofthe order of input of parameters and may be only one of manyoptimal solutions. Therefore, in CREDOS the user is given theoption to programmatically randomise the processing order ofthe value layers prior to processing by entering x number ofiterations. Each iteration of the model processes the valuelayers in a different order and adds the previous solution asa constraint to the subsequent iteration. A different solutionis produced at each iteration.
An important attribute of an SDSS is the ability to performsensitivity analyses by adjusting the parameters used for ananalysis, assessing the results, and comparing those resultswith previous analyses. Information relating to all aspects ofan analysis must be capable of being recalled and reviewedat any time for successful sensitivity analyses. Therefore,
CREDOS was structured to store operational and solutiondata in dbase file format. Each database file is a table repre-senting a class of data that can easily be imported into, or ex-ported from, the ArcObjects environment. Subsets of the datacan be retrieved by defining a cursor, and tables can be joinedwith other tables to add value to the data. The contents of thesedatabase files can reviewed by adding them to the map docu-ment and opening them with the standard GIS tools.
CREDOS produces a summed irreplaceability score for eachsite by summing for each site the number of times it is includedin a solution under multiple iterations. The summed irreplace-ability score as defined here has been used recently (McDonnellet al., 2002; Leslie et al., 2003) as an indicator of the value ofa site relative to the other sites. However, it should be notedthat summed irreplaceability is not an appropriate measure todesign the reserve system. For example, for a model run of100 iterations, selecting sites that have a summed irreplaceabil-ity score of 50 or higher will not guarantee the most efficientsolution nor that the conservation targets are satisfied. Summedirreplaceability is intended more to guide the inclusion of highvalue sites through interactive planning.
457N.D. Crossman et al. / Environmental Modelling & Software 22 (2007) 449e463
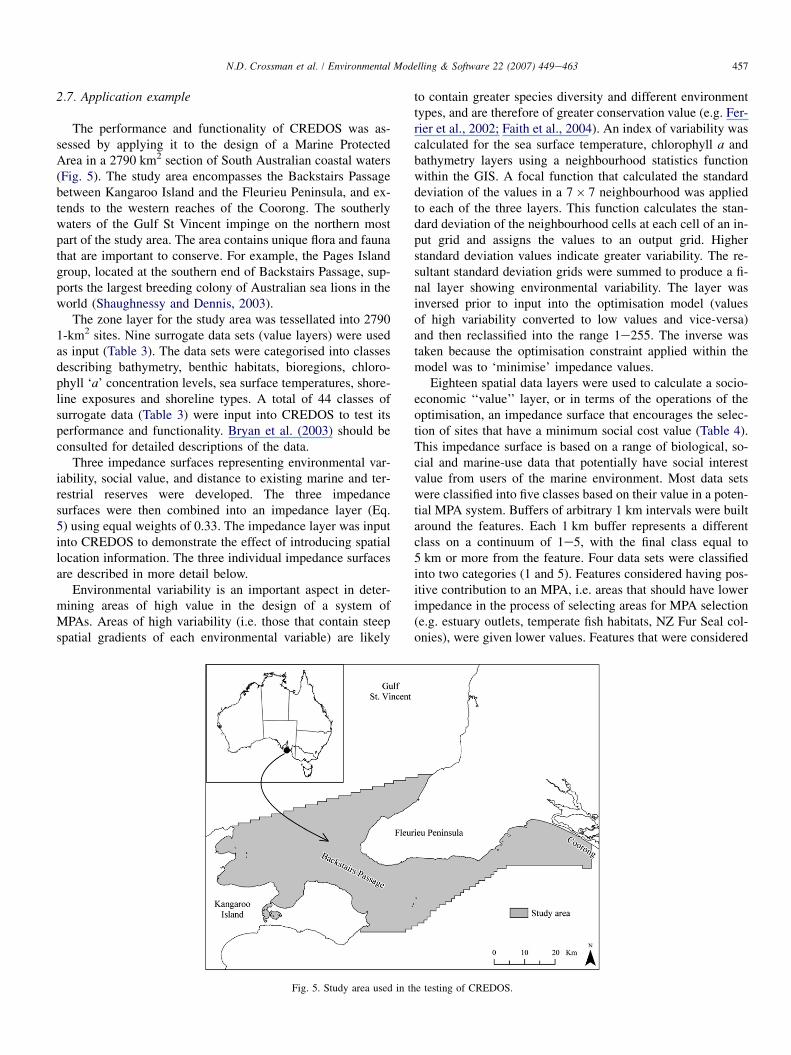
2.7. Application example
The performance and functionality of CREDOS was as-sessed by applying it to the design of a Marine ProtectedArea in a 2790 km2 section of South Australian coastal waters(Fig. 5). The study area encompasses the Backstairs Passagebetween Kangaroo Island and the Fleurieu Peninsula, and ex-tends to the western reaches of the Coorong. The southerlywaters of the Gulf St Vincent impinge on the northern mostpart of the study area. The area contains unique flora and faunathat are important to conserve. For example, the Pages Islandgroup, located at the southern end of Backstairs Passage, sup-ports the largest breeding colony of Australian sea lions in theworld (Shaughnessy and Dennis, 2003).
The zone layer for the study area was tessellated into 27901-km2 sites. Nine surrogate data sets (value layers) were usedas input (Table 3). The data sets were categorised into classesdescribing bathymetry, benthic habitats, bioregions, chloro-phyll ‘a’ concentration levels, sea surface temperatures, shore-line exposures and shoreline types. A total of 44 classes ofsurrogate data (Table 3) were input into CREDOS to test itsperformance and functionality. Bryan et al. (2003) should beconsulted for detailed descriptions of the data.
Three impedance surfaces representing environmental var-iability, social value, and distance to existing marine and ter-restrial reserves were developed. The three impedancesurfaces were then combined into an impedance layer (Eq.5) using equal weights of 0.33. The impedance layer was inputinto CREDOS to demonstrate the effect of introducing spatiallocation information. The three individual impedance surfacesare described in more detail below.
Environmental variability is an important aspect in deter-mining areas of high value in the design of a system ofMPAs. Areas of high variability (i.e. those that contain steepspatial gradients of each environmental variable) are likely
to contain greater species diversity and different environmenttypes, and are therefore of greater conservation value (e.g. Fer-rier et al., 2002; Faith et al., 2004). An index of variability wascalculated for the sea surface temperature, chlorophyll a andbathymetry layers using a neighbourhood statistics functionwithin the GIS. A focal function that calculated the standarddeviation of the values in a 7� 7 neighbourhood was appliedto each of the three layers. This function calculates the stan-dard deviation of the neighbourhood cells at each cell of an in-put grid and assigns the values to an output grid. Higherstandard deviation values indicate greater variability. The re-sultant standard deviation grids were summed to produce a fi-nal layer showing environmental variability. The layer wasinversed prior to input into the optimisation model (valuesof high variability converted to low values and vice-versa)and then reclassified into the range 1e255. The inverse wastaken because the optimisation constraint applied within themodel was to ‘minimise’ impedance values.
Eighteen spatial data layers were used to calculate a socio-economic ‘‘value’’ layer, or in terms of the operations of theoptimisation, an impedance surface that encourages the selec-tion of sites that have a minimum social cost value (Table 4).This impedance surface is based on a range of biological, so-cial and marine-use data that potentially have social interestvalue from users of the marine environment. Most data setswere classified into five classes based on their value in a poten-tial MPA system. Buffers of arbitrary 1 km intervals were builtaround the features. Each 1 km buffer represents a differentclass on a continuum of 1e5, with the final class equal to5 km or more from the feature. Four data sets were classifiedinto two categories (1 and 5). Features considered having pos-itive contribution to an MPA, i.e. areas that should have lowerimpedance in the process of selecting areas for MPA selection(e.g. estuary outlets, temperate fish habitats, NZ Fur Seal col-onies), were given lower values. Features that were considered
Fig. 5. Study area used in the testing of CREDOS.

458 N.D. Crossman et al. / Environmental Modelling & Software 22 (2007) 449e463
to have a potentially negative effect on an MPA (e.g. jettiesand ports) were assigned high impedances. Table 4 summa-rises the classification method and associated class valuesfor each layer. The classified social value layers were summed,with the resultant layer reclassified into the range 1e255.Values closer to ‘1’ indicate higher social value (low imped-ance to MPA site selection) and values closer to ‘255’ indicatelower social value (high impedance to MPA site selection).
Table 3
Surrogate data (value layers) and associated class descriptions used as input
into CREDOS demonstration
Value layer Class
Bathymetry 40þm BSL
20e40 m BSL
0e20 m BSL
Benthic habitat Sand
Granite Reef
Low Profile Platform Reef
Heavy Limestone or
Calcarenite Reef
Seagrass
(dense/medium/sparse/patches)
Bioregions St. Vincent’s Gulf
Coorong
Chlorophyll ‘a’ content
(concentration levels)
1268e3995 mg/m3
3995e6800 mg/m3
6800e13,309 mg/m3
Shoreline type Artificial
Bedrock platform
Boulder beach
Cliff high
Cliff medium
Coarse sand beach
Cobble beach
Fine-medium sand beach
Mixed sand-cobble/pebble/beach
Mixed sand-shellgrit beach
Saltmarsh
Sandflats
Seagrass intertidal/shallow
Shoreline exposure Exposed
Moderate
Sheltered
Sea surface temperature
(summerewinter range �C)
4.30e5.60
5.04e5.60
5.61e6.24
6.25e6.98
6.99e8.01
Sea surface temperature
(summer �C)
18.65e19.09
19.10e19.4
19.42e19.84
19.85e20.38
20.39e20.96
Sea surface temperature
(winter �C)
12.34e13.06
13.07e13.46
13.47e13.82
13.82e14.12
14.13e14.48
The third impedance surface encourages site selection to-ward existing marine and terrestrial reserves. Terrestrial re-serves were included because many biotic and abioticprocesses occur across the terrestrial/marine interface. The im-pedance surface was generated by calculating the Euclideandistance each 1 km cell in the study area is from the nearestterrestrial or marine reserve. The distance layer was also re-classified into the range of 1e255.
3. Results
3.1. Performance
System performance was assessed on a desktop computerwith an Intel Pentium 4, 1.7 GHz processor with 500 Mb ofRAM. A typical analysis over 10 iterations using the 44 clas-ses of data, 2790 sites and impedance layer took 21 min 40 s tocomplete. The most time consuming portion of an analysiswas the TabulateAreas function used to process the classand impedance layer data into an integer format that can beread by the optimisation model. Recent work has developedan alternative to TabulateAreas that performs the same opera-tions in just a few seconds (Crossman et al., unpublished). TheIP optimisation process was the least time consuming portionof an analysis over a small number of model iterations, witheach iteration taking an average of 4 s to perform. Each itera-tion becomes progressively slower because each solution isadded as a constraint to the next model iteration. In the sampledata used here, the first iteration takes only a few seconds toperform. However, tests using 300 iterations revealed thateach iteration takes 47 s by the 300th. Care should be takenin deciding upon the number of iterations. Testing on a morepowerful (3 GHz processor, 1 Gb RAM) computer reducedthese processing times by approximately half.
Table 4
Data layers and classification methods employed in construction of social
value impedance surface
Data layer Classification Social ‘value’ and
impedance score
Crownland Classed 1 and 5 High¼ 1; Low¼ 5
Coastal wetlands Classed 1 and 5 High¼ 1; Low¼ 5
Estuary outlets Buffered 1e5 High¼ 1; Low¼ 5
Temperature fish habitats Buffered 1e5 High¼ 1; Low¼ 5
Geological monuments Classed 1 and 5 High¼ 1; Low¼ 5
Hobart aquatic reserve Buffered 1e5 High¼ 5; Low¼ 1
Jetties Buffered 1e5 High¼ 1; Low¼ 5
Macroalgae Buffered 1e5 High¼ 1; Low¼ 5
Net closures Buffered 1e5 High¼ 1; Low¼ 5
NZ fur seals Buffered 1e5 High¼ 5; Low¼ 1
Ports Buffered 1e5 High¼ 1; Low¼ 5
Recreational fishing areas Buffered 1e5 High¼ 1; Low¼ 5
Restricted boating Buffered 1e5 High¼ 1; Low¼ 5
Saltmarsh Classed 1 and 5 High¼ 1; Low¼ 5
Sealion Buffered 1e5 High¼ 1; Low¼ 5
Ship wrecks Buffered 1e5 High¼ 1; Low¼ 5
Shipping density Buffered 1e5 High¼ 5; Low¼ 1
Whale aggregation areas Buffered 1e5 High¼ 1; Low¼ 5
Each data layer feature is assessed for its contribution to an MPA.

459N.D. Crossman et al. / Environmental Modelling & Software 22 (2007) 449e463
3.2. Solutions
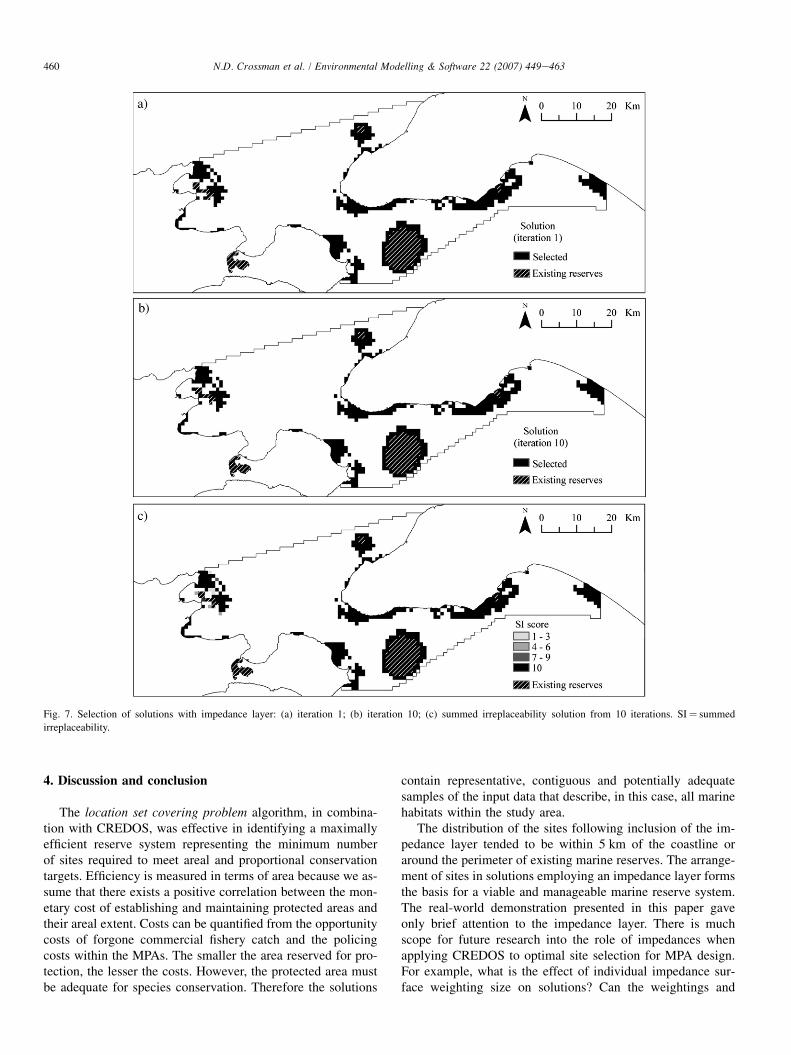
Two analyses were investigated to test the functionality ofCREDOS. Both analyses included 10 iterations but only oneincluded an impedance layer. In the analysis where the im-pedance layer is not included (Fig. 6), the order of process-ing of the value layers has a significant impact upon thedistribution of sites. A comparison of optimal solutionsfrom two iterations of the same analysis shows some broadsimilarities in the distribution of sites, along with many dif-ferences (Fig. 6a and b). There is clustering in both solu-tions. However, examination of the summed irreplaceabilitysolution produced from the 10 iterations (Fig. 6c) pointsto considerable variation in each optimal solution. The
summed irreplaceability solution identifies sites chosenmore often. These sites are of greater importance in a reservesystem.
Fig. 7 demonstrates the impact of including an impedancelayer when calculating solutions. The scattered distributionof sites in Fig. 6a and b, whilst still satisfying conservation tar-gets and providing a comprehensive, adequate and representa-tive reserve system, are neither manageable nor practical. Theimpedance layer organises the scattered sites into a compact,spatially contiguous arrangement that is more meaningful toa conservation planner. The single solutions (Fig. 7a and b)are nearly identical, as is evident in the summed irreplaceabil-ity solution (Fig. 7c) in which most sites are selectedrepeatedly.
Fig. 6. Selection of solutions without impedance layer: (a) iteration 1; (b) iteration 10; (c) summed irreplaceability solution from 10 iterations. SI¼ summed
irreplaceability.
460 N.D. Crossman et al. / Environmental Modelling & Software 22 (2007) 449e463
Fig. 7. Selection of solutions with impedance layer: (a) iteration 1; (b) iteration 10; (c) summed irreplaceability solution from 10 iterations. SI¼ summed
irreplaceability.
4. Discussion and conclusion
The location set covering problem algorithm, in combina-tion with CREDOS, was effective in identifying a maximallyefficient reserve system representing the minimum numberof sites required to meet areal and proportional conservationtargets. Efficiency is measured in terms of area because we as-sume that there exists a positive correlation between the mon-etary cost of establishing and maintaining protected areas andtheir areal extent. Costs can be quantified from the opportunitycosts of forgone commercial fishery catch and the policingcosts within the MPAs. The smaller the area reserved for pro-tection, the lesser the costs. However, the protected area mustbe adequate for species conservation. Therefore the solutions
contain representative, contiguous and potentially adequatesamples of the input data that describe, in this case, all marinehabitats within the study area.
The distribution of the sites following inclusion of the im-pedance layer tended to be within 5 km of the coastline oraround the perimeter of existing marine reserves. The arrange-ment of sites in solutions employing an impedance layer formsthe basis for a viable and manageable marine reserve system.The real-world demonstration presented in this paper gaveonly brief attention to the impedance layer. There is muchscope for future research into the role of impedances whenapplying CREDOS to optimal site selection for MPA design.For example, what is the effect of individual impedance sur-face weighting size on solutions? Can the weightings and

461N.D. Crossman et al. / Environmental Modelling & Software 22 (2007) 449e463
subsequent impedance layer realistically represent the variousinterests of marine users in the process of MPA design?
Careful consideration must be given to the number ofmodel iterations used in any analysis. The number of sites se-lected by each iteration of the model varied by only a smallnumber of sites when impedance layers are included, indicat-ing that there is little benefit in performing a large number ofiterations. The processing time increases exponentially witheach iteration because the solutions from each iteration areadded as constraints to subsequent iterations. A point isreached where analyses performing large numbers of iterationsfail to provide interactive, quick-response information supportfor decision-making processes. However, it is still important toprovide the capability to perform large numbers of iterationsfor those occasions when a comprehensive analysis is re-quired. It should also be noted that the summed irreplaceabil-ity score of a solution is not an optimal solution and whendesigning reserve systems the summed irreplaceability scoreshould be used in conjunction with the single optimalsolutions.
Comparisons between CREDOS and the existing reservedesign systems WORLDMAP (Williams, 1999), MARXAN(Possingham et al., 2000), and C-Plan (Pressey et al., 1995;Ferrier et al., 2000) reveal potential advantages and disadvan-tages of our system. CREDOS has the advantage of being ableto find optimal solutions through linkage with IP optimisationsoftware. Existing systems we examined are limited to findingsub-optimal solutions. Doubt surrounds the imperative of find-ing optimal (as opposed to sub-optimal) solutions (Presseyet al., 1996) because existing systems that use heuristic tech-niques can find near-optimal solutions to complex, albeitsmaller, non-linear problems in quick time. However, we dem-onstrate the potential of IP optimisation for solving largerproblems (22,000 sites, 70 classes of data) in our terrestriallandscape planning applications (Crossman and Bryan, 2006;Crossman et al., in press). CREDOS also has the advantageof greater interaction with a GIS, thus necessitating minimalpre-processing of spatial data. Tight coupling with the GISalso enables fast spatial queries and analyses of outputs. A dis-advantage with CREDOS, but not with any of the existing sys-tems, is the need to go to a third-party commercialoptimisation package to obtain solutions. WORLDMAP,MARXAN and C-Plan are all contain stand-alone algorithmsfor site selection in reserve design. On the other hand, CRE-DOS requires, at a minimum, the ILOG CPLEX engine. TheILOG OPL Studio package is recommended for IP modeldevelopment. The cheapest license (for academic institu-tions) for CPLEX and OPL Studio start at US$1745(ILOG, 2004).
A general disadvantage with IP, and hence CREDOS, inconservation planning is the restriction to problems of a linearnature. For example, recent laudable efforts to incorporatenon-linear models of threatened species population viabilityinto terrestrial landscape configuration exercises for conserva-tion planning (Westphal et al., 2003) are intractable for tradi-tional IP. However the main drawback of conservationplanning exercises aiming to satisfy the demands of individual
or a suite of species is the data-intensive nature of such mod-elling. Furthermore, conservation planning exercises that placeconsiderable emphasis on satisfying the requirements of singleor a small suite of ‘focal’, ‘keystone’ or ‘umbrella’ species,while at the same time degrading the value of environmentalsurrogates, have been questioned (Simberloff, 1998; Andel-man and Fagan, 2000; Lindenmayer et al., 2002; Brookset al., 2004; Cowling et al., 2004; Higgins et al., 2004; Pressey,2004). We recognise the shortcomings of IP, but contend thatspecies data deficiency is even greater in marine environments,therefore placing greater value on surrogates. In this light IP isa suitable approach to MPA planning.
The South Australian Government’s Department for Envi-ronment and Heritage (DEH) is investigating methods thatmay enhance the MPA selection process. DEH consider thatthe selection of priority sites for dedicated conservation man-agement is a critical intermediate step in zoning an MPA.These priority sites are identified using a community consulta-tion approach in conjunction with modelling. Automated mod-elling processes generate alternative arrangements of sitesbased upon differing criteria, thereby providing additional ma-terial for discussion between decision-makers. However, ifthese models are to be effective, they must be able to be con-strained by specific conservation targets. CREDOS includesfeatures that allow such constraints to be applied, and usesan analytical model that guarantees optimal solutions. Thespatial optimisation approach to systematic conservation plan-ning proposed in this paper is therefore of interest to DEH, andwill be used in conjunction with traditional methods to aid theprocess of MPA selection.
Consequently, DEH have adopted CREDOS for the designof a system of MPAs in the South Australian coastal waters.Recent government policy (Department for Environment andHeritage, 2004) commits resources to the establishment ofa system of 19 MPAs by the year 2010. The study area inwhich CREDOS is tested in this paper is one of the 19. Atthe time of writing, DEH are combining outputs from CRE-DOS with community consultation to establish zones withinthe study area that adequately protect representative samplesof marine habitat. DEH can take outputs from CREDOS tothe community and community concerns and recommenda-tions can be documented. Included/excluded site sets and tar-gets can be modified according to community feedback andCREDOS can be re-run to find solutions to meet new conser-vation targets. Non-technical staff of DEH can perform this it-erative process, thus providing a very flexible mechanism toaid decision-making in MPA design. In this way DEH are ap-plying a form of SCP.
CREDOS has made good progress in linking optimisationanalyses to GIS and making these analyses accessible and ap-plicable, thereby providing conservation authorities witha valuable and comprehensive spatial decision support capa-bility. In this sense CREDOS is an advance on existing re-serve design systems. Customisations like CREDOS allownon-technical conservation planning professionals to use ad-vanced forms of spatial analyses that are lacking in proprie-tary GIS packages. The value of such customisations in

462 N.D. Crossman et al. / Environmental Modelling & Software 22 (2007) 449e463
serving to advance the spatial information technology industryis therefore considerable. As far as we are aware this is thefirst attempt to directly link a GIS with an IP optimisationpackage. CREDOS removes the requirement for extensivedata manipulation and import/export procedures necessaryfor conventional transfer of data between the GIS and IP soft-ware. Solutions can then be examined, and in a short spaceof time, reproduced given new information. CREDOS facili-tates rapid decision-making for MPA design within an SCPframework.
Acknowledgments
This work was supported by the Australian Research Coun-cil grant LP0348771. The Coast and Marine Branch within theSouth Australian Department for Environment and Heritageprovided valuable financial and technical support. The authorsthank four anonymous reviewers for valuable comments on anearlier version of the manuscript.
References
Adenso-Dıaz, B., Tuya, J., Goitia, M., 2005. EDSS for the evaluation of alter-
natives in waste water collecting systems design. Environmental Modelling
and Software 20, 639e649.
Airame, S., Dugan, J.E., Lafferty, K.D., Leslie, H., McArdle, D.A.,
Warner, R.R., 2003. Applying ecological criteria to marine reserve design:
a case study from the California Channel Islands. Ecological Applications
13, S170eS184.
Andelman, S.J., Fagan, W.F., 2000. Umbrellas and flagships: efficient conser-
vation surrogates or expensive mistakes? Proceedings of the National
Academy of Sciences, USA 97, 5954e5959.
Ando, A., Camm, J., Polasky, S., Solow, A., 1998. Species distributions, land
values, and efficient conservation. Science 279, 2126e2128.
Arthur, J.L., Camm, J.D., Haight, R.G., Montgomery, C.A., Polasky, S., 2004.
Weighting conservation objectives: maximum expected coverage versus
endangered species protection. Ecological Applications 14, 1936e1945.
Australian and New Zealand Environment and Conservation Council Task
Force on Marine Protected Areas, 1999. Strategic Plan of Action for the
National Representative System of Marine Protected Areas: a Guide for
Action by Australian Governments. Environment Australia, Canberra.
Austin, M.P., Margules, C.R., 1986. In: Usher, M.B. (Ed.), Wildlife Conserva-
tion Evaluation. Chapman and Hall, London.
Ball, I.R. 2000. Mathematical applications for conservation ecology: the dy-
namics of tree hollows and the design of nature reserves. PhD thesis,
The University of Adelaide.
Bedward, M., Pressey, R.L., Keith, D.A., 1992. A new approach for selecting
fully representative reserve networks: addressing efficiency, reserve design
and land suitability with an iterative analysis. Biological Conservation 62,
115e125.
Belbin, L., 1993. Environmental representativeness: regional partitioning and
reserve selection. Biological Conservation 66, 223e230.
Bivand, R.S., 1996. Scripting and toolbox approaches to spatial analysis in
a GIS context. In: Fischer, M., Scholten, H.J., Unwin, D. (Eds.), Spatial
Analytical Perspectives on GIS. Taylor and Francis, London.
Brooks, T., Da Fonseca, G.A.B., Rodrigues, A.S.L., 2004. Species, data, and
conservation planning. Conservation Biology 18, 1682e1688.
Bryan, B.A., 2002. Reserve selection for nature conservation in South
Australia: past, present and future. Australian Geographical Studies 40,
196e209.
Bryan, B.A., Kinloch, M., Gerner, D.B., 2003. GIS and remote sensing tech-
niques for the assembly of a database characterising the spatio-temporal
character of the South Australian Continental Shelf environments. In:
Woodroffe, C.D., Furness, R.A. (Eds.), Wollongong Papers on Maritime
Policy No 14: Coastal GIS 2003: an Integrated Approach to Australian
Coastal Issues. Centre for Maritime Policy, Wollongong, New South
Wales.
Camm, J.D., Polasky, S., Solow, A., Csuti, B., 1996. A note on optimal algo-
rithms for reserve site selection. Biological Conservation 78, 353e355.
Chu, A.K.M., Kwok, R.C.W., Yu, K.N., 2005. Study of pollution dispersion in
urban areas using Computational Fluid Dynamics (CFD) and Geographic
Information Systems (GIS). Environmental Modelling and Software 20,
273e277.
Church, R.L., ReVelle, C., 1974. The maximal covering location problem.
Papers of the Regional Science Association 32, 101e118.
Church, R.L., Stoms, D.M., Davis, F.W., 1996. Reserve selection as a maximal
covering location problem. Biological Conservation 76, 105e112.
Cocks, K.D., Baird, I.A., 1989. Using mathematical programming to address
the multiple reserve selection problem: an example from the Eyre Penin-
sula, South Australia. Biological Conservation 49, 113e130.
Cowling, R.M., Knight, A.T., Faith, D.P., Ferrier, S., Lombard, A.T.,
Driver, A., Rouget, M., Maze, K., Desmet, P.G., 2004. Nature conservation
requires more than a passion for species. Conservation Biology 18, 1674e
1676.
Cowling, R.M., Pressey, R.L., Rouget, M., Lombard, A.T., 2003. A conserva-
tion plan for a global biodiversity hotspot e the Cape Floristic Region,
South Africa. Biological Conservation 112, 191e216.
C-Plan, 2001. C-Plan Conservation Planning Software User Manual, <http://
members.ozemail.com.au/~cplan/download.html>.
Crossman, N.D., Bryan, B.A., 2006. Systematic landscape restoration using in-
teger programming. Biological Conservation 128, 369e383.
Crossman, N.D., Bryan, B.A., Ostendorf, B., Collins, S. Systematic landscape
restoration in the ruraleurban fringe: meeting conservation planning and
policy goals. Landscape and Urban Planning, in press.
Csuti, B., Polasky, S., Williams, P.H., Pressey, R.L., Camm, J.D., Kershaw, M.,
Kiester, A.R., Downs, B., Hamilton, R., Huso, M., Sohr, K., 1997. A com-
parison of reserve selection algorithms using data on terrestrial vertebrates
in Oregon. Biological Conservation 80, 83e97.
Davis, F.W., Stoms, D.M., Estes, J.E., Scepan, J., Scott, J.M., 1990. An
information systems approach to the preservation of biological diversity.
International Journal of Geographical Information Systems 4, 55e78.
Department for Environment and Heritage, 2004. Living Coast Strategy for
South Australia. Department for Environment and Heritage, Adelaide.
ESRI, 2002. ArcGIS 8.3. ESRI, Redlands, California.
Faith, D.P., Ferrier, S., Walker, P.A., 2004. The ED strategy: how species-level
surrogates indicate general biodiversity patterns through an ‘environmental
diversity’ perspective. Journal of Biogeography 31, 1207e1217.
Ferrier, S., Pressey, R.L., Barrett, T.W., 2000. A new predictor of the irreplace-
ability of areas for achieving a conservation goal, its application to real-
world planning, and a research agenda for further refinements. Biological
Conservation 93, 303e325.
Ferrier, S., Drielsma, M., Manion, G., Watson, G., 2002. Extended statistical
approaches to modelling spatial pattern in biodiversity in northeast New
South Wales. II. Community-level modelling. Biodiversity and Conserva-
tion 11, 2309e2338.
Gerner, D.B., Bryan, B.A., 2003. Geographic information systems and optimi-
sation algorithms to assist in the design of marine protected areas: a case
study of the Encounter Region, South Australia. In: Proceedings of the
Spatial Sciences Institute of Australia Inaugural Conference. Spatial
Sciences Institute, Canberra, Australia.
Haight, R.G., ReVelle, C.S., Snyder, S.A., 2000. An integer optimisation
approach to a probabilistic reserve site selection problem. Operations
Research 48, 697e708.
Haight, R.G., Snyder, S.A., ReVelle, C.S., 2005. Metropolitan open-space pro-
tection with uncertain site availability. Conservation Biology 19, 327e337.
Higgins, J.V., Ricketts, T.H., Parrish, J.D., Dinerstein, E., Powell, G.,
Palminteri, S., Hoekstra, J.M., Morrison, J., Tomasek, A., Adams, J.,
2004. Beyond Noah: saving species is not enough. Conservation Biology
18, 1672e1673.
ILOG, 2003. CPLEX 9.0 and OPL Studio 3.6. ILOG, Mountain View,
California.

463N.D. Crossman et al. / Environmental Modelling & Software 22 (2007) 449e463
ILOG, 2004. ILOG home page and price list, <http://www.ilog.com/partners/
academic/pricelist.cfm>.
International Union for the Conservation of Nature, 1994. Guidelines for Pro-
tected Area Management Categories. Commission on National Parks and
Protected Areas, Switzerland.
Kingsland, S., 2002. Creating a science of nature reserve design: perspectives
from history. Environmental Modeling and Assessment 7, 61e69.
Kirkpatrick, J.B., 1983. An iterative method for establishing priorities for the
selection of nature reserves: an example from Tasmania. Biological Con-
servation 25, 127e134.
Leslie, H., Ruckelshaus, M., Ball, I.R., Andelman, S., Possingham, H.P., 2003.
Using siting algorithms in the design of marine reserve networks. Ecolog-
ical Applications 13, S185eS198.
Lim, L.L., Hughes, S.J., Hellawell, E.E., 2005. Integrated decision support
system for urban air quality assessment. Environmental Modelling and
Software 20, 947e954.
Lindenmayer, D.B., Manning, A.D., Smith, P.L., Possingham, H.P., Fischer, J.,
Oliver, I., McCarthy, M.A., 2002. The focal-species approach and land-
scape restoration: a critique. Conservation Biology 16, 338e345.
Margules, C.R., Nicholls, A.O., Pressey, R.L., 1988. Selecting networks of re-
serves to maximise biological diversity. Biological Conservation 43,
63e76.
Margules, C.R., Pressey, R.L., 2000. Systematic conservation planning. Nature
405, 243e253.
Margules, C.R., Pressey, R.L., Williams, P.H., 2002. Representing biodiver-
sity: data and procedures for identifying priority areas for conservation.
Journal of Bioscience 27, 309e326.
McDonnell, M.D., Possingham, H.P., Ball, I.R., Cousins, E.A., 2002. Mathe-
matical methods for spatially cohesive reserve design. Environmental
Modeling and Assessment 7, 107e114.
Moore, J.L., Folkmann, M., Balmford, A., Brooks, T., Burgess, N., Rahbek, C.,
Williams, P.H., Krarup, J., 2003. Heuristic and optimal solutions for set-
covering problems in conservation biology. Ecography 26, 595e601.
Nalle, D.J., Arthur, J.L., Sessions, J., 2002. Designing compact and contiguous
reserve networks with a hybrid heuristic algorithm. Forest Science 48, 59e68.
Naoum, S., Tsanis, I.K., Fullarton, M., 2005. A GIS pre-processor for pollutant
transport modelling. Environmental Modelling and Software 20, 55e68.
Nicholls, A.O., Margules, C.R., 1993. An upgraded reserve selection algo-
rithm. Biological Conservation 64, 165e169.
Onal, H., 2003. First-best, second-best, and heuristic solutions in conservation
reserve site selection. Biological Conservation 115, 55e62.
Onal, H., Briers, R.A., 2002. Incorporating spatial criteria in optimum reserve
selection. Proceedings of the Royal Society of London B 269, 2437e2441.
Onal, H., Briers, R.A., 2003. Selection of a minimum-boundary reserve net-
work using integer programming. Proceedings of the Royal Society of
London B 270, 1487e1491.
Possingham, H.P., Ball, I., Andelman, S., 2000. Mathematical methods for
identifying representative reserve networks. In: Ferson, S., Burgman, M.
(Eds.), Quantitative Methods for Conservation Biology. Springer-Verlag,
New York.
Pressey, R.L., 1994. Ad hoc reservations: forward or backward steps in devel-
oping representative reserve systems? Conservation Biology 8, 662e668.
Pressey, R.L., 2004. Conservation planning and biodiversity: assembling the
best data for the job. Conservation Biology 18, 1677e1681.
Pressey, R.L., Ferrier, S., Hutchinson, C.D., Sivertsen, D.P., Manion, G., 1995.
Planning for negotiation: using an interactive geographic information sys-
tem to explore alternative protected area networks. In: Saunders, D.A.,
Craig, J.L., Mattiske, E.M. (Eds.), Nature Conservation: the Role of Net-
works. Surrey Beatty and Sons, Sydney.
Pressey, R.L., Humphries, C.J., Margules, C.R., Vane-Wright, R.I.,
Williams, P.H., 1993. Beyond opportunism: key principles for systematic
reserve selection. Trends in Ecology & Evolution 8, 124e129.
Pressey, R.L., Possingham, H.P., Day, J.R., 1997. Effectiveness of alternative
heuristic algorithms for identifying indicative minimum requirements for
conservation reserves. Biological Conservation 80, 207e219.
Pressey, R.L., Possingham, H.P., Logan, V.S., Day, J.R., Williams, P.H., 1999.
Effects of data characteristics on the results of reserve selection algo-
rithms. Journal of Biogeography 26, 179e191.
Pressey, R.L., Possingham, H.P., Margules, C.R., 1996. Optimality in reserve
selection algorithms: when does it matter and how much? Biological Con-
servation 76, 259e267.
ReVelle, C.S., Williams, J.C., Boland, J.J., 2002. Counterpart models in facil-
ity location science and reserve selection science. Environmental Modeling
and Assessment 7, 71e80.
Rizzoli, A.E., Young, W.J., 1997. Delivering environmental decision support
systems: software tools and techniques. Environmental Modelling and
Software 12, 237e249.
Rodrigues, A.S.L., Gaston, K.J., 2002. Optimisation in reserve selection pro-
cedures e why not? Biological Conservation 107, 123e129.
Rodrigues, A.S.L., Akcakaya, H.R., Andelman, S.J., Bakarr, M.I., Boitani, L.,
Brooks, T.M., Chanson, J.S., Fishpool, L.D.C., da Fonseca, G.A.B.,
Gaston, K.J., Hoffman, M., Marquet, P.A., Pilgrim, J.D., Pressey, R.L.,
Schipper, J., Sechrest, W., Stuart, S.N., Underhill, L.G., Waller, R.W.,
Watts, M.E.J., Yan, X., 2004. Global gap analysis: priority regions for
expanding the global protected-area network. Bioscience 54, 1092e1100.
Roetter, R.P., Hoanh, C.T., Laborte, A.G., Van Keulen, H., Van Ittersum, M.K.,
Dreiser, C., Van Diepen, C.A., De Ridder, N., Van Laar, H.H., 2005.
Integration of Systems Network (SysNet) tools for regional land use
scenario analysis in Asia. Environmental Modelling and Software 20,
291e307.
Sarkar, S., Pappas, C., Garson, J., Aggarwal, A., Cameron, S., 2004. Place
prioritization for biodiversity conservation using probabilistic surrogate
distribution data. Diversity and Distributions 10, 125e133.
Schluter, M., Savitsky, A.G., McKinney, D.C., Lieth, H., 2005. Optimizing
long-term water allocation in the Amudarya River delta: a water manage-
ment model for ecological impact assessment. Environmental Modelling
and Software 20, 529e545.
Shaughnessy, P., Dennis, T., 2003. Population assessment of New Zealand fur
seals and Australian sea lions in some South Australian colonies, 2002e03.
Unpublished report, Department for Environment and Heritage,
Adelaide.
Shen, J., Parker, A., Riverson, J., 2005. A new approach for a windows-based
watershed modelling system based on a database-supporting architecture.
Environmental Modelling and Software 20, 1127e1138.
Simberloff, D., 1998. Flagships, umbrellas, and keystones: is single-species
management passe in the landscape era? Biological Conservation 83,
247e257.
Snyder, S., ReVelle, C., Haight, R., 2004. One- and two-objective approaches
to an area-constrained habitat reserve site selection problem. Biological
Conservation 119, 565e574.
Soule, M.E. (Ed.), 1987. Viable Populations for Conservation. Cambridge
University Press, Cambridge.
Underhill, L.G., 1994. Optimal and suboptimal reserve selection algorithms.
Biological Conservation 70, 85e87.
Ward, T.J., Vanderklift, M.A., Nicholls, A.O., Kenchington, R.A., 1999. Se-
lecting marine reserves using habitats and species assemblages as surro-
gates for biological diversity. Ecological Applications 9, 691e698.
Wessels, K.J., Freitag, S., van Jaarsveld, A.S., 1999. The use of land facets as
biodiversity surrogates during reserve selection at a local scale. Biological
Conservation 89, 21e38.
Westphal, M.I., Pickett, M., Getz, W.M., Possingham, H.P., 2003. The use of
stochastic dynamic programming in optimal landscape reconstruction for
metapopulations. Ecological Applications 13, 543e555.
Williams, P.H., 1998. Key sites for conservation: area-selection methods for
biodiversity. In: Mace, G.M., Balmford, A., Ginsberg, J.R. (Eds.), Conser-
vation in a Changing World: Integrating Processes into Priorities for Ac-
tion. Cambridge University Press, Cambridge.
Williams, P.H., 1999e. Worlsmap 4 Windows: Software and Help Document
4.2. The Natural History Museum, London, <http://www.nhm.ac.uk/
science/projects/worldmap/>.
Williams, J.C., ReVelle, C.S., 1996. A 0-1 programming approach to
delineating protected reserves. Environment and Planning B 23,
607e624.
Williams, J.C., ReVelle, C.S., 1998. Reserve assemblage of critical areas e
a zero-one programming approach. European Journal of Operational
Research 104, 497e509.