Embed Size (px)
Citation preview
South Dakota State University South Dakota State University
Open PRAIRIE: Open Public Research Access Institutional Open PRAIRIE: Open Public Research Access Institutional
Repository and Information Exchange Repository and Information Exchange
Electronic Theses and Dissertations
2017
An Integrated Evaluation of the Conservation Reserve An Integrated Evaluation of the Conservation Reserve
Enhancement Program in South Dakota Enhancement Program in South Dakota
Jarrett D. Pfrimmer South Dakota State University
Follow this and additional works at: https://openprairie.sdstate.edu/etd
Part of the Ecology and Evolutionary Biology Commons, and the Natural Resources Management and
Policy Commons
Recommended Citation Recommended Citation Pfrimmer, Jarrett D., "An Integrated Evaluation of the Conservation Reserve Enhancement Program in South Dakota" (2017). Electronic Theses and Dissertations. 1196. https://openprairie.sdstate.edu/etd/1196
This Thesis - Open Access is brought to you for free and open access by Open PRAIRIE: Open Public Research Access Institutional Repository and Information Exchange. It has been accepted for inclusion in Electronic Theses and Dissertations by an authorized administrator of Open PRAIRIE: Open Public Research Access Institutional Repository and Information Exchange. For more information, please contact [email protected].
AN INTEGRATED EVALUATION OF THE CONSERVATION RESERVE
ENHANCEMENT PROGRAM IN SOUTH DAKOTA
BY
JARRETT D. PFRIMMER
A dissertation submitted in partial fulfillment of the requirements for the
Doctor of Philosophy
Major in Wildlife and Fisheries Sciences
South Dakota State University
2017

iii
ACKNOWLEDGEMENTS
I owe a debt of gratitude to many people who provided support and
encouragement throughout this entire process. First, I would like to thank the South
Dakota Department of Game, Fish and Parks (GF&P) for making this project possible
through the State Wildlife Grants program. I would also like to thank the numerous
GF&P staff that participated in all of the Conservation Reserve Enhancement Program
research meetings and for providing the great feedback. Thank you to Mark Norton and
Eileen Dowd-Stukel for assisting above and beyond throughout this entire project. I
would also like to recognize and thank the Kempeska Chapter of the Izaak Walton
League of America for their funding support and recognition of the importance of human
dimensions research. A special thank you to my advisor and mentor, Dr. Joshua Stafford;
your constant encouragement and guidance through this opportunity has made my
experience much more rewarding. Your mentorship guided me to grow personally and
professionally. I would like to show my appreciation and gratitude to Dr. Katie Bertrand,
Dr. Kent Jensen, Dr. Kristel Bakker, and Dr. Larry Gigliotti for taking time out of their
schedules and serving as committee members for my dissertation research and education.
My research would not have been possible without the support of staff at the USGS
Cooperative Research Unit and the Department of Natural Resource Management at
South Dakota State University.
As with all research, the success in this study would not have been possible
without all of the hard-working field technicians. I would like to thank all of my crews
for their countless hours of data collection and management in the field and lab. Most of
all, thank you for sticking with me through all of the grueling early mornings and long
iv
days. I want to express my upmost appreciation and gratitude to all of my fellow graduate
students for your assistance, guidance, input, and even the productivity killing moments -
Adam Janke, David Schumann, Neal Martorelli, Eli Felts, Brandy Felts, Ryann Cressey,
and Will Inselman.
Most importantly, I would like to give a special thank you to my wife, Ashley, for
her support and encouragement through this long endeavor. Without her, this project
would not have been possible. I cannot thank you enough for putting up all of my ranting,
grassland and bird talk, and motivating me through the long hours in the field and the lab.
Most of all, thank you for being so supportive and putting your life on hold to allow me
to achieve my dream. As I mentioned before, this would not have been possible without
you by my side.
v
TABLE OF CONTENTS
ABSTRACT ..................................................................................................................... viii
CHAPTER 1: AN INTEGRATED EVALUATION OF THE CONSERVATION
RESERVE ENHANCEMENT PROGRAM IN SOUTH DAKOTA: AN
INTRODUCTION ...............................................................................................................1
Dissertation Research.....................................................................................................5
Literature Cited ..............................................................................................................7
CHAPTER 2: FIELD AND LANDSCAPE FACTOR INFLUENCES ON BREEDING
BIRD USE OF CONSERVATION RESERVE ENHANCEMENT PROGRAM LANDS
IN SOUTH DAKOTA .......................................................................................................15
Abstract ........................................................................................................................16
Introduction ..................................................................................................................17
Materials and Methods .................................................................................................19
Site Selection .........................................................................................................19
Vegetation Surveys ................................................................................................20
Avian Surveys ........................................................................................................21
Arthropod Surveys .................................................................................................22
Data Analysis .........................................................................................................23
vi
Results ..........................................................................................................................26
Discussion ....................................................................................................................27
Acknowledgements ......................................................................................................31
Literature Cited ............................................................................................................31
CHAPTER 3: SPATIAL SCALE CONSERVATION PROGRAM INFLUENCES
AFFECTING GRASSLAND NESTING AVIFAUNA IN SOUTH DAKOTA ...............45
Abstract ........................................................................................................................46
Introduction ..................................................................................................................47
Materials and Methods .................................................................................................49
Site Selection .........................................................................................................49
Vegetation Surveys ................................................................................................50
Nest Surveys and Monitoring ................................................................................50
Arthropod Surveys .................................................................................................51
Data Analysis .........................................................................................................52
Results ..........................................................................................................................55
Discussion ....................................................................................................................59
Acknowledgements ......................................................................................................65
Literature Cited ............................................................................................................66
vii
CHAPTER 4: MOTIVATIONS FOR ENROLLMENT INTO THE CONSERVATION
RESERVE ENHANCEMENT PROGRAM IN SOUTH DAKOTA ................................84
Abstract ........................................................................................................................85
Introduction ..................................................................................................................86
Methods........................................................................................................................88
Results ..........................................................................................................................90
Discussion ....................................................................................................................92
Acknowledgements ......................................................................................................94
References ....................................................................................................................95
CHAPTER 5: INTEGRATED EVALUATION OF CONSERVATION PROGRAMS:
SUMMARY AND CONCLUSIONS ..............................................................................105
Research Assessment .................................................................................................106
Biological .............................................................................................................106
Human Dimensions ..............................................................................................109
Management Implications ..........................................................................................110
Conclusion .................................................................................................................111
Literature Cited ..........................................................................................................112
viii
ABSTRACT
AN INTEGRATED EVALUATION OF THE CONSERVATION RESERVE
ENHANCEMENT PROGRAM IN SOUTH DAKOTA
JARRETT PFRIMMER
2017
Grassland restoration efforts in North America typically share the goal of
improving ecological conditions for wildlife; however, it is unclear in many cases if goals
are met. The South Dakota Conservation Reserve Enhancement Program (CREP) was
initiated to alleviate agriculturally-related environmental degradation by converting
40,469 hectares of eligible cropland and marginal pastureland to perennial vegetation.
The program aims to provide habitat for obligate grassland breeding songbirds, while
producing an additional 285,000 pheasants and 60,000 ducks annually. As part of a
collaborative comprehensive evaluation effort, my research assessed the response of
grassland-dependent breeding birds to CREP implementation at varying spatial scales
between May 2013 and August 2015. My study highlighted both field and landscape
scale variables are critical to understanding the interconnected ecological network and
meeting program goals. Competitive model variables presented variability between avian
demographics and our species groups (i.e., other species, song bird species, CREP focal
species, and waterfowl species) related to the ecology of species and functional groups;
emphasizing that implementation of conservation programs with broad and non-
collaborative objectives may receive undesired outcomes. In addition to the biological
assessment, I integrated a human dimensions study to evaluate CREP landowner
motivations for program enrollment. My study highlighted three themes of motivation for

ix
CREP enrollment. First, the requirement of providing public access with CREP
enrollment delivered additional financial and non-financial incentive for enrollees.
Second, based on demographics data, landowner age represented a potential shift of
producers towards retirement and decisions to reduce active production fields. Third,
CREP landowners conceptualized their own personal motivations within the program that
would provide greater benefit to their family, community, and local fish and wildlife.
Implementation of an integrated stepwise platform based on biological and socio-
economic data will benefit resource managers’ and policy makers’ understanding of
conservation program effectiveness and future success.
1
CHAPTER 1: AN INTEGRATED EVALUATION OF THE CONSERVATION
RESERVE ENHANCEMENT PROGRAM IN SOUTH DAKOTA: AN
INTRODUCTION
Conversion of native prairie for agricultural production in the Mid-continental
U.S. has been deemed one of the most rapid and comprehensive environmental
alterations (Smith 1998). In South Dakota, >85% of native tallgrass prairie has been
converted (Samson and Knopf 1994), with much of the landscape today being dominated
by annual crops (Wright and Wimberly 2013). The expansion and intensification of
agricultural production systems and subsequent loss of grasslands has driven significant
declines in biodiversity in the region (Warner 1994, Fletcher and Koford 2002, Murphy
2003, Wiens et al. 2011). In particular, Midwestern grassland birds have experienced
widespread population declines over the past four decades (Knopf 1994, Brennan and
Kuvlesky 2005, Sauer et al. 2011). Current populations of these species have become
dependent on intensively managed agricultural lands for breeding habitat (Askins et al.
2007).
Recent historically-high crop prices, combined with federal mandates promoting
expanded corn ethanol and cellulosic biofuel production (EISA 2007, Sumner and Zulauf
2012), have further driven agricultural expansion and intensification in the Midwestern
U.S. For example, approximately 5.7 million ha of grassland, wetland, and shrubland
habitats were converted to corn (Zea mays) and soybean (Glycine max) production during
2008 to 2011, with conversion primarily occurring in the Midwest (Faber et al. 2012).
From 2006 to 2011, grass-dominated land cover in the Western Corn Belt states (North
and South Dakota, Nebraska, Minnesota, and Iowa) declined by 528,000 ha, concomitant
2
with a significant expansion of corn and soybean production onto marginal lands (Wright
and Wimberly 2013).
In response to declining ecological function and overall habitat loss in these
important transitional zones, restoration of native landscapes and local riparian areas are
now widely advocated through a variety of federal and state conservation programs
(Allen 2005, Teels et al. 2006). The rate of decline in ecosystem functions (i.e., water
supply, nutrient cycling, soil erosion, and biological diversity; Dodds et al. 2008) were
greatest prior to 1985, but slowed following the inception of various conservation
programs (e.g., the Conservation Reserve Program; Gray and Teels 2006). Throughout
the Midwest, such conservation initiatives included provisions for the protection and
restoration of specific features of degraded grassland and wetland habitats, with focus on
environmentally and economically important watersheds (Goodwin et al. 1997, Allen
2005). Because it is not often realistic to return such systems to historical conditions, and
few studies have documented changes in the condition of aquatic and terrestrial resources
in response to conservation efforts (Kauffmann et al. 1997, Gray and Teels 2006, Teels et
al. 2006), scientists must determine how best to manage systems for particular ecological
benefits. Habitat reconstruction and restoration efforts undertaken throughout the U.S.
typically share similar goals of improving conditions for terrestrial and aquatic resources;
nonetheless, it remains unclear if projects tend to achieve such results (Kleiman et al.
2000, Bash and Ryan 2002, Stem et al. 2003). Currently, the relative effectiveness of
most restoration practices to meet desired ecological goals is poorly understood, in part
due to limited post-implementation monitoring and evaluation (~10%; Bernhardt et al.
2005, Palmer and Bernhardt 2006, De Bello et al. 2010). Restoration monitoring and
3
subsequent assessment can offer resource managers valuable feedback and improve the
outlook of achieving anticipated ecological goals, while also facilitating adaptive
management opportunities. These efforts may ultimately improve future management of
resources through refinement of restoration methods and techniques.
Widespread ecological restoration efforts focus generally on improving the
capacity of select watersheds to provide clean water, consumable fisheries, wildlife
habitat, and generally improve the overall health and function of such systems (Allen
2005, Palmer and Bernhardt 2006). However, conflicting needs of diverse interest groups
have necessitated a clear understanding of the impacts of restoration at varying spatial
scales and benefits to terrestrial and aquatic components (Sear et al. 1998, Cole et al.
2010, Shanahan et al. 2011, Kroll et al. 2014). Effective ecological restoration must
include a comprehensive approach that embraces biological responses and human
dimension integration (Meyerson et al. 2005, Palmer and Bernhardt 2006, Heneghan et
al. 2008, Dallimer and Strange 2015, Selinskeet al. 2015, Velasco et al. 2015).
Furthermore, an integrated approach must be taken to evaluate biological responses
toward multiple variables. For example, the illumination of the link between large-scale
ecological dynamics and local management, rather than limited focus on isolated
manipulations of individual elements, will maximize functional benefits of restoration
efforts (Cunningham and Johnson 2006, Shanahan et al. 2011, Kroll et al. 2014).
Therefore, development of large-scale approaches that evaluate local, site-by-site
improvements, as well as multi-scale changes, will provide important landscape concepts
that can be used to prioritize future conservation efforts and effectively quantify
environmental change to terrestrial and aquatic resources (Teels et al. 2006, Shanahan et
4
al. 2010, Kroll et al. 2014). Present research using this multi-scale methodology often
neglect to evaluate limiting factors (e.g., forage availability). This oversight may hinder
modeled outcomes. For example, McIntyre and Thompson (2003) documented the
positive influence of arthropod abundance on bird abundance in Conservation Reserve
Program plantings. Modeling all factors previously discussed in this chapter could
potentially identify the biological variables of significance to the success of a
conservation program.
Along with the evaluation of ecological goals and restoration effectiveness, the
social-economic impacts of these programs should not be ignored. With approximately
72% of the U.S. land base under private ownership (Vincent et al. 2014), and the demand
for lower-cost foods and environmental sustainability at an all-time high (Godfray et al.
2010), it is a crucial time to understand agricultural producers’ environmental beliefs.
Landowner attitudes throughout the U.S. are highly complex and variable (Leatherman et
al. 2007). For example, agricultural producers may evaluate a conservation program with
entirely different beliefs based on requirements of conservation compliance, age,
education, and attitude (Hua et al. 2004). Even farmers characterized as dedicated to
environmental conservation have distinct gaps in their principles (Ahnstrӧm et al. 2009).
Research has shown that factors such as benefits to wildlife and minimizing soil erosion
were ranked as the most important factors influencing decision to enroll land into CRP
(Kurzejeski et al. 1992). However, the most influential variable has been shown to
fluctuate across the U.S. (Kurzejeski et al. 1992); therefore, it is crucial for conservation
to integrate human dimensions surveys within biological research.
5
DISSERTATION RESEARCH
My study was conducted as part of an integrated approach to evaluate
conservation programs based on terrestrial and aquatic resources as well as the human
dimensions of involved stakeholders. My dissertation will not include assessments or
findings from the evaluation of aquatic resources. My evaluation of terrestrial resources
was based on breeding bird response to implementation of the Conservation Reserve
Enhancement Program (CREP) in South Dakota, U.S.
The CREP is a natural resource conservation program involving a federal-state
partnership to enhance selected watersheds nationwide to address conservation priorities
by alleviating agriculturally-related environmental concerns (Allen 2005, USDA 2011).
Since the inception of the CREP in Maryland in 1997, the program has grown
substantially in support in various states. From 2007 to 2012, the CREP increased from
3.7 million acres to 5.3 million acres nationwide (Hellerstein 2012) and has contributed
to several large-scale conservation efforts in systems such as the Chesapeake Bay
tributaries in Pennsylvania, Minnesota River Basin in Minnesota, the Saginaw Bay
Watershed in Michigan, the Illinois River Watershed in Illinois, and the Lake Erie
ecosystem in Ohio (Allen 2005, Teels et al. 2006, O’Neal et al. 2008). In South Dakota,
the CREP project was proposed for the James River Basin in November 2009, with a goal
of 40,469 hectares total enrollment (10-15 year contracts). The CREP is and has been a
valuable tool for grassland and wetland conservation. The program was intended to
restore hydrologic conditions (e.g., increase water quality and channel stabilization) and
provide perennial habitat (e.g., grasslands and wetlands) for breeding game and non-
game wildlife (USDA 2011). In addition to non-game wildlife species, a goal of the
6
South Dakota CREP was also to produce an additional 285,000 ring-necked pheasants
(Phasianus colchicus) and 60,000 ducks (Anatidae) annually (USDA 2009). Further, the
program is unique in that all lands under contract are required to allow public access
through South Dakota’s Walk-in Area Program and require all landowners to comply
with aquatic and terrestrial monitoring. This program coupling has simultaneously
allowed the program to provide increased financial incentive for private landowners in
comparison to other conservation programs; thus, it provides unique opportunities for
financial growth, public recreation, and research.
My study entailed surveys of breeding and nesting birds, vegetation, invertebrate
assemblage and biomass, and landowner motivations for enrollment. Moreover, my study
included a multi-scale approach to assess the influence of landscape-scale (1,500m field
buffers) CREP implementation and local contract site selected variables. This integrated
approach provided applicable assessment and identification of potential conservation
thresholds for future program standards.
Conceptualizing my overarching goal of developing an integrated evaluation of
CREP in South Dakota, my dissertation is comprised of 5 chapters. This introduction
(chapter 1) was developed to provide background content and outline future chapters.
Chapter 2 analyzes field and landscape factor models to identify variables most
influential to overall breeding bird abundance and species richness by functional group
and CREP focal species of concern. Chapter 3 further examines field and landscape
factor models to identify variables most influential to nest density, species richness, and
survival by functional group and CREP program focal species of concern. With this,
chapters 2 and 3 stand to evaluate current CREP conditions and work to develop an
7
integrated platform for future conservation program implantation. Chapter 4 integrates
human dimensions evaluation of CREP enrolled landowners for analysis of
demographics, conservation beliefs, and motivations for enrollment. I close my
dissertation with chapter 5 as a discussion of conclusions and future implications made
throughout my study to portray my findings and detail the benefits of this integrated
evaluation approach.
My research highlights successes and points of concern to conservation program
implementation, as well as potential limits to management strategies for future allocation
of resources and prioritization of future enrollments. The conservation field in general
could benefit from reflecting on the effects of individual contract management techniques
to terrestrial resources with an integration of multi-scale and human dimensions
perspectives.
LITERATURE CITED
Ahnström, J., J. Höckert, H. L. Bergeå, C. A. Francis, P. Skelton, and L. Hallgren. 2009.
Farmers and nature conservation: What is known about attitudes, context factors
and actions affecting conservation? Renewable Agriculture and Food Systems
24:38–47.
Allen, A. 2005. The Conservation Reserve Enhancement Program. USGS Staff --
Published Research. http://digitalcommons.unl.edu/usgsstaffpub/191.
8
Askins R. A., F. Chavez-Ramirez, B. C. Dale, C. A. Haas, J. R. Herkert, F. L. Knopf, and
P. D. Vickery. 2007. Conservation of Grassland Birds in North America:
Understanding Ecological Processes in Different Regions. Ornithological
Monographs 64:1–46.
Bash, J. S., and C. M. Ryan. 2002. Stream Restoration and Enhancement Projects: Is
Anyone Monitoring?. Environmental Management 29:877–885.
Bernhardt, E. S., M. A. Palmer, J. D. Allan, G. Alexander, K. Barnas, S. Brooks, J. Carr,
S. Clayton, C. Dahm, J. Follstad-Shah, D. Galat, S. Gloss, P. Goodwin, D. Hart,
B. Hassett, R. Jenkinson, S. Katz, G. M. Kondolf, P. S. Lake, R. Lave, J. L.
Meyer, T. K. O’Donnell, L. Pagano, B. Powell, and E. Sudduth. 2005.
Synthesizing U.S. River Restoration Efforts. Science 308:636–637.
Brennan L. A., and W. P. Kuvlesky. 2005. North American Grassland Birds: An
Unfolding Conservation Crisis? The Journal of Wildlife Management 69:1–13.
Cole, L. J., M. L. Pollock, D. Robertson, J. P. Holland, D. I. McCracken, and W.
Harrison. 2010. The Influence of Fine-Scale Habitat Heterogeneity on
Invertebrate Assemblage Structure in Upland Semi-Natural Grassland.
Agriculture, Ecosystems & Environment 136:69–80.
Cunningham, M. A., and D. H. Johnson. 2006. Proximate and landscape factors influence
grassland bird distributions. Ecological Applications 16:1062–1075.
Dallimer, M., and N. Strange. 2015. Why socio-political borders and boundaries matter in
conservation. Trends in Ecology & Evolution 30:132–139.
9
De Bello, F., S. Lavorel, P. Gerhold, U. Reier, and M. Partel. 2010. A Biodiversity
Monitoring Framework for Practical Conservation of Grasslands and Shrublands.
Biological Conservation 143:9–17.
Dodds, W. K., K. C. Wilson, R. L. Rehmeier, G. L. Knight, S. Wiggam, J. A. Falke, H. J.
Dalgleish, and K. N. Bertrand. 2008. Comparing Ecosystem Goods and Services
Provided by Restored and Native Lands. BioScience 58:837–845.
Energy Independence and Security Act. 2007. 110-140 H. R. 6.
Faber, S., S. Rundquist, and T. Male. 2012. Plowed Under: How Crop Subsidies
Contribute to Massive Habitat Losses. Environmental Working Group research
report. Accessed 31 January 2012. http://static.ewg.org/pdf/plowed_under.pdf.
Fletcher, R. J., and R. R. Koford. 2002. Habitat and Landscape Associations of Breeding
Birds in Native and Restored Grasslands. The Journal of Wildlife Management
66:1011–1022.
Godfray, HCJ., JR Beddington, IR. Crute, L. Haddad, D. Lawrence, JF. Muir, J. Pretty, S.
Robinson, SM. Thomas, and C. Toulmin. 2010. Food security: the challenge of
feeding 9 billion people. Science 327:812–818.
Goodwin, C. N., C. P. Hawkins, and J. L. Kershner. 1997. Riparian Restoration in the
Western United States: Overview and Perspective. Restoration Ecology 5:4–14.
Gray, R. L., and B. M. Teels. 2006. Wildlife and Fish Conservation through the Farm
Bill. Wildlife Society Bulletin 34:906–913.
10
Hellerstein, D. 2012. Conservation reserve program: Status and trends. Agricultural
Resources and Environmental Indicators, 2012 Edition: 44.
Heneghan, L., S. P. Miller, S. Baer, M. A. Callaham, J. Montgomery, M. Pavao-
Zuckerman, C. C. Rhoades, and S. Richardson. 2008. Integrating Soil Ecological
Knowledge into Restoration Management. Restoration Ecology 16:608–617.
Hua, W., C. Zulauf, and B. Sohngen. 2004. To adopt or not to adopt: Conservation
decisions and participation in watershed groups. Paper presented at the 2004
annual meetings of the American Agricultural Economics Association, Denver,
CO. Available: http://purl.umn.edu/20076.
Kauffman, J. B., R. L. Beschta, N. Otting, and D. Lytjen. 1997. An Ecological
Perspective of Riparian and Stream Restoration in the Western United States.
Fisheries 22:12–24.
Kleiman, D. G., R. P. Reading, B. J. Miller, T. W. Clark, J. M. Scott, J. Robinson, R. L.
Wallace, R. J. Cabin, and F. Felleman. 2000. Improving the Evaluation of
Conservation Programs. Conservation Biology 14:356–365.
Knopf, F. L. 1994. Avian Assemblages in Altered Grasslands. Studies in Avian Biology
15: 247–257.
Kroll, A. J., Y. Ren, J. E. Jones, J. Giovanini, R. W. Perry, R. E. Thill, D. White Jr., and
T. B. Wigley. 2014. Avian Community Composition Associated with Interactions
between Local and Landscape Habitat Attributes. Forest Ecology and
Management 326:46–57.
11
Kurzejeski, E. W., Burger, Jr., L. W., Monson, M. J., and Lenkner, R. 1992. Wildlife
conservation attitudes and land use intentions of Conservation Reserve Program
participants in Missouri. Wildlife Society Bulletin 20:253–259.
Leatherman, J. C., Peterson, J. M., and Smith, C. M. 2007. Attitudes of Great Plains
producers about best management practices, conservation programs, and water
quality. Journal of Soil and Water Conservation 62:97A–103A.
McIntyre, N. E., and T. R. Thompson. 2003. A comparison of Conservation Reserve
Program habitat plantings with respect to arthropod prey for grassland birds. The
American Midland Naturalist 150:291–301.
Meyerson, L. A., J. Baron, J. M Melillo, R. J. Naiman, R. I. O’Malley, G. Orians, M. A.
Palmer, A. S. P. Pfaff, S. W. Running, and O. E. Sala. 2005. Aggregate Measures
of Ecosystem Services: Can We Take the Pulse of Nature?. Frontiers in Ecology
and the Environment 3:56–59.
Murphy, M. T. 2003. Avian population trends within the evolving agricultural landscape
of eastern and central United States. The Auk 120:20–34.
O’Neal, B. J., E. J. Heske, and J. D. Stafford. 2008. Waterbird Response to Wetlands
Restored through the Conservation Reserve Enhancement Program. The Journal
of Wildlife Management 72:654–664.
Palmer, M. A., and E. S. Bernhardt. 2006. Hydroecology and River Restoration: Ripe for
Research and Synthesis. Water Resources Research 42:W03S07.
12
Samson, F. B., and F. L. Knopf. 1994. Prairie Conservation in North America.
BioScience 44:418–421.
Sauer, J. R., J. E. Hines, J. E. Fallon, K. L. Pardieck, D. J. Ziolkowski Jr., and W. A.
Link. 2011. The North American Breeding Bird Survey, Results and Analysis
1966 - 2009. Version 3.23.2011 USGS Patuxent Wildlife Research Center,
Laurel, MD.
Sear, D. A., A. Briggs, and A. Brookes. 1998. A Preliminary Analysis of the
Morphological Adjustment within and Downstream of a Lowland River Subject
to River Restoration. Aquatic Conservation: Marine and Freshwater Ecosystems
8:167–183.
Selinske, M. J., Coetzee, J., Purnell, K., and Knight, A. T. 2015. Understanding the
motivations, satisfaction, and retention of landowners in private land conservation
programs. Conservation Letters 8:282–289.
Shanahan, D. F., C. Miller, H. P. Possingham, and R. A. Fuller. 2011. The Influence of
Patch Area and Connectivity on Avian Communities in Urban Revegetation.
Biological Conservation 144:722–729.
Smith, D. D. 1998. Iowa prairie: original extent and loss, preservation and recovery
attempts. Proceedings of the Iowa Academy of Science 105:98–108.
Stem, C., R. Margoluis, N. Salafsky, and M. Brown. 2005. Monitoring and evaluation in
conservation: a review of trends and approaches. Conservation Biology 19:295–
309.
13
Sumner, D. A. and C. Zulauf. 2012. Economic and Environmental Effects of Agricultural
Insurance Programs. The Council on Food, Agriculture and Resource Economics.
Teels, B. M., C. A. Rewa, and J. Myers. 2006. Aquatic Condition Response to Riparian
Buffer Establishment. Wildlife Society Bulletin 34:927–935.
United States Department of Agriculture: Farm Service Agency. 2009. The South Dakota
James River Watershed Conservation Reserve Enhancement Program.
Programmatic Environmental Assessment. Available:
https://www.fsa.usda.gov/Assets/USDA-FSA-Public/usdafiles/Environ-
Cultural/jrwcrepfnlstmtagmt0109.pdf
United States Department of Agriculture: Farm Service Agency. 2011. South Dakota
Conservation Reserve Enhancement Program. Fact Sheet. Available:
https://www.fsa.usda.gov/Internet/FSA_File/crepsdfactsheet.pdf
Velasco, D., García-Llorente, M., Alonso, B., Dolera, A., Palomo, I., Iniesta-Arandia, I.,
and Martín-López, B. 2015. Biodiversity conservation research challenges in the
21st century: A review of publishing trends in 2000 and 2011. Environmental
Science & Policy 54:90–96.
Vincent, C.H., L.A. Hanson, and J.P. Bjelopera. 2014. Federal Land Ownership:
Overview and Data. Congressional Research Service Report for Congress
R42346. Congressional Research Service, Washington, DC. Available:
fas.org/sgp/crs/misc/R42346.pdf.
14
Warner, R. E. 1994. Agricultural Land Use and Grassland Habitat in Illinois: Future
Shock for Midwestern Birds. Conservation Biology 8:147-156.
Wiens, J., J. Fargione, and J. Hill. 2011. Biofuels and Biodiversity. Ecological
Applications 21:1085–1095.
Wright, C. K., and M. C. Wimberly. 2013. Recent Land Use Change in the Western Corn
Belt Threatens Grasslands and Wetlands. Proceedings of the National Academy
of Sciences.
15
CHAPTER 2: FIELD AND LANDSCAPE FACTOR INFLUENCES ON BREEDING
BIRD USE OF CONSERVATION RESERVE ENHANCEMENT PROGRAM LANDS
IN SOUTH DAKOTA
This chapter is being prepared for submission in the Journal of Wildlife Management.
16
ABSTRACT
Habitat restoration and enhancement efforts in North America typically share the
goal of improving ecological conditions for wildlife; however, in many cases it is unclear
if goals are met. The South Dakota Conservation Reserve Enhancement Program (CREP)
partnership was initiated in 2009 with the objective of improving agriculturally-related
environmental degradation by enrolling and converting 40,469 hectares of eligible
cropland or marginal pastureland in the James River Basin to perennial vegetation. The
program also intended to provide habitat for obligate grassland breeding birds. As part of
a comprehensive study, our research assessed the response of grassland-dependent
breeding birds (i.e., upland game birds and songbirds) to CREP implementation at
varying spatial extents between May 2013 and August 2015. Our study focused on a
comprehensive approach that integrated field and landscape factor modeling to evaluate
variables most influential to breeding bird abundance and species richness by 3 groups:
1) song bird species; 2) other species, and; 3) CREP focal species. Competitive models
revealed unique influential variable differences between the 3 groups of breeding birds.
In evaluation of scale, field level had statistically greater influences on dependent
variables (e.g., abundance of all 3 bird groups, species richness of other and song bird
species groups) than landscape level variables for all groups. However, landscape scale
variables were influential in models of the songbird species group (i.e., abundance and
species richness), with a negative influence from percent cropland and a positive
influence from percent grassland and woodland. Evaluation across multiple focus levels
in our 3 groups of grassland breeding birds identified key similarities and differences that
must be accounted for by resource managers and policy makers in setting initial goals
17
(e.g., focal species selection, focus level influence varies by species or functional group)
and assessing mid-contract management in order to reach anticipated conservation
objectives.
INTRODUCTION
Grassland landscapes are being continuously converted throughout the Midwest
and Great Plains (Samson and Knopf 1994; Wright and Wimberly 2013) and
environmental incentive program enrollment caps are declining; therefore, there is a need
to assess current conservation program strategies to improve the effectiveness of
conservation efforts. Unfortunately, wildlife managers often fail to evaluate and monitor
implemented programs (Nichols and Williams 2006, De Bello et al. 2010). Many
Midwestern grassland birds have experienced population declines in recent decades
(Knopf 1994, Brennan and Kuvlesky 2005, Sauer et al. 2011) and are becoming more
dependent on smaller parcels of lands for breeding habitats (Askins et al. 2007). Habitat
reconstruction and restoration projects typically share basic goals of improving
environmental conditions for both terrestrial and aquatic resources, yet it is unclear if the
majority of projects achieve these goals (Bash and Ryan 2002). It has been recommended
that a mosaic composition of vegetation structure, plant diversity, and management
techniques may maximize useable space for multiple avian species with varying habitat
requirements over time (Van Dyke et al. 2004, Coppedge et al. 2008). When evaluations
are conducted, the majority of studies maintain a narrow focus that encompasses few
influential factors, such as vegetation structure, landscape context, or forage availability
(e.g., Delisle and Savidge 1997, Lloyd and Martin 2005). Comprehensive restoration
18
monitoring and assessment can offer managers valuable information for adaptive
management opportunities.
It is well established that conservation programs implemented throughout the
United States since the 1985 Farm Bill have improved environmental conditions and
ecosystem functions (i.e., disturbance regulation, water supply, nutrient cycling, soil
erosion control production of commodities and biological diversity; Gray and Teels 2006,
Dodds et al. 2008). However, with the current budget priority and reduction of
government funding, conservation managers and policy makers must identify new
options for maximizing remaining conservation funds. For example, this situation has
generated conservation initiatives for the protection and restoration of specific watersheds
of conservation concern (Goodwin et al. 1997, Allen 2005). Nonetheless, if implemented
programs within these regions are not evaluated, program success remains unknown and
it becomes difficult to impossible to target future conservation efforts and allocate
funding efficiently.
The South Dakota CREP partnership was initiated in November 2009 to restore
hydrologic conditions and upland buffers of prairie pothole wetlands by enrolling 40,469
hectares of cropland and/or marginal pastureland to perennial vegetation within the James
River Basin (USDA 2011). The South Dakota CREP was intended to provide habitat for
various game and non-game fish and wildlife species annually through 10-15 year
contracts.
Our study was part of a large-scale evaluation of the Conservation Reserve
Enhancement Program (CREP) in the James River Basin of South Dakota. We focused
on quantifying field and landscape ecological dynamics via modeling to identify
19
variables most influential to restoration success; that is, developing a large-scale
approach to evaluate local, site-by-site variation to prioritize future conservation efforts
(Teels et al. 2006, Shanahan et al. 2011, Kroll et al. 2014). Because it is not often realistic
to return such systems to historic conditions, and few studies have documented changes
in the condition of aquatic and terrestrial resources in response to conservation efforts
(Kauffmann et al. 1997, Gray and Teels 2006, Teels et al. 2006), scientists must
determine how best to manage systems for particular ecological benefits.
The overall goal of our study was to identify field and landscape level variables
most influential on achieving the CREP goal of maximizing suitable habitat for grassland
avifauna. Our specific research objectives were to model and evaluate avian abundance
and species richness by functional and CREP focal species groups in relation to: 1)
variation in vegetation composition and structure; 2) invertebrate abundance, species
richness, and biomass, and; 3) variation in landscape context. This comprehensive
approach was intended to provide managers with a framework that may be used to plan
for the implementation of future CREP or other conservation programs.
MATERIALS AND METHODS
Site Selection
We used a stratified multi-stage sampling design (MSS) with 4 stages to estimate
the effects of management and implementation of the CREP on terrestrial and aquatic
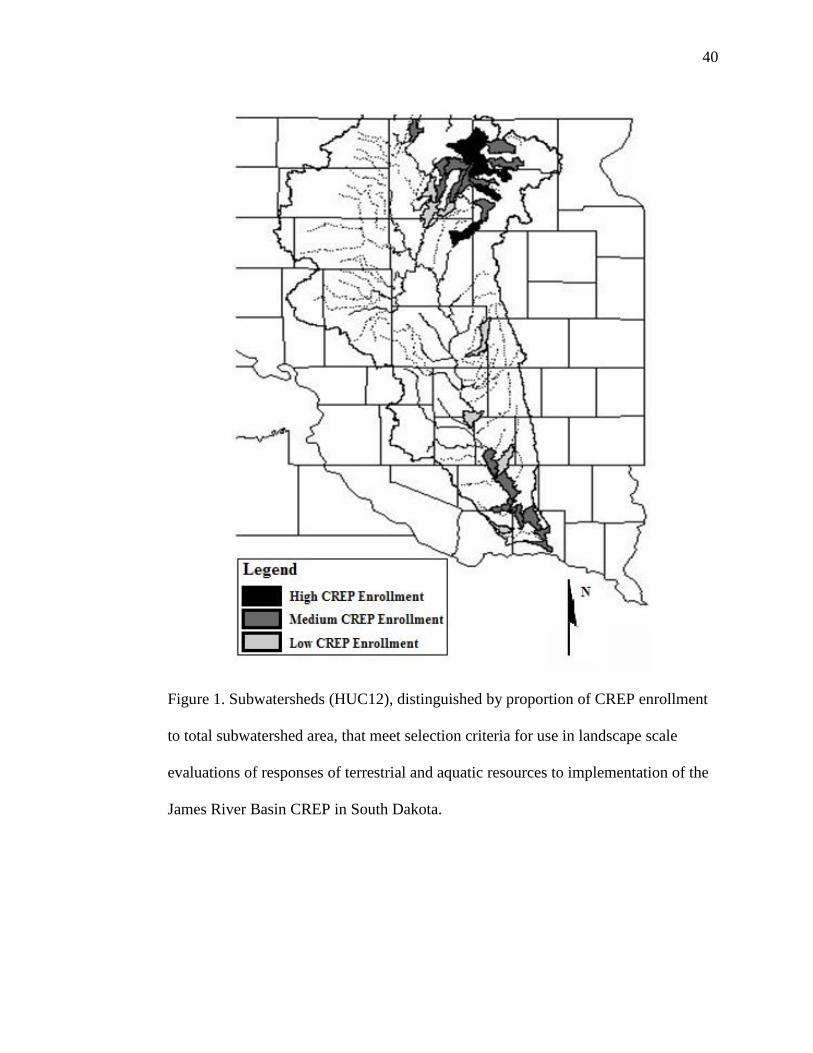
resources within the James River Basin (Stafford et al. 2006). We selected 10
subwatersheds with a stratified random approach throughout the James River Basin in
South Dakota, U.S.A. to allow for inferences to be drawn to the entire program area
(Figure 1). We based stratification on the need for areas to have habitat components to
20
support both terrestrial and aquatic studies, which resulted in 20 study fields (2-3 years
post-seeding) for the terrestrial evaluation. Primary sample units were subwatersheds
stratified by percent CREP enrollment of the total subwatershed area. We stratified
secondary sample units to include subwatersheds, which contained a minimum of 2
CREP sites of which an individual site met the following criteria: 1) implementation of
CREP management on both stream banks; 2) no inflowing tributaries, and; 3) aquatic
sites contained water and were expected to maintain flowing conditions throughout the
sampling period (Figure 1; aquatic sampling will not be discussed further). We deemed
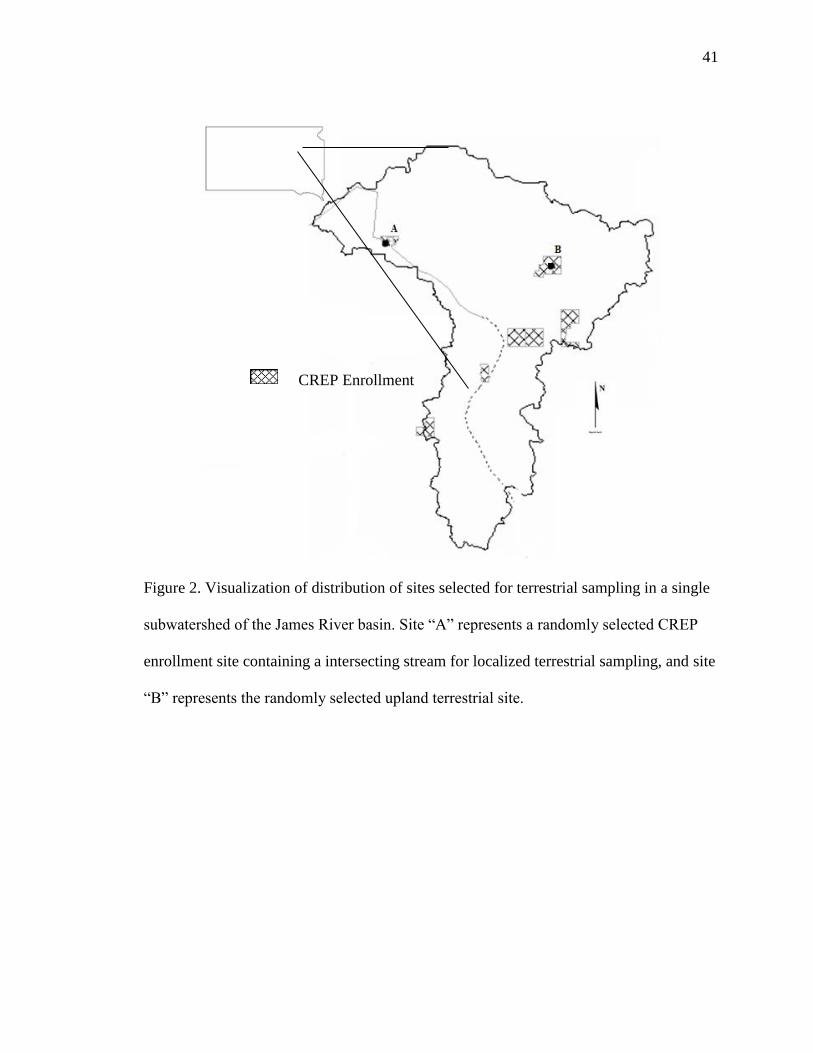
tertiary sample units as subwatersheds that included a CREP stream site and a
supplementary CREP site that was not required to include a stream (Figure 2). All sites
were randomly selected within each identified subwatershed for terrestrial sampling and
comparisons. Quaternary sample units were randomly placed research transects within
the stratified sites. We used PROC SURVEYSELECT in SAS v 9.2 (SAS Institute, 2008)
to randomly select subwatersheds, CREP enrollment localities, and local sampling units,
with respect to each proportional weighting value (i.e., relative probability of selection).
Vegetation Surveys
We surveyed vegetation composition and structure in each study field during the
avian breeding season (May-August) in 2013-2015. We randomly placed 4 100 m2 plots
at each CREP site and re-randomized these locations each year. We surveyed vegetation
characteristics along the north-south 100 m transect using 10 1 m2 quadrats placed at
randomized distances up to 50 m east or west of the transect. We initiated vegetation
quadrat surveys 5 m from the endpoint of each transect, and surveyed one quadrat every
10 m along the transect. In each 1 m2 quadrat, we measured vegetation height-density
21
(cm) by recording visual obstruction readings (VOR) using a Robel pole (Robel et al.
1970). We calculated canopy cover based on estimated visual overhead percent cover in
each quadrat. We used the Daubenmire cover class method (Daubenmire 1959) to
estimate percent bare ground, litter, and canopy coverage of standing dead and live
grasses, forbs, and woody vegetation.
Avian Surveys
We conducted visual surveys of breeding birds in 2 of the 100 m2 vegetation
sampling plots per CREP field by walking (1 m per 5 sec) the north-south transect. We
counted all birds observed or heard within the survey plot, and excluded all birds flying
overhead or using adjacent vegetation. We identified all birds with the aid of 10 x 40
binoculars and used auditory cues to ensure correct identification. For each observation,
we recorded species, location within the plot, and whether the bird was alone, paired, or
in a flock. We recorded behavior of each individual as: 1) entering plot; 2) flushed; 3)
foraging; 4) perched; 5) singing male; 6) fighting males; 7) courting; 8) mating; 9)
attending nest, or; 10) attending young.
We conducted breeding bird surveys between 30 min after sunrise and 1100, and
did not survey when there was precipitation, fog, or local wind speeds exceeding 25 km/h
(Ralph et al. 1993). We collected local weather data prior to surveys (temperature, wind
speed, cloud cover, and humidity) using a Kestrel® 3500 Pocket Weather® Meter at each
sampling location.
We surveyed each research plot 6 times between May and July each year (2
surveys per month). We randomly selected subsets of 6 to 14 fields to be surveyed per
day during a survey period and randomly selected the order to be surveyed, to minimize
22
bias associated with temporal or climatic variation. Each round of surveys (40 plots) was
completed within 5 days. If plots within a field were randomly placed adjacent to one
another, we conducted surveys simultaneously with 2 observers to avoid double counting
birds flushed from adjacent plots.
Arthropod Surveys
We surveyed arthropods in 2014 and 2015 using 2 common methods: pitfall
trapping and sweep-net surveys (O’Leske et al. 1997, Standen 2000, Doxon et al. 2011).
We surveyed arthropods in 10 of the 20 CREP fields, which were randomly selected
based on grass monocultures vs. grass-forb mix plant communities present in the 2013
vegetation sampling data and by NRCS contract seeding plans. We used NRCS
documents to provide insight into potential plant community shifts in future field seasons
(2014 and 2015).
Pitfall traps consisted of 2 cm x 16 cm PVC pipes placed in the soil to ground
level into which we inserted 18 mm x 150 mm glass test tubes 1/3 full of 70% ethanol
(Olson 1991, Nemec 2014). We placed traps 10 m west and 10 m towards the plot center
at both ends of each vegetation line transect 1 week prior to the first avian sampling
period of each year and collected trap contents weekly through the end of July. We
combined trap contents collected from a single transect each day.
We conducted sweep-net sampling 6 times during the field season in coordination
with avian survey periods. We conducted sampling using a standard 38 cm canvas sweep-
net and surveyed based on a 20 sweep collection method at approximately 1 sweep/meter
across the upper 25% of the vegetation (O’Leske et al. 1997, Standen 2000, Doxon et al.
2011). We conducted surveys along each of the 4 vegetation transects, initiated 40 m
23
from the endpoint of the north-south transect in each plot. Upon completion of the
sweeps, we transferred all collected arthropods to a sealed freezer bag and placed in cold-
storage for later sorting (Doxon et al. 2011). We classified arthropod samples to Suborder
for evaluation of abundance and richness and we obtained dry-weight biomass by
Suborder by drying samples at 60 degrees C for 48 hours in a drying oven (Taylor et al.
2006).
Data Analysis
We separated observed bird species into 3 groups: 1) song bird species; 2) other
species, and; 3) CREP focal species to assess influential variables (USDA 2009). The
song bird group and other species group encompassed all observed bird species in the
study with no overlap of species between them. The song bird group included all
passerines, whereas the group titled “Other” encompassed the Upland Sandpiper
(Bartramia longicauda), Ring-necked Pheasant (Phasianus colchicus), Mourning Dove
(Zenaida macroura), and Sharp-tailed Grouse (Tympanuchus phasianellus). The CREP
focal species group was an assemblage of the 8 bird species identified for conservation
program focus and the goal of improving habitat for these species of concern,
specifically: Bobolink (Dolichonyx oryzivorus), Chestnut-collared Longspur (Calcarius
ornatus), Dickcissel (Spiza americana), Grasshopper Sparrow (Ammodramus
savannarum), Savannah Sparrow (Passerculus sandwichensis), Sedge Wren (Cistothorus
platensis), Upland Sandpiper, and Western Meadowlark (Sturnella neglecta).
In addition to evaluating breeding bird abundance and species richness, we used
the Partners in Flight (PIF) species assessment database (Partners in Flight Science
Committee 2012) for the Prairie Pothole Region to obtain Regional Conservation
24
Concern Scores for each evaluated bird species based on species density. Scores assess
factors (i.e., population size, breeding distribution, non-breeding distribution, threats, and
population trend) related to the vulnerability and regional conservation status for all
North American landbird species (Panjabi 2012).
We evaluated the influence of field and landscape variables on breeding bird
abundance, species richness, and PIF Regional Conservation Score by using the glmulti
package in program R (R Foundation for statistical Computing; Vienna, Austria). This
package allowed for creation of a global model to assess variables most influential in
candidate models based on low Akaike Information Criterion values for small sample
sizes (AICc). Further, we assessed a generalized linear model that was additive of all
variables in the previous glmulti global model to evaluate significance of each variable
and potential difference between the two methods. Anderson and Burnham (2002)
suggested this methodology may be problematic if the research objective is to identify a
best model. Corresponding to Anderson and Burnham’s (2002) suggestions to avoid
pitfalls, our study was based on a quality question using the information-theoretic
approach that was not expected to reveal a best model. Our research intended to identify
variables influential to breeding birds based on the presence and significance of variables
in competitive candidate models (∆AICc < 2). We used this approach to evaluate and
eliminate variables of potential influence included in the global model. Further, due to the
objectives of our study as part of a comprehensive evaluation program to provide a
platform for conservation program site selection criteria, field and landscape variable
models were maintained as unique analyses, not combined evaluations. We evaluated
25
influence of covariates of competitive models by calculating 95% confidence intervals
about parameter estimates.
Variables included in the field model were in 3 categories: 1) vegetation structure
and composition; 2) field characteristics, and; 3) invertebrate composition. We assessed
vegetation structural characteristics based on the following variables: VOR, percent
canopy coverage, and percent forb coverage. Field characteristics included: present
wetland types (none, stream only, basin only, and both stream and basin), field size, edge
within the field (i.e., fragmentation), percent grassland composition, and percent
woodland composition. The invertebrate composition variable used invertebrate metrics
(i.e., abundance, richness, and biomass) derived from pitfall and sweep-net data. Due to
the lack of importance and presence in competitive models, we removed invertebrate
variables from the global model and the model was re-evaluated to minimize total
number of models. Herewith, invertebrate data will not be discussed within the results
section.
We analyzed landscape context variables at 3 spatial scales (500 m, 1000 m, and
1500 m) using the Patch Analyst software extension for ArcGIS (Rempel et al. 2012).
Research sites were buffered from the field edge out to the specified distance, so that only
land cover variables outside the research site were included in landscape analyses. Land
cover within the 1,500 m buffer was digitized by hand over aerial imagery and ground
truthed. To eliminate error associated with total area variability within the landscape
buffer due to field size differences, we calculated all land cover variables by percent of or
density within total buffer area (i.e., percent cropland, development, grassland, woodland,
wetland, and density of hard edge [i.e., transition between 2 cover types]). We found the
26
3 buffer scales to be correlated (r > 0.68) and opted to only use data from the 1,000 m
buffer, since it was the middle distance of the 3 buffers.
RESULTS
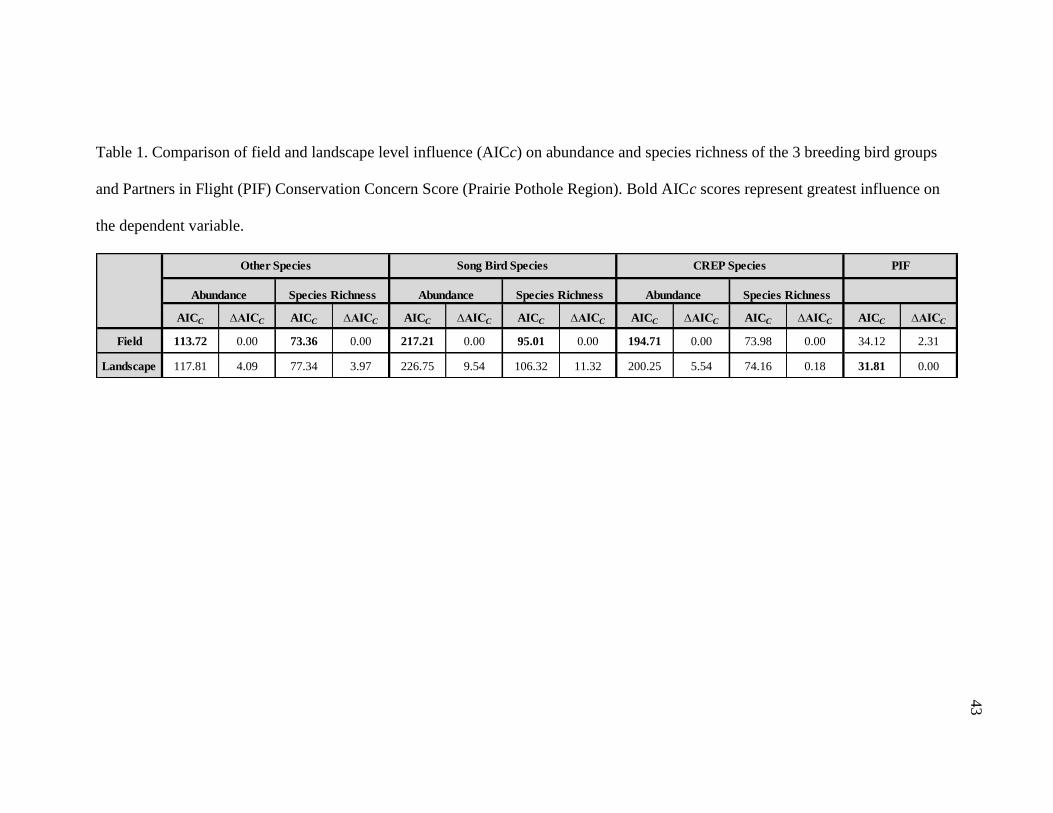
We recorded 3,011 bird observations from 46 species during the 2013–2015 field
seasons. Field scale models were more influential than landscape scale models in our
evaluation of bird abundance and species richness across all 3 avian groups (Table 1).
Partners in Flight score was the only factor in the landscape scale model that was more
influential (∆AICc = 2.3) than in the field level model (Table 1); however, no individual
variable within the PIF competitive models had confidence intervals that excluded zero.
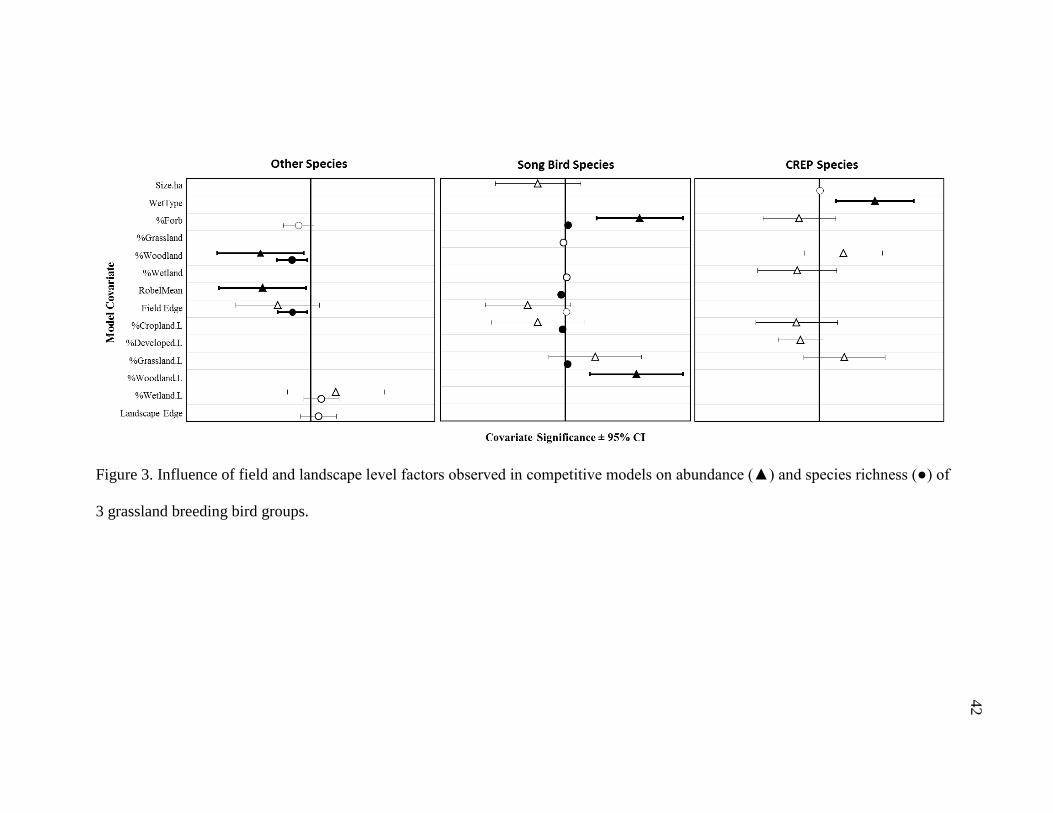
Competitive models (based on AICc) included unique influential variable
differences between each of the 3 groups (Figure 3). The song bird species group was the
only group that included substantial influences of variables at the landscape scale
(percent cropland, grassland, and woodland). Species richness was negatively associated
with percent cropland (β = -1.28, 95% CI = -0.15 – -2.41) and positively associated with
percent grassland (β = 1.26, 95% CI = 2.40 – 0.13). Percent woodland was positively
associated with abundance (β = 37.10, 95% CI = 12.82 – 61.38; Table 2).
Models of the influence of field variables on each of the 3 species groups
indicated that only percent forb had a meaningful positive association (β = 38.74, 95% CI
= 16.26 – 61.22) in competitive models of abundance and species richness (β = 1.41, 95%
CI = 0.42 – 2.39) of the song bird species group. Further, mean visual obstruction
supported a negative influence (β = -1.54, 95% CI = -2.94 – -0.14) in models of
abundance for the other species group and species richness (β = -2.00, 95% CI = -0.99 – -
3.02) for the song bird species group. Two field scale variables were negatively
27
associated with species richness of the other species group: percent woodland (β = -0.60,
95% CI = -0.11 – -1.09) and field edge density (β = -0.58, 95% CI = -0.10 – -1.06).
Wetland type was the only variable that was positively associated with abundance (β =
17.83, 95% CI = 5.37 – 30.29) of the CREP focal species, such that fields with no
wetlands had lower CREP species abundance and fields with both streams and basins had
highest abundances (Table 2).
DISCUSSION
We modeled abundance and species richness of 3 breeding bird groups (other
species, song bird species, and CREP focal species) with respect to field and landscape
level variables. Our objective was to evaluate current program implementation based on a
multi-scale assessment of factors influential to breeding grassland birds. The lack of a
strong association between the dependent variables and the arthropod variables may
suggest that all surveyed fields had sufficient invertebrate resources, or that arthropod
availability for foraging was not a driving factor influencing abundance and species
richness at our study sites (McIntyre and Thompson 2003). We suggest future research
evaluate variables which can be directly influenced by resource managers (e.g., wetland
type present, percent forb, and percent cropland) for conservation program improvement.
Each avian species group responded uniquely to field and landscape level
variables, demonstrating that conservation programs with general/broad conservation
goals for breeding grassland birds could result in vague or undesirable outcomes. Similar
to previous research by Cunningham and Johnson (2006), we found field models of
abundance and species richness included a greater percentage of informative variables for
each species group than landscape scale models. We also observed that landscape
28
variables were only influential (i.e., positive) to abundance and species richness of song
bird species only (Ribic and Sample 2001).
Field Scale
Patch size and area sensitivity have long been considered factors influential to
grassland bird populations (Davis 2004, Renfrew and Ribic 2008, Ribic et al. 2009);
however, we observed little influence of patch size on all dependent variables in our
models. The influence of field level factors varied among the 3 bird groups. Mean VOR
and in-field edge density were the only variables that had constant, negative influences in
competitive models across all groups (Fletcher and Koford 2002, Davis 2004). All other
variables suggested contradictory influences among avian groups, or appeared in only
one group’s competitive models. Type of wetland and percent wetland cover within fields
were represented only in competitive models of CREP focal species. Of these, wetland
type was the only positive influence, suggesting that evaluating contract sites solely on
wetland presence is likely inadequate for the species groups we evaluated (Homan et al.
2000, Reynolds et al. 2006); thus, sites encompassing wetland basins or both basins and
streams would positively influence abundance and species richness of grassland breeding
birds.
Evaluation of percent woody cover at the field scale demonstrated a negative
influence on the abundance and species richness of the other species group, with no
influence on the other two avian groups. Previous studies have documented trees
increasing diversity of avian species; however, presence of woody species has also been
known to have significant, negative effects on game and non-game grassland birds
(Coppedge et al. 2008, Fletcher and Koford 2002, Bakker 2003, Fletcher and Koford
29
2003, Grant et al. 2004). Our results suggest selection of enrollment sites with minimal to
no woody cover presence or implementation of woody species removal prior to program
implementation. Adoption of this requirement on conservation programs could benefit
obligate grassland avifauna with little negative association.
Percent forb cover was the only influential variable in competitive models of all 3
avian groups. The song bird group was the only group with a positive influence of forb
cover on both abundance and species richness. Similar to previous research, our results
suggested that grassland mixes that included an abundant and diverse forb component
provided greater benefit to grassland bird populations than low diversity plantings (e.g.,
cool and warm-season monocultures). These data support the notion that managers and
researchers should work to restore areas that more closely resemble diverse native sod
prairies to benefit grassland birds (McIntyre and Thompson 2003, Bakker and Higgins
2009, Riffell et al. 2010).
Landscape Scale
Our results revealed that landscapes with increased grassland and decreased
cropland cover positively influenced grassland breeding birds, which coincides with other
research findings (Ribic and Sample 2001, Koper and Schmiegelow 2006, Renfrew and
Ribic 2008). With the continued conversion of land for agricultural production (Wright
and Wimberly 2013), and reduced funding for conservation, our results support the need
tailor integrated evaluation methods into conservation programs to maximize
environmental and ecological benefits.
Evaluation of landscape variables indicated that edge (i.e., fragmentation) did not
have a substantial influence on any of the 3 bird groups in our study. However, this lack
30
of relationship may have been due to the homogeneous state of the landscape in our study
region and the large size of surrounding agricultural fields. As reported by Askins et al.
(2007), grasslands not only become fragmented in the Midwest and Great Plains, but
existing tracts have become islands of remnant relics, or artificial habitats built to
preserve populations even if conditions not ideal. For example, our results identified a
positive relationship between song bird abundance and percent woodland cover in the
landscape. Although we did not find this at the field level, avifauna may be required to
use unfit and undesired locations based on availability of usable space (Van Horne 1983,
Guthery 1997). Future research should continue to identify factors influencing avian site
selection and preference to facilitate continued conservation program advancement, and
focus on metrics influencing fitness (e.g., survival and reproduction).
Analysis of PIF score by field emphasized the importance of landscape variables
over field scale variables to species of greatest conservation concern in the prairie pothole
region. Though no individual variable showed a strong relationship with PIF score,
research has demonstrated the impact of spatial dependence on many of these species.
For this reason, we suggest using a multi-scale evaluation approach to conservation
programs and believe our study design and approach might serve as a model for future
evaluations (Vickery and Herkert 2001, Ribic et al. 2009).
Management Implications
Our study highlighted the importance of setting detailed program goals that are
complementing and consider habitat use of desired species at multiple (potentially
influential) spatial extents. Goals should be dictated based on ecological similarities of
species and environmental requirements. Our results suggest, that contract location
31
selection and implementation be based on a stepwise process that incorporates landscape
and field level factors. Within the program region of greatest conservation concern,
emphasis on this process would allow program managers to designate landscapes with
variables of greatest significance, especially to species with specific spatial requirements
(e.g., Bobolink; Fletcher and Koford 2003). Following landscape selection, assessment of
field scale attributes (i.e., individual contract requirements and implementation) would
best capitalize on potential restoration success towards conservation program goals.
Our study stresses the importance for resource managers and policy makers to
evaluate the effectiveness of current and future conservation program planning and
implementation. Appraisal of potential constraints to program goals would benefit game
and nongame birds of conservation concern throughout the Midwest and the Great Plains
of North America.
ACKNOWLEDGEMENTS
We would like to sincerely thank all the summer technicians that helped with
difficult field work and those who continued working through the year to sort
invertebrate samples. This project would not have been possible without your dedication.
We would also like to thank the South Dakota Department of Game, Fish and Parks
(GF&P) for funding our research through the State Wildlife Grants program. We are
grateful to the many GF&P staff that participated in the development and implementation
of this research project; without their feedback this project would not have been possible.
LITERATURE CITED
Allen, A. 2005. The Conservation Reserve Enhancement Program. USGS Staff --
Published Research. http://digitalcommons.unl.edu/usgsstaffpub/191.
32
Anderson, D. R., and K. P. Burnham. 2002. Avoiding pitfalls when using information-
theoretic methods. The Journal of Wildlife Management 912–918.
Askins R. A., F. Chavez-Ramirez, B. C. Dale, C. A. Haas, J. R. Herkert, F. L. Knopf, and
P. D. Vickery. 2007. Conservation of Grassland Birds in North America:
Understanding Ecological Processes in Different Regions. Ornithological
Monographs 64:1–46.
Bakker, K. K. 2003. A synthesis of the effect of woody vegetation on grassland nesting
birds. In Proceedings of the South Dakota Academy of Science 82: 119-141.
Bakker, K. K., and K. F. Higgins. 2009. Planted grasslands and native sod prairie:
equivalent habitat for grassland birds?. Western North American Naturalist
69:235–242.
Bash, J. S., and C. M. Ryan. 2002. Stream Restoration and Enhancement Projects: Is
Anyone Monitoring?. Environmental Management 29:877–885.
Brennan L. A., and W. P. Kuvlesky. 2005. North American Grassland Birds: An
Unfolding Conservation Crisis? The Journal of Wildlife Management 69:1–13.
Coppedge, B. R., S. D. Fuhlendorf, W. C. Harrell, and D. M. Engle. 2008. Avian
Community Response to Vegetation and Structural Features in Grasslands
Managed with Fire and Grazing. Biological Conservation 141:1196–1203.
Cunningham, M. A., and D. H. Johnson. 2006. Proximate and landscape factors influence
grassland bird distributions. Ecological Applications 16:1062–1075.
33
Daubenmire, R. 1959. A canopy-coverage method of vegetational analysis. Northwest
Science 33:43–64.
Davis, S. K. 2004. Area sensitivity in grassland passerines: effects of patch size, patch
shape, and vegetation structure on bird abundance and occurrence in southern
Saskatchewan. The Auk 121:1130–1145.
De Bello, F., S. Lavorel, P. Gerhold, U. Reier, and M. Partel. 2010. A Biodiversity
Monitoring Framework for Practical Conservation of Grasslands and Shrublands.
Biological Conservation 143:9–17.
Delisle, J. M., and J. A. Savidge. 1997. Avian Use and Vegetation Characteristics of
Conservation Reserve Program Fields. Journal of Wildlife Management 61:318–
325.
Dodds, W. K., K. C. Wilson, R. L. Rehmeier, G. L. Knight, S. Wiggam, J. A. Falke, H. J.
Dalgleish, and K. N. Bertrand. 2008. Comparing Ecosystem Goods and Services
Provided by Restored and Native Lands. BioScience 58:837–845.
Doxon, E. D., C. A. Davis, and S. D. Fuhlendorf. 2011. Comparison of Two Methods for
Sampling Invertebrates: Vacuum and Sweep-Net Sampling. Journal of Field
Ornithology 82:60–67.
Fletcher, R. J., and R. R. Koford. 2002. Habitat and Landscape Associations of Breeding
Birds in Native and Restored Grasslands. The Journal of Wildlife Management
66:1011–1022.
34
Fletcher Jr, R. J., and R. R. Koford. 2003. Changes in breeding bird populations with
habitat restoration in northern Iowa. The American midland naturalist 150:83–94.
Goodwin, C. N., C. P. Hawkins, and J. L. Kershner. 1997. Riparian Restoration in the
Western United States: Overview and Perspective. Restoration Ecology 5:4–14.
Grant, T. A., Madden, E., & Berkey, G. B. 2004. Tree and shrub invasion in northern
mixed-grass prairie: implications for breeding grassland birds. Wildlife Society
Bulletin 32:807–818.
Gray, R. L. and B. M. Teels. 2006 Wildlife and Fish Conservation through the Farm Bill.
Wildlife Society Bulletin 34:906–913.
Guthery, F. S. 1997. A philosophy of habitat management for northern bobwhites. The
Journal of wildlife management 291–301.
Homan, H. J., G. M. Linz, and W. J. Bleier. 2000. Winter habitat use and survival of
female ring-necked pheasants (Phasianus colchicus) in southeastern North
Dakota. The American Midland Naturalist 143:463–480.
Kauffman, J. B., R. L. Beschta, N. Otting, and D. Lytjen. 1997. An Ecological
Perspective of Riparian and Stream Restoration in the Western United States.
Fisheries 22:12–24.
Koper, N., and F. K. Schmiegelow. 2006. A multi-scaled analysis of avian response to
habitat amount and fragmentation in the Canadian dry mixed-grass prairie.
Landscape Ecology 21:1045–1059.
35
Knopf, F. L. 1994. Avian Assemblages in Altered Grasslands. Studies in Avian Biology
15:247–257.
Kroll, A. J., Y. Ren, J. E. Jones, J. Giovanini, R. W. Perry, R. E. Thill, D. White Jr., and
T. B. Wigley. 2014. Avian Community Composition Associated with Interactions
between Local and Landscape Habitat Attributes. Forest Ecology and
Management 326:46–57.
Lloyd, J. D., and T. E. Martin. 2005. Reproductive Success of Chestnut-collared
Longspurs in Native and Exotic Grassland. The Condor 107:363–374.
McIntyre, N. E., and T. R. Thompson. 2003. A comparison of Conservation Reserve
Program habitat plantings with respect to arthropod prey for grassland birds. The
American Midland Naturalist 150:291–301.
Nemec, K. 2014. Eleven New Records of Spiders (Arachnida, Araneae) for Nebraska.
Journal of the Kansas Entomological Society 87:249–252.
Nichols, J. D., and B. K. Williams. 2006. Monitoring for Conservation. TRENDS in
Ecology and Evolution 21:668–673.
O’Leske, D. L., R. J. Robel, and K. E. Kemp. 1997. Sweepnet-Collected Invertebrate
Biomass from High- and Low-Input Agricultural Fields in Kansas. Wildlife
Society Bulletin 25:133–138.
36
Olson, D. M. 1991. A comparison of the efficacy of litter sifting and pitfall traps for
sampling leaf litter ants (Hymenoptera, Formicidae) in a tropical wet forest, Costa
Rica. Biotropica 166-172.
Panjabi, A. O., P. J. Blancher, R. Dettmers, and K. V. Rosenberg. 2012. Partners in Flight
Technical Series No. 3. Rocky Mountain Bird Observatory website:
http://www.rmbo.org/pubs/downloads/Handbook2012.pdf
Partners in Flight Science Committee. 2012. Species Assessment Database, version 2012.
Available at http://rmbo.org/pifassessment. Accessed on July 23, 2016.
Ralph, C. J., G. R. Geupel, P. Pyle, T. E. Martin, and D. F. DeSante. 1993. Handbook of
Field Methods for Monitoring Landbirds. U.S. Department of Agriculture,
General Technical Report PSW-GTR-144:41.
Rempel, R. S., D. E. Reid, and J. Jackson. 2012. Batcheler-corrected point distance
versus belt transect for sampling habitat and woody vegetation. Canadian Journal
of Forest Research 42:2052–2063.
Renfrew, R. B., C. A. Ribic, J. L. Nack. 2005. Edge Avoidance by Nesting Grassland
Birds: A Futile Strategy in a Fragmented Landscape. The Auk 122:618–636.
Renfrew, R. B., C. A. Ribic. 2008. Multi-scale models of grassland passerine abundance
in a fragmented system in Wisconsin. Landscape Ecology 23:181–193.
37
Reynolds, R. E., Shaffer, T. L., Loesch, C. R., & Cox Jr, R. R. 2006. The Farm Bill and
duck production in the Prairie Pothole Region: increasing the benefits. Wildlife
Society Bulletin, 34:963–974.
Ribic, C. A., and Sample, D. W. 2001. Associations of grassland birds with landscape
factors in southern Wisconsin. The American Midland Naturalist 146:105–121.
Ribic, C. A., R. R. Koford, J. R. Herkert, D. H. Johnson, N. D. Niemuth, D. E. Naugle, K.
K. Bakker, D. W. Sample, and R. B. Renfrew. 2009. Area sensitivity in North
American grassland birds: patterns and processes. The Auk 126:233–244.
Riffell, S., D. Scognamillo, L. Burger, J. Wes, and S. Bucholtz. 2010. Broad-scale
relations between Conservation Reserve Program and grassland birds: do cover
type, configuration and contract age matter. Open Ornithology Journal 3:112–123.
Robel R. J., J. N. Briggs, A. D. Dayton, and L. C. Hulbert. 1970. Relationships Between
Visual Obstruction Measurements and Weight of Grassland Vegetation. Journal
of Range Management 23:295–297.
Samson, F. B., and F. L. Knopf. 1994. Prairie Conservation in North America.
BioScience 44:418–421.
Sauer, J. R., J. E. Hines, J. E. Fallon, K. L. Pardieck, D. J. Ziolkowski Jr., and W. A.
Link. 2011. The North American Breeding Bird Survey, Results and Analysis
1966 - 2009. Version 3.23.2011 USGS Patuxent Wildlife Research Center,
Laurel, MD.
38
Shanahan, D. F., C. Miller, H. P. Possingham, and R. A. Fuller. 2011. The Influence of
Patch Area and Connectivity on Avian Communities in Urban Revegetation.
Biological Conservation 144:722–729.
Stafford, J. D., R. M. Kaminski, K. J. Reinecke, and S. W. Manley. 2006. Waste rice for
waterfowl in the Mississippi Alluvial Valley. Journal of Wildlife Management
70:61–69.
Standen, V. 2000. The adequacy of collecting techniques for estimating species richness
of grassland invertebrates. Journal of Applied Ecology 37:884–893.
Taylor, R. L., B. D. Maxwell, and R. J. Boik. 2006. Indirect Effects of Herbicides on Bird
Food Resources and Beneficial Arthropods. Agriculture, Ecosystems &
Environment 116:157–164.
Teels, B. M., C. A. Rewa, and J. Myers. 2006. Aquatic Condition Response to Riparian
Buffer Establishment. Wildlife Society Bulletin 34:927–935.
United States Department of Agriculture: Farm Service Agency. 2009. The South Dakota
James River Watershed Conservation Reserve Enhancement Program.
Programmatic Environmental Assessment. Available:
https://www.fsa.usda.gov/Assets/USDA-FSA-Public/usdafiles/Environ-
Cultural/jrwcrepfnlstmtagmt0109.pdf
United States Department of Agriculture: Farm Service Agency. 2011. South Dakota
Conservation Reserve Enhancement Program. Fact Sheet. Available:
https://www.fsa.usda.gov/Internet/FSA_File/crepsdfactsheet.pdf
39
Van Dyke, F., S. B. Van Kley, C. B. Page, and J. G. Van Beek. 2004. Restoration Efforts
for Plant and Bird Communities in Tallgrass Prairies Using Prescribed Burning
and Mowing. Restoration Ecology 12:575–585.
Van Horne, B. 1983. Density as a misleading indicator of habitat quality. The Journal of
Wildlife Management 893–901.
Vickery, P. D., and J. R. Herkert. 2001. Recent Advances in Grassland Bird Research:
Where do we go from here? The Auk 118:11–15.
Wright, C. K., and M. C. Wimberly. 2013. Recent Land Use Change in the Western Corn
Belt Threatens Grasslands and Wetlands. Proceedings of the National Academy
of Sciences.
40
Figure 1. Subwatersheds (HUC12), distinguished by proportion of CREP enrollment
to total subwatershed area, that meet selection criteria for use in landscape scale
evaluations of responses of terrestrial and aquatic resources to implementation of the
James River Basin CREP in South Dakota.
41
Figure 2. Visualization of distribution of sites selected for terrestrial sampling in a single
subwatershed of the James River basin. Site “A” represents a randomly selected CREP
enrollment site containing a intersecting stream for localized terrestrial sampling, and site
“B” represents the randomly selected upland terrestrial site.
CREP Enrollment
42
Figure 3. Influence of field and landscape level factors observed in competitive models on abundance (▲) and species richness (●) of
3 grassland breeding bird groups.
43
Table 1. Comparison of field and landscape level influence (AICc) on abundance and species richness of the 3 breeding bird groups
and Partners in Flight (PIF) Conservation Concern Score (Prairie Pothole Region). Bold AICc scores represent greatest influence on
the dependent variable.
AICC ∆AICC AICC ∆AICC AICC ∆AICC AICC ∆AICC AICC ∆AICC AICC ∆AICC AICC ∆AICC
Field 113.72 0.00 73.36 0.00 217.21 0.00 95.01 0.00 194.71 0.00 73.98 0.00 34.12 2.31
Landscape 117.81 4.09 77.34 3.97 226.75 9.54 106.32 11.32 200.25 5.54 74.16 0.18 31.81 0.00
Species Richness
PIF
Abundance Species Richness
Song Bird Species CREP Species
Abundance Species Richness
Other Species
Abundance
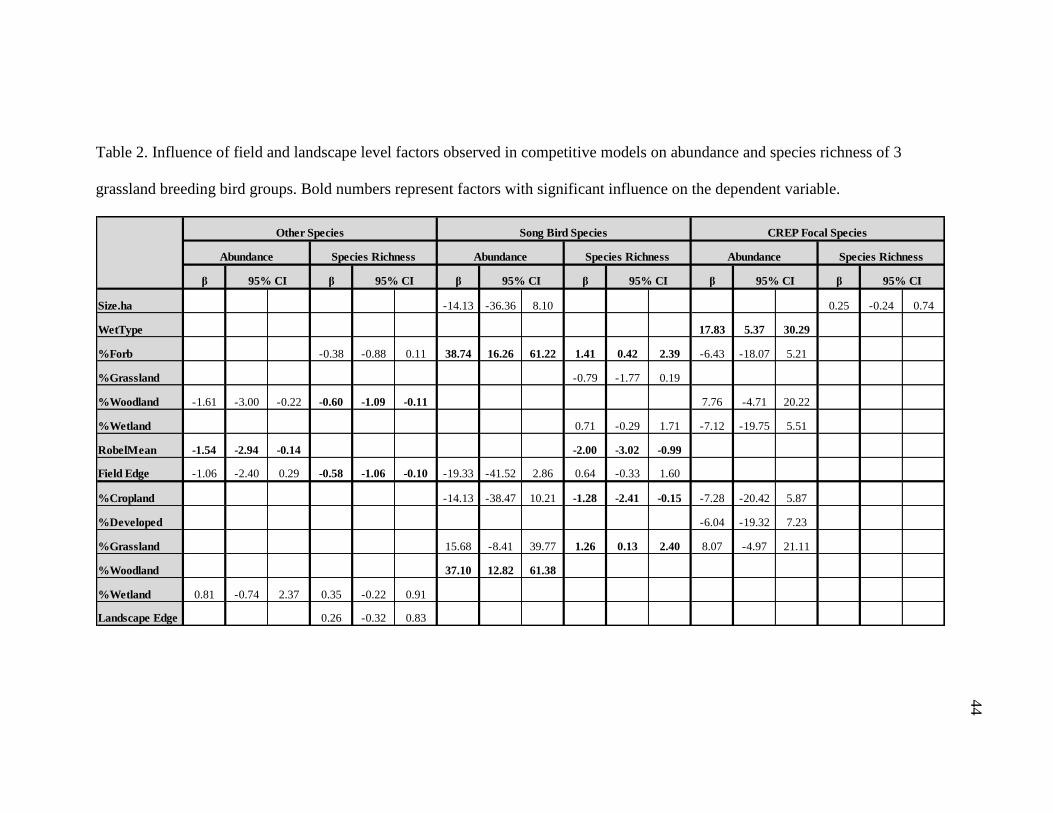
44
Table 2. Influence of field and landscape level factors observed in competitive models on abundance and species richness of 3
grassland breeding bird groups. Bold numbers represent factors with significant influence on the dependent variable.
β β β β β β
Size.ha -14.13 -36.36 8.10 0.25 -0.24 0.74
WetType 17.83 5.37 30.29
%Forb -0.38 -0.88 0.11 38.74 16.26 61.22 1.41 0.42 2.39 -6.43 -18.07 5.21
%Grassland -0.79 -1.77 0.19
%Woodland -1.61 -3.00 -0.22 -0.60 -1.09 -0.11 7.76 -4.71 20.22
%Wetland 0.71 -0.29 1.71 -7.12 -19.75 5.51
RobelMean -1.54 -2.94 -0.14 -2.00 -3.02 -0.99
Field Edge -1.06 -2.40 0.29 -0.58 -1.06 -0.10 -19.33 -41.52 2.86 0.64 -0.33 1.60
%Cropland -14.13 -38.47 10.21 -1.28 -2.41 -0.15 -7.28 -20.42 5.87
%Developed -6.04 -19.32 7.23
%Grassland 15.68 -8.41 39.77 1.26 0.13 2.40 8.07 -4.97 21.11
%Woodland 37.10 12.82 61.38
%Wetland 0.81 -0.74 2.37 0.35 -0.22 0.91
Landscape Edge 0.26 -0.32 0.83
Other Species Song Bird Species
95% CI
AbundanceAbundance Species Richness
95% CI 95% CI
Species Richness
95% CI
CREP Focal Species
Abundance Species Richness
95% CI 95% CI
45
CHAPTER 3: MULTI-SCALE CONSERVATION PROGRAM INFLUENCES
AFFECTING GRASSLAND NESTING AVIFAUNA IN SOUTH DAKOTA
This chapter is being prepared for submission in the Journal of Wildlife Management.
46
ABSTRACT
With decreasing grasslands in the United States, maximizing the effectiveness of
conservation programs is a critical conservation priority. Many of these programs
highlight goals of benefiting grassland bird populations and the South Dakota
Conservation Reserve Enhancement Program is no exception. The program intends to
provide habitat for obligate grassland breeding songbirds, while producing an additional
285,000 pheasants and 60,000 ducks annually. As part of a multi-scale integrated
evaluation, our study assessed the influence of field (vegetation composition and
structure and arthropod demographics) and landscape (percent land cover and
heterogeneity) variables to nest demographics of grassland breeding birds. Assessment of
the three tiered multi-scale (i.e., nest site, field, and landscape level) influences validated
the complexity and necessity of evaluating conservation program goals. Implementing
conservation programs with broad objectives may receive undesired outcomes. Field
models included a greater percentage of important variables for nest density and species
richness for each species group, excluding waterfowl species and nest density of CREP
focal species. Appraisal of nest survival identified field level influences significant only
to the song bird species group. Inclusion of nest site level covariates detailed greatest
influence on survival for the waterfowl species group. However, nest site level variables
were found to resemble directional influence of variables at the field scale. Incorporating
our findings into an integrated stepwise platform could benefit conservation planning and
decision making to improve program effectiveness, implementation, and potential
constraints to management strategies for grassland nesting birds.
47
INTRODUCTION
Historical land use changes in the upper Midwest transformed continuous
unbroken grasslands into fragmented refugia and continues to break patches into smaller
parcels (Samson and Knopf 1994; Wright and Wimberly 2013). These alterations have
resulted in several grassland bird species to experience population declines (Knopf 1994,
Vickery and Herkert 2001, Fletcher and Koford 2002, Brennan and Kuvlesky 2005,
Green et al. 2005, Askins et al. 2007, Sauer et al. 2011).
Historically, government conservation programs were viewed as a crucial
component to the future of environmental conservation (Gray and Teels 2006, Dodds et
al. 2008). Conversely, it is unclear if the majority of habitat reconstruction and restoration
efforts in North America are achieving their goals of improving environmental
conditions, primarily due to the limited monitoring and evaluation after implementation
(Bash and Ryan 2002, De Bello et al. 2010). Many studies that have focused on
evaluation of conservation programs have improperly investigate the true drivers of
environmental health on these lands, due to the lack of a comprehensive approach (e.g.,
avian, invertebrate, and fisheries demographics; Delisle and Savidge 1997, McCoy et al.
1999, Lloyd and Martin 2005, Fletcher et al. 2006, Haroldson et al. 2006, Nichols and
Williams 2006, De Bello et al. 2010). Properly done, restoration monitoring and
subsequent assessment can offer resource managers valuable feedback toward achieving
ecological goals and facilitate adaptive management for future conservation.
There are still many gaps in the knowledge of fish and wildlife response to the
establishment and management of grassland conservation programs in an agricultural
landscape. A comprehensive evaluation could significantly influence the success of a
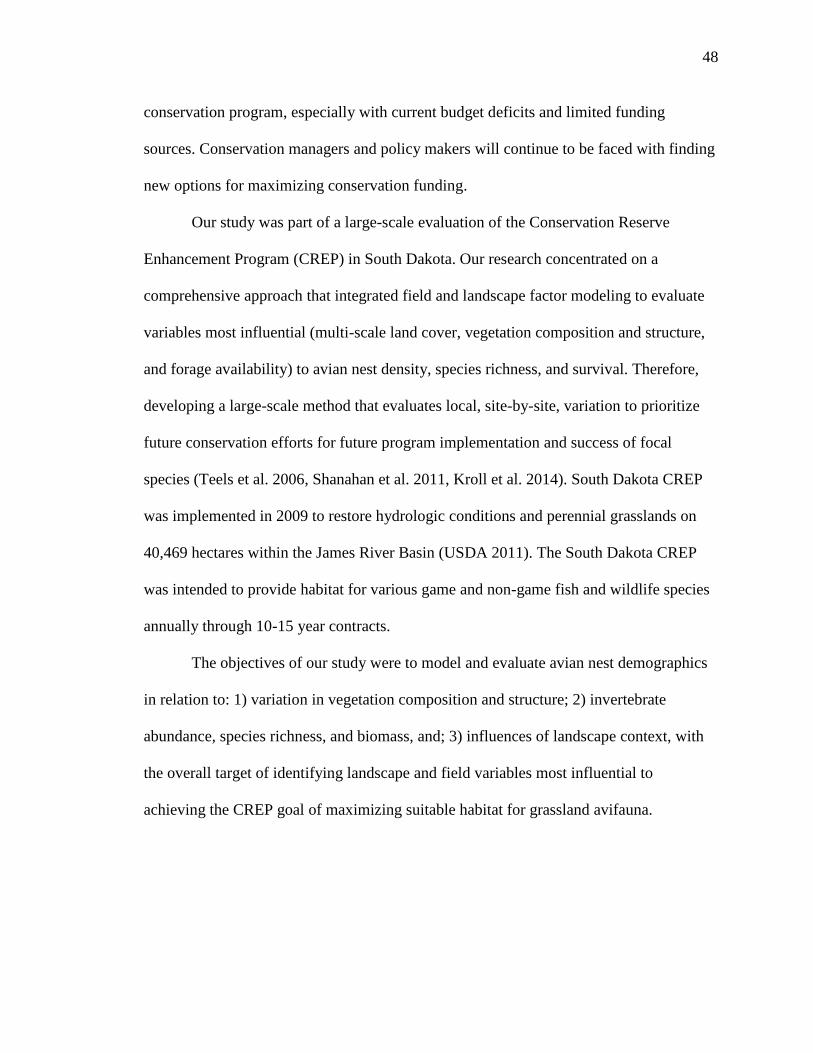
48
conservation program, especially with current budget deficits and limited funding
sources. Conservation managers and policy makers will continue to be faced with finding
new options for maximizing conservation funding.
Our study was part of a large-scale evaluation of the Conservation Reserve
Enhancement Program (CREP) in South Dakota. Our research concentrated on a
comprehensive approach that integrated field and landscape factor modeling to evaluate
variables most influential (multi-scale land cover, vegetation composition and structure,
and forage availability) to avian nest density, species richness, and survival. Therefore,
developing a large-scale method that evaluates local, site-by-site, variation to prioritize
future conservation efforts for future program implementation and success of focal
species (Teels et al. 2006, Shanahan et al. 2011, Kroll et al. 2014). South Dakota CREP
was implemented in 2009 to restore hydrologic conditions and perennial grasslands on
40,469 hectares within the James River Basin (USDA 2011). The South Dakota CREP
was intended to provide habitat for various game and non-game fish and wildlife species
annually through 10-15 year contracts.
The objectives of our study were to model and evaluate avian nest demographics
in relation to: 1) variation in vegetation composition and structure; 2) invertebrate
abundance, species richness, and biomass, and; 3) influences of landscape context, with
the overall target of identifying landscape and field variables most influential to
achieving the CREP goal of maximizing suitable habitat for grassland avifauna.
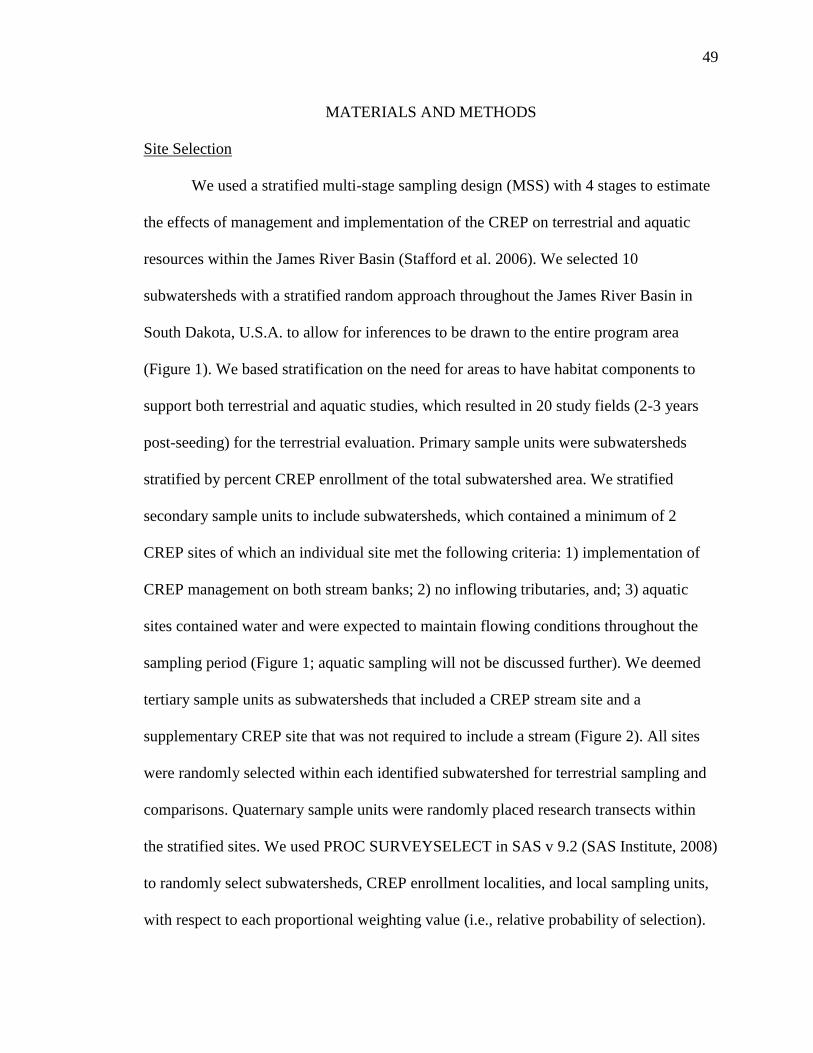
49
MATERIALS AND METHODS
Site Selection
We used a stratified multi-stage sampling design (MSS) with 4 stages to estimate
the effects of management and implementation of the CREP on terrestrial and aquatic
resources within the James River Basin (Stafford et al. 2006). We selected 10
subwatersheds with a stratified random approach throughout the James River Basin in
South Dakota, U.S.A. to allow for inferences to be drawn to the entire program area
(Figure 1). We based stratification on the need for areas to have habitat components to
support both terrestrial and aquatic studies, which resulted in 20 study fields (2-3 years
post-seeding) for the terrestrial evaluation. Primary sample units were subwatersheds
stratified by percent CREP enrollment of the total subwatershed area. We stratified
secondary sample units to include subwatersheds, which contained a minimum of 2
CREP sites of which an individual site met the following criteria: 1) implementation of
CREP management on both stream banks; 2) no inflowing tributaries, and; 3) aquatic
sites contained water and were expected to maintain flowing conditions throughout the
sampling period (Figure 1; aquatic sampling will not be discussed further). We deemed
tertiary sample units as subwatersheds that included a CREP stream site and a
supplementary CREP site that was not required to include a stream (Figure 2). All sites
were randomly selected within each identified subwatershed for terrestrial sampling and
comparisons. Quaternary sample units were randomly placed research transects within
the stratified sites. We used PROC SURVEYSELECT in SAS v 9.2 (SAS Institute, 2008)
to randomly select subwatersheds, CREP enrollment localities, and local sampling units,
with respect to each proportional weighting value (i.e., relative probability of selection).
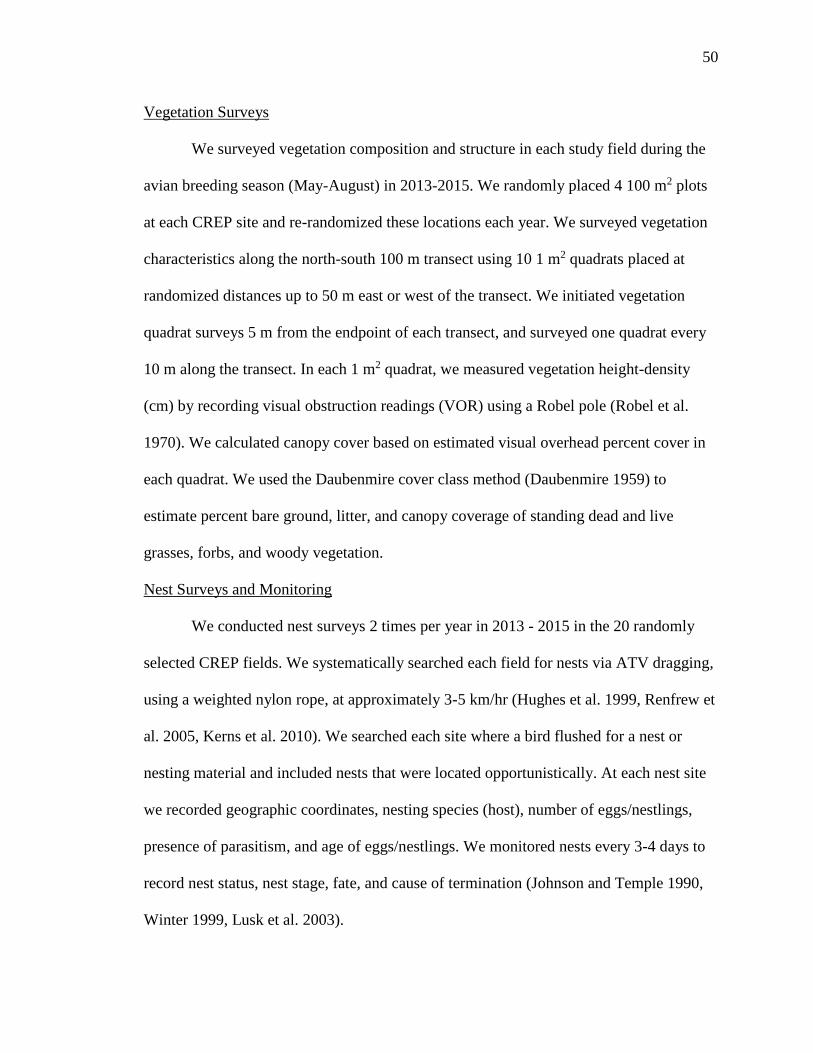
50
Vegetation Surveys
We surveyed vegetation composition and structure in each study field during the
avian breeding season (May-August) in 2013-2015. We randomly placed 4 100 m2 plots
at each CREP site and re-randomized these locations each year. We surveyed vegetation
characteristics along the north-south 100 m transect using 10 1 m2 quadrats placed at
randomized distances up to 50 m east or west of the transect. We initiated vegetation
quadrat surveys 5 m from the endpoint of each transect, and surveyed one quadrat every
10 m along the transect. In each 1 m2 quadrat, we measured vegetation height-density
(cm) by recording visual obstruction readings (VOR) using a Robel pole (Robel et al.
1970). We calculated canopy cover based on estimated visual overhead percent cover in
each quadrat. We used the Daubenmire cover class method (Daubenmire 1959) to
estimate percent bare ground, litter, and canopy coverage of standing dead and live
grasses, forbs, and woody vegetation.
Nest Surveys and Monitoring
We conducted nest surveys 2 times per year in 2013 - 2015 in the 20 randomly
selected CREP fields. We systematically searched each field for nests via ATV dragging,
using a weighted nylon rope, at approximately 3-5 km/hr (Hughes et al. 1999, Renfrew et
al. 2005, Kerns et al. 2010). We searched each site where a bird flushed for a nest or
nesting material and included nests that were located opportunistically. At each nest site
we recorded geographic coordinates, nesting species (host), number of eggs/nestlings,
presence of parasitism, and age of eggs/nestlings. We monitored nests every 3-4 days to
record nest status, nest stage, fate, and cause of termination (Johnson and Temple 1990,
Winter 1999, Lusk et al. 2003).
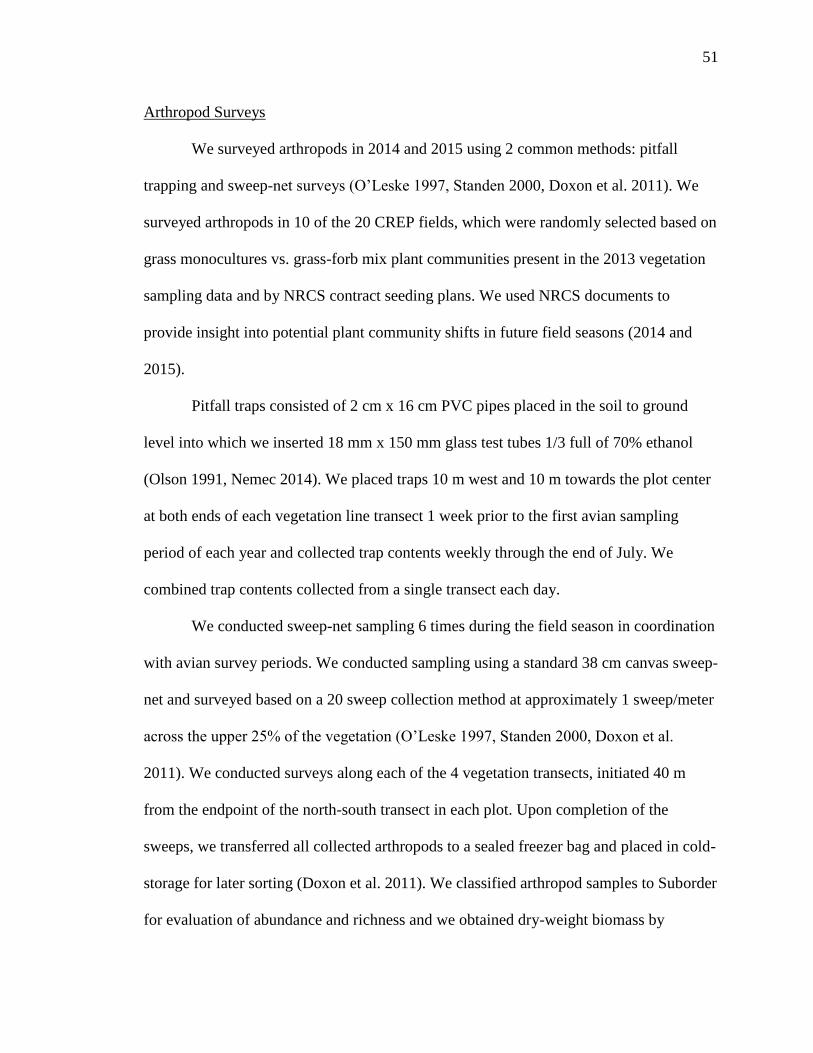
51
Arthropod Surveys
We surveyed arthropods in 2014 and 2015 using 2 common methods: pitfall
trapping and sweep-net surveys (O’Leske 1997, Standen 2000, Doxon et al. 2011). We
surveyed arthropods in 10 of the 20 CREP fields, which were randomly selected based on
grass monocultures vs. grass-forb mix plant communities present in the 2013 vegetation
sampling data and by NRCS contract seeding plans. We used NRCS documents to
provide insight into potential plant community shifts in future field seasons (2014 and
2015).
Pitfall traps consisted of 2 cm x 16 cm PVC pipes placed in the soil to ground
level into which we inserted 18 mm x 150 mm glass test tubes 1/3 full of 70% ethanol
(Olson 1991, Nemec 2014). We placed traps 10 m west and 10 m towards the plot center
at both ends of each vegetation line transect 1 week prior to the first avian sampling
period of each year and collected trap contents weekly through the end of July. We
combined trap contents collected from a single transect each day.
We conducted sweep-net sampling 6 times during the field season in coordination
with avian survey periods. We conducted sampling using a standard 38 cm canvas sweep-
net and surveyed based on a 20 sweep collection method at approximately 1 sweep/meter
across the upper 25% of the vegetation (O’Leske 1997, Standen 2000, Doxon et al.
2011). We conducted surveys along each of the 4 vegetation transects, initiated 40 m
from the endpoint of the north-south transect in each plot. Upon completion of the
sweeps, we transferred all collected arthropods to a sealed freezer bag and placed in cold-
storage for later sorting (Doxon et al. 2011). We classified arthropod samples to Suborder
for evaluation of abundance and richness and we obtained dry-weight biomass by
52
Suborder by drying samples at 60 degrees C for 48 hours in a drying oven (Taylor et al.
2006).
Data Analysis
We separated observed bird species into 4 groups: 1) song bird species; 2) other
species; 3) CREP focal species, and; 4) waterfowl species to assess influential variables
(USDA 2009). The waterfowl species, song bird species, and other species groups
encompassed all observed bird species in the study with no overlap of species between
them. The waterfowl species group included the American Bittern (Botaurus
lentiginosus), Blue-winged Teal (Anas discors), Canada Goose (Branta canadensis),
Gadwall (Anas strepera), Mallard (Anas platyrhynchos), Northern Pintail (Anas acuta),
and Northern Shoveler (Anas clypeata). The song bird group included all passerines,
whereas the group titled “Other” encompassed the Upland Sandpiper (Bartramia
longicauda), Ring-necked Pheasant (Phasianus colchicus), Mourning Dove (Zenaida
macroura), and Northern Harrier (Circus cyaneus). The CREP focal species group was
an assemblage of the 8 bird species identified for conservation program focus and the
goal of improving habitat for these species of concern, specifically: Bobolink
(Dolichonyx oryzivorus), Chestnut-collared Longspur (Calcarius ornatus), Dickcissel
(Spiza americana), Grasshopper Sparrow (Ammodramus savannarum), Savannah
Sparrow (Passerculus sandwichensis), Sedge Wren (Cistothorus platensis), Upland
Sandpiper, and Western Meadowlark (Sturnella neglecta).
We evaluated the influence of field and landscape variables on avian nest density,
species richness, and survival using the glmulti package in program R (R Foundation for
statistical Computing; Vienna, Austria). This package allowed for creation of a global
53
model to assess variables most influential in candidate models based on low Akaike
Information Criterion values corrected for small sample sizes (AICc). Further, we
assessed a generalized linear model that was additive of all variables in the previous
glmulti global model to evaluate significance of each variable and potential difference
between the two methods. Anderson and Burnham (2002) suggested this methodology
may be problematic if the research objective is to identify a best model. Corresponding to
Anderson and Burnham’s (2002) suggestions to avoid pitfalls, our study was based on a
quality question using the information-theoretic approach that was not expected to reveal
a best model. Our research intended to identify variables influential to breeding birds
based on the presence and significance of variables in competitive candidate models
(∆AICc < 2). We used this approach to evaluate and eliminate variables of potential
influence included in the global model. Further, due to the objectives of our study as part
of a comprehensive evaluation program to provide a platform for conservation program
site selection criteria, field and landscape variable models were maintained as unique
analyses, not combined evaluations. We evaluated influence of covariates of competitive
models by calculating 95% confidence intervals about parameter estimates.
Variables included in the field model were in 3 categories: 1) vegetation structure
and composition; 2) field characteristics, and; 3) invertebrate composition. We assessed
vegetation structural characteristics based on the following variables: VOR, percent
canopy coverage, and percent forb coverage. Field characteristics included: present
wetland types (none, stream only, basin only, and both stream and basin), field size, edge
within the field (i.e., fragmentation), percent grassland composition, and percent
woodland composition. The invertebrate composition variable used invertebrate metrics
54
(i.e., abundance, richness, and biomass) derived from pitfall and sweep-net data. Due to
the lack of importance and presence in competitive models, we removed invertebrate
variables from the global model and the model was re-evaluated to minimize total
number of models. Herewith, invertebrate data will not be discussed within the results
section.
We analyzed landscape context variables at 3 spatial scales (500 m, 1000 m, and
1500 m) using the Patch Analyst software extension for ArcGIS (Rempel et al. 2012).
Research sites were buffered from the field edge out to the specified distance, so that only
land cover variables outside the research site were included in landscape analyses. Land
cover within the 1,500 m buffer was digitized by hand over aerial imagery and ground
truthed. To eliminate error associated with total area variability within the landscape
buffer due to field size differences, we calculated all land cover variables by percent of or
density within total buffer area (i.e., percent cropland, development, grassland, woodland,
wetland, and density of hard edge [i.e., transition between 2 cover types]). We found the
3 buffer scales to be correlated (r > 0.68) and opted to only use data from the 1,000 m
buffer, since it was the middle distance of the 3 buffers.
We conducted logistic-exposure analysis of daily nest survival to explore field
and landscape models (Lloyd and Tewksbury 2007, Shaffer and Thompson 2007, Walk et
al. 2010). In addition, due to invertebrate variables being non-influential in regards to the
presence in competitive candidate models, they were also excluded from final model
analysis.
55
RESULTS
Nest Surveys
We documented 705 nests of 26 species in our CREP study fields from 2013 to
2015. The 10 most abundant nesting species were Mallard (32.3%), Red-winged
Blackbird (Agelaius phoeniceus; 19.1%), Blue-winged Teal (7.7%), Mourning Dove
(7.7%), Clay-colored Sparrow (Spizella pallida; 5.8%), Gadwall (5.5%), Sedge Wren
(Cistothorus platensis; 2.8%), Ring-necked Pheasant (2.6%), Savanna Sparrow
(Passerculus sandwichensis; 2.1%), and Meadowlark (Sturnella spp.; 1.8%); these
species accounted for 87.5% of observed species.
In evaluation of focal scale on the 4 groups of nest birds, both field and landscape
level influence varied between groups. Models for the waterfowl group at the landscape
level were more influential than field scale models of nest density (∆AICc = 6.5) and
species richness (∆AICc = 4.8). In contrast, field level models for the song bird and
CREP species groups performed better than landscape models of nest density (∆AICc =
10.5 [song bird]; ∆AICc = 2.5 [CREP]) and species richness (∆AICc = 2.5 [song bird];
∆AICc = 3.1 [CREP]; Table 1a). Models for the other species group indicated
approximately equal support of field and landscape models of nest density (∆AICc = 0.3;
landscape AICc = 0.0) and species richness (∆AICc = 1.9; field AICc = 0.0; Table 1b).
Competitive model variables of nest density and species richness concluded
unique combinations of variables for the 4 avian groups. The other species group was the
only group which encompassed all covariates at least one of competitive models for
either nest density or species richness, although not all represented a meaningful
influence within competitive models (Figure 3, Table 1b). Further, the other species
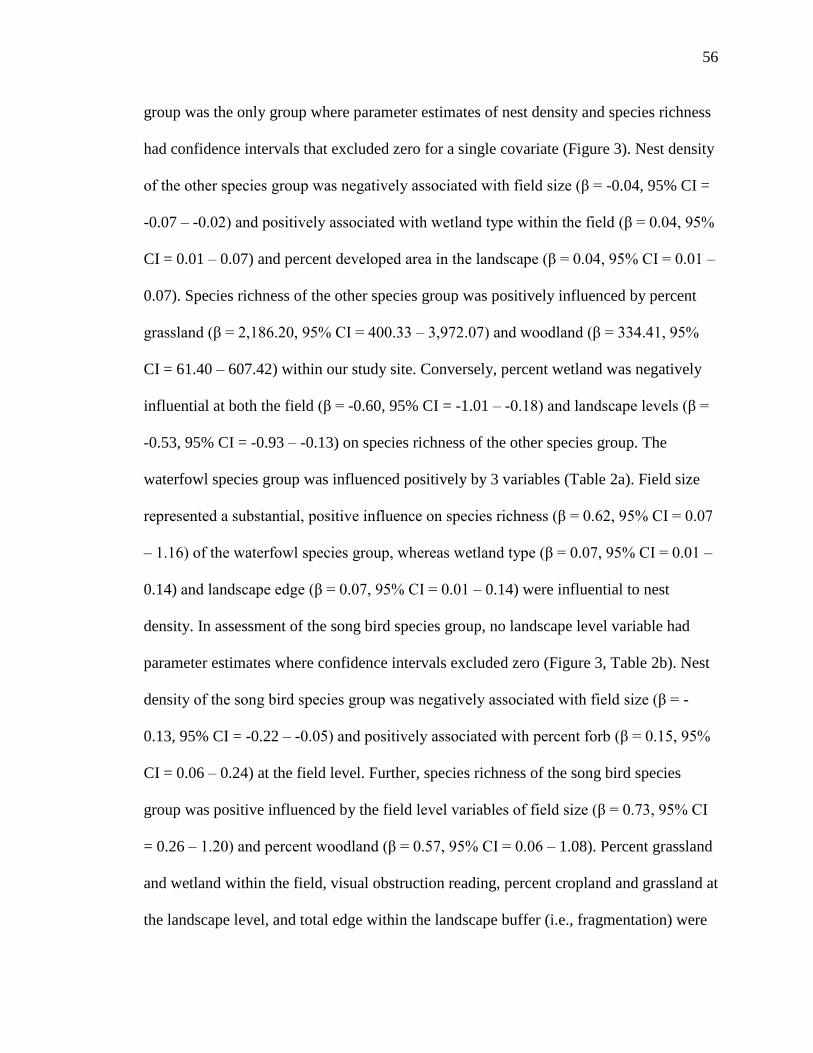
56
group was the only group where parameter estimates of nest density and species richness
had confidence intervals that excluded zero for a single covariate (Figure 3). Nest density
of the other species group was negatively associated with field size (β = -0.04, 95% CI =
-0.07 – -0.02) and positively associated with wetland type within the field (β = 0.04, 95%
CI = 0.01 – 0.07) and percent developed area in the landscape (β = 0.04, 95% CI = 0.01 –
0.07). Species richness of the other species group was positively influenced by percent
grassland (β = 2,186.20, 95% CI = 400.33 – 3,972.07) and woodland (β = 334.41, 95%
CI = 61.40 – 607.42) within our study site. Conversely, percent wetland was negatively
influential at both the field (β = -0.60, 95% CI = -1.01 – -0.18) and landscape levels (β =
-0.53, 95% CI = -0.93 – -0.13) on species richness of the other species group. The
waterfowl species group was influenced positively by 3 variables (Table 2a). Field size
represented a substantial, positive influence on species richness (β = 0.62, 95% CI = 0.07
– 1.16) of the waterfowl species group, whereas wetland type (β = 0.07, 95% CI = 0.01 –
0.14) and landscape edge (β = 0.07, 95% CI = 0.01 – 0.14) were influential to nest
density. In assessment of the song bird species group, no landscape level variable had
parameter estimates where confidence intervals excluded zero (Figure 3, Table 2b). Nest
density of the song bird species group was negatively associated with field size (β = -
0.13, 95% CI = -0.22 – -0.05) and positively associated with percent forb (β = 0.15, 95%
CI = 0.06 – 0.24) at the field level. Further, species richness of the song bird species
group was positive influenced by the field level variables of field size (β = 0.73, 95% CI
= 0.26 – 1.20) and percent woodland (β = 0.57, 95% CI = 0.06 – 1.08). Percent grassland
and wetland within the field, visual obstruction reading, percent cropland and grassland at
the landscape level, and total edge within the landscape buffer (i.e., fragmentation) were
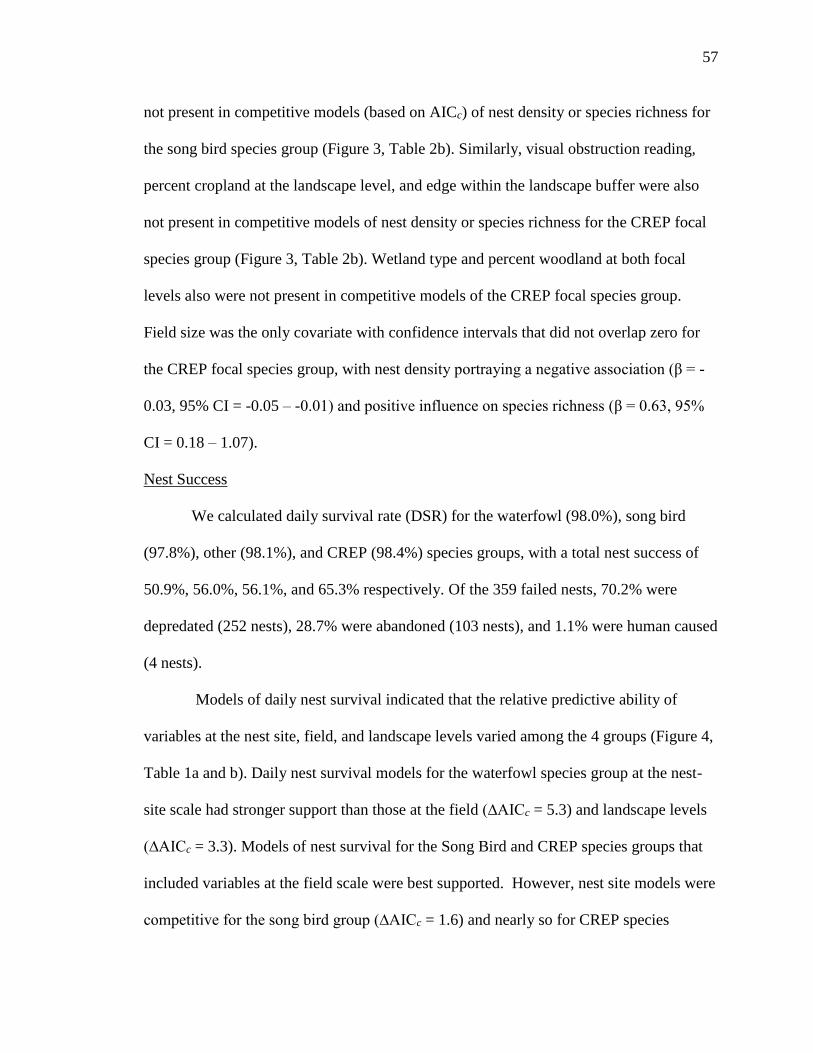
57
not present in competitive models (based on AICc) of nest density or species richness for
the song bird species group (Figure 3, Table 2b). Similarly, visual obstruction reading,
percent cropland at the landscape level, and edge within the landscape buffer were also
not present in competitive models of nest density or species richness for the CREP focal
species group (Figure 3, Table 2b). Wetland type and percent woodland at both focal
levels also were not present in competitive models of the CREP focal species group.
Field size was the only covariate with confidence intervals that did not overlap zero for
the CREP focal species group, with nest density portraying a negative association (β = -
0.03, 95% CI = -0.05 – -0.01) and positive influence on species richness (β = 0.63, 95%
CI = 0.18 – 1.07).
Nest Success
We calculated daily survival rate (DSR) for the waterfowl (98.0%), song bird
(97.8%), other (98.1%), and CREP (98.4%) species groups, with a total nest success of
50.9%, 56.0%, 56.1%, and 65.3% respectively. Of the 359 failed nests, 70.2% were
depredated (252 nests), 28.7% were abandoned (103 nests), and 1.1% were human caused
(4 nests).
Models of daily nest survival indicated that the relative predictive ability of
variables at the nest site, field, and landscape levels varied among the 4 groups (Figure 4,
Table 1a and b). Daily nest survival models for the waterfowl species group at the nest-
site scale had stronger support than those at the field (∆AICc = 5.3) and landscape levels
(∆AICc = 3.3). Models of nest survival for the Song Bird and CREP species groups that
included variables at the field scale were best supported. However, nest site models were
competitive for the song bird group (∆AICc = 1.6) and nearly so for CREP species
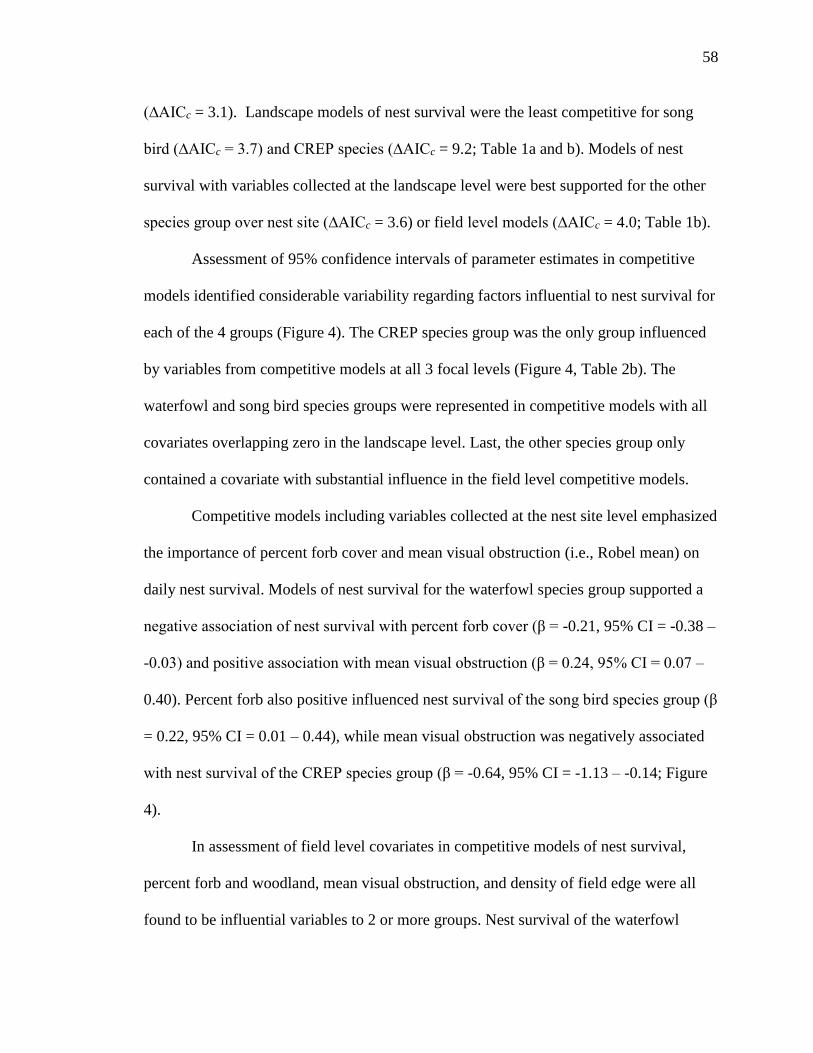
58
(∆AICc = 3.1). Landscape models of nest survival were the least competitive for song
bird (∆AICc = 3.7) and CREP species (∆AICc = 9.2; Table 1a and b). Models of nest
survival with variables collected at the landscape level were best supported for the other
species group over nest site (∆AICc = 3.6) or field level models (∆AICc = 4.0; Table 1b).
Assessment of 95% confidence intervals of parameter estimates in competitive
models identified considerable variability regarding factors influential to nest survival for
each of the 4 groups (Figure 4). The CREP species group was the only group influenced
by variables from competitive models at all 3 focal levels (Figure 4, Table 2b). The
waterfowl and song bird species groups were represented in competitive models with all
covariates overlapping zero in the landscape level. Last, the other species group only
contained a covariate with substantial influence in the field level competitive models.
Competitive models including variables collected at the nest site level emphasized
the importance of percent forb cover and mean visual obstruction (i.e., Robel mean) on
daily nest survival. Models of nest survival for the waterfowl species group supported a
negative association of nest survival with percent forb cover (β = -0.21, 95% CI = -0.38 –
-0.03) and positive association with mean visual obstruction (β = 0.24, 95% CI = 0.07 –
0.40). Percent forb also positive influenced nest survival of the song bird species group (β
= 0.22, 95% CI = 0.01 – 0.44), while mean visual obstruction was negatively associated
with nest survival of the CREP species group (β = -0.64, 95% CI = -1.13 – -0.14; Figure
4).
In assessment of field level covariates in competitive models of nest survival,
percent forb and woodland, mean visual obstruction, and density of field edge were all
found to be influential variables to 2 or more groups. Nest survival of the waterfowl
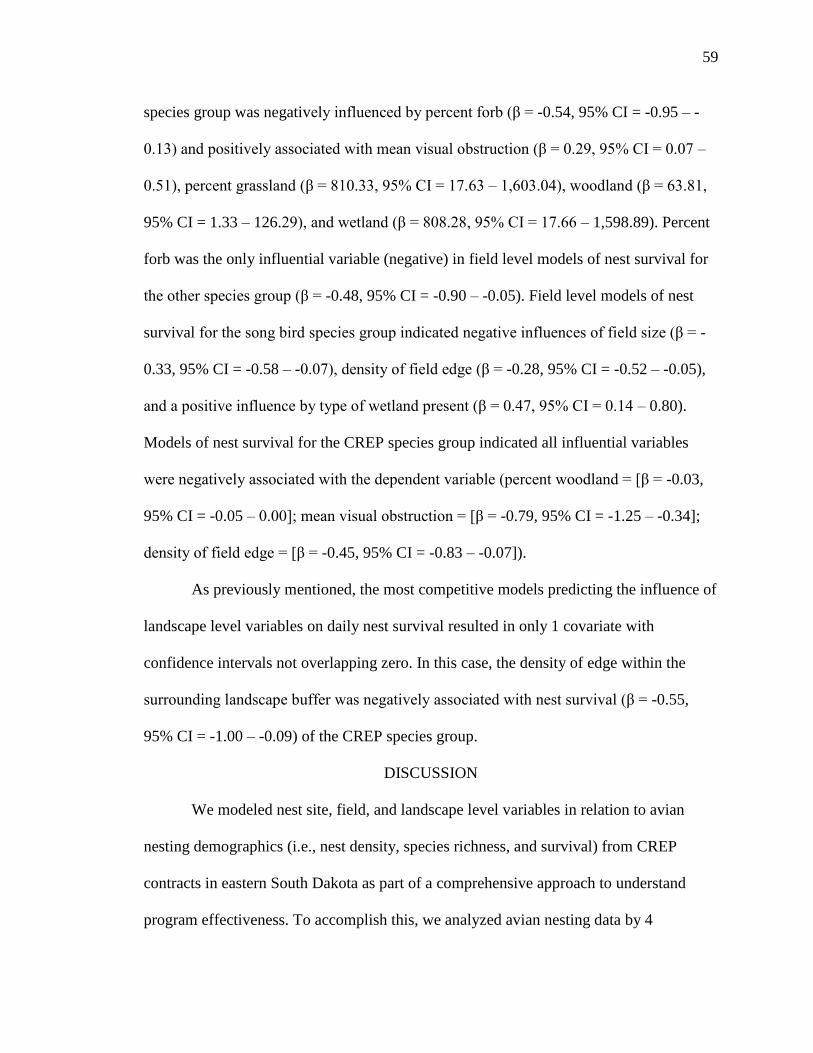
59
species group was negatively influenced by percent forb (β = -0.54, 95% CI = -0.95 – -
0.13) and positively associated with mean visual obstruction (β = 0.29, 95% CI = 0.07 –
0.51), percent grassland (β = 810.33, 95% CI = 17.63 – 1,603.04), woodland (β = 63.81,
95% CI = 1.33 – 126.29), and wetland (β = 808.28, 95% CI = 17.66 – 1,598.89). Percent
forb was the only influential variable (negative) in field level models of nest survival for
the other species group (β = -0.48, 95% CI = -0.90 – -0.05). Field level models of nest
survival for the song bird species group indicated negative influences of field size (β = -
0.33, 95% CI = -0.58 – -0.07), density of field edge (β = -0.28, 95% CI = -0.52 – -0.05),
and a positive influence by type of wetland present (β = 0.47, 95% CI = 0.14 – 0.80).
Models of nest survival for the CREP species group indicated all influential variables
were negatively associated with the dependent variable (percent woodland = [β = -0.03,
95% CI = -0.05 – 0.00]; mean visual obstruction = [β = -0.79, 95% CI = -1.25 – -0.34];
density of field edge = [β = -0.45, 95% CI = -0.83 – -0.07]).
As previously mentioned, the most competitive models predicting the influence of
landscape level variables on daily nest survival resulted in only 1 covariate with
confidence intervals not overlapping zero. In this case, the density of edge within the
surrounding landscape buffer was negatively associated with nest survival (β = -0.55,
95% CI = -1.00 – -0.09) of the CREP species group.
DISCUSSION
We modeled nest site, field, and landscape level variables in relation to avian
nesting demographics (i.e., nest density, species richness, and survival) from CREP
contracts in eastern South Dakota as part of a comprehensive approach to understand
program effectiveness. To accomplish this, we analyzed avian nesting data by 4
60
subgroups: waterfowl species, other species, song bird species, and CREP focal species,
with the primary objective of evaluating contract assessment process in a multi-scale
fashion to guide future platforms based on current program implementation.
Our initial modeling effort indicated that arthropod variables represented little
influence in explaining variation in avian nest demographics. Research by McIntyre and
Thompson (2003) suggested similar results, in that restored grasslands in their study
represented similar levels of arthropod availability for avian foraging requirements, but
were less abundant than in native sod prairies. With this, we suggest future research
evaluate differences between restored and remnant grasslands for future improvement of
conservation programs.
Assessment of the influence of nest site, field, and landscape level variables
demonstrated the complexity of natural ecosystems and need to evaluate the progress of
conservation programs with respect to goals. Implementing conservation programs with
broad objectives may yield undesired outcomes due to the lack of specificity in the
process to obtain goals or running a greater risk of including contradictory objectives that
potentially negate other successes (McCoy et al. 1999, Fletcher et al. 2006). Our research
revealed the importance of taking a multi-scale approach to program evaluation, given
that field models included a greater number of important variables describing variation in
nest density and species richness for each species group, except for waterfowl and nest
density of CREP focal species, which were both best described by landscape-level
variables (Ribic and Sample 2001, Cunningham and Johnson 2006). Similarly, our multi-
scale approach to estimating nest survival also highlighted variability across avian
61
groups, where song bird species were the only group where variables measured at the
field level explained important variation in nest survival.
Nest-site Scale
Our results indicated that the inclusion of variables collected at the nest site level
were only important in nest survival models for the waterfowl species group, whereas
nest survival for the other 3 groups was best estimated by variables collected at other
spatial extents. Interestingly, nest site level covariates tended to mirror the directional
influence of the field scale variables; for example, percent forb and mean visual
obstruction (i.e., Robel mean) presented a negative and positive influence respectively for
the waterfowl species group at both levels (Figure 4). This relationship also held true for
variable influence on the song bird and CREP focal species groups. Further research is
needed to assess the potential of evaluating avian demographics based on field level
covariates vs nest site specific data. This study could highlight the potential ability of
assessing avian use of conservation program sites based on field level data collection.
Field Scale
Area sensitivity has been a topic of high importance in avian research and
management for many years (Davis 2004, Renfrew and Ribic 2008, Ribic et al. 2009).
Our study not only highlighted the importance of patch size on nest density, species
richness, and daily survival rate of our 4 avian groups, but also the variability associated
among nest demographics and avian groups. Our study represented a positive influence
of field size on species richness of nesting birds and a negative influence on nest density;
emphasizing the significance of field size to many species of conservation concern (i.e.,
grassland song bird species; Bollinger and Gavin 2004). Nest success in many cases has
62
been shown to increase with size of grassland area (Skagen et al. 2005). Similar to Winter
et al. (2006), our findings varied among species groups, with daily survival rate of the
song bird species group representing the only significant influence (i.e., negative) to field
size. Our results suggest that this relationship may have been driven by abandonment
prone or high density nesting species (e.g., Red-winged Blackbird), but a species-specific
evaluation would be required to evaluate this hypothesis. Area sensitivity was also shown
to be influenced by fragmentation, in which, nest survival for the song bird and CREP
focal species groups was negatively associated with edge density within fields. Within
field edge density represented hard line transition zones between types of vegetation (i.e.,
grassland, wetland, woodland, etc.), which could be considered further fragmentation and
potentially impacting rates of nest predation or availability of usable space within
restored grasslands (Guthery 1997, Herkert et al 2003).
As reported in various studies, our findings depicted that presence of woody
species increased species richness of nesting avifauna; however, these additional species
tended to be generalist, edge preference species of lesser conservation concern (Bakker
2003, Grant et al. 2004, Stephens et al. 2004). Mean visual obstruction (i.e., nest site and
field level) was only observed as influential to daily nest survival of the waterfowl (i.e.,
positive) and CREP focal species groups (i.e., negative). This variability may be due to
the early season initiation of nesting by waterfowl species compared to the CREP focal
species, implying waterfowl species select fields and nesting locations with increased
visual obstruction for nest concealment (Hines and Mitchell 1983, Borgo and Conover
2016). Assessment of the ecology of CREP focal species in our study revealed that nest
preferences were generally for mid-vegetation nesting and open vegetation for ground
63
nesting species (DeCasare et al. 2013). Considering these ecological preferences for open
visibility, increased mean visual obstruction may have led to stress-induced abandonment
or behaviors that led to potential increased depredation (Seltmann et al. 2014, Tan et al.
2015). As documented in previous research, our study supports the notion that diverse
forb-rich grassland mixes better support grassland avifauna (Bakker and Higgins 2009,
Riffell et al. 2010). For example, percent forb supported a positive influence on the nest
density (i.e., field level) and daily survival (i.e., nest site) of the song bird species group.
Daily survival rate of the waterfowl (i.e., nest site and field level) and the other species
groups (i.e., field level) represented a negative association; however, these results may
have been an indirect result due to ecological dynamics. For example, prior research has
documented that early nesting individuals tend to have higher rates of nest survival, while
phenology of forb grow climax is mid-growing season; which may result in an indirect
false influence between timing of nest initiation and percent forb cover (Dzus and Clark
1998, Arzel et al. 2014). We suggest further research be conducted to confirm our
assumption.
Being that much of the CREP program region lies within the Prairie Pothole
Region, and a sub-focus goal of the program is to provide habitat for waterfowl
production, we found it crucial to incorporate percent wetland cover and type of wetland
within the field. Interestingly, we observed type of wetland to have a positive influence
not only on nest density of the waterfowl species group, but also nest density of the other
species group and daily nest survival of the song bird species group. These results detail
an opportunity for program managers to highlight the duel benefit of program contracts
which include wetland basins or both wetland basins and streams to positively impact
64
diverse avian populations and hydrology of enrolled sites (Homan et al. 2000, Reynolds
et al. 2006). Further, we found wetland type to have a greater positive influence on avian
dependent variables across our 4 nesting bird groups.
Landscape Scale
Compared to local-scale models, results of modeling at the landscape level
yielded more consistent directional influence of covariates on nest density, species
richness, and daily survival of the 4 avian species groups. However, landscape scale
competitive models detailed few variables which explain meaningful amounts of
variation in the dependent variables (i.e., 95% confidence intervals overlapped zero).
This may indicate that factors identified in competitive models contributed additively to
the variation of dependent variables (Seltmann et al. 2014, Tan et al. 2015) or the global
model was missing 1 or more influential covariates. Past research has emphasized
increased grassland cover in agricultural dominated landscapes as a means of increasing
demographic parameters for breeding birds (Ribic and Sample 2001, Renfrew and Ribic
2008); although, our results suggest that density of edge (i.e., fragmentation) within the
landscape may be more influential to grassland nesting birds within conservation
program sites (Schmidt and Whelan 1999). Even though we observed positive trends of
landscape edge influence on nest density and species richness of avian species groups, we
also found a negative influential trend on daily survival rate of avian species groups. This
details that increased edge density at all focal levels may increase the interconnectedness
of predator travel via corridors (Koper and Schmiegelow 2006).
65
Management Implications
Our study highlights the importance of evaluating potential constraints to reaching
program goals; in which, program objectives need to be interconnected and
simultaneously obtainable. We recommend incorporating an integrated stepwise
evaluation for conservation programs that would assess multi-scale factor variability,
allowing obtainable benefits for species with diverse ecological preferences (Schmidt and
Whelan 1999, Vickery and Herkert 2001, Ribic et al. 2009). For example, assessment of
landscape variables within the program region, separated into zones if beneficial, to
quantify a suite of potential species suitable to environmental factors (e.g., Bobolink;
Best et al. 1997, Naugle et al. 1999, Fletcher and Koford 2002, Fletcher and Koford
2003, Pretelli et al. 2015). Within selected region or focal zones, assessment of field scale
attributes (e.g., contract site selection and seed mixture) should tailor towards focal
species within the landscape’s avian suite to best capitalize restoration success towards
program goals. Ascertaining further insights to preferred avian preference, stands as
necessity to tailoring integrated conservation program targeting methods to maximize
platform implementation for game and non-game bird species alike.
ACKNOWLEDGEMENTS
We would like to sincerely thank all the summer technicians that helped with
difficult fieldwork and those who continued working through the year to sort invertebrate
samples. This project would not have been possible without your dedication. We would
also like to thank the South Dakota Department of Game, Fish and Parks (GF&P) for
funding our research through the State Wildlife Grants program. We are grateful to the
66
many GF&P staff that participated in the development and implementation of this
research project; without their feedback this project would not have been possible.
LITERATURE CITED
Anderson, D. R., and Burnham, K. P. 2002. Avoiding pitfalls when using information-
theoretic methods. The Journal of Wildlife Management, 912–918.
Arzel, C., Dessborn, L., Pöysä, H., Elmberg, J., Nummi, P., & Sjöberg, K. 2014. Early
springs and breeding performance in two sympatric duck species with different
migration strategies. Ibis 156:288–298.
Askins R. A., F. Chavez-Ramirez, B. C. Dale, C. A. Haas, J. R. Herkert, F. L. Knopf, and
P. D. Vickery. 2007. Conservation of Grassland Birds in North America:
Understanding Ecological Processes in Different Regions. Ornithological
Monographs 64:1–46.
Bakker, K. K. 2003. A synthesis of the effect of woody vegetation on grassland nesting
birds. In Proceedings of the South Dakota Academy of Science 82:119–141.
Bakker, K. K., & Higgins, K. F. 2009. Planted grasslands and native sod prairie:
equivalent habitat for grassland birds?. Western North American Naturalist
69:235–242.
Bash, J. S. and C. M. Ryan. 2002. Stream Restoration and Enhancement Projects: Is
Anyone Monitoring?. Environmental Management 29:877–885.
Best, L.B., H. Campa III, K. E. Kemp, R. J. Robel, M. R. Ryan, J. A. Savidge, H. P.
Weeks Jr, and S. R. Winterstein. 1997. Bird abundance and nesting in CRP fields
67
and cropland in the Midwest: a regional approach. Wildlife Society Bulletin 864–
877.
Bollinger, E. K., and T. A. Gavin. 2004. Responses of nesting bobolinks (Dolichonyx
oryzivorus) to habitat edges. The Auk 121:767–776.
Borgo, J. S., and M. R. Conover. 2016. Visual and olfactory concealment of duck nests:
influence on nest site selection and success. Human-Wildlife Interactions 10:110–
121.
Brennan L. A., and W. P. Kuvlesky. 2005. North American Grassland Birds: An
Unfolding Conservation Crisis? The Journal of Wildlife Management 69:1–13.
Cunningham, M. A., and D. H. Johnson. 2006. Proximate and landscape factors influence
grassland bird distributions. Ecological Applications 16:1062–1075.
Daubenmire, R. 1959. A canopy-coverage method of vegetational analysis. Northwest
Science 33:43–64.
Davis, S. K. 2004. Area sensitivity in grassland passerines: effects of patch size, patch
shape, and vegetation structure on bird abundance and occurrence in southern
Saskatchewan. The Auk 121:1130-1145.
De Bello, F., S. Lavorel, P. Gerhold, U. Reier, and M. Partel. 2010. A Biodiversity
Monitoring Framework for Practical Conservation of Grasslands and Shrublands.
Biological Conservation 143:9–17.
68
DeCesare, N. J., M. Hebblewhite, M. Bradley, D. Hervieux, L. Neufeld, and M. Musiani.
2013. Linking habitat selection and predation risk to spatial variation in survival.
Journal of animal ecology 83:343-352.
Delisle, J. M., and J. A. Savidge. 1997. Avian Use and Vegetation Characteristics of
Conservation Reserve Program Fields 61:318-325.
Dodds, W. K., K. C. Wilson, R. L. Rehmeier, G. L. Knight, S. Wiggam, J. A. Falke, H. J.
Dalgleish, and K. N. Bertrand. 2008. Comparing Ecosystem Goods and Services
Provided by Restored and Native Lands. BioScience 58:837–845.
Doxon, E. D., C. A. Davis, and S. D. Fuhlendorf. 2011. Comparison of Two Methods for
Sampling Invertebrates: Vacuum and Sweep-Net Sampling. Journal of Field
Ornithology 82:60–67.
Dzus, E. H., and R. G. Clark. 1998. Brood survival and recruitment of mallards in
relation to wetland density and hatching date. The Auk 311–318.
Fletcher, R. J., and R. R. Koford. 2002. Habitat and Landscape Associations of Breeding
Birds in Native and Restored Grasslands. The Journal of Wildlife Management
66:1011–1022.
Fletcher Jr, R. J., and R. R. Koford. 2003. Changes in breeding bird populations with
habitat restoration in northern Iowa. The American midland naturalist 150:83–94.
69
Fletcher Jr, R. J., R. R. Koford, and D. A. Seaman. 2006. Critical demographic
parameters for declining songbirds breeding in restored grasslands. Journal of
Wildlife Management 70:145–157.
Grant, T. A., E. Madden, and G. B. Berkey. 2004. Tree and shrub invasion in northern
mixed-grass prairie: implications for breeding grassland birds. Wildlife Society
Bulletin 32:807–818.
Gray, R. L., and B. M. Teels. 2006 Wildlife and Fish Conservation through the Farm Bill.
Wildlife Society Bulletin 34:906–913.
Green, R. E., S. J. Cornell, J. P. Scharlemann, and A. Balmford. 2005. Farming and the
fate of wild nature. Science 307:550–555.
Guthery, F. S. 1997. A philosophy of habitat management for northern bobwhites. The
Journal of wildlife management 291–301.
Haroldson, K. J., R. O. Kimmel, M. R. Riggs, and A. H. Berner. 2006. Association of
ring-necked pheasant, gray partridge, and meadowlark abundance to Conservation
Reserve Program grasslands. Journal of Wildlife Management 70:1276–1284.
Herkert, J.R., D. L. Reinking, D. A. Wiedenfeld, M. Winter, J. L. Zimmerman, W. E.
Jensen, E. J. Finck, R. R. Koford, D. H. Wolfe, S. K. Sherrod, and M. A. Jenkins.
2003. Effects of prairie fragmentation on the nest success of breeding birds in the
midcontinental United States. Conservation Biology 17:587–594.
70
Hines, J. E., and G. J. Mitchell. 1983. Gadwall nest-site selection and nesting success.
The Journal of Wildlife Management 1063–1071.
Homan, H. J., G. M. Linz, and W. J. Bleier. 2000. Winter habitat use and survival of
female ring-necked pheasants (Phasianus colchicus) in southeastern North
Dakota. The American Midland Naturalist 143:463–480.
Hughes, J. P., R. J. Robel, K. E. Kemp, and J. L. Zimmerman. 1999. Effects of habitat on
Dickcissel abundance and nest success in Conservation Reserve Program fields in
Kansas. The Journal of wildlife management 523–529.
Johnson, R. G., and S. A. Temple. 1990. Nest predation and brood parasitism of tallgrass
prairie birds. The Journal of Wildlife Management 106–111.
Kerns, C. K., M. R. Ryan, R. K. Murphy, F. R. Thompson III, and C. S. Rubin. 2010.
Factors affecting songbird nest survival in northern mixed-grass prairie. Journal
of Wildlife Management 74:257–264.
Koper, N., and F. K. Schmiegelow. 2006. A multi-scaled analysis of avian response to
habitat amount and fragmentation in the Canadian dry mixed-grass prairie.
Landscape Ecology 21:1045–1059.
Knopf, F. L. 1994. Avian Assemblages in Altered Grasslands. Studies in Avian Biology
15:247–257.
Kroll, A. J., Y. Ren, J. E. Jones, J. Giovanini, R. W. Perry, R. E. Thill, D. White Jr., and
T. B. Wigley. 2014. Avian Community Composition Associated with Interactions
71
between Local and Landscape Habitat Attributes. Forest Ecology and
Management 326:46–57.
Lloyd, J. D., and T. E. Martin. 2005. Reproductive Success of Chestnut-collared
Longspurs in Native and Exotic Grassland. The Condor 107:363–374.
Lloyd, J. D., and J. J. Tewksbury. 2007. Analyzing avian nest survival in forests and
grasslands: a comparison of the Mayfield and logistic-exposure methods. Studies
in avian biology 34:96–104.
Lusk, J. J., K. S. Wells, F. S. Guthery, and S. D. Fuhlendorf. 2003. Lark Sparrow
(Chondestes grammacus) nest-site selection and success in a mixed-grass prairie.
The Auk 120:120–129.
Martin, P. A., D. L. Johnson, D. J. Forsyth, and B. D. Hill. 2000. Effects of two
grasshopper control insecticides on food resources and reproductive success of
two species of grassland songbirds. Environmental Toxicology and Chemistry
19:2987–2996.
McCoy, T. D., M. R. Ryan, E. W. Kurzejeski, and L. W. Burger Jr. 1999. Conservation
Reserve Program: source or sink habitat for grassland birds in Missouri?. The
Journal of wildlife management 530–538.
McIntyre, N. E., and T. R. Thompson. 2003. A comparison of Conservation Reserve
Program habitat plantings with respect to arthropod prey for grassland birds. The
American Midland Naturalist 150:291–301.
72
Naugle, D. E., K. F. Higgins, S. M. Nusser, and W. C. Johnson. 1999. Scale-dependent
habitat use in three species of prairie wetland birds. Landscape ecology 14:267–
276.
Nemec, K. 2014. Eleven New Records of Spiders (Arachnida, Araneae) for Nebraska.
Journal of the Kansas Entomological Society 87:249–252.
Nichols, J. D. and B. K. Williams. 2006. Monitoring for Conservation. TRENDS in
Ecology and Evolution 21:668–673.
O’Leske, D. L., R. J. Robel, and K. E. Kemp. 1997. Sweepnet-Collected Invertebrate
Biomass from High- and Low-Input Agricultural Fields in Kansas. Wildlife
Society Bulletin 25:133–138.
Olson, D. M. 1991. A comparison of the efficacy of litter sifting and pitfall traps for
sampling leaf litter ants (Hymenoptera, Formicidae) in a tropical wet forest, Costa
Rica. Biotropica 166–172.
Pretelli, M. G., J. P. Isacch, and D. A. Cardoni. 2015. Effects of fragmentation and
landscape matrix on the nesting success of grassland birds in the Pampas
grasslands of Argentina. Ibis 157:688–699.
Rempel, R. S., D. E. Reid, and J. Jackson. 2012. Batcheler-corrected point distance
versus belt transect for sampling habitat and woody vegetation. Canadian Journal
of Forest Research 42:2052–2063.
73
Renfrew, R. B., C. A. Ribic, and J. L. Nack. 2005. Edge Avoidance by Nesting Grassland
Birds: A Futile Strategy in a Fragmented Landscape. The Auk 122.2:618–636.
Renfrew, R. B., and C. A. Ribic. 2008. Multi-scale models of grassland passerine
abundance in a fragmented system in Wisconsin. Landscape Ecology 23:181–193.
Reynolds, R. E., T. L. Shaffer, C. R. Loesch, and R. R. Cox Jr. 2006. The Farm Bill and
duck production in the Prairie Pothole Region: increasing the benefits. Wildlife
Society Bulletin 34:963–974.
Ribic, C. A., and D. W. Sample. 2001. Associations of grassland birds with landscape
factors in southern Wisconsin. The American Midland Naturalist 146:105–121.
Ribic, C. A., R. R. Koford, J. R. Herkert, D. H. Johnson, N. D. Niemuth, D. E. Naugle, K.
K. Bakker, D. W. Sample, and R. B. Renfrew. 2009. Area sensitivity in North
American grassland birds: patterns and processes. The Auk 126:233–244.
Riffell, S., D. Scognamillo, L. Burger, J. Wes, and S. Bucholtz. 2010. Broad-scale
relations between Conservation Reserve Program and grassland birds: do cover
type, configuration and contract age matter. Open Ornithology Journal 3:112–123.
Robel R. J., J. N. Briggs, A. D. Dayton, and L. C. Hulbert. 1970. Relationships Between
Visual Obstruction Measurements and Weight of Grassland Vegetation. Journal
of Range Management 23:295–297.
Samson, F. B., and F. L. Knopf. 1994. Prairie Conservation in North America.
BioScience 44:418–421.
74
Sauer, J. R., J. E. Hines, J. E. Fallon, K. L. Pardieck, D. J. Ziolkowski Jr., and W. A.
Link. 2011. The North American Breeding Bird Survey, Results and Analysis
1966 - 2009. Version 3.23.2011 USGS Patuxent Wildlife Research Center,
Laurel, MD.
Schmidt, K. A., and C. J. Whelan. 1999. Nest placement and mortality: Is nest predation
a random event in space and time?. Condor 916–920.
Seltmann, M. W., K. Jaatinen, B. B. Steele, and M. Öst. 2014. Boldness and stress
responsiveness as drivers of nest-site selection in a ground-nesting bird. Ethology
120:77–89.
Shaffer, T. L., and F. R. Thompson. 2007. Making meaningful estimates of nest survival
with model-based methods. Studies in Avian Biology 34:84–95.
Shanahan, D. F., C. Miller, H. P. Possingham, and R. A. Fuller. 2011. The Influence of
Patch Area and Connectivity on Avian Communities in Urban Revegetation.
Biological Conservation 144:722–729.
Skagen, S. K., A. A. Y. Adams, and R. D. Adams. 2005. Nest survival relative to patch
size in a highly fragmented shortgrass prairie landscape. The Wilson Bulletin,
117:23–34.
Stafford, J. D., R. M. Kaminski, K. J. Reinecke, and S. W. Manley. 2006. Waste rice for
waterfowl in the Mississippi Alluvial Valley. Journal of Wildlife Management
70:61–69.
75
Standen, V. 2000. The adequacy of collecting techniques for estimating species richness
of grassland invertebrates. Journal of Applied Ecology 37:884–893.
Stephens, S. E., D. N. Koons, J. J. Rotella, and D. W. Willey. 2004. Effects of habitat
fragmentation on avian nesting success: a review of the evidence at multiple
spatial scales. Biological Conservation 115:101–110.
Tan, L. X., K. L. Buchanan, G. S. Maguire, and M. A. Weston. 2015. Cover, not caging,
influences chronic physiological stress in a ground-nesting bird. Journal of avian
biology 46:482–488.
Taylor, R. L., B. D. Maxwell, and R. J. Boik. 2006. Indirect Effects of Herbicides on Bird
Food Resources and Beneficial Arthropods. Agriculture, Ecosystems &
Environment 116:157–164.
Teels, B. M., C. A. Rewa, and J. Myers. 2006. Aquatic Condition Response to Riparian
Buffer Establishment. Wildlife Society Bulletin 34:927–935.
United States Department of Agriculture: Farm Service Agency. 2009. The South Dakota
James River Watershed Conservation Reserve Enhancement Program.
Programmatic Environmental Assessment. Available:
https://www.fsa.usda.gov/Assets/USDA-FSA-Public/usdafiles/Environ-
Cultural/jrwcrepfnlstmtagmt0109.pdf
United States Department of Agriculture: Farm Service Agency. 2011. South Dakota
Conservation Reserve Enhancement Program. Fact Sheet. Available:
https://www.fsa.usda.gov/Internet/FSA_File/crepsdfactsheet.pdf
76
Vickery, P. D. and J. R. Herkert. 2001. Recent Advances in Grassland Bird Research:
Where do we go from here? The Auk 118:11–15.
Walk, J. W., E. L. Kershner, T. J. Benson, and R. E. Warner. 2010. Nesting success of
grassland birds in small patches in an agricultural landscape. The Auk 127:328–
334.
Winter, M. 1999. Nesting biology of Dickcissels and Henslow's Sparrows in
southwestern Missouri prairie fragments. The Wilson Bulletin 515–526.
Winter, M., D. H. Johnson, J. A. Shaffer, T. M. Donovan, and W. D. Svedarsky. 2006.
Patch size and landscape effects on density and nesting success of grassland birds.
Journal of Wildlife Management 70:158–172.
Wright, C. K., and M. C. Wimberly. 2013. Recent Land Use Change in the Western Corn
Belt Threatens Grasslands and Wetlands. Proceedings of the National Academy
of Sciences.
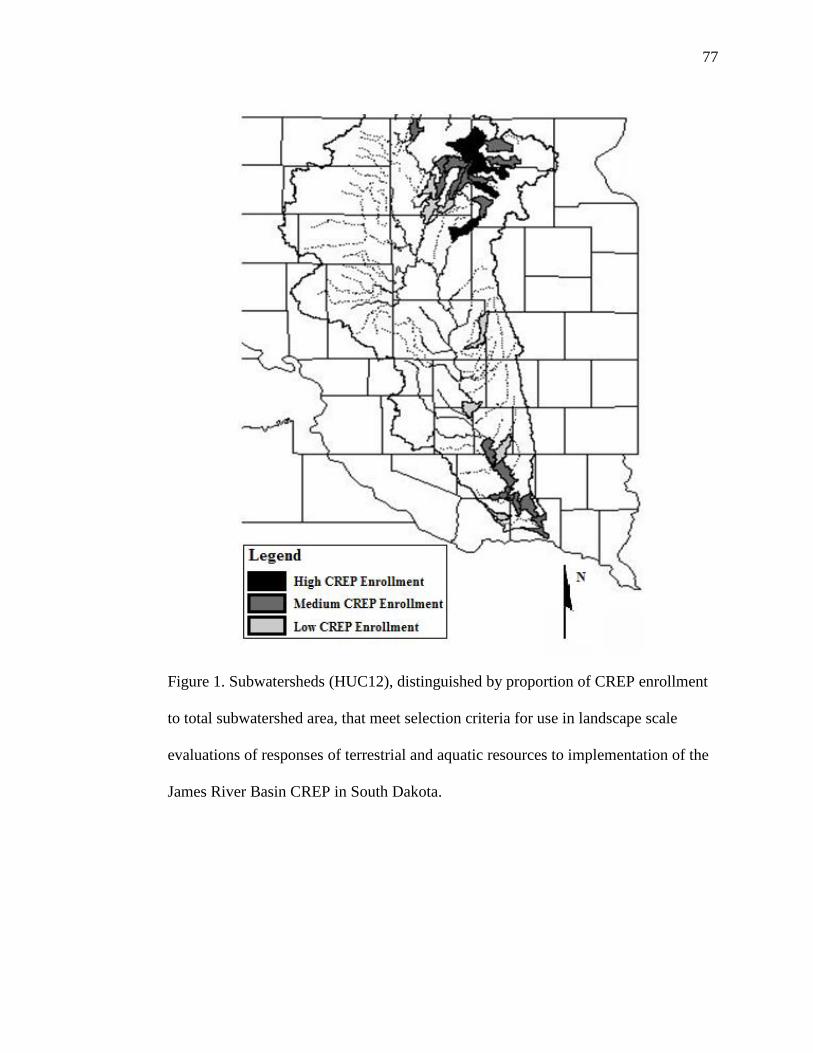
77
Figure 1. Subwatersheds (HUC12), distinguished by proportion of CREP enrollment
to total subwatershed area, that meet selection criteria for use in landscape scale
evaluations of responses of terrestrial and aquatic resources to implementation of the
James River Basin CREP in South Dakota.
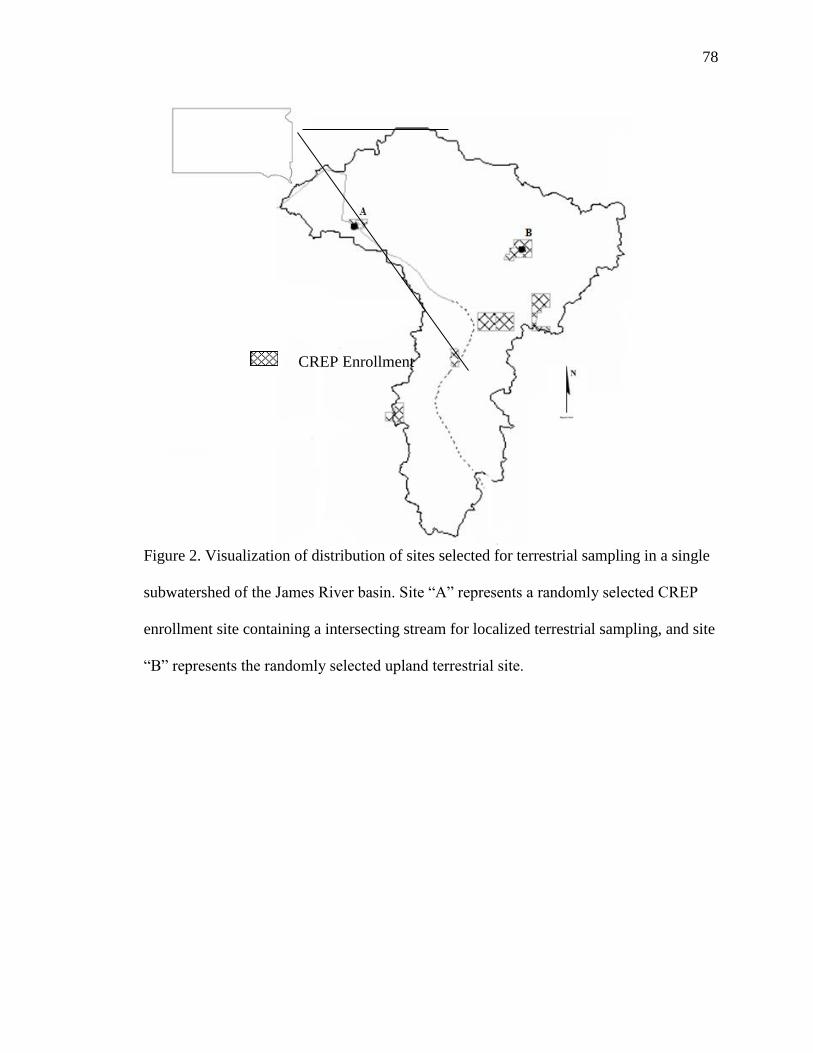
78
Figure 2. Visualization of distribution of sites selected for terrestrial sampling in a single
subwatershed of the James River basin. Site “A” represents a randomly selected CREP
enrollment site containing a intersecting stream for localized terrestrial sampling, and site
“B” represents the randomly selected upland terrestrial site.
CREP Enrollment
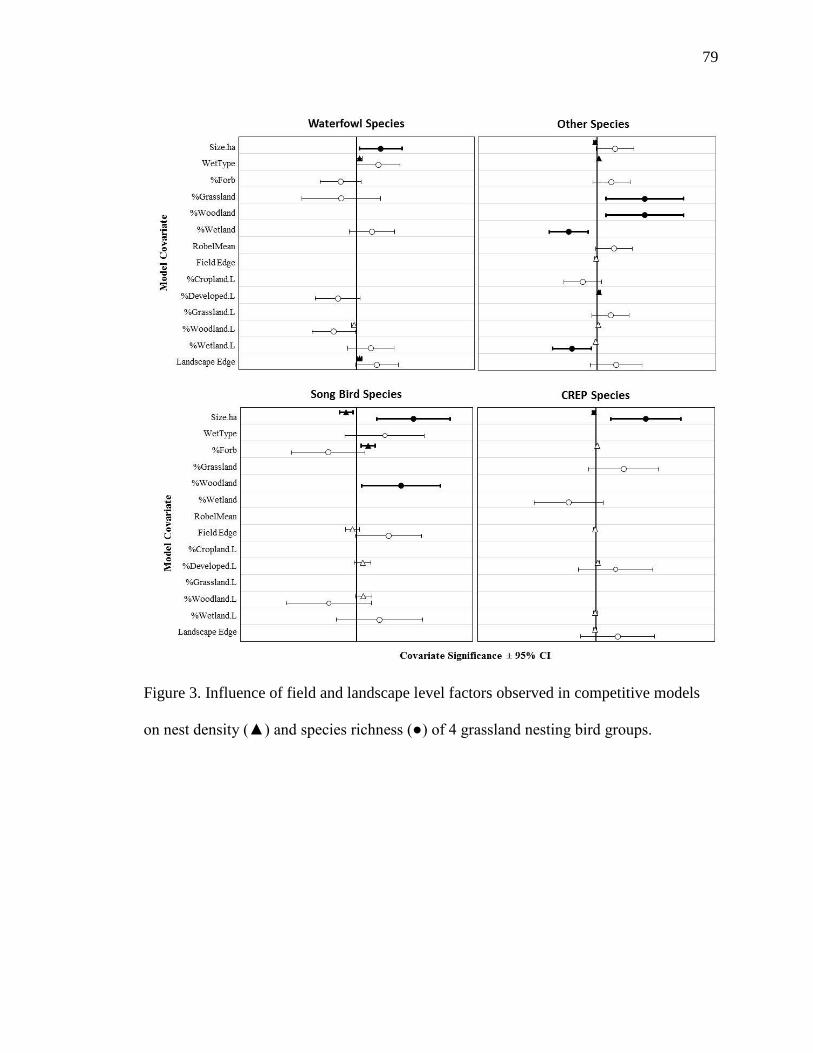
79
Figure 3. Influence of field and landscape level factors observed in competitive models
on nest density (▲) and species richness (●) of 4 grassland nesting bird groups.
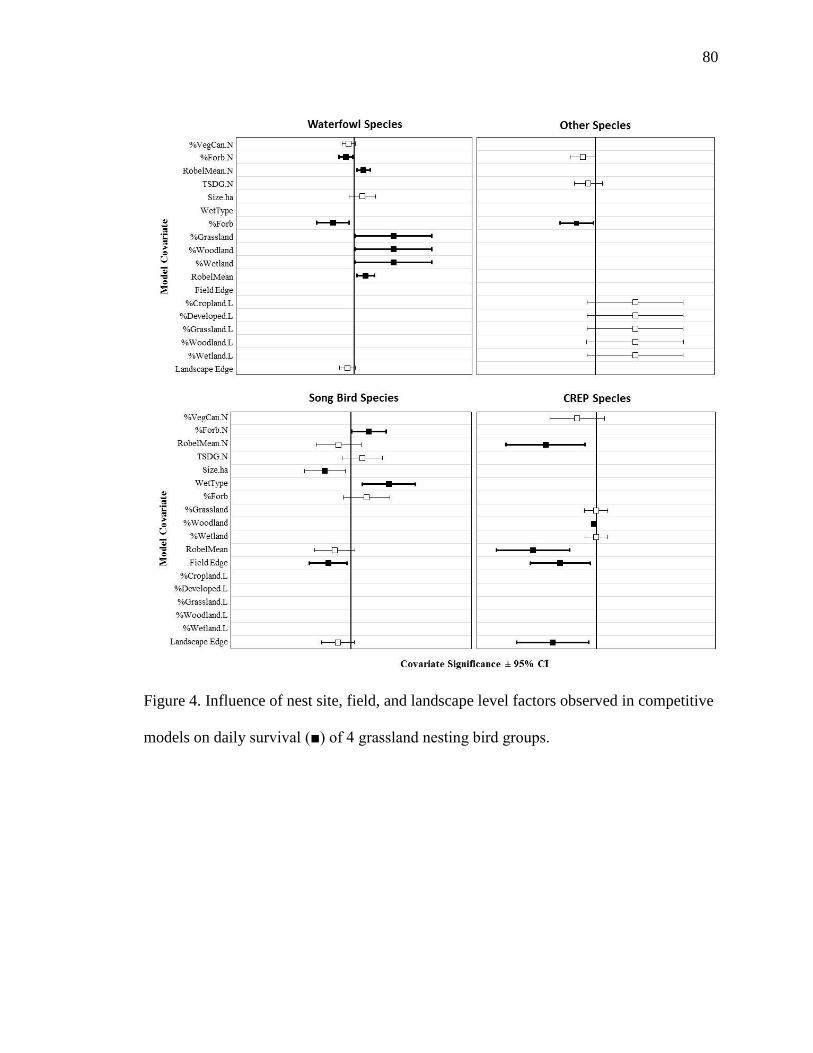
80
Figure 4. Influence of nest site, field, and landscape level factors observed in competitive
models on daily survival (■) of 4 grassland nesting bird groups.
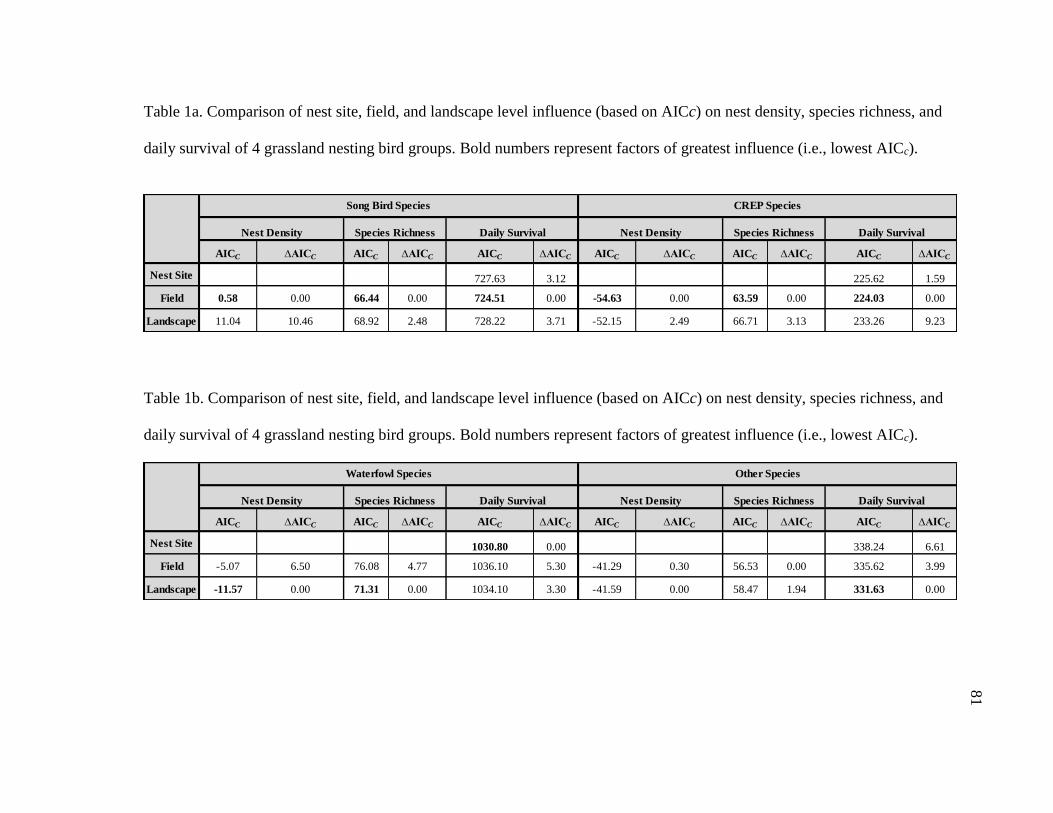
81
Table 1a. Comparison of nest site, field, and landscape level influence (based on AICc) on nest density, species richness, and
daily survival of 4 grassland nesting bird groups. Bold numbers represent factors of greatest influence (i.e., lowest AICc).
Table 1b. Comparison of nest site, field, and landscape level influence (based on AICc) on nest density, species richness, and
daily survival of 4 grassland nesting bird groups. Bold numbers represent factors of greatest influence (i.e., lowest AICc).
AICC ∆AICC AICC ∆AICC AICC ∆AICC AICC ∆AICC AICC ∆AICC AICC ∆AICC
Nest Site 727.63 3.12 225.62 1.59
Field 0.58 0.00 66.44 0.00 724.51 0.00 -54.63 0.00 63.59 0.00 224.03 0.00
Landscape 11.04 10.46 68.92 2.48 728.22 3.71 -52.15 2.49 66.71 3.13 233.26 9.23
Daily SurvivalNest Density Species Richness Daily Survival Nest Density Species Richness
Song Bird Species CREP Species
AICC ∆AICC AICC ∆AICC AICC ∆AICC AICC ∆AICC AICC ∆AICC AICC ∆AICC
Nest Site 1030.80 0.00 338.24 6.61
Field -5.07 6.50 76.08 4.77 1036.10 5.30 -41.29 0.30 56.53 0.00 335.62 3.99
Landscape -11.57 0.00 71.31 0.00 1034.10 3.30 -41.59 0.00 58.47 1.94 331.63 0.00
Other Species
Nest Density Species Richness Daily SurvivalSpecies RichnessNest Density Daily Survival
Waterfowl Species
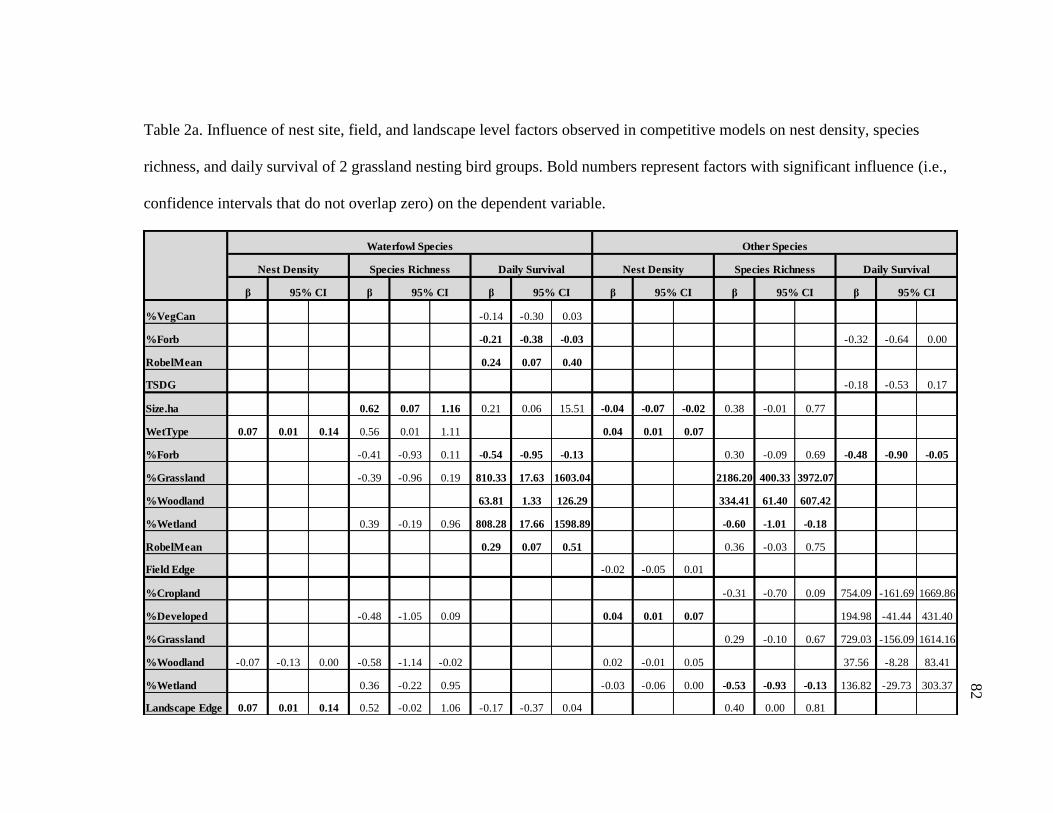
82
Table 2a. Influence of nest site, field, and landscape level factors observed in competitive models on nest density, species
richness, and daily survival of 2 grassland nesting bird groups. Bold numbers represent factors with significant influence (i.e.,
confidence intervals that do not overlap zero) on the dependent variable.
β β β β β β
%VegCan -0.14 -0.30 0.03
%Forb -0.21 -0.38 -0.03 -0.32 -0.64 0.00
RobelMean 0.24 0.07 0.40
TSDG -0.18 -0.53 0.17
Size.ha 0.62 0.07 1.16 0.21 0.06 15.51 -0.04 -0.07 -0.02 0.38 -0.01 0.77
WetType 0.07 0.01 0.14 0.56 0.01 1.11 0.04 0.01 0.07
%Forb -0.41 -0.93 0.11 -0.54 -0.95 -0.13 0.30 -0.09 0.69 -0.48 -0.90 -0.05
%Grassland -0.39 -0.96 0.19 810.33 17.63 1603.04 2186.20 400.33 3972.07
%Woodland 63.81 1.33 126.29 334.41 61.40 607.42
%Wetland 0.39 -0.19 0.96 808.28 17.66 1598.89 -0.60 -1.01 -0.18
RobelMean 0.29 0.07 0.51 0.36 -0.03 0.75
Field Edge -0.02 -0.05 0.01
%Cropland -0.31 -0.70 0.09 754.09 -161.69 1669.86
%Developed -0.48 -1.05 0.09 0.04 0.01 0.07 194.98 -41.44 431.40
%Grassland 0.29 -0.10 0.67 729.03 -156.09 1614.16
%Woodland -0.07 -0.13 0.00 -0.58 -1.14 -0.02 0.02 -0.01 0.05 37.56 -8.28 83.41
%Wetland 0.36 -0.22 0.95 -0.03 -0.06 0.00 -0.53 -0.93 -0.13 136.82 -29.73 303.37
Landscape Edge 0.07 0.01 0.14 0.52 -0.02 1.06 -0.17 -0.37 0.04 0.40 0.00 0.81
95% CI 95% CI 95% CI
Other Species
Nest Density Species Richness Daily Survival
95% CI
Waterfowl Species
Nest Density Species Richness Daily Survival
95% CI 95% CI
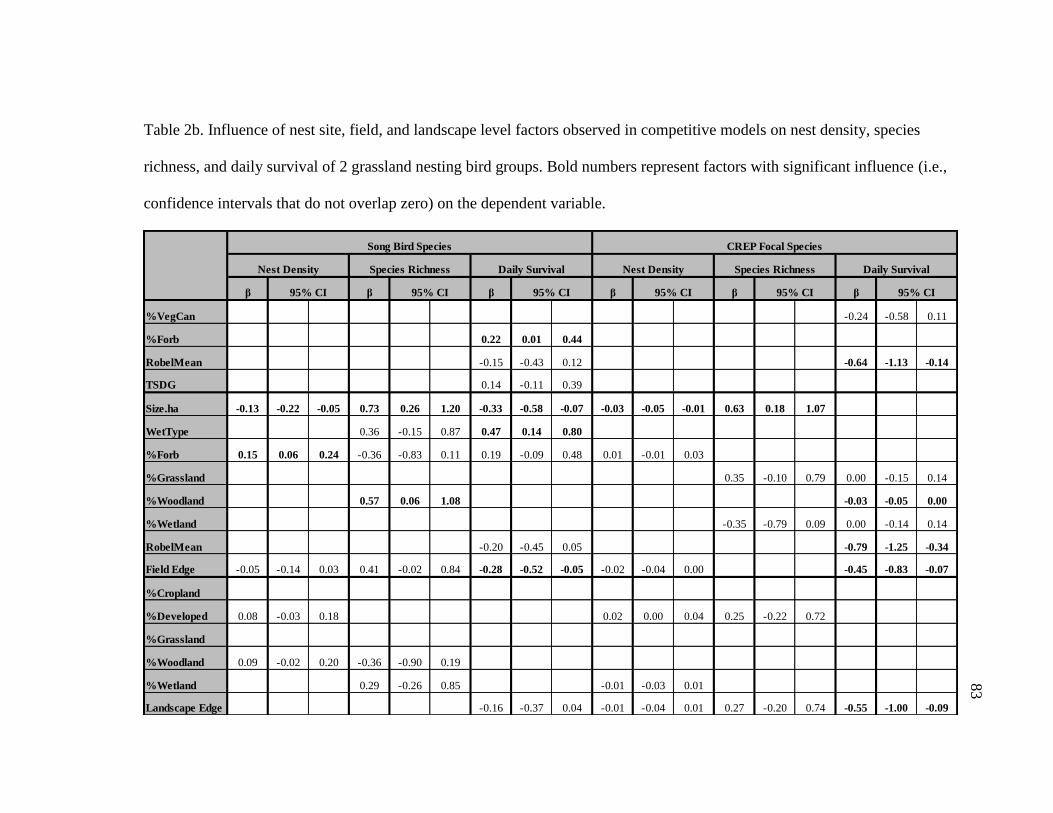
83
Table 2b. Influence of nest site, field, and landscape level factors observed in competitive models on nest density, species
richness, and daily survival of 2 grassland nesting bird groups. Bold numbers represent factors with significant influence (i.e.,
confidence intervals that do not overlap zero) on the dependent variable.
β β β β β β
%VegCan -0.24 -0.58 0.11
%Forb 0.22 0.01 0.44
RobelMean -0.15 -0.43 0.12 -0.64 -1.13 -0.14
TSDG 0.14 -0.11 0.39
Size.ha -0.13 -0.22 -0.05 0.73 0.26 1.20 -0.33 -0.58 -0.07 -0.03 -0.05 -0.01 0.63 0.18 1.07
WetType 0.36 -0.15 0.87 0.47 0.14 0.80
%Forb 0.15 0.06 0.24 -0.36 -0.83 0.11 0.19 -0.09 0.48 0.01 -0.01 0.03
%Grassland 0.35 -0.10 0.79 0.00 -0.15 0.14
%Woodland 0.57 0.06 1.08 -0.03 -0.05 0.00
%Wetland -0.35 -0.79 0.09 0.00 -0.14 0.14
RobelMean -0.20 -0.45 0.05 -0.79 -1.25 -0.34
Field Edge -0.05 -0.14 0.03 0.41 -0.02 0.84 -0.28 -0.52 -0.05 -0.02 -0.04 0.00 -0.45 -0.83 -0.07
%Cropland
%Developed 0.08 -0.03 0.18 0.02 0.00 0.04 0.25 -0.22 0.72
%Grassland
%Woodland 0.09 -0.02 0.20 -0.36 -0.90 0.19
%Wetland 0.29 -0.26 0.85 -0.01 -0.03 0.01
Landscape Edge -0.16 -0.37 0.04 -0.01 -0.04 0.01 0.27 -0.20 0.74 -0.55 -1.00 -0.09
Song Bird Species
Nest Density Species Richness Daily Survival
95% CI 95% CI 95% CI
Nest Density Species Richness Daily Survival
95% CI 95% CI 95% CI
CREP Focal Species
84
CHAPTER 4: MOTIVATIONS FOR ENROLLMENT INTO THE CONSERVATION
RESERVE ENHANCEMENT PROGRAM IN SOUTH DAKOTA
This chapter is being prepared for submission in the Journal of Human Dimensions of
Wildlife.
85
Abstract
The Conservation Reserve Enhancement Program (CREP) targets high-priority
conservation needs (e.g., water quality, wildlife habitat) by paying landowners an annual
rental rate to remove environmentally sensitive or agriculturally unproductive lands from
rowcrop production, and then implement conservation practices on these lands. This
study examined motivations of South Dakota landowners for enrolling in the James River
Basin CREP. All 517 newly-enrolled landowners were mailed a questionnaire in 2014
measuring demographics, behaviors, opinions, and motivations (60% response rate).
Cluster analysis of 10 motivations for enrolling identified three motivation groups
(wildlife=40%, financial=35%, environmental=25%). The financial group had the
youngest mean age (62 years), followed by the wildlife (65) and environmental groups
(68). Among respondents, 43% favored the public access requirement of this CREP with
the environmental group most in favor. Understanding landowner enrollment motivations
and decision criteria will assist in strategies (e.g., financial incentives, increasing yield
via habitat restoration) for increasing future participation.
Keywords: Conservation Reserve Enhancement Program, CREP, grassland management,
landowner motivations
86
Introduction
Increasing demand for lower-cost foods and alternative energy production is
threatening critical wildlife habitats (Green, Cornell, Scharlemann, & Balmford, 2005).
Natural resource conservation programs are designed to maintain, improve, or reclaim
important wildlife habitats, but are mostly dependent on voluntary participation by
landowners. The success of these programs depends, in part, on understanding
agricultural producer motivations toward these conservation programs and wildlife
habitats. Motivations describe why people select and participate in various activities to
meet their goals or satisfy their needs (Manning, 2011). Understanding agricultural
producer motivations for enrollment may lead to improved conservation programs with
increased adoption and program satisfaction among landowners (Selinske, Coetzee,
Purnell, & Knight, 2015).
Agricultural producer motivations toward conservation throughout the Great
Plains and the Midwest are complex and offer no unified strategy to increase
participation in conservation programs (Smith, Peterson, & Leatherman, 2007).
Agricultural producers may react to an individual situation or conservation program in a
number of ways. For example, studies of agricultural producers have shown that
conservation compliance requirements, age, education, organization affiliation, and
attitudes toward wildlife and conservation are all influential factors affecting
conservation decision making (Allen & Vandever, 2003; Beedell & Rehman, 1999, 2000;
Hua, Zulauf, & Sohngen, 2004; Knowler & Bradshaw, 2007; Poudyal & Hodges, 2009;
Sorice & Conner, 2010). A survey of Conservation Reserve Program (CRP) participants
in Missouri, for example, found that 49% of respondents denoted some importance of
87
benefiting wildlife as influencing their decision to enroll land into the CRP (Kurzejeski,
Burger, Monson, & Lenkner, 1992). However, Kurzejeski et al. (1992) found that in
ranking the most important factors for landowners enrolling land in the CRP, concerns
about soil erosion (23%) ranked the highest, whereas providing wildlife habitat ranked
fifth out of seven variables (12%). These studies highlight an inherent variability among
individuals and regions. Moreover, these studies detail the overarching vulnerability of
conservation programs that are implemented on a national scale or programs that fail to
consider landowner desires.
Even among farmers who characterize themselves as dedicated to natural
resources, there is a distinct separation in conservation priorities as a result of variable
definitions of “conservation.” Does conservation mean tiling practices for “best” water
management, maintaining waterways for runoff benefits, implementing cover crops for
erosion or minimizing air/water quality impacts, maintaining wildlife habitat with
agriculture practices, or implementing a combination of practices depending on their
view of conservation (Ahnstrӧm et al., 2009)? These definitions are also influenced by
the social-economic pressures that can alter a farmer’s perspective. The term
“conservation,” therefore, is truly in the eye of the beholder.
In South Dakota, a Conservation Reserve Enhancement Program (CREP) project
was initiated for the James River Basin in November 2009, with a goal of enrolling
100,000 acres in 10-15 year contracts. This CREP has been valuable for grassland and
wetland conservation by forming federal partnerships (i.e., Natural Resource
Conservation Service [NRCS]) with state agencies (i.e., South Dakota Game, Fish and
Parks) in an effort to address specific regional conservation priorities. This program was
88
intended not only to benefit water quality and stabilize stream-channels, but also to
increase habitat available to game and non-game fish and wildlife. This CREP is
administered similar to the Conservation Reserve Program (CRP) through local NRCS
offices. Furthermore, the South Dakota CREP project is unique in that all lands under
contract were required to allow public access through South Dakota’s Walk-in Area
Program and all enrolled landowners were required to comply with aquatic and terrestrial
monitoring. Coupling the CREP with the State Walk-in Area Program provides
landowners an additional 40% over the financial incentive for other CRP’s in the state
(USDA, 2009, 2011).
This research focused on the human dimensions aspects of a comprehensive
project to evaluate the successes of the James River CREP. The objective of this study
was to gain a better understanding of the motivations for landowner enrollment into the
South Dakota CREP. This research note addressed three main questions: (a) what are the
characteristics and demographics of CREP enrollees and how is age related to
enrollment, (b) how do CREP enrollees feel about the requirement to provide public
access, and (c) what are the most important motivational factors for enrollment and can
these be grouped into clusters? This research provides additional insight into the value of
landowner characteristics and motivations for informing future conservation and program
expansion efforts.
Methods
This research involved a census of 517 landowners with land that was newly
enrolled (January 2010 – November 2012) in the South Dakota CREP. In other words,
properties in this study were not re-enrolled from previous grassland conservation
89
programs. Packages containing a cover letter describing the study details and purpose, a
questionnaire, and a postage-paid business-reply envelope were mailed to each
landowner in November 2014. Follow-up mailings included a: (a) postcard reminder; (b)
second mailing of a cover letter, questionnaire, and postage-paid business-reply envelope;
and (c) final postcard reminder. A 60% useable response rate was achieved (n = 338;
after removal of non-deliverables). The limited project budget prohibited a non-response
bias check.
The questionnaire was a 12-page booklet with 10 pages of questions including
one page for optional comments about how the CREP can be improved. The
questionnaire included descriptive questions about farming and ranching practices,
various evaluations of their CREP enrollment, and motivations for enrolling land into the
CREP. This analysis included 10 motivational variables based on a literature review of
peer-review articles (e.g., Ahnström et al., 2009; Allen & Vandever, 2003; Kurzejeski et
al., 1992; Smith, et al., 2007). The 10 motivations (Figure 1) were measured on a scale
from 1 “no influence” to 5 “highly influential” on their decision to enroll land into the
CREP. The questions, topics of discussion, and format were formulated specifically for
the CREP, but similarity to other studies (e.g., Allen & Vandever, 2003) was maintained
for ease of comparison, if applicable.
Data were evaluated using descriptive statistics via frequency tables and means
among associated variables. Cluster analysis (K-means solved for three clusters with
pairwise exclusion of cases) was used for classifying CREP enrollment based on
evaluation of the 10 motivations. Significant differences among cluster groups were
90
assessed using ANOVA (p ≤ .05) and post hoc multiple comparisons tests. Effect sizes
were assessed using eta values (Vaske, 2008).
Results
The average age of CREP enrolled landowners (64.8 years) was 8.9 years older
than the average landowner in South Dakota (55.9 years; USDA, 2014a, 2014b). Among
respondents, 92% were owners of the enrolled land, with 46% of respondents being
active agricultural operators and 46% non-operators (4% were renters, 3% were trustees).
Most respondents (87%) were current South Dakota residents, 10% were non-residents
who had lived in South Dakota in the past, and 3% were non-residents who had never
lived in South Dakota. Respondents primarily elected for the shortest CREP contract
length of 10 years (77%), followed by 15-year (17%) and 11-year (6%) contracts. The
average respondent had 1.9 CREP contracts and averaged 183 enrolled acres. Forty-two
percent of respondents had participated in a previous conservation program within the
past five years.
The 10 motivational variables evaluated for landowner enrollment in the CREP
ranged from financial incentive (M = 3.9 ± 0.1) rated as the highest motivation to air
quality (M = 2.2 ± 0.2) having the lowest overall rating (Table 1, Figure 1). Cluster
analysis of these 10 variables identified three types of landowners based on how they
rated the importance of each variable in their decision to enroll land in the CREP.
Landowner types were named “wildlife,” “financial,” and “environmental” based on each
group’s motivations. Of the total respondents, 40% were classified in the wildlife group,
35% in the financial group, and 25% in the environmental group. The financial group
rated the financial incentive motivation slightly higher than the other two groups and
91
rated the other nine motivations relatively low in influence (Figure 2). In addition to
rating financial incentives relatively high, the wildlife group also rated four additional
motivations (fish / wildlife populations, wildlife viewing, public access, personal hunting
/ fishing) relatively high, indicating the importance of wildlife and hunting / fishing
opportunities as additional reasons influencing enrollment in the CREP. The
environmental group rated all 10 motivations quite high in importance and rated five
motivations (soil erosion, local water quality scenic quality, national water quality, air
quality) measuring general environmental parameters much higher than the other two
groups .The financial group had the youngest mean age of 61.8 (± 2.3) years, followed by
the wildlife group (64.7 ± 2.4) and the environmental group (67.8 ± 3.1) (F (2, 262) =
4.76, p = .009, η = .19). This eta effect size indicates a minimal to typical relationship
(Vaske, 2008).
Forty-three percent of respondents were favorable (10% slightly, 19%
moderately, 14% strongly) toward the requirement for enrolled land to be open for public
access, with 34% neutral and 23% disliking the requirement (11% slightly, 5%
moderately, 7% strongly). Several respondents commented on the importance of
providing outdoor recreation areas for the next generation. Based on a scale of 1
“strongly dislike” to 7 “strongly like,” the environmental landowner group was
significantly more in favor of the requirement (M = 5.3 ± 0.4) than the wildlife (M = 4.3
± 0.3) and financial (M = 4.1 ± 0.4) groups, (F (2, 267) = 11.10, p < .001, η = .28). This
eta effect size indicates a typical relationship (Vaske, 2008).
92
Discussion
Despite continued grassland and wetland habitat loss in the continental United
States, some progress has been made in recent decades to offset these losses through
grassland, wetland, and conservation cover restoration efforts across the Midwest and the
Great Plains (Rashford, Walker, & Bastian, 2011; Wright & Wimberly, 2013). Further
advancement of grassland and wetland conservation programs will require studies such as
this to gain a better understanding of agricultural producer beliefs toward environmental
conservation and their motivations for program enrollment to ensure program success.
Results here identified different groups of motivations for enrolling in conservation
programs.
A number of variables have been documented as influential to landowner
enrollment in a conservation program. For example, some studies have identified
environmental variables (e.g., soil erosion, improvement of water quality) as most
influential to landowner enrollment (Allen & Vandever, 2003; Reimer & Prokopy, 2014).
In contrast, much of the previous research has demonstrated economic incentives to be
the most influential factor (Gustafson & Hill, 1993; Hodur, Leistritz, & Bangsund, 2002;
Wachenheim, Lesch, & Dhingra, 2014; Yeboah, Lupi, & Kaplowitz, 2015). Results from
this study were consistent with the majority of these studies, which documented direct or
intrinsic benefits (i.e., financial incentives, benefiting fish and wildlife populations, soil
erosion) to be the most important motivations for enrollment. In comparison, all large-
scale or altruistic motivational variables (e.g., nationwide water quality and air quality)
ranked lowest of all 10 motivation variables (Greiner & Gregg, 2011).
93
The older age of the CREP enrollees suggests that CREP and other conservation
programs may serve as a buffer for landowners entering retirement (Hodur et al., 2002;
Janssen, Klein, Taylor, Opoku, & Holbeck, 2008). Future research is needed to confirm if
this association is consistent across all programs. Age was also found to differ
significantly among the three respondent clusters (wildlife, financial, environmental
concern). Although all three clusters rated financial incentive as a high motive for
enrollment, older landowners rated non-financial motivations higher compared to
younger landowners. This significance of age may result from a recognition by older
landowners of the need to conserve wildlife and other natural resources; portraying older
landowners’ recognition of land alterations throughout recent decades or the result of
younger landowners having greater financial needs.
The requirement to provide public access through the South Dakota Walk-in
program is unique to the South Dakota CREP and was favored by 43% of the enrolled
landowners; only 23% disliked the public access requirement. This requirement of
providing public access was a unique strategy for simultaneously offering additional
financial benefit to landowners (i.e., 40% higher than on CRPs in South Dakota),
increasing access to lands for public recreation (i.e., over 81,000 acres), and promoting
habitat for fish and wildlife (i.e., requiring contract minimum of 40 acres; USDA, 2009,
2011). Future research is needed to evaluate environmental, social, and economical
differences and benefits of large-scale and holistic (i.e., >40 acres, public access, unique
or additional financial incentives) conservation programs, such as the South Dakota
CREP, in comparison to detailed environmentally focused programs (i.e., water quality

94
improvement, Iowa CREP; USDA, 2001). Such research may prove vital to evaluating
cost-benefit in times of economic strain and deterioration of funding caps.
It is intuitive that most landowners wanted to maximize their financial profit, but
with budget shortages, agencies must be able to identify new financial incentives for all
stakeholders. Yeboah et al. (2015) indicated that one-time payments, such as a signing
bonus, may not yield a significant increase in landowner participation. Although some
landowners are solely motivated by the financial benefit of participating in conservation
programs, it appears that emphasizing wildlife and environmental benefits may provide
effective, additional incentives for some landowners to participate. Identifying innovative
ways for advancing financial and non-financial incentives for landowners will be key to
promoting conservation programs in the future and ensuring program enrollment,
relevance, and success (Morzillo & Needham, 2015; Sorice & Conner, 2010;
Wachenheim et al., 2014). Even though all landowner clusters in this study desired to
maximize financial gain for their effort, this research also identified that non-financial
incentives were important to a majority of landowners.
Note
The use of trade names or products does not constitute endorsement by the U.S.
Government.
Acknowledgements
We would like to sincerely thank the Kempeska Chapter of the Izaak Walton
League of America and South Dakota Department of Game, Fish and Parks (GF&P; State
Wildlife Grants program) for funding our research. We are grateful to the many GF&P
staff that participated in this research project; without their feedback this project would
not have been possible. This study was approved by an Institutional Review Board (IRB-
1409022-EXM).
95
References
Ahnström, J., Höckert, J., Bergeå, H. L., Francis, C. A., Skelton, P., & Hallgren, L.
(2009). Farmers and nature conservation: What is known about attitudes, context
factors and actions affecting conservation? Renewable Agriculture and Food
Systems, 24, 38-47.
Allen, A. W., & Vandever, M. W. (2003). A national survey of Conservation Reserve
Program (CRP) participants on environmental effects, wildlife issues, and
vegetation management on program lands. Biological Science Report,
USGS/BRD/BSR-2003-0001.
Beedell, J. D. C., & Rehman, T. (1999). Explaining farmers' conservation behaviour:
Why do farmers behave the way they do? Journal of Environmental management,
57, 165-176.
Beedell, J., & Rehman, T. (2000). Using social-psychology models to understand
farmers’ conservation behaviour. Journal of Rural Studies, 16, 117-127.
Green, R. E., Cornell, S. J., Scharlemann, J. P., & Balmford, A. (2005). Farming and the
fate of wild nature. Science, 307, 550-555.
Greiner, R., & Gregg, D. (2011). Farmers’ intrinsic motivations, barriers to the adoption
of conservation practices and effectiveness of policy instruments: Empirical
evidence from northern Australia. Land Use Policy, 28, 257-265.
Gustafson, C., & Hill, C. L. (1993). Future land use decisions of North Dakota
Conservation Reserve Program participants. Agricultural Economics Reports
23191. Fargo, ND: Agricultural Experiment Station, North Dakota State University.
96
Hodur, N. M., Leistritz, F. L., & Bangsund, D. A. (2002). Local socioeconomic impacts
of the Conservation Reserve Program. Agribusiness & Applied Economics Report
No. 476. Fargo, ND: North Dakota State University. Retrieved from:
http://purl.umn.edu/23551.
Hua, W., Zulauf, C., & Sohngen, B. (2004). To adopt or not to adopt: Conservation
decisions and participation in watershed groups. Paper presented at the 2004
annual meetings of the American Agricultural Economics Association, Denver, CO.
Retrieved from: http://purl.umn.edu/20076.
Janssen, L., Klein, N., Taylor, G., Opoku, E., & Holbeck, M. (2008). Conservation
Reserve Program in South Dakota: Major findings from 2007 Survey of South
Dakota CRP respondents. Economic Research Report 2008 – 1. Retrieved from:
http://ageconsearch.umn.edu/bitstream/37936/2/CRP2008.pdf#sthash.HWC9z4Sc.d
puf
Knowler, D., & Bradshaw, B. (2007). Farmers’ adoption of conservation agriculture: A
review and synthesis of recent research. Food Policy, 32, 25-48.
Kurzejeski, E. W., Burger, Jr., L. W., Monson, M. J., & Lenkner, R. (1992). Wildlife
conservation attitudes and land use intentions of Conservation Reserve Program
participants in Missouri. Wildlife Society Bulletin, 20, 253-259.
Manning, R. (2011). Studies in outdoor recreation: Search and research for satisfaction.
Corvallis, OR: Oregon State University Press.
Morzillo, A. T., & Needham, M. D. (2015). Landowner incentives and normative
tolerances for managing beaver impacts. Human Dimensions of Wildlife, 20, 514-
530.
97
Poudyal, N., & Hodges, D. (2009). Factors influencing landowner interest in managing
wildlife and avian habitat on private forestland. Human Dimensions of Wildlife,
14, 240–250.
Rashford, B. S., Walker, J. A., & Bastian, C. T. (2011). Economics of grassland
conversion to cropland in the Prairie Pothole Region. Conservation Biology, 25,
276-284.
Reimer, A. P., & Prokopy, L. S. (2014). Farmer participation in US Farm Bill
conservation programs. Environmental Management, 53, 318-332.
Selinske, M. J., Coetzee, J., Purnell, K., & Knight, A. T. (2015). Understanding the
motivations, satisfaction, and retention of landowners in private land conservation
programs. Conservation Letters, 8, 282-289.
Smith, C. M., Peterson, J. M., & Leatherman, J. C. (2007). Attitudes of Great Plains
producers about best management practices, conservation programs, and water
quality. Journal of Soil and Water Conservation, 62(5), 97A-103A.
Sorice, M., & Conner, J. (2010). Predicting private landowner intentions to enroll in an
incentive program to protect endangered species. Human Dimensions of Wildlife,
15, 77–89.
United States Department of Agriculture (USDA) (2001). Conservation Reserve Program
Iowa Enhancement Program fact sheet. Retrieved from:
https://www.fsa.usda.gov/Internet/FSA_File/crepia01.pdf
United States Department of Agriculture (USDA) (2009). The South Dakota James River
Watershed Conservation Reserve Enhancement Program, Programmatic
Environmental Assessment. Retrieved from:
98
https://www.fsa.usda.gov/Assets/USDA-FSA-Public/usdafiles/Environ-
Cultural/jrwcrepfnlstmtagmt0109.pdf
United States Department of Agriculture (USDA) (2011). South Dakota Conservation
Reserve Enhancement Program fact sheet. Retrieved from:
https://www.fsa.usda.gov/Internet/FSA_File/crepsdfactsheet.pdf
United States Department of Agriculture (USDA) (2014a). 2012 Census of Agriculture,
Unites States Summary and State Data, Vol. 1, Geographic Area Series Part 51,
AC-12-A-51. Retrieved from:
https://www.agcensus.usda.gov/Publications/2012/Full_Report/Volume_1,_Chapter
_1_US/usv1.pdf
United States Department of Agriculture (USDA) (2014b). 2012 Census of Agriculture,
State and County Data, Vol. 1, Chapter 2: County Level. Retrieved from:
https://www.agcensus.usda.gov/Publications/2012/Online_Resources/County_Profil
es/South_Dakota/
Vaske, J. J. (2008). Survey research and analysis: Applications in parks, recreation and
human dimensions. State College, PA: Venture.
Wachenheim, C. J., Lesch, W. C., & Dhingra, N. (2014). The conservation reserve
program: A literature review. Agricultural Economics Report 723. Retrieved from:
http://ageconsearch.umn.edu/bitstream/164829/2/AAE723.pdf
Wright, C. K., & Wimberly, M. C. (2013). Recent land use change in the Western Corn
Belt threatens grasslands and wetlands. Proceedings of the National Academy of
Sciences, 110, 4134-4139.

99
Yeboah, F. K., Lupi, F., & Kaplowitz, M. D. (2015). Agricultural landowners’
willingness to participate in a filter strip program for watershed protection. Land
Use Policy, 49, 75-85.
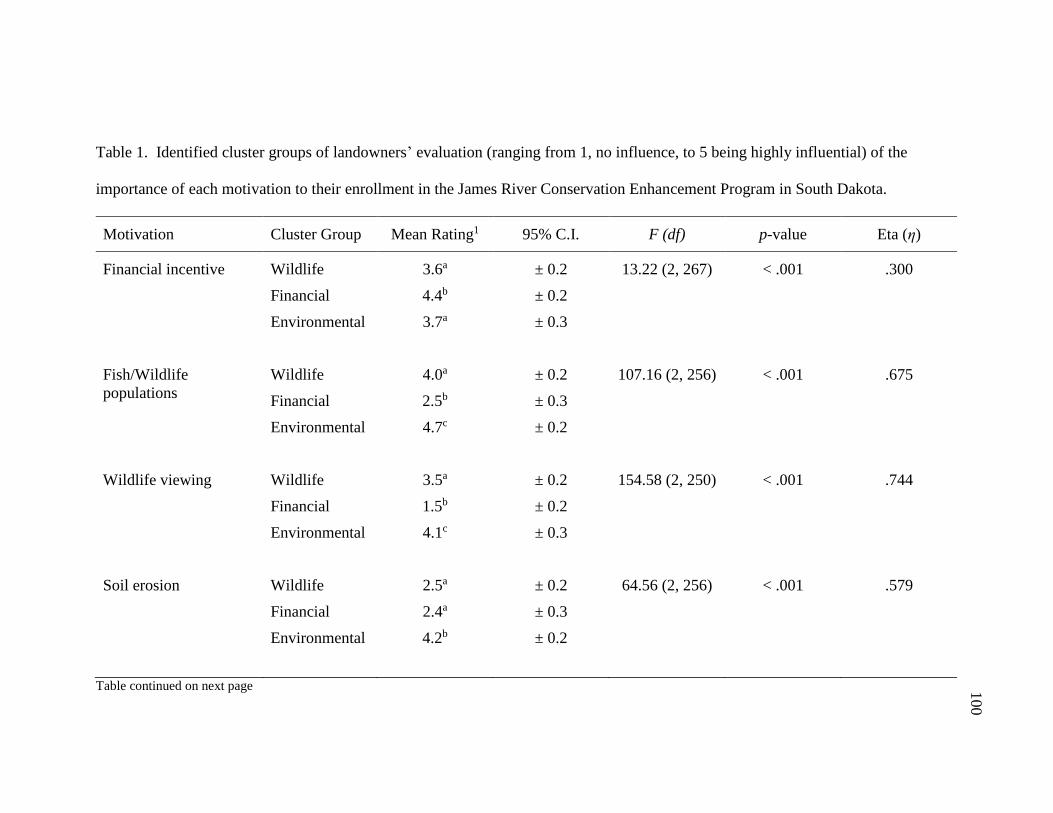
100
Table 1. Identified cluster groups of landowners’ evaluation (ranging from 1, no influence, to 5 being highly influential) of the
importance of each motivation to their enrollment in the James River Conservation Enhancement Program in South Dakota.
Motivation Cluster Group Mean Rating1 95% C.I. F (df) p-value Eta (η)
Financial incentive Wildlife 3.6a ± 0.2 13.22 (2, 267) < .001 .300
Financial 4.4b ± 0.2
Environmental 3.7a ± 0.3
Fish/Wildlife
populations
Wildlife 4.0a ± 0.2 107.16 (2, 256) < .001 .675
Financial 2.5b ± 0.3
Environmental 4.7c ± 0.2
Wildlife viewing Wildlife 3.5a ± 0.2 154.58 (2, 250) < .001 .744
Financial 1.5b ± 0.2
Environmental 4.1c ± 0.3
Soil erosion Wildlife 2.5a ± 0.2 64.56 (2, 256) < .001 .579
Financial 2.4a ± 0.3
Environmental 4.2b ± 0.2
Table continued on next page
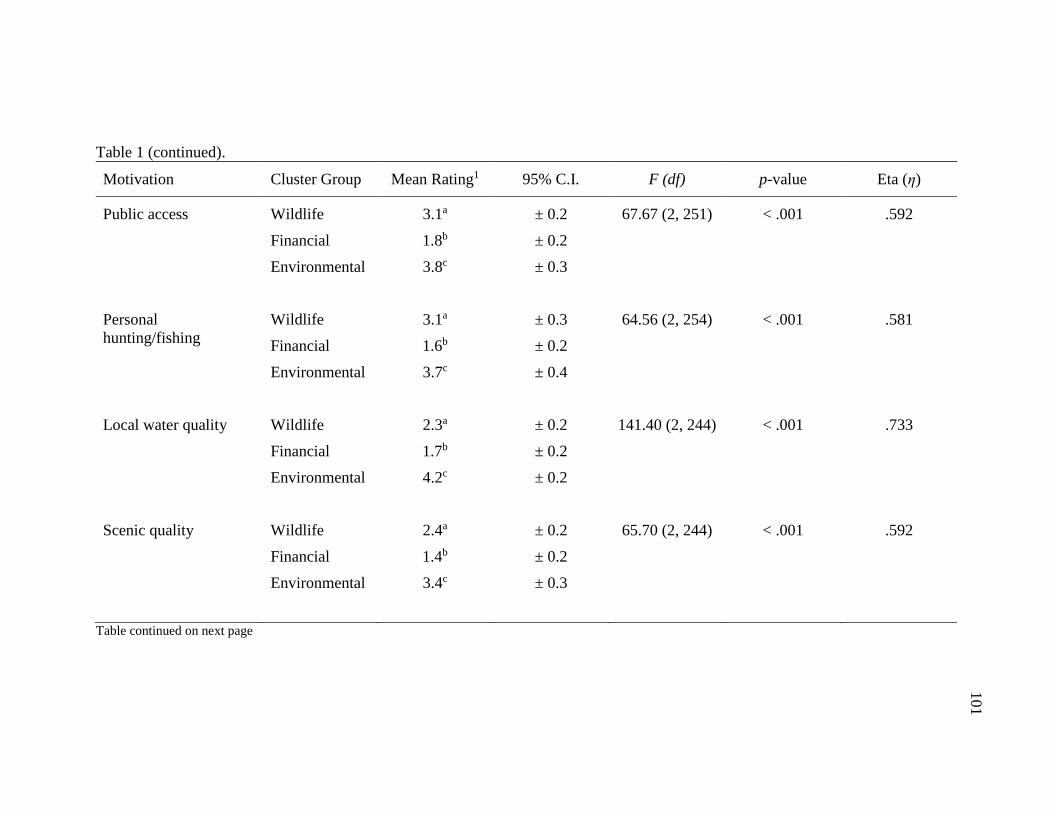
101
Table 1 (continued).
Motivation Cluster Group Mean Rating1 95% C.I. F (df) p-value Eta (η)
Public access Wildlife 3.1a ± 0.2 67.67 (2, 251) < .001 .592
Financial 1.8b ± 0.2
Environmental 3.8c ± 0.3
Personal
hunting/fishing
Wildlife 3.1a ± 0.3 64.56 (2, 254) < .001 .581
Financial 1.6b ± 0.2
Environmental 3.7c ± 0.4
Local water quality Wildlife 2.3a ± 0.2 141.40 (2, 244) < .001 .733
Financial 1.7b ± 0.2
Environmental 4.2c ± 0.2
Scenic quality Wildlife 2.4a ± 0.2 65.70 (2, 244) < .001 .592
Financial 1.4b ± 0.2
Environmental 3.4c ± 0.3
Table continued on next page
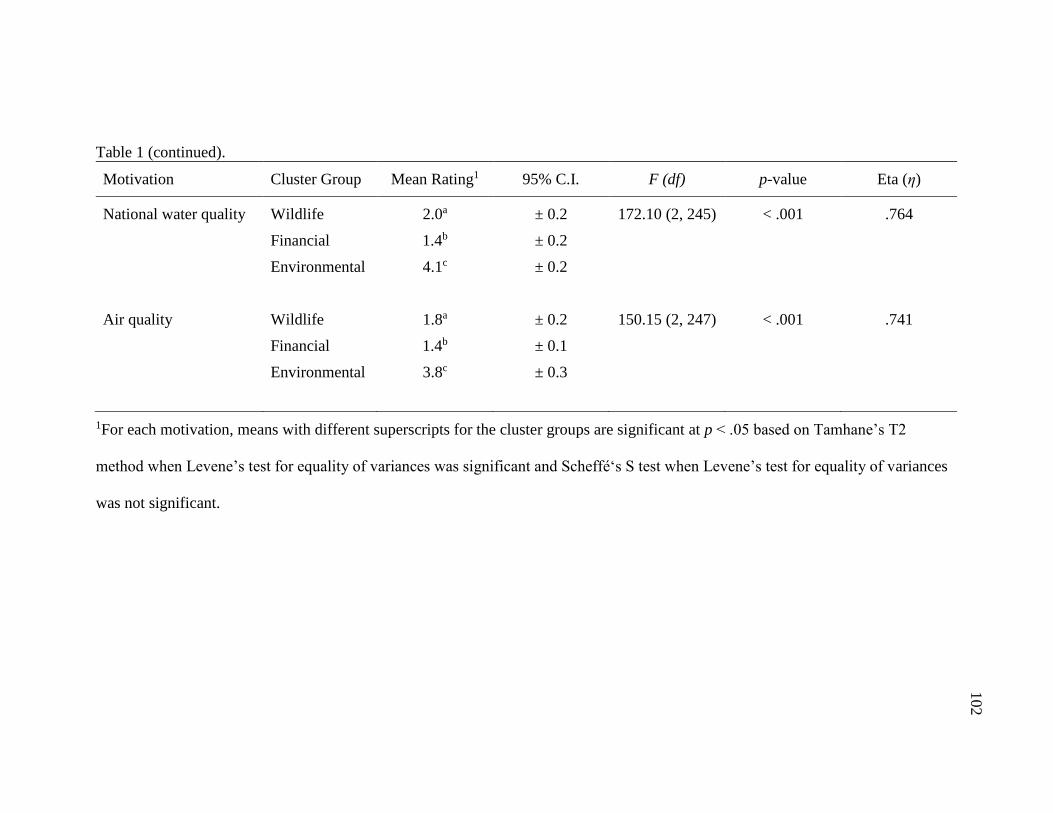
102
Table 1 (continued).
Motivation Cluster Group Mean Rating1 95% C.I. F (df) p-value Eta (η)
National water quality Wildlife 2.0a ± 0.2 172.10 (2, 245) < .001 .764
Financial 1.4b ± 0.2
Environmental 4.1c ± 0.2
Air quality Wildlife 1.8a ± 0.2 150.15 (2, 247) < .001 .741
Financial 1.4b ± 0.1
Environmental 3.8c ± 0.3
1For each motivation, means with different superscripts for the cluster groups are significant at p < .05 based on Tamhane’s T2
method when Levene’s test for equality of variances was significant and Scheffé‘s S test when Levene’s test for equality of variances
was not significant.
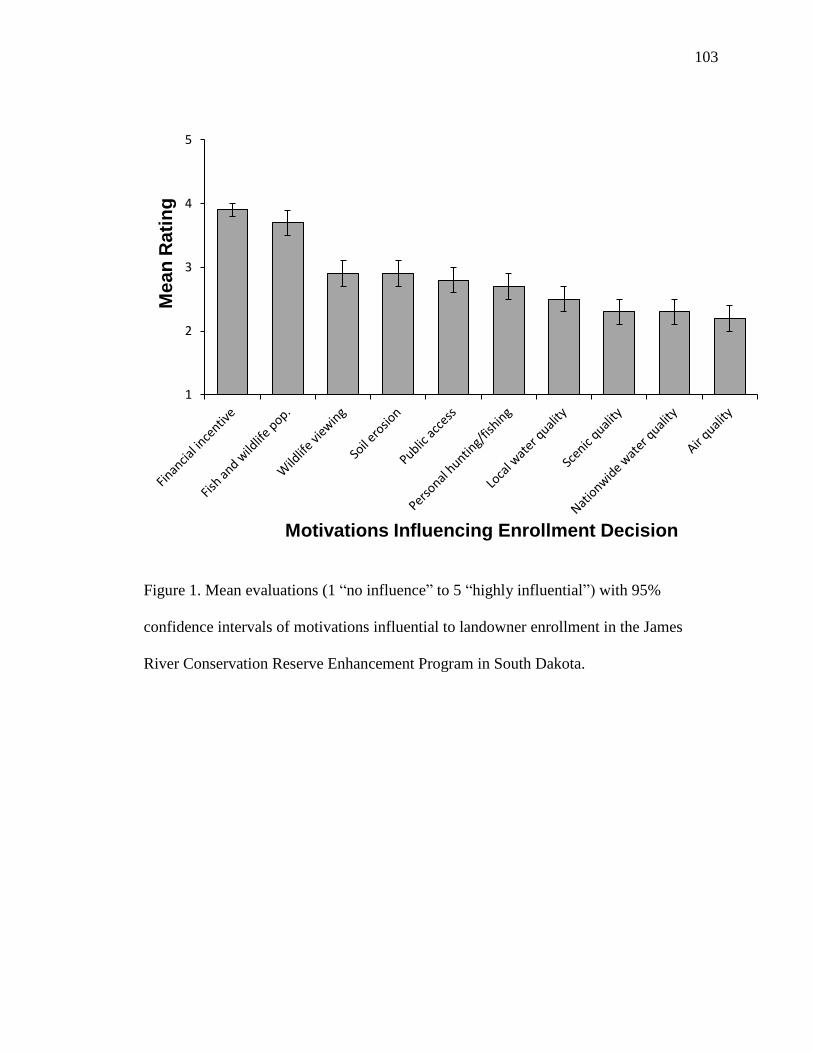
103
Figure 1. Mean evaluations (1 “no influence” to 5 “highly influential”) with 95%
confidence intervals of motivations influential to landowner enrollment in the James
River Conservation Reserve Enhancement Program in South Dakota.
1
2
3
4
5
Me
an
Ra
tin
g
Motivations Influencing Enrollment Decision
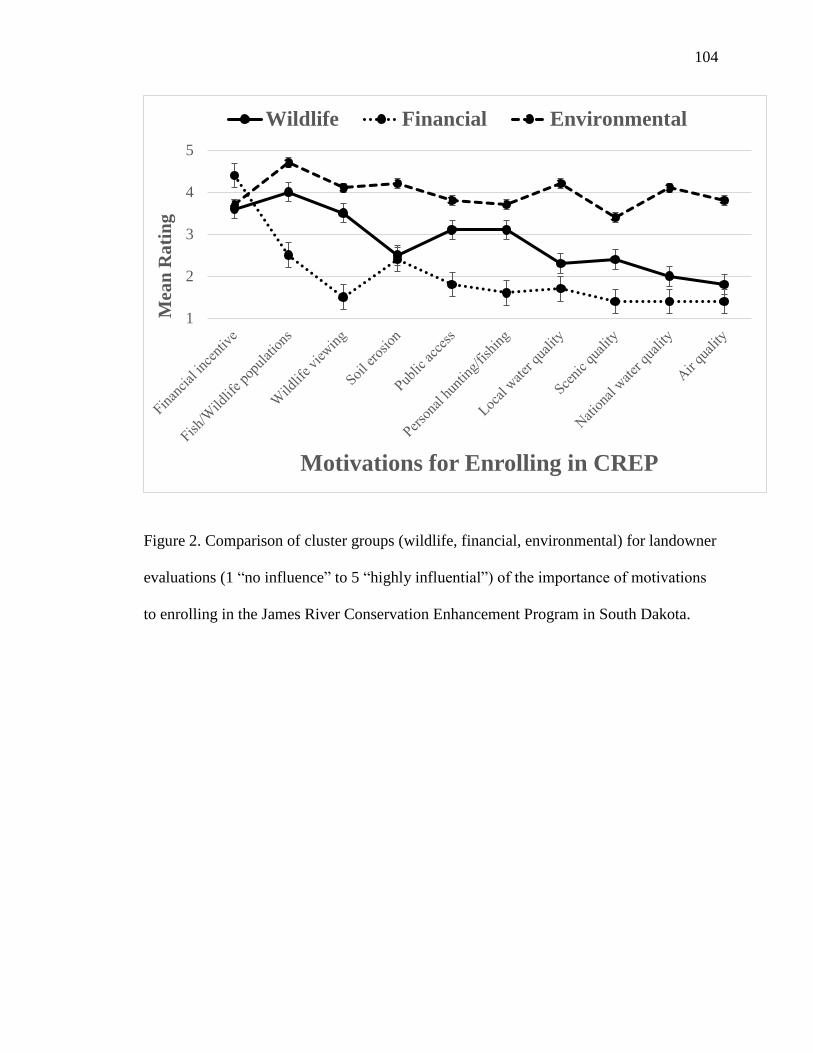
104
Figure 2. Comparison of cluster groups (wildlife, financial, environmental) for landowner
evaluations (1 “no influence” to 5 “highly influential”) of the importance of motivations
to enrolling in the James River Conservation Enhancement Program in South Dakota.
1
2
3
4
5M
ean
Ra
tin
g
Motivations for Enrolling in CREP
Wildlife Financial Environmental
105
CHAPTER 5: INTEGRATED EVALUATION OF CONSERVATION PROGRAMS:
SUMMARY AND CONCLUSIONS
Restoration of grassland and wetland complexes are widely advocated practices
through various conservation programs (Allen 2005, Teels et al. 2006). Recent focus on
these restorations have emphasized improving watersheds that have been deemed
particularly environmentally and economically important (Goodwin et al. 1997, Allen
2005, USDA 2011). Recognizing that ecosystems cannot be fully restored to native states
(Kauffmann et al. 1997, Gray and Teels 2006, Teels et al. 2006), future platforms must
determine how best to maximize system potential in working landscapes.
Assessment and improvement of restoration success of ecological systems for
environmental variables and wildlife populations will be less effective and efficient
without integration of the social-economic impacts of these programs. The complexity
and variability of landowner attitudes throughout the U.S. (Leatherman et al. 2007) has
led to revealing conflicting needs of diverse interest groups (Sear et al. 1998, Cole et al.
2010, Shanahan et al. 2010, Kroll et al. 2014). With approximately 72% of the U.S. land
privately owned (Vincent et al. 2014), and the demand for lower-cost foods and
environmental sustainability at an all-time high (Godfray et al. 2010), it is a crucial time
to understand agricultural producers’ environmental beliefs. Thus, effective conservation
program planning and implementation must incorporate a multi-scale comprehensive
biological and human dimensions assessment (Meyerson et al. 2005, Palmer and
Bernhardt 2006; Heneghan et al. 2008; Dallimer & Strange, 2015; Selinske, Coetzee,
Purnell, & Knight, 2015; Velasco, García-Llorente, Alonso, Dolera, Palomo, Iniesta-
Arandia, & Martin-López, 2015).
106
RESEARCH ASSESSMENT
Biological
Through my integrated, stepwise evaluation, 2 concepts became apparent: 1) both
field and landscape scale variables were important in predicting avian parameters and,
thus, meeting CREP program goals and understanding the interconnected ecological
network, and; 2) implementing conservation programs with broad and non-cooperative
objectives may result in undesired outcomes (McCoy et al. 1999, Fletcher et al. 2006).
My evaluation documented positive associations of grassland avifauna to
landscapes with increased grassland and decreased cropland cover, with density of edge
(i.e., field and landscape scale fragmentation) having the most meaningful, negative
influence on daily survival rate of nests (Schmidt and Whelan 1999, Ribic and Sample
2001, Koper and Schmiegelow 2006, Askins et al. 2007, Renfrew and Ribic 2008). These
results highlight the need for contract evaluations to focus on areas with increased
grassland abundance at larger and less fragmented scales, which will minimize grassland
islands that are cross-sectioned and interconnected by travel corridors that allow for ease
of predator movements. Partners in Flight Regional Conservation Score (Prairie Pothole
Region) modeling of all breeding birds emphasized the significance of incorporating
landscape variables for species of greatest conservation concern and confirmed the need
for a multi-scale approach (Vickery and Herkert 2001, Ribic et al. 2009). Landscape level
models also better predicted nest density and nest species richness of waterfowl species
group and nest survival of the other species group than field scale models.
Increasing patch size has been advocated in avian research as a technique to
benefit spatially sensitive species (Davis 2004, Renfrew and Ribic 2008, Ribic et al.
107
2009). My study of 4 avian species groups documented no substantial influence of field
size on abundance or species richness of breeding birds and no influence on daily
survival rate of nesting avifauna. Conversely, nest density and species richness were
negatively and positively associated with patch size, respectively, potentially highlighting
the importance of area sensitivity for species of conservation concern in restored
grasslands (i.e., CREP focal species; Herkert et al 2003, Bollinger and Gavin 2004,
Skagen et al. 2005).
Evaluation of percent woody cover at field and landscape levels resonated with
previous research. Our study depicted that presence of woody species generally portrays
a negative influence; however, results represented a positive influence of percent woody
cover at the field level on species richness of 2 groups of nesting avifauna (i.e., other and
song bird species groups). Prior research has shown that additional species tend to be
generalist, edge preference species of lesser conservation concern (Coppedge et al. 2008,
Koford 2002, Bakker 2003, Fletcher and Koford 2003, Grant et al. 2004, Stephens et al.
2004). Woody cover presence is a key example of how an integrated stepwise platform
can be tailored for obtainable objectives (i.e., goal of increasing avian abundance and
species richness or obligate species focus).
Percent forb cover and mean visual obstruction readings (VOR; Robel et al. 1970)
had variable associations with different species groups. Percent forb cover was present in
competitive models for all avian groups, excluding nest survival of CREP focal species;
which advocates the importance of seed mix design to achieving program objectives
(McIntyre and Thompson 2003, Bakker et al. 2006, Bakker and Higgins 2009, Riffell et
al. 2010). For example, percent forb supported a positive influence on the breeding and
108
nesting song bird species groups. Percent forb depicted a negative association to the
waterfowl and the other species groups; however, these results may have been an indirect
result due to false influence between timing of nest initiation and percent forb cover
(Dzus and Clark 1998, Arzel et al. 2014). Variability of visual obstruction was illustrated
by species groups’ ecological preferences (i.e., nest site characteristics; Jungers et al.
2015, Fisher and Davis 2010). Mean visual obstruction had a negative influence on
breeding and nesting demographics of the song bird, CREP, and other species groups,
which may have been driven by general nest preferences for mid-vegetation nesting
species and open vegetation for ground nesting species (DeCasare et al. 2013). Breeding
and nesting demographics of the waterfowl species group portrayed a positive association
with mean visual obstruction, which may be due to early season nest initiation
influencing selection of fields and nesting locations with increased visual obstruction for
nest concealment (Hines and Mitchell 1983, Borgo and Conover 2016).
Given my study area lies in the heart of the Prairie Pothole region, it was crucial
that I included variables in my models that accounted for percent wetland cover and type
of wetland present. Type of wetland and percent wetland cover within fields represented
a positive association across all breeding and nesting avian species groups, excluding the
negative influence of present wetland on nest species richness of the other and CREP
species groups. This suggests that assessing potential enrollment locations based solely
on wetland presence is likely inadequate for the species groups we evaluated (Homan et
al. 2000, Higgins et al. 2002, Reynolds et al. 2006).
109
Human Dimensions
The enthusiasm of CREP enrollees for the program was positive and impressive.
My study highlighted 4 themes of motivation for CREP enrollment. First, the requirement
of providing public access with CREP enrollment offered additional financial incentive
for enrollees, and many respondents detailed their enthusiasm to “pay it forward” and
provide recreational opportunities for future generations. Although all three respondent
clusters (financial incentive, wildlife oriented, and environmental concern) rated financial
incentive as a strong motivation for enrollment, older individuals demonstrated higher
levels of motivation to provide benefits to the non-financial variables (e.g.,
environmental). Second, based on demographic data, landowner age represented a
potential shift of producers towards retirement and decisions to reduce active production
(Hodur, Leistritz, & Bangsund 2002, Hua et al. 2004, Leatherman et al. 2007, Janssen,
Klein, Taylor, Opoku, & Holbeck 2008). Mean age of CREP landowners (x̅ = 64.8 years)
was approximately 9 years older than the average South Dakota producer (x̅ = 55.9 years;
USDA 2014). Third, because this CREP targeted the James River Basin, landowners may
have conceptualized their own personal motivations with the program to benefit the local
community and wildlife. For example, of the ten motivational variables for enrollment,
local impact variables (e.g., financial incentive and benefit to fish and wildlife
populations) rated higher than large-scale influence variables (e.g., nationwide water
quality and air quality; Allen & Vandever 2003, Reimer & Prokopy 2014). I believe this
result suggests motivation by landowners to provide greater benefit to their family,
community, and local fish and wildlife (Gustafson & Hill, 1993; Hodur et al., 2002;
Wachenheim, Lesch, & Dhingra, 2014; Yeboah, Lupi, & Kaplowitz, 2015).
110
MANAGEMENT IMPLICATIONS
Although competitive field models tended to include more meaningful variables
across species groups than competitive landscape models (Cunningham and Johnson
2006), it was also apparent that the landscape level was in some instances more
influential (e.g., daily survival rate of the other species group) to breeding and nesting
bird groups than the field level (Ribic and Sample 2001). Thus, I suggest taking a top-
down approach to an integrated stepwise conservation program design and
implementation. My integrated evaluation identified a design which assesses potential
variability of landscape aspects (i.e., could be evaluated by zones within program
regions) to compute a prospective species suite (i.e., focal species group) suitable for
greatest potential success (e.g., Best et al. 1997, Naugle et al. 1999, Fletcher and Koford
2002, Fletcher and Koford 2003, Pretelli et al. 2015). A collection of suitable species will
allow for tailored assessment options based on field scale attributes (e.g., contract site
selection and seed mixture) for desired focal species. Such an approach would permit
managers to focus implementation and management plans to best capitalize restoration
success and meet program goals. I recommend conservation managers conduct further
research into the ecology of focal avifauna to tailor integrated conservation program
platforms for game and non-game bird species alike. Despite continued grassland and
wetland habitat loss in the continental United States, some progress has been made in
recent decades to overcome such losses through restoration efforts across the Midwest
and the Great Plains. Further advancement will require better understanding of
agricultural producers’ beliefs towards environmental conservation to ensure program
success.

111
It is intuitive that most landowners wanted to maximize their financial profit;
however, with the continued budget shortages, agencies must be able to identify solutions
for all stakeholders (Wachenheim et al. 2014). Advancing innovative financial and non-
financial incentives for landowners will be key to advancing conservation programs for
the future. Coupling public access through the Walk-in program with the CREP in South
Dakota was a unique strategy for offering additional financial benefit to landowners,
increasing access to lands for public recreation, and promoting habitat for fish and
wildlife. Developing and presenting non-financial incentives may offer improved
concepts to attract and maintain landowner enrollment in future platforms. For example,
multiple landowners suggested they would take up to a 25% rental payment cut during
management years if they were allowed to hay their lands. This option could not only
maintain financial expenditures of the agency implementing the conservation program,
but potentially provide additional financial savings for agencies to place additional grass
on the landscape. Research has shown that haying management regimes can provide
benefits to a variety of grassland breeding birds, including many species of conservation
concern (McMaster et al. 2005).
CONCLUSION
There are still many gaps in the knowledge of avian response to the establishment
and management of grassland conservation programs in agricultural landscapes. I believe
that a multi-scaled evaluation framework and proper vegetation composition and
management could significantly influence the success of restoration programs, thereby
providing additional useable space for breeding and nesting birds. Targeted conservation
research in Illinois has demonstrated that programs, such as CREP, have the potential to
112
increase cost-effectiveness for environmental variables (Yang et al. 2005, Riffell et al.
2010). My research supports the notion that the contract selection process should be more
thorough. However, emphasis should be based on a stepwise approach that accentuates
district conservation priorities within the program region and implements success within
districts based on tailored contract level detail. More importantly, management of natural
resources is making strides into a new era of conservation on a working landscape.
Identifying of the successes of implemented programs begins and ends with landowners.
With that, evaluating and understanding stakeholder motivations and beliefs is key to
conservation advancement.
I encourage resource managers and policy makers to incorporate an integrated
program evaluation of current and future platforms based on a comprehensive approach
emphasizing biological and human dimension factors. Although difficult, comprehensive
frameworks have the potential to minimize program constraints throughout the design,
delivery, and management processes.
LITERATURE CITED
Allen, A. 2005. The Conservation Reserve Enhancement Program. USGS Staff --
Published Research. http://digitalcommons.unl.edu/usgsstaffpub/191.
Allen, A. W. and M. W. Vandever. 2003. A national survey of Conservation Reserve
Program (CRP) participants on environmental effects, wildlife issues, and
vegetation management on program lands. Biological Science Report
USGS/BRD/BSR-2003-0001.
113
Arzel, C., L. Dessborn, H. Pöysä, J. Elmberg, P. Nummi, and K. Sjöberg. 2014. Early
springs and breeding performance in two sympatric duck species with different
migration strategies. Ibis 156:288–298.
Askins R. A., F. Chavez-Ramirez, B. C. Dale, C. A. Haas, J. R. Herkert, F. L. Knopf, and
P. D. Vickery. 2007. Conservation of Grassland Birds in North America:
Understanding Ecological Processes in Different Regions. Ornithological
Monographs 64:1–46.
Bakker, K. K. 2003. A synthesis of the effect of woody vegetation on grassland nesting
birds. In Proceedings of the South Dakota Academy of Science 82:119–141.
Bakker, K. K., and K. F. Higgins. 2009. Planted grasslands and native sod prairie:
equivalent habitat for grassland birds?. Western North American Naturalist,
69:235–242.
Best, L. B., H. Campa III, K. E. Kemp, R. J. Robel, M. R. Ryan, J. A. Savidge, H. P.
Weeks Jr, and S. R. Winterstein. 1997. Bird abundance and nesting in CRP fields
and cropland in the Midwest: a regional approach. Wildlife Society Bulletin 864–
877.
Bollinger, E. K., and Gavin, T. A. 2004. Responses of nesting bobolinks (Dolichonyx
oryzivorus) to habitat edges. The Auk 121:767–776.
Borgo, J. S., and M. R. Conover. 2016. Visual and olfactory concealment of duck nests:
influence on nest site selection and success. Human-Wildlife Interactions 10:110–
121.
114
Cole, L. J., M. L. Pollock, D. Robertson, J. P. Holland, D. I. McCracken, and W.
Harrison. 2010. The Influence of Fine-Scale Habitat Heterogeneity on
Invertebrate Assemblage Structure in Upland Semi-Natural Grassland.
Agriculture, Ecosystems & Environment 136:69–80.
Coppedge, B. R., S. D. Fuhlendorf, W. C. Harrell, and D. M. Engle. 2008. Avian
Community Response to Vegetation and Structural Features in Grasslands
Managed with Fire and Grazing. Biological Conservation 141:1196–1203.
Cunningham, M. A., and D. H. Johnson. 2006. Proximate and landscape factors influence
grassland bird distributions. Ecological Applications 16:1062–1075.
Dallimer, M., and N. Strange. 2015. Why socio-political borders and boundaries matter in
conservation. Trends in Ecology & Evolution 30:132–139.
Davis, S. K. 2004. Area sensitivity in grassland passerines: effects of patch size, patch
shape, and vegetation structure on bird abundance and occurrence in southern
Saskatchewan. The Auk 121:1130–1145.
DeCesare, N. J., M. Hebblewhite, M. Bradley, D. Hervieux, L. Neufeld, and M. Musiani.
2013. Linking habitat selection and predation risk to spatial variation in survival.
Journal of animal ecology 83:343–352.
Dzus, E. H., and R. G. Clark. 1998. Brood survival and recruitment of mallards in
relation to wetland density and hatching date. The Auk 311–318.
115
Fisher, R. J., and S. K. Davis. 2010. From Wiens to Robel: a review of grassland-bird
habitat selection. Journal of Wildlife Management 74:265–273.
Fletcher, R. J., and R. R. Koford. 2002. Habitat and Landscape Associations of Breeding
Birds in Native and Restored Grasslands. The Journal of Wildlife Management
66:1011–1022.
Fletcher Jr, R. J., and R. R. Koford. 2003. Changes in breeding bird populations with
habitat restoration in northern Iowa. The American midland naturalist 150:83–94.
Fletcher Jr, R. J., R. R. Koford, and D. A. Seaman. 2006. Critical demographic
parameters for declining songbirds breeding in restored grasslands. Journal of
Wildlife Management 70:145–157.
Godfray, H. C. J., J. R. Beddington, I. R. Crute, L. Haddad, D. Lawrence, J. F. Muir, J.
Pretty, S. Robinson, S. M. Thomas, and C. Toulmin. 2010. Food security: the
challenge of feeding 9 billion people. Science 327:812–818.
Goodwin, C. N., C. P. Hawkins, and J. L. Kershner. 1997. Riparian Restoration in the
Western United States: Overview and Perspective. Restoration Ecology 5:4–14.
Grant, T. A., E. Madden, and G. B. Berkey. 2004. Tree and shrub invasion in northern
mixed-grass prairie: implications for breeding grassland birds. Wildlife Society
Bulletin 32:807–818.
Gray, R. L. and B. M. Teels. 2006 Wildlife and Fish Conservation through the Farm Bill.
Wildlife Society Bulletin 34:906–913.
116
Gustafson, C., and C. L. Hill. 1993. Future land use decisions of North Dakota
Conservation Reserve Program participants, Agricultural Economics Reports
23191, Agricultural Experiment Station, North Dakota State University.
Heneghan, L., S. P. Miller, S. Baer, M. A. Callaham, J. Montgomery, M. Pavao-
Zuckerman, C. C. Rhoades, and S. Richardson. 2008. Integrating Soil Ecological
Knowledge into Restoration Management. Restoration Ecology 16:608–617.
Herkert, J. R., D. L. Reinking, D. A. Wiedenfeld, M. Winter, J. L. Zimmerman, W. E.
Jensen, E. J. Finck, R. R. Koford, D. H. Wolfe, S. K. Sherrod, and M. A. Jenkins.
2003. Effects of prairie fragmentation on the nest success of breeding birds in the
midcontinental United States. Conservation Biology 17:587–594.
Hines, J. E., and G. J. Mitchell. 1983. Gadwall nest-site selection and nesting success.
The Journal of Wildlife Management 1063–1071.
Hodur, N. M., F. L. Leistritz, and D. A. Bangsund. 2002. Local socioeconomic impacts
of the Conservation Reserve Program. Agribusiness & Applied Economics Report
No. 476, North Dakota State University. Retrieved from:
http://purl.umn.edu/23551.
Homan, H. J., G. M. Linz, and W. J. Bleier. 2000. Winter habitat use and survival of
female ring-necked pheasants (Phasianus colchicus) in southeastern North
Dakota. The American Midland Naturalist 143:463–480.
Hua, W., C. Zulauf, and B. Sohngen. 2004. To adopt or not to adopt: Conservation
decisions and participation in watershed groups. Paper presented at the 2004
117
annual meetings of the American Agricultural Economics Association, Denver,
CO. Retrieved from: http://purl.umn.edu/20076.
Janssen, L., N. Klein, G. Taylor, E. Opoku, and M. Holbeck. 2008. Conservation Reserve
Program in South Dakota: Major findings from 2007 Survey of South Dakota
CRP respondents, Economic Research Report 2008 – 1. Retrieved from:
http://ageconsearch.umn.edu/bitstream/37936/2/CRP2008.pdf#sthash.HWC9z4Sc
.dpuf
Jungers, J. M., T. W. Arnold, and C. Lehman. 2015. Effects of grassland biomass harvest
on nesting pheasants and ducks. The American Midland Naturalist 173.1:122-132.
Kauffman, J. B., R. L. Beschta, N. Otting, and D. Lytjen. 1997. An Ecological
Perspective of Riparian and Stream Restoration in the Western United States.
Fisheries 22:12–24.
Koper, N., and F. K. Schmiegelow. 2006. A multi-scaled analysis of avian response to
habitat amount and fragmentation in the Canadian dry mixed-grass prairie.
Landscape Ecology 21:1045–1059.
Kroll, A. J., Y. Ren, J. E. Jones, J. Giovanini, R. W. Perry, R. E. Thill, D. White Jr., and
T. B. Wigley. 2014. Avian Community Composition Associated with Interactions
between Local and Landscape Habitat Attributes. Forest Ecology and
Management 326:46–57.
118
Leatherman, J. C., J. M. Peterson, and C. M. Smith. 2007. Attitudes of Great Plains
producers about best management practices, conservation programs, and water
quality. Journal of Soil and Water Conservation 62:97A–103A.
McCoy, T. D., M. R. Ryan, E. W. Kurzejeski, and L. W. Burger Jr. 1999. Conservation
Reserve Program: source or sink habitat for grassland birds in Missouri?. The
Journal of wildlife management 530–538.
McIntyre, N. E., and T. R. Thompson. 2003. A comparison of Conservation Reserve
Program habitat plantings with respect to arthropod prey for grassland birds. The
American Midland Naturalist 150:291–301.
McMaster, D. G., J. H. Devries, and S. K. Davis. 2005. Grassland birds nesting in
haylands of southern Saskatchewan: landscape influences and conservation
priorities. Journal of Wildlife Management 69:211–221.
Meyerson, L. A., J. Baron, J. M. Melillo, R. J. Naiman, R. I. O’Malley, G. Orians, M. A.
Palmer, A. S. P. Pfaff, S. W. Running, and O. E. Sala. 2005. Aggregate Measures
of Ecosystem Services: Can We Take the Pulse of Nature?. Frontiers in Ecology
and the Environment 3:56–59.
Naugle, D. E., K. F. Higgins, S. M. Nusser, and W. C. Johnson. 1999. Scale-dependent
habitat use in three species of prairie wetland birds. Landscape ecology 14:267–
276.
Palmer, M. A., and E. S. Bernhardt. 2006. Hydroecology and River Restoration: Ripe for
Research and Synthesis. Water Resources Research 42:W03S07.
119
Pretelli, M. G., J. P. Isacch, and D. A. Cardoni. 2015. Effects of fragmentation and
landscape matrix on the nesting success of grassland birds in the Pampas
grasslands of Argentina. Ibis 157:688–699.
Reimer, A. P., and L. S. Prokopy. 2014. Farmer participation in US Farm Bill
conservation programs. Environmental Management 53:318–332.
Renfrew, R. B., and C. A. Ribic. 2008. Multi-scale models of grassland passerine
abundance in a fragmented system in Wisconsin. Landscape Ecology 23:181–193.
Reynolds, R. E., T. L. Shaffer, C. R. Loesch, and R. R. Cox Jr. 2006. The Farm Bill and
duck production in the Prairie Pothole Region: increasing the benefits. Wildlife
Society Bulletin 34:963–974.
Ribic, C. A., and D. W. Sample. 2001. Associations of grassland birds with landscape
factors in southern Wisconsin. The American Midland Naturalist 146:105–121.
Ribic, C. A., R. R. Koford, J. R. Herkert, D. H. Johnson, N. D. Niemuth, D. E. Naugle, K.
K. Bakker, D. W. Sample, and R. B. Renfrew. 2009. Area sensitivity in North
American grassland birds: patterns and processes. The Auk 126:233–244.
Riffell, S., D. Scognamillo, L. Burger, J. Wes, and S. Bucholtz. 2010. Broad-scale
relations between Conservation Reserve Program and grassland birds: do cover
type, configuration and contract age matter. Open Ornithology Journal 3:112–123.
120
Robel R. J., J. N. Briggs, A. D. Dayton, and L. C. Hulbert. 1970. Relationships Between
Visual Obstruction Measurements and Weight of Grassland Vegetation. Journal
of Range Management 23:295–297.
Sear, D. A., A. Briggs, and A. Brookes. 1998. A Preliminary Analysis of the
Morphological Adjustment within and Downstream of a Lowland River Subject
to River Restoration. Aquatic Conservation: Marine and Freshwater Ecosystems
8:167–183.
Schmidt, K. A., and C. J. Whelan. 1999. Nest placement and mortality: Is nest predation
a random event in space and time?. Condor 916–920.
Selinske, M. J., J. Coetzee, K. Purnell, and A. T. Knight. 2015. Understanding the
motivations, satisfaction, and retention of landowners in private land conservation
programs. Conservation Letters 8:282–289.
Shanahan, D. F., C. Miller, H. P. Possingham, and R. A. Fuller. 2011. The Influence of
Patch Area and Connectivity on Avian Communities in Urban Revegetation.
Biological Conservation 144:722–729.
Skagen, S. K., A. A. Y. Adams, and R. D. Adams. 2005. Nest survival relative to patch
size in a highly fragmented shortgrass prairie landscape. The Wilson Bulletin
117:23–34.
Stephens, S. E., D. N. Koons, J. J. Rotella, and D. W. Willey. 2004. Effects of habitat
fragmentation on avian nesting success: a review of the evidence at multiple
spatial scales. Biological Conservation 115:101–110.
121
Teels, B. M., C. A. Rewa, and J. Myers. 2006. Aquatic Condition Response to Riparian
Buffer Establishment. Wildlife Society Bulletin 34:927–935.
United States Department of Agriculture: Farm Service Agency. 2011. South Dakota
Conservation Reserve Enhancement Program. Fact Sheet. Available:
https://www.fsa.usda.gov/Internet/FSA_File/crepsdfactsheet.pdf
United States Department of Agriculture. 2014a. 2012 Census of Agriculture, Unites
States Summary and State Data, Vol. 1, Geographic Area Series Part 51, AC-12-
A-51. Retrieved from:
https://www.agcensus.usda.gov/Publications/2012/Full_Report/Volume_1,_Chapt
er_1_US/usv1.pdf
United States Department of Agriculture. 2014b. 2012 Census of Agriculture, State and
County Data, Vol. 1, Chapter 2: County Level. Retrieved from:
https://www.agcensus.usda.gov/Publications/2012/Online_Resources/County_Pro
files/South_Dakota/
Velasco, D., M. García-Llorente, B. Alonso, A. Dolera, I. Palomo, I. Iniesta-Arandia, and
B. Martín-López. 2015. Biodiversity conservation research challenges in the 21st
century: A review of publishing trends in 2000 and 2011. Environmental Science
& Policy 54:90–96.
Vickery, P. D., and J. R. Herkert. 2001. Recent Advances in Grassland Bird Research:
Where do we go from here? The Auk 118:11–15.
122
Vincent, C.H., L.A. Hanson, and J.P. Bjelopera. 2014. Federal Land Ownership:
Overview and Data. Congressional Research Service Report for Congress
R42346. Congressional Research Service, Washington, DC. Available:
fas.org/sgp/crs/misc/R42346.pdf.
Wachenheim, C. J., W. C. Lesch, and N. Dhingra. 2014. The Conservation Reserve
Program: A literature review. Agricultural Economics Report 723. Retrieved from:
http://ageconsearch.umn.edu/bitstream/164829/2/AAE723.pdf
Yang, W., M. Khanna, and R. Farnsworth. 2005. Effectiveness of conservation programs
in Illinois and gains from targeting. American Journal of Agricultural Economics
87:1248–1255.
Yeboah, F. K., F. Lupi, and M. D. Kaplowitz. 2015. Agricultural landowners’ willingness
to participate in a filter strip program for watershed protection. Land Use Policy
49:75–85.