Embed Size (px)
Citation preview

(This is a sample cover image for this issue. The actual cover is not yet available at this time.)
This article appeared in a journal published by Elsevier. The attachedcopy is furnished to the author for internal non-commercial researchand education use, including for instruction at the authors institution
and sharing with colleagues.
Other uses, including reproduction and distribution, or selling orlicensing copies, or posting to personal, institutional or third party
websites are prohibited.
In most cases authors are permitted to post their version of thearticle (e.g. in Word or Tex form) to their personal website orinstitutional repository. Authors requiring further information
regarding Elsevier’s archiving and manuscript policies areencouraged to visit:
http://www.elsevier.com/copyright

Author's personal copy
Country-specific correlations across Europe between modelled atmosphericcadmium and lead deposition and concentrations in mosses
H. Harmens a,*, I. Ilyin b, G. Mills a, J.R. Aboal c, R. Alber d, O. Blum e, M. Coskun f, L. De Temmerman g,J.Á. Fernández c, R. Figueira h, M. Frontasyeva i, B. Godzik j, N. Goltsova k, Z. Jeran l, S. Korzekwam,E. Kubin n, K. Kvietkus o, S. Leblond p, S. Liiv q, S.H. Magnússon r, B. Ma�nkovská s, O. Nikodemus t, R. Pesch u,J. Poikolainen n, D. Radnovi�c v, Å. Rühlingw, J.M. Santamaria x, W. Schröder u, Z. Spiric y, T. Stafilov z,E. Steinnes aa, I. Suchara ab, G. Tabors t, L. Thöni ac, G. Turcsányi ad, L. Yurukova ae, H.G. Zechmeister af
aCentre for Ecology and Hydrology, Environment Centre Wales, Deiniol Road, Bangor, Gwynedd LL57 2UW, UKbMeteorological Synthesizing Centre East of EMEP, Krasina pereulok, 16/1, 123056 Moscow, Russian FederationcUniversity of Santiago de Compostela, Faculty of Biology, Department of Ecology, 15782 Santiago de Compostela, Spaind Environmental Agency of Bolzano, 39055 Laives, ItalyeNational Botanical Garden, Academy of Science of Ukraine, Timiryazevs’ka St. 1, 01014 Kyiv, UkrainefCanakkale Onsekiz Mart University, 17100 Çanakkale, TurkeygVeterinary and Agrochemical Research Centre, Leuvensesteenweg 17, 3080 Tervuren, Belgiumh Jardim Botânico da Universidada de Lisboa, Lisbon, Portugali Joint Institute for Nuclear Research, Str. Joliot-Curie 6, 141980 Dubna, Russian Federationj Institute of Botany, Polish Academy of Sciences, Lubicz 46, 31512 Krakow, Polandk St Petersburg State University, St Petersburg, Russian Federationl Jo�zef Stefan Institute, Department of Environmental Sciences, Jamova 39, 1000 Ljubljana, SloveniamUniversity of Opole, Polandn Finnish Forest Research Institute, Kirkkosaarentie 7, 91500 Muhos, Finlando Institute of Physics, Savanoriu Ave 231, 02300 Vilnius, LithuaniapMuséum National d’Histoire Naturelle, 57 rue Cuvier, Case 39, 75005 Paris, Franceq Tallinn Botanic Garden, Kloostrimetsa tee 52, 11913 Tallinn, Estoniar Icelandic Institute of Natural History, Hlemmur 3, 125 Reykjavík, Icelands Institute of Landscape Ecology, Slovak Academy of Science, �Stefánikova Str. 3, 814 99 Bratislava, SlovakiatUniversity of Latvia, Riga, LatviauChair of Landscape Ecology, University of Vechta, PO Box 1553, D-49356 Vechta, Germanyv Faculty of Science, University of Novi Sad, Trg D. Obradovica 4, 21000 Novi Sad, SerbiawHumlekärrshultsvägen 10, 572 41 Oskarshamn, SwedenxUniversity of Navarra, Irunlarrea No 1, 31008 Pamplona, SpainyOikon Ltd., Institute for Applied Ecology, Avenija V. Holjevca 20, 10020 Zagreb, Croatiaz Saints Cyril and Methodius University, PO Box 162, 1000 Skopje, FYR MacedoniaaaDepartment of Chemistry, Norwegian University of Science and Technology, 7491 Trondheim, Norwayab Silva Tarouca Research Institute for Landscape and Ornamental Gardening, Kvetnove namesti 391, 252 43 Pruhonice, Czech Republicac FUB-Research Group for Environmental Monitoring, Alte Jonastrasse 83, 8640 Rapperswil, Switzerlandad Szent István University, Gödöll}o, Hungaryae Institute of Botany, Bulgarian Academy of Sciences, Acad. G.Bonchev Str., Block 23, 1113 Sofia, BulgariaafUniversity of Vienna, Althanstraße 14, 1090 Vienna, Austria
* Corresponding author.E-mail addresses: [email protected] (H. Harmens), [email protected] (I. Ilyin), [email protected] (G. Mills), [email protected] (J.R. Aboal), [email protected]
(R. Alber), [email protected] (O. Blum), [email protected] (M. Coskun), [email protected] (L. De Temmerman), [email protected](J.Á. Fernández), [email protected] (R. Figueira), [email protected] (M. Frontasyeva), [email protected] (B. Godzik), [email protected] (N. Goltsova),[email protected] (Z. Jeran), [email protected] (S. Korzekwa), [email protected] (E. Kubin), [email protected] (K. Kvietkus), [email protected] (S. Leblond), [email protected] (S. Liiv), [email protected] (S.H. Magnússon), [email protected] (B. Ma�nkovská), [email protected] (O. Nikodemus), [email protected](R. Pesch), [email protected] (J. Poikolainen), [email protected] (D. Radnovi�c), [email protected] (Å. Rühling), [email protected](J.M. Santamaria), [email protected] (W. Schröder), [email protected] (Z. Spiric), [email protected] (T. Stafilov), [email protected](E. Steinnes), [email protected] (I. Suchara), [email protected] (G. Tabors), [email protected] (L. Thöni), [email protected] (G. Turcsányi), [email protected](L. Yurukova), [email protected] (H.G. Zechmeister).
Contents lists available at SciVerse ScienceDirect
Environmental Pollution
journal homepage: www.elsevier .com/locate/envpol
0269-7491/$ e see front matter � 2012 Elsevier Ltd. All rights reserved.doi:10.1016/j.envpol.2012.02.013
Environmental Pollution 166 (2012) 1e9
Author's personal copy
a r t i c l e i n f o
Article history:Received 10 January 2012Received in revised form21 February 2012Accepted 25 February 2012
Keywords:BiomonitoringEMEPHeavy metalsMetal depositionBryophytes
a b s t r a c t
Previous analyses at the European scale have shown that cadmium and lead concentrations in mosses areprimarily determined by the total deposition of these metals. Further analyses in the current study showthat Spearman rank correlations between the concentration in mosses and the deposition modelled bythe European Monitoring and Evaluation Programme (EMEP) are country and metal-specific. Significantpositive correlations were found for about two thirds or more of the participating countries in 1990,1995, 2000 and 2005 (except for Cd in 1990). Correlations were often not significant and sometimesnegative in countries where mosses were only sampled in a relatively small number of EMEP grids.Correlations frequently improved when only data for EMEP grids with at least three moss sampling sitesper grid were included. It was concluded that spatial patterns and temporal trends agree reasonably wellbetween lead and cadmium concentrations in mosses and modelled atmospheric deposition.
� 2012 Elsevier Ltd. All rights reserved.
1. Introduction
Since 1979, the Convention on Long-range Transboundary AirPollution has addressed major air pollution problems in the UNECE(United Nations Economic Commission for Europe) region throughscientific collaboration and policy negotiation. The Convention hasbeen extended by eight protocols that identify specific measures tobe taken by countries to cut their emissions of air pollutants. The1998 Aarhus Protocol on heavy metals targeted three harmfulheavy metals (cadmium (Cd), lead (Pb) and mercury (Hg)) andentered into force in 2003. Within the Convention, the EuropeanMonitoring and Evaluation Programme (EMEP) i) collects emissiondata from Parties, ii) measures air and precipitation quality, and iii)models atmospheric transport and deposition of air pollutants.Deposition of the heavy metals Cd, Hg and Pb is modelled using theEMEP atmospheric transport model MSCE-HM (Travnikov and Ilyin,2005) and is calculated from official emission data reported by thecountries. The modelled data are verified against concentrations inair and precipitation measured at EMEP monitoring stations.However, the number of EMEPmonitoring stations and their spatialdistribution across Europe are limited: in the period from 1990 to2009 there were between 40 and 77 stations annually reportingmeasurement data on heavy metals to EMEP (http://www.nilu.no/projects/ccc/index.html). The EMEPmonitoring network for Cd andPb is scarce or absent in the southern and eastern parts of Europe,whereas Hg is primarily measured in northern Europe.
Under the Working Group on Effects of the Convention, the ICPVegetation (International Cooperative Programme on Effects of AirPollution on Natural Vegetation and Crops) has been coordinatingthe European moss survey since 2000. The survey has beenrepeated at five-yearly intervals since 1990 and the latest surveywas conducted in 2005/6 with 28 countries participating andmosses being sampled at almost 6000 sites across Europe. TheEuropean moss survey provides data on concentrations of twelvetrace elements (Al, As, Cd, Cr, Cu, Fe, Hg, Ni, Pb, Sb, V, Zn) in naturallygrowing mosses (Harmens et al., 2010). In 2005/06, the N concen-tration in mosses was also determined (Harmens et al., 2011b) andin the current ongoing survey in 2010/11, a pilot study was initiatedin selected countries to determine the concentration of selectedpersistent organic pollutants (POPs), particularly polycyclicaromatic hydrocarbons (PAHs), in mosses (Harmens et al., 2011a).
In recent decades, mosses have been applied successfully asbiomonitors of heavy metal deposition (Harmens et al., 2007,2008b, 2010; Zechmeister et al., 2003) across Europe. Heavymetal concentrations in mosses provide a complementary, time-integrated measure of the spatial patterns and temporal trends ofheavy metal deposition from the atmosphere to terrestrial systems,at least for the metals Cd and Pb (Aboal et al., 2010). It has beenshown that at the European scale atmospheric deposition is the
main factor determining the accumulation of Cd and Pb in mosses(Holy et al., 2010; Schröder et al., 2010). Compared to the EMEPmonitoring network, the moss survey has the following mainadvantages: i) the density of the moss monitoring network is muchhigher and ii) their spatial distribution is wider, including parts ofsouthern and eastern Europe. Although the heavy metal concen-tration in mosses provides no direct quantitative measurement ofdeposition, this information has been derived in some countries byusing regression or correlation approaches relating the results frommoss surveys to deposition data (e.g. Berg and Steinnes, 1997; Berget al., 2003; Schröder and Pesch, 2010; Thöni et al., 2011). Based onstatistical relations between concentrations of Cd and Pb inmodelled atmospheric deposition and mosses across Europe,deposition maps with a spatial resolution of 5 km by 5 km werecalculated using a regression kriging approach for Germany(Schröder et al., 2011). However, based on a recent study, Boqueteet al. (2011) recommended that the results of moss biomonitoringstudies should be regarded as qualitative or semi-qualitative, ratherthan attempting to provide absolute data, which may not betemporally representative, and may have a high degree of uncer-tainty associated with them, at least in Spain.
In the current study, we analysed in more detail the relationshipbetween EMEP modelled atmospheric deposition of Cd and Pb andtheir concentration in mosses for individual European countries.Although previous studies have shown good correlations betweenboth parameters at the European scale, other factors also contributeto the variation of Cd and Pb concentrations in mosses (Harmenset al., 2008b; Holy et al., 2010; Schröder et al., 2010). As thesefactors and their influence on the relationship is likely to bedifferentfor different countries and/or climatic regions (e.g. Thöni et al.,2011), we hypothesise that the correlations between both param-eters will be country-specific, with good correlations expected insome but less good correlations expected in other countries.
2. Materials and methods
2.1. Determination of Cd and Pb concentrations in mosses
Moss samples were collected across Europe in 1990/1 (Rühling, 1994), 1995/6(Rühling and Steinnes, 1998), 2000/1 (Buse et al., 2003) and 2005/6 (Harmens et al.,2008a, 2010). Throughout the paper we refer to the years of moss survey as 1990,1995, 2000 and 2005 respectively. Because the mosses were collected in a range ofhabitats from the sub-arctic climate of northern Scandinavia to the hot and dryclimate of southern Europe, it was not possible to sample just one carpet-formingmoss species across Europe. Pleurozium schreberi was the most frequentlysampled species in all surveys, accounting for 40.8e52.7% of the samples, followedby Hylocomium splendens (20.5e39.3%), Hypnum cupressiforme (7.4e22.0%) andPseudoscleropodium purum (3.4e11.9%); other species constituted only 2.2e6.5% ofthe mosses sampled. The moss sampling procedure was according to the guidelinesdescribed in the protocol for the 2005 survey (ICP Vegetation, 2005). Only the lastthree years’ growth of moss material was used for the analyses. The concentrationsof Cd and Pbwere determined by a range of analytical techniques; for further details
H. Harmens et al. / Environmental Pollution 166 (2012) 1e92

Author's personal copy
we refer to the reports of the individual surveys (Buse et al., 2003; Harmens et al.,2008a, 2010; Rühling, 1994; Rühling and Steinnes, 1998). A comprehensive qualitycontrol exercise was conducted in 1995 (Steinnes et al., 1997) and 2005 (Harmenset al., 2010) with moss reference material being distributed amongst participatinglaboratories. In addition, some laboratories used other certified reference materialfor quality assurance. Recommended values were established in 1995 for mossreference material. For example, the recommended values for Cd and Pb for mossreference M2 were 0.454� 0.019 and 6.37� 0.43 mg kg�1 (mean� standard devi-ation) respectively and 0.106� 0.005 and 3.33� 0.25 mg kg�1 respectively for mossreference M3 (Steinnes et al., 1997). No amendment of these recommended valueswas required in 2005 (Harmens et al., 2010). For further details we refer to Steinneset al. (1997) and Harmens et al. (2010).
2.2. Modelling the deposition of Cd and Pb
Deposition of the heavy metals Cd and Pb was modelled using the EMEPatmospheric transport model MSCE-HM (Travnikov and Ilyin, 2005). MSCE-HM isa three-dimensional Eulerian-type chemical transport model driven by off-linemeteorological data. The model takes into account heavy metal emissions fromanthropogenic and natural sources, wind re-suspension of dust particles containingheavy metals, transport in the atmosphere, chemical transformations of mercuryand ecosystem-dependent deposition to the surface. The model computationdomain is defined on the polar stereographic projection. Its spatial resolution is50 km� 50 km at 60�N. Modelled deposition of heavy metals was calculated fromofficial emission data reported by the countries. The modelled data were verifiedagainst concentrations in air and precipitation measured at EMEP monitoringstations. The intrinsic uncertainty of the model (without uncertainty in reportedemission data) is about 30e40% for concentrations in air, concentrations inprecipitation and total deposition for Cd and Pb (Travnikov and Ilyin, 2005). Theuncertainty of country-specific totals of heavy metal emission typically rangedbetween 30 and 60% and the overall uncertainty of measured wet deposition wasaround 20% for Cd and Pb. Modelling results agreed with measurement data withsatisfactory accuracy, keeping in mind uncertainties of the emission and monitoringdata. At most of the monitoring stations modelled and observed levels of Cd and Pbagreed within �50% and the spatial correlation coefficient between modelled andobserved values is between 0.6 and 0.9 (Ilyin et al., 2010).
2.3. Correlations between EMEP modelled deposition and concentrations in mosses
Country-specific Spearman rank correlations between various forms of EMEPmodelled atmospheric deposition (dry, wet and total deposition) and concentrationsin mosses for Cd and Pb were determined using SigmaPlot version 11. In thisinvestigation, we computed the Spearman rank correlation coefficient rs because themetal concentrations mostly proved not to be normally distributed. Although thisnon-parametric correlation method is less powerful than parametric methods if theassumptions underlying the latter are met, it is less likely to give distorted resultswhen the assumptions fail. The coefficient rs equals �1, if the two rankings arecompletely opposite to each other, rs equals 0 if the rankings are completely inde-pendent and þ1 if there is complete agreement between the two rankings. Withinthe interval [�1, þ1] the strength of correlation can be classified as follows: rs values<j0.2j are very low, between j0.2j and j0.5j low, from j0.5j to j0.7jmoderate, betweenj0.7j and j0.9j high and � j0.9j very high (Schröder et al., 2010).
As the last three years of moss growth was selected for heavy metal determi-nation, representing the accumulation of Cd and Pb in mosses in the three yearsprevious to sampling (ICP Vegetation, 2005), EMEP data were accumulated andaveraged over the previous three years where possible. For 1990, the EMEPmodelleddata for 1990 were used as data for earlier years was not available. To assess theimpact of using EMEP modelled data averaged over three years in comparison tomodelled data for the year previous to moss sampling, correlations were alsodetermined using only the EMEP modelled data for the year previous to mosssampling. Individual moss data were averaged per 50 km� 50 km EMEP grid beforecorrelations were calculated. Moss data outside the mean� 3 standard deviationswere eliminated from the analysis leading to exclusion of 2�3% of the moss data.
In addition to calculating Spearman rank correlations, the moss concentrationand modelled deposition data for individual countries were also normalized to theirEuropean mean values to assess the resemblance between spatial patterns for bothdata sets. For total deposition only EMEP grid cells were includedwheremossesweresampled, hence for calculation of the normalized values only data from the areas ofthe countrieswheremosseswere sampledwereused. For calculation of the Europeanmean, the data per country were weighted by the area of EMEP grid cells in whichmosses were sampled, i.e. more weight was given to countries where mosses weresampled inmore grid cells. The normalized value of a country was then calculated asthemean concentration inmosses ormean totalmodelled deposition of that countrydivided by the European mean value for mosses or deposition respectively. Finally,temporal trendswere comparedper country for bothdatasets, includingonlydata forEMEP grid cells where mosses were sampled in every survey year.
3. Results and discussion
3.1. Correlations between EMEP modelled deposition andconcentrations in mosses
Previous analyses had indicated that total atmospheric deposi-tion of Cd and Pb is the main factor explaining the variation in Cdand Pb concentrations in mosses across Europe (Holy et al., 2010;Schröder et al., 2010). However, other factors also contribute tospatial variation of heavymetal concentrations inmosses, includingfor example the variation in moss species sampled across Europe,land use in the area surrounding the moss sampling sites, altitudeand competition for sea salt ions in coastal areas (Steinnes, 1995;Harmens et al., 2008b; Holy et al., 2010; Schröder et al., 2010). Inaddition, the temporal variability of metal concentrations can behigh in some countries (Boquete et al., 2011). In the current study,country- and metal-specific correlations were observed (Tables 1and 2, Figs. 1 and 2) and correlations varied between years(Table 1). High correlations (0.7� rs< 0.9) were generally observedfor the Czech Republic (except for 1990), Finland, Sweden, and forPb also in Norway for the earlier years (Table 1). Moderate corre-lations (0.5� rs< 0.7) were generally found in France (for Pb inparticular), Norway (for Cd) and Poland (with sometimes highcorrelations being observed). Other countries with moderate tohigh correlations for at least one of the metals for at least twosurvey years include Bulgaria, Iceland, Latvia, Switzerland, Ukraineand the United Kingdom. The generally lower correlations inNorway compared to Finland and Sweden might be related to themore complex topography of Norway with orographic depositionhaving a greater role. In addition, the lower correlations for Cdmight be due to the competition with sea salt ions in the extensivecoastal area of Norway (Steinnes, 1995). Significant positive corre-lations were found for about two thirds or more of the participatingcountries (except for Cd in 1990). As to be expected, non-significantor significant negative correlations were mainly found in smallercountries or in countries where mosses were sampled in a smallernumber of grid squares (<60), although this was not always thecase (e.g. Iceland for Pb, Latvia, Ukraine, Switzerland). Negativecorrelations were significant only twice, i.e. in 1990 for Cd inLithuania and Portugal.
As the heavy metal concentrations in mosses were determinedover the last three years of growth before the date of sampling, itwas assumed that the concentration in mosses represents theaccumulation of Cd and Pb atmospheric deposition over the sameperiod. Therefore, the metal concentration in mosses wascompared with the average EMEP modelled annual deposition forthe three years previous to moss sampling. However, this was notfeasible for 1990 as only modelled annual deposition data wasavailable for 1990 and not for the previous years. To investigatewhether this would have any effect on the determined Spearmanrank correlations, we also calculated the Spearman rank correla-tions based on the EMEP modelled total deposition for the yearprevious to moss sampling for the years 1995e2005. As anexample, the results for 2000 are shown in Table 2. The results forthe year 2000 clearly indicate that the correlations per country arehardly affected bywhich EMEPmodelled total deposition datawereused. This might be explained by the fact that the relationshipbetween the 1997e1999 (annual average) and 1999 EMEPmodelled total deposition data was significantly linear with the1999 values in general being slightly lower than the annual aver-ages for 1997e1999 (data not shown). The previous European scaleanalyses had reached the same conclusion (Holy et al., 2010;Schröder et al., 2010). Therefore, the correlations determined for1990 are not likely to be affected by the fact that only one year ofEMEP modelled total deposition data was used.
H. Harmens et al. / Environmental Pollution 166 (2012) 1e9 3

Author's personal copy
An alternative explanation for the fact that correlations arehardly affected by the accumulation period for modelled depositionmight be that the metal concentrations in mosses do not reflect theintegration of air pollutants over a certain period as the moss mightbe in an unstable equilibrium with its environment, resulting ina high temporal variability of heavymetal concentrations in mosses(Boquete et al., 2011; Couto et al., 2004). However, whether this istrue for other moss species than P. purum and for other climateconditions than the Mediterranean requires further investigation.For example, Berg and Steinnes (1997) and Thöni et al. (1996) foundno seasonal variation in heavy metal concentrations for the moss
Table 2Spearman rank correlation coefficients (rs) between the EMEP modelled totaldeposition and concentrations in mosses for Cd and Pb for the moss survey year2000. The modelled total deposition data was based on either the annual average ofthe three year sum (3 year) or the annual deposition in the year before mosssampling (1 year). N¼ number of EMEP grid cells (50 km� 50 km) for which mossdata was available; values in bold: P� 0.05.
Country Cadmium (Cd) Lead (Pb) N
3 year 1 year 3 year 1 year
Austria 0.34 0.29 0.23 0.23 56Belgium 0.14 0.24 �0.48 �0.49 15Bulgaria 0.57 0.62 0.33 0.32 66e70Czech Republic 0.75 0.75 0.80 0.81 48Estonia �0.31 �0.15 �0.09 �0.04 30Finland 0.76 0.77 0.89 0.89 156France 0.42 0.42 0.56 0.58 260Germany 0.43 0.42 0.44 0.44 185Hungary �0.16 �0.20 0.35 0.25 27Iceland 0.21 0.21 0.69 0.68 44e45Italy 0.34 0.31 0.32 0.32 80e88Latvia 0.70 0.70 0.50 0.51 35e37Lithuania 0.40 0.43 0.30 0.38 37Macedonia 0.02 0.07 �0.31 �0.44 17Norway 0.58 0.61 0.72 0.75 172e173Poland 0.73 0.73 0.84 0.82 34e35Portugal 0.14 0.17 0.39 0.38 53e54Russian Federation �0.02 �0.01 0.49 0.48 74e82Slovakia 0.00 �0.02 0.07 0.13 24Spain 0.05 0.06 0.21 0.27 24Sweden 0.76 0.78 0.78 0.78 173Switzerland 0.60 0.57 0.29 0.24 29Ukraine 0.53 0.53 0.58 0.58 32United Kingdom 0.71 0.67 0.70 0.67 103
Table 1Spearman rank correlation coefficients (rs) between the EMEPmodelled total deposition data (annual average of three year sum except for 1990) and concentrations in mossesfor Cd and Pb for those countries that participated in at least three moss surveys during 1990e2005. N¼ number of EMEP grid cells (50 km� 50 km) for which moss data wasavailable; n.d.¼ not determined; values in bold: P� 0.05.
Country Cadmium (Cd) Lead (Pb) N
1990 1995 2000 2005 1990 1995 2000 2005 1990 1995 2000 2005
Austria 0.08 0.05 0.34 0.30 0.52 0.16 0.23 0.39 34 56 56 56Bulgaria n.d. 0.45 0.57 0.56 n.d. 0.42 0.33 0.42 n.d. 65e66 66e70 66e68Czech Republic 0.09 0.85 0.75 0.78 0.19 0.72 0.80 0.81 18 44e45 48 47Estonia 0.21 �0.20 �0.31 0.08 0.10 �0.05 �0.09 n.d. 28 30 30 31Finland 0.88 0.67 0.76 0.83 0.86 0.82 0.89 0.83 158 159 156 151France n.d. 0.52 0.42 0.47 n.d. 0.56 0.56 0.58 n.d. 245e246 260 267Germany 0.49 0.52 0.43 0.39 0.33 0.45 0.44 0.43 153e181 184e185 185 186Iceland 0.13 0.05 0.21 0.43 0.71 0.33 0.69 0.66 43 45e46 44e45 45e46Latvia 0.18 0.65 0.70 0.18 0.53 0.37 0.50 0.39 37 34 35e36 33e34Lithuania L0.37 �0.10 0.40 0.52 �0.10 0.35 0.30 0.26 37 38 37 37Norway 0.54 0.65 0.58 0.53 0.77 0.81 0.72 0.63 179 176 172e173 176e177Poland 0.60 0.53 0.73 0.75 0.53 0.58 0.84 0.57 112 145 35 35e36Portugal L0.33 0.09 0.14 n.d. 0.23 0.12 0.39 n.d. 55 53 53e54 n.d.Slovakia �0.45 0.42 0.00 0.05 0.70 0.16 0.07 0.09 18 21 24 21Spain n.d. 0.16 0.05 0.40 n.d. 0.01 0.21 0.52 n.d. 68e69 24 30Sweden 0.81 0.74 0.76 0.72 0.88 0.79 0.78 0.70 199 200e202 173 183e184Switzerland 0.56 0.41 0.60 0.48 0.67 0.32 0.29 0.53 28 29 29 29Ukraine n.d. 0.50 0.53 �0.07 n.d. 0.39 0.58 0.21 n.d. 38e39 32 23United Kingdom 0.22 0.46 0.71 0.47 0.54 0.48 0.70 0.60 61e64 66 103 99
-0.8
-0.6
-0.4
-0.2
0.0
0.2
0.4
0.6
0.8
1.0
Aust
riaBe
lgiu
mBu
lgar
iaC
zech
Rep
.Es
toni
aFi
nlan
dFr
ance
Ger
man
yH
unga
ryIc
elan
dIta
lyLa
tvia
Lith
uani
aM
aced
onia
Nor
way
Pola
ndPo
rtuga
lR
ussia
Slov
akia
Spai
nSw
eden
Switz
erla
ndU
krai
neU
.K.
Spea
rman
cor
rela
tion
(rs)
Cd - 2000
TotalWetDry
-0.8
-0.6
-0.4
-0.2
0.0
0.2
0.4
0.6
0.8
1.0
Aust
riaBe
lgiu
mBu
lgar
iaC
zech
Rep
.Es
toni
aFi
nlan
dFr
ance
Ger
man
yH
unga
ryIc
elan
dIta
lyLa
tvia
Lith
uani
aM
aced
onia
Nor
way
Pola
ndPo
rtuga
lR
ussia
Slov
akia
Spai
nSw
eden
Switz
erla
ndU
krai
neU
.K.
Spea
rman
cor
rela
tion
(rs)
Pb - 2000
TotalWetDry
Fig. 1. Spearman rank correlation coefficients (rs) between the EMEP modelleddeposition (total, wet and dry) and concentrations in mosses for Cd and Pb for themoss survey year 2000. The modelled deposition data was based on the annualaverage of the three year sum for 1997e1999.
H. Harmens et al. / Environmental Pollution 166 (2012) 1e94

Author's personal copy
species H. splendens and P. schreberi in Norway and Switzerland,respectively. The equilibrium between mosses and the environ-ment is complex and depends on various factors. Inputs andoutputs of elements in moss will depend on physicochemical (e.g.solubilization and leaching of elements, cation competition, anioniccomplexation) and biological processes (e.g. rate and type ofgrowth, physiological activity, phenotypic adaptations). In addition,all of these variables will depend on environmental factors (pH,salinity, temperature), whichmay vary within short periods of time(Boquete et al., 2011).
The impact of precipitation on the concentration of elements inmosses is unclear and there is no evidence that the intensity orfrequency of precipitation affects heavy metal concentrations inmosses. On the one hand, rainwater may wash the moss, resultingin removal of the particulate material deposited on its surface, onthe other hand, rainwater may dissolve elements adsorbed onmosstissue, thus facilitating their uptake. The most important way thatprecipitation may influence metals already present on the mosssurface might be via exchange with other cations, including thosefrom marine origin (Gjengedal and Steinnes, 1990; Steinnes et al.,1995). In the current study, Spearman rank correlations betweenCd and Pb concentrations in mosses and EMEPmodelled deposition
(total, wet or dry) were not significantly affected by the fraction ofEMEP modelled wet deposition (data not shown). The distributionof the annual deposition between thewet and dry part is controlledby a combination of two main factors: 1) the annual sum ofprecipitation and 2) the distribution of forests e dry depositionvelocity of particles (and hence particulate species like Cd and Pb)to areas with tall vegetation is greater than that to areas with shortvegetation. The combination of these two factors results in a rela-tively high fraction of dry deposition in central Europe (e.g. CzechRepublic, Germany, Poland with moderate precipitation and highforested area) and in regions of southern Europe (Portugal,southern Spain, Italy). In the recent surveys mosses were sampledin northern Spain and Italy in mountainous regions with higherannual precipitation than other parts of these countries.
We also investigated whether Spearman rank correlations wereaffected by the form of atmospheric deposition, i.e. wet, dry andtotal deposition of Cd and Pb. The results show that indeed thecorrelations are affected by the form of atmospheric deposition, asshown in Fig. 1 for 2000. As mosses accumulate both dry and wetdeposition of heavy metals, one might expect the correlations to behighest for total atmospheric deposition, however this was notalways the case. For Pb, 74% of the countries that had significantSpearman rank correlations showed the highest correlations withtotal deposition in 2000. However, for Cd this was the case for only50% of the countries, with 22 and 28% of the countries showing thehighest correlations with wet and dry deposition respectively in2000. For other years of the survey, the number of countriesshowing the highest correlations with total deposition was alsohigher than the number of countries showing the highest correla-tions with either wet or dry deposition, except for Cd in 2005 whenonly 27% of the countries showed the highest correlation with total
& & &
&
&&
0.0
0.2
0.4
0.6
0.8
1.0
Austria
Bulgaria
Croatia
Czech R
ep.FinlandFranceG
ermany
IcelandLatviaLithuaniaN
orway
Poland
Serbia
Spain
Sw
edenS
witzerland
U.K.
Spea
rman
cor
rela
tion
(rs)
Cd - 2005All EMEP grids≥ 3 moss sites
&: P > 0.05
&&
&
&
0.0
0.2
0.4
0.6
0.8
1.0
Austria
Bulgaria
Croatia
Czech R
ep.FinlandFranceG
ermany
IcelandLatviaLithuaniaN
orway
Poland
Serbia
Spain
Sw
edenS
witzerland
U.K
.
Spea
rman
cor
rela
tion
(r s) Pb - 2005All EMEP grids
≥ 3 moss sites&: P > 0.05
Fig. 2. Spearman rank correlation coefficients (rs) between the EMEP modelled totaldeposition and concentrations in mosses for Cd and Pb for the moss survey year 2005.Correlations are shown for all EMEP grids (black bar) where mosses were sampled oronly for EMEP grids with at least three moss sampling sites (white bar) in at least 15grids. The modelled deposition data was based on the annual average of the three yearsum for 2003e2005.
0
1
2
3
4
5
Bulg
aria
Slov
akia
Belg
ium
Slov
enia
Ukr
aine
Mac
edon
iaPo
land
Italy
Turk
eyC
zech
Rep
.Fr
ance
Lith
uani
aC
roat
iaU
.K.
Aust
riaLa
tvia
Ger
man
ySw
itzer
land
Spai
nEs
toni
aFi
nlan
dN
orw
aySw
eden
Icel
and
Nor
mal
ized
val
ue P
b
Moss
Deposition
0
1
2
3
4
5
Belg
ium
Slov
akia
Bulg
aria
Slov
enia
Pola
ndM
aced
onia
Turk
eyC
roat
iaU
krai
neR
ussi
aC
zech
Rep
.La
tvia
Ger
man
yAu
stria
Esto
nia
Switz
erla
ndFi
nlan
dLi
thua
nia
Swed
enFr
ance
U.K
.N
orw
ayIta
lySp
ain
Icel
and
Nor
mal
ized
val
ue C
d Moss
Deposition
Fig. 3. Normalized values (relative to the overall European mean) of the average Cdand Pb concentration in mosses (2005/6) and EMEP modelled average total annualdeposition (2003e2005) per country. For the calculation of the normalized values theareas of the countries where mosses were sampled were taken into account.
H. Harmens et al. / Environmental Pollution 166 (2012) 1e9 5
Author's personal copy
deposition. As to be expected, the highest variations in correlationsfor different atmospheric deposition forms (with often very low oreven negative correlations) were generally observed in countrieswhere mosses were sampled in a relatively small number of EMEPgrid squares (N� 30), such as Belgium, Estonia, Hungary,Macedonia, Slovakia, Spain and Switzerland for 2000 (Fig. 1).
In a previous study with nitrogenwe found that the relationshipbetween the total nitrogen concentration in mosses and EMEPmodelled total atmospheric nitrogen deposition for Europeimproved when the relationship was based on data for EMEP gridsquares where at least five moss sampling sites were present(Harmens et al., 2011b). This can be explained by the fact thatatmospheric deposition of air pollutants is highly variable withineach EMEP grid due to for example non-uniform distribution ofemission sources within the grid cell, variation in roughness ofvegetation including mosses, sub-grid variability of meteorologicalparameters, and orographic effects. Therefore, a singlemeasurementof concentration inmosses can hardly characterize conditions for themodel grid cell as a whole. Hence, for heavy metals we would alsoexpect an improvement of the correlations between concentrationsin mosses (site specific) and EMEP modelled total atmosphericdeposition (per 50 km� 50 km grid) if EMEP grids with only one or
twomoss sampling sites were excluded from the analysis. Indeed, inthe majority of countries (�70%) there was an improvement in thecorrelations, which appeared to be most pronounced for Pb (Fig. 2).The improvement in correlations is observeddespite the fact that thenumber of EMEP grids with the required data is lower thanwhen allEMEP grids with moss data are included.
As for the nitrogen study (Harmens et al., 2011b) we alsocompared the correlations including all EMEP grids with thecorrelations including EMEP grids with at least five moss samplingsites (data not shown). However, in contrast to the European-widerelationship established for nitrogen, in the current country-specific analysis with heavy metals the number of EMEP gridswith at least five sampling sites was low in many countries,resulting in a decline in the number of significant correlations (i.e.correlations were significant in only eight of the 15 countries forwhich correlations could be determined) compared to including allEMEP grids or EMEP grids with at least three moss sampling sites(Fig. 2). Only four (i.e. Czech Republic, Finland, Germany andSweden) out of the 17 countries included in Fig. 2 hadmore than 25EMEP grids with at least five moss sampling sites, whereas in sevenout of the 17 countries the number of EMEP grids with at least fivemoss sampling sites was less than 15.
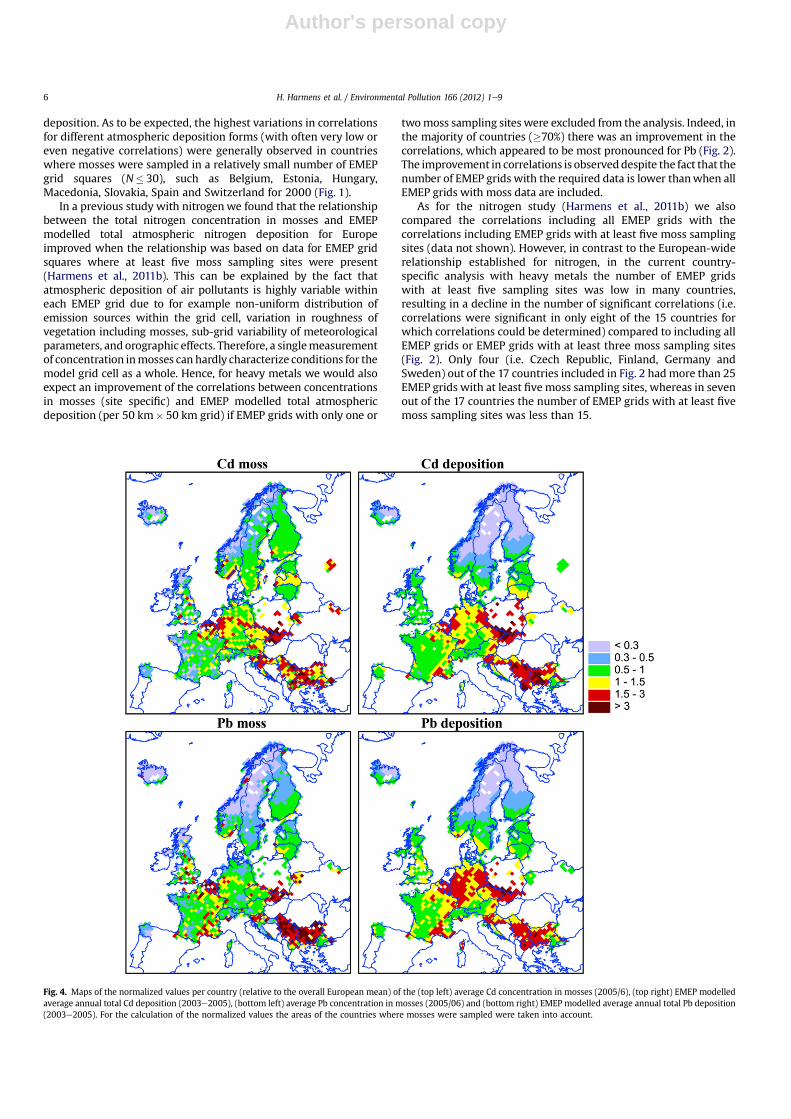
Fig. 4. Maps of the normalized values per country (relative to the overall European mean) of the (top left) average Cd concentration in mosses (2005/6), (top right) EMEP modelledaverage annual total Cd deposition (2003e2005), (bottom left) average Pb concentration in mosses (2005/06) and (bottom right) EMEP modelled average annual total Pb deposition(2003e2005). For the calculation of the normalized values the areas of the countries where mosses were sampled were taken into account.
H. Harmens et al. / Environmental Pollution 166 (2012) 1e96

Author's personal copy
3.2. Spatial patterns and temporal trends in moss concentrationsand modelled deposition
To compare the spatial patterns of Cd and Pb concentrations inmosses and EMEP modelled total deposition, both datasets werenormalized against the Europeanmean (seeMaterials andMethodsfor details). Figs. 3 and 4 show that the spatial patterns for 2005 arequite similar, i.e. regions in Europe with a deposition rate below(e.g. big parts of northern and western Europe) or above theEuropean mean (e.g. Belgium, eastern part of Europe and parts ofcentral Europe) also showed concentrations in mosses below orabove the European mean respectively, particularly for Cd. Never-theless some discrepancies can be observed: For Cd, modelleddeposition is relatively high (i.e. the ratio of normalized depositionto moss concentration �1.5) in Macedonia, Spain and Lithuaniacompared to the concentration in mosses. The opposite is true forBelgium, Finland and the Russian Federation (i.e. the ratio ofnormalized moss concentration to deposition �1.5). For Pb,
modelled deposition is relatively high in the Czech Republic,Germany and Iceland, whereas the opposite is true for Belgium,Bulgaria, Italy, Slovakia and Ukraine. The relatively high Pbconcentrations in mosses in these countries result in relatively lownormalized values in central Europe in comparison with thenormalized deposition values (Fig. 4).
Previously we reported on the similarity between temporaltrends observed for Cd and Pb concentrations in mosses and EMEPmodelled total deposition between 1990 and 2005 at the Europeanscale (Harmens et al., 2010). In the current study, we compared thetemporal trends in further detail for individual countries. Someexamples are shown in Fig. 5 and in general the temporal trends inconcentrations in mosses agree reasonably well with the temporaltrends in deposition at the national scale too. Nevertheless, incertain periods the decline of calculated deposition seemed to beunderestimated in comparison to the decline of concentrations inmosses (e.g. for Cd in Lithuania and the Czech Republic between1990 and 1995, for Pb in Estonia between 1990 and 1995) or vice
0
20
40
60
80
0.0
0.1
0.2
0.3
0.4
1990 1995 2000 2005
Dep
ositi
on (g
km
-2y-1
)
Cd
in m
oss
(mg
kg-1) Czech Republic
MossDeposition
0
35
70
105
140
0.0
0.1
0.2
0.3
0.4
1990 1995 2000 2005
Dep
ositi
on (g
km
-2y-1
)
Cd
in m
oss
(mg
kg-1) Lithuania
0
60
120
180
-0.2
0.0
0.2
0.4
0.6
1990 1995 2000 2005
Dep
ositi
on (g
km
-2y-1
)
Cd
in m
oss
(mg
kg-1) Poland
0
10
20
30
0.0
0.1
0.2
0.3
1990 1995 2000 2005
Dep
ositi
on (g
km
- 2y-1
)
Cd
in m
oss
(mg
kg-1) Sweden
0
1000
2000
3000
4000
0
4
8
12
16
1990 1995 2000 2005
Dep
ositi
on (g
km
-2y-1
)
Pb in
mos
s (m
g kg
-1) Estonia
0
400
800
1200
1600
0
4
8
12
1990 1995 2000 2005
Dep
ositi
on (g
km
-2y-1
)
Pb in
mos
s (m
g kg
-1) Finland
0
2000
4000
6000
8000
0
5
10
15
20
1990 1995 2000 2005
Dep
ositi
on (g
km
-2y-1
)
Pb in
mos
s (m
g kg
-1) Germany
0
3000
6000
9000
0
20
40
60
1990 1995 2000 2005
Dep
ositi
on (g
km
-2y-1
)
Pb in
mos
s (m
g kg
-1) Slovakia
Fig. 5. Examples of temporal trends of concentrations in mosses (bars) and EMEP modelled total atmospheric deposition (lines) for Cd (charts on the left) and Pb (charts on theright) between 1990 and 2005 for selected European countries.
H. Harmens et al. / Environmental Pollution 166 (2012) 1e9 7

Author's personal copy
versa (e.g. for Cd in Poland between 1995 and 2000 or for Pb inSlovakia between 1995 and 2000). The sometimes higherconcentrations of Cd (Czech Republic and Lithuania) and Pb(Estonia) in mosses compared to modelled deposition in 1990might reflect the presence of more local pollution sources thataffect concentrations in mosses but are not included in modelleddeposition. In many countries smaller local pollution sourcesclosed down in the early 1990s. On the other hand, it might reflectmore inadequate emission inventories in 1990 compared to lateryears.
Considering the uncertainties in the EMEP modelled deposi-tion data (see Introduction) and the potential limitations andconfounding factors in the use of mosses as monitors of atmo-spheric deposition (Aboal et al., 2010; Boquete et al., 2011;Harmens et al., 2008b; Steinnes, 1995), the spatial patterns andtemporal trends of both data sets agree reasonably well for Cdand Pb. The results confirm once again that Cd and Pb concen-trations in mosses can serve as a complementary method todetermine spatial patterns and temporal trends of Cd and Pbdeposition (Aboal et al., 2010; Harmens et al., 2010). CurrentlyEMEP is conducting a case study to assess heavy metal pollutionat country-scale levels, employing a spatial resolution finer (e.g.5 km� 5 km) than that currently used (50 km� 50 km). TheEuropean moss survey will provide valuable field-basedmeasurement data for the validation of the finer-resolutionmodelled atmospheric deposition (Ilyin et al., 2011).
4. Conclusions
The following main conclusions can be drawn:
� For Cd and Pb the correlations between concentrations inmosses and the EMEP modelled total atmospheric depositionare country- and metal-specific, with sometimes considerablevariation being observed between years. However, significantpositive correlations were found for about two thirds or moreof the participating countries (except for Cd in 1990). Non-significant or significant negative correlations (only two)were mainly found in smaller countries or in countries wheremosses were sampled in a relative small number of EMEP gridsquares;
� Correlations were generally not affected by using EMEPmodelled deposition data for the year previous to sampling oraveraged over three years previous to sampling of the mosses.As expected, correlations mainly improved when the analysiswas limited to using EMEP grids in which at least three mosssampling sites were present;
� For the majority of countries across Europe, the use of mossesas biomonitors of atmospheric deposition for Cd and Pbprovides a valid, complementary method for assessing thespatial patterns and temporal trends of atmospheric depositionfor these metals.
The current study confirms that environmental monitoringprogrammes such as the moss survey are appropriate tools fornational regulatory bodies in many European countries to assessthe efficiency and effectiveness of national air pollution abatementstrategies for the metals Cd and Pb. To further investigate therelationship between atmospheric deposition of Cd and Pb andtheir concentration in mosses and the robustness of this relation-ship, we recommend that countries sample mosses at EMEPmonitoring stations and/or national deposition monitoringstations. The presence of a dense national heavy metal depositionmonitoring network andmeasurement of concentrations in mossesat the same sites is likely to reduce the uncertainty in modelled
deposition data and might provide further insight into why in one-third of the countries correlations were not significantly positivebetween the two data sets.
Acknowledgements
We thank the United Kingdom Department for Environment,Food and Rural Affairs (Defra; contract AQ0810 and AQ0816), theUNECE (Trust Fund) and the Natural Environment Research Council(NERC) for funding the ICP Vegetation Programme CoordinationCentre at CEH Bangor, UK. The contributions of many more scien-tists and all the funding bodies in each country are gratefullyacknowledged (for full details see Rühling (1994), Rühling andSteinnes (1998), Buse et al. (2003) and Harmens et al. (2008a)).
References
Aboal, J.R., Fernández, J.A., Boquete, T., Carballeira, A., 2010. Is it possible to estimateatmospheric deposition of heavy metals by analysis of terrestrial mosses?Science of the Total Environment 408, 6291e6297.
Berg, T., Hjellbrekke, A., Rühling, Å, Steinnes, E., Kubin, E., Larsen, M.M., Piispanen, J.,2003. Absolute Deposition Maps of Heavy Metals for the Nordic CountriesBased on the Moss Survey. TemaNord 2003:505. Nordic Council of Ministers,Copenhagen, Denmark.
Berg, T., Steinnes, E., 1997. Use of mosses (Hylocomium splendens and Pleuroziumschreberi) as biomonitors of heavy metal deposition: from relative to absolutevalues. Environmental Pollution 98, 61e71.
Boquete, M.T., Fernandez, J.A., Aboal, J.R., Carballeira, A., 2011. Analysis of temporalvariability in the concentrations of some elements in the terrestrial moss Pseu-doscleropodium purum. Environmental and Experimental Botany 72, 210e216.
Buse, A., Norris, D., Harmens, H., Büker, P., Ashenden, T., Mills, G., 2003. HeavyMetals in European Mosses: 2000/2001 Survey. ICP Vegetation ProgrammeCoordination Centre, Centre for Ecology and Hydrology, Bangor, UK. http://icpvegetation.ceh.ac.uk.
Couto, J.A., Fernandez, J.A., Aboal, J.R., Carballeira, C., 2004. Active biomonitoring ofelement uptake with terrestrial mosses: a comparison of bulk and dry depo-sition. Science of the Total Environment 324, 211e222.
Gjengedal, E., Steinnes, E., 1990. Uptake of metal ions in moss from artificialprecipitation. Environmental Monitoring and Assessment 14, 77e87.
Harmens, H., Mills, G., Hayes, F., Norris, D., the participants of the ICP Vegetation,2011a. Air Pollution and Vegetation. ICP Vegetation annual report 2010/2011.http://icpvegetation.ceh.ac.uk.
Harmens, H., Norris, D., the participants of the moss survey, 2008a. Spatial andTemporal Trends in Heavy Metal Accumulation in Mosses in Europe(1990e2005). Programme Coordination Centre for the ICP Vegetation, Centrefor Ecology and Hydrology, Bangor, UK. http://icpvegetation.ceh.ac.uk.
Harmens, H., Norris, D.A., Cooper, D.M., Mills, G., Steinnes, E., Kubin, E., Thöni, L.,Aboal, J.R., Alber, R., Carballeira, A., Coskun, M., De Temmerman, L., Frolova, M.,Gonzáles-Miqueo, L., Jeran, Z., Leblond, S., Liiv, S., Ma�nkovská, B., Pesch, R.,Poikolainen, J., Rühling, Å, Santamaria, J.M., Simonèiè, P., Schröder, W.,Suchara, I., Yurukova, L., Zechmeister, H.G., 2011b. Nitrogen concentrations inmosses indicate the spatial distribution of atmospheric nitrogen deposition inEurope. Environmental Pollution 159, 2852e2860.
Harmens, H., Norris, D.A., Koerber, G.R., Buse, A., Steinnes, E., Rühling, Å, 2007.Temporal trends in the concentration of arsenic, chromium, copper, iron, nickel,vanadium and zinc in mosses across Europe between 1990 and 2000. Atmo-spheric Environment 41, 6673e6687.
Harmens, H., Norris, D.A., Koerber, G.R., Buse, A., Steinnes, E., Rühling, Å,2008b. Temporal trends (1990 e 2000) in the concentration of cadmium,lead and mercury in mosses across Europe. Environmental Pollution 151,368e376.
Harmens, H., Norris, D.A., Steinnes, E., Kubin, E., Piispanen, J., Alber, R.,Aleksiayenak, Y., Blum, O., Coskun, M., Dam, M., De Temmerman, L.,Fernández, J.A., Frolova, M., Frontasyeva, M., González-Miqueo, L.,Grodzi�nska, K., Jeran, Z., Korzekwa, S., Krmar, M., Kvietkus, K., Leblond, S.,Liiv, S., Magnússon, S.H., Ma�nkovská, B., Pesch, R., Rühling, Å, Santamaria, J.M.,Schröder, W., Spiric, Z., Suchara, I., Thöni, L., Urumov, V., Yurukova, L.,Zechmeister, H.G., 2010. Mosses as biomonitors of atmospheric heavy metaldeposition: spatial and temporal trends in Europe. Environmental Pollution158, 3144e3156.
Holy, M., Pesch, R., Schröder, W., Harmens, H., Ilyin, I., Alber, R., Aleksiayenak, Y.,Blum, O., Coskun, M., Dam, M., De Temmerman, L., Fedorets, N., Figueira, R.,Frolova, M., Frontasyeva, M., Goltsova, N., González Miqueo, L., Grodzi�nska, K.,Jeran, Z., Korzekwa, S., Krmar, M., Kubin, E., Kvietkus, K., Larsen, M., Leblond, S.,Liiv, S., Magnússon, S., Ma�nkovská, B., Mocanu, R., Piispanen, J., Rühling, Å,Santamaria, J., Steinnes, E., Suchara, I., Thöni, L., Turcsányi, G., Urumov, V.,Wolterbeek, H.T., Yurukova, L., Zechmeister, H.G., 2010. First thorough identi-fication of factors associated with Cd, Hg and Pb concentrations in mossessampled in the European Surveys 1990, 1995, 2000 and 2005. Journal ofAtmospheric Chemistry 63, 109e124.
H. Harmens et al. / Environmental Pollution 166 (2012) 1e98

Author's personal copy
ICP Vegetation, 2005. Heavy Metals in European Mosses: 2005/2006 Survey.Monitoring Manual. ICP Vegetation Programme Coordination Centre, CEHBangor, UK. http://icpvegetation.ceh.ac.uk.
Ilyin, I., Rozovskaya, O., Sokovyh, V., Travnikov, O., Varygina, M., Aas, W.,Uggerud, H.T., 2010. EMEP Status Report 2/2010. Heavy Metals: TransboundaryPollution of the Environment. http://www.msceast.org.
Ilyin, I., Rozovskaya, O., Travnikov, O., Varygina, M., Aas, W., Uggerud, H.T., 2011.EMEP Status Report 2/2011. Heavy Metals: Transboundary Pollution of theEnvironment. http://www.msceast.org.
Rühling,Å,1994.AtmosphericHeavyMetalDeposition inEuropee EstimationBasedonMoss Analysis. NORD 1994:9. Nordic Council of Ministers, Copenhagen, Denmark.
Rühling, Å, Steinnes, E., 1998. Atmospheric Heavy Metal Deposition in Europe1995e1996. NORD 1998:15, Nordic Council of Ministers, Copenhagen, Denmark.
Schröder, W., Holy, M., Pesch, R., Harmens, H., Ilyin, I., Steinnes, E., Alber, R.,Aleksiayenak, Y., Blum, O., Coskun, M., Dam, M., De Temmerman, L., Frolova, M.,Frontasyeva, M., González Miqueo, L., Grodzi�nska, K., Jeran, Z., Korzekwa, S.,Krmar,M., Kubin, E., Kvietkus, K., Leblond, S., Liiv, S., Magnússon, S., Ma�nkovská, B.,Piispanen, J., Rühling, Å, Santamaria, J., Spiric, Z., Suchara, I., Thöni, L., Urumov, V.,Yurukova, L., Zechmeister, H.G., 2010. Are cadmium, lead and mercury concen-trations inmosses across Europe primarily determined by atmospheric depositionof these metals? Journal of Soil and Sediments 10, 1572e1584.
Schröder, W., Holy, M., Pesch, R., Zechmeister, H.G., Harmens, H., Ilyin, I., 2011.Mapping atmospheric depositions of cadmium and lead in Germany based on
EMEP deposition data and the European Moss Survey 2005. EnvironmentalSciences Europe 23 (19), 1e14.
Schröder, W., Pesch, R., 2010. Long-term monitoring of the metal accumulation inforests measured by use of the moss technique. European Journal of ForestResearch 129, 475e488.
Steinnes, E., 1995. A critical evaluation of the use of naturally growing moss tomonitor the deposition of atmospheric metals. The Science of the Total Envi-ronment 160/161, 243e249.
Steinnes, E., Rühling, Å, Lippo, H.,Mäkinen, A.,1997. Referencematerial for large-scalemetal deposition surveys. Accreditation and Quality Assurance 2, 243e249.
Thöni, L., Schnyder, N., Krieg, F., 1996. Comparison of metal concentrations in threespecies of mosses and metal freights in bulk precipitations. Fresenius’ Journal ofAnalytical Chemistry 354, 703e708.
Thöni, L., Yurukova, L., Bergamini, A., Ilyin, I., Matthaei, D., 2011. Temporal trendsand spatial patterns of heavy metal concentrations in mosses in Bulgaria andSwitzerland: 1990e2005. Atmospheric Environment 45, 1899e1912.
Travnikov, O., Ilyin, I., 2005. Regional Model MSCE-HM of Heavy Metal Trans-boundary Air Pollution in Europe. EMEP/MSC-E Technical report 6/2005.Meteorological Synthesizing Centre - East, Moscow, Russian Federation. http://www.msceast.org.
Zechmeister, H.G., Grodzi�nska, K., Szarek-qukaszewska, G., 2003. Bryophytes. In:Markert, B.A., Breure, A.M., Zechmeister, H.G. (Eds.), Bioindicators and Bio-monitors. Elsevier Science Ltd., Amsterdam, pp. 329e375.
H. Harmens et al. / Environmental Pollution 166 (2012) 1e9 9


