Embed Size (px)
Citation preview
processes
Review
Corrosion and Corrosion Fatigue of Steels in Downhole CCSEnvironment—A Summary
Anja Pfennig 1 , Marcus Wolf 2 and Axel Kranzmann 2,*
�����������������
Citation: Pfennig, A.; Wolf, M.;
Kranzmann, A. Corrosion and
Corrosion Fatigue of Steels in
Downhole CCS Environment—A
Summary. Processes 2021, 9, 594.
https://doi.org/10.3390/pr9040594
Academic Editor: Aneta Magdziarz
Received: 3 March 2021
Accepted: 24 March 2021
Published: 29 March 2021
Publisher’s Note: MDPI stays neutral
with regard to jurisdictional claims in
published maps and institutional affil-
iations.
Copyright: © 2021 by the authors.
Licensee MDPI, Basel, Switzerland.
This article is an open access article
distributed under the terms and
conditions of the Creative Commons
Attribution (CC BY) license (https://
creativecommons.org/licenses/by/
4.0/).
1 HTW Berlin, Wilhelminenhofstraße 75A, 12459 Berlin, Germany; [email protected] BAM Federal Institute of Materials Research and Testing, Unter den Eichen 87, 12205 Berlin, Germany;
[email protected]* Correspondence: [email protected]; Tel.: +49-501-94231
Abstract: Static immersion tests of potential injection pipe steels 42CrMo4, X20Cr13, X46Cr13,X35CrMo4, and X5CrNiCuNb16-4 at T = 60 ◦C and ambient pressure, as well as p = 100 bar wereperformed for 700–8000 h in a CO2-saturated synthetic aquifer environment similar to CCS sites inthe Northern German Basin (NGB). Corrosion rates at 100 bar are generally lower than at ambientpressure. The main corrosion products are FeCO3 and FeOOH with surface and local corrosionphenomena directly related to the alloy composition and microstructure. The appropriate heattreatment enhances corrosion resistance. The lifetime reduction of X46Cr13, X5CrNiCuNb16-4,and duplex stainless steel X2CrNiMoN22-5-3 in a CCS environment is demonstrated in the in situcorrosion fatigue CF experiments (axial push-pull and rotation bending load, 60 ◦C, brine: StuttgartAquifer and NGB, flowing CO2: 30 L/h, +/− applied potential). Insulating the test setup is necessaryto gain reliable data. S-N plots, micrographic-, phase-, fractographic-, and surface analysis provethat the life expectancy of X2CrNiMoN22-5-3 in the axial cyclic load to failure is clearly related tothe surface finish, applied stress amplitude, and stress mode. The horizontal grain attack withincorrosion pit cavities, multiple fatigue cracks, and preferable deterioration of austenitic phase mainlycause fatigue failure. The CF life range increases significantly when a protective potential is applied.
Keywords: steel; high alloyed steel; corrosion; corrosion fatigue; CCS; carbon capture and storage
1. Introduction
The carbon capture and storage process (CCS [1,2]) is a well acknowledged techniqueto mitigate climate change. Emission gases—mostly from combustion processes of poweror cement production plants—are compressed into safe deep onshore or offshore geologicallayers. However, steels used as pipes for transport or injecting into, e.g., a saline aquifer(onshore CCS site) are susceptible to CO2-corrosion [3–9] influenced by:
• Temperature and CO2 partial pressure;• alloy composition and compositions of the corrosive media;• contamination of alloy and media;• flow conditions and injection pressure and;• protective corrosion scales [5,6,10–21].
The corrosion resistance of various steels is mostly dependent on the composition ofthe alloys [22] and their heat treatment [23–25]: Ni- and Cr reduce surface corrosion phe-nomena [26,27] and retained austenite reduces local corrosion [26]. The higher temperatureduring austenitizing of martensitic steels [28–30] and annealing of lean duplex stainlesssteels [22,23,28] decreases the potential for local phenomena. If C-Mn (carbon) steels areheat treated to the martensitic microstructure, grain boundaries react in a H2S-containingNaCl resulting in lower corrosion resistance compared to the ferritic or ferritic-bainiticmicrostructure [31].
Processes 2021, 9, 594. https://doi.org/10.3390/pr9040594 https://www.mdpi.com/journal/processes
Processes 2021, 9, 594 2 of 33
Corrosion also leads to early failure of stainless steels that are mechanicallyloaded [32–34] since chemical reactions as well as local changes of lattice energy at thesurface and mechanical load enhance pitting [35,36]. Pit-, selective-, and intergranular cor-rosion are generally correlated to the local lattice mismatch leading to crack formation [33]at dual or triple points of grain/phase boundaries with higher grain/phase boundaryaccelerating crack formation and propagation [32,34]. Pfennig et al. [35,36] modified apossible crack initiation first presented by Han et al. [37].
When exposing steels to the CO2-environment, the corrosion products found on thesurface and within pits are similar [15,17], mostly comprising of siderite FeCO3 [3,38].The low solubility of FeCO3 in water is low (pKsp = 10.54 at 25 ◦C [29,37]) causing anodiciron dissolution initialized by forming of transient iron hydroxide Fe(OH)2 [6,30]. The pHincreases locally causing reactions (Equations (1) to (6) [15,29]) that lead to the precipitationof an internal and external ferrous carbonate film:
CO2 (g) + H2O (L)→ H+ + HCO3−
(aq) (1)
Cathodic: 2 HCO3− + 2 e− → 2 CO3
2− + H2 (2)
Anodic: Fe→ Fe2+ + 2e− (3)
Fe2+ + CO32− → FeCO3 (4)
Fe2+ + 2 HCO3− → Fe(HCO3)2 (5)
Fe(HCO3)2 → FeCO3+ CO2 + H2O (6)
The literature widely describes the influence of frequency, temperature and chlo-ride concentration [35,36,39–43], topography [44], geometric [45], and compression pre-cracking [46,47], as well as foreign impact [48–51] on the corrosion fatigue behavior andespecially on the crack initiation and crack growth [45–51]. In general, corrosion processeswith or without the applied mechanical stress are enhanced [49,52], especially in steels withlow chromium content [6,10,11], with the presence of chloride [48,50,53,54], hydrogen [55],hydrogen sulfide (H2S) [56,57], and CO2 [8,58,59]. The stress corrosion resistance underthe unidirectional load in CO2-saturated brines and the endurance limit decreases with theincreasing temperature, increasing mechanical load, and decreasing pH for high alloyedsteels [60–62]. On the contrary, it increases with the increasing chromium content in ferritic,austenitic, and duplex steels [63], as well as the internal compressive stress in surfaceregions [49,64]. The martensitic microstructure shows a brittle fracture under the cyclicload [65], but improves the corrosion fatigue [66], while precipitations of copper or oxideinclusions will cause early failure already at a small number of cycles [36,67].
Standard duplex stainless steel DSS X2CrNiMoN22-5-3 (AISI 2205), usually used inoperational units of desalinations plants, heat exchangers, and chemical and petroleumindustries [68], is a forward-looking candidate regarding corrosion fatigue in both CCSand geothermal applications since it is highly resistant to stress corrosion cracking [69]as well as corrosive environments [70,71]. The surface quality of steels directly influencesthe corrosion fatigue behavior [72–80], which is improved by smooth surfaces [81], deeperplastic deformations and compressive surface stress [82–84], shot peeing [85], and inferritic stainless steel when Ra exceeded 0.5 µm [86]. The corrosion fatigue resistance ofX2CrNiMoN22-5-3 under different environments [87–90] has first been tested under in situgeothermal conditions [91–93] and the results are now combined.
This paper comprises and compares summarized data of previously published workby the authors.
2. Materials and Methods
To examine the influence of the corrosive media on the corrosion fatigue behaviorof high alloyed steels, the specimens were tested by choosing conditions similar to those
Processes 2021, 9, 594 3 of 33
occurring during carbon capture and storage CCS (static corrosion) and conditions ingeothermal energy production (corrosion fatigue).
2.1. Steels
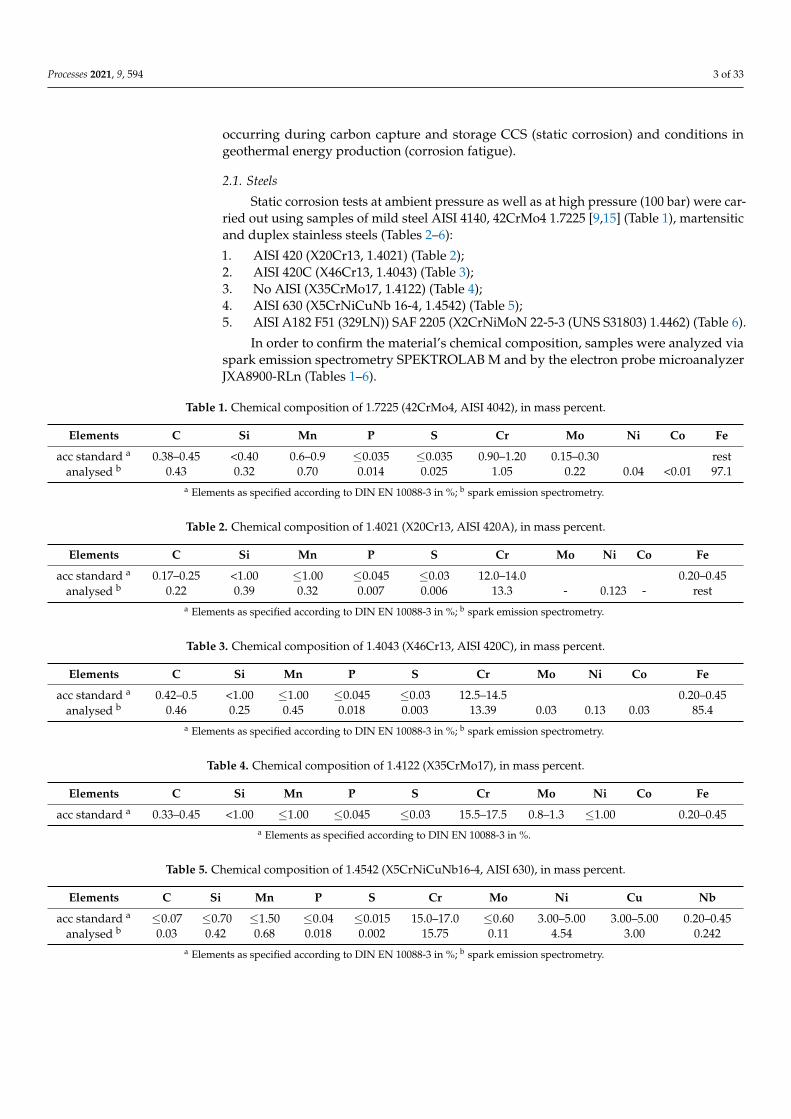
Static corrosion tests at ambient pressure as well as at high pressure (100 bar) were car-ried out using samples of mild steel AISI 4140, 42CrMo4 1.7225 [9,15] (Table 1), martensiticand duplex stainless steels (Tables 2–6):
1. AISI 420 (X20Cr13, 1.4021) (Table 2);2. AISI 420C (X46Cr13, 1.4043) (Table 3);3. No AISI (X35CrMo17, 1.4122) (Table 4);4. AISI 630 (X5CrNiCuNb 16-4, 1.4542) (Table 5);5. AISI A182 F51 (329LN)) SAF 2205 (X2CrNiMoN 22-5-3 (UNS S31803) 1.4462) (Table 6).
In order to confirm the material’s chemical composition, samples were analyzed viaspark emission spectrometry SPEKTROLAB M and by the electron probe microanalyzerJXA8900-RLn (Tables 1–6).
Table 1. Chemical composition of 1.7225 (42CrMo4, AISI 4042), in mass percent.
Elements C Si Mn P S Cr Mo Ni Co Fe
acc standard a 0.38–0.45 <0.40 0.6–0.9 ≤0.035 ≤0.035 0.90–1.20 0.15–0.30 restanalysed b 0.43 0.32 0.70 0.014 0.025 1.05 0.22 0.04 <0.01 97.1
a Elements as specified according to DIN EN 10088-3 in %; b spark emission spectrometry.
Table 2. Chemical composition of 1.4021 (X20Cr13, AISI 420A), in mass percent.
Elements C Si Mn P S Cr Mo Ni Co Fe
acc standard a 0.17–0.25 <1.00 ≤1.00 ≤0.045 ≤0.03 12.0–14.0 0.20–0.45analysed b 0.22 0.39 0.32 0.007 0.006 13.3 - 0.123 - rest
a Elements as specified according to DIN EN 10088-3 in %; b spark emission spectrometry.
Table 3. Chemical composition of 1.4043 (X46Cr13, AISI 420C), in mass percent.
Elements C Si Mn P S Cr Mo Ni Co Fe
acc standard a 0.42–0.5 <1.00 ≤1.00 ≤0.045 ≤0.03 12.5–14.5 0.20–0.45analysed b 0.46 0.25 0.45 0.018 0.003 13.39 0.03 0.13 0.03 85.4
a Elements as specified according to DIN EN 10088-3 in %; b spark emission spectrometry.
Table 4. Chemical composition of 1.4122 (X35CrMo17), in mass percent.
Elements C Si Mn P S Cr Mo Ni Co Fe
acc standard a 0.33–0.45 <1.00 ≤1.00 ≤0.045 ≤0.03 15.5–17.5 0.8–1.3 ≤1.00 0.20–0.45a Elements as specified according to DIN EN 10088-3 in %.
Table 5. Chemical composition of 1.4542 (X5CrNiCuNb16-4, AISI 630), in mass percent.
Elements C Si Mn P S Cr Mo Ni Cu Nb
acc standard a ≤0.07 ≤0.70 ≤1.50 ≤0.04 ≤0.015 15.0–17.0 ≤0.60 3.00–5.00 3.00–5.00 0.20–0.45analysed b 0.03 0.42 0.68 0.018 0.002 15.75 0.11 4.54 3.00 0.242
a Elements as specified according to DIN EN 10088-3 in %; b spark emission spectrometry.
Processes 2021, 9, 594 4 of 33
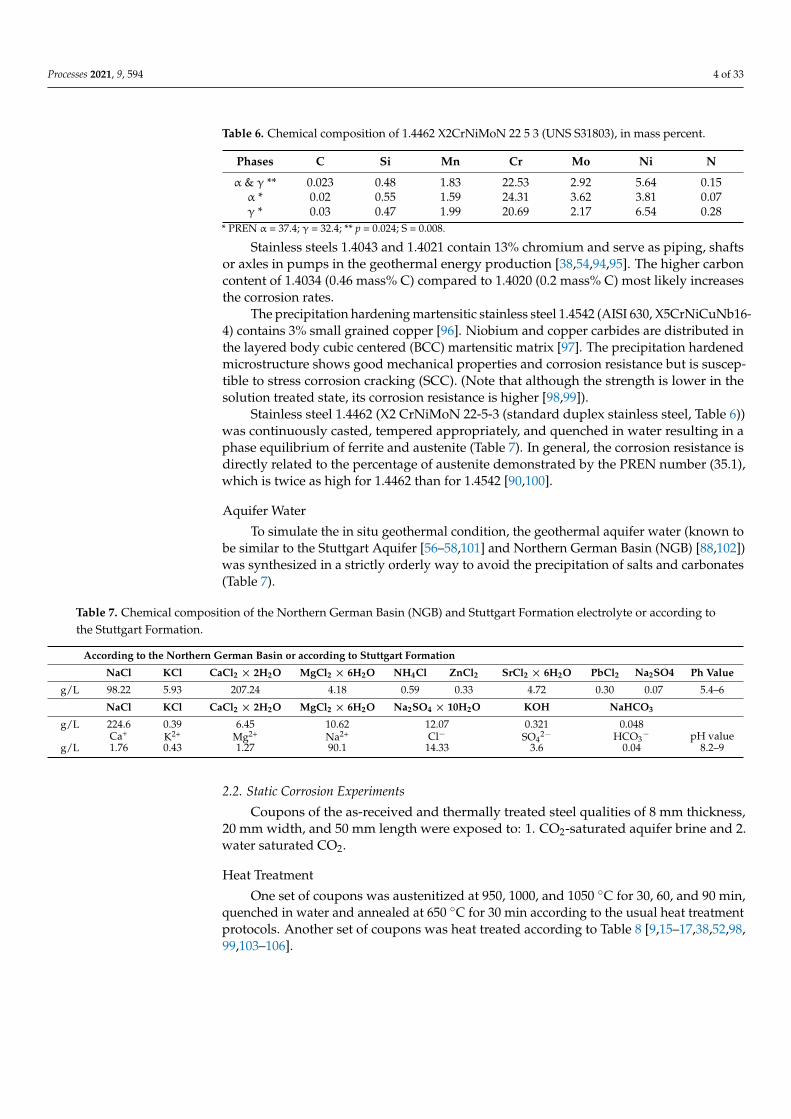
Table 6. Chemical composition of 1.4462 X2CrNiMoN 22 5 3 (UNS S31803), in mass percent.
Phases C Si Mn Cr Mo Ni N
α & γ ** 0.023 0.48 1.83 22.53 2.92 5.64 0.15α * 0.02 0.55 1.59 24.31 3.62 3.81 0.07γ * 0.03 0.47 1.99 20.69 2.17 6.54 0.28
* PREN α = 37.4; γ = 32.4; ** p = 0.024; S = 0.008.
Stainless steels 1.4043 and 1.4021 contain 13% chromium and serve as piping, shaftsor axles in pumps in the geothermal energy production [38,54,94,95]. The higher carboncontent of 1.4034 (0.46 mass% C) compared to 1.4020 (0.2 mass% C) most likely increasesthe corrosion rates.
The precipitation hardening martensitic stainless steel 1.4542 (AISI 630, X5CrNiCuNb16-4) contains 3% small grained copper [96]. Niobium and copper carbides are distributed inthe layered body cubic centered (BCC) martensitic matrix [97]. The precipitation hardenedmicrostructure shows good mechanical properties and corrosion resistance but is suscep-tible to stress corrosion cracking (SCC). (Note that although the strength is lower in thesolution treated state, its corrosion resistance is higher [98,99]).
Stainless steel 1.4462 (X2 CrNiMoN 22-5-3 (standard duplex stainless steel, Table 6))was continuously casted, tempered appropriately, and quenched in water resulting in aphase equilibrium of ferrite and austenite (Table 7). In general, the corrosion resistance isdirectly related to the percentage of austenite demonstrated by the PREN number (35.1),which is twice as high for 1.4462 than for 1.4542 [90,100].
Aquifer Water
To simulate the in situ geothermal condition, the geothermal aquifer water (known tobe similar to the Stuttgart Aquifer [56–58,101] and Northern German Basin (NGB) [88,102])was synthesized in a strictly orderly way to avoid the precipitation of salts and carbonates(Table 7).
Table 7. Chemical composition of the Northern German Basin (NGB) and Stuttgart Formation electrolyte or according tothe Stuttgart Formation.
According to the Northern German Basin or according to Stuttgart Formation
NaCl KCl CaCl2 × 2H2O MgCl2 × 6H2O NH4Cl ZnCl2 SrCl2 × 6H2O PbCl2 Na2SO4 Ph Value
g/L 98.22 5.93 207.24 4.18 0.59 0.33 4.72 0.30 0.07 5.4–6
NaCl KCl CaCl2 × 2H2O MgCl2 × 6H2O Na2SO4 × 10H2O KOH NaHCO3
g/L 224.6 0.39 6.45 10.62 12.07 0.321 0.048Ca+ K2+ Mg2+ Na2+ Cl− SO4
2− HCO3− pH value
g/L 1.76 0.43 1.27 90.1 14.33 3.6 0.04 8.2–9
2.2. Static Corrosion Experiments
Coupons of the as-received and thermally treated steel qualities of 8 mm thickness,20 mm width, and 50 mm length were exposed to: 1. CO2-saturated aquifer brine and 2.water saturated CO2.
Heat Treatment
One set of coupons was austenitized at 950, 1000, and 1050 ◦C for 30, 60, and 90 min,quenched in water and annealed at 650 ◦C for 30 min according to the usual heat treatmentprotocols. Another set of coupons was heat treated according to Table 8 [9,15–17,38,52,98,99,103–106].
Processes 2021, 9, 594 5 of 33
Table 8. Heat treatment protocol for X20Cr13, X46Cr13, and X5CrNiCuNb16-4.
Heat Treatment TAustenitizing/◦C TAustenitizing/◦C TAnnealing/◦C TAnnealing/◦C Time Cooling
X20Cr13/X46Cr13 X5CrNi-CuNb16-4
X20Cr13 andX46Cr13
X5CrNi-CuNb16-4 Min Medium
HT1 normalizing HT1 785 850 30 oil
HT2 hardening 1000 1040 30 oil
HT3 hardening + tempering 1 1040 100 550 655 30 oil
HT4 hardening + tempering 2 1040 1000 650 670 30 oil
HT5 hardening + tempering 3 1040 1000 700 755 30 oil
Specimens were positioned by a hole of 3.9 mm and tested in the vapor phase andliquid phase. A capillary meter GDX600_man by QCAL Messtechnik GmbH, Municcontrolled the CO2 flow (purity 99,995 vol%) into the aquifer water in ambient pressureexperiments at 3 NL/h. Specimens were exposed for 700 to 8000 h using separate reactionvessels at 60 ◦C and 100 bar, as well as ambient pressure [9,15,16] and at 100 bar [9,15–17,38,52,98,99,103–107].
Beforehand, steel surfaces were grinded under water with SiC-paper down to 120 µm.After corrosion testing, samples were dissected with corrosion scales (for scale analysis)and descaled with 37% HCl (for kinetic analysis). Sample parts were embedded usingEpoxicure, Buehler cold resin, then cut and polished from 180 to 1200 µm with SiC-paperunder water and finished with 6 and 1 µm using diamond paste.
2.3. Corrosion Fatigue Experiments
Test Setup
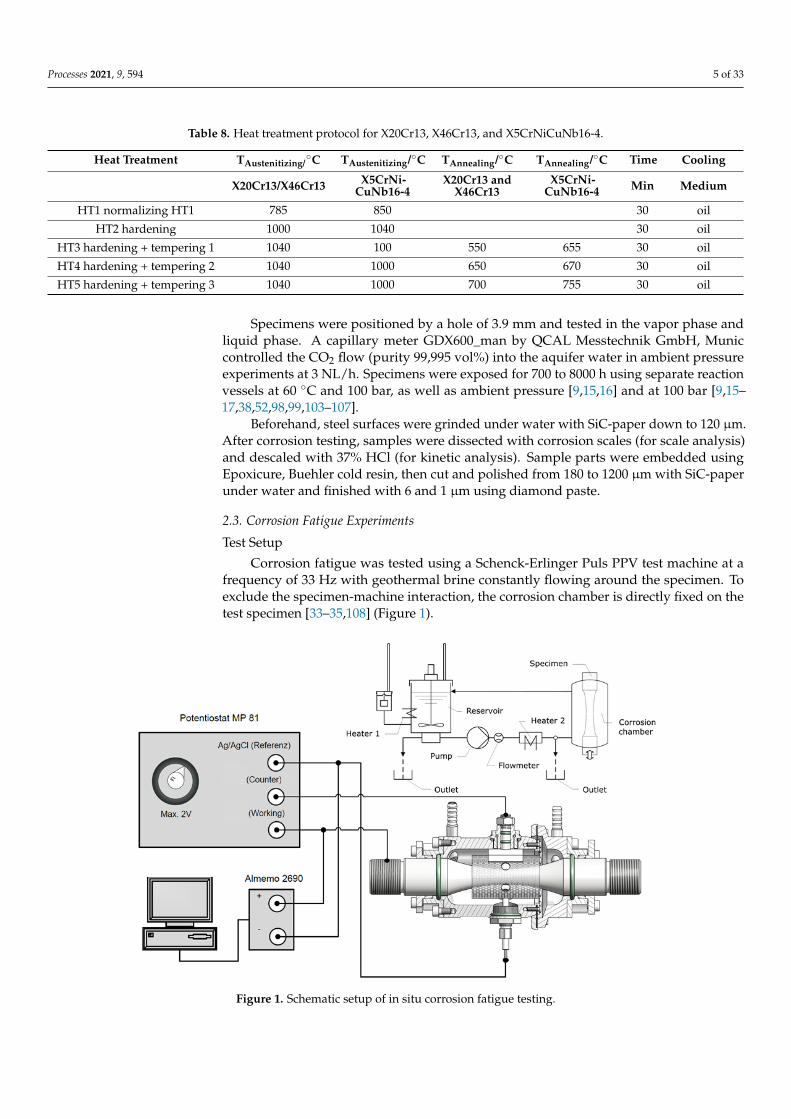
Corrosion fatigue was tested using a Schenck-Erlinger Puls PPV test machine at afrequency of 33 Hz with geothermal brine constantly flowing around the specimen. Toexclude the specimen-machine interaction, the corrosion chamber is directly fixed on thetest specimen [33–35,108] (Figure 1).
Processes 2021, 9, x FOR PEER REVIEW 5 of 33
Table 8. Heat treatment protocol for X20Cr13, X46Cr13, and X5CrNiCuNb16-4.
Heat Treatment T Austenitizing/°C T Austenitizing/°C T Annealing/°C T Annealing/°C Time Cooling
X20Cr13/X46
Cr13 X5CrNi-
CuNb16-4 X20Cr13 and
X46Cr13 X5CrNiCuNb16-4 Min Medium
HT1 normalizing HT1 785 850 30 oil HT2 hardening 1000 1040 30 oil
HT3 hardening + tempering 1 1040 100 550 655 30 oil HT4 hardening + tempering 2 1040 1000 650 670 30 oil HT5 hardening + tempering 3 1040 1000 700 755 30 oil
Specimens were positioned by a hole of 3.9 mm and tested in the vapor phase and liquid phase. A capillary meter GDX600_man by QCAL Messtechnik GmbH, Munic con-trolled the CO2 flow (purity 99,995 vol%) into the aquifer water in ambient pressure ex-periments at 3 NL/h. Specimens were exposed for 700 to 8000 h using separate reaction vessels at 60 °C and 100 bar, as well as ambient pressure [9,15,16] and at 100 bar [9,15–17,38,52,98,99,103–107].
Beforehand, steel surfaces were grinded under water with SiC-paper down to 120 µm. After corrosion testing, samples were dissected with corrosion scales (for scale anal-ysis) and descaled with 37% HCl (for kinetic analysis). Sample parts were embedded us-ing Epoxicure, Buehler cold resin, then cut and polished from 180 to 1200 µm with SiC-paper under water and finished with 6 and 1 µm using diamond paste.
2.3. Corrosion Fatigue Experiments Test Setup
Corrosion fatigue was tested using a Schenck-Erlinger Puls PPV test machine at a frequency of 33 Hz with geothermal brine constantly flowing around the specimen. To exclude the specimen-machine interaction, the corrosion chamber is directly fixed on the test specimen [33–35,108] (Figure 1).
Figure 1. Schematic setup of in situ corrosion fatigue testing. Figure 1. Schematic setup of in situ corrosion fatigue testing.
Processes 2021, 9, 594 6 of 33
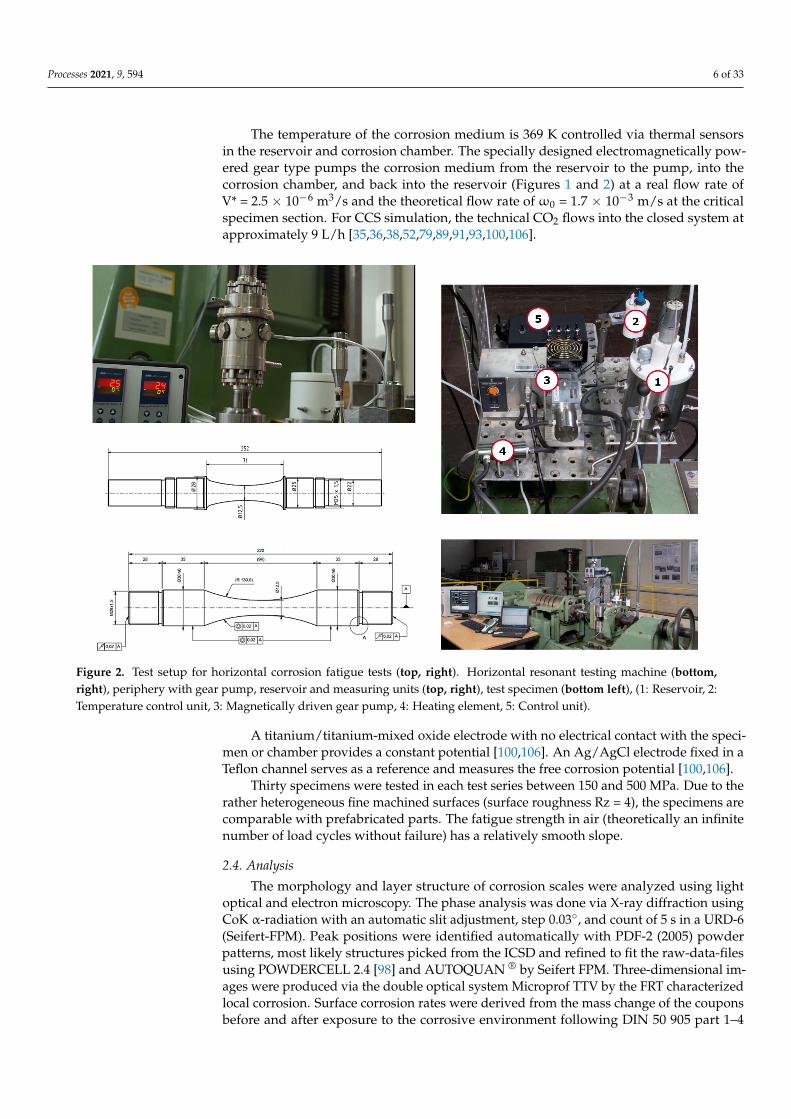
The temperature of the corrosion medium is 369 K controlled via thermal sensorsin the reservoir and corrosion chamber. The specially designed electromagnetically pow-ered gear type pumps the corrosion medium from the reservoir to the pump, into thecorrosion chamber, and back into the reservoir (Figures 1 and 2) at a real flow rate ofV* = 2.5 × 10⁻⁶ m3/s and the theoretical flow rate of ω0 = 1.7 × 10⁻³ m/s at the criticalspecimen section. For CCS simulation, the technical CO2 flows into the closed system atapproximately 9 L/h [35,36,38,52,79,89,91,93,100,106].
Processes 2021, 9, x FOR PEER REVIEW 6 of 33
The temperature of the corrosion medium is 369 K controlled via thermal sensors in the reservoir and corrosion chamber. The specially designed electromagnetically powered gear type pumps the corrosion medium from the reservoir to the pump, into the corrosion chamber, and back into the reservoir (Figures 1 and 2) at a real flow rate of V* = 2.5× 10⁻⁶ m3/s and the theoretical flow rate of ω0 = 1.7 × 10⁻³ m/s at the critical specimen section. For CCS simulation, the technical CO2 flows into the closed system at approximately 9 L/h [35,36,38,52,79,89,91,93,100,106].
Figure 2. Test setup for horizontal corrosion fatigue tests (top, right). Horizontal resonant testing machine (bottom, right), periphery with gear pump, reservoir and measuring units (top, right), test specimen (bottom left), (1: Reservoir, 2: Tem-perature control unit, 3: Magnetically driven gear pump, 4: Heating element, 5: Control unit).
A titanium/titanium-mixed oxide electrode with no electrical contact with the speci-men or chamber provides a constant potential [100,106]. An Ag/AgCl electrode fixed in a Teflon channel serves as a reference and measures the free corrosion potential [100,106].
Thirty specimens were tested in each test series between 150 and 500 MPa. Due to the rather heterogeneous fine machined surfaces (surface roughness Rz = 4), the specimens are comparable with prefabricated parts. The fatigue strength in air (theoretically an infi-nite number of load cycles without failure) has a relatively smooth slope.
2.4. Analysis The morphology and layer structure of corrosion scales were analyzed using light
optical and electron microscopy. The phase analysis was done via X-ray diffraction using CoK α-radiation with an automatic slit adjustment, step 0.03°, and count of 5 s in a URD-6 (Seifert-FPM). Peak positions were identified automatically with PDF-2 (2005) powder patterns, most likely structures picked from the ICSD and refined to fit the raw-data-files using POWDERCELL 2.4 [98] and AUTOQUAN ® by Seifert FPM. Three-dimensional im-ages were produced via the double optical system Microprof TTV by the FRT character-ized local corrosion. Surface corrosion rates were derived from the mass change of the coupons before and after exposure to the corrosive environment following DIN 50 905
Figure 2. Test setup for horizontal corrosion fatigue tests (top, right). Horizontal resonant testing machine (bottom,right), periphery with gear pump, reservoir and measuring units (top, right), test specimen (bottom left), (1: Reservoir, 2:Temperature control unit, 3: Magnetically driven gear pump, 4: Heating element, 5: Control unit).
A titanium/titanium-mixed oxide electrode with no electrical contact with the speci-men or chamber provides a constant potential [100,106]. An Ag/AgCl electrode fixed in aTeflon channel serves as a reference and measures the free corrosion potential [100,106].
Thirty specimens were tested in each test series between 150 and 500 MPa. Due to therather heterogeneous fine machined surfaces (surface roughness Rz = 4), the specimens arecomparable with prefabricated parts. The fatigue strength in air (theoretically an infinitenumber of load cycles without failure) has a relatively smooth slope.
2.4. Analysis
The morphology and layer structure of corrosion scales were analyzed using lightoptical and electron microscopy. The phase analysis was done via X-ray diffraction usingCoK α-radiation with an automatic slit adjustment, step 0.03◦, and count of 5 s in a URD-6(Seifert-FPM). Peak positions were identified automatically with PDF-2 (2005) powderpatterns, most likely structures picked from the ICSD and refined to fit the raw-data-filesusing POWDERCELL 2.4 [98] and AUTOQUAN ® by Seifert FPM. Three-dimensional im-ages were produced via the double optical system Microprof TTV by the FRT characterizedlocal corrosion. Surface corrosion rates were derived from the mass change of the couponsbefore and after exposure to the corrosive environment following DIN 50 905 part 1–4
Processes 2021, 9, 594 7 of 33
(Equation (7)). Moreover, the semi-automatic analyzing program Analysis Docu ax-4 byAquinto allowed for analyzing corrosion kinetics.
corrosion rate[
mmyear
]=
8760[
hoursyear
]· 10[mm
cm]· weight loss[g]
area[cm2] · density[
gcm3
]· time[hour]
(7)
3. Results
In general, the CO2 is injected in its supercritical phase [9,15,17] and reacts with saltsof the aquifer to mineralize in a rather short time [88,101,102]. However, in the case ofinjection intermissions and technical revisions, the aquifer water may rise backwardsinto the borehole creating a three phase boundary consisting of CO2, aquifer water, andsteel from the injection pipe. Here, the steels are most susceptible to a corrosive attackas summarized by Pfennig and Kranzmann [108]. Stable corrosion rates are reliablydetermined after 1 year of exposure [9,15].
3.1. Surface Corrosion
Data regarding surface corrosion was compiled from references: [9,15,36,98,99,105,108].The pitting resistance equivalent (PRE = %Cr + 3.3% Mo + 16% N) is a measure to
describe the pitting resistance of high alloyed stainless steel in corrosive media containinghalogen-ions (e.g., Cl−, F−, etc.). The PRE is identified by the chromium, nitrogen, andmolybdenum content of a steel, the latter particularly increasing the resistance to localand crevice corrosion. A high PRE guarantees a greater reliability and broader field ofapplication since the steel is more resistant against a corrosive attack. Both the ferrite andaustenite phase of duplex stainless steel X2 CrNiMoN 22-5-3 with a high PRE number (53.1)do not deteriorate or show corrosion phenomena, neither after exposure up to 1 year toCO2-saturated Stuttgart Aquifer water [101] nor to the Northern German Basin [88,102].The microstructural change and crack propagation under the dynamic load was analyzedin detail by Wolf et al. [52,100,109].
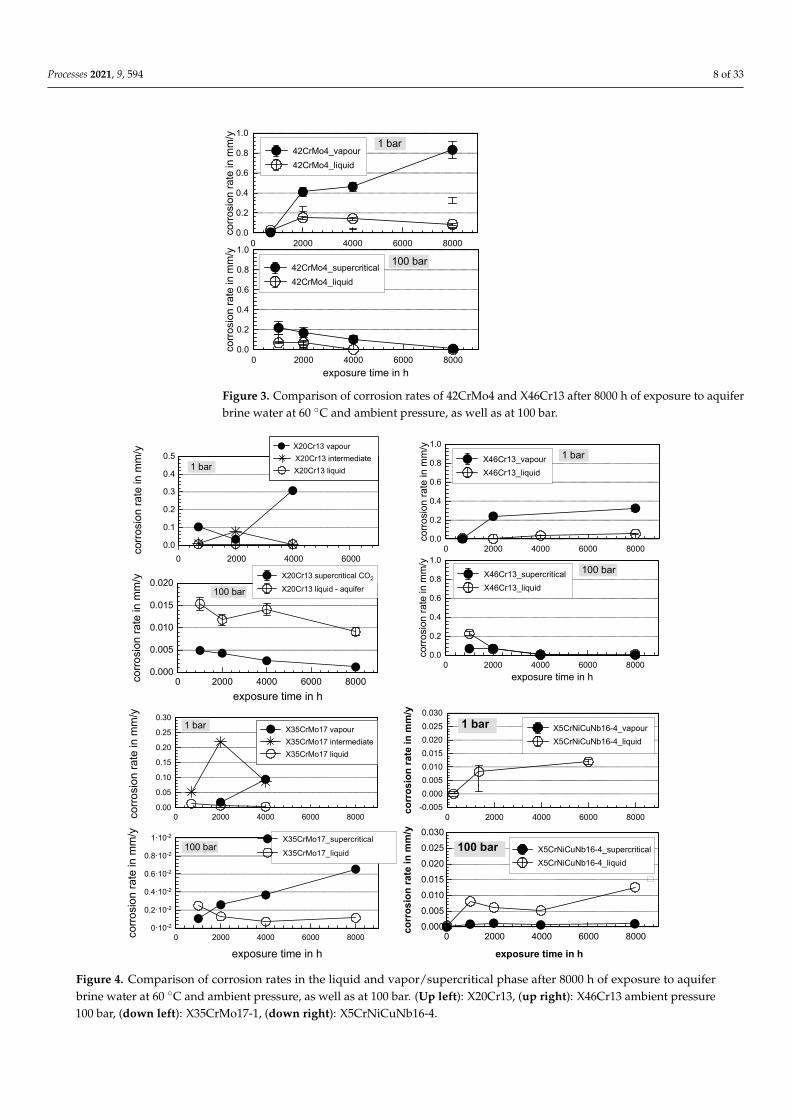
The influence of chromium as a corrosion resistant element is clearly shown for42CrMo4. The stainless steel 42CrMo4 has a relatively high Mo-content of 0.22 wt%exceeding that of X46Cr13 by a factor of 7 (0.03 wt%). However, corrosion rates are highdue to the low chromium content (1.05 wt%) compared to the much lower corrosion ratesresulting in a smaller corrosion layer of X46Cr13 (PRE = 12.5–14.5, Cr = 13.39 wt%).
Under pressure at 100 bar corrosion rates are lower than at ambient pressure, asshown for the mild steel 42CrMo4 in Figure 3 [9,15,105,108] and martensitic stainless steelsX20Cr13, X46Cr13, X35CrMo17, and X5CrNiCuNb 16-4 in Figure 4 [9,15,105,108]. Highercorrosion rates at ambient pressure may be attributed to the corrosion layer with an opencapillary system (not present at 100 bar) enabling a fast mutual diffusion of ionic species asa requirement for scale growth [105].
Corrosion scale: The complicated multi-layered corrosion scale analyzed after exposureat ambient pressure [15,105,108] reveals a carbonate/oxide structure that mainly comprisesof siderite FeCO3, goethite a-FeOOH, mackinawite FeS, and akaganeite Fe8O8(OH)8Cl1.34.Additionally, various chemically different spinel-phases and carbides (Fe3C or Cr-rich ironcarbides, first described by Hünert et al. [110]) are present. Note that the corrosion productsin pits are the same as in the surface corrosion layers [16,105,108].
Processes 2021, 9, 594 8 of 33Processes 2021, 9, x FOR PEER REVIEW 8 of 33
Figure 3. Comparison of corrosion rates of 42CrMo4 and X46Cr13 after 8000 h of exposure to aqui-fer brine water at 60 °C and ambient pressure, as well as at 100 bar.
Figure 4. Comparison of corrosion rates in the liquid and vapor/supercritical phase after 8000 h of exposure to aquifer brine water at 60 °C and ambient pressure, as well as at 100 bar. (Up left): X20Cr13, (up right): X46Cr13 ambient pressure 100 bar, (down left): X35CrMo17-1, (down right): X5CrNiCuNb16-4.
0.0
0.2
0.4
0.6
0.8
1.0
corro
sion
rate
in m
m/y
0 2000 4000 6000 8000exposure time in h
0.0
0.2
0.4
0.6
0.8
1.0
corro
sion
rate
in m
m/y
0 2000 4000 6000 8000
42CrMo4_supercritical42CrMo4_liquid
1 bar
100 bar
42CrMo4_vapour42CrMo4_liquid
0·10-2
0.2·10-2
0.4·10-2
0.6·10-2
0.8·10-2
1·10-2
corro
sion
rate
in m
m/y
0 2000 4000 6000 8000
exposure time in h
X35CrMo17_liquid
X35CrMo17_supercritical 100 bar
0.00
0.05
0.10
0.15
0.20
0.25
0.30
corro
sion
rate
in m
m/y
0 2000 4000 6000 8000
X35CrMo17 vapourX35CrMo17 intermediateX35CrMo17 liquid
1 bar
-0.0050.0000.0050.0100.0150.0200.0250.030
corr
osio
n ra
te in
mm
/y
0 2000 4000 6000 8000
� 1 bar
0.000
0.005
0.010
0.015
0.020
0.025
0.030
corr
osio
n ra
te in
mm
/y
0 2000 4000 6000 8000
exposure time in h
X5CrNiCuNb16-4_vapourX5CrNiCuNb16-4_liquid
X5CrNiCuNb16-4_supercriticalX5CrNiCuNb16-4_liquid
100 bar
0.000
0.005
0.010
0.015
0.020
corro
sion
rate
in m
m/y
0 2000 4000 6000 8000exposure time in h
X20Cr13 supercritical CO2
X20Cr13 liquid - aquifer 100 bar
1 bar
0.0
0.1
0.2
0.3
0.4
0.5
corro
sion
rate
in m
m/y
0 2000 4000 6000
X20Cr13 vapourX20Cr13 intermediateX20Cr13 liquid
0.0
0.2
0.4
0.6
0.8
1.0
corro
sion
rate
in m
m/y
0 2000 4000 6000 8000exposure time in h
0.0
0.2
0.4
0.6
0.8
1.0
corro
sion
rate
in m
m/y
0 2000 4000 6000 8000
X46Cr13_supercriticalX46Cr13_liquid
1 bar
100 bar
X46Cr13_vapourX46Cr13_liquid
Figure 3. Comparison of corrosion rates of 42CrMo4 and X46Cr13 after 8000 h of exposure to aquiferbrine water at 60 ◦C and ambient pressure, as well as at 100 bar.
Processes 2021, 9, x FOR PEER REVIEW 8 of 33
Figure 3. Comparison of corrosion rates of 42CrMo4 and X46Cr13 after 8000 h of exposure to aqui-fer brine water at 60 °C and ambient pressure, as well as at 100 bar.
Figure 4. Comparison of corrosion rates in the liquid and vapor/supercritical phase after 8000 h of exposure to aquifer brine water at 60 °C and ambient pressure, as well as at 100 bar. (Up left): X20Cr13, (up right): X46Cr13 ambient pressure 100 bar, (down left): X35CrMo17-1, (down right): X5CrNiCuNb16-4.
0.0
0.2
0.4
0.6
0.8
1.0
corro
sion
rate
in m
m/y
0 2000 4000 6000 8000exposure time in h
0.0
0.2
0.4
0.6
0.8
1.0co
rrosi
on ra
te in
mm
/y
0 2000 4000 6000 8000
42CrMo4_supercritical42CrMo4_liquid
1 bar
100 bar
42CrMo4_vapour42CrMo4_liquid
0·10-2
0.2·10-2
0.4·10-2
0.6·10-2
0.8·10-2
1·10-2
corro
sion
rate
in m
m/y
0 2000 4000 6000 8000
exposure time in h
X35CrMo17_liquid
X35CrMo17_supercritical 100 bar
0.00
0.05
0.10
0.15
0.20
0.25
0.30
corro
sion
rate
in m
m/y
0 2000 4000 6000 8000
X35CrMo17 vapourX35CrMo17 intermediateX35CrMo17 liquid
1 bar
-0.0050.0000.0050.0100.0150.0200.0250.030
corr
osio
n ra
te in
mm
/y
0 2000 4000 6000 8000
�
1 bar
0.000
0.005
0.010
0.015
0.020
0.025
0.030
corr
osio
n ra
te in
mm
/y
0 2000 4000 6000 8000
exposure time in h
X5CrNiCuNb16-4_vapourX5CrNiCuNb16-4_liquid
X5CrNiCuNb16-4_supercriticalX5CrNiCuNb16-4_liquid
100 bar
0.000
0.005
0.010
0.015
0.020
corro
sion
rate
in m
m/y
0 2000 4000 6000 8000exposure time in h
X20Cr13 supercritical CO2
X20Cr13 liquid - aquifer 100 bar
1 bar
0.0
0.1
0.2
0.3
0.4
0.5
corro
sion
rate
in m
m/y
0 2000 4000 6000
X20Cr13 vapourX20Cr13 intermediateX20Cr13 liquid
0.0
0.2
0.4
0.6
0.8
1.0
corro
sion
rate
in m
m/y
0 2000 4000 6000 8000exposure time in h
0.0
0.2
0.4
0.6
0.8
1.0
corro
sion
rate
in m
m/y
0 2000 4000 6000 8000
X46Cr13_supercriticalX46Cr13_liquid
1 bar
100 bar
X46Cr13_vapourX46Cr13_liquid
Figure 4. Comparison of corrosion rates in the liquid and vapor/supercritical phase after 8000 h of exposure to aquiferbrine water at 60 ◦C and ambient pressure, as well as at 100 bar. (Up left): X20Cr13, (up right): X46Cr13 ambient pressure100 bar, (down left): X35CrMo17-1, (down right): X5CrNiCuNb16-4.
Processes 2021, 9, 594 9 of 33
Exposure time: For 42CrMo4, X20Cr13, and X46Cr13, the corrosion rates increase withtime at ambient pressure and decrease with time at 100 bar. In the vapor phase at ambientpressure, the corrosion rate for 42CrMo4 doubles from 4000 h (0.45 mm/year) of exposureto 8000 h (0.8 mm/year). In the liquid phase, the exposure time has little impact on the cor-rosion rate. The same applies for both atmospheres at 100 bar [105,108]. This correspondswith the thickness of the precipitation layer that is greater in the vapor/supercritical thanin the liquid phase. Possibly, the experimental low pressure system is not completely gastight and excess oxygen accelerates the corrosive degradation of the steel rates as a functionof time. At 100 bar, however, fast forming hydroxides [3,12,37,105,108] passivate the steelsurface initially then react to form a siderite-layer that increases with time and acts as adiffusion barrier. For X5CrNiCuNb16-4 and X35CrMo17, corrosion rates generally increaseslightly (at ambient pressure as well as at 100 bar) [105] attributed to the passivating layerbreaking down. Although the alloy composition accounts for a stable passivating layer,additional local corrosion phenomena increase the overall corrosion rates.
Pressure: The corrosion rates at ambient pressure are much higher for 42CrMo4,X20Cr13, and X35CrMo4 than at 100 bar. Stainless steels X20Cr13 and X5CrNiCuNb16-4show less dependence on pressure.
Atmosphere with regards to pressure: At ambient pressure, corrosion rates in the vaporphase (water-saturated CO2) are higher by a factor of 3–8 compared to the liquid phase(CO2-saturated water). At 100 bar, corrosion rates in the liquid phase can be both higher orlower than in the vapor/supercritical phase.
The atmosphere (liquid, vapor or supercritical atmosphere) does not significantly influ-ence the general corrosive behavior. That is: It cannot be stated that the vapor/supercriticalatmosphere (water saturated CO2) leads to higher or lower corrosion rates than the liquidatmosphere (CO2-saturated water). In the vapor phase, the supercritical CO2 is satu-rated with H2O in contrast to the liquid phase where liquid H2O saturated with CO2.Although it is known that the corrosion rate increases with the increasing CO2-partialpressure [3,105,108], the explanation that higher corrosion rates in the vapor (supercritical)phase correspond with the high CO2 partial pressure compared to the liquid phase with alower CO2 partial pressure does not count here.
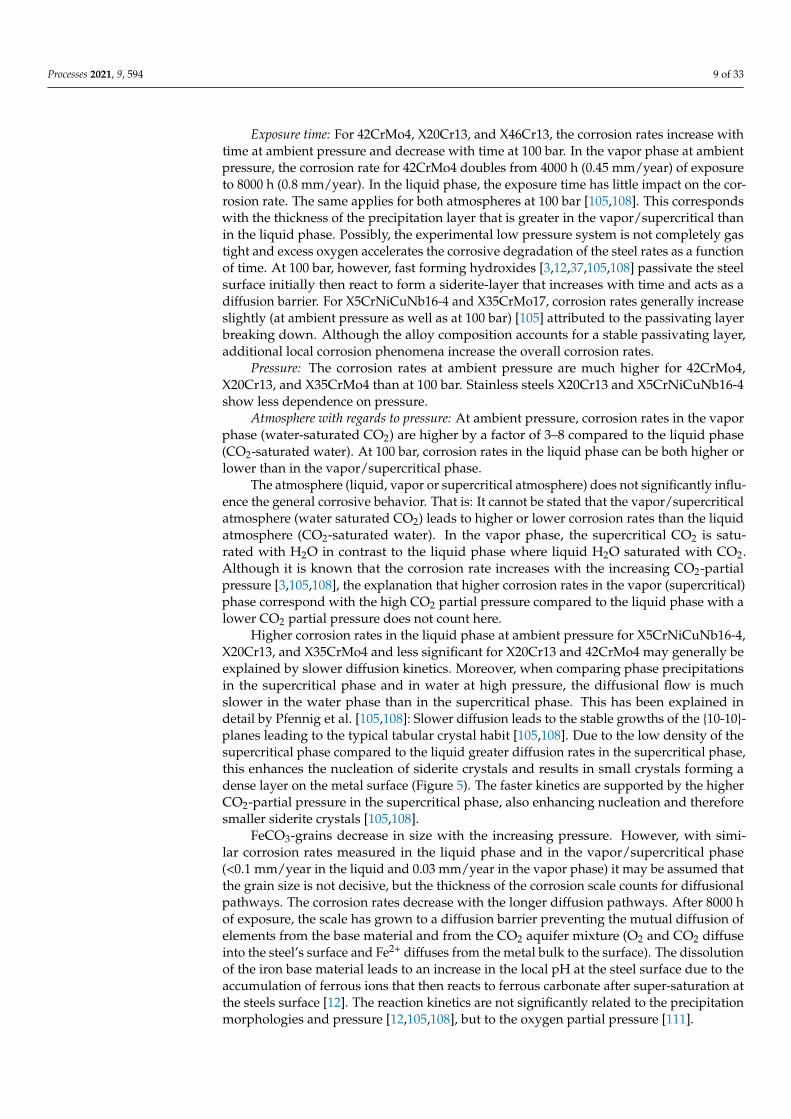
Higher corrosion rates in the liquid phase at ambient pressure for X5CrNiCuNb16-4,X20Cr13, and X35CrMo4 and less significant for X20Cr13 and 42CrMo4 may generally beexplained by slower diffusion kinetics. Moreover, when comparing phase precipitationsin the supercritical phase and in water at high pressure, the diffusional flow is muchslower in the water phase than in the supercritical phase. This has been explained indetail by Pfennig et al. [105,108]: Slower diffusion leads to the stable growths of the {10-10}-planes leading to the typical tabular crystal habit [105,108]. Due to the low density of thesupercritical phase compared to the liquid greater diffusion rates in the supercritical phase,this enhances the nucleation of siderite crystals and results in small crystals forming adense layer on the metal surface (Figure 5). The faster kinetics are supported by the higherCO2-partial pressure in the supercritical phase, also enhancing nucleation and thereforesmaller siderite crystals [105,108].
FeCO3-grains decrease in size with the increasing pressure. However, with simi-lar corrosion rates measured in the liquid phase and in the vapor/supercritical phase(<0.1 mm/year in the liquid and 0.03 mm/year in the vapor phase) it may be assumed thatthe grain size is not decisive, but the thickness of the corrosion scale counts for diffusionalpathways. The corrosion rates decrease with the longer diffusion pathways. After 8000 hof exposure, the scale has grown to a diffusion barrier preventing the mutual diffusion ofelements from the base material and from the CO2 aquifer mixture (O2 and CO2 diffuseinto the steel’s surface and Fe2+ diffuses from the metal bulk to the surface). The dissolutionof the iron base material leads to an increase in the local pH at the steel surface due to theaccumulation of ferrous ions that then reacts to ferrous carbonate after super-saturation atthe steels surface [12]. The reaction kinetics are not significantly related to the precipitationmorphologies and pressure [12,105,108], but to the oxygen partial pressure [111].
Processes 2021, 9, 594 10 of 33
Processes 2021, 9, x FOR PEER REVIEW 10 of 33
precipitation morphologies and pressure [12,105,108], but to the oxygen partial pressure [111].
Figure 5. Surface precipitation on 42CrMo4 after exposure to CO2 saturated saline aquifer water for 8000 h at ambient pressure and 100 bar. (Top left and right): Cross section (vapor), (bottom left): Vapor, (right): Liquid.
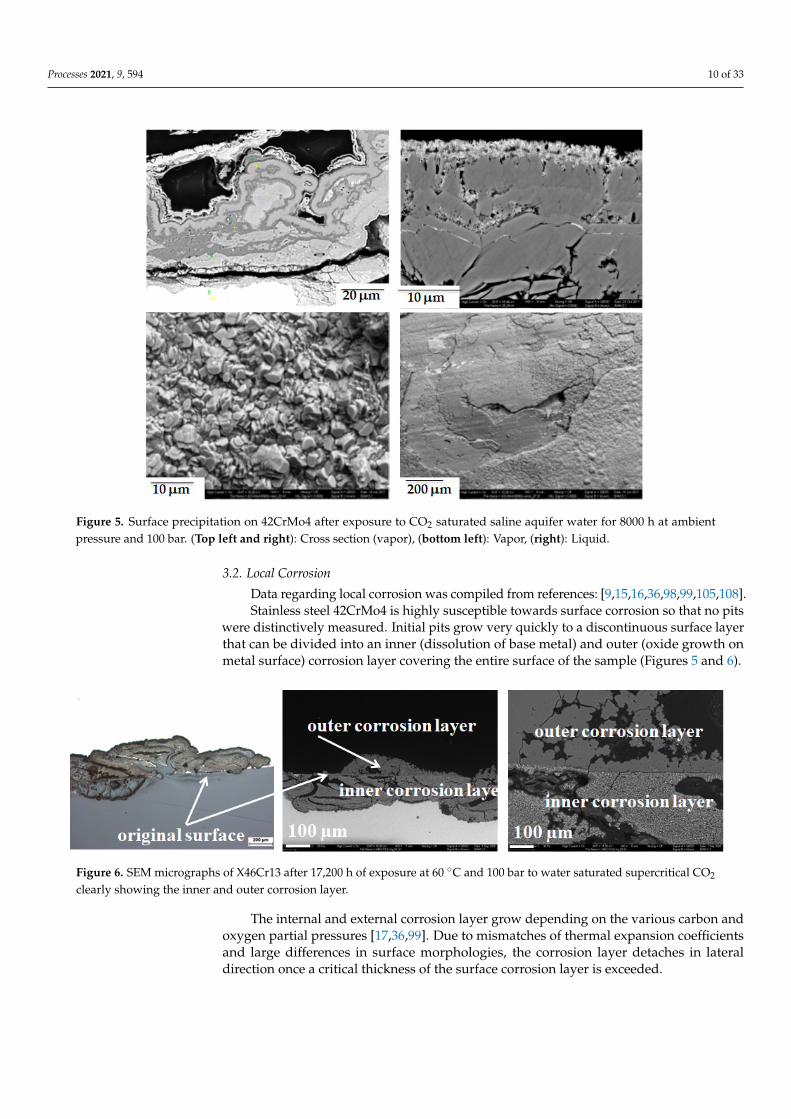
3.2. Local Corrosion Data regarding local corrosion was compiled from references:
[9,15,16,36,98,99,105,108]. Stainless steel 42CrMo4 is highly susceptible towards surface corrosion so that no
pits were distinctively measured. Initial pits grow very quickly to a discontinuous surface layer that can be divided into an inner (dissolution of base metal) and outer (oxide growth on metal surface) corrosion layer covering the entire surface of the sample (Figures 5 and 6).
Figure 6. SEM micrographs of X46Cr13 after 17,200 h of exposure at 60 °C and 100 bar to water saturated supercritical CO2 clearly showing the inner and outer corrosion layer.
The internal and external corrosion layer grow depending on the various carbon and oxygen partial pressures [17,36,99]. Due to mismatches of thermal expansion coefficients
Figure 5. Surface precipitation on 42CrMo4 after exposure to CO2 saturated saline aquifer water for 8000 h at ambientpressure and 100 bar. (Top left and right): Cross section (vapor), (bottom left): Vapor, (right): Liquid.
3.2. Local Corrosion
Data regarding local corrosion was compiled from references: [9,15,16,36,98,99,105,108].Stainless steel 42CrMo4 is highly susceptible towards surface corrosion so that no pits
were distinctively measured. Initial pits grow very quickly to a discontinuous surface layerthat can be divided into an inner (dissolution of base metal) and outer (oxide growth onmetal surface) corrosion layer covering the entire surface of the sample (Figures 5 and 6).
Processes 2021, 9, x FOR PEER REVIEW 10 of 33
precipitation morphologies and pressure [12,105,108], but to the oxygen partial pressure [111].
Figure 5. Surface precipitation on 42CrMo4 after exposure to CO2 saturated saline aquifer water for 8000 h at ambient pressure and 100 bar. (Top left and right): Cross section (vapor), (bottom left): Vapor, (right): Liquid.
3.2. Local Corrosion Data regarding local corrosion was compiled from references:
[9,15,16,36,98,99,105,108]. Stainless steel 42CrMo4 is highly susceptible towards surface corrosion so that no
pits were distinctively measured. Initial pits grow very quickly to a discontinuous surface layer that can be divided into an inner (dissolution of base metal) and outer (oxide growth on metal surface) corrosion layer covering the entire surface of the sample (Figures 5 and 6).
Figure 6. SEM micrographs of X46Cr13 after 17,200 h of exposure at 60 °C and 100 bar to water saturated supercritical CO2 clearly showing the inner and outer corrosion layer.
The internal and external corrosion layer grow depending on the various carbon and oxygen partial pressures [17,36,99]. Due to mismatches of thermal expansion coefficients
Figure 6. SEM micrographs of X46Cr13 after 17,200 h of exposure at 60 ◦C and 100 bar to water saturated supercritical CO2
clearly showing the inner and outer corrosion layer.
The internal and external corrosion layer grow depending on the various carbon andoxygen partial pressures [17,36,99]. Due to mismatches of thermal expansion coefficientsand large differences in surface morphologies, the corrosion layer detaches in lateraldirection once a critical thickness of the surface corrosion layer is exceeded.
Processes 2021, 9, 594 11 of 33
This local surface degradation is enhanced since oxygen vacancies, as a result ofEquations (1)–(6), consolidate and condense at the hydroxide/brine interface. The depen-dence on the anionic concentration of the consecutive reactions has been discussed byWei et al. [112]. As a consequence, the siderite detaches from a transient hydroxide film de-scribed in detail by various authors [6,17,26,36] with vacancies generated by carbonate ionsbeing the main cause for the precipitation of oxygen vacancies (Equations (8) and (9)a,b):
Fe + 2H2O→ [Fe(OH)2]ads +2H+ + 2e− (8)
[Fe(OH)2]ads + H2O→ alpha-FeOOH + 3H+ + 3e− (9a)
[Fe(OH)2]ads + [H2CO3]ads→ FeCO3 + 2H2O (9b)
The flowing corrosive media removes the remaining film causing the pit to growwider and eventually covers the entire surface.
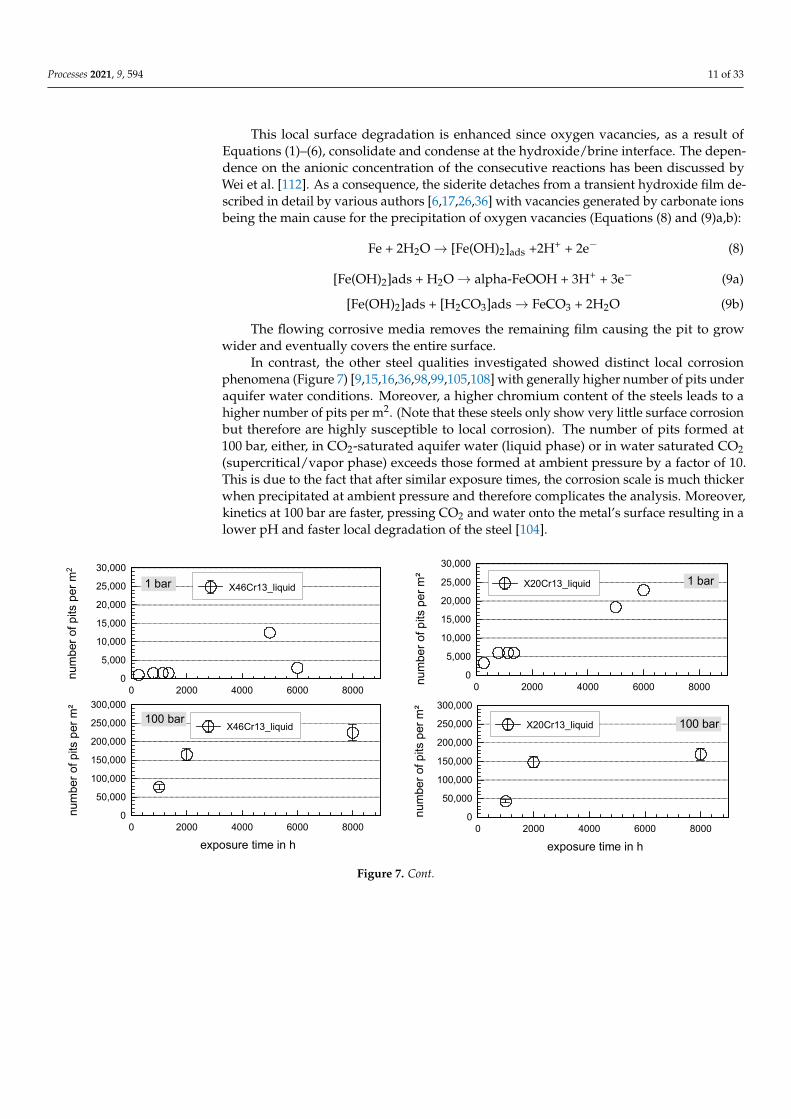
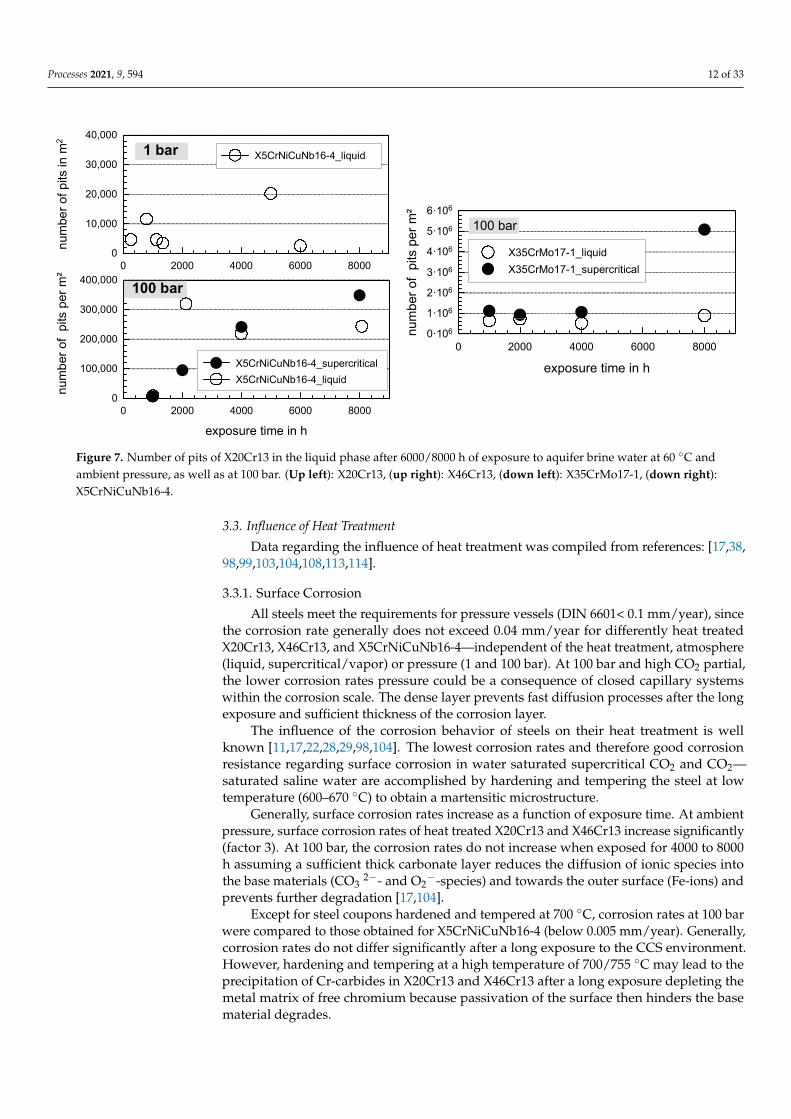
In contrast, the other steel qualities investigated showed distinct local corrosionphenomena (Figure 7) [9,15,16,36,98,99,105,108] with generally higher number of pits underaquifer water conditions. Moreover, a higher chromium content of the steels leads to ahigher number of pits per m2. (Note that these steels only show very little surface corrosionbut therefore are highly susceptible to local corrosion). The number of pits formed at100 bar, either, in CO2-saturated aquifer water (liquid phase) or in water saturated CO2(supercritical/vapor phase) exceeds those formed at ambient pressure by a factor of 10.This is due to the fact that after similar exposure times, the corrosion scale is much thickerwhen precipitated at ambient pressure and therefore complicates the analysis. Moreover,kinetics at 100 bar are faster, pressing CO2 and water onto the metal’s surface resulting in alower pH and faster local degradation of the steel [104].
Processes 2021, 9, x FOR PEER REVIEW 11 of 33
and large differences in surface morphologies, the corrosion layer detaches in lateral di-rection once a critical thickness of the surface corrosion layer is exceeded.
This local surface degradation is enhanced since oxygen vacancies, as a result of Equations (1)–(6), consolidate and condense at the hydroxide/brine interface. The depend-ence on the anionic concentration of the consecutive reactions has been discussed by Wei et al. [112]. As a consequence, the siderite detaches from a transient hydroxide film de-scribed in detail by various authors [6,17,26,36] with vacancies generated by carbonate ions being the main cause for the precipitation of oxygen vacancies (Equations 8 and 9a,b):
Fe + 2H2O → [Fe(OH)2]ads +2H+ + 2e− (8)
[Fe(OH)2]ads + H2O → alpha-FeOOH + 3H+ + 3e− (9a)
[Fe(OH)2]ads + [H2CO3]ads → FeCO3 + 2H2O (9b)
The flowing corrosive media removes the remaining film causing the pit to grow wider and eventually covers the entire surface.
In contrast, the other steel qualities investigated showed distinct local corrosion phe-nomena (Figure 7) [9,15,16,36,98,99,105,108] with generally higher number of pits under aquifer water conditions. Moreover, a higher chromium content of the steels leads to a higher number of pits per m2. (Note that these steels only show very little surface corro-sion but therefore are highly susceptible to local corrosion). The number of pits formed at 100 bar, either, in CO2-saturated aquifer water (liquid phase) or in water saturated CO2 (supercritical/vapor phase) exceeds those formed at ambient pressure by a factor of 10. This is due to the fact that after similar exposure times, the corrosion scale is much thicker when precipitated at ambient pressure and therefore complicates the analysis. Moreover, kinetics at 100 bar are faster, pressing CO2 and water onto the metal’s surface resulting in a lower pH and faster local degradation of the steel [104].
0
5,000
10,000
15,000
20,000
25,000
30,000
num
ber o
f pits
per
m2
0 2000 4000 6000 8000
0
50,000
100,000
150,000
200,000
250,000
300,000
num
ber o
f pits
per
m²
0 2000 4000 6000 8000
exposure time in h
X46Cr13_liquid 100 bar
1 bar X46Cr13_liquid
0
50,000
100,000
150,000
200,000
250,000
300,000
num
ber o
f pits
per
m²
0 2000 4000 6000 8000
exposure time in h
100 bar
0
5,000
10,000
15,000
20,000
25,000
30,000
num
ber o
f pits
per
m²
0 2000 4000 6000 8000
1 bar
X20Cr13_liquid
X20Cr13_liquid
Figure 7. Cont.
Processes 2021, 9, 594 12 of 33Processes 2021, 9, x FOR PEER REVIEW 12 of 33
Figure 7. Number of pits of X20Cr13 in the liquid phase after 6000/8000 h of exposure to aquifer brine water at 60 °C and ambient pressure, as well as at 100 bar. (Up left): X20Cr13, (up right): X46Cr13, (down left): X35CrMo17-1, (down right): X5CrNiCuNb16-4.
3.3. Influence of Heat Treatment Data regarding the influence of heat treatment was compiled from references:
[17,38,98,99,103,104,108,113,114]. 3.3.1. Surface Corrosion
All steels meet the requirements for pressure vessels (DIN 6601< 0.1 mm/year), since the corrosion rate generally does not exceed 0.04 mm/year for differently heat treated X20Cr13, X46Cr13, and X5CrNiCuNb16-4—independent of the heat treatment, atmos-phere (liquid, supercritical/vapor) or pressure (1 and 100 bar). At 100 bar and high CO2 partial, the lower corrosion rates pressure could be a consequence of closed capillary sys-tems within the corrosion scale. The dense layer prevents fast diffusion processes after the long exposure and sufficient thickness of the corrosion layer.
The influence of the corrosion behavior of steels on their heat treatment is well known [11,17,22,28,29,98,104]. The lowest corrosion rates and therefore good corrosion resistance regarding surface corrosion in water saturated supercritical CO2 and CO2—saturated sa-line water are accomplished by hardening and tempering the steel at low temperature (600–670 °C) to obtain a martensitic microstructure.
Generally, surface corrosion rates increase as a function of exposure time. At ambient pressure, surface corrosion rates of heat treated X20Cr13 and X46Cr13 increase signifi-cantly (factor 3). At 100 bar, the corrosion rates do not increase when exposed for 4000 to 8000 h assuming a sufficient thick carbonate layer reduces the diffusion of ionic species into the base materials (CO3 2− -and O2− -species) and towards the outer surface (Fe-ions) and prevents further degradation [17,104].
Except for steel coupons hardened and tempered at 700 °C, corrosion rates at 100 bar were compared to those obtained for X5CrNiCuNb16-4 (below 0.005 mm/year). Gener-ally, corrosion rates do not differ significantly after a long exposure to the CCS environ-ment. However, hardening and tempering at a high temperature of 700/755 °C may lead to the precipitation of Cr-carbides in X20Cr13 and X46Cr13 after a long exposure depleting the metal matrix of free chromium because passivation of the surface then hinders the base material degrades.
0
100,000
200,000
300,000
400,000
num
ber o
f pi
ts p
er m
²
0 2000 4000 6000 8000
exposure time in h
0
10,000
20,000
30,000
40,000
num
ber o
f pits
in m
2
0 2000 4000 6000 8000
1 bar
100 bar
X5CrNiCuNb16-4_liquid
X5CrNiCuNb16-4_supercriticalX5CrNiCuNb16-4_liquid
0·106
1·106
2·106
3·106
4·106
5·106
6·106
num
ber o
f pi
ts p
er m
²
0 2000 4000 6000 8000
exposure time in h
X35CrMo17-1_liquidX35CrMo17-1_supercritical
100 bar
Figure 7. Number of pits of X20Cr13 in the liquid phase after 6000/8000 h of exposure to aquifer brine water at 60 ◦C andambient pressure, as well as at 100 bar. (Up left): X20Cr13, (up right): X46Cr13, (down left): X35CrMo17-1, (down right):X5CrNiCuNb16-4.
3.3. Influence of Heat Treatment
Data regarding the influence of heat treatment was compiled from references: [17,38,98,99,103,104,108,113,114].
3.3.1. Surface Corrosion
All steels meet the requirements for pressure vessels (DIN 6601< 0.1 mm/year), sincethe corrosion rate generally does not exceed 0.04 mm/year for differently heat treatedX20Cr13, X46Cr13, and X5CrNiCuNb16-4—independent of the heat treatment, atmosphere(liquid, supercritical/vapor) or pressure (1 and 100 bar). At 100 bar and high CO2 partial,the lower corrosion rates pressure could be a consequence of closed capillary systemswithin the corrosion scale. The dense layer prevents fast diffusion processes after the longexposure and sufficient thickness of the corrosion layer.
The influence of the corrosion behavior of steels on their heat treatment is wellknown [11,17,22,28,29,98,104]. The lowest corrosion rates and therefore good corrosionresistance regarding surface corrosion in water saturated supercritical CO2 and CO2—saturated saline water are accomplished by hardening and tempering the steel at lowtemperature (600–670 ◦C) to obtain a martensitic microstructure.
Generally, surface corrosion rates increase as a function of exposure time. At ambientpressure, surface corrosion rates of heat treated X20Cr13 and X46Cr13 increase significantly(factor 3). At 100 bar, the corrosion rates do not increase when exposed for 4000 to 8000h assuming a sufficient thick carbonate layer reduces the diffusion of ionic species intothe base materials (CO3
2−- and O2−-species) and towards the outer surface (Fe-ions) and
prevents further degradation [17,104].Except for steel coupons hardened and tempered at 700 ◦C, corrosion rates at 100 bar
were compared to those obtained for X5CrNiCuNb16-4 (below 0.005 mm/year). Generally,corrosion rates do not differ significantly after a long exposure to the CCS environment.However, hardening and tempering at a high temperature of 700/755 ◦C may lead to theprecipitation of Cr-carbides in X20Cr13 and X46Cr13 after a long exposure depleting themetal matrix of free chromium because passivation of the surface then hinders the basematerial degrades.
Processes 2021, 9, 594 13 of 33
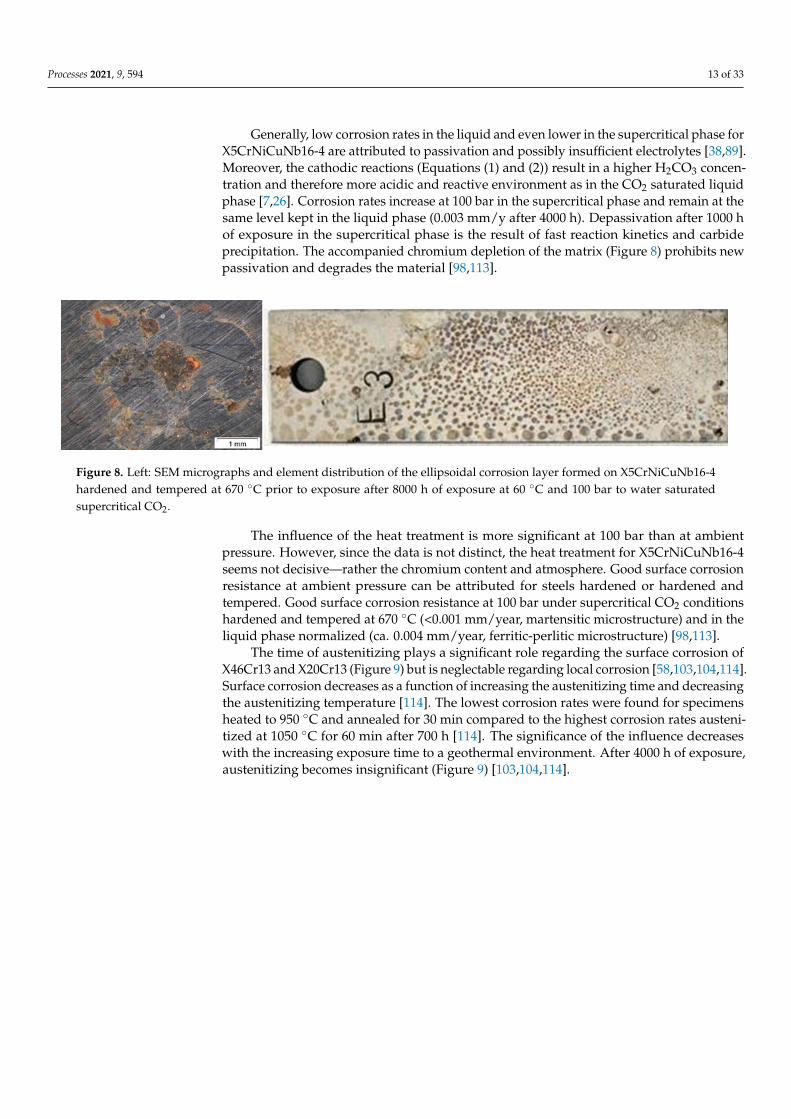
Generally, low corrosion rates in the liquid and even lower in the supercritical phase forX5CrNiCuNb16-4 are attributed to passivation and possibly insufficient electrolytes [38,89].Moreover, the cathodic reactions (Equations (1) and (2)) result in a higher H2CO3 concen-tration and therefore more acidic and reactive environment as in the CO2 saturated liquidphase [7,26]. Corrosion rates increase at 100 bar in the supercritical phase and remain at thesame level kept in the liquid phase (0.003 mm/y after 4000 h). Depassivation after 1000 hof exposure in the supercritical phase is the result of fast reaction kinetics and carbideprecipitation. The accompanied chromium depletion of the matrix (Figure 8) prohibits newpassivation and degrades the material [98,113].
Processes 2021, 9, x FOR PEER REVIEW 13 of 33
Generally, low corrosion rates in the liquid and even lower in the supercritical phase for X5CrNiCuNb16-4 are attributed to passivation and possibly insufficient electrolytes [38,89]. Moreover, the cathodic reactions (Equations (1) and (2)) result in a higher H2CO3 concentration and therefore more acidic and reactive environment as in the CO2 saturated liquid phase [7,26]. Corrosion rates increase at 100 bar in the supercritical phase and re-main at the same level kept in the liquid phase (0.003 mm/y after 4000 h). Depassivation after 1000 h of exposure in the supercritical phase is the result of fast reaction kinetics and carbide precipitation. The accompanied chromium depletion of the matrix (Figure 8) pro-hibits new passivation and degrades the material [98,113].
Figure 8. Left: SEM micrographs and element distribution of the ellipsoidal corrosion layer formed on X5CrNiCuNb16-4 hardened and tempered at 670 °C prior to exposure after 8000 h of exposure at 60 °C and 100 bar to water saturated supercritical CO2.
The influence of the heat treatment is more significant at 100 bar than at ambient pressure. However, since the data is not distinct, the heat treatment for X5CrNiCuNb16-4 seems not decisive—rather the chromium content and atmosphere. Good surface corro-sion resistance at ambient pressure can be attributed for steels hardened or hardened and tempered. Good surface corrosion resistance at 100 bar under supercritical CO2 conditions hardened and tempered at 670 °C (<0.001 mm/year, martensitic microstructure) and in the liquid phase normalized (ca. 0.004 mm/year, ferritic-perlitic microstructure) [98,113].
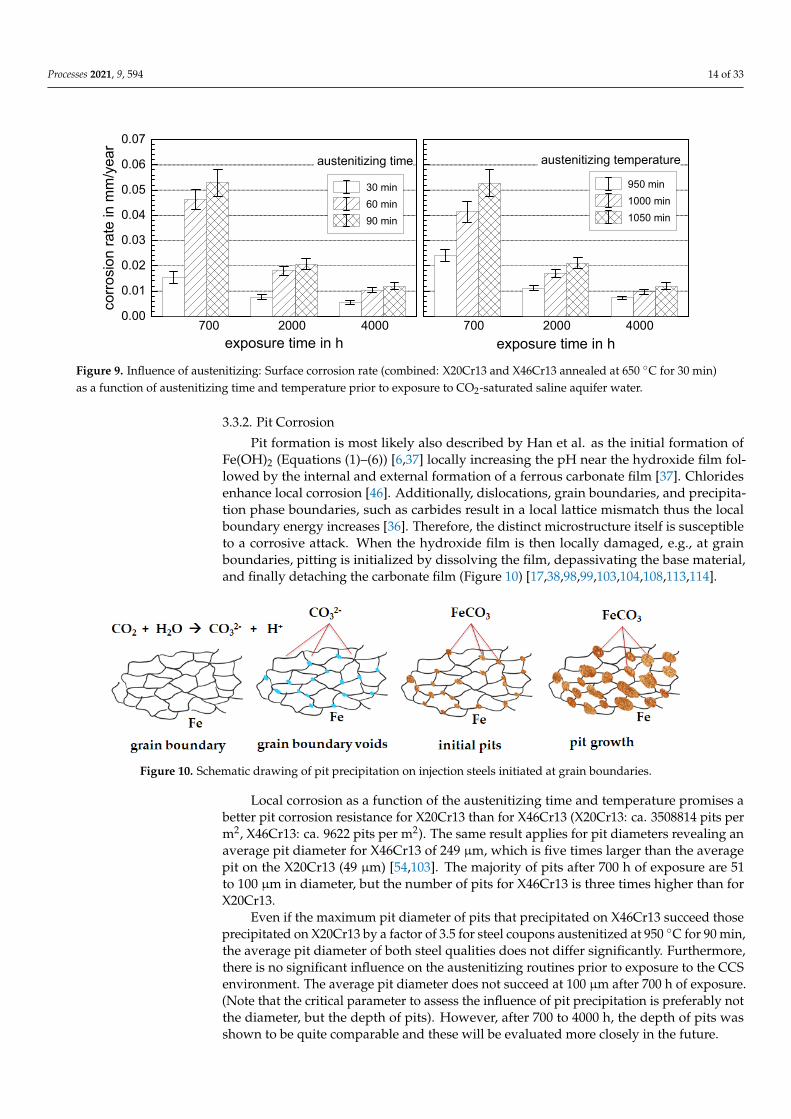
The time of austenitizing plays a significant role regarding the surface corrosion of X46Cr13 and X20Cr13 (Figure 9) but is neglectable regarding local corrosion [58,103,104,114]. Surface corrosion decreases as a function of increasing the austenitizing time and decreasing the austenitizing temperature [114]. The lowest corrosion rates were found for specimens heated to 950 °C and annealed for 30 min compared to the highest corrosion rates austenitized at 1050 °C for 60 min after 700 h [114]. The significance of the influence decreases with the increasing exposure time to a geothermal environment. After 4000 h of exposure, austenitizing becomes insignificant (Figure 9) [103,104,114].
0.00
0.01
0.02
0.03
0.04
0.05
0.06
0.07
corro
sion
rate
in m
m/y
ear
exposure time in h
30 min60 min90 min
exposure time in h
950 min1000 min1050 min
austenitizing time austenitizing temperature
700 2000 4000 700 2000 4000
Figure 8. Left: SEM micrographs and element distribution of the ellipsoidal corrosion layer formed on X5CrNiCuNb16-4hardened and tempered at 670 ◦C prior to exposure after 8000 h of exposure at 60 ◦C and 100 bar to water saturatedsupercritical CO2.
The influence of the heat treatment is more significant at 100 bar than at ambientpressure. However, since the data is not distinct, the heat treatment for X5CrNiCuNb16-4seems not decisive—rather the chromium content and atmosphere. Good surface corrosionresistance at ambient pressure can be attributed for steels hardened or hardened andtempered. Good surface corrosion resistance at 100 bar under supercritical CO2 conditionshardened and tempered at 670 ◦C (<0.001 mm/year, martensitic microstructure) and in theliquid phase normalized (ca. 0.004 mm/year, ferritic-perlitic microstructure) [98,113].
The time of austenitizing plays a significant role regarding the surface corrosion ofX46Cr13 and X20Cr13 (Figure 9) but is neglectable regarding local corrosion [58,103,104,114].Surface corrosion decreases as a function of increasing the austenitizing time and decreasingthe austenitizing temperature [114]. The lowest corrosion rates were found for specimensheated to 950 ◦C and annealed for 30 min compared to the highest corrosion rates austeni-tized at 1050 ◦C for 60 min after 700 h [114]. The significance of the influence decreaseswith the increasing exposure time to a geothermal environment. After 4000 h of exposure,austenitizing becomes insignificant (Figure 9) [103,104,114].
Processes 2021, 9, 594 14 of 33
Processes 2021, 9, x FOR PEER REVIEW 13 of 33
Generally, low corrosion rates in the liquid and even lower in the supercritical phase for X5CrNiCuNb16-4 are attributed to passivation and possibly insufficient electrolytes [38,89]. Moreover, the cathodic reactions (Equations (1) and (2)) result in a higher H2CO3 concentration and therefore more acidic and reactive environment as in the CO2 saturated liquid phase [7,26]. Corrosion rates increase at 100 bar in the supercritical phase and re-main at the same level kept in the liquid phase (0.003 mm/y after 4000 h). Depassivation after 1000 h of exposure in the supercritical phase is the result of fast reaction kinetics and carbide precipitation. The accompanied chromium depletion of the matrix (Figure 8) pro-hibits new passivation and degrades the material [98,113].
Figure 8. Left: SEM micrographs and element distribution of the ellipsoidal corrosion layer formed on X5CrNiCuNb16-4 hardened and tempered at 670 °C prior to exposure after 8000 h of exposure at 60 °C and 100 bar to water saturated supercritical CO2.
The influence of the heat treatment is more significant at 100 bar than at ambient pressure. However, since the data is not distinct, the heat treatment for X5CrNiCuNb16-4 seems not decisive—rather the chromium content and atmosphere. Good surface corro-sion resistance at ambient pressure can be attributed for steels hardened or hardened and tempered. Good surface corrosion resistance at 100 bar under supercritical CO2 conditions hardened and tempered at 670 °C (<0.001 mm/year, martensitic microstructure) and in the liquid phase normalized (ca. 0.004 mm/year, ferritic-perlitic microstructure) [98,113].
The time of austenitizing plays a significant role regarding the surface corrosion of X46Cr13 and X20Cr13 (Figure 9) but is neglectable regarding local corrosion [58,103,104,114]. Surface corrosion decreases as a function of increasing the austenitizing time and decreasing the austenitizing temperature [114]. The lowest corrosion rates were found for specimens heated to 950 °C and annealed for 30 min compared to the highest corrosion rates austenitized at 1050 °C for 60 min after 700 h [114]. The significance of the influence decreases with the increasing exposure time to a geothermal environment. After 4000 h of exposure, austenitizing becomes insignificant (Figure 9) [103,104,114].
0.00
0.01
0.02
0.03
0.04
0.05
0.06
0.07
corro
sion
rate
in m
m/y
ear
exposure time in h
30 min60 min90 min
exposure time in h
950 min1000 min1050 min
austenitizing time austenitizing temperature
700 2000 4000 700 2000 4000
Figure 9. Influence of austenitizing: Surface corrosion rate (combined: X20Cr13 and X46Cr13 annealed at 650 ◦C for 30 min)as a function of austenitizing time and temperature prior to exposure to CO2-saturated saline aquifer water.
3.3.2. Pit Corrosion
Pit formation is most likely also described by Han et al. as the initial formation ofFe(OH)2 (Equations (1)–(6)) [6,37] locally increasing the pH near the hydroxide film fol-lowed by the internal and external formation of a ferrous carbonate film [37]. Chloridesenhance local corrosion [46]. Additionally, dislocations, grain boundaries, and precipita-tion phase boundaries, such as carbides result in a local lattice mismatch thus the localboundary energy increases [36]. Therefore, the distinct microstructure itself is susceptibleto a corrosive attack. When the hydroxide film is then locally damaged, e.g., at grainboundaries, pitting is initialized by dissolving the film, depassivating the base material,and finally detaching the carbonate film (Figure 10) [17,38,98,99,103,104,108,113,114].
1
Figure 10. Schematic drawing of pit precipitation on injection steels initiated at grain boundaries.
Local corrosion as a function of the austenitizing time and temperature promises abetter pit corrosion resistance for X20Cr13 than for X46Cr13 (X20Cr13: ca. 3508814 pits perm2, X46Cr13: ca. 9622 pits per m2). The same result applies for pit diameters revealing anaverage pit diameter for X46Cr13 of 249 µm, which is five times larger than the averagepit on the X20Cr13 (49 µm) [54,103]. The majority of pits after 700 h of exposure are 51to 100 µm in diameter, but the number of pits for X46Cr13 is three times higher than forX20Cr13.
Even if the maximum pit diameter of pits that precipitated on X46Cr13 succeed thoseprecipitated on X20Cr13 by a factor of 3.5 for steel coupons austenitized at 950 ◦C for 90 min,the average pit diameter of both steel qualities does not differ significantly. Furthermore,there is no significant influence on the austenitizing routines prior to exposure to the CCSenvironment. The average pit diameter does not succeed at 100 µm after 700 h of exposure.(Note that the critical parameter to assess the influence of pit precipitation is preferably notthe diameter, but the depth of pits). However, after 700 to 4000 h, the depth of pits wasshown to be quite comparable and these will be evaluated more closely in the future.
Processes 2021, 9, 594 15 of 33
At ambient pressure and at 100 bar, as well as the number of pits per unit area arenot significantly influenced by the particular heat treatment (no significant lowest numberof pits) [16,17,103,108,114]. Hardening and tempering between 600 and 670 ◦C realize thelowest number of pits after 6000 h of exposure. (Note that the pits may consolidate to ashallow pit corrosion phenomena and therefore lead to unusual low numbers of pits).
Generally, pitting is independent of the heat treatment. Steels with martensitic mi-crostructure and higher carbon-content were developed in fewer pits with smaller max-imum intrusion depths. At ambient pressure, the number of pits levels off for X20Cr13,X46Cr13, and X5CrNiCuNb16-4 (<40,000 per m2). At 100 bar, the number of pits is in-dependent of the heat treatment and atmosphere (water saturated supercritical CO2 andCO2 saturated aquifer) except for coupons hardened and tempered at 670 ◦C. Althoughknown as corrosion resistant, X5CrNiCuNb16-4 shows a high number of pits per m2 inboth atmospheres at ambient pressure and 100 bar [98].
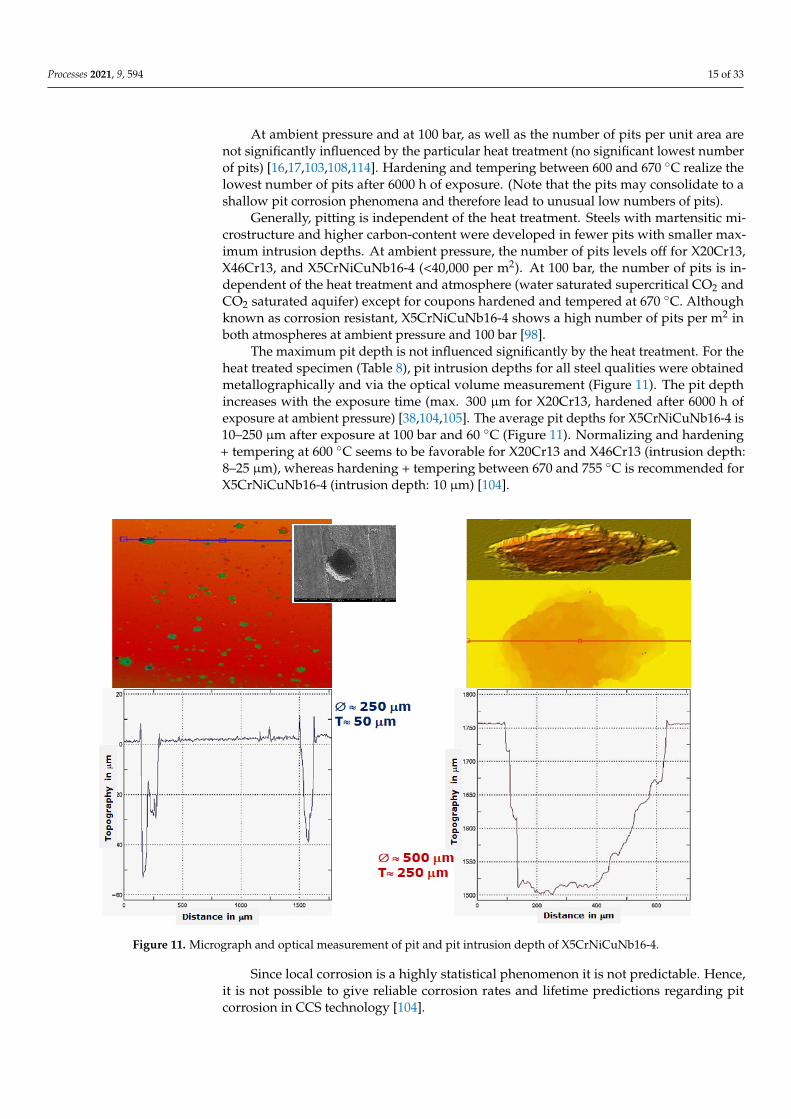
The maximum pit depth is not influenced significantly by the heat treatment. For theheat treated specimen (Table 8), pit intrusion depths for all steel qualities were obtainedmetallographically and via the optical volume measurement (Figure 11). The pit depthincreases with the exposure time (max. 300 µm for X20Cr13, hardened after 6000 h ofexposure at ambient pressure) [38,104,105]. The average pit depths for X5CrNiCuNb16-4 is10–250 µm after exposure at 100 bar and 60 ◦C (Figure 11). Normalizing and hardening+ tempering at 600 ◦C seems to be favorable for X20Cr13 and X46Cr13 (intrusion depth:8–25 µm), whereas hardening + tempering between 670 and 755 ◦C is recommended forX5CrNiCuNb16-4 (intrusion depth: 10 µm) [104].
Processes 2021, 9, x FOR PEER REVIEW 15 of 33
as corrosion resistant, X5CrNiCuNb16-4 shows a high number of pits per m2 in both at-mospheres at ambient pressure and 100 bar [98].
The maximum pit depth is not influenced significantly by the heat treatment. For the heat treated specimen (Table 8), pit intrusion depths for all steel qualities were obtained metallographically and via the optical volume measurement (Figure 11). The pit depth increases with the exposure time (max. 300 µm for X20Cr13, hardened after 6000 h of ex-posure at ambient pressure) [38,104,105]. The average pit depths for X5CrNiCuNb16-4 is 10–250 µm after exposure at 100 bar and 60 °C (Figure 11). Normalizing and hardening + tempering at 600 °C seems to be favorable for X20Cr13 and X46Cr13 (intrusion depth: 8–25 µm), whereas hardening + tempering between 670 and 755 °C is recommended for X5CrNiCuNb16-4 (intrusion depth: 10 µm) [104].
Figure 11. Micrograph and optical measurement of pit and pit intrusion depth of X5CrNiCuNb16-4.
Since local corrosion is a highly statistical phenomenon it is not predictable. Hence, it is not possible to give reliable corrosion rates and lifetime predictions regarding pit cor-rosion in CCS technology [104].
3.4. Statistical Approach in Corrosion Fatigue Specimens were tested at different stress levels each (the string of pearls method).
Logarithms of stress amplitude σa and the number of cycles to failure Nf were used in the following method of linear regression analysis assuming a logarithmic normal distribu-tion of the number of cycles to failure Nf [36,52]. As a result, the scatter bands for the sur-vival probabilities PS are parallel to the PS = 50% straight (regression) line according to: • log(σa): Logarithm of stress amplitude σa, independent (error-free) variable x; • log(Nf): Logarithm of cycles to failure Nf, dependent variable y (inaccurate); • m: Estimate for the slope of the regression line; • b: Estimate for the intercept of the regression line; • tX: One-sided barrier of standard normal distribution for PS = x %;
Figure 11. Micrograph and optical measurement of pit and pit intrusion depth of X5CrNiCuNb16-4.
Since local corrosion is a highly statistical phenomenon it is not predictable. Hence,it is not possible to give reliable corrosion rates and lifetime predictions regarding pitcorrosion in CCS technology [104].
Processes 2021, 9, 594 16 of 33
3.4. Statistical Approach in Corrosion Fatigue
Specimens were tested at different stress levels each (the string of pearls method).Logarithms of stress amplitude σa and the number of cycles to failure Nf were used in thefollowing method of linear regression analysis assuming a logarithmic normal distributionof the number of cycles to failure Nf [36,52]. As a result, the scatter bands for the survivalprobabilities PS are parallel to the PS = 50% straight (regression) line according to:
• log(σa): Logarithm of stress amplitude σa, independent (error-free) variable x;• log(Nf): Logarithm of cycles to failure Nf, dependent variable y (inaccurate);• m: Estimate for the slope of the regression line;• b: Estimate for the intercept of the regression line;• tX: One-sided barrier of standard normal distribution for PS = x %;• sN: Standard error of the estimate of N;• PS: Probability of survival.
Therefore, Equation (10) of the S-N curve follows:
log(
N f
)= m log(σa) + b + txsN
respectively
log(σa) =log(N f )−b−txsN
m
(10)
The important standard error sN of the regression calculation is determined from themean square deviation of each value of the regression line (Equation (11)). The residualvariance sN
2 reveals the scatter which cannot be explained by regression:
sN =
√√√√√ n∑
i=1{log(Ni)− b−m log(σa,i)}2
n− 2(11)
The linear regression was calculated according to Equation (12) as follows:
N50 = NA·(
Sa
SA
)−kf or Sa ≥ SA (12)
given:
• N50 50% probability cycle value;• NA reference cycle value;• SA reference stress value;• Sa selected stress value.
The scatter range TN is the quotient between the probability cycle value of 10% and90% (Equation (13)):
TN = 1 :log N90
log N10(13)
given:
• N90 90% probability cycle value;• N10 10% probability cycle value;• TN scatter range.
The R2 value varies from 0 to 1. The higher number indicates higher coherence andstatistical certainty. The R2 value is unusually high (0, 99 therefore, very close to 1) possiblydue to the scarce dataset or the same fatigue mechanism.
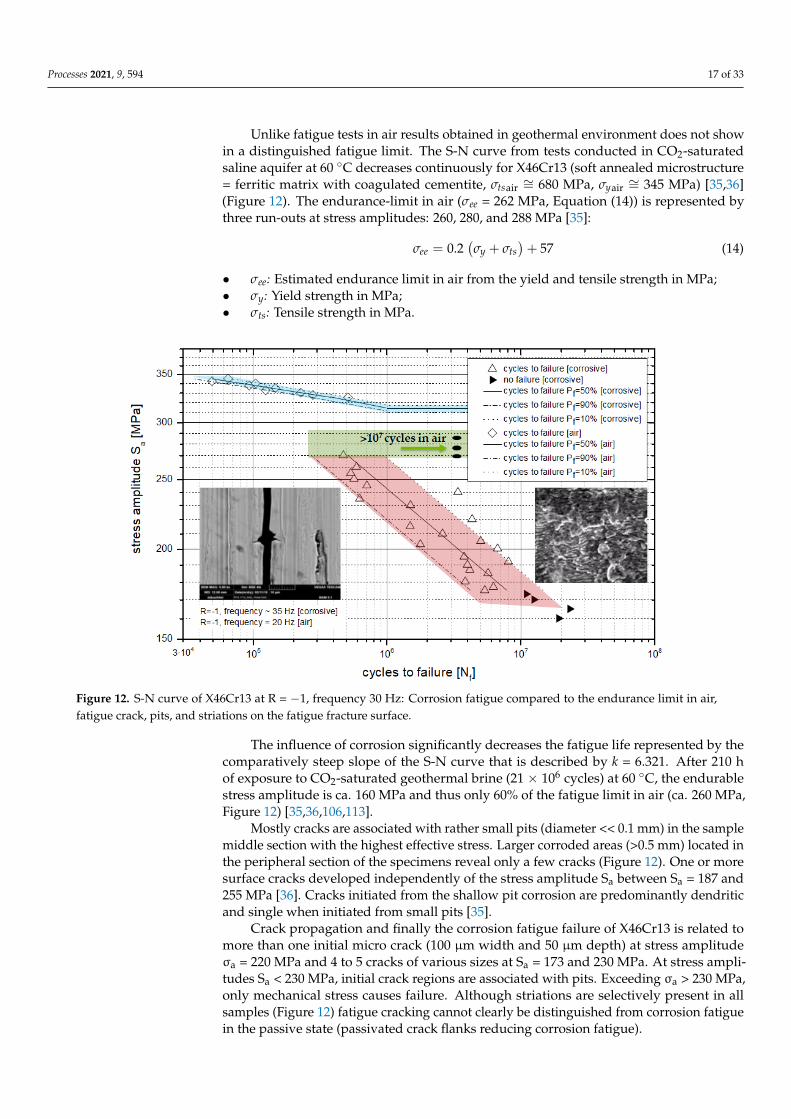
3.5. Corrosion Fatigue of X46Cr13 (Air: σts = 680 MPa, σy = 345 MPa, Fatigue Limit: 260 MPa)
Data regarding corrosion fatigue of X46Cr13 was mainly compiled from references: [35,36].
Processes 2021, 9, 594 17 of 33
Unlike fatigue tests in air results obtained in geothermal environment does not showin a distinguished fatigue limit. The S-N curve from tests conducted in CO2-saturatedsaline aquifer at 60 ◦C decreases continuously for X46Cr13 (soft annealed microstructure= ferritic matrix with coagulated cementite, σtsair ∼= 680 MPa, σyair ∼= 345 MPa) [35,36](Figure 12). The endurance-limit in air (σee = 262 MPa, Equation (14)) is represented bythree run-outs at stress amplitudes: 260, 280, and 288 MPa [35]:
σee = 0.2(σy + σts
)+ 57 (14)
• σee: Estimated endurance limit in air from the yield and tensile strength in MPa;• σy: Yield strength in MPa;• σts: Tensile strength in MPa.
Processes 2021, 9, x FOR PEER REVIEW 17 of 33
• σee: Estimated endurance limit in air from the yield and tensile strength in MPa; • σy: Yield strength in MPa; • σts: Tensile strength in MPa.
The influence of corrosion significantly decreases the fatigue life represented by the comparatively steep slope of the S-N curve that is described by k = 6.321. After 210 h of exposure to CO2-saturated geothermal brine (21 × 106 cycles) at 60 °C, the endurable stress amplitude is ca. 160 MPa and thus only 60% of the fatigue limit in air (ca. 260 MPa, Figure 12) [35,36,106,113].
Figure 12. S-N curve of X46Cr13 at R = −1, frequency 30 Hz: Corrosion fatigue compared to the endurance limit in air, fatigue crack, pits, and striations on the fatigue fracture surface.
Mostly cracks are associated with rather small pits (diameter << 0.1 mm) in the sam-ple middle section with the highest effective stress. Larger corroded areas (>0.5 mm) lo-cated in the peripheral section of the specimens reveal only a few cracks (Figure 12). One or more surface cracks developed independently of the stress amplitude Sa between Sa = 187 and 255 MPa [36]. Cracks initiated from the shallow pit corrosion are predominantly dendritic and single when initiated from small pits. [35]
Crack propagation and finally the corrosion fatigue failure of X46Cr13 is related to more than one initial micro crack (100 µm width and 50 µm depth) at stress amplitude σa
= 220 MPa and 4 to 5 cracks of various sizes at Sa = 173 and 230 MPa. At stress amplitudes Sa < 230 MPa, initial crack regions are associated with pits. Exceeding σa > 230 MPa, only mechanical stress causes failure. Although striations are selectively present in all samples (Figure 12) fatigue cracking cannot clearly be distinguished from corrosion fatigue in the passive state (passivated crack flanks reducing corrosion fatigue).
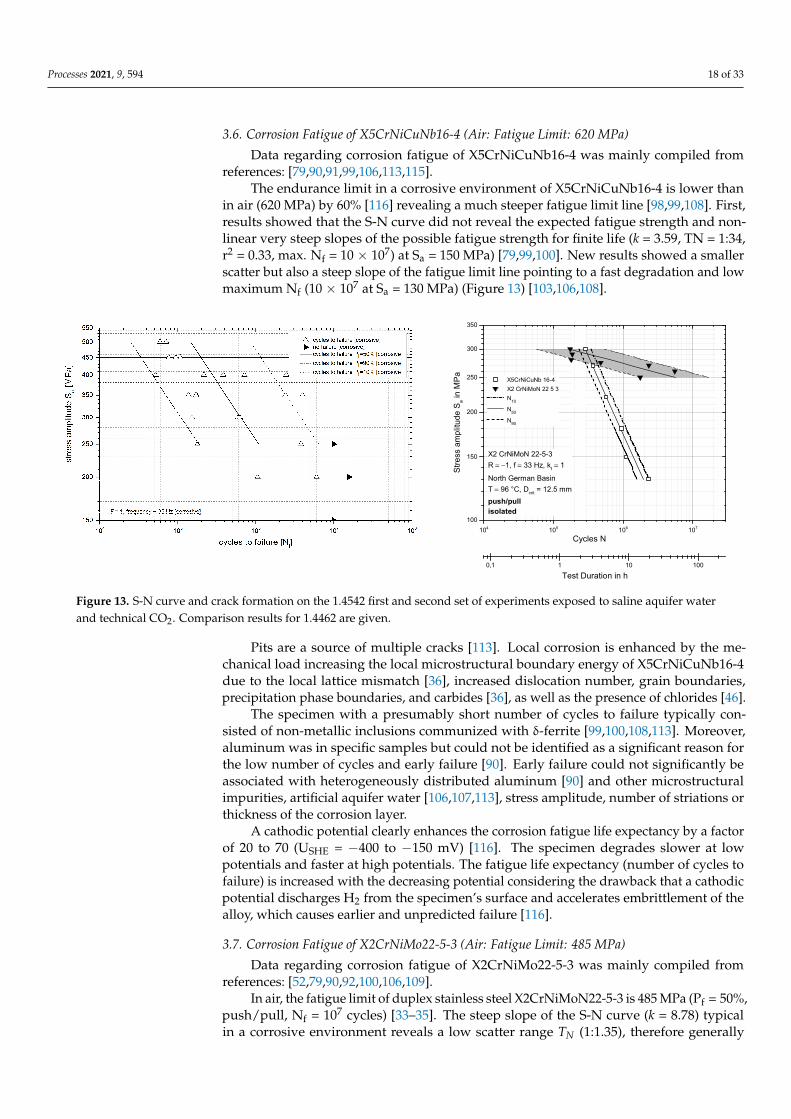
3.6. Corrosion Fatigue of X5CrNiCuNb16-4 (Air: Fatigue Limit: 620 MPa) Data regarding corrosion fatigue of X5CrNiCuNb16-4 was mainly compiled from ref-
erences: [79,90,91,99,106,113,115]. The endurance limit in a corrosive environment of X5CrNiCuNb16-4 is lower than in
air (620 MPa) by 60% [116] revealing a much steeper fatigue limit line [98,99,108]. First, results showed that the S-N curve did not reveal the expected fatigue strength and non-linear very steep slopes of the possible fatigue strength for finite life (k = 3.59, TN = 1:34,
Figure 12. S-N curve of X46Cr13 at R = −1, frequency 30 Hz: Corrosion fatigue compared to the endurance limit in air,fatigue crack, pits, and striations on the fatigue fracture surface.
The influence of corrosion significantly decreases the fatigue life represented by thecomparatively steep slope of the S-N curve that is described by k = 6.321. After 210 hof exposure to CO2-saturated geothermal brine (21 × 106 cycles) at 60 ◦C, the endurablestress amplitude is ca. 160 MPa and thus only 60% of the fatigue limit in air (ca. 260 MPa,Figure 12) [35,36,106,113].
Mostly cracks are associated with rather small pits (diameter << 0.1 mm) in the samplemiddle section with the highest effective stress. Larger corroded areas (>0.5 mm) located inthe peripheral section of the specimens reveal only a few cracks (Figure 12). One or moresurface cracks developed independently of the stress amplitude Sa between Sa = 187 and255 MPa [36]. Cracks initiated from the shallow pit corrosion are predominantly dendriticand single when initiated from small pits [35].
Crack propagation and finally the corrosion fatigue failure of X46Cr13 is related tomore than one initial micro crack (100 µm width and 50 µm depth) at stress amplitudeσa = 220 MPa and 4 to 5 cracks of various sizes at Sa = 173 and 230 MPa. At stress ampli-tudes Sa < 230 MPa, initial crack regions are associated with pits. Exceeding σa > 230 MPa,only mechanical stress causes failure. Although striations are selectively present in allsamples (Figure 12) fatigue cracking cannot clearly be distinguished from corrosion fatiguein the passive state (passivated crack flanks reducing corrosion fatigue).
Processes 2021, 9, 594 18 of 33
3.6. Corrosion Fatigue of X5CrNiCuNb16-4 (Air: Fatigue Limit: 620 MPa)
Data regarding corrosion fatigue of X5CrNiCuNb16-4 was mainly compiled fromreferences: [79,90,91,99,106,113,115].
The endurance limit in a corrosive environment of X5CrNiCuNb16-4 is lower thanin air (620 MPa) by 60% [116] revealing a much steeper fatigue limit line [98,99,108]. First,results showed that the S-N curve did not reveal the expected fatigue strength and non-linear very steep slopes of the possible fatigue strength for finite life (k = 3.59, TN = 1:34,r2 = 0.33, max. Nf = 10 × 107) at Sa = 150 MPa) [79,99,100]. New results showed a smallerscatter but also a steep slope of the fatigue limit line pointing to a fast degradation and lowmaximum Nf (10 × 107 at Sa = 130 MPa) (Figure 13) [103,106,108].
Processes 2021, 9, x FOR PEER REVIEW 18 of 33
r2 = 0.33, max. Nf = 10 × 107) at Sa = 150 MPa) [79,99,100]. New results showed a smaller scatter but also a steep slope of the fatigue limit line pointing to a fast degradation and low maximum Nf (10 × 107 at Sa = 130 MPa) (Figure 13) [103,106,108].
Figure 13. S-N curve and crack formation on the 1.4542 first and second set of experiments exposed to saline aquifer water and technical CO2. Comparison results for 1.4462 are given.
Pits are a source of multiple cracks [113]. Local corrosion is enhanced by the mechan-ical load increasing the local microstructural boundary energy of X5CrNiCuNb16-4 due to the local lattice mismatch [36], increased dislocation number, grain boundaries, precip-itation phase boundaries, and carbides [36], as well as the presence of chlorides [46].
The specimen with a presumably short number of cycles to failure typically consisted of non-metallic inclusions communized with δ-ferrite [99,100,108,113]. Moreover, alumi-num was in specific samples but could not be identified as a significant reason for the low number of cycles and early failure [90]. Early failure could not significantly be associated with heterogeneously distributed aluminum [90] and other microstructural impurities, artificial aquifer water [106,107,113], stress amplitude, number of striations or thickness of the corrosion layer.
A cathodic potential clearly enhances the corrosion fatigue life expectancy by a factor of 20 to 70 (USHE = −400 to −150 mV) [116]. The specimen degrades slower at low potentials and faster at high potentials. The fatigue life expectancy (number of cycles to failure) is increased with the decreasing potential considering the drawback that a cathodic poten-tial discharges H2 from the specimen’s surface and accelerates embrittlement of the alloy, which causes earlier and unpredicted failure [116].
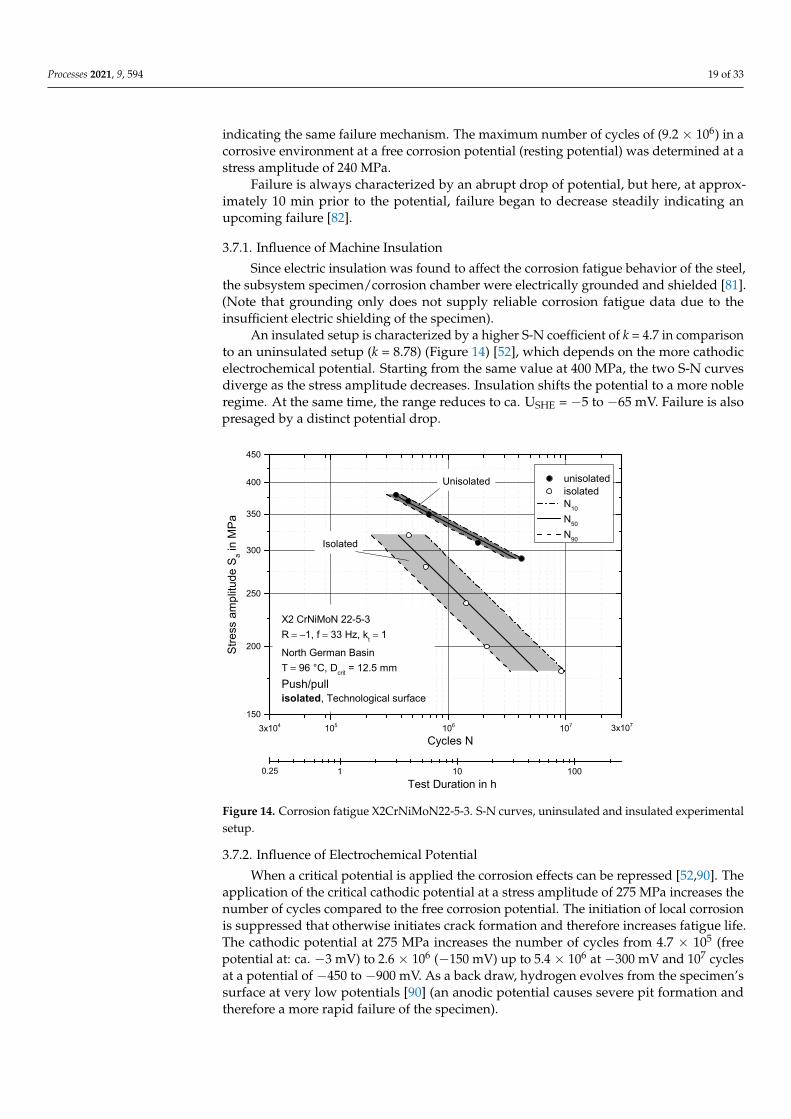
3.7. Corrosion Fatigue of X2CrNiMo22-5-3 (Air: Fatigue Limit: 485 MPa) Data regarding corrosion fatigue of X2CrNiMo22-5-3 was mainly compiled from ref-
erences: [52,79,90,92,100,106,109]. In air, the fatigue limit of duplex stainless steel X2CrNiMoN22-5-3 is 485 MPa (Pf =
50%, push/pull, Nf = 107 cycles) [33–35]. The steep slope of the S-N curve (k = 8.78) typical in a corrosive environment reveals a low scatter range 𝑇 (1:1.35), therefore generally in-dicating the same failure mechanism. The maximum number of cycles of (9.2 × 10⁶) in a corrosive environment at a free corrosion potential (resting potential) was determined at a stress amplitude of 240 MPa.
Failure is always characterized by an abrupt drop of potential, but here, at approxi-mately 10 min prior to the potential, failure began to decrease steadily indicating an up-coming failure [82].
104 105 106 107
100
150
200
250
300
350
X5CrNiCuNb 16-4 X2 CrNiMoN 22 5 3 N10
N50
N90
X2 CrNiMoN 22-5-3R = −1, f = 33 Hz, kt = 1
North German BasinT = 96 °C, Dcrit = 12.5 mmpush/pull isolated
Cycles N
Stre
ss a
mpl
itude
Sa i
n M
Pa
0,1 1 10 100
Test Duration in h
Figure 13. S-N curve and crack formation on the 1.4542 first and second set of experiments exposed to saline aquifer waterand technical CO2. Comparison results for 1.4462 are given.
Pits are a source of multiple cracks [113]. Local corrosion is enhanced by the me-chanical load increasing the local microstructural boundary energy of X5CrNiCuNb16-4due to the local lattice mismatch [36], increased dislocation number, grain boundaries,precipitation phase boundaries, and carbides [36], as well as the presence of chlorides [46].
The specimen with a presumably short number of cycles to failure typically con-sisted of non-metallic inclusions communized with δ-ferrite [99,100,108,113]. Moreover,aluminum was in specific samples but could not be identified as a significant reason forthe low number of cycles and early failure [90]. Early failure could not significantly beassociated with heterogeneously distributed aluminum [90] and other microstructuralimpurities, artificial aquifer water [106,107,113], stress amplitude, number of striations orthickness of the corrosion layer.
A cathodic potential clearly enhances the corrosion fatigue life expectancy by a factorof 20 to 70 (USHE = −400 to −150 mV) [116]. The specimen degrades slower at lowpotentials and faster at high potentials. The fatigue life expectancy (number of cycles tofailure) is increased with the decreasing potential considering the drawback that a cathodicpotential discharges H2 from the specimen’s surface and accelerates embrittlement of thealloy, which causes earlier and unpredicted failure [116].
3.7. Corrosion Fatigue of X2CrNiMo22-5-3 (Air: Fatigue Limit: 485 MPa)
Data regarding corrosion fatigue of X2CrNiMo22-5-3 was mainly compiled fromreferences: [52,79,90,92,100,106,109].
In air, the fatigue limit of duplex stainless steel X2CrNiMoN22-5-3 is 485 MPa (Pf = 50%,push/pull, Nf = 107 cycles) [33–35]. The steep slope of the S-N curve (k = 8.78) typicalin a corrosive environment reveals a low scatter range TN (1:1.35), therefore generally
Processes 2021, 9, 594 19 of 33
indicating the same failure mechanism. The maximum number of cycles of (9.2 × 10⁶) in acorrosive environment at a free corrosion potential (resting potential) was determined at astress amplitude of 240 MPa.
Failure is always characterized by an abrupt drop of potential, but here, at approx-imately 10 min prior to the potential, failure began to decrease steadily indicating anupcoming failure [82].
3.7.1. Influence of Machine Insulation
Since electric insulation was found to affect the corrosion fatigue behavior of the steel,the subsystem specimen/corrosion chamber were electrically grounded and shielded [81].(Note that grounding only does not supply reliable corrosion fatigue data due to theinsufficient electric shielding of the specimen).
An insulated setup is characterized by a higher S-N coefficient of k = 4.7 in comparisonto an uninsulated setup (k = 8.78) (Figure 14) [52], which depends on the more cathodicelectrochemical potential. Starting from the same value at 400 MPa, the two S-N curvesdiverge as the stress amplitude decreases. Insulation shifts the potential to a more nobleregime. At the same time, the range reduces to ca. USHE = −5 to −65 mV. Failure is alsopresaged by a distinct potential drop.
Processes 2021, 9, x FOR PEER REVIEW 19 of 33
3.7.1. Influence of Machine Insulation Since electric insulation was found to affect the corrosion fatigue behavior of the steel,
the subsystem specimen/corrosion chamber were electrically grounded and shielded [81]. (Note that grounding only does not supply reliable corrosion fatigue data due to the in-sufficient electric shielding of the specimen).
An insulated setup is characterized by a higher S-N coefficient of k = 4.7 in compari-son to an uninsulated setup (k = 8.78) (Figure 14) [52], which depends on the more cathodic electrochemical potential. Starting from the same value at 400 MPa, the two S-N curves diverge as the stress amplitude decreases. Insulation shifts the potential to a more noble regime. At the same time, the range reduces to ca. USHE = −5 to −65 mV. Failure is also presaged by a distinct potential drop.
Figure 14. Corrosion fatigue X2CrNiMoN22-5-3. S-N curves, uninsulated and insulated experi-mental setup.
3.7.2. Influence of Electrochemical Potential When a critical potential is applied the corrosion effects can be repressed [52,90. The
application of the critical cathodic potential at a stress amplitude of 275 MPa increases the number of cycles compared to the free corrosion potential. The initiation of local corrosion is suppressed that otherwise initiates crack formation and therefore increases fatigue life. The cathodic potential at 275 MPa increases the number of cycles from 4.7 × 10⁵ (free po-tential at: ca. −3 mV) to 2.6 × 10⁶ (−150 mV) up to 5.4 × 10⁶ at −300 mV and 107 cycles at a potential of −450 to −900 mV. As a back draw, hydrogen evolves from the specimen’s sur-face at very low potentials [90] (an anodic potential causes severe pit formation and there-fore a more rapid failure of the specimen).
3.7.3. Influence of Load Type The superior corrosion fatigue resistance in a geothermal environment under the ro-
tation bending load is significant by the factor 1.11–1.25 in the cycle range 105 to 106 [90]. The initially better corrosion fatigue properties under the rotation bending load (higher stress amplitudes at a certain number of failure) become less significant with the increas-ing number of cycles. The S-N 50% probability graphs converge at approximately 3.5 × 10⁶ cycles (30 h of cyclic loading), eliminating the advantage of the rotation bending load
3x10⁴ 105 106 107
150
200
250
300
350
400
450
0.25
3x10⁷
Test Duration in h
unisolated isolated N10
N50
N90
Stre
ss a
mpl
itude
Sa i
n M
Pa
Cycles N
Unisolated
Isolated
1 10 100
X2 CrNiMoN 22-5-3R = −1, f = 33 Hz, kt = 1
North German BasinT = 96 °C, Dcrit = 12.5 mm Push/pullisolated, Technological surface
Figure 14. Corrosion fatigue X2CrNiMoN22-5-3. S-N curves, uninsulated and insulated experimentalsetup.
3.7.2. Influence of Electrochemical Potential
When a critical potential is applied the corrosion effects can be repressed [52,90]. Theapplication of the critical cathodic potential at a stress amplitude of 275 MPa increases thenumber of cycles compared to the free corrosion potential. The initiation of local corrosionis suppressed that otherwise initiates crack formation and therefore increases fatigue life.The cathodic potential at 275 MPa increases the number of cycles from 4.7 × 10⁵ (freepotential at: ca. −3 mV) to 2.6 × 10⁶ (−150 mV) up to 5.4 × 10⁶ at −300 mV and 107 cyclesat a potential of −450 to −900 mV. As a back draw, hydrogen evolves from the specimen’ssurface at very low potentials [90] (an anodic potential causes severe pit formation andtherefore a more rapid failure of the specimen).
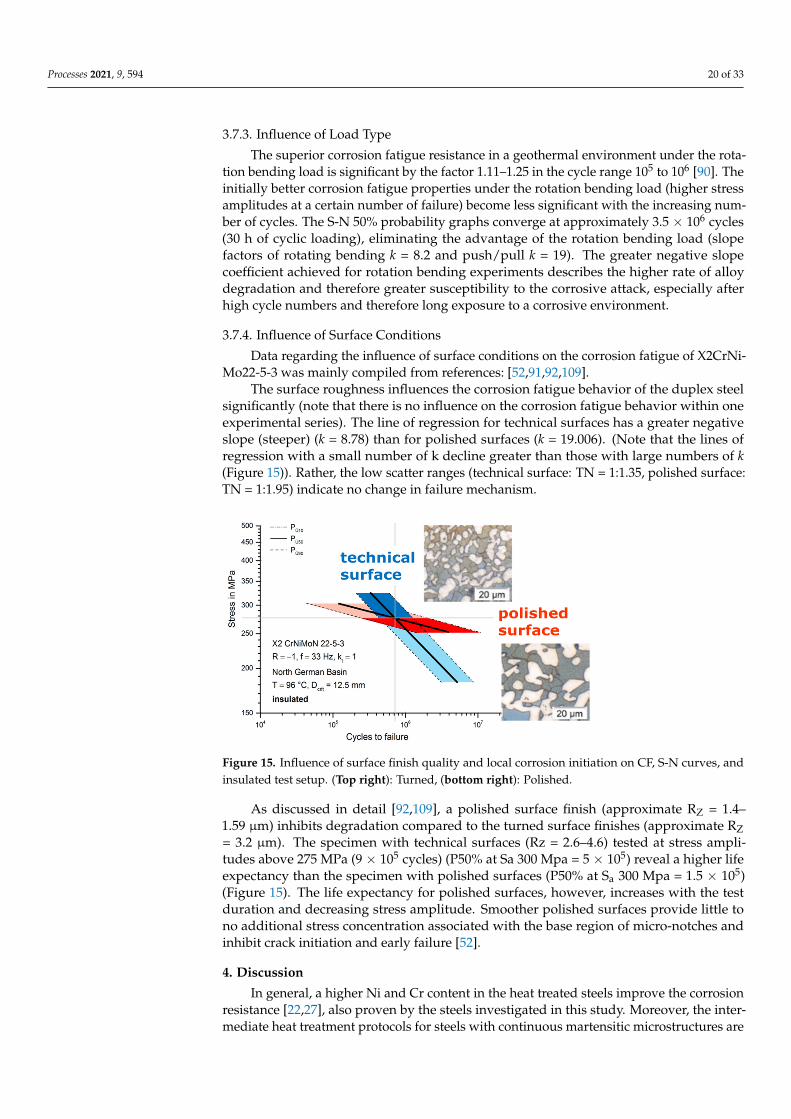
Processes 2021, 9, 594 20 of 33
3.7.3. Influence of Load Type
The superior corrosion fatigue resistance in a geothermal environment under the rota-tion bending load is significant by the factor 1.11–1.25 in the cycle range 105 to 106 [90]. Theinitially better corrosion fatigue properties under the rotation bending load (higher stressamplitudes at a certain number of failure) become less significant with the increasing num-ber of cycles. The S-N 50% probability graphs converge at approximately 3.5 × 10⁶ cycles(30 h of cyclic loading), eliminating the advantage of the rotation bending load (slopefactors of rotating bending k = 8.2 and push/pull k = 19). The greater negative slopecoefficient achieved for rotation bending experiments describes the higher rate of alloydegradation and therefore greater susceptibility to the corrosive attack, especially afterhigh cycle numbers and therefore long exposure to a corrosive environment.
3.7.4. Influence of Surface Conditions
Data regarding the influence of surface conditions on the corrosion fatigue of X2CrNi-Mo22-5-3 was mainly compiled from references: [52,91,92,109].
The surface roughness influences the corrosion fatigue behavior of the duplex steelsignificantly (note that there is no influence on the corrosion fatigue behavior within oneexperimental series). The line of regression for technical surfaces has a greater negativeslope (steeper) (k = 8.78) than for polished surfaces (k = 19.006). (Note that the lines ofregression with a small number of k decline greater than those with large numbers of k(Figure 15)). Rather, the low scatter ranges (technical surface: TN = 1:1.35, polished surface:TN = 1:1.95) indicate no change in failure mechanism.
Processes 2021, 9, x FOR PEER REVIEW 20 of 33
(slope factors of rotating bending k = 8.2 and push/pull k = 19). The greater negative slope coefficient achieved for rotation bending experiments describes the higher rate of alloy degradation and therefore greater susceptibility to the corrosive attack, especially after high cycle numbers and therefore long exposure to a corrosive environment.
3.7.4. Influence of Surface Conditions Data regarding the influence of surface conditions on the corrosion fatigue of
X2CrNiMo22-5-3 was mainly compiled from references: [52,91,92,109]. The surface roughness influences the corrosion fatigue behavior of the duplex steel
significantly (note that there is no influence on the corrosion fatigue behavior within one experimental series). The line of regression for technical surfaces has a greater negative slope (steeper) (k = 8.78) than for polished surfaces (k = 19.006). (Note that the lines of regression with a small number of k decline greater than those with large numbers of k (Figure 15)). Rather, the low scatter ranges (technical surface: TN = 1:1.35, polished sur-face: TN = 1:1.95) indicate no change in failure mechanism.
Figure 15. Influence of surface finish quality and local corrosion initiation on CF, S-N curves, and insulated test setup. (Top right): Turned, (bottom right): Polished.
As discussed in detail [92,109], a polished surface finish (approximate RZ = 1.4–1.59 µm) inhibits degradation compared to the turned surface finishes (approximate RZ = 3.2 µm). The specimen with technical surfaces (Rz = 2.6–4.6) tested at stress amplitudes above 275 MPa (9 × 10⁵ cycles) (P50% at Sa 300 Mpa = 5 × 10⁵) reveal a higher life expectancy than the specimen with polished surfaces (P50% at Sa 300 Mpa = 1.5 × 10⁵) (Figure 15). The life expectancy for polished surfaces, however, increases with the test duration and decreas-ing stress amplitude. Smoother polished surfaces provide little to no additional stress con-centration associated with the base region of micro-notches and inhibit crack initiation and early failure [52].
4. Discussion In general, a higher Ni and Cr content in the heat treated steels improve the corrosion
resistance [22,27], also proven by the steels investigated in this study. Moreover, the in-termediate heat treatment protocols for steels with continuous martensitic microstruc-tures are favorable in terms of good corrosion resistance and are widely discussed before [9,17]. The corrosion rate is more susceptible to the heat treatment at 100 bar than at am-bient pressure. Therefore, the heat treatment is less significant compared to the chromium content and atmosphere. Hardening or hardening and tempering coupons are promising at ambient pressure with regards to low surface corrosion rates. Considering surface cor-rosion only, at 100 bar the martensitic microstructure (hardened and tempered at 650 °C for the supercritical phase: < 0.001 mm/year) is superior in water saturated supercritical
Figure 15. Influence of surface finish quality and local corrosion initiation on CF, S-N curves, andinsulated test setup. (Top right): Turned, (bottom right): Polished.
As discussed in detail [92,109], a polished surface finish (approximate RZ = 1.4–1.59 µm) inhibits degradation compared to the turned surface finishes (approximate RZ= 3.2 µm). The specimen with technical surfaces (Rz = 2.6–4.6) tested at stress ampli-tudes above 275 MPa (9 × 10⁵ cycles) (P50% at Sa 300 Mpa = 5 × 10⁵) reveal a higher lifeexpectancy than the specimen with polished surfaces (P50% at Sa 300 Mpa = 1.5 × 10⁵)(Figure 15). The life expectancy for polished surfaces, however, increases with the testduration and decreasing stress amplitude. Smoother polished surfaces provide little tono additional stress concentration associated with the base region of micro-notches andinhibit crack initiation and early failure [52].
4. Discussion
In general, a higher Ni and Cr content in the heat treated steels improve the corrosionresistance [22,27], also proven by the steels investigated in this study. Moreover, the inter-mediate heat treatment protocols for steels with continuous martensitic microstructures are
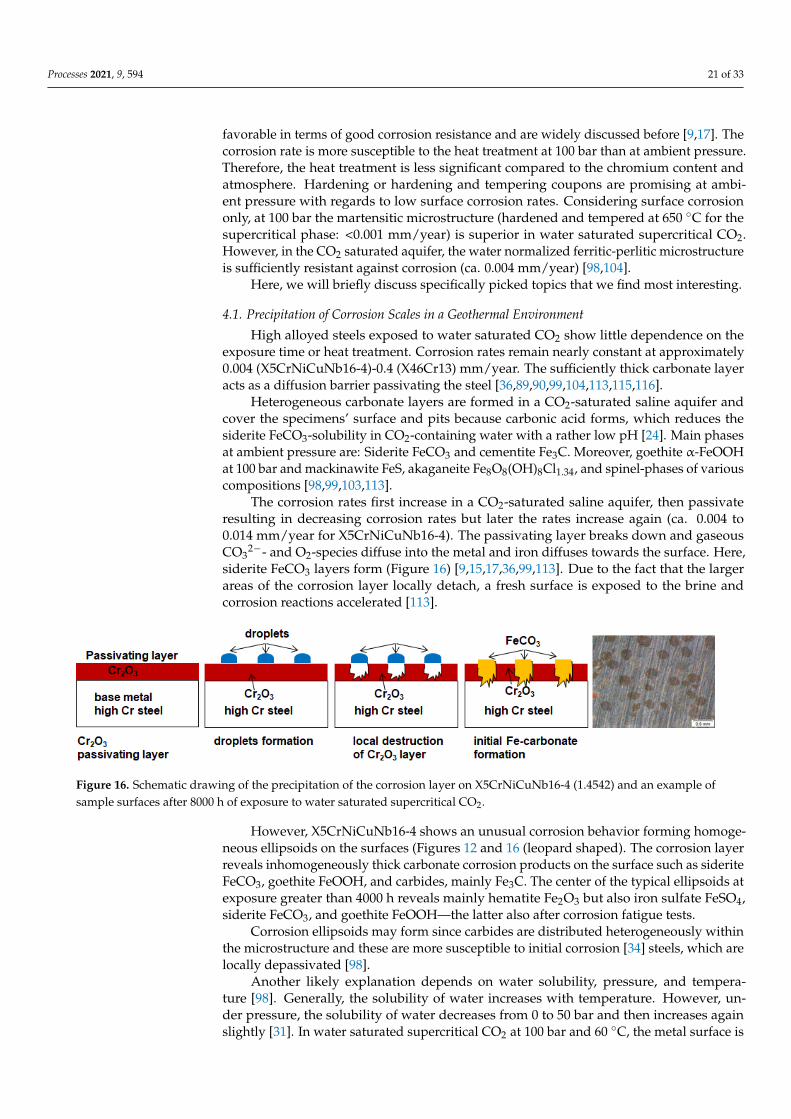
Processes 2021, 9, 594 21 of 33
favorable in terms of good corrosion resistance and are widely discussed before [9,17]. Thecorrosion rate is more susceptible to the heat treatment at 100 bar than at ambient pressure.Therefore, the heat treatment is less significant compared to the chromium content andatmosphere. Hardening or hardening and tempering coupons are promising at ambi-ent pressure with regards to low surface corrosion rates. Considering surface corrosiononly, at 100 bar the martensitic microstructure (hardened and tempered at 650 ◦C for thesupercritical phase: <0.001 mm/year) is superior in water saturated supercritical CO2.However, in the CO2 saturated aquifer, the water normalized ferritic-perlitic microstructureis sufficiently resistant against corrosion (ca. 0.004 mm/year) [98,104].
Here, we will briefly discuss specifically picked topics that we find most interesting.
4.1. Precipitation of Corrosion Scales in a Geothermal Environment
High alloyed steels exposed to water saturated CO2 show little dependence on theexposure time or heat treatment. Corrosion rates remain nearly constant at approximately0.004 (X5CrNiCuNb16-4)-0.4 (X46Cr13) mm/year. The sufficiently thick carbonate layeracts as a diffusion barrier passivating the steel [36,89,90,99,104,113,115,116].
Heterogeneous carbonate layers are formed in a CO2-saturated saline aquifer andcover the specimens’ surface and pits because carbonic acid forms, which reduces thesiderite FeCO3-solubility in CO2-containing water with a rather low pH [24]. Main phasesat ambient pressure are: Siderite FeCO3 and cementite Fe3C. Moreover, goethite α-FeOOHat 100 bar and mackinawite FeS, akaganeite Fe8O8(OH)8Cl1.34, and spinel-phases of variouscompositions [98,99,103,113].
The corrosion rates first increase in a CO2-saturated saline aquifer, then passivateresulting in decreasing corrosion rates but later the rates increase again (ca. 0.004 to0.014 mm/year for X5CrNiCuNb16-4). The passivating layer breaks down and gaseousCO3
2−- and O2-species diffuse into the metal and iron diffuses towards the surface. Here,siderite FeCO3 layers form (Figure 16) [9,15,17,36,99,113]. Due to the fact that the largerareas of the corrosion layer locally detach, a fresh surface is exposed to the brine andcorrosion reactions accelerated [113].
Processes 2021, 9, x FOR PEER REVIEW 21 of 33
CO2. However, in the CO2 saturated aquifer, the water normalized ferritic-perlitic micro-structure is sufficiently resistant against corrosion (ca. 0.004 mm/year) [98,104].
Here, we will briefly discuss specifically picked topics that we find most interesting.
4.1. Precipitation of Corrosion Scales in a Geothermal Environment High alloyed steels exposed to water saturated CO2 show little dependence on the
exposure time or heat treatment. Corrosion rates remain nearly constant at approximately 0.004 (X5CrNiCuNb16-4)-0.4 (X46Cr13) mm/year. The sufficiently thick carbonate layer acts as a diffusion barrier passivating the steel [36,89,90,99,104,113,115,116].
Heterogeneous carbonate layers are formed in a CO2-saturated saline aquifer and cover the specimens’ surface and pits because carbonic acid forms, which reduces the si-derite FeCO3-solubility in CO2-containing water with a rather low pH [24]. Main phases at ambient pressure are: Siderite FeCO3 and cementite Fe3C. Moreover, goethite α-FeOOH at 100 bar and mackinawite FeS, akaganeite Fe8O8(OH)8Cl1.34, and spinel-phases of various compositions [98,99,103,113].
The corrosion rates first increase in a CO2-saturated saline aquifer, then passivate re-sulting in decreasing corrosion rates but later the rates increase again (ca. 0.004 to 0.014 mm/year for X5CrNiCuNb16-4). The passivating layer breaks down and gaseous CO32-- and O2 -species diffuse into the metal and iron diffuses towards the surface. Here, siderite FeCO3 layers form (Figure 16) [9,15,17,36,99,113]. Due to the fact that the larger areas of the corrosion layer locally detach, a fresh surface is exposed to the brine and corrosion reactions accelerated [113].
Figure 16. Schematic drawing of the precipitation of the corrosion layer on X5CrNiCuNb16-4 (1.4542) and an example of sample surfaces after 8000 h of exposure to water saturated supercritical CO2.
However, X5CrNiCuNb16-4 shows an unusual corrosion behavior forming homoge-neous ellipsoids on the surfaces (Figures 12 and 16 (leopard shaped). The corrosion layer reveals inhomogeneously thick carbonate corrosion products on the surface such as sider-ite FeCO3, goethite FeOOH, and carbides, mainly Fe3C. The center of the typical ellipsoids at exposure greater than 4000 h reveals mainly hematite Fe2O3 but also iron sulfate FeSO4, siderite FeCO3, and goethite FeOOH—the latter also after corrosion fatigue tests.
Corrosion ellipsoids may form since carbides are distributed heterogeneously within the microstructure and these are more susceptible to initial corrosion [34] steels, which are locally depassivated [98].
Another likely explanation depends on water solubility, pressure, and temperature [98]. Generally, the solubility of water increases with temperature. However, under pres-sure, the solubility of water decreases from 0 to 50 bar and then increases again slightly [31]. In water saturated supercritical CO2 at 100 bar and 60 °C, the metal surface is wetted due to the decreasing water solubility in the supercritical CO2. Consequently, small and very thin “leopard”-shaped droplets form and thin corrosion layers grow. Due to the ox-ygen content (Figure 12), these are most likely iron carbonate or iron hydroxide.
Consolidating droplets form small pits around the former droplet and corrosion pro-cesses are enhanced at this distinct multiphase boundary (water, metal, supercritical CO2). Since small droplets are formed much faster, the consolidated water diffuses back into the
Figure 16. Schematic drawing of the precipitation of the corrosion layer on X5CrNiCuNb16-4 (1.4542) and an example ofsample surfaces after 8000 h of exposure to water saturated supercritical CO2.
However, X5CrNiCuNb16-4 shows an unusual corrosion behavior forming homoge-neous ellipsoids on the surfaces (Figures 12 and 16 (leopard shaped). The corrosion layerreveals inhomogeneously thick carbonate corrosion products on the surface such as sideriteFeCO3, goethite FeOOH, and carbides, mainly Fe3C. The center of the typical ellipsoids atexposure greater than 4000 h reveals mainly hematite Fe2O3 but also iron sulfate FeSO4,siderite FeCO3, and goethite FeOOH—the latter also after corrosion fatigue tests.
Corrosion ellipsoids may form since carbides are distributed heterogeneously withinthe microstructure and these are more susceptible to initial corrosion [34] steels, which arelocally depassivated [98].
Another likely explanation depends on water solubility, pressure, and tempera-ture [98]. Generally, the solubility of water increases with temperature. However, un-der pressure, the solubility of water decreases from 0 to 50 bar and then increases againslightly [31]. In water saturated supercritical CO2 at 100 bar and 60 ◦C, the metal surface is
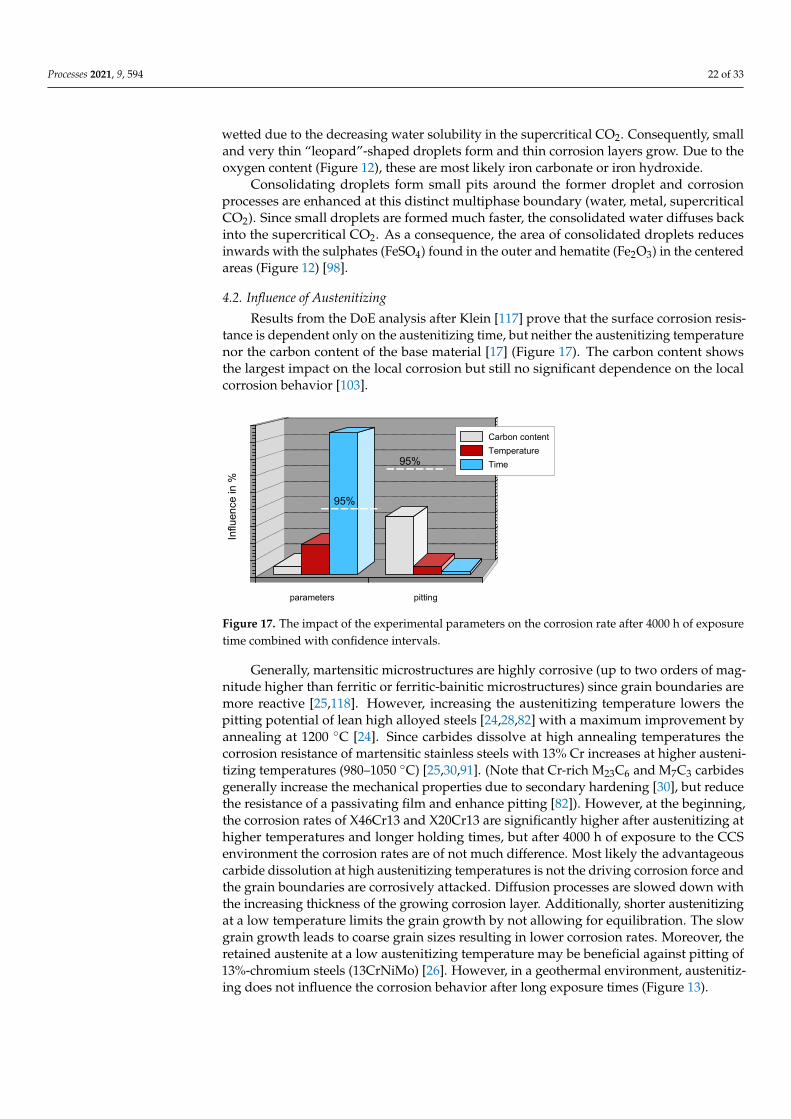
Processes 2021, 9, 594 22 of 33
wetted due to the decreasing water solubility in the supercritical CO2. Consequently, smalland very thin “leopard”-shaped droplets form and thin corrosion layers grow. Due to theoxygen content (Figure 12), these are most likely iron carbonate or iron hydroxide.
Consolidating droplets form small pits around the former droplet and corrosionprocesses are enhanced at this distinct multiphase boundary (water, metal, supercriticalCO2). Since small droplets are formed much faster, the consolidated water diffuses backinto the supercritical CO2. As a consequence, the area of consolidated droplets reducesinwards with the sulphates (FeSO4) found in the outer and hematite (Fe2O3) in the centeredareas (Figure 12) [98].
4.2. Influence of Austenitizing
Results from the DoE analysis after Klein [117] prove that the surface corrosion resis-tance is dependent only on the austenitizing time, but neither the austenitizing temperaturenor the carbon content of the base material [17] (Figure 17). The carbon content showsthe largest impact on the local corrosion but still no significant dependence on the localcorrosion behavior [103].
Processes 2021, 9, x FOR PEER REVIEW 22 of 33
supercritical CO2. As a consequence, the area of consolidated droplets reduces inwards with the sulphates (FeSO4) found in the outer and hematite (Fe2O3) in the centered areas (Figure 12) [98].
4.2. Influence of Austenitizing Results from the DoE analysis after Klein [117] prove that the surface corrosion re-
sistance is dependent only on the austenitizing time, but neither the austenitizing temper-ature nor the carbon content of the base material [17] (Figure 17). The carbon content shows the largest impact on the local corrosion but still no significant dependence on the local corrosion behavior [103].
Figure 17. The impact of the experimental parameters on the corrosion rate after 4000 h of expo-sure time combined with confidence intervals.
Generally, martensitic microstructures are highly corrosive (up to two orders of mag-nitude higher than ferritic or ferritic-bainitic microstructures) since grain boundaries are more reactive [25,118]. However, increasing the austenitizing temperature lowers the pit-ting potential of lean high alloyed steels [24,28,82] with a maximum improvement by an-nealing at 1200 °C [24]. Since carbides dissolve at high annealing temperatures the corro-sion resistance of martensitic stainless steels with 13% Cr increases at higher austenitizing temperatures (980–1050 °C) [25,30,91]. (Note that Cr-rich M23C6 and M7C3 carbides gener-ally increase the mechanical properties due to secondary hardening [30], but reduce the resistance of a passivating film and enhance pitting [82]). However, at the beginning, the corrosion rates of X46Cr13 and X20Cr13 are significantly higher after austenitizing at higher temperatures and longer holding times, but after 4000 h of exposure to the CCS environment the corrosion rates are of not much difference. Most likely the advantageous carbide dissolution at high austenitizing temperatures is not the driving corrosion force and the grain boundaries are corrosively attacked. Diffusion processes are slowed down with the increasing thickness of the growing corrosion layer. Additionally, shorter aus-tenitizing at a low temperature limits the grain growth by not allowing for equilibration. The slow grain growth leads to coarse grain sizes resulting in lower corrosion rates. More-over, the retained austenite at a low austenitizing temperature may be beneficial against pitting of 13%-chromium steels (13CrNiMo) [26]. However, in a geothermal environment, austenitizing does not influence the corrosion behavior after long exposure times (Figure 13).
4.3. Crack Initiation and Corrosion Fatigue Failure of High Alloyed Steels X46Cr13 and X5CrNiCuNb16-4
The deterioration of grain boundaries and pit formation initiate crack formation thus failure of high alloyed steels under cyclic load in a (CO2-saturated) corrosive geothermal environment [32–34,36,99,113].
parameters pitting
Influ
ence
in %
Carbon contentTemperatureTime
95%
95%
Figure 17. The impact of the experimental parameters on the corrosion rate after 4000 h of exposuretime combined with confidence intervals.
Generally, martensitic microstructures are highly corrosive (up to two orders of mag-nitude higher than ferritic or ferritic-bainitic microstructures) since grain boundaries aremore reactive [25,118]. However, increasing the austenitizing temperature lowers thepitting potential of lean high alloyed steels [24,28,82] with a maximum improvement byannealing at 1200 ◦C [24]. Since carbides dissolve at high annealing temperatures thecorrosion resistance of martensitic stainless steels with 13% Cr increases at higher austeni-tizing temperatures (980–1050 ◦C) [25,30,91]. (Note that Cr-rich M23C6 and M7C3 carbidesgenerally increase the mechanical properties due to secondary hardening [30], but reducethe resistance of a passivating film and enhance pitting [82]). However, at the beginning,the corrosion rates of X46Cr13 and X20Cr13 are significantly higher after austenitizing athigher temperatures and longer holding times, but after 4000 h of exposure to the CCSenvironment the corrosion rates are of not much difference. Most likely the advantageouscarbide dissolution at high austenitizing temperatures is not the driving corrosion force andthe grain boundaries are corrosively attacked. Diffusion processes are slowed down withthe increasing thickness of the growing corrosion layer. Additionally, shorter austenitizingat a low temperature limits the grain growth by not allowing for equilibration. The slowgrain growth leads to coarse grain sizes resulting in lower corrosion rates. Moreover, theretained austenite at a low austenitizing temperature may be beneficial against pitting of13%-chromium steels (13CrNiMo) [26]. However, in a geothermal environment, austenitiz-ing does not influence the corrosion behavior after long exposure times (Figure 13).
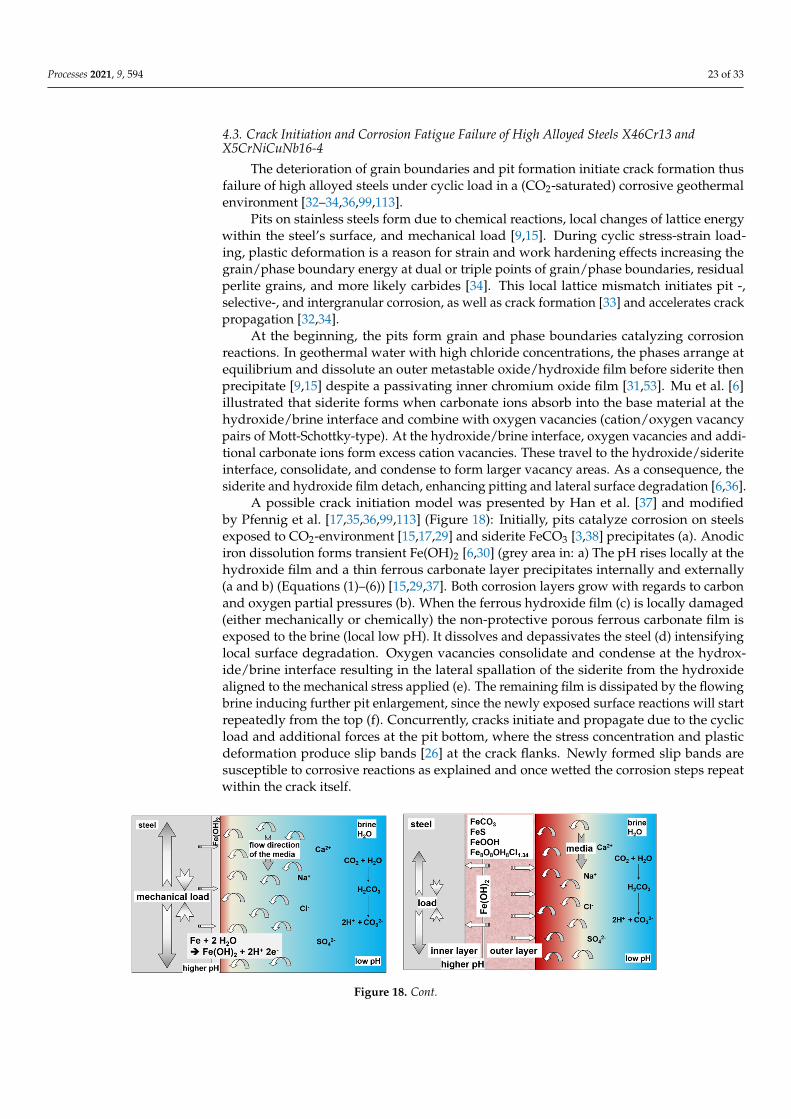
Processes 2021, 9, 594 23 of 33
4.3. Crack Initiation and Corrosion Fatigue Failure of High Alloyed Steels X46Cr13 andX5CrNiCuNb16-4
The deterioration of grain boundaries and pit formation initiate crack formation thusfailure of high alloyed steels under cyclic load in a (CO2-saturated) corrosive geothermalenvironment [32–34,36,99,113].
Pits on stainless steels form due to chemical reactions, local changes of lattice energywithin the steel’s surface, and mechanical load [9,15]. During cyclic stress-strain load-ing, plastic deformation is a reason for strain and work hardening effects increasing thegrain/phase boundary energy at dual or triple points of grain/phase boundaries, residualperlite grains, and more likely carbides [34]. This local lattice mismatch initiates pit -,selective-, and intergranular corrosion, as well as crack formation [33] and accelerates crackpropagation [32,34].
At the beginning, the pits form grain and phase boundaries catalyzing corrosionreactions. In geothermal water with high chloride concentrations, the phases arrange atequilibrium and dissolute an outer metastable oxide/hydroxide film before siderite thenprecipitate [9,15] despite a passivating inner chromium oxide film [31,53]. Mu et al. [6]illustrated that siderite forms when carbonate ions absorb into the base material at thehydroxide/brine interface and combine with oxygen vacancies (cation/oxygen vacancypairs of Mott-Schottky-type). At the hydroxide/brine interface, oxygen vacancies and addi-tional carbonate ions form excess cation vacancies. These travel to the hydroxide/sideriteinterface, consolidate, and condense to form larger vacancy areas. As a consequence, thesiderite and hydroxide film detach, enhancing pitting and lateral surface degradation [6,36].
A possible crack initiation model was presented by Han et al. [37] and modifiedby Pfennig et al. [17,35,36,99,113] (Figure 18): Initially, pits catalyze corrosion on steelsexposed to CO2-environment [15,17,29] and siderite FeCO3 [3,38] precipitates (a). Anodiciron dissolution forms transient Fe(OH)2 [6,30] (grey area in: a) The pH rises locally at thehydroxide film and a thin ferrous carbonate layer precipitates internally and externally(a and b) (Equations (1)–(6)) [15,29,37]. Both corrosion layers grow with regards to carbonand oxygen partial pressures (b). When the ferrous hydroxide film (c) is locally damaged(either mechanically or chemically) the non-protective porous ferrous carbonate film isexposed to the brine (local low pH). It dissolves and depassivates the steel (d) intensifyinglocal surface degradation. Oxygen vacancies consolidate and condense at the hydrox-ide/brine interface resulting in the lateral spallation of the siderite from the hydroxidealigned to the mechanical stress applied (e). The remaining film is dissipated by the flowingbrine inducing further pit enlargement, since the newly exposed surface reactions will startrepeatedly from the top (f). Concurrently, cracks initiate and propagate due to the cyclicload and additional forces at the pit bottom, where the stress concentration and plasticdeformation produce slip bands [26] at the crack flanks. Newly formed slip bands aresusceptible to corrosive reactions as explained and once wetted the corrosion steps repeatwithin the crack itself.
Processes 2021, 9, x FOR PEER REVIEW 23 of 33
Pits on stainless steels form due to chemical reactions, local changes of lattice energy within the steel’s surface, and mechanical load [9,15]. During cyclic stress-strain loading, plastic deformation is a reason for strain and work hardening effects increasing the grain/phase boundary energy at dual or triple points of grain/phase boundaries, residual perlite grains, and more likely carbides [34]. This local lattice mismatch initiates pit -, se-lective-, and intergranular corrosion, as well as crack formation [33] and accelerates crack propagation [32,34].
At the beginning, the pits form grain and phase boundaries catalyzing corrosion re-actions. In geothermal water with high chloride concentrations, the phases arrange at equilibrium and dissolute an outer metastable oxide/hydroxide film before siderite then precipitate [9,15] despite a passivating inner chromium oxide film [31,53]. Mu et al. [6] illustrated that siderite forms when carbonate ions absorb into the base material at the hydroxide/brine interface and combine with oxygen vacancies (cation/oxygen vacancy pairs of Mott-Schottky-type). At the hydroxide/brine interface, oxygen vacancies and ad-ditional carbonate ions form excess cation vacancies. These travel to the hydroxide/sider-ite interface, consolidate, and condense to form larger vacancy areas. As a consequence, the siderite and hydroxide film detach, enhancing pitting and lateral surface degradation [6,36].
A possible crack initiation model was presented by Han et al. [37] and modified by Pfennig et al. [17,35,36,99,113] (Figure 18): Initially, pits catalyze corrosion on steels ex-posed to CO2-environment [15,17,29] and siderite FeCO3 [3,38] precipitates (a). Anodic iron dissolution forms transient Fe(OH)2 [6,30] (grey area in: a) The pH rises locally at the hydroxide film and a thin ferrous carbonate layer precipitates internally and externally (a and b) (Equations (1)–(6)) [15,29,37]. Both corrosion layers grow with regards to carbon and oxygen partial pressures (b). When the ferrous hydroxide film (c) is locally damaged (either mechanically or chemically) the non-protective porous ferrous carbonate film is exposed to the brine (local low pH). It dissolves and depassivates the steel (d) intensifying local surface degradation. Oxygen vacancies consolidate and condense at the hydrox-ide/brine interface resulting in the lateral spallation of the siderite from the hydroxide aligned to the mechanical stress applied (e). The remaining film is dissipated by the flow-ing brine inducing further pit enlargement, since the newly exposed surface reactions will start repeatedly from the top (f). Concurrently, cracks initiate and propagate due to the cyclic load and additional forces at the pit bottom, where the stress concentration and plastic deformation produce slip bands [26] at the crack flanks. Newly formed slip bands are susceptible to corrosive reactions as explained and once wetted the corrosion steps repeat within the crack itself.
Figure 18. Cont.
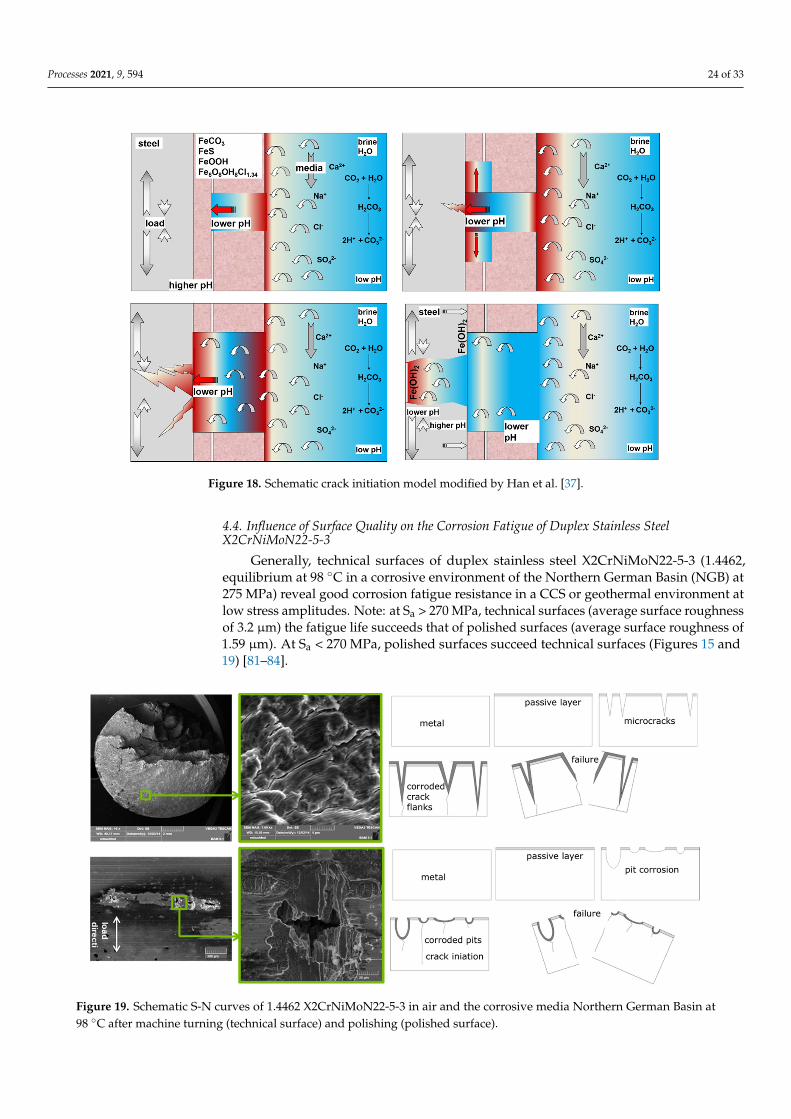
Processes 2021, 9, 594 24 of 33Processes 2021, 9, x FOR PEER REVIEW 24 of 33
Figure 18. Schematic crack initiation model modified by Han et al. [37].
4.4. Influence of Surface Quality on the Corrosion Fatigue of Duplex Stainless Steel X2CrNiMoN22-5-3
Generally, technical surfaces of duplex stainless steel X2CrNiMoN22-5-3 (1.4462, equilibrium at 98 °C in a corrosive environment of the Northern German Basin (NGB) at 275 MPa) reveal good corrosion fatigue resistance in a CCS or geothermal environment at low stress amplitudes. Note: at Sa > 270 MPa, technical surfaces (average surface roughness of 3.2 µm) the fatigue life succeeds that of polished surfaces (average surface roughness of 1.59 µm). At Sa < 270 MPa, polished surfaces succeed technical surfaces (Figures 15 and 19) [81–84].
Figure 19. Schematic S-N curves of 1.4462 X2CrNiMoN22-5-3 in air and the corrosive media Northern German Basin at 98 °C after machine turning (technical surface) and polishing (polished surface).
Figure 18. Schematic crack initiation model modified by Han et al. [37].
4.4. Influence of Surface Quality on the Corrosion Fatigue of Duplex Stainless SteelX2CrNiMoN22-5-3
Generally, technical surfaces of duplex stainless steel X2CrNiMoN22-5-3 (1.4462,equilibrium at 98 ◦C in a corrosive environment of the Northern German Basin (NGB) at275 MPa) reveal good corrosion fatigue resistance in a CCS or geothermal environment atlow stress amplitudes. Note: at Sa > 270 MPa, technical surfaces (average surface roughnessof 3.2 µm) the fatigue life succeeds that of polished surfaces (average surface roughness of1.59 µm). At Sa < 270 MPa, polished surfaces succeed technical surfaces (Figures 15 and19) [81–84].
Processes 2021, 9, x FOR PEER REVIEW 24 of 33
Figure 18. Schematic crack initiation model modified by Han et al. [37].
4.4. Influence of Surface Quality on the Corrosion Fatigue of Duplex Stainless Steel X2CrNiMoN22-5-3
Generally, technical surfaces of duplex stainless steel X2CrNiMoN22-5-3 (1.4462, equilibrium at 98 °C in a corrosive environment of the Northern German Basin (NGB) at 275 MPa) reveal good corrosion fatigue resistance in a CCS or geothermal environment at low stress amplitudes. Note: at Sa > 270 MPa, technical surfaces (average surface roughness of 3.2 µm) the fatigue life succeeds that of polished surfaces (average surface roughness of 1.59 µm). At Sa < 270 MPa, polished surfaces succeed technical surfaces (Figures 15 and 19) [81–84].
Figure 19. Schematic S-N curves of 1.4462 X2CrNiMoN22-5-3 in air and the corrosive media Northern German Basin at 98 °C after machine turning (technical surface) and polishing (polished surface).
Figure 19. Schematic S-N curves of 1.4462 X2CrNiMoN22-5-3 in air and the corrosive media Northern German Basin at98 ◦C after machine turning (technical surface) and polishing (polished surface).
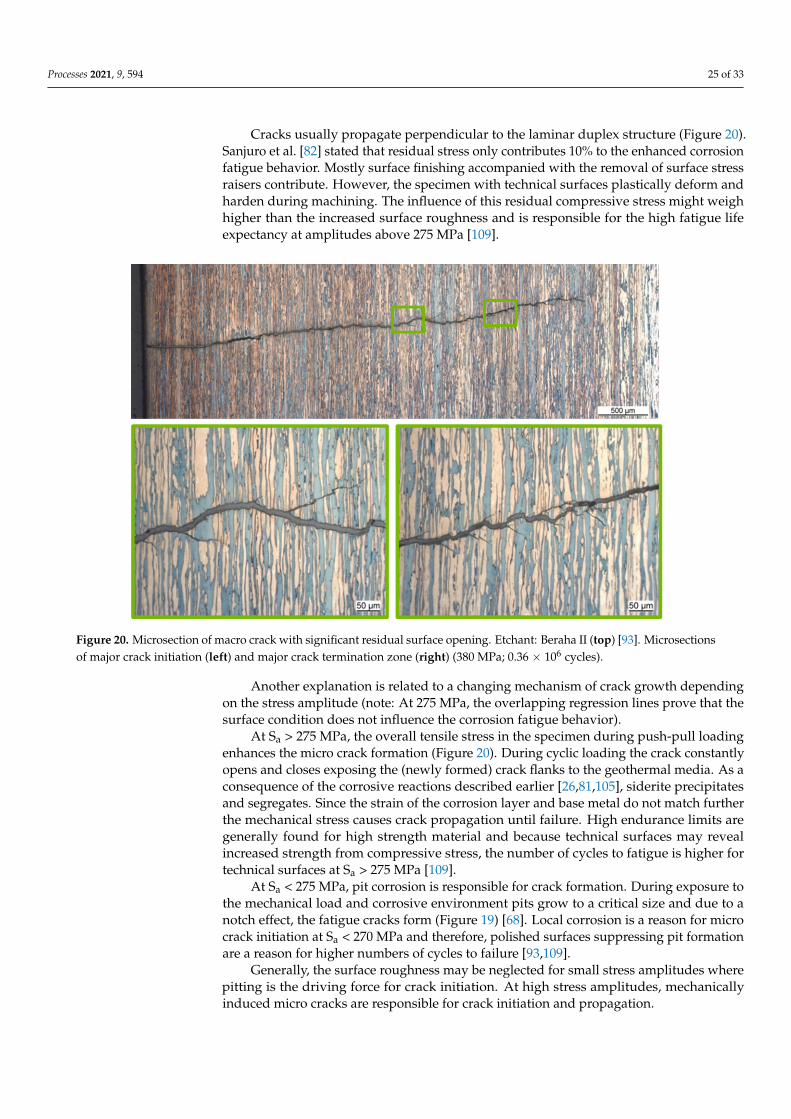
Processes 2021, 9, 594 25 of 33
Cracks usually propagate perpendicular to the laminar duplex structure (Figure 20).Sanjuro et al. [82] stated that residual stress only contributes 10% to the enhanced corrosionfatigue behavior. Mostly surface finishing accompanied with the removal of surface stressraisers contribute. However, the specimen with technical surfaces plastically deform andharden during machining. The influence of this residual compressive stress might weighhigher than the increased surface roughness and is responsible for the high fatigue lifeexpectancy at amplitudes above 275 MPa [109].
Processes 2021, 9, x FOR PEER REVIEW 25 of 33
Cracks usually propagate perpendicular to the laminar duplex structure (Figure 20). Sanjuro et al. [82] stated that residual stress only contributes 10% to the enhanced corro-sion fatigue behavior. Mostly surface finishing accompanied with the removal of surface stress raisers contribute. However, the specimen with technical surfaces plastically de-form and harden during machining. The influence of this residual compressive stress might weigh higher than the increased surface roughness and is responsible for the high fatigue life expectancy at amplitudes above 275 MPa [109].
Figure 20. Microsection of macro crack with significant residual surface opening. Etchant: Beraha II (top) [93]. Microsec-tions of major crack initiation (left) and major crack termination zone (right) (380 MPa; 0.36 × 10⁶ cycles).
Another explanation is related to a changing mechanism of crack growth depending on the stress amplitude (note: At 275 MPa, the overlapping regression lines prove that the surface condition does not influence the corrosion fatigue behavior).
At Sa > 275 MPa, the overall tensile stress in the specimen during push-pull loading enhances the micro crack formation (Figure 20). During cyclic loading the crack constantly opens and closes exposing the (newly formed) crack flanks to the geothermal media. As a consequence of the corrosive reactions described earlier [26,81,105], siderite precipitates and segregates. Since the strain of the corrosion layer and base metal do not match further the mechanical stress causes crack propagation until failure. High endurance limits are generally found for high strength material and because technical surfaces may reveal in-creased strength from compressive stress, the number of cycles to fatigue is higher for technical surfaces at Sa > 275 MPa [109].
At Sa < 275 MPa, pit corrosion is responsible for crack formation. During exposure to the mechanical load and corrosive environment pits grow to a critical size and due to a notch effect, the fatigue cracks form (Figure 19) [68]. Local corrosion is a reason for micro crack initiation at Sa < 270 MPa and therefore, polished surfaces suppressing pit formation are a reason for higher numbers of cycles to failure [93,109].
Generally, the surface roughness may be neglected for small stress amplitudes where pitting is the driving force for crack initiation. At high stress amplitudes, mechanically induced micro cracks are responsible for crack initiation and propagation.
Figure 20. Microsection of macro crack with significant residual surface opening. Etchant: Beraha II (top) [93]. Microsectionsof major crack initiation (left) and major crack termination zone (right) (380 MPa; 0.36 × 10⁶ cycles).
Another explanation is related to a changing mechanism of crack growth dependingon the stress amplitude (note: At 275 MPa, the overlapping regression lines prove that thesurface condition does not influence the corrosion fatigue behavior).
At Sa > 275 MPa, the overall tensile stress in the specimen during push-pull loadingenhances the micro crack formation (Figure 20). During cyclic loading the crack constantlyopens and closes exposing the (newly formed) crack flanks to the geothermal media. As aconsequence of the corrosive reactions described earlier [26,81,105], siderite precipitatesand segregates. Since the strain of the corrosion layer and base metal do not match furtherthe mechanical stress causes crack propagation until failure. High endurance limits aregenerally found for high strength material and because technical surfaces may revealincreased strength from compressive stress, the number of cycles to fatigue is higher fortechnical surfaces at Sa > 275 MPa [109].
At Sa < 275 MPa, pit corrosion is responsible for crack formation. During exposure tothe mechanical load and corrosive environment pits grow to a critical size and due to anotch effect, the fatigue cracks form (Figure 19) [68]. Local corrosion is a reason for microcrack initiation at Sa < 270 MPa and therefore, polished surfaces suppressing pit formationare a reason for higher numbers of cycles to failure [93,109].
Generally, the surface roughness may be neglected for small stress amplitudes wherepitting is the driving force for crack initiation. At high stress amplitudes, mechanicallyinduced micro cracks are responsible for crack initiation and propagation.
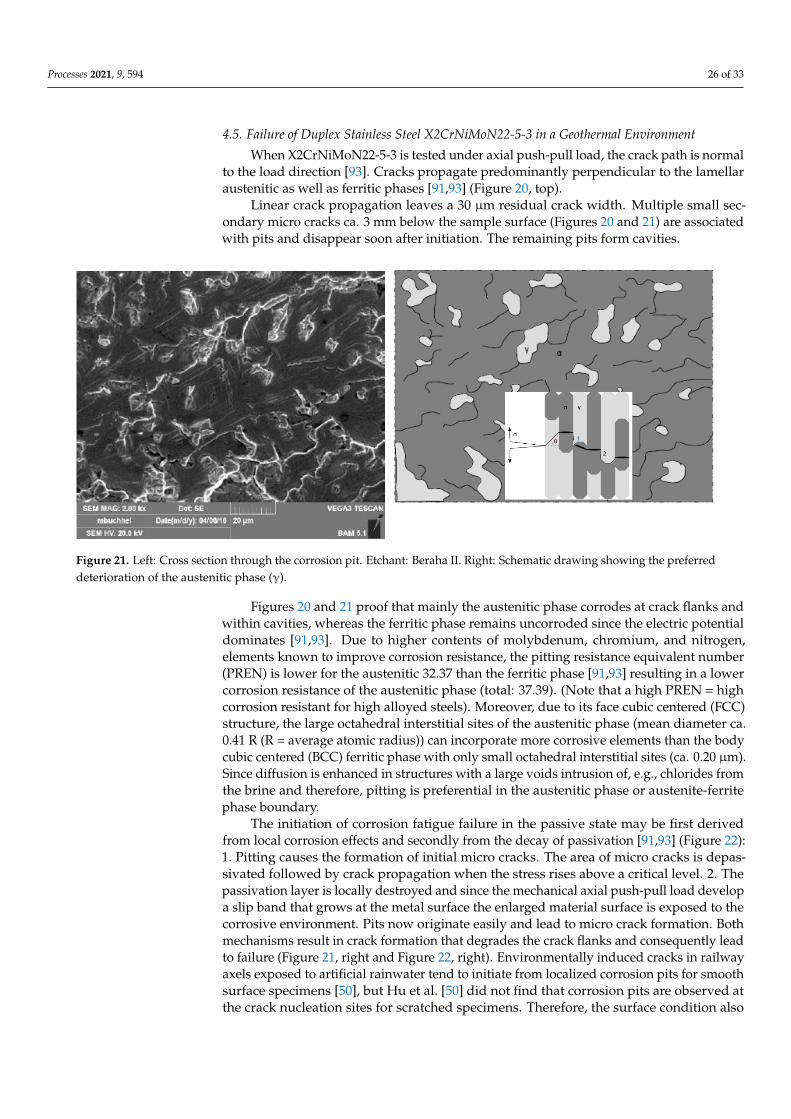
Processes 2021, 9, 594 26 of 33
4.5. Failure of Duplex Stainless Steel X2CrNiMoN22-5-3 in a Geothermal Environment
When X2CrNiMoN22-5-3 is tested under axial push-pull load, the crack path is normalto the load direction [93]. Cracks propagate predominantly perpendicular to the lamellaraustenitic as well as ferritic phases [91,93] (Figure 20, top).
Linear crack propagation leaves a 30 µm residual crack width. Multiple small sec-ondary micro cracks ca. 3 mm below the sample surface (Figures 20 and 21) are associatedwith pits and disappear soon after initiation. The remaining pits form cavities.
Processes 2021, 9, x FOR PEER REVIEW 26 of 33
4.5. Failure of Duplex Stainless Steel X2CrNiMoN22-5-3 in a Geothermal Environment When X2CrNiMoN22-5-3 is tested under axial push-pull load, the crack path is nor-
mal to the load direction [93]. Cracks propagate predominantly perpendicular to the la-mellar austenitic as well as ferritic phases [91,93] (Figure 20, top).
Linear crack propagation leaves a 30 µm residual crack width. Multiple small sec-ondary micro cracks ca. 3 mm below the sample surface (Figures 20 and 21) are associated with pits and disappear soon after initiation. The remaining pits form cavities.
Figure 21. Left: Cross section through the corrosion pit. Etchant: Beraha II. Right: Schematic drawing showing the pre-ferred deterioration of the austenitic phase (γ).
Figures 20 and 21 proof that mainly the austenitic phase corrodes at crack flanks and within cavities, whereas the ferritic phase remains uncorroded since the electric potential dominates [91,93]. Due to higher contents of molybdenum, chromium, and nitrogen, ele-ments known to improve corrosion resistance, the pitting resistance equivalent number (PREN) is lower for the austenitic 32.37 than the ferritic phase [91,93] resulting in a lower corrosion resistance of the austenitic phase (total: 37.39). (Note that a high PREN = high corrosion resistant for high alloyed steels). Moreover, due to its face cubic centered (FCC) structure, the large octahedral interstitial sites of the austenitic phase (mean diameter ca. 0.41 R (R = average atomic radius)) can incorporate more corrosive elements than the body cubic centered (BCC) ferritic phase with only small octahedral interstitial sites (ca. 0.20 µm). Since diffusion is enhanced in structures with a large voids intrusion of, e.g., chlo-rides from the brine and therefore, pitting is preferential in the austenitic phase or austen-ite-ferrite phase boundary.
The initiation of corrosion fatigue failure in the passive state may be first derived from local corrosion effects and secondly from the decay of passivation [91,93] (Figure 22): 1. Pitting causes the formation of initial micro cracks. The area of micro cracks is depas-sivated followed by crack propagation when the stress rises above a critical level. 2. The passivation layer is locally destroyed and since the mechanical axial push-pull load de-velop a slip band that grows at the metal surface the enlarged material surface is exposed to the corrosive environment. Pits now originate easily and lead to micro crack formation. Both mechanisms result in crack formation that degrades the crack flanks and conse-quently lead to failure (Figure 21, right and Figure 22, right). Environmentally induced cracks in railway axels exposed to artificial rainwater tend to initiate from localized cor-rosion pits for smooth surface specimens [50], but Hu et al. [50] did not find that corrosion pits are observed at the crack nucleation sites for scratched specimens. Therefore, the sur-face condition also influences crack nucleation with or without pitting. Intergranular
Figure 21. Left: Cross section through the corrosion pit. Etchant: Beraha II. Right: Schematic drawing showing the preferreddeterioration of the austenitic phase (γ).
Figures 20 and 21 proof that mainly the austenitic phase corrodes at crack flanks andwithin cavities, whereas the ferritic phase remains uncorroded since the electric potentialdominates [91,93]. Due to higher contents of molybdenum, chromium, and nitrogen,elements known to improve corrosion resistance, the pitting resistance equivalent number(PREN) is lower for the austenitic 32.37 than the ferritic phase [91,93] resulting in a lowercorrosion resistance of the austenitic phase (total: 37.39). (Note that a high PREN = highcorrosion resistant for high alloyed steels). Moreover, due to its face cubic centered (FCC)structure, the large octahedral interstitial sites of the austenitic phase (mean diameter ca.0.41 R (R = average atomic radius)) can incorporate more corrosive elements than the bodycubic centered (BCC) ferritic phase with only small octahedral interstitial sites (ca. 0.20 µm).Since diffusion is enhanced in structures with a large voids intrusion of, e.g., chlorides fromthe brine and therefore, pitting is preferential in the austenitic phase or austenite-ferritephase boundary.
The initiation of corrosion fatigue failure in the passive state may be first derivedfrom local corrosion effects and secondly from the decay of passivation [91,93] (Figure 22):1. Pitting causes the formation of initial micro cracks. The area of micro cracks is depas-sivated followed by crack propagation when the stress rises above a critical level. 2. Thepassivation layer is locally destroyed and since the mechanical axial push-pull load developa slip band that grows at the metal surface the enlarged material surface is exposed to thecorrosive environment. Pits now originate easily and lead to micro crack formation. Bothmechanisms result in crack formation that degrades the crack flanks and consequently leadto failure (Figure 21, right and Figure 22, right). Environmentally induced cracks in railwayaxels exposed to artificial rainwater tend to initiate from localized corrosion pits for smoothsurface specimens [50], but Hu et al. [50] did not find that corrosion pits are observed atthe crack nucleation sites for scratched specimens. Therefore, the surface condition also
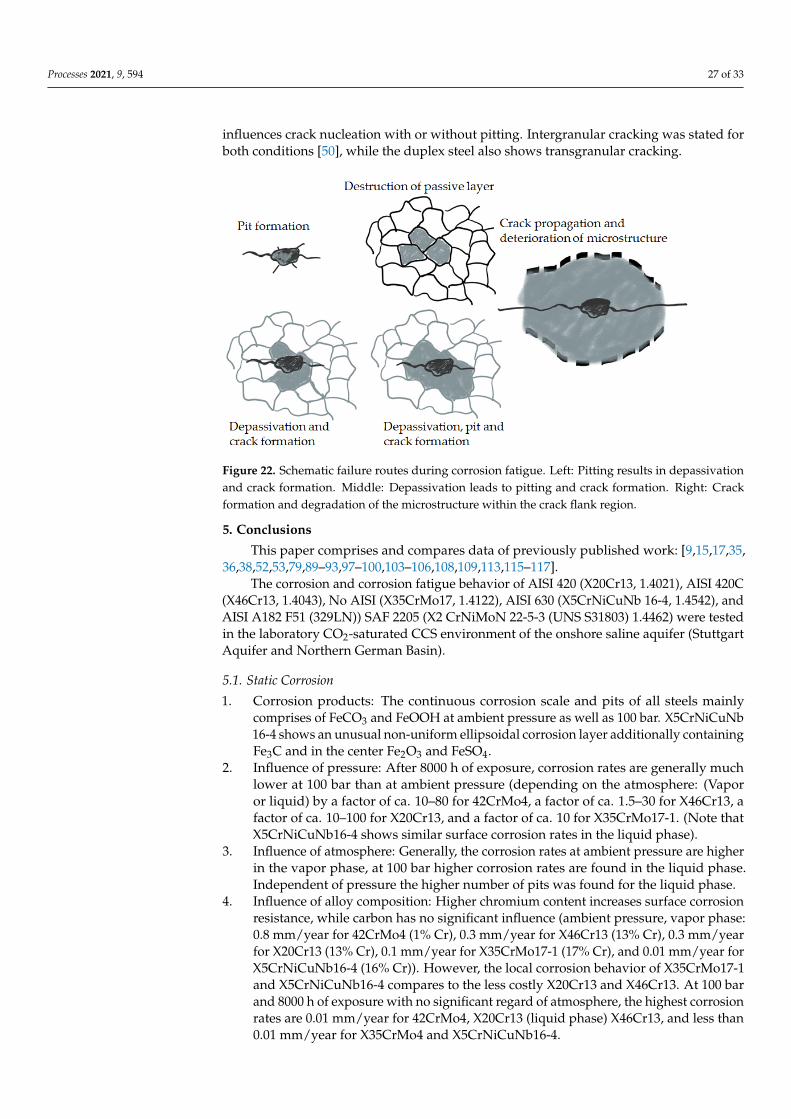
Processes 2021, 9, 594 27 of 33
influences crack nucleation with or without pitting. Intergranular cracking was stated forboth conditions [50], while the duplex steel also shows transgranular cracking.
Processes 2021, 9, x FOR PEER REVIEW 27 of 33
cracking was stated for both conditions [50], while the duplex steel also shows transgran-ular cracking.
Figure 22. Schematic failure routes during corrosion fatigue. Left: Pitting results in depassivation and crack formation. Middle: Depassivation leads to pitting and crack formation. Right: Crack formation and degradation of the microstructure within the crack flank region.
5. Conclusions This paper comprises and compares data of previously published work:
[9,15,17,35,36,38,52,53,79,89–93,97–100,103–106,108,109,113,115–117. The corrosion and corrosion fatigue behavior of AISI 420 (X20Cr13, 1.4021), AISI
420C (X46Cr13, 1.4043), No AISI (X35CrMo17, 1.4122), AISI 630 (X5CrNiCuNb 16-4, 1.4542), and AISI A182 F51 (329LN)) SAF 2205 (X2 CrNiMoN 22-5-3 (UNS S31803) 1.4462) were tested in the laboratory CO2-saturated CCS environment of the onshore saline aqui-fer (Stuttgart Aquifer and Northern German Basin).
5.1. Static Corrosion 1. Corrosion products: The continuous corrosion scale and pits of all steels mainly com-
prises of FeCO3 and FeOOH at ambient pressure as well as 100 bar. X5CrNiCuNb 16-4 shows an unusual non-uniform ellipsoidal corrosion layer additionally containing Fe3C and in the center Fe2O3 and FeSO4.
2. Influence of pressure: After 8000 h of exposure, corrosion rates are generally much lower at 100 bar than at ambient pressure (depending on the atmosphere: (Vapor or liquid) by a factor of ca. 10–80 for 42CrMo4, a factor of ca. 1.5–30 for X46Cr13, a factor of ca. 10–100 for X20Cr13, and a factor of ca. 10 for X35CrMo17-1. (Note that X5CrNi-CuNb16-4 shows similar surface corrosion rates in the liquid phase).
3. Influence of atmosphere: Generally, the corrosion rates at ambient pressure are higher in the vapor phase, at 100 bar higher corrosion rates are found in the liquid phase. Independent of pressure the higher number of pits was found for the liquid phase.
4. Influence of alloy composition: Higher chromium content increases surface corrosion resistance, while carbon has no significant influence (ambient pressure, vapor phase: 0.8 mm/year for 42CrMo4 (1% Cr), 0.3 mm/year for X46Cr13 (13% Cr), 0.3 mm/year for X20Cr13 (13% Cr), 0.1 mm/year for X35CrMo17-1 (17% Cr), and 0.01 mm/year for X5CrNiCuNb16-4 (16% Cr)). However, the local corrosion behavior of X35CrMo17-1 and X5CrNiCuNb16-4 compares to the less costly X20Cr13 and X46Cr13. At 100 bar
Figure 22. Schematic failure routes during corrosion fatigue. Left: Pitting results in depassivationand crack formation. Middle: Depassivation leads to pitting and crack formation. Right: Crackformation and degradation of the microstructure within the crack flank region.
5. Conclusions
This paper comprises and compares data of previously published work: [9,15,17,35,36,38,52,53,79,89–93,97–100,103–106,108,109,113,115–117].
The corrosion and corrosion fatigue behavior of AISI 420 (X20Cr13, 1.4021), AISI 420C(X46Cr13, 1.4043), No AISI (X35CrMo17, 1.4122), AISI 630 (X5CrNiCuNb 16-4, 1.4542), andAISI A182 F51 (329LN)) SAF 2205 (X2 CrNiMoN 22-5-3 (UNS S31803) 1.4462) were testedin the laboratory CO2-saturated CCS environment of the onshore saline aquifer (StuttgartAquifer and Northern German Basin).
5.1. Static Corrosion
1. Corrosion products: The continuous corrosion scale and pits of all steels mainlycomprises of FeCO3 and FeOOH at ambient pressure as well as 100 bar. X5CrNiCuNb16-4 shows an unusual non-uniform ellipsoidal corrosion layer additionally containingFe3C and in the center Fe2O3 and FeSO4.
2. Influence of pressure: After 8000 h of exposure, corrosion rates are generally muchlower at 100 bar than at ambient pressure (depending on the atmosphere: (Vaporor liquid) by a factor of ca. 10–80 for 42CrMo4, a factor of ca. 1.5–30 for X46Cr13, afactor of ca. 10–100 for X20Cr13, and a factor of ca. 10 for X35CrMo17-1. (Note thatX5CrNiCuNb16-4 shows similar surface corrosion rates in the liquid phase).
3. Influence of atmosphere: Generally, the corrosion rates at ambient pressure are higherin the vapor phase, at 100 bar higher corrosion rates are found in the liquid phase.Independent of pressure the higher number of pits was found for the liquid phase.
4. Influence of alloy composition: Higher chromium content increases surface corrosionresistance, while carbon has no significant influence (ambient pressure, vapor phase:0.8 mm/year for 42CrMo4 (1% Cr), 0.3 mm/year for X46Cr13 (13% Cr), 0.3 mm/yearfor X20Cr13 (13% Cr), 0.1 mm/year for X35CrMo17-1 (17% Cr), and 0.01 mm/year forX5CrNiCuNb16-4 (16% Cr)). However, the local corrosion behavior of X35CrMo17-1and X5CrNiCuNb16-4 compares to the less costly X20Cr13 and X46Cr13. At 100 barand 8000 h of exposure with no significant regard of atmosphere, the highest corrosionrates are 0.01 mm/year for 42CrMo4, X20Cr13 (liquid phase) X46Cr13, and less than0.01 mm/year for X35CrMo4 and X5CrNiCuNb16-4.
Processes 2021, 9, 594 28 of 33
5. Influence of heat treatment: In general, the shorter austenitizing time and loweraustenitizing temperature result in better corrosion resistance regarding surface corro-sion, but has no significant impact on the number of pit and pit sizes. At 100 bar aswell as at ambient pressure and 60 ◦C, hardening and tempering at low temperatures(600 to 670 ◦C) for X20Cr13, X46Cr13, and X5CrNiCuNb16-4 result in the lowestcorrosion rates and reveal good resistance against local corrosion. Therefore, the bestcorrosion resistance is achieved by a continuous martensitic microstructure.
5.2. Corrosion Fatigue
In general, the fatigue strength of steels in a CCS environment is reduced and no typicalendurance limit of S-N curves exists compared to non-corrosive conditions. Primarily,pitting (pit/local corrosion) driven by the formation of carbonic acid, not the mechanicalloading, induces crack formation and propagation and therefore, is most likely the causefor failure.
X46Cr13 (air: Endurance limit: 260 MPa). Max. number of cycles to failure is1.10 × 107 at stress amplitude 173
MPa under CCS conditions. Corrosion fatigue in the passive state is assumingly themain cause for failure. Above Sa = 170 MPa, 90% of the specimen has typical multiplecracks that originate from a central 0.2 mm pit. The initial local corrosion initiates cracksthat then condition the inter crystalline corrosion.
X5CrNiCuNb16-4 (air: Endurance limit: 620 MPa). Corrosion phenomena are unusual,such as: Elliptic surface pattern, no typical corrosion fatigue limits of S-N plot, high Wöhler-exponent (k = 3.5 and scatter range (TN = 1:34), and very small coefficient of correlation(r2 = 0.33). The max. number of cycles to failure of 10 × 106 at Sa = 150 MPa is even lowerin a second experimental set (10 × 107 at Sa = 130 MPa). Local corrosion and inclusions atthe fracture surface as well as the inter crystalline corrosion of crack flanks during crackpropagation lower the number of cycles to failure independent of: Hardness (335 HV10),aquifer water composition, and microstructure.
X2CrNiMoN22-5-3 (air: Endurance limit: 485 MPa): Max. number of cycles forstandard duplex stainless steel X2CrNiMoN22-5-3 without insulation of the testing machineis 4.2 × 10⁶ at Sa = 290 MPa and 9.2 × 10⁶ at Sa = 240 MPa with insulation. Initially, thecrack follows a linear path perpendicular to the axial load followed by a delta-like microcrack structure with an overall curved path with considerable horizontal degradation of theaustenitic phase only. Crack initiation may be allocated to both: First, early pit formationresults in depassivation and then second, local depassivation results in pit formation.
At the critical electrical potential at USHE = −450 to −900 mV at Sa = 275 MPa, thespecimen did not fail (107 cycles to failure). However, at low potentials hydrogen evolvesto degrading the steel.
Polished surface finishes result in a higher corrosion fatigue life expectancy at mediumto low stress amplitudes (long exposure time). At low stress amplitudes, local corrosionis likely to initialize the crack growth. Technical surfaces perform better at high stressamplitudes (and shorter exposure). At high stress amplitudes, micro cracks are the reasonfor crack propagation and failure.
Author Contributions: Conceptualization, A.P. and M.W.; methodology, A.P. and M.W.; software,M.W.; validation, A.P., M.W. and A.K.; formal analysis, A.P. and M.W.; investigation, A.P. and M.W.;resources, A.P., A.K. and M.W.; data curation, A.P. and M.W.; writing—original draft preparation,A.P.; writing—review and editing, A.P.; visualization, A.P.; supervision, A.P. and A.K.; projectadministration, A.P.; funding acquisition, A.P. All authors have read and agreed to the publishedversion of the manuscript.
Funding: This research received no external funding.
Institutional Review Board Statement: Not applicable.
Informed Consent Statement: Not applicable.
Processes 2021, 9, 594 29 of 33
Conflicts of Interest: The authors declare no conflict of interest.
References1. Thomas, C. Carbon Dioxide Capture for Storage in Deep Geologic Formations—Results from CO2 Capture Project; Elsevier Ltd.: London,
UK, 2005; ISBN 0080445748.2. Broek, M.V.D.; Hoefnagels, R.; Rubin, E.; Turkenburg, W.; Faaij, A. Effects of technological learning on future cost and performance
of power plants with CO2 capture. Prog. Energy Combust. Sci. 2009, 35, 457–480. [CrossRef]3. Nešic, S. Key issues related to modelling of internal corrosion of oil and gas pipelines—A review. Corros. Sci. 2007, 49, 4308–4338.
[CrossRef]4. Hurter, S. Impact of Mutual Solubility of H2O and CO2 on Injection Operations for Geological Storage of CO2. In Proceedings of
the International Conference of the Properties of Water and Steem ICPWS, Berlin, Germany, 8–11 September 2012.5. Zhang, L.; Yang, J.; Sun, J.S.; Lu, M. Effect of pressure on wet H2S/CO2 corrosion of pipeline steel. No. 09565. In Proceedings of
the NACE Corrosion 2008 Conference and Expo, New Orleans, LA, USA, 16–20 March 2008.6. Mu, L.J.; Zhao, W.Z. Investigation on Carbon Dioxide Corrosion Behaviors of 13Cr Stainless Steel in Simulated Strum Water.
Corros. Sci. 2010, 2, 82–89. [CrossRef]7. Seiersten, M. Material selection for separation, transportation and disposal of CO2. In CORROSION/2001; Paper no. 01042; NACE
International: Houston, TX, USA, 2001.8. Cui, Z.D.; Wu, S.L.; Zhu, S.L.; Yang, X.J. Study on corrosion properties of pipelines in simulated produced water saturat-ed with
supercritical CO2. Appl. Surf. Sci. 2006, 252, 2368–2374. [CrossRef]9. Pfennig, A.; Kranzmann, A. Reliability of pipe steels with different amounts of C and Cr during onshore carbon dioxide injection.
Int. J. Greenh. Gas Control 2011, 5, 757–769. [CrossRef]10. Zhang, H.; Zhao, Y.L.; Jiang, Z.D. Effects of temperature on the corrosion behavior of 13Cr martensitic stainless steel dur-ing
exposure to CO2 and Cl environment. Mat. Let. 2005, 59, 3370–3374. [CrossRef]11. Alhajji, J.; Reda, M. The effect of alloying elements on the electrochemical corrosion of low residual carbon steels in stagnant
CO2-saturated brine. Corros. Sci. 1993, 34, 1899–1911. [CrossRef]12. Choi, Y.-S.; Nešic, S. Corrosion behavior of carbon steel in supercritical CO2-water environments. No. 09256. In Proceedings of
the NACE Corrosion 2008 Conference and Expo, New Orleans, LA, USA, 16–20 March 2008.13. Jiang, X.; Nešic, S.; Huet, F. The Effect of Electrode Size on Electrochemical Noise Measurements and the Role of Chloride on
Localized CO2 Corrosion of Mild Steel. Paper No. 09575. In Proceedings of the NACE Corrosion 2008 Conference and Expo, NewOrleans, LA, USA, 16–20 March 2008.
14. Ahmad, Z.; Allam, I.M.; Abdul, B.; Aleem, J. Effect of environmental factors on the atmospheric corrosion of mild steel inaggressive sea coastal environment. Anti Corros. Methods Mater. 2000, 47, 215–225. [CrossRef]
15. Pfennig, A.L.; Bäßler, R. Effect of CO2 on the stability of steels with 1% and 13% Cr in saline water. Corros. Sci. 2009, 51, 931–940.[CrossRef]
16. Pfennig, A.; Kranzmann, A. The role of pit corrosion in engineering the carbon storage site at Ketzin, Germany. AIR Pollut. 2010,136, 109–119. [CrossRef]
17. Pfennig, A.; Zastrow, P.; Kranzmann, A. Influence of heat treatment on the corrosion behavior of stainless steels during CO2-sequestration into saline aquifer. Int. J. Greenh. Gas Control 2013, 15, 213–224. [CrossRef]
18. Nyborg, R. Controlling Internal Corrosion in Oil and Gas Pipelines. Business Briefing: Exploration & Production. Oil Gas Rev.2005, 2, 70–74.
19. Carvalho, D.S.; Joia, C.; Mattos, O. Corrosion rate of iron and iron–chromium alloys in CO2 medium. Corros. Sci. 2005, 47,2974–2986. [CrossRef]
20. Linter, B.R.; Burstein, G.T. Reactions of pipeline steels in carbon dioxide solutions. Corr. Sci. 1999, 41, 117–139. [CrossRef]21. Wu, S.L.; Cui, Z.D.; Zhao, G.X.; Yan, M.L.; Zhu, S.L.; Yang, X.J. EIS study of the surface film on the surface of carbon steel form
supercritical carbon dioxide corrosion. Appl. Surf. Sci. 2004, 228, 17–25. [CrossRef]22. Bülbül, S.; Sun, Y. Corrosion behavior of high Cr-Ni cast steels in the HCl solution. J. Alloys.Comp. 2010, 598, 143–147. [CrossRef]23. Hou, B.; Li, Y.; Li, Y.; Zhang, J. Effect of alloy elements on the anti-corrosion properties of low alloy steel. Bull. Mater. Sci 2000, 23,
189–192. [CrossRef]24. Cvijovic, Z.; Radenkovic, G. Microstructure and pitting corrosion resistance of annealed duplex stainless steel. Corros. Sci. 2006,
48, 3887–3906. [CrossRef]25. Park, J.-Y.; Park, Y.-S. The effects of heat-treatment parameters on corrosion resistance and phase transformations of 14Cr–3Mo
martensitic stainless steel. Mater. Sci. Eng. A 2007, 449–451, 1131–1134. [CrossRef]26. Banas, J.; Lelek-Borkowska, U.; Mazurkiewicz, B.; Solarski, W. Effect of CO2 and H2S on the composition and stability of passive
film on iron alloys in geothermal water. Electrochimica Acta 2007, 52, 5704–5714. [CrossRef]27. Bilmes, P.; Llorente, C.; Méndez, C.; Gervasi, C. Microstructure, heat treatment and pitting corrosion of 13CrNiMo plate and weld
metals. Corros. Sci. 2009, 51, 876–881. [CrossRef]28. Zhang, L.; Zhang, W.; Jiang, Y.; Deng, B.; Sun, D.; Li, J. Influence of annealing treatment on the corrosion resistance of lean duplex
stainless steel 2101. Electrochimica Acta 2009, 54, 5387–5392. [CrossRef]
Processes 2021, 9, 594 30 of 33
29. Brown, B.; Parakala, S.R.; Nešic, S. CO2 corrosion in the presence of trace amounts of H2S. paper No. 04736. In Proceedings of theNACE International Corrosion Conference Series: Corrosion 2004, New Orleans, LA, USA, 28 March–1 April 2004.
30. Isfahany, A.N.; Saghafian, H.; Borhani, G. The effect of heat treatment on mechanical properties and corrosion behavior of AISI420martensitic stainless steel. J. Alloys Compd. 2011, 509, 3931–3936. [CrossRef]
31. Lucio-Garcia, M.; Gonzalez-Rodriguez, J.; Casales, M.; Martinez, L.; Chacon-Nava, J.; Neri-Flores, M.; Martinez-Villafañe, A.Effect of heat treatment on H2S corrosion of a micro-alloyed C–Mn steel. Corros. Sci. 2009, 51, 2380–2386. [CrossRef]
32. Madduri, C.; Prakash, R.V. Corrosion Fatigue Crack Growth Studies in Ni-Cr-Mn steels. Int. J. Mech. Mat. Eng. 2010, 1, 20–25.33. Seo, M. Initiation and stability of localized corrosion processes on stainless steels. Electrochemical Society. Corrosion Division,
Passivity and localized corrosion: An International Symposium in Honour of Professor Norio Sato. Electrochem. Soc. 1999, 99–27,483–492.
34. Vignal, V.; Delrue, O.; Peultier, J.; Oltra, R. Critical Factors in Localized Corrosion 5: A Symposium in Honour of Hugh Isaacs.In Local Mechanical-Electrochemical Behavior of Duplex Stainless Steels; The Electrochemical Society: Pennington, NJ, USA, 2007;pp. 102–104.
35. Pfennig, A.; Wolf, M.; Böllinghaus, T. Corrosion Fatigue of X46Cr13 in CCS Environment. In Energy Technology 2016; SpringerScience and Business Media LLC.: New York, NY, USA, 2016; pp. 49–56.
36. Pfennig, A.; Wiegand, R.; Wolf, M.; Bork, C.-P. Corrosion and corrosion fatigue of AISI 420C (X46Cr13) at 60 ◦C in CO2-saturatedartificial geothermal brine. Corros. Sci. 2013, 68, 134–143. [CrossRef]
37. Han, J.; Yang, Y.; Nešic, S.; Brown, N.B. Roles of passivation and galvanic effects in localized CO2 corrosion of mild steel. PaperNo. 08332. In Proceedings of the NACE Corrosion 2008, New Orleans, LA, USA, 16–20 March 2008.
38. Pfennig, A.; Wolthusen, H.; Zastrow, P.; Kranzmann, A. Evaluation of heat treatment performance of potential pipe steels inCCS-environment. In Energy Technology 2015; Springer: Cham, Switzerland, 2015; pp. 15–22.
39. Thomas, J.P.; Wei, R.P. Corrosion fatigue crack growth of steels in aqueous solutions I: Experimental results and mod-eling theeffects of frequency and temperature. Mater. Sci. Eng. 1992, A159, 205–221. [CrossRef]
40. Wei, R.P.; Chiou, S. Corrosion fatigue crack growth and electrochemical reactions for an X-70 linepipe steel in car-bonate-bicarbonate solution. Eng. Fract. Mech. 1992, 41, 463–473. [CrossRef]
41. Cerisola, G.; Busca, G.; de Anna, P.L. Corrosion fatigue behavior of iron in different aqueous environments. Mater. Chem. Phys.1983, 9, 387–403. [CrossRef]
42. Palin-Luc, T.; Pérez-Mora, R.; Bathias, C.; Domínguez, G.; Paris, P.C.; Arana, J.L. Fatigue crack initiation and growth on a steel inthe very high cycle regime with sea water corrosion. Eng. Fract. Mech. 2010, 77, 1953–1962. [CrossRef]
43. Yeske, R.A.; Roth, L.D. Environmental effects on fatigue of stainless steel at very high frequencies. In Ultrasonic Fatigue;The Metallurgical Society of AIME: New York, NY, USA, 1982; pp. 349–364.
44. Macek, W.; Branco, R.; Szala, M.; Marciniak, Z.; Ulewicz, R.; Sczygiol, N.; Kardasz, P. Profile and Areal Surface Parameters forFatigue Fracture Characterisation. Materials 2020, 13, 3691. [CrossRef]
45. Mazzola, L.; Regazzi, D.; Beretta, S.; Bruni, S. Fatigue assessment of old design axles: Service simulation and life extension. Proc.Inst. Mech. Eng. Part F J. Rail Rapid Transit 2014, 230, 572–584. [CrossRef]
46. Beretta, S.; Carboni, M.; Conte, A.L.; Regazzi, D.; Trasatti, S.; Rizzi, M. Crack Growth Studies in Railway Axles under CorrosionFatigue: Full-scale Experiments and Model Validation. Procedia Eng. 2011, 10, 3650–3655. [CrossRef]
47. Carboni, M.; Beretta, S.; Conte, A.L. Research on corrosion fatigue of railway axles. Insight Non-Destructive Test. Cond. Monit.2011, 53, 361–367. [CrossRef]
48. Beretta, S.; Carboni, M.; Regazzi, D. Load interaction effects in propagation lifetime and inspections of railway axles. Int. J. Fatigue2016, 91, 423–433. [CrossRef]
49. Hassani-Gangaraj, S.; Carboni, M.; Guagliano, M. Finite element approach toward an advanced understanding of deep rollinginduced residual stresses, and an application to railway axles. Mater. Des. 2015, 83, 689–703. [CrossRef]
50. Hu, Y.; Wu, S.; Withers, P.J.; Cao, H.; Chen, P.; Zhang, Y.; Shen, Z.; Vojtek, T.; Hutar, P. Corrosion fatigue lifetime assessment ofhigh-speed railway axle EA4T steel with artificial scratch. Eng. Fract. Mech. 2021, 245, 107588. [CrossRef]
51. Wu, S.; Xu, Z.; Kang, G.; He, W. Probabilistic fatigue assessment for high-speed railway axles due to foreign object damages. Int.J. Fatigue 2018, 117, 90–100. [CrossRef]
52. Pfennig, A.; Wolf, M. Influence of geothermal environment on the corrosion fatigue behavior of standard duplex stainless steelX2CrNiMoN22-5-32. J. Phys. Conf. Ser. 2019, 1425, 012183.
53. Yevtushenko, O.; Bäßler, R.; Pfennig, A. Corrosion behavior of Cr13steel in CO2 saturated brine with high chloride con-centration.Mater. Corros. 2012, 62, 517–521. [CrossRef]
54. Unigovski, Y.B.; Lothongkum, G.; Gutman, E.M.; Alush, D.; Cohen, R. Low-cycle fatigue behavior of 316L-type stain-less steel inchloride solutions. Corr. Sci. 2009, 51, 3014–3120. [CrossRef]
55. Brück, S.; Schippl, V.; Schwarz, M.; Christ, H.-J.; Fritzen, C.-P.; Weihe, S. Hydrogen Embrittlement Mechanism in Fatigue Behaviorof Austenitic and Martensitic Stainless Steels. Metals 2018, 8, 339. [CrossRef]
56. Holtam, C.M.; Baxter, D.P.; Ashcroft, I.A.; Thomson, R.C. Effect of crack depth on fatigue crack growth rates for a C–Mn pipelinesteel in a sour environment. Int. J. Fatigue 2010, 32, 288–296. [CrossRef]
57. Li, M.-Q.; Wei, Z.-W.; Zhang, F.-S.; Tang, J.-Q. The corrosion fatigue of medium strength structural steels. Corros. Sci. 1993, 34,1403–1410. [CrossRef]
Processes 2021, 9, 594 31 of 33
58. Thorbjörnsson, I. Corrosion fatigue testing of eight different steels in an Icelandic geothermal environment. Mater. Des. 1995, 16,97–102. [CrossRef]
59. Russick, E.M.; Poulter, G.A.; Adkins, C.L.J.; Sorensen, N.R. Corrosive Effects of Supercritical Carbon Dioxide and Cosolvents onMetals. J. Supercrit. Fluids 1996, 9, 43–50. [CrossRef]
60. Fang, B.Y.; Atrens, A.; Wang, J.Q.; Han, E.H.; Zhu, Z.Y.; Ke, W. Review of stress corrosion cracking of pipeline steels in ‘low’ and‘high’ pH solutions. J. Mat. Sci. 2003, 38, 127–132. [CrossRef]
61. Schmitt-Thomas, K.G. Schwingungsrisskorrosionsanfälligkeit Verschiedener Werkstoffe in. Korrosion Verstehen—Korrosionsschädenvermeiden, Band 2; Verlag Irene Kuron: Bonn, Germany, 1994.
62. Roeder, E.; Bassler, H.-J.; Huber, M.; Vollmar, J. Vollmar. Schwingungsrisskorrosionsverhalten des austenitischen StahlesX6CrNiMoTi 17 12 2 in 3%iger NaCl-Lösung unter Umlaufbiegebelastung. Mater. Corros. 1992, 43, 426–431. [CrossRef]
63. Spähn, R. Mechanismen der Schwingungsrisskorrosion und Prüfungen in: Korrosion Verstehen Korrosionsschäden Vermeiden, Band 2;Verlag Irene Kuron: Bonn, Germany, 1994.
64. Lipp, H.-J. Schwingungsrißkorrosionsuntersuchungen an ferritischen rostfreien Stählen. Mater. Corros. 1975, 26, 825–831.[CrossRef]
65. Schmitt-Thomas, K.G.; Häpple, T.; Wunderlich, R. Untersuchung des SwRK-Verhaltens des hochreinen martensitaushärtendenStahles X5CrNiCuNb 17 4 PH im Vergleich zum weichmartensitischen Stahl X4CrNiMo 16 5 1 ESU in chloridhaltigen wässrigenLösungen. Mater. Corros. 1989, 40, 427–436. [CrossRef]
66. Huneau, B.; Mendez, J. Evaluation of environmental effects on fatigue crack growth behavior of a high strength steel in a salinesolution with cathodic protection. Int. J. Fatigue 2006, 28, 124–131. [CrossRef]
67. Ebara, R. Corrosion fatigue crack initiation behavior of stainless steels. Procedia Eng. 2010, 2, 1297–1306. [CrossRef]68. Alvarez-Armas, I. Duplex Stainless Steels: Brief History and Some Recent Alloys. Recent Pat. Mech. Eng. 2008, 1, 51–57. [CrossRef]69. Prosek, T.; Le Gac, A.; Thierry, D.; Le Manchet, S.; Lojewski, C.; Fanica, A.; Johansson, E.; Canderyd, C.; Dupoiron, F.; Snauwaert,
T.; et al. Low-Temperature Stress Corrosion Cracking of Austenitic and Duplex Stainless Steels Under Chloride Deposits. Corrosion2014, 70, 1052–1063. [CrossRef]
70. Schultze, S.; Göllner, J.; Eick, K.; Veit, P.; Heyse, H. Selektive Korrosion von Duplexstahl. Teil 1: Aussagekraft herkömmlicherund neuartiger Methoden zur Untersuchung des Korrosionsverhaltens von Duplexstahl X2CrNiMoN22-5-3 unter besondererBerücksichtigung der Mikrostruktur. Mater. Corros. 2010, 52/1, 26–36. [CrossRef]
71. Arnold, N.; Gümpel, P.; Heitz, T.W. Chloride induced corrosion on stainless steels at indoor swimming pools atmos-pheres Part 2:Influence of hypochlorite. Mater. Corros. 1999, 49, 140–145. [CrossRef]
72. Zhang, W.; Fang, K.; Hu, Y.; Wang, S.; Wang, X. Effect of machining-induced surface residual stress on initiation of stress corrosioncracking in 316 austenitic stainless steel. Corros. Sci. 2016, 108, 173–184. [CrossRef]
73. Shahryari, A.; Kamal, W.; Omanovic, S. The effect of surface roughness on the efficiency of the cyclic potentiodynamic passivation(CPP) method in the improvement of general and pitting corrosion resistance of 316LVM stainless steel. Mater. Lett. 2008, 62,3906–3909. [CrossRef]
74. Ahmed, A.A.; Mhaede, M.; Basha, M.; Wollmann, M.; Wagner, L. The effect of shot peening parameters and hydroxyap-atitecoating on surface properties and corrosion behavior of medical grade AISI 316L stainless steel. Surf. Coat. Technol. 2015, 280,347–358. [CrossRef]
75. Lee, S.M.; Lee, W.G.; Kim, Y.H.; Jang, H. Surface roughness and the corrosion resistance of 21Cr ferritic stainless steel. Corros. Sci.2012, 63, 404–409. [CrossRef]
76. Takemoto, M. Study on the Failure Threshold Stress Criteria for the Prevention and Mechanism of Stress Corrosion Cracking; Faculty ofScience and Engineering, Aoyama Gakuin University: Tokyo, Japan, 1984.
77. Asma, R.N.; Yuli, P.; Mokhtar, C. Study on the Effect of Surface Finish on Corrosion of Carbon Steel in CO2 Environment. J. Appl.Sci. 2011, 11, 2053–2057. [CrossRef]
78. Lv, J.; Guo, W.; Liang, T. The effect of pre-deformation on corrosion resistance of the passive film formed on 2205 duplex stainlesssteel. J. Alloys Compd. 2016, 686, 176–183. [CrossRef]
79. Pfennig, A.; Wolf, M.; Bork, C.-P.; Trenner, S.; Wiegand, R. Comparison between X5CrNiCuNb16-4 and X46Cr13 under CorrosionFatigue. Paper No. 3776; In Corrosion; NACE International: San Antonio, TX, USA, 2014.
80. Vollmar, J.; Roeder, E. Auswirkungen des elektrochemischen Probenpotentials auf das SwRK-Verhalten des DuplexstahlsX2CrNiMoN22-5-3 in NaCl-Lösung. Werkstoffe und Korrosion 1994, 45, 378–386. [CrossRef]
81. Evgenya, B.; Hughesa, T.; Eskinba, D. Effect of surface roughness on corrosion behavior of low carbon steelin inhibited 4 Mhydrochloric acid under laminar and turbulent flow conditions. Corr. Sci. 2016, 103, 196–205. [CrossRef]
82. Sanjurjo, P.; Rodríguez, C.; Pariente, I.F.; Belzunce, F.J.; Canteli, A.F. The influence of shot peening on the fatigue behav-ior ofduplex stainless steels. Procedia Eng. 2010, 2, 1539–1546. [CrossRef]
83. Abdulstaar, M.; Mhaede, M.; Wollmann, M.; Wagner, L. Investigating the effects of bulk and surface severe plastic de-formationon the fatigue, corrosion behavior and corrosion fatigue of AA5083. Surf. Coat. Technol. 2014, 254, 244–251. [CrossRef]
84. Wu, X.; Guan, H.; Han, E.H.; Ke, W.; Katada, Y. Influence of surface finish on fatigue cracking behavior of reactor pressure vesselsteel in high temperature water. Mater. Corros. 2006, 57, 868–871. [CrossRef]
85. Lo, I.-H.; Tsai, W.-T. Effect of selective dissolution on fatigue crack initiation in 2205 duplex stainless steel. Corros. Sci. 2007, 49,1847–1861. [CrossRef]
Processes 2021, 9, 594 32 of 33
86. Mathis, R. Initiation and early growth mechanisms of corrosion fatigue cracks in stainless steels. J. Mater. Sci. 1987, 22, 907–914.[CrossRef]
87. Garcia, R.L.; Muñoz-Portero, M.; Garcia-Anton, J. Corrosion behaviour of sensitized and unsensitized Alloy 900 (UNS 1.4462) inconcentrated aqueous lithium bromide solutions at different temperatures. Corros. Sci. 2010, 52, 950–959. [CrossRef]
88. Forster, A.; Schoner, R.; Förster, H.-J.; Norden, B.; Blaschke, A.-W.; Luckert, J.; Beutler, G.; Gaupp, R.; Rhede, D. Reservoircharacterization of a CO2 storage aquifer: The Upper Triassic Stuttgart Formation in the Northeast German Basin. Mar. Pet. Geol.2010, 27, 2156–2172. [CrossRef]
89. Pfennig, A.; Trenner, S.; Wolf, M.; Bork, C. Vibration Tests for Determination of Mechanical Behavior in CO2-Containing SolutionsinEuropean Corrosion Congress EuroCorr 2013; Estoril Congress Center: Estoril, Portugal, 2013.
90. Wolf, M.; Afanasiev, R.; Böllinghaus, T.; Pfennig, A. Investigation of Corrosion Fatigue of Duplex Steel X2CrNiMoN22-5 3Exposed to a Geothermal Environment under Different Electrochemical Conditions and Load Types. Energy Procedia 2017, 114,5337–5345. [CrossRef]
91. Pfennig, A.; Gröber, A.; Simkin, R.; Kranzmann, A. Influence of Surface Qualıty on the Corrosıon and Corrosıon Fatıgue Behavıorof Hıgh Alloyed Steels Exposed to Dıfferent Salıne Aquıfer Water Envıronments. Matter Int. J. Sci.; Tech. 2019, 5, 609–631.[CrossRef]
92. Pfennig, A.; Simkin, R.; Gröber, A.; Kranzmann, A. The Role of Surface Texture on the Corrosion Behavior of High Al-loyedSteels Exposed to Different Saline Aquifer Water Environments. In Proceedings of the 14th Greenhouse Gas Control TechnologiesConference, Melbourne, Australia, 21–26 October 2018; (GHGT-14). SSRN’s eLibrary ISSN 1556-5068. Available online: https://ssrn.com/abstract=3365580 (accessed on 26 March 2021).
93. Pfennig, A.; Kranzmann, A. Failure of standard duplex stainless steel X2CrNiMoN22-5-3 under corrosion fatigue in geother-malenvironment. IOP Conf. Ser. Mater. Sci. Eng. 2020, 894, 93–98.
94. López, D.; Pérez, T.; Simison, S. The influence of microstructure and chemical composition of carbon and low alloy steels in CO2corrosion. A state-of-the-art appraisal. Mater. Des. 2003, 24, 561–575. [CrossRef]
95. Enerhaug, J. A study of localized corrosion in super martensitic stainless steel weldments. Ph.D. Thesis, Norwegian University ofScience and Technology (NTNU), Trondheim, Norway, 2002.
96. Mousavi, S.A.; Sufizadeh, A. Metallurgical investigations of pulsed Nd:YAG laser welding of AISI 321 and AISI 630 stainlesssteels. Mater. Des. 2009, 30, 3150–3157. [CrossRef]
97. Wang, J.; Zou, H. Relationship of microstructure transformation and hardening behavior of type 630 stainless steel. J. Univ. Sci.Tech. Beijing 2006, 3, 213–221. [CrossRef]
98. Pfennig, A.; Wolthusen, H.; Kranzmann, A. Unusual Corrosion Behavior of 1.4542 Exposed a Laboratory Saline Aquifer WaterCCS-environment. Energy Procedia 2017, 114, 5229–5240. [CrossRef]
99. Pfennig, A.; Kranzmann, A. Potential of martensitic stainless steel X5CrNiCuNb 16-4 as pipe steel in corrosive CCS envi-ronment.Int. J. Env. Sci. Dev. 2017, 8, 466–473. [CrossRef]
100. Pfennig, A.; Heynert, K.; Wolf, M.; Böllinghaus, T. First in-situ Electrochemical Measurement During Fatigue Testing of In-jectionPipe Steels to Determine the Reliability of a Saline Aquifer Water CCS-site in the Northern German Basin Original. Energy Procedia2014, 63, 5773–5786. [CrossRef]
101. Förster, A.; Norden, B.; Zinck-Jørgensen, K.; Frykman, P.; Kulenkampff, J.; Spangenberg, E.; Erzinger, J.; Zimmer, M.; Kopp, J.;Borm, G.; et al. Baseline characterization of the CO2SINK geological storage site at Ketzin, Germany. Environ. Geosci. 2006, 13,145–161. [CrossRef]
102. Bäßler, R.; Sobetzki, J.; Klapper, H.S. Corrosion Resistance of High-Alloyed Materials in Artificial Geothermal Fluids. InProceedings of the Corrosion 2013, Orlando, FL, USA, 17 March 2013.
103. Pfennig, A.; HTW University of Applied Sciences Berlin; Kranzmann, A. BAM Federal Institute of Materials Research and TestingBorehole Integrity of Austenitized and Annealed Pipe Steels Suitable for Carbon Capture and Storage (CCS). Int. J. Mater. Mech.Manuf. 2017, 5, 213–218. [CrossRef]
104. Pfennig, A.; Wolthusen, H.; Wolf, M.; Kranzmann, A. Effect of heat Treatment of Injection Pipe Steels on the Reliability of a SalineAquifer Water CCS-site in the Northern German Basin. Energy Procedia 2014, 63, 5762–5772. [CrossRef]
105. Pfennig, A.; Kranzmann, A. Effect of CO2 and pressure on the stability of steels with different amounts of chromium in salinewater. Corros. Sci. 2012, 65, 441–452. [CrossRef]
106. Pfennig, A.; Wolf, M.; Kranzmann, A. Evaluating corrosion and corrosion fatigue behavior via laboratory testing tech-niques inhighly corrosive CCS-environment. In Proceedings of the GHGT15 the Greenhouse Gas Control Technologies Conference, AbuDhabi, United Arab Emirates, 15–18 March 2021.
107. Kraus, S.W.; Nolze, G. POWDER CELL—A program for the representation and manipulation of crystal structures and calculationof the resulting X-ray powder patterns. J. Appl. Cryst. 1996, 29, 301–303. [CrossRef]
108. Pfennig, A.; Wolf, M.; Kranzmann, A. Effects of saline aquifer water on the corrosion behavior of martensitic stainless steelsduring exposure to CO2 environment. In Proceedings of the GHGT15 the Greenhouse Gas Control Technologies Conference, AbuDhabi, United Arab Emirates, 15–18 March 2021.
109. Pfennig, A.; Wolf, M.; Kranzmann, A. The Role of Surface Texture on the Corrosion Fatigue Behavior of High Alloyed StainlessSteel Exposed to Saline Aquifer Water Environment. Int. J. Mater. Sci. Eng. 2019, 7, 26–33. [CrossRef]
Processes 2021, 9, 594 33 of 33
110. Kranzmann, A.; Huenert, D.; Rooch, H.; Urban, I.; Schulz, W.; Österle, W. Reactions at the Interface between Steel and Oxide Scale inwet CO2 Containing Atmospheres; NACE Corrosion Conference & Expo: Atlanta, GA, USA, 22–26 March 2009.
111. Zhang, Y.; Gao, K.; Schmitt, G. Corrosion inhibition of steels in aqueous media in contact with supercritical carbon diox-ide.In Proceedings of the EUROCORR 2011 Conference—The European Corrosion Congress, Stockholm, Sweden, Switzerland,5–8 September 2011.
112. Wei, L.; Pang, X.; Liu, C.; Gao, K. Formation mechanism and protective property of corrosion product scale on X70 steel undersupercritical CO2 environment. Corr. Sci. 2015, 100, 404–420. [CrossRef]
113. Pfennig, A.; Kranzmann, A. Corrosion And Fatigue Of Heat Treated Martensitic Stainless Steel 1.4542 Used For GeothermalApplications. Matter Int. J. Sci. Technol. 2019, 5, 138–158. [CrossRef]
114. Schiz, J. Einfluss der Austenitisierungsparameter auf die Korrosionsbeständigkeit von Stählen in CCS-Umgebung. Bachelor’sThesis, HTW Berlin, FB2 Mechanical Engineering, Berlin, Germany, 2011.
115. Pfennig, A.; Wolf, M.; Kranzmann, A. In-situ testing of corrosion and corrosion fatigue behavior of stainless steels in ge-othermalenvironment. Int. Proc. Chem. Biol. Env. Eng. 2018, 103, 13–20.
116. Pfennig, A.; Marcus, W.; Gröber, A.; Böllinghaus, T.; Kranzmann, A. Corrosion Fatigue of 1.4542 Exposed to a Laboratory SalineAquifer Water CCS-environment. Energy Procedia 2017, 114, 5219–5228. [CrossRef]
117. Klein, B. Versuchsplanung DoE. Edition: 4 Label: De Gruyter Oldenbourg; De Gruyter Oldenbourg Medium: Berlin, Germany, 2014;p. 371.
118. Choi, Y.-S.; Kim, J.-G.; Park, Y.-S.; Park, J.-Y. Austenitzing treatment influence on the electrochemical corrosion behavior of0.3C-14Cr-3Mo martensitic stainless steel. Mater. Lett. 2007, 61, 244–247. [CrossRef]