Embed Size (px)
Citation preview

Folia Geobotanica 39: 13–26, 2004
CONTRASTING PATTERNS OF SPATIAL GENETICSTRUCTURE OF DIPLOID AND TRIPLOID POPULATIONS OFTHE CLONAL AQUATIC SPECIES, BUTOMUS UMBELLATUS(BUTOMACEAE ), IN CENTRAL EUROPE
Jan Kirschner, Igor Bartish, Zdenka Hroudová, Lída Kirschnerová & Petr Zákravský
Institute of Botany, Academy of Sciences of the Czech Republic, CZ-252 43 Prùhonice 1, Czech Republic;
e-mail [email protected], [email protected], [email protected], [email protected],
zakravsky@ ibot.cas.cz
Abstract: Genetic diversity in a sample of an aquatic plant Butomus umbellatus from 37 localities in Czechiaand Slovakia was studied by analyzing six polymorphic loci in three enzymatic systems (SKDH, PGD andAAT). Diversity among ramets was low in eight populations with relatively extensive sampling (only onepopulation possessed more than one multilocus genotype), suggesting high clonality of reproduction in thesepopulations. However, among-population diversity was high: G = 0.782 and 0.881 for the samples of diploid andtriploid populations, respectively. Heterozygosity of individual plants averaged over variable loci was also high:H = 0.554 for diploids and 0.453 for triploids. Genetic differentiation among populations was additionallystudied using cluster analysis. Several populations of diploids clustered separately from all other populations,whereas another group of diploid populations clustered with some triploid populations, indicating the possibilityof relatively recent, probably multiple origin of these triploid populations from their diploid progenitors.Association between matrices of Nei’s genetic distances among populations from different localities andmatrices of geographic distances among these localities revealed highly significant correlation for the sample ofdiploid populations (r = 0.60, P < 0.001) but no significant correlation for the sample of triploid populations (r =
0.02, P = 0.593). These results indicate a spatial structure of diploid populations in accordance with the isolationby distance model, and a random distribution of genotypes among triploid populations of B. umbellatus.
Keywords: Allozymes, Autocorrelation analysis, Genetic diversity, Mantel test, Polyploidy
INTRODUCTION
Butomus umbellatus L., a widespread water macrophyte, has recently been thoroughlystudied from the viewpoints of karyology, ecology and reproductive behaviour (HROUDOVÁ
& ZÁKRAVSKÝ 1993, KRAHULCOVÁ & JAROLÍMOVÁ 1993). On the territory of Czechia andSlovakia, two cytotypes were found to coexist: diploids and triploids. The co-existence of thetwo cytotypes within populations was not ascertained. The two cytotypes can be discerned bymeans of their floral morphology (HROUDOVÁ & ZÁKRAVSKÝ, unpubl.). The diploidsoccupy a narrower ecological range (a lower tolerance of high nutrient level), and thefrequency of their occurrence is much lower in the region (HROUDOVÁ & ZÁKRAVSKÝ 1993:431 and Fig. 1). The main difference distinguishing the two cytotypes is the breeding system:diploids are self-compatible, while triploids are self-incompatible (KRAHULCOVÁ &JAROLÍMOVÁ 1993).

Many water macrophyte populations are clonal (WIDÉN et al. 1994), and the samebehaviour is observed in the case of Butomus umbellatus (ECKERT et al. 2003). Seedlingrecruitment is an infrequent situation in aquatic habitats (ASPINWALL & CHRISTIAN 1992,ECKERT & BARRETT 1993) and B. umbellatus is not an exception to this rule: sexualrecruitment of seedlings of B. umbellatus and their establishment at new sites, based on fieldobservations, is rather rare (HROUDOVÁ & ZÁKRAVSKÝ 1993b). The triploids, expectedly,have very limited fertility and seed reproduction; they mostly spread vegetatively by means ofrhizome fragments. In natural habitats of diploid populations, seedlings are very rarely found(despite high seed production), and diploid populations are therefore also expected to be ofclonal origin (HROUDOVÁ & ZÁKRAVSKÝ 1993).
FERNANDO & CASS (1996) studied clonality of Butomus umbellatus in the secondarydistribution range in Canada (three collection sites, in British Columbia, Alberta andManitoba). They failed to detect any isozyme variation, in spite of an extensiveelectrophoretic screening of as many as 40 isozyme loci in 150 ramets; their RAPD analysesof a much more limited material revealed a certain variation (the British Columbia siteharboured two RAPD clones, while the other two populations were composed of another(single) RAPD genotype). It is difficult to make conclusions from this study because of thelack of important introductory information (ploidy level of the plants studied, samplingdesign). However, there is a evident high clonality in the Canadian B. umbellatus.
In spite of the previous failure of isozyme electrophoresis to reveal variation in thesecondary distribution range of the species, we used this otherwise promising method (seealso BARRETT et al. 1993) to study the Czech and Slovak material. The level of isozymevariation proved suitable for a more detailed analysis in our area.
14 J. Kirschner et al.
15o
48o
20o
15o
20o
50 km
U
U
U
UF
SS T
I
J
RS
U
AA A
BB
GP
O O
V
NKL
MJJJ
H
DEA
AA
CC
51o
Fig. 1. Spatial distribution of multilocus allozyme genotypes of Butomus umbellatus in Czech and Slovak
Republics. A to H represent diploids, I to V triploids.

In the present study we investigated genetic relationships within and among populations ofa representative sample from Central Europe. The objective was to check if the differencesbetween the two cytotypes in floral morphology, breeding system and ecological preferencesare reflected in the genetic structure of populations. Cluster analysis of genetic distancesamong populations was applied to reveal the genetic relationships among populations fromthe combined sample of two cytotypes. Because the results of this analysis indicatedcontrasting geographic structure within different cytotypes, we also tested these patternsusing the Mantel test. In this test we analyzed two sets of populations with different cytotypesseparately. We used autocorrelation analysis to follow the patterns of geographic structureacross the whole range of geographic distances among populations. Different cytotypes wereanalyzed separately.
MATERIAL AND METHODS
Character of populations
The development of Butomus umbellatus populations is stimulated by occasional andtemporary decreases in water level. The dynamics of water level and the slope of the shoreinfluence the spatial pattern of plants in populations:
(1) In the most frequent case, a short time-decrease of water level results in the appearanceof the belt of the exposed bottom along the shoreline. Consequently, sprouting of rhizomes ofB. umbellatus stored in the bottom is promoted, resulting in the formation of the stand ofB. umbellatus as a belt bordering open water areas in front of reed. When the water decrease isslow, and occurs over a long time and the shore is moderately sloping, the stand belt may beseveral metres wide; in the case of a less considerable water level decrease and/or steep shore,a very narrow belt of B. umbellatus may develop (in an extreme case one line of tussocks).
(2) A long-term exposed bottom (summer drainage of fishponds) supports the sprouting ofplants of B. umbellatus from rhizomes over the whole bottom area; mosaic-like stand mayarise following vegetative dispersal of plants. In this case, the stand is patchy, formed bytussocks or clumps of tussocks dispersed irregularly on the bottom. Optimum development ofthe population may be attained in the year following draining, when the water level remainslowered; however, a mosaic-like pattern of tussocks in the population persists.
(3) In the case of a highly increased water level, some plants of B. umbellatus may reachwater level only scarcely and mostly remain sterile; some plants may survive in submergedform or only as dormant rhizomes.
In sampling plants to study the population homogeneity in natural habitats, we were notable to find submerged plants owing to water turbidity. This means that only emergent plantscould be sampled, and it is nearly impossible to state or estimate the total number of plants perpopulation in habitats with turbid water. Moreover, B. umbellatus is a vegetativelyreproducing rhizomatous plant, forming dense underground rhizome systems and is quitedifficult (when often knee-deep in mud) to recognize the range of one genet. Thus, because ofthe above difficulties we are unable to express the ratio of sampled shoots to the number ofplant individuals in the whole population, and samples representing different populations maynot be fully comparable.
Genetic structure of Butomus umbellatus 15

Sampling design in natural habitats
Rhizome cuttings with shoots of 31 plants were collected in each of the eight populations(see Table 1), with the exception of the Velká Laguna locality where only 14 tussocks ofButomus umbellatus were present. Plants were sampled at regular distances to cover thewhole range of the population. Sampling points were separated to avoid multiple samplingwithin a patch. The distance between sampling points fluctuated depending on populationsize, from 1 to 5 m. In belt-forming stands, the samples were collected in transect along thebelt. In the case of a sparse line of tussocks, samples were collected from each tussock orclump of tussocks (localities Velká Laguna and Malý Panenský). In other populations, thesampling points formed a grid over the whole area of the stand. Plant samples were cultivatedin the experimental garden at Prùhonice, Czech Republic. Not all plants survived the winterseason; consequently, the sample size used for analyses varied from 21 to 31 (see Table 1).
In addition, plants from other regions of the Czech Republic and Slovakia were sampled tocover the main areas of distribution in the region. Additional diploid plants from 12 localitiesand triploids from 17 localities were collected; these samples consisted of a single plant each.In total, 226 plants were used in isozyme analyses (see Table 1 for survey of localities, andFig. 1 for distribution of samples).
Isozyme analysis
Fresh young leaves were ground in cool mortars with 0.6 ml of extraction buffer: 100 ml 75mM Tris-H3PO4 (pH 7.5), 50 mg citric acid, 4 g polyvinylpyrrolidone, 120 mg DTE, 100 µlmercaptoethanol, 1 g DOWEX Cl- (M. TICHÝ in KIRSCHNER 1995). Homogenates werecentrifugated at 15,000 r/min for 10 min in a refrigerated centrifuge. Electrophoresis usingdiscontinuous polyacrylamide gels ran for 4 hours: first at 20 mA (concentration gel), then at25 mA per gel (separation gel). The area of the gel cross section was 140 mm2. We usedTris-glycine (pH 8.39) as discontinuous electrode buffer. Enzyme detections were madefollowing VALLEJOS (1983) with occasional modifications (KIRSCHNER et al. 1994). Thefollowing enzyme systems were tested: PGM, GPI, 6-PGD, ME, LAP, SOD, SKD, IDH,ADH, NADDH, AAT; 20 isozyme loci were identified. Three enzyme systems with a total ofsix variable loci were used for the evaluation of clonal diversity (see Table 2). Expression ofAat-1 locus depended on the ontogenetic stage of examined plants (only mature plants at earlystage of flowering yielded detectable products); triploids were not scored for this locusbecause of the rare expression.
Data analysis
The data matrix of allele frequencies in each genotype was used to create the matrix ofpairwise Nei’s genetic distances among genotypes (NEI72 in SIMINT, NTSYS-pc, version1.8, ROHLF 1997). The same method was applied to create two additional matrices of geneticdistances among diploid and triploid genotypes separately. Cluster analysis (UPGMA, SAHNin NTSYS) was performed on the matrix of genetic distances of the total sample ofpopulations. A cophenetic value matrix (COPH in NTSYS) was produced from the treematrix obtained in cluster analysis. This matrix was used to check goodness-of-fit for thecluster analysis by comparing it to the matrix of genetic distances (MXCOMP in NTSYS).
16 J. Kirschner et al.

Genetic structure of Butomus umbellatus 17
Table 1. Survey of localities of plants analyzed. Names of sites, number of ramets sampled, and coordinates of
the localities are given (details of localities may be obtained from the authors on request).
Site Name Number of ramets analyzed Geographical Position
N E
DIPLOIDSCzech Republic
1. Køtìný fishpond 1 49º 05� 06.53� 14º 46� 28.14�
2. Hluboký Sax fishpond 1 49º 09� 43.55� 14º 46� 02.44�
3. Pøední Pasecký fishpond 1 49º 04� 51.46� 14º 47� 42.68�
4. Opaøany 1 49º 23� 35.39� 14º 28� 23.66�
5. Stehlík fishpond 1 49º 05� 31.46� 14º 45� 15.41�
6. Hluboký fishpond near Hamr 1 49º 09� 36.16� 14º 46� 06.86�
7. Trubný fishpond 1 49º 22� 36.12� 14º 26� 39.78�
8. Velký Dubovec fishpond 22 49º 04� 04.04� 14º 43� 13.21�
9. Pohoøelec fishpond 1 49º 06� 05.03� 14º 47� 37.37�
10. Luz¡nice River in Tábor 1 49º 24� 23.64� 14º 40� 15.63�
11. Malý Panenský fishpond 27 49º 04� 11.55� 14º 44� 05.10�
12. Rozkoš reservoir near Domkov 1 50º 22� 48.35� 16º 05� 47.28�
13. Jistebník 1 49º 45� 07.65� 18º 09� 53.91�
14. Velký Vaèek fishpond 22 49º 46� 07.44� 18º 11� 17.16�
Slovak Republic15. Vojany 1 48º 34� 17.39� 21º 58� 06.75�
TRIPLOIDSCzech Republic16. Sány near Podìbrady 1 50º 07� 14.62� 15º 14� 31.37�
17. Knìz¡ský Horní fishpond 1 50º 19� 17.64� 15º 10� 07.36�
18. Labe River in Nymburk 1 50º 10� 57.87� 15º 02� 37.50�
19. Zbraslav 1 49º 58� 51.37� 14º 23� 48.95�
20. Èeská Lípa 1 50º 40� 15.34� 14º 30� 41.02�
21. Poèedìlice 1 50º 22� 30.02� 13º 53� 33.43�
22. Tašovice 31 50º 10� 00.69� 13º 00� 57.95�
23. Høešihlavy 1 49º 55� 29.51� 13º 36� 02.49�
24. Malšova Lhota 31 50º 12� 38.96� 15º 52� 38.27�
25. Labe River in Pardubice 1 50º 02� 31.34� 15º 46� 10.60�
26. Nový u Krèe near Protivín 1 49º 12� 39.10� 14º 15� 16.28�
27. Nové Mlýny 1 48º 51� 25.78� 16º 43� 34.11�
28. Kuchyòka fishpond near Tøebíè 1 49º 13� 17.87� 15º 52� 04.13�
29. Allah IV fishpond near Valtice 1 48º 45� 50.71� 16º 47� 09.61�
30. Hlohovec 1 48º 46� 43.19� 16º 45� 05.18�
31. Podivín-Lednice 21 48º 49� 01.10� 16º 49� 44.55�
32. Velká Laguna 14 48º 53� 47.54� 16º 34� 04.70�
33. Nový rybník near Mikulov 26 48º 46� 57.54� 16º 40� 31.94�
Slovak Republic34. Stráz¡ne 1 48º 22� 18.97� 21º 51� 41.44�
35. Bo�any 1 48º 26� 27.60� 22º 05� 51.58�
36. Leles 1 48º 27� 02.30� 22º 00� 55.76�
37. Strekov 1 47º 53� 42.47� 18º 52� 26.16�

To study whether genetic distances among populations correlated with geographicdistances among them, we computed two matrices of geographic distances from the data set ofgeographical coordinates of each site (Table 1) for diploid and triploid populations separately(KIRVAN 1997). These matrices of geographical distances were compared with thecorrespondent matrices of genetic distances to investigate the possible association betweengenetic and geographical distances (Mantel test, MXCOMP in NTSYS). The Mantel test wasalso carried out on log-transformed genetic and geographic distances, as suggested bySLATKIN (1993).
We carried out the autocorrelation analysis (ODEN & SOKAL 1986) to check how thepresence or absence of geographic structure is distributed across the whole range ofgeographic distances among populations. In this analysis each pairwise geographic distancebetween a pair of localities was attributed to a certain distance class. The distance classes werecreated by dividing of the whole range of geographic distances within our sample, from a pairof the closest localities to a pair of the most distant ones, into several stretches. We tried toallocate pairwise comparisons into distance classes approximately evenly, keeping at thesame time ranges of the classes equidistant, when it was possible. Consequently, a series ofbinary matrices of “1s” and “0s” was produced so that all pairwise distances amongpopulations would receive “0” if they were included into the same distance class, and “1” ifthey were out of a specific distance class (BARTISH et al. 2000). Two such series of matriceswere created for localities of diploid and triploid genotypes separately.
The matrices of Nei’s genetic distances were repeatedly compared with binary matrices,separately for each distance class (MXCOMP in NTSYS). As a result, an autocorrelationcoefficient (Raobs) was obtained for each distance class for both diploid and triploid data setsand its significance was tested by the Mantel test (1000 permutations). Additionally,corresponding autocorrelation coefficients were obtained by comparing matrices ofgeographic distances (separately for diploid and triploid populations) with the same binarymatrices, as in the case of matrices of genetic distances. The resulting autocorrelationcoefficients (Raexp) represent the “ideal” or expected values that would be obtained if therewere an ideal correlation between genetic and geographic distances in the total data set
18 J. Kirschner et al.
Table 2. Multilocus allozyme genotypes (clones) found in the populations of diploid and triploid Butomus
umbellatus with extensive sampling (see also Table 1). n – number of analyzed plants, * – whole population
representing 14 plants was studied.
Locality Ploidy n Skd Pgd-1 Pgd-2 Aat-1 Aat-2 Aat-3 Multilocus
genotype
8. Velký Dubovec 2x 22 bb aa ce bc bc ab A
11. Malý Panenský 2x 27 bb aa ce bc bc ab A
14. Velký Vaèek 2x 22 bd aa cc bc cc aa B
22. Tašovice 3x 31 bcc aaa ccc - bcc aaa U
24. Malšova Lhota 3x 31 aae aaa acc - ccc aaa I
31. Podivín-Lednice 3x 15 bce aaa acc - bbc aaa J
6 cee aaa acc - bcc aaa K
32. Velká Laguna 3x 14* bbc aaa bcd - abc aaa L
33. Nový rybník 3x 26 aee aaa ccc - bcc aaa M

Genetic structure of Butomus umbellatus 19
Table 3. Survey of multilocus genotypes found in 37 representatives of clones of Butomus umbellatus in Czechia
and Slovakia. For localities, see Table 1. * – incomplete data, ** – co-existing clones, Het – mean
among-population frequency of heterozygous loci per plant.
Locality Skd Pgd-1 Pgd-2 Aat-1 Aat-2 Aat-3 Het Multilocus
genotype
Diploids
1 bb aa ce bb bc ab 0.5 C
2 ab aa cd bb cc aa 0.33 D
3 bb aa ce bb bc ab 0.5 C
4 bb aa - bc bc ab 0.6 A*
5 bc aa - bc ac aa 0.6 H*
6 bb aa ce bc ab aa 0.5 E
7 bb aa ce bc bc ab 0.67 A
8 bb aa ce bc bc ab 0.67 A
9 bb aa ce bc bc ab 0.67 A
10 bb aa ce bc bc ab 0.67 A
11 bb aa ce bc bc ab 0.67 A
12 be aa cc ab ac aa 0.5 F
13 bd aa cc bc cc aa 0.33 B
14 bd aa cc bc cc aa 0.33 B
15 ab aa cc bb aa aa 0.17 G
Triploids
16 aee aaa ccc - ccc aaa 0.2 S
17 bcc aaa - - bcc aaa 0.5 U*
18 aee aaa ccc - ccc aaa 0.2 S
19 bee aaa ccc - ccc aaa 0.2 R
20 bcc aaa ccc - bcc aaa 0.4 U
21 bcc aaa ccc - bcc aaa 0.4 U
22 bcc aaa ccc - bcc aaa 0.4 U
23 aee aaa ccc - ccc aaa 0.2 S
24 aae aaa acc - ccc aaa 0.4 I
25 bce aaa acc - ccc aaa 0.4 T
26 bcc aaa ccc - bcc aaa 0.4 U
27 aae aaa bcd - ccc aaa 0.4 N
28 bce aaa acc - bbc aaa 0.6 J
29 bce aaa acc - bbc aaa 0.6 J
30 bce aaa acc - bbc aaa 0.6 J
31a** bce aaa acc - bbc aaa 0.6 J
31b** cee aaa acc - bcc aaa 0.6 K
32 bbc aaa bcd - abc aaa 0.6 L
33 aee aaa ccc - bcc aaa 0.4 M
34 bce aab ccc - - - 0.67 O*
35 bce aab ccc - bcc aaa 0.6 O
36 bce aaa aac - ccc aaa 0.4 P
37 bcc aaa acc - bcc aaa 0.6 V
(BARTISH et al. 2000). Two plots, based on observed and expected autocorrelationcoefficients for each distance class of geographic distances, calculated separately for diploidand triploid populations, illustrate the pattern of relationships between genetic and geographicdistances across the whole range of geographic distances for our sample.
Calculation of genetic diversity estimates within and among genotypes and populations isexplained in Table 4.
RESULTS
Genetic diversity within populations
Analysis of polymorphism in allozyme loci from different ramets within eight populationsrevealed a mainly clonal nature of the studied populations. Seven populations proved to beuniclonal, and only one population consisted of two multilocus genotypes: the triploidpopulation from Podivín-Lednice was represented by 15 individuals with genotype J and 6individuals with genotype K (Table 2). Therefore, the probability of co-existence of two ormore allozyme genotypes within a population and within-population diversity should beconsidered as very low in Butomus umbellatus from Central Europe; thus, we generallysuppose that all the 37 populations sampled are uniclonal or oligoclonal. This low variabilityamong ramets from the same locality was in contrast with their relatively high meanamong-loci heterozygosity. In the majority of populations estimates of the frequency ofheterozygous loci within a genotype were as high as 0.40–0.67 (Table 3). The mean number ofalleles per locus was also high: A = 3.33 for the whole sample, A = 2.83 in diploids, and A =
2.80 in triploids (Table 4).
Genetic diversity among populations
Overall among-locality genotype diversity was high: G = 0.918 for the whole sample.Within different cytotypes this measure of diversity among populations was only slightlylower: G = 0.782 for diploids and 0.881 for triploids (Table 4).
Cluster analysis of populations
We found a relatively high correlation (r = 0.81, P < 0.001) between matrix of pairwiseNei’s genetic distances among populations and the corresponding matrix of copheneticvalues, obtained after doing a UPGMA cluster analysis of the matrix of genetic distances.
20 J. Kirschner et al.
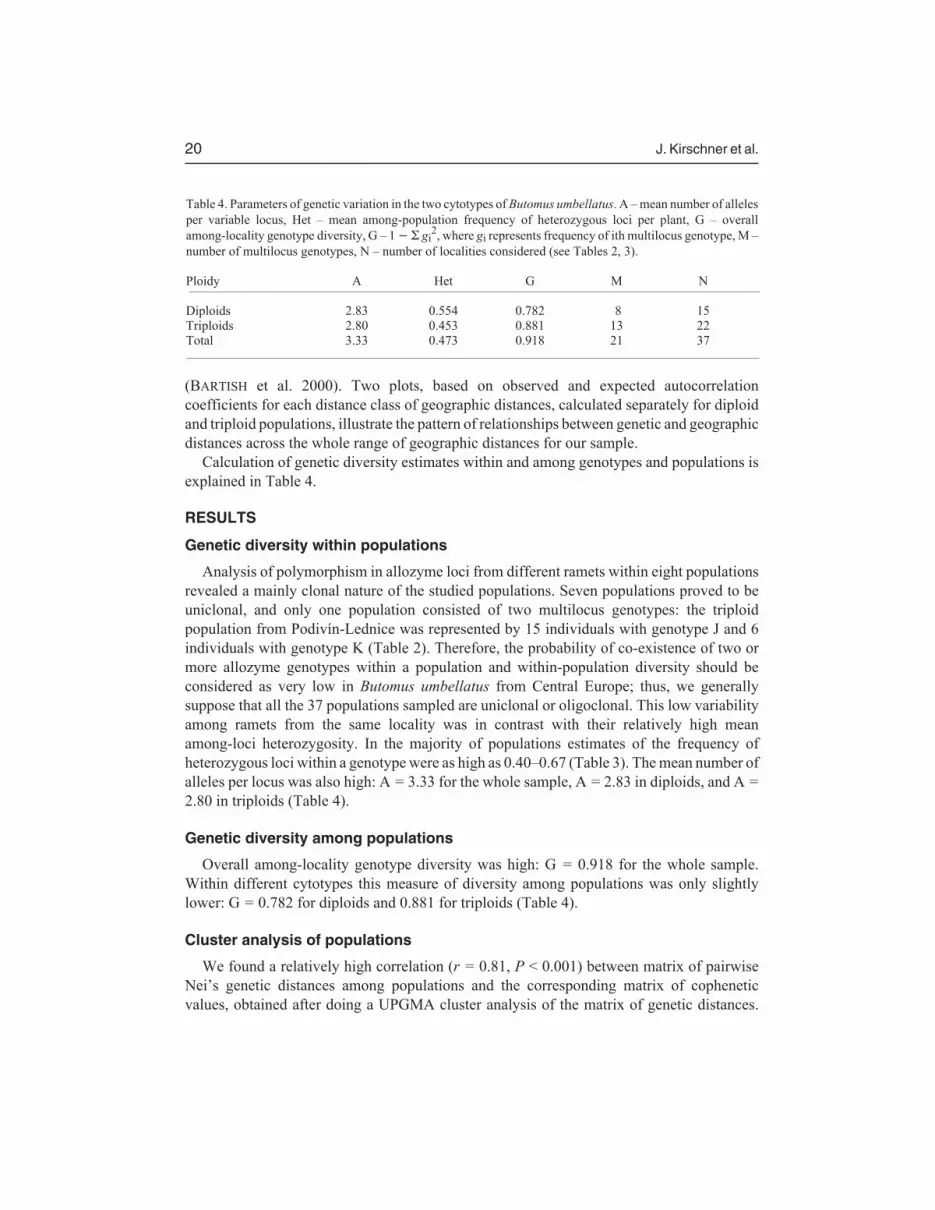
Table 4. Parameters of genetic variation in the two cytotypes of Butomus umbellatus. A – mean number of alleles
per variable locus, Het – mean among-population frequency of heterozygous loci per plant, G – overall
among-locality genotype diversity, G – 1 � � gi2, where gi represents frequency of ith multilocus genotype, M –
number of multilocus genotypes, N – number of localities considered (see Tables 2, 3).
Ploidy A Het G M N
Diploids 2.83 0.554 0.782 8 15
Triploids 2.80 0.453 0.881 13 22
Total 3.33 0.473 0.918 21 37

This result indicated good representation of genetic relationships among populations in theresulting dendrogram (Fig. 2).
The genetic differentiation among populations was not random in relation to cytotypes: themajority of diploid populations (genotypes A, C, E, and G) clustered separately from triploidpopulations (Fig. 2). The diploid population from Vojany (East Slovakia, genotype G) was theleast heterozygous and most differentiated from the rest of the other populations. Diploidgenotypes B, D, and F were clustered with triploid genotypes I, N, O, R, S, M, and diploidgenotype H appeared to be closely related to triploid genotype L. The remainig triploidgenotypes were strongly differentiated from all the other genotypes. This pattern indicates arelatively recent origin of these triploid populations from their diploid progenitors.
Association between genetic and geographic distances
Geographic distribution of genotypes shows a certain pattern: groups of genotypes areconfined to mutually exclusive regions (Fig. 1). The five clones identified in Bohemia (CzechRepublic) (I, R, S, T, U) were not found in the NW Pannonian region (S Moravia, CzechRepublic, and SW Slovakia), nor in E Slovakia. The clones found in S Moravia and SWSlovakia (J, K, L, M, N, V) were restricted to that region, and the three clones from E Slovakia
Genetic structure of Butomus umbellatus 21
�
�
�
�
�
�
�
�
�
�
�
�
�
�
�
�
�
�
�
�
�
�
C
A
0.3 0.2 0.1 0.00.4
�
Fig. 2. Dendrogram of UPGMA cluster analysis of Nei’s genetic distances among populations of Butomus
umbellatus. Capital letters correspond to multilocus genotypes. Numbers 1 to 15 belong to diploids, 16 to 37
(asterisked) to triploids (for localities see Table 1). Scale bar indicates genetic distance.

(O, P, and G) were not found elsewhere. Another feature of the pattern is the existence ofgenotypes widely distributed within a river system: diploid genotype A is common in theLuz¡nice system, and triploid genotype J is common along the Dyje River and neighbouringponds.
The relationship between genetic and geographic distances in the total sample is not clear.Some genetically closely related genotypes were collected from distant localities, whereasothers were found in nearby ponds (e.g., genotypes A and C, J and K, Fig. 1). However, theresults of statistical analyses, when Mantel tests of correlation between matrices of geneticand geographic distances among populations were carried out separately for diploid andtriploid populations, are more straightforward. These tests revealed highly significantcorrelation in the case of diploid (r = 0.60, P < 0.001) but not triploid (r = 0.02, P = 0.593)populations. The same tests for log-transformed distances show a similar pattern: r = 0.48,P < 0.001 for diploids, and r = �0.02, P = 0.486 for triploids.
Autocorrelation analysis
When analysis was based on genetic distances among diploid populations, the observedautocorrelation coefficients were relatively close to the expected values along the whole rangeof distance classes (with exception, perhaps, of distance classes from 6 km to 10 km, and from525 km to 530 km), in a good accordance with the results of the Mantel test for the wholerange of geographic distances. Autocorrelation coefficients for distance classes with smalland large distances were significantly different from zero, with exception of the distance class6–10 km. Raobs in the middle of the range were all non-significant. In contrast, relativelygood fit between expected and observed Ra was obtained only for distance classes in themiddle of the range for the data set of triploid populations (Fig. 3b), and only in one distanceclass (24–100 km) was Raobs significantly different from zero.
DISCUSSION
Clonal species with a very limited sexual recruitment were reported to be usuallymulticlonal, often possessing a considerable variation within and between populations(ELLSTRAND & ROSE 1987). However, the behaviour of clonal plant species ranges betweenmulticlonality and an almost absolute uniclonality, with various situations encountered withinpopulations: average number of multilocus genotypes per population ranging from 1 to 34.8(WIDÉN et al. 1994).
Total isozyme uniformity was found in 150 ramets of Butomus umbellatus from threedistant localities in Canada (FERNANDO & CASS 1996). The notion of low genetic diversity inthis sample was further enforced by a very low isozyme heterozygosity: only two of the 40analyzed loci were heterozygous. The study of FERNANDO & CASS (1996), however,emphasized the importance of a molecular marker system in distinguishing differentiatedgenotypes of this species, because the application of RAPD analysis to just a small fraction(11 ramets) of the same sample revealed three genotypes. A similar result was reported for theEuropean Sparganium erectum: according to allozyme analysis seven populations appearedto have identical genotype, but according to the oligonucleotide fingerprints a number ofclones were found to occur within a population (PIQUOT et al. 1996). Therefore, the low level
22 J. Kirschner et al.

of differentiation among ramets within a population, found in our allozyme study of B.
umbellatus from Central Europe, may be an underestimation of the total within-populationdiversity in this sample. The presence of several geographically widespread “clones” in oursample, such as genotypes A, U, and S (Fig. 1), can be a result of insufficient polymorphism inthe marker system used and would probably be resolved into separate clones by applying amore efficient marker system. The question would remain, however, concerning the age andnature of the clones detected by means of more sensitive “anonymous” methods.
Results of an allozyme analysis despite its limitations in detecting within-populationpolymorphism, however, may be considered as a good representation of the total genetic
Genetic structure of Butomus umbellatus 23
Ra
Ra
Ra
Ra
Fig. 3. Spatial autocorrelation analysis of genetic relationships among populations of Butomus umbellatus.
Analysis is based on the separate data sets of genetic distances among diploid (a) and triploid (b) populations.
Raobs – observed autocorrelation values; Raexp – autocorrelation values expected under hypothesis of ideal
correlation between genetic and geographic distances. Vertical axis: Values of autocorrelation coefficient.
Horizontal axis: Distance classes (The distance classes were created by dividing the whole range of geographic
distances within our sample into several stretches. The pairwise comparisons were allocated into distance
classes approximately evenly, keeping at the same time ranges of the classes equidistant when possible.).

diversity within a species (PIQUOT et al. 1996, NYBOM & BARTISH 2000). Therefore,regardless of whether populations in our sample are represented by single or multiple clones,the main part of total genetic variability of Butomus umbellatus is represented, most probably,by among-population diversity.
In a striking contrast with the sample of this species from Canada (FERNANDO & CASS
1996: Table 1), heterozygosity of ramets from our sample is high. There could be severalreasons for these contrasting patterns of B. umbellatus in Europe and in North America:(i) founder effect, genetic drift or bottleneck effect experienced by the American populations;(ii) continuous habitat disturbance due to human activities in Europe (HROUDOVÁ &ZÁKRAVSKÝ 1993). Unfortunately, presently available data are insufficient to test any ofthese hypotheses.
The analysis of a sample of 44 populations of Eichhornia paniculata from Brasil with 25allozyme loci indicated strong dependence of estimated genetic distances among populationson geographic distances among localities (BARRETT et al. 1993). According to the authors ofthe study, although gene flow is limited among sampled populations in general, most of itoccurs between neighbouring populations, and the long-distance gene flow is of lesssignificance to local population structure.
In our study contrasting relationships between genetic and geographic distances in twogroups of populations with different cytotypes were revealed: genetic distances amongdiploid populations are in accordance with the isolation-by-distance model, whereas intriploid populations no correlation between genetic and geographic distances was found. Thegeographically random distribution of triploid populations may be in agreement with theclonal reproduction of this aquatic species and the absence of detectable gene flow amongpopulations within this cytotype. However, the genetic structure implies the occurrence oflimited gene flow within the group of diploid populations.
A comparison of expected and observed values of Ra may be useful when deviations fromthe purely isolation-by-distance model of population structure need to be revealed withina sample. For instance, spectacular deviations from isolation-by-distance were found forsome groups of pairwise distances among populations of Hippophae rhamnoides fromtemperate areas of Eurasia, while the association between geographic and genetic distanceswas moderately high and significant for the whole set of pairwise distances (BARTISH et al.2000). These deviations indicate specific evolutionary history for certain groups ofpopulations, when isolation-by-distance is the main factor of population structure within ataxon.
We found only moderate deviations from expectations of the absoluteisolation-by-distance model in the data set of diploid populations across the whole range ofgeographic distances among these populations. Although Raobs was not significant in themiddle of the range, this result may be explained by the generally lower statistical power ofthe Mantel test for this group of distance classes and probably does not reflect the realrelationships between geographic and genetic distances within these ranges. In fact, Ra are notexpected to be much different from zero in the middle of the range of geographic distances(Fig. 3, distance classes from 100 to 300 km for both data sets). The only strong deviationfrom isolation by distance in the data set of diploid populations was found for the range of
24 J. Kirschner et al.

geographic distances between 6 and 10 km, reflecting the strong genetic differentiationbetween geographically close genotypes A, E, and H. This strong differentiation may be aresult of colonization of the same area by genotypes from different Pleistocene refugia.
The absence of association between geographic and genetic distances may be alsoexpected, if plants of the same genotype rapidly colonize large areas by means of vegetativereproduction, as can be examplified by distribution of genotypes S and U (Fig. 2). In contrast,post-glacial recolonization of diploid populations could proceed in a stepping-stone fashionfrom a restricted number of refugia, so that at each dispersal event only a restricted area isoccupied by a migrant genotype and the recolonization is slow. As a result, a deeper geneticdifferentiation is expected for geographically distant populations. Since recruitment ofseedlings may be extremely rare in diploid populations, gene flow between these populationsshould be very restricted and sporadic. Therefore, differences in colonization abilitiesbetween diploids and triploids, but not in their breeding system, may be one of the mostprobable reasons for the revealed contrast in geographic structure of populations from the twocytotypes.
CONCLUSIONS
Genetic diversity on the regional scale was studied within Butomus umbellatus byallozyme analysis. Low within-population and high among-population variability were themain characters of genetic structure of this species. Heterozygosity of genotypes was high inour study and this result is in contrast with the low heterozygosity reported for B. umbellatus
from North America. Contrasting relationships between genetic and geographic distanceswere found within two cytotypes: significant correlation was found for the group of diploidpopulations, but no correlation was found for the group of triploid populations. Thesedifferences might be explained by the contrasting colonization abilities of the two cytotypes.
Acknowledgements: The authors are indebted to Dr Helena Štorchová, CSc., for her generous advice andunfailing interest throughout the study. We are grateful to Ms. Karin Kottová, Eva Zamazalová, and DrŠ. Neuschlová for their invaluable technical assistance. Thanks are due to Dr Judith Fehrer for careful reading ofthe manuscript, and to J. Kirschner jr. for technical assistance in the figure preparation. The study was supportedby grants of the Grant Agency of the Czech Republic, no. 206/93/1178 and no. 206/95/0508, and the NationalResearch Project, no. AV 0Z 6005908.
REFERENCES
ASPINWALL N. & CHRISTIAN T. (1992): Clonal structure, genotypic diversity, and seed production inpopulations of Filipendula rubra (Rosaceae) from the Northcentral United States. Amer. J. Bot. 79: 294–299.
BARRETT S.C.H., ECKERT C.G. & HUSBAND B.C. (1993): Evolutionary processes in aquatic plant populations.Aquatic Bot. 44: 105–145.
BARTISH I.V., JEPPSSON N., BARTISH G.I., LU R. & NYBOM H. (2000): Inter- and intraspecific genetic variationin Hippophae (Eleagnaceae) investigated by RAPD markers. Pl. Syst. Evol. 225: 85–101.
ECKERT C.G. & BARRETT S.C.H. (1993): Clonal reproduction and patterns of genotypic diversity in Decodon
verticillatus (Lythraceae). Amer. J. Bot. 80: 1175–1182.ECKERT C.G., LUI K., BRONSON K., CORRADINI P. & BRUNEAU A. (2003): Population genetic consequences of
extreme variation in sexual and clonal reproduction in an aquatic plant. Molec. Ecol. 12: 331–334.ELLSTRAND N.C. & ROSE M.L. (1987): Patterns in genotypic diversity in clonal plant species. Amer. J. Bot. 74:
123–131.
Genetic structure of Butomus umbellatus 25

FERNANDO D.D. & CASS D.D. (1996): Genotypic differentiation in Butomus umbellatus (Butomaceae) usingisozymes and random amplified polymorphic DNAs. Canad. J. Bot. 74: 647–652.
HROUDOVÁ Z. & ZÁKRAVSKÝ P. (1993): Ecology of two cytotypes of Butomus umbellatus. III. Distribution andhabitat differentiation in the Czech and Slovak Republics. Folia Geobot. Phytotax. 28: 425–435.
KIRSCHNER J. (1995): Allozyme analysis of Luzula sect. Luzula (Juncaceae) in Ireland: Evidence of the originof tetraploids. Folia Geobot. Phytotax. 30: 283–290.
KIRSCHNER J., KIRSCHNEROVÁ L., ŠTEPÁNEK J. & TICHÝ M. (1994): Analýza isoenzymù v populaèní biologii
rostlin (Isozyme analysis in plant population biology). Institute of Botany AS CR, Prùhonice.KIRVAN A.P. (1997): Latitude/Longitude, NCGIA Core Curriculum in GI Science.
http://www.ncgia.ucsb.edu/giscc/ units/u014/u014.html, posted October 29,1997.KRAHULCOVÁ A. & JAROLÍMOVÁ V. (1993): Ecology of two cytotypes of Butomus umbellatus. I. Karyology
and breeding behaviour. Folia Geobot. Phytotax. 28: 385–411.NYBOM H. & BARTISH I.V. (2000): Effects of life history traits and sampling strategies on genetic diversity
estimates obtained with RAPD markers in plants. Perspectives Pl. Ecol. Evol. Syst. 3: 93–114.PIQUOT Y., SAUMITOU-LARPADE P., PETIT D., VERNET P. & EPPLEN J.T. (1996): Genotypic diversity revealed
by allozymes and oligonucleotide DNA fingerprinting in French populations of the aquatic macrophyteSparganium erectum. Molec. Ecol. 5: 251–258.
ODEN N.L. & SOKAL R.R. (1986): Directional autocorrelation: An extension of spatial correlograms to twodimension. Syst. Zool. 35: 608–617.
ROHLF F.J. (1997): NTSYS/pc. Numerical taxonomy and multivariate analysis system. Version 1.80. ExeterSoftware, Setauket.
SLATKIN M. (1993): Isolation by distance in equilibrium and non-equilibrium populations. Evolution 47:264–279.
VALLEJOS C.E. (1983): Enzyme activity staining. In: TANKSLEY S.D. & ORTON T.J. (eds.), Isozymes in plant
genetics and breeding, Part A, Elsevier, Amsterdam, pp. 469–516.WIDÉN B., CRONBERG N. & WIDÉN M. (1994): Genotypic diversity, molecular markers and spatial distribution
of genetic variation in clonal plants, a literature survey. Folia Geobot. Phytotax. 29: 245–263.
Received 16 January 2002, revision received 11 August 2003, accepted 20 August 2003
26 J. Kirschner et al.