Embed Size (px)
Citation preview
Consumer Evaluation of Low Sodium Mozzarella Cheese and Development of a
Novel Method for Evaluating Emotions
A Thesis Presented to the Faculty of
California Polytechnic State University
San Luis Obispo
In Partial Fulfillment of the Requirements for the Degree of
Master of Science in Agriculture, with Specialization in Food Science and Nutrition
By Lauren Alyse Collinsworth
January 2013

ii
© 2013
Lauren Alyse Collinsworth
ALL RIGHTS RESERVED
iii
COMMITTEE MEMBERSHIP
TITLE: Consumer Evaluation of Low Sodium Mozzarella Cheese and
Development of a Novel Method for Evaluating Emotions
AUTHOR: Lauren Alyse Collinsworth
DATE SUBMITTED: January 2013
COMMITTEE CHAIR: Amy Lammert, PhD
Assistant Professor, Food Science and Nutrition
COMMITTEE MEMBER: Nana Farkye, PhD
Professor, Dairy Science
COMMITTEE MEMBER: Amanda Lathrop, PhD
Assistant Professor, Food Science and Nutrition
COMMITTEE MEMBER: Karen McGaughey, PhD
Associate Professor, Statistics
iv
ABSTRACT
Consumer Evaluation of Low Sodium Mozzarella Cheese and Development of a
Novel Method for Evaluating Emotions
Lauren Alyse Collinsworth
Mozzarella cheese is currently the highest consumed cheese in the United States.
The popularity of mozzarella cheese is typically attributed to the high consumption rates
of pizza cheese and string cheese; both of which are low moisture part skim (LMPS)
mozzarella cheese. A single serving of LMPS mozzarella cheese contains approximately
8% of the daily value (DV) for sodium, a mineral which is currently consumed in excess
among most Americans. On average, one in three Americans has hypertension. This
condition is strongly associated with excessive sodium intake, and it is a leading risk
factor for cardiovascular disease and stroke in the United States. Considering the
popularity of LMPS mozzarella cheese, its sodium content, and the alarmingly high rates
of hypertension among the American population, mozzarella cheese appears to be a
product worth pursuing for sodium reduction. Salt (NaCl) provides several key benefits
to cheese including: flavor enhancement, preservation, moisture control, and syneresis;
thus reducing its concentration in cheese can result in multiple quality concerns.
Previous research has investigated the effects of lower sodium in a variety of
cheeses including: cheddar, feta, and imitation cheese. Typical methods for reducing
sodium content in cheese include reduction of NaCl alone to a level which is still
acceptable or partial substitution of NaCl with salt replacers including KCl. For assessing
the consumer acceptability of low sodium cheeses, researchers have typically employed
v
the use of traditional hedonic, preference, and ranking questions; however, consumer
scientists have recently suggested the benefits of asking consumers questions which go
beyond typical acceptability questions. Purchase intent and decision making have been
associated with consumer emotions, and perhaps by better understanding consumer
emotions toward nutritional alternative foods, including low sodium mozzarella cheese, a
more successful low sodium cheese can be developed.
The current study implemented a series of tests to progressively understand the
role NaCl plays in mozzarella cheese and consumer opinion of low sodium cheese. A
series of traditional sensory tests, including triangle, duo-trio, and hedonic tests, were
performed to determine a sensory transparent antimicrobial and a consumer acceptable
salt replacer. Based upon this sequence of tests, a single antimicrobial (SEA-i F75) and
concentration (0.275%) were selected in addition to the most consistently preferred salt
replacer in a low sodium mozzarella cheese system; however, the most preferred salt
replacer was dependent upon the type of mozzarella cheese (direct acid or bacteria
cultured).
In order to address the potentially limited information from traditional sensory
testing, a novel method for evaluating emotions was developed. The IMET (Image
Measurement of Emotion and Texture) method utilized consumer provided images of
emotions, researcher generated emotion images, and emotion words (the current industry
standard) to aid in emotion testing, and the use of texture images and texture words
(industry standard) for texture assessment. The IMET method was tested and validated
across three commercial food product categories: orange soda, dairy beverages, and
convenience cheeses. The IMET study indicated consumer selected emotion images were
vi
less variable than emotion words in a positive emotion, but the words only method was
less variable in a negative emotion. Additionally, subjects were more likely to use images
of themselves for positive emotions, and images of others for the negative emotions.
After validation of the IMET method, the consumer emotion images method was
used in conjunction with consumer acceptability testing and instrumental texture analysis
in non-commercial low sodium mozzarella cheese. This study indicated the full sodium
cheese was consistently liked most, followed by the 100% KCl cheese sample.
Additionally, cheese with higher hedonic scores had increased changes in the positive
emotions, while the disliked products had increased changes in the negative emotions
across the eating experience. The instrumental texture analysis resulted in significant
textural differences between the eight samples tested, and samples with higher mean
scores for all texture attributes were associated with having higher mean hedonic scores.
The studies performed in this thesis are important contributions for better
understanding the role of NaCl in LMPS mozzarella cheese, and the consumer’s
perception and potential acceptance of this nutritional alternative product. Additionally,
the development of a novel emotion testing method may impact how researchers ask
consumer questions, conduct consumer research, and investigate the effects of images on
emotion testing with consumers.
Keywords: low sodium mozzarella cheese, consumer testing, emotional responses,
texture analysis, images
vii
ACKNOWLEDGEMENTS
I would like to thank my entire committee, Dr. Amy Lammert, Dr. Nana Farkye, Dr.
Amanda Lathrop, and Dr. Karen McGaughey, for their endless guidance, support, passion
and knowledge; I’m truly thankful for the time and effort you have put into helping me
grow and learn throughout graduate school. To Dr. Lammert, a special thank you, for all
the amazing opportunities you have provided me, I am forever grateful.
Thank you to all the wonderful graduate students at the Dairy Products Technology
Center for your knowledge, entertainment, and support; I am so thankful to have met you
all. Thank you to Matt Arnold and Katy Lees for your help and guidance.
I am very appreciative of the financial support provided by Dairy Management Inc.
(DMI) and the California State University Agricultural Research Initiative (CSU ARI).
I would like to finally acknowledge the unfailing love, support, and inspiration of my
family, thank you for everything you all have done.
viii
TABLE OF CONTENTS
LIST OF TABLES........................................................................................................... xiv
LIST OF FIGURES ........................................................................................................ xvii
1.0 Introduction....................................................................................................................1
2.0 Literature Review...........................................................................................................4
2.1 Low Sodium Mozzarella Cheese ................................................................................4
2.1.1 Reducing Sodium Intake.......................................................................................4
2.1.2 Mozzarella Cheese ................................................................................................5
2.2 Sensory Evaluation .....................................................................................................8
2.2.1 Traditional Sensory Testing..................................................................................8
2.2.1.1. Affective Testing ...........................................................................................8
2.2.1.2. Discrimination Testing.................................................................................10
2.2.1.3. Descriptive Analysis ....................................................................................10
2.2.2 Current Sensory Evaluation of Low Sodium Cheeses........................................12
2.2.2.1. Decrease NaCl Concentration......................................................................13
2.2.2.2. Substitution of NaCl ....................................................................................14
2.3 Emotions ...................................................................................................................16
2.3.1 Why Evaluate Emotions?....................................................................................16
2.3.2 Decision Making and Reward Mechanisms .......................................................19
2.3.3 Brain Relationship between Emotion, Taste, Texture, and Images....................22
2.3.3.1 Emotion.........................................................................................................22
2.3.3.2. Taste and Texture.........................................................................................24
2.3.3.3. Images ..........................................................................................................25
2.3.4 Current Emotion Testing Methods......................................................................28
2.3.4.1. EsSense Profile™ Method...........................................................................29
ix
2.3.4.2. Best-Worst Scaling ......................................................................................31
2.3.4.3. Product Emotion Measure (PrEmo) ............................................................34
2.3.4.4. Eliciting Emotions with Odors and Pictures................................................36
2.4 Justification for Work ..................................................................................................38
3.0 Sensory Evaluation of Antimicrobials and Salt Replacers in Low Sodium
Mozzarella Cheese .......................................................................................................40
3.1 Introduction...............................................................................................................41
3.2 Methodology.............................................................................................................43
3.2.1 Materials: Antimicrobials ...................................................................................43
3.2.2 Methods: Antimicrobials ....................................................................................43
3.2.2.1 Triangle Test with Full Sodium Mozzarella Cheese.....................................45
3.2.2.2 Triangle Test with Low Sodium Mozzarella Cheese....................................46
3.2.2.3 Duo-Trio Tests with Low Sodium Mozzarella Cheese.................................46
3.2.2.4 Hedonic Testing with Low Sodium Mozzarella Cheese...............................47
3.2.2.5 Effect of Time and Concentration of Antimicrobial Dip on
Discrimination ..............................................................................................47
3.2.3 Materials: Salt Replacers ....................................................................................48
3.2.4 Methods: Salt Replacers .....................................................................................49
3.2.4.1 Hedonic and Ranking in Direct Acidified and Bacteria Cultured
Mozzarella Cheese ........................................................................................50
3.2.5 General Sensory Testing Procedures ..................................................................50
3.3 Data Analysis ............................................................................................................51
3.4 Results.......................................................................................................................51
3.4.1 Antimicrobial Sensory Results ...........................................................................51
3.4.1.1 Triangle Test with Full Sodium Mozzarella Cheese.....................................51
x
3.4.1.2 Triangle Test with Low Sodium Mozzarella Cheese....................................52
3.4.1.3 Duo-Trio with Low Sodium Mozzarella Cheese ..........................................54
3.4.1.4 Hedonic Testing with Low Sodium Mozzarella Cheese...............................55
3.4.1.5 Effect of Time and Concentration of Antimicrobial Dip on
Discrimination...............................................................................................56
3.4.2 Salt Replacer Sensory Results ............................................................................57
3.4.2.1 Hedonic and Ranking Scores for Direct Acidified Mozzarella
Cheese ...........................................................................................................57
3.4.2.2 Hedonic and Ranking Scores for Bacteria Cultured Mozzarella
Cheese ...........................................................................................................60
3.5 Discussion .................................................................................................................62
3.5.1 Antimicrobial Sensory Testing ...........................................................................62
3.5.2 Salt Replacer Sensory Testing ............................................................................66
3.6 Conclusion ................................................................................................................68
4.0 Development of a Novel Method for Evaluating Emotions and Texture:
Imagery versus Language ............................................................................................70
4.1 Introduction...............................................................................................................72
4.2 Methodology.............................................................................................................76
4.2.1 Subjects ...............................................................................................................76
4.2.2 Products...............................................................................................................77
4.2.3 Emotion Methods................................................................................................79
4.2.4 Emotions for Testing...........................................................................................81
4.2.5 Questionnaire ......................................................................................................81
4.2.6 Texture Methods .................................................................................................82
4.3 Data Analysis ............................................................................................................83
xi
4.3.1 Emotion Analysis................................................................................................83
4.3.2 Texture Analysis .................................................................................................84
4.4 Results.......................................................................................................................84
4.4.1 Emotion Methods and Each Emotion .................................................................84
4.4.2 Change in Texture Attributes and Emotions by Texture Methods .....................88
4.4.3 Texture Methods and Change in Emotion ..........................................................88
4.5 Discussion .................................................................................................................90
4.5.1 Image Measurement of Emotion and Texture ....................................................90
4.5.2 Emotion Method Findings ..................................................................................91
4.5.3 Current Emotion Methodologies.........................................................................93
4.5.4 Texture Method Findings....................................................................................96
4.5.5 Current Texture Measurement Methodologies ...................................................98
4.6 Conclusion ..............................................................................................................100
5.0 Evaluating Consumer Emotional Responses and Liking to Non-Commercial
Low Sodium Mozzarella Cheese ...............................................................................101
5.1 Introduction.............................................................................................................103
5.2 Methodology...........................................................................................................105
5.2.1 Materials ...........................................................................................................105
5.2.2 Samples .............................................................................................................105
5.2.3 Subjects .............................................................................................................107
5.2.4 Questionnaire and Testing Procedure ...............................................................107
5.2.5 Texture Analysis ...............................................................................................109
5.3 Data Analysis ..........................................................................................................110
5.3.1 Product Hedonic Analysis.................................................................................110
5.3.2 Comparison of First, Middle, and End Liking Scores ......................................111
xii
5.3.3 Liking Score Change between Day 1 and Day 2 ..............................................111
5.3.4 Comparison of Each Change in Emotion by Cheese Variable .........................112
5.3.5 Comparison of First Emotion Scores to End Emotion Scores..........................113
5.3.6 Emotional Changes between Day 1 and Day 2.................................................113
5.3.7 Comparison of Change in Emotion by Gender.................................................113
5.3.8 Texture Analysis ...............................................................................................114
5.4 Results.....................................................................................................................114
5.4.1 Product Hedonic Analysis.................................................................................114
5.4.2 Comparison of First, Middle and End Liking Scores .......................................117
5.4.3 Liking Score Change between Day 1 and Day 2 ..............................................118
5.4.4 Comparison of Each Change in Emotion by Cheese Variable .........................119
5.4.5 Comparison of First Emotion Scores to End Emotion Scores..........................124
5.4.6 Emotional Changes between Day 1 and Day 2.................................................126
5.4.7 Comparison of Change in Emotion by Gender.................................................127
5.4.8 Texture Analysis ...............................................................................................128
5.5 Discussion ...............................................................................................................130
5.5.1 Product Hedonics ..............................................................................................131
5.5.2 Comparison of First, Middle, and End Liking Scores ......................................132
5.5.3 Changes in Liking Scores between Day 1 and Day 2.......................................133
5.5.4 Comparison of Each Change in Emotion by Cheese Variable .........................134
5.5.5 Comparison of First Emotion Score to End Emotion Score .............................135
5.5.6 Emotional Changes between Day 1 and Day 2.................................................136
5.5.7 Comparison of Change in Emotion by Gender.................................................136
5.5.8 Texture Profile Analysis ...................................................................................137
5.5.9 Main Study Objectives and Outcomes..............................................................138
xiii
5.6 Conclusion ..............................................................................................................140
6.0 Conclusions................................................................................................................141
7.0 Future Research .........................................................................................................143
8.0 References..................................................................................................................144
xiv
LIST OF TABLES
Table Page
2.1 NaCl and Na Concentrations in Cheeses ...........................................................6
2.2 EsSense Profile™ List of Emotions.................................................................30
2.3 Best-Worst Scaling List of Emotions ..............................................................33
2.4 Comparison of Emotion Methods....................................................................38
3.1 Antimicrobial Time and Concentration Parameters ........................................48
3.2 Specifications for Salt Replacer Cheese Variables ..........................................49
3.3 Day 1 and Day 2 Sensory Testing with Antimicrobials ..................................52
3.4 Session 1: Triangle Test with All Antimicrobials............................................53
3.5 Session 2: Triangle Test with All Antimicrobials............................................53
3.6 Session 1: Duo-Trio Test with All Antimicrobials ..........................................54
3.7 Session 2: Duo-Trio Test with All Antimicrobials ..........................................55
3.8 Hedonic Test – “Aroma” Post Hoc Analysis ...................................................56
3.9 Time and Concentration Duo-Trio Results......................................................57
3.10 Direct Acid Hedonic Test Post Hoc Analysis..................................................59
3.11 Direct Acid Ranking Scores Post Hoc Analysis ..............................................59
3.12 Bacteria Cultured Hedonic Test Post Hoc Analysis ........................................61
3.13 Bacteria Cultured Ranking Scores Post Hoc Analysis ....................................61
4.1 Orange Soda Samples ......................................................................................77
4.2 Dairy Beverage Samples..................................................................................78
4.3 Convenience Cheese Samples..........................................................................78
4.4 Texture Attributes ............................................................................................82
4.5 Change in Caring by Emotion Method ............................................................85
4.6 Change in Sociable by Emotion Method .........................................................86
xv
4.7 Change in Self Confident by Emotion Method................................................86
4.8 Change in Caring by Gender............................................................................87
4.9 Change in Sociable by Gender.........................................................................87
4.10 Change in Sad by Gender ................................................................................87
4.11 Number of Post Hoc Significant Differences ..................................................89
5.1 Specifications for Salt Replacer Cheese Variables and Controls ..................106
5.2 Texture Analysis Settings ..............................................................................110
5.3 Hedonic Attribute Post Hoc Comparison of Day 1 .......................................116
5.4 Hedonic Attribute Post Hoc Comparison of Day 2 .......................................116
5.5 Change in Overall Flavor Liking Day 1 ........................................................117
5.6 Change in Saltiness Liking Day 1..................................................................117
5.7 Change in Texture Liking Day 1 ...................................................................117
5.8 Change in Aroma Liking Day 1.....................................................................117
5.9 Average Liking Day 1 versus Average Liking Day 2....................................119
5.10 Change in Caring by Variable Day 1.............................................................119
5.11 Change in Excited by Variable Day 1............................................................120
5.12 Change in Self Confident by Variable Day 1 ................................................120
5.13 Change in Fatigued by Variable Day 1..........................................................120
5.14 Change in Judgmental by Variable Day 1 .....................................................121
5.15 Change in Sad by Variable Day 1..................................................................121
5.16 Change in Caring by Variable Day 2.............................................................122
5.17 Change in Excited by Variable Day 2............................................................122
5.18 Change in Sociable by Variable Day 2 ..........................................................123
5.19 Change in Self Confident by Variable Day 2 ................................................123
5.20 Change in Judgmental by Variable Day 2 .....................................................124
xvi
5.21 Change in Raging by Variable Day 2 ............................................................124
5.22 Change in Emotion: First versus End Day 1..................................................125
5.23 Change in Emotion: First versus End Day 2..................................................126
5.24 Comparing Day 1 Emotion Changes to Day 2 Emotion Changes .................127
5.25 Change in Emotions by Gender Day 1 ..........................................................128
5.26 Change in Emotions by Gender Day 2 ..........................................................128
5.27 Hardness by Cheese Variable ........................................................................129
5.28 Cohesiveness by Cheese Variable .................................................................129
5.29 Gumminess by Cheese Variable ....................................................................129
5.30 Chewiness by Cheese Variable......................................................................130
xvii
LIST OF FIGURES
Figure Page
2.1 Example of 9-Point Hedonic Scale ....................................................................9
2.2 Consumer Perception and Conceptualization of Products...............................17
2.3 Decision Making and Reward Mechanism Areas of the Brain........................20
2.4 Sensation Convergence Pathways in the Brain................................................28
2.5 Example of Best-Worst Scaling.......................................................................32
2.6 PrEmo Emotion Animations ............................................................................35
3.1 Overview of Antimicrobial Sensory Testing .................................................. 44
4.1 The Predefined Pictures Method......................................................................80
4.2 Example of My Pictures Method .....................................................................80
4.3 Example of Texture Image Cards ....................................................................82
4.4 Change in Emotion by Emotion Type and Method .........................................85
4.5 Change in Emotion by Emotion and Method ..................................................90
1
1.0
Introduction
Salt (NaCl) has been used as a flavor enhancer and preservative in foods for
centuries and is currently found in packaged, processed, and restaurants foods, making it
one of the most ubiquitous ingredients in today’s food supply (CDC, 2012). Although
consumption of sodium (Na) is essential for humans, most Americans consume NaCl in
excess due to its widespread use in a variety of foods. High sodium consumption is
associated with hypertension (high blood pressure) which is a leading risk factor for
cardiovascular disease and stroke, the primary causes of death in the United States (CDC,
2012). Considering approximately 68 million Americans have hypertension, several
initiatives have been created to lower sodium by 25% in a variety of foods including
snacks and convenience products (CDC, 2012; Saltos & Bowman, 1997).
Mozzarella cheese is the most highly consumed cheese in the United States, with
a per capita consumption rate of 11.29 pounds in 2010 (IDFA, 2012). The popularity of
mozzarella cheese is often attributed to its use in pizza cheese and string cheese, both of
which are low moisture part skim (LMPS) mozzarella cheese. Most cheeses contain a
substantial amount of salt, and mozzarella cheese is no exception, containing
approximately 1.4-1.8% sodium; essentially, one stick of string cheese (~28g) contributes
approximately 8% of the daily value (DV) of sodium. Considering the consumption rate
of mozzarella cheese and its sodium content, LMPS mozzarella appears to be a food
product worth pursuing low sodium research and development.
Success of a low sodium mozzarella cheese is dependent on the microbiological
and sensory quality of the product. Previous sensory studies have investigated the effects
2
of lowering NaCl only in cheese as well as partial substitution of NaCl with other salt
replacers in a variety of cheeses. Findings have suggested lowering NaCl levels alone by
25% are likely to be unsuccessful considering decreasing sodium levels in cottage cheese
and cheese sauces by 8% was detected by consumers (Drake et al., 2011). Partial
substitution of NaCl with other salt replacers, including KCl have been relatively
successful in cheeses including cheddar, feta, and imitation cheeses; however, ratios of
NaCl to KCl greater than 1:1 have been found to elicit a bitter aftertaste (Cruz et al.,
2011; Grummer et al., 2012), therefore the ratio must be carefully monitored in a given
cheese system. Previous sensory studies have employed the use of traditional sensory
testing methods (hedonic, preference, ranking, etc.); however, consumer and sensory
scientists have suggested the benefits of asking consumers questions which go beyond
liking with the use of emotion testing (Macht, 1999; King et al., 2010; Desmet et al.,
2000; Thomson & Crocker, 2011).
Testing emotional responses to food products began in the psychology field with
abnormal eaters; however, market researchers and consumer scientists have understood
the benefits of capturing the consumer’s emotional responses to a product. Given this
increase in interest with emotion testing, a variety of different emotion testing methods
have been developed to easily and accurately capture consumer emotions. Although
many emotion methods have been developed, the effectiveness of several of these
methods is still being questioned. Most current emotion tests only provide the consumer
with a list of emotion words and the consumer is asked to consume or experience a
product and indicated which (if any) emotions were elicited (King et al., 2010; Thomson
& Crocker, 2011); however, additional emotion research has suggested a link between
3
emotions and images (Holmes et al., 2008; Rolls & Grabenhorst, 2008; Zaltman &
Coulter, 1995). Perhaps the use of images concurrently with emotion testing would better
elicit the emotions used during testing.
The objectives of this thesis were to: 1) conduct a series of traditional sensory
tests to determine a sensory transparent antimicrobial and consistently most acceptable
salt replacer in low sodium mozzarella cheese, 2) develop and validate a novel method
for evaluating emotions with consumers during the eating experience of different food
products, and 3) conduct consumer testing with both the traditional consumer testing and
the novel emotion testing method to determine if similar emotions could be evoked while
consuming low sodium cheese compared to those emotions which are experienced while
consuming full sodium mozzarella cheese. Through conducting this progression of
traditional consumer and emotion testing, a better understanding of consumer perception
and acceptability of low sodium mozzarella cheese may be obtained, and this information
can be used to develop a more successful low sodium mozzarella cheese product.
4
2.0
Literature Review
2.1. Low Sodium Mozzarella Cheese
2.1.1. Reducing Sodium Intake
Salt’s (NaCl) multifunctional role (i.e. flavor enhancer, preservative, moisture
control, etc.) in a variety of food matrices has yielded its ubiquitous presence in a variety
of packaged, processed, and restaurant foods within the United States (CDC, 2012) with
approximately 75% of sodium consumed coming from processed foods (USDA, 2005).
In terms of human consumption, salt is defined as, “crystallized sodium chloride
extracted from natural sources, with the obligatory addition of iodine” (Cruz et al., 2011).
Although salt intake is essential for humans for regulating blood pressure, intracellular
water transport, and nerve impulse transmission (Cruz et al., 2011), Americans are
consuming far beyond the required amount. Due to the abundance of salt in the current
food market many Americans are consuming excessive amounts of sodium with an
average estimated intake of 3,300mg of sodium daily, 1,000mg greater than
recommended by the U.S. dietary guidelines (CDC, 2012). According to the U.S.
Guidelines for Americans (2010), on average individuals with higher sodium intake will
have higher blood pressure and individuals with high blood pressure, systolic greater than
140mmHg or diastolic greater than 90mmHg, (NHLBI, 2012) are at an increased risk of
heart disease and stroke, the two leading causes of death in the United States (CDC,
2012). Approximately 68 million (one in three) American adults are estimated to have
hypertension (CDC, 2012); given these alarming rates, a variety of initiatives have been
5
developed to increase awareness of hypertension and to decrease sodium intake.
Proposals include government funded programs and initiatives within companies such as
Pepsi, Dole, Nestle, and General Mills that have been developed to reduce sodium intake
by 25% by 2015 (Saltos & Bowman, 1997; Fern, 2009).
Although many foods are targeted for decreasing sodium content, this review will
focus on the sodium content and reduction with mozzarella cheese. Many cheeses,
including mozzarella, are nutrient rich food products, which provide an estimated “9% of
the protein, 11% of the phosphorus, and 27% of the calcium in the U.S. food supply”
(Johnson et al., 2009). Despite the significant contribution of calcium via cheese to the
food supply, the large proportion of sodium also currently associated with cheese may
hinder the bioavailability of calcium; considering a high sodium intake may interfere with
calcium bioactivity and increase renal excretion of this mineral (Cruz et al., 2011). The
significance for reducing sodium in cheese is threefold: 1) to decrease the consumption of
sodium by consumers to help prevent hypertension, cardiovascular disease, and stroke, 2)
to help increase retention of cheeses’, arguably most significant mineral, calcium, and 3)
to aid in increased cheese consumption.
2.1.2. Mozzarella Cheese
Cheese consumption rates continue to increase annually, with approximately nine
billion pounds of cheese produced annually in the United States, and approximately 3.4
billion pounds being mozzarella cheese alone (USDA, 2010). In 2002, mozzarella cheese
surpassed cheddar cheese as the most highly consumed cheese in the U.S. with a
suggested per capita consumption rate of 11.29 pounds in 2010 (IDFA, 2012). The recent
6
popularity of mozzarella cheese is often attributed to the high consumption of pizza
cheese and convenient dairy products such as string cheese, both of which are made with
low moisture part skim (LMPS) mozzarella cheese. Mozzarella string cheese has
traditionally been marketed as a convenient and healthy snack high in calcium and other
milk nutrients (National Dairy Council, 2011), containing approximately 8% daily value
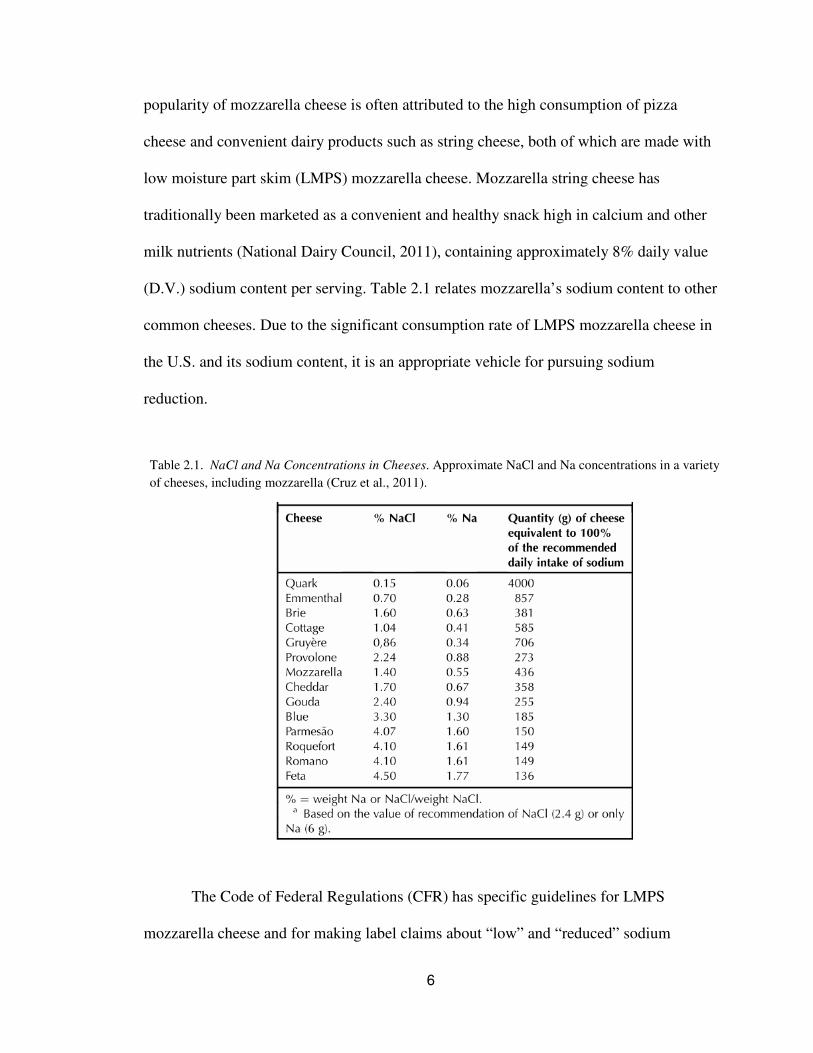
(D.V.) sodium content per serving. Table 2.1 relates mozzarella’s sodium content to other
common cheeses. Due to the significant consumption rate of LMPS mozzarella cheese in
the U.S. and its sodium content, it is an appropriate vehicle for pursuing sodium
reduction.
The Code of Federal Regulations (CFR) has specific guidelines for LMPS
mozzarella cheese and for making label claims about “low” and “reduced” sodium
Table 2.1. NaCl and Na Concentrations in Cheeses. Approximate NaCl and Na concentrations in a variety
of cheeses, including mozzarella (Cruz et al., 2011).
7
products. 21 CFR 133.156 (a)(1) states in order to be LMPS mozzarella cheese the
product must contain at least 45% milkfat by weight of solids and the moisture content
must be greater than 45% but less than 52%. Additionally, 21 CFR 133.155 (b)(3)(iii)
states that salt is an optional ingredient in mozzarella cheese, suggesting that even when
completely removing salt from mozzarella cheese, it is still considered “mozzarella
cheese” (Mozzarella cheese and Scamorza cheese, 1993). In regards to “low” and
“reduced” sodium claims, 21 CFR 101.61 (4)(i) states to make a “low sodium” claim the
food product must have a serving size (less than 30g) with 140 mg or less sodium per
serving size and a “reduced sodium” claim as stated by 21 CFR 101.61 (6)(i) requires at
least 25% less sodium per serving size than “an appropriate reference food” (Food
Labeling, 2012).
Despite the obvious need for reducing sodium in processed and packed foods, the
difficulty in successfully reducing sodium in natural cheeses is its multifunctional
beneficial effects including: flavor enhancement, decreasing water activity, enzymatic
and culture activity, and syneresis (Grummer et al., 2012; Guinee, 2004). Additionally,
consumers often perceive low sodium products as flavorless, boring, and bland (Drake et
al., 2010). A variety of studies have been conducted to better understand the
consequences on consumer perception and descriptive sensory analysis in lower sodium
cheese-type products (Drake et al., 2010; Grummer et al., 2012; Cruz et al., 2011;
Katsiari et al., 1997; Fitzgerald & Buckley, 1985); however, despite the popularity of
mozzarella cheese in the U.S., limited information is available regarding low/reduced
sodium mozzarella cheese sensory and consumer analysis as a majority of low/reduced
sodium cheese work has been focused on cheddar cheese or cheddar-based products
8
(Grummer et al., 2012; Drake et al., 2011; Schroeder et al., 1988; Fitzgerald & Buckley,
1985). Considering the current domestic consumption rate of mozzarella cheese and
limited low-sodium mozzarella sensory research, there is an apparent need for
understanding how consumers perceive low-sodium mozzarella cheese rather than
cheddar cheese or lower consumption cheeses.
2.2. Sensory Evaluation
2.2.1. Traditional Sensory Testing
The frequently used Sensory Evaluation Division of the Institute of Food
Technologists (Anonymous, 1975) definition of sensory evaluation is: “a scientific
discipline used to evoke, measure, analyze, and interpret reactions to those characteristics
of foods and materials as they are perceived by the senses of sight, smell, taste, touch,
and hearing.”Sensory evaluation has been used for decades, across a variety of industries
and by both government and private parties to gain knowledge of product acceptability,
similarities, or differences by a target group. The importance of sensory evaluation
appears to be generally agreed upon; however, the specific methods and techniques to
employ are still debated (Stone et al., 2012). Although a variety of sensory testing
techniques exist, a brief review of affective, discrimination, and descriptive sensory
testing will be covered to outline each of these methods.
2.2.1.1. Affective Testing
Affective testing within sensory evaluation is typically employed amongst current
or potential consumers to evaluate the “personal response” or liking to a product or
product idea by way of measuring preference or acceptance (Meilgaard et al., 2007). The
9
aim of affective testing is to gather information about a target population therefore
screening for the appropriate subjects is essential; however, it is not expected that these
subjects have been screened for sensory acuity or trained in sensory (Stone et al., 2012).
The two most commonly used affective tests are: 1) the paired-comparison test and 2) the
9-point hedonic test. Other methods exist, however these are typically adaptations of the
two mentioned tests. The paired-comparison test requires the subject to select the
preferred product, either A or B; in some cases a “no preference” or “dislike-both-
equally” may be selected as well. This test is very simple for subjects to understand and
perform, and given the correct test wording and design, provides an overall result of
preference between two products. The paired-comparison test does not provide any
degree of difference between the two products, only if there is a preference or not
(Meilgaard et al., 2007; Stone et al., 2012). If the objective of the test is to determine a
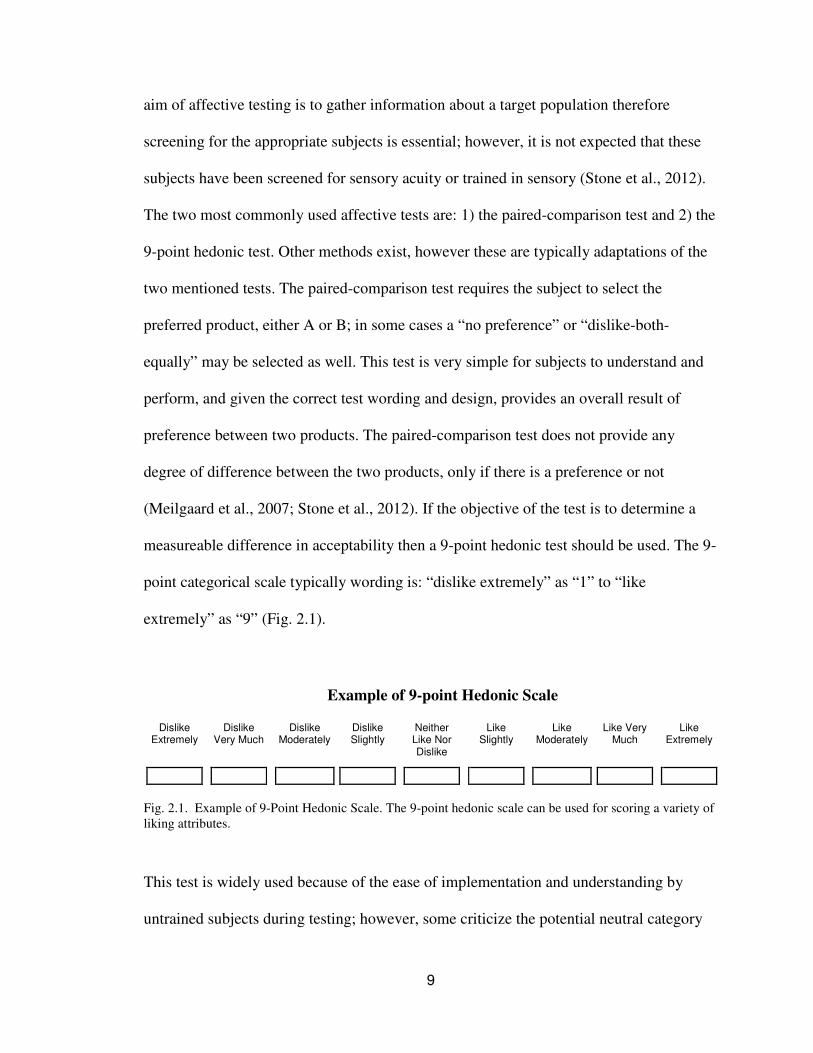
measureable difference in acceptability then a 9-point hedonic test should be used. The 9-
point categorical scale typically wording is: “dislike extremely” as “1” to “like
extremely” as “9” (Fig. 2.1).
Dislike
Extremely
Dislike
Very Much
Dislike
Moderately
Dislike Slightly
Neither Like Nor Dislike
Like
Slightly
Like
Moderately
Like Very
Much
Like
Extremely
Fig. 2.1. Example of 9-Point Hedonic Scale. The 9-point hedonic scale can be used for scoring a variety of
liking attributes.
This test is widely used because of the ease of implementation and understanding by
untrained subjects during testing; however, some criticize the potential neutral category
Example of 9-point Hedonic Scale
10
avoidance by subjects and lack of evidence for equality between categories (Stone et al.,
2012).
2.2.1.2. Discrimination Testing
Discrimination testing has stricter requirements for subjects including: 1) being a
product user, 2) frequent participation in sensory tests, 3) not have information about the
project at hand, and 4) having a certain level of sensory acuity. Two frequently used
discrimination tests are the duo-trio and triangle tests. The duo-trio test requires group of
unknowns where the subject is tasked with selecting the product which is most similar to
the reference sample and the chance probability is p = ½ (Stone et al., 2012). The popular
triangle test uses two different samples again; however, two cups contain the same
product and one cup contains the other product, with possible order presentations being:
ABB, BAA, AAB, BBA, ABA, and BAB (Meilgaard et al., 2007). Some sensory
scientists suggest that the duo-trio test is statistically less effective compared to the
triangle test because of the chance probability (Meilgaard et al., 2007). Others argue that
although the chance probability of the triangle test is p = 0.333, it is in fact not more
statistically sensitive because “fewer correct scores required for statistical significance
should not be confused with the totally separate issue of sensitivity” (Stone et al., 2012).
2.2.1.3. Descriptive Analysis
Descriptive sensory analysis is considered by some to be the most sophisticated
and sensitive sensory testing tool (Murray et al., 2001). At least seven different
descriptive sensory methods exist; however, only two of the most commonly used
methods will be reviewed here: Quantitative Descriptive Analysis™ (Stone et al., 1974)
11
and the Spectrum™ method (Meilgaard et al., 1991). Descriptive analysis techniques
employ the use of 8 – 15 qualified subjects who conduct a complete sensory evaluation
using quantitative descriptions of products (Stone et al., 2012; Meilgaard et al., 2007;
Murray et al., 2001). Descriptive analysis participants are tasked with “taking into
account all sensations that are perceived – visual, auditory, olfactory, kinesthetic, etc. –
when the product is evaluated” (Stone et al., 2012).
The Quantitative Descriptive Analysis™ (QDA) method was developed in the
1970’s to help eliminate some perceived problems with the descriptive methods used at
the time (Murray et al., 2001), specifically the lack of quantitative data and the use of
“expert” panelists (Stone et al., 2012). The QDA™ method uses consumer language to
reduce bias of words provided in a lexicon; subjects are selected based upon sensory
acuity and being a consumer of the test product. Reference standards are rarely used
during language development, scores are captured on an unstructured line scale, and the
panel moderator does not contribute to product scoring in QDA™ (Murray et al., 2001).
Subjects in QDA™ do go through training, approximately 10-15 hours (Murray et al.,
2001); however, subjects test samples in at least triplicate to decrease variability within
subjects and disregard any between subject variance (Stone et al., 2012).
The Spectrum™ method was also developed in the 1970’s and uses extensive
reference lists, and “specialize panel training and scaling procedures” (Murray et al.,
2001). The Spectrum™ method carries out approximately 100 hours of panelist training
prior to testing, and requires the panelists understand the basic physiology and
psychology of sensory. This method uses line scales with specific product reference
points along the range of the scale to decrease variability between panelists. The cost
12
associated with the long training and number of reference samples can be quite high;
however, a major perceived benefit of the Spectrum™ method is the expected total
calibration of the panelists (Murray et al., 2001; Lawless & Heymann, 1998).
The QDA™ and Spectrum™ methods are quite different; therefore, selection of
the most appropriate method may depend on specific project objectives and parameters.
Murray et al. (2001) argues that if a company needed descriptive analysis performed on a
product which had been tested previously by the descriptive panel and a large budget
existed, perhaps the Spectrum™ method would be best. If the company had a product
which had not been previously evaluated by a descriptive analysis panel in the past and
the project budget was more limited, then perhaps the QDA™ method would be the
better choice.
2.2.2. Current Sensory Evaluation of Low Sodium Cheeses
Considering the expressed need for reducing sodium in foods, the number of
studies involved in reducing sodium in dairy products, specifically cheese, is
unsurprising. Studies investigating the sensory effects of sodium reduction in cheese have
focused on a variety of different cheese products including: cheddar cheese (Grummer et
al., 2012; Guinee, 2004; Fitzgerald & Buckley, 1985), feta cheese (Katsiari et al., 1997),
imitation cheese (El-Bakry et al., 2011), cottage cheese and cheese sauces (Drake et al.,
2011). Approaches to reducing sodium typically focus on either production of cheese by
reducing the amount of NaCl or by substituting NaCl (Cruz et al., 2011).
13
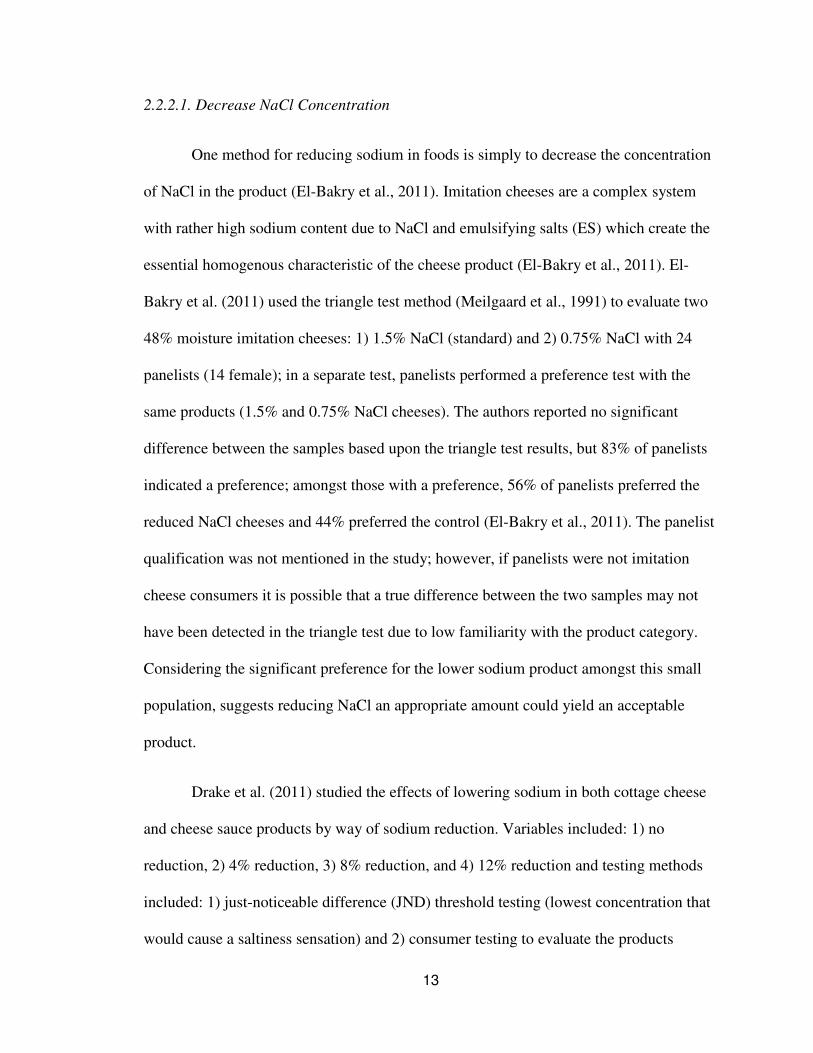
2.2.2.1. Decrease NaCl Concentration
One method for reducing sodium in foods is simply to decrease the concentration
of NaCl in the product (El-Bakry et al., 2011). Imitation cheeses are a complex system
with rather high sodium content due to NaCl and emulsifying salts (ES) which create the
essential homogenous characteristic of the cheese product (El-Bakry et al., 2011). El-
Bakry et al. (2011) used the triangle test method (Meilgaard et al., 1991) to evaluate two
48% moisture imitation cheeses: 1) 1.5% NaCl (standard) and 2) 0.75% NaCl with 24
panelists (14 female); in a separate test, panelists performed a preference test with the
same products (1.5% and 0.75% NaCl cheeses). The authors reported no significant
difference between the samples based upon the triangle test results, but 83% of panelists
indicated a preference; amongst those with a preference, 56% of panelists preferred the
reduced NaCl cheeses and 44% preferred the control (El-Bakry et al., 2011). The panelist
qualification was not mentioned in the study; however, if panelists were not imitation
cheese consumers it is possible that a true difference between the two samples may not
have been detected in the triangle test due to low familiarity with the product category.
Considering the significant preference for the lower sodium product amongst this small
population, suggests reducing NaCl an appropriate amount could yield an acceptable
product.
Drake et al. (2011) studied the effects of lowering sodium in both cottage cheese
and cheese sauce products by way of sodium reduction. Variables included: 1) no
reduction, 2) 4% reduction, 3) 8% reduction, and 4) 12% reduction and testing methods
included: 1) just-noticeable difference (JND) threshold testing (lowest concentration that
would cause a saltiness sensation) and 2) consumer testing to evaluate the products
14
(Drake et al., 2011). The authors concluded that small reductions (2% to 5%) where not
noticed by consumers and the “no reduction”, “4% reduction”, and “8% reduction” were
not significantly different for overall liking, appearance liking, and salty intensity; all
samples tested were not significantly different (P < 0.05) for flavor liking (Drake et al.,
2011). A main sodium reduction goal for several companies is to decrease sodium in
foods by 25%, thus this study suggests a 25% reduction in sodium would likely be
detected and accepted significantly less than the traditional product by consumers.
2.2.2.2. Substitution of NaCl
Substitution of NaCl with potassium chloride (KCl) is a frequently used method
to lower the sodium content in foods by 25% without the loss of palatability (Cruz et al.,
2011); however, substitution of KCl for NaCl must be done with care considering KCl
can leave a metallic, sour dairy and/or bitter note in cheeses (Cruz et al., 2011; Grummer
et al., 2012). Grummer et al. (2012) investigated the use of NaCl in cheddar cheese with
the following variables: sea salt, KCl, modified KCl, MgCl2, CaCl2, and sea salt with:
KCl, modified KCl, and MgCl2. The descriptive analysis results indicated the cheddar
cheeses with NaCl & KCl and NaCl & modified KCl were positioned the closest to the
NaCl standard on a Principle Component Analysis (PCA). Grummer et al., (2012)
suggested the relative proximity of these variables to the control indicated they had
similar sensory attributes. Further investigation of these results found the control and
NaCl & modified KCl did differ significantly in overall flavor, but all other flavor
attributes did not differ significantly; no consumer acceptability or hedonic data was
collected in the study.
15
When partial substitution of NaCl by KCl was tested in feta cheese with the
following variables: 1) control, 2) 3:1 NaCl:KCl, and 3) 1:1 NaCl:KCl, no significant
difference in appearance, body and texture, flavor, and “total score” was found (Katsiari
et al., 1997). However, the 5 member panel rated the samples on levels of “quality” rather
than the conventional intensity scale; additionally, neither the level of training nor
qualification for being a panel member was mentioned. Katsiari et al., (1997) concluded
that the cheeses did not differ significantly from the control while having a 25% to 50%
lower sodium concentration, a 1NaCl: 1KCl ratio was suggested based on their results
and nutrition recommendations.
Ayyash and Shah (2011) evaluated the chemical composition and functional
properties of partially substituted KCl mozzarella cheese; however, no sensory or texture
analysis was performed on the samples. Two functional properties which are somewhat
related to sensory were evaluated: meltability and browning. The 1NaCl:1KCl, and
1NaCl:3KCl salted samples were higher in meltability and browning compared to the
NaCl only control (Ayyash & Shah, 2011). Although this information is a positive step
toward understanding the role of KCl in mozzarella cheese, additional information is
needed about consumer acceptability, descriptive and texture analysis of KCl substituted
and NaCl reduced mozzarella cheese. Based upon studies which have observed the
effects of KCl partial substitution in different cheeses, a suggested ratio close to
1NaCl:1KCl appears to be the most effective from both a functional and sensory
perspective (Ayyash & Shah, 2011; Cruz et al., 2011; Katsiari et al., 1997); however,
other studies have suggested a 70%NaCl to 30%KCl may be more appropriate (Guinee,
2004; Guinee & O’Kennedy, 2007), clearly further research is needed. Cruz et al. (2011)
16
stated that a group of United Kingdom specialists suggested a sodium reduction of 10 to
25% could not be detected by consumers; however, other studies have suggested
otherwise (Drake et al., 2011; Johnson et al., 2009). Substitution of NaCl with KCl has
been studied in a variety of different cheeses, most of which have strong or complex
flavors (i.e. cheddar and feta); however, mozzarella cheese is known for being a blander
cheese, in which case the KCl substitution may be more obvious, thus additional research
in this area is needed. Sodium reduction in cheese is an obviously challenging goal, but
by assessing other aspects of the cheese consumption experience, researchers may gain a
clearer understanding of how to address this difficult objective.
2.3. Emotions
2.3.1. Why Evaluate Emotions?
Several sensory researchers have suggested the need for additional information
above and beyond what basic hedonics provides with the goal of better understanding
consumer food choice behavior (King & Meiselman, 2010; Macht, 2008; Macht &
Simons, 2000; Seo et al., 2009; Thomson et al., 2010). Thomson et al. (2010) argued that
with increased exposure to a product, consumers develop a conceptual association to that
specific product. The authors defined these conceptualizations as “constructions created
in the mind that allow us to interpret, understand and otherwise assign meaning to what
we experience.” Eventually, the authors stated that conceptualization, despite being
“infinitely diverse”; could be categorized into three key concepts: functional, emotional,
and abstract conceptualizations (Fig. 2.2) and are described as follows:
• Functional: the product meets the basic functional needs required of the product.
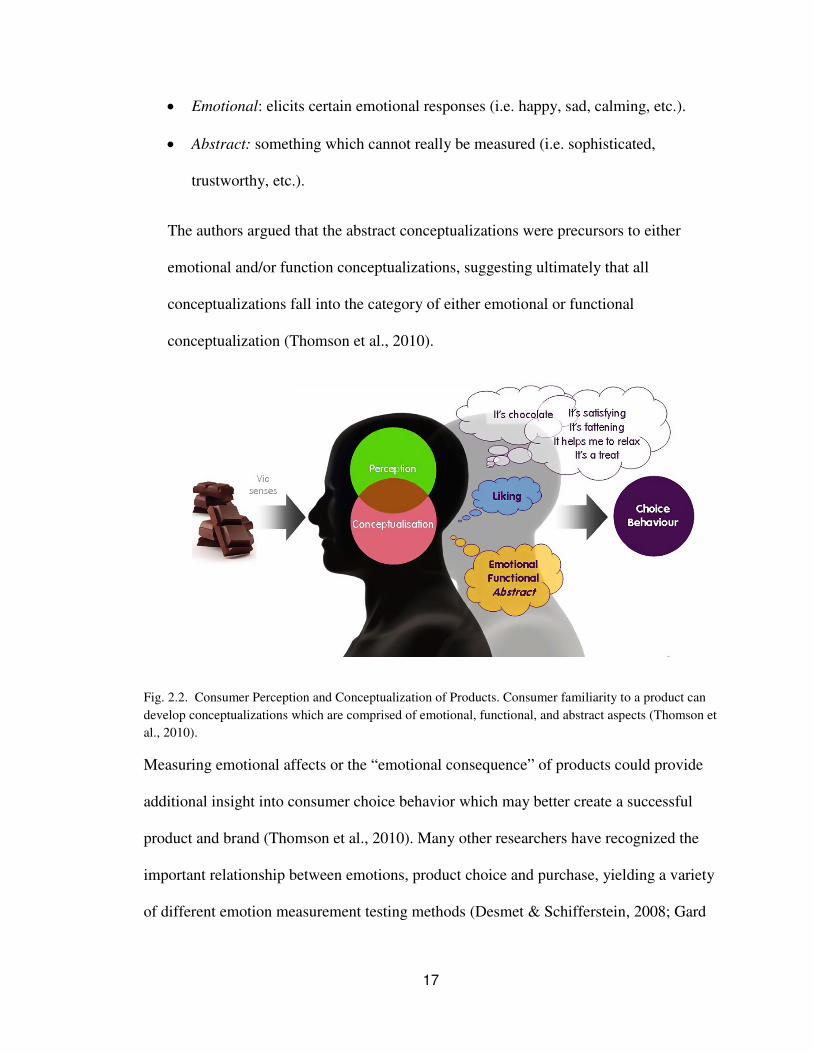
17
• Emotional: elicits certain emotional responses (i.e. happy, sad, calming, etc.).
• Abstract: something which cannot really be measured (i.e. sophisticated,
trustworthy, etc.).
The authors argued that the abstract conceptualizations were precursors to either
emotional and/or function conceptualizations, suggesting ultimately that all
conceptualizations fall into the category of either emotional or functional
conceptualization (Thomson et al., 2010).
Fig. 2.2. Consumer Perception and Conceptualization of Products. Consumer familiarity to a product can
develop conceptualizations which are comprised of emotional, functional, and abstract aspects (Thomson et
al., 2010).
Measuring emotional affects or the “emotional consequence” of products could provide
additional insight into consumer choice behavior which may better create a successful
product and brand (Thomson et al., 2010). Many other researchers have recognized the
important relationship between emotions, product choice and purchase, yielding a variety
of different emotion measurement testing methods (Desmet & Schifferstein, 2008; Gard
18
& Kring, 2007; King & Meiselman, 2010; Macht & Simons, 2000; McNair et al., 1971;
Thomson et al., 2010).
Human eating behavior, which is typically influenced by a food, bodily, social
and physical environment cues, is generally accepted to also be affected by and related to
emotions (Desmet & Shifferstein, 2008). Although traditional sensory evaluation of food
has focused on the measuring of basic tastes, it is understood that consumers often
purchase food products “based on emotional response triggered by the products” (Seo et
al., 2009). The use of emotion testing alone or in addition to traditional consumer sensory
evaluation is gaining popularity within the industry (King & Meiselman, 2010). Increase
in the use of emotion testing is likely due to the hypothesis that consumer purchase
behavior can be driven by emotional responses which are elicited by the chosen product,
rather than just the basic taste profile of the product (Seo et al., 2009). Due to the
promising future of emotions in sensory evaluation, a variety of different emotion testing
methods have been developed (i.e. Croy et al., 2011; King & Meiselman, 2010; Thomson
et al., 2010; Seo et al., 2009; Gard & Kring, 2007); these emotion tests seek to accurately
capture the consumer’s emotional relationship with food and purchasing intent. Several
current emotion testing methods are well thought out and privy to the psychology of
emotions; however, in order to critically evaluate these methods in this review, decision
making, reward mechanisms, specific stimuli, and emotional processing will be assessed
as they likely play a significant role of human emotional responses.
19
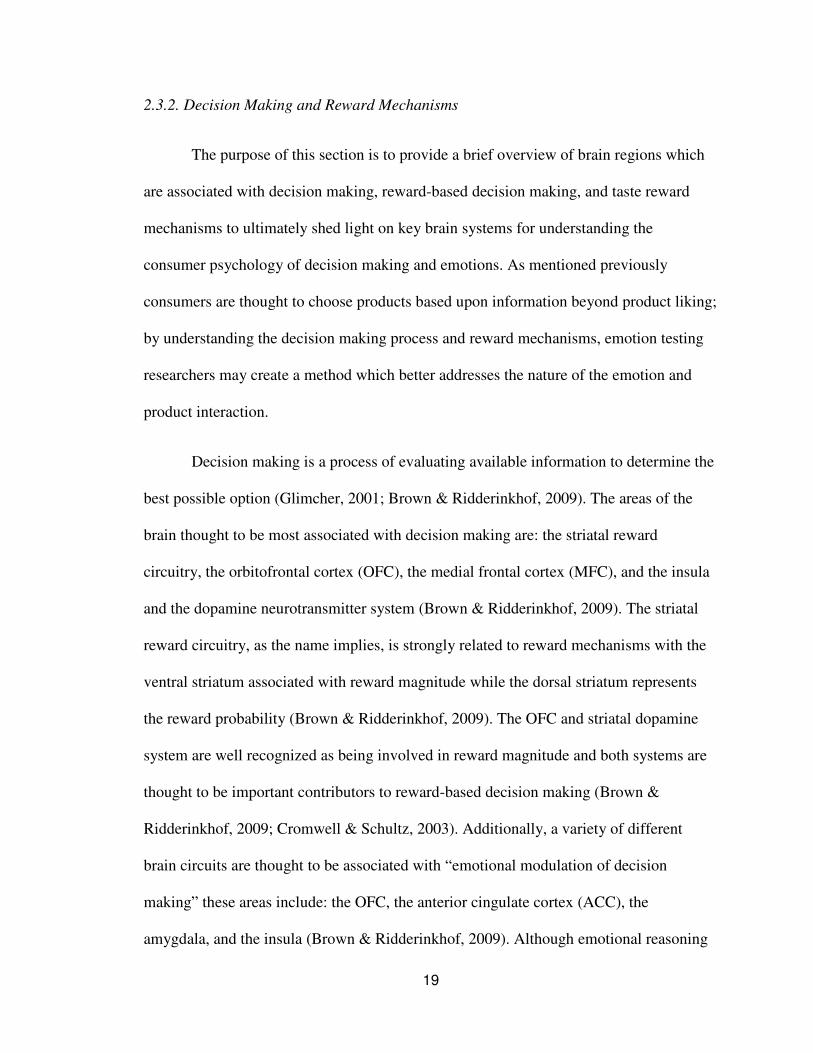
2.3.2. Decision Making and Reward Mechanisms
The purpose of this section is to provide a brief overview of brain regions which
are associated with decision making, reward-based decision making, and taste reward
mechanisms to ultimately shed light on key brain systems for understanding the
consumer psychology of decision making and emotions. As mentioned previously
consumers are thought to choose products based upon information beyond product liking;
by understanding the decision making process and reward mechanisms, emotion testing
researchers may create a method which better addresses the nature of the emotion and
product interaction.
Decision making is a process of evaluating available information to determine the
best possible option (Glimcher, 2001; Brown & Ridderinkhof, 2009). The areas of the
brain thought to be most associated with decision making are: the striatal reward
circuitry, the orbitofrontal cortex (OFC), the medial frontal cortex (MFC), and the insula
and the dopamine neurotransmitter system (Brown & Ridderinkhof, 2009). The striatal
reward circuitry, as the name implies, is strongly related to reward mechanisms with the
ventral striatum associated with reward magnitude while the dorsal striatum represents
the reward probability (Brown & Ridderinkhof, 2009). The OFC and striatal dopamine
system are well recognized as being involved in reward magnitude and both systems are
thought to be important contributors to reward-based decision making (Brown &
Ridderinkhof, 2009; Cromwell & Schultz, 2003). Additionally, a variety of different
brain circuits are thought to be associated with “emotional modulation of decision
making” these areas include: the OFC, the anterior cingulate cortex (ACC), the
amygdala, and the insula (Brown & Ridderinkhof, 2009). Although emotional reasoning
20
was not included in early decision making theories, it is currently thought to be important
in the assessment of reward outcomes (Brown & Ridderinkhof, 2009), which agrees with
Thomson et al.’s (2010) concept for consumer decision making. Lastly, areas in the brain
thought to be associated with rewards include: the midbrain, striatum, OFC, and
amygdala. The OFC and amygdala appear to be pivotal brain areas for decision making
and reward processing; therefore they will be explored further and eventually connected
to salty taste rewards. Fig. 2.3 outlines the key regions of the brain for decision making,
although not all components are included.
Fig. 2.3. Decision Making and Reward Mechanism Areas of the Brain. The key areas of the brain involved
in decision making and reward mechanisms, specifically the amygdala and orbitofrontal cortex (OFC)
(Kenny, 2011).
The OFC houses the “affective value” of unlearned rewards such as taste, touch,
texture, and facial expression. It eventually associates additional stimuli with these
unlearned rewards to anticipate reward values for visual, auditory and abstract stimuli;
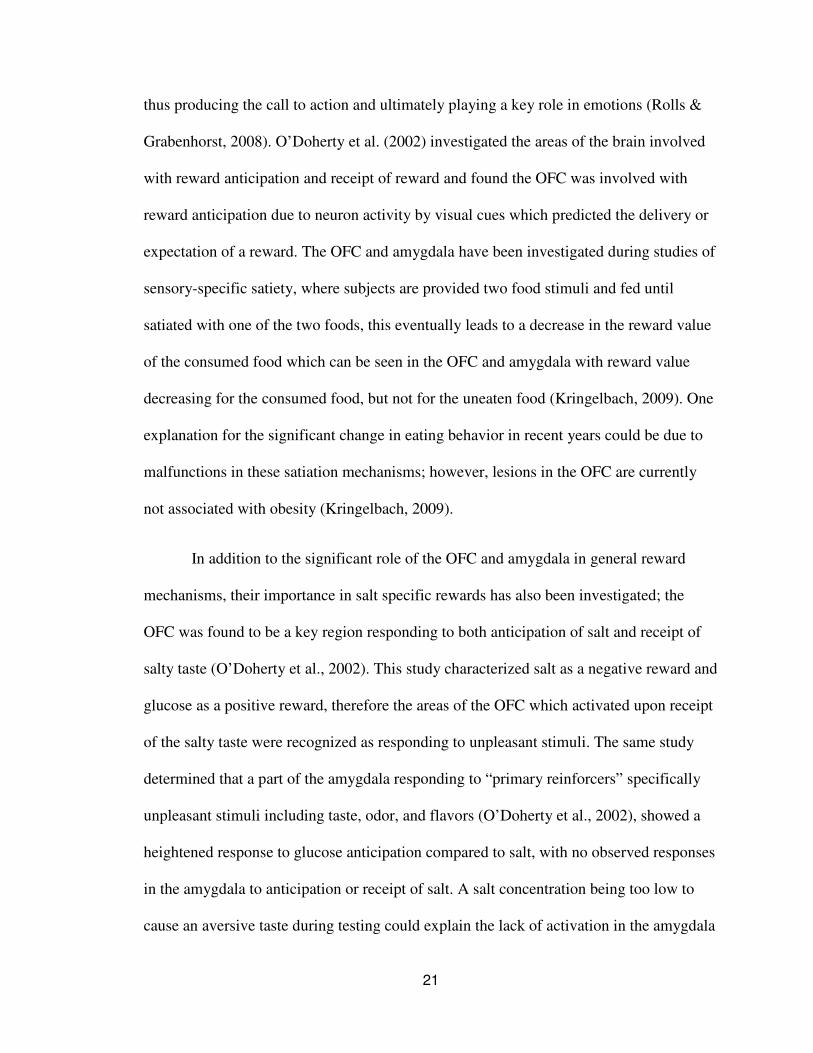
21
thus producing the call to action and ultimately playing a key role in emotions (Rolls &
Grabenhorst, 2008). O’Doherty et al. (2002) investigated the areas of the brain involved
with reward anticipation and receipt of reward and found the OFC was involved with
reward anticipation due to neuron activity by visual cues which predicted the delivery or
expectation of a reward. The OFC and amygdala have been investigated during studies of
sensory-specific satiety, where subjects are provided two food stimuli and fed until
satiated with one of the two foods, this eventually leads to a decrease in the reward value
of the consumed food which can be seen in the OFC and amygdala with reward value
decreasing for the consumed food, but not for the uneaten food (Kringelbach, 2009). One
explanation for the significant change in eating behavior in recent years could be due to
malfunctions in these satiation mechanisms; however, lesions in the OFC are currently
not associated with obesity (Kringelbach, 2009).
In addition to the significant role of the OFC and amygdala in general reward
mechanisms, their importance in salt specific rewards has also been investigated; the
OFC was found to be a key region responding to both anticipation of salt and receipt of
salty taste (O’Doherty et al., 2002). This study characterized salt as a negative reward and
glucose as a positive reward, therefore the areas of the OFC which activated upon receipt
of the salty taste were recognized as responding to unpleasant stimuli. The same study
determined that a part of the amygdala responding to “primary reinforcers” specifically
unpleasant stimuli including taste, odor, and flavors (O’Doherty et al., 2002), showed a
heightened response to glucose anticipation compared to salt, with no observed responses
in the amygdala to anticipation or receipt of salt. A salt concentration being too low to
cause an aversive taste during testing could explain the lack of activation in the amygdala
22
with salty stimuli (O’Doherty et al., 2002). Another study which explored reward
behavior in rats found that even at the most preferred concentration, NaCl does not have
the same hedonic impact as sugar, even when salt deprived; rats will not undergo brain
agitation for salt but will for sugar (McCaughey & Scott, 1998). Although the
reinforcement for salt may be more subtle than that of sugar, a reward for consumption
does exist (McCaughey & Scott, 1998). The above studies explored the reward
mechanisms of salt under two extreme conditions: 1) during salt depletion in the body
and 2) salt concentration as an irritant. Little information is known about salt rewards at
typically consumed levels in those with healthy to high levels of NaCl in the body, future
research should explore this relationship.
2.3.3. Brain Relationship between Emotion, Taste, Texture, and Images
Different brain regions and mechanisms for rewards and decision-making were
explored in the previous section; this section will investigate the brain regions and
processes associated with emotion, taste, texture, and images. The relationships between
these stimuli and emotion need to be understood in order to develop a comprehensive
emotion evaluation testing method in the context of eating.
2.3.3.1 Emotion
The amygdala has been thought to play a role in emotional significance regulation
of certain events (Martin-Soelch et al., 2007). The amygdala has also been associated
with fear, aggression, and rage and interactions with the hippocampus for transcription
and storage of emotional memories (O’Doherty et al., 2002; Freberg, 2009; Sander,
2012). However, Sander (2012) suggested little empirical evidence exists to make the
23
overly simplified relationship between the amygdala and fear. Alternatively, he proposed
the amygdala is capable of taking broader information into consideration including an
individual’s immediate concerns such as “goals, needs, and values” and thus suggested
the amygdala is crucial to affective relevance. Sander (2012) also argued that relevance
detection occurs before any mental representation of bodily responses because relevance
detection is involved with eliciting emotional responses, which includes the
“generalization of bodily sensations.” The general role of the amygdala is to identify both
positive and negative experiences which are subjectively evaluated based upon the
individual’s current needs, goals, and values; ultimately being a key driver in emotional
and motivational assessment (Sander, 2012).
In addition to the amygdala’s significant role in emotional responses, the OFC is
thought to have major contributions to emotional assessment (Rolls, 1999; Rolls &
Grabenhorst, 2008). Emotions are reactions to reinforcing or reward stimuli and the OFC
contains major cortical representation of taste and texture (among other sensations) which
are primary reinforcers, thus suggesting a role of the OFC with emotions (Rolls, 1999;
Rolls & Grabenhorst, 2008). Rolls and Grabenhorst’s (2008) general theory about
emotions is similar to that of Sander (2012) suggesting emotions are periods prompted by
goals or reinforcers. However, Rolls and Grabenhorst (2008) also have suggested the tool
by which the reinforcer is presented will modify the emotional outcome; stating an
individual’s emotional state will differ depending on which reward (food, monetary,
social, etc.) was or was not presented. Not only is the OFC involved in emotional
responses through primary reinforcers, but physical damage to the OFC has been shown
24
to impair an individual’s “emotional behavior and subjective emotional states” (Rolls et
al., 1994).
2.3.3.2. Taste and Texture
In primates, taste neurons can be found in the OFC, hypothalamus, ventral
striatum, and the amygdala, in addition to these locations the primary taste cortex
contains neurons sensitive to NaCl, glucose, HCl, and quinine (Rolls, 1997). The OFC
contains certain neurons which only respond to taste, others which respond to different
oral stimuli including viscosity and texture, and the use of fMRIs has demonstrated
activation in the medial region of the OFC by taste, texture, and olfactory stimuli (Rolls
& Grabenhorst, 2008). Flavor is defined as the combination of taste, aroma, and chemical
sensations (Meilgaard et al., 2007). The merging of taste and aroma is thought to occur in
the OFC, thus playing a significant role in the pleasantness affect and reward mechanisms
in the OFC (Rolls & Grabenhorst, 2008). Certain tastes or aromas acting alone may be
perceived as unpleasant, but the combination of taste and aroma produces a pleasurable
sensation and positive reward value in the OFC. Neurons exist in the OFC which respond
to textures in the mouth including varying viscosities and fatty mouthfeel and fat in
mouth is perceived as pleasant when hungry; however, fatty food eating induced satiety
can decrease the OFC neuron responses to the texture of fat in mouth (Rolls &
Grabenhorst, 2008).
In addition to the importance of the OFC, the amygdala is involved in feeding
control due to its sensitivity to taste inputs and responses from other brain regions
including the primary taste cortex which sends gustatory information to nuclei in three
25
regions of the amygdala (Scott et al., 1993). The amygdala has been found to be
specifically important for sodium intake, with lesions to the central amygdala causing
decreased sodium intake (Li et al., 2012). Li et al. (2012) found when the central nucleus
of the amygdala (CeA) was damaged in rats, there was a significant increase in salt
(NaCl) sensitivity; suggesting this brain region is involved in the interpretation of salty
taste intensity. Li et al. (2012) also found involvement of the CeA in not only regulating
salty taste intensity, but also regulation of sodium consumption. Scott et al. (1993) found
63% of “taste-responsive cells” in the amygdala gave their highest responses to either
glucose or NaCl, suggesting the sensitivity to these primary tastes compared to that of
sour and bitter flavors. Taste, specifically salty taste, appears to play a significant role in
brain regions (the OFC and amygdala) which also interpret reward values, emotions, and
decision-making. By decreasing salt in food and beverage products, there may be a
physiological consequence prompting the negative hedonic response measured by
traditional sensory methods that could be explained with concurrent emotion testing.
2.3.3.3. Images
General interpretation of the brain has suggested the left hemisphere is associated
more with language, mathematics, and logical processing, while the right hemisphere is
associated with music, intuition, and art; however, this is known to be an over
simplification of the true processes (Freberg, 2009). Psychologists have generally
understood common links which exist between emotions and mental imagery rather than
other types of processes; however, little empirical evidence has been able to validate this
theory (Holmes et al., 2008). Holmes et al. (2008) argued that emotions and images are
linked for the following three reasons: 1) basic emotion processes developed early on in
26
the brain, prior to language, and are more sensitive to “sensory-perceptual” information
suggesting images may elicit emotions more easily than language-based concepts, 2)
memories from imagined events can be confused with actual event memories, this type of
confusion is more likely when imaged based techniques are used rather than verbal
techniques, and 3) personal memories are mostly stored as images including the
emotional association to those memories; suggesting images may be helpful in
remembering certain memories with their corresponding emotion.
These theories for linking emotions and mental imagery are in accordance with
the Zaltman Metaphor Elicitation Technique (ZMET), a well-established and validated
consumer metaphor-based research method. The first three principles of the ZMET
method are: 1) most communication is nonverbal, 2) thought occurs as images, and 3)
metaphors are essential units of thought; the method suggests the importance of
researching beyond the linguistic language with consumers and focusing on
understanding their thoughts, emotions, and memories by way of images. The ZMET
method suggests the use of images allows researchers to get closer to how thoughts are
processed and thus a clearer idea of how the consumer really thinks (Zaltman & Coulter,
1995).
Holmes et al. (2008) evaluated the use of images versus words for emotion testing
where subjects were asked to perform a task with either verbal or visual instructions, a
“memory for words” taste, an anxiety questionnaire for the tasks, and a subjective
experience questionnaire regarding the performed tasks. Results from this study found the
image instructions, compared to verbal instructions, elicited: 1) increased anxiety after
viewing negative pictures and 2) decreased anxiety after viewing the neutral pictures. The
27
magnified emotional response in the image testing suggests increased “evaluative
learning” and imagery instructions elicited more emotional valence than verbal
instructions. Holmes et al. (2008) ultimately argued that the study suggests “imagery has
causal effects on emotion.”
In addition to these arguments by Holmes et al. (2008), Rolls and Grabenhorst
(2008) suggest both visual and emotional processing occur in the OFC and Rolls et al.
(2005) found a group of neurons in the primate OFC which respond to only new visual
stimuli. The specific purpose of these neurons is unknown; however, activation of this
area of the OFC in humans has been associated with the encoding of memories of new
visual stimuli (Rolls et al., 2005).
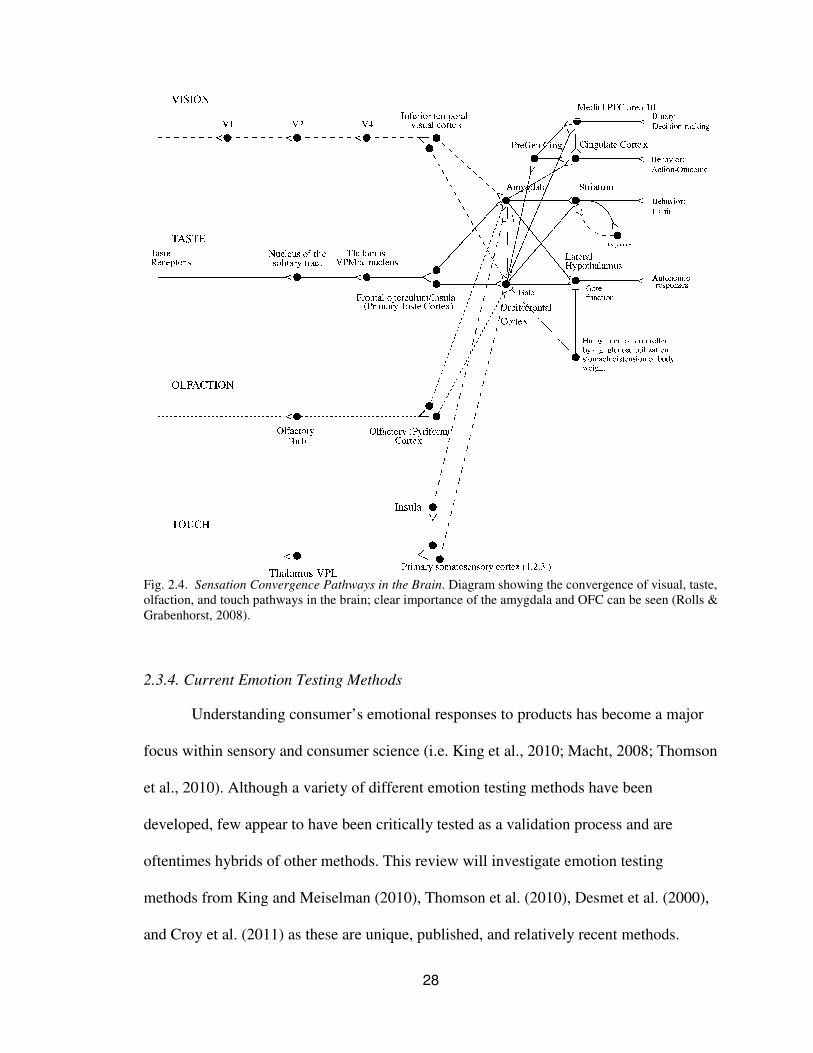
Overall there appears to be findings which suggest a relationship between the
brain processing areas involved with emotions, taste and texture, and images. Fig. 2.4
provides the processes by which different senses are processed in the brain, with the OFC
and amygdala appearing to be main centers for all the indicated senses. Each sensation
follows a series of pathways before arriving at the OFC and amygdala which interpret the
sensation information and relay it to other areas of the brain for additional interpretation
and reaction to the specific sensation (Rolls & Grabenhorst, 2008). Additionally, many of
these brain regions share similarities with decision-making and reward mechanisms in the
brain. This overview of brain regions and processes has brought to light important
information and will be used as a criterion for evaluating current emotion testing
methods.
28
Fig. 2.4. Sensation Convergence Pathways in the Brain. Diagram showing the convergence of visual, taste,
olfaction, and touch pathways in the brain; clear importance of the amygdala and OFC can be seen (Rolls &
Grabenhorst, 2008).
2.3.4. Current Emotion Testing Methods
Understanding consumer’s emotional responses to products has become a major
focus within sensory and consumer science (i.e. King et al., 2010; Macht, 2008; Thomson
et al., 2010). Although a variety of different emotion testing methods have been
developed, few appear to have been critically tested as a validation process and are
oftentimes hybrids of other methods. This review will investigate emotion testing
methods from King and Meiselman (2010), Thomson et al. (2010), Desmet et al. (2000),
and Croy et al. (2011) as these are unique, published, and relatively recent methods.
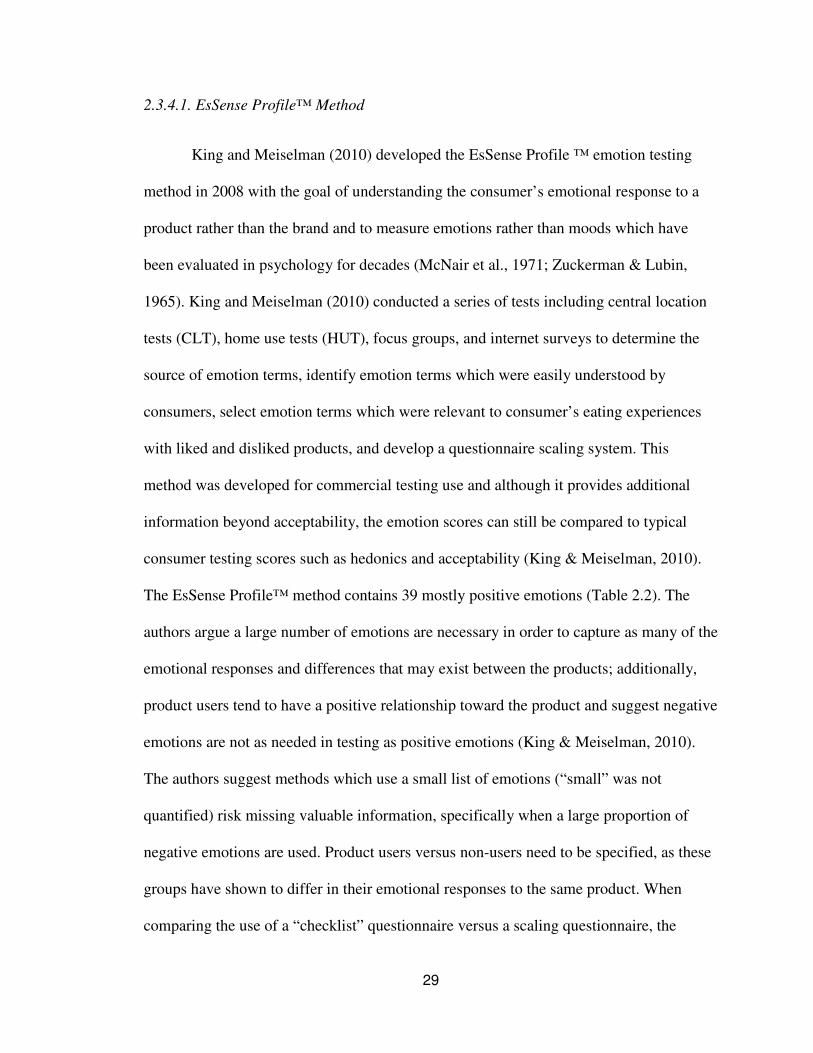
29
2.3.4.1. EsSense Profile™ Method
King and Meiselman (2010) developed the EsSense Profile ™ emotion testing
method in 2008 with the goal of understanding the consumer’s emotional response to a
product rather than the brand and to measure emotions rather than moods which have
been evaluated in psychology for decades (McNair et al., 1971; Zuckerman & Lubin,
1965). King and Meiselman (2010) conducted a series of tests including central location
tests (CLT), home use tests (HUT), focus groups, and internet surveys to determine the
source of emotion terms, identify emotion terms which were easily understood by
consumers, select emotion terms which were relevant to consumer’s eating experiences
with liked and disliked products, and develop a questionnaire scaling system. This
method was developed for commercial testing use and although it provides additional
information beyond acceptability, the emotion scores can still be compared to typical
consumer testing scores such as hedonics and acceptability (King & Meiselman, 2010).
The EsSense Profile™ method contains 39 mostly positive emotions (Table 2.2). The
authors argue a large number of emotions are necessary in order to capture as many of the
emotional responses and differences that may exist between the products; additionally,
product users tend to have a positive relationship toward the product and suggest negative
emotions are not as needed in testing as positive emotions (King & Meiselman, 2010).
The authors suggest methods which use a small list of emotions (“small” was not
quantified) risk missing valuable information, specifically when a large proportion of
negative emotions are used. Product users versus non-users need to be specified, as these
groups have shown to differ in their emotional responses to the same product. When
comparing the use of a “checklist” questionnaire versus a scaling questionnaire, the
30
authors found the checklist/choose-all-that-apply (CATA) format to be effective at
distinguishing different flavor profile products, while the scaling questionnaire was
effective at determining different flavors of the same product. Lastly, the authors suggest
the EsSense Profile™ method is most effective when tested in a CLT or internet survey
format and can provide a common emotion language which can be used to facilitate
communication about emotions between the sensory science, marketing, and product
development fields (King & Meiselman, 2010).
Table 2.2. EsSense Profile™ List of Emotions. List of the 39 emotions selected for use in the EsSense
Profile™ method (King & Meiselman, 2010).
Considering the method was recently published in 2010, little published critiques
of this method exist; however, it has been suggested the EsSense Profile™ method
consists of emotion words which are not relative or applicable to certain products and
consumers have found some words to be ambiguous (Jaeger, 2012). The EsSense
Profile™ method has also been criticized for not taking cultural differences into account
as translating the current emotion words often do not translate correctly (Spinelli, 2012),
also not taking into account any aids to help easily elicit emotions, and its limited number
of negative emotions. The popular and heavily used hedonic 9-point scale has been
studied and evaluated for decades and the importance of a balanced scale has been noted
and reviewed (Lim, 2011) and the asymmetry in emotion testing has been criticized
EsSense Profile™ List of Emotions
31
(Schifferstein & Desmet, 2010); perhaps the EsSense Profile™ method could look into
creating a more balanced emotion list to better evaluated the eating experience. The
EsSense Profile™ does appear to provide a simple and straightforward method for
evaluating emotional responses; however, other methods may help decrease the
limitations found in the current EsSense Profile™ method.
2.3.4.2. Best-Worst Scaling
Thomson et al. (2010) took a different approach when developing an emotion
method with the primary call to action being to go beyond the “obvious, apparently
intuitive and otherwise associated with immediate liking…” in order to capture more
intrinsic motivations and conceptualizations which influence choice. The authors state
that although words provide richness to language and an ease for emotion measurement,
their use in emotion research has been criticized because it is wrongly assumed to require
a type of measurement scale. The use of scaling leads subjects to think about the meaning
of the words which involves the use of cognitive, rational thinking, while the objective of
the test is to instead capture information about emotions and choice which maybe more
non-cognitive or irrationally focused. Additionally, when words are used for scaling,
subjects often focus on the literal meaning of the words, when in fact the metaphoric
meaning often provides the fullness and complexity behind the word. Thomson et al.
(2010) suggested the use of best-worst scaling (Jaeger et al., 2008) because it provides
the opportunity to use words (ideal for researchers) without requiring “external
measurement scales.” The general objective of this method is to provide the subject with
the test product and four or five words at a time from a larger list of terms, and the
subject simply needs to decide which of the words provided s/he feels is the most and the
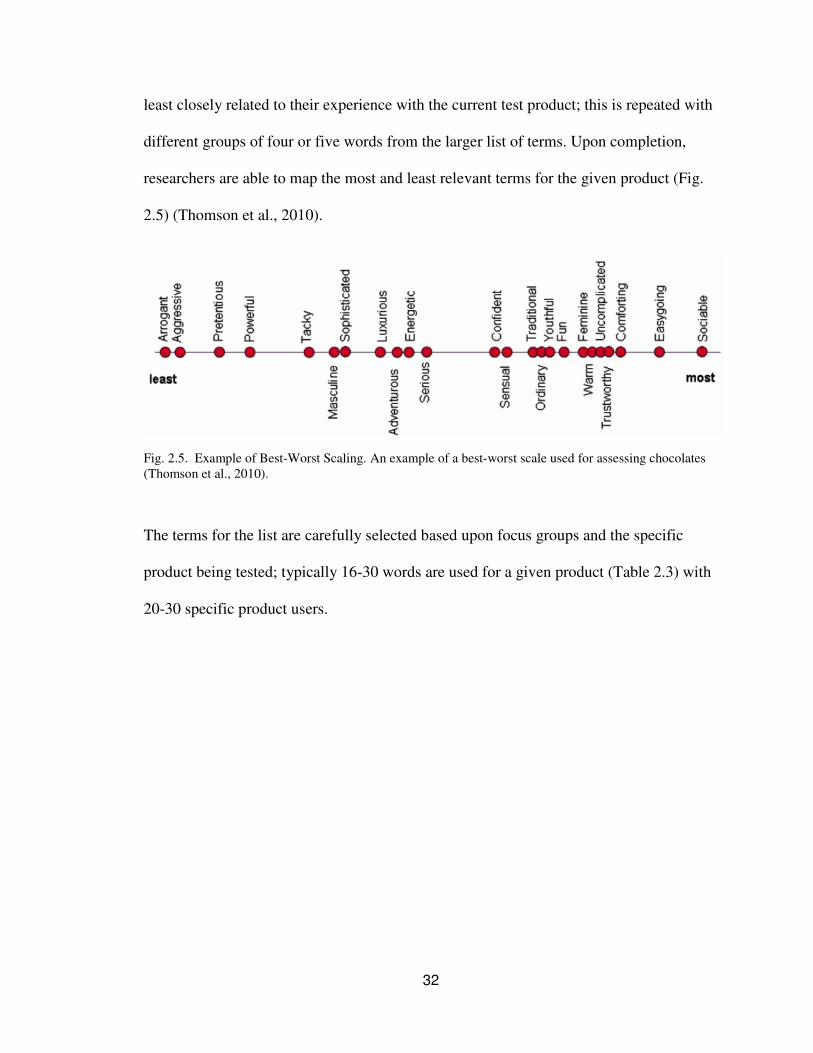
32
least closely related to their experience with the current test product; this is repeated with
different groups of four or five words from the larger list of terms. Upon completion,
researchers are able to map the most and least relevant terms for the given product (Fig.
2.5) (Thomson et al., 2010).
Fig. 2.5. Example of Best-Worst Scaling. An example of a best-worst scale used for assessing chocolates
(Thomson et al., 2010).
The terms for the list are carefully selected based upon focus groups and the specific
product being tested; typically 16-30 words are used for a given product (Table 2.3) with
20-30 specific product users.
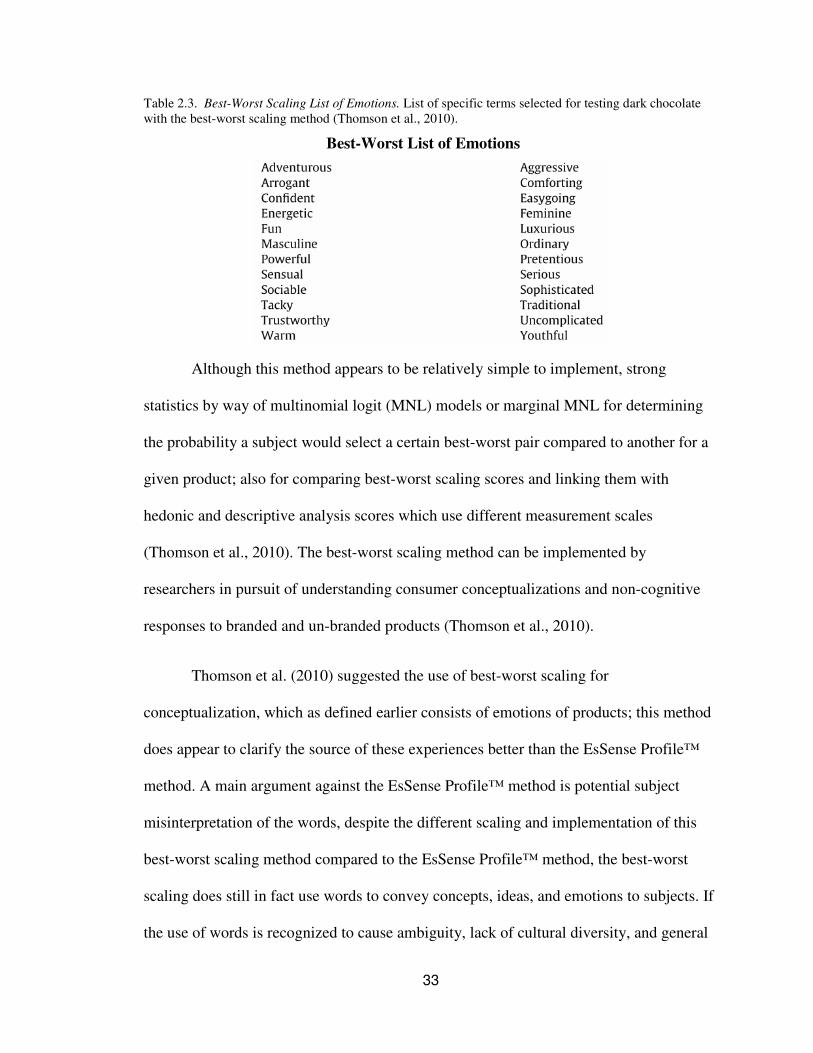
33
Table 2.3. Best-Worst Scaling List of Emotions. List of specific terms selected for testing dark chocolate
with the best-worst scaling method (Thomson et al., 2010).
Although this method appears to be relatively simple to implement, strong
statistics by way of multinomial logit (MNL) models or marginal MNL for determining
the probability a subject would select a certain best-worst pair compared to another for a
given product; also for comparing best-worst scaling scores and linking them with
hedonic and descriptive analysis scores which use different measurement scales
(Thomson et al., 2010). The best-worst scaling method can be implemented by
researchers in pursuit of understanding consumer conceptualizations and non-cognitive
responses to branded and un-branded products (Thomson et al., 2010).
Thomson et al. (2010) suggested the use of best-worst scaling for
conceptualization, which as defined earlier consists of emotions of products; this method
does appear to clarify the source of these experiences better than the EsSense Profile™
method. A main argument against the EsSense Profile™ method is potential subject
misinterpretation of the words, despite the different scaling and implementation of this
best-worst scaling method compared to the EsSense Profile™ method, the best-worst
scaling does still in fact use words to convey concepts, ideas, and emotions to subjects. If
the use of words is recognized to cause ambiguity, lack of cultural diversity, and general
Best-Worst List of Emotions
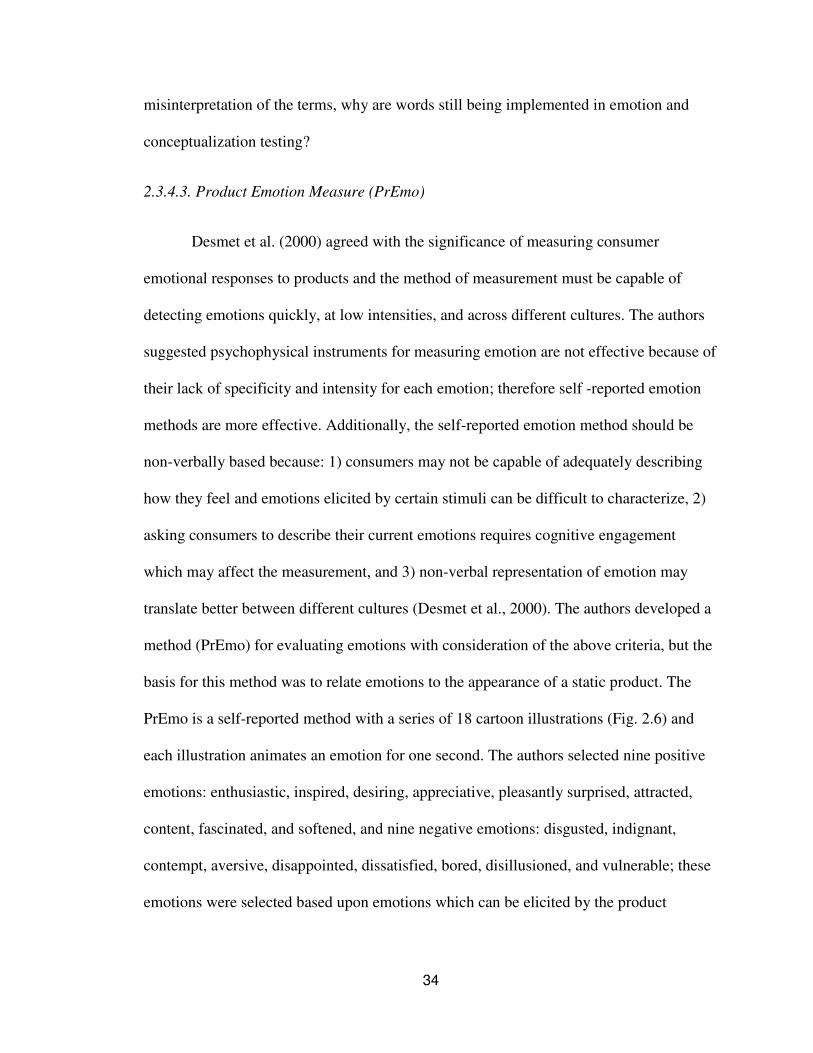
34
misinterpretation of the terms, why are words still being implemented in emotion and
conceptualization testing?
2.3.4.3. Product Emotion Measure (PrEmo)
Desmet et al. (2000) agreed with the significance of measuring consumer
emotional responses to products and the method of measurement must be capable of
detecting emotions quickly, at low intensities, and across different cultures. The authors
suggested psychophysical instruments for measuring emotion are not effective because of
their lack of specificity and intensity for each emotion; therefore self -reported emotion
methods are more effective. Additionally, the self-reported emotion method should be
non-verbally based because: 1) consumers may not be capable of adequately describing
how they feel and emotions elicited by certain stimuli can be difficult to characterize, 2)
asking consumers to describe their current emotions requires cognitive engagement
which may affect the measurement, and 3) non-verbal representation of emotion may
translate better between different cultures (Desmet et al., 2000). The authors developed a
method (PrEmo) for evaluating emotions with consideration of the above criteria, but the
basis for this method was to relate emotions to the appearance of a static product. The
PrEmo is a self-reported method with a series of 18 cartoon illustrations (Fig. 2.6) and
each illustration animates an emotion for one second. The authors selected nine positive
emotions: enthusiastic, inspired, desiring, appreciative, pleasantly surprised, attracted,
content, fascinated, and softened, and nine negative emotions: disgusted, indignant,
contempt, aversive, disappointed, dissatisfied, bored, disillusioned, and vulnerable; these
emotions were selected based upon emotions which can be elicited by the product
35
appearance, not from buying or using the product (Desmet et al., 2000). Note: no neutral
emotions were included.
Fig. 2.6. PrEmo Emotion Animations. The 18 emotion animations used on the computer-based emotion
method, PrEmo (Desmet et al., 2000).
The expression of these cartoon characters is based upon the research of Ekman
and Friesen (1986) on universal expressions of emotion. The emotions discussed for
universal expressions of emotion are based upon basic emotions (i.e. fear and happiness)
while the emotions used in PrEmo are more subtle, in which case Desmet et al., (2000)
decided to use facial and bodily expressions of emotions to magnify and clarify the
targeted emotions. Additionally, the authors suggest measuring these specific emotions
provides clues as to why certain products elicit certain emotions, eventually allowing
designers, marketers, product developers, and sensory scientists the opportunity to
compare the products and emotions to understand what attributes may have elicited these
certain emotions in some products and not in others (Desmet et al., 2000).
36
The PrEmo method accounts for issues with emotion testing which other methods
have neglected, specifically using images to decrease wording ambiguity, facilitate use
by different cultures, and limit cognitive involvement all through the use of animated
images. Although this method has many benefits, it does only consist of 18 emotions
which may not be enough to capture the entire consumer emotional experience with the
product (King & Meiselman, 2010); however, an appropriate or acceptable number of
emotions is still debated. Additionally, PrEmo was developed for the consumer’s emotion
response to the appearance of the product and not necessarily for those emotions
associated with purchasing or using the product. The PrEmo method is promising in its
non-verbal approach to measuring emotions; however, further information is needed
about additional emotion images and the effectiveness of this method when evaluating
the emotions associated with purchasing and using a product.
2.3.4.4. Eliciting Emotions with Odors and Pictures
The sense of smell has long been associated with eliciting emotions (Croy et al.,
2011) and as explored earlier olfaction and emotion processes occur in similar regions of
the brain, including the OFC (Rolls & Grabenhorst, 2008), thus Croy et al., (2011) was
interested in the elicitation of emotions by odors and pictures. Participants were asked to
list odors which they thought would elicit specified emotions: happiness, anger, disgust,
sadness, anxiety, and surprise. A control group was asked to provide images which they
thought would elicit the same emotions; the researchers hypothesized that it would be
easier for participants to find visual cues which evoked different emotions compared to
odors (Croy et al., 2011). Common groups for evoking happiness in the odor group were:
plants (58%) and food (26%), and for disgust: death and waste (55%) and culture
37
products (15%). Typical pictures used for happiness were: nature (25%), humans (24%),
and plants (21%), and for disgust: death and waste (48%) and animals (34%). Ultimately,
participants were better able to name visual evokers rather than olfactory evokers for
anger and sadness, suggesting the elicitation of different emotions is very complex and
difficult to perform through the olfactory system (Croy et al., 2011).
Although this study does not provide ground-breaking information in the world of
emotion, it does aid in the development of an emotion testing method through finding: 1)
subjects are better able to connect emotions to pictures/visual cues compared to odor
cues, and 2) the importance of not only a stimulus, but also the significance of the
stimulus chosen for understanding emotional responses (Croy et al., 2011). Only basic
emotions were used in this study, perhaps validation with additional/less basic emotions
would provide further insight into the effectiveness of emotional stimuli. Lastly, perhaps
reversing the method for connecting stimuli and emotion by asking subjects to list
emotions evoked from certain aromas may help product development, sensory scientists,
designers, and marketers understand what emotional response is expected from a certain
stimuli.
Through reviewing these fundamentally different emotion testing methodologies,
the following aspects appear to be paramount: 1) selection of just enough (amount not
specified) emotions to capture the consumer experience to a specific product, 2) use of
both positive and negative emotions to understand how product users and non-users will
related to a product, and 3) the use of images to decrease ambiguity, confusion, and
misinterpretation of emotion words and better evoke basic emotions compared to odors
(Table 2.4). The clear connection seen between pictures/visual cues and emotions is
38
consistent with the understanding of decision-making, reward mechanisms, visual, and
emotion processing observed in the brain.
Table 2.4. Comparison of Emotion Methods. Comparison of critical aspects for each emotion method, it
appears PrEmo method contains more of the important aspects of testing compared to the other mentioned
methods.
Tested
with Food
Used
Images
Cultural
Ease
Beyond Basic
Emotions
Balanced
+ and -
emotions
EsSense™
Best-Worst
Scaling
PrEmo
Odors and
Pictures
2.4. Justification for Work
There is an obvious need for Americans to reduce their sodium intake by a large
margin. Although a total dietary modification is likely needed to achieve the
recommended sodium intake levels, reducing sodium in a variety of popular foods could
help Americans achieve their sodium intake goals. Mozzarella cheese is the most highly
consumed cheese in the United States and is a good source of calcium and protein;
however, the 8% DV sodium content in just one stick of mozzarella string cheese makes
it a prime candidate for sodium reduction. Consumer acceptability for low or reduced
sodium cheese products is typically quite low, and thus low sodium cheese products are
not as successful as their full sodium counterpart. Perhaps the current questions sensory
scientists are asking about low sodium cheese including acceptability, hedonics, and
Comparison of Emotion Methods
39
descriptive analysis are not clearly assessing why consumers do not like and/or will not
repurchase low sodium cheese products. Considering the relationship between decision-
making, reward mechanisms, and emotions in the brain, emphasis should be placed on
capitalizing on this relationship to develop a method which dives deeper into the
consumer’s conceptualizations and emotions toward products.
In this thesis, a series of traditional sensory tests were performed to select a
sensory transparent antimicrobial and a consumer acceptable flavor enhancer to develop a
low sodium LMPS mozzarella cheese product. Additionally, a novel emotion testing
method was developed which compared the use of images versus language for eliciting
emotional responses in consumers. For validation of this method, imagery and language
for emotion testing were compared across three product categories with commercially
available products. Finally, the newly developed emotion testing method was
implemented with the low sodium mozzarella cheese prototypes. By measuring consumer
emotions as they related to nutritional alternative food products, such as low sodium
mozzarella cheese, provided additional information beyond liking and acceptability and
thus provided a greater understanding of the consumer’s mindset. Low sodium cheese
products are useless to the consumer if they are not enjoyable to eat; the goal of this
novel emotion testing method is to determine if similar emotional responses typically
experienced with the full sodium product can be manifested in the consumer when
consuming the low sodium cheese product.
40
3.0
Sensory Evaluation of Antimicrobials and Salt Replacers in Low Sodium
Mozzarella Cheese
Abstract
Dietary sodium intake for most Americans is far beyond the recommended
allowance, and many Americans are looking for foods which provide the same taste of
traditional full sodium products but with lower sodium content. Considering the sodium
contribution dairy foods make to the America diet and the amount of sodium in cheese,
this study focused on the development and consumer sensory evaluation of low sodium
LMPS mozzarella cheese. Four antimicrobials were compared through a series of
affective and hedonic consumer tests to determine the most sensory transparent product
with LMPS mozzarella cheese. Upon selection of the most appropriate antimicrobial,
NaCl reduced and substituted mozzarella cheese systems were made using both direct
acidification and bacteria cultured acidification cheeses. Subjects were asked hedonic and
preference ranking questions regarding both styles of the low sodium mozzarella cheese,
and based upon hedonic scores a recommendation for manufacturers was made.
Highlights: > Discrimination and affective testing of four antimicrobials on LMPS
mozzarella cheese. > Hedonic testing with 6 variables for determining the most liked salt
replacer. > Salt replacer hedonic testing performed in direct acidification and bacteria
culture acidification mozzarella cheese.
Keywords: sodium reduction, consumer sensory testing, antimicrobials, salt replacers,
mozzarella cheese
41
3.1. Introduction
Increased dietary sodium consumption is associated with hypertension which is a
leading risk factor for stroke and cardiovascular disease, the two leading causes of death
in the United States (CDC, 2012; USDA, 2005). Ninety percent of Americans are
estimated to consume higher levels of sodium than recommended, with an approximate
consumption rate of 3,300 mg of sodium daily, 1,000 mg more than the U.S. dietary
guideline recommendations (CDC, 2012). High sodium intake is often contributed to the
abundance of NaCl in a variety of typically consumed processed and convenience foods
including: breads, processed meats, pizza, dairy products, soups, and snacks and
restaurant foods (CDC, 2012). Dairy products alone are thought to contribute
approximately 11% of the total sodium in American diets (Demott, 1985). Although
mozzarella cheese does not have the highest sodium content compared to other cheeses, it
does contain approximately 1.40% NaCl (Cruz et al., 2011), resulting in roughly 8% of
the Daily Value (DV) of sodium in one serving. Consequently, individuals looking to
reduce dietary sodium often restrict dairy foods, specifically cheese due to the high
sodium content (Katsiari et al., 1997). The dairy industry is in pursuit of methods to
decrease the sodium content of cheeses which contain higher levels of sodium compared
to other types of dairy products (Reddy& Marth, 1993), and the industry has been
relatively successful in reducing sodium in some cheeses including cheddar (Grummer et
al., 2012) and feta (Katsiari et al., 1997).
Sensory consequences of sodium reduction in mozzarella cheese have not been
well studied; however, the investigation of chemical composition and functional
properties of LMPS mozzarella with partial substitution of NaCl with KCl has been
42
evaluated (Ayyash & Shah, 2011). Ayyash and Shah (2011) determined the use of
1NaCl:1KCl and 1NaCl:3KCl in mozzarella cheese had similar effects on all components
tested including: chemical composition, organic acids profiles, functional properties,
meltability and browning, but sensory testing was not performed. Sensory evaluation of
this traditionally bland cheese is necessary in order to understand the most appropriate
and effective method for reducing the sodium content in mozzarella cheese while still
being acceptable to consumers.
Considering two traditional methods exist for lowering sodium in foods, reducing
NaCl and substitution of NaCl (Cruz et al., 2011), this study will investigate the effect of
reducing sodium in mozzarella cheese alone, and also the partial substitution of NaCl
with three flavor modifiers. The main objectives of this study are to: 1) conduct sensory
tests on four antimicrobials with mozzarella cheese to determine the most sensory
transparent product, 2) perform sensory testing on sodium reduced and substituted
mozzarella products using two types of mozzarella cheese (direct acidification and
bacteria cultured acidification) with consumers to determine the most liked and preferred
product, and 3) provide an antimicrobial and salt replacer formulation recommendation
for manufacturers for lowering sodium content in LMPS mozzarella cheese. It is
hypothesized that a salt substitute rather than sodium reduction alone will be more
preferred by consumers and liking/preference scores for the reduced sodium cheese will
be lower than a traditional full sodium LMPS mozzarella cheese.
43
3.2. Methodology
3.2.1. Materials: Antimicrobials
Four commercially available antimicrobials were tested: Protect-M (Purac
America, lot number: 1010001940), NovaGard CB1 (Danisco, lot number: CB1-032110),
SEA-i F75 (Bienca, lot number:101027), and PuraQ Verdad RV75 (Purac America, lot
number: 0910002224). Full salt and low salt LMPS mozzarella cheese from Saputo
(Saputo Cheese USA Inc., Tulare, CA) was used for the antimicrobial sensory testing.
3.2.2. Methods: Antimicrobials
A series of sensory evaluation tests were completed to determine detectability and
likeability of the different antimicrobials, sensory tests included: triangle, duo-trio, and 9-
point hedonic tests with product category users (Fig. 3.1).
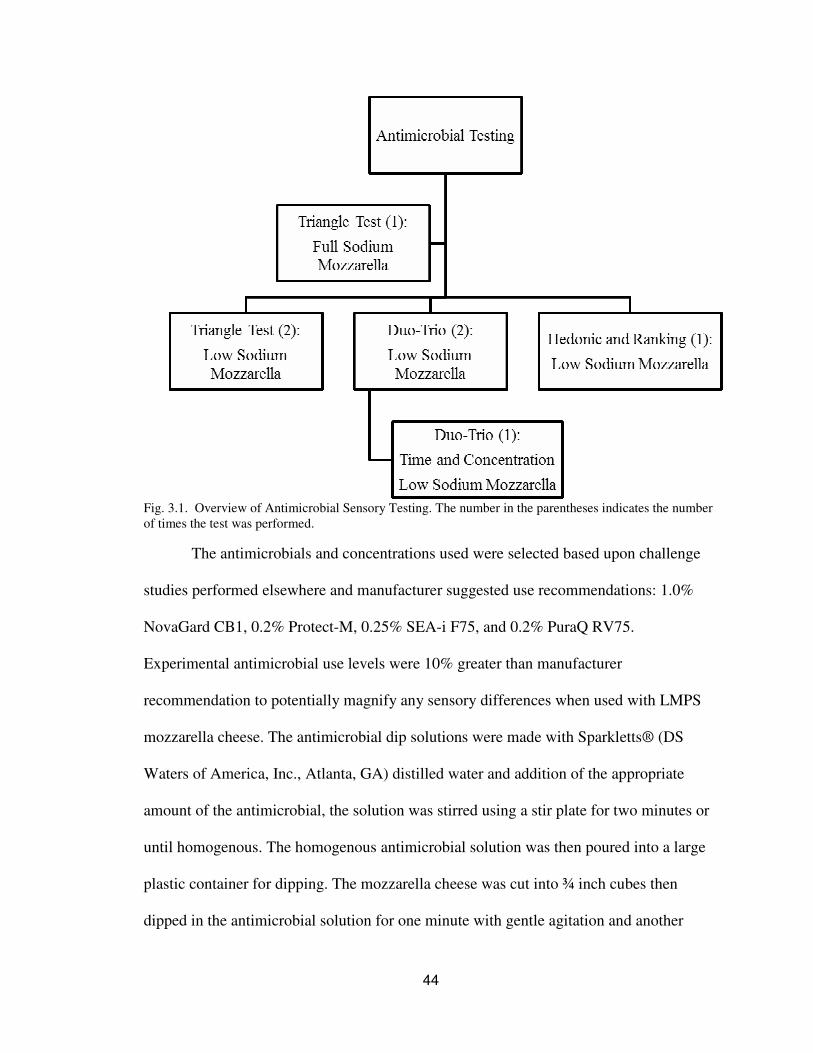
44
Fig. 3.1. Overview of Antimicrobial Sensory Testing. The number in the parentheses indicates the number
of times the test was performed.
The antimicrobials and concentrations used were selected based upon challenge
studies performed elsewhere and manufacturer suggested use recommendations: 1.0%
NovaGard CB1, 0.2% Protect-M, 0.25% SEA-i F75, and 0.2% PuraQ RV75.
Experimental antimicrobial use levels were 10% greater than manufacturer
recommendation to potentially magnify any sensory differences when used with LMPS
mozzarella cheese. The antimicrobial dip solutions were made with Sparkletts® (DS
Waters of America, Inc., Atlanta, GA) distilled water and addition of the appropriate
amount of the antimicrobial, the solution was stirred using a stir plate for two minutes or
until homogenous. The homogenous antimicrobial solution was then poured into a large
plastic container for dipping. The mozzarella cheese was cut into ¾ inch cubes then
dipped in the antimicrobial solution for one minute with gentle agitation and another
45
minute of soaking. The cheese cubes were strained from the solution and allowed to air-
dry at ambient temperature on labeled aluminum foil for 30-45 minutes or until no longer
wet. Once the dipped cubes were dry, they were placed in two ounce clear plastic
SOLO® cups (SOLO® Cup Company, Lake Forest, IL) with randomized 3-digit codes
and cupped. Cheese samples were kept at 37ºF overnight prior to sensory testing and
were kept refrigerated until 30 minutes prior to testing. The control cheese was dipped in
distilled water using the above procedure, the distilled water dipped samples will be
referred to as “non-dipped” samples despite having been dipped in water; all testing
preparations were completed the day prior to the sensory testing.
3.2.2.1. Triangle Test with Full Sodium Mozzarella Cheese
Two separate triangle testing sessions were performed using full sodium (~1.8%)
LMPS mozzarella from Saputo, where each antimicrobial was tested with product
category users defined as consuming mozzarella cheese “once every few months” to
“everyday.” NovaGard CB1 and Protect-M were tested among consumers (n=38) to
determine if there was a detectable difference between cheeses containing an
antimicrobial. Two triangle tests were performed where: 1) the NovaGard CB1 cheeses
were compared to non-dipped cheese, and 2) the Protect-M cheeses were tested with non-
dipped cheese. A ten second delay was programmed into the test protocol between each
sample set to decrease any carryover between samples. The SEA-i F75 and PuraQ RV75
antimicrobial triangle tests were performed two days later with a similar population
(n=30). Each session took approximately five minutes to complete.
46
3.2.2.2. Triangle Test with Low Sodium Mozzarella Cheese
Two sensory testing sessions were performed with all four antimicrobials tested in
each session on low sodium mozzarella cheese provided by Saputo. The mozzarella
cheese product was made for commercial distribution, but had bypassed the brining stage
of manufacturing and thus had lower sodium content (0.86%) than typical Saputo LMPS
mozzarella string cheese (1.6-1.8%). In each session, subjects were randomly assigned
the order of the triangle tests and all four antimicrobial triangle tests were completed at
one session; each triangle test compared antimicrobial containing cheese to control
cheese with a ten second delay between sample sets. The second session (n=17) occurred
two days after the first session (n=24) and was performed as a pseudo-replicate of the
first session to validate results, considering the sample population size was rather small.
Each testing session took less than ten minutes to complete and subjects were product
category users defined as consuming mozzarella string cheese “once every few months”
to “every day.”
3.2.2.3. Duo-Trio Tests with Low Sodium Mozzarella Cheese
Two sessions of duo-trio tests were performed with all four antimicrobials tested
at each session, with each discrimination test comparing the antimicrobial cheese to the
control cheese. All duo-trio tests used as a balance reference design, with the reference
presented on the left for all subjects, and subjects were asked to indicate the sample
which was different from the reference sample. Sample set order was randomized for
each subject, and a mandatory ten second delay was programmed between each sample
set. Subjects for session one (n=30) and two (n=28) included those who consume
47
mozzarella string cheese “once every few months” to “every day.” Session one and two
had the same protocol with similar populations, session two was executed seven days
after session one. Testing took participants less than ten minutes on average to complete.
3.2.2.4. Hedonic Testing with Low Sodium Mozzarella Cheese
Following the testing in 3.2.2.3, hedonic testing was implemented to understand
which, if any, of the antimicrobials was most preferred. The low sodium mozzarella
cheese was used for testing the four antimicrobials and the control (dipped in distilled
water and dried). Subjects (n=22) included those consuming mozzarella string cheese “2-
3 times per week” to “once every few months” were asked the following liking questions
on a 9-point scale for each of the five cheese samples: overall acceptance, aroma, flavor,
and aftertaste. Samples were presented using the William’s design, were samples were
randomized within and across subjects, and samples were presented one at a time with a
ten second delay between each sample. Testing took approximately ten minutes for
subjects to complete.
3.2.2.5. Effect of Time and Concentration of Antimicrobial Dip on Discrimination
In order to understand the effects of the soaking time and the concentration of the
antimicrobial dip on the flavor of the mozzarella cheese, a study was performed using
only the selected antimicrobial (SEA-i F75) at varying times and concentrations in the
antimicrobial bath. The typical procedure, as stated previously, included placing unbrined
cheese cubes in a 0.275% SEA-i F75 solution for 120 seconds prior to removal and air-
drying. For this experiment, a 22 design was created with two factors of time: 30 seconds
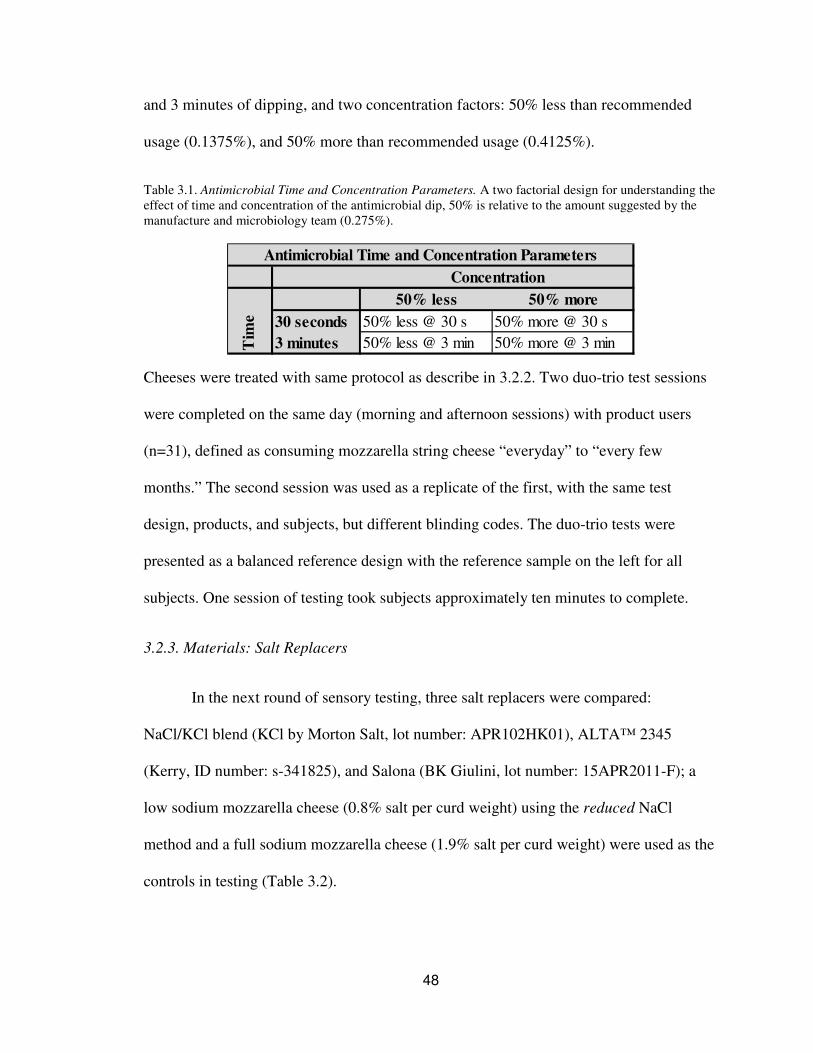
48
and 3 minutes of dipping, and two concentration factors: 50% less than recommended
usage (0.1375%), and 50% more than recommended usage (0.4125%).
Table 3.1. Antimicrobial Time and Concentration Parameters. A two factorial design for understanding the
effect of time and concentration of the antimicrobial dip, 50% is relative to the amount suggested by the
manufacture and microbiology team (0.275%).
50% less 50% more
30 seconds 50% less @ 30 s 50% more @ 30 s
3 minutes 50% less @ 3 min 50% more @ 3 min
Concentration
Tim
eAntimicrobial Time and Concentration Parameters
Cheeses were treated with same protocol as describe in 3.2.2. Two duo-trio test sessions
were completed on the same day (morning and afternoon sessions) with product users
(n=31), defined as consuming mozzarella string cheese “everyday” to “every few
months.” The second session was used as a replicate of the first, with the same test
design, products, and subjects, but different blinding codes. The duo-trio tests were
presented as a balanced reference design with the reference sample on the left for all
subjects. One session of testing took subjects approximately ten minutes to complete.
3.2.3. Materials: Salt Replacers
In the next round of sensory testing, three salt replacers were compared:
NaCl/KCl blend (KCl by Morton Salt, lot number: APR102HK01), ALTA™ 2345
(Kerry, ID number: s-341825), and Salona (BK Giulini, lot number: 15APR2011-F); a
low sodium mozzarella cheese (0.8% salt per curd weight) using the reduced NaCl
method and a full sodium mozzarella cheese (1.9% salt per curd weight) were used as the
controls in testing (Table 3.2).
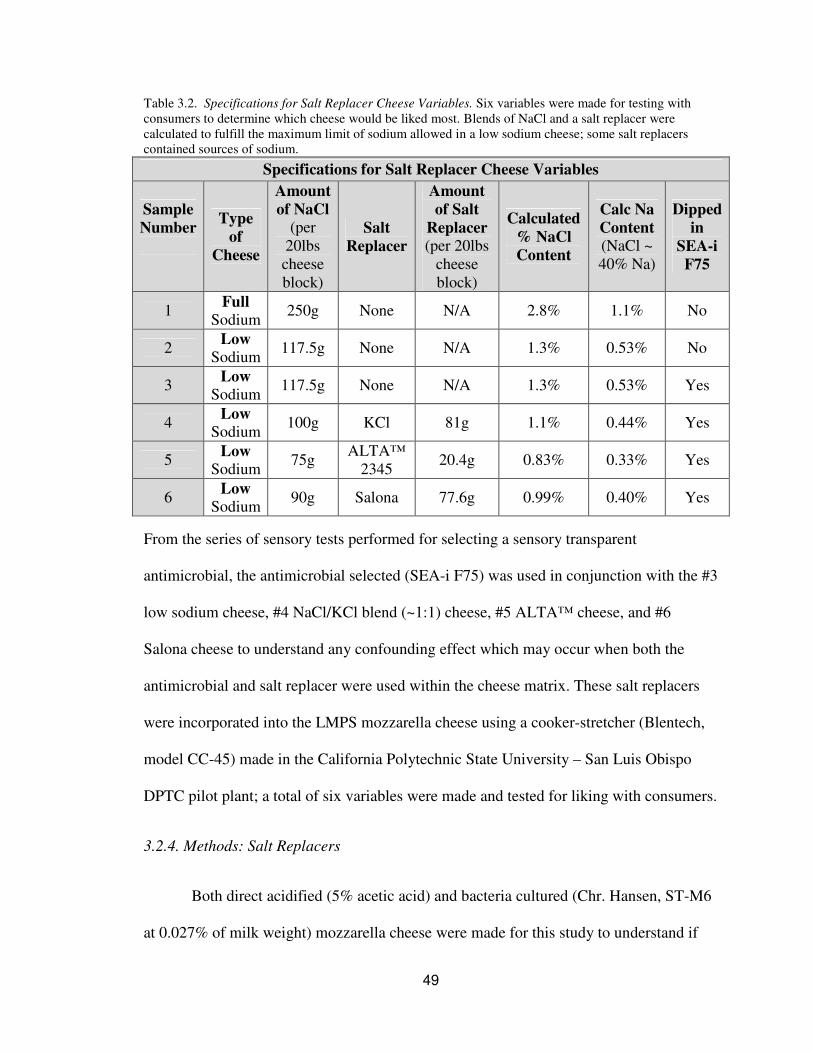
49
Table 3.2. Specifications for Salt Replacer Cheese Variables. Six variables were made for testing with
consumers to determine which cheese would be liked most. Blends of NaCl and a salt replacer were
calculated to fulfill the maximum limit of sodium allowed in a low sodium cheese; some salt replacers
contained sources of sodium.
From the series of sensory tests performed for selecting a sensory transparent
antimicrobial, the antimicrobial selected (SEA-i F75) was used in conjunction with the #3
low sodium cheese, #4 NaCl/KCl blend (~1:1) cheese, #5 ALTA™ cheese, and #6
Salona cheese to understand any confounding effect which may occur when both the
antimicrobial and salt replacer were used within the cheese matrix. These salt replacers
were incorporated into the LMPS mozzarella cheese using a cooker-stretcher (Blentech,
model CC-45) made in the California Polytechnic State University – San Luis Obispo
DPTC pilot plant; a total of six variables were made and tested for liking with consumers.
3.2.4. Methods: Salt Replacers
Both direct acidified (5% acetic acid) and bacteria cultured (Chr. Hansen, ST-M6
at 0.027% of milk weight) mozzarella cheese were made for this study to understand if
Specifications for Salt Replacer Cheese Variables
Sample
Number
Type
of
Cheese
Amount
of NaCl (per
20lbs
cheese
block)
Salt
Replacer
Amount
of Salt
Replacer
(per 20lbs
cheese
block)
Calculated
% NaCl
Content
Calc Na
Content
(NaCl ~
40% Na)
Dipped
in
SEA-i
F75
1 Full
Sodium 250g None N/A 2.8% 1.1% No
2 Low
Sodium 117.5g None N/A 1.3% 0.53% No
3 Low
Sodium 117.5g None N/A 1.3% 0.53% Yes
4 Low
Sodium 100g KCl 81g 1.1% 0.44% Yes
5 Low
Sodium 75g
ALTA™
2345 20.4g 0.83% 0.33% Yes
6 Low
Sodium 90g Salona 77.6g 0.99% 0.40% Yes
50
the type of mozzarella cheese was a factor when asking consumers his/her liking and
ranking scores for each of the salt replacer variables.
3.2.4.1. Hedonic and Ranking in Direct Acidified and Bacteria Cultured Mozzarella
Cheese
Hedonic and ranking tests were performed with 98 subjects, all of whom
consumed cheese at least “once per month” and 91 whom consumed mozzarella string
cheese “everyday” to “every few months.” Subjects were first asked hedonic and ranking
questions in regards to the six variables of salt replacers in the bacteria cultured cheese.
After a mandatory one minute break, the subjects were asked hedonic and ranking
questions in regards to the six salt replacer variables in the direct acidified cheese.
Testing took subjects 20-25 minutes on average to complete.
3.2.5. General Sensory Testing Procedures
All sensory tests were approved by the California Polytechnic State University –
San Luis Obispo Institutional Review Board prior to testing; additionally, all sensory
tests were implemented in white sensory booths with unique lighting and airflow to aid in
sensory testing and participants were provided unsalted crackers, drinking water, and an
expectoration cup to decrease sensory fatigue and carryover between samples. Testing
was performed on Compusense® 5.2 Plus software (Compusense Inc., Guelph, Ontario,
Canada) and subjects received candy or food for participating in the studies.
51
3.3. Data Analysis
Data analysis for all triangle tests, duo-trio tests, hedonic and ranking scores were
analyzed using the Compusense® 5.2 software. Compusense® analyses of the triangle
and duo-trio tests were performed based upon binomial distribution tables in the sensory
literature (i.e. Roessler et al., 1978), the hedonic scores were analyzed using Analysis of
Variance (ANOVA) with Tukey’s HSD at 5% significance for all post hoc comparisons,
and ranking analysis was calculated by the Friedman’s Test using a chi-square
distribution.
3.4. Results
3.4.1. Antimicrobial Sensory Results
The series of antimicrobial sensory testing yielded the results for selecting a
sensory transparent antimicrobial.
3.4.1.1. Triangle Test with Full Sodium Mozzarella Cheese
Consumers were not able to detect a difference (α=0.05) between the NovaGard
CB1 cheese, and non-dipped cheese, Protect-M and non-dipped cheese, SEA-i F75 and
non-dipped cheese, or PuraQ RV75 and non-dipped cheese (Table 3.3). Although
consumers were not able to detect a difference between any of the dipped and non-dipped
cheeses, it appears consumers were correct more often in discriminating between the
Protect-M dipped samples and non-dipped samples compared to the NovaGard CB1
triangle test. Based upon these tests alone, if one antimicrobial had to be selected for
being sensory transparent the NovaGard CB1 would be chosen due to the highest number
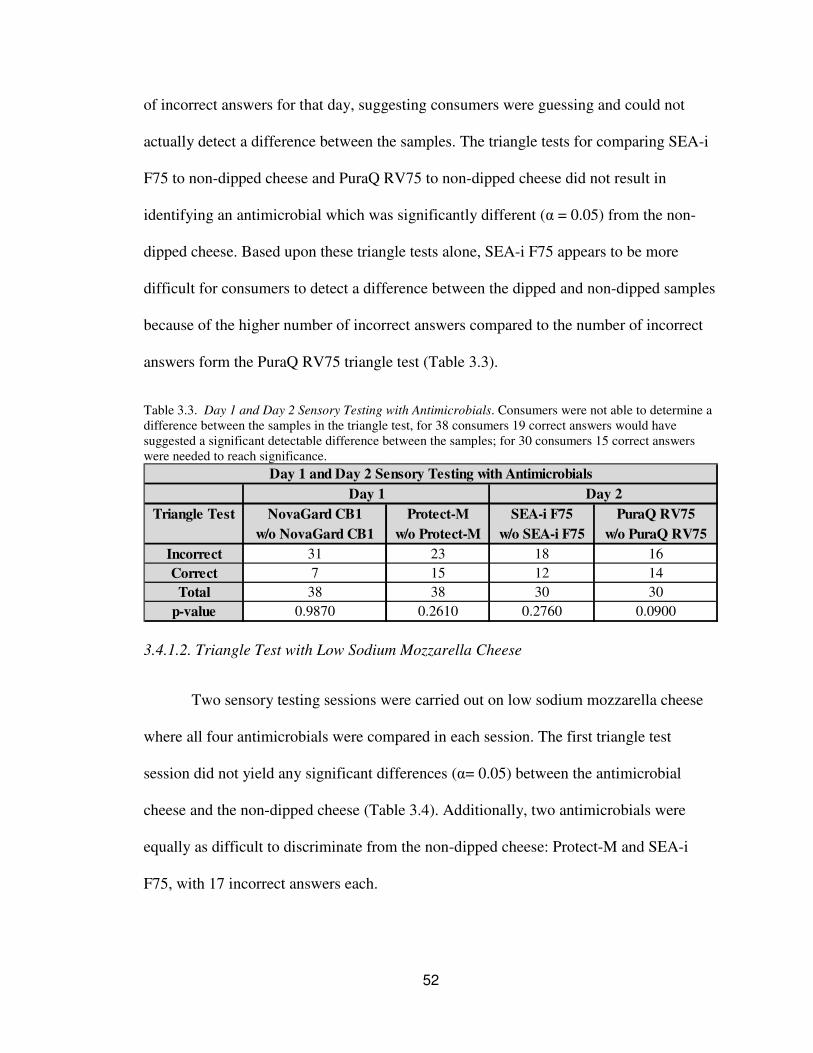
52
of incorrect answers for that day, suggesting consumers were guessing and could not
actually detect a difference between the samples. The triangle tests for comparing SEA-i
F75 to non-dipped cheese and PuraQ RV75 to non-dipped cheese did not result in
identifying an antimicrobial which was significantly different (α = 0.05) from the non-
dipped cheese. Based upon these triangle tests alone, SEA-i F75 appears to be more
difficult for consumers to detect a difference between the dipped and non-dipped samples
because of the higher number of incorrect answers compared to the number of incorrect
answers form the PuraQ RV75 triangle test (Table 3.3).
Table 3.3. Day 1 and Day 2 Sensory Testing with Antimicrobials. Consumers were not able to determine a
difference between the samples in the triangle test, for 38 consumers 19 correct answers would have
suggested a significant detectable difference between the samples; for 30 consumers 15 correct answers
were needed to reach significance.
Triangle Test NovaGard CB1 Protect-M SEA-i F75 PuraQ RV75
w/o NovaGard CB1 w/o Protect-M w/o SEA-i F75 w/o PuraQ RV75
Incorrect 31 23 18 16
Correct 7 15 12 14
Total 38 38 30 30
p-value 0.9870 0.2610 0.2760 0.0900
Day 1 and Day 2 Sensory Testing with Antimicrobials
Day 1 Day 2
3.4.1.2. Triangle Test with Low Sodium Mozzarella Cheese
Two sensory testing sessions were carried out on low sodium mozzarella cheese
where all four antimicrobials were compared in each session. The first triangle test
session did not yield any significant differences (α= 0.05) between the antimicrobial
cheese and the non-dipped cheese (Table 3.4). Additionally, two antimicrobials were
equally as difficult to discriminate from the non-dipped cheese: Protect-M and SEA-i
F75, with 17 incorrect answers each.
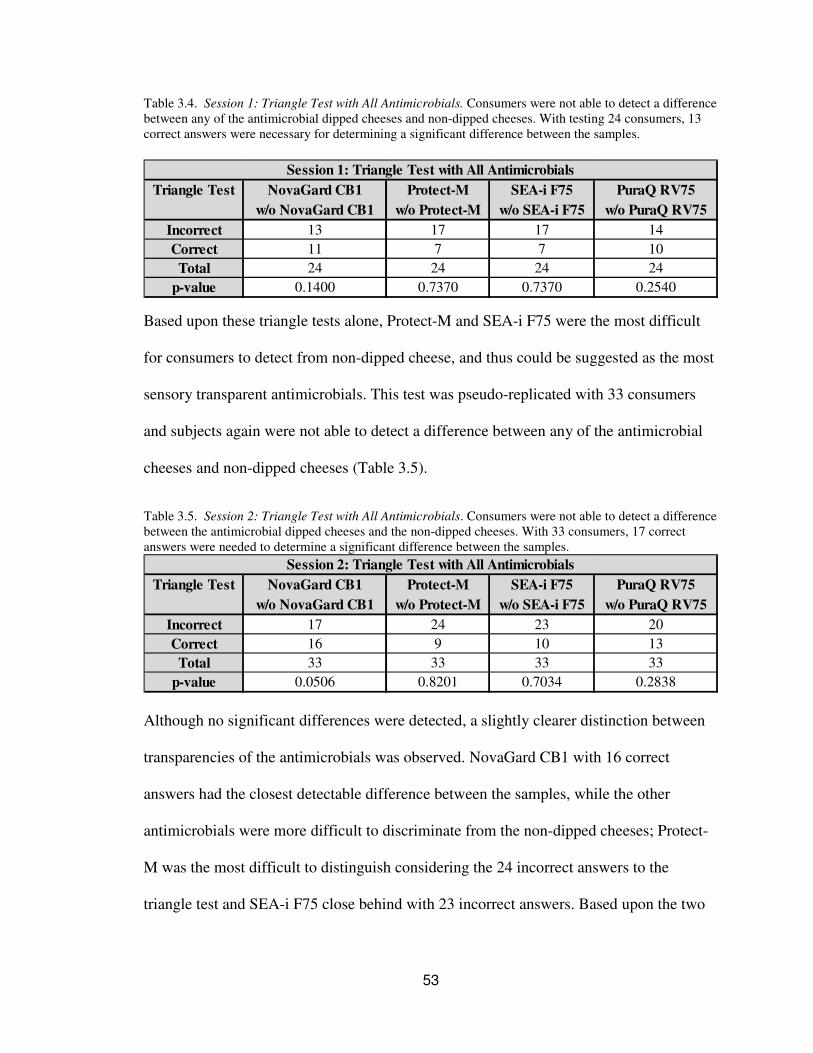
53
Table 3.4. Session 1: Triangle Test with All Antimicrobials. Consumers were not able to detect a difference
between any of the antimicrobial dipped cheeses and non-dipped cheeses. With testing 24 consumers, 13
correct answers were necessary for determining a significant difference between the samples.
Triangle Test NovaGard CB1 Protect-M SEA-i F75 PuraQ RV75
w/o NovaGard CB1 w/o Protect-M w/o SEA-i F75 w/o PuraQ RV75
Incorrect 13 17 17 14
Correct 11 7 7 10
Total 24 24 24 24
p-value 0.1400 0.7370 0.7370 0.2540
Session 1: Triangle Test with All Antimicrobials
Based upon these triangle tests alone, Protect-M and SEA-i F75 were the most difficult
for consumers to detect from non-dipped cheese, and thus could be suggested as the most
sensory transparent antimicrobials. This test was pseudo-replicated with 33 consumers
and subjects again were not able to detect a difference between any of the antimicrobial
cheeses and non-dipped cheeses (Table 3.5).
Table 3.5. Session 2: Triangle Test with All Antimicrobials. Consumers were not able to detect a difference
between the antimicrobial dipped cheeses and the non-dipped cheeses. With 33 consumers, 17 correct
answers were needed to determine a significant difference between the samples.
Triangle Test NovaGard CB1 Protect-M SEA-i F75 PuraQ RV75
w/o NovaGard CB1 w/o Protect-M w/o SEA-i F75 w/o PuraQ RV75
Incorrect 17 24 23 20
Correct 16 9 10 13
Total 33 33 33 33
p-value 0.0506 0.8201 0.7034 0.2838
Session 2: Triangle Test with All Antimicrobials
Although no significant differences were detected, a slightly clearer distinction between
transparencies of the antimicrobials was observed. NovaGard CB1 with 16 correct
answers had the closest detectable difference between the samples, while the other
antimicrobials were more difficult to discriminate from the non-dipped cheeses; Protect-
M was the most difficult to distinguish considering the 24 incorrect answers to the
triangle test and SEA-i F75 close behind with 23 incorrect answers. Based upon the two
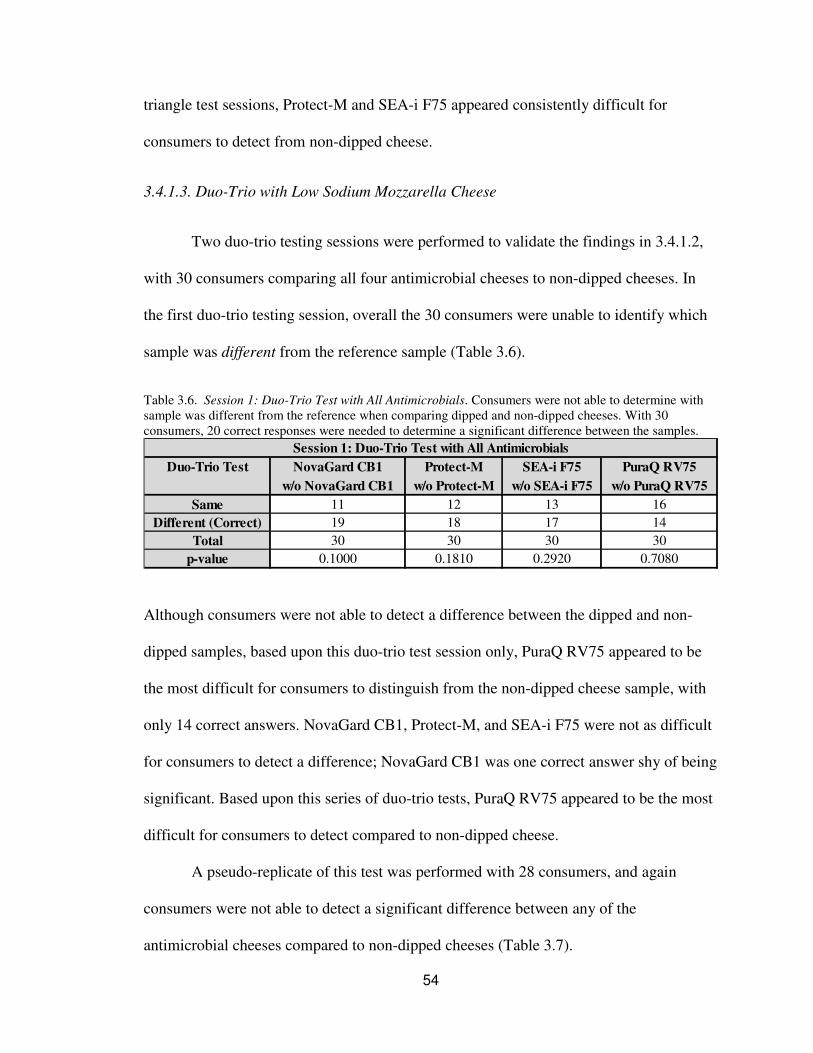
54
triangle test sessions, Protect-M and SEA-i F75 appeared consistently difficult for
consumers to detect from non-dipped cheese.
3.4.1.3. Duo-Trio with Low Sodium Mozzarella Cheese
Two duo-trio testing sessions were performed to validate the findings in 3.4.1.2,
with 30 consumers comparing all four antimicrobial cheeses to non-dipped cheeses. In
the first duo-trio testing session, overall the 30 consumers were unable to identify which
sample was different from the reference sample (Table 3.6).
Table 3.6. Session 1: Duo-Trio Test with All Antimicrobials. Consumers were not able to determine with
sample was different from the reference when comparing dipped and non-dipped cheeses. With 30
consumers, 20 correct responses were needed to determine a significant difference between the samples.
Duo-Trio Test NovaGard CB1 Protect-M SEA-i F75 PuraQ RV75
w/o NovaGard CB1 w/o Protect-M w/o SEA-i F75 w/o PuraQ RV75
Same 11 12 13 16
Different (Correct) 19 18 17 14
Total 30 30 30 30
p-value 0.1000 0.1810 0.2920 0.7080
Session 1: Duo-Trio Test with All Antimicrobials
Although consumers were not able to detect a difference between the dipped and non-
dipped samples, based upon this duo-trio test session only, PuraQ RV75 appeared to be
the most difficult for consumers to distinguish from the non-dipped cheese sample, with
only 14 correct answers. NovaGard CB1, Protect-M, and SEA-i F75 were not as difficult
for consumers to detect a difference; NovaGard CB1 was one correct answer shy of being
significant. Based upon this series of duo-trio tests, PuraQ RV75 appeared to be the most
difficult for consumers to detect compared to non-dipped cheese.
A pseudo-replicate of this test was performed with 28 consumers, and again
consumers were not able to detect a significant difference between any of the
antimicrobial cheeses compared to non-dipped cheeses (Table 3.7).
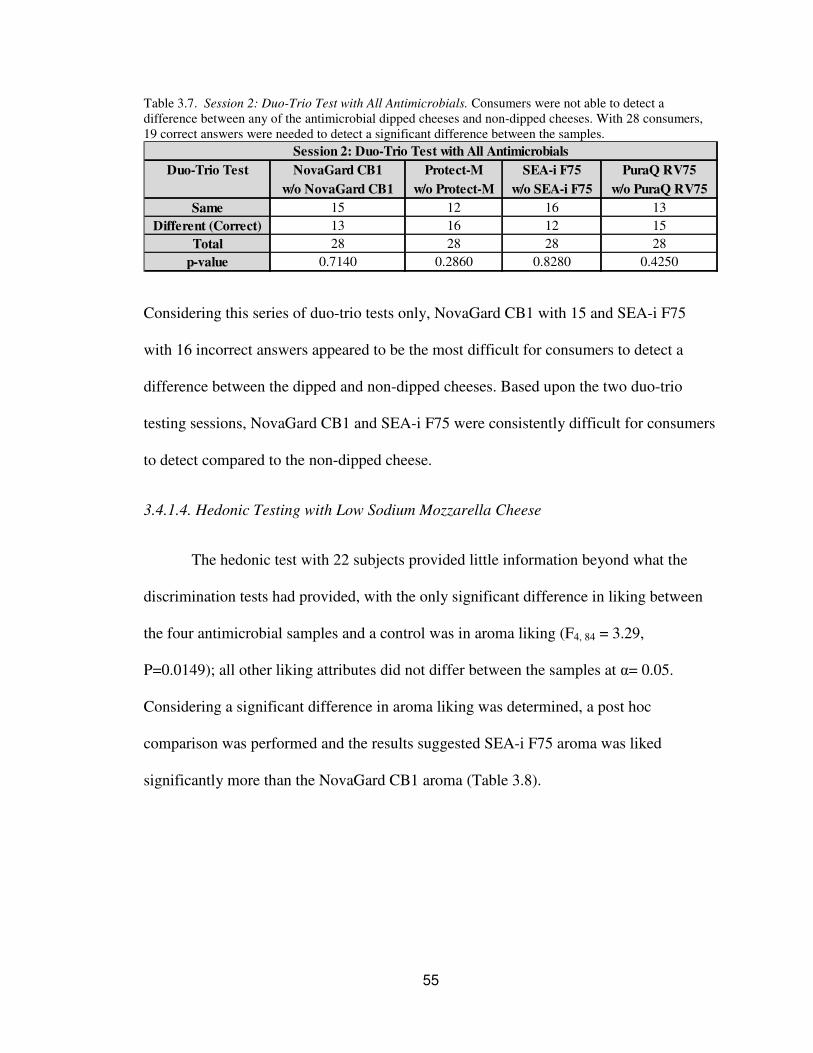
55
Table 3.7. Session 2: Duo-Trio Test with All Antimicrobials. Consumers were not able to detect a
difference between any of the antimicrobial dipped cheeses and non-dipped cheeses. With 28 consumers,
19 correct answers were needed to detect a significant difference between the samples.
Duo-Trio Test NovaGard CB1 Protect-M SEA-i F75 PuraQ RV75
w/o NovaGard CB1 w/o Protect-M w/o SEA-i F75 w/o PuraQ RV75
Same 15 12 16 13
Different (Correct) 13 16 12 15
Total 28 28 28 28
p-value 0.7140 0.2860 0.8280 0.4250
Session 2: Duo-Trio Test with All Antimicrobials
Considering this series of duo-trio tests only, NovaGard CB1 with 15 and SEA-i F75
with 16 incorrect answers appeared to be the most difficult for consumers to detect a
difference between the dipped and non-dipped cheeses. Based upon the two duo-trio
testing sessions, NovaGard CB1 and SEA-i F75 were consistently difficult for consumers
to detect compared to the non-dipped cheese.
3.4.1.4. Hedonic Testing with Low Sodium Mozzarella Cheese
The hedonic test with 22 subjects provided little information beyond what the
discrimination tests had provided, with the only significant difference in liking between
the four antimicrobial samples and a control was in aroma liking (F4, 84 = 3.29,
P=0.0149); all other liking attributes did not differ between the samples at α= 0.05.
Considering a significant difference in aroma liking was determined, a post hoc
comparison was performed and the results suggested SEA-i F75 aroma was liked
significantly more than the NovaGard CB1 aroma (Table 3.8).
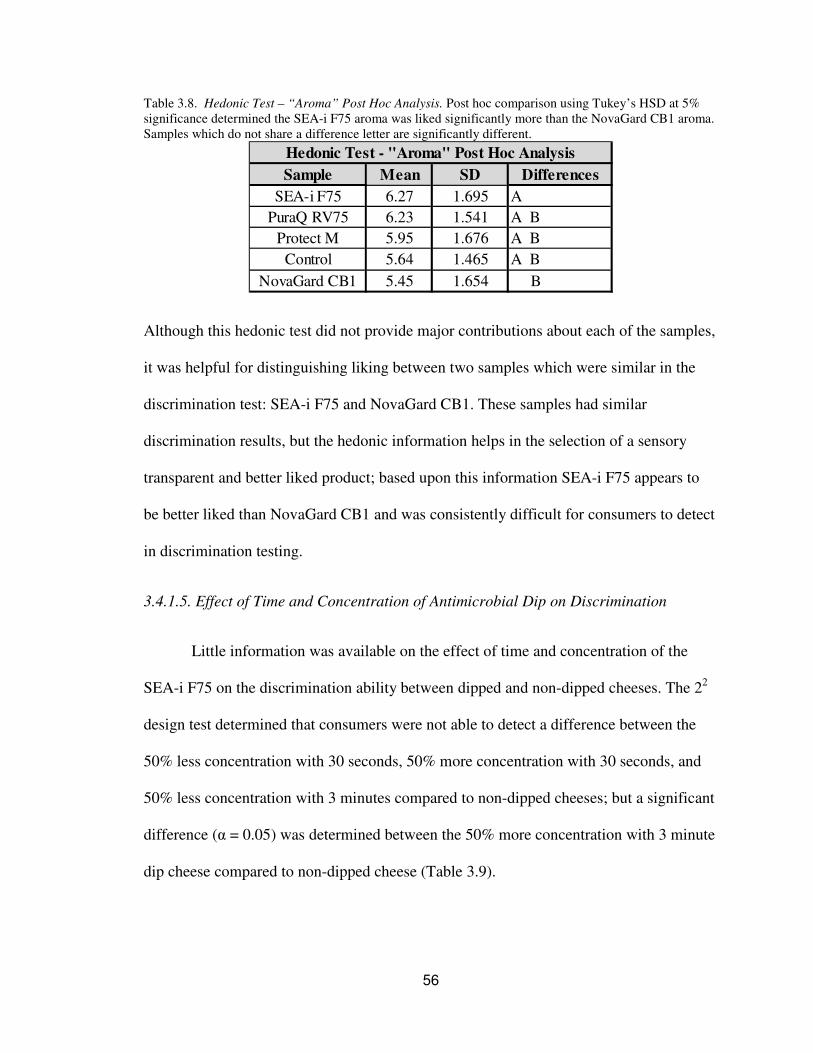
56
Table 3.8. Hedonic Test – “Aroma” Post Hoc Analysis. Post hoc comparison using Tukey’s HSD at 5%
significance determined the SEA-i F75 aroma was liked significantly more than the NovaGard CB1 aroma.
Samples which do not share a difference letter are significantly different.
Sample Mean SD Differences
SEA-i F75 6.27 1.695 A
PuraQ RV75 6.23 1.541 A B
Protect M 5.95 1.676 A B
Control 5.64 1.465 A B
NovaGard CB1 5.45 1.654 B
Hedonic Test - "Aroma" Post Hoc Analysis
Although this hedonic test did not provide major contributions about each of the samples,
it was helpful for distinguishing liking between two samples which were similar in the
discrimination test: SEA-i F75 and NovaGard CB1. These samples had similar
discrimination results, but the hedonic information helps in the selection of a sensory
transparent and better liked product; based upon this information SEA-i F75 appears to
be better liked than NovaGard CB1 and was consistently difficult for consumers to detect
in discrimination testing.
3.4.1.5. Effect of Time and Concentration of Antimicrobial Dip on Discrimination
Little information was available on the effect of time and concentration of the
SEA-i F75 on the discrimination ability between dipped and non-dipped cheeses. The 22
design test determined that consumers were not able to detect a difference between the
50% less concentration with 30 seconds, 50% more concentration with 30 seconds, and
50% less concentration with 3 minutes compared to non-dipped cheeses; but a significant
difference (α = 0.05) was determined between the 50% more concentration with 3 minute
dip cheese compared to non-dipped cheese (Table 3.9).
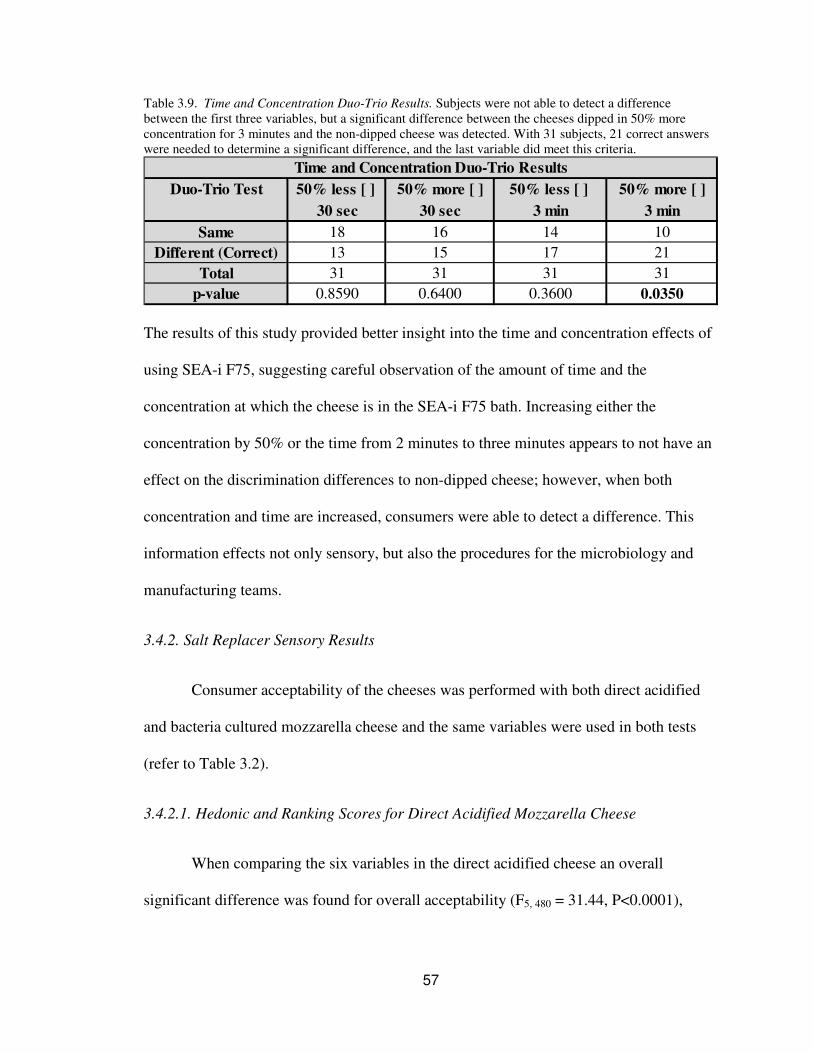
57
Table 3.9. Time and Concentration Duo-Trio Results. Subjects were not able to detect a difference
between the first three variables, but a significant difference between the cheeses dipped in 50% more
concentration for 3 minutes and the non-dipped cheese was detected. With 31 subjects, 21 correct answers
were needed to determine a significant difference, and the last variable did meet this criteria.
Duo-Trio Test 50% less [ ] 50% more [ ] 50% less [ ] 50% more [ ]
30 sec 30 sec 3 min 3 min
Same 18 16 14 10
Different (Correct) 13 15 17 21
Total 31 31 31 31
p-value 0.8590 0.6400 0.3600 0.0350
Time and Concentration Duo-Trio Results
The results of this study provided better insight into the time and concentration effects of
using SEA-i F75, suggesting careful observation of the amount of time and the
concentration at which the cheese is in the SEA-i F75 bath. Increasing either the
concentration by 50% or the time from 2 minutes to three minutes appears to not have an
effect on the discrimination differences to non-dipped cheese; however, when both
concentration and time are increased, consumers were able to detect a difference. This
information effects not only sensory, but also the procedures for the microbiology and
manufacturing teams.
3.4.2. Salt Replacer Sensory Results
Consumer acceptability of the cheeses was performed with both direct acidified
and bacteria cultured mozzarella cheese and the same variables were used in both tests
(refer to Table 3.2).
3.4.2.1. Hedonic and Ranking Scores for Direct Acidified Mozzarella Cheese
When comparing the six variables in the direct acidified cheese an overall
significant difference was found for overall acceptability (F5, 480 = 31.44, P<0.0001),
58
overall flavor (F5, 480 = 28.74, P<0.0001), and saltiness liking (F5, 480 = 31.74, P<0.0001),
Tukey’s HSD at 5% significance was used for post hoc analysis (Table 3.10).
For overall acceptability, the full sodium mozzarella direct acidified cheese was
liked significantly more than the other cheeses, while the NaCl/KCl blend, Salona, and
ALTA™ were not significantly different from one another. The ALTA™ and low
sodium (non-dipped) cheeses were not significantly different from one another, and low
sodium non-dipped cheese was not significantly different from low sodium dipped
mozzarella cheese.
The overall flavor liking scores yielded similar results to the overall acceptability
scores, where the full sodium cheese was liked significantly more than the other
variables, and the low sodium cheeses (dipped and non-dipped) were liked the least. The
NaCl/KCl blend, Salona, ALTA™, and low sodium (non-dipped) cheeses were not
significantly different from each other for overall flavor liking. Lastly, the low sodium
(non-dipped) was not significantly different from the low sodium dipped cheese.
The saltiness liking scores for the direct acidified cheeses were similar to those of
the overall liking, and overall flavor scores with the full sodium cheese having the most
liked saltiness flavor, and the low sodium cheeses having the least liked saltiness flavor.
The NaCl/KCl blend, Salona, and ALTA™ were not significantly different from one
another, while ALTA™ and the low sodium (non-dipped) cheese were not significantly
different, and the low sodium (non-dipped) cheese was not significantly different from
the low sodium (dipped) samples.
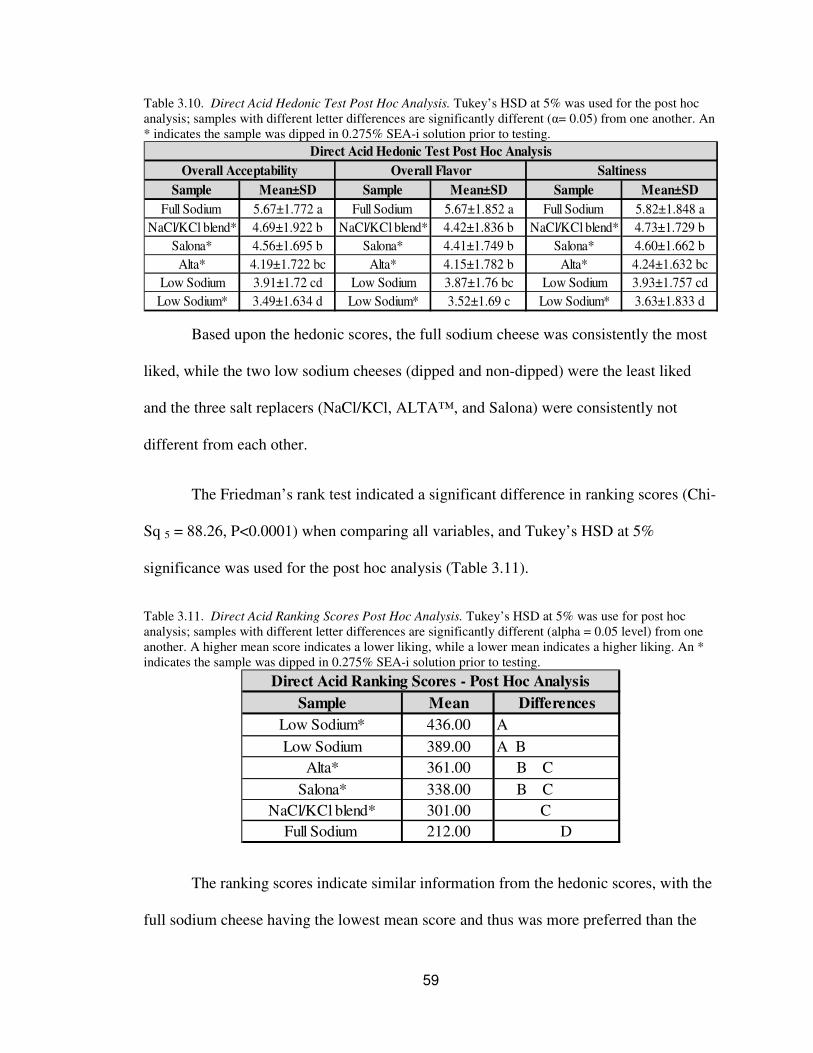
59
Table 3.10. Direct Acid Hedonic Test Post Hoc Analysis. Tukey’s HSD at 5% was used for the post hoc
analysis; samples with different letter differences are significantly different (α= 0.05) from one another. An
* indicates the sample was dipped in 0.275% SEA-i solution prior to testing.
Sample Mean±SD Sample Mean±SD Sample Mean±SD
Full Sodium 5.67±1.772 a Full Sodium 5.67±1.852 a Full Sodium 5.82±1.848 a
NaCl/KCl blend* 4.69±1.922 b NaCl/KCl blend* 4.42±1.836 b NaCl/KCl blend* 4.73±1.729 b
Salona* 4.56±1.695 b Salona* 4.41±1.749 b Salona* 4.60±1.662 b
Alta* 4.19±1.722 bc Alta* 4.15±1.782 b Alta* 4.24±1.632 bc
Low Sodium 3.91±1.72 cd Low Sodium 3.87±1.76 bc Low Sodium 3.93±1.757 cd
Low Sodium* 3.49±1.634 d Low Sodium* 3.52±1.69 c Low Sodium* 3.63±1.833 d
Direct Acid Hedonic Test Post Hoc Analysis
Overall Acceptability Overall Flavor Saltiness
Based upon the hedonic scores, the full sodium cheese was consistently the most
liked, while the two low sodium cheeses (dipped and non-dipped) were the least liked
and the three salt replacers (NaCl/KCl, ALTA™, and Salona) were consistently not
different from each other.
The Friedman’s rank test indicated a significant difference in ranking scores (Chi-
Sq 5 = 88.26, P<0.0001) when comparing all variables, and Tukey’s HSD at 5%
significance was used for the post hoc analysis (Table 3.11).
Table 3.11. Direct Acid Ranking Scores Post Hoc Analysis. Tukey’s HSD at 5% was use for post hoc
analysis; samples with different letter differences are significantly different (alpha = 0.05 level) from one
another. A higher mean score indicates a lower liking, while a lower mean indicates a higher liking. An *
indicates the sample was dipped in 0.275% SEA-i solution prior to testing.
Sample Mean Differences
Low Sodium* 436.00 A
Low Sodium 389.00 A B
Alta* 361.00 B C
Salona* 338.00 B C
NaCl/KCl blend* 301.00 C
Full Sodium 212.00 D
Direct Acid Ranking Scores - Post Hoc Analysis
The ranking scores indicate similar information from the hedonic scores, with the
full sodium cheese having the lowest mean score and thus was more preferred than the
60
other samples, and the low sodium cheeses (dipped and non-dipped) were preferred the
least. The full sodium cheese was preferred significantly more than the other cheeses,
while the NaCl/KCl blend, Salona, and ALTA™ were not significantly different in
ranking scores. The ALTA™ and low sodium (non-dipped) cheese were not significantly
different and the low sodium (non-dipped) cheese was not significantly different from the
low sodium (dipped) cheese.
3.4.2.2. Hedonic and Ranking Scores for Bacteria Cultured Mozzarella Cheese
An overall significant difference was found for overall acceptability (F5, 485 =
41.54, P<0.0001), overall flavor (F5, 485 = 48.81, P<0.0001), and saltiness liking (F5, 485 =
45.72, P<0.0001) when comparing the six variables in the bacteria cultured cheese,
Tukey’s HSD at 5% significance was used for post hoc analysis (Table 3.12).
The overall acceptability liking indicated the full sodium bacteria cultured cheese
was liked significantly more than the other cheeses, while the low sodium (dipped and
non-dipped) cheeses were liked the least. The Salona, ALTA™, and NaCl/KCl blend
were not significantly different from one another.
The overall flavor liking scores were similar to those found in the overall
acceptability test, with the full sodium mozzarella cheese was liked significantly more
than the other cheeses, and the two low sodium cheeses (dipped and non-dipped) were
liked the least. Again, Salona, ALTA™, and NaCl/KCl blend were not significantly
different from one another.
The saltiness liking scores indicated similar information found from the overall
acceptability and overall flavor liking scores, where the full sodium mozzarella cheese
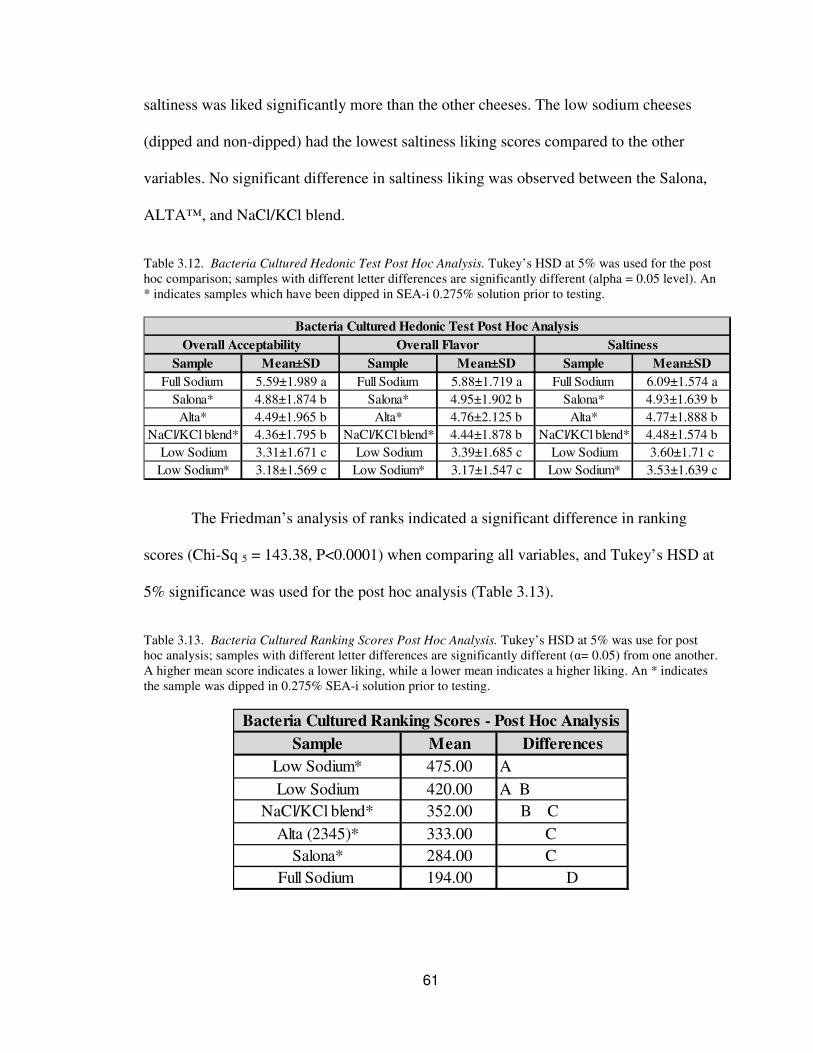
61
saltiness was liked significantly more than the other cheeses. The low sodium cheeses
(dipped and non-dipped) had the lowest saltiness liking scores compared to the other
variables. No significant difference in saltiness liking was observed between the Salona,
ALTA™, and NaCl/KCl blend.
Table 3.12. Bacteria Cultured Hedonic Test Post Hoc Analysis. Tukey’s HSD at 5% was used for the post
hoc comparison; samples with different letter differences are significantly different (alpha = 0.05 level). An
* indicates samples which have been dipped in SEA-i 0.275% solution prior to testing.
Sample Mean±SD Sample Mean±SD Sample Mean±SD
Full Sodium 5.59±1.989 a Full Sodium 5.88±1.719 a Full Sodium 6.09±1.574 a
Salona* 4.88±1.874 b Salona* 4.95±1.902 b Salona* 4.93±1.639 b
Alta* 4.49±1.965 b Alta* 4.76±2.125 b Alta* 4.77±1.888 b
NaCl/KCl blend* 4.36±1.795 b NaCl/KCl blend* 4.44±1.878 b NaCl/KCl blend* 4.48±1.574 b
Low Sodium 3.31±1.671 c Low Sodium 3.39±1.685 c Low Sodium 3.60±1.71 c
Low Sodium* 3.18±1.569 c Low Sodium* 3.17±1.547 c Low Sodium* 3.53±1.639 c
Overall Acceptability Overall Flavor Saltiness
Bacteria Cultured Hedonic Test Post Hoc Analysis
The Friedman’s analysis of ranks indicated a significant difference in ranking
scores (Chi-Sq 5 = 143.38, P<0.0001) when comparing all variables, and Tukey’s HSD at
5% significance was used for the post hoc analysis (Table 3.13).
Table 3.13. Bacteria Cultured Ranking Scores Post Hoc Analysis. Tukey’s HSD at 5% was use for post
hoc analysis; samples with different letter differences are significantly different (α= 0.05) from one another.
A higher mean score indicates a lower liking, while a lower mean indicates a higher liking. An * indicates
the sample was dipped in 0.275% SEA-i solution prior to testing.
Sample Mean Differences
Low Sodium* 475.00 A
Low Sodium 420.00 A B
NaCl/KCl blend* 352.00 B C
Alta (2345)* 333.00 C
Salona* 284.00 C
Full Sodium 194.00 D
Bacteria Cultured Ranking Scores - Post Hoc Analysis
62
The ranking scores among the six variables of bacteria cultured cheese yielded
similar results to those found in the hedonic testing. The full sodium cheese had the
lowest mean ranking score and thus was preferred more than the other cheeses, while the
low sodium (dipped and non-dipped) cheeses were preferred the least. The Salona,
ALTA™, and NaCl/KCl blend were not significantly different in preference; additionally
the NaCl/KCl blend was not significantly different from the low sodium (non-dipped)
cheese. The non-dipped low sodium cheese was not significantly different from the
dipped low sodium cheese for ranking preference.
When comparing the six variables the full sodium cheese was consistently liked
and preferred the most, the NaCl/KCl blend, Salona, and ALTA™ were consistently not
significantly different from one another in liking and preference, and the low sodium
(dipped and non-dipped) cheeses were typically not significantly different from each
other and were liked and preferred the least.
3.5. Discussion
Decreasing sodium in cheese is a major challenge, reducing the sodium in
mozzarella cheese is especially difficult due to the naturally bland flavor of mozzarella. A
series of affective and discrimination sensory tests were employed to understand the
effect of reducing sodium in mozzarella cheese. Due to the complex role sodium plays in
cheese, the sensory testing was implemented in two phases: 1) antimicrobial testing, and
2) salt replacer testing, to understand these effects separately.
63
3.5.1. Antimicrobial Sensory Testing
One of sodium’s major roles in cheese is inhibition of microbial growth through
decreasing water activity (Guinee, 2004); with decreasing sodium levels in cheese an
additional antimicrobial needs to be incorporated into the modified cheese matrix to
maintain quality. The first triangle tests were performed on mozzarella cheese with
typical sodium levels (1.8%) while only testing two antimicrobials at each session. These
tests provided a preliminary understanding of how the antimicrobials were perceived by
the consumers; however, they did not provide a clear understanding of how the
antimicrobials were perceived during the same session by the same consumers. After
testing, the commercial/typically consumed sodium level in the test cheeses were
hypothesized to perhaps be interfering with the flavors of the antimicrobials, by
potentially masking off-flavors. Despite the initial tests having limitations, antimicrobials
in full and low sodium cheese are still useful and of importance; the data suggested
further investigation of NovaGard CB1 considering consumer difficulty of detecting this
antimicrobial when compared to the non-dipped cheeses (Table 3.3).
The subsequent triangle tests were performed on lower sodium mozzarella cheese
(0.86%) which was thought to simplify the flavor of the cheese and antimicrobial, and
would provide a clearer understanding of the consumer acceptability of these
antimicrobials with lower sodium mozzarella cheese. These triangle tests required
consumers to discriminate between all of the antimicrobial dipped cheeses compared to
non-dipped cheeses in each session; thus, providing additional information on how the
antimicrobials compared in terms of sensory transparency. Although no significant
differences were observed between the antimicrobials, the results suggested further
64
investigation of Protect-M and SEA-i F75 due to the number of incorrect answers when
attempting to discriminate between dipped and non-dipped cheeses (Tables 3.4 and 3.5).
These two triangles tests provided further insight into the use of these antimicrobials on
lower sodium cheeses and with consumers of mozzarella cheese. Consumers are thought
to be more effective at discriminating between product differences compared to non-
product consumers (Stone et al., 2012); despite the relatively low sample numbers (n=24
and 33) the data is thought to be more accurate when using mozzarella consumers.
Additional investigation of Protect-M and SEA-i F75 was clearer from the results of
these triangle tests.
Considering the debate between whether triangle tests or duo-trio tests are more
effective at determining differences between products (Meilgaard et al., 2007; Stone et
al., 2012) two duo-trio tests were performed to test the four antimicrobials in the same
session compared to non-dipped cheese with consumers and compared these findings to
those of the previous triangle tests. The results from the duo-trio tests differed slightly
from those of the triangle tests, with consumers having greater difficulty identifying the
sample which was different from the reference in the PuraQ and SEA-i F75 samples
(Table 3.6). In the second duo-trio test, consumers had greater difficulty identify the
different sample for the SEA-i F75 and NovaGard CB1 samples, although there were no
significant differences in either the first or second duo-trio test sessions (Table 3.7).
Whether the duo-trio test was more or less powerful is still unclear, but it did provide an
additional review of the samples and the SEA-i F75 antimicrobial solution was the most
consistently difficult sample for consumers to detect from the non-dipped cheeses
compared to the other antimicrobials. However, increasing the number of subjects would
65
increase power, and the potential to see differences between samples, but due to the
consumer’s consistent inability to detect SEA-i F75 dipped cheeses compared to non-
dipped cheeses, it was recommended at the tested concentration of 0.275% for further
sensory testing with the salt replacers.
After discrimination testing was completed, a hedonic test was performed to
ensure one antimicrobial was not liked significantly more than the others. The only
significant difference found between the four antimicrobials and a control was in aroma
liking, where the aroma of SEA-i F75 was liked significantly more than the aroma of
NovaGard CB1 (Table 3.8). These findings were useful for validation of selecting SEA-i
F75 as the antimicrobial to be tested with the salt replacers. Considering these
antimicrobials are thought to be relatively sensory transparent, it is slightly surprising one
would be liked more than another; however, one theory for explaining this could be SEA-
i F75 was the most liked because it had suggested through the series of discrimination
tests to be transparent while the other antimicrobials did not yield the same results.
Considering SEA-i F75’s transparency, perhaps SEA-i F75 has no aroma was liked more
than the potentially foul aromas of the other samples or possibly had a pleasant aroma
and thus liked more than the others. Regardless, the hedonic test further validated the use
of SEA-i F75 in sensory tests with salt replacers.
The time and concentration test was developed to better understand what effects
modifying dip time and solution concentration of the SEA-i F75 antimicrobial would
have on difference detection between a dipped and non-dipped cheese. The results of the
time and concentration sensory test indicated either increasing the time in solution from 2
to 3 minutes or increasing the solution concentration by fifty percent could not be
66
detected by the consumers; however, when both the solution dip time and concentration
were increased, the consumers were able to detect a difference between those dipped
cheeses and the non-dipped cheeses (Table 3.9). Increasing either dip time or solution
concentration had no apparent effect on the discrimination between the dipped and non-
dipped cheeses; this information is useful for recommended use and processing
specifications when manufacturing a low sodium mozzarella cheese.
3.5.2. Salt Replacer Sensory Testing
Both direct acidification and bacteria cultured acidification methods are used by
industry manufacturers when making mozzarella cheese. Both methods were tested with
the SEA-i F75 antimicrobial and salt replacers to make a recommendation for a given
manufacturer (using direct or bacteria acidification) for low sodium mozzarella cheese.
Considering a salt replacer is expected to elicit flavor in a low sodium mozzarella cheese,
there was no need to perform discrimination testing with the salt replacer variables
because there would be obvious and expected differences between a cheese containing
salt replacers and a cheese without salt replacers. The main objective of the salt replacers
sensory testing was simply to determine which of the salt replacers was the most liked by
subjects. Considering the test was an affective test the use of consumers alone was not
necessary, both consumers and non-users of mozzarella cheese were used in this testing.
The results of both the direct acidification cheese and the bacteria cultured
acidification cheeses had significantly different liking scores across the salt replacer
variables. In both types of cheeses, the full sodium cheese was liked and preferred the
most while the low sodium cheeses (dipped and non-dipped) were consistently liked and
67
preferred the least; both of these results were expected. Note, the highest hedonic scores
of the full sodium cheese were just above 5.0 which is considered “neither like nor
dislike” on the hedonic scale, all other samples ranked below 5.0, and thus considered
“disliked” samples. The cheese used for the hedonic sensory testing was produced five
days prior to sensory testing, this “new” cheese did not have time to rest and equilibrate
with the salt replacers before testing, which could be one explanation for why the hedonic
scores were lower than expected. In both cheese types, the NaCl/KCl blend, Salona, and
ALTA™, typically were not significantly different from one another in liking or
preference ranking scores; however, in the direct acidified cheese the NaCl/KCl blend
was liked (non-significantly) more than the Salona and ALTA™ cheeses, while in the
bacteria cultured cheese the Salona was liked (non-significantly) more than the ALTA™
and NaCl/KCl blend. Due to the apparent similarities between the NaCl/KCl blend,
Salona, and ALTA™ salt replacers in mozzarella cheese, the most appropriate salt
replacer appears to be relative. If a manufacturer produces mozzarella cheese made with
bacteria cultures, perhaps the best replacer is Salona, while if the cheese is made by direct
acidification perhaps the manufacturer should use the NaCl/KCl blend.
There were no significant differences found between the three salt replacers in
either type of cheese, therefore statistically speaking the three replacers are
interchangeable. However, if one salt replacer was far more inexpensive (i.e. NaCl/KCl
blend) than the other options, perhaps the cheaper product should be considered first.
Additionally, more literature and information is available regarding the use of a
NaCl/KCl blend in cheeses (El-Bakry et al., 2011; Cruz et al., 2011; Guinee, 2004;
Grummer et al., 2012; Katsaiari et al., 1997; Ayyash & Shah, 2010) compared to other
68
salt replacers, especially Salona and ALTA™. From a health perspective, increased
consumption of potassium can elicit a positive health effect on those with sodium-
induced hypertension (Katsiari et al., 1997), manufacturers can use the information
available in the literature to their advantage by working with NaCl/KCl to find the blend
ratio which works best in their specific cheese matrix. The NaCl/KCl blend used for this
study was approximately a 1:1 ratio, other studies have found a 1:1 ratio to be an
effective replacement in cheese (Cruz et al., 2011; Katsiari, 1997) while others suggest a
slightly lower ratio may decrease bitterness (Grummer et al., 2012).
Based upon these series of sensory tests NaCl/KCl blend, Salona, or ALTA™
would be appropriate salt replacers to use in a low sodium mozzarella cheese and dipped
in a 0.275% solution of SEA-i F75 for two minutes; however, the NaCl/KCl blend
appears to have slightly more benefits. Although this study provided a series of liking and
discrimination testing, valuable information could be obtained from broader consumer
testing or descriptive analysis of the different cheeses to determine drivers of liking, and
degree of difference from a control or full sodium mozzarella cheese sample.
3.6. Conclusion
Sodium reduction has been a major challenge for a variety of food manufacturers,
and especially difficult for mozzarella cheese manufacturers due to the naturally bland
flavor of mozzarella. Reducing sodium content in a variety of cheeses has been studied,
but little information is available regarding the effect of lowering sodium in LMPS
mozzarella cheese. This study performed a series of affective and discrimination sensory
tests to identify an effective and sensory transparent antimicrobial. After selecting an
69
appropriate antimicrobial (SEA-i F75), hedonic testing was implemented to determine
which of three specific salt replacers was liked best by subjects in mozzarella cheese
dipped in the selected antimicrobial. Although the three salt replacers were not
significantly different for hedonic or ranking scores, certain salt replacers may be
advantageous in certain types of mozzarella cheese or in certain circumstances.
Additional sensory testing, including larger consumer tests and descriptive analysis,
should be performed with the flavor enhancers to better understand key differences
between the samples, and eventually aid in selection of the best salt replacer for a given
cheese or manufacturer. These preliminary sensory studies provide new insight into
options for reducing sodium in mozzarella cheese.
70
4.0
Development of a Novel Method for Evaluating Emotions and Texture:
Imagery versus Language
Abstract
Could images be the next step to understanding consumers’ attitudes toward
texture and emotion? Little work has been conducted to evaluate the relationship between
texture and its emotional response with consumers. The objectives of this study were: 1)
to investigate the use of two texture assessment methods across three different food
categories and 25 specific texture attributes, 2) evaluate the effectiveness of three
emotion methods, 3) to measure change in emotional responses throughout the
consumption experience, and 4) assess both the changes in emotion and texture attributes.
Subjects were randomly selected to use one of two emotion image methods or an
emotion words method and either the texture image cards or texture words only.
Consumer selected emotion images were less variable than emotion words in a positive
emotion. Differences between the two texture methods occurred among samples tested on
the first day of testing, but not for those tested on the second and third day. Identifying
the variability between the emotions allows researchers to more consistently link emotion
and texture methodology to the consumer’s change in emotion and perceived textural
changes perceived over the consumption experience.
71
Highlights: >Novel methods for evaluating emotions and texture were developed and
tested. >Higher variability in a positive emotion was found in the words only emotion
testing method. >Greater variability in a negative emotion was found in the My Pictures
emotion testing method. >Differences in change in texture attributes between texture
testing methods. >Careful selections of images for the texture cards should be
implemented to increase consistency amongst subjects.
Keywords: texture, emotion, alternative methodology, imagery, consumer perception,
IMET
72
4.1. Introduction
Textural characteristics, in addition to appearance and flavor comprise the
primary sensory elements which determine food acceptability by consumers (Bourne,
1978) and the importance of texture analysis as it relates to sensory assessments has been
well documented (Civille & Liska, 1974; Brandt et al., 1962; Pons & Fiszman, 1996;
Breene, 1975). A variety of different texture methods developed to correlate instrumental
texture measurements to sensory texture assessments exist, including: Texture profile
analysis (TPA), temporal dominance of sensation (TDS), jaw-muscle EMGs, and
dynamic mechanical analysis (DMA) to name a few (Bourne, 1978; Foegeding et al.,
2011; Anker et al., 1999). Many studies to date have used the TPA method for texture
analysis (Ares et al., 2006; Breene, 1975; El-Bakry et al., 2011; Pons & Fiszman, 1996)
with the key advantage of TPA being the suggested correlation between the instrument
texture measurements and sensory texture assessments (Bourne, 1978; Pons & Fiszman,
1996). Despite this advantage, other texture methods take into account the physiological
and psychophysical elements of texture in addition to the mechanical and physical
aspects present in TPA (Foegeding et al., 2011), thus providing texture assessments
which are closer to consumer perceptions of food textures. The aim of consumer texture
perception methods provides the opportunity to develop alternative methods of texture
analysis measurements.
Traditionally, texture measurements are correlated with descriptive sensory
texture assessments; however, they do not necessarily correlate with the consumer’s
textural perception of the product (Foegeding et al., 2011; Moskowitz, 1987). Consumers
are typically not asked to perform highly specific texture attribute questions because they
73
are not trained in how to characterize these textures (Moskowitz, 1987). Yet, if the
consumers were given images which depicted these specific texture attributes perhaps
two key outcomes could be obtained: 1) additional textural attributes could be assessed
above what is currently available through TPA (fracturability, hardness, cohesiveness,
adhesiveness, springiness, gumminess, and chewiness) and other methods (Pons &
Fiszman, 1996; Bourne, 1978) and 2) capture specific textural characteristics of food
products as perceived directly from the consumers themselves. Texture is a multimodal
characteristic of food (Foegeding et al., 2011) and several successful approaches have
been developed to obtain texture attributes; however, none of the current texture methods
utilize texture images and consumer perceptions to help understand texture
characteristics.
In addition to consumer perception of texture characteristics, perhaps the
development of alternative texture methods may go beyond texture liking and rating.
Rolls and Grabenhorst (2008) suggests emotions and oral texture are both processed in
the orbitofrontal cortex (OFC) of the brain and perhaps combining emotion and texture
methods may yield novel information about both fields. Emotion testing with flavor and
aroma has been well studied (Seo et al., 2009; Macht, 1999; Thomson & Crocker, 2011;
Croy et al., 2011; Desmet & Schifferstein, 2008; Macht, 2008; King & Meiselman, 2010;
King et al., 2010), but little investigation has been done on the potential relationship
between texture and emotion in the context of eating.
One caveat of measuring emotion is the non-cognitive nature of emotions which
can be difficult to measure and quantify. Additionally, one criticism of current emotion
testing is the potential for variability from person to person, again an intrinsic
74
characteristic of emotions (Schifferstein & Desmet, 2010). Thomson et al. (2010)
mentions the difficulty of using words in emotion testing due to the issues of scaling and
the rational thought processes that occur with words and scaling. Emotions and picture
images are thought to be more effectively processed in the brain’s right cerebral
hemisphere, while language and logic are thought to be better processed in the left
hemisphere (Freberg, 2009), although this is an over simplification (Sander, 2012);
however, exploration of this idea could shed light on opportunities for alternative
emotion testing methods. Furthermore, Croy et al. (2011) investigated the use of
alternative emotion evoking stimuli through visual and olfactory stimuli versus no stimuli
and found visual stimuli was better at evoking negative emotions than olfactory stimuli;
overall, either stimulus was better than no stimulus at evoking emotion. The opportunity
to develop an alternative emotion and texture measurement method exists considering the
difficulties in understanding consumer acceptance of specific texture attributes and the
inherit difficulties of measuring emotions with consumers. Given the apparent
relationship between emotion and texture (Rolls & Grabenhorst, 2008) as well as emotion
and imagery (Freberg, 2009), perhaps the use of images for eliciting emotions and to
visually explain texture attributes could be provided to consumers to obtain novel
information about both emotions and texture as perceived by consumers.
Additionally, the relationship between gender and emotion will be explored
considering general social convention suggests that women are “more emotional” than
men (Gard & Kring, 2007) and extensive data indicates women may actually be more
emotionally expressive than men (Brody, 1997). Other studies have found significant
differences in emotional expressions or responses between males and females (Gard &
75
Kring, 2007; Kring & Gordon, 1998; Macht, 1999; Seo et al., 2009). Studies comparing
the relationship between emotion and gender/sex differences in the context of food are
often conducted only with abnormal eating behaviors (Costanzo et al., 1999; Macht et al.,
2003). Previous studies suggest an underlying difference in regard to emotions between
males and females (King et al., 2010; Kring & Gordon, 1998; Seo et al., 2009; Macht,
1999; Costanzo et al., 1999); this study anticipates finding a significant difference
between sexes. Additionally, Kring and Gordon (1998) suggest the frequency or intensity
of positive and negative emotional experiences are manifested more in women; similar
findings are anticipated for this emotional comparison between men and women.
The use of emotion images is thought to be more effective at capturing
consumer’s emotional responses to food products rather than words alone by decreasing
movement between the two cerebral hemispheres. The use of personal emotion evoking
images and predefined emotion images will be investigated to understand variability in
emotions. The effectiveness of these methods were tested by comparing emotional
responses across three food product categories and in two geographic locations. This
study used three different emotion testing methods (two image related, and one word) to
determine: 1) whether the testing methods yield significantly different emotion results
and, 2) which methods provide the most consistent (least variable) results. An image
related emotion testing method was hypothesized to have significantly different changes
in emotion and less variability than the words only method. Additionally, changes in
emotion were compared between males and females to observe any differences between
genders. To investigate the effectiveness of images for texture attribute testing, two
texture methods were used: 1) texture words, and 2) texture images. The texture images
76
were provided by the investigators for testing and will contain 25 unique texture
attributes. The objectives for understanding texture the effectiveness of the texture
methods among consumers were to: 1) provide consumers with texture images cards to
identify specific texture attributes of three food categories, 2) capture changes in specific
texture attributes across the eating experience, and 3) observe potential relationships
between the texture method used and the changes in texture attributes and emotions
across the eating experience. It was hypothesized that through the use of texture images,
smaller changes (decreased variability) in texture attribute responses would occur among
consumers.
4.2. Methodology
Emotion testing was conducted across three days in two geographical locations
(California Polytechnic State University – San Luis Obispo, and The Ohio State
University). The four commercial carbonated orange soda products (Table 4.1) were
tested on day one (n= 217). The six commercial dairy beverages (Table 4.2) were tested
on day two (n=219), and seven samples of commercial convenience cheese samples
(Table 4.3) were tested on day three (n=216). This protocol was approved by the
California Polytechnic State University and The Ohio State University Institutional
Review Board prior to testing.
4.2.1. Subjects
Subjects were recruited by university and public advertisements and email;
subjects were selected based upon being consumers of the test products (consumed
“everyday” to “about once a month”) and non-users of Crest-Pro health products. Prior to
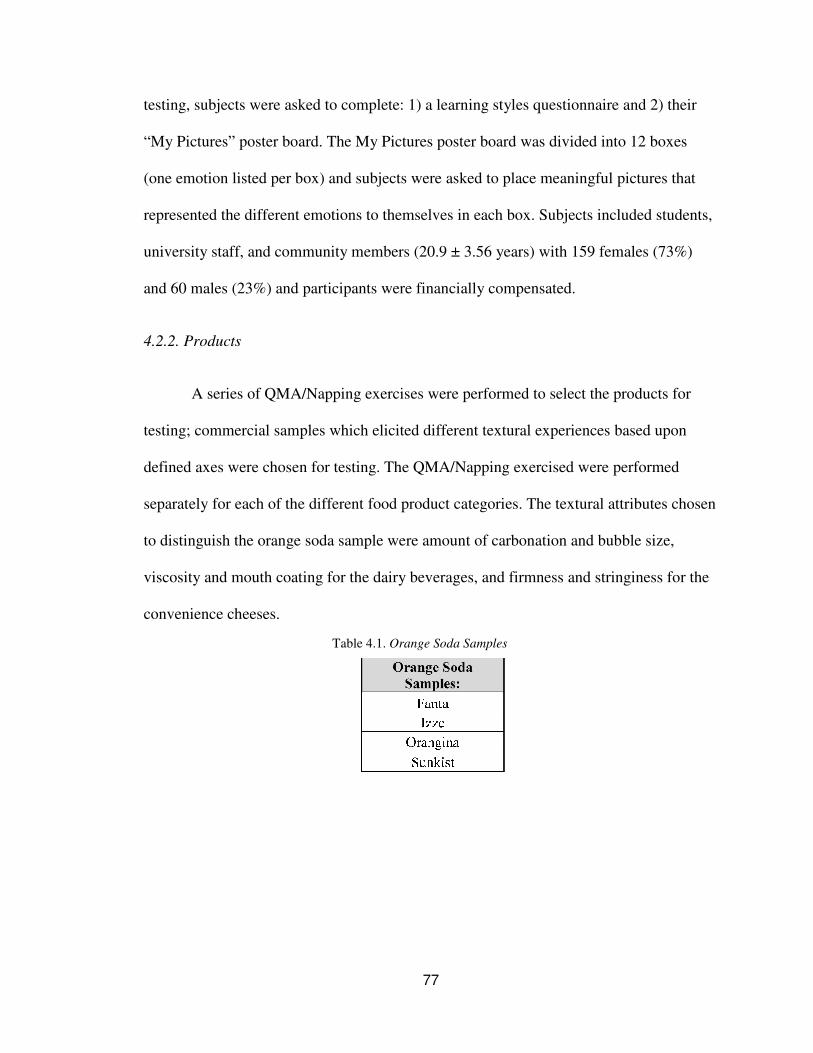
77
testing, subjects were asked to complete: 1) a learning styles questionnaire and 2) their
“My Pictures” poster board. The My Pictures poster board was divided into 12 boxes
(one emotion listed per box) and subjects were asked to place meaningful pictures that
represented the different emotions to themselves in each box. Subjects included students,
university staff, and community members (20.9 ± 3.56 years) with 159 females (73%)
and 60 males (23%) and participants were financially compensated.
4.2.2. Products
A series of QMA/Napping exercises were performed to select the products for
testing; commercial samples which elicited different textural experiences based upon
defined axes were chosen for testing. The QMA/Napping exercised were performed
separately for each of the different food product categories. The textural attributes chosen
to distinguish the orange soda sample were amount of carbonation and bubble size,
viscosity and mouth coating for the dairy beverages, and firmness and stringiness for the
convenience cheeses.
Table 4.1. Orange Soda Samples
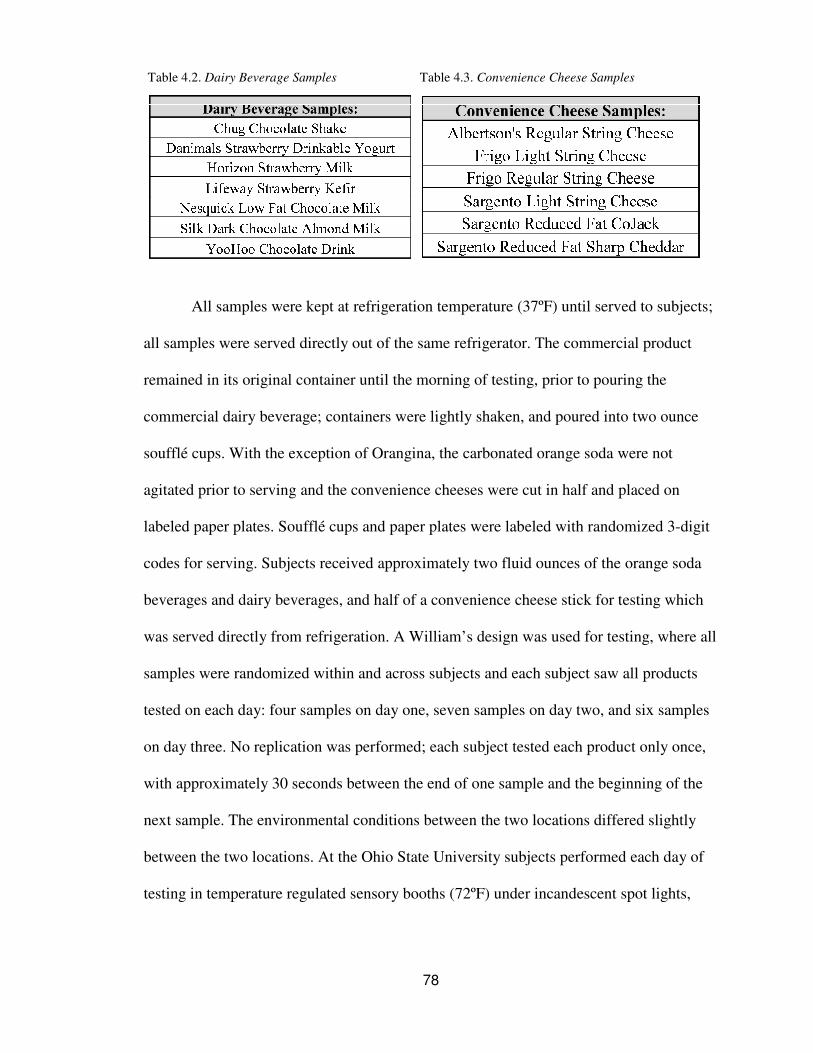
78
All samples were kept at refrigeration temperature (37ºF) until served to subjects;
all samples were served directly out of the same refrigerator. The commercial product
remained in its original container until the morning of testing, prior to pouring the
commercial dairy beverage; containers were lightly shaken, and poured into two ounce
soufflé cups. With the exception of Orangina, the carbonated orange soda were not
agitated prior to serving and the convenience cheeses were cut in half and placed on
labeled paper plates. Soufflé cups and paper plates were labeled with randomized 3-digit
codes for serving. Subjects received approximately two fluid ounces of the orange soda
beverages and dairy beverages, and half of a convenience cheese stick for testing which
was served directly from refrigeration. A William’s design was used for testing, where all
samples were randomized within and across subjects and each subject saw all products
tested on each day: four samples on day one, seven samples on day two, and six samples
on day three. No replication was performed; each subject tested each product only once,
with approximately 30 seconds between the end of one sample and the beginning of the
next sample. The environmental conditions between the two locations differed slightly
between the two locations. At the Ohio State University subjects performed each day of
testing in temperature regulated sensory booths (72ºF) under incandescent spot lights,
Table 4.2. Dairy Beverage Samples Table 4.3. Convenience Cheese Samples
79
while at Cal Poly State University subjects completed the test in a large conference room
(70ºF) with 14 subjects testing at a time, evenly spaced under fluorescent lighting.
4.2.3. Emotion Methods
Three different emotion methods were used for testing 1) words only, 2)
Predefined pictures, and 3) My Pictures. The emotion method (My Pictures, Predefined
pictures, and words) were randomly allocated to the subjects upon arrival to the testing
sight; randomization occurred separately for each day of testing. The words only method
was a control to compare the use of words during emotion testing to pictures during
testing. With the words only method no visual aid was provided, only the words used on
the questionnaire were given. The emotion words were presented in choose-all-that-apply
(CATA) format. The Predefined pictures method consisted of a poster board with 12
emotion images (Fig. 4.1); the investigators selected the images by consensus based upon
universal images of emotions. All Predefined pictures poster boards were the exact same,
with the same emotion word location and pictures, thus acting as a control between the
two image-based methods.
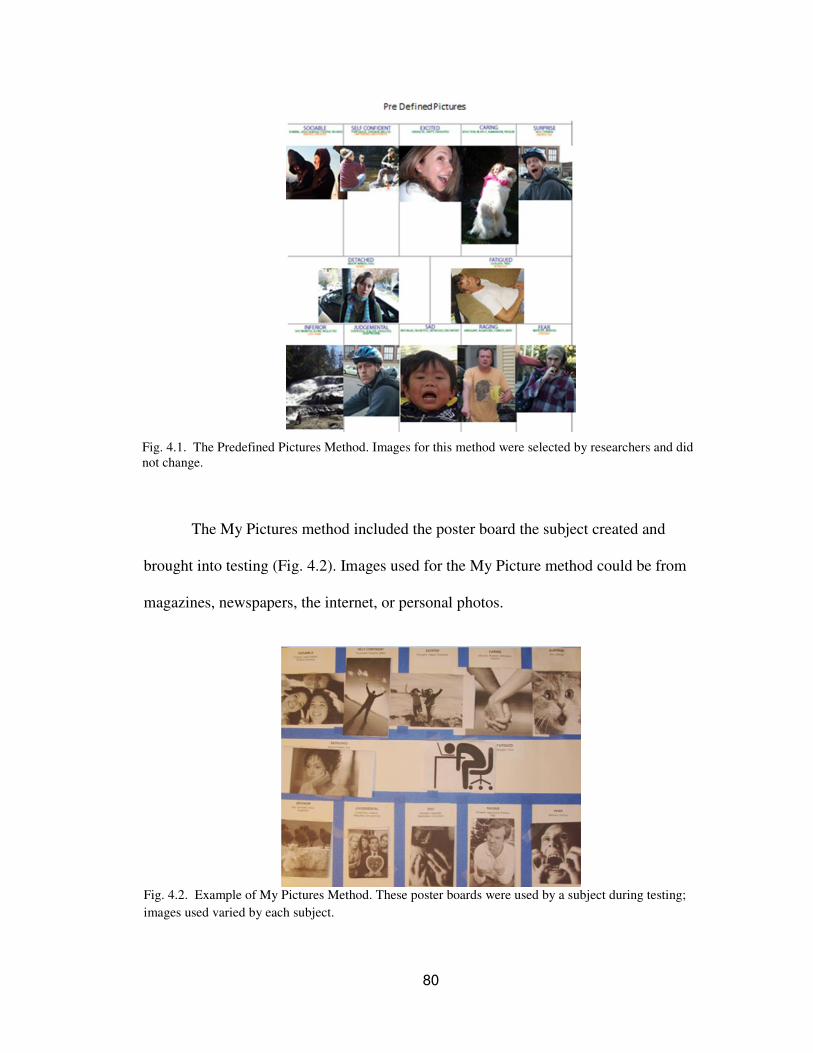
80
The My Pictures method included the poster board the subject created and
brought into testing (Fig. 4.2). Images used for the My Picture method could be from
magazines, newspapers, the internet, or personal photos.
Fig. 4.2. Example of My Pictures Method. These poster boards were used by a subject during testing;
images used varied by each subject.
Fig. 4.1. The Predefined Pictures Method. Images for this method were selected by researchers and did
not change.
81
4.2.4. Emotions for Testing
The following twelve emotion words were selected for testing: sociable, self-
confident, excited, caring, surprise, detached, fatigued, inferior, judgmental, sad, raging,
and fear. These emotion words were selected based upon research done by Thomson and
Crocker (2011), where emotion testing was conducted across four countries with
hundreds of emotion words. The twelve emotions selected were amongst those
considered most suitable for emotion testing with consumers. For analytical purposes the
first five emotions listed were considered “positive” emotions, the following two
“neutral” emotions, and the last five “negative” emotions.
4.2.5. Questionnaire
Subjects were required to complete demographic questions before beginning the
test including age, sex, and ethnicity. The questionnaire first asked for the subject’s initial
emotion(s) presented as CATA; the subject used their emotion method tool, based upon
randomization, at this point. Next subjects were asked to rank 25 texture attribute
questions (using designated texture method), overall liking, overall flavor liking, and
overall texture liking at the first taste, halfway through, and at the end of consuming the
product. Texture attribute questions were ranked using a categorical intensity scale, and a
9-point hedonic scale was used for all liking questions. Subjects then entered their
emotional state (CATA) after consuming the product, and proceed to the next sample.
Compusense® at-hand was used for data collection at both testing sites.
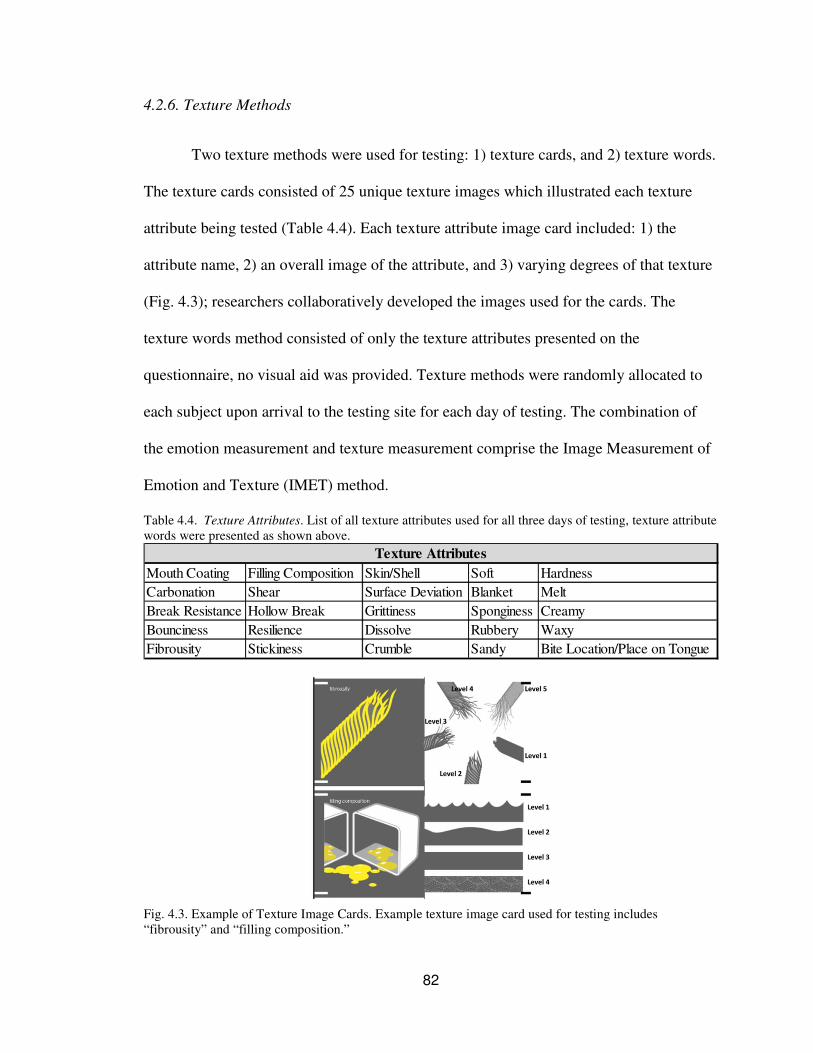
82
4.2.6. Texture Methods
Two texture methods were used for testing: 1) texture cards, and 2) texture words.
The texture cards consisted of 25 unique texture images which illustrated each texture
attribute being tested (Table 4.4). Each texture attribute image card included: 1) the
attribute name, 2) an overall image of the attribute, and 3) varying degrees of that texture
(Fig. 4.3); researchers collaboratively developed the images used for the cards. The
texture words method consisted of only the texture attributes presented on the
questionnaire, no visual aid was provided. Texture methods were randomly allocated to
each subject upon arrival to the testing site for each day of testing. The combination of
the emotion measurement and texture measurement comprise the Image Measurement of
Emotion and Texture (IMET) method.
Table 4.4. Texture Attributes. List of all texture attributes used for all three days of testing, texture attribute
words were presented as shown above.
Mouth Coating Filling Composition Skin/Shell Soft Hardness
Carbonation Shear Surface Deviation Blanket Melt
Break Resistance Hollow Break Grittiness Sponginess Creamy
Bounciness Resilience Dissolve Rubbery Waxy
Fibrousity Stickiness Crumble Sandy Bite Location/Place on Tongue
Texture Attributes
Fig. 4.3. Example of Texture Image Cards. Example texture image card used for testing includes
“fibrousity” and “filling composition.”
83
4.3. Data Analysis
4.3.1. Emotion Analysis
The statistical analysis of the change in emotion was calculated by subtracting the
end emotions from the beginning emotions; an oneway ANOVA comparison between
each change in emotion by emotion method was performed using JMP (JMP, Version 10.
SAS Institute Inc., Cary, NC). Although the emotional responses were captured as
categorical, the data was treated as continuous in order to interpret the direction and
intensity of the emotion changes and how that change related to the different emotion
types (positive, neutral, and negative) by each product. Considering the emotion data was
analyzed as continuous after being captured as categorical, the Kruskal-Wallis rank sum
test was used for analysis to help aid with issues of non-normality in the data. If a
significant Kruskal-Wallis rank sum p-value occurred (α=0.05), the Steel-Dwass all pairs
nonparametric post hoc comparison was performed to determine which methods were
significantly different from one another (α=0.05). Additionally, in order to understand the
equality of variances between the three testing methods, an unequal variance test was
performed, and the Brown-Forsythe’s test was used to determine equality of variance;
this test is more robust to non-normality compared to the more popular Levene’s test.
When considering the changes in emotion by gender, an overall MANOVA
comparing all changes in emotion by gender was performed; given a significant whole
model (α=0.05) further investigation was carried out to determine which changes in
emotion differed by gender. Considering the changes in emotion were treated as
84
continuous, the Wilcoxon rank test was used for determining significant differences
(α=0.05) among the changes in emotion by gender ANOVAs.
4.3.2. Texture Analysis
For texture analysis, a MANOVA was performed comparing the change in
texture attributes by texture method for orange soda only, dairy beverage only, cheese
only, and all data combined. If a significant whole model effect existed, then each texture
attribute was compared separately by way of a pooled t-test. Additionally, oneway
ANOVAs were performed on the changes in emotion by texture method (words and
cards) for each food product category. The Kruskal-Wallis rank sum test was used for
analysis (α=0.05), if a significant p-value was determined, the Steel-Dwass all pairs
nonparametric post hoc comparison was performed to determine which emotions were
significantly different (α=0.05); all analysis was performed using JMP (JMP, Version 10.
SAS Institute Inc., Cary, NC).
4.4. Results
4.4.1. Emotion methods and each emotion
When comparing each change in emotion by emotion testing method, significant
differences between emotion methods only appeared in the positive emotions: caring
(Chi-Sq 2 = 8.7333, P=0.0127) (Table 4.5), sociable (Chi-Sq 2 = 8.4442, P=0.0147) (Table
4.6), and self-confident (Chi-Sq 2 = 7.7391, P=0.0209) (Table 4.7). All other comparisons
between each change in emotion and emotion testing method were not significant
(α=0.05). Fig. 4.4 provides general comparisons between the changes in emotion by type
of emotion (positive, neutral, and negative) and emotion testing methods. Among the
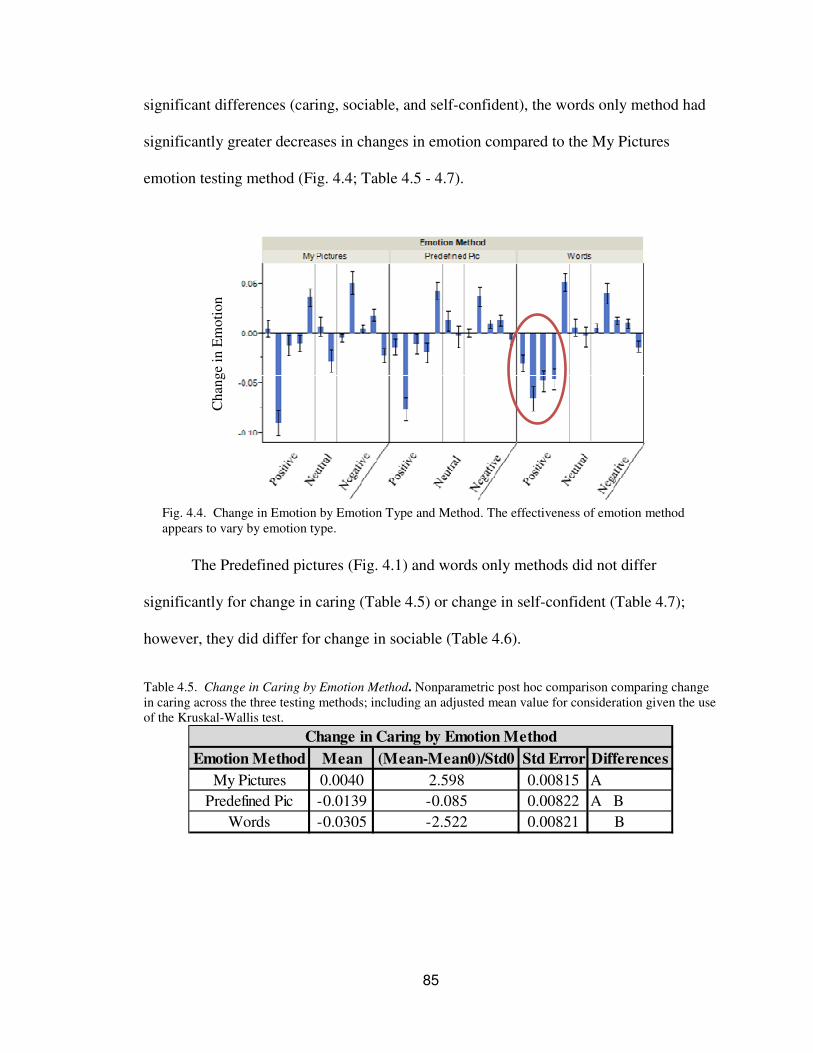
85
significant differences (caring, sociable, and self-confident), the words only method had
significantly greater decreases in changes in emotion compared to the My Pictures
emotion testing method (Fig. 4.4; Table 4.5 - 4.7).
The Predefined pictures (Fig. 4.1) and words only methods did not differ
significantly for change in caring (Table 4.5) or change in self-confident (Table 4.7);
however, they did differ for change in sociable (Table 4.6).
Table 4.5. Change in Caring by Emotion Method. Nonparametric post hoc comparison comparing change
in caring across the three testing methods; including an adjusted mean value for consideration given the use
of the Kruskal-Wallis test.
Emotion Method Mean (Mean-Mean0)/Std0 Std Error Differences
My Pictures 0.0040 2.598 0.00815 A
Predefined Pic -0.0139 -0.085 0.00822 A B
Words -0.0305 -2.522 0.00821 B
Change in Caring by Emotion Method
Chan
ge
in E
mo
tio
n
Fig. 4.4. Change in Emotion by Emotion Type and Method. The effectiveness of emotion method
appears to vary by emotion type.
Change in Emotion by Emotion Type and Method
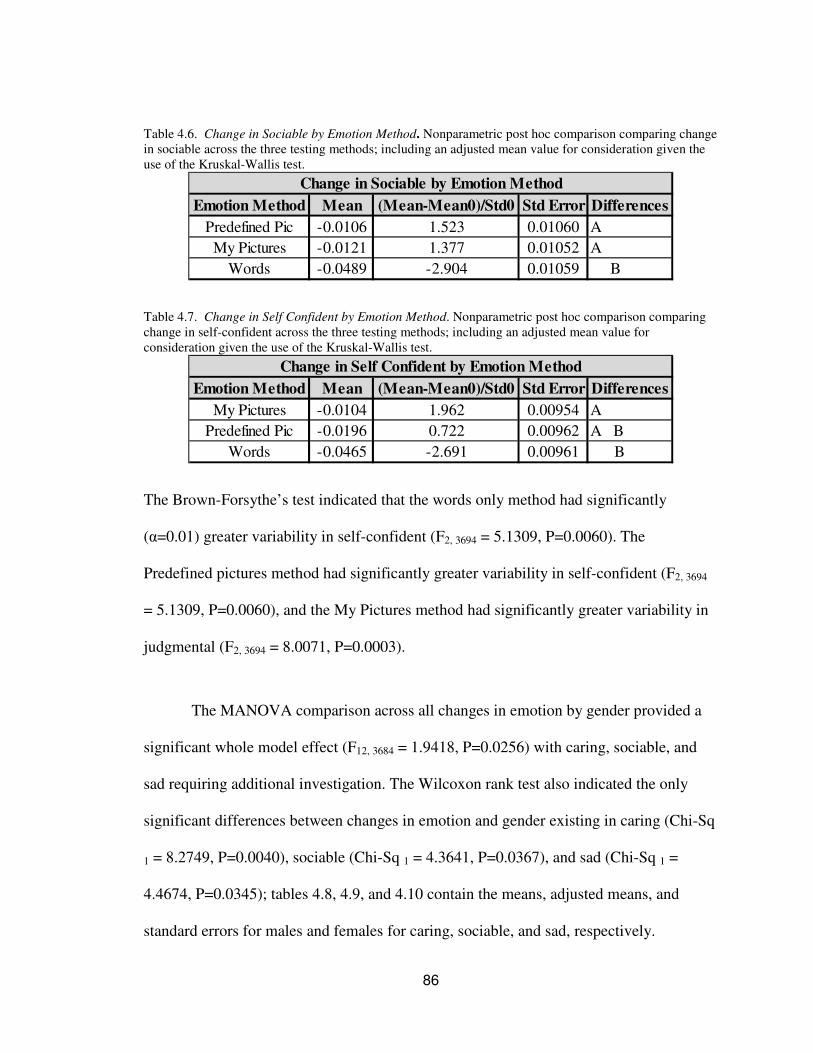
86
Table 4.6. Change in Sociable by Emotion Method. Nonparametric post hoc comparison comparing change
in sociable across the three testing methods; including an adjusted mean value for consideration given the
use of the Kruskal-Wallis test.
Emotion Method Mean (Mean-Mean0)/Std0 Std Error Differences
Predefined Pic -0.0106 1.523 0.01060 A
My Pictures -0.0121 1.377 0.01052 A
Words -0.0489 -2.904 0.01059 B
Change in Sociable by Emotion Method
Table 4.7. Change in Self Confident by Emotion Method. Nonparametric post hoc comparison comparing
change in self-confident across the three testing methods; including an adjusted mean value for
consideration given the use of the Kruskal-Wallis test.
Emotion Method Mean (Mean-Mean0)/Std0 Std Error Differences
My Pictures -0.0104 1.962 0.00954 A
Predefined Pic -0.0196 0.722 0.00962 A B
Words -0.0465 -2.691 0.00961 B
Change in Self Confident by Emotion Method
The Brown-Forsythe’s test indicated that the words only method had significantly
(α=0.01) greater variability in self-confident (F2, 3694 = 5.1309, P=0.0060). The
Predefined pictures method had significantly greater variability in self-confident (F2, 3694
= 5.1309, P=0.0060), and the My Pictures method had significantly greater variability in
judgmental (F2, 3694 = 8.0071, P=0.0003).
The MANOVA comparison across all changes in emotion by gender provided a
significant whole model effect (F12, 3684 = 1.9418, P=0.0256) with caring, sociable, and
sad requiring additional investigation. The Wilcoxon rank test also indicated the only
significant differences between changes in emotion and gender existing in caring (Chi-Sq
1 = 8.2749, P=0.0040), sociable (Chi-Sq 1 = 4.3641, P=0.0367), and sad (Chi-Sq 1 =
4.4674, P=0.0345); tables 4.8, 4.9, and 4.10 contain the means, adjusted means, and
standard errors for males and females for caring, sociable, and sad, respectively.
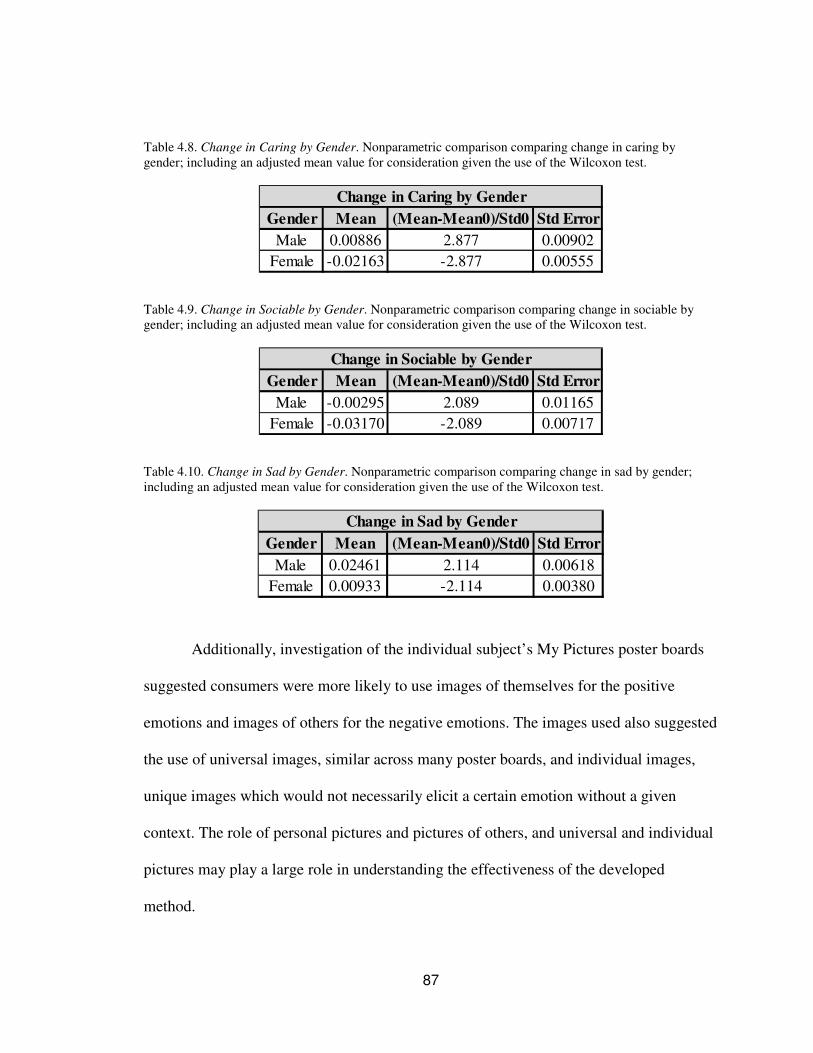
87
Table 4.8. Change in Caring by Gender. Nonparametric comparison comparing change in caring by
gender; including an adjusted mean value for consideration given the use of the Wilcoxon test.
Gender Mean (Mean-Mean0)/Std0 Std Error
Male 0.00886 2.877 0.00902
Female -0.02163 -2.877 0.00555
Change in Caring by Gender
Table 4.9. Change in Sociable by Gender. Nonparametric comparison comparing change in sociable by
gender; including an adjusted mean value for consideration given the use of the Wilcoxon test.
Gender Mean (Mean-Mean0)/Std0 Std Error
Male -0.00295 2.089 0.01165
Female -0.03170 -2.089 0.00717
Change in Sociable by Gender
Table 4.10. Change in Sad by Gender. Nonparametric comparison comparing change in sad by gender;
including an adjusted mean value for consideration given the use of the Wilcoxon test.
Gender Mean (Mean-Mean0)/Std0 Std Error
Male 0.02461 2.114 0.00618
Female 0.00933 -2.114 0.00380
Change in Sad by Gender
Additionally, investigation of the individual subject’s My Pictures poster boards
suggested consumers were more likely to use images of themselves for the positive
emotions and images of others for the negative emotions. The images used also suggested
the use of universal images, similar across many poster boards, and individual images,
unique images which would not necessarily elicit a certain emotion without a given
context. The role of personal pictures and pictures of others, and universal and individual
pictures may play a large role in understanding the effectiveness of the developed
method.
88
4.4.2. Change in texture attributes and emotions by texture methods
The MANOVA results for all the data combined found a significant difference
across all changes in texture attributes by texture method (F25, 3643 = 1.7163, P = 0.0148).
When testing each texture attribute for significance between the two methods, grittiness
(F 1, 3667 = 4.0449, P=0.0444) and waxy (F 1, 3667 = 8.4091, P=0.0038) were significantly
different between texture cards and texture words. The orange soda only overall texture
method MANOVA was significant when comparing all changes in texture between the
two texture methods (F25, 842= 2.1395, P = 0.0010); the significant specific attributes
included: stickiness (F 1, 866 = 6.7688, P=0.0094), surface deviation (F 1, 866 = 4.2179,
P=0.0403), crumble (F 1, 866 = 6.7630, P=0.0095), creamy (F 1, 866 = 4.7922, P=0.0289),
waxy (F 1, 866 = 13.1322, P=0.0003), and place on tongue (F 1, 866 = 5.2248, P=0.0225).
The MANOVA whole model results for change in texture attributes by texture method
for both dairy beverages and cheese were insignificant (P=0.1781 and P=0.2113,
respectively).
4.4.3. Texture methods and change in emotion
The results of the oneway ANOVAs for each change in emotion by texture
method indicated differences between the texture cards and words across each of the
product categories separately and combined. Significant differences between the changes
in emotions by both texture methods exist for: orange soda (cards: Chi-Sq 12 = 116.54,
P<0.0001; words: Chi-Sq 12 = 138.28, P<0.0001), dairy beverages (cards: Chi-Sq 12 =
61.06, P<0.0001; words: Chi-Sq 12 = 106.51, P<0.0001), and convenience cheeses (cards:
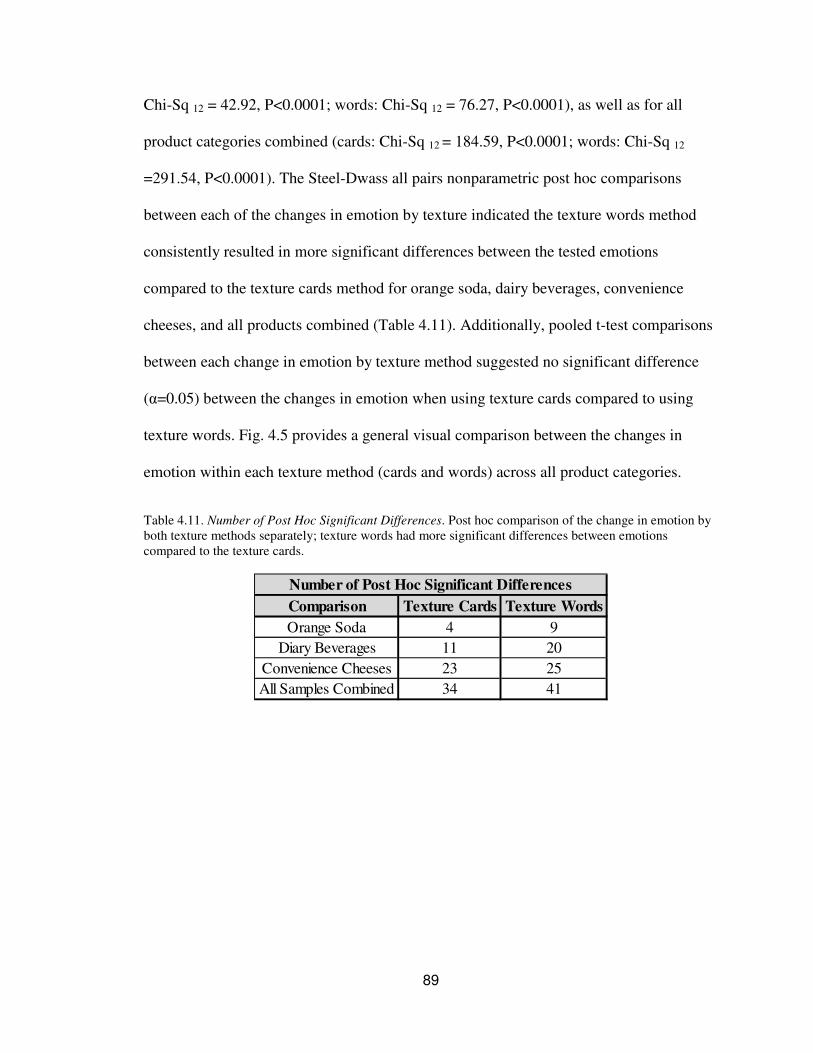
89
Chi-Sq 12 = 42.92, P<0.0001; words: Chi-Sq 12 = 76.27, P<0.0001), as well as for all
product categories combined (cards: Chi-Sq 12 = 184.59, P<0.0001; words: Chi-Sq 12
=291.54, P<0.0001). The Steel-Dwass all pairs nonparametric post hoc comparisons
between each of the changes in emotion by texture indicated the texture words method
consistently resulted in more significant differences between the tested emotions
compared to the texture cards method for orange soda, dairy beverages, convenience
cheeses, and all products combined (Table 4.11). Additionally, pooled t-test comparisons
between each change in emotion by texture method suggested no significant difference
(α=0.05) between the changes in emotion when using texture cards compared to using
texture words. Fig. 4.5 provides a general visual comparison between the changes in
emotion within each texture method (cards and words) across all product categories.
Table 4.11. Number of Post Hoc Significant Differences. Post hoc comparison of the change in emotion by
both texture methods separately; texture words had more significant differences between emotions
compared to the texture cards.
Comparison Texture Cards Texture Words
Orange Soda 4 9
Diary Beverages 11 20
Convenience Cheeses 23 25
All Samples Combined 34 41
Number of Post Hoc Significant Differences
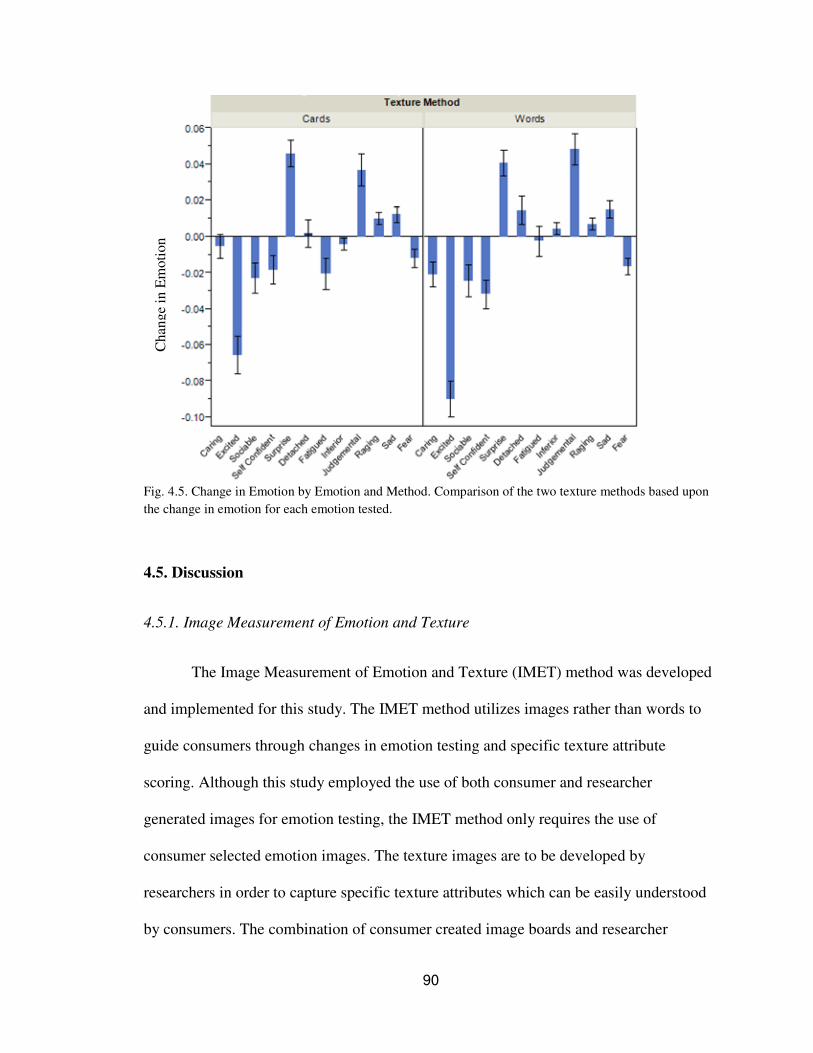
90
Fig. 4.5. Change in Emotion by Emotion and Method. Comparison of the two texture methods based upon
the change in emotion for each emotion tested.
4.5. Discussion
4.5.1. Image Measurement of Emotion and Texture
The Image Measurement of Emotion and Texture (IMET) method was developed
and implemented for this study. The IMET method utilizes images rather than words to
guide consumers through changes in emotion testing and specific texture attribute
scoring. Although this study employed the use of both consumer and researcher
generated images for emotion testing, the IMET method only requires the use of
consumer selected emotion images. The texture images are to be developed by
researchers in order to capture specific texture attributes which can be easily understood
by consumers. The combination of consumer created image boards and researcher
Ch
ang
e in
Em
oti
on
Change in Emotion by Emotion and Method
91
developed texture cards can likely provide an effective and dynamic method for
understanding consumer emotions as they related to texture and provide the opportunity
for development of emotion specific products.
4.5.2. Emotion Method Findings
This study investigated the development of a novel emotion testing method for
use with consumers and how the testing methods differ in terms of changes in emotional
responses using three product categories. The words only emotion testing method had
significantly greater changes between emotional responses compared to the My Pictures
emotion testing when comparing the caring (Table 4.5) and self-confident (Table 4.7)
emotions and greater than My Pictures and Predefined pictures when comparing the
sociable emotion (Table 4.6). The standard deviation (SD) was significantly greater for
the words only method among a positive emotion and the SD variability for My Pictures
was significantly greater for a negative emotion. Additionally, the My Picture images
used varied by the type of emotion, positive or negative, and could be universal or
individual/context-driven images.
These findings suggest when personal self-pictures are used to identify emotions
the My Pictures method is less variable than the words only method; however, the words
only method appears to be less variable than the My Pictures method when non-self
images are used (specifically in negative emotions). Perhaps if consumers were required
to use images of themselves to portray all emotions, the My Pictures method would be
less variable across all emotion types (positive, neutral, and negative) compared to the
words only method. The personal pictures used in the My Pictures method may act as an
92
emotional anchor for consumers, providing a contextual representation of the emotion as
opposed to the emotion expressed by others (observed in Predefined pictures method and
negative emotion My Picture images).
In regard to gender differences, minor differences were seen between male and
female changes in emotion. Although there was a significant whole model effect between
the changes in emotion and gender, only three changes in emotion had significantly
different responses by gender: caring (Table 4.8), sociable (Table 4.9), and sad (Table
4.10). Despite the MANOVA whole model effect being significant, only three out of 12
significant changes in emotion occurred, which gives rise to the question as to whether
there was truly a significant difference in male and females emotional responses overall.
The number of male and female participants was not even, given approximately 70%
women and 30% men; this could have played a substantial role in determining significant
differences between genders. Additionally, considering the study was preliminary the
emotions asked may not have been relevant for determining differences in emotional
responses between males and females. The MANOVA results appear to concur with
other findings which have suggested differences between men and women in their
emotional responses (King et al., 2010; Kring & Gordon, 1998; Seo et al., 2009; Macht,
1999; Costanzo et al., 1999); however, some limitations within this study hinder the
conclusion that an obvious difference in emotional responses between males and females
exist. Future research should investigate the changes in emotion between males and
females with similar sample sizes and perhaps among a broader range of emotions for
assessing more of the human experience with eating.
93
4.5.3. Current Emotion Methodologies
Recently, a variety of different emotion testing methods have been developed to
better understand the typical consumer’s emotional response to food products.
Traditionally, consumers are not provided visual aids to help elicit emotional responses
during emotion testing with food (Macht, 1999; Macht & Simons, 2000; King et al.,
2010; Thomson et al., 2010). Although the use of words has many advantages in emotion
testing, for example simplicity and easy of communication, its use has its disadvantages
and has been criticized. Thomson et al. (2010) stated the two main criticisms of emotion
words are: 1) the use of scaling may cause subjects to think about the meaning of the
words, thus inducing “cognitive thought processes” while the influence of purchase intent
and liking may be due to “irrational influences”, and 2) the rational or cognitive thought
process may cause the subject to interpret the word’s literal meaning as opposed to the
metaphoric meaning. Considering these disadvantages of emotion words, the use of
emotion pictures may be an avenue worth pursuing for emotion testing in a food related
context. It is thought that language and logic are more effectively processed in the left
hemisphere of the brain, while emotions and picture images are better processed in the
brain’s right hemisphere (Freberg, 2009). Perhaps the use of images may limit rational or
cognitive thought processes during emotion testing and yield more consistent emotional
responses by encouraging the irrational processes to be more prominent.
Images have been used in a variety of different ways for emotion testing, film
clips have been used to elicit negative and neutral emotions (Kring & Gordon, 1998),
while other studies have used images of food in attempt to elicit certain emotional
responses or reward mechanisms in subjects (Blechert et al., 2010; Piech et al., 2010).
94
Gard and Kring (2007) used 60 images to elicit emotions, equally balance across positive,
neutral, and negative, amongst subjects in a non-food related context to understand sex
differences and emotion; although no control to evoke emotions was used, the use of
pictures appeared effective and appropriate for emotion testing. Recently, Croy et al.
(2011) investigated the emotion evoking ability of olfactory stimuli versus emotion
pictures and no emotion stimuli. Their results suggested the benefits of a stimulus, either
olfactory or visual, to evoke emotions; additionally subjects were able to name more
emotion elicitors through visual stimuli compared to olfactory stimuli for anger and
sadness (Croy et al., 2011). Results of the current study indicated greater variability for
no emotion stimuli (words only) in the positive emotions, and greater emotional
variability in the My Pictures method in the negative emotions. Perhaps the ideal type of
stimuli to evoke emotions (pictures, words, or odors) depends on the type of emotions the
researcher is pursuing (positive, neutral, or negative emotions); future research should
investigate this potential relationship between stimulus and emotion type and potential
for product specific emotions. Regardless, the use of a stimulus (beyond words) appears
to be a beneficial technique for emotion testing to aid in eliciting specific emotions.
In addition to the use of emotion images, this study captured the change in
emotion frequencies across the eating experience of three product categories. Macht and
Simons (2000) argue the importance of capturing emotion frequencies, suggesting greater
frequencies of an emotion during eating may indicate a stronger relationship than other
emotions in an eating context. Furthermore, Gard and Kring (2007) suggested the benefit
of capturing the change in emotion rather than a “snapshot”; by capturing emotional
responses at multiple time points provides a better understanding of the relationship
95
between emotions and eating. The current study’s results provided additional information
about changes in emotion across the eating experience, but also the strength of that
change. The use of several food product categories was paramount for observing these
changes across several food forms; similar results were seen across all three product
categories.
As emotion testing becomes more frequent, the investigation, development and
testing of additional methods should be investigated in order to create the most effective
and efficient testing methods. This study provides relevant industry information through
the investigation of emotion testing with beyond basic emotions, frequencies and changes
in emotions, and the use of personal and prescribed emotion images for testing. The use
of personal consumer derived emotion images provides a relatively simple and
reproducible method for measuring consumer emotions. Accurate and reproducible
emotion data may eventually provide insight on consumer’s purchase intent and the
emotional power of occasion and brands. Although this study’s findings are helpful for
investigating alternative emotion testing methods, this work is preliminary and several
limitations exist. Firstly, the questionnaire was lengthy with asking initial emotion(s),
beginning, middle and end texture attributes and overall, flavor, and texture liking, and
end emotions. The length of the questionnaire may have had a confounding effect on the
end emotions which could alter the change in emotion results; when possible, future
studies should work to limit the length of the questionnaire used for emotion testing or
consider more refined objectives. Secondly, the subjects were randomly allocated a new
emotion testing method for each day of testing; consumers may have experienced some
“carryover” from the previous day’s emotion testing method. The severity of the potential
96
carryover is unknown, but may be trivial do to consumers already knowing the emotion
words and their own images prior to testing.
Further research should investigate: 1) the use of self/individual emotion pictures
of the subject versus predefined emotion images and words, 2) additional emotions for
testing that go beyond basic emotions or are specific to certain products, and 3)
alternative scaling methods which move away from the rational/word usage and towards
a more non-cognitive method of capturing emotional responses from consumers.
4.5.4. Texture Method Findings
This study developed and tested an innovative procedure for texture measurement
with consumers by exploring the relationship between imaged based testing aids and
words only methods. The effectiveness of the texture methods varied when comparing
them by changes in texture attributes. When considering all the data combined and
orange soda only, a significant difference was observed between the two methods in the
changes in texture attributes; however, no significant difference was observed for dairy
beverages and cheese. It is possible when consumers were re-randomized a new testing
method for the second and third day of testing there was “carryover” from the previous
testing days, especially if the consumer had a texture card on the first day, but not on the
following testing days. The texture cards had not been viewed prior to the first day of
testing; perhaps the results of the first day are the most accurate account between the
texture cards and texture words. This considered, perhaps the orange soda data (tested on
the first day) should be used for comparing the two methods. Perhaps if randomization of
testing methods was only done on the first day of testing there would be a clearer
97
distinction between the two methods; however, based upon the data of the first day there
appears to be some differences between the two methods for the change in texture
attributes across the eating experience.
When exploring changes in emotion by texture method, the texture words method
had consistently more significant differences between emotions compared to the texture
cards method (Table 4.11). The texture words method indicated greater differences
between the emotions compared to the texture cards method, suggesting the texture
words method may actually provide a clearer distinction between emotions compared to
the texture cards method. Perhaps the texture cards, while acting as a texture anchor, may
have also decreased differences in emotions consumers might typically experience when
consuming the product; by providing consumers specific texture images this may have
inhibited the array of emotional experience usually experienced by the consumer during
consumption. Although, when comparing each individual change in emotion by texture
method, no significant differences were observed; perhaps the texture method used
effects the elicitation of different emotions across the eating experience, but not
necessarily effecting the changes in each emotion. Based upon the results of this study,
the texture methods appeared to have little effect on the consumer’s changes in emotional
response during the eating experience, but may affect the differences seen between the
difference emotions.
This study provides a preliminary look at emotion and texture testing with
consumers through the development and implementation of two novel testing methods
for emotion and texture. Texture images may be beneficial for use with consumers
because the images could act as a visual anchor during testing which may decrease
98
variability within and across consumers while allowing researchers to ask more specific
texture questions than traditionally asked with consumers. The use of texture image cards
may be additionally beneficial for testing concurrently with emotion testing as images,
emotions, and oral texture are thought to be mostly processed in the orbitofrontal cortex
(Rolls & Grabenhorst, 2008; Freberg, 2009). Perhaps the development of methods which
utilize the proximity of these processes will yield consistent emotion and texture attribute
testing among consumers.
4.5.5. Current Texture Measurement Methodologies
Instrumental texture analysis assessments are often related to descriptive sensory
texture attributes to understand the textural quality of foods (Breene, 1975); however,
little is known about consumer reactions to texture and avenues for modifying physical
characteristics to maximize consumer acceptability (Moskowitz, 1987). Foegeding et al.
(2011) states, “human perception of any product is best and optimally measured by
humans, not machines,” perhaps then consumer related texture questions should be
answered by consumers, providing the opportunity for consumer focused alternative
texture methods. Consumers are typically asked acceptance and liking questions about
texture, but perhaps through the use of texture image cards, developed by sensory
scientists and product developers, a clearer understanding of how consumers perceive
textural changes in food and how these specific textural attributes are related to product
liking and acceptability could be obtained. Little information is known about the
effectiveness of texture image cards with consumers especially in the context of
emotions, but one study investigated the effect of texture on the relationship between
certain colors and emotions (Lucassen et al., 2011). The results suggested the addition of
99
visual textures played a significant role in the color/emotion relationship on a hard-soft
scale, and a non-significant trend for masculine-feminine, heavy-light, and warm-cool
emotion scales (Lucassen et al., 2011). Although Lucassen et al. (2011) did not
investigate oral texture, it does suggest a potential relationship between texture and
emotions, and further investigation of this relationship appears to be justified. Our study
provides a preliminary look at the use of texture images cards for use with consumers and
a glimpse of texture and emotion testing by way of alternative testing methods.
Instrumental texture measurements have been around for decades; however, these
measurements are often correlated to descriptive sensory texture assessments rather than
consumer perceptions of food textures. Instrumental and descriptive sensory texture
measurements are essential for a variety of different objectives within the food industry;
however, for consumer texture research, alternative methods may be a route worth
pursuing. Utilization of food texture cards for use by consumers may provide important
consumer texture perception data without the use of instrumental or descriptive sensory
testing, thus saving valuable time, money, and resources. The use of texture image cards
for other food forms should be investigated to better understand the effectiveness of these
cards over a wide variety of textures. Additionally, researchers should continue to explore
the effect of specific textural attributes on certain emotions. Consumer texture attribute
responses could be compared to TPA or other instrumental texture measurements to
understand the relationship between consumer-perceived texture and instrumental texture
assessments.
100
4.6. Conclusion
The use of emotion testing has greatly increased within sensory science; however,
alternative methods should be pursued to create an ideal emotion testing method. Due to
the non-cognitive nature of emotions, they can be difficult to capture and quantify
therefore methods should be created to measure emotions in the most natural way
possible. Images and emotions are thought to be processed in the same cerebral
hemisphere and through similar pathways, thus a visual emotional stimulus maybe key to
accurately capturing emotions. The current study’s results suggest the images used
(emotion images of self, images of people the subject knows but not self, or pictures of
others/strangers) for testing may be the key to the consistency and reproducibility of
using emotion images rather than words only. The use of personal emotion images
appears to be a promising emotion testing method and should be investigated further.
A variety of different instrumental texture analysis methods have been developed
and are frequently used to correlated instrumental texture measurements to descriptive
sensory analysis; perhaps specific texture attributes can be tested with consumers if the
right texture method is used. For samples tested on the first day (clearest distinction
between the two methods) there was a significant difference between the changes in
textures by texture method. The use of texture image cards provides an opportunity to
capture consumer perceived texture attributes rather than instrument or descriptive
sensory panel texture analysis. Texture images appear to be an appropriate method for
capturing specific texture attributes and exploration of different emotional responses with
consumers. This first look at the IMET methodology demonstrated the advantages and
disadvantages of assessing emotion and texture simultaneously among consumers.
101
5.0
Evaluating Consumer Emotional Responses and Liking to Non-Commercial Low
Sodium Mozzarella Cheese
Abstract
Americans, on average, consume far beyond the recommended daily allowance of
sodium, thus putting them a higher risk of hypertension, cardiovascular disease, and
stroke. Mozzarella cheese is currently the most popularly consumed cheese in the U.S.
and provides approximately 8% DV of sodium in one string cheese stick (approximately
28g); thus mozzarella cheese appears to be an appropriate food for researching sodium
reduction. Sodium reduction has been challenging for manufacturers considering
consumers view low sodium products as bland and flavorless.
The current study employed the use of traditional acceptability testing in addition
to a novel method for evaluating subject’s emotional responses to products in order to
obtain additional information above and beyond what traditional sensory testing methods
provide to researchers. Eight cheese variables were tested, seven low sodium levels and
one full sodium sample, in order to determine which salt replacer was the most liked by
subjects and how subject’s emotions varied between samples. Instrumental texture
analysis was also performed to ensure the textural quality of the low sodium cheeses was
maintained and comparable to the texture attributes of the full sodium cheese.
The study’s results indicated: 1) the full sodium cheese was consistently the most
preferred sample for all liking attributes, followed by the 100% KCl cheese variable, 2)
low sodium variables including 50% Salona, 100% KCl, and 50% KCl samples were able
102
to elicit similar emotional responses to those experienced during consumption of the full
sodium cheese, and 3) higher mean scores for the tested texture attributes were associated
with the most liked cheese samples. The 100% KCl low sodium cheese variable was
recommended for further research in low sodium cheese testing.
Highlights: >Production of eight variables of bacteria cultured mozzarella cheeses were
carried out with seven variables of low sodium cheese with different salt replacers.
>Acceptability testing and emotional responses were captured for all eight samples across
two days of testing to determine changes in liking and emotions. >Texture analysis was
performed on all cheese samples to ensure textural quality and comparison of texture
measurements between the selected low sodium sample and the full sodium cheese.
Keywords: emotion testing, hedonic testing, texture analysis, non-commercial low
sodium mozzarella cheese
103
5.1. Introduction
Hypertension is a leading risk factor for the two most frequent causes of death,
cardiovascular disease and stroke, in the United States, and hypertension is associated
with increased sodium consumption. The alarmingly high rates of hypertension among
the American population has given rise to a number of initiatives for decreasing sodium
content in a variety of food products (CDC, 2012; NHLBI, 2012; USDA, 2010). Given
mozzarella cheese is currently the most consumed cheese in the United States, it’s a clear
avenue for pursuing sodium reduction (IDFA, 2012). Sodium reduction in a variety of
different cheeses including: cheddar, feta, and imitation cheeses (Grummer et al., 2012;
Katsiari et al., 1997; El-Bakry et al., 2011), has been somewhat successful; however, the
traditionally mild/bland flavor of mozzarella cheese offers a major challenge for
decreasing salt content while still delivering the same flavor, saltiness, and texture
consumers expect. Additionally, consumer researchers are pursuing alternative methods
for measuring the consumer’s experience with food, and capturing the consumer’s
emotional response to products appears to be a method worth investigating (King &
Meisleman, 2010; King et al., 2010; Macht, 1999; Macht, 2008; Macht & Simons, 2000).
Perhaps the limited success of low sodium products is due to researchers asking
consumers the wrong questions about what really drives them to purchase, consume, and
enjoy products; through emotion measurement, a better understanding of the consumer’s
mindset may be obtained.
The current study manufactured seven varieties of low sodium bacteria cultured
mozzarella cheese and one variable of full sodium cheese. These eight samples were used
for traditional acceptability testing and for capturing the subject’s change in emotional
104
responses to the products, using a unique method of emotion measurement (IMET),
across two days of testing. Lastly, instrumental texture analysis was performed on the
samples to determine the effects of lowering sodium on certain texture attributes of the
cheese. The objectives of this study were to: 1) identify one salt replacer which was
consistently most preferred compared to the other variables and ideally not significantly
different in liking compared to the full sodium control, 2) determine if similar emotional
responses could be elicited in a low sodium cheese as those evoked when consuming the
full sodium sample, and 3) identify which texture attributes were associated with the
samples which were most liked.
Products with higher salt content were hypothesized to have higher subject
acceptability scores and would have increased changes in positive emotions, while the
low sodium cheeses were hypothesized to be liked less by subjects and have greater
increases in negative emotions; these hypotheses are based upon previous results from the
researchers, Development of a Novel Method for Evaluating Emotions and Texture:
Imagery and Language (Collinsworth et al., 2013). Additionally, significant differences
in changes between the first and last emotional responses and first and last liking scores
were expected, and liking scores were thought to decrease between the first and second
day of testing. The full sodium cheese sample was hypothesized to have significantly
different texture attribute measurements compared to the low sodium cheeses, and the
more liked samples would have significantly different texture attribute measurements
compared to the disliked samples.
105
5.2. Methodology
5.2.1. Materials
Unsalted bacteria cultured mozzarella cheese curd manufactured by Rizo Lopez
Foods, Inc. (Modesto, CA) was used for testing with eight cheese variables; curd was
kept refrigerated (37°F) prior to use. Curd was weighed then placed into a cooker-
stretcher (Blentech, model CC-45) and the curd was made molten (160-170°F) by low
auger agitation and heat. Predetermined salt and salt replacer amounts were added to the
molten curd in the cooker-stretcher and were allowed approximately five minutes to
combine. After mixing, each cheese variable was placed into a metal rectangular cheese
hoop lined with cheese cloth, then placed in refrigeration (37°F). Salt replacers used for
testing included: NaCl/KCl blend (KCl by Morton Salt, lot number: APR102HK01),
ALTA™ 2345 (Kerry, ID number: s-341825), and Salona (BK Giulini, lot number:
15APR2011-F). The antimicrobial dip used for testing was SEA-i F75 (Bienca, lot
number: 101027) at 0.275%.
5.2.2. Samples
A total of eight variables were used for testing, the eight samples included: full
sodium, low sodium, 100% NaCl/KCl blend, 50% NaCl/KCl blend, 100% ALTA™, 50%
ALTA™, 100% Salona, and 50% Salona (Table 5.1).
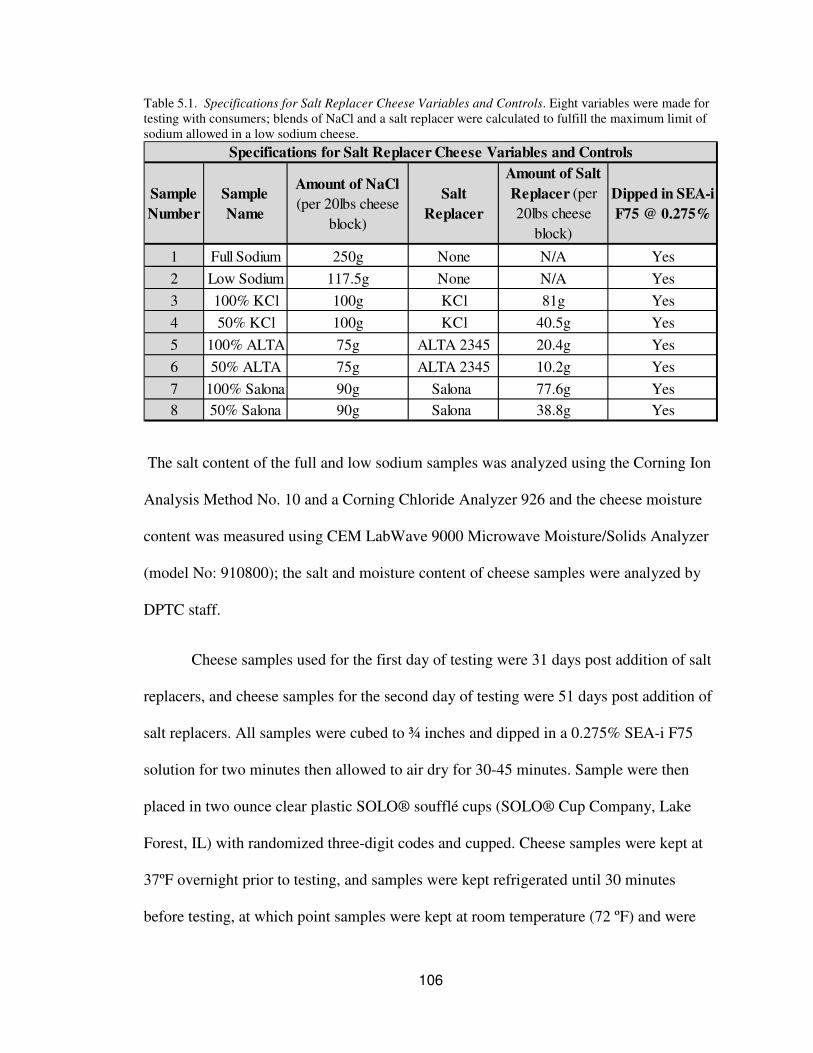
106
Table 5.1. Specifications for Salt Replacer Cheese Variables and Controls. Eight variables were made for
testing with consumers; blends of NaCl and a salt replacer were calculated to fulfill the maximum limit of
sodium allowed in a low sodium cheese.
Sample
Number
Sample
Name
Amount of NaCl
(per 20lbs cheese
block)
Salt
Replacer
Amount of Salt
Replacer (per
20lbs cheese
block)
Dipped in SEA-i
F75 @ 0.275%
1 Full Sodium 250g None N/A Yes
2 Low Sodium 117.5g None N/A Yes
3 100% KCl 100g KCl 81g Yes
4 50% KCl 100g KCl 40.5g Yes
5 100% ALTA 75g ALTA 2345 20.4g Yes
6 50% ALTA 75g ALTA 2345 10.2g Yes
7 100% Salona 90g Salona 77.6g Yes
8 50% Salona 90g Salona 38.8g Yes
Specifications for Salt Replacer Cheese Variables and Controls
The salt content of the full and low sodium samples was analyzed using the Corning Ion
Analysis Method No. 10 and a Corning Chloride Analyzer 926 and the cheese moisture
content was measured using CEM LabWave 9000 Microwave Moisture/Solids Analyzer
(model No: 910800); the salt and moisture content of cheese samples were analyzed by
DPTC staff.
Cheese samples used for the first day of testing were 31 days post addition of salt
replacers, and cheese samples for the second day of testing were 51 days post addition of
salt replacers. All samples were cubed to ¾ inches and dipped in a 0.275% SEA-i F75
solution for two minutes then allowed to air dry for 30-45 minutes. Sample were then
placed in two ounce clear plastic SOLO® soufflé cups (SOLO® Cup Company, Lake
Forest, IL) with randomized three-digit codes and cupped. Cheese samples were kept at
37ºF overnight prior to testing, and samples were kept refrigerated until 30 minutes
before testing, at which point samples were kept at room temperature (72 ºF) and were
107
served to subjects at this adjusted temperature. Samples were presented in a William’s
design, where sample order was randomized within and across subjects.
5.2.3. Subjects
Participants for this study were recruited by email and flyers; subjects were
selected for testing based upon their willingness to consume low sodium string cheese,
frequently consuming mozzarella cheese, consuming a nutritional alternative dairy
product (including low fat cheese, ice cream, milk or low/reduced sodium cheese), and
being a non-user of Crest-Pro health products. Once selected for testing, subjects were
asked to complete “homework” prior to arriving to the testing site. For “homework”,
participants were given a poster board with 12 sections, each with a unique emotion word
with three to four associated adjectives; subjects were required to attach one image which
they found best represented each of the 12 emotion words. A total of 85 subjects (20.5 ±
2.5 years), including students, university staff, and community members participated in
the first day of testing with 65 females (76.5%) and 20 males (23.5) and 61 subjects
participated in the second day of testing with 48 females (79%) and 13 males (21%).
Subjects received a total of thirty-five dollars in gift cards for participating in the two
days of testing, with twenty-five dollars for the first day and ten dollars for the second
day.
5.2.4. Questionnaire and testing procedure
The questionnaire involved asking the subject their initial emotional state in a
choose-all-that-apply (CATA) format prior to consuming the sample, the twelve
emotions consisted of: caring, excited, sociable, self-confident, surprised, detached,
108
fatigued, inferior, judgmental, raging, sad, and fear, a “none of these” option was also
included. Emotions selected for testing were selected based upon previous research
(Thomson & Crocker, 2011) where hundreds of emotions were testing with consumers
across four countries to determine a more refined list of emotion testing words. All
subjects were instructed to use the images on their personal poster board to help elicit or
anchor the subject to the emotions listed. Subjects were then directed to consume and
score the hedonics of a given product, liking attributes included: overall flavor, saltiness,
texture, appearance, and aroma liking. Subjects were asked to score each hedonic
attribute when first consuming, halfway through consuming, and at the end of consuming
the product. Upon completing the hedonic portion, subjects entered their emotional state
after consuming the product, in the same format as presented for assessing the initial
emotions. Consumers were asked to comment on what aspect of the product they liked
the most before moving onto the next sample. A ten second delay occurred between each
sample where subjects were asked to rinse their palate with the provided drinking water
and unsalted crackers to help decrease carryover and sensory fatigue. Testing was
performed using Compusense® at-hand.
On average, subjects were able to complete the test in 20 minutes. Testing was
conducted in an open lab, where subjects were not in sensory booths but rather dispersed
around a “U” shaped table; subjects were monitored to reduce noise or conversations
between subjects. Sensory testing was implemented at California Polytechnic State
University - San Luis Obispo, and was performed twice with the same subjects with the
second day of testing occurring 20 days after the first day of testing. Subject selection and
109
sensory testing procedures were reviewed and approved by the California Polytechnic
State University - San Luis Obispo Institutional Review Board prior to testing.
5.2.5. Texture Analysis
Upon completion of all sensory testing, instrumental texture analysis of all eight
cheese variables was performed using the TA-XT2 Texture Analyzer (Texture
Technology Corporation, Scarsdale, NY). Cheese samples were cut into two centimeter
cubes, and covered and refrigerated for four hours prior to testing. Cheese samples were
left out at room temperature (72ºF) for 30 minutes prior to analysis and sample analysis
order was randomized. The texture profile analysis (TPA) method was used for testing
the eight cheese variables, and each cheese variable was tested five times. The TPA
method traditionally measures the following attributes: fracturability, hardness,
cohesiveness, adhesiveness, springiness, gumminess, and chewiness (Bourne, 1978); data
for measuring all TPA attributes were captured, expect for fracturability and
adhesiveness. Pons and Fiszman (1996) state the definitions for each of the five tested
TPA attributes as defined previously by Bourne (1978) as:
• Hardness is “the peak force during the first compression cycle” (“first bite”).
• Cohesiveness is “the ratio of the positive force area during the second
compression portion to that during the first compression…”
• Springiness is “the height that the food recovers during the time that elapses
between the end of the first bite and the start of the second bite.”
• Gumminess is “hardness X cohesiveness.”
• Chewiness is “gumminess X springiness.”
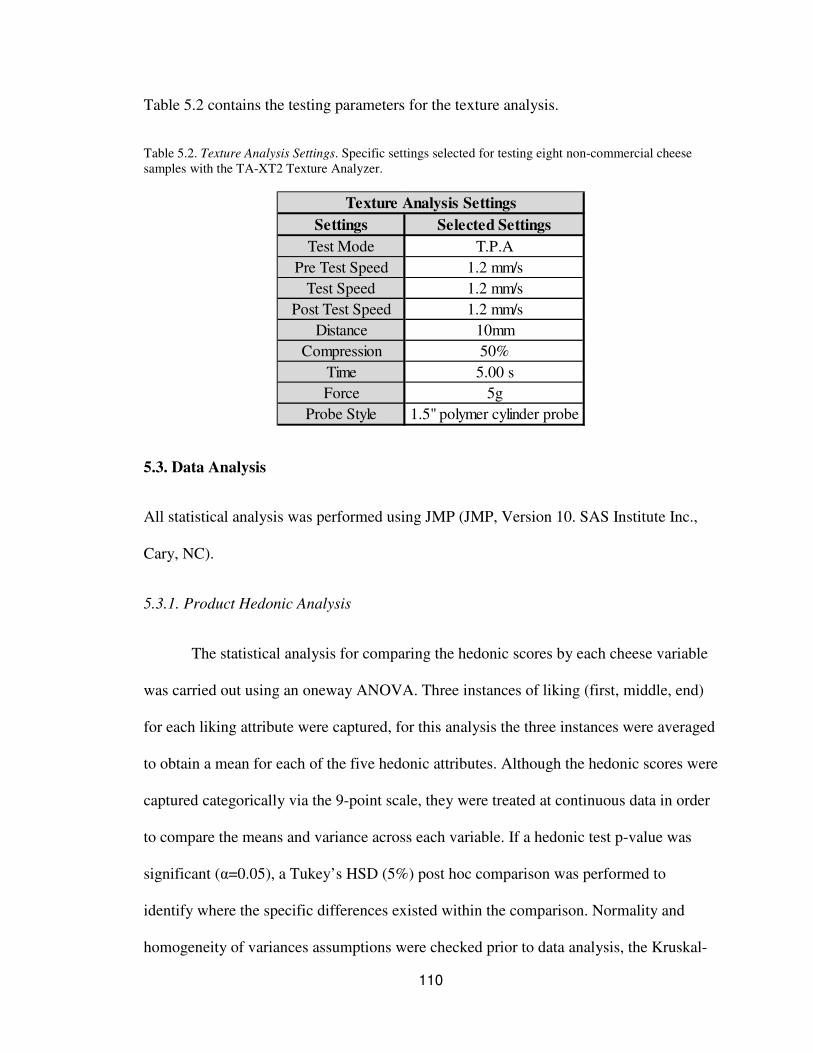
110
Table 5.2 contains the testing parameters for the texture analysis.
Table 5.2. Texture Analysis Settings. Specific settings selected for testing eight non-commercial cheese
samples with the TA-XT2 Texture Analyzer.
Settings Selected Settings
Test Mode T.P.A
Pre Test Speed 1.2 mm/s
Test Speed 1.2 mm/s
Post Test Speed 1.2 mm/s
Distance 10mm
Compression 50%
Time 5.00 s
Force 5g
Probe Style 1.5" polymer cylinder probe
Texture Analysis Settings
5.3. Data Analysis
All statistical analysis was performed using JMP (JMP, Version 10. SAS Institute Inc.,
Cary, NC).
5.3.1. Product Hedonic Analysis
The statistical analysis for comparing the hedonic scores by each cheese variable
was carried out using an oneway ANOVA. Three instances of liking (first, middle, end)
for each liking attribute were captured, for this analysis the three instances were averaged
to obtain a mean for each of the five hedonic attributes. Although the hedonic scores were
captured categorically via the 9-point scale, they were treated at continuous data in order
to compare the means and variance across each variable. If a hedonic test p-value was
significant (α=0.05), a Tukey’s HSD (5%) post hoc comparison was performed to
identify where the specific differences existed within the comparison. Normality and
homogeneity of variances assumptions were checked prior to data analysis, the Kruskal-
111
Wallis ranked sum test was used for analysis of data when the normality assumption was
not met and Welch’s test was used for data which did not meet the homogeneity of
variances assumption (p-value <0.01).
5.3.2. Comparison of First, Middle and End Liking Scores
In order to understand how the liking scores changed across the eating experience,
an oneway ANOVA was employed to compare the change in each hedonic attribute
(overall flavor, saltiness, texture, appearance, and aroma) between the first, middle, and
last hedonic scores; the first, middle, and last hedonic scores were compared within each
of the five different hedonic attributes. A global p-value of less than 0.05 justified a
Tukey’s HSD post hoc comparison for identifying which hedonic time points were
significantly different (5%). Normality and homogeneity of variance assumptions were
checked, and the Kruskal-Wallis ranked sum test for concerns with normality and
Welch’s test for issues with unequal variances were used when necessary.
5.3.3. Liking Score Change between Day 1 and Day 2
For assessing the changes in liking scores between the two days of testing, the
average of the three time points for each hedonic attribute were calculated for both days.
The average for each hedonic attribute from day one was compared to the average of the
same hedonic attributes in day two by way of a two factor analysis of variance comparing
each average hedonic attribute by day and cheese variable; possible interactions between
day and cheese variable were also explored. P-values less than 0.05 were considered
significantly different and thus a significant change in the average hedonic score of the
given hedonic attribute occurred between the two days. Normality and homogeneity of
112
variances assumptions were checked, and where appropriate the Wilcoxon signed ranked
test and Welch’s test p-values and test statistics were utilized.
5.3.4. Comparison of Each Change in Emotion by Cheese Variable
To analyze the change in emotion, the first emotion score was subtracted from the
end emotion score for each of the emotions; an oneway ANOVA was used for comparing
the change in each emotion across the eight cheese variables. Although the emotion
scores were captured as categorical data, they were analyzed as continuous to evaluate
the direction of the emotion change and that relationship to the type of emotion (positive,
negative, or neutral) being assessed and to the cheese product. Considering the issues
which may occur when analyzing categorical data as continuous, the Kruskal-Wallis rank
sum test was used for all emotion data to help alleviate concerns with the lack of
normality in the data. Given the lack of normality in this data, the Brown-Forsythe p-
value was used for assessing equality of variances due to its decreased sensitivity to non-
normal data compared to the Levene’s test, p-values less than 0.01 were considered
unequal. Tests with Kruskal-Wallis p-values less than 0.05 were considered significant
and the Steel-Dwass all pairs nonparametric post hoc comparison at (α=0.05) was used
for determining which specific cheese samples differed by change in each emotion. Note:
the Steel-Dwass all pairs post hoc comparison is the nonparametric equivalent to the
Tukey’s HSD all pairs comparison, and takes into consideration the family-wise error
rate (JMP, 2012).
113
5.3.5. Comparison of First Emotion Scores to End Emotion Scores
For both days of testing, the first emotional responses for each emotion were
compared to the end emotional responses by way of a matched pairs analysis, considering
the lack of independence between the two groups. The emotion data was analyzed as
continuous data, and to help with issues of non-normality the Wilcoxon signed rank test
was used for analysis. Comparisons with p-values less than 0.05 were considered
significantly different, and thus suggesting a significant change in a given emotion had
occurred across the eating experience. The Brown-Forsythe p-value was used for
assessing equality of variances between the groups (p-value < 0.01).
5.3.6. Emotional Changes between Day 1 and Day 2
In order to assess if any significant changes in emotion occurred between the two
days of testing, the change in emotion (end – first) for each emotion from the first day
was compared to the changes in emotion from the second day by way of a matched pairs
analysis. The Wilcoxon signed rank test was used with a significance level of α=0.05,
thus emotion comparisons with p-values less than this criteria were considered
significantly different and suggested a significant change in emotion between the two
days of testing. The Brown-Forsythe (p-values < 0.01) was used for assessing
homogeneity of variances.
5.3.7. Comparison of Change in Emotion by Gender
All emotional changes (end - first) were compared between men and women, and
for both days of testing. A MANOVA was performed comparing the change in all
emotions by gender for both days; given a significant global p-value, additional
114
investigation to determine which emotions differed significantly by gender was
implemented. Each change in emotion was considered continuous, and the Wilcoxon
rank test was used for the ANOVAs at α=0.05; change in emotion by gender comparisons
with p-values less than 0.05 were considered significantly different and thus one gender
had different changes in an emotion compared to the other gender. The Brown-Forsythe
(p-values < 0.01) was used for assessing homogeneity of variances.
5.3.8. Texture Analysis
Each of the five TPA attributes: hardness, cohesiveness, springiness, gumminess,
and chewiness, were compared across the eight cheese variables in an oneway ANOVA;
homogeneity of variances and normality assumptions were checked prior to interpretation
of results. The Welch’s test was used for interpreting results of tests which did not meet
the homogeneity of variances assumption, and the Kruskal-Wallis test was used for tests
which did not meet the normality assumption. P-values less than 0.05 were considered
significantly different and the Steel-Dwass all-pairs post hoc comparison was performed
to determine which samples were significantly different from one another (α=0.05). If the
data met the normality assumption, Tukey’s HSD method was used for post hoc
comparisons.
5.4. Results
5.4.1. Product Hedonic Analysis
When comparing the average liking of the five hedonic attributes by the eight
cheese variables for the first day of testing, a significant difference was determined in
overall flavor liking (F 7, 286.88 = 54.4, P< 0.0001), saltiness liking (F7, 672 = 27.4, P<
115
0.0001), texture liking (F7, 672 = 23.5, P< 0.0001), appearance liking (Chi-Sq 7 = 35.9, P <
0.0001), and aroma liking (Chi-Sq 7 = 57.3, P<0.0001). Due to issues with homogeneity
of variances, Welch’s test was used for overall flavor liking and due to issues with
normality the Kruskal-Wallis test was used for appearance liking and aroma liking. The
post hoc comparison for the first day can be seen in Table 5.3 for all significant
attributes: overall flavor liking, saltiness liking, texture liking, appearance liking, and
aroma liking; variables which do not share difference letters are significantly different
(5%).
For the second day of testing, significant differences were observed for overall
flavor liking (F7,480 = 28.5, P< 0.0001), saltiness liking (F7,480 = 20.5, P< 0.0001), texture
liking (F7,480 = 18.2, P< 0.0001), appearance liking (Chi-Sq 7 = 50.5, P< 0.0001), and
aroma liking (Chi-Sq 7 = 55.8, P< 0.0001). Due to issues with normality the Kruskal-
Wallis test was used for appearance liking and aroma liking. The post hoc comparison for
the second day can be seen in Table 5.4 for all significant hedonic attributes; variables
which do not share difference letters are significantly different (5%).
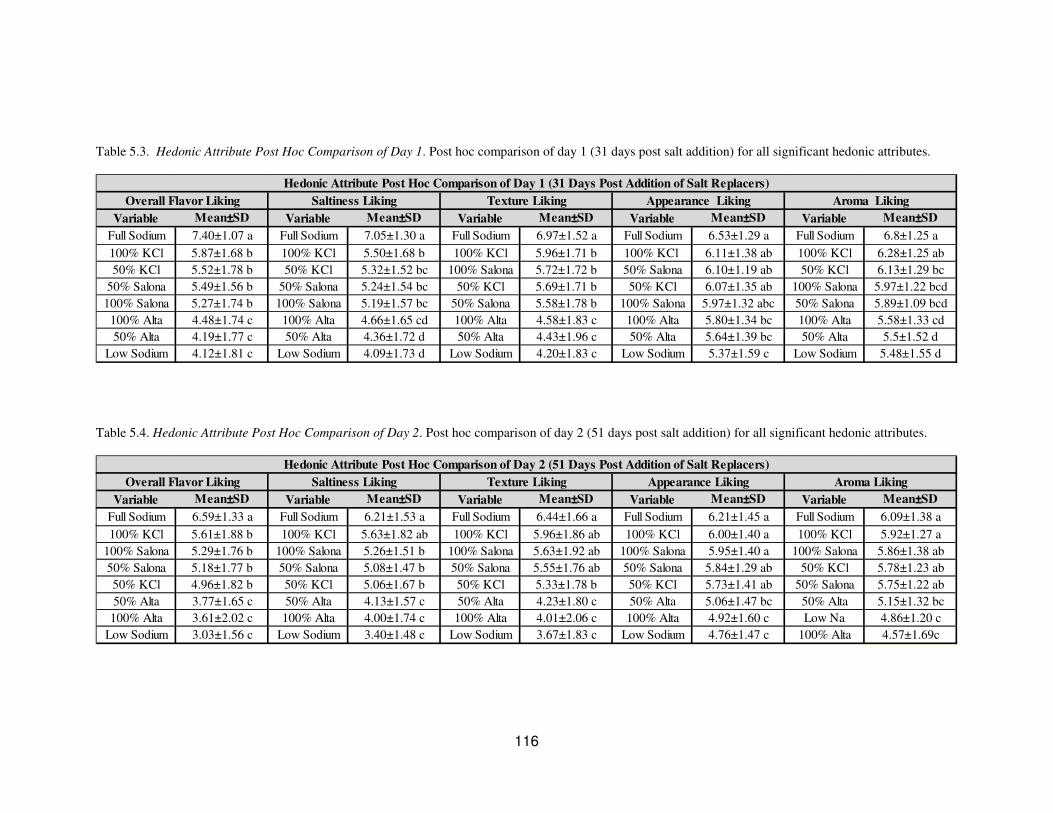
116
Table 5.3. Hedonic Attribute Post Hoc Comparison of Day 1. Post hoc comparison of day 1 (31 days post salt addition) for all significant hedonic attributes.
Variable Mean±SD Variable Mean±SD Variable Mean±SD Variable Mean±SD Variable Mean±SD
Full Sodium 7.40±1.07 a Full Sodium 7.05±1.30 a Full Sodium 6.97±1.52 a Full Sodium 6.53±1.29 a Full Sodium 6.8±1.25 a
100% KCl 5.87±1.68 b 100% KCl 5.50±1.68 b 100% KCl 5.96±1.71 b 100% KCl 6.11±1.38 ab 100% KCl 6.28±1.25 ab
50% KCl 5.52±1.78 b 50% KCl 5.32±1.52 bc 100% Salona 5.72±1.72 b 50% Salona 6.10±1.19 ab 50% KCl 6.13±1.29 bc
50% Salona 5.49±1.56 b 50% Salona 5.24±1.54 bc 50% KCl 5.69±1.71 b 50% KCl 6.07±1.35 ab 100% Salona 5.97±1.22 bcd
100% Salona 5.27±1.74 b 100% Salona 5.19±1.57 bc 50% Salona 5.58±1.78 b 100% Salona 5.97±1.32 abc 50% Salona 5.89±1.09 bcd
100% Alta 4.48±1.74 c 100% Alta 4.66±1.65 cd 100% Alta 4.58±1.83 c 100% Alta 5.80±1.34 bc 100% Alta 5.58±1.33 cd
50% Alta 4.19±1.77 c 50% Alta 4.36±1.72 d 50% Alta 4.43±1.96 c 50% Alta 5.64±1.39 bc 50% Alta 5.5±1.52 d
Low Sodium 4.12±1.81 c Low Sodium 4.09±1.73 d Low Sodium 4.20±1.83 c Low Sodium 5.37±1.59 c Low Sodium 5.48±1.55 d
Overall Flavor Liking
Hedonic Attribute Post Hoc Comparison of Day 1 (31 Days Post Addition of Salt Replacers)
Saltiness Liking Texture Liking Appearance Liking Aroma Liking
Table 5.4. Hedonic Attribute Post Hoc Comparison of Day 2. Post hoc comparison of day 2 (51 days post salt addition) for all significant hedonic attributes.
Variable Mean±SD Variable Mean±SD Variable Mean±SD Variable Mean±SD Variable Mean±SD
Full Sodium 6.59±1.33 a Full Sodium 6.21±1.53 a Full Sodium 6.44±1.66 a Full Sodium 6.21±1.45 a Full Sodium 6.09±1.38 a
100% KCl 5.61±1.88 b 100% KCl 5.63±1.82 ab 100% KCl 5.96±1.86 ab 100% KCl 6.00±1.40 a 100% KCl 5.92±1.27 a
100% Salona 5.29±1.76 b 100% Salona 5.26±1.51 b 100% Salona 5.63±1.92 ab 100% Salona 5.95±1.40 a 100% Salona 5.86±1.38 ab
50% Salona 5.18±1.77 b 50% Salona 5.08±1.47 b 50% Salona 5.55±1.76 ab 50% Salona 5.84±1.29 ab 50% KCl 5.78±1.23 ab
50% KCl 4.96±1.82 b 50% KCl 5.06±1.67 b 50% KCl 5.33±1.78 b 50% KCl 5.73±1.41 ab 50% Salona 5.75±1.22 ab
50% Alta 3.77±1.65 c 50% Alta 4.13±1.57 c 50% Alta 4.23±1.80 c 50% Alta 5.06±1.47 bc 50% Alta 5.15±1.32 bc
100% Alta 3.61±2.02 c 100% Alta 4.00±1.74 c 100% Alta 4.01±2.06 c 100% Alta 4.92±1.60 c Low Na 4.86±1.20 c
Low Sodium 3.03±1.56 c Low Sodium 3.40±1.48 c Low Sodium 3.67±1.83 c Low Sodium 4.76±1.47 c 100% Alta 4.57±1.69c
Hedonic Attribute Post Hoc Comparison of Day 2 (51 Days Post Addition of Salt Replacers)
Aroma LikingOverall Flavor Liking Saltiness Liking Texture Liking Appearance Liking
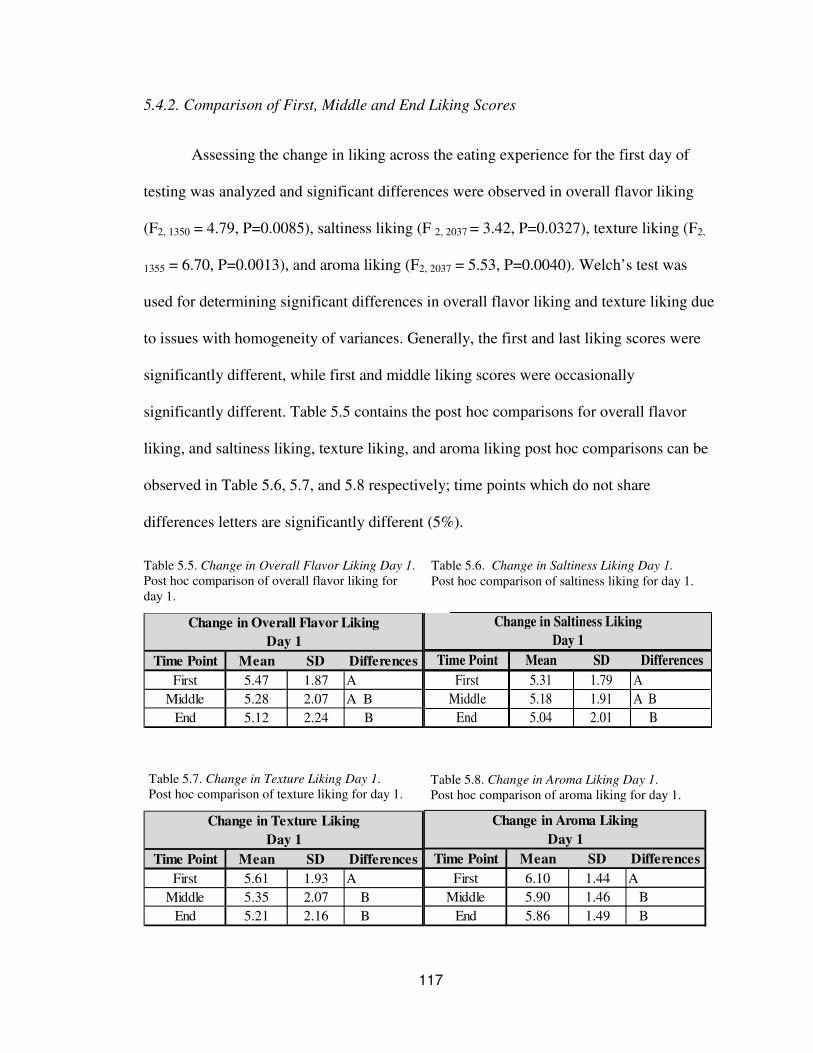
117
5.4.2. Comparison of First, Middle and End Liking Scores
Assessing the change in liking across the eating experience for the first day of
testing was analyzed and significant differences were observed in overall flavor liking
(F2, 1350 = 4.79, P=0.0085), saltiness liking (F 2, 2037 = 3.42, P=0.0327), texture liking (F2,
1355 = 6.70, P=0.0013), and aroma liking (F2, 2037 = 5.53, P=0.0040). Welch’s test was
used for determining significant differences in overall flavor liking and texture liking due
to issues with homogeneity of variances. Generally, the first and last liking scores were
significantly different, while first and middle liking scores were occasionally
significantly different. Table 5.5 contains the post hoc comparisons for overall flavor
liking, and saltiness liking, texture liking, and aroma liking post hoc comparisons can be
observed in Table 5.6, 5.7, and 5.8 respectively; time points which do not share
differences letters are significantly different (5%).
Time Point Mean SD Differences
First 5.47 1.87 A
Middle 5.28 2.07 A B
End 5.12 2.24 B
Change in Overall Flavor Liking
Day 1
Time Point Mean SD Differences
First 5.31 1.79 A
Middle 5.18 1.91 A B
End 5.04 2.01 B
Day 1
Change in Saltiness Liking
Time Point Mean SD Differences
First 5.61 1.93 A
Middle 5.35 2.07 B
End 5.21 2.16 B
Change in Texture Liking
Day 1
Time Point Mean SD Differences
First 6.10 1.44 A
Middle 5.90 1.46 B
End 5.86 1.49 B
Day 1
Change in Aroma Liking
Table 5.5. Change in Overall Flavor Liking Day 1.
Post hoc comparison of overall flavor liking for
day 1.
Table 5.7. Change in Texture Liking Day 1.
Post hoc comparison of texture liking for day 1. Table 5.8. Change in Aroma Liking Day 1.
Post hoc comparison of aroma liking for day 1.
Table 5.6. Change in Saltiness Liking Day 1.
Post hoc comparison of saltiness liking for day 1.
118
For the second day of testing, liking scores across the eating experience were
analyzed and no significant differences (α=0.05) between first, middle, and end liking
were observed in any of the five hedonic attributes.
5.4.3. Liking Score Change between Day 1 and Day 2
A two factor (day and cheese variable) analysis of variance of average overall
flavor liking revealed main effects for day (F1, 1344 = 16.6, P<0.0001), and cheese variable
(F7, 1344 = 75.6, P<0.0001), but no significant day by cheese variable interaction (F7, 1344 =
0.4788, P=0.8504) was observed. The two factor analysis for average salty liking
revealed a significant main effect for day (F1, 1344 = 8.82, P=0.0030) and cheese variable
(F7, 1344 = 53.53, P<0.0001), but no significant day by cheese variable interaction (F7, 1344
= 0.6339, P=0.7281). The two factor analysis for average texture liking indicated a
significant main effect for cheese variable (F7, 1344 = 47.5, P<0.0001), but no significant
main effects for day (F1, 1344 = 1.60, P=0.2059) or day by cheese variable interaction (F7,
1344 = 0.1622, P=0.9923) were observed. The factorial analysis for average appearance
liking indicated a significant main effect for cheese variable (F7, 1344 = 12.37, P<0.0001),
but no significant main effect for day (F1, 1344 = 2.6019, P=0.1070) or significant
interaction (F7, 1344 = 0.7347, P= 0.6424) were observed. The two factor analysis for
average aroma liking revealed a significant main effect for day (F1, 1344 = 16.39,
P<0.0001) and cheese variable (F7, 1344 = 21.77, P<0.0001), but no significant day by
cheese variable interaction (F7, 1344 = 1.57, P=0.1400) was observed. When a significant
main effect for day was observed, the first day of testing had a higher mean score
compared to the second day of testing (Table 5.9).
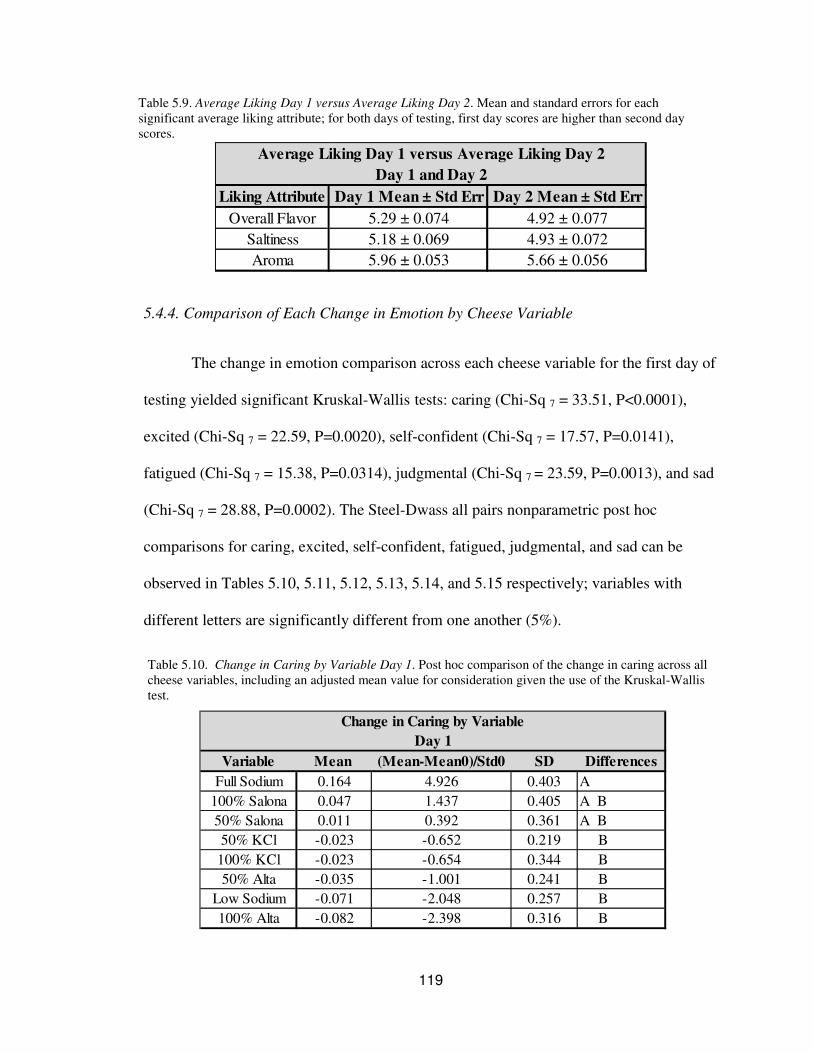
119
Table 5.9. Average Liking Day 1 versus Average Liking Day 2. Mean and standard errors for each
significant average liking attribute; for both days of testing, first day scores are higher than second day
scores.
Liking Attribute Day 1 Mean ± Std Err Day 2 Mean ± Std Err
Overall Flavor 5.29 ± 0.074 4.92 ± 0.077
Saltiness 5.18 ± 0.069 4.93 ± 0.072
Aroma 5.96 ± 0.053 5.66 ± 0.056
Average Liking Day 1 versus Average Liking Day 2
Day 1 and Day 2
5.4.4. Comparison of Each Change in Emotion by Cheese Variable
The change in emotion comparison across each cheese variable for the first day of
testing yielded significant Kruskal-Wallis tests: caring (Chi-Sq 7 = 33.51, P<0.0001),
excited (Chi-Sq 7 = 22.59, P=0.0020), self-confident (Chi-Sq 7 = 17.57, P=0.0141),
fatigued (Chi-Sq 7 = 15.38, P=0.0314), judgmental (Chi-Sq 7 = 23.59, P=0.0013), and sad
(Chi-Sq 7 = 28.88, P=0.0002). The Steel-Dwass all pairs nonparametric post hoc
comparisons for caring, excited, self-confident, fatigued, judgmental, and sad can be
observed in Tables 5.10, 5.11, 5.12, 5.13, 5.14, and 5.15 respectively; variables with
different letters are significantly different from one another (5%).
Variable Mean (Mean-Mean0)/Std0 SD Differences
Full Sodium 0.164 4.926 0.403 A
100% Salona 0.047 1.437 0.405 A B
50% Salona 0.011 0.392 0.361 A B
50% KCl -0.023 -0.652 0.219 B
100% KCl -0.023 -0.654 0.344 B
50% Alta -0.035 -1.001 0.241 B
Low Sodium -0.071 -2.048 0.257 B
100% Alta -0.082 -2.398 0.316 B
Change in Caring by Variable
Day 1
Table 5.10. Change in Caring by Variable Day 1. Post hoc comparison of the change in caring across all
cheese variables, including an adjusted mean value for consideration given the use of the Kruskal-Wallis
test.
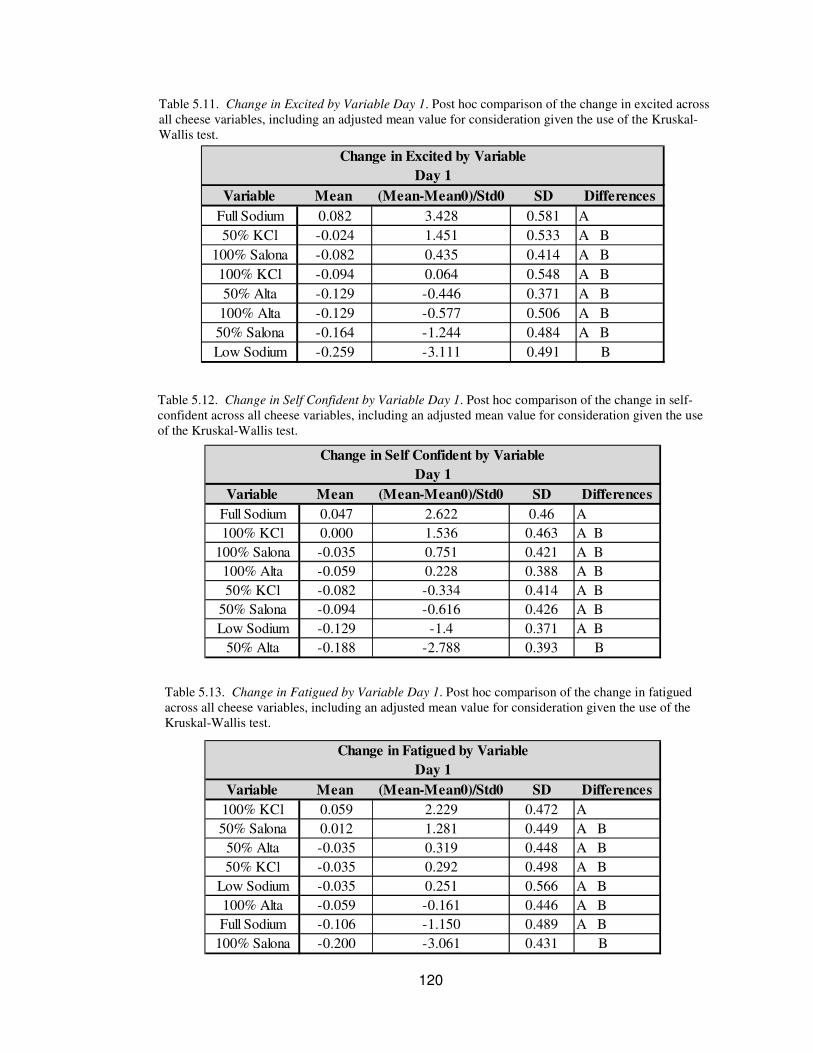
120
Table 5.11. Change in Excited by Variable Day 1. Post hoc comparison of the change in excited across
all cheese variables, including an adjusted mean value for consideration given the use of the Kruskal-
Wallis test.
Variable Mean (Mean-Mean0)/Std0 SD Differences
Full Sodium 0.082 3.428 0.581 A
50% KCl -0.024 1.451 0.533 A B
100% Salona -0.082 0.435 0.414 A B
100% KCl -0.094 0.064 0.548 A B
50% Alta -0.129 -0.446 0.371 A B
100% Alta -0.129 -0.577 0.506 A B
50% Salona -0.164 -1.244 0.484 A B
Low Sodium -0.259 -3.111 0.491 B
Change in Excited by Variable
Day 1
Variable Mean (Mean-Mean0)/Std0 SD Differences
Full Sodium 0.047 2.622 0.46 A
100% KCl 0.000 1.536 0.463 A B
100% Salona -0.035 0.751 0.421 A B
100% Alta -0.059 0.228 0.388 A B
50% KCl -0.082 -0.334 0.414 A B
50% Salona -0.094 -0.616 0.426 A B
Low Sodium -0.129 -1.4 0.371 A B
50% Alta -0.188 -2.788 0.393 B
Change in Self Confident by Variable
Day 1
Variable Mean (Mean-Mean0)/Std0 SD Differences
100% KCl 0.059 2.229 0.472 A
50% Salona 0.012 1.281 0.449 A B
50% Alta -0.035 0.319 0.448 A B
50% KCl -0.035 0.292 0.498 A B
Low Sodium -0.035 0.251 0.566 A B
100% Alta -0.059 -0.161 0.446 A B
Full Sodium -0.106 -1.150 0.489 A B
100% Salona -0.200 -3.061 0.431 B
Change in Fatigued by Variable
Day 1
Table 5.12. Change in Self Confident by Variable Day 1. Post hoc comparison of the change in self-
confident across all cheese variables, including an adjusted mean value for consideration given the use
of the Kruskal-Wallis test.
Table 5.13. Change in Fatigued by Variable Day 1. Post hoc comparison of the change in fatigued
across all cheese variables, including an adjusted mean value for consideration given the use of the
Kruskal-Wallis test.
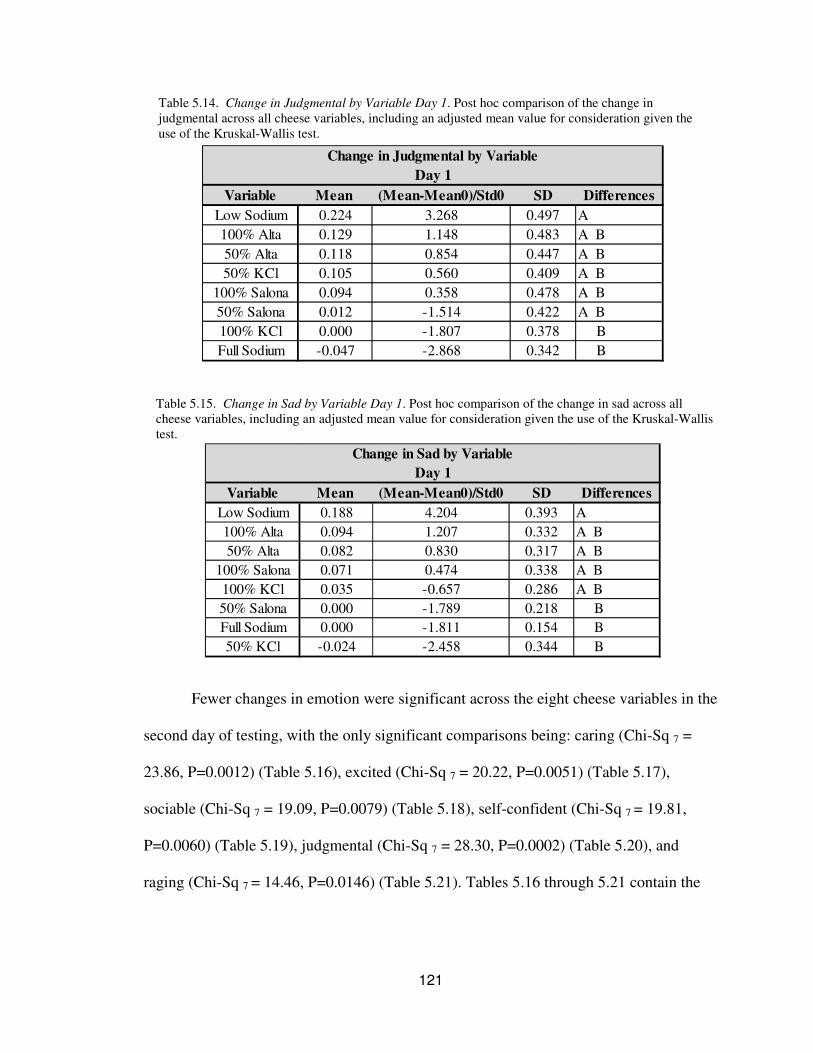
121
Table 5.14. Change in Judgmental by Variable Day 1. Post hoc comparison of the change in
judgmental across all cheese variables, including an adjusted mean value for consideration given the
use of the Kruskal-Wallis test.
Table 5.15. Change in Sad by Variable Day 1. Post hoc comparison of the change in sad across all
cheese variables, including an adjusted mean value for consideration given the use of the Kruskal-Wallis
test.
Variable Mean (Mean-Mean0)/Std0 SD Differences
Low Sodium 0.224 3.268 0.497 A
100% Alta 0.129 1.148 0.483 A B
50% Alta 0.118 0.854 0.447 A B
50% KCl 0.105 0.560 0.409 A B
100% Salona 0.094 0.358 0.478 A B
50% Salona 0.012 -1.514 0.422 A B
100% KCl 0.000 -1.807 0.378 B
Full Sodium -0.047 -2.868 0.342 B
Change in Judgmental by Variable
Day 1
Variable Mean (Mean-Mean0)/Std0 SD Differences
Low Sodium 0.188 4.204 0.393 A
100% Alta 0.094 1.207 0.332 A B
50% Alta 0.082 0.830 0.317 A B
100% Salona 0.071 0.474 0.338 A B
100% KCl 0.035 -0.657 0.286 A B
50% Salona 0.000 -1.789 0.218 B
Full Sodium 0.000 -1.811 0.154 B
50% KCl -0.024 -2.458 0.344 B
Change in Sad by Variable
Day 1
Fewer changes in emotion were significant across the eight cheese variables in the
second day of testing, with the only significant comparisons being: caring (Chi-Sq 7 =
23.86, P=0.0012) (Table 5.16), excited (Chi-Sq 7 = 20.22, P=0.0051) (Table 5.17),
sociable (Chi-Sq 7 = 19.09, P=0.0079) (Table 5.18), self-confident (Chi-Sq 7 = 19.81,
P=0.0060) (Table 5.19), judgmental (Chi-Sq 7 = 28.30, P=0.0002) (Table 5.20), and
raging (Chi-Sq 7 = 14.46, P=0.0146) (Table 5.21). Tables 5.16 through 5.21 contain the
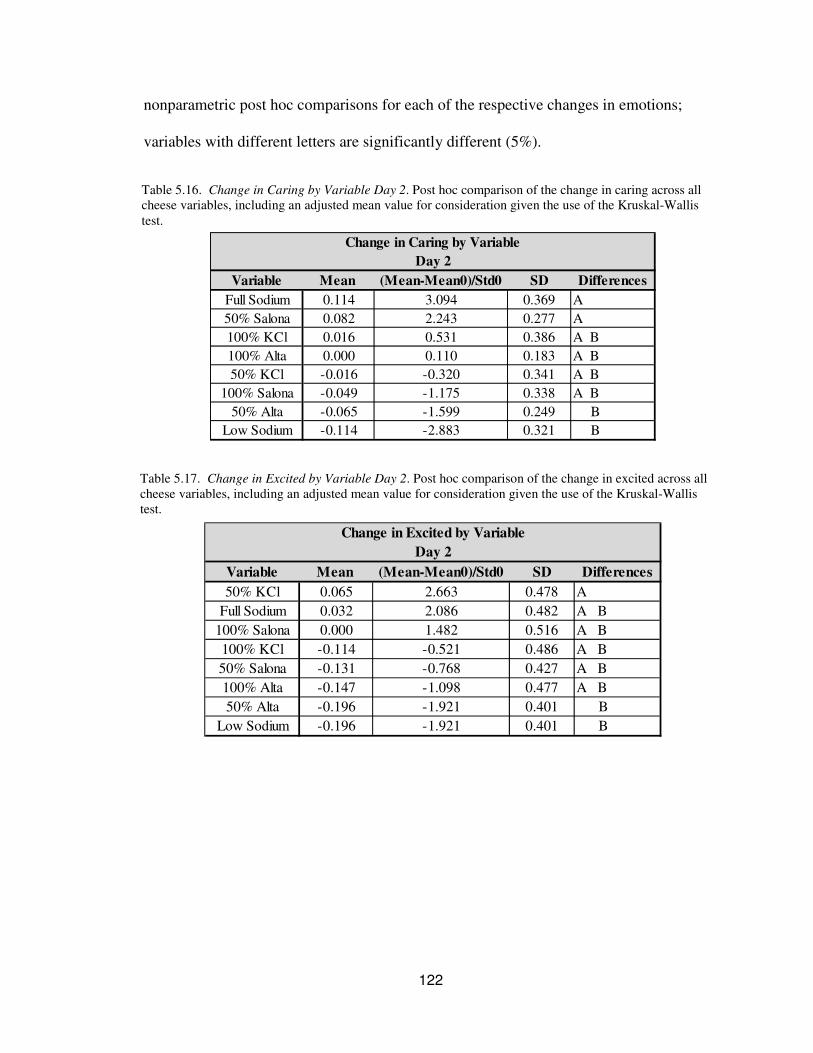
122
Table 5.16. Change in Caring by Variable Day 2. Post hoc comparison of the change in caring across all
cheese variables, including an adjusted mean value for consideration given the use of the Kruskal-Wallis
test.
Table 5.17. Change in Excited by Variable Day 2. Post hoc comparison of the change in excited across all
cheese variables, including an adjusted mean value for consideration given the use of the Kruskal-Wallis
test.
nonparametric post hoc comparisons for each of the respective changes in emotions;
variables with different letters are significantly different (5%).
Variable Mean (Mean-Mean0)/Std0 SD Differences
Full Sodium 0.114 3.094 0.369 A
50% Salona 0.082 2.243 0.277 A
100% KCl 0.016 0.531 0.386 A B
100% Alta 0.000 0.110 0.183 A B
50% KCl -0.016 -0.320 0.341 A B
100% Salona -0.049 -1.175 0.338 A B
50% Alta -0.065 -1.599 0.249 B
Low Sodium -0.114 -2.883 0.321 B
Change in Caring by Variable
Day 2
Variable Mean (Mean-Mean0)/Std0 SD Differences
50% KCl 0.065 2.663 0.478 A
Full Sodium 0.032 2.086 0.482 A B
100% Salona 0.000 1.482 0.516 A B
100% KCl -0.114 -0.521 0.486 A B
50% Salona -0.131 -0.768 0.427 A B
100% Alta -0.147 -1.098 0.477 A B
50% Alta -0.196 -1.921 0.401 B
Low Sodium -0.196 -1.921 0.401 B
Change in Excited by Variable
Day 2
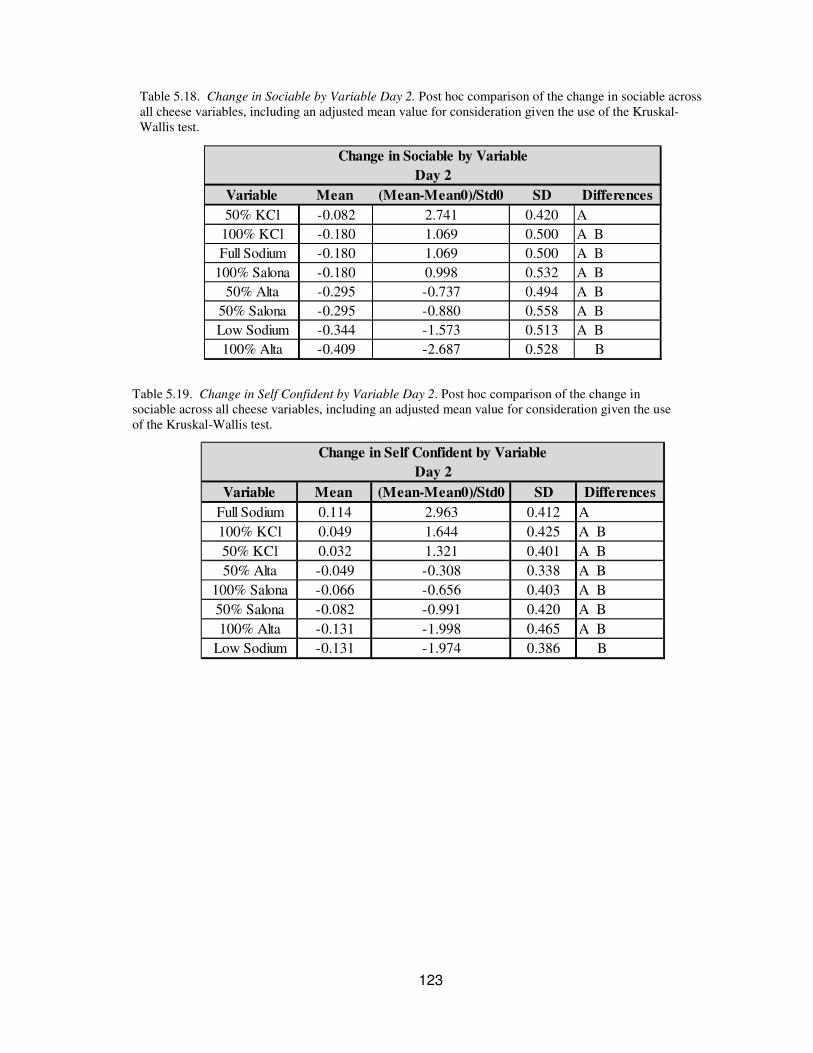
123
Table 5.18. Change in Sociable by Variable Day 2. Post hoc comparison of the change in sociable across
all cheese variables, including an adjusted mean value for consideration given the use of the Kruskal-
Wallis test.
Variable Mean (Mean-Mean0)/Std0 SD Differences
50% KCl -0.082 2.741 0.420 A
100% KCl -0.180 1.069 0.500 A B
Full Sodium -0.180 1.069 0.500 A B
100% Salona -0.180 0.998 0.532 A B
50% Alta -0.295 -0.737 0.494 A B
50% Salona -0.295 -0.880 0.558 A B
Low Sodium -0.344 -1.573 0.513 A B
100% Alta -0.409 -2.687 0.528 B
Change in Sociable by Variable
Day 2
Variable Mean (Mean-Mean0)/Std0 SD Differences
Full Sodium 0.114 2.963 0.412 A
100% KCl 0.049 1.644 0.425 A B
50% KCl 0.032 1.321 0.401 A B
50% Alta -0.049 -0.308 0.338 A B
100% Salona -0.066 -0.656 0.403 A B
50% Salona -0.082 -0.991 0.420 A B
100% Alta -0.131 -1.998 0.465 A B
Low Sodium -0.131 -1.974 0.386 B
Change in Self Confident by Variable
Day 2
Table 5.19. Change in Self Confident by Variable Day 2. Post hoc comparison of the change in
sociable across all cheese variables, including an adjusted mean value for consideration given the use
of the Kruskal-Wallis test.
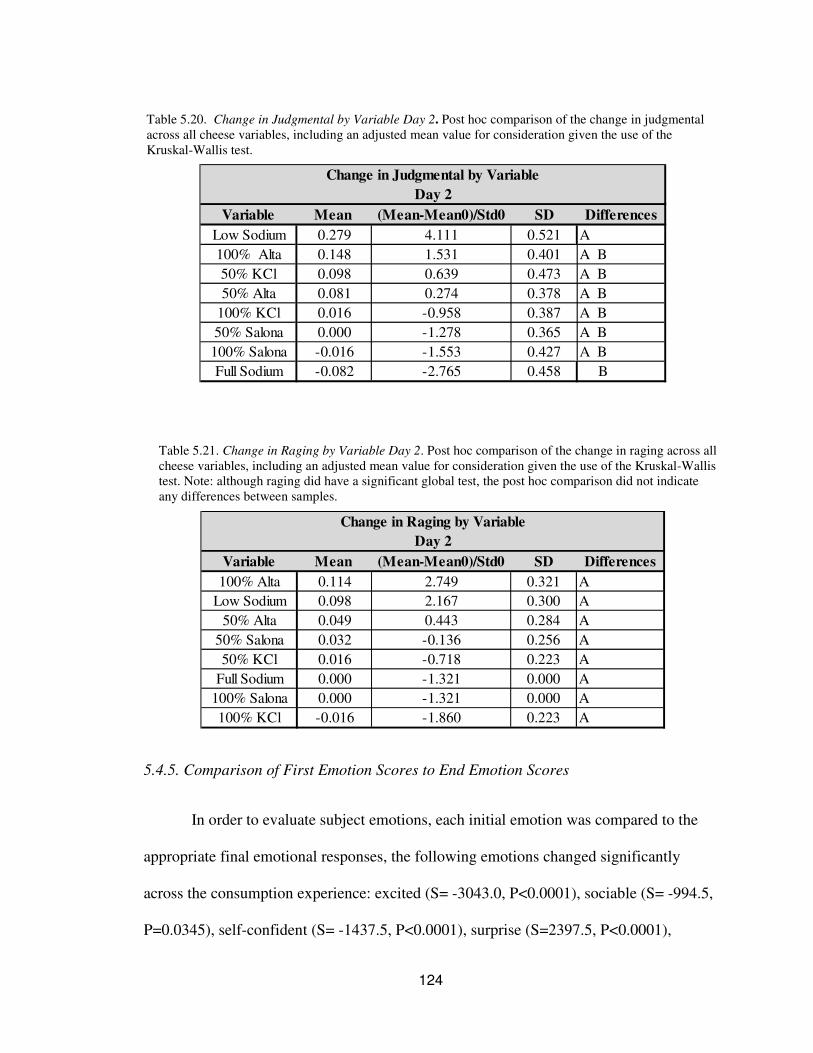
124
Table 5.20. Change in Judgmental by Variable Day 2. Post hoc comparison of the change in judgmental
across all cheese variables, including an adjusted mean value for consideration given the use of the
Kruskal-Wallis test.
Variable Mean (Mean-Mean0)/Std0 SD Differences
Low Sodium 0.279 4.111 0.521 A
100% Alta 0.148 1.531 0.401 A B
50% KCl 0.098 0.639 0.473 A B
50% Alta 0.081 0.274 0.378 A B
100% KCl 0.016 -0.958 0.387 A B
50% Salona 0.000 -1.278 0.365 A B
100% Salona -0.016 -1.553 0.427 A B
Full Sodium -0.082 -2.765 0.458 B
Change in Judgmental by Variable
Day 2
Variable Mean (Mean-Mean0)/Std0 SD Differences
100% Alta 0.114 2.749 0.321 A
Low Sodium 0.098 2.167 0.300 A
50% Alta 0.049 0.443 0.284 A
50% Salona 0.032 -0.136 0.256 A
50% KCl 0.016 -0.718 0.223 A
Full Sodium 0.000 -1.321 0.000 A
100% Salona 0.000 -1.321 0.000 A
100% KCl -0.016 -1.860 0.223 A
Change in Raging by Variable
Day 2
5.4.5. Comparison of First Emotion Scores to End Emotion Scores
In order to evaluate subject emotions, each initial emotion was compared to the
appropriate final emotional responses, the following emotions changed significantly
across the consumption experience: excited (S= -3043.0, P<0.0001), sociable (S= -994.5,
P=0.0345), self-confident (S= -1437.5, P<0.0001), surprise (S=2397.5, P<0.0001),
Table 5.21. Change in Raging by Variable Day 2. Post hoc comparison of the change in raging across all
cheese variables, including an adjusted mean value for consideration given the use of the Kruskal-Wallis
test. Note: although raging did have a significant global test, the post hoc comparison did not indicate
any differences between samples.
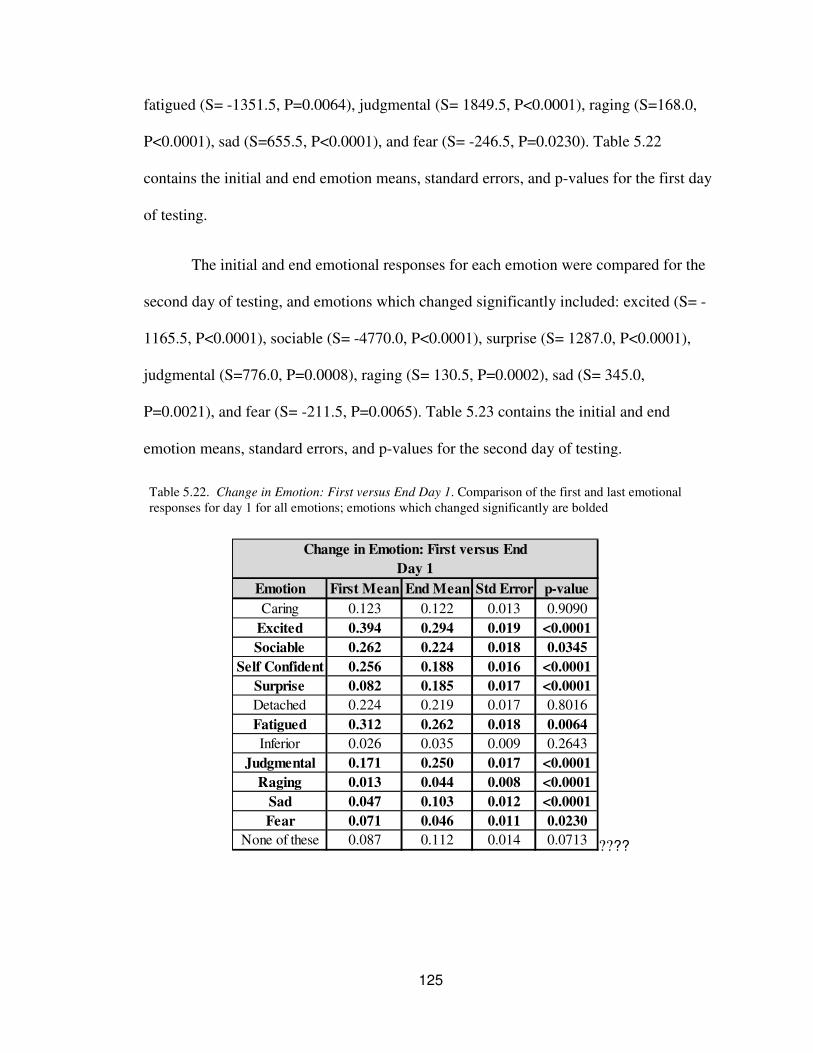
125
fatigued (S= -1351.5, P=0.0064), judgmental (S= 1849.5, P<0.0001), raging (S=168.0,
P<0.0001), sad (S=655.5, P<0.0001), and fear (S= -246.5, P=0.0230). Table 5.22
contains the initial and end emotion means, standard errors, and p-values for the first day
of testing.
The initial and end emotional responses for each emotion were compared for the
second day of testing, and emotions which changed significantly included: excited (S= -
1165.5, P<0.0001), sociable (S= -4770.0, P<0.0001), surprise (S= 1287.0, P<0.0001),
judgmental (S=776.0, P=0.0008), raging (S= 130.5, P=0.0002), sad (S= 345.0,
P=0.0021), and fear (S= -211.5, P=0.0065). Table 5.23 contains the initial and end
emotion means, standard errors, and p-values for the second day of testing.
Emotion First Mean End Mean Std Error p-value
Caring 0.123 0.122 0.013 0.9090
Excited 0.394 0.294 0.019 <0.0001
Sociable 0.262 0.224 0.018 0.0345
Self Confident 0.256 0.188 0.016 <0.0001
Surprise 0.082 0.185 0.017 <0.0001
Detached 0.224 0.219 0.017 0.8016
Fatigued 0.312 0.262 0.018 0.0064
Inferior 0.026 0.035 0.009 0.2643
Judgmental 0.171 0.250 0.017 <0.0001
Raging 0.013 0.044 0.008 <0.0001
Sad 0.047 0.103 0.012 <0.0001
Fear 0.071 0.046 0.011 0.0230
None of these 0.087 0.112 0.014 0.0713
Change in Emotion: First versus End
Day 1
????
Table 5.22. Change in Emotion: First versus End Day 1. Comparison of the first and last emotional
responses for day 1 for all emotions; emotions which changed significantly are bolded
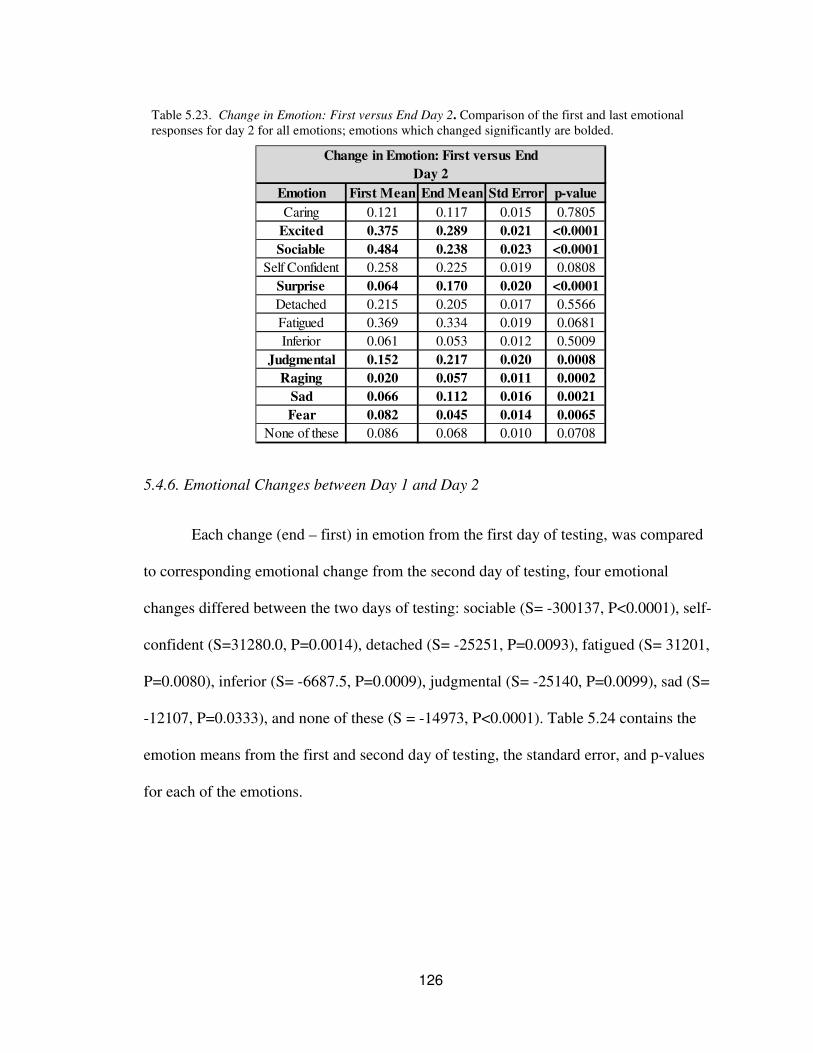
126
Emotion First Mean End Mean Std Error p-value
Caring 0.121 0.117 0.015 0.7805
Excited 0.375 0.289 0.021 <0.0001
Sociable 0.484 0.238 0.023 <0.0001
Self Confident 0.258 0.225 0.019 0.0808
Surprise 0.064 0.170 0.020 <0.0001
Detached 0.215 0.205 0.017 0.5566
Fatigued 0.369 0.334 0.019 0.0681
Inferior 0.061 0.053 0.012 0.5009
Judgmental 0.152 0.217 0.020 0.0008
Raging 0.020 0.057 0.011 0.0002
Sad 0.066 0.112 0.016 0.0021
Fear 0.082 0.045 0.014 0.0065
None of these 0.086 0.068 0.010 0.0708
Change in Emotion: First versus End
Day 2
5.4.6. Emotional Changes between Day 1 and Day 2
Each change (end – first) in emotion from the first day of testing, was compared
to corresponding emotional change from the second day of testing, four emotional
changes differed between the two days of testing: sociable (S= -300137, P<0.0001), self-
confident (S=31280.0, P=0.0014), detached (S= -25251, P=0.0093), fatigued (S= 31201,
P=0.0080), inferior (S= -6687.5, P=0.0009), judgmental (S= -25140, P=0.0099), sad (S=
-12107, P=0.0333), and none of these (S = -14973, P<0.0001). Table 5.24 contains the
emotion means from the first and second day of testing, the standard error, and p-values
for each of the emotions.
Table 5.23. Change in Emotion: First versus End Day 2. Comparison of the first and last emotional
responses for day 2 for all emotions; emotions which changed significantly are bolded.
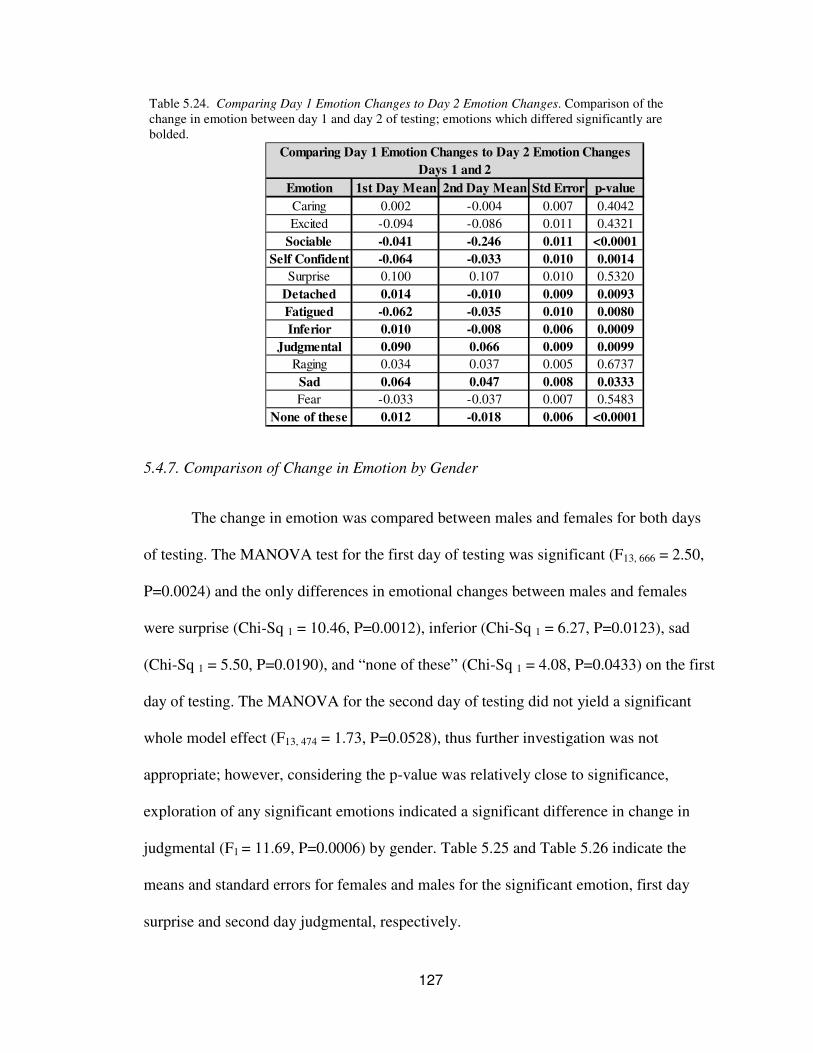
127
Emotion 1st Day Mean 2nd Day Mean Std Error p-value
Caring 0.002 -0.004 0.007 0.4042
Excited -0.094 -0.086 0.011 0.4321
Sociable -0.041 -0.246 0.011 <0.0001
Self Confident -0.064 -0.033 0.010 0.0014
Surprise 0.100 0.107 0.010 0.5320
Detached 0.014 -0.010 0.009 0.0093
Fatigued -0.062 -0.035 0.010 0.0080
Inferior 0.010 -0.008 0.006 0.0009
Judgmental 0.090 0.066 0.009 0.0099
Raging 0.034 0.037 0.005 0.6737
Sad 0.064 0.047 0.008 0.0333
Fear -0.033 -0.037 0.007 0.5483
None of these 0.012 -0.018 0.006 <0.0001
Comparing Day 1 Emotion Changes to Day 2 Emotion Changes
Days 1 and 2
5.4.7. Comparison of Change in Emotion by Gender
The change in emotion was compared between males and females for both days
of testing. The MANOVA test for the first day of testing was significant (F13, 666 = 2.50,
P=0.0024) and the only differences in emotional changes between males and females
were surprise (Chi-Sq 1 = 10.46, P=0.0012), inferior (Chi-Sq 1 = 6.27, P=0.0123), sad
(Chi-Sq 1 = 5.50, P=0.0190), and “none of these” (Chi-Sq 1 = 4.08, P=0.0433) on the first
day of testing. The MANOVA for the second day of testing did not yield a significant
whole model effect (F13, 474 = 1.73, P=0.0528), thus further investigation was not
appropriate; however, considering the p-value was relatively close to significance,
exploration of any significant emotions indicated a significant difference in change in
judgmental (F1 = 11.69, P=0.0006) by gender. Table 5.25 and Table 5.26 indicate the
means and standard errors for females and males for the significant emotion, first day
surprise and second day judgmental, respectively.
Table 5.24. Comparing Day 1 Emotion Changes to Day 2 Emotion Changes. Comparison of the
change in emotion between day 1 and day 2 of testing; emotions which differed significantly are
bolded.
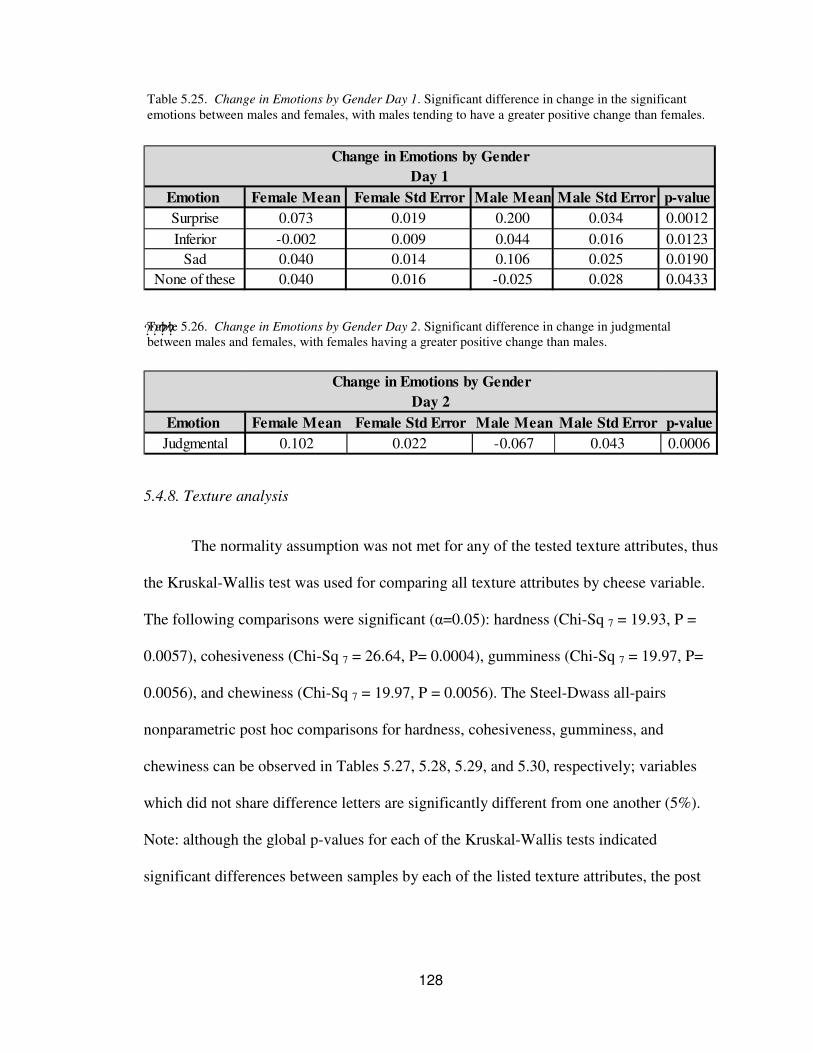
128
Emotion Female Mean Female Std Error Male Mean Male Std Error p-value
Surprise 0.073 0.019 0.200 0.034 0.0012
Inferior -0.002 0.009 0.044 0.016 0.0123
Sad 0.040 0.014 0.106 0.025 0.0190
None of these 0.040 0.016 -0.025 0.028 0.0433
Change in Emotions by Gender
Day 1
????
Emotion Female Mean Female Std Error Male Mean Male Std Error p-value
Judgmental 0.102 0.022 -0.067 0.043 0.0006
Change in Emotions by Gender
Day 2
5.4.8. Texture analysis
The normality assumption was not met for any of the tested texture attributes, thus
the Kruskal-Wallis test was used for comparing all texture attributes by cheese variable.
The following comparisons were significant (α=0.05): hardness (Chi-Sq 7 = 19.93, P =
0.0057), cohesiveness (Chi-Sq 7 = 26.64, P= 0.0004), gumminess (Chi-Sq 7 = 19.97, P=
0.0056), and chewiness (Chi-Sq 7 = 19.97, P = 0.0056). The Steel-Dwass all-pairs
nonparametric post hoc comparisons for hardness, cohesiveness, gumminess, and
chewiness can be observed in Tables 5.27, 5.28, 5.29, and 5.30, respectively; variables
which did not share difference letters are significantly different from one another (5%).
Note: although the global p-values for each of the Kruskal-Wallis tests indicated
significant differences between samples by each of the listed texture attributes, the post
Table 5.25. Change in Emotions by Gender Day 1. Significant difference in change in the significant
emotions between males and females, with males tending to have a greater positive change than females.
Table 5.26. Change in Emotions by Gender Day 2. Significant difference in change in judgmental
between males and females, with females having a greater positive change than males.
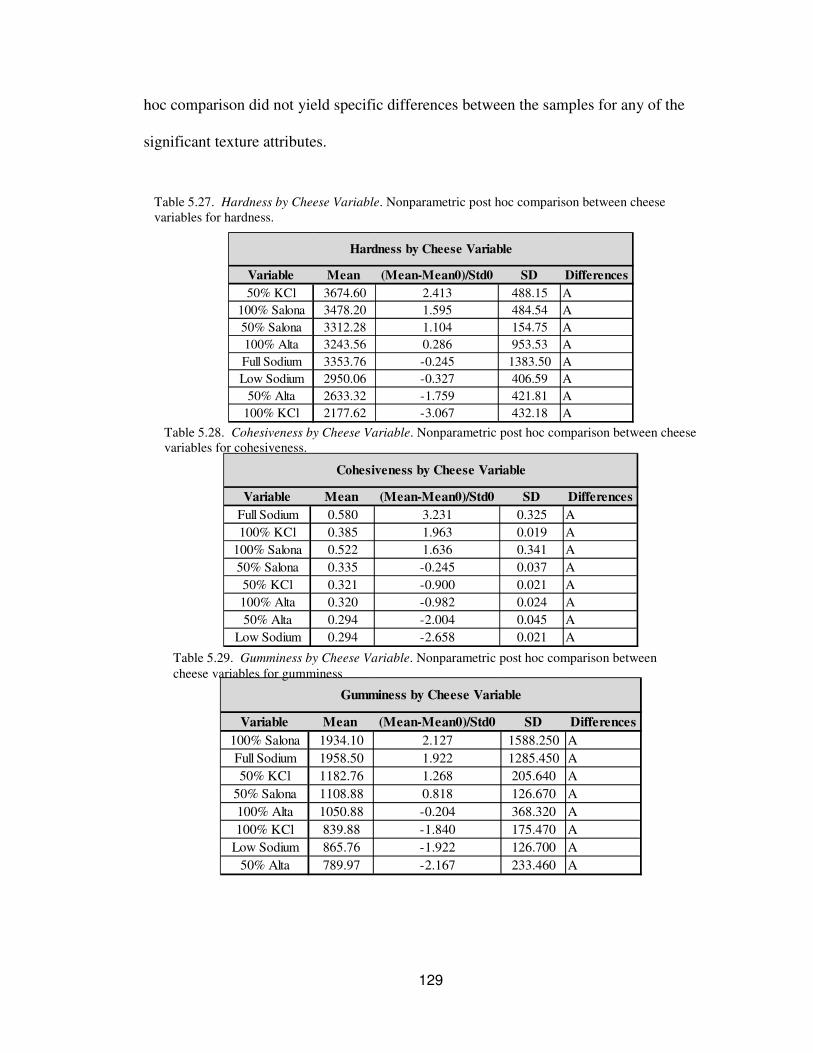
129
hoc comparison did not yield specific differences between the samples for any of the
significant texture attributes.
Variable Mean (Mean-Mean0)/Std0 SD Differences
50% KCl 3674.60 2.413 488.15 A
100% Salona 3478.20 1.595 484.54 A
50% Salona 3312.28 1.104 154.75 A
100% Alta 3243.56 0.286 953.53 A
Full Sodium 3353.76 -0.245 1383.50 A
Low Sodium 2950.06 -0.327 406.59 A
50% Alta 2633.32 -1.759 421.81 A
100% KCl 2177.62 -3.067 432.18 A
Hardness by Cheese Variable
Variable Mean (Mean-Mean0)/Std0 SD Differences
Full Sodium 0.580 3.231 0.325 A
100% KCl 0.385 1.963 0.019 A
100% Salona 0.522 1.636 0.341 A
50% Salona 0.335 -0.245 0.037 A
50% KCl 0.321 -0.900 0.021 A
100% Alta 0.320 -0.982 0.024 A
50% Alta 0.294 -2.004 0.045 A
Low Sodium 0.294 -2.658 0.021 A
Cohesiveness by Cheese Variable
Variable Mean (Mean-Mean0)/Std0 SD Differences
100% Salona 1934.10 2.127 1588.250 A
Full Sodium 1958.50 1.922 1285.450 A
50% KCl 1182.76 1.268 205.640 A
50% Salona 1108.88 0.818 126.670 A
100% Alta 1050.88 -0.204 368.320 A
100% KCl 839.88 -1.840 175.470 A
Low Sodium 865.76 -1.922 126.700 A
50% Alta 789.97 -2.167 233.460 A
Gumminess by Cheese Variable
Table 5.27. Hardness by Cheese Variable. Nonparametric post hoc comparison between cheese
variables for hardness.
Table 5.28. Cohesiveness by Cheese Variable. Nonparametric post hoc comparison between cheese
variables for cohesiveness.
Table 5.29. Gumminess by Cheese Variable. Nonparametric post hoc comparison between
cheese variables for gumminess
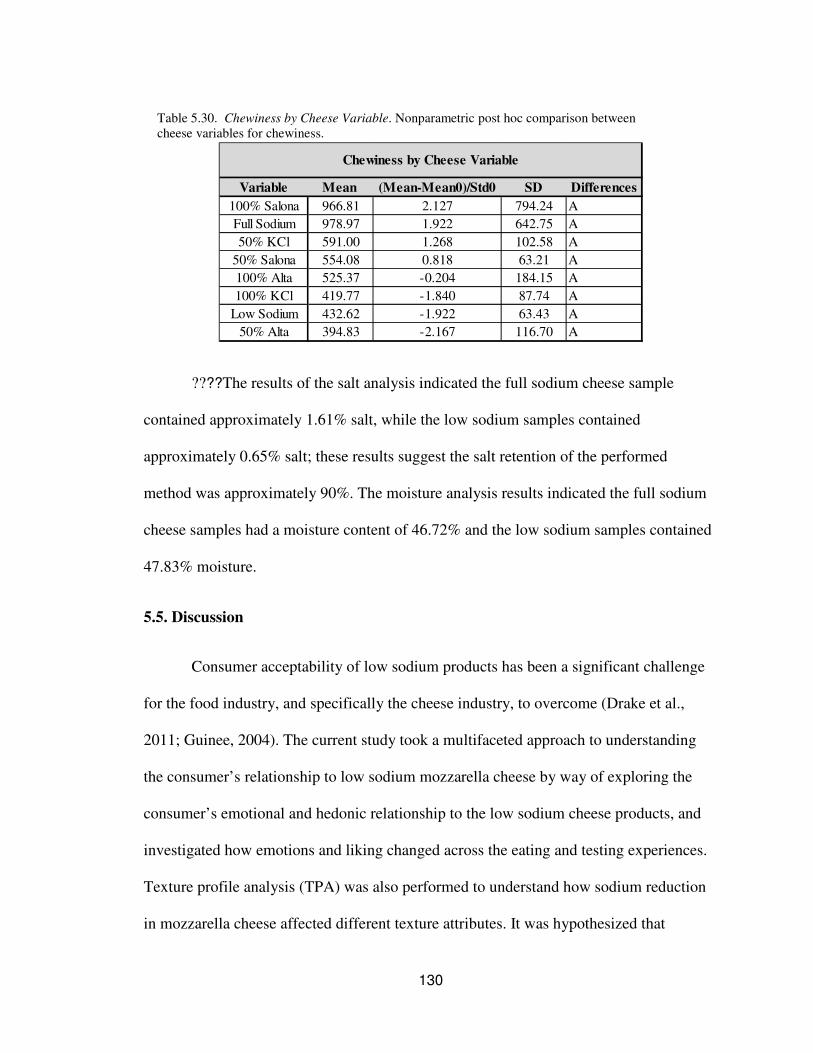
130
Variable Mean (Mean-Mean0)/Std0 SD Differences
100% Salona 966.81 2.127 794.24 A
Full Sodium 978.97 1.922 642.75 A
50% KCl 591.00 1.268 102.58 A
50% Salona 554.08 0.818 63.21 A
100% Alta 525.37 -0.204 184.15 A
100% KCl 419.77 -1.840 87.74 A
Low Sodium 432.62 -1.922 63.43 A
50% Alta 394.83 -2.167 116.70 A
Chewiness by Cheese Variable
????The results of the salt analysis indicated the full sodium cheese sample
contained approximately 1.61% salt, while the low sodium samples contained
approximately 0.65% salt; these results suggest the salt retention of the performed
method was approximately 90%. The moisture analysis results indicated the full sodium
cheese samples had a moisture content of 46.72% and the low sodium samples contained
47.83% moisture.
5.5. Discussion
Consumer acceptability of low sodium products has been a significant challenge
for the food industry, and specifically the cheese industry, to overcome (Drake et al.,
2011; Guinee, 2004). The current study took a multifaceted approach to understanding
the consumer’s relationship to low sodium mozzarella cheese by way of exploring the
consumer’s emotional and hedonic relationship to the low sodium cheese products, and
investigated how emotions and liking changed across the eating and testing experiences.
Texture profile analysis (TPA) was also performed to understand how sodium reduction
in mozzarella cheese affected different texture attributes. It was hypothesized that
Table 5.30. Chewiness by Cheese Variable. Nonparametric post hoc comparison between
cheese variables for chewiness.
131
products with higher salt content would have higher subject acceptability scores and
would have a net positive change in the positive emotion and a net negative change in the
negative emotions, while the low sodium cheeses were hypothesized to be less liked by
subjects and decrease in positive emotions and increase in negative emotions over the
testing experience; these hypotheses are based upon results of a previous study from the
researchers (Collinsworth et al., 2013).
5.5.1. Product Hedonics
The results suggested the full sodium cheese was liked significantly more than all
other variables in all liking attributes expect for appearance and aroma liking, where the
100% KCl was not significantly different than the full sodium product (Table 5.3). The
investigators were most interested in determining differences between samples in overall
flavor, saltiness, and texture liking. For overall flavor liking, although the full sodium
cheese was liked significantly more than all the other variables (Table 5.3), 100% KCl,
50% KCl, 50% Salona, and 100% Salona did not have significantly different liking
scores and their mean liking scores were all above 5.0, for the first day of testing (31 days
post addition of salt replacers). Considering the 9-point hedonic scale, the “5” is
considered “neither liked nor disliked”, therefore these samples are not “disliked” and
thus acceptable. The saltiness liking scores suggest the 100% KCl variable, although
liked less than the full sodium sample, had the next highest mean score and did not share
difference letters with any of the lower mean (less than 5.0) scored samples (Table 5.3).
The texture liking results indicated similar findings to the overall flavor liking results,
suggesting 100% KCl, 100% Salona, 50% KCl, and 50% Salona had the next highest
mean scores after the full sodium product, and their mean scores were all above 5.0
132
(Table 5.3). Based upon the hedonic scores from the first day of testing, it appears the
100% KCl cheese sample would be the most consumer acceptable “low sodium” cheese
compared to the other tested cheeses variables.
The second day of testing results were similar to those of the first day, with 100%
KCl consistently having the second highest mean scores after the full sodium variable;
remarkably, the mean scores of the full sodium and 100% KCl variables for saltiness
liking did not differ significantly. Based upon both days of testing, the 100% KCl sample
appears to be the most appropriate sample for further investigation with consumer
acceptability of low sodium cheese. These results are not surprising considering the
favorable effects of using KCl for partial substitution of NaCl found in several other
studies which investigated this relationship in different cheeses including: feta, cheddar,
and imitation cheese (Katsiari et al., 1997; Grummer et al., 2012; El-Bakry et al., 2011).
Although partial substitution of NaCl with KCl is promising, one potential setback of
using KCl is the potential bitter aftertaste which is typically associable with KCl (Cruz et
al., 2011; Grummer et al., 2012). The current study did not ask consumers about the
potential “bitterness” or “aftertaste” of the samples, perhaps in future testing with these
variables consumers should be ask to answer hedonic questions regarding “aftertaste” in
order to understand the full consequences of using KCl as a NaCl substitute.
5.5.2. Comparison of First, Middle, and End Liking Scores
Observations in changes in liking score over the eating experience were of
interest; thus hedonic scores were recorded at the first, halfway, and end of consuming
each cheese product. The results from the first day of testing indicated a significant
133
difference between the first (initial) and last (end) consumption liking scores for overall
flavor (Table 5.5), saltiness (Table 5.6), texture (Table 5.7), and aroma liking (Table 5.8);
additionally, the first liking time point was significantly higher than both the middle and
end consumption for the texture and aroma hedonic scores. These results are not
surprising considering what is known about sensory specific satiety (Rolls et al., 1981;
Kringelbach, 2009) where subjects like a product less after consuming it compared to an
uneaten product; however, a potential aftertaste effect of the salt replacers could also lead
to similar results. The second day of testing did not yield significant results for change in
liking for any of the testing hedonic attributes. Determining which day’s results are more
accurate is still unclear; however, the middle or halfway through consuming liking scores
appear to be unnecessary, considering they were not significantly different from both the
first and last hedonic scores. Further investigation of capturing first and last liking scores
appears to have value.
5.5.3. Changes in Liking Scores between Day 1 and Day 2
The average for each liking attribute from the first day (31 days post addition of
salt replacer) of testing was compared to the corresponding liking score for the second
day of testing (51 days post addition of salt replacer), the results indicated the mean
flavor, saltiness, and aroma liking attributes for the first day of testing were significantly
higher than those from the second day of testing. Although, these results are somewhat
expected considering subjects may prefer a fresher mozzarella cheese compared to an
older mozzarella cheese, this information is relevant for manufacturers interested in
making low sodium cheese. The samples used in the second day of testing were
approximately seven weeks old and a significant reduction in liking is unacceptable
134
considering the shelf-life for mozzarella cheese should be closer to 60-90 days post
production. Considering the significant decrease in sensory liking between the two days
of testing, perhaps the salt replacers and antimicrobial were not able to remain active for
the length of time between the two days of testing or perhaps flavor and texture changes
during the aging process resulted in undesirable outcomes. Additional investigation of
extending the sensory quality shelf-life of low sodium cheeses is necessary for success of
the product.
5.5.4. Comparison of Each Change in Emotion by Cheese Variable
Findings for the changes in emotion by each cheese variable mostly confirmed the
investigator’s hypotheses with the higher hedonic scored products having an increase in
positive emotions over the eating experience, while lower hedonic scored products
decreased in positive emotions over time. For change in caring (Table 5.10), the full
sodium variable had significantly higher changes in caring compared to 100% ALTA™
and the low sodium cheese (disliked products). Similarly, for change in excited (Table
5.11), the full sodium product had higher changes in excited over the eating experience
compared to the low sodium variable; similar trends were seen in self-confident (Table
5.12). The reverse was seen for the negative emotions, judgmental (Table 5.14) and sad
(Table 5.15), where disliked products such as the low sodium variable increased over the
eating experience, while the more liked products such as the full sodium and KCl
samples decreased in negative emotions over the eating experience. These trends were
less clear for the fatigued emotion (Table 5.13), which may be due to it being a neutral
emotion, and therefore it does not follow the trends seen in either the positive or negative
emotions.
135
Similar trends were found in the results from the second day of testing, with the
full sodium cheese having a greater change in the positive emotions including: caring and
self-confident, over time compared to the disliked products (Tables 5.16 and 5.19), and
50% KCl (relatively high hedonic scores) had greater positive changes in excited (Table
5.17) and sociable (Table 5.18), both positive emotions. The low sodium cheeses had
greater changes in the negative emotions, judgmental and raging (insignificant trend for
raging) over time (Table 5.20 and 5.21). Considering the emotions were captured as
categorical data, but treated as continuous the data should be interpreted with care;
however, these findings are quite conservative and do show interesting trends with
increases in positive emotions over time for liked products and increases in negative
emotions overtime for disliked products. Additionally, when considering the analysis that
was performed, the power was likely lower than if the emotions would have been
analyzed as categorical, yet significant differences were still seen. Perhaps analyzing the
current data differently would yield even more obvious emotion differences between the
high and low hedonic scored products.
5.5.5. Comparison of First Emotion Score to End Emotion Score
When comparing the first emotional response to the end emotional response for
each emotion, only certain emotions yielded a significant change. For first day of testing
nine emotions changed significantly across the eating experience (Table 5.22), while only
seven emotions changed significantly for the second day of testing (Table 5.23);
considering the emotions which did change significantly were very similar between the
two days, perhaps these emotions are the most relevant for the product category. The
emotions which did not change significantly overtime perhaps are not as relevant to low
136
sodium cheese, and thus additional investigation of alternative emotion words could be
pursued for this category.
5.5.6. Emotional Changes between Day 1 and Day 2
The changes in emotion for all emotions from the first day of testing were
compared to the corresponding change in emotions from the second day of testing, and
seven emotional changes and the “none of these” option differed significantly between
the two days (Table 5.24); changes were relatively even across the different types of
emotions (positive, neutral, and negative). These results are not surprising considering the
significant changes in liking observed between the first and second day of testing, and the
observed relationship between liking scores and changes in emotion. However, for the
emotions which did not change significant, perhaps the subjects were more consistent in
their emotional responses due to their poster board with the emotion images which may
have kept them anchored to those certain emotions despite the testing dates occurring
three weeks apart; the consistency of the emotional responses is helpful for validation of
the individualized poster board for future emotion testing research. Perhaps if liking
scores did not change significantly between the two days of testing, more consistent
emotional responses would have been observed.
5.5.7. Comparison of Change in Emotion by Gender
Although investigation of gender and emotion was not a major objective of this
specific test, analysis was performed to compare the change in emotional response from
males compared to females considering the cultural stereotype that women are “more
emotional” than men. The results from the first day of testing suggested the only
137
significant differences in change in emotion between men and women were in surprise,
inferior, sad, and the “none of these” option (Table 5.25). Although the whole model
MANOVA test for gender was not significant for the second day of testing, the only
potentially significant emotion was judgmental (Table 5.26). Considering only three
changes in emotion were significant between the 12 emotions tested across two days,
there does not appear to be any major difference in gender when considering changes in
emotion. Other studies suggested males and females likely experience the same emotions
during a given stimuli; however, differences exist in expression and intensity of the
emotional responses (Gard & Kring, 2007; Kring & Gordon, 1998). Several other studies
have identified differences between men and women in their emotional responses to
certain stimuli, including food (Costanzo et al., 1999; Macht, 1999; Seo et al., 2009);
overall suggesting a difference in emotional responses between men and women. One
limitation of the current study is the uneven number of males (~30%) and females
(~70%), this difference in sample populations could affect the results, and thus the
findings should be interpreted with caution.
5.5.8. Texture Profile Analysis
TPA was performed on all cheese variables after completion of the second day of
testing. The samples differed significantly by hardness (Table 5.27), cohesiveness (Table
5.28), gumminess (Table 5.29), and chewiness (Table 5.30). Samples which were most
preferred for overall flavor and saltiness liking (full sodium, 100% KCl, 50% KCl, 100%
Salona, and 50% Salona) appeared to have higher, but not statistically significant mean
scores in the four significant texture attributes compared to the disliked samples (low
sodium, 100% ALTA™, and 50% ALTA™). These results are noteworthy considering
138
the only differences between the samples were the salt replacers, thus the different salt
replacers resulted in difference texture measurements; findings similar to these results
were anticipated. Texture Profile Analysis has traditionally been correlated with
descriptive sensory results, specifically Spectrum™ method descriptive analysis (Bourne,
1978; Pons & Fiszman, 1996; Murray et al., 2001); however, limited published
information is available comparing the texture attribute profile of a low sodium cheese
compared to the consumer liking scores. This information is valuable to manufacturers
looking to produce a consumer acceptable low sodium cheese, because the importance of
these texture attributes and their relationship to consumer acceptability is better
understood.
5.5.9. Main Study Objectives and Outcomes
One major objective of the current study was to determine a salt replacer which
was consistently acceptable and liked closely to a full sodium control cheese sample.
Based upon the results of this study, the 100% KCl bacteria cultured cheese variable
(dipped in 0.275% SEA-i F75) appears to be the most appropriate for further
investigation within mozzarella cheese. The 100% KCl sample was a close to a 1:1 ratio
of NaCl to KCl (100g NaCl: 81g KCl), other studies have suggested this ratio appears to
be the most effective at reducing sodium while still maintaining the sensory and
functional properties of the cheese (El-Bakry et al., 2011; Cruz et al., 2011; Guinee,
2004; Grummer et al., 2012; Katsiari et al., 1997; Ayyash & Shah, 2011). The tested
cheese contained 47.83% moisture and 0.65% salt (salt contains approximately 39%
sodium); meeting the moisture parameters for a LMPS mozzarella cheese and the sodium
content for a low sodium cheese. In order to be a low sodium cheese as defined by the
139
Code of Federal Regulations, a 30g sample (or 50g sample if reference amount
customarily consumed is less than 30g) must contain less than 140 mg of sodium
(Mozzarella cheese and scamorza cheese, 1993), considering the tested cheese contained
0.65% salt, and 39% of 0.65% a 50g sample would contain approximately 127mg of
sodium. Therefore, the tested low sodium cheese sample did meet the “low sodium” CFR
requirements.
Another major objective of this study was to determine if the emotional responses
experienced when consuming a full sodium cheese can also be experienced when
consuming a low sodium cheese. Based upon the results in section 5.4.4, the 100% and
50% Salona sample had the same caring response as the full sodium variable, 50% KCl
had a similar excited experience as the full sodium sample, and 100% KCl and 50%
Salona had the same judgmental experience as the full sodium, and 50% KCl, 50%
Salona, 100% KCl, and 100% Salona had similar sad experiences as the full sodium
cheese, for the first day of testing; similar results were seen in the second day of testing.
Overall, it appears similar emotions which are experienced in a full sodium cheese can
also be experienced in a low sodium cheese; perhaps additional or more relevant
emotions to the product category would provide further insight into how consumers
emotionally relate to these nutritional alternative products compared to the traditional
product.
Overall, the results of this study indicated the use of 100% KCl (dipped in 0.257%
SEA-i F75) may be the most appropriate and well liked sample after a full sodium
mozzarella cheese. In regards to texture, higher mean scores of hardness, cohesiveness,
gumminess, and chewiness were associated with cheeses which were most liked. Lastly,
140
the cheeses with higher hedonic scores had increased changes in positive emotions and
decreased changes in negative emotions, and the reverse was seen with disliked cheese
products.
5.6. Conclusion
Decreasing the sodium content in mozzarella cheese has been a difficult
undertaking for cheese manufacturers due to the traditionally mild flavor of the cheese.
Partial substitution of NaCl with KCl has been relatively successful in other cheese
varieties, and the current study determined the use of an approximately 1:1 ratio of NaCl
to KCl provided a mozzarella cheese with similar saltiness and overall flavor liking to the
full sodium control. Additionally, the emotional responses to the different cheeses were
captured, and 100% Salona, 100% KCl, and 50% KCl had relatively consistent similar
emotional responses compared to the full sodium variable. Further research should
investigate the use of additional and/or more relevant emotions to the food product
category to determine whether a low sodium cheese is able to elicit similar emotional
responses to those experienced when consuming the full sodium product. TPA indicated
samples with higher means score in hardness, cohesiveness, gumminess, and chewiness
were associated with the more liked cheese samples, thus providing additional
information for manufacturers for developing a consumer acceptable low sodium
mozzarella cheese.
141
6.0
Conclusions
Mozzarella cheese is the most highly consumed cheese in the United States, and
appears to be a promising product for providing a low sodium option into the American
diet. Decreasing one’s sodium intake requires a modification of the entire diet; however,
considering the per capita consumption rate of mozzarella cheese, an acceptable low
sodium mozzarella cheese would likely make a beneficial dietary impact for those
pursuing a lower sodium diet. Given the importance of a consumer acceptable low
sodium product, researchers must go beyond traditional consumer testing methods in
order to better understand how consumers feel about a product and any potential
psychophysical effects a lower sodium mozzarella cheese might have on the consumer.
Through the research of this thesis, a sensory transparent antimicrobial was
selected for use in a lower sodium cheese system, and the hedonic relationship between
three salt replacers was determined. Based upon preliminary consumer testing, the results
suggested the more acceptable salt replacer in a low sodium cheese was dependent upon
what type of mozzarella cheese (direct acidification or bacteria cultured) was used.
The development, testing, and validation of a novel emotion and texture method
(IMET) across three different product categories indicated the benefits of using consumer
generated emotion images. The words only method had greater emotional changes in
caring, self-confident, and sociable when compared to the My Pictures method.
Additionally, the variability was greater for the words only for a positive emotion, while
variability was greater for My Pictures in a negative emotion. Considering consumers
142
were more likely to use images of themselves for positive emotions and images of others
for negative emotions, it is hypothesized that consumers were better able to associate
with the images of themselves (specifically in the positive emotions in the My Pictures
method) compared to words only. Moving forward, perhaps consumers should be asked
to use only images of themselves for helping to evoke the testing emotions and thus
provide the most consistent results.
The consumer provided emotion image aspect of the IMET method was used in
emotion and traditional consumer testing with non-commercial bacteria cultured low
sodium mozzarella cheeses. The results of this study suggested the full sodium
mozzarella cheese was consistently the most preferred samples, followed by the 100%
KCl cheese, suggesting the use of 100% KCl with SEA-i F75 at 0.275% would be the
most appropriate formulation for a low sodium mozzarella cheese. The results also
indicated cheese samples which where the most liked had greater increases in positive
emotions over time while the least liked samples had greater increases in negative
emotions over the consumption experience; additionally, similar emotions which were
elicited in the full sodium cheeses were experience in some of the lower sodium cheeses.
Texture analysis suggested cheese samples with the highest mean scores for all
significant texture attributes were associated with the highest hedonic scored samples.
Additionally, the low sodium cheese sample did meet the sodium level for making a “low
sodium” label claim. Overall the series of tests in this thesis provide a better
understanding of the role of antimicrobials and salt replacers in low sodium mozzarella
cheese and consumer acceptability and emotional responses to this nutritional alternative
product.
143
7.0
Future Research
• Explore salt reward mechanisms at typically consumed levels with healthy to high
levels of NaCl in the body.
• Descriptive sensory testing and broader consumer testing in low sodium
mozzarella cheese is needed to understand key flavor characteristics, drivers of
liking, and gain power on differences between samples.
• Investigate changes in emotion between males and females among similar sample
population sizes and with a broader range of emotions.
• Investigate the relationship between a stimulus and emotion type (positive,
neutral, and negative) and the potential for emotion specific products.
• Include “bitterness” and “aftertaste” in the hedonic questions whenever
performing low sodium product testing.
144
8.0
References
Anker, M., Stading, M., & Hermansson, A. M. (1999). Effects of pH and the gel state on
the mechanical properties, moisture contents, and glad transition temperatures of
whey protein films. Journal of Agricultural and Food Chemistry. 47, 1878-1886.
Anonymous. (1975). Minutes of Division Business Meeting. Institute of Food
Technologists – Sensory Evaluation Division. In Stone. H., Bleibaum, R., &
Thomas, H. A. (2012). Sensory Evaluation Practices (4th
ed.). London, UK:
Academic Press.
Ares, G., Gimenez, A., & Gambaro, A. (2006). Preference mapping of texture of dulce de
leche. Journal of Sensory Studies, 21(6), 553-571.
Ayyash, M. M., & Shah, N. P. (2011). The effect of substitution of NaCl with KCl on
chemical composition and functional properties of low-moisture Mozzarella
cheese. Journal of Dairy Science, 94(8), 3761-3768.
Blechert, J., Feige, B., Hajcak, G., & Tuschen-Caffier, B. (2010). To eat or not to eat?
Availability of food modulates the electrocortical response to food pictures in
restrained eaters. Appetite, 54(2), 262-268.
Bourne, M. C. (1978). Texture profile analysis. Journal of Food Technology, 32(7), 62-
66.
Brandt, M. A., Skinner, E. Z., & Coleman, J. A. (1962). Texture profile method. Journal
of Food Science, 28(4), 404-409.
Breene, W. M. (1975). Application of texture profile analysis to instrumental food texture
evaluation. Journal of Texture Studies, 6, 53-82.
145
Brody, L. R. (1997). Gender and emotion: Beyond stereotypes. Journal of Social Issues,
53(2), 369-393.
Brown, S., & Ridderinkhof, K. R. (2009). Aging and the neuroeconomics of decision
making: A review. Cognitive Affective & Behavioral Neuroscience, 9(4), 365-
379.
CDC. (2012). Where’s the sodium? There’s too much in many common foods. Retrieved
from http://www.cdc.gov/Features/VitalSigns/Sodium/.
Civille, G. V., & Liska, I. H. (1974). Modifications and applications to foods of the
General Foods sensory texture profile technique. Journal of Texture Studies, 6,
19-31.
Collinsworth, L. A., Lammert, A. M., Ashman, H., Leidheiser, M., Garza, J., & Keener,
M. (2013). Development of a novel method for evaluating emotions and texture:
Imagery versus language. Manuscript in preparation.
Costanzo, P. R., Musante, G. J., Friedman, K. E., Kern, L. S., & Tomlinson, K. (1999).
The gender specificity of emotional, situational, and behavioral indicators of
binge eating in a diet-seeking obese population. International Journal of Eating
Disorders, 26(2), 205-210.
Cromwell, H. C., & Schultz, W. (2003). Effects of expectations for different reward
magnitudes on neuronal activity in primate striatum. Journal of Neurophysiology,
89, 2823-2838.
Croy, I., Olgun, S., & Joraschky, P. (2011). Basic emotions elicited by odors and
pictures. Emotion, 11(6), 1331-1335.
146
Cruz, A. G., Faria, J. A. F., Pollonio, M. A. R., Bolini, H. M. A., Celeghini, R. M. S.,
Granato, D., Shah, N. P. (2011). Cheeses with reduced sodium content: Effects on
functionality, public health benefits and sensory properties. Trends in Food
Science & Technology, 22(6), 276-291.
Demott, B. J. (1985). Nutrient ratios in dairy products. Cultured Dairy Products Journal,
20(4), 6-9.
Desmet, P. M. A., Hekkert, P., & Jacobs, J. J. (2000). When a car makes you smile:
Development and application of an instrument to measure product emotions.
Advances in Consumer Research, 27, 111-117.
Desmet, P. M. A., & Schifferstein, H. N. J. (2008). Sources of positive and negative
emotions in food experience. Appetite, 50(2-3), 290-301.
Drake, M. A., Miracle, R. E., & McMahon, D. J. (2010). Impact of fat reduction on flavor
and flavor chemistry of cheddar cheeses. Journal of Dairy Science, 93(11), 5069-
5081.
Drake, S. L., Lopetcharat, K., & Drake M. A. (2011). Salty taste in dairy foods: Can we
reduce the salt? Journal of Dairy Science, 94:636-645.
Ekman, P., & Friesen, W. V. (1986). A new pan-cultural facial expression of emotion.
Motivation and Emotion, 10(2), 159-168.
El-Bakry, M., Beninati, F., Duggan, E., O'Riordan, E. D., & O'Sullivan, M. (2011).
Reducing salt in imitation cheese: Effects on manufacture and functional
properties. Food Research International, 44(2), 589-596.
147
Fern, E. 2009. Nestle’s Salt Reduction Policy. Corporate Nutrition, Nestlé, Vevey,
Switzerland.
Fitzgerald, E., & Buckley, J. (1985). Effect of total and partial substitution of sodium-
chloride on the quality of cheddar cheese. Journal of Dairy Science, 68(12), 3127-
3134.
Foegeding, E. A., Daubert, C. R., Drake, M. A., Essick, G., Trulsson, M., Vinyard, C. J.,
& Van de Velde, F. (2011). A comprehensive approach to understanding textural
properties of semi- and soft-solid foods. Journal of Texture Studies, 42(2), 103-
129.
Freberg, L. (2009). Discovering biological psychology (2nd
ed.). Belmont, CA:
Wadsworth.
Food Labeling, 21 C.F.R. pt. 1 (2012).
Gard, M. G., & Kring, A. M. (2007). Sex differences in the time course of emotion.
Emotion, 7(2), 429-437.
Glimcher, P. W. (2001). Making choices: The neurophysiology of visual-saccadic
decision making. Trends in Neurosciences, 24(11), 654-659.
Grummer, J., Karalus, M., Zhang, K., Vickers, Z., & Schoenfuss, T. C. (2012).
Manufacture of reduced-sodium cheddar-style cheese with mineral salt replacers.
Journal of Dairy Science, 95(6), 2830-2839.
Guinee, T. P. (2004). Salting and the role of salt in cheese. International Journal of Dairy
Technology, 57(2-3), 99-109.
Guinee. T. P., & O’Kennedy, B. T. (2007). Reducing salt in foods: Practical strategies,
(pp. 246-287). Boca Raton LA, USA: CRC Press.
148
Holmes, E. A., Mathews, A., Mackintosh, B., & Dalgleish, T. (2008). The causal effect
of mental imagery on emotion assessed using picture-word cues. Emotion, 8(3),
395-409.
IDFA. (2012). Cheese Sales & Trends. Retrieved October 2012, from
http://www.idfa.org/news--views/media-kits/cheese/cheese-sales-and-trends/.
Jaeger, S. R., Jørgensen, A. S., Aaslyng, M. D., & Bredie, W. L. (2008). Best–worst
scaling: An introduction and initial comparison with monadic rating for
preference elicitation with food products. Food Quality and Preference, 19(6),
579-588.
Jaeger, S. R. (2012). Fifth EuroSense Conference; Bern, Switzerland.
JMP. (2012). Nonparametric: Descriptions of nonparametric tests. Retrieved December
2012, from http://www.jmp.com/support/help/Nonparametric.shtml#658209.
Johnson, M. E., Kapoor, R., McMahon, D. J., McCoy, D. R., & Narasimmon, R. G.
(2009). Reduction of sodium and fat levels in natural and processed cheeses:
Scientific and technological aspects. Comprehensive Reviews in Food Science and
Food Safety, 8(3), 252-268.
Katsiari, M. C., Voutsinas, L. P., Alichanidis, E., & Roussis, I. G. (1997). Reduction of
sodium content in feta cheese by partial substitution of NaCl by KCl.
International Dairy Journal, 7(6-7), 465-472.
Kenny, P. J. (2011). Reward Mechanisms in Obesity: New Insights and Future
Directions. Neuron, 69(4), 664-679.
149
King, S. C., & Meiselman, H. L. (2010). Development of a method to measure consumer
emotions associated with foods. Food Quality and Preference, 21(2), 168-177.
King, S. C., Meiselman, H. L., & Carr, B. T. (2010). Measuring emotions associated with
foods in consumer testing. Food Quality and Preference, 21(8), 1114-1116.
Kring, A. M., & Gordon, A. H. (1998). Sex differences in emotion: Expression,
experience, and physiology. Journal of Personality and Social Psychology, 74(3),
686-703.
Kringelbach, M. L. (2009). Neural basis of mental representations of motivation,
emotion, and pleasure. Handbook of Neuroscience for the Behavior Sciences.
Lawless, H.T., & Heymann, H. (1998). Sensory evaluation of food: Principals and
practices. New York: Chapman and Hall.
Li, J. R., Yan, J. Q., Chen, K., Lu, B., Wang, Q., Yan, W., et al. (2012). Lesions of the
central nucleus of the amygdala decrease taste threshold for sodium chloride in
rats. Brain Research Bulletin, 89(1-2), 8-15.
Lucassen, M. P., Gevers, T., & Gijsenij, A. (2011). Texture affects color emotion. Color
Research and Application, 36(6), 426-436.
Macht, M. (1999). Characteristics of eating in anger, fear, sadness and joy. Appetite,
33(1), 129-139.
Macht, M. (2008). How emotions affect eating: A five-way model. Appetite, 50(1), 1-11.
Macht, M., Gerer, J., & Ellgring, H. (2003). Emotions in overweight and normal-weight
women immediately after eating foods differing in energy. Physiology &
Behavior, 80(2-3), 367-374.
Macht, M., & Simons, G. (2000). Emotions and eating in everyday life. Appetite, 35(1),
150
65-71.
Martin-Soelch, C., Linthicum, J., & Ernst, M. (2007). Appetitive conditioning: Neural
bases and implications for psychopathology. Neuroscience and Biobehavioral
Reviews, 31(3), 426-440.
McCaughey, S. A., & Scott, T. R. (1998). The taste of sodium. Neuroscience and
Biobehavioral Reviews, 22(5), 663-676.
McNair, F. M., Lorr, M., & Droppleman, L. F. (1971). Profile of mood states. San Diego:
Educational and Industrial Testing Service.
Meilgaard, M. C., Civille, G. V., & Carr, B. T. (1991). Sensory evaluation techniques (2nd
ed.). Baton Rouge, LA: CRC Press.
Meilgaard, M. C., Civille, G. V., & Carr, B. T. (2007). Sensory evaluation techniques (4th
ed.). Baton Rouge, LA: CRC Press.
Moskowitz, H.R. (1987). Food Texture: Instrumental and sensory measurement. New
York, NY: Marcel Dekker, Inc.
Mozzarella cheese and scamorza cheese, 21 C.F.R. pt. 1 (1993).
Murray, J. M., Delahunty, C. M., & Baxter, I. A. (2001). Descriptive sensory analysis:
Past, present and future. Food Research International, 34(6), 461-471.
National Dairy Council. (2011). Health Professional Cheese Nutrition. Retrieved
October, 2012 from
http://www.nationaldairycouncil.org/SiteCollectionDocuments/education_materia
ls/cheese/Health%20Professional%20Cheese%20Nutrition%20Brochure%20Final
.pdf.
151
NHLBI. (2012). What is high blood pressure? Retrieved October, 2012 from
http://www.nhlbi.nih.gov/health/health-topics/topics/hbp/.
O'Doherty, J. P., Deichmann, R., Critchley, H. D., & Dolan, R. J. (2002). Neural
responses during anticipation of a primary taste reward. Neuron, 33(5), 815-826.
Piech, R. M., Pastorino, M. T., & Zald, D. H. (2010). All I saw was the cake. Hunger
effects on attentional capture by visual food cues. Appetite, 54(3), 579-582.
Pons, M., & Fiszman, S. M. (1996). Instrumental texture profile analysis with particular
reference to gelled systems. Journal of Texture Studies, 27(6), 597-624.
Reddy, K. A., & Marth, E. H. (1993). Composition of cheddar cheese made with sodium
chloride and potassium chloride either singly or as mixtures. Journal of Food
Composition and Analysis, 6, 354-363.
Roessler, E. B., Pangborn, R. M., Sidel, J. L., & Stone, H. (1978). Expanded statistical
tables for estimating significance in paired-preference, paired-difference, duo-trio,
and triangle tests. Journal of Food Science, 43(3), 940-943.
Rolls, B. J., Rolls, E. T., Rowe, E. A., & Sweeney, K. (1981). Sensory specific satiety in
man. Physiology & Behavior, 27(1), 137-142.
Rolls, E. T. (1997). Taste and olfactory processing in the brain and its relation to the
control of eating. Critical Reviews in Neurobiology, 11(4), 263-287.
Rolls, E. T. (1999). The functions of the orbitofrontal cortex. Neurocase, 5(4), 301-312.
Rolls, E. T., Browning, A. S., Inoue, K., & Hernadi, I. (2005). Novel visual stimuli
activate a population of neurons in the primate orbitofrontal cortex. Neurobiology
of Learning and Memory, 84(2), 111-123.
Rolls, E. T., & Grabenhorst, F. (2008). The orbitofrontal cortex and beyond: From affect
152
to decision-making. Progress in Neurobiology, 86(3), 216-244.
Rolls, E. T., Hornak, J., Wade, D., McGarth, J. (1994). Emotion-related learning in
patients with social and emotional changes associated with frontal lobe damage.
Journal of Neurology, Neurosurgery, and Psychiatry, 57, 1518-1524.
Saltos, E. S., & Bowman, S. (1997). Dietary guidance on sodium: Should we take it with
a grain of salt? Nutrition Insights, USDA.
Sander, D. (2012). The role of the amygdala in the appraising brain. Behavioral and
Brain Sciences, 35(3), 161.
Schifferstein, H. N. J., & Desmet, P. M. A. (2010). Hedonic asymmetry in emotional
responses to consumer products. Food Quality and Preference, 21(8), 1100-1104.
Schroeder, C. L., Bodyfelt, F. W., Wyatt, C. J., & McDaniel, M. R. (1988). Reduction of
sodium chloride in cheddar cheese: Effect on sensory, microbiological, and
chemical properties. Journal of Dairy Science, 71(8), 2010-2020.
Scott, T. R., Karadi, Z., Oomura, Y., Nishino, H., Platasalaman, C. R., Lenard, L., Giza,
B. K., Aou, S. (1993). Gustatory neural coding in the amygdala of the alert
macaque monkey. Journal of Neurophysiology, 69(6), 1810-1820.
Seo, H. S., Lee, Y., Yoon, N. R., Song, J. M., Shin, J. M., Lee, S. Y., Hwang, I. (2009).
Impacts of sensory attributes and emotional responses on the hedonic ratings of
odors in dairy products. Appetite, 53(1), 50-55.
Spinelli, S. (2012). Fifth EuroSense Conference; Bern, Switzerland.
Stone. H., Bleibaum, R., & Thomas, H. A. (2012). Sensory Evaluation Practices (4th
ed.).
London, UK: Academic Press.
153
Thomson, D. M. H., & Crocker, C. (2011). A data-driven classification of states of mind
and an appraisal of the role played by state of mind in choice behavior [O9.1
Abstract]. Pangborn Symposium.
Thomson, D. M. H., Crocker, C., & Marketo, C. G. (2010). Linking sensory
characteristics to emotions: An example using dark chocolate. Food Quality and
Preference, 21(8), 1117-1125.
USDA. (2010). Dietary Guidelines for Americans: Chapter 8: Sodium and potassium. US
Department of Health and Human Services; USDA. Retrieved October, 2012
from http://www.healthierus.gov/dietaryguidelines.
USDA. (2010). Economic Research Service: Background. Retrieved October, 2012 from
http://www.ers.usda.gov/topics/animal-products/dairy/background.aspx.
Zaltman, G., & Coulter, R. H. (1995). Seeing the voice of the customer: Metaphor-based
advertising research. Journal of Advertising Research, 35(4), 35-51.
Zuckerman, M., & Lubin, B. (1965). Normative data for the multiple affect adjective
check list. Psychological reports, 16(2), 438-438.


