Embed Size (px)
Citation preview
Quality of Norwegian goat milk for cheese production
Kvalitet på norsk geitemelk til osteproduksjon
Philosophiae Doctor (PhD) Thesis
Ragnhild Aabøe Inglingstad
Department of Chemistry, Biotechnology and Food Science Faculty of Veterinary Medicine and Biosciences
Norwegian University of Life Sciences
Ås 2016
Thesis number 2016:19 ISSN 1894-6402
ISBN 978-82-575-1348-1

1
Contents
Acknowledgements ............................................................................................................................................ 2
Summary ............................................................................................................................................................ 5
Sammendrag ...................................................................................................................................................... 7
Abbreviations ..................................................................................................................................................... 9
List of papers .................................................................................................................................................... 10
1. Introduction ................................................................................................................................................. 13
1.1 Milk in human nutrition – a historical perspective ................................................................................. 13
1.2 The Goat and its milk .............................................................................................................................. 14
1.3 Norwegian goats and milk production .................................................................................................... 15
1.4 Milk composition and technological parameters .................................................................................... 17
1.5 Challenges and strategies to improve Norwegian goat milk quality ....................................................... 25
2. Background for the project “Quality goat milk for cheese production” and aims of current study .... 29
3. Experimental design .................................................................................................................................... 30
4. Summary of papers...................................................................................................................................... 33
5. Key results and general discussion ............................................................................................................. 39
5.1 Goats on pastures - effects in milk .......................................................................................................... 39
5.2 Lipid supplements – effects in milk ........................................................................................................ 42
5.3 Polymorphism at the αs1-casein locus- effects in milk ............................................................................ 44
5.4 Factors influencing the rennet coagulation properties in Norwegian goat milk ...................................... 45
5.5 Factors influencing the level of FFA in Norwegian goat milk ................................................................ 46
6. Current status, concluding remarks and further perspectives ................................................................ 49
7. References..................................................................................................................................................... 50
8. Enclosed papers I-V ..................................................................................................................................... 60
2
Acknowledgements
Financial support for this thesis was provided by the Norwegian Research Council and TINE
(Norwegian Dairies Association).
First, I would like to thank my main supervisor, Gerd Vegarud, for giving me the opportunity
to become a PhD student and your never-ending support. Your encouragement and gentle
“pushes” have been highly valued! I would also express my gratitude to my co-supervisors
Siv Skeie, Tove Devold and Margrete Eknæs: Siv Skeie, thank you for your great interest
and overview in this project, and your considerable contribution to my work and studies. Tove
Devold, your door is always open, and you are always up for a discussion. Thank you for
your time and support whenever needed. Margrete Eknæs, thank you for a nice cooperation
with the feeding experiment, and for sharing your great knowledge about feeding and
physiology of goats. You did all guided me in scientific writing (and thinking) and you were
always supporting me even if I sometimes failed. I was very fortunate to have this nice team
of supervisors!
Further, I am very grateful to all those involved in the project “Quality goat milk for cheese
production”. Thank you for sharing your great knowledge about various factors influencing
the milk quality. I would especially like to thank Håvard Steinshamn for the great
collaboration with the Gibostad pasture project, and for your contribution to the two papers
we wrote together. I really learned a lot from you! Elling Rukke, I appreciate your good and
specific advices regarding both the experimental design and in writing manuscripts and for
being my co-supervisor for a while. Lise Brunborg, I am so happy that you joined us and did
the work for your master degree related to this project. The cheesemaking really added
something to the study. Thank you for some joyful months when we shared office. I am very
grateful to Tormod Ådnøy, for excellent leadership of the project, for sharing of your great
knowledge about breeding and for supplying me with old articles, conference proceeding etc.
Binyam Dagnachew, I am thankful for all the fruitful discussion regarding genotypes, SNPs,
breeding, PCA, and for patiently explaining FTIR prediction and additive and dominance
effects repeatedly…
I would like to express my gratitude to all the co-authors, for your valuable comments and
discussions regarding the papers. I am especially grateful to Yves Chilliard for sharing his
great knowledge about LPL, lipolysis and effects of lipid feeding. Andrea Criscione and
3
Bernardo Valenti are acknowledged for their contribution in quantification of individual
caseins and for valuable discussions.
Knut Erik Grindaker, thank you for sharing your knowledge about rennet coagulation
properties and FFA of the Norwegian goats! And for being in charge of the sensory evaluation
of each and every milk sample in the 2011 experiment together with Helga Kvamsås and Kåre
Joahn Vassbotn. I am also thankful to the staff at Distriktslaboratoriet Brumunddal for
analysing the samples at specific time points and providing the results of the routine milk
analysis.
During the experimental periods, there were loads of milk samples that required immediately
analysis and/or preparation. I was unable to take care of all of them alone, and I am very
thankful for the assistance of: Irene Comi in milk sampling and distribution, Claes-Gøran
Fristedt for measuring milk fat globules, Mestawet Taye Asfaw for protein and casein
analysis, May Aalberg for shipping of milk samples and in protein analysis, Ida Block for
measuring calcium content, Tone Molland, Thor Bruun, Bjørg Holter and my supervisors for
extra assistance in the lab whenever needed. Dag Ekeberg, Hanne Devle and Kristi Ekrann
Aarak are acknowledged for valuable discussions and tips regarding identification and
quantification of fatty acids, and Kari Olsen for supervising in identification and analysis of
fatty acids by GC-FID. Magnhild Nymo and Agnes Koulman and other staff members at
Gibostad vgs and Animal Production Experimental Centre of NMBU are acknowledged for
great care of the goats and assistance in milk sampling.
Thanks to past and present fellow PhD-students, master students, post docs, researchers and
colleges for coffee or tea breaks, scientific and non-scientific talks, for sharing ups and downs
and making a nice working environment. Too many to be named one by one, you know who
you are!
I am especially thankful for the friendship of three special colleges: Mestawet, Ellen and
Irene. Thank you for being there for me and for being you.
Thanks to all my good friends for always cheering on me, and to my dearest sisters for all
kinds of support: milk sampling at the mountain pasture, proof reading of tables and texts,
babysitting, taking care of my horses…
Mum and dad, being a PhD-student, mother of two young children and running a farm would
have been much more difficult without you making everyday life a bit easier. Thanks to the
cottage for housing me –a great part of this thesis was written there.
4
Erik, thank you for your love and support, and for taking care of our children, home and the
farm when I spent most of my time writing. Anton Mattias and Ingrid Elise, my dearest
treasures, thank you for your endless love and for being constant reminders of what really
matters in life <3
Ås, January 2016
Ragnhild Aabøe Inglingstad
5
Summary
Inglingstad, R. A. 2016. Quality of Norwegian goat milk for cheese production. Norwegian
University of Life Sciences, Philosophiae Doctor Thesis, 2016:19, ISSN: 1894-6402, ISBN:
978-82-575-1348-1
Norwegian goat milk has faced a number of challenges related to the quality of the milk.
These challenges have been particularly related to poor rennet coagulation properties and off-
flavours. The aim of the project "Quality goat milk for cheese production was to improve the
milk quality for cheese production, and this thesis is part of this project.
The purpose of this study was to identify factors influencing the milk properties and
composition with emphasis on rennet coagulation parameters and free fatty acids (FFA). The
thesis contains five papers from three different experiments.
In the first experiment, milk from goats grazing two different pastures (rangeland and
cultivated) was compared with milk from goats that were fed hay indoors. The experiment
was conducted twice during the grazing season; early and late, and time of kidding was
adjusted so the goats were in the same lactation stage in the two grazing periods. The rennet
coagulation parameters were not influenced by pasture type (rangeland or cultivated) or hay,
although casein content was higher in milk from goats grazing. However, there was a marked
deterioration of rennet coagulation properties in late grazing season and this was observed
both in milk from goats on pastures and in those receiving hay. Milk yield was lower in late
grazing season (Paper I). There was no difference in the content of FFA in milk from goats
grazing rangeland or cultivated pastures or those fed hay, and there was no increase in FFA
in late grazing season (Paper II).
In the second experiment, the goats were fed three different types of lipid supplements
concentrates: Saturated (palm oil), unsaturated (rapeseed oil) and a control feed without extra
lipids. Milk samples were analysed through the entire lactation period, and cheeses were made
three times during the lactation. The results showed that the content of FFA and the incidence
of rancid and tart flavor of milk were highest in mid lactation but decreased if the goat
received the concentrate added rapeseed oil. The composition of fatty acids in milk were
affected by type of lipid supplement, and supplementation of rapeseed oil in feed increased
the content of unsaturated fatty acids in milk (Paper III). Lipid supplements did not affect the
composition of and content of proteins, nor rennet coagulation properties, as these properties
were affected by the lactation stage (Paper IV) and genotype (Paper V). Highest casein and
6
protein content, and the best rennet coagulation- and cheese making properties were obtained
in early lactation and when the goats were grazing mountain pastures (Paper IV). Both type
of lipid supplement (Paper IV) and genotype (Paper V) affected the cheese quality and -
ripening. Supplementation of saturated lipids to the goats gave cheese with better structure
than cheese produced from milk of goats that had received unsaturated lipids in the diet.
In the third experiment, we investigated how a genetic defect, which is found in a high
frequency in the Norwegian goat herd, influenced rennet coagulation properties and cheese
quality. Goats carrying two defective alleles in exon 12 of CSN1S1 (E12-00) had low levels
of αs1-casein and a lower protein content than goats with only one defective allele (E12-01).
Furthermore, the cheese produced from milk of goats E12-00 had poorer structure and higher
incidence of rancid and tart flavor compared with the cheese produced from milk of goats
E12-01 (Paper V).
The main conclusions of this study is that the content of FFA and incidence of rancid and tart
flavours in milk is highest when goats are in mid lactation. Furthermore, rangeland pasture
did not increase the content of FFA, and the content of FFA was reduced if the goats in mid
lactation received concentrate with rapeseed oil. The relationship between the content of FFA
and off-flavours was high. TINE’s routine analysis of FFA therefore provides a good
indication of the milk sensory properties. Supplementation of rapeseed oil in the goats’ feed
gave a more favorable fatty acid composition of the milk with regard to human nutrition, but
rapeseed oil had little or no effect on the milk protein content and rennet coagulation
properties. Stage of lactation, and especially genotype, had the greatest influence on
composition and content of proteins, FFA, rennet coagulation properties and cheese quality.
Further improvement of rennet coagulation properties could be achieved by genetic selection
for content of casein and αs1-casein. Development of a concentrate supplemented with
rapeseed oil would be beneficial as rapeseed oil reduce levels of FFA, and because it can be
produced from Norwegian resources, it is more sustainable compared to palm oil.
The Norwegian goat milk quality has improved due to the last year’s efforts in especially
breeding and feeding. Norwegian goat milk is of high quality and excellent for the production
of cheese.
7
Sammendrag
Inglingstad, R. A. 2016. Kvalitet på norsk geitemelk til osteproduksjon. Norges Miljø- og
Biovitenskapelige Universitet, PhD avhandling 2016:19, ISSN: 1894-6402, ISBN: 978-82-
575-1348-1
Norsk geitemelk har hatt en rekke utfordringer knyttet til kvaliteten på melka. Disse
utfordringene har vært særlig relatert til svake ysteegneskaper og smaksfeil. Prosjektet
«Kvalitetsmjølk for kvit geitost» har hatt som formål å bedre melkekvaliteten med tanke på
ysting, og denne avhandlinga er en del av dette prosjektet.
Formålet med denne studien har vært å kartlegge faktorer som påvirker melkas egenskaper
og sammensetning med vekt på løpekoagulering og frie fettsyrer (FFS). Avhandlinga
inneholder fem artikler fra tre ulike forsøk.
I det første forsøket ble melk fra geiter som hadde gått på to ulike beiter (innmark og
utmarksbeite) sammenliknet med melk fra geiter som var fôret innendørs med høy. Forsøket
ble utført to ganger i løpet av beiteperioden; tidlig og seint, og kjeingstidspunktet var justert
slik at geitene var i samme laktasjonsstadium i de to beiteperiodene. Ysteegenskapene ble
ikke påvirka av beitetype (innmark eller utmark) eller av høy, selv om kaseininnholdet var
høyere i melk fra geiter som gikk på beite. Derimot var det en markant forverring av
ystingsegenskapene seint i beiteperioden, og dette ble observert i melk fra geiter både på beite
og hos de som fikk høy. Også geitenes melkeytelse var lavere utover i beiteperioden (Artikkel
I). Det var ingen forskjell i innhold av FFS i melk fra geiter på utmarksbeite og innmarksbeite,
og det var heller ingen økning utover i beiteperioden (Artikkel II).
I det andre forsøket ble geiter fôret med tre ulike typer fettilskudd i kraftfôret: Metta
(palmeolje), umetta (rapsolje) og et kontrollfôr uten tilsatt fett. Melkeprøver ble analysert
gjennom en hel laktasjonsperiode, og det ble ystet ost tre ganger i løpet av laktasjonsperioden.
Resultatene viste at innholdet av FFS og forekomsten av harsk og besk smak på melka var
høyest i midtlaktasjon, men ble redusert dersom geita fikk kraftfôr tilsatt rapsolje.
Sammensetninga av fettsyrene i melka ble påvirket av type fettilskudd, og geiter som fikk
rapsolje hadde høyere innhold av umetta fettsyrer i melka (Artikkel III). Fettilskudd påvirket
ikke sammensetninga og mengde av proteiner, og heller ikke løpekoaguleringsegenskaper,
disse egenskapene ble påvirket av geitas laktasjonsstadium (Artikkel IV) og genotype
(Artikkel V). Melka hadde best ystingsegenskaper og høyest kasein- og proteininnhold tidlig
i laktasjonen og i tida geitene gikk på fjellbeite. (Artikkel IV). Både type fettilskudd (Artikkel
8
IV) og genotype (Artikkel V) påvirket ostens kvalitet og modning. Tilskudd av metta fett i
geitas fôr gav ost med bedre struktur ost ystet av melk fra geiter som hadde fått umetta fett i
fôret.
I det tredje forsøket undersøkte vi hvordan en genfeil, som har hatt stor utbredelse i den norske
geitebestanden, påvirket ystingsegenskaper og ostekvalitet. Geiter som hadde to defekte
alleler i exon 12 i CSN1S1 (E12-00) hadde lavt innhold av αs1-kasein og lavere proteininnhold
enn geiter med kun ett defekt allel (E12-01). Videre hadde ost ystet av melk fra E12-00 geiter
dårligere struktur og høyere forekomst av harsk og besk smak sammenlignet med ost ystet av
melk fra E12-01 geiter (Artikkel V).
Hovedkonklusjonen i denne studien er at innhold av FFS og forekomst av harsk og besk smak
i melka er høyest når geitene er i midtlaktasjon. Utmarksbeite økte ikke innholdet av FFS, og
innhold av FFS ble redusert dersom geitene i midtlaktasjon fikk tilskudd av rapsolje.
Sammenhengen mellom innhold av FFS og smaksfeil var høy. TINEs rutineanalyse av FFS
gir derfor en god indikasjon på melkas sensoriske egenskaper. Tilskudd av rapsolje i foret,
gav en mer gunstig fettsyresammensetning i melka med tanke på human ernæring, men
rapsolje påvirket i liten eller ingen grad melkas innhold av proteiner eller ystingsegenskaper.
Laktasjonstidspunkt, og særlig genotype, har størst påvirkning på melkas sammensetning av
proteiner, FFS, ystingsegenskaper og ostekvalitet. Det vil trolig være mulig å oppnå enda
bedre ystingsegenskaper dersom det i avlen selekteres for høyere innhold av αs1-kasein og
totalt innhold av kasein, da disse faktorene har en positiv påvirkning på ystingsegenskapene.
Utvikling av et kraftfôr tilsatt rapsolje til geit vil være positivt både fordi rapsolje gir et lavere
innhold av FFS og en mer gunstig fettsyresammensetning i melka, og pga økt bærekraft (i
forhold til palmeolje) siden rapsolje kan produseres av norske ressurser.
De siste årene med økt fokus på avl, fôring og helse, har hevet kvaliteten på geitemelka
betydelig. Norsk geitemelk er et råstoff av høy kvalitet som er utmerket til produksjon av ost.
9
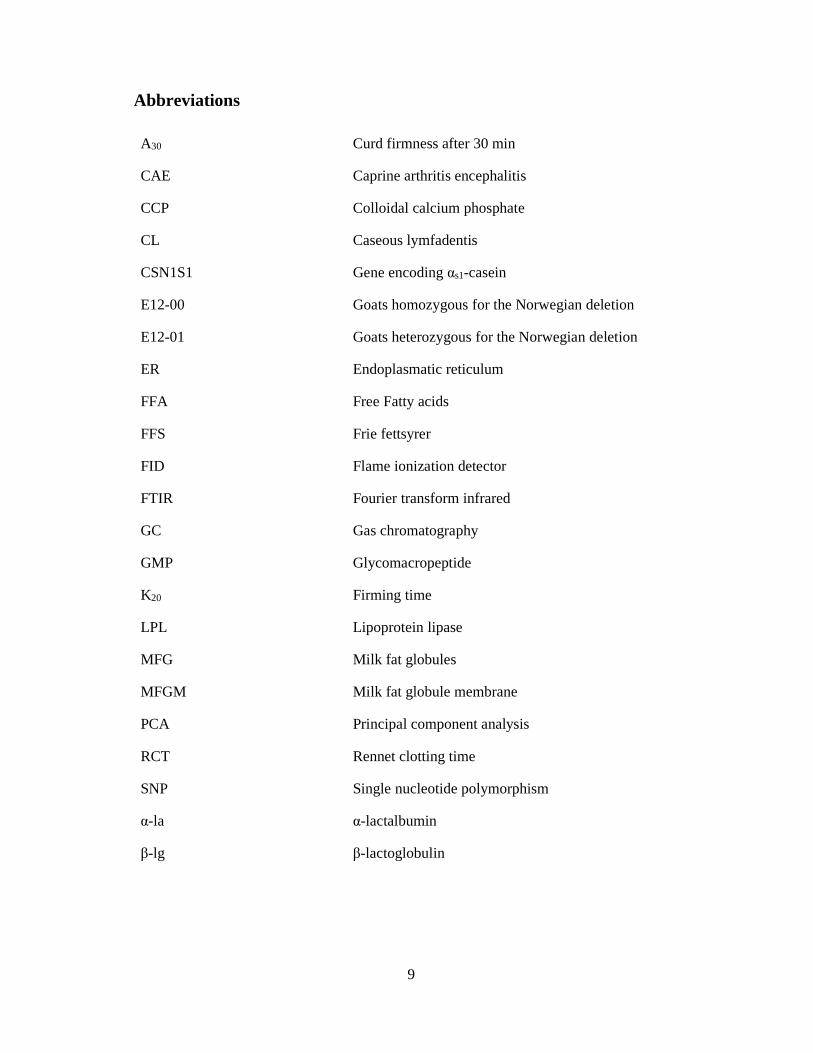
Abbreviations
A30 Curd firmness after 30 min
CAE Caprine arthritis encephalitis
CCP Colloidal calcium phosphate
CL Caseous lymfadentis
CSN1S1 Gene encoding αs1-casein
E12-00 Goats homozygous for the Norwegian deletion
E12-01 Goats heterozygous for the Norwegian deletion
ER Endoplasmatic reticulum
FFA Free Fatty acids
FFS Frie fettsyrer
FID Flame ionization detector
FTIR Fourier transform infrared
GC Gas chromatography
GMP Glycomacropeptide
K20 Firming time
LPL Lipoprotein lipase
MFG Milk fat globules
MFGM Milk fat globule membrane
PCA Principal component analysis
RCT Rennet clotting time
SNP Single nucleotide polymorphism
α-la α-lactalbumin
β-lg β-lactoglobulin
10
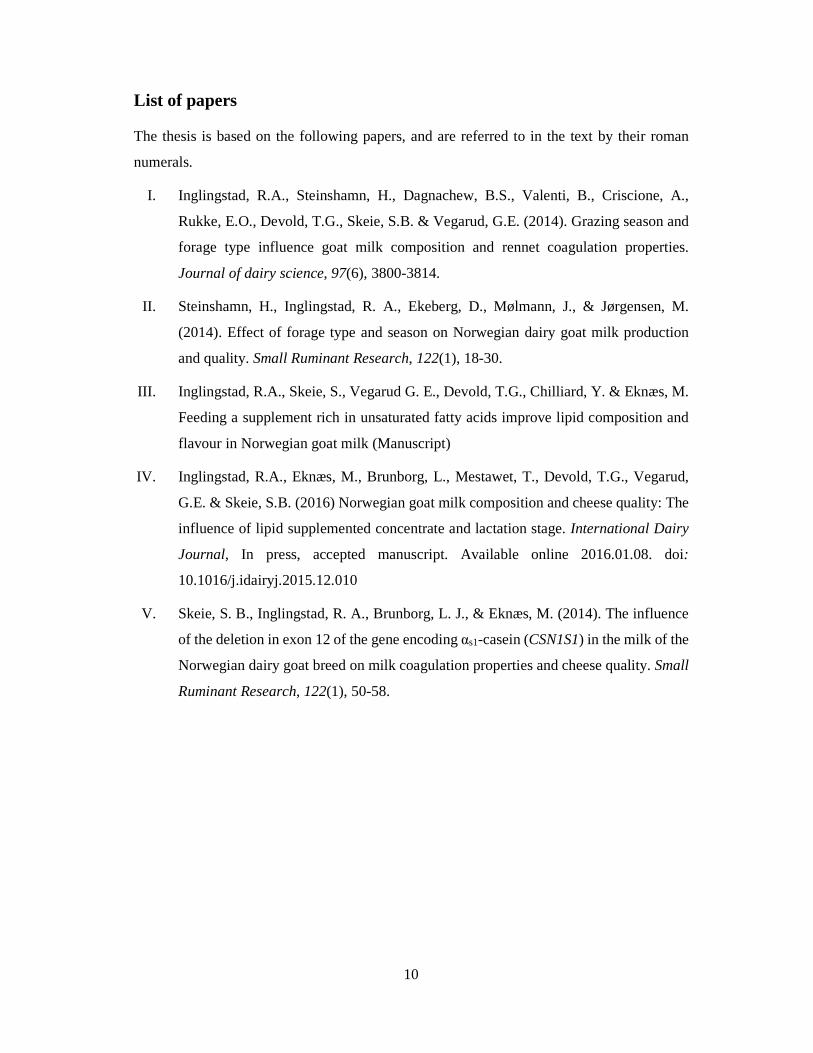
List of papers
The thesis is based on the following papers, and are referred to in the text by their roman
numerals.
I. Inglingstad, R.A., Steinshamn, H., Dagnachew, B.S., Valenti, B., Criscione, A.,
Rukke, E.O., Devold, T.G., Skeie, S.B. & Vegarud, G.E. (2014). Grazing season and
forage type influence goat milk composition and rennet coagulation properties.
Journal of dairy science, 97(6), 3800-3814.
II. Steinshamn, H., Inglingstad, R. A., Ekeberg, D., Mølmann, J., & Jørgensen, M.
(2014). Effect of forage type and season on Norwegian dairy goat milk production
and quality. Small Ruminant Research, 122(1), 18-30.
III. Inglingstad, R.A., Skeie, S., Vegarud G. E., Devold, T.G., Chilliard, Y. & Eknæs, M.
Feeding a supplement rich in unsaturated fatty acids improve lipid composition and
flavour in Norwegian goat milk (Manuscript)
IV. Inglingstad, R.A., Eknæs, M., Brunborg, L., Mestawet, T., Devold, T.G., Vegarud,
G.E. & Skeie, S.B. (2016) Norwegian goat milk composition and cheese quality: The
influence of lipid supplemented concentrate and lactation stage. International Dairy
Journal, In press, accepted manuscript. Available online 2016.01.08. doi:
10.1016/j.idairyj.2015.12.010
V. Skeie, S. B., Inglingstad, R. A., Brunborg, L. J., & Eknæs, M. (2014). The influence
of the deletion in exon 12 of the gene encoding αs1-casein (CSN1S1) in the milk of the
Norwegian dairy goat breed on milk coagulation properties and cheese quality. Small
Ruminant Research, 122(1), 50-58.
11
In addition, the candidate has contributed to the following papers (not regarded as a part of
the thesis):
a. Inglingstad, R. A., Devold, T. G., Eriksen, E. K., Holm, H., Jacobsen, M., Liland, K.
H., Rukke, E.O., & Vegarud, G. E. (2010). Comparison of the digestion of caseins
and whey proteins in equine, bovine, caprine and human milks by human
gastrointestinal enzymes. Dairy science & technology, 90(5), 549-563.
b. Eriksen, E. K., Holm, H., Jensen, E., Aabøe, R., Devold, T. G., Jacobsen, M., &
Vegarud, G. E. (2010). Different digestion of caprine whey proteins by human and
porcine gastrointestinal enzymes. British journal of nutrition, 104(03), 374-381
c. Eknæs, M., Volden, H., Hove, K., Inglingstad, R. A., Bernard, L., Leroux C. &
Chilliard, Y. Feeding different lipid supplements throughout lactation in dairy goats:
Effects on energy balance and milk production (Manuscript)

12
13
1. Introduction
1.1 Milk in human nutrition – a historical perspective
Compared to all other agricultural products, milk is unique in the sense that being food is its
main and primarily purpose. It contains all the important nutrients needed for the little
mammal to develop in the postpartum period. In addition, the content of immunogenic
components like immunoglobulins and several other bioactive compounds plays an active
protective role. Milk is highly nutritious due to its unique content of fat, proteins,
carbohydrates, minerals and minor nutrients. The milk typically consists of mainly water (87
%), lactose (4.6 %), fat (4 %), proteins (3.5 %), minerals (0.7 %) and other elements (like
vitamins, organic acids etc.)(1). Milk may at first glance appear to be a homogenous liquid;
however, the term “oil-in-water-emulsion” is a more correct description. The fat is dispersed
as fat globules in the aqueous phase, and a major part of the proteins are organized into
spherical colloidal particles, so-called casein micelles. The unique biochemical structure of
milk fat globules and casein micelles are to be described in detail later on.
Surly the ability to ingest milk in adulthood must have been an evolutionary advantage in
those days when access to food was limited also in our part of the world. The ability to tolerate
milk depends upon presence of the enzyme lactase (or more correctly: lactase phlorizin
hydrolase, LPH), which catalyses the hydrolysis of lactose into glucose and galactose.
Normally the expression of lactase decreases after the weaning period, however, some part
of the human population (approximately 35 %) are able to tolerate milk also after suckling
period because the gene encoding lactase is not down-regulated. This phenomena is known
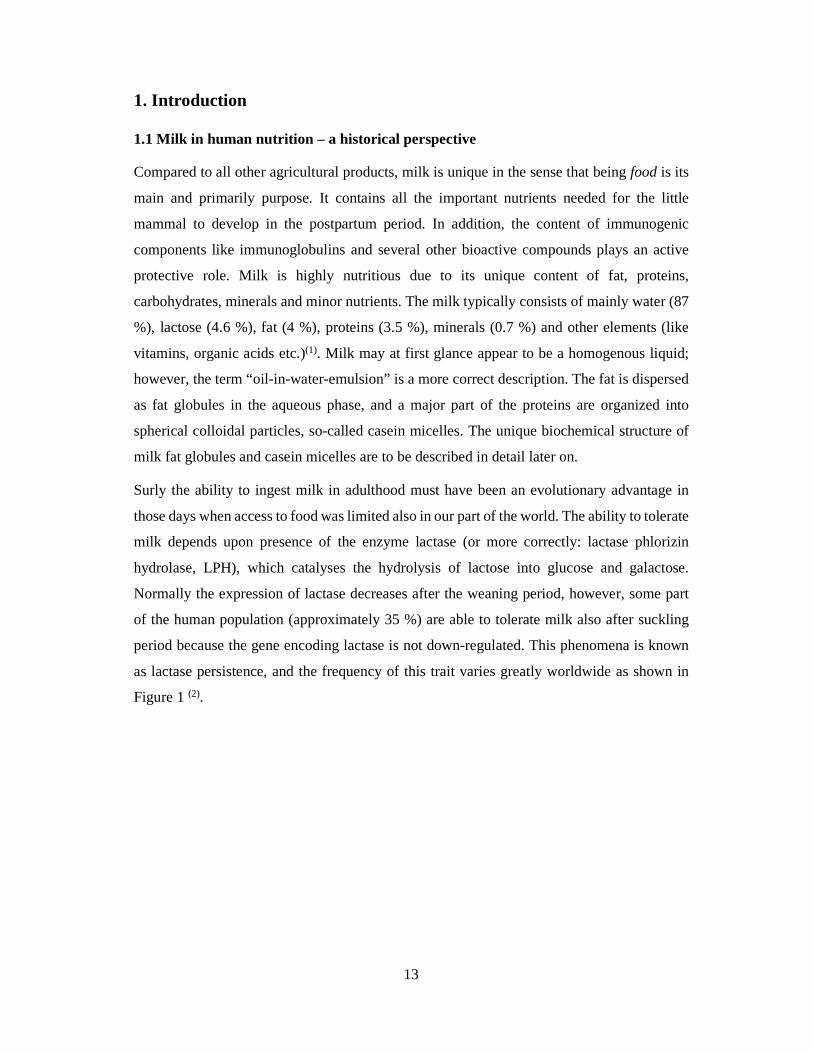
as lactase persistence, and the frequency of this trait varies greatly worldwide as shown in
Figure 1 (2).
14
Figure 1. The frequency of lactase persistence in the human population worldwide (2)
The differences in distribution of this trait seems to be correlated to dairying (3). By studying
an allele that is strongly associated to lactase persistence, it is believed that lactase persistence
and dairying coevolved some 7500 years ago in areas somewhere between the central Europe
and the central Balkan (4). The finding of whey protein peptides (from β-lactoglobulin) in
teeth of several human individuals who lived in Europe and Northern Southwest Asia 5000
years ago (5), provides a direct evidence of milk consumption in those areas. However, the
milk lipids found in 9000 years old pottery are probably the earliest evidence for dairying (6).
1.2 The Goat and its milk
Goats were the first animal domesticated by humans 10 000 years ago, in the highlands near
Mesopotamia (7-9). The goat, also referred to as “the poor man’s cow”, still plays an important
role in small-scale households in many developing countries. Compared to cows, goats are
superior because the cost of investments and keeping is low, and she produces milk even on
marginal feed. The goat is able to utilize plants, herbs and shrubs that are indigestible for
humans, in addition she is sure-footed and may live in harsh and rural areas where other
animals may not thrive. Goats are often kept by farmers with very little or no land, and are
commonly managed by children or women whose survival may depend on their goats (10; 11).
The goats are kept for meat or milk production, or as a dual purpose animal. Goat milk
contributes to approximately 2 % of the total milk production in the world (12). The total
number of goats counts 976 millions (13), of which the population in Asia, Africa and Latin-
15
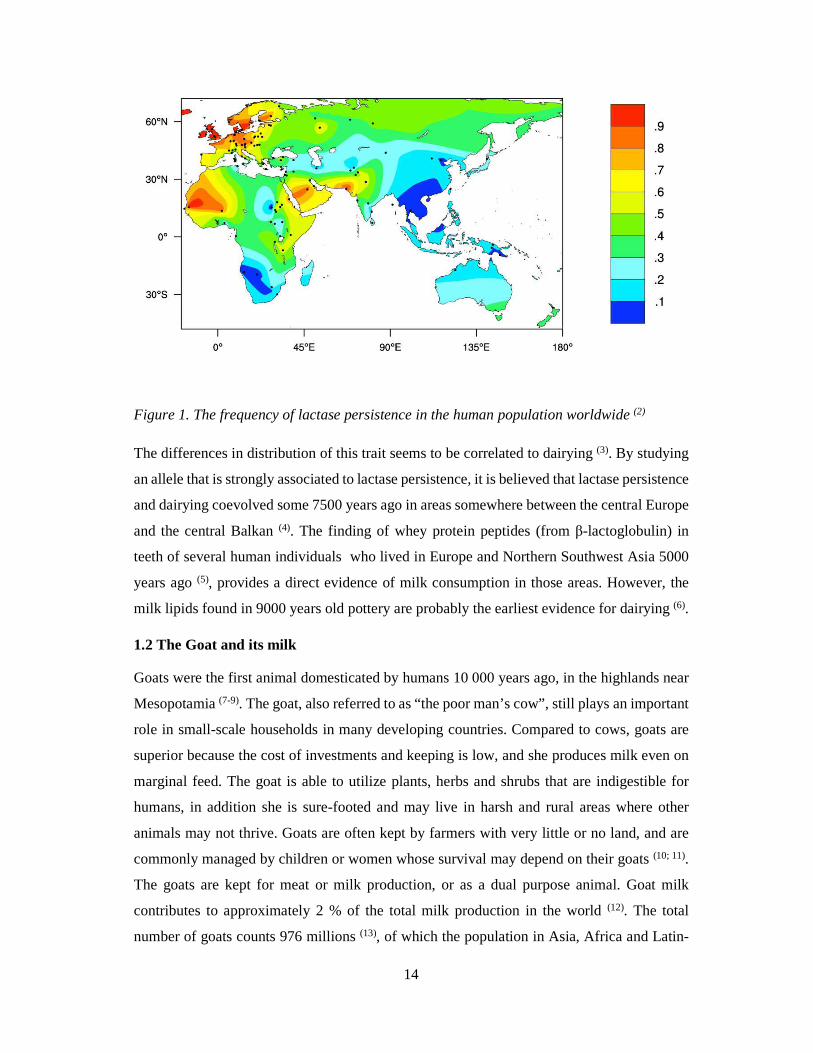
America contributes more than 95 % (12; 13) (Figure 2). While the number of goats in Europe
only contributes to less than 2 % of the world’s goat population (Figure 2), Europe produces
about 20 % of the total goat milk (10) and 45 % of the goat milk cheese (13). Most of the goat
milk and –cheese production in Europe is located in the Mediterranean countries In these
countries goat milk products are highly valued, and milk production is often supported by
governmental grants (7).
Figure 2. Distribution of goats in the world (2013)(13).
1.3 Norwegian goats and milk production
Most goats in Norway are dairy goats, however, the number of goats for meat production is
slightly increasing (14). The number of Norwegian goat farms counts 300 and the average herd
size is just above 100 animals. The goat milk production is largest in the northern and western
part of the country (14). The production is seasonal with kidding in January-March, and almost
no milk is produced from November to January (15). Due to the harsh climate in Norway,
pastoral production is only possible during the summer months, while the goats are fed indoor
most of the year. Some farmers still utilizes mountain pastures, and the goat’s browsing is
important to avoid areas to become overgrown (16). The goats graze to a large extent natural
unimproved grassland or free range in forest and mountain grasslands. The quality of these
pastures is variable and declines during the grazing season (17). Low prices of concentrates
has lead to a more intensive production less dependent of pastures. This production system
increases in Europe (10), however in Norway farmers receive grants for pastoral production (14).
16
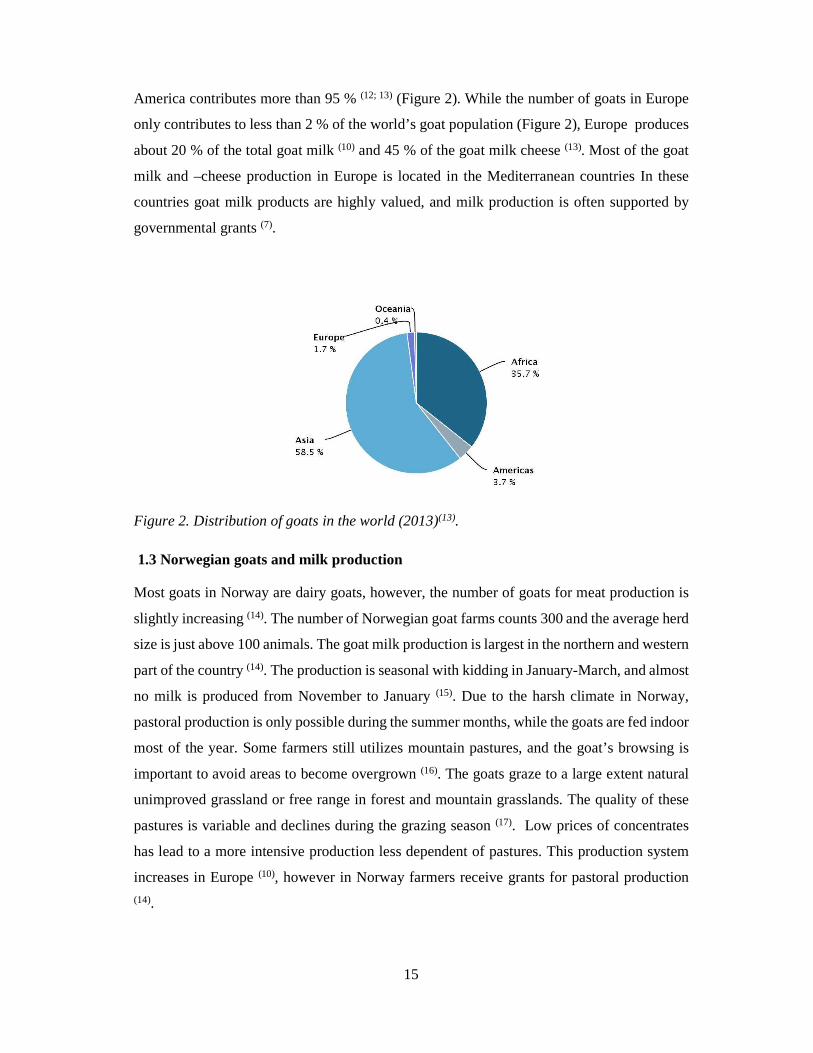
Keeping domesticated goats has long traditions in Norway. In the middle of the 19.th century,
the total number of goats counted 350 000 heads (15), today the herd counts only 33 000
animals (14). While the number of goats and producers are declining, the milk production has
been stable the last 20 years (Figure 3). Compared to other Scandinavian countries, the
number of dairy goats in Norway is relatively high (13).
Most of the produced milk is sold to the Norwegian dairy cooperative (TINE), while only a
small proportion is processed at the farm. About 70-80 % of the milk is used for production
of Brunost (a sweet whey “cheese”) and 6 % of the milk is used for production of the
spreadable cheese Snøfrisk (15). The sales and consumption of Brunost is declining, while the
demand for chevre and feta –type of cheeses is increasing. The consequence is a surplus of
goat milk, and development and marketing of new goat milk products is required. However,
until recently, the milk has been of variable quality, both regarding off-flavours and poor
coagulation ability (18). This has caused a delay in development of new products, and has
created (and maintained) a reputation among consumers of tart and rancid goat milk products.
Figure 3. Goats and goat milk production in Norway 1990-2015 (19)
0
10000
20000
30000
40000
50000
60000
70000
1980 1990 2000 2010 2020Year
Dairy goats
Milk production(Lx1000)
17
1.4 Milk composition and technological parameters
1.4.1 Proteins
The protein content in milk varies with factors like species (20), breed (21), genotype (22),
lactation stage (23) and feed (24). The protein content in goat milk is similar to that of cow milk
and is reported to vary from 2.6-4.8 % (21; 25). The major whey proteins are α-lactalbumin (α-
la) and β-lactoglobulin (β-lg), while the casein fraction consists of αs1-, αs2-, β- and κ-casein
and together these proteins comprise more than 95 % of the total protein content of milk.
Several minor proteins present in milk include immunoglobulins, serum albumin, lysozyme,
lactoferrin, transferrin, prolactin, lactoperoxidase, lipoprotein lipase (LPL) among others (26;
27). The ratio of αs1-, αs2-, β- and κ-casein in cow milk is roughly 4:1:4:1, while the proportion
of β-casein is higher in goat milk compared to the cow (27-29). αs1-casein was earlier reported
to be totally absent in goat milk (27), but later it was shown that the content of αs1-casein was
extremely variable due to the polymorphism at the αs1-casein locus (22; 30; 31).
1.4.1.1 Caseins and casein micelles
The casein monomers; αs1-, αs2-, β- and κ-casein, have unique molecular properties that
explain why they are present in an aggregated form, the casein micelles, in the milk. The
caseins have an uneven distribution of charged and hydrophobic amino acids in the primary
sequence, which gives rise to their amphiphilic nature. Some secondary structures exists (32),
but is rather low due to a high content of prolines. Moreover, their structure is open and
flexible as the amino acid cysteine is totally absent or present as only in minor quantities,
hence the possibility to stabilize their tertiary structures by disulphide bridges is limited. αs1-
, αs2- and β-casein are referred to as calcium sensitive as they precipitate in concentrations of
calcium above a certain level. Calcium interacts with their phosphorylated serine residues
presented in clusters along the primary sequence. κ-casein is different in this aspect, and this
is why this casein is located at the exterior of the casein micelle (33).
Their main function of the casein micelles, in addition to supply essential amino acids and
nitrogen, is transport of calcium phosphate from the mammary gland to the little infant. At
the natural milk pH (6.7) the calcium phosphate has low solubility, and if it was not for these
unique transport vehicles, the casein micelles, calcium phosphate would precipitate in the
mammary gland (34; 35). The structure of the casein micelle in cow milk has been investigated
over the last 70 years, and different models have been proposed (33; 36-46).
18
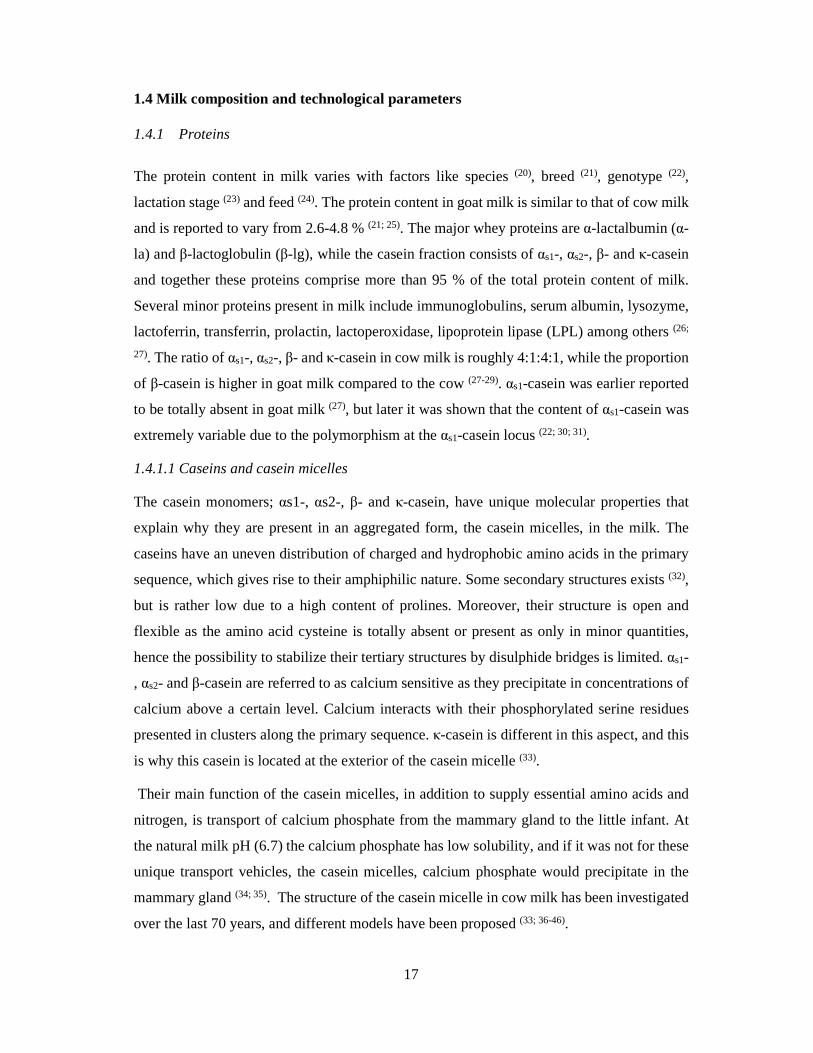
Nanoclusters of colloidal calcium phosphate (CCP) serves as interlocking points in the
interior of the casein micelle (40; 44). In addition, the caseins are linked together via
hydrophobic interactions (47). β- and κ-casein each have one hydrophobic region, and αs1-
caseins have two closely located hydrophobic regions, while αs2-caseins have two (or three)
hydrophobic regions (47). The β- and αs1-caseins acts as chain extenders, while αs2-casein acts
as a branch point as it contains two main hydrophobic regions and one or more phosphoserine
cluster(s) in the casein micelle formation (44; 47). Because κ-casein does not contain
phosphoserine clusters, and its C-terminal is hydrophilic, it can only interact with the other
caseins through its hydrophobic region. In this way, the κ-casein acts as a chain terminator,
with its hydrophilic, glycosylated and negatively charged C-terminal protruding into the
solvent (47). This features of the κ-casein gives the impression of a “hairy” casein micelle (33),
and its concentration is negatively proportional to the size of the casein micelles (48)
Most models agrees upon an network of β-and α-caseins, in addition to nanoclusters of
calcium phosphate in the interior of the casein micelle, and κ-casein located on the surface
with its hydrophilic, glycosylated and negatively charged C-terminal protruding into the
solvent (33; 44; 45; 49; 50)
The most recent model of Dalgleish (45; 49) is presented in Figure 4.
19
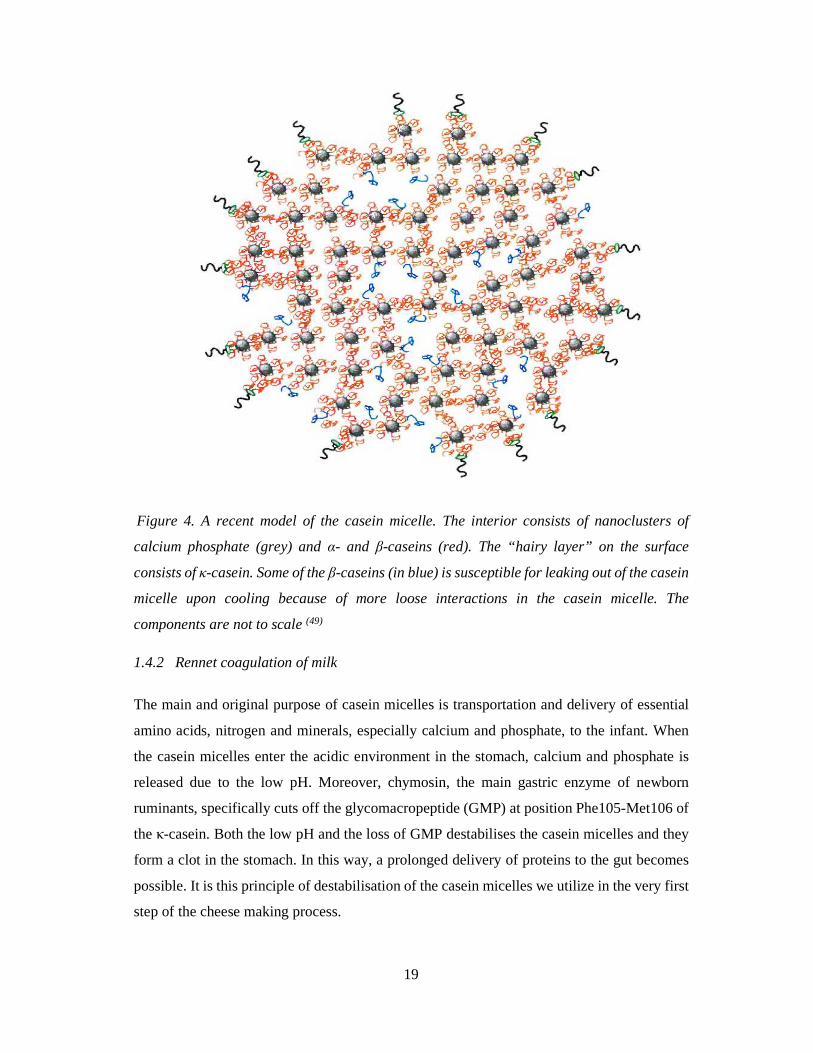
Figure 4. A recent model of the casein micelle. The interior consists of nanoclusters of
calcium phosphate (grey) and α- and β-caseins (red). The “hairy layer” on the surface
consists of κ-casein. Some of the β-caseins (in blue) is susceptible for leaking out of the casein
micelle upon cooling because of more loose interactions in the casein micelle. The
components are not to scale (49)
1.4.2 Rennet coagulation of milk
The main and original purpose of casein micelles is transportation and delivery of essential
amino acids, nitrogen and minerals, especially calcium and phosphate, to the infant. When
the casein micelles enter the acidic environment in the stomach, calcium and phosphate is
released due to the low pH. Moreover, chymosin, the main gastric enzyme of newborn
ruminants, specifically cuts off the glycomacropeptide (GMP) at position Phe105-Met106 of
the κ-casein. Both the low pH and the loss of GMP destabilises the casein micelles and they
form a clot in the stomach. In this way, a prolonged delivery of proteins to the gut becomes
possible. It is this principle of destabilisation of the casein micelles we utilize in the very first
step of the cheese making process.
20
Rennet is an extract of digestive enzymes from the fourth stomach (the abomasum) of
unweaned calves. Rennet made from stomachs of young calves contains a higher proportion
of chymosin, and the proportion of pepsin increases with the age of the animal (51). Rennet or
acid (usually produced by lactic acid bacteria), or a combination of both is used to destabilize
the casein micelles in the cheese making process.
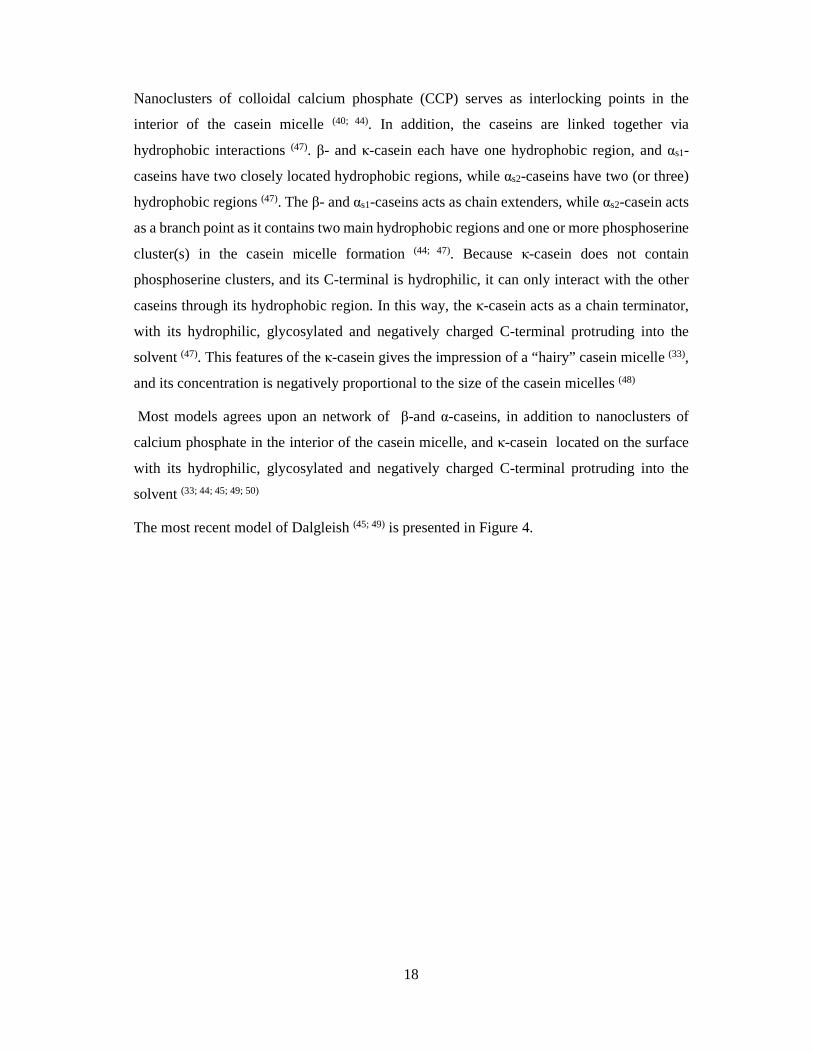
At the natural pH of milk, the casein micelles cannot approach each other due the negative
net charge and steric stabilization provided by the κ-casein (Figure 5 A). The chymosin
hydrolyses κ-casein between the phenylalanine-105 and methionine-106 residues and
releases the negatively charged part of the κ-casein, the glycomacropeptide (GMP) into the
whey. The loss of the GMP causes a gradual decrease in zeta potential and electrostatic
repulsion between the casein micelles (Figure 5 A) (47; 49). The removal of the steric hindrance
(GMP) of the casein micelles allows new interactions (mainly hydrophobic) between the
micelles which leads to aggregation. The aggregation do not start until the removal of GMP
is almost complete, and small snowflake-like aggregates becomes visible in the milk and the
viscosity increases (49; 52). This is referred to as the rennet clotting time (RCT) (52), and is
further described in 1.4.2.1.
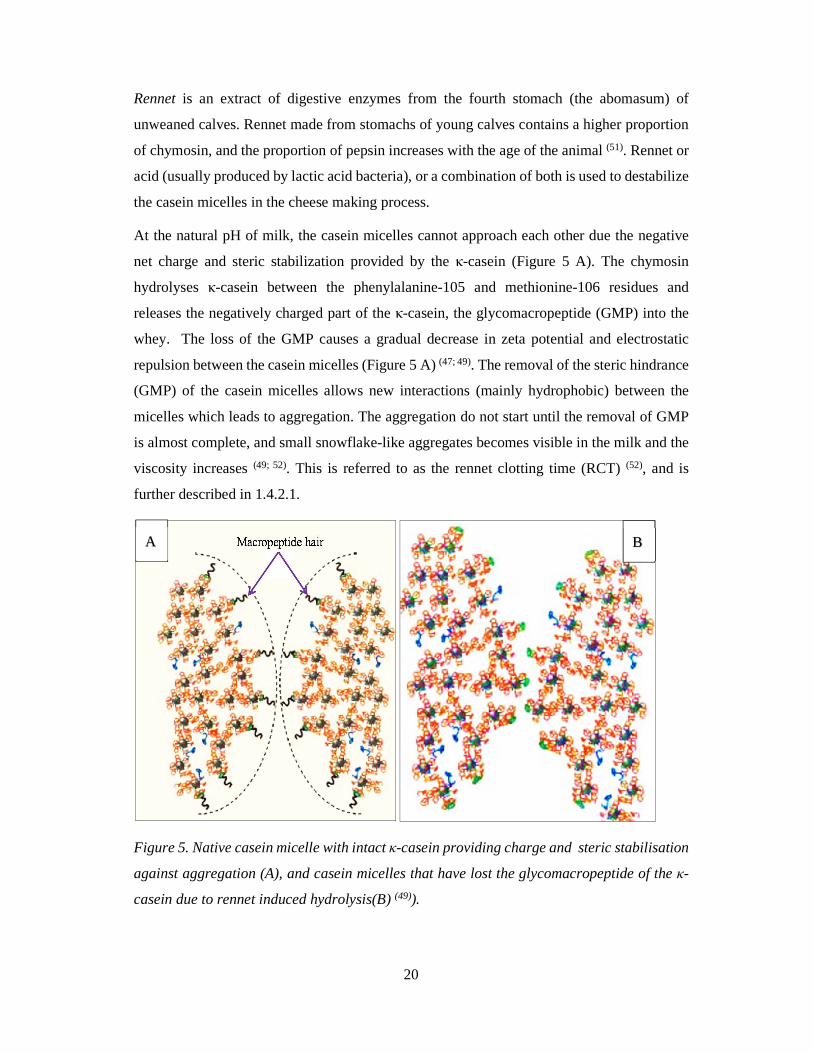
Figure 5. Native casein micelle with intact κ-casein providing charge and steric stabilisation
against aggregation (A), and casein micelles that have lost the glycomacropeptide of the κ-
casein due to rennet induced hydrolysis(B) (49)).
A B
21
No aggregation occurs below 15°C or without presence of calcium, whereas a decrease in pH
leads to shorter RCT and increased gel firmness (52). At the initial stages of aggregation,
hydrophobic interactions between the rennet-destabilized micelles is the main force. As the
gelation proceeds, the colloidal calcium phosphate (CCP) becomes increasingly important in
the creation of the gel network (52). A continuous network entraps whey, fat globules and
microbes within. Rennet induced gels tends to stick to the cheese vat and do not contracts
notably if not wetted or disrupted by cutting. However, upon cutting, the gel network shrinks
and expels whey. This process is called syneresis (1). During the syneresis, the number of
interactions in the gel network increases, and the pore size of the gel gets smaller and the
moisture content decreases. Rennet induced gels are capable of obtaining a much lower
moisture content compared to acid induced gels, and this is most probably due CCP
interactions, as acids precipitated casein micelles do not contain CCP (52).
1.4.2.1 Measuring rennet coagulation properties.
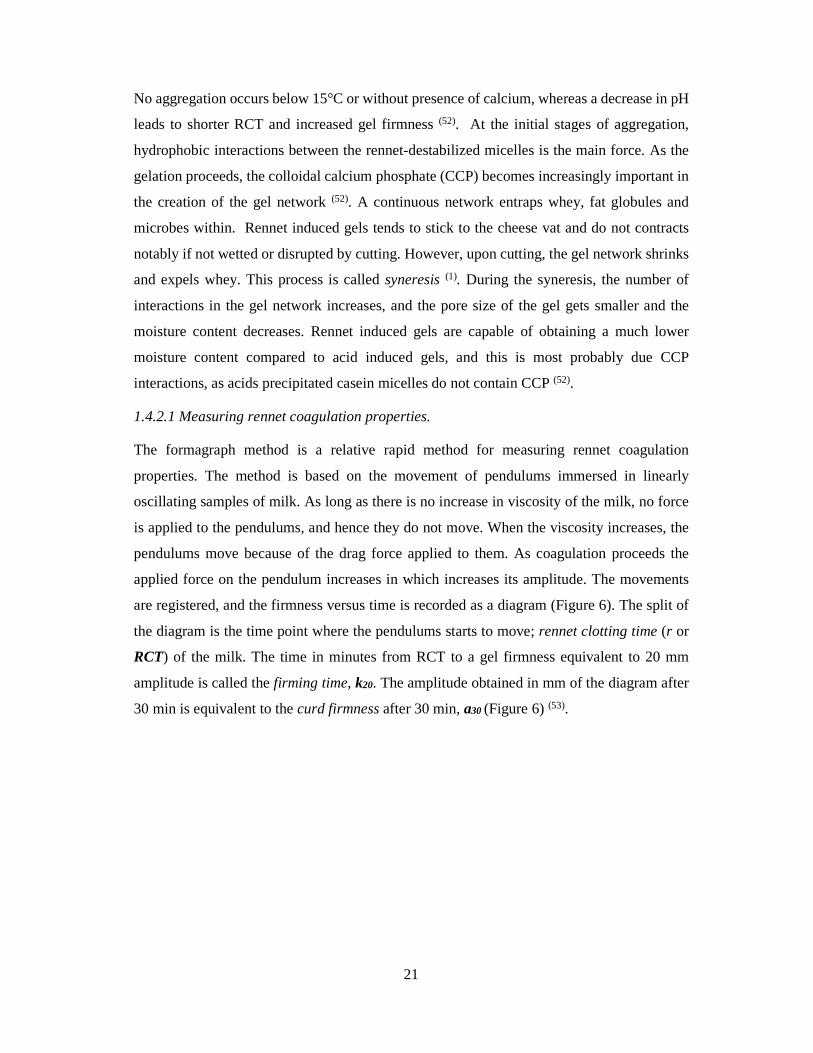
The formagraph method is a relative rapid method for measuring rennet coagulation
properties. The method is based on the movement of pendulums immersed in linearly
oscillating samples of milk. As long as there is no increase in viscosity of the milk, no force
is applied to the pendulums, and hence they do not move. When the viscosity increases, the
pendulums move because of the drag force applied to them. As coagulation proceeds the
applied force on the pendulum increases in which increases its amplitude. The movements
are registered, and the firmness versus time is recorded as a diagram (Figure 6). The split of
the diagram is the time point where the pendulums starts to move; rennet clotting time (r or
RCT) of the milk. The time in minutes from RCT to a gel firmness equivalent to 20 mm
amplitude is called the firming time, k20. The amplitude obtained in mm of the diagram after
30 min is equivalent to the curd firmness after 30 min, a30 (Figure 6) (53).
22
Figure 6. Illustration of the recorder unit of the Formagraph to the left. A: oscillating plate,
B: sample block, C: milk sample, D: pendulum, E: girder attached to the pendulum, F:
mirror, G: light, H: recording paper. A typical diagram with the milk coagulation parameters
obtained from the formagraph is shown to the right. Modified figures from (53; 54).
1.4.3 Lipids
The main purpose of milk lipids is to serve as energy source of the neonate, and the fat content
varies greatly among species depending of the need of the respectively progeny. The fat
content of goat milk is somewhat similar to that of cow milk; ~4 %, but like cow milk, it
varies with factors like stage of lactation, milk yield, feeding, breed etc. (55). Milk lipids are a
source of essential fatty acids (like omega-3 fatty acids), and the milk fat is important for the
rheological properties of dairy products. Goat milk lacks agglutinin, and therefore, in addition
to smaller milk fat globules, displays a slower creaming rate compared to cow milk.
Moreover, goat milk do not contain β-carotene, and the fat of goat milk therefore appear much
whiter than the fat of cow milk (55; 56). More than 400 different fatty acids are identified in
cow milk (57), and goat milk most likely has a comparable number of fatty acids. Several of
these fatty acids may serve as precursors of both favourable and unfavourable flavour
compounds (55). Most of these 400 fatty acids are found in very low concentrations, including
different varieties of branched chain fatty acids (BCFA). Several of those are known to have
a very low oral detection thresholds (58), and these are reported higher in goat milk compared
to cow milk (59).
23
1.4.3.1 Lipid synthesis and structure of the milk fat globules
Fatty acids in ruminant milk originate partly from de novo synthesis in mammary gland and
partly from lipids from feed or adipose tissue. Short and medium chain fatty acids with less
than 16 carbons and some of the C16s are synthesized de novo by using acetate and β-
hydroxybutyrate as substrate. Longer fatty acids originate from the diet and adipose tissue (55). Compared to the fatty acids composition of cow milk, the goat milk contains a higher
proportion of the fatty acids C6, C8 and C10 (60; 61) and Capra (goat) is reflected in the trivial
names of these fatty acids: Caproic-, caprylic- and capric acids, respectively. The milk lipids
are secreted as milk fat globules (MFG) into the milk. The diameter of cow MFG size vary
from approximately 0.1-15 µm (reported range of goat MFG is 0.73-8.58 µm (62)). The content
of small fat globules in milk is high, however they comprise only a small part of the total fat
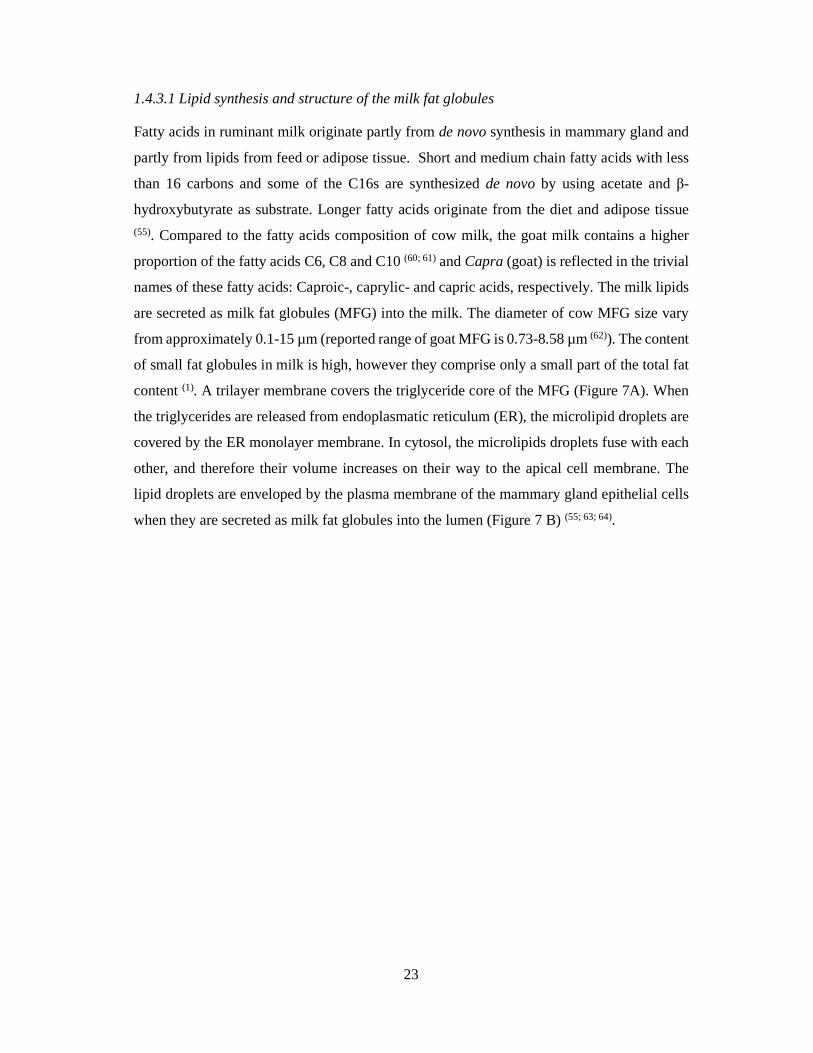
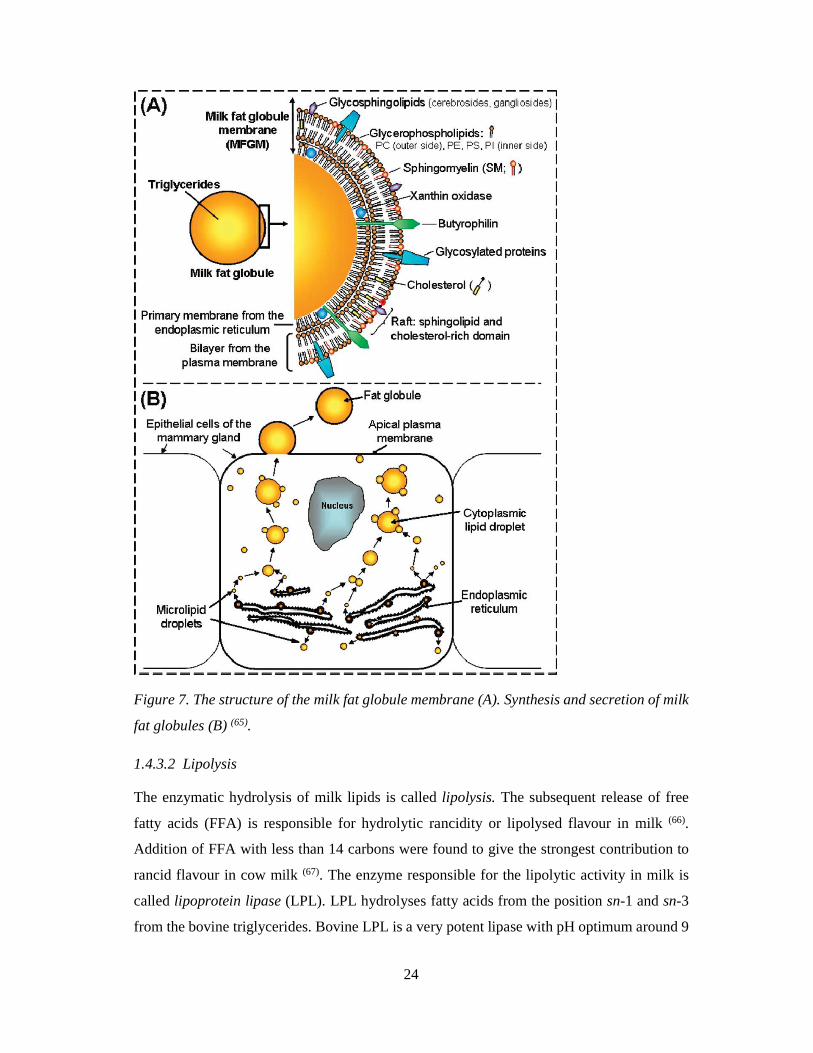
content (1). A trilayer membrane covers the triglyceride core of the MFG (Figure 7A). When
the triglycerides are released from endoplasmatic reticulum (ER), the microlipid droplets are
covered by the ER monolayer membrane. In cytosol, the microlipids droplets fuse with each
other, and therefore their volume increases on their way to the apical cell membrane. The
lipid droplets are enveloped by the plasma membrane of the mammary gland epithelial cells
when they are secreted as milk fat globules into the lumen (Figure 7 B) (55; 63; 64).
24
Figure 7. The structure of the milk fat globule membrane (A). Synthesis and secretion of milk
fat globules (B) (65).
1.4.3.2 Lipolysis
The enzymatic hydrolysis of milk lipids is called lipolysis. The subsequent release of free
fatty acids (FFA) is responsible for hydrolytic rancidity or lipolysed flavour in milk (66).
Addition of FFA with less than 14 carbons were found to give the strongest contribution to
rancid flavour in cow milk (67). The enzyme responsible for the lipolytic activity in milk is
called lipoprotein lipase (LPL). LPL hydrolyses fatty acids from the position sn-1 and sn-3
from the bovine triglycerides. Bovine LPL is a very potent lipase with pH optimum around 9
25
and a temperature optimum of 37 °C and is capable of turning the milk rancid within 10 min (68; 69). However, due to its association with the casein micelles (in bovine milk) and the
protective MFGM enveloping the triglycerides, very little lipolysis normally occurs. Cow
milk that is prone to high degree of lipolysis appears to have a higher level of activation
factors like apolipoproteins or lower levels of LPL inhibitors like proteose peptone fraction
PP3 than normal milk (68; 69). Similar factors of LPL activation and inhibition is also reported
in goat milk (61), but those are not extensively investigated.
Contrary to cow milk, only 8 % of the lipolytic activity is found in the casein fraction, while
the activity was primarly detected in the cream (46 %) and the serum (46 %) phase in goat
milk (70). The association of LPL with the fat globules in goat milk rather than the casein
micelles may explain the higher correlation between LPL activity and FFA in goat milk
compared to cow milk (61).
As the potential of LPL is much higher than the actual lipolysis, the LPL’s accessibility to its
substrate (the triglycerides) is most likely an important factor. Therefore, a different
composition of the MFGM of susceptible samples may explain the different degrees of
lipolysis between samples (71; 72). A recent comparative study of the proteins of MFGM in
different species revealed that goat MFGM has a remarkably higher content of xanthine
dehydrogenase/oxidase, stomatin and MAP34-B protein compared to MFGM of cow, human
and yak milk (73). Interestingly, a higher content of stomatin in addition to lactadherin, was
reported in goats with low or no synthesis of αs1-casein (homozygous for null alleles, O/O)
compared to goats with high synthesis of αs1-casein (homozygous for the strong alleles, A/A) (74). Whether the differences in the protein composition of the MFGM affects lipolysis in goat
milk remains unknown, and warrants further investigations.
1.5 Challenges and strategies to improve Norwegian goat milk quality
1.5.1 Milk protein polymorphism and milk quality
A single nucleotide polymorphism (SNP) in exon 12 of the gene encoding αs1-casein
(CSN1S1), is detected in the Norwegian goat population. Three different alleles of this SNP
is present in the Norwegian dairy goat heard, and one of the alleles carry a deletion of one of
six consecutive adenosines. This allele was first described by Lien (75) after a collaboration
with the French pioneers in this field (Grosclaude, Mahé and Martin) in the early nineties (15).
The deletion leads to a premature stop codon (75-77), and the truncated protein not detectable
26
by isoelectric focusing (IEF) (78). The frequency of this defective allele was extremely high
(73 %) in the Norwegian goat population (77; 79). Goats that carry two alleles of this genotype
are denoted E12-00, heterozygous goats as E12-01 and non-carrier goats as E12-11. E12-00
goats have a higher content of FFA (80), lower casein content and longer RCT and k20 and
weaker a30 (80; 81) compared to E12-01 or E12-11 goats.
Even though it was known during the early nineties that the number of E12-00 goats (“null”-
goats) was high (75; 78), it took several years before it was implemented in the breeding
programme and performance studies of Norwegian goats. An effort to reduce the frequency
of the defective allele started in 2008, when all farmers were offered to have their bucks
genotyped. When the first genotyping of bucks started in 2005, the frequency of the defective
allele among the bucks was as high as 80 %, while in 2012 it was reduced to 16 % (82). The
(unofficial) allele frequency among genotyped licenced bucks (382) is now (in 2015) 5 % (83).
A high frequency of a null allele of αs1-casein is recently reported in goats of the Swedish
Landrace, and may be the same type of polymorphism as in Norwegian dairy goats as
Norwegian bucks have been used for breeding in Sweden (84; 85).
It has been suggested that αs1-casein plays an important role in transport of caseins from the
endoplasmatic reticulum (ER)(86). Accumulation of immature caseins in ER cisterna is
observed in goats with reduced synthesis of αs1-casein (86), and this has been suggested to also
influence secretion of other milk components (87). Moreover, polymorphism at CSN1S1 locus
has been shown to affect gene expression of several genes influencing lipid synthesis and
secretion, membrane fluidity and cell interactions (88). Recently, polymorphism at CSN1S1
locus was shown to affect the membrane composition of the milk fat globules (MFG) (74).
This may explain why goats with no or low levels of αs1-casein including the E-12-00 goats
are different concerning other milk components.
1.5.2 Goat flavour and off-flavours
In the early sixties, there was raised a concern about the decrease in distinctness of flavour in
the Norwegian goat milk (89). Rønningen (1965) studied factors related to variation in goat
milk flavour, and found that flavour intensity was related to higher milk yield but lower milk
fat content. Therefore, he suggested selection for a high milk yield in order to increase the
flavour intensity of the goat milk (89). Selection experiments for increasing goat milk flavour
started in 1969 at the former Agricultural University of Norway (90; 91), and after five
generations the flavour intensity, content of palmitic acid and FFA and milk yield had
27
increased, and the fat content decreased (92). Many years later, a positive correlation of milk
yield and FFA and (too) strong flavour, and a negative correlation to fat, protein and lactose,
similar to what was reported by Rønningen (89) and Skjevdal (92), was found. However,
because of new technology and knowledge, Dagnachew et al. were able to link these traits to
a specific SNP (79). This SNP (called SNP 14 in (79)) is the position of the aforementioned
deletion in exon 12 of the gene encoding αs1-casein, and therefore the selection for strong
flavour and high milk yield may explain the high frequency of this genotype among the
Norwegian dairy goats. However, during the years between the selection for a stronger
flavour and the confirmation of the genetic link between strong flavour and low content of
αs1-casein, the flavour had become too strong or the flavour preferences among consumers
had changed (93). While ‘strong flavour’ was regarded as positive in 1965, ‘strong flavour’
caused problems in later years (18). One can wonder if the strong flavour was regarded as only
positive when reading the first line of the review by Skjevdal (1979): “The specific flavour
of goat’s milk is undesirable for direct consumption but for cheese production its presence
can be advantageous” (92). During the eighties and nineties, the flavour was so prominent that
some of the goat cheeses were withdrawn from the market (Knut Erik Grindaker, pers.comn
2014). Whether this was due to increase in flavour, change in the consumers preferences or a
combination of these factors is uncertain. However, in order to improve the flavour, “goat
flavour” was defined as something different from tart and rancid flavour (93). The tart and
rancid flavour are often related to content of free fatty acids, while the origin to the goat
flavour is more complex and not fully known. The goat flavour should be characteristic
“goaty”, but without tart or rancid off-flavours. The tart or rancid flavour may have been
misinterpreted as goat flavour because the goat milk are more likely to develop such flavours (93). Moreover, the lipolysed flavour caused by FFA is also sometimes described as “goaty”,
“soapy”, “bitter” or “butyric”. However, these descriptions are regarded as ambiguous
because they may be caused by other reactions than lipolysis (66).
Sensory evaluation of goat milk as basis for payment started in 2002. Measurement of FFA
was included in the routine control in 2003 in addition to sensory evaluation. From 2008,
measurement of FFA replaced sensory evaluation as basis for payment to the farmers. From
2014, the producers got a deduction in payment if content FFA exceeded 1.6 mM (94). The
focus of reducing FFA levels has led to a decrease of average annual FFA content form 1.53
in 2005 to 0.63 mM in 2012 (Helga Kvamsås and Kunt Erik Grindaker, pers.comn).
28
1.5.3 Healthier Goats- Eradication of common goat diseases
Up to recent years, the goat population has faced challenges due to a high frequency of
contagious bacterial and viral infections. The three essential diseases are 1) Caprine arthritis
and encephalitis (CAE), 2) Caseous lymfadentis (CL) (“byllesjuke”) and 3) Para
tuberculosis/Johne’s disease. Antibodies against the CAE virus was detected in nearly 90 %
of the goat population (in 1998) (95). The diseases are regarded at chronic, with no efficient
treatment or vaccine available. In 2001, the project “Healthier Goats” were initiated with the
goal of eradicate CAE (96). A method called “snatching” (snapping) was developed to
establish a new healthy goat herd. Once born, the kid is immediately taken away from its dam
and raised separately from the herd. The old goats are all slaughtered and the production
continues with the snatched kids after extensive cleaning of the barn, surroundings and
equipment (97; 98). This procedure is laborious, and may resist farmers from eradication of their
herds (99), however the healthier goats produces more milk (98; 100). The “Healthier goats”
project proved to be successful, and from 2013, all goat milk delivered to TINE came from
CAE free herds (96). At present, CAE, CL and caprine paratuberculosis are eradicated from
the Norwegian dairy goat population. This has lead to an increase in both milk yield (100) and
the goat’s welfare (101).
29
2. Background for the project “Quality goat milk for cheese production”
and aims of current study
As described in the previous chapter, there were several challenges regarding the Norwegian
goat milk at the turn of the century. The milk had quality problems regarding impaired
rennetability and off-flavours, and a large proportion of the goats were infected with various
diseases (see section 1.5). What about the large proportion of the “null”-goats? Were they the
unique and true Norwegian goats and their flavour a reflection of the rough Norwegian
nature? Maybe their poor rennet clotting ability was an indication of a more digestible milk,
and maybe people allergic to cow milk could tolerated it (102)? The digestibility of the milk
was examined, and even goat milk proved to have some positive bioactive properties (103; 104),
there was no difference between the “null”-goats and those with a higher content of αs1-casein (105). Nevertheless, it was decided to improve the goat milk with regards to cheese production
rather than marketing the milk as a “health-food”. The genetic testing of bucks for breeding
started in 2008, and the project “Healthier goats” with the goal of eradication CAE was
running. The same year, a large project involving recourses in breeding, feeding, forage,
physiology, milk and cheese quality got founded. This project was called “Quality goat milk
for cheese production” and the aim was to “Establish breeding and feeding strategies that
ensure optimal and stable goat milk quality for consumer preferred cheese products” (106). The
project was a collaboration between NMBU (formerly UMB), Bioforsk, Tine BA and the
Association of Sheep and Goat Breeders (NSG), and I got a possibility to study goat milk
quality for my PhD thesis within this project.
The aims of this thesis were to increase the knowledge of:
• Effect of pasture on milk quality and composition in early and late grazing season.
• Effect of palm oil vs rapeseed oil on milk quality and composition and cheesemaking
parameters
• The influence of genotype at CSN1S1 locus on rennet coagulation and cheesemaking
properties of goat milk
• Factors influencing the levels of FFA
• Factors influencing rennet coagulation properties

30
3. Experimental design
The goat milk used in these studies were collected from two different goat heards (Gibostad
(A) and Ås (B and C) at three different locations in Norway: From the university farm (Ås),
from Gibostad research centre (Troms) and the mountain pasture at Folldal (Ås-goats) (Figure
8).
The study is based on three main experiments and the results are presented in five papers:
A) Effects of forage and grazing season on milk production, composition and quality
and rennet coagulation properties
Paper I
Paper II
B) Effects of lipid supplemented concentrate on milk quality, rennet coagulation and
cheesemaking properties
Paper III
Paper IV
C) Effects of CSN1S1 genotype on rennet coagulation and cheese making properties
Paper V
Figure 8. Goat milk was collected from Gibostad in the north (Paper I & II), from the
mountain pasture in Einunndalen (Paper III and IV) and at the University farm (Paper III,
IV and V). Photos by K. Hansen, www.botnhamn.no, R. Inglingstad, www.statsbygg.no.
31
A) Effects of forage and grazing season on milk production, milk quality and rennet
coagulation properties
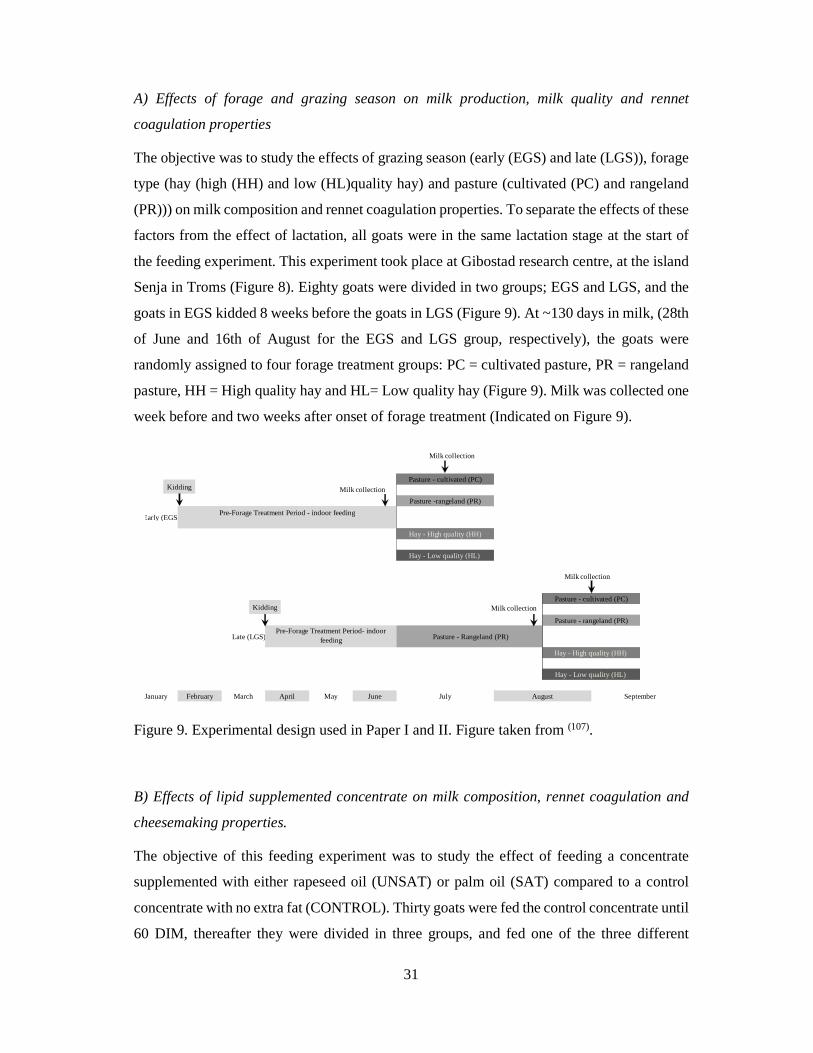
The objective was to study the effects of grazing season (early (EGS) and late (LGS)), forage
type (hay (high (HH) and low (HL)quality hay) and pasture (cultivated (PC) and rangeland
(PR))) on milk composition and rennet coagulation properties. To separate the effects of these
factors from the effect of lactation, all goats were in the same lactation stage at the start of
the feeding experiment. This experiment took place at Gibostad research centre, at the island
Senja in Troms (Figure 8). Eighty goats were divided in two groups; EGS and LGS, and the
goats in EGS kidded 8 weeks before the goats in LGS (Figure 9). At ~130 days in milk, (28th
of June and 16th of August for the EGS and LGS group, respectively), the goats were
randomly assigned to four forage treatment groups: PC = cultivated pasture, PR = rangeland
pasture, HH = High quality hay and HL= Low quality hay (Figure 9). Milk was collected one
week before and two weeks after onset of forage treatment (Indicated on Figure 9).
Figure 9. Experimental design used in Paper I and II. Figure taken from (107).
B) Effects of lipid supplemented concentrate on milk composition, rennet coagulation and
cheesemaking properties.
The objective of this feeding experiment was to study the effect of feeding a concentrate
supplemented with either rapeseed oil (UNSAT) or palm oil (SAT) compared to a control
concentrate with no extra fat (CONTROL). Thirty goats were fed the control concentrate until
60 DIM, thereafter they were divided in three groups, and fed one of the three different
January
Pre-Forage Treatment Period - indoor feeding
February March April May June
Early (EGS)
Pasture - cultivated (PC)
Pasture -rangeland (PR)
Hay - High quality (HH)
Hay - Low quality (HL)
Pasture - cultivated (PC)
Pasture - rangeland (PR)
Hay - High quality (HH)
Hay - Low quality (HL)
Pre-Forage Treatment Period- indoor feeding Pasture - Rangeland (PR)
July August September
Late (LGS)
Milk collection
Milk cMilk
Kidding
Kidding
Milk collection
Milk collection
Milk collection
32
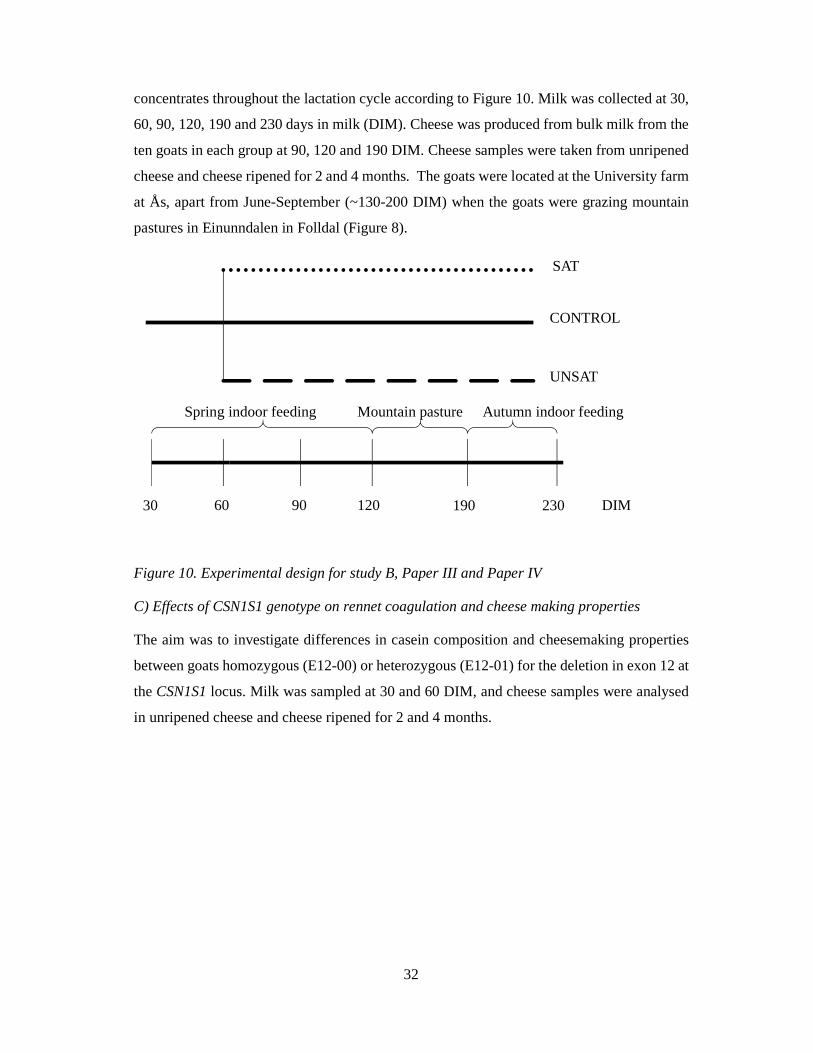
concentrates throughout the lactation cycle according to Figure 10. Milk was collected at 30,
60, 90, 120, 190 and 230 days in milk (DIM). Cheese was produced from bulk milk from the
ten goats in each group at 90, 120 and 190 DIM. Cheese samples were taken from unripened
cheese and cheese ripened for 2 and 4 months. The goats were located at the University farm
at Ås, apart from June-September (~130-200 DIM) when the goats were grazing mountain
pastures in Einunndalen in Folldal (Figure 8).
Figure 10. Experimental design for study B, Paper III and Paper IV
C) Effects of CSN1S1 genotype on rennet coagulation and cheese making properties
The aim was to investigate differences in casein composition and cheesemaking properties
between goats homozygous (E12-00) or heterozygous (E12-01) for the deletion in exon 12 at
the CSN1S1 locus. Milk was sampled at 30 and 60 DIM, and cheese samples were analysed
in unripened cheese and cheese ripened for 2 and 4 months.
Autumn indoor feeding
30 60 90 120 190 230
Spring indoor feeding Mountain pasture
SAT
CONTROL
UNSAT
DIM
33
4. Summary of papers
Paper I
Grazing season and forage type influence goat milk composition and rennet coagulation
properties
Milk protein composition and rennet coagulation properties were analysed in milk from goats
grazing two types of pasture (rangeland, PR and cultivated, PC) in early (EGS) and late (LGS)
grazing season. Milk from goats kept indoor and fed hay was used as comparison.
Main results
• Higher content of αs1- and κ-casein was obtained in milk from goats grazing PC.
• Higher content of β-casein was obtained in milk from goats grazing PR.
• Higher milk yield, contents of total protein, casein and calcium were found in milk in
EGS grazing season compared to LGS.
• Lower pH, shorter RCT, shorter firming time, and higher curd firmness were obtained
in milk from EGS compared to LGS.
• Content of αs2-casein, lactose and calcium were positively correlated to curd firmness
Main conclusion
The different types of forage did not influence rennet coagulation parameters; however,
milk collected in late grazing season did show impaired coagulation ability. The effects
observed in late season grazing may be confounded with the pre-experimental feeding
treatment for the goats, as similar effects were observed in milk from goats fed hay indoor.
34
Paper II
Effect of forage type and season on Norwegian dairy goat milk production and quality
Milk production parameters, fatty acid composition and content of free fatty acids were
analysed in milk from goats grazing two different types of pasture (rangeland, PR (woodland
is the term used in the published paper) and cultivated, PC) in early (EGS) and late (LGS)
grazing season. Milk from goats fed hay indoor was used as comparison.
Main results
• Milk from goats grazing PR yielded less milk, but the milk had a higher content of fat
and total solids compared to PC and hay feeding.
• Content of free fatty acids did not vary with the experimental factors (feeding or
grazing season).
• The milk from goats grazing PR had a lower proportion of medium-chain fatty acids
C10:0–C14:0 and C18:2c9t11, and a higher proportion of C18:0, C18:2c9,12 and
C20:0 than milk from goats grazing PC.
• Milk from grazing goats had lower proportion of the medium-chained fatty acids
C12:0, C14:0 and C16:0 and higher proportion of the long-chained fatty acids C18:0,
C18:1t11, C18:2c9,t11, C18:3c9,12,15, C20:0 than milk from goats fed hay.
• Content of short- and medium-chained fatty acids (C6:0–C14:0) and C16:0 were
higher in late than in early grazing season, while the proportion of long chained fatty
acids (C18:0, C18:1c9, C18:1t11, C18:2c9,12,C18:2c9t11 and C18:3c9,12,15) were
lower.
Main conclusion
Milk from goats grazing rangeland produced less milk, but with a higher content of fat and
total solids. Rangeland pasture did not increase the content of free fatty acids in the milk.
35
Paper III
Feeding a supplement rich in unsaturated fatty acids improve lipid composition and
flavour in Norwegian goat milk
The objective of this experiment was to study the effect of feeding goats a concentrate
supplemented with either saturated (palm oil) (SAT) or unsaturated (rapeseed oil) (UNSAT)
lipids on milk fatty acid composition, content and composition of FFA, LPL-activity and
flavour. A concentrate with no extra lipids was used as a control feed (CONTROL). Milk was
sampled and analysed at 30, 60, 90, 120, 190 and 230 days in milk (DIM).
Main results
• Milk from goats receiving the UNSAT feed produced milk with higher content of
unsaturated fatty acids. In addition, this milk had a lower content of FFA and obtained
better flavour scores.
• FFA content was highly correlated with off-flavours in milk, but not to lipoprotein
lipase activity.
• FFA content in milk was highest at mid-lactation, before the goats went on pasture.
Main conclusion
Feeding unsaturated lipids (rapeseed oil) had many positive effects on the milk quality, and
resulted in future promises for development of concentrates based on rapeseed oil to replace
the present lipid source (palm oil) used in feeds to dairy goats.
36
Paper IV
Effect of unsaturated lipid supplementation on milk composition and cheese making
parameters
The objective was to study the effect of feeding goats a concentrate supplemented with either
saturated (palm oil) or unsaturated (rapeseed oil) lipids on milk composition, rennet
coagulation parameters and cheese making properties. A concentrate with no extra lipids was
used as a control feed. The milk and cheeses from the three feeding groups were denoted as
SAT, UNSAT and CONTROL, respectively. Milk composition was analysed six times during
the lactation period (30, 60, 90, 120, 190 and 230), and cheese was made three times (90, 120
and 190) during the same lactation period including when goats were grazing mountain
pasture.
Main Results
• Only minor effects of feeding different lipid supplemented concentrate on milk
composition, individual casein content and rennet coagulation properties
• Lactation stage influenced all parameters except content of whey proteins
• UNSAT cheese ripened slower and had the highest moisture content and the poorest
texture. SAT cheese had the highest content of free amino acids (FAA) and appeared
therefore to ripen faster than UNSAT cheese.
• Cheese produced from milk at the mountain pasture (190 DIM) had a higher content
of total solids and better texture than cheese produced at 90 and 120 DIM
Main conclusion
Only minor effects of feeding different lipid supplements were observed on milk protein
composition and rennet coagulation properties, however, cheese composition and quality was
affected. The source of lipid appeared to influence the proteolysis in cheese during ripening.
37
Paper V
The influence of the deletion in exon 12 of the gene encoding αs1-casein (CSN1S1) in the
milk of the Norwegian dairy goat breed on milk coagulation properties and cheese
quality
The aim of this study was to investigate the effect of the deletion in exon 12 of the gene
encoding αs1-casein (CSN1S1) on milk protein composition, cheese making properties and
cheese ripening. Milk from goats homozygous for the deletion (E12-00) were compared with
heterozygous goats (E12-01).
Main results
• Milk from E12-00 goats had a lower content of total protein andαs1-casein, and a
higher content of β-casein compared to their E12-01 herdmates.
• Rennet clotting time (RCT) did not differ in milk from the two genotypes, but milk
from E12-01 goats had shorter firming time (k20) and obtained a firmer curd (a30) than
E12-01 goats.
• Cheese made of milk from E12-00 goats had a higher moisture content and more
pronounced rancid flavour compared to E12-01.
Main conclusion
Milk from goats heterozygous for the deletion in exon 12 (E12-01) was more suitable for
cheese production, because the cheese obtained a better texture and flavour score than milk
from homozygous goats (E12-00).

38
39
5. Key results and general discussion
5.1 Goats on pastures - effects in milk
Rangeland and mountain pastures are important feed resources during the summer months,
and mountain farming has long traditions in Norway. Inferred quality with regard to
coagulation properties and especially off-flavours (71; 72) has been reported in milk during the
grazing period. Decrease in the body weight due to decreased forage quality and energy spent
on wandering on rangeland pasture is believed to increase content of FFA and subsequent
off-flavours in the milk (108; 109). However, the physiological mechanisms still remains unclear
as another study have shown that higher energy intake and positive energy balance were
correlated to high levels of FFA (110; 111). Moreover, it has been shown that milk composition
varies during the lactation cycle (23) and LPL-activity is at maximum in mid-lactation (61). In
contrast to cow-dairying, where calving proceeds all year around, goats usually have their
kids during springtime. Therefore, compositional factors determined by lactation stage and
by season (time when goats are let on pasture) may be confounded.
In Paper I and II, the effects of forage type on goat milk composition and production
parameters and were studied. One group of goats grazed rangeland (PR) and another group
grazed cultivated pasture (PC). Two groups of goats were indoor receiving hay of high (HH)
or low (HL) quality, respectively. The experiment was conducted twice during a grazing
season: in July (early grazing season, EGS) and in mid-August-September (late grazing
season, LGS).
Type of forage affected milk yield and composition. Goats on PR yielded less milk (27 %),
but had a higher fat content than goats on PC. As Goats on PR had a higher feed intake, the
lower milk yield is most likely explained by more energy spent on wandering and not by the
quality of the forage on PR (Paper II). Milk from pastoral goats had higher protein and casein
content compared to hay fed goats. The casein composition was different in pastoral
compared to hay fed goats, and by grazing PR vs PC (Paper I). The most prominent effect of
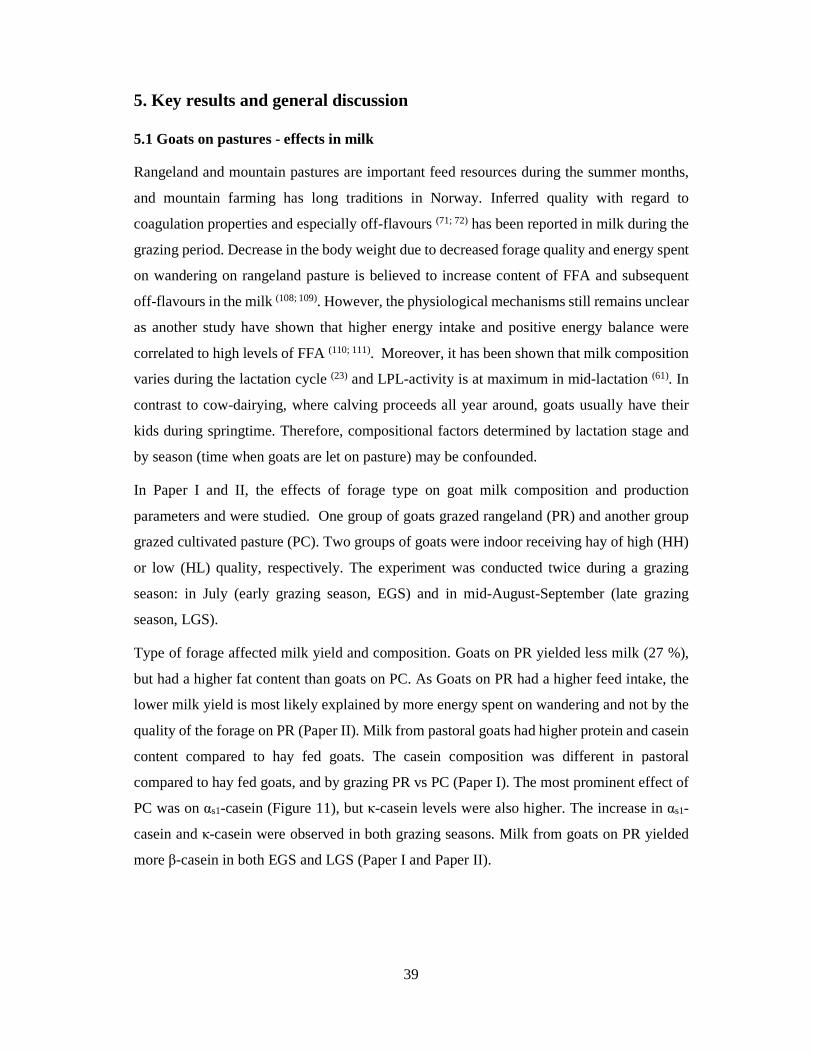
PC was on αs1-casein (Figure 11), but κ-casein levels were also higher. The increase in αs1-
casein and κ-casein were observed in both grazing seasons. Milk from goats on PR yielded
more β-casein in both EGS and LGS (Paper I and Paper II).
40
Figure 11. Content of αs1-casein in Early (EGS) and Late (LGS) grazing season. Two types
of pasture (green); cultivated (PC) and rangeland (PR) were compared to two types of hay
(blue); high (HH) and low (HL) quality. Modified figure from Paper I (107).
One would probably expect improved rennet coagulation properties when the content of αs1-
and κ-casein increased. However, apart from longer RCT in milk from goats grazing, no
differences in rennet coagulation parameters were found between the different forage types.
The grazing season influenced the rennet coagulation parameters: weaker curd (a30) and
especially longer firming time (k20) occurred in LGS. A large proportion of the milk samples,
which included all E12-00 goats, did not obtain k20 in LGS. The explanation for the impaired
rennet coagulation properties in LGS remains unclear, as this was also observed for the
control groups receiving hay indoor. The effect of season was confounded with the pre-
experimental period because the goats in LGS was grazing on rangeland before they were
allocated to their feeding groups, while the goats in EGS received silage in the pre-
experimental period (Figure 9). A plausible explanation of the changes that occurred from
EGS to LGS may be attributed to increased plasmin activity. Factors like stress and late
lactation are known to increase the plasmin activity in milk (112; 113), however, the goats were
in the same lactation stage in both EGS and LGS. Degradation of caseins by plasmin may
impair the curd firmness and reduce the cheese yield (114). In addition, the milk yield was
reduced in LGS. Plasmin has been reported to generate a peptide from β-casein (fragment 1-
28) that blocks the K+ channels of the mammary epithelial cells, which is associated with
0
1
2
3
4
5
6
EGS LGS
αs1
-cas
ein,
gL-1
PC PR HH HL
41
reduced milk yield (113). The reduction of αs2- and β-casein content in LGS may imply
degradation of these caseins by plasmin, which is known to impair the clotting properties of
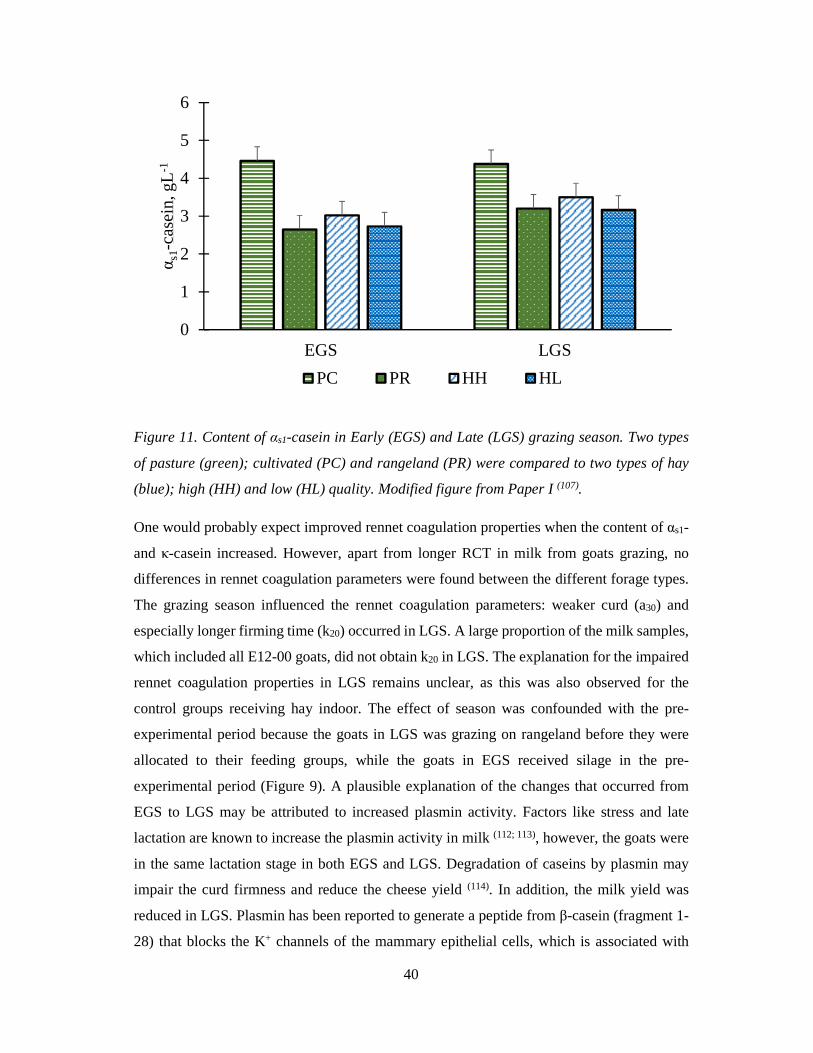
milk (112; 115). Impaired rennet coagulation properties in milk from E12-00 goats were
observed at mountain pasture in a later study (Figure 12, Inglingstad, unpublished data). The
E12-01 goats displayed even better rennet coagulation properties at mountain pasture (190
DIM) than at early lactation stages (Paper V), and the difference between the two genotypes
were prominent indeed (Figure 10).
Figure 12. Rennet coagulation parameters measured at mountain pasture in milk from goats
with different genotype at exon 12 CSN1S1. E12-01 (n=21) and E12-00 (n=10). Unpublished
results.
In a previous study (108) the level of FFA in milk increased during the mountain grazing period,
therefore a higher content of FFA was expected on PR, especially in LGS due to decreasing
pasture quality in the later season (17). However, no effect of forage nor grazing season was
found for levels of FFA in milk (Paper II). In fact, the levels of FFA were lower in EGS than
in LGS. In another study (Paper III), the FFA level peaked around 90 DIM when the goats
were still indoor receiving silage. The level of FFA did not increase in milk at the end of the
mountain grazing period (190 DIM). This implies that increased level of FFA may be caused
0
5
10
15
20
25
30
0 4 8 12 16 20 24 28
a 30(m
m)
min
E12-01 E12-00
RCT
k20
42
by factors related to lactation stage rather than energy spent on wandering or the decrease in
pasture quality.
5.2 Lipid supplements – effects in milk
Fatty acid composition in milk can be altered by feeding lipid supplements (116; 117), however,
excess of especially unsaturated lipids may cause milk fat depression in cows (118). Goats
responds differently to lipid feeding, and it is possible both to increase the milk fat content
and change the lipid composition (61). In addition, French studies have shown that by feeding
unsaturated lipids to goats, the LPL-activity decreased (119). However, in Norwegian goats the
frequency of off-flavors was reduced when receiving extra saturated lipids (mainly C16:0 and
C18:0) (71). Based on the latter study, the hypothesis of the mechanism for the improved flavor
was that increased cholesterol levels would provide increased stability to the MFGM and
thereby reducing the LPL’s access to the triglycerides. This would lead to lower content of
FFA and hence reduce the off-flavours (71). The type of fat used in the study described above
is now a standard fat source in concentrate to dairy animals (120), as calcium soaps of palm oil.
However, lately the use of palm oil in food, and now also in feed, has been severely criticized (121). The demand for more sustainable lipid source of both food and feed is increasing.
Rapeseeds is the only type of oil seed that is produced in significant amounts in Norway.
Rapeseed oil (UNSAT) was therefore included as an experimental comparison to palm oil
(SAT), also because of the positive effects observed of unsaturated lipids in other studies (119).
In addition, concentrate with no extra fat was included as a control (CONTROL). The three
different concentrates were examined for the effect on milk composition, milk flavor and
cheese making properties.
As expected, the fat content in milk increased when the goats received concentrate
supplemented with extra fat (Paper III). This is also shown by several others (122-124). A higher
fat content normally increases the total solids (TS) and the cheese yield (125). In addition, fat
content is positively correlated to the mean size of MFG in goats (Paper III) (74), and cows (126) and buffalos (127; 128). The lipid source of the goats feed influences the lipid composition
of the milk (Paper III) (61), and therefore increasing the proportion of unsaturated fatty acids
is possible. An increased intake of unsaturated fat and a decreased intake of saturated fat in
the human diet is recommended by health authorities worldwide (129; 130). Pasture (Paper II)
and rapeseed oil (Paper III) both increased the proportion of unsaturated lipids at the expense
of the saturated fatty acids in the milk, and this is also supported by several other studies (131;
43
132). When no extra fat was fed to the goats, the proportion of saturated fatty acids with less
than 16 carbons and odd- and branched chained fatty acids increased. The odd- and branched
chain fatty acids originates from ruminal metabolism of branched-chain amino acids,
propionate and butyrate (61). The SAT concentrate increased the content of C16:0 and C16:1
which reflects the high content of C16:0 in the SAT concentrate, and this is in accordance
with a previous study by Eknæs et al. (72). This study showed that when the content of C16:0
increased in the milk, the frequency of tart and rancid flavors were reduced, but without
affecting the content of FFA. In the present study (Paper III), the UNSAT milk had
significantly lower content of FFA at mid lactation (90-120 DIM) compared to SAT and
CONTROL milk. This was somewhat unexpected, as we hypothesized that feeding more
C16:0 would increase the cholesterol levels in the MFGM and thereby increase the stability
towards lipolysis.
The highest levels of FFA were measured when the goats were in mid lactation (90-120 DIM)
and fed silage Previous studies showed that the LPL-activity in French goat milk was highest
in mid lactation (61) and decreased if unsaturated lipids were fed to the goats (116; 133). Similar
trends of lactation stage and UNSAT diet were observed in our study (Paper III), however,
the effects were not as prominent as in the French studies, and not directly correlated to
content of FFA (r= -0.2, n=186). Therefore, there must me other factors involved that explains
the elevated levels of FFA in some goats and this warrants further research. While content of
FFA and LPL-activity were not correlated, there was a strong negative correlation (r= -0.8,
P<0.0001, n=184) between high levels of FFA and good milk flavour. UNSAT milk received
best score for its flavour, while flavour scores of SAT and CONTROL milk did not differ.
The inclusion of rapeseed in the goats’ diet is promising with regard to both an improved fatty
acid composition, reduction of content of FFA and improved flavour. However, effects of
replacing saturated with an unsaturated lipid source warrants investigations of the non-fat
components of milk and of its technological properties. Until today, very little data covering
these issues is published. Therefore, in Paper IV, we investigated the effect of SAT, UNSAT
and CONTROL concentrates on milk content of non-fat components and rennet coagulation
properties during a whole lactation cycle. In addition, cheese was made of bulk milk from the
three feeding groups at three different lactation stages (90, 120 and 190 DIM) (134). The milk
parameters that was investigated was total contents of protein, casein, individual caseins, and
lactose, SCC and pH, in addition to rennet coagulation parameters. Our investigation revealed
that these parameters were not significantly influenced by the lipid source of the concentrate.
44
In this study, an experimental cheese of Havarti type was produced. Cheese analysis were
performed in fresh cheese, and after 2 and 4 months of ripening. The content of free amino
acids (FAA) reflects proteolytic activity and may therefore be used as a measure of the degree
of ripening (135). SAT cheese had a higher content of FAA compared to UNSAT, and appeared
therefore to have higher proteolytic activity. UNSAT cheese received lower scores for texture
and was described as more doughy. As there was no major differences in the protein
composition of the milk that can explain this difference, it is likely that the observed
differences are due to different fatty acid composition or content of FFA. As at least the short
chain FFA are relatively polar, they are probably gone with the whey at drainage. Hence, it
is likely that the fatty acid composition explains the differences between the cheeses. UNSAT
milk had a higher proportion of unsaturated lipids (Paper III), and from other studies it is
known that the fatty acid composition in milk and the corresponding cheese is very similar (136). A higher content of unsaturated fatty acids gives a softer and more spreadable cheese,
but may also be characterized as doughy with poor texture compared the cheeses with a higher
proportion of saturated fatty acids (Paper IV). The best texture was obtained for cheeses
made at 190 DIM of milk from goats grazing mountain pasture, and this was probably related
to increased content of total solids in the cheese. In addition, curd firmness of the rennet
coagulated milk was higher at 190 DIM compared to 90 and 120 DIM.
5.3 Polymorphism at the αs1-casein locus- effects in milk
Milk from goats homozygous for the deletion in exon 12 (E12-00) has previously showed to
have a lower content of protein, fat and lactose, but higher frequency of elevated levels of
FFA and off-flavours (79). Moreover, E12-00 goats often displays impaired rennet coagulation
properties (81). It was suggested to use genetic selection of casein alleles already in 1995, when
this genotype first was discovered (75). The Norwegian researcher of this study, S. Lien,
suggested an investigation of the cheese making properties ahead of the selection. However,
this investigation was not undertaken until 2012 (134) and was included as a part of Paper V.
Genetic testing and selection based of this allele was not implemented in the breeding
program of Norwegian Dairy goats before 2008 (15). This allele was originally described as
an 0-allele (75), because there was no evidence of αs1-casein on protein level performed by IEF
gel electrophoresis (78). Therefore, it was surprising to find a protein eluting at the same time
as αs1-casein in all E12-00 goat milk samples using capillary zone electrophoresis (Paper I,
Paper IV and Paper V), even if the levels were low. If the peak corresponding to αs1-casein
in these goats truly is an evidence of this protein, remains to be investigated. While the rennet
45
coagulation properties have been investigated (81), the properties of cheeses made from milk
from E12-00 goats were unknown. Therefore, the aim of Paper V was to study the cheese
making properties and cheese quality during ripening in milk from E12-00 goats compared
to E12-01 goats. The E12-00 cheese was more doughy with a poorer texture as compared to
E12-01 cheese, and this is probably explained by lower contents of total solids. Moreover,
E12-00 milk had a higher content of β-casein and larger casein micelles (81) (Paper I), which
may explain the more hydrated cheese matrix. The composition of FAA did also differ in
cheese from E12-00 and E12-01 goats, which indicates different proteolytic activity. The
cheesemaking was performed at 30 and 60 DIM. Even though the content of FFA in milk was
low at this lactation stage, and with no difference between E12-00 and E12-01, the cheeses
from E12-00 developed a pronounced rancid flavour during ripening (Paper V).
5.4 Factors influencing the rennet coagulation properties in Norwegian goat milk
To increase the understanding of whether rennet coagulation properties were influenced by
management or genetic factors, 25 goats with poor rennet coagulation properties from the
north of Norway were moved to the university farm (Ås) in 1990 (137; 138). These goats were
compared to goats at the university farm over two subsequent lactations, in addition, the
performance of the progeny from two groups of goats was compared. While content of milk
components (fat, proteins, lactose and total solids) seemed to be inherited, the rennet
coagulation properties seemed influenced by both management and genetic factors (139).
Therefore, in this study effects of different forage (Pasture or hay, Paper I) and lipid
supplementation (rapeseed or palm oil, Paper IV) on rennet coagulation properties were
investigated. Feeding did not seem to affect rennet coagulation parameters directly (Paper 1
and Paper IV), however in Paper 1 an effect of grazing season, with impaired rennet
coagulation in late season, was observed. This effect was most likely explained by the pre-
experimental treatment. In another experiment, the rennet coagulation properties obtained
when the goats were grazing mountain pasture was different between E12-01 and E12-00
goats (Figure 12). Therefore, it seems like the rennet coagulation properties are impaired in
some goats after a period with reduced forage quality and more energy spent on wandering,
and the E12-00 goats seems more susceptible (Paper 1 and unpublished data).
Content of αs1-casein is positively correlated to curd firmness (a30) (140; 141), which is
confirmed in this study (Paper I, Paper V and unpublished data (Figure 13). However in Paper
1, content of αs2-casein was stronger correlated than αs1-casein to a30. This strong correlation
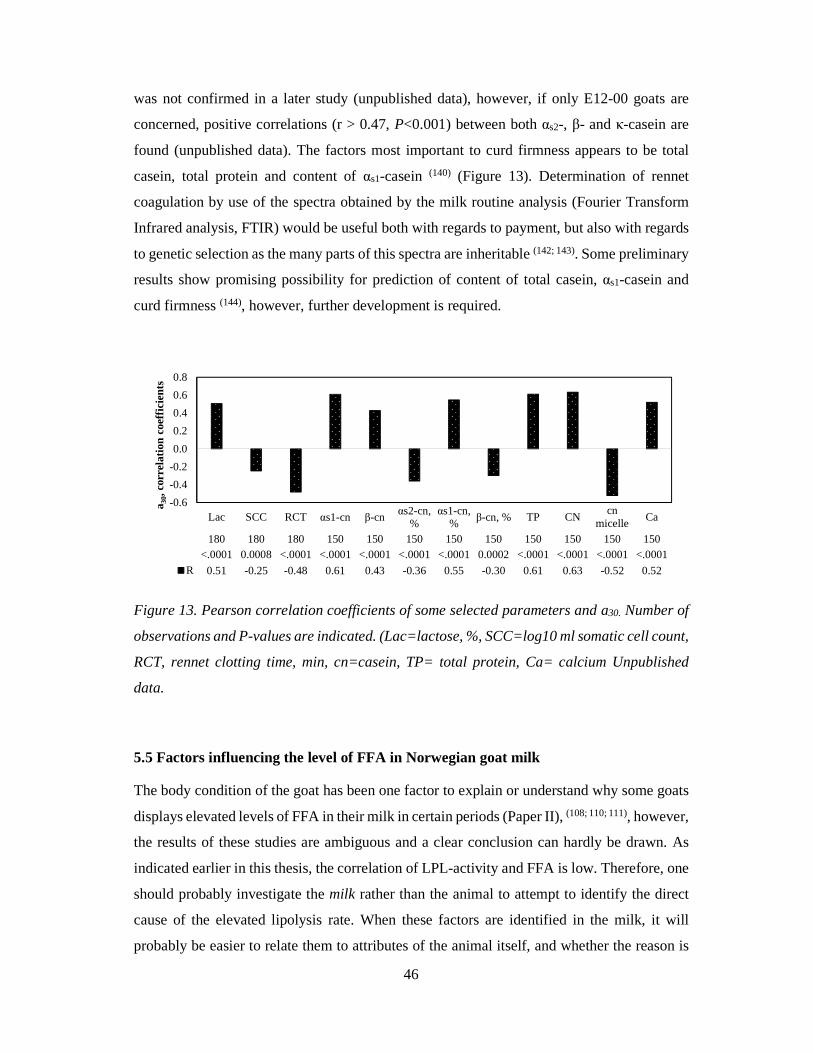
46
was not confirmed in a later study (unpublished data), however, if only E12-00 goats are
concerned, positive correlations (r > 0.47, P<0.001) between both αs2-, β- and κ-casein are
found (unpublished data). The factors most important to curd firmness appears to be total
casein, total protein and content of αs1-casein (140) (Figure 13). Determination of rennet
coagulation by use of the spectra obtained by the milk routine analysis (Fourier Transform
Infrared analysis, FTIR) would be useful both with regards to payment, but also with regards
to genetic selection as the many parts of this spectra are inheritable (142; 143). Some preliminary
results show promising possibility for prediction of content of total casein, αs1-casein and
curd firmness (144), however, further development is required.
Figure 13. Pearson correlation coefficients of some selected parameters and a30. Number of
observations and P-values are indicated. (Lac=lactose, %, SCC=log10 ml somatic cell count,
RCT, rennet clotting time, min, cn=casein, TP= total protein, Ca= calcium Unpublished
data.
5.5 Factors influencing the level of FFA in Norwegian goat milk
The body condition of the goat has been one factor to explain or understand why some goats
displays elevated levels of FFA in their milk in certain periods (Paper II), (108; 110; 111), however,
the results of these studies are ambiguous and a clear conclusion can hardly be drawn. As
indicated earlier in this thesis, the correlation of LPL-activity and FFA is low. Therefore, one
should probably investigate the milk rather than the animal to attempt to identify the direct
cause of the elevated lipolysis rate. When these factors are identified in the milk, it will
probably be easier to relate them to attributes of the animal itself, and whether the reason is
Lac SCC RCT αs1-cn β-cnαs2-cn,
%αs1-cn,
%β-cn, % TP CN
cnmicelle
Ca
180 180 180 150 150 150 150 150 150 150 150 150<.0001 0.0008 <.0001 <.0001 <.0001 <.0001 <.0001 0.0002 <.0001 <.0001 <.0001 <.0001
R 0.51 -0.25 -0.48 0.61 0.43 -0.36 0.55 -0.30 0.61 0.63 -0.52 0.52
-0.6
-0.4
-0.2
0.0
0.2
0.4
0.6
0.8
a 30,
cor
rela
tion
coef
ficie
nts
47
genetic or physiologic or a combination of these factors. The MFGM protects the triglycerides
from lipolysis by the LPL. It is known that disruption of MFGM by e.g. homogenisation and
agitation can cause extensive lipolysis (145). All milk samples in the three main experiments
in this thesis (A, B and C) were handled with great care using a standardized protocol. Still
the variation in content of FFA between samples was large. To increase the understanding of
why some milk samples have a high content of FFA whereas other samples have a low
content, a few milk samples were analysed for their phospholipid composition and cholesterol
content (Paper III). Samples with elevated levels of FFA had a higher content of cholesterol
and lysolecitin (a result of phospholipase activity (63)) and a lower content of
phosphatidyletanolamine than samples with low levels of FFA. Unfortunately, only six
samples were analysed, which is too few to draw any conclusion. Nevertheless, the results
strongly indicate that the composition of the MFGM may be of great importance, and other
studies (71; 72) pointing to the MFGM composition as an important factor. Cholesterol,
together with sphingomyelin, are the major constituents of lipid rafts in MFGM; structures
involved in different cellular processes (146), and cholesterol is reported to affect the MFGM
organization in bovine milk (147).
It has been shown that when cows received a diet supplemented with unsaturated lipids, the
concentration of unsaturated lipids increased in the MFGM (65). Therefore, it is likely that the
goats receiving unsaturated lipids in present study (Paper III) also increased their content of
unsaturated lipids in the MFGM. Moreover, these goats did also have the lowest content of
FFA in their milk. Increased fluidity of the MFGM may therefore increase the resistance
against lipolysis of the triglycerides.
Based on the findings in this thesis, it appears that FFA levels in the milk are highest in mid
lactation and from E12-00 goats. Furthermore, levels of FFA decrease if rapeseed oil is fed
to the goats. There is no evidence for increased levels of FFA on mountain or rangeland
pasture. As the frequency of the defective allele in CSN1S1 used to be extremely high, it is
likely that most of the goats in the previous studies (71; 72; 109) were E12-00. The response to
energy intake and selection of feeds are different between goats with strong and weak alleles
(148; 149), which may partly explain the contradictory findings from earlier studies in the
nineties and turn of the century in Norwegian goats (71; 72; 109) compared to the findings in
these present studies.

48
49
6. Current status, concluding remarks and further perspectives
The results of studies on feeding, breeding and milk quality has been successfully
implemented in the goat milk production during the last fifteen years. The implementation of
genotype testing in the breeding programme has reduced the frequency of E12-00 goats in
the population. In addition, the “Healthier goats” project has led to increased milk yield and
quality and improved the health and welfare of the goats. The milk quality has increased
thanks to a joint effort of researchers, advisors and last, but surly not least: the producers.
They really deserves honour for their willingness to apply and implement the findings of
scientific research in practice. Now the TINE dairy has to come forward and follow up in the
development of new product and marketing. The milk is surly too good to be fed pigs or
poured into the drain! The project “Quality milk for cheese production” has increased the
knowledge of breeding, pasture quality, feeding and physiology and how these parameters
influences the milk quality. The focus of this thesis was milk quality and milk composition,
and the main conclusions are:
• Pasture did not increase the content of FFA. Elevated levels of FFA occurred at mid-
lactation.
• Rapeseed oil decreased the level of FFA at mid-lactation.
• There is a strong correlation between a high level of FFA and off-flavours.
• Lipid supplemented concentrate affects the fatty acid composition, but not the protein
composition.
• Lactation stage, genotype and grazing season affects protein composition and rennet
coagulation properties.
• Cheese made of milk from E12-01 goats was preferred over cheese made from milk
of E12-00 goats
Because of the positive effects of rapeseed oil on FFA and flavour, rapeseed oil should be
implemented in commercial feed for dairy goats. The composition of the MFGM should be
investigated to understand the mechanism of why some goats are more prone to have elevated
levels of FFA in their milk. There is still a great potential of increasing the rennet coagulation
properties of the Norwegian goat milk. By identifying SNPs or areas in the FTIR spectra
(Milkoscan) correlated to curd firmness and/or content of αs1-casein, genetic selection for
improved rennet coagulation properties would be possible. With such a good goat milk
quality, further development of products and increased marketing is crucial.
50
7. References
1. Walstra P, Wouters JT, Geurts TJ (2005) Dairy science and technology: CRC press.
2. Itan Y, Jones BL, Ingram CJE, Swallow DM, Thomas MG (2010) A worldwide correlation of lactase persistence phenotype and genotypes. BMC Evolutionary Biology 10, 36-36.
3. Gerbault P, Roffet-Salque M, Evershed RP, Thomas MG (2013) How long have adult humans been consuming milk? IUBMB Life 65, 983-990.
4. Itan Y, Powell A, Beaumont MA, Burger J, Thomas MG (2009) The Origins of Lactase Persistence in Europe. PLoS Comput Biol 5, e1000491.
5. Warinner C, Hendy J, Speller C, Cappellini E, Fischer R, Trachsel C, Arneborg J, Lynnerup N, Craig OE, Swallow DM, Fotakis A, Christensen RJ, Olsen JV, Liebert A, Montalva N, Fiddyment S, Charlton S, Mackie M, Canci A, Bouwman A, Rühli F, Gilbert MTP, Collins MJ (2014) Direct evidence of milk consumption from ancient human dental calculus. Scientific Reports 4, 7104.
6. Evershed RP, Payne S, Sherratt AG, Copley MS, Coolidge J, Urem-Kotsu D, Kotsakis K, Ozdogan M, Ozdogan AE, Nieuwenhuyse O, Akkermans PMMG, Bailey D, Andeescu R-R, Campbell S, Farid S, Hodder I, Yalman N, Ozbasaran M, Bicakci E, Garfinkel Y, Levy T, Burton MM (2008) Earliest date for milk use in the Near East and southeastern Europe linked to cattle herding. Nature 455, 528-531.
7. Boyazoglu J, Hatziminaoglou I, Morand-Fehr P (2005) The role of the goat in society: Past, present and perspectives for the future. Small Rumin Res 60, 13-23.
8. Haenlein GFW (2007) About the evolution of goat and sheep milk production. Small Rumin Res 68, 3-6.
9. Zeder MA, Hesse B (2000) The initial domestication of goats (Capra hircus) in the Zagros mountains 10,000 years ago. Science (New York, NY) 287, 2254-2257.
10. Escareño L, Salinas-Gonzalez H, Wurzinger M, Iñiguez L, Sölkner J, Meza-Herrera C (2012) Dairy goat production systems. Trop Anim Health Prod 45, 17-34.
11. Sahlu T, Goetsch AL (2005) A foresight on goat research. Small Rumin Res 60, 7-12.
12. Devendra C, Liang JB (2012) Conference summary of dairy goats in Asia: Current status, multifunctional contribution to food security and potential improvements. Small Rumin Res 108, 1-11.
13. FAOSTAT (2015) Total number of goats 2013. http://faostat3.fao.org/browse/Q/QA/E.
51
14. Landbruksdirektoratet (2014) Utredning av endring av produksjonstilskudd for sau/lam og geit/kje. Rapport fra arbeidsgruppe til jordbruksforhandlingene 2014. https://www.slf.dep.no/no/dokumenter/publikasjoner/_attachment/35512: SLF.
15. Ådnøy T (2014) The dairy goat industry in Norway: Challenges in a historical perspective. Small Rumin Res 122, 4-9.
16. Todnem J (2009) Kasjmirgeit – kulturlandskapspleieren. no. 4(32)/2009. Bioforsk.
17. Lunnan T, Todnem J (2011) Forage quality of native grasses in mountain pastures of southern Norway. Grassland farming and land management systems in mountainous regions Proceedings of the 16th Symposium of the European Grassland Federation, 568-570.
18. Skeie (2014) Quality aspects of goat milk for cheese production in Norway: A review. Small Rumin Res 122, 10-17.
19. SSB (2015) Statistics Norway http://www.ssb.no/. http://www.ssb.no/.
20. Inglingstad RA, Devold TG, Eriksen EK, Holm H, Jacobsen M, Liland KH, Rukke EO, Vegarud GE (2010) Comparison of the digestion of caseins and whey proteins in equine, bovine, caprine and human milks by human gastrointestinal enzymes. Dairy Sci Technol 90, 549-563.
21. Raynal-Ljutovac K, Lagriffoul G, Paccard P, Guillet I, Chilliard Y (2008) Composition of goat and sheep milk products: An update. Small Rumin Res 79, 57-72.
22. Grosclaude F, Martin P (1997) Casein polymorphism in the goat. In Milk Protein Polymorphism (IDF Seminar), pp. pp. 241-253. Palmerston North, NZ.
23. Brendehaug J, Abrahamsen RK (1986) Chemical composition of milk from a herd of Norwegian goats. Journal of Dairy Research 53, 211-221.
24. Soryal KA, Zeng SS, Min BR, Hart SP, Beyene FA (2004) Effect of feeding systems on composition of goat milk and yield of Domiati cheese. Small Rumin Res 54, 121-129.
25. Mestawet TA, Girma A, Ådnøy T, Devold TG, Vegarud GE (2013) Newly identified mutations at the CSN1S1 gene in Ethiopian goats affect casein content and coagulation properties of their milk. J Dairy Sci 96, 4857-4869.
26. Selvaggi M, Laudadio V, Dario C, Tufarelli V (2014) Major proteins in goat milk: an updated overview on genetic variability. Mol Biol Rep 41, 1035-1048.
27. Jenness R (1980) Composition and Characteristics of Goat Milk: Review 1968−19791. J Dairy Sci 63, 1605-1630.
28. Moatsou G, Samolada M, Panagiotou P, Anifantakis E (2004) Casein fraction of bulk milks from different caprine breeds. Food Chemistry 87, 75-81.
52
29. Mestawet, Girma A, Ådnøy T, Devold T, Narvhus J, Vegarud G (2014) New insights in goat breeds of Ethiopia: High content of α s1-CN and its association with coagulation properties, whey syneresis and micelle size. Small Rumin Res 119, 146-155.
30. Boulanger A, Grosclaude F, Mahé M-F (1984) Polymorphisme des caséines As1 et As2 de la chèvre (Capra hircus). Genet Sel Evol 16, 157-176.
31. Grosclaude F, Mahe MF, Brignon G, Distasio L, Jeunet R (1987) A Mendelian Polymorphism Underlying Quantitative Variations of Goat A-S1-Casein. Genet Sel Evol 19, 399-411.
32. Farrell HM, Jr., Brown EM, Malin EL (2013) Higher Order Structures of the Caseins: A Paradox? In Advanced Dairy Chemistry, pp. 161-184 [PLH McSweeney and PF Fox, editors]: Springer US.
33. Holt C, Horne DS (1996) The hairy casein micelle: Evolution of the concept and its implications for dairy technology. Neth Milk Dairy J 50, 85-111.
34. Fox PF, Brodkorb A (2008) The casein micelle: Historical aspects, current concepts and significance. Int Dairy J 18, 677-684.
35. Holt C, Carver JA, Ecroyd H, Thorn DC (2013) Invited review: Caseins and the casein micelle: Their biological functions, structures, and behavior in foods1. J Dairy Sci 96, 6127-6146.
36. Slattery CW, Evard R (1973) A model for the formation and structure of casein micelles from subunits of variable composition. Biochim Biophys Acta Volume 317, 529-538.
37. Buchheim W, Welsch U (1973) Evidence for the submicellar composition of casein micelles on the basis of electron microscopical studies. Netherland Milk and Dairy Journal 27, 163-180.
38. Schmidt D (1982) Association of caseins and casein micelle structure. Developments in dairy chemistry 1-Proteins 1, 61 - 85.
39. Walstra P, Jenness R (1984) Casein Micelles. In Dairy Chemistry and Physics, pp. 229-253. New York: John Wiley and Sons, Inc.
40. Holt C (1992) Structure and stability of bovine casein micelles. Adv Protein Chem 43, 63 - 151.
41. Dalgleish DG (1998) Casein micelles as colloids: Surface structures and stabilities. J Dairy Sci 81, 3013-3018.
42. Horne DS (2003) Casein micelles as hard spheres: limitations of the model in acidified gel formation. Colloids and Surfaces A: Physicochemical and Engineering Aspects 213, 255-263.
43. Horne DS (2006) Casein micelle structure: Models and muddles. Curr Opin Colloid Interface Sci 11, 148-153.
53
44. McMahon DJ, Oommen BS (2008) Supramolecular Structure of the Casein Micelle. J Dairy Sci 91, 1709-1721.
45. Dalgleish DG (2011) On the structural models of bovine casein micelles-review and possible improvements. Soft Matter.
46. Ingham B, Erlangga GD, Smialowska A, Kirby NM, Wang C, Matia-Merino L, Haverkamp RG, Carr AJ (2015) Solving the mystery of the internal structure of casein micelles. Soft Matter 11, 2723-2725.
47. Horne DS, Abby T, Mike B, Harjinder S (2008) Casein micelle structure and stability. In Milk Proteins, pp. 133-162. San Diego: Academic Press.
48. Dalgleish DG, Horne DS, Law AJR (1989) Size-Related Differences in Bovine Casein Micelles. Biochim Biophys Acta 991, 383-387.
49. Dalgleish DG, Corredig M (2012) The Structure of the Casein Micelle of Milk and Its Changes During Processing. In Annual Review of Food Science and Technology, Vol 3, vol. 3, pp. 449-467 [MP Doyle and TR Klaenhammer, editors].
50. Horne DS (2009) Casein micelle structure and stability. Milk proteins: From expression to food, 133e162.
51. Crabbe MJC (2004) Rennets: General and Molecular Aspects. In Cheese: Chemistry, Physics and Microbiology, vol. Volume 1, pp. 19-45 [PLHMTMC Patrick F. Fox and PG Timothy, editors]: Academic Press.
52. Lucey JA (2002) Formation and Physical Properties of Milk Protein Gels. J Dairy Sci 85, 281-294.
53. McMahon DJ, Brown RJ (1982) Evaluation of Formagraph for Comparing Rennet Solutions. J Dairy Sci 65, 1639-1642.
54. Meinardi CA, Alonso AA, Hynes ER, Zalazar CA (2002) Influence of milk-clotting enzymes on acidification rate of natural whey starter culture. Int J Dairy Technol 55, 139-144.
55. Fox PF, Uniacke-Lowe T, McSweeney PLH, O’Mahony JA (2015) Milk Lipids. In Dairy Chemistry and Biochemistry, pp. 69-144: Springer International Publishing.
56. Park YW, Juárez M, Ramos M, Haenlein GFW (2007) Physico-chemical characteristics of goat and sheep milk. Small Rumin Res 68, 88-113.
57. Patton S, Jensen RG (1975) Lipid metabolism and membrane functions of the mammary gland. Progress in the Chemistry of Fats and other Lipids 14, 163-277.
58. Brennand CP, Ha JK, Lindsay RC (1989) AROMA PROPERTIES AND THRESHOLDS OF SOME BRANCHED-CHAIN AND OTHER MINOR VOLATILE FATTY ACIDS OCCURRING IN MILKFAT AND MEAT LIPIDS1. Journal of Sensory Studies 4, 105-120.
54
59. Kim Ha J, Lindsay RC (1993) Release of Volatile Branched-Chain and Other Fatty Acids from Ruminant Milk Fats by Various Lipases. J Dairy Sci 76, 677-690.
60. Mele M, Buccioni A, Serra A, Antongiovanni M, Secchiari P (2008) 3 Lipids of Goat’s Milk: Origin, Composition and Main Sources of Variation. In Dairy goats feeding and nutrition, pp. 47 [A Cannas, G Paulina and AHD Francesconi, editors]. Oxfordshire, UK: CAB International.
61. Chilliard, Ferlay A, Rouel J, Lamberet G (2003) A Review of Nutritional and Physiological Factors Affecting Goat Milk Lipid Synthesis and Lipolysis. J Dairy Sci 86, 1751-1770.
62. Attaie R, Richter RL (2000) Size Distribution of Fat Globules in Goat Milk. J Dairy Sci 83, 940-944.
63. Lopez C (2011) Milk fat globules enveloped by their biological membrane: Unique colloidal assemblies with a specific composition and structure. Curr Opin Colloid Interface Sci 16, 391-404.
64. Heid HW, Keenan TW (2005) Intracellular origin and secretion of milk fat globules. European Journal of Cell Biology 84, 245-258.
65. Lopez C, Briard-Bion V, Menard O, Rousseau F, Pradel P, Besle J-M (2008) Phospholipid, Sphingolipid, and Fatty Acid Compositions of the Milk Fat Globule Membrane are Modified by Diet. J Agric Food Chem 56, 5226-5236.
66. Shipe WF, Bassette R, Deane DD, Dunkley WL, Hammond EG, Harper WJ, Kleyn DH, Morgan ME, Nelson JH, Scanlan RA (1978) Off Flavors of Milk: Nomenclature, Standards, and Bibliography1. J Dairy Sci 61, 855-869.
67. Scanlan RA, Sather LA, Day EA (1965) Contribution of Free Fatty Acids to the Flavor of Rancid Milk1,2. J Dairy Sci 48, 1582-1584.
68. Fox PF, Uniacke-Lowe T, McSweeney PLH, O’Mahony JA (2015) Enzymology of Milk and Milk Products. In Dairy Chemistry and Biochemistry, pp. 377-414: Springer International Publishing.
69. Deeth HC (2006) Lipoprotein lipase and lipolysis in milk. Int Dairy J 16, 555-562.
70. Chilliard Y, Selselet-Attou G, Bas P, Morand-Fehr P (1984) Characteristics of Lipolytic System in Goat Milk. J Dairy Sci 67, 2216-2223.
71. Eknæs M, Skeie S (2006) Effect of different level of roughage availability and contrast levels of concentrate supplementation on flavour of goat milk. Small Rumin Res 66, 32-43.
72. Eknæs, Havrevoll Ø, Volden H, Hove K (2009) Fat content, fatty acid profile and off-flavours in goats milk—Effects of feed concentrates with different fat sources during the grazing season. Anim Feed Sci Technol 152, 112-122.
55
73. Lu J, Wang X, Zhang W, Liu L, Pang X, Zhang S, Lv J (2016) Comparative proteomics of milk fat globule membrane in different species reveals variations in lactation and nutrition. Food Chemistry 196, 665-672.
74. Cebo C, Lopez C, Henry C, Beauvallet C, Ménard O, Bevilacqua C, Bouvier F, Caillat H, Martin P (2012) Goat αs1-casein genotype affects milk fat globule physicochemical properties and the composition of the milk fat globule membrane. J Dairy Sci 95, 6215-6229.
75. Lien S (1995) Bovine and caprine milk protein alleles. Identification, genetic mapping and use as markers. Dr Agric Thesis, Agricultural University of Norway.
76. Fürst K (1994) Identification and characterization of three alpha s1-casein alleles in the Norwegian breed of dairy goat Examensarbete, SLU.
77. Hayes B, Hagesæther N, Adnøy T, Pellerud G, Berg PR, Lien S (2006) Effects on Production Traits of Haplotypes Among Casein Genes in Norwegian Goats and Evidence for a Site of Preferential Recombination. Genetics 174, 455-464.
78. Vegarud GE, Devold TG, Opheim R, Loeding E, Svenning C, Abrahamsen RK, Lien S, Langsrud T (1999) Genetic variants of Norwegian goats milk composition, micellar size and renneting properties. Int Dairy J 9, 367-368.
79. Dagnachew B, Thaller G, Lien S, Adnoy T (2011) Casein SNP in Norwegian goats: additive and dominance effects on milk composition and quality. Genet Sel Evol 43, 31.
80. Adnøy T, Vegarud G, Devold TG, Nordbø R, Colbjørnsen I, Brovold M, Markovic B, Roseth A, Lien S (2003) Effects of the 0- and F-alleles of a s1 casein in two farms of northern Norway. Proceedings of the international workshop on major genes and qtl in sheep and goat CD-ROM communication no 2-20. pp.1-5.
81. Devold TG, Nordbø R, Langsrud T, Svenning C, Brovold M, Sørensen E, Christensen B, Ådnøy T, Vegarud G (2011) Extreme frequencies of the αs1-casein “null” variant in milk from Norwegian dairy goats— implications for milk composition, micellar size and renneting properties. Dairy Sci Technol 91, 39-51.
82. Blichfeldt T (2013) Breeding for goat milk quality in Norway. In Goat Milk Quality, Regional IGA Conference [T Ådnøy and I Dønnem, editors]. Tromsø, Norway: IGA.
83. www.nsg.no (2015) Møtereferater. Fagråded for geit. (accessed 22.12.2015 2015)
84. Monika Johansson MH, Anders Andrén (2015) Relation Between αS1-Casein Content and Coagulation Properties of Milk from Swedish Dairy Goats. The Open Food Science Journal 9, 1-4.
85. Johansson M, Högberg M, Andrén A (2014) High Frequencies of the αS1-Casein Zero Variant in Milk from Swedish Dairy Goats. Sheep and Goat Research Journal 29, 1-4.
56
86. Chanat E, Martin P, Ollivier-Bousquet M (1999) Alpha(S1)-casein is required for the efficient transport of beta- and kappa-casein from the endoplasmic reticulum to the Golgi apparatus of mammary epithelial cells. Journal of Cell Science 112, 3399-3412.
87. Neveu C, Riaublanc A, Miranda G, Chich J-F, Martin P (2002) Is the apocrine milk secretion process observed in the goat species rooted in the perturbation of the intracellular transport mechanism induced by defective alleles at the $\alpha_{{\rm s}1}$-Cn locus? Reprod Nutr Dev 42, 163-172.
88. Ollier S, Chauvet S, Martin P, Chilliard Y, Leroux C (2008) Goat's as1-casein polymorphism affects gene expression profile of lactating mammary gland. Animal 2, 566-573.
89. Ronningen K (1965) Causes of Variation in the Flavour Intensity of Goat Milk. Acta Agriculturae Scandinavica 15, 301-342.
90. Bakke H, Steine T, Eggum Å (1977) Flavour Score and Content of Free Fatty Acids in Goat Milk. Acta Agriculturae Scandinavica 27, 245-249.
91. Steine TA (1978) Results from 5 generations of selection for goat milk flavour. In EAAP Annu Meeting vol. 5, pp. 5. Stockholm.
92. Skjevdal T (1979) Flavour of goat's milk: A review of studies on the sources of its variations. Livest Prod Sci 6, 397-405.
93. Skeie S (1998) Geitemjølk som råstoff. Meieriposten 87, 306-309.
94. Medlem TRo (2014) TINEs regelverk om bedømmelse og betaling av leverandørmelk etter kvalitet. 2015)
95. Nord K, Rimstad E, K. Storset A, Løken T (1998) Prevalence of antibodies against caprine arthritis–encephalitis virus in goat herds in Norway. Small Rumin Res 28, 115-121.
96. Lindheim D, Sølverød LS (2013) Healthier goats: a project for eradicat-ing contagious diseases in Norwegian goats. In Goat Milk Quality2013, Regional IGA Conference, . Tromsø.
97. http://geithelse.tine.no/English (2013) Disease eradication in Norwegian goats. (accessed 11.12.2015
98. Nagel-Alne GE, Asheim LJ, Hardaker JB, Solverod L, Lindheim D, Valle PS (2014) The Norwegian Healthier Goats programme--a financial cost-benefit analysis. Preventive veterinary medicine 114, 96-105.
99. Torunn Kleppe, Birgitta Netland, Ødegård S (2008) Friskere geiter og geitebønders motivasjon for sykdomssanering, Norges veterinærhøgskole.
100. Nagel-Alne GE, Krontveit R, Bohlin J, Valle PS, Skjerve E, Sølverød LS (2014) The Norwegian Healthier Goats program—Modeling lactation curves using a multilevel cubic spline regression model. J Dairy Sci 97, 4166-4173.
57
101. Muri K, Leine N, Valle PS (2015) Welfare effects of a disease eradication programme for dairy goats. animal FirstView , 1-9.
102. Haenlein GFW (2004) Goat milk in human nutrition. Small Rumin Res 51, 155-163.
103. Eriksen EK, Vegarud GE, Langsrud T, Almaas H, Lea T (2008) Effect of milk proteins and their hydrolysates on in vitro immune responses. Small Rumin Res 79, 29-37.
104. Almaas H, Berner V, Holm H, Langsrud T, Vegarud GE (2008) Degradation of whey from caprine milk by human proteolytic enzymes, and the resulting antibacterial effect against Listeria monocytogenes. Small Rumin Res 79, 11-15.
105. Almaas H, Cases A-L, Devold TG, Holm H, Langsrud T, Aabakken L, Ådnøy T, Vegarud GE (2006) In vitro digestion of bovine and caprine milk by human gastric and duodenal enzymes. Int Dairy J 16, 961-968.
106. Taugbøl O, Devold TG, Eknæs MJ, Marit; Randby ÅT, Skeie SB, Steinshamn H, Vegarud G, Volden H, Ådnøy T (2009) Kvalitetsmjølk for kvit geitost - presentasjon av samarbeidsprosjektet. Husdyrforsøksmøtet 2009
107. Inglingstad RA, Steinshamn H, Dagnachew BS, Valenti B, Criscione A, Rukke EO, Devold TG, Skeie SB, Vegarud GE (2014) Grazing season and forage type influence goat milk composition and rennet coagulation properties. J Dairy Sci 97, 3800-3814.
108. Eknæs M, Kolstad K, Volden H, Hove K (2006) Changes in body reserves and milk quality throughout lactation in dairy goats. Small Rumin Res 63, 1-11.
109. Eknæs M (2009) Free fatty acids and off-flavours in goat milk: effect of energy balance and different feeding regimes. PhD, Norwegian University of Life Sciences, Department of Animal and Aquacultural Sciences.
110. Dønnem I, Eknæs M, Randby ÅT (2011) Energy status, measured by computer tomography (CT)-scanning, and milk quality of dairy goats fed rations with various energy concentrations. Livestock Science 142, 235-244.
111. Dønnem I, Randby ÅT, Eknæs M (2011) Effect of grass silage harvesting time and level of concentrate supplementation on goat milk quality. Anim Feed Sci Technol 163, 118-129.
112. Fantuz F, Polidori F, Cheli F, Baldi A (2001) Plasminogen Activation System in Goat Milk and its Relation with Composition and Coagulation Properties. Journal of dairy science 84, 1786-1790.
113. Silanikove N, Shamay A, Shinder D, Moran A (2000) Stress down regulates milk yield in cows by plasmin induced β-casein product that blocks K+ channels on the apical membranes. Life Sciences 67, 2201-2212.
114. Bastian ED, Brown RJ (1996) Plasmin in milk and dairy products: an update. Int Dairy J 6, 435-457.
58
115. Leitner G, Krifucks O, Merin U, Lavi Y, Silanikove N (2006) Interactions between bacteria type, proteolysis of casein and physico-chemical properties of bovine milk. Int Dairy J 16, 648-654.
116. Bernard L, Bonnet M, Leroux C, Shingfield K, Chilliard Y (2009) Effect of sunflower-seed oil and linseed oil on tissue lipid metabolism, gene expression, and milk fatty acid secretion in alpine goats fed maize silage–based diets. J Dairy Sci 92, 6083-6094.
117. Chilliard Y, Toral PG, Shingfield KJ, Rouel J, Leroux C, Bernard L (2014) Effects of diet and physiological factors on milk fat synthesis, milk fat composition and lipolysis in the goat: A short review. Small Rumin Res 122, 31-37.
118. Dumalisile P, Witthuhn RC, Britz TJ (2005(Har ikke)) Impact of different pasteurization temperatures on the survival of microbial contaminants isolated from pasteurized milk. Int J Dairy Technol 58, 74-82.
119. Ollier S, Leroux C, de la Foye A, Bernard L, Rouel J, Chilliard Y (2009) Whole intact rapeseeds or sunflower oil in high-forage or high-concentrate diets affects milk yield, milk composition, and mammary gene expression profile in goats. J Dairy Sci 92, 5544-5560.
120. Onetti SG, Grummer RR (2004) Response of lactating cows to three supplemental fat sources as affected by forage in the diet and stage of lactation: a meta-analysis of literature. Anim Feed Sci Technol 115, 65-82.
121. Gilbert N (2012) Palm-oil boom raises conservation concerns. Nature 487, 14-15.
122. Chilliard, Ferlay (2004) Dietary lipids and forages interactions on cow and goat milk fatty acid composition and sensory properties. Reprod Nutr Dev 44, 467-492.
123. Tudisco R, Chiofalo B, Addi L, Presti VL, Rao R, Calabro’ S, Musco N, Grossi M, Cutrignelli MI, Mastellone V, Lombardi P, Infascelli F (2015) Effect of hydrogenated palm oil dietary supplementation on milk yield and composition, fatty acids profile and Stearoyl-CoA desaturase expression in goat milk. Small Rumin Res.
124. Sanz Sampelayo MR, Chilliard Y, Schmidely P, Boza J (2007) Influence of type of diet on the fat constituents of goat and sheep milk. Small Rumin Res 68, 42-63.
125. Fekadu B, Soryal K, Zeng S, Hekken DV, Bah B, Villaquiran M (2005) Changes in goat milk composition during lactation and their effect on yield and quality of hard and semi-hard cheeses. Small Rumin Res 59, 55-63.
126. Wiking L, Stagsted J, Bjorck L, Nielsen JH (2004) Milk fat globule size is affected by fat production in dairy cows. Int Dairy J 14, 909-913.
127. Islam MA, Alam MK, Islam MN, Khan MAS, Ekeberg D, Rukke EO, Vegarud GE (2014) Principal Milk Components in Buffalo, Holstein Cross, Indigenous Cattle and Red Chittagong Cattle from Bangladesh. Asian-Australasian Journal of Animal Sciences 27, 886-897.
59
128. Ménard O, Ahmad S, Rousseau F, Briard-Bion V, Gaucheron F, Lopez C (2010) Buffalo vs. cow milk fat globules: Size distribution, zeta-potential, compositions in total fatty acids and in polar lipids from the milk fat globule membrane. Food Chemistry 120, 544-551.
129. FAO (2010) Fats and fatty acids in human nutrition Report of an expert consultation. Rome: FOOD AND AGRICULTURE ORGANIZATION OF THE UNITED NATIONS.
130. co-operation N (2012) Nordic Nutrition Recommendations 2012 Integrating nutrition and physical activity. DK-1061 Copenhagen K.
131. Renna M, Lussiana C, Cornale P, Fortina R, Mimosi A (2012) Changes in goat milk fatty acids during abrupt transition from indoor to pasture diet. Small Rumin Res 108, 12-21.
132. Andrade P, Schmidely P (2006) Influence of percentage of concentrate in combination with rolled canola seeds on performance, rumen fermentation and milk fatty acid composition in dairy goats. Livestock Science 104, 77-90.
133. Bernard L, Rouel J, Leroux C, Ferlay A, Faulconnier Y, Legrand P, Chilliard Y (2005) Mammary Lipid Metabolism and Milk Fatty Acid Secretion in Alpine Goats Fed Vegetable Lipids. J Dairy Sci 88, 1478-1489.
134. Jakobsen LB (2012) Quality goat milk for rennet coagualted cheese.
135. Fox PF, Guinee TP, Cogan TM, McSweeney PLH (2000) Fundamentals of Cheese Science. Gaithersburg, MD: Aspen publishers.
136. Chilliard Y, Rouel J, Ferlay A, Bernard L, Gaborit P, Raynal-Ljutovac K, Lauret A, Leroux C (2006) Optimising goat's milk and cheese fatty acid composition. . In Improving the fat content of foods, vol. Chapter 12, pp. 281-312 [CWaJ Buttriss, editor]. Cambridge, UK: Woodhead Publishing Ltd.
137. Ådnøy T, Abrahamsen RK (1995) Variation in renneting properties of Norwegian goat milk. Production and utilization of ewe and goat milk S.I. 9603, 274.
138. Ådnøy T, Eik LO (1992) Mjølkekvalitet hjå geit som tidlegare harprodusert mjølk med ulikt turrstoffinnhald. In Husdyrforsøksmøtet, pp. 196-200.
139. Ådnøy T, Abrahamsen R, Eik LO (1996) Breeding of feeding for milk quality and renneting properties in goats? In Annual meeting for the European association for animal production, vol. 47. Lillehammer, Norway.
140. Clark S, Sherbon JW (2000) As1-casein, milk composition and coagulation properties of goat milk. Small Rumin Res 38, 123-134.
141. Ambrosoli R, di Stasio L, Mazzocco P (1988) Content of [alpha]s1-Casein and Coagulation Properties in Goat Milk. J Dairy Sci 71, 24-28.
60
142. Dagnachew BS, Meuwissen THE, Ådnøy T Genetic components of milk Fourier-transform infrared spectra used to predict breeding values for milk composition and quality traits in dairy goats. J Dairy Sci 96, 5933-5942.
143. Dagnachew BS, Kohler A, Ådnøy T (2013) Genetic and environmental information in goat milk Fourier transform infrared spectra. J Dairy Sci 96, 3973-3985.
144. Dagnachew BS, Inglingstad RA, Kohler A, Steinshamn H, Ådnøy T (2011) Prediksjon av mjølkekoagulering med FTIR- spektroskopi. Geitdagene.
145. Evers JM (2004) The milkfat globule membrane--compositional and structural changes post secretion by the mammary secretory cell. Int Dairy J 14, 661-674.
146. Lopez C, Madec M-N, Jimenez-Flores R (2010) Lipid rafts in the bovine milk fat globule membrane revealed by the lateral segregation of phospholipids and heterogeneous distribution of glycoproteins. Food Chemistry 120, 22-33.
147. Murthy AVR, Guyomarc'h F, Paboeuf G, Vié V, Lopez C (2015) Cholesterol strongly affects the organization of lipid monolayers studied as models of the milk fat globule membrane: Condensing effect and change in the lipid domain morphology. Biochimica et Biophysica Acta (BBA) - Biomembranes 1848, 2308-2316.
148. Valenti B, Pagano RI, Avondo M (2012) Effect of diet at different energy levels on milk casein composition of Girgentana goats differing in CSN1S1 genotype. Small Rumin Res 105, 135-139.
149. Valenti B, Pagano RI, Pennisi P, Lanza M, Avondo M (2010) Polymorphism at αs1-casein locus. Effect of genotype×diet interaction on milk fatty acid composition in Girgentana goat. Small Rumin Res 94, 210-213.
8. Enclosed papers I-V

Paper I

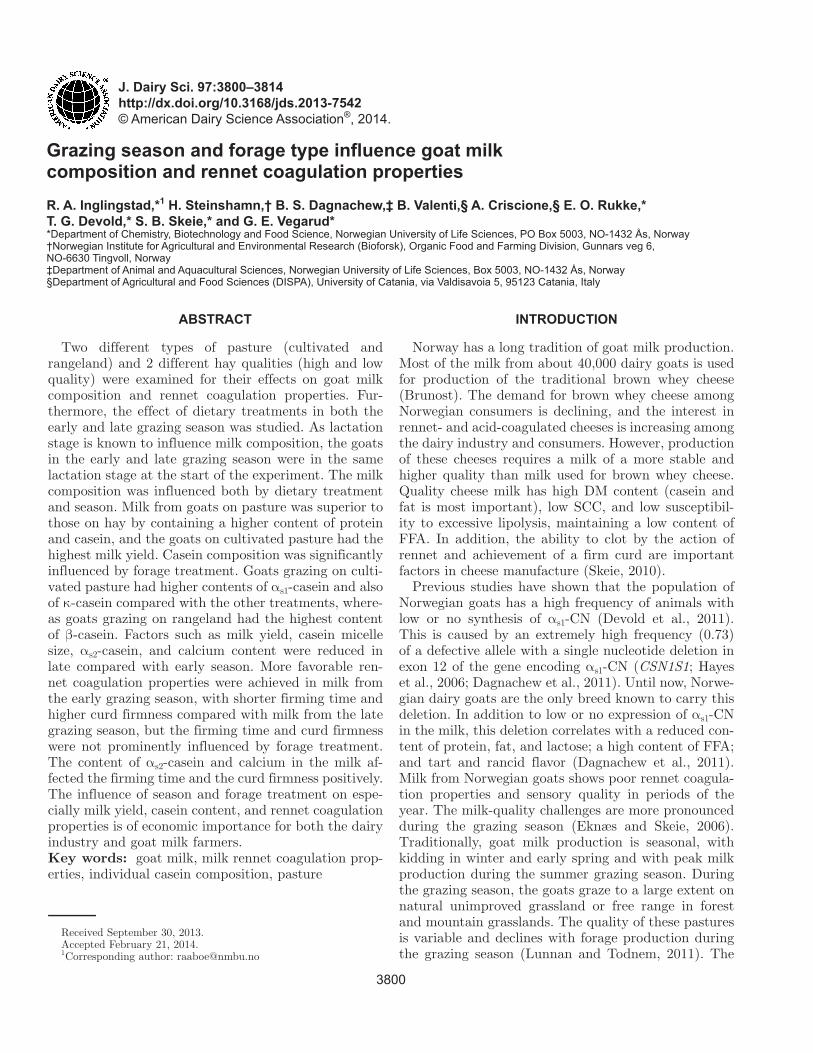
3800
J. Dairy Sci. 97 :3800–3814http://dx.doi.org/ 10.3168/jds.2013-7542 © American Dairy Science Association®, 2014 .
ABSTRACT
Two different types of pasture (cultivated and rangeland) and 2 different hay qualities (high and low quality) were examined for their effects on goat milk composition and rennet coagulation properties. Fur-thermore, the effect of dietary treatments in both the early and late grazing season was studied. As lactation stage is known to influence milk composition, the goats in the early and late grazing season were in the same lactation stage at the start of the experiment. The milk composition was influenced both by dietary treatment and season. Milk from goats on pasture was superior to those on hay by containing a higher content of protein and casein, and the goats on cultivated pasture had the highest milk yield. Casein composition was significantly influenced by forage treatment. Goats grazing on culti-vated pasture had higher contents of αs1-casein and also of κ-casein compared with the other treatments, where-as goats grazing on rangeland had the highest content of β-casein. Factors such as milk yield, casein micelle size, αs2-casein, and calcium content were reduced in late compared with early season. More favorable ren-net coagulation properties were achieved in milk from the early grazing season, with shorter firming time and higher curd firmness compared with milk from the late grazing season, but the firming time and curd firmness were not prominently influenced by forage treatment. The content of αs2-casein and calcium in the milk af-fected the firming time and the curd firmness positively. The influence of season and forage treatment on espe-cially milk yield, casein content, and rennet coagulation properties is of economic importance for both the dairy industry and goat milk farmers. Key words: goat milk , milk rennet coagulation prop-erties , individual casein composition , pasture
INTRODUCTION
Norway has a long tradition of goat milk production. Most of the milk from about 40,000 dairy goats is used for production of the traditional brown whey cheese (Brunost). The demand for brown whey cheese among Norwegian consumers is declining, and the interest in rennet- and acid-coagulated cheeses is increasing among the dairy industry and consumers. However, production of these cheeses requires a milk of a more stable and higher quality than milk used for brown whey cheese. Quality cheese milk has high DM content (casein and fat is most important), low SCC, and low susceptibil-ity to excessive lipolysis, maintaining a low content of FFA. In addition, the ability to clot by the action of rennet and achievement of a firm curd are important factors in cheese manufacture (Skeie, 2010).
Previous studies have shown that the population of Norwegian goats has a high frequency of animals with low or no synthesis of αs1-CN (Devold et al., 2011). This is caused by an extremely high frequency (0.73) of a defective allele with a single nucleotide deletion in exon 12 of the gene encoding αs1-CN (CSN1S1; Hayes et al., 2006; Dagnachew et al., 2011). Until now, Norwe-gian dairy goats are the only breed known to carry this deletion. In addition to low or no expression of αs1-CN in the milk, this deletion correlates with a reduced con-tent of protein, fat, and lactose; a high content of FFA; and tart and rancid flavor (Dagnachew et al., 2011). Milk from Norwegian goats shows poor rennet coagula-tion properties and sensory quality in periods of the year. The milk-quality challenges are more pronounced during the grazing season (Eknæs and Skeie, 2006). Traditionally, goat milk production is seasonal, with kidding in winter and early spring and with peak milk production during the summer grazing season. During the grazing season, the goats graze to a large extent on natural unimproved grassland or free range in forest and mountain grasslands. The quality of these pastures is variable and declines with forage production during the grazing season (Lunnan and Todnem, 2011). The
Grazing season and forage type influence goat milk composition and rennet coagulation properties R. A. Inglingstad ,*1 H. Steinshamn ,† B. S. Dagnachew ,‡ B. Valenti ,§ A. Criscione ,§ E. O. Rukke ,* T. G. Devold ,* S. B. Skeie ,* and G. E. Vegarud * * Department of Chemistry, Biotechnology and Food Science, Norwegian University of Life Sciences, PO Box 5003, NO-1432 Ås, Norway † Norwegian Institute for Agricultural and Environmental Research (Bioforsk), Organic Food and Farming Division, Gunnars veg 6, NO-6630 Tingvoll, Norway ‡ Department of Animal and Aquacultural Sciences, Norwegian University of Life Sciences, Box 5003, NO-1432 Ås, Norway § Department of Agricultural and Food Sciences (DISPA), University of Catania, via Valdisavoia 5, 95123 Catania, Italy
Received September 30, 2013. Accepted February 21, 2014. 1 Corresponding author: [email protected]
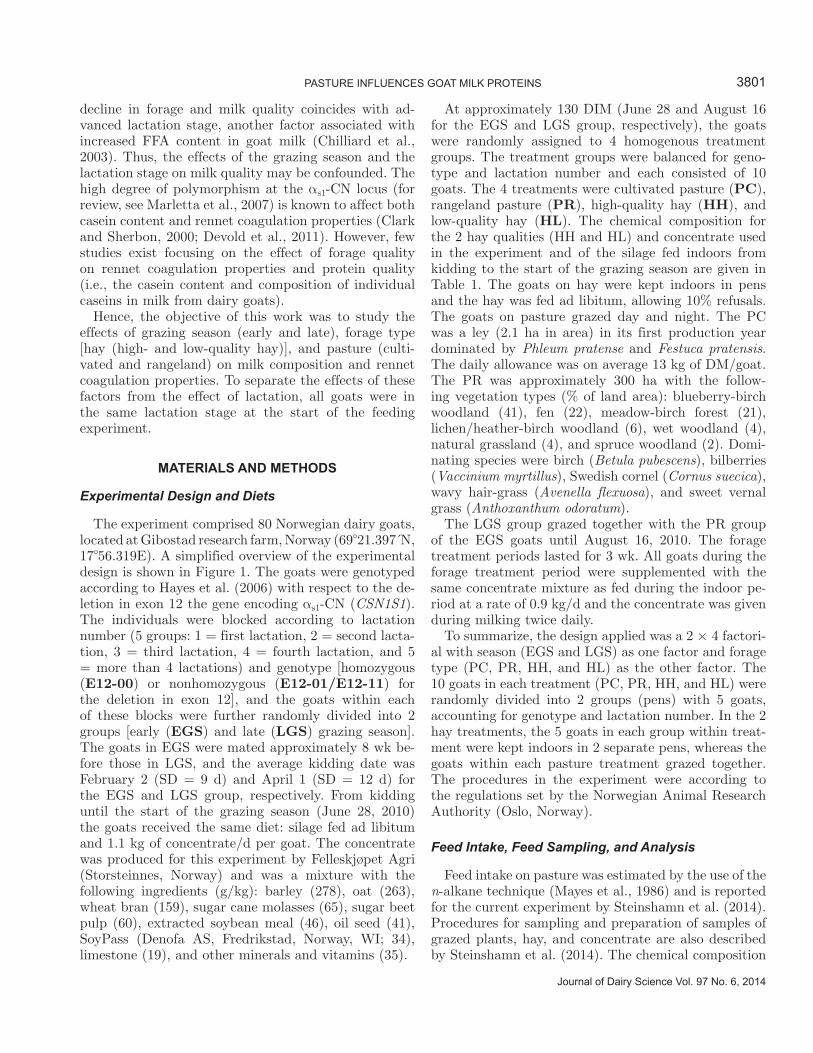
Journal of Dairy Science Vol. 97 No. 6, 2014
PASTURE INFLUENCES GOAT MILK PROTEINS 3801
decline in forage and milk quality coincides with ad-vanced lactation stage, another factor associated with increased FFA content in goat milk (Chilliard et al., 2003). Thus, the effects of the grazing season and the lactation stage on milk quality may be confounded. The high degree of polymorphism at the αs1-CN locus (for review, see Marletta et al., 2007) is known to affect both casein content and rennet coagulation properties (Clark and Sherbon, 2000; Devold et al., 2011). However, few studies exist focusing on the effect of forage quality on rennet coagulation properties and protein quality (i.e., the casein content and composition of individual caseins in milk from dairy goats).
Hence, the objective of this work was to study the effects of grazing season (early and late), forage type [hay (high- and low-quality hay)], and pasture (culti-vated and rangeland) on milk composition and rennet coagulation properties. To separate the effects of these factors from the effect of lactation, all goats were in the same lactation stage at the start of the feeding experiment.
MATERIALS AND METHODS
Experimental Design and Diets
The experiment comprised 80 Norwegian dairy goats, located at Gibostad research farm, Norway (69°21.397´N, 17°56.319E). A simplified overview of the experimental design is shown in Figure 1. The goats were genotyped according to Hayes et al. (2006) with respect to the de-letion in exon 12 the gene encoding αs1-CN (CSN1S1). The individuals were blocked according to lactation number (5 groups: 1 = first lactation, 2 = second lacta-tion, 3 = third lactation, 4 = fourth lactation, and 5 = more than 4 lactations) and genotype [homozygous (E12-00) or nonhomozygous (E12-01/E12-11) for the deletion in exon 12], and the goats within each of these blocks were further randomly divided into 2 groups [early (EGS) and late (LGS) grazing season]. The goats in EGS were mated approximately 8 wk be-fore those in LGS, and the average kidding date was February 2 (SD = 9 d) and April 1 (SD = 12 d) for the EGS and LGS group, respectively. From kidding until the start of the grazing season (June 28, 2010) the goats received the same diet: silage fed ad libitum and 1.1 kg of concentrate/d per goat. The concentrate was produced for this experiment by Felleskjøpet Agri (Storsteinnes, Norway) and was a mixture with the following ingredients (g/kg): barley (278), oat (263), wheat bran (159), sugar cane molasses (65), sugar beet pulp (60), extracted soybean meal (46), oil seed (41), SoyPass (Denofa AS, Fredrikstad, Norway, WI; 34), limestone (19), and other minerals and vitamins (35).
At approximately 130 DIM (June 28 and August 16 for the EGS and LGS group, respectively), the goats were randomly assigned to 4 homogenous treatment groups. The treatment groups were balanced for geno-type and lactation number and each consisted of 10 goats. The 4 treatments were cultivated pasture (PC), rangeland pasture (PR), high-quality hay (HH), and low-quality hay (HL). The chemical composition for the 2 hay qualities (HH and HL) and concentrate used in the experiment and of the silage fed indoors from kidding to the start of the grazing season are given in Table 1. The goats on hay were kept indoors in pens and the hay was fed ad libitum, allowing 10% refusals. The goats on pasture grazed day and night. The PC was a ley (2.1 ha in area) in its first production year dominated by Phleum pratense and Festuca pratensis. The daily allowance was on average 13 kg of DM/goat. The PR was approximately 300 ha with the follow-ing vegetation types (% of land area): blueberry-birch woodland (41), fen (22), meadow-birch forest (21), lichen/heather-birch woodland (6), wet woodland (4), natural grassland (4), and spruce woodland (2). Domi-nating species were birch (Betula pubescens), bilberries (Vaccinium myrtillus), Swedish cornel (Cornus suecica), wavy hair-grass (Avenella flexuosa), and sweet vernal grass (Anthoxanthum odoratum).
The LGS group grazed together with the PR group of the EGS goats until August 16, 2010. The forage treatment periods lasted for 3 wk. All goats during the forage treatment period were supplemented with the same concentrate mixture as fed during the indoor pe-riod at a rate of 0.9 kg/d and the concentrate was given during milking twice daily.
To summarize, the design applied was a 2 × 4 factori-al with season (EGS and LGS) as one factor and forage type (PC, PR, HH, and HL) as the other factor. The 10 goats in each treatment (PC, PR, HH, and HL) were randomly divided into 2 groups (pens) with 5 goats, accounting for genotype and lactation number. In the 2 hay treatments, the 5 goats in each group within treat-ment were kept indoors in 2 separate pens, whereas the goats within each pasture treatment grazed together. The procedures in the experiment were according to the regulations set by the Norwegian Animal Research Authority (Oslo, Norway).
Feed Intake, Feed Sampling, and Analysis
Feed intake on pasture was estimated by the use of the n-alkane technique (Mayes et al., 1986) and is reported for the current experiment by Steinshamn et al. (2014). Procedures for sampling and preparation of samples of grazed plants, hay, and concentrate are also described by Steinshamn et al. (2014). The chemical composition
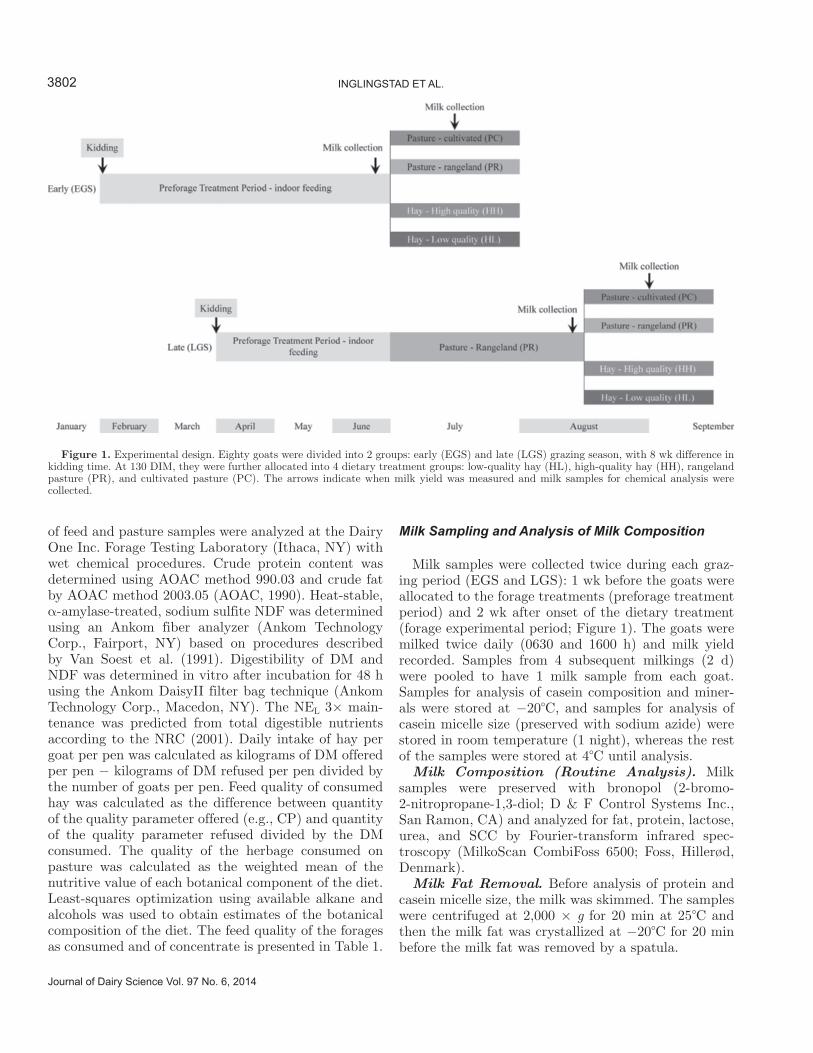
3802 INGLINGSTAD ET AL.
Journal of Dairy Science Vol. 97 No. 6, 2014
of feed and pasture samples were analyzed at the Dairy One Inc. Forage Testing Laboratory (Ithaca, NY) with wet chemical procedures. Crude protein content was determined using AOAC method 990.03 and crude fat by AOAC method 2003.05 (AOAC, 1990). Heat-stable, α-amylase-treated, sodium sulfite NDF was determined using an Ankom fiber analyzer (Ankom Technology Corp., Fairport, NY) based on procedures described by Van Soest et al. (1991). Digestibility of DM and NDF was determined in vitro after incubation for 48 h using the Ankom DaisyII filter bag technique (Ankom Technology Corp., Macedon, NY). The NEL 3× main-tenance was predicted from total digestible nutrients according to the NRC (2001). Daily intake of hay per goat per pen was calculated as kilograms of DM offered per pen − kilograms of DM refused per pen divided by the number of goats per pen. Feed quality of consumed hay was calculated as the difference between quantity of the quality parameter offered (e.g., CP) and quantity of the quality parameter refused divided by the DM consumed. The quality of the herbage consumed on pasture was calculated as the weighted mean of the nutritive value of each botanical component of the diet. Least-squares optimization using available alkane and alcohols was used to obtain estimates of the botanical composition of the diet. The feed quality of the forages as consumed and of concentrate is presented in Table 1.
Milk Sampling and Analysis of Milk Composition
Milk samples were collected twice during each graz-ing period (EGS and LGS): 1 wk before the goats were allocated to the forage treatments (preforage treatment period) and 2 wk after onset of the dietary treatment (forage experimental period; Figure 1). The goats were milked twice daily (0630 and 1600 h) and milk yield recorded. Samples from 4 subsequent milkings (2 d) were pooled to have 1 milk sample from each goat. Samples for analysis of casein composition and miner-als were stored at −20°C, and samples for analysis of casein micelle size (preserved with sodium azide) were stored in room temperature (1 night), whereas the rest of the samples were stored at 4°C until analysis.
Milk Composition (Routine Analysis). Milk samples were preserved with bronopol (2-bromo-2-nitropropane-1,3-diol; D & F Control Systems Inc., San Ramon, CA) and analyzed for fat, protein, lactose, urea, and SCC by Fourier-transform infrared spec-troscopy (MilkoScan CombiFoss 6500; Foss, Hillerød, Denmark).
Milk Fat Removal. Before analysis of protein and casein micelle size, the milk was skimmed. The samples were centrifuged at 2,000 × g for 20 min at 25°C and then the milk fat was crystallized at −20°C for 20 min before the milk fat was removed by a spatula.
Figure 1. Experimental design. Eighty goats were divided into 2 groups: early (EGS) and late (LGS) grazing season, with 8 wk difference in kidding time. At 130 DIM, they were further allocated into 4 dietary treatment groups: low-quality hay (HL), high-quality hay (HH), rangeland pasture (PR), and cultivated pasture (PC). The arrows indicate when milk yield was measured and milk samples for chemical analysis were collected.
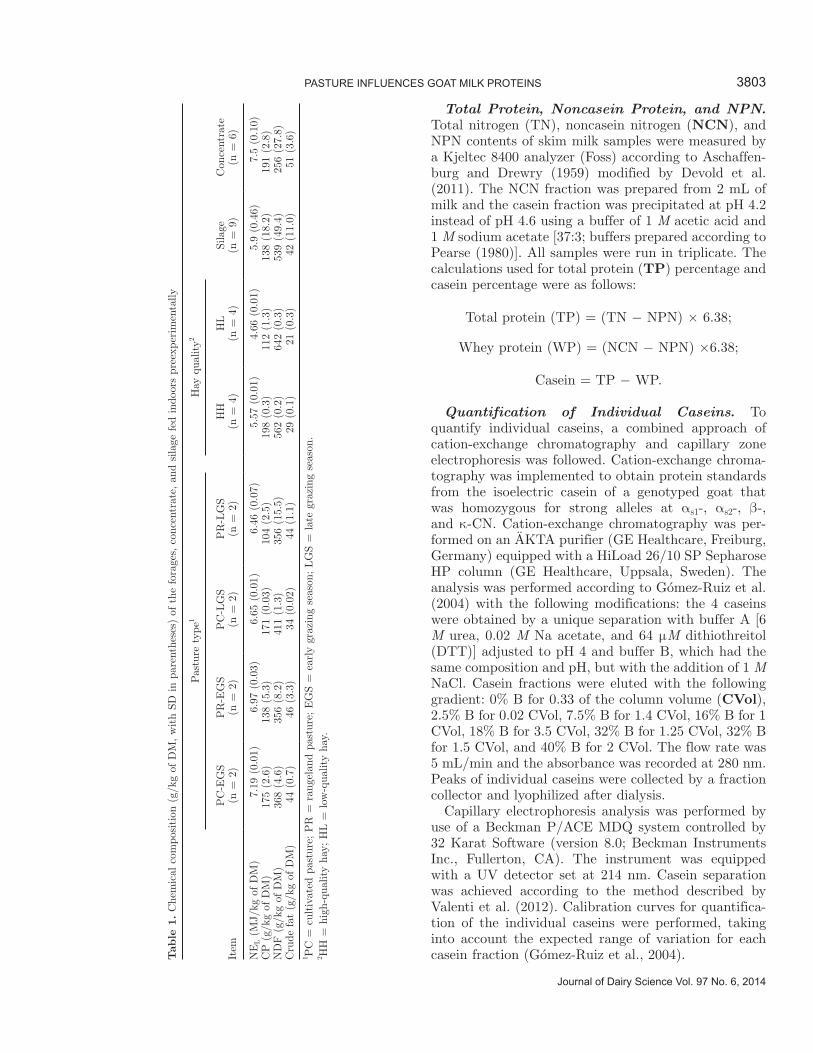
Journal of Dairy Science Vol. 97 No. 6, 2014
PASTURE INFLUENCES GOAT MILK PROTEINS 3803
Total Protein, Noncasein Protein, and NPN. Total nitrogen (TN), noncasein nitrogen (NCN), and NPN contents of skim milk samples were measured by a Kjeltec 8400 analyzer (Foss) according to Aschaffen-burg and Drewry (1959) modified by Devold et al. (2011). The NCN fraction was prepared from 2 mL of milk and the casein fraction was precipitated at pH 4.2 instead of pH 4.6 using a buffer of 1 M acetic acid and 1 M sodium acetate [37:3; buffers prepared according to Pearse (1980)]. All samples were run in triplicate. The calculations used for total protein (TP) percentage and casein percentage were as follows:
Total protein (TP) = (TN − NPN) × 6.38;
Whey protein (WP) = (NCN − NPN) ×6.38;
Casein = TP − WP.
Quantification of Individual Caseins. To quantify individual caseins, a combined approach of cation-exchange chromatography and capillary zone electrophoresis was followed. Cation-exchange chroma-tography was implemented to obtain protein standards from the isoelectric casein of a genotyped goat that was homozygous for strong alleles at αs1-, αs2-, β-, and κ-CN. Cation-exchange chromatography was per-formed on an ÄKTA purifier (GE Healthcare, Freiburg, Germany) equipped with a HiLoad 26/10 SP Sepharose HP column (GE Healthcare, Uppsala, Sweden). The analysis was performed according to Gómez-Ruiz et al. (2004) with the following modifications: the 4 caseins were obtained by a unique separation with buffer A [6 M urea, 0.02 M Na acetate, and 64 μM dithiothreitol (DTT)] adjusted to pH 4 and buffer B, which had the same composition and pH, but with the addition of 1 M NaCl. Casein fractions were eluted with the following gradient: 0% B for 0.33 of the column volume (CVol), 2.5% B for 0.02 CVol, 7.5% B for 1.4 CVol, 16% B for 1 CVol, 18% B for 3.5 CVol, 32% B for 1.25 CVol, 32% B for 1.5 CVol, and 40% B for 2 CVol. The flow rate was 5 mL/min and the absorbance was recorded at 280 nm. Peaks of individual caseins were collected by a fraction collector and lyophilized after dialysis.
Capillary electrophoresis analysis was performed by use of a Beckman P/ACE MDQ system controlled by 32 Karat Software (version 8.0; Beckman Instruments Inc., Fullerton, CA). The instrument was equipped with a UV detector set at 214 nm. Casein separation was achieved according to the method described by Valenti et al. (2012). Calibration curves for quantifica-tion of the individual caseins were performed, taking into account the expected range of variation for each casein fraction (Gómez-Ruiz et al., 2004).T
able
1. C
hem
ical
com
posi
tion
(g/
kg o
f D
M, w
ith
SD in
pare
nthe
ses)
of th
e fo
rage
s, c
once
ntra
te, an
d si
lage
fed
ind
oors
pre
expe
rim
enta
lly
Item
Pas
ture
typ
e1H
ay q
ualit
y2
Sila
ge
(n =
9)
Con
cent
rate
(n
= 6
)P
C-E
GS
(n =
2)
PR
-EG
S
(n =
2)
PC
-LG
S
(n =
2)
PR
-LG
S
(n =
2)
HH
(n
= 4
)H
L
(n =
4)
NE
L (
MJ/
kg o
f D
M)
7.19
(0.
01)
6.97
(0.
03)
6.65
(0.
01)
6.46
(0.
07)
5.57
(0.
01)
4.66
(0.
01)
5.9
(0.4
6)7.
5 (0
.10)
CP
(g/
kg o
f D
M)
175
(2.6
)13
8 (5
.3)
171
(0.0
3)10
4 (2
.5)
198
(0.3
)11
2 (1
.3)
138
(18.
2)19
1 (2
.8)
ND
F (
g/kg
of D
M)
368
(4.6
)35
6 (8
.2)
411
(1.3
)35
6 (1
5.5)
562
(0.2
)64
2 (0
.3)
539
(49.
4)25
6 (2
7.8)
Cru
de fat
(g/
kg o
f D
M)
44 (
0.7)
46 (
3.3)
34 (
0.02
)44
(1.
1)29
(0.
1)21
(0.
3)42
(11
.0)
51 (
3.6)
1 PC
= c
ultiva
ted
past
ure;
PR
= r
ange
land
pas
ture
; E
GS
= e
arly
gra
zing
sea
son;
LG
S =
lat
e gr
azin
g se
ason
.2 H
H =
hig
h-qu
ality
hay;
HL =
low
-qua
lity
hay.
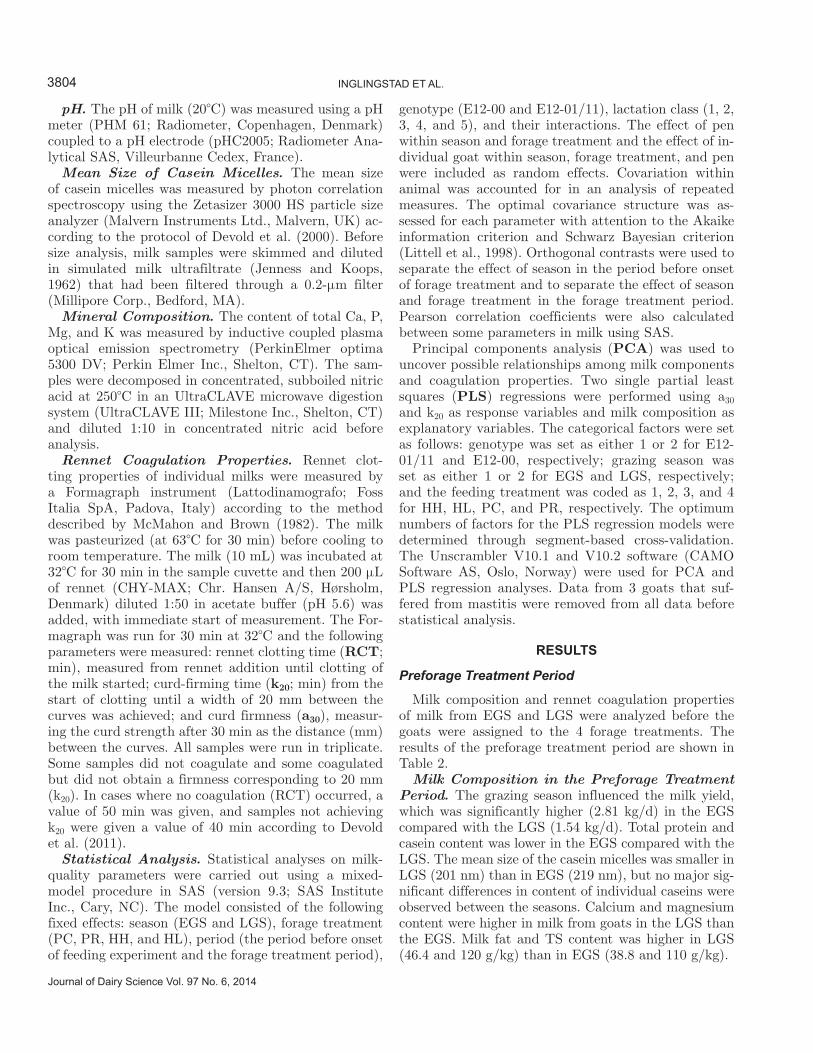
3804 INGLINGSTAD ET AL.
Journal of Dairy Science Vol. 97 No. 6, 2014
pH. The pH of milk (20°C) was measured using a pH meter (PHM 61; Radiometer, Copenhagen, Denmark) coupled to a pH electrode (pHC2005; Radiometer Ana-lytical SAS, Villeurbanne Cedex, France).
Mean Size of Casein Micelles. The mean size of casein micelles was measured by photon correlation spectroscopy using the Zetasizer 3000 HS particle size analyzer (Malvern Instruments Ltd., Malvern, UK) ac-cording to the protocol of Devold et al. (2000). Before size analysis, milk samples were skimmed and diluted in simulated milk ultrafiltrate (Jenness and Koops, 1962) that had been filtered through a 0.2-μm filter (Millipore Corp., Bedford, MA).
Mineral Composition. The content of total Ca, P, Mg, and K was measured by inductive coupled plasma optical emission spectrometry (PerkinElmer optima 5300 DV; Perkin Elmer Inc., Shelton, CT). The sam-ples were decomposed in concentrated, subboiled nitric acid at 250°C in an UltraCLAVE microwave digestion system (UltraCLAVE III; Milestone Inc., Shelton, CT) and diluted 1:10 in concentrated nitric acid before analysis.
Rennet Coagulation Properties. Rennet clot-ting properties of individual milks were measured by a Formagraph instrument (Lattodinamografo; Foss Italia SpA, Padova, Italy) according to the method described by McMahon and Brown (1982). The milk was pasteurized (at 63°C for 30 min) before cooling to room temperature. The milk (10 mL) was incubated at 32°C for 30 min in the sample cuvette and then 200 μL of rennet (CHY-MAX; Chr. Hansen A/S, Hørsholm, Denmark) diluted 1:50 in acetate buffer (pH 5.6) was added, with immediate start of measurement. The For-magraph was run for 30 min at 32°C and the following parameters were measured: rennet clotting time (RCT; min), measured from rennet addition until clotting of the milk started; curd-firming time (k20; min) from the start of clotting until a width of 20 mm between the curves was achieved; and curd firmness (a30), measur-ing the curd strength after 30 min as the distance (mm) between the curves. All samples were run in triplicate. Some samples did not coagulate and some coagulated but did not obtain a firmness corresponding to 20 mm (k20). In cases where no coagulation (RCT) occurred, a value of 50 min was given, and samples not achieving k20 were given a value of 40 min according to Devold et al. (2011).
Statistical Analysis. Statistical analyses on milk-quality parameters were carried out using a mixed-model procedure in SAS (version 9.3; SAS Institute Inc., Cary, NC). The model consisted of the following fixed effects: season (EGS and LGS), forage treatment (PC, PR, HH, and HL), period (the period before onset of feeding experiment and the forage treatment period),
genotype (E12-00 and E12-01/11), lactation class (1, 2, 3, 4, and 5), and their interactions. The effect of pen within season and forage treatment and the effect of in-dividual goat within season, forage treatment, and pen were included as random effects. Covariation within animal was accounted for in an analysis of repeated measures. The optimal covariance structure was as-sessed for each parameter with attention to the Akaike information criterion and Schwarz Bayesian criterion (Littell et al., 1998). Orthogonal contrasts were used to separate the effect of season in the period before onset of forage treatment and to separate the effect of season and forage treatment in the forage treatment period. Pearson correlation coefficients were also calculated between some parameters in milk using SAS.
Principal components analysis (PCA) was used to uncover possible relationships among milk components and coagulation properties. Two single partial least squares (PLS) regressions were performed using a30 and k20 as response variables and milk composition as explanatory variables. The categorical factors were set as follows: genotype was set as either 1 or 2 for E12-01/11 and E12-00, respectively; grazing season was set as either 1 or 2 for EGS and LGS, respectively; and the feeding treatment was coded as 1, 2, 3, and 4 for HH, HL, PC, and PR, respectively. The optimum numbers of factors for the PLS regression models were determined through segment-based cross-validation. The Unscrambler V10.1 and V10.2 software (CAMO Software AS, Oslo, Norway) were used for PCA and PLS regression analyses. Data from 3 goats that suf-fered from mastitis were removed from all data before statistical analysis.
RESULTS
Preforage Treatment Period
Milk composition and rennet coagulation properties of milk from EGS and LGS were analyzed before the goats were assigned to the 4 forage treatments. The results of the preforage treatment period are shown in Table 2.
Milk Composition in the Preforage Treatment Period. The grazing season influenced the milk yield, which was significantly higher (2.81 kg/d) in the EGS compared with the LGS (1.54 kg/d). Total protein and casein content was lower in the EGS compared with the LGS. The mean size of the casein micelles was smaller in LGS (201 nm) than in EGS (219 nm), but no major sig-nificant differences in content of individual caseins were observed between the seasons. Calcium and magnesium content were higher in milk from goats in the LGS than the EGS. Milk fat and TS content was higher in LGS (46.4 and 120 g/kg) than in EGS (38.8 and 110 g/kg).
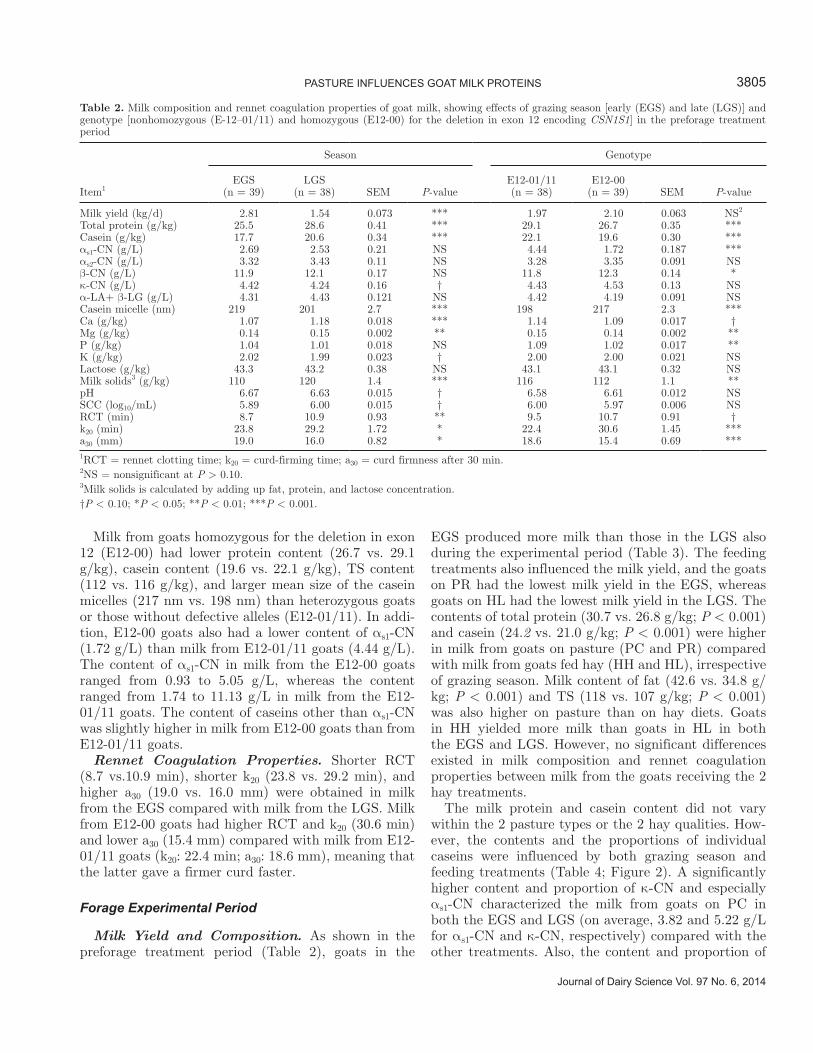
Journal of Dairy Science Vol. 97 No. 6, 2014
PASTURE INFLUENCES GOAT MILK PROTEINS 3805
Milk from goats homozygous for the deletion in exon 12 (E12-00) had lower protein content (26.7 vs. 29.1 g/kg), casein content (19.6 vs. 22.1 g/kg), TS content (112 vs. 116 g/kg), and larger mean size of the casein micelles (217 nm vs. 198 nm) than heterozygous goats or those without defective alleles (E12-01/11). In addi-tion, E12-00 goats also had a lower content of αs1-CN (1.72 g/L) than milk from E12-01/11 goats (4.44 g/L). The content of αs1-CN in milk from the E12-00 goats ranged from 0.93 to 5.05 g/L, whereas the content ranged from 1.74 to 11.13 g/L in milk from the E12-01/11 goats. The content of caseins other than αs1-CN was slightly higher in milk from E12-00 goats than from E12-01/11 goats.
Rennet Coagulation Properties. Shorter RCT (8.7 vs.10.9 min), shorter k20 (23.8 vs. 29.2 min), and higher a30 (19.0 vs. 16.0 mm) were obtained in milk from the EGS compared with milk from the LGS. Milk from E12-00 goats had higher RCT and k20 (30.6 min) and lower a30 (15.4 mm) compared with milk from E12-01/11 goats (k20: 22.4 min; a30: 18.6 mm), meaning that the latter gave a firmer curd faster.
Forage Experimental Period
Milk Yield and Composition. As shown in the preforage treatment period (Table 2), goats in the
EGS produced more milk than those in the LGS also during the experimental period (Table 3). The feeding treatments also influenced the milk yield, and the goats on PR had the lowest milk yield in the EGS, whereas goats on HL had the lowest milk yield in the LGS. The contents of total protein (30.7 vs. 26.8 g/kg; P < 0.001) and casein (24.2 vs. 21.0 g/kg; P < 0.001) were higher in milk from goats on pasture (PC and PR) compared with milk from goats fed hay (HH and HL), irrespective of grazing season. Milk content of fat (42.6 vs. 34.8 g/kg; P < 0.001) and TS (118 vs. 107 g/kg; P < 0.001) was also higher on pasture than on hay diets. Goats in HH yielded more milk than goats in HL in both the EGS and LGS. However, no significant differences existed in milk composition and rennet coagulation properties between milk from the goats receiving the 2 hay treatments.
The milk protein and casein content did not vary within the 2 pasture types or the 2 hay qualities. How-ever, the contents and the proportions of individual caseins were influenced by both grazing season and feeding treatments (Table 4; Figure 2). A significantly higher content and proportion of κ-CN and especially αs1-CN characterized the milk from goats on PC in both the EGS and LGS (on average, 3.82 and 5.22 g/L for αs1-CN and κ-CN, respectively) compared with the other treatments. Also, the content and proportion of
Table 2. Milk composition and rennet coagulation properties of goat milk, showing effects of grazing season [early (EGS) and late (LGS)] and genotype [nonhomozygous (E-12–01/11) and homozygous (E12-00) for the deletion in exon 12 encoding CSN1S1] in the preforage treatment period
Item1
Season Genotype
EGS (n = 39)
LGS (n = 38) SEM P-value
E12-01/11 (n = 38)
E12-00 (n = 39) SEM P-value
Milk yield (kg/d) 2.81 1.54 0.073 *** 1.97 2.10 0.063 NS2
Total protein (g/kg) 25.5 28.6 0.41 *** 29.1 26.7 0.35 ***Casein (g/kg) 17.7 20.6 0.34 *** 22.1 19.6 0.30 ***αs1-CN (g/L) 2.69 2.53 0.21 NS 4.44 1.72 0.187 ***αs2-CN (g/L) 3.32 3.43 0.11 NS 3.28 3.35 0.091 NSβ-CN (g/L) 11.9 12.1 0.17 NS 11.8 12.3 0.14 *κ-CN (g/L) 4.42 4.24 0.16 † 4.43 4.53 0.13 NSα-LA+ β-LG (g/L) 4.31 4.43 0.121 NS 4.42 4.19 0.091 NSCasein micelle (nm) 219 201 2.7 *** 198 217 2.3 ***Ca (g/kg) 1.07 1.18 0.018 *** 1.14 1.09 0.017 †Mg (g/kg) 0.14 0.15 0.002 ** 0.15 0.14 0.002 **P (g/kg) 1.04 1.01 0.018 NS 1.09 1.02 0.017 **K (g/kg) 2.02 1.99 0.023 † 2.00 2.00 0.021 NSLactose (g/kg) 43.3 43.2 0.38 NS 43.1 43.1 0.32 NSMilk solids3 (g/kg) 110 120 1.4 *** 116 112 1.1 **pH 6.67 6.63 0.015 † 6.58 6.61 0.012 NSSCC (log10/mL) 5.89 6.00 0.015 † 6.00 5.97 0.006 NSRCT (min) 8.7 10.9 0.93 ** 9.5 10.7 0.91 †k20 (min) 23.8 29.2 1.72 * 22.4 30.6 1.45 ***a30 (mm) 19.0 16.0 0.82 * 18.6 15.4 0.69 ***1RCT = rennet clotting time; k20 = curd-firming time; a30 = curd firmness after 30 min. 2NS = nonsignificant at P > 0.10.3Milk solids is calculated by adding up fat, protein, and lactose concentration.†P < 0.10; *P < 0.05; **P < 0.01; ***P < 0.001.
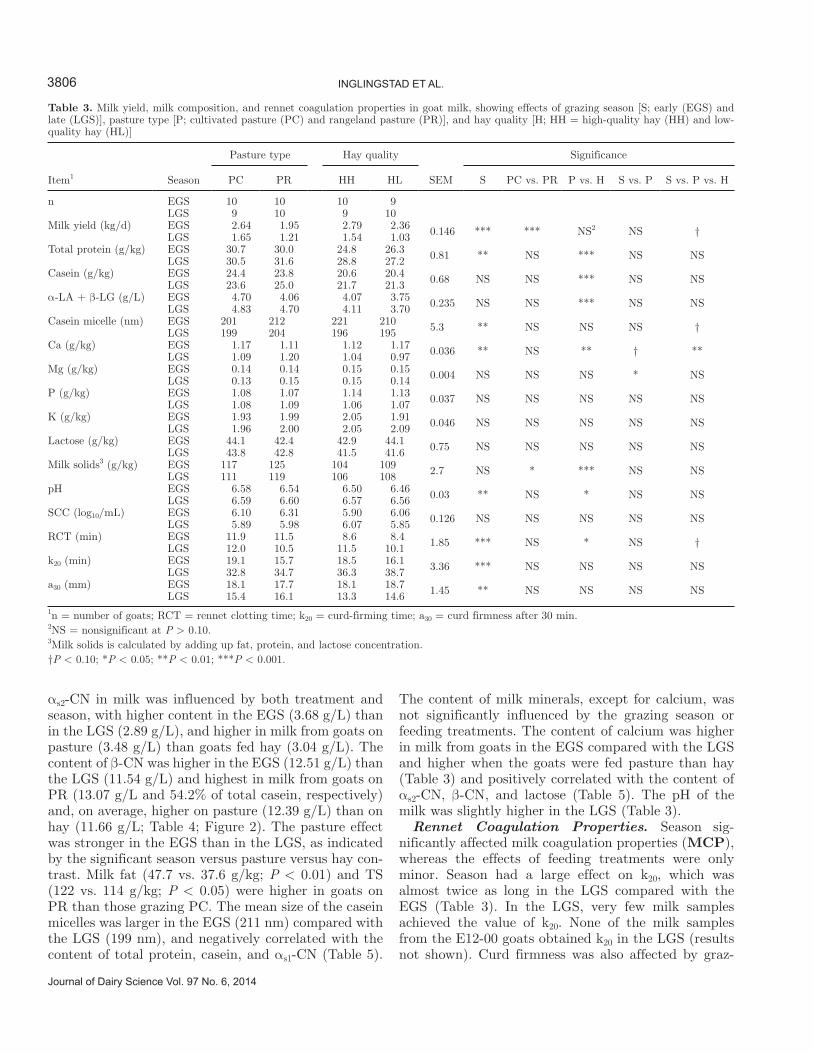
3806 INGLINGSTAD ET AL.
Journal of Dairy Science Vol. 97 No. 6, 2014
αs2-CN in milk was influenced by both treatment and season, with higher content in the EGS (3.68 g/L) than in the LGS (2.89 g/L), and higher in milk from goats on pasture (3.48 g/L) than goats fed hay (3.04 g/L). The content of β-CN was higher in the EGS (12.51 g/L) than the LGS (11.54 g/L) and highest in milk from goats on PR (13.07 g/L and 54.2% of total casein, respectively) and, on average, higher on pasture (12.39 g/L) than on hay (11.66 g/L; Table 4; Figure 2). The pasture effect was stronger in the EGS than in the LGS, as indicated by the significant season versus pasture versus hay con-trast. Milk fat (47.7 vs. 37.6 g/kg; P < 0.01) and TS (122 vs. 114 g/kg; P < 0.05) were higher in goats on PR than those grazing PC. The mean size of the casein micelles was larger in the EGS (211 nm) compared with the LGS (199 nm), and negatively correlated with the content of total protein, casein, and αs1-CN (Table 5).
The content of milk minerals, except for calcium, was not significantly influenced by the grazing season or feeding treatments. The content of calcium was higher in milk from goats in the EGS compared with the LGS and higher when the goats were fed pasture than hay (Table 3) and positively correlated with the content of αs2-CN, β-CN, and lactose (Table 5). The pH of the milk was slightly higher in the LGS (Table 3).
Rennet Coagulation Properties. Season sig-nificantly affected milk coagulation properties (MCP), whereas the effects of feeding treatments were only minor. Season had a large effect on k20, which was almost twice as long in the LGS compared with the EGS (Table 3). In the LGS, very few milk samples achieved the value of k20. None of the milk samples from the E12-00 goats obtained k20 in the LGS (results not shown). Curd firmness was also affected by graz-
Table 3. Milk yield, milk composition, and rennet coagulation properties in goat milk, showing effects of grazing season [S; early (EGS) and late (LGS)], pasture type [P; cultivated pasture (PC) and rangeland pasture (PR)], and hay quality [H; HH = high-quality hay (HH) and low-quality hay (HL)]
Item1 Season
Pasture type Hay quality
SEM
Significance
PC PR HH HL S PC vs. PR P vs. H S vs. P S vs. P vs. H
n EGS 10 10 10 9LGS 9 10 9 10
Milk yield (kg/d) EGS 2.64 1.95 2.79 2.36 0.146 *** *** NS2 NS †LGS 1.65 1.21 1.54 1.03Total protein (g/kg) EGS 30.7 30.0 24.8 26.3 0.81 ** NS *** NS NSLGS 30.5 31.6 28.8 27.2Casein (g/kg) EGS 24.4 23.8 20.6 20.4 0.68 NS NS *** NS NSLGS 23.6 25.0 21.7 21.3α-LA + β-LG (g/L) EGS 4.70 4.06 4.07 3.75 0.235 NS NS *** NS NSLGS 4.83 4.70 4.11 3.70Casein micelle (nm) EGS 201 212 221 210 5.3 ** NS NS NS †LGS 199 204 196 195Ca (g/kg) EGS 1.17 1.11 1.12 1.17 0.036 ** NS ** † **LGS 1.09 1.20 1.04 0.97Mg (g/kg) EGS 0.14 0.14 0.15 0.15 0.004 NS NS NS * NSLGS 0.13 0.15 0.15 0.14P (g/kg) EGS 1.08 1.07 1.14 1.13 0.037 NS NS NS NS NSLGS 1.08 1.09 1.06 1.07K (g/kg) EGS 1.93 1.99 2.05 1.91 0.046 NS NS NS NS NSLGS 1.96 2.00 2.05 2.09Lactose (g/kg) EGS 44.1 42.4 42.9 44.1 0.75 NS NS NS NS NSLGS 43.8 42.8 41.5 41.6Milk solids3 (g/kg) EGS 117 125 104 109 2.7 NS * *** NS NSLGS 111 119 106 108pH EGS 6.58 6.54 6.50 6.46 0.03 ** NS * NS NSLGS 6.59 6.60 6.57 6.56SCC (log10/mL) EGS 6.10 6.31 5.90 6.06 0.126 NS NS NS NS NSLGS 5.89 5.98 6.07 5.85RCT (min) EGS 11.9 11.5 8.6 8.4 1.85 *** NS * NS †LGS 12.0 10.5 11.5 10.1k20 (min) EGS 19.1 15.7 18.5 16.1 3.36 *** NS NS NS NSLGS 32.8 34.7 36.3 38.7a30 (mm) EGS 18.1 17.7 18.1 18.7 1.45 ** NS NS NS NSLGS 15.4 16.1 13.3 14.61n = number of goats; RCT = rennet clotting time; k20 = curd-firming time; a30 = curd firmness after 30 min. 2NS = nonsignificant at P > 0.10.3Milk solids is calculated by adding up fat, protein, and lactose concentration. †P < 0.10; *P < 0.05; **P < 0.01; ***P < 0.001.
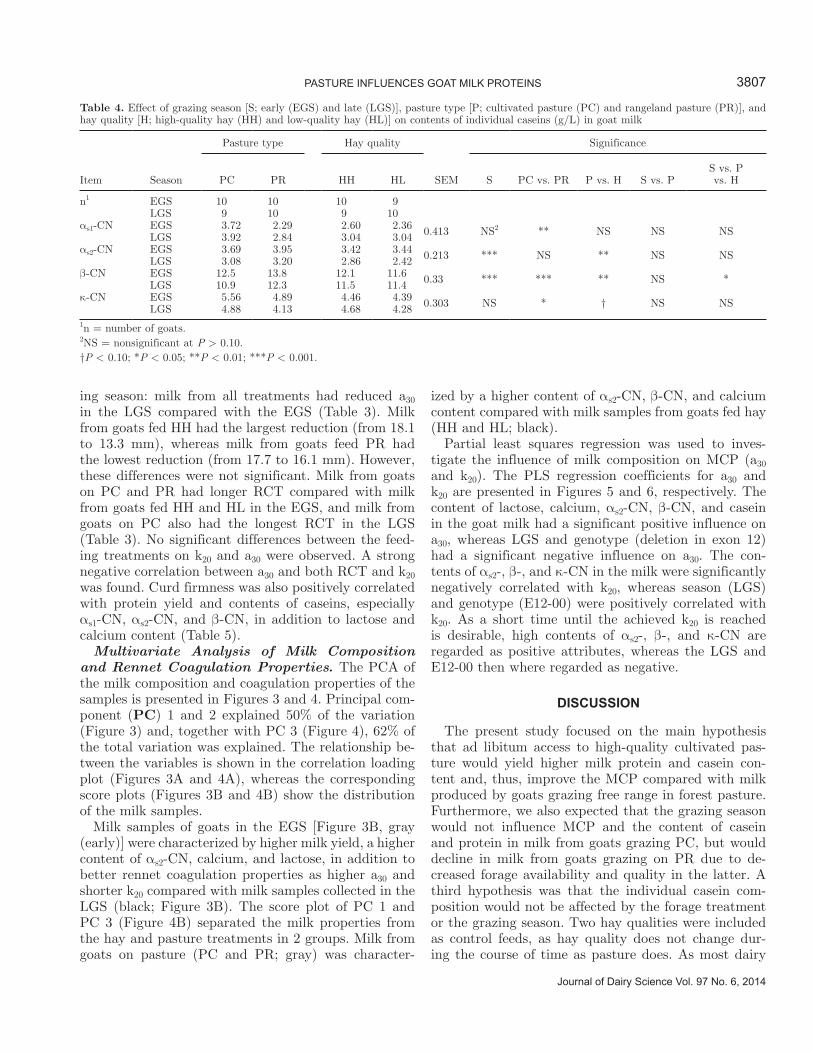
Journal of Dairy Science Vol. 97 No. 6, 2014
PASTURE INFLUENCES GOAT MILK PROTEINS 3807
ing season: milk from all treatments had reduced a30 in the LGS compared with the EGS (Table 3). Milk from goats fed HH had the largest reduction (from 18.1 to 13.3 mm), whereas milk from goats feed PR had the lowest reduction (from 17.7 to 16.1 mm). However, these differences were not significant. Milk from goats on PC and PR had longer RCT compared with milk from goats fed HH and HL in the EGS, and milk from goats on PC also had the longest RCT in the LGS (Table 3). No significant differences between the feed-ing treatments on k20 and a30 were observed. A strong negative correlation between a30 and both RCT and k20 was found. Curd firmness was also positively correlated with protein yield and contents of caseins, especially αs1-CN, αs2-CN, and β-CN, in addition to lactose and calcium content (Table 5).
Multivariate Analysis of Milk Composition and Rennet Coagulation Properties. The PCA of the milk composition and coagulation properties of the samples is presented in Figures 3 and 4. Principal com-ponent (PC) 1 and 2 explained 50% of the variation (Figure 3) and, together with PC 3 (Figure 4), 62% of the total variation was explained. The relationship be-tween the variables is shown in the correlation loading plot (Figures 3A and 4A), whereas the corresponding score plots (Figures 3B and 4B) show the distribution of the milk samples.
Milk samples of goats in the EGS [Figure 3B, gray (early)] were characterized by higher milk yield, a higher content of αs2-CN, calcium, and lactose, in addition to better rennet coagulation properties as higher a30 and shorter k20 compared with milk samples collected in the LGS (black; Figure 3B). The score plot of PC 1 and PC 3 (Figure 4B) separated the milk properties from the hay and pasture treatments in 2 groups. Milk from goats on pasture (PC and PR; gray) was character-
ized by a higher content of αs2-CN, β-CN, and calcium content compared with milk samples from goats fed hay (HH and HL; black).
Partial least squares regression was used to inves-tigate the influence of milk composition on MCP (a30 and k20). The PLS regression coefficients for a30 and k20 are presented in Figures 5 and 6, respectively. The content of lactose, calcium, αs2-CN, β-CN, and casein in the goat milk had a significant positive influence on a30, whereas LGS and genotype (deletion in exon 12) had a significant negative influence on a30. The con-tents of αs2-, β-, and κ-CN in the milk were significantly negatively correlated with k20, whereas season (LGS) and genotype (E12-00) were positively correlated with k20. As a short time until the achieved k20 is reached is desirable, high contents of αs2-, β-, and κ-CN are regarded as positive attributes, whereas the LGS and E12-00 then where regarded as negative.
DISCUSSION
The present study focused on the main hypothesis that ad libitum access to high-quality cultivated pas-ture would yield higher milk protein and casein con-tent and, thus, improve the MCP compared with milk produced by goats grazing free range in forest pasture. Furthermore, we also expected that the grazing season would not influence MCP and the content of casein and protein in milk from goats grazing PC, but would decline in milk from goats grazing on PR due to de-creased forage availability and quality in the latter. A third hypothesis was that the individual casein com-position would not be affected by the forage treatment or the grazing season. Two hay qualities were included as control feeds, as hay quality does not change dur-ing the course of time as pasture does. As most dairy
Table 4. Effect of grazing season [S; early (EGS) and late (LGS)], pasture type [P; cultivated pasture (PC) and rangeland pasture (PR)], and hay quality [H; high-quality hay (HH) and low-quality hay (HL)] on contents of individual caseins (g/L) in goat milk
Item Season
Pasture type Hay quality
SEM
Significance
PC PR HH HL S PC vs. PR P vs. H S vs. PS vs. P vs. H
n1 EGS 10 10 10 9LGS 9 10 9 10
αs1-CN EGS 3.72 2.29 2.60 2.36 0.413 NS2 ** NS NS NSLGS 3.92 2.84 3.04 3.04αs2-CN EGS 3.69 3.95 3.42 3.44 0.213 *** NS ** NS NSLGS 3.08 3.20 2.86 2.42β-CN EGS 12.5 13.8 12.1 11.6 0.33 *** *** ** NS *LGS 10.9 12.3 11.5 11.4κ-CN EGS 5.56 4.89 4.46 4.39 0.303 NS * † NS NSLGS 4.88 4.13 4.68 4.281n = number of goats. 2NS = nonsignificant at P > 0.10.†P < 0.10; *P < 0.05; **P < 0.01; ***P < 0.001.
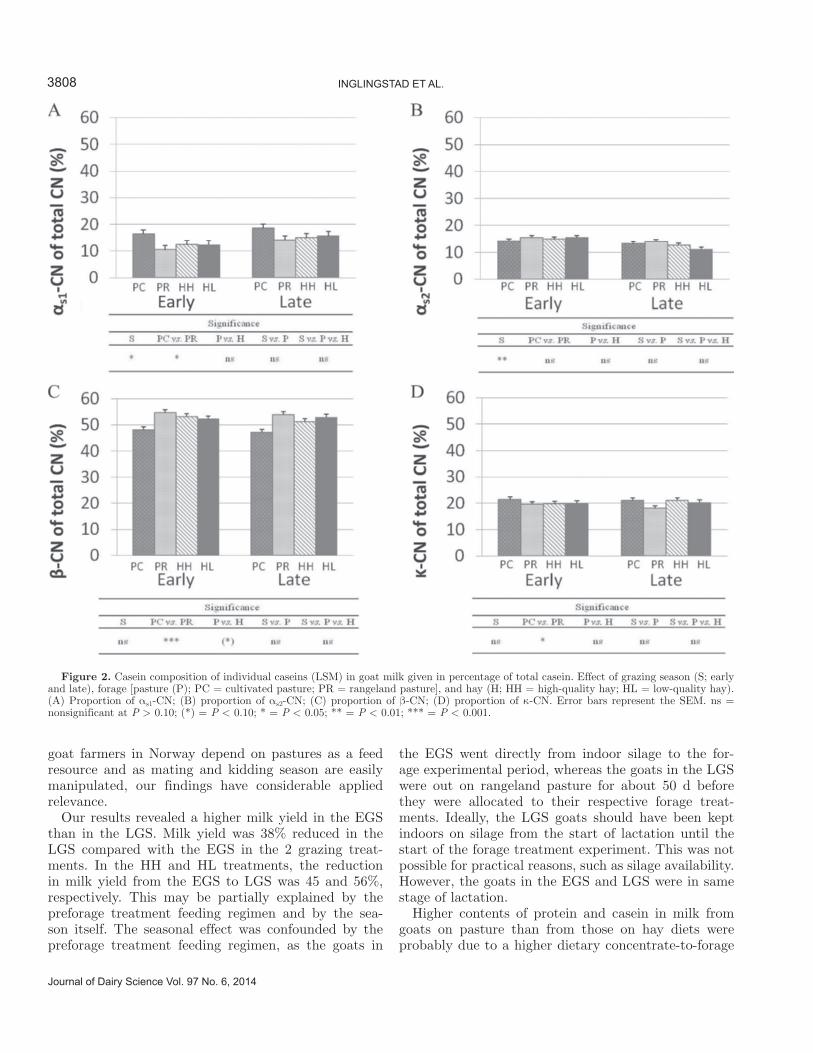
3808 INGLINGSTAD ET AL.
Journal of Dairy Science Vol. 97 No. 6, 2014
goat farmers in Norway depend on pastures as a feed resource and as mating and kidding season are easily manipulated, our findings have considerable applied relevance.
Our results revealed a higher milk yield in the EGS than in the LGS. Milk yield was 38% reduced in the LGS compared with the EGS in the 2 grazing treat-ments. In the HH and HL treatments, the reduction in milk yield from the EGS to LGS was 45 and 56%, respectively. This may be partially explained by the preforage treatment feeding regimen and by the sea-son itself. The seasonal effect was confounded by the preforage treatment feeding regimen, as the goats in
the EGS went directly from indoor silage to the for-age experimental period, whereas the goats in the LGS were out on rangeland pasture for about 50 d before they were allocated to their respective forage treat-ments. Ideally, the LGS goats should have been kept indoors on silage from the start of lactation until the start of the forage treatment experiment. This was not possible for practical reasons, such as silage availability. However, the goats in the EGS and LGS were in same stage of lactation.
Higher contents of protein and casein in milk from goats on pasture than from those on hay diets were probably due to a higher dietary concentrate-to-forage
Figure 2. Casein composition of individual caseins (LSM) in goat milk given in percentage of total casein. Effect of grazing season (S; early and late), forage [pasture (P); PC = cultivated pasture; PR = rangeland pasture], and hay (H; HH = high-quality hay; HL = low-quality hay). (A) Proportion of αs1-CN; (B) proportion of αs2-CN; (C) proportion of β-CN; (D) proportion of κ-CN. Error bars represent the SEM. ns = nonsignificant at P > 0.10; (*) = P < 0.10; * = P < 0.05; ** = P < 0.01; *** = P < 0.001.
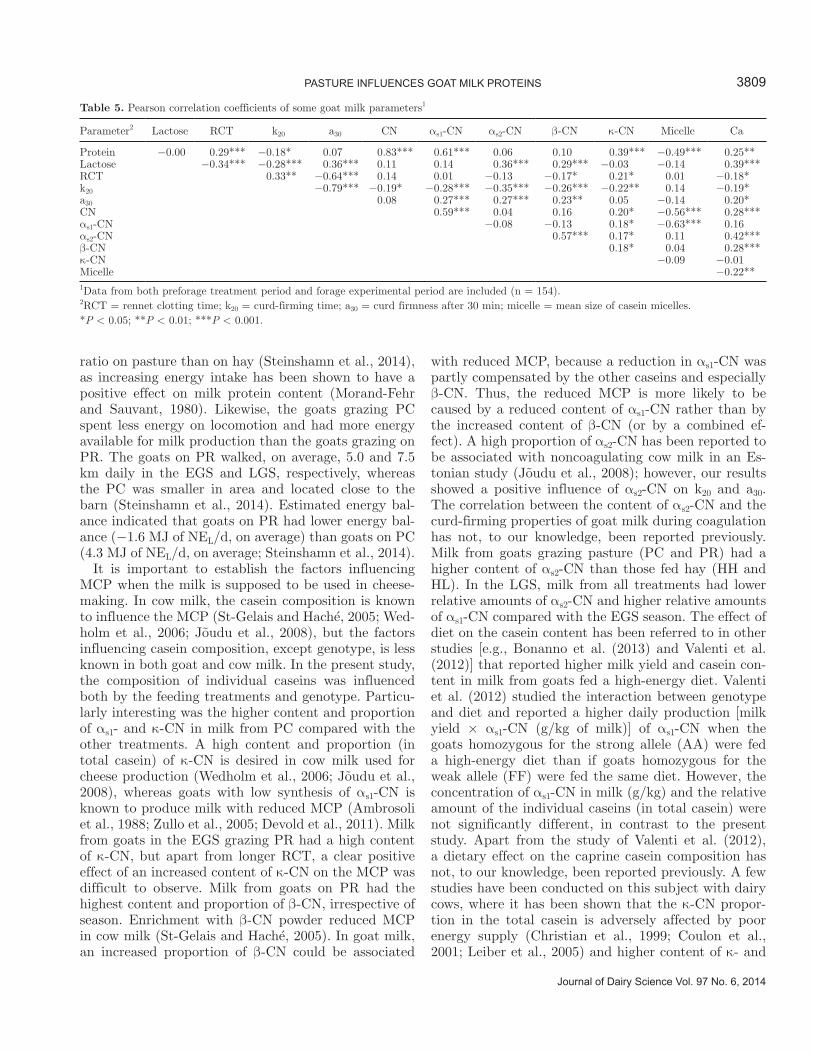
Journal of Dairy Science Vol. 97 No. 6, 2014
PASTURE INFLUENCES GOAT MILK PROTEINS 3809
ratio on pasture than on hay (Steinshamn et al., 2014), as increasing energy intake has been shown to have a positive effect on milk protein content (Morand-Fehr and Sauvant, 1980). Likewise, the goats grazing PC spent less energy on locomotion and had more energy available for milk production than the goats grazing on PR. The goats on PR walked, on average, 5.0 and 7.5 km daily in the EGS and LGS, respectively, whereas the PC was smaller in area and located close to the barn (Steinshamn et al., 2014). Estimated energy bal-ance indicated that goats on PR had lower energy bal-ance (−1.6 MJ of NEL/d, on average) than goats on PC (4.3 MJ of NEL/d, on average; Steinshamn et al., 2014).
It is important to establish the factors influencing MCP when the milk is supposed to be used in cheese-making. In cow milk, the casein composition is known to influence the MCP (St-Gelais and Haché, 2005; Wed-holm et al., 2006; Jõudu et al., 2008), but the factors influencing casein composition, except genotype, is less known in both goat and cow milk. In the present study, the composition of individual caseins was influenced both by the feeding treatments and genotype. Particu-larly interesting was the higher content and proportion of αs1- and κ-CN in milk from PC compared with the other treatments. A high content and proportion (in total casein) of κ-CN is desired in cow milk used for cheese production (Wedholm et al., 2006; Jõudu et al., 2008), whereas goats with low synthesis of αs1-CN is known to produce milk with reduced MCP (Ambrosoli et al., 1988; Zullo et al., 2005; Devold et al., 2011). Milk from goats in the EGS grazing PR had a high content of κ-CN, but apart from longer RCT, a clear positive effect of an increased content of κ-CN on the MCP was difficult to observe. Milk from goats on PR had the highest content and proportion of β-CN, irrespective of season. Enrichment with β-CN powder reduced MCP in cow milk (St-Gelais and Haché, 2005). In goat milk, an increased proportion of β-CN could be associated
with reduced MCP, because a reduction in αs1-CN was partly compensated by the other caseins and especially β-CN. Thus, the reduced MCP is more likely to be caused by a reduced content of αs1-CN rather than by the increased content of β-CN (or by a combined ef-fect). A high proportion of αs2-CN has been reported to be associated with noncoagulating cow milk in an Es-tonian study (Jõudu et al., 2008); however, our results showed a positive influence of αs2-CN on k20 and a30. The correlation between the content of αs2-CN and the curd-firming properties of goat milk during coagulation has not, to our knowledge, been reported previously. Milk from goats grazing pasture (PC and PR) had a higher content of αs2-CN than those fed hay (HH and HL). In the LGS, milk from all treatments had lower relative amounts of αs2-CN and higher relative amounts of αs1-CN compared with the EGS season. The effect of diet on the casein content has been referred to in other studies [e.g., Bonanno et al. (2013) and Valenti et al. (2012)] that reported higher milk yield and casein con-tent in milk from goats fed a high-energy diet. Valenti et al. (2012) studied the interaction between genotype and diet and reported a higher daily production [milk yield × αs1-CN (g/kg of milk)] of αs1-CN when the goats homozygous for the strong allele (AA) were fed a high-energy diet than if goats homozygous for the weak allele (FF) were fed the same diet. However, the concentration of αs1-CN in milk (g/kg) and the relative amount of the individual caseins (in total casein) were not significantly different, in contrast to the present study. Apart from the study of Valenti et al. (2012), a dietary effect on the caprine casein composition has not, to our knowledge, been reported previously. A few studies have been conducted on this subject with dairy cows, where it has been shown that the κ-CN propor-tion in the total casein is adversely affected by poor energy supply (Christian et al., 1999; Coulon et al., 2001; Leiber et al., 2005) and higher content of κ- and
Table 5. Pearson correlation coefficients of some goat milk parameters1
Parameter2 Lactose RCT k20 a30 CN αs1-CN αs2-CN β-CN κ-CN Micelle Ca
Protein −0.00 0.29*** −0.18* 0.07 0.83*** 0.61*** 0.06 0.10 0.39*** −0.49*** 0.25**Lactose −0.34*** −0.28*** 0.36*** 0.11 0.14 0.36*** 0.29*** −0.03 −0.14 0.39***RCT 0.33** −0.64*** 0.14 0.01 −0.13 −0.17* 0.21* 0.01 −0.18*k20 −0.79*** −0.19* −0.28*** −0.35*** −0.26*** −0.22** 0.14 −0.19*a30 0.08 0.27*** 0.27*** 0.23** 0.05 −0.14 0.20*CN 0.59*** 0.04 0.16 0.20* −0.56*** 0.28***αs1-CN −0.08 −0.13 0.18* −0.63*** 0.16αs2-CN 0.57*** 0.17* 0.11 0.42***β-CN 0.18* 0.04 0.28***κ-CN −0.09 −0.01Micelle −0.22**1Data from both preforage treatment period and forage experimental period are included (n = 154).2RCT = rennet clotting time; k20 = curd-firming time; a30 = curd firmness after 30 min; micelle = mean size of casein micelles.*P < 0.05; **P < 0.01; ***P < 0.001.
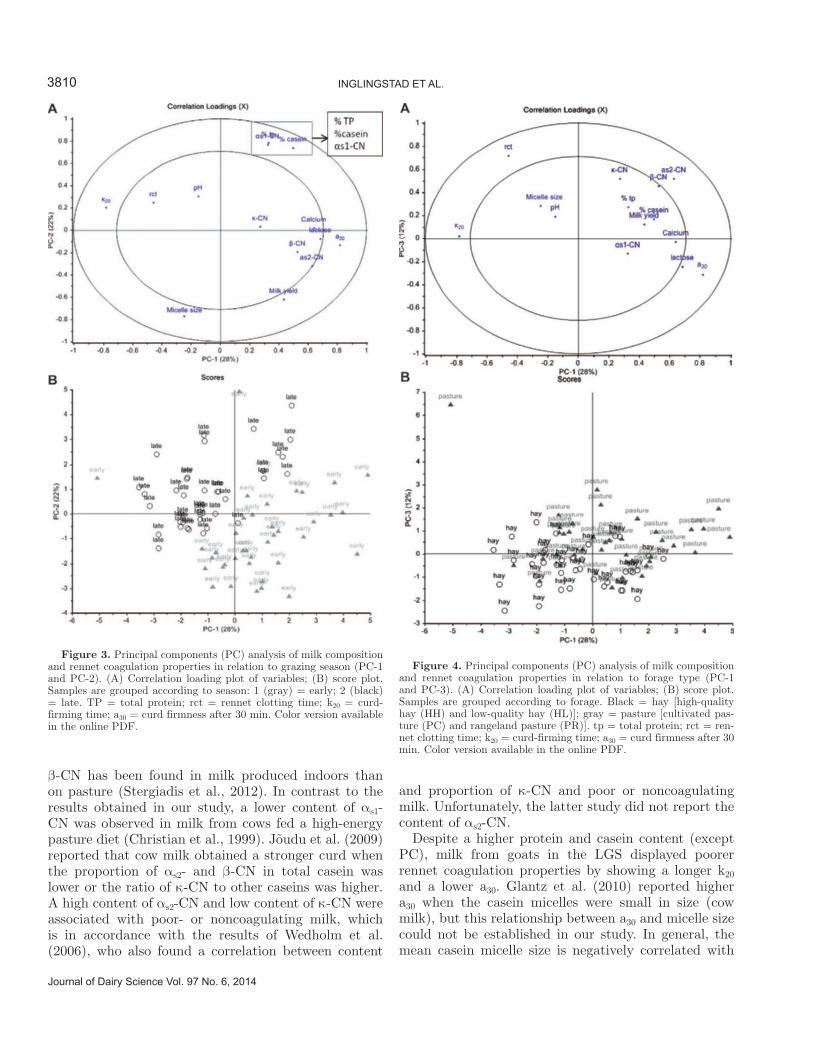
3810 INGLINGSTAD ET AL.
Journal of Dairy Science Vol. 97 No. 6, 2014
β-CN has been found in milk produced indoors than on pasture (Stergiadis et al., 2012). In contrast to the results obtained in our study, a lower content of αs1-CN was observed in milk from cows fed a high-energy pasture diet (Christian et al., 1999). Jõudu et al. (2009) reported that cow milk obtained a stronger curd when the proportion of αs2- and β-CN in total casein was lower or the ratio of κ-CN to other caseins was higher. A high content of αs2-CN and low content of κ-CN were associated with poor- or noncoagulating milk, which is in accordance with the results of Wedholm et al. (2006), who also found a correlation between content
and proportion of κ-CN and poor or noncoagulating milk. Unfortunately, the latter study did not report the content of αs2-CN.
Despite a higher protein and casein content (except PC), milk from goats in the LGS displayed poorer rennet coagulation properties by showing a longer k20 and a lower a30. Glantz et al. (2010) reported higher a30 when the casein micelles were small in size (cow milk), but this relationship between a30 and micelle size could not be established in our study. In general, the mean casein micelle size is negatively correlated with
Figure 3. Principal components (PC) analysis of milk composition and rennet coagulation properties in relation to grazing season (PC-1 and PC-2). (A) Correlation loading plot of variables; (B) score plot. Samples are grouped according to season: 1 (gray) = early; 2 (black) = late. TP = total protein; rct = rennet clotting time; k20 = curd-firming time; a30 = curd firmness after 30 min. Color version available in the online PDF.
Figure 4. Principal components (PC) analysis of milk composition and rennet coagulation properties in relation to forage type (PC-1 and PC-3). (A) Correlation loading plot of variables; (B) score plot. Samples are grouped according to forage. Black = hay [high-quality hay (HH) and low-quality hay (HL)]; gray = pasture [cultivated pas-ture (PC) and rangeland pasture (PR)]. tp = total protein; rct = ren-net clotting time; k20 = curd-firming time; a30 = curd firmness after 30 min. Color version available in the online PDF.
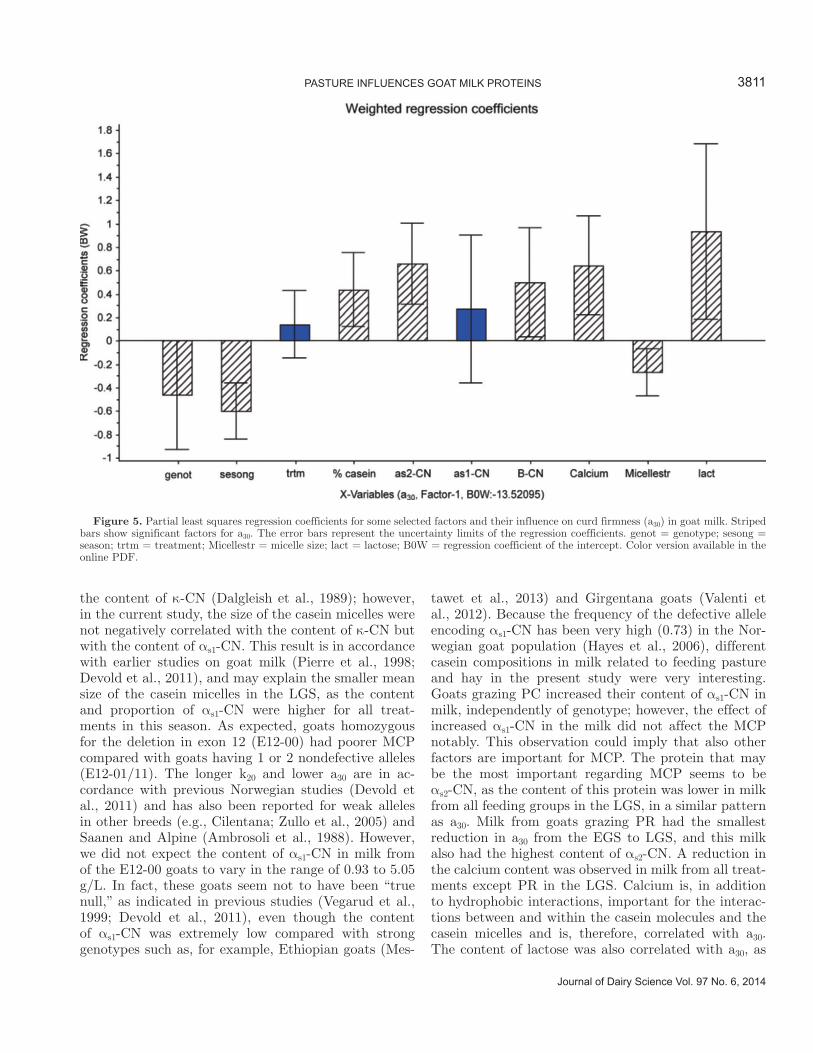
Journal of Dairy Science Vol. 97 No. 6, 2014
PASTURE INFLUENCES GOAT MILK PROTEINS 3811
the content of κ-CN (Dalgleish et al., 1989); however, in the current study, the size of the casein micelles were not negatively correlated with the content of κ-CN but with the content of αs1-CN. This result is in accordance with earlier studies on goat milk (Pierre et al., 1998; Devold et al., 2011), and may explain the smaller mean size of the casein micelles in the LGS, as the content and proportion of αs1-CN were higher for all treat-ments in this season. As expected, goats homozygous for the deletion in exon 12 (E12-00) had poorer MCP compared with goats having 1 or 2 nondefective alleles (E12-01/11). The longer k20 and lower a30 are in ac-cordance with previous Norwegian studies (Devold et al., 2011) and has also been reported for weak alleles in other breeds (e.g., Cilentana; Zullo et al., 2005) and Saanen and Alpine (Ambrosoli et al., 1988). However, we did not expect the content of αs1-CN in milk from of the E12-00 goats to vary in the range of 0.93 to 5.05 g/L. In fact, these goats seem not to have been “true null,” as indicated in previous studies (Vegarud et al., 1999; Devold et al., 2011), even though the content of αs1-CN was extremely low compared with strong genotypes such as, for example, Ethiopian goats (Mes-
tawet et al., 2013) and Girgentana goats (Valenti et al., 2012). Because the frequency of the defective allele encoding αs1-CN has been very high (0.73) in the Nor-wegian goat population (Hayes et al., 2006), different casein compositions in milk related to feeding pasture and hay in the present study were very interesting. Goats grazing PC increased their content of αs1-CN in milk, independently of genotype; however, the effect of increased αs1-CN in the milk did not affect the MCP notably. This observation could imply that also other factors are important for MCP. The protein that may be the most important regarding MCP seems to be αs2-CN, as the content of this protein was lower in milk from all feeding groups in the LGS, in a similar pattern as a30. Milk from goats grazing PR had the smallest reduction in a30 from the EGS to LGS, and this milk also had the highest content of αs2-CN. A reduction in the calcium content was observed in milk from all treat-ments except PR in the LGS. Calcium is, in addition to hydrophobic interactions, important for the interac-tions between and within the casein molecules and the casein micelles and is, therefore, correlated with a30. The content of lactose was also correlated with a30, as
Figure 5. Partial least squares regression coefficients for some selected factors and their influence on curd firmness (a30) in goat milk. Striped bars show significant factors for a30. The error bars represent the uncertainty limits of the regression coefficients. genot = genotype; sesong = season; trtm = treatment; Micellestr = micelle size; lact = lactose; B0W = regression coefficient of the intercept. Color version available in the online PDF.
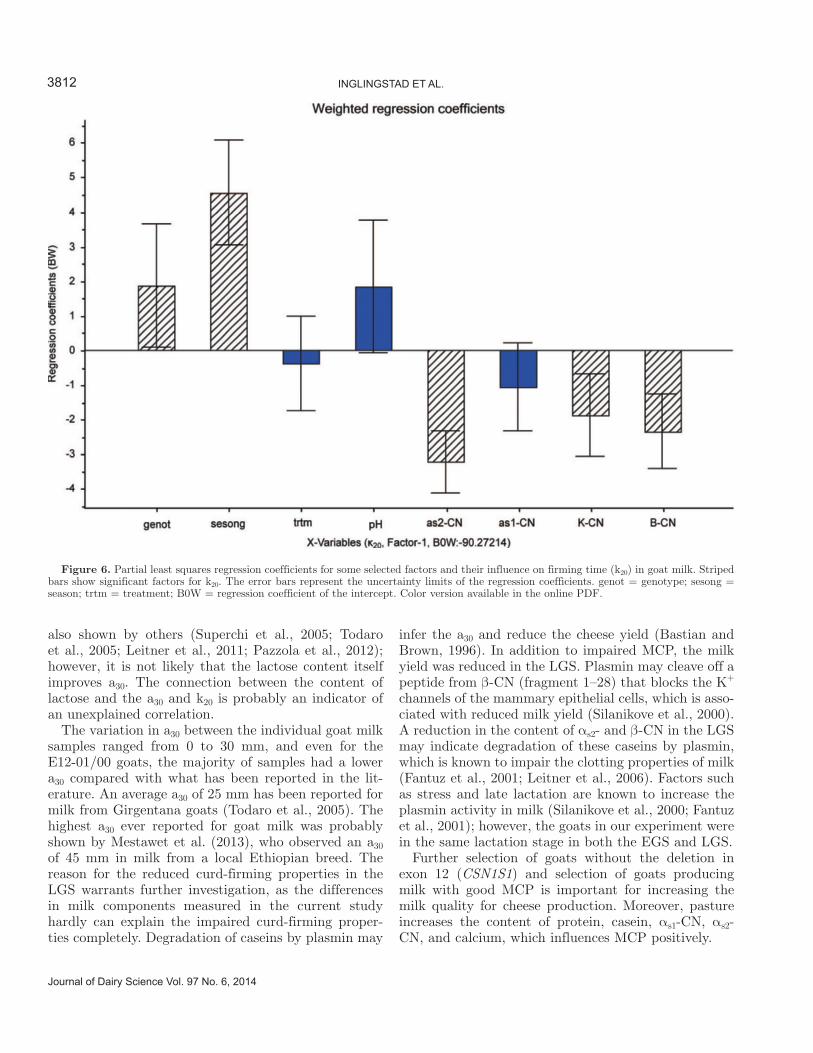
3812 INGLINGSTAD ET AL.
Journal of Dairy Science Vol. 97 No. 6, 2014
also shown by others (Superchi et al., 2005; Todaro et al., 2005; Leitner et al., 2011; Pazzola et al., 2012); however, it is not likely that the lactose content itself improves a30. The connection between the content of lactose and the a30 and k20 is probably an indicator of an unexplained correlation.
The variation in a30 between the individual goat milk samples ranged from 0 to 30 mm, and even for the E12-01/00 goats, the majority of samples had a lower a30 compared with what has been reported in the lit-erature. An average a30 of 25 mm has been reported for milk from Girgentana goats (Todaro et al., 2005). The highest a30 ever reported for goat milk was probably shown by Mestawet et al. (2013), who observed an a30 of 45 mm in milk from a local Ethiopian breed. The reason for the reduced curd-firming properties in the LGS warrants further investigation, as the differences in milk components measured in the current study hardly can explain the impaired curd-firming proper-ties completely. Degradation of caseins by plasmin may
infer the a30 and reduce the cheese yield (Bastian and Brown, 1996). In addition to impaired MCP, the milk yield was reduced in the LGS. Plasmin may cleave off a peptide from β-CN (fragment 1–28) that blocks the K+ channels of the mammary epithelial cells, which is asso-ciated with reduced milk yield (Silanikove et al., 2000). A reduction in the content of αs2- and β-CN in the LGS may indicate degradation of these caseins by plasmin, which is known to impair the clotting properties of milk (Fantuz et al., 2001; Leitner et al., 2006). Factors such as stress and late lactation are known to increase the plasmin activity in milk (Silanikove et al., 2000; Fantuz et al., 2001); however, the goats in our experiment were in the same lactation stage in both the EGS and LGS.
Further selection of goats without the deletion in exon 12 (CSN1S1) and selection of goats producing milk with good MCP is important for increasing the milk quality for cheese production. Moreover, pasture increases the content of protein, casein, αs1-CN, αs2-CN, and calcium, which influences MCP positively.
Figure 6. Partial least squares regression coefficients for some selected factors and their influence on firming time (k20) in goat milk. Striped bars show significant factors for k20. The error bars represent the uncertainty limits of the regression coefficients. genot = genotype; sesong = season; trtm = treatment; B0W = regression coefficient of the intercept. Color version available in the online PDF.
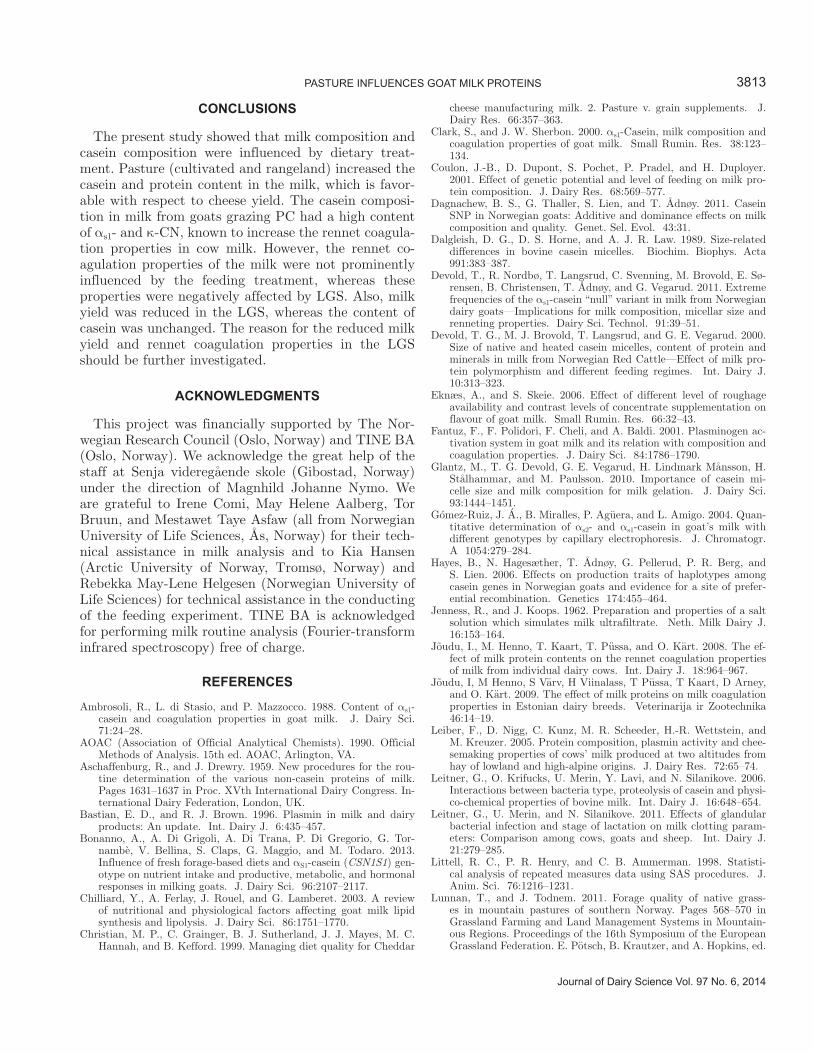
Journal of Dairy Science Vol. 97 No. 6, 2014
PASTURE INFLUENCES GOAT MILK PROTEINS 3813
CONCLUSIONS
The present study showed that milk composition and casein composition were influenced by dietary treat-ment. Pasture (cultivated and rangeland) increased the casein and protein content in the milk, which is favor-able with respect to cheese yield. The casein composi-tion in milk from goats grazing PC had a high content of αs1- and κ-CN, known to increase the rennet coagula-tion properties in cow milk. However, the rennet co-agulation properties of the milk were not prominently influenced by the feeding treatment, whereas these properties were negatively affected by LGS. Also, milk yield was reduced in the LGS, whereas the content of casein was unchanged. The reason for the reduced milk yield and rennet coagulation properties in the LGS should be further investigated.
ACKNOWLEDGMENTS
This project was financially supported by The Nor-wegian Research Council (Oslo, Norway) and TINE BA (Oslo, Norway). We acknowledge the great help of the staff at Senja videregående skole (Gibostad, Norway) under the direction of Magnhild Johanne Nymo. We are grateful to Irene Comi, May Helene Aalberg, Tor Bruun, and Mestawet Taye Asfaw (all from Norwegian University of Life Sciences, Ås, Norway) for their tech-nical assistance in milk analysis and to Kia Hansen (Arctic University of Norway, Tromsø, Norway) and Rebekka May-Lene Helgesen (Norwegian University of Life Sciences) for technical assistance in the conducting of the feeding experiment. TINE BA is acknowledged for performing milk routine analysis (Fourier-transform infrared spectroscopy) free of charge.
REFERENCES
Ambrosoli, R., L. di Stasio, and P. Mazzocco. 1988. Content of αs1-casein and coagulation properties in goat milk. J. Dairy Sci. 71:24–28.
AOAC (Association of Official Analytical Chemists). 1990. Official Methods of Analysis. 15th ed. AOAC, Arlington, VA.
Aschaffenburg, R., and J. Drewry. 1959. New procedures for the rou-tine determination of the various non-casein proteins of milk. Pages 1631–1637 in Proc. XVth International Dairy Congress. In-ternational Dairy Federation, London, UK.
Bastian, E. D., and R. J. Brown. 1996. Plasmin in milk and dairy products: An update. Int. Dairy J. 6:435–457.
Bonanno, A., A. Di Grigoli, A. Di Trana, P. Di Gregorio, G. Tor-nambè, V. Bellina, S. Claps, G. Maggio, and M. Todaro. 2013. Influence of fresh forage-based diets and αS1-casein (CSN1S1) gen-otype on nutrient intake and productive, metabolic, and hormonal responses in milking goats. J. Dairy Sci. 96:2107–2117.
Chilliard, Y., A. Ferlay, J. Rouel, and G. Lamberet. 2003. A review of nutritional and physiological factors affecting goat milk lipid synthesis and lipolysis. J. Dairy Sci. 86:1751–1770.
Christian, M. P., C. Grainger, B. J. Sutherland, J. J. Mayes, M. C. Hannah, and B. Kefford. 1999. Managing diet quality for Cheddar
cheese manufacturing milk. 2. Pasture v. grain supplements. J. Dairy Res. 66:357–363.
Clark, S., and J. W. Sherbon. 2000. αs1-Casein, milk composition and coagulation properties of goat milk. Small Rumin. Res. 38:123–134.
Coulon, J.-B., D. Dupont, S. Pochet, P. Pradel, and H. Duployer. 2001. Effect of genetic potential and level of feeding on milk pro-tein composition. J. Dairy Res. 68:569–577.
Dagnachew, B. S., G. Thaller, S. Lien, and T. Ådnøy. 2011. Casein SNP in Norwegian goats: Additive and dominance effects on milk composition and quality. Genet. Sel. Evol. 43:31.
Dalgleish, D. G., D. S. Horne, and A. J. R. Law. 1989. Size-related differences in bovine casein micelles. Biochim. Biophys. Acta 991:383–387.
Devold, T., R. Nordbø, T. Langsrud, C. Svenning, M. Brovold, E. Sø-rensen, B. Christensen, T. Ådnøy, and G. Vegarud. 2011. Extreme frequencies of the αs1-casein “null” variant in milk from Norwegian dairy goats—Implications for milk composition, micellar size and renneting properties. Dairy Sci. Technol. 91:39–51.
Devold, T. G., M. J. Brovold, T. Langsrud, and G. E. Vegarud. 2000. Size of native and heated casein micelles, content of protein and minerals in milk from Norwegian Red Cattle—Effect of milk pro-tein polymorphism and different feeding regimes. Int. Dairy J. 10:313–323.
Eknæs, A., and S. Skeie. 2006. Effect of different level of roughage availability and contrast levels of concentrate supplementation on flavour of goat milk. Small Rumin. Res. 66:32–43.
Fantuz, F., F. Polidori, F. Cheli, and A. Baldi. 2001. Plasminogen ac-tivation system in goat milk and its relation with composition and coagulation properties. J. Dairy Sci. 84:1786–1790.
Glantz, M., T. G. Devold, G. E. Vegarud, H. Lindmark Månsson, H. Stålhammar, and M. Paulsson. 2010. Importance of casein mi-celle size and milk composition for milk gelation. J. Dairy Sci. 93:1444–1451.
Gómez-Ruiz, J. Á., B. Miralles, P. Agüera, and L. Amigo. 2004. Quan-titative determination of αs2- and αs1-casein in goat’s milk with different genotypes by capillary electrophoresis. J. Chromatogr. A 1054:279–284.
Hayes, B., N. Hagesæther, T. Ådnøy, G. Pellerud, P. R. Berg, and S. Lien. 2006. Effects on production traits of haplotypes among casein genes in Norwegian goats and evidence for a site of prefer-ential recombination. Genetics 174:455–464.
Jenness, R., and J. Koops. 1962. Preparation and properties of a salt solution which simulates milk ultrafiltrate. Neth. Milk Dairy J. 16:153–164.
Jõudu, I., M. Henno, T. Kaart, T. Püssa, and O. Kärt. 2008. The ef-fect of milk protein contents on the rennet coagulation properties of milk from individual dairy cows. Int. Dairy J. 18:964–967.
Jõudu, I, M Henno, S Värv, H Viinalass, T Püssa, T Kaart, D Arney, and O. Kärt. 2009. The effect of milk proteins on milk coagulation properties in Estonian dairy breeds. Veterinarija ir Zootechnika 46:14–19.
Leiber, F., D. Nigg, C. Kunz, M. R. Scheeder, H.-R. Wettstein, and M. Kreuzer. 2005. Protein composition, plasmin activity and chee-semaking properties of cows’ milk produced at two altitudes from hay of lowland and high-alpine origins. J. Dairy Res. 72:65–74.
Leitner, G., O. Krifucks, U. Merin, Y. Lavi, and N. Silanikove. 2006. Interactions between bacteria type, proteolysis of casein and physi-co-chemical properties of bovine milk. Int. Dairy J. 16:648–654.
Leitner, G., U. Merin, and N. Silanikove. 2011. Effects of glandular bacterial infection and stage of lactation on milk clotting param-eters: Comparison among cows, goats and sheep. Int. Dairy J. 21:279–285.
Littell, R. C., P. R. Henry, and C. B. Ammerman. 1998. Statisti-cal analysis of repeated measures data using SAS procedures. J. Anim. Sci. 76:1216–1231.
Lunnan, T., and J. Todnem. 2011. Forage quality of native grass-es in mountain pastures of southern Norway. Pages 568–570 in Grassland Farming and Land Management Systems in Mountain-ous Regions. Proceedings of the 16th Symposium of the European Grassland Federation. E. Pötsch, B. Krautzer, and A. Hopkins, ed.
3814 INGLINGSTAD ET AL.
Journal of Dairy Science Vol. 97 No. 6, 2014
Agricultural Research and Education Centre (AREC), Raumberg-Gumpenstein, Irdning, Austria.
Marletta, D., A. Criscione, S. Bordonaro, A. M. Guastella, and G. D’Urso. 2007. Casein polymorphism in goat’s milk. Lait 87:491–504.
Mayes, R. W., C. S. Lamb, and P. M. Colgrove. 1986. The use of dosed and herbage n-alkanes as markers for the determination of herbage intake. J. Agric. Sci. 107:161–170.
McMahon, D. J., and R. J. Brown. 1982. Evaluation of Formagraph for comparing rennet solutions. J. Dairy Sci. 65:1639–1642.
Mestawet, T. A., A. Girma, T. Ådnøy, T. G. Devold, and G. E. Vega-rud. 2013. Newly identified mutations at the CSN1S1 gene in Ethiopian goats affect casein content and coagulation properties of their milk. J. Dairy Sci. 96:4857–4869.
Morand-Fehr, P., and D. Sauvant. 1980. Composition and yield of goat milk as affected by nutritional manipulation. J. Dairy Sci. 63:1671–1680.
NRC. 2001. Nutrient Requirements of Dairy Cattle. 7th rev. ed. Na-tional Academy Press, Washington, DC.
Pazzola, M., F. Balia, V. Carcangiu, M. L. Dettori, G. Piras, and G. M. Vacca. 2012. Higher somatic cells counted by the electronic counter method do not influence renneting properties of goat milk. Small Rumin. Res. 102:32–36.
Pearse, A. G. E. 1980. Histochemistry, Theoretical and Applied: Pre-parative and Optical Technology. Churchill Livingstone, London, UK.
Pierre, A., F. Michel, Y. Le Graët, and L. Zahoute. 1998. Casein mi-celle size in relation with casein composition and αs1, αs2, β and κ casein contents in goat milk. Lait 78:591–605.
Silanikove, N., A. Shamay, D. Shinder, and A. Moran. 2000. Stress down regulates milk yield in cows by plasmin induced β-casein product that blocks K+ channels on the apical membranes. Life Sci. 67:2201–2212.
Skeie, S. B. 2010. Milk quality requirements for cheesemaking. Pages 433–453 in Improving the Safety and Quality of Milk. M. Griffiths, ed. Woodhead Publishing, Cambridge, UK.
St-Gelais, D., and S. Haché. 2005. Effect of β-casein concentration in cheese milk on rennet coagulation properties, cheese composition and cheese ripening. Food Res. Int. 38:523–531.
Steinshamn, H., R. A. Inglingstad, D. Ekeberg, J. Mølmann, and M. Jørgensen. 2014. Effect of forage type and season on Norwegian dairy goat milk production and quality. Small Rumin. Res. (Ac-cepted).
Stergiadis, S., C. Leifert, C. J. Seal, M. D. Eyre, J. H. Nielsen, M. K. Larsen, T. Slots, H. Steinshamn, and G. Butler. 2012. Effect of feeding intensity and milking system on nutritionally relevant milk components in dairy farming systems in the North East of England. J. Agric. Food Chem. 60:7270–7281.
Superchi, P., A. Summer, A. Sabbioni, M. Malacarne, P. Franceschi, and P. Mariani. 2005. Feeding management and production factors affecting goat milk composition and quality. I. Titratable acid-ity and rennet-coagulation. Pages 219–225 in Proc. 11th FAO-CIHEAM Network on Sheep and Goat Nutrition Options Méditer-ranéennes, Series A. Accessed Mar. 26, 2014. http://om.ciheam.org/article.php?IDPDF=800383.
Todaro, M., M. L. Scatassa, and P. Giaccone. 2005. Multivariate fac-tor analysis of Girgentana goat milk composition. Ital. J. Anim. Sci. 4:403–410.
Valenti, B., R. I. Pagano, and M. Avondo. 2012. Effect of diet at differ-ent energy levels on milk casein composition of Girgentana goats differing in CSN1S1 genotype. Small Rumin. Res. 105:135–139.
Van Soest, P. J., J. B. Robertson, and B. A. Lewis. 1991. Methods for dietary fiber, neutral detergent fiber, and nonstarch polysaccha-rides in relation to animal nutrition. J. Dairy Sci. 74:3583–3597.
Vegarud, G. E., T. G. Devold, R. Opheim, E. Loeding, C. Svenning, R. K. Abrahamsen, S. Lien, and T. Langsrud. 1999. Genetic variants of Norwegian goats milk composition, micellar size and renneting properties. Int. Dairy J. 9:367–368.
Wedholm, A., L. B. Larsen, H. Lindmark-Månsson, A. H. Karlsson, and A. Andrén. 2006. Effect of protein composition on the cheese-making properties of milk from individual dairy cows. J. Dairy Sci. 89:3296–3305.
Zullo, A., C. M. A. Barone, L. Chianese, P. Colatruglio, M. Occidente, and D. Matassino. 2005. Protein polymorphisms and coagulation properties of Cilentana goat milk. Small Rumin. Res. 58:223–230.


Paper II

Small Ruminant Research 122 (2014) 18–30
Contents lists available at ScienceDirect
Small Ruminant Research
jou rn al h om epa ge : w ww.elsev ier .com/ locate /smal l rumres
Effect of forage type and season on Norwegian dairy goatmilk production and quality�
H. Steinshamna,∗, R. Aa. Inglingstadb, D. Ekebergb, J. Mølmanna, M. Jørgensena
a Bioforsk, Norwegian Institute for Agricultural and Environmental Research, Fredrik A Dahls vei 20, NO-1430 Ås, Norwayb Department of Chemistry, Biotechnology and Food Science, Norwegian University of Life Sciences, P.O. Box 5003, NO-1432 Ås, Norway
a r t i c l e i n f o
Article history:Available online 21 July 2014
Keywords:Goat milkWoodland grazingForage qualityMilk yieldMilk composition
a b s t r a c t
Goat milk quality produced by goats grazing on rangeland may have inferior quality withlow content of solids and high content of free fatty acids (FFA). The main objective of thisexperiment was to test the effect of grazing woodland or cultivated pasture on dairy goatmilk production and quality in early (EGS) and late (LGS) grazing seasons. Two different hayqualities (high and low quality) were used as control feeds. Eighty Norwegian dairy goatswere grouped according to genotype and lactation number and randomly divided into twogroups with approximately 8 weeks difference in kidding date. The EGS and LGS feedingexperiments had 8 weeks departure in time, when the goats in the two kidding groupswere in the same stage of lactation, on average 132 (SD 11.5) days in milk. The goats in eachgroup were randomly allocated to four forage treatment groups: WR, woodland rangeland;PC, cultivated pasture; HH, high quality hay; HL, low quality hay. Goats on WR yielded lessmilk (1.58 vs. 2.15 kg/d, P < 0.001) but with higher milk fat (47.7 vs. 37.6 g/kg, P < 0.01) andtotal solids content (122 vs. 114 g/kg, P < 0.05) than goats on PC. Milk FFA content was notaffected (P > 0.1) by pasture type. The effects of pasture type on milk yield and milk grosscomposition were similar in EGS and LGS, but milk yield (2.44 vs. 1.36 kg/d, P < 0.001) andmilk content of FFA (0.35 vs. 0.23 mEq/L, P < 0.05) were higher in EGS than LGS. Grazingresulted in similar milk yield but higher milk fat (42.6 vs. 34.8 g/kg, P < 0.001), protein (32.3vs. 29.6 g/kg, P < 0.001) and total solids (118 vs. 107 g/kg, P < 0.001) content and tended toyield lower content of FFA (0.23 vs. 0.34 mEq/L, P = 0.068) than hay diet. The milk from thegoats on WR had lower (P < 0.05) proportion of medium-chain fatty acids (FA), C10:0–C14:0and C18:2c9t11, but higher (P < 0.05) proportion of C18:0, C18:2c9,12 and C20:0 than onPC. Grazing compared to hay feeding resulted in milk with lower proportion of medium-chained FAs (C12:0–C14:0) and C16:0 and higher proportion of the long-chained FAs C18:0,C18:1t11, C18:2c9,t11, C18:3c9,12,15, C20:0 than hay feeding. The milk proportion of theshort- and medium-chained FAs (C6:0–C14:0) and C16:0 was higher (P < 0.0001) in LGS thanin EGS, whilst the proportion of long chained FAs (C18:0, C18:1c9, C18:1t11, C18:2c9,12,C18:2c9t11 and C18:3c9,12,15) were lower (P < 0.001). In conclusion, woodland rangelandyielded less milk than cultivated pasture but milk gross composition and content of FFAwere not altered.
© 2014 Elsevier B.V. All rights reserved.
� This paper is part of the special issue entitled, Selected lectures from The Regional IGA Conference on Goat Milk Quality, Tromsø Norway, Guest Editedby Dr. N. Silanikove.
∗ Corresponding author at: Bioforsk, Norwegian Institute for Agricultural and Environmental Research, Organic Food and Farming Division, Gunnars veg6, NO-6630 Tingvoll, Norway. Tel.: +47 40480314; fax: +47 71534405.
E-mail address: [email protected] (H. Steinshamn).
http://dx.doi.org/10.1016/j.smallrumres.2014.07.0130921-4488/© 2014 Elsevier B.V. All rights reserved.
H. Steinshamn et al. / Small Ruminant Research 122 (2014) 18–30 19
1. Introduction
Dairy goat milk quality in Norway is variable, and itoften does not meet the requirements of the industry forcheese making. Lipolysis and high content of free fatty acids(FFA) and tart and rancid off-flavour are among the mainproblems. Much of the inferior milk quality may be ascribedto genetic factors. The Norwegian dairy goat breed has avery high frequency (>0.70) of a defective allele with a sin-gle nucleotide deletion in exon 12 of the gene encoding�s1-casein in milk (Hayes et al., 2006; Dagnachew et al.,2011). Milk from goats with deletion in exon 12 �s1-caseingene has reduced protein and fat content (Dagnachew et al.,2011), low or no �s1-casein and poor rennetability (Devoldet al., 2010). Milk from goats that have “weak” variants of�s1-casein is also more prone to lipolysis and high contentof FFA (Chilliard et al., 2003; Dagnachew et al., 2011). Aslong as goat milk was used for the traditional whey prod-uct ‘brown cheese’, inferior clotting properties and high FFAcontent were not major problems. However, the interest forrennet- and acid coagulated cheeses by Norwegian indus-tries and consumers is increasing, and production of thesetypes of cheeses requires milk of a different quality.
Traditionally, goat milk production in Norway is sea-sonal with kidding in winter and early spring and withpeak milk production during the summer grazing sea-son. During the grazing season, goats to a large extentgraze natural unimproved grasslands or graze free rangein woodlands and mountains. The forage quality of range-land herbage is variable and declines during the grazingseason due to the phenological development of the grazedplants (Lunnan and Todnem, 2011). Reduced allowanceand decreased quality of herbage, together with under-feeding and consequently negative energy balance, arealso assumed to contribute substantially to the problemsof high FFA content and off-flavour (Eknæs and Skeie,2006). Supporting this, the milk content of FFA (recordedby the Norwegian Goat Milk Recording System, Blichfeldtpersonal communications) is highest during the summermonths. Increased FFA in milk during the grazing sea-son has also been observed in experimental trials (Eknæset al., 2006; Eknæs and Skeie, 2006). Off-flavour occursin periods when dry matter (DM) content in milk is low,and a number of studies have revealed a negative correla-tion between off-flavour and milk DM content (Rønningen,1965; Bakke et al., 1977; Skjevdal, 1979). It is thereforerecommended to supplement goats on pasture with con-centrate, preserved forages, vegetable oils and fat-enrichedconcentrates. Particularly oil and fat supplementation hasshown to be efficient in decreasing the frequency of off-taste, lipolysis and the concentration of milk FFA (Skjevdal,1979; Astrup et al., 1985; Chilliard et al., 2003; Eknæs et al.,2009). Chilliard et al. (2003) found that the lipoproteinlipase (LPL) activity decreased with increasing milk C16:0proportion (r = −0.70). Diets that increase the milk fat pro-portion of C16:0 and reduce the proportion of C6:0–C10:0reduce the frequency of rancid and tart flavours (Eknæset al., 2009) and the level of FFA (Astrup et al., 1985).However, it has also been found that high C16:0 and lowC18:1c9 proportion in milk and a high energy balance maybe related to high FFA content and off-flavours (Dønnem
et al., 2011b). It is well known that grazing has strongimpact on milk fatty acid (FA) composition by decreasingsaturated FA and increasing FA considered beneficial, likeC18:1c9, C18:3c9,12,15 and C18:2c9t11, in goats whencompared to diets based on preserved forages and concen-trates (Tsiplakou et al., 2006; Chilliard et al., 2007; Rennaet al., 2012b). However, less is known on how rangeland, asused in Norway, influence milk FA profile and milk contentof FFA. Eknæs and Skeie (2006) found that goat milk sen-sory quality improved (less rancid taste) and milk contentof FFA decreased when hay, fed ad libitum, replaced range-land for a short period (2 d). They also found that whenthe goats later grazed a cultivated pasture after rangeland,the milk quality improved with reduced FFA content. Itis known that the lipoprotein lipase activity and lipolysisare more pronounced during mid-lactation (3–6 months)than at early (<2 months) and late lactation (Chilliard et al.,2003). Mid-lactation coincides with the time goats tradi-tionally are on pastures in Norway. Therefore, the effect offorage type (rangeland) or grazing season on milk qualityis confounded with the effect of lactation stage.
The aim of this study was to unravel some of these dis-crepancies, by testing the effects of forage type and quality,i.e. rangeland vs. cultivated pasture or grazing vs. hay, ongoat milk production and milk quality. Additionally, wetested whether there was a seasonal effect (early and lateseason) of forage quality on the same production traits withgoats in the same stage of lactation. We used two hay types,with known quality (high and low), as controls as pasturequality changes during the grazing season.
2. Materials and methods
2.1. Animals, experimental design and management
Eighty Norwegian dairy goats at Senja videregående skole, Norway(N 69◦21.397′ , E 17◦56.319′) were blocked according to genotype (withand without double deletion in exon 12 of the gene encoding �s1-casein(CSN1S1)) and lactation number (5 groups; 1–4 according to lactationnumber, group 5 = more than 4 lactations) before mating and randomlydivided into two groups: early grazing season (EGS) and late grazing sea-son (LGS) with approximately 8 weeks difference in mating time. Thegenotyping was performed according to Hayes et al. (2006). Average kid-ding date was February 2 (SD 9 d) and April 1 (SD 12 d), 2010. At the startof the grazing season, June 28th, the goats within each of the two groups,EGS and LGS, blocked for genotype (with and without deletion in exon12 of the CSN1S1 casein gene) and lactation number (1–5), were ran-domly allocated to four forage treatment groups: PC = cultivated pasture,WR = woodland rangeland, HH = High quality hay, HL = low quality hay.Thus, the design applied was a 2 × 4 factorial with season (EGS and LGS)as one factor and forage type (PC, WR, HH and HL) as the other factor, with10 goats in each treatment. The 10 goats in each forage treatment wererandomly divided into two sub-groups (pens) with 5 goats, accounting forgenotype and lactation number. In the two hay treatments the five goatsin each group within treatment were kept indoors in separate pens (i.e.two replicates per treatment), while the sub-groups of goats within eachpasture treatment grazed together.
The EGS goats went directly from the indoor silage based ration totheir respective forage treatment groups on the 28th of June 2010. The40 goats in the LGS group grazed together with the WR group of the EGSgoats until the 16th of August 2010 before they were allocated to theirrespective forage treatment groups. The forage treatment periods lastedfor 3 weeks.
All goats were machine milked twice a day at 06:30 and 16:00 h. Con-centrate was distributed in equal amounts two times per day at eachmilking. The goats were weighed for three consecutive days in the weekbefore they entered the feeding treatments (June 21–23 and August 9–11
20 H. Steinshamn et al. / Small Ruminant Research 122 (2014) 18–30
in EGS and LGS, respectively) and in the week after commencement ofthe forage treatment periods (July 21–23 and September 8–10 in EGS andLGS, respectively) when they were on the same diet.
Data from three goats that suffered from mastitis were removed fromall data. The milk sample for fatty acid analysis for one goat on treatmentPC in EGS could not be analysed.
The procedures in the experiment were according to the regula-tions set by the Norwegian Animal Research Authority, Oslo, Norway(http://www.mattilsynet.no/fdu/), which is in accordance with EU Direc-tive (86/609/EEC) and the European convention (ETS No. 170) on theprotection of animals used for experimental and other scientific purposes.
2.2. Feeding and grassland characteristics
From kidding until start of the grazing season (28th of June 2010) thegoats received the same diet: silage fed ad libitum [net energy for lactation(NEL) = 5.91 (SD 0.42) MJ/kg DM; crude protein (CP) = 138 (SD 18) g/kg DM;neutral detergent fibre (NDF) = 539 (SD 49) g/kg DM] and 1.1 kg concen-trate (as fed) per day per head. The concentrate contained the followingingredients (g/kg): barley (278), oat (263), wheat bran (159), sugar canemolasses (65), sugar beet pulp (60), extracted soybean meal (46), oil seed(41), Soy Pass® (34), limestone (19), and other minerals and vitamins (35).During the forage treatment periods, all goats were supplemented withthe same concentrate mixture as fed indoors, applied at a rate of 0.9 kgDM per day per head.
The cultivated pasture (PC) was a ley (2.1 ha in area and 10 m abovesea level) in its first production year dominated by the sown grasses (pro-portion of DM yield in EGS/LGS) Phleum pratense L. (0.60/0.45), Festucapratensis L. (0.05/0.09) and Poa pratensis L. (0.04/0.06), with some unsownspecies such as Elytrigia repens L. (0.03/0.22), Stellaria media L. (0.16/0.12)and Matricaria matricarioides Porter ex Britton (0.07/0.02) as assessed bythe dry weight rank method (Mannetje and Haydock, 1963). The esti-mated daily allowance was on average 13 and 30 kg DM/goat in EGS andLGS, respectively. The high allowance was given to ensure that the goatscould select high quality forage. After finishing the grazing in EGS the fieldwas cut and the regrowth was used in the in LGS experiment. The dom-inating grass species, P. pratensis, was in the booting stage at the start ofEGS and in vegetative regrowth stage in LGS. The rangeland (WR) wasapproximately 450 ha, ranging from 65 to 265 m above sea level, with thefollowing vegetation types (% of land area): blueberry-birch woodland(41), fen (22), meadow-birch woodland (21), lichen/heather-birch wood-land (6), wet woodland (4), natural grassland (3) and spruce woodland (2).Dominating species were birch (Betula pubescens Ehrh.), bilberries (Vac-cinium myrtillus L.), Swedish cornel (Cornus suecica L.), wavy hair-grass(Avenella flexuosa L.) and sweet vernal grass (Anthoxanthum odoratum L.).The hay was produced from the first cut of a ley in 2009. The dominatingspecies were P. pratense (0.61) and F. pratensis (0.27). The HH quality wascut at early booting stage and HL at beginning of flowering of P. pratense.The hay was fed ad libitum twice daily after milking allowing a residue of10%. The goats on pastures grazed day and night.
2.3. Data collection and sampling
2.3.1. Milk yield, sampling and analysisIndividual milk yield was measured and individual milk samples were
collected twice in each grazing periods; (1) the week (6–8 d) before goatswere allocated to the forage dietary treatments [on average 137 (SA 9)and 127 (SA 12) days in milk (DIM) in EGS and LGS, respectively], and (2)on days 14–16 after onset of the dietary treatment [on average 158 (SA9) and 148 (SA 12) DIM in EGS and LGS, respectively]. The milk sampleswere collected during morning and evening for three consecutive days.The samples were stored at 4 ◦C and four samples from the first two daysin each period were pooled into one sample for each goat and period.The pooled samples were split in two: one added a tablet of Bronopol(2-bromo-2-nitropropane-1,3-diol; D&F Inc., USA) and was analysed forfat, protein, lactose, urea and FFA content with an infrared milk analyser(Milkoscan 6000, Foss-Electric, Hillerød, Denmark) and the other parallelwas used for extraction of fat and further analysis of fatty acid compo-sition. The samples collected the third day were kept frozen as sparesamples.
Total lipids were extracted by a modified method of (Folch et al., 1957).In brief, 20 mL of chloroform (Merck, Darmstad, Germany) and methanol(Merck, Darmstad, Germany) (2:1) were added to 1 mL of milk. The sam-ples were centrifuged at 2000 rpm for 10 min after addition of 4 mL of 0.9%
NaCl in distilled, filtered water. The lower fraction containing the lipidswas collected, and the solvent was evaporated under a gentle stream of N2.The extracted lipids were re-dissolved in hexane:chloroform:methanol(95:3:2) and loaded on a 500 mg aminopropyl column (Bond Elut, Var-ian, Harbor City, CA, USA) previously activated by 7 mL of hexane (Merck,Darmstad, Germany). The neutral lipids were eluted by 5 mL chloroform(Pinkart et al., 1998; Ruiz et al., 2004). The solvents were evaporated undera gentle stream of N2. The neutral lipids were transesterified by adding1.5 mL sodium methanolate (33.3 mg/mL) and 2 mL hexane before placinghorizontally at an orbital shaker platform at 400 rpm for 30 min, accordingto Devle et al. (2009). The fatty acid methyl esters (FAME) in hexane weretransferred to GC-vials and stored at −20 ◦C until analysis by GC–MS.
The FAMEs were separated and identified by using GC–MS accord-ing to Devle (2009) with some modifications. The mass spectrometerwas equipped with an electron ionization ion source producing 70 eV,the mass range was m/z 40–600. The scan time used was 0.4 s and theinter scan delay time was 0.20 s. The mass spectrometer was tuned to aresolution of 1200. The ion source temperature was 200 ◦C and the trans-fer line was held at 220 ◦C. An Agilent 6890 Series gas chromatograph(Agilent Technology, Wilmington, DE, USA) was applied for the GC–MScombination. The column used was a 50 m CP-Sil 88 capillary columnwith ID 0.25 mm and 0.20 �m film thickness (Varian, Middelburgh, theNetherlands). Injections were made in split mode 1:10. The GC oven tem-perature was programmed from 70 ◦C (2 min) to 150 ◦C (0.5 min) at a rateof 30 ◦C/min, then the temperature was increased to 160 ◦C (14 min) ata rate of 2.0◦/min, thereafter the temperature was increased to 167 ◦C(10 min) at a rate of 1.0 ◦C/min, then to 174 ◦C (7 min) at a rate of 7 ◦C/min,then 230 ◦C (0.5 min) with a rate of 7 ◦C/min and finally to 240 ◦C at50 ◦C/min and held for 0.5 min. The total run time was 60 min. The injec-tion temperature was 250 ◦C and the injection volume 1.0. Identificationwas performed by comparing retention times with a 37-component FAMEmix (Food Industry Fame Mix, Restek, Bellefonte, PA, USA) in additionto MS library search. The individual FAMEs were expressed in relativeamounts of total FAME.
2.3.2. Feed intake, sampling and chemical analysisThe goats on pasture WR and PC were dosed with synthetic even-chain
C32 alkane twice daily (191 mg/d per goat) for 12 d starting on day 8 afteronset of forage treatment in each of the two grazing periods. Individualfaecal grab samples were collected twice daily at milking during the lastfive days (days 15–19) of the alkane-dosing period and stored frozen at−20 ◦C. Before chemical analysis, the faeces samples were bulked to onesample per goat and period. Grazed plants were sampled daily during thesame period as dosing C32 (days 8–17) by hand plucking plant parts thatwere observed to be grazed by the goats. Two persons, one on WR and oneon PC conducted the herbage sampling simultaneously. At least 50 g freshmaterial of each species was collected at different occasions during eachperiod giving 3–5 samples for each species and period. The samples werefrozen at −20 ◦C from collection until milling, approximately 2 months,and thereafter frozen for about 2 months before analysis of alkane and 6months before feed quality analysis. Sampling of plant species and plantpart (leaf, stem, bark, inflorescence etc.) was based on (1) knowledge onwhich plant species and plant part goats prefer as observed in Norway(Mayes et al., 1994), (2) visual signs on the plants of grazing and (3) highfrequency of the plant species in the pasture. Individual feed intake onpasture was calculated according to Mayes et al. (1986):
I = Fi/Fj × (Dj + Ic × Cj) − Ic × Ci
Hi − Fi/Fj × Hj
where I is the herbage intake (kg DM/d); Dj is the dose rate of C32 alkane(191 mg/d); Fi , Ci and Hi are respective concentrations (mg/kg DM) of theodd-chain C31 alkane in faeces, concentrate and herbage, and Fj , Cj and Hj
are respective concentrations (mg/kg DM) of C32. The faecal recovery ofthe dosed and plant alkane where considered to be equal.
The amount of hay offered and the refusal for each pen and periodwere weighed daily from days 1 to 19, and samples of offered and refusedhay and of concentrate were collected daily from days 15 to 19. The dailycollected samples were bulked to one sample of each feed, pen and periodfor chemical analyses.
Feed and plant samples were stored frozen (−20 ◦C) freeze dried andstored frozen again until chemical analysis. Feed and plant samples forthe analysis of alkanes and long-chain alcohols were ground using a ballmill, while feed and plant samples for feed quality analysis were ground
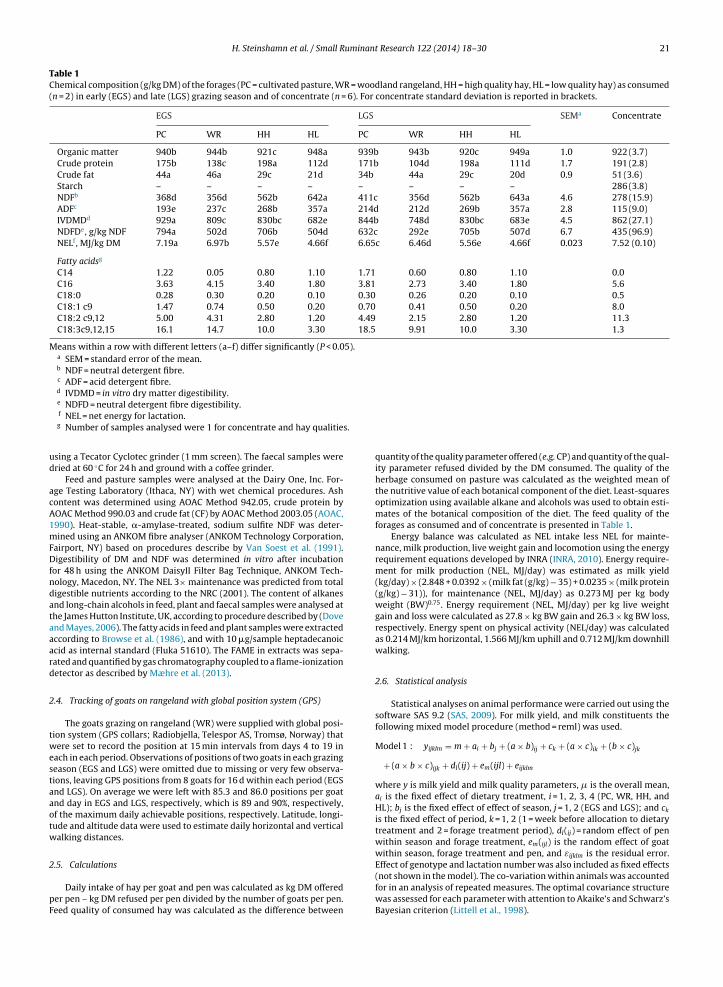
H. Steinshamn et al. / Small Ruminant Research 122 (2014) 18–30 21
Table 1Chemical composition (g/kg DM) of the forages (PC = cultivated pasture, WR = woodland rangeland, HH = high quality hay, HL = low quality hay) as consumed(n = 2) in early (EGS) and late (LGS) grazing season and of concentrate (n = 6). For concentrate standard deviation is reported in brackets.
EGS LGS SEMa Concentrate
PC WR HH HL PC WR HH HL
Organic matter 940b 944b 921c 948a 939b 943b 920c 949a 1.0 922 (3.7)Crude protein 175b 138c 198a 112d 171b 104d 198a 111d 1.7 191 (2.8)Crude fat 44a 46a 29c 21d 34b 44a 29c 20d 0.9 51 (3.6)Starch – – – – – – – – 286 (3.8)NDFb 368d 356d 562b 642a 411c 356d 562b 643a 4.6 278 (15.9)ADFc 193e 237c 268b 357a 214d 212d 269b 357a 2.8 115 (9.0)IVDMDd 929a 809c 830bc 682e 844b 748d 830bc 683e 4.5 862 (27.1)NDFDe, g/kg NDF 794a 502d 706b 504d 632c 292e 705b 507d 6.7 435 (96.9)NELf, MJ/kg DM 7.19a 6.97b 5.57e 4.66f 6.65c 6.46d 5.56e 4.66f 0.023 7.52 (0.10)
Fatty acidsg
C14 1.22 0.05 0.80 1.10 1.71 0.60 0.80 1.10 0.0C16 3.63 4.15 3.40 1.80 3.81 2.73 3.40 1.80 5.6C18:0 0.28 0.30 0.20 0.10 0.30 0.26 0.20 0.10 0.5C18:1 c9 1.47 0.74 0.50 0.20 0.70 0.41 0.50 0.20 8.0C18:2 c9,12 5.00 4.31 2.80 1.20 4.49 2.15 2.80 1.20 11.3C18:3c9,12,15 16.1 14.7 10.0 3.30 18.5 9.91 10.0 3.30 1.3
Means within a row with different letters (a–f) differ significantly (P < 0.05).a SEM = standard error of the mean.b NDF = neutral detergent fibre.c ADF = acid detergent fibre.d IVDMD = in vitro dry matter digestibility.e NDFD = neutral detergent fibre digestibility.f NEL = net energy for lactation.g Number of samples analysed were 1 for concentrate and hay qualities.
using a Tecator Cyclotec grinder (1 mm screen). The faecal samples weredried at 60 ◦C for 24 h and ground with a coffee grinder.
Feed and pasture samples were analysed at the Dairy One, Inc. For-age Testing Laboratory (Ithaca, NY) with wet chemical procedures. Ashcontent was determined using AOAC Method 942.05, crude protein byAOAC Method 990.03 and crude fat (CF) by AOAC Method 2003.05 (AOAC,1990). Heat-stable, �-amylase-treated, sodium sulfite NDF was deter-mined using an ANKOM fibre analyser (ANKOM Technology Corporation,Fairport, NY) based on procedures describe by Van Soest et al. (1991).Digestibility of DM and NDF was determined in vitro after incubationfor 48 h using the ANKOM DaisyII Filter Bag Technique, ANKOM Tech-nology, Macedon, NY. The NEL 3× maintenance was predicted from totaldigestible nutrients according to the NRC (2001). The content of alkanesand long-chain alcohols in feed, plant and faecal samples were analysed atthe James Hutton Institute, UK, according to procedure described by (Doveand Mayes, 2006). The fatty acids in feed and plant samples were extractedaccording to Browse et al. (1986), and with 10 �g/sample heptadecanoicacid as internal standard (Fluka 51610). The FAME in extracts was sepa-rated and quantified by gas chromatography coupled to a flame-ionizationdetector as described by Mæhre et al. (2013).
2.4. Tracking of goats on rangeland with global position system (GPS)
The goats grazing on rangeland (WR) were supplied with global posi-tion system (GPS collars; Radiobjella, Telespor AS, Tromsø, Norway) thatwere set to record the position at 15 min intervals from days 4 to 19 ineach in each period. Observations of positions of two goats in each grazingseason (EGS and LGS) were omitted due to missing or very few observa-tions, leaving GPS positions from 8 goats for 16 d within each period (EGSand LGS). On average we were left with 85.3 and 86.0 positions per goatand day in EGS and LGS, respectively, which is 89 and 90%, respectively,of the maximum daily achievable positions, respectively. Latitude, longi-tude and altitude data were used to estimate daily horizontal and verticalwalking distances.
2.5. Calculations
Daily intake of hay per goat and pen was calculated as kg DM offeredper pen – kg DM refused per pen divided by the number of goats per pen.Feed quality of consumed hay was calculated as the difference between
quantity of the quality parameter offered (e.g. CP) and quantity of the qual-ity parameter refused divided by the DM consumed. The quality of theherbage consumed on pasture was calculated as the weighted mean ofthe nutritive value of each botanical component of the diet. Least-squaresoptimization using available alkane and alcohols was used to obtain esti-mates of the botanical composition of the diet. The feed quality of theforages as consumed and of concentrate is presented in Table 1.
Energy balance was calculated as NEL intake less NEL for mainte-nance, milk production, live weight gain and locomotion using the energyrequirement equations developed by INRA (INRA, 2010). Energy require-ment for milk production (NEL, MJ/day) was estimated as milk yield(kg/day) × (2.848 + 0.0392 × (milk fat (g/kg) − 35) + 0.0235 × (milk protein(g/kg) − 31)), for maintenance (NEL, MJ/day) as 0.273 MJ per kg bodyweight (BW)0.75. Energy requirement (NEL, MJ/day) per kg live weightgain and loss were calculated as 27.8 × kg BW gain and 26.3 × kg BW loss,respectively. Energy spent on physical activity (NEL/day) was calculatedas 0.214 MJ/km horizontal, 1.566 MJ/km uphill and 0.712 MJ/km downhillwalking.
2.6. Statistical analysis
Statistical analyses on animal performance were carried out using thesoftware SAS 9.2 (SAS, 2009). For milk yield, and milk constituents thefollowing mixed model procedure (method = reml) was used.
Model 1 : yijklm = m + ai + bj + (a × b)ij + ck + (a × c)ik + (b × c)jk
+ (a × b × c)ijk + dl(ij) + em(ijl) + eijklm
where y is milk yield and milk quality parameters, � is the overall mean,ai is the fixed effect of dietary treatment, i = 1, 2, 3, 4 (PC, WR, HH, andHL); bj is the fixed effect of effect of season, j = 1, 2 (EGS and LGS); and ck
is the fixed effect of period, k = 1, 2 (1 = week before allocation to dietarytreatment and 2 = forage treatment period), dl(ij) = random effect of penwithin season and forage treatment, em(ijl) is the random effect of goatwithin season, forage treatment and pen, and εijklm is the residual error.Effect of genotype and lactation number was also included as fixed effects(not shown in the model). The co-variation within animals was accountedfor in an analysis of repeated measures. The optimal covariance structurewas assessed for each parameter with attention to Akaike’s and Schwarz’sBayesian criterion (Littell et al., 1998).
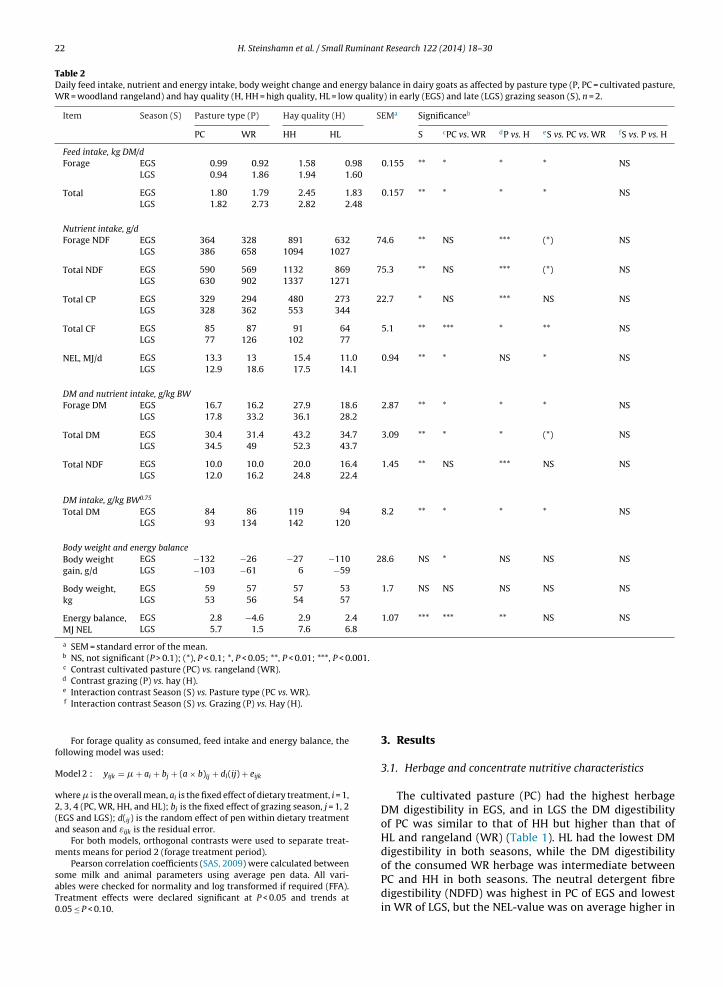
22 H. Steinshamn et al. / Small Ruminant Research 122 (2014) 18–30
Table 2Daily feed intake, nutrient and energy intake, body weight change and energy balance in dairy goats as affected by pasture type (P, PC = cultivated pasture,WR = woodland rangeland) and hay quality (H, HH = high quality, HL = low quality) in early (EGS) and late (LGS) grazing season (S), n = 2.
Item Season (S) Pasture type (P) Hay quality (H) SEMa Significanceb
PC WR HH HL S cPC vs. WR dP vs. H eS vs. PC vs. WR fS vs. P vs. H
Feed intake, kg DM/dForage EGS 0.99 0.92 1.58 0.98 0.155 ** * * * NS
LGS 0.94 1.86 1.94 1.60
Total EGS 1.80 1.79 2.45 1.83 0.157 ** * * * NSLGS 1.82 2.73 2.82 2.48
Nutrient intake, g/dForage NDF EGS 364 328 891 632 74.6 ** NS *** (*) NS
LGS 386 658 1094 1027
Total NDF EGS 590 569 1132 869 75.3 ** NS *** (*) NSLGS 630 902 1337 1271
Total CP EGS 329 294 480 273 22.7 * NS *** NS NSLGS 328 362 553 344
Total CF EGS 85 87 91 64 5.1 ** *** * ** NSLGS 77 126 102 77
NEL, MJ/d EGS 13.3 13 15.4 11.0 0.94 ** * NS * NSLGS 12.9 18.6 17.5 14.1
DM and nutrient intake, g/kg BWForage DM EGS 16.7 16.2 27.9 18.6 2.87 ** * * * NS
LGS 17.8 33.2 36.1 28.2
Total DM EGS 30.4 31.4 43.2 34.7 3.09 ** * * (*) NSLGS 34.5 49 52.3 43.7
Total NDF EGS 10.0 10.0 20.0 16.4 1.45 ** NS *** NS NSLGS 12.0 16.2 24.8 22.4
DM intake, g/kg BW0.75
Total DM EGS 84 86 119 94 8.2 ** * * * NSLGS 93 134 142 120
Body weight and energy balanceBody weightgain, g/d
EGS −132 −26 −27 −110 28.6 NS * NS NS NSLGS −103 −61 6 −59
Body weight,kg
EGS 59 57 57 53 1.7 NS NS NS NS NSLGS 53 56 54 57
Energy balance,MJ NEL
EGS 2.8 −4.6 2.9 2.4 1.07 *** *** ** NS NSLGS 5.7 1.5 7.6 6.8
a SEM = standard error of the mean.b NS, not significant (P > 0.1); (*), P < 0.1; *, P < 0.05; **, P < 0.01; ***, P < 0.001.c Contrast cultivated pasture (PC) vs. rangeland (WR).d Contrast grazing (P) vs. hay (H).e Interaction contrast Season (S) vs. Pasture type (PC vs. WR).f Interaction contrast Season (S) vs. Grazing (P) vs. Hay (H).
For forage quality as consumed, feed intake and energy balance, thefollowing model was used:
Model 2 : yijk = � + ai + bj + (a × b)ij + dl(ij) + eijk
where � is the overall mean, ai is the fixed effect of dietary treatment, i = 1,2, 3, 4 (PC, WR, HH, and HL); bj is the fixed effect of grazing season, j = 1, 2(EGS and LGS); d(ij) is the random effect of pen within dietary treatmentand season and εijk is the residual error.
For both models, orthogonal contrasts were used to separate treat-ments means for period 2 (forage treatment period).
Pearson correlation coefficients (SAS, 2009) were calculated betweensome milk and animal parameters using average pen data. All vari-ables were checked for normality and log transformed if required (FFA).Treatment effects were declared significant at P < 0.05 and trends at0.05 ≤ P < 0.10.
3. Results
3.1. Herbage and concentrate nutritive characteristics
The cultivated pasture (PC) had the highest herbageDM digestibility in EGS, and in LGS the DM digestibilityof PC was similar to that of HH but higher than that ofHL and rangeland (WR) (Table 1). HL had the lowest DMdigestibility in both seasons, while the DM digestibilityof the consumed WR herbage was intermediate betweenPC and HH in both seasons. The neutral detergent fibredigestibility (NDFD) was highest in PC of EGS and lowestin WR of LGS, but the NEL-value was on average higher in
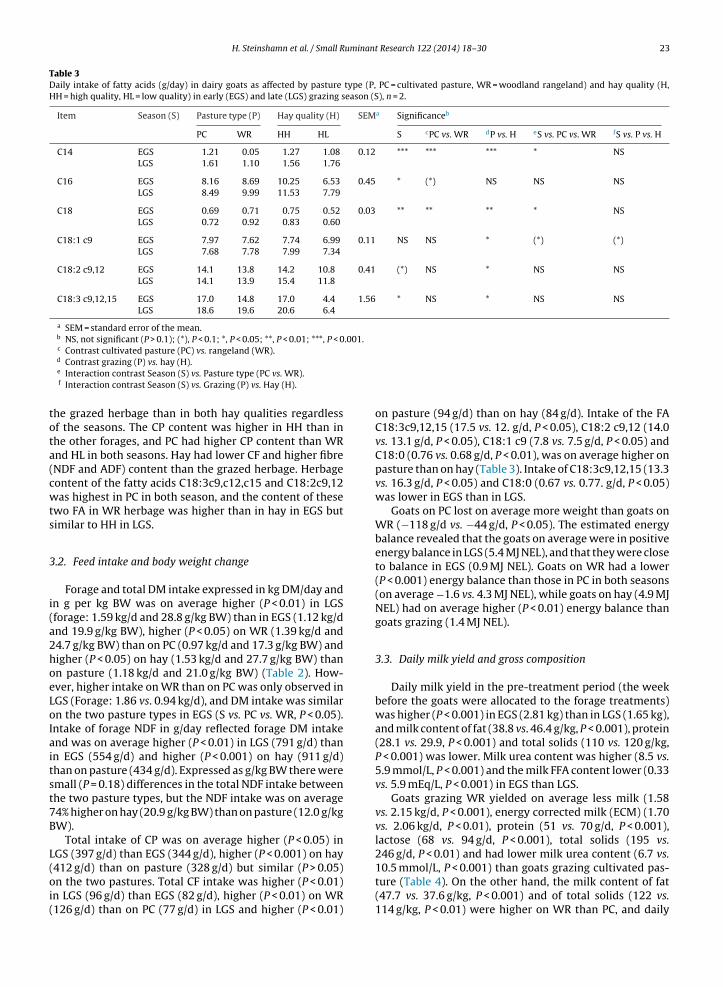
H. Steinshamn et al. / Small Ruminant Research 122 (2014) 18–30 23
Table 3Daily intake of fatty acids (g/day) in dairy goats as affected by pasture type (P, PC = cultivated pasture, WR = woodland rangeland) and hay quality (H,HH = high quality, HL = low quality) in early (EGS) and late (LGS) grazing season (S), n = 2.
Item Season (S) Pasture type (P) Hay quality (H) SEMa Significanceb
PC WR HH HL S cPC vs. WR dP vs. H eS vs. PC vs. WR fS vs. P vs. H
C14 EGS 1.21 0.05 1.27 1.08 0.12 *** *** *** * NSLGS 1.61 1.10 1.56 1.76
C16 EGS 8.16 8.69 10.25 6.53 0.45 * (*) NS NS NSLGS 8.49 9.99 11.53 7.79
C18 EGS 0.69 0.71 0.75 0.52 0.03 ** ** ** * NSLGS 0.72 0.92 0.83 0.60
C18:1 c9 EGS 7.97 7.62 7.74 6.99 0.11 NS NS * (*) (*)LGS 7.68 7.78 7.99 7.34
C18:2 c9,12 EGS 14.1 13.8 14.2 10.8 0.41 (*) NS * NS NSLGS 14.1 13.9 15.4 11.8
C18:3 c9,12,15 EGS 17.0 14.8 17.0 4.4 1.56 * NS * NS NSLGS 18.6 19.6 20.6 6.4
a SEM = standard error of the mean.b NS, not significant (P > 0.1); (*), P < 0.1; *, P < 0.05; **, P < 0.01; ***, P < 0.001.c Contrast cultivated pasture (PC) vs. rangeland (WR).d Contrast grazing (P) vs. hay (H).e Interaction contrast Season (S) vs. Pasture type (PC vs. WR).f Interaction contrast Season (S) vs. Grazing (P) vs. Hay (H).
the grazed herbage than in both hay qualities regardlessof the seasons. The CP content was higher in HH than inthe other forages, and PC had higher CP content than WRand HL in both seasons. Hay had lower CF and higher fibre(NDF and ADF) content than the grazed herbage. Herbagecontent of the fatty acids C18:3c9,c12,c15 and C18:2c9,12was highest in PC in both season, and the content of thesetwo FA in WR herbage was higher than in hay in EGS butsimilar to HH in LGS.
3.2. Feed intake and body weight change
Forage and total DM intake expressed in kg DM/day andin g per kg BW was on average higher (P < 0.01) in LGS(forage: 1.59 kg/d and 28.8 g/kg BW) than in EGS (1.12 kg/dand 19.9 g/kg BW), higher (P < 0.05) on WR (1.39 kg/d and24.7 g/kg BW) than on PC (0.97 kg/d and 17.3 g/kg BW) andhigher (P < 0.05) on hay (1.53 kg/d and 27.7 g/kg BW) thanon pasture (1.18 kg/d and 21.0 g/kg BW) (Table 2). How-ever, higher intake on WR than on PC was only observed inLGS (Forage: 1.86 vs. 0.94 kg/d), and DM intake was similaron the two pasture types in EGS (S vs. PC vs. WR, P < 0.05).Intake of forage NDF in g/day reflected forage DM intakeand was on average higher (P < 0.01) in LGS (791 g/d) thanin EGS (554 g/d) and higher (P < 0.001) on hay (911 g/d)than on pasture (434 g/d). Expressed as g/kg BW there weresmall (P = 0.18) differences in the total NDF intake betweenthe two pasture types, but the NDF intake was on average74% higher on hay (20.9 g/kg BW) than on pasture (12.0 g/kgBW).
Total intake of CP was on average higher (P < 0.05) inLGS (397 g/d) than EGS (344 g/d), higher (P < 0.001) on hay(412 g/d) than on pasture (328 g/d) but similar (P > 0.05)on the two pastures. Total CF intake was higher (P < 0.01)in LGS (96 g/d) than EGS (82 g/d), higher (P < 0.01) on WR(126 g/d) than on PC (77 g/d) in LGS and higher (P < 0.01)
on pasture (94 g/d) than on hay (84 g/d). Intake of the FAC18:3c9,12,15 (17.5 vs. 12. g/d, P < 0.05), C18:2 c9,12 (14.0vs. 13.1 g/d, P < 0.05), C18:1 c9 (7.8 vs. 7.5 g/d, P < 0.05) andC18:0 (0.76 vs. 0.68 g/d, P < 0.01), was on average higher onpasture than on hay (Table 3). Intake of C18:3c9,12,15 (13.3vs. 16.3 g/d, P < 0.05) and C18:0 (0.67 vs. 0.77. g/d, P < 0.05)was lower in EGS than in LGS.
Goats on PC lost on average more weight than goats onWR (−118 g/d vs. −44 g/d, P < 0.05). The estimated energybalance revealed that the goats on average were in positiveenergy balance in LGS (5.4 MJ NEL), and that they were closeto balance in EGS (0.9 MJ NEL). Goats on WR had a lower(P < 0.001) energy balance than those in PC in both seasons(on average −1.6 vs. 4.3 MJ NEL), while goats on hay (4.9 MJNEL) had on average higher (P < 0.01) energy balance thangoats grazing (1.4 MJ NEL).
3.3. Daily milk yield and gross composition
Daily milk yield in the pre-treatment period (the weekbefore the goats were allocated to the forage treatments)was higher (P < 0.001) in EGS (2.81 kg) than in LGS (1.65 kg),and milk content of fat (38.8 vs. 46.4 g/kg, P < 0.001), protein(28.1 vs. 29.9, P < 0.001) and total solids (110 vs. 120 g/kg,P < 0.001) was lower. Milk urea content was higher (8.5 vs.5.9 mmol/L, P < 0.001) and the milk FFA content lower (0.33vs. 5.9 mEq/L, P < 0.001) in EGS than LGS.
Goats grazing WR yielded on average less milk (1.58vs. 2.15 kg/d, P < 0.001), energy corrected milk (ECM) (1.70vs. 2.06 kg/d, P < 0.01), protein (51 vs. 70 g/d, P < 0.001),lactose (68 vs. 94 g/d, P < 0.001), total solids (195 vs.246 g/d, P < 0.01) and had lower milk urea content (6.7 vs.10.5 mmol/L, P < 0.001) than goats grazing cultivated pas-ture (Table 4). On the other hand, the milk content of fat(47.7 vs. 37.6 g/kg, P < 0.001) and of total solids (122 vs.114 g/kg, P < 0.01) were higher on WR than PC, and daily
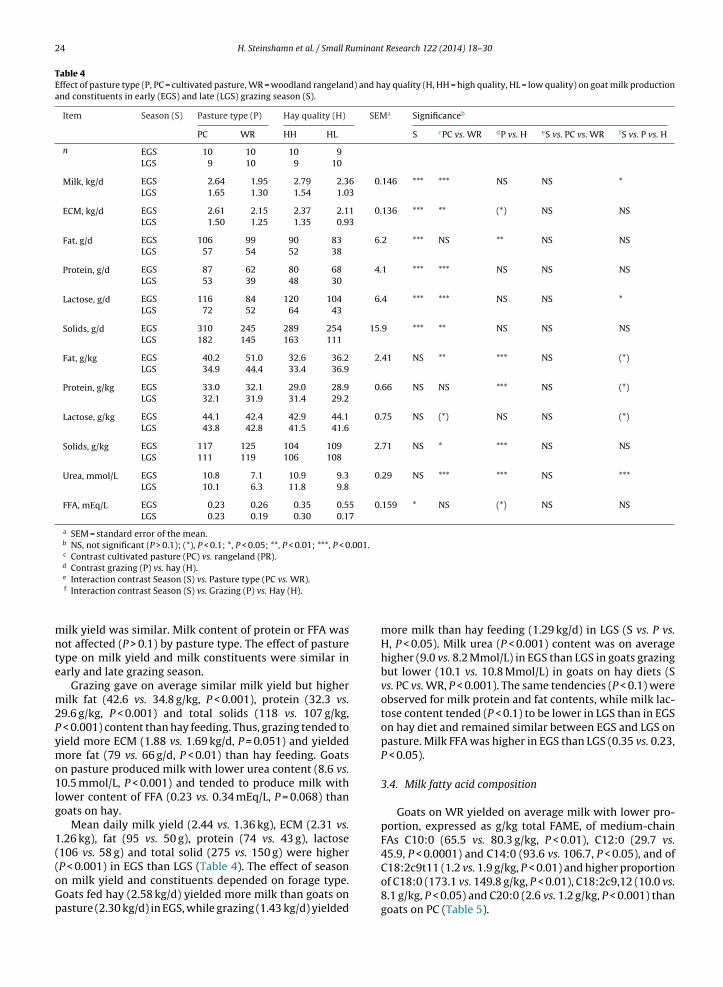
24 H. Steinshamn et al. / Small Ruminant Research 122 (2014) 18–30
Table 4Effect of pasture type (P, PC = cultivated pasture, WR = woodland rangeland) and hay quality (H, HH = high quality, HL = low quality) on goat milk productionand constituents in early (EGS) and late (LGS) grazing season (S).
Item Season (S) Pasture type (P) Hay quality (H) SEMa Significanceb
PC WR HH HL S cPC vs. WR dP vs. H eS vs. PC vs. WR fS vs. P vs. H
n EGS 10 10 10 9LGS 9 10 9 10
Milk, kg/d EGS 2.64 1.95 2.79 2.36 0.146 *** *** NS NS *LGS 1.65 1.30 1.54 1.03
ECM, kg/d EGS 2.61 2.15 2.37 2.11 0.136 *** ** (*) NS NSLGS 1.50 1.25 1.35 0.93
Fat, g/d EGS 106 99 90 83 6.2 *** NS ** NS NSLGS 57 54 52 38
Protein, g/d EGS 87 62 80 68 4.1 *** *** NS NS NSLGS 53 39 48 30
Lactose, g/d EGS 116 84 120 104 6.4 *** *** NS NS *LGS 72 52 64 43
Solids, g/d EGS 310 245 289 254 15.9 *** ** NS NS NSLGS 182 145 163 111
Fat, g/kg EGS 40.2 51.0 32.6 36.2 2.41 NS ** *** NS (*)LGS 34.9 44.4 33.4 36.9
Protein, g/kg EGS 33.0 32.1 29.0 28.9 0.66 NS NS *** NS (*)LGS 32.1 31.9 31.4 29.2
Lactose, g/kg EGS 44.1 42.4 42.9 44.1 0.75 NS (*) NS NS (*)LGS 43.8 42.8 41.5 41.6
Solids, g/kg EGS 117 125 104 109 2.71 NS * *** NS NSLGS 111 119 106 108
Urea, mmol/L EGS 10.8 7.1 10.9 9.3 0.29 NS *** *** NS ***LGS 10.1 6.3 11.8 9.8
FFA, mEq/L EGS 0.23 0.26 0.35 0.55 0.159 * NS (*) NS NSLGS 0.23 0.19 0.30 0.17
a SEM = standard error of the mean.b NS, not significant (P > 0.1); (*), P < 0.1; *, P < 0.05; **, P < 0.01; ***, P < 0.001.c Contrast cultivated pasture (PC) vs. rangeland (PR).d Contrast grazing (P) vs. hay (H).e Interaction contrast Season (S) vs. Pasture type (PC vs. WR).f Interaction contrast Season (S) vs. Grazing (P) vs. Hay (H).
milk yield was similar. Milk content of protein or FFA wasnot affected (P > 0.1) by pasture type. The effect of pasturetype on milk yield and milk constituents were similar inearly and late grazing season.
Grazing gave on average similar milk yield but highermilk fat (42.6 vs. 34.8 g/kg, P < 0.001), protein (32.3 vs.29.6 g/kg, P < 0.001) and total solids (118 vs. 107 g/kg,P < 0.001) content than hay feeding. Thus, grazing tended toyield more ECM (1.88 vs. 1.69 kg/d, P = 0.051) and yieldedmore fat (79 vs. 66 g/d, P < 0.01) than hay feeding. Goatson pasture produced milk with lower urea content (8.6 vs.10.5 mmol/L, P < 0.001) and tended to produce milk withlower content of FFA (0.23 vs. 0.34 mEq/L, P = 0.068) thangoats on hay.
Mean daily milk yield (2.44 vs. 1.36 kg), ECM (2.31 vs.1.26 kg), fat (95 vs. 50 g), protein (74 vs. 43 g), lactose(106 vs. 58 g) and total solid (275 vs. 150 g) were higher(P < 0.001) in EGS than LGS (Table 4). The effect of seasonon milk yield and constituents depended on forage type.Goats fed hay (2.58 kg/d) yielded more milk than goats onpasture (2.30 kg/d) in EGS, while grazing (1.43 kg/d) yielded
more milk than hay feeding (1.29 kg/d) in LGS (S vs. P vs.H, P < 0.05). Milk urea (P < 0.001) content was on averagehigher (9.0 vs. 8.2 Mmol/L) in EGS than LGS in goats grazingbut lower (10.1 vs. 10.8 Mmol/L) in goats on hay diets (Svs. PC vs. WR, P < 0.001). The same tendencies (P < 0.1) wereobserved for milk protein and fat contents, while milk lac-tose content tended (P < 0.1) to be lower in LGS than in EGSon hay diet and remained similar between EGS and LGS onpasture. Milk FFA was higher in EGS than LGS (0.35 vs. 0.23,P < 0.05).
3.4. Milk fatty acid composition
Goats on WR yielded on average milk with lower pro-portion, expressed as g/kg total FAME, of medium-chainFAs C10:0 (65.5 vs. 80.3 g/kg, P < 0.01), C12:0 (29.7 vs.45.9, P < 0.0001) and C14:0 (93.6 vs. 106.7, P < 0.05), and ofC18:2c9t11 (1.2 vs. 1.9 g/kg, P < 0.01) and higher proportionof C18:0 (173.1 vs. 149.8 g/kg, P < 0.01), C18:2c9,12 (10.0 vs.8.1 g/kg, P < 0.05) and C20:0 (2.6 vs. 1.2 g/kg, P < 0.001) thangoats on PC (Table 5).
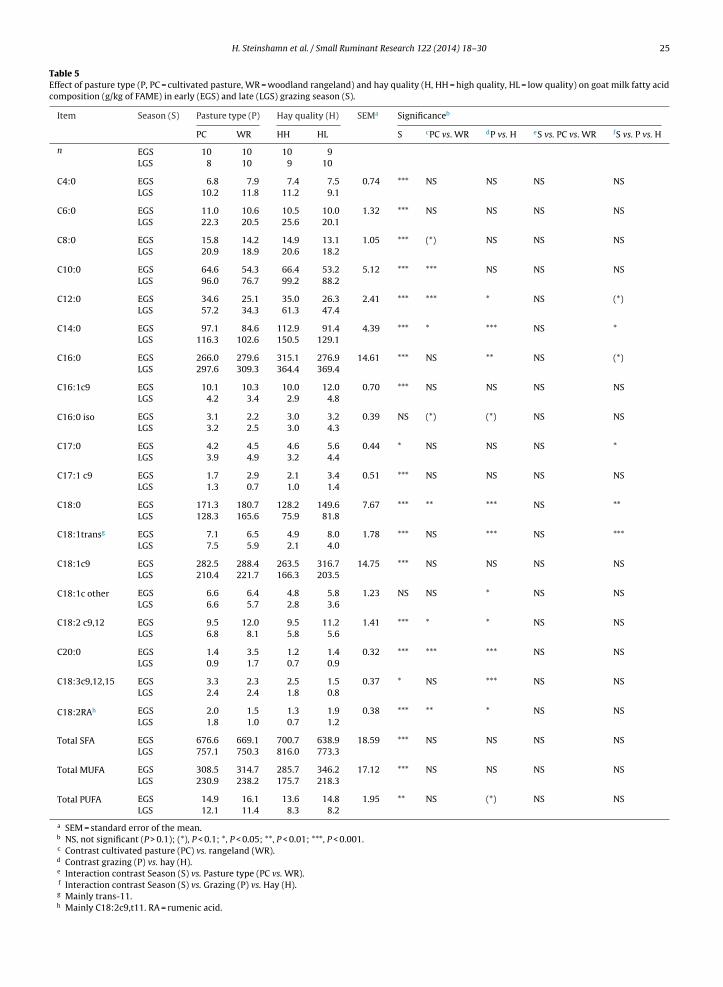
H. Steinshamn et al. / Small Ruminant Research 122 (2014) 18–30 25
Table 5Effect of pasture type (P, PC = cultivated pasture, WR = woodland rangeland) and hay quality (H, HH = high quality, HL = low quality) on goat milk fatty acidcomposition (g/kg of FAME) in early (EGS) and late (LGS) grazing season (S).
Item Season (S) Pasture type (P) Hay quality (H) SEMa Significanceb
PC WR HH HL S cPC vs. WR dP vs. H eS vs. PC vs. WR fS vs. P vs. H
n EGS 10 10 10 9LGS 8 10 9 10
C4:0 EGS 6.8 7.9 7.4 7.5 0.74 *** NS NS NS NSLGS 10.2 11.8 11.2 9.1
C6:0 EGS 11.0 10.6 10.5 10.0 1.32 *** NS NS NS NSLGS 22.3 20.5 25.6 20.1
C8:0 EGS 15.8 14.2 14.9 13.1 1.05 *** (*) NS NS NSLGS 20.9 18.9 20.6 18.2
C10:0 EGS 64.6 54.3 66.4 53.2 5.12 *** *** NS NS NSLGS 96.0 76.7 99.2 88.2
C12:0 EGS 34.6 25.1 35.0 26.3 2.41 *** *** * NS (*)LGS 57.2 34.3 61.3 47.4
C14:0 EGS 97.1 84.6 112.9 91.4 4.39 *** * *** NS *LGS 116.3 102.6 150.5 129.1
C16:0 EGS 266.0 279.6 315.1 276.9 14.61 *** NS ** NS (*)LGS 297.6 309.3 364.4 369.4
C16:1c9 EGS 10.1 10.3 10.0 12.0 0.70 *** NS NS NS NSLGS 4.2 3.4 2.9 4.8
C16:0 iso EGS 3.1 2.2 3.0 3.2 0.39 NS (*) (*) NS NSLGS 3.2 2.5 3.0 4.3
C17:0 EGS 4.2 4.5 4.6 5.6 0.44 * NS NS NS *LGS 3.9 4.9 3.2 4.4
C17:1 c9 EGS 1.7 2.9 2.1 3.4 0.51 *** NS NS NS NSLGS 1.3 0.7 1.0 1.4
C18:0 EGS 171.3 180.7 128.2 149.6 7.67 *** ** *** NS **LGS 128.3 165.6 75.9 81.8
C18:1transg EGS 7.1 6.5 4.9 8.0 1.78 *** NS *** NS ***LGS 7.5 5.9 2.1 4.0
C18:1c9 EGS 282.5 288.4 263.5 316.7 14.75 *** NS NS NS NSLGS 210.4 221.7 166.3 203.5
C18:1c other EGS 6.6 6.4 4.8 5.8 1.23 NS NS * NS NSLGS 6.6 5.7 2.8 3.6
C18:2 c9,12 EGS 9.5 12.0 9.5 11.2 1.41 *** * * NS NSLGS 6.8 8.1 5.8 5.6
C20:0 EGS 1.4 3.5 1.2 1.4 0.32 *** *** *** NS NSLGS 0.9 1.7 0.7 0.9
C18:3c9,12,15 EGS 3.3 2.3 2.5 1.5 0.37 * NS *** NS NSLGS 2.4 2.4 1.8 0.8
C18:2RAh EGS 2.0 1.5 1.3 1.9 0.38 *** ** * NS NSLGS 1.8 1.0 0.7 1.2
Total SFA EGS 676.6 669.1 700.7 638.9 18.59 *** NS NS NS NSLGS 757.1 750.3 816.0 773.3
Total MUFA EGS 308.5 314.7 285.7 346.2 17.12 *** NS NS NS NSLGS 230.9 238.2 175.7 218.3
Total PUFA EGS 14.9 16.1 13.6 14.8 1.95 ** NS (*) NS NSLGS 12.1 11.4 8.3 8.2
a SEM = standard error of the mean.b NS, not significant (P > 0.1); (*), P < 0.1; *, P < 0.05; **, P < 0.01; ***, P < 0.001.c Contrast cultivated pasture (PC) vs. rangeland (WR).d Contrast grazing (P) vs. hay (H).e Interaction contrast Season (S) vs. Pasture type (PC vs. WR).f Interaction contrast Season (S) vs. Grazing (P) vs. Hay (H).g Mainly trans-11.h Mainly C18:2c9,t11. RA = rumenic acid.
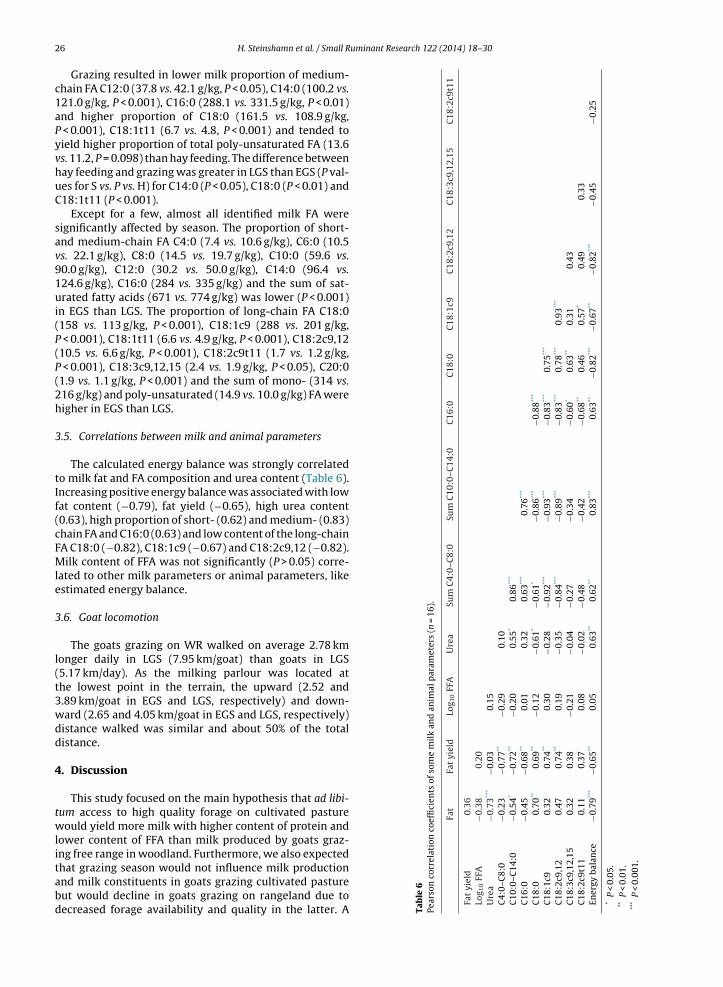
26 H. Steinshamn et al. / Small Ruminant Research 122 (2014) 18–30
Grazing resulted in lower milk proportion of medium-chain FA C12:0 (37.8 vs. 42.1 g/kg, P < 0.05), C14:0 (100.2 vs.121.0 g/kg, P < 0.001), C16:0 (288.1 vs. 331.5 g/kg, P < 0.01)and higher proportion of C18:0 (161.5 vs. 108.9 g/kg,P < 0.001), C18:1t11 (6.7 vs. 4.8, P < 0.001) and tended toyield higher proportion of total poly-unsaturated FA (13.6vs. 11.2, P = 0.098) than hay feeding. The difference betweenhay feeding and grazing was greater in LGS than EGS (P val-ues for S vs. P vs. H) for C14:0 (P < 0.05), C18:0 (P < 0.01) andC18:1t11 (P < 0.001).
Except for a few, almost all identified milk FA weresignificantly affected by season. The proportion of short-and medium-chain FA C4:0 (7.4 vs. 10.6 g/kg), C6:0 (10.5vs. 22.1 g/kg), C8:0 (14.5 vs. 19.7 g/kg), C10:0 (59.6 vs.90.0 g/kg), C12:0 (30.2 vs. 50.0 g/kg), C14:0 (96.4 vs.124.6 g/kg), C16:0 (284 vs. 335 g/kg) and the sum of sat-urated fatty acids (671 vs. 774 g/kg) was lower (P < 0.001)in EGS than LGS. The proportion of long-chain FA C18:0(158 vs. 113 g/kg, P < 0.001), C18:1c9 (288 vs. 201 g/kg,P < 0.001), C18:1t11 (6.6 vs. 4.9 g/kg, P < 0.001), C18:2c9,12(10.5 vs. 6.6 g/kg, P < 0.001), C18:2c9t11 (1.7 vs. 1.2 g/kg,P < 0.001), C18:3c9,12,15 (2.4 vs. 1.9 g/kg, P < 0.05), C20:0(1.9 vs. 1.1 g/kg, P < 0.001) and the sum of mono- (314 vs.216 g/kg) and poly-unsaturated (14.9 vs. 10.0 g/kg) FA werehigher in EGS than LGS.
3.5. Correlations between milk and animal parameters
The calculated energy balance was strongly correlatedto milk fat and FA composition and urea content (Table 6).Increasing positive energy balance was associated with lowfat content (−0.79), fat yield (−0.65), high urea content(0.63), high proportion of short- (0.62) and medium- (0.83)chain FA and C16:0 (0.63) and low content of the long-chainFA C18:0 (−0.82), C18:1c9 (−0.67) and C18:2c9,12 (−0.82).Milk content of FFA was not significantly (P > 0.05) corre-lated to other milk parameters or animal parameters, likeestimated energy balance.
3.6. Goat locomotion
The goats grazing on WR walked on average 2.78 kmlonger daily in LGS (7.95 km/goat) than goats in LGS(5.17 km/day). As the milking parlour was located atthe lowest point in the terrain, the upward (2.52 and3.89 km/goat in EGS and LGS, respectively) and down-ward (2.65 and 4.05 km/goat in EGS and LGS, respectively)distance walked was similar and about 50% of the totaldistance.
4. Discussion
This study focused on the main hypothesis that ad libi-tum access to high quality forage on cultivated pasturewould yield more milk with higher content of protein andlower content of FFA than milk produced by goats graz-ing free range in woodland. Furthermore, we also expectedthat grazing season would not influence milk productionand milk constituents in goats grazing cultivated pasturebut would decline in goats grazing on rangeland due todecreased forage availability and quality in the latter. A Ta
ble
6Pe
arso
n
corr
elat
ion
coef
fici
ents
of
som
e
mil
k
and
anim
al
par
amet
ers
(n
=
16).
Fat
Fat
yiel
dLo
g 10
FFA
Ure
a
Sum
C4:
0–C
8:0
Sum
C10
:0–C
14:0
C16
:0
C18
:0
C18
:1c9
C18
:2c9
,12
C18
:3c9
,12,
15
C18
:2c9
t11
Fat
yiel
d
0.36
Log 1
0FF
A
−0.3
8
0.20
Ure
a
−0.7
3***
−0.0
3
0.15
C4:
0–C
8:0
−0.2
3
−0.7
7**−0
.29
0.10
C10
:0–C
14:0
−0.5
4*−0
.72**
−0.2
0
0.55
*0.
86**
*
C16
:0
−0.4
5
−0.6
8**0.
01
0.32
0.63
***
0.76
***
C18
:0
0.70
**0.
69**
−0.1
2
−0.6
1*−0
.61*
−0.8
6***
−0.8
8***
C18
:1c9
0.32
0.74
**0.
30
−0.2
8
−0.9
2***
−0.9
3***
−0.8
3***
0.75
***
C18
:2c9
,12
0.47
0.74
**0.
19−0
.35
−0.8
4***
−0.8
9***
−0.8
3***
0.78
***
0.93
***
C18
:3c9
,12,
15
0.32
0.38
−0.2
1
−0.0
4
−0.2
7
−0.3
4
−0.6
0*0.
63**
0.31
0.43
C18
:2c9
t11
0.11
0.37
0.08
−0.0
2
−0.4
8 −0
.42
−0.6
8**0.
46
0.57
*0.
49
0.33
Ener
gy
bala
nce
−0.7
9***
−0.6
5**0.
05
0.63
**0.
62**
0.83
***
0.63
**−0
.82**
*−0
.67**
−0.8
2***
−0.4
5
−0.2
5
*P
<
0.05
.**
P
<
0.01
.**
*P
<
0.00
1.
H. Steinshamn et al. / Small Ruminant Research 122 (2014) 18–30 27
third hypothesis was that milk FA profile, due to differencesin forage botanical composition and phenological develop-ment, would be affected by forage type and grazing season.Two hay qualities were included as control feeds, as hayquality does not change during the course of time like pas-ture. The seasonal effect was confounded by the feedingregime preceding the forage treatments, as the goats in EGSwent directly from indoor silage to the forage experimen-tal period while the goats in LGS were out on rangeland forabout 50 d before they were allocated to their respectiveforage treatments. Daily milk yield was about 80% lowerin LGS than in EGS in the week before allocation to for-age treatment. Ideally, the LGS goats should also have beenkept indoor on silage until start of forage treatment exper-iment. This was not possible due to practical reasons, likeforage availability. However, our findings have consider-able applied relevance. Most dairy goat farmers in Norwaydepend on grazing rangeland or other pastures due both totraditions and to the fact that preserved forages have beenspent during the long indoor feeding season and that for-ages harvested and preserved during the grazing season isrequired for the following indoor season. Mating/kiddingtime is, on the other hand, easily manipulated, so delay-ing the kidding season in order to have goats in earlierstage of lactation in late grazing season, as done in the cur-rent experiment, is relevant. No other studies, as far as weknow, have compared seasonal effects with goats in thesame stage of lactation.
4.1. Effects on feed intake
Goats are more than any other domestic livestockspecies able to choose parts of plants with high nutritiousvalue, like high protein content, low fibre content and highdigestibility (Lu, 1988; Baumont et al., 2000). The presentstudy confirmed this, illustrated by the low fibre content(ADF, NDF) and relatively high digestibility of the selectedforages on pasture, particularly on PC, compared to thehay consumed (Table 1). The stocking rate was very low inthe current study in order to allow selective feeding andmaximize intake. Goats are also ‘opportunistic feeders’and change their feeding behaviour according to changesin the availability of feed and their physiological stage andrequirement (Fedele et al., 1993, 2002). Goats are browsers,and if available, as in WR, browse constitute 50–80% of theforages selected by goats (Silanikove et al., 2010). Browseoften contain large amounts of polyphenols, like tannins,that may restrict the digestibility and utilization, as indi-cated in the current study by the lower fibre digestibility ofthe forage selected by goats on WR than on the other diets,particularly in LGS (Table 1). It is known that dietary expe-rience modulates feeding behaviour and diet selection, andas such less experienced animals may graze considerablyless than experienced animals in the same environment(Provenza et al., 2003). Changes in diet, as imposed inthe current experiment, may have had an impact on theresults. In addition, likely due to their high selective ability,goats have hedonic behaviour and search for feed diversityprobably to maintain the rumen environment with respectto physiological and microbial parameters (Morand-Fehr,2003). Consequently, predicting voluntary intake by goats
based on traditional dietary parameters normally used forpredicting intake in other ruminants is difficult (Avondoet al., 2008). Thus, the relatively great difference in DMintake observed in the current study is likely due to thiscomplexity of interaction between animal metabolicrequirement and forage properties. The average total DMintake on PC in both seasons and on WR in EGS and HL inLGS, ranging between 31 and 35 g/kg BW, was similar tolevels found in the same breed fed good quality silage orhay ad libitum (Hussain et al., 1996; Dønnem et al., 2011c).The intake in goats fed HH and WR in LGS (50 g DM/kgBW) is considerably higher but it has been observed inother studies (Santini et al., 1992; Fedele et al., 2002), evenby browsing goats in Mediterranean woodland (Decandiaet al., 2008) and on mountain pasture in Norway (Eknæsand Skeie, 2006). Lower DM and NDF intake by goats onpasture than on hay is likely because the grazing goats hadthe opportunity to practice high degree of selectivity, asthe feed offer on the pasture was high. Therefore, the goatsgrazing reached their nutritional requirement at lowerintake level, i.e. dry matter intake was more governedby metabolic control of energy intake than physical fill(Santini et al., 1992). Others have also observed increasedforage DM intake with increasing forage fibre content(García et al., 1995; Bonanno et al., 2008). In the presentstudy, the CP and NDF concentrations of the total dietby goats grazing PC were on average across seasons 18and 34%, respectively, while the corresponding figures forgoats on rangeland were 16 and 32% in EGS and 13 and33% in LGS. Except for lower content of CP in LGS on WR,the dietary CP and NDF levels were strikingly similar andvery much in line with findings in free choice trials wherelactating goats themselves have shown to regulate the dietCP and NDF levels to 16.5 and 34%, respectively (Avondoet al., 2008). The CP and NDF concentration of the totaldiet by goats fed HH, with far less possibilities to selectplant parts compared to goats on pasture, was 19.6 and47%, respectively, while those receiving the low qualityhay (HL) on average consumed a diet containing 14.4% RPand 49% NDF. The results of the current study demonstratethat forage intake on pasture differs fundamentally fromhoused goats, and confirms that prediction of pastureintake based on herbage chemical analysis is difficult.
4.2. Effects on milk production and composition
The difference in milk yield and milk gross composi-tion between goats on rangeland and cultivated pasturecan be, to a large extent, explained by two factors, i.e. lowerfeed value of rangeland herbage as consumed and energyexpenditure due to locomotion on rangeland. Based on thewalking distances calculated from positions recorded bythe GPS collars, we estimated that the goats spent on aver-age 5.8 and 9.0 MJ NEL daily on locomotion in EGS and LGS,which was about 45 and 49% of their total energy intake,respectively. We do not have records of the physical activ-ity by the goat on PC, but we think that it was negligiblecompared to the goats on PR as the cultivated pasture wasadjacent to the milking parlour. Milk and energy correctedmilk yields production were on average 27 and 17% lower,respectively, on WR than on PC. Even though the forage
28 H. Steinshamn et al. / Small Ruminant Research 122 (2014) 18–30
quality as consumed was slightly lower on WR than on PC(Table 1), DM and net energy intake was similar or higheron rangeland than on cultivated pasture. Thus, energyrequirement for locomotion was the most important factordetermining differences in milk production between WRand PC.
As discussed earlier, higher milk production in EGS thanin LGS can mainly be explained by the pre-experimentalfeeding regime. However, the response to the forage treat-ments on production and milk quality in general wassimilar in the two seasons. Goats on PC managed tomaintain their milk production during the course of theexperimental period in both seasons, calculated as the milkproduction in the experiment relative to the milk produc-tion at the start of the experimental period. The goats onHH, WR and HL reduced their daily production of energycorrected milk by 13, 19 and 26%, respectively, in EGS, whilethe corresponding figures in LGS was 24, 24 and 71%.
Higher content of fat and total solids in milk producedon rangeland than on cultivated pasture is a concentra-tion effect due to lower milk yield (Santini et al., 1991).Higher milk fat content on pasture than on hay is in accor-dance with Morand-Fehr and Sauvant (1980) who foundthat the fat content in milk was higher when the dietaryconcentrate proportion increased in goats that had similarenergy intake. In the current experiment, goats on hay andpasture had on average similar energy intake and produc-tion, but the concentrate proportion of the diet was slightlyhigher (0.42 vs. 0.36%) on the goats grazing, particularlythe PC group (0.47) as a consequence of the lower forageintake on pastures. Higher milk fat content on WR thanon PC and on pasture compared to hay may also be dueto lower energy balance on WR and on pasture relative tohay. This is because mobilization of body fat contributes tomilk fat synthesis, and there is a highly significant correla-tion between milk fat content and energy balance (Chilliardet al., 2003), as also seen in the current study (Table 6).
Higher milk protein content on pasture than on haymight also be due to a somewhat higher dietary concen-trate to forage ratio on pasture than on hay (Morand-Fehret al., 2007). In addition, the balance between energy andprotein for rumen microbial protein synthesis and thesubsequently milk protein synthesis were probably moreoptimal on pasture, indicated by lower milk urea contenton pasture than on hay. Min et al. (2005) also found lowermilk urea content in goats grazing than goats fed hay butsimilar milk protein content.
The content of FFA in milk was in general low and atan acceptable level with respect to sensory attributes inboth EGS and LGS for all forage types. Even in LGS, wherethe pasture quality was lower than in EGS, particularly onrangeland, the content of FFA was lower than in EGS. Othershave found that high milk content of FFA is associated withpositive energy balance, high proportion of C16:0 and lowproportion of C18:0 and C18:1c9 (Dønnem et al., 2011b),while others have observed higher free fatty acid contentduring last part of the mountain rangeland period and hasassociated this with inferior herbage quality and intake(Eknæs and Skeie, 2006). We could find no associationbetween milk FFA content and calculated energy balance orother milk quality parameters. Hence, we believe that the
high content of FFA frequently observed in milk from goatsgrazing rangeland in Norway must have been caused byother factors, e.g. that the goats have reached a state wherethey allocate more resources to maintain body weight orgain rather than to milk production. It has been demon-strated in ruminants that long-term homeostasis is ensuredby mechanisms that favour the return to the body lipidstarting point after mobilization (Chilliard et al., 2000), andthe activity of lipoprotein lipase, the enzyme responsiblefor liberating fatty acids, rises when body fat is deposited(Chilliard et al., 1987). However, the mechanism betweenpositive energy balance, increased lipoprotein lipase activ-ity in adipose tissue and lipolysis in milk as observed byDønnem et al. (2011a) is still blurred, and warrant furtherresearch.
The FA composition in milk is known to be influenced byforage type (e.g. LeDoux et al., 2002; Chilliard and Ferlay,2004; Chilliard et al., 2007; Sanz Sampelayo et al., 2007),and changing from hay or silage based diets to pastureis known to decrease the proportion of saturated FA andincrease that of unsaturated FA (Tsiplakou et al., 2006;Chilliard et al., 2007; Renna et al., 2012a, 2012b). Manyof the unsaturated fatty FA that are claimed to have pos-itive health effects increase in milk from grazing animals,particularly C18:3c9,12,15, C18:1t11 and C18:2c9t11 (RA,rumenic acid). This effect was also observed in the presentstudy, where goats on pasture had lower proportion of thesaturated fatty acids C12:0–C16:0 and higher proportion ofC18:1 t11, C18:2c9,12, C18:3c9,12,15 and RA. Higher pro-portion of C18:1t11 and RA in milk produced on WR than onHH could not be explained by higher intake of the precur-sors, C18:2c9,12 and C18:3c9,12,15, as they were similar.It may be due change in the microbial flora in the rumenof the goat due to differences in the diet (Chilliard andFerlay, 2004) or due to plant secondary metabolites, liketannins, present in grazed woodland species that may mod-ify rumen biohydrogenation. Grazing condensed tanninscontaining herbage have shown to reduce milk proportionsof C18:1t11 and RA and increase proportions of C18:2c9,12and C18:3c9,12,15 in ewes (Cabiddu et al., 2009). Similarly,the milk proportion of RA was lower and of C18:2c9,12higher on WR than on PR in the present study. However,if this effect was due to differences in intake pf con-densed tannins warrant further studies. The relatively highproportion of C18:1t11 and RA in HL, particularly com-pared to HH despite lower intake of precursors, has beenobserved in other studies as well (Chilliard et al., 2007).Although the mechanism is ambiguous, the effect is likelydue to a reduced biohydrogenation of the precursor FAC18:3c9,12,15 in HL (Harstad and Steinshamn, 2010).
Different types of pastures also influence the FA profileof cow and sheep milk (Cabiddu et al., 2005; Chilliard et al.,2007). Fewer studies have been made in goats, but Di Tranaet al. (2005) found that milk C18:1t11 and RA were posi-tively correlated with the increasing intake of grass. Thisis in line with the current study, as the intake of the pre-cursors C18:3c9,12,15 and C18:3c9,12 were higher, and theproportions of RA and C18:1t11 were higher in milk on thegrass-dominated PC than on WR. The goats on WR had ahigh proportion of forbs and browse of trees and shrubs inthe diet (figures not shown).
H. Steinshamn et al. / Small Ruminant Research 122 (2014) 18–30 29
Lower proportion C8:0–C14:0 FA and higher propor-tion of C18:0 and C18:2c9,12 in milk produced on WR thanon PC may be due to differences in energy balance. Thereis a strong negative correlation between energy balanceand milk proportion of C18:0 (Table 6) because mobi-lized lipids stored in animal tissue are transferred to themammary gland by plasma and are used in the milk syn-thesis (Chilliard et al., 2003). Difference in energy balance,also likely explains the difference in milk FA compositionbetween EGS and LGS. The goats in EGS had lower energybalance than the goats in LGS, and their milk was charac-terized by higher proportion of FA mobilized from body fattissues than milk produced in LGS. The milk produced inLGS, when the goats had higher energy balance, was char-acterized by higher proportion of de novo synthesized FA(C4:0–C14:0).
The study confirmed the hypothesis that goats grazingcultivated pasture yielded more milk than goats grazingon rangeland. However, the difference was not mainly dueto difference in feed intake and herbage quality but dueto energy spent on locomotion. We could not confirm thatgrazing season had no impact on milk production and qual-ity because of confounded effects of pre-experimental diet.However, when corrected for difference in milk yield andquality at start of each period the effects of the forage treat-ment were similar in both periods, and the hypothesis thatmilk from goats grazing rangeland would have lower qual-ity in late than in early grazing season had to be rejected.The third hypothesis, that milk FA was influenced by foragetreatment and season, was confirmed.
5. Conclusion
Goats grazing heterogeneous rangeland produced 26%less milk, but the milk had higher fat and total solids con-tent when compared to goats grazing cultivated pasture.Consequently, the difference in energy corrected milk yieldwas less, i.e. 17% less milk on rangeland than on culti-vated pasture. Rangeland did not impair milk quality withrespect to FFA. The effect of pasture type was similar in bothearly and late grazing season. Grazing resulted in milk withhigher content of fat, protein, DM and lower content of ureaand FFA than hay diets. The results indicate that rangelandgrazing does not necessarily lead to high milk content ofFFA and to increased level of FFA during the grazing season.
Conflict of interest
None.
Acknowledgements
This work is financially supported by the ResearchCouncil of Norway and TINE SA under the research project185135/I10. We acknowledge the great help of the staffat Senja videregående skole, Gibostad, under the directonof Magnhild Johanne Nymo. We are grateful to Kia Hansenand Rebekka May-Lene Helgesen for technical assistance inconducting the feeding experiment. TINE is acknowledgedfor performing milk routine analysis (FTIR) free of charge.
Thanks are also due to Alemayehu Kidane Sagaye for theimprovement of the English language.
References
Astrup, H.N., Steine, T.A., Robstad, A.M., 1985. Taste, free fatty acidsand fatty acids content in goat milk. Acta Agric. Scand. 35,315–320.
AOAC, 1990. Official Methods of Analysis, 15th edition. Assoc. Off. Anal.Chem., Arlington, VA.
Avondo, M., Biondi, L., Pagano, R.I., Bonanno, A., Lutri, L., 2008. Feed intake.In: Cannas, A., Pulina, G. (Eds.), Dairy Goats Feeding and Nutrition. CABIInternational, Wallingford, UK, pp. 147–160.
Bakke, H., Steine, T., Eggum, Å., 1977. Flavour score and content of freefatty acids in goat milk. Acta Agric. Scand. 27, 245–249.
Baumont, R., Prache, S., Meuret, M., Morand-Fehr, P., 2000. How foragecharacteristics influence behaviour and intake in small ruminants: areview. Livest. Prod. Sci. 64, 15–28.
Bonanno, A., Todaro, M., Di Grigoli, A., Scatassa, M., Tornambé, G., Ali-cata, M., 2008. Relationships between dietary factors and milk ureanitrogen level in goats grazing herbaceous pasture. Ital. J. Anim. Sci. 7,219–235.
Browse, J., McCourt, P.J., Somerville, C.R., 1986. Fatty-acid compositionof leaf lipids determined after combined digestion and fatty-acidmethyl-ester formation from fresh tissue. Anal. Biochem. 152,141–145.
Cabiddu, A., Decandia, M., Addis, M., Piredda, G., Pirisi, A., Molle, G.,2005. Managing Mediterranean pastures in order to enhance thelevel of beneficial fatty acids in sheep milk. Small Rumin. Res. 59,169–180.
Cabiddu, A., Molle, G., Decandia, M., Spada, S., Fiori, M., Piredda, G.,Addis, M., 2009. Responses to condensed tannins of flowering sulla(Hedysarum coronarium L.) grazed by dairy sheep. Part 2: Effects onmilk fatty acid profile. Livest. Sci. 123, 230–240.
Chilliard, Y., Ferlay, A., 2004. Dietary lipids and forages interactions on cowand goat milk fatty acid composition and sensory properties. Reprod.Nutr. Dev. 44, 467–492.
Chilliard, Y., Ferlay, A., Faulconnier, Y., Bonnet, M., Rouel, J., Bocquier, F.,2000. Adipose tissue metabolism and its role in adaptations to under-nutrition in ruminants. Proc. Nutr. Soc. 59, 127–134.
Chilliard, Y., Ferlay, A., Rouel, J., Lamberet, G., 2003. A review of nutri-tional and physiological factors affecting goat milk lipid synthesis andlipolysis. J. Dairy Sci. 86, 1751–1770.
Chilliard, Y., Glasser, F., Ferlay, A., Bernard, L., Rouel, J., Doreau, M., 2007.Diet, rumen biohydrogenation and nutritional quality of cow and goatmilk fat. Eur. J. Lipid Sci. Technol. 109, 828–855.
Chilliard, Y., Sauvant, D., Morand-Fehr, P., Delouis, C., 1987. Relations entrele bilan energetique et l’activit, metabolique du tissu adipeux de lachevre au cours de la premiere moiti’ de la lactation. Reprod. Nutr.Dev. 27, 307–308.
Dagnachew, B., Thaller, G., Lien, S., Adnoy, T., 2011. Casein SNP in Norwe-gian goats: additive and dominance effects on milk composition andquality. Genet. Select. Evol. 43, 31.
Decandia, M., Yiakoulaki, M.D., Pinna, G., Cabiddu, A., Molle, G., 2008.Foraging behaviour and intake of goats browsing on mediteraneanshrublands. In: Cannas, A., Pulina, G. (Eds.), Dairy Goats Feeding andNutrition. CABI International, Wallingford, UK, pp. 161–188.
Devle, H., Rukke, E.-O., Naess-Andresen, C.F., Ekeberg, D., 2009. A GC –magnetic sector MS method for identification and quantification offatty acids in ewe milk by different acquisition modes. J. Sep. Sci. 32,3738–3745.
Devold, T.G., Nordbø, R., Langsrud, T., Svenning, C., Jansen Brovold, M.,Sørensen, E.S., Christensen, B., Ådnøy, T., Vegarud, G.E., 2010. Extremefrequencies of the �s1-casein “null” variant in milk from Norwegiandairy goats – implications for milk composition, micellar size andrenneting properties. Dairy Sci. Technol. 91, 39–51.
Di Trana, A., Cifuni, G.F., Impemba, G., Braghieri, A., Claps, S., Rubino, R.,2005. Relationships among diet botanical composition, milk fatty acidand herbage fatty acid content in grazing goats. In: Molina Alcaide,E., Ben Salem, H., Biala, K., Morand-Fehr, P. (Eds.), Sustainable Graz-ing, Nutritional Utilization and Quality of Sheep and Goat Products.First Joint Seminar of the FAO-CIHEAM Sheep and Goat Nutritionand Mountain and Mediterranean Pasture Sub-Networks. 2–4 October2003, Granada, pp. 269–273.
Dove, H., Mayes, R.W., 2006. Protocol for the analysis of n-alkanes andother plant–wax compounds and for their use as markers for quanti-fying the nutrient supply of large mammalian herbivores. Nat. Protoc.1, 1680–1697.
30 H. Steinshamn et al. / Small Ruminant Research 122 (2014) 18–30
Dønnem, I., Eknæs, M., Randby, Å.T., 2011a. Energy status, measuredby computer tomography (CT)-scanning, and milk quality of dairygoats fed rations with various energy concentrations. Livest. Sci. 142,235–244.
Dønnem, I., Randby, Å.T., Eknæs, M., 2011b. Effect of grass silage harvestingtime and level of concentrate supplementation on goat milk quality.Anim. Feed Sci. Technol. 163, 118–129.
Dønnem, I., Randby, Å.T., Eknæs, M., 2011c. Effects of grass silage har-vesting time and level of concentrate supplementation on nutrientdigestibility and dairy goat performance. Anim. Feed Sci. Technol. 163,150–160.
Eknæs, M., Havrevoll, O., Volden, H., Hove, K., 2009. Fat content, fatty acidprofile and off-flavours in goats milk – effects of feed concentrateswith different fat sources during the grazing season. Anim. Feed Sci.Technol. 152, 112–122.
Eknæs, M., Kolstad, K., Volden, H., Hove, K., 2006. Changes in body reservesand milk quality throughout lactation in dairy goats. Small Rumin. Res.63, 1–11.
Eknæs, M., Skeie, S., 2006. Effect of different level of roughage availabilityand contrast levels of concentrate supplementation on flavour of goatmilk. Small Rumin. Res. 66, 32–43.
Fedele, V., Claps, S., Rubino, R., Calandrelli, M., Pilla, A.M., 2002. Effect offree-choice and traditional feeding systems on goat feeding behaviourand intake. Livest. Prod. Sci. 74, 19–31.
Fedele, V., Pizzillo, M., Claps, S., Morand-Fehr, P., Rubino, R., 1993. Grazingbehavior and diet selection of goats on native pasture in SouthernItaly. Small Rumin. Res. 11, 305–322.
Folch, J., Lees, M., Stanley, G.H.S., 1957. A simple method for the isolationand purification of total lipids from animal tissues. J. Biol. Chem. 226,497–509.
García, M.A., Aguilera, J.F., Alcaide, E.M., 1995. Voluntary intake and kinet-ics of degradation and passage of unsupplemented and supplementedpastures from semiarid lands in grazing goats and sheep. Livest. Prod.Sci. 44, 245–255.
Harstad, O.M., Steinshamn, H., 2010. Cow’s diet and milk composition.In: Griffiths, M.W. (Ed.), Imorving the Safety and Quality of Milk. Vol.1: Milk Production and Processing. Woodhead Publishing Limited,Oxford/Cambridge/New Delhi, pp. 223–245.
Hayes, B., Hagesaether, N., Adnoy, T., Pellerud, G., Berg, P.R., Lien, S., 2006.Effects on production traits of haplotypes among casein genes in Nor-wegian goats and evidence for a site of preferential recombination.Genetics 174, 455–464.
Hussain, Q., Havrevoll, Ø., Eik, L.O., 1996. Effect of type of roughage on feedintake, milk yield and body condition of pregnant goats. Small Rumin.Res. 22, 131–139.
INRA, 2010. Alimentation des bovins, ovins et caprins. Besoins des ani-maux – Valeurs des aliments – Tables inra 2007.
LeDoux, M., Rouzeau, A., Bas, P., Sauvant, D., 2002. Occurrence of trans-C18:1 fatty acid isomers in goat milk: effect of two dietary regimens.J. Dairy Sci. 85, 190–197.
Littell, R.C., Henry, P.R., Ammerman, C.B., 1998. Statistical analysis ofrepeated measures data using SAS procedures. J. Anim. Sci. 76,1216–1231.
Lu, C.D., 1988. Grazing behavior and diet selection of goats. Small Rumin.Res. 1, 205–216.
Lunnan, T., Todnem, J., 2011. Forage quality of native grasses in mountainpastures of southern Norway. In: Pötsch, E., Krautzer, B., Hopkins, A.(Eds.), Grassland Farming and Land Management Systems in Moun-tainous Regions. Proceedings of the 16th Symposium of the EuropeanGrassland Federation. Agricultural Research and Education Centre(AREC) Raumberg-Gumpenstein, Irdning, Austria, pp. 568–570.
Mannetje, L., Haydock, K.P., 1963. The dry weight rank method for botan-ical analysis of pasture. J. Br. Grassl. Soc. 18, 268–275.
Mayes, R.W., Lamb, C.S., Colgrove, P.M., 1986. The use of dosed and herbagen-alkanes as markers for the determination of herbage intake. J. Agric.Sci. 107, 161–170.
Mayes, R.W., Beresford, N.A., Lamb, C.S., Barnett, C.L., Howard, B.J., Jones,B.-E.V., Eriksson, O., Hove, K., Pedersen, Ø., Staines, B.W., 1994. Novelapproaches to the estimation of intake and bioavailability of radio-caesium in ruminants grazing forested areas. Sci. Total Environ. 157,289–300.
Min, B.R., Hart, S.P., Sahlu, T., Satter, L.D., 2005. The effect of diets on milkproduction and composition, and on lactation curves in pastured dairygoats. J. Dairy Sci. 88, 2604–2615.
Morand-Fehr, P., 2003. Dietary choices of goats at the trough. Small Rumin.Res. 49, 231–239.
Morand-Fehr, P., Fedele, V., Decandia, M., Le Frieleux, Y., 2007. Influenceof farming and feeding systems on composition and quality of goatand sheep milk. Small Rumin. Res. 68, 20–34.
Morand-Fehr, P., Sauvant, D., 1980. Composition and yield of goat milk asaffected by nutritional manipulation. J. Dairy Sci. 63, 1671–1680.
Mæhre, H.K., Hamre, K., Elvevoll, E.O., 2013. Nutrient evaluation ofrotifers and zooplankton: feed for marine fish larvae. Aquac. Nutr. 19,301–311.
Pinkart, H.C., Devereux, R., Chapman, P.J., 1998. Rapid separation of micro-bial lipids using solid phase extraction columns. J. Microbiol. Methods34, 9–15.
Provenza, F.D., Villalba, J.J., Dziba, L.E., Atwood, S.B., Banner, R.E., 2003.Linking herbivore experience, varied diets, and plant biochemicaldiversity. Small Rumin. Res. 49, 257–274.
Renna, M., Cornale, P., Lussiana, C., Malfatto, V., Mimosi, A., Battaglini, M.,2012a. Fatty acid profile of milk from goats fed diets with differentlevels of conserved and fresh forages. Int. J. Dairy Technol. 65, 201–207.
Renna, M., Lussiana, C., Cornale, P., Fortina, R., Mimosi, A., 2012b. Changesin goat milk fatty acids during abrupt transition from indoor to pasturediet. Small Rumin. Res. 108, 12–21.
Ruiz, J., Antequera, T., Andres, A.I., Petron, M.J., Muriel, E., 2004. Improve-ment of a solid phase extraction method for analysis of lipid fractionsin muscle foods. Anal. Chim. Acta 520, 201–205.
Rønningen, K., 1965. Causes of variation in the flavour intensity of goatmilk. Acta Agric. Scand. 15, 301–342.
Santini, F.J., Lu, C.D., Potchoiba, M.J., Coleman, S.W., 1991. Effects of aciddetergent fiber intake on early postpartum milk production and chew-ing activities in dairy goats fed alfalfa hay. Small Rumin. Res. 6, 63–71.
Santini, F.J., Lu, C.D., Potchoiba, M.J., Fernandez, J.M., Coleman, S.W., 1992.Dietary fiber and milk yield, mastication, digestion, and rate of passagein goats fed alfalfa hay. J. Dairy Sci. 75, 209–219.
Sanz Sampelayo, M.R., Chilliard, Y., Schmidely, P., Boza, J., 2007. Influenceof type of diet on the fat constituents of goat and sheep milk. SmallRumin. Res. 68, 42–63.
SAS, 2009. SAS/STAT 9.2 User’s Guide, 2nd edition. SAS Inst., Inc., Cary, NC.Silanikove, N., Leitner, G., Merin, U., Prosser, C.G., 2010. Recent advances
in exploiting goat’s milk: quality, safety and production aspects. SmallRumin. Res. 89, 110–124.
Skjevdal, T., 1979. Flavor of goats milk – review of studies on the sourcesof its variations. Livest. Prod. Sci. 6, 397–405.
Tsiplakou, E., Mountzouris, K.C., Zervas, G., 2006. Concentration of conju-gated linoleic acid in grazing sheep and goat milk fat. Livest. Sci. 103,74–84.
Van Soest, P.J., Robertson, J.B., Lewis, B.A., 1991. Methods for dietary fiber,neutral detergent fiber, and nonstarch polysaccharides in relation toanimal nutrition. J. Dairy Sci. 74, 3583–3597.


Paper III

1
Feeding a supplement rich in unsaturated fatty acids improve lipid
composition and flavour in Norwegian goat milk
R. Aa. Inglingstad,*1 S. Skeie,* G. E. Vegarud,* T. G. Devold,* Y. Chilliard, † and M. Eknæs‡
*Department of Chemistry, Biotechnology and Food Science (IKBM), Norwegian University
of Life Sciences (NMBU).
†UMR1213 Herbivores, Institut National de la Recherche Agronomique (INRA)-Clermont-
Theix-Lyon, F-63122 Saint-Genès-Champanelle, France.
‡Department of Animal and Aquacultural Sciences (IHA), NMBU
1Corresponding author: [email protected]
ABSTRACT
The present study aimed to examine the effect of lipid supplemented concentrates on milk fat
content, fatty acid composition, free fatty acids (FFA), lipoprotein lipase (LPL) activity,
sensory properties and size of milk fat globules of goat milk. Thirty goats assigned to three
experimental groups were fed different concentrates from 60 DIM until late lactation (230
DIM). The diets were 1) control concentrate (CONTR), 2) control concentrate added 8 % of
saturated lipids (Akofeed Gigant 60; rich in C16:0) (SAT) and 3) control concentrate added 8
% of unsaturated lipids (rapeseed oil, rich in C18:1c9 and 18:2c9,12) (UNSAT).
The SAT group produced milk with the highest fat content, and the fat content was positively
correlated with the mean size of milk fat globules. Goats in the UNSAT group had a higher
content of the long- and unsaturated fatty acids, while milk from goats in SAT group had a
higher content of palmitic and palmitoleic acid (C16:0 and C16:1). The CONTROL group
produced milk with a higher content of short-, medium-, odd- and branched chain fatty acids
compared to the two other groups. The content of FFA in milk were low in early and late
lactation, and peaked at mid lactation (90-120 DIM). A high content of FFA were correlated
with poor sensory properties (tart/rancid flavour). Goats fed the UNSAT concentrate produced
a milk with a lower LPL-activity and content of FFA, better sensory properties and a higher
proportion of unsaturated fatty acids.
Key Words: goat milk, fatty acid composition, FFA, milk fat globules, milk sensory properties.
2
INTRODUCTION
The Norwegian goat milk has previously been of variable quality both with regards to rennet
coagulation properties and off-flavours, which may be a problem in the production of cheese.
The problem is most prominent in mid-lactation, which sometimes coincidence with the time
when the goats are let out on mountain or rangeland pasture (Eknæs et al., 2006). The off-
flavours of goat milk has been found to be correlated with the content of free fatty acids (FFA)
(Dønnem et al., 2011). FFA are a result of lipoprotein lipase (LPL) which hydrolyses mainly
triglycerides into glycerol and FFA. The LPL is a highly potent enzyme, however it does not
reach its fully lipolytic potential in milk because its substrate (the triglycerides) is localised in
milk fat globules (MFG) surrounded by a protective membrane: the milk fat globule membrane
(MFGM) (Deeth, 2006). In cow milk, LPL is associated with the casein micelles; however, in
goat milk it is, most probably, associated with the MFGM (Chilliard et al., 2003). If the MFGM
is damaged or broken, the LPL will have access to the triglycerides with excessive lipolysis as
a consequence. Previous studies (Eknæs et al., 2009) have shown that extra supplements of
saturated fat (C16:0 and C18:0) in the diet of goats improve the milk flavour. Calcium salts of
palm oil derived fatty acids are now largely used for dairy energy supplements (Onetti &
Grummer, 2004). However, the use of palm oil is criticized severely, both from an
environmental sustainability point of view (Wilcove et al., 2013) and from a human health
perspective since it increases milk palmitic acid which is not recommended (Shingfield et al.,
2008). Hence, the search for a good substitute to palm oil in animal feed becomes increasingly
important.
Oilseeds were introduced to Norway in the late fifties, and the land used for cultivation today
is less than one percent of the total cultivated farmland (Granlund et al., 2010).
Rapeseeds could be a more sustainable substitute for palm oil. Feeding experiments with
rapeseeds or rapeseed oil to dairy goats in other countries have shown a positive effect on milk
quality. LPL activity and the level of FFA were reduced (Ollier et al., 2009) and contents of
saturated fatty acids, especially C16:0 decreased and trans-C18:1 isomers, linoleic-, linolenic
and conjugated linoleic acids (CLA) increased (Andrade & Schmidely, 2006; Gulati et al.,
1997; Mir et al., 1999).
The aim of this study was to evaluate the effect of lipid supplemented concentrate on the
following milk parameters: fat content, fatty acid composition, lipolysis, LPL-activity, FFA,
and size of milk fat globules (MFG) Two different lipid sources were used (saturated palm oil
3
or unsaturated rapeseed oil). A concentrate with no added fat was used as a control feed. Milk
samples from individual goats allocated to three feeding groups were collected six times
throughout the lactation cycle.
MATERIALS AND METHODS
Experimental Design
Thirty Norwegian Dairy Goats kidding in February 2011 were fed a control diet with a
concentrate mixture consisting of barley, rapeseed meal (Expro 00SF, AarhusKarlshamn
Sweden AB, SE 374 82 Karlshamn, Sweden), soy bean meal, beet pulp, molasses and
mineral/vitamin premix until 60 days in milk (DIM). Thereafter, the goats were assigned to
three experimental groups each of 10 goats receiving three types of feed.
The diets were 1) control concentrate, 2) control concentrate added 8 % of saturated lipids
from palm oil and 3) control concentrate added 8% of unsaturated lipids from rapeseed oil.
The experimental groups 1) Control, 2) Saturated and 3) Unsaturated are further denoted
CONTR, SAT and UNSAT, respectively. These abbreviations is also used to describe the milk
(SAT milk etc.).
A detailed description of the experimental design is described previously (Inglingstad et al.,
2015).
The goats received 0.9 kg of the experimental concentrate per day until the start of the
mountain grazing season, thereafter 0.7 kg per day. The experimental concentrate mixtures
were produced by The Centre for Feed Technology at the Norwegian University of Life
Sciences, and the fat content and the fatty acid composition of the concentrates and the silage
is shown in Table 1.
Milk Sampling
The goats were milked 6:00 in the morning and 15:30 in the evening. Because milk yield was
lower in the evening, morning and evening milk was pooled in the ratio 0.6:0.4. Preparation
and analysis of milk samples were performed on 3.5 days old milk stored at 4°C (84 hrs) (age
of milk when processed by the dairies), unless otherwise specified. At 190 DIM, the goats were
at the summer mountain pasture and due to limited laboratory facilities, the milk were
transported by car 400 km to the University for preparation and analyses.
4
Total Content of Fat and FFA
To study the development of FFA during storage of the goat milk, samples for measurement
of the content of FFA were analysed at three different time points : 1) at time zero (shortly after
milking the milk was pasteurized, 63°C for 30 min, to inactivate LPL), 2) 36 hrs after milking
and 3) 84 hrs after milking. The fat content was measured in 36 hrs old milk. The samples were
added one tablet of Bronopol (2-bromo-2-nitropropane-1, 3-diol; D&F Inc., USA) and were
kept at 4°C until analysis by FTIR/milkoscan (MilkoScan Combifoss 6500; Foss, Hillerød,
Denmark).
Extraction, Separation and Analysis of Milk Lipids
The total lipids were extracted as described by Steinshamn et al. (2014) using a modified
method of Folch et al. (1957). Internal standards (trinonadecanoin and trinonadecanoic acid,
Larodan) dissolved in chloroform were added to the samples prior extraction.
The extracted lipids were re-dissolved in hexane:chloroform:methanol (95:3:2, v/v) and
loaded on 500 mg aminopropyl cartriges (Hypersep spe, Thermo Scientific, Bellfonte PA,
USA) for solid phase extraction (SPE). The cartriges were conditioned with 7 mL of hexane
before loading. Neutral lipids (mainly triglycerides (TG)) were eluted by 5 mL chloroform,
thereafter the free fatty acids were eluted by 5 mL 2 % acetic acid in diethyl ether. The solvents
were evaporated under a gentle stream of N2.
Transesterification and esterification of fatty acids were performed according to Devle et al.
(2014), and the fatty acid methyl esters (FAME) in hexane were transferred to GC-vials and
stored at -20°C until analysis.
The FAME were analysed with gas chromatography (GC) with a flame ionization detector
(FID) as described by by Eknæs and Skeie (2006). The column used was a 50 m CP-Sil 88
capillary column with a inner diameter of 0.25 mm and 0.20 µm film thickness (Varian, Agilent
Technologies, Matriks, Norway). The GC oven temperature was 60°C for 3 min, then raised
with 10°C/min to 140°C and held for 1 min, thereafter raised with10°C/min to 160°C and held
for 1 min, and finally raised with 2.5°C/min to 210°C and held for 20 min.. FID signals were
transferred to a Total Chrom workstation for interpretation and calibration. FAME were
identified by comparing retention time (RT) of standards from Larodan Fine Chemicals
(Malmö, Sweden) and Sigma in addition to fatty acid profiles of goat milk obtained by GC-
MS in a previous study (Steinshamn et al., 2014). Due to carry over of free fatty acids (mainly
5
C16:0 and C18:0) from polypropylene cartriges and tubes during sample preparation, these
fatty acids were omitted from the results. This was only a problem in the fraction of FFA, and
did not infer the TG fraction.
Measurement of LPL-activity
The LPL-activity was measured in milk sampled at 30, 60, 120, 200 and 230 DIM and kept
at -20°C before analysis. LPL (EC 3.1.1.34) activity was measured using an artificial emulsion
containing [3H]-triolein (Bernard et al., 2005).
Measurement of Milk Fat Globule Size and Composition of the Milk Fat Globule Membrane
The size of the milk fat globules were measured by laser light scattering (LLS) using a
Mastersizer 2000 (Malvern Instruments, Malvern, UK). The method used is previously
described by Michalski et al. (2001), except that the 0.1 % SDS solution was replaced by MilliQ
water.
The composition of phospholipids and cholesterol in the MFGM were analysed by Vitas AS,
Oslo. Six milk samples (3 with high and 3 with low content of FFA) from the sampling at 90
DIM were chosen for this analysis, and only milk from goats on the SAT group was used to
omit confounding factors such as lactation and feeding. The milk samples were kept at -20°C
before analysis. For identification and quantification of polar lipids and sphingomyelin,
samples were accurately weighted, dissolved in isopropanol, shaken and centrifuged. The
supernatants were transferred to new vials. The pellets were washed with isopropanol,
centrifuged, and the resulting supernatants were pooled with the first ones . The supernatants
were evaporated to dryness and dissolved in a mix of chloroform:methanol:water and analysed
with an Agilent 1100 normal phase liquid chromatography system using an Evaporative Light
Scattering Detector (ELSD). Separation were performed on a PVC-SIL-NP 250x4.6 mm HPLC
column (YMC) using hexane, isopropanol, acetonitrile, chloroform, tert-butyl methyl ether,
water and acetic acid as mobile phase. Analytes were calibrated against known standards
(Lipoid GMBH). Samples for quantification of cholesterol were accurately weighted and
dissolved in methanol and a sodium hydroxide solution, then incubated for 60 minutes at 50°C
to hydrolyse cholesteryl esters to free cholesterol and then centrifuged. Cholesterols were
determined by an Agilent reversed phase liquid chromatography system using a diode array
detector (DAD). Separation were performed on an Eclipse XDB-C8 150x4.6 particle size 5 µm
6
column from Agilent using methanol with ammonium acetate as mobile phase. Analytes were
calibrated against known standard from Sigma-Aldrich.
Sensory evaluation of milk
Three panellists trained for sensory analysis of goat milk performed the sensory analysis of
the goat milk samples. The analysis was done by scoring using a scale from 1-5, where 1
indicates pronounced flavour deviation and 5 indicates good milk without off-flavours.
Statistical analysis
Analysis of variance was performed using the MIXED procedure (Littell et al., 1998) of SAS
(SAS, 1992). The measurements of milk were repeated several times for each goat, and
appeared correlated. Therefore, this correlation was considered in the statistical model. The
covariance structure of the repeated measurements was chosen by comparing potential
structures using Akaike’s and Schwarz’s Bayesian information criterion (Wolfinger, 1996).
Variance components (VC) covariance structure proved useful for all the milk data. The value
at 60 DIM was used as a covariate. Analysis of variance with repeated measurements of the
milk data was performed according to the following model:
Y ijkl = µ + A i + B j + A x B (ij) + C k + A x C (ik) + d(At) Ɛ ijkl
Where µ is the intercept; Ai is the fixed effect of concentrate type, i=1, 2, 3 (CONTROL,
SAT, UNSAT); Bj is the fixed effect of DIM, j=1, 2,….4 (DIM 90, 120, 200, 230); A x B (ij ) is
the interaction between concentrate type i and DIM j; Ck is the fixed effect of genotype at the
CSN1S1 locus, k=1,2 (E12-00, E12-01); A x C (ik) is the interaction between concentrate type i
and genotype j; d(At) is random effect of goat within concentrate type and genotype and Ɛijkl
represents the experimental error.
The difference between means was estimated by the calculated lsmeans. Differences were
considered statistically significant when P < 0.05.
Principal component analysis (PCA) of the fatty acids composition (in TG), FFA content and
composition and sensory data was conducted using The Unscrambler® X 10.3 (CAMO Process
AS, Oslo, Norway). The fatty acid data were weighted by dividing each response variable by
its standard deviation, while the sensory data were not weighted as the same scale was used
during analysis. Full cross-validation was used to validate the data set.
7
RESULTS AND DISCUSSION
Fat Content and Fatty Acid Composition in Triglycerides
The fat content in milk was influenced both by DIM (P<0.0001) and type of lipid
supplementation (P<0.0007). The fat content in milk was highest shortly after kidding (30
DIM) and in SAT milk (Table 2). A high fat content in early lactation is in accordance with
other studies (Chilliard et al., 2003; Eknæs et al., 2006), and extra dietary fat fed to goats is
also known to increase the fat content in the milk (Chilliard & Ferlay, 2004; Sanz Sampelayo
et al., 2007; Tudisco et al., 2015). However, the difference in fat content (P<0.02) between the
SAT and the UNSAT groups was not expected. One of the limitations of feeding fat
supplements to dairy cows is the inhibition of their rumen microbial activity (Palmquist, 1984)
which affects fibre digestion in the rumen (Palmquist, 1984) and probably depresses fibre
intake (Khorasani et al., 1996). Furthermore, feeding a surplus of unsaturated fats to cows may
cause milk fat depression (Bauman & Griinari, 2003). However, goats seem to tolerate addition
of unsaturated fat well, and hence it is possible to alter their milk fatty acid composition by
feeding (Chilliard et al., 2003). In total, 32 different fatty acids were identified and quantified
from the TG fraction (Table 3). The most abundant fatty acids were palmitic acid (C16:0), oleic
acid (C18:1c9) and stearic acid (C18:0). The contents ofall fatty acids were influenced by the
lactation stage except arachidonic acid (C20:4). The content of saturated fatty acids (C4:0-
C14:0 were highest in early and late stage of lactation, while the unsaturated fatty acids were
highest in mid lactation. The influence of the different lipid supplements on the fatty acid
composition is shown by principal component analysis (PCA). The PCA score plot separated
the goats in three distinct clusters according to the feeding they received (Figure 1).
Comparison of the loading plot (milk fatty acids) with score plot (goats) shows that goats in
the CONTR group produced milk with a higher proportion of saturated fatty acids (except for
C4:0) with less than 16 carbon atoms, including a higher content of odd- and branched chain
fatty acids compared to the SAT and UNSAT groups. The odd- and branched chain fatty acids
originates from ruminal metabolism of branched-chain amino acids, propionate and butyrate
(Chilliard et al., 2003). A higher content of 16:0 and 16:1c9 throughout lactation characterized
the SAT milk compared to the milk from the two other groups. These results are in accordance
with previous results using the same source of saturated lipids (Eknæs et al., 2009) and reflects
its high 16:0 content. The UNSAT milk had a higher content of C16:1t9 and fatty acids with
18 or more carbons, mainly 18:0 and 18:1c9. However, linoleic- (18:2c9,12) and linolenic acid
8
(C18:3c9,12,15) were higher in CONTR milk, and the content of arachidonic acid was not
influenced by feed or DIM. This is likely due to the almost complete biohydrogenation in the
rumen of linoleic and linolenic acids from dietary rapeseed oil, which are transformed into 18:0
and several cis or trans intermediates (Chilliard et al., 2007). Intake of long- and unsaturated
fatty acids have been recommended for human consumption by health authorities and
intergovernmental organizations (Fao, 2010), and some fatty acids are claimed to have health-
promoting properties (Shingfield et al., 2008). If the milk is to be processed into products like
cheese and butter, a higher content of unsaturated fatty acids may result in products with a
softer texture. Different lipid supplementation to dairy goats has also shown to influence the
proteolysis during cheese ripening (Inglingstad et al., 2015), which most probably may be
explained by the influence of the different fatty acid profiles on the cheese ripening.
Mean Diameter of the Milk Fat Globules
The mean size of the MFG decreased during lactation from 3.46 µm at 30 DIM to 2.88 µm
at 230 DIM, and a similar effect of lactation on the MFG size has been reported by others in
bovine milk (Wiking et al., 2004). A decline in MFG size with increasing intake of grass (and
an increase in milk yield) (Couvreur et al., 2006) and unsaturated lipids extruded linseeds
(Lopez et al., 2008) was reported for cows, however no decrease in MFG size were observed
when the goats were let out on pasture (at 200 DIM, Table 2) in this present study. The average
size of MFG varies between breeds; smaller MFG were reported in milk from French Alpine
(2.76 µm) (Attaie & Richter, 2000) and Sarda (2.73 µm) than in Saanen (3.63 µm) goats
(Pisanu et al., 2013). The MFG size of Norwegian Dairy goats seems to be in between those
breeds with an average of 3.2 µm at mid lactation (120 DIM). However, the above-mentioned
effects of breed, diet and lactation stage may be confounded with fat content. Several authors
report a positive relationship between the fat content and the mean diameter of the MFG of
goats (Cebo et al., 2012), cows (Wiking et al., 2004) and buffalo (Ménard et al., 2010), a trend
which is also confirmed in this study (r=0.72, n=186, P<0.0001). Polymorphism at the CSN1S1
may also influence MFG size as goats of the “strong” genotype (A/A) are reported to have
larger MFG than those of the “weak” (0/0) genotype (Cebo et al., 2012), however the effect
of genotype in the present study was not significant (results not shown). In bovine milk, smaller
MFG displays also a less firm and more spreadable butter (Couvreur et al., 2006) and cheese
(Michalski et al., 2004). However, smaller MFG increases the total surface area of the MFG
9
fraction, which makes the fat more susceptible for lipolysis by human pancreatic lipase (Berton
et al., 2012) and maybe also by the indigenous milk LPL.
Lipoprotein Lipase Activity, Free Fatty Acids and Milk Flavour
Lipoprotein lipase activity decreased between 120 and 230 DIM (Table 2), which is in
agreement with a study in cows (Chazal & Chilliard, 1986) but opposite to results obtained in
another (Ahrné & Björck, 1985). Previous studies on goat milk showed low activity in early
and late lactation and a high LPL-activity between 60-210 DIM (Chilliard et al., 2003). UNSAT
milk had lower LPL-activity than CONTR (P=0.001 and SAT (P=0.02), which is supported by
other studies also showing a lower LPL-activity when goats were fed unsaturated lipids
(Bernard et al., 2009; Bernard et al., 2005). In early lactation, the content of FFA was low in
general, although large variations were seen among goats (lowest 0.1 mM vs. highest 1.4 mM
at 30 DIM). The FFA content peaked at mid-lactation (90-120 DIM, Figure 2A, in agreement
with Chilliard et al. (2003)), where some goats displayed an unacceptable high content (up to
3.3 mM) of FFA in milk. However, other goats produced milk with a low content (0.1 mM) of
FFA throughout the lactation, even at mid-lactation. Interestingly, milk from the UNSAT group
had a remarkably lower content of FFA (0.8 mM) compared to milk from the CONTR (1.7
mM, P=0.05) and SAT (1.9 mM, P=0.02) groups at 90 DIM, when the problem with high level
of FFA was most prominent (Figure 2A). The increase in the content of FFA from 0 to 84 hrs
after milking is shown in Figure 3. The post-milking lipolysis was lower in UNSAT milk at
90-120 DIM, compared to SAT and CONTR milk, as previously observed (Chilliard et al.,
2003; Ollier et al., 2009).
Both lactation stage and feed group influenced milk flavour. The highest scores were obtained
in early and late lactation, while milk from mid-lactation received lower scores (Figure 2B).
Milk samples with low flavour scores (1 and 2) were described as tart and/or rancid. The
average sensory score for UNSAT milk was 4.5, which was higher than CONTR (3.3, P=0.004
and SAT (3.5, P=0.01) (Figure 3). This findings conflict with those from a previous study
(Eknæs et al., 2009), where surplus of saturated fat in the diet decreased off-flavours in the
milk compared to a diet enriched with sunflower oil rich in unsaturated fatty acids. However,
other studies have shown that supplementation with unsaturated fat may reduce the content of
LPL/FFA/goaty flavour in milk (Chilliard et al., 2003; Skjevdal, 1979). Indeed, previous
studies have shown a correlation between the content of FFA in milk and off-flavours (Deeth
& Fitz-Gerald, 2006), and this is also supported by this experiment (Figure 2 and 4, r= -0.84,
10
n= 184). Liberation of short- and medium chain fatty acids (C6:0-C10:0) is believed to be the
cause of the specific goaty flavour (Brandsaeter & Abate, 1959), and maybe also tart or rancid
flavours. Branched chain variants (methyl and ethyl) of caprylic acid are volatiles with very
low flavour thresholds (Brennand et al., 1989), and are believed to be strong contributors to the
flavours of goat milk (Chilliard et al., 2003). More than 20 of the free fatty acids were analysed
in order to identify specific fatty acids responsible for the tart and rancid flavour. Fatty acid
profiles of the FFA fraction in two samples with high and low content of FFA is shown in
Figure 5. Samples with a high content of FFA and low flavour score had a high content of all
the identified fatty acids, and most of the free fatty acids were highly correlated to off-flavours
(Figure 4). Therefore, we were not able to link any specific fatty acid to either goat flavour or
to specific off-flavours (tart or rancid). We were not able to identify any branched chain
variants of caprylic acids in our samples.
Although the analysis of individual FFA may provide useful information, the method has a
great potential of improvement. The use of polypropylene tubes is a common practice in most
laboratories today, however, in contact with organic solvents, fatty acids are released from the
material. We detected considerable amounts of C16:0 and C18:0 fatty acids in blank samples
originating both from the tubes and the SPE cartridges. Those fatty acids are the most common
fatty acids in milk and we decided to omit those from the results. We strongly recommend the
use of acid washed glassware for sample preparation and frequent control of blank samples.
This problem was only observed in the fraction containing the FFA, the blanks from the
fraction of neutral lipids (triglycerides) were free from contaminations.
Some goats produced milk with a high (above 0.8 mM) content of FFA throughout the whole
lactation period, while others had a high content only in mid lactation but acceptable levels at
the start and end of the lactation period. On the other hand, there are goats that constantly
produced milk with a low content of FFA and received high scores for flavour. We know from
previous studies that there is a genetic factor (of the CSN1S1-locus) linked to high content of
FFA in the milk of Norwegian Dairy goats (Dagnachew et al., 2011; Dagnachew & Ådnøy,
2014), however, goats of other genotypes than E12-00 may also have high content of FFA and
off-flavours in their milk. Milk LPL activity and FFA content are reported to be higher in
French goats of “weak” genotypes of CSN1S1 (Chilliard et al., 2003), however, no correlation
was found in the present study between the LPL activity and content of FFA in milk (r= -0.187,
n=155) nor to the genotype of CSN1S1 (results not shown).
11
Composition of Phospholipids and Cholesterol of the MFGM in Selected Samples
As differences in LPL-activity cannot explain the increased FFA content in some samples,
we hypothesize that substrate availability may explain the differences in FFA content among
the milk samples. The MFGM protects the triglycerides from lipolytic degradation, and the
stability of the MFGM may depend on it composition. We therefore examined possible
differences in phospholipid and cholesterol composition of the MFGM to find a possible
explanation of the different degree of lipolysis in the milk samples. Examination of the
phospholipid composition and cholesterol content in milk of six goats of the SAT group at 90
DIM revealed differences between milk with a high content of FFA (2.9 mM, +/- 1.25) versus
those with a low content of FFA (0.5 mM, +/- 0.17) (Figure 6). In addition, those with a high
content of FFA had a higher content of cholesterol (14.2 mg/100 g (+/- 1.22)) compared to
those with low content of FFA (11.7 mg/100 g (+/- 1.79)). Cholesterol, together with
sphingomyelin, are the major constituents of lipid rafts in MFGM; structures involved in
different cellular processes, and cholesterol is reported to affect the MFGM organization
(Murthy et al., 2015). The content of a hydrolysed variant of phosphatidyl choline (PC), lyso
phosphatidyl choline (LPC) (also called lysolecithin), were found in remarkably higher
concentration in samples with a high content of FFA (21.4 vs. 7.5 mg/100 g milk).
Lysophospholipids are known to have a strong affinity for both LPL and lipoproteins and may
aid the LPL by disruption of the MFGM (Deeth & Fitz-Gerald, 1983). Sundheim et al. (1983)
showed that exogenous LPC enhances cow milk lipolysis when activated by blood serum but
not in milk without serum addition.
The goat milk samples with a high degree of lipolysis also displayed a low content of
phosphatidyletanolamine (PE). Phosphatidylinositol (PI) and phosphatidylserine (PS) were not
detected in any of the samples.
CONCLUSION
This study showed that it is possible to alter the milk fat content and composition, and that
feeding goats with a concentrate supplemented with unsaturated lipids increased the content of
most unsaturated fatty acids and decreased the content of saturated fatty acids in goat milk. In
addition, unsaturated fat supplements gave lower LPL-activity in the milk, lower content of
FFA and a higher flavour score compared to milk from goats receiving saturated fat
supplements or goats receiving a diet without fat supplements. Both saturated and unsaturated
12
supplemented feeds increased the fat content in the milk, which correlates positively with the
milk fat globule size. The presence of off-flavours and the total content of FFA in milk were
highly correlated, and the FFA content obtained from the routine analysis (Milkoscan)
therefore provides a good proxy of the sensory properties of the milk. The positive effect of
inclusion of unsaturated lipids in the diet of goats gives good promises for development of new
feeding strategies with feed based on more sustainable produced lipid sources, like rapeseed
oil.
Acknowledgements
The Norwegian research council (NFR) and TINE BA financed this study. We would like to
thank the staff at the Animal Production Experimental Centre of NMBU for animal care and
assistance with sampling procedures, Irene Comi, IKBM, NMBU, for technical assistance
during milk sampling, Claes-Gøran Fristedt, IHA, NMBU, for measurements of the milk fat
globule size, Kari Olsen, IKBM, NMBU, for assistance in the GC-FID analysis of the fatty
acids and Vitas AS, Oslo, for analysis of the content of phospholipids and cholesterol and Cyril
Labonne for assistance in LPL analysis. We are very thankful for the sensory evaluation of the
milk samples performed by Knut Erik Grindaker, Helga Kvamsås and Kåre Johan Vassbotn.
TINE provided Milcoscan analysis free of charge.
13
REFERENCES
Ahrné, L., & Björck, L. (1985). Lipolysis and the distribution of lipase activity in bovine milk
in relation to stage of lactation and time of milking. J. Dairy Res, 52(01), 55-64. doi:
doi:10.1017/S002202990002389X
Andrade, P., & Schmidely, P. (2006). Influence of percentage of concentrate in combination
with rolled canola seeds on performance, rumen fermentation and milk fatty acid
composition in dairy goats. Livestock Science, 104(1), 77-90.
Attaie, R., & Richter, R. L. (2000). Size Distribution of Fat Globules in Goat Milk. J Dairy Sci,
83(5), 940-944. doi: http://dx.doi.org/10.3168/jds.S0022-0302(00)74957-5
Bauman, D. E., & Griinari, J. M. (2003). Nutritional regulation of milk fat synthesis. Annual
review of nutrition, 23(1), 203-227.
Bernard, L., Bonnet, M., Leroux, C., Shingfield, K., & Chilliard, Y. (2009). Effect of
sunflower-seed oil and linseed oil on tissue lipid metabolism, gene expression, and milk
fatty acid secretion in alpine goats fed maize silage–based diets. J Dairy Sci, 92(12),
6083-6094.
Bernard, L., Rouel, J., Leroux, C., Ferlay, A., Faulconnier, Y., Legrand, P., & Chilliard, Y.
(2005). Mammary Lipid Metabolism and Milk Fatty Acid Secretion in Alpine Goats
Fed Vegetable Lipids. J Dairy Sci, 88(4), 1478-1489. doi:
http://dx.doi.org/10.3168/jds.S0022-0302(05)72816-2
Berton, A., Rouvellac, S., Robert, B., Rousseau, F., Lopez, C., & Crenon, I. (2012). Effect of
the size and interface composition of milk fat globules on their in vitro digestion by the
human pancreatic lipase: Native versus homogenized milk fat globules. Food
Hydrocolloids, 29(1), 123-134. doi: http://dx.doi.org/10.1016/j.foodhyd.2012.02.016
Brandsaeter, E., & Abate, V. (1959). Flavour compounds in goat's milk and goat whey cheese.
2. Occurrence of free fatty acids in goat whey cheese. Meldinger fra Norges
Landbrukshogskole, 38(10), 12.
Brennand, C. P., Ha, J. K., & Lindsay, R. C. (1989). AROMA PROPERTIES AND
THRESHOLDS OF SOME BRANCHED-CHAIN AND OTHER MINOR
VOLATILE FATTY ACIDS OCCURRING IN MILKFAT AND MEAT LIPIDS1.
Journal of Sensory Studies, 4(2), 105-120. doi: 10.1111/j.1745-459X.1989.tb00461.x
Cebo, C., Lopez, C., Henry, C., Beauvallet, C., Ménard, O., Bevilacqua, C., Bouvier, F.,
Caillat, H., & Martin, P. (2012). Goat αs1-casein genotype affects milk fat globule
14
physicochemical properties and the composition of the milk fat globule membrane. J
Dairy Sci, 95(11), 6215-6229. doi: http://dx.doi.org/10.3168/jds.2011-5233
Chazal, M. P., & Chilliard, Y. (1986). Effect of stage of lactation, stage of pregnancy, milk
yield and herd management on seasonal variation in spontaneous lipolysis in bovine
milk. J. Dairy Res, 53(4), 529-538.
Chilliard, & Ferlay. (2004). Dietary lipids and forages interactions on cow and goat milk fatty
acid composition and sensory properties. Reprod. Nutr. Dev., 44(5), 467-492.
Chilliard, Ferlay, A., Rouel, J., & Lamberet, G. (2003). A Review of Nutritional and
Physiological Factors Affecting Goat Milk Lipid Synthesis and Lipolysis. J Dairy Sci,
86(5), 1751-1770.
Chilliard, Glasser, F., Ferlay, A., Bernard, L., Rouel, J., & Doreau, M. (2007). Diet, rumen
biohydrogenation and nutritional quality of cow and goat milk fat. European Journal of
Lipid Science and Technology, 109(8), 828-855. doi: 10.1002/ejlt.200700080
Couvreur, S., Hurtaud, C., Lopez, C., Delaby, L., & Peyraud, J. L. (2006). The Linear
Relationship Between the Proportion of Fresh Grass in the Cow Diet, Milk Fatty Acid
Composition, and Butter Properties. J Dairy Sci, 89(6), 1956-1969. doi:
http://dx.doi.org/10.3168/jds.S0022-0302(06)72263-9
Dagnachew, B., Thaller, G., Lien, S., & Adnoy, T. (2011). Casein SNP in Norwegian goats:
additive and dominance effects on milk composition and quality. Genet Sel Evol, 43(1),
31.
Dagnachew, B. S., & Ådnøy, T. (2014). Additive and dominance effects of casein haplotypes
on milk composition and quality in Norwegian dairy goats. Small Rumin Res, 122(1),
59-69. doi: 10.1016/j.smallrumres.2014.07.020
Deeth, H., & Fitz-Gerald, C. (1983). Lipolytic enzymes and hydrolytic rancidity in milk and
milk products Developments in dairy chemistry—2 (pp. 195-239): Springer.
Deeth, H. C. (2006). Lipoprotein lipase and lipolysis in milk. Int Dairy J, 16(6), 555-562.
Deeth, H. C., & Fitz-Gerald, C. H. (2006). Lipolytic Enzymes and Hydrolytic Rancidity. In P.
F. Fox & P. L. H. McSweeney (Eds.), Advanced Dairy Chemistry Volume 2 Lipids (pp.
481-556): Springer US.
Devle, H., Ulleberg, E. K., Naess-Andresen, C. F., Rukke, E.-O., Vegarud, G., & Ekeberg, D.
(2014). Reciprocal interacting effects of proteins and lipids during ex vivo digestion of
bovine milk. Int Dairy J, 36(1), 6-13. doi:
http://dx.doi.org/10.1016/j.idairyj.2013.11.008
15
Dønnem, I., Randby, Å. T., & Eknæs, M. (2011). Effect of grass silage harvesting time and
level of concentrate supplementation on goat milk quality. Anim. Feed Sci. Technol,
163(2–4), 118-129. doi: http://dx.doi.org/10.1016/j.anifeedsci.2010.10.013
Eknæs, Havrevoll, Ø., Volden, H., & Hove, K. (2009). Fat content, fatty acid profile and off-
flavours in goats milk—Effects of feed concentrates with different fat sources during
the grazing season. Anim. Feed Sci. Technol, 152(1–2), 112-122. doi:
http://dx.doi.org/10.1016/j.anifeedsci.2009.04.006
Eknæs, M., Kolstad, K., Volden, H., & Hove, K. (2006). Changes in body reserves and milk
quality throughout lactation in dairy goats. Small Rumin Res, 63(1-2), 1-11.
Eknæs, M., & Skeie, S. (2006). Effect of different level of roughage availability and contrast
levels of concentrate supplementation on flavour of goat milk. Small Rumin Res, 66(1–
3), 32-43. doi: http://dx.doi.org/10.1016/j.smallrumres.2005.06.029
FAO. (2010). Fats and fatty acids in human nutrition Report of an expert consultation (pp. 180).
Rome: FOOD AND AGRICULTURE ORGANIZATION OF THE UNITED
NATIONS.
Folch, J., Lees, M., & Sloane Stanley, G. H. (1957). A simple method for the isplation and
purification of total lipids from animal tissue. The Journal of Biological Chemistry,
226(1), 497-509.
Granlund, L. L., Eltun, R., Hohle, E. E., Nesheim, L., Waalen, W., & Åssveen, M. (2010).
Biodiesel fra norske jordbruksvekster, Utredning for prosjekt ”Opportunities for
Norwegian production of biodiesel from agricultural crops” (Bioforsk, Trans.) (Vol. 5,
pp. 39). www.bioforsk.no: Bioforsk and Energigården AS-senter for Bioenergi.
Gulati, S. K., Byers, E. B., Byers, Y. G., Ashes, J. R., & Scott, T. W. (1997). Effect of feeding
different fat supplements on the fatty acid composition of goat milk. Anim. Feed Sci.
Technol, 66(1–4), 159-164. doi: http://dx.doi.org/10.1016/S0377-8401(96)01117-0
Inglingstad, R. A., Eknæs, M., Brunborg, L. J., Mestawet, T. A., Devold, T. G., Vegarud, G.,
& Skeie, S. (2015). Norwegian goat milk composition and cheese quality: The influence
of lipid supplemented concentrate and lactation stage. Int Dairy J, Accepted. doi:
10.1016/j.idairyj.2015.12.010
Khorasani, G. R., Okine, E. K., & Kennelly, J. J. (1996). Forage Source Alters Nutrient Supply
to the Intestine Without Influencing Milk Yield. J Dairy Sci, 79(5), 862-872. doi:
http://dx.doi.org/10.3168/jds.S0022-0302(96)76435-4
16
Littell, R. C., Henry, P. R., & Ammerman, C. B. (1998). Statistical analysis of repeated
measures data using SAS procedures. J Anim Sci, 76(4), 1216-1231.
Lopez, C., Briard-Bion, V., Menard, O., Rousseau, F., Pradel, P., & Besle, J.-M. (2008).
Phospholipid, Sphingolipid, and Fatty Acid Compositions of the Milk Fat Globule
Membrane are Modified by Diet. J Agric Food Chem, 56(13), 5226-5236. doi:
10.1021/jf7036104
Ménard, O., Ahmad, S., Rousseau, F., Briard-Bion, V., Gaucheron, F., & Lopez, C. (2010).
Buffalo vs. cow milk fat globules: Size distribution, zeta-potential, compositions in
total fatty acids and in polar lipids from the milk fat globule membrane. Food
Chemistry, 120(2), 544-551. doi: 10.1016/j.foodchem.2009.10.053
Michalski, M.-C., Briard, V., & Michel, F. (2001). Optical parameters of milk fat globules for
laser light scattering measurements. Lait, 81(6), 787-796.
Michalski, M.-C., Camier, B., Briard, V., Leconte, N., Gassi, J.-Y., Goudédranche, H., Michel,
F., & Fauquant, J. (2004). The size of native milk fat globules affects physico-chemical
and functional properties of Emmental cheese. Lait, 84(4), 343-358.
Mir, Z., Goonewardene, L. A., Okine, E., Jaegar, S., & Scheer, H. D. (1999). Effect of feeding
canola oil on constituents, conjugated linoleic acid (CLA) and long chain fatty acids in
goats milk. Small Rumin Res, 33(2), 137-143. doi: http://dx.doi.org/10.1016/S0921-
4488(99)00016-4
Murthy, A. V. R., Guyomarc'h, F., Paboeuf, G., Vié, V., & Lopez, C. (2015). Cholesterol
strongly affects the organization of lipid monolayers studied as models of the milk fat
globule membrane: Condensing effect and change in the lipid domain morphology.
Biochimica et Biophysica Acta (BBA) - Biomembranes, 1848(10, Part A), 2308-2316.
doi: http://dx.doi.org/10.1016/j.bbamem.2015.06.014
Ollier, S., Leroux, C., de la Foye, A., Bernard, L., Rouel, J., & Chilliard, Y. (2009). Whole
intact rapeseeds or sunflower oil in high-forage or high-concentrate diets affects milk
yield, milk composition, and mammary gene expression profile in goats. J Dairy Sci,
92(11), 5544-5560. doi: http://dx.doi.org/10.3168/jds.2009-2022
Onetti, S. G., & Grummer, R. R. (2004). Response of lactating cows to three supplemental fat
sources as affected by forage in the diet and stage of lactation: a meta-analysis of
literature. Anim. Feed Sci. Technol, 115(1), 65-82. doi:
10.1016/j.anifeedsci.2004.02.009
17
Palmquist, D. L. (1984). CALCIUM SOAPS OF FATTY ACIDS WITH VARYING
UNSATURATION AS FAT SUPPLEMENTS FOR LACTATING COWS. Canadian
Journal of Animal Science, 64(5), 240-241. doi: 10.4141/cjas84-242
Pisanu, S., Marogna, G., Pagnozzi, D., Piccinini, M., Leo, G., Tanca, A., Roggio, A. M.,
Roggio, T., Uzzau, S., & Addis, M. F. (2013). Characterization of size and composition
of milk fat globules from Sarda and Saanen dairy goats. Small Rumin Res, 109(2–3),
141-151. doi: http://dx.doi.org/10.1016/j.smallrumres.2012.07.024
Sanz Sampelayo, M. R., Chilliard, Y., Schmidely, P., & Boza, J. (2007). Influence of type of
diet on the fat constituents of goat and sheep milk. Small Rumin Res, 68(1–2), 42-63.
doi: http://dx.doi.org/10.1016/j.smallrumres.2006.09.017
Shingfield, K. J., Chilliard, Y., Toivonen, V., Kairenius, P., & Givens, D. I. (2008). Trans Fatty
Acids and Bioactive Lipids in Ruminant Milk. In Z. Bösze (Ed.), Bioactive
Components of Milk (Vol. 606, pp. 3-65): Springer New York.
Skjevdal, T. (1979). Flavour of goat's milk: A review of studies on the sources of its variations.
Livest. Prod. Sci, 6(4), 397-405.
Steinshamn, H., Inglingstad, R. A., Ekeberg, D., Mølmann, J., & Jørgensen, M. (2014). Effect
of forage type and season on Norwegian dairy goat milk production and quality. Small
Rumin Res, 122(1–3), 18-30. doi: http://dx.doi.org/10.1016/j.smallrumres.2014.07.013
Sundheim, G., Zimmer, T.-L., & Astrup, H. (1983). Induction of milk lipolysis by lipoprotein
components of bovine blood serum. J Dairy Sci, 66(3), 400-406.
Tudisco, R., Chiofalo, B., Addi, L., Presti, V. L., Rao, R., Calabro’, S., Musco, N., Grossi, M.,
Cutrignelli, M. I., Mastellone, V., Lombardi, P., & Infascelli, F. (2015). Effect of
hydrogenated palm oil dietary supplementation on milk yield and composition, fatty
acids profile and Stearoyl-CoA desaturase expression in goat milk. Small Rumin Res.
doi: 10.1016/j.smallrumres.2015.10.006
Wiking, L., Stagsted, J., Bjorck, L., & Nielsen, J. H. (2004). Milk fat globule size is affected
by fat production in dairy cows. Int Dairy J, 14(10), 909-913.
Wilcove, D. S., Giam, X., Edwards, D. P., Fisher, B., & Koh, L. P. (2013). Navjot's nightmare
revisited: logging, agriculture, and biodiversity in Southeast Asia. Trends in Ecology
& Evolution, 28(9), 531-540. doi: http://dx.doi.org/10.1016/j.tree.2013.04.005
Wolfinger, R. D. (1996). Heterogeneous variance: covariance structures for repeated measures.
Journal of Agricultural, Biological, and Environmental Statistics, 1(2), 205-230.
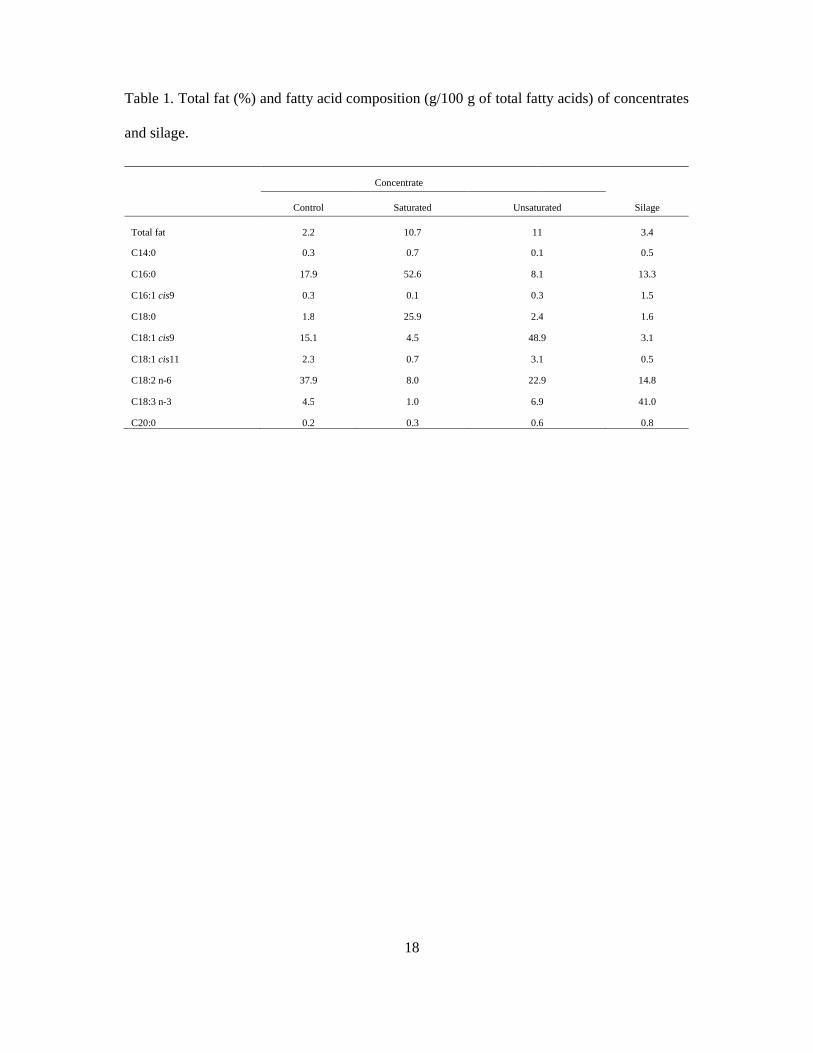
18
Table 1. Total fat (%) and fatty acid composition (g/100 g of total fatty acids) of concentrates
and silage.
Concentrate
Control Saturated Unsaturated Silage
Total fat 2.2 10.7 11 3.4
C14:0 0.3 0.7 0.1 0.5
C16:0 17.9 52.6 8.1 13.3
C16:1 cis9 0.3 0.1 0.3 1.5
C18:0 1.8 25.9 2.4 1.6
C18:1 cis9 15.1 4.5 48.9 3.1
C18:1 cis11 2.3 0.7 3.1 0.5
C18:2 n-6 37.9 8.0 22.9 14.8
C18:3 n-3 4.5 1.0 6.9 41.0
C20:0 0.2 0.3 0.6 0.8
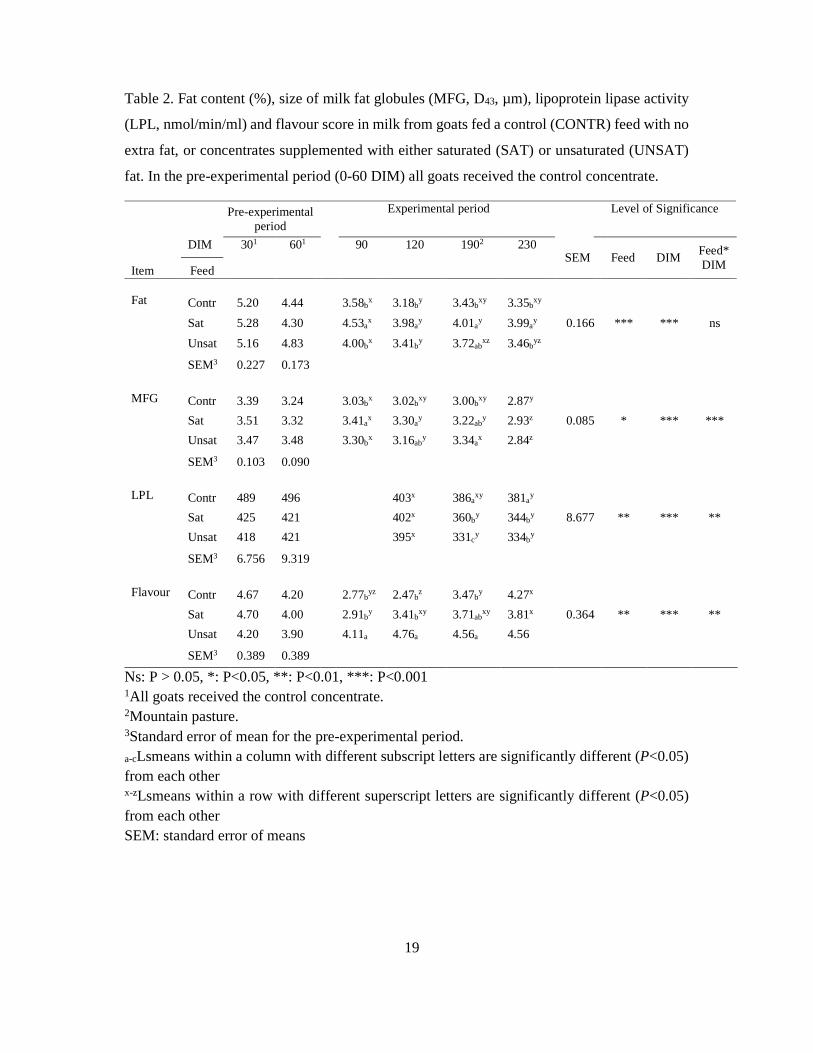
19
Table 2. Fat content (%), size of milk fat globules (MFG, D43, µm), lipoprotein lipase activity
(LPL, nmol/min/ml) and flavour score in milk from goats fed a control (CONTR) feed with no
extra fat, or concentrates supplemented with either saturated (SAT) or unsaturated (UNSAT)
fat. In the pre-experimental period (0-60 DIM) all goats received the control concentrate.
Pre-experimental period
Experimental period Level of Significance
Item
DIM 301 601 90 120 1902 230 SEM Feed DIM
Feed* DIM Feed
Fat Contr 5.20 4.44 3.58b
x 3.18by 3.43b
xy 3.35bxy
0.166 *** *** ns Sat 5.28 4.30 4.53ax 3.98a
y 4.01ay 3.99a
y
Unsat 5.16 4.83 4.00bx 3.41b
y 3.72abxz 3.46b
yz
SEM3 0.227 0.173
MFG Contr 3.39 3.24 3.03b
x 3.02bxy 3.00b
xy 2.87y
0.085 * *** *** Sat 3.51 3.32 3.41ax 3.30a
y 3.22aby 2.93z
Unsat 3.47 3.48 3.30bx 3.16ab
y 3.34ax 2.84z
SEM3 0.103 0.090
LPL Contr 489 496 403x
386axy
381ay
8.677 ** *** ** Sat 425 421 402x
360by 344b
y
Unsat 418 421 395x 331c
y 334by
SEM3 6.756 9.319
Flavour Contr 4.67 4.20 2.77b
yz 2.47bz 3.47b
y 4.27x
0.364 ** *** ** Sat 4.70 4.00 2.91by 3.41b
xy 3.71abxy 3.81x
Unsat 4.20 3.90 4.11a 4.76a 4.56a 4.56
SEM3 0.389 0.389
Ns: P > 0.05, *: P<0.05, **: P<0.01, ***: P<0.001 1All goats received the control concentrate. 2Mountain pasture. 3Standard error of mean for the pre-experimental period. a-cLsmeans within a column with different subscript letters are significantly different (P<0.05) from each other x-zLsmeans within a row with different superscript letters are significantly different (P<0.05) from each other SEM: standard error of means
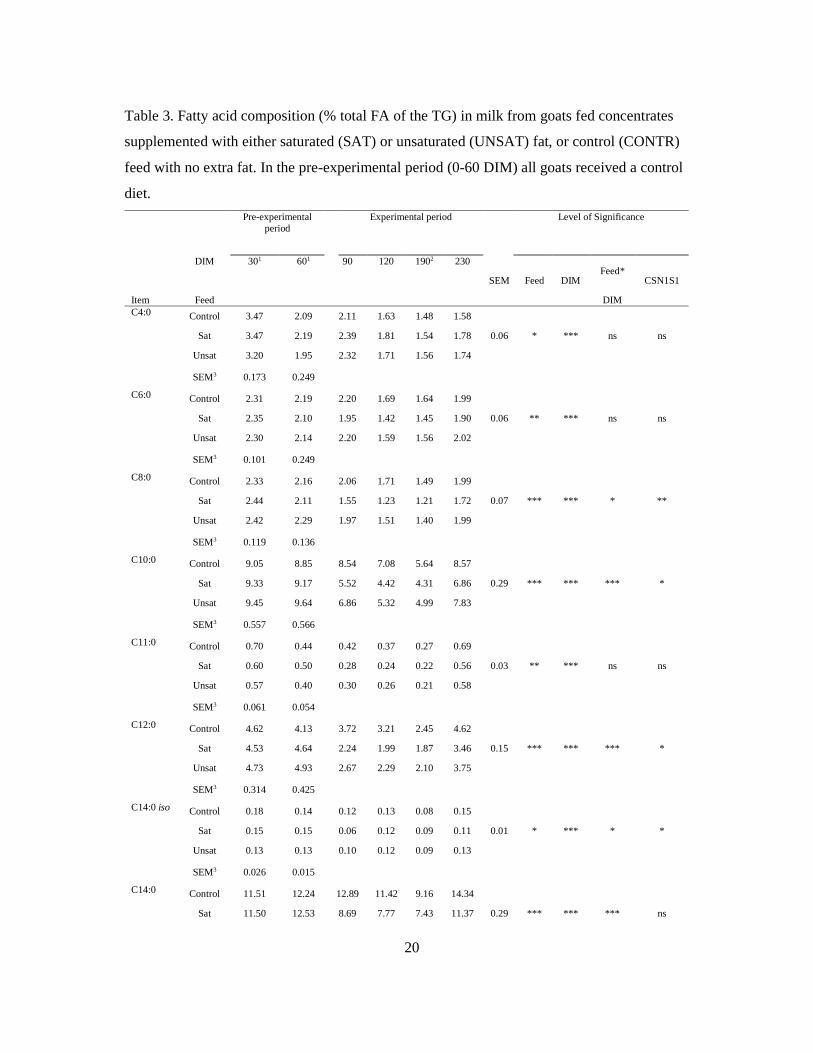
20
Table 3. Fatty acid composition (% total FA of the TG) in milk from goats fed concentrates
supplemented with either saturated (SAT) or unsaturated (UNSAT) fat, or control (CONTR)
feed with no extra fat. In the pre-experimental period (0-60 DIM) all goats received a control
diet.
Pre-experimental period
Experimental period Level of Significance
Item
DIM 301 601 90 120 1902 230
SEM Feed DIM Feed*
CSN1S1
Feed DIM C4:0
Control 3.47 2.09 2.11 1.63 1.48 1.58
Sat 3.47 2.19 2.39 1.81 1.54 1.78 0.06 * *** ns ns
Unsat 3.20 1.95 2.32 1.71 1.56 1.74
SEM3 0.173 0.249
C6:0
Control 2.31 2.19 2.20 1.69 1.64 1.99
Sat 2.35 2.10 1.95 1.42 1.45 1.90 0.06 ** *** ns ns
Unsat 2.30 2.14 2.20 1.59 1.56 2.02
SEM3 0.101 0.249
C8:0
Control 2.33 2.16 2.06 1.71 1.49 1.99
Sat 2.44 2.11 1.55 1.23 1.21 1.72 0.07 *** *** * **
Unsat 2.42 2.29 1.97 1.51 1.40 1.99
SEM3 0.119 0.136
C10:0 Control 9.05 8.85 8.54 7.08 5.64 8.57
Sat 9.33 9.17 5.52 4.42 4.31 6.86 0.29 *** *** *** *
Unsat 9.45 9.64 6.86 5.32 4.99 7.83
SEM3 0.557 0.566
C11:0 Control 0.70 0.44 0.42 0.37 0.27 0.69
Sat 0.60 0.50 0.28 0.24 0.22 0.56 0.03 ** *** ns ns
Unsat 0.57 0.40 0.30 0.26 0.21 0.58
SEM3 0.061 0.054
C12:0 Control 4.62 4.13 3.72 3.21 2.45 4.62
Sat 4.53 4.64 2.24 1.99 1.87 3.46 0.15 *** *** *** *
Unsat 4.73 4.93 2.67 2.29 2.10 3.75
SEM3 0.314 0.425
C14:0 iso Control 0.18 0.14 0.12 0.13 0.08 0.15
Sat 0.15 0.15 0.06 0.12 0.09 0.11 0.01 * *** * *
Unsat 0.13 0.13 0.10 0.12 0.09 0.13
SEM3 0.026 0.015
C14:0 Control 11.51 12.24 12.89 11.42 9.16 14.34
Sat 11.50 12.53 8.69 7.77 7.43 11.37 0.29 *** *** *** ns
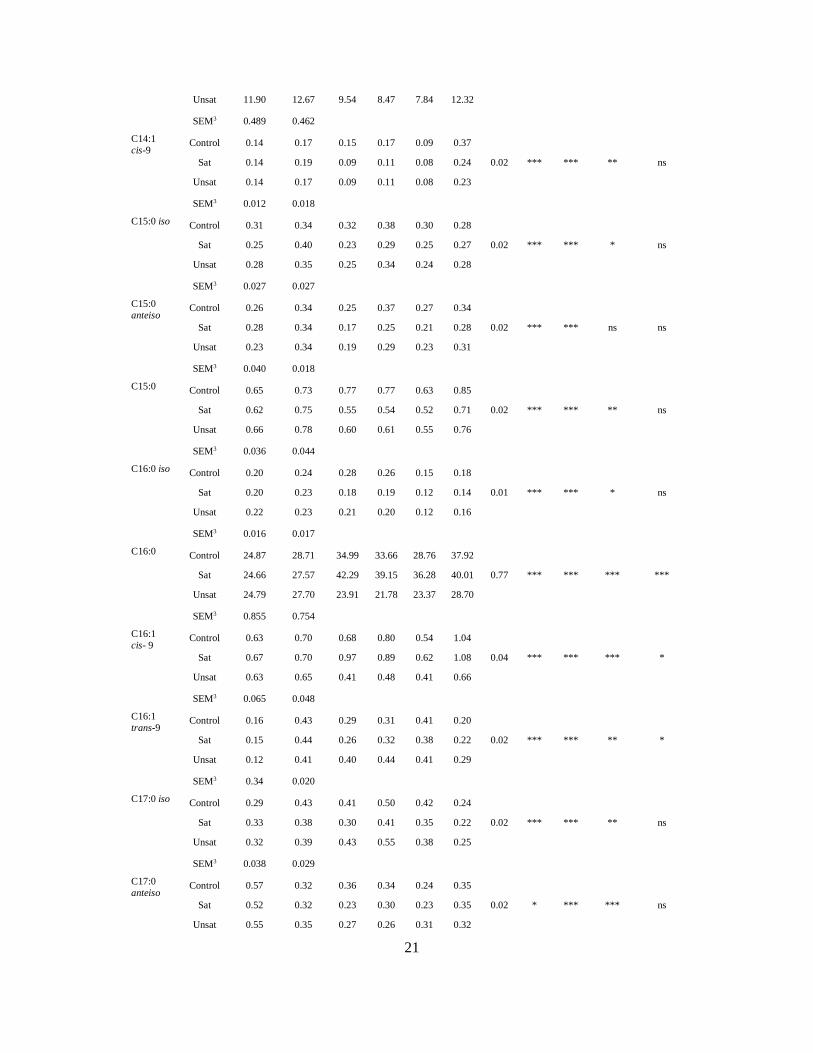
21
Unsat 11.90 12.67 9.54 8.47 7.84 12.32
SEM3 0.489 0.462
C14:1 cis-9
Control 0.14 0.17 0.15 0.17 0.09 0.37
Sat 0.14 0.19 0.09 0.11 0.08 0.24 0.02 *** *** ** ns
Unsat 0.14 0.17 0.09 0.11 0.08 0.23
SEM3 0.012 0.018
C15:0 iso Control 0.31 0.34 0.32 0.38 0.30 0.28
Sat 0.25 0.40 0.23 0.29 0.25 0.27 0.02 *** *** * ns
Unsat 0.28 0.35 0.25 0.34 0.24 0.28
SEM3 0.027 0.027
C15:0 anteiso
Control 0.26 0.34 0.25 0.37 0.27 0.34
Sat 0.28 0.34 0.17 0.25 0.21 0.28 0.02 *** *** ns ns
Unsat 0.23 0.34 0.19 0.29 0.23 0.31
SEM3 0.040 0.018
C15:0 Control 0.65 0.73 0.77 0.77 0.63 0.85
Sat 0.62 0.75 0.55 0.54 0.52 0.71 0.02 *** *** ** ns
Unsat 0.66 0.78 0.60 0.61 0.55 0.76
SEM3 0.036 0.044
C16:0 iso Control 0.20 0.24 0.28 0.26 0.15 0.18
Sat 0.20 0.23 0.18 0.19 0.12 0.14 0.01 *** *** * ns
Unsat 0.22 0.23 0.21 0.20 0.12 0.16
SEM3 0.016 0.017
C16:0 Control 24.87 28.71 34.99 33.66 28.76 37.92
Sat 24.66 27.57 42.29 39.15 36.28 40.01 0.77 *** *** *** ***
Unsat 24.79 27.70 23.91 21.78 23.37 28.70
SEM3 0.855 0.754
C16:1 cis- 9
Control 0.63 0.70 0.68 0.80 0.54 1.04
Sat 0.67 0.70 0.97 0.89 0.62 1.08 0.04 *** *** *** *
Unsat 0.63 0.65 0.41 0.48 0.41 0.66
SEM3 0.065 0.048
C16:1 trans-9
Control 0.16 0.43 0.29 0.31 0.41 0.20
Sat 0.15 0.44 0.26 0.32 0.38 0.22 0.02 *** *** ** *
Unsat 0.12 0.41 0.40 0.44 0.41 0.29
SEM3 0.34 0.020
C17:0 iso Control 0.29 0.43 0.41 0.50 0.42 0.24
Sat 0.33 0.38 0.30 0.41 0.35 0.22 0.02 *** *** ** ns
Unsat 0.32 0.39 0.43 0.55 0.38 0.25
SEM3 0.038 0.029
C17:0 anteiso
Control 0.57 0.32 0.36 0.34 0.24 0.35
Sat 0.52 0.32 0.23 0.30 0.23 0.35 0.02 * *** *** ns
Unsat 0.55 0.35 0.27 0.26 0.31 0.32
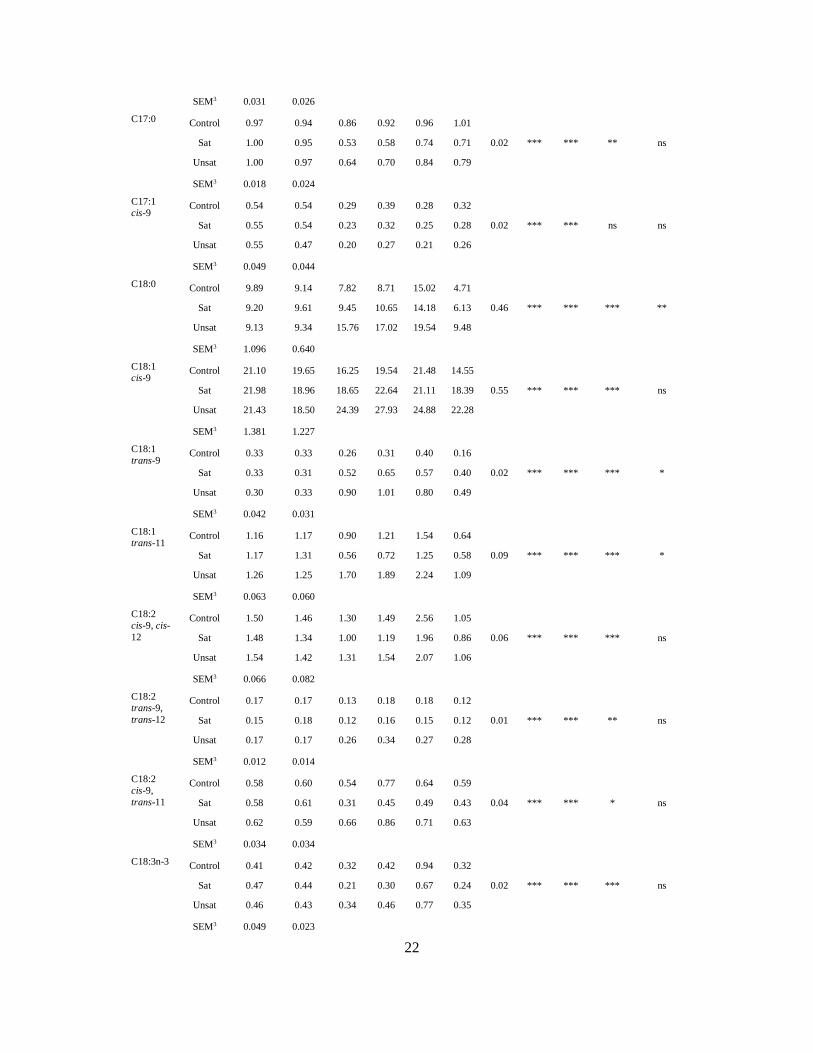
22
SEM3 0.031 0.026
C17:0 Control 0.97 0.94 0.86 0.92 0.96 1.01
Sat 1.00 0.95 0.53 0.58 0.74 0.71 0.02 *** *** ** ns
Unsat 1.00 0.97 0.64 0.70 0.84 0.79
SEM3 0.018 0.024
C17:1 cis-9
Control 0.54 0.54 0.29 0.39 0.28 0.32
Sat 0.55 0.54 0.23 0.32 0.25 0.28 0.02 *** *** ns ns
Unsat 0.55 0.47 0.20 0.27 0.21 0.26
SEM3 0.049 0.044
C18:0 Control 9.89 9.14 7.82 8.71 15.02 4.71
Sat 9.20 9.61 9.45 10.65 14.18 6.13 0.46 *** *** *** **
Unsat 9.13 9.34 15.76 17.02 19.54 9.48
SEM3 1.096 0.640
C18:1 cis-9
Control 21.10 19.65 16.25 19.54 21.48 14.55
Sat 21.98 18.96 18.65 22.64 21.11 18.39 0.55 *** *** *** ns
Unsat 21.43 18.50 24.39 27.93 24.88 22.28
SEM3 1.381 1.227
C18:1 trans-9
Control 0.33 0.33 0.26 0.31 0.40 0.16
Sat 0.33 0.31 0.52 0.65 0.57 0.40 0.02 *** *** *** *
Unsat 0.30 0.33 0.90 1.01 0.80 0.49
SEM3 0.042 0.031
C18:1 trans-11
Control 1.16 1.17 0.90 1.21 1.54 0.64
Sat 1.17 1.31 0.56 0.72 1.25 0.58 0.09 *** *** *** *
Unsat 1.26 1.25 1.70 1.89 2.24 1.09
SEM3 0.063 0.060
C18:2 cis-9, cis-12
Control 1.50 1.46 1.30 1.49 2.56 1.05
Sat 1.48 1.34 1.00 1.19 1.96 0.86 0.06 *** *** *** ns
Unsat 1.54 1.42 1.31 1.54 2.07 1.06
SEM3 0.066 0.082
C18:2 trans-9, trans-12
Control 0.17 0.17 0.13 0.18 0.18 0.12
Sat 0.15 0.18 0.12 0.16 0.15 0.12 0.01 *** *** ** ns
Unsat 0.17 0.17 0.26 0.34 0.27 0.28
SEM3 0.012 0.014
C18:2 cis-9, trans-11
Control 0.58 0.60 0.54 0.77 0.64 0.59
Sat 0.58 0.61 0.31 0.45 0.49 0.43 0.04 *** *** * ns
Unsat 0.62 0.59 0.66 0.86 0.71 0.63
SEM3 0.034 0.034
C18:3n-3 Control 0.41 0.42 0.32 0.42 0.94 0.32
Sat 0.47 0.44 0.21 0.30 0.67 0.24 0.02 *** *** *** ns
Unsat 0.46 0.43 0.34 0.46 0.77 0.35
SEM3 0.049 0.023
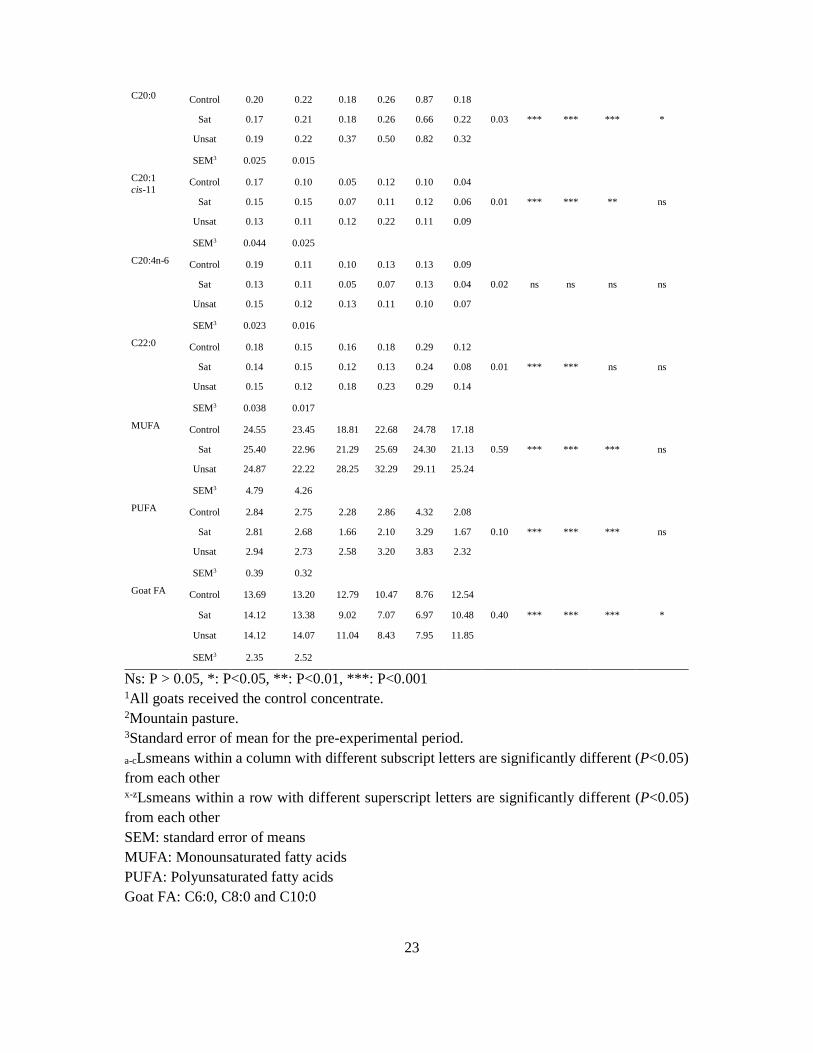
23
C20:0 Control 0.20 0.22 0.18 0.26 0.87 0.18
Sat 0.17 0.21 0.18 0.26 0.66 0.22 0.03 *** *** *** *
Unsat 0.19 0.22 0.37 0.50 0.82 0.32
SEM3 0.025 0.015
C20:1 cis-11
Control 0.17 0.10 0.05 0.12 0.10 0.04
Sat 0.15 0.15 0.07 0.11 0.12 0.06 0.01 *** *** ** ns
Unsat 0.13 0.11 0.12 0.22 0.11 0.09
SEM3 0.044 0.025
C20:4n-6 Control 0.19 0.11 0.10 0.13 0.13 0.09
Sat 0.13 0.11 0.05 0.07 0.13 0.04 0.02 ns ns ns ns
Unsat 0.15 0.12 0.13 0.11 0.10 0.07
SEM3 0.023 0.016
C22:0 Control 0.18 0.15 0.16 0.18 0.29 0.12
Sat 0.14 0.15 0.12 0.13 0.24 0.08 0.01 *** *** ns ns
Unsat 0.15 0.12 0.18 0.23 0.29 0.14
SEM3 0.038 0.017
MUFA Control 24.55 23.45 18.81 22.68 24.78 17.18
Sat 25.40 22.96 21.29 25.69 24.30 21.13 0.59 *** *** *** ns
Unsat 24.87 22.22 28.25 32.29 29.11 25.24
SEM3 4.79 4.26
PUFA Control 2.84 2.75 2.28 2.86 4.32 2.08
Sat 2.81 2.68 1.66 2.10 3.29 1.67 0.10 *** *** *** ns
Unsat 2.94 2.73 2.58 3.20 3.83 2.32
SEM3 0.39 0.32
Goat FA Control 13.69 13.20 12.79 10.47 8.76 12.54
Sat 14.12 13.38 9.02 7.07 6.97 10.48 0.40 *** *** *** *
Unsat 14.12 14.07 11.04 8.43 7.95 11.85
SEM3 2.35 2.52
Ns: P > 0.05, *: P<0.05, **: P<0.01, ***: P<0.001 1All goats received the control concentrate. 2Mountain pasture. 3Standard error of mean for the pre-experimental period.
a-cLsmeans within a column with different subscript letters are significantly different (P<0.05) from each other x-zLsmeans within a row with different superscript letters are significantly different (P<0.05) from each other SEM: standard error of means MUFA: Monounsaturated fatty acids PUFA: Polyunsaturated fatty acids Goat FA: C6:0, C8:0 and C10:0
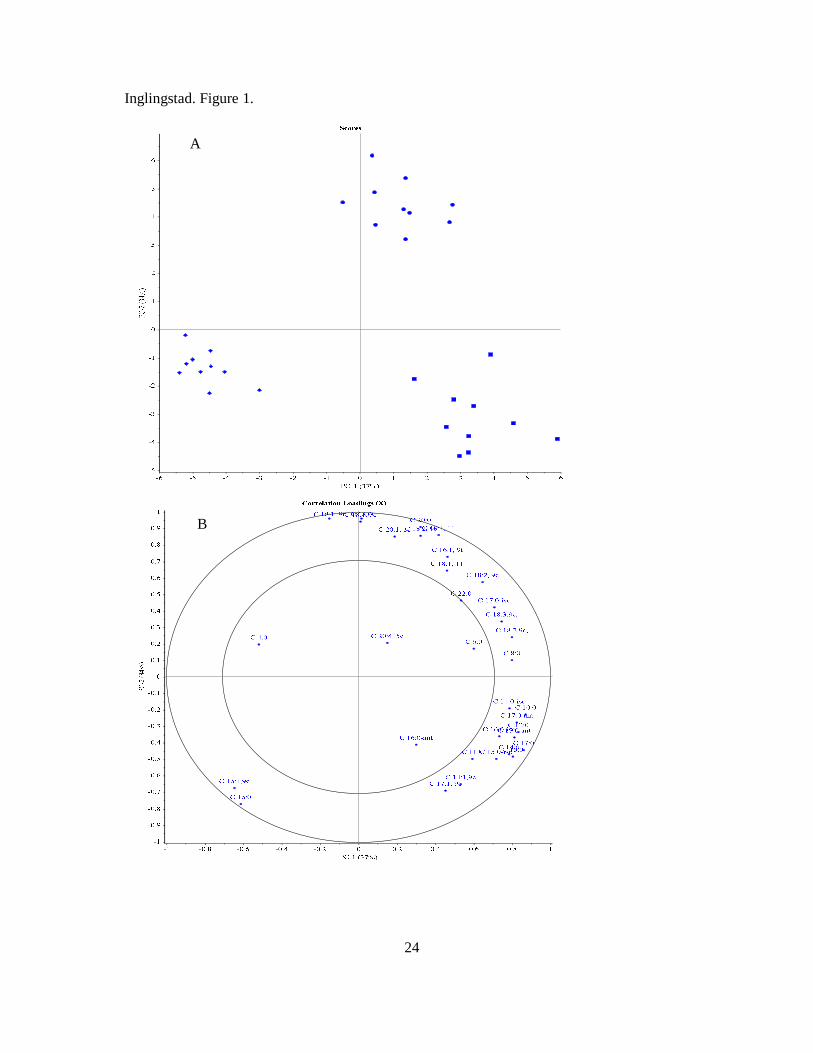
24
Inglingstad. Figure 1.
B
A
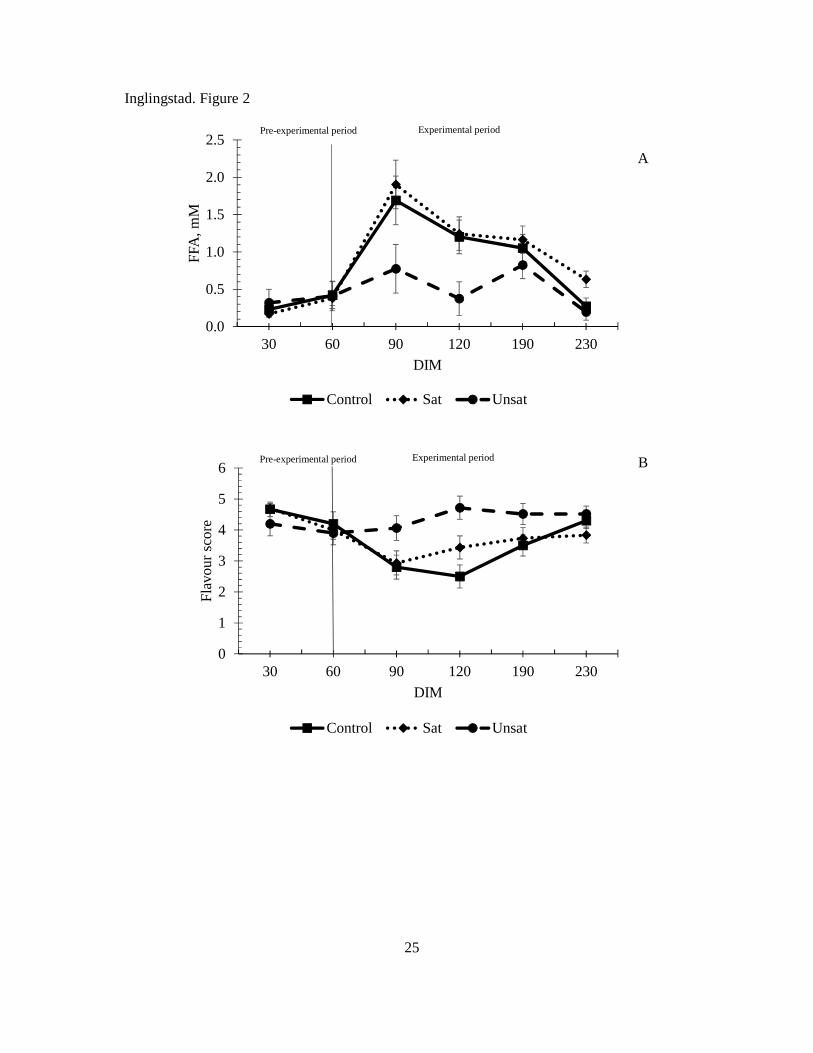
25
Inglingstad. Figure 2
0.0
0.5
1.0
1.5
2.0
2.5
30 60 90 120 190 230
FFA
, m
M
DIM
Control Sat Unsat
0
1
2
3
4
5
6
30 60 90 120 190 230
Fla
vour
sco
re
DIM
Control Sat Unsat
A
B
Pre-experimental period
Pre-experimental period
Experimental period
Experimental period
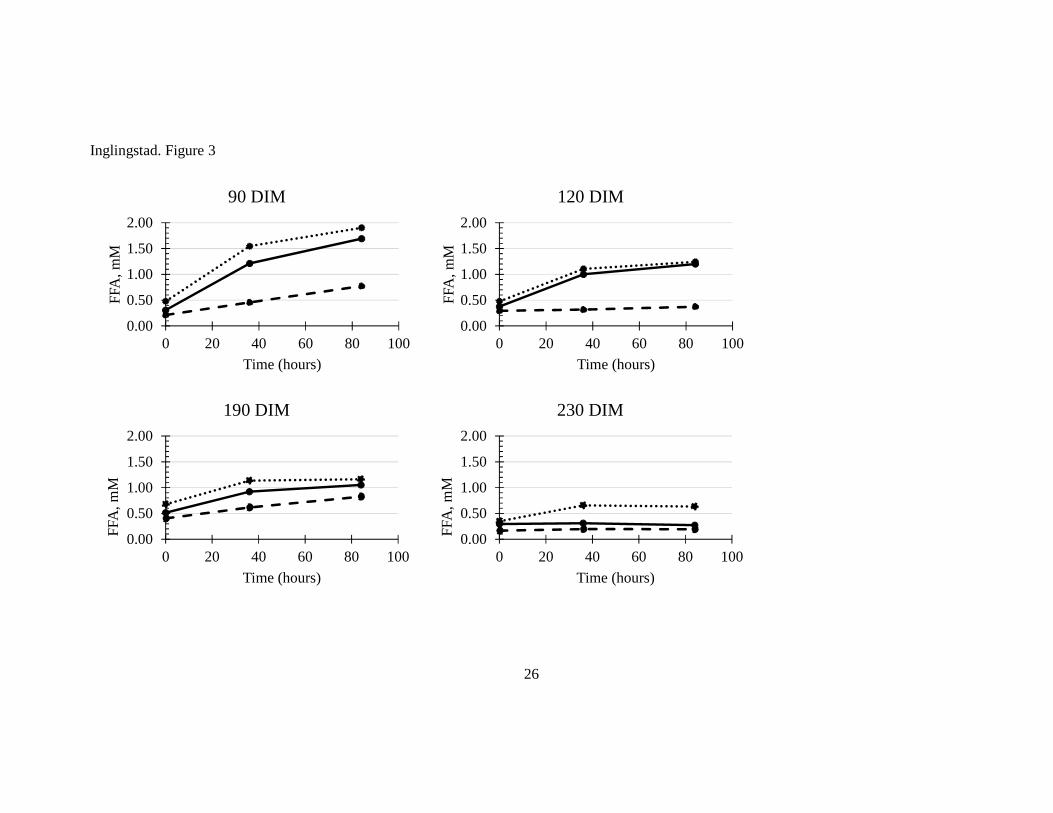
26
Inglingstad. Figure 3
0.00
0.50
1.00
1.50
2.00
0 20 40 60 80 100
FFA
, m
M
Time (hours)
90 DIM
0.00
0.50
1.00
1.50
2.00
0 20 40 60 80 100
FFA
, m
M
Time (hours)
120 DIM
0.00
0.50
1.00
1.50
2.00
0 20 40 60 80 100
FFA
, m
M
Time (hours)
190 DIM
0.00
0.50
1.00
1.50
2.00
0 20 40 60 80 100
FFA
, m
M
Time (hours)
230 DIM
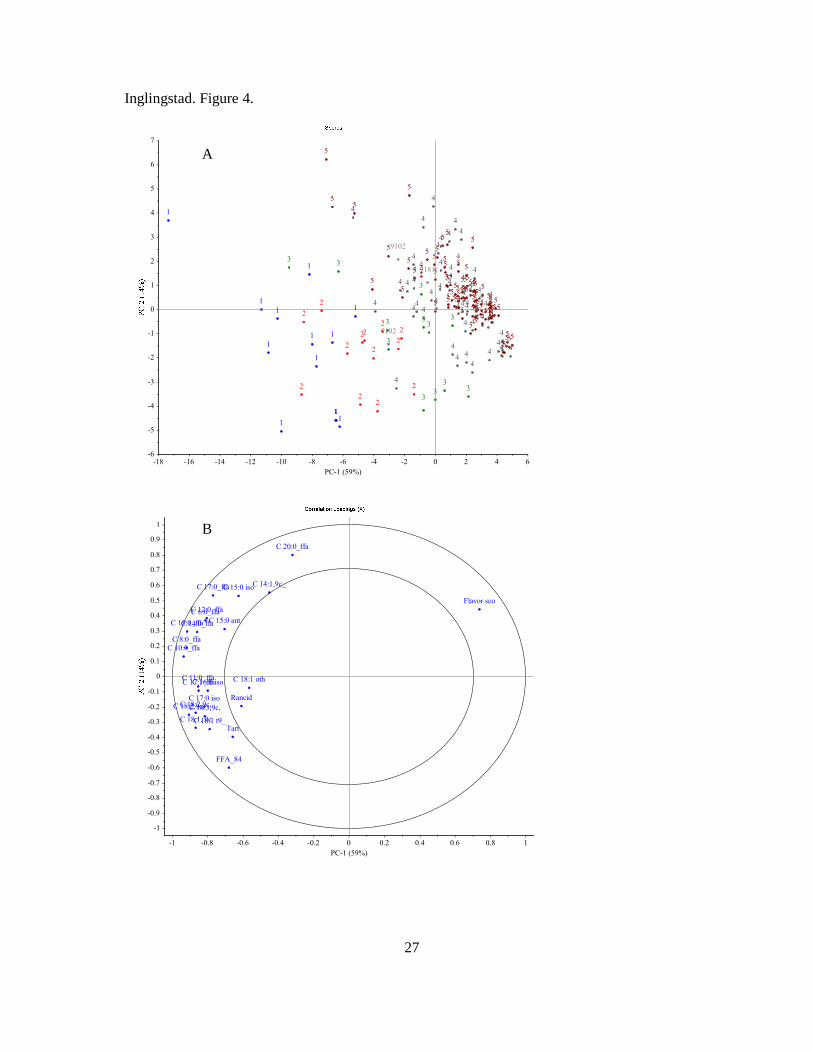
27
Inglingstad. Figure 4.
PC-1 (59%)
-18 -16 -14 -12 -10 -8 -6 -4 -2 0 2 4 6-6
-5
-4
-3
-2
-1
0
1
2
3
4
5
6
7
4
5
4 55
5
5
4
4
5
5
53
5
5
1
5
5
4
4
5
4
9181
55
5
5
4
5
5
4
5
5
4
4
3
4
4 4
49102
5
1 2
41
5
5
44
5 44
45
55
3
54
4
5
2
4
5
2
1
2
4
5
9102
3
1
33
1
3
4
44
2
4
4
1
5
44
4
55
3
4
2
45
3
2
1
4
55
4
1
5
2
5
2
5
5
5
15
3
1
55
54 5
5
5
54
4
5
424
3
4
5
5
1
5
21
5
55
5
2
5
4
2
555 5
554
4
2
54
5 44
4
5
554
5
3
4 55
4
54
55
44
554
5
4
PC-1 (59%)
-1 -0.8 -0.6 -0.4 -0.2 0 0.2 0.4 0.6 0.8 1
-1
-0.9
-0.8
-0.7
-0.6
-0.5
-0.4
-0.3
-0.2
-0.1
0
0.1
0.2
0.3
0.4
0.5
0.6
0.7
0.8
0.9
1
Flavor sco
FFA_84
Tart
Rancid
C 6:0_ffa
C 8:0_ffaC 10:0_ffa
C 11:0_ffa
C 12:0_ffa
C 14:0_ffa
C 15:0 iso
C 15:0 ant
C 14:1,9c_
C 15:0_ffa
C 16:0 iso
C 17:0 iso
C 16:1 t9_
C 17:0_ffa
C 17:1_ffa
C 18:1, 9c
C 18:1 oth
C 18:2,9c,
C 20:0_ffa
C 18:3,9c,C 18:2 9c,
A
B
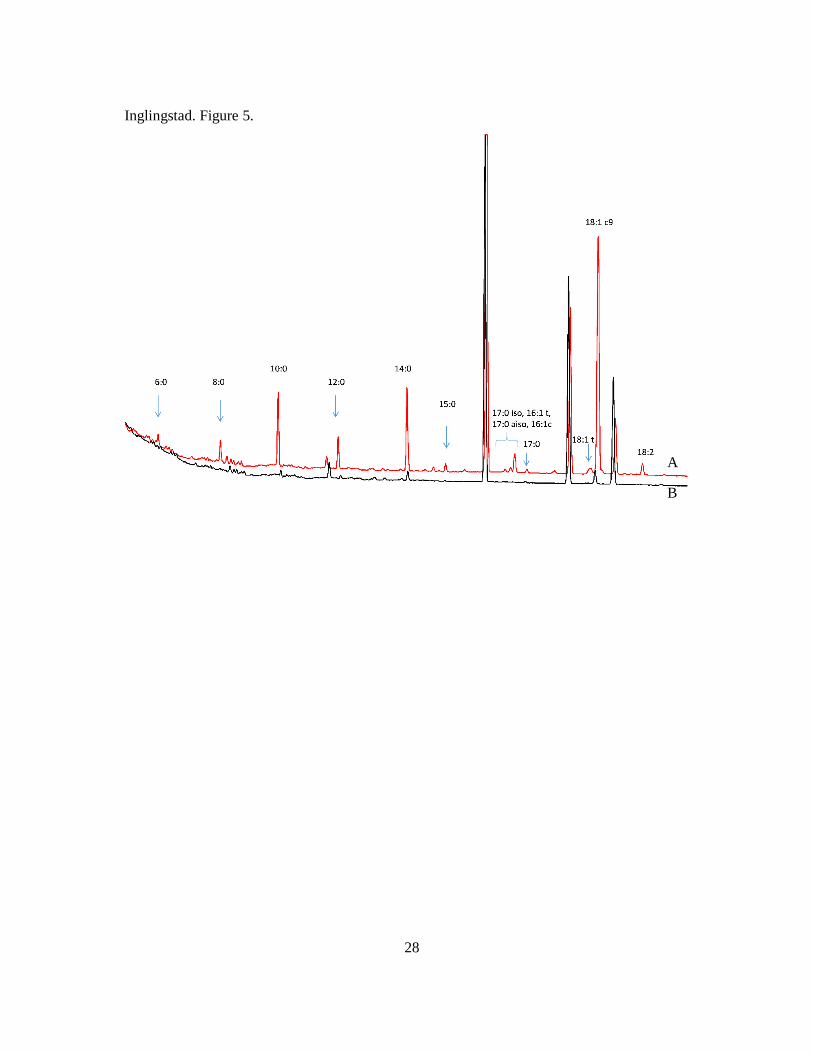
28
Inglingstad. Figure 5.
A
B
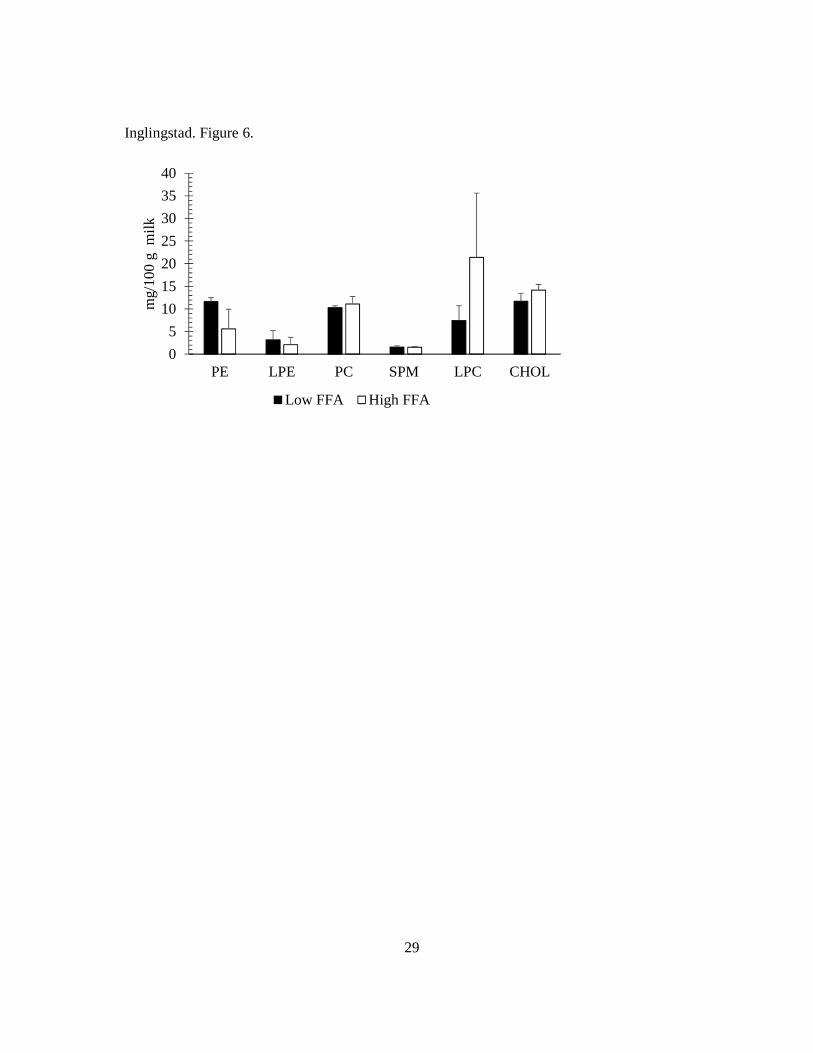
29
Inglingstad. Figure 6.
0
5
10
15
20
25
30
35
40
PE LPE PC SPM LPC CHOL
mg/
100
g m
ilk
Low FFA High FFA
30
Figure captions
Figure 1. Principal component analysis (PCA) of the triglyceride (TG) fatty acid profile in
milk at 90 DIM. The score plot (A) shows the distribution of the samples indicated by
feeding groups (CONTR ■, SAT ♦ and UNSAT ●) and the corresponding loading plot (B)
shows the distribution of variables (fatty acids). More than 70 % of the variation is explained
by principal component (PC) 1 and 2. The PCA analysis revealed a similar distribution of the
loadings and scores at 120-230 DIM.
Figure 2. FFA content in milk (A) and milk flavour scores (B) throughout a whole lactation
from goats receiving different lipid supplemented (saturated ∙∙∙∙, unsaturated ----, or control
──) concentrates from 61-230 DIM. The vertical line indicates start of the experimental period.
Values at 30 and 60 DIM are means, 90-230 are LS-means.
Figure 3. FFA content measured in samples at 0, 36 and 84 hours, respectively in milk from
goats receiving different lipid supplemented (saturated ∙∙∙∙, unsaturated ----, or control ──)
concentrates from 90-230 DIM.
Figure 4. Principal component analysis of FFA profile, total FFA and flavour scores of all
samples from 30-230 DIM. The score plot (A) shows the distribution of samples indicated by
their flavour score (1-5, where 5 is best (no off-flavours) and 1 indicates high degree of off-
flavours) and the corresponding loading plot (B) shows the distribution of variables (fatty
acids, flavours). Principal component (PC) 1 and 2 explained more than 70 % of the
variation.
Figure 5. Comparison of chromatograms of the free fatty acids (FFA) in goat milk with the
highest (4.3 mM, A) and lowest (0.1 mM, B) content of FFA measured at 90 DIM.
Figure 6. Content of polar lipids and cholesterol in milk from goats with high degree of
lipolysis (white) and low degree of lipolysis (black). PE=Phosphtidyletanolamine,
LPE=Lysophosphatidyletanolamine, PC=Phosphatidylcholine, SPM=Sphingomyelin,
LPC=Lysophosphatidylcholine, CHOL=Cholesterol

31


Paper IV

1
Norwegian goat milk composition and cheese quality: The influence of lipid supplemented 1
concentrate and lactation stage 2
3
Inglingstad, R.Aa.a*, Eknæs, M.b, Brunborg, L.a, Mestawet, T.a, Devold, T.G.a, Vegarud, G.E.a& 4
Skeie, S.B.a 5
a Department of Chemistry, Biotechnology and Food Science, Norwegian University of Life 6
Sciences, Ås, Norway 7
b Department of Animal and Aquaculture Sciences, Norwegian University of Life Sciences, Ås, 8
Norway 9
*Corresponding author: R.Aa Inglingstad, e-mail address: [email protected], Tel.: +47 10
677232494, Box 5003, N-1432 Ås, Norway 11
12
Abstract 13
In this study, milk from Norwegian goats fed a concentrate high in saturated (SAT) or unsaturated 14
(UNSAT) lipids were compared with milk from goats fed a control concentrate (CONTROL). Milk 15
from individual goats was sampled six times throughout the lactation (at 30, 60, 90, 120, 190 and 16
230 days in milk (DIM)). The milk was analysed for protein composition, renneting- and cheese 17
making properties. Cheeses were made from milk at 90, 120 and 190 DIM. As expected, lactation 18
stage influenced the milk composition and rennet coagulation parameters, while only minor effects 19
of SAT and UNSAT concentrate were observed. The lipid supplemented concentrates affected 20
cheese composition and ripening. SAT cheese had higher content of total solids and the UNSAT 21
cheese had the lowest content of free amino acids indicating a slower ripening. 22
2
23
1. Introduction 24
In Norway, an increasing amount of goat milk is processed into cheese, hence quality aspects 25
related to cheese production is becoming increasingly important. Cheese milk should be high in 26
total solids; in particular casein, have a low somatic cell count (SCC), and good coagulation 27
properties. It is known that the content of αs1-casein influences the rennet coagulation properties 28
of goat milk (Ambrosoli, di Stasio, & Mazzocco, 1988; Skeie, Inglingstad, Brunborg, & Eknæs, 29
2014), and the polymorphism of the gene encoding αs1-casein, CSN1S1, is widely studied (Caroli 30
et al., 2007; Martin, Ollivier-Bousquet, & Grosclaude, 1999; Ollier, Chauvet, Martin, Chilliard, & 31
Leroux, 2008). In addition to a high frequency of a “null-allele” of CSN1S1 in the Norwegian goat 32
population (Adnøy et al., 2003; Devold et al., 2011), flavour deviations in the milk, sometimes 33
including a prominent rancid-tart flavour, has been a major problem (Dagnachew, Thaller, Lien, 34
& Adnoy, 2011; Eknæs & Skeie, 2006; Skeie, 2014). Rancid and tart flavour is caused by lipolysis 35
of the milk fat and release of free fatty acids (FFA) (Lamberet, Delacroix-Buchet, & Degas, 2000). 36
The supply of fatty acids to the mammary gland seems to be of fundamental importance to achieve 37
goat milk of good quality. When as much as 5% of the dry matter in the diet of goats is supplied 38
as fat, the fat concentration in goat milk generally increases, and the lipolysis and content of FFA 39
in milk decreases (Chilliard, Ferlay, Rouel, & Lamberet, 2003; Chilliard et al., 2007; Morand-40
Fehr, 2005). Eknæs et al. (2009) observed improved sensory quality of milk when increased levels 41
of saturated long chain fatty acids (LCFA) were added to the diet of lactating goats. To improve 42
goat milk quality, the feed industry produces concentrate mixtures supplemented with fat, mainly 43
saturated LCFA. However, these saturated LCFA are considered as unfavourable in human 44
nutrition. On the other hand, plant oils can be used to obtain beneficial changes in milk fat 45
3
composition by reduction in fatty acids synthesized de novo (C10:0-C16:0) and an increase in 46
C18:0, cis-C18:1, conjugated linoleic acid (CLA) and polyunsaturated fatty acids (PUFA) 47
(Bernard, Bonnet, Leroux, Shingfield, & Chilliard, 2009). There are several publications showing 48
an effect of different lipid supplements on the fatty acid profile in goat milk (Chilliard & Ferlay, 49
2004; Chilliard et al., 2003; Eknæs et al., 2009). However, only a limited number of studies on 50
how lipid feeding affects goat milk protein composition (Sanz Sampelayo, Pérez, Martı́n Alonso, 51
Amigo, & Boza, 2002), cheese making properties and cheese quality (Álvarez et al., 2007; Sanz 52
Sampelayo, Amigo, Ares, Sanz, & Boza, 1998) are available. 53
The objective of this study was to investigate the effect of feeding Norwegian dairy goats a 54
saturated (SAT; rich in C16:0 and C18:0) or unsaturated (UNSAT; rich in C18:1 and C18:2) lipid 55
based concentrate during lactation and compare those to a control (CONTROL; no extra fat) 56
concentrate with respect to milk composition, milk coagulation properties, and sensory and 57
chemical quality of cheese during ripening. 58
59
2. Materials and Methods 60
2.1 Experimental design and diets 61
The experiment was carried out in 2011 on 30 goats of the Norwegian Dairy Breed in their 2nd to 62
4th lactation. The goats kidded from February 3rd to March 7th in 2011. The experiment was 63
performed over a whole lactation, from 0-230 days in milk (DIM). The period from 0-60 DIM was 64
pre-experimental, where the goats were fed a control diet. At 60 DIM the goats were allocated into 65
three experimental groups: CONTROL, SAT and UNSAT. The groups consisted of 10 goats each, 66
balanced according to age, date of kidding, body weight and milk yield. Each of the three feeding 67
groups consisted of seven goats heterozygous (E12-01) for the deletion in exon 12 at the αS1-casein 68
4
locus, while three were homozygous (E12-00) for this deletion. From 0-130 DIM and from 200-69
230 DIM the goats were stabled in individual pens and received silage according to appetite (10% 70
refusals). At 130 DIM the goats were taken to the mountain pasture. The mountain pastures were 71
located in Folldal (62°19’N; 10°1’E), 900-1000 m above sea level (m.a.s.l.), and the goats grazed 72
together as a flock and had free access to pasture day and night until 200 DIM. The goats received 73
0.9 kg of their specific concentrate per day until the start of the mountain grazing season (130 74
DIM), thereafter 0.7 kg per day. 75
The concentrate in the control feed consisted of barley, rape seed meal (Expro 00SF, 76
AarhusKarlshamn Sweden AB, SE 374 82 Karlshamn, Sweden), soy bean meal, beet pulp, 77
molasses and mineral/vitamin premix. The goats in the CONTROL group received this concentrate 78
during the whole experiment. The concentrate mixtures in the groups SAT and UNSAT were based 79
on the same mixture as the control with addition of 8 % of a source of saturated (Akofeed Gigant 80
60, AarhusKarlshamn Sweden AB, SE 374 82 Karlshamn, Sweden; rich in C16:0) or unsaturated 81
(rapeseed oil (AarhusKarlshamn Sweden AB, SE 374 82 Karlshamn, Sweden), rich in C18:1 and 82
C18:2) fat, respectively. Due to the lower fat content, the control feed had somewhat lower (7.5 83
MJ kg -1 DM) NEL than SAT and UNSAT feeds (both 8.2 MJ kg DM -1), however, the different 84
feeds were as isoproteic as possible: 196, 191 and 195 g kg-1 DM for Control, SAT and UNSAT, 85
respectively 86
2.2 Milk sampling and analyses 87
Milk was sampled from each individual goat at 30, 60, 90, 120, 190 and 230 DIM (at 90 DIM, 88
only some analyses were performed). Milk was collected twice a day, at 6:00 in the morning and 89
15:30 in the evening during each sampling day in separate buckets from each goat. Evening and 90
morning milk of each individual goat were pooled in the ratio 40:60 (1L in total), due to higher 91
5
milk yield in the morning. Samples were kept at 4°C until analysis (appx. 36 h), except aliquots 92
for casein composition and calcium content that were stored at -20°C. Milk samples for protein 93
analysis by the Kjeldahl method and casein micelle size were skimmed as described previously 94
(Inglingstad et al., 2014). 95
The content of lactose and somatic cells count (SCC) were analysed by Fourier Transform Infrared 96
Spectroscopy (FTIR) (MilkoScan Combifoss 6500; Foss, Hillerød, Denmark). The milk (50 mL) 97
samples for FTIR analysis were preserved with Bronopol (2-bromo-2-nitropropane-1, 3-diol; D&F 98
Control Systems Inc., San Ramon, CA). The pH, content of total protein, casein and non-protein 99
nitrogen of milk and mean size of casein micelles was measured as described by Inglingstad et al. 100
(2014). The identification and quantification of individual caseins were analysed using capillary 101
zone electrophoresis, Agilent CE (Agilent Technologies, Waldbronn, Germany) according to 102
Mestawet et al. (2014) and Skeie et al. (2014). The calcium content of milk was measured by 103
complexiometric titration with di-sodium hydrogen salt of EDTA and Erichrom black T as 104
indicator according to Visser (1976). 105
Rennet clotting properties of milk from individual goats were analysed by Formagraph 106
(Lattodinamografo, Foss Italy, Padova, Italy) according to McMahon and Brown (1982). Rennet 107
clotting time (RCT), firming time (k20) and gel strength (a30) were recorded as described by Skeie 108
et al. (2014). 0.08 IMCU of rennet (CHYMAX, Chr. Hansen A/S, Hørsholm, Denmark) were 109
added per mL milk. 110
2.3 Cheese processing 111
A semi-soft cheese (Havarti type), was produced at 90, 120 and 190 DIM. At 90 and 120 DIM two 112
replicate blocks of cheese were made at the University Pilot Plant from 50 L milk, with two days 113
6
between each replicate block. From each vat 10 cheeses (0.5 kg) were obtained. The cheese 114
produced at 190 DIM was made at the end of the mountain pasture period, in 10 L cheese vats 115
with only one replicate block (2 cheeses per group were obtained). Milk for the cheese produced 116
at 190 DIM were collected from two consecutive milkings (morning and evening). For cheese 117
production at 90 and 120 DIM, the milk used was collected over two days (four consecutive 118
milkings), and for practical reasons cheese making were performed the week before the collection 119
of milk for other milk samples. A starter culture CHN19 (Chr. Hansen A/S) and a Lb. casei, as an 120
adjunct culture, was added into the milk. The cheese was produced as described by Skeie et al. 121
(2014). 122
2.4 Cheese analysis 123
Samples were taken from the pasteurised milk, from cheese after 24 h and after 2 and 4 mo of 124
ripening. A new cheese (0.5 kg) was sampled at each sampling point. Sampling for chemical and 125
microbial analyses were performed according to IDF-standard 50C (IDF/FIL, 1995). pH, organic 126
acids (mg g-1), total solids % (TS %) and the total number of microorganisms (CFU) were analysed 127
immediately after sampling (Skeie et al., 2014). Cheese samples for analysis of free amino acids 128
(FAA) were grated and stored at -20°C until analysis on HPLC as described by Martinovic et al. 129
(2013). Cheese made at 190 DIM and ripened for 4 mo were only subjected to sensory analysis 130
due to small sample size. Sensory evaluation of the experimental cheeses ripened for two and four 131
months were performed as described by (Skeie et al., 2014). 132
2.5 Statistical analysis 133
Analysis of variance was performed using the MIXED procedure (Littell, Henry, & Ammerman, 134
1998) of SAS (SAS, 1992). The measurements of milk were repeated several times for each 135
7
animal, and appeared correlated. Consequently, this correlation was taken into account in the 136
statistical model. The covariance structure of the repeated measurements was chosen by comparing 137
potential structures using Akaike’s and Schwarz’s Bayesian information criterion (Wolfinger, 138
1996). Variance components (VC) covariance structure proved useful for all the milk data. The 139
value at 60 DIM was used as a covariate. Analysis of variance with repeated measurements of the 140
milk data was performed according to the following model: 141
Yijkl = µ + A i + B j + A x B (ij) + C k + A x C (ik) + d(At) Ɛ ijkl 142
Where µ is the intercept; Ai is the fixed effect of concentrate type, i=1, 2, 3 (CONTROL, SAT, 143
UNSAT); Bj is the fixed effect of DIM, j=1, 2,….4 (DIM 90, 120, 200, 230); A x B (ij) is the 144
interaction between concentrate type i and DIM j; Ck is the fixed effect of genotype at the αS1-145
casein locus, k=1,2 (E12-00, E12-01); A x C (ik) is the interaction between concentrate type i and 146
genotype j; d(At) is random effect of goat within concentrate type and genotype and Ɛijkl represents 147
the experimental error. For the statistical analysis of the cheese data an autoregression covariation 148
structure proved useful for all data. Significant differences (P<0.05) between the fixed treatment 149
factors during cheese making and the ripening age on the dependent variables of the cheese were 150
found by an analysis of variance with repeated measurements according to the following model: 151
Y ijkl = µ + Ai + Bj + Ck + d + Ɛijkl where µ is the intercept; Ai the fixed effect of concentrate, i=1,2,3 152
(CONTROL, SAT, UNSAT); Bj is the fixed effect of DIM, j=1,2,3 (DIM 90, 120, 200); Ck is the 153
repeated effect of ripening age, with k=1,2 (two months, four months); d is the random effect of 154
the two replicate blocks; and Ɛijkl is the experimental error. 155
Partial least square regression using the FAA data as X variables and sensory scores as Y 156
variables was conducted with The Unscrambler® X (CAMO Process AS, Oslo, Norway). The 157
amino acid data were weighted by dividing each response variable by its standard deviation, 158
8
while the sensory data were not weighted as the same scale was used during analysis. A full 159
cross-validation was used to validate the data set. 160
161
162
3 Results and Discussion 163
3.1 Milk 164
3.1.1 Effects of feeding 165
The content of non-fat solids in the goat milk were, in general, only affected to a minor extent by 166
the different lipid supplemented concentrates. This is in accordance with previously reported 167
results in Norwegian goats milk (Eknæs et al., 2009) for protein and lactose. However, at mid-168
lactation (90-120 DIM) significant effects of the lipid composition of the concentrate were found 169
for the content of lactose (P< 0.05), calcium (P<0.01) and in pH (P<0.01). These parameters 170
obtained higher values in the UNSAT milk compared to the CONTROL milk (Table 1). Such 171
effects on milk components of unsaturated fats in the feed of goats has not been previously reported 172
according to our knowledge. Despite a higher (but not statistically significant, P>0.05) SCC, the 173
UNSAT milk had the highest gel firmness at mid-lactation. This indicates that a high SCC does 174
not automatically give a poor cheese milk, and this is in accordance with other published results 175
(Chen, Wang, Van Kessel, Ren, & Zeng, 2010). The content of lactose in milk has previously been 176
found to be correlated with gel firmness during renneting (Inglingstad et al., 2014; Leitner, Merin, 177
& Silanikove, 2011) 178
9
Studies on different protein feed sources (Sanz Sampelayo, Pérez, Gil Extremera, Boza, & Boza, 179
1999) and different types of pastures (Inglingstad et al., 2014) revealed that feeding may change 180
the proportion of the individual caseins in goat milk. Sanz Samplayo et al. (2002) studied the effect 181
of three levels of PUFA in the goat diet (0 %, 9 % and 12 %), and showed a lower content of αs-182
caseins in the milk when the concentration of PUFA in the feed increased. In the present study, a 183
significant difference (P<0.05) between the feeding groups was only found in the ratio of κ-casein 184
to total casein in mid-lactation (120 DIM) where the concentration of κ-casein was higher in 185
CONTROL (24.7%) milk than in SAT (22.5%) milk. Studies of cow milk have revealed a decrease 186
in protein and especially casein content when the content of fat (especially unsaturated fat) was 187
increased in the diet (Chilliard & Ferlay, 2004; Coppock & Wilks, 1991; Jenkins & Jenny, 1992). 188
However, this was not observed in our study on goat milk. Actually the UNSAT milk had the 189
highest protein content measured when the goats were at the mountain pasture (190 DIM) (P<0.05 190
compared to SAT). Otherwise, no significant differences in total content of protein, casein, or non-191
protein nitrogen (NPN) between the CONTROL, SAT or UNSAT milk were observed. 192
Several studies report no or few effects on rennet coagulation properties of milk by feeding 193
different unsaturated oils (Martínez Marín et al., 2011), different forage to concentrate ratio (Mele, 194
Serra, Rafanelli, Conte, & Secchiari, 2010; Tufarelli, Dario, & Laudadio, 2009), different protein 195
sources (Laudadio & Tufarelli, 2010; Sanz Sampelayo et al., 1998) or different forage (Inglingstad 196
et al., 2014). Even though feeding hardly changes the rennet coagulation properties of milk, our 197
study showed an improved k20 by feeding lipid supplemented concentrates. The CONTROL milk 198
had longer firming time (36 min) compared to SAT (26 min, P<0.05) and UNSAT milk (23 min, 199
P<0.01) at 90 DIM. The UNSAT milk displayed the most stable values of a30 throughout lactation 200
(Figure 2). 201
10
3.1.2 Effects of lactation stage 202
Stage of lactation is one of the many factors that influence milk composition and its technological 203
properties, and this was also reflected on the different milk components in the current study (Table 204
1). The content of lactose in the milk decreased throughout the lactation period (from 4.86% at 30 205
DIM to 4.06% at 230 DIM, P<0.0001), except for a plateau at 90-120 DIM. The SCC was highest 206
(7.2 log units mL-1, P<0.0001) at 190 DIM, when the goats were grazing mountain pasture. Also 207
the highest milk pH was measured when the goats were on mountain pasture, 6.80 compared to 208
6.59 at 60 DIM during indoor feeding. The effect of the lactation stage on pH was significant (P< 209
0.0001). The contents of total protein and casein were higher in early lactation, decreased as the 210
goats entered their mid lactation, and increased again in the late lactation period. The effect of the 211
lactation stage was significant (P<0.0001) with respect to protein and casein content. The highest 212
content of total protein (3.2%) and casein (2.5%) was measured at the first sampling (30 DIM) and 213
then the protein content gradually decreased to its lowest level (2.5% and 1.9%, protein and casein, 214
respectively) at 120 DIM. The protein content increased again towards the end of lactation (3.0% 215
and 2.8% protein at 190 and 230 DIM respectively and 2.4% and 2.2% casein at 190 and 230 DIM 216
respectively). The content of whey proteins were not influenced by lactation stage nor by the 217
concentrate (Table 1). The highest casein to whey ratio was measured at 190 DIM (mountain 218
pasture), and was significantly (P<0.05) different from 120 DIM, but not from 230 DIM. The 219
lowest content of non-protein nitrogen (NPN) in the milk (0.04%) was measured during mountain 220
grazing and the highest values (0.05%) were observed at the start and end of lactation, where 221
lactation stage was highly significant (P<0.0001). The content of calcium decreased gradually 222
from 1.53 g kg-1 at 30 DIM and 1.6 g kg-1 at 60 DIM to 1.3 g kg-1 at 230 DIM (Table 1), and the 223
main effect of lactation stage was highly significant (P<0.0001). Similar trends have been reported 224
11
by Brendehaug and Abrahamsen (1986); Guo, Park, Dixon, Gilmore and Kindstedt (2004); 225
Mestawet et al. (2014); Mestawet et al. (2012). The composition of the individual caseins is shown 226
in Figure 1. The most abundant casein in all samples was β-casein, which constituted to more than 227
half of the casein fraction. β-casein displayed a gradual decrease when lactation proceeded, with 228
the lowest level found at 120 DIM (12.6 g L-1). The relative values of β-casein content to total 229
casein were lowest at the start (56% at 30 DIM) and at the very end of lactation (55.5% at 230 230
DIM), and highest at 190 DIM (60.6%). κ-casein, in contrast to β-casein, were highest in relative 231
value to total casein at the start (25.5% at 30 DIM) and end of the lactation curve (27.2% at 230 232
DIM). The relative content of κ-casein was lowest at 200 DIM, contributing to 22.7% of the total 233
casein. The content of αs1-casein was highest at the start (11.2% and 3.5 g L-1 at 30 DIM) and at 234
the end (11.4% and 2.9 g L-1 at 230 DIM) of lactation, while the lowest contents were measured 235
at 120 DIM, where the relative concentration contributed with only 9.8% to the total casein and 236
2.2 g L-1 milk. In contrast to the other caseins, the content of αs2-casein was not influenced by 237
lactation stage. The relative concentration of αs2-casein to total casein was quite constant at ~7.5% 238
from 30-190 DIM, before it was reduced to 6.5% at 230 DIM (P<0.0001). In the current study, the 239
content of all caseins were higher in the early lactation stage than at the later stages. This finding 240
is different from the finding reported by Mestawet et al. (2014) in Ethiopian goats during the late 241
lactation period. During this period, as the milk volume decreases, the milk components are 242
expected to concentrate and hence to be higher than in the earlier stages of lactation. In this study 243
the individual caseins were at their lowest in the mid-lactation stage (DIM 120) except for the 244
content of αs2-CN which was unaffected by lactation stage. 245
The micelle size was influenced by lactation stage (Table 1). The casein micelles were about 220 246
nm in the start of lactation (30 and 60 DIM) and smallest towards the end (210 nm at 230 DIM) of 247
12
lactation. The casein micelles were larger at mid-lactation (229 nm at 120-190 DIM) than at 230 248
DIM (210 nm) (P<0.0001). Similar effects of lactation stage is also reported by Mestawet et al. 249
(2014) for Ethiopian goats, otherwise information on how stage of lactation affects the size 250
distribution of casein micelles in goat milk is scarce and to the best of our knowledge, very little 251
data has been reported. Previous studies on milk of individual cows found no correlation of casein 252
micelle size with lactation stage, nor with the fat or protein content of the milk, age of cow or the 253
milk volume produced (de Kruif & Huppertz, 2012). 254
The rennet coagulation properties of milk were improved (shorter RCT, smaller k20 and greater 255
a30) in early compared to late lactation. The RCT values increased sharply from 10 min at 90 DIM, 256
to 16 min at 190 DIM (Figure 2). Highest values of a30 was obtained at 30, 60 and 190 DIM. The 257
increase in curd firmness at 190 DIM when the goats were at mountain pasture (Figure 2) was 258
somewhat unexpected as there is no obvious indications of this with regards to the milk 259
composition. However, it is most likely that the increased protein and casein content may be the 260
main factors. 261
3.1.3 Effects of Genotype 262
The influence of genotype at the αs1-locus was not the aim of this paper, however, as we know 263
from previous studies that genotype influences also other parameters than the content of αs1-casein 264
(Devold et al., 2011; Pierre et al., 1998; Skeie et al., 2014), it was included as a factor in our 265
statistical model. Norwegian goats homozygous for the deletion in exon 12, E-00, had a lower total 266
protein-, and casein content, and a lower content of individual caseins and calcium. In addition, 267
these goats had longer RCT, longer gel firming time (k20) and a weaker curd (a30) compared to the 268
heterozygous goats, E12-01. 269
13
3.2 Cheese 270
3.2.1 Effects of feeding 271
The cheese made of milk from goats fed a concentrate with saturated fat (SAT cheese) obtained a 272
higher (P<0.01) total solids (TS) content than the cheese made of milk from the goats fed a 273
concentrate of unsaturated fat (UNSAT cheese) (Table 2). The TS in cheese made of milk from 274
goats fed the control concentrate (CONTROL cheese) did not differ significantly from the other 275
cheeses. As the cheeses were ripened in foil, the total solids did not change significantly during 276
the ripening period. The cheese pH was not influenced by feeding regime, however, as expected, 277
pH increased significantly (P<0.001) during ripening. The fat source of the concentrate influenced 278
the texture of the cheese, but not the flavour. The CONTROL cheeses generally obtained a better 279
texture score than the UNSAT cheese. The sensory analyses revealed that the texture attributes of 280
the cheeses were significantly (P<0.05) influenced by type of concentrate (Table 2). The texture 281
of the UNSAT cheese obtained a lower score (P<0.05) than the CONTROL cheese and the 282
UNSAT cheese was also more doughy (P<0.01) than the CONTROL and the SAT cheese. The 283
texture, taste and flavour of the cheeses did not improve during ripening, as after 2 mo of ripening 284
the main scores were higher (P<0.05, effects 0.3, 0.6 and 0.4, respectively), and the cheese were 285
less doughy (P<0.01, effect -0.5) than after 4 mo of ripening. 286
During cheese ripening, the caseins are degraded by enzymes from rennet, lactic acid bacteria 287
(LAB) and indigenous enzymes (i.e. plasmin). Therefore the content of FAA in the cheese can be 288
used as a ripening index (Fox, Guinee, Cogan, & McSweeney, 2000). The proteolysis is mainly 289
responsible for the textural changes and flavour development during ripening. The content of FAA 290
increased (P<0.001) in all cheeses during ripening (from 2 to 4 mo), and the increase of FAA from 291
2 to 4 mo were higher in the CONTROL and SAT cheeses than in the UNSAT cheeses (Figure 292
14
3a). The ripened SAT cheese had higher levels (65.5 µmol g-1 cheese) (P<0.05) of all FAA except 293
for gamma-aminobutyric acid (GABA), than UNSAT (50 µmol g-1 cheese) and CONTROL (55 294
µmol g-1 cheese) cheese. The CONTROL cheese had higher (0.14 µmol g-1 cheese) (P<0.01) 295
amounts of GABA than the UNSAT cheese (0.1 µmol g-1 cheese). Due to the slower increase of 296
FAA, the UNSAT cheese therefore appeared to have a slower proteolysis than the CONTROL and 297
the SAT cheese (Figure 3a). The development of FAA are influenced by factors like moisture 298
content, pH and the content of proteolytic enzymes. Generally, a lower proteolytic activity is 299
obtained as the moisture content decreases in cheese. However, the UNSAT cheese had the highest 300
moisture content of the cheeses (Table 2), and a slower proteolysis was not expected. It is unlikely 301
that the UNSAT cheese had a higher content of ripening enzymes derived from the starter culture, 302
as the highest content of Lc. spp throughout ripening was found in the CONTROL cheese (P<0.05), 303
with SAT and UNSAT cheese having a similar, but somewhat lower content (Table 2). The content 304
of Lactobacilli did not differ between the cheeses (results not shown). The pH in the different 305
cheeses was similar and should not facilitate differences in proteolytic activity between the 306
cheeses. Differences in moisture, pH and ripening enzymes from lactic acid bacteria (LAB) can 307
therefore not explain the differences in the content of FAA in the experimental cheeses. 308
3.2.2 Effects of lactation stage 309
Cheese produced at 190 DIM had a higher content of TS (P<0.001) and a higher pH (P<0.001) 310
than cheese made at 90 and 120 DIM. This can be attributed to differences during cheese 311
production, as the cheese produced at 190 DIM was made on the mountain summer farm. The 312
summer farm is located 6 h drive from the dairy pilot plant with no transport possibilities to the 313
university pilot plant. The cheeses were therefore made at the summer farm in small 10 L cheese 314
vats, which obviously made it somewhat difficult to replicate the cheese made at 90 and 120 DIM. 315
15
However, as described above, a higher curd firmness (a30) were obtained at this lactation stage 316
(190 DIM) compared to 90 and 120 DIM (Figure 2). 317
All the FAA except of Arg and GABA were influenced (P<0.05) by DIM (Figure 3a). Ripened 318
cheese produced at 90 DIM had lower content of FAA than cheese produced at 120 and 190 DIM. 319
The content of all FAA except for GABA increased (P<0.05) during cheese ripening. The higher 320
content of FAA in cheese produced at 120 and 190 DIM indicates higher proteolysis in those 321
cheeses. Hence, proteolytic activity may be dependent upon lactation and it is known that the 322
plasmin activity in goat milk is higher in late lactation (Cortellino, Locci, & Rampilli, 2006; 323
Fantuz, Polidori, Cheli, & Baldi, 2001). The development of most FAA during ripening was 324
similar; however, the development of GABA, Tyr, Arg and Trp differed somewhat from the others. 325
Tyr was highest (P<0.001) in cheese made from 120 DIM (Figure 3b), while the development of 326
Arg was not influenced by DIM (results not shown). During ripening the content of Trp was higher 327
(P<0.001) and increased more during ripening in cheese made at 120 and 190 DIM (Figure 3c) 328
than cheese made at 90 DIM. Plasmin and rennet hydrolyse the most abundant proteins, αS1-CN 329
and β-CN where they split specifically at Trp and Tyr positions (Upadhyay, McSweeney, 330
Magboul, & Fox, 2004). Moreover, it has been shown that in goat milk cheeses, the αS-CNs are 331
the most extensively degraded CNs (Hayaloglu, Tolu, & Yasar, 2013; Tejada, Abellán, Cayuela, 332
Martínez-Cacha, & Fernández-Salguero, 2008). 333
Cheeses produced at 190 DIM obtained a better texture score (P<0.001) than cheese produced at 334
90 and 120 DIM. This is most probably connected to the differences in TS, and a higher TS seems 335
to be beneficial for the cheese variety made in the present experiment. 336
3.3.3 Multivariate analysis of free amino acids and sensory data 337
16
Partial least square (PLS) regression analysis revealed that texture properties were influenced by 338
the content of FAA (Figure 4). Factor 1 and factor 2 separated the cheeses according to their 339
content of FAA and their texture properties, respectively. All UNSAT cheeses were doughy and 340
had a poor texture, except UNSAT cheese made at mountain pasture (190 DIM). In addition, the 341
UNSAT cheeses had a low content of FAA (Figure 3) which means that these cheeses had a less 342
pronounced proteolysis. Cheeses ripened for 4 mo (in the ellipse in Figure 4b) had a higher content 343
of FAA, as expected. However, the SAT cheeses appeared more ripened (higher content of FAA) 344
than the UNSAT and the CONTROL cheeses. The PLS revealed that cheeses made at 90 DIM had 345
a low content of FAA, while the difference between cheese ripened for 2 or 4 mo were less for the 346
UNSAT and the CONTROL cheeses than for the SAT cheeses. Moreover, cheeses made at the 347
mountain pasture had the best texture, most probably due to a higher TS content (Table 2). 348
349
5. Conclusion 350
In this study the effects of lactation stage and lipid supplemented concentrate on the composition 351
of goat milk and its cheese making properties were investigated. Faster ripening and a better texture 352
were obtained in cheese made of milk from goats that received concentrate supplemented with 353
saturated lipids than cheese made from milk from goats that received the control concentrate or 354
the concentrate supplemented with unsaturated fat. Lipid supplemented concentrate did not 355
influence the casein content and or other main components in the goat milk. Stage of lactation 356
influenced casein composition, content of lactose, protein, casein, NPN and calcium, and pH, SCC 357
and the mean size of casein micelles. 358
Acknowledgements 359
17
The Norwegian research council (NFR) and TINE BA financed this study. We would like to thank 360
Harald Volden for his advices regarding the experimental design, the staff at the Animal 361
Production Experimental Centre of the Norwegian University of Life Sciences for animal care and 362
assistance with sampling procedures, Irene Comi for technical assistance during milk sampling, 363
and May Helene Aalberg and Ida Block for technical assistance. TINE provided Milcoscan 364
analysis free of charge. 365
366
References 367
Adnøy, T., Vegarud, G., Devold, T. G., Nordbø, R., Colbjørnsen, I., Brovold, M., Markovic, B., 368
Roseth, A., & Lien, S. (2003). Effects of the 0- and F-alleles of a s1 casein in two farms 369
of northern Norway. Paper presented at the Proceedings of the international workshop on 370
major genes and qtl in sheep and goat, Toulouse, France, 8-11 December 2003,. 371
Álvarez, S., Fresno, M., Méndez, P., Castro, N., Fernández, J. R., & Sanz Sampelayo, M. R. 372
(2007). Alternatives for Improving Physical, Chemical, and Sensory Characteristics of 373
Goat Cheeses: The Use of Arid-Land Forages in the Diet. Journal of Dairy Science, 90, 374
2181-2188. 375
Ambrosoli, R., di Stasio, L., & Mazzocco, P. (1988). Content of [alpha]s1-Casein and 376
Coagulation Properties in Goat Milk. Journal of Dairy Science, 71, 24-28. 377
Bernard, L., Bonnet, M., Leroux, C., Shingfield, K., & Chilliard, Y. (2009). Effect of sunflower-378
seed oil and linseed oil on tissue lipid metabolism, gene expression, and milk fatty acid 379
secretion in alpine goats fed maize silage–based diets. Journal of Dairy Science, 92, 380
6083-6094. 381
18
Brendehaug, J., & Abrahamsen, R. K. (1986). Chemical composition of milk from a herd of 382
Norwegian goats. Journal of Dairy Research, 53, 211-221. 383
Caroli, A., Chiatti, F., Chessa, S., Rignanese, D., Ibeagha-Awemu, E. M., & Erhardt, G. (2007). 384
Characterization of the Casein Gene Complex in West African Goats and Description of 385
a New {alpha}s1-Casein Polymorphism. Journal of Dairy Science, 90, 2989-2996. 386
Chen, S. X., Wang, J. Z., Van Kessel, J. S., Ren, F. Z., & Zeng, S. S. (2010). Effect of somatic 387
cell count in goat milk on yield, sensory quality, and fatty acid profile of semisoft cheese. 388
Journal of Dairy Science, 93, 1345-1354. 389
Chilliard, & Ferlay. (2004). Dietary lipids and forages interactions on cow and goat milk fatty 390
acid composition and sensory properties. Reprod. Nutr. Dev., 44, 467-492. 391
Chilliard, Ferlay, A., Rouel, J., & Lamberet, G. (2003). A Review of Nutritional and 392
Physiological Factors Affecting Goat Milk Lipid Synthesis and Lipolysis. Journal of 393
Dairy Science, 86, 1751-1770. 394
Chilliard, Glasser, F., Ferlay, A., Bernard, L., Rouel, J., & Doreau, M. (2007). Diet, rumen 395
biohydrogenation and nutritional quality of cow and goat milk fat. European Journal of 396
Lipid Science and Technology, 109, 828-855. 397
Coppock, C. E., & Wilks, D. L. (1991). Supplemental fat in high-energy rations for lactating 398
cows: effects on intake, digestion, milk yield, and composition. Journal of Animal 399
Science, 69, 3826-3837. 400
Cortellino, G., Locci, F., & Rampilli, M. (2006). An investigation of the plasmin–plasminogen 401
system in caprine milk and cheese. International Dairy Journal, 16, 619-622. 402
19
Dagnachew, B., Thaller, G., Lien, S., & Adnoy, T. (2011). Casein SNP in Norwegian goats: 403
additive and dominance effects on milk composition and quality. Genetics Selection 404
Evolution, 43, 31. 405
de Kruif, C. G., & Huppertz, T. (2012). Casein Micelles: Size Distribution in Milks from 406
Individual Cows. Journal of Agricultural and Food Chemistry, 60, 4649-4655. 407
Devold, T. G., Nordbø, R., Langsrud, T., Svenning, C., Brovold, M., Sørensen, E., Christensen, 408
B., Ådnøy, T., & Vegarud, G. (2011). Extreme frequencies of the αs1-casein “null” 409
variant in milk from Norwegian dairy goats— implications for milk composition, 410
micellar size and renneting properties. Dairy Science & Technology, 91, 39-51. 411
Eknæs, Havrevoll, Ø., Volden, H., & Hove, K. (2009). Fat content, fatty acid profile and off-412
flavours in goats milk—Effects of feed concentrates with different fat sources during the 413
grazing season. Animal Feed Science and Technology, 152, 112-122. 414
Eknæs, M., & Skeie, S. (2006). Effect of different level of roughage availability and contrast 415
levels of concentrate supplementation on flavour of goat milk. Small Ruminant Research, 416
66, 32-43. 417
Fantuz, F., Polidori, F., Cheli, F., & Baldi, A. (2001). Plasminogen Activation System in Goat 418
Milk and its Relation with Composition and Coagulation Properties. Journal of Dairy 419
Science, 84, 1786-1790. 420
Fox, P. F., Guinee, T. P., Cogan, T. M., & McSweeney, P. L. H. (2000). Fundamentals of Cheese 421
Science. Gaithersburg, MD: Aspen publishers. 422
Guo, M., Park, Y. W., Dixon, P. H., Gilmore, J. A., & Kindstedt, P. S. (2004). Relationship 423
between the yield of cheese (Chevre) and chemical composition of goat milk. Small 424
Ruminant Research, 52, 103-107. 425
20
Hayaloglu, A. A., Tolu, C., & Yasar, K. (2013). Influence of goat breeds and starter culture 426
systems on gross composition and proteolysis in Gokceada goat cheese during ripening. 427
Small Ruminant Research, 113, 231-238. 428
IDF/FIL. (1995). Milk and milk products: guidance on sampling IDF Standard 50C. Brussels, 429
Belgium: International Dairy Federation. 430
Inglingstad, R. A., Steinshamn, H., Dagnachew, B. S., Valenti, B., Criscione, A., Rukke, E. O., 431
Devold, T. G., Skeie, S. B., & Vegarud, G. E. (2014). Grazing season and forage type 432
influence goat milk composition and rennet coagulation properties. Journal of Dairy 433
Science, 97, 3800-3814. 434
Jenkins, T. C., & Jenny, B. F. (1992). Nutrient Digestion and Lactation Performance of Dairy 435
Cows Fed Combinations of Prilled Fat and Canola Oil1. Journal of Dairy Science, 75, 436
796-803. 437
Lamberet, G., Delacroix-Buchet, A., & Degas, C. (2000). Intensité de la lipolyse initiale des laits 438
de chèvre et perception de l’arôme «chèvre» dans les fromages. Paper presented at the 439
Proc. Technical Symp. 7th Int. Conf. Goats: Recent Advances on Goat Milk Quality, 440
Raw Material for Cheesemaking.(ITPLC Ed.). Poitiers, France. 441
Laudadio, V., & Tufarelli, V. (2010). Effects of pelleted total mixed rations with different rumen 442
degradable protein on milk yield and composition of Jonica dairy goat. Small Ruminant 443
Research, 90, 47-52. 444
Leitner, G., Merin, U., & Silanikove, N. (2011). Effects of glandular bacterial infection and stage 445
of lactation on milk clotting parameters: Comparison among cows, goats and sheep. 446
International Dairy Journal, 21, 279-285. 447
21
Littell, R. C., Henry, P. R., & Ammerman, C. B. (1998). Statistical analysis of repeated measures 448
data using SAS procedures. Journal of Animal Science, 76, 1216-1231. 449
Martin, P., Ollivier-Bousquet, M., & Grosclaude, F. (1999). Genetic polymorphism of caseins: a 450
tool to investigate casein micelle organization. International Dairy Journal, 9, 163-171. 451
Martínez Marín, A. L., Gómez-Cortés, P., Gómez Castro, A. G., Juárez, M., Pérez Alba, L. M., 452
Pérez Hernández, M., & de la Fuente, M. A. (2011). Animal performance and milk fatty 453
acid profile of dairy goats fed diets with different unsaturated plant oils. Journal of Dairy 454
Science, 94, 5359-5368. 455
Martinovic, A., Moe, K. M., Romeih, E., Aideh, B., Vogensen, F. K., Østlie, H., & Skeie, S. 456
(2013). Growth of adjunct Lactobacillus casei in Cheddar cheese differing in milk fat 457
globule membrane components. International Dairy Journal, 31, 70-82. 458
McMahon, D. J., & Brown, R. J. (1982). Evaluation of Formagraph for Comparing Rennet 459
Solutions. Journal of Dairy Science, 65, 1639-1642. 460
Mele, M., Serra, A., Rafanelli, M. R., Conte, G., & Secchiari, P. (2010). Effect of 461
forage/concentrate ratio and soybean oil supplementation on milk yield and quality from 462
dairy goats. 2010, 3. 463
Mestawet, Girma, A., Ådnøy, T., Devold, T., Narvhus, J., & Vegarud, G. (2014). New insights in 464
goat breeds of Ethiopia: High content of α s1-CN and its association with coagulation 465
properties, whey syneresis and micelle size. Small Ruminant Research, 119, 146-155. 466
Mestawet, Girma, A., Ådnøy, T., Devold, T. G., Narvhus, J. A., & Vegarud, G. E. (2012). Milk 467
production, composition and variation at different lactation stages of four goat breeds in 468
Ethiopia. Small Ruminant Research, 105, 176-181. 469
22
Morand-Fehr, P. (2005). Recent developments in goat nutrition and application: A review. Small 470
Ruminant Research, 60, 25-43. 471
Ollier, S., Chauvet, S., Martin, P., Chilliard, Y., & Leroux, C. (2008). Goat's as1-casein 472
polymorphism affects gene expression profile of lactating mammary gland. Animal, 2, 473
566-573. 474
Pierre, A., Le Quéré, J.-L., Riaublanc, A., Le Graët, Y., Demaizières, D., & Michel, F. (1998). 475
Composition and physico-chemical characteristics of goat milks containing the A or O 476
αsl casein variants. Lait, 78, 191-202. 477
Sanz Sampelayo, M. R., Amigo, L., Ares, J. L., Sanz, B., & Boza, J. (1998). The use of diets 478
with different protein sources in lactating goats: Composition of milk and its suitability 479
for cheese production. Small Ruminant Research, 31, 37-43. 480
Sanz Sampelayo, M. R., Pérez, L., Martı́n Alonso, J. J., Amigo, L., & Boza, J. (2002). Effects of 481
concentrates with different contents of protected fat rich in PUFAs on the performance 482
lactating Granadina goats: Part II. Milk production and composition. Small Ruminant 483
Research, 43, 141-148. 484
Sanz Sampelayo, M. R., Pérez, M. L., Gil Extremera, F., Boza, J. J., & Boza, J. (1999). Use of 485
Different Dietary Protein Sources for Lactating Goats: Milk Production and Composition 486
as Functions of Protein Degradability and Amino Acid Composition1. Journal of Dairy 487
Science, 82, 555-565. 488
Skeie. (2014). Quality aspects of goat milk for cheese production in Norway: A review. Small 489
Ruminant Research, 122, 10-17. 490
Skeie, Inglingstad, R. A., Brunborg, L. J., & Eknæs, M. (2014). The influence of the deletion in 491
exon 12 of the gene encoding αs1-casein (CSN1S1) in the milk of the Norwegian dairy 492
23
goat breed on milk coagulation properties and cheese quality. Small Ruminant Research, 493
122, 50-58. 494
Tejada, L., Abellán, A., Cayuela, J. M., Martínez-Cacha, A., & Fernández-Salguero, J. (2008). 495
Proteolysis in goats’ milk cheese made with calf rennet and plant coagulant. International 496
Dairy Journal, 18, 139-146. 497
Tufarelli, V., Dario, M., & Laudadio, V. (2009). Forage to concentrate ratio in Jonica breed 498
goats: influence on lactation curve and milk composition. Journal of Dairy Research, 76, 499
124-128. 500
Upadhyay, V. K., McSweeney, P. L. H., Magboul, A. A. A., & Fox, P. F. (2004). Proteolysis in 501
cheese during ripening. In P. F. Fox, P. L. H. McSweeney, T. M. Cogan & P. G. Timothy 502
(Eds.), Cheese: chemistry, physics and microbiology (Vol. 1, pp. 391-434). London, UK: 503
Elsevier Academic Press. 504
Visser, F. M. W. (1976). Method for the manufacture of rennet-free cheese. Netherlands Milk 505
and Dairy Journal, 30, 41-54. 506
Wolfinger, R. D. (1996). Heterogeneous variance: covariance structures for repeated measures. 507
Journal of Agricultural, Biological, and Environmental Statistics, 1, 205-230. 508
509
510
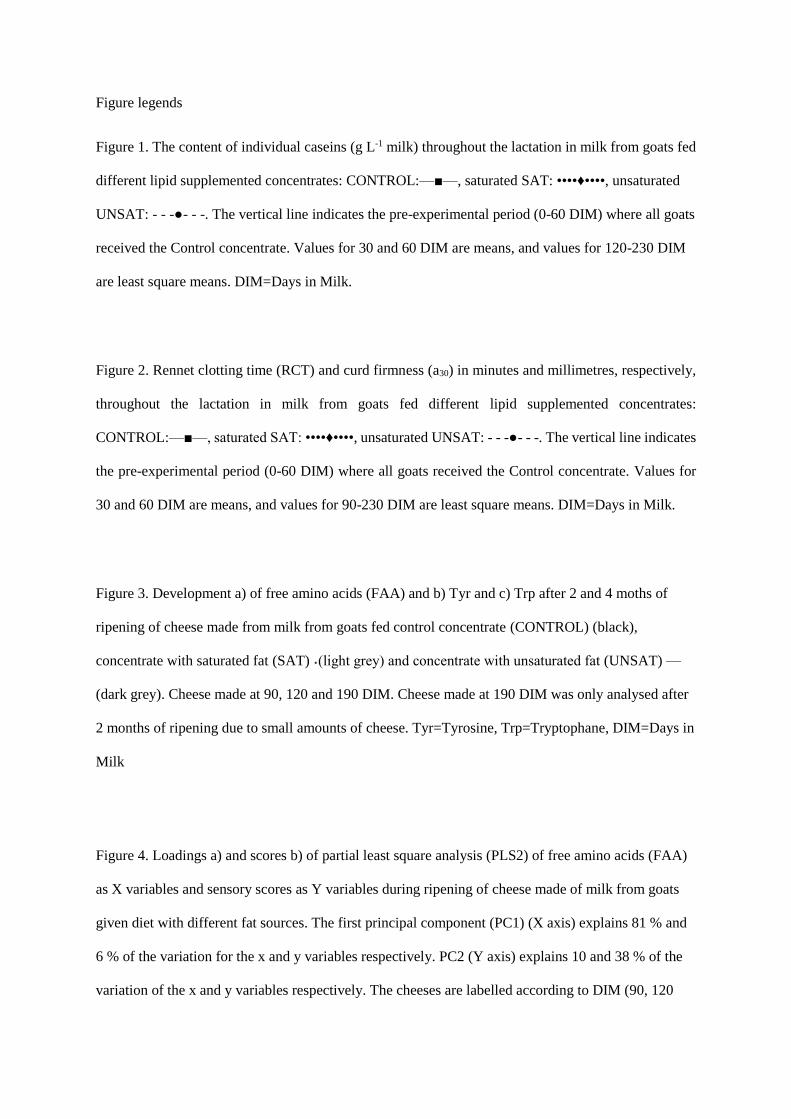
Figure legends
Figure 1. The content of individual caseins (g L-1 milk) throughout the lactation in milk from goats fed
different lipid supplemented concentrates: CONTROL:—■—, saturated SAT: ••••♦••••, unsaturated
UNSAT: - - -●- - -. The vertical line indicates the pre-experimental period (0-60 DIM) where all goats
received the Control concentrate. Values for 30 and 60 DIM are means, and values for 120-230 DIM
are least square means. DIM=Days in Milk.
Figure 2. Rennet clotting time (RCT) and curd firmness (a30) in minutes and millimetres, respectively,
throughout the lactation in milk from goats fed different lipid supplemented concentrates:
CONTROL:—■—, saturated SAT: ••••♦••••, unsaturated UNSAT: - - -●- - -. The vertical line indicates
the pre-experimental period (0-60 DIM) where all goats received the Control concentrate. Values for
30 and 60 DIM are means, and values for 90-230 DIM are least square means. DIM=Days in Milk.
Figure 3. Development a) of free amino acids (FAA) and b) Tyr and c) Trp after 2 and 4 moths of
ripening of cheese made from milk from goats fed control concentrate (CONTROL) (black),
concentrate with saturated fat (SAT) ˖(light grey) and concentrate with unsaturated fat (UNSAT) —
(dark grey). Cheese made at 90, 120 and 190 DIM. Cheese made at 190 DIM was only analysed after
2 months of ripening due to small amounts of cheese. Tyr=Tyrosine, Trp=Tryptophane, DIM=Days in
Milk
Figure 4. Loadings a) and scores b) of partial least square analysis (PLS2) of free amino acids (FAA)
as X variables and sensory scores as Y variables during ripening of cheese made of milk from goats
given diet with different fat sources. The first principal component (PC1) (X axis) explains 81 % and
6 % of the variation for the x and y variables respectively. PC2 (Y axis) explains 10 and 38 % of the
variation of the x and y variables respectively. The cheeses are labelled according to DIM (90, 120

and 190), fat source in concentrate (C;control, U;unsaturated and S;saturated) and age of ripening (2
and 4 months). The attributes in between the ellipses of the loadings plot (a) contributes significantly
to the variation. The ellipse in the score plot (b) surrounds the cheeses matured for 4 months.
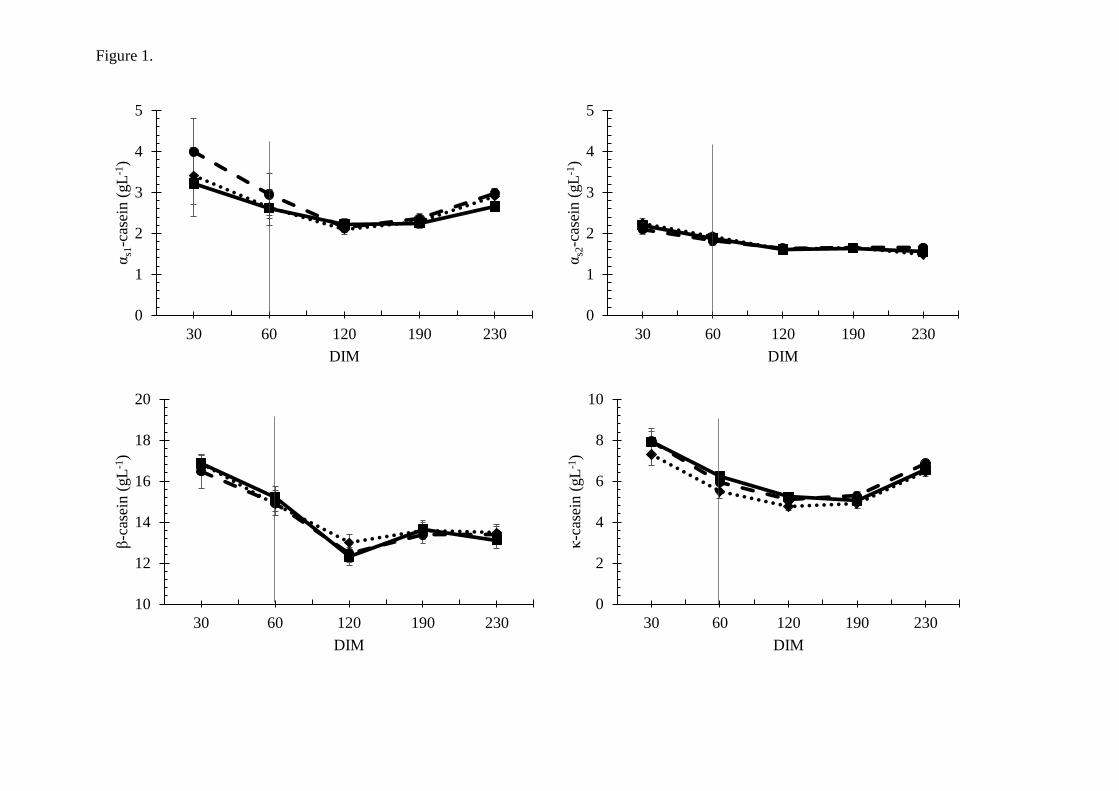
Figure 1.
0
1
2
3
4
5
30 60 120 190 230
αs1
-cas
ein (
gL
-1)
DIM
0
1
2
3
4
5
30 60 120 190 230
αs2
-cas
ein (
gL
-1)
DIM
10
12
14
16
18
20
30 60 120 190 230
β-c
asei
n (
gL
-1)
DIM
0
2
4
6
8
10
30 60 120 190 230
κ-c
asei
n (
gL
-1)
DIM
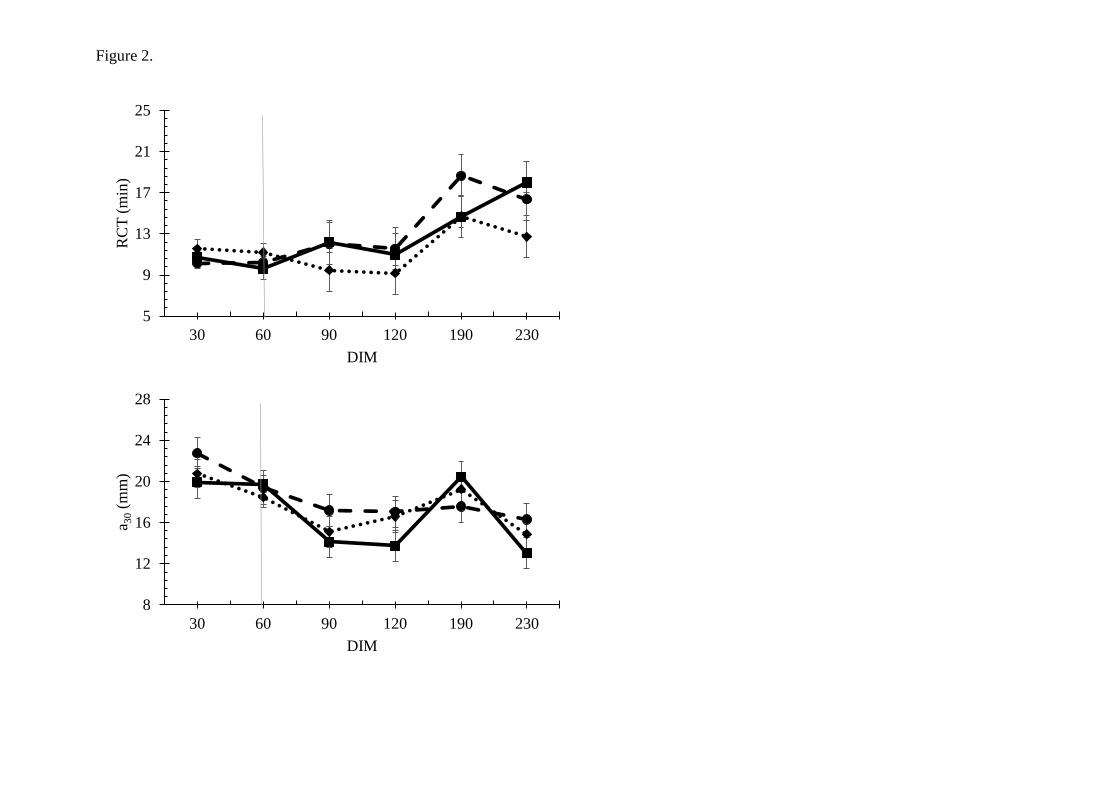
Figure 2.
5
9
13
17
21
25
30 60 90 120 190 230
RC
T (
min
)
DIM
8
12
16
20
24
28
30 60 90 120 190 230
a 30
(mm
)
DIM
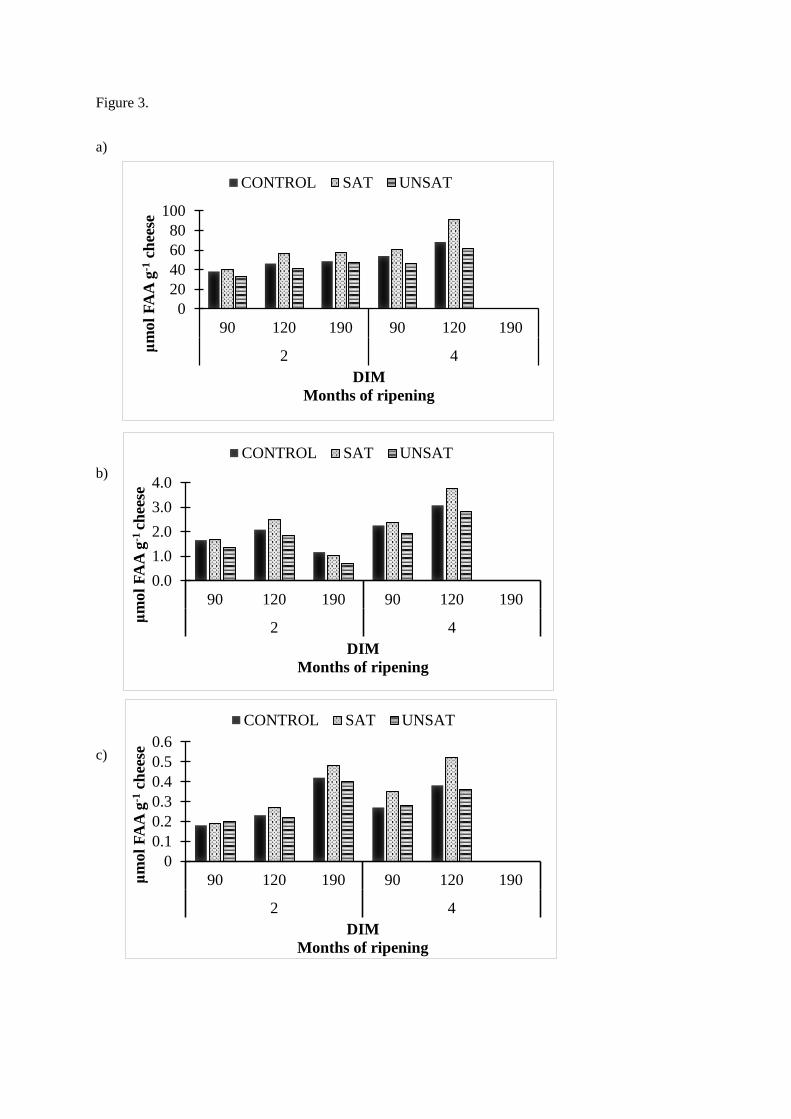
0
20
40
60
80
100
90 120 190 90 120 190
2 4
μm
ol
FA
A g
-1ch
eese
DIM
Months of ripening
CONTROL SAT UNSAT
0
0.1
0.2
0.3
0.4
0.5
0.6
90 120 190 90 120 190
2 4
μm
ol
FA
A g
-1ch
eese
DIM
Months of ripening
CONTROL SAT UNSAT
0.0
1.0
2.0
3.0
4.0
90 120 190 90 120 190
2 4
μm
ol
FA
A g
-1 c
hee
se
DIM
Months of ripening
CONTROL SAT UNSAT
Figure 3.
a)
b)
c)
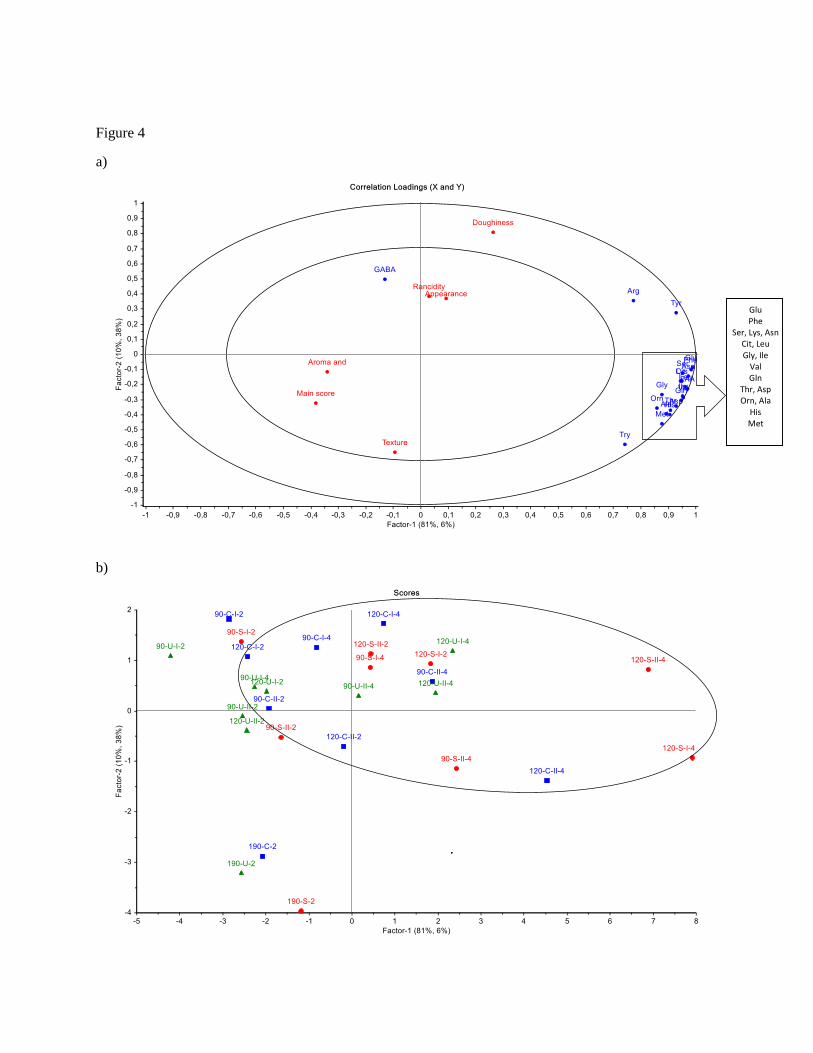
Figure 4
a)
b)
Glu Phe
Ser, Lys, Asn Cit, Leu Gly, Ile
Val Gln
Thr, Asp Orn, Ala
His Met

Table 1. Milk composition of goats fed different lipid supplemented concentrate (control
(CONTROL), saturated (SAT) and unsaturated (UNSAT)) throughout the lactation. Values are given
as means for 30-60 DIM (Days in milk) and least square means for 90-230 DIM. Different superscript
(horizontally) letters indicates significantly (P< 0.05) differences within a row (DIM), and different
subscript letters indicates significantly (P< 0.05) differences within a column (concentrate feed).
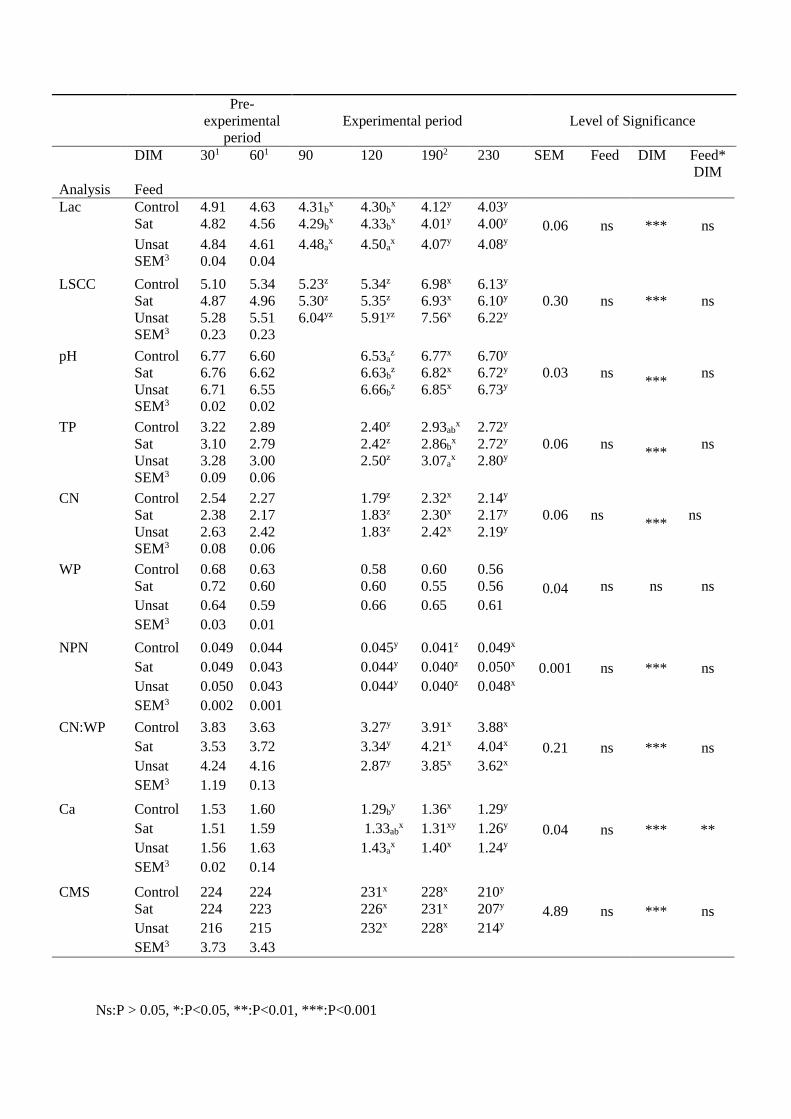
Pre-
experimental
period
Experimental period Level of Significance
Analysis
DIM
301 601 90 120 1902 230 SEM Feed DIM Feed*
DIM
Feed
Lac
Control 4.91 4.63 4.31bx 4.30b
x 4.12y 4.03y
0.06
ns *** ns Sat 4.82 4.56 4.29bx 4.33b
x 4.01y 4.00y
Unsat 4.84 4.61 4.48ax 4.50a
x 4.07y 4.08y
SEM3 0.04 0.04
LSCC Control 5.10 5.34 5.23z 5.34z 6.98x 6.13y
0.30
ns *** ns Sat 4.87 4.96 5.30z 5.35z 6.93x 6.10y
Unsat 5.28 5.51 6.04yz 5.91yz 7.56x 6.22y
SEM3 0.23 0.23
pH
Control 6.77 6.60 6.53az 6.77x 6.70y
0.03
ns
*** ns Sat 6.76 6.62 6.63b
z 6.82x 6.72y
Unsat 6.71 6.55 6.66bz 6.85x 6.73y
SEM3 0.02 0.02
TP
Control 3.22 2.89 2.40z 2.93abx 2.72y
0.06
ns
*** ns Sat 3.10 2.79 2.42z 2.86b
x 2.72y
Unsat 3.28 3.00 2.50z 3.07ax 2.80y
SEM3 0.09 0.06
CN
Control 2.54 2.27 1.79z 2.32x 2.14y
0.06
ns
*** ns Sat 2.38 2.17 1.83z 2.30x 2.17y
Unsat 2.63 2.42 1.83z 2.42x 2.19y
SEM3 0.08 0.06
WP
Control 0.68 0.63 0.58 0.60 0.56
0.04
ns
ns
ns Sat 0.72 0.60 0.60 0.55 0.56
Unsat 0.64 0.59 0.66 0.65 0.61
SEM3 0.03 0.01
NPN
Control 0.049 0.044 0.045y 0.041z 0.049x
0.001
ns *** ns Sat 0.049 0.043 0.044y 0.040z 0.050x
Unsat 0.050 0.043 0.044y 0.040z 0.048x
SEM3 0.002 0.001
CN:WP
Control 3.83 3.63 3.27y 3.91x 3.88x
0.21
ns *** ns Sat 3.53 3.72 3.34y 4.21x 4.04x
Unsat 4.24 4.16 2.87y 3.85x 3.62x
SEM3 1.19 0.13
Ca
Control 1.53 1.60 1.29by 1.36x 1.29y
0.04
ns *** ** Sat 1.51 1.59 1.33abx 1.31xy 1.26y
Unsat 1.56 1.63 1.43ax 1.40x 1.24y
SEM3 0.02 0.14
CMS
Control 224 224 231x 228x 210y
4.89
ns *** ns Sat 224 223 226x 231x 207y
Unsat 216 215 232x 228x 214y
SEM3 3.73 3.43
Ns:P > 0.05, *:P<0.05, **:P<0.01, ***:P<0.001

1All goats received the control concentrate.
2Mountain pasture.
3Standard error of mean for the pre-experimental period.
a-cLsmeans within a column with different subscript letters differs (P<0.05).
x-zLsmeans within a row with different superscript letters differs (P<0.05).
SEM: standard error of means, Lac: lactose, %, LSCC: log transformed somatic cell count, TP: Total
protein, CN: casein, %, WP: Whey protein, %, NPN: non protein nitrogen, %, Ca: Calcium, g kg-1,
CMS: Casein micelle size, nm.
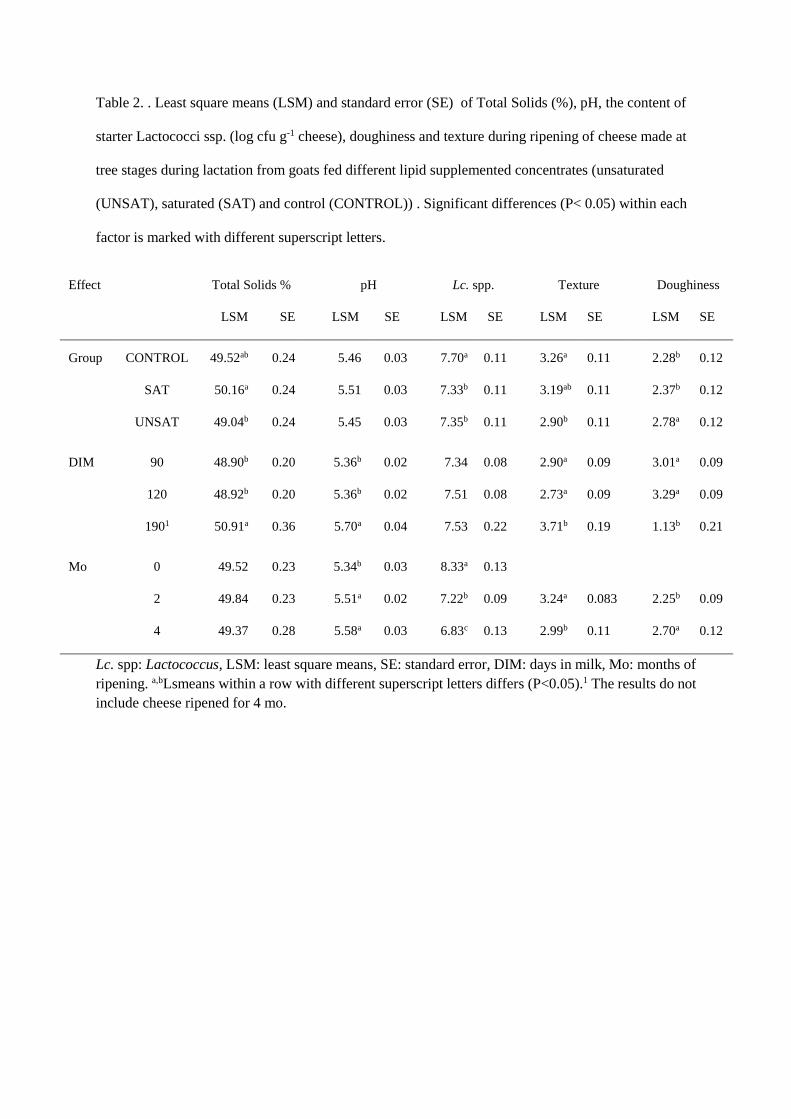
Table 2. . Least square means (LSM) and standard error (SE) of Total Solids (%), pH, the content of
starter Lactococci ssp. (log cfu g-1 cheese), doughiness and texture during ripening of cheese made at
tree stages during lactation from goats fed different lipid supplemented concentrates (unsaturated
(UNSAT), saturated (SAT) and control (CONTROL)) . Significant differences (P< 0.05) within each
factor is marked with different superscript letters.
Effect Total Solids % pH Lc. spp. Texture Doughiness
LSM SE LSM SE LSM SE LSM SE LSM SE
Group CONTROL 49.52ab 0.24 5.46 0.03 7.70a 0.11 3.26a 0.11 2.28b 0.12
SAT 50.16a 0.24 5.51 0.03 7.33b 0.11 3.19ab 0.11 2.37b 0.12
UNSAT 49.04b 0.24 5.45 0.03 7.35b 0.11 2.90b 0.11 2.78a 0.12
DIM 90 48.90b 0.20 5.36b 0.02 7.34 0.08 2.90a 0.09 3.01a 0.09
120 48.92b 0.20 5.36b 0.02 7.51 0.08 2.73a 0.09 3.29a 0.09
1901 50.91a 0.36 5.70a 0.04 7.53 0.22 3.71b 0.19 1.13b 0.21
Mo 0 49.52 0.23 5.34b 0.03 8.33a 0.13
2 49.84 0.23 5.51a 0.02 7.22b 0.09 3.24a 0.083 2.25b 0.09
4 49.37 0.28 5.58a 0.03 6.83c 0.13 2.99b 0.11 2.70a 0.12
Lc. spp: Lactococcus, LSM: least square means, SE: standard error, DIM: days in milk, Mo: months of
ripening. a,bLsmeans within a row with different superscript letters differs (P<0.05).1 The results do not
include cheese ripened for 4 mo.


Paper V

Small Ruminant Research 122 (2014) 50–58
Contents lists available at ScienceDirect
Small Ruminant Research
jou rn al h om epa ge : w ww.elsev ier .com/ locate /smal l rumres
The influence of the deletion in exon 12 of the gene encoding�s1-casein (CSN1S1) in the milk of the Norwegian dairy goatbreed on milk coagulation properties and cheese quality�
S.B. Skeiea,∗, R.Aa. Inglingstada, L.J. Brunborga,1, M. Eknæsb
a Department of Chemistry, Biotechnology and Food Science, Norwegian University of Life Sciences, Ås, Norwayb Department of Animal and Aquaculture Sciences, Norwegian University of Life Sciences, Ås, Norway
a r t i c l e i n f o
Article history:Available online 21 July 2014
Keywords:Goat milk�S1-CNCheeseCheese ripening
a b s t r a c t
The influence on the cheese making properties and ripening of cheese made from goats’ milkhomozygous or heterozygous for the deletion in exon 12 of the gene encoding �s1-casein(CSN1S1) of the Norwegian dairy goat breed was investigated. Milk from goats heterozy-gous for the deletion contained a high content of �S1-CN compared with the milk fromgoats homozygous for the deletion that contained very low amounts of �S1-CN. Milk fromheterozygous goats contained the highest fat and protein content and exhibited the bestcoagulation properties; therefore, it was more preferable for cheese making. Cheese man-ufactured from milk from the heterozygous goats obtained a better and more stable cheesequality than did cheese made from the homozygous goats. The latter cheese had a highermoisture content, a more often rancid flavour and a different composition of free aminoacids.
© 2014 Elsevier B.V. All rights reserved.
1. Introduction
Until 2007, the Norwegian dairy goats population exhib-ited a high frequency of goats with low or no synthesis of�s1-casein, caused by an extremely high frequency (0.73) ofa defective allele with a single nucleotide deletion in exon12 of the gene encoding �s1-casein (CSN1S1) (Dagnachewet al., 2011; Devold et al., 2011; Hayes et al., 2006). Thisdeletion seems to be specific to the Norwegian dairy goatbreed, and the deletion correlates with increased milk
� This paper is part of the special issue entitled, Selected lectures fromThe Regional IGA Conference on Goat Milk Quality, Tromsø Norway, GuestEdited by Dr. N. Silanikove.
∗ Corresponding author at: Box 5003, N-1432 Ås, Norway.Tel.: +47 64965844.
E-mail address: [email protected] (S.B. Skeie).1 Present address: Norwegian Farmers and Smallholders Union, Oslo,
Norway.
yield, reduced protein, fat and lactose content, a high con-tent of free fatty acids (FFA) and a tart and rancid flavour(Dagnachew et al., 2011). The frequency of the deletion hasbeen found to vary between 58% and 86% (Vegarud et al.,1999; Ådnøy et al., 2003). Later in this paper, goats homozy-gous for the deletion in exon 12 of the gene encoding�s1-casein (CSN1S1) are denoted E12-00 goats, and goatsheterozygous for the deletion are denoted E12-01 goats.
Previously, the Norwegian goat milk was mainly used toproduce brown whey goat milk cheese, or “Brun Geitost”,which has a distinctive sweet flavour with a slightlypungent rancid goaty background note balanced by thesweetness of the caramelised lactose. The goaty back-ground note of this cheese was previously preferred byconsumers until the late 1970s. Current consumers findthis flavour less attractive. The rancid goaty flavour isconsidered a negative trait when manufacturing acid orrennet coagulating cheeses. During the 1960s and 1970s,the goaty flavour in the brown whey goat milk cheese
http://dx.doi.org/10.1016/j.smallrumres.2014.07.0190921-4488/© 2014 Elsevier B.V. All rights reserved.
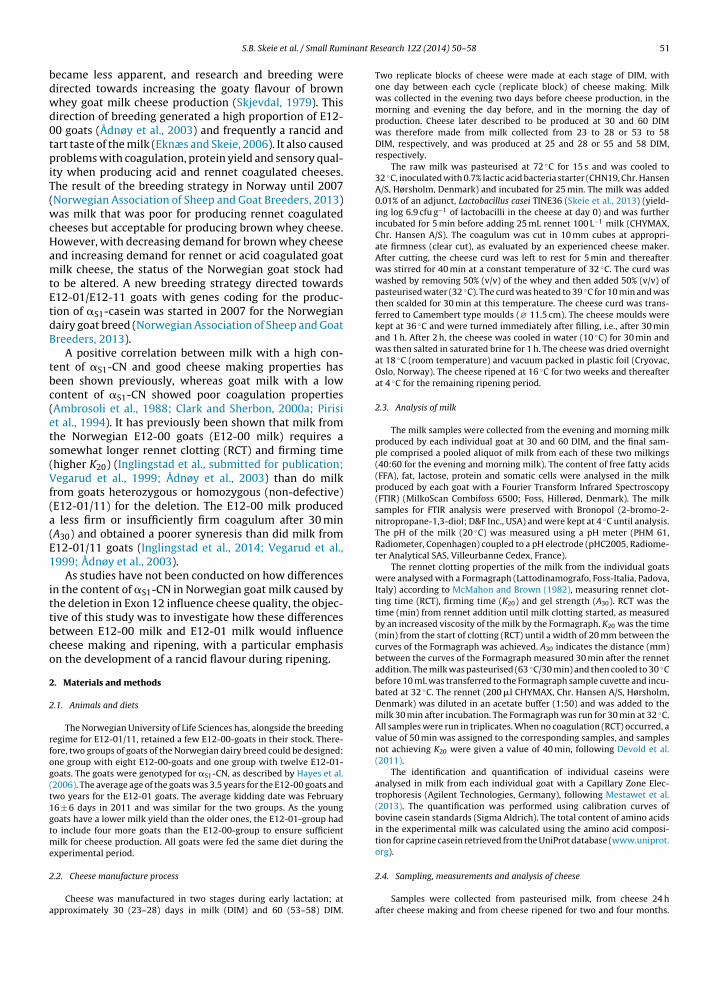
S.B. Skeie et al. / Small Ruminant Research 122 (2014) 50–58 51
became less apparent, and research and breeding weredirected towards increasing the goaty flavour of brownwhey goat milk cheese production (Skjevdal, 1979). Thisdirection of breeding generated a high proportion of E12-00 goats (Ådnøy et al., 2003) and frequently a rancid andtart taste of the milk (Eknæs and Skeie, 2006). It also causedproblems with coagulation, protein yield and sensory qual-ity when producing acid and rennet coagulated cheeses.The result of the breeding strategy in Norway until 2007(Norwegian Association of Sheep and Goat Breeders, 2013)was milk that was poor for producing rennet coagulatedcheeses but acceptable for producing brown whey cheese.However, with decreasing demand for brown whey cheeseand increasing demand for rennet or acid coagulated goatmilk cheese, the status of the Norwegian goat stock hadto be altered. A new breeding strategy directed towardsE12-01/E12-11 goats with genes coding for the produc-tion of �S1-casein was started in 2007 for the Norwegiandairy goat breed (Norwegian Association of Sheep and GoatBreeders, 2013).
A positive correlation between milk with a high con-tent of �S1-CN and good cheese making properties hasbeen shown previously, whereas goat milk with a lowcontent of �S1-CN showed poor coagulation properties(Ambrosoli et al., 1988; Clark and Sherbon, 2000a; Pirisiet al., 1994). It has previously been shown that milk fromthe Norwegian E12-00 goats (E12-00 milk) requires asomewhat longer rennet clotting (RCT) and firming time(higher K20) (Inglingstad et al., submitted for publication;Vegarud et al., 1999; Ådnøy et al., 2003) than do milkfrom goats heterozygous or homozygous (non-defective)(E12-01/11) for the deletion. The E12-00 milk produceda less firm or insufficiently firm coagulum after 30 min(A30) and obtained a poorer syneresis than did milk fromE12-01/11 goats (Inglingstad et al., 2014; Vegarud et al.,1999; Ådnøy et al., 2003).
As studies have not been conducted on how differencesin the content of �S1-CN in Norwegian goat milk caused bythe deletion in Exon 12 influence cheese quality, the objec-tive of this study was to investigate how these differencesbetween E12-00 milk and E12-01 milk would influencecheese making and ripening, with a particular emphasison the development of a rancid flavour during ripening.
2. Materials and methods
2.1. Animals and diets
The Norwegian University of Life Sciences has, alongside the breedingregime for E12-01/11, retained a few E12-00-goats in their stock. There-fore, two groups of goats of the Norwegian dairy breed could be designed:one group with eight E12-00-goats and one group with twelve E12-01-goats. The goats were genotyped for �S1-CN, as described by Hayes et al.(2006). The average age of the goats was 3.5 years for the E12-00 goats andtwo years for the E12-01 goats. The average kidding date was February16 ± 6 days in 2011 and was similar for the two groups. As the younggoats have a lower milk yield than the older ones, the E12-01-group hadto include four more goats than the E12-00-group to ensure sufficientmilk for cheese production. All goats were fed the same diet during theexperimental period.
2.2. Cheese manufacture process
Cheese was manufactured in two stages during early lactation; atapproximately 30 (23–28) days in milk (DIM) and 60 (53–58) DIM.
Two replicate blocks of cheese were made at each stage of DIM, withone day between each cycle (replicate block) of cheese making. Milkwas collected in the evening two days before cheese production, in themorning and evening the day before, and in the morning the day ofproduction. Cheese later described to be produced at 30 and 60 DIMwas therefore made from milk collected from 23 to 28 or 53 to 58DIM, respectively, and was produced at 25 and 28 or 55 and 58 DIM,respectively.
The raw milk was pasteurised at 72 ◦C for 15 s and was cooled to32 ◦C, inoculated with 0.7% lactic acid bacteria starter (CHN19, Chr. HansenA/S, Hørsholm, Denmark) and incubated for 25 min. The milk was added0.01% of an adjunct, Lactobacillus casei TINE36 (Skeie et al., 2013) (yield-ing log 6.9 cfu g−1 of lactobacilli in the cheese at day 0) and was furtherincubated for 5 min before adding 25 mL rennet 100 L−1 milk (CHYMAX,Chr. Hansen A/S). The coagulum was cut in 10 mm cubes at appropri-ate firmness (clear cut), as evaluated by an experienced cheese maker.After cutting, the cheese curd was left to rest for 5 min and thereafterwas stirred for 40 min at a constant temperature of 32 ◦C. The curd waswashed by removing 50% (v/v) of the whey and then added 50% (v/v) ofpasteurised water (32 ◦C). The curd was heated to 39 ◦C for 10 min and wasthen scalded for 30 min at this temperature. The cheese curd was trans-ferred to Camembert type moulds (∅ 11.5 cm). The cheese moulds werekept at 36 ◦C and were turned immediately after filling, i.e., after 30 minand 1 h. After 2 h, the cheese was cooled in water (10 ◦C) for 30 min andwas then salted in saturated brine for 1 h. The cheese was dried overnightat 18 ◦C (room temperature) and vacuum packed in plastic foil (Cryovac,Oslo, Norway). The cheese ripened at 16 ◦C for two weeks and thereafterat 4 ◦C for the remaining ripening period.
2.3. Analysis of milk
The milk samples were collected from the evening and morning milkproduced by each individual goat at 30 and 60 DIM, and the final sam-ple comprised a pooled aliquot of milk from each of these two milkings(40:60 for the evening and morning milk). The content of free fatty acids(FFA), fat, lactose, protein and somatic cells were analysed in the milkproduced by each goat with a Fourier Transform Infrared Spectroscopy(FTIR) (MilkoScan Combifoss 6500; Foss, Hillerød, Denmark). The milksamples for FTIR analysis were preserved with Bronopol (2-bromo-2-nitropropane-1,3-diol; D&F Inc., USA) and were kept at 4 ◦C until analysis.The pH of the milk (20 ◦C) was measured using a pH meter (PHM 61,Radiometer, Copenhagen) coupled to a pH electrode (pHC2005, Radiome-ter Analytical SAS, Villeurbanne Cedex, France).
The rennet clotting properties of the milk from the individual goatswere analysed with a Formagraph (Lattodinamografo, Foss-Italia, Padova,Italy) according to McMahon and Brown (1982), measuring rennet clot-ting time (RCT), firming time (K20) and gel strength (A30). RCT was thetime (min) from rennet addition until milk clotting started, as measuredby an increased viscosity of the milk by the Formagraph. K20 was the time(min) from the start of clotting (RCT) until a width of 20 mm between thecurves of the Formagraph was achieved. A30 indicates the distance (mm)between the curves of the Formagraph measured 30 min after the rennetaddition. The milk was pasteurised (63 ◦C/30 min) and then cooled to 30 ◦Cbefore 10 mL was transferred to the Formagraph sample cuvette and incu-bated at 32 ◦C. The rennet (200 �l CHYMAX, Chr. Hansen A/S, Hørsholm,Denmark) was diluted in an acetate buffer (1:50) and was added to themilk 30 min after incubation. The Formagraph was run for 30 min at 32 ◦C.All samples were run in triplicates. When no coagulation (RCT) occurred, avalue of 50 min was assigned to the corresponding samples, and samplesnot achieving K20 were given a value of 40 min, following Devold et al.(2011).
The identification and quantification of individual caseins wereanalysed in milk from each individual goat with a Capillary Zone Elec-trophoresis (Agilent Technologies, Germany), following Mestawet et al.(2013). The quantification was performed using calibration curves ofbovine casein standards (Sigma Aldrich). The total content of amino acidsin the experimental milk was calculated using the amino acid composi-tion for caprine casein retrieved from the UniProt database (www.uniprot.org).
2.4. Sampling, measurements and analysis of cheese
Samples were collected from pasteurised milk, from cheese 24 hafter cheese making and from cheese ripened for two and four months.
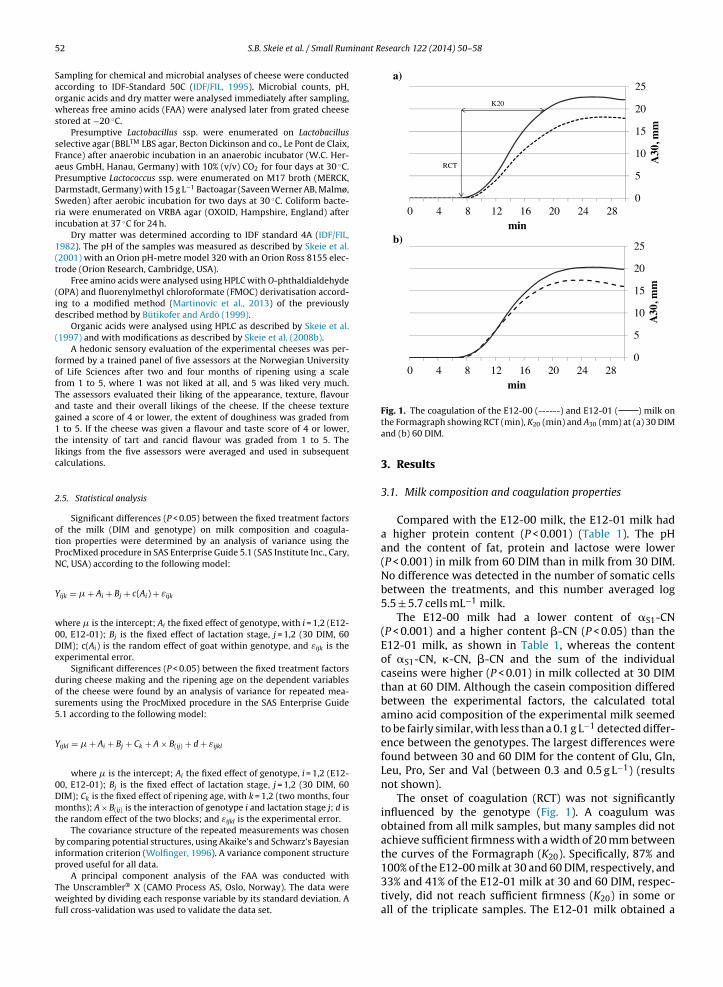
52 S.B. Skeie et al. / Small Ruminant Research 122 (2014) 50–58
Sampling for chemical and microbial analyses of cheese were conductedaccording to IDF-Standard 50C (IDF/FIL, 1995). Microbial counts, pH,organic acids and dry matter were analysed immediately after sampling,whereas free amino acids (FAA) were analysed later from grated cheesestored at −20 ◦C.
Presumptive Lactobacillus ssp. were enumerated on Lactobacillusselective agar (BBLTM LBS agar, Becton Dickinson and co., Le Pont de Claix,France) after anaerobic incubation in an anaerobic incubator (W.C. Her-aeus GmbH, Hanau, Germany) with 10% (v/v) CO2 for four days at 30 ◦C.Presumptive Lactococcus ssp. were enumerated on M17 broth (MERCK,Darmstadt, Germany) with 15 g L−1 Bactoagar (Saveen Werner AB, Malmø,Sweden) after aerobic incubation for two days at 30 ◦C. Coliform bacte-ria were enumerated on VRBA agar (OXOID, Hampshire, England) afterincubation at 37 ◦C for 24 h.
Dry matter was determined according to IDF standard 4A (IDF/FIL,1982). The pH of the samples was measured as described by Skeie et al.(2001) with an Orion pH-metre model 320 with an Orion Ross 8155 elec-trode (Orion Research, Cambridge, USA).
Free amino acids were analysed using HPLC with O-phthaldialdehyde(OPA) and fluorenylmethyl chloroformate (FMOC) derivatisation accord-ing to a modified method (Martinovic et al., 2013) of the previouslydescribed method by Bütikofer and Ardö (1999).
Organic acids were analysed using HPLC as described by Skeie et al.(1997) and with modifications as described by Skeie et al. (2008b).
A hedonic sensory evaluation of the experimental cheeses was per-formed by a trained panel of five assessors at the Norwegian Universityof Life Sciences after two and four months of ripening using a scalefrom 1 to 5, where 1 was not liked at all, and 5 was liked very much.The assessors evaluated their liking of the appearance, texture, flavourand taste and their overall likings of the cheese. If the cheese texturegained a score of 4 or lower, the extent of doughiness was graded from1 to 5. If the cheese was given a flavour and taste score of 4 or lower,the intensity of tart and rancid flavour was graded from 1 to 5. Thelikings from the five assessors were averaged and used in subsequentcalculations.
2.5. Statistical analysis
Significant differences (P < 0.05) between the fixed treatment factorsof the milk (DIM and genotype) on milk composition and coagula-tion properties were determined by an analysis of variance using theProcMixed procedure in SAS Enterprise Guide 5.1 (SAS Institute Inc., Cary,NC, USA) according to the following model:
Yijk = � + Ai + Bj + c(Ai) + εijk
where � is the intercept; Ai the fixed effect of genotype, with i = 1,2 (E12-00, E12-01); Bj is the fixed effect of lactation stage, j = 1,2 (30 DIM, 60DIM); c(Ai) is the random effect of goat within genotype, and εijk is theexperimental error.
Significant differences (P < 0.05) between the fixed treatment factorsduring cheese making and the ripening age on the dependent variablesof the cheese were found by an analysis of variance for repeated mea-surements using the ProcMixed procedure in the SAS Enterprise Guide5.1 according to the following model:
Yijkl = � + Ai + Bj + Ck + A × B(ij) + d + εijkl
where � is the intercept; Ai the fixed effect of genotype, i = 1,2 (E12-00, E12-01); Bj is the fixed effect of lactation stage, j = 1,2 (30 DIM, 60DIM); Ck is the fixed effect of ripening age, with k = 1,2 (two months, fourmonths); A × B(ij) is the interaction of genotype i and lactation stage j; d isthe random effect of the two blocks; and εijkl is the experimental error.
The covariance structure of the repeated measurements was chosenby comparing potential structures, using Akaike’s and Schwarz’s Bayesianinformation criterion (Wolfinger, 1996). A variance component structureproved useful for all data.
A principal component analysis of the FAA was conducted withThe Unscrambler® X (CAMO Process AS, Oslo, Norway). The data wereweighted by dividing each response variable by its standard deviation. Afull cross-validation was used to validate the data set.
0
5
10
15
20
25
0 4 8 12 16 20 24 28
A30
, mm
min
a)
b)
0
5
10
15
20
25
0 4 8 12 16 20 24 28
A30
, mm
min
RCT
K20
Fig. 1. The coagulation of the E12-00 (------) and E12-01 ( ) milk onthe Formagraph showing RCT (min), K20 (min) and A30 (mm) at (a) 30 DIMand (b) 60 DIM.
3. Results
3.1. Milk composition and coagulation properties
Compared with the E12-00 milk, the E12-01 milk hada higher protein content (P < 0.001) (Table 1). The pHand the content of fat, protein and lactose were lower(P < 0.001) in milk from 60 DIM than in milk from 30 DIM.No difference was detected in the number of somatic cellsbetween the treatments, and this number averaged log5.5 ± 5.7 cells mL−1 milk.
The E12-00 milk had a lower content of �S1-CN(P < 0.001) and a higher content �-CN (P < 0.05) than theE12-01 milk, as shown in Table 1, whereas the contentof �S1-CN, �-CN, �-CN and the sum of the individualcaseins were higher (P < 0.01) in milk collected at 30 DIMthan at 60 DIM. Although the casein composition differedbetween the experimental factors, the calculated totalamino acid composition of the experimental milk seemedto be fairly similar, with less than a 0.1 g L−1 detected differ-ence between the genotypes. The largest differences werefound between 30 and 60 DIM for the content of Glu, Gln,Leu, Pro, Ser and Val (between 0.3 and 0.5 g L−1) (resultsnot shown).
The onset of coagulation (RCT) was not significantlyinfluenced by the genotype (Fig. 1). A coagulum wasobtained from all milk samples, but many samples did notachieve sufficient firmness with a width of 20 mm betweenthe curves of the Formagraph (K20). Specifically, 87% and100% of the E12-00 milk at 30 and 60 DIM, respectively, and33% and 41% of the E12-01 milk at 30 and 60 DIM, respec-tively, did not reach sufficient firmness (K20) in some orall of the triplicate samples. The E12-01 milk obtained a
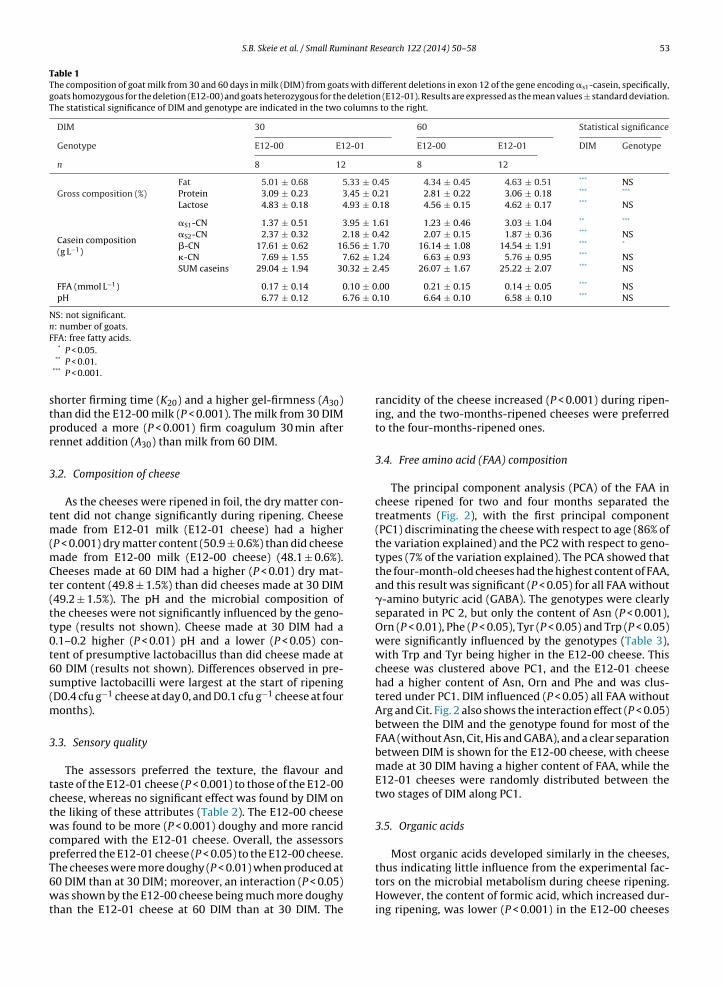
S.B. Skeie et al. / Small Ruminant Research 122 (2014) 50–58 53
Table 1The composition of goat milk from 30 and 60 days in milk (DIM) from goats with different deletions in exon 12 of the gene encoding �s1-casein, specifically,goats homozygous for the deletion (E12-00) and goats heterozygous for the deletion (E12-01). Results are expressed as the mean values ± standard deviation.The statistical significance of DIM and genotype are indicated in the two columns to the right.
DIM 30 60 Statistical significance
Genotype E12-00 E12-01 E12-00 E12-01 DIM Genotype
n 8 12 8 12
Gross composition (%)Fat 5.01 ± 0.68 5.33 ± 0.45 4.34 ± 0.45 4.63 ± 0.51 *** NSProtein 3.09 ± 0.23 3.45 ± 0.21 2.81 ± 0.22 3.06 ± 0.18 *** ***
Lactose 4.83 ± 0.18 4.93 ± 0.18 4.56 ± 0.15 4.62 ± 0.17 *** NS
Casein composition(g L−1)
�S1-CN 1.37 ± 0.51 3.95 ± 1.61 1.23 ± 0.46 3.03 ± 1.04 ** ***
�S2-CN 2.37 ± 0.32 2.18 ± 0.42 2.07 ± 0.15 1.87 ± 0.36 *** NS�-CN 17.61 ± 0.62 16.56 ± 1.70 16.14 ± 1.08 14.54 ± 1.91 *** *
�-CN 7.69 ± 1.55 7.62 ± 1.24 6.63 ± 0.93 5.76 ± 0.95 *** NSSUM caseins 29.04 ± 1.94 30.32 ± 2.45 26.07 ± 1.67 25.22 ± 2.07 *** NS
FFA (mmol L−1) 0.17 ± 0.14 0.10 ± 0.00 0.21 ± 0.15 0.14 ± 0.05 *** NSpH 6.77 ± 0.12 6.76 ± 0.10 6.64 ± 0.10 6.58 ± 0.10 *** NS
NS: not significant.n: number of goats.FFA: free fatty acids.
* P < 0.05.** P < 0.01.
*** P < 0.001.
shorter firming time (K20) and a higher gel-firmness (A30)than did the E12-00 milk (P < 0.001). The milk from 30 DIMproduced a more (P < 0.001) firm coagulum 30 min afterrennet addition (A30) than milk from 60 DIM.
3.2. Composition of cheese
As the cheeses were ripened in foil, the dry matter con-tent did not change significantly during ripening. Cheesemade from E12-01 milk (E12-01 cheese) had a higher(P < 0.001) dry matter content (50.9 ± 0.6%) than did cheesemade from E12-00 milk (E12-00 cheese) (48.1 ± 0.6%).Cheeses made at 60 DIM had a higher (P < 0.01) dry mat-ter content (49.8 ± 1.5%) than did cheeses made at 30 DIM(49.2 ± 1.5%). The pH and the microbial composition ofthe cheeses were not significantly influenced by the geno-type (results not shown). Cheese made at 30 DIM had a0.1–0.2 higher (P < 0.01) pH and a lower (P < 0.05) con-tent of presumptive lactobacillus than did cheese made at60 DIM (results not shown). Differences observed in pre-sumptive lactobacilli were largest at the start of ripening(D0.4 cfu g−1 cheese at day 0, and D0.1 cfu g−1 cheese at fourmonths).
3.3. Sensory quality
The assessors preferred the texture, the flavour andtaste of the E12-01 cheese (P < 0.001) to those of the E12-00cheese, whereas no significant effect was found by DIM onthe liking of these attributes (Table 2). The E12-00 cheesewas found to be more (P < 0.001) doughy and more rancidcompared with the E12-01 cheese. Overall, the assessorspreferred the E12-01 cheese (P < 0.05) to the E12-00 cheese.The cheeses were more doughy (P < 0.01) when produced at60 DIM than at 30 DIM; moreover, an interaction (P < 0.05)was shown by the E12-00 cheese being much more doughythan the E12-01 cheese at 60 DIM than at 30 DIM. The
rancidity of the cheese increased (P < 0.001) during ripen-ing, and the two-months-ripened cheeses were preferredto the four-months-ripened ones.
3.4. Free amino acid (FAA) composition
The principal component analysis (PCA) of the FAA incheese ripened for two and four months separated thetreatments (Fig. 2), with the first principal component(PC1) discriminating the cheese with respect to age (86% ofthe variation explained) and the PC2 with respect to geno-types (7% of the variation explained). The PCA showed thatthe four-month-old cheeses had the highest content of FAA,and this result was significant (P < 0.05) for all FAA without�-amino butyric acid (GABA). The genotypes were clearlyseparated in PC 2, but only the content of Asn (P < 0.001),Orn (P < 0.01), Phe (P < 0.05), Tyr (P < 0.05) and Trp (P < 0.05)were significantly influenced by the genotypes (Table 3),with Trp and Tyr being higher in the E12-00 cheese. Thischeese was clustered above PC1, and the E12-01 cheesehad a higher content of Asn, Orn and Phe and was clus-tered under PC1. DIM influenced (P < 0.05) all FAA withoutArg and Cit. Fig. 2 also shows the interaction effect (P < 0.05)between the DIM and the genotype found for most of theFAA (without Asn, Cit, His and GABA), and a clear separationbetween DIM is shown for the E12-00 cheese, with cheesemade at 30 DIM having a higher content of FAA, while theE12-01 cheeses were randomly distributed between thetwo stages of DIM along PC1.
3.5. Organic acids
Most organic acids developed similarly in the cheeses,thus indicating little influence from the experimental fac-tors on the microbial metabolism during cheese ripening.However, the content of formic acid, which increased dur-ing ripening, was lower (P < 0.001) in the E12-00 cheeses
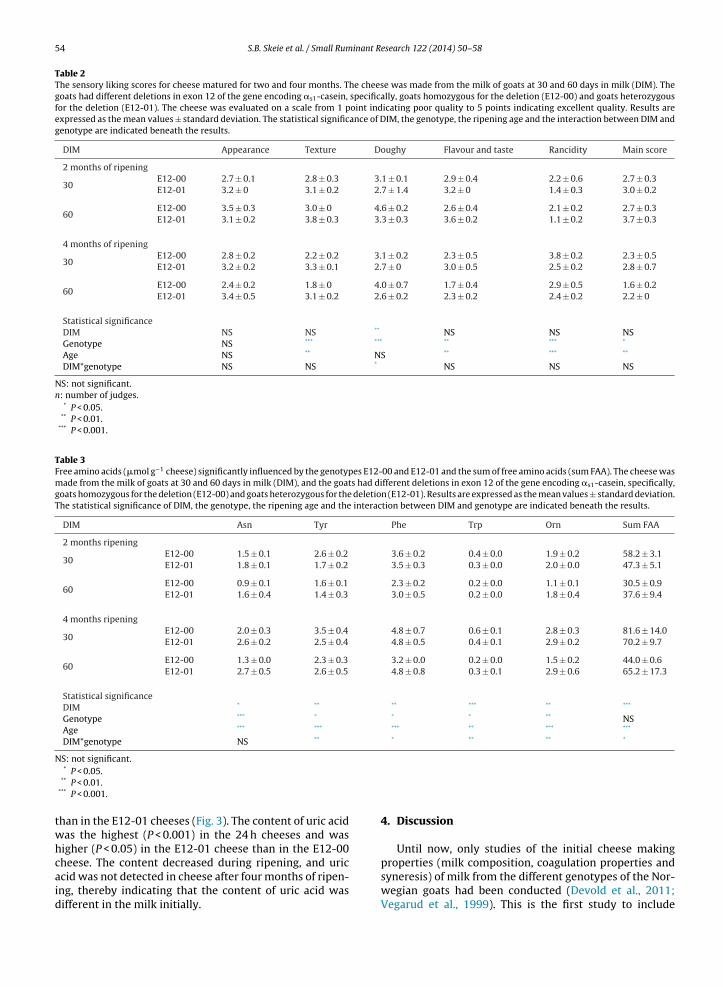
54 S.B. Skeie et al. / Small Ruminant Research 122 (2014) 50–58
Table 2The sensory liking scores for cheese matured for two and four months. The cheese was made from the milk of goats at 30 and 60 days in milk (DIM). Thegoats had different deletions in exon 12 of the gene encoding �s1-casein, specifically, goats homozygous for the deletion (E12-00) and goats heterozygousfor the deletion (E12-01). The cheese was evaluated on a scale from 1 point indicating poor quality to 5 points indicating excellent quality. Results areexpressed as the mean values ± standard deviation. The statistical significance of DIM, the genotype, the ripening age and the interaction between DIM andgenotype are indicated beneath the results.
DIM Appearance Texture Doughy Flavour and taste Rancidity Main score
2 months of ripening
30E12-00 2.7 ± 0.1 2.8 ± 0.3 3.1 ± 0.1 2.9 ± 0.4 2.2 ± 0.6 2.7 ± 0.3E12-01 3.2 ± 0 3.1 ± 0.2 2.7 ± 1.4 3.2 ± 0 1.4 ± 0.3 3.0 ± 0.2
60E12-00 3.5 ± 0.3 3.0 ± 0 4.6 ± 0.2 2.6 ± 0.4 2.1 ± 0.2 2.7 ± 0.3E12-01 3.1 ± 0.2 3.8 ± 0.3 3.3 ± 0.3 3.6 ± 0.2 1.1 ± 0.2 3.7 ± 0.3
4 months of ripening
30E12-00 2.8 ± 0.2 2.2 ± 0.2 3.1 ± 0.2 2.3 ± 0.5 3.8 ± 0.2 2.3 ± 0.5E12-01 3.2 ± 0.2 3.3 ± 0.1 2.7 ± 0 3.0 ± 0.5 2.5 ± 0.2 2.8 ± 0.7
60E12-00 2.4 ± 0.2 1.8 ± 0 4.0 ± 0.7 1.7 ± 0.4 2.9 ± 0.5 1.6 ± 0.2E12-01 3.4 ± 0.5 3.1 ± 0.2 2.6 ± 0.2 2.3 ± 0.2 2.4 ± 0.2 2.2 ± 0
Statistical significanceDIM NS NS ** NS NS NSGenotype NS *** *** ** *** *
Age NS ** NS ** *** **
DIM*genotype NS NS * NS NS NS
NS: not significant.n: number of judges.
* P < 0.05.** P < 0.01.
*** P < 0.001.
Table 3Free amino acids (�mol g−1 cheese) significantly influenced by the genotypes E12-00 and E12-01 and the sum of free amino acids (sum FAA). The cheese wasmade from the milk of goats at 30 and 60 days in milk (DIM), and the goats had different deletions in exon 12 of the gene encoding �s1-casein, specifically,goats homozygous for the deletion (E12-00) and goats heterozygous for the deletion (E12-01). Results are expressed as the mean values ± standard deviation.The statistical significance of DIM, the genotype, the ripening age and the interaction between DIM and genotype are indicated beneath the results.
DIM Asn Tyr Phe Trp Orn Sum FAA
2 months ripening
30E12-00 1.5 ± 0.1 2.6 ± 0.2 3.6 ± 0.2 0.4 ± 0.0 1.9 ± 0.2 58.2 ± 3.1E12-01 1.8 ± 0.1 1.7 ± 0.2 3.5 ± 0.3 0.3 ± 0.0 2.0 ± 0.0 47.3 ± 5.1
60E12-00 0.9 ± 0.1 1.6 ± 0.1 2.3 ± 0.2 0.2 ± 0.0 1.1 ± 0.1 30.5 ± 0.9E12-01 1.6 ± 0.4 1.4 ± 0.3 3.0 ± 0.5 0.2 ± 0.0 1.8 ± 0.4 37.6 ± 9.4
4 months ripening
30E12-00 2.0 ± 0.3 3.5 ± 0.4 4.8 ± 0.7 0.6 ± 0.1 2.8 ± 0.3 81.6 ± 14.0E12-01 2.6 ± 0.2 2.5 ± 0.4 4.8 ± 0.5 0.4 ± 0.1 2.9 ± 0.2 70.2 ± 9.7
60E12-00 1.3 ± 0.0 2.3 ± 0.3 3.2 ± 0.0 0.2 ± 0.0 1.5 ± 0.2 44.0 ± 0.6E12-01 2.7 ± 0.5 2.6 ± 0.5 4.8 ± 0.8 0.3 ± 0.1 2.9 ± 0.6 65.2 ± 17.3
Statistical significanceDIM * ** ** *** ** ***
Genotype *** * * * ** NSAge *** *** *** ** *** ***
DIM*genotype NS ** * ** ** *
NS: not significant.* P < 0.05.
** P < 0.01.*** P < 0.001.
than in the E12-01 cheeses (Fig. 3). The content of uric acidwas the highest (P < 0.001) in the 24 h cheeses and washigher (P < 0.05) in the E12-01 cheese than in the E12-00cheese. The content decreased during ripening, and uricacid was not detected in cheese after four months of ripen-ing, thereby indicating that the content of uric acid wasdifferent in the milk initially.
4. Discussion
Until now, only studies of the initial cheese makingproperties (milk composition, coagulation properties andsyneresis) of milk from the different genotypes of the Nor-wegian goats had been conducted (Devold et al., 2011;Vegarud et al., 1999). This is the first study to include
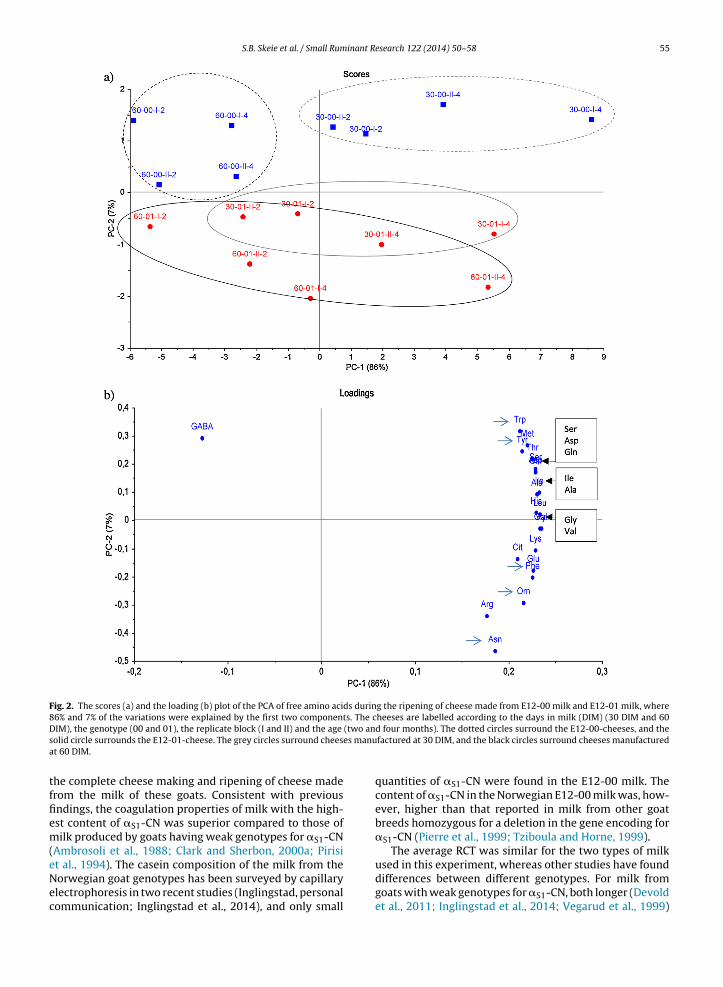
S.B. Skeie et al. / Small Ruminant Research 122 (2014) 50–58 55
Fig. 2. The scores (a) and the loading (b) plot of the PCA of free amino acids during the ripening of cheese made from E12-00 milk and E12-01 milk, where86% and 7% of the variations were explained by the first two components. The cheeses are labelled according to the days in milk (DIM) (30 DIM and 60DIM), the genotype (00 and 01), the replicate block (I and II) and the age (two and four months). The dotted circles surround the E12-00-cheeses, and thesolid circle surrounds the E12-01-cheese. The grey circles surround cheeses manufactured at 30 DIM, and the black circles surround cheeses manufacturedat 60 DIM.
the complete cheese making and ripening of cheese madefrom the milk of these goats. Consistent with previousfindings, the coagulation properties of milk with the high-est content of �S1-CN was superior compared to those ofmilk produced by goats having weak genotypes for �S1-CN(Ambrosoli et al., 1988; Clark and Sherbon, 2000a; Pirisiet al., 1994). The casein composition of the milk from theNorwegian goat genotypes has been surveyed by capillaryelectrophoresis in two recent studies (Inglingstad, personalcommunication; Inglingstad et al., 2014), and only small
quantities of �S1-CN were found in the E12-00 milk. Thecontent of �S1-CN in the Norwegian E12-00 milk was, how-ever, higher than that reported in milk from other goatbreeds homozygous for a deletion in the gene encoding for�S1-CN (Pierre et al., 1999; Tziboula and Horne, 1999).
The average RCT was similar for the two types of milkused in this experiment, whereas other studies have founddifferences between different genotypes. For milk fromgoats with weak genotypes for �S1-CN, both longer (Devoldet al., 2011; Inglingstad et al., 2014; Vegarud et al., 1999)
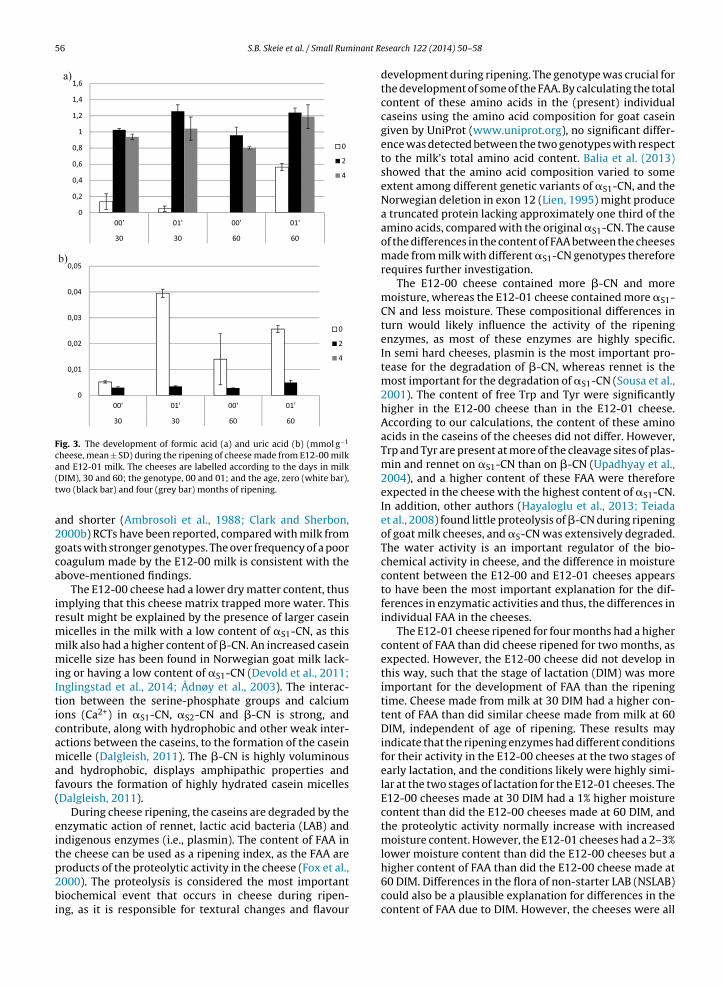
56 S.B. Skeie et al. / Small Ruminant Research 122 (2014) 50–58
a)
b)
Fig. 3. The development of formic acid (a) and uric acid (b) (mmol g−1
cheese, mean ± SD) during the ripening of cheese made from E12-00 milkand E12-01 milk. The cheeses are labelled according to the days in milk(DIM), 30 and 60; the genotype, 00 and 01; and the age, zero (white bar),two (black bar) and four (grey bar) months of ripening.
and shorter (Ambrosoli et al., 1988; Clark and Sherbon,2000b) RCTs have been reported, compared with milk fromgoats with stronger genotypes. The over frequency of a poorcoagulum made by the E12-00 milk is consistent with theabove-mentioned findings.
The E12-00 cheese had a lower dry matter content, thusimplying that this cheese matrix trapped more water. Thisresult might be explained by the presence of larger caseinmicelles in the milk with a low content of �S1-CN, as thismilk also had a higher content of �-CN. An increased caseinmicelle size has been found in Norwegian goat milk lack-ing or having a low content of �S1-CN (Devold et al., 2011;Inglingstad et al., 2014; Ådnøy et al., 2003). The interac-tion between the serine-phosphate groups and calciumions (Ca2+) in �S1-CN, �S2-CN and �-CN is strong, andcontribute, along with hydrophobic and other weak inter-actions between the caseins, to the formation of the caseinmicelle (Dalgleish, 2011). The �-CN is highly voluminousand hydrophobic, displays amphipathic properties andfavours the formation of highly hydrated casein micelles(Dalgleish, 2011).
During cheese ripening, the caseins are degraded by theenzymatic action of rennet, lactic acid bacteria (LAB) andindigenous enzymes (i.e., plasmin). The content of FAA inthe cheese can be used as a ripening index, as the FAA areproducts of the proteolytic activity in the cheese (Fox et al.,2000). The proteolysis is considered the most importantbiochemical event that occurs in cheese during ripen-ing, as it is responsible for textural changes and flavour
development during ripening. The genotype was crucial forthe development of some of the FAA. By calculating the totalcontent of these amino acids in the (present) individualcaseins using the amino acid composition for goat caseingiven by UniProt (www.uniprot.org), no significant differ-ence was detected between the two genotypes with respectto the milk’s total amino acid content. Balia et al. (2013)showed that the amino acid composition varied to someextent among different genetic variants of �S1-CN, and theNorwegian deletion in exon 12 (Lien, 1995) might producea truncated protein lacking approximately one third of theamino acids, compared with the original �S1-CN. The causeof the differences in the content of FAA between the cheesesmade from milk with different �S1-CN genotypes thereforerequires further investigation.
The E12-00 cheese contained more �-CN and moremoisture, whereas the E12-01 cheese contained more �S1-CN and less moisture. These compositional differences inturn would likely influence the activity of the ripeningenzymes, as most of these enzymes are highly specific.In semi hard cheeses, plasmin is the most important pro-tease for the degradation of �-CN, whereas rennet is themost important for the degradation of �S1-CN (Sousa et al.,2001). The content of free Trp and Tyr were significantlyhigher in the E12-00 cheese than in the E12-01 cheese.According to our calculations, the content of these aminoacids in the caseins of the cheeses did not differ. However,Trp and Tyr are present at more of the cleavage sites of plas-min and rennet on �S1-CN than on �-CN (Upadhyay et al.,2004), and a higher content of these FAA were thereforeexpected in the cheese with the highest content of �S1-CN.In addition, other authors (Hayaloglu et al., 2013; Teiadaet al., 2008) found little proteolysis of �-CN during ripeningof goat milk cheeses, and �S-CN was extensively degraded.The water activity is an important regulator of the bio-chemical activity in cheese, and the difference in moisturecontent between the E12-00 and E12-01 cheeses appearsto have been the most important explanation for the dif-ferences in enzymatic activities and thus, the differences inindividual FAA in the cheeses.
The E12-01 cheese ripened for four months had a highercontent of FAA than did cheese ripened for two months, asexpected. However, the E12-00 cheese did not develop inthis way, such that the stage of lactation (DIM) was moreimportant for the development of FAA than the ripeningtime. Cheese made from milk at 30 DIM had a higher con-tent of FAA than did similar cheese made from milk at 60DIM, independent of age of ripening. These results mayindicate that the ripening enzymes had different conditionsfor their activity in the E12-00 cheeses at the two stages ofearly lactation, and the conditions likely were highly simi-lar at the two stages of lactation for the E12-01 cheeses. TheE12-00 cheeses made at 30 DIM had a 1% higher moisturecontent than did the E12-00 cheeses made at 60 DIM, andthe proteolytic activity normally increase with increasedmoisture content. However, the E12-01 cheeses had a 2–3%lower moisture content than did the E12-00 cheeses but ahigher content of FAA than did the E12-00 cheese made at60 DIM. Differences in the flora of non-starter LAB (NSLAB)could also be a plausible explanation for differences in thecontent of FAA due to DIM. However, the cheeses were all
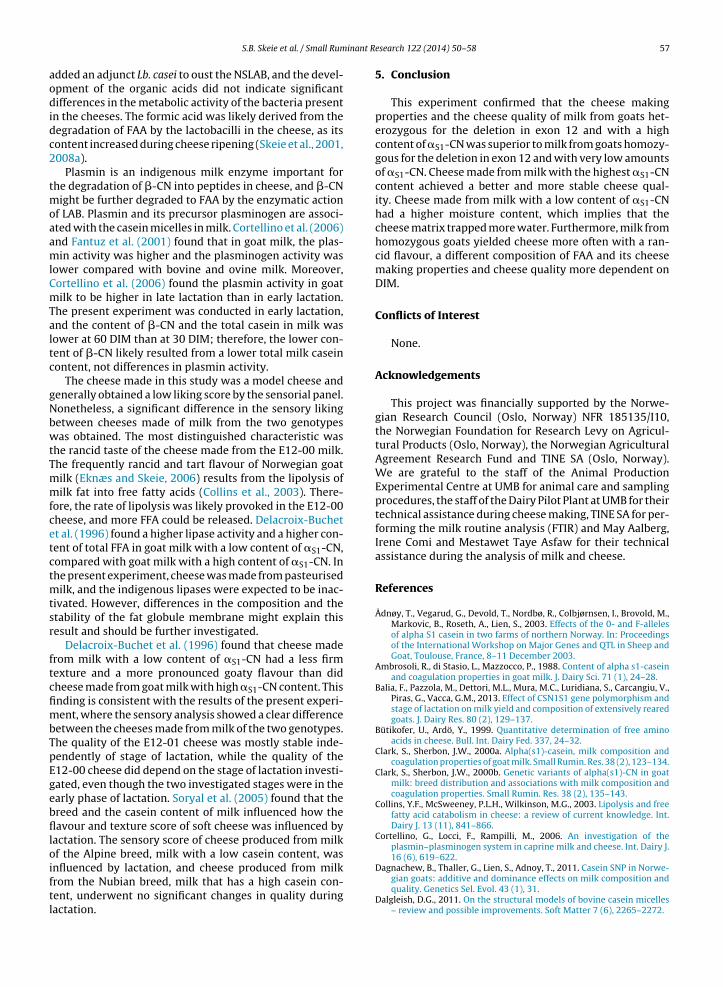
S.B. Skeie et al. / Small Ruminant Research 122 (2014) 50–58 57
added an adjunct Lb. casei to oust the NSLAB, and the devel-opment of the organic acids did not indicate significantdifferences in the metabolic activity of the bacteria presentin the cheeses. The formic acid was likely derived from thedegradation of FAA by the lactobacilli in the cheese, as itscontent increased during cheese ripening (Skeie et al., 2001,2008a).
Plasmin is an indigenous milk enzyme important forthe degradation of �-CN into peptides in cheese, and �-CNmight be further degraded to FAA by the enzymatic actionof LAB. Plasmin and its precursor plasminogen are associ-ated with the casein micelles in milk. Cortellino et al. (2006)and Fantuz et al. (2001) found that in goat milk, the plas-min activity was higher and the plasminogen activity waslower compared with bovine and ovine milk. Moreover,Cortellino et al. (2006) found the plasmin activity in goatmilk to be higher in late lactation than in early lactation.The present experiment was conducted in early lactation,and the content of �-CN and the total casein in milk waslower at 60 DIM than at 30 DIM; therefore, the lower con-tent of �-CN likely resulted from a lower total milk caseincontent, not differences in plasmin activity.
The cheese made in this study was a model cheese andgenerally obtained a low liking score by the sensorial panel.Nonetheless, a significant difference in the sensory likingbetween cheeses made of milk from the two genotypeswas obtained. The most distinguished characteristic wasthe rancid taste of the cheese made from the E12-00 milk.The frequently rancid and tart flavour of Norwegian goatmilk (Eknæs and Skeie, 2006) results from the lipolysis ofmilk fat into free fatty acids (Collins et al., 2003). There-fore, the rate of lipolysis was likely provoked in the E12-00cheese, and more FFA could be released. Delacroix-Buchetet al. (1996) found a higher lipase activity and a higher con-tent of total FFA in goat milk with a low content of �S1-CN,compared with goat milk with a high content of �S1-CN. Inthe present experiment, cheese was made from pasteurisedmilk, and the indigenous lipases were expected to be inac-tivated. However, differences in the composition and thestability of the fat globule membrane might explain thisresult and should be further investigated.
Delacroix-Buchet et al. (1996) found that cheese madefrom milk with a low content of �S1-CN had a less firmtexture and a more pronounced goaty flavour than didcheese made from goat milk with high �S1-CN content. Thisfinding is consistent with the results of the present experi-ment, where the sensory analysis showed a clear differencebetween the cheeses made from milk of the two genotypes.The quality of the E12-01 cheese was mostly stable inde-pendently of stage of lactation, while the quality of theE12-00 cheese did depend on the stage of lactation investi-gated, even though the two investigated stages were in theearly phase of lactation. Soryal et al. (2005) found that thebreed and the casein content of milk influenced how theflavour and texture score of soft cheese was influenced bylactation. The sensory score of cheese produced from milkof the Alpine breed, milk with a low casein content, wasinfluenced by lactation, and cheese produced from milkfrom the Nubian breed, milk that has a high casein con-tent, underwent no significant changes in quality duringlactation.
5. Conclusion
This experiment confirmed that the cheese makingproperties and the cheese quality of milk from goats het-erozygous for the deletion in exon 12 and with a highcontent of �S1-CN was superior to milk from goats homozy-gous for the deletion in exon 12 and with very low amountsof �S1-CN. Cheese made from milk with the highest �S1-CNcontent achieved a better and more stable cheese qual-ity. Cheese made from milk with a low content of �S1-CNhad a higher moisture content, which implies that thecheese matrix trapped more water. Furthermore, milk fromhomozygous goats yielded cheese more often with a ran-cid flavour, a different composition of FAA and its cheesemaking properties and cheese quality more dependent onDIM.
Conflicts of Interest
None.
Acknowledgements
This project was financially supported by the Norwe-gian Research Council (Oslo, Norway) NFR 185135/I10,the Norwegian Foundation for Research Levy on Agricul-tural Products (Oslo, Norway), the Norwegian AgriculturalAgreement Research Fund and TINE SA (Oslo, Norway).We are grateful to the staff of the Animal ProductionExperimental Centre at UMB for animal care and samplingprocedures, the staff of the Dairy Pilot Plant at UMB for theirtechnical assistance during cheese making, TINE SA for per-forming the milk routine analysis (FTIR) and May Aalberg,Irene Comi and Mestawet Taye Asfaw for their technicalassistance during the analysis of milk and cheese.
References
Ådnøy, T., Vegarud, G., Devold, T., Nordbø, R., Colbjørnsen, I., Brovold, M.,Markovic, B., Roseth, A., Lien, S., 2003. Effects of the 0- and F-allelesof alpha S1 casein in two farms of northern Norway. In: Proceedingsof the International Workshop on Major Genes and QTL in Sheep andGoat, Toulouse, France, 8–11 December 2003.
Ambrosoli, R., di Stasio, L., Mazzocco, P., 1988. Content of alpha s1-caseinand coagulation properties in goat milk. J. Dairy Sci. 71 (1), 24–28.
Balia, F., Pazzola, M., Dettori, M.L., Mura, M.C., Luridiana, S., Carcangiu, V.,Piras, G., Vacca, G.M., 2013. Effect of CSN1S1 gene polymorphism andstage of lactation on milk yield and composition of extensively rearedgoats. J. Dairy Res. 80 (2), 129–137.
Bütikofer, U., Ardö, Y., 1999. Quantitative determination of free aminoacids in cheese. Bull. Int. Dairy Fed. 337, 24–32.
Clark, S., Sherbon, J.W., 2000a. Alpha(s1)-casein, milk composition andcoagulation properties of goat milk. Small Rumin. Res. 38 (2), 123–134.
Clark, S., Sherbon, J.W., 2000b. Genetic variants of alpha(s1)-CN in goatmilk: breed distribution and associations with milk composition andcoagulation properties. Small Rumin. Res. 38 (2), 135–143.
Collins, Y.F., McSweeney, P.L.H., Wilkinson, M.G., 2003. Lipolysis and freefatty acid catabolism in cheese: a review of current knowledge. Int.Dairy J. 13 (11), 841–866.
Cortellino, G., Locci, F., Rampilli, M., 2006. An investigation of theplasmin–plasminogen system in caprine milk and cheese. Int. Dairy J.16 (6), 619–622.
Dagnachew, B., Thaller, G., Lien, S., Adnoy, T., 2011. Casein SNP in Norwe-gian goats: additive and dominance effects on milk composition andquality. Genetics Sel. Evol. 43 (1), 31.
Dalgleish, D.G., 2011. On the structural models of bovine casein micelles– review and possible improvements. Soft Matter 7 (6), 2265–2272.
58 S.B. Skeie et al. / Small Ruminant Research 122 (2014) 50–58
Delacroix-Buchet, A., Degas, C., Lamberet, G., Vassal, L., 1996. Effect ofAA and FF caprine �S1-casein variants on cheesemaking. Lait 76 (3),217–241.
Devold, T.G., Nordbø, R., Langsrud, T., Svenning, C., Brovold, M.J., Sorensen,E.S., Christensen, B., Adnoy, T., Vegarud, G.E., 2011. Extreme frequen-cies of the alpha(s1)-casein “null” variant in milk from Norwegiandairy goats – implications for milk composition, micellar size andrenneting properties. Dairy Sci. Technol. 91 (1), 39–51.
Eknæs, M., Skeie, S., 2006. Effect of different level of roughage availabilityand contrast levels of concentrate supplementation on flavour of goatmilk. Small Rumin. Res. 66 (1–3), 32–43.
Fantuz, F., Polidori, F., Cheli, F., Baldi, A., 2001. Plasminogen activationsystem in goat milk and its relation with composition and coagulationproperties. J. Dairy Sci. 84 (8), 1786–1790.
Fox, P.F., Guinee, T.P., Cogan, T.M., McSweeney, P.L.H., 2000. Fundamentalsof Cheese Science. Aspen Publishers Inc., Gaithersburg, MD.
Hayaloglu, A.A., Tolu, C., Yasar, K., 2013. Influence of goat breeds andstarter culture systems on gross composition and proteolysis inGokceada goat cheese during ripening. Small Rumin. Res. 113 (1),231–238.
Hayes, B., Hagesæther, N., Adnøy, T., Pellerud, G., Berg, P.R., Lien, S., 2006.Effects on production traits of haplotypes among casein genes in Nor-wegian goats and evidence for a site of preferential recombination.Genetics 174 (1), 455–464.
IDF/FIL, 1982. Cheese and processed cheese: determination of the totalsolids content. In: IDF Standard 4A, Vol. 88:1979. International DairyFederation, Brussels, Belgium.
IDF/FIL, 1995. Milk and milk products: guidance on sampling. In: IDF Stan-dard 50C, Vol. 50C. International Dairy Federation, Brussels, Belgium.
Inglingstad, R.A., Steinshamn, H., Dagnachew, B.S., Valenti, B., Criscione,A., Rukke, E.O., Devold, T.G., Skeie, S.B., Vegarud, G.E., 2014. Effectsof pasture type compared with hay diet on composition and rennetcoagulation properties of Norwegian goat milk. J. Dairy Sci. 97 (6),3800–3814.
Lien, S., (Dr. Sci. thesis) 1995. Bovine and Caprine Milk Protein Alleles:Identification, Genetic Mapping and Use as Markers. The AgriculturalUniversity of Norway, Ås.
Martinovic, A., Moe, K.M., Romeih, E., Aideh, B., Vogensen, F.K., Østlie, H.,Skeie, S., 2013. Growth of adjunct Lactobacillus casei in Cheddar cheesediffering in milk fat globule membrane components. Int. Dairy J. 31 (2),70–82.
McMahon, D.J., Brown, R.J., 1982. Evaluation of formagraph for comparingrennet solutions. J. Dairy Sci. 65 (8), 1639–1642.
Mestawet, T.A., Girma, A., Adnoy, T., Devold, T.G., Vegarud, G.E., 2013.Newly identified mutations at the CSN1S1 gene in Ethiopian goatsaffect casein content and coagulation properties of their milk. J. DairySci. 96 (8), 4857–4869.
Norwegian Association of Sheep and Goat Breeders, 2013. Avlsmålfor Norsk melkegeit (Breeding Goals for Norwegian Dairy Goats).http://www.nsg.no/avlsmaal/category682.html
Pierre, A., Michel, F., Zahoute, L., 1999. Composition of casein micelles inrelation to size in goat milks with A and null alphaS1-casein variants.Int. Dairy J. 9 (3–6), 179–182.
Pirisi, A., Colin, O., Laurent, F., Scher, J., Parmentier, M., 1994. Com-parison of milk composition, cheesemaking properties and texturalcharacteristics of the cheese from two groups of goats with ahigh or low rate of alpha(S1)-casein synthesis. Int. Dairy J. 4 (4),329–345.
Sousa, M.J., Ardö, Y., McSweeney, P.L.H., 2001. Advances in the study ofproteolysis during cheese ripening. Int. Dairy J. 11 (4–7), 327–345.
Skeie, S., Alseth, G.M., Østlie, H., Abrahamsen, R.K., Johansen, A.G., Øyaas, J.,2013. Improvement of the quality of low-fat cheese using a two-stepstrategy. Int. Dairy J. 33 (2), 153–162.
Skeie, S., Kieronczyk, A., Eidet, S., Reitan, M., Olsen, K., Østlie, H., 2008a.Interaction between starter bacteria and adjunct Lactobacillus plan-tarum INF15D on the degradation of citrate, asparagine and aspartatein a washed-curd cheese. Int. Dairy J. 18 (2), 169–177.
Skeie, S., Kieronczyk, A., Næss, R.M., Østlie, H., 2008b. Lactobacillusadjuncts in cheese: their influence on the degradation of citrate andserine during ripening of a washed curd cheese. Int. Dairy J. 18 (2),158–168.
Skeie, S., Lindberg, C., Narvhus, J., 2001. Development of amino acids andorganic acids in Norvegia, influence of milk treatment and adjunctLactobacillus. Int. Dairy J. 11 (4–7), 399–411.
Skeie, S., Narvhus, J.A., Ardo, Y., Thorvaldsen, K., Abrahamsen, R.K., 1997.The effect of reduced salt content on the function of liposome-encapsulated neutrase and heat-treated lactobacilli in rindless low-fatcheese. Lait 77 (5), 575–585.
Skjevdal, T., 1979. Flavour of goat’s milk: a review of studies on the sourcesof its variations. Livest. Prod. Sci. 6 (4), 397–405.
Soryal, K., Fekadu, B., Zeng, S., Bah, B., Tesfai, K., 2005. Effect of goatbreed and milk composition on yield, sensory quality, fatty acid con-centration of soft cheese during lactation. Small Rumin. Res. 58 (3),275–281.
Teiada, L., Abellan, A., Cayuela, J.M., Martinez-Cacha, A., Fernandez-Salguero, J., 2008. Proteolysis in goats’ milk cheese made with calfrennet and plant coagulant. Int. Dairy J. 18 (2), 139–146.
Tziboula, A., Horne, D.S., 1999. The role of alphaS1-casein in the structureof caprine casein micelles. Int. Dairy J. 9 (3–6), 173–178.
Upadhyay, V.K., McSweeney, P.L.H., Magboul, A.A.A., Fox, P.F., 2004. Pro-teolysis in cheese during ripening. In: Fox, P.F., McSweeney, P.L.H.,Cogan, T.M., Guinee, T.P. (Eds.), Cheese: Chemistry, Physics and Micro-biology, vol. 1. Academic Press, Amsterdam, pp. 391–433.
Vegarud, G.E., Devold, T.G., Opheim, R., Loeding, E., Svenning, C., Abraham-sen, R.K., Lien, S., Langsrud, T., 1999. Genetic variants of Norwegiangoats milk composition, micellar size and renneting properties. Int.Dairy J. 9 (3–6), 367–368.
Wolfinger, R.D., 1996. Heterogeneous variance–covariance structures forrepeated measures. J. Agric. Biol. Environ. Stat. 1 (2), 205–230.


