Embed Size (px)
Citation preview
Masteroppgave
TRA950 Samferdselsplanlegging (Erfaringsbasert)
Comparison between Legacy and Low Cost Airlines on
the Norwegian Aviation Market
Furat Gebory
Totalt antall sider inkludert forsiden: 85
Molde, 12.12.2013
Obligatorisk egenerklæring/gruppeerklæring
Den enkelte student er selv ansvarlig for å sette seg inn i hva som er lovlige hjelpemidler, retningslinjer
for bruk av disse og regler om kildebruk. Erklæringen skal bevisstgjøre studentene på deres ansvar og
hvilke konsekvenser fusk kan medføre. Manglende erklæring fritar ikke studentene fra sitt ansvar.
Du/dere fyller ut erklæringen ved å klikke i ruten til høyre for den enkelte del 1-6:
1. Jeg/vi erklærer herved at min/vår besvarelse er mitt/vårt eget arbeid,
og at jeg/vi ikke har brukt andre kilder eller har mottatt annen hjelp
enn det som er nevnt i besvarelsen.
2. Jeg/vi erklærer videre at denne besvarelsen:
• ikke har vært brukt til annen eksamen ved annen
avdeling/universitet/høgskole innenlands eller utenlands.
• ikke refererer til andres arbeid uten at det er oppgitt.
• ikke refererer til eget tidligere arbeid uten at det er oppgitt.
• har alle referansene oppgitt i litteraturlisten.
• ikke er en kopi, duplikat eller avskrift av andres arbeid eller
besvarelse.
3. Jeg/vi er kjent med at brudd på ovennevnte er å betrakte som fusk og
kan medføre annullering av eksamen og utestengelse fra universiteter
og høgskoler i Norge, jf. Universitets- og høgskoleloven §§4-7 og 4-8 og
Forskrift om eksamen §§14 og 15.
4. Jeg/vi er kjent med at alle innleverte oppgaver kan bli plagiatkontrollert
i Ephorus, se Retningslinjer for elektronisk innlevering og publisering av
studiepoenggivende studentoppgaver
5. Jeg/vi er kjent med at høgskolen vil behandle alle saker hvor det
forligger mistanke om fusk etter høgskolens retningslinjer for
behandling av saker om fusk
6. Jeg/vi har satt oss inn i regler og retningslinjer i bruk av kilder og
referanser på biblioteket sine nettsider
Publiseringsavtale Studiepoeng: 30 Veileder: Odd I. Larsen
Fullmakt til elektronisk publisering av oppgaven Forfatter(ne) har opphavsrett til oppgaven. Det betyr blant annet enerett til å gjøre verket tilgjengelig for allmennheten (Åndsverkloven. §2). Alle oppgaver som fyller kriteriene vil bli registrert og publisert i Brage HiM med forfatter(ne)s godkjennelse. Oppgaver som er unntatt offentlighet eller båndlagt vil ikke bli publisert. Jeg/vi gir herved Høgskolen i Molde en vederlagsfri rett til å gjøre oppgaven tilgjengelig for elektronisk publisering: ja nei Er oppgaven båndlagt (konfidensiell)? ja nei (Båndleggingsavtale må fylles ut) - Hvis ja: Kan oppgaven publiseres når båndleggingsperioden er over? ja nei Er oppgaven unntatt offentlighet? ja nei (inneholder taushetsbelagt informasjon. Jfr. Offl. §13/Fvl. §13) Dato: 12.12.2013
Acknowledgements This master thesis marks the end of my study in the master course in transport planning at
Molde University College. The choice of the topic has been made, based on my curiosity,
interest and current job related involvement with the developments on this exciting market.
Writing this master thesis was a learning experience for me, which I have enjoyed. I have
been able to complete it thanks to the assistance of some people, to whom I would like to
extend my gratitude.
On the first place, I would like to thank my supervisor - Professor Odd I. Larsen from Molde
University for the excellent guidance and support provided to me during the thesis
preparation. During this period I could always count on his expert advice, constructive
feedback, and guidelines.
I would also like to thank Associate Professor Harald M. Hjelle for his guidance and
coordination during my whole study period in Molde University College.
Finally, I would like to thank my wife for her support and understanding during my whole
course of study and especially during the period of writing this paper.
Preface This master thesis discusses issues, related to the comparison between Legacy Airlines (LA)
and Low Cost Airlines (LCA) on the Norwegian aviation market. The objective is to try to
provide a picture of the market and the positions of these types of airlines on it.
The first chapter represents an introduction to the topic, which contains formulation of the
main research question and sub questions.
The second chapter provides a description of the evolutionary development of the aviation
market until its present state. For a long while the competition in the aviation has been
characterized by limitations, related to pricing, market entry and optimal output. Gradually,
the European market became liberalized. New airlines appeared on the scene, following a low
cost business model of operation and offering new opportunities for cooperation with the
already existing companies. As a result the number of passengers rose significantly and the
started deregulation left the market open for new entrants.
The third chapter deals with the impact of the macro-economic environment on the airlines.
The global economic situation has always had a big impact on aviation. When the economic
development is good, the aviation activities are positively affected. The period 2000 - 2005
was a period of deep global crisis. In 2000, the dot-com bubble burst out, causing economic
decline and the demand for air transport almost immediately collapsed. In 2001, the SARS
virus and the 9/11 attacks in USA contributed to the further decline in the demand for
passengers’ transport. The market somehow managed to recover, but the latest economic
crisis broke out in 2008. The profits went down and the market was overflown by
bankruptcies, mergers, acquisitions and strife for market consolidation.
The fourth chapter focuses on the business models, followed by the Legacy Airlines and the
Low Cost Airlines. The Legacy companies follow a “hub-and-spoke” network model and
use different strategies to differentiate their product from that of the other airlines. On the
other hand, the Low Cost Airlines follow a cost minimization strategy and try to achieve their
competitive advantage through operational efficiency. They achieve this efficiency, applying
a “point-to-point” network model and operation, involving using one fleet type and not
offering any free-of-charge services – i.e. in contrast to the Legacy Airlines there are no free
meals, beverages and luggage. They also save on airport charges (using secondary airports)
and on ground handling services.
The fifth and sixth chapter contain analysis of the most important airlines in the Norwegian
market, based on their business models. Two airlines are selected for this purpose – i.e.
Scandinavian Airlines (SAS) and Norwegian Air Shuttle1 (NAS). SAS is classified as a
Legacy Airline, while Norwegian Air Shuttle can be defined as following a low cost strategy,
but including some elements of the model, followed by a Legacy Airline.
The seventh chapter contains findings and conclusions.
1 The new established Norwegian Long Haul (NLH) will not be discussed in this thesis.
Comparison between Legacy and Low Cost Airlines on the Norwegian Aviation Market
Page 7
Table of Contents Chapter 1: Introduction and Problem Definition ........................................................................ 9
1.1 Problem Definition ........................................................................................................... 9
1.2 Research Questions ........................................................................................................ 11
1.2.1. Main Research Question ........................................................................................ 11
1.2.2. Research Sub-Questions ......................................................................................... 11
1.3. Research Methodology .................................................................................................. 12
Chapter 2: Liberalisation of the Aviation Sector ..................................................................... 13
2.1. Introduction ................................................................................................................... 13
2.2. Initiation of a New Market ............................................................................................ 13
2.3 Development of the Norwegian Aviation Market ..................................................... 18
2.4. Creation of the European Single Market ....................................................................... 23
2.5. EU-US Open Skies Agreement ..................................................................................... 24
2.4.1. The First Phase ....................................................................................................... 26
2.4.2. The Second Phase ................................................................................................... 27
2.6. The Effects from the Creation of the European Single Market ..................................... 28
2.6.1. Network Development ........................................................................................... 28
2.6.2. Market Consolidation ............................................................................................. 28
2.6.3. Rise of the Low Cost Airlines ................................................................................ 29
2.6.4. Global Economy and Aviation ............................................................................... 29
Chapter 3: The Impact of the Macro-Economic Environment on the Aviation Market .......... 31
3.1. The aviation market during the period 2000-2005 ........................................................ 31
3.2. The aviation market during the period 2006-2012 ........................................................ 33
Chapter 4: Business models of Legacy Airlines and Low Cost Airlines ................................. 36
4.1. Types of Air Carriers and Principles of Operation........................................................ 36
4.2. Legacy Airlines ............................................................................................................. 37
4.2.1. Differentiation Strategy .......................................................................................... 37
4.2.2. Services .................................................................................................................. 38
4.2.3. Air Fleet .................................................................................................................. 38
4.2.4. “Hub-and-Spoke” Network .................................................................................... 40
4.2.5. Airports ................................................................................................................... 41
Comparison between Legacy and Low Cost Airlines on the Norwegian Aviation Market
Page 8
4.2.6. Costs ....................................................................................................................... 42
4.2.7. Strategic Alliances .................................................................................................. 43
4.2.8. Pricing Strategy ...................................................................................................... 44
4.3. Low Cost Airlines ......................................................................................................... 45
4.3.1. Cost Leadership ...................................................................................................... 45
4.3.2. Services .................................................................................................................. 46
4.3.3. Air Fleet .................................................................................................................. 47
4.3.4. “Point-to-Point” Network ....................................................................................... 48
4.3.5. Airports ................................................................................................................... 50
4.3.6. Costs ....................................................................................................................... 52
4.3.7. Pricing Strategy ...................................................................................................... 54
4.4. Blur of the Business Models ......................................................................................... 55
Chapter 5: Airline Metric Analysis .......................................................................................... 59
5.1. Available Seat Kilometres (ASK) ............................................................................. 59
5.2. Revenue Passenger Kilometres (RPK) ...................................................................... 60
5.3. Load Factor ................................................................................................................ 61
5.4. Yield .......................................................................................................................... 62
5.5. Unit Cost: Cost per Available Seat Kilometres (CASK) ........................................... 63
5.6. Number of Passengers ............................................................................................... 64
Chapter 6: SWOT Analysis of NAS & SAS ............................................................................ 66
6.1. NAS SWOT Analysis ................................................................................................ 66
6.2. SAS SWOT Analysis ................................................................................................. 72
Chapter 7: Conclusions ............................................................................................................ 80
References ................................................................................................................................ 82
Comparison between Legacy and Low Cost Airlines on the Norwegian Aviation Market
Page 9
Chapter 1: Introduction and Problem Definition
1.1 Problem Definition
During the past few years aviation has been characterized by many important changes. The
market liberalisation, the economic crisis, and the rise of the Low Cost Airlines have had a
big impact on the way the airlines compete with each other.
Numerous articles have been written on these issues, showing that market liberalisation is a
key development factor in the aviation story. Since the start of the liberalization process, the
sector has experienced big changes. The market has become more competitive, prices have
gone down and the number of passengers has increased. It has become possible to be more
profitable by being more efficiently operating. This has been ensured by the improved use of
their networks and by the introduction of new pricing strategies.
Additionally, strategic alliances in the form of mergers and acquisitions represent a frequently
used method to secure itself against the competition or to increase the market power. The
deregulation of the market with regard to the property right has made this possible. The
economic crisis has also had an important impact. The number of passengers dropped in 2009,
which is very evident from the publication of IATA (International Air Transport
Association)2. This decline was indicative for the global aviation - the sector was hit the
hardest in its segment, in which service quality was crucially important, such as the business
class flights. Here, the decrease in the number of the passengers was much bigger, compared
to this in other segments.
This drop in the growth of the passengers’ number was important for the revision of the
strategic approaches. There was an active search for cost-cutting measures, improved capacity
and other revenue-generating sources on the part of the airlines. Some of the business models
were reviewed and adapted to the market changes.
The large number of takeovers, mergers and cooperation agreements for cooperation was
characteristic for the period. It was possible to use the networks more efficiently but also to
2 Reference Nr. [4] Annual Report – IATA (2011).
Comparison between Legacy and Low Cost Airlines on the Norwegian Aviation Market
Page 10
have more power with extended air fleet. A Norwegian example for that approach is
Braathens, which was established in 1946 and taken over by SAS in 2002.
Strategic alliances have both positive and negative implications on the consumers according
to Oum & Zhang3. This approach enables the accomplishment of cost savings in several
ways, as a result of which the consumer prices can be reduced. But this approach can also
have a negative impact, when only one player is left to operate on a route – i.e. the route is
monopolized.
It is clear that the market has profoundly changed and is still undergoing changes. The crisis
and the fuel prices are the causes for potential problems (Wall, Compart & Mathews)4.
According to Oum & Zhang, the European market grows faster than the other markets
because it is still experiencing deregulation effects and because the Eastern European
countries are still developing, causing increase in the passengers’ numbers.
In addition to that, the emergence of the Low Cost Airlines has heavily influenced the market.
The Low Cost Airlines keep their prices low, deleting additional services, relying on
secondary airports, and offering point-to-point flights. The lack of extras means less extensive
services, but due to the low prices it adds value for the consumers in a different way. LCA
strategy differs in several ways from LA strategies (De Groote)5.
The welfare growth and popularity of the Low Cost Airlines increased the demand for
aviation services (Ko & Hwang)6. To compete with the Low Cost Airlines the Legacy
companies are expanding under another name, offering cheap flights. But whether this
strategy is the best one, has not been proven. Harvey and Turnbull7 have concluded that staff
motivation is often lower for the employees working for a Low Cost Airline, than for a
Legacy Airline. Before the emergence of the Low Cost Airlines, there has been direct
3 Reference Nr. [26] Oum, T. H., Fu, X., & Zhang, A. (2009) “Air transport liberalization and its impacts on airline competition and air passenger traffic”. International Transport Forum. 4 Reference Nr. [33] Wall, R., Shannon, D., Compart, A., & Mathews, N. (2009) “Yielding to Reality”. Aviation Week & Space Technology. 5 Reference Nr. [13] De Groote, P. (2005) “The Success Story of European Low-Cost Carriers in a Changing Air world”. 6 Reference Nr. [22] Ko, Y., & Hwang, H. (2010) “Management strategy of full-service carrier and its subsidiary low cost carrier”. The International Journal of Advanced Manufacturing Technology. 7 Reference Nr. [18] Harvey, G., & Turnbull, P. (2010) “On the Go: Walking the high road at a low cost airline”. The International Journal of Human Resource Management.
Comparison between Legacy and Low Cost Airlines on the Norwegian Aviation Market
Page 11
competition among the Legacy Airlines for the identical services, which they offered. The
companies could differentiate themselves through the image and quality of the services
provided by them. Nowadays, the competition in aviation is tackled in a very different way,
which besides individuality and service, includes also a price war.
This master thesis contains a description of the evolution and analysis of the current
competitive situation in aviation with an emphasis on the Norwegian market, including the
most important changes during previous periods and current challenges, faced by the main
players on the Norwegian market. The strategic approaches of the legacy and low cost airlines
to the competitive market are compared to exhibit their pros and cons and to arrive at specific
conclusions and recommendations.
1.2 Research Questions
1.2.1. Main Research Question
Since this master thesis is limited to a relatively small area (Norway), it is possible to make a
fairly good analysis of the sector. The main research question is formulated as follows:
"What are the characteristics of the competition between the main players on the
Norwegian aviation market?”
This paper will focus mainly on the distinction between the two types of companies: Legacy
and Low Cost Airlines, including review and analysis of Scandinavian Airlines (SAS) and
Norwegian Air Shuttle.
1.2.2. Research Sub-Questions
Connected to the main research questions are the following sub questions:
1. How has the aviation landscape been changed by the liberalization of the air transport and the economic crisis?
2. How has the aviation in Norway evolved during the past decade and how has the regrouping of the companies in the market been transformed into gaining of competitive advantage?
3. What effects have the changes in the aviation landscape had on the decision-making process of the consumers?
Comparison between Legacy and Low Cost Airlines on the Norwegian Aviation Market
Page 12
1.3. Research Methodology
Research strategies use primary and secondary data. Primary information is the data collected
from interviews, surveys, focus groups, panel discussions, etc. Secondary information relates
to statistical or other type of processed data.
Aviation is internationally important industry and much research has been carried out. There
is a large quantity of different outputs, resulting from it. In-depth studies of the available
literature could help the preparation of recommendations for the solution of concrete practical
problems.
This master thesis uses mainly secondary information, as well as published results from
interviews with important stakeholders in the sector. The analysis, which is an important part
of this paper, uses data, contained in the annual reports of the selected airlines, which show
the results from their strategic decisions and their operation. To gain better understanding of
the strategy and vision of the airlines, available data from interviews with different target
groups have also been used to finally reach a conclusion, concerning the impact of the
microenvironment and competition in aviation on the above mentioned airlines and on the
choices of the passengers.
For the comparison of the two selected companies (one Legacy and one Low Cost Airline)
SWOT analysis is used, which is a good basis for coming up with justified conclusions.
Comparison between Legacy and Low Cost Airlines on the Norwegian Aviation Market
Page 13
Chapter 2: Liberalisation of the Aviation Sector
2.1. Introduction
When discussing the Norwegian aviation market, it is important to consider this market as a
part of a larger one – i.e. the European market. This chapter describes how the gradually
deregulated airline industry in Europe has impacted the air space liberalisation and what has
been the impact of that on the airline market. But this story will not be complete, if the place,
where everything has been started – i.e. the United States of America, will not be included in
the picture.
2.2. Initiation of a New Market
R. Doganis8 defines aviation as a great paradox. According to him, the operational activities
range beyond any industry, but the power and control are limited to within national borders.
In the past, the aviation market was highly regulated and the airlines were limited in their
choices, related to pricing, market entry and optimal output. The degree of regulation directly
effected on the competition between the airlines. In 1944, an attempt was made in Chicago to
deregulate the aviation market, but the efforts were limited to the technical and legal
framework. The states still had the power of decision over the airspace above their territory.
Since the economic limitations were not addressed, it was not possible to develop the airline
market in a more structural and bold manner.
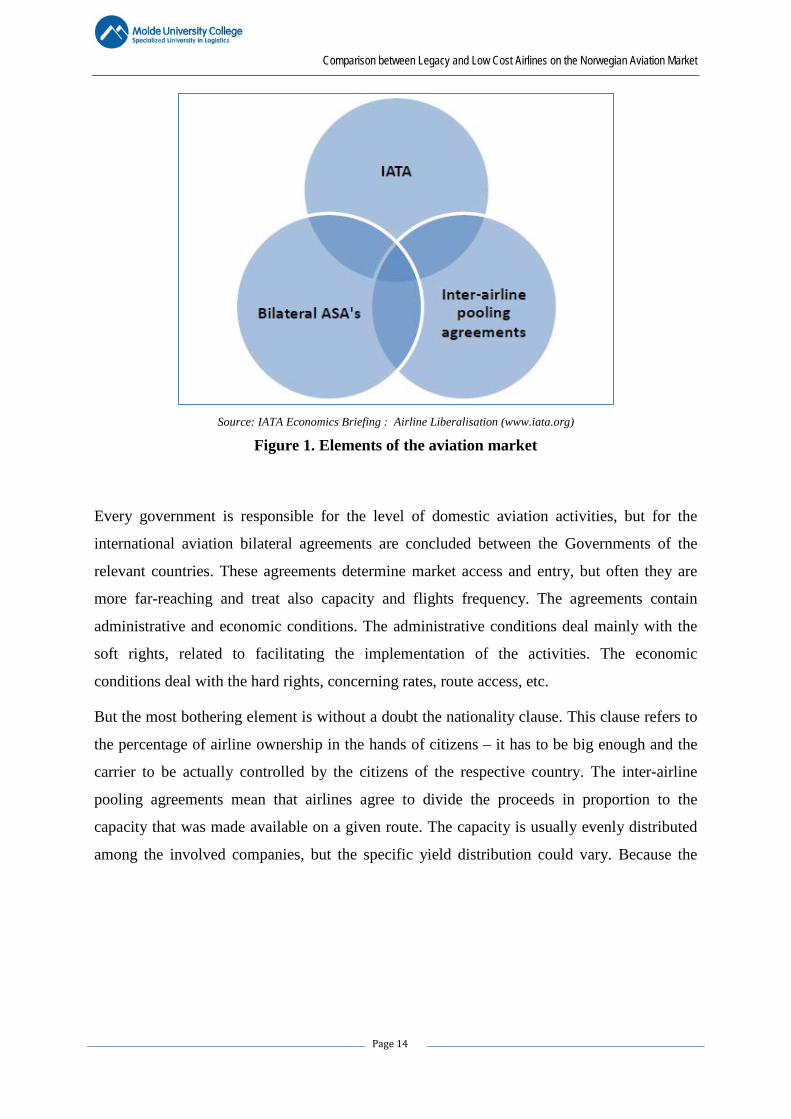
Until the end of the 1970s, the aviation market was determined by three important and closely
linked elements - bilateral air service agreements (ASA), inter-airline pooling agreements and
International Air Transport Association (IATA) rate determining system (See Figure 1).
8 Reference Nr. [15] Doganis, R. (2006) “Airline Business in the 21st Century”.
Comparison between Legacy and Low Cost Airlines on the Norwegian Aviation Market
Page 14
Source: IATA Economics Briefing : Airline Liberalisation (www.iata.org)
Figure 1. Elements of the aviation market
Every government is responsible for the level of domestic aviation activities, but for the
international aviation bilateral agreements are concluded between the Governments of the
relevant countries. These agreements determine market access and entry, but often they are
more far-reaching and treat also capacity and flights frequency. The agreements contain
administrative and economic conditions. The administrative conditions deal mainly with the
soft rights, related to facilitating the implementation of the activities. The economic
conditions deal with the hard rights, concerning rates, route access, etc.
But the most bothering element is without a doubt the nationality clause. This clause refers to
the percentage of airline ownership in the hands of citizens – it has to be big enough and the
carrier to be actually controlled by the citizens of the respective country. The inter-airline
pooling agreements mean that airlines agree to divide the proceeds in proportion to the
capacity that was made available on a given route. The capacity is usually evenly distributed
among the involved companies, but the specific yield distribution could vary. Because the
Comparison between Legacy and Low Cost Airlines on the Norwegian Aviation Market
Page 15
distribution of proceeds is not always proper, the competition, even though to a limited extent,
is encouraged.
With the creation of the inter-airline pooling agreements IATA companies tried to standardize
the ticket prices9. IATA was founded in Hague in 1919 by six European airlines. The goal
was to avoid the price war between the air carriers and therefore they reached a market
agreement. This agreement applied to all members and was related to the ticket prices, but
also to the level of the offered service. This version of IATA was limited to European airlines
until the entering of Pan American in 1939.
After the Second World War, the accent was shifted to the global focus. In 1946, the United
Kingdom and the United States signed the Bermuda agreement - a ground-breaking
agreement at that time. This agreement meant admission of the original price agreements,
which were inconsistent with the antitrust laws of the United States. This form of market
power was not waterproof. In the 70's there was an emerging pressure on the part of the
charter companies and the Asian airlines. The charter companies, which represented non-
regular services were not bound by IATA agreements and were therefore free to reduce their
price, making the number of the passengers to increase rapidly.
In their turn, the Asian airlines joined the routes between Europe and Asia, where they also
were not bound by IATA agreements. Asian Airlines offered much better services for lower
prices. At the same time many national airlines were hampered by their IATA membership.
According to R. Doganis10 aviation liberalization flared in the late 1970s. The market
liberalization was one of the political promises of President Carter, who supported the idea of
improving consumers’ welfare. In 1978, he signed the “Airline Deregulation Act”, whereby
the Government engaged itself to maximize the consumers’ benefits. In practical terms, this
meant that the bilateral agreements needed to be reviewed, allowing more competition and
fewer restrictions.
In the same year, first agreement was signed with the Netherlands, which set the tone for
subsequent actions. Both countries had a liberal vision whereby the role of the Government
was brought to a minimum and was related to prices, capacity and frequency. Later in that
9 Reference Nr. [40] IATA HISTORY – the early days (www.iata.org) 10 Reference Nr. [14] Doganis, R. (2002) “Flying off Course”.
Comparison between Legacy and Low Cost Airlines on the Norwegian Aviation Market
Page 16
year, an agreement was also signed with Norway. These agreements gave the American
Airlines a higher edge, compared with the airlines of the other country. US carriers had the
right to fly unlimitedly to any point in the United States or to the country of issue, but in the
reverse direction the right was limited to a given number of destinations.
Despite this imbalance, many authorities nevertheless agreed to sign the agreements. Their
national airlines got access to some high traffic routes with routes, which could generate
additional revenues. Other countries were also forced to reach an agreement with the United
States, since they otherwise would have missed some proceeds, because passengers derived
from countries, who had signed such agreements.
In 1977, Great Britain and the United States signed a new agreement – i.e. Bermuda II
agreement, which was not in line with the trend in Europe. Instead of further deregulation, the
rights of US and charter airlines were limited.
According to Doganis the American Airlines got a large room for manoeuvre within the
framework of the fifth freedom rights because other countries also signed an agreement with
the United States. For them it was possible to fly to any country with which they had an
agreement, and also to fly between the countries concerned. Conversely, this was not possible,
since flights within the US territory belonged to cabotage11, which was virtually excluded
from all agreements.
In 1984, the Netherlands and the United Kingdom arrived at a more liberal version of the
previous agreement. At that time it became possible to fly unlimitedly any along route
between the two countries with no rate settings, which represented an open market.
Nevertheless there was no restriction for the number of airlines; the national legislation
established which airlines to be admitted. This new agreement set the tone for the revision of
other existing agreements on the European market.
Other European countries followed herein and thus gradual deregulation started taking place.
This coincided with the issuance of two liberalisation packages by the European Community.
The open market arrangements though failed, because of several obstacles in front of the full
11 Cabotage rights: the right for a foreign airline to offer routes entirely within the domestic borders of another country)
Comparison between Legacy and Low Cost Airlines on the Norwegian Aviation Market
Page 17
liberalization of the air transport market. Thus, the nationality clause remained an important
element of the agreements, as well as the number of airports, to which flights could be made,
remained limited. The exercise of the rights of the fifth and the seventh freedom was not, or
was rarely permitted and the cabotage remained uncovered by the agreements.
The 80's brought with it a liberalisation of the national markets, which in practical terms
meant that airlines were allowed to run only domestic flights also were allowed to run
international flights. In this period there were also new airlines as at that time they got the
chance to build international network. An example of this was the emergence of Ryanair in
Ireland. With the new open market agreements in the United States the establishment of many
airlines was possible and the competition for national and international routes increased.
In the early 1990s it became clear that the air transport market deregulation was not bold
enough. Some developments made it clear, that there was a need for further liberalisation. The
aviation experts and the Government shared the opinion that air transport had to be treated as
other industries. Aviation had also further developed in the meantime - there were airlines,
which were partly privatized, and there were mergers for achieving economies of scale.
As in the earlier years, the United States of America were also the catalyst of the process. The
US airlines took their advantage from the fact that they had a large home market. This large
home market made it possible to generate economies of scale and contained a large number of
potential passengers. In Europe as well there was demand for a more liberal aviation market.
KLM - Dutch national airline was keen to get rid of the market restrictive legislation, which
the agreement of 1987 had laid them. In 1992, the Dutch Government signed the first open
skies agreement with the United States of America. A small country like the Netherlands had
much to gain from a further deregulation, especially being the first European country to do so.
This open skies agreement went further than the previous ones, whereby multiple airlines
including charter airlines were entitled to fly to any point in the other country. The frequency,
capacity and rates were no longer limited, only in case of extreme deviations from the rate
ranges, an intervention was still possible. Arrangements, such as code sharing and break or
gauge were admitted.
The bringing of US aviation market to the next level was discussed by the Clinton
administration in 1995. They made an analysis of the situation and came to the conclusion
that there had to be an open air space created, to which the countries concerned would have
unlimited access. The analysis also showed that the increasing demand for passenger transport
Comparison between Legacy and Low Cost Airlines on the Norwegian Aviation Market
Page 18
through the years has been changed to more and more long-haul flights. As a response to this,
it was necessary the airlines to develop a larger network, but this turned out to be only
possible through agreements concerning code sharing and connected flights between multiple
airlines.
This could only be achieved if more open skies agreements were signed. In 1995, there were
agreements, signed with nine smaller European countries. In 1996, this list was joined by
Germany. At the turn of the century, USA had 35 new agreements, but two important
countries were still missing in this list, namely Japan and the United Kingdom. In 2008, the
United States already had open skies agreements with 16 of the 27 European Member States.
2.3 Development of the Norwegian Aviation Market
In 1986, the Norwegian Parliament passed a bill, specifying principles for awarding traffic
rights to domestic air carriers. The document legalized the government's licensing practice,
especially the liberalization of some market entries introduced by the Norwegian civil
aviation authorities between 1975 and 1985. Interestingly, however, the policy did not pertain
to the entire Norwegian air transport industry, but only to the regional airlines.
The Norwegian air transport industry is an oligopolistic system, dominated by three large
carriers, SAS, Braathens SAFE, and Widerøe Flyveselskap, which divide the entire market
into three operational segments: domestic nonsubsidized routes, domestic subsidized air
services, and international non-subsidized routes. Within each segment the incumbent carrier
in practice enjoys a monopolistic position12.
Historical Background:
The most privileged as regards the magnitude of monopolistic favours is SAS.
Scandinavian Airlines System (SAS) was founded in 1951 by a trilateral agreement
between the governments of Denmark, Sweden, and Norway. The agreement
guarantees SAS exclusive traffic rights on international flights and on a number of
domestic routes in three Scandinavian countries.
12 Reference Nr. [24] Ludvigsen J. (1993) “Liberalization of Market Entry for Norwegian Regional Airlines”, Transportation Journal.
Comparison between Legacy and Low Cost Airlines on the Norwegian Aviation Market
Page 19
In Norway, its monopoly is maintained through state regulatory control of entry, route
structure, capacity, and fares. The Norwegian government is thus bound by the
international agreement to protect SAS's rights as sole carrier on the entire network of
internationally scheduled flights, and on a number of feeder flights connecting
important domestic service points with international traffic flows.
There are historical reasons for accommodating two airlines in the domestic air travel
market. Braathens SAFE is a private company founded in 1946 to fly Norwegian ship
crews overseas. The company was deprived of its rights to operate on international
routes in 1951, when SAS was established and awarded a monopoly of all
international traffic.
Despite the strict regulatory division between SAS's and Braathens SAFE's fields of
operation, there is some competition between them. This stems partly from rivalry
concerning service quality, but is also a consequence of the spatial vicinity between
trunk airports and the partial overlap of their traffic hinterlands.
The third actor in the domestic Norwegian air travel market is Widerøe airline, a short-
field operations airline, which provides air transport to the communities in the sparsely
populated northern and north-western coastal regions and feed-in services for SAS and
Braathens SAFE. The company enjoys an effective monopoly within its operational
area and is eligible for state subsidies.
Finally, there is a group of interregional non-subsidized airlines which operate
secondary routes in eastern Norway and serve low-density markets –i.e. communities,
where passenger numbers are too low to support a profitable trunk airline service.
In the mid '70s a number of communities in densely populated eastern regions of the
country realized that their demand for air travel was not satisfied by the existing trunk
route system. These communities experienced a sudden increase in demand for
transportation services due to the rapid development of oil industry on the west coast
and a rapidly growing demand for the workforce from their areas. The growth of the
oil industry stimulated the interregional mobility of the workforce and put pressure on
improvement of communications between eastern and western Norway.
Some signs of relaxation of market entry to the short-haul regional air service market
have been traced since 1975. The first operator of a scheduled air taxi line was the
small airline A/S Norving, which started a route service between Skien and Oslo
flying ten-seats Beech King Craft.
Comparison between Legacy and Low Cost Airlines on the Norwegian Aviation Market
Page 20
Liberalization gained momentum in 1980-1985, when five new local carriers were
granted operational permits for short- and medium-range regional flights.
In 1984, the civil aviation regulator - Ministry of Transport and Communications,
went so far in accommodating the needs of Sandefjord that it curtailed Braathens
SAFE's area monopoly by issuing Norsk Air with a permit for the Sandefjord-
Stavanger route.
An additional explanation for Norsk Air's poor financial performance on the route
Sandefjord-Stavanger was intense competition from Braathens SAFE. The route in
question lay within the principal carrier's market segment. The licensing of Norsk Air
was a clear infringement of Braathens' geographical monopoly, as embodied in the
system of market division between the two trunk carriers. However, this does not
weaken the main argument that the negative differential between capacity and demand
volume caused financial problems for both Norsk Air and Braathens SAFE. The data
on Braathens SAFE's financial performance on this very route support this argument.
The relaxation of market entry prompted a surge in the number of operational
applications from small local carriers. These were interested in providing air route
connections between relatively densely populated communities in southeast Norway
and the country's main urban and industrial centres, Oslo, Bergen, and Stavanger.
Between 1980 and 1989 over twenty new traffic certificates were granted to small-
scale carriers.
National and international commitments, particularly as regards SAS13, effectively limited the
government's freedom of action with regard to the scope of liberalization. Certification of a
new type of carrier, short- and medium-range regional airlines, meant encroachment upon the
market areas of the two incumbent trunk operators. The licensing authorities were afraid that a
new market division would change the balance of power between the two major carriers. The
fear was that such a dislocation would cause traffic diversion from the trunk airline markets,
thus eroding the financial bases for cross-subsidization between their loss-making and
profitable routes. This situation prevailed until 1985, when a committee was appointed by the
13 Reference Nr. [24] Ludvigsen J. (1993) “Liberalization of Market Entry for Norwegian Regional Airlines”, Transportation Journal.
Comparison between Legacy and Low Cost Airlines on the Norwegian Aviation Market
Page 21
Ministry of Transport and Communications. The committee submitted a report which drafted
policy principles. These were incorporated into a governmental bill in 1986, which later
became the Principles for Awarding Traffic Rights Act, enacted in 1987. The primary purpose
of this bill was not to design a new liberalization policy but retrospectively to legitimate the
relaxation of market entry into one segment of the domestic air travel market - the regional
airlines. The lack of coherence in the government's liberalization activities and the apparent
absence of a rational decision made the process deserving in-depth explanation. In pursuit of
another explanatory instrument, one can turn to C.E. Lindblom’s model included in "The
Science of Muddling Through."14.
Lindblom differentiates two methods of policy formulation: the rational comprehensive
method, which draws on the assumption of the rationality paradigm, and a successive limited
approximation. The latter is less normative with regard to goal-means consistency, but
simultaneously less biased with regard to belief in the functional coherence of governmental
policy making. Lindblom asserts that this requirement is simply not workable due to a general
lack of consensus on social values and types of action taken for their attainment. This lack of
congruity makes social values only marginally comparable and acceptable. Administrators are
often confronted with a choice among a number of conflicting values, when designing the
policies for their attainment.
Applying the method of successive limited comparisons, it could be said that when the
government started the process of liberalization in the mid '70s, its general goal was to make
air travel more accessible to a broad Norwegian public.
However, due to a continuously growing demand for intra- and interregional air travel and
pressure from the new carriers and municipalities for more service points, the government
responded by allowing the old air taxi operators to establish a regular route service and
licensed a number of new destinations. This change could not be far-reaching since the
government still lacked an explicit mandate to reform the airline industry by dividing it into
smaller service segments. On the contrary, it was committed by the existing international and
14 Reference Nr. [11] Lindblom. C.E, (1959) “The Science of "Muddling Through”
Comparison between Legacy and Low Cost Airlines on the Norwegian Aviation Market
Page 22
domestic agreements to preserve a market monopoly for SAS and market shares for other
incumbent carriers.
The impressive growth rate of the passenger traffic and the legislative vacuum with regard to
licensing policy prompted the government to make another incremental change, an attempt to
formalize this new service provision by launching a policy bill. Its purpose was to justify the
licensing practice followed hitherto and the emergence of a new type of air service. The
justification for licensing the regional airline operators was found in the shortcomings and
inadequacies of the previous state of affairs, and specifically in the fact that the large
established carriers neglected the travel needs of small communities.
The governmental bill outlined principles for awarding traffic rights to domestic carriers. First
it reinstated the traditional market division among the three major airlines. Second, it
sanctioned the past licensing practice with regard to the regional carriers but introduced no
formal criteria for certification of new entrants to this segment of the air travel market. The
obvious reason for this was that the state regulator wished to maintain the strategic freedom to
decide on the number of future entries to the airline market. This freedom was sustained by
the right to adjust its own licensing practice upon an ad hoc assessment of the possible impact
of new entries on the airline market structure, that is, changes in the principal carriers' market
shares and their competitive positions15.
15 Reference Nr. [24] Ludvigsen J. (1993) “Liberalization of Market Entry for Norwegian Regional Airlines”.
Comparison between Legacy and Low Cost Airlines on the Norwegian Aviation Market
Page 23
2.4. Creation of the European Single Market
A feature of the European Union is that liberalisation brought together a large number of
national markets, which were connected by a network of bilateral agreements. The conditions
under which air traffic took place between two Member States were settled by these bilateral
agreements. This imposed limitations, since any change needed the approval of both Member
States.
These restrictions resulted in the situation that each country had its own airline. The only
exception to this was SAS - Denmark, Norway and Sweden's joint airline. Great Britain was
the only country where more than one Legacy airline was present, namely British Airways,
Virgin Atlantic and BMI. The European aviation market was a fragmented market, which
consisted of 28 national Legacy Airlines16.
The bilateral agreements granted the right to transport commercial passengers and cargoes
between two countries, thus determining the capacity and the price and limiting the accession
to the predetermined routes. It was up to the governments to decide frequency, aircraft type
and ticket price.
When at the end of the year showed that a given airline had flown more often than the own
“national flag carrier” were the extra revenue generated by the other company donated to the
national airline, this in the name of “honest” competition. Many of these national airlines
were, to a large extent, in the possession of the Government and received subsidies. All this
was right in front of a free and efficient aviation market.
The six initial countries (Belgium, France, Italy, Luxemburg, W. Germany and the
Netherlands) of the European Union signed the Treaty of Rome on 25 March 1957, stating
that there must be worked to the free movement of goods, services and capital. The sea and air
transport however, were exempted from this Treaty. But after lobbying on the part of carriers
and consumers, seeing the example of the US liberalisation and experiencing pressure from
the European Commission, the political environment was changed in such a way that it was
possible to apply the Treaty of Rome on aviation. After this ruling, the European Commission
16 Reference Nr. [3] Annual Analyses of the EU Air Transport Market report – EU Commission (2008).
Comparison between Legacy and Low Cost Airlines on the Norwegian Aviation Market
Page 24
undertook the next step, regulating that all airlines should contact them to report violations of
the competition principles. If these could be unheeded, the Commission could take further
steps to counter fight them.
In 1986, it was decided to liberalise the highly regulated market. Article 14 of the Treaty
establishing the European Community states that there should be a single market created by
1993. This obligation referred to a gradual transition. This was very different from the
liberalisation in the United States, where the Airline Deregulation Act deregulated the entire
sector in 1987 at a stroke.
In 1993, an internal market was created for the airline industry in Europe. But the markets on
the Member State were fully deregulated in 1997, when it became possible for Community
companies to fly along domestic flights in another Member State, also known as cabotage.
2.5. EU-US Open Skies Agreement
The international market was very important, as this market contained a lot of growth
potential, higher margins relative to the internal market and many passengers. The
liberalisation of the transatlantic (US-EU) market positively impacted the airlines.
The transatlantic traffic was governed by individual bilateral agreements between the United
States and the respective Member State. This network of bilateral agreements did not lead to
an efficient network, neither on the European nor on the transatlantic market.
The rights for acquired by the deregulation were not fully used by the airlines, particularly by
the airline alliance. This was due to the fact that airlines could through an alliance with
airlines from other member states lose some of their rights included in the bilateral
agreements. European airlines tried to get around this limitation by different types of
agreements such as code-sharing. Thanks to these agreements they could preserve their
international rights, but still enjoy the benefits of the alliances17.
17 Reference Nr. [2] Annual Analyses of the EU Air Transport Market report – EU Commission (2011).
Comparison between Legacy and Low Cost Airlines on the Norwegian Aviation Market
Page 25
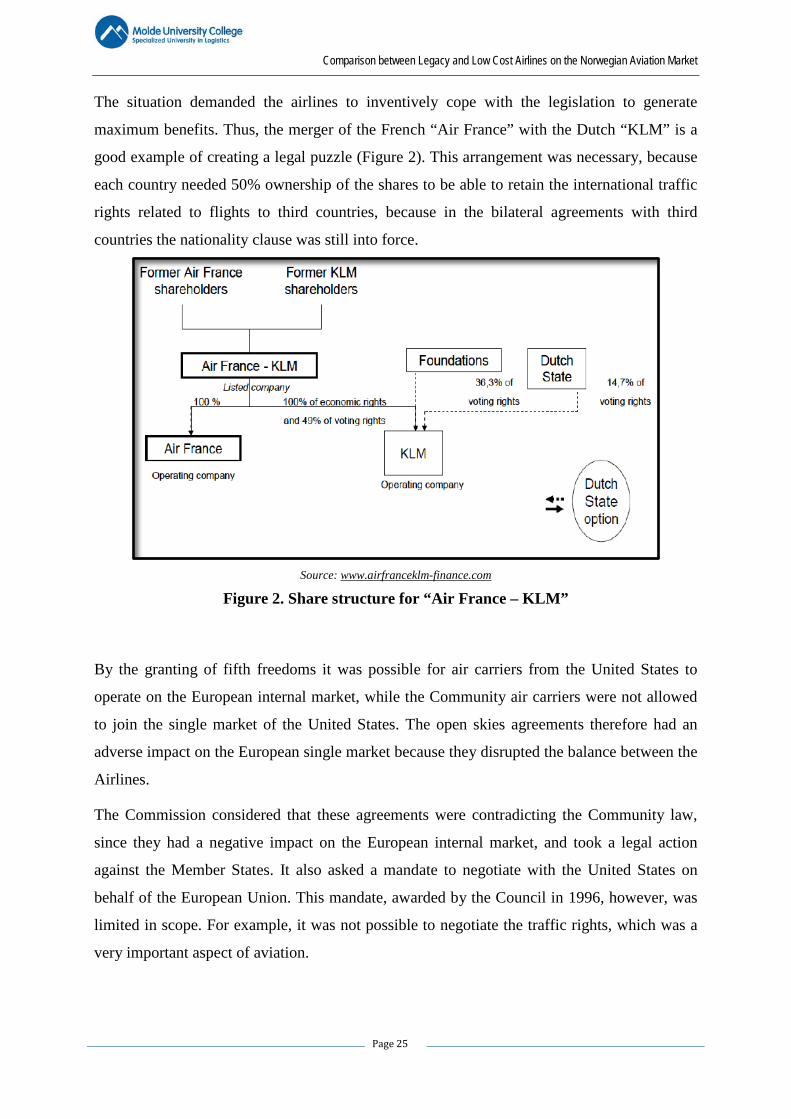
The situation demanded the airlines to inventively cope with the legislation to generate
maximum benefits. Thus, the merger of the French “Air France” with the Dutch “KLM” is a
good example of creating a legal puzzle (Figure 2). This arrangement was necessary, because
each country needed 50% ownership of the shares to be able to retain the international traffic
rights related to flights to third countries, because in the bilateral agreements with third
countries the nationality clause was still into force.
Source: www.airfranceklm-finance.com
Figure 2. Share structure for “Air France – KLM”
By the granting of fifth freedoms it was possible for air carriers from the United States to
operate on the European internal market, while the Community air carriers were not allowed
to join the single market of the United States. The open skies agreements therefore had an
adverse impact on the European single market because they disrupted the balance between the
Airlines.
The Commission considered that these agreements were contradicting the Community law,
since they had a negative impact on the European internal market, and took a legal action
against the Member States. It also asked a mandate to negotiate with the United States on
behalf of the European Union. This mandate, awarded by the Council in 1996, however, was
limited in scope. For example, it was not possible to negotiate the traffic rights, which was a
very important aspect of aviation.
Comparison between Legacy and Low Cost Airlines on the Norwegian Aviation Market
Page 26
The Court concluded that the nationality clause, included in the open skies agreements, was
inconsistent with Community law. Notwithstanding this decision, the open skies agreements
were not declared invalid, as the Commission did not have exclusive powers regarding the
external aviation policy. The Commission requested the Member States to terminate the open
skies agreements with the United States, but this did not happen.
The importance of clear and uniform agreements with third parties was emphasised by the
Commission in 2003 during a mandate, whose scope was considerably extended. This
mandate made it possible to negotiate the aviation services with the United States.
This mandate included apart from the “soft rights” also “hard rights”, so that arrangements for
prices, routes, traffic rights, market entry, capacity, etc. became possible. A full liberalisation
of the transatlantic traffic would mean that there was a market created where no restrictions
regarding access rights existed. However, this turned out to be an idealistic picture.
2.4.1. The First Phase
In 2007, however, there was an EU-US Open Skies agreement, which replaced the previous
agreements between the Member States and the United States. This agreement came into
force on 30 March 2008 and allowed the flying between any location of the United States and
of the European Union.
This agreement made it possible for US carriers to offer flights within the European market.
For the European airlines, however, it is not possible to offer flights on the domestic US
market, which was considered to be unfair.
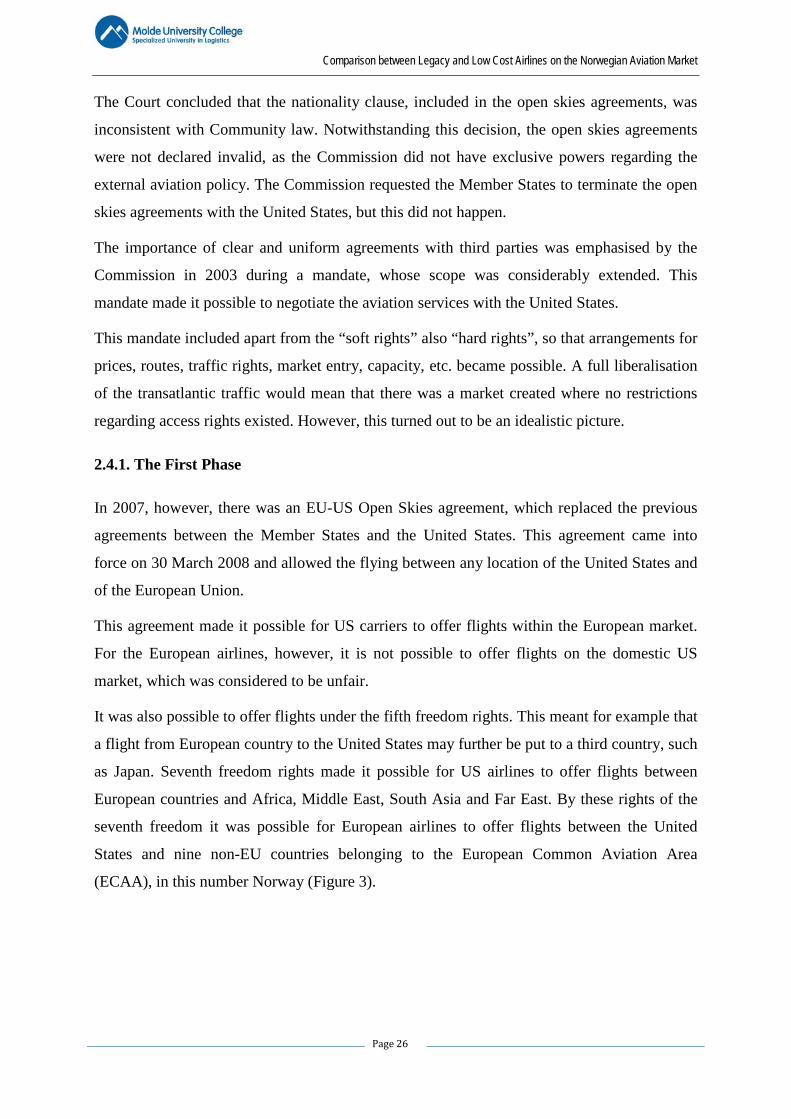
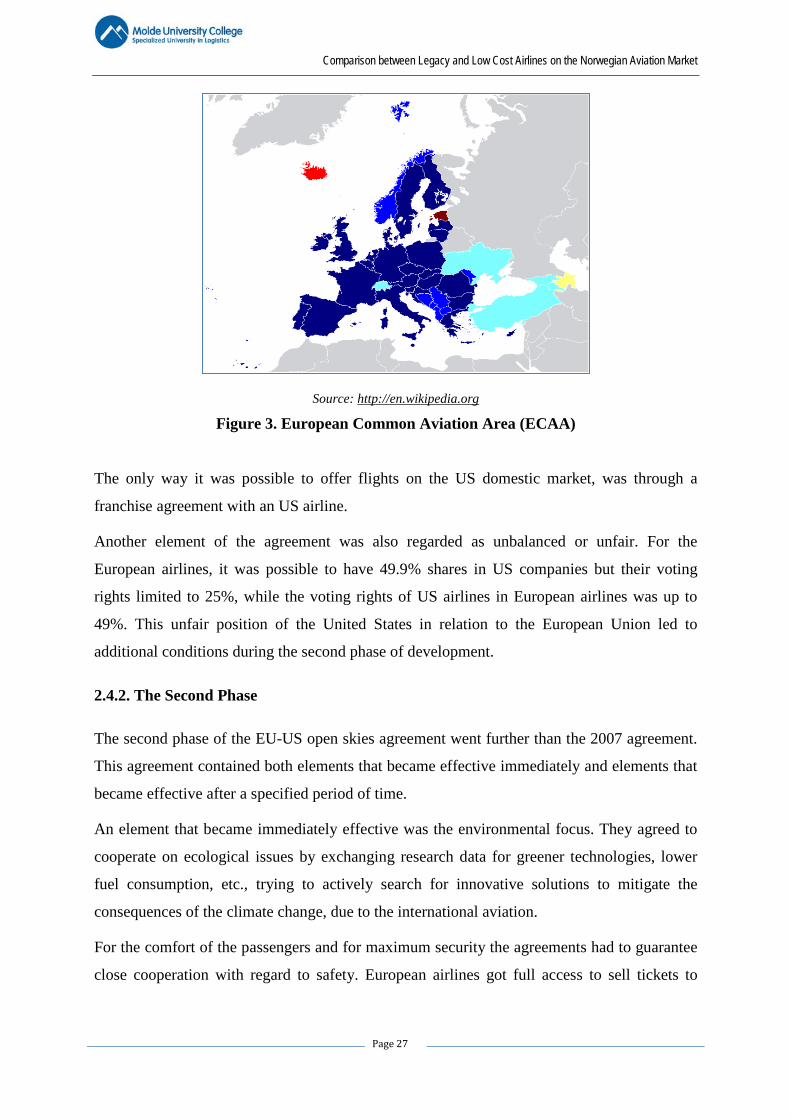
It was also possible to offer flights under the fifth freedom rights. This meant for example that
a flight from European country to the United States may further be put to a third country, such
as Japan. Seventh freedom rights made it possible for US airlines to offer flights between
European countries and Africa, Middle East, South Asia and Far East. By these rights of the
seventh freedom it was possible for European airlines to offer flights between the United
States and nine non-EU countries belonging to the European Common Aviation Area
(ECAA), in this number Norway (Figure 3).
Comparison between Legacy and Low Cost Airlines on the Norwegian Aviation Market
Page 27
Source: http://en.wikipedia.org
Figure 3. European Common Aviation Area (ECAA)
The only way it was possible to offer flights on the US domestic market, was through a
franchise agreement with an US airline.
Another element of the agreement was also regarded as unbalanced or unfair. For the
European airlines, it was possible to have 49.9% shares in US companies but their voting
rights limited to 25%, while the voting rights of US airlines in European airlines was up to
49%. This unfair position of the United States in relation to the European Union led to
additional conditions during the second phase of development.
2.4.2. The Second Phase
The second phase of the EU-US open skies agreement went further than the 2007 agreement.
This agreement contained both elements that became effective immediately and elements that
became effective after a specified period of time.
An element that became immediately effective was the environmental focus. They agreed to
cooperate on ecological issues by exchanging research data for greener technologies, lower
fuel consumption, etc., trying to actively search for innovative solutions to mitigate the
consequences of the climate change, due to the international aviation.
For the comfort of the passengers and for maximum security the agreements had to guarantee
close cooperation with regard to safety. European airlines got full access to sell tickets to
Comparison between Legacy and Low Cost Airlines on the Norwegian Aviation Market
Page 28
American contractors, but only a partial access to accomplish sales to officials. It was also
agreed to implement this agreement in a way that did not affect the rights of the staff.
It is worth noting that these were but small elements compared with what the EU wanted to
achieve, namely access to the internal aviation market of the United States. In addition to that
these elements took effect with a delay since they were dependent on the adoption of the
relevant legislative changes.
2.6. The Effects from the Creation of the European Single Market
With the new airlines on the routes, the rates went down drastically, rapidly increasing the
number of the passengers along these routes. Because the airlines could determine which
capacity and frequency their flights should have and what rates they should be charging, it
became possible for them to operate more efficiently and thus to compete in a better manner.
This made it possible to offer better service at lower price rates. The quality improvement of
the service translated itself to a higher flight frequency and, for example, the use of a frequent
flyer program, which increased the number of passengers.
2.6.1. Network Development
The number of passengers was increased because of the optimized network, resulting from the
liberalisation of the aviation market. Legacy Airlines further developed their “hub-and-spoke”
network and the approach to these new, smaller markets did not only increase the number of
passengers, but also the number of destinations.
The ability to develop the network and to optimize the pricing strategy enabled the airlines to
operate more efficiently and to achieve higher load factors, reducing their costs.
2.6.2. Market Consolidation
After the liberalisation the aviation market consolidated. The weaker competitors signed
cooperation agreements or merged to cut costs and expand the network. The competition was
also increased as a result of the implementation of new and more efficient approaches, such as
the use of online tickets, self-service check-in desks, etc.
The consolidation process, however, was dependent on the permit awarding authorities. So
the mergers between Air France & KLM and between Lufthansa & Swiss were allowed, but
the merger between Aer Lingus & Ryanair was not. This was because both companies were
Comparison between Legacy and Low Cost Airlines on the Norwegian Aviation Market
Page 29
operating on the same routes and a potential merger could eliminate competition and produce
monopoly.
The consolidation process did not automatically mean a reduction of the competition. Often, it
could be said that airlines became stronger through consolidation and more effectively
competition to the benefit of the consumers.
2.6.3. Rise of the Low Cost Airlines
The liberalisation of the skies also brought a large number of new airlines to the market along
with it. These air carriers were characterized by their bright business model, focused on cost
minimization. Their low rates increased competition, new market entire, number of routes and
the passengers’ numbers. An important part of their business model is for example the use of
secondary airports, which bears relevance to the increase of the national and regional income.
In response to the increasing competition caused by the rise of Low Cost Airlines, some
Legacy Airlines established their own low cost subsidiaries. Thus, in 1998 British Airways
founded the low cost subsidiary GO to operate on the European market18.
2.6.4. Global Economy and Aviation
The global economy and aviation have a reciprocal impact on each other. For example, when
the global economy is doing well, airlines (LCA & LA) can increase their revenues. During
good economic period many people would like to use air transport both for business and
leisure purposes. The airline industry is also known for its positive external effects on other
industries such as tourism, hotels, but also just on the global economy19.
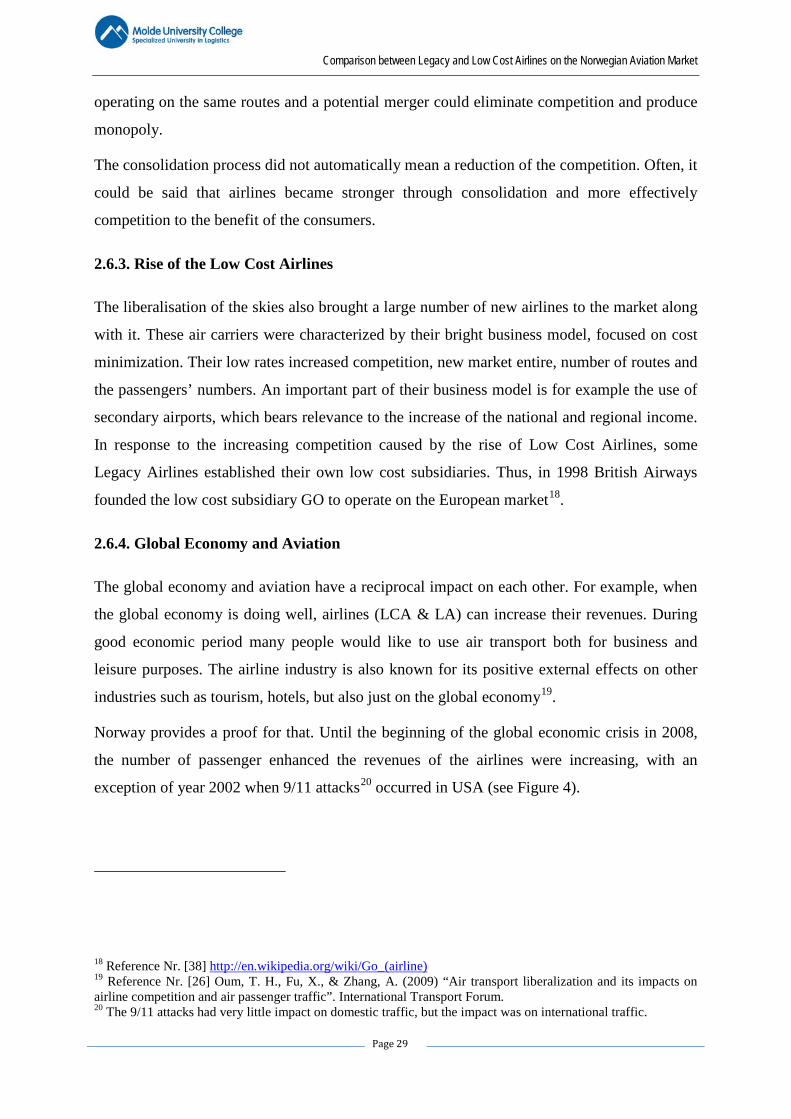
Norway provides a proof for that. Until the beginning of the global economic crisis in 2008,
the number of passenger enhanced the revenues of the airlines were increasing, with an
exception of year 2002 when 9/11 attacks20 occurred in USA (see Figure 4).
18 Reference Nr. [38] http://en.wikipedia.org/wiki/Go_(airline) 19 Reference Nr. [26] Oum, T. H., Fu, X., & Zhang, A. (2009) “Air transport liberalization and its impacts on airline competition and air passenger traffic”. International Transport Forum. 20 The 9/11 attacks had very little impact on domestic traffic, but the impact was on international traffic.
Comparison between Legacy and Low Cost Airlines on the Norwegian Aviation Market
Page 30
Source: Author’s development, based on website data from avinor (www.avinor.no)
Figure 4. Total number of passengers (domestic and international) 1999-2012 (million)
in Norway
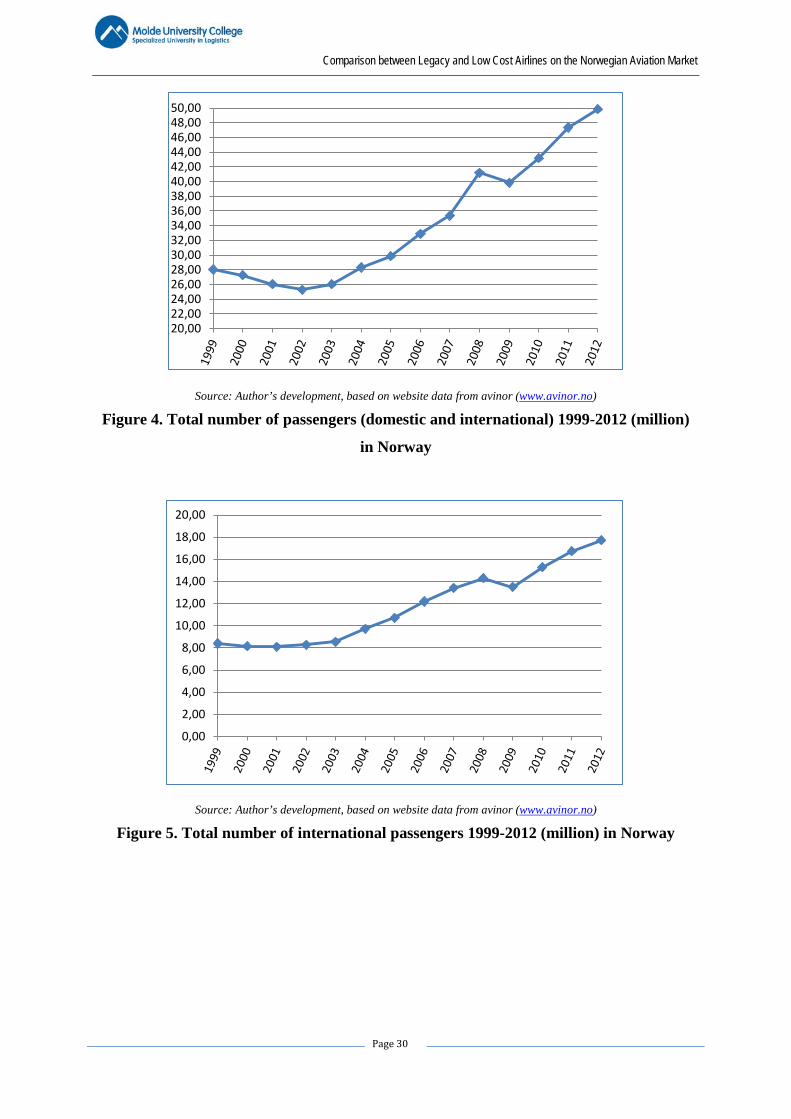
Source: Author’s development, based on website data from avinor (www.avinor.no)
Figure 5. Total number of international passengers 1999-2012 (million) in Norway
20,0022,0024,0026,0028,0030,0032,0034,0036,0038,0040,0042,0044,0046,0048,0050,00
0,00
2,00
4,00
6,00
8,00
10,00
12,00
14,00
16,00
18,00
20,00
Comparison between Legacy and Low Cost Airlines on the Norwegian Aviation Market
Page 31
Chapter 3: The Impact of the Macro-Economic Environment on
the Aviation Market
3.1. The aviation market during the period 2000-2005
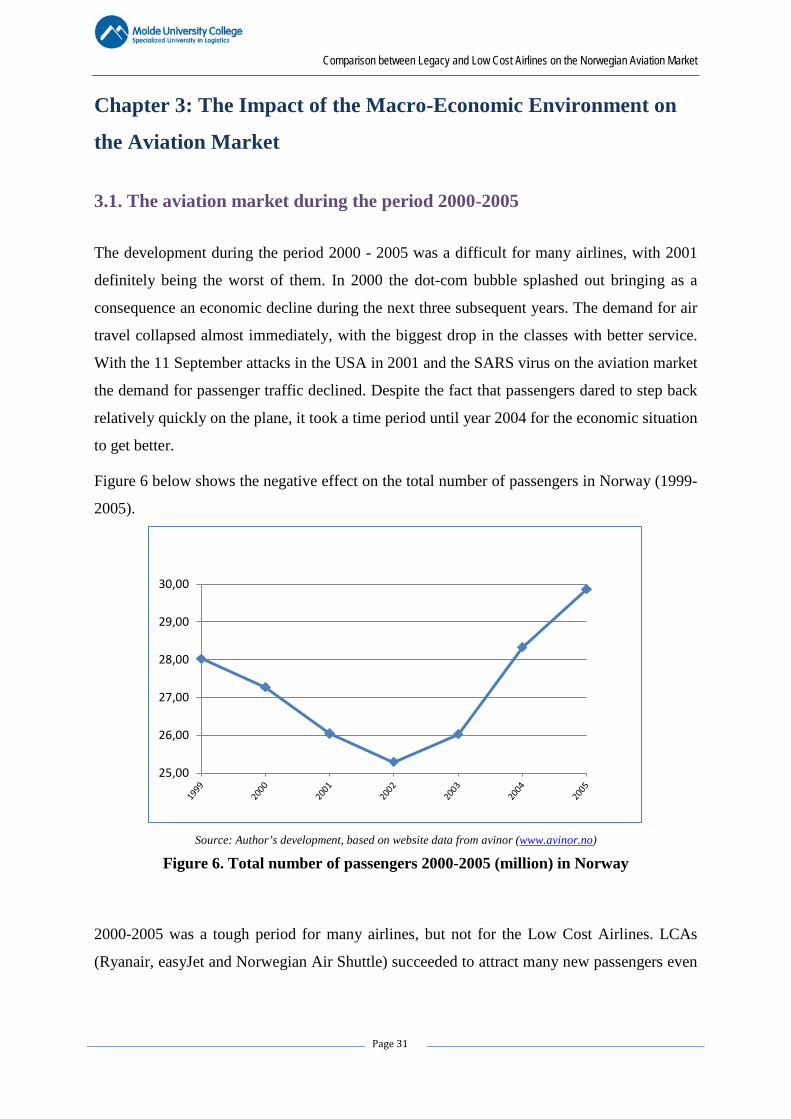
The development during the period 2000 - 2005 was a difficult for many airlines, with 2001
definitely being the worst of them. In 2000 the dot-com bubble splashed out bringing as a
consequence an economic decline during the next three subsequent years. The demand for air
travel collapsed almost immediately, with the biggest drop in the classes with better service.
With the 11 September attacks in the USA in 2001 and the SARS virus on the aviation market
the demand for passenger traffic declined. Despite the fact that passengers dared to step back
relatively quickly on the plane, it took a time period until year 2004 for the economic situation
to get better.
Figure 6 below shows the negative effect on the total number of passengers in Norway (1999-
2005).
Source: Author’s development, based on website data from avinor (www.avinor.no)
Figure 6. Total number of passengers 2000-2005 (million) in Norway
2000-2005 was a tough period for many airlines, but not for the Low Cost Airlines. LCAs
(Ryanair, easyJet and Norwegian Air Shuttle) succeeded to attract many new passengers even
25,00
26,00
27,00
28,00
29,00
30,00
Comparison between Legacy and Low Cost Airlines on the Norwegian Aviation Market
Page 32
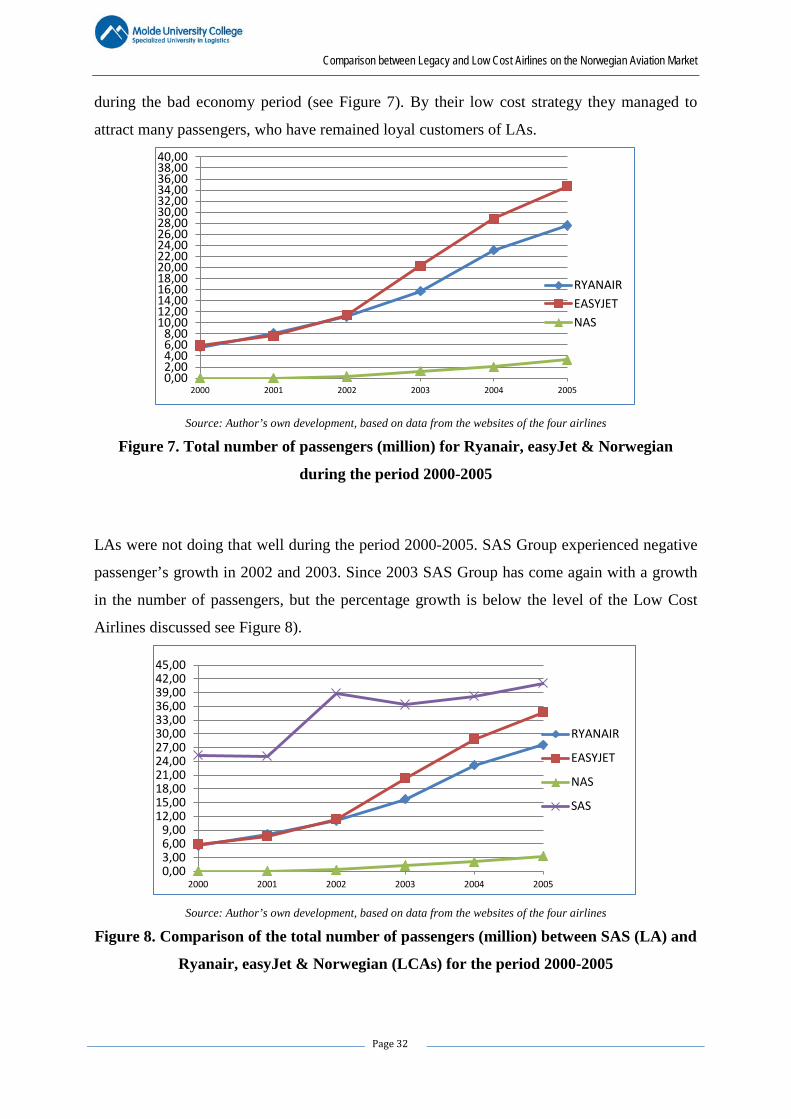
during the bad economy period (see Figure 7). By their low cost strategy they managed to
attract many passengers, who have remained loyal customers of LAs.
Source: Author’s own development, based on data from the websites of the four airlines
Figure 7. Total number of passengers (million) for Ryanair, easyJet & Norwegian
during the period 2000-2005
LAs were not doing that well during the period 2000-2005. SAS Group experienced negative
passenger’s growth in 2002 and 2003. Since 2003 SAS Group has come again with a growth
in the number of passengers, but the percentage growth is below the level of the Low Cost
Airlines discussed see Figure 8).
Source: Author’s own development, based on data from the websites of the four airlines
Figure 8. Comparison of the total number of passengers (million) between SAS (LA) and
Ryanair, easyJet & Norwegian (LCAs) for the period 2000-2005
0,002,004,006,008,00
10,0012,0014,0016,0018,0020,0022,0024,0026,0028,0030,0032,0034,0036,0038,0040,00
2000 2001 2002 2003 2004 2005
RYANAIREASYJETNAS
0,003,006,009,00
12,0015,0018,0021,0024,0027,0030,0033,0036,0039,0042,0045,00
2000 2001 2002 2003 2004 2005
RYANAIR
EASYJET
NAS
SAS
Comparison between Legacy and Low Cost Airlines on the Norwegian Aviation Market
Page 33
3.2. The aviation market during the period 2006-2012
The impact of the recession in 2008, except for the recession after World War II, was much
larger than of other recessions on the airlines. The number of passengers on the international
aviation market sank enormously. As with the previous crisis it was impossible for
unprofitable companies to stay operational. This crisis accelerated the consolidation of the
market. There were many accomplished mergers and acquisitions during this period.
In the first half of 2008 the fuel prices increased drastically, whereby the realized profit that
the airlines could manage was getting smaller. Fortunately, the fuel prices declined just before
the crisis erupted in 2008, which still left the airlines some margin21.
The advantage to the Legacy Airlines during this crisis, compared to the previous crisis in
2000-2001 was that a redefinition of the business model was not the main issue. At the first
signs of a relapse, Legacy companies reduced their capacity by grounding some airplanes. In
the short run, this resulted in a more stable environment. In the long run, this meant that extra
costs should be incurred to bring these grounded airplanes in operation again. For low cost
airlines this period (2006-2012), was just like the previous one (2000-2005), involving a
growing number of passengers.
The decrease in demand was not as extreme as expected, since many passengers did not
change their air transport choices. The large decline was observed primarily in the business
class segment. The customer loyalty was very important for the Legacy Airlines, but the
economic considerations made it necessary for them to look at and revise their long term
growth strategy.
21 Referance Nr. [16] Franke, M., & John, F. (2011) “What comes next after recession?” Journal of Air Transport Management.
Comparison between Legacy and Low Cost Airlines on the Norwegian Aviation Market
Page 34
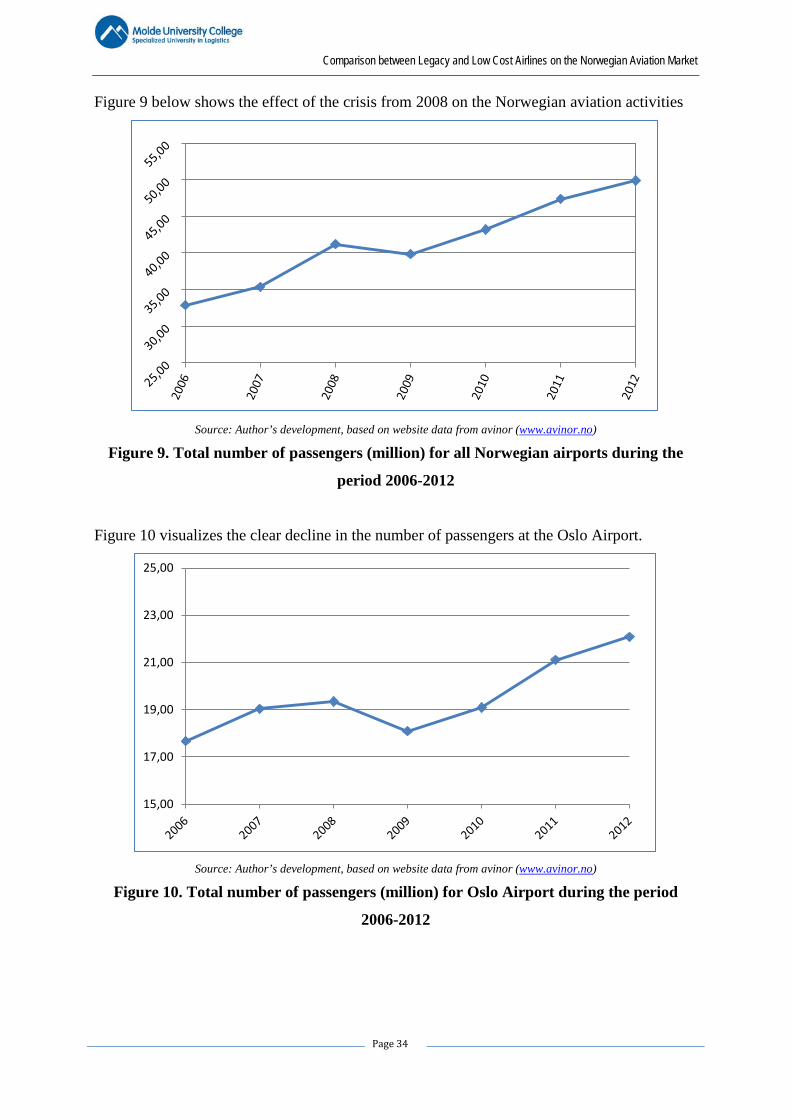
Figure 9 below shows the effect of the crisis from 2008 on the Norwegian aviation activities
Source: Author’s development, based on website data from avinor (www.avinor.no)
Figure 9. Total number of passengers (million) for all Norwegian airports during the
period 2006-2012
Figure 10 visualizes the clear decline in the number of passengers at the Oslo Airport.
Source: Author’s development, based on website data from avinor (www.avinor.no)
Figure 10. Total number of passengers (million) for Oslo Airport during the period
2006-2012
15,00
17,00
19,00
21,00
23,00
25,00
Comparison between Legacy and Low Cost Airlines on the Norwegian Aviation Market
Page 35
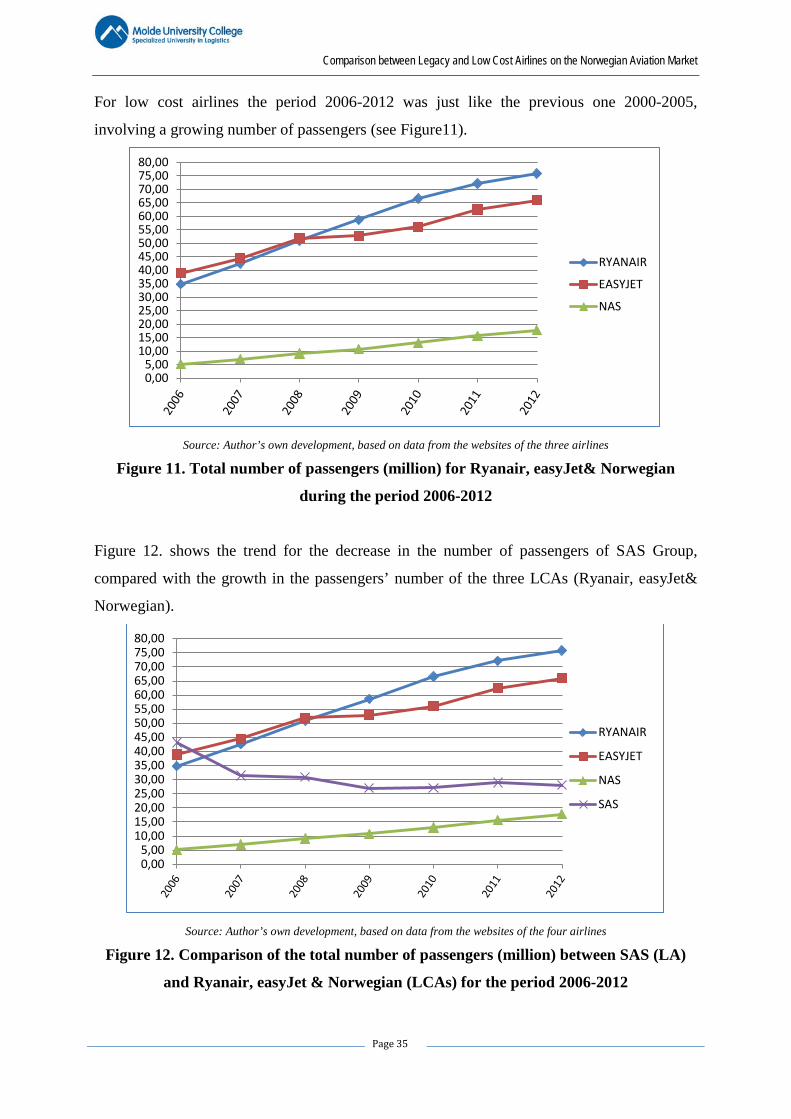
For low cost airlines the period 2006-2012 was just like the previous one 2000-2005,
involving a growing number of passengers (see Figure11).
Source: Author’s own development, based on data from the websites of the three airlines
Figure 11. Total number of passengers (million) for Ryanair, easyJet& Norwegian
during the period 2006-2012
Figure 12. shows the trend for the decrease in the number of passengers of SAS Group,
compared with the growth in the passengers’ number of the three LCAs (Ryanair, easyJet&
Norwegian).
Source: Author’s own development, based on data from the websites of the four airlines
Figure 12. Comparison of the total number of passengers (million) between SAS (LA)
and Ryanair, easyJet & Norwegian (LCAs) for the period 2006-2012
0,005,00
10,0015,0020,0025,0030,0035,0040,0045,0050,0055,0060,0065,0070,0075,0080,00
RYANAIR
EASYJET
NAS
0,005,00
10,0015,0020,0025,0030,0035,0040,0045,0050,0055,0060,0065,0070,0075,0080,00
RYANAIR
EASYJET
NAS
SAS
Comparison between Legacy and Low Cost Airlines on the Norwegian Aviation Market
Page 36
Chapter 4: Business models of Legacy Airlines and Low Cost
Airlines
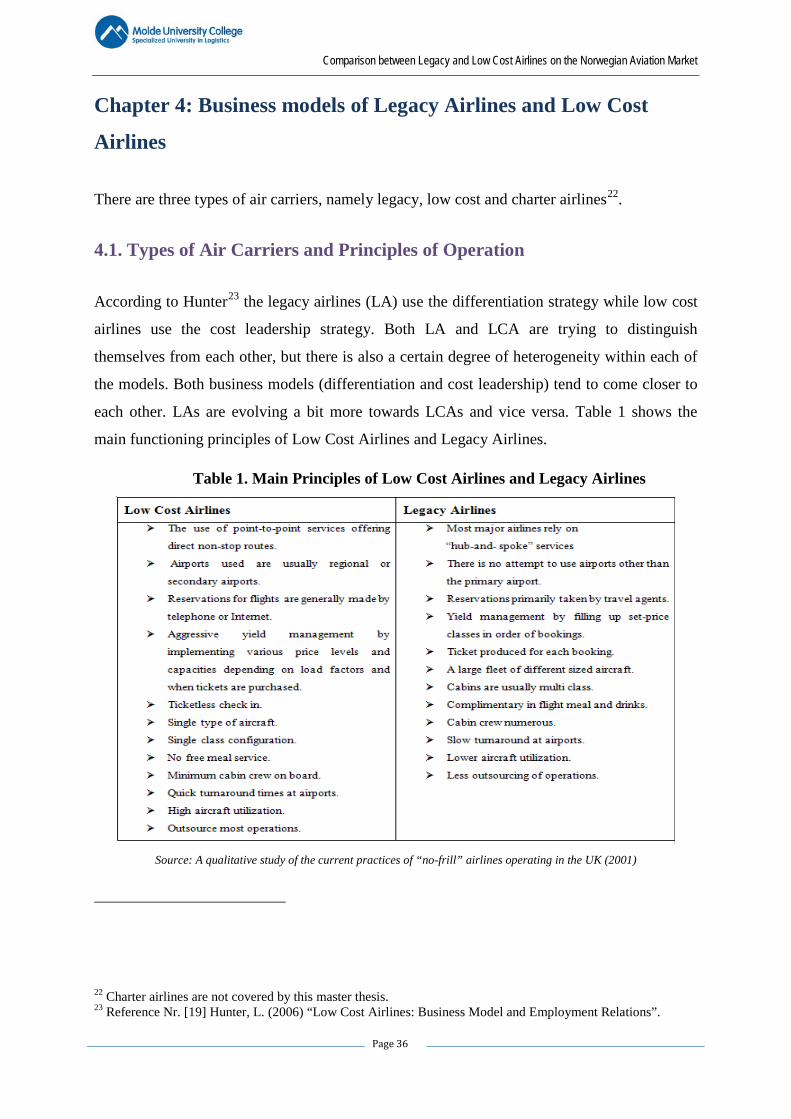
There are three types of air carriers, namely legacy, low cost and charter airlines22.
4.1. Types of Air Carriers and Principles of Operation
According to Hunter23 the legacy airlines (LA) use the differentiation strategy while low cost
airlines use the cost leadership strategy. Both LA and LCA are trying to distinguish
themselves from each other, but there is also a certain degree of heterogeneity within each of
the models. Both business models (differentiation and cost leadership) tend to come closer to
each other. LAs are evolving a bit more towards LCAs and vice versa. Table 1 shows the
main functioning principles of Low Cost Airlines and Legacy Airlines.
Table 1. Main Principles of Low Cost Airlines and Legacy Airlines
Source: A qualitative study of the current practices of “no-frill” airlines operating in the UK (2001)
22 Charter airlines are not covered by this master thesis. 23 Reference Nr. [19] Hunter, L. (2006) “Low Cost Airlines: Business Model and Employment Relations”.
Comparison between Legacy and Low Cost Airlines on the Norwegian Aviation Market
Page 37
4.2. Legacy Airlines
Legacy airlines (also known in Europe as a network carriers / full service carriers) according
to Analyses of the European Air Transport Market24 are mainly characterized as the national
airlines, which have been existing for a long time (e.g. Lufthansa and Air France-KLM, etc.).
But there are also more recent examples of airlines, which have emerged as successors of the
national airlines. The aviation market liberalisation had great consequences for the airlines.
The market that they knew underwent major changes, related to the revision of the economic
and legislative rules. This opened opportunities for the existing airlines, but also for the
newcomers. The newcomers (low cost airlines) finally got the chance to enter the market and
shift the emphasis to cost efficiency.
Since the liberalisation process in Europe started later and was gradual, the European airlines
were lagging behind the American airlines. Their growth strategy however, differed from that
of the US carriers. They first tried to maximize power in the country of origin through
acquisitions and mergers. When this was accomplished, the focus was expanded to the
European market. They bought out airlines and as a next step in their growth strategy were
joining or setting up alliances, which enabled them to enter important markets outside
Europe25.
4.2.1. Differentiation Strategy
In the context of their differentiation strategy, the Legacy airlines provide good service, both
prior to and during the flight. This also implies that there is a variety of classes and that
connecting flights offered. Most Legacy airlines have a diversified air fleet and use a “hub-
and-spoke” network. The geographical scope of their network is global, with the exception of
some smaller companies, whose network is limited to the European territory.
The differentiation strategy concerns knowing what main dimensions the industry buyers
value, and to be unique compared to others in these dimensions. If a company is unique in
relation to the special attributes valued by customer a higher price can be set for that product.
24 Reference Nr. [3] Annual Analyses of the EU Air Transport Market report – EU Commission (2008). 25 Reference Nr. [15] Doganis, R. (2006) “Airline Business in the 21st Century”.
Comparison between Legacy and Low Cost Airlines on the Norwegian Aviation Market
Page 38
The differentiation attributes can be based (for example) on the product and how it is
distributed. For this strategy, there can be more than one differentiation strategy in a specific
industry that is successful26.
4.2.2. Services
Legacy Airlines use a differentiation strategy. They achieve this through more space and
comfort offered during the flight, but also in-flight entertainment, free food and alcoholic
beverages. In addition to that they reward their loyal customers, using a frequent flyer
program27.
In-flight entertainment:
Alamdari (1999) 28 states that by increasing competition, caused by the legislation flexibility,
more and more companies invest in in-flight service, and mainly entertainment to accomplish
product differentiation. The existing in-flight entertainment systems are mainly composed of
communication, audio and display systems. The communication systems include telephone
and telefax equipment and built-in charging stations. The audio systems offer music channels
and programs, such as interviews with well-known or public figures, etc. The systems, based
on a display, include information about the destination, on-demand movies, gambling,
computer games, catalogues, exterior camera view, etc.
Frequent flyer program:
Such program enables the consumer to gain points each time they reserve a flight. The
collected points can later be exchanged for free flights, upgrades of ticket type (economy to
business), and vouchers for shopping, free nights at hotels, charity donations, etc.
4.2.3. Air Fleet
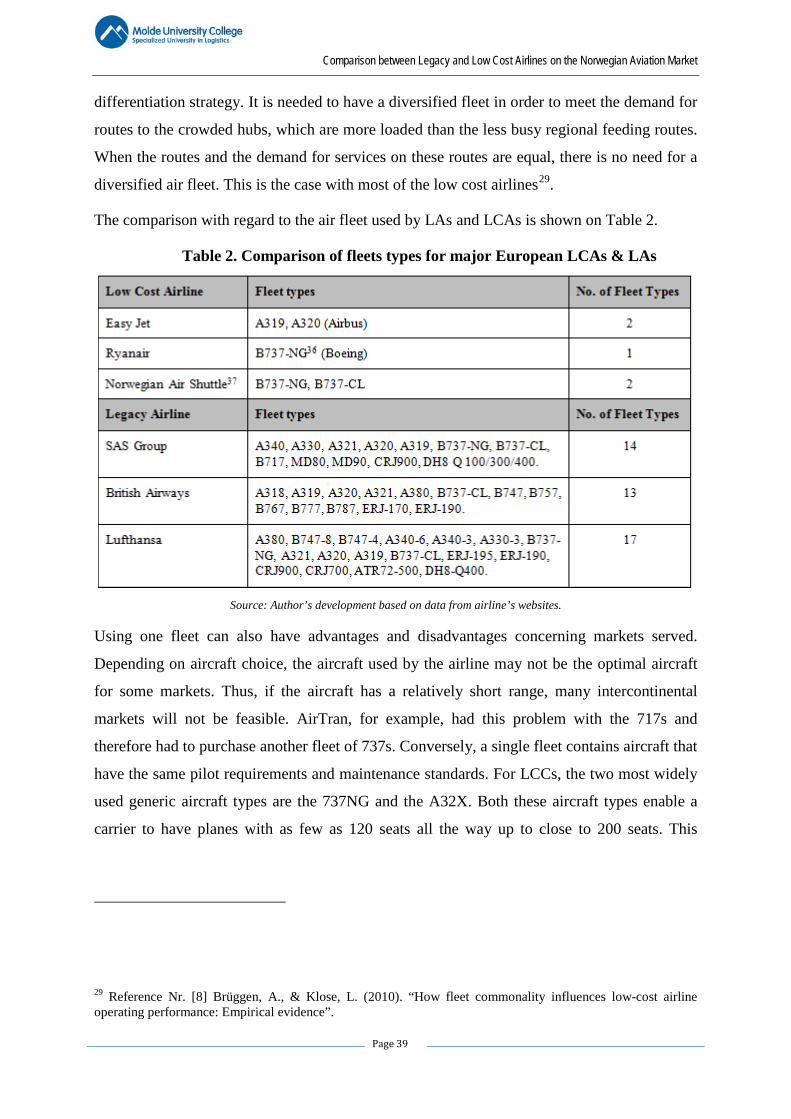
Unlike Low Cost Airlines, Legacy Airlines frequently have a highly diversified type of fleet.
This variation is necessary to comply with their network. It represents a part of their
26 Reference Nr. [28] Porter, M. E. (1985) “Competitive advantage: Creating and sustaining superior performance”. 27 Reference Nr. [19] Hunter, L. (2006). “Low Cost Airlines: Business Model and Employment Relations”. 28 Reference Nr. [20] Kaibuchi, K.; Kuroda, S.; Fukata, M.; Nakagawa, M.; Alamdari, F. (1999). “Airline in-flight entertainment: the passengers' perspective”.
Comparison between Legacy and Low Cost Airlines on the Norwegian Aviation Market
Page 39
differentiation strategy. It is needed to have a diversified fleet in order to meet the demand for
routes to the crowded hubs, which are more loaded than the less busy regional feeding routes.
When the routes and the demand for services on these routes are equal, there is no need for a
diversified air fleet. This is the case with most of the low cost airlines29.
The comparison with regard to the air fleet used by LAs and LCAs is shown on Table 2.
Table 2. Comparison of fleets types for major European LCAs & LAs
Source: Author’s development based on data from airline’s websites.
Using one fleet can also have advantages and disadvantages concerning markets served.
Depending on aircraft choice, the aircraft used by the airline may not be the optimal aircraft
for some markets. Thus, if the aircraft has a relatively short range, many intercontinental
markets will not be feasible. AirTran, for example, had this problem with the 717s and
therefore had to purchase another fleet of 737s. Conversely, a single fleet contains aircraft that
have the same pilot requirements and maintenance standards. For LCCs, the two most widely
used generic aircraft types are the 737NG and the A32X. Both these aircraft types enable a
carrier to have planes with as few as 120 seats all the way up to close to 200 seats. This
29 Reference Nr. [8] Brüggen, A., & Klose, L. (2010). “How fleet commonality influences low-cost airline operating performance: Empirical evidence”.
Comparison between Legacy and Low Cost Airlines on the Norwegian Aviation Market
Page 40
enables them to switch aircraft sizes interchangeably to better meet demand on any given
day30.
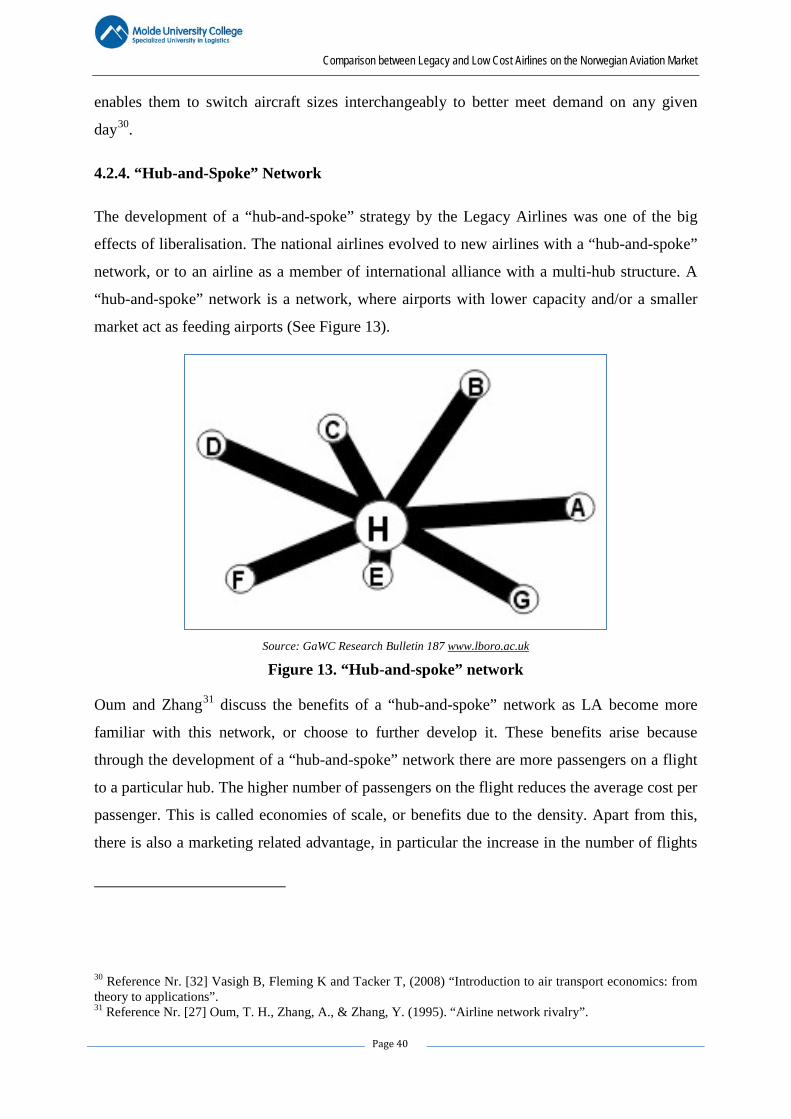
4.2.4. “Hub-and-Spoke” Network
The development of a “hub-and-spoke” strategy by the Legacy Airlines was one of the big
effects of liberalisation. The national airlines evolved to new airlines with a “hub-and-spoke”
network, or to an airline as a member of international alliance with a multi-hub structure. A
“hub-and-spoke” network is a network, where airports with lower capacity and/or a smaller
market act as feeding airports (See Figure 13).
Source: GaWC Research Bulletin 187 www.lboro.ac.uk
Figure 13. “Hub-and-spoke” network
Oum and Zhang31 discuss the benefits of a “hub-and-spoke” network as LA become more
familiar with this network, or choose to further develop it. These benefits arise because
through the development of a “hub-and-spoke” network there are more passengers on a flight
to a particular hub. The higher number of passengers on the flight reduces the average cost per
passenger. This is called economies of scale, or benefits due to the density. Apart from this,
there is also a marketing related advantage, in particular the increase in the number of flights
30 Reference Nr. [32] Vasigh B, Fleming K and Tacker T, (2008) “Introduction to air transport economics: from theory to applications”. 31 Reference Nr. [27] Oum, T. H., Zhang, A., & Zhang, Y. (1995). “Airline network rivalry”.
Comparison between Legacy and Low Cost Airlines on the Norwegian Aviation Market
Page 41
per hub. This increase in the flight frequency means that the airline is more attractive for the
customers.
In Analyses of the European Air Transport Market: Annual Report32 it could be noticed that
an increase in the demand can also justify the use of larger aircrafts, causing reduction on the
unit costs per place, also known as economies of scale. This paper also discusses multi-
product economies of scale. They arise because one can go through more efficient facilities,
such as centralized hub maintenance.
In summary, it could be said that the “hub-and-spoke” network is needed to reduce the costs
and improve the quality of services. These benefits are called network effect. The network
effect means that as an airline develops a more connected network, the marginal profit will
increase.
According to Berry33, the choice of a “hub-and-spoke” network brings other advantages.
Because an airline centralizes its activities into given hubs, the presence of this airline is
magnified compared to other airlines. This increased presence means that the air carrier in
question is given more power, since it represents an important funding source of the airports.
The control of the airline on the airport makes it possible to bypass other airlines or their
expansion at the airport. Analyses of the European Air Transport Market: Annual Report
(2008) indicates, however, also the disadvantages of the network approach. It is not easy to
draw up complex flight schedules within limited time, when one wants to make the shortest
possible turnaround. There is also extra pressure, which arises during peak periods because of
the many flights that might be leaving and the delays these may cause.
4.2.5. Airports
Legacy Airlines in particular is highly sensitive to network connectivity, alliance linkages and
the availability of land transport in choosing an airport. All surveys of passenger preferences
show that on-line connections are preferred to transfer ones. People are more confident that
they will get the boarding passes for both sectors when they first check in, removing the need
for a visit to the Transfer Desk when they arrive at the hub airport. They feel there is a greater
32 Reference Nr. [2 & 3] Annual Analyses of the EU Air Transport Market reports 2008-2011. 33 Reference Nr. [7] Berry, S. (1990). “Airport presence as product differentiation”.
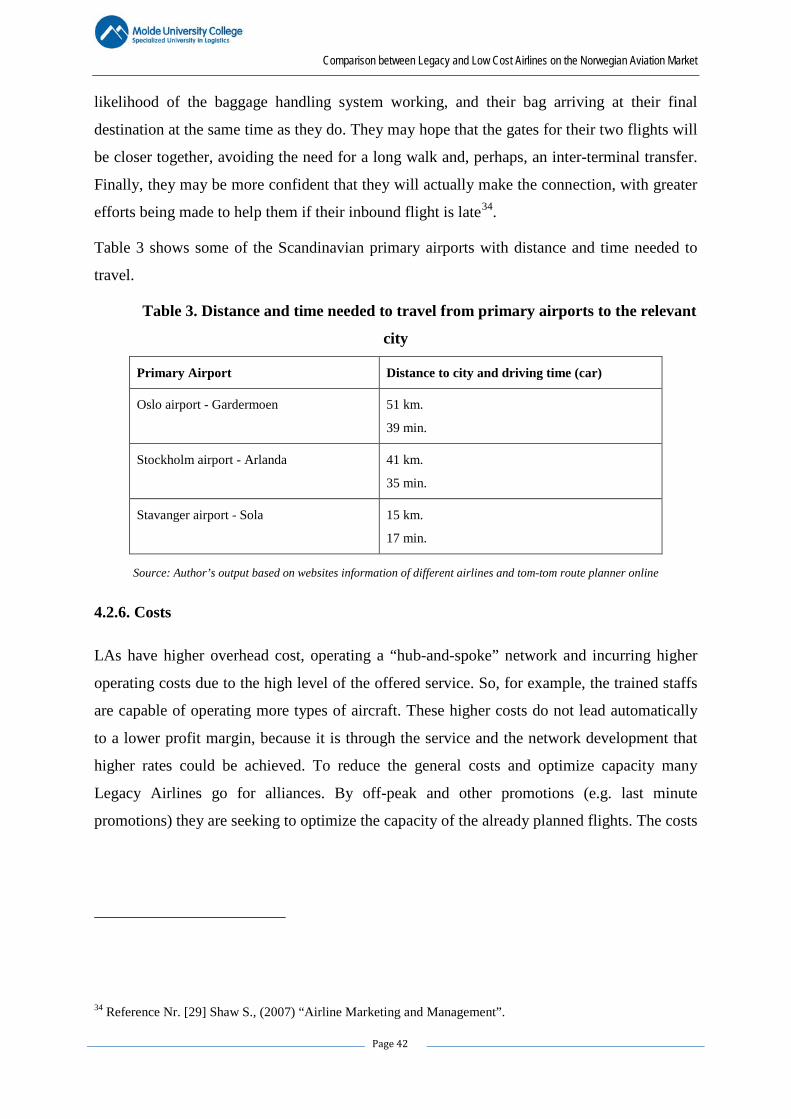
Comparison between Legacy and Low Cost Airlines on the Norwegian Aviation Market
Page 42
likelihood of the baggage handling system working, and their bag arriving at their final
destination at the same time as they do. They may hope that the gates for their two flights will
be closer together, avoiding the need for a long walk and, perhaps, an inter-terminal transfer.
Finally, they may be more confident that they will actually make the connection, with greater
efforts being made to help them if their inbound flight is late34.
Table 3 shows some of the Scandinavian primary airports with distance and time needed to
travel.
Table 3. Distance and time needed to travel from primary airports to the relevant
city
Primary Airport Distance to city and driving time (car)
Oslo airport - Gardermoen 51 km.
39 min.
Stockholm airport - Arlanda 41 km.
35 min.
Stavanger airport - Sola 15 km.
17 min.
Source: Author’s output based on websites information of different airlines and tom-tom route planner online
4.2.6. Costs
LAs have higher overhead cost, operating a “hub-and-spoke” network and incurring higher
operating costs due to the high level of the offered service. So, for example, the trained staffs
are capable of operating more types of aircraft. These higher costs do not lead automatically
to a lower profit margin, because it is through the service and the network development that
higher rates could be achieved. To reduce the general costs and optimize capacity many
Legacy Airlines go for alliances. By off-peak and other promotions (e.g. last minute
promotions) they are seeking to optimize the capacity of the already planned flights. The costs
34 Reference Nr. [29] Shaw S., (2007) “Airline Marketing and Management”.
Comparison between Legacy and Low Cost Airlines on the Norwegian Aviation Market
Page 43
of a scheduled flight are sunk costs, since this flight will go ahead anyway, irrespective of
whether 15 passengers or 100 passengers are on board the airplane35.
4.2.7. Strategic Alliances
The liberalisation in aviation provides more freedom to the air carriers to fly to more
destinations. The new opportunities though, required evolution of the networks. International
networks required cooperation between different companies in strategic locations for the
purpose of network optimization. Through alliances efficient network could be developed,
costs could be saved and passengers’ numbers could rise. Cost savings are possible through
joint purchases and joint marketing.
Alliance relationships now have a long, and chequered, history in the industry. Throughout
the history of commercial air transport, carriers have often preferred the comfort of co-
operative rather than competitive relationships, but the modern alliance movement can be
dated to 1993. Then, KLM and Northwest Airlines announced their wish to set up a strategic
partnership. The KLM/Northwest move was followed in 1995 by Lufthansa and United
Airlines proposing what has become the Star Alliance. The Star Alliance grew rapidly in
terms of the number of members it had, with it currently consisting of 19 member airlines.
The evolution of the modern alliance scene was completed in 1999 when Air France and
Delta Airlines formed the Sky team alliance. Sky team initially followed a different policy
from Star, in that limited itself to a smaller, but, arguably, more manageable number of
members.
With airline alliances, perhaps the most fundamental criticism to be made of them is that they
illustrate a mind-set which has bedevilled the commercial airline industry almost since its
inception. When faced with a tough competitor, it has nearly always been the airlines' instinct
to form collusive, rather than competitive, relationships36.
35 Reference Nr. [19] Hunter, L. (2006). “Low Cost Airlines: Business Model and Employment Relations”. 36 Reference Nr. [29] Shaw S., (2007) “Airline Marketing and Management”.
Comparison between Legacy and Low Cost Airlines on the Norwegian Aviation Market
Page 44
4.2.8. Pricing Strategy
The fare charged is only one aspect of the product or service provided by an airline to
different classes of passenger. Other product features include frequency, timings, seat
comfort, the quality and nature of ground and in-flight services, and so on. In planning the
supply of services on each route it serves, an airline must also decide on the various price and
product mixes which it feels will generate the level of demand it requires. In markets which
are less regulated and where there is a high degree of price competition, the pricing options
available are much wider but the choice between them is more difficult to make37.
LAs use various pricing tools to maximize the profit. They have different classes, based on
different rates, which is also called price differentiation. Discount systems, offered for
customer’s loyalty, are also important for the pricing process.
LAs make use of the transfer technique. This means, that based on statistical data a decision
to sell more tickets than the available places, can be taken. For example, this will apply to a
greater extent for a flight on Monday morning, because it is expected that more passengers
will be stuck in the file and their flight will not be met. As a result, they generate more
revenue by ticket sales, than when tickets corresponding to the number of the available places.
Most Legacy Airlines also offer last minute offers, which do not, or rarely occurs with the
Low Cost Airlines. By cheap rates it was possible to offer cheap tickets in advance with the
obligatory Saturday night stay over to make a distinction between business people with a
relatively high willingness to pay and holiday makers with a lower willingness to pay. The
last group of passengers was willing to pay for their tickets ample time in advance to use the
price advantage. The Saturday night stay over requirement usually created no obstacle, since a
holiday period often contains a weekend38.
37 Reference Nr. [14] Doganis, R. (2002). “Flying off Course”. 38 Reference Nr. [23] Koenigsberg, O., Muller, E., & Vilcassim, N. (2012) “easy Jet pricing strategy: Should low-fare airlines offer last-minute deals?”.
Comparison between Legacy and Low Cost Airlines on the Norwegian Aviation Market
Page 45
4.3. Low Cost Airlines
The liberalisation of aviation market had great consequences for the airlines. The market that
they knew in the past went under major changes, related to the reconsideration of the
economic and legislative rules. This provided opportunities for the existing airlines, but also
for newcomers. The newcomers (low cost airlines) have got the chance to enter the market
and implemented their cost leadership model.
The growth strategy of LCA is accomplished through maximizing of their power on the
market in the country of origin through acquisitions and mergers. Further they have focused
on expansion to the European market.
4.3.1. Cost Leadership
Porter (1985) identified cost leadership strategies as one of the ways to achieve competitive
advantages. The business model of the LCA is characterized by cost leadership as a
competitive strategy. This translates to a strong focus on cost savings throughout the entire
organization.
Porter39 (1985) has provided definition of cost leadership:
“A firm pursuing a cost-leadership strategy attempts to gain a competitive advantage
primarily by reducing its economic costs below its competitors. If cost-leadership
strategies can be implemented by numerous firms in an industry, or if no firms face a
cost disadvantage in imitating a cost-leadership strategy, then being a cost leader
does not generate a sustained competitive advantage for a firm. The ability of a
valuable cost-leadership competitive strategy is to generate a sustained competitive
advantage depends on that strategy being rare and costly to imitate40.
The “Analyses of the European Air Transport Market: Annual Report 2008” includes
discussion of the strategic choices, which allow the LCAs to minimize their costs. These are
39 Reference Nr. [28] Porter, M.E. (1985). “Competitive advantage: Creating and sustaining superior performance”. 40 Reference Nr. [39] www.wikipedia.org.
Comparison between Legacy and Low Cost Airlines on the Norwegian Aviation Market
Page 46
divided into cost categories: in-flight service, air fleet, point-to-point network, airports,
pricing strategy, etc.
The concept of Cost Leadership strategies is by no means new in the airline industry. In 1971,
a new carrier, Southwest Airlines, was set up (after a series of drawn out legal battles
instigated by incumbent carriers), to serve the US market. The airline became profitable in
1975, and, remarkably, has stayed profitable ever since.
There are three large and rapidly growing airlines following this model in Europe, Ryanair,
easyJet and Norwegian, as well as many smaller new entrants. Besides these existing players,
a high proportion of the start-up proposals being put forward at the present time include Cost
Leadership elements in them.
It is instructive to ask the question why recent times have seen this explosion in the use of
Cost Leadership strategies, when the success of the pioneer, Southwest, had been obvious for
many years. Regulatory liberalisation is one obvious explanation. The agreement for the
setting up of the Single Aviation Market of the European Union gave opportunities for new
entry which never existed before41.
4.3.2. Services
Historically, one of the clearest examples to consumers of the difference between LCAs and
LAs was a "no-frills" service. In the US on a Legacy airlines flight, passengers received a
complimentary hot meal with an extensive beverage service whereas on a Southwest flight a
passenger would receive peanuts and a soda. However, with the cost-cutting measures
implemented by legacy airlines, all economy class service in North America has turned into
"no-frills." In Europe, LCAs have gone one step further where everything, including
beverages, is on a buy-on-board basis. Therefore, the in-flight food service that used to easily
distinguish low-cost airlines from "full-service" carriers is no longer applicable. However, no-
frills service does not just pertain to in-flight service. Many LCAs also do not have frequent-
flyer programs or expensive business lounges; these amenities are not offered in order to cut
costs. Another cost-cutting measure that has recently been implemented by LCAs is the
41 Reference Nr. [29] Shaw S., (2007) “Airline Marketing and Management”.
Comparison between Legacy and Low Cost Airlines on the Norwegian Aviation Market
Page 47
restriction on luggage allowances. Particularly in Europe, LCAs have strict rules concerning
luggage allowance weights per passenger; this conserves fuel and generates extra marginal
revenue.
The underlying premise behind the LCAs' no-frills service strategy is ultimately a "pay as you
go" approach, where the ticket price entitles you to just a seat on the aircraft. As a result of
this strategy, LCAs can offer attractive airfares. While these service cuts may seem minimal,
when they are compounded over the number of flights, it can actually make the difference
between profit and loss.
4.3.3. Air Fleet
Another major characteristic of successful low-cost carriers is the use of a common fleet type.
Southwest Airlines was the pioneer of this strategy, focusing its entire fleet around the Boeing
737. A single fleet type provides many advantages for an airline; these include a reduction in
maintenance spare parts inventories, reduced flight crew training expenses, and increased
operational flexibility. In addition to the economies of scale savings, a single fleet provides
increased operational flexibility. In the event of irregular operations, a single fleet type makes
it easier to find a replacement aircraft or usually, more importantly, a replacement flight crew.
Since airlines usually have a reserve pilot pool for each fleet type, restricting the number of
fleet types limits the number of reserve pilots the airline requires.
Most successful Cost Leader airlines today are pursuing a so-called "Fleet Commonality"
policy, having only one type of aircraft in their fleet. In turn, for many, this one type is the
various members of the Boeing 737 family. Whatever this aircraft may now lack (at least
according to Airbus) in passenger appeal and the use of the latest technology, it has rugged
and proven reliability as its greatest asset. These are exactly the qualities needed by a Cost
Leader airline, and both Southwest Airlines (with a fleet now consisting of more than 400
737s) and Ryanair illustrate very well a commonality policy with 737s. By sticking to one
type of aircraft, they are gaining substantial economies in such areas as pilot training and
maintenance42.
42 Reference Nr. [29] Shaw S., (2007) “Airline Marketing and Management”.
Comparison between Legacy and Low Cost Airlines on the Norwegian Aviation Market
Page 48
The savings on maintenance costs are achieved through the lower cost of the spare parts.
There is also saving, related to the storage costs and to the costs, caused by the aging of the
components. The standardization of the air fleet also allows savings for the implementation of
the maintenance process itself, because it is possible to work faster and because the
maintenance personnel are trained for only one type of device. The standardisation of the air
fleet ensures that savings in the crew training costs can be achieved at the expense of the
financing for the backup crew. If for example, someone from the crew will get sick, he/she
can be easily replaced because one and the same air fleet is used.
The ground handling at the airport can be simplified, making the handling process more cost-
effective. Therefore, cost savings can be achieved when purchasing this ground handling
equipment and training the staff43.
Finally, the purchase of a standardized air fleet can be accomplished at a lower price
compared to the price for purchasing varied air fleet. Irrespective of the previous
justifications, it may still be appropriate to add an extra type in the air fleet. This could happen
in a case, when the airline wants to operate on a route, where there are many business
travellers who use it and where there is a demand for a high flight frequency. On such route it
is recommendable to fly with a smaller aircraft, if this route, of course, is not already served
by Legacy Airlines.
4.3.4. “Point-to-Point” Network
The network of the Low Cost Airlines consists of secondary airports and is in fact a point-to-
point network. Characteristic of the low cost model are the short-haul flights, but increasingly
also the medium distance flights outside Europe. This means that the passengers can only fly
from point A to point B and that there are no daily flights. If passengers want to fly from point
A to point C and there is no direct flight between these two points, then these passengers
should book their connected flights to point C. The characteristic feature of these flights is
that there is no transfer baggage service. This means that the passengers are responsible to
43 Reference Nr. [8] Brüggen, A., & Klose, L. (2010). “How fleet commonality influences low-cost airline operating performance: Empirical evidence”.
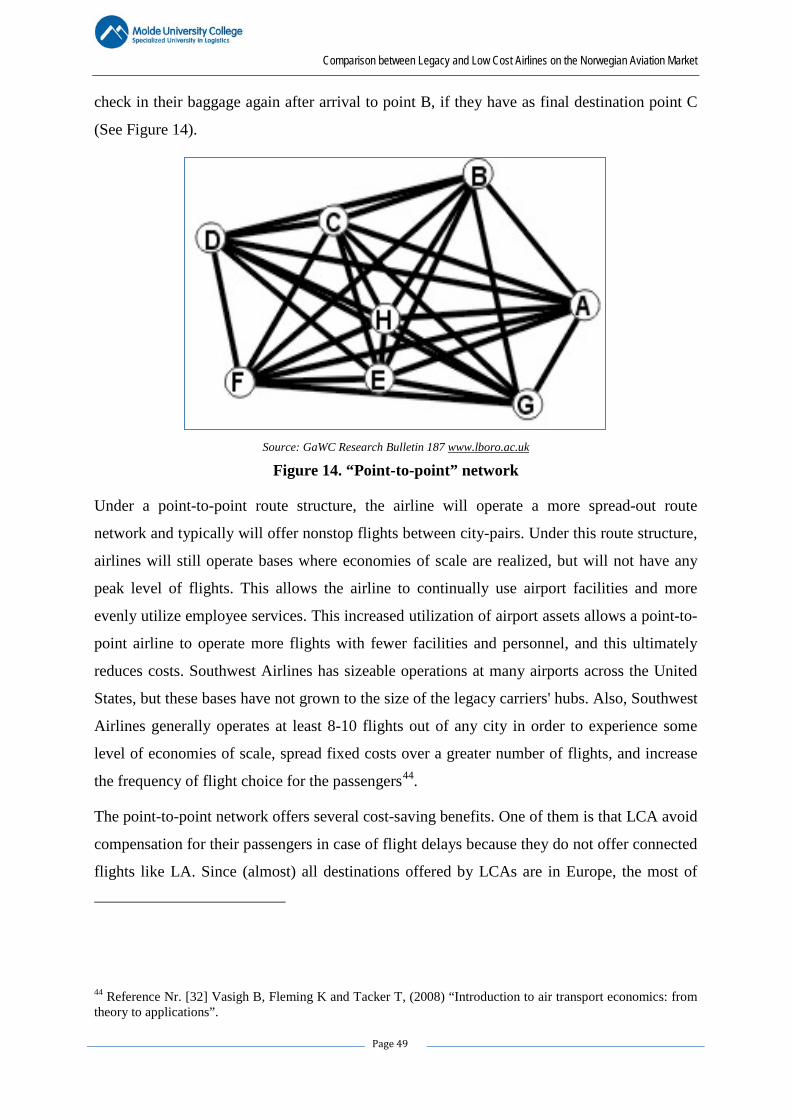
Comparison between Legacy and Low Cost Airlines on the Norwegian Aviation Market
Page 49
check in their baggage again after arrival to point B, if they have as final destination point C
(See Figure 14).
Source: GaWC Research Bulletin 187 www.lboro.ac.uk
Figure 14. “Point-to-point” network
Under a point-to-point route structure, the airline will operate a more spread-out route
network and typically will offer nonstop flights between city-pairs. Under this route structure,
airlines will still operate bases where economies of scale are realized, but will not have any
peak level of flights. This allows the airline to continually use airport facilities and more
evenly utilize employee services. This increased utilization of airport assets allows a point-to-
point airline to operate more flights with fewer facilities and personnel, and this ultimately
reduces costs. Southwest Airlines has sizeable operations at many airports across the United
States, but these bases have not grown to the size of the legacy carriers' hubs. Also, Southwest
Airlines generally operates at least 8-10 flights out of any city in order to experience some
level of economies of scale, spread fixed costs over a greater number of flights, and increase
the frequency of flight choice for the passengers44.
The point-to-point network offers several cost-saving benefits. One of them is that LCA avoid
compensation for their passengers in case of flight delays because they do not offer connected
flights like LA. Since (almost) all destinations offered by LCAs are in Europe, the most of
44 Reference Nr. [32] Vasigh B, Fleming K and Tacker T, (2008) “Introduction to air transport economics: from theory to applications”.
Comparison between Legacy and Low Cost Airlines on the Norwegian Aviation Market
Page 50
these flights are categorized as short haul. Such flights take approximately 2-3 hours. The
short haul flight gives the opportunity for LCAs to offer their passengers minimal comfort
during the flight. For example, little legroom, no (free) meal or drink, no (free) in-flight
entertainment, etc. In addition, LCA will save on hotel costs for the crew staff, since the crew
will not stay overnight at the destination.
4.3.5. Airports
The destinations of low cost airlines are mostly within Europe. They have their flights based
on secondary and less busy airports. The distance to the city centre is a disadvantage, but
there are other advantages when choosing secondary airports, as follows.
These airports are not as crowded as the primary (national) airports, which enables a
shorter turnaround time and higher flights frequency. LCA turnaround time is between
20-25 minutes between landing and take-off. This provides a big advantage for LCA,
compared to LA, whose turnaround time is about 40 minutes.
The use of secondary airports is a source of great saving, because the charges of these
airports are actually lower. The possibility of bargaining with these airports is far more
possible than with the main airports, due to the traffic generated by the opening of
lines at these destination points. In some cases, the airports subsidize the companies on
their own to attract them more easily.
At any airport, there are several charges specific to that particular airport. There are
airport-related costs primarily from airport taxes. Additionally, LCA has to pay for
ground handling services but these payments at the secondary airports are much lower
than at the large primary airports. By using secondary airports, LCA save on ground
handling costs and maximize their staff flexibility – i.e. they need less staff to perform
the ground operations.
Secondary airport costs are even lower, because they do not offer business lounges,
check-in desks, and other terminal facilities to their passengers.
Comparison between Legacy and Low Cost Airlines on the Norwegian Aviation Market
Page 51
Low cost airlines can also save from the way the passengers get on board the plane
before the flight and get off after it. The passengers usually walk to/walk away from
the plane without the use of expensive buses or air bridges.
By using secondary airports, LCA may avoid the monopoly of the traditional airlines
in the time SLOTS45.
LCAs have their activities built around secondary airports, just because negotiations on the
charged rates are possible. This in combination with the interests of the local economy
frequently ensures the bargaining of more favourable conditions for the LCA.
LCAs are sensitive to changes in the charged rates, which is due to the preferences they
allocate to their target customers. These passengers are much more price sensitive than the
passengers of the Legacy airlines, making the price elasticity of demand for services of the
LCAs bigger than this of the Legacy airlines.
In the real markets, where there is a diversity of services offered, and the services are
heterogeneous, the reverse development is demonstrated. Thus, a low cost airline will be hit
harder by a rise in the charged rates than a Legacy company, which is reflected in a greater
decline in the LCA output.
Neither LA, nor LCA can fully charge the consumer with the price increase. What does
actually a drop in the operating profit imply for both of them. This drop however will be
greater for the LCAs, since they have higher price elasticity, compared to the LAs.
45 SLOT: A reservation for an IFR (Instruments Flight Rules) takeoff or landing by an aircraft. During peak traffic, ATC (Air Traffic Control) uses IFR slots to promote a smooth flow of traffic.
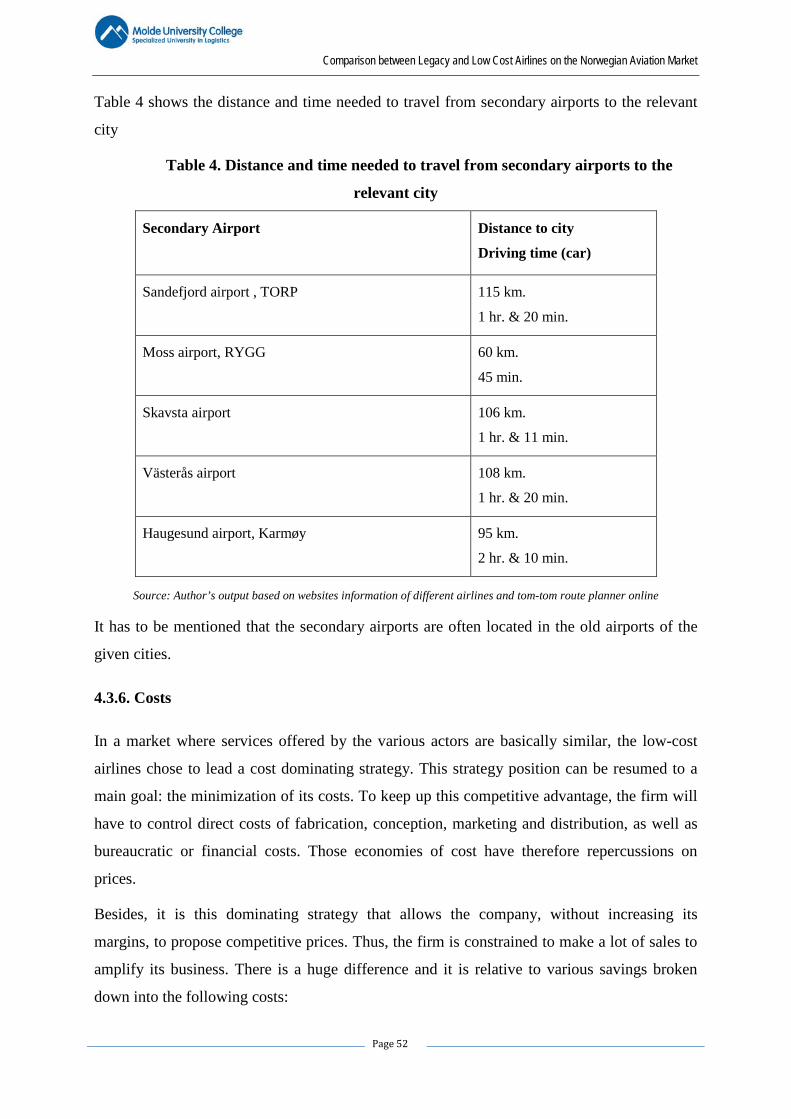
Comparison between Legacy and Low Cost Airlines on the Norwegian Aviation Market
Page 52
Table 4 shows the distance and time needed to travel from secondary airports to the relevant
city
Table 4. Distance and time needed to travel from secondary airports to the
relevant city
Secondary Airport Distance to city Driving time (car)
Sandefjord airport , TORP 115 km. 1 hr. & 20 min.
Moss airport, RYGG 60 km. 45 min.
Skavsta airport 106 km. 1 hr. & 11 min.
Västerås airport 108 km. 1 hr. & 20 min.
Haugesund airport, Karmøy 95 km. 2 hr. & 10 min.
Source: Author’s output based on websites information of different airlines and tom-tom route planner online
It has to be mentioned that the secondary airports are often located in the old airports of the
given cities.
4.3.6. Costs
In a market where services offered by the various actors are basically similar, the low-cost
airlines chose to lead a cost dominating strategy. This strategy position can be resumed to a
main goal: the minimization of its costs. To keep up this competitive advantage, the firm will
have to control direct costs of fabrication, conception, marketing and distribution, as well as
bureaucratic or financial costs. Those economies of cost have therefore repercussions on
prices.
Besides, it is this dominating strategy that allows the company, without increasing its
margins, to propose competitive prices. Thus, the firm is constrained to make a lot of sales to
amplify its business. There is a huge difference and it is relative to various savings broken
down into the following costs:
Comparison between Legacy and Low Cost Airlines on the Norwegian Aviation Market
Page 53
The Flying Costs: The fuel costs are approximately the same as for the major
airlines. However, the low-cost companies reduce the staff on board and their
services such as lunch; for instance, easyJet uses on average three people against
four/five for the major companies.
The Maintenance Costs of the Aircraft: The business model recommends a unique
type of plane. Therefore there is an economy of scale on maintenance, staff
training and the licenses of flights.
The Depreciation Costs of the Aircraft: The depreciation is very weak since the
low cost companies are using quite recent airplanes: Boeing 737.
Taxes and Insurance: Concerning the insurance and the taxes of flying, the low-
cost companies are not allowed to make savings.
However, landing into secondary airports enables them to pay much lower airport taxes than
on big hubs. The cost per seat of low-cost companies is as a result relatively diminished.
Using new technologies of communication also diminishes many functioning costs:
The Internet. Actually, the sale of the flight tickets is done on line: direct selling.
There is no commission to intermediaries any longer, such as travel agencies.
Moreover the low-cost companies save by the following respecting rules:
More seats in every airplane: the reduction of space between the rows, the lack of
toilets and the suppression of first and business classes allow the low cost companies
to increase the capacity of their aircraft (20% more than the major airlines). Hence the
seat/kilometre cost is necessarily lower.
Lower Labor Costs per Hour of Productivity. Many LCAs simply pay lower than
industry average wages. Since labor costs are one of the largest costs for any airline, it
is imperative for LCAs to keep their labor costs under control and/or increase labor
productivity.
A more intensive use of airplanes: this particularity is directly linked to secondary
airports and to the organisation avoiding the hubs. There are fewer take-offs and
landing on the runways, as well as less waiting at the end of the runway. The time
saved is thus significant; the aeroplanes fly 20 to 30% longer than the airplanes of the
traditional companies.
Comparison between Legacy and Low Cost Airlines on the Norwegian Aviation Market
Page 54
4.3.7. Pricing Strategy
The pricing strategy of the most LCAs is characterized by dynamics. Therefore, the ticket
rates are much, lower if these are bought long on advance. Also, the LCAs outreach a new
audience – i.e. the cost-conscious passenger. This target group consists of passengers, who
without these low rates would not fly. Low Cost Airlines also generate a large part of their
turnover from additional products and services, offered during the flight, or through their
website. This additional revenue is specific for the discussed airlines.
LCAs use the market as a lever. In fact, by informing the markets that the goals of such
companies contribute to the reductions of costs and hence the increase of their profitability,
such companies ensure an induced growth of the share prices. A high share price protects the
companies from possible predators46.
Since its introduction in the share market, the price of the Ryanair share has been multiplied
by three. The price of the easyJet share introduced into the share market one year after is
noticeably in regression in comparison with its introduction price. This phenomenon is due to
two factors: the “bulimia” of easyJet and its diversification (namely through its external
growth by buying out Go, or by exploiting more routes than its competitor), in comparison
with Ryanair that does not lead these strategies.
46 Reference Nr. [12] Combe N., (2004) “The Conquest of the Sky by Low-Cost Carriers”.
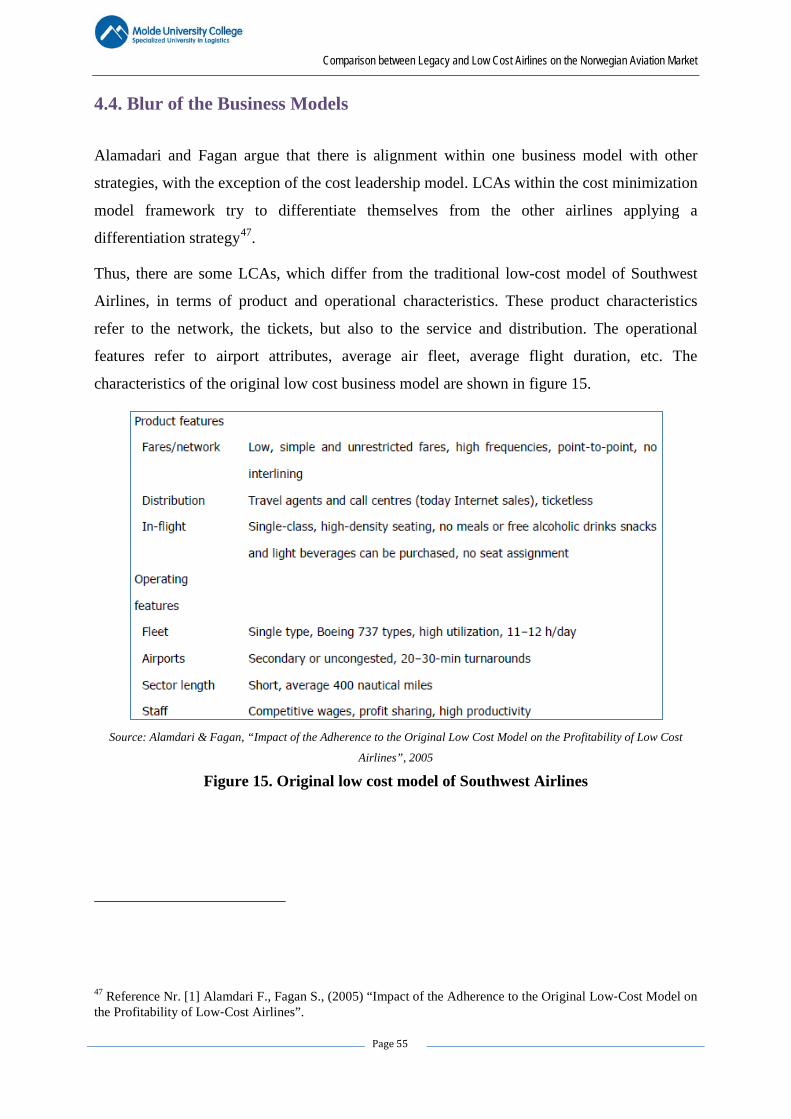
Comparison between Legacy and Low Cost Airlines on the Norwegian Aviation Market
Page 55
4.4. Blur of the Business Models
Alamadari and Fagan argue that there is alignment within one business model with other
strategies, with the exception of the cost leadership model. LCAs within the cost minimization
model framework try to differentiate themselves from the other airlines applying a
differentiation strategy47.
Thus, there are some LCAs, which differ from the traditional low-cost model of Southwest
Airlines, in terms of product and operational characteristics. These product characteristics
refer to the network, the tickets, but also to the service and distribution. The operational
features refer to airport attributes, average air fleet, average flight duration, etc. The
characteristics of the original low cost business model are shown in figure 15.
Source: Alamdari & Fagan, “Impact of the Adherence to the Original Low Cost Model on the Profitability of Low Cost
Airlines”, 2005
Figure 15. Original low cost model of Southwest Airlines
47 Reference Nr. [1] Alamdari F., Fagan S., (2005) “Impact of the Adherence to the Original Low‐Cost Model on the Profitability of Low‐Cost Airlines”.
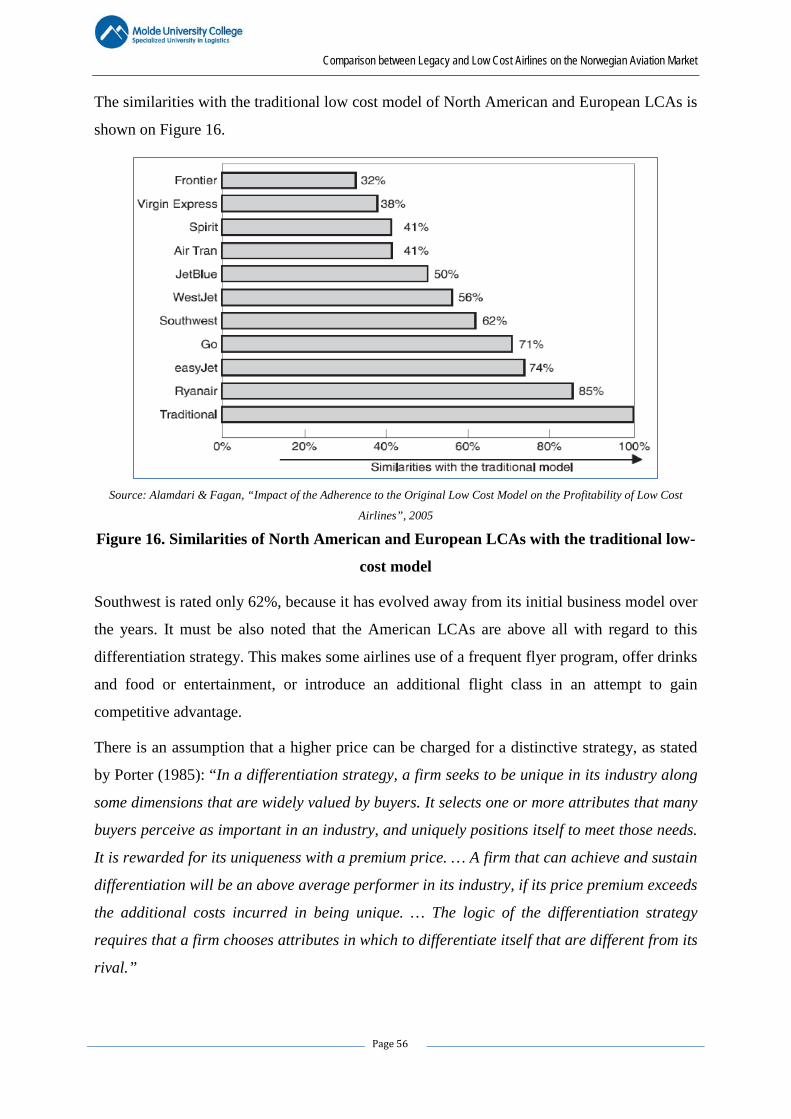
Comparison between Legacy and Low Cost Airlines on the Norwegian Aviation Market
Page 56
The similarities with the traditional low cost model of North American and European LCAs is
shown on Figure 16.
Source: Alamdari & Fagan, “Impact of the Adherence to the Original Low Cost Model on the Profitability of Low Cost
Airlines”, 2005
Figure 16. Similarities of North American and European LCAs with the traditional low-
cost model
Southwest is rated only 62%, because it has evolved away from its initial business model over
the years. It must be also noted that the American LCAs are above all with regard to this
differentiation strategy. This makes some airlines use of a frequent flyer program, offer drinks
and food or entertainment, or introduce an additional flight class in an attempt to gain
competitive advantage.
There is an assumption that a higher price can be charged for a distinctive strategy, as stated
by Porter (1985): “In a differentiation strategy, a firm seeks to be unique in its industry along
some dimensions that are widely valued by buyers. It selects one or more attributes that many
buyers perceive as important in an industry, and uniquely positions itself to meet those needs.
It is rewarded for its uniqueness with a premium price. … A firm that can achieve and sustain
differentiation will be an above average performer in its industry, if its price premium exceeds
the additional costs incurred in being unique. … The logic of the differentiation strategy
requires that a firm chooses attributes in which to differentiate itself that are different from its
rival.”
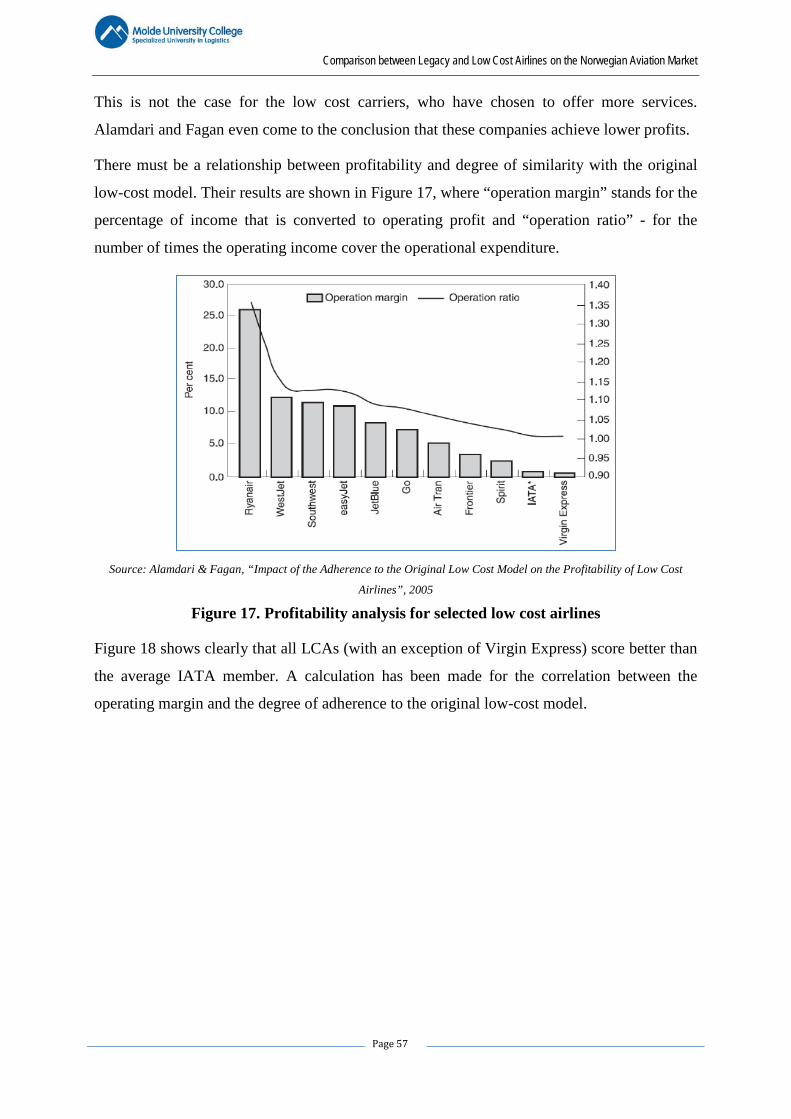
Comparison between Legacy and Low Cost Airlines on the Norwegian Aviation Market
Page 57
This is not the case for the low cost carriers, who have chosen to offer more services.
Alamdari and Fagan even come to the conclusion that these companies achieve lower profits.
There must be a relationship between profitability and degree of similarity with the original
low-cost model. Their results are shown in Figure 17, where “operation margin” stands for the
percentage of income that is converted to operating profit and “operation ratio” - for the
number of times the operating income cover the operational expenditure.
Source: Alamdari & Fagan, “Impact of the Adherence to the Original Low Cost Model on the Profitability of Low Cost
Airlines”, 2005
Figure 17. Profitability analysis for selected low cost airlines
Figure 18 shows clearly that all LCAs (with an exception of Virgin Express) score better than
the average IATA member. A calculation has been made for the correlation between the
operating margin and the degree of adherence to the original low-cost model.
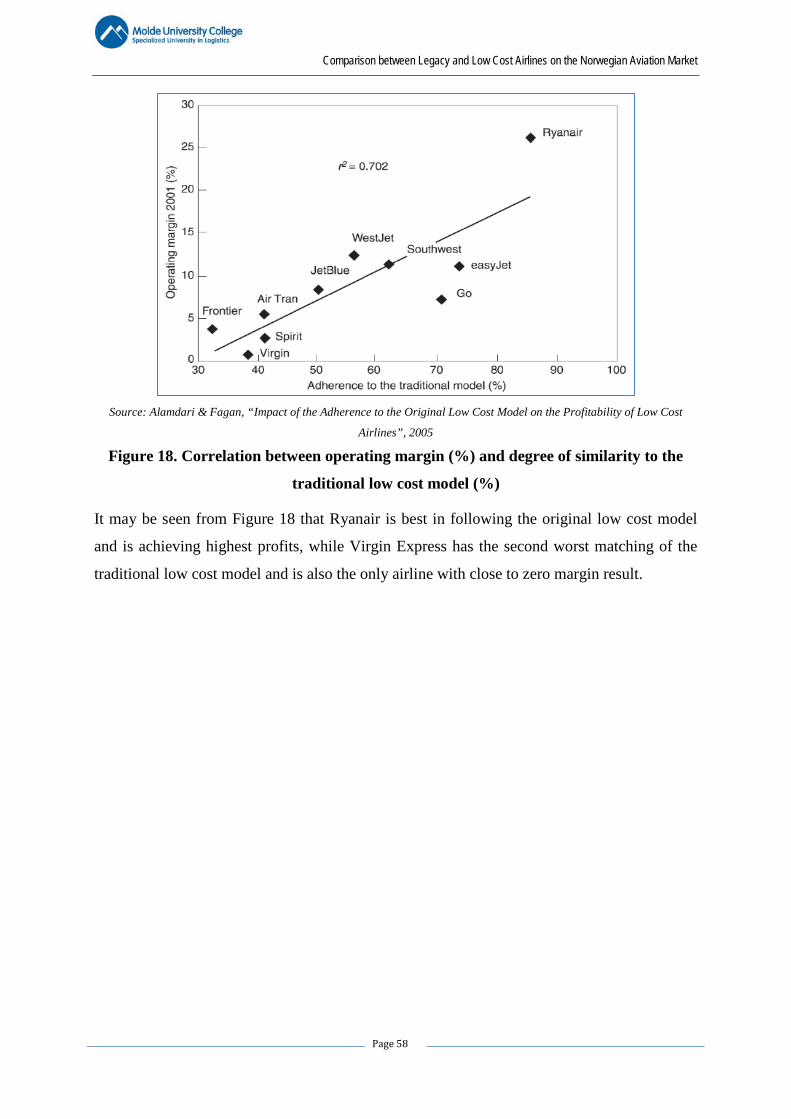
Comparison between Legacy and Low Cost Airlines on the Norwegian Aviation Market
Page 58
Source: Alamdari & Fagan, “Impact of the Adherence to the Original Low Cost Model on the Profitability of Low Cost
Airlines”, 2005
Figure 18. Correlation between operating margin (%) and degree of similarity to the
traditional low cost model (%)
It may be seen from Figure 18 that Ryanair is best in following the original low cost model
and is achieving highest profits, while Virgin Express has the second worst matching of the
traditional low cost model and is also the only airline with close to zero margin result.
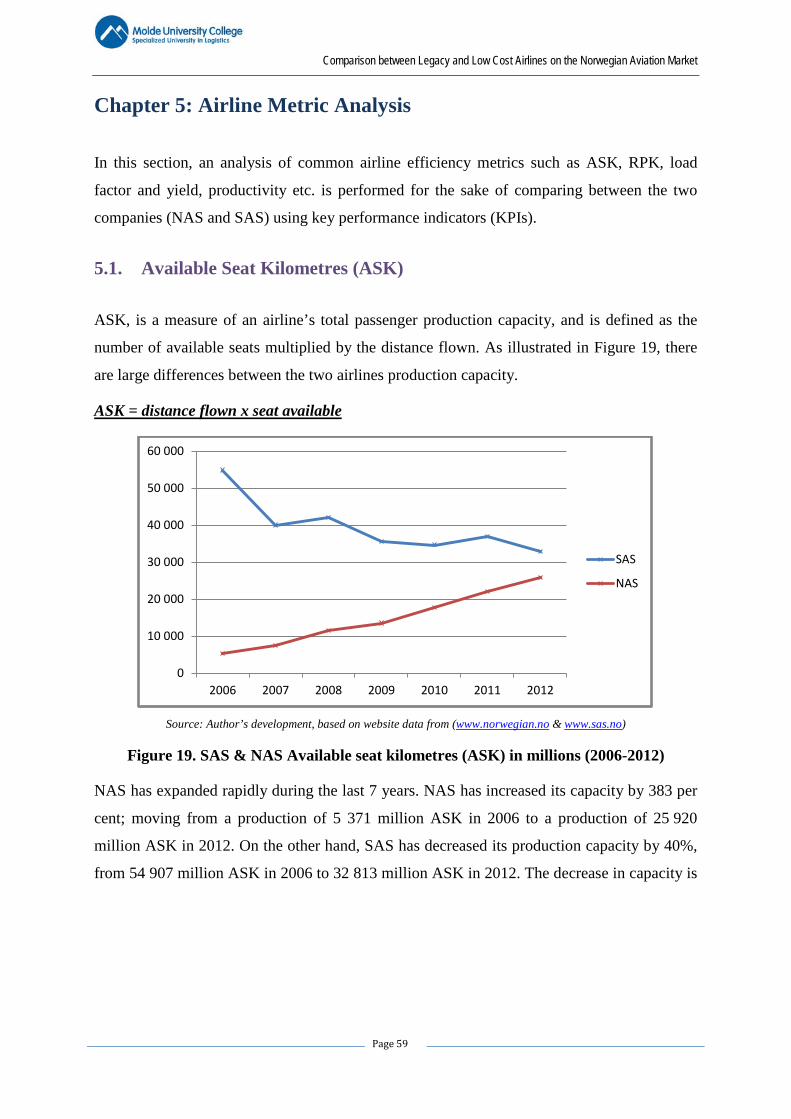
Comparison between Legacy and Low Cost Airlines on the Norwegian Aviation Market
Page 59
Chapter 5: Airline Metric Analysis
In this section, an analysis of common airline efficiency metrics such as ASK, RPK, load
factor and yield, productivity etc. is performed for the sake of comparing between the two
companies (NAS and SAS) using key performance indicators (KPIs).
5.1. Available Seat Kilometres (ASK)
ASK, is a measure of an airline’s total passenger production capacity, and is defined as the
number of available seats multiplied by the distance flown. As illustrated in Figure 19, there
are large differences between the two airlines production capacity.
ASK = distance flown x seat available
Source: Author’s development, based on website data from (www.norwegian.no & www.sas.no)
Figure 19. SAS & NAS Available seat kilometres (ASK) in millions (2006-2012)
NAS has expanded rapidly during the last 7 years. NAS has increased its capacity by 383 per
cent; moving from a production of 5 371 million ASK in 2006 to a production of 25 920
million ASK in 2012. On the other hand, SAS has decreased its production capacity by 40%,
from 54 907 million ASK in 2006 to 32 813 million ASK in 2012. The decrease in capacity is
0
10 000
20 000
30 000
40 000
50 000
60 000
2006 2007 2008 2009 2010 2011 2012
SAS
NAS
Comparison between Legacy and Low Cost Airlines on the Norwegian Aviation Market
Page 60
a result of the Core SAS48 strategy restructuring programme, which aims to divest and
outsource subsidiaries not being a part of SAS, as well as run a more cost efficient fleet by
reducing the number of different aircraft models (SAS - annual report 2010). In 2011,
4Excellence49 was introduced, which started to deliver positive results in 2012 – both in the
form of passenger growth and through a reduced cost base. (SAS - annual report 2012).
5.2. Revenue Passenger Kilometres (RPK)
In contrast to ASK which measures an airline’s total production capacity regardless of
passengers, RPK is a measure of actual production because it contains the number of
passengers. Further, RPK could be defined as the number of occupied seats multiplied by the
distance flown.
RPK = distance flown x sold seats
For this reason the graphs depicted in Figure 5A look quite similar to those in Figure 20.
However, the values starting points on the Y-axis differs slightly as RPK reveals the airlines
actual production indicating the revenue generated by seated passengers. In line with the
developments in ASK, NAS has had a remarkable increase in RPK during the 7 year period.
NAS has increased its RPK by 382%, whereas SAS due to divestments, outsourcing and
streamlining of its aircraft fleet has decreased its RPK by 37% over the same period.
48 Core SAS is a renewed strategy implemented in 2009, intended to provide the key elements necessary to support a competitive SAS, including a new, streamlined and simplified organization. The strategy aims to create a company, which generates long-term value for shareholders and pro-actively addresses the current industry dynamics, internal challenges and the global recessionary environment. 49 4Ecellence is a new strategy that replaces its successful “Core SAS” turnaround program, which will be brought to an end in 2012. 4Excellence will build on the foundations of its predecessor by concentrating the airline’s resources on four key areas: commercial, sales, operational and people excellence.
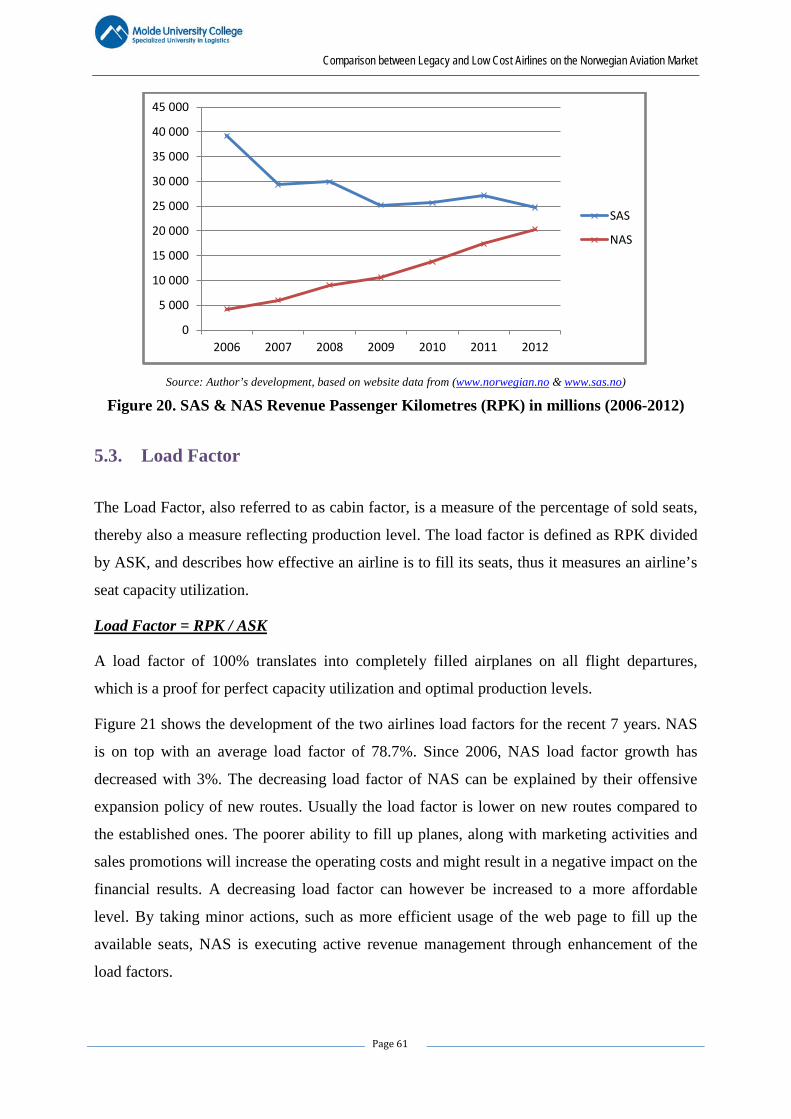
Comparison between Legacy and Low Cost Airlines on the Norwegian Aviation Market
Page 61
Source: Author’s development, based on website data from (www.norwegian.no & www.sas.no)
Figure 20. SAS & NAS Revenue Passenger Kilometres (RPK) in millions (2006-2012)
5.3. Load Factor
The Load Factor, also referred to as cabin factor, is a measure of the percentage of sold seats,
thereby also a measure reflecting production level. The load factor is defined as RPK divided
by ASK, and describes how effective an airline is to fill its seats, thus it measures an airline’s
seat capacity utilization.
Load Factor = RPK / ASK
A load factor of 100% translates into completely filled airplanes on all flight departures,
which is a proof for perfect capacity utilization and optimal production levels.
Figure 21 shows the development of the two airlines load factors for the recent 7 years. NAS
is on top with an average load factor of 78.7%. Since 2006, NAS load factor growth has
decreased with 3%. The decreasing load factor of NAS can be explained by their offensive
expansion policy of new routes. Usually the load factor is lower on new routes compared to
the established ones. The poorer ability to fill up planes, along with marketing activities and
sales promotions will increase the operating costs and might result in a negative impact on the
financial results. A decreasing load factor can however be increased to a more affordable
level. By taking minor actions, such as more efficient usage of the web page to fill up the
available seats, NAS is executing active revenue management through enhancement of the
load factors.
0
5 000
10 000
15 000
20 000
25 000
30 000
35 000
40 000
45 000
2006 2007 2008 2009 2010 2011 2012
SAS
NAS
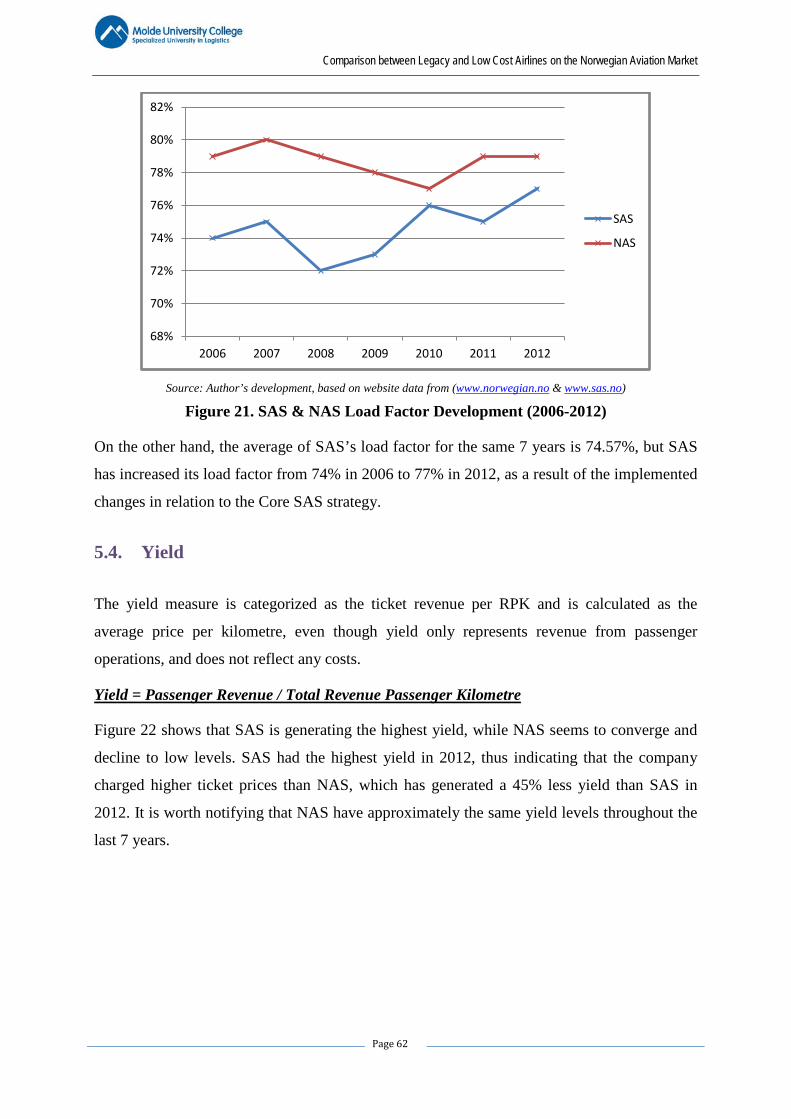
Comparison between Legacy and Low Cost Airlines on the Norwegian Aviation Market
Page 62
Source: Author’s development, based on website data from (www.norwegian.no & www.sas.no)
Figure 21. SAS & NAS Load Factor Development (2006-2012)
On the other hand, the average of SAS’s load factor for the same 7 years is 74.57%, but SAS
has increased its load factor from 74% in 2006 to 77% in 2012, as a result of the implemented
changes in relation to the Core SAS strategy.
5.4. Yield
The yield measure is categorized as the ticket revenue per RPK and is calculated as the
average price per kilometre, even though yield only represents revenue from passenger
operations, and does not reflect any costs.
Yield = Passenger Revenue / Total Revenue Passenger Kilometre
Figure 22 shows that SAS is generating the highest yield, while NAS seems to converge and
decline to low levels. SAS had the highest yield in 2012, thus indicating that the company
charged higher ticket prices than NAS, which has generated a 45% less yield than SAS in
2012. It is worth notifying that NAS have approximately the same yield levels throughout the
last 7 years.
68%
70%
72%
74%
76%
78%
80%
82%
2006 2007 2008 2009 2010 2011 2012
SAS
NAS
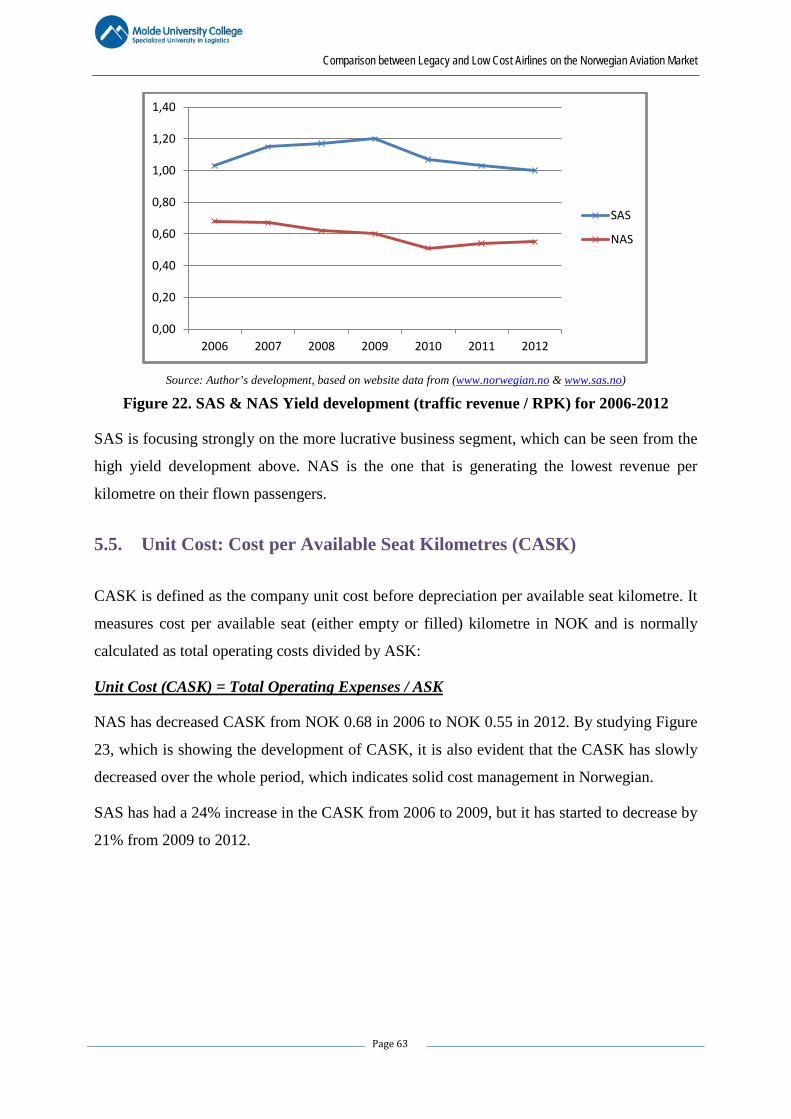
Comparison between Legacy and Low Cost Airlines on the Norwegian Aviation Market
Page 63
Source: Author’s development, based on website data from (www.norwegian.no & www.sas.no)
Figure 22. SAS & NAS Yield development (traffic revenue / RPK) for 2006-2012
SAS is focusing strongly on the more lucrative business segment, which can be seen from the
high yield development above. NAS is the one that is generating the lowest revenue per
kilometre on their flown passengers.
5.5. Unit Cost: Cost per Available Seat Kilometres (CASK)
CASK is defined as the company unit cost before depreciation per available seat kilometre. It
measures cost per available seat (either empty or filled) kilometre in NOK and is normally
calculated as total operating costs divided by ASK:
Unit Cost (CASK) = Total Operating Expenses / ASK
NAS has decreased CASK from NOK 0.68 in 2006 to NOK 0.55 in 2012. By studying Figure
23, which is showing the development of CASK, it is also evident that the CASK has slowly
decreased over the whole period, which indicates solid cost management in Norwegian.
SAS has had a 24% increase in the CASK from 2006 to 2009, but it has started to decrease by
21% from 2009 to 2012.
0,00
0,20
0,40
0,60
0,80
1,00
1,20
1,40
2006 2007 2008 2009 2010 2011 2012
SAS
NAS
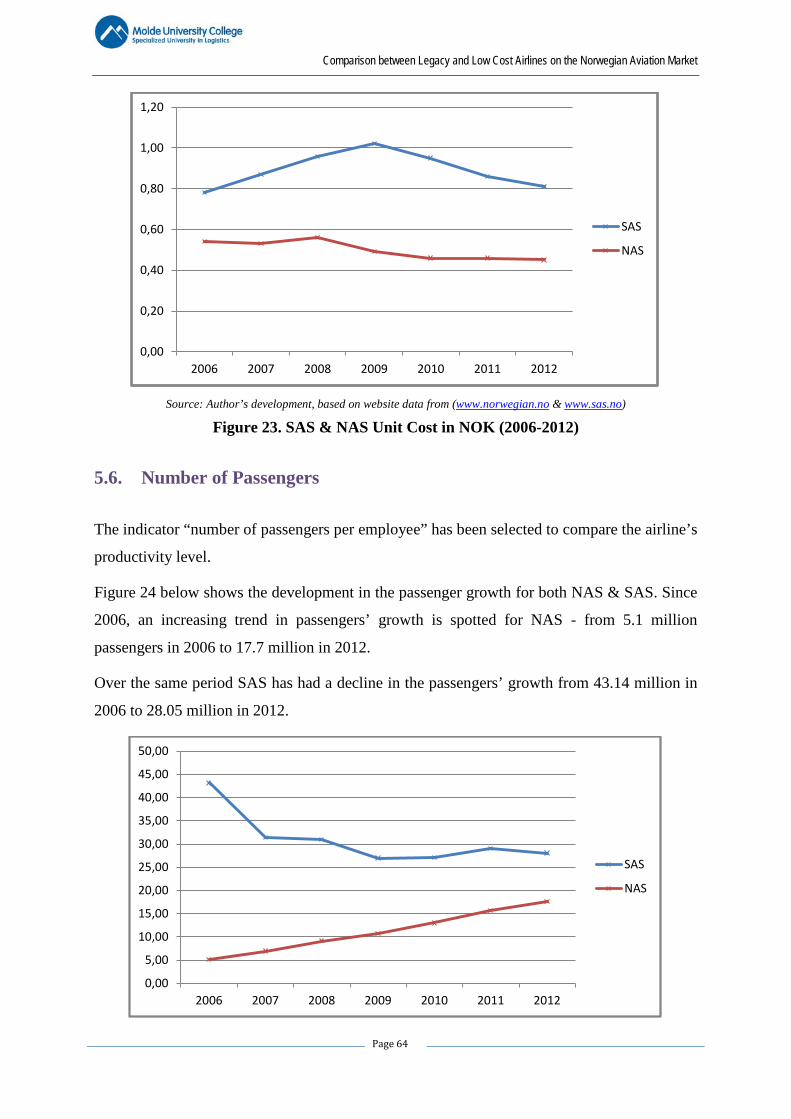
Comparison between Legacy and Low Cost Airlines on the Norwegian Aviation Market
Page 64
Source: Author’s development, based on website data from (www.norwegian.no & www.sas.no)
Figure 23. SAS & NAS Unit Cost in NOK (2006-2012)
5.6. Number of Passengers
The indicator “number of passengers per employee” has been selected to compare the airline’s
productivity level.
Figure 24 below shows the development in the passenger growth for both NAS & SAS. Since
2006, an increasing trend in passengers’ growth is spotted for NAS - from 5.1 million
passengers in 2006 to 17.7 million in 2012.
Over the same period SAS has had a decline in the passengers’ growth from 43.14 million in
2006 to 28.05 million in 2012.
0,00
0,20
0,40
0,60
0,80
1,00
1,20
2006 2007 2008 2009 2010 2011 2012
SAS
NAS
0,00
5,00
10,00
15,00
20,00
25,00
30,00
35,00
40,00
45,00
50,00
2006 2007 2008 2009 2010 2011 2012
SAS
NAS
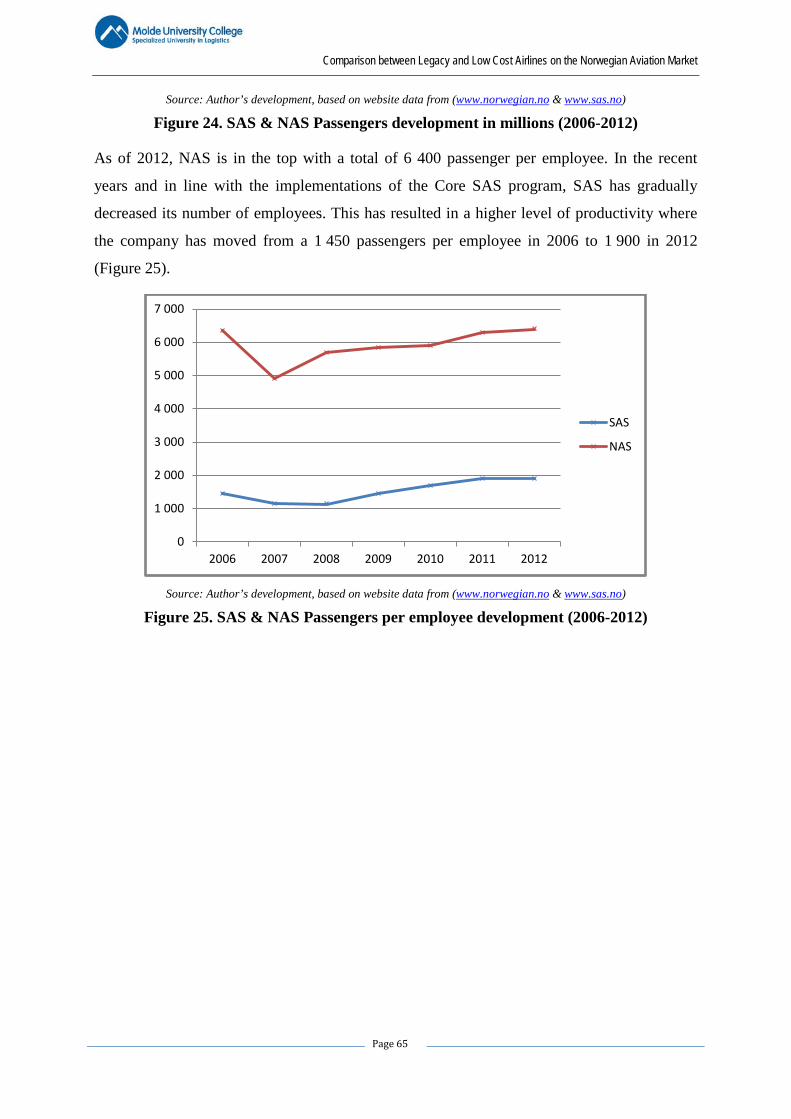
Comparison between Legacy and Low Cost Airlines on the Norwegian Aviation Market
Page 65
Source: Author’s development, based on website data from (www.norwegian.no & www.sas.no)
Figure 24. SAS & NAS Passengers development in millions (2006-2012)
As of 2012, NAS is in the top with a total of 6 400 passenger per employee. In the recent
years and in line with the implementations of the Core SAS program, SAS has gradually
decreased its number of employees. This has resulted in a higher level of productivity where
the company has moved from a 1 450 passengers per employee in 2006 to 1 900 in 2012
(Figure 25).
Source: Author’s development, based on website data from (www.norwegian.no & www.sas.no)
Figure 25. SAS & NAS Passengers per employee development (2006-2012)
0
1 000
2 000
3 000
4 000
5 000
6 000
7 000
2006 2007 2008 2009 2010 2011 2012
SAS
NAS
Comparison between Legacy and Low Cost Airlines on the Norwegian Aviation Market
Page 66
Chapter 6: SWOT Analysis of NAS & SAS
Johnson, G., Sholes, K. and Whittington, R. defines the SWOT analysis in the following way
- “it summarizes the key issues from the business environment and the strategic capability of
an organization that are most likely to impact on strategy development”. In other words, the
goal of this analysis is to identify the strengths and weaknesses, which are internal of the
company and the opportunities and threats, which occur on the external level. On one hand,
the external factors deal with the environmental models of competitive advantage, on the
other hand, the internal factors are related to the core competencies and capabilities of the
company and may influence the future strategic orientation50.
6.1. NAS SWOT Analysis
NAS strengths are its ability to capitalise on capacity reductions by its struggling
Scandinavian competitors, its success in generating increased ancillary revenues and its
timely implementation of measures, aimed at better positioning of the carrier to ensure its
short-term survival.
The SWOT analysis is summarized in Table 5, where strengths, weaknesses, opportunities
and threats are all examined and categorized. The four categories are described on the basis of
the strategic analysis, being supported by information derived from the metric data. The
external analysis has provided deep insight into the opportunities and threats the airline is
facing.
The internal analysis however, gives an understanding of operational performance, efficiency,
growth and capacity utilization and therefore is the foundation behind the strength and
weakness findings.
50 Reference Nr. [9] CAPA – Centre for Aviation - Norwegian Air Shuttle SWOT Analysis NAS SWOT http://centreforaviation.com/analysis/norwegian-air-shuttle-swot-analysis-scandinavias-largest-lcc-reports-most-profitable-2q-in-its-his-8530.
Comparison between Legacy and Low Cost Airlines on the Norwegian Aviation Market
Page 67
Strengths
NAS major strength is their successful low cost strategy, being a major reason to the
increased market share over the years. Passenger numbers will continue to grow as
people perceive air travelling as a safe and fast way to travel. NAS brand name can
also be seen as strength, as the company has a good regularity record for its scheduled
flights. They were also recognized as the market leader for being able to stay in
business through challenging times and for adapting the low cost strategy to the
Scandinavian market.
NAS low unit costs enable them to follow the low cost strategy, and they will
therefore have a clear competitive advantage. As unit costs are depending on the fuel
price, landing fees and staff costs, the new and more environmentally friendly
airplanes Boeing 737-800 will help NAS decrease their unit costs further, as the new
planes increase capacity and decrease emission levels.
NAS has also invented a low price calendar on their webpage, registered as protected
design. They do not have a patent on the technical aspects, only the graphic symbols
and the web interface, but this will give the company a competitive edge as it makes it
easier for customer to search for low price tickets.
In the Airline metrics analysis we discovered that NAS has an efficient cost structure
as it operates with a low CASK compared to SAS. Additionally, the airline has
relatively high load factors and high levels of employee productivity. We believe that
the combination of NAS strong brand name, uniform aircraft fleet (one type aircraft),
innovative capabilities, and efficient sales and distribution channels contribute to
shaping the airline’s competitive advantage51.
51 Reference Nr. [31] Vårbo K. & Lindseth G., (2011) “Strategic analysis and evaluation of Norwegian Air Shuttle ASA”. Reference Nr. [21] Kjærnes K & Qvist C (2011) “Valuations of Norwegian Air Shuttle ASA”.
Comparison between Legacy and Low Cost Airlines on the Norwegian Aviation Market
Page 68
Weaknesses
A huge weakness for NAS is that they are not a market leader on punctuality. Even
though they have a high regularity rate, it has been decreasing over the years. Delays
are the most annoying thing that could happen when travelling by air. SAS was the
most punctual airline company in the last years, and Norwegian might lose potential
customers that values punctuality high to SAS.
Another weakness is that Norwegian is not part of an alliance, as Star Alliance and
they can therefore loose potential customers.
At the same time, the majority of NAS competitive advantages are imitable, and the
company has a cost structure that is inferior to the leading European LCA Ryanair. As
a result of the company’s heavy investments and rapid expansion over the previous
years, its liquidity figures is not as optimal as they could be, and the punctuality rate is
poor compared to its peer group. Further, we argue that the company is more exposed
to jet-fuel price volatility than its competitors.
Opportunities
NAS is one of the airlines that invest in new and more environmentally friendly
airplanes (e.g. Boeing 737-800) will benefit from this upswing as it will create lower
unit costs due to lower fuel emissions and landing fees.
New planes will increase capacity, and it will be possible to attract new customers
who care for the environment. Reputation is a very important factor in this industry,
and there is a good possibility to improve reputation by improving punctuality seen as
an important factor when people choose an airline company.
The aviation cycles represent both opportunities and threats, and therefore NAS might
gain an advantage relative to its competitors if it will manage to carefully time its
investments and strategic actions52.
52 Kjærnes K & Qvist C (2011) “Valuations of Norwegian Air Shuttle ASA”. Vårbo K. & Lindseth G., (2011) “Strategic analysis and evaluation of Norwegian Air Shuttle ASA”.
Comparison between Legacy and Low Cost Airlines on the Norwegian Aviation Market
Page 69
As a result of Norway agreeing to the EU-US Open Skies Agreements53 in 2009, NAS
gained the opportunity to explore and establish new routes. The low-cost long-haul
segment is currently unexplored in the Nordic markets, and we believe that the
combination of a high GDP per capita and a high demand for air travel indicates that
this segment might be an attractive option.
Threats
There are several challenges for the airline companies, and during the last years of
economic recession, higher oil prices and fluctuating exchange rates have been a
problem. The oil price increase is important as fuel is a major expense for the airline
companies, and the same refers to the unstable dollar and Euro exchange rates, as
suppliers often trade in these currencies.
It is all about having the lowest unit costs possible in order to offer customers lower
tickets price and still generate a profit.
New regulations are also seen as a threat, especially for the traditional airlines, just
like in 1997 when the liberalisation process started and the result was an increase in
competition.
The environmental issues are also important for the airline industry and different
actions are being established such as purchase of climate quotas and landing fees,
depending on noise and emission levels (Boeing and Airbus being constantly in
competition to offer the newest technologies).
Other threats are the fierce competition in the industry, because the many companies
offering travels to the same destinations. The only different is the level of service.
Therefore not being a member of an alliance can be detrimental. An alliance is
working together to create different route networks to make it possible to collect bonus
points on travels, which is a benefit for customers and simplifies travel.
53 The EU–US Open Skies Agreement is an open skies air transport agreement between the EU and the US. The agreement allows any airline of the European Union and any airline of the United States to fly between any point in the European Union and any point in the United States. Airlines of the United States are also allowed to fly between points in the European Union. Airlines of the European Union are also allowed to fly between the US and non-EU countries like Norway.
Comparison between Legacy and Low Cost Airlines on the Norwegian Aviation Market
Page 70
There is also the risk of terror attacks and accidents involving airplanes, particularly
after the terror attacks September 11, 2001 when the numbers of the passengers
decreased dramatically.
In addition, NAS main rival, SAS, receives financial aid from the Scandinavian
governments, which slightly distorts competition.
Moreover, a historically high crude oil price leads to high and volatile jet-fuel costs.
Jet-fuel costs account for a large share of NAS total operating expenses, thus
persistent high crude oil prices directly affect NAS profits severely.
On the last place, the airline industry’s inclusion in the EU Emissions Trading
Scheme54 comes into effect in 2012, which will require NAS to monitor and report its
CO2 emissions.
However, the Open Skies Agreements, the underserved low-cost long-haul market and
the high demand for air travel all might contribute to increased competition, both
domestically and internationally.
After the deregulation in 1997, the European airline market could see a switch where
the numbers of airline companies started to increase and the competition intensified.
Today the market is filled with companies offering all segments from low ticket price
to the more exclusive. The same is the threat of substitutes as customers on long
distances will save time and money travelling by air than car, train and sailing.
54 The European Union Emissions Trading Scheme (EU ETS), was the first large emissions trading scheme in the world, and remains the biggest. It was launched in 2005 to combat climate change and is a major pillar of EU climate policy.
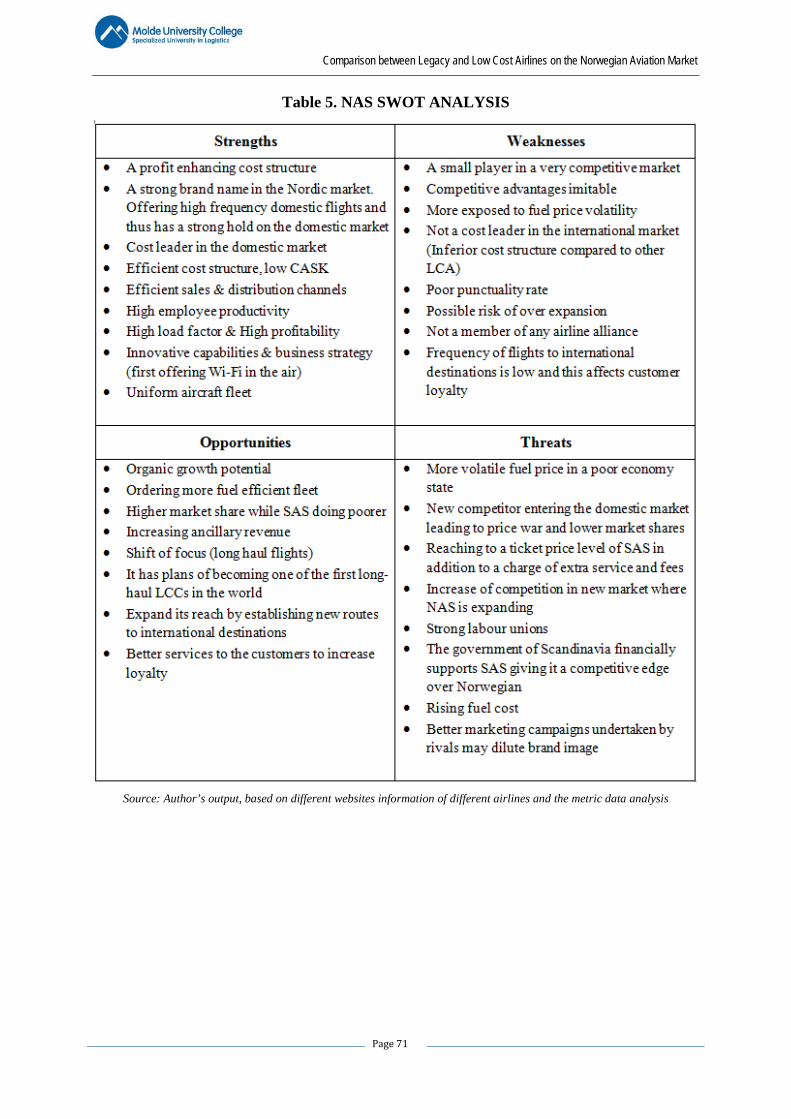
Comparison between Legacy and Low Cost Airlines on the Norwegian Aviation Market
Page 71
Table 5. NAS SWOT ANALYSIS
Source: Author’s output, based on different websites information of different airlines and the metric data analysis
Comparison between Legacy and Low Cost Airlines on the Norwegian Aviation Market
Page 72
6.2. SAS SWOT Analysis
The SAS Group will intensify its efforts to ensure a pleasant overall experience for customers
when they choose SAS. This comprises everything from booking, checking in and time at the
airport to, naturally, the actual flight. In 2012, SAS started the implementation of their new
clear identity at airports. The focus on new routes and greater frequency is high on the agenda
as is upholding of the position as one of the most punctual airlines in the world55.
Strengths
SAS has the best network in the Nordic region. SAS Group airplanes flow to 136
destinations with an average of 1,111 departures per day in the January – October
2012 period. Together with other partners, this enables SAS to offer the Nordic
region’s best timetable by far. In total, the Group flew about 28 million passengers on
scheduled services in the 2012 fiscal year, which represents an increase of 1 million on
year-on-year basis. Membership of Star Alliance is the foundation of the SAS Group’s
global partner and network strategy. Together, the 27 airlines offer 21,900 daily
departures to 194 countries and transport approximately 670 million passengers per
year (SAS annual report 2012).
SAS customers are thereby offered access to a global network of flights with a flexible
and smooth travel experience and the opportunity to redeem bonus points all round the
world. Customers are also offered other benefits through access to loyalty programs
and the lounges of other Star Alliance member airlines.
SAS has been through many restructuring programs and capital raisings over a number
of years. Yet it still has high unit costs and poor labour productivity, is loss-making
and has a weak balance sheet.
SAS is the biggest carrier in a region of Europe that is relatively remote from a
geographical point of view. This was historically a positive for SAS as other
55 Reference Nr. [10] CAPA, Centre for Aviation, SAS SWOT Analysis http://centreforaviation.com/analysis/sas-swot-final-call-to-establish-a-sustainable-scandinavian-airlines-100695.
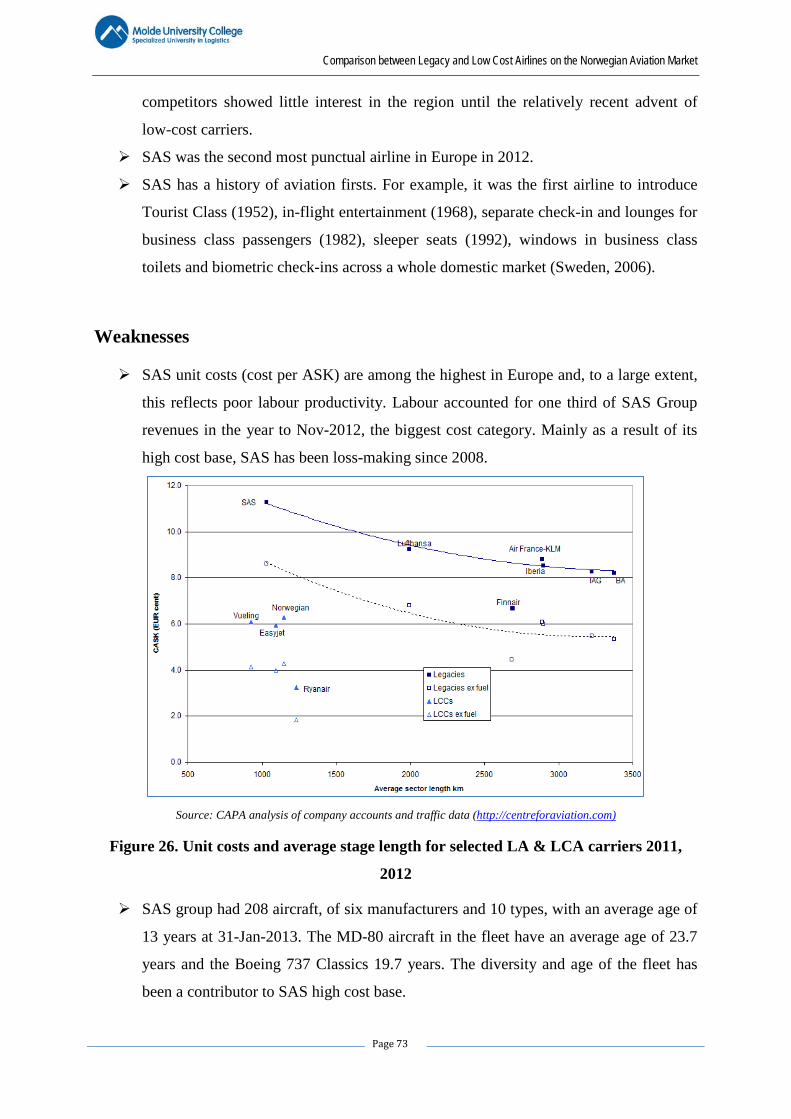
Comparison between Legacy and Low Cost Airlines on the Norwegian Aviation Market
Page 73
competitors showed little interest in the region until the relatively recent advent of
low-cost carriers.
SAS was the second most punctual airline in Europe in 2012.
SAS has a history of aviation firsts. For example, it was the first airline to introduce
Tourist Class (1952), in-flight entertainment (1968), separate check-in and lounges for
business class passengers (1982), sleeper seats (1992), windows in business class
toilets and biometric check-ins across a whole domestic market (Sweden, 2006).
Weaknesses
SAS unit costs (cost per ASK) are among the highest in Europe and, to a large extent,
this reflects poor labour productivity. Labour accounted for one third of SAS Group
revenues in the year to Nov-2012, the biggest cost category. Mainly as a result of its
high cost base, SAS has been loss-making since 2008.
Source: CAPA analysis of company accounts and traffic data (http://centreforaviation.com)
Figure 26. Unit costs and average stage length for selected LA & LCA carriers 2011,
2012
SAS group had 208 aircraft, of six manufacturers and 10 types, with an average age of
13 years at 31-Jan-2013. The MD-80 aircraft in the fleet have an average age of 23.7
years and the Boeing 737 Classics 19.7 years. The diversity and age of the fleet has
been a contributor to SAS high cost base.
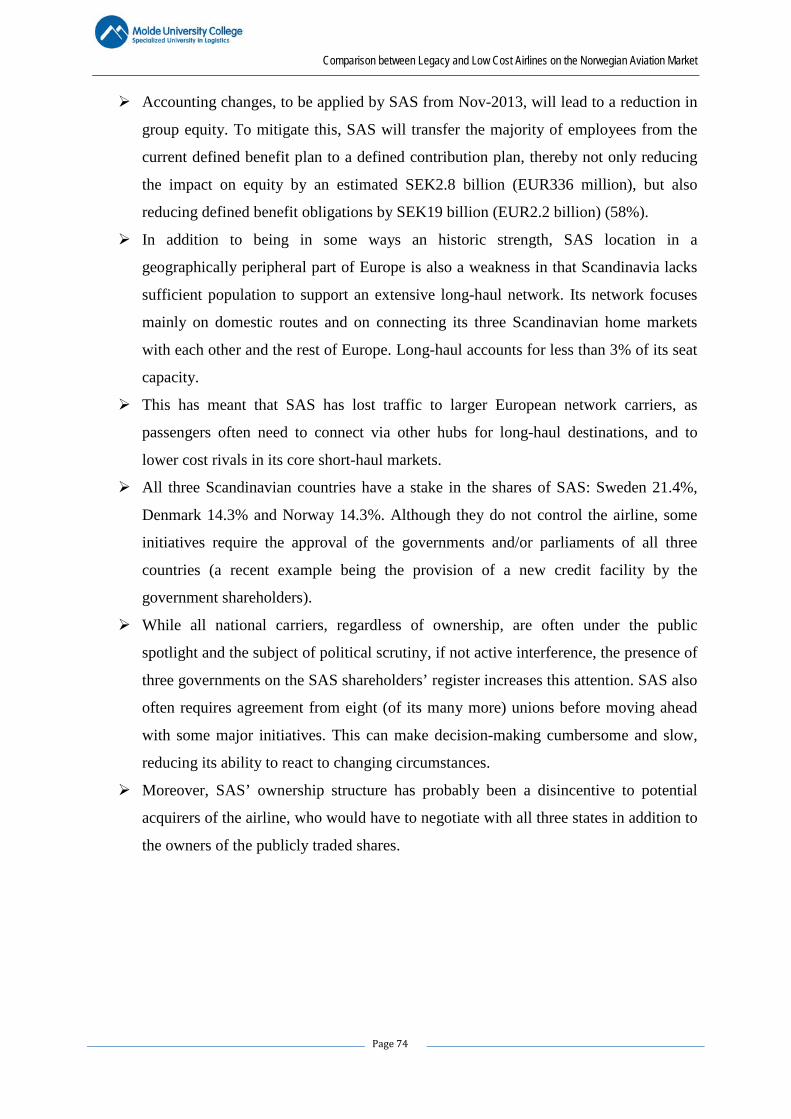
Comparison between Legacy and Low Cost Airlines on the Norwegian Aviation Market
Page 74
Accounting changes, to be applied by SAS from Nov-2013, will lead to a reduction in
group equity. To mitigate this, SAS will transfer the majority of employees from the
current defined benefit plan to a defined contribution plan, thereby not only reducing
the impact on equity by an estimated SEK2.8 billion (EUR336 million), but also
reducing defined benefit obligations by SEK19 billion (EUR2.2 billion) (58%).
In addition to being in some ways an historic strength, SAS location in a
geographically peripheral part of Europe is also a weakness in that Scandinavia lacks
sufficient population to support an extensive long-haul network. Its network focuses
mainly on domestic routes and on connecting its three Scandinavian home markets
with each other and the rest of Europe. Long-haul accounts for less than 3% of its seat
capacity.
This has meant that SAS has lost traffic to larger European network carriers, as
passengers often need to connect via other hubs for long-haul destinations, and to
lower cost rivals in its core short-haul markets.
All three Scandinavian countries have a stake in the shares of SAS: Sweden 21.4%,
Denmark 14.3% and Norway 14.3%. Although they do not control the airline, some
initiatives require the approval of the governments and/or parliaments of all three
countries (a recent example being the provision of a new credit facility by the
government shareholders).
While all national carriers, regardless of ownership, are often under the public
spotlight and the subject of political scrutiny, if not active interference, the presence of
three governments on the SAS shareholders’ register increases this attention. SAS also
often requires agreement from eight (of its many more) unions before moving ahead
with some major initiatives. This can make decision-making cumbersome and slow,
reducing its ability to react to changing circumstances.
Moreover, SAS’ ownership structure has probably been a disincentive to potential
acquirers of the airline, who would have to negotiate with all three states in addition to
the owners of the publicly traded shares.
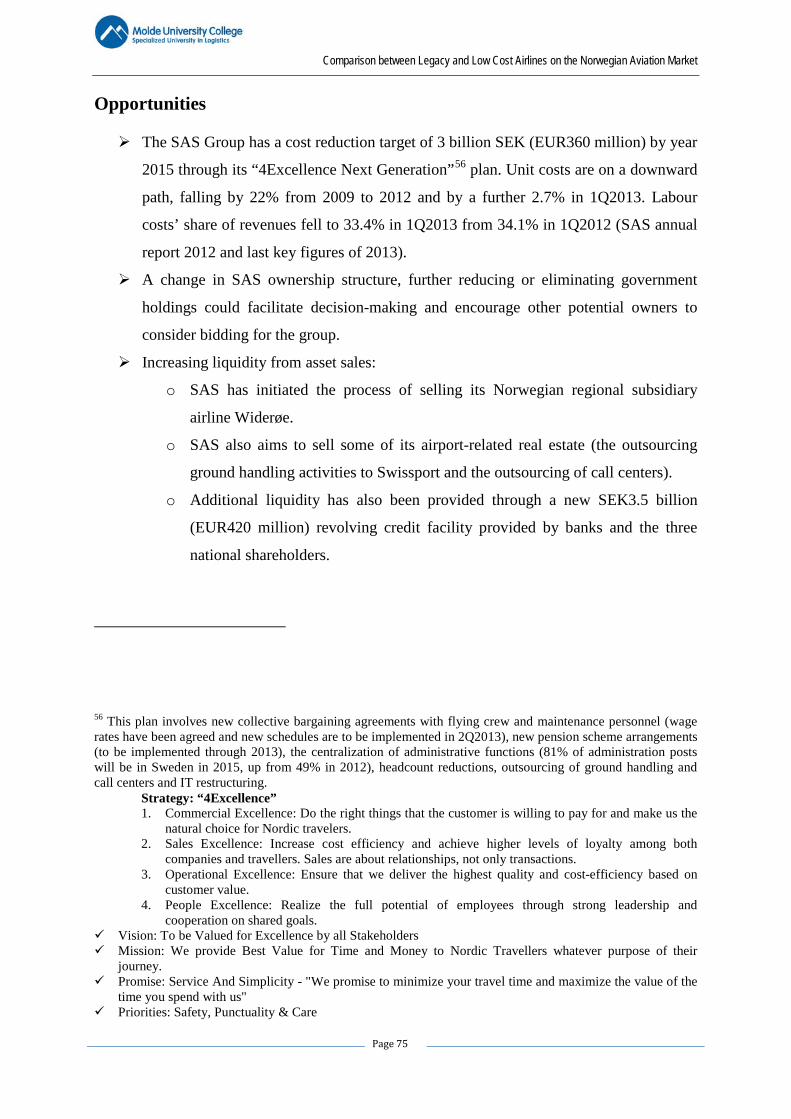
Comparison between Legacy and Low Cost Airlines on the Norwegian Aviation Market
Page 75
Opportunities
The SAS Group has a cost reduction target of 3 billion SEK (EUR360 million) by year
2015 through its “4Excellence Next Generation”56 plan. Unit costs are on a downward
path, falling by 22% from 2009 to 2012 and by a further 2.7% in 1Q2013. Labour
costs’ share of revenues fell to 33.4% in 1Q2013 from 34.1% in 1Q2012 (SAS annual
report 2012 and last key figures of 2013).
A change in SAS ownership structure, further reducing or eliminating government
holdings could facilitate decision-making and encourage other potential owners to
consider bidding for the group.
Increasing liquidity from asset sales:
o SAS has initiated the process of selling its Norwegian regional subsidiary
airline Widerøe.
o SAS also aims to sell some of its airport-related real estate (the outsourcing
ground handling activities to Swissport and the outsourcing of call centers).
o Additional liquidity has also been provided through a new SEK3.5 billion
(EUR420 million) revolving credit facility provided by banks and the three
national shareholders.
56 This plan involves new collective bargaining agreements with flying crew and maintenance personnel (wage rates have been agreed and new schedules are to be implemented in 2Q2013), new pension scheme arrangements (to be implemented through 2013), the centralization of administrative functions (81% of administration posts will be in Sweden in 2015, up from 49% in 2012), headcount reductions, outsourcing of ground handling and call centers and IT restructuring.
Strategy: “4Excellence” 1. Commercial Excellence: Do the right things that the customer is willing to pay for and make us the
natural choice for Nordic travelers. 2. Sales Excellence: Increase cost efficiency and achieve higher levels of loyalty among both
companies and travellers. Sales are about relationships, not only transactions. 3. Operational Excellence: Ensure that we deliver the highest quality and cost-efficiency based on
customer value. 4. People Excellence: Realize the full potential of employees through strong leadership and
cooperation on shared goals. Vision: To be Valued for Excellence by all Stakeholders Mission: We provide Best Value for Time and Money to Nordic Travellers whatever purpose of their
journey. Promise: Service And Simplicity - "We promise to minimize your travel time and maximize the value of the
time you spend with us" Priorities: Safety, Punctuality & Care
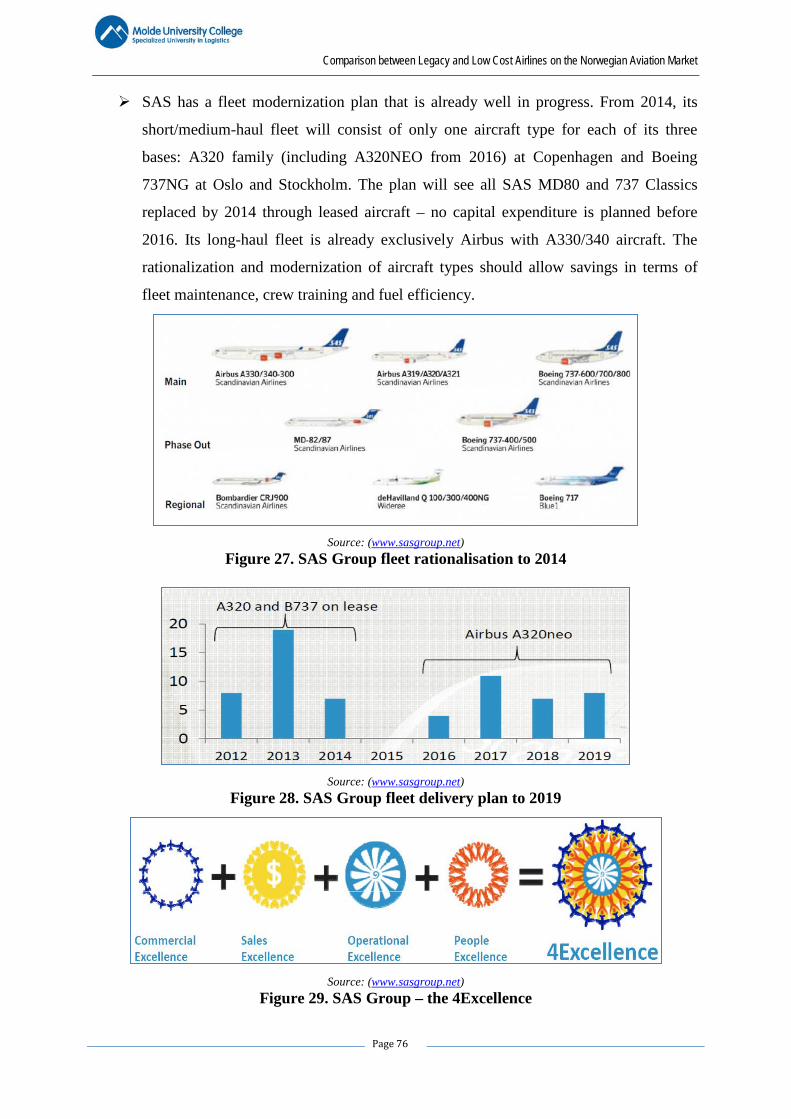
Comparison between Legacy and Low Cost Airlines on the Norwegian Aviation Market
Page 76
SAS has a fleet modernization plan that is already well in progress. From 2014, its
short/medium-haul fleet will consist of only one aircraft type for each of its three
bases: A320 family (including A320NEO from 2016) at Copenhagen and Boeing
737NG at Oslo and Stockholm. The plan will see all SAS MD80 and 737 Classics
replaced by 2014 through leased aircraft – no capital expenditure is planned before
2016. Its long-haul fleet is already exclusively Airbus with A330/340 aircraft. The
rationalization and modernization of aircraft types should allow savings in terms of
fleet maintenance, crew training and fuel efficiency.
Source: (www.sasgroup.net)
Figure 27. SAS Group fleet rationalisation to 2014
Source: (www.sasgroup.net)
Figure 28. SAS Group fleet delivery plan to 2019
Source: (www.sasgroup.net)
Figure 29. SAS Group – the 4Excellence
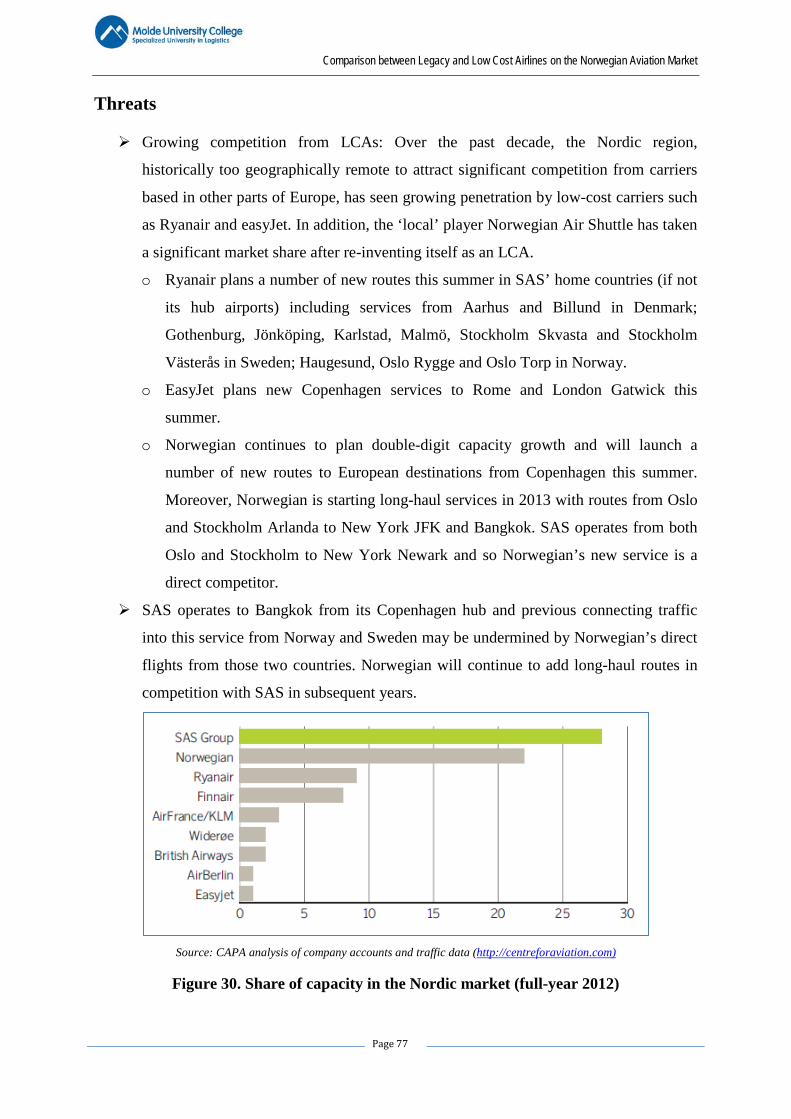
Comparison between Legacy and Low Cost Airlines on the Norwegian Aviation Market
Page 77
Threats
Growing competition from LCAs: Over the past decade, the Nordic region,
historically too geographically remote to attract significant competition from carriers
based in other parts of Europe, has seen growing penetration by low-cost carriers such
as Ryanair and easyJet. In addition, the ‘local’ player Norwegian Air Shuttle has taken
a significant market share after re-inventing itself as an LCA.
o Ryanair plans a number of new routes this summer in SAS’ home countries (if not
its hub airports) including services from Aarhus and Billund in Denmark;
Gothenburg, Jönköping, Karlstad, Malmö, Stockholm Skvasta and Stockholm
Västerås in Sweden; Haugesund, Oslo Rygge and Oslo Torp in Norway.
o EasyJet plans new Copenhagen services to Rome and London Gatwick this
summer.
o Norwegian continues to plan double-digit capacity growth and will launch a
number of new routes to European destinations from Copenhagen this summer.
Moreover, Norwegian is starting long-haul services in 2013 with routes from Oslo
and Stockholm Arlanda to New York JFK and Bangkok. SAS operates from both
Oslo and Stockholm to New York Newark and so Norwegian’s new service is a
direct competitor.
SAS operates to Bangkok from its Copenhagen hub and previous connecting traffic
into this service from Norway and Sweden may be undermined by Norwegian’s direct
flights from those two countries. Norwegian will continue to add long-haul routes in
competition with SAS in subsequent years.
Source: CAPA analysis of company accounts and traffic data (http://centreforaviation.com)
Figure 30. Share of capacity in the Nordic market (full-year 2012)
Comparison between Legacy and Low Cost Airlines on the Norwegian Aviation Market
Page 78
As with any labour-intensive service industry, airlines are vulnerable to labour unrest,
not only among their own staff, but also among key airport-based suppliers such as
ATC, ground handling, security and ground transport. For SAS, labor costs are a
higher percentage of total costs and employee costs per employee are higher than for
any other significant European airline.
Although its eight key unions have agreed to labor productivity improvement
measures under the 4Excellence Next Generation plan, the extent of change required
cannot be underestimated and any deterioration in industrial relations would be a
serious threat to the turnaround plan.
In an industry that remains highly sensitive to economic fortunes, all airlines are
vulnerable to continued economic sluggishness. In addition, air travel, regardless of
the carrier, is vulnerable to geopolitical events and natural phenomena such as
earthquakes and volcanic ash disruption.
The price of jet fuel, which accounts for more than one fifth of SAS’ costs, is highly
volatile. This reflects not only the unpredictable price of crude oil, but also variations
in the crack spread, or refinery premium. In addition, 31% of its costs, but only 7% of
revenues, are in USD, making it vulnerable to a strengthening of the dollar against the
Scandinavian currencies.
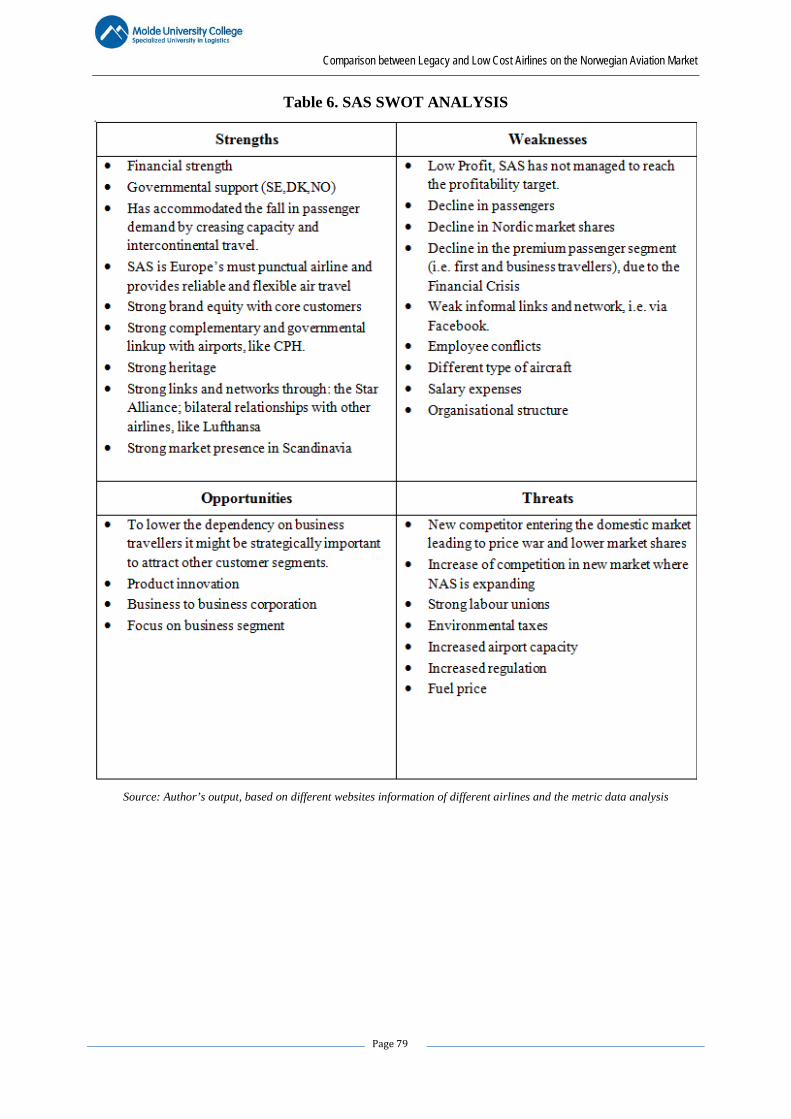
Comparison between Legacy and Low Cost Airlines on the Norwegian Aviation Market
Page 79
Table 6. SAS SWOT ANALYSIS
Source: Author’s output, based on different websites information of different airlines and the metric data analysis
Comparison between Legacy and Low Cost Airlines on the Norwegian Aviation Market
Page 80
Chapter 7: Conclusions
LCAs have expanded rapidly during the last decade. On the local Norwegian market NAS has
increased its capacity by 383 % from 2006 to 2012, while SAS has decreased its production
capacity by 40% for the same period. Since 2006, an increasing trend in passengers’ growth is
spotted for NAS - from 5.1 million passengers in 2006 to 17.7 million in 2012. Over the same
period SAS has experienced a decline in the passengers’ growth from 43.14 million in 2006 to
28.05 million in 2012.
The reason for the positive development of NAS is based on cost reduction and higher
efficiency mainly on the domestic and European market. Compared to NAS, SAS has put its
efforts into international markets and the business segment where they could face with less
competition. This could be seen from SAS highest yield in 2012, indicating that the company
has charged higher ticket prices than NAS, which has generated a 45% less yield than SAS in
2012.
However, the future of NAS as a successful representative of a LCA seems promising. NAS
strategy is based on growth, resulting in a total order of 222 aircraft. The company goal is to
achieve success of the low cost model in the international flights. It is still not clear what will
be the result of such a model, but the company is coming to meet the strong competition of
both LAs (SAS) and LCAs (Easy Jet, Ryanair). The better established network connections
for the international flights give LAs a better competitive advantage compared to LCAs,
which are trying to enter this market. The governmental support for many of the LAs is also
an important benefit.
It seems that NAS competitive advantages for expansion in the international market will be
reduction the fuel consumption through the use of a new generation aircrafts and through the
reduction of the personnel costs by moving some of the company’s activities to countries with
cheaper labour such as Ireland, Spain and Thailand.
At the same time, SAS is struggling with a heavy organisational structure and strong labour
unions. As of 2012, NAS is in the top with a total of 6 400 passenger per employee. In the
recent years and in line with the implementations of the Core SAS program, SAS has
gradually decreased its number of employees. This has resulted in a higher level of
productivity where the company has moved from a 1 450 passengers per employee in 2006 to
1 900 in 2012.
Comparison between Legacy and Low Cost Airlines on the Norwegian Aviation Market
Page 81
SAS will try to increase its competitive advantage by developing a better organisational
structure (4-Excellence strategy), offering better services and by increasing its business
segment customers.
In the same time the boundary between NAS and the SAS seems more and more blurred.
During 2012 NAS offered better service to its customers by introducing free of charge Wi-Fi
on all its aircrafts, SAS in its turn won the price for most punctual airline of 2012.
It seems that the competition between SAS and Norwegian is growing stronger and stronger
every year. As of today, the outcome of this competition is not easy to be predicted. The only
fact which is evident is that the rivalry between the two companies is beneficial to the
customers, who can expect better prices and services.
Comparison between Legacy and Low Cost Airlines on the Norwegian Aviation Market
Page 82
References
[1] Alamdari F., Fagan S., (2005)
“Impact of the Adherence to the Original Low‐Cost Model on the Profitability of Low‐Cost
Airlines”.
http://www.tandfonline.com/doi/abs/10.1080/01441640500038748
[2] Annual Analyses of the EU Air Transport Market report – EU Commission (2011) http://ec.europa.eu/transport/modes/air/internal_market/observatory_market/doc/annual-2011.pdf
[3] Annual Analyses of the EU Air Transport Market report – EU Commission (2008) http://ec.europa.eu/transport/modes/air/observatory_market/doc/annual_2008_summary.pdf
[4] Annual Report – IATA (2011) http://www.iata.org/pressroom/Documents/annual-report-2011.pdf.
[5] Annual Report – NAS (2012)
http://annualreport.norwegian.no/2012/the_year_in_brief.
[6] Annual Report – SAS (2012) http://www.sasgroup.net/SASGROUP_IR/CMSForeignContent/2012eng.pdf.
[7] Berry, S. (1990)
“Airport Presence as Product Differentiation”, American Economic Review.
[8] Brüggen, A., & Klose, L. (2010)
“How fleet commonality influences low-cost airline operating performance: Empirical
evidence”. Journal of Air Transport Management.
[9] CAPA – Centre for Aviation - Norwegian Air Shuttle SWOT Analysis http://centreforaviation.com/analysis/norwegian-air-shuttle-swot-analysis-scandinavias-largest-lcc-
reports-most-profitable-2q-in-its-his-8530.
[10] CAPA – Centre for Aviation - SAS SWOT Analysis
http://centreforaviation.com/analysis/sas-swot-final-call-to-establish-a-sustainable-scandinavian-
airlines-100695.
[11] Lindblom C.E., (1959) “The Science of "Muddling Through” http://faculty.washington.edu/mccurdy/SciencePolicy/Lindblom%20Muddling%20Through.pdf
[12] Combe N., (2004)
“The Conquest of the Sky by Low-Cost Carriers”,
[13] De Groote, P. (2005)
Comparison between Legacy and Low Cost Airlines on the Norwegian Aviation Market
Page 83
“The Success Story of European Low-Cost Carriers in a Changing Air world” http://www.lboro.ac.uk/gawc/rb/rb174.html
[14] Doganis, R. (2002)
“Flying off Course”.
[15] Doganis, R. (2006)
“Airline Business in the 21st Century”.
[16] Franke, M., & John, F. (2011)
“What comes next after recession?” Journal of Air Transport Management.
[17] Gilbert, D., Child, D. & Bennett, M. (2001)
“A qualitative study of the current practices of ‘no-frills’ airlines operating in the UK”.
Journal of Vacation Marketing.
[18] Harvey, G., & Turnbull, P. (2010)
“On the Go: Walking the high road at a low cost airline”. The International Journal of
Human Resource Management. http://ec.europa.eu/transport/modes/air/observatory_market/doc/annual_2008.pdf
[19] Hunter, L. (2006)
“Low Cost Airlines: Business Model and Employment Relations”. European Management
Journal.
[20] Kaibuchi, K.; Kuroda, S.; Fukata, M.; Nakagawa, M.; Alamdari, F. (1999)
“Airline in-flight entertainment: the passengers' perspective. Journal of Air Transport
Management”.http://www.ingentaconnect.com/content/els/09696997/1999/00000005/00000004/art
00014
[21] Kjærnes K & Qvist C (2011)
“Valuations of Norwegian Air Shuttle ASA” , Copenhagen Business School.
[22] Ko, Y., & Hwang, H. (2010)
“Management strategy of full-service carrier and its subsidiary low cost carrier”. The
International Journal of Advanced Manufacturing Technology.
[23] Koenigsberg, O., Muller, E., & Vilcassim, N. (2007)
“easy Jet pricing strategy: Should low-fare airlines offer last-minute deals?” http://www1.gsb.columbia.edu/mygsb/faculty/research/pubfiles/2810/easyJetPricingOctober2007fin
al.pdf.
Comparison between Legacy and Low Cost Airlines on the Norwegian Aviation Market
Page 84
[24] Ludvigsen J. (1993)
“Liberalization of Market Entry for Norwegian Regional Airlines”, Transportation Journal. http://www.highbeam.com/doc/1G1-14380785.html.
[25] Marmorstein, H., Rossomme, J. Sarel, D. (2003)
“Unleashing the Power of Yield Management in the Internet Era: opportunities and
challenges”. California Management Review.
[26] Oum, T. H., Fu, X., & Zhang, A. (2009)
“Air transport liberalization and its impacts on airline competition and air passenger
traffic”. International Transport Forum.
[27] Oum, T. H., Zhang, A., & Zhang, Y. (1995)
“Airline network rivalry” Canadian Journal of Economics. https://www.u-
cursos.cl/ingenieria/2013/1/CI5310/1/material_docente/bajar?id_material=740623
[28] Porter, M. E. (1985)
Competitive advantage: Creating and sustaining superior performance.
[29] Shaw S., (2007)
“Airline Marketing and Management”.
[30] Sørensen T. , (2005)
“An analysis of the European low fare airline industry- with focus on Ryanair” , Aarhus
School of Business
[31] Vårbo K. & Lindseth G., (2011)
“Strategic analysis and evaluation of Norwegian Air Shuttle ASA”, Copenhagen Business
School.
[32] Vasigh B., Fleming K and Tacker T, (2008)
“Introduction to air transport economics: from theory to applications”.
[33] Wall, R., Shannon, D., Compart, A., & Mathews, N. (2009)
“Yielding to Reality”. Aviation Week & Space Technology.
[34] www.airfranceklm-finance.com
[35] www.avinor.no
[36] www.norwegian.no
[37] www.sasgroup.net

Comparison between Legacy and Low Cost Airlines on the Norwegian Aviation Market
Page 85
[38] http://en.wikipedia.org/wiki/Go_(airline)
[39] www.wikipedia.org
[40] www.iata.org


