Embed Size (px)
Citation preview
Citation: Divate, N.R.; Huang, P.-J.;
Chen, G.-H.; Chung, Y.-C.
Construction of Recombinant
Saccharomyces cerevisiae with Ethanol
and Aldehydes Tolerance via
Overexpression of Aldehyde
Reductase. Microorganisms 2022, 10,
850. https://doi.org/10.3390/
microorganisms10050850
Academic Editor: Matthias Sipiczki
Received: 7 March 2022
Accepted: 15 April 2022
Published: 20 April 2022
Publisher’s Note: MDPI stays neutral
with regard to jurisdictional claims in
published maps and institutional affil-
iations.
Copyright: © 2022 by the authors.
Licensee MDPI, Basel, Switzerland.
This article is an open access article
distributed under the terms and
conditions of the Creative Commons
Attribution (CC BY) license (https://
creativecommons.org/licenses/by/
4.0/).
microorganisms
Communication
Construction of Recombinant Saccharomyces cerevisiae withEthanol and Aldehydes Tolerance via Overexpression ofAldehyde ReductaseNileema R. Divate 1, Pei-Ju Huang 1, Gen-Hung Chen 2 and Yun-Chin Chung 1,*
1 Department of Food and Nutrition, Providence University, Taichung 43301, Taiwan;[email protected] (N.R.D.); [email protected] (P.-J.H.)
2 Department of Cosmetic Science, Providence University, Taichung 43301, Taiwan; [email protected]* Correspondence: [email protected]; Tel.: +886-4-2632-8001
Abstract: Furfural and hydroxy-methyl-furfural (HMF) are produced by lignocellulosic biomassduring heat or acid pretreatment and are toxic to yeast. Aldehyde reductase is the main enzymeto reduce furfural and HMF. To improve the conversion efficiency of lignocellulosic biomass intoethanol, we constructed Saccharomyces cerevisiae with overexpression of aldehyde reductase (encodedby ari1). The gene of aldehyde reductase (encoded by ari1) was cloned via polymerase chain reaction(PCR) and ligated with the expression vector pGAPZαC. Western blot coupled with anti-His tagconfirmed overexpression of the ari1 gene. The growth curves of the wild and ari1-overexpressedstrain in the YPD medium were found to be almost identical. Compare to the ari1-overexpressedstrain, the wild strain showed a longer doubling time and lag phase in the presence of 20 mM furfuraland 60 mM HMF, respectively. The real-time PCR results showed that furfural was much more potentthan HMF in stimulating ari1 expression, but the cell growth patterns showed that 60 mM HMF wasmore toxic to yeast than 20 mM furfural. S. cerevisiae with ari1 overexpression appeared to conferhigher tolerance to aldehyde inhibitors, thereby increasing the growth rate and ethanol productioncapacity of S. cerevisiae in an aldehyde-containing environment.
Keywords: Saccharomyces cerevisiae; furfural; hydroxy-methyl-furfural; aldehyde reductase; ethanolproduction
1. Introduction
Based on the concept of low-cost waste utilization, lignocellulosic biomass and agri-cultural residues are ideal raw materials for bioethanol production [1,2]. The productionof ethanol from lignocellulosic biomass involves the main operations of pretreatment,hydrolysis, fermentation and distillation [3]. Acid hydrolysis or alkali swelling combinedwith heating is the key technology used to destroy the cellulose crystal structure [4]. Pre-treatment of the biomass with acid hydrolysis will produce furfural or hydroxymethylfurfural (HMF), which is the most effective and representative inhibitory compound thatinterferes with subsequent fermentation [5,6]. After acid/heat treatment, furfural and HMFare formed from the dehydration of pentose and hexose sugars, respectively [7,8]. Researchhas shown that ethanol productivity in S. cerevisiae can be reduced under 30 mM furfuralor 60 mM HMF [9]. These inhibitors hinder yeast growth by disrupting cell walls andmembranes, reducing enzyme activity, damaging DNA and inhibiting protein and RNAsynthesis [9].
Saccharomyces cerevisiae, a species of yeast, has been traditionally used for brewing and fuelethanol production. Additionally, the aldehyde reductase originally present in S. cerevisiae canreduce furfural and HMF to furfuryl alcohol [10,11] and 2,5-bis-hydroxymethylfuran [5], respec-tively. However, in high furfural or HMF environments, S. cerevisiae growth is inhibited and,when furfural and HMF are reduced to sufficiently low concentrations, cell growth recovers
Microorganisms 2022, 10, 850. https://doi.org/10.3390/microorganisms10050850 https://www.mdpi.com/journal/microorganisms
Microorganisms 2022, 10, 850 2 of 12
and ethanol production resumes until fermentation is complete [12,13]. Overexpressionof the dehydrogenase/reductase genes adh6 (encodes for NADPH-dependent AlcoholDehydrogenase 6), adh7 (encodes for NADPH-dependent Alcohol Dehydrogenase 7), ari1(encodes for NADPH-dependent aldehyde reductase) and ald6 (encodes for Magnesium-activated aldehyde dehydrogenase) increase furfural and/or HMF reduction and host S.cerevisiae strain tolerance to inhibitors [14–17].
Liu and Moon [11] discovered a new aldehyde reductase gene, ari1/YGL157W, fromS. cerevisiae, NRRL Y-12632, which is a NADPH-dependent aldehyde reduction enzyme(Saccharomyces Genome Database http://www.yeastgenome.org/; accessed on 10 October2021) with reduction activity for 14 aldehydes. The optimum temperature for this enzyme’sactivity is 25 ◦C, the optimum pH is 7.0 and the protein molecular weight is 38 kDa.This enzyme is an intermediate member of the short-chain dehydrogenase/reductasesuperfamily and catalyzes Tyr169-XXX-Lys173, whose catalytic position requires fouramino acids: Asn106, Ser131, Tyr169 and Lys173. The cofactor binding site for this enzymeis Gly11-XX-Gly14-XX-Ala17 near the N-terminal position [10,11].
In the present study, ari1 was overexpressed in S. cerevisiae BCRC 21685. The engi-neered strain exhibited higher tolerance to aldehyde inhibitors, thereby enhancing thegrowth rate of S. cerevisiae and its ethanol production capacity. We investigated the growthpatterns and degradation capacity of wild and engineered strains in YPD broth supple-mented with furfural (20 mM) and HMF (60 mM). The engineered strains constructed inthis study exhibited better responses at higher concentrations of HMF (60 mM).
2. Materials and Methods2.1. Strains, Vectors and Media
S. cerevisiae (BCRC 21685) was purchased from the Bioresource Collection and ResearchCenter, Food Industry Research and Development Institution, Shinchu, Taiwan. Escherichiacoli TOP10F’ and the expression vector pGAPZαC were purchased from Novagen Inc.(Madison, WI, USA) and Invitrogen (Carlsbad, CA, USA) and served as the cloning hostcell and expression vector, respectively.
Parent E. coli TOP10F’ and the Zeocin-resistant transformant were cultured, respec-tively, in a Luria–Bertani (LB) medium (10 g/L peptone, 10 g/L NaCl and 5 g/L yeastextract) and low salt Zeocin-LB plates (10 g/L peptone, 5 g/L NaCl, 5 g/L yeast extractand 25 mg/L Zeocin) at 37 ◦C. S. cerevisiae was maintained in a YPD medium (10 g/L yeastextract, 20 g/L peptone, 20 g/L dextrose) at 28 ◦C and 100 mg/L of Zeocin (InvitrogenCorp., Carlsbad, CA, USA) was used to select the engineered yeast. Vectors in the E. coliTOP10F’ and yeast genomic DNA were extracted using a Gene-spin miniprep plasmidpurification kit (Protech Technology, Taipei, Taiwan) and Genomic DNA purification kit(BioKit, Miaoli, Taiwan).
2.2. Primers
Table 1 lists the primers used for ari1 cloning, verification of the ari1 gene insertionand quantitative real-time PCR in this study. The nucleotide sequences of the ari1 gene(GenBank ID: NM_001181022.3) and taf10 (GenBank ID: NM_001180474.3) (housekeepinggenes used as the internal control) from S. cerevisiae were acquired from the NCBI website(National Center for Biotechnology Information, Bethesda, MD, USA).
2.3. Genetic Manipulation
The expression vector pGAPZαC carrying the ari1 gene (pGAPZC-ari1) was con-structed according to our previous study [12]. After being linearized with the AvrII enzyme,pGAPZC-ari1 was transformed via electroporation according to the manufacturer’s in-structions (MicroPulser electroporation apparatus, Bio-Rad Laboratories, Hercules, CA,USA). Zeocin-resistant colonies were selected and confirmed with PCR. The yeast carryingpGAPZC-ari1 was named SCA, while the parent S. cerevisiae was named SC.
Microorganisms 2022, 10, 850 3 of 12
Table 1. Oligonucleotides used in this study.
Primer Sequence 5′-3′ Purpose
Forward
Microorganisms 2022, 9, x FOR PEER REVIEW 3 of 13
Table 1. Oligonucleotides used in this study.
Primer Sequence 5′-3′ Purpose
Forward 5′TCGTTCGAAAAAATGGCGACTACTGATACCACTGTTTTCGTTTCTG-3′
ari1 cloning
Reverse 5′TCACTCGAGTTAGGCTTCATTTTGAACTTCTAACATTTGCGCCGC-3′
VF TTCGAAAAAATGGGTACTAC Verification of ari1 gene inser-tion VR AGTGATGGTGATGGTGATGG
qAri1-F TTGTGCTACACACTGCCTCC
Quantitative real-time PCR qAri1-R CGTTCACTGCAGGGGTTAGT qTaf10-F TCCAGGATCAGGTCTTCCGT qTaf10-R TGTCCTTGCAATAGCTGCCT
Underlined text indicates BstB1 and Xho1 recognition sequences in the forward and reverse primers, respectively; highlighted text indicates the Kozak consensus sequence; ATG and TTA represent the start and stop codons.
2.3. Genetic Manipulation The expression vector pGAPZαC carrying the ari1 gene (pGAPZC-ari1) was con-
structed according to our previous study [12]. After being linearized with the AvrII en-zyme, pGAPZC-ari1 was transformed via electroporation according to the manufacturer’s instructions (MicroPulser electroporation apparatus, Bio-Rad Laboratories, Hercules, CA, USA). Zeocin-resistant colonies were selected and confirmed with PCR. The yeast carry-ing pGAPZC-ari1 was named SCA, while the parent S. cerevisiae was named SC.
2.4. Expression of Recombinant Protein Yeast was incubated in a YPD broth with shaking (150 rpm) at 30 °C for 9 h and
pellets were collected for protein extraction [13]. Proteins were separated using SDS-PAGE according to Laemmli [14] and the target protein (aldehyde reductase) probed with the Anti-His tag was visualized with Western blotting [12].
2.5. Quantification of Gene Expression via Real-Time Reverse Transcription PCR (RT-qPCR) To evaluate the ari1 expression level under the pressure of furfural or HMF, yeast
was cultured in fresh YPD broth (100 mL) containing 20 mM furfural or 60 mM HMF at 30 °C with shaking (150 rpm).
At the indicated time intervals, cells were collected and centrifuged at 10,000× g for 5 min. TRIzol reagent was applied to extract the total RNA (Life Technologies, Inc., Grand Island, NY, USA). An iScriptTM cDNA synthesis kit (BioRad, Hercules, CA, USA) was used to reverse transcribe RNA to DNA. Real-time PCR was performed with iQ SYBR Green Supermix (BioRad, Hercules, CA, USA) and quantified using a MiniOpticonTM system (BioRad, Hercules, CA, USA). Amplifications were performed under the following thermo-cycle conditions: pre-denaturation at 95 °C/3 min, 40 cycles at 95 °C/10 s and 57.8 °C/30 s and final extension at 95 °C/10 s. The gene expression level was analyzed using the BioRad CFX manager 2.1 software (BioRad, Hercules, CA, USA) and presented as the ratio of ari1 to taf10 [15].
2.6. Microorganism Growth The growth of yeast was determined by measuring the OD600 or Colony Forming
Units with YPD broth or YPD agar at the relevant time intervals.
ari1 cloning
Reverse
Microorganisms 2022, 9, x FOR PEER REVIEW 3 of 13
Table 1. Oligonucleotides used in this study.
Primer Sequence 5′-3′ Purpose
Forward 5′TCGTTCGAAAAAATGGCGACTACTGATACCACTGTTTTCGTTTCTG-3′
ari1 cloning
Reverse 5′TCACTCGAGTTAGGCTTCATTTTGAACTTCTAACATTTGCGCCGC-3′
VF TTCGAAAAAATGGGTACTAC Verification of ari1 gene inser-tion VR AGTGATGGTGATGGTGATGG
qAri1-F TTGTGCTACACACTGCCTCC
Quantitative real-time PCR qAri1-R CGTTCACTGCAGGGGTTAGT qTaf10-F TCCAGGATCAGGTCTTCCGT qTaf10-R TGTCCTTGCAATAGCTGCCT
Underlined text indicates BstB1 and Xho1 recognition sequences in the forward and reverse primers, respectively; highlighted text indicates the Kozak consensus sequence; ATG and TTA represent the start and stop codons.
2.3. Genetic Manipulation The expression vector pGAPZαC carrying the ari1 gene (pGAPZC-ari1) was con-
structed according to our previous study [12]. After being linearized with the AvrII en-zyme, pGAPZC-ari1 was transformed via electroporation according to the manufacturer’s instructions (MicroPulser electroporation apparatus, Bio-Rad Laboratories, Hercules, CA, USA). Zeocin-resistant colonies were selected and confirmed with PCR. The yeast carry-ing pGAPZC-ari1 was named SCA, while the parent S. cerevisiae was named SC.
2.4. Expression of Recombinant Protein Yeast was incubated in a YPD broth with shaking (150 rpm) at 30 °C for 9 h and
pellets were collected for protein extraction [13]. Proteins were separated using SDS-PAGE according to Laemmli [14] and the target protein (aldehyde reductase) probed with the Anti-His tag was visualized with Western blotting [12].
2.5. Quantification of Gene Expression via Real-Time Reverse Transcription PCR (RT-qPCR) To evaluate the ari1 expression level under the pressure of furfural or HMF, yeast
was cultured in fresh YPD broth (100 mL) containing 20 mM furfural or 60 mM HMF at 30 °C with shaking (150 rpm).
At the indicated time intervals, cells were collected and centrifuged at 10,000× g for 5 min. TRIzol reagent was applied to extract the total RNA (Life Technologies, Inc., Grand Island, NY, USA). An iScriptTM cDNA synthesis kit (BioRad, Hercules, CA, USA) was used to reverse transcribe RNA to DNA. Real-time PCR was performed with iQ SYBR Green Supermix (BioRad, Hercules, CA, USA) and quantified using a MiniOpticonTM system (BioRad, Hercules, CA, USA). Amplifications were performed under the following thermo-cycle conditions: pre-denaturation at 95 °C/3 min, 40 cycles at 95 °C/10 s and 57.8 °C/30 s and final extension at 95 °C/10 s. The gene expression level was analyzed using the BioRad CFX manager 2.1 software (BioRad, Hercules, CA, USA) and presented as the ratio of ari1 to taf10 [15].
2.6. Microorganism Growth The growth of yeast was determined by measuring the OD600 or Colony Forming
Units with YPD broth or YPD agar at the relevant time intervals.
VF TTCGAAAAAATGGGTACTAC Verification of ari1 gene insertionVR AGTGATGGTGATGGTGATGG
qAri1-F TTGTGCTACACACTGCCTCCQuantitative real-time PCRqAri1-R CGTTCACTGCAGGGGTTAGT
qTaf10-F TCCAGGATCAGGTCTTCCGTqTaf10-R TGTCCTTGCAATAGCTGCCT
Underlined text indicates BstB1 and Xho1 recognition sequences in the forward and reverse primers, respectively;highlighted text indicates the Kozak consensus sequence; ATG and TTA represent the start and stop codons.
2.4. Expression of Recombinant Protein
Yeast was incubated in a YPD broth with shaking (150 rpm) at 30 ◦C for 9 h andpellets were collected for protein extraction [13]. Proteins were separated using SDS-PAGEaccording to Laemmli [14] and the target protein (aldehyde reductase) probed with theAnti-His tag was visualized with Western blotting [12].
2.5. Quantification of Gene Expression via Real-Time Reverse Transcription PCR (RT-qPCR)
To evaluate the ari1 expression level under the pressure of furfural or HMF, yeast wascultured in fresh YPD broth (100 mL) containing 20 mM furfural or 60 mM HMF at 30 ◦Cwith shaking (150 rpm).
At the indicated time intervals, cells were collected and centrifuged at 10,000× g for5 min. TRIzol reagent was applied to extract the total RNA (Life Technologies, Inc., GrandIsland, NY, USA). An iScriptTM cDNA synthesis kit (BioRad, Hercules, CA, USA) wasused to reverse transcribe RNA to DNA. Real-time PCR was performed with iQ SYBRGreen Supermix (BioRad, Hercules, CA, USA) and quantified using a MiniOpticonTMsystem (BioRad, Hercules, CA, USA). Amplifications were performed under the followingthermo-cycle conditions: pre-denaturation at 95 ◦C/3 min, 40 cycles at 95 ◦C/10 s and57.8 ◦C/30 s and final extension at 95 ◦C/10 s. The gene expression level was analyzedusing the BioRad CFX manager 2.1 software (BioRad, Hercules, CA, USA) and presentedas the ratio of ari1 to taf10 [15].
2.6. Microorganism Growth
The growth of yeast was determined by measuring the OD600 or Colony FormingUnits with YPD broth or YPD agar at the relevant time intervals.
2.7. Furfural and HMF Reduction
In a 500 mL baffled Erlenmeyer flask, one mL of log-growth culture was adjusted to anOD600 value of 0.3 and added to 100 mL of YPD broth containing 20 mM furfural or 60 mMHMF, and incubated at 30 ◦C with shaking at 150 rpm. After centrifugation at 10,000× gfor 10 min, the supernatant was collected and filtered through a 0.45 mm membrane.To determine furfural and HMF concentrations, the HPLC system was equipped with arefractive index detector and ICSep ICE-COREGEL-87H3 column (Transgenomic, Omaha,NB, USA). The mobile phase was 5 mM H2SO4 with a flow rate of 0.8 mL/min [16].The reduction of furfural and HMF was expressed as the decrease in furfural and HMFconcentrations in the growth broth over time.
2.8. Ethanol Productivity
The log-growth yeast (1 mL, 3 × 10⁷ cells/mL) was inoculated into 100 mL YP broth(10 g/L yeast extract, 20 g/L peptone) containing 10% glucose. The cells were incubatedstatically at 30 ◦C and 1 mL of liquid was withdrawn at each indicated time interval. Gaschromatography was performed according to the procedure in [17].
Microorganisms 2022, 10, 850 4 of 12
3. Results3.1. Molecular Characteristics
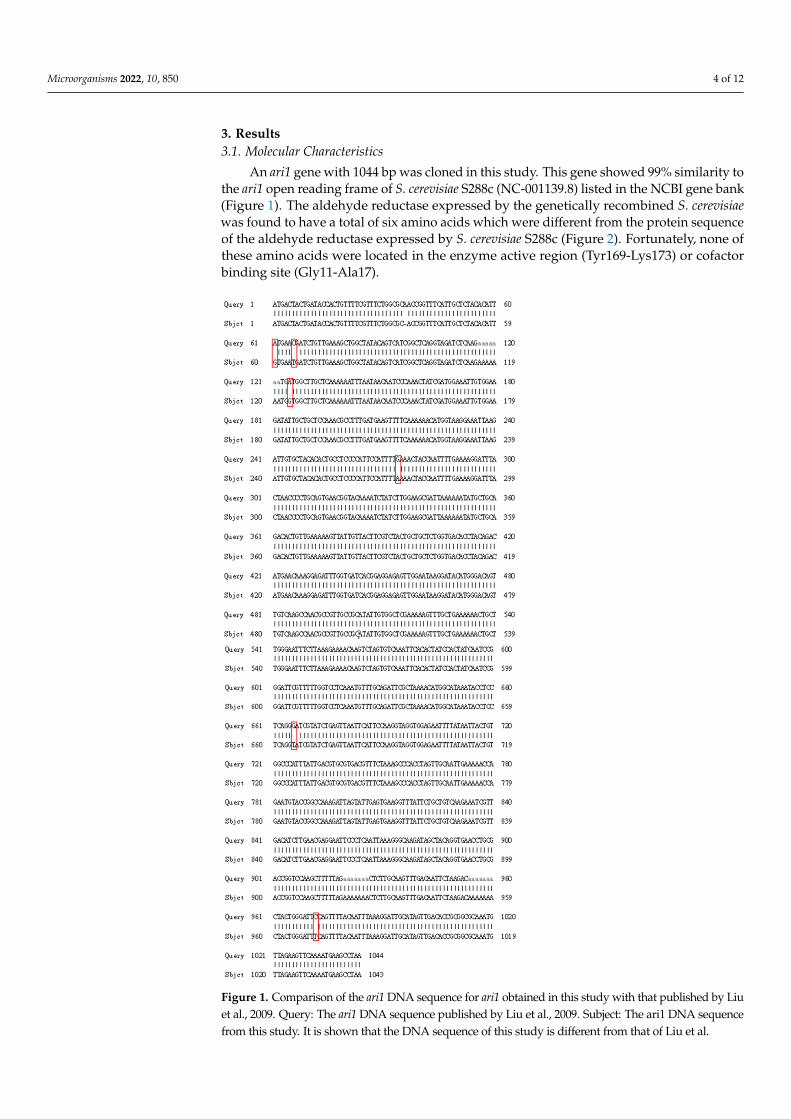
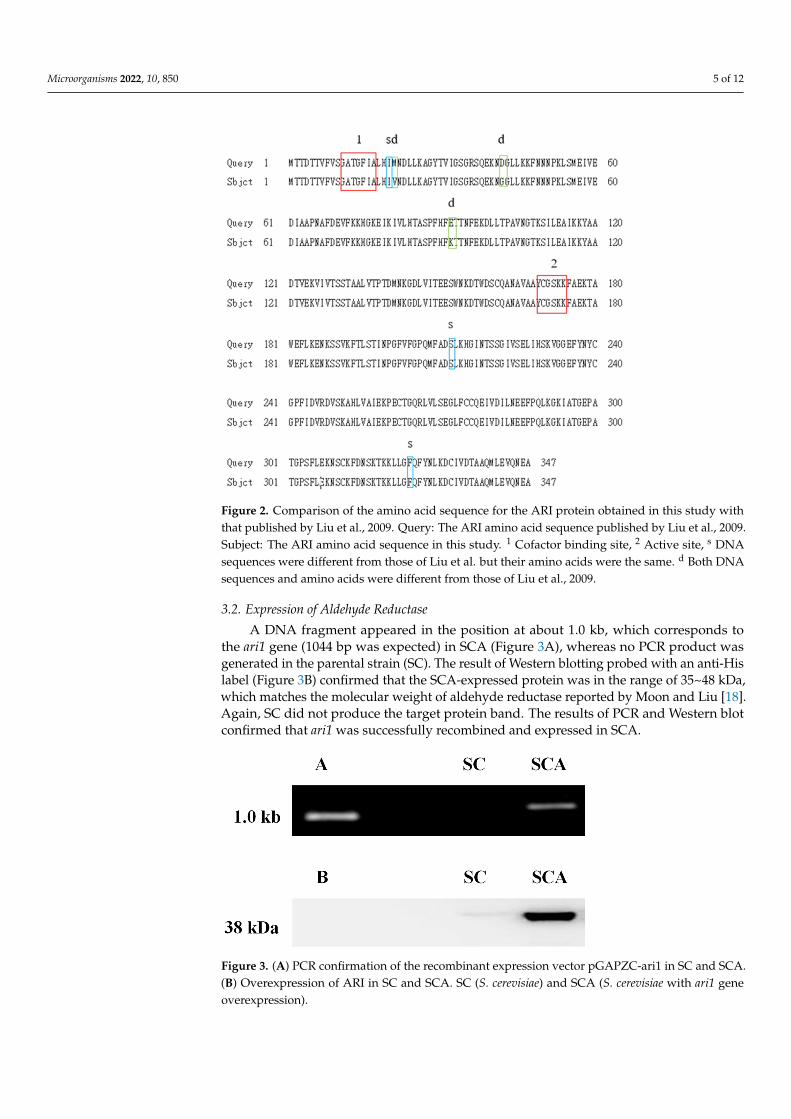
An ari1 gene with 1044 bp was cloned in this study. This gene showed 99% similarity tothe ari1 open reading frame of S. cerevisiae S288c (NC-001139.8) listed in the NCBI gene bank(Figure 1). The aldehyde reductase expressed by the genetically recombined S. cerevisiaewas found to have a total of six amino acids which were different from the protein sequenceof the aldehyde reductase expressed by S. cerevisiae S288c (Figure 2). Fortunately, none ofthese amino acids were located in the enzyme active region (Tyr169-Lys173) or cofactorbinding site (Gly11-Ala17).
Microorganisms 2022, 9, x FOR PEER REVIEW 5 of 13
Figure 1. Comparison of the ari1 DNA sequence for ari1 obtained in this study with that published by Liu et al., 2009. Query: The ari1 DNA sequence published by Liu et al., 2009. Subject: The ari1 DNA sequence from this study. It is shown that the DNA sequence of this study is different from that of Liu et al.
Figure 1. Comparison of the ari1 DNA sequence for ari1 obtained in this study with that published by Liuet al., 2009. Query: The ari1 DNA sequence published by Liu et al., 2009. Subject: The ari1 DNA sequencefrom this study. It is shown that the DNA sequence of this study is different from that of Liu et al.
Microorganisms 2022, 10, 850 5 of 12Microorganisms 2022, 9, x FOR PEER REVIEW 6 of 13
Figure 2. Comparison of the amino acid sequence for the ARI protein obtained in this study with that published by Liu et al., 2009. Query: The ARI amino acid sequence published by Liu et al., 2009. Subject: The ARI amino acid sequence in this study. 1 Cofactor binding site, 2 Active site, s DNA sequences were different from those of Liu et al. but their amino acids were the same. d Both DNA sequences and amino acids were different from those of Liu et al., 2009.
3.2. Expression of Aldehyde Reductase A DNA fragment appeared in the position at about 1.0 kb, which corresponds to the
ari1 gene (1044 bp was expected) in SCA (Figure 3A), whereas no PCR product was gen-erated in the parental strain (SC). The result of Western blotting probed with an anti-His label (Figure 3B) confirmed that the SCA-expressed protein was in the range of 35~48 kDa, which matches the molecular weight of aldehyde reductase reported by Moon and Liu [18]. Again, SC did not produce the target protein band. The results of PCR and Western blot confirmed that ari1 was successfully recombined and expressed in SCA.
Figure 3. (A) PCR confirmation of the recombinant expression vector pGAPZC-ari1 in SC and SCA. (B) Overexpression of ARI in SC and SCA. SC (S. cerevisiae) and SCA (S. cerevisiae with ari1 geneoverexpression).
Figure 2. Comparison of the amino acid sequence for the ARI protein obtained in this study withthat published by Liu et al., 2009. Query: The ARI amino acid sequence published by Liu et al., 2009.Subject: The ARI amino acid sequence in this study. 1 Cofactor binding site, 2 Active site, s DNAsequences were different from those of Liu et al. but their amino acids were the same. d Both DNAsequences and amino acids were different from those of Liu et al., 2009.
3.2. Expression of Aldehyde Reductase
A DNA fragment appeared in the position at about 1.0 kb, which corresponds tothe ari1 gene (1044 bp was expected) in SCA (Figure 3A), whereas no PCR product wasgenerated in the parental strain (SC). The result of Western blotting probed with an anti-Hislabel (Figure 3B) confirmed that the SCA-expressed protein was in the range of 35~48 kDa,which matches the molecular weight of aldehyde reductase reported by Moon and Liu [18].Again, SC did not produce the target protein band. The results of PCR and Western blotconfirmed that ari1 was successfully recombined and expressed in SCA.
Microorganisms 2022, 9, x FOR PEER REVIEW 6 of 13
Figure 2. Comparison of the amino acid sequence for the ARI protein obtained in this study with that published by Liu et al., 2009. Query: The ARI amino acid sequence published by Liu et al., 2009. Subject: The ARI amino acid sequence in this study. 1 Cofactor binding site, 2 Active site, s DNA sequences were different from those of Liu et al. but their amino acids were the same. d Both DNA sequences and amino acids were different from those of Liu et al., 2009.
3.2. Expression of Aldehyde Reductase A DNA fragment appeared in the position at about 1.0 kb, which corresponds to the
ari1 gene (1044 bp was expected) in SCA (Figure 3A), whereas no PCR product was gen-erated in the parental strain (SC). The result of Western blotting probed with an anti-His label (Figure 3B) confirmed that the SCA-expressed protein was in the range of 35~48 kDa, which matches the molecular weight of aldehyde reductase reported by Moon and Liu [18]. Again, SC did not produce the target protein band. The results of PCR and Western blot confirmed that ari1 was successfully recombined and expressed in SCA.
Figure 3. (A) PCR confirmation of the recombinant expression vector pGAPZC-ari1 in SC and SCA. (B) Overexpression of ARI in SC and SCA. SC (S. cerevisiae) and SCA (S. cerevisiae with ari1 gene overexpression).
Figure 3. (A) PCR confirmation of the recombinant expression vector pGAPZC-ari1 in SC and SCA.(B) Overexpression of ARI in SC and SCA. SC (S. cerevisiae) and SCA (S. cerevisiae with ari1 geneoverexpression).
Microorganisms 2022, 10, 850 6 of 12
3.3. Furfural Tolerance
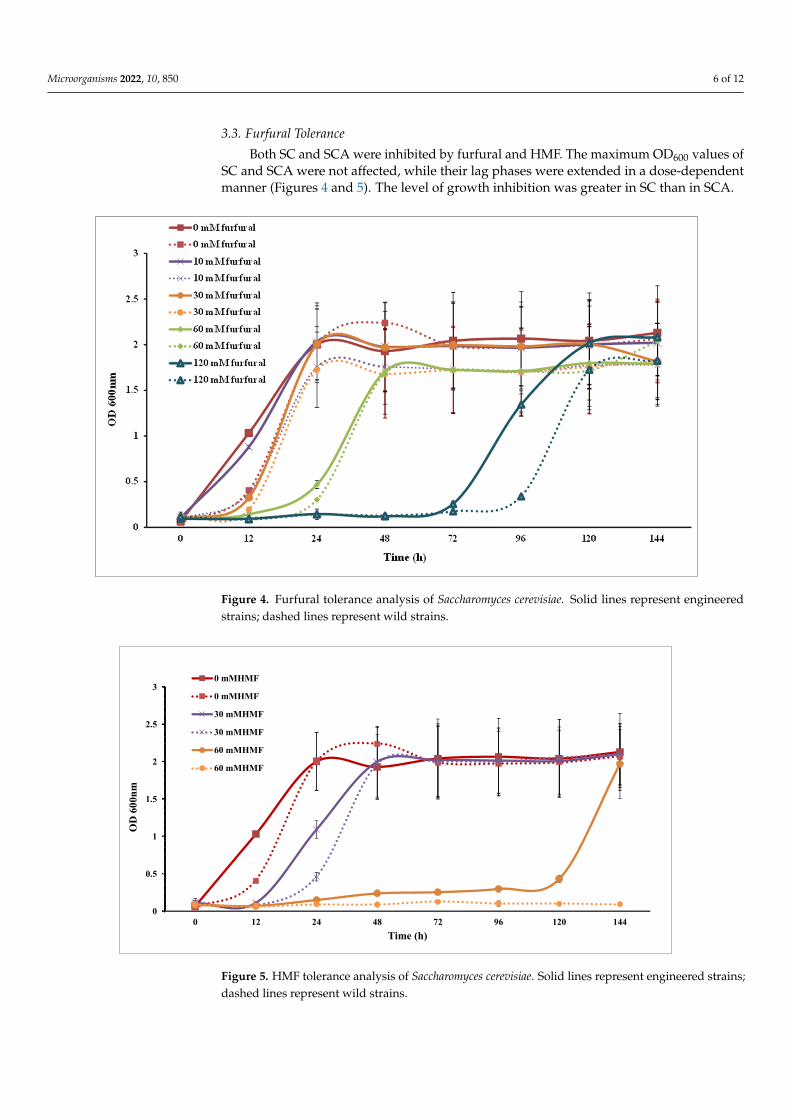
Both SC and SCA were inhibited by furfural and HMF. The maximum OD600 values ofSC and SCA were not affected, while their lag phases were extended in a dose-dependentmanner (Figures 4 and 5). The level of growth inhibition was greater in SC than in SCA.
Microorganisms 2022, 9, x FOR PEER REVIEW 7 of 13
3.3. Furfural Tolerance Both SC and SCA were inhibited by furfural and HMF. The maximum OD600 values
of SC and SCA were not affected, while their lag phases were extended in a dose-depend-ent manner (Figures 4 and 5). The level of growth inhibition was greater in SC than in SCA.
Figure 4. Furfural tolerance analysis of Saccharomyces cerevisiae. Solid lines represent engineered strains; dashed lines represent wild strains.
Figure 5. HMF tolerance analysis of Saccharomyces cerevisiae. Solid lines represent engineered strains; dashed lines represent wild strains.
0
0.5
1
1.5
2
2.5
3
0 12 24 48 72 96 120 144
OD
600
nm
Time (h)
0 mMHMF
0 mMHMF
30 mMHMF
30 mMHMF
60 mMHMF
60 mMHMF
Figure 4. Furfural tolerance analysis of Saccharomyces cerevisiae. Solid lines represent engineeredstrains; dashed lines represent wild strains.
Microorganisms 2022, 9, x FOR PEER REVIEW 7 of 13
3.3. Furfural Tolerance Both SC and SCA were inhibited by furfural and HMF. The maximum OD600 values
of SC and SCA were not affected, while their lag phases were extended in a dose-depend-ent manner (Figures 4 and 5). The level of growth inhibition was greater in SC than in SCA.
Figure 4. Furfural tolerance analysis of Saccharomyces cerevisiae. Solid lines represent engineered strains; dashed lines represent wild strains.
Figure 5. HMF tolerance analysis of Saccharomyces cerevisiae. Solid lines represent engineered strains; dashed lines represent wild strains.
0
0.5
1
1.5
2
2.5
3
0 12 24 48 72 96 120 144
OD
600
nm
Time (h)
0 mMHMF
0 mMHMF
30 mMHMF
30 mMHMF
60 mMHMF
60 mMHMF
Figure 5. HMF tolerance analysis of Saccharomyces cerevisiae. Solid lines represent engineered strains;dashed lines represent wild strains.
Microorganisms 2022, 10, 850 7 of 12
3.4. ari1 Gene Expression
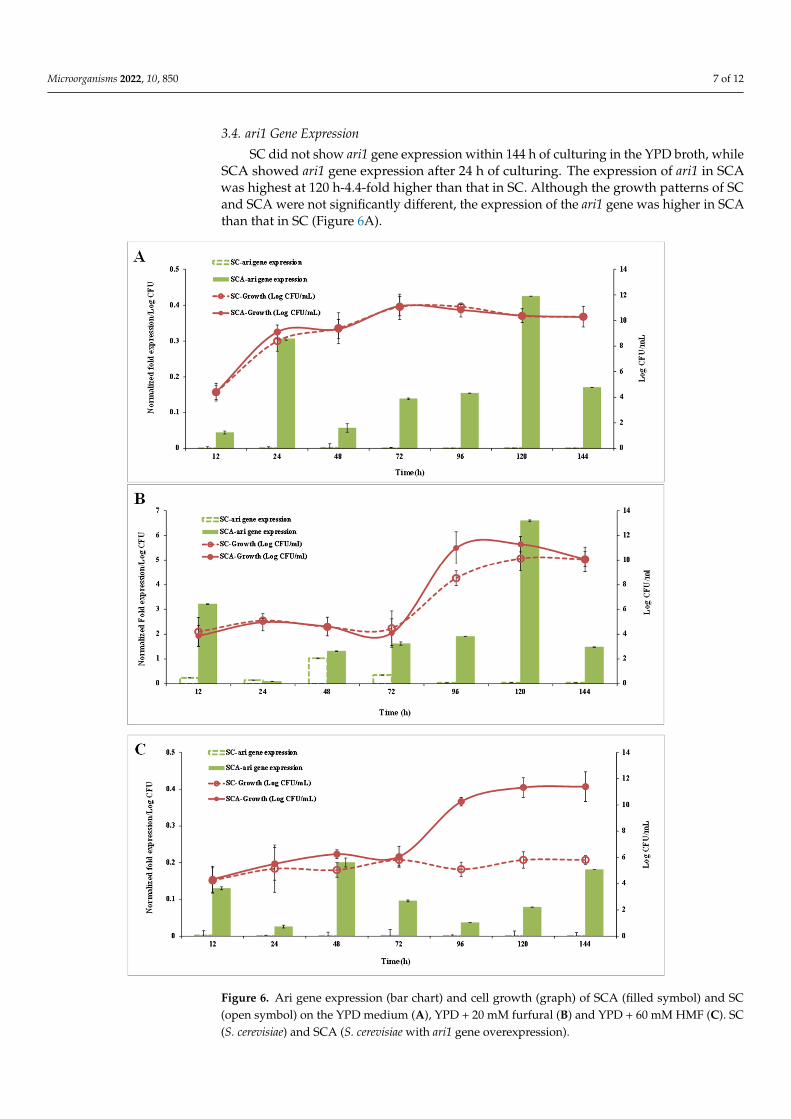
SC did not show ari1 gene expression within 144 h of culturing in the YPD broth, whileSCA showed ari1 gene expression after 24 h of culturing. The expression of ari1 in SCAwas highest at 120 h-4.4-fold higher than that in SC. Although the growth patterns of SCand SCA were not significantly different, the expression of the ari1 gene was higher in SCAthan that in SC (Figure 6A).
Microorganisms 2022, 9, x FOR PEER REVIEW 8 of 13
3.4. ari1 Gene Expression SC did not show ari1 gene expression within 144 h of culturing in the YPD broth,
while SCA showed ari1 gene expression after 24 h of culturing. The expression of ari1 in SCA was highest at 120 h-4.4-fold higher than that in SC. Although the growth patterns of SC and SCA were not significantly different, the expression of the ari1 gene was higher in SCA than that in SC (Figure 6A).
Figures 6B,C show the ari1 gene expression and growth performance of SC and SCA in the YPD broth supplemented with 20 mM furfural or 60 mM HMF, respectively. When YPD contained 20 mM furfural, the expression of ari1 in SCA was higher than that in SC after 12 h of culturing and the expression of ari1 in SCA was the highest after 120 h of culturing (74 times higher than that of SC). Both SC and SCA entered the logarithmic growth phase after 72 h of incubation; however, SCA showed the highest growth at 96 h of incubation (Figure 6B). In the presence of 60 mM HMF, the expression of ari1 in SCA increased from 1.2-fold to 2-fold over an incubation period of 48~144 h. However, expres-sion of the ari1 gene in the parental strain remained below 0.008-fold. On the other hand, SCA entered the logarithmic growth phase after 72 h of culturing, but when there was a large amount of HMF (60 mM) in the medium, the SC did not show significant growth (Figure 6C).
Microorganisms 2022, 9, x FOR PEER REVIEW 9 of 13
Figure 6. Ari gene expression (bar chart) and cell growth (graph) of SCA (filled symbol) and SC (open symbol) on the YPD medium (A), YPD + 20 mM furfural (B) and YPD + 60 mM HMF (C). SC (S. cerevisiae) and SCA (S. cerevisiae with ari1 gene overexpression).
3.5. Furfural and HMF Reduction Capacities SC and SCA were independently incubated in the YPD broth and challenged with
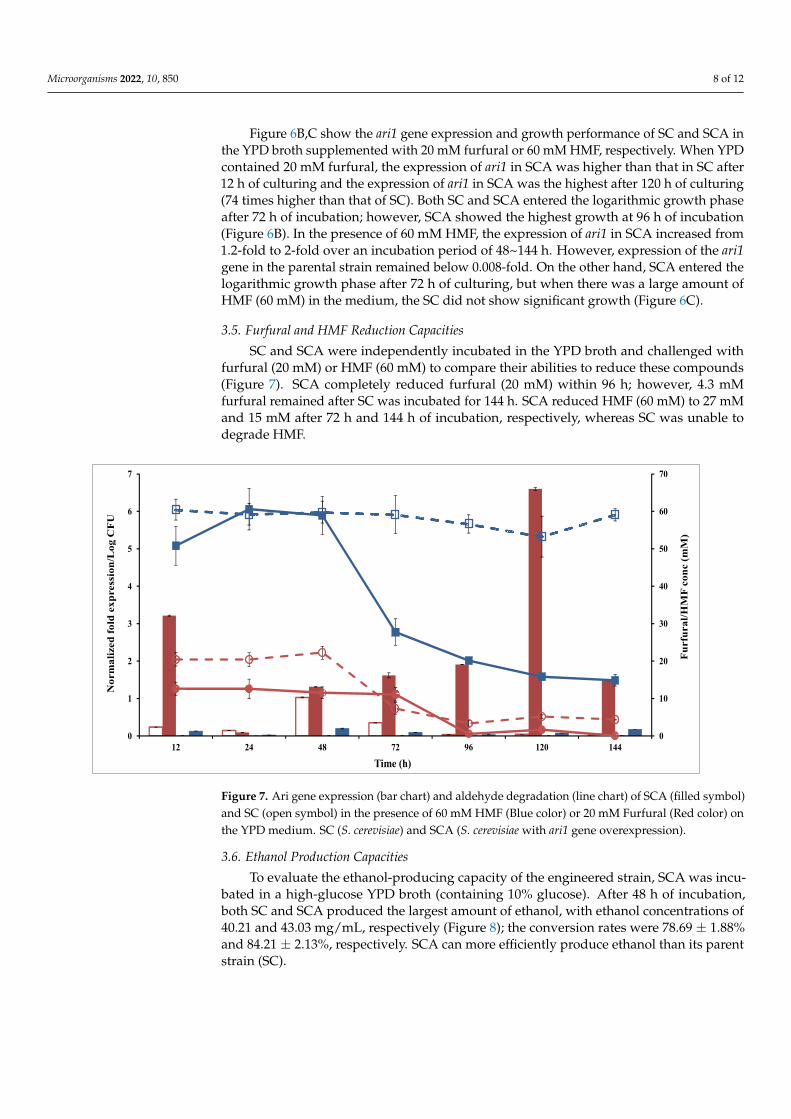
furfural (20 mM) or HMF (60 mM) to compare their abilities to reduce these compounds (Figure 7). SCA completely reduced furfural (20 mM) within 96 h; however, 4.3 mM fur-fural remained after SC was incubated for 144 h. SCA reduced HMF (60 mM) to 27 mM and 15 mM after 72 h and 144 h of incubation, respectively, whereas SC was unable to degrade HMF.
Figure 7. Ari gene expression (bar chart) and aldehyde degradation (line chart) of SCA (filled sym-bol) and SC (open symbol) in the presence of 60 mM HMF (Blue color) or 20 mM Furfural (Red color) on the YPD medium. SC (S. cerevisiae) and SCA (S. cerevisiae with ari1 gene overexpression).
3.6. Ethanol Production Capacities To evaluate the ethanol-producing capacity of the engineered strain, SCA was incu-
bated in a high-glucose YPD broth (containing 10% glucose). After 48 h of incubation, both SC and SCA produced the largest amount of ethanol, with ethanol concentrations of 40.21 and 43.03 mg/mL, respectively (Figure 8); the conversion rates were 78.69 ± 1.88% and
0
10
20
30
40
50
60
70
0
1
2
3
4
5
6
7
12 24 48 72 96 120 144
Furf
ural
/HM
F co
nc (m
M)
Nor
mal
ized
fold
exp
ress
ion/
Log
CFU
Time (h)
Figure 6. Ari gene expression (bar chart) and cell growth (graph) of SCA (filled symbol) and SC(open symbol) on the YPD medium (A), YPD + 20 mM furfural (B) and YPD + 60 mM HMF (C). SC(S. cerevisiae) and SCA (S. cerevisiae with ari1 gene overexpression).
Microorganisms 2022, 10, 850 8 of 12
Figure 6B,C show the ari1 gene expression and growth performance of SC and SCA inthe YPD broth supplemented with 20 mM furfural or 60 mM HMF, respectively. When YPDcontained 20 mM furfural, the expression of ari1 in SCA was higher than that in SC after12 h of culturing and the expression of ari1 in SCA was the highest after 120 h of culturing(74 times higher than that of SC). Both SC and SCA entered the logarithmic growth phaseafter 72 h of incubation; however, SCA showed the highest growth at 96 h of incubation(Figure 6B). In the presence of 60 mM HMF, the expression of ari1 in SCA increased from1.2-fold to 2-fold over an incubation period of 48~144 h. However, expression of the ari1gene in the parental strain remained below 0.008-fold. On the other hand, SCA entered thelogarithmic growth phase after 72 h of culturing, but when there was a large amount ofHMF (60 mM) in the medium, the SC did not show significant growth (Figure 6C).
3.5. Furfural and HMF Reduction Capacities
SC and SCA were independently incubated in the YPD broth and challenged withfurfural (20 mM) or HMF (60 mM) to compare their abilities to reduce these compounds(Figure 7). SCA completely reduced furfural (20 mM) within 96 h; however, 4.3 mMfurfural remained after SC was incubated for 144 h. SCA reduced HMF (60 mM) to 27 mMand 15 mM after 72 h and 144 h of incubation, respectively, whereas SC was unable todegrade HMF.
Microorganisms 2022, 9, x FOR PEER REVIEW 9 of 13
Figure 6. Ari gene expression (bar chart) and cell growth (graph) of SCA (filled symbol) and SC (open symbol) on the YPD medium (A), YPD + 20 mM furfural (B) and YPD + 60 mM HMF (C). SC (S. cerevisiae) and SCA (S. cerevisiae with ari1 gene overexpression).
3.5. Furfural and HMF Reduction Capacities SC and SCA were independently incubated in the YPD broth and challenged with
furfural (20 mM) or HMF (60 mM) to compare their abilities to reduce these compounds (Figure 7). SCA completely reduced furfural (20 mM) within 96 h; however, 4.3 mM fur-fural remained after SC was incubated for 144 h. SCA reduced HMF (60 mM) to 27 mM and 15 mM after 72 h and 144 h of incubation, respectively, whereas SC was unable to degrade HMF.
Figure 7. Ari gene expression (bar chart) and aldehyde degradation (line chart) of SCA (filled sym-bol) and SC (open symbol) in the presence of 60 mM HMF (Blue color) or 20 mM Furfural (Red color) on the YPD medium. SC (S. cerevisiae) and SCA (S. cerevisiae with ari1 gene overexpression).
3.6. Ethanol Production Capacities To evaluate the ethanol-producing capacity of the engineered strain, SCA was incu-
bated in a high-glucose YPD broth (containing 10% glucose). After 48 h of incubation, both SC and SCA produced the largest amount of ethanol, with ethanol concentrations of 40.21 and 43.03 mg/mL, respectively (Figure 8); the conversion rates were 78.69 ± 1.88% and
0
10
20
30
40
50
60
70
0
1
2
3
4
5
6
7
12 24 48 72 96 120 144
Furf
ural
/HM
F co
nc (m
M)
Nor
mal
ized
fold
exp
ress
ion/
Log
CFU
Time (h)
Figure 7. Ari gene expression (bar chart) and aldehyde degradation (line chart) of SCA (filled symbol)and SC (open symbol) in the presence of 60 mM HMF (Blue color) or 20 mM Furfural (Red color) onthe YPD medium. SC (S. cerevisiae) and SCA (S. cerevisiae with ari1 gene overexpression).
3.6. Ethanol Production Capacities
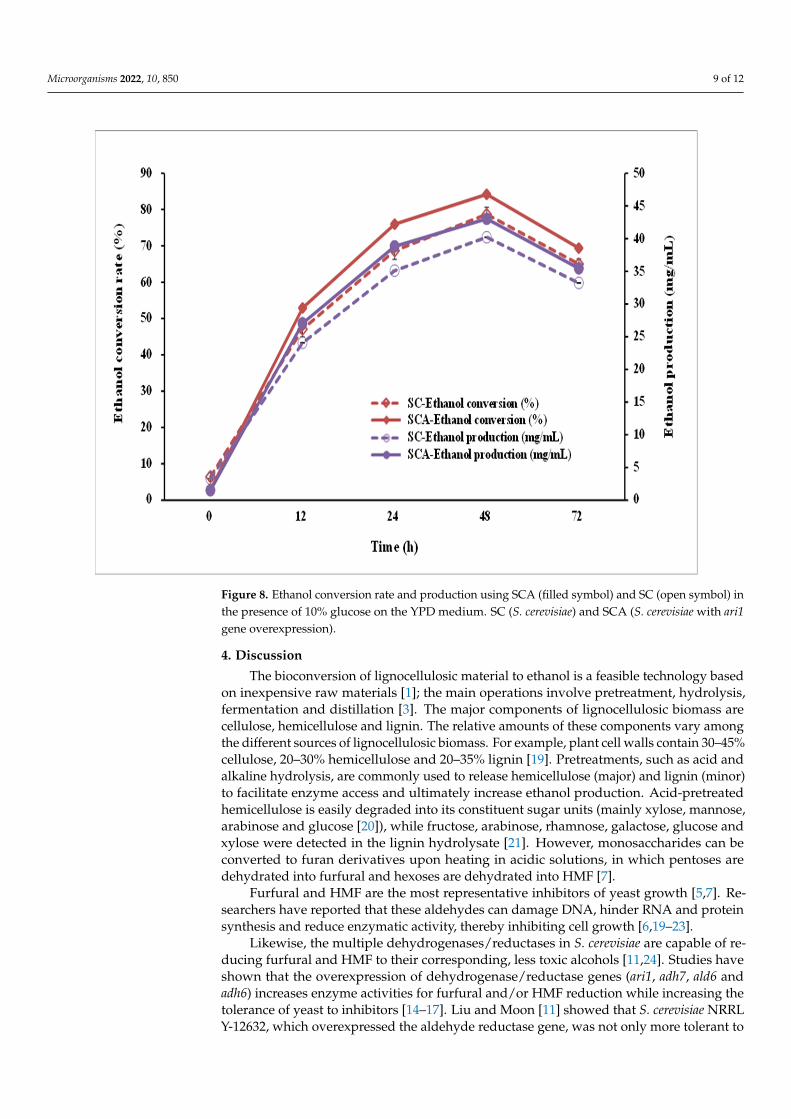
To evaluate the ethanol-producing capacity of the engineered strain, SCA was incu-bated in a high-glucose YPD broth (containing 10% glucose). After 48 h of incubation,both SC and SCA produced the largest amount of ethanol, with ethanol concentrations of40.21 and 43.03 mg/mL, respectively (Figure 8); the conversion rates were 78.69 ± 1.88%and 84.21 ± 2.13%, respectively. SCA can more efficiently produce ethanol than its parentstrain (SC).
Microorganisms 2022, 10, 850 9 of 12
Microorganisms 2022, 9, x FOR PEER REVIEW 10 of 13
84.21 ± 2.13%, respectively. SCA can more efficiently produce ethanol than its parent strain (SC).
Figure 8. Ethanol conversion rate and production using SCA (filled symbol) and SC (open symbol) in the presence of 10% glucose on the YPD medium. SC (S. cerevisiae) and SCA (S. cerevisiae with ari1 gene overexpression).
4. Discussion The bioconversion of lignocellulosic material to ethanol is a feasible technology based
on inexpensive raw materials [1]; the main operations involve pretreatment, hydrolysis, fermentation and distillation [3]. The major components of lignocellulosic biomass are cel-lulose, hemicellulose and lignin. The relative amounts of these components vary among the different sources of lignocellulosic biomass. For example, plant cell walls contain 30–45% cel-lulose, 20–30% hemicellulose and 20–35% lignin [19]. Pretreatments, such as acid and alka-line hydrolysis, are commonly used to release hemicellulose (major) and lignin (minor) to facilitate enzyme access and ultimately increase ethanol production. Acid-pretreated hemicellulose is easily degraded into its constituent sugar units (mainly xylose, mannose, arabinose and glucose [20]), while fructose, arabinose, rhamnose, galactose, glucose and xylose were detected in the lignin hydrolysate [21]. However, monosaccharides can be converted to furan derivatives upon heating in acidic solutions, in which pentoses are de-hydrated into furfural and hexoses are dehydrated into HMF [7].
Furfural and HMF are the most representative inhibitors of yeast growth [5,7]. Re-searchers have reported that these aldehydes can damage DNA, hinder RNA and protein synthesis and reduce enzymatic activity, thereby inhibiting cell growth [6,19–23].
Likewise, the multiple dehydrogenases/reductases in S. cerevisiae are capable of re-ducing furfural and HMF to their corresponding, less toxic alcohols [11,24]. Studies have shown that the overexpression of dehydrogenase/reductase genes (ari1, adh7, ald6 and
Figure 8. Ethanol conversion rate and production using SCA (filled symbol) and SC (open symbol) inthe presence of 10% glucose on the YPD medium. SC (S. cerevisiae) and SCA (S. cerevisiae with ari1gene overexpression).
4. Discussion
The bioconversion of lignocellulosic material to ethanol is a feasible technology basedon inexpensive raw materials [1]; the main operations involve pretreatment, hydrolysis,fermentation and distillation [3]. The major components of lignocellulosic biomass arecellulose, hemicellulose and lignin. The relative amounts of these components vary amongthe different sources of lignocellulosic biomass. For example, plant cell walls contain 30–45%cellulose, 20–30% hemicellulose and 20–35% lignin [19]. Pretreatments, such as acid andalkaline hydrolysis, are commonly used to release hemicellulose (major) and lignin (minor)to facilitate enzyme access and ultimately increase ethanol production. Acid-pretreatedhemicellulose is easily degraded into its constituent sugar units (mainly xylose, mannose,arabinose and glucose [20]), while fructose, arabinose, rhamnose, galactose, glucose andxylose were detected in the lignin hydrolysate [21]. However, monosaccharides can beconverted to furan derivatives upon heating in acidic solutions, in which pentoses aredehydrated into furfural and hexoses are dehydrated into HMF [7].
Furfural and HMF are the most representative inhibitors of yeast growth [5,7]. Re-searchers have reported that these aldehydes can damage DNA, hinder RNA and proteinsynthesis and reduce enzymatic activity, thereby inhibiting cell growth [6,19–23].
Likewise, the multiple dehydrogenases/reductases in S. cerevisiae are capable of re-ducing furfural and HMF to their corresponding, less toxic alcohols [11,24]. Studies haveshown that the overexpression of dehydrogenase/reductase genes (ari1, adh7, ald6 andadh6) increases enzyme activities for furfural and/or HMF reduction while increasing thetolerance of yeast to inhibitors [14–17]. Liu and Moon [11] showed that S. cerevisiae NRRLY-12632, which overexpressed the aldehyde reductase gene, was not only more tolerant to
Microorganisms 2022, 10, 850 10 of 12
furfural (20 mM) and HMF (40 mM) than the wild type but also more easily recovered andsubject to better growth. Strain improvement played important roles in cell viability andethanol production under several different stress conditions.
Consistent with the above-mentioned factors, the engineered strain SCA (overexpres-sion of ari1 gene) constructed in this study showed greater tolerance to HMF and furfuraland consequently increased ethanol production. SCA was more tolerant to furfural andHM than SC and increased resistance to HMF to a greater extent than furfural. Even thoughthe air1 expression in SCA incubated with 60 mM HMF was not as good as that in 20 mMfurfural, the level of expression was sufficient to remove almost 100% of HMF.
Without the presence of HMF or furfural, the growth of SC and SCA was almostthe same. Studies have shown that HMF is less toxic to yeast than furfural [25], so wecompared the effects of higher HMF concentrations on yeast to those of lower furfuralconcentrations. According to Fenske et al. [23], the concentrations of furfural and HMF areapproximately 0.01 g/L (0.1 mM) in corn stover, switchgrass and poplar pre-hydrolysates.Almeida et al. [22] reported that the HMF concentrations in spruce hydrolysate can varyfrom 2.0 to 5.9 g/L (15.8 and 46.6 mM), depending on whether one-step- or two-step-dilution acid hydrolysis is performed. The HMF concentrations are around 1 g/L (10 mM).A recent study reported by Erkan et al. [24] showed that 1 mM furfural decreased theethanol yield by 10% when using Saccharomyces cerevisiae. Furfural is more toxic to S.cerevisiae. Based on the above literature, in this study 20 mM furfural and 60 mM HMF wereused to analyze the air1 gene expression levels when simulating the conversion process oflignocellulosic biomass.
SC was found to overcome the toxicity of 20 mM furfural after 72 h incubation andsubsequently showed growth. However, the growth rate was slower compared to that ofSCA. On the other hand, 60 mM HMF was toxic to SC and caused SC to cease growth for144 h. Inhibition with HMF and furfural exhibited distinct patterns on SC: 20 mM furfuralincreased the doubling time during logarithmic growth and decreased the amount of totalbiomass, while 60 mM HMF increased the lag phase to 144 h, the end of the experiment time.Both decreased the biomass or prolonged the lag phase under the stress of furfural andHMF, respectively, suggesting that the cells had difficulty adapting to the stress conditions.In terms of furfural and HMF’s reduction capacities, SCA significantly expressed ari1 andreduced HMF from 60 to 29 mM under 72 h incubation, which allowed SCA to overcomethe inhibitory effect of HMF. SC exhibited the ability to reduce furfural when cultured for72 h, which was why SC did not show a delay in the lag phase but did present a decreasein biomass.
At the same concentration levels, yeast strains are more sensitive to inhibition withfurfural than that with HMF [25]. The effects of furfural and 5-hydroxymethylfurfural(5-HMF) on oxidative metabolism and fermentation were also investigated using Candidaguilliermondii and S. cerevisiae, respectively. When added to the medium at a concentrationof 0.2%, furfural was found to be a strong inhibitor of both functions, whereas a smallerdose of furoic acid was detected in the supernatant of the C. guillermondii medium. Theinhibitory effect of 5-HMF on fermentation and growth was weak and no metabolite wasdetected in the supernatant. The results showed that the metabolic pathways of furfuraland 5-HMF are different depending on whether they enter the fermentation pathway orthe oxidative pathway in the yeast strains studied [6].
5. Conclusions
In this study, an inhibitor-tolerant yeast strain was constructed. This strain showedenhanced abilities to reduce furfural and/or HMF through overexpression of the ari1 gene,thus indicating higher cell viability in the environment containing aldehydes.
Author Contributions: N.R.D.: manuscript preparation and experiment executor. P.-J.H.: experimentexecutor. G.-H.C.: technique and instrumentation support. Y.-C.C.: experiment supervisor, projectIP and manuscript preparation. All authors have read and agreed to the published version ofthe manuscript.
Microorganisms 2022, 10, 850 11 of 12
Funding: This research was supported by the Ministry of Science and Technology, R.O.C. Taiwan(MOST110-2313-B-126-003-MY3). This financial support is greatly appreciated.
Institutional Review Board Statement: The study protocol was approved by the Biological Experi-ment Safety Committee of Providence University (27 December 2010).
Informed Consent Statement: Not applicable.
Data Availability Statement: The data presented in this study are available on request from thecorresponding author.
Conflicts of Interest: The authors declare no conflict of interest.
References1. Bothast, R.J.; Saha, B.C. Ethanol production from agricultural biomass substrates. Adv. Appl. Microbiol. 1997, 44, 261–286.
[CrossRef]2. Saha, B.C. Hemicellulose bioconversion. J. Ind. Microbiol. Biotechnol. 2003, 30, 279–291. [CrossRef] [PubMed]3. Galbe, M.; Zacchi, G. Pretreatment of lignocellulosic materials for efficient bioethanol production. Adv. Biochem. Eng. Biotechnol.
2007, 108, 41–65. [CrossRef]4. Sun, Y.; Cheng, J. Hydrolysis of lignocellulosic materials for ethanol production: A review. Bioresour. Technol. 2002, 83, 1–11.
[CrossRef]5. Elander, M.; Myrback, K. Isolation of crystalline trehalose after fermentation of glucose by maceration juice. Arch. Biochem. 1949,
21, 249–255. [PubMed]6. Sanchez, B.; Bautista, J. Effects of furfural and 5-hydroxymethylfurfural on the fermentation of Saccharomyces cerevisiae and
biomass production from Candida guilliermondii. Enzyme Microb. Technol. 1988, 10, 315–318. [CrossRef]7. Boopathy, R.; Bokang, H.; Daniels, L. Biotransformation of furfural and 5-hydroxymethyl furfural by enteric bacteria. J. Ind.
Microbiol. 1993, 11, 147–150. [CrossRef]8. Larsson, S.; Palmqvist, E.; Hahn-Hgerdal, B.; Tengborg, C.; Stenberg, K.; Zacchi, G.; Nilvebrant, N.O. The generation of
fermentation inhibitors during dilute acid hydrolysis of softwood. Enzyme Microb. Technol. 1999, 24, 151–159. [CrossRef]9. Liu, Z.L.; Blaschek, H.P. Biomass Conversion Inhibitors and In Situ Detoxification. Biomass Biofuels Strateg. Glob. Ind. 2010,
233–259. [CrossRef]10. Lewis Liu, Z.; Moon, J.; Andersh, B.J.; Slininger, P.J.; Weber, S. Multiple gene-mediated NAD(P)H-dependent aldehyde reduction
is a mechanism of in situ detoxification of furfural and 5-hydroxymethylfurfural by Saccharomyces cerevisiae. Appl. Microbiol.Biotechnol. 2008, 81, 743–753. [CrossRef]
11. Liu, Z.L.; Moon, J. A novel NADPH-dependent aldehyde reductase gene from Saccharomyces cerevisiae NRRL Y-12632 involvedin the detoxification of aldehyde inhibitors derived from lignocellulosic biomass conversion. Gene 2009, 446, 1–10. [CrossRef][PubMed]
12. Divate, N.R.; Chen, G.H.; Divate, R.D.; Ou, B.R.; Chung, Y.C. Metabolic engineering of Saccharomyces cerevisiae for improvementin stresses tolerance. Bioengineered 2017, 8, 524–535. [CrossRef] [PubMed]
13. Horvath, A.; Riezman, H. Rapid protein extraction from Saccharomyces cerevisiae. Yeast 1994, 10, 1305–1310. [CrossRef] [PubMed]14. Laemmli, U.K. Cleavage of structural proteins during the assembly of the head of bacteriophage T4. Nature 1970, 227, 680–685.
[CrossRef]15. Teste, M.A.; Duquenne, M.; François, J.M.; Parrou, J.L. Validation of reference genes for quantitative expression analysis by
real-time RT-PCR in Saccharomyces cerevisiae. BMC Mol. Biol. 2009, 10, 99. [CrossRef]16. Kupiainen, L.; Ahola, J.; Tanskanen, J. Kinetics of glucose decomposition in formic acid. Chem. Eng. Res. Des. 2011, 89, 2706–2713.
[CrossRef]17. Divate, N.R.; Chen, G.H.; Wang, P.M.; Ou, B.R.; Chung, Y.C. Engineering Saccharomyces cerevisiae for improvement in ethanol
tolerance by accumulation of trehalose. Bioengineered 2016, 7, 445–458. [CrossRef]18. Moon, J.; Liu, Z.L. Direct enzyme assay evidence confirms aldehyde reductase function of Ydr541cp and Ygl039wp from
Saccharomyces cerevisiae. Yeast 2015, 32, 399–407. [CrossRef]19. Carrasco, J.E.; Sáiz, M.C.; Navarro, A.; Soriano, P.; Sáez, F.; Martinez, J.M. Effects of dilute acid and steam explosion pretreatments
on the cellulose structure and kinetics of cellulosic fraction hydrolysis by dilute acids in lignocellulosic materials. Appl. Biochem.Biotechnol. 1994, 45, 23–34. [CrossRef]
20. Sjöström, E. Wood Chemistry: Fundamentals and Applications; Academic Press: San Diego, CA, USA, 1993.21. Mirpoor, S.F.; Restaino, O.F.; Schiraldi, C.; Giosafatto, C.V.L.; Ruffo, F.; Porta, R. Lignin/carbohydrate complex isolated from
posidonia oceanica sea balls (Egagropili): Characterization and antioxidant reinforcement of protein-based films. Int. J. Mol. Sci.2021, 22, 9147. [CrossRef]
22. Almeida, J.R.M.; Modig, T.; Petersson, A.; Hähn-Hägerdal, B.; Lidén, G.; Gorwa-Grauslund, M.F. Increased tolerance andconversion of inhibitors in lignocellulosic hydrolysates by Saccharomyces cerevisiae. J. Chem. Technol. Biotechnol. 2007, 82, 340–349.[CrossRef]
Microorganisms 2022, 10, 850 12 of 12
23. Fenske, J.J.; Griffin, D.A.; Penner, M.H. Comparison of aromatic monomers in lignocellulosic biomass prehydrolysates. J. Ind.Microbiol. Biotechnol. 1998, 20, 364–368. [CrossRef]
24. Erkan, S.B.; Yatmaz, E.; Germec, M.; Turhan, I. Effect of furfural concentration on ethanol production using Saccharomyces cerevisiaein an immobilized cells stirred-tank bioreactor with glucose-based medium and mathematical modeling. J. Food Process. Preserv.2021, 45, e14635. [CrossRef]
25. Liu, Z.L.; Slininger, P.J.; Dien, B.S.; Berhow, M.A.; Kurtzman, C.P.; Gorsich, S.W. Adaptive response of yeasts to furfural and5-hydroxymethylfurfural and new chemical evidence for HMF conversion to 2,5-bis-hydroxymethylfuran. J. Ind. Microbiol.Biotechnol. 2004, 31, 345–352. [CrossRef]


![Isolation of the CAR] Gene from Saccharomyces cerevisiae](https://img.dokumen.tips/doc/110x75/63393bdcf940ec0de8073352/isolation-of-the-car-gene-from-saccharomyces-cerevisiae-.jpg)


