Embed Size (px)
Citation preview
Mutation rate variation in the yeast, Saccharomyces cerevisiae
A dissertation presented
by
Gregory Ian Lang
to
The Department of Molecular and Cellular Biology
in partial fulfillment of the requirements
for the degree of
Doctor of Philosophy
in the subject of
Biology
Harvard University
Cambridge, Massachusetts
May 2007

ii
© 2007 – Gregory Ian Lang
All rights reserved

iii
Andrew W. Murray Gregory Ian Lang
Mutation rate variation in the yeast, Saccharomyces cerevisiae
Abstract
Mutation is a fundamental process in biology. Mutation is necessary for
evolution and lies at the heart of human disease. Variation in the rate at which mutations
are produced can have profound consequences. Microorganisms that generate mutations
at a higher rate have a selective advantage when adapting to novel environments, and this
may play an important role in pathogenesis. An increase in the mutation rate of somatic
cells may be a necessary step in the evolution of cancer, and individuals who inherit an
elevated mutation rate are predisposed to developing the disease. For these reasons, the
study of mutation rate variation has attracted great attention and impacted our
understanding of nearly every aspect of biology from the dynamics of evolution, the
mechanisms of bacterial pathogenesis, the functioning of the immune system, and the
development of cancer. Despite its importance, the degree to which mutation rate can
vary and the mechanisms underlying this variation are not entirely understood. A
common method used to measure mutation rate is the fluctuation assay. I have increased
the throughput of this assay and used it to characterize mutation rate variation in the
budding yeast, Saccharomyces cerevisiae. I show that mutation rate is robust to variation

iv
in the duration of the cell cycle, but varies between strain backgrounds, between
environments, and within the genome. I show that mutation rate varies between two
common laboratory yeast strains and that mutation rate is increased under osmotic stress,
consistent with the hypothesis that high salt induces strand breaks. In addition, I show
that the mutation rate in the yeast genome is correlated with replication timing, consistent
with a model regarding the temporal segregation of two modes of DNA damage tolerance
during replication: error-free DNA damage tolerance and translesion synthesis. In
support of this model, I show that elimination of translesion synthesis reduces mutation
rate variation within the genome.
v
Contents
Abstract iii
List of figures vii
List of tables ix
Acknowledgements x
Preface xiii
Chapter 1 Introduction 1
1.1 The importance of mutation rate 2
1.2 Examples of mutation rate variation 8
1.3 Summary 16
Chapter 2 Improving the performance and analysis of fluctuation assays 19
2.1 Materials and methods 20
2.2 Methods for measuring mutation rate 27
2.3 Fluctuation assays 29
2.4 Phenotypic mutation rates 34
Chapter 3 Effective target size and the per-base-pair mutation rate 39
3.1 Materials and methods 40
3.2 Mutational spectra 42
3.3 Effective target size 52
3.4 Mutation rate per base pair per generation 59
Chapter 4 Mutation rate variation I: Variation across the yeast genome 62
4.1 Introduction 63
4.2 Materials and methods 66
4.3 Mutation rate varies across Chromosome VI 76
4.4 Mutation rate is correlated with replication timing 81
vi
4.5 Model for replication timing and mutation rate 87
4.6 Discussion 90
Chapter 5 Mutation rate variation II: Variation with the duration
of the cell cycle, environment, and strain background 97
5.1 Materials and methods 98
5.2 Mutations occur at a constant rate per cell division 100
5.3 Elevation of mutation rate under osmotic stress 101
5.4 Fixation of a mutator allele in a laboratory strain 108
Chapter 6 Conclusions and future directions 113
6.1 Summary of major results 114
6.2 The concept of effective target size 115
6.3 Deviations from the Luria-Delbrück distribution 117
6.4 Mutation rate variation between strain backgrounds 119
6.5 The role of mutator strains in evolution 120
6.6 The importance of mismatch repair in mutation rate variation 124
6.7 The molecular basis of mutation rate 125
6.8 Genome structure, function, and evolution 127
Appendix A Notes and observations 130
A.1 Variability of mutation rate estimates from fluctuation assays 131
A.2 An alternative method for measuring mutation rates 131
A.3 Mutations observed in the yeast deletion collection 135
A.4 Growth of W303 and S288c on 5FOA 137
A.5 Selection for multiple mutations on 5FOA 139
A.6 Decreased cold tolerance in msh2Δ strains 141
Appendix B Programs to analyze data from fluctuation assays 143
References 147
vii
List of figures
Chapter 2
2-1 The fluctuation assay 22
2-2 Fluctuation assay on 5FOA 24
2-3 Fluctuation assay on 10 x canavanine 25
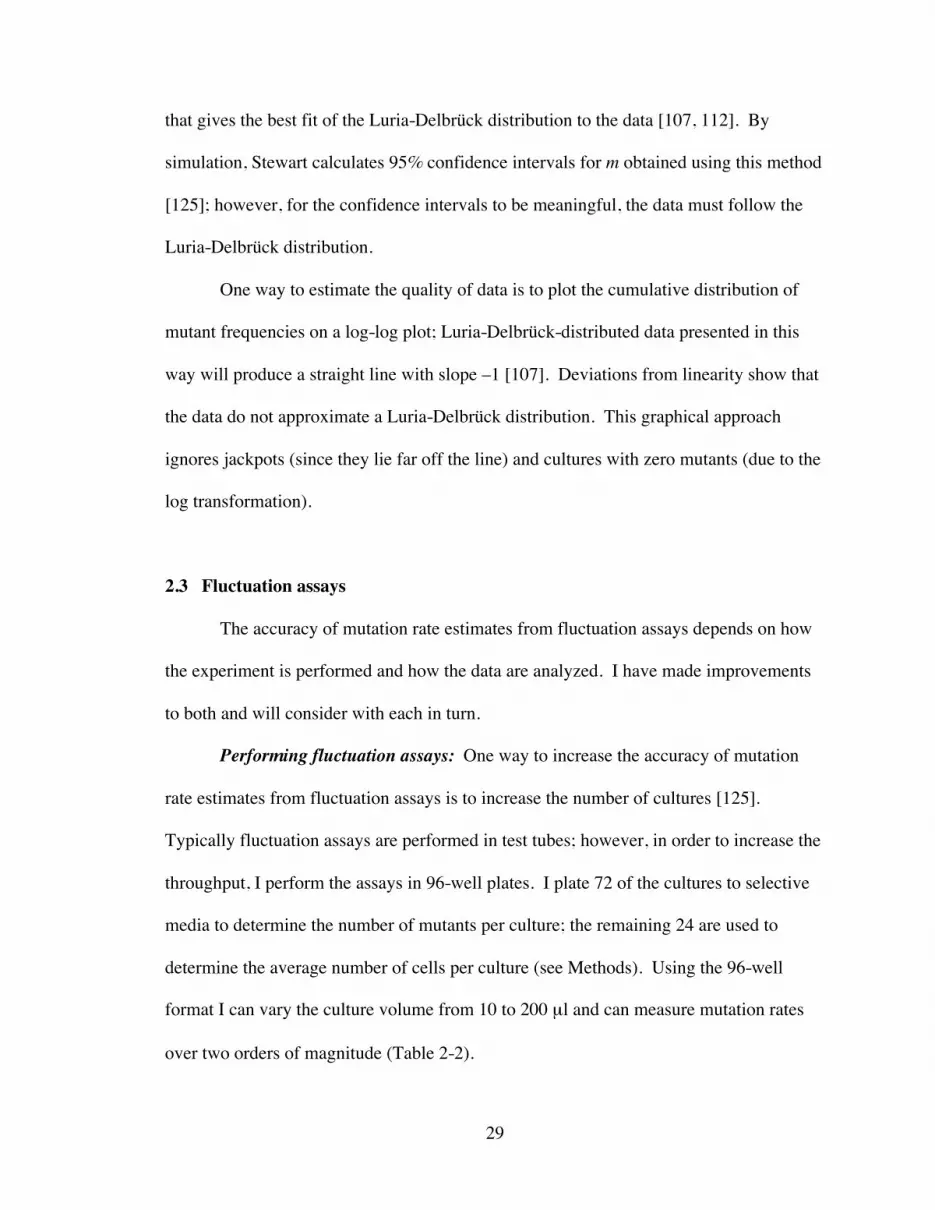
2-4 Fitting data from fluctuation assays 31
2-5 Simulation of fluctuation assays 38
Chapter 3
3-1 Mutational spectra for 5FOA resistant ura3 mutants 43
3-2 Mutational spectra for canavanine resistant can1 mutants 44
3-3 Probability of in-frame slippage events in the yeast genome 51
Chapter 4
4-1 Schematic of strain construction 72
4-2 Coverage of Chromosome VI 73
4-3 Mutation rate varies across Chromosome VI 77
4-4 Pairwise comparisons of mutation rates at URA3 and CAN1 79
4-5 Mutation rate is correlated with replication timing 82
4-6 Comparison of replication timing and mutation rate 84
4-7 A model for template switching and translesion synthesis 88
4-8 Mutation rate variation is dependent upon translesion synthesis 91
4-9 Synonymous substitution rate and mutation rate 95
Chapter 5
5-1 Mutations occur at a constant rate per cell division 102
5-2 Mutation rate increases under osmotic stress 104
5-3 Salt sensitivity of rad52Δ strains 107

viii
5-4 Mutation rate variation between common laboratory strains 110
5-5 A derived laboratory strain of W303 contains a single mutator allele 112
Appendix A
A-1 Comparison of growth on 5FOA 138
A-2 Selection for multiple mutations on 5FOA 140

ix
List of tables
Chapter 2
2-1 Per-genome per-generation mutation rates for ten clones of GIL104 35
2-2 Fitting data to a two-parameter model of post-plating growth 36
Chapter 3
3-1 Primers used in Chapter 3 41
3-2 Multiple mutation events 48
Chapter 4
4-1 Primers used in Chapter 4 67
4-2 Strains used for URA3 integration 69
4-3 Autonomously replicating sequences on Chromosome VI 85
Chapter 5
5-1 Strains used in Chapter 5 99
5-2 Mutational spectra 106
Appendix A
A-1 Variability in mutation rate estimates from fluctuation assays 132
A-2 Mutations in the yeast deletion collection 136
A-3 Decreased cold tolerance in msh2Δ strains 142

x
Acknowledgements
Despite my frequent use of the word “I,” the work described in this thesis is far
from an individual effort—I received help and support from numerous people, both
inside and outside of the lab. Most notably, my thesis advisor Andrew Murray made
many intellectual contributions and provided a great deal of support throughout my stay
in his laboratory. In many ways Andrew was the ideal advisor: he afforded me the
freedom to work on several projects that lie outside of the main focus of his lab, he was
readily accessible, and he provided me with helpful feedback throughout this process.
One of Andrew’s best attributes is his ability to recruit excellent graduate students
and post-docs to his lab who not only bring expertise in many fields, but also have made
working here very enjoyable. Over my years, I have overlapped with a number of
individuals: Jun-Yi, Dawn, Soni, Chin-Lin, Erik, Grzegorz, John, Kevin, Matthieu,
Scott, Thomas, Ayellet, Derek, Joana, Larry, Michael, Nate, Nick, Nilay, Vahan, Will,
Anu, Beverly, Juliet, and Linda, all of whom have helped me in one way or another.
I would like to thank Erin O’Shea, Dan Hartl, Matt Michael, and Roy Kishony
(my thesis committee) for providing their thoughts on my project and for suggesting a

xi
number of experiments. In addition, I benefited greatly from discussions with individuals
outside of Harvard, in particular, Tom Petes, Graham Walker, and members of the
Walker Lab.
My classmates and friends have played an integral part in my graduate
experience—I feel that I have learned as much outside of the lab as I did at the bench.
Importantly, our time away from the lab made life in Boston enjoyable; I am thankful to
have been brought in with such a great group.
I would not be the person I am if not for my family: my parents John and Lois and
my wife, Suzanne. My parents have supported me in everything and Suzanne was
willing to uproot and move up here to Boston. This thesis means as much to them as it
does to me. Since I am the only scientist, my family doesn’t understand exactly what it is
that I do; however, they are always cheering for me, and that is all that matters.

xii
For my parents, John and Lois,
and my wife, Suzanne.

xiii
Preface
It was not my intention to devote my graduate career to studying mutation rate. I
often claim—although others may not agree—that I was the first graduate student to join
this lab with the explicit intention of studying experimental evolution. My initial
motivation in learning the fluctuation assay was to determine if a fraction of mutations
occur at a constant rate per unit time, and if so, to determine if this is sufficient to explain
the observation that the per-genome mutation rate increases under nutritional stress. It
took several years before I was sufficiently comfortable with the assay to feel confident
in my estimates of mutation rate. Two things occurred during this time: I became
interested in improving the fluctuation assay itself and I made several observations
regarding mutation rate variation that were worth pursuing—that pursuit is described
here. As is always true with any research project, I could not follow up on all of my
observations, and it is my hope that this thesis is sufficiently clear and well organized
such that others may bring these projects to fruition.
In many ways this thesis is presented in reverse-chronological order. My earliest
experiments, examining mutation rate variation with respect to growth rate, environment,

xiv
and strain background, are described in Chapter 5. The examination of mutation rate
variation across yeast Chromosome VI, the observation that mutation rate is correlated
with replication timing, and a proposed mechanism for this relationship occupy Chapter
4. My most recent work: generating accurate estimates of the per-base-pair mutation
rate in yeast, along with a description of the improvements I have made to the fluctuation
assay, is presented in Chapters 2 and 3. The bookends, Chapter 1 and Chapter 6, provide
examples of the importance of mutation rate variation, place this work in the context of
those studies, and highlight the important unanswered questions.
I expect to publish two papers from this thesis. Chapters 2 and 3 have been
submitted to Genetics with the title “Estimating the per-base-pair mutation rate in the
yeast, Saccharomyces cerevisiae.” Chapter 4 is in preparation and will be submitted
shortly. Chapter 1 was written with the intent that it can serve as the basis of a review
article, should I choose to write one. In addition, I hope that the observations and
discussions in Chapter 6 and Appendix A will one day serve as the basis for publications
by other authors.

1
Chapter 1
Introduction
1.1 The importance of mutation rate
Determining the optimal mutation rate
Selection for elevated mutation rates
1.2 Examples of mutation rate variation
Genetic variation
Variation within the genome
Environmental variation
Variation inferred from sequence data
1.3 Summary
2
Abstract
The vast majority of mutations are deleterious. Therefore, there is selection
pressure to keep mutation rates low. Two arguments have been used to explain why
mutation rate is not zero: there is a cost associated with ensuring fidelity and some
mutation is necessary to generation variation so that a species can adapt to changing
environments. There exists a large amount of variation in mutation rate, which plays a
role in evolution, in cancer progression, in the ability of the immune system to function,
and in the ability of pathogenic bacteria to evade the immune system. In this chapter, I
review the forces acting on mutation rate, the degree to which mutation rate varies, and
the biological significance of this variation.
1.1 The importance of mutation rate
Determining the optimal mutation rate: Early observations regarding
spontaneous mutation showed that the vast majority of mutations are deleterious, raising
the question of why the mutation rate does not evolve to zero [127]. There are two
possible explanations. The cost associated with increasing fidelity may prevent mutation
rate from being lowered [13, 55]. Alternatively the existence of beneficial mutations may
be responsible for setting the lower bound on mutation rate [65]. Theory predicts that for
an asexual population periodically exposed to new environments where beneficial
mutations exist, the optimal mutation rate will be proportional to the frequency with
which new environments are encountered [92]. However, there are several difficulties
with the hypothesis that mutation rate reflects a balance between the effects of deleterious
and beneficial mutations [121]. If the time between environmental shifts is long, during

3
the intervening period selection will lower mutation rate below the optimal level [97]. It
has been shown experimentally that continued exposure to environments where beneficial
mutations exist selects for mutation rates orders of magnitude higher than the wild-type
mutation rate [95, 122]. Therefore, a population in a changing environment may
overshoot the long-term optimal mutation rate during periods of selection. A third
difficulty is that the effect of beneficial mutations on mutation rate is limited in sexual
populations, since alleles modifying the mutation rate are unlinked from the mutations
they generate [65]. Therefore, any genetic exchange will limit the effect that beneficial
mutations will have on setting the optimal mutation rate. Given these concerns, it is more
likely that mutation rate reflects a balance between the fitness cost associated with the
accumulation of deleterious mutations and the physiological cost of maintaining fidelity.
However, there is little experimental evidence showing that lowering mutation rate
imposes a fitness cost [121]. Strains with a lower mutation rate are difficult to isolate;
those that have been studied have a lower mutation rate not because of increased fidelity,
but due to the loss of the ability to tolerate DNA lesions, which would otherwise be
converted into mutations [106].
It is thought that the selective pressures responsible for tuning mutation rates act
on the per-genome mutation rate (rather than the per-base-pair mutation rate) and that
most DNA-based organisms have settled on a similar per-genome mutation rate, implying
that all organisms are under the same selective pressures [23]. These conclusions are
based on the observation, that for DNA-based organisms, the per-base-pair mutation rate
varies by four orders of magnitude, whereas the per-genome mutation rate is roughly
4
constant [23]. This observation breaks down in higher eukaryotes, where the per-base
pair mutation appears to reach a minimum of 10-10 per base pair per generation [22].
Selection for elevated mutation rates: Since the vast majority of mutations are
deleterious, theory predicts that for a population well adapted to its environment,
selection will lower mutation rate to the point at which the benefit does not outweigh the
cost associated with increased fidelity. However, in many regimes in which beneficial
mutations exist, mutation rate sets the rate of adaptation and higher mutation rates will be
favored. Despite the deleterious effect of mutation, strains with an elevated mutation rate
exist in natural populations at frequencies higher than predicted by mutation/selection
balance [5, 64, 79]. Many laboratory competition experiments using microorganisms
such as Escherichia coli and Saccharomyces cerevisiae, show that strains with an
elevated mutation rate (mutators) can out-compete strains with a wild-type mutation rate
(non-mutators) [9, 62, 131]. A typical competition experiment involves mixing mutators
and non-mutators in a fixed ratio and monitoring their relative frequencies over many
generations. This requires that the strains be differentially labeled using auxotrophic
markers, drug markers, or fluorescent reporters, each of which may carry a fitness cost
which must be taken into account when interpreting results from these experiments.
Competitions are typically performed under conditions that laboratory strains are not
frequently exposed to, such as low glucose, a condition where mutators have a high
probability of fixing in a population that starts as a 1:1 mixture of mutators to non-
mutators. Several lines of evidence show that the advantage of the mutator strains is not
due to the mutator allele itself, but is an indirect advantage resulting from the ability of
the mutator strain to produce beneficial mutations at a higher rate than non-mutators and
5
hitchhike to fixation with these mutations [9, 117, 121]. The dynamics of competition
experiments show that at early times the mutators have either no fitness advantage or a
slight disadvantage, presumably due to the accumulation of deleterious mutations [9]. In
addition, mutators do not increase in frequency until after a lag period corresponding to
the waiting time for the first beneficial mutation. Consistent with this, the lag time is
dependent upon the strength of the mutator allele: the higher the elevation of mutation
rate, the shorter the lag time [9]. Mutator strains, which arise and fix in long-term
evolution experiments, can be transfected with the wild-type allele without diminishing
the fitness of the strain [117].
The probability that mutators will win a competition is frequency dependent, in
that the fraction of mutators in a population will increase when mutators are frequent and
decrease when mutators are rare [9]. This is because, as stated above, the advantage of
mutator strains is that they are able to generate beneficial mutations more rapidly than
non-mutators. However, when mutators are exceedingly rare it becomes more likely that
the next beneficial mutation will occur in the non-mutator subpopulation. Therefore,
there exists a critical frequency of initial mutators in a population above which the
mutators will win the majority of the competitions and below which the non-mutators
will win. This critical frequency depends upon the initial population size [62]. In one
experiment it was found that at an initial wild-type population size of 105, the critical
frequency of mutS- mutators needed to win the competition is 1 in 100; whereas, if the
initial population size is 107, the critical mutator frequency is reduced to 1 in 105 [62].
This result has been interpreted to mean that the probability of mutators winning is
frequency-independent and depends only upon the existence of at lease one mutator
6
bacterium containing a beneficial mutation prior to the start of the competition [62].
However another explanation is that mutators are not only competing against the non-
mutator subpopulation but also against the accrual of deleterious mutations. Therefore, in
order for a mutator to win the competition, the mutator population must generate a
beneficial mutation before the non-mutator population and before the accrual of
deleterious mutations eliminates the mutator population.
The discussion thus far has assumed that a competition is decided by which
population acquires the first beneficial mutation. This may be true for small population
sizes with a low beneficial mutation rate; however, in most situations, multiple beneficial
mutations will occur on top of one another [17]. In this situation the winner of the
competition is determined by the rate at which the most-fit clone in each subpopulation
increases its fitness. The outcome of these competitions is difficult to evaluate
analytically and may require numerical simulation.
Mutators have been shown to arise and fix during evolution experiments with E.
coli in glucose-limited media [69, 94, 95, 122] and in the mouse gut [39]. In one
experiment, twelve lines of E. coli were established and transferred daily to fresh media
[68]. After 20,000 generations, four out of twelve lines were fixed for mutators [69,
122]. Analysis of this experiment shows that, consistent with the competition
experiments, the benefit of the mutator strain is independent of the mutator allele itself;
therefore, the mutator strain hitchhiked to fixation. In two of the three lines the fitness of
the population increased during the time where the mutator strain was sweeping the
population. The rate at which the mutator strain sweeps through the population is an
indication of the fitness of the beneficial mutation it acquired relative to the population

7
average. During competition experiments with small population sizes and low mutation
rates, this is approximately equal to the effect of a beneficial mutation on the ancestral
background, since the mutation responsible for the increase of the mutator subpopulation
is likely to be the first beneficial to have occurred and is likely to have occurred in a
background with a minimal deleterious load. However, during the long-term evolution
experiment the rate at which the mutator allele increased in frequency is slower than
would be predicted based upon the fitness of the clone [117]. This slowing of the
mutator sweep is due to clonal interference, the presence of multiple beneficial mutations
increasing in frequency concurrently, which increases the average population fitness and
slows the rate at which the highest fitness clone overtakes the population [37]. Clonal
interference can diminish the advantage of elevated mutation rates in large asexual
populations [12, 17, 37, 138].
The existence of mutator alleles at low frequencies in populations is thought to
increase the rate of adaptation [129]. When beneficial mutations are plentiful, high
mutation rates will be favored and low frequency mutator alleles will rise to fixation in
the population by hitchhiking with beneficial mutations. However, when a population is
well adapted to its environment and beneficial mutations are rare, selection favors a lower
mutation rate and the frequency of mutators should decline, since the cost of deleterious
mutations favors reversion of mutator to non-mutator strains [129]. Indeed, many
commensal and pathogenic strains are commonly found to possess an elevated mutation
rate [43, 64, 79]. Screening of the Food and Drug Administration’s bacterial pathogen
collection and reference collections of natural isolates of E. coli and Salmonella enterica
for strains with elevated mutation rates shows that over 1% of pathogenic E. coli and S.
8
enterica strains show mutator phenotypes due to the loss of mismatch repair [64]. Many
studies have detected high frequencies of mutator alleles in clinical isolates such as
uropathogenic E. coli [14] and Pseudomonas aeruginosa isolates from the lungs of Cystic
Fibrosis patients [96]. There are several explanations for the existence of mutator alleles
in pathogenic strains. One possibility is that since pathogenic strains derive nutrients
from the host, many mutations, which would otherwise be deleterious, are selectively
neutral; therefore, pathogenic strains are not under the same selective pressure to
minimize mutation rate and mutators may become enriched through drift [128]. Higher
mutation rates may also be favored as a consequence of antibiotic selection. Multiple
rounds of antibiotic selection will increase the fraction of mutators in a population [78].
However, antibiotic resistance in pathogenic strains is usually conferred by the
acquisition of multi-drug resistance plasmids rather than point mutation [135]. An
additional possibility is that higher rates of mutation allow for loss of many nonessential
proteins that could otherwise be targeted by the host immune system [128].
In addition to the role of mutators in pathogenic bacteria, an elevated mutation
rate is also a hallmark of cancer progression. Cancer cells are associated with many
forms of genetic instability including aneuploidy, chromosomal instability, microsatellite
instability, and an abundance of point mutations [72]. These observations led to the
suggestion that an cancer cells must have acquired mutations in genes involved in
maintaining genomic fidelity and that this may be a necessary event for the development
of cancer [71, 73]. In addition, the observation that the basal mutation rate is insufficient
to account for the number of mutations necessary in the evolution of cancer suggests that
acquiring an elevated mutation rate may be an early event in the evolution of cancer

9
rather than an outcome of cancer progression [72]. This hypothesis is supported by the
observation of microsatellite instability in the early stages of cancer progression [48, 118]
and the association of mutations in mismatch repair genes with a hereditary form of colon
cancer [6, 26, 63, 99].
1.2 Examples of mutation rate variation
Genetic variation: Because of the role of mutator strains in evolution,
pathogenesis, and cancer, and the usefulness of mutator strains in studying the
mechanism of DNA repair pathways, a large amount of research has focused on genetic
variation of mutation rate, including several screens to identify mutator alleles [31, 83].
Over 30 mutator loci have been identified in E. coli [47]. A screen of the yeast deletion
collection for strains with elevated mutation rates identified over 30 mutator alleles
including most of the known mutator alleles and fourteen previously uncharacterized
mutator alleles [49]. Mutator alleles have been found to be involved in many cellular
functions such as mismatch repair, base-excision repair, nucleotide-excision repair, DNA
replication, recombinational repair, cell-cycle checkpoints, and oxidative stress response
[31]. Mutator alleles preferentially increase particular types of mutational events and
range in strength up to 100-fold yeast and 1000-fold in E. coli [47, 49, 83].
Many of the mutator strains found in nature and during experimental evolution
result from loss of mismatch repair. The role of mismatch repair is to correct errors made
during replication, primarily one or two base-pair frameshift mutations and missense
mutations [31, 60, 87]. In bacteria, thirteen proteins are necessary for mismatch repair,
most of which play roles in other repair pathways [60]. The three core proteins of

10
mismatch repair are MutS, MutL, and MutH. MutS functions as a homodimer and is
responsible for recognizing and binding to mismatched bases. MutL coordinates
association of MutS with and other components of the repair machinery. MutH
discriminates the old strand from the new and preferentially nicks the new strand so that
the inappropriate nucleotides can be removed. In eukaryotes the MutS function is carried
out by two heterodimeric complexes of MutS Homolog proteins (MSH2/3 and MSH2/6).
Similarly, the MutL function is carried out by two heterodimeric complexes of MutL
Homolog proteins and PMS2 (MLH1/PMS2, MLH1/2, and MLH1/3). Eukaryotes do not
possess a MutH homolog; instead, the MLH proteins may carry out the functions of
MutH [52].
Three of the four bacterial lines that evolved elevated mutation rates during a
long-term evolution experiment contain mutations in components of mismatch repair:
two mutL- mutators and one mutS- mutator [122]. Mutations in the human homologs of
these genes hMSH2 [26, 63] and hMLH1 [6, 99] are associated with hereditary
nonpolyposis colon cancer (HNPCC). Studies of natural populations show that mismatch
repair mutators are commonly found in commensal and pathogenic strains [64, 79, 96].
Why mismatch repair mutators are frequently selected is an area of increasing interest; it
is possible that loss of mismatch repair confers additional benefits, that the loss of other
pathways imposes a fitness cost, or they are frequently selected since they are among the
strongest identified mutators.
Variation within the genome: In addition to genetic variation, mutation rate
varies within the genome. Inverted repeats in the promoter of Salmonella flagellar
synthesis genes can undergo frequent recombination events [120]. Microsatellite

11
sequences and polynucleotide runs are prone to frameshift mutations, even in cells
proficient for mismatch repair. Bacteria have found a way to make use of this increased
rate of mutation by placing these hypermutable sequences in the regulatory or coding
regions of genes where phenotypic variation is beneficial [2]. Loci containing of these
sequences are known as contingency loci and the process of using these sequences to
create variation is known as phase variation [89]. Screening of whole genome sequences
of the human pathogens, Haemophilus influenzae [133], Neisseria meningitidis [113],
and Campylobacter jejuni [101] have identified over 50 loci subject to phase variation.
These contingency loci are typically involved in the biosynthesis of cell surface
components, such as lipopolysaccharides, adhesions, and capsular proteins. Phase
variation may be responsible for the rapid generation of antigenic variation of pathogenic
strains following a population bottleneck [2].
Employing hypermutable sequences to generate phenotypic variation is not
limited to prokaryotes. A screen of the yeast genome identified 44 loci containing
tandemly repeated intergenic sequences, the majority of which show length variation
between different strains [134]. Most of the tandem repeats are found in genes encoding
cell wall proteins or proteins involved in cell wall synthesis and maintenance [134].
Interestingly, the number of tandem repeats correlates with phenotype: increasing the
number of repeats in the cell surface adhesion gene, FLO1, increases the strength of
adhesion [134]. A similar observation has been made in dogs; namely, the number of
tandem repeats in developmental genes correlates with physical features such as snout
length [27]. The overrepresentation of triplet repeats in developmental genes could
explain the rapid morphological changes seen in domesticated dogs [27, 103].
12
In order to recognize a vast array of antigens, cells of the immune system must be
able to generate a large amount of sequence diversity within the variable region of
antibodies. It is estimated that humans generate 109 unique antibodies [18]. The immune
cells use a two-step process for generating this diversity. First the antigen-contacting
region is assembled in a combinatorial fashion by recombination between variable (V),
diversity (D), and joining (J) segments through non-homologous end joining known as
V(D)J recombination [114]. The amount of variation created by this process is small
compared to the diversity seen in antibodies. The majority of the diversity is generated
by somatic hypermutation, a process by which the immune cell targets the variable region
for mutagenesis [18]. The first step in somatic hypermutation is the targeting activation-
induced deaminase (AID) to the variable region. AID is B-cell specific cytosine
deaminase that acts on DNA to produce deoxyuridine [91]. Targeted deoxycytidine
deamination can produce mutations through multiple pathways [18]. Replication across
deoxyuridine results in a transitions from G:C to A:T base pairs. Recognition of the
inappropriate G:U base pair by mismatch repair can result in mutations at adjacent sites.
In addition, uracil-DNA glycosylase may excise the uracil base leaving an abasic site.
Abasic sites can result in mutagenesis by either initiating non-homologous end joining or
translesion synthesis [18].
Both of the mechanisms described above, phase variation in pathogenic bacteria
and somatic hypermutation in the immune system, allow cells to generate variation
specifically in regions where it is needed; and, unlike mutator alleles, avoid the cost of
globally elevating the mutation rate. There are other forms of mutation rate variation
within the genome that do not have an obvious selective benefit; rather, may simply be a
13
consequence of genome structure. The yeast genome contains eight nearly identical
tRNA-Tyr loci any one of which can be mutated to an ochre-suppressor tRNA; and it was
noticed that there is a large difference in the frequency with which each of the eight
tRNAs acquire the suppressor mutation [50]. Although the mechanism for variation in
mutation rate across the genome is not know for the case of the tRNA-Tyr ochre
suppressor mutation, it has been observed that the ability of repair proteins to access the
DNA can lead to variation in mutation rate across the genome. Incorporating a
microsatellite sequence in frame with the URA3 reporter at various locations in the yeast
genome, reveals that the rate of microsatellite frameshift mutation varies 16-fold over ten
different locations in the genome [46]. Repeating this experiment in a mismatch repair-
deficient strain dramatically reduces this variation, suggesting that the majority of the
variation in frameshift mutation rates results from variation in the ability of mismatch
repair proteins to access the DNA and not from the variation in the polymerase-error rate
[46]. In addition to variation in the ability to repair frameshift mutations across the
genome, mismatch repair is more efficient in correcting errors on the lagging rather than
the leading strand during replication in yeast [102]. The difference is attributed to the
model of mismatch repair strand discrimination in eukaryotes, where nicks generated
during replication are used to identify the nascent strand. Due to the asymmetry of
replication, nicks are more frequent on the lagging strand; therefore, misincorporated
bases on this strand can be more easily excised.
Environmental variation: In addition to mutation rate variation within the
genome, mutation rate can vary with the environment. There are two ways the
environment can influence mutation rate. The environment can be directly mutagenic; or
14
the environment may cause a cell to enter a compromised state in which mutations occur
at a higher frequency. The former would include all environmental mutagens including
ionizing radiation, UV radiation, alkylating agents such as methyl chloride and ethyl
methanesulfonate, crosslinking agents such as nitrogen mustard and cisplatin, and
intercalating agents such as psoralens and aflatoxins [31].
An example of an environment that causes an elevation of mutation rate without
directly damaging DNA is high cadmium concentrations [51]. Cadmium has been shown
to increase mutation rate by inhibiting mismatch repair; and, exposure of yeast cells to
micromolar concentrations of cadmium increases mutation rate to levels 50% of that seen
in mismatch repair deficient cells [51]. The ability of cadmium to inhibit mismatch
repair provides a possible mechanism to explain cadmium toxicity [80].
Another example of an environmental effect on mutation rate is the observation of
an elevated mutation rate in non-growing (or slowly-growing) stationary-phase cells
[110]. The classic Luria-Delbrück experiment shows that mutations in E. coli conferring
resistance to T1 bacteriophage occur prior to exposure to the phage [75]. It has been
pointed out that such a strong selection can only detect mutations that occur prior to
plating since sensitive cells are killed once the phage has been encountered; therefore,
this experiment leaves open the possibility that additional mutations can occur after
exposure to selection [8]. Using nutritional reporters in both bacteria [8, 41, 115] and
yeast [42, 123], several experiments report that mutations continue to occur in apparently
non-dividing cells after exposure to selection, and these mutations occur preferentially at
the locus under selection. This idea that mutations are targeted specifically to regions
where they are likely to confer a selective advantage is known as directed mutagenesis.

15
The suggestion that mutations occur more frequently when beneficial than when neutral
is in conflict with the Darwinian assumption that the rate at which variation is generated
is independent of any selective benefit that it may provide. Several alternative
explanations were proposed to explain this observation, such as selection against
mutations prior to plating and additional post-plating cell divisions due to the selection
for an intermediate genotype [66, 67, 85]. Currently, directed mutation has little support
and this phenomenon is now referred to as adaptive mutation in order to distinguish it
from directed mutation [28]. Adaptive mutation states that the global mutation rate is
elevated in stationary phase (non-dividing) cells [29, 108], and that this may be a general
stress response [108]; although the subject remains controversial [109]. A survey of
natural populations found variation in the degree to which strains undergo stationary
phase mutation, in that strains with a high mutation rate during exponential growth show
less stationary phase mutation than strains with a low mutation rate during exponential
growth [4].
Variation inferred from sequence data: Due to the wealth of genomic data
available several inferences have been made regarding variation in mutation rate across
the genome. These experiments utilize sequence data to characterize the distribution of
neutral substitutions between sequence alignments; such as substitutions at synonymous
sites, intergenic sequences, introns, and repetitive elements [25]. Two confounding
factors in these analyses are that the mutations themselves may not be selectively neutral
and that changes to genome structure during evolution may alter the patterns of
substitution. Despite the caveats, these analyses have revealed mutation rate variation on
many length scales from individual bases to entire chromosomes [25]. At the smallest
16
level are sequence context effects, where mutation rate varies depending upon the
identity of the flanking bases [57] and on length scales less than ten base-pairs [119].
Mutation rate variation is also identified on the kilobase to megabase length scale in the
mammalian genome [119]. Comparison of substitutions in repetitive elements supports
the existence of mutation rate variation on the megabase length scale in the mammalian
genome and suggests that little variation exists on length scales less than 100 kilobases
[33]. This variation has potential biological importance in that regions of high neutral
substitution rates are enriched for genes involved in extracellular communication,
whereas housekeeping genes tend to be found in regions of low substitution rates [11].
Interestingly, similar analyses have failed to find evidence for mutation rate variation in
the yeast genome [10].
In addition to variation along a chromosome, substitution rates also vary between
chromosomes [70]. In humans, the X chromosome shows a lower rate of synonymous
substitutions compared to the Y chromosome and the autosomes [70]. Several
explanations have been put forward to explain this phenomenon such as higher mutation
rates in males due to more germ-line division [86] or selection pressure for lower
mutation rate on the X chromosome due to exposure of deleterious mutation when
hemizygous in males [81].
1.3 Summary
Mutation rate is an important parameter in evolution. It limits the speed of
adaptation in populations with beneficial mutations; in the absence of beneficial
mutations it sets the equilibrium fitness of the population. Mutation rates vary between
17
species, between individuals of the same species, within the genome, and between
environments. This variation can have important biological consequences in setting the
rate of adaptation, in the struggle between pathogenic strains and the host immune
system, and in the evolution of cancer. Despite its importance, the extent of mutation rate
variation is unknown and there are large uncertainties in estimates of the per-genome per-
generation mutation rate. Using the budding yeast, Saccharomyces cerevisiae, I have
made improvements to the calculation of mutation rates and characterized mutation rate
variation. Chapter 2 describes improvements I have made to the performance and
analysis of the fluctuation assay in order to generate accurate estimates of the phenotypic
mutation rate. Conversion of phenotypic mutation rates into per-base-pair rates requires
an estimate of the target size for phenotypic mutation. Chapter 3 outlines a probabilistic
definition for the effective target sizes of genes, which acknowledges that mutation rate
varies across the genome. By sequencing over 200 loss-of-function mutations of ura3
and can1, I calculate the effective target sizes for these genes. Chapters 4 and 5 use the
improvements to the fluctuation assay described in Chapter 2 to investigate mutation rate
variation. The basis for Chapter 4 is an experiment in which 43 strains were generated
where the URA3 reporter was integrated at a different location in each strain,
approximately every 3.8 kilobases along Chromosome VI. The results from this
experiment show that (1) the mutation rate varies 6-fold across this chromosome, (2)
mutation rate is clustered such that Chromosome VI is divided into three regions of
length 50 to 100 kilobases of relatively uniform mutation rate, and (3) mutation rate is
correlated with replication timing. The correlation between replication timing and
mutation rate is discussed with reference to a new model regarding the temporal

18
segregation of two modes of DNA damage tolerance during replication: error-free DNA
damage tolerance and translesion synthesis. In addition to mutation rate variation across
the genome, I have investigated variation between strain backgrounds, variation between
environments, and variation with the duration of the cell cycle. These experiments are
described in Chapter 5. Chapter 6 summarizes my work and puts it in the context of the
work described above. In addition, I lay out what I believe are the important unanswered
questions regarding mutation rates, how my data have bearing on these questions, and
where possible, I provide experiments aimed at addressing these questions.

19
Chapter 2
Improving the performance and analysis of
fluctuation assays
2.1 Materials and methods
Strains and media
Fluctuation assays
Analysis of fluctuation data
Computational Analysis
2.2 Methods for measuring mutation rate
2.3 Fluctuation assays
Performing fluctuation assays
Analyzing fluctuation data 1: Post-plating growth on 1 x canavanine
Analyzing fluctuation data 2: Quality of data
2.4 Phenotypic mutation rates

20
Abstract
Mutation rate is an important parameter in evolution. It limits the speed of
adaptation in populations with beneficial mutations; in the absence of beneficial
mutations it sets the equilibrium fitness of the population. Despite its importance, there
are large uncertainties in estimates of the per-genome per-generation mutation rate.
Estimating this parameter is typically a three-step process: determining the mutation rate
to a particular phenotype, converting this phenotypic rate into a per-base-pair mutation
rate in a particular gene and extrapolating this local rate to the entire genome. In this
chapter, I focus on the technical challenge of accurately determining phenotypic mutation
rates. I have improved the execution and analysis of the fluctuation assay and have
developed methods for asking whether observed data is derived from a Luria-Delbrück
distribution. I find that the phenotypic mutation rates to 5FOA, canavanine, and α-factor
resistance to be 5.43 x 10⁻⁸, 1.52 x 10⁻⁷, and 3.07 x 10⁻⁶ per genome per generation.
2.1 Materials and methods
Strains and media: GIL104 is a haploid yeast strain derived from the W303
background with genotype URA3, leu2, trp1, CAN1, ade2, his3, bar1Δ::ADE2, MATa.
Yeast were grown in either complete synthetic media (SC), complete synthetic media
without uracil (SC-Ura), or complete synthetic media with only 1% glucose (SCLG).
Fluctuation assays were plated onto four types of selective media: 1 x canavanine
(complete synthetic media without arginine [SC-Arg], 60 mg/L l-canavanine, Sigma-
Aldrich, St. Louis, MO), 10 x canavanine (SC-Arg, 0.6 g/L l-canavanine), 5FOA (SC-
Ura, 1 g/L 5FOA, Sigma-Aldrich, St. Louis, MO), and α-factor (YPD [Yeast Extract,

21
Peptone, Dextrose], 10 mg/L αF, Bio-Synthesis, Lewisville, TX). 5FOA is nontoxic, but
can be converted into toxic 5-fluoro-uracil by the uracil biosynthesis pathway. The
product of the URA3 gene catalyzes a key step in this process; therefore, 5FOA
predominantly selects for ura3 loss-of-function mutants. Canavanine is a toxic arginine
analog, whose uptake requires the arginine transporter. Canavanine selects for loss-of-
function mutants of this transporter, which is encoded by the CAN1 gene. α-factor is a
peptide pheromone secreted by mating-type α (MATα) cells. Binding of the pheromone
to the Ste2 receptor on a MATa cell signals through a MAP-kinase cascade to initiate the
mating response genes and a G1-arrest [21]. Wild-type MATa cells secrete a protease,
Bar1, which degrades α-factor; deleting BAR1 prevents growth on media containing α-
factor and allows us to measure the rate of resistance to α-factor using the fluctuation
assay. There are at least ten genes whose loss-of-function results in α-factor resistance;
therefore, the mutation rate to α-factor resistance is expected to be an order of magnitude
higher than the mutation rates to 5FOA and canavanine resistance.
Fluctuation assays: Fluctuation assays were performed on ten clones of GIL104
to determine the rate at which cells mutated to become resistant to 5FOA, 10 x
canavanine, or α-factor. Media and culture volumes were chosen such that a similar
number of mutants would be counted for each phenotype: 200 µl of SC, 100 µl SC, and
10 µl of SCLG for resistance to 5FOA, 10 x canavanine, and α-factor, respectively.
To begin each fluctuation assay, a single clone was grown overnight to saturation
in SC-Ura, diluted 1:10,000 in into the appropriate media, and dispensed into 96-well
plates (Figure 2-1b). This represents initial innocula of approximately 2000, 1000, and
200 cells for the cultures assayed for mutations to 5FOA, 10 x canavanine, and α-factor

2
0
5
0
6
107
0
.
.
.
.
.
.
A
B
Figure 2-1. The fluctuation assay. During the growth of a culture the number of mutation events will follow the Poisson distribution; however, the number of mutants per culture will have a larger variance. (A) Each of the three cultures had two mutation events occur during growth; however, the number of mutant cells varies depending upon when during growth the mutations arose. (B) To perform the fluctuation assay, an overnight culture is diluted 1:10,000 and distributed into 96 parallel cultures. Each culture is plated on selective media to determine the distribution of the number of mutants per culture (the Luria-Delbrück distribution). When a mutation event occurs early in the growth of a culture it leads to a jackpot (A, middle panel; B, the culture with 107 mutants).
Generations
23
resistance. Cultures were grown for two days at 30° without shaking (only one day for
the low glucose cultures, which saturated after one days growth) and re-suspended using
a Titramax 1000 orbital shaker (Rose Scientific Inc, Cincinnati, OH) prior to plating.
Twenty-four cultures were pooled, diluted, and counted in triplicate using a Beckman
Coulter particle counter (Beckman Coulter, Fullerton, CA) to determine the average
number of cells per culture. The remaining 72 cultures were spot plated onto over-dried
plates to select for mutants: 200 µl cultures were spotted onto 12 5FOA plates (six
spots/plate, Figure 2-2); 100 µl cultures were spotted onto eight 10 x canavanine pates
(nine spots/plate, Figure 2-3); 10 µl cultures were brought up to 100 µl with sterile water
and spotted onto eight 10 x canavanine plates (nine spots/plate). A Tecan Genesis liquid
handler (Tecan US, Durham, NC) was used to semi-automate spot plating. In preparation
for spot plating, the plates were over-dried by pressing a Whatman filter paper (Grade 3,
90 mm) onto the plates using a replica plating block and allowing the filter to remain in
place for at least 30 min. The filters remove approximately 1 mL of liquid and plates can
be used for several days after filters have been removed.
Plates were allowed to dry overnight at room temperature, then incubated at 30°
for one, two, or five days for αF, 10 x canavanine, and 5FOA, respectively, after which
time the number of mutants per spot was counted using a dissection microscope. For 10
x canavanine and α-factor plates I used a size threshold: colonies smaller than 1 mm at
10 x magnification for canavanine or 3 mm at 6 x magnification for α-factor were
presumed to result from mutations that had occurred after the cells were plated and were
not counted. The choice of the size cutoff was based on looking for a natural break in the
colony size distribution. However, the size distribution was not bimodal; therefore, it is

Figure 2-2. Fluctuation assay on 5FOA. 72 200 L cultures were spot-plated onto 12 5FOA plates 5FOA plates. Colonies were counted after five days of growth.
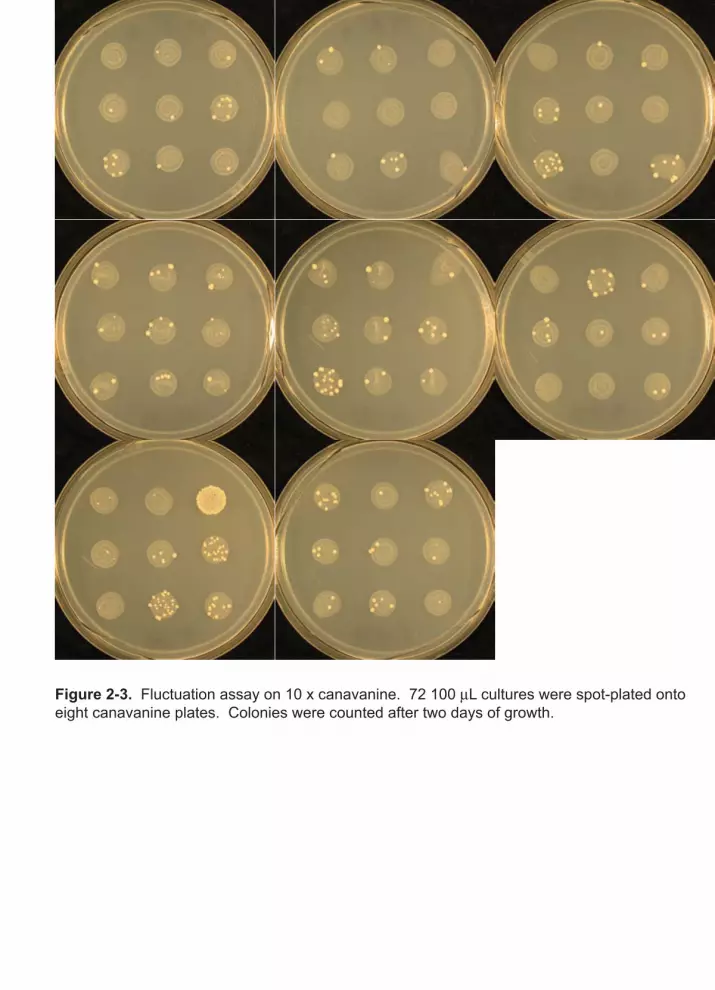
Figure 2-3. Fluctuation assay on 10 x canavanine. 72 100 L cultures were spot-plated onto eight canavanine plates. Colonies were counted after two days of growth.

26
reasonable to assume that some leaky mutants were excluded. This is clear when I
observe jackpots of mutants smaller than the size threshold, which were excluded from
the analysis. For this reason, it is important that the strains I sequenced to determine
target size were selected off of the plates from the fluctuation assays so that any leaky
mutants, which were excluded from the determination of mutation rates, were also
excluded from the calculation of target size. Fluctuation assays for resistance to 1 x
canavanine were performed similarly to those for 10 x canavanine except 1 x canavanine
plates were counted three days post plating.
Analysis of fluctuation data: Fluctuation data were analyzed by the Ma-Sandri-
Sarkar maximum likelihood method in which the data are fit to a model of the Luria-
Delbrück distribution based upon a single parameter m, the expected number of mutation
events per culture [112]. Mutation rate is calculated from the equation µ = m/N, where N
is the average number of cells per culture (approximately equal to the number of cell
divisions per culture since the initial inoculum is much smaller than N). Ninety-five
percent confidence intervals on m and µ were assigned using equations 24 and 25 from
[107].
The data were also fit to a two-parameter model that accounts for post-plating
growth and mutation. This model is a Luria-Delbrück distribution combined with a
Poisson distribution with a rate Nµd = md, where d is the mean number of cell divisions
(in which mutants could occur and be detected) in the lineage of cells that were plated on
the selective plates; d can be related to the number of generations of growth post plating
(g) by d = 2g - 1. The probability distribution for the number of mutants per culture in the
two-parameter model is thus the joint distribution of the Luria-Delbrück (parameter m)

27
and the Poisson (parameter n = md); the m’s are the same assuming that the mutation rate
is the same for the post-plating cell divisions. Akaike’s information criterion was used to
determine which model best fits each fluctuation assay while using the fewest free
parameters.
Computational Analysis: The Ma-Sandri-Sarkar maximum likelihood analysis
and the two-parameter fitting was performed in Matlab (The MathWorks, Natick, MA).
Fitting to the two-parameter model was achieved by optimizing m (with d fixed),
optimizing d (with m fixed) and repeating this process until convergence. Akaike’s
information criterion (AIC) was used to determine which model best fits the data [1].
AIC is calculated as 2P – 2(lnL) where L likelihood of observing the data given the best-
fit parameters and P is the number of free parameters. The model that provides the
lowest AIC score is the preferred model. Matlab was also used to simulate fluctuation
data, calculate the sum-of-the-square differences between Luria-Delbrück distributions
and data.
2.2 Methods for measuring mutation rate
Three methods are commonly employed to measure phenotypic mutation rates:
mutation accumulation assays, mutant accumulation assays, and fluctuation assays. The
mutation accumulation assay involves passing a culture through recurrent bottlenecks,
ideally of a single cell/individual, such that all mutations are nearly neutral. This is useful
for determining the rate of mutations effecting fitness since repeated bottlenecks will
reduce the effect of selection [54, 142]. This method works well in multicellular
organisms, where the population size can be maintained at the bottleneck; however, in

28
microorganisms, where a visible colony must be allowed to form, selection will still
occur between the bottlenecks. Several methods are available for estimating phenotypic
mutation rates from mutation accumulation assays [34]; alternatively, direct sequencing
can be used since all mutations occur in the same genome [16, 40].
In the mutant accumulation assay, the frequency of a neutral phenotype is
monitored in an exponentially growing culture by periodically plating an aliquot of the
culture onto selective media. Once the population reaches a size such that the probability
of a new mutation occurring in the next generation is approximately one, the frequency of
mutants will increase linearly with time. An accurate estimate of phenotypic mutation
rate requires a long period of time between frequency measurements, making these
experiments vulnerable to beneficial mutations, which are more likely to occur in the
non-mutant population and slow the accumulation of mutants.
In the fluctuation assay, many parallel cultures are inoculated with a small
number of cells, grown under non-selective conditions, and plated to select for mutants
[75]. The number of mutations that arise in each culture will follow the Poisson
distribution; however, the number of mutant cells per culture will vary greatly since early
mutations will lead to “jackpots,” cultures that contain a great many mutant individuals.
The simplest way to estimate the expected number of mutations that occur in each
culture (m) is from the fraction of cultures with zero mutants, which should be equal to
e-m. Luria and Delbrück used this method (the P0 method) in the original paper describing
the fluctuation assay [75]. The full distribution of mutants per culture (the Luria-
Delbrück distribution) can be described by a set of recursive equations [76]. The most
accurate method for estimating m (Ma-Sandri-Sarkar maximum likelihood) finds the m
29
that gives the best fit of the Luria-Delbrück distribution to the data [107, 112]. By
simulation, Stewart calculates 95% confidence intervals for m obtained using this method
[125]; however, for the confidence intervals to be meaningful, the data must follow the
Luria-Delbrück distribution.
One way to estimate the quality of data is to plot the cumulative distribution of
mutant frequencies on a log-log plot; Luria-Delbrück-distributed data presented in this
way will produce a straight line with slope –1 [107]. Deviations from linearity show that
the data do not approximate a Luria-Delbrück distribution. This graphical approach
ignores jackpots (since they lie far off the line) and cultures with zero mutants (due to the
log transformation).
2.3 Fluctuation assays
The accuracy of mutation rate estimates from fluctuation assays depends on how
the experiment is performed and how the data are analyzed. I have made improvements
to both and will consider with each in turn.
Performing fluctuation assays: One way to increase the accuracy of mutation
rate estimates from fluctuation assays is to increase the number of cultures [125].
Typically fluctuation assays are performed in test tubes; however, in order to increase the
throughput, I perform the assays in 96-well plates. I plate 72 of the cultures to selective
media to determine the number of mutants per culture; the remaining 24 are used to
determine the average number of cells per culture (see Methods). Using the 96-well
format I can vary the culture volume from 10 to 200 µl and can measure mutation rates
over two orders of magnitude (Table 2-2).

30
Rather than spreading cultures onto selective media, I spot cultures onto over-
dried plates, where they spread uniformly over an area of 1.3 to 3 cm2, depending on the
volume spotted. This increases efficiency and reduces the number of plates since up to
nine cultures can be spotted onto one plate.
The combination of spot plating and the 96-well format allow for automation of
the fluctuation assay. To demonstrate this, I semi-automated the process using a liquid
handler; this enabled me to perform all fluctuation assays described here—the equivalent
of three 720-tube fluctuation assays—in parallel.
Analyzing fluctuation data 1: Post-plating growth on 1 x canavanine: There are
many methods for calculating mutation rates from fluctuation data [30] of which the Ma-
Sandri-Sarkar maximum likelihood method is preferred because it is the most accurate, it
is valid for any range of the expected number of mutation events per culture (m), and
95% confidence intervals can be calculated by an empirically determined set of equations
[107, 125]. In order for estimates of mutation rates and 95% confidence intervals
generated from this method to be accurate the data must approximate the Luria-Delbrück
distribution.
I tested this approximation by using the Ma-Sandri-Sarkar maximum likelihood
method to estimate m and then plotting the predicted cumulative frequency distribution of
mutants against the experimental data. Fluctuation assays on 5FOA produced close
agreement between predicted and observed distributions (Figure 2-4). In contrast, assays
on 1 x canavanine and αF produced data that deviates significantly from the Luria-
Delbrück distribution. Compared to the expected distribution, cultures with a small
number of mutants are underrepresented and cultures with many mutants are
1.0
0.5
00 5 10 15 20 25
Mutants per culture
Cum
ulat
ive
dist
ribut
ion
1.0
0.5
00 5 10 15 20 25
Mutants per culture
Cum
ulat
ive
dist
ribut
ion
1 x canavanine
1.0
0.5
00 5 10 15 20 25
Mutants per culture
Cum
ulat
ive
dist
ribut
ion
10 x canavanine
5FOA
Data
One-parameter modelTwo-parameter model
1.0
0.5
00 5 10 15 20 25
Mutants per culture
Cum
ulat
ive
dist
ribut
ion
-factor
Figure 2-4. Fitting data from fluctuation assays. Four 72-tube fluctuation assays using GIL104 Clone A plated were plated onto 1 x canavanine, 5FOA, 10 x canavanine, and -factor. Black circles show the cumulative distribution of the data. Solid curves indicate the cumulative Luria-Delbrück (one-parameter model) distributions fit to the data with parameter m = 4.80, 1.31, 2.82, and 1.97 for 1 x canavanine, 5FOA, 10 x canavanine, and -factor, respectively. The broad shaded curve is the two-parameter model of post-plating growth fit to the data with m = 2.31, d = 2.62; m = 2.39, d = 0.37; and m = 1.10 and d = 1.42 for 1 x canavanine, 10 x canavanine, and
-factor, respectively. The one-parameter and two-parameter models are the same for 5FOA. Using Akaike’s information criterion (Akaike 1974), the 5FOA and 10 x canavanine fluctuation assays are best described by the one-parameter model; whereas, the 1 x canavanine and
-factor fluctuation assays are best described by the two-parameter model.
32
overrepresented in the 1 x canavanine experiment (Figure 2-4, one-parameter model).
This deviation can be explained as the combination of a Luria-Delbrück distribution and
a Poisson distribution.
One possible explanation is that canavanine-sensitive cells can divide and give
rise to canavanine-resistant mutations after they have been plated; the number of
additional mutant colonies will follow the Poisson distribution. I fit the distribution of
mutant frequencies to a two-parameter model that incorporating post-plating growth and
mutation. This model is the joint distribution of a Luria-Delbrück distribution (with
parameter m) and a Poisson distribution (with parameter n = md). The data from 1 x
canavanine fit better to the two-parameter model (Figure 2-4).
I quantified the improvement of the fit by calculating the sum-of-the-squared
differences between the cumulative distribution of the data and the theoretical curve for
both models. I define the improvement of fit as the decrease in the sum-of-the-square
differences between the one-parameter and the two-parameter models. The two-
parameter model will always fit the data as well or better than the one-parameter model;
therefore, Akaike’s information criterion (AIC) was used to determine whether the
increase in fit justifies the additional parameter.
For fluctuation assays on 1 x canavanine, the sum-of-the-square differences for
the one-parameter model and the two-parameter model are 1.27 and 0.13, giving an
improvement of 1.14. By AIC, the data is best fit by the two-parameter model. For
fluctuation assays on 5FOA, there is no improvement of fit using the two-parameter
model. To minimize post-plating mutation I increased the canavanine concentration 10-
fold and counted the plates one day earlier. Although the two-parameter model still gives

33
a slightly better fit (Figure 2-4, improvement of fit 0.09), according to AIC, the data are
best fit by the one-parameter model. For the fluctuation assay on αF, the data are best fit
by the two-parameter model with an improvement of fit of 0.26; however, both models
fail to capture all features of this distribution (Figure 2-4).
Analyzing fluctuation data 2: Quality of data: The Ma-Sandri-Sarkar maximum
likelihood method is the most accurate method for estimating the expected number of
mutants per culture (m) from fluctuation data; however, this method assumes that the data
follow the Luria-Delbrück distribution. I have shown that post-plating proliferation and
mutation of canavanine-sensitive cells on 1 x canavanine plates can be detected since it
produces a deviation from the expected Luria-Delbrück distribution. If the data are not
corrected, this leads to an overestimation of the mutation rate. One can correct for this by
fitting the data to a two-parameter model that accounts for post-plating growth or largely
eliminate it by increasing the concentration of canavanine. Other processes that
introduce error into mutation rate estimates such as differential growth rates between
mutants and non-mutants [143] and poor plating efficiency [124, 126] will also produce
deviations from the expected Luria-Delbrück distribution. Therefore, I suggest that
fitting fluctuation data to the cumulative distribution and comparing the sum-of-the-
square differences with simulated data should be used as a general method for assaying
the quality of data resulting from fluctuation assays.
I can assign significance to deviations from the Luria-Delbrück distribution by
simulation. Data from the 1 x canavanine fluctuation assay (Figure 2-4) give a maximum
likelihood value of m = 4.80 and a sum-of-the-square differences = 1.27 for the one-
parameter model. To determine the expected sum-of-the-square differences, I simulated

34
10,000 72-tube fluctuation assays by sampling from the Luria-Delbrück distribution with
m = 4.80 and calculated the sum-of-the-square differences for each simulated experiment.
I find that only 3.5% of the simulated experiments have a poorer fit to the Luria-Delbrück
distribution than the observed 1 x canavanine data compared to 30% and 41% for 10 x
canavanine and 5FOA respectively.
2.4 Phenotypic mutation rates
Fluctuation assays were performed to determine mutation rates to α-factor, 10 x
canavanine, and 5FOA resistance for ten isogenic clones of a strain from the W303
background (GIL104); the data were analyzed using the one-parameter and two-
parameter models (Table 2-1 and Table 2-2, respectively). All fluctuation assays on αF
and six of the ten fluctuation assays on 10 x canavanine are best described by the two-
parameter model. Whereas, all fluctuation assays on 5FOA and four of the ten
fluctuation assays on 10 x canavanine are best described by the Luria-Delbrück
distribution (the one-parameter model).
Using the combined data from the 10 clones (effectively a fluctuation assay with
720 parallel cultures) and the two-parameter model I determine phenotypic mutation rates
to α-factor, 10 x canavanine, and 5FOA resistance to be 3.07 x 10⁻⁶, 1.52 x 10⁻⁷, and 5.43
x 10-8, respectively. For 5FOA resistance, the data are best described by the one-
parameter model (d = 0 for the two-parameter model, meaning that post-plating growth
and mutation does not occur); therefore, I can use equations 24 and 25 from [107] to
assign a 95% confidence interval to my estimate of mutation rate. This yields a
confidence interval of 5.00 to 5.93 x 10⁻⁸ per generation (Table 2-2). For the two-

Table 2-1. Per-genome per-generation mutation rates for ten clones of GIL104
Mutation rate
Clone α-factorR (x 10
-6) Can
R (x 10
-7) 5FOA
R (x 10
-8)
A 5.51 (4.47-7.03) 2.08 (1.72-2.57) 6.49 (5.12-8.58)
B 5.51 (4.47-7.02) 1.81 (1.49-2.26) 4.77 (3.71-6.44)
C 6.28 (5.13-7.92) 2.21 (1.82-2.76) 7.19 (5.72-9.41)
D 6.58 (5.40-8.26) 1.88 (1.55-2.34) 5.08 (3.94-6.90)
E 5.60 (4.55-7.11) 2.06 (1.70-2.57) 4.48 (3.44-6.15)
F 6.07 (4.97-7.65) 1.87 (1.53-2.34) 6.70 (5.32-8.77)
G 5.35 (4.36-6.78) 1.76 (1.45-2.20) 4.74 (3.68-6.40)
H 6.05 (4.95-7.63) 2.05 (1.70-2.55) 5.01 (3.89-6.78)
I 6.00 (4.91-7.56) 1.79 (1.47-2.23) 7.03 (5.56-9.25)
J 5.50 (4.49-6.95) 2.09 (1.72-2.61) 3.05 (2.27-4.39)
Avg ± Stdev 5.85 ± 0.41 1.96 ± 0.16 5.45 ± 1.34
Combined 5.86 (5.48-6.29) 1.95 (1.83-2.09) 5.43 (5.00-5.93)
Parentheses indicate the 95% confidence intervals calculated using equations 24 and 25 fromRosche and Foster (2000). The combined data set treats the ten 72-tube fluctuation assays asone 720-tube fluctuation assay.

Table 2-2. Fitting data to a two-parameter model of post-plating growth
α-factor resistance Canvanine resistance 5FOA resistance
Clone Mut. rate x
10-6
Div. postplating
#Improv. of
fit Mut. rate x
10-7
Div. postplating
#Improv. of
fit Mut. rate x
10-8
Div. postplating
#Improv. of
fit
A 3.07 1.42†0.26 1.76 0.37 0.09 6.49 0 0
B 3.66 0.95†0.22 1.16 1.08
†0.19 4.77 0 0
C 4.17 0.96†0.22 1.5 0.94
†0.21 7.19 0 0
D 2.89 2.45†0.37 1.19 1.12
†0.17 4.97 0.03 0.0006
E 2.14 2.74†0.33 1.53 0.67
†0.14 4.48 0 0
F 3.34 1.48†0.24 1.46 0.54
†0.14 6.7 0 0
G 2.94 1.46†0.15 1.69 0.08 0.02 4.74 0 0
H 2.61 2.32†0.26 1.88 0.18 0.01 5.01 0 0
I 2.56 2.45†0.32 1.48 0.42 0.02 7.03 0 0
J 3.36 1.17†0.21 1.55 0.72
†0.21 3.05 0 0
Avg ± Stdev 3.07 ± 0.59 1.74 ± 0.68 0.26 ± 0.06 1.52 ± 0.23 0.61 ± 0.36 0.12 ± 0.08 5.44 ± 1.34 < 0.01 < 0.01
*Combined
3.07 1.66
†0.26 1.52 0.57
†0.12 5.43 0 0
The mutation rates are the phenotypic mutation rates per genome per generation.
* The combined data set treats the ten 72-tube fluctuation assays as one 720-tube fluctuation assay.
# The improvement of fit is a measure of how much better the data fit to the two-parameter model, which incorporates post plating
growth and mutation, than to the one-parameter model, where all mutants arose during the growth of the culture. For both modelswe calculate the sum-of-the-squared differences between the cumulative distribution of the data and the best-fit curve. We define theimprovement of fit as the decrease in the sum-of-the-square differences between the one-parameter and the two-parameter models.
† Fluctuation assays where the two-parameter model is accepted over the one-parameter model by Akaike information criterion (see
text and Akaike 1974).

37
parameter model I determined confidence intervals by simulation. For each combined
720-culture fluctuation assay I determined the most-likely values for m and d, given the
data. In order to gauge the expected variation in these parameters, I simulated 1000
fluctuation assays by sampling the combined Luria-Delbrück/Poisson distribution using
parameters determined from the data (Figure 2-5). I take the 95% confidence intervals
for my estimates of m to be the values of m that encompass 95% of the simulated
experiments. From this I calculate the 95% confidence intervals on the two-parameter
model to be 2.65 to 3.62 x 10⁻⁶, 1.34 to 1.71 x 10⁻⁷, and 4.78 to 5.87 x 10⁻⁸ for α-factor, 10
x canavanine, and 5FOA resistance, respectively.

2.521.510 0.50
2.5
2
1.5
1
0.5
3
m
d
5FOA
10 x canavanine
-factor
Figure 2-5. Simulation of fluctuation assays. To determine confidence intervals for values of m generated from the two-parameter model, 1000 720-tube fluctution assays were simulated using the values for m and d estimated from the combined fluctuaiton assays (indicated by the large symbols; m = 2.04 d = 0.57, m = 1.11 d = 0, m = 1.15 d = 1.66 for 10 x canavanine, 5FOA, and
-factor, respectively). For each simulated fluctuation assay the most likely values for m and d were calculated using the two-parameter model (small symbols).

39
Chapter 3
Effective target size and the per-base-pair
mutation rate
3.1 Materials and methods
Sequencing of ura3 and can1 mutants
Computational Analysis
3.2 Mutational spectra
Determining mutational spectra
Analyzing mutational spectra
Per-base-pair rate of nonsense mutations
3.3 Effective target size
Definition of effective target size
Calculation of effective target size and the per-base-pair mutation rate
Discussion of effective target size
Target size for mutations conferring resistance to α-factor
3.4 Mutation rate per base pair per generation
40
Abstract
In order to convert phenotypic mutation rates into per-base-pair mutation rates
one needs to estimate the effective target size for phenotypic mutation. Although the
concept of effective target size is important in evolutionary theory—it links the mutation
rate to a particular phenotype to the mutation rate per genome per generation—it has not
been explicitly defined. In this chapter, I propose a definition of effective target size that
illustrates the relationship between phenotypic and genomic mutation rates, shows where
uncertainties in estimates of genomic mutation rate arise, and provides a method for
calculating this parameter from experimental data. Combining the estimates effective
target size for loss-of-function at URA3 and CAN1 with the phenotypic mutation rates in
Chapter 2, I conclude that the per-base-pair mutation rate at URA3 and CAN1 is 3.80 x
10-10 and 6.44 x 10⁻¹⁰ per base pair per generation, respectively, suggesting that the
mutation rate varies across the yeast genome.
3.1 Materials and methods
Sequencing of ura3 and can1 mutants: Table 3-1 lists the primers that were
used to amplify and sequence the ura3 and can1 alleles from 5FOA and 10 x canavanine
resistant colonies, respectively. Prior to the isolation of genomic DNA, 5FOA and 10 x
canavanine resistant colonies were restreaked on selective media.
Computational Analysis: Matlab was used to bootstrap estimates of effective
target sizes to generate 95% confidence intervals. Yeast coding and non-coding
sequences were downloaded from ftp site of the Saccharomyces genome database
(http://www.yeastgenome.org, orf_coding.fasta.gz and NotFeature.fasta.gz). Each file

Table 3-1. Primers used in Chapter 3
Primer Name Sequence Purpose
URA3extF 5’ ATCAAAGAAGGTTAATGTGG 3’ PCR
URA3extR 5’ TCATTATAGAAATCATTACG 3’ PCR/Sequencing
URA3extF3 5’ TTGATTCGGTAATCTCCGAG 3’ Sequencing
URA3intF2 5’ TGGGCAGACATTACGAATGC 3’ Sequencing
URA3intR2 5’ CAAACCGCTAACAATACCTG 3’ Sequencing
CAN1extF2 5’ TCTTCAGACTTCTTAACTCC 3’ PCR
CAN1extR2 5’ ATAGTAAGCTCATTGATCCC 3’ PCR/Sequencing
CAN1ext/intF1 5’ AAAAAAGGCATAGCAATGAC 3’ Sequencing
CAN1intF2 5’ GACGTACAAAGTTCCACTGG 3’ Sequencing
CAN1intF3 5’ TCAAAGAACAAGTTGGCTCC 3’ Sequencing
CAN1intR2 5’ TAGATGTCTCCATGTAAGCC 3’ Sequencing
CAN1intR3 5’ AACTTTGATGGAAGCGACCC 3’ Sequencing
42
was concatenated into one string and the coding sequence was shuffled to generate the
randomized coding sequence. To calculate the frequency distribution for motifs of length
x, bases 1 through x and were used as a query and searched for the next occurrence of that
sequence starting at base x+1. The search was terminated once a match was found or if
there was no match within 150 base pairs. This process was reiterated for bases 2
through x+1, 3 through x+2, and so on, until the end of the sequence was reached.
3.2 Mutational spectra
Determining mutational spectra: I wanted to convert the phenotypic mutation
rates to per-base-pair mutation rates. The raw material for this conversion is the
mutational spectra; from the fluctuation assays in Chapter 2, I sequenced 237 ura3 alleles
and 227 can1 alleles from 5FOA and 10 x canavanine resistant strains, respectively.
Thirty 5FOA resistant mutants contain wild-type URA3 alleles; 29 of these mutants are
uracil prototrophs. It has been reported that mutations in FUR1 can confer this
phenotype; however, I failed to find any mutations within the coding sequence of this
gene for any of the 29 5FOA resistant uracil prototrophs (data not shown). None of the
207 ura3 mutants are prototrophic, and each contains a single mutation or two mutations
within a few nucleotides. There are 167 base-pair substitutions (64 nonsense and 103
missense), 22 single-base-pair deletions, three two-base-pair deletions, three single-base-
pair insertions, one three-base-pair insertion, two large tandem duplications and nine
double mutations (Figure 3-1). All 227 10 x canavanine resistant mutants contain a
single mutation or closely adjacent mutations at the CAN1 locus. I find 150 base-pair
substitutions (70 nonsense and 80 missense), 55 single-base-pair deletions, eight single-
TAA
TAA TAG TAA
TAA TAG GAC TGA TAA TAG TAG
G R D A K V E G E R Y R K A G W E A Y L R R C G Q Q N *GGA AGG GAT GCT AAG GTA GAG GGT GAA CGT TAC AGA AAA GCA GGC TGG GAA GCA TAT TTG AGA AGA TGC GGC CAG CAA AAC TAA 804
AGCAGCGAC TAA CGTGAC TAA CAC CGTGCC TAA TAA CAC GAT TTT AGAGTC TAA TAA CAC GAT GAG TGA TTT GAAGTC TAA TGA TAG CCA CGC GAT GAG TGA TAA TGA TAT TTT TGA TAG
G F I A Q R D M G G R D E G Y D W L I M T P G V G L D D K G D A L G Q Q Y R T V D D V V S T G S D I I I V G R G L F A KGGC TTT ATT GCT CAA AGA GAC ATG GGT GGA AGA GAT GAA GGT TAC GAT TGG TTG ATT ATG ACA CCC GGT GTG GGT TTA GAT GAC AAG GGA GAC GCA TTG GGT CAA CAG TAT AGA ACC GTG GAT GAT GTG GTC TCT ACA GGA TCT GAC ATT ATT ATT GTT GGA AGA GGA CTA TTT GCA AAG 720
-AA -GA -T -T -C -A-A
CGCGAC TAA TGA
GAC TAA TGA
GAC CAT TAA TAA TGA
GAA TAG TAA TAG ATA GAC CAT TAA TAG TAA TGA GAG GAT
A H G V V G P G I V S G L K Q A A E E V T K E P R G L L M L A E L S C K G S L A T G E Y T K G T V D I A K S D K D F V IGCA CAC GGT GTG GTG GGC CCA GGT ATT GTT AGC GGT TTG AAG CAG GCG GCG GAA GAA GTA ACA AAG GAA CCT AGA GGC CTT TTG ATG TTA GCA GAA TTG TCA TGC AAG GGC TCC CTA TCT ACT GGA GAA TAT ACT AAG GGT ACT GTT GAC ATT GCG AAG AGC GAC AAA GAT TTT GTT ATC 540
-G -C +G -T -A
AAC GGGCAC TCG
AAA GAA GAA TTGTAT CAA TAA AAA GAA ATA GAA TAG AAG AAATAT CCA TAA TAA GAA ATA TAA TAG GAA TGA AAG CATTAT CCC CCA TAA TTC TAA TAA GAG TGA CAA GTT CCT AAC TAG TAG TAG GAA TGA GAA AAT AAG TAT
H V D I L T D F S M E G T V K P L K A L S A K Y N F L L F E D R K F A D I G N T V K L Q Y S A G V Y R I A E W A D I T NCAT GTG GAT ATC TTG ACT GAT TTT TCC ATG GAG GGC ACA GTT AAG CCG CTA AAG GCA TTA TCC GCC AAG TAC AAT TTT TTA CTC TTC GAA GAC AGA AAA TTT GCT GAC ATT GGT AAT ACA GTC AAA TTG CAG TAC TCT GCG GGT GTA TAC AGA ATA GCA GAA TGG GCA GAC ATT ACG AAT 360
+A -T -G -T -A-C -G
-G
AAAAAA
CCA AAAAAA TTA AGA
AGA AAA TTA CCATAA ATA AAA TAT TTA TAA TAA TAT CCA
TAG TAA TAA CCT CCT TAA GAA ATA AAG TGG TTA TAA TGA TTT TAA GAT TTT CCA
M S K A T Y K E R A A T H P S P V A A K L F N I M H E K Q T N L C A S L D V R T T K E L L E L V E A L G P K I C L L K TATG TCG AAA GCT ACA TAT AAG GAA CGT GCT GCT ACT CAT CCT AGT CCT GTT GCT GCC AAG CTA TTT AAT ATC ATG CAC GAA AAG CAA ACA AAC TTG TGT GCT TCA TTG GAT GTT CGT ACC ACC AAG GAA TTA CTG GAG TTA GTT GAA GCA TTA GGT CCC AAA ATT TGT TTA CTA AAA ACA 180
-G -G -G -A +A -A-G
CAA C(+TATTTAATATCATGCACGAAAAGC)AA
CTA C(+AAA)TA
ACA AAGA
ATC TCTC
ATC TTG AT- -TG
GAT AA-
AAT CATT
ATA A(+AATTTGCTGACATTGGTAATACAGTCAAATTGCAGTACTCTGCGGGTGTATACAGAA)TA
GTG GGT GGG GGTT
24 bp Duplication
3 bp Insertion
Double
57 bp DuplicationDouble
DoubleDouble
2 bp Deletion
Double
Base pair substitutions
Insertion/deletion and complex mutations
GGC AGG
DoubleTGC TAA
Double
GGC GAT
Double
GGT GAC
Double
TAA
Figure 3-1. Mutational spectra for 5FOA resistant ura3 mutants. 207 mutations are shown. Black text represents missense mutations; white text on a black background represents nonsense mutations. A horizontal line separates different mutations at the same codon. Complex mutational events such as large duplications and multiple mutations in the same strain are indicated below the nucleotide sequence.
AGGCGGCGGTAG
TAG
TGA CACTGA TGA TAA TGA TGA TAA TAG TAA
F L I Y C F C M V C G A G V T G P V G F R Y W R N P G A W G P G I I S K D K N E G R F L G W V S S L I N A A F T F Q G TTTT CTA ATA TAC TGT TTT TGT ATG GTT TGT GGT GCT GGG GTT ACC GGC CCA GTT GGA TTC CGT TAT TGG AGA AAC CCA GGT GCC TGG GGT CCA GGT ATA ATA TCT AAG GAT AAA AAC GAA GGG AGG TTC TTA GGT TGG GTT TCC TCT TTG ATT AAC GCT GCC TTC ACA TTT CAA GGT ACT 900
-G -G -T -G -T -C
AGTTAA TAG TAG GAC GTT AAG AGG
CGG CAA TAA TAA TGA TAG TGA TAG CTT TTC GAT TGT TAA GCG TGA CCT GAT AGG
F A L E L S V V G Q V I Q F W T Y K V P L A A W I S I F W V I I T I M N L F P V K Y Y G E F E F W V A S I K V L A I I GTTT GCC CTG GAA CTT AGT GTA GTT GGC CAA GTC ATT CAA TTT TGG ACG TAC AAA GTT CCA CTG GCG GCA TGG ATT AGT ATT TTT TGG GTA ATT ATC ACA ATA ATG AAC TTG TTC CCT GTC AAA TAT TAC GGT GAA TTC GAG TTC TGG GTC GCT TCC ATC AAA GTT TTA GCC ATT ATC GGG 720
-G -C -A +T -T -C -C -C -C
CGT CGT TAG TAA TAA AAG CAT TAT GAT TAA TAG GCT
G A L I S Y L F M G S L A Y S V T Q S L G E M A T F I P V T S S F T V F S Q R F L S P A F G A A N G Y M Y W F S W A I TGGC GCT CTT ATA TCA TAT TTA TTT ATG GGT TCT TTG GCA TAT TCT GTC ACG CAG TCC TTG GGT GAA ATG GCT ACA TTC ATC CCT GTT ACA TCC TCT TTC ACA GTG TTC TCA CAA AGA TTC CTT TCT CCA GCA TTT GGT GCG GCC AAT GGT TAC ATG TAT TGG TTT TCT TGG GCA ATC ACT 540
-G -G -T -C +A +G -C -G -C
AGCAGC
CGT CGCGAT GACGAT ATA GAC
TAG TAG TAG GAT GAT TGT CCA GAC CTA
G E D T F S M E D G I G D E D E G E V Q N A E V K R E L K Q R H I G M I A L G G T I G T G L F I G L S T P L T N A G P VGGC GAG GAT ACG TTC TCT ATG GAG GAT GGC ATA GGT GAT GAA GAT GAA GGA GAA GTA CAG AAC GCT GAA GTG AAG AGA GAG CTT AAG CAA AGA CAT ATT GGT ATG ATT GCC CTT GGT GGT ACT ATT GGT ACA GGT CTT TTC ATT GGT TTA TCC ACA CCT CTG ACC AAC GCC GGC CCA GTG 360
-C -T
TAA TAA
TAA GCC TAA TAA TAA TAA
M T N S K E D A D I E E K H M Y N E P V T T L F H D V E A S Q T H H R R G S I P L K D E K S K E L Y P L R S F P T R V NATG ACA AAT TCA AAA GAA GAC GCC GAC ATA GAG GAG AAG CAT ATG TAC AAT GAG CCG GTC ACA ACC CTC TTT CAC GAC GTT GAA GCT TCA CAA ACA CAC CAC AGA CGT GGG TCA ATA CCA TTG AAA GAT GAG AAA AGT AAA GAA TTG TAT CCA TTG CGC TCT TTC CCG ACG AGA GTA AAT 180
-C -T
-TTGGTATGATTGCCCTTGGTGGTACTA
AGT A(+GTATTTTTGGGGTAATTATCACAATAATGA)GTGTT CCA -TT TCA
TGT TTTT GGG C-G TTT CAA ATT TAA
Base pair substitutions
Insertion/deletion and complex mutations
27 bp Deletion
30 bp Duplication (Imperfect)DoubleTTC CCT T-C CCC
Double
Double Double Double
§ TTC
Double
TAG
TAG
TAA
§
Figure 3-2. Mutational spectra for canavanine resistant can1 mutants. Continued on next page.

TGA
TGA
TGA TAA
TGA TAA
W I L F Q C I F R C R F I W K I G D V D I D S D R R D I E A I V W E D H E P K T F W D K F W N V V A *
TGG ATC TTA TTT CAA TGC ATA TTC AGA TGC AGA TTT ATT TGG AAG ATT GGA GAT GTC GAC ATC GAT TCC GAT AGA AGA GAC ATT GAG GCA ATT GTA TGG GAA GAT CAT GAA CCA AAG ACT TTT TGG GAC AAA TTT TGG AAT GTT GTA GCA TAG 1773
-C
AAATAG TAA TGA CTC TAG TAA
R G I S R D E L P F K A K L M P G L A Y Y A A T F M T I I I I I Q G F T A F A P K F N G V S F A A A Y I S I F L F L A VCGT GGC ATC TCT CGT GAC GAG TTA CCA TTT AAA GCT AAA TTA ATG CCC GGC TTG GCT TAT TAT GCG GCC ACA TTT ATG ACG ATC ATT ATC ATT ATT CAA GGT TTC ACG GCT TTT GCA CCA AAA TTC AAT GGT GTT AGC TTT GCT GCC GCC TAT ATC TCT ATT TTC CTG TTC TTA GCT GTT 1620
-C -G -T -C -G -G -T
CGCCGC GACGAC GTC
GTT TAG GAC TAA CGT GTC TAA TGA
G V P Y I A V F V T A A F G A L A Y M E T S T G G D K V F E W L L N I T G V A G F F A W L F I S I S H I R F M Q A L K YGGT GTT CCA TAC ATT GCA GTT TTC GTT ACT GCT GCA TTT GGC GCT TTG GCT TAC ATG GAG ACA TCT ACT GGT GGT GAC AAA GTT TTC GAA TGG CTA TTA AAT ATC ACT GGT GTT GCA GGC TTT TTT GCA TGG TTA TTT ATC TCA ATC TCG CAC ATC AGA TTT ATG CAA GCT TTG AAA TAC 1440
C -T -T -G -G +TT -G
AGTAGTAGTCAT
TAA CATTAA CTT TTA
TAG CCA TAA CGT TAC GGT TTATAG TGA TTT TAG CGT TTC TGT TTA TAA
P F I I A I E N S G T K V L P H I F N A V I L T T I I S A A N S N I Y V G S R I L F G L S K N K L A P K F L S R T T K GCCC TTT ATT ATT GCT ATT GAG AAC TCT GGT ACA AAG GTT TTG CCA CAT ATC TTC AAC GCT GTT ATC TTA ACA ACC ATT ATT TCT GCC GCA AAT TCA AAT ATT TAC GTT GGT TCC CGT ATT TTA TTT GGT CTA TCA AAG AAC AAG TTG GCT CCT AAA TTC CTG TCA AGG ACC ACC AAA GGT 1260
+T -A -G -T -C -T +T +C -G-C
CATCAT TCC
AAA CCT TAA TAG TAA
TAA GTT AAA CCT GGT TAA TGA TAG TAA
E L V G I T A G E A A N P R K S V P R A I K K V V F R I L T F Y I G S L L F I G L L V P Y N D P K L T Q S T S Y V S T SGAA CTA GTT GGT ATC ACT GCT GGT GAA GCT GCA AAC CCC AGA AAA TCC GTT CCA AGA GCC ATC AAA AAA GTT GTT TTC CGT ATC TTA ACC TTC TAC ATT GGC TCT CTA TTA TTC ATT GGA CTT TTA GTT CCA TAC AAT GAC CCT AAA CTA ACA CAA TCT ACT TCC TAC GTT TCT ACT TCT 1080
-C -C -A -C -A -C -A +A -T-C+C GAC AA-
TCA TTAA
TTG AAA TTT -AA
TCG CAC ATC AGA --G CAC ATC ATATCG CAC ATC AGA --G CAC ATC ATA
Double
DoubleDouble
Mutations in the same strain
Double
GGC AGG
Double
§
Figure 3-2 (continued). Mutational spectra of canavanine resistant can1 mutants. 227 mutations are shown. Black text represents missense mutations; white text on a black background represents nonsense mutations. A horizontal line separates different mutations at the same codon. Complex mutational events such as large duplications and multiple mutations in the same strain are indicated below the nucleotide sequence.

46
base-pair insertions, one two-base-pair insertion, ten double mutations, and three
complex mutations including a can1 allele containing a 27 base pair deletion and a 30-
base-pair tandem duplication (Figure 3-2).
Analyzing mutational spectra: I sequenced 237 5FOA resistant ura3 alleles and
227 10 x canavanine resistant can1 alleles in order to determine the locus-specific
effective target size for phenotypic mutations. From these data sets one can garner
additional information regarding the mutagenic processes leading to loss of function at
URA3 and CAN1. Nonsense mutations represent a larger fraction of base pair
substitutions in the can1 data set (47% versus 38%). This indicates that a larger fraction
of missense mutations cause loss of function for URA3 (10.9% versus 6.8% as calculated
by dividing the number of possible loss-of-function missense mutations by the number of
possible missense mutations). This difference is reflected in my calculation of locus-
specific effective target size where, although the coding sequence of CAN1 is 2.2 times
larger, the effective target size for loss of function by way of base-pair substitutions is
only 1.6 times larger (see below). Loss-of-function mutations in the mutational spectra
are overrepresented at conserved residues (p = 1.5 x 10⁻⁵, Wilcoxon rank-sum, A. Singhal
and A. Segre, data not shown). In my compiled URA3 and CAN1 mutational spectra I
identified 88 single base-pair insertions/deletions in which deletions were
overrepresented by 7:1 (p < 0.001, Chi-square).
There are two ways I can test whether mutations occur randomly within the target
sequences. Since I know every position where a nonsense mutation can occur I can ask if
mutations fall randomly over these sites. When looking at the distribution of nonsense
mutations I assume that all nonsense mutations result in loss of function. For URA3 this
47
assumption is reasonable since the data set includes a nonsense mutation eight amino
acids before the stop codon removing the last 1% of the protein. Dividing the URA3 and
CAN1 sequences into fifths I find that the observed number of nonsense mutations in
each region does not differ significantly from expectation (URA3: observed, 10, 10, 19,
10, 15; expected, 13, 12, 12, 11, 16, p > 0.05, Chi-square; CAN1: observed, 10, 18, 17,
14, 11; expected, 14, 15, 13, 13, 15, p > 0.05, Chi-square).
In addition, I can test for mutational hotspots/coldspots by asking if the number of
times I found a given base-pair substitution deviates from what I would expect from
binomial sampling. For URA3 the number of mutations I identified 0, 1, 2, 3, or 4 times
is 206, 71, 18, 12, and 6. This deviates significantly from the expectation of binomial
sampling (184, 98, 26, 5, and 1; p < 0.01, Chi-square). Similarly, for CAN1 the number
of mutations I identified 0, 1, 2, 3, or 4 times is 373, 91, 20, 5, and 1, which deviates
significantly from binomial sampling (360, 111, 17, 2, and 0; p < 0.05, Chi-square).
Therefore, although I do not see regional biases in the mutational spectra I do find
particular substitutions to be over/under-represented, possibly reflecting biases due to
local sequence context effects. The variation I find in the yeast URA3 and CAN1 genes is
significantly less that the degree of variation seen across the LacI gene in E. coli [84].
I found 20 instances of multiple mutation events occurring in the same strain.
One can1 allele contains a 27 base pair deletion and a 30 base pair imperfect duplication
separated by 312 wild-type base pairs. The remaining 20 were multiple mutation events
occurring within a few nucleotides of each other; 9 in ura3 and 11 in can1 (Table 3-2).
In one case the same complex mutation, a double deletion and base-pair substitution, was
found in two can1 strains which were adjacent during much of the processing
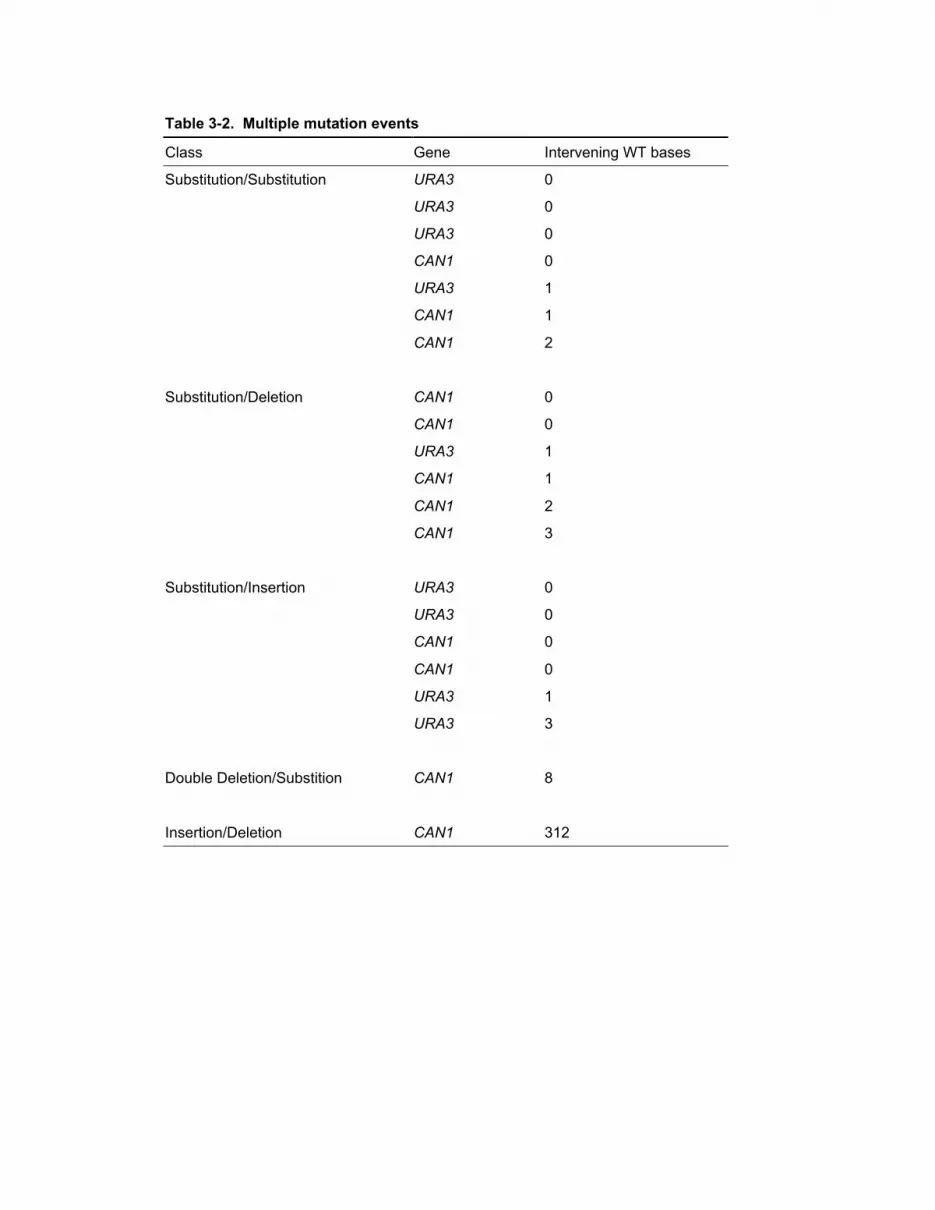
Table 3-2. Multiple mutation events
Class Gene Intervening WT bases
Substitution/Substitution URA3 0
URA3 0
URA3 0
CAN1 0
URA3 1
CAN1 1
CAN1 2
Substitution/Deletion CAN1 0
CAN1 0
URA3 1
CAN1 1
CAN1 2
CAN1 3
Substitution/Insertion URA3 0
URA3 0
CAN1 0
CAN1 0
URA3 1
URA3 3
Double Deletion/Substition CAN1 8
Insertion/Deletion CAN1 312

49
(restreaking, genomic DNA preparation, PCR, and sequencing); therefore, this may
represent a single event which was inadvertently sampled twice. Half of the multiple
mutation events are interspersed with one or more bases of wild type sequence; therefore,
multiple mutation events must have occurred. These events may represent instances
where lesion bypass has occurred and the multiple mutations result from decreased
fidelity of translesion polymerases [44]. The translesion polymerase Polζ can efficiently
extend unpaired primer termini resulting from incorporation opposite a lesion and it is
thought that up to half of all spontaneous mutations occur in a Polζ-dependent manner
[61, 104, 106].
Four large insertion/deletion mutations were found. These include tandem
duplications of 24 and 57 base pairs in URA3, and a 30-base-pair tandem duplication and
a 27-base-pair deletion in the same can1 mutant. In addition, in another sequencing
experiment (Chapter 5), an additional 18-base-pair tandem duplication was identified.
All five mutations are flanked by 4 to 6 base pair repeats (or imperfect repeats) and result
in in-frame insertions/deletions. One might assume that the probability of an event
between nearby repeats leading to an in-frame mutations is 1/3; therefore the probability
of detecting five in-frame mutations is (1/3)5 = 0.4%. However, due to constraints on
amino acid and codon usage, particular nucleotide motifs may be overrepresented in one
of the three frames resulting in events between tandem repeats being more likely to result
in in-frame mutations than expected. I tested this using three data sets: a concatenated
string consisting of all yeast coding sequences (8,755,812 base pairs), a concatenated
string consisting of all yeast non-coding sequences (3,091,831 base pairs), and a string
consisting of the shuffled sequence of all yeast coding sequences (8,755,812 base pairs).

50
In each data set I determined the distance between sequence motifs. For each sequence
motif along a string I determined the distance to the next occurrence of that sequence. For
yeast coding sequences (but not non-coding or randomized coding sequences) the
frequency distribution for the distances between nearest occurrences of a given motif is
punctuated at every third position (Figure 3-3) resulting for a 43% chance that events
between 4 base pairs motifs will result in an in-frame mutation. The in-frame probability
increases with motif length and is above 50% for motifs greater that 5 base pairs (Figure
3-3).
Per-base-pair rate of nonsense mutations: From the results thus far, I can
calculate the per-base-pair mutation rate to nonsense mutations at the CAN1 and URA3
genes. First I need to correct the phenotypic mutation rate to 5FOA resistance to take
into account that only 207 out of 237 5FOA mutants are URA3 mutants. This results in a
mutation rate for loss of function of 4.75 x 10⁻⁸ for URA3 and 1.52 x 10⁻⁷ for CAN1. If I
multiply these rates by the fraction of nonsense mutations in the mutational spectra I find
that the rate of nonsense mutations at URA3 and CAN1 is 1.47 x 10⁻⁸ and 4.69 x 10⁻⁸,
respectively. For URA3 and CAN1, I counted the number of possible nonsense
substitutions from the known sequences of these genes. URA3 is 804 base pairs;
therefore, there are 2412 possible substitutions (804 base pairs x 3 possible substitutions
per base pair). Of these, 123 result in nonsense mutations. By dividing these rates by the
number of possible nonsense substitutions and multiplying by 3, since there are 3
possible mutations at each base, I find that the nonsense mutation rate normalized per
base pair is 3.58 x 10⁻¹⁰ for URA3 and 6.21 x 10⁻¹⁰ for CAN1. Repeating the above
analysis for all ten fluctuation assays at CAN1 and URA3 from Table 3-2 I find that the
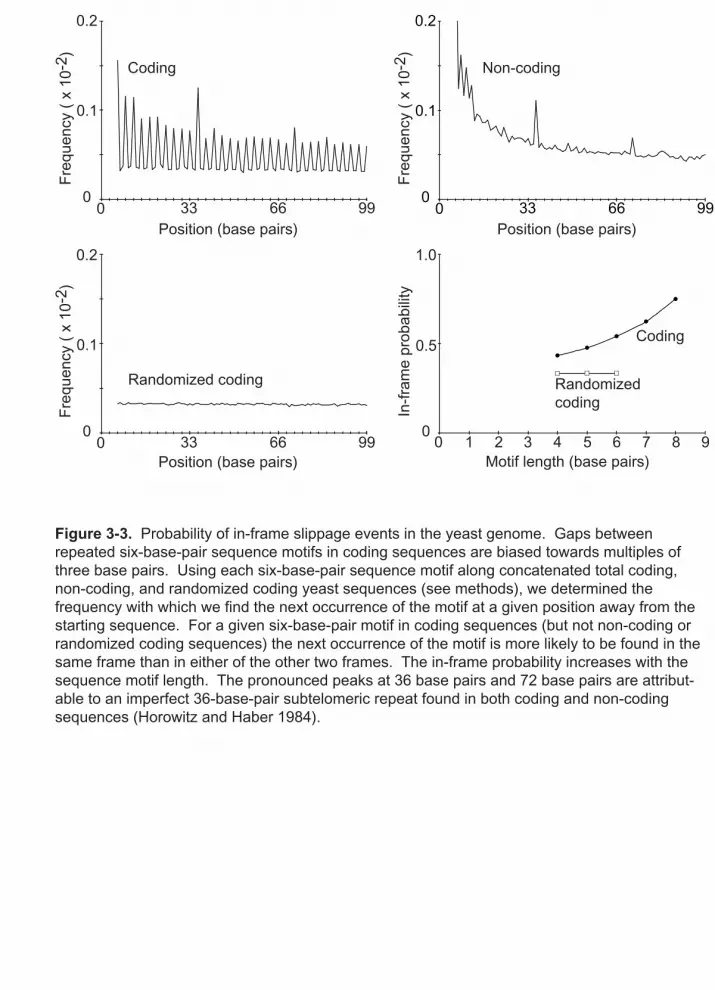
Position (base pairs)
Fre
quen
cy (
x 1
0-2 )
Position (base pairs)
Fre
quen
cy (
x 1
0-2 )
0.2
00 33 66 99
Position (base pairs)
Fre
quen
cy (
x 1
0-2 )
Coding
In-f
ram
e pr
obab
ility
Motif length (base pairs)
1.0
0.5
0
0.1
0.2
00 33 66 99
0.1
0.2
00 33 66 99
0.1
0 1 2 3 4 5 6 7 8 9
Non-coding
Randomized coding Randomized coding
Coding
Figure 3-3. Probability of in-frame slippage events in the yeast genome. Gaps between repeated six-base-pair sequence motifs in coding sequences are biased towards multiples of three base pairs. Using each six-base-pair sequence motif along concatenated total coding, non-coding, and randomized coding yeast sequences (see methods), we determined the frequency with which we find the next occurrence of the motif at a given position away from the starting sequence. For a given six-base-pair motif in coding sequences (but not non-coding or randomized coding sequences) the next occurrence of the motif is more likely to be found in the same frame than in either of the other two frames. The in-frame probability increases with the sequence motif length. The pronounced peaks at 36 base pairs and 72 base pairs are attribut-able to an imperfect 36-base-pair subtelomeric repeat found in both coding and non-coding sequences (Horowitz and Haber 1984).

52
per-base-pair nonsense mutation rates differ significantly at these two loci (Wilcoxon
rank-sum, p < 1.83 x 10⁻⁴). These calculations were performed with mutation rates from
the two-parameter model, correcting for post-plating growth and mutation on canavanine
plates. Had I used the one-parameter model, the difference in mutation rates between
URA3 and CAN1 would have been greater, since the one-parameter model overestimates
the phenotypic mutation rates to canavanine resistance.
3.3 Effective target size
Definition of effective target size: I define effective target size as the size of the
genome, G, multiplied by the probability that introducing a single genomic mutation (this
could be a base-pair substitution, insertion/deletion, transposition, etc.) will result in the
phenotype of interest:
€
τ =G ⋅ P{mutation results in phenotype |mutation in genome}.
Thus, the effective target size to canavanine resistance is
€
τCan
R =G ⋅ P{mutation results in CanR|mutation in genome}.
One can specify the effective target size given a particular class of mutation. For
instance, the target size for mutation to canavanine resistance by way of a base-pair
substitution is
€
τCan
R| BPS
=G ⋅ P{BPS results in CanR|BPS in genome}.
Furthermore, one can restrict the region of the genome in question to define a locus-
specific effective target size. For example, the locus-specific effective target size for
canavanine resistance by way of a base-pair substitution at the CAN1 locus is
€
τCan
R| BPS
CAN1= (1773 bp) ⋅ P{BPS results in Can
R|BPS at CAN1}
53
were 1773 base pairs is the size of the CAN1 locus. Notice that
€
µCan
R
τCan
R
= ˆ µ bp =Ug
G,
where
€
µCan
R is the mutation rate to canavanine resistance,
€
ˆ µ bp is the genome-wide
average mutation rate per base pair per generation, and
€
Ug is the mutation rate per-
genome per-generation. Similarly,
€
µCan
R
τCan
R
CAN1= µbp
CAN1,
where
€
τCan
R
CAN1 is the locus-specific effective target size for canavanine resistance at the
CAN1 locus and
€
µbp
CAN1 is the average mutation rate per base pair per generation at the
CAN1 locus.
€
τCan
R
CAN1 and
€
µbp
CAN1 are related to
€
τCan
R and
€
ˆ µ bp through the parameter λCAN1
which is the ratio of the mutation rate at the CAN1 locus compared to the genome-wide
average; λ = 1 identifies loci where the mutation rate equals the genomic average, loci
where λ < 1 are coldspots, and those where λ > 1 are hotspots:
€
λCAN1 ⋅ τCan
R
CAN1= τ
CanR , and
€
µbp
CAN1 = λCAN1⋅ ˆ µ bp .
Calculation of effective target size and the per-base-pair mutation rate: The
effective target size to canavanine resistance,
€
τCan
R , is difficult to determine
experimentally; however, from mutational spectra I can determine the locus-specific
effective target size to canavanine resistance conditioned on a mutation at the CAN1
locus,
€
τCan
R
CAN1, by rewriting it as
€
τCan
R
CAN1= fBPS ⋅ τCan R
| BPS
CAN1+ f INDEL ⋅ τCan R
| INDEL
CAN1 ,

54
where
€
fBPS and
€
fINDEL are the frequency with which base pair substitutions and insertion,
deletion, or other DNA rearrangements (which I collectively refer to as indels) occur.
Assuming that all indels in CAN1 result in loss of function,
€
τCan
R| INDEL
CAN1 is 1773 base pairs.
To determine
€
τCan
R| BPS
CAN1 , I separated the observed base-pair substitutions into nonsense
and missense (70 and 80, respectively). CAN1 contains 226 possible nonsense
substitutions 54 of which I found (as expected, some mutations were identified multiple
times). The 80 missense mutations represent 63 unique substitutions. Assuming I
identified the same proportion of possible missense and nonsense mutations, I can
calculate the possible number of missense mutations conferring canavanine resistance as
63(226/54) = 264. Since there are three possible substitutions at each base, the locus-
specific effective target size for canavanine resistance at the CAN1 locus by way of
missense and nonsense mutations is 264/3 = 88 base pairs and 226/3 = 75 base pairs,
respectively. From the CAN1 sequence I know the location of every nonsense mutation.
I also know that there are 264 possible missense mutations; however, this method is blind
to the locations of mutations other than those identified in the mutational spectra. A
locus-specific effective target size for missense mutations of 88 base pairs could
represent 88 positions where any of the three possible substitutions causes a phenotype,
or 264 positions where only one out of three substitutions causes a phenotype, or
something in between.
Combining locus-specific effective target sizes for nonsense and missense
mutations I find that
€
τCan
R| BPS
CAN1 = 88 bp + 75 bp = 163 bp.

55
This locus-specific effective target size indicates that 163/1773 (9%) of base-pair
substitutions at the CAN1 locus result in canavanine resistance. In order to calculate the
mutation rate per base pair per generation by way of base-pair substitutions, I need to
consider that only 150 of 227 mutations detected at the CAN1 locus were base-pair
substitutions; therefore,
€
µbp | BPS
CAN1 = 1.52 x 10⁻⁷ (150 / 227) / 163 bp = 6.15 x 10⁻¹⁰ /bp/generation,
I can now calculate the mutation rate per base pair per generation for all mutations. The
frequency of base-pair substitutions and indel mutations in the CAN1 mutational
spectrum is 150/227 (~66%) and 77/227 (~34%), respectively, but only 9% of base pair
substitutions result in canavanine resistance. Thus the fraction of mutations that are
substitutions,
€
fBPS , is actually 0.95 (
€
fBPS = (0.66/0.09)/((0.66/0.09) + 0.34)) and those
that are indels,
€
fINDEL , is only 0.05. Using these values, I estimate the locus-specific
effective target size to canavanine resistance at the CAN1 locus to be
€
τCan
R
CAN1 = (0.95)(163 bp) + (0.05)(1773 bp) = 236 bp; therefore,
€
µbp
CAN1 = 1.52 x 10⁻⁷ / 236 bp = 6.44 x 10⁻¹⁰ /bp/generation.
Similar calculations for URA3 show that
€
τ5FOA
R| BPS
URA3 = 104 bp, and
€
τ5FOA
R
URA3 = 125 bp.
Taking into account that only 207 of the 237 5FOA resistant mutants sequenced were
ura3 mutants, the rate of mutation to 5FOA resistance at URA3 is 4.75 x
10-8/cell/generation. Thus I calculate
€
µbp | BPS
URA3 = 4.75 x 10⁻⁸ (167 / 207) / 104 bp = 3.68 x 10⁻¹⁰ /bp/generation, and

56
€
µbp
URA3 = 4.75 x 10⁻⁸ / 125 bp = 3.80 x 10⁻¹⁰ /bp/generation.
Discussion of effective target size: The mutation rate per genome per generation
is a fundamental parameter in molecular evolution. Here I introduce the effective target
size (τ) to phenotypic mutation as a way to link the mutation rate per genome per
generation to the measurable phenotypic mutation rate. I have defined effective target
size as
€
τ =G ⋅ P{mutation results in phenotype |mutation in genome}.
I use a bottom up approach based upon mutational spectra to calculate the effective target
size to phenotypic mutation. For example, for canavanine resistance I first calculate the
effective target size to phenotypic mutation by way of a base-pair substitution at the
CAN1 locus (
€
τCan
R| BPS
CAN1 = 163 base pairs). Intuitively this means that if one considers
only base-pair substitutions, the CAN1 gene is effectively 163 base pairs where any base-
pair substitution will result in canavanine resistance. This value is then used to calculate
the locus-specific effective target size to canavanine resistance by way of any mutation
(
€
τCan
R
CAN1 = 236 base pairs) meaning that CAN1 is effectively 236 base pairs where any
mutation will result in canavanine resistance. In order to calculate
€
τCan
R
CAN1 one needs to
weight the effective target sizes for canavanine resistance by way of each particular class
of mutation by the frequency with which that mutation occurs.
The effective target sizes that are calculated are valid only as long as the
frequencies of particular classes of mutation are conserved and, therefore are likely to
vary between strain backgrounds and growth conditions. Varying the selective media
may alter the fraction of missense mutations; for example some ura3 mutants will form
colonies at low concentrations of 5-fluoro-orotic acid but not at high ones. Therefore, it
57
is critical that I determined the effective target sizes by sequencing mutant ura3 and can1
alleles from the same plates that were used for the fluctuation assays.
Genes of similar lengths may have very different effective target sizes.
Mutational hotspots such as microsatellite sequences and poly-nucleotide runs will
increase the effective target size by increasing the local rate of frameshift mutations.
Mutator alleles not only increase the mutation rate, but also influence the effective target
size by altering the mutational spectra. In addition, since mutation rates are believed to
vary across the genome [46, 50], the effective target size may change if a gene is moved
to a different location. In the context of this experiment, if CAN1 were moved to a
location in the genome where the mutation rate is two-fold higher than at its endogenous
locus, the target size will be twice as large, since, given the definition of effective target
size, moving the gene doubles the probability of a mutation resulting in canavanine
resistance given a single mutation occurring anywhere in the genome. In my notation, I
do not explicitly state that the CAN1 gene is at endogenous location. I do, however,
indicate that my estimate of locus-specific effective target size is conditioned upon a
mutation within the 1773 base-pair region of the CAN1 coding sequence. I specify this
with the superscript CAN1 (
€
τCan
R
CAN1) to distinguish this locus-specific effective target size
from the effective target size for a mutation occurring anywhere within the genome
(
€
τCan
R ).
€
τCan
R
CAN1 and
€
τCan
R are related by the hotspot parameter λ,
€
λCAN1 ⋅ τCan
R
CAN1= τ
CanR .
Target size for mutations conferring resistance to α-factor: If I take
€
ˆ µ bp to be the
average of the per-base-pair mutation rates at CAN1 and URA3, 5.12 x 10⁻¹⁰, I can
estimate the effective target size for mutation to α-factor resistance as
58
€
ταF R = µ
αF R / ˆ µ bp = 3.07 x 10⁻⁶ / 5.12 x 10-10 = 5996 bp.
Taking the mean ratio of target size to gene size for CAN1 and URA3, 0.14, this suggests
the total length of genes in which a loss-of-function mutation results in α-factor
resistance is 41.5 kilobase pairs. Summing over the lengths of known targets (STE2,
STE4, STE5, STE7, STE11, STE12, STE20, STE50, FAR1, and FUS1) accounts for only
18.6 kilobase pairs. There are four possible explanations for this inconsistency. There
could be unidentified genes whose inactivation results in α-factor resistance; however,
given the degree to which the mating pathway has been studied, it is unlikely that enough
components remain unidentified to account for this difference. It is could be that many
more loss-of-function missense mutations are possible for signaling proteins than for
enzymes or transporters. The third possibility is that a change of the mating type locus
from MATa to MATα provides an additional class of mutation to α-factor resistance.
Although the strain used in this study is heterothallic, a spontaneous double-strand break
at the MAT locus can be repaired off of the silent HMLα cassette resulting in mating type
switching and α-factor resistance. The rate of mating type switching in heterothallic
yeast is estimated to be between 10-7 and 10-6 [56]. An additional possibility is that CAN1
and URA3 are located in regions that are coldspots compared to the genome-wide average
mutation rate (or one or more of the genes involved in α-factor resistance could be
located in a mutational hotspot; however, since the target for α-factor resistance is spread
over the genome, it likely averages over local hotspots and coldspots). Asserting that the
known genes that can mutate to confer α-factor resistance have an average λ of 1 predicts
λCAN1 = 0.55 and λURA3 = 0.32.
59
3.4 Mutation rate per base pair per generation
I measured phenotypic mutation rates and, from the same experiments, the locus-
specific effective target sizes to phenotypic mutation. My results indicate that the per-
base-pair mutation rate at URA3 and CAN1 is
€
µbp
URA3 = 3.80 x 10⁻¹⁰ and
€
µbp
CAN1 = 6.44 x 10⁻¹⁰
per base pair per generation, respectively. Drake [22] obtains similar values, but his
method differs slightly. He also utilizes fluctuation assays and mutational spectra;
however, rather than calculate the effective target size to phenotypic mutation, Drake
estimates the number of base-pair substitutions that occurred in the coding sequence as
64/3 times the number of nonsense mutations detected, ignoring missense mutations
detected in the mutational spectra. He then calculates a correction factor (the inverse of
the detection frequency) to scale the mutation rate then divides the corrected mutation
rate by the size of the open reading frame.
In principle Drake’s method and mine should yield similar values for the per-
base-pair mutation rate. Analyzing mydata using the Drake method yields estimates of
€
µbp
URA3 = 3.49 x 10⁻¹⁰ and
€
µbp
CAN1 = 5.92 x 10⁻¹⁰ per base pair per generation, respectively.
Drake converts the per-base-pair mutation rate to a per-genome mutation rate by scaling
to the size of the genome. Since these estimates of the per-base-pair mutation rate are
specific for particular loci, scaling up is accurate only if mutation rate is uniform across
the genome. Several experiments suggest that mutation rate varies across the genome by
at least an order of magnitude [46, 50]. On a genomic scale, URA3 and CAN1 are
relatively close (83 kilobases apart on the left arm of Chromosome V) yet my two point
estimates of the per-base-pair mutation rate differ by a factor of 1.7.

60
In order to determine if this difference in mutation rate is significant, I need to
place confidence limits on the per-base-pair mutation rate estimates. In Section 2.4, I
showed that the 95% confidence intervals for my estimates of phenotypic mutation rate
are 1.34 to 1.71 x 10⁻⁷, and 4.78 to 5.87 x 10⁻⁸ for resistance to 10 x canavanine and
5FOA, respectively. Since only 207 of 237 5FOA resistant mutation are URA3 mutants,
the 95% confidence interval for the rate of loss of function of URA3 is 4.17 to 5.13 x 10⁻⁸.
I used a bootstrapping method to generate 95% confidence intervals around the
estimates of the effective target size by discarding 25% of the mutational spectra data and
recalculating the effective target sizes. This process was iterated 10,000 times for both
€
τ5FOA
R
URA3 and
€
τCan
R
CAN1. The range of these distributions is 99.90 to 162.82 and 190.64 to
285.60 for
€
τ5FOA
R
URA3 and
€
τCan
R
CAN1. Excluding the extreme 2.5% at either end of the
distribution, 95% of the values lie between 109.17 and 140.81 for
€
τ5FOA
R
URA3 and between
207.16 and 257.73 for
€
τCan
R
CAN1. To place conservative confidence limits on the per-base-
pair mutation rate estimates I took the lower bound for phenotypic mutation rate divided
by the upper bound for the effective target size and vice-versa. This yields non-
overlapping confidence intervals of 2.96 to 4.70 x 10⁻¹⁰ and 5.21 to 8.24 x 10⁻¹⁰ per base
pair per generation for
€
µbp
URA3 and
€
µbp
CAN1, respectively.
In this chapter, I have shown that the per-base-pair mutation rate varies on two
length scales: between different positions within the CAN1 and URA3 genes and between
the genes themselves. It is possible that these two observations are related; however,
since I measured forward mutation rates over large targets, I likely averaged over the
local sequence effects. Therefore, the difference in the per-base-pair mutation rate I
observe between CAN1 and URA3 is most likely due to mutation rate variation on a
61
larger scale. Ito-Harashima et al. [50] find that the frequencies of ochre suppressor
mutations, detected at eight identical tRNA-Tyr alleles, vary by a factor of about 20.
Hawk et al. [46] show that the rate of microsatellite frameshift mutations varies 16-fold
across the genome, due in part to variation in the efficiency of mismatch repair.
Consistent with this, I show that the per-base-pair per-generation spontaneous mutation
rate is non-uniform across the genome and varies about 2-fold between two reporters, 83
kilobases apart, on the left arm of Chromosome V.

62
Chapter 4
Mutation rate variation I:
Variation across the yeast genome
4.1 Introduction
4.2 Materials and methods
Primers, strains, and media
Plasmid construction
Strain construction
Fluctuation assays
Computational analysis
4.3 Mutation rate varies across Chromosome VI
Measuring mutation rate across Chromosome VI
Identification of outliers
4.4 Mutation rate is correlated with replication timing
4.5 Model for replication timing and mutation rate
4.6 Discussion
In relation to previous work
Biological significance

63
Abstract
Results from the previous chapter suggest that mutation rate is non-uniform
across the yeast genome. Previous experimental studies also support this conclusion. In
order to characterize mutation rate variation across the genome more precisely, I
measured the mutation rate of the URA3 reporter integrated at 43 different locations tiled
across Chromosome VI. In this chapter, I show that mutation rate varies six-fold across
the genome, that this variation is correlated with replication timing, and I propose a
model to explain this variation that relies on the temporal separation of two processes for
replicating past damaged DNA: error-free DNA damage tolerance and translesion
synthesis. This model is supported by the observation that eliminating translesion
synthesis decreases this variation. These results are discussed in relation to previous
studies and their biological significance is examined.
4.1 Introduction
In Chapter 3, I presented evidence for a two-fold difference in the per-base-pair
mutation rate between the URA3 and the CAN1 loci in yeast. This is consistent with
previous reports of mutation rate variation within the yeast genome. One experiment
looked at the frequency at which tRNA-Tyr ochre suppressors occur [50]. Ochre
suppressor mutations occur when a GC to TA transversion converts the GTA tRNA-Tyr
anticodon into TTA, which is capable of decoding the TAA ochre stop codon. Ochre
suppressors can be isolated based on their ability to read through an ochre stop codon in a
reporter gene. The yeast genome contains eight nearly identical tRNA-Tyr genes
distributed between five chromosomes, containing only one polymorphic site located in

64
the intron [50]. Assuming that mutation rates are uniform across the yeast genome, one
would expect each of the ochre suppressor mutations (SUP2-o, SUP3-o, SUP4-o, SUP5-
o, SUP6-o, SUP7-o, SUP8-o, and SUP11-o) to occur with equal probability. However,
when 126 independent ochre suppressor mutations were analyzed it was found that the
tRNA-Tyr genes do not mutate at equal frequency; SUP6-o mutations represent 31% of
the ochre suppressors whereas SUP2-o and SUP8-o combined represent only 3%,
suggesting that the rate of GC to TA transversions is non-uniform across the yeast
genome [50]. The authors rule out that this variation is due to trivial causes such as the
intron polymorphism or the ability of each tRNA-Tyr to act as a suppressor by showing
that the suppressor frequency is not correlated with the identity of the polymorphism or
the strength of the suppressor. In addition, the rate of tRNA-Tyr ochre suppressor
mutations is uncorrelated with replication timing, the rate of fork movement, or proximity
to centromeres, telomeres, Ty or delta elements [50]. However, the orientation of the
tRNA-Tyr gene relative to the nearest origin of replication may account for some of the
variation observed in mutation frequency. The three least-frequently observed ochre
suppressor genes are transcribed in the same direction as replication fork movement,
whereas the other five ochre suppressor genes are in the opposite orientation relative to
the replication fork [50].
Another experiment examined the effect of genome position on the stability of a
microsatellite sequence by placing 16.5 copies of the GT dinucleotide in frame with the
URA3 reporter and integrating this construct at ten locations across the yeast genome
[46]. The locations for integration of this construct were chosen to be near genomic
features such as centromeres, telomeres, replication origins, and at the SUP2-o and
65
SUP6-o loci, which were shown to mutate at different frequencies. Between these ten
strains there is a 16-fold difference in the mutation rate to 5FOA resistance, and the
majority of these mutations resulted from frameshift mutations within the polyGT tract.
Mismatch repair is primarily responsible for correcting these types of mutations [31, 60].
In order to determine if this mutation rate variation is due to variation in the production of
errors or to variation in the ability to correct errors, a key gene involved in mismatch
repair, msh2, was deleted in six of the strains. In the mismatch repair deficient strains the
mutation rate variation is reduced from 16-fold to two-fold, suggesting that the variation
in microsatellite stability across the genome is largely due to variation in the efficiency of
mismatch repair [46].
Although the authors were able to identify mismatch repair as the mechanism
responsible for variation of microsatellite stability, they were unable to identify genomic
features underlying the variation in the efficiency of mismatch repair. The rate of
microsatellite frameshift mutations is not correlated with proximity to replication origins,
orientation relative to replication origins, replication timing, rates of transcription, or GC
content [46]. The authors propose that this variation may result from differences in the
ability of mismatch repair to recognize and/or access mismatched bases [46].
In order to better characterize the degree of mutation rate variation within the
yeast genome, I sought to integrate the URA3 gene at different locations in the yeast
genome and, using the fluctuation assay, measure the rate of mutation in each strain. To
aid in strain construction, I took advantage of the existence of the yeast deletion
collection, where every non-essential open reading frame (ORF) was systematically
deleted and replaced with the KanMX4 reporter, conferring resistance to the drug G418

66
[139]. To integrate URA3 at different locations, strains were pulled from the deletion
collection and the KanMX4 cassette was replaced with the URA3 gene. Rather than
integrate the URA3 gene at locations selected randomly across the genome, I chose to
systematically integrate the gene across a single chromosome. By doing so, I did not bias
the results by integrating reporters near particular genomic features and I avoided any
complications that may result from variation in mutation rates between the chromosomes.
I chose Chromosome VI for several reasons: it is the second smallest chromosome (270
kilobases, 40 kilobases larger than Chromosome I), it is close to being metacentric, the
gene closest to any centromere (DEG1) is on this chromosome, two of the tRNA-Tyr
ochre suppressor genes are on this chromosome, and none of the 30 known mutator
alleles are on this chromosome. As it turned out, Chromosome VI was a convenient
choice for another reason: it is the chromosome for which replication timing has been
most carefully studied [32, 105, 141]. I created 43 strains with the URA3 gene integrated
at a different location tiled across Chromosome VI. Using this collection, I show that
mutation rate varies at least six-fold across the yeast genome, that this variation exists on
a length scale of 50 to 100 kilobases and that mutation rate is correlated with replication
timing as a consequence of the temporal separation of two mechanisms of DNA damage
tolerance: error-free DNA damage tolerance and translesion synthesis.
4.2 Materials and methods
Primers, strains, and media: The sequences of oligonucleotides used for plasmid
construction, gene replacement, verification, and sequencing are described Table 4-1.
The yeast strain GIL066 (described in Chapter 5) was used a source for the URA3 gene

Table 4-1. Primers used in this chapter
Primer Name Sequence Purpose
URA3extF_integration 5' AGACCTGCGAGCAGGGAAACGCTCCCCTCA Strain contruction
CAGACGCGTTGAATTGTCCCCACGCCGCGC
ATCAAAGAAGGTTAATGTGG 3'
URA3extR_integration 5' TGTCAGTACTGATTAGAAAAACTCATCGAG Strain contruction
CATCAAATGAAACTGCAATTTATTCATATC
TCATTATAGAAATCATTACG 3'
U1 5' GATGTCCACGAGGTCTCT 3' PCR/Sequencing
D1 5' CGGTGTCGGTCTCGTAG 3' PCR/Sequencing
URA3intF2 5’ TGGGCAGACATTACGAATGC 3’ Sequencing
URA3intR2 5’ CAAACCGCTAACAATACCTG 3’ Sequencing
YFL063W_F 5' ACAGTTACCCTCCAATTAC 3' PCR/Sequencing
YFL063W_R 5' AGAGCATAGTGGTATGACGG 3' PCR/Sequencing
YFL011W_F 5' GGACACAAGAAATGTGTTGG 3' PCR/Sequencing
YFL011W_R 5' GTGACGCCATTAATAAAGGC 3' PCR/Sequencing
YFR030W_F 5' ATATAAGCAACAGAGGGCAG 3' PCR/Sequencing
YFR030W_R 5' AGAAATGTTCAAGACAGGTTC 3' PCR/Sequencing
YFR043C_F 5' TTCGAATTCTGAAAAGAGAGG 3' PCR/Sequencing
YFR043C_R 5' TTTTACTAGCATACTTCCCTG 3' PCR/Sequencing
YFR049W_F 5' ACCATTAAGGAGTACTTCCC 3' PCR/Sequencing
YFR049W_R 5' TCATCACTCTTCTCTCTTCC 3' PCR/Sequencing
ARS607_F5 5' CATTAGAGACAGAGAAACTATTCATTGTAC Plasmid construction
ATTCTCCAAATGTGGTGATATAAACACTAC
ATTCGCTAAATTACATTAGATATGCTTTGG 3'
ARS607_R5 5' GCGAATGTGATTCTATGCTTTCTAGTACCT Plasmid construction
ACTGTGCCGAATAATGTGTAAGTCTCAAAA
TTCTTTTCTTCCAAAGCATATCTAATGTAA 3'
ARS607_F6 5' AAGTAAATGCATCATTAGAGACAGAGAAAC 3' Plasmid construction
ARS607_R6 5' ATCGATGAATTCGCGAATGTGATTCTATGC 3' Plasmid construction
ARS607_F4 5' ACAGAGAAACTATTCATTGTACATTCTCCA Strain contruction
AATGTGGTGATATAAACACTACATTCGCTA
AATTACATTAATCAAAGAAGGTTAATGTGG 3'
ARS607_R7 5' TTCGGTACGACACAAAAACAACTATTGTGT Strain contruction
CGCAGTCCATAGAAGGAGCAAGAAAAAAGA
ATGTCTTTAAAGGCGAATGTGATTCTATGC 3'
ARS607_extF1 5' GTTTTCAGTTTGAGGGATCC 3' PCR/Sequencing
ARS607_extR1 5' GTGTCGCAGTCCATAGAAGG 3' PCR/Sequencing
REV1extF1 5' TCGCATCAACTTAAACATTGG 3' Strain contruction
REV1extR1 5' GAGTCGGCCATTCCAATACC 3' Strain contruction
REV1extF3 5' TTGGTGTTGAAATGGCGAGG 3' PCR
KanMXintF 5' CAGTTTCATTTGATGCTCGATG 3' PCR

68
used in this study. The nomenclature in this chapter is such that strains pulled from the
yeast deletion collection are named after the deleted ORF. If the KanMX4 cassette is
replaced with the URA3 gene in these strains they are referred to by their “GL”
designation in Table 4-2. Yeast cultures were grown in either complete synthetic media
(SC), or complete synthetic media without uracil (SC-Ura). Fluctuation assays were
plated onto either 10 x canavanine (complete synthetic media without arginine [SC-Arg],
0.6 g/L l-canavanine, Sigma-Aldrich, St. Louis, MO), or 5FOA (SC-Ura, 1 g/L 5FOA,
Sigma-Aldrich, St. Louis, MO). In preparation for plating several spots of mutant
cultures on each plate, the plates were over-dried by pressing a Whatman filter paper
(Grade 3, 90 mm) onto the plates using a replica plating block and allowing the filter to
remain in place for at least 30 min. The filters remove approximately 1 mL of liquid and
plates can be used for several days after filters have been removed.
Plasmid construction: The plasmid pGIL001 was made in order to efficiently
and accurately replace the KanMX4 cassette with the URA3 gene. The URA3 gene was
amplified from a genomic preparation of the yeast strain GIL066 (W303 background)
using primers URA3extF_integration and URA3extR_integration. These primers amplify
a 1.8 kilobase fragment containing the yeast URA3 promoter and coding sequence. In
addition, these primers contain 60 base-pairs of homology to the KanMX4 cassette. This
PCR fragment was used to transform the strain YEL020C. Transformants were
sequenced using primers U1, D1, URA3intF2, and URA3intF3 to identify ones where no
mutations were introduced into the URA3 gene during the construction. The
kanMX4Δ::URA3 cassette was amplified using primers U1 and D1 (the universal
upstream and downstream primers from the yeast deletion collection [139]), digested

Table 4-2. Strains used for URA3 integration
Strain ORF Description†
Position Strain ORF Description Position
GL·0 YEL020C hypothetical Chr. V GL·25 YFL003C MSH4 134516
GL·1 YFL063W hypothetical 5066 GL·26 YFL001W DEG1 147126
GL·2 YFL056C AAD6 14793 GL·27 YFR001W LOC1 149105
GL·3 YFL055W AGP3 17004 GL·28 YFR006W hypothetical 156139
GL·4 YFL054C hypothetical 20847 GL·29 YFR007W hypothetical 159293
GL·5 YFL052W hypothetical 28232 GL·30 YFR009W GCN20 162482
GL·6 YFL050C ALR2 33272 GL·31 YFR012W hypothetical 167881
GL·7 YFL049W hypothetical 36803 GL·32 YFR014C CMK1 172529
GL·8 YFL047W RGD2 40421 GL·33 YFR016C hypothetical 177034
GL·9 YFL044C YOD1 44655 GL·34 YFR017C hypothetical 182262
GL·10 YFL041W FET5 49139 GL·35 YFR019W FAB1 184490
GL·11 YFL036W RPO41 58781 GL·36 YFR021W ATG18 194800
GL·12 YFL034W uncharacterized 65475 GL·37 YFR023W PES4 199862
GL·13 YFL032W hypothetical 74870 GL·38 YFR026C hypothetical 205736
GL·14 YFL027C GYP8 80417 GL·39 YFR030W MET10 213300
GL·15 YFL025C BST1 84143 GL·40 YFR032C hypothetical 222078
GL·16 YFL023W BUD27 90984 GL·41 YFR035C hypothetical 226109
GL·17 YFL021W GAT1 95964 GL·42 YFR039C hypothetical 231999
GL·18 YFL019C hypothetical 100246 GL·43 YFR043C hypothetical 239101
GL·19 YFL015C hypothetical 106463 GL·44 YFR045W hypothetical 242129
GL·20 YFL012W hypothetical 110641 GL·45 YFR049W YMR31 248510
GL·21 YFL011W HXT10 112339 GL·46 YFR053C HXK1 253579
GL·22 YFL010C WWM1 115102 GL·47 YFR054C hypothetical 258842
GL·23 YFL007W BLM3 123474 GL·48 YFR055W hypothetical 264191
GL·24 YFL004W VTC2 131805 GL·49 YFR057W hypothetical 269048
† Position is the location at which the gene is first encountered moving across Chromosome VI starting at the left telomere.

70
with EcoRI and BamHI and cloned into the plasmid pFA6a-KanMX4 (which was
digested with EcoRI and BamHI to remove the KanMX4 gene and expose the
corresponding restriction enzyme overhangs). Proper construction of the plasmid was
verified by restriction digesting and sequencing. The resulting plasmid, pGIL001, is
pFA6a-KanMX4 with a 1.8 kilobase URA3 fragment is inserted in the KanMX4 cassette.
On either side of the URA3 fragment is 300 base-pairs of homology to the KanMX4
cassette including a partial TEF promoter upstream, and some remaining KanMX4
coding sequence and the TEF terminator downstream. The URA3 sequence of pGIL001
differs from the published genomic sequence for URA3 by eight mutations. One
mutation (an insertion of a T to a run of seven T’s in the promoter region) was created
during the construction of this plasmid. The other seven were present in the URA3 gene
in our laboratory W303 background; therefore, these mutations are present in the URA3
genes described in previous and subsequent chapters. Only one of these seven mutations
is in the coding sequence and results in the substitution of serine for alanine at position
160.
Plasmid pGIL008 was constructed to facilitate deletion of ARS607. Primers
ARS607_F5 and ARS607_R5 were annealed and extended, generating a 160 base pair
fragment corresponding to approximately 80 base pairs of homology to the regions
flanking ARS607 but devoid of the 111 base pair ARS607 sequence itself. This fragment
was amplified using primers ARS607_F6 and ARS607_R6, which contain NsiI and EcoRI
sites, respectively. The fragment was cut and cloned into the NsiI and EcoRI sites of
pGIL001. The resulting plasmid, pGIL008, contains the URA3 gene followed by a 160

71
base pair fragment corresponding to approximately 80 base pairs of sequence from each
sides of ARS607.
Strain construction: Forty-nine strains were constructed each with the URA3
gene in a different location tiled across Chromosome VI and with the CAN1 gene at its
endogenous locus on Chromosome V (Figure 4-1). Initially 49 locations along
Chromosome VI were selected for integration of the URA3 gene. The locations were
chosen such that the average spacing between reporters was on average 3.8 kilobases
(Figure 4-2), and that the reporters were approximately evenly spaced across the length of
the chromosome. Since the yeast deletion collection was being used for construction,
care was taken to avoid any strains where the gene replacement resulted in fitness
defects; therefore, many of the integrations were made in hypothetical ORFs (those that
have no ascribed function and were identified by their likelihood of encoding protein).
Table 4-2 reports the identity of the 49 strains selected for this experiment.
To replace the KanMX4 cassette with the URA3 gene, pGIL001 was digested
with EcoRI and BamHI, phenol chloroform extracted, ethanol precipitated, and used to
transform each of the 49 strains. Transformants were subjected to three rounds of
screening. First each was screened for the proper phenotype (Uracil prototrophy and
G418 sensitivity). PCR, using primers U1 and D1, was used to verify integration in the
phenotypically correct strains. The amplified KanMX4Δ::URA3 cassettes were then
sequenced using primers U1, D1, URA3intF2, and URA3intR2 to verify (1) that the
strains were correct based upon the barcode used in the yeast deletion project, and (2) that
no mutations were introduced in the reporter during transformation. For five
phenotypically correct strains (GL·1, GL·21, GL·39, GL·43, and GL·45), I was unable to

0 100 200 300 400 500 577 kb0 50 100 150 200 270 kb
Chromosome VI Chromosome V
Strain #
1
2
3
4
5
6
7
.
.
.
URA3Different position in each strain
CAN1Same position in every strain
.
.
.
.
.
.
Figure 4-1. Schematic of strain construction. Forty-nine strains were constructed with the URA3 gene integrated at a different location tiled
across Chromosome VI. Each strain contains the wild-type CAN1 gene at its endogenous location on Chromosome V. The location of the
reporter genes is represented as bands on the chromosomes.
250
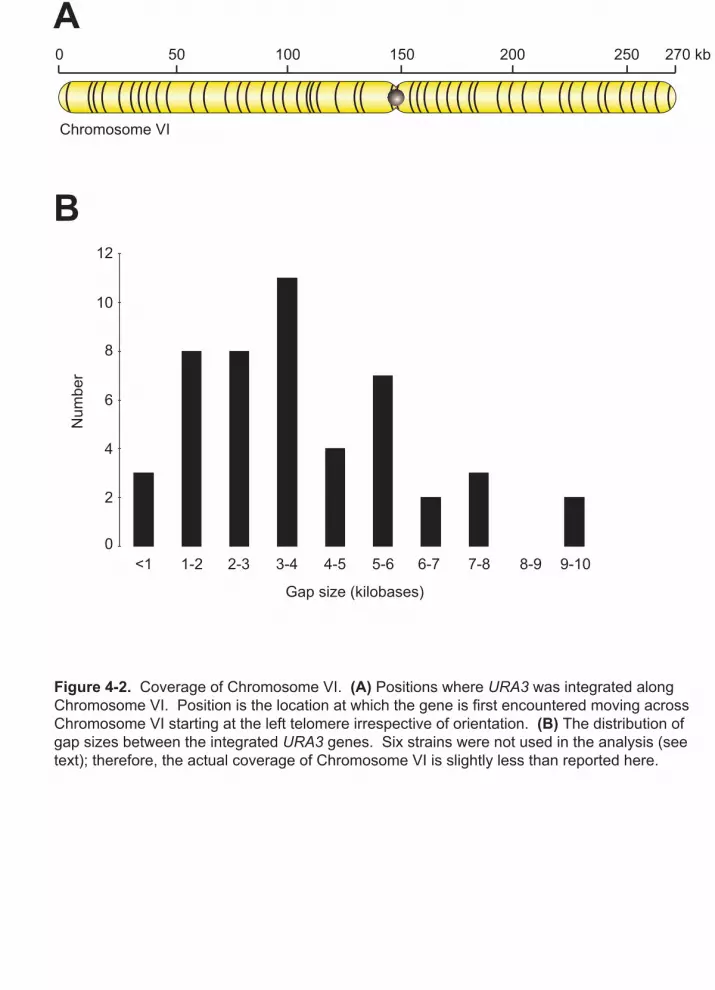
250 270 kb200150100500
Chromosome VI
Num
ber
Gap size (kilobases)
9-108-97-86-75-64-53-42-31-2<1
0
4
8
12
A
B
Figure 4-2. Coverage of Chromosome VI. (A) Positions where URA3 was integrated along
Chromosome VI. Position is the location at which the gene is first encountered moving across
Chromosome VI starting at the left telomere irrespective of orientation. (B) The distribution of
gap sizes between the integrated URA3 genes. Six strains were not used in the analysis (see
text); therefore, the actual coverage of Chromosome VI is slightly less than reported here.
6
10
2

74
generate a PCR product using the primers U1 and D1. For these strains I used ORF-
specific primers. Using these primers, I was able amplify the cassette from GL·21 and
GL·39 and verify that these strains are correct. For GL·43 and GL·45, I was again unable
to generate a PCR product; therefore, I could not verify that the URA3 gene in these
strains was properly integrated; therefore, these strains were excluded from further
analysis. For GL·1, I was able to generate a PCR product showing that, although this
strain is phenotypically correct (meaning that URA3 is integrated within the KanMX4
reporter), the KanMX4 reporter is not at the YFL063W locus. This strain, too, was
excluded from further analysis.
In order to manipulate replication timing, a two-step method was used in order to
create a perfect deletion the early and efficient origin, ARS607. First the URA3 gene
followed by approximately 80 base pairs of homology to the regions flanking ARS607
(but devoid of the 111 base pair ARS607 sequence itself) was amplified using primers
ARS607_F4 and ARS607_R7. This fragment was used to transform the strain YFR021W.
There are two ways that this fragment can integrate into the genome: in place of ARS607
or adjacent to ARS607. This is because one end of the fragment contains homology
upstream and downstream of ARS607. The second step of strain construction was to
select for popout of the URA3 gene. If the URA3 fragment integrated in place of ARS607,
the popout will result in a perfect deletion of the 111 base pair ARS607 sequence;
however, if the URA3 fragment integrated adjacent to ARS607, the popout will
reconstitute the wild-type sequence. Following URA3 integration, 12 transformants were
grown overnight in SC-Ura and cells were plated on 5FOA to select for loss of URA3.
Deletion of ARS607 was determined by PCR using primers ARS607ext_F1 and

75
ARS607ext_R1, which flank the ARS607 sequence. Following popout of URA3 at the
deleted ARS607 locus, the URA3 gene was integrated in place of the KanMX4 cassette to
create the strain GL·36ARS607Δ.
To eliminate translesion synthesis, the rev1Δ::KanMX4 cassette was amplified
from the deletion collection using primers REV1extF1 and REV1extR1, and this fragment
was used to transform strains GL·3, GL·15, GL·24, and GL·37. Deletion of REV1 was
verified phenotypically by assaying for UV-sensitivity and by PCR using primers
REV1intF1/REV1extR3 and KanMXintF/REV1extR3.
Fluctuation assays: Fluctuation assays were performed essentially as described
in Chapter 2. For each strain, 48 100 µl cultures and 48 200 µl cultures of a 1:10,000
dilution of a saturated overnight culture were established in a 96-well plate. Twelve 100
µl cultures and 12 200 µl cultures were pooled to determine the number of cells per
culture. The remaining 36 100 µl cultures were plated onto canavanine plates (0.6 g/L
canavanine, the same as the 10 x canavanine plates in Chapter 2) and the remaining 36
200 µl cultures were plated onto 5FOA plates. Mutants were counted after two
(canavanine) or seven (5FOA) days of growth and mutation rates were calculated using
the Ma-Sandri-Sarkar maximum likelihood method [112]. Ninety-five percent
confidence intervals on were calculated using equations 24 and 25 from [107].
Computational analysis: Mutation rates were calculated using the Matlab
program findMLm described in Appendix B. Mutation rates across Chromosome VI were
compared to several other datasets to look for correlations; these include recombination
rate [38] and replication timing [105]. Perl was used to calculate GC content 500 base
pairs upstream and downstream of each reporter. The Spearman rank correlation test was
76
performed in Matlab. The sequences of RM11-1a and YJM789 were obtained from the
Broad Institute Fungal Genome Initiative
(http://www.broad.mit.edu/annotation/fungi/fgi/) and the Stanford Genome Technology
Center (version 2, http://med.stanford.edu/sgtc/research/yjm789.html), respectively.
Genes were identified by blasting the S288c sequences against these databases.
Sequences were manually extracted and aligned to S288c. Synonymous substitution rates
between S288c, RM11-1a, and YJM789 were calculated in Perl. ORFs where S288c
contained the allele of one of the strains (RM11-1a or YJM789) were excluded from the
analysis. Synonymous substitution rates between S. cerevisiae and S. paradoxus were
obtained from [53].
4.3 Mutation rate varies across Chromosome VI
Measuring mutation rate across Chromosome VI: To determine whether
mutation rate varies across the yeast genome, I created 43 strains, each of which has the
URA3 gene integrated at a different location tiled across Chromosome VI. In addition to
the URA3 gene, all of these strains contain the wild-type CAN1 gene at its endogenous
locus (Figure 4-1). Fluctuation assays were performed using these 43 strains to
determine the mutation rate at the URA3 and CAN1 genes (5FOA resistance and
canavanine resistance, respectively). Figure 4-3 shows the results from this experiment.
The mutation rate at the CAN1 locus varies between the 43 strains, but this variation is
within the range that is expected by chance: only one point lies outside the 95%
confidence interval of the median mutation rate of the 43 strains (Figure 4-3b, shaded
region). In contrast, the degree of mutation rate variation at the URA3 gene is greater

250 2702001501005000
1
2
3
4
5
6
7
8
9
Chromosomal Position (kb)
Mut
atio
n R
ate
( x
10-8)
Strain Number
Mut
atio
n R
ate
( x
10-7)
4310
0.5
1.0
1.5
A
B
Figure 4-3. Mutation rate varies across Chromosome VI. (A) Mutation rate to 5FOA resistance from 43 strains (where URA3 is integrated in a different location in each strain) reveals that mutation rate varies by an order of magnitude across Chromosome VI. The shaded region corresponds to the 95% confidence interval for the median mutation rate. (B) There is less variation for mutation rates for 10 x canavanine resistance from the same 43 strains (where CAN1 is in the same location in every strain). Only two of the 43 points lie outside of the 95% confi-dence interval for median mutation rate (shaded region).

78
than expected by chance. There are 25 strains where the mutation rate lies outside the
95% confidence interval of the median (Figure 4-3a). The degree of variability is better
illustrated by comparing all pairwise comparisons between mutation rates in the 43
strains (Figure 4-4). For mutation rates at CAN1 there are only three significant pairwise
comparisons out 903 (Figure 4-4b; the plot is symmetrical across the diagonal, thus every
comparison is shown twice); however, for URA3, 262 out of the 903 pairwise
comparisons are significantly different (Figure 4-4a). From the pairwise comparisons, it
is apparent that there are three regions of Chromosome VI, each with a length scale of 50
to 100 kilobases. Within a region, mutation rate is not significantly different, but the
region as a whole is significantly different from adjacent regions. The three regions on
Chromosome VI correspond to a region of high mutation rate on the left arm of the
chromosome, a region of low mutation rate extending across the centromere, and a region
of median mutation rate on the right arm of the chromosome.
Identification of outliers: The original strain construction for this experiment
involved integrating URA3 at 49 locations across Chromosome VI. Fluctuation assays
were performed on all 49 strains; however, six of the strains were eliminated from further
analysis. Difficulties with three of the strains were apparent during construction. For
two strains (GL·43 and GL·45), I was unable to generate a PCR product using either the
universal primers or ORF-specific primers, both of which were able to generate PCR
products in a wild-type strain. Therefore, it is possible that a chromosomal
rearrangement occurred in these strains. Interestingly, these two strains have the lowest
mutation rates of the 49 measured strains (0.5 x 10⁻⁸ and 0.7 x 10⁻⁸, respectively). For the
strain GL·1, ORF-specific PCR shows that in the strain pulled from the deletion

Strain number1 43
1
43
Str
ain
num
ber
Strain number1 43
1
43
Mutation rate at URA3 Mutation rate at CAN1
95% Conf IntsOverlap
NoDifference
SignificantlyDifferent
Mutation Rate
+ 95% CI
- 95% CI
Figure 4-4. Pairwise comparisons of mutation rates at URA3 and CAN1. Ninety-five percent confidence intervals were generated for all 43 points in Figure 4-3. To determine if mutation rate varies significantly across Chromosome VI all pairwise comparisons of mutation rates from the 43 strains are shown for both URA3 and CAN1. The plots are symmetrical along the diagonal. For CAN1 there are only three significant differences in mutation rate; whereas, for URA3, 262 out of the 903 pairwise comparisons are significantly different. In particular, mutation rates cluster such that there are three regions of Chromosome VI with a relatively uniform mutation rate. These correspond to a region of high mutation rate along the left arm of Chromosome VI, a region of low mutation rate across the centromere, and a region of median mutation rate on the right arm (see Figure 4-3). The length scale over which mutation rate is relatively constant is 50 to 100 kilobases (Figure 4-3).

80
collection, the KanMX4 is not integrated at the subtelomeric YFL063W locus.
Phenotypically, I show that URA3 successfully replaced the KanMX4 cassette; however,
since this strain is one where the universal primers fail to produce a PCR product, I am
unable to determine the location of the KanMX4Δ::URA3 cassette. Interestingly, this
strain shows the highest mutation rate (46.8 x10⁻⁸, 5.3-fold higher than the second highest
strain, which is also an outlier, described below), as one might expect for a subtelomeric
reporter, which can be inactivated by silencing as well as mutation. Given the similarity
of yeast telomeres, it is possible that this reporter is located in a subtelomeric region on a
different chromosome.
In addition to the three outliers detected during strain construction, three outliers
were detected during the experiment. As mentioned above, the strain with the second
highest mutation rate at URA3 (8.8 x 10⁻⁸) is also an outlier. This is because this strain
(GL·11) also has an elevated mutation rate at CAN1 (4.5 x 10⁻⁷, 4.8-fold higher than the
median), indicating that this strain has a globally elevated mutation rate. None of the 30
known mutator alleles are found on Chromosome VI and there is no reason to suspect
that the gene deleted during construction of the strain (RPO41, encoding a mitochondrial
RNA polymerase) is a mutator allele. Given that the yeast genome has been screened for
mutator alleles [49], one of this strength is unlikely to have gone undetected; therefore, it
is likely that this strain carries a spontaneous, transformation-induced mutation in one of
the 30 genes that are known to be capable of giving rise to mutators. Two strains (GL·31
and GL·35) were eliminated from further analysis because they harbor a mutation causing
them to grow differently on 5FOA than the rest of the strains. Both strains show a high
mutation rate at URA3. This phenotype is discussed further in Appendix A.
81
4.4 Mutation rate is correlated with replication timing
In order to determine the cause of mutation rate variation across Chromosome VI,
I sought to determine if mutation rate is correlated to any other features of the
chromosome. One possibility, which must be ruled out is that this variation is not
position-dependent, but rather strain-dependent and that I do not detect this variation in
the CAN1 reporter because it may be less sensitive to this variation than the URA3
reporter. This situation could arise if, for instance, the URA3 gene contained mutational
hotspots, which were missing (or underrepresented) in CAN1, and this experiment was
really detecting strain-to-strain variation for one particular type of mutation. This
situation is unlikely since both URA3 and CAN1 are large targets for mutation and do not
contain any significant mutational hotspots as shown in Chapter 3; therefore, there is no
expectation that one reporter would be more sensitive to variation. If such a mechanism
were acting in this experiment one would expect that this strain-to-strain variation would
act in the same direction for both reporters, although the magnitude of the responses
would be different. In other words, one would expect the mutation rates at CAN1 and
URA3 to be correlated. I find no correlation between mutation rates in the two reporters
(Figure 4-5a, p = 0.07, Spearman); therefore, the mutation rate variation I see at the
URA3 gene in these strains is likely due to their position on Chromosome VI.
To look for features of the chromosome that are correlated with mutation rate, one
should start by looking for properties of the genome that vary on a similar length scale
(50 to 100 kilobases). GC content is one such feature [90, 116]. The average GC content
for the 500 base-pairs upstream and downstream of each gene does not correlate

Mu
tatio
n R
ate
(x 1
0-8)
0
3
6
9
25 30 35 40 45
%GC
0 0.5 1.0 1.5 2.0 2.5
Recombination rate
Mu
tatio
n R
ate
(x 1
0-8)
0
Mutation Rate at CAN1 (x 10-7)
0 0.4 0.8 1.2 1.6
0 10 20 30 40 50
Replicaiton timing (minutes)
60
A B
DC
p = 0.74
p = 0.02 p < 10-4
Figure 4-5. Mutation rate is correlated with replication timing. (A) In order to rule out that the
observed mutation rate variation is strain-to-strain variation for which the URA3 reporter is more
sensitive mutation rates at URA3 and CAN1 were compared and show no significant correla-
tion. (B-D) To determine if mutation rate is correlated with a known property of the chromo-
some, mutation rate across was compared to GC content, recombination rate, and replication
timing. (B) Mutation rate is not correlated with the average GC content 500 base pairs
upstream and downstream of the integrated URA3. (C) Mutation rate shows a weak negative
correlation to recombination rate. Recombination rates are from Gerton et al. (2000). (D) Mutation rate is strongly correlated with replication timing. Replication timing is from Raghura-
man et al. (2001). The correlation between mutation rate and recombination rate can be
accounted for by a weak negative correlation between replication timing and recombination rate
(p = 0.02). p-values were determined using the Spearman rank correlation test.
p = 0.07
3
6
9
Mu
tatio
n R
ate
(x 1
0-8)
0
3
6
9
Mu
tatio
n R
ate
(x 1
0-8)
0
3
6
9

83
with its mutation rate (Figure 4-5b, p = 0.32, Spearman). Recombination rate is another
feature that may influence mutation rate. Although the data set for recombination rate
was generated in meiosis [38], and the strains in this experiment were growing
mitotically, the same sequences that stimulate recombination may also influence mutation
rate. There is a weak negative correlation between recombination rates and mutation
rates on Chromosome VI (Figure 4-5c, p = 0.04, Spearman). Another feature of the
chromosome, which varies on a length scale of approximately 50 to 100 kilobases is
replication timing. In yeast, replication of the genome is performed in a spatially and
temporarily coordinated fashion, which is largely reproducible from cell cycle to cell
cycle. The complete replication profile of the yeast genome has been determined [105].
There is a strong correlation between the time at which a region of the chromosome is
replicated and its mutation rate (Figure 4-5d, p < 10-5, Spearman). This correlation is
such that early replicating regions have a low mutation rate and late replicating regions
have a high mutation rate. Figure 4-6 shows a comparison of the replication profile and
the mutation profile of Chromosome VI.
Chromosome VI contains 12 autonomous replicating sequences (ARSs) capable
of initiating replication, each identified by the presence of a conserved ARS consensus
sequence and by their ability to act as a replication origin on a plasmid (Table 4-3). In
the genome, an ARS can constitute an origin of replication; the terms ARS and origin are
often used interchangeably (ARS is a structural/sequence description, whereas origin is a
functional description). Although Chromosome VI contains 12 ARS sequences, there are
only seven prominent origins of replication (origins that fire in more than one quarter of
cell cycles, Table 4-3). Origins are classified by two measures: their efficiency (the

Replication Timing
Early
Late
Mutation Rate
High
Low
Figure 4-6. Comparison of the replication timing and mutation rate. Replication profile from Raghuraman et al. (2001). Both axes are linear and the range of mutation rates and replication times is the same as in Figure 4-5d.
Chromosome VI
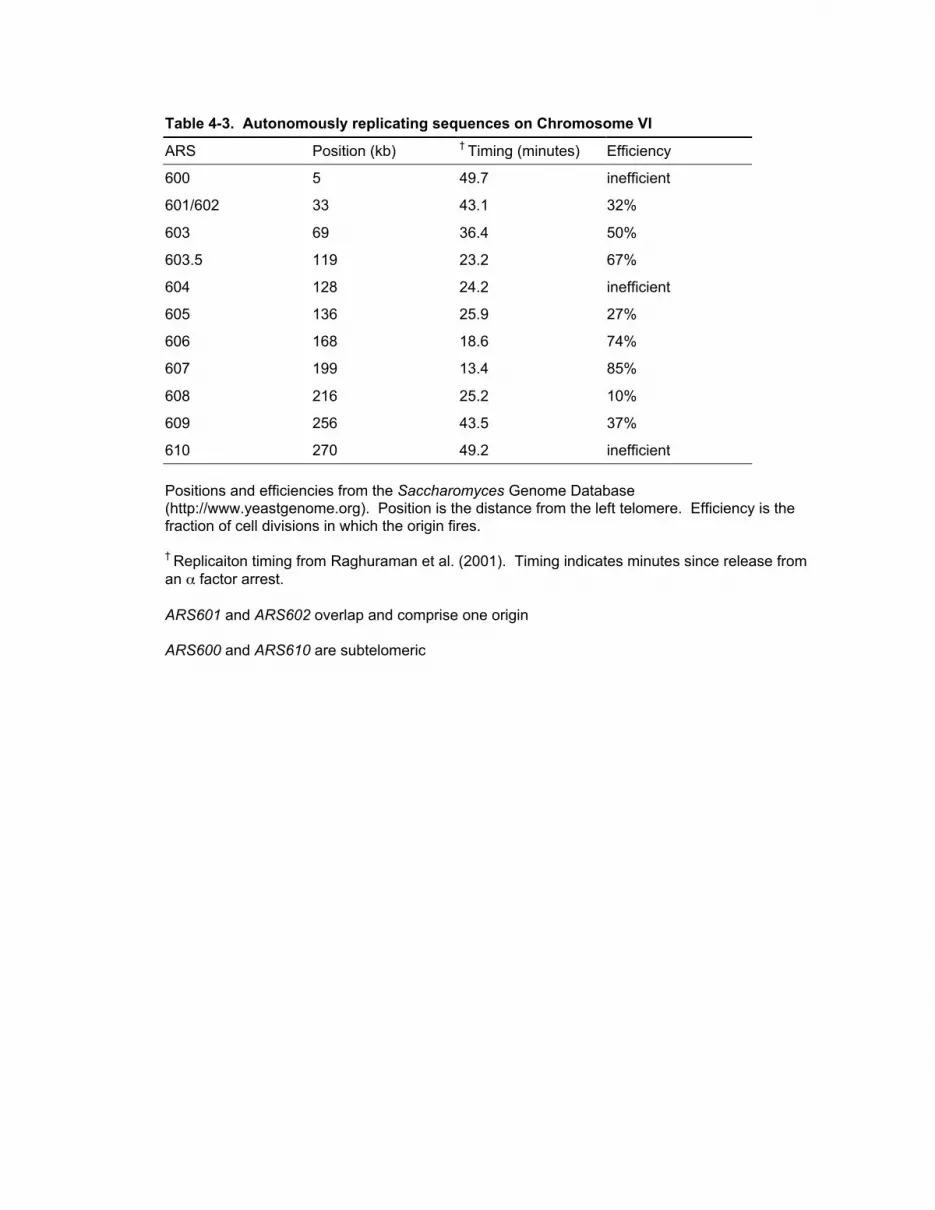
Table 4-3. Autonomously replicating sequences on Chromosome VI
ARS Position (kb)†
Timing (minutes) Efficiency
600 5 49.7 inefficient
601/602 33 43.1 32%
603 69 36.4 50%
603.5 119 23.2 67%
604 128 24.2 inefficient
605 136 25.9 27%
606 168 18.6 74%
607 199 13.4 85%
608 216 25.2 10%
609 256 43.5 37%
610 270 49.2 inefficient
Positions and efficiencies from the Saccharomyces Genome Database(http://www.yeastgenome.org). Position is the distance from the left telomere. Efficiency is thefraction of cell divisions in which the origin fires.
† Replicaiton timing from Raghuraman et al. (2001). Timing indicates minutes since release from
an α factor arrest.
ARS601 and ARS602 overlap and comprise one origin
ARS600 and ARS610 are subtelomeric

86
number of cell divisions where the origin fires) and their timing of firing during S-phase.
Based upon their timing, origins are classified as either early or late. Although the times
at which origins fire lie on a continuum, early and late origins are distinct in terms of the
proteins associated with pre-origin complex and the genetic requirements for firing [111].
During the design of this experiment I did not anticipate that mutation rate would
be correlated with replication timing. Since the strains were constructed such that URA3
was integrated in place of an ORF, by chance three of these ORF deletions remove
known yeast origins. ARS605, ARS606, and ARS608 are deleted in strains GL·25, GL·31,
and GL·39, respectively. Disruption of ARS605 should have a small effect due to its
close proximity to earlier firing ARS603.5. In addition, disruption of ARS608 should
have a negligible effect since it fires in only 10% of cell cycles. However, disruption of
ARS606 should affect the timing of replication since it is an early and efficient origin.
Strain GL·31 was not used in the analysis because its growth on 5FOA is different from
the other strains (Appendix A). Interestingly, this strain had a high mutation rate (6.5 x
10-8) compared to other URA3 reporters in the same region, which may be partly
attributable to disruption of ARS606.
To test if disruption of an origin of replication can increase the local mutation rate
in an early replicating/low mutation rate region, the earliest and most efficient origin,
ARS607, was deleted in strain GL·36, where the URA3 gene is located 3 kilobases away
from the origin. Deletion of ARS607 increased the mutation rate at URA3 by 30% (from
2.21 x 10⁻⁷ to 2.88 x 10⁻⁷) without increasing the mutation rate at CAN1 (0.81 x 10⁻⁷ in
GL·36 and 0.76 x 10⁻⁷ in GL·36ARS607Δ). This slight increase in mutation rate is not
significant given the error in fluctuation assays. It is possible that deletion of ARS607 did

87
not significantly delay replication timing in the region. The early but inefficient ARS608
is 17 kilobases away. In the absence of ARS607, ARS608 may fire in more cell cycles
and allow for early replication of this region.
4.5 Model for replication timing and mutation rate
The correlation between replication timing and mutation rate can be understood in
terms of a model for how cells deal with damaged bases during replication [136]. The
genome is subject to numerous types of DNA damage including alkylation, ionizing
radiation, UV radiation, and oxidative damage, resulting in a variety of damaged bases
[31]. Prior to S-phase, damaged bases are corrected by base excision repair and
nucleotide excision repair; however, some damaged bases escape repair and interfere
with DNA replication. The replicative DNA polymerases (Polδ and Polε in yeast) have a
high processivity and a low error rate; however, they are unable to efficiently incorporate
opposite a non-canonical base [36]. Therefore, when a replication fork encounters a
lesion, the leading and lagging strands decouple and replication resumes downstream of
the lesion [74]. The result is a single-stranded region (including the damaged base)
behind the replication fork, known as a daughter-strand gap. There are two ways a cell
can fill in this gap: an error-prone method using a translesion polymerase to copy the
damaged template or an error-free method using the newly formed sister strand as a
template (template switching). Error-free repair can occur as soon as the replication fork
has passed and the homologous sequence is available. Recent work suggests that
translesion synthesis is used only as a last-ditch effort to fill in these gaps and cannot
occur until the end of S-phase (Figure 4-7) [136]. Therefore, regions of the genome that

template switching translesion synthesis
Figure 4-7. A model for error-free DNA damage tolerance and translesion synthesis. Damaged bases encountered by the replicative polymerase during S-phase result in single-strand gaps behind the replication fork. There are two ways a cell can fill in these gaps: a error-free approach (such as template switching) using the newly formed sister strand as a template, or error-prone translesion synthesis. Error-free DNA damage tolerance can occur as soon as the replication fork has passed and the sister sequence is available. Recent evidence suggests that translesion synthesis does not occur until the end of S-phase and into Mitosis (Waters and Walker 2006). Therefore, regions replicated early are more likely to undergo error-free repair; whereas, regions replicated late are more likely to be subjected to translesion synthesis. This figure is adapted from Waters and Walker (2006).
Replication MitosisG1
Error-free repair Translesion synthesis

89
are replicated early in S-phase have longer to undergo error-free repair to replicate past
lesions, whereas regions replicated late are more likely to require translesion synthesis.
It should be noted that the model of temporal separation of error-free repair and
translesion synthesis is in contrast with earlier models where translesion synthesis occurs
at the replication fork. It was originally thought that when a replicative polymerase
encounters a lesion, the replication fork stalls leading to the dissociation of the replicative
polymerase. A translesion synthesis polymerase is then used to replicate across the
lesion, after which it will dissociate, due to its low processivity, and the replicative
polymerase will again take over. Several observations contradict the model of translesion
synthesis acting at the replication fork. It has been observed that in a UV-irradiated
excision repair-deficient strain, single stranded regions are generated behind the
replication fork [74]. The accumulation of single stranded regions is increased in strains
deficient in translesion synthesis, homologous recombination, or the DNA damage
checkpoint [74]. Disruption of translesion synthesis or checkpoint function only
increases single stranded regions late in S-phase; whereas, loss of homologous
recombination increases single stranded regions throughout S-phase [74]. In order to test
the model that translesion synthesis is operating late in S-phase, expression levels of the
three yeast translesion DNA polymerases were monitored during cell cycle progression
[136]. Interestingly, Rev1, a translesion DNA polymerase essential for translesion
synthesis, is not expressed until late in S-phase and into mitosis, after most of the DNA
has been replicated [136]. These results support the model that translesion synthesis is an
option of last resort employed to repair daughter-strand gaps in the genome. This model,
in turn, provides an explanation for the observation that early replicating regions have a

90
low mutation rate and late replication regions have a high mutation rate: early replicating
regions are more likely to use an error-free mechanism (template switching) to tolerate
lesions, whereas late replicating regions are more likely to be subjected to the mutagenic
process of translesion synthesis.
To test this model, I deleted the REV1 gene from four strains (two early
replicating/low mutation rate and two late replicating/elevated mutation rate). Strains
GL·3, GL·15, GL·24, and GL·37 are replicated at 44.5, 43.8, 26.5, and 13.7 minutes,
respectively. Disruption of translesion synthesis results in a great reduction of mutation
rate in the late replicating/high mutation rate region (Figure 4-8). For early replicating
regions with low mutation rates, there is no significant effect of REV1 deletion (Figure 4-
8).
4.6 Discussion
In relation to previous work: The correlation between replication timing and
mutation rate in this work raises the question why this relationship was not identified in
previous studies. Two earlier experiments show that mutation rate varies across the
genome for ochre suppressor mutations and frameshifts at microsatellite repeats. In the
latter experiment the 16-fold difference in mutation rates in a wild-type strain is reduced
to two-fold in an msh2∆ strain, indicating that the observed variation is due to differential
ability of mismatch repair across the genome [46]. The variation in mutation rate for the
tRNA suppressor mutations can also be explained as variation in the effectiveness of
mismatch repair. Much of the observed variation can be attributed to the orientation of

Figure 4-8. Mutation rate variation is dependent upon translesion synthesis. To test the hypoth-esis that the correlation between replication time and mutation rate is due to the temporal separa-tion of error-free repair and translesion synthesis (Figure 4-7), REV1 (which encodes a transle-sion polymerase essential for translesion synthesis) was deleted in four strains that show varia-tion in mutation rate and replication timing. Strains GL·3, GL·15, GL·24, and GL·37 are replicated at 44.5, 43.8, 26.5, and 13.7 minutes, respectively. Disruption of translesion synthesis results in a great reduction of mutation rate in the late replicating/high mutation rate region. For early repli-cating regions with low mutation rates, there is no significant effect of REV1 deletion.
Mut
atio
n ra
te (
x 1
0-7)
0
0.4
0.8
1.2
WT
rev1
13.7 26.5 43.8 44.5
Replication timing (min)
92
the tRNA gene with respect to the nearest origin of replication. The three tRNAs with
the lowest mutation frequencies are transcribed in the direction of fork progression;
whereas the other five tRNAs are transcribed in the opposite direction [50]. Ochre
suppressors arise by a GC to TA transversion in the anticodon of tRNA-Tyr. Therefore,
this could by either incorporation of an adenine opposite guanine on one strand or by the
incorporation of a thymine opposite cytosine on the opposite strand. A common type
oxidative DNA damage is 8-oxo-guanine, which can pair with adenine causing a GC to
TA transversion [31]. Mismatch repair is more efficient at correcting 8-oxo-guanine-
adenine base pairs on the lagging strand than the leading strand, possibly due to the
presence of more nicks on the lagging strand [102]. The tRNA-Tyr alleles with low
mutation rates to ochre suppressors are oriented such that adenine incorporation opposite
8-oxo-guanine will occur on the lagging strand, whereas, for the tRNA-Tyr alleles with
high mutation rates this will occur on leading strand, and have a greater potential of
escaping mismatch repair.
This result shows that orientation with respect to the replication fork can have an
impact on mutation rate for a single base-pair substitution; however, this is unlikely to
impact mutation rates in my experiment, since I am detecting loss of function mutations
over an entire gene, which will average out these small-scale effects. Classifying the
strains based upon the orientation of URA3 with respect to the most likely direction of
fork movement does not reveal an orientation bias in my results (p > 0.05, Wilcoxon
rank-sum). Additionally, orientation relative to the replication fork is not responsible for
variation of mutation rate observed for microsatellite frameshift mutations [46].

93
In these three studies where mutation rate variation was observed across the
genome, it is likely that they each has a different underlying mechanism. Variation in the
rate of frameshift mutations is largely due to variation in the efficiency of mismatch
repair across the genome, although the genomic feature responsible for this variation is
unknown. Variation in the rate of tRNA-Tyr ochre suppressor mutations is associated
with the orientation of the gene with respect to the nearest replication origin and may
result from differential efficiencies of mismatch repair on the leading and lagging strands.
In the experiment described in this chapter, mutation rate variation is shown to correlate
with replication timing and may result from the temporal separation of error-free repair
(template switching) and translesion synthesis. Therefore, the replication profile can
impact mutation rate in two ways, by the direction of replication fork movement and the
timing of replication. Although the mechanism for variation in microsatellite mutations
is unknown, neither replication timing nor orientation can account for it, suggesting that
other aspects of genome structure can influence the mutation rate.
Biological significance: An open question in the field of DNA repair is whether
translesion synthesis occurs at or behind the replication fork. Based on the observation
that the translesion polymerase, Rev1, is not expressed until late S-phase and into
Mitosis, it has been proposed that translesion synthesis is separated temporally from
error-free methods of DNA damage tolerance such as template switching [136]. In order
to minimize mutation rate, it is advantageous to use recombination-based mechanisms of
damage tolerance as long as the sister strand is available and employ error-prone
translesion synthesis only after the sister chromatids have separated. The observation
that early replicating regions have a low mutation rate and late replicating regions have a

94
high mutation rate supports this model since early replicating regions will have more time
to undergo error-free repair and late replicating regions are more likely to subjected to
translesion synthesis.
To determine if this mutation rate variation influences the synonymous
substitution rate, I compared the measured mutation rates with the synonymous
substitution rate between S. cerevisiae and S. paradoxus and found no correlation (Figure
4-9a, p = 0.54, Spearman). This is consistent with previous work showing that the
synonymous substitution rate between S. cerevisiae and S. paradoxus does not vary
across the genome [10]. One explanation for this is that replication timing may change
rapidly on an evolutionary time scale. A survey of nine origins on Chromosome VI
shows strain-to-strain variation in the efficiency of at least one origin within S. cerevisiae
[141]. To examine the synonymous substitution rate over a shorter evolutionary distance,
I calculated the synonymous substitution rate between S288c and two other S. cerevisiae
strains, RM11-1a and YJM789. Figure 4-9b shows that the synonymous substitution
within S. cerevisiae is correlated to mutation rate (p = 0.02, Spearman).
Although replication timing may change rapidly on an evolutionary time scale,
budding yeast centromeres are consistently replicated early and telomeres are consistently
replicated late [105]. It has been observed that essential genes tend to be located near
centromeres [130]. This positioning may have been selected for in order to keep essential
genes in regions of low mutation rate. Telomeres are sites of rapid genomic change [53].
In Plasmodium falciparum, genes families involved in generating antigenic variation are
located at the telomeres [35]. Placement of these genes in late replicating regions
increases the likelihood that they will be subjected to mutagenic translesion synthesis.

Mutation rate (x 10-8)
Ks
(S. cere
vis
iae
v. S
. para
doxus, x
10-1
)
0.15
0
0.3
0.45
0 3 6 9
A
Mutation rate (x 10-8)
Ks
(S28
8c v
. YJM
789
and
RM
11, x
10-1
)
0.06
0
0.12
0.18
0 3 6 9
B
Figure 4-9. Synonymous substitution rate and mutation rate. The synonymous substitution rate between within S. cerevisiae, but not between S. cerevisiae and S. pradoxus, is correlated with mutation rate. The sequences of RM11-1a and YJM789 were obtained from the Broad Institute Fungal Genome Initiative (http://www.broad.mit.edu/annotation/fungi/fgi/) and the Stanford Genome Technology Center (version 2, http://med.stanford.edu/sgtc/research/yjm789.html), respectively. ORFs where S288c contains the allele one of the strains (RM11-1a or YJM789) were excluded from the analysis. Synonymous substitution rates between S. cerevisiae and S.
paradoxus were obtained from Kellis et al. (2003). p-values were determined using the Spear-man rank correlation test.
p = 0.54
p = 0.02

96
In this chapter, I have shown that mutation rate varies across the yeast genome
and that this variation is correlated to replication timing. This observation supports the
model of temporal separation of two mechanisms of DNA damage tolerance (error-free
DNA damage tolerance and translesion synthesis). This variation affects the synonymous
substitution rate within S. cerevisiae; however, since replication timing may change
rapidly on an evolutionary time scale, this effect is not detected between S. cerevisiae and
S. paradoxus. Mutation rate variation within the genome may put selective pressure on
essential genes to localize to regions, such as centromeres, which consistently replicate
early and on rapidly evolving genes to localize to regions such as telomeres, which
consistently replicate late.

97
Chapter 5
Mutation rate variation II: Variation with the
duration of the cell cycle, environment, and strain
background
5.1 Materials and methods
Strains
Fluctuation assays
5.2 Mutations occur at a constant rate per cell division
5.3 Elevation of mutation rate under osmotic stress
Evidence for elevation of mutation rate
Strand breakage model for osmotic stress
5.4 Fixation of a mutator allele in a laboratory strain
Evidence for a mutator phenotype
Segregation of the mutator phenotype
98
Abstract
In this chapter, I examine three possible sources of mutation rate variation: the
length of the cell cycle, environment, and strain background. Several studies in bacteria
and yeast suggest that the per-genome per-generation mutation rate is increased under
stress. One possible explanation for this is that if a fraction of mutations occur at a
constant rate per unit time, increasing the duration of the cell cycle would increase the
mutation rate per genome per generation. Here I show the per-genome per-generation
mutation rate is robust to variation in the cell cycle. One exception to this rule is that
mutation rate is elevated under osmotic stress. This can be explained by the hypothesis
that salt directly damages DNA by inducing strand breaks. In the last section of this
chapter, I present evidence that a mutator allele has fixed during propagation of a
common laboratory strain.
5.1 Materials and methods
Strains: The strains used in this study are described in Table 5-1. W303 strains
originating from our lab are referred to as “derived,” whereas strains constructed from the
original W303-1a strain (obtained from R. Rothstein) are referred to as “ancestral.”
Fluctuation assays: For Sections 5.3 and 5.4, fluctuation assays were performed
essentially as described in Chapter 2. Each assay was performed in 96-well plates, where
24 cultures were used to determine the cells per culture and 72 cultures were plated to
determine the expected number of mutation events per culture, m. The canavanine plates
used in this chapter are equivalent to the 1 x canavanine plates described in Chapter 2 (60
mg/L canavanine). Mutation rates were calculated using the Ma-Sandri-Sarkar maximum

Table 5-1. Strains used in Chapter 5
Strain Genotype
JYL338 W303 (URA3 ade2-1 his3-11,15 leu2-3,112 trp1-1 CAN1 Matα)
JYL516 W303 (URA3 ade2-1 his3-11,15 leu2-3,112 trp1-1 CAN1 msh2Δ::KanMX
hmlαΔ::LEU2 Matα)
GIL066 W303 (URA3 ade2-1 his3-11,15 leu2-3,112 trp1-1 CAN1 bar1Δ::ADE2
hmlαΔ::LEU2 Mata)
GIL074 W303 (URA3 ade2-1 his3-11,15 leu2-3,112 trp1-1 CAN1 bar1Δ::ADE2
hog1Δ::KanMX Mata)
GIL076 W303 (URA3 ade2-1 his3-11,15 leu2-3,112 trp1-1 CAN1 bar1Δ::ADE2
rad52Δ::KanMX Mata)
GIL087 W303 (URA3 ade2-1 his3-11,15 leu2-3,112 trp1-1 can1 Mata)
GIL102 W303 (URA3 ade2-1 his3-11,15 leu2-3,112 trp1-1 CAN1 bar1Δ::ADE2
hmlαΔ::LEU2 Matα)
GIL104 W303 (URA3 ade2-1 his3-11,15 leu2-3,112 trp1-1 CAN1 bar1Δ::ADE2 Mata)
GIL051 S288c (URA3 his3Δ0 leu2Δ0 trp1Δ0 metΔ0 Mata)
BY4741 S288c (ura3Δ0 his3Δ0 leu2Δ0 trp1Δ0 metΔ0 Mata)
YEL020C S288c (ura3Δ0 his3Δ0 leu2Δ0 trp1Δ0 metΔ0 YEL020CΔ::KanMX Mata)
YML032C S288c (ura3Δ0 his3Δ0 leu2Δ0 trp1Δ0 metΔ0 YML032C(rad52)Δ::KanMX Mata)
YPR032W S288c (ura3Δ0 his3Δ0 leu2Δ0 trp1Δ0 metΔ0 YPR032W(sro7)Δ::KanMX Mata)

100
likelihood method [112]. Ninety-five percent confidence intervals on mutation rates were
calculated using equations 24 and 25 from [107]. In Section 5.2, a modified fluctuation
assay was used to determine mutation rate. This method (the selection/counterselection
method) is used to measure mutation rate at URA3 and takes advantage of the fact that
one can select both for and against this locus. Briefly a small number of cultures (3 to
10) are grown in synthetic media lacking uracil (SC-Ura) and plated onto 5FOA to
determine the frequency or ura3 mutants. The logic behind this assay is that ura3
mutants will arise in the culture during the growth period, but be unable to divide until
plated onto 5FOA, thus eliminating jackpot cultures associated with the fluctuation assay.
The advantage is that one can use fewer cultures (possibly a single culture) to determine
mutation rates. This assay is complicated because uracil auxotrophs eventually die in
SC-Ura media and jackpots, due to 5FOA resistance mutations at other loci, can still
occur (Appendix A).
5.2 Mutations occur at a constant rate per cell division
It has been proposed that mutation rate is elevated under stress and that this is an
adaptive response [29, 108], although this conclusion remains controversial [109]. One
explanation for this observation could be that mutations occur at a constant rate per unit
time; therefore, when nutrient limitation shows proliferation, the per-generation mutation
rate is elevated due to the lengthening of the cell cycle. Previous work in bacteria using
tryptophan-limited chemostat cultures suggests shows that mutations indeed do
accumulate at a constant rate per unit time [58]. However, this is complicated by the
observation that under glucose-limitation mutations accumulate at a constant rate per cell

101
division [58]. In order to determine if the mutation rate in yeast growing in rich media is
constant per unit time or constant per cell division, mutation rates were measured in
cultures whose growth rate was slowed by varying concentrations of NaCl, by varying
concentrations of the protein synthesis inhibitor, cycloheximide, and using synthetic
media with glycerol as the sole carbon source. The results in Figure 5-1 shows that the
mutation rate is robust to changes in the duration of the cell cycle caused by low
concentrations of cycloheximide or alternative carbon sources out to a doubling time of
650 minutes (the increase in mutation rate due to high salt concentration will be dealt
with in the next section). This result is important because it indicates that the mutation
rate per generation is constant, consistent with the idea that the majority of mutations
occur during S-phase. Since the timing of replication is tightly regulated and highly
synchronous, it is likely that slowing the cell cycle does not increase the duration of S-
phase; rather, the G1-phase of the cell cycle is extended under these perturbations [45].
This result justifies expressing the mutation rate per cell division, rather than per unit
time.
5.3 Elevation of mutation rate under osmotic stress
Evidence for elevation of mutation rate: When determining how the duration of
the cell cycle effects mutation rate, I noticed that the per-genome per-generation mutation
rate increased in high NaCl concentrations (Figure 5-1). It can be ruled out that this
increase is due simply to the slowing of the cell cycle and the accumulation of mutations
occurring at a constant rate per unit time. First, slowing the cell cycle by other means
fails to increase the mutation rate. In addition, the slope of the increase in mutation rate

Doubling time (minutes)
50 150 250 350 450 550 6500
1
2
3
4
5
6
Mut
atio
n fr
eque
ncy
(x 1
0-7)
No stressNaClGlycerolCycloheximide
Figure 5-1. Mutations occur at a constant rate per cell division. The selection/counterselection method was used to determine mutation frequencies under a variety of conditions that slow the cell cycle. Slowing the cell cycle by altering the carbon source of using low doses of cyclohexi-mide does not increase the mutation frequency; however, mutation rate increases with increasing NaCl concentrations. Each data point is a single culture of JYL338. Four cultures (1 “no stress,” and 3 “cycloheximide”) had a very high mutation frequncy compared to the other replicates and were omitted from the analysis. NaCl concentration varied from 0.25 to 1 M. Cycloheximide concentration ranged from 0.025 to 0.2 g/ml. Three “glycerol” samples were deprived of lysine, further increasing doubling time.

103
is greater than one, indicating that doubling the length of the cell cycle by increasing the
salt concentration more than doubles the mutation rate. This would argue that the effect
of high salt on mutation rate cannot be solely due to its effect on growth rate.
An increase in mutation rate is also observed in high sorbitol and high glucose
concentrations suggesting that this is an effect of osmotic, and not ionic, stress (Figure 5-
2a). In addition, this effect is also observed at the CAN1 locus, showing that this increase
in mutation rate is not specific to mutations at URA3 (Figure 5-2b). Osmotic stress
cannot be inhibiting some aspect of mismatch repair, since the strain used in Figure 5-2 is
msh2Δ and thus defective for mismatch repair.
Strand breakage model for osmotic stress: One possible explanation for the
observed increase in mutation rate in response to osmotic stress is that cells may
upregulate their mutation rate as a stress response. If this were a general stress response,
one might expect the response to be diminished in cells adapted to high salt. A diploid
strain adapted to growth in high salt [131] was sporulated and the
selection/counterselection assay was performed to determine the mutation rate in the
presence and absence of 1 M NaCl for two haploid URA3 spores. Salt-adapted strains
display the same increase in mutation rate as non-adapted strains indicating that either the
increase in mutation rate is not due to a stress-response or that these strains have not been
sufficiently adapted to high salt such that the osmotic stress response is alleviated (data
not shown).
Another possible explanation for this observation is that high salt may be
genotoxic either by interfering with some aspect of maintaining fidelity or by directly
damaging DNA. It has been proposed that osmotic stress is mutagenic in mammalian

Muta
tion r
ate
at URA3
( x 1
0-6)
1.5
0
3
4.5
Control
A
Figure 5-2. Mutation rate increases under osmotic stress. (A) Fluctuation assays were
performed using strain JYL516 to determine if the increase in mutation rate observed in high salt
is also seen using other osmolytes. A low dose of cycloheximide (0.1 g/ml) was used as control.
(B) This increase in mutation rate is also observed at the CAN1 locus.
7.5
6
NaCl Glucose Sorbitol Cyclohex.
Control
B
NaCl
Muta
tion r
ate
at URA3
( x 1
0-6)
1.5
0
3
4.5
7.5
6

105
cells [7, 88] and yeast [100]. Although the molecular basis for this mutagenic effect is
unknown, evidence suggests that high osmotic stress inhibits normal DNA repair and
checkpoint function and induces double strand breaks [19, 20, 59]. Double strand breaks
cause an elevation in the frequency of base pair substitutions [137]. In order to determine
if high salt increases base pair substitutions, 48, 24, 21, 24, and 24 independent ura3 loss-
of-function alleles were sequenced from wild-type, wild-type + 1 M NaCl, gamma-
irradiated wild-type (370 Gy in benomyl/nocodazol arrested cells), msh2Δ, and msh2Δ +
1 M NaCl cultures. Table 5-2 shows that high salt elevates the fraction of base-pair
substitutions in the mutational spectra under osmotic stress in both wild-type and msh2Δ
strains, a phenomenon that has been correlated with double strand break repair in
previous studies; however, in contrast to previous work, the fraction of base-pair
substitutions remained the same following gamma-irradiation.
Strains deficient for Rad52 are sensitive to double strand breaks. Thus the
hypothesis that high osmotic strength leads to double strand breaks predicts that a rad52Δ
strain would be hypersensitive to osmotic stress. The salt-sensitivity experiment was
carried out in both S288c and W303 backgrounds (Figures 5-3). Strains were compared
to wild type and a known osmo-sensitive strain (sro7Δ or hog1Δ). For each experiment,
serial dilutions of each strain were spotted onto either YPD plates or YPD + 1 M NaCl
plates. For both strain backgrounds, the rad52Δ strain showed intermediate growth on
high salt, whereas all three strains grew nearly equally well on rich media (the W303
rad52Δ strain shows a slight defect on YPD compared to wild-type and hog1Δ strains).
Next, the rad52Δ strain (W303 background) was assayed for mutation rate in the

Table 5-2. Mutational spectra
MSH2 MSH2 + NaClMSH2 +Gamma
msh2Δ msh2Δ + NaCl
Base-pair substitutions 32/48 20/24 18/27 11/24 12/22
Transitions 11/48 6/24 7/27 8/24 7/22
Transversions 21/48 14/24 11/27 3/24 5/22
Missense 21/48 11/24 7/27 11/24 9/22
Nonsense1
11/48 9/24 8/27 — 3/22
Insertions/Deletions 13/48 4/24 7/27 13/24 9/22
Poly A/T 1/48 — — 12/24 9/22
Non-poly A/T 12/48 3/24 7/27 1/24 —
Insertions 1/48 — — 4/24 1/22
Deletions 12/48 3/24 7/27 9/24 8/22
Other 3/48 — 2/27 — 1/22
Double-mutations 2/48 — 2/27 — —
Duplications 1/48 — — — —
Unknown2
— — — — 1/22
Strains used in this study: JYL338 (MSH2) and JYL516 (msh2Δ)
1 Includes start codon mutations
2 Wild-type URA3 and FUR1

Wild type
rad52
sro7
Wild type
rad52
hog1
S288c
W303
0 -1 -2 -3 -4 -5Dilution (log
10)
0 -1 -2 -3 -4 -5Dilution (log
10)
No NaCl 1 M NaCl
Figure 5-3. Salt sensitivity of a rad52 strain. Salt sensitivity was assayed for wild type, rad52 , and known salt sensitive strains (sro7 or hog1 ) in both S288c and W303 backgrounds. Dupli-cate serial dilutions were spotted onto rich media or rich media with 1 M NaCl. The strains used in this experiment are YEL020C (S288c, wild type), YML032C (S288c, rad52 ), YPR032W (S288c, sro7 ), GIL066 (W303, wild type), GIL076 (W303, rad52 ), and GIL074 (W303, hog1 ).

108
presence and absence of 1 M NaCl. This strain shows less of an increase in mutation rate
in high salt (3.51 x 10⁻⁷ in 2 x SC versus 4.80 x 10⁻⁷ in 2 x SC + 1 M NaCl).
The above results: an increase in base-pair substitutions in high salt, salt
sensitivity of rad52Δ strains, and a diminished elevation of mutation rate in a rad52Δ
strain, are consistent with the hypothesis that high salt increases double strand breaks.
The elevation of mutation rate in high salt seen in the rad52Δ strain could be due to
production of single strand breaks, which are processed in a Rad52-independent manner.
5.4 Fixation of a mutator allele in a laboratory strain
Evidence for a mutator phenotype: An early observation in my studies of
mutation rate is that the mutation rate of mismatch-repair proficient strains in our
laboratory (JYL338, GIL066, GIL074, GIL076, and GIL102 in Table 5-1) is higher than
published rates, whereas the mutation rate in our mismatch-repair deficient strain
(JYL516) is consistent with published rates [142]. These strains share common origin
suggesting that our strains contain a mutator allele conferring a five-fold elevation of
mutation rate and that this mutator allele is epistatic with the msh2 deletion since
elimination of mismatch repair in our background only confers a 20-fold elevation of
mutation rate compared to the 100-fold elevation observed in other strains [142]. This
raises the possibility that our strains contain defect in mismatch repair. Given that
elimination of MSH2 has a profound effect on the mutational spectra (enriching for
insertion/deletions at polynucleotide runs, compared to our wild-type strain, Table 5-2) it
is unlikely that our strains have lost the function of the MSH2/MSH3 complex, which is
primarily responsible for correcting these slippage events [60]. However, MSH2 also

109
functions as a heterodimer with MSH6, which is primarily responsible for correcting
base-pair substitutions [60]. Disruption of MSH6 in our wild-type background has little
effect on the papillation frequency or on the ability of strains to compete with wild type
in laboratory competition experiments (D. Thompson, unpublished). In addition, msh6
mutants are reported to have a 10-fold increase in mutation rate [49]. Sequencing of the
MSH6 gene from our strain background revealed two nonsynonymous substitutions in
conserved regions of the protein compared to the sequenced S288c strain.
Segregation of the mutator phenotype: To determine the number of genes
involved in the mutator phenotype, our W303 strain (JYL338) was crossed to an S288c
strain (GIL051) with a 10-fold lower in mutaion rate. Ten tetrads were dissected and
fluctuation assays were performed for the 40 spores (Figure 5-4). The cross shows a
large amount of variation in mutation rate, which may be due to differences in the strain
backgrounds (this cross also shows a large amount of variation in the saturation densities
of the cultures, data not shown). Looking for a natural break in the data, I designate
mutation rates greater than 1.2 x 10⁻⁷ as “elevated.” By looking at the segregation within
each tetrad there are five 2:2, three 3:1, and two 4:0 segregants of low and elevated
mutation rate, respectively. This is inconsistent with one locus (since all tetrads are
expected to show a 2:2 segregation) and with three loci (p < 0.001, Chi-square). The data
are unable to exclude the possibility of two major-effect loci (p > 0.15, Chi-square). In
addition, the fraction of spores with high mutation rate (13/40) is consistent with the
expected fraction given two loci required for this phenotype (10/40). To determine if the
MSH6 gene contributes to the 10-fold elevation in mutation rate in our laboratory strains,
primers specific to the S288c and W303 alleles of were designed and used to determine if

51 2 3 4 6 7 8 9 10
S288c
W303
0
1
2
4
3
Tetrad number
Mut
atio
n ra
te (
x 10
-7)
MSH6 allele from S288c
MSH6 allele from W303
W303S288c
9-a 9-b 9-c 9-d 10-a 10-b 10-c 10-d
A
Figure 5-4. Mutation rate variation between common laboratory strains. A complex segregation pattern of mutation rate is observed from a cross between W303 and S288c. Ten tetrads were dissected from a cross between JYL338 (W303) and GIL051 (S288c). Fluctuation assays were performed to determine the mutation rate of each of the 40 spores and PCR genotyping was used to determine the identity of the MSH6 allele (which varies by two synonymous substitutions between the parental strains). Mutation is unlinked to the MSH6 allele in this cross. The data are inconsistent with locus (since all tetrads are expected to show 2:2 segregation) and with three loci (p < 0.001, Chi-square). The data cannot rule out the possibility two major effect loci (p > 0.15, Chi-square).

111
the MSH6 alleles segregate with mutation rate in this cross. It is clear from Figure 5-4
that the MSH6 allele does not contribute to the different mutation rates between these
strains.
In order to determine if the elevation of mutation rate is specific to our laboratory
strain or is present in all W303 strains, the original W303-1a strain was obtained
(courtesy of R. Rothstein). This strain was transformed with the wild-type URA3 gene to
generate the strain GIL087. Figure 5-5a shows that the mutator allele is specific to our
laboratory strain background. A cross between our derived W303 background and the
ancestral W303 background shows that the mutator allele segregates 2:2 (Figures 5-5b,
c), suggesting that the mutation rate variation between the ancestral and derived W303
strains is due to a single mutation.
The results from these two crosses imply that the ancestral W303 contains one of
the two mutations seen segregating in the cross between the derived W303 strain and
S288c. The mutation rate of the ancestral strain in Figure 5-5a is 1.6-fold higher than
S288c. Although this is within the error of the fluctuation assay, it is seen consistently
from experiment to experiment. As for the mutations responsible for the difference
between the ancestral and derived strains of W303, MSH6 has been ruled out since both
W303 strains contain the same allele and this allele does not segregate with mutation rate
in the derived W303/S288c cross. Since the mutation is epistatic with msh2Δ, it is
possible that this mutation is itself a partial loss-of-function allele of MSH2; however,
sequencing of MSH2 revealed that W303 and S288c contain the same allele. It remains
possible that this mutation is in another component of mismatch repair.
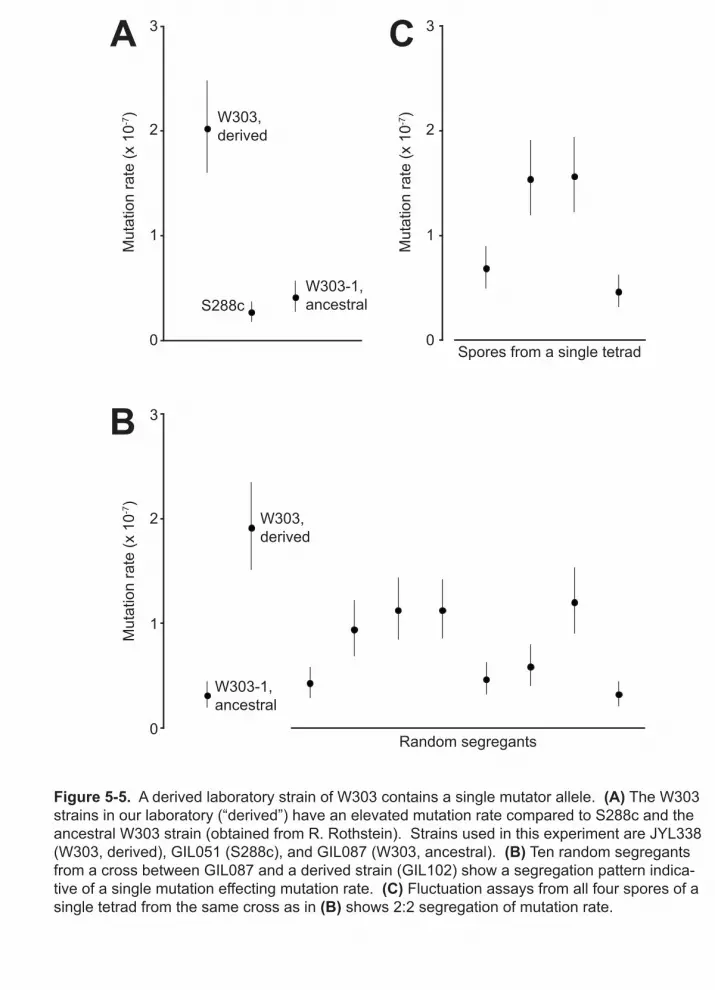
W303-1,
ancestral
W303,
derived
Random segregants
W303,
derived
S288c
W303-1,
ancestral
Spores from a single tetrad
Muta
tion r
ate
(x 1
0-7)
0
1
2
3
Muta
tion r
ate
(x 1
0-7)
0
1
2
3
Muta
tion r
ate
(x 1
0-7)
0
1
2
3
B
A C
Figure 5-5. A derived laboratory strain of W303 contains a single mutator allele. (A) The W303
strains in our laboratory (“derived”) have an elevated mutation rate compared to S288c and the
ancestral W303 strain (obtained from R. Rothstein). Strains used in this experiment are JYL338
(W303, derived), GIL051 (S288c), and GIL087 (W303, ancestral). (B) Ten random segregants
from a cross between GIL087 and a derived strain (GIL102) show a segregation pattern indica-
tive of a single mutation effecting mutation rate. (C) Fluctuation assays from all four spores of a
single tetrad from the same cross as in (B) shows 2:2 segregation of mutation rate.

113
Chapter 6
Conclusions and future directions
6.1 Summary of major results
6.2 The concept of effective target size
6.3 Deviations from the Luria-Delbrück distribution
Detecting deviations from the Luria-Delbrück distribution
Interpreting deviations from the Luria-Delbrück distribution
6.4 Mutation rate variation between strain backgrounds
6.5 The role of mutator strains in evolution
Competition experiments and the role of deleterious mutations
Reversion of mutator alleles
6.6 The importance of mismatch repair in mutation rate variation
6.7 The molecular basis of mutation rate
The role of translesion synthesis
Do transient mutators exist?
6.8 Genome structure, function, and evolution

114
Abstract
I have used an improved method for measuring mutation rates to examine the
degree to which mutation rate varies in the yeast, Saccharomyces cerevisiae. I determine
that mutation rate is robust to variations in the duration of the cell cycle, but varies
between strain backgrounds, between environments, and within the genome. In each
case, I investigated the mechanism underlying this variation. In Section 6.1, I summarize
the work described in this thesis. In Sections 6.2 through 6.4, I discuss extensions of the
work described above. In Sections 6.5 through 6.7, I recast my results in terms of the big
picture described in Chapter 1. I highlight what I feel are the important unanswered
questions and, where possible, I describe experiments aimed at addressing these
questions.
6.1 Summary of major results
In this thesis I describe several improvements to the measurement of mutation
rates using fluctuation assay. They are as follows:
• Scaling down and semi-automating the fluctuation assay to improve the
throughput of this assay (Chapter 2).
• Improving the analysis of data generated from fluctuation assays to detect
deviations from the Luria-Delbrück distribution (Chapter 2).
• I provide a definition for the effective target size used to convert phenotypic
mutation rates into per-base-pair mutation rates (Chapter 3).

115
In this thesis I use the fluctuation assay to investigate mutation rate variation. The
major results are as follows:
• The per-base-pair per-generation mutation rate varies 2-fold between URA3 and
CAN1 (3.80 x 10⁻¹⁰ and 6.44 x 10⁻¹⁰, respectively, Chapter 3).
• Mutation rate varies 6-fold across yeast Chromosome VI (Chapter 4).
• Mutation rate across Chromosome VI is correlated with replication timing
(Chapter 4).
• Mutation rate variation across Chromosome VI is dependent upon translesion
synthesis (Chapter 4).
• Mutation rate variation across the genome influences synonymous substitution
rates on short time scales and potentially gene location on longer time scales
(Chapter 4).
• Mutation rate is robust to variation in the duration of the cell cycle (Chapter 5).
• Mutation rate is elevated in a derived W303 strain compared to the ancestral
W303 and S288c strains (Chapter 5).
• Osmotic stress increases mutation rate, possibly by inducing strand breaks
(Chapter 5).
6.2 The concept of effective target size
In order to convert phenotypic mutation rates into per-base-pair rates, one needs
an estimate of the target size for phenotypic mutations. There are two ways one can think
about target size. One can think of target size as the number of possible base changes
that can give rise to a phenotype. For the selections described in this thesis, this
116
corresponds to the number of mutations capable of disrupting protein function and is an
inherent property of the sequence. Alternatively one could think probabilistically about
target size. I define the effective target size as the size of the genome, G, multiplied by
the probability that introducing a single genomic mutation (this could be a base-pair
substitution, insertion/deletion, transposition, etc.) will result in the phenotype of interest:
€
τ =G ⋅ P{mutation results in phenotype |mutation in genome}.
The effective target size relates the phenotypic mutation rate to the average per-base-pair
mutation rate and the per-genome mutation rate,
€
µCan
R
τCan
R
= ˆ µ bp =Ug
G,
where
€
µCan
R is the mutation rate to canavanine resistance,
€
ˆ µ bp is the genome-wide
average mutation rate per base pair per generation, and
€
Ug is the mutation rate per
genome per generation. Similarly,
€
µCan
R
τCan
R
CAN1= µbp
CAN1,
where
€
τCan
R
CAN1 is the locus-specific effective target size for canavanine resistance at the
CAN1 locus (the probability of a mutation resulting in canavanine resistance given a
mutation at the CAN1 locus) and
€
µbp
CAN1 is the average mutation rate per base pair per
generation at the CAN1 locus.
€
τCan
R
CAN1 and
€
µbp
CAN1 are related to
€
τCan
R and
€
ˆ µ bp through the
parameter λCAN1 which is the ratio of the mutation rate at the CAN1 locus compared to the
genome-wide average; λ = 1 identifies loci where the mutation rate equals the genomic
average, loci where λ < 1 are coldspots, and those where λ > 1 are hotspots:
€
λCAN1 ⋅ τCan
R
CAN1= τ
CanR , and

117
€
µbp
CAN1 = λCAN1⋅ ˆ µ bp .
The probabilistic definition of effective target size was put forward for two reasons: (1)
to calculate the locus-specific mutation rate per base pair per generation and (2) in
response to the observation in Chapter 4 that moving a gene to a different location can
change its mutation rate.
6.3 Deviations from the Luria-Delbrück distribution
Detecting deviations from the Luria-Delbrück distribution: Chapter 2 shows
that data generated from fluctuation assays often deviate from the expected Luria-
Delbrück distribution. In addition to fitting data to the one-parameter Luria-Delbrück
distribution, I fit the data to a two-parameter convolution between a Luria-Delbrück
distribution and a Poisson distribution, and quantify the improvement of fit by calculating
the sum-of-the-squared differences between the cumulative distribution of the data and
the theoretical curve for both models. I define the improvement of fit as the decrease in
the sum-of-the-square differences between the one-parameter and the two-parameter
models and I use Akaike’s information criterion to determine which model best fits the
data while using the fewest parameters.
In addition to the improvement of fit metric used in this thesis, other metrics
could be used to detect deviations from the Luria-Delbrück distribution. One possibility
is to determine the expected number of mutation events per culture, m, for each data set
using two methods: the P0 method using the fraction of cultures with zero mutants, and
the Ma-Sandri-Sarkar maximum likelihood method [112] using the number of cultures
with one or more mutants, while excluding those cultures with zero mutants. This would

118
yield two independent estimates of m from the same data set. Comparing the agreement
between these estimates of m could serve as an additional method for assessing the
quality of data generated from fluctuation assays.
Interpreting deviations from the Luria-Delbrück distribution: In Chapter 2, I
used the quality of data assay to show that post-plating growth and mutation occurs on
canavanine plates; a result that was confirmed by demonstrating that this effect is
diminished by increasing the concentration of canavanine in the media. Other processes
that introduce error into mutation rate estimates such as differential growth rates between
mutants and non-mutants [143] and poor plating efficiency [124, 126] will also produce
deviations from the expected Luria-Delbrück distribution. Therefore, fitting fluctuation
data to the cumulative distribution and comparing the sum-of-the-square differences with
simulated data is a general method for assaying the quality of data resulting from
fluctuation assays.
Testing for deviations from the Luria-Delbrück distribution can be used to ask
biologically important questions. For example, mutation rate is believed to increase
during meiosis [77]. This conclusion was based upon examining the frequency of
mutants before and after sporulation and assumes that no divisions went undetected. An
alternative way to address this question is to perform a fluctuation assay using a diploid
strain homozygous for the URA3 gene near the centromere (to avoid loss of
heterozygosity in strains where a mutation has occurred). After the exponential (mitotic)
growth period, cultures can be sporulated so that the final cell division will be meiotic.
The resulting spores can be assayed for 5FOA resistance. If mutation rate in meiosis is
the same as in mitosis the distribution of 5FOA resistant mutants will follow the Luria-

119
Delbrück distribution. However, if the mutation rate is increased in meiosis, the
distribution of 5FOA resistant mutants will be a convolution of the Luria-Delbrück
distribution and Poisson distributions; a difference that can be detected using the methods
described in Chapter 2.
6.4 Mutation rate variation between strain backgrounds
In Chapter 5, I show that a derived W303 background harbors a single mutation
not present in the ancestral W303 background, which confers a 5-fold elevated mutation
rate. In addition, I show that this mutation is epistatic with an msh2Δ, suggesting that the
mutation may be in a component of mismatch repair. A candidate gene approach ruled
out MSH6 and MSH2 itself. It is possible that the mutation is in another component of
mismatch repair.
There are several observations regarding the difference in mutation rate between
derived and ancestral W303 that warrant discussion here. Table A-1 shows a summary of
62 fluctuation assays using several selections and several strain backgrounds. Although
the derived W303 shows an elevated mutation rate compared to the ancestral W303 for
5FOA resistance and canavanine resistance, there does not appear to be a difference in
mutation rate to α-factor resistance between these two backgrounds. The simple
explanation for this is that the derived strain used in this study (GIL066) is deleted for the
silent mating cassette, HMLα; whereas, the ancestral strain (GIL104) is not (Table 5-1).
Therefore, the ancestral strain possesses an additional mechanism for becoming α-factor
resistant: gene conversion with HMLα. This is consistent with the claim in Chapter 3

120
that the mutation rate to α-factor resistance in GIL104 is higher than expected given the
number of genes involved the mating response.
Another observation, for which I do not have an explanation, is that in Figure 5-
5b, the mutation rate of the progeny from a cross between derived and ancestral W303
shows 2:2 segregation; however, none of the progeny have a mutation rate equal to that
of the derived W303 parental strain. It could be that this difference is within the error of
the fluctuation assay, or it is possible that there is something more complicated at work,
which could shed light on the search for genetic basis of the elevated mutation rate in our
derived W303 strain background.
Figure 5-4 shows a segregation pattern of mutation rate from a cross between a
derived W303 strain and an S288c strain that is most consistent with two major-effect
loci. This raises the possibility that the slight difference in mutation rate observed
between the ancestral W303 strain and S288c has a genetic basis. Prior to this, I
suspected that the slight difference mutation rate between these strains was due to
differential growth on 5FOA (Appendix A). To distinguish between these two
possibilities, mutation rate can be measured at both URA3 and CAN1 in a cross between
an ancestral W303 strain and S288c.
6.5 The role of mutator strains in evolution
Competition experiments and the role of deleterious mutations: In well-adapted
populations, the mutation rate reflects a balance between the costs of accumulating
deleterious mutations and maintaining fidelity [13]. However, in environments where
beneficial mutations exist, the mutation rate sets the rate of adaptation and higher

121
mutation rates can be favored. Competition experiments have been used to examine
conditions under which mutators are favored [9, 62, 131]. The simplest expectation is
that the first population to acquire a beneficial mutation will win; therefore, the outcome
of the competition is determined only by the initial frequency of mutators and the
strength of the mutator allele. This is insufficient to explain either the results or the
dynamics of competition experiments [9, 62, 131]. In reality the outcome of a
competition experiment depends upon the initial ratio of mutator to wild type, the
population size, the mutation rate, the mutator strength, the ratio of beneficial to
deleterious mutations, and the effects of beneficial and deleterious mutations on fitness.
An effect of deleterious mutations can be observed in the early time points of a
competition by the initial decrease in the frequency of mutators due to an increasing
deleterious load [9]. If the ratio of beneficial to deleterious mutations is low and the
fitness effect of deleterious mutations is high then mutators risk being eliminated (or
dramatically reduced in frequency) before the first beneficial mutation occurs. This
effect becomes more severe in small population sizes. It has been observed in
competition experiments that there exists a critical initial frequency of mutators, above
the mutators will win the majority of competitions and below which they will lose the
majority [62]. This critical frequency increases when the initial population size is
decreased. By carefully measuring how the critical frequency changes with population
size, one can gain insight into the importance of deleterious mutations in competition
experiments.
Reversion of mutator alleles: In natural populations, mutator alleles exist at low
frequency due to mutations in genes responsible for maintaining fidelity, such as the
122
mismatch-repair gene, MSH2. Mutator alleles increase fitness by increasing the
likelihood that a beneficial mutation will occur; when a beneficial mutation linked to a
mutator allele fixes (as in an asexual population), the population becomes entirely
mutators. Once a population has become maximally adapted to its environment, selection
favors a lower mutation rate and the frequency of mutators should decline, since accruing
deleterious mutations imposes a cost that favors reversion of mutator to non-mutator
strains [129]. In laboratory experiments, mutators have been found to arise and fix in
non-mutator populations [122], but the reverse has not been observed. The ease with
which mutators overtake non-mutator populations in the laboratory raises the question
why mutators are not more prevalent in nature. There are three possible explanations.
Mutators may not be able to invade non-mutator populations as readily in nature; for
instance, if the ratio of beneficial to deleterious mutations is greater under laboratory
conditions. This illustrates the need to accurately determine the distribution of fitness
effects under a variety of conditions. Another possibility is that mutators are ultimately
an evolutionary dead end, because they generate a greater mutational load. The third
possibility is that mutators in nature revert to non-mutators when lower mutation rates are
favorable.
The simplest mechanism for reversion is a mutation that reverts the mutator allele
itself. Assuming that the target size for reversion of an msh2 allele is 100-times smaller
than the target size for the loss-of-function of this gene, and that the msh2 allele elevates
the mutation rate 100-fold, one would expect the rates at which non-mutators are
produced in a mutator population and vice-versa to be equal; however, there are several
problems with this reasoning. If a lower mutation rate is favored, any second-site

123
mutation that partially restores Msh2 function will be selected for in the population.
Even without selection, a second site mutation could occur and fix through drift.
Depending on the nature of the second site mutation, reverting back to wild type may
now require two mutations and may require going through an intermediate with an
elevated mutation rate. Another obstacle in reverting mutator alleles is that the mutational
spectra in a wild type and a mutator will differ. For example, in an msh2 strain, 50% of
ura3 loss-of-function mutations are frameshifts at polynucleotide runs, compared to < 1%
in a wild-type strain. Therefore, it is unlikely that a frameshift mutation that occurred in
a non-repetitive sequence in a wild-type strain will be perfectly reverted in an msh2
strain.
To test the idea that mutator alleles can revert by mutation, one could select for
loss-of-function of msh2 followed by selection for restoration of function. This can be
done in a strain with an MSH2-ADE2 fusion protein. ade2 cells are adenine auxotrophs
and accumulate a red pigment on low-adenine media. Exposing a culture to a series of
selective conditions enriches for low frequency mutator alleles within a population. After
several rounds of selection, the culture can be plated onto low adenine media and red
colonies will indicate strains carrying an msh2 allele. To select for a compensatory
frameshift mutation in the msh2 background, the cells can be plated onto media lacking
adenine. Alternatively, combining the msh2 allele with a polymerase (pol32) mutation,
with which it has a synthetic growth defect [98], can select for compensatory mutations.
Sequencing can reveal the locations of both mutations and fluctuation assays can be
performed to determine how the mutation rate in the reverted strain compares to the wild
type and to the mutator. By assaying many combinations of loss-of-function and

124
compensatory mutations, one can gauge the likelihood that mutator populations revert by
way of a precise reversion. If mutators cannot easily revert to non-mutators in this way,
then an additional mechanism, such as horizontal-gene transfer [15], is necessary to
rescue beneficial mutations from a mutator background; therefore, long-term-evolution
experiments, where mutators have fixed in the population, and there is no exogenous
source of the wild-type allele, may succumb to a mutational meltdown and ultimately be
an evolutionary dead end.
6.6 The importance of mismatch repair in mutation rate variation
Throughout this thesis, mismatch repair was invoked as a likely mechanism
underlying mutation rate variation. Although mutation rate variation described in
Chapter 4 can be attributed to the temporal separation of error-free DNA damage
tolerance and translesion synthesis, two previous studies on mutation rate variation within
the genome can be attributed to variation in the efficiency of mismatch repair either to
correct frameshift mutations in microsatellite sequences [46] or to proofread the leading
and lagging strands during replication [50, 102]. Mismatch repair deficiency is the most
commonly observed mechanism for the elevation of mutation rate in naturally occurring
mutator strains [64, 96] and in mutator strains originating during long-term evolution in
the laboratory [122]. Mismatch repair may also be responsible for the mutation rate
variation observed between laboratory strains in Chapter 5.
Future work is needed to address why mismatch repair mutators are so common.
It is possible that mismatch repair is a large target for mutation or that they are frequently
selected since they are among the strongest mutators. Another possibility is that other

125
mutator alleles are not selected because of an associated fitness cost. In a long-term
evolution experiment 4 out of 12 lineages became fixed for mutators, three of which lost
mismatch repair function [122]. The other mutator carries a fitness defect, although it
unclear if the is a result of the mutator allele itself, a product of the mutator allele, or an
unrelated mutation [69].
6.7 The molecular basis of mutation rate
The role of translesion synthesis: Figure 5-1 shows that, in yeast, the mutation
rate is constant per cell division, not per unit time. A simple interpretation of this result
is that mutations are introduced at a single point in the cell cycle, most likely S-phase.
During S-phase there are several processes acting that can contribute to spontaneous
mutation rate: DNA replication, mismatch repair, recombination (template switching),
and translesion synthesis. Proteins belonging to the RAD6 epistasis group mediate the
template switching and translesion synthesis [31]. Deletion of RAD6 disrupts both error-
free DNA damage tolerance and translesion synthesis and reduces the spontaneous
mutation rate. Disruption of only translesion synthesis (rev1, rev3, or rev7), but not
recombination, decreases mutation rate to same extent as a rad6Δ, suggesting that RAD6-
dependent mutations result from translesion synthesis [31]. The extent to which mutation
rate is decreased in these strains suggests that the majority of spontaneous mutations
result from translesion synthesis [61, 106]. Figure 4-8 shows that elimination of the
translesion polymerase, REV1, reduces mutation rate by 80% in late replicating regions
but has little effect on mutation rate in early replicating regions (Figure 4-8).

126
What is the mechanism responsible for generating the remainder of spontaneous
mutations that occur independently of translesion synthesis? One possibility is that each
step involved in maintaining fidelity (such as replication and mismatch repair) has an
associated error rate and that the spontaneous mutation rate is a product of those error
rates. This would suggest that all cells in a population have the same mutation rate. An
alternative possibility is if all proteins involved in maintaining fidelity are present in their
optimal concentration, the mutation rate is essentially zero; however, given noise in gene
expression and the potential for errors during transcription and translation, cells may fail
to produce the amounts and ratios of proteins needed to maintain fidelity and thus
transiently possess a substantially elevated mutation rate [93].
Do transient mutators exist?: The results in Chapter 4 show that mutation rate
varies spatially within the genome and that this variation is dependent upon translesion
synthesis. In order to determine the mechanism for translesion synthesis-independent
mutation, I want to test the transient mutator model by asking if mutation rate varies
within a population.
The transient-mutator hypothesis makes two testable predictions: the rate of
double mutations is greater than the product of the rates of two single mutations; and
when a double mutation occurs, both mutations are more likely to be drawn from a single
class of mutation rather than the mixture of classes seen when spontaneous mutations are
sampled from populations of cells. This second prediction stems from the observation
that mutator alleles do not increase the rate of all types of mutation equally; therefore,
mutators can often be identified by their mutational spectra. For example, in a rad27
strain, 75% of ura3 loss-of-function mutations result from large deletions or duplications
127
flanked by 5 to 10 base-pair repeats [132]. These events represent 1% of ura3 loss-of-
function mutations in a wild-type strain. I have isolated three loss-of-function alleles of
ura3, which can be reverted only by this type of mutation (Figure 3-1 and Table 5-2).
Taking a strain containing one of these alleles and selecting simultaneously for reversion
of this mutation and for α-factor resistance (or for α-factor resistance alone) will allow
me to test both predictions of the transient mutator hypothesis: that mutations to α-factor
resistance are more frequent in cells that also have reverted the ura3 mutation, and that
most of these mutations will result from large duplications or deletions. If mutation rate
is uniform within a population, the probability of α-factor resistance resulting from a
large deletion/duplication is 1%, regardless as to whether uracil prototrophy was selected
concurrently, as long as genetic mutators are not enriched during selection. In contrast,
the transient-mutator model predicts that this probability will vary greatly between these
two selections: 1% for α-factor resistance alone and 75% if selection is concurrent with
selection for reversion of the ura3 allele. If mutation rate is uniform across a population
of cells, it suggests that mutation rate is set by the intrinsic accuracy of DNA replication
and repair; however, if the transient-mutator model is correct, it suggests that the
mutation rate is set by processes other than replication and repair, such noise in gene
expression and errors during transcription and translation.
6.8 Genome structure, function, and evolution
There is an intimate relationship between the structure, function, and evolution of
the genome. The genome must be structured such that each chromosome is faithfully
replicated and segregated in each cell cycle. This puts a selective pressure on the number

128
and distribution of replication origins to ensure that the entire genome is replicated before
the completion of S-phase. In addition, several genomic features tend to be replicated at
particular times: centromeres early and telomeres late. Centromeres must function at the
end of S-phase; therefore, it makes sense that they are replicated early so that any
daughter-strand gaps have adequate time to be repaired by error-free repair. Telomeres
may be replicated late as part of a regulatory mechanism. A recent report shows that the
shortening of telomeres relieves repression of a subtelomeric origin, which results in
early replication and the recruitment of telomerase [3].
The replication profile, in turn, helps to dictate genomic evolution by biasing the
rates and types of mutations occurring across the genome. For instance, mismatch repair
is more efficient in correcting mutations on the lagging strand [102]; therefore, the
direction of fork movement biases the rate of ochre suppressor mutations [50]. In
addition, in Chapter 4, I showed that the timing of replication effects mutation rate, in
that, late replicating regions are more likely to be subjected to translesion synthesis and
have a higher mutation rate. The relationship between genome structure and evolution is
true for karyotype changes as well. The positioning of tRNAs and transposons
predisposes particular translocation events [24, 82], and the distribution of essential and
dosage-sensitive genes across the genome can restrict which karyotype changes are
possible. In Chapter 4, I showed that mutation rate variation within the genome may
influence the location of genes such that such essential genes tend to be located near
centromeres [130] and genes involved in generating antigenic diversity are located near
the telomeres [35]. However, further analyses should be done to determine the effect of
replication timing on gene location.

129
The genome is both the product of and substrate for evolution. It is clear that the
mutation rate varies within the genome, between environments and between strain
backgrounds. Characterizing this variation and the underlying mechanisms will give us
insight into the forces responsible for shaping the genome.

130
Appendix A
Notes and observations
A.1 Variability of mutation rate estimates from fluctuation assays
A.2 An alternative method for measuring mutation rates
A.3 Mutations observed in the yeast deletion collection
A.4 Growth of W303 and S288c on 5FOA
A.5 Selection for multiple mutations on 5FOA
A.6 Decreased cold tolerance in msh2Δ strains
131
Abstract
During the course of my research I made several observation that may be useful
for reference or may serve as the basis for future research. Although all of this
information is in my notebooks, the purpose here is to present this material in a more
organized, accessible form and to comment on these observations with regard to the work
in the main body of this thesis.
A.1 Variability of mutation rate estimates from fluctuation assays
Table A-1 summarizes mutation rate estimates from 62 fluctuation assays using
different genetic backgrounds, strains, media, and culture volumes. Fluctuation assays
performed only a single time are not included in this table, nor are the fluctuation assays
from Chapter 4. All assays in Table A-1 were performed in 96-well plates and 72
cultures were plated on selective media to determine the expected number of mutants per
culture, m. This table is organized such that fluctuation assays, which are expected to
produce similar results, are grouped together, and the average mutation rate is reported.
This shows what has been stated several times in this thesis; namely, that there is a great
deal of variability in mutation rate estimates from fluctuation assays consistent with the
size of the 95% confidence intervals calculated from equations 24 and 25 from [107].
A.2 An alternative method for measuring mutation rates
Because of the difficulties in measuring mutation rates using the fluctuation assay,
I sought to develop an alternative method: the selection/counterselection method. This
method requires a reporter gene for which one can select both for and against its function,

Table A-1. Variability in mutation rate estimates from fluctuation assays
Mutation rate to 5FOAR
Background Strain Vol (µL) Condition m N µ µAVERAGE
JYL338 100 2 x SC 2.32 11530400 2.01E-07
JYL338 100 2 x SC 1.46 13127000 1.11E-07
JYL338 100 2 x SC 2.41 12476200 1.93E-07
JYL338 100 2 x SC 1.66 16696000 9.94E-08
JYL338 100 2 x SC 1.08 4147125 2.60E-07
JYL338 100 2 x SC 1.06 6402450 1.66E-07
GIL066 100 2 x SC 1.15 13884200 8.29E-08
GIL066 100 2 x SC 1.08 14356200 7.55E-08
GIL066 100 2 x SC 1.94 13615800 1.42E-07
GIL066 100 YPD 1.53 14306200 1.07E-07
1.44E-07
JYL338 100 2 x SC + 1 M NaCl 2.53 6380200 3.97E-07
JYL338 100 2 x SC + 1 M NaCl 1.25 8344000 1.50E-07
GIL066 100 2 x SC + 1 M NaCl 1.03 4740400 2.17E-07
GIL066 100 2 x SC + 1 M NaCl 1.02 5916200 1.73E-07
GIL066 100 2 x SC + 1 M NaCl 1.30 5434600 2.39E-07
GIL066 100 YPD + 1 M NaCl 0.97 1537200 6.31E-07
3.01E-07
JYL516 10 2 x SC 1.71 1399400 1.22E-06
JYL516 10 2 x SC 1.80 1229873 1.46E-06
JYL516 10 2 x SC 1.92 1274631 1.51E-06
JYL516 10 2 x SC 0.81 595987 1.36E-06
1.39E-06
JYL516 10 2 x SC + 1 M NaCl 4.78 919700 5.20E-06
JYL516 10 2 x SC + 1 M NaCl 4.75 726453 6.54E-06
W303,derived
JYL516 10 2 x SC + 1 M NaCl 5.78 987118 5.86E-06
5.86E-06
GIL051 100 2 x SC 0.48 18304400 2.65E-08
GIL051 100 2 x SC 0.31 26676000 1.16E-08S288c
GIL051 100 2 x SC 0.31 22543200 1.38E-08
1.73E-08
GIL087 100 2 x SC 0.48 11725600 4.07E-08
GIL087 100 2 x SC 0.32 10432800 3.08E-08
GIL104 200 2 x SC 1.31 20230400 6.49E-08
GIL104 200 2 x SC 1.07 22503200 4.77E-08
GIL104 200 2 x SC 1.47 20477600 7.19E-08
GIL104 200 2 x SC 1.01 19800800 5.08E-08
GIL104 200 2 x SC 0.90 20068000 4.48E-08
GIL104 200 2 x SC 1.45 21666400 6.70E-08
GIL104 200 2 x SC 1.06 22272800 4.74E-08
GIL104 200 2 x SC 1.04 20832000 5.01E-08
GIL104 200 2 x SC 1.37 19536000 7.03E-08
W303,ancestral
GIL104 200 2 x SC 0.61 19968800 3.05E-08
5.14E-08

Table A-1 (continued).
Mutation rate to 10 x CanR
Background Strain Vol. (µL) Condition m N µ µAVERAGE
GIL066 20 2 x SC 0.98 1448160 6.77E-07W303,derived GIL066 30 2 x SC 1.38 2543800 5.42E-07
6.10E-07
GIL104 100 2 x SC 2.82 13590400 2.08E-07
GIL104 100 2 x SC 2.54 14040000 1.81E-07
GIL104 100 2 x SC 2.63 11880000 2.21E-07
GIL104 100 2 x SC 2.68 14212000 1.88E-07
GIL104 100 2 x SC 2.72 13174000 2.06E-07
GIL104 100 2 x SC 2.48 13298800 1.87E-07
GIL104 100 2 x SC 2.55 14480800 1.76E-07
GIL104 100 2 x SC 2.74 13326400 2.05E-07
GIL104 100 2 x SC 2.58 14465600 1.79E-07
W303,ancestral
GIL104 100 2 x SC 2.59 12358400 2.09E-07
1.96E-07
Mutation rate to α-factorR
Background Strain Vol. (µL) Condition m N µ µAVERAGE
GIL066 10 SC (0.2% Glucose) 2.47 488640 5.06E-06W303,derived GIL066 10 SC (0.2% Glucose) 2.51 438800 5.73E-06
5.40E-06
GIL104 10 SC (0.2% Glucose) 1.97 356540 5.51E-06
GIL104 10 SC (0.2% Glucose) 2.00 362340 5.51E-06
GIL104 10 SC (0.2% Glucose) 2.24 357372 6.28E-06
GIL104 10 SC (0.2% Glucose) 2.42 367866 6.58E-06
GIL104 10 SC (0.2% Glucose) 2.07 370548 5.60E-06
GIL104 10 SC (0.2% Glucose) 2.30 378342 6.07E-06
GIL104 10 SC (0.2% Glucose) 2.13 398016 5.35E-06
GIL104 10 SC (0.2% Glucose) 2.28 376866 6.05E-06
GIL104 10 SC (0.2% Glucose) 2.31 384390 6.00E-06
W303,ancestral
GIL104 10 SC (0.2% Glucose) 2.23 405630 5.50E-06
5.85E-06
Strain descriptions are in Table 5-1 except GIL104, which is described in Chapter 2.
All fluctuation assays in this table were performed in 96-well plates and 72 cultures were used todetermine mutation rate. Values for the expected number of mutation events per culture weredetermined using the Ma-Sandri-Sarkar maximum likelihood method (Sarkar et al. 1992).

134
such as URA3. To perform this assay a small number of cultures (3 to 10) are grown in
synthetic media selecting for the function or the reporter (SC-Ura in the case of URA3),
then plated onto media selecting against function (5FOA for ura3 mutants). The logic
behind this assay is that ura3 mutants will arise in the culture during the growth period,
but be unable to divide until plated onto 5FOA, thus eliminating jackpot cultures
associated with the fluctuation assay. The advantage is that one can use fewer cultures
(possibly a single culture) to determine mutation rates.
This assay is complicated for two reasons. First, jackpots will still occur due to
mutations at loci other than URA3. Out of 110 cultures, jackpots (instances where the
number of 5FOA mutants was greatly above the mean of other replicates) were observed
in 4 cultures. Even after excluding these samples, the variance in the remaining
replicates is greater than expected from the Poisson distribution (data not shown). This
suggests that the existence mutations in other loci conferring resistance to 5FOA while
permitting growth in SC-Ura pose a serious problem to the selection/counterselection
method of measuring mutation rate at URA3. One way to correct for this is to replica
plate onto SC-Ura and subtract from the data those colonies that are uracil prototrophs.
There is another complication with the selection/counterselection method: ura3 mutants
lose the ability to form colonies after being quiescent in SC-Ura. To demonstrate this,
JYL338 was used to inoculate four 96 well plates, two with 100 µl cultures in SC
(fluctuation assays) and two with 100 µl cultures in SC-Ura (selection/counterselection
assays). The cultures grew to saturation and were plated on 5FOA. The size of the zero
class (the fraction of the cultures without any 5FOA resistant mutants) in the fluctuation
assays was 31% and 40%; whereas, the zero class in the selection/counterselection assays

135
was 78% and 90%, suggesting that uracil auxotrophs cannot form colonies after
prolonged exposure media lacking uracil.
It is still possible that the selection/counterselection method of measuring
mutation rates will prove to be useful; however, it remains to be shown that, with respect
to the fluctuation assay, the selection/counterselection method will be easier to implement
for multiple loci and will not increase the uncertainty in mutation rate estimates.
A.3 Mutations observed in the yeast deletion collection
In Chapter 4, the yeast deletion collection was used to aid in construction of the
URA3-integration strain collection. During this process, 47 Uptags and 5 Downtags were
sequenced and three deviations from the reported sequences were observed (Table A-2,
several point mutations were also observed; however, since most primer sites were only
sequenced to 1 x coverage, they are not reported here). In all three cases the mutation is a
combination of a deletion (5 to 7 bases) and a tandem duplication (4 to 8 bases). An
additional point mutation was also found in the Uptag of YFR012W, although this may
represent a mistake in the sequencing read. In addition, for 5 of the 49 strains, the
universal primers (U1 and D1, Table 4-1) were unable to generate a PCR product. For
two of those strains, ORF specific primers were able to generate a product over the
primer sites, and revealed multiple mutations in both D1 primer-binding sites, which in
YFL011W, carried over to the Downtag (Table A-2).

Table A-2. Mutations in the yeast deletion collection
Strain Feature From deletion project From sequencing
YFL023W Uptag ATATAGCTCCCACATTGCAG ATATAGCTCCCATATAGCTCC
YFR012W Uptag CATCAGGACCGTACAGAGAG C-TCAGGCATTAAGTAGAGAG
YFL001W Downtag TACGGTAGACCATTGCCGAG TACGGTAGACCATTGATG
YFL011W Downtag CACTTAGGTGGAATATCGAG TAGAAATTACGGTATATGAG
YFL011W Primer D1 CGGTGTCGGTCTCGTAG CAGAGTACAAGAATATT
YFR030W Primer D1 CGGTGTCGGTCTCGTAG CGGTGTCGG-CTCGCAG
137
A.4 Growth of W303 and S288c on 5FOA
Comparison of growth on 5FOA for strains of the W303 and S288c backgrounds
shows that W303 forms large uniformly sized colonies with minimal background growth,
whereas S288c shows more background growth and forms variably sized colonies that
become smaller towards the center of each spot (Figure A-1). From the experiment
described in Chapter 4, where URA3 was integrated at 49 locations across Chromosome
VI, it was noticed that two of these strains (GL·31 and GL·35) formed W303-like
colonies on 5FOA. This phenotype is not due to the URA3 reporter or any cis-acting
factor, since this phenotype is still observed when URA3 is integrated on a different
chromosome. Backcrossing these strains to S288c (strain BY4742) shows that this
phenotype is due to a single locus in each strain and that the locus is linked to the
KanMX cassette on Chromosome VI. The progeny from this cross were assayed
qualitatively, so it is difficult to determine it the linkage is perfect, leaving two
possibilities: deleting either of these ORFs [YFR012W and YFR019W (FAB1)] causes
this phenotype, or there is another mutation on the right arm of Chromosome VI
responsible for this phenotype. These two strains were not produced in the same batch
during construction of the yeast deletion collection and other strains produced from the
same clone do not show this phenotype. It is not apparent that either gene would be
implicated in growth on 5FOA; YFR012W is a hypothetical ORF with no known
function and FAB1 encodes a phosphatidylinositol kinase involved in vacuolar sorting
[140]. The observation of this phenotype in W303 and 2 out of 50 S288c strains suggests
that many mutations may be available conferring the differential growth phenotype on
5FOA.
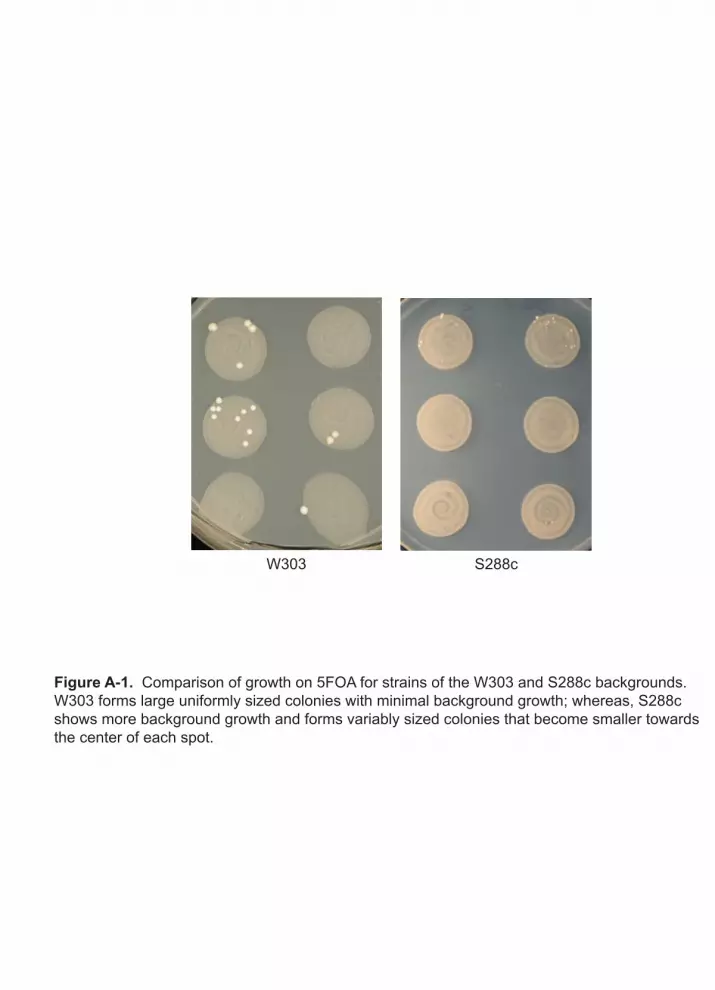
W303 S288c
Figure A-1. Comparison of growth on 5FOA for strains of the W303 and S288c backgrounds. W303 forms large uniformly sized colonies with minimal background growth; whereas, S288c shows more background growth and forms variably sized colonies that become smaller towards the center of each spot.

139
A.5 Selection for multiple mutations on 5FOA
Since URA3 is a small, conserved gene whose function can be selected for both
positively and negatively, it may serve as a useful model for studying protein evolution.
In this role it would be useful to select for multiple mutations conferring varying degrees
of 5FOA resistance. Figure A-2 shows selection for additional mutations in 5FOA
resistant strains that confer an increased growth advantage on this media. 240 single
colonies from a fluctuation assay to 5FOA resistance using strain GIL104 were grown to
saturation in YPD then pin transferred onto 5FOA. Of the 238 strains that grew, 37
(16%) showed papillation on 5FOA after 10 days of growth. Sequencing of the strains
prior to plating on 5FOA shows that each started as a homogeneous culture containing a
single 5FOA mutation, with the few exceptions described in Chapter 3. Not much
information can be garnered from the existence or number of papillae for an individual
strain. Since each culture was grown non-selectively prior to plating, each tube was
essentially a single-tube fluctuation assay. Several strains contain the same loss-of-
function ura3 allele; however, there is no correlation between the identity of the ura3
allele and the number of papillae. There are three possibilities for the nature of these
mutations: they could be additional loss of function mutations at the already mutated
ura3 locus, they could be mutations occurring at another locus or loci conferring
additional resistance to 5FOA, or they could be mutations increasing the general growth
rate irrespective of drug resistance.

Figure A-2. Selection for multiple mutations on 5FOA. 240 single colonies from a fluctuation
assay to 5FOA resistance using strain GIL104 were grown to saturation in YPD then pin trans-
ferred onto 5FOA. After ten days of growth, two strains failed to grow. Of the remaining 238
strains, 37 (16%) showed papillation on 5FOA.
Normal growth on 5FOA
Papillation on 5FOA
No growth on 5FOA

141
A.6 Decreased cold tolerance in msh2Δ strains
One disadvantage of mutator strains described in Chapter 1 is that they quickly
lose the ability to withstand stressful conditions to which they are not regularly exposed.
I have observed an example of this with respect to cold tolerance (Table A-3). 98 single
colonies of a wild-type strain and 321 single colonies of an msh2Δ mutator strain were
picked off of plates and inoculated into individual wells of 96-well plates. All of the
strains grew to saturation then were held at 4° C. After 18 months all of the pellets from
the wild type cells were intact and appeared normal; however, in 35 of the 321 msh2Δ
strains, intact pellets were not observed, indicating cell lysis. Cells were pin transferred
to fresh YPD and grown overnight. All 98 wild-type cells grew in YPD; however, of the
286 msh2Δ mutator strains with intact pellets, 46 did not grow. Since these strains were
picked from a single colony, the simplest explanation for this result is that the msh2Δ
strains acquired cold-sensitive mutations, which were fixed when passaged through the
single cell bottleneck.
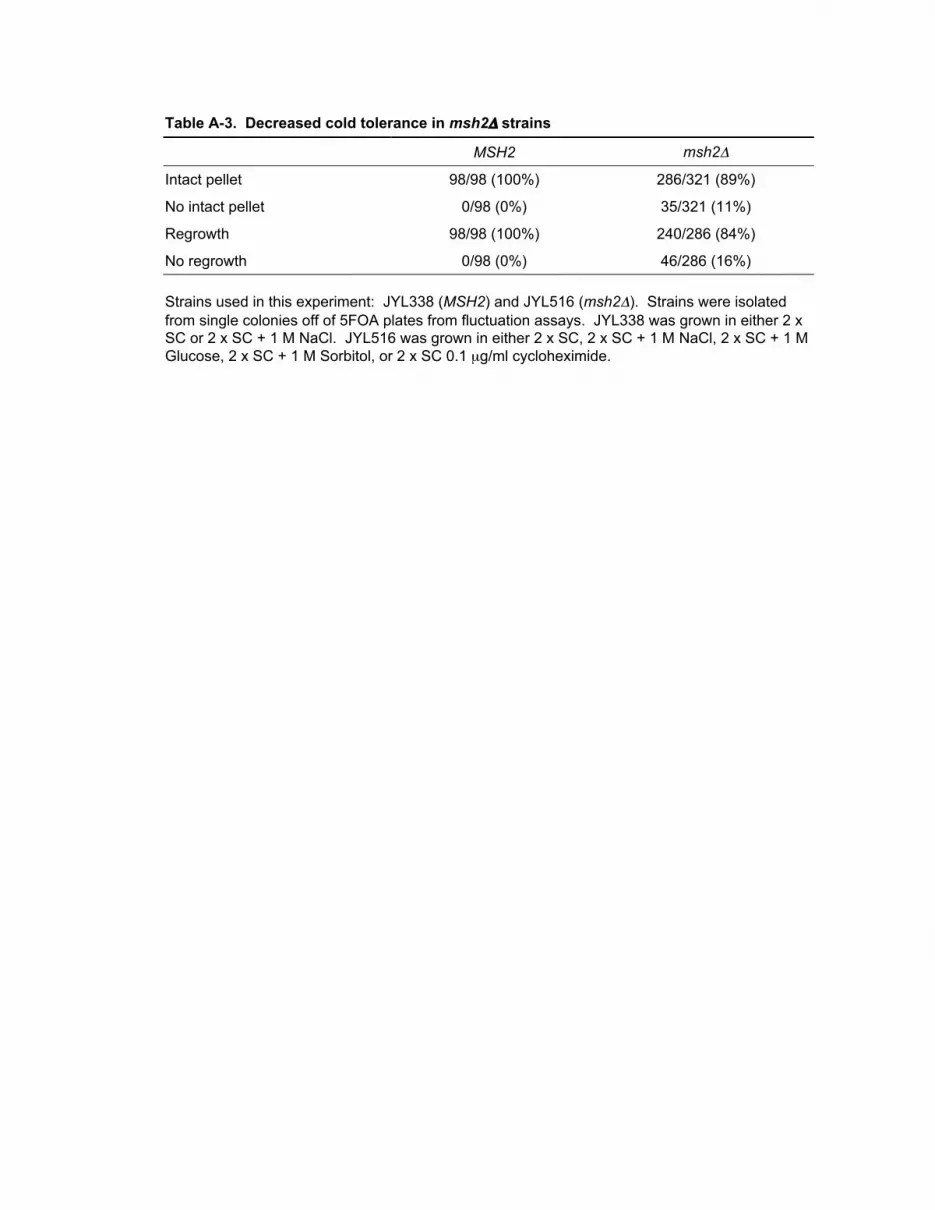
Table A-3. Decreased cold tolerance in msh2Δ strains
MSH2 msh2Δ
Intact pellet 98/98 (100%) 286/321 (89%)
No intact pellet 0/98 (0%) 35/321 (11%)
Regrowth 98/98 (100%) 240/286 (84%)
No regrowth 0/98 (0%) 46/286 (16%)
Strains used in this experiment: JYL338 (MSH2) and JYL516 (msh2Δ). Strains were isolated
from single colonies off of 5FOA plates from fluctuation assays. JYL338 was grown in either 2 xSC or 2 x SC + 1 M NaCl. JYL516 was grown in either 2 x SC, 2 x SC + 1 M NaCl, 2 x SC + 1 M
Glucose, 2 x SC + 1 M Sorbitol, or 2 x SC 0.1 µg/ml cycloheximide.
143
Appendix B
Programs to analyze data from fluctuation assays
findMLm
findMLmTwoParam
scoreData
scoreDataTwoParam
generateLD
generatePO
generateTwoParam
sampleLD
sampleTwoParam
SSDScoreLD
SSDScoreTwoParam

144
Abstract
Several programs were written to aid in the analysis of data from fluctuation
assays as described in Chapter 2. All programs were written in Matlab and the code is
available online (http://murraylab.mcb.harvard.edu/fluctuation/). A summary and
description of each program is provided below.
findMLm
Input: data from fluctuation assay.
Output: most likely value of m given the data.
Command: findMLm(data)
This program requires the following programs to run:
scoreData, generateLD.
findMLmTwoParam
Input: data from fluctuation assay.
Output: most likely values of m and d given the data.
Command: findMLmTwoParameter(data)
This program requires the following programs to run:
scoreDataTwoParam, generateLD, generatePO, generateTwoParam.
scoreData
Input: data from fluctuation assay and m.
Output: -log probability of observing the data given m.
Command: scoreData(data, m)
This program requires the following program to run:
generateLD.
scoreDataTwoParam
Input: data from fluctuation assay, m, and d.
Output: -log probability of observing data given m and d.
Command: scoreDataTwoParam(data, m, d)
This program requires the following programs to run:
generateLD, generatePO, generateTwoParam.
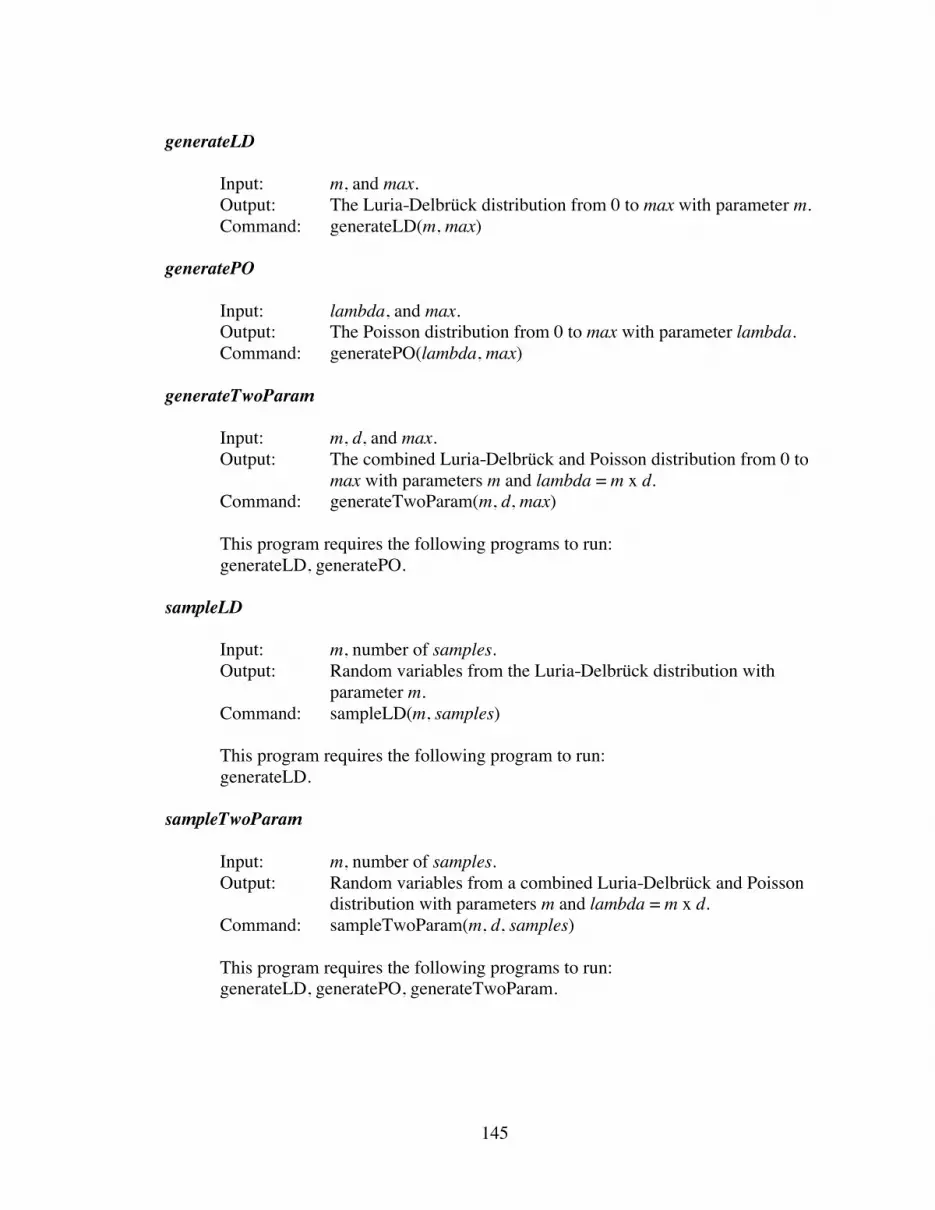
145
generateLD
Input: m, and max.
Output: The Luria-Delbrück distribution from 0 to max with parameter m.
Command: generateLD(m, max)
generatePO
Input: lambda, and max.
Output: The Poisson distribution from 0 to max with parameter lambda.
Command: generatePO(lambda, max)
generateTwoParam
Input: m, d, and max.
Output: The combined Luria-Delbrück and Poisson distribution from 0 to
max with parameters m and lambda = m x d.
Command: generateTwoParam(m, d, max)
This program requires the following programs to run:
generateLD, generatePO.
sampleLD
Input: m, number of samples.
Output: Random variables from the Luria-Delbrück distribution with
parameter m.
Command: sampleLD(m, samples)
This program requires the following program to run:
generateLD.
sampleTwoParam
Input: m, number of samples.
Output: Random variables from a combined Luria-Delbrück and Poisson
distribution with parameters m and lambda = m x d.
Command: sampleTwoParam(m, d, samples)
This program requires the following programs to run:
generateLD, generatePO, generateTwoParam.

146
SSDScoreLD
Input: data from fluctuation assay.
Output: sum of the squared differences between the cumulative distribution
of the data and the cumulative Luria-Delbrück distribution with
parameter m determined from the data.
Command: SSDScore(data)
This program requires the following programs to run:
findMLm, scoreData, generateLD.
SSDScoreTwoParam
Input: data from fluctuation assay.
Output: sum of the squared differences between the cumulative distribution
of the data and the cumulative combined Luria-Delbrück and
Poisson distribution with parameters m and lambda = m x d
determined from the data.
Command: SSDScoreTwoParam(data)
This program requires the following programs to run:
findMLmTwoParam, scoreDataTwoParam, generateLD, generatePO,
generateTwoParam.

147
References
[1] AKAIKE, H., 1974 A new look at the statistical model identification. IEEE Transactions on
Automatic Control 16: 716-723.
[2] BAYLISS, C. D., D. FIELD, and E. R. MOXON, 2001 The simple sequence contingency loci ofHaemophilus influenzae and Neisseria meningitidis. J Clin Invest 107: 657-662.
[3] BIANCHI, A., and D. SHORE, 2007 Early replication of short telomeres in budding yeast. Cell 128:
1051-1062.
[4] BJEDOV, I., O. TENAILLON, B. GERARD, V. SOUZA, E. DENAMUR, M. RADMAN, F. TADDEI, and I.MATIC, 2003 Stress-induced mutagenesis in bacteria. Science 300: 1404-1409.
[5] BOE, L., M. DANIELSEN, S. KNUDSEN, J. B. PETERSEN, J. MAYMANN, and P. R. JENSEN, 2000 Thefrequency of mutators in populations of Escherichia coli. Mutat Res 448: 47-55.
[6] BRONNER, C. E., S. M. BAKER, P. T. MORRISON, G. WARREN, L. G. SMITH, M. K. LESCOE, M.KANE, C. EARABINO, J. LIPFORD et al., 1994 Mutation in the DNA mismatch repair genehomologue hMLH1 is associated with hereditary non-polyposis colon cancer. Nature 368: 258-261.
[7] BRUSICK, D., 1986 Genotoxic effects in cultured mammalian cells produced by low pH treatmentconditions and increased ion concentrations. Environ Mutagen 8: 879-886.
[8] CAIRNS, J., J. OVERBAUGH, and S. MILLER, 1988 The origin of mutants. Nature 335: 142-145.
[9] CHAO, L., and E. C. COX, 1983 Competition between high and low mutating strains ofEscherichia coli. Evolution 37: 125-134.
[10] CHIN, C. S., J. H. CHUANG, and H. LI, 2005 Genome-wide regulatory complexity in yeastpromoters: separation of functionally conserved and neutral sequence. Genome Res 15: 205-213.
[11] CHUANG, J. H., and H. LI, 2004 Functional bias and spatial organization of genes in mutational hotand cold regions in the human genome. PLoS Biol 2: E29.
[12] COLEGRAVE, N., 2002 Sex releases the speed limit on evolution. Nature 420: 664-666.

148
[13] DAWSON, K. J., 1998 Evolutionarily stable mutation rates. J Theor Biol 194: 143-157.
[14] DENAMUR, E., S. BONACORSI, A. GIRAUD, P. DURIEZ, F. HILALI, C. AMORIN, E. BINGEN, A.ANDREMONT, B. PICARD et al., 2002 High frequency of mutator strains among humanuropathogenic Escherichia coli isolates. J Bacteriol 184: 605-609.
[15] DENAMUR, E., G. LECOINTRE, P. DARLU, O. TENAILLON, C. ACQUAVIVA, C. SAYADA, I.SUNJEVARIC, R. ROTHSTEIN, J. ELION et al., 2000 Evolutionary implications of the frequenthorizontal transfer of mismatch repair genes. Cell 103: 711-721.
[16] DENVER, D. R., K. MORRIS, M. LYNCH, and W. K. THOMAS, 2004 High mutation rate andpredominance of insertions in the Caenorhabditis elegans nuclear genome. Nature 430: 679-682.
[17] DESAI, M. M., D. S. FISHER, and A. W. MURRAY, 2007 The speed of evolution and maintenanceof variation in asexual populations. Curr Biol 17: 385-394.
[18] DI NOIA, J. M., and M. S. NEUBERGER, 2007 Molecular Mechanisms of Antibody SomaticHypermutation. Annu Rev Biochem.
[19] DMITRIEVA, N. I., D. V. BULAVIN, and M. B. BURG, 2003 High NaCl causes Mre11 to leave thenucleus, disrupting DNA damage signaling and repair. Am J Physiol Renal Physiol 285: F266-274.
[20] DMITRIEVA, N. I., Q. CAI, and M. B. BURG, 2004 Cells adapted to high NaCl have many DNAbreaks and impaired DNA repair both in cell culture and in vivo. Proc Natl Acad Sci U S A 101:
2317-2322.
[21] DOHLMAN, H. G., 2002 G proteins and pheromone signaling. Annu Rev Physiol 64: 129-152.
[22] DRAKE, J. W., 1991 A constant rate of spontaneous mutation in DNA-based microbes. Proc Natl
Acad Sci U S A 88: 7160-7164.
[23] DRAKE, J. W., B. CHARLESWORTH, D. CHARLESWORTH, and J. F. CROW, 1998 Rates ofspontaneous mutation. Genetics 148: 1667-1686.
[24] DUNHAM, M. J., H. BADRANE, T. FEREA, J. ADAMS, P. O. BROWN, F. ROSENZWEIG, and D.BOTSTEIN, 2002 Characteristic genome rearrangements in experimental evolution ofSaccharomyces cerevisiae. Proc Natl Acad Sci U S A 99: 16144-16149.
[25] ELLEGREN, H., N. G. SMITH, and M. T. WEBSTER, 2003 Mutation rate variation in the mammaliangenome. Curr Opin Genet Dev 13: 562-568.
[26] FISHEL, R., M. K. LESCOE, M. R. RAO, N. G. COPELAND, N. A. JENKINS, J. GARBER, M. KANE,and R. KOLODNER, 1993 The human mutator gene homolog MSH2 and its association withhereditary nonpolyposis colon cancer. Cell 75: 1027-1038.
[27] FONDON, J. W., 3RD, and H. R. GARNER, 2004 Molecular origins of rapid and continuousmorphological evolution. Proc Natl Acad Sci U S A 101: 18058-18063.
[28] FOSTER, P. L., 1999 Mechanisms of stationary phase mutation: a decade of adaptive mutation.Annu Rev Genet 33: 57-88.
[29] FOSTER, P. L., 2004 Adaptive mutation in Escherichia coli. J Bacteriol 186: 4846-4852.
[30] FOSTER, P. L., 2006 Methods for determining spontaneous mutation rates. Methods Enzymol 409:
195-213.

149
[31] FRIEDBERG, E. C., G. C. WALKER, W. SIEDE, R. D. WOOD, R. A. SCHULTZ, and T. ELLENBERGER,2005 DNA Repair And Mutagenesis. ASM Press.
[32] FRIEDMAN, K. L., B. J. BREWER, and W. L. FANGMAN, 1997 Replication profile ofSaccharomyces cerevisiae chromosome VI. Genes Cells 2: 667-678.
[33] GAFFNEY, D. J., and P. D. KEIGHTLEY, 2005 The scale of mutational variation in the muridgenome. Genome Res 15: 1086-1094.
[34] GARCIA-DORADO, A., and A. GALLEGO, 2003 Comparing analysis methods for mutation-accumulation data: a simulation study. Genetics 164: 807-819.
[35] GARDNER, M. J., N. HALL, E. FUNG, O. WHITE, M. BERRIMAN, R. W. HYMAN, J. M. CARLTON,A. PAIN, K. E. NELSON et al., 2002 Genome sequence of the human malaria parasite Plasmodium
falciparum. Nature 419: 498-511.
[36] GARG, P., and P. M. BURGERS, 2005 DNA polymerases that propagate the eukaryotic DNAreplication fork. Crit Rev Biochem Mol Biol 40: 115-128.
[37] GERRISH, P. J., and R. E. LENSKI, 1998 The fate of competing beneficial mutations in an asexualpopulation. Genetica 102-103: 127-144.
[38] GERTON, J. L., J. DERISI, R. SHROFF, M. LICHTEN, P. O. BROWN, and T. D. PETES, 2000 Inauguralarticle: global mapping of meiotic recombination hotspots and coldspots in the yeastSaccharomyces cerevisiae. Proc Natl Acad Sci U S A 97: 11383-11390.
[39] GIRAUD, A., I. MATIC, O. TENAILLON, A. CLARA, M. RADMAN, M. FONS, and F. TADDEI, 2001Costs and benefits of high mutation rates: adaptive evolution of bacteria in the mouse gut. Science
291: 2606-2608.
[40] HAAG-LIAUTARD, C., M. DORRIS, X. MASIDE, S. MACASKILL, D. L. HALLIGAN, B.CHARLESWORTH, and P. D. KEIGHTLEY, 2007 Direct estimation of per nucleotide and genomicdeleterious mutation rates in Drosophila. Nature 445: 82-85.
[41] HALL, B. G., 1988 Adaptive evolution that requires multiple spontaneous mutations. I. Mutationsinvolving an insertion sequence. Genetics 120: 887-897.
[42] HALL, B. G., 1992 Selection-induced mutations occur in yeast. Proc Natl Acad Sci U S A 89:
4300-4303.
[43] HALL, L. M., and S. K. HENDERSON-BEGG, 2006 Hypermutable bacteria isolated from humans--acritical analysis. Microbiology 152: 2505-2514.
[44] HARFE, B. D., and S. JINKS-ROBERTSON, 2000 DNA polymerase zeta introduces multiplemutations when bypassing spontaneous DNA damage in Saccharomyces cerevisiae. Mol Cell 6:
1491-1499.
[45] HARTWELL, L. H., and M. W. UNGER, 1977 Unequal division in Saccharomyces cerevisiae and itsimplications for the control of cell division. J Cell Biol 75: 422-435.
[46] HAWK, J. D., L. STEFANOVIC, J. C. BOYER, T. D. PETES, and R. A. FARBER, 2005 Variation inefficiency of DNA mismatch repair at different sites in the yeast genome. Proc Natl Acad Sci U S
A 102: 8639-8643.

150
[47] HORST, J. P., T. H. WU, and M. G. MARINUS, 1999 Escherichia coli mutator genes. Trends
Microbiol 7: 29-36.
[48] HUANG, J., N. PAPADOPOULOS, A. J. MCKINLEY, S. M. FARRINGTON, L. J. CURTIS, A. H.WYLLIE, S. ZHENG, J. K. WILLSON, S. D. MARKOWITZ et al., 1996 APC mutations in colorectaltumors with mismatch repair deficiency. Proc Natl Acad Sci U S A 93: 9049-9054.
[49] HUANG, M. E., A. G. RIO, A. NICOLAS, and R. D. KOLODNER, 2003 A genomewide screen inSaccharomyces cerevisiae for genes that suppress the accumulation of mutations. Proc Natl Acad
Sci U S A 100: 11529-11534.
[50] ITO-HARASHIMA, S., P. E. HARTZOG, H. SINHA, and J. H. MCCUSKER, 2002 The tRNA-Tyr genefamily of Saccharomyces cerevisiae: agents of phenotypic variation and position effects onmutation frequency. Genetics 161: 1395-1410.
[51] JIN, Y. H., A. B. CLARK, R. J. SLEBOS, H. AL-REFAI, J. A. TAYLOR, T. A. KUNKEL, M. A.RESNICK, and D. A. GORDENIN, 2003 Cadmium is a mutagen that acts by inhibiting mismatchrepair. Nat Genet 34: 326-329.
[52] KADYROV, F. A., L. DZANTIEV, N. CONSTANTIN, and P. MODRICH, 2006 Endonucleolytic functionof MutLalpha in human mismatch repair. Cell 126: 297-308.
[53] KELLIS, M., N. PATTERSON, M. ENDRIZZI, B. BIRREN, and E. S. LANDER, 2003 Sequencing andcomparison of yeast species to identify genes and regulatory elements. Nature 423: 241-254.
[54] KIBOTA, T. T., and M. LYNCH, 1996 Estimate of the genomic mutation rate deleterious to overallfitness in E. coli. Nature 381: 694-696.
[55] KIMURA, M., 1967 On the evolutionary adjustment of spontaneous mutation rates. Genetics
Research 9: 23-34.
[56] KLEIN, F., and U. WINTERSBERGER, 1988 Determination of mating-type conversion rates ofheterothallic Saccharomyces cerevisiae with the fluctuation test. Curr. Genet. 14: 355-362.
[57] KRAWCZAK, M., E. V. BALL, and D. N. COOPER, 1998 Neighboring-nucleotide effects on the ratesof germ-line single-base-pair substitution in human genes. Am J Hum Genet 63: 474-488.
[58] KUBITSCHEK, H. E., and H. E. BENDIGKEIT, 1964 Mutation in Continuous Cultures. I. Dependenceof Mutational Response Upon Growth-Limiting Factors. Mutat Res 106: 113-120.
[59] KULTZ, D., and D. CHAKRAVARTY, 2001 Hyperosmolality in the form of elevated NaCl but noturea causes DNA damage in murine kidney cells. Proc Natl Acad Sci U S A 98: 1999-2004.
[60] KUNKEL, T. A., and D. A. ERIE, 2005 DNA mismatch repair. Annu Rev Biochem 74: 681-710.
[61] LAWRENCE, C. W., 2002 Cellular roles of DNA polymerase zeta and Rev1 protein. DNA Repair
(Amst) 1: 425-435.
[62] LE CHAT, L., M. FONS, and F. TADDEI, 2006 Escherichia coli mutators: selection criteria andmigration effect. Microbiology 152: 67-73.
[63] LEACH, F. S., N. C. NICOLAIDES, N. PAPADOPOULOS, B. LIU, J. JEN, R. PARSONS, P. PELTOMAKI,P. SISTONEN, L. A. AALTONEN et al., 1993 Mutations of a mutS homolog in hereditarynonpolyposis colorectal cancer. Cell 75: 1215-1225.

151
[64] LECLERC, J. E., B. LI, W. L. PAYNE, and T. A. CEBULA, 1996 High mutation frequencies amongEscherichia coli and Salmonella pathogens. Science 274: 1208-1211.
[65] LEIGH, E. G., JR., 1973 The evolution of mutation rates. Genetics 73: Suppl 73:71-18.
[66] LENSKI, R. E., M. SLATKIN, and F. J. AYALA, 1989 Another alternative to directed mutation.Nature 337: 123-124.
[67] LENSKI, R. E., M. SLATKIN, and F. J. AYALA, 1989 Mutation and selection in bacterialpopulations: alternatives to the hypothesis of directed mutation. Proc Natl Acad Sci U S A 86:
2775-2778.
[68] LENSKI, R. E., and M. TRAVISANO, 1994 Dynamics of adaptation and diversification: a 10,000-generation experiment with bacterial populations. Proc Natl Acad Sci U S A 91: 6808-6814.
[69] LENSKI, R. E., C. L. WINKWORTH, and M. A. RILEY, 2003 Rates of DNA sequence evolution inexperimental populations of Escherichia coli during 20,000 generations. J Mol Evol 56: 498-508.
[70] LERCHER, M. J., E. J. WILLIAMS, and L. D. HURST, 2001 Local similarity in evolutionary ratesextends over whole chromosomes in human-rodent and mouse-rat comparisons: implications forunderstanding the mechanistic basis of the male mutation bias. Mol Biol Evol 18: 2032-2039.
[71] LOEB, L. A., 1991 Mutator phenotype may be required for multistage carcinogenesis. Cancer Res
51: 3075-3079.
[72] LOEB, L. A., 2001 A mutator phenotype in cancer. Cancer Res 61: 3230-3239.
[73] LOEB, L. A., C. F. SPRINGGATE, and N. BATTULA, 1974 Errors in DNA replication as a basis ofmalignant changes. Cancer Res 34: 2311-2321.
[74] LOPES, M., M. FOIANI, and J. M. SOGO, 2006 Multiple mechanisms control chromosome integrityafter replication fork uncoupling and restart at irreparable UV lesions. Mol Cell 21: 15-27.
[75] LURIA, S., and M. DELBRÜCK, 1943 Mutations of bacteria from virus sensitivity to virusresistance. Genetics 28: 491-511.
[76] MA, W. T., G. H. SANDRI, and S. SARKAR, 1992 Analysis of the Luria-Delbrück distribution usingdiscrete convolution powers. J App Prob 29: 255-267.
[77] MAGNI, G. E., and R. C. VON BORSTEL, 1962 Different Rates of Spontaneous Mutation duringMitosis and Meiosis in Yeast. Genetics 47: 1097-1108.
[78] MAO, E. F., L. LANE, J. LEE, and J. H. MILLER, 1997 Proliferation of mutators in a cell population.J Bacteriol 179: 417-422.
[79] MATIC, I., M. RADMAN, F. TADDEI, B. PICARD, C. DOIT, E. BINGEN, E. DENAMUR, and J. ELION,1997 Highly variable mutation rates in commensal and pathogenic Escherichia coli. Science 277:
1833-1834.
[80] MCMURRAY, C. T., and J. A. TAINER, 2003 Cancer, cadmium and genome integrity. Nat Genet
34: 239-241.
[81] MCVEAN, G. T., and L. D. HURST, 1997 Evidence for a selectively favourable reduction in themutation rate of the X chromosome. Nature 386: 388-392.

152
[82] MIECZKOWSKI, P. A., F. J. LEMOINE, and T. D. PETES, 2006 Recombination betweenretrotransposons as a source of chromosome rearrangements in the yeast Saccharomyces
cerevisiae. DNA Repair (Amst) 5: 1010-1020.
[83] MILLER, J. H., 1996 Spontaneous mutators in bacteria: insights into pathways of mutagenesis andrepair. Annu Rev Microbiol 50: 625-643.
[84] MILLER, J. H., D. GANEM, P. LU, and A. SCHMITZ, 1977 Genetic studies of the lac repressor. I.Correlation of mutational sites with specific amino acid residues: construction of a colinear gene-protein map. J Mol Biol 109: 275-298.
[85] MITTLER, J. E., and R. E. LENSKI, 1990 New data on excisions of Mu from E. coli MCS2 castdoubt on directed mutation hypothesis. Nature 344: 173-175.
[86] MIYATA, T., H. HAYASHIDA, K. KUMA, K. MITSUYASU, and T. YASUNAGA, 1987 Male-drivenmolecular evolution: a model and nucleotide sequence analysis. Cold Spring Harb Symp Quant
Biol 52: 863-867.
[87] MODRICH, P., 2006 Mechanisms in eukaryotic mismatch repair. J Biol Chem 281: 30305-30309.
[88] MOORE, M. M., and K. H. BROCK, 1988 High concentrations of sodium chloride induce a"positive" response at the TK locus of L5178Y/TK+/- mouse lymphoma cells. Environ Mol
Mutagen 12: 265-268.
[89] MOXON, E. R., P. B. RAINEY, M. A. NOWAK, and R. E. LENSKI, 1994 Adaptive evolution ofhighly mutable loci in pathogenic bacteria. Curr Biol 4: 24-33.
[90] MURAKAMI, Y., M. NAITOU, H. HAGIWARA, T. SHIBATA, M. OZAWA, S. SASANUMA, M.SASANUMA, Y. TSUCHIYA, E. SOEDA et al., 1995 Analysis of the nucleotide sequence ofchromosome VI from Saccharomyces cerevisiae. Nat Genet 10: 261-268.
[91] MURAMATSU, M., V. S. SANKARANAND, S. ANANT, M. SUGAI, K. KINOSHITA, N. O. DAVIDSON,and T. HONJO, 1999 Specific expression of activation-induced cytidine deaminase (AID), a novelmember of the RNA-editing deaminase family in germinal center B cells. J Biol Chem 274:
18470-18476.
[92] NILSSON, M., and N. SNOAD, 2002 Optimal mutation rates in dynamic environments. Bull Math
Biol 64: 1033-1043.
[93] NINIO, J., 1991 Transient mutators: a semiquantitative analysis of the influence of translation andtranscription errors on mutation rates. Genetics 129: 957-962.
[94] NOTLEY-MCROBB, L., R. PINTO, S. SEETO, and T. FERENCI, 2002 Regulation of mutY and natureof mutator mutations in Escherichia coli populations under nutrient limitation. J Bacteriol 184:
739-745.
[95] NOTLEY-MCROBB, L., S. SEETO, and T. FERENCI, 2002 Enrichment and elimination of mutY
mutators in Escherichia coli populations. Genetics 162: 1055-1062.
[96] OLIVER, A., R. CANTON, P. CAMPO, F. BAQUERO, and J. BLAZQUEZ, 2000 High frequency ofhypermutable Pseudomonas aeruginosa in cystic fibrosis lung infection. Science 288: 1251-1254.
[97] ORR, H. A., 2000 The rate of adaptation in asexuals. Genetics 155: 961-968.
[98] PAN, X., P. YE, D. S. YUAN, X. WANG, J. S. BADER, and J. D. BOEKE, 2006 A DNA integritynetwork in the yeast Saccharomyces cerevisiae. Cell 124: 1069-1081.

153
[99] PAPADOPOULOS, N., N. C. NICOLAIDES, Y. F. WEI, S. M. RUBEN, K. C. CARTER, C. A. ROSEN, W.A. HASELTINE, R. D. FLEISCHMANN, C. M. FRASER et al., 1994 Mutation of a mutL homolog inhereditary colon cancer. Science 263: 1625-1629.
[100] PARKER, K. R., and R. C. VON BORSTEL, 1987 Base-substitution and frameshift mutagenesis bysodium chloride and potassium chloride in Saccharomyces cerevisiae. Mutat Res 189: 11-14.
[101] PARKHILL, J., B. W. WREN, K. MUNGALL, J. M. KETLEY, C. CHURCHER, D. BASHAM, T.CHILLINGWORTH, R. M. DAVIES, T. FELTWELL et al., 2000 The genome sequence of the food-borne pathogen Campylobacter jejuni reveals hypervariable sequences. Nature 403: 665-668.
[102] PAVLOV, Y. I., I. M. MIAN, and T. A. KUNKEL, 2003 Evidence for preferential mismatch repair oflagging strand DNA replication errors in yeast. Curr Biol 13: 744-748.
[103] PENNISI, E., 2004 Genetics. A ruff theory of evolution: gene stutters drive dog shape. Science 306:
2172.
[104] PRAKASH, S., R. E. JOHNSON, and L. PRAKASH, 2005 Eukaryotic translesion synthesis DNApolymerases: specificity of structure and function. Annu Rev Biochem 74: 317-353.
[105] RAGHURAMAN, M. K., E. A. WINZELER, D. COLLINGWOOD, S. HUNT, L. WODICKA, A. CONWAY,D. J. LOCKHART, R. W. DAVIS, B. J. BREWER et al., 2001 Replication dynamics of the yeastgenome. Science 294: 115-121.
[106] RATTRAY, A. J., and J. N. STRATHERN, 2003 Error-prone DNA polymerases: when making amistake is the only way to get ahead. Annu Rev Genet 37: 31-66.
[107] ROSCHE, W. A., and P. L. FOSTER, 2000 Determining mutation rates in bacterial populations.Methods 20: 4-17.
[108] ROSENBERG, S. M., and P. J. HASTINGS, 2004 Adaptive point mutation and adaptive amplificationpathways in the Escherichia coli Lac system: stress responses producing genetic change. JBacteriol 186: 4838-4843.
[109] ROTH, J. R., and D. I. ANDERSSON, 2004 Adaptive mutation: how growth under selectionstimulates Lac(+) reversion by increasing target copy number. J Bacteriol 186: 4855-4860.
[110] RYAN, F. J., 1955 Spontaneous Mutation in Non-Dividing Bacteria. Genetics 40: 726-738.
[111] SANTOCANALE, C., and J. F. DIFFLEY, 1998 A Mec1- and Rad53-dependent checkpoint controlslate-firing origins of DNA replication. Nature 395: 615-618.
[112] SARKAR, S., W. T. MA, and G. H. SANDRI, 1992 On fluctuation analysis: a new, simple andefficient method for computing the expected number of mutants. Genetica 85: 173-179.
[113] SAUNDERS, N. J., A. C. JEFFRIES, J. F. PEDEN, D. W. HOOD, H. TETTELIN, R. RAPPUOLI, and E. R.MOXON, 2000 Repeat-associated phase variable genes in the complete genome sequence ofNeisseria meningitidis strain MC58. Mol Microbiol 37: 207-215.
[114] SCHATZ, D. G., 2004 V(D)J recombination. Immunol Rev 200: 5-11.
[115] SHAPIRO, J. A., 1984 Observations on the formation of clones containing araB-lacZ cistronfusions. Mol Gen Genet 194: 79-90.

154
[116] SHARP, P. M., and A. T. LLOYD, 1993 Regional base composition variation along yeastchromosome III: evolution of chromosome primary structure. Nucleic Acids Res 21: 179-183.
[117] SHAVER, A. C., P. G. DOMBROWSKI, J. Y. SWEENEY, T. TREIS, R. M. ZAPPALA, and P. D.SNIEGOWSKI, 2002 Fitness evolution and the rise of mutator alleles in experimental Escherichia
coli populations. Genetics 162: 557-566.
[118] SHIBATA, D., W. NAVIDI, R. SALOVAARA, Z. H. LI, and L. A. AALTONEN, 1996 Somaticmicrosatellite mutations as molecular tumor clocks. Nat Med 2: 676-681.
[119] SILVA, J. C., and A. S. KONDRASHOV, 2002 Patterns in spontaneous mutation revealed by human-baboon sequence comparison. Trends Genet 18: 544-547.
[120] SIMON, M., J. ZIEG, M. SILVERMAN, G. MANDEL, and R. DOOLITTLE, 1980 Phase variation:evolution of a controlling element. Science 209: 1370-1374.
[121] SNIEGOWSKI, P. D., P. J. GERRISH, T. JOHNSON, and A. SHAVER, 2000 The evolution of mutationrates: separating causes from consequences. Bioessays 22: 1057-1066.
[122] SNIEGOWSKI, P. D., P. J. GERRISH, and R. E. LENSKI, 1997 Evolution of high mutation rates inexperimental populations of E. coli. Nature 387: 703-705.
[123] STEELE, D. F., and S. JINKS-ROBERTSON, 1992 An examination of adaptive reversion inSaccharomyces cerevisiae. Genetics 132: 9-21.
[124] STEWART, F. M., 1991 Fluctuation analysis: the effect of plating efficiency. Genetica 84: 51-55.
[125] STEWART, F. M., 1994 Fluctuation tests: how reliable are the estimates of mutation rates? Genetics
137: 1139-1146.
[126] STEWART, F. M., D. M. GORDON, and B. R. LEVIN, 1990 Fluctuation analysis: the probabilitydistribution of the number of mutants under different conditions. Genetics 124: 175-185.
[127] STURTEVANT, A. H., 1937 Essays on evolution. I. On the effects of selection on mutation rate.Quarterly Review of Biology 12: 464-467.
[128] TADDEI, F., I. MATIC, B. GODELLE, and M. RADMAN, 1997 To be a mutator, or how pathogenicand commensal bacteria can evolve rapidly. Trends Microbiol 5: 427-428; discussion 428-429.
[129] TADDEI, F., M. RADMAN, J. MAYNARD-SMITH, B. TOUPANCE, P. H. GOUYON, and B. GODELLE,1997 Role of mutator alleles in adaptive evolution. Nature 387: 700-702.
[130] TAXIS, C., P. KELLER, Z. KAVAGIOU, L. J. JENSEN, J. COLOMBELLI, P. BORK, E. H. STELZER, andM. KNOP, 2005 Spore number control and breeding in Saccharomyces cerevisiae: a key role for aself-organizing system. J Cell Biol 171: 627-640.
[131] THOMPSON, D. A., M. M. DESAI, and A. W. MURRAY, 2006 Ploidy controls the success ofmutators and nature of mutations during budding yeast evolution. Curr Biol 16: 1581-1590.
[132] TISHKOFF, D. X., N. FILOSI, G. M. GAIDA, and R. D. KOLODNER, 1997 A novel mutationavoidance mechanism dependent on S. cerevisiae RAD27 is distinct from DNA mismatch repair.Cell 88: 253-263.
[133] VAN BELKUM, A., S. SCHERER, W. VAN LEEUWEN, D. WILLEMSE, L. VAN ALPHEN, and H.VERBRUGH, 1997 Variable number of tandem repeats in clinical strains of Haemophilus
influenzae. Infect Immun 65: 5017-5027.

155
[134] VERSTREPEN, K. J., A. JANSEN, F. LEWITTER, and G. R. FINK, 2005 Intragenic tandem repeatsgenerate functional variability. Nat Genet 37: 986-990.
[135] WALSH, T. R., 2006 Combinatorial genetic evolution of multiresistance. Curr Opin Microbiol 9:
476-482.
[136] WATERS, L. S., and G. C. WALKER, 2006 The critical mutagenic translesion DNA polymeraseRev1 is highly expressed during G(2)/M phase rather than S phase. Proc Natl Acad Sci U S A 103:
8971-8976.
[137] WIJKER, C. A., M. V. LAFLEUR, H. VAN STEEG, G. R. MOHN, and J. RETEL, 1996 Gamma-radiation-induced mutation spectrum in the episomal lacI gene of Escherichia coli under oxicconditions. Mutat Res 349: 229-239.
[138] WILKE, C. O., 2004 The speed of adaptation in large asexual populations. Genetics 167: 2045-2053.
[139] WINZELER, E. A., D. D. SHOEMAKER, A. ASTROMOFF, H. LIANG, K. ANDERSON, B. ANDRE, R.BANGHAM, R. BENITO, J. D. BOEKE et al., 1999 Functional characterization of the S. cerevisiae
genome by gene deletion and parallel analysis. Science 285: 901-906.
[140] YAMAMOTO, A., D. B. DEWALD, I. V. BORONENKOV, R. A. ANDERSON, S. D. EMR, and D.KOSHLAND, 1995 Novel PI(4)P 5-kinase homologue, Fab1p, essential for normal vacuole functionand morphology in yeast. Mol Biol Cell 6: 525-539.
[141] YAMASHITA, M., Y. HORI, T. SHINOMIYA, C. OBUSE, T. TSURIMOTO, H. YOSHIKAWA, and K.SHIRAHIGE, 1997 The efficiency and timing of initiation of replication of multiple replicons ofSaccharomyces cerevisiae chromosome VI. Genes Cells 2: 655-665.
[142] ZEYL, C., and J. A. DEVISSER, 2001 Estimates of the rate and distribution of fitness effects ofspontaneous mutation in Saccharomyces cerevisiae. Genetics 157: 53-61.
[143] ZHENG, Q., 2005 New algorithms for Luria-Delbrück fluctuation analysis. Math Biosci 196: 198-214.
![Production of tranilast [N-(3',4'-dimethoxycinnamoyl)-anthranilic acid] and its analogs in yeast Saccharomyces cerevisiae](https://img.dokumen.tips/doc/110x75/633bb983d09e12acb205a586/production-of-tranilast-n-34-dimethoxycinnamoyl-anthranilic-acid-and-its.jpg)


![[8] Cytochrome-c oxidase from Saccharomyces cerevisiae](https://img.dokumen.tips/doc/110x75/635b7a829d85dc43cb0777af/8-cytochrome-c-oxidase-from-saccharomyces-cerevisiae.jpg)

![Isolation of the CAR] Gene from Saccharomyces cerevisiae](https://img.dokumen.tips/doc/110x75/63393bdcf940ec0de8073352/isolation-of-the-car-gene-from-saccharomyces-cerevisiae-.jpg)


