Embed Size (px)
Citation preview
1
Configure IP SLA Monitor Objects
For Releases 16.1R2 and later.
You can monitor an IP address by configuring an IP SLA monitor object and then associating the object with the IP
address. The IP SLA monitor sends ICMP packets to verify whether the IP address is up or down. Each IP SLA monitor
object can monitor one IP address.
Configure an IP SLA Monitor Object
1. In Director view:
a. Select the Configuration tab in the top menu bar.
b. Select Devices > Devices in the horizontal menu bar.
c. Select an organization in the left menu bar.
d. Select a branch or Controller node in the main pane. The view changes to Appliance view.
2. Select the Configuration tab in the top menu bar.
3. Select Networking > IP SLA > Monitor in the left menu bar. The main pane displays the IP SLA monitor objects that are already configured.
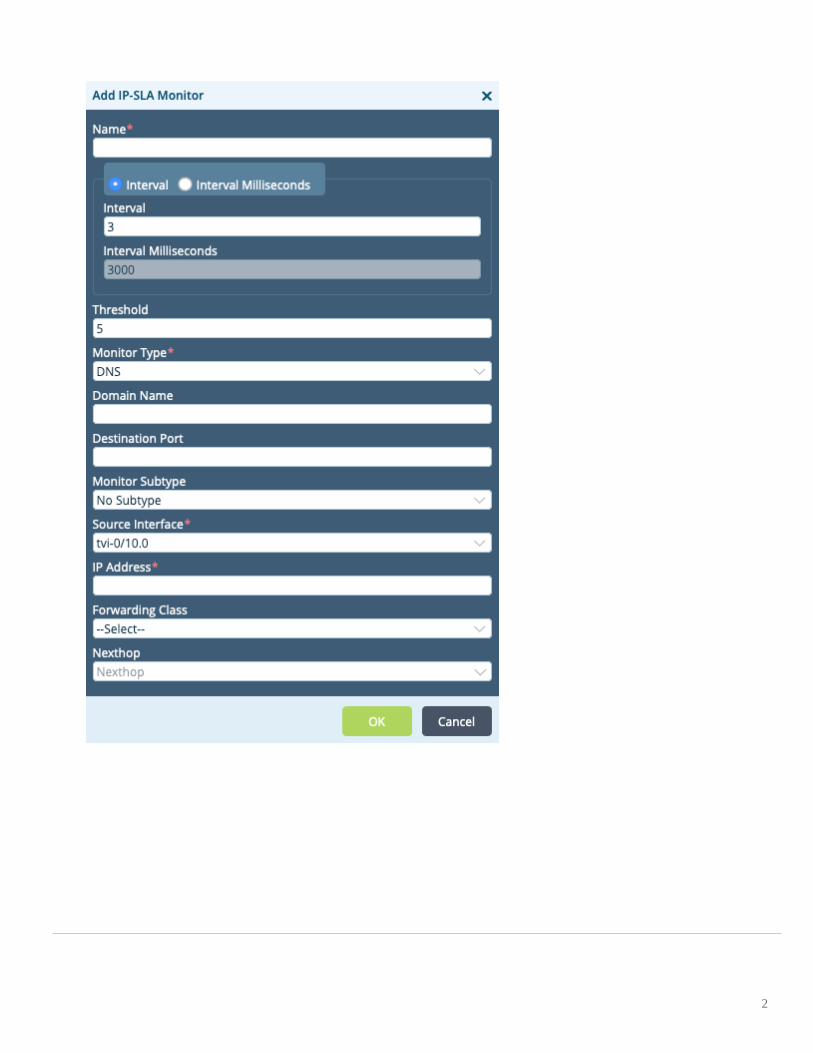
4. Click the Add icon. In the Add IP SLA Monitor popup window, enter information for the following fields.
2
3
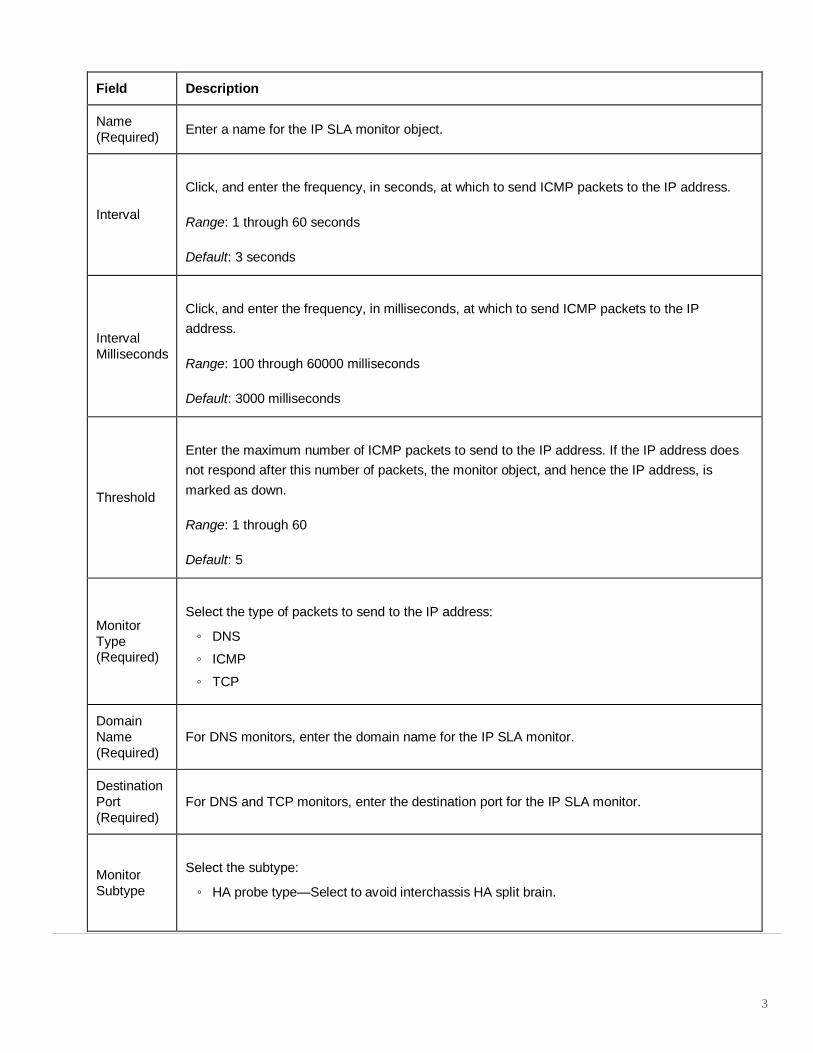
Field Description
Name
(Required)
Enter a name for the IP SLA monitor object.
Interval
Click, and enter the frequency, in seconds, at which to send ICMP packets to the IP address.
Range: 1 through 60 seconds
Default: 3 seconds
Interval
Milliseconds
Click, and enter the frequency, in milliseconds, at which to send ICMP packets to the IP
address.
Range: 100 through 60000 milliseconds
Default: 3000 milliseconds
Threshold
Enter the maximum number of ICMP packets to send to the IP address. If the IP address does
not respond after this number of packets, the monitor object, and hence the IP address, is
marked as down.
Range: 1 through 60
Default: 5
Monitor
Type (Required)
Select the type of packets to send to the IP address:
◦ DNS
◦ ICMP
◦ TCP
Domain
Name
(Required)
For DNS monitors, enter the domain name for the IP SLA monitor.
Destination
Port
(Required)
For DNS and TCP monitors, enter the destination port for the IP SLA monitor.
Monitor
Subtype
Select the subtype:
◦ HA probe type—Select to avoid interchassis HA split brain.
4
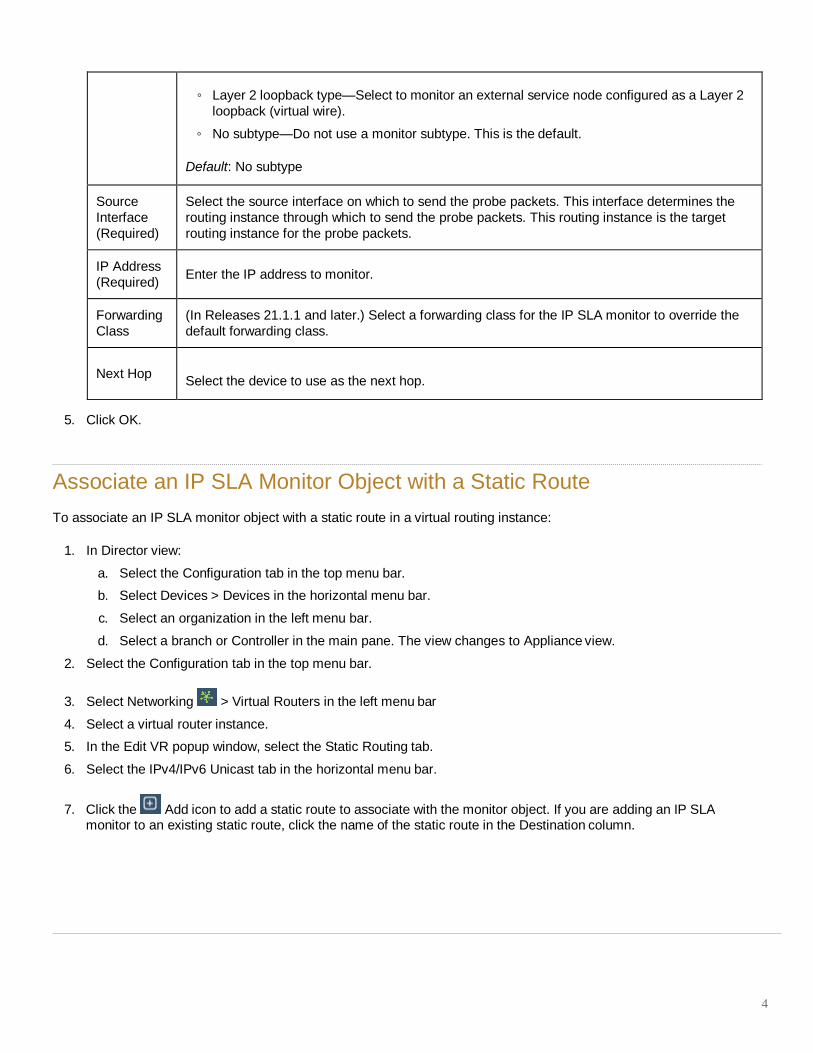
◦ Layer 2 loopback type—Select to monitor an external service node configured as a Layer 2
loopback (virtual wire).
◦ No subtype—Do not use a monitor subtype. This is the default.
Default: No subtype
Source
Interface
(Required)
Select the source interface on which to send the probe packets. This interface determines the
routing instance through which to send the probe packets. This routing instance is the target
routing instance for the probe packets.
IP Address
(Required)
Enter the IP address to monitor.
Forwarding
Class
(In Releases 21.1.1 and later.) Select a forwarding class for the IP SLA monitor to override the
default forwarding class.
Next Hop
Select the device to use as the next hop.
5. Click OK.
Associate an IP SLA Monitor Object with a Static Route
To associate an IP SLA monitor object with a static route in a virtual routing instance:
1. In Director view:
a. Select the Configuration tab in the top menu bar.
b. Select Devices > Devices in the horizontal menu bar.
c. Select an organization in the left menu bar.
d. Select a branch or Controller in the main pane. The view changes to Appliance view.
2. Select the Configuration tab in the top menu bar.
3. Select Networking > Virtual Routers in the left menu bar
4. Select a virtual router instance.
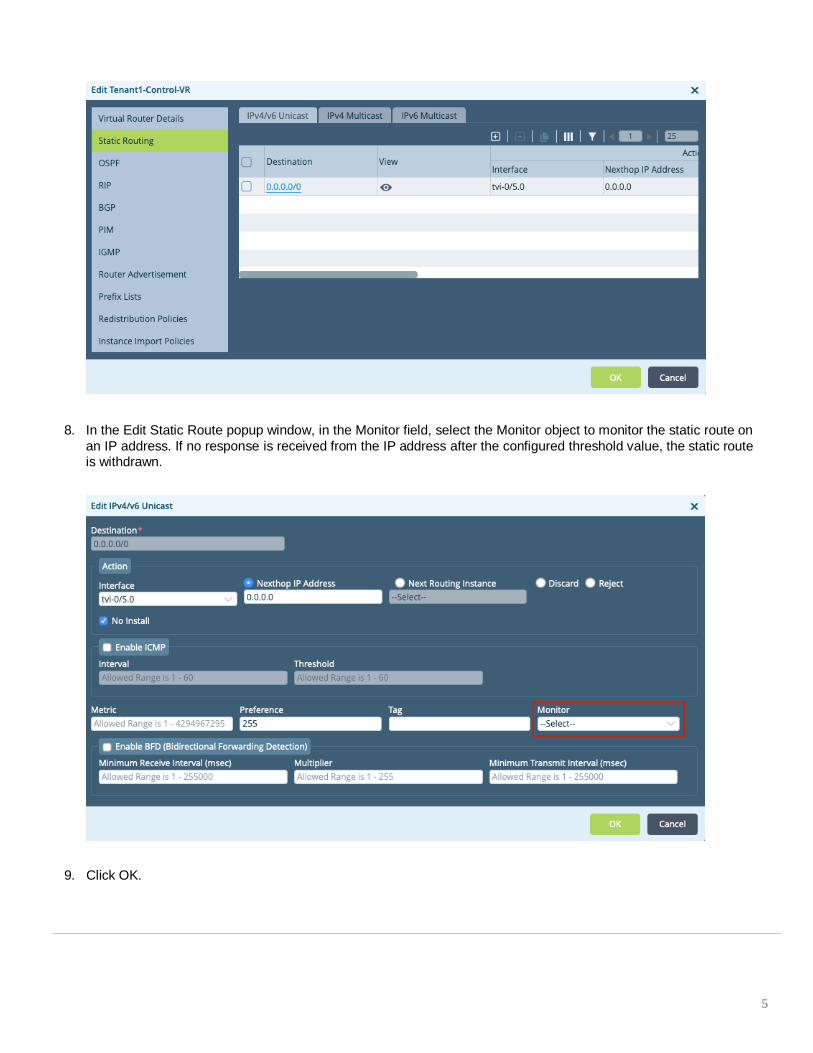
5. In the Edit VR popup window, select the Static Routing tab.
6. Select the IPv4/IPv6 Unicast tab in the horizontal menu bar.
7. Click the Add icon to add a static route to associate with the monitor object. If you are adding an IP SLA monitor to an existing static route, click the name of the static route in the Destination column.
5
8. In the Edit Static Route popup window, in the Monitor field, select the Monitor object to monitor the static route on
an IP address. If no response is received from the IP address after the configured threshold value, the static route is withdrawn.
9. Click OK.
6
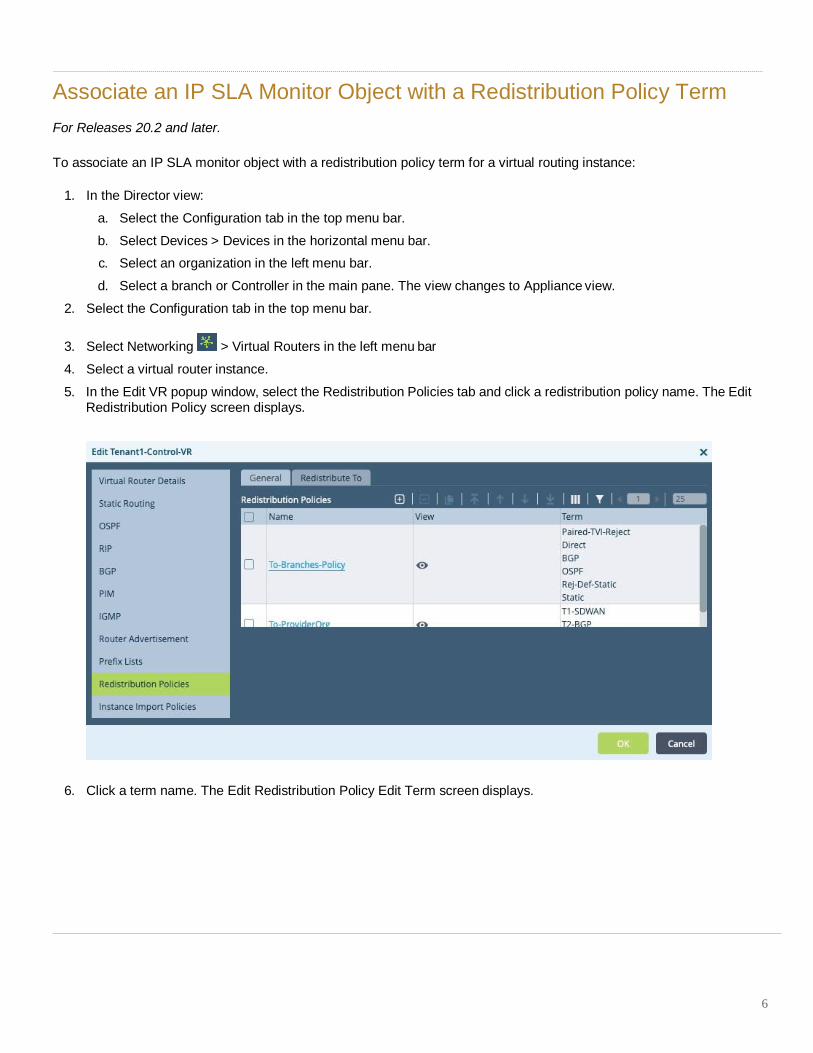
Associate an IP SLA Monitor Object with a Redistribution Policy Term
For Releases 20.2 and later.
To associate an IP SLA monitor object with a redistribution policy term for a virtual routing instance:
1. In the Director view:
a. Select the Configuration tab in the top menu bar.
b. Select Devices > Devices in the horizontal menu bar.
c. Select an organization in the left menu bar.
d. Select a branch or Controller in the main pane. The view changes to Appliance view.
2. Select the Configuration tab in the top menu bar.
3. Select Networking > Virtual Routers in the left menu bar
4. Select a virtual router instance.
5. In the Edit VR popup window, select the Redistribution Policies tab and click a redistribution policy name. The Edit Redistribution Policy screen displays.
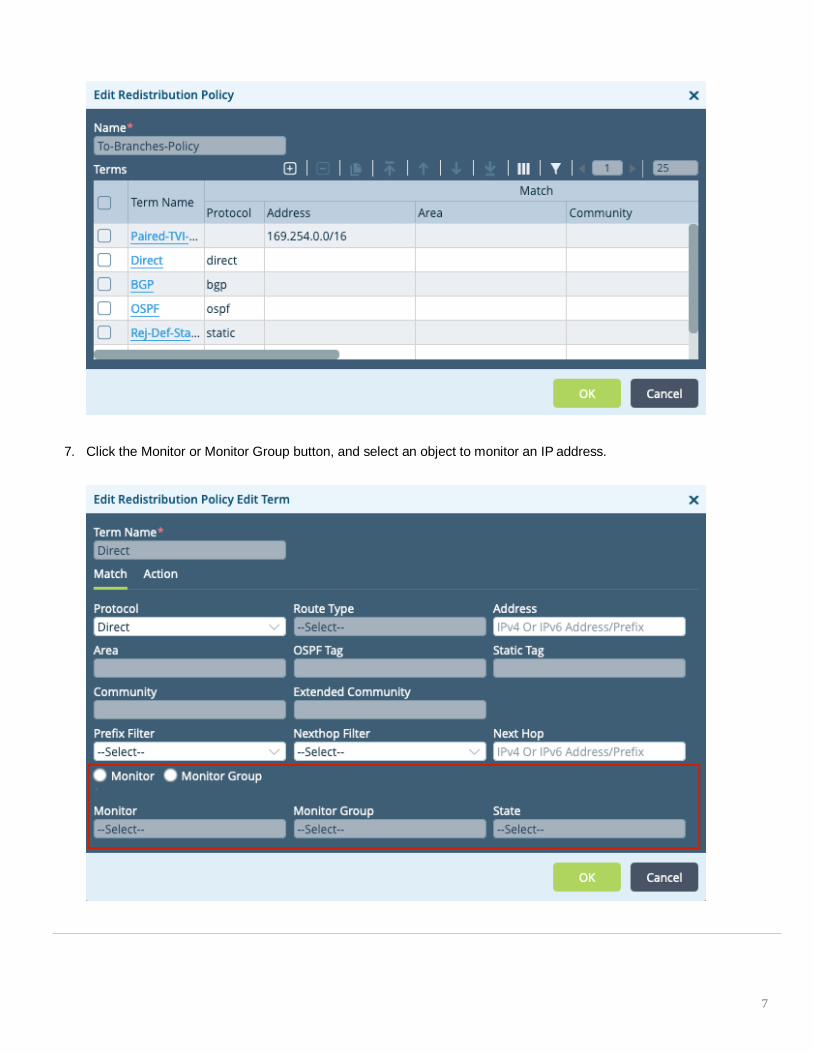
6. Click a term name. The Edit Redistribution Policy Edit Term screen displays.
7
7. Click the Monitor or Monitor Group button, and select an object to monitor an IP address.
8
8. Click OK.
Configure SLA Monitor Optimization
In Releases 21.2.1 and later.
This section discusses options you can configure to optimize the behavior of the SLA monitor on a SteelConnect EX OS and Controller device.
SLA Damping
SteelConnect EX OS and Controller devices perform SLA monitoring of various SD-WAN paths to check the health of
the paths. The SteelConnect EX OS and Controller device marks a path down if three back-to-back SLA protocol data
units (PDUs) are lost, and it marks the path back up when it again receives an SLA PDU response. As the path
changes state between up and down, known as a flap, many events are triggered, such as alarm generation and traffic-
steering evaluation. When there are frequent flaps because of lossy links, the large number of events can cause
unpredictable behavior. To avoid this issue, you can set SLA monitor options to damp the flaps.
By default, the number of flaps is counted every 60 seconds, which is the damping interval. If the number of flaps (the
flap threshold) exceeds 10 in this interval, the SteelConnect EX OS and Controller device stops noting path state
changes until the path remains stable for 300 seconds (the damp clear interval). You can change the flap threshold,
damp interval, and damp clear interval by editing SLA monitor options.
SLA Monitor Log Optimization
By default, SD-WAN SLA monitor logging is done every 5 minutes on every active path of a SteelConnect EX OS and
Controller device. In networks with thousands of devices configured in full-mesh, partial-mesh, or hub-and-spoke
topologies, a large number of logs is generated even when you configure adaptive monitoring. This large number of
logs can cause scaling and performance issues on Analytics nodes and can lead to a lag when you are viewing recent
log data. To avoid this situation, you can enable and configure SLA monitor log optimization.
You configure SLA monitor log optimization in the SLA monitor settings for a SteelConnect EX OS and Controller device.
You set a threshold for the average number of SLA monitor logs sent every 5 minutes from the SteelConnect EX OS and
Controller device and then enable log optimization. If the threshold is exceeded, the SteelConnect EX OS and Controller
device goes into log optimization mode. In this mode, for certain metrics, such as those that fluctuate very little over a
time period, the SteelConnect EX OS and Controller device aggregates the metrics in multiple logs into a single log, thus
reducing the number of logs sent. The SteelConnect EX OS and Controller device remains in log optimization mode for
60 minutes, and then the threshold is checked again. If the average number of logs is less than the threshold, the device
reverts to the default log mode. You cannot change the amount of time that the SteelConnect EX OS and Controller
device is in log optimization mode.
9
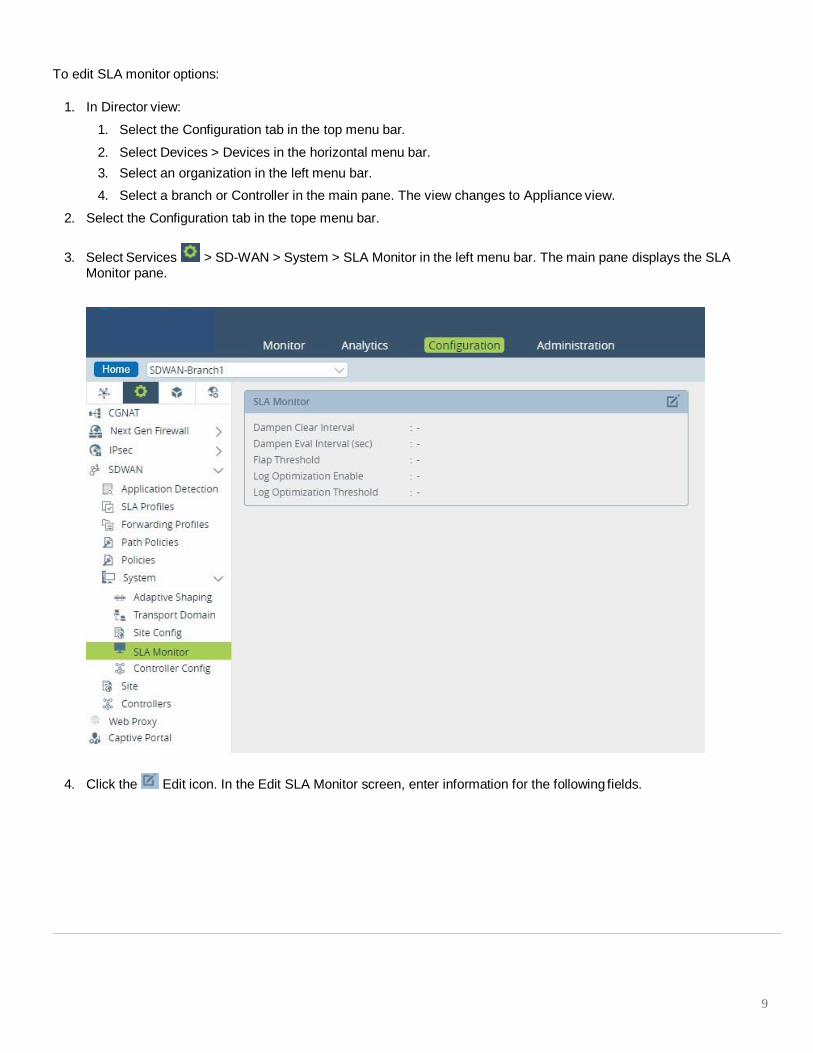
To edit SLA monitor options:
1. In Director view:
1. Select the Configuration tab in the top menu bar.
2. Select Devices > Devices in the horizontal menu bar.
3. Select an organization in the left menu bar.
4. Select a branch or Controller in the main pane. The view changes to Appliance view.
2. Select the Configuration tab in the tope menu bar.
3. Select Services > SD-WAN > System > SLA Monitor in the left menu bar. The main pane displays the SLA Monitor pane.
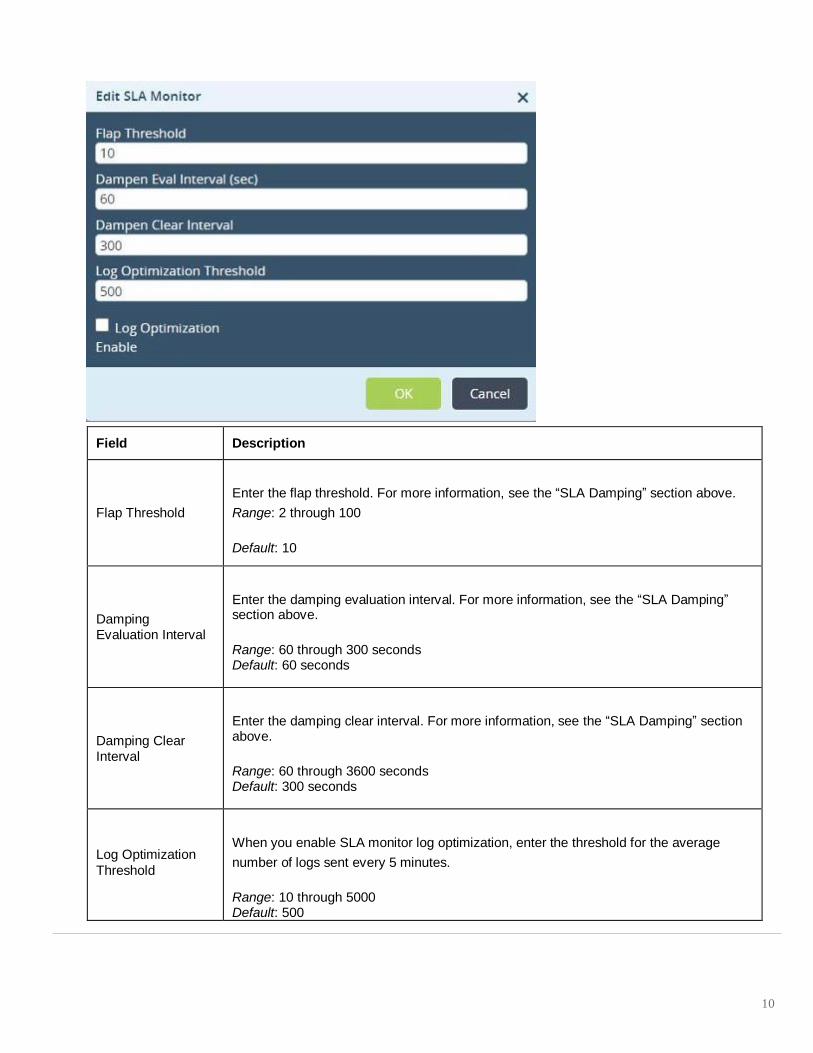
4. Click the Edit icon. In the Edit SLA Monitor screen, enter information for the following fields.
10
Field Description
Flap Threshold
Enter the flap threshold. For more information, see the “SLA Damping” section above.
Range: 2 through 100
Default: 10
Damping Evaluation Interval
Enter the damping evaluation interval. For more information, see the “SLA Damping” section above.
Range: 60 through 300 seconds Default: 60 seconds
Damping Clear Interval
Enter the damping clear interval. For more information, see the “SLA Damping” section above.
Range: 60 through 3600 seconds Default: 300 seconds
Log Optimization
Threshold
When you enable SLA monitor log optimization, enter the threshold for the average
number of logs sent every 5 minutes.
Range: 10 through 5000 Default: 500
11
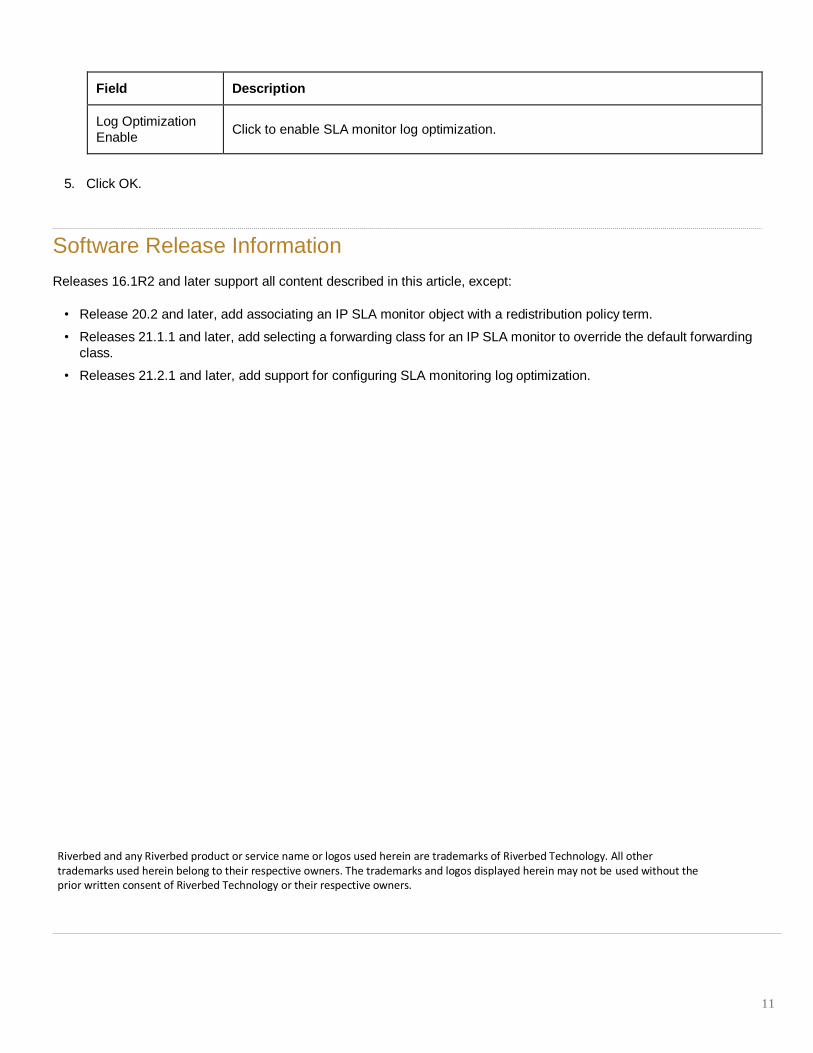
Field Description
Log Optimization
Enable
Click to enable SLA monitor log optimization.
5. Click OK.
Software Release Information
Releases 16.1R2 and later support all content described in this article, except:
• Release 20.2 and later, add associating an IP SLA monitor object with a redistribution policy term.
• Releases 21.1.1 and later, add selecting a forwarding class for an IP SLA monitor to override the default forwarding
class.
• Releases 21.2.1 and later, add support for configuring SLA monitoring log optimization.
Riverbed and any Riverbed product or service name or logos used herein are trademarks of Riverbed Technology. All other trademarks used herein belong to their respective owners. The trademarks and logos displayed herein may not be used without the prior written consent of Riverbed Technology or their respective owners.