Embed Size (px)
Citation preview
International RILEM Workshop on Repair Mortars for Historic Masonry Delft, The Netherlands, 26th - 28th January 2005
162
COMPRESSIVE AND FLEXURAL STRENGTH TESTING OF BRICK MASONRY PANELS CONSTRUCTED WITH TWO CONTRASTING TRADITIONALLY PRODUCED LIME MORTARS John J. Hughes1 and Adrian K. Taylor2 (1) Historic Masonry Group, University of Paisley, Scotland (2). Buro Happold, Pacific Quay, Glasgow, Scotland Abstract Brick masonry wall panels were constructed using two different mortar types made from two different limestones. The mortars comprised lime produced by a traditional batch kiln method, and were moderately hydraulic and dolomitic-hydraulic in composition. The mortars were prepared as hot-lime mixes, using a traditional hot-mix (or “dry-slaking”) method. Masonry specimens were tested to establish the compressive and flexural strengths of brick masonry made from each mortar type. Difficulties were experienced with late hydration of quicklime within the mortars and with variations in workmanship. This paper presents the results of testing, discusses the test procedures and compares the test data with strength predictions of BS 5628. 1. Introduction Lime mortars declined in popularity during most of the 20th Century, but their use has revived in the last decade or so. Masonry codes no longer present any strength data for masonry built using lime mortars, and from this distance the provenance and applicability of data presented in the superseded Code of Practice CP101, is unclear. The testing described in this paper is the first phase of testing conducted to establish strength data for masonry using lime mortar. This research is intended to help restore designer confidence in this traditional material, which in many applications can be more sympathetic to the surrounding masonry than a dense mortar mix made using Portland Cement.
International RILEM Workshop on Repair Mortars for Historic Masonry Delft, The Netherlands, 26th - 28th January 2005
163
2. Materials The masonry panels were constructed using Hanson London Brick, which has a high water absorption and a relatively low strength (Manufacturers information; class MN, 25-35N/mm2, 20-24% water absorption). The mortar used was manufactured using fresh lump quicklime produced in a small scale traditional-based batch process lime kiln. The details of lime burning to produce fresh lime binder are presented by the authors elsewhere [1]. The quicklime was produced from two different limestone sources: the Blue Lias (BL) limestone from Somerset, SW England, and the Charlestown (CH) Limestone from Fife, Scotland. The former (BL) produces a moderately hydraulic material that has a long history of production and the latter (CH) is a dolomitic-hydraulic lime, that was produced historically in large quantities and is found in many historic buildings in Scotland and further afield [2]. Table 1 presents compositional data for the two limestones. The aggregate used was Clodach building sand, from Elgin in Moray, Scotland, which was dried before use. The grain size distribution for the aggregate used is presented in Figure 1. Table 1: Compositional analyses of samples of the two limestone types burnt to produce quicklime for mortar production. Percentage element oxide values.
Blue Lias (BL) Charlestown (CH) Si02 4.20 7.85
Al2O3 1.39 0.34 Fe2O3 0.66 4.93 CaO 50.79 39.03 MgO 0.84 17.8
SO3 0.74 0.03 K2O 0.44 0.02
Na2O 0.07 0.03 Cl 0.008 0.016
Soluble silica 0.25 N/a LOI 40.7 41.28
Insolubles 3.51 5.31 3. Methods 3.1 Manufacture and proportioning of hot lime mortars The mortars were made using a “hot” mixing (or dry slaking) method. Materials were proportioned by weight. Most contemporary mortars are proportioned using lime in dry
International RILEM Workshop on Repair Mortars for Historic Masonry Delft, The Netherlands, 26th - 28th January 2005
164
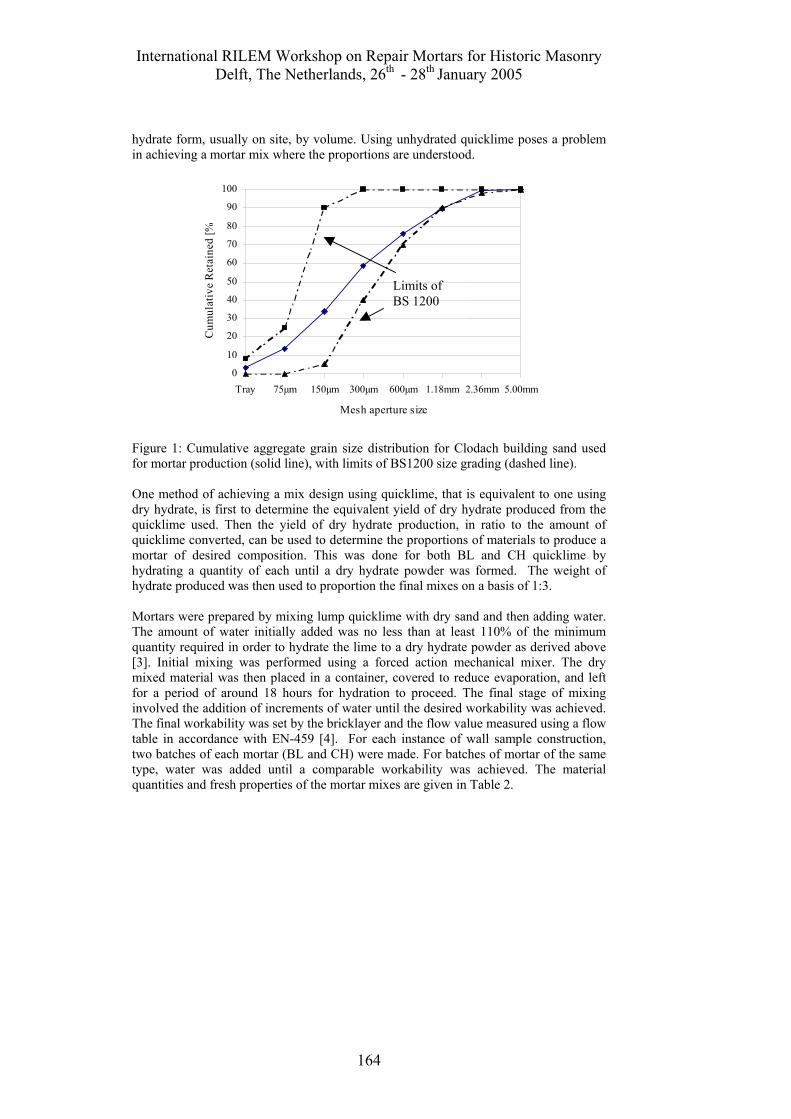
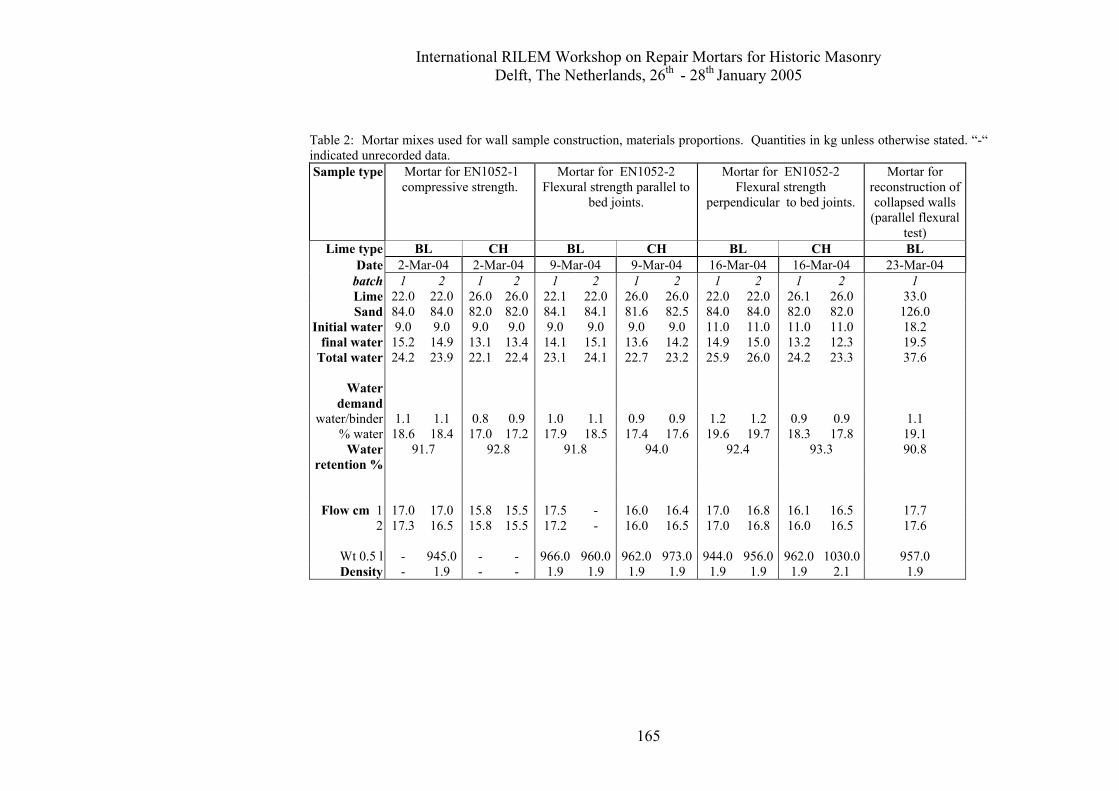
hydrate form, usually on site, by volume. Using unhydrated quicklime poses a problem in achieving a mortar mix where the proportions are understood. Figure 1: Cumulative aggregate grain size distribution for Clodach building sand used for mortar production (solid line), with limits of BS1200 size grading (dashed line). One method of achieving a mix design using quicklime, that is equivalent to one using dry hydrate, is first to determine the equivalent yield of dry hydrate produced from the quicklime used. Then the yield of dry hydrate production, in ratio to the amount of quicklime converted, can be used to determine the proportions of materials to produce a mortar of desired composition. This was done for both BL and CH quicklime by hydrating a quantity of each until a dry hydrate powder was formed. The weight of hydrate produced was then used to proportion the final mixes on a basis of 1:3. Mortars were prepared by mixing lump quicklime with dry sand and then adding water. The amount of water initially added was no less than at least 110% of the minimum quantity required in order to hydrate the lime to a dry hydrate powder as derived above [3]. Initial mixing was performed using a forced action mechanical mixer. The dry mixed material was then placed in a container, covered to reduce evaporation, and left for a period of around 18 hours for hydration to proceed. The final stage of mixing involved the addition of increments of water until the desired workability was achieved. The final workability was set by the bricklayer and the flow value measured using a flow table in accordance with EN-459 [4]. For each instance of wall sample construction, two batches of each mortar (BL and CH) were made. For batches of mortar of the same type, water was added until a comparable workability was achieved. The material quantities and fresh properties of the mortar mixes are given in Table 2.
0
10
20
30
40
50
60
70
80
90
100
Tray 75µm 150µm 300µm 600µm 1.18mm 2.36mm 5.00mm
Mesh aperture size
Cum
ulat
ive
Ret
aine
d [%
Limits of BS 1200
International RILEM Workshop on Repair Mortars for Historic Masonry Delft, The Netherlands, 26th - 28th January 2005
165
Table 2: Mortar mixes used for wall sample construction, materials proportions. Quantities in kg unless otherwise stated. “-“ indicated unrecorded data. Sample type Mortar for EN1052-1
compressive strength. Mortar for EN1052-2
Flexural strength parallel to bed joints.
Mortar for EN1052-2 Flexural strength
perpendicular to bed joints.
Mortar for reconstruction of collapsed walls
(parallel flexural test)
Lime type BL CH BL CH BL CH BL Date 2-Mar-04 2-Mar-04 9-Mar-04 9-Mar-04 16-Mar-04 16-Mar-04 23-Mar-04
batch 1 2 1 2 1 2 1 2 1 2 1 2 1 Lime 22.0 22.0 26.0 26.0 22.1 22.0 26.0 26.0 22.0 22.0 26.1 26.0 33.0 Sand 84.0 84.0 82.0 82.0 84.1 84.1 81.6 82.5 84.0 84.0 82.0 82.0 126.0
Initial water 9.0 9.0 9.0 9.0 9.0 9.0 9.0 9.0 11.0 11.0 11.0 11.0 18.2 final water 15.2 14.9 13.1 13.4 14.1 15.1 13.6 14.2 14.9 15.0 13.2 12.3 19.5
Total water 24.2 23.9 22.1 22.4 23.1 24.1 22.7 23.2 25.9 26.0 24.2 23.3 37.6
Water demand
water/binder 1.1 1.1 0.8 0.9 1.0 1.1 0.9 0.9 1.2 1.2 0.9 0.9 1.1 % water 18.6 18.4 17.0 17.2 17.9 18.5 17.4 17.6 19.6 19.7 18.3 17.8 19.1
Water retention %
91.7 92.8 91.8 94.0 92.4 93.3 90.8
Flow cm 1 17.0 17.0 15.8 15.5 17.5 - 16.0 16.4 17.0 16.8 16.1 16.5 17.7 2 17.3 16.5 15.8 15.5 17.2 - 16.0 16.5 17.0 16.8 16.0 16.5 17.6
Wt 0.5 l - 945.0 - - 966.0 960.0 962.0 973.0 944.0 956.0 962.0 1030.0 957.0 Density - 1.9 - - 1.9 1.9 1.9 1.9 1.9 1.9 1.9 2.1 1.9
International RILEM Workshop on Repair Mortars for Historic Masonry Delft, The Netherlands, 26th - 28th January 2005
166
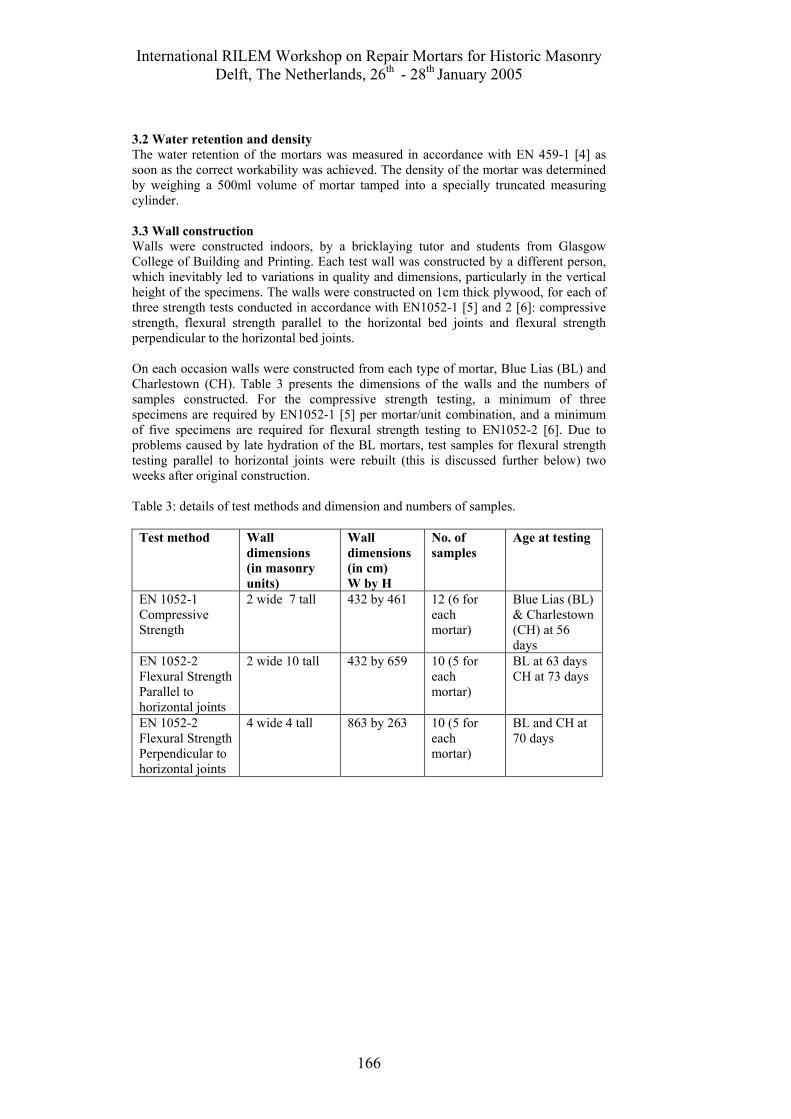
3.2 Water retention and density The water retention of the mortars was measured in accordance with EN 459-1 [4] as soon as the correct workability was achieved. The density of the mortar was determined by weighing a 500ml volume of mortar tamped into a specially truncated measuring cylinder. 3.3 Wall construction Walls were constructed indoors, by a bricklaying tutor and students from Glasgow College of Building and Printing. Each test wall was constructed by a different person, which inevitably led to variations in quality and dimensions, particularly in the vertical height of the specimens. The walls were constructed on 1cm thick plywood, for each of three strength tests conducted in accordance with EN1052-1 [5] and 2 [6]: compressive strength, flexural strength parallel to the horizontal bed joints and flexural strength perpendicular to the horizontal bed joints. On each occasion walls were constructed from each type of mortar, Blue Lias (BL) and Charlestown (CH). Table 3 presents the dimensions of the walls and the numbers of samples constructed. For the compressive strength testing, a minimum of three specimens are required by EN1052-1 [5] per mortar/unit combination, and a minimum of five specimens are required for flexural strength testing to EN1052-2 [6]. Due to problems caused by late hydration of the BL mortars, test samples for flexural strength testing parallel to horizontal joints were rebuilt (this is discussed further below) two weeks after original construction. Table 3: details of test methods and dimension and numbers of samples.
Test method Wall dimensions (in masonry units)
Wall dimensions (in cm) W by H
No. of samples
Age at testing
EN 1052-1 Compressive Strength
2 wide 7 tall
432 by 461 12 (6 for each mortar)
Blue Lias (BL) & Charlestown (CH) at 56 days
EN 1052-2 Flexural Strength Parallel to horizontal joints
2 wide 10 tall
432 by 659 10 (5 for each mortar)
BL at 63 days CH at 73 days
EN 1052-2 Flexural Strength Perpendicular to horizontal joints
4 wide 4 tall
863 by 263 10 (5 for each mortar)
BL and CH at 70 days
International RILEM Workshop on Repair Mortars for Historic Masonry Delft, The Netherlands, 26th - 28th January 2005
167
3.4 Curing After construction, the walls were covered with wet hessian and polythene. The hessian was kept wet for one week, and thereafter the floor around the specimens was soaked once per day for a further week. The hessian’s contact with the wet floor was sufficient to maintain conditions of high humidity around the samples through capillary suction in the hessian. After two weeks the plastic and hessian were removed. The ambient laboratory conditions were15oC ± 3o and 45 ± 10% RH. Under the hessian and plastic the conditions of curing were recorded as 15oC ± 3o and 90 ± 5% RH. After construction the samples for flexural strength testing were pre-loaded with two courses of brick, laid dry, to help ensure a compact wall mass. 3.4 Mortar prism manufacture and testing Mortar test prisms of 40 x 40 x 160mm were cast at the time of construction of the walls. These were cured under wet hessian and plastic in the same manner as the walls and were demoulded after 6 days. The mortar prisms were later tested for compressive and flexural strengths, in accordance with EN1015-11 [7], at 28 days and at the time of testing of the walls (56 to 70 days, as in table 3). 3.5 Compressive strength testing Compressive strength testing of the masonry panels was performed at 56 days, the method used based closely on that given in EN 1052-1, using an 2000 kN ESH universal testing apparatus, under displacement control, at a rate of 1.3 mm/minute, measured in the vertical by the testing apparatus. Maximum load was achieved at between 10 and 15 minutes and a complete test was performed in around 20 minutes. 3.6 Method for flexural strength testing The flexural strength testing of the walls was achieved by performing four-point bending tests, in accordance with EN 1052-2, by applying load horizontally onto the walls by a hydraulic jack controlled by an Instron Universal Test apparatus operated under displacement control, at 1mm/minute. The displacement of the jack during testing was recorded using an LVDT attached to the jack, and load by a load cell placed behind the jack. Full details of the test regime and the experimental set up are not presented here due to lack of space. 4. Results 4.1 Effects of delayed or late hydration of hot-lime mortars After construction and prism manufacture there appeared to be continuing late hydration and expansion of the hot-lime mortars. In an extreme case the entire set of wall specimens for parallel flexure constructed using Blue Lias lime suffered mortar expansion, bending of the specimens and eventual collapse. Many prism specimens also suffered from lime-inclusion expansion and destruction. This was more severe for mortars prepared using the Blue Lias lime than the Charlestown lime. (It is important here to state clearly that the material we used differs greatly from that recently produced
International RILEM Workshop on Repair Mortars for Historic Masonry Delft, The Netherlands, 26th - 28th January 2005
168
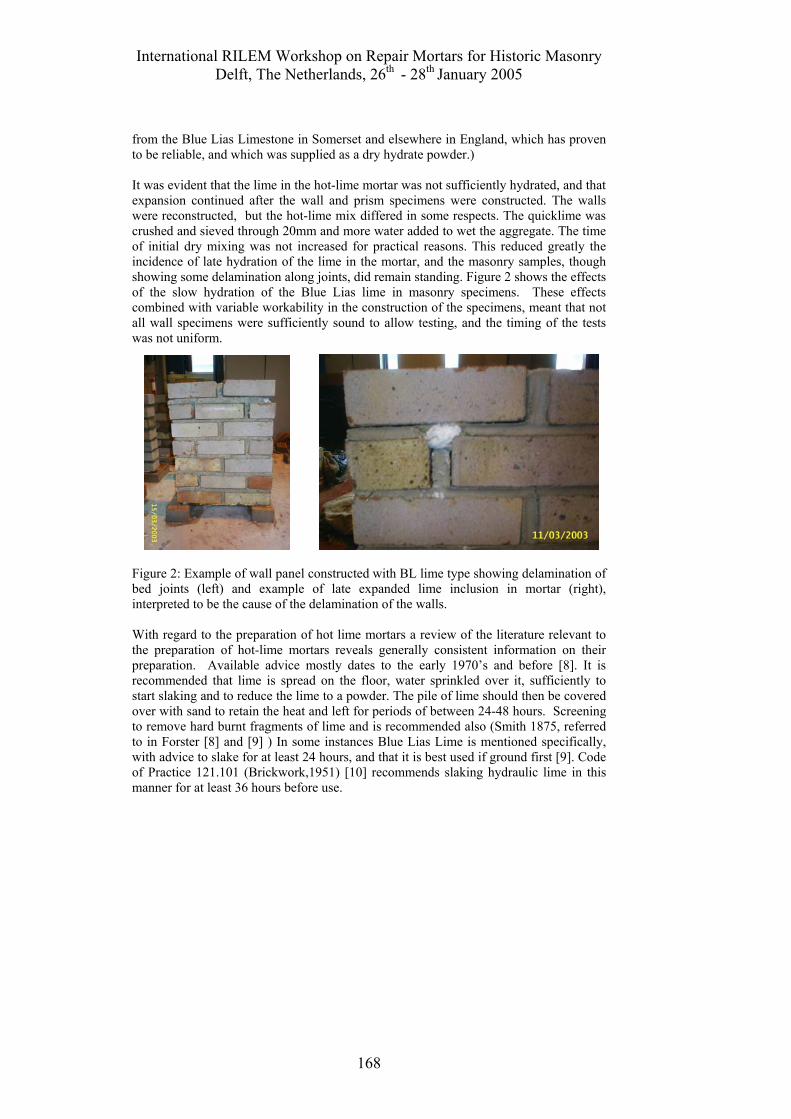
from the Blue Lias Limestone in Somerset and elsewhere in England, which has proven to be reliable, and which was supplied as a dry hydrate powder.) It was evident that the lime in the hot-lime mortar was not sufficiently hydrated, and that expansion continued after the wall and prism specimens were constructed. The walls were reconstructed, but the hot-lime mix differed in some respects. The quicklime was crushed and sieved through 20mm and more water added to wet the aggregate. The time of initial dry mixing was not increased for practical reasons. This reduced greatly the incidence of late hydration of the lime in the mortar, and the masonry samples, though showing some delamination along joints, did remain standing. Figure 2 shows the effects of the slow hydration of the Blue Lias lime in masonry specimens. These effects combined with variable workability in the construction of the specimens, meant that not all wall specimens were sufficiently sound to allow testing, and the timing of the tests was not uniform.
Figure 2: Example of wall panel constructed with BL lime type showing delamination of bed joints (left) and example of late expanded lime inclusion in mortar (right), interpreted to be the cause of the delamination of the walls. With regard to the preparation of hot lime mortars a review of the literature relevant to the preparation of hot-lime mortars reveals generally consistent information on their preparation. Available advice mostly dates to the early 1970’s and before [8]. It is recommended that lime is spread on the floor, water sprinkled over it, sufficiently to start slaking and to reduce the lime to a powder. The pile of lime should then be covered over with sand to retain the heat and left for periods of between 24-48 hours. Screening to remove hard burnt fragments of lime and is recommended also (Smith 1875, referred to in Forster [8] and [9] ) In some instances Blue Lias Lime is mentioned specifically, with advice to slake for at least 24 hours, and that it is best used if ground first [9]. Code of Practice 121.101 (Brickwork,1951) [10] recommends slaking hydraulic lime in this manner for at least 36 hours before use.
International RILEM Workshop on Repair Mortars for Historic Masonry Delft, The Netherlands, 26th - 28th January 2005
169
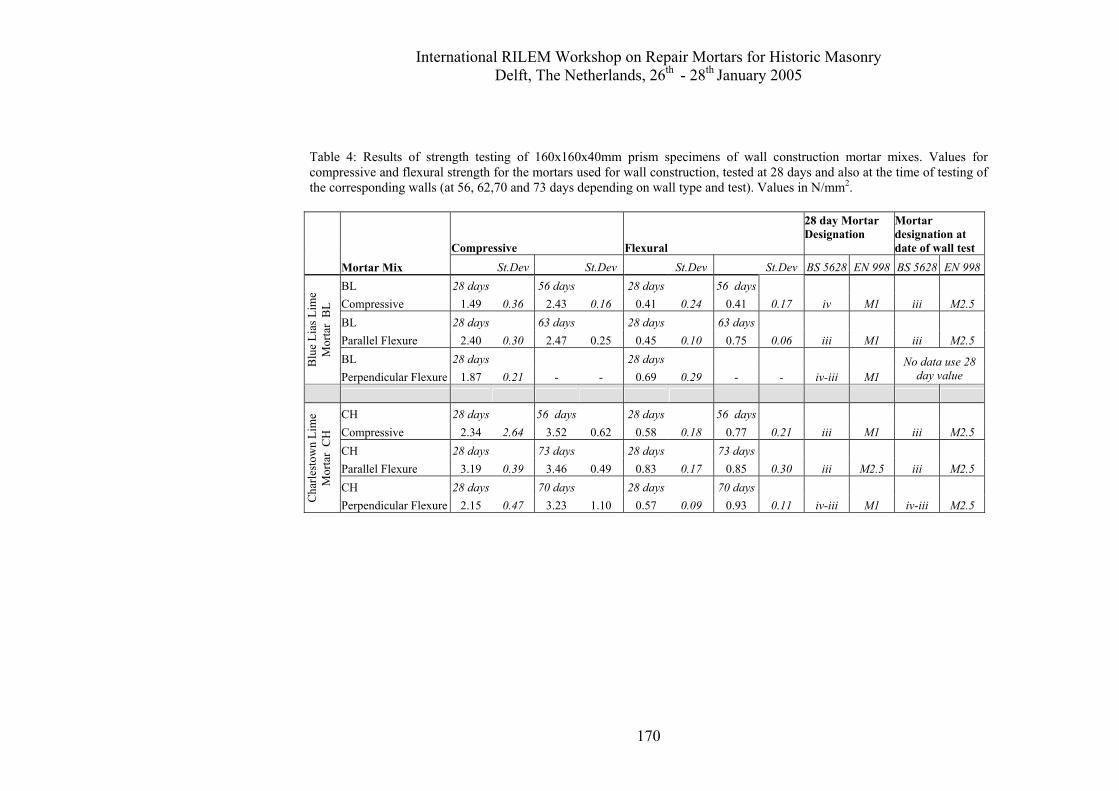
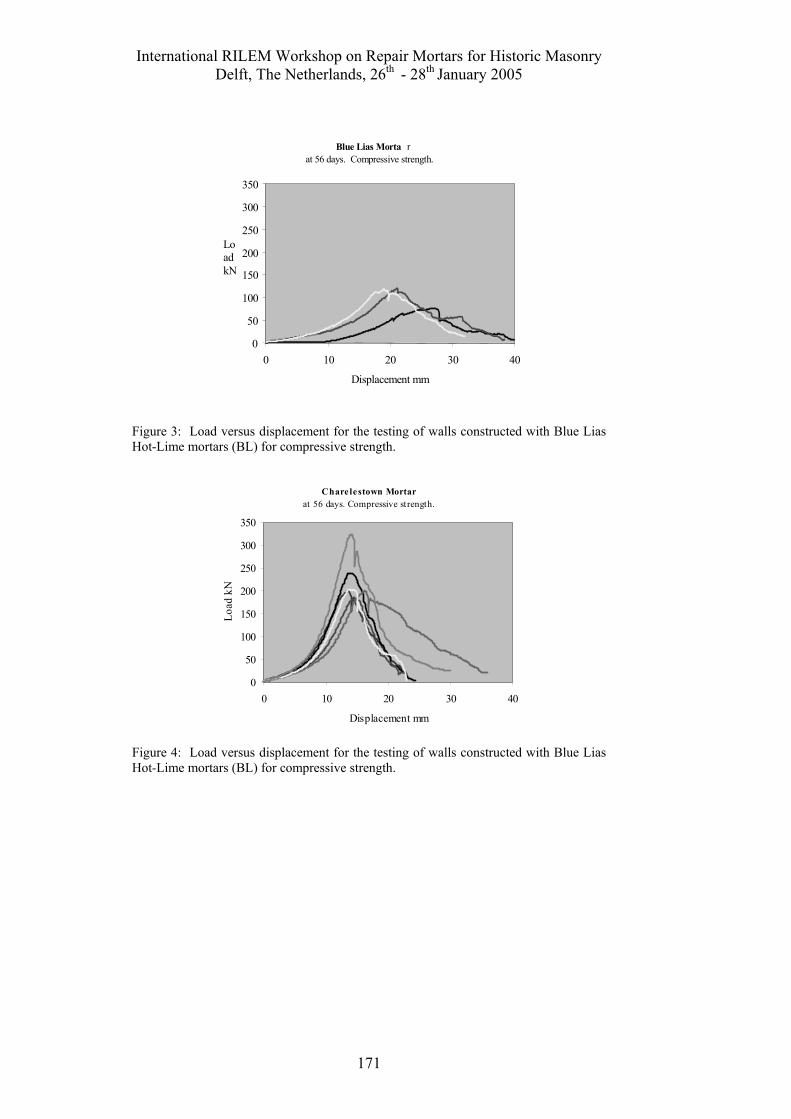
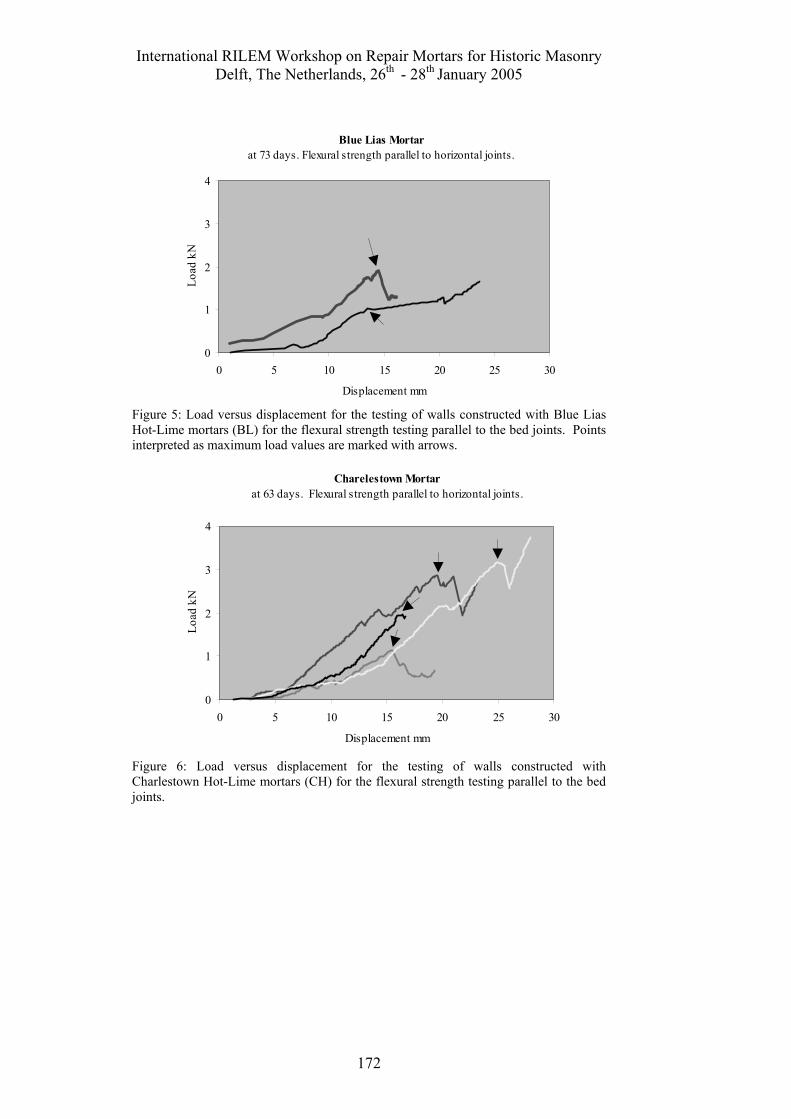
4.2 Mortar Prism samples The mortar prisms were tested at 28 days and also at dates between 56 and 73 days (see Table 4). The missing data for BL perpendicular flexure test mortars is due to the degradation of the samples through the late expansion of unhydrated lime inclusions. The results show general increases in both compressive and flexural strength with age. For BL mortars the results indicate a strength range at 28 days of between 1.5 and 2.4 N/mm2. This equates to a mortar fitting the designation somewhere between a class (iv) and a class (iii) of BS5628 [11], and an M1 to M2.5 of BS EN 998-2 [12]. For CH mortars the compressive strength ranges between 2.1 and 3.2 N/mm2. This equates to a mortar fitting class (iii - iv) of BS 5628, and M2.5 of BS EN 998-2. At the time of testing of the walls the designations had not changed significantly and a class (iv) mortar was assumed for calculating masonry strength for comparisons with measured strengths below. 4.3 Strength testing of wall panels 4.3.1 Compressive strength testing of wall panels. Figures 3 & 4 show the load versus displacement graphs for the compressive strength testing of the wall panels. Due to the difficulties with expansive mortar explained above, only three samples of walls with the BL mortar could be tested. However, this does still satisfy the requirements of the method in EN 1052-1. Table 4 summarises the results of the compressive and flexural strength testing of the wall panels. The walls constructed with the Charlestown (CH) Lime mortar failed at higher loads than the walls constructed using the Blue Lias (BL) Lime Mortar. This is corroborated by the results of the mechanical testing of the mortar prisms (Table 4) which also show higher values of maximum load for the CH mortars. 4.3.2 Flexural strength testing of wall panels parallel to horizontal joints. Figures 5 & 6 below, show the load versus displacement graphs for the testing of wall panels for flexural strength parallel to horizontal bed joints. For BL mortar two samples were available and for CH mortar five samples were available. The results show some variability and also are difficult to interpret individually. During the tests the pattern of cracking was not followed, so the exact moment of first failure was not noted directly. It has been interpreted from the first significant deflection of the load versus displacement graph (points marked with an arrow). These points are used to derive the value of maximum load that is used to calculate the flexural strength of the masonry. The individual values of maximum load for each test and the calculated values of strength are given in Table 5. However the values derived in this test for the walls with BL mortar are considered unsound, especially for the longer displacement curve. The forces recorded the latter part of this graph are interpreted to represent that needed to continue to support the fragments of wall as they rotate around their points of flexural failure.
International RILEM Workshop on Repair Mortars for Historic Masonry Delft, The Netherlands, 26th - 28th January 2005
170
Table 4: Results of strength testing of 160x160x40mm prism specimens of wall construction mortar mixes. Values for compressive and flexural strength for the mortars used for wall construction, tested at 28 days and also at the time of testing of the corresponding walls (at 56, 62,70 and 73 days depending on wall type and test). Values in N/mm2.
Compressive Flexural
28 day Mortar Designation
Mortar designation at date of wall test
Mortar Mix St.Dev St.Dev St.Dev St.Dev BS 5628 EN 998 BS 5628 EN 998BL 28 days 56 days 28 days 56 days Compressive 1.49 0.36 2.43 0.16 0.41 0.24 0.41 0.17 iv M1 iii M2.5 BL 28 days 63 days 28 days 63 days Parallel Flexure 2.40 0.30 2.47 0.25 0.45 0.10 0.75 0.06 iii M1 iii M2.5 BL 28 days 28 days B
lue
Lias
Lim
e M
orta
r B
L
Perpendicular Flexure 1.87 0.21 - - 0.69 0.29 - - iv-iii M1 No data use 28
day value
CH 28 days 56 days 28 days 56 days Compressive 2.34 2.64 3.52 0.62 0.58 0.18 0.77 0.21 iii M1 iii M2.5 CH 28 days 73 days 28 days 73 days Parallel Flexure 3.19 0.39 3.46 0.49 0.83 0.17 0.85 0.30 iii M2.5 iii M2.5 CH 28 days 70 days 28 days 70 days
Cha
rlest
own
Lim
e M
orta
r C
H
Perpendicular Flexure 2.15 0.47 3.23 1.10 0.57 0.09 0.93 0.11 iv-iii M1 iv-iii M2.5
International RILEM Workshop on Repair Mortars for Historic Masonry Delft, The Netherlands, 26th - 28th January 2005
171
Figure 3: Load versus displacement for the testing of walls constructed with Blue Lias Hot-Lime mortars (BL) for compressive strength. Figure 4: Load versus displacement for the testing of walls constructed with Blue Lias Hot-Lime mortars (BL) for compressive strength.
Charelestown Mortarat 56 days. Compressive strength.
0
50
100
150
200
250
300
350
0 10 20 30 40
Displacement mm
Load
kN
Blue Lias Morta rat 56 days. Compressive strength.
0 50
100 150 200 250 300 350
0 10 20 30 40
Displacement mm
Load kN
International RILEM Workshop on Repair Mortars for Historic Masonry Delft, The Netherlands, 26th - 28th January 2005
172
Figure 5: Load versus displacement for the testing of walls constructed with Blue Lias Hot-Lime mortars (BL) for the flexural strength testing parallel to the bed joints. Points interpreted as maximum load values are marked with arrows. Figure 6: Load versus displacement for the testing of walls constructed with Charlestown Hot-Lime mortars (CH) for the flexural strength testing parallel to the bed joints.
Charelestown Mortarat 63 days. Flexural strength parallel to horizontal joints.
0
1
2
3
4
0 5 10 15 20 25 30
Displacement mm
Load
kN
Blue Lias Mortarat 73 days. Flexural strength parallel to horizontal joints.
0
1
2
3
4
0 5 10 15 20 25 30
Displacement mm
Load
kN
International RILEM Workshop on Repair Mortars for Historic Masonry Delft, The Netherlands, 26th - 28th January 2005
173
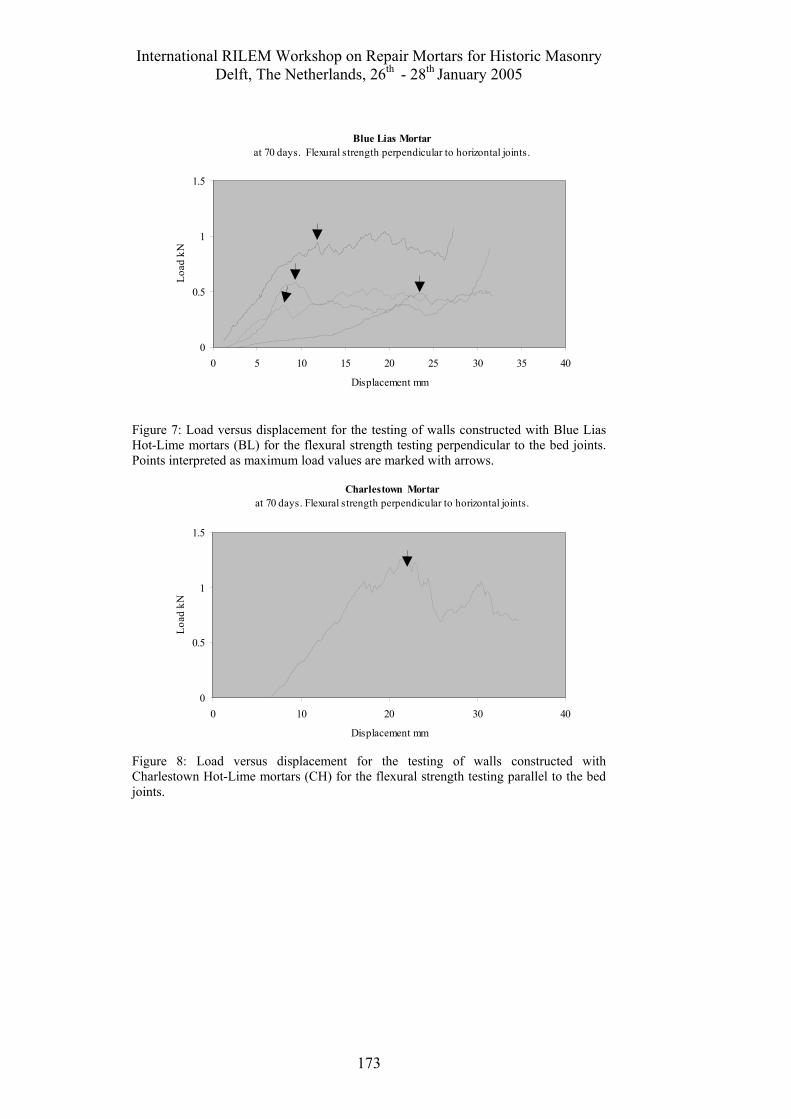
Figure 7: Load versus displacement for the testing of walls constructed with Blue Lias Hot-Lime mortars (BL) for the flexural strength testing perpendicular to the bed joints. Points interpreted as maximum load values are marked with arrows. Figure 8: Load versus displacement for the testing of walls constructed with Charlestown Hot-Lime mortars (CH) for the flexural strength testing parallel to the bed joints.
Blue Lias Mortarat 70 days. Flexural strength perpendicular to horizontal joints.
0
0.5
1
1.5
0 5 10 15 20 25 30 35 40
Displacement mm
Load
kN
Charlestown Mortarat 70 days. Flexural strength perpendicular to horizontal joints.
0
0.5
1
1.5
0 10 20 30 40
Displacement mm
Load
kN
International RILEM Workshop on Repair Mortars for Historic Masonry Delft, The Netherlands, 26th - 28th January 2005
174
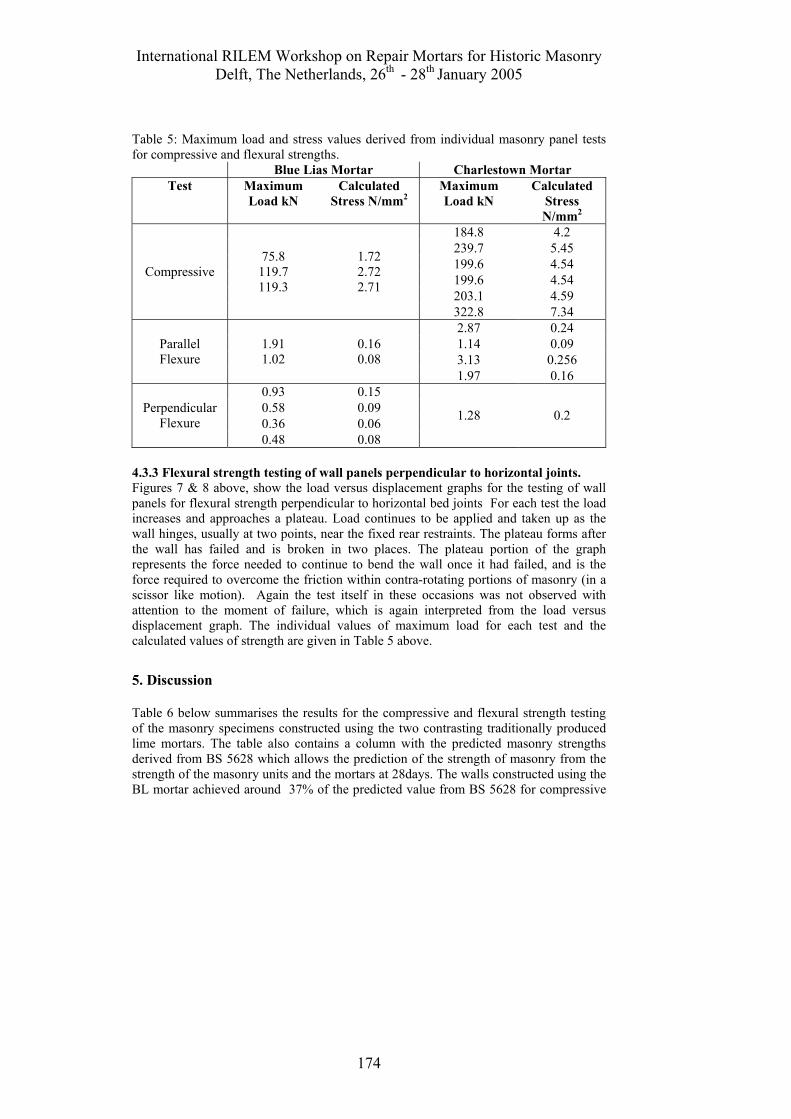
Table 5: Maximum load and stress values derived from individual masonry panel tests for compressive and flexural strengths.
Blue Lias Mortar Charlestown Mortar Test Maximum
Load kN Calculated
Stress N/mm2 Maximum Load kN
Calculated Stress N/mm2
184.8 4.2 239.7 5.45 199.6 4.54 199.6 4.54 203.1 4.59
Compressive 75.8
119.7 119.3
1.72 2.72 2.71
322.8 7.34 2.87 0.24 1.14 0.09 3.13 0.256
Parallel Flexure
1.91 1.02
0.16 0.08
1.97 0.16 0.93 0.15 0.58 0.09 0.36 0.06
Perpendicular Flexure
0.48 0.08
1.28 0.2
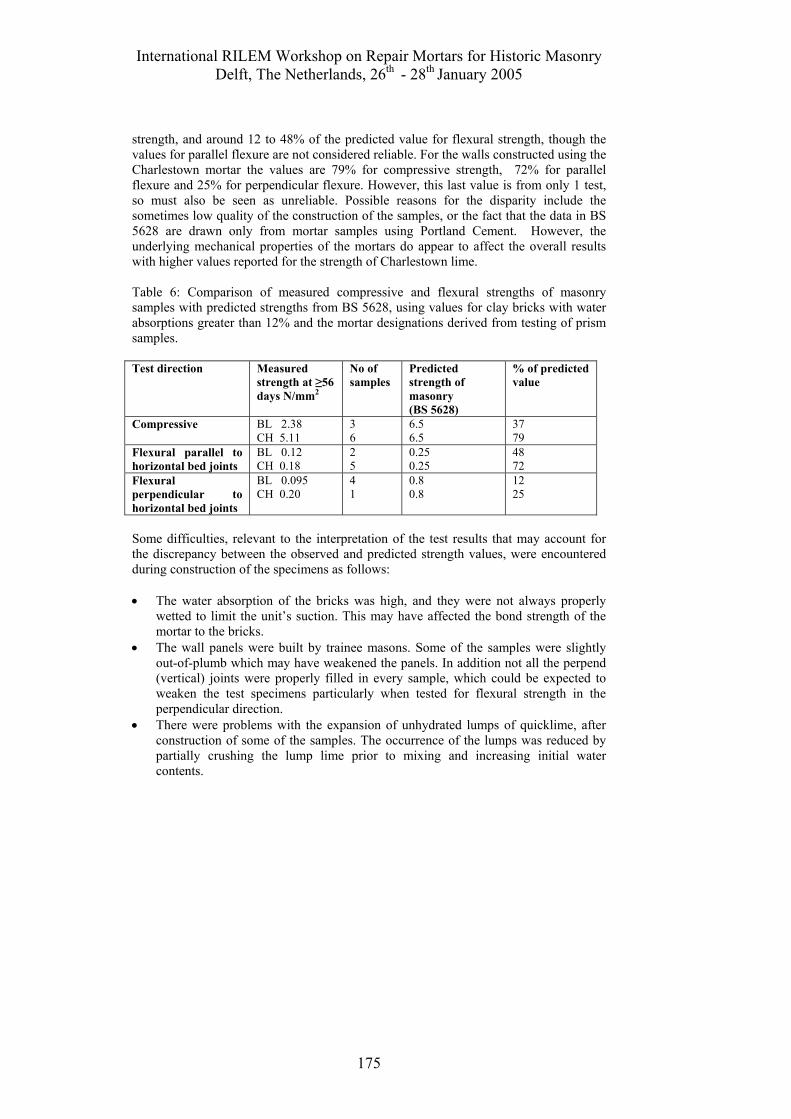
4.3.3 Flexural strength testing of wall panels perpendicular to horizontal joints. Figures 7 & 8 above, show the load versus displacement graphs for the testing of wall panels for flexural strength perpendicular to horizontal bed joints For each test the load increases and approaches a plateau. Load continues to be applied and taken up as the wall hinges, usually at two points, near the fixed rear restraints. The plateau forms after the wall has failed and is broken in two places. The plateau portion of the graph represents the force needed to continue to bend the wall once it had failed, and is the force required to overcome the friction within contra-rotating portions of masonry (in a scissor like motion). Again the test itself in these occasions was not observed with attention to the moment of failure, which is again interpreted from the load versus displacement graph. The individual values of maximum load for each test and the calculated values of strength are given in Table 5 above. 5. Discussion Table 6 below summarises the results for the compressive and flexural strength testing of the masonry specimens constructed using the two contrasting traditionally produced lime mortars. The table also contains a column with the predicted masonry strengths derived from BS 5628 which allows the prediction of the strength of masonry from the strength of the masonry units and the mortars at 28days. The walls constructed using the BL mortar achieved around 37% of the predicted value from BS 5628 for compressive
International RILEM Workshop on Repair Mortars for Historic Masonry Delft, The Netherlands, 26th - 28th January 2005
175
strength, and around 12 to 48% of the predicted value for flexural strength, though the values for parallel flexure are not considered reliable. For the walls constructed using the Charlestown mortar the values are 79% for compressive strength, 72% for parallel flexure and 25% for perpendicular flexure. However, this last value is from only 1 test, so must also be seen as unreliable. Possible reasons for the disparity include the sometimes low quality of the construction of the samples, or the fact that the data in BS 5628 are drawn only from mortar samples using Portland Cement. However, the underlying mechanical properties of the mortars do appear to affect the overall results with higher values reported for the strength of Charlestown lime. Table 6: Comparison of measured compressive and flexural strengths of masonry samples with predicted strengths from BS 5628, using values for clay bricks with water absorptions greater than 12% and the mortar designations derived from testing of prism samples. Test direction Measured
strength at ≥56 days N/mm2
No of samples
Predicted strength of masonry (BS 5628)
% of predicted value
Compressive
BL 2.38 CH 5.11
3 6
6.5 6.5
37 79
Flexural parallel to horizontal bed joints
BL 0.12 CH 0.18
2 5
0.25 0.25
48 72
Flexural perpendicular to horizontal bed joints
BL 0.095 CH 0.20
4 1
0.8 0.8
12 25
Some difficulties, relevant to the interpretation of the test results that may account for the discrepancy between the observed and predicted strength values, were encountered during construction of the specimens as follows: • The water absorption of the bricks was high, and they were not always properly
wetted to limit the unit’s suction. This may have affected the bond strength of the mortar to the bricks.
• The wall panels were built by trainee masons. Some of the samples were slightly out-of-plumb which may have weakened the panels. In addition not all the perpend (vertical) joints were properly filled in every sample, which could be expected to weaken the test specimens particularly when tested for flexural strength in the perpendicular direction.
• There were problems with the expansion of unhydrated lumps of quicklime, after construction of some of the samples. The occurrence of the lumps was reduced by partially crushing the lump lime prior to mixing and increasing initial water contents.
International RILEM Workshop on Repair Mortars for Historic Masonry Delft, The Netherlands, 26th - 28th January 2005
176
• The individual dimensions of the test specimens were not measured prior to testing. Strength results in stress terms were therefore calculated based on the “target” dimensions of the wall panels.
6. Conclusions 1. The mortar prisms for both the Charlestown and the Blue Lias mortars were
characterised as type iv-iii (for BS 5628) mortars in compressive strength terms at 56 days age.
2. The wall panels achieved 37% (BL) and 79% (CH) of the masonry compressive strength (fk), predicted for 30N/mm2 bricks in type iv OPC mortar.
3. The wall panels achieved 72% (CH) of the masonry’s parallel flexural strength predicted for clay bricks of water absorption greater than 12%, in type iv OPC mortar. The data for walls built with Blue Lias mortar, is considered unreliable, in this test direction.
4. The wall panels achieved 12% (BL) and 25% (CH) of the masonry’s perpendicular flexural strength predicted for clay bricks of water absorption greater than 12%, in type iv OPC mortar
5. Possible reasons for the actual values for the disparity between actual and predicted values falling below those predicted by BS 5628 for masonry built with OPC mortars of similar strengths, could be: (a) Difficulties with construction of the specimens (high brick water absorption, workmanship), discussed in section 5 above. (b) The data presented in BS 5628 are not valid for masonry built with lime mortars. (c) BS 5628 gives 95% confidence; ours are averages. (d) 28 / 56 day age differences.
6. Improved hot-lime mortar preparation methods are required, with reference to practice given in superseded codes of practice, requiring longer slaking, probable quicklime crushing and hot-mix screening to remove lumps that could be slow to slake and that could compromise the quality of the mortar.
It is planned to conduct another phase of wall strength testing, using improved materials, workmanship and testing procedure, in order to establish a better dataset for the compressive and flexural strength of brick masonry built using the Blue Lias and Charlestown hot lime mortars. This will also allow a better comparison to be made between these values and those predicted by BS 5628 for masonry using OPC mortars. 7. Acknowledgements This research was funded by the UK Government’s Department of Trade and Industry as part of the Partners in Innovation scheme. Technical support was provided by Bill Matthews and David Cloney with the testing apparatus operated by Neil Cox at the University of Paisley. John Brown and the students of Glasgow College of Building and
International RILEM Workshop on Repair Mortars for Historic Masonry Delft, The Netherlands, 26th - 28th January 2005
177
Printing are thanked for their sterling efforts in the construction of the wall panels. Brian Cameron and Stirling Weir provided excellent practical technical support for the mixing of mortars and the aftercare of the wall panels. 8. References 1. Hughes, J.J., Banfill, P.F.G., Forster , A., Johnston, D., Livesey, P., Sagar, J. and
Swift, D.S., “Practical application of small-scale burning for traditional lime binder production: skills development for conservation of the built heritage.” In: Martens, D. and Vermeltfoort, A. (Eds.) Proceedings of the 13th Int. Brick and Block Masonry Conference, Amsterdam, 2004, paper 197.
2. Maxwell, I., ‘Introduction to lime in Scotland’, Newsletter No.3, 2rd International EUROLIME meeting, Mainz, 1st – 2nd May, 1998, pp. 88-99.
3. Callebaut, K., 2000, Characterisation of historic lime mortars in Belgium: implications for restoration mortars, PhD thesis, Katholieke Universiteit Leuven, Leuven.
4. British Standards Institution, 2001, EN 459 EN 459-2 Building Lime: Part 2. Test methods.
5. British Standards Institution, 1999, BS EN 1052-1, Methods of test for masonry- Determination of compressive strength.
6. British Standards Institution, 1999, BS EN 1052-2, Methods of test for masonry- Determination of flexural strength.
7. British Standards Institution, 1999, BS EN 1015-11, Methods of test for mortar for masonry- Determination of flexural and compressive strength of hardened mortar.
8. Forster, A., 2004, Hot-Lime Mortars: A Current Perspective, J. Architectural Conservation, 10, 7-27.
9. Burnell, G.R., 1900, Rudimentary Treatise on Limes, Cements, Mortars, Concretes, Mastics, Plastering, etc, Crosby Lockwood and Son, London (15th Edition).
10. British Standards Institution, 1951, British Standard Code of Practice 121.101, Brickwork, BSI, London.
11. British Standards Institution, 1985-2001, BS 5628, Code of practice for use of masonry
12. British Standards Institution, 2003, BS EN 998-2, Specification for mortar for masonry - Part 2: Masonry mortar


