Embed Size (px)
Citation preview

Government of IndiaMinistry of Urban Development
Preparing a Comprehensive MobilityPlan CMP – A Toolkit
iv
Preparing a Comprehensive Mobility Plan (CMP) – A Toolkit (Revised)
v
Foreword
I have great pleasure in presenting the revised toolkit for the preparation of Comprehensive Mobility Plan (CMP) for a city. The toolkit has been prepared jointly by the Institute of Urban Transport (IUT) India, a team of researchers and consultants from premier institutions in India, the United Nations Environment Programme (UNEP), and UNEP DTU Partnership.The revision of the toolkit has been carried out under the advice of MoUD.
The current revision of the toolkitis based on experiences from the review of existing CMP implementation done by IUT & TERI, and the preparation of Low-carbon Comprehensive Mobility Plans under the UNEP project “Promoting Low Carbon Transport in India” for the cities of Rajkot, Vishakhapatnam and Udaipur. The preparation process has also involved consultation with experts (27) on the first draft on 17 October 2013 and with the city officials and other stakeholders from states (22) on 25 November 2013. Their inputs have made a valuable contribution to the revision of the toolkit.
The revised toolkit has a clear focus on climate change and sustainable development and takes forward the process of integrating the actions necessary for the transport sector as per the “National Mission on Sustainable Habitat,” for which MoUD is the nodal ministry. The toolkit provides a clear guidance for integrating the inclusiveness agenda within the transport planning processes with a strong focus on integration of land use and transport bringing the CMP closer to the development plans/master plans of the city.
I congratulate all those who have contributed directly and indirectly to this task.
Secretary
Ministry of Urban Development

vi
Preparing a Comprehensive Mobility Plan (CMP) – A Toolkit (Revised)
vii
Preface
In 2008 Ministry of Urban Development (MoUD), with the assistance of the Asian Development Bank (ADB),prepared and issued a toolkit for the preparation of a Comprehensive Mobility Plan (CMP) for cities. MoUD encouraged cities to prepare CMPs before seeking funding for urban transport projects under Jawaharlal Nehru National Urban Renewal Mission (JnNURM). More than 50 cities have prepared CMPs using the CMP toolkit. A critical review of some of the CMPs submitted by city authorities, undertaken by IUT and TERI, revealed that CMPs have not followed the toolkit in letter and spirit and do not meet the requirement of social, economic and environmental sustainability of urban transport.
Since then as part of National Action Plan on Climate Change, Government of India constituted 8 missions on various themes of national importance including National Mission on Sustainable Habitat with Ministry of Urban Development as the nodal ministry for this mission. The mission aims at making urban habitats sustainable through urban planning techniques, modal shift in favour of public transport and non-motorised transport and to achieve reduction in CO2 emissions. The existing toolkit does not require and the CMPs have not estimated the long-term GHG (Green House Gases) emissions.
Simultaneously, the United Nations Environment Programme (UNEP) took up a project on promoting low carbon transport in India by taking up case studies of Udaipur, Rajkot and Vishakhapatnam. The project is endorsed by the Ministry of Environment and Forest, Government of India. As part of the project, a methodology has been developed for preparing Low Carbon Mobility Plan with a focus on improving the quality of local environment, social inclusiveness for all sections of society, genders and also reduction in GHG emissions.
Review and update of the toolkit for CMP was also necessary to incorporate various suggestions and recommendations of the expert committees and groups on urban transport and the policy enunciations by the Government of India in the recent past. Accordingly, Ministry of Urban Development directed IUT to review and revise the toolkit for CMP. IUT and UNEP discussed the work being done and agreed to collaborate and prepare the revised CMP toolkit.
The draft revised toolkit was discussed at the Expert Review Workshop held on 17th-18thOctober 2013 at IUT in which experts, study team members and other invitees participated. The agencies involved
viii
Preparing a Comprehensive Mobility Plan (CMP) – A Toolkit (Revised)
in the revision provided inputs for the identified sections of the toolkit. Inputs from various reports of the expert committees and groups on urban transport of the 11th and 12th five-year plans, working group report on urban transport for NTDPC, national mission on sustainable habitat, service level benchmarks, advisories issued by MoUD, code of practices for design of urban roads, global case studies on transport master plan such as London, Singapore and Bogota; have been taken into consideration while revising the toolkit. The revised draft toolkit was also discussed at a national level workshop held at Goa on 25-26 November 2013 with the city officials from various states across the country.
This revised toolkit for CMP has been prepared after taking the views of the experts, city officials and other stakeholders into consideration. Although it is based on the existing toolkit, the revised toolkit has almost been re-written. The authors have taken the methodology of the original CMP as the starting point toprepare the revised toolkit of the CMP, which has both low-carbon and inclusive transport agenda interwoven. It emphasises the need to promote sustainable urban transport and requires an assessment of improvement in GHG emission as a result of implementation of the CMP.
In terms of approach, the toolkit has moved from a deterministic forecasting approach to a more flexible scenario-based approach, relying on projections. The scenario-based approach takes two broad views for the future: i) which mimics the current development patterns and where the land use for future is closely tied to the master plan (or development plan) document and ii) where specific interventions for land use, infrastructures, public transport/non-motorised transport and the change in regulations for personal motorised transport are envisaged. The revised approach therefore allows the policy makers and stakeholders at the city level to make an assessment of the benefits they can gain from implementing the CMP approach.
In terms of comprehensiveness, the CMP toolkit has been modified to include new data collection formats so that information on different socio-economic groups and gender is explicitly collected and used for transport planning projections. The second change is with regards to environment and CO2 emissions which involvesthe collection of data on vehicles (related to energy and emissions characteristics). The third aspect is related to safety. The more important aspect is that all these data are used to create information on future sustainable and low carbon transport scenarios, which are quantified in terms of indicators for mobility and accessibility,infrastructure and land use; safety and security; environmental impacts (including CO2 emissions) and economic aspects. The indicators allow easy comparison with service-level benchmarks and can therefore aid policymakers and consultants at the city level.
The authors believe that the toolkit is a working document and after 5 years there could be a new context to which the toolkit may have to be adapted.
Institute of Urban Transport (India)
ix
Acknowledgement
The revised toolkit for Comprehensive Mobility Plan has been prepared for the Ministry of Urban Development (MoUD), Government of India, jointly by IUT and a team of researchers and consultants working on the UNEP project on “Promoting Low Carbon Transport in India”.
The team from IUT involved Mr. M.L. Chotani, Ms. Kanika Kalra and Ms. Vijaya Rohini Kodati whereas UNEP project team is comprised of Dr Anvita Arora, Dr. Subash Dhar, Mr. Ranjan Jyoti Dutta, Mr. Ravi Gadepalli, Ms. Deepty Jain, Prof. Darshini Mahadevia, Dr. Talat Munshi, Prof. P.R. Shukla and Prof. Geetam Tiwari.
The team expresses its heartfelt thanks to Shri O.P. Agarwal, D.G. IUT, Shri. B. I. Singal,Ex. D.G. IUT and Shri. S. K. Lohia,former OSD (UT) and Ex-officio JS MoUD for their advice and guidance from time to time in carrying out the revision of the toolkit.
The team would like to thank external experts, Ms Chhavi Dhingra, Ms. Akshima T Ghate, Prof. Sanjay Gupta, Ms. Nupur Gupta and Prof. Sewa Ram, who provided inputs for the toolkit at the expert workshop held at IUT on 17 October 2013. The team would also like to thank Ms. Kamala Ernest for her comments on the draft CMP and her constant support to the team.
The team would also like to thank participants from various cities, who provided inputs for the revision of the CMP toolkit at the workshop held at Goa on 25 November 2013.
The team would also like to acknowledge the consultants’ team who earlier prepared the CMP toolkit comprising Dr. Chiaki Kuranami, Mr. Christopher Rose and Mr. Satoshi Ogita under the technical assistance from Asian Development Bank.

x
Preparing a Comprehensive Mobility Plan (CMP) – A Toolkit (Revised)
xi
Table of Contents
Foreword .............................................................................................................................................................. v
Preface .................................................................................................................................................................vii
Acknowledgement................................................................................................................................................ix
Abbreviations and Acronyms ...............................................................................................................................xv
Section 1: Introduction ................................................................................................................................. 1
Background.............................................................................................................................................. 1
What is a CMP? ................................................................................................................................. 1
Need for Revision of CMP, 2008 ........................................................................................................ 2
Vision of a CMP ................................................................................................................................. 2
Scope of CMP .................................................................................................................................... 2
Surveys for CMP Preparation ............................................................................................................ 3
Main Features of CMP ...................................................................................................................... 3
Key Outcomes of a CMP .................................................................................................................... 3
Relationship Between a CMP and Other Existing Plans ........................................................................... 3
Relationship with CDP ....................................................................................................................... 4
Relationship with the Master Plan .................................................................................................... 4
Relationship with the CTTS ............................................................................................................... 5
Frequently Asked Questions on Comprehensive Mobility Plan ............................................................... 5
Preparing for a CMP: Where to Start? .............................................................................................. 6
Understanding Key CMP Tasks ................................................................................................................. 6
Section II: Task Descriptions .......................................................................................................................... 7
TASK 1: Defining the Scope of the CMP .................................................................................................. 7
Consultation for Validation of CMP ................................................................................................... 8
Task 2: Data Collection and Analysis of the Existing Urban Transport and Environment ..................... 8
Task 2.1 Review of the City Profile .................................................................................................... 8
xii
Preparing a Comprehensive Mobility Plan (CMP) – A Toolkit (Revised)
Task 2.2 Delineation of Traffic Analysis Zones ................................................................................... 9
Task 2.3 Review of Land Use Pattern and Population Density ........................................................ 10
Task 2.4 Review of the Existing Transport Systems ......................................................................... 12
Task 2.5 Study of Existing Travel Behaviour .................................................................................... 14
Task 2.6 Review of Energy and Environment .................................................................................. 14
Task 2.7 Service Level Benchmarks ................................................................................................. 16
Task 2.8 Analysis and Indicators (Comparison with Benchmarks) .................................................. 17
Task 3: Development of Business as Usual (BAU) Scenario ................................................................. 20
Task 3.1 Framework for Scenarios .................................................................................................. 20
Task 3.2 Socio-Economic Projections .............................................................................................. 21
Task 3.3 Land Use Transitions ......................................................................................................... 21
Task 3.4 Transport Demand Analysis ............................................................................................... 23
Task 3.5 Technology Transitions ...................................................................................................... 23
Task 3.6 CO2 Emissions and Air Quality .......................................................................................... 25
Task 3.7 Analysis and Indicators (Comparison with Benchmarks) .................................................. 29
Task 4: Development of Sustainable Urban Transport Scenarios ........................................................ 30
Task 4.1 Framework for Scenario .................................................................................................... 30
Task 4.2 Strategies for Sustainable Urban Transport Scenario ........................................................ 31
Task 4.3 Transport Demand Analysis of Alternative Strategies for Sustainable Urban Transport .....33
Task 4.4 Technology Transitions under a Low Carbon Scenario ...................................................... 34
Task 4.5 CO2 Emissions and Air Quality (Refer to tasks 3-6.) .......................................................... 35
Task 4.6 Analysis and Indicators (Comparison with Benchmarks) .................................................. 35
Task 5: Development of Urban Mobility Plan ...................................................................................... 36
Task 5.1 Integrated Land Use and Urban Mobility Plan .................................................................. 36
Task 5.2 Formulation of the Public Transport Improvement Plan ................................................... 37
Task 5.3 Preparation of Road Network Development Plan ............................................................. 38
Task 5.4 Preparation of NMT Facility Improvement Plan ................................................................ 38
Task 5.5 Freight Movement Plan ..................................................................................................... 39
Task 5.6 Mobility Management Measures ...................................................................................... 39
Task 5.7 Development of Fiscal Measures ...................................................................................... 40
Task 5.8 Mobility Improvement Measures and NUTP Objectives ................................................... 40
Task 6: Preparation of the Implementation Program .......................................................................... 41
Task 6.1 Preparation of Implementation Programs......................................................................... 41
Task 6.2 Identification and Prioritization of Projects ....................................................................... 41
Task 6.3 Funding of Projects ........................................................................................................... 42
Task 6.4 Monitoring of CMP Implementation ................................................................................. 43
xiii
Preparing a Comprehensive Mobility Plan (CMP) – A Toolkit (Revised)
Section III: Methodology for Small Cities .................................................................................................... 45
Section IV: ANNEXURES ............................................................................................................................... 47
Annexure 1. Sample Survey Forms ....................................................................................................... 47
Annexure 2. Stakeholder Consultation ................................................................................................. 81 Annexure 3. List of NUIS Scheme Towns ........................................................................................ 85
Annexure 4. Data Collection Approach – Methodology and Sources ................................................... 89
Annexure 5. Four-Step Modelling ......................................................................................................... 94
Annexure 6. Emission Factors for Vehicle Fleets under Alternative Scenarios...................................... 99
Annexure 7. Sample TOR for Appointment of Consultant for Preparation of CMP ............................ 103
Annexure 8. Sample Work Schedule for Preparation of a CMP for a city ........................................... 111
Annexure 9. Sample Table of Contents of CMP Document ................................................................. 112
Annexure 10. Self-Appraisal Checklist to be filled by the consultant/client ........................................ 114
Annexure 11. Indicative Checklist for Evaluating CMPs ...................................................................... 120
Annexure 12. List of Maps to be Prepared .......................................................................................... 122
Annexure 13. Example of cross-classification method ........................................................................ 123
List of Tables
Table 1: Illustrative Comparison of Major Tasks of CMPs and other Existing Plans ...................................... 4
Table 2: Suggested Planning Area for Preparing a CMP Based on Population Size ....................................... 7
Table 3: Indicative Time for Preparing the CMP ........................................................................................... 8
Table 4: City Profile ....................................................................................................................................... 9
Table 5: Existing Transport Systems ............................................................................................................ 12
Table 6: Energy Balance .............................................................................................................................. 15
Table 7: Vehicle Inventory .......................................................................................................................... 15
Table 8: Data related to Emissions and Environment ................................................................................. 15
Table 9: Surveys to be conducted to incorporate SLB ................................................................................ 16
Table 10: Indicators to be Measured for Existing and Future Scenarios ..................................................... 17
Table 11: Vehicle Occupancy (Sample) ....................................................................................................... 27
Table 12: Vehicles: VKTs and Fuel Mix (Sample) ......................................................................................... 27
Table 13: CO2 Emission Coefficients for Different Fossil Fuels ................................................................... 28
Table 14: Emission of PM 2.5 ...................................................................................................................... 28
xiv
Preparing a Comprehensive Mobility Plan (CMP) – A Toolkit (Revised)
Table 15: Differences in Four-Step Models for Alternative Scenarios ......................................................... 34
Table 16: Desirable Modal Split for Indian Cities (as % of Total Trips) ........................................................ 36
Table 17: TDM Measures Varying from Push and Pull Fators ..................................................................... 40
Table 18: Tasks to be followed for Small Cities ........................................................................................... 46
List of Figures
Figure 1: Fuel Mix for the BAU Scenario ..................................................................................................... 24
Figure 2: Fuel Economy Improvement in Cars ............................................................................................ 24
Figure 3: CO2 Intensity of Electricity from Grid .......................................................................................... 25
Figure 4: Overall Modelling Framework for CMP ....................................................................................... 26
Figure 5: Air Pollutant Concentrations Map, PM10 for Udaipur Using SIM air Model ............................... 29
Figure 6: Four Broad Strategies and Accompanying Policies Used for Sustainable Scenarios .................... 31
Figure 7: Fuel Mix for Transport in Sustainable Low Carbon Scenario ....................................................... 35
Figure 8: Fiscal Dependence of ULBs .......................................................................................................... 42
xv
Abbreviations and AcronymsADB Asian Development BankBAU Business as UsualBOO Build Own OperateBOOT Build Own Operate TransferBOT Build Operate TransferBPL Below Poverty LineBRT Bus Rapid TransitBT Build TransferBTO Build Transfer OperateCBD Central Business DistrictCDM Clean Development MechanismCDP City Development PlanCEA Central Electricity AuthorityCEF Composite Environment FeeCEPT Centre for Environmental Planning and TechnologyCMP Comprehensive Mobility PlanCNG Compressed Natural GasCO Carbon OxideCO2 Carbon DioxideCSOs Civil Society OrganisationsCTTS Comprehensive Traffic and Transportation StudiesDBFO / M Design Build Finance Operate / MaintainDBM Design Build MaintainDBOM Design Build Operate MaintainDMIC Delhi Mumbai Industrial CorridorDP Development PlanDPR Detailed Project ReportEB Enumeration BlockEPCA Environment Pollution Control Authority
Abbreviations
xvi
Preparing a Comprehensive Mobility Plan (CMP) – A Toolkit (Revised)
FAQs Frequently Asked QuestionsFAR Floor Area RatioFSI Floor Space indexGHG Green House GasesGIS Geographic Information SystemHC HydrocarbonHH HouseholdHSD High Speed DieselHUDCO Housing and Urban Development CorporationIDFC Infrastructure Development Finance CompanyILFS Infrastructure Leasing and Financial ServicesIPCC Inter-governmental Panel on Climate ChangeITS Intelligent Transport SystemIUT Institute of Urban Transport (India)JICA Japan International Cooperation AgencyJnNURM Jawaharlal Nehru National Urban Renewal MissionLCMP Low-Carbon Comprehensive Mobility PlanLCS Low Carbon ScenarioLCV Light Commercial VehicleLPG Liquefied Petroleum GasLRT Light Rail TransitMFA Multilateral Funding AgencyMLA Member of legislative AssemblyMoUD Ministry of Urban DevelopmentMP Member of ParliamentMRT Mass Rapid TransportationMtoe Million Tonne of Oil EquilentMTW Motorised Two / Three WheelerNAMA Nationally Appropriate Mitigation ActionsNAPCC National Action Plan on Climate ChangeNGOs Non Governmental OrganisationsNHAI National Highway Authority of IndiaNMT Non-Motorised TransportNOx Nitrogen OxideNSSO National Sample Survey OrganisationNUIS National Urban Information SystemNUTP National Urban Transport PolicyPBS Public Bicycle SharingPM Particulate MatterPPP Public Private Partnership
xvii
Preparing a Comprehensive Mobility Plan (CMP) – A Toolkit (Revised)
PT Public TransportPUC Pollution Under ControlROW Right of WayRTA Regional Transport AuthoritySC Scheduled CasteSLB Service Level BenchmarksSOx Sulphur OxideSUV Sports Utility VehicleTAZ Traffic Analysis ZoneTDM Travel Demand ManagementTERI The Energy and Research InstituteTOD Transit Oriented DevelopmentUIDSSMT Urban Infrastructure Development Scheme for Small and Medium TownsULBs Urban Local BodiesUMTA Unified Metropolitan Transport AuthorityUNEP United Nations Environment ProgrammeUNFCCC United Nations Framework Convention on Climate ChangeUT Urban TransportUTF Urban Transport Fund

xviii
Preparing a Comprehensive Mobility Plan (CMP) – A Toolkit (Revised)
1
Section I:
Introduction
Background
Cities are rapidly becoming the engines of economic growth all over the developing world. In India, though only about 30% of the national population resides in urban areas, they generate over 60% of the GDP. It is also expected that cities will propel the future growth of the country. It is, therefore, essential to ensure that these urban centres are well equipped in terms of infrastructure, if India is to continue on its growth trajectory.
It is in this context that the Government of India has decided to promote 100 “Smart Cities” in the country. These will be an initial set of pilots, with the ultimate objective of making all our cities smart cities. Urban Mobility or the ease of being able to move from one place to another is at the core of a “Smart City”. A highly efficient transport system, which offers easy access to jobs, education, healthcare and other needs, is essential. To ensure mobility for all, cities need to develop a comprehensive urban transport strategy. Under the present scenario, urban transport projects are prepared and implemented in a piecemeal manner and generally not integrated with land use pattern. Some cities do prepare urban transport master plan by conducting traffic and transportation studies, but such plans mainly focus on vehicle movement and do not pay enough attention to the mobility of people and goods. The major emphasis in these plans remains on extensive infrastructure development such as road network, flyovers, improvement of road geometry, regulatory measures etc. The mobility of people as a whole is not addressed appropriately.
The concept of Comprehensive Mobility Plan (CMP) is to have a long-term vision for desirable accessibility and mobility pattern for people and goods in the urban agglomeration. It focuses on the mobility of people to address urban tranpsort problems and promote better use of existing infrastructure (i.e., improvement of public transport, pedestrian and NMT facilities). which as such leads to the integration of land use and transport development and is essential to building smart cities.
What is a CMP?
CMP is a vision statement of the direction in which Urban Transport in the city should grow. It should cover all elements of Urban Transport under an integrated planning process.
2
Preparing a Comprehensive Mobility Plan (CMP) – A Toolkit (Revised)
Need for Revision of CMP, 2008
The toolkit for preparation of CMP was first prepared by MoUD in association with ADB in August 2008. The focus of the toolkit was on the following:
1. To optimize the “mobility pattern of people and goods” rather than of vehicles
2. To focus on the improvement and promotion of public transport, NMVs and pedestrians, as important transport modes in Indian cities
3. To provide a recognized and effective platform for integrating land use and transport planning
4. To focus on the optimization of goods movement
However,to address the various mobility aspects of Smart Cities and the growing concerns of social and environmental sustainability of cities, a need was felt to review the existing guidelines and provide new guidelines for cities to plan and meet the growing challenges of overall sustainability.
The revised toolkit would ensure the following:
• A low-carbon mobility growth scenario for the city
• Equity to all sections of the society including urban poor and differently abled
• Service level benchmarks incorporation
Vision of a CMP
The CMP is a long-term vision for desirable accessibility and mobility pattern for people and goods in the city to provide, safe, secure, efficient, reliable and seamless connectivity that supports and enhances economic, social and environmental sustainability.
Scope of CMP
The preparation of CMP includes the following steps:
a) Understand the present travel characteristics and forecast travel demand for the planning horizon.
b) Estimate emissions from urban transport based on the travel demand and technological choices.
c) Integrate transport options with land use structure and develop alternative scenarios for sustainable transport.
d) Work out the mobility plan which is economically, socially, environmentally and technologically sustainable and be an integral part of development plans / master plans.
e) Suggest an implementation programme for a successful execution of the selected interventions.
3
Surveys for CMP Preparation
For the preparation of Comprehensive Mobility Plan, the required information will be collected and compiled through primary surveys and secondary sources as per the survey formats listed in Section IV (Annexure 1). It provides a comprehensive list of formats required for all cities of population greater than 1 lakh, however for smaller cities some of the data may not be needed
Main Features of CMP
The main features of CMP are the following:
a) Prioritise mobility for all socio economic groups and genders.
b) Give adequate attention to sustainable modes of transport (i.e., public transport, pedestrians and non-motorised).
c) Provide a recognised and effective platform for integrating land use and transport planning.
d) Integrate impacts of transport on local air quality,emissions, safety and social aspects.
e) Focus on the optimisation of goods transport.
Key Outcomes of a CMP
The CMP should lead to the following outcomes in the long term:
a) Improvement in mobility for all socio-economic groups and genders
b) Improvement in air quality of Sustainable Urban Transport Scenario with reference to the BAU scenario
c) Improvement in safety and security for pedestrians, NMT and liveability in the city
d) Increase in sustainable transport mode share and a decrease in private motor vehicle use
e) Achievement of desirable indicators and benchmarks
f) Integral part of Master Plan
Relationship Between a CMP and Other Existing Plans
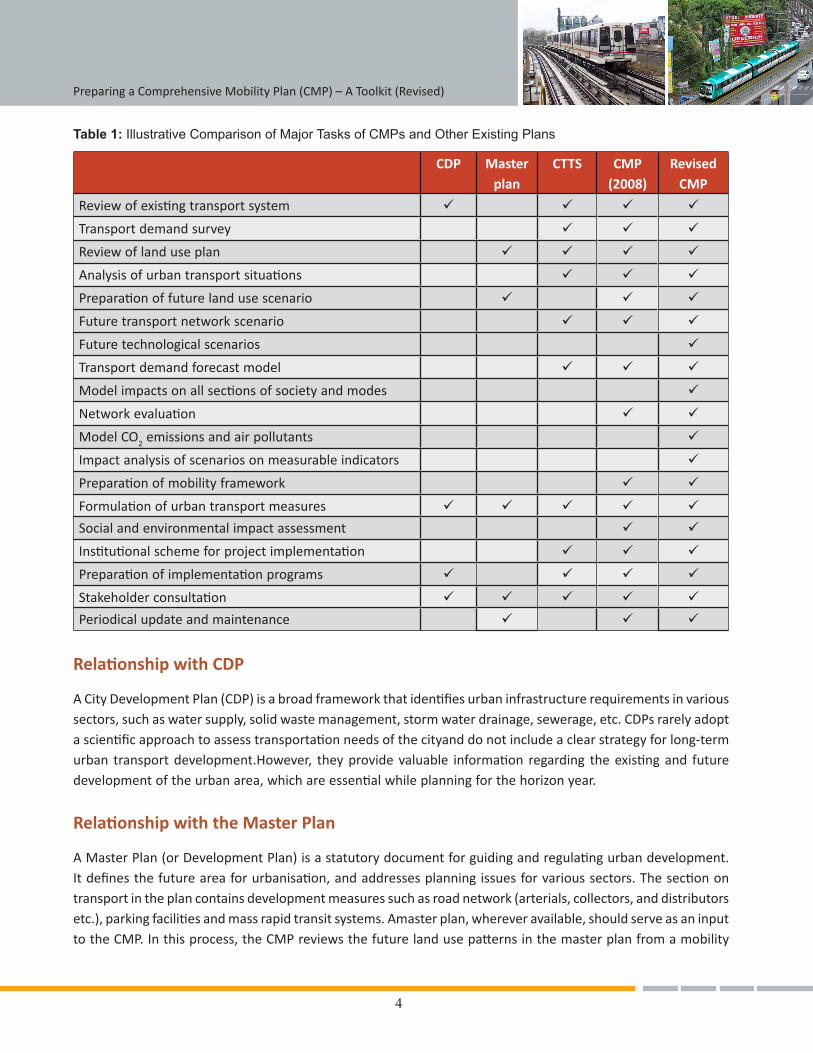
There are a few important plans and studies that need to be referred to when a CMP is prepared.For example: City Development Plans (CDPs), Master Plans and Comprehensive Traffic &Transportation Studies (CTTS) if available. A comparison of these plans and studies with the CMP is summarized in Table1.
Introduction
4
Preparing a Comprehensive Mobility Plan (CMP) – A Toolkit (Revised)
Table 1: Illustrative Comparison of Major Tasks of CMPs and Other Existing Plans
CDP Master plan
CTTS CMP (2008)
Revised CMP
Review of existing transport system ü ü ü ü
Transport demand survey ü ü ü
Review of land use plan ü ü ü ü
Analysis of urban transport situations ü ü ü
Preparation of future land use scenario ü ü ü
Future transport network scenario ü ü ü
Future technological scenarios ü
Transport demand forecast model ü ü ü
Model impacts on all sections of society and modes ü
Network evaluation ü ü
Model CO2 emissions and air pollutants ü
Impact analysis of scenarios on measurable indicators ü
Preparation of mobility framework ü ü
Formulation of urban transport measures ü ü ü ü ü
Social and environmental impact assessment ü ü
Institutional scheme for project implementation ü ü ü
Preparation of implementation programs ü ü ü ü
Stakeholder consultation ü ü ü ü ü
Periodical update and maintenance ü ü ü
Relationship with CDP
A City Development Plan (CDP) is a broad framework that identifies urban infrastructure requirements in various sectors, such as water supply, solid waste management, storm water drainage, sewerage, etc. CDPs rarely adopt a scientific approach to assess transportation needs of the cityand do not include a clear strategy for long-term urban transport development.However, they provide valuable information regarding the existing and future development of the urban area, which are essential while planning for the horizon year.
Relationship with the Master Plan
A Master Plan (or Development Plan) is a statutory document for guiding and regulating urban development. It defines the future area for urbanisation, and addresses planning issues for various sectors. The section on transport in the plan contains development measures such as road network (arterials, collectors, and distributors etc.), parking facilities and mass rapid transit systems. Amaster plan, wherever available, should serve as an input to the CMP. In this process, the CMP reviews the future land use patterns in the master plan from a mobility
5
optimisation point of view and selects a preferred pattern of land use / transport integration as necessary. If the recommendation by the CMP on urban growth pattern differs from the one in the master plan, the CMP recommendation may be reflected in afuture version of the master plan. This would also ensure integrated planning which is the key ingredient for smart cities, For cities where master plan is not available, the CMP may be used as the starting point for preparation of the master plan.
Relationship with the CTTS
Some cities have already conducted CTTSs by examining traffic and transport issues and recommending improvement measures. While CTTS focuses on vehicle flows, the CMP will concentrate on the mobility of people. CTTS does not develop scenarios as the CTTS is basically a transport sector study. However the model developed for the CTTS can be used for the further development of scenarios while preparing the CMP. Also it may provide useful strategies and future network, which are essential for developing the plan for the future..
Frequently Asked Questions on Comprehensive Mobility Plan
Who should use this toolkit?
Targeted users of this CMP toolkit include policy makers, city authorities and consultants. The toolkit provides:
1. Guidance in setting CMP visions/objectives for policy makers;
2. The structure and process of CMP development for city authorities;
3. Detailed tasks to be performed by consultants for preparation of CMP; and
4. A guidance for the policy makers and city authorities on what to expect from the consultants.
Who should be responsible for the preparation of CMP?
City authorities should be responsible for the preparation of CMPs. During the process of the CMP preparation, a wider consultation with key stakeholders like the Development Authority, Municipal Corporation, ULBs, RTO, etc. is recommended to organize seminars and workshops to obtain feedback from the stakeholders.
Why do CMPs need to be prepared BEFORE the feasibility studies of specific projects?
To ensure sustainable development of cities, it is essential that a city-wide macro-level plan is prepared, which identifies and prioritises projects. CMP is that macro-level plan for the city. Feasibility studies and DPRs of prioritised projects identified in the CMPwill give best value for money.
How much detail is required in the recommended policy measures included in a CMP?
Although a CMP serves as a visionary document, it should also provide a clear and logicalmethodology to achieve the objectives. As such, any project recommended in a CMP should broadly identifyan implementation organisation.A further study, required for feasibility assessment and detailed design, should beperformed after the CMP is approved.
Introduction
Preparing a Comprehensive Mobility Plan (CMP) – A Toolkit (Revised)
6
Do CMPs need to be updated regularly?
Yes. Since cities are constantly changing, it is recommended that every city updates its CMP atleast once in every five years.
Preparing for a CMP: Where to Start?
A Master Plan1 for the city can be taken as a starting point for preparation of CMP. Land use structure and transport proposal indicated in the master plan can serve as guidance for the BAU scenario. CMP however analyses alternative land use scenarios and accordingly the required changes in the land use structure may be suggested to be incorporated in the revised version of the master plan.
Understanding Key CMP Tasks
The major tasks to develop a CMP are set out below. Detailed task descriptions are given in Section II
Task 1: Defining Scope of the CMP
Task 2: Data Collection and Analysis of the Existing Urban Transport Environment
Task 3: Development of Business as Usual (BAU) Scenario
Task 4: Development of Sustainable Urban Transport Scenarios
Task 5: Development of Urban Mobility Plan
Task 6: Preparation of the Implementation Program
1Most of the cities have a Master Plan; if not available then any other available Development Plan can be used as a reference.
TASK1: Defining the Scope of the CMP
The first step in preparing a CMP is to define the scope of the project. The consultant must prepare an Inception Report clearly indicating the following details:
l Planning area
l Planning horizon
l Work Plan
l Vision
Planning Area
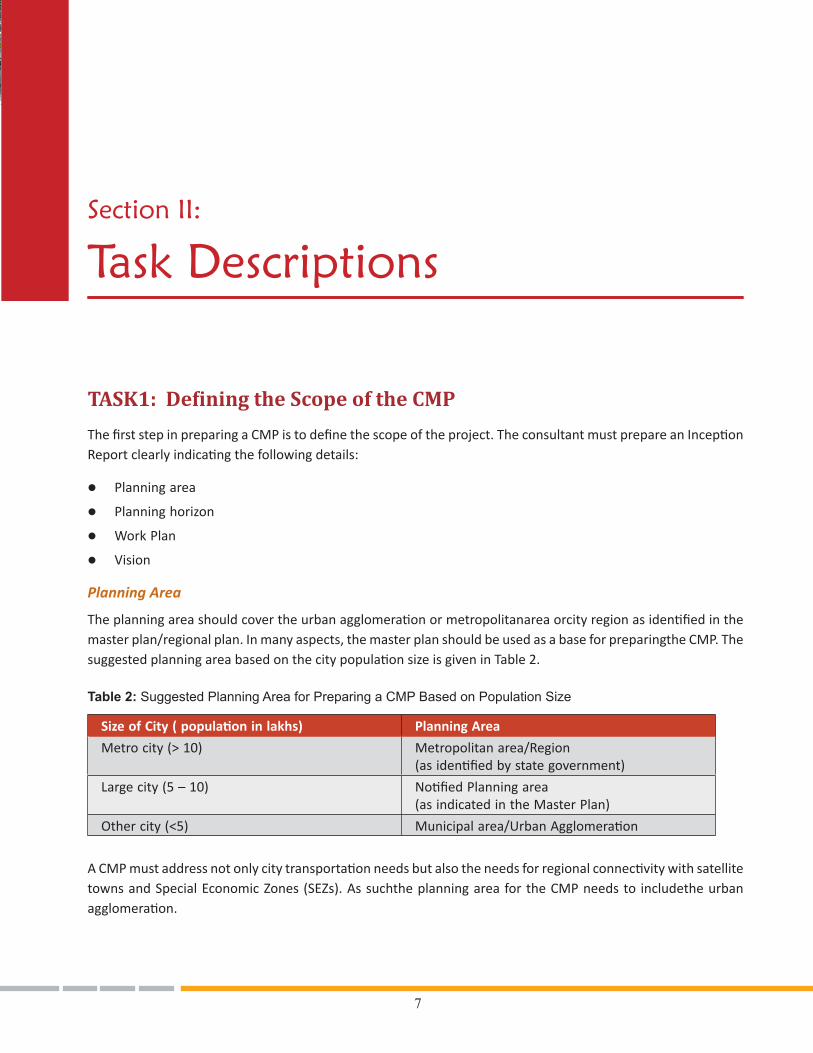
The planning area should cover the urban agglomeration or metropolitanarea orcity region as identified in the master plan/regional plan. In many aspects, the master plan should be used as a base for preparingthe CMP. The suggested planning area based on the city population size is given in Table 2.
Table 2: Suggested Planning Area for Preparing a CMP Based on Population Size
Size of City ( population in lakhs) Planning Area
Metro city (> 10) Metropolitan area/Region (as identified by state government)
Large city (5 – 10) Notified Planning area(as indicated in the Master Plan)
Other city (<5) Municipal area/Urban Agglomeration
A CMP must address not only city transportation needs but also the needs for regional connectivity with satellite towns and Special Economic Zones (SEZs). As suchthe planning area for the CMP needs to includethe urban agglomeration.
Section II:
Task Descriptions
7
8
Preparing a Comprehensive Mobility Plan (CMP) – A Toolkit (Revised)
Planning Horizon
If we consider that CMP leads to investments in transport infrastructures with long-term impacts on climate change and other issues, its planning horizon should be at least 20 years. In addition, immediate (optional), short-term and medium-term target with a range of 2 (two), 5 (five) and 10 (ten) years,respectively, should be included. The CMP horizon should be aligned with the Master Plan horizon, as much as possible.
Work Plan
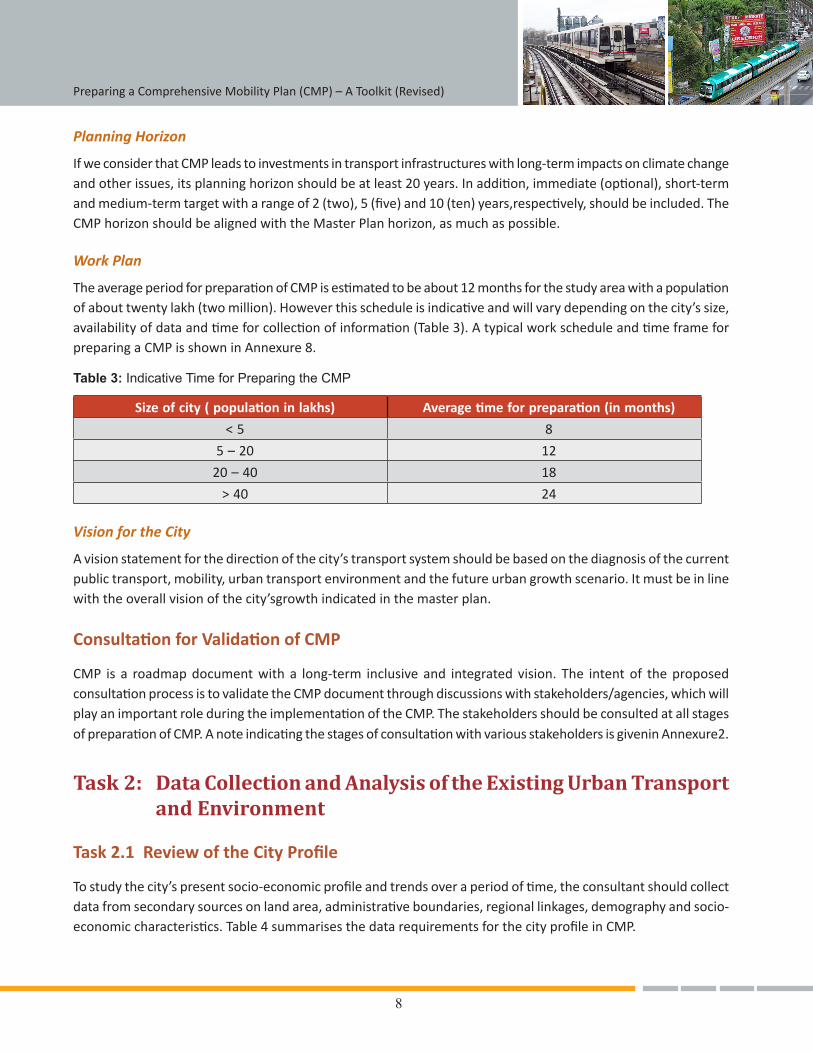
The average period for preparation of CMP is estimated to be about 12 months for the study area with a population of about twenty lakh (two million). However this schedule is indicative and will vary depending on the city’s size, availability of data and time for collection of information (Table 3). A typical work schedule and time frame for preparing a CMP is shown in Annexure 8.
Table 3: Indicative Time for Preparing the CMP
Size of city ( population in lakhs) Average time for preparation (in months)
< 5 8
5 – 20 12
20 – 40 18
> 40 24
Vision for the City
A vision statement for the direction of the city’s transport system should be based on the diagnosis of the current public transport, mobility, urban transport environment and the future urban growth scenario. It must be in line with the overall vision of the city’sgrowth indicated in the master plan.
Consultation for Validation of CMP
CMP is a roadmap document with a long-term inclusive and integrated vision. The intent of the proposed consultation process is to validate the CMP document through discussions with stakeholders/agencies, which will play an important role during the implementation of the CMP. The stakeholders should be consulted at all stages of preparation of CMP. A note indicating the stages of consultation with various stakeholders is givenin Annexure2.
Task 2: Data Collection and Analysis of the Existing Urban Transport and Environment
Task 2.1 Review of the City Profile
To study the city’s present socio-economic profile and trends over a period of time, the consultant should collect data from secondary sources on land area, administrative boundaries, regional linkages, demography and socio-economic characteristics. Table 4 summarises the data requirements for the city profile in CMP.
9
Table 4: City Profile
Data required Description Source for Primary Data Data level
Location Geographical locationMaster plans of the city and region if available/ CDP
City wide
Land area
Total land area Master plan of the city and region City wide
Growth pattern Master plan of the city and region City wide
Identification of notified areas Master plan of the city and region City wide
Regional linkages Road & Rail Network Master plan/CDP City wide
Demography
Population growth trends by census wards or enumeration blocks
Census City wide
Number and size of house hold Census City wide
Age-sex pyramid Census City wide
Socio-economic data
Populat ion by income / expenditure on transport at TAZ or ward level
If city level GIS data available or enumeration block data of the census and primary surveys
City wide
Vehicle ownership (including bicycles) by social group
RTO, other local agencies / primary surveys
City wide
Task 2.2 Delineation of Traffic Analysis Zones
For the purpose of analysis and development of travel demand forecasting model, the study area is required to be subdivided into smaller areas known as Traffic Analysis Zones (TAZs) or Zones as they are commonly referred to. Zones are an aggregation of various units such as households work place, shopping area, and other activities, which cannot otherwise be represented individually.TAZs which are located inside the planning area, as defined in Task 1, are called internal zones. The areas, outside the study area are aggregated into larger zones along the major directions of travel and are termedas external zones. These zones help analyse trip interactions between internal-internal, internal-external, external-external and external-internal.
The Basis of Zoning
TAZs are delineated taking into account various factors such as administrative boundaries, physical barriers like water bodies, railway lines, highways and homogeneous land uses.
There are no standards to delineate the TAZ boundaries but thefollowing criteria can help in guiding the delineation of TAZ boundaries:
1. Administrative boundaries:TAZ boundaries should follow administrative boundaries, including those of municipal corporations, villages, investment areas, and so on. Within these boundaries, TAZs should follow census ward boundaries.This is to ensure availability of secondary information like population, land use and other socio-economic information which can be useful to start with. In case a master plan is available, the zones or sub-zones of the city as indicated in the plan may be used.
Task Descriptions
10
Preparing a Comprehensive Mobility Plan (CMP) – A Toolkit (Revised)
2. Physical barriers in the city like rivers, lakes, canals, railway lines may be considered for delineating TAZ.
3. Road network and public transport (PT) network in the study area: The zone size would also get affected by the road and PT network in the study area.
4. Homogeneity in land use: This is another important consideration. For example, major centres like industrial areas or major residential pockets should be considered as a single zone.
5. Special traffic generators at regional / city level like railway station, sports complexes / major freight centres etc. might be considered as separate zones.
Zone sizes
Within the developed area of the parent city, the zone sizes should be as uniform as possible. If some zones are much bigger than the others, a significant number of trips will be made within the zone (intra-zonal trips) that will not reflect on the network.
As a general guide, a population of 1,000 – 3,000 is optimum for a small area and a population of 5,000 – 10,000 may be optimum for a large area2. If the study area includes outskirts and peripheral areas around the city which are not fully developed, these may be merged with the existing administrative zones at which socio-economic, census, etc data is available.
Task 2.3 Review of Land Use Patternand Population Density
Once the zones for the study area have been defined, the next step is to collect data in which, slums should also be considered as a part of residential land use and not a separate land use. And also residential land use zones should have income groups marked as well. This can be done by using data on household assetsand the type of building (available from property tax data/ household survey3) as a proxy. If data on household assets is not available then the disaggregation of residential land use into income groups can also be done by using per capita floor area as a proxy, which can be calculated using the formula given below:
per capita floor area =household area
(no.of members in the household)
Housing characteristics can be a useful indicator of income. The per capita floor space4 is also an indicator of a low-income household.
Land Use Data
CDP or master plans are the prime data sources for reviewing existing land-use patterns. However, there are well-documented concerns about poor enforcement of development control in India5, and development plans
2 Source: 1. Traffic Engineering & Transport Planning, Dr L.R. Kadiyali 2. A Recommended Approach to Delineating Traffic Analysis Zones in Florida, Cambridge Systematics, Inc. & AECOM Consultant 3 Refer Task 2-5 4 The per capita floor area, derived by dividing total floor area of the dwelling unit by household size (members). 5 See Pucher, J., et al. (2005). “Urban transport crisis in India.” Transport Policy 12(3): 185-198.; Dimitriou, H. T. (2006). “Towards a generic sustainable
urban transport strategy for middle-sized cities in Asia: Lessons from Ningbo, Kanpur and Solo.” Habitat International 30(4): 1082-1099., Alan, T. (1992). “Urban planning in the developing world: Lessons from experience.” Ibid. 16(2): 113-126.,
11
and master plans often do not represent actual development on the ground6. An alternative source for land use information collected by the National Urban Information System (NUIS)7 Scheme may therefore be used. A list of 152 cities for which GIS data is available under NUIS is enclosed in Annexure 3.
In cities where NUIS data is not available, CDPs or Master Plans can be used in conjunction with property tax data, which is available from the respective municipal corporation. The pattern of land use needs to be analysed, for land/floor area consumption per land use in each TAZ. This indicator is represented as a percentage of land under each land use. The ratio of residential land use and employment-generating land use has been found to have a significant influence on travel distance and choice of walking, bicycle and public transport modes. This is generally measured as a ratio of the number of jobs to the number of household in each zone. Similarly, an indicator that influences the distance individuals travel for obligatory activities like shopping, recreation, etc. has been included as a question in the household survey (Annexure1 and 4).
Analysing Density
In addition to residential densities, job densities must also be studied and analysed. Ward-level decadal data on population is available from the Census of India and can be used for the analysis. To estimate the number of persons/job per unit area, the following equation may be used:
No. of persons/job per unit area =Rj
ARj x AJj
Where,Rj = no of residents in a zoneARj = area under residential purpose landuse in the zoneAJj = no.of jobs in the zone to the area under land uses that generate these jobs respectively
Another important parameter to be analysed is the Floor space used per activity per unit area, which is estimated as:
Floor space used per activity per unit area = number of floors x land use (activity)
Using floor space per activity as an indicator will help compare the BAU urban development projection with sustainable urban policy scenarios. For example, comparing land use scenarios when a different Floor Space Index8 (F.S.I) norm is introduced may reveal changes in either the per-activity consumption of floor space or in the sheer number of activities available in the same amount of land as before.
6 See Munshi, T. (2013). Built form , Travel Behaviour and Low Carbon Development in Ahmedabad, India. Faculty of ITC. Enschede, the Netherlands, University of Twente. PhD.
7 Available online at http://urbanindia.nic.in/programme/lsg/nuis.htm ).
8 Ratio of built-up area to land area
Task Descriptions
12
Preparing a Comprehensive Mobility Plan (CMP) – A Toolkit (Revised)
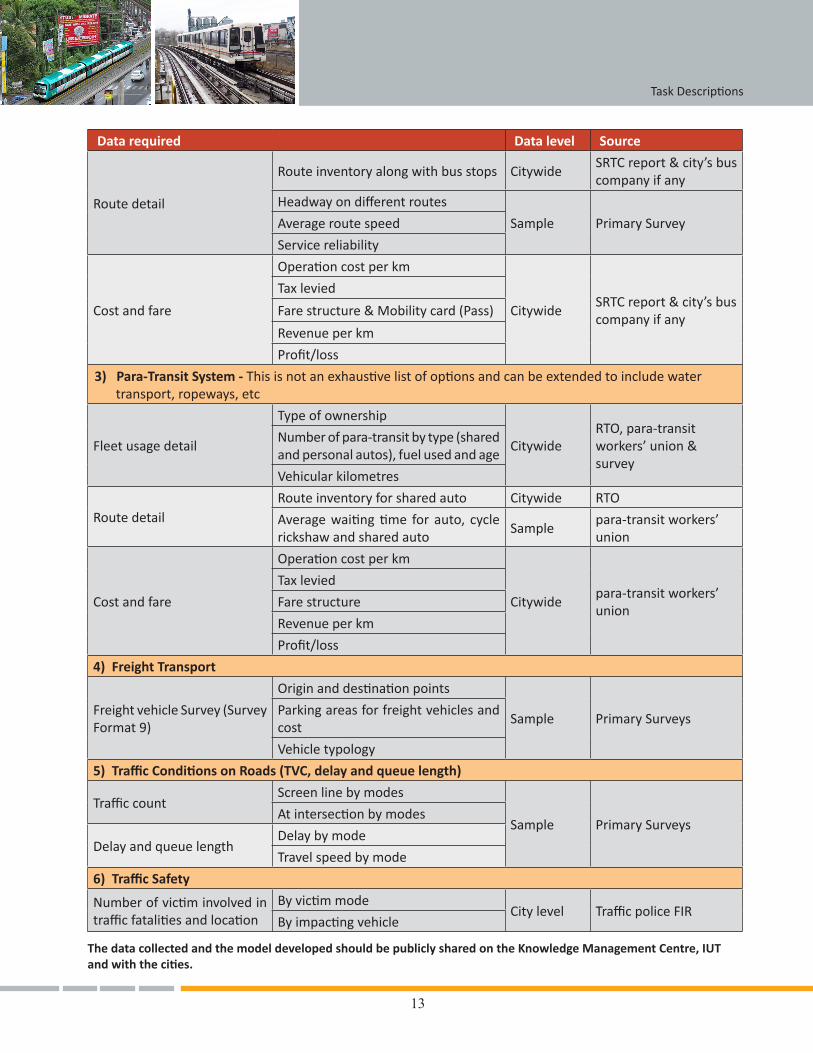
Task 2.4 Review of the Existing Transport Systems
A review of existing transport infrastructure and facilities needs to be done for all transport modes including public transport (private and public), private vehicles, walking, cycling, cycle rickshaw, auto rickshaw, shared auto rickshaw, etc. For this purpose, a number of surveys need to be conducted. The data collected must be visually represented, such as on maps, to avoid any ambiguity.The information that needs to be collected is given in Table 5. The maps that need to be prepared are given in Annexure 11.
Table 5: Existing Transport Systems
Data required Data level Source
1) Road Network Inventory
Infrastructure for pedestrians
Footpath (Survey format 1b) Sample Primary Survey
Intersections (Survey format 2)Sample Primary Survey
Access (Survey format 1b)
Infrastructure for bicycle and cycle rickshaws
Lanes (Survey format 1c) Sample Primary Survey
Intersection treatment (Survey format 2)
Sample Primary Survey
Public transport (bus) - In absence of bus services, a similar analysis can also be made of the shared rickshaw services.
Infrastructure (Survey format 7c)
Sample Primary Survey
Bus stop (Survey format 7a & b) Sample Primary Survey
Road Network Inventory
Road infrastructure (Survey format 1a)
Sample Primary Survey
Intersections (Survey format 2) Sample Primary Survey
Parking (Survey format 4) Sample Primary Survey
2) Public Transport System – City Bus, and also for other mass transit systems if any (Metro, LRT, etc)
Fleet usage detail
Number of buses by type of bus (standard, mini, low floor), fuel used and age
Citywide ULB & RTO
Fleet utilization rate Citywide
State Road Transport Corporation (SRTC) report & city’s bus company if any
Vehicular kilometers Citywide SRTC report
Average kilometers per bus per day
Citywide SRTC report
Percentage occupancy- peak hour and average
CitywideSRTC report & city’s bus company if any
Total passengers per day Citywide SRTC report
13
Data required Data level Source
Route detail
Route inventory along with bus stops CitywideSRTC report & city’s bus company if any
Headway on different routes
Sample Primary SurveyAverage route speed
Service reliability
Cost and fare
Operation cost per km
CitywideSRTC report & city’s bus company if any
Tax levied
Fare structure & Mobility card (Pass)
Revenue per km
Profit/loss
3) Para-Transit System - This is not an exhaustive list of options and can be extended to include water transport, ropeways, etc
Fleet usage detail
Type of ownership
CitywideRTO, para-transit workers’ union & survey
Number of para-transit by type (shared and personal autos), fuel used and age
Vehicular kilometres
Route detail Route inventory for shared auto Citywide RTO
Average waiting time for auto, cycle rickshaw and shared auto
Samplepara-transit workers’ union
Cost and fare
Operation cost per km
Citywidepara-transit workers’ union
Tax levied
Fare structure
Revenue per km
Profit/loss
4) Freight Transport
Freight vehicle Survey (Survey Format 9)
Origin and destination points
Sample Primary SurveysParking areas for freight vehicles and cost
Vehicle typology
5) Traffic Conditions on Roads (TVC, delay and queue length)
Traffic countScreen line by modes
Sample Primary SurveysAt intersection by modes
Delay and queue lengthDelay by mode
Travel speed by mode
6) Traffic Safety
Number of victim involved in traffic fatalities and location
By victim mode City level Traffic police FIR
By impacting vehicle
The data collected and the model developed should be publicly shared on the Knowledge Management Centre, IUT and with the cities.
Task Descriptions
14
Preparing a Comprehensive Mobility Plan (CMP) – A Toolkit (Revised)
Key locations for data verification must be identified through a process that must be communicated in the CMP to capture a wide range of possible origins and destinations. However, the number of points and counts will vary depending on the travel characteristics and demographics of the study area. Locations must be balanced between those immediately adjacent to city centres/business districts and those on the urban periphery.
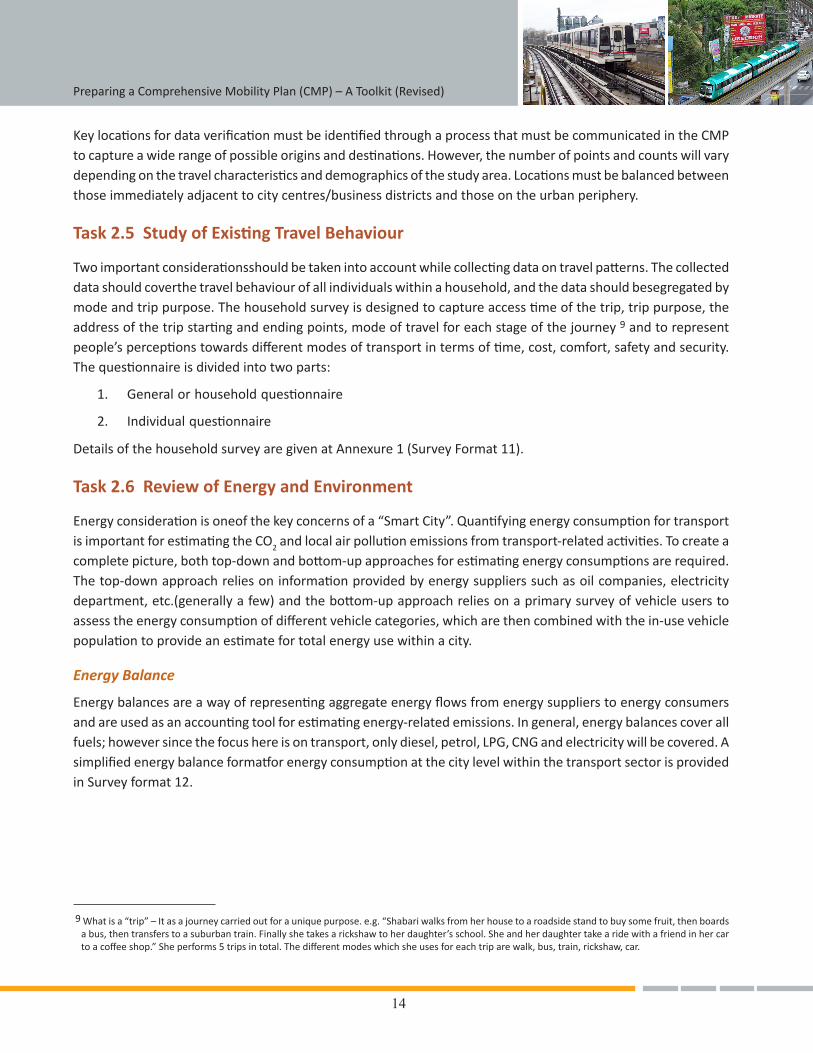
Task 2.5 Study of Existing Travel Behaviour
Two important considerationsshould be taken into account while collecting data on travel patterns. The collected data should coverthe travel behaviour of all individuals within a household, and the data should besegregated by mode and trip purpose. The household survey is designed to capture access time of the trip, trip purpose, the address of the trip starting and ending points, mode of travel for each stage of the journey 9 and to represent people’s perceptions towards different modes of transport in terms of time, cost, comfort, safety and security. The questionnaire is divided into two parts:
1. General or household questionnaire
2. Individual questionnaire
Details of the household survey are given at Annexure 1 (Survey Format 11).
Task 2.6 Review of Energy and Environment
Energy consideration is oneof the key concerns of a “Smart City”. Quantifying energy consumption for transport is important for estimating the CO2 and local air pollution emissions from transport-related activities. To create a complete picture, both top-down and bottom-up approaches for estimating energy consumptions are required. The top-down approach relies on information provided by energy suppliers such as oil companies, electricity department, etc.(generally a few) and the bottom-up approach relies on a primary survey of vehicle users to assess the energy consumption of different vehicle categories, which are then combined with the in-use vehicle population to provide an estimate for total energy use within a city.
Energy Balance
Energy balances are a way of representing aggregate energy flows from energy suppliers to energy consumers and are used as an accounting tool for estimating energy-related emissions. In general, energy balances cover all fuels; however since the focus here is on transport, only diesel, petrol, LPG, CNG and electricity will be covered. A simplified energy balance formatfor energy consumption at the city level within the transport sector is provided in Survey format 12.
9 What is a “trip” – It as a journey carried out for a unique purpose. e.g. “Shabari walks from her house to a roadside stand to buy some fruit, then boards a bus, then transfers to a suburban train. Finally she takes a rickshaw to her daughter’s school. She and her daughter take a ride with a friend in her car to a coffee shop.” She performs 5 trips in total. The different modes which she uses for each trip are walk, bus, train, rickshaw, car.
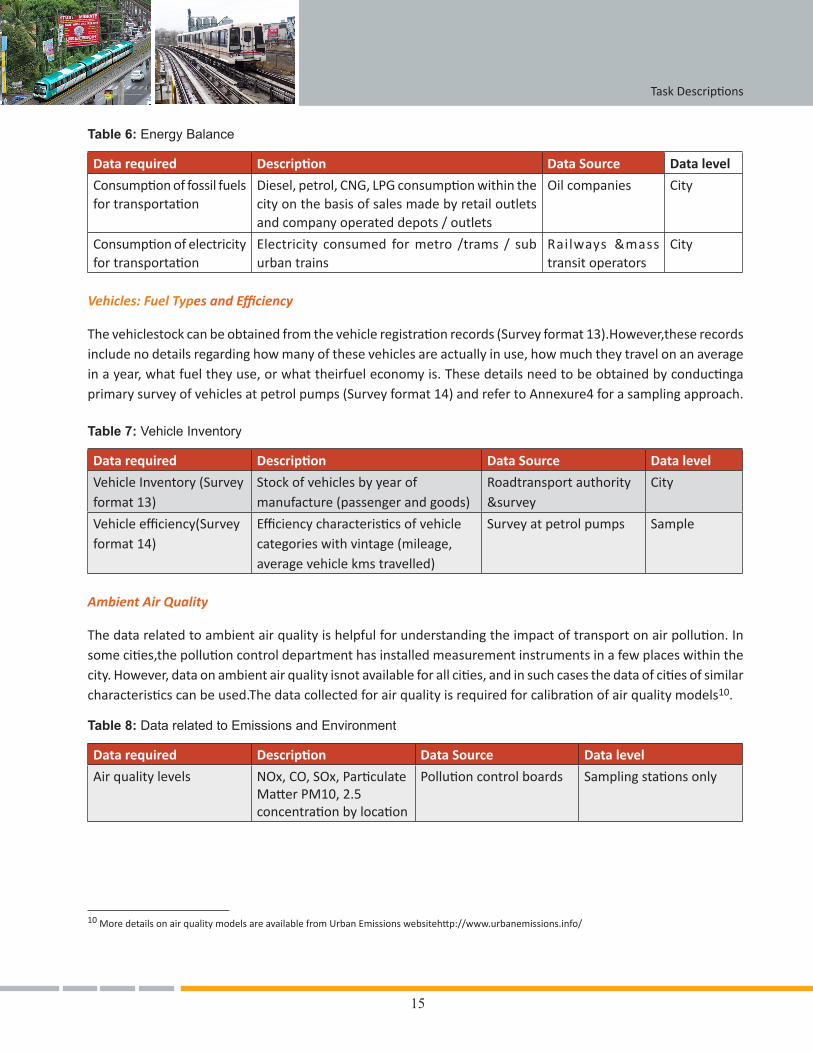
15
Table 6: Energy Balance
Data required Description Data Source Data level
Consumption of fossil fuels for transportation
Diesel, petrol, CNG, LPG consumption within the city on the basis of sales made by retail outlets and company operated depots / outlets
Oil companies City
Consumption of electricity for transportation
Electricity consumed for metro /trams / sub urban trains
Railways &mass transit operators
City
Vehicles: Fuel Types and Efficiency
The vehiclestock can be obtained from the vehicle registration records (Survey format 13).However,these records include no details regarding how many of these vehicles are actually in use, how much they travel on an average in a year, what fuel they use, or what theirfuel economy is. These details need to be obtained by conductinga primary survey of vehicles at petrol pumps (Survey format 14) and refer to Annexure4 for a sampling approach.
Table 7: Vehicle Inventory
Data required Description Data Source Data level
Vehicle Inventory (Survey format 13)
Stock of vehicles by year of manufacture (passenger and goods)
Roadtransport authority &survey
City
Vehicle efficiency(Survey format 14)
Efficiency characteristics of vehicle categories with vintage (mileage, average vehicle kms travelled)
Survey at petrol pumps Sample
Ambient Air Quality
The data related to ambient air quality is helpful for understanding the impact of transport on air pollution. In some cities,the pollution control department has installed measurement instruments in a few places within the city. However, data on ambient air quality isnot available for all cities, and in such cases the data of cities of similar characteristics can be used.The data collected for air quality is required for calibration of air quality models10.
Table 8: Data related to Emissions and Environment
Data required Description Data Source Data level
Air quality levels NOx, CO, SOx, Particulate Matter PM10, 2.5 concentration by location
Pollution control boards Sampling stations only
10 More details on air quality models are available from Urban Emissions websitehttp://www.urbanemissions.info/
Task Descriptions
16
Preparing a Comprehensive Mobility Plan (CMP) – A Toolkit (Revised)
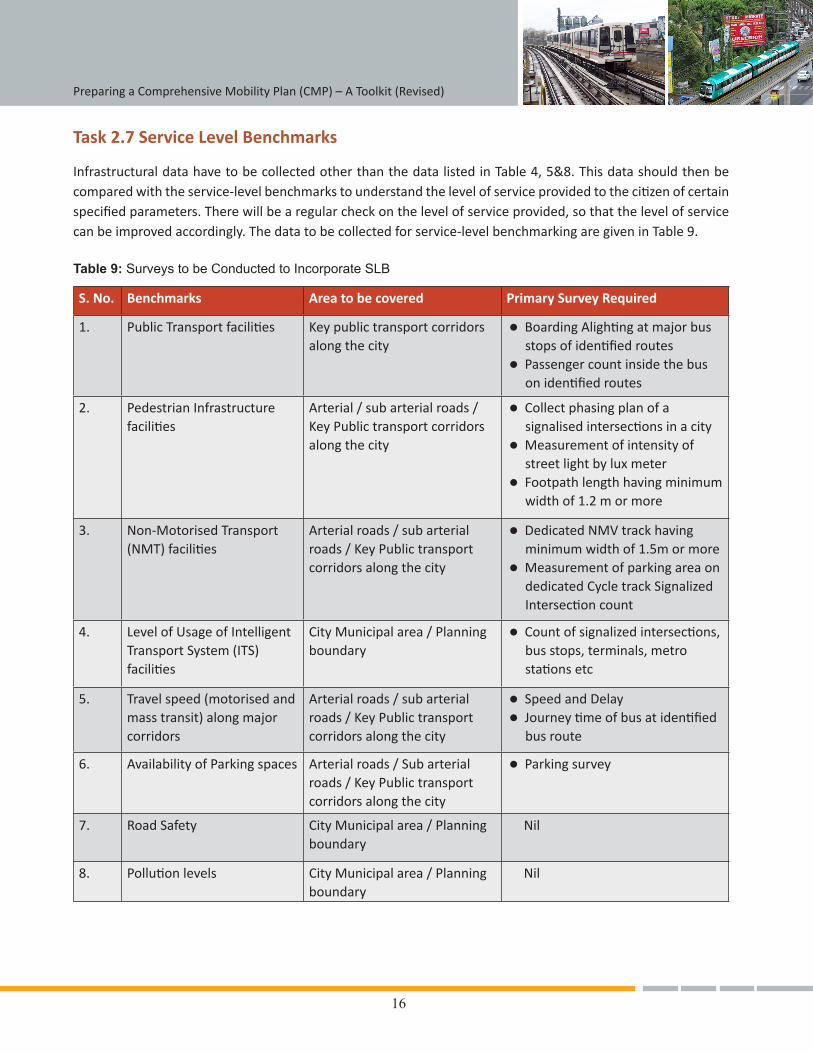
Task 2.7 Service Level Benchmarks
Infrastructural data have to be collected other than the data listed in Table 4, 5&8. This data should then be compared with the service-level benchmarks to understand the level of service provided to the citizen of certain specified parameters. There will be a regular check on the level of service provided, so that the level of service can be improved accordingly. The data to be collected for service-level benchmarking are given in Table 9.
Table 9: Surveys to be Conducted to Incorporate SLB
S. No. Benchmarks Area to be covered Primary Survey Required
1. Public Transport facilities Key public transport corridors along the city
l Boarding Alighting at major bus stops of identified routes
l Passenger count inside the bus on identified routes
2. Pedestrian Infrastructure facilities
Arterial / sub arterial roads / Key Public transport corridors along the city
l Collect phasing plan of a signalised intersections in a city
l Measurement of intensity of street light by lux meter
l Footpath length having minimum width of 1.2 m or more
3. Non-Motorised Transport (NMT) facilities
Arterial roads / sub arterial roads / Key Public transport corridors along the city
l Dedicated NMV track having minimum width of 1.5m or more
l Measurement of parking area on dedicated Cycle track Signalized Intersection count
4. Level of Usage of Intelligent Transport System (ITS) facilities
City Municipal area / Planning boundary
l Count of signalized intersections, bus stops, terminals, metro stations etc
5. Travel speed (motorised and mass transit) along major corridors
Arterial roads / sub arterial roads / Key Public transport corridors along the city
l Speed and Delayl Journey time of bus at identified
bus route
6. Availability of Parking spaces Arterial roads / Sub arterial roads / Key Public transport corridors along the city
l Parking survey
7. Road Safety City Municipal area / Planning boundary
Nil
8. Pollution levels City Municipal area / Planning boundary
Nil
17
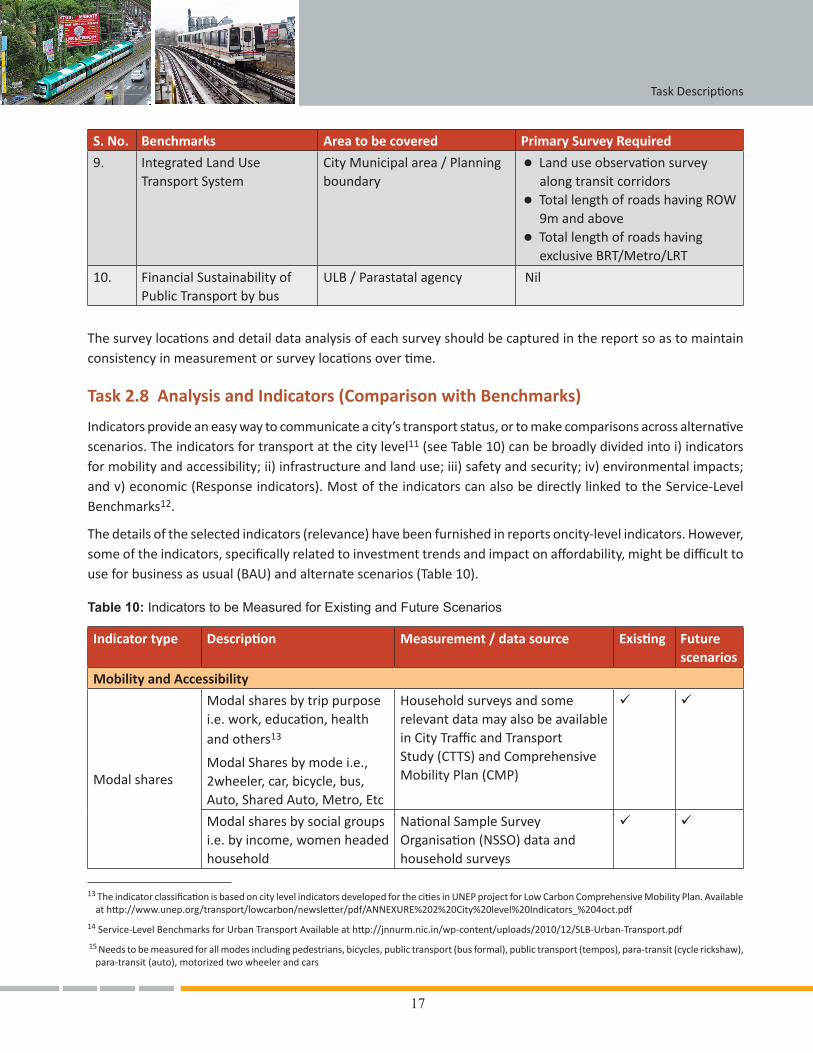
S. No. Benchmarks Area to be covered Primary Survey Required
9. Integrated Land Use Transport System
City Municipal area / Planning boundary
l Land use observation survey along transit corridors
l Total length of roads having ROW 9m and above
l Total length of roads having exclusive BRT/Metro/LRT
10. Financial Sustainability of Public Transport by bus
ULB / Parastatal agency Nil
The survey locations and detail data analysis of each survey should be captured in the report so as to maintain consistency in measurement or survey locations over time.
Task 2.8 Analysis and Indicators (Comparison with Benchmarks)
Indicators provide an easy way to communicate a city’s transport status, or to make comparisons across alternative scenarios. The indicators for transport at the city level11 (see Table 10) can be broadly divided into i) indicators for mobility and accessibility; ii) infrastructure and land use; iii) safety and security; iv) environmental impacts; and v) economic (Response indicators). Most of the indicators can also be directly linked to the Service-Level Benchmarks12.
The details of the selected indicators (relevance) have been furnished in reports oncity-level indicators. However, some of the indicators, specifically related to investment trends and impact on affordability, might be difficult to use for business as usual (BAU) and alternate scenarios (Table 10).
Table 10: Indicators to be Measured for Existing and Future Scenarios
Indicator type Description Measurement / data source Existing Future scenarios
Mobility and Accessibility
Modal shares
Modal shares by trip purpose i.e. work, education, health and others13
Modal Shares by mode i.e., 2wheeler, car, bicycle, bus, Auto, Shared Auto, Metro, Etc
Household surveys and some relevant data may also be available in City Traffic and Transport Study (CTTS) and Comprehensive Mobility Plan (CMP)
ü ü
Modal shares by social groups i.e. by income, women headed household
National Sample Survey Organisation (NSSO) data and household surveys
ü ü
13 The indicator classification is based on city level indicators developed for the cities in UNEP project for Low Carbon Comprehensive Mobility Plan. Available at http://www.unep.org/transport/lowcarbon/newsletter/pdf/ANNEXURE%202%20City%20level%20Indicators_%204oct.pdf
14 Service-Level Benchmarks for Urban Transport Available at http://jnnurm.nic.in/wp-content/uploads/2010/12/SLB-Urban-Transport.pdf
15 Needs to be measured for all modes including pedestrians, bicycles, public transport (bus formal), public transport (tempos), para-transit (cycle rickshaw), para-transit (auto), motorized two wheeler and cars
Task Descriptions
18
Preparing a Comprehensive Mobility Plan (CMP) – A Toolkit (Revised)
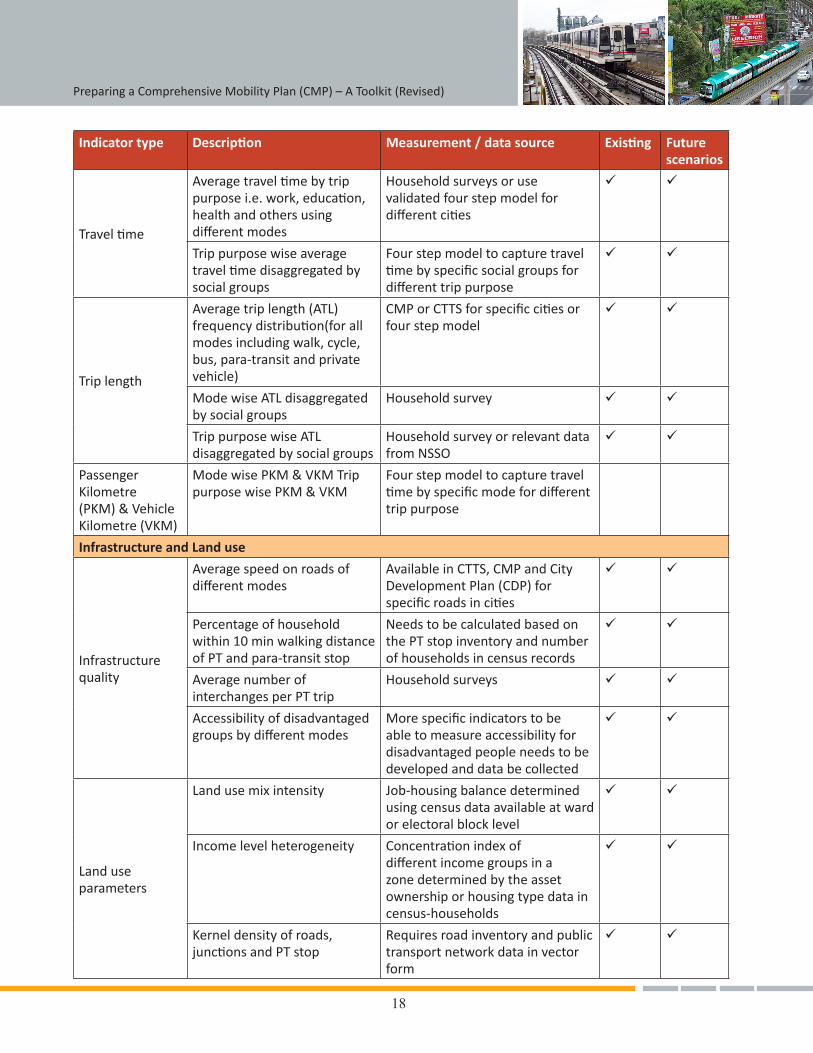
Indicator type Description Measurement / data source Existing Future scenarios
Travel time
Average travel time by trip purpose i.e. work, education, health and others using different modes
Household surveys or use validated four step model for different cities
ü ü
Trip purpose wise average travel time disaggregated by social groups
Four step model to capture travel time by specific social groups for different trip purpose
ü ü
Trip length
Average trip length (ATL) frequency distribution(for all modes including walk, cycle, bus, para-transit and private vehicle)
CMP or CTTS for specific cities or four step model
ü ü
Mode wise ATL disaggregated by social groups
Household survey ü ü
Trip purpose wise ATL disaggregated by social groups
Household survey or relevant data from NSSO
ü ü
Passenger Kilometre (PKM) & Vehicle Kilometre (VKM)
Mode wise PKM & VKM Trip purpose wise PKM & VKM
Four step model to capture travel time by specific mode for different trip purpose
Infrastructure and Land use
Infrastructure quality
Average speed on roads of different modes
Available in CTTS, CMP and City Development Plan (CDP) for specific roads in cities
ü ü
Percentage of household within 10 min walking distance of PT and para-transit stop
Needs to be calculated based on the PT stop inventory and number of households in census records
ü ü
Average number of interchanges per PT trip
Household surveys ü ü
Accessibility of disadvantaged groups by different modes
More specific indicators to be able to measure accessibility for disadvantaged people needs to be developed and data be collected
ü ü
Land use parameters
Land use mix intensity Job-housing balance determined using census data available at ward or electoral block level
ü ü
Income level heterogeneity Concentration index of different income groups in a zone determined by the asset ownership or housing type data in census-households
ü ü
Kernel density of roads, junctions and PT stop
Requires road inventory and public transport network data in vector form
ü ü
19
Indicator type Description Measurement / data source Existing Future scenarios
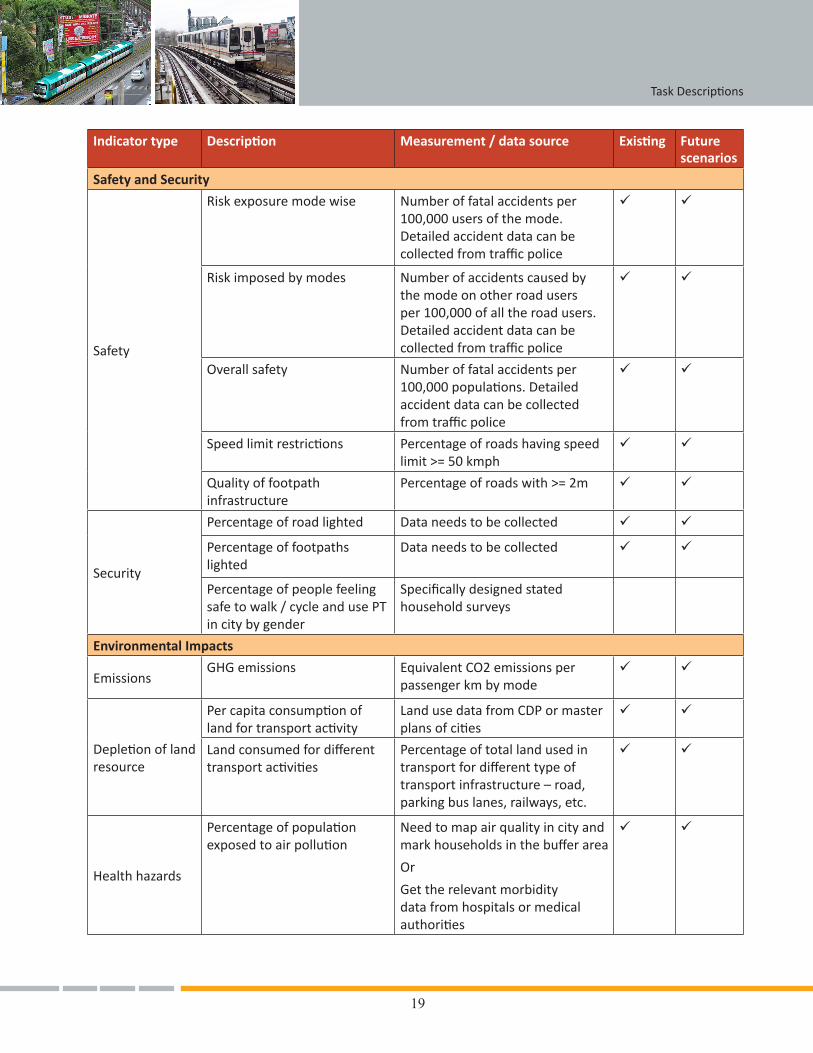
Safety and Security
Safety
Risk exposure mode wise Number of fatal accidents per 100,000 users of the mode. Detailed accident data can be collected from traffic police
ü ü
Risk imposed by modes Number of accidents caused by the mode on other road users per 100,000 of all the road users. Detailed accident data can be collected from traffic police
ü ü
Overall safety Number of fatal accidents per 100,000 populations. Detailed accident data can be collected from traffic police
ü ü
Speed limit restrictions Percentage of roads having speed limit >= 50 kmph
ü ü
Quality of footpath infrastructure
Percentage of roads with >= 2m ü ü
Security
Percentage of road lighted Data needs to be collected ü ü
Percentage of footpaths lighted
Data needs to be collected ü ü
Percentage of people feeling safe to walk / cycle and use PT in city by gender
Specifically designed stated household surveys
Environmental Impacts
EmissionsGHG emissions Equivalent CO2 emissions per
passenger km by modeü ü
Depletion of land resource
Per capita consumption of land for transport activity
Land use data from CDP or master plans of cities
ü ü
Land consumed for different transport activities
Percentage of total land used in transport for different type of transport infrastructure – road, parking bus lanes, railways, etc.
ü ü
Health hazards
Percentage of population exposed to air pollution
Need to map air quality in city and mark households in the buffer area
Or
Get the relevant morbidity data from hospitals or medical authorities
ü ü
Task Descriptions
20
Preparing a Comprehensive Mobility Plan (CMP) – A Toolkit (Revised)
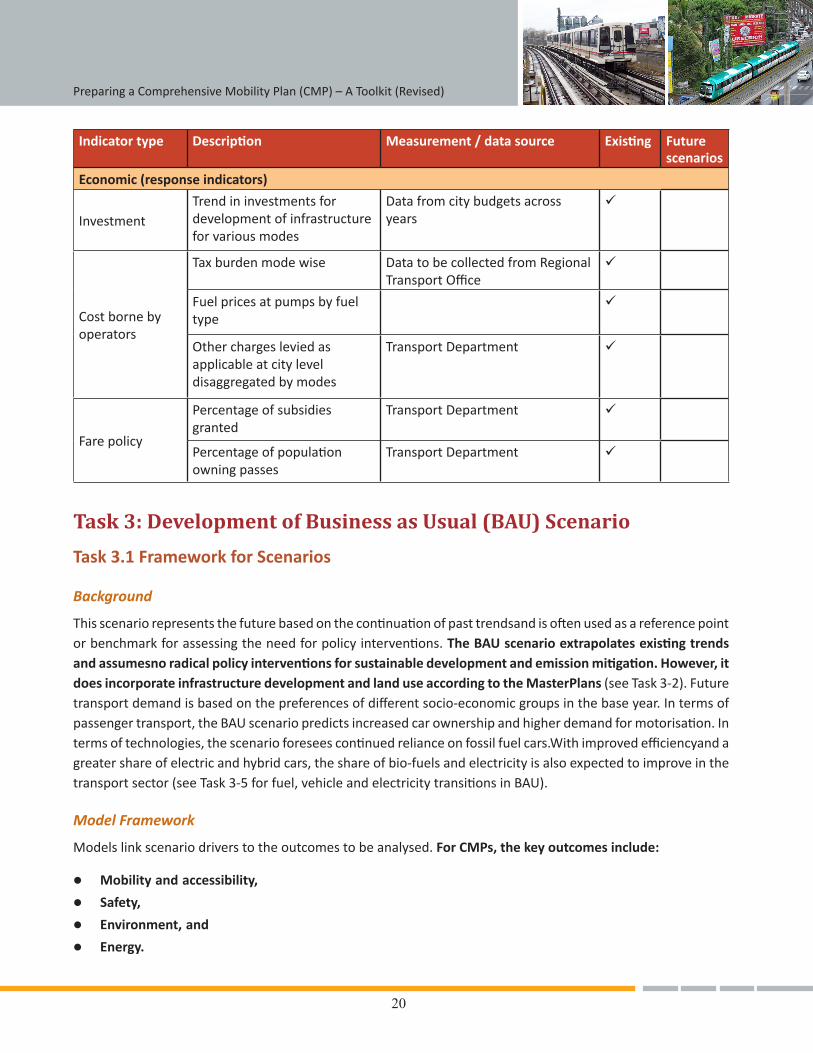
Indicator type Description Measurement / data source Existing Future scenarios
Economic (response indicators)
InvestmentTrend in investments for development of infrastructure for various modes
Data from city budgets across years
ü
Cost borne by operators
Tax burden mode wise Data to be collected from Regional Transport Office
ü
Fuel prices at pumps by fuel type
ü
Other charges levied as applicable at city level disaggregated by modes
Transport Department ü
Fare policy
Percentage of subsidies granted
Transport Department ü
Percentage of population owning passes
Transport Department ü
Task 3: Development of Business as Usual (BAU) Scenario
Task 3.1 Framework for Scenarios
Background
This scenario represents the future based on the continuation of past trendsand is often used as a reference point or benchmark for assessing the need for policy interventions. The BAU scenario extrapolates existing trends and assumesno radical policy interventions for sustainable development and emission mitigation. However, it does incorporate infrastructure development and land use according to the MasterPlans (see Task 3-2). Future transport demand is based on the preferences of different socio-economic groups in the base year. In terms of passenger transport, the BAU scenario predicts increased car ownership and higher demand for motorisation. In terms of technologies, the scenario foresees continued reliance on fossil fuel cars.With improved efficiencyand a greater share of electric and hybrid cars, the share of bio-fuels and electricity is also expected to improve in the transport sector (see Task 3-5 for fuel, vehicle and electricity transitions in BAU).
Model Framework
Models link scenario drivers to the outcomes to be analysed. For CMPs, the key outcomes include:
l Mobility and accessibility,
l Safety,
l Environment, and
l Energy.
21
Given this wide variety of outcomes, it is obvious that acombination of models is required. A description of the model for the CMP work is provided in Task 3-4 (the transport planning model) and Task 3-6 (overall model framework and linkage between transport planning and CO2 emissions and air quality model).
Task 3.2 Socio-Economic Projections
A city’s future economic transitions depend on the current economic transitions taking place across the country. It is also necessary to understand the city’s role in the state and country’s economic development planning goals. For example, if the proposed DMIC14 includes a certain city, it would lead to more economic development than the general trend for the country as a whole, or past trends for the city. Economic transition also leads to social transitions in terms of population (local and migrant), household size, income levels and vehicle ownership.
Demographic Projections
Demographic projection includes population projections for the city along with other demographic variables like family size, agegroup, gender proportion, etc. The population projections should also consider rural-urban, rural-rural and urban-rural migration. The population for each TAZ estimated under Task 2-3 can be used as the basis.
Employment Projection
The jobs for each activity in a particular TAZ,as has been calculated under Task 2-3, can be further projected for the coming years.
Industrial Growth Projection
The employment projections are also affected by the industrial growth in the region. Industrial growth projection depends on the national and state level policies for the region and the growth trend for each of the city’s existing and planned industrial sectors. The growth rates for large industrial sectors (e.g., steel, cement, chemicals, textiles) are linked to the overall economic growth projections for India. The growth projections for the 12th five-year plan are available from the Planning Commission document.15
Task 3.3 Land Use Transitions
The objective of successful land-use development and growth models is to identify where, how much and what kinds of land use will develop. When modelling urban developments, it is necessary to consider changes from a vacant land to built-up, as well as changes in the land use itself, such as from residential to commercial. Simulation tools should be used to study these types of land use changes.
14 Delhi Mumbai Industrial Corridor (DMIC) is a major infrastructure development stretching across the states of Maharashtra, Gujarat, Rajasthan, MP, Delhi, Haryana and Uttar Pradeshwhich will lead to high industrial growth in the corridor area.
15 For 12th Five Year refer http://planningcommission.gov.in/plans/planrel/12thplan/welcome.html
Task Descriptions
22
Preparing a Comprehensive Mobility Plan (CMP) – A Toolkit (Revised)
The input requirements needed for land use simulation consist of the following:
l Existing land use type and its floor area (property tax department) and
l Floor space requirement per capita16 for each land use/TAZ within the city as estimated under Task 2-3.
The land use type should be disaggregated into residential, commercial, retail, recreational, industrial, educational, religious, and other categories. Land use projections and allocations for the coming years should be done in three steps.
Step 1 - This includes the projection of population and employment and estimating the per capita space requirements for each activity as per the equations given below.
FSR = FAR × PR
Where,
FSR = floor space requirement for residential (for various income groups)
FAR = existing per capita floor area for residential
PR = projected residential population (for various income groups17)
FSE = FAE × PE
Where,
FSE = floor space requirement for employment (for various sectors)
FAE = existing per capita floor area for employment
PE = projected employment (for various sectors)
Step 2 - The second step involves two stages:
Stage A—the allocation of non-residential activities based on past trends, Master Plan provisions, as well as the availability of space
Stage B—the allocation of residential activity based on accessibility to jobs for each TAZ, Master Plan provision and availability of space
While allocating activities the General Development Control Regulations (GDCRs) of the city must be referred to as they define the quantum of floor space that can be developed under various land uses.
Step 3 - The third step includes the scope of the land use transition. For example, the probability that a certain area will become completely commercial will shift the residential space to the city’s outer areas in the coming years.
16 The per capita floor area, derived by dividing total floor area of the dwelling unit by household size (members).
17 Reference Income Groups are: Group 1 – Low Income Group – residing in kuttcha or independent houses without any assets(i.e. television or telephone) and do not own any motorized vehicle
Group 2 – Middle Income Group – residing in independent houses or apartments and own 1 motorized two wheeler (scooter/ motorbike)Group 3 – High Income Group – residing in independent houses or apartments and own a four wheeler with other assets
23
Once the allocation of activities is completed, the impact of land use on transport mustbe analysed. When that is done, either the allocation of activities is accepted, or activity allocation process continues and the loop from land use simulation to transport impacts can be re-assessed until low carbon transport mobility goals are achieved.
Task 3.4 Transport Demand Analysis
The demand for passenger transport can be estimated using a four-step model (see Annexure 5 for a detailed description). The four-step model is based on inputs ofexisting travel behaviour obtained from the household survey(Survey format 11), and of transport infrastructure and service quality. As the first step, the model is developed for the base year.The traffic flows on different road links are compared with the actual traffic volume counts observed at various locations across the city. The model is then recalibrated to match the actual volume counts. The base year model can then be used to identify and test various short-term measures that can be incorporated to improve the existing transportation system.
Once the transport demand model is calibrated for the base year, it can be used for analyzing the future of the BAU scenario. The inputs for this analysis will be theplanned strategies, changes in socio-economic drivers[i.e., population and employment projections (Task 3-2)] and changes in land use (Task 3-3).The BAU scenario assumes that people’s travel behaviour(within the same age and socio-economic group)remains the same as the base year.
Task 3.5 Technology Transitions
An understanding of vehicles, fuels and CO2 emissions from electricity use in transportation system is essential to learning the implications of travel demand on CO2 emissions and air quality (Task 3-6).
Vehicles and Fuels
The transport sector relies primarily on fossil fuels. The dependence on fossil fuels is linked to the domination of internal combustion engine technology on a global scale. In future, however, multiple transitions can affectvehicles and associated infrastructures. There could be:
i. a change in fuels due to greater use of CNG, bio-fuels, and cleaner petrol and diesel;
ii. more efficient engines; or
iii. more electricity for transportation such as metro rail and other rail based transit,as well aselectric vehicles (2 wheelers, cars, etc.) for road transport.
Task Descriptions
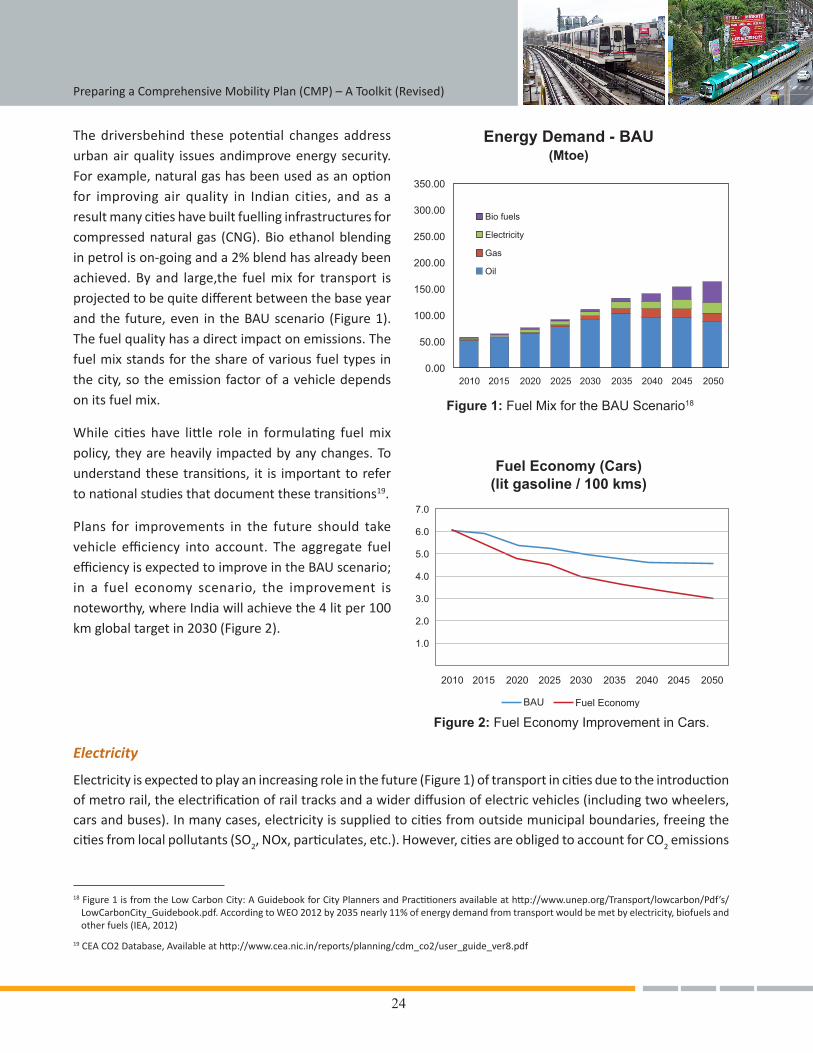
24
Preparing a Comprehensive Mobility Plan (CMP) – A Toolkit (Revised)
The driversbehind these potential changes address urban air quality issues andimprove energy security. For example, natural gas has been used as an option for improving air quality in Indian cities, and as a result many cities have built fuelling infrastructures for compressed natural gas (CNG). Bio ethanol blending in petrol is on-going and a 2% blend has already been achieved. By and large,the fuel mix for transport is projected to be quite different between the base year and the future, even in the BAU scenario (Figure 1). The fuel quality has a direct impact on emissions. The fuel mix stands for the share of various fuel types in the city, so the emission factor of a vehicle depends on its fuel mix.
While cities have little role in formulating fuel mix policy, they are heavily impacted by any changes. To understand these transitions, it is important to refer to national studies that document these transitions19.
Plans for improvements in the future should take vehicle efficiency into account. The aggregate fuel efficiency is expected to improve in the BAU scenario; in a fuel economy scenario, the improvement is noteworthy, where India will achieve the 4 lit per 100 km global target in 2030 (Figure 2).
18 Figure 1 is from the Low Carbon City: A Guidebook for City Planners and Practitioners available at http://www.unep.org/Transport/lowcarbon/Pdf’s/LowCarbonCity_Guidebook.pdf. According to WEO 2012 by 2035 nearly 11% of energy demand from transport would be met by electricity, biofuels and other fuels (IEA, 2012)
19 CEA CO2 Database, Available at http://www.cea.nic.in/reports/planning/cdm_co2/user_guide_ver8.pdf
Figure 1: Fuel Mix for the BAU Scenario18
Energy Demand - BAU(Mtoe)
Fuel Economy (Cars)(lit gasoline / 100 kms)
Figure 2: Fuel Economy Improvement in Cars.
Electricity
Electricity is expected to play an increasing role in the future (Figure 1) of transport in cities due to the introduction of metro rail, the electrification of rail tracks and a wider diffusion of electric vehicles (including two wheelers, cars and buses). In many cases, electricity is supplied to cities from outside municipal boundaries, freeing the cities from local pollutants (SO2, NOx, particulates, etc.). However, cities are obliged to account for CO2 emissions
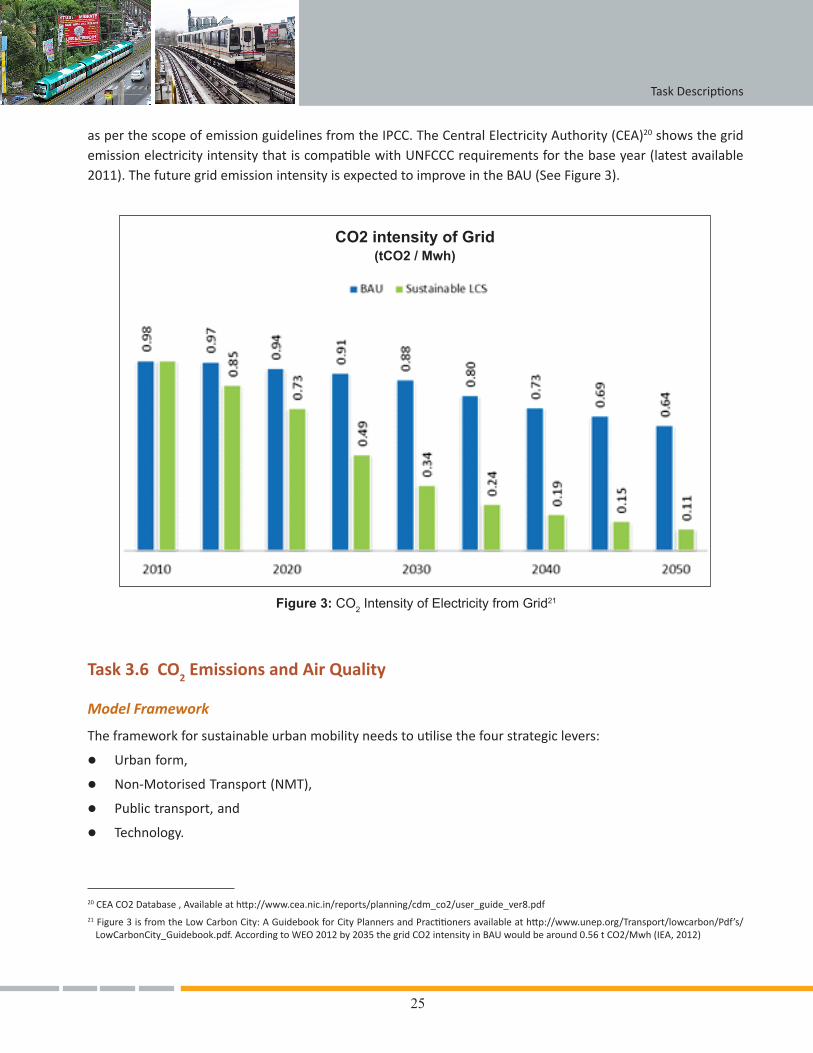
25
as per the scope of emission guidelines from the IPCC. The Central Electricity Authority (CEA)20 shows the grid emission electricity intensity that is compatible with UNFCCC requirements for the base year (latest available 2011). The future grid emission intensity is expected to improve in the BAU (See Figure 3).
Figure 3: CO2 Intensity of Electricity from Grid21
CO2 intensity of Grid(tCO2 / Mwh)
20 CEA CO2 Database , Available at http://www.cea.nic.in/reports/planning/cdm_co2/user_guide_ver8.pdf21 Figure 3 is from the Low Carbon City: A Guidebook for City Planners and Practitioners available at http://www.unep.org/Transport/lowcarbon/Pdf’s/
LowCarbonCity_Guidebook.pdf. According to WEO 2012 by 2035 the grid CO2 intensity in BAU would be around 0.56 t CO2/Mwh (IEA, 2012)
Task 3.6 CO2 Emissions and Air Quality
Model Framework
The framework for sustainable urban mobility needs to utilise the four strategic levers:
l Urban form,
l Non-Motorised Transport (NMT),
l Public transport, and
l Technology.
Task Descriptions
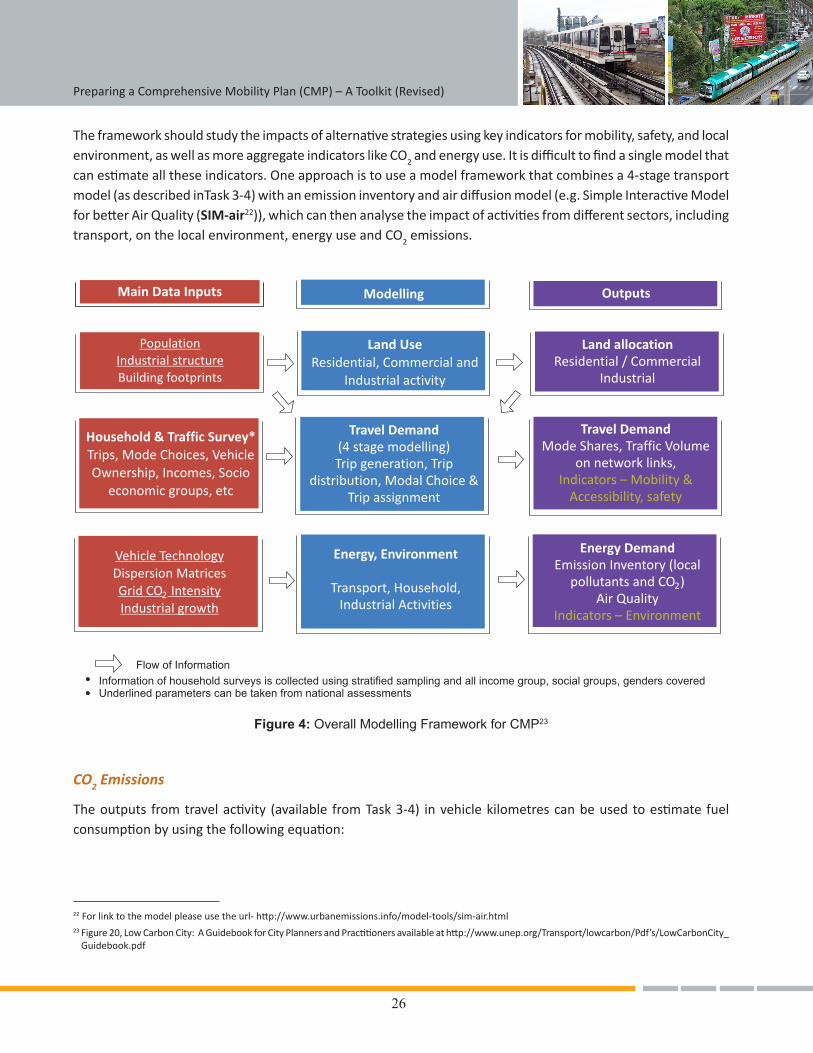
26
Preparing a Comprehensive Mobility Plan (CMP) – A Toolkit (Revised)
The framework should study the impacts of alternative strategies using key indicators for mobility, safety, and local environment, as well as more aggregate indicators like CO2 and energy use. It is difficult to find a single model that can estimate all these indicators. One approach is to use a model framework that combines a 4-stage transport model (as described inTask 3-4) with an emission inventory and air diffusion model (e.g. Simple Interactive Model for better Air Quality (SIM-air22)), which can then analyse the impact of activities from different sectors, including transport, on the local environment, energy use and CO2 emissions.
Figure 4: Overall Modelling Framework for CMP23
22 For link to the model please use the url- http://www.urbanemissions.info/model-tools/sim-air.html23 Figure 20, Low Carbon City: A Guidebook for City Planners and Practitioners available at http://www.unep.org/Transport/lowcarbon/Pdf’s/LowCarbonCity_
Guidebook.pdf
CO2 Emissions
The outputs from travel activity (available from Task 3-4) in vehicle kilometres can be used to estimate fuel consumption by using the following equation:
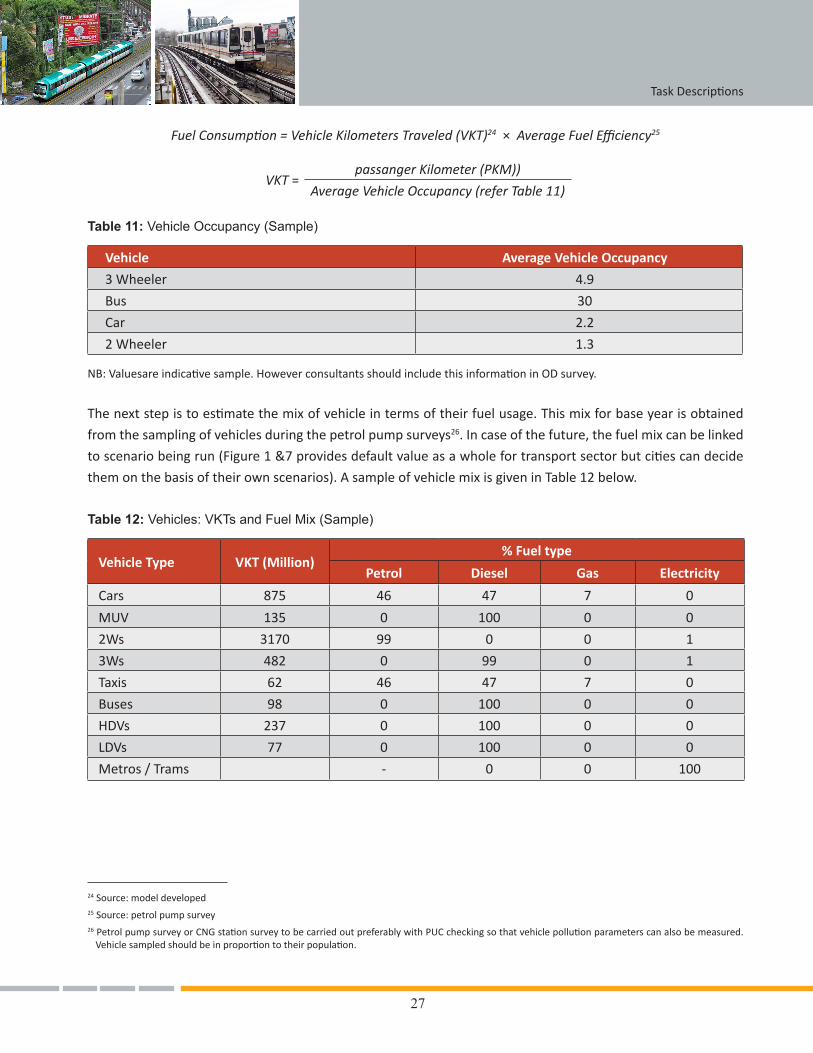
27
Fuel Consumption = Vehicle Kilometers Traveled (VKT)24 × Average Fuel Efficiency25
VKT =passanger Kilometer (PKM))
Average Vehicle Occupancy (refer Table 11)
Table 11: Vehicle Occupancy (Sample)
Vehicle Average Vehicle Occupancy
3 Wheeler 4.9
Bus 30
Car 2.2
2 Wheeler 1.3
NB: Valuesare indicative sample. However consultants should include this information in OD survey.
The next step is to estimate the mix of vehicle in terms of their fuel usage. This mix for base year is obtained
from the sampling of vehicles during the petrol pump surveys26. In case of the future, the fuel mix can be linked
to scenario being run (Figure 1 &7 provides default value as a whole for transport sector but cities can decide
them on the basis of their own scenarios). A sample of vehicle mix is given in Table 12 below.
Table 12: Vehicles: VKTs and Fuel Mix (Sample)
Vehicle Type VKT (Million)% Fuel type
Petrol Diesel Gas Electricity
Cars 875 46 47 7 0
MUV 135 0 100 0 0
2Ws 3170 99 0 0 1
3Ws 482 0 99 0 1
Taxis 62 46 47 7 0
Buses 98 0 100 0 0
HDVs 237 0 100 0 0
LDVs 77 0 100 0 0
Metros / Trams - 0 0 100
24 Source: model developed25 Source: petrol pump survey26 Petrol pump survey or CNG station survey to be carried out preferably with PUC checking so that vehicle pollution parameters can also be measured.
Vehicle sampled should be in proportion to their population.
Task Descriptions
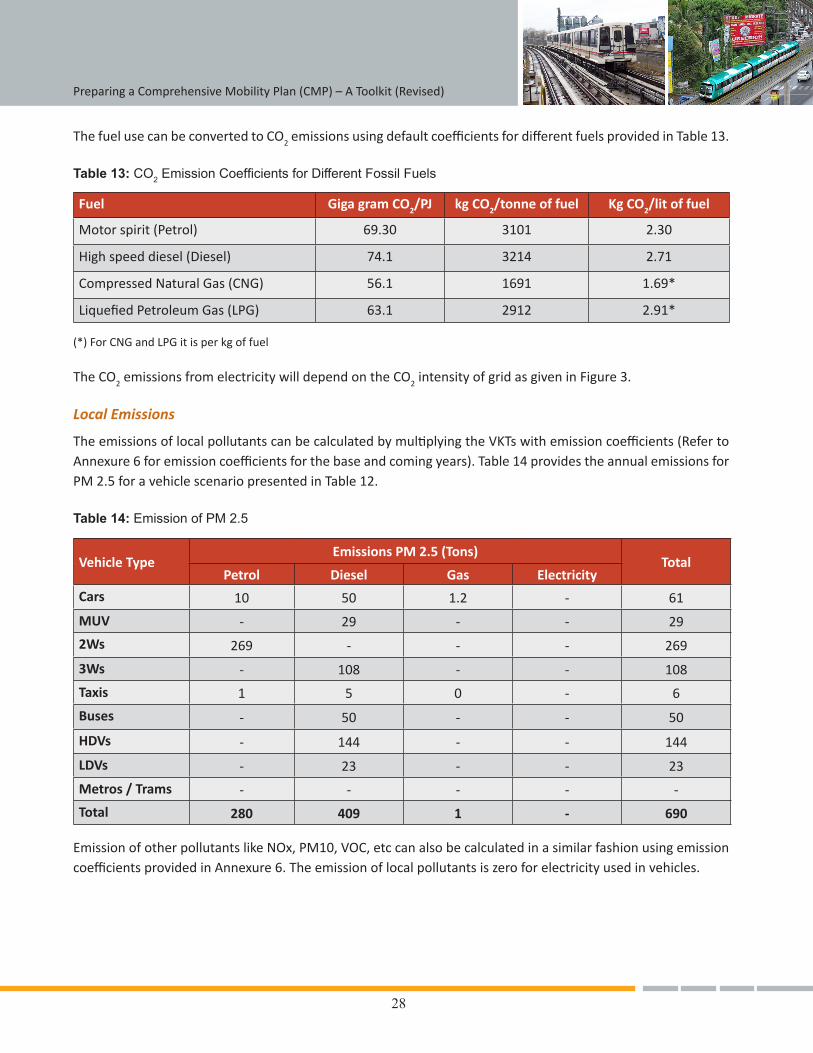
28
Preparing a Comprehensive Mobility Plan (CMP) – A Toolkit (Revised)
The fuel use can be converted to CO2 emissions using default coefficients for different fuels provided in Table 13.
Table 13: CO2 Emission Coefficients for Different Fossil Fuels
Fuel Giga gram CO2/PJ kg CO2/tonne of fuel Kg CO2/lit of fuel
Motor spirit (Petrol) 69.30 3101 2.30
High speed diesel (Diesel) 74.1 3214 2.71
Compressed Natural Gas (CNG) 56.1 1691 1.69*
Liquefied Petroleum Gas (LPG) 63.1 2912 2.91*
(*) For CNG and LPG it is per kg of fuel
The CO2 emissions from electricity will depend on the CO2 intensity of grid as given in Figure 3.
Local Emissions
The emissions of local pollutants can be calculated by multiplying the VKTs with emission coefficients (Refer to Annexure 6 for emission coefficients for the base and coming years). Table 14 provides the annual emissions for PM 2.5 for a vehicle scenario presented in Table 12.
Table 14: Emission of PM 2.5
Vehicle TypeEmissions PM 2.5 (Tons)
TotalPetrol Diesel Gas Electricity
Cars 10 50 1.2 - 61
MUV - 29 - - 29
2Ws 269 - - - 269
3Ws - 108 - - 108
Taxis 1 5 0 - 6
Buses - 50 - - 50
HDVs - 144 - - 144
LDVs - 23 - - 23
Metros / Trams - - - - -
Total 280 409 1 - 690
Emission of other pollutants like NOx, PM10, VOC, etc can also be calculated in a similar fashion using emission coefficients provided in Annexure 6. The emission of local pollutants is zero for electricity used in vehicles.
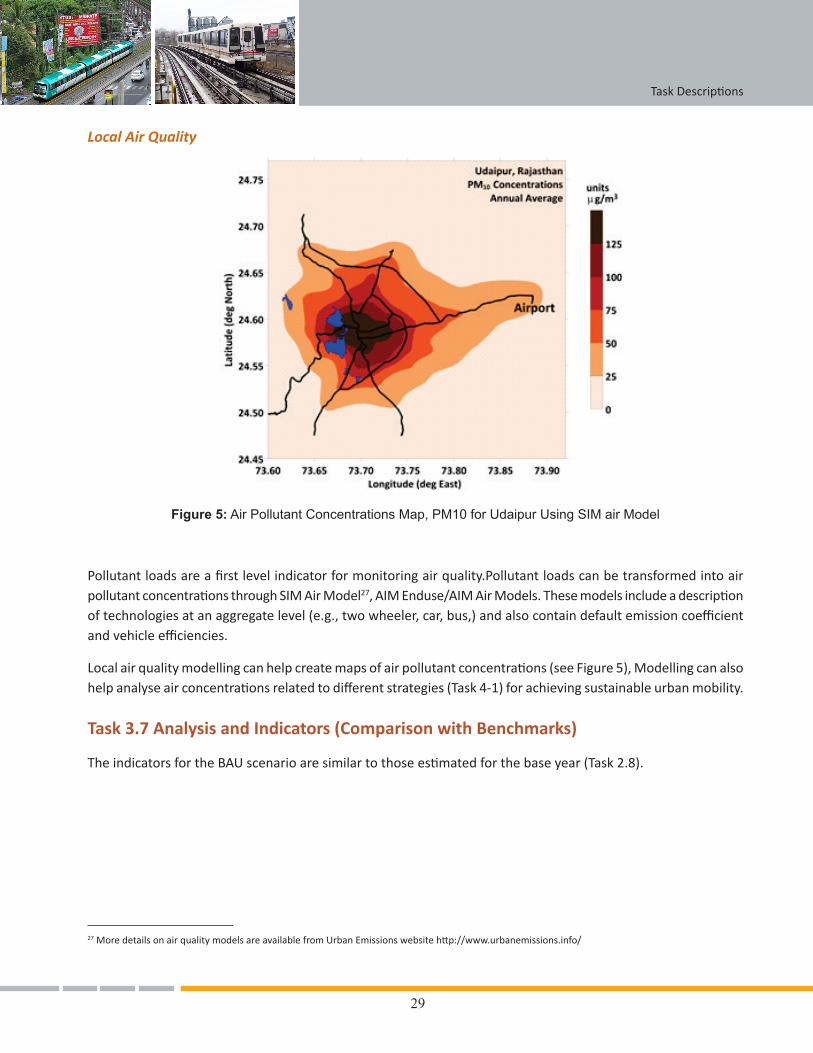
29
Pollutant loads are a first level indicator for monitoring air quality.Pollutant loads can be transformed into air pollutant concentrations through SIM Air Model27, AIM Enduse/AIM Air Models. These models include a description of technologies at an aggregate level (e.g., two wheeler, car, bus,) and also contain default emission coefficient and vehicle efficiencies.
Local air quality modelling can help create maps of air pollutant concentrations (see Figure 5), Modelling can also help analyse air concentrations related to different strategies (Task 4-1) for achieving sustainable urban mobility.
Task 3.7 Analysis and Indicators (Comparison with Benchmarks)
The indicators for the BAU scenario are similar to those estimated for the base year (Task 2.8).
Local Air Quality
Figure 5: Air Pollutant Concentrations Map, PM10 for Udaipur Using SIM air Model
27 More details on air quality models are available from Urban Emissions website http://www.urbanemissions.info/
Task Descriptions
30
Preparing a Comprehensive Mobility Plan (CMP) – A Toolkit (Revised)
Task 4: Development of Sustainable Urban Transport Scenarios
Task 4.1 Framework for Scenario
Review of National Carbon Indicators
CO2 is the predominant constituent of greenhouse gas and therefore indicators for CO2 at the national level are more easily available than for other greenhouse gases (e.g., CH4 and N20). The per capita CO2 emissions based on the second national communication was 1.0 t CO2
29 in 2000. Due to the rapid pace of development, the per capita CO2 emissions increased to 1.33 t CO2
30 in 2010. For future emission trajectories, a reference can be made to studies undertaken by the Climate Modelling Forum31 in 2009, or to more recent modelling work under a UNEP project32 that provides CO2 indicators for the BAU as well as sustainable scenarios.
Background
The sustainable urban transport scenario visualises social, economic, environmental and technological transitions through which societies respond to climate change, local environment and mobility challenges. The scenario assumes the following:
l Deep emission cuts using low carbon energy sources (such as renewable’s, natural gas, nuclear power)
l Use of highly efficient technologies (e.g., improved vehicle efficiency)
l Adoption of behavioural and consumption styles consistent with sustainable development
l Changes in urban development
l Enhanced use of non-motorised and public transport infrastructures.
The sustainable development pathway allows CO2 mitigation without having to sacrifice the original objective of enhancing economic and social development.
Identification and Quantification of Drivers
The main drivers are socio-economic projections, land use, infrastructure and policy change. The socio-economic projections in the BAU scenario can be used, however for changes in land use, infrastructures and policies please refer to Task 4.2.
Model Framework
Same as provided in Task 3.1.
28 Ministry of Environment & Forests (2012) India: Second National Communication to UNFCCC available at http://moef.nic.in/downloads/public-information/India%20Second%20National%20Communication%20to%20UNFCCC.pdf.
29 Considering population as 1021 million and excluding bunker fuel emissions
30 As per IEA (2012), World Energy Outlook total CO2 emissions from energy 1635 Million tCO2 in 2010 and the the population in 2010 as 1224 million
31 Climate Modelling Forum (2009) India’s GHG Emissions Profile http://moef.nic.in/downloads/home/GHG-report.pdf
32 See Figure 13, Low Carbon City: A Guidebook for City Planners and Practitioners available at http://www.unep.org/Transport/lowcarbon/Pdf’s/LowCarbonCity_Guidebook.pdf
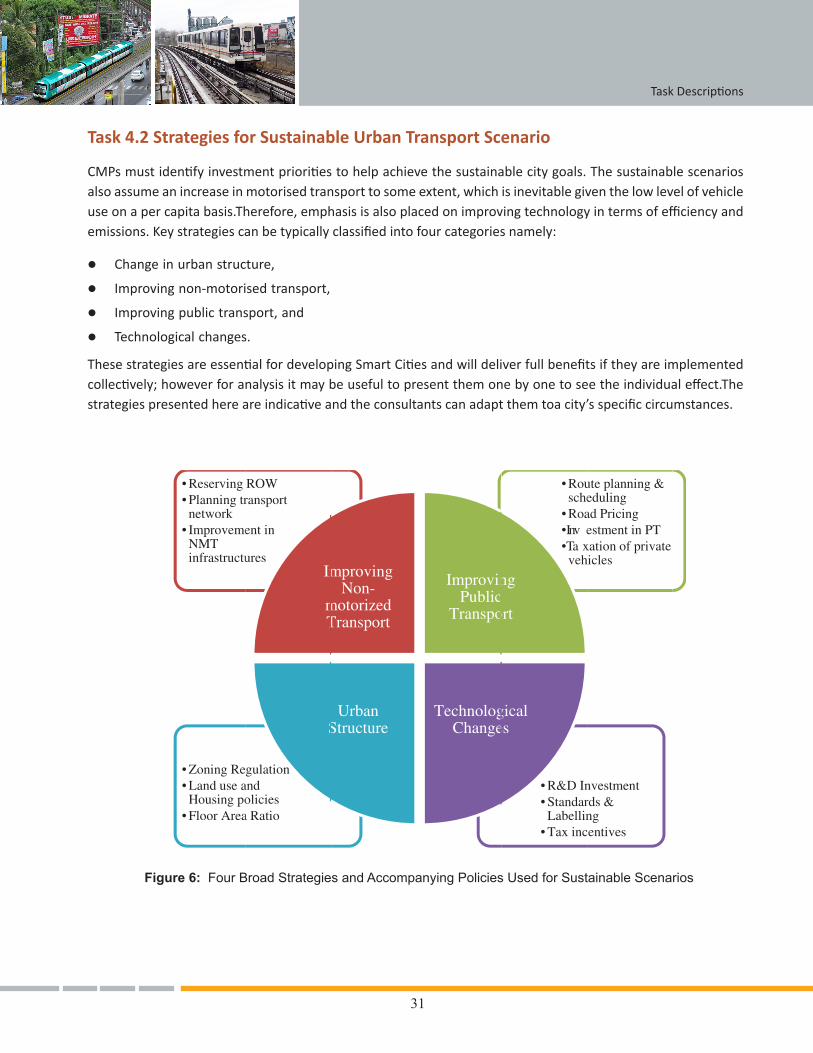
31
Task 4.2 Strategies for Sustainable Urban Transport Scenario
CMPs must identify investment priorities to help achieve the sustainable city goals. The sustainable scenarios also assume an increase in motorised transport to some extent, which is inevitable given the low level of vehicle use on a per capita basis.Therefore, emphasis is also placed on improving technology in terms of efficiency and emissions. Key strategies can be typically classified into four categories namely:
l Change in urban structure,
l Improving non-motorised transport,
l Improving public transport, and
l Technological changes.
These strategies are essential for developing Smart Cities and will deliver full benefits if they are implemented collectively; however for analysis it may be useful to present them one by one to see the individual effect.The strategies presented here are indicative and the consultants can adapt them toa city’s specific circumstances.
Figure 6: Four Broad Strategies and Accompanying Policies Used for Sustainable Scenarios
Task Descriptions
32
Preparing a Comprehensive Mobility Plan (CMP) – A Toolkit (Revised)
A: Urban Structure
Urban sprawl and uncontrolled growth of cities result in increased trip lengths, which is not a desirable scenario. Therefore, the focus should be to develop compact cities with high density and multi-nuclei development.It will help shorten trip lengths and improve access to public transport. The changes in zoning regulations and floor area ratio (FAR) include some of the planning and regulatory measures, which can help achieve higher densityand compact development.
B: Non-Motorised Transport Infrastructure
The scenario considers improvements in NMT user experience by enhancing footpaths and bicycle lanes. It also addresses improvement in safety and accessibilityfor pedestrians and bicycles at intersections. Reducing barriers and impediments on roads to improve bicycle safety is another aspect considered under the scenario. Reduced conflicts between NMT users and buses on roads can result in a small increase in bus speed.
C: Public Transport
The public transport scenarioincludesNMT,as any public transit trip includes a component of NMT for access and egress. Since most Indian cities lack a reliable bus service, two kinds of scenarios for public transport may be considered:
1. Improved bus service with compatiblepedestrian and bicycle infrastructure
The scenario assumes thatbus infrastructure and operations are improved so that reliable bus service is available at least along all arterial roads. In addition,initial ideas on operational interventions like better routing and scheduling,improved frequency, better bus stop design, improve bus speed, overall safety and bus user comfort should be incorporated.Option of providing para transit modes on the sub arterial and connecting roads should also be considered. This will help limit the access/egress trip length to less than 1 km. Stress should also be given to the provision of access and egress support infrastructures for walking and bicycle. The above mentioned changes should be used to check the stated preference mode choice of respondents in the household survey. This will help compute the increased demand for public transport in the scenario where limitations of infrastructures (which exists in the BAU scenario) for public and non-motorised transport are removed.
2. Improved bus service and mass rapid transit with compatiblepedestrian and bicycle infrastructure
This scenario includes all improvementsdetailed above in the improved bus service scenario, as well as a mass rapid transit system on selected traffic corridors. Mass rapid transit options could include BRT (exclusive lanes on all arterial roads), light rail, a metro rail system or mono rail system.3334
33 For an overview of Mass Transit Cost Analysis see Life Cycle Cost Analysis of Five Urban Transport Systems available at http://www.iutindia.org/downloads/documents
34 For an overview of Mass Transit Options see Table 9. Low Carbon City: A Guidebook for City Planners and Practitioners available at http://www.unep.org/Transport/lowcarbon/Pdf’s/LowCarbonCity_Guidebook.pdf
33
D: Improving Public Transport, NMT and Urban Structure
This scenario looks at how the implementation of NMT, public transport and urban structure strategies combine and complement each other.
E: Technology
Technology changes can encompass changes in vehicles design, fuels use, energy use and reduction in CO2
emissions related to electrically driven vehicle based on central / state policies.See Task 4-4.
F: Regulatory and Financial Measures (Incentives and Disincentives)
A wide variety of measures can be undertaken tohelp shift people from private transport modes to sustainable urban transport under a regulatory and financial measure scenario. These measures try to internalise the cost of externalities imposed by private vehicles. Examples of such measures include parking policies, congestion pricing and carbon-taxes by central / state decisions. These are incorporated in the model in form of increased generalized cost of travel by private modes. As an example, described below is the approach for modelling parking policies.
Parking Policies
Parking is generally low costif not freein Indian cities. As a result, there is no disincentive for owners of private transport modes like cars and motorised two-wheelers to stop using them to get from one place to another.Instead, there are plenty of incentives to keep using them, as they offer a high amount of personal mobility.
In this scenario, infrastructure improvements are made for pedestrians, bicycles and public transport along with increased parking cost. Toimplementarobuston-streetparking managementand enforcementsystem, on-street parking spaces must be regulated by the cities, and priced according to the demand for parking. Theexistingparking management system, includingcurrentearningsand expenditures, operationalsystems, and publicperception must be documented, assessed and improved. Anexpandedand improved parking managementsystem can helpfacilitatetheefficientallocation ofroad space, generaterevenue forsustainabletransport projects, and encourageashift tomoresustainablemodes. In the four-step model these should increase the generalized cost of travel of motorised modes as compared to NMT and PT mode, which will favour use of NMT and PT modes.
Task 4.3 Transport Demand Analysisof Alternative Strategies for Sustainable Urban Transport
The above scenario’s(A, B, C, D, Eand F)aim is to improve transport infrastructure and increase the cost of using personal motorised vehicles. Two methods can be used to estimate travel demand for different modes under alternative scenarios:
Method 1: Repeating a four-step model
In this method, a four-step model (as discussed in Task 3-4) is repeated, taking into account changes in parameters associated with different modes such as cost, travel time, availability, comfort and safety. These changes result in a changed impedance to different modes and consequently,changes in people’s transport choices. Likely changes to be accounted in the four-step model in alternate scenarios are described in the Table 15.
Task Descriptions
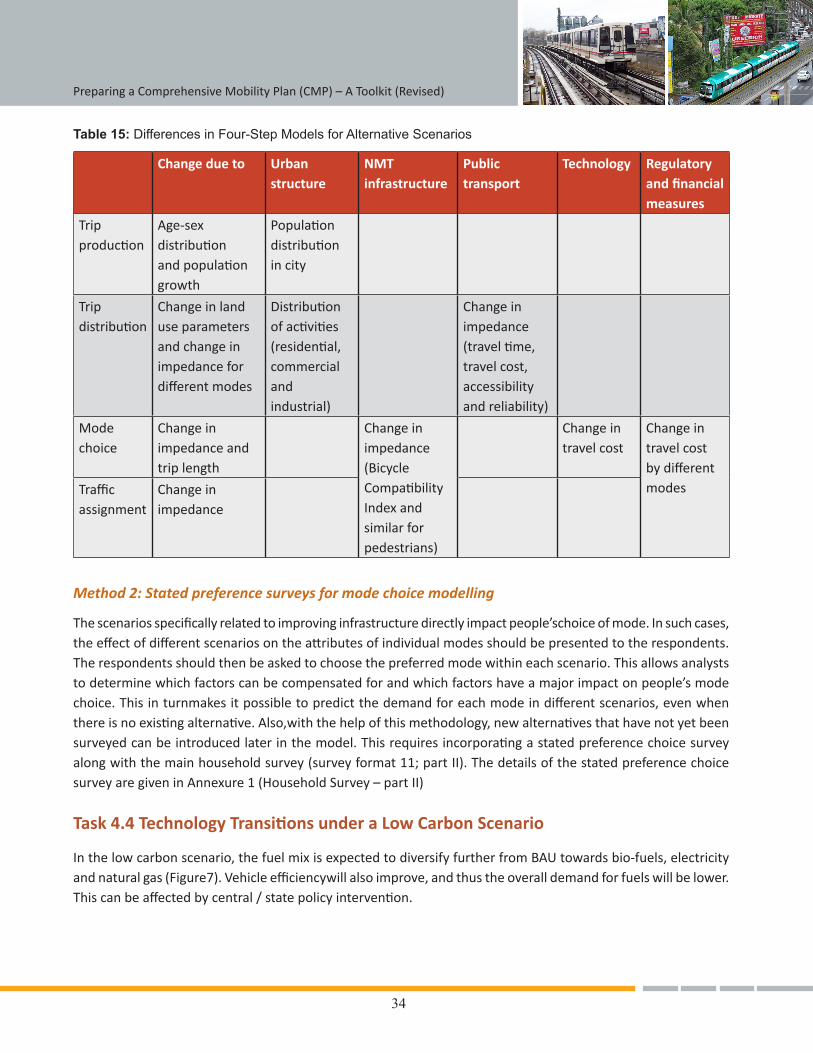
34
Preparing a Comprehensive Mobility Plan (CMP) – A Toolkit (Revised)
Table 15: Differences in Four-Step Models for Alternative Scenarios
Change due to Urban structure
NMT infrastructure
Public transport
Technology Regulatory and financial measures
Trip production
Age-sex distribution and population growth
Population distribution in city
Trip distribution
Change in land use parameters and change in impedance for different modes
Distribution of activities (residential, commercial and industrial)
Change in impedance (travel time, travel cost, accessibility and reliability)
Mode choice
Change in impedance and trip length
Change in impedance (Bicycle Compatibility Index and similar for pedestrians)
Change in travel cost
Change in travel cost by different modesTraffic
assignmentChange in impedance
Method 2: Stated preference surveys for mode choice modelling
The scenarios specifically related to improving infrastructure directly impact people’schoice of mode. In such cases, the effect of different scenarios on the attributes of individual modes should be presented to the respondents. The respondents should then be asked to choose the preferred mode within each scenario. This allows analysts to determine which factors can be compensated for and which factors have a major impact on people’s mode choice. This in turnmakes it possible to predict the demand for each mode in different scenarios, even when there is no existing alternative. Also,with the help of this methodology, new alternatives that have not yet been surveyed can be introduced later in the model. This requires incorporating a stated preference choice survey along with the main household survey (survey format 11; part II). The details of the stated preference choice survey are given in Annexure 1 (Household Survey – part II)
Task 4.4 Technology Transitions under a Low Carbon Scenario
In the low carbon scenario, the fuel mix is expected to diversify further from BAU towards bio-fuels, electricity and natural gas (Figure7). Vehicle efficiencywill also improve, and thus the overall demand for fuels will be lower. This can be affected by central / state policy intervention.
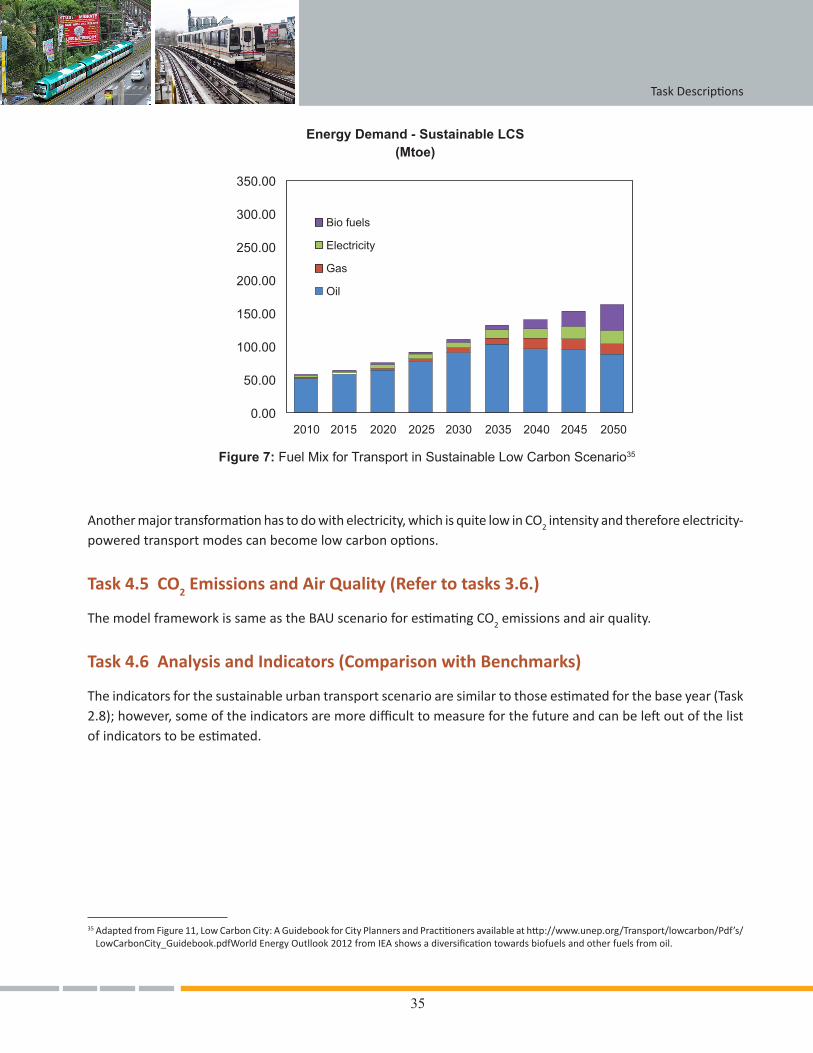
35
Another major transformation has to do with electricity, which is quite low in CO2 intensity and therefore electricity-powered transport modes can become low carbon options.
Task 4.5 CO2 Emissions and Air Quality (Refer to tasks 3.6.)
The model framework is same as the BAU scenario for estimating CO2 emissions and air quality.
Task 4.6 Analysis and Indicators (Comparison with Benchmarks)
The indicators for the sustainable urban transport scenario are similar to those estimated for the base year (Task 2.8); however, some of the indicators are more difficult to measure for the future and can be left out of the list of indicators to be estimated.
Figure 7: Fuel Mix for Transport in Sustainable Low Carbon Scenario35
Energy Demand - Sustainable LCS(Mtoe)
35 Adapted from Figure 11, Low Carbon City: A Guidebook for City Planners and Practitioners available at http://www.unep.org/Transport/lowcarbon/Pdf’s/LowCarbonCity_Guidebook.pdfWorld Energy Outllook 2012 from IEA shows a diversification towards biofuels and other fuels from oil.
Task Descriptions
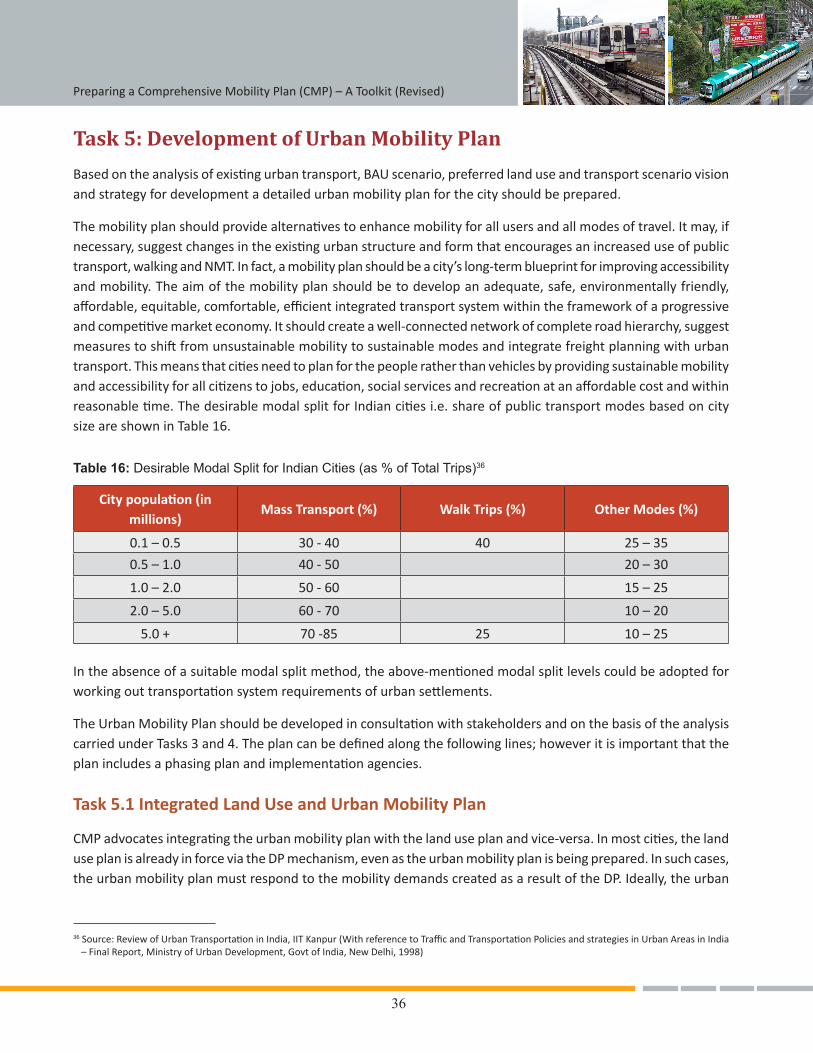
36
Preparing a Comprehensive Mobility Plan (CMP) – A Toolkit (Revised)
Task 5: Development of Urban Mobility Plan
Based on the analysis of existing urban transport, BAU scenario, preferred land use and transport scenario vision and strategy for development a detailed urban mobility plan for the city should be prepared.
The mobility plan should provide alternatives to enhance mobility for all users and all modes of travel. It may, if necessary, suggest changes in the existing urban structure and form that encourages an increased use of public transport, walking and NMT. In fact, a mobility plan should be a city’s long-term blueprint for improving accessibility and mobility. The aim of the mobility plan should be to develop an adequate, safe, environmentally friendly, affordable, equitable, comfortable, efficient integrated transport system within the framework of a progressive and competitive market economy. It should create a well-connected network of complete road hierarchy, suggest measures to shift from unsustainable mobility to sustainable modes and integrate freight planning with urban transport. This means that cities need to plan for the people rather than vehicles by providing sustainable mobility and accessibility for all citizens to jobs, education, social services and recreation at an affordable cost and within reasonable time. The desirable modal split for Indian cities i.e. share of public transport modes based on city size are shown in Table 16.
Table 16: Desirable Modal Split for Indian Cities (as % of Total Trips)36
City population (in millions)
Mass Transport (%) Walk Trips (%) Other Modes (%)
0.1 – 0.5 30 - 40 40 25 – 35
0.5 – 1.0 40 - 50 20 – 30
1.0 – 2.0 50 - 60 15 – 25
2.0 – 5.0 60 - 70 10 – 20
5.0 + 70 -85 25 10 – 25
In the absence of a suitable modal split method, the above-mentioned modal split levels could be adopted for working out transportation system requirements of urban settlements.
The Urban Mobility Plan should be developed in consultation with stakeholders and on the basis of the analysis carried under Tasks 3 and 4. The plan can be defined along the following lines; however it is important that the plan includes a phasing plan and implementation agencies.
Task 5.1 Integrated Land Use and Urban Mobility Plan
CMP advocates integrating the urban mobility plan with the land use plan and vice-versa. In most cities, the land use plan is already in force via the DP mechanism, even as the urban mobility plan is being prepared. In such cases, the urban mobility plan must respond to the mobility demands created as a result of the DP. Ideally, the urban
36 Source: Review of Urban Transportation in India, IIT Kanpur (With reference to Traffic and Transportation Policies and strategies in Urban Areas in India – Final Report, Ministry of Urban Development, Govt of India, New Delhi, 1998)
37
mobility plan should be an integral part of the DP document. Urban structure determine the travel demand and transport system influence the urban structure. Location of various land use and activity nodes have influence on travel pattern. At the same time, the transport nodes or hubs impact the allocation of land use both at the city and local level. As such, integrating urban development with transport should be the key consideration towards compact and sustainable development of cities. National Urban Transport Policy also emphasised the integrated land use and transport planning. Thus, elements for land use transport integration would be as follows:
l Enabling urban structure
l Completing the hierarchy of roads
l Aligning public transit with high density areas, mixed land use to capture the land value
l Integrating multimodal transit interchange policy and planning integration at vertical and horizontal level
Integrating land use with the urban mobility plan would entail a two-way interaction between the two plans. High density residential areas intertwined with high density employment areas, along with increased travel costs and an efficient public transport system will incite people to use NMT for short trips and public transport for long ones. The land use should be allocated in a manner that encourages short and fewer trips, thereby enabling improved accessibility to activities. This will also help people shift from private travel modes such as cars to NMT (including cycling and walking). Additionally to encourage NMT, neighbourhood design measures such as variety in public spaces, pedestrian footpaths and cycling tracks must be implemented. To summarize, the land use plan should locate activities in a manner that encourages low-carbon mobility and the urban mobility plan, in turn, should facilitate access to activities.
Task 5.2 Formulation of the Public Transport Improvement Plan
CMP divides Public Transport Improvement Plans into a number of sections, including service improvements for buses, trams and para-transit, appropriate MRT options and infrastructure development plansand intermodal integration plans.
Formulating a public transport improvement plan in a small-sized Indian city can involve several challenges. These can range from assessing transport demand to service provision and its alignment with land use. Most Indian cities, especially middle-sized ones, do not have an extensive public transport network. Therefore, it is very difficult to judge the demand for public transport based on revealed preferences. The only alternative is the data collected on stated preferences, which should be used for demand assessment of public transport systems.
Improving the public transport involves infrastructural improvements like reserving lanes and tracks and operational improvements like optimizing routes and scheduling. It is necessary to identify the type of improvement required to improve the level of service. The improvement in level of service is likely to not only maintain the existing modal share of public transport but also create a shift from other modes to public transport. These shifts are determined by the city’s structure and travel behaviour. The fleet must be optimized based on the demand: instead of offering a 50-seat bus every 20 minutes, it might be better to provide 25-seat buses every 10 minutes. Secondly, most of these small cities are likely to grow into large metropolitan centres in future, so a gradual progression towards public transport technology can also be suggested.For example,a strategy could start with
Task Descriptions
38
Preparing a Comprehensive Mobility Plan (CMP) – A Toolkit (Revised)
city buses and progress to BRT and eventually to a metro rail. This is also important from the low-carbon point of view, as operating a public transport system at low capacities will result in high per-capita carbon emissions from transport use, in comparison to a PT system operating near its capacity.
System planning should consider not only where terminal, routes and stops are placed (i.e. routes and stops), but also whether they are accessible to all potential users. The plans for the system should take into account the accessibility issues for pedestrians and cyclists, thedifferentlyabled and elderly people, as well as private vehicle users after they have parked their vehicles.
Task 5.3 Preparation of Road Network Development Plan
CMP should list out road projects which are to be developed, strengthened, upgraded and interconnected including hierarchical road network, arterial road construction / widening projects, secondary road construction / widening projects, intersection improvement projects, flyover projects, railway over bridge or underpass projects. The hierarchical road network should be based on travel demand. CMPs should reflect induced demand effects to estimate the overall benefit of any new road capacity. In addition to assigning the proper hierarchy to the road network, which is derived from its land use, it is important to consider urban roads as streets and function to be assigned. The availability of additional road capacity often induces new travel. Thus, the induced demand must be considered for project cost and benefit. Considering that the very high number of trips recorded in India are NMT, it is essential that roads prioritise space for NMT. Despite the latent demand for motorised vehicle use, proposals to improve motorised vehicle mobility by increasing road space under the pretext of easing congestion should be discouraged as much as possible. New construction/ widening projects, flyover projects and underpass projects must also be discouraged.
Task 5.4 Preparation of NMT Facility Improvement Plan
In preparing NMT facility improvement plans, the most important consideration to keep in mind is that a large proportion of urban travel involves using these transport modes. Thus,it is essential to identify specific streets and the street types preferred by individualswhen walking or using a bicycle. As stated earlier, if the TAZ sizes are small, the generalized cost of spatial interaction between zones can be obtained from the road network using street attributes and their suitability for walking and bicycle use. The modelling spatial interaction should represent the current preferences and demand, as well as for stated choices, which represent demand for walking and bicycling if a certain level of infrastructure is provided. When planning NMT infrastructure, due consideration should be given to the existing networks and not patches.For example, all roads where individual are likely to walk should include at least 2 metres of clear, walkable footpath. Moreover, all potential walking or bicycling locations should have NMT infrastructure, including comfortable footpaths, cycle tracks, streetlights, cycle stand, formal pedestrian crossing and NMT-designed signals at all junctions. Access to activities and transport services should also be taken into account. The design of these facilities should be such that they are inclusive, and provide travel opportunities tothe so-called disadvantagedsectors of society (the physically challenged, urban poor, women, children and individuals with special needs).
39
While at a policy level, NMT planning may be accepted, detailed NMT improvement plans and traffic management measures should be worked out for CBD, commercial centres, and other major activity centres. These detailed plans define NMT policy for the whole region, and provide the cost basis for implementing such policy. Besides,on-the-ground traffic management for pedestrians and cyclists, city level infrastructure planning for pedestrians and cyclists, who account for 40 to 50% of trips in mid-sized should also be done.
Task 5.5 Freight Movement Plan
Freight traffic and movement of goods within city and passing through inter-city traffic affects the overall city mobility. Since the transportation of goods will grow with economic growth, the planning for the movement of goods needs to be given a much greater focus. The planning for freight movement should address the problem of intermixing of local and regional traffic. The plan should assess the expected growth of freight by taking into consideration the past trends, extent of industrial and commercial activities distribution and storage facilities in the city, location of wholesale markets, direction of city growth etc. and indicate the need for relocation of wholesale markets and shifting of truck terminals at appropriate locations, preferably on the periphery of city.
The freight planning needs to be integrated with mobility plan by organising the freight movement in the city. Apart from the motorised modes of freight transport, non-motorised modes also play significant role in the total freight movement. It is, therefore, important to recognise the benefit of non-motorised freight transport while addressing the issue of the last leg connectivity in freight movement. Location of distribution centres for goods should be based on the scale of movement of goods. The freight management plan should address issues regarding the location of distribution centres, mode of transport, time restrictions, air and noise pollution etc. For example, a regional distribution centre can be located on the periphery of the city in conjunction with transport network infrastructure and a local distribution centres can be located suitable at a number of locations within the city preferably closer to commercial centres.
Task 5.6 Mobility Management Measures
In CMP, traffic management plans cover parking management plans, traffic control measures, intermodal facilities, demand management measures, traffic safety plan and ITS.
Mobility management measures suggested in the CMP should enableenhanced use of public transit and NMT modes. As shown in Table 17, additional measures should be added to increase the cost to discourage the use of personal motorisedtravel, including the taxation of cars and fuel, land use planning that encourages shorter travel distances and traffic management by reallocating space on the roads.
Task Descriptions
40
Preparing a Comprehensive Mobility Plan (CMP) – A Toolkit (Revised)
Table 17: TDM Measures Varying from Push and Pull Fators
TDM Measures
Taxation of cars and fuel Tele-working
Closure of city centres for car traffic Land-use planning encouraging shorter travel distances
Road pricing Traffic management reallocating space between modes and vehicles
Parking control Parking fee, No-parking zones
Decreasing speed limits Improved infrastructure for walking and biking
Avoiding major new road infrastructure Optimum use of existing road infrastructure
Source: Gärling et al. (2002)
Task 5.7 Development of Fiscal Measures
Fiscal measures should also be considered to achieve a balanced modal split, and to secure thebudget necessary to implement urban transport projects. As fiscal measures usually correspondto institutional and regulatory measures, the following aspects may have to be examined in theCMP document for consideration of state government:
l Fare policy for public transportation, intermediate public transport and parking;
l Subsidy policy for public transport operators and intermediate transport operators;
l Taxation on private vehicles and public transport vehicles;
l Permits and regularisation of intermediate public transport;
l Potential for road congestion charging;
l Influence private vehicle usage through parking and disincentavise free parking with private developments;
l Setting up of Unified Metropolitan Transport Authority to coordinate urban transport and related issues in million plus cities;
l Creating Special Purpose Vehicles particularly for Mass Transit System.
Task 5.8 Mobility Improvement Measures and NUTP Objectives
The land use and transport measures proposed in the CMP will improve the mobility in themetropolitan area and cover the critical issues addressed in the NUTP. A table can be preparedsummarising the relationship between the NUTP objectives and the measures proposed in the study, together with a classification of the measures according to their implementation timeframe (immediate, short, mediumand long term) as per the provision of NUTP.
Traffic Engineering Measures already covered like improvement of Road / Junction sections need to be identified. City-specific plans like Tourist management plan, water transport plan, hill transport like rope ways etc may be prepared as part of CMP.
41
Task 6: Preparation of the Implementation Program
Task 6.1 Preparation of Implementation Programs
Task 5 involves the development of various urban mobility measures as discussed earlier. The necessary interventions for these measures include a set of actionable projects to be implemented in the city and prioritised based on a linear timeframe. CMPs should guide cities to prioritise various projects simultaneously such that preliminary study and feasibility assessment of long-term projects can be an immediate priority. CMPs can base their timeframe into the following categories:
l Immediate priority / actions (0 - 2 years)
l Short term (2-5 years)
l Medium term (5-10 years)
l Long term (more than 10 years)
All the projects are presented to the city stakeholders and the implementing agency to identify the priority of the projects.
It should be made clear in the CMP that the project list is merely a description of priority projects. Detailed project reports with cost estimates and financing will have to be prepared by the city authorities separately and approved by the urban local body and state government before seeking funding from the MoUD or any other agency.
Task 6.2 Identification and Prioritization of Projects
All sustainable transport projects must have equal priority, but their planning can be phased based on short, medium and long-term planning. The prioritisation of projects into short, medium and long term can be done using the following criteria:
l Immediate and short-term measures are aimed at improving the safety and accessibility of pedestrians, cyclists and public transport users, area level traffic circulation plans and measures like implementing traffic signals.
l Medium-term measures typically involve corridor-level projects such as implementing cycle tracks and mass-transit corridors, city level initiatives like public transport fleet improvement and efficient scheduling, developing area level cycle networks and Public Bicycle Sharing (PBS) schemes, parking policy development and implementation in the city. They are primarily aimed at halting the decrease in the city’s public transport and non-motorised transport mode shares.
l Long-term measures include implementing the overall vision of the CMP. This includes developing city-level networks for walking and cycling, bus systems, mass-transit networks, parking regulation measures and pricing strategies as a demand management tool, improving the overall road network to provide adequate accessibility for existing developed areas and new ones as thecity grows, centralised control measures for traffic signal systems and public transport operations
Task Descriptions
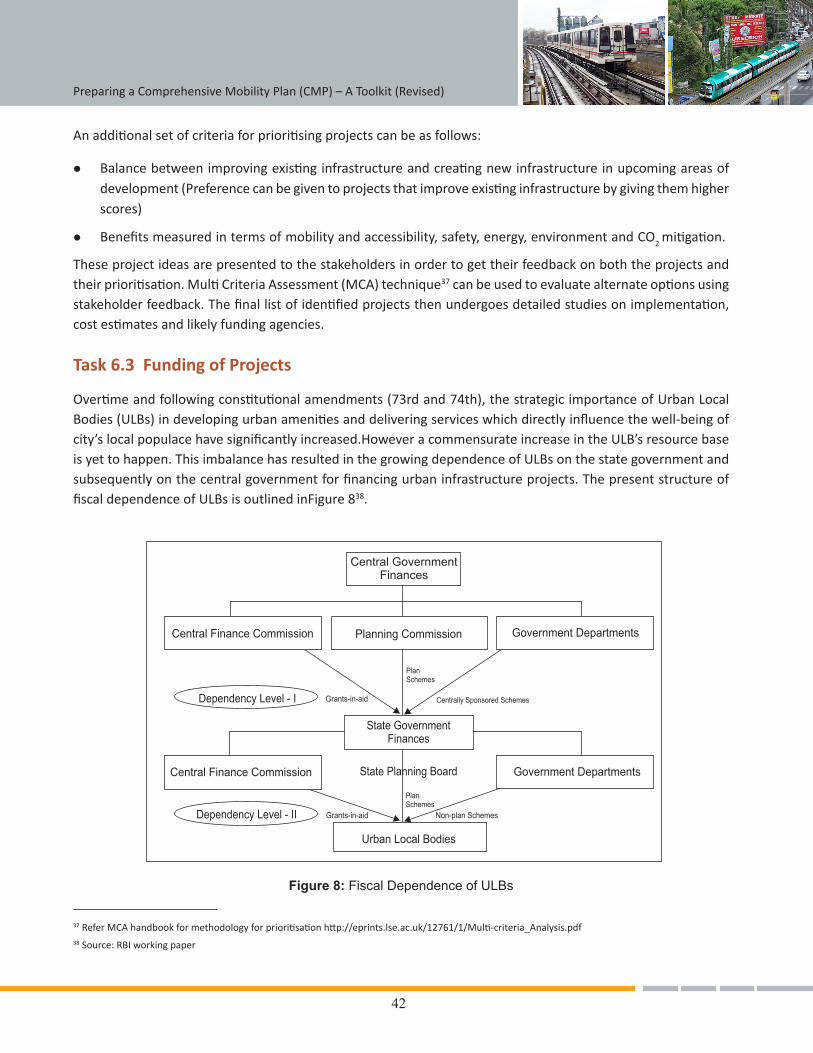
42
Preparing a Comprehensive Mobility Plan (CMP) – A Toolkit (Revised)
An additional set of criteria for prioritising projects can be as follows:
l Balance between improving existing infrastructure and creating new infrastructure in upcoming areas of development (Preference can be given to projects that improve existing infrastructure by giving them higher scores)
l Benefits measured in terms of mobility and accessibility, safety, energy, environment and CO2 mitigation.
These project ideas are presented to the stakeholders in order to get their feedback on both the projects and their prioritisation. Multi Criteria Assessment (MCA) technique37 can be used to evaluate alternate options using stakeholder feedback. The final list of identified projects then undergoes detailed studies on implementation, cost estimates and likely funding agencies.
Task 6.3 Funding of Projects
Overtime and following constitutional amendments (73rd and 74th), the strategic importance of Urban Local Bodies (ULBs) in developing urban amenities and delivering services which directly influence the well-being of city’s local populace have significantly increased.However a commensurate increase in the ULB’s resource base is yet to happen. This imbalance has resulted in the growing dependence of ULBs on the state government and subsequently on the central government for financing urban infrastructure projects. The present structure of fiscal dependence of ULBs is outlined inFigure 838.
37 Refer MCA handbook for methodology for prioritisation http://eprints.lse.ac.uk/12761/1/Multi-criteria_Analysis.pdf38 Source: RBI working paper
Figure 8: Fiscal Dependence of ULBs
43
As the CMP is a long-term vision for the city authority, the overall ownership of the CMP lies with ULBs. Given the ULB’s dependence on funding, a city’s CMP should make a resource assessment for all the projects listed in the CMP and should suggest the city authority, city-specific and project-specific indicative source of financing for the project. Financing options for urban transport needs to be suggested based on the details given in the toolkit on financing and financial analysis of urban transport available at iutindia.org/CapacityBuilding/Toolkits.aspx.
Task 6.4 Monitoring of CMP Implementation
As per the MoUD advisory, CMP is the basis for approving projects, plans and various regulatory measures within the city related to transport,and it is therefore importantto monitor and measure the impact of interventions taken as an outcome of CMP.
The first level of monitoring can be with regard to the status of implementation of the Urban Mobility Plan (Task 5) in terms of time frames proposed and achieved. This is helpful to understand the pace of CMP implementation.
The second level of monitoring can be to understand the impact of CMP implementation. The indicators created as a part of CMP can form the basis of this monitoring which can be done on a biannual basis. CO2 emissions are also a part of these indicators, and if a city wants to register its CMP as a nationally appropriate mitigation action39 (NAMA), then a more comprehensive approach for monitoring reporting and verification (MRV40) is required.
39 Cities have registered their Comprehensive Mobility Plans as NAMA (Shukla, P.R., Sharma, S, & Dhar,S 2013 NAMA in transport sector http://www.unep.org/Transport/lowcarbon/Pdf’s/NAMA_ClimateFinancing.pdf or visit UNFCCC website for a listing of NAMAs http://www4.unfccc.int/sites/nama/SitePages/Home.aspx )
40 For a detailed guidance on MRV for NAMAs is available in the following guidebook http://www.lowemissiondevelopment.org/docs/resources/Guidance_for_NAMA_Design_2013_.pdf
Task Descriptions

Preparing a Comprehensive Mobility Plan (CMP) – A Toolkit (Revised)
44
Section III:
Methodology for Small Cities
45
There are 73 cities as per 2011 census that have a population of more than 0.5 million. Most of these cities
require large investments in urban transport infrastructures (e.g., BRT, metros) to prevent unchecked growth
of private motorised transport and transform them into smart cities. Some of the decisions on transport
projects they take now would however have long-term consequences and therefore all these cities need to
go for a full CMP, which looks at accessibility for all socio economic groups and genders, studies impact of
transport system on safety, environment and CO2 emissions. The revised toolkit has provided a comprehensive
approach for these cities.
According to 2011 Census, 60% of urban population lives in towns and cities with population less than 0.5
million. Most of these cities have small size, short trip lengths, and high share of walking and will benefit
through improvement in operational effectiveness of para-transit and public transport systems. In the next
5-10 years, no major infrastructure changes in these cities are envisaged. In such a situation, undertaking a
full CMP is not required since it involves a reasonable time (minimum one year) and reasonable budget to
enable data collection, analysis and report write up. Such cities could still make use of CMP toolkit with the
following modifications which reduce the need for extensive modelling.
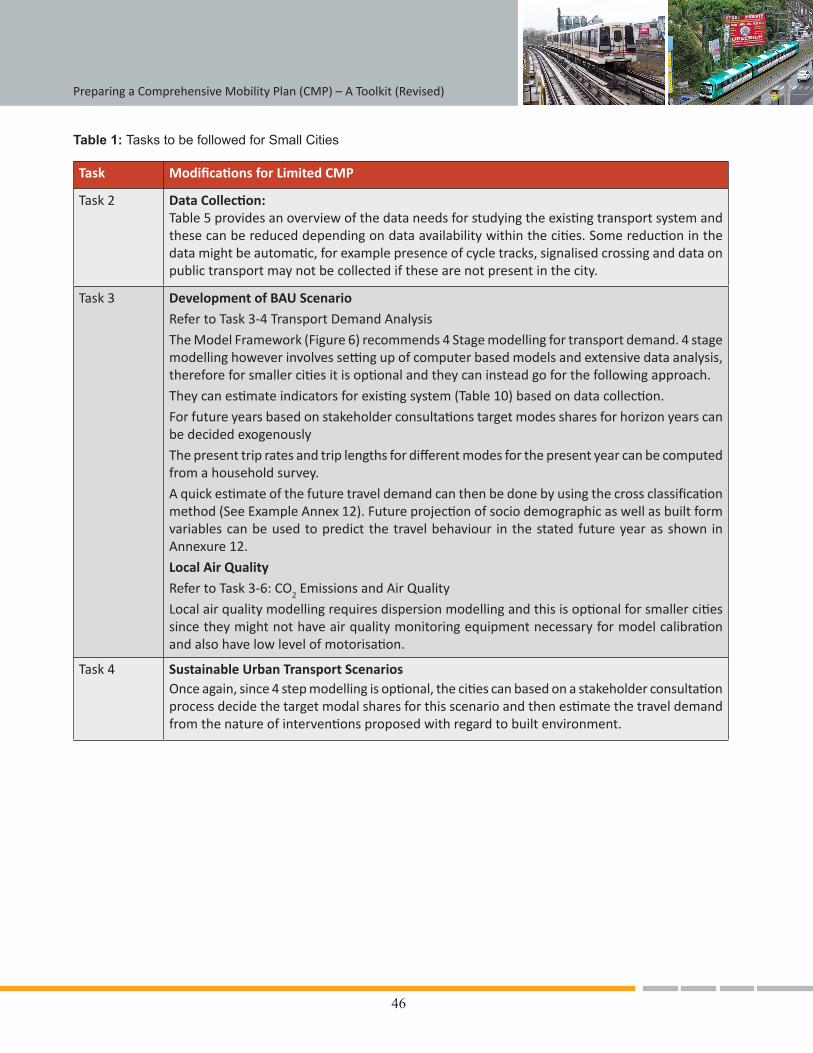
46
Preparing a Comprehensive Mobility Plan (CMP) – A Toolkit (Revised)
Task Modifications for Limited CMP
Task 2 Data Collection:Table 5 provides an overview of the data needs for studying the existing transport system and these can be reduced depending on data availability within the cities. Some reduction in the data might be automatic, for example presence of cycle tracks, signalised crossing and data on public transport may not be collected if these are not present in the city.
Task 3 Development of BAU ScenarioRefer to Task 3-4 Transport Demand AnalysisThe Model Framework (Figure 6) recommends 4 Stage modelling for transport demand. 4 stage modelling however involves setting up of computer based models and extensive data analysis, therefore for smaller cities it is optional and they can instead go for the following approach.They can estimate indicators for existing system (Table 10) based on data collection.For future years based on stakeholder consultations target modes shares for horizon years can be decided exogenouslyThe present trip rates and trip lengths for different modes for the present year can be computed from a household survey.A quick estimate of the future travel demand can then be done by using the cross classification method (See Example Annex 12). Future projection of socio demographic as well as built form variables can be used to predict the travel behaviour in the stated future year as shown in Annexure 12.Local Air QualityRefer to Task 3-6: CO2 Emissions and Air QualityLocal air quality modelling requires dispersion modelling and this is optional for smaller cities since they might not have air quality monitoring equipment necessary for model calibration and also have low level of motorisation.
Task 4 Sustainable Urban Transport ScenariosOnce again, since 4 step modelling is optional, the cities can based on a stakeholder consultation process decide the target modal shares for this scenario and then estimate the travel demand from the nature of interventions proposed with regard to built environment.
Table 1: Tasks to be followed for Small Cities
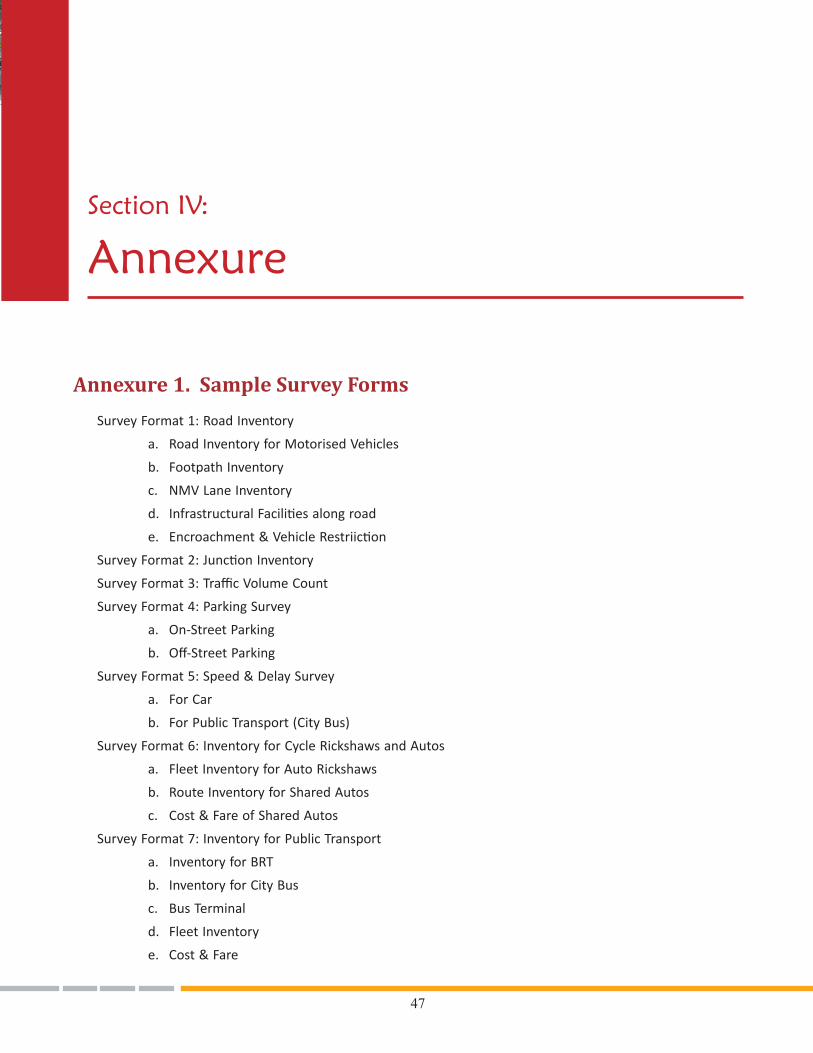
47
Annexure 1. Sample Survey Forms
Survey Format 1: Road Inventory
a. Road Inventory for Motorised Vehicles
b. Footpath Inventory
c. NMV Lane Inventory
d. Infrastructural Facilities along road
e. Encroachment & Vehicle Restriiction
Survey Format 2: Junction Inventory
Survey Format 3: Traffic Volume Count
Survey Format 4: Parking Survey
a. On-Street Parking
b. Off-Street Parking
Survey Format 5: Speed & Delay Survey
a. For Car
b. For Public Transport (City Bus)
Survey Format 6: Inventory for Cycle Rickshaws and Autos
a. Fleet Inventory for Auto Rickshaws
b. Route Inventory for Shared Autos
c. Cost & Fare of Shared Autos
Survey Format 7: Inventory for Public Transport
a. Inventory for BRT
b. Inventory for City Bus
c. Bus Terminal
d. Fleet Inventory
e. Cost & Fare
Section IV:
Annexure
48
Preparing a Comprehensive Mobility Plan (CMP) – A Toolkit (Revised)
f. Route Inventory
g. Boarding & Alighting
h. Interchange Survey
Survey Format 8: Landuse Survey along PT Corridor (BRT / Metro)
Survey Format 9: Freight Survey
Survey Format 10: Traffic Safety
Survey Format 11: Household Survey
• Part – I: Revealed Preference Survey
• Part – II: Stated Prefernce Survey
Survey Format 12: Energy Consumption in Transport: City level
Survey Format 13: Vehicle Inventory –Registered Vehicles at City
Survey Format 14: Vehicle Survey at Petrol Pump
Survey Format 15: Air Quality levels – Secondary Data
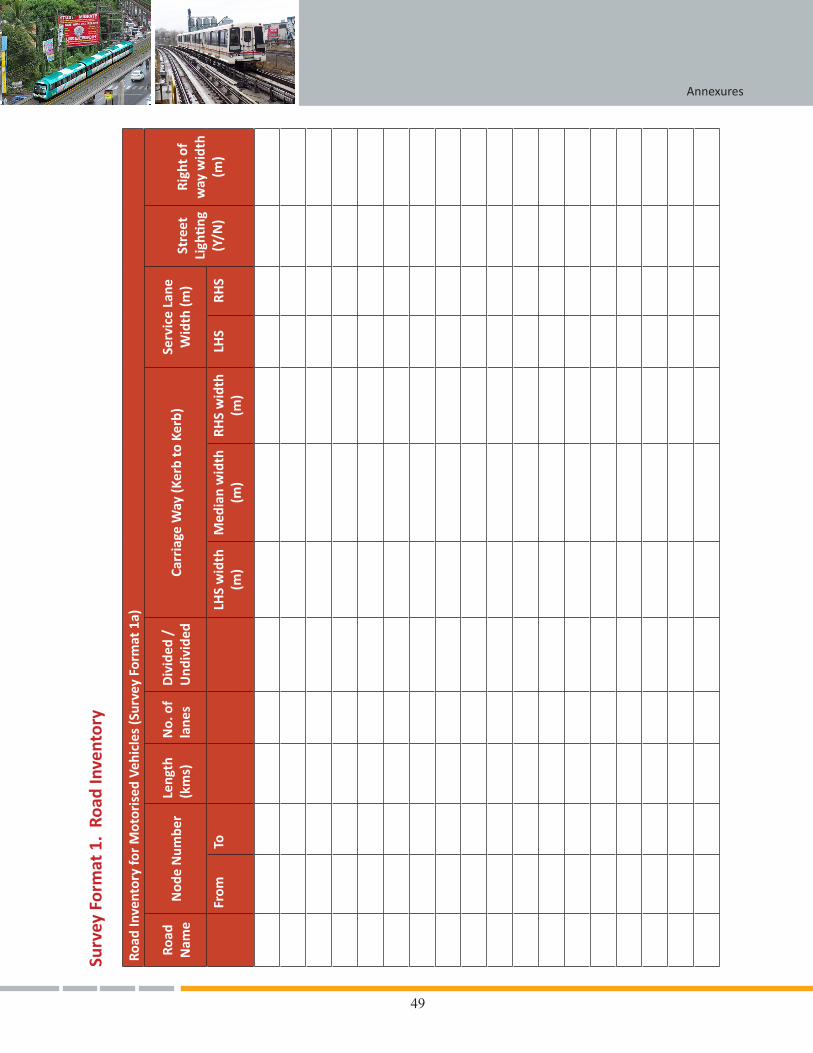
49
Annexures
Road
Inve
ntor
y fo
r M
otor
ised
Veh
icle
s (S
urve
y Fo
rmat
1a)
Road
N
ame
Nod
e N
umbe
rLe
ngth
(k
ms)
No.
of
lane
sD
ivid
ed /
U
ndiv
ided
Carr
iage
Way
(Ker
b to
Ker
b)Se
rvic
e La
ne
Wid
th (m
)St
reet
Li
ghti
ng
(Y/N
)
Righ
t of
w
ay w
idth
(m
)Fr
omTo
LHS
wid
th
(m)
Med
ian
wid
th
(m)
RHS
wid
th
(m)
LHS
RHS
Surv
ey F
orm
at 1
. Ro
ad In
vent
ory
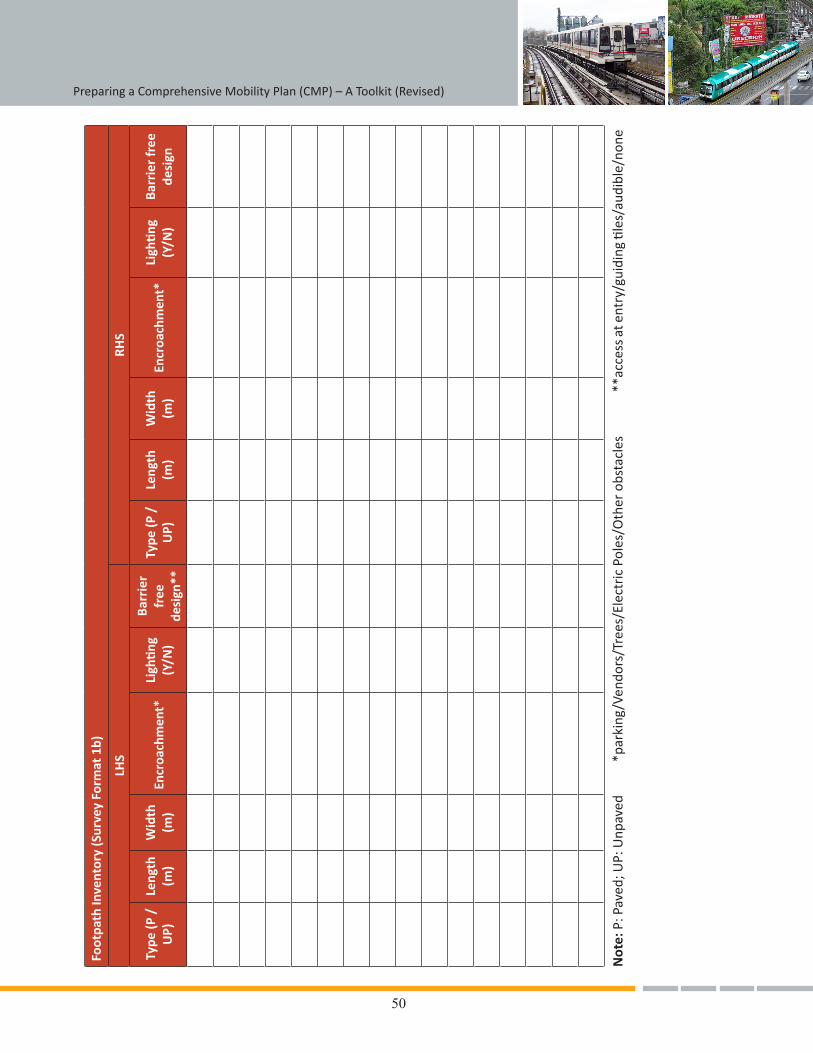
50
Preparing a Comprehensive Mobility Plan (CMP) – A Toolkit (Revised)Fo
otpa
th In
vent
ory
(Sur
vey
Form
at 1
b)
LHS
RHS
Type
(P /
U
P)Le
ngth
(m
)W
idth
(m
)En
croa
chm
ent*
Ligh
ting
(Y
/N)
Barr
ier
free
de
sign
**
Type
(P /
U
P)Le
ngth
(m
)W
idth
(m
)En
croa
chm
ent*
Ligh
ting
(Y
/N)
Barr
ier
free
de
sign
Not
e: P
: Pav
ed; U
P: U
npav
ed
*
park
ing/
Vend
ors/
Tree
s/El
ectr
ic P
oles
/Oth
er o
bsta
cles
**
acce
ss a
t ent
ry/g
uidi
ng ti
les/
audi
ble/
none
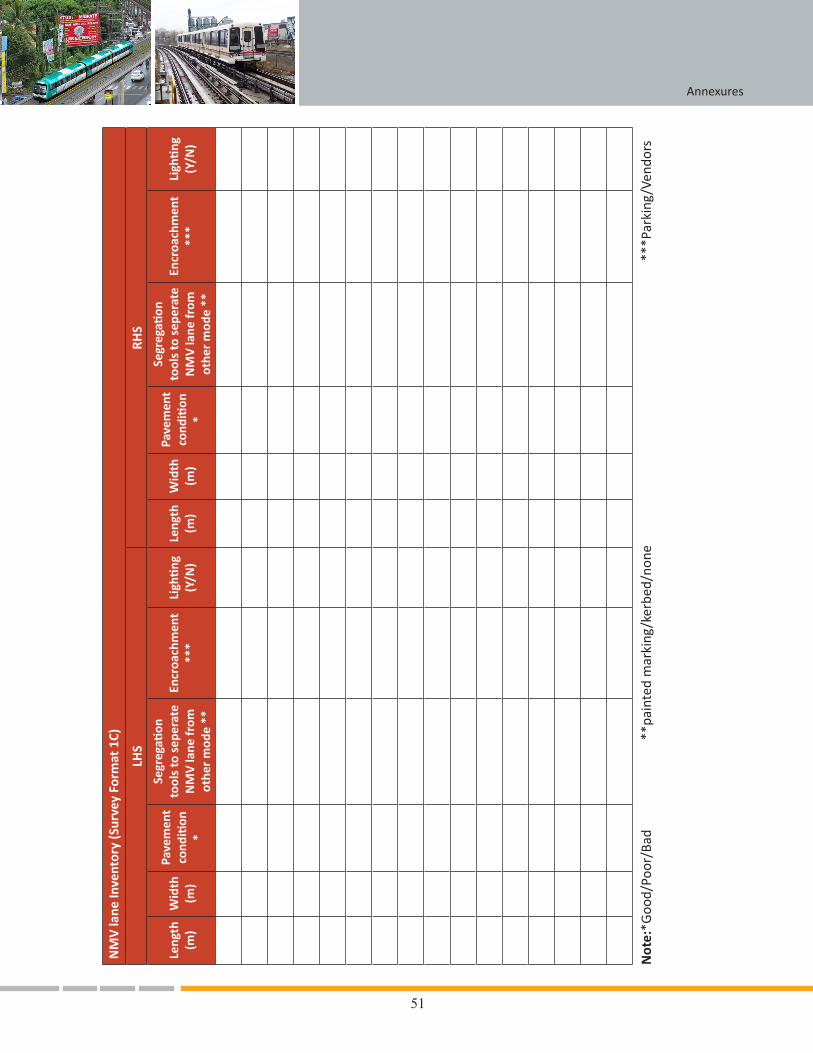
51
Annexures
NM
V la
ne In
vent
ory
(Sur
vey
Form
at 1
C)
LHS
RHS
Leng
th
(m)
Wid
th
(m)
Pave
men
t co
nditi
on
*
Segr
egati
on
tool
s to
sep
erat
e N
MV
lane
from
ot
her
mod
e **
Encr
oach
men
t **
*Li
ghti
ng
(Y/N
)Le
ngth
(m
)W
idth
(m
)
Pave
men
t co
nditi
on
*
Segr
egati
on
tool
s to
sep
erat
e N
MV
lane
from
ot
her
mod
e **
Encr
oach
men
t **
*Li
ghti
ng
(Y/N
)
Not
e:*G
ood/
Poor
/Bad
*
*pai
nted
mar
king
/ker
bed/
none
***
Park
ing/
Vend
ors
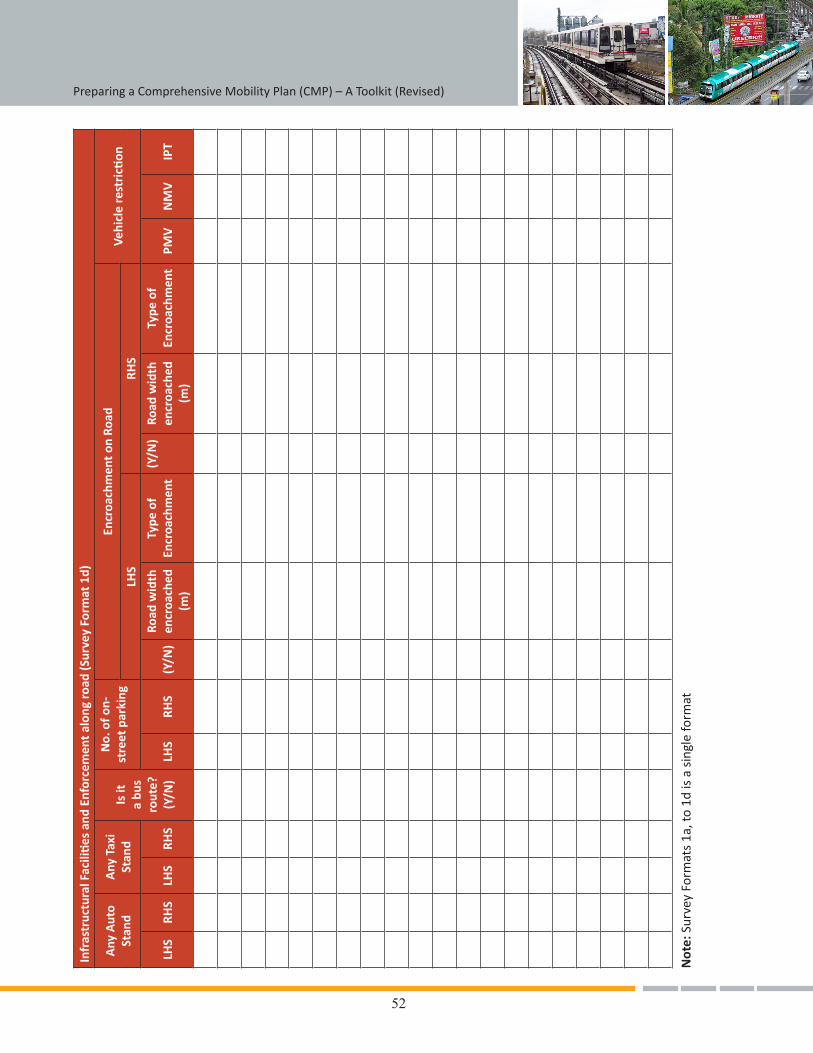
52
Preparing a Comprehensive Mobility Plan (CMP) – A Toolkit (Revised)In
fras
truc
tura
l Fac
iliti
es a
nd E
nfor
cem
ent
alon
g ro
ad (S
urve
y Fo
rmat
1d)
Any
Aut
o St
and
Any
Tax
i St
and
Is it
a
bus
rout
e?
(Y/N
)
No.
of o
n-st
reet
par
king
Encr
oach
men
t on
Road
Vehi
cle
rest
ricti
onLH
SRH
S
LHS
RHS
LHS
RHS
LHS
RHS
(Y/N
)Ro
ad w
idth
en
croa
ched
(m
)
Type
of
Encr
oach
men
t(Y
/N)
Road
wid
th
encr
oach
ed
(m)
Type
of
Encr
oach
men
tPM
VN
MV
IPT
Not
e: S
urve
y Fo
rmat
s 1a
, to
1d is
a s
ingl
e fo
rmat
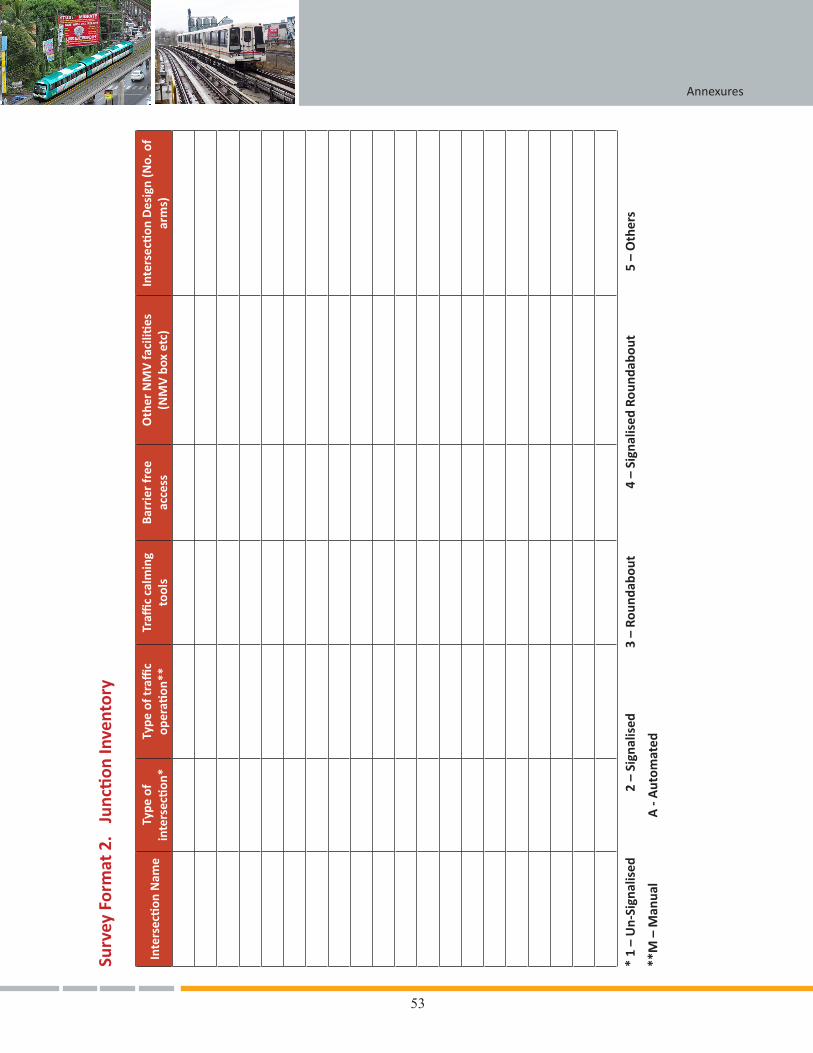
53
AnnexuresSu
rvey
For
mat
2.
Junc
tion
Inve
ntor
y
Inte
rsec
tion
Nam
eTy
pe o
f in
ters
ecti
on*
Type
of t
raffi
c
oper
ation
**Tr
affic
calm
ing
tool
sBa
rrie
r fr
ee
acce
ssO
ther
NM
V fa
ciliti
es
(NM
V b
ox e
tc)
Inte
rsec
tion
Des
ign
(No.
of
arm
s)
* 1
– U
n-Si
gnal
ised
2 –
Sig
nalis
ed
3
– R
ound
abou
t
4 –
Sign
alis
ed R
ound
abou
t
5
– O
ther
s
**M
– M
anua
l
A -
Aut
omat
ed
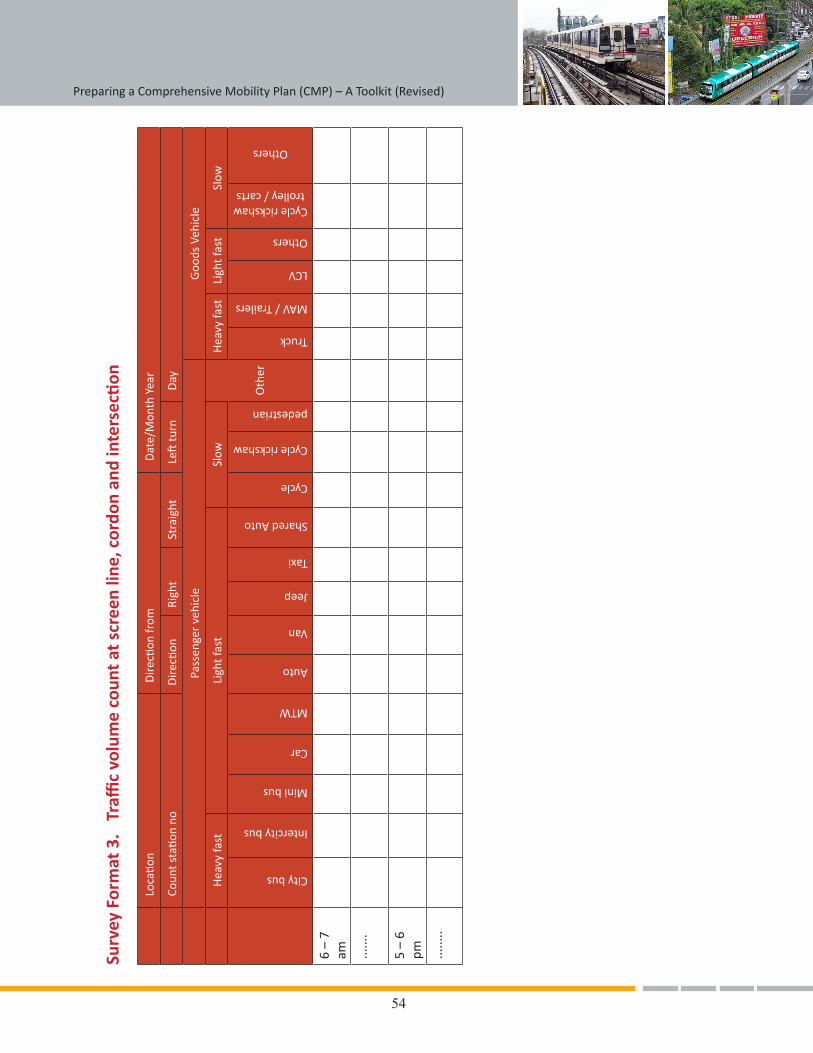
54
Preparing a Comprehensive Mobility Plan (CMP) – A Toolkit (Revised)
Surv
ey F
orm
at 3
. Tr
affic
volu
me
coun
t at s
cree
n lin
e, c
ordo
n an
d in
ters
ecti
on
Loc
ation
Dire
ction
from
Dat
e/M
onth
Yea
r
Cou
nt s
tatio
n no
Dire
ction
Rig
ht S
trai
ght
Left
turn
Day
Pass
enge
r ve
hicl
eG
oods
Veh
icle
Hea
vy fa
stLi
ght f
ast
Slow
Oth
er
Hea
vy fa
stLi
ght f
ast
Slow
City bus
Intercity bus
Mini bus
Car
MTW
Auto
Van
Jeep
Taxi
Shared Auto
Cycle
Cycle rickshaw
pedestrian
Truck
MAV / Trailers
LCV
Others
Cycle rickshaw trolley / carts
Others
6 –
7 am ...
....
5 –
6 pm ...
.....
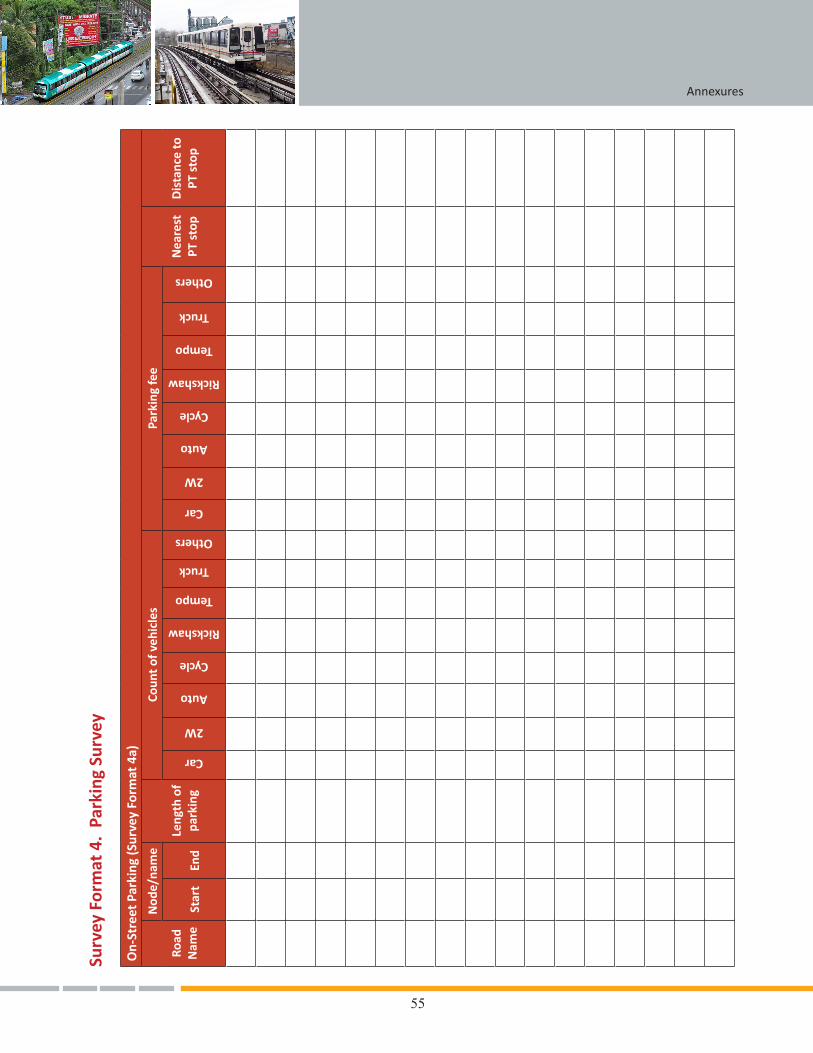
55
AnnexuresSu
rvey
For
mat
4.
Park
ing
Surv
ey
On-
Stre
et P
arki
ng (S
urve
y Fo
rmat
4a)
Road
N
ame
Nod
e/na
me
Leng
th o
f pa
rkin
g
Coun
t of v
ehic
les
Park
ing
fee
Nea
rest
PT
sto
pD
ista
nce
to
PT s
top
Star
tEn
d
Car
2W
Auto
Cycle
Rickshaw
Tempo
Truck
Others
Car
2W
Auto
Cycle
Rickshaw
Tempo
Truck
Others
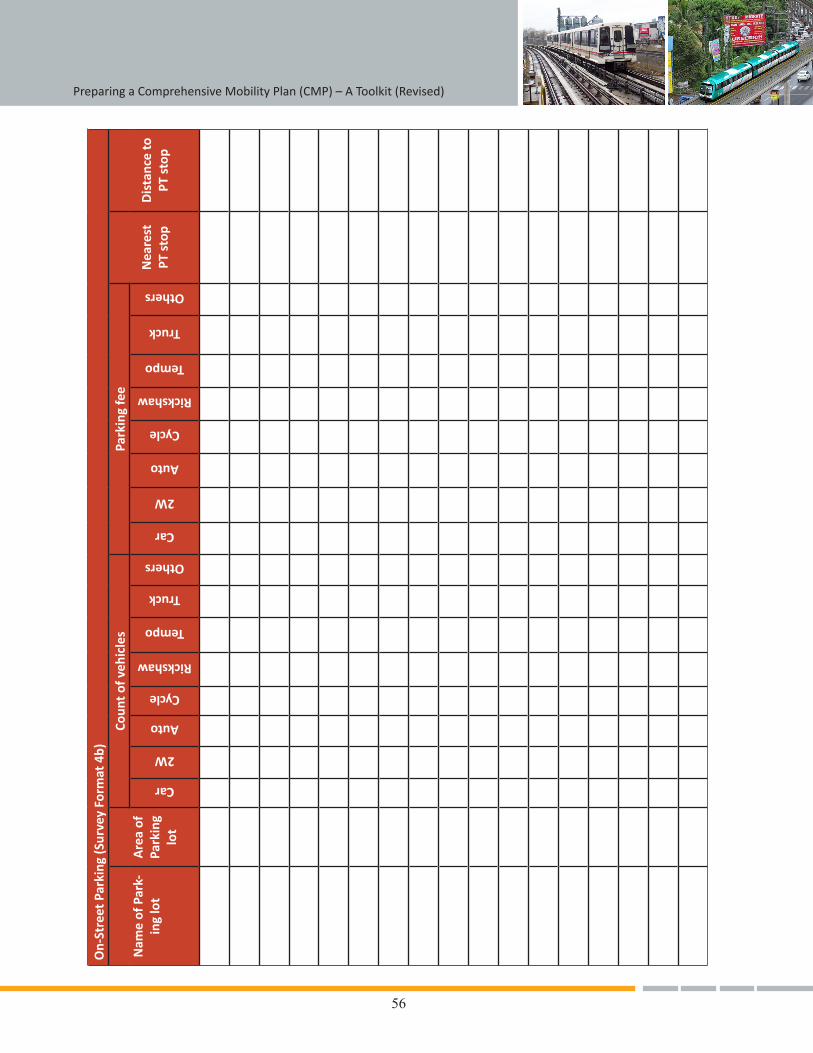
56
Preparing a Comprehensive Mobility Plan (CMP) – A Toolkit (Revised)O
n-St
reet
Par
king
(Sur
vey
Form
at 4
b)
Nam
e of
Par
k-in
g lo
tA
rea
of
Park
ing
lot
Coun
t of v
ehic
les
Park
ing
fee
Nea
rest
PT
sto
pD
ista
nce
to
PT s
top
Car
2W
Auto
Cycle
Rickshaw
Tempo
Truck
Others
Car
2W
Auto
Cycle
Rickshaw
Tempo
Truck
Others
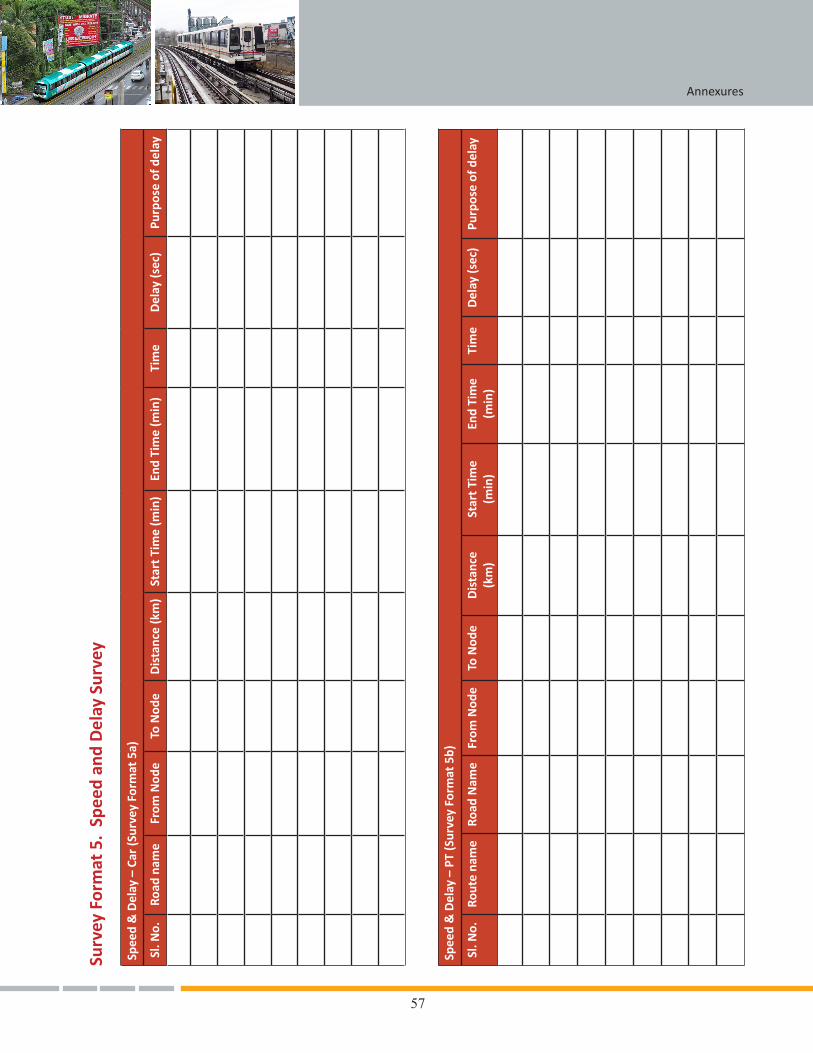
57
AnnexuresSu
rvey
For
mat
5.
Spee
d an
d D
elay
Sur
vey
Spee
d &
Del
ay –
Car
(Sur
vey
Form
at 5
a)
Sl. N
o.Ro
ad n
ame
From
Nod
eTo
Nod
eD
ista
nce
(km
)St
art T
ime
(min
)En
d Ti
me
(min
)Ti
me
Del
ay (s
ec)
Purp
ose
of d
elay
Spee
d &
Del
ay –
PT
(Sur
vey
Form
at 5
b)
Sl. N
o.Ro
ute
nam
eRo
ad N
ame
From
Nod
eTo
Nod
eD
ista
nce
(km
)St
art T
ime
(min
)En
d Ti
me
(min
)Ti
me
Del
ay (s
ec)
Purp
ose
of d
elay
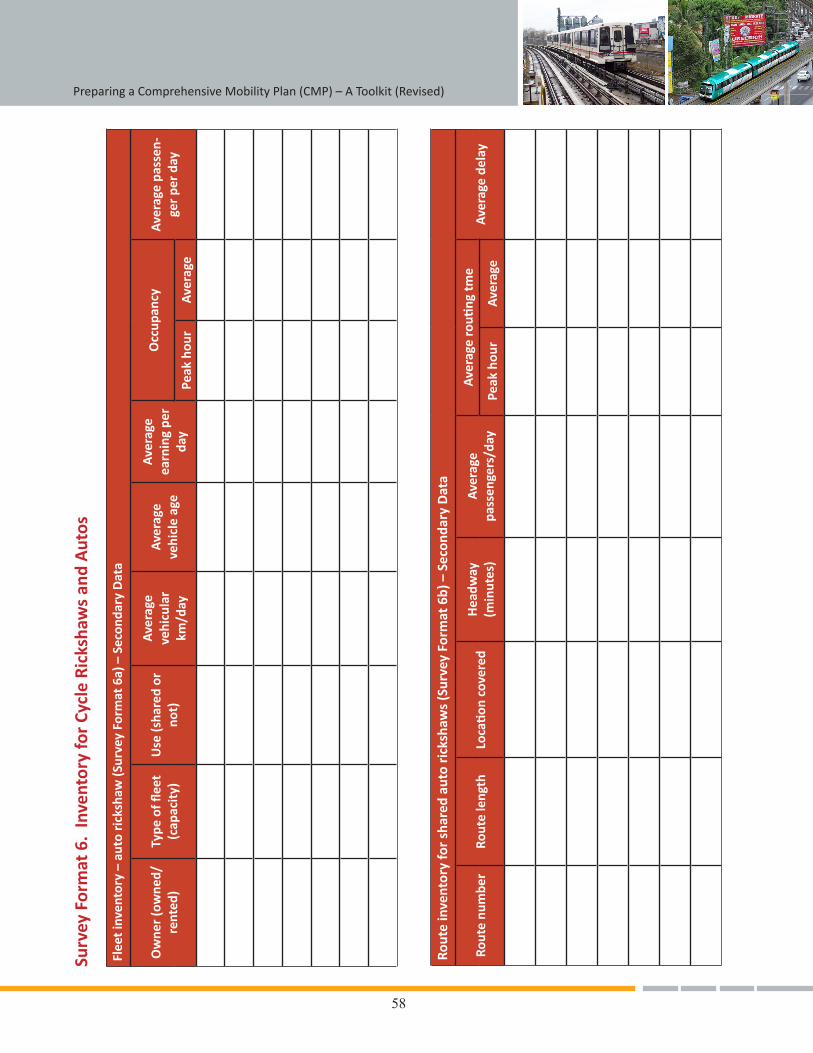
58
Preparing a Comprehensive Mobility Plan (CMP) – A Toolkit (Revised)Su
rvey
For
mat
6.
Inve
ntor
y fo
r Cy
cle
Rick
shaw
s an
d A
utos
Flee
t in
vent
ory
– au
to r
icks
haw
(Sur
vey
Form
at 6
a) –
Sec
onda
ry D
ata
Ow
ner
(ow
ned/
rent
ed)
Type
of fl
eet
(cap
acit
y)U
se (s
hare
d or
no
t)
Ave
rage
ve
hicu
lar
km
/day
Ave
rage
ve
hicl
e ag
e
Ave
rage
ea
rnin
g pe
r da
y
Occ
upan
cyA
vera
ge p
asse
n-ge
r pe
r da
yPe
ak h
our
Ave
rage
Rout
e in
vent
ory
for
shar
ed a
uto
rick
shaw
s (S
urve
y Fo
rmat
6b)
– S
econ
dary
Dat
a
Rout
e nu
mbe
rRo
ute
leng
thLo
cati
on c
over
edH
eadw
ay
(min
utes
)A
vera
ge
pass
enge
rs/d
ay
Ave
rage
routi
ng tm
eA
vera
ge d
elay
Peak
hou
rA
vera
ge
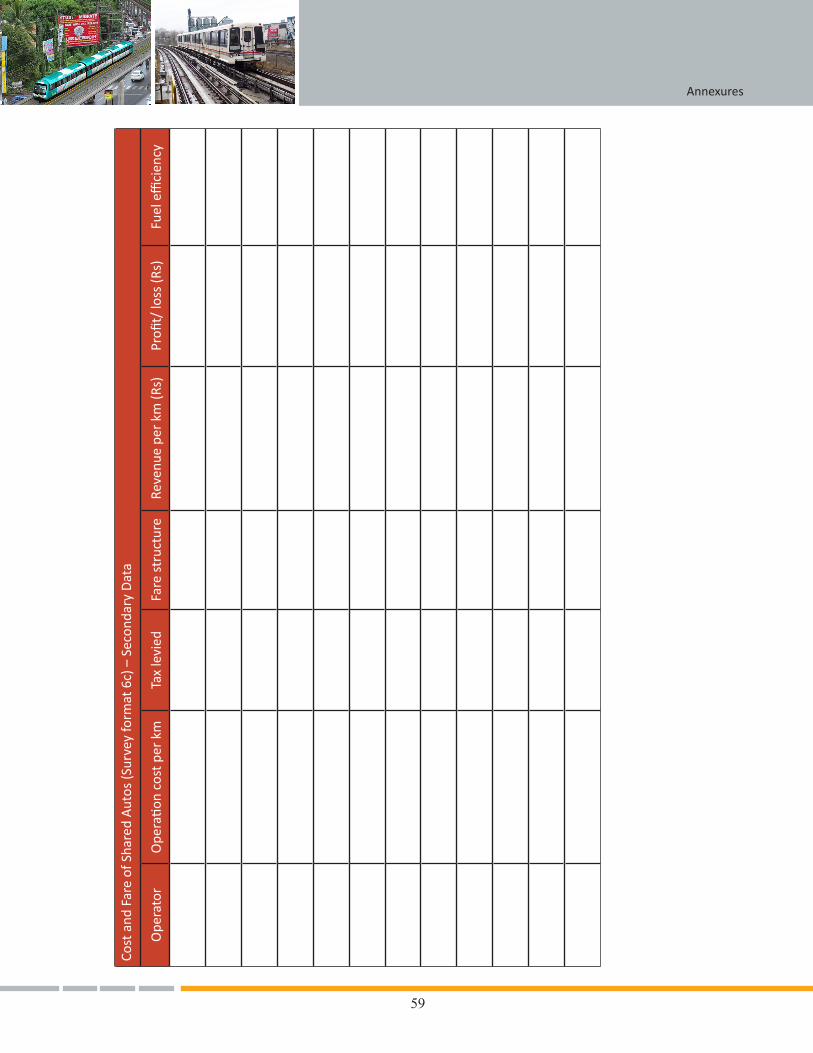
59
Annexures
Cost
and
Far
e of
Sha
red
Aut
os (S
urve
y fo
rmat
6c)
– S
econ
dary
Dat
a
Ope
rato
rO
pera
tion
cost
per
km
Tax
levi
edFa
re s
truc
ture
Reve
nue
per
km (R
s)Pr
ofit/
loss
(Rs)
Fuel
effi
cien
cy
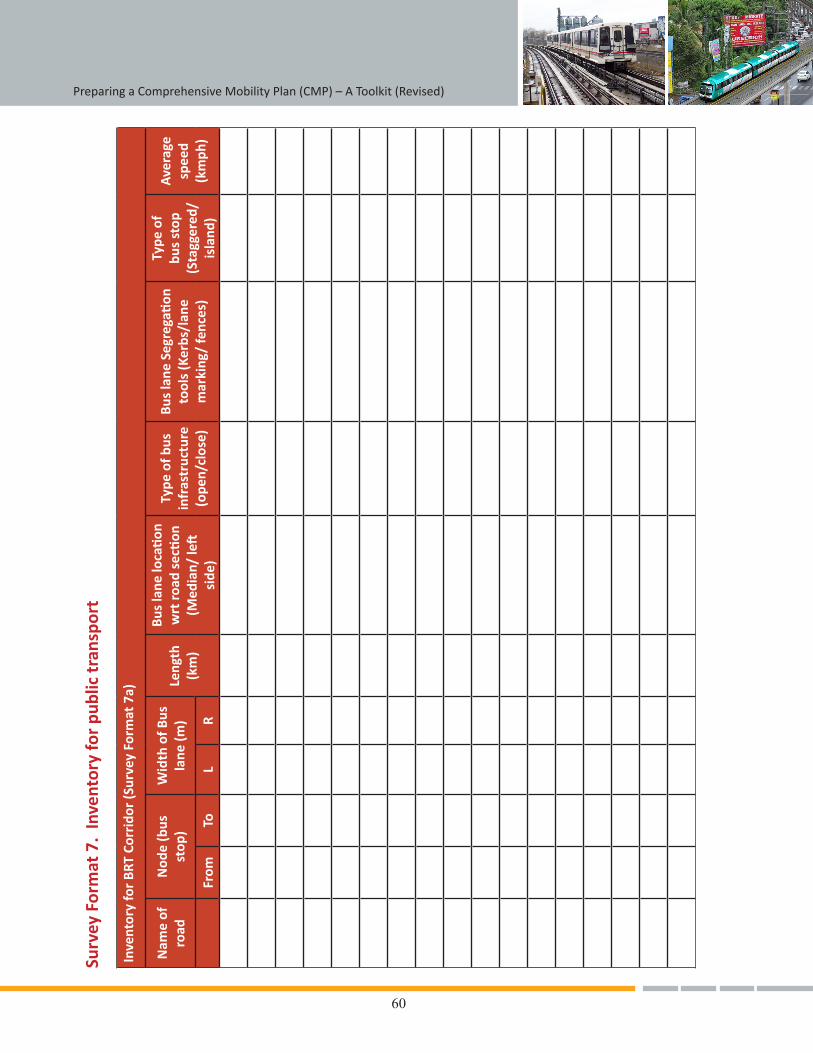
60
Preparing a Comprehensive Mobility Plan (CMP) – A Toolkit (Revised)Su
rvey
For
mat
7.
Inve
ntor
y fo
r pu
blic
tran
spor
t
Inve
ntor
y fo
r BR
T Co
rrid
or (S
urve
y Fo
rmat
7a)
Nam
e of
ro
adN
ode
(bus
st
op)
Wid
th o
f Bus
la
ne (m
)Le
ngth
(k
m)
Bus
lane
loca
tion
w
rt ro
ad s
ecti
on
(Med
ian/
left
si
de)
Type
of b
us
infr
astr
uctu
re
(ope
n/cl
ose)
Bus
lane
Seg
rega
tion
to
ols
(Ker
bs/l
ane
mar
king
/ fe
nces
)
Type
of
bus
stop
(S
tagg
ered
/ is
land
)
Ave
rage
sp
eed
(km
ph)
From
ToL
R
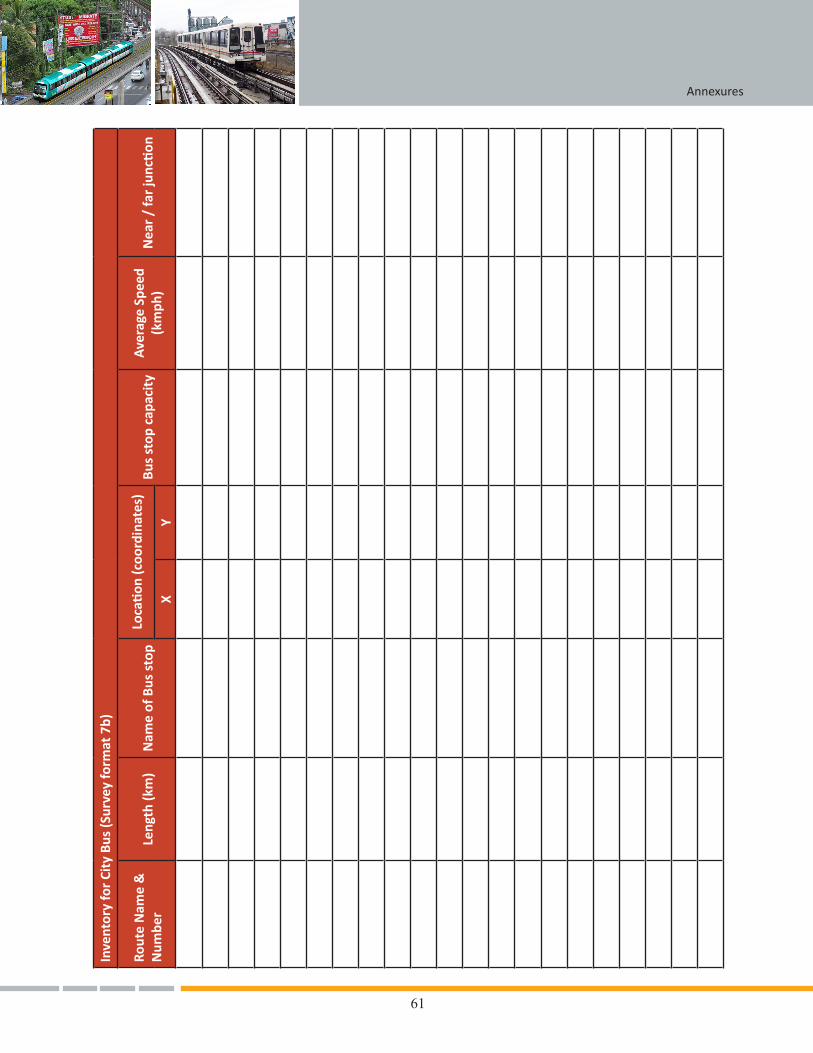
61
AnnexuresIn
vent
ory
for
City
Bus
(Sur
vey
form
at 7
b)
Rout
e N
ame
&
Num
ber
Leng
th (k
m)
Nam
e of
Bus
sto
pLo
cati
on (c
oord
inat
es)
Bus
stop
cap
acit
yA
vera
ge S
peed
(k
mph
)N
ear
/ fa
r ju
ncti
onX
Y
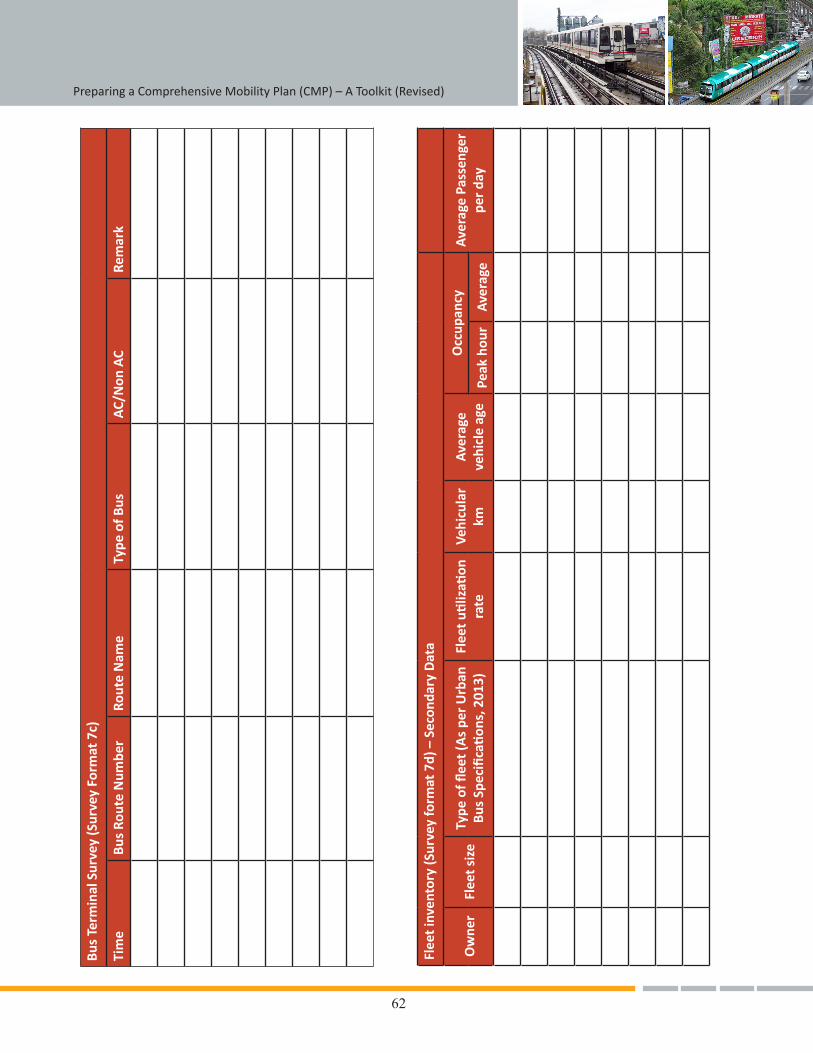
62
Preparing a Comprehensive Mobility Plan (CMP) – A Toolkit (Revised)Bu
s Te
rmin
al S
urve
y (S
urve
y Fo
rmat
7c)
Tim
eBu
s Ro
ute
Num
ber
Rout
e N
ame
Type
of B
usA
C/N
on A
CRe
mar
k
Flee
t inv
ento
ry (S
urve
y fo
rmat
7d)
– S
econ
dary
Dat
a
Ow
ner
Flee
t siz
eTy
pe o
f flee
t (A
s pe
r U
rban
Bu
s Sp
ecifi
cati
ons,
201
3)Fl
eet u
tiliz
ation
ra
teVe
hicu
lar
kmA
vera
ge
vehi
cle
age
Occ
upan
cyA
vera
ge P
asse
nger
pe
r da
yPe
ak h
our
Ave
rage
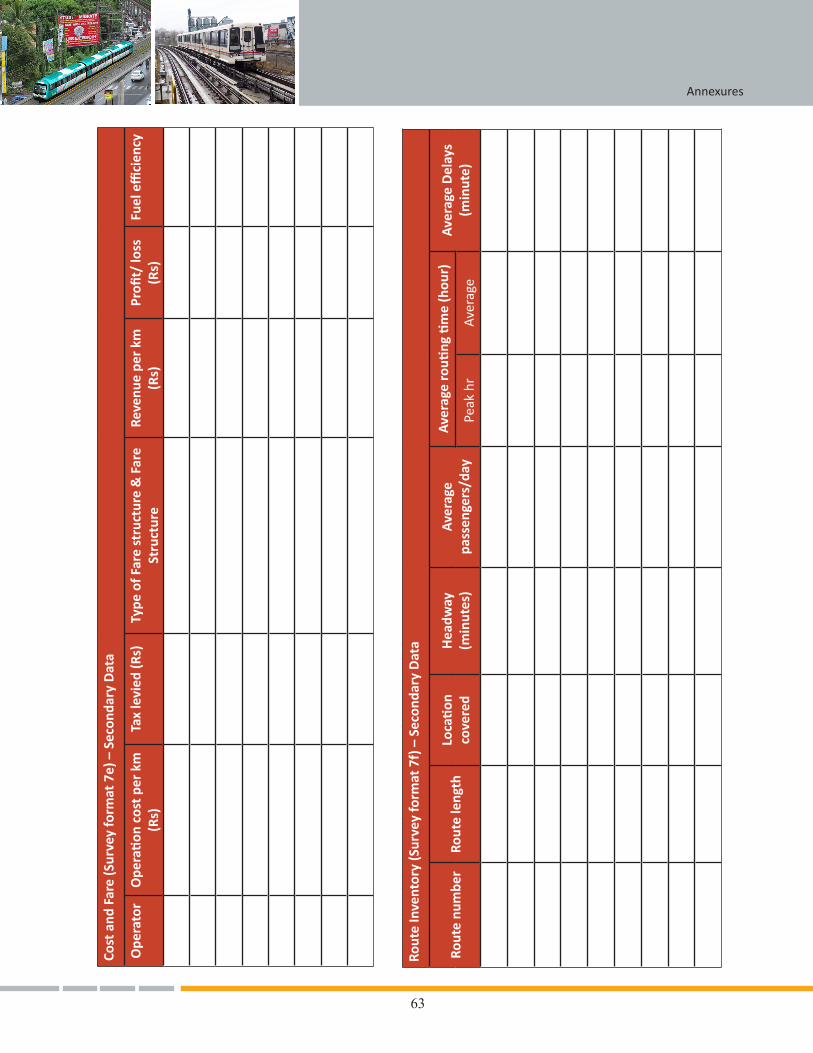
63
AnnexuresCo
st a
nd F
are
(Sur
vey
form
at 7
e) –
Sec
onda
ry D
ata
Ope
rato
rO
pera
tion
cos
t per
km
(R
s)Ta
x le
vied
(Rs)
Type
of F
are
stru
ctur
e &
Far
e St
ruct
ure
Reve
nue
per
km
(Rs)
Profi
t/ lo
ss
(Rs)
Fuel
effi
cien
cy
Rout
e In
vent
ory
(Sur
vey
form
at 7
f) –
Sec
onda
ry D
ata
Rout
e nu
mbe
rRo
ute
leng
thLo
cati
on
cove
red
Hea
dway
(m
inut
es)
Ave
rage
pa
ssen
gers
/day
Ave
rage
routi
ng ti
me
(hou
r)A
vera
ge D
elay
s (m
inut
e)Pe
ak h
rAv
erag
e
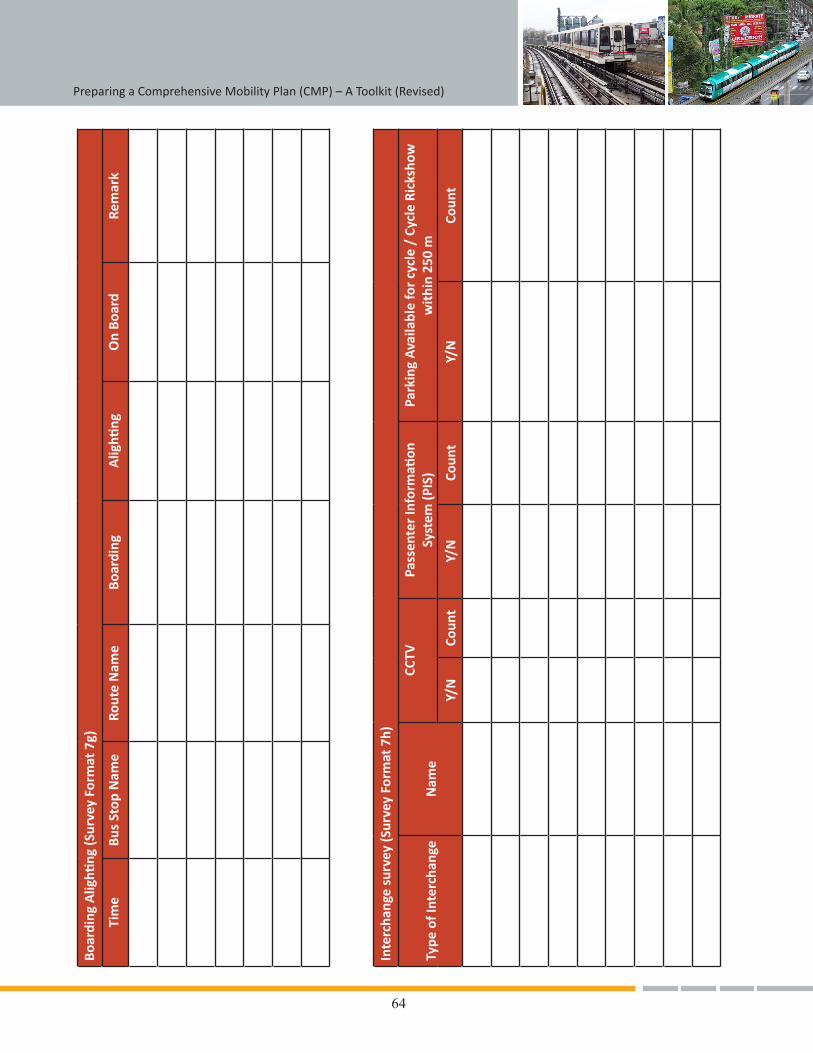
64
Preparing a Comprehensive Mobility Plan (CMP) – A Toolkit (Revised)Bo
ardi
ng A
lighti
ng (S
urve
y Fo
rmat
7g)
Tim
eBu
s St
op N
ame
Rout
e N
ame
Boar
ding
Alig
hting
On
Boar
dRe
mar
k
Inte
rcha
nge
surv
ey (S
urve
y Fo
rmat
7h)
Type
of I
nter
chan
geN
ame
CCTV
Pass
ente
r In
form
ation
Sy
stem
(PIS
)Pa
rkin
g A
vaila
ble
for
cycl
e /
Cycl
e Ri
cksh
ow
wit
hin
250
m
Y/N
Coun
tY/
NCo
unt
Y/N
Coun
t
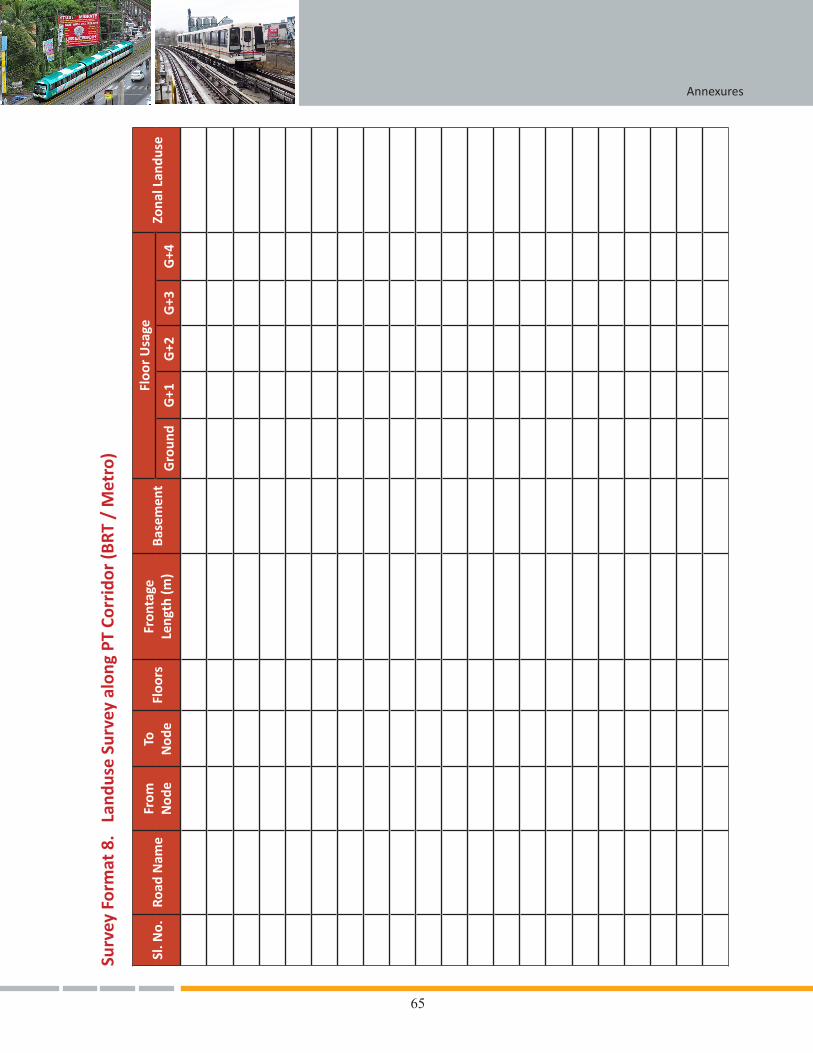
65
AnnexuresSu
rvey
For
mat
8.
Land
use
Surv
ey a
long
PT
Corr
idor
(BRT
/ M
etro
)
Sl. N
o.Ro
ad N
ame
From
N
ode
To
Nod
eFl
oors
Fron
tage
Le
ngth
(m)
Base
men
tFl
oor
Usa
geZo
nal L
andu
seG
roun
dG
+1G
+2G
+3G
+4
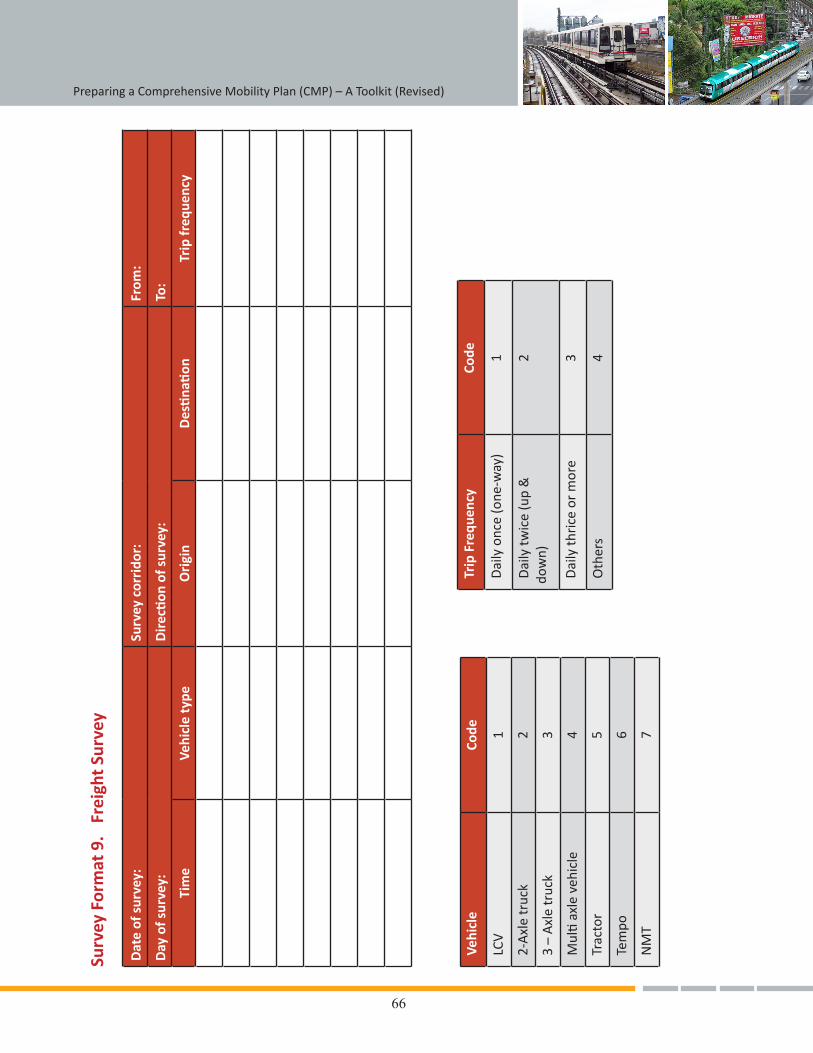
66
Preparing a Comprehensive Mobility Plan (CMP) – A Toolkit (Revised)Su
rvey
For
mat
9.
Frei
ght S
urve
y
Dat
e of
sur
vey:
Surv
ey c
orri
dor:
From
:
Day
of s
urve
y:D
irec
tion
of s
urve
y:To
:
Tim
eVe
hicl
e ty
peO
rigi
nD
esti
nati
onTr
ip fr
eque
ncy
Vehi
cle
Code
LCV
1
2-A
xle
truc
k2
3 –
Axl
e tr
uck
3
Mul
ti ax
le v
ehic
le4
Trac
tor
5
Tem
po6
NM
T7
Trip
Fre
quen
cyCo
de
Dai
ly o
nce
(one
-way
)1
Dai
ly tw
ice
(up
&
dow
n)2
Dai
ly th
rice
or
mor
e3
Oth
ers
4
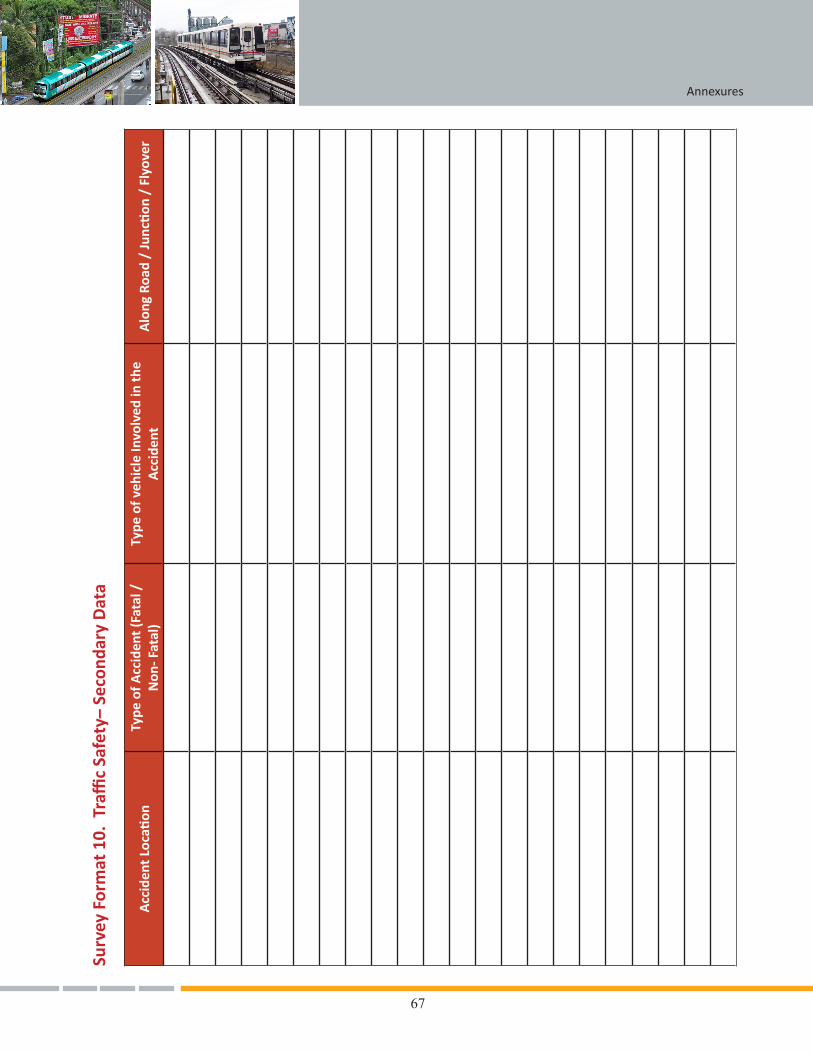
67
AnnexuresSu
rvey
For
mat
10.
Tra
ffic
Safe
ty–
Seco
ndar
y D
ata
Acc
iden
t Lo
cati
onTy
pe o
f Acc
iden
t (Fa
tal /
N
on- F
atal
)Ty
pe o
f veh
icle
Invo
lved
in t
he
Acc
iden
tA
long
Roa
d /
Junc
tion
/ F
lyov
er
68
Preparing a Comprehensive Mobility Plan (CMP) – A Toolkit (Revised)
Survey Format 11. Household Survey
General or Household interview
Socio-demographic characteristics, activity patterns and travel behaviour are inter-related. In order to effectively
understand transport demand and supply, personal as well as socio-demographic characteristics such as age,
gender, employment status, family size, income levels, etc. must be taken into consideration. The study of travel
behaviour based on these characteristics will also help ensure that transport proposals are inclusive (that is, the
benefits and costs are distributed proportionally across socio-demographic sectors). Therefore, it is essential
to collect the above information while conducting the household survey for the comprehensive and inclusive
mobility plan. It is possible that the income data gathered will not be representative. Therefore, for determining
the income status, it is important that details on household assets are also collected during the household survey.
Individual survey
For conducting the household survey, a travel diary method is to be used, wherein the respondent is asked to
recount his or her travel behaviour on the previous day, and all trips, including the trip-chains, short distance
and casual trips are noted. An analysis of travel behaviour should only draw on data collected from individuals
who have been interviewed for the survey. For this sample to be truly representative, it is important to collect
and include data on the travel behaviour of women, children and old people.
The household survey questionnaire can be broadly divided into two sections: a revealed preference survey41 and
a stated preference choice42. The revealed preference survey must include questions related to information on
the household and its members as well as their choices under existing conditions, whereas the stated preference
choice includes their alternative choices which may be non-existent.
Based on the identified indicators for CMP, it is necessary to collect information regarding the existing use and
availability of modes, and criteria related to safety, security and cost. Also, the trip chain data should be able to
capture details for multi-modal use and include information like access and egress mode, distance, travel time
and cost.
41 Revealed Preference survey is based on actual market behaviour which cannot directly predict response to new alternative. It requires large sample.
42 Stated Preference survey is based on hypothetical scenarios which can elicit preferences for new alternatives. It requires smaller sample as compared to revealed preference survey.
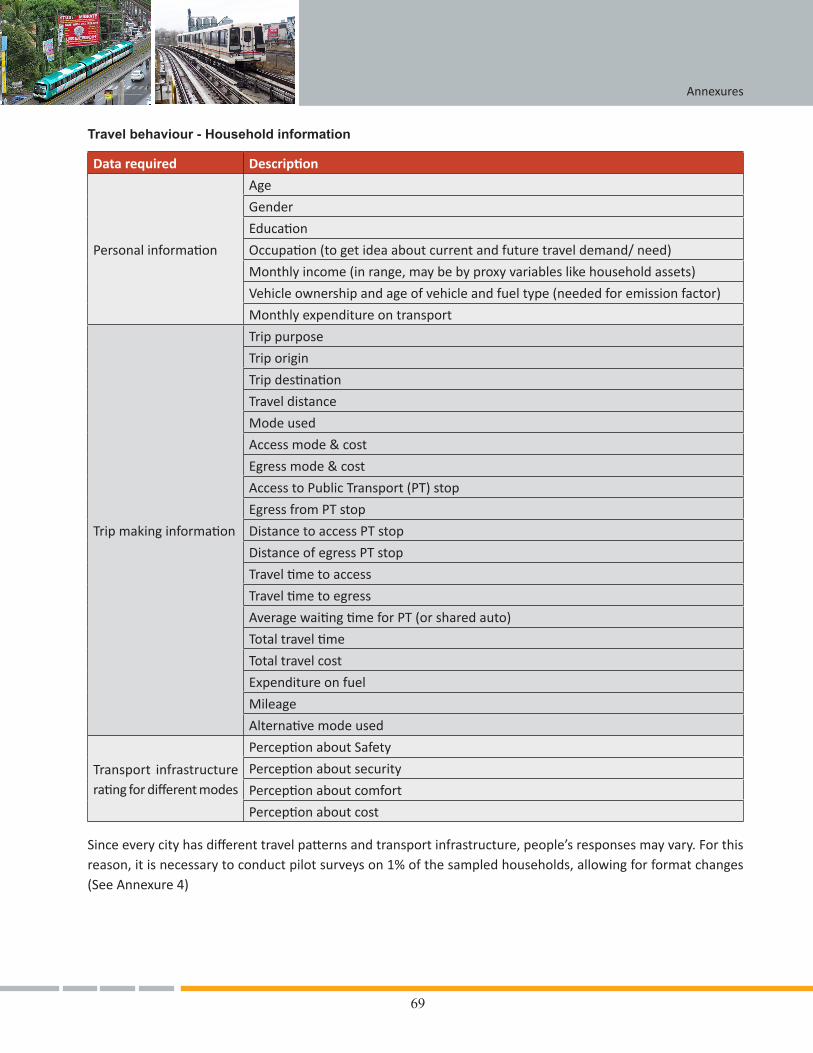
69
Annexures
Travel behaviour - Household information
Data required Description
Personal information
Age
Gender
Education
Occupation (to get idea about current and future travel demand/ need)
Monthly income (in range, may be by proxy variables like household assets)
Vehicle ownership and age of vehicle and fuel type (needed for emission factor)
Monthly expenditure on transport
Trip making information
Trip purpose
Trip origin
Trip destination
Travel distance
Mode used
Access mode & cost
Egress mode & cost
Access to Public Transport (PT) stop
Egress from PT stop
Distance to access PT stop
Distance of egress PT stop
Travel time to access
Travel time to egress
Average waiting time for PT (or shared auto)
Total travel time
Total travel cost
Expenditure on fuel
Mileage
Alternative mode used
Transport infrastructure rating for different modes
Perception about Safety
Perception about security
Perception about comfort
Perception about cost
Since every city has different travel patterns and transport infrastructure, people’s responses may vary. For this reason, it is necessary to conduct pilot surveys on 1% of the sampled households, allowing for format changes (See Annexure 4)
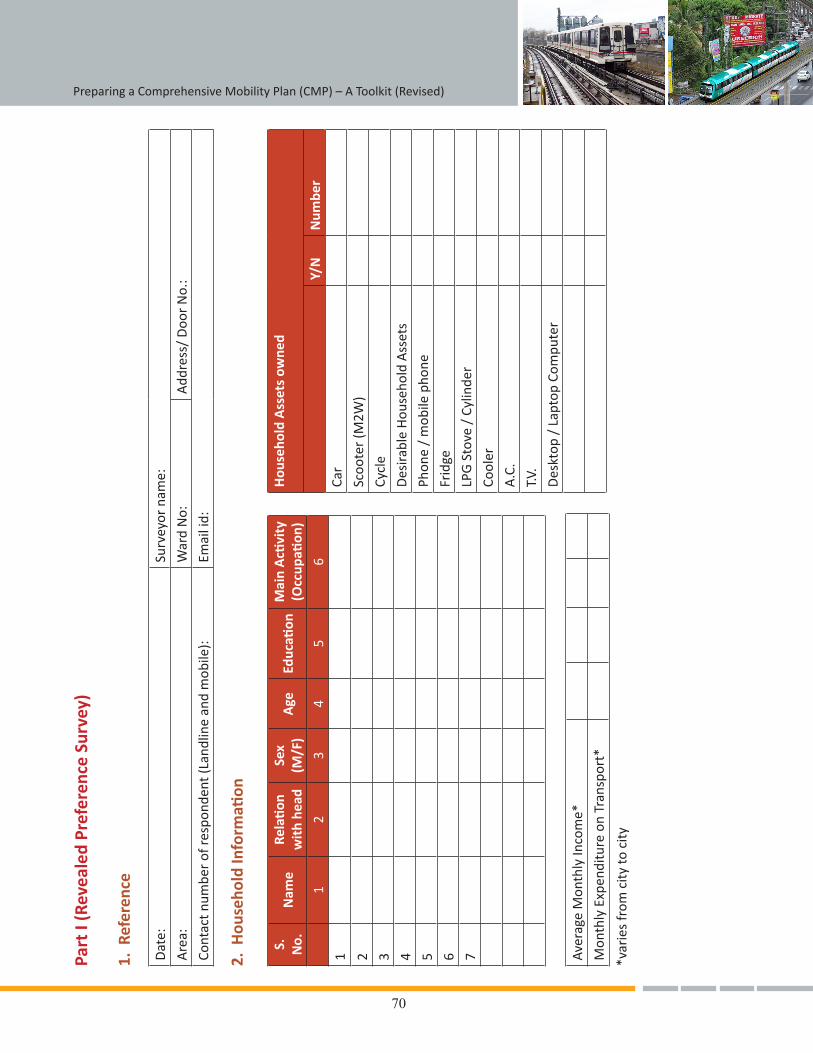
70
Preparing a Comprehensive Mobility Plan (CMP) – A Toolkit (Revised)Pa
rt I
(Rev
eale
d Pr
efer
ence
Sur
vey)
1. R
efer
ence
Dat
e:Su
rvey
or n
ame:
Are
a:W
ard
No:
Add
ress
/ D
oor
No.
:
Cont
act n
umbe
r of
resp
onde
nt (L
andl
ine
and
mob
ile):
Emai
l id:
2. H
ouse
hold
Info
rmati
on
S.
No.
Nam
eRe
lati
on
wit
h he
adSe
x (M
/F)
Age
Educ
ation
Mai
n A
ctivi
ty
(Occ
upati
on)
12
34
56
1 2 3 4 5 6 7
Hou
seho
ld A
sset
s ow
ned
Y/N
Num
ber
Car
Scoo
ter
(M2W
)
Cycl
e
Des
irabl
e H
ouse
hold
Ass
ets
Phon
e /
mob
ile p
hone
Frid
ge
LPG
Sto
ve /
Cyl
inde
r
Cool
er
A.C
.
T.V.
Des
ktop
/ L
apto
p Co
mpu
ter
Aver
age
Mon
thly
Inco
me*
Mon
thly
Exp
endi
ture
on
Tran
spor
t*
*var
ies
from
city
to c
ity
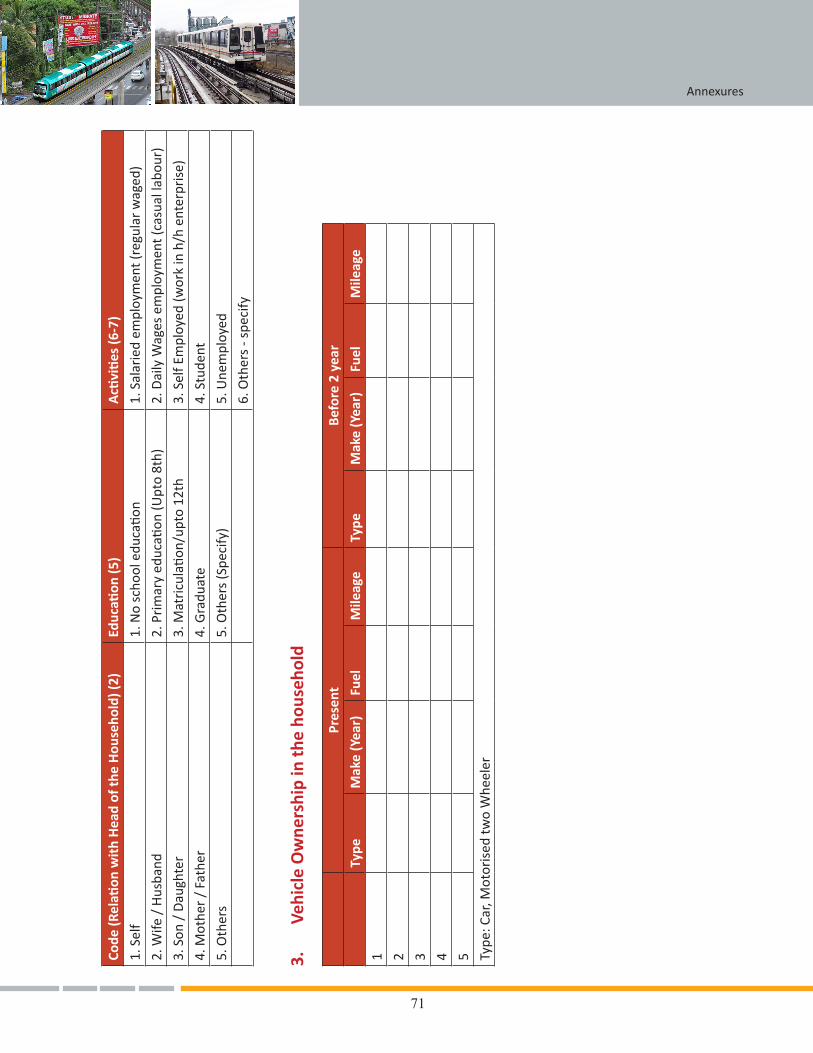
71
Annexures
Code
(Rel
ation
wit
h H
ead
of th
e H
ouse
hold
) (2)
Educ
ation
(5)
Acti
viti
es (6
-7)
1. S
elf
1. N
o sc
hool
edu
catio
n1.
Sal
arie
d em
ploy
men
t (re
gula
r w
aged
)
2. W
ife /
Hus
band
2. P
rim
ary
educ
ation
(Upt
o 8t
h)2.
Dai
ly W
ages
em
ploy
men
t (ca
sual
labo
ur)
3. S
on /
Dau
ghte
r3.
Mat
ricu
latio
n/up
to 1
2th
3. S
elf E
mpl
oyed
(wor
k in
h/h
ent
erpr
ise)
4. M
othe
r /
Fath
er4.
Gra
duat
e4.
Stu
dent
5. O
ther
s5.
Oth
ers
(Spe
cify
)5.
Une
mpl
oyed
6. O
ther
s - s
peci
fy
3.
Vehi
cle
Ow
ners
hip
in t
he h
ouse
hold
Pres
ent
Befo
re 2
yea
r
Type
M
ake
(Yea
r)Fu
elM
ileag
eTy
peM
ake
(Yea
r)Fu
elM
ileag
e
1 2 3 4 5 Type
: Car
, Mot
oris
ed tw
o W
heel
er
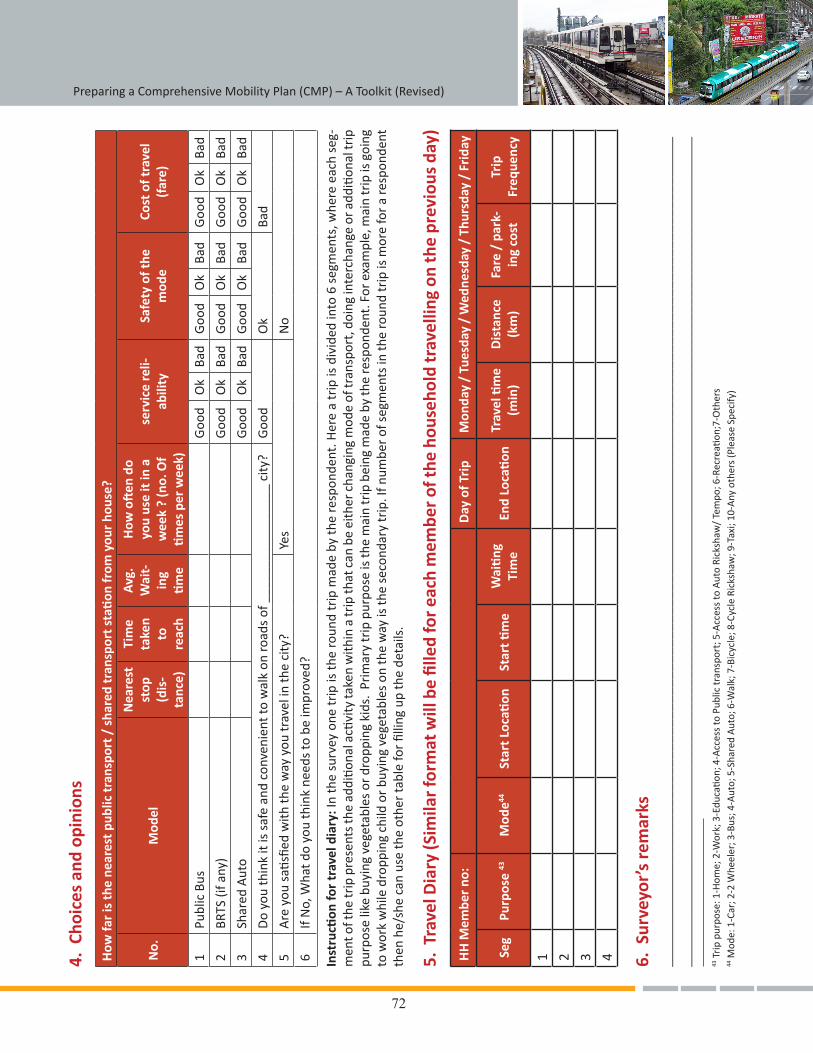
72
Preparing a Comprehensive Mobility Plan (CMP) – A Toolkit (Revised)
5. T
rave
l Dia
ry (S
imila
r for
mat
will
be
fille
d fo
r eac
h m
embe
r of t
he h
ouse
hold
trav
ellin
g on
the
prev
ious
day
)
HH
Mem
ber
no:
Day
of T
rip
Mon
day
/ Tu
esda
y /
Wed
nesd
ay /
Thu
rsda
y /
Frid
ay
Seg
Purp
ose
43M
ode44
St
art L
ocati
onSt
art ti
me
Wai
ting
Ti
me
End
Loca
tion
Trav
el ti
me
(min
)D
ista
nce
(km
)Fa
re /
par
k-in
g co
stTr
ip
Freq
uenc
y
1 2 3 4 6. S
urve
yor’
s re
mar
ks________________________________________________________________________________________________________
________________________________________________________________________________________________________
43 T
rip
purp
ose:
1-H
ome;
2-W
ork;
3-E
duca
tion;
4-A
cces
s to
Pub
lic tr
ansp
ort;
5-A
cces
s to
Aut
o Ri
cksh
aw/
Tem
po; 6
-Rec
reati
on;7
-Oth
ers
44 M
ode:
1-C
ar; 2
-2 W
heel
er; 3
-Bus
; 4-A
uto;
5-S
hare
d A
uto;
6-W
alk;
7-B
icyc
le; 8
-Cyc
le R
icks
haw
; 9-T
axi;
10-A
ny o
ther
s (P
leas
e Sp
ecify
)
4. C
hoic
es a
nd o
pini
ons
How
far
is th
e ne
ares
t pub
lic t
rans
port
/ s
hare
d tr
ansp
ort s
tati
on fr
om y
our
hous
e?
No.
Mod
el
Nea
rest
st
op
(dis
-ta
nce)
Tim
e ta
ken
to
reac
h
Avg
. W
ait-
ing
tim
e
How
oft
en d
o yo
u us
e it
in a
w
eek
? (n
o. O
f ti
mes
per
wee
k)
serv
ice
reli-
abili
tySa
fety
of t
he
mod
eCo
st o
f tra
vel
(far
e)
1Pu
blic
Bus
Goo
dO
kBa
dG
ood
Ok
Bad
Goo
dO
kBa
d
2BR
TS (i
f any
)G
ood
Ok
Bad
Goo
dO
kBa
dG
ood
Ok
Bad
3Sh
ared
Aut
oG
ood
Ok
Bad
Goo
dO
kBa
dG
ood
Ok
Bad
4D
o yo
u th
ink
it is
saf
e an
d co
nven
ient
to w
alk
on ro
ads
of _
____
____
____
____
city
?G
ood
Ok
Bad
5A
re y
ou s
atisfi
ed w
ith th
e w
ay y
ou tr
avel
in th
e ci
ty?
Yes
No
6If
No,
Wha
t do
you
thin
k ne
eds
to b
e im
prov
ed?
Inst
ructi
on fo
r tr
avel
dia
ry: I
n th
e su
rvey
one
trip
is th
e ro
und
trip
mad
e by
the
resp
onde
nt. H
ere
a tr
ip is
div
ided
into
6 s
egm
ents
, whe
re e
ach
seg-
men
t of t
he tr
ip p
rese
nts
the
addi
tiona
l acti
vity
take
n w
ithin
a tr
ip th
at c
an b
e ei
ther
cha
ngin
g m
ode
of tr
ansp
ort,
doi
ng in
terc
hang
e or
add
ition
al tr
ip
purp
ose
like
buyi
ng v
eget
able
s or
dro
ppin
g ki
ds.
Prim
ary
trip
pur
pose
is th
e m
ain
trip
bei
ng m
ade
by th
e re
spon
dent
. For
exa
mpl
e, m
ain
trip
is g
oing
to
wor
k w
hile
dro
ppin
g ch
ild o
r buy
ing
vege
tabl
es o
n th
e w
ay is
the
seco
ndar
y tr
ip. I
f num
ber o
f seg
men
ts in
the
roun
d tr
ip is
mor
e fo
r a re
spon
dent
th
en h
e/sh
e ca
n us
e th
e ot
her
tabl
e fo
r fil
ling
up th
e de
tails
.
73
Annexures
Household Survey – Part II (Stated Preference Choice survey)
This survey format is designed to capture people’s behavior in making choices when alternative mode is available and improved. This requires providing choices to the respondents including the improved and existing alternatives. The respondents can then either choose among the given alternatives or choose an alternative within a scenario.
However, there are certain points of concern while formulating the choice set within each scenario:
• People may be biased for a certain alternative either on negative or on positive side.
• Time and cost attributes are comparatively easy to introduce and understand; however the change in safety and security parameters needs to be strongly addressed.
• It is likely that inferior modes are not considered as an available alternative for middle income and high income group.
• It is extremely important to ensure that an alternative within a choice set does not dominate as it is difficult to determine the trade-offs between different alternatives.
Stated preference choice surveys can help an analyst to identify the probability of a respondent shifting from one mode to another under varying conditions and thus estimate shifts in alternative scenarios for CMP. This requires analysing the effect of factors on the mode choice of people. Thus, in the survey various scenarios are presented to respondent that shows variations in the attributes of different modes/options and the respondent is asked to choose one preferred mode of travel in each scenario. With the help of variations in attributes of modes and respondent choice, the effect of parameters can be determined in making mode choice that can be extrapolated based on the socio-economic profile of the respondent. BIOGEME (freeware) or N-logit (licensed) can be used by the analyst to determine the co-efficient of each of the individual parameter taken into account. The survey methodology enables the analyst to understand the impact of improving infrastructure, taxation and pricing regime or introducing new choice mode in alternative scenarios.
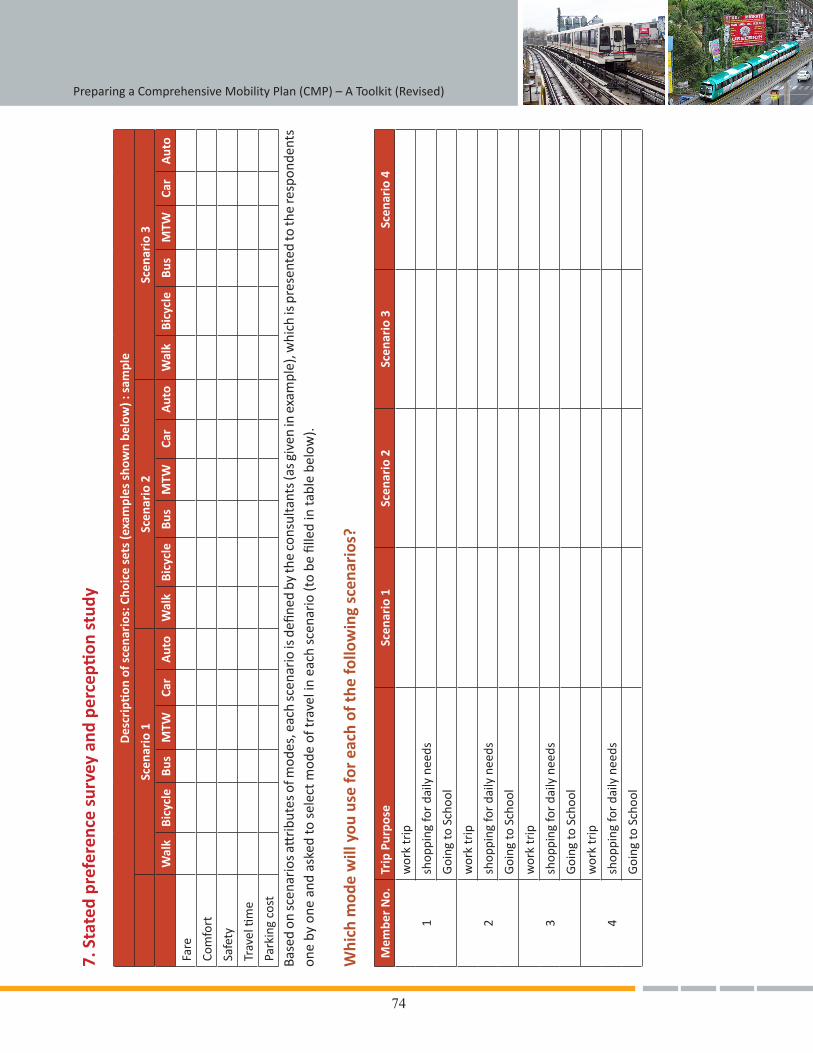
74
Preparing a Comprehensive Mobility Plan (CMP) – A Toolkit (Revised)7.
Sta
ted
pref
eren
ce s
urve
y an
d pe
rcep
tion
stu
dy
Des
crip
tion
of s
cena
rios
: Cho
ice
sets
(exa
mpl
es s
how
n be
low
) : s
ampl
e
Scen
ario
1Sc
enar
io 2
Scen
ario
3
Wal
kBi
cycl
eBu
sM
TWCa
rA
uto
Wal
kBi
cycl
eBu
sM
TWCa
rA
uto
Wal
kBi
cycl
eBu
sM
TWCa
rA
uto
Fare
Com
fort
Safe
ty
Trav
el ti
me
Park
ing
cost
Base
d on
scen
ario
s att
ribu
tes o
f mod
es, e
ach
scen
ario
is d
efine
d by
the
cons
ulta
nts (
as g
iven
in e
xam
ple)
, whi
ch is
pre
sent
ed to
the
resp
onde
nts
one
by o
ne a
nd a
sked
to s
elec
t mod
e of
trav
el in
eac
h sc
enar
io (t
o be
fille
d in
tabl
e be
low
).
Whi
ch m
ode
will
you
use
for
each
of t
he fo
llow
ing
scen
ario
s?
Mem
ber
No.
Trip
Pur
pose
Scen
ario
1Sc
enar
io 2
Scen
ario
3Sc
enar
io 4
1
wor
k tr
ip
shop
ping
for
daily
nee
ds
Goi
ng to
Sch
ool
2
wor
k tr
ip
shop
ping
for
daily
nee
ds
Goi
ng to
Sch
ool
3
wor
k tr
ip
shop
ping
for
daily
nee
ds
Goi
ng to
Sch
ool
4
wor
k tr
ip
shop
ping
for
daily
nee
ds
Goi
ng to
Sch
ool
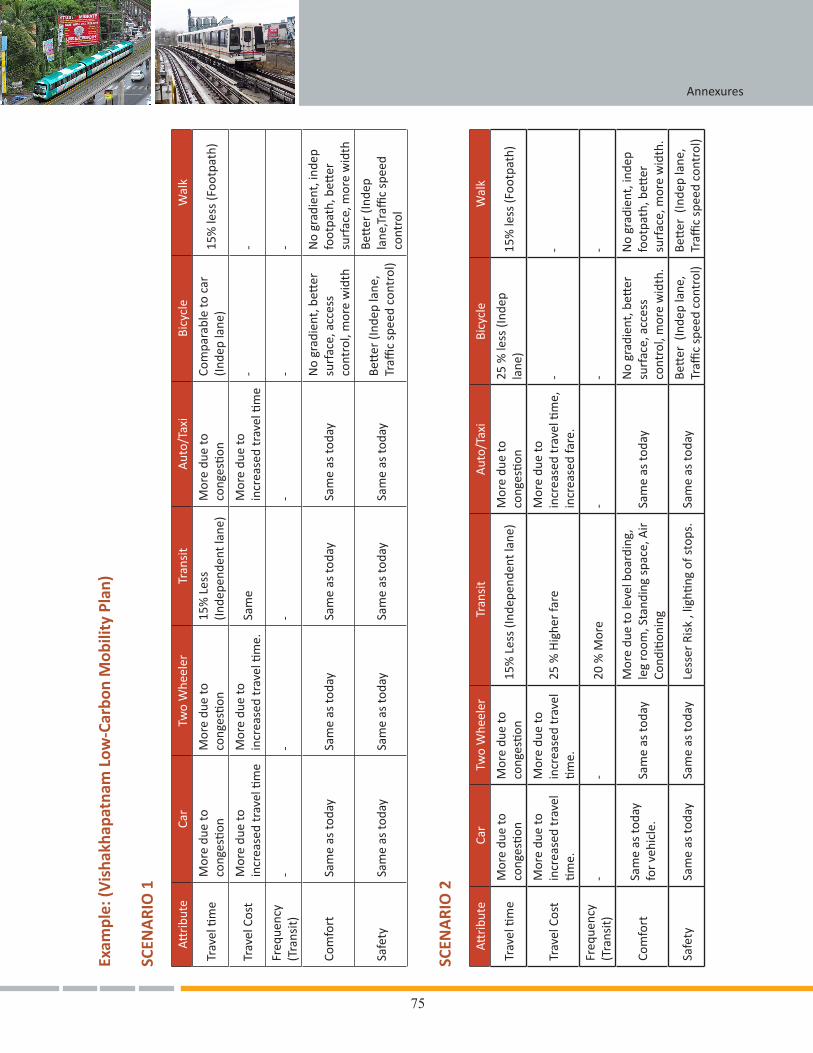
75
AnnexuresEx
ampl
e: (V
isha
khap
atna
m L
ow-C
arbo
n M
obili
ty P
lan)
SCEN
ARI
O 1
Attri
bute
Car
Two
Whe
eler
Tran
sit
Aut
o/Ta
xiBi
cycl
eW
alk
Trav
el ti
me
Mor
e du
e to
co
nges
tion
Mor
e du
e to
co
nges
tion
15%
Les
s (In
depe
nden
t lan
e)M
ore
due
to
cong
estio
nCo
mpa
rabl
e to
car
(In
dep
lane
)15
% le
ss (F
ootp
ath)
Trav
el C
ost
Mor
e du
e to
in
crea
sed
trav
el ti
me
Mor
e du
e to
in
crea
sed
trav
el ti
me.
Sam
eM
ore
due
to
incr
ease
d tr
avel
tim
e-
-
Freq
uenc
y (T
rans
it)-
--
--
-
Com
fort
Sam
e as
toda
ySa
me
as to
day
Sam
e as
toda
ySa
me
as to
day
No
grad
ient
, bett
er
surf
ace,
acc
ess
cont
rol,
mor
e w
idth
No
grad
ient
, ind
ep
foot
path
, bett
er
surf
ace,
mor
e w
idth
Safe
tySa
me
as to
day
Sam
e as
toda
ySa
me
as to
day
Sam
e as
toda
y Be
tter
(Ind
ep la
ne,
Traffi
c sp
eed
cont
rol)
Bett
er (I
ndep
la
ne,T
raffi
c sp
eed
cont
rol
SCEN
ARI
O 2
Attri
bute
Car
Two
Whe
eler
Tran
sit
Aut
o/Ta
xiBi
cycl
eW
alk
Trav
el ti
me
Mor
e du
e to
co
nges
tion
Mor
e du
e to
co
nges
tion
15%
Les
s (In
depe
nden
t lan
e)
Mor
e du
e to
co
nges
tion
25 %
less
(Ind
ep
lane
)15
% le
ss (F
ootp
ath)
Trav
el C
ost
Mor
e du
e to
in
crea
sed
trav
el
time.
Mor
e du
e to
in
crea
sed
trav
el
time.
25 %
Hig
her
fare
Mor
e du
e to
in
crea
sed
trav
el ti
me,
in
crea
sed
fare
.-
-
Freq
uenc
y (T
rans
it)
--
20 %
Mor
e -
--
Com
fort
Sa
me
as to
day
for
vehi
cle.
Sam
e as
toda
yM
ore
due
to le
vel b
oard
ing,
le
g ro
om, S
tand
ing
spac
e, A
ir
Cond
ition
ing
Sam
e as
toda
yN
o gr
adie
nt, b
etter
su
rfac
e, a
cces
s co
ntro
l, m
ore
wid
th.
No
grad
ient
, ind
ep
foot
path
, bett
er
surf
ace,
mor
e w
idth
.
Safe
tySa
me
as to
day
Sam
e as
toda
yLe
sser
Ris
k , l
ighti
ng o
f sto
ps.
Sam
e as
toda
yBe
tter
(In
dep
lane
, Tr
affic
spee
d co
ntro
l)Be
tter
(In
dep
lane
, Tr
affic
spee
d co
ntro
l)
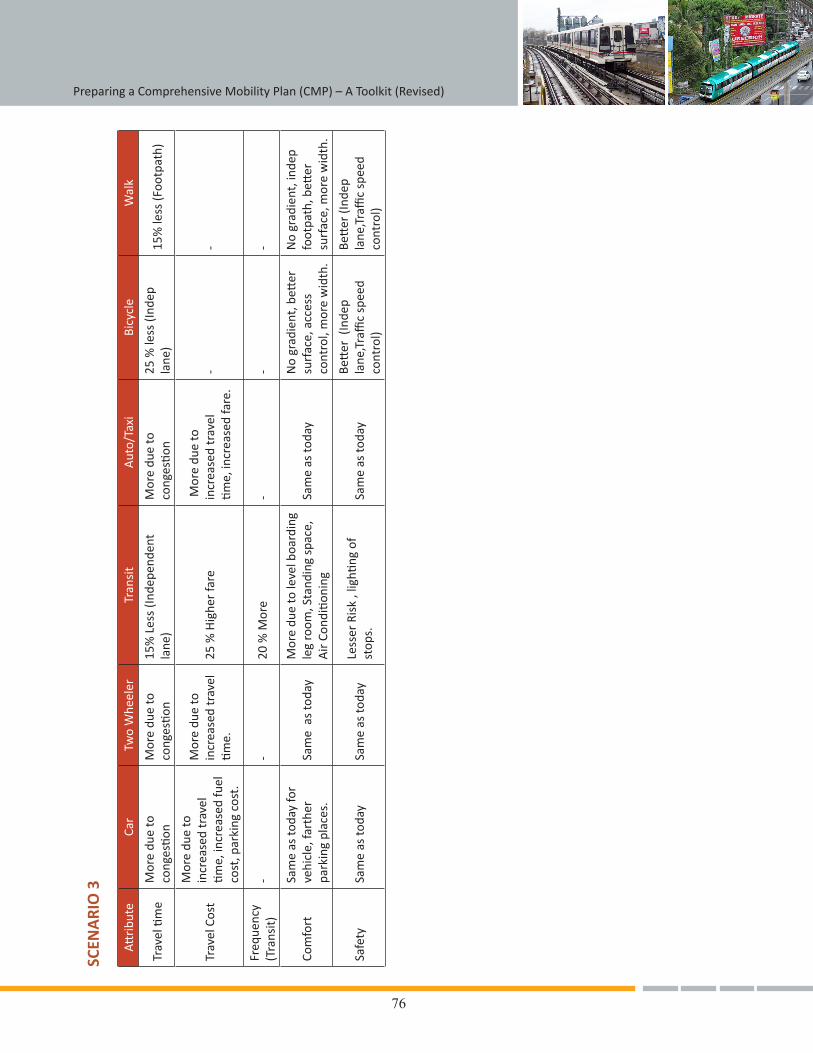
76
Preparing a Comprehensive Mobility Plan (CMP) – A Toolkit (Revised)SC
ENA
RIO
3
Attri
bute
Car
Two
Whe
eler
Tran
sit
Aut
o/Ta
xiBi
cycl
eW
alk
Trav
el ti
me
Mor
e du
e to
co
nges
tion
Mor
e du
e to
co
nges
tion
15%
Les
s (In
depe
nden
t la
ne)
Mor
e du
e to
co
nges
tion
25 %
less
(Ind
ep
lane
)15
% le
ss (F
ootp
ath)
Trav
el C
ost
Mor
e du
e to
in
crea
sed
trav
el
time,
incr
ease
d fu
el
cost
, par
king
cos
t.
Mor
e du
e to
in
crea
sed
trav
el
time.
25 %
Hig
her
fare
M
ore
due
to
incr
ease
d tr
avel
tim
e, in
crea
sed
fare
. -
-
Freq
uenc
y (T
rans
it)-
-20
% M
ore
- -
-
Com
fort
Sam
e as
toda
y fo
r ve
hicl
e, fa
rthe
r pa
rkin
g pl
aces
.Sa
me
as
toda
yM
ore
due
to le
vel b
oard
ing
leg
room
, Sta
ndin
g sp
ace,
A
ir C
ondi
tioni
ngSa
me
as to
day
No
grad
ient
, bett
er
surf
ace,
acc
ess
cont
rol,
mor
e w
idth
.
No
grad
ient
, ind
ep
foot
path
, bett
er
surf
ace,
mor
e w
idth
.
Safe
tySa
me
as to
day
Sam
e as
toda
yLe
sser
Ris
k , l
ighti
ng o
f st
ops.
Sam
e as
toda
yBe
tter
(In
dep
lane
,Tra
ffic
spee
d co
ntro
l)
Bett
er (I
ndep
la
ne,T
raffi
c sp
eed
cont
rol)
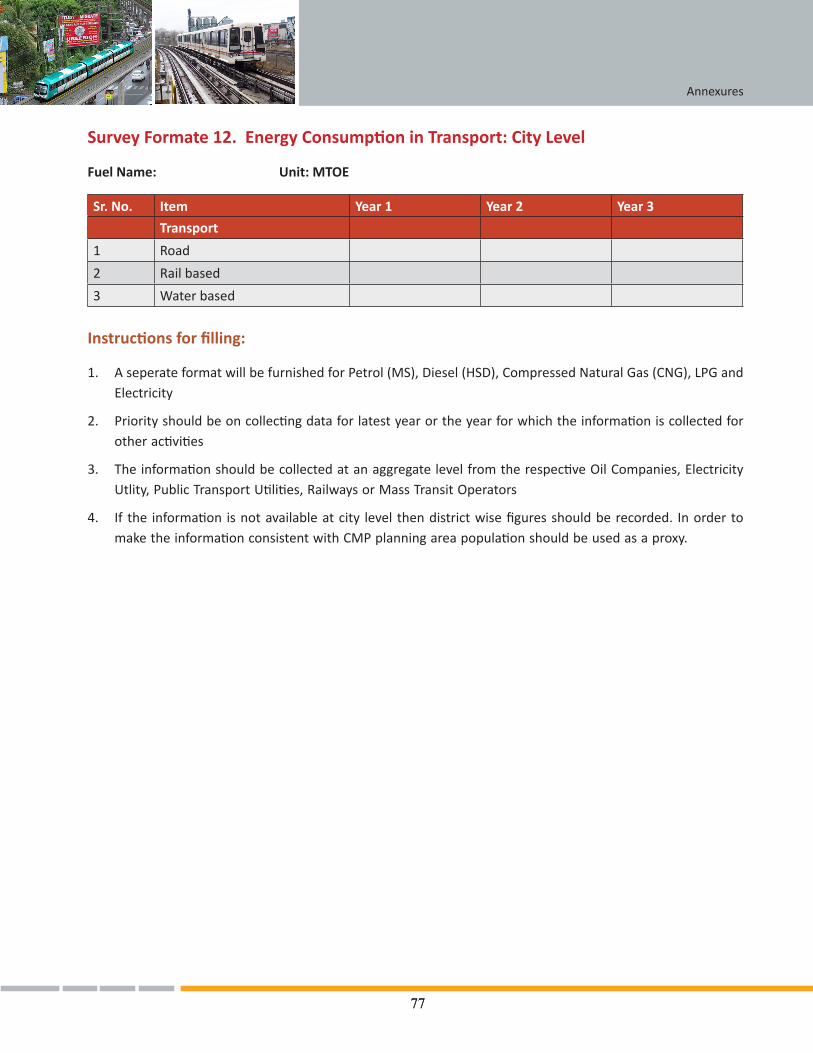
77
Survey Formate 12. Energy Consumption in Transport: City Level
Fuel Name: Unit: MTOE
Sr. No. Item Year 1 Year 2 Year 3
Transport
1 Road
2 Rail based
3 Water based
Instructions for filling:
1. A seperate format will be furnished for Petrol (MS), Diesel (HSD), Compressed Natural Gas (CNG), LPG and Electricity
2. Priorityshouldbeoncollectingdataforlatestyearortheyearforwhichtheinformationiscollectedforotheractivities
3. TheinformationshouldbecollectedatanaggregatelevelfromtherespectiveOilCompanies,ElectricityUtlity,PublicTransportUtilities,RailwaysorMassTransitOperators
4. If the information isnotavailableatcity level thendistrictwisefiguresshouldberecorded. InordertomaketheinformationconsistentwithCMPplanningareapopulationshouldbeusedasaproxy.
77
Annexures
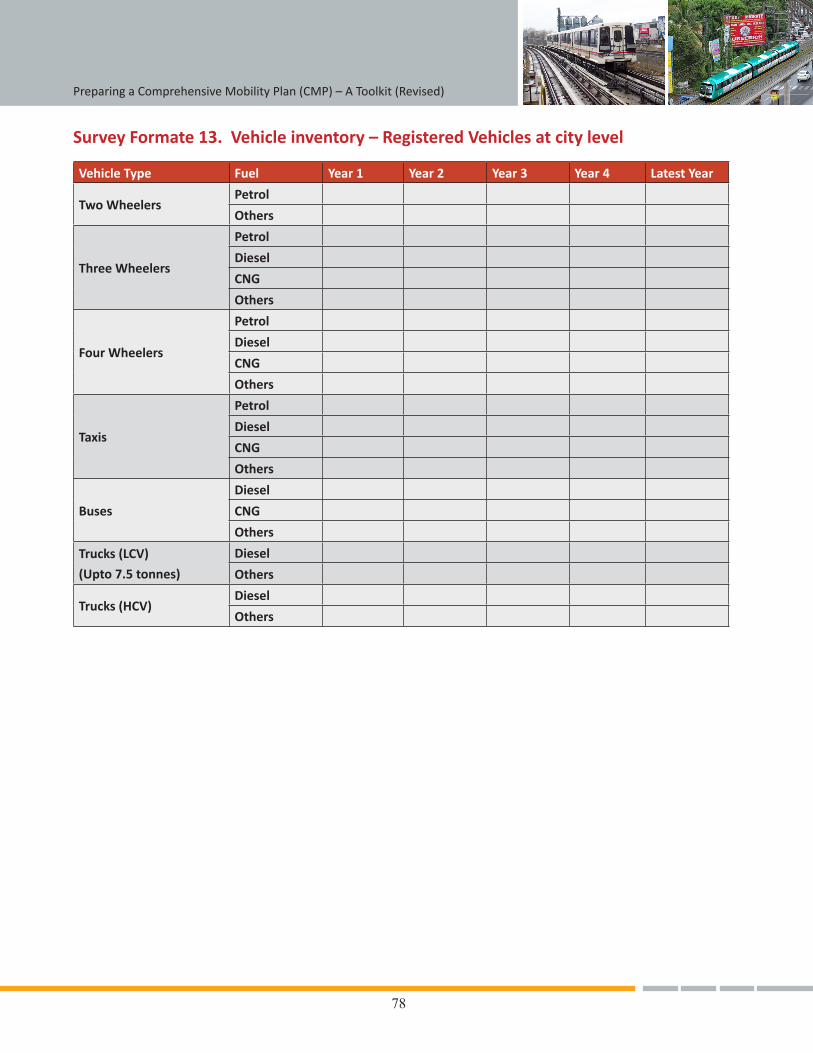
78
Preparing a Comprehensive Mobility Plan (CMP) – A Toolkit (Revised)
Survey Formate 13. Vehicle inventory – Registered Vehicles at city level
Vehicle Type Fuel Year 1 Year 2 Year 3 Year 4 Latest Year
Two WheelersPetrol
Others
Three Wheelers
Petrol
Diesel
CNG
Others
Four Wheelers
Petrol
Diesel
CNG
Others
Taxis
Petrol
Diesel
CNG
Others
Buses
Diesel
CNG
Others
Trucks (LCV)
(Upto 7.5 tonnes)
Diesel
Others
Trucks (HCV)Diesel
Others
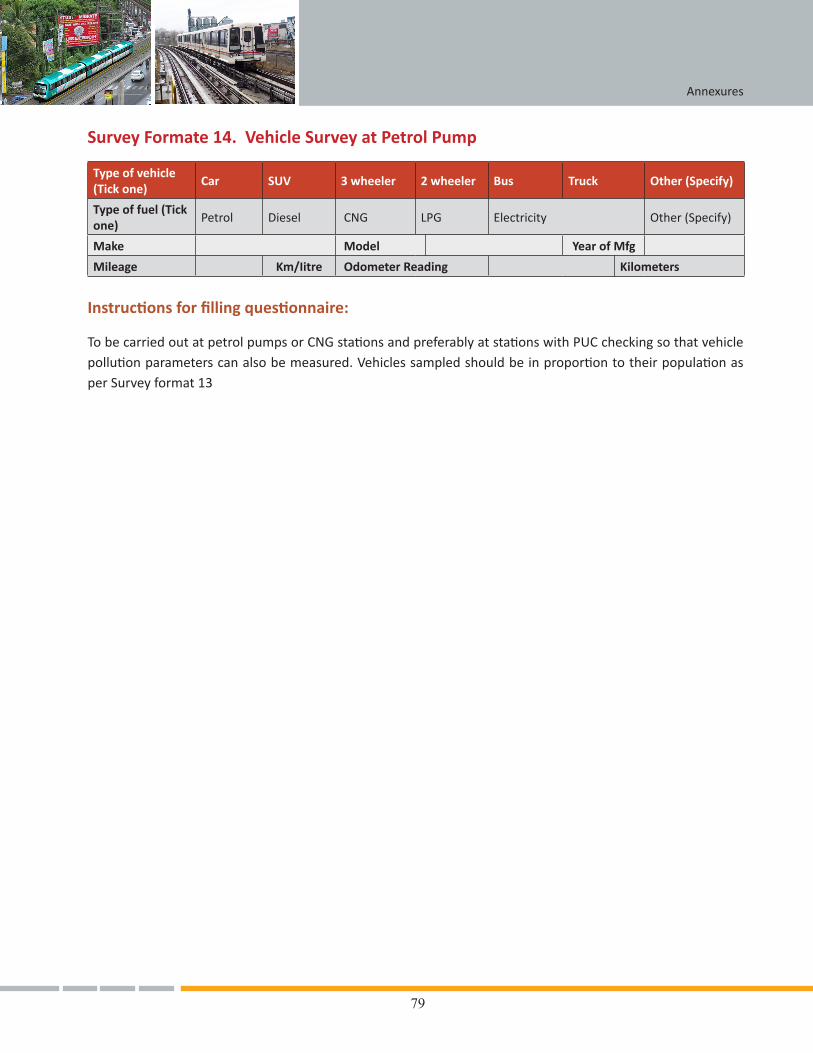
79
Annexures
Survey Formate 14. Vehicle Survey at Petrol Pump
Type of vehicle (Tick one)
Car SUV 3 wheeler 2 wheeler Bus Truck Other (Specify)
Type of fuel (Tick one)
Petrol Diesel CNG LPG Electricity Other(Specify)
Make Model Year of Mfg
Mileage Km/Iitre Odometer Reading Kilometers
Instructions for filling questionnaire:
TobecarriedoutatpetrolpumpsorCNGstationsandpreferablyatstationswithPUCcheckingsothatvehiclepollutionparameterscanalsobemeasured.VehiclessampledshouldbeinproportiontotheirpopulationasperSurveyformat13
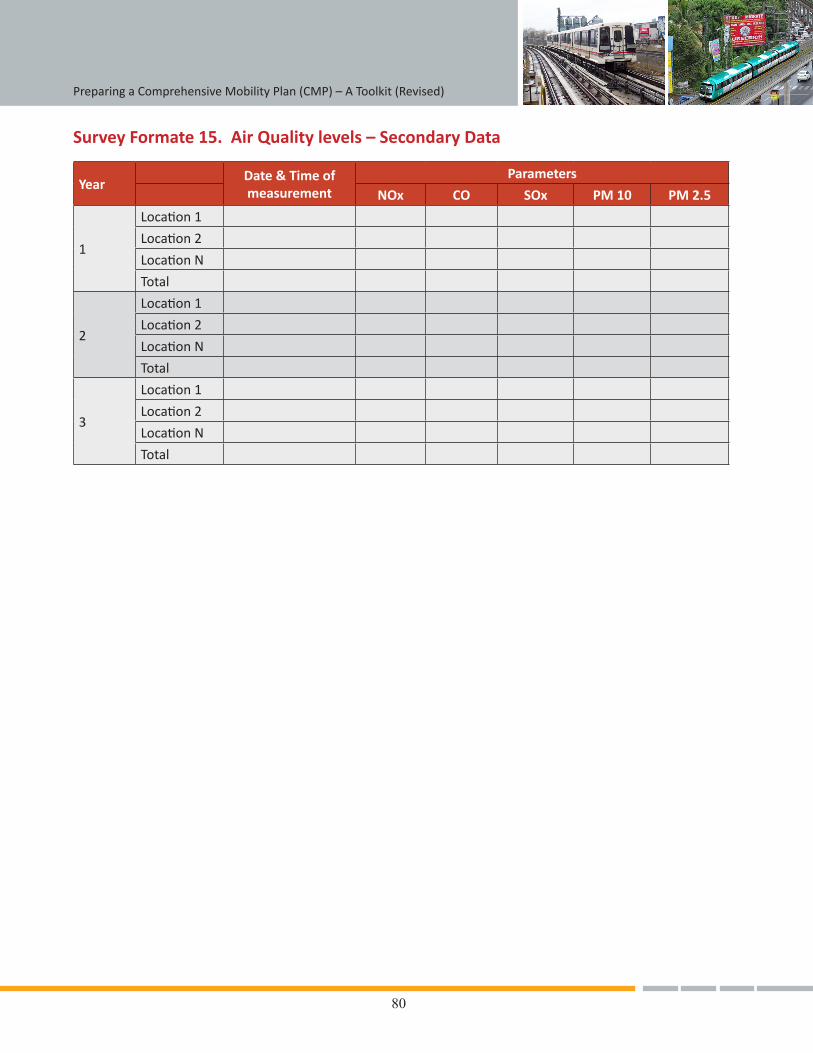
80
Preparing a Comprehensive Mobility Plan (CMP) – A Toolkit (Revised)
Survey Formate 15. Air Quality levels – Secondary Data
YearDate & Time of measurement
Parameters
NOx CO SOx PM 10 PM 2.5
1
Location1
Location2
LocationN
Total
2
Location1
Location2
LocationN
Total
3
Location1
Location2
LocationN
Total
81
Annexures
Annexure 2. Stakeholder Consultation
Stakeholderconsultationisanimportantexerciseforvariousreasons:
a) Understanding the city:Itisnecessarytoengagewithstakeholderswhoworkinthecity.Groundexperienceofthestakeholderswiththecityisvaluableandmustbecaptured.Thisexercisewillhelpusunderstandnotjustthecharacteristicsofthecitybutalsohelpusunderstandthemainbottlenecksandstrengthsofthecity.Byunderstandingthelimitationswithinwhichthestakeholderswork,wewillbeabletodevelopmorerelevantscenariosforthecityandmakebetterrecommendations.
b) Stakeholder consultations: Ithasbeenwidelyrecognizedasan importantexercise inrecenttimes.Thetop-downapproach,where recommendations aremade to a citywithout involving stakeholders in thedeliberationprocessandusing itsknow-how,hasbeenwidelycriticised. It isnowrecognized thateachcityhas itsuniquecharacter.Therecommendationsmade,havetosuittheuniquecircumstancesunderwhichthecityfunctions.
c) The scope of work of each organisation:Thereareanumberofagenciesthatoperateinacity.Sometimes,multipleagencieswillbeinvolvedinthesamearea.Forexample:Constructionandmaintenanceofroadsina citywon’t fall under the jurisdictionofa singleagency.Anumberof agenciesare involved in thatprocess.Thereisusuallyacleardemarcationofeachagency’sscopeofworkandthereforeunderstandingthe exact jurisdiction of each agency is important. Thiswill help in understanding the exact tasks thateach organisation is responsible for and also identifying areas where there is an overlap of tasks andresponsibilities.
d) Developing alternative scenarios: CMPwill involvedevelopingalternativescenariosofurbantransport.Thedifferencebetween thealternativeswillbedifferences inpolicy; institutional framework; transportplansof thecity; technological innovationsandothersuchdetails.Stakeholderconsultationwillhelp inbuildingthesealternativescenarios.
e) Building a rapport with the city:Byengagingwiththestakeholders,arapportwillbebuiltwiththecity.ThisisvitalbecauserecommendationsmadeintheCMPwillneedtobeimplemented.Havingarapportwiththecitywillensurethattherecommendationsaresmoothlyimplementedandproblemsandbottlenecksareminimizedintheimplementationstage.
f) ItistobenotedthatcertainstakeholdersmaynotcontributetothecreationofCMPbutcouldbepowerfulenoughtohindertheimplementation.Engagingthesestakeholders,keepingthemregularlyintheloopoftheprojectandtakingsomeoftheirrecommendationsintoconsiderationwillhelpinensuringmaximumsupport from the city.
Identifying Stakeholders
Stakeholderswillincludethefollowing:
i. GovernmentBodieslikeMunicipalcorporations,DevelopmentAuthorities,PublicWorksDepartments,TrafficPolice,TransportDepartment,EnvironmentPollutionControlAuthority(EPCA),EnvironmentDepartment,CantonmentBoard,TransportCorporations,etc.
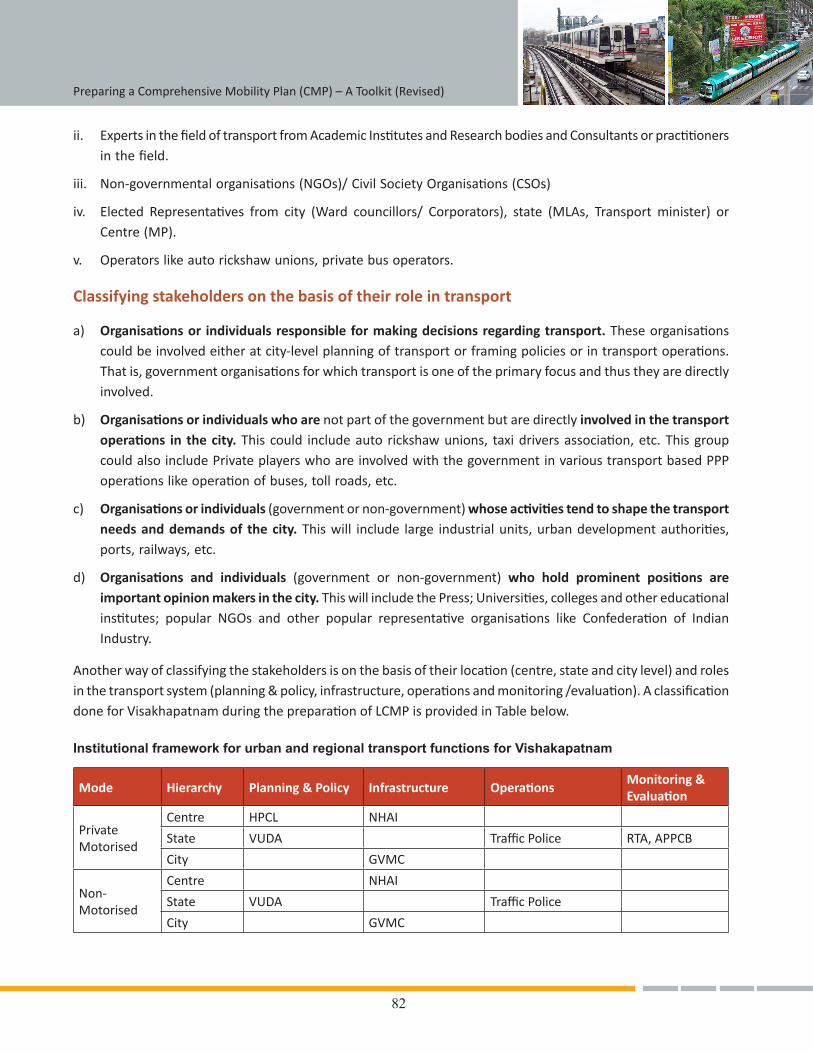
82
Preparing a Comprehensive Mobility Plan (CMP) – A Toolkit (Revised)
ii. ExpertsinthefieldoftransportfromAcademicInstitutesandResearchbodiesandConsultantsorpractitionersinthefield.
iii. Non-governmentalorganisations(NGOs)/CivilSocietyOrganisations(CSOs)
iv. Elected Representatives from city (Ward councillors/ Corporators), state (MLAs, Transport minister) orCentre (MP).
v. Operatorslikeautorickshawunions,privatebusoperators.
Classifying stakeholders on the basis of their role in transport
a) Organisations or individuals responsible for making decisions regarding transport.Theseorganisationscouldbeinvolvedeitheratcity-levelplanningoftransportorframingpoliciesorintransportoperations.Thatis,governmentorganisationsforwhichtransportisoneoftheprimaryfocusandthustheyaredirectlyinvolved.
b) Organisations or individuals who arenotpartofthegovernmentbutaredirectly involved in the transport operations in the city. Thiscould includeauto rickshawunions, taxidriversassociation,etc.ThisgroupcouldalsoincludePrivateplayerswhoareinvolvedwiththegovernmentinvarioustransportbasedPPPoperationslikeoperationofbuses,tollroads,etc.
c) Organisations or individuals (governmentornon-government)whose activities tend to shape the transport needs and demands of the city. Thiswill include large industrialunits,urbandevelopmentauthorities,ports, railways, etc.
d) Organisations and individuals (government or non-government) who hold prominent positions are important opinion makers in the city.ThiswillincludethePress;Universities,collegesandothereducationalinstitutes; popular NGOs and other popular representative organisations like Confederation of IndianIndustry.
Anotherwayofclassifyingthestakeholdersisonthebasisoftheirlocation(centre,stateandcitylevel)androlesinthetransportsystem(planning&policy,infrastructure,operationsandmonitoring/evaluation).AclassificationdoneforVisakhapatnamduringthepreparationofLCMPisprovidedinTablebelow.
Institutional framework for urban and regional transport functions for Vishakapatnam
Mode Hierarchy Planning & Policy Infrastructure OperationsMonitoring & Evaluation
Private Motorised
Centre HPCL NHAI
State VUDA TrafficPolice RTA, APPCB
City GVMC
Non- Motorised
Centre NHAI
State VUDA TrafficPolice
City GVMC
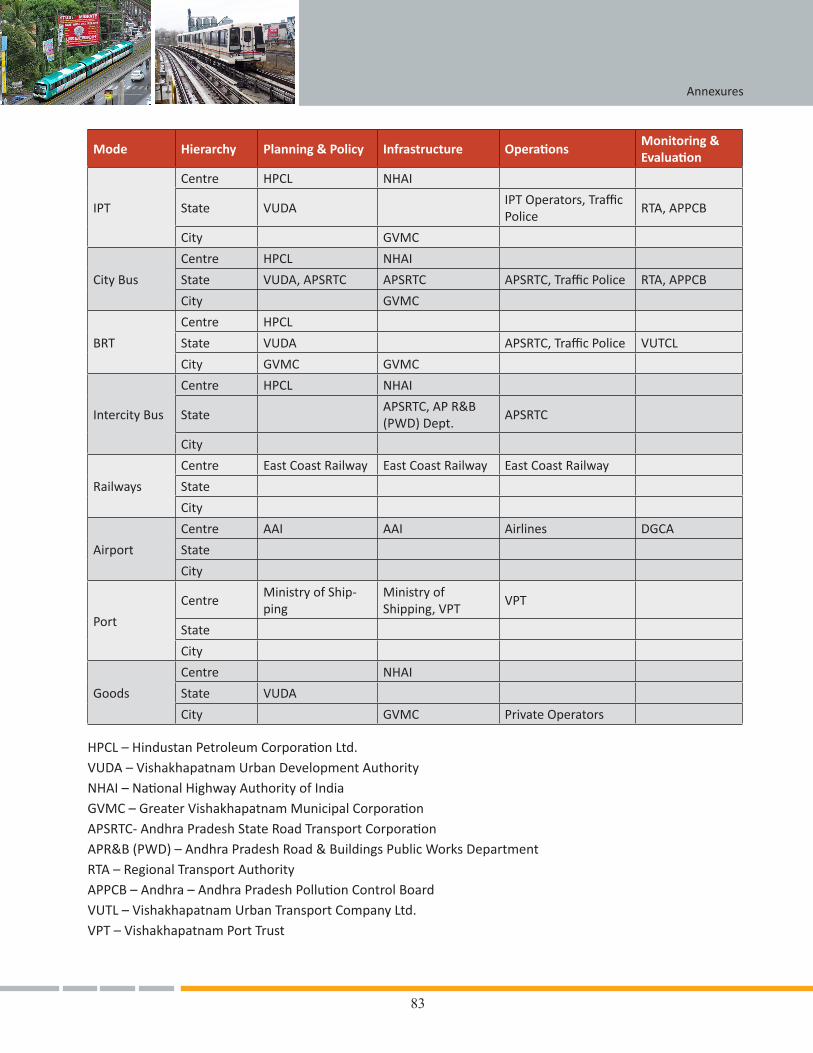
83
Annexures
Mode Hierarchy Planning & Policy Infrastructure OperationsMonitoring & Evaluation
IPT
Centre HPCL NHAI
State VUDAIPTOperators,TrafficPolice
RTA, APPCB
City GVMC
City Bus
Centre HPCL NHAI
State VUDA,APSRTC APSRTC APSRTC,TrafficPolice RTA, APPCB
City GVMC
BRT
Centre HPCL
State VUDA APSRTC,TrafficPolice VUTCL
City GVMC GVMC
Intercity Bus
Centre HPCL NHAI
StateAPSRTC,APR&B(PWD) Dept.
APSRTC
City
Railways
Centre East Coast Railway East Coast Railway East Coast Railway
State
City
Airport
Centre AAI AAI Airlines DGCA
State
City
Port
CentreMinistry of Ship-ping
Ministry of Shipping,VPT
VPT
State
City
Goods
Centre NHAI
State VUDA
City GVMC PrivateOperators
HPCL–HindustanPetroleumCorporationLtd.VUDA–VishakhapatnamUrbanDevelopmentAuthorityNHAI–NationalHighwayAuthorityofIndiaGVMC–GreaterVishakhapatnamMunicipalCorporationAPSRTC-AndhraPradeshStateRoadTransportCorporationAPR&B(PWD)–AndhraPradeshRoad&BuildingsPublicWorksDepartmentRTA–RegionalTransportAuthorityAPPCB–Andhra–AndhraPradeshPollutionControlBoardVUTL–VishakhapatnamUrbanTransportCompanyLtd.VPT–VishakhapatnamPortTrust
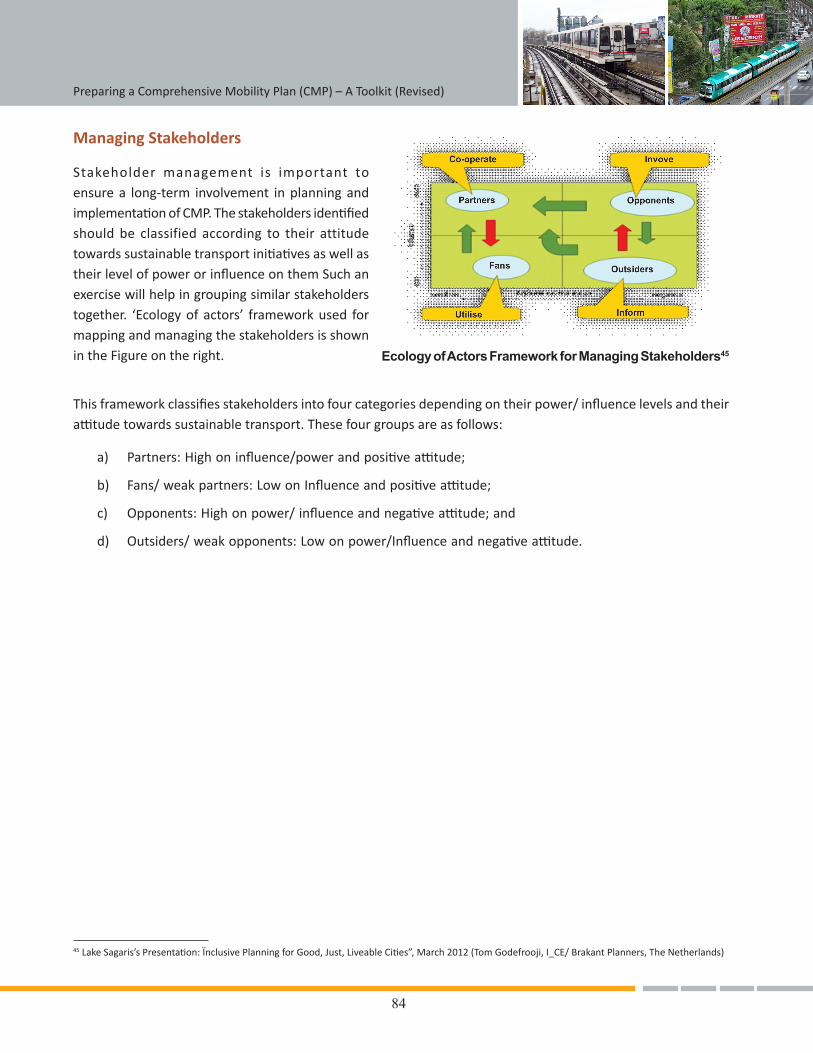
PreparingaComprehensiveMobilityPlan(CMP)–AToolkit(Revised)
84
Managing Stakeholders
Stakeholder management is important toensurea long-term involvement inplanningandimplementationofCMP.Thestakeholdersidentifiedshould be classified according to their attitudetowardssustainabletransportinitiativesaswellastheirlevelofpowerorinfluenceonthemSuchanexercisewillhelpingroupingsimilarstakeholderstogether. ‘Ecologyofactors’ frameworkused formappingandmanagingthestakeholdersisshownintheFigureontheright. Ecology of Actors Framework for Managing Stakeholders45
45LakeSagaris’sPresentation:ÏnclusivePlanningforGood,Just,LiveableCities”,March2012(TomGodefrooji,I_CE/BrakantPlanners,TheNetherlands)
Thisframeworkclassifiesstakeholdersintofourcategoriesdependingontheirpower/influencelevelsandtheirattitudetowardssustainabletransport.Thesefourgroupsareasfollows:
a) Partners:Highoninfluence/powerandpositiveattitude;
b) Fans/weakpartners:LowonInfluenceandpositiveattitude;
c) Opponents:Highonpower/influenceandnegativeattitude;and
d) Outsiders/weakopponents:Lowonpower/Influenceandnegativeattitude.
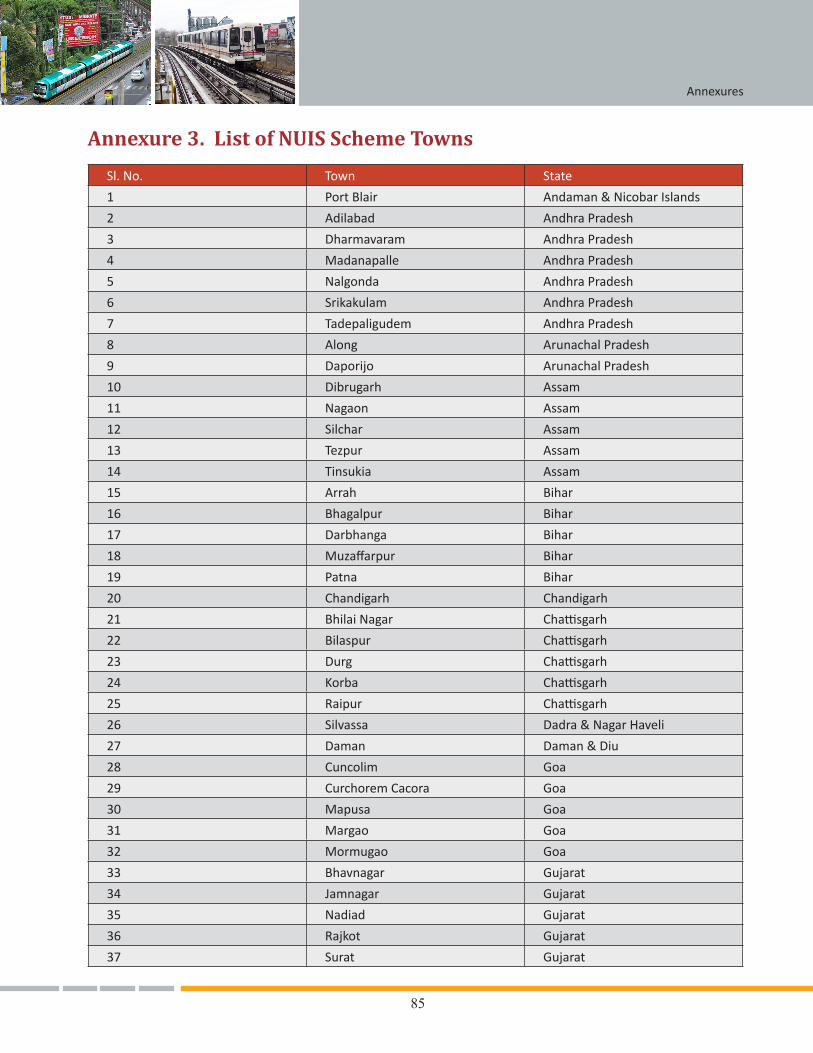
Annexures
85
Annexure 3. List of NUIS Scheme Towns
Sl. No. Town State
1 Port Blair Andaman&NicobarIslands
2 Adilabad Andhra Pradesh
3 Dharmavaram Andhra Pradesh
4 Madanapalle Andhra Pradesh
5 Nalgonda Andhra Pradesh
6 Srikakulam Andhra Pradesh
7 Tadepaligudem Andhra Pradesh
8 Along Arunachal Pradesh
9 Daporijo Arunachal Pradesh
10 Dibrugarh Assam
11 Nagaon Assam
12 Silchar Assam
13 Tezpur Assam
14 Tinsukia Assam
15 Arrah Bihar
16 Bhagalpur Bihar
17 Darbhanga Bihar
18 Muzaffarpur Bihar
19 Patna Bihar
20 Chandigarh Chandigarh
21 BhilaiNagar Chattisgarh
22 Bilaspur Chattisgarh
23 Durg Chattisgarh
24 Korba Chattisgarh
25 Raipur Chattisgarh
26 Silvassa Dadra&NagarHaveli
27 Daman Daman&Diu
28 Cuncolim Goa
29 Curchorem Cacora Goa
30 Mapusa Goa
31 Margao Goa
32 Mormugao Goa
33 Bhavnagar Gujarat
34 Jamnagar Gujarat
35 Nadiad Gujarat
36 Rajkot Gujarat
37 Surat Gujarat
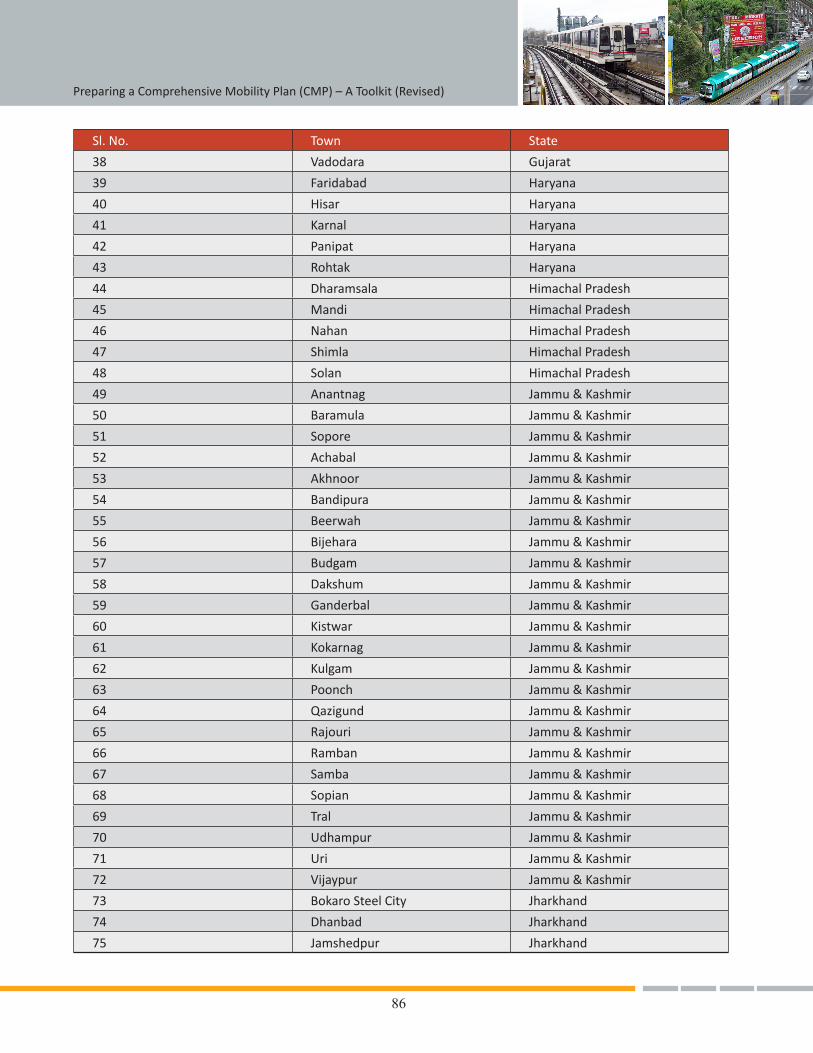
86
Preparing a Comprehensive Mobility Plan (CMP) – A Toolkit (Revised)
Sl. No. Town State
38 Vadodara Gujarat
39 Faridabad Haryana
40 Hisar Haryana
41 Karnal Haryana
42 Panipat Haryana
43 Rohtak Haryana
44 Dharamsala Himachal Pradesh
45 Mandi Himachal Pradesh
46 Nahan Himachal Pradesh
47 Shimla Himachal Pradesh
48 Solan Himachal Pradesh
49 Anantnag Jammu&Kashmir
50 Baramula Jammu&Kashmir
51 Sopore Jammu&Kashmir
52 Achabal Jammu&Kashmir
53 Akhnoor Jammu&Kashmir
54 Bandipura Jammu&Kashmir
55 Beerwah Jammu&Kashmir
56 Bijehara Jammu&Kashmir
57 Budgam Jammu&Kashmir
58 Dakshum Jammu&Kashmir
59 Ganderbal Jammu&Kashmir
60 Kistwar Jammu&Kashmir
61 Kokarnag Jammu&Kashmir
62 Kulgam Jammu&Kashmir
63 Poonch Jammu&Kashmir
64 Qazigund Jammu&Kashmir
65 Rajouri Jammu&Kashmir
66 Ramban Jammu&Kashmir
67 Samba Jammu&Kashmir
68 Sopian Jammu&Kashmir
69 Tral Jammu&Kashmir
70 Udhampur Jammu&Kashmir
71 Uri Jammu&Kashmir
72 Vijaypur Jammu&Kashmir
73 Bokaro Steel City Jharkhand
74 Dhanbad Jharkhand
75 Jamshedpur Jharkhand
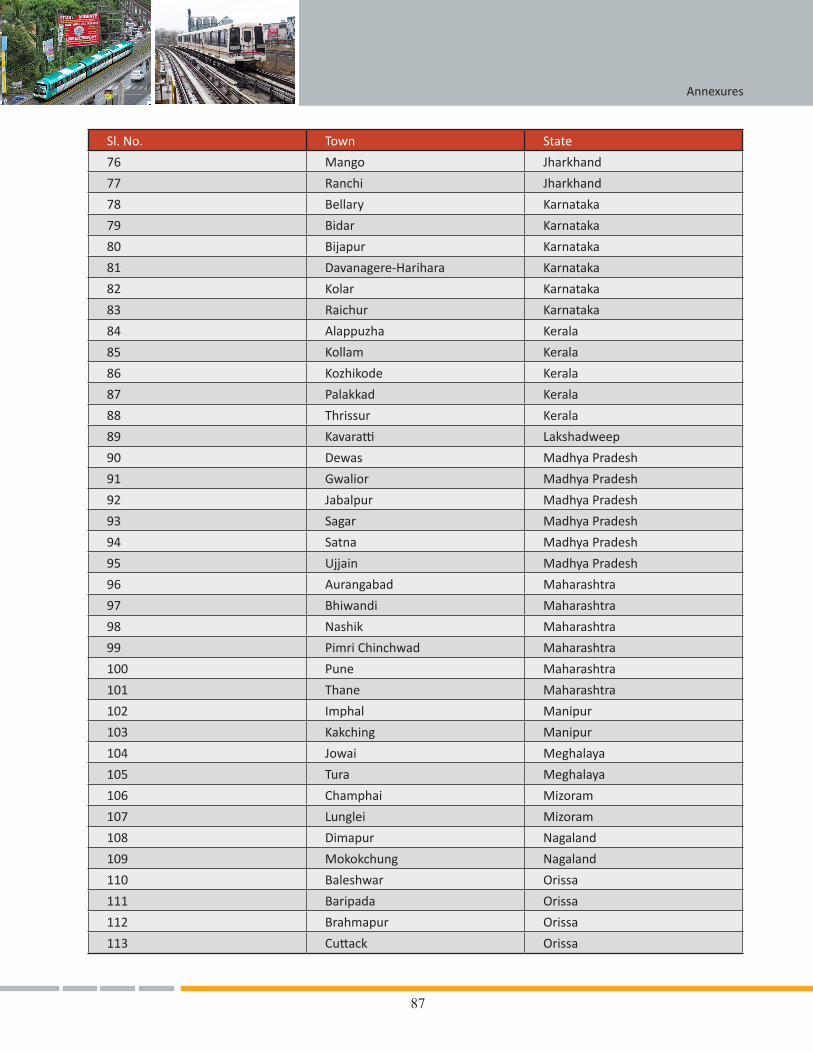
87
Annexures
Sl. No. Town State
76 Mango Jharkhand
77 Ranchi Jharkhand
78 Bellary Karnataka
79 Bidar Karnataka
80 Bijapur Karnataka
81 Davanagere-Harihara Karnataka
82 Kolar Karnataka
83 Raichur Karnataka
84 Alappuzha Kerala
85 Kollam Kerala
86 Kozhikode Kerala
87 Palakkad Kerala
88 Thrissur Kerala
89 Kavaratti Lakshadweep
90 Dewas Madhya Pradesh
91 Gwalior Madhya Pradesh
92 Jabalpur Madhya Pradesh
93 Sagar Madhya Pradesh
94 Satna Madhya Pradesh
95 Ujjain Madhya Pradesh
96 Aurangabad Maharashtra
97 Bhiwandi Maharashtra
98 Nashik Maharashtra
99 Pimri Chinchwad Maharashtra
100 Pune Maharashtra
101 Thane Maharashtra
102 Imphal Manipur
103 Kakching Manipur
104 Jowai Meghalaya
105 Tura Meghalaya
106 Champhai Mizoram
107 Lunglei Mizoram
108 Dimapur Nagaland
109 Mokokchung Nagaland
110 Baleshwar Orissa
111 Baripada Orissa
112 Brahmapur Orissa
113 Cuttack Orissa
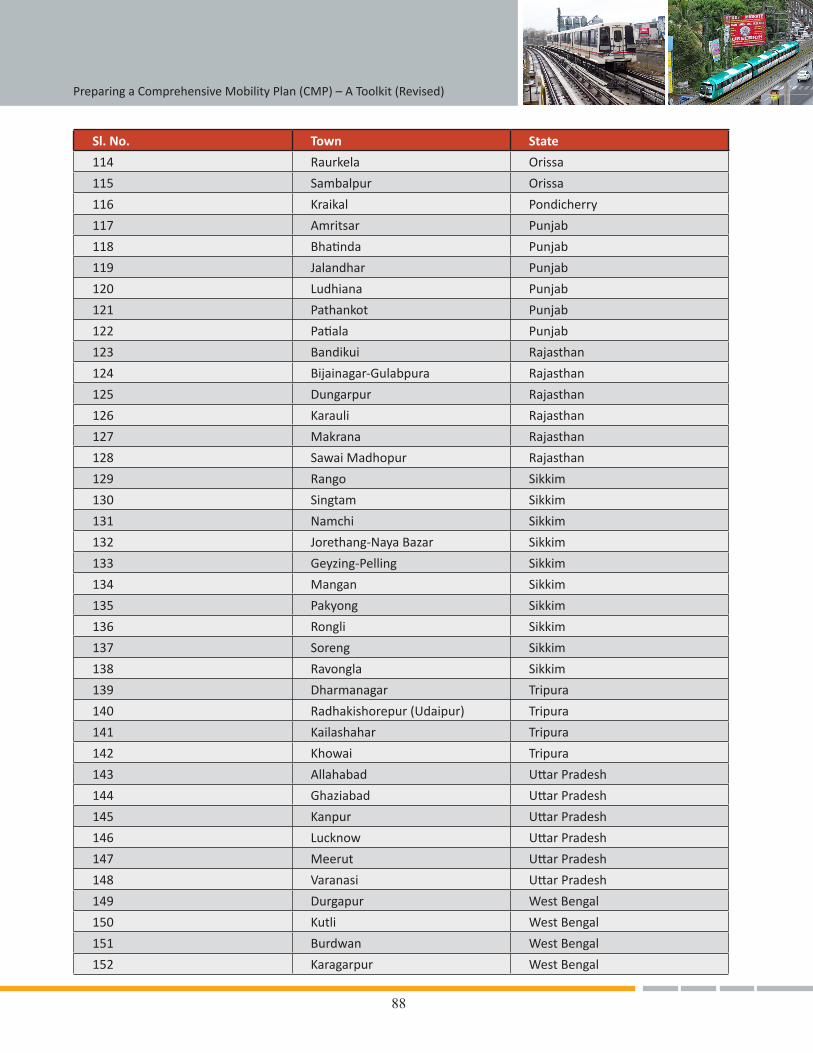
88
Preparing a Comprehensive Mobility Plan (CMP) – A Toolkit (Revised)
Sl. No. Town State
114 Raurkela Orissa
115 Sambalpur Orissa
116 Kraikal Pondicherry
117 Amritsar Punjab
118 Bhatinda Punjab
119 Jalandhar Punjab
120 Ludhiana Punjab
121 Pathankot Punjab
122 Patiala Punjab
123 Bandikui Rajasthan
124 Bijainagar-Gulabpura Rajasthan
125 Dungarpur Rajasthan
126 Karauli Rajasthan
127 Makrana Rajasthan
128 Sawai Madhopur Rajasthan
129 Rango Sikkim
130 Singtam Sikkim
131 Namchi Sikkim
132 Jorethang-NayaBazar Sikkim
133 Geyzing-Pelling Sikkim
134 Mangan Sikkim
135 Pakyong Sikkim
136 Rongli Sikkim
137 Soreng Sikkim
138 Ravongla Sikkim
139 Dharmanagar Tripura
140 Radhakishorepur (Udaipur) Tripura
141 Kailashahar Tripura
142 Khowai Tripura
143 Allahabad UttarPradesh
144 Ghaziabad UttarPradesh
145 Kanpur UttarPradesh
146 Lucknow UttarPradesh
147 Meerut UttarPradesh
148 Varanasi UttarPradesh
149 Durgapur WestBengal
150 Kutli WestBengal
151 Burdwan WestBengal
152 Karagarpur WestBengal
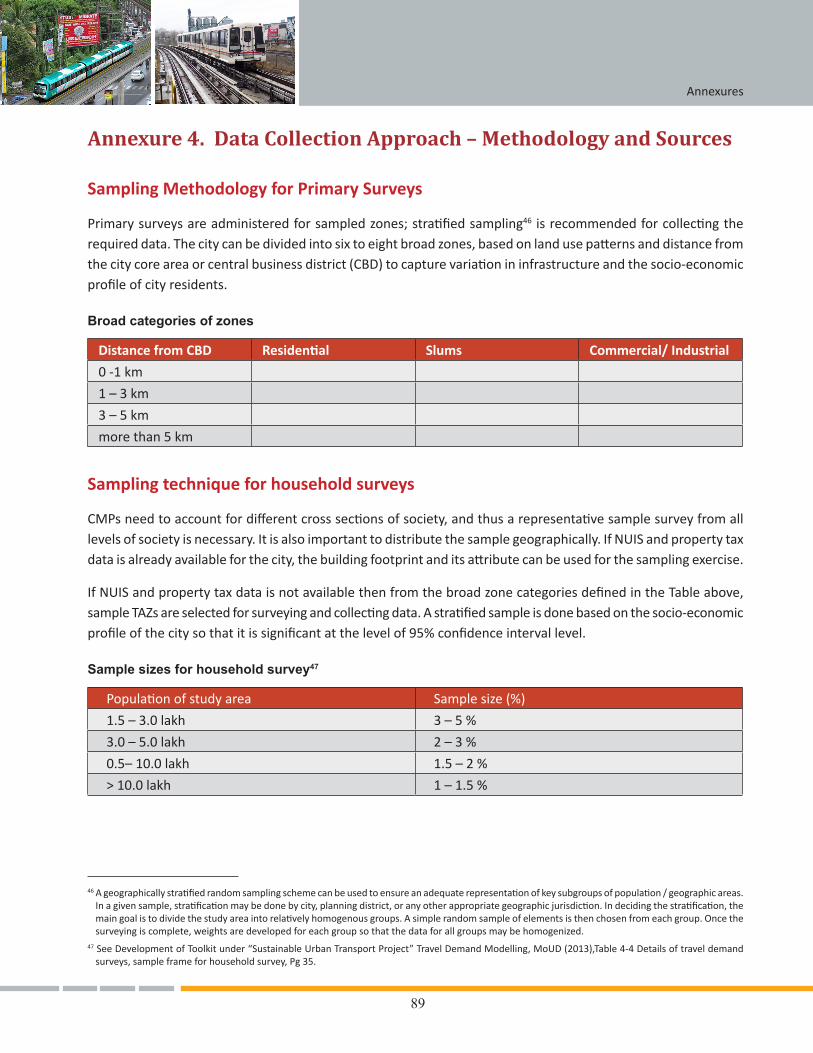
89
Annexures
Annexure 4. Data Collection Approach – Methodology and Sources
Sampling Methodology for Primary Surveys
Primarysurveysareadministeredforsampledzones;stratifiedsampling46 isrecommendedforcollectingtherequireddata.Thecitycanbedividedintosixtoeightbroadzones,basedonlandusepatternsanddistancefromthecitycoreareaorcentralbusinessdistrict(CBD)tocapturevariationininfrastructureandthesocio-economicprofileofcityresidents.
Broad categories of zones
Distance from CBD Residential Slums Commercial/ Industrial
0-1km
1 – 3 km
3 – 5 km
more than 5 km
Sampling technique for household surveys
CMPsneedtoaccountfordifferentcrosssectionsofsociety,andthusarepresentativesamplesurveyfromalllevelsofsocietyisnecessary.Itisalsoimportanttodistributethesamplegeographically.IfNUISandpropertytaxdataisalreadyavailableforthecity,thebuildingfootprintanditsattributecanbeusedforthesamplingexercise.
IfNUISandpropertytaxdataisnotavailablethenfromthebroadzonecategoriesdefinedintheTableabove,sampleTAZsareselectedforsurveyingandcollectingdata.Astratifiedsampleisdonebasedonthesocio-economicprofileofthecitysothatitissignificantatthelevelof95%confidenceintervallevel.
Sample sizes for household survey47
Populationofstudyarea Samplesize(%)
1.5–3.0lakh 3–5%
3.0–5.0lakh 2–3%
0.5–10.0lakh 1.5–2%
>10.0lakh 1–1.5%
46Ageographicallystratifiedrandomsamplingschemecanbeusedtoensureanadequaterepresentationofkeysubgroupsofpopulation/geographicareas.Inagivensample,stratificationmaybedonebycity,planningdistrict,oranyotherappropriategeographicjurisdiction.Indecidingthestratification,themaingoalistodividethestudyareaintorelativelyhomogenousgroups.Asimplerandomsampleofelementsisthenchosenfromeachgroup.Oncethesurveyingiscomplete,weightsaredevelopedforeachgroupsothatthedataforallgroupsmaybehomogenized.
47SeeDevelopmentofToolkitunder“SustainableUrbanTransportProject”TravelDemandModelling,MoUD(2013),Table4-4Detailsoftraveldemandsurveys,sampleframeforhouseholdsurvey,Pg35.
90
Preparing a Comprehensive Mobility Plan (CMP) – A Toolkit (Revised)
Sampling method note
Thepurposeofthehouseholdsurveysistoquantifyandanalyzethetravelcharacteristicsofpeoplebelongingtovarioussocio-economicgroups inthecity.Besides,thehousehold levelsurveywillalsohelp inmodellingorigin-destinationoftrips,vehicleemissionsandstatedpreferencesetc.Thissurveymainlycapturestheexistingconditionsoftherespondentsandtheirpreferencesorchoicesasstatedbythem.
Sampling
Urbanareasarelargeandhighlydiverse.Anassessmentofthefulluniverseforanappropriatesamplingisitselfahardtask,giventhatmanyoftheavailabledatafromthecensustracks,whichcanbeusedforgettingthecharacteristicsoftheuniverse,arenotavailableinthepublicdomain.Secondly,forsuchlargeuniverses,astratifiedsystematicsamplingisrequiredprovidedweareabletoidentifythestratafromtheavailabledataset.Thereafterthetaskistodecidethestrataforsurveyandthenidentifysampleswithineachstratum.Themorediversifiedthesample,themorethestrataidentifiedandthebettertheidentificationofstratamorerepresentativethesampleis.Wediscussbelowtheprocessofidentifyingdifferentstrataandsub-stratainacityandthenselectingsamplehouseholdsfordetailedstructuredquestionnairesurveys.
1. Stratifying the city by spatial (geographic) units
Theurbanareasneedtobeselectedforsurveyonthebasisofunbiasedspatialrepresentation.Thefirsttaskistoidentifythespatialunitsfromwithinwhichthesecondlevelofstratificationisdone.Basedonthedemographiccharacteristicsanddelineationoftrafficanalysiszones(TAZs),thefirstlevelofstratacanbeidentified.Atthefirstlevel,thecitycanbedividedintodifferentspatialunitsbasedoneitherpopulationdensityordelineatedTAZincasethelatterdataisavailable.SincethedataofTAZsisnotavailable,thedemographicdatahastobeused.
Fortheuseofdemographicdata,thehypothesisis:‘peopleofsameeconomicandsocialcharacteristicscongregateinthesamearea’andthatdensitiesindicateeconomiccharacteristicsofaneighbourhood.Populationcensusgivesthedemographiccharacteristicsandfromamongtheavailabledata,foursetscanbeofuseincombinationorindividually(i)housingcharacteristics–kutchahousingrepresentingthepoorandpuccahousingrepresentingtherichandthemiddleclasses(ii)femaleliteracyrate–highertheincomehigheristhefemaleliteracy,(iii)densityand(iv)proportionofScheduledCastes/minorities.
Thecensushasthedataforeachhouseholdbutwhenthedataisgivenout,itisbywardsofthecity.Awardcanbeusedasabasicunitofspatialstratification,ifthewardsarenottoolarge.Ifthewardsaretoolargethenwehavetogoatthesub-wardlevelandweneedtofindoutfromtheUrbanLocalBody(ULB)ifithasthisdata.IfitisnotavailablewiththeULBthenonecanusethedataoftheenumerationblockofthecensus,whichisadataaggregatedforabout100to120households.Thisdatacanbeplottedonthemaptogetthespatialdivisionsandthenpickupthestrataforsampling.ThisistheFirstStageStratification.SomeofthecitiesnowhaveaGeographicInformationSystem(GIS)datawithbuildingfootprintsandfrommappingthese;wecanidentifyhomogenouszonesasFirstStageStrata(FSS).Sincethedemographicdataareavailableatamicrospatialunitlevel,thesedatacanbeusedtoprepareanindex,whichismappedonaGISbasetoidentifyzonesofdifferenteconomicstrata.
91
Annexures
Scheduledcastedominatedzonescanalsobeidentifiedthusandthesecanbesuperimposedontheeconomicstratatoidentifydifferentzones/spatialunitswithdifferenteconomicandsocialcharacteristics.Thechallengewillremaintoidentifyspatialunitswithconcentrationofminoritygroups,iftheyareinsubstantialnumbers.ManyIndiancitiesaresegmentedbyreligionaswellandthroughdiscussionswithkeyinformantsandphysicallymovingacrossthecity,thespatialunitswhereminoritiesareconcentratedcanbeidentified.
2. Second stage strata for transport studies
IftheTAZsareavailablethenthatcanbeused.Ifnotthenitisassumedthatspatialunitslocatedatdifferentdistancefromthecitycentrewouldhavedifferenttravelcharacteristics’andhencesecondlevelofstratificationcanbebasedondifferentdistancefromthecitycentre.InIndiancities,informalityallowspeopletostayneartheirworkplace if theycannotafforda formalhouseandhence industrialworkers tend to stay inornearindustrialareasandloaders-unloaderstendtostayneartherailwaystationorwholesalemarkets.Distancefromthecitycentrecanbeinterpretedasdistancefromtheworkcentresandhencezonescanbedelineatedbasedontheland-use.Thecitywoulddefinitelyhavealand-usemap,andthroughphysicalmovementinthecitybytheresearchers,abroadideaofthecity’semploymentcentrescanbeobtained.Thiscanbeusedforpreparingzones.Subsequentlyafurtherstratificationcanbedonebasedonlocationbydistancefromthecentre,e.g.core,intermediatezone,peripheryandouterperipherydependingonthesizeofthecityandland-usestructure(ormorphology)ofthecity.
Tosummarize,theurbanareasinacitycanbeselectedrepresentingfollowingcriteriatorepresentunbiasedspatialdistribution:
I. Spatialdistributiondeterminedbyadministrativeunits(basedondemographics)suchasmunicipalwardstogetspatialunitsrepresentingdifferenteconomicandsocialgroups.
II. Landusestructureorcity’smorphology
III. Distance from the city centre (Core city, intermediate, peripheral and outer periphery)
IV. Spatialdistributiondeterminedbytraffic-analysiszonesifavailable
Whileensuringunbiased spatialdistribution, it is important toensure that various socio-economicgroupsarealsowell-representedaspartofthesesamples.Withineachspatiallyrepresentativearea/zone/clusterofzones,thelow-incomegrouphousingorslumhouseholdsshouldbeincludedinthesample.Thesampleofslumhouseholdsineachselectedzone/areashouldbeatleastasmuchasthepercentageofpopulationresidinginslumsatthecitylevel(oratthezonelevelifdataatzonallevelisavailable).
3. Identifying settlements for survey
Oncethespatialzones/unitshavebeenidentifiedforsurvey,settlementswithinthemhavetobeidentified.Atthisstage,housingtypologycanbeusedformakingthedecision.Thehousingtypologiesare:(i)slumsandchawls(ii)independentbungalows,(iii)twinbungalows,(iv)lowriseapartmentsand(v)highriseapartments.Low-riseapartmentstendtohouselowermiddleincomegroupswhereashighriseapartmentstendtohousehighermiddleincometohighincomegroups.Bungalowstendtohousehighincomegroupsandelites.After
92
Preparing a Comprehensive Mobility Plan (CMP) – A Toolkit (Revised)
selectingthesettlement,eitherrandomsamplingusingrandomnumbersorsystematicsampling(everynthhousedependingonthesamplesizerequiredforthesettlement)canbedeployed.Ifthesettlementislarge,assomeoftheslumorhousingboardcoloniesmaybethenclusterscanbeidentifiedinthesettlementtocapturethehomogenousgroupswithinasettlementafterwhichrandomorsystematicsamplingmethodcanbeapplied.
Withintheselectedarea, itshouldbeensuredthatall socio-economicgroupsarewell-represented.Whilesurveyinginlow-incomehousingorslums,itshouldbeensuredthathousingtypologies(i.e.kutchahouses)andsociallyvulnerablegroups(i.e.female-headedhouseholds).Inslums,caremustbetakentopickupsamplesofhouseholdslivinginkutchahousingtobeabletogetasampleof the poorest of the poor.
Logistics
l Theh/hsurveysshouldbeconductedinthehouseholdsettingsansweredbyoneadultmemberofthefamily.
l Thereshouldbeateamoftwoseniorpeopletomonitorthesurveyteams.
l Ideally,data-entryofthesurveysshouldbesimultaneouslydonesothatincaseofmissinginformationorerrors,thesurveyorcanbesentbackagainforthesurvey.
l ThisisagenericsamplingguideforthepurposeoftransportrelatedhouseholdsurveyinIndiancities.Indiancitieshavediversesetofdataandsituations,theresearcherscanusethisnoteasaguidewhiletakingcognizanceofthediversesituationindifferentcitiesbasedontheirownperceptionsandintuition.
Instruction to Surveyors
A detailed workshop should beconductedwithsurveyorstoexplainthepurposeofthesurveysandthedatathatneedstobecollected.Specificinstructionsincludethefollowing:
1. Thetripstakenandtravelneedsforthelastdayaretoberecorded.Thiswillincludeallmultipleorsingletripsmadeduringthelastdaybyeverymemberofthehousehold.
2. Theaccessandegresspartofthetripsneedstoberecordedifpublictransportorpara-transitmodesoftransportareused.Thismeanstherewillbeaminimumofthreesegmentsforeachtrip:theaccesstrip,theline-haultripandtheegresstrip.Boardingandalightingtime,boardingandalightingstations,accessandegressdistanceandaccessandegressmodeswillallbeincluded. Iftransfersaremadetochangethebusorotherrouteitshouldbedefinedasaseparatesegment.
3. Surveyorsneedtorecordparkingchargesifrespondentorpersonmakingtripisusingprivatemodesoftransport(includingbicycle).
Cross-Checks and Continuous Monitoring
Surveyformsshouldberandomlycheckedatregularintervalstokeeptrackofthequalityofinformationbeingcollected.Also,crosschecksarerequiredregardingthetypeofinformationcollected.Itisadvisedthatforsurvey
93
Annexures
personnel,asuitablenumberofsupervisorsareprovidedbytheconsultant.Asecondwayofcrosscheckingistriangulationfordatasothatsomedataarecollectedusingdifferentapproachestoseethedifferences.
Sampling technique for collecting data related to infrastructure
In order to prepareaninfrastructureinventory,informationabouttheexistinglevelofserviceandinfrastructuretype is to be collected for non-motorised transport, para transit, public transport and personal motor transport. Dataonroadsand infrastructuretype iscollectedforthreecategoriesof roads,basedontheROWandthepurposeserved:arterialorsub-arterial;collectorroads;andlocalroads.TheroadinventoryfortheentirecityisdevelopedonGISplatformanddataiscollectedusingasampleofroadamenitiesandfacilities.Fromeachofthebroadcategoryofzonesdefinedearlier,sampleTAZsareselectedbasedontheirspatialdistribution. From each of the selected TAZs, a detailed survey is conducted on minimum 50% of the randomly selected roads covering arterial, collector and local roads.BasedonthelandusecharacteristicandspatialdistributionofTAZs,arelationshipcanbedrawntoextrapolatetheinfrastructure type.
Sampling technique for freight
Both motorised and non-motorisedvehiclescarryinggoodscomingintothecityandmovingwithincityneedstobesurveyed.Thiscanbedoneatsampledoutercordonsandcordonpointswherethesevehiclesenterthecorecityarea.Forexample,incaseofVisakhapatnam,fiveoutoftwentysampledintersectionswereselectedforcollectingdatarelatedtofreightmovementinthecity.Ofthesethreewereoutercordonswhileothertwowereentrypointstothecore-cityarea.16hourturningmovementcountshavebeencarriedoutateachoftheseintersectionsonatypicalworkingday.Alongwithoriginanddestinationofthetrips;thesurveyalsoneedstocapturetypeofvehicleusedandcommoditycarried(Surveyformat9)
Sampling Methodology for the Petrol Pump Survey
The choiceofpetrolpumpsshouldbebasedonconveniencesamplingbutpreferablyindifferentareasofthecity. Random vehicles are surveyed in proportion of 33% cars, 33% two wheelers, 10% three wheelers, 12% buses and 12% trucks to develop a confidence level at 95% significance. Simultaneously, a crosscheck on the compositionofvehicles(ageandtype)needstobedoneasperthenumberofregisteredvehicles.A sample of at least 3,00048 vehicles(two-wheelers,cars,buses,autosandtrucks)shouldbecollectedtocoverthesufficientnumberofvehiclesofdifferentvintage.
48Thesamplesizeof3000isrecommendedbasedonsurveyscarriedinDelhi,Vishakhapatnam,RajkotandUdaipurtoachievestatisticallysignificantsampleforeachvehiclecategoryfordifferentvintage
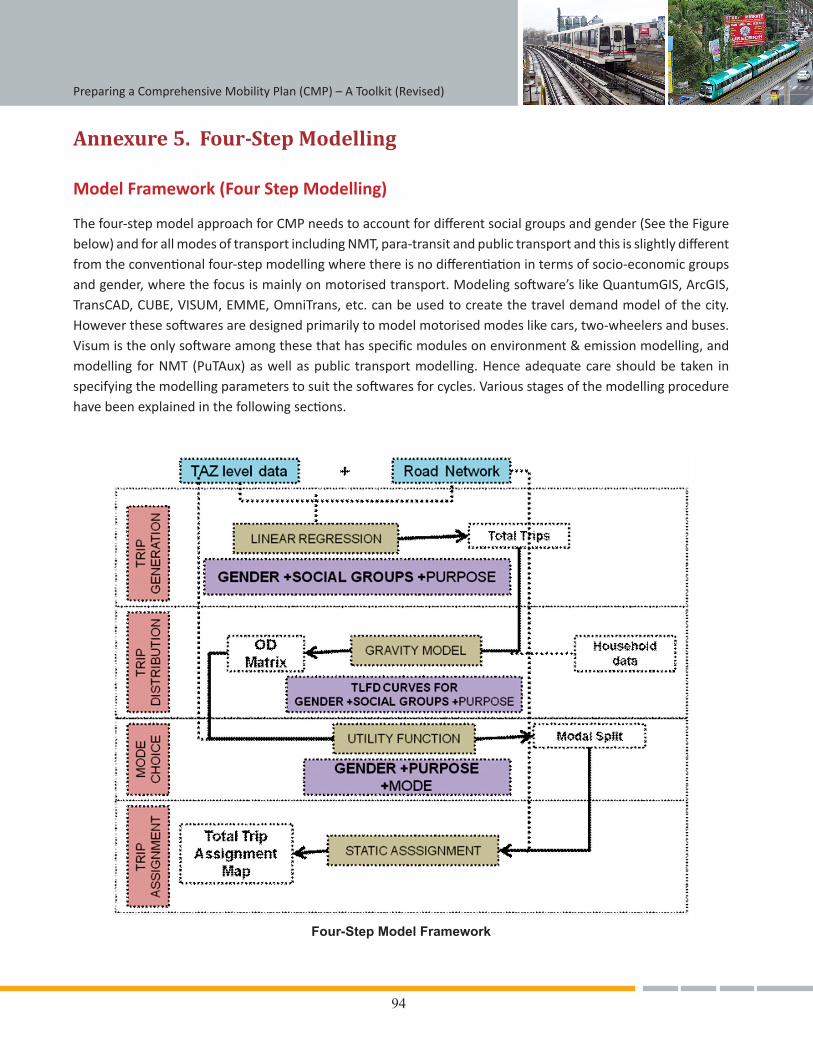
94
Preparing a Comprehensive Mobility Plan (CMP) – A Toolkit (Revised)
Annexure 5. Four-Step Modelling
Model Framework (Four Step Modelling)
Thefour-stepmodelapproachforCMPneedstoaccountfordifferentsocialgroupsandgender(SeetheFigurebelow)andforallmodesoftransportincludingNMT,para-transitandpublictransportandthisisslightlydifferentfromtheconventionalfour-stepmodellingwherethereisnodifferentiationintermsofsocio-economicgroupsandgender,wherethefocusismainlyonmotorisedtransport.Modelingsoftware’slikeQuantumGIS,ArcGIS,TransCAD,CUBE,VISUM,EMME,OmniTrans,etc.canbeusedtocreatethetraveldemandmodelofthecity.Howeverthesesoftwaresaredesignedprimarilytomodelmotorisedmodeslikecars,two-wheelersandbuses.Visumistheonlysoftwareamongthesethathasspecificmodulesonenvironment&emissionmodelling,andmodelling forNMT(PuTAux)aswellaspublic transportmodelling.Henceadequatecareshouldbetaken inspecifyingthemodellingparameterstosuitthesoftwaresforcycles.Variousstagesofthemodellingprocedurehavebeenexplainedinthefollowingsections.
Four-Step Model Framework
95
Annexures
Thebaseyeartraveldemandmodel isrequiredtoreplicatetheroadnetworkandtravelpatternsofthecityinmodelingsoftwareandtotest forvariousshort-termmeasuresthatcanbetakento improvetheexistingtransportationsystems.Thefollowingtablegivestheinputparametersandtheirdatasourcesusedfordevelopingthe base year model.
Modeling components and input sources
Model Component Input Source
TrafficAnalysisZoneMap DerivedfromWardMap
Road Network DerivedfromPrimaryDatacollectedforroadinventory&Linkspeedsandsec-ondary data on road widths(Itcanalsobederivedfromopenstreetmaps,ifVISUMsoftwareisusedformodeling.Openstreetmapshelpsinincorporatingalltheroadcharacteristics).
TripProductionPatterns HouseholdInterviewDataandcensus
TripAttractionPatterns LandUseDatafromMasterPlanandBuildingwiseusagetypefromPropertyTaxDatabase
TripDistribution TriplengthdistributionpatternsfromHouseholdInterviewdatatocalibratetheGravity Model
Base Year Mode Shares HouseholdInterviewData
TripAssignment TrafficVolumeCountsusedfornetworkcalibration
Trip Generation
TripgenerationinvolvesestimatingthetotalnumberoftripsproducedandattractedtoeachTAZ.Tripproductionisdependentonsocio-economiccharacteristicsofhouseholdswithintheTAZwhiletripattractiondependsontheland-usetypeoftheTAZasexplainedbelow.
Trip production
Householdinterviewdataisnormallyusedtoestimatethetripproductiontrendsforvarioustypesofhouseholdsusingthefollowingsteps:
l Purpose-wise trips (eg., work, school/college, social, recreation, etc) produced in each household arederivedasafunctionofthesocio-economicattributesofthehouseholdlikehouseholdsize,incomeandvehicleownership.
l TotalnumberofhouseholdsineachTAZisderivedfromthecensusdataorthepropertytaxdatabaseanditstotalhouseholdsandnumberoftripsproducedareestimated.
l Thesocio-economiccharacteristicsofeachTAZarederivedfromtheHHInterviewdata.
l If detailed household level data is not available, TAZ level data and parameters like TAZ population,employment opportunitiesetc.areusedtoderivetheproductionsforeachTAZ.
Trip Attraction
ThenumberoftripsattractedtoeachTAZisestimatedinthisstep.Theattractivenessofazoneisafunctionof
96
Preparing a Comprehensive Mobility Plan (CMP) – A Toolkit (Revised)
thetypeofland-useofthatzone.Forexampleresidentiallandusesproducetripswhilecommercial,institutionalandindustrialareastypicallyattracttrips.HencetheexistinglandusemixisconsideredasthecriticalvariableindeterminingthetripsattractedtoeachTAZ.LandusedataatthecitylevelisprovidedbytheMasterplanofthecity,buttheyareonlyindicativeasthelanduseallocationinthemasterplanandtheactualusageoflanduseisobservedtobevaryingwidelyinpractice.
ThePropertytaxdatafromthemunicipalcorporationsmaintainbuildingwiselandusetypeanditsplintharea.Typesoflanduseinthebuildingsinclude:Residential,Commercial,Educational,Industrial,PublicUse,Shops,Hospital,Cinema/PubEntertainment,Others.Exceptresidential,allotherlandusetypesattracttrips.Hence, the total plinth area of each type of attracting land uses can be calculated and used as a measure of attractiveness of the TAZ.
Purpose-wise trips attracted to each zone from the household interviews is correlated with land use types in each TAZ, using multiple linear regression technique to derive the relation between the trips attracted and the land uses of the TAZ.Basedontheseequations,thenumberoftripsattractedtoeachzoneisre-calculatedusingtheequations.Thishoweveronlygivesthenumberoftripsatthescaleofthesamplesizeofdata,sincethesampletripsareusedforderivingtheequation.Thereforetheseattractionsareusedastherelativeattractivenessofeachzone.The attractions of each zone are then up scaled proportionally to the total attractions based on the total trips produced for each purpose.
Trip Distribution
TripdistributionisusedtoderivetheOrigin-Destination(OD)matrixfromtheProductionAttraction(PA)tableprepared in tripgeneration.GravityMethod is generally adopted for tripdistribution. In thismethod tripsbetweenzoneiandzonej(Tij)aredistributedinproportiontothenumberoftripsproducedini,numberoftripsattractedinjandintheinverseproportionoftheimpedancebetweenthesezonesi.e.traveltime,travelcost,relativesafetyetc.
Tij = Pi [Ai Fij ⁄ ∑Aj Fij]
Where,
Tij=tripsproducedatIandattractedatj,
Pi=totaltripproductionati,
Aj=totaltripproductionatj,
Fij=(frictionfactor)orcomputedusingtheTLFDcurves
i=originzone,
j=destinationzone
TripDistributioncanbecarriedoutpurposewiseormode-wisebasedoncityspecificcharacteristics.(e.g.,)Triplengthdistributionshouldbeobservedbothpurposewiseandmodewise,andwhicheverparameterhasmoreclearlydefinedtriplengthdistributionsshouldbeselectedfordistribution.If the type of mode is affecting trip length more, mode share split can be carried out before the trip distribution.Thefollowingisthestepwiseprocedure.
97
Annexures
l ThepurposewisepeakhourtripsareaddeduptogetthetotaltripsproducedandattractedtoeachTAZ.
l TheTAZwisemode-sharevaluescanbederivedfromtheHHInterviewdataandappliedtothePAtabletogetthemode-wisePAtableforallzones.
l Currentusers:ThemodeshareofpublictransportandcyclesineachTAZisderivedfromthehouseholdinterviewdataandisusedtoderivethePAtableforcurrentpublictransportandcyclingtrips.ThePAtablecanbeforthepeakhourorfortheentiredaybasedonthestudyrequirements.
l Potentialusers:Allthetripsinthecityformthepotentialpublictransportandcycleusersinthecityanditisimportanttomodelthesetripsinparalleltoestimatetheirpotentialshifttopublictransportandcyclesrespectively.
l One of the features of the four-stage demandmodeling process is that only the inter-zonal trips areconsideredforassignment.Hence,theproportionof intra-zonaltrips ineachTAZ iscalculatedfromtheHHInterviewdataandthesetripsareexcludedfromthedemandmodelingprocess.
l ThePAtablecontaininginter-zonalpublictransporttripsisusedastheinputfortripdistribution.
Forpublictransporttrips,thegeneralizedcostisconsideredasimpedancewhichisworkedoutbasedontimetakenforaccess,waiting,linehaul,transfer,linehaulandegress,anddis-utilityofeachoftheseinmonetaryterms.
Mode Choice
Modechoicemodelsshouldbedevelopedforallmodesoftransportincludingpublictransportandpara-transitmodes.AsdiscussedinTask2-2TAZsizeformodellingthusneedstobesmallenoughtocatertowalk,bicycletripsandaccountforimpactofaccess/egresstripsonpublictransport.
Mode choice equations
ThesearecomputedbasedonrevealedandstatedpreferenceofindividualssurveyedintheHHsurvey.AMulti-nominallogitorNestedlogitmodelsoranyotherlogitfunctionwereruntoachievethemodechoiceequations.Asstatedmodechoiceisthedependentvariableandsocio-demographicsoftheindividual,builtformindicatorsatthetrip’soriginandendandtravelcostaretheindependentvariablesintheequation.
Mode choice for walk and bicycle
OneofthemajordifferencesinmodellingNMTmodesascomparedtomotorisedmodesistheimpactofspeedonmodechoice.SpeedofNMT(walkandbicycle)isconstantandthereisnegligibleimpactofcongestion.Whileotherparameterslikedistancetobetravelled,infrastructurequality,safetyandsecurityconcernshavewiderimpactovermodechoiceofwalkandbicycle.Alongwiththemode-relatedparametersindividualsocio-economicinformationneedstobeaccountedformodellingmodechoiceforNMTmodesoftransport.
Mode choice for public transport
Utilityofpublictransporthasminimumthreeinter-relatedsegmentsi.e.accesstrip,haultripandegresstrip.Studieshaveshownthataccess/egresstriphasasignificantimpactoverpublictransportasamodechoice.The
98
Preparing a Comprehensive Mobility Plan (CMP) – A Toolkit (Revised)
impactisnotonlyintermsofpublictransportinvicinitytoorigin/destinationbutisalsointermsofthediscomfortanddisutilityassociatedwiththemodesusedforaccess/egresstripsandmodeinterchanges.Theutilityfunctionforpublic transport thus involveswaitingtimeanddiscomfortof changingmodesother thanmode relatedparametersforaccess/egresstripandhaultrip.
Trip Assignment
Thisstepisperformedtodeterminenumberoftripsmadebydifferentmodesoneachoftheexistingtransportnetworklinkduringpeakandoff-peakhourperiod.TripassignmentforNMTshouldaccounttolanduseanddensityparametersinthevicinityoftheinfrastructure/facility.Tripassignmentforbicyclealsoincludesparametersrelatedtopavementquality,slope,trafficvolumeandspeed.Thisinvolvesusingbicyclecompatibilityindex(BCI)and other such measures.
ThepersontripODmatricesforcurrentandpotentialusersareconvertedtovehicletripsbasedontheaverageoccupancyobserved ineachmode fromtheoccupancysurveycarriedout in thecity.However, thefloatingpopulationscomingintothecitythroughthenumerousentrypointsarecapturedfromODsurveysattheselocations.These sample surveysareup scaled to total volumebasedon the trafficvolumecountsat thoselocations.The OD matrices from these surveys are added to the OD from trip distribution to develop the overall OD matrix of the city.
Themode-wisecalibratedODmatricesderivedfromtheabovestepareassignedontotheroadnetworkusingUser-Equilibrium or Capacity Restraint methods based on Wardrops equilibrium49 for motorised modes. For cyclists All or Nothing (AON) method is used in general by considering the minimum BCI or travel distance between ODs of the cyclists as the determining factor for route choice.Sincemostlinksareassumedtohaveenoughcapacityforcyclistsandsincecyclistsaresensitivetosafetyandsecurityissuesmorethanthespeed,AONmethodisadopted.
Network Validation
Thelinkflowsobservedfromtripassignmentarecomparedwiththeactualtrafficflowsobservedfromtrafficvolumecountsconductedatvariouslocationsacrossthecity.If it isobservedthatthelinkflowsfromtrafficassignmentvary fromthetrafficvolumecounts, thenetworkneedstobere-checkedfor itsaccuracy.Somemissinglinksintheroadnetworkareidentifiedthroughthisprocedure.However,thelargercontributingfactortothiserrorcanbetheODmatrixderivedfromtripdistribution.TheODmatrixhastobere-calibratedforittomatchthetrafficvolumecounts.Forthis,aniterativeprocessisavailableinmodelingsoftwarescalledtheODmatrixestimation(TransCAD,CUBE)/t-flowfuzzy(VISUM).Usingthisprocedure,thenetworkiscalibratedtomatchtheactualvolumecountsobservedonground.
FordetailsrefertoDemandAssessmentModuleavailableat
https://www.dropbox.com/sh/99ngmessm2cgb76/IRv2lC9AwZ
49DeDiosOrtuzar,JandL.G.Willumsen(2001).Modellingtransport,Wiley.
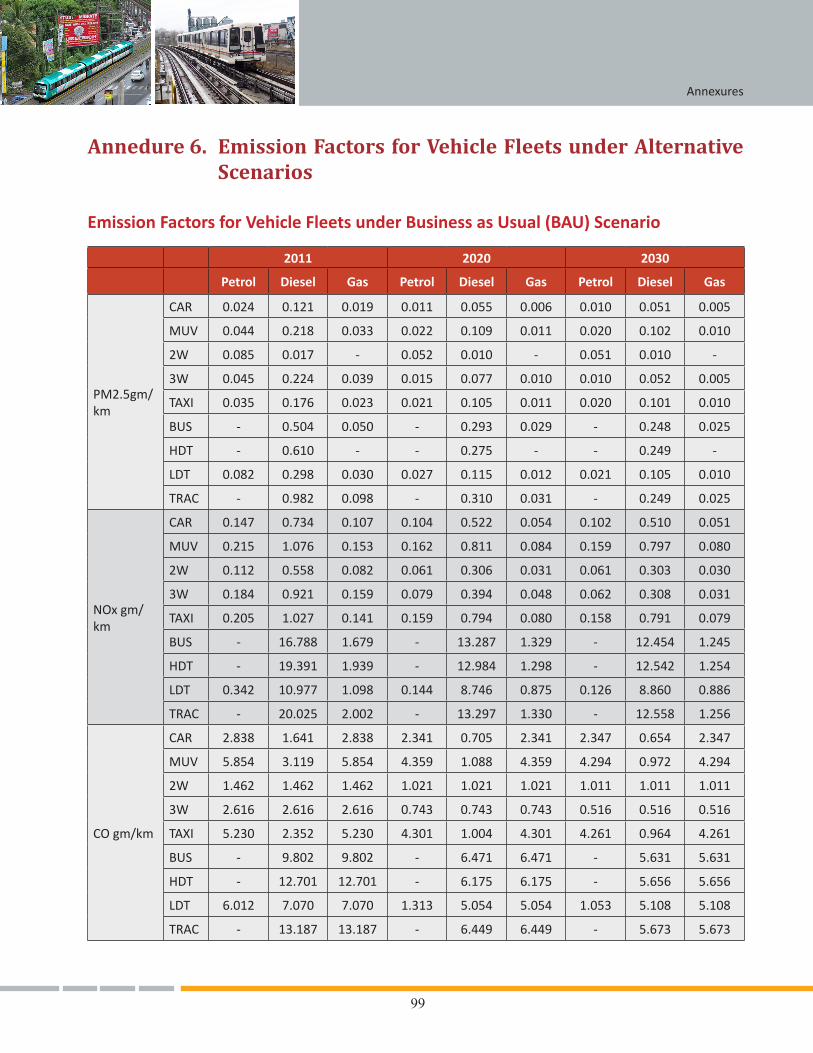
99
Annexures
Annedure 6. Emission Factors for Vehicle Fleets under Alternative Scenarios
Emission Factors for Vehicle Fleets under Business as Usual (BAU) Scenario
2011 2020 2030
Petrol Diesel Gas Petrol Diesel Gas Petrol Diesel Gas
PM2.5gm/km
CAR 0.024 0.121 0.019 0.011 0.055 0.006 0.010 0.051 0.005
MUV 0.044 0.218 0.033 0.022 0.109 0.011 0.020 0.102 0.010
2W 0.085 0.017 - 0.052 0.010 - 0.051 0.010 -
3W 0.045 0.224 0.039 0.015 0.077 0.010 0.010 0.052 0.005
TAXI 0.035 0.176 0.023 0.021 0.105 0.011 0.020 0.101 0.010
BUS - 0.504 0.050 - 0.293 0.029 - 0.248 0.025
HDT - 0.610 - - 0.275 - - 0.249 -
LDT 0.082 0.298 0.030 0.027 0.115 0.012 0.021 0.105 0.010
TRAC - 0.982 0.098 - 0.310 0.031 - 0.249 0.025
NOxgm/km
CAR 0.147 0.734 0.107 0.104 0.522 0.054 0.102 0.510 0.051
MUV 0.215 1.076 0.153 0.162 0.811 0.084 0.159 0.797 0.080
2W 0.112 0.558 0.082 0.061 0.306 0.031 0.061 0.303 0.030
3W 0.184 0.921 0.159 0.079 0.394 0.048 0.062 0.308 0.031
TAXI 0.205 1.027 0.141 0.159 0.794 0.080 0.158 0.791 0.079
BUS - 16.788 1.679 - 13.287 1.329 - 12.454 1.245
HDT - 19.391 1.939 - 12.984 1.298 - 12.542 1.254
LDT 0.342 10.977 1.098 0.144 8.746 0.875 0.126 8.860 0.886
TRAC - 20.025 2.002 - 13.297 1.330 - 12.558 1.256
COgm/km
CAR 2.838 1.641 2.838 2.341 0.705 2.341 2.347 0.654 2.347
MUV 5.854 3.119 5.854 4.359 1.088 4.359 4.294 0.972 4.294
2W 1.462 1.462 1.462 1.021 1.021 1.021 1.011 1.011 1.011
3W 2.616 2.616 2.616 0.743 0.743 0.743 0.516 0.516 0.516
TAXI 5.230 2.352 5.230 4.301 1.004 4.301 4.261 0.964 4.261
BUS - 9.802 9.802 - 6.471 6.471 - 5.631 5.631
HDT - 12.701 12.701 - 6.175 6.175 - 5.656 5.656
LDT 6.012 7.070 7.070 1.313 5.054 5.054 1.053 5.108 5.108
TRAC - 13.187 13.187 - 6.449 6.449 - 5.673 5.673
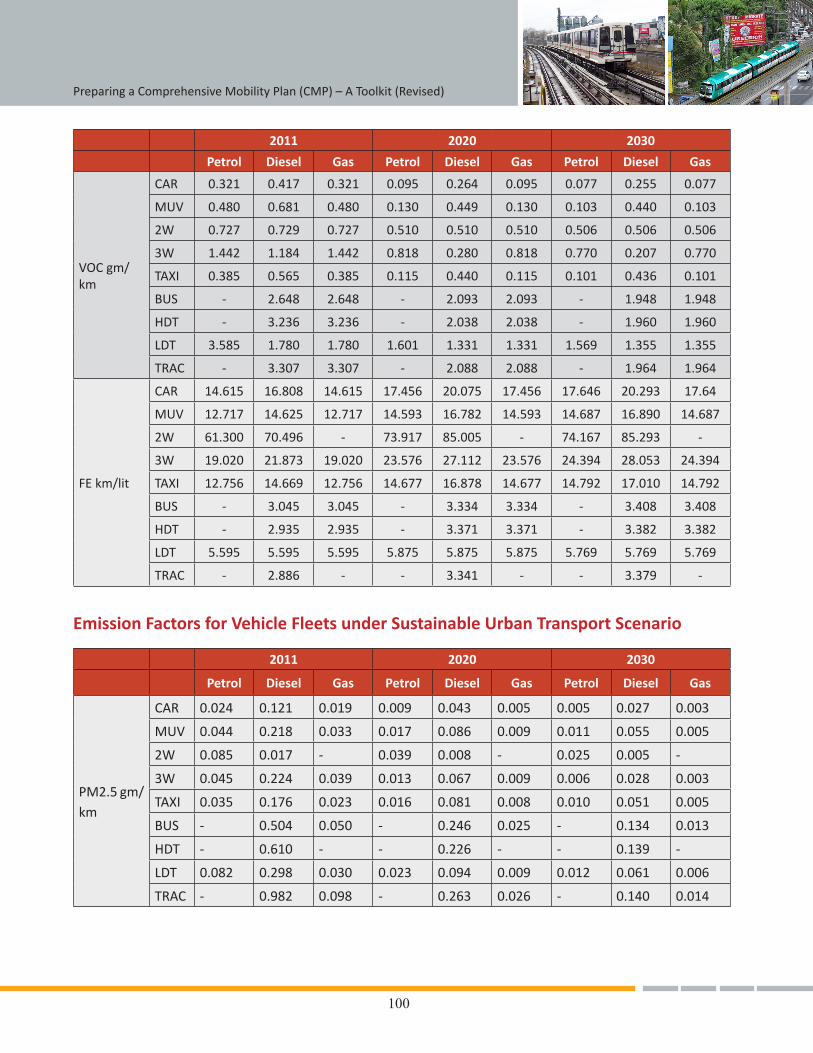
100
Preparing a Comprehensive Mobility Plan (CMP) – A Toolkit (Revised)
2011 2020 2030
Petrol Diesel Gas Petrol Diesel Gas Petrol Diesel Gas
VOCgm/km
CAR 0.321 0.417 0.321 0.095 0.264 0.095 0.077 0.255 0.077
MUV 0.480 0.681 0.480 0.130 0.449 0.130 0.103 0.440 0.103
2W 0.727 0.729 0.727 0.510 0.510 0.510 0.506 0.506 0.506
3W 1.442 1.184 1.442 0.818 0.280 0.818 0.770 0.207 0.770
TAXI 0.385 0.565 0.385 0.115 0.440 0.115 0.101 0.436 0.101
BUS - 2.648 2.648 - 2.093 2.093 - 1.948 1.948
HDT - 3.236 3.236 - 2.038 2.038 - 1.960 1.960
LDT 3.585 1.780 1.780 1.601 1.331 1.331 1.569 1.355 1.355
TRAC - 3.307 3.307 - 2.088 2.088 - 1.964 1.964
FEkm/lit
CAR 14.615 16.808 14.615 17.456 20.075 17.456 17.646 20.293 17.64
MUV 12.717 14.625 12.717 14.593 16.782 14.593 14.687 16.890 14.687
2W 61.300 70.496 - 73.917 85.005 - 74.167 85.293 -
3W 19.020 21.873 19.020 23.576 27.112 23.576 24.394 28.053 24.394
TAXI 12.756 14.669 12.756 14.677 16.878 14.677 14.792 17.010 14.792
BUS - 3.045 3.045 - 3.334 3.334 - 3.408 3.408
HDT - 2.935 2.935 - 3.371 3.371 - 3.382 3.382
LDT 5.595 5.595 5.595 5.875 5.875 5.875 5.769 5.769 5.769
TRAC - 2.886 - - 3.341 - - 3.379 -
Emission Factors for Vehicle Fleets under Sustainable Urban Transport Scenario
2011 2020 2030
Petrol Diesel Gas Petrol Diesel Gas Petrol Diesel Gas
PM2.5gm/km
CAR 0.024 0.121 0.019 0.009 0.043 0.005 0.005 0.027 0.003
MUV 0.044 0.218 0.033 0.017 0.086 0.009 0.011 0.055 0.005
2W 0.085 0.017 - 0.039 0.008 - 0.025 0.005 -
3W 0.045 0.224 0.039 0.013 0.067 0.009 0.006 0.028 0.003
TAXI 0.035 0.176 0.023 0.016 0.081 0.008 0.010 0.051 0.005
BUS - 0.504 0.050 - 0.246 0.025 - 0.134 0.013
HDT - 0.610 - - 0.226 - - 0.139 -
LDT 0.082 0.298 0.030 0.023 0.094 0.009 0.012 0.061 0.006
TRAC - 0.982 0.098 - 0.263 0.026 - 0.140 0.014
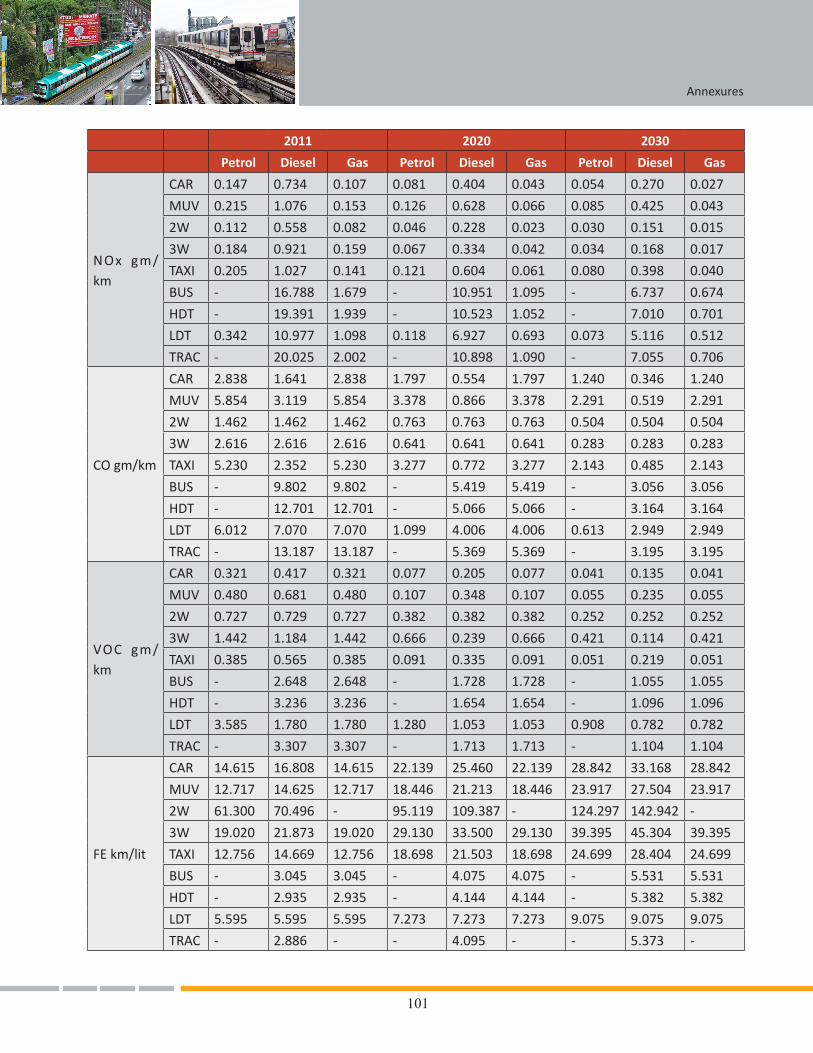
101
Annexures
2011 2020 2030
Petrol Diesel Gas Petrol Diesel Gas Petrol Diesel Gas
NOx gm/km
CAR 0.147 0.734 0.107 0.081 0.404 0.043 0.054 0.270 0.027
MUV 0.215 1.076 0.153 0.126 0.628 0.066 0.085 0.425 0.043
2W 0.112 0.558 0.082 0.046 0.228 0.023 0.030 0.151 0.015
3W 0.184 0.921 0.159 0.067 0.334 0.042 0.034 0.168 0.017
TAXI 0.205 1.027 0.141 0.121 0.604 0.061 0.080 0.398 0.040
BUS - 16.788 1.679 - 10.951 1.095 - 6.737 0.674
HDT - 19.391 1.939 - 10.523 1.052 - 7.010 0.701
LDT 0.342 10.977 1.098 0.118 6.927 0.693 0.073 5.116 0.512
TRAC - 20.025 2.002 - 10.898 1.090 - 7.055 0.706
COgm/km
CAR 2.838 1.641 2.838 1.797 0.554 1.797 1.240 0.346 1.240
MUV 5.854 3.119 5.854 3.378 0.866 3.378 2.291 0.519 2.291
2W 1.462 1.462 1.462 0.763 0.763 0.763 0.504 0.504 0.504
3W 2.616 2.616 2.616 0.641 0.641 0.641 0.283 0.283 0.283
TAXI 5.230 2.352 5.230 3.277 0.772 3.277 2.143 0.485 2.143
BUS - 9.802 9.802 - 5.419 5.419 - 3.056 3.056
HDT - 12.701 12.701 - 5.066 5.066 - 3.164 3.164
LDT 6.012 7.070 7.070 1.099 4.006 4.006 0.613 2.949 2.949
TRAC - 13.187 13.187 - 5.369 5.369 - 3.195 3.195
VOC gm/km
CAR 0.321 0.417 0.321 0.077 0.205 0.077 0.041 0.135 0.041
MUV 0.480 0.681 0.480 0.107 0.348 0.107 0.055 0.235 0.055
2W 0.727 0.729 0.727 0.382 0.382 0.382 0.252 0.252 0.252
3W 1.442 1.184 1.442 0.666 0.239 0.666 0.421 0.114 0.421
TAXI 0.385 0.565 0.385 0.091 0.335 0.091 0.051 0.219 0.051
BUS - 2.648 2.648 - 1.728 1.728 - 1.055 1.055
HDT - 3.236 3.236 - 1.654 1.654 - 1.096 1.096
LDT 3.585 1.780 1.780 1.280 1.053 1.053 0.908 0.782 0.782
TRAC - 3.307 3.307 - 1.713 1.713 - 1.104 1.104
FEkm/lit
CAR 14.615 16.808 14.615 22.139 25.460 22.139 28.842 33.168 28.842
MUV 12.717 14.625 12.717 18.446 21.213 18.446 23.917 27.504 23.917
2W 61.300 70.496 - 95.119 109.387 - 124.297 142.942 -
3W 19.020 21.873 19.020 29.130 33.500 29.130 39.395 45.304 39.395
TAXI 12.756 14.669 12.756 18.698 21.503 18.698 24.699 28.404 24.699
BUS - 3.045 3.045 - 4.075 4.075 - 5.531 5.531
HDT - 2.935 2.935 - 4.144 4.144 - 5.382 5.382
LDT 5.595 5.595 5.595 7.273 7.273 7.273 9.075 9.075 9.075
TRAC - 2.886 - - 4.095 - - 5.373 -
102
Preparing a Comprehensive Mobility Plan (CMP) – A Toolkit (Revised)
Note:BasedonnationaltransportemissionsanalysisoutlinedinGuttikundaandMohan(2014);BAUScenarioassumesnochangeinemissionnormsasarecurrentlyinforce.SustainableScenarioassumesBharatStage–IVacrossIndiain2015andBharatStage–Vin2020forallvehicles.VehiclepopulationgrowthbasedoninputsfromSIAM.Electricvehicleshavenolocalemissionshoweverthefuelefficiencynumbers(inkm/kwh)areasfollowsfor CAR – 6.67, 2W – 18.75, 3W – 10, TAXI – 6.67, BUS – 0.83. As there is no fuel economy road maps for them, thesenumbersareassumedtoremainconstantforthehorizonyears.
GuttikundaSK,MohanD(2014)Re-fuelingroadtransportforbetterairqualityinIndia.EnergyPolicy68:556-561
103
Annexures
Annexure 7. Sample TOR for Appointment of Consultant for Preparation of CMP50
1. SCOPE OF WORKThe tasks to be carried out are detailed below.
l Task 1: DefinescopeandtimeframeoftheCMP.
l Task 2: Collectdataandanalysetheexistingurbantransportenvironment.
l Task 3: DevelopBusinessasUsual(BAU)Scenario.
l Task 4: DevelopSustainableUrbanTransportScenarios.
l Task 5: DevelopUrbanMobilityPlans.
l Task 6: PrepareImplementationProgram.
Task 1: Define scope and timeframe of the CMP.
Asaninitialtask,theareacoveredbytheCMP,theplanninghorizonsshouldbeclearlydefinedandthevisionshouldbeset,inassociationwithagenciesconcerned.Thebaseyearshouldpreferablybethecurrentyearorthelatestyearforwhichdataiswidelyavailableatthestartofwork.Thiswilltypicallybetheyearprecedingthestudy.
Task 2: Collect data and analyse the existing urban transport and environment.
Task 2.1 Review City Profile
PrepareabriefprofileoftheCMPplanningareafromavailabledocuments,includinglocation,landarea,regionallinkages,demographicdataandsocio-economicdata.
Task 2.2 Delineation of Traffic Analysis Zones
CMPaimstoensuresafeaccessibilityforall,irrespectiveoftheirsocio-economicbackgroundandinawaythatdoesnotaffectthecity’senvironment.TAZsaredelineatedtakingintoaccountvariousfactorslikeadministrativeboundaries,physicalbarrierslikewaterbodies,railwaylineswhicharecuttingacrosszones,roadnetworkandpublictransportnetworkinthestudyarea,homogeneouslandusesandspecialgeneratorslikerailwaystation,sportscomplexes/majorfreightcentresetcmaybeconsideredasseparatezones.
Task 2.3 Review of Land Use Pattern& Population Density
Oncethezonesforthestudyareahavebeendefined,thenextstepistocollectdatainwhichslumsshouldalsobeconsideredaspartofresidentiallanduseandnotaseparatelanduse.Alsoresidentiallanduseshouldhaveincomegroupsmarkedaswell.
50Note:TheTORshouldbeamendedwherenecessarytoreflecteachcity’scharacteristics.
104
Preparing a Comprehensive Mobility Plan (CMP) – A Toolkit (Revised)
CDPormasterplansaretheprimedatasourcesforreviewingexistingland-usepatterns.ThesealongwithothersourcessuchasinformationavailablefromtheNationalUrbanInformationSystem(NUIS)Scheme,propertytaxdatamaybeusedtocomputetheresidentialdensityandfloorspaceusedperactivityperunitarea.Inadditiontoresidentialdensities,jobsdensitiesmustalsobestudiedandanalysed.
Task 2.4 Review of the Existing Transport Systems
Areviewoftheexistingtransportinfrastructureandfacilitiesneedstobedoneforeachtransportmode,whichmay includewalking,bicycle, cycle rickshaw,auto rickshaw, sharedauto-rickshawandpublic transport.Thereviewshouldincludealltypesoffacilitiesandamenitiessuchaspavementdescription,intersectionstreatment,lighting,parkingspace,parkingcost,etc.Thefollowingaspectsshouldbereviewed:
l RoadNetworkInventory(existinginfrastructurequalitywithrespecttoeachofthemodes)
l PublicTransportSystem(performanceandlevelofserviceprovisionforpublictransportusers)
l Para-TransitSystem(fleetusagedetail,routedetail,costandfare,etc)
l FreightTransport(VehiclemovementandParkingfacilities)
l TrafficConditionsonRoads(trafficconditions,manualclassifiedcountsandspeed&delaysurveys)
l TrafficSafety(accidentdata)
The data collected and the model developed are to be publicly shared on the Knowledge Management Centre of IUT and with the cities.
Task 2.5 Study of Existing Travel Behaviour
Twoimportantconsiderationsshouldbetakenintoaccountwhilecollectingdataontravelpatterns.Thecollecteddatashouldberepresentativeandcoverthetravelbehaviourofallindividualswithinahousehold,andthedatashouldbesegregatedbysocialgroupandtrippurpose,whichcanrepresentpeople’sperceptionstowardsdifferentmodesoftransportintermsoftime,cost,comfort,safetyandsecurity.
Task 2.6 Review of Energy and Environment
QuantifyingenergyconsumptionfortransportisimportantforestimatingtheCO2 and local air pollutant emissions fromtransport-relatedactivities.Tocreateacompletepicture,bothtop-downandbottom-upapproachesforestimatingenergyconsumptionsarerequired.
Ingeneral,energybalancescoverallfuels,howeversincethefocushereisontransport,onlydiesel,petrol,LPG,CNG51andelectricitywillbecovered.Ambientairqualityshouldbecollectedforunderstandingtheimpactsoftransportonairpollution.
51Whereeverapplicable
105
Annexures
Task 2.7 Service-Level Benchmarks
InfrastructuraldatahavetobecollectedotherthanthedatalistedinTask2-4toTask2-6.Thisdatashouldbethencomparedwiththeservice-levelbenchmarkstounderstandthelevelofserviceprovidedtothecitizenofcertainspecifiedparameters.
Task 2.8 Analysis and Indicators (Comparison with Benchmarks)
Indicatorsprovideaneasywaytocommunicateacity’stransportstatus,ortomakecomparisonsacrossalternativescenarios.Theindicatorsfortransportlevelcanbebroadlydividedinthefollowingcategories:
i. Indicatorsformobilityandaccessibility;
ii. Infrastructureandlanduse;
iii. Safetyandsecurity;
iv. Environmentalimpacts;and
v. Economic
MostoftheindicatorscanalsobedirectlylinkedtotheServiceLevelBenchmarksofMoUD.
Task 3: Development of Business as Usual (BAU) Urban Transport Scenario
Task 3.1 Framework for Scenarios
TheBAUscenario is tobedevelopedbasedonexisting trendswithoutany radicalpolicy interventions forsustainabledevelopmentandemissionmitigation.However,itshouldconsiderinfrastructuredevelopmentandlanduseaccordingtotheMasterPlans.
Task 3.2 Socio-Economic Projections
Acity’sfutureeconomictransitionsdependonthecurrenteconomictransitionstakingplaceacrossthecountry.Assuchfollowingprojectionsshouldbeattempted.
i. DemographicProjections
ii. EmploymentProjection
iii. IndustrialGrowthProjection
Task 3.3 Land Use Transitions
Theobjectiveofsuccessfulland-usedevelopmentandgrowthmodelsistoidentifywhere,howmuchandwhatkindsoflandusewilldevelop.Whenmodellingurbandevelopments,itisnecessarytoconsiderchangesfromvacanttobuilt-up,aswellaschangestothelanduseitself,suchasfromresidentialtocommercial.Simulationtoolsshouldbeusedtostudythesetypesoflandusechanges.Thelandusetypeshouldbedisaggregatedintoresidential,commercial,retail,recreational,industrial,educational,religious,andothercategories.
106
Preparing a Comprehensive Mobility Plan (CMP) – A Toolkit (Revised)
Task 3.4 Transport Demand Analysis
Demandforpassengertransportcanbeestimatedusingafour-stepmodel.ThemodeldevelopedcanthenbeusedforanalyzingthehorizonyearsoftheBAUscenario.
Task 3.5 Technology Transitions
Anunderstandingofvehicles,fuelsandCO2emissionsfromelectricityusedintransportationsystemisessentialtounderstandtheimplicationsoftraveldemandonCO2 emissions and air quality.
Task 3.6 CO2 Emissions and Air Quality
Theframeworkforsustainableurbanmobilityneedstoutilisethefourstrategiclevers:urbanform,NonMotorisedTransport(NMT),PublicTransport(PT)andTechnology.Theframeworkshouldstudytheimpactsofalternativestrategiesusingkeyindicatorsformobility,safety,andlocalenvironment,aswellasmoreaggregateindicatorslikeCO2andenergyuse.
Task 3.7 Analysis and Indicators (Comparison with Benchmarks)
TheindicatorsfortheBAUscenario,similartothoseestimatedforthebaseyear,shouldbeanalysedandcompared.
Task 4: Development of Sustainable Urban Transport Scenarios
Task 4.1 Framework for Scenario
Thesustainableurbantransportscenarioshouldvisualisesocial,economic,environmentalandtechnologicaltransitionsthroughwhichsocietiesrespondtoclimatechange,localenvironmentandmobilitychallenges.Thescenarioassumesdeepemissionscutsusing lowcarbonenergysources(e.g., renewables,naturalgas,etc.),highlyefficienttechnologies(e.g.,improvedvehicleefficiency),adoptionofbehaviouralandconsumptionstylesconsistentwithsustainabledevelopment,changesinurbandevelopmentandenhanceduseofnon-motorisedand public transport infrastructures.
Task 4.2 Strategies for Sustainable Urban Transport Scenario
Thescenariosdescribedherearerelatedtotheplansandpoliciesaimedatlimitingprivatevehicleusage.Thescenariosalsoassumeanincreaseinmotorisedtransporttosomeextent,whichisinevitablegiventhelowlevelofvehicleuseonapercapitabasis.Therefore,emphasis isalsoplacedonimprovingtechnologyintermsofefficiencyandemissions.Thestrategiescanbetypicallycategorisedintothefollowingfourcategories:
l Changeinurbanstructure
l Improvingnon-motorisedtransport
l Improvingpublictransport
l Technologicalchanges
107
Annexures
Thesestrategieswilldeliverfullbenefitsiftheyareimplementedcollectively;howeverforanalysisitmaybeusefultopresentthemonebyonetoseetheindividualeffect.Thestrategiespresentedhereareindicative,andtheconsultantscanadaptthemtoacity’sspecificcircumstances.
A: Urban Structure
Thescenarioshouldexplorealternatedevelopmentstrategiesforreducingtriplengthsandimprovingaccesstopublictransportthroughchangesinzoningregulationsandfloorarearatiotoachievehigherdensity,diversityandbetterdesign.
B: Non-Motorised Transport Infrastructure
ThescenarioshouldconsiderimprovingtheuseofNMTmodeandimprovementofNMTinfrastructurethereof.The scenario should also consider the safety of NMT users.
C: Public Transport
SincemostIndiancitieslackreliablebusservice,twokindsofscenariosforpublictransportshouldbeconsidered:
1. Improvedbusservicewithcompatiblepedestrianandbicycleinfrastructure
2. Improvedbusserviceandmasstransitwithcompatiblepedestrianandbicycleinfrastructure
D: Improving Public Transport, NMT and Urban Structure
ThisscenariolooksathowtheimplementationofNMT,publictransportandurbanstructurestrategiescombineand complement each other.
E: Technology
Technology changes canencompass changes tovehiclesdesign, fueluse,energyuseand reduction inCO2emissions related to electricity.
F: Regulatory and Financial Measures (Incentives and Disincentives)
Awidevarietyofmeasurescanbeundertakentohelpshiftpeoplefromprivatetransportmodestosustainableurbantransportunderaregulatoryandfinancialmeasurescenario.Thesemeasurestrytointernalisethecostofexternalitiesimposedbyprivatevehicles.Thesemaybeincorporatedinthemodelinformofincreasedgeneralisedcostoftravelbyprivatemodes.
Task 4.3 Transport Demand Analysis of Alternative Strategies for Sustainable Urban Transport
Basedontheabovescenario(A,B,C,DandF),improvementininfrastructureforsustainableurbantransportneedstobesuggested.
Task 4.4 Technology Transitions under a Low Carbon Scenario
Inthelowcarbonscenario,thefuelmixisexpectedtodiversifyfurtherfromBAUtowardsbio-fuels,electricityandnaturalgas.Optionsfortechnologytransitionsshouldbesuggested.
108
Preparing a Comprehensive Mobility Plan (CMP) – A Toolkit (Revised)
Task 4.5 CO2 Emissions and Air Quality (Refer task 3-6)
ThemodelframeworkissameastheBAUscenarioforestimatingCO2emissionsandairquality.
Task 4.6 Analysis and Indicators (Comparison with Benchmarks)
Sustainable urban transport scenario should be compared with indicators and benchmarks.
Task 5: Development of Urban Mobility Plan
ThegoalshouldbetoprovideforComfortablePublicTransport,NMTincorporatedwithothermodesoftransportandFreightmovementplanaspartofCMP.
TheUrbanMobilityPlanshouldbedevelopedinconsultationwithstakeholdersandonthebasisoftheanalysiscarriedunderTasks3and4.Theurbanmobilityplancanbedefinedalongthefollowing lines;however it isimportantthattheplanincludesaphasingplanandimplementationagencies:
i. IntegratedLandUseandUrbanMobilityPlan
ii. PublicTransportImprovementPlan
iii. RoadNetworkDevelopmentPlan
iv. NMTFacilityImprovementPlan
v. FreightMovementPlan
vi. MobilityManagementMeasures
vii. FiscalMeasures
Task 5.1 Mobility Improvement Measures and NUTP Objectives
A table shouldbeprepared summarising the relationshipbetween theNUTPobjectivesand themeasuresproposed intheCMP,togetherwithaclassificationofthemeasuresaccordingtotheir implementationtimeframe(immediate,short,mediumandlongterm).
Task 6: Preparation of the Implementation Program
Proposedprojectsshouldbeevaluatedandprioritisedagainstclearcriteriaandclassifiedintoimmediate,short,mediumandlong-term.AstheCMPisalong-termvisionforthecityauthority,theoverallownershipoftheCMPlieswithULBs.GiventheULB’sdependenceonfunding,acity’sCMPshouldmakearesourceassessmentforalltheprojectslistedintheCMPandshouldsuggestthecityauthority,city-specificandproject-specificindicativesourceoffinancingfortheproject.
2. STUDY DELIVERABLES
TheCMPdocumentshouldbeasperthesamplecontentsattachedherewith.Thestudyistobecompletedwithinxx(ReferTable3).Thedeliverablesarelistedbelow.
109
Annexures
Deliverables Submission date (maximum no. Of months from start of work)* No. of copies
<5 lakh 5 – 20 lakh 20 – 40 lakh >40 lakh
Dateofsigningofagreement
M M M M
InceptionReportand Detailed Work Plan
M+1 M+1 M+1 M+1 X
Interim Report M+3 M+6 M+9 M+12 X
Draft Final CMP M+7 M+11 M+17 M+23 X
Final CMP with Executive summary
Within 1 month of receipt of comments
Within 1 month of receipt of comments
Within 1 month of receipt of comments
Within 1 month of receipt of comments
X
*Thetimelinedoesnotincludethetimetakenbytheclientinapprovalsandstakeholdersconsultation
A soft copy including database material (in PDF and Word /Excel /PPT/Dwg format) shall be submitted with each of the above. Even the model developed should be submitted in PDF as well as in the software used for modelling.
3. COST OF CMP PREPARATION
TentativecostforCMPpreparationasper2013priceindexwouldbeasunderwhichmaybeincreasedwiththegrowingpriceindexproportionately.
City Size Rates for New CMP (Rs in Lakh)
Lessthan0.3million 20
0.3-0.5million 30
0.5-1million 40
1-2 million 60
2-4 million 80
4-8 million 120
Above8million 200
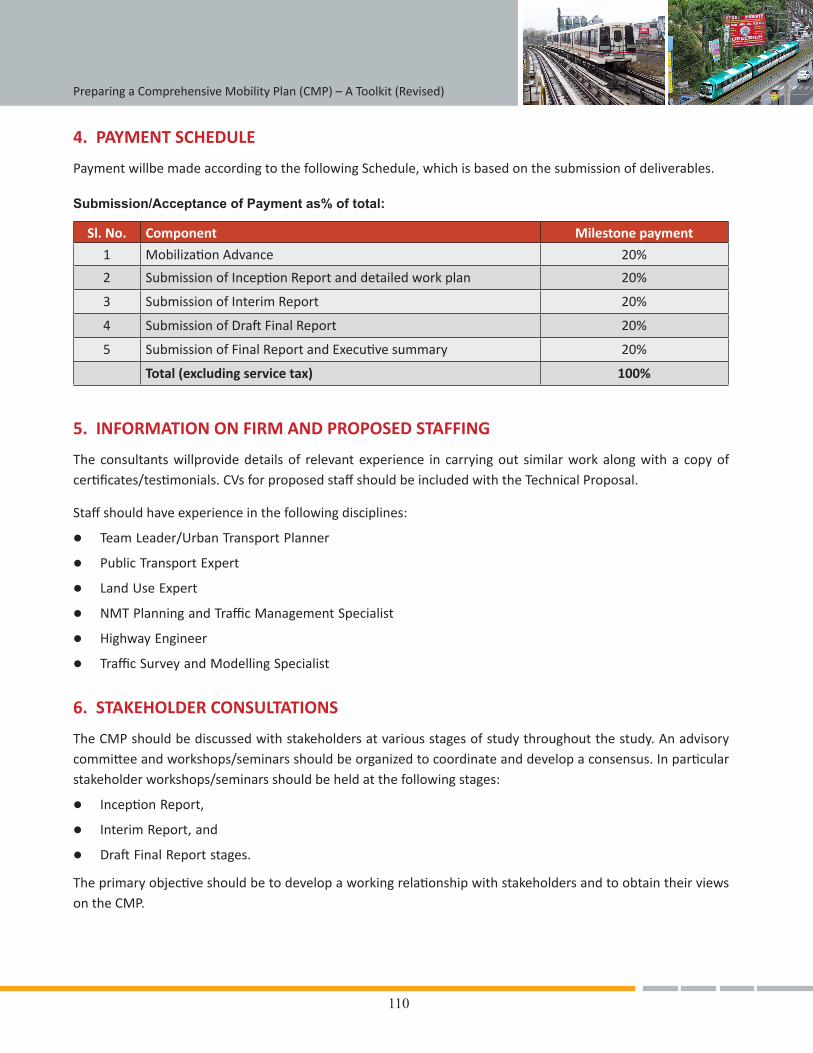
110
Preparing a Comprehensive Mobility Plan (CMP) – A Toolkit (Revised)
4. PAYMENT SCHEDULE
PaymentwillbemadeaccordingtothefollowingSchedule,whichisbasedonthesubmissionofdeliverables.
Submission/Acceptance of Payment as% of total:
Sl. No. Component Milestone payment
1 MobilizationAdvance 20%
2 SubmissionofInceptionReportanddetailedworkplan 20%
3 Submission of Interim Report 20%
4 SubmissionofDraftFinalReport 20%
5 SubmissionofFinalReportandExecutivesummary 20%
Total (excluding service tax) 100%
5. INFORMATION ON FIRM AND PROPOSED STAFFING
Theconsultantswillprovidedetailsof relevantexperience in carryingout similarworkalongwitha copyofcertificates/testimonials.CVsforproposedstaffshouldbeincludedwiththeTechnicalProposal.
Staffshouldhaveexperienceinthefollowingdisciplines:
l TeamLeader/UrbanTransportPlanner
l PublicTransportExpert
l LandUseExpert
l NMTPlanningandTrafficManagementSpecialist
l HighwayEngineer
l TrafficSurveyandModellingSpecialist
6. STAKEHOLDER CONSULTATIONS
TheCMPshouldbediscussedwithstakeholdersatvariousstagesofstudythroughoutthestudy.Anadvisorycommitteeandworkshops/seminarsshouldbeorganizedtocoordinateanddevelopaconsensus.Inparticularstakeholderworkshops/seminarsshouldbeheldatthefollowingstages:
l InceptionReport,
l Interim Report, and
l DraftFinalReportstages.
Theprimaryobjectiveshouldbetodevelopaworkingrelationshipwithstakeholdersandtoobtaintheirviewson the CMP.
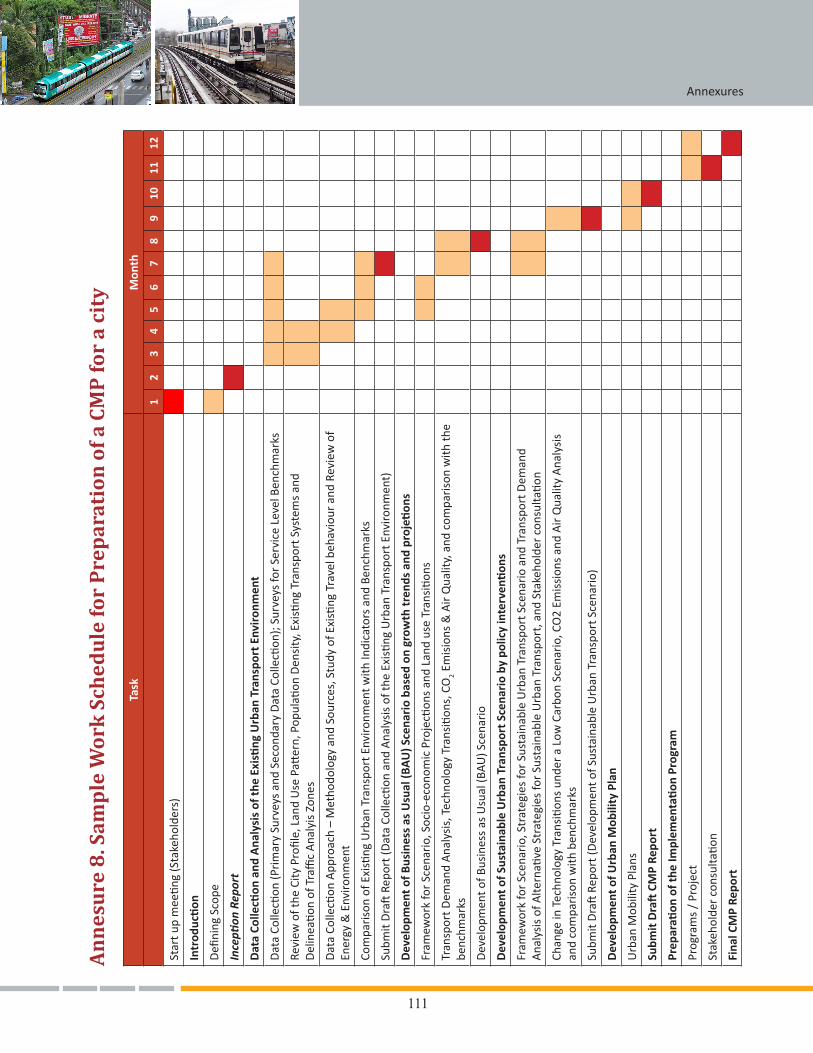
111
AnnexuresA
nn
esu
re 8
. Sam
ple
Wor
k S
ched
ule
for
Pre
par
atio
n o
f a C
MP
for
a ci
ty
Task
Mon
th
12
34
56
78
910
1112
Startu
pmee
ting(Stakeho
lders)
Intr
oduc
tion
Defi
ning
Scope
Ince
ption
Rep
ort
Dat
a Co
llecti
on a
nd A
naly
sis
of th
e Ex
isti
ng U
rban
Tra
nspo
rt E
nvir
onm
ent
DataCo
llecti
on(P
rimarySu
rveysan
dSecond
aryDataCo
llecti
on);Su
rveysforServiceLevelB
enchmarks
Review
ofthe
City
Profile,Lan
dUsePatt
ern,Pop
ulati
onDen
sity,Existing
Transpo
rtSystemsan
dDelineatio
nofTrafficAna
lyisZon
es
DataCo
llecti
onApp
roach–Metho
dologyand
Sou
rces,Study
ofE
xisting
Travelb
ehaviourand
Reviewof
Energy&Enviro
nmen
t
Compa
risonofExisting
Urban
Transpo
rtEnviro
nmen
twith
Indicatorsand
Ben
chmarks
Subm
itDraftRep
ort(DataCo
llecti
onand
Ana
lysisofth
eExistin
gUrban
Transpo
rtEnviro
nmen
t)
Dev
elop
men
t of B
usin
ess
as U
sual
(BA
U) S
cena
rio
base
d on
gro
wth
tren
ds a
nd p
roje
tion
s
Fram
eworkforScen
ario,Socio-econo
micProjecti
onsan
dLand
useTransition
s
Tran
sportD
eman
dAna
lysis,Techn
olog
yTran
sitio
ns,C
O2E
misions&AirQua
lity,and
com
parisonwith
the
benc
hmar
ks
Develop
men
tofB
usinessasUsual(B
AU)S
cena
rio
Dev
elop
men
t of S
usta
inab
le U
rban
Tra
nspo
rt S
cena
rio
by p
olic
y in
terv
enti
ons
Fram
eworkforScen
ario,StrategiesforSu
staina
bleUrban
Transpo
rtScena
rioan
dTran
sportD
eman
dAna
lysisofAlte
rnati
veStrategiesforSu
staina
bleUrban
Transpo
rt,and
Stakeho
ldercon
sulta
tion
Chan
gein
Techn
olog
yTran
sitio
nsund
eraLow
Carbo
nScen
ario,C
O2Em
ission
san
dAirQua
lityAna
lysis
and
com
pari
son
with
ben
chm
arks
Subm
itDraftRep
ort(Develop
men
tofS
ustainab
leUrban
Transpo
rtScena
rio)
Dev
elop
men
t of U
rban
Mob
ility
Pla
n
Urb
an M
obili
ty P
lans
Subm
it D
raft
CM
P Re
port
Prep
arati
on o
f the
Impl
emen
tati
on P
rogr
am
Prog
rams/Project
Stakeh
olde
rconsultatio
n
Fina
l CM
P Re
port
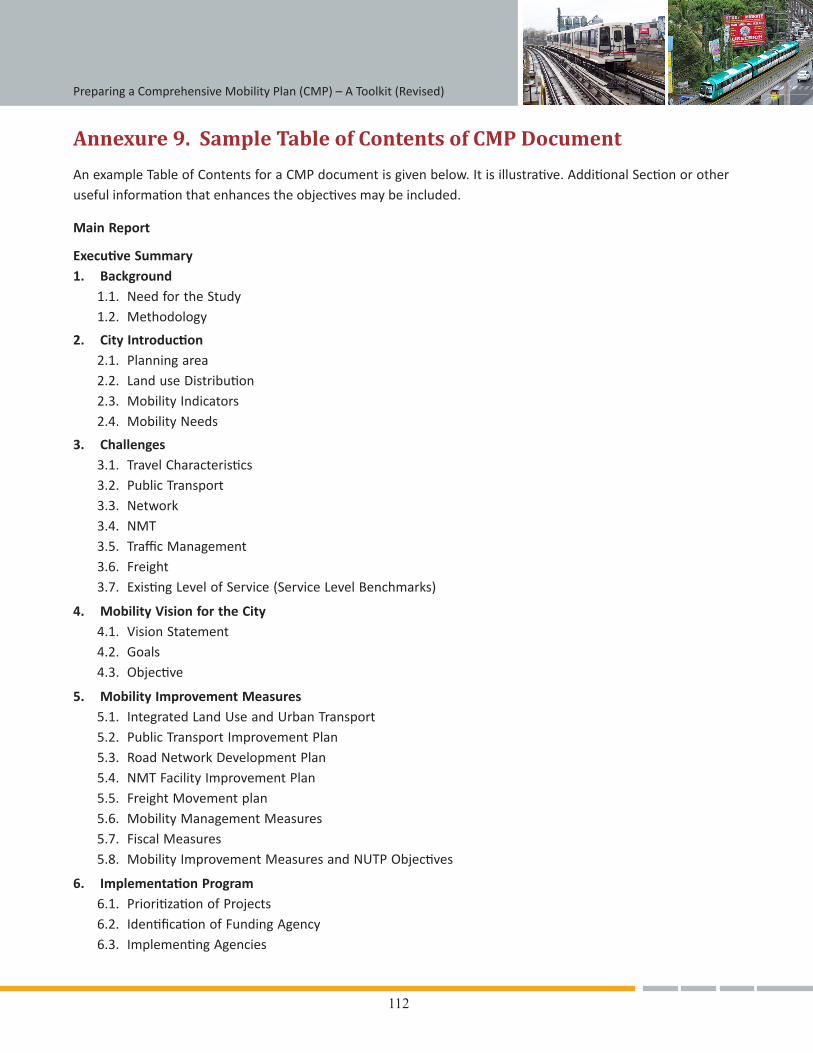
112
Preparing a Comprehensive Mobility Plan (CMP) – A Toolkit (Revised)
Annexure 9. Sample Table of Contents of CMP Document
AnexampleTableofContentsforaCMPdocumentisgivenbelow.Itisillustrative.AdditionalSectionorotherusefulinformationthatenhancestheobjectivesmaybeincluded.
Main Report
Executive Summary1. Background
1.1. Need for the Study1.2. Methodology
2. City Introduction2.1. Planningarea2.2. LanduseDistribution2.3. Mobility Indicators 2.4. Mobility Needs
3. Challenges3.1. TravelCharacteristics3.2. Public Transport3.3. Network3.4. NMT3.5. TrafficManagement3.6. Freight3.7. ExistingLevelofService(ServiceLevelBenchmarks)
4. Mobility Vision for the City4.1. VisionStatement4.2. Goals4.3. Objective
5. Mobility Improvement Measures5.1. IntegratedLandUseandUrbanTransport5.2. PublicTransportImprovementPlan5.3. RoadNetworkDevelopmentPlan5.4. NMTFacilityImprovementPlan5.5. FreightMovementplan5.6. MobilityManagementMeasures5.7. FiscalMeasures5.8. MobilityImprovementMeasuresandNUTPObjectives
6. Implementation Program6.1. PrioritizationofProjects6.2. IdentificationofFundingAgency6.3. ImplementingAgencies
113
Annexures
7. Outcomes 7.1. ImprovementsinMobilityIndicators7.2. ImprovementsinSLB
Annexures
1. Planning Forecast
1.1. DemographicForecasting
1.2. LanduseinHorizonYear
1.3. EconomicForecast
2. Base Year Travel Demand Model
2.1. Introduction
2.2. TransportationStudyProcess
2.3. StudyAreaZoning
2.4. NetworkDevelopment
2.5. BaseYearTravelPattern
2.6. Model Structure
3. Development of Business as Usual (BAU) Scenario
3.1. SocioEconomicTransitions
3.2. CityStructureTransitions(Landuse)
3.3. TravelDemand(FourStepmodeling)
3.4. Transport Infrastructure
3.5. OutcomesofBAUScenario
3.6. EmissionsofCO2 and Local Pollutants
4. Alternative Development Scenario (Low Carbon Scenario)
4.1. UrbanStructure(LandUseStrategy)Strategy
4.2. PublicTransportStrategy
4.3. Mobility&AccessibilityResultsforPTScenario
4.4. Non-MotorisedTransportStrategy
4.5. Mobility&AccessibilityResultsforNMTScenario
4.6. LanduseIntervention,PublicTransportIntervention,Non-MotorisedTransportIntervention
4.7. Mobility&AccessibilityResultsforCombinedScenario
4.8. ComparativeAnalysis
5 Survey Data
6 Details of Traffic Demand Modeling
7 Details of Stakeholder Consultation
8 Self-Appraisal Checklist (enclosed at Annexure 10)
ThetableofcontentisforCMPsofcitieswithmorethan0.5millionpopulationandmaybemodifiedforsmallercities.
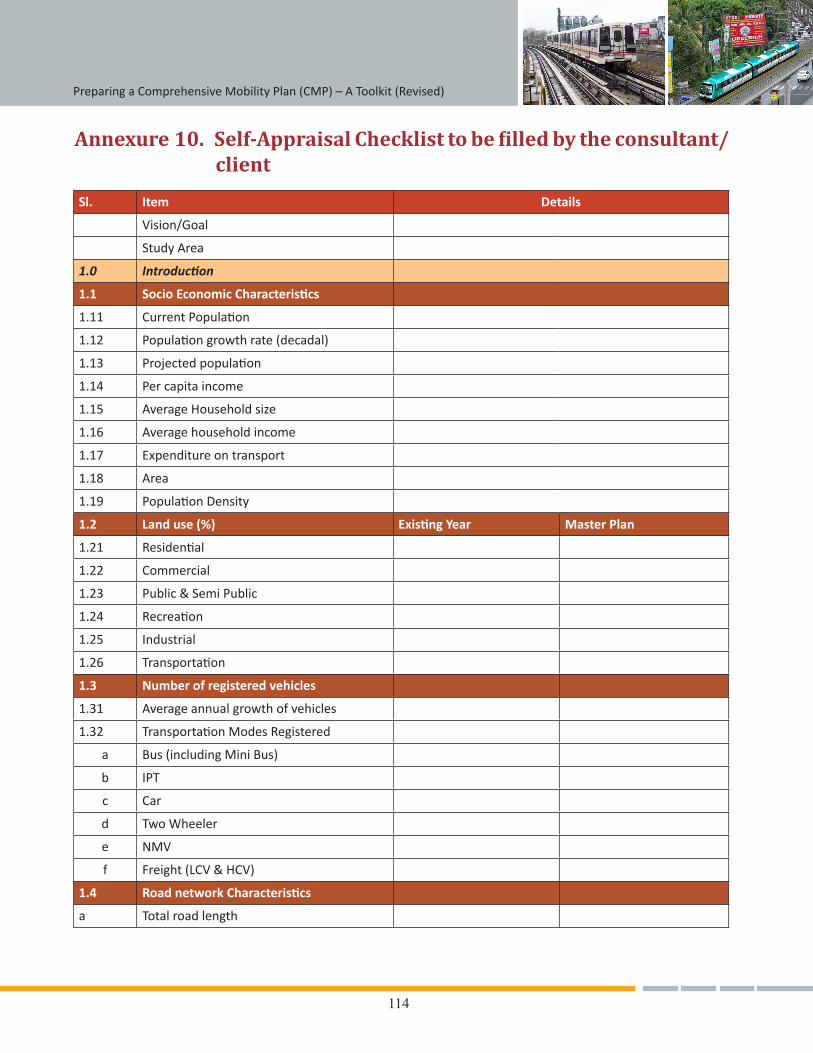
114
Preparing a Comprehensive Mobility Plan (CMP) – A Toolkit (Revised)
Annexure 10. Self-Appraisal Checklist to be filled by the consultant/client
Sl. Item Details
Vision/Goal
Study Area
1.0 Introduction
1.1 Socio Economic Characteristics
1.11 CurrentPopulation
1.12 Populationgrowthrate(decadal)
1.13 Projectedpopulation
1.14 Per capita income
1.15 AverageHouseholdsize
1.16 Averagehouseholdincome
1.17 Expenditureontransport
1.18 Area
1.19 PopulationDensity
1.2 Land use (%) Existing Year Master Plan
1.21 Residential
1.22 Commercial
1.23 Public&SemiPublic
1.24 Recreation
1.25 Industrial
1.26 Transportation
1.3 Number of registered vehicles
1.31 Averageannualgrowthofvehicles
1.32 TransportationModesRegistered
a Bus(includingMiniBus)
b IPT
c Car
d Two Wheeler
e NMV
f Freight(LCV&HCV)
1.4 Road network Characteristics
a Totalroadlength
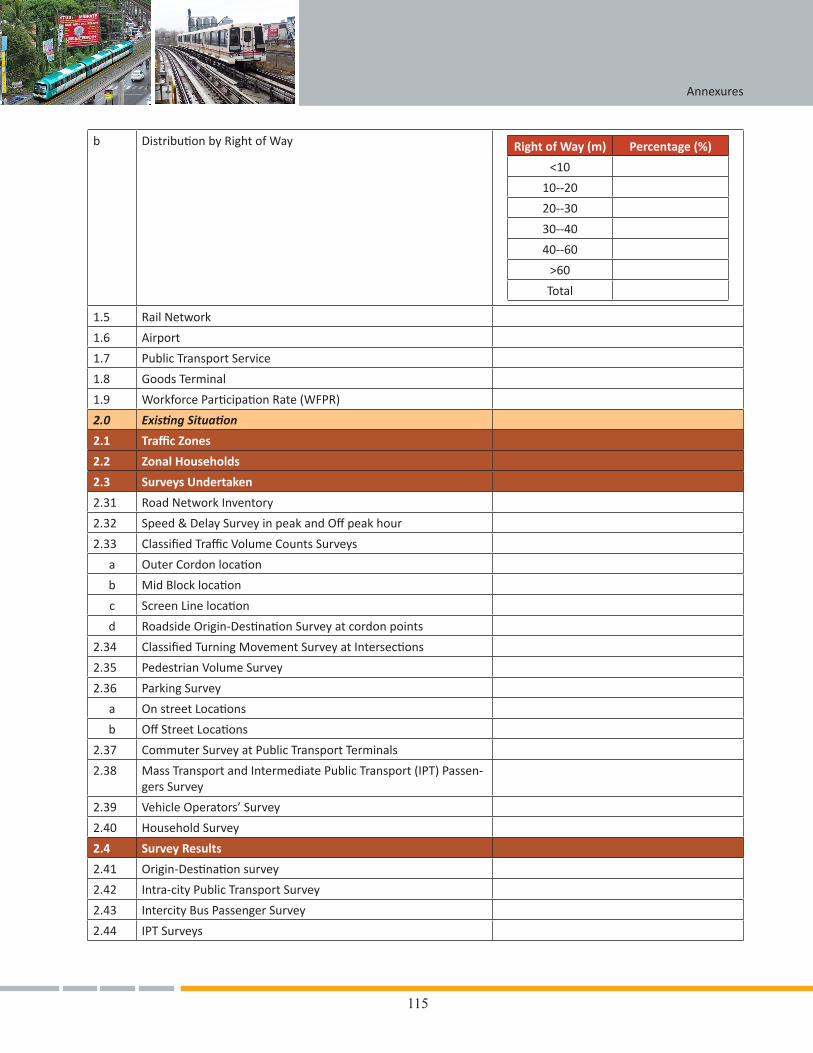
115
Annexures
b DistributionbyRightofWay Right of Way (m) Percentage (%)
<10
10--20
20--30
30--40
40--60
>60
Total
1.5 Rail Network
1.6 Airport
1.7 PublicTransportService
1.8 Goods Terminal
1.9 WorkforceParticipationRate(WFPR)
2.0 Existing Situation
2.1 Traffic Zones
2.2 Zonal Households
2.3 Surveys Undertaken
2.31 RoadNetworkInventory
2.32 Speed&DelaySurveyinpeakandOffpeakhour
2.33 ClassifiedTrafficVolumeCountsSurveys
a OuterCordonlocation
b MidBlocklocation
c ScreenLinelocation
d RoadsideOrigin-DestinationSurveyatcordonpoints
2.34 ClassifiedTurningMovementSurveyatIntersections
2.35 PedestrianVolumeSurvey
2.36 ParkingSurvey
a OnstreetLocations
b OffStreetLocations
2.37 CommuterSurveyatPublicTransportTerminals
2.38 Mass Transport and Intermediate Public Transport (IPT) Passen-gersSurvey
2.39 VehicleOperators’Survey
2.40 HouseholdSurvey
2.4 Survey Results
2.41 Origin-Destinationsurvey
2.42 Intra-cityPublicTransportSurvey
2.43 IntercityBusPassengerSurvey
2.44 IPTSurveys
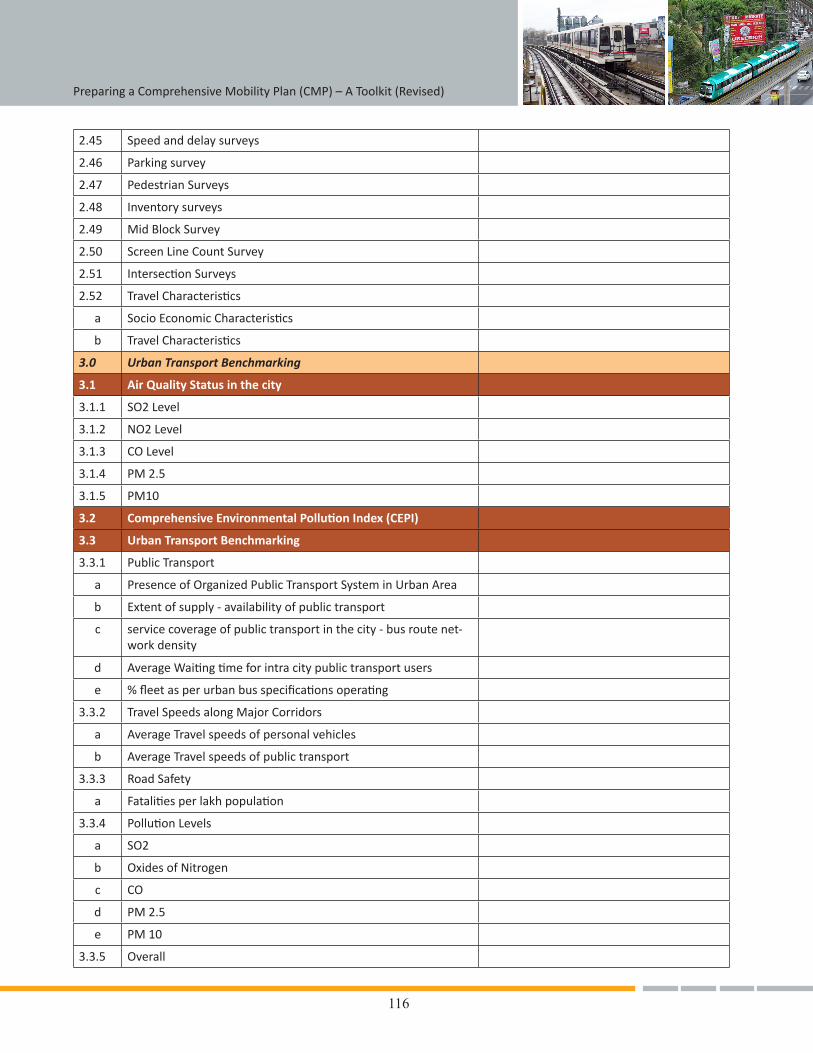
116
Preparing a Comprehensive Mobility Plan (CMP) – A Toolkit (Revised)
2.45 Speedanddelaysurveys
2.46 Parkingsurvey
2.47 PedestrianSurveys
2.48 Inventorysurveys
2.49 MidBlockSurvey
2.50 ScreenLineCountSurvey
2.51 IntersectionSurveys
2.52 TravelCharacteristics
a SocioEconomicCharacteristics
b TravelCharacteristics
3.0 Urban Transport Benchmarking
3.1 Air Quality Status in the city
3.1.1 SO2Level
3.1.2 NO2Level
3.1.3 COLevel
3.1.4 PM 2.5
3.1.5 PM10
3.2 Comprehensive Environmental Pollution Index (CEPI)
3.3 Urban Transport Benchmarking
3.3.1 Public Transport
a PresenceofOrganizedPublicTransportSysteminUrbanArea
b Extentofsupply-availabilityofpublictransport
c servicecoverageofpublictransportinthecity-busroutenet-work density
d AverageWaitingtimeforintracitypublictransportusers
e %fleetasperurbanbusspecificationsoperating
3.3.2 TravelSpeedsalongMajorCorridors
a AverageTravelspeedsofpersonalvehicles
b AverageTravelspeedsofpublictransport
3.3.3 Road Safety
a Fatalitiesperlakhpopulation
3.3.4 PollutionLevels
a SO2
b OxidesofNitrogen
c CO
d PM 2.5
e PM10
3.3.5 Overall
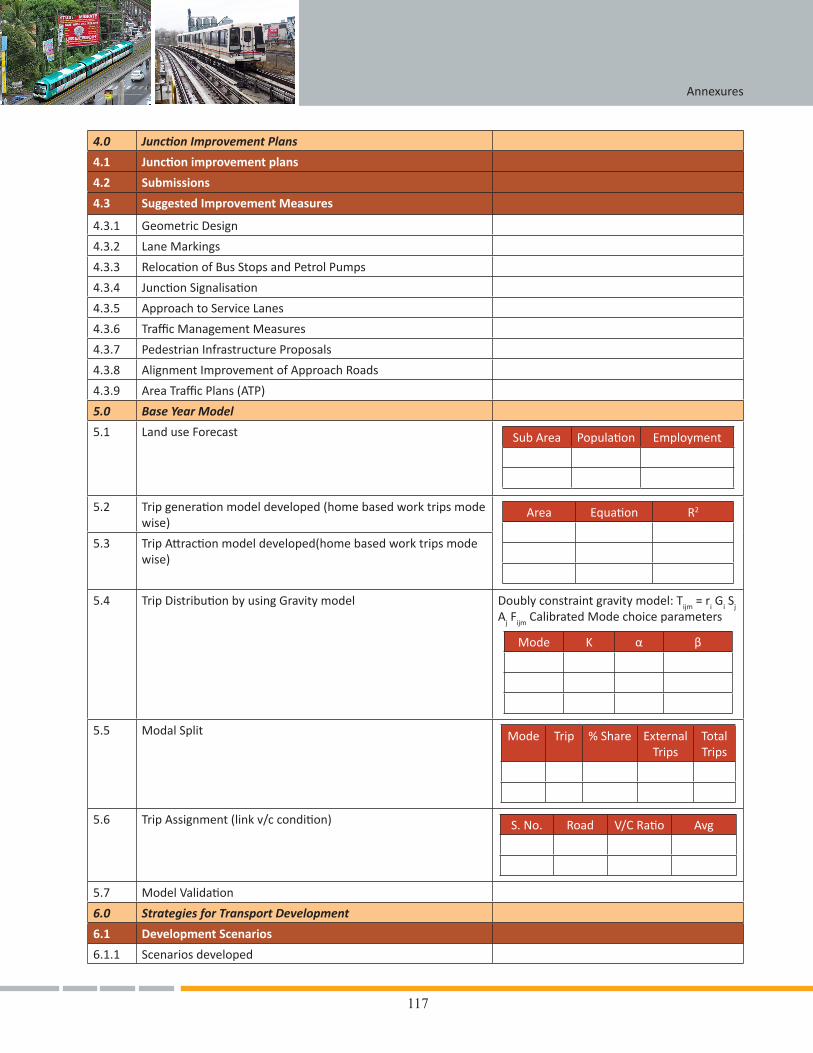
117
Annexures
4.0 Junction Improvement Plans
4.1 Junction improvement plans
4.2 Submissions
4.3 Suggested Improvement Measures
4.3.1 GeometricDesign
4.3.2 LaneMarkings
4.3.3 RelocationofBusStopsandPetrolPumps
4.3.4 JunctionSignalisation
4.3.5 ApproachtoServiceLanes
4.3.6 TrafficManagementMeasures
4.3.7 Pedestrian Infrastructure Proposals
4.3.8 AlignmentImprovementofApproachRoads
4.3.9 AreaTrafficPlans(ATP)
5.0 Base Year Model
5.1 LanduseForecast Sub Area Population Employment
5.2 Tripgenerationmodeldeveloped(homebasedworktripsmodewise)
Area Equation R2
5.3 TripAttractionmodeldeveloped(homebasedworktripsmodewise)
5.4 TripDistributionbyusingGravitymodel Doublyconstraintgravitymodel:Tijm = ri Gi Sj AjFijm Calibrated Mode choice parameters
Mode K α β
5.5 Modal Split Mode Trip %Share ExternalTrips
Total Trips
5.6 TripAssignment(linkv/ccondition) S. No. Road V/CRatio Avg
5.7 ModelValidation
6.0 Strategies for Transport Development
6.1 Development Scenarios
6.1.1 Scenariosdeveloped
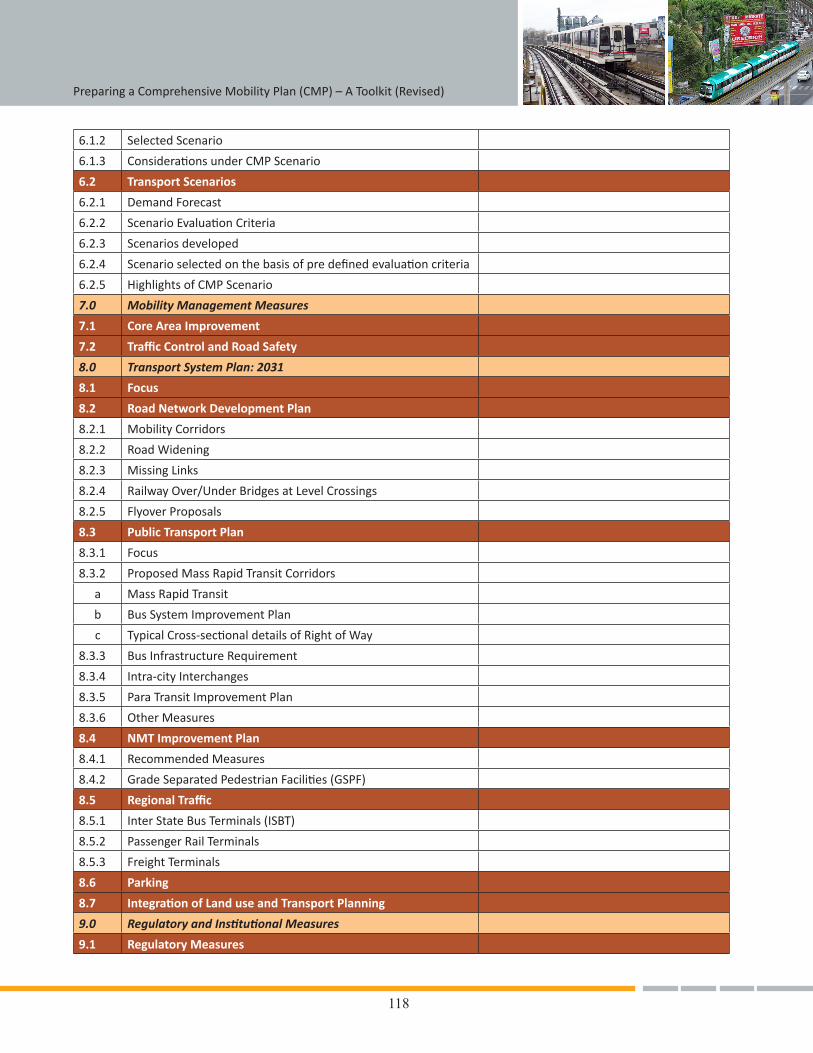
118
Preparing a Comprehensive Mobility Plan (CMP) – A Toolkit (Revised)
6.1.2 Selected Scenario
6.1.3 ConsiderationsunderCMPScenario
6.2 Transport Scenarios
6.2.1 DemandForecast
6.2.2 ScenarioEvaluationCriteria
6.2.3 Scenariosdeveloped
6.2.4 Scenarioselectedonthebasisofpredefinedevaluationcriteria
6.2.5 HighlightsofCMPScenario
7.0 Mobility Management Measures
7.1 Core Area Improvement
7.2 Traffic Control and Road Safety
8.0 Transport System Plan: 2031
8.1 Focus
8.2 Road Network Development Plan
8.2.1 Mobility Corridors
8.2.2 RoadWidening
8.2.3 MissingLinks
8.2.4 RailwayOver/UnderBridgesatLevelCrossings
8.2.5 FlyoverProposals
8.3 Public Transport Plan
8.3.1 Focus
8.3.2 Proposed Mass Rapid Transit Corridors
a Mass Rapid Transit
b BusSystemImprovementPlan
c TypicalCross-sectionaldetailsofRightofWay
8.3.3 Bus Infrastructure Requirement
8.3.4 Intra-cityInterchanges
8.3.5 ParaTransitImprovementPlan
8.3.6 OtherMeasures
8.4 NMT Improvement Plan
8.4.1 Recommended Measures
8.4.2 GradeSeparatedPedestrianFacilities(GSPF)
8.5 Regional Traffic
8.5.1 Inter State Bus Terminals (ISBT)
8.5.2 PassengerRailTerminals
8.5.3 FreightTerminals
8.6 Parking
8.7 Integration of Land use and Transport Planning
9.0 Regulatory and Institutional Measures
9.1 Regulatory Measures
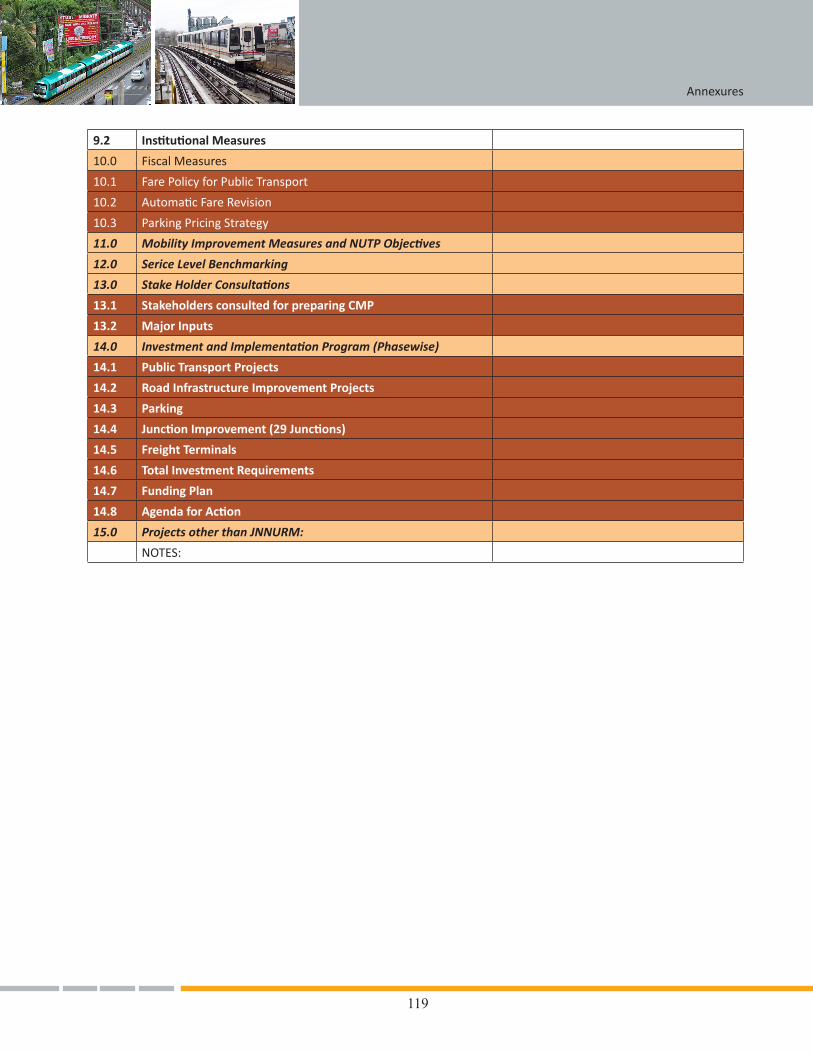
119
Annexures
9.2 Institutional Measures
10.0 FiscalMeasures
10.1 FarePolicyforPublicTransport
10.2 AutomaticFareRevision
10.3 ParkingPricingStrategy
11.0 Mobility Improvement Measures and NUTP Objectives
12.0 Serice Level Benchmarking
13.0 Stake Holder Consultations
13.1 Stakeholders consulted for preparing CMP
13.2 Major Inputs
14.0 Investment and Implementation Program (Phasewise)
14.1 Public Transport Projects
14.2 Road Infrastructure Improvement Projects
14.3 Parking
14.4 Junction Improvement (29 Junctions)
14.5 Freight Terminals
14.6 Total Investment Requirements
14.7 Funding Plan
14.8 Agenda for Action
15.0 Projects other than JNNURM:
NOTES:
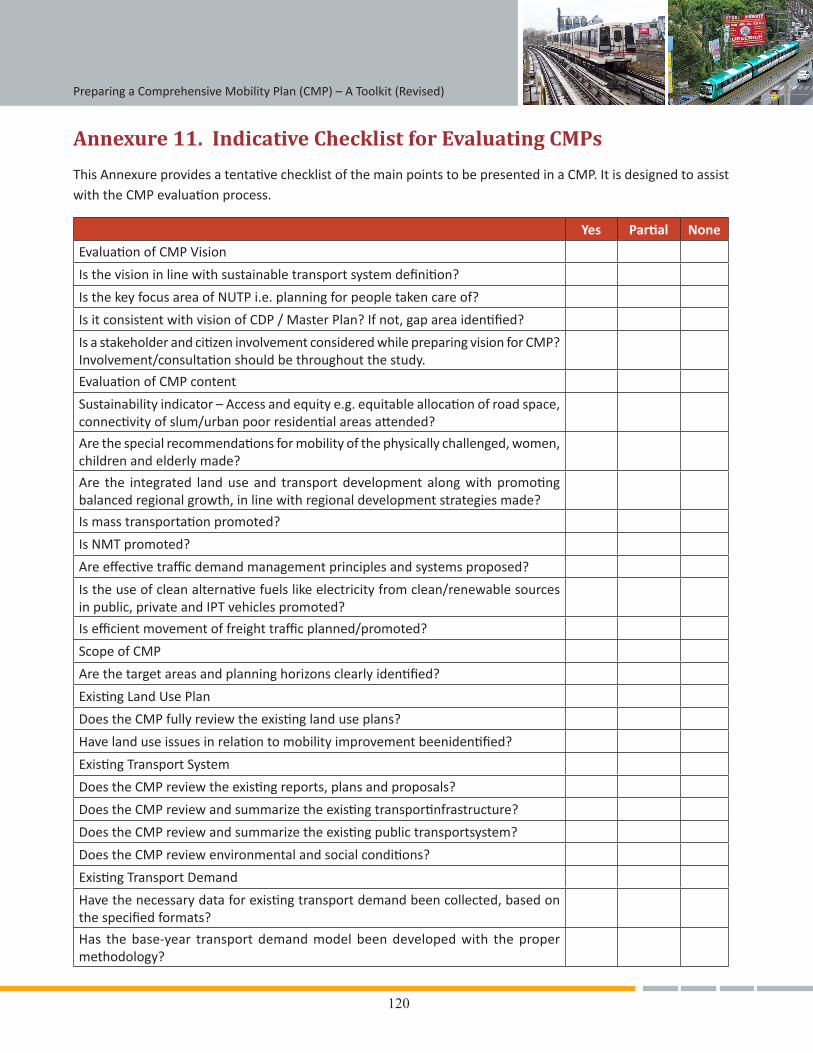
120
Preparing a Comprehensive Mobility Plan (CMP) – A Toolkit (Revised)
Annexure 11. Indicative Checklist for Evaluating CMPs
ThisAnnexureprovidesatentativechecklistofthemainpointstobepresentedinaCMP.ItisdesignedtoassistwiththeCMPevaluationprocess.
Yes Partial None
EvaluationofCMPVision
Isthevisioninlinewithsustainabletransportsystemdefinition?
IsthekeyfocusareaofNUTPi.e.planningforpeopletakencareof?
IsitconsistentwithvisionofCDP/MasterPlan?Ifnot,gapareaidentified?
IsastakeholderandcitizeninvolvementconsideredwhilepreparingvisionforCMP?Involvement/consultationshouldbethroughoutthestudy.
EvaluationofCMPcontent
Sustainabilityindicator–Accessandequitye.g.equitableallocationofroadspace,connectivityofslum/urbanpoorresidentialareasattended?
Arethespecialrecommendationsformobilityofthephysicallychallenged,women,childrenandelderlymade?
Are the integrated landuseand transportdevelopmentalongwithpromotingbalancedregionalgrowth,inlinewithregionaldevelopmentstrategiesmade?
Ismasstransportationpromoted?
IsNMTpromoted?
Areeffectivetrafficdemandmanagementprinciplesandsystemsproposed?
Istheuseofcleanalternativefuelslikeelectricityfromclean/renewablesourcesinpublic,privateandIPTvehiclespromoted?
Isefficientmovementoffreighttrafficplanned/promoted?
Scope of CMP
Arethetargetareasandplanninghorizonsclearlyidentified?
ExistingLandUsePlan
DoestheCMPfullyreviewtheexistinglanduseplans?
Havelanduseissuesinrelationtomobilityimprovementbeenidentified?
ExistingTransportSystem
DoestheCMPreviewtheexistingreports,plansandproposals?
DoestheCMPreviewandsummarizetheexistingtransportinfrastructure?
DoestheCMPreviewandsummarizetheexistingpublictransportsystem?
DoestheCMPreviewenvironmentalandsocialconditions?
ExistingTransportDemand
Havethenecessarydataforexistingtransportdemandbeencollected,basedonthespecifiedformats?
Has thebase-year transportdemandmodelbeendevelopedwith thepropermethodology?
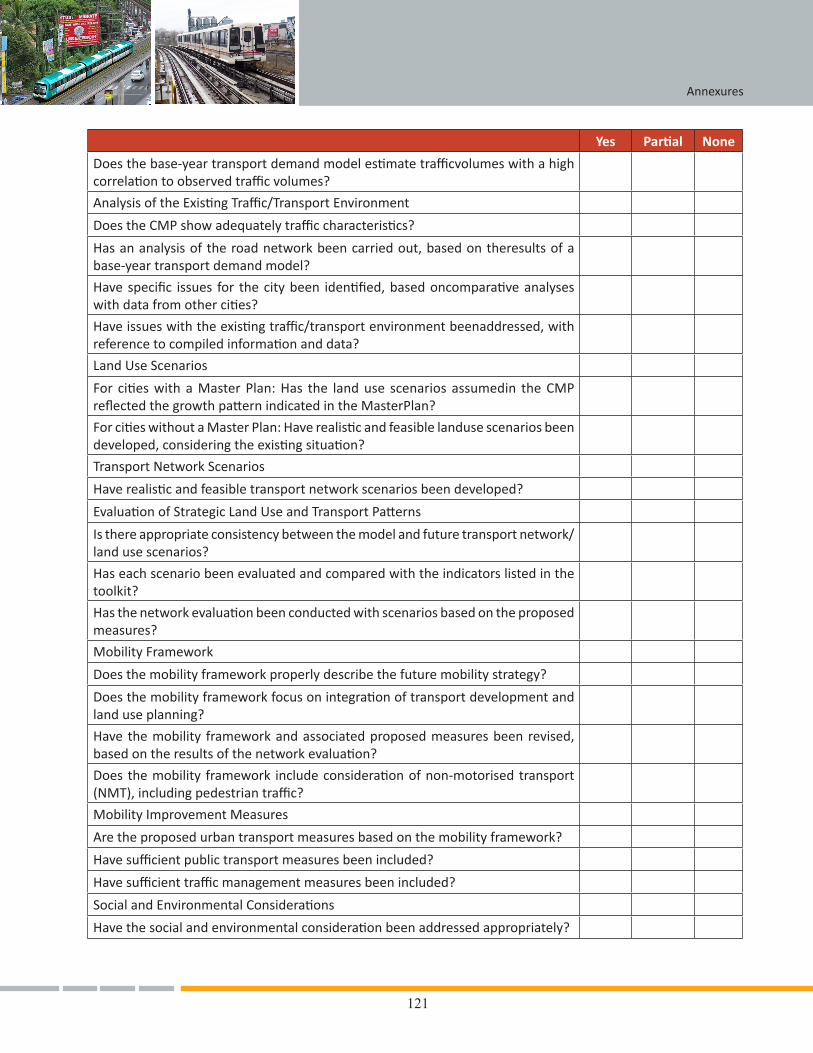
121
Annexures
Yes Partial None
Doesthebase-yeartransportdemandmodelestimatetrafficvolumeswithahighcorrelationtoobservedtrafficvolumes?
AnalysisoftheExistingTraffic/TransportEnvironment
DoestheCMPshowadequatelytrafficcharacteristics?
Has an analysis of the road network been carried out, based on theresults of a base-yeartransportdemandmodel?
Havespecific issues for thecitybeen identified,basedoncomparativeanalyseswithdatafromothercities?
Haveissueswiththeexistingtraffic/transportenvironmentbeenaddressed,withreferencetocompiledinformationanddata?
Land Use Scenarios
For citieswithaMasterPlan:Has the landuse scenariosassumedin theCMPreflectedthegrowthpatternindicatedintheMasterPlan?
ForcitieswithoutaMasterPlan:Haverealisticandfeasiblelandusescenariosbeendeveloped,consideringtheexistingsituation?
Transport Network Scenarios
Haverealisticandfeasibletransportnetworkscenariosbeendeveloped?
EvaluationofStrategicLandUseandTransportPatterns
Isthereappropriateconsistencybetweenthemodelandfuturetransportnetwork/landusescenarios?
Haseachscenariobeenevaluatedandcomparedwiththeindicatorslistedinthetoolkit?
Hasthenetworkevaluationbeenconductedwithscenariosbasedontheproposedmeasures?
MobilityFramework
Doesthemobilityframeworkproperlydescribethefuturemobilitystrategy?
Doesthemobilityframeworkfocusonintegrationoftransportdevelopmentandlanduseplanning?
Havethemobility frameworkandassociatedproposedmeasuresbeenrevised,basedontheresultsofthenetworkevaluation?
Doesthemobility framework includeconsiderationofnon-motorisedtransport(NMT),includingpedestriantraffic?
MobilityImprovementMeasures
Aretheproposedurbantransportmeasuresbasedonthemobilityframework?
Havesufficientpublictransportmeasuresbeenincluded?
Havesufficienttrafficmanagementmeasuresbeenincluded?
SocialandEnvironmentalConsiderations
Havethesocialandenvironmentalconsiderationbeenaddressedappropriately?
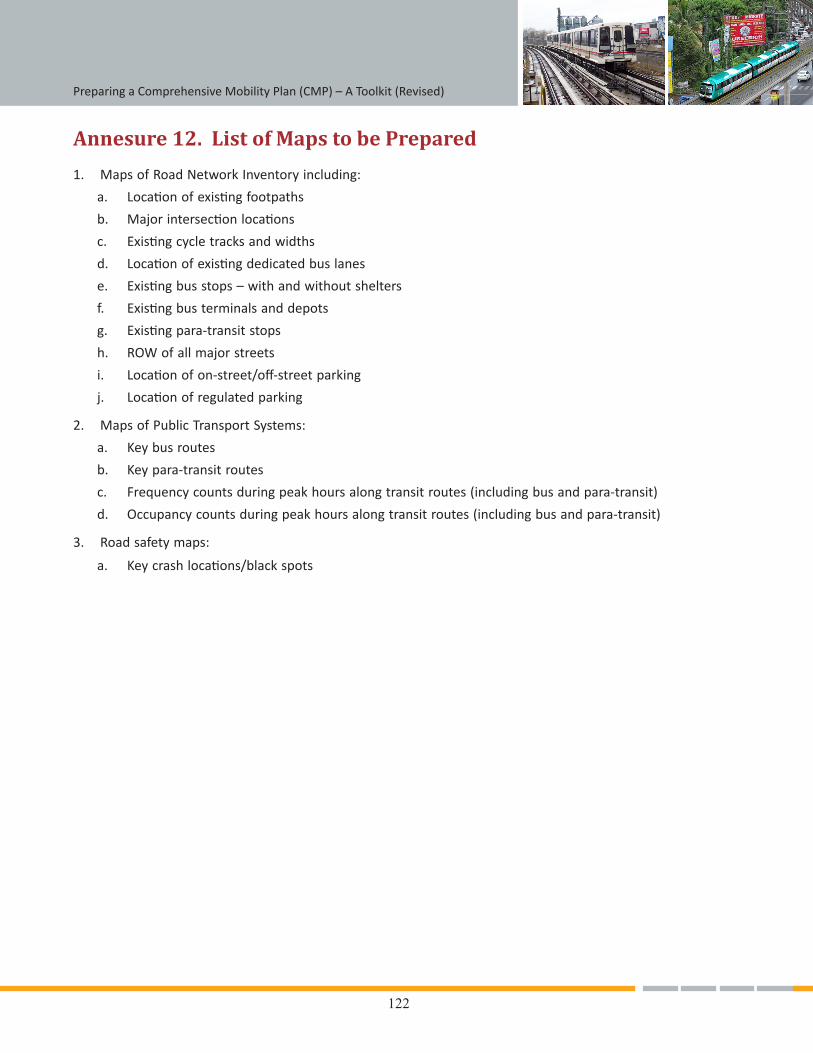
122
Preparing a Comprehensive Mobility Plan (CMP) – A Toolkit (Revised)
Annesure 12. List of Maps to be Prepared
1. MapsofRoadNetworkInventoryincluding:
a. Locationofexistingfootpaths
b. Majorintersectionlocations
c. Existingcycletracksandwidths
d. Locationofexistingdedicatedbuslanes
e. Existingbusstops–withandwithoutshelters
f. Existingbusterminalsanddepots
g. Existingpara-transitstops
h. ROWofallmajorstreets
i. Locationofon-street/off-streetparking
j. Locationofregulatedparking
2. MapsofPublicTransportSystems:
a. Key bus routes
b. Key para-transit routes
c. Frequencycountsduringpeakhoursalongtransitroutes(includingbusandpara-transit)
d. Occupancycountsduringpeakhoursalongtransitroutes(includingbusandpara-transit)
3. Roadsafetymaps:
a. Keycrashlocations/blackspots
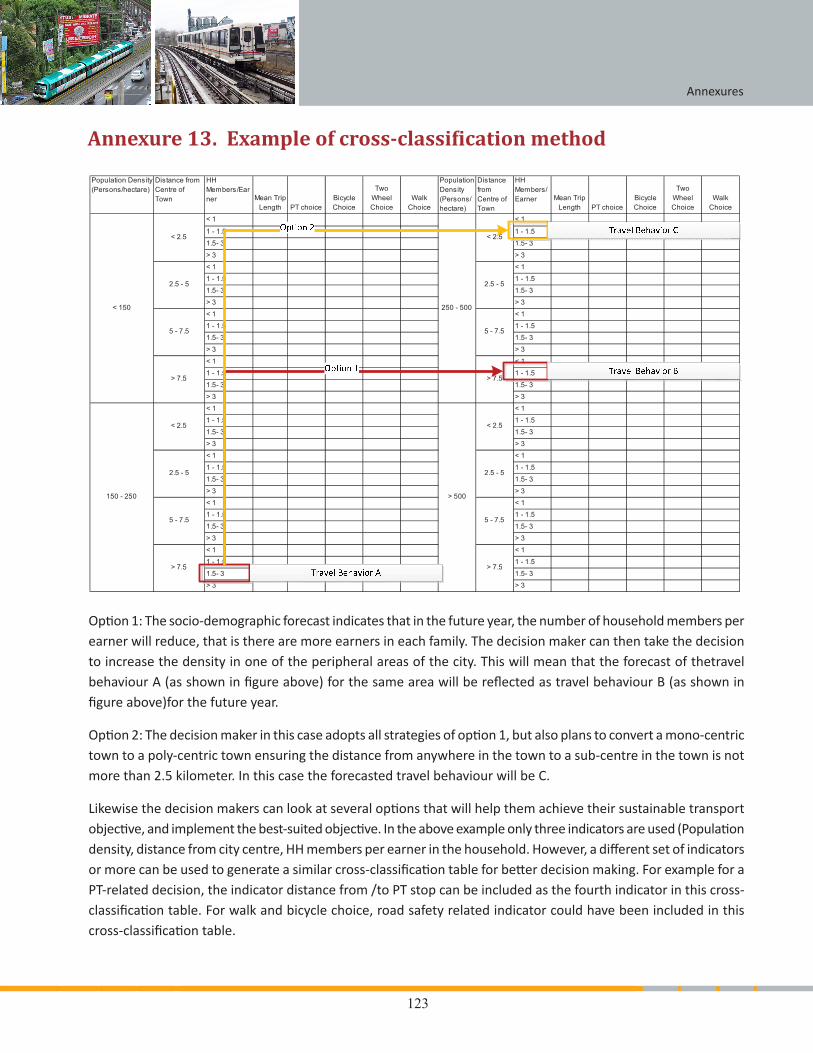
123
Annexures
Option1:Thesocio-demographicforecastindicatesthatinthefutureyear,thenumberofhouseholdmembersperearner will reduce, that is there are more earners in each family. The decision maker can then take the decision toincreasethedensityinoneoftheperipheralareasofthecity.ThiswillmeanthattheforecastofthetravelbehaviourA(asshowninfigureabove)forthesameareawillbereflectedastravelbehaviourB(asshowninfigureabove)forthefutureyear.
Option2:Thedecisionmakerinthiscaseadoptsallstrategiesofoption1,butalsoplanstoconvertamono-centrictowntoapoly-centrictownensuringthedistancefromanywhereinthetowntoasub-centreinthetownisnotmorethan2.5kilometer.InthiscasetheforecastedtravelbehaviourwillbeC.
Likewisethedecisionmakerscanlookatseveraloptionsthatwillhelpthemachievetheirsustainabletransportobjective,andimplementthebest-suitedobjective.Intheaboveexampleonlythreeindicatorsareused(Populationdensity,distancefromcitycentre,HHmembersperearnerinthehousehold.However,adifferentsetofindicatorsormorecanbeusedtogenerateasimilarcross-classificationtableforbetterdecisionmaking.ForexampleforaPT-relateddecision,theindicatordistancefrom/toPTstopcanbeincludedasthefourthindicatorinthiscross-classificationtable.Forwalkandbicyclechoice,roadsafetyrelatedindicatorcouldhavebeenincludedinthiscross-classificationtable.
Annexure 13. Example of cross-classification method

124
Preparing a Comprehensive Mobility Plan (CMP) – A Toolkit (Revised)