Embed Size (px)
Citation preview
COMPOSITIONAL NUTRIENT DIAGNOSIS (CND) OF ONION
M.N. Yousuf1 *, S. Akter2 . M.I. Haque3 , N. Mohammad4 and M.S. Zaman3
1-3 Regional Spices Research Centre,4 Agricultural Statistics and Information & communication Technology
Division Bangladesh Agricultural Research Institute,
Joydebpur, Gazipur-1701, Bangladesh. *Corresponding Author: [email protected]
Abstract
Nutritional constraints often restrict yields of field crops in farmers’
fields. Plant nutrient status is currently diagnosed using empirically
derived nutrient norms from arbitrarily defined high and low yielding
subpopulations above a quantitative yield target. Generic models can
assist Compositional Nutrient Diagnosis (CND) in providing a yield cutoff
value between high-and low-yielding subpopulations for small databases.
The present study aimed to determine minimum bulb yield target of high
yielding subpopulations in farmers’ field and nutritional difference
between high and low yielding subpopulations. Popular high yielding onion
(variety BARI piaz-1) was extensively grown in northern region of
Bangladesh. Data were collected at random using a survey database of 42
observations from nine districts of northern region of Bangladesh
including bulb yield and green portion or leaf nutrient concentrations.
Nutrient composition was determined form leaf at 45-50 days after
transplanting. Mean, median, minimum, maximum, standard deviations,
skewness of yield as well as nutrient concentration for N, P, S, Ca, Mg, Na,
K, Zn, Mn, Fe and B were determined and a R, which comprises all nutrients
not chemically analyzed and quantified in onion. Row centered log ratio
and cumulative variance ratio function of each nutrient was calculated.
1 Scientific Officer2 Principal Scientific Officer3 Senior Scientific Officer4 Scientific Officer
1
The CND generic model gave 10.61 t/ha as minimum cutoff yield of the high-
yield subpopulation. Boron was identified as the core yield limiting
nutrient for onion in piedmont plain, floodplain and basin soils of
Bangladesh. However, S, N, P and Zn also play a significant role for
increasing bulb yield of onion. Onion in farmers’ fields of northern
region of Bangladesh may require higher B fertilizer dose for better bulb
yield. From the studied piedmont plain, floodplain and basin soils of
Bangladesh, the yield limiting nutrients were established the following
series: B>S>N>P>Zn>Fe>Ca>K>Mg.
Introduction
Plant foods contain almost all of the mineral and organic nutrients
established as essential for animal and human nutrition, as well as a
number of unique organic phytochemicals that have been linked to the
promotion of good health. Since the 19th century, it is well known that
plant growth is always limited by the first factor whose availability in
the aerial and root environments start to limit plant growth. Soil
fertility is among these governing factors, meaning mineral nutrients
might be limiting plant growth. Therefore, the appraisal of soil fertility
and the assessment of plant mineral requirements are fundamental for crop
management. In this context, whole plant or plant-organ testing is widely
used because it gives a direct measurement of the actual quantities of
nutrients taken up by crop. The leaf has been the most used organ for this
purpose.
Approaches to diagnosing leaf nutrient status include the Critical Value
Approach (CVA) (Bates, 1971), the Diagnosis and Recommendation2
Integrated System (DRIS) (Walworth and Sumner, 1987), and Compositional
Nutrient Diagnosis (CND) (Parent and Dafir, 1992; Parent et al. , 1994). When
selecting nutrient norms, a yield cutoff value is decided arbitrarily for
defining a high yield subpopulation. For CVA, the cutoff value is
generally 90% to 95% of maximum yield while relating percentage yield to
nutrient concentration (Ware et al., 1982), assuming that all nutrients
except the one being diagnosed are in sufficient, and no excessive
amounts. For DRIS and CND, the high-yield subpopulation is selected from a
crop survey database. Walworth and Sumner (1987) proposed to consider
variance ratios of nutrient expressions to discriminate between the
subpopulations. However, no formal procedure was proposed to optimize the
partition. Parent and Dafir (1992) expected that multivariate analysis
could provide a means to define the high yield subpopulations. Parent et al.
(1994) proposed the chi-square distribution function to define a CND
threshold value for nutrient imbalance. At local level, small databases
are available to define effective nutrient norms as related to yield
target (Walworth et al ., 1988). Escano et al. (1981) pointed out that local
calibration improve the accuracy of DRIS diagnosis. However, DRIS
provides no generic approach to support local diagnosis of nutrient
imbalance using small databases as the CND approach dose it because of the
chi-square distribution function support (Parent et al ., 1994).
Onion ( Allium cepa L.) is the most important bulb crop of cultivated Alliums
throughout the world and used as vegetables and spice in different ways.
Several factors are responsible for low productivity in onion of which
nutrient deficiency is most important and causing considerable losses
during the nursery raising, bulb production in field.
Few studies considering tissue analysis in onion ( Allium cepa ) have been
developed on the concentration of the nutrients in green portion of onion.
In general, N, P, K and micronutrient except Cu and Zn tend to be more in
3
concentration in mature onion than in young ones (Mills and Benton Jones,
1996). The CND improved the yield tissue N relationships as polynomial or
liner plateau curves compared with CVA in conifer seedlings, onion and
potato (Parent et al. , 1995). The CND approach is applicable to small size
crop nutrient database for solving nutrient imbalance problems in
specific agro-ecosystems (Khiari et al. , 2001a)
The present investigation aimed (i) to compute the preliminary CND norms
for onion grown on the farmers’ field of the northern region of Bangladesh;
and (ii) to identify significant nutrient interactions through principal
component analyses taking into account the CND indexes.
Theory of Compositional Nutrient Diagnosis (CND) of onion
As indicated by Parent and Dafir (1992), plant tissue composition forms a d
dimensional nutrient arrangement, i.e ., simplex (Sd ) made of d +1 nutrient
proportions including d nutrients and a filling value defined as follows:
S d = [(N, P, K,....,Rd):N>0,P>0,K>0,....Rd >0, N+P+K+...+Rd = 100]
(1)
where 100 is the dry matter concentration (%); N,P,K,... are nutrient
proportions computed as follows;
Rd =100- (N+P+K+...)
(2)
The nutrient proportions become scale invariant after they have divided by
geometric mean (G ) of the d +1 components including Rd (Aitchinson, 1986)
as follows:
G=[NxPxKx...xRd]
(3)
Row-centered log rations are computed as follows:4
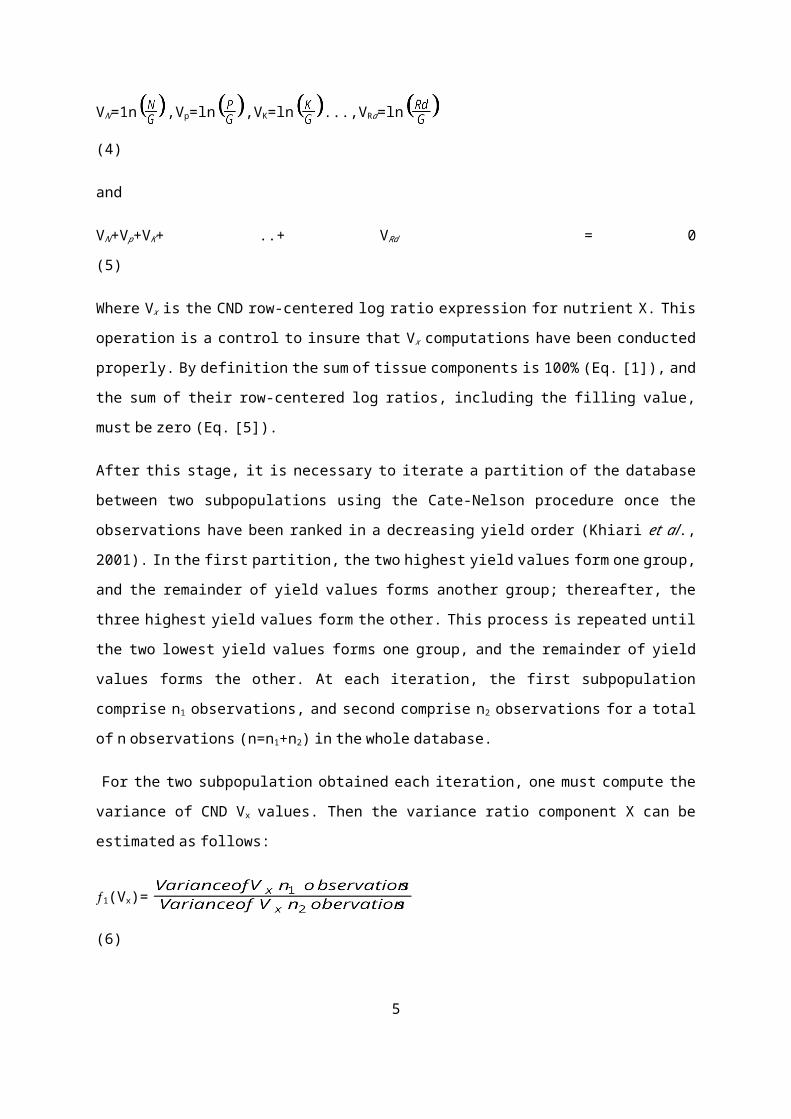
VN=1n ,Vp=ln ,VK=ln ...,VRd=ln
(4)
and
VN+Vp+VK + ..+ V Rd = 0
(5)
Where Vx is the CND row-centered log ratio expression for nutrient X. This
operation is a control to insure that Vx computations have been conducted
properly. By definition the sum of tissue components is 100% (Eq. [1]), and
the sum of their row-centered log ratios, including the filling value,
must be zero (Eq. [5]).
After this stage, it is necessary to iterate a partition of the database
between two subpopulations using the Cate-Nelson procedure once the
observations have been ranked in a decreasing yield order (Khiari et al.,
2001). In the first partition, the two highest yield values form one group,
and the remainder of yield values forms another group; thereafter, the
three highest yield values form the other. This process is repeated until
the two lowest yield values forms one group, and the remainder of yield
values forms the other. At each iteration, the first subpopulation
comprise n1 observations, and second comprise n2 observations for a total
of n observations (n=n1+n2 ) in the whole database.
For the two subpopulation obtained each iteration, one must compute the
variance of CND V x values. Then the variance ratio component X can be
estimated as follows:
1(Vx)=
(6)
5
Where 1(Vx ) is the ratio function between two subpopulation, for nutrient
X at the i th iteration (i=ni -1) and the Vx is the CND row-centered log ratio
expression for nutrient X. The first variance ratio function computed for
the two highest yields is put on the same line as the highest yield, thus
leaving three empty bottom lines.
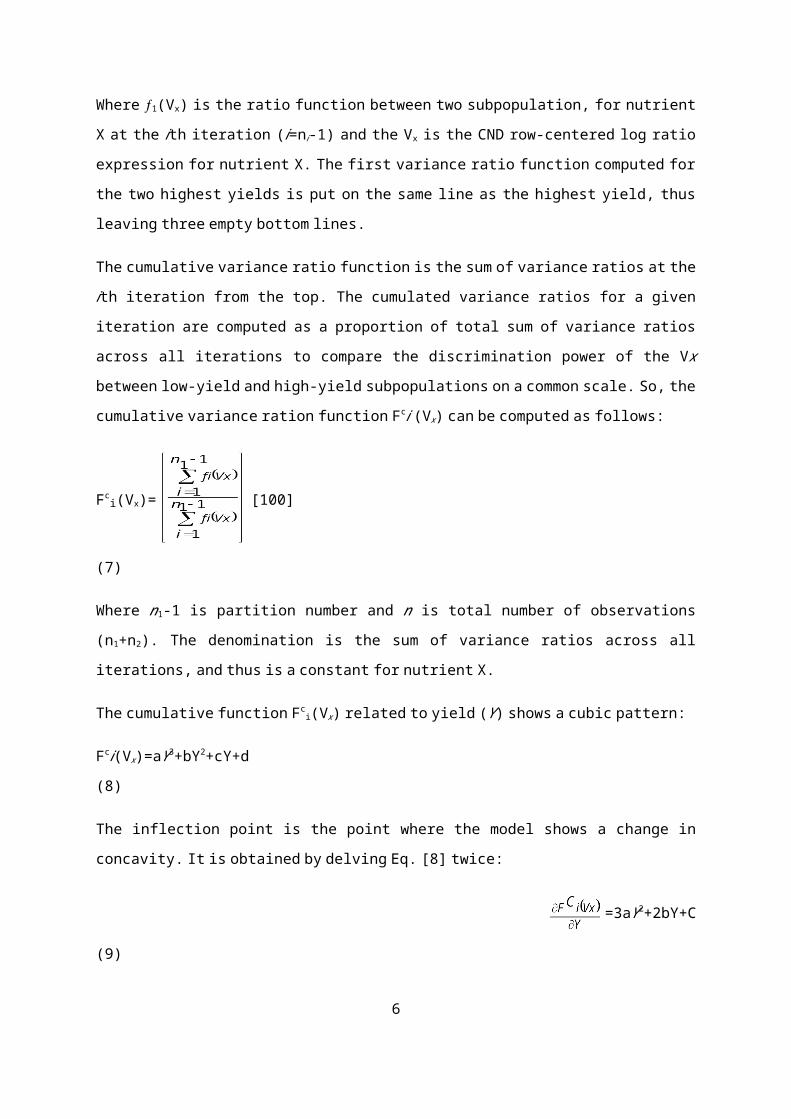
The cumulative variance ratio function is the sum of variance ratios at the
i th iteration from the top. The cumulated variance ratios for a given
iteration are computed as a proportion of total sum of variance ratios
across all iterations to compare the discrimination power of the Vx
between low-yield and high-yield subpopulations on a common scale. So, the
cumulative variance ration function Fci (Vx ) can be computed as follows:
Fci(Vx)= [100]
(7)
Where n1 -1 is partition number and n is total number of observations
(n1+n2 ). The denomination is the sum of variance ratios across all
iterations, and thus is a constant for nutrient X.
The cumulative function Fci(Vx ) related to yield (Y ) shows a cubic pattern:
Fci(Vx)=aY3+bY2+cY+d
(8)
The inflection point is the point where the model shows a change in
concavity. It is obtained by delving Eq. [8] twice:
=3aY2+2bY+C
(9)
6
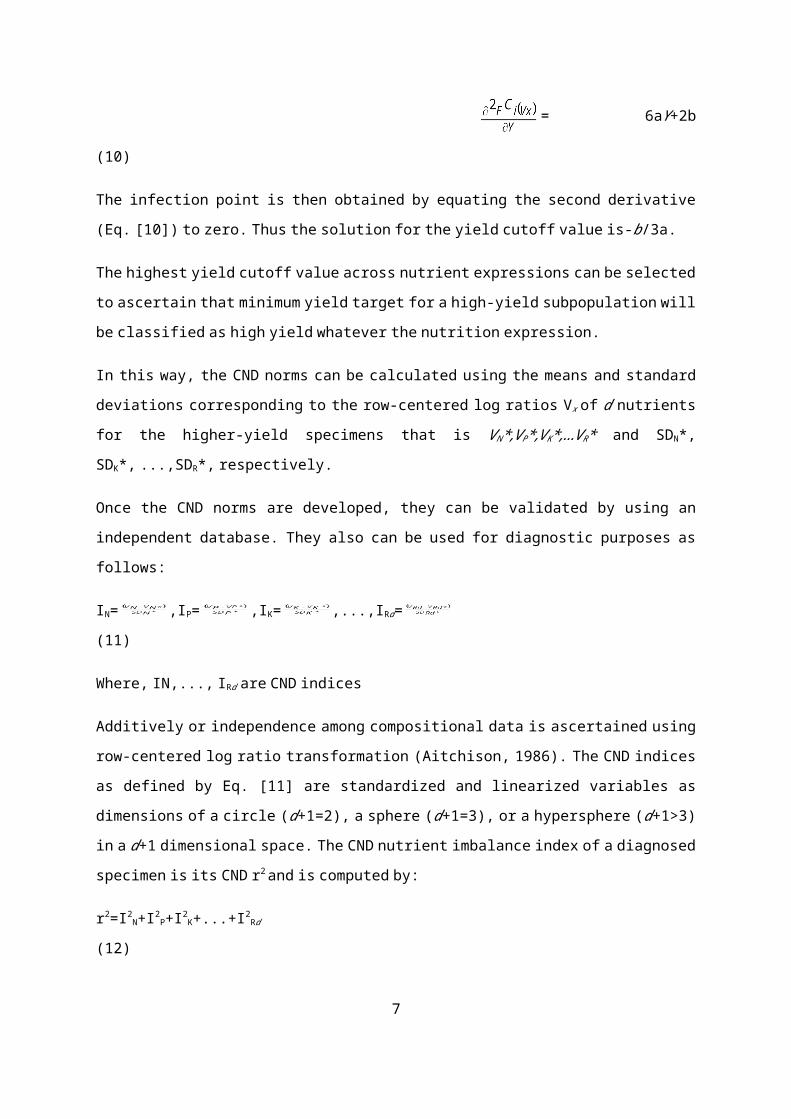
= 6aY+2b
(10)
The infection point is then obtained by equating the second derivative
(Eq. [10]) to zero. Thus the solution for the yield cutoff value is-b /3a.
The highest yield cutoff value across nutrient expressions can be selected
to ascertain that minimum yield target for a high-yield subpopulation will
be classified as high yield whatever the nutrition expression.
In this way, the CND norms can be calculated using the means and standard
deviations corresponding to the row-centered log ratios V x of d nutrients
for the higher-yield specimens that is VN*,VP*,VK*,...VR* and SDN*,
SDK *, ...,SDR *, respectively.
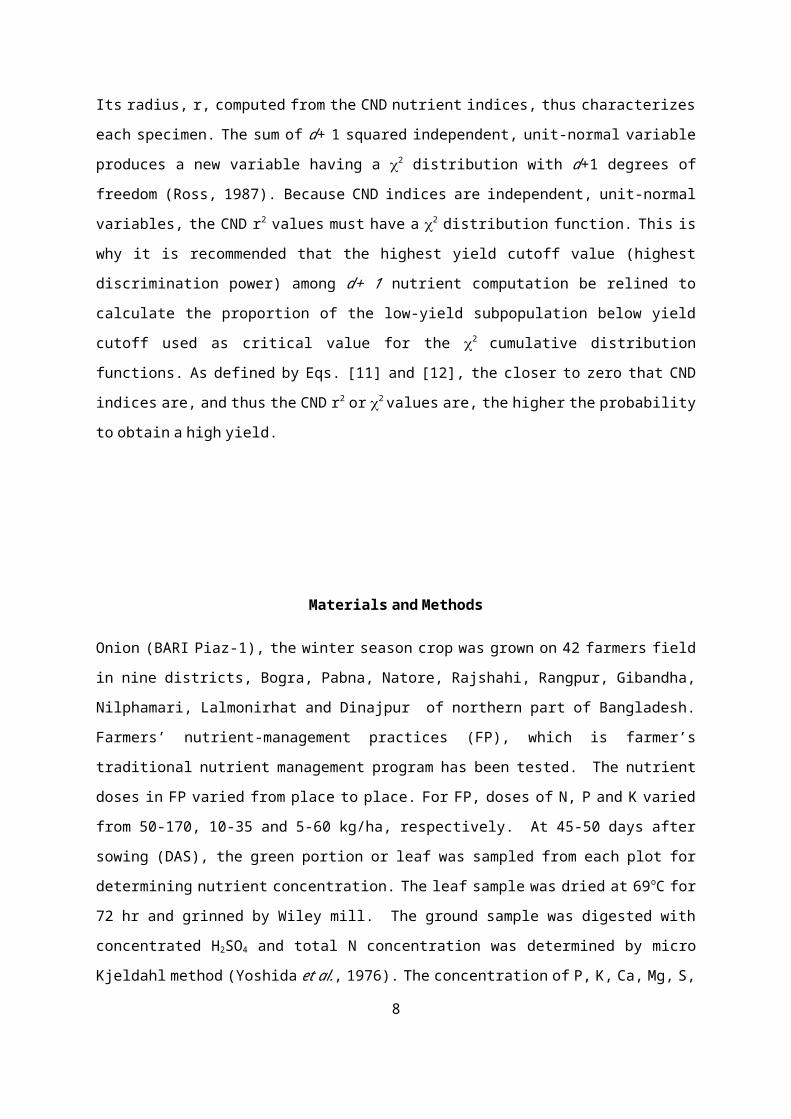
Once the CND norms are developed, they can be validated by using an
independent database. They also can be used for diagnostic purposes as
follows:
IN= ,IP= ,IK= ,...,IRd=
(11)
Where, IN,..., IRd are CND indices
Additively or independence among compositional data is ascertained using
row-centered log ratio transformation (Aitchison, 1986). The CND indices
as defined by Eq. [11] are standardized and linearized variables as
dimensions of a circle (d +1=2), a sphere (d +1=3), or a hypersphere (d+1>3)
in a d +1 dimensional space. The CND nutrient imbalance index of a diagnosed
specimen is its CND r 2 and is computed by:
r2=I2N+I2
P+I2K+...+I2
Rd
(12)
7
Its radius, r, computed from the CND nutrient indices, thus characterizes
each specimen. The sum of d + 1 squared independent, unit-normal variable
produces a new variable having a 2 distribution with d +1 degrees of
freedom (Ross, 1987). Because CND indices are independent, unit-normal
variables, the CND r2 values must have a 2 distribution function. This is
why it is recommended that the highest yield cutoff value (highest
discrimination power) among d+ 1 nutrient computation be relined to
calculate the proportion of the low-yield subpopulation below yield
cutoff used as critical value for the 2 cumulative distribution
functions. As defined by Eqs. [11] and [12], the closer to zero that CND
indices are, and thus the CND r2 or 2 values are, the higher the probability
to obtain a high yield.
Materials and Methods
Onion (BARI Piaz-1), the winter season crop was grown on 42 farmers field
in nine districts, Bogra, Pabna, Natore, Rajshahi, Rangpur, Gibandha,
Nilphamari, Lalmonirhat and Dinajpur of northern part of Bangladesh.
Farmers’ nutrient-management practices (FP), which is farmer’s
traditional nutrient management program has been tested. The nutrient
doses in FP varied from place to place. For FP, doses of N, P and K varied
from 50-170, 10-35 and 5-60 kg/ha, respectively. At 45-50 days after
sowing (DAS), the green portion or leaf was sampled from each plot for
determining nutrient concentration. The leaf sample was dried at 69o C for
72 hr and grinned by Wiley mill. The ground sample was digested with
concentrated H2SO4 and total N concentration was determined by micro
Kjeldahl method (Yoshida et al. , 1976). The concentration of P, K, Ca, Mg, S,
8
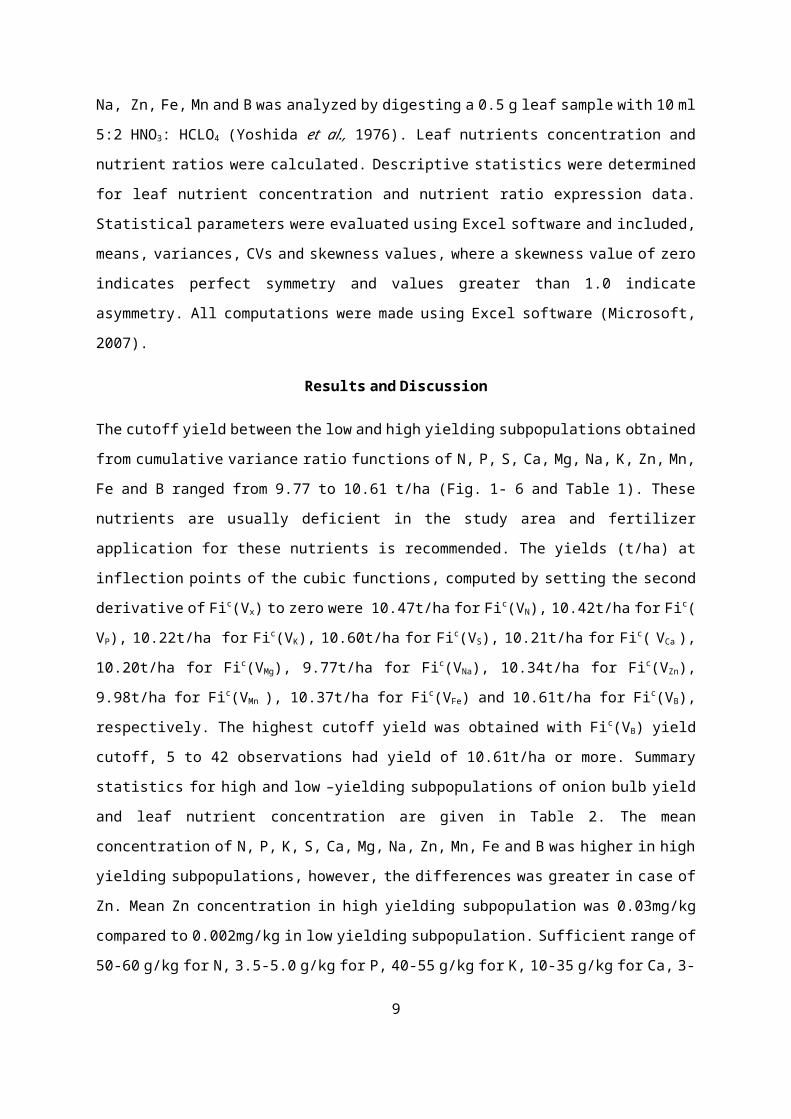
Na, Zn, Fe, Mn and B was analyzed by digesting a 0.5 g leaf sample with 10 ml
5:2 HNO3 : HCLO4 (Yoshida et al., 1976). Leaf nutrients concentration and
nutrient ratios were calculated. Descriptive statistics were determined
for leaf nutrient concentration and nutrient ratio expression data.
Statistical parameters were evaluated using Excel software and included,
means, variances, CVs and skewness values, where a skewness value of zero
indicates perfect symmetry and values greater than 1.0 indicate
asymmetry. All computations were made using Excel software (Microsoft,
2007).
Results and Discussion
The cutoff yield between the low and high yielding subpopulations obtained
from cumulative variance ratio functions of N, P, S, Ca, Mg, Na, K, Zn, Mn,
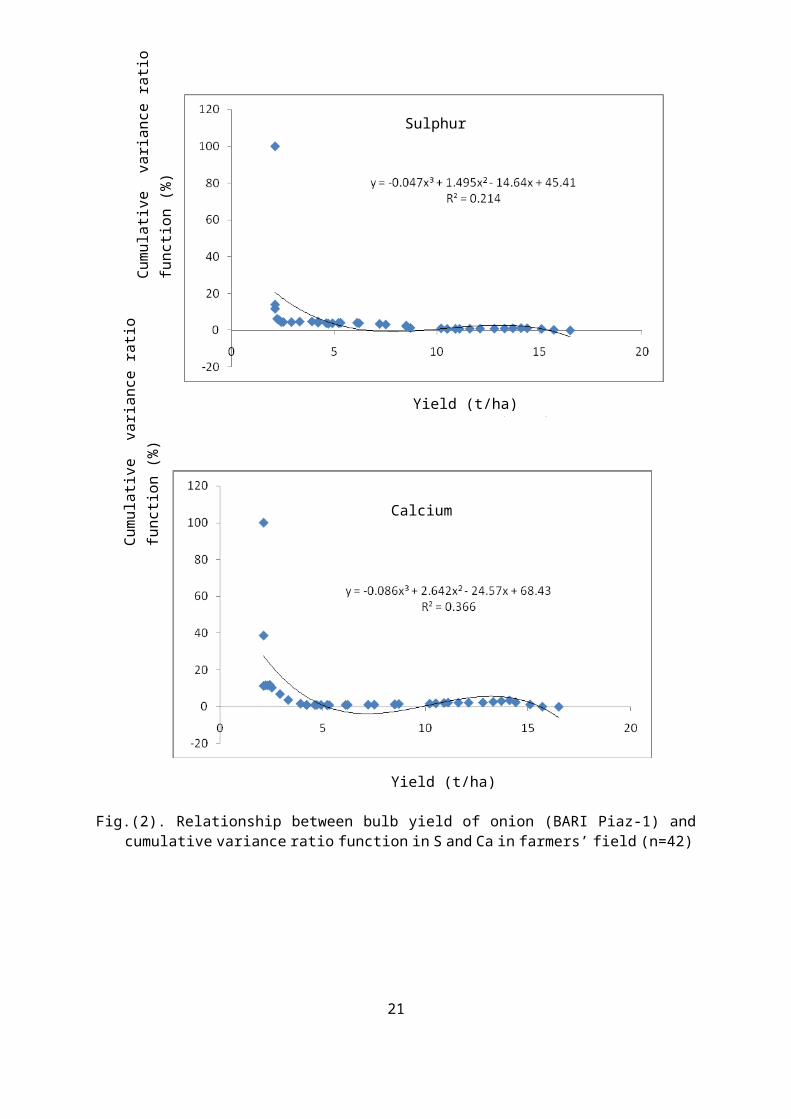
Fe and B ranged from 9.77 to 10.61 t/ha (Fig. 1- 6 and Table 1). These
nutrients are usually deficient in the study area and fertilizer
application for these nutrients is recommended. The yields (t/ha) at
inflection points of the cubic functions, computed by setting the second
derivative of Fic(Vx ) to zero were 10.47t/ha for Fic(VN ), 10.42t/ha for Fic(
VP ), 10.22t/ha for Fic(VK ), 10.60t/ha for Fic(VS ), 10.21t/ha for Fic ( V Ca ),
10.20t/ha for Fic(VMg ), 9.77t/ha for Fic(VNa ), 10.34t/ha for Fic(VZn),
9.98t/ha for Fic(V Mn ), 10.37t/ha for Fic(VFe ) and 10.61t/ha for Fic(VB),
respectively. The highest cutoff yield was obtained with Fic(VB ) yield
cutoff, 5 to 42 observations had yield of 10.61t/ha or more. Summary
statistics for high and low –yielding subpopulations of onion bulb yield
and leaf nutrient concentration are given in Table 2. The mean
concentration of N, P, K, S, Ca, Mg, Na, Zn, Mn, Fe and B was higher in high
yielding subpopulations, however, the differences was greater in case of
Zn. Mean Zn concentration in high yielding subpopulation was 0.03mg/kg
compared to 0.002mg/kg in low yielding subpopulation. Sufficient range of
50-60 g/kg for N, 3.5-5.0 g/kg for P, 40-55 g/kg for K, 10-35 g/kg for Ca, 3-
9
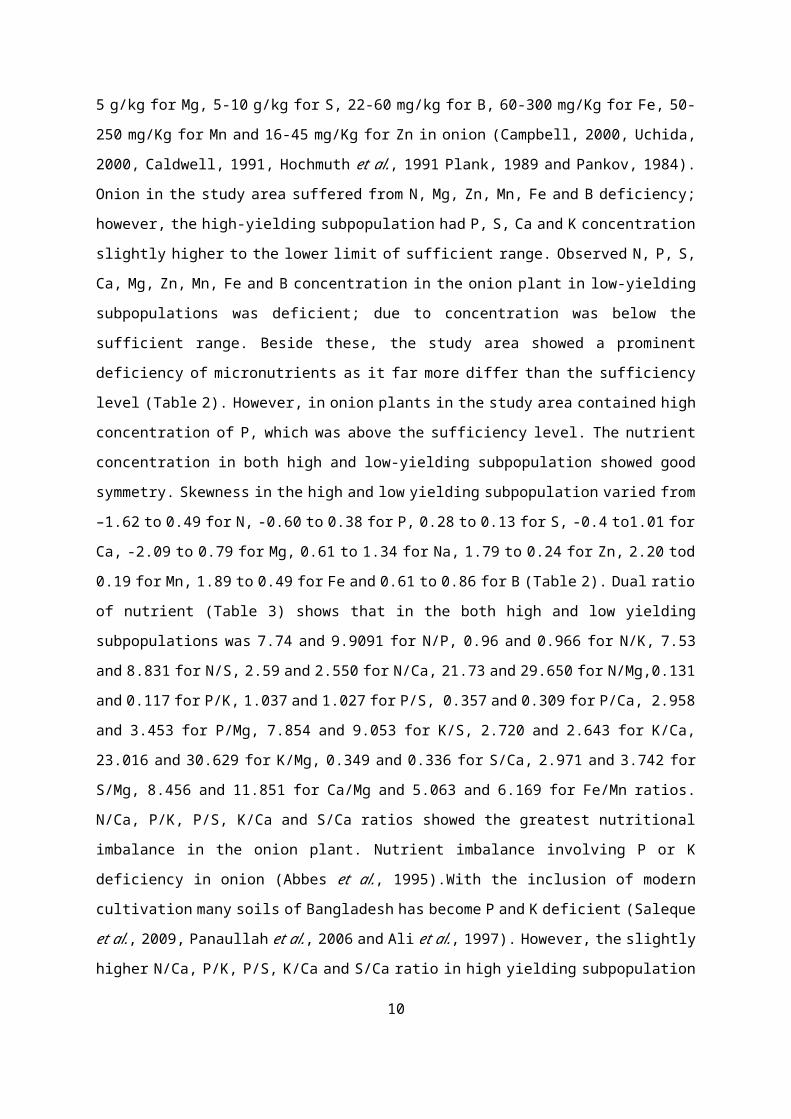
5 g/kg for Mg, 5-10 g/kg for S, 22-60 mg/kg for B, 60-300 mg/Kg for Fe, 50-
250 mg/Kg for Mn and 16-45 mg/Kg for Zn in onion (Campbell, 2000, Uchida,
2000, Caldwell, 1991, Hochmuth et al. , 1991 Plank, 1989 and Pankov, 1984).
Onion in the study area suffered from N, Mg, Zn, Mn, Fe and B deficiency;
however, the high-yielding subpopulation had P, S, Ca and K concentration
slightly higher to the lower limit of sufficient range. Observed N, P, S,
Ca, Mg, Zn, Mn, Fe and B concentration in the onion plant in low-yielding
subpopulations was deficient; due to concentration was below the
sufficient range. Beside these, the study area showed a prominent
deficiency of micronutrients as it far more differ than the sufficiency
level (Table 2). However, in onion plants in the study area contained high
concentration of P, which was above the sufficiency level. The nutrient
concentration in both high and low-yielding subpopulation showed good
symmetry. Skewness in the high and low yielding subpopulation varied from
–1.62 to 0.49 for N, -0.60 to 0.38 for P, 0.28 to 0.13 for S, -0.4 to1.01 for
Ca, -2.09 to 0.79 for Mg, 0.61 to 1.34 for Na, 1.79 to 0.24 for Zn, 2.20 tod
0.19 for Mn, 1.89 to 0.49 for Fe and 0.61 to 0.86 for B (Table 2). Dual ratio
of nutrient (Table 3) shows that in the both high and low yielding
subpopulations was 7.74 and 9.9091 for N/P, 0.96 and 0.966 for N/K, 7.53
and 8.831 for N/S, 2.59 and 2.550 for N/Ca, 21.73 and 29.650 for N/Mg,0.131
and 0.117 for P/K, 1.037 and 1.027 for P/S, 0.357 and 0.309 for P/Ca, 2.958
and 3.453 for P/Mg, 7.854 and 9.053 for K/S, 2.720 and 2.643 for K/Ca,
23.016 and 30.629 for K/Mg, 0.349 and 0.336 for S/Ca, 2.971 and 3.742 for
S/Mg, 8.456 and 11.851 for Ca/Mg and 5.063 and 6.169 for Fe/Mn ratios.
N/Ca, P/K, P/S, K/Ca and S/Ca ratios showed the greatest nutritional
imbalance in the onion plant. Nutrient imbalance involving P or K
deficiency in onion (Abbes et al. , 1995).With the inclusion of modern
cultivation many soils of Bangladesh has become P and K deficient (Saleque
et al. , 2009, Panaullah et al. , 2006 and Ali et al. , 1997). However, the slightly
higher N/Ca, P/K, P/S, K/Ca and S/Ca ratio in high yielding subpopulation
10
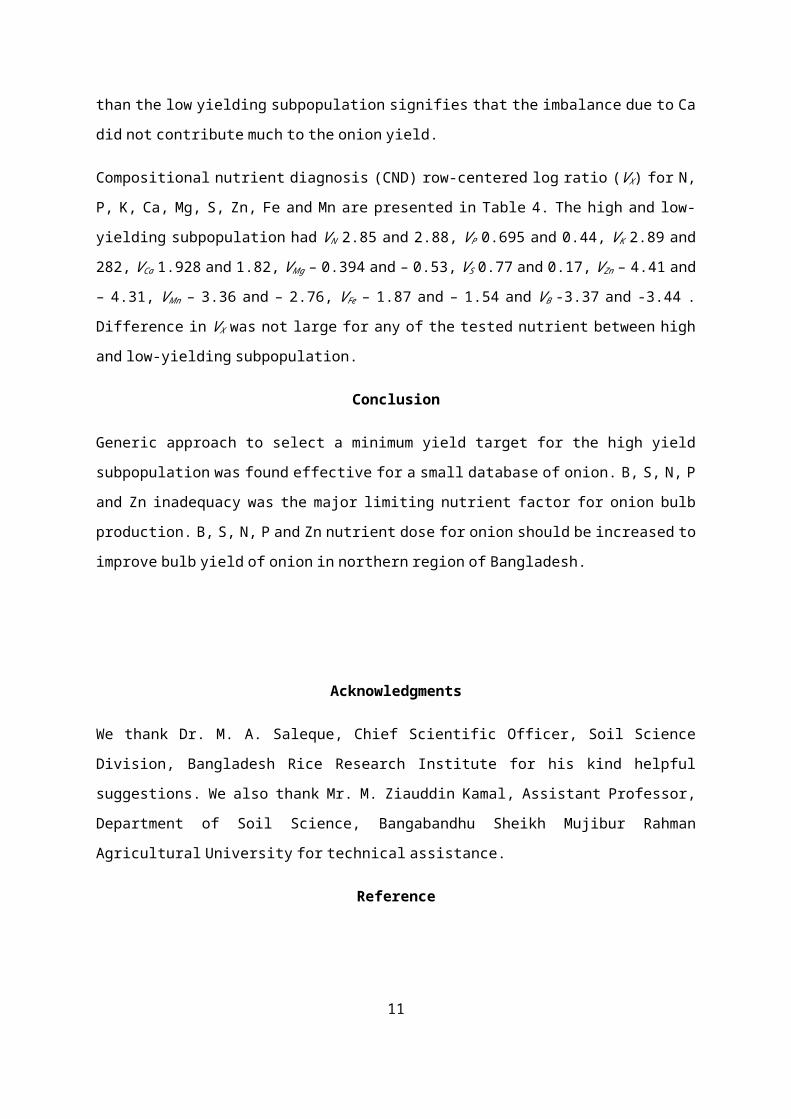
than the low yielding subpopulation signifies that the imbalance due to Ca
did not contribute much to the onion yield.
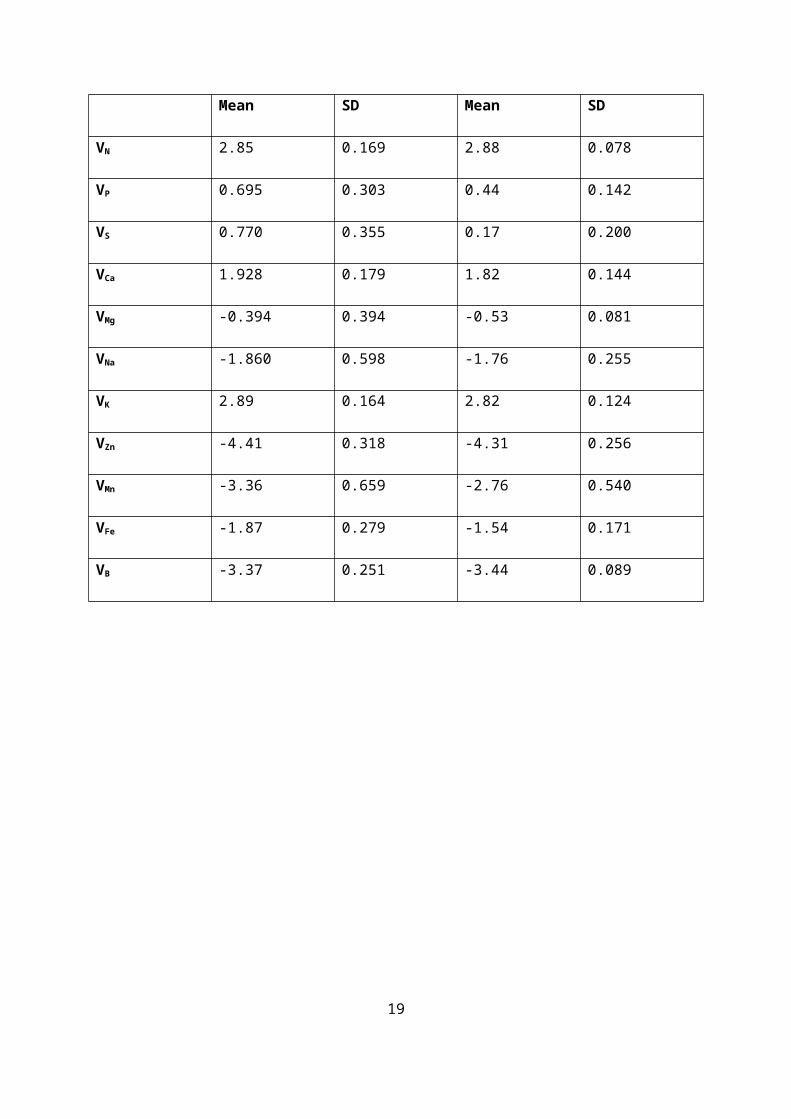
Compositional nutrient diagnosis (CND) row-centered log ratio (VX ) for N,
P, K, Ca, Mg, S, Zn, Fe and Mn are presented in Table 4. The high and low-
yielding subpopulation had VN 2.85 and 2.88, VP 0.695 and 0.44, VK 2.89 and
282, VCa 1.928 and 1.82, VMg – 0.394 and – 0.53, VS 0.77 and 0.17, VZn – 4.41 and
– 4.31, VMn – 3.36 and – 2.76, VFe – 1.87 and – 1.54 and V B -3.37 and -3.44 .
Difference in VX was not large for any of the tested nutrient between high
and low-yielding subpopulation.
Conclusion
Generic approach to select a minimum yield target for the high yield
subpopulation was found effective for a small database of onion. B, S, N, P
and Zn inadequacy was the major limiting nutrient factor for onion bulb
production. B, S, N, P and Zn nutrient dose for onion should be increased to
improve bulb yield of onion in northern region of Bangladesh.
Acknowledgments
We thank Dr. M. A. Saleque, Chief Scientific Officer, Soil Science
Division, Bangladesh Rice Research Institute for his kind helpful
suggestions. We also thank Mr. M. Ziauddin Kamal, Assistant Professor,
Department of Soil Science, Bangabandhu Sheikh Mujibur Rahman
Agricultural University for technical assistance.
Reference
11
Abbes, C.; Parent, L.E.; Karam, A. and Isfan, D. 1995. Onion response to
ammoniated peat and ammonium sulfate in relation to ammonium
toxicity. Can. J. Soil Sci.261-271.
Ali, M.M.; Saheed,S.M.; Kubota, D.; Masunaga,T. and Wakatsuki,T.1997.
Soil degradation during the period 1967–1995 in Bangladesh. II.
Selected chemical characteristics. Soil Sci Plant Nutr 43: 879–890
Aitchison, J. 1986. Statistical analysis of compositional data. Chapman and Hall, New York.
Bates, T.E. 1971. Factors affecting critical nutrient concentrations in plant and their evaluation: A review Soil Sci.112:116-130.
Caldwell, JO. 1991. Foliar and soil diagnosis and recommendation integrated system (DRIS)
norms for onions ( Allium cepa L.) and the effects of N and S on yield and pungency [MSc
thesis]. Athens (GA): University of Georgia.
Campbell, C.R. 2000. Reference sufficiency ranges for plant analysis in the southern region of the United States.
www.ncagr.gov/agronomi/saaesd/scsb394.pdf
Escano, C.R.; Jones, C.A. and Uehara, G. 1981. Nutrient diagnosis in corn grown in Hydric Dystrandepts:II. Comparison of two systems of tissue
diagnosis. Soil Sci. Am. J. pp.1140-1144.
Hochmuth, G.J.; Maynard, D.; Vavrina, C. and Hanlon E.A. 1991. Plant tissue analysis and interpretations for vegetable crops in Florida.
Gainesville (FL): University of Florida Cooperative Extension Service. Publication SS-VEC-42.
Khiari, L.; Parent, L.E. and Tremblay, N. 2001a. Selecting the high-yield subpopulation for diagnosing nutrient imbalance in crops. Agron. J.
93:802-808.
Mills, H.A. and J. Benton Jones, Jr. 1996. Plant analysis handbook II. A
practical sampling, preparation, analysis, and interpretation
guide. MICROMACRO Publishing, Athens, Georgia. 422p.
12
Panaullah, G.M.; Timsina ,J.; Saleque, M.A.; Ishaque, M.;, Pathan,
A.B.M.B.U.; Connor, D.J.; Humphreys, E.; Saha, P.K.; Quayyum, M.A.
and Meisner, C.A. 2006. Nutrient concentrations, uptake and apparent
balances for rice-wheat sequences. III. Potassium. J Plant Nutr 29:
173 – 187.
Pankov, V.V. 1984. Leaf analysis in relation to onion nutrition. In: Proceedings 6th international colloquium for the optimization of
plant nutrition. Volume 2. Montpellier (France): AIONP/GERDAT. p449–56.
Parent, L.E. and Dafir, M.A. 1992. Theoretical concept of compositional nutrient diagnosis. J. Am. Soc. Hort. Sci.117:239-242.
Parent, L.E.; Cambouris, A.N. and Muhaweniman, A. 1994. Multivariate diagnosis of nutrient imbalance in potato crops. Soil Sci. Soc. Am. J.
58:1432-1438.
Parent, L.E.; Piorier, M. and Asselin, M. 1995. Multinutrient diagnosis of nitrogen status in plants. J. Plant Nutr. 18:1013:1025.
Plank C.O. 1989. Plant analysis handbook for Georgia. Athens (GA): University of Georgia
Cooperative Extension Service. 64 p.
Ross, S.M. 1987. Introduction to probability and Statistics for Engineers and Scientists. John Wiley & Sons, New York, USA
Saleque, M.A.; Uddin, M.K.; Ferdous, A.K.M.; Khatun, A. and Rashid, M.H.
2009. An evaluation of nutritional constraints on irrigated rice
yield. http;//repositories.cdlib.org/ipnc/xvi/1083
Ware, G.O.; Ohki, K. and Moon, L.C. 1982. The Mitscherlich plant growth model for determining critical nutrient deficiency levels. Agron. J.
74:88-91.
Walworth, J.L. and Sumner, M.E. 1987. The Diagnosis and Recommendation Integrated System (DRIS). Adv. Soil Sci. pp149-188.
Uchida, R. 2000. Recommended plant tissue nutrient levels for some vegetable, fruit and ornamental foliage and flowering plants in
Hawaii. Plant Nutrient Management in Hawaii’s soils. Approaches for tropical and subtropical Agriculture. I. A. Silva and R. Uchida
13
(eds.). College of Tropical Agriculture and Human Resources, University of Hawaii at Manoa. pp 57-65.
Yoshida, S. 1981. Fundamentals of rice crop science , Los Banos,
Philippines: IRRI.
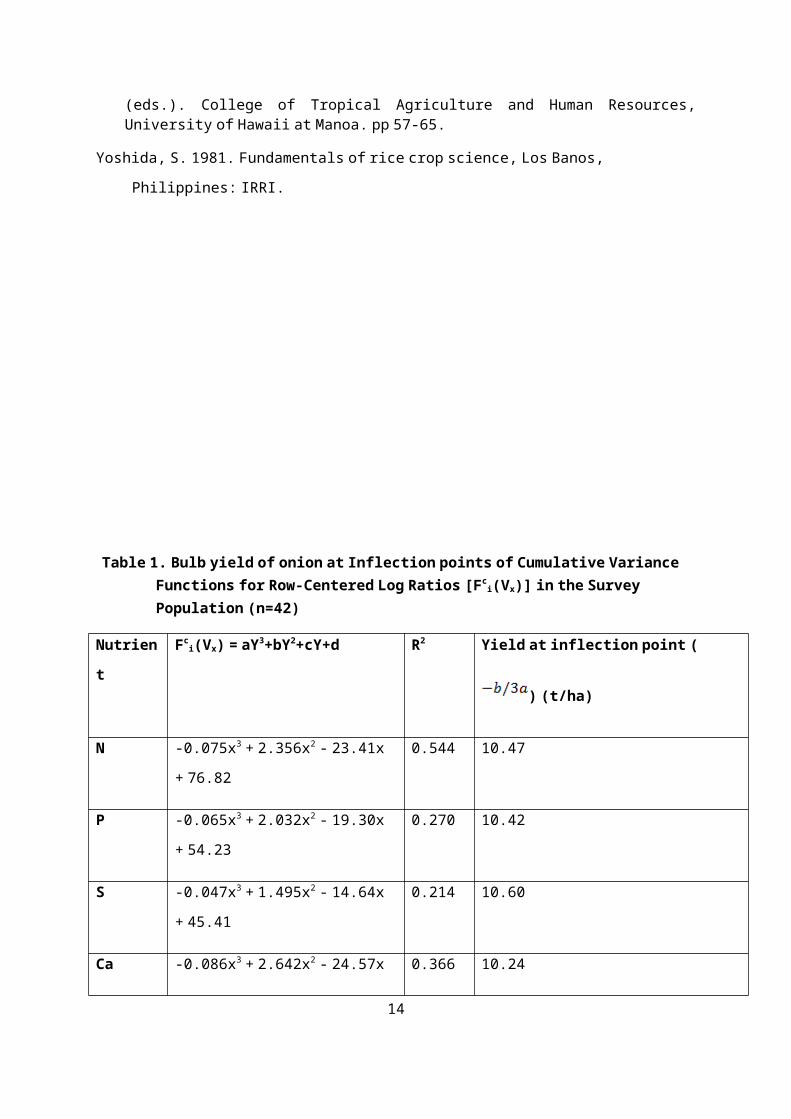
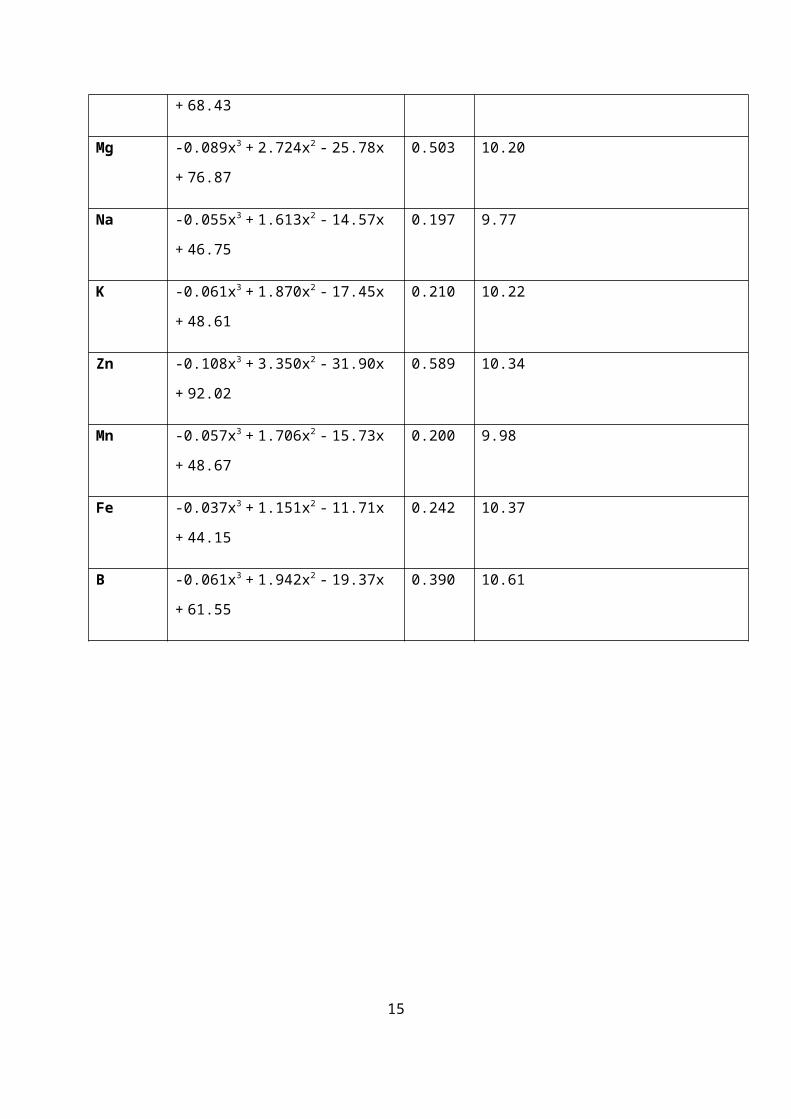
Table 1. Bulb yield of onion at Inflection points of Cumulative Variance Functions for Row-Centered Log Ratios [Fc
i(Vx )] in the Survey Population (n=42)
Nutrien
t
Fci(Vx ) = aY3+bY2+cY+d R2 Yield at inflection point (
) (t/ha)
N -0.075x3 + 2.356x2 - 23.41x
+ 76.82
0.544 10.47
P -0.065x3 + 2.032x2 - 19.30x
+ 54.23
0.270 10.42
S -0.047x3 + 1.495x2 - 14.64x
+ 45.41
0.214 10.60
Ca -0.086x3 + 2.642x2 - 24.57x 0.366 10.24
14
+ 68.43
Mg -0.089x3 + 2.724x2 - 25.78x
+ 76.87
0.503 10.20
Na -0.055x3 + 1.613x2 - 14.57x
+ 46.75
0.197 9.77
K -0.061x3 + 1.870x2 - 17.45x
+ 48.61
0.210 10.22
Zn -0.108x3 + 3.350x2 - 31.90x
+ 92.02
0.589 10.34
Mn -0.057x3 + 1.706x2 - 15.73x
+ 48.67
0.200 9.98
Fe -0.037x3 + 1.151x2 - 11.71x
+ 44.15
0.242 10.37
B -0.061x3 + 1.942x2 - 19.37x
+ 61.55
0.390 10.61
15
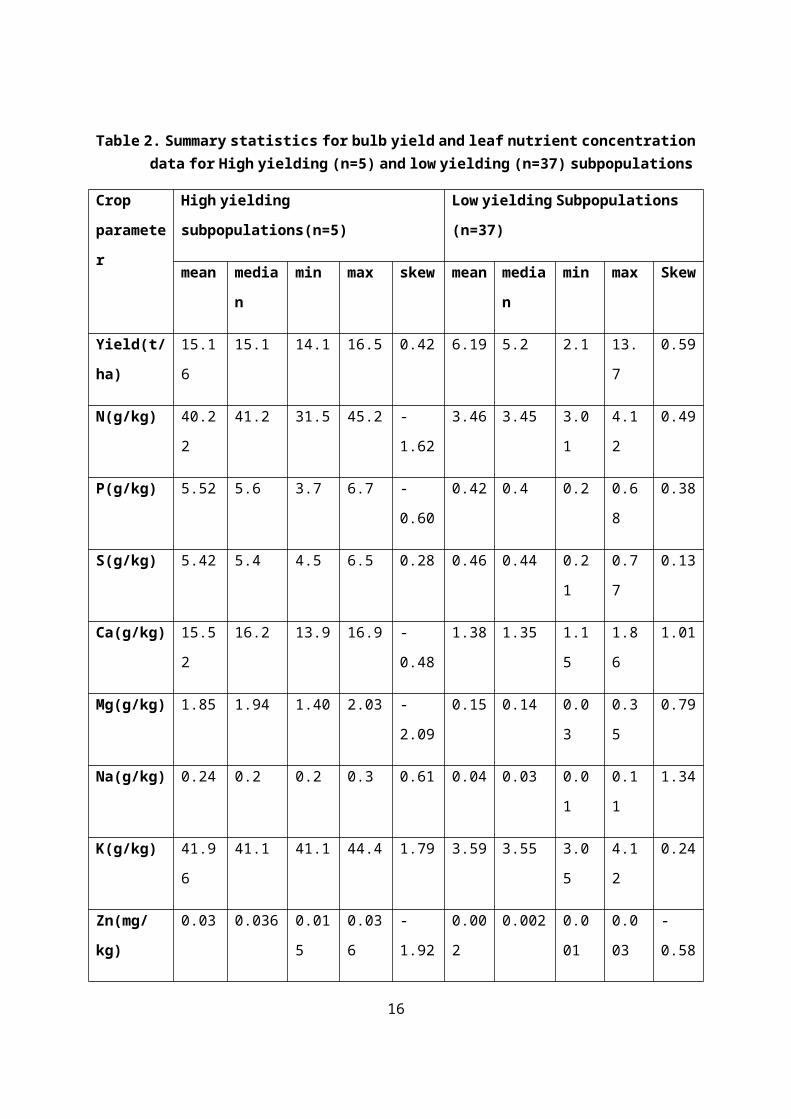
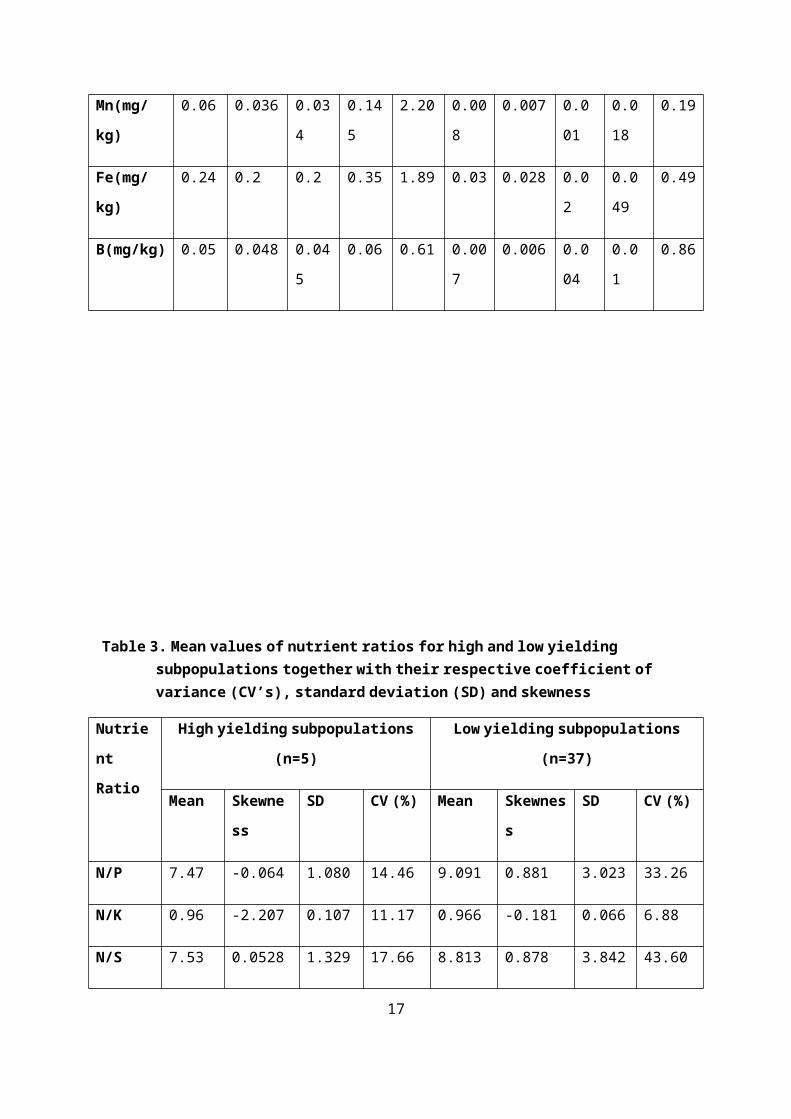
Table 2. Summary statistics for bulb yield and leaf nutrient concentration data for High yielding (n=5) and low yielding (n=37) subpopulations
Crop
paramete
r
High yielding
subpopulations(n=5)
Low yielding Subpopulations
(n=37)
mean media
n
min max skew mean media
n
min max Skew
Yield(t/
ha)
15.1
6
15.1 14.1 16.5 0.42 6.19 5.2 2.1 13.
7
0.59
N(g/kg) 40.2
2
41.2 31.5 45.2 -
1.62
3.46 3.45 3.0
1
4.1
2
0.49
P(g/kg) 5.52 5.6 3.7 6.7 -
0.60
0.42 0.4 0.2 0.6
8
0.38
S(g/kg) 5.42 5.4 4.5 6.5 0.28 0.46 0.44 0.2
1
0.7
7
0.13
Ca(g/kg) 15.5
2
16.2 13.9 16.9 -
0.48
1.38 1.35 1.1
5
1.8
6
1.01
Mg(g/kg) 1.85 1.94 1.40 2.03 -
2.09
0.15 0.14 0.0
3
0.3
5
0.79
Na(g/kg) 0.24 0.2 0.2 0.3 0.61 0.04 0.03 0.0
1
0.1
1
1.34
K(g/kg) 41.9
6
41.1 41.1 44.4 1.79 3.59 3.55 3.0
5
4.1
2
0.24
Zn(mg/
kg)
0.03 0.036 0.01
5
0.03
6
-
1.92
0.00
2
0.002 0.0
01
0.0
03
-
0.58
16
Mn(mg/
kg)
0.06 0.036 0.03
4
0.14
5
2.20 0.00
8
0.007 0.0
01
0.0
18
0.19
Fe(mg/
kg)
0.24 0.2 0.2 0.35 1.89 0.03 0.028 0.0
2
0.0
49
0.49
B(mg/kg) 0.05 0.048 0.04
5
0.06 0.61 0.00
7
0.006 0.0
04
0.0
1
0.86
Table 3. Mean values of nutrient ratios for high and low yielding subpopulations together with their respective coefficient of
variance (CV’s), standard deviation (SD) and skewness
Nutrie
nt
Ratio
High yielding subpopulations
(n=5)
Low yielding subpopulations
(n=37)
Mean Skewne
ss
SD CV (%) Mean Skewnes
s
SD CV (%)
N/P 7.47 -0.064 1.080 14.46 9.091 0.881 3.023 33.26
N/K 0.96 -2.207 0.107 11.17 0.966 -0.181 0.066 6.88
N/S 7.53 0.0528 1.329 17.66 8.813 0.878 3.842 43.60
17
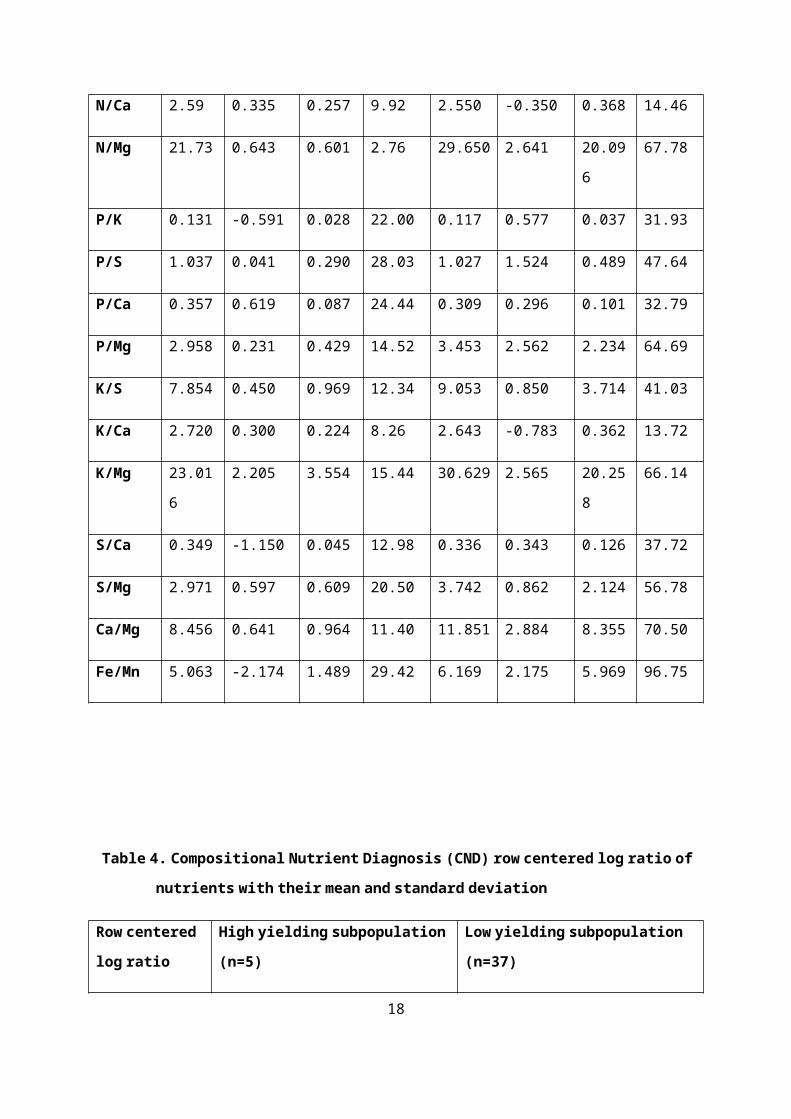
N/Ca 2.59 0.335 0.257 9.92 2.550 -0.350 0.368 14.46
N/Mg 21.73 0.643 0.601 2.76 29.650 2.641 20.09
6
67.78
P/K 0.131 -0.591 0.028 22.00 0.117 0.577 0.037 31.93
P/S 1.037 0.041 0.290 28.03 1.027 1.524 0.489 47.64
P/Ca 0.357 0.619 0.087 24.44 0.309 0.296 0.101 32.79
P/Mg 2.958 0.231 0.429 14.52 3.453 2.562 2.234 64.69
K/S 7.854 0.450 0.969 12.34 9.053 0.850 3.714 41.03
K/Ca 2.720 0.300 0.224 8.26 2.643 -0.783 0.362 13.72
K/Mg 23.01
6
2.205 3.554 15.44 30.629 2.565 20.25
8
66.14
S/Ca 0.349 -1.150 0.045 12.98 0.336 0.343 0.126 37.72
S/Mg 2.971 0.597 0.609 20.50 3.742 0.862 2.124 56.78
Ca/Mg 8.456 0.641 0.964 11.40 11.851 2.884 8.355 70.50
Fe/Mn 5.063 -2.174 1.489 29.42 6.169 2.175 5.969 96.75
Table 4. Compositional Nutrient Diagnosis (CND) row centered log ratio of
nutrients with their mean and standard deviation
Row centered
log ratio
High yielding subpopulation
(n=5)
Low yielding subpopulation
(n=37)
18
Mean SD Mean SD
VN 2.85 0.169 2.88 0.078
VP 0.695 0.303 0.44 0.142
VS 0.770 0.355 0.17 0.200
VCa 1.928 0.179 1.82 0.144
VMg -0.394 0.394 -0.53 0.081
VNa -1.860 0.598 -1.76 0.255
VK 2.89 0.164 2.82 0.124
VZn -4.41 0.318 -4.31 0.256
VMn -3.36 0.659 -2.76 0.540
VFe -1.87 0.279 -1.54 0.171
VB -3.37 0.251 -3.44 0.089
19
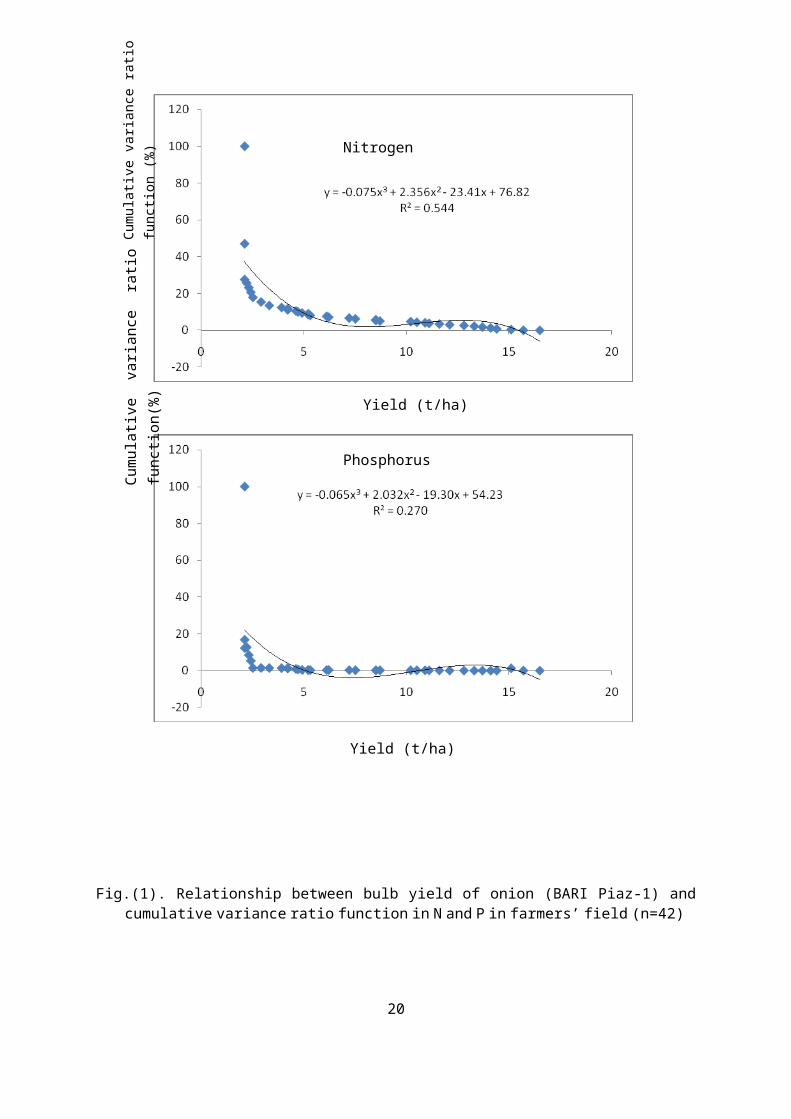
Fig.(1). Relationship between bulb yield of onion (BARI Piaz-1) and cumulative variance ratio function in N and P in farmers’ field (n=42)
20
Cumu
lati
ve
vari
ance
rati
o func
tion
(%)
Nitrogen
Yield (t/ha)
Cumulative variance ratio
function (%)
Yield (t/ha)
Phosphorus
Yield (t/ha)
Fig.(2). Relationship between bulb yield of onion (BARI Piaz-1) and cumulative variance ratio function in S and Ca in farmers’ field (n=42)
21
Sulphur
Yield (t/ha)
Cumula
tive
vari
ance
ratio
fu
ncti
on (
%)
Calcium
Yield (t/ha)
Cumu
lati
ve vari
ance
ratio
func
tion
(%)
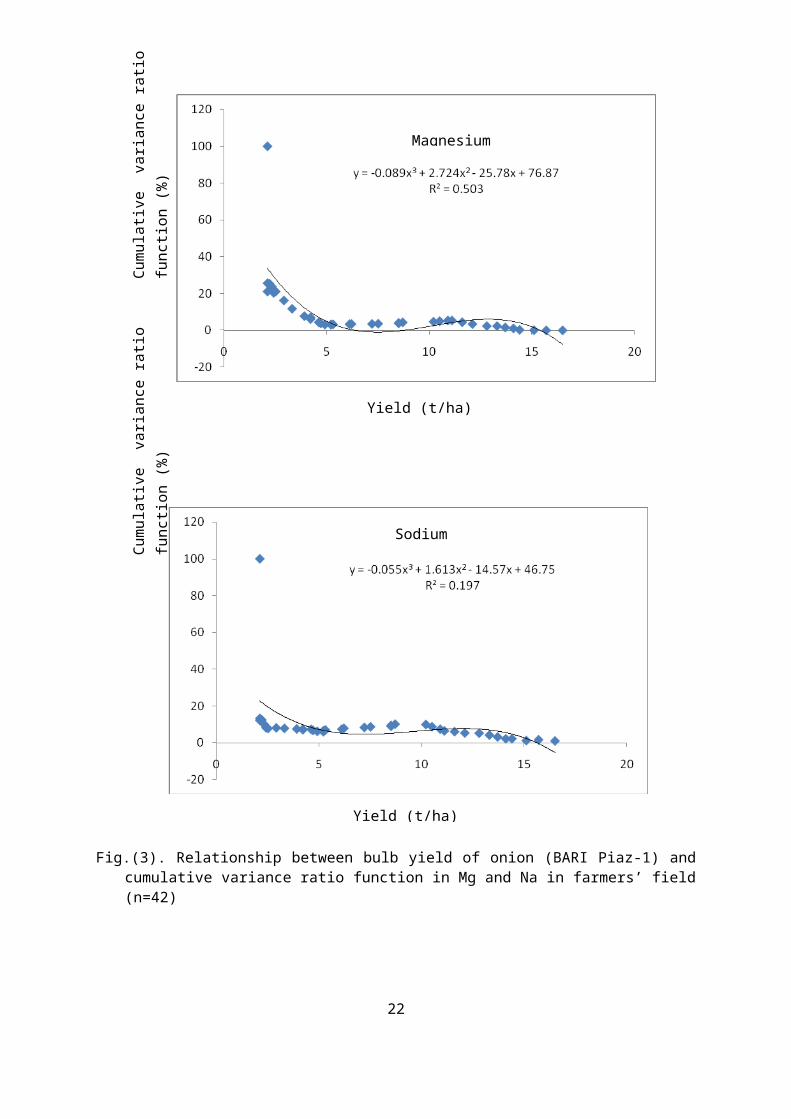
Fig.(3). Relationship between bulb yield of onion (BARI Piaz-1) and cumulative variance ratio function in Mg and Na in farmers’ field
(n=42)
22
Magnesium
Yield (t/ha)
Cumu
lati
ve
vari
ance r
atio
fu
ncti
on (%)
Sodium
Yield (t/ha)
Cumu
lati
ve
vari
ance
rat
io
func
tion
(%)
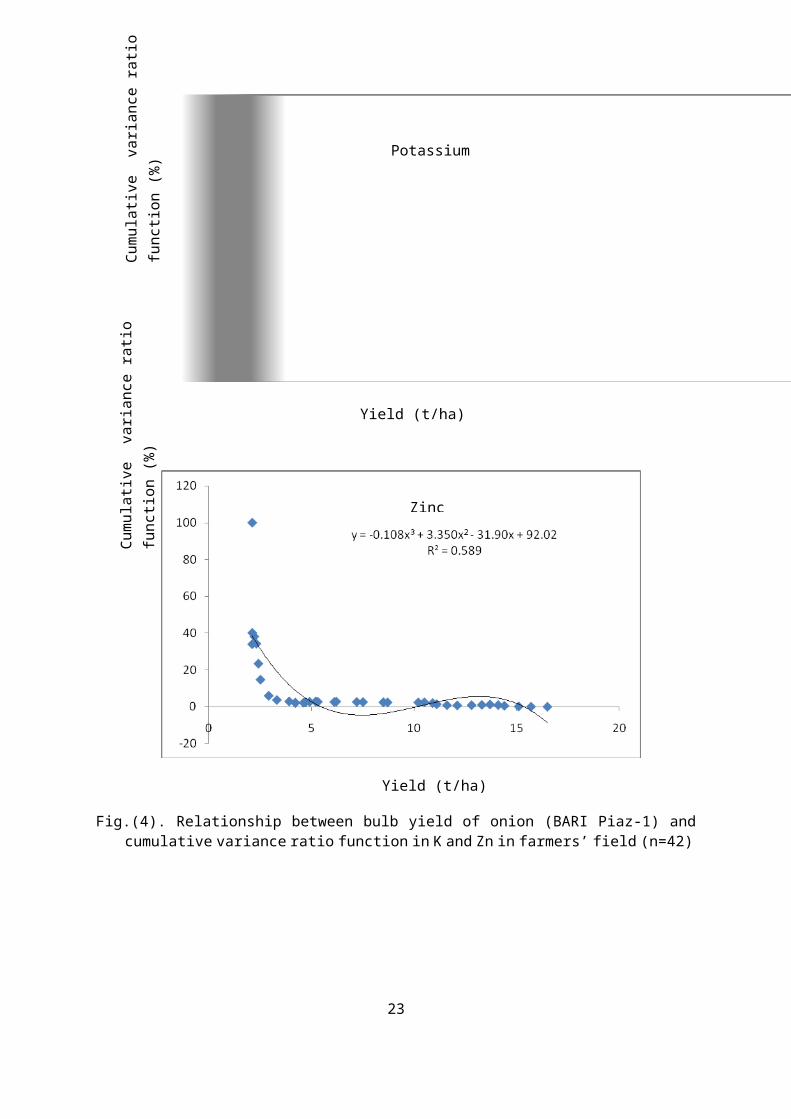
Fig.(4). Relationship between bulb yield of onion (BARI Piaz-1) and cumulative variance ratio function in K and Zn in farmers’ field (n=42)
23
Potassium
Yield (t/ha)
Cumu
lati
ve
vari
ance r
atio
fu
ncti
on (%)
Zinc
Yield (t/ha)
Cumu
lati
ve vari
ance
ratio
func
tion
(%)
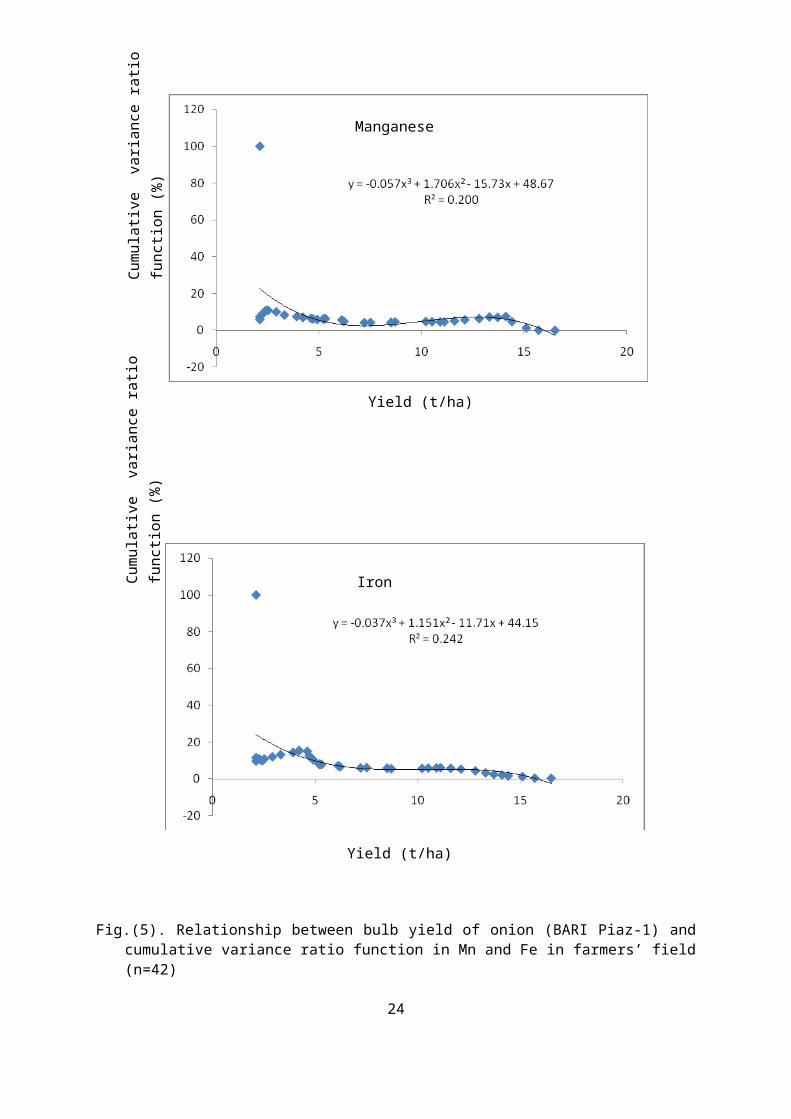
Fig.(5). Relationship between bulb yield of onion (BARI Piaz-1) and cumulative variance ratio function in Mn and Fe in farmers’ field
(n=42)
24
Manganese
Yield (t/ha)
Cumu
lati
ve va
rian
ce rat
io
func
tion
(%)
Iron
Yield (t/ha)
Cumu
lati
ve
variance
rat
io
func
tion
(%)
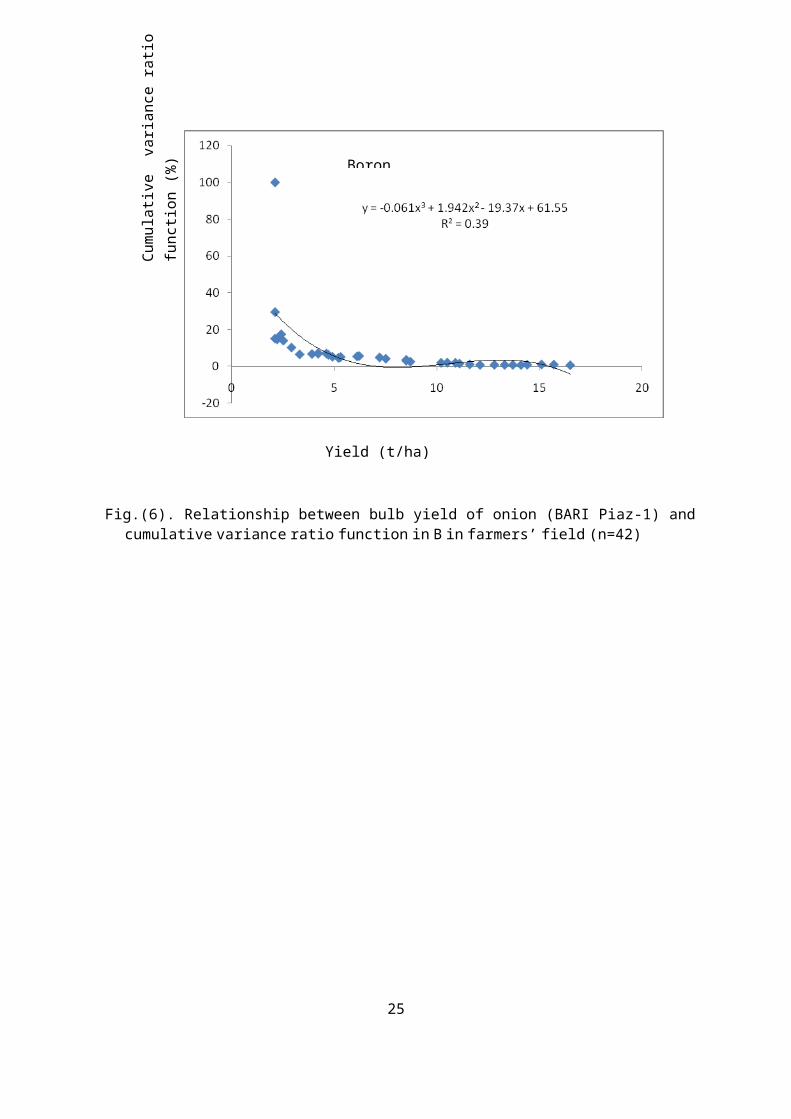
Fig.(6). Relationship between bulb yield of onion (BARI Piaz-1) and cumulative variance ratio function in B in farmers’ field (n=42)
25
Boron
Yield (t/ha)
Cumu
lati
ve va
rian
ce rat
io
func
tion
(%)


