Embed Size (px)
Citation preview
DEPARTMENT OF THE INTERIOR U.S. GEOLOGICAL SURVEY
Composition of Co-Rich Ferromanganese Crusts and Substrate Rocks from the NW Marshall Islands and International Waters
to the North, Tunes 6 Cruise
by
James R. Hein 1 , Susan E. Zielinski 1 , Hubert Staudigel2, Se-Won Chang3 Michelle Greene 1 , and Malcolm S. Pringle4
Open File Report 97-482
1997
*U.S. Geological Survey, Menlo Park, CA2University of California, Scripps Institute (3Korea Institute of Geology, Mining, and M4Scottish Universities Research and Reactor Centre, Kilbride, UK
2University of California, Scripps Institute of Oceanography, La Jolla, CA 3Korea Institute of Geology, Mining, and Materials, Taejon, Korea
This report is preliminary and has not been reviewed for conformity with the U.S.Geological Survey editorial standards or with the North American Stratigraphic Code. Any
use of trade, product, or firm names is for descriptive purposes only and does not implyendorsement by the U.S. Government.
INTRODUCTION
Thirteen northwest Pacific seamounts and guyots were dredged during the Tunes 6 cruise, which took place from 31 October to 2 December, 1991 aboard the R.V. Thomas Washington under the direction of H. Staudigel. The primary objectives of the cruise were to study seamount ages and basalt chemistry in order to better understand the long term history of the South Pacific thermal anomaly (SOPITA). Representative ferromanganese oxyhydroxide crusts (Fe-Mn crusts) from most dredges were collected for this study, which extends our previous work on Fe-Mn crusts collected from the Marshall Islands and Federated States of Micronesia to seamounts located farther north (Hein, Kang et al., 1990; Hein, Ann et al., 1992).
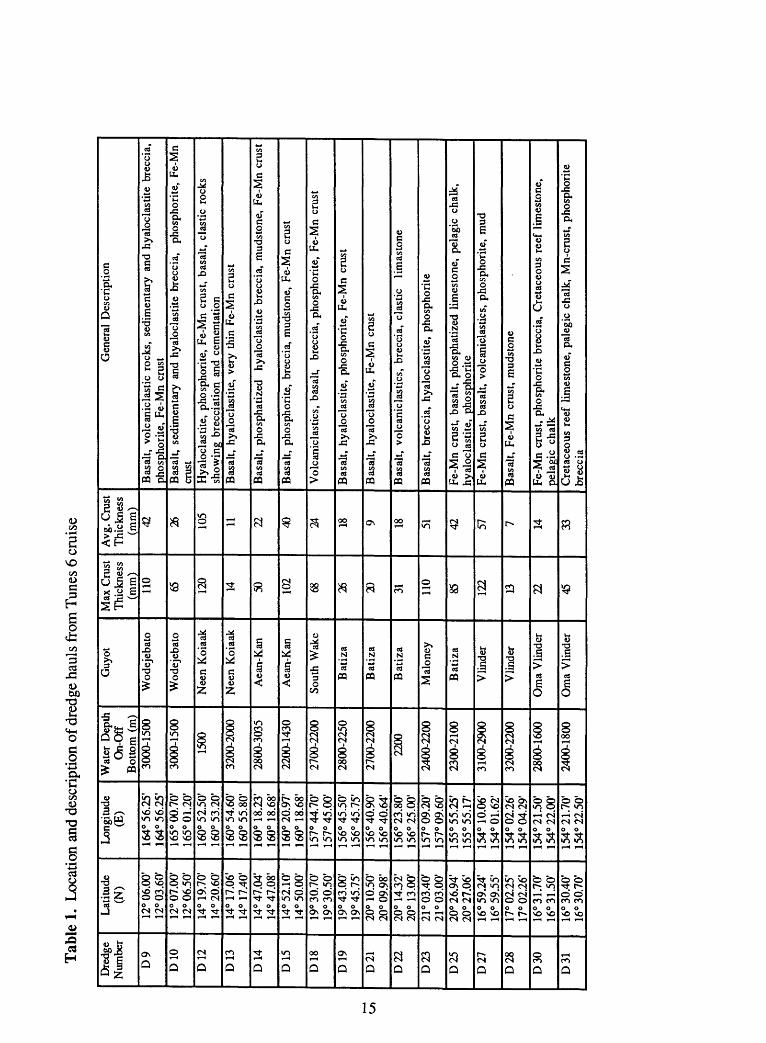
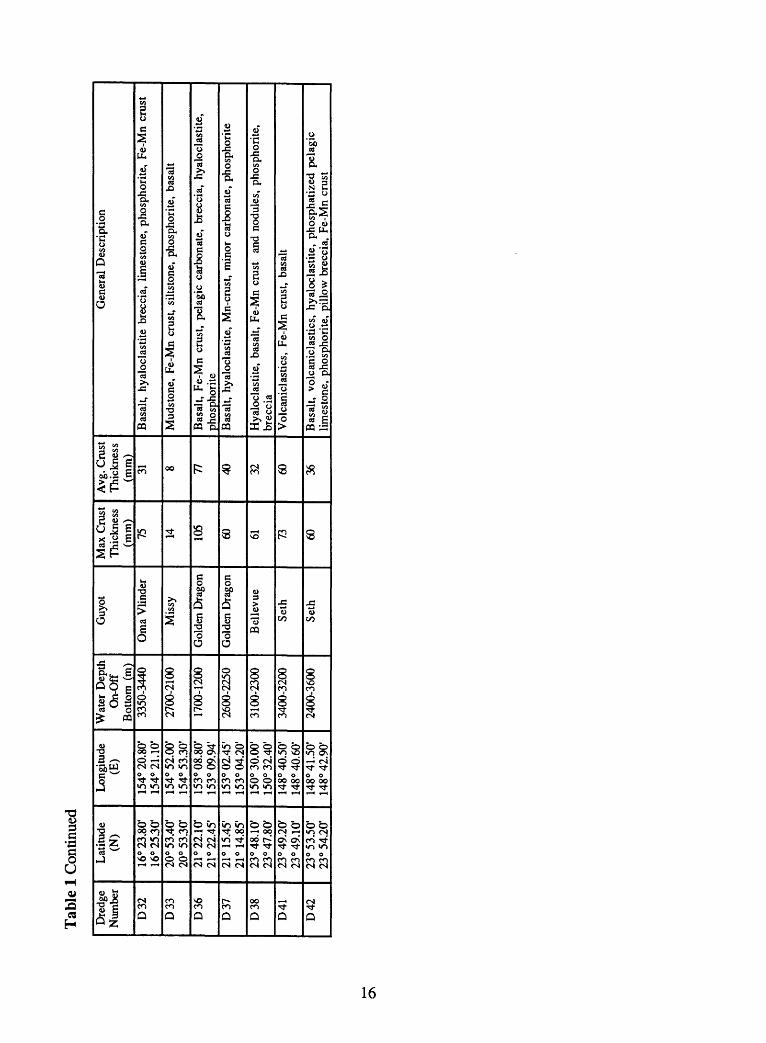
Most dredge recoveries were from 11 seamounts located in international waters north of the Marshall Islands Exclusive Economic Zone (EEZ), whereas only one seamount was sampled within the EEZ of the Marshall Islands (Fig. 1; Table 1). A total of 35 dredges were attempted and 23 recovered Fe-Mn crust samples and substrate rocks. One or two dredge hauls recovered samples from most guyots, however, Vlinder and Batiza Guyots yielded five and four dredge haul recoveries, respectively. Several guyots had previous bathymetric surveys (Batiza, Jennings, Maloney, Missy, Golden Dragon), or were crossed because they were close to the ship's track (Alcatraz, Bellevue) and therefore only minor additional bathymetric surveys were conducted during Tunes 6.
Most volcanic edifices studied are flat-topped guyots and many of those appear from seismic-reflection records to be devoid of summit reefs. However, Jennings Guyot yielded Cretaceous shallow-water limestone and five other guyots (mostly at the western end of the Marcus-Wake seamount group) yielded carbonates. Bellevue, Alcatraz, and Seth Guyots have steep and smooth upper flanks that are morphologically uniform to great depths, indicating carbonate thicknesses up to 1000 m. Drowned atolls typically have steep upper flanks that slope at 24-36° and the reefs form a 20-40 m rim around the summit platform. Vlinder Guyot has a volcanic cone projecting through the summit platform, indicating rejuvenation of volcanism. Guyots without limestones typically have summits that slope at low angles from a central high to the main break in slope between the summit and flanks. Below the main slope break, flanks slope at 12-20° down to the abyssal seafloor.
This report presents data for those dredge hauls from which Fe-Mn crusts were studied. Data include sample descriptions, detailed chemical (major, minor, Pt-group, and rare earth elements) and mineralogical analyses of bulk Fe-Mn crusts and individual crust layers, and major oxide compositions and mineralogy for substrate rocks collected during the Tunes 6 cruise. Correlation coefficients are used to determine relationships between elements and Q-mode factor analysis to determine the grouping of elements with various crust phases.
METHODS
X-ray diffraction was completed on a Philips diffractometer using Cuka radiation and a curved-crystal carbon monochromator. Abundances of major oxides in substrate rocks were determined by X-ray fluorescence spectroscopy (Taggart et al., 1987), Fe(II) by colorimetric titration (Peck, 1964), CO2 by coulometric titration (Engleman et al., 1985), H2O+ by water evolved at 925°C as determined coulometrically by Karl-Fischer titration (Jackson et al., 1987), and H2O- by sample weight difference at 110°C for greater than one hour (Shapiro, 1975). The low totals for the phosphorite samples occur because fluorine and sulfur were not determined and therefore are not included in the totals. High fluorine (to 4.4%) and sulfur (to 2.1% 803) contents are typical of marine carbonate fluorapatite (Cullen and Burnett, 1986; Burnett et al., 1987; Hein et al., 1993). For Fe-Mn crusts, the concentrations of most major and minor elements were determined by inductively coupled
plasma-atomic emission spectrometry, except those of K, Zn, and Pb, which were determined by flame atomic-absorption spectroscopy, and those of As, Cr, and Cd, determined by graphite-furnace atomic absorption spectroscopy on air-dried samples (Aruscavage et al., 1989). Concentrations of platinum-group elements (PGEs) and rare earth elements (REEs) for Fe-Mn crusts were determined by inductively coupled plasma- mass spectrometry (Lichte et al., 1987a,b).
The usual Pearson product moment correlation coefficient was used to calculate the correlation coefficient matrices. For Q-mode factor analysis, each variable percentage was scaled to the percent of the maximum value before the values were row-normalized and cosine theta coefficients calculated. Factors were derived from orthogonal rotations of principal component eigenvectors using the Varimax method (Klovan and Imbrie, 1971). All communalities are >0.93. Low factor scores, < 10.21, were discarded because they are not statistically significant.
SUBSTRATE ROCK DESCRIPTIONS AND COMPOSITION
Substrate rocks in decreasing order of abundance are basalt, breccia, phosphorite, hyaloclastite, limestone, volcaniclastic siltstone and sandstone, and mudstone (Table 1). As many as five different rock types were recovered in a single dredge haul. As seen in hand samples, breccias most commonly consist of basalt clasts in a hyaloclastite matrix, and/or carbonate fluorapatite (CFA) cement. Many samples have Mn oxide impregnations that commonly form dendrites. Volcanogenic clasts in breccias and volcaniclastic rocks are commonly replaced by clay minerals and iron oxides. Basalts are aphanitic with common plagioclase phenocrysts and CFA infilling fractures and vesicles. Some samples have vesicles filled with carbonate mud or Fe-Mn oxides. Reef limestones consist of rounded carbonate clasts with calcite cement and moldic porosity; pelagic limestones are micritic and bioturbated to massive. Mudstones are mostly bioturbated with Fe-Mn oxides lining some burrows. Phosphorites have carbonate mud in cracks and Fe-Mn oxide impregnations.
X-ray Diffraction Mineralogy and Petrography
Primary Volcanogenic and sedimentary minerals include plagioclase, pyroxene, magnetite, and calcite; and secondary minerals include CFA, smectite, calcite, phillipsite, clinoptilolite, goethite, hematite, barite, and potassium feldspar (Table 2). Secondary CFA is the most abundant mineral in these samples and occurs in 73% of the samples as a major or moderate constituent, regardless of rock type (Table 2).
Hyaloclastite and hyaloclastite breccias consist chiefly of CFA and phillipsite (Table 2), with moderate to minor amounts of plagioclase, pyroxene, and magnetite. Most samples contain minor amounts of smectite. One sample consists predominantly of goethite. Hyaloclastites are predominantly completely altered to phillipsite, clinoptilolite, smectite, and Fe oxides, which in turn are cemented by CFA and/or replaced in varying degrees by CFA. Consequently, all gradations exist from altered hyaloclastite to phosphorite with relict hyaloclastite textures. Vesicles are lined with smectite and infilled by zeolites.
Mineralogically, most basalts consist chiefly of plagioclase and pyroxene, although some contain large amounts of CFA, hematite, and goethite. One sample (D21-2) is almost completely replaced by goethite and hematite, whereas another sample (D38-2) is nearly completely replaced by CFA, but shows a relict basalt microcrystalline texture. A wide range of basalt types were collected with variable amounts and combinations of plagioclase, pyroxene, olivine, and rarely amphibole phenocrysts. Groundmass textures include holocrystalline, subophitic, intersertal, microcrystalline, aphanitic, and doleritic. Samples range from highly vesicular to massive. Detailed descriptions of the basalts are available from H. Staudigel, Scripps Institution of Oceanography (see also Koppers, 1997).
Rocks identified as limestones from hand samples are overwhelmingly CFA mineralogically, with moderate amounts of plagioclase, calcite, barite, phillipsite, and potassium feldspar and trace amounts of chlorite, smectite, and quartz. Calcite is primary and the other minerals are due to various admixtures of volcanogenic grains and their alteration products, or to cementation and replacement. Barite forms veins and lenses. All gradations exist from unaltered limestone to phosphorite with relict limestone textures, especially CFA-replaced foraminiferal sands, some with abundant relict radiolarians.
Three types of mudstones were sampled from this region. The first type is composed mainly of magnetite, hematite, and smectite with lesser amounts of phillipsite and clinoptilolite. The second type of mudstone consists of variable amounts of CFA, potassium feldspar, smectite, phillipsite, and plagioclase, whereas the third type is composed solely of smectite. The first type is most likely either an altered ash or altered fine-grained hyaloclastite. The second type is a CFA-replaced altered volcaniclastic mudstone and the third type is bentonite.
Phosphorites are composed of CFA with plagioclase, smectite, and other minerals (Table 2). CFA commonly cements all of the clastic rock types and variably replaces grains in all rock types from incipient to complete replacement. The most commonly replaced rock type is pelagic limestone, where the foraminifera, radiolarians, other grains, and presumably the nannofossil matrix have been completely replaced by CFA. The grains (except the nannofossils) occur as ghosts. Barite veins and lenses commonly occur in the phosphatized pelagic limestone. In addition, shallow-water limestone, volcaniclastic rocks, hyaloclastite, and rarely basalt are completely replaced by CFA, thereby forming phosphorite.
Chemistry
The most P2Os rich CFA-replaced sedimentary rocks have CaO/?2Os ratios of 1.60 to 1.66 (Table 3), whereas theoretical chemical compositions for CFA range from 1.5 to 1.6 (Manheim and Gulbrandsen, 1979). The slight excess Ca over P in some of our samples is due to additional Ca associated with minor contamination by volcanogenic plagioclase, phillipsite cement (an alteration product of volcanic debris), and to relict calcite in the phosphatized limestone.
Smectite occurs in major to moderate amounts in 29% of the samples analyzed, and is especially abundant in the mudstones. It is found in at least trace amounts in over 70% of the samples analyzed. The one sample of nearly pure smectite (D33-3) has relatively high Al, Fe, and Mg contents and low Ca content, indicative of an iron-rich montmorillonite.
Phillipsite is also a common mineral, occurring in major to moderate abundances in 26% of the samples, primarily in the breccias and phosphatized limestones. The samples measured for chemistry, which have abundant phillipsite, have Si/Al ratios ranging from 3.0 to 3.4, which is higher than the range for most marine phillipsites (2.3-2.8) and significantly higher than the values for mafic igneous rocks (1.3-2.4; Kastner, 1979). These high values are the result of contamination by Si-rich volcanogenic and other phases.
Most of the basalt and basalt clasts in breccia are altered to smectite and goethite and are rarely replaced by phosphorite and phillipsite. Alteration is best characterized by increases in Fe2Os and water and decreases in FeO and K2O contents (Table 3). Volcaniclastic mudstones and hyaloclastites have compositions comparable to highly altered basalts.
FERROMANGANESE CRUSTS
Fe-Mn crusts studied here vary in thickness from 3 to 114 mm (Tables 1,4), although crusts were collected during Tunes 6 that range from a patina to 200 mm or more (D18,
South Wake Guyot). The thickest crust studied (114 mm) was dredged from the western flank of Vlinder Guyot in dredge D27. The thickest crust average from the various dredge hauls is 49 mm collected from Neen Koiaak Guyot in dredge D12. Limited availability of personnel on the Tunes 6 cruise did not allow for detailed records to be kept of maximum and average crust thicknesses for each dredge and the values listed in this report are predominately for samples analyzed here and from sketchy notes in the original logs.
Thicker crusts are composed of two or more layers, six being the maximum and two being the most common. Polished thin sections show that various layers are typically botryoidal, columnar, mottled, and laminated, in that order of abundance and are typical of other central Pacific crusts (Hein et al., 1992a). If the substrate rock has an irregular surface, then the first Fe-Mn oxyhydroxide layer is botryoidal, with initial points of growth being on the projections. If the substrate rock has a smooth surface, the first oxyhydroxide layer may be laminated, massive, or mottled. Mottled layers are porous and commonly have the most contamination by detrital minerals relative to the other layer types. Detrital minerals also accumulate between columns and are the chief cause for the directed growth of the columnar structure.
Growth Rates and Ages
Because the flux of Co into Fe-Mn crusts is relatively constant over time, growth rates can be determined from the Co content using the equation of Puteanus and Halbach (1988):
Growth Rate (mm/Ma) = 1.28 / (Co% - 0.24) (1)
The faster a crust grows, the lower the Co concentration. Crusts in which the older parts have been heavily phosphatized (>1 weight % P), however, do not have such a simple relationship because P dilutes the Co and likely mobilizes many of the metals within that older crust generation (Hein, Kang, et al., 1990; Koschinsky and Halbach, 1995). Growth rates in phosphatized parts of crusts may be determined using Co, Mn, and P contents and another set of equations of Puteanus and Halbach (1988):
CoW - Co(x)m (Mn / CoW) / (Mn / Co(b>) (2)
CoW" = CoW (1 - 0.05 AP)-1 (3)
where CoW is the Co concentration corrected for phosphate dilution; CoWm is the Co concentration measured in layer (x); Mn/CoW and Mn/Co(b) are the Mn/Co ratios measured in layer (x) and the boundary layer, respectively; AP is the difference between the CFA fraction of layer (x) and the average of the younger crust; and CoW" is the doubly corrected Co concentration in layer (x). Based on Co content for samples with less than one weight percent P and based on Co, P, and Mn contents for the remaining crust samples, growth rates for bulk crusts varied from 2.1 mm/Ma to 9.8 mm/Ma (Table 4). The average growth rate for bulk crusts was 5.0 mm/Ma, which is within the range of growth rates for hydrogenetic crusts (Hein et al., 1987b; 1990), but is a somewhat faster mean rate than for crusts from areas to the south and southeast. Growth rates for Tunes 6 crusts generally decrease with decreasing latitude, with the highest growth rates calculated for crusts from Oma Vlinder and Missy Guyots. Individual crust layers grew at rates from 2.2 to 14.3 mm/Ma.
The five thickest crusts analyzed, D27-5 (114 mm), D15-4 (95 mm), D 36-3 (81 mm), D25-3 (80 mm), and D41-1 (73 mm) began growing at 24.4, 37.5, 21.5, 15.8, and 13.0 Ma respectively, based on the growth rates of individual layers and the thickness of each
layer (Table 4). These ages of initiation of crust growth are minimum ages because the technique does not take into account dissolution and erosional unconformities which can add another several million years to the age of the crusts (Futa et al., 1988; Ingram et al., 1990; Ling et al., 1997). The oldest crust, from Aean Kan Guyot, is of late Eocene age (37.5 Ma), but is still 37-67 Ma younger than ages typical of central Pacific Cretaceous seamounts.
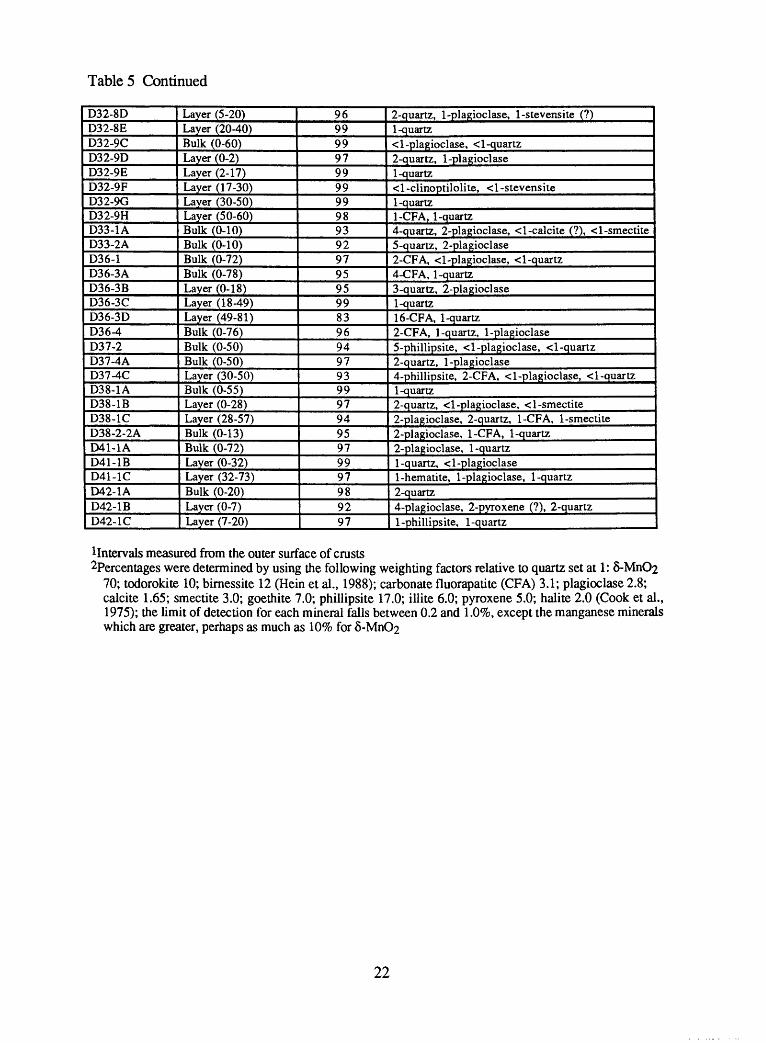
X-ray Diffraction Mineralogy
Great care was taken in sampling crusts for chemical and mineralogical analyses. All contamination from recent sediments was removed, which was especially critical in porous crust layers. Also, special attention was paid to obtaining a clean separation of the lower crust layers from the substrate. Any minerals or elements determined to exist in the various crust layers were incorporated into those layers during deposition or diagenesis and are not due to sampling procedures or post-depositional infiltration of sediment. Finally, all encrusting organisms and other debris were cleaned from the crust surfaces before sampling. Bulk always refers to the entire crust thickness, whether composed of layers or not.
All but two of the 79 samples of Fe-Mn crusts contain greater than 90% S-MnO? (vernadite; Table 5), which has only two X-ray reflections at about 2.42A and 1.41 A. X- ray amorphous Fe oxyhydroxide epitaxially intergrown with the §-MnO2 is also a dominant phase in these crusts, but is not included with the crystalline phases listed in Table 2. This X-ray amorphous iron phase crystallized to goethite in three of the bulk crusts and two of the individual layers analyzed. In the individual layers, goethite was present only in the innermost layer, indicating that those layers have undergone the most advanced diagenetic alteration. Two more samples, one an innermost layer (D41-1C) and the other a thin bulk crust (D14-17A), contain hematite, which is likely due to contamination by altered volcanogenic debris in the thin bulk crust, but may instead be due to diagenesis in the inner layer of the thick crust. CFA occurs in 24% of the bulk crusts and 19% of the layers analyzed. Layered samples contain up to 19% CFA, always within the innermost one or two layers of the crust. CFA is not found in the outer layers.
Quartz was found in all but three crusts. Of those samples that contain quartz, all but five have three percent or less quartz, whereas the other five have 4-5% quartz. Plagioclase (trace to 5%) was found in 75% of the samples. The quartz and some of the plagioclase are of eolian origin, carried by the westerlies from Asia, as there is no local or regional source for quartz in the west-central Pacific. The Marshall Islands are south of the main westerly wind belt which is reflected in lower quartz contents compared to crusts from higher latitudes (Hein et al., 1985a,b; 1987a; 1990). The remainder of the plagioclase, as well as the phillipsite, pyroxene, and calcite are reworked from local outcrops and incorporated into the crusts during precipitation of the Fe-Mn oxyhydroxides.
Calcite occurs in trace amounts in only two bulk samples of thin crusts and none of the layers. Calcite probably occurs from incorporation of biogenic calcite in the outermost millimeter of those crusts during accretion of the oxyhydroxides. The calcite is replaced by the oxyhydroxides once the incorporated calcite is buried by accretion of additional layers.
Todorokite is rare in hydrogenetic seamount crusts (Hein et al., 1987a), but occurs questionably in one of the samples analyzed here (D15-1B, Aean-Kan Guyot). Todorokite may form under different redox conditions than the more oxidized &-MnO2 phase, either during initial precipitation, during diagenesis, or during low-temperature hydrothermal precipitation. A diagenetic origin for D15-1 todorokite is unlikely because the crust is too thin for significant diagenesis.
Chemistry
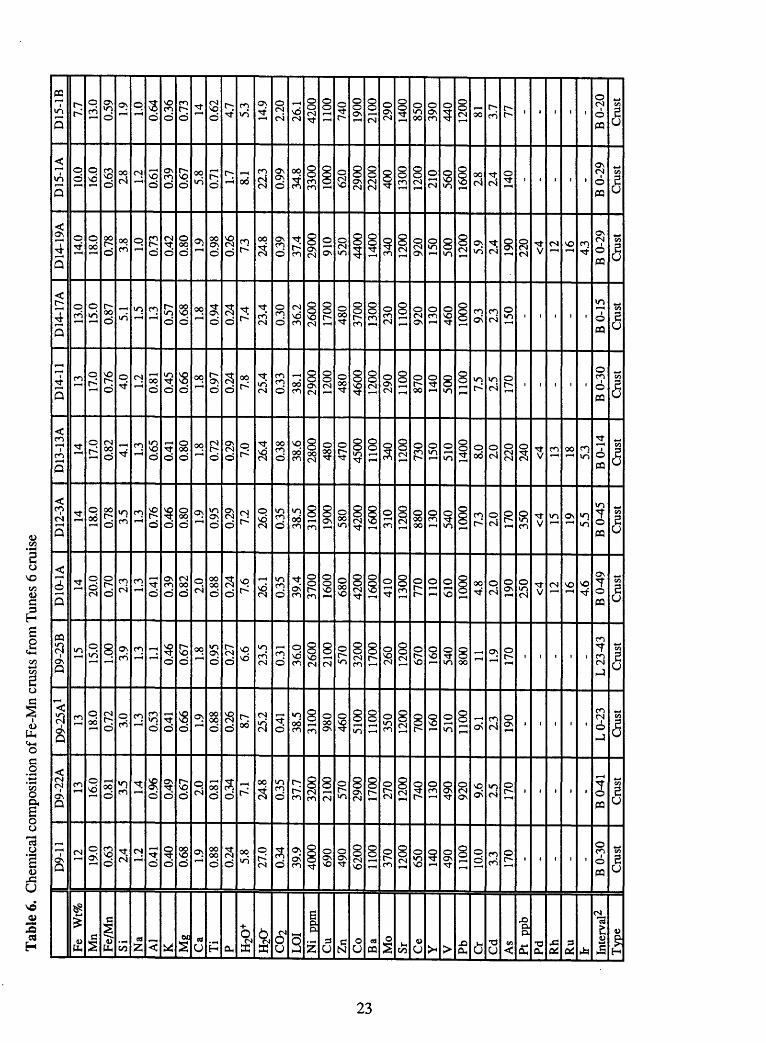
Bulk Crusts: Chemical analyses for 84 samples and subsamples of crusts are presented in Tables 6 and 7 (normalized to 0% t^O"). General statistics for each dataset are presented in Tables 8, 9, and 10.
Water-normalized contents are often used because hygroscopic water varies with humidity in the lab in which samples are analyzed. Therefore, t^O", and consequently the abundances of other elements, will vary accordingly and significantly as hygroscopic water contents can be as high as 30%. Compositions normalized to 0% H2O" (Table 7) can be more meaningfully compared and may also more closely represent the grade of the potential ore. Consequently, the following discussion is based on hygroscopic water-free data.
The mean Fe and Mn contents of the 46 bulk crust samples are 16.7% and 22.1 %, respectively (Table 9). The mean Fe/Mn ratio (0.76) is comparable to the mean ratio for the entire central Pacific region (0.77; Hein et al., 1992b), but is somewhat higher than the mean ratio for the Marshall Islands EEZ (0.65; Hein, Kang, et al., 1990). Mean Fe content is less and Mn somewhat less compared to bulk crust samples from the Marshall Islands EEZ, 15.3% and 23.6%, respectively. The mean contents of the economically important metals Co (0.52%), Ni (0.40%), and Pt (0.50 ppm) are somewhat less than the Marshall Islands EEZ mean contents of 0.66%, 0.50%, and 0.58 ppm, respectively. The mean Co content is less, Ni about the same, and Pt much higher than mean contents for the equatorial Pacific. Phosphorus, a potential byproduct for mining, has a low mean value of 0.72% compared to the central Pacific mean of more than 1% and the Marshall Islands EEZ mean of nearly 2%.
Analysis of a large number of thick crusts lowers the mean contents of most metals (except platinum), and that is probably why this study shows mean concentrations below the regional and Marshall Islands means. Studies that include only analyses of thin crusts yield mean concentrations higher than those of regional means (for example, Pichocki and Hoffert, 1987; see Hein et al., 1992b for discussion).
Layers: In general, Co contents decrease from the outer surface to the substrate through Fe-Mn crusts (Halbach et al., 1982; Hein et al., 1985b); but in Tunes 6 samples, only about half show that decrease (Tables 6,7), whereas in the other half Co increases with depth; in one sample, the Co content remains unchanged with depth in the crust. This geographic area is unique in having so many samples that show an increase in Co with depth in the crusts. Other elements also change with depth in the crusts. Although there are exceptions, the following changes typically occur with depth in the Tunes 6 crusts: Fe, Si, Al, Pb, Cr, and As decrease, while Mn, Ni, Cu, Zn, Ba, Ce, and Pt increase.
Those trends indicate that, in general, elements representative of the aluminosilicate detrital fraction decrease toward the substrate (with notable exceptions), in contrast to the trend found in other studies. This decreasing trend with depth in the crusts is also true for the Fe oxyhydroxide phase and associated elements, whereas the Mn oxyhydroxide phase and associated elements show the opposite trend. Most of the PGEs increase toward the substrate, which is typical of the trend observed in other studies. Phosphorus remains relatively constant in thin crusts and increases significantly in the lower layers of thick crusts. Strongly phosphatized crusts disrupt the trends in the elements as noted above. A few crusts have the highest concentrations of elements in one of the internal layers.
Thinner crusts are similar chemically to the outer parts of thicker crusts. Thinner crusts (<15 mm) have less Mn and Co than thicker crusts and significantly less P, Cu, Mo, and Ni, but more Fe than thicker crusts. These trends are similar to those reported by Hein, Ann, et al. (1992) for Micronesian crusts, but contrast with trends in crusts from other areas. These differences probably are related to milder phosphatization of Tunes 6 crusts compared to those from other areas. Phosphatization dilutes these elements with depth in the crusts, making their overall grades lower than for thinner, non-phosphatized crusts. In addition to those element trends, thin crusts have higher Al, Si, K, and Cr and much lower
Pt concentrations than thick crusts. The Pt contents of two inner layers of thick crusts are extremely high, among the highest measured in any Pacific crusts, 2.1 ppm (D25-3D) and 2.7 ppm (D32-9H). The other PGEs are also very high in these crust layers.
Platinum Group Elements (PGEs)
We report the concentrations of Pt, Pd, Rh, Ru, and Ir for 19 bulk crusts and 33 crust layers (Tables 6,7). This is the fourth report of Ru and Ir contents in Fe-Mn crusts (see Hein, Kang, et al., 1990; Hein, Ann, et al., 1992; Hein, Gramm-Osipov, et al., 1994). Platinum contents vary from 0.133 ppm to 0.874 ppm for bulk crusts and from 0.133 ppm to 2.65 ppm for crust layers (Tables 9, 10). Palladium is below the limit of detection of 4 ppb (based on the original hygroscopic water-bearing dataset); the other PGEs vary by factors of three to nine: Rh (9.8-97.6 ppb), Ru (8.7-32.3 ppb), and Ir (4.1-22.3 ppb). The maximum values for each PGE (except Pd) are extremely high compared to those in other crusts analyzed to date. However, the mean values of bulk crusts are significantly less than mean values of Marshall Islands EEZ crusts for Ir, somewhat less for Pt and Rh, and somewhat more for Ru. The Tunes 6 PGE contents are significantly enriched over lithospheric and seawater abundances, but not over chondrite abundances (Figs. 2, 3; Parthe and Crocket, 1978; Hodge et al., 1986; Goldberg, 1987; Anders and Grevesse, 1989; Colodner, 1991; Bertine et al., 1993). For comparison, the sample with the highest PGE enrichment (D32-9H, layer 50-60 mm) is plotted in Fig. 3. Relative to chondrites, Ir and Ru ratios are a few times greater in D32-9H compared to the mean values for bulk crusts, Rh an order of magnitude greater, and Pt is enriched by three orders of magnitude. Relative to surface seawater, Ir is the most enriched for the mean bulk crust dataset, whereas Pt is the most enriched for sample D32-9H, but only somewhat more enriched than Ir, Ru, and Rh. Pd probably has about the same enrichment for both mean crust and most enriched crust datasets.
The highest Pt, Rh, and Ir concentrations occur in the inner layer of crust D32-9H, which was recovered from the deepest water dredge site, whereas the highest Ru content is in the innermost layer of crust D18-1C. Enrichment of PGEs in the inner parts of crusts is common for central Pacific crusts. The highest Pd and Ru concentrations occur in crusts from the Yap and Mariana arcs, as do other elements indicative of clastic input. As shown in previous studies, Pt, Ir, and Rh are derived predominantly from seawater, whereas Pd and much of the Ru are derived from clastic debris, the remainder of the Ru being derived from seawater. The extraterrestrial component (meteorite debris) in the bulk crusts is small. However, meteorite debris may be concentrated locally in the crusts by formation of dissolution unconformities, or by proximity of the crust to meteorite fallout during formation of the layer. Localized extraterrestrial debris-rich horizons, however, do not alter the overall hydrogenetic signature of the PGEs in the crusts. The high Pt contents in three crusts studied here occur over many millimeters of the inner crusts, which represent millions of years of accretion of Fe-Mn oxyhydroxides and therefore cannot be explained as the result of meteorite impacts, as those are essentially instantaneous events and would form only a very thin lamina in the crusts. In addition, the PGE ratios are non-chondritic, with Fe-Mn crust compositions showing more than an order of magnitude more Pt relative to Ir and Rh relative to Ir. More likely, Pt is a redox sensitive element and its changing concentration reflects changing redox conditions and diagenesis (see Hein et al., 1997).
Rare Earth Elements (REEs)
The concentrations of REEs are reported for 19 bulk crust samples and 33 individual crust layers (Table 11). For bulk crusts, ZREEs range from 0.13% to 0.32%, with a mean
of 0.21%. Nearly the same range is found for individual layers (0.14-0.35%) (Table 11). Out of 13 samples in which layers were analyzed, 11 of those show increases of EREEs with depth in the crusts; the other two samples show the opposite trend although the differences in percentages of EREEs between layers is quite small in those two samples. For crusts D18-1, D23-1, D37-4, and D41-1, the outer layer of each crust has the highest concentration of each REE, except Ce, which is highest in the middle layer. This is the same trend reported by Hein, Ann, et al. (1992) for crusts from Micronesia. D15-4 and D27-1 show the same trends, but also have inner layers with the highest Yb contents. For crusts D25-3, D27-5, D32-9, D36-3, and D42-1, the innermost layers have the highest concentrations of all REEs. D-32-8 has the highest concentrations of all the REEs except Ce in the middle layer.
Chondrite (Anders and Grevesse, 1989)-normalized patterns show a positive Ce anomaly (2Ce/La+Pr from chondrite-normalized data), light REE enrichment, and a slight decrease in heavy REEs with increasing atomic number; whereas, post-Archean Australian shale (PAAS; McLennan, 1989)-normalized patterns show nearly flat heavy REEs, light REE depletion, and positive Ce anomaly (Fig. 4). Normalized REE patterns for bulk crusts and layers are shown in Figures 4-17. Patterns for individual samples (Figs. 5-17), in additional to the above characteristics, show a small positive Gd anomaly, typical of hydrogenetic Fe-Mn crusts and of seawater (Hein et al., 1988). In crusts where two layers were analyzed, the largest Ce anomaly occurs in the inner layer as does the highest enrichment of Ce relative to chondrites. When more than two layers were analyzed, the largest Ce anomaly was either in an interior layer or the innermost layer, whereas the greatest enrichment relative to chondrites occurred in the innermost layer.
Interelement Relationships
Correlation coefficient matrices were constructed from the chemical compositions of 46 bulk crusts (Table 12), nine thick bulk crusts (>70 mm; Table 13), five thin bulk crusts (<11 mm; Table 14), five layers from D27-5 (Table 15), and five layers from D32-9 (Table 16). In addition to 28 elements, all matrices include H2O+, H2O, CO2, LOI, and the tables for bulk crusts include longitude, latitude, water depth, and crust thickness.
For the 46 bulk crusts, statistically significant positive correlations at the 99% confidence level are found among the following selected elements, listed in order of decreasing significance for each element (Table 12): Mn: Mo, H2O+, LOI, Ni, Zn, H2O~, Cu, Co, Cd, V, Ti; Fe: Na, As, Si, V; Si: Al, Na, K, Mg, Cr, As; P: CO2, Ca, Y, Sr, Mo; Ba: Ce, Sr, V, Mo, Pb, Y, Zn, Ti, Ca; Pt: Rh, Ir.
All elements are associated with one or more mineral phase(s) in the crusts. We interpret these correlations and others in Table 12 to indicate the following phases and their associated elements: 8-MnO2: Mn, Ni, Co, Mo, Cd, Cu, V, Ti; Fe oxyhydroxide: Fe, V, As; aluminosilicate: Si, Al, K, Na, Mg, Cr, As; CFA: Ca, P, Y, CO2, Sr; residual biogenic: Ba, Zn, V, Cu, Ce, Sr, Y, Ca. In general, these interelement associations are similar to those determined for crusts from other areas of the central Pacific, although regional differences do occur (Hein et al., 1990,1992b; Hein, Kang, et al., 1990).
Weak correlations exist for dredge haul locations and crust compositions. Y increases with increasing latitude (to the north) and Zn, Mn, Fe, Co, and V increase with increasing longitude (to the east), whereas Co and Zn decrease with increasing latitude. Only Ti increases with increasing water depth. Most PGEs (Pt, Ir, Rh), the CFA phase, and Ni increase with increasing crust thickness, whereas the iron and aluminosilicate phases decrease with increasing crust thickness.
For the nine bulk crusts thicker than 70 mm (Table 13), the following positive correlations between elements are found: Mn: Zn, Na, Pb, As, Co, H2O+; Fe: Ba, Mg,
Ti, Cu, H2O-, Si, Na, K, Al, LOI; Si: K, Fe, H2O~, Al, Ti, Ba, Cu, Mg, Ce, LOI; P: Ca, CO2, Sr, Y; Ba: Fe, Si, Na, Mg, Ti, H2Q-, Cu, Zn, Ru; Pt: Co, IT. Notable differences from the entire bulk crust dataset are the correlations of Pb with Mn and Cu with Fe. Fe and Ti are more strongly associated with the aluminosilicate phase and there has been a transfer of elements between the residual biogenic and iron oxyhydroxide phases. These differences indicate that diagenesis has affected the thicker crusts. The CFA phase and crust thickness decrease with increasing latitude. Co increases and Ce decreases with increasing longitude. With increasing water depth, Al, K, Ti, Si, Cu, Ce, and Cr increase and Ni, Co, Sr, and Cd decrease.
The five thin bulk crusts (<11 mm) have statistically significant positive correlations between the following elements (Table 14): Mn: H2O~, Ca, Ba, LOI, Co, and at just below the 95% confidence level, Ni and Mo; Fe: P, Sr, Pb, As; Si: none; P: Fe, Sr, V, As; Ba: Mo, Mn, LOI, Y. These thin crusts have no CFA mineralization and P is correlated with Fe, and Ca with the Mn phase. These correlations indicate that there are at least two mechanisms that incorporate P into crusts: Syndepositional adsorption and later- stage diagenesis. No elements are correlated with crust thickness, water depth, or latitude. With increasing longitude, Mo, Ba, LOI, Y, V, and CO2 increase, whereas Si, Al, and Cu decrease.
For the five layers of crust D27-5 (west side of Vlinder Guyot), the following elements have statistically significant positive correlations (Table 15): Mn: H2O', LOI, Ni, Cu, Rh, Ir; Fe: H2O+ , As; Si: H2O+; P: Ca, Y, CO2 , Sr, Ba; Ba: Ca, P, Sr, Ce; Pt: Rh, Ir, Zn, Cu. There is a strong negative correlation between layer thickness and Si and H2O+. The hydrogenetic PGEs may be associated with the Mn phase.
The five crust layers from D32-9 (Oma Vlinder Guyot) have the following positive element correlations (Table 16): Mn: Ti; Fe and Si have none; P: Ca, Ba, Y, Pt, Rh, Ir; Ba: Ir, Rh, Pt, Ca, P, Ce, Al; Pt: Rh, Ba, Ir, Ce, Ca, P, Al, Y. The interesting aspect of these correlations is the possible association of the PGEs with the CFA phase; or the CFA phase and some other PGE-bearing phase may simply co-vary. However, Ir and Rh have perfect correlations with Ba.
The only association common to all of these groups is the composition of CFA, with Ca, P, Y, CO2, and Sr being consistently positively correlated.
Grouping of Elements: Q-Mode Factor Analysis
Q-mode factor analysis was completed on chemical data for the 46 bulk crusts (Figs. 18,19). Grouped elements are assigned to five factors, four of which are essentially the same as those interpreted from the correlation coefficient data. Factor analysis did not identify a group of elements that we interpret as a residual biogenic phase from correlation coefficients. Instead, factor 2 is a PGE-bearing phase that may or may not be a residual biogenic phase. Two elements that have factor scores somewhat less than the 10.21 cutoff are Sr and Mg, which are commonly part of a residual biogenic (loosely bound) phase and support the interpretation of factor 2 as a residual biogenic phase. Differences are minor in elements assigned to the other four phases through interpretation of correlation coefficients and Q-mode factor assignments. Q-mode factor analysis does not include V, Ti, and Cu in the 6-MnO2 phase; V in the FeOOH phase; Cr and As in the aluminosilicate phase; and Sr in the CFA phase. Factor analysis additionally includes Ba in the FeOOH phase; Ti and Fe in the aluminosilicate phase; and Mo in the CFA phase.
The statistical data show that the partitioning of elements in crusts is complex and that many elements occur in several crust phases. Element distributions depend on the location of Fe-Mn crust formation that is both geographic and water depth locations. Distributions also depend on crust thickness, which reflects changes in growth rates with time and
10
diagenesis within the thicker crusts. Compositions further depend on global oceanic and atmospheric changes, which manifest in temporal changes in seawater chemistry.
RESOURCE CONSIDERATIONS
The commonly cited cut off grade for potential economic development is 0.8% Co and the cut off thickness is 40 mm. On a water-free basis, these samples are high in Pt (0.50 ppm); high in Mn (22.1%); and moderate in Ni (0.40%), Co (0.52%), and Cu (0.14 %), with a mean Co+Ni+Cu content of 1.06%. The mean crust thickness is 40 mm, but the true mean crust thickness from each dredge is poorly known.
REFERENCES
Anders, E. and Grevesse, N., 1989, Abundances of the elements: Meteoritic and solar.Geochimica et Cosmochimica Acta, v. 53, p. 197-214.
Aruscavage, P.J., Kirschenbaum, H., and Brown, F., 1989, Analytical methods: Thedetermination of 27 elements in ferromanganese materials: in Manheim, F.T. andLane-Bostwick, C.M. (eds.), Chemical Composition of Ferromanganese Crusts in theWorld Ocean: A Review and Comprehensive Database. U.S. Geological Survey OpenFile Report 89-020, 200 p. plus 3 appendices.
Bertine, K.K., Koide, M., and Goldberg, E.D., 1993, Aspects of rhodium marinechemistry. Marine Chemistry, v. 42, p. 199-210.
Burnett, W.C., Cullen, D.J., and McMurtry, G.M., 1987, Open-ocean phosphorites-in aclass by themselves? in Teleki, P.G., Dobson, M.R., Moore, J.R., and vonStackelberg, U. (eds.), Marine Minerals, D. Reidel, Dordrecht, p. 119-134.
Colodner, D.C., Boyle, E.A., and Edmond, J.M., 1991, Platinum in seawater: Abstractsand Program, 1992 Ocean Sciences Meeting, EOS, Transactions of the AmericanGeophysical Union, v. 72, no. 51, p. 44.
Cook, H.E., Johnson, P.D., Matti, J.C., and Zemmels, I., 1975, Methods of samplepreparation and X-ray diffraction data analysis (X-ray mineralogy laboratory, Deep SeaDrilling Project, University of California Riverside): in Hays, D.E., Frakes. L.A., etal., Initial Reports of the Deep Sea Drilling Project, U.S. Government Printing Office,Washington, D.C., v. 28, p. 999-1007.
Cullen, DJ. and Burnett, W.C., 1986, Phosphorite associations on seamounts in thetropical southwest Pacific Ocean. Marine Geology, v. 71, p. 215-236.
Engleman, E.E., Jackson, L.L., and Norton, D.R., 1985, Determination of carbonatecarbon in geological materials by coulometric titration. Chemical Geology, v. 53, p.125-128.
Futa, K., Peterman, Z.E., and Hein, J.R., 1988, Sr and Nd isotopic variations inferromanganese crusts from the central Pacific: Implications for age and sourceprovenance. Geochimica et Cosmochimica Acta, v. 52, p. 2229-2233.
Goldberg, E.D., 1987, Heavy metal analyses in the marine environment-approaches toquality control. Marine Chemistry, v. 22, p. 117-124.
Halbach, P., Manheim, F.T., and Otten, P., 1982, Co-rich ferromanganese deposits in themarginal seamount regions of the central Pacific basin results of the Midpac '81:Erzmetall, v. 35, p. 447-453.
Hein, J.R., Manheim, F.T., Schwab, W.C., and Davis, A.S., 1985a, Ferromanganesecrusts from Necker Ridge, Horizon Guyot, and S.P. Lee Guyot: Geologicalconsiderations. Marine Geology, v. 69, p. 25-54.
Hein, J.R., Manheim, F.T., Schwab, W.C., Davis, A.S., Daniel, C.L., Bouse, R.M.,Morgenson, L.A., Sliney, R.E., Clague, D.A., Tate, G.B., and Cacchione, D.A.,1985b, Geological and geochemical data for seamounts and associated ferromanganese
11
crusts in and near the Hawaiian, Johnston Island, and Palmyra Island Exclusive Economic Zones. U.S. Geological Survey Open-File Report 85-292, 129 p.
Hein, J.R., Morgenson, L.A., Clague, D.A., and Koski, R.A., 1987a, Cobalt-rich ferromanganese crusts from the Exclusive Economic Zone of the United States and nodules from the oceanic Pacific: in Scholl, D.W., Grantz, A., and Vedder, J.G. (eds.), Geology and Resource Potential of the Continental Margin of Western North America and Adjacent Ocean Basins-Beaufort Sea to Baja California. Circum-Pacific Council for Energy and Mineral Resources, Earth Science Series, Houston, Texas, v. 6, p. 753-771.
Hein, J.R., Schwab, W.C., Foot, D.G., Masuda, Y., Usui, A., Davis, A.S., Fleishman, C.L., Barna, D.L., Pickthorn, L.-B., Larson, D.A., Ruzzi, P., Benninger, L.M., and Gein, L.M., 1987b, Farnella cruise F7-86-HW, cobalt-rich ferromanganese crust data report for Karin Ridge and Johnston Island, central Pacific. U.S. Geological Survey Open File Report 87-663, 34 p.
Hein, J.R., Schwab, W.C. and Davis, A.S., 1988, Cobalt and platinum-richferromanganese crusts and associated substrate rocks from the Marshall Islands. Marine Geology, v. 78, p. 255-283.
Hein, J.R., Kang, J.-K., Schulz, M.S., Park, B.-K., Kirschenbaum, H., Yoon, S.-H., Olson, R.L., Smith, V.K., Park., D.-W., Riddle, G.O., Quinterno, P.J., Lee, Y.-O., Davis, A.S., Kirn, S.R., Pringle, M.S., Choi, D.-L., Pickthorn, L., Schlanger, S.O., Duennebier, F.K., Bergersen, D.D. and Lincoln, J.M., 1990, Geological, geochemical, geophysical, and oceanographic data and interpretations of seamounts and Co-rich ferromanganese crusts from the Marshall Islands, KORDI-USGS R. V. Farnella Cruise F10-89-CP. U.S. Geological Survey Open File Report 90-407, 246 p.
Hein, J.R., Kirschenbaum, H., Schwab, W.C., Usui, A., Taggart, J.E., Stewart, K.C., Davis, A.S., Terashima, S., Quinterno, P.J., Olson, R.L., Pickthorn, L.G., Schulz, M.S., Morgan, C.L., 1990, Mineralogy and geochemistry of Co-rich ferromanganese crusts and substrate rocks from Karin Ridge and Johnston Island, Farnella Cruise F7- 86-HW. U.S. Geological Survey Open File Report 90-298, 80 pp.
Hein, J.R., Ahn, J.-H., Wong, J.C., Kang, J-K., Smith, V.K., Yoon, S-H., d'Angelo, W.M., Yoo, S-O., Gibbs, A.E., Kirn, H-J., Quinterno, P.J., Jung, M.-Y., Davis, A.S., Park, B.-K., Gillison, J.R., Marlow, M.S., Schulz, M.S., Siems, D.F., Taggart, J.E., Rait, N., Gray, L., Malcolm, M.J., Kavulak, M.G., Yeh, H.-W., Mann, D.M., Noble, M., Riddle, G.O., Roushey, B.H., and Smith, H., 1992, Geology, geophysics, geochemistry, and deep-sea mineral deposits, Federated States of Micronesia: KORDI-USGS R.V. Farnella cruise F11-90-CP. U.S. Geological Survey Open File Report 92-218, 191 pp.
Hein, J.R., Bohrson, W.A., Schulz, M.S., Noble, M., and Clague, D.A., 1992a, Variations in the fine-scale composition of a central Pacific ferromanganese crust: Paleoceanographic implications. Paleoceanography, v. 7, p. 63-77.
Hein, J. R., Schulz, M. S., Gein, L. M., 1992b, Central Pacific cobalt-richferromanganese crusts: Historical perspective and regional variability: in Keating, B. H., and Bolton, B. R., (eds.), Geology and Offshore Mineral Resources of the Central Pacific Basin. Circum-Pacific Council for Energy and Mineral Resources, Earth Sciences Series, v. 14, New York, Springer-Verlag, p. 261-283.
Hein, J.R., Yeh, H.-W., Gunn, S.H., Sliter, W.V., Benninger, L.M., and Wang, C- H., 1993, Two major Cenozoic episodes of phosphogenesis recorded in equatorial Pacific seamount deposits. Paleoceanography, v. 8, p. 293-311.
Hein, J.R., Gramm-Osipov, L., Gibbs, A.E., Kalyagin, A.N., d'Angelo, W.M., Nachaev, V.P., Briggs, P.H., Bychkov, A.S., Davis, A.S., Gusev, V.V., Chezar, H., Gorbarenko, S.A., Bullock, J.H., Kraynikov, G.A., Siems, D.F., Mikhailik, E.V., Smith, H., Eyberman, M.F., Schutt, M.J., Beloglazov, A.I., Mozherovsky, A.V., and Chichkin, R.V., 1994, Description and composition of Fe-Mn crusts, rocks, and sediments collected on Karin Ridge, R.V. Aleksandr Vinogradov cruise 91-AV-
12
19/2: in Hein, J.R., Bychkov, A.S., and Gibbs, A.E. (eds.), Data and results from R.V. Aleksandr Vinogradov cruises 91-AV-19/1, north Pacific hydrochemistry transect; 91-AV-19/2, north equatorial Pacific Karin Ridge Fe-Mn crust studies; and 91-AV-19/4, northwest Pacific and Bering Sea sediment geochemistry and paleoceanographic studies. U.S. Geological Survey Open-File Report 94-230, p. 39- 91.
Hein, J.R., Koschinsky, A., Halbach, P., Manheim, F.T., Bau, M, Kang, J.-K., and Lubick, N., 1997, Iron and manganese oxide mineralization in the Pacific: in Nicholson, K., Hein, J.R., Btihn, B., and Dasgupta, S. (eds.) Manganese Mineralization: Geochemistry and Mineralogy of Terrestrial and Marine Deposits. Geological Society Special Publication No. 119, London, p. 123-138.
Hodge, V., Stallar, M., Koide, M., and Goldberg, E.D., 1986, Determination of platinum and indium in marine waters, sediments, and organisms. Analytical Chemistry, v. 58, p. 616-620.
Ingram, B.L., Hein, J.R., and Farmer, G.L., 1990, Age determinations and growth rates of Pacific ferromanganese deposits using strontium isotopes. Geochimica et Cosmochimica Acta, v. 54, p. 1709-1721.
Jackson, L.L., Brown, F.W., and Neil, S.T., 1987, Major and minor elements requiring individual determination, classical whole rock analysis, and rapid rock analysis: in Baedecker, P.A. (ed.) Methods for Geochemical Analysis. U.S. Geological Survey Bulletin 1770, p. G1-G23.
Kastner, M., 1979, Zeolites: in Burns, R.G. (ed.), Marine Minerals, Mineralogical Society of America Short Course Notes, v. 6, p. 111-122.
Klovan, I.E. and Imbrie, J., 1971, An algorithm and FORTRAN-TV program for large- scale Q-mode factor analysis and calculation of factor scores. Mathematical Geology, v. 3, p. 61-77A
Koppers, A., 1997, The geochronology of western seamounts and implications for plate motion. Ph.D. thesis, Fee University of Amsterdam, December, 1997.
Koschinsky, A. and Halbach, P., 1995, Sequential leaching of marine ferromanganese precipitates: Genetic implications. Geochimica et Cosmochimica Acta, v. 59, p. 5113- 5132.
Lichte, F.E., Golightly, D.W., and Lamothe, P.J., 1987a, Inductively coupled plasma- atomic emission spectrometry: in Baedecker, P.A. (ed.), Methods for Geochemical Analysis. U.S. Geological Survey Bulletin 1770, p. B1-B10.
Lichte, F.E., Meier, A.L., and Crock, J.G., 1987b, Determination of the rare earth elements in geological materials by inductively coupled plasma-mass spectrometry. Analytical Chemistry, v. 59, p. 1150-1157.
Ling, H.F., Burton, K.W., O'Nions, R.K., Kamber, B.S., von Blanckenburg, F., Gibbs, A.J., and Hein, J.R., 1997, Evolution of Nd and Pb isotopes in central Pacific seawater from ferromanganese crusts. Earth and Planetary Science Letters, v. 146, p. 1-12.
Manheim, F.T. and Gulbrandsen, R.A., 1979, Marine phosphorites, in Burns, R.G. (ed.), Marine Minerals. Mineralogical Society of America Short Course Notes, v. 6, p. 151-173.
McLennan, S.M., 1989, Rare earth elements in sedimentary rocks: Influence of provenance and sedimentary processes: in Lipin, B.R. and McKay, G.A. (eds.) Geochemistry and Mineralogy of Rare Earth Elements. Mineralogical Society of America's Reviews in Mineralogy, v. 21, Washington D.C.
Panne", E. and Crocket, J.H., 1978, Platinum group: in Wedepohl, K.H. (ed.) Handbook of Geochemistry, v. n/5, Springer-Verlag, Berlin, p. 78-A1-78-O7.
Peck, L.C., 1964, Systematic analysis of silicates. U.S. Geological Survey Bulletin 1170, 89 p.
Pichochi, C. and Hoffert, M., 1987, Characteristics of Co-rich ferromanganese nodules and crusts sampled in French Polynesia. Marine Geology, v. 77, p. 109-119.
13
Puteanus, D. and Halbach, P., 1988, Correlation of Co concentration and growth rate: A method for age determination of ferromanganese crusts. Chemical Geology, v. 69, p. 73-85.
Shapiro, L., 1975, Rapid analysis of silicate, carbonate, and phosphate rocks revised edition. U.S. Geological Survey Bulletin 1401, 76 p.
Taggart, J.E., Lindsay, J.R., Scott, B.A., Vivit, D.V., Bartel, A.J., and Stewart, K.C., 1987, Analysis of geologic materials by wavelength-dispersive X-ray fluorescence spectrometry: in Baedecker, P.A. (ed.), Methods for Geochemical Analysis. U.S. Geological Survey Bulletin 1770, p. El-El 9.
14
Tab
le 1
. Lo
catio
n an
d de
scrip
tion
of d
redg
e ha
uls
from
Tun
es 6
cru
ise
Dre
dge
Num
ber
D9
DIG
D12
D13
D14
D15
D18
D19
D21
D22
D23
D25
D27
D28
D30
D31
Latit
ude
(N)
12° 0
6.00
' 12
° 03.
60'
12° 0
7.00
' 12
° 06.
50'
14°
19.7
0'
14° 2
0.60
'14
° 17
.06'
14
° 17
.40'
14° 4
7.04
' 14
° 47.
08'
14° 5
2.10
' 14
° 50.
00'
19° 3
0.70
' 19
° 30.
50'
19° 4
3.00
' 19
° 45.
75'
20°
10.5
0'
20°
09.9
8'20
° 14
.32'
20
° 13
.00'
21°
03.4
0'
21°
03.0
0'20
° 26.
94'
20° 2
7.06
'16
° 59.
24'
16° 5
9.55
'17
° 02.
25'
17° 0
2.26
'16
° 3 1
.70'
16
° 3 1.
50'
16° 3
0.40
' 16
° 30.
70'
Long
itude
(E
)
164°
56.
25'
164°
56.
25'
165°
00.
70'
165°
01.
20'
160°
52.
50'
160°
53.
20'
160°
54.
60'
1 60°
55.
80'
160°
18.
23'
160°
18.
68'
160°
20.
97'
160°
18.
68'
157°
44.
70'
157°
45.
00'
1 56°
45.
50'
156°
45.
75'
156°
40.
90'
156°
40.
64'
156°
23.
80'
156°
25.
00'
157°
09.
20'
157°
09.
60'
155°
55.
25'
155°
55.
17'
154°
10.
06'
154°
01.
62'
154°
02.
26'
154°
04.
29'
154°
2 1.
50'
154°
22.
00'
154°
2 1.
70'
154°
22.
50'
Wat
er D
epth
O
n-O
ff
Bot
tom
(m
)30
00-1
500
3000
-150
0
1500
3200
-200
0
2800
-303
5
2200
-143
0
2700
-220
0
2800
-225
0
2700
-220
0
2200
2400
-220
0
2300
-210
0
3100
-290
0
3200
-220
0
2800
-160
0
2400
-180
0
Guy
ot
Wod
ejeb
ato
Wod
ejeb
ato
Nee
n K
oiaa
k
Nee
n K
oiaa
k
Aea
n-K
an
Aea
n-K
an
Sout
h W
ake
Bat
iza
Bat
iza
Bat
iza
Mal
oney
Bat
iza
Vlin
der
Vlin
der
Om
a V
linde
r
Om
a V
linde
r
Max
Cru
st
Thic
knes
s (m
m)
110
65 120
14 50 102
68 26 20 31 110
85 122
13 22 45
Avg
. Cru
st
Thi
ckne
ss
(mm
)42 26 10
5 11 22 40 24 18 9 18 51 42 57 7 14 33
Gen
eral
Des
crip
tion
Bas
alt,
volc
anic
last
ic r
ocks
, se
dim
enta
ry a
nd h
yalo
clas
tite
brec
cia,
ph
osph
orite
, Fe
-Mn
crus
tB
asal
t, se
dim
enta
ry a
nd h
yalo
clas
tite
brec
cia,
ph
osph
orite
, Fe
-Mn
crus
tH
yalo
clas
tite,
pho
spho
rite,
Fe-
Mn
crus
t, ba
salt,
cla
stic
roc
ks
show
ing
brec
ciat
ion
and
cem
enta
tion
Bas
alt,
hyal
ocla
stite
, ve
ry t
hin
Fe-M
n cr
ust
Bas
alt,
phos
phat
ized
hy
aloc
last
ite b
recc
ia,
mud
ston
e, F
e-M
n cr
ust
Bas
alt,
phos
phor
ite,
brec
cia,
mud
ston
e, F
e-M
n cr
ust
Vol
cani
clas
tics,
bas
alt,
brec
cia,
pho
spho
rite
, Fe
-Mn
crus
t
Bas
alt,
hyal
ocla
stite
, ph
osph
orite
, Fe
-Mn
crus
t
Bas
alt,
hyal
ocla
stite
, Fe
-Mn
crus
t
Bas
alt,
volc
anic
last
ics,
bre
ccia
, cl
astic
lim
asto
ne
Bas
alt,
brec
cia,
hya
locl
astit
e, p
hosp
hori
te
Fe-M
n cr
ust,
basa
lt, p
hosp
hatiz
ed l
imes
tone
, pe
lagi
c ch
alk,
hy
aloc
last
ite,
phos
phor
iteFe
-Mn
crus
t, ba
salt,
vol
cani
clas
tics,
pho
spho
rite
, m
ud
Bas
alt,
Fe-M
n cr
ust,
mud
ston
e
Fe-M
n cr
ust,
phos
phor
ite b
recc
ia,
Cre
tace
ous
reef
lim
esto
ne,
pela
gic
chal
kC
reta
ceou
s re
ef l
imes
tone
, pa
legi
c ch
alk,
Mn-
crus
t, ph
osph
orite
br
ecci
a
Tab
le 1
Con
tinue
d
Dre
dge
Num
ber
D32
D33
D36
D37
D38
D41
D42
Lat
itude
(N
)
16°
23.8
0'
16°
25.3
0'20
° 53
.40'
20°
53.3
0'21
° 22
.10'
21°
22.4
5'21
° 15
.45'
21°
14.8
5'23
° 48
.10'
23
° 47
.80'
23°
49.2
0'
23°
49.1
0'23
° 53
.50'
23
° 54
.20'
Lon
gitu
de
(E)
154°
20.
80'
154°
21.
10'
154°
52.
00'
154°
53.
30'
153°
08.
80'
153°
09.
94'
153°
02.
45'
153°
04.
20'
150°
30.
00'
150°
32.
40'
148°
40.
50'
148°
40.
60'
148°
41.
50'
148°
42.
90'
Wat
er D
epth
O
n-O
ff
Bot
tom
(m
)33
50-3
440
2700
-210
0
1700
-120
0
2600
-225
0
3100
-230
0
3400
-320
0
2400
-360
0
Guy
ot
Om
a V
linde
r
Mis
sy
Gol
den
Dra
gon
Gol
den
Dra
gon
Bel
levu
e
Seth
Seth
Max
Cru
st
Thi
ckne
ss
(mm
)75 14 10
5
60 61 73 60
Avg
. Cru
st
Thi
ckne
ss
(mm
)31 8 77 40 32 60 36
Gen
eral
Des
crip
tion
Bas
alt,
hyal
ocla
stite
bre
ccia
, lim
esto
ne,
phos
phor
ite,
Fe-M
n cr
ust
Mud
ston
e, F
e-M
n cr
ust,
silts
tone
, ph
osph
orite
, ba
salt
Bas
alt,
Fe-M
n cr
ust,
pela
gic
carb
onat
e, b
recc
ia,
hyal
ocla
stite
, ph
osph
orite
Bas
alt,
hyal
ocla
stite
, M
n-cr
ust,
min
or c
arbo
nate
, ph
osph
orite
Hya
locl
astit
e, b
asal
t, Fe
-Mn
crus
t an
d no
dule
s, p
hosp
hori
te,
brec
cia
Vol
cani
clas
tics,
Fe-
Mn
crus
t, ba
salt
Bas
alt,
volc
anic
last
ics,
hya
locl
astit
e, p
hosp
hatiz
ed p
elag
ic
limes
tone
, ph
osph
orite
, pi
llow
bre
ccia
, Fe
-Mn
crus
t
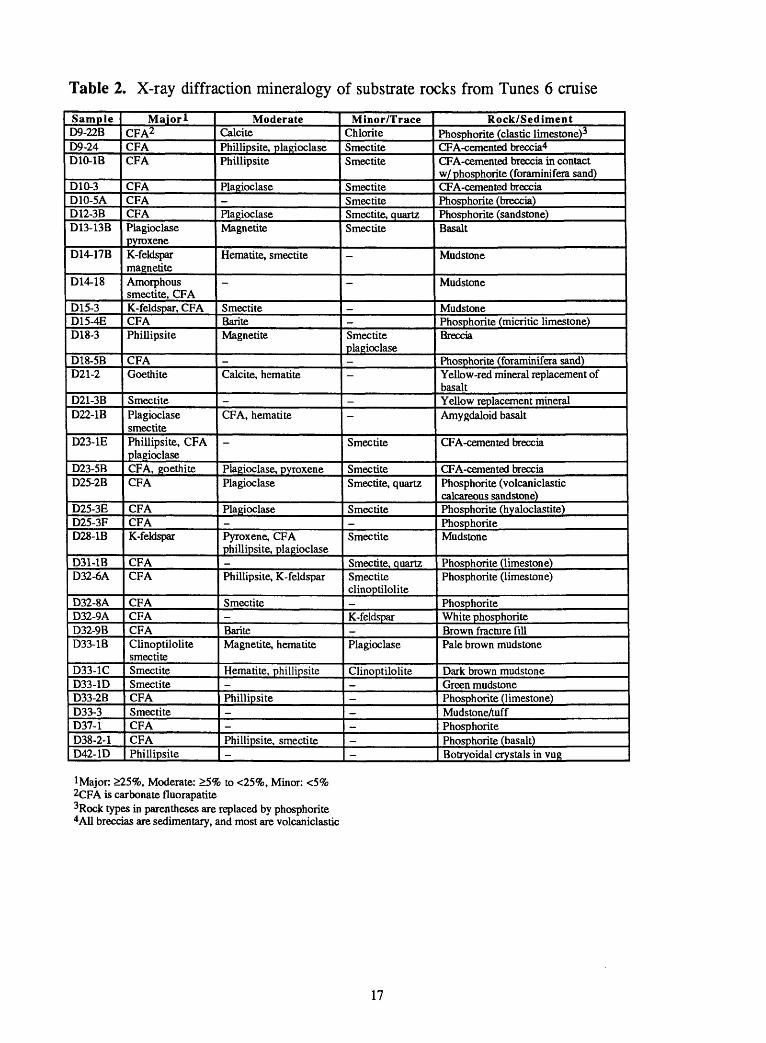
Table 2. X-ray diffraction mineralogy of substrate rocks from Tunes 6 cruise
SampleD9-22BD9-24D10-1B
D10-3D10-5AD12-3BD13-13B
D14-17B
D14-18
D15-3D15-4ED18-3
D18-5BD21-2
D21-3BD22-1B
D23-1E
D23-5BD25-2B
D25-3ED25-3FD28-1B
D31-1BD32-6A
D32-8AD32-9AD32-9BD33-1B
D33-1CD33-1DD33-2BD33-3D37-1D38-2-1D42-1D
MajorlCFA2CFACFA
CFACFACFAPlagioclase pyroxeneK-feldspar magnetiteAmorphous smectite, CFAK-feldspar, CFACFAPhillipsite
CFAGoethite
SmectitePlagioclase smectitePhillipsite, CFA plagioclaseCFA, goethiteCFA
CFACFAK-feldspar
CFACFA
CFACFACFAClinoptilolite smectiteSmectiteSmectiteCFASmectiteCFACFAPhillipsite
ModerateCalcitePhillipsite, plagioclasePhillipsite
Plagioclase-PlagioclaseMagnetite
Hematite, smectite
-
SmectiteBariteMagnetite
-Calcite, hematite
-CFA, hematite
Plagioclase, pyroxenePlagioclase
Plagioclase-Pyroxene, CFA Phillipsite, plagioclase-Phillipsite, K-feldspar
Smectite-BariteMagnetite, hematite
Hematite, phillipsite-Phillipsite--Phillipsite, smectite-
Minor/TraceChloriteSmectiteSmectite
SmectiteSmectiteSmectite, quartzSmectite
-
-
_-Smectite plagioclase--
--
Smectite
SmectiteSmectite, quartz
Smectite-Smectite
Smectite, quartzSmectite clinoptilolite_K-feldspar-Plagioclase
Clinoptilolite_-__--
Rock/SedimentPhosphorite [clastic limestone)3CFA-cemented breccia4CFA-cemented breccia in contact w/ phosphorite (foraminifera sand)CFA-cemented brecciaPhosphorite (breccia)Phosphorite (sandstone)Basalt
Mudstone
Mudstone
MudstonePhosphorite (micritic limestone)Breccia
Phosphorite (foraminifera sand)Yellow-red mineral replacement of basaltYellow replacement mineralAmygdaloid basalt
CFA-cemented breccia
CFA-cemented brecciaPhosphorite (volcaniclastic calcareous sandstone)Phosphorite (hyaloclastite)PhosphoriteMudstone
Phosphorite (limestone)Phosphorite (limestone)
PhosphoriteWhite phosphoriteBrown fracture fillPale brown mudstone
Dark brown mudstoneGreen mudstonePhosphorite (limestone)MudstoneAuffPhosphoritePhosphorite (basalt)Botryoidal crystals in vug
1 Major: >25%, Moderate: >5% to <25%, Minor: <5% 2CFA is carbonate fluorapatite 3Rock types in parentheses are replaced by phosphorite 4A11 breccias are sedimentary, and most are volcaniclastic
17
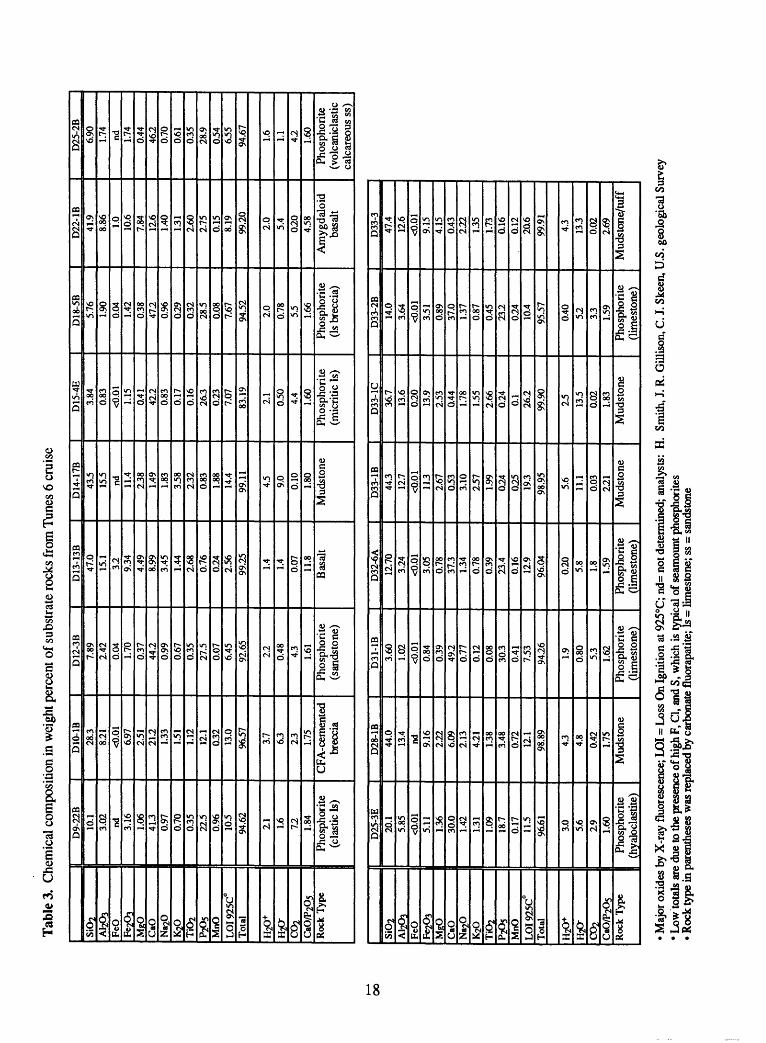
Tab
le 3
. C
hem
ical
com
posi
tion
in w
eigh
t per
cent
of s
ubst
rate
rock
s fr
om T
unes
6 c
ruis
e
Si0
2A
12Q
3Fc
OFc
2O3
MR0
CaO
Na2
0K
20TK
)2P2
P5M
nOL
OI9
25C
°T
otal
H20
+H
20-
C02
CaO
/P2O
sR
ock
Typ
e
D9-
22B
10.1
3.02 nd 3.16
1.06
413
0.97
0.70
0.35
125
0.%
10.5
94.6
2
2.1 1.6
72 1.84
Phos
phor
ite
(cla
stic
Is)
D10
-1B
28.3
8.21
<0.0
16.
972.
5121
.21.
331.
511.
1212
.10.
3213
.096
.57
3.7
63 23 1.75
CFA
-cem
ente
d br
ecci
a
D12
-3B
7.89
2.42
0.04 1.70
0.37
44.2
0.99
0.67
0.35
27.5
0.07
6.45
92.6
5
2.2
0.48 4.3
1.61
Phos
phor
ite
(san
dsto
ne)
D13
-13B
47.0
15.1
32 9.34
4.49
8.99
3.45
1.44
2.68
0.76
0.24
2.56
99.2
5
1.4
1.4
0.07
11.8
Bas
alt
D14
-17B
43.5
15.5
nd 11.4
238
1.49
1.83
3.58
232
0.83 1.88
14.4
99.1
1
4.5
9.0
0.10 1.80
Mud
s ton
e
D15
-4E
3.84
0.83
<0.0
11.
150.
4142
.20.
830.
170.
1626
.30.
237.
0783
.19
2.1
0.50 4.4
1.60
Phos
phor
ite
(mic
ritic
Is)
D18
-5B
5.76
1.90
0.04 1.42
038
472
0.%
029
032
28.5
0.08
7.67
94.5
2
2.0
0.78 5.5
1.66
Phos
phor
ite
(Is
brec
cia)
D22
-1B
41.9
8.86 1.0
10.6
7.84 12.6
1.40
131
2.60
2.75
0.15
8.19
99.2
0
2.0
5.4
020
4.58
Am
ygda
loid
ba
salt
D25
-2B
6.90
1.74 nd 1.74
0.44
462
0.70
0.61
0.35
28.9
0.54
6.55
94.6
7
1.6
1.1 42 1.60
Phos
phor
ite
(vol
cani
clas
tic
calc
areo
us s
s)
Si02
Al^
FcO
Fc2<
*M
gOC
aON
a20
K20
TK>2
P2P5
MnO
LO
I 92
5C°
Tot
al
H^
H2Q
-
0^
CaO
/P2O
5R
ock
Typ
e
D25
-3E
20.1
5.85
<0.0
15.
11 1.36
30.0
1.42
1.31
1.09
18.7
0.17 11.5
96.6
1
3.0
5.6
2.9
1.60
Phos
phor
ite
(hya
locl
astit
e)
D28
-1B
44.0
13.4
nd 9.16
2.22
6.09
2.13
4.21
1.38
3.48
0.72
12.1
98.8
9
43 4.8
0.42
1.75
Mud
s ton
e
D31
-1B
3.60
1.02
<0.0
10.
840.
3949
.20.
770.
120.
0830
.30.
417.
5394
.26
1.9
0.80 5.3
1.62
Phos
phor
ite
(lim
esto
ne)
D32
-6A
12.7
03.
24<0
.01
3.05
0.78
37.3
1.34
0.78
0.39
23.4
0.16
12.9
96.0
4
0.20 5.8 1.8
1.59
Phos
phor
ite
(lim
esto
ne)
D33
-1B
44.3
12.7
<0.0
111
32.
670.
533.
102.
57 1.99
024
025
19.3
98.9
5
5.6
11.1
0.03
221
Mud
s ton
e
D33
-1C
36.7
13.6
0.20
13.9
2.53
0.44
1.78
1.55
2.66
0.24 0.1
26.2
99.9
0
2.5
13.5
0.02
1.83
Mud
ston
e
D33
-2B
14.0
3.64
<0.0
13.
510.
8937
.013
70.
870.
4523
202
410
.495
.57
0.40 52 33 1.59
Phos
phor
ite
(lim
esto
ne)
D33
-347
.412
.6<0
.01
9.15
4.15
0.43
222
135
1.73
0.16
0.12
20.6
99.9
1
4.3
133
0.02
2.69
Mud
s ton
e/tu
ff
Maj
or o
xide
s by
X-r
ay f
luor
esce
nce;
LO
I = L
oss
On
Igni
tion
at 9
25°C
; nd=
not
det
erm
ined
; an
alys
ts:
H.
Smith
, J. R
. G
illis
on, C
. J. S
keen
, U.S
. geo
logi
cal S
urve
y L
ow to
tals
are
due
to th
e pr
esen
ce o
f hig
h F,
Cl,
and
S, w
hich
is ty
pica
l of s
eam
ount
pho
spho
rites
Roc
k ty
pe in
par
enth
eses
was
repl
aced
by
carb
onat
e flu
orap
atite
; Is =
lim
esto
ne; s
s =
sand
ston
e
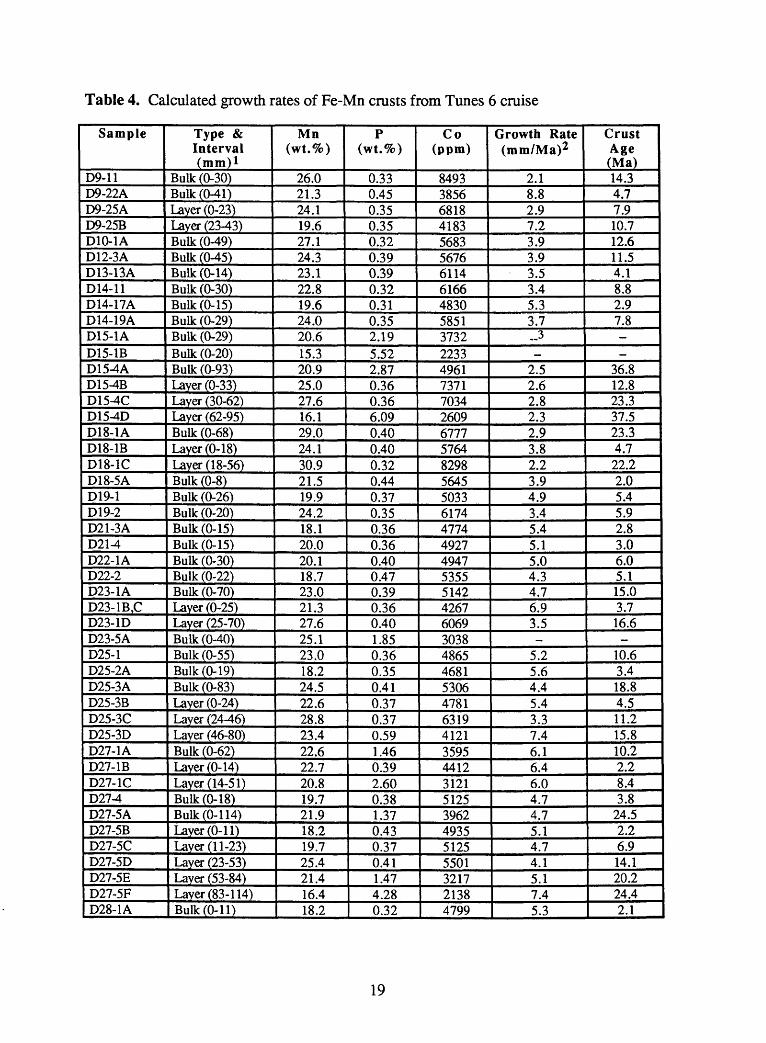
Table 4. Calculated growth rates of Fe-Mn crusts from Tunes 6 cruise
Sample
D9-11D9-22AD9-25AD9-25BD10-1AD12-3AD13-13AD14-11D14-17AD14-19AD15-1AD15-1BD15^AD15^BD15^CD15^DD18-1AD18-1BD18-1CD18-5AD19-1D19-2D21-3AD2MD22-1AD22-2D23-1AD23-1B,CD23-1DD23-5AD25-1D25-2AD25-3AD25-3BD25-3CD25-3DD27-1AD27-1BD27-1CD27^D27-5AD27-5BD27-5CD27-5DD27-5ED27-5FD28-1A
Type & Interval (mm) 1
Bulk (0-30)Bulk (0-41)Layer (0-23)Layer (23-43)Bulk (0-49)Bulk (0-45)Bulk (0-14)Bulk (0-30)Bulk (0-15)Bulk (0-29)Bulk (0-29)Bulk (0-20)Bulk (0-93)Layer (0-33)Layer (30-62)Layer (62-95)Bulk (0-68)Layer (0-18)Layer (18-56)Bulk (0-8)Bulk (0-26)Bulk (0-20)Bulk (0-15)Bulk (0-15)Bulk (0-30)Bulk (0-22)Bulk (0-70)Layer (0-25)Layer (25-70)Bulk (0-40)Bulk (0-55)Bulk (0-19)Bulk (0-83)Layer (0-24)Layer (24^6)Layer (46-80)Bulk (0-62)Layer (0-14)Layer (14-51)Bulk (0-18)Bulk (0-1 14)Layer (0-11)Layer (11-23)Layer (23-53)Layer (53-84)Layer (83- 114)Bulk (0-11)
Mn(wt.%)
26.021.324.119.627.124.323.122.819.624.020.615.320.925.027.616.129.024.130.921.519.924.218.120.020.118.723.021.327.625.123.018.224.522.628.823.422.622.720.819.721.918.219.725.421.416.418.2
P(wt.%)
0.330.450.350.350.320.390.390.320.310.352.195.522.870.360.366.090.400.400.320.440.370.350.360.360.400.470.390.360.401.850.360.350.410.370.370.591.460.392.600.381.370.430.370.411.474.280.32
Co (ppm)
84933856681841835683567661146166483058513732223349617371703426096777576482985645503361744774492749475355514242676069303848654681530647816319412135954412312151253962493551255501321721384799
Growth Rate (mm/Ma)2
2.18.82.97.23.93.93.53.45.33.7__3
2.52.62.82.32.93.82.23.94.93.45.45.15.04.34.76.93.5
5.25.64.45.43.37.46.16.46.04.74.75.14.74.15.17.45.3
Crust Age(Ma)14.34.77.910.712.611.54.18.82.97.8-
36.812.823.337.523.34.722.22.05.45.92.83.06.05.115.03.716.6-
10.63.418.84.511.215.810.22.28.43.8
24.52.26.914.120.224.42.1
19
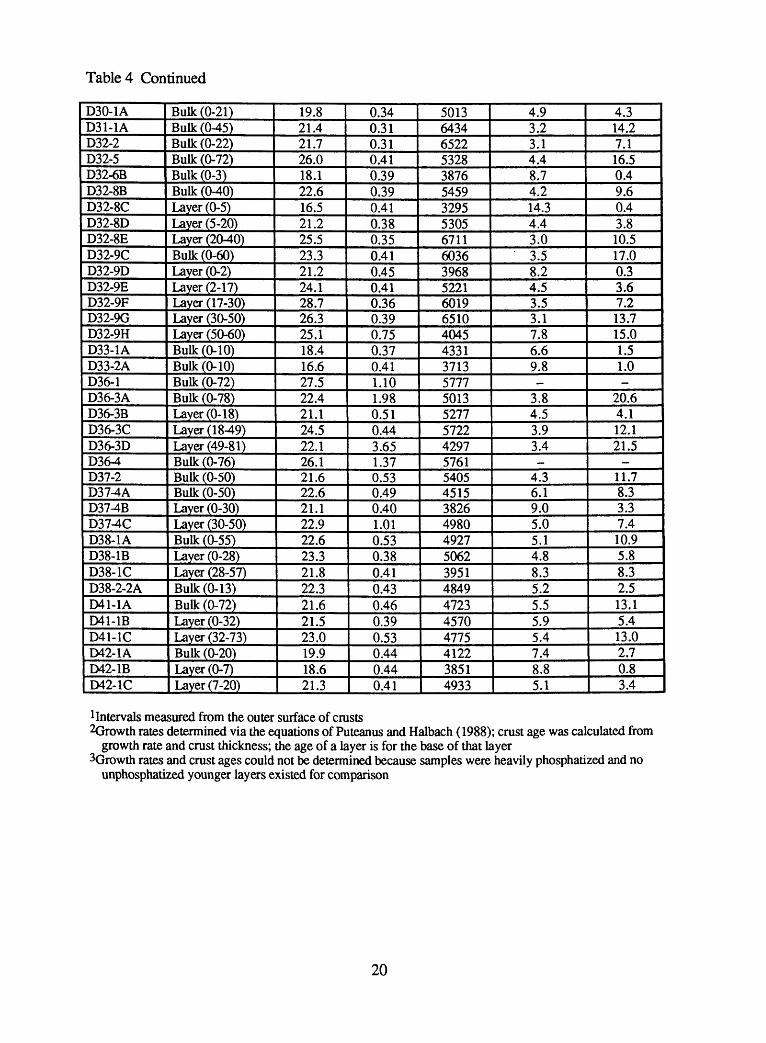
Table 4 Continued
D30-1AD31-1AD32-2D32-5D32-6BD32-8BD32-8CD32-8DD32-8ED32-9CD32-9DD32-9ED32-9FD32-9GD32-9HD33-1AD33-2AD36-1D36-3AD36-3BD36-3CD36-3DD36-4D37-2D37-4AD37-4BD37-4CD38-1AD38-1BD38-1CD38-2-2AD41-1AD41-1BD41-1CD42-1AD42-1BD42-1C
Bulk (0-21)Bulk (0-45)Bulk (0-22)Bulk (0-72)Bulk (0-3)Bulk (0-40)Layer (0-5)Layer (5-20)Layer (20-40)Bulk (0-60)Layer (0-2)Layer (2-17)Layer (17-30)Layer (30-50)Layer (50-60)Bulk (0-10)Bulk (0-10)Bulk (0-72)Bulk (0-78)Layer (0-18)Layer (18-49)Layer (49-81)Bulk (0-76)Bulk (0-50)Bulk (0-50)Layer (0-30)Layer (30-50)Bulk (0-55)Layer (0-28)Layer (28-57)Bulk (0-13)Bulk (0-72)Layer (0-32)Layer (32-73)Bulk (0-20)Layer (0-7)Layer (7-20)
19.821.421.726.018.122.616.521.225.523.321.224.128.726.325.118.416.627.522.421.124.522.126.121.622.621.122.922.623.321.822.321.621.523.019.918.621.3
0.340.310.310.410.390.390.410.380.350.410.450.410.360.390.750.370.411.101.980.510.443.651.370.530.490.401.010.530.380.410.430.460.390.530.440.440.41
5013643465225328387654593295530567116036396852216019651040454331371357775013527757224297576154054515382649804927506239514849472345704775412238514933
4.93.23.14.48.74.214.34.43.03.58.24.53.53.17.86.69.8
3.84.53.93.4
4.36.19.05.05.14.88.35.25.55.95.47.48.85.1
4.314.27.116.50.49.60.43.810.517.00.33.67.213.715.01.51.0-
20.64.112.121.5-
11.78.33.37.410.95.88.32.513.15.413.02.70.83.4
Intervals measured from the outer surface of crusts2Growth rates determined via the equations of Puteanus and Halbach (1988); crust age was calculated from
growth rate and crust thickness; the age of a layer is for the base of that layer 3Growth rates and crust ages could not be determined because samples were heavily phosphatized and no
unphosphatized younger layers existed for comparison
20
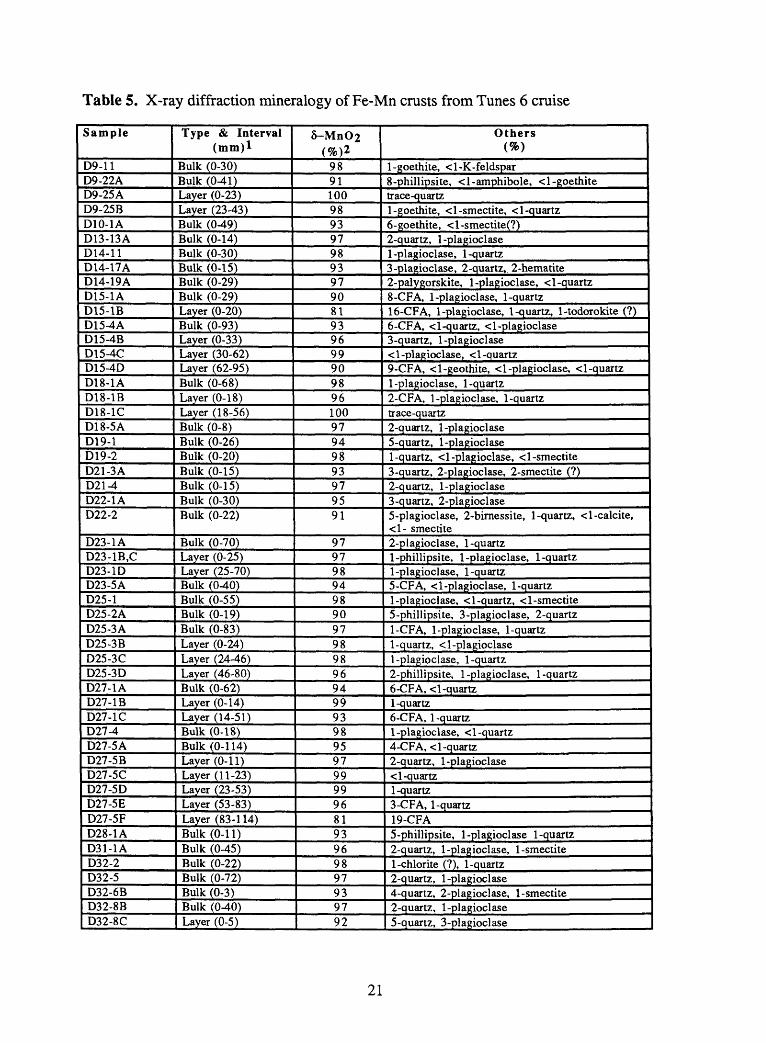
Table 5. X-ray diffraction mineralogy of Fe-Mn crusts from Tunes 6 cruise
Sample
D9-11D9-22AD9-25AD9-25BD10-1AD13-13AD14-11D14-17AD14-19AD15-1AD15-1BD15-4AD15-4BD15-4CD15-4DD18-1AD18-1BD18-1CD18-5AD19-1D19-2D21-3AD21-4D22-1AD22-2
D23-1AD23-1B,CD23-1DD23-5AD25-1D25-2AD25-3AD25-3BD25-3CD25-3DD27-1AD27-1BD27-1CD27-4D27-5AD27-5BD27-5CD27-5DD27-5ED27-5FD28-1AD31-1AD32-2D32-5D32-6BD32-8BD32-8C
Type & Interval (mm)l
Bulk (0-30)Bulk (0-41)Layer (0-23)Layer (23-43)Bulk (0-49)Bulk (0-14)Bulk (0-30)Bulk (0-15)Bulk (0-29)Bulk (0-29)Layer (0-20)Bulk (0-93)Layer (0-33)Layer (30-62)Layer (62-95)Bulk (0-68)Layer (0-18)Layer (18-56)Bulk (0-8)Bulk (0-26)Bulk (0-20)Bulk (0-15)Bulk (0-15)Bulk (0-30)Bulk (0-22)
Bulk (0-70)Layer (0-25)Layer (25-70)Bulk (0-40)Bulk (0-55)Bulk (0-19)Bulk (0-83)Layer (0-24)Layer (24-46)Layer (46-80)Bulk (0-621Layer (0-14)Layer (14-51)Bulk (0-18)Bulk (0-114)Layer (0-11)Layer (11-23)Layer (23-53)Layer (53-83)Layer (83-114)Bulk (0-11)Bulk (0-45)Bulk (0-22)Bulk (0-72)Bulk (0-3)Bulk (0-40)Layer (0-5)
5-MnO2(%)2
9891100989397989397908193969990989610097949893979591
979798949890979898969499939895979999968193969897939792
Others (%)
1-goethite, <l-K-feldspar8-phillipsite, <l-amphibole, <l-goethitetrace -quartz1-goethite, <l-smectite, <l-quartz6-goethite, <l-smectite(?)2-quartz, 1-plagioclase1-plagioclase, 1 -quartz3-plagioclase, 2-quartz,. 2-hematite2-palygorskite, 1-plagioclase, <1 -quartz8-CFA, 1-plagioclase, 1 -quartz16-CFA, 1-plagioclase, 1 -quartz, 1-todorokite (?)6-CFA, <l-quartz, < 1-plagioclase3-quartz, 1-plagioclase< 1-plagioclase, <1 -quartz9-CFA, <l-geothite, <l-plagioclase, <l-quartz1-plagioclase, 1 -quartz2-CFA, 1-plagioclase, 1 -quartztrace-quartz2-quartz, 1-plagioclase5-quartz, 1-plagioclase1-quartz, <l-plagioclase, <l-smectite3-quartz, 2-plagioclase, 2-smectite (?)2-quartz, 1-plagioclase3-quartz, 2-plagioclase5-plagioclase, 2-birnessite, 1-quartz, <l-calcite, <1- smectite2-plagioclase, 1-quartz1-phillipsite, 1-plagioclase, 1-quartz1-plagioclase, 1-quartz5-CFA, < 1-plagioclase, 1-quartz1-plagioclase, <l-quartz, <l-smectite5-phillipsite, 3-plagioclase, 2-quartz1-CFA, 1-plagioclase, 1-quartz1-quartz, < 1-plagioclase1-plagioclase, 1-quartz2-phillipsite, 1-plagioclase, 1-quartz6-CFA, <l-quartz1-quartz6-CFA, 1-quartz1-plagioclase, < 1-quartz4-CFA, <l-quartz2-quartz, 1-plagioclase< 1-quartz1-quartz3-CFA, 1-quartz19-CFA5-phillipsite, 1-plagioclase 1-quartz2-quartz, 1-plagioclase, 1 -smectite1-chlorite (?), 1-quartz2-quartz, 1-plagioclase4-quartz, 2-plagioclase, 1 -smectite2-quartz, 1-plagioclase5-quartz, 3-plagioclase
21
TableS Continued
D32-8DD32-8ED32-9CD32-9DD32-9ED32-9FD32-9GD32-9HD33-1AD33-2AD36-1D36-3AD36-3BD36-3CD36-3DD36-4D37-2D37-4AD37-4CD38-1AD38-1BD38-1CD38-2-2AD41-1AD41-1BD41-1CD42-1AD42-1BD42-1C
Layer (5-20)Layer (20-40)Bulk (0-60)Layer (0-2)Layer (2-17)Layer (17-30)Layer (30-501Layer (50-60)Bulk (0-10)Bulk (0-10)Bulk (0-72)Bulk (0-78)Layer (0-18)Layer (18-49)Layer (49-81)Bulk (0-76)Bulk (0-50)Bulk (0-50)Layer (30-50)Bulk (0-55)Layer (0-28)Layer (28-57)Bulk (0-13)Bulk (0-72)Layer (0-32)Layer (32-73)Bulk (0-20)Layer (0-7)Layer (7-20)
9699999799999998939297959599839694979399979495979997989297
2-quartz, 1-plagioclase, 1-stevensite (?)1 -quartz< 1-plagioclase, <1 -quartz2-quartz, 1-plagioclase1 -quartz<l-clinoptilolite, < 1-stevensite1 -quartz1-CFA, 1 -quartz4-quartz, 2-plagioclase, <l-calcite (?), <1 -smectite5-quartz, 2-plagioclase2-CFA, < 1-plagioclase, <1 -quartz4-CFA, 1 -quartz3-quartz, 2-plagioclase1 -quartz16-CFA, 1-quartz2-CFA, 1-quartz, 1-plagioclase5-phillipsite, < 1-plagioclase, <l-quartz2-quartz, 1-plagioclase4-phillipsite, 2-CFA, < 1-plagioclase, < 1-quartz1-quartz2-quartz, <l-plagioclase, <1 -smectite2-plagioclase, 2-quartz, 1-CFA, 1 -smectite2-plagioclase, 1-CFA, 1-quartz2-plagioclase, 1-quartz1-quartz, < 1-plagioclase1 -hematite, 1-plagioclase, 1-quartz2-quartz4-plagioclase, 2-pyroxene (?), 2-quartz1-phillipsite, 1-quartz
llntervals measured from the outer surface of crusts^Percentages were determined by using the following weighting factors relative to quartz set at 1: 6-MnO2
70; todorokite 10; birnessite 12 (Hein et al., 1988); carbonate fluorapatite (CFA) 3.1; plagioclase 2.8;calcite 1.65; smectite 3.0; goethite 7.0; phillipsite 17.0; illite 6.0; pyroxene 5.0; halite 2.0 (Cook et al.,1975); the limit of detection for each mineral falls between 0.2 and 1.0%, except the manganese mineralswhich are greater, perhaps as much as 10% for 8-MnO2
22
Tab
le 6
. C
hem
ical
com
posi
tion
of F
e-M
n cr
usts
fro
m T
unes
6 c
ruis
e
|[ D
9-11
Fe
Wt%
Mn
Fe/M
nS
iN
aA
lK M
gC
aT
iP H
20+
H2O
CO
2L
OI
Ni
ppm
Cu
Zn
Co
Ba
Mo
Sr Ce
Y V Pb Cr
Cd
As
Pt
ppb
Pd Rh
Ru
fr Inte
rval
^T
ype
12 19.0
0.63 2.4
1.2
0.41
0.40
0.68 1.9
0.88
0.24 5.8
27.0
0.34
39.9
4000
690
490
6200
1100
370
1200
650
140
490
1100
10.0
3.3
170 - - - - -
BO
-30
Cru
st
D9-
22A
13 16.0
0.81 3.5 1.4
0.96
0.49
0.67 2.0
0.81
0.34 7.1
24.8
0.35
37.7
3200
2100
570
2900
1700
270
1200
740
130
490
920
9.6
2.5
170 - - - - -
BO
-41
Cru
st
D9-
25A
1
13 18.0
0.72 3.0 1.3
0.53
0.41
0.66 1.9
0.88
0.26 8.7
25.2
0.41
38.5
3100
980
460
5100
1100
350
1200
700
160
510
1100
9.1
2.3
190 - - - - -
LO
-23
Cru
st
D9-
25B
15 15.0
1.00 3.9
1.3
1.1
0.46
0.67 1.8
0.95
0.27 6.6
23.5
0.31
36.0
2600
2100
570
3200
1700
260
1200
670
160
540
800
11 1.9
170 - - - - -
L23
^t3
Cru
st
D10
-1A
14 20.0
0.70 2.3 1.3
0.41
0.39
0.82 2.0
0.88
0.24 7.6
26.1
0.35
39.4
3700
1600
680
4200
1600
410
1300
770
110
610
1000
4.8
2.0
190
250
<4 12 16 4.6
BO
-49
Cru
st
D12
-3A
14 18.0
0.78 3.5 1.3
0.76
0.46
0.80 1.9
0.95
0.29 7.2
26.0
0.35
38.5
3100
1900
580
4200
1600
310
1200
880
130
540
1000
7.3
2.0
170
350
<4 15 19 5.5
BO
-45
Cru
st
D13
-13A
14 17.0
0.82 4.1 1.3
0.65
0.41
0.80 1.8
0.72
0.29 7.0
26.4
0.38
38.6
2800
480
470
4500
1100
340
1200
730
150
510
1400
8.0
2.0
220
240
<4 13 18 5.3
BO
-14
Cru
st
D14
-11
13 17.0
0.76 4.0
1.2
0.81
0.45
0.66 1.8
0.97
0.24 7.8
25.4
0.33
38.1
2900
1200
480
4600
1200
290
1100
870
140
500
1100
7.5
2.5
170 - - - - -
BO
-30
Cru
st
D14
-17A
13.0
15.0
0.87 5.1 1.5
1.3
0.57
0.68 1.8
0.94
0.24 7.4
23.4
0.30
36.2
2600
1700
480
3700
1300
230
1100
920
130
460
1000
9.3
2.3
150 - - - - -
BO
-15
Cru
st
D14
-19A
14.0
18.0
0.78 3.8 1.0
0.73
0.42
0.80 1.9
0.98
0.26 7.3
24.8
0.39
37.4
2900
910
520
4400
1400
340
1200
920
150
500
1200
5.9
2.4
190
220
<4 12 16 4.3
BO
-29
Cru
st
D15
-1A
10.0
16.0
0.63 2.8 1.2
0.61
0.39
0.67 5.8
0.71 1.7
8.1
22.3
0.99
34.8
3300
1000
620
2900
2200
400
1300
1200
210
560
1600
2,8
2,4
140 - - - - -
BO
-29
Cru
st
D15
-1B
7.7
13.0
0.59 1.9
1.0
0.64
0.36
0.73 14 0.62 4.7
5.3
14.9
2.20
26.1
4200
1100
740
1900
2100
290
1400
850
390
440
1200 81 3.7
77 - - - - -B
O-2
0C
rust
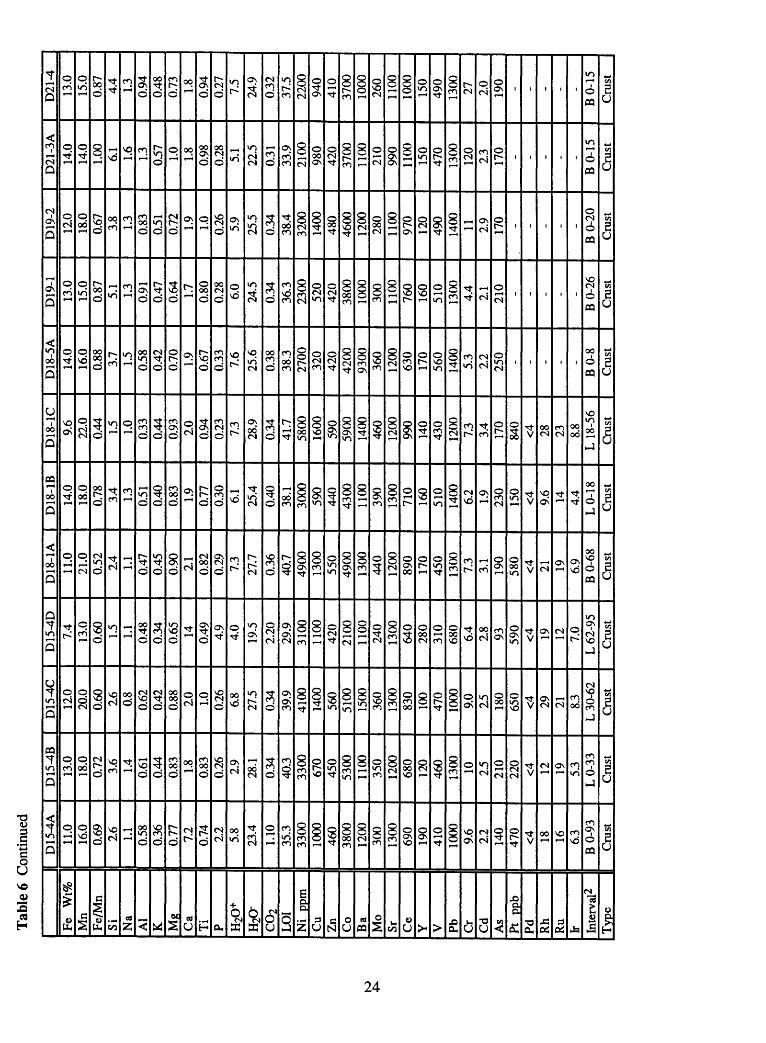
Tab
le 6
Con
tinue
d
II D
15-4
AFe
W
t%M
nFe
/Mn
Si Na
Al
K Mg
Ca
Ti
P H2O
+
H2CT
C02
LOI
Ni
ppm
Cu
Zn
Co
Ba
Mo
Sr Ce
Y V Pb Cr
Cd
As
Pt
ppb
Pd Rh
Ru
fr Inte
rval
2T
ype
11.0
16.0
0.69 2.6 1.1 0.
580.
360.
77 7.2
0.74 2.2
5.8
23.4
1.10
35.3
3300
1000
460
3800
1200
300
1300
690
190
410
1000
9.6
2.2
140
470
<4 18 16 6.3
BO
-93
Cru
st
D15
-4B
13.0
18.0
0.72 3.6
1.4
0.61
0.44
0.83 1.8
0.83
0.26 2.9
28.1
0.34
40.3
3300
670
450
5300
1100
350
1200
680
120
460
1300 10 25 210
220
<4 12 19 5.3
LO
-33
Cru
st
D15
-4C
12.0
20.0
0.60 2.6
0.8
0.62
0.42
0.88 2.0 1.0
0.26 6.8
27.5
0.34
39.9
4100
1400
560
5100
1500
360
1300
830
100
470
1000
9.0
2.5
180
650
<4 29 21 8.3
L 30
-62
Cru
st
D15
-4D
7.4
13.0
0.60 1.5
1.1 0.48
0.34
0.65 14 0.49 4.9
4.0
19.5
2.20
29.9
3100
1100
420
2100
1100
240
1300
640
280
310
680
6.4
2.8
93 590
<4 19 12 7.0
L 62
-95
Cru
st
D18
-1A
11.0
21.0
0.52 2.4
1.1
0.47
0.45
0.90 2.1
0.82
0.29 7.3
27.7
0.36
40.7
4900
1300
550
4900
1300
440
1200
890
170
450
1300
7.3
3.1
190
580
<4 21 19 6.9
BO
-68
Cru
st
D18
-1B
14.0
18.0
0.78 3.4
1.3
0.51
0.40
0.83 1.9
0.77
0.30 6.1
25.4
0.40
38.1
3000
590
440
4300
1100
390
1300
710
160
510
1400
6.2
1.9
230
150
<4 9.6 14 4.4
LO
-18
Cru
st
D18
-1C
9.6
22.0
0.44 1.5
1.0
0.33
0.44
0.93 2.0
0.94
0.23 7.3
28.9
0.34
41.7
5800
1600
590
5900
1400
460
1200
990
140
430
1200
7.3
3.4
170
840
<4 28 23 8.8
L 18
-56
Cru
st
D18
-5A
14.0
16.0
0.88 3.7
1.5
0.58
0.42
0.70 1.9
0.67
0.33 7.6
25.6
0.38
38.3
2700
320
420
4200
9300
360
1200
630
170
560
1400
5.3
2.2
250 - - - - -
BO
-8
Cru
st
D19
-113
.015
.00.
87 5.1 1.3
0.91
0.47
0.64 1.7
0.80
0.28 6.0
24.5
0.34
36.3
2300
520
420
3800
1000
300
1100
760
160
510
1300
4.4
2.1
210 - - - - -
BO
-26
Cru
st
D19
-212
.018
.00.
67 3.8 1.3
0.83
0.51
0.72 1.9
1.0
0.26 5.9
25.5
0.34
38.4
3200
1400
480
4600
1200
280
1100
970
120
490
1400 11 2.9
170 - - - - -
BO
-20
Cru
st
D21
-3A
14.0
14.0
1.00 6.1 1.6
1.3
0.57 1.0
1.8
0.98
0.28 5.1
22.5
0.31
33.9
2100
980
420
3700
1100
210
990
1100
150
470
1300
120
2.3
170 - - - - -
BO
-15
Cru
st
D21
-413
.015
.00.
87 4.4
1.3
0.94
0.48
0.73 1.8
0.94
0.27 7.5
24.9
0.32
37.5
2200
940
410
3700
1000
260
1100
1000
150
490
1300 27 2.0
190 - - - - -
BO
-15
Cru
st
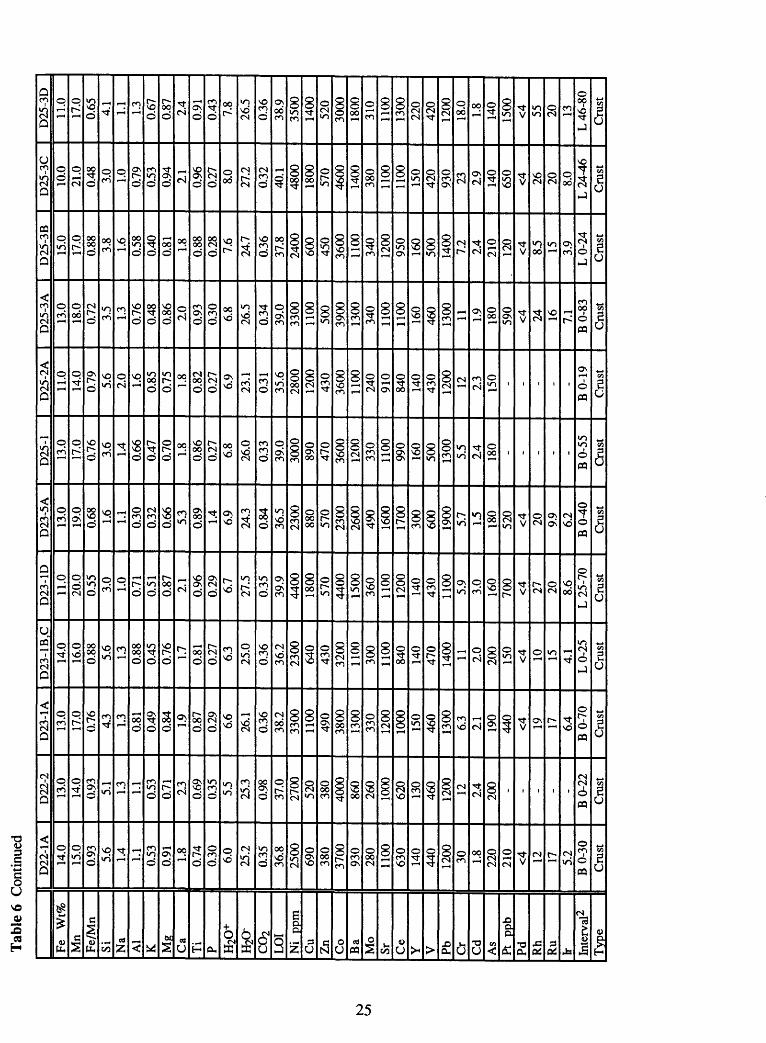
Tab
le 6
Con
tinue
d
II D
22-1
AFe
W
t%M
nF
e/M
nSi N
aA
lK M
gC
aTi P H
2O+
H2a
C02
LOI
Ni
ppm
Cu
Zn
Co
Ba
Mo
Sr Ce
Y V Pb Cr
Cd
As
Pt
ppb
Pd Rh
Ru
fr Inte
rval
^T
ype
14.0
15.0
0.93 5.6
1.4
1.1 0.53
0.91 1.8
0.74
0.30 6.0
25.2
0.35
36.8
2500
690
380
3700
930
280
1100
630
140
440
1200 30 1.8
220
210
<4 12 17 5.2
BO
-30
Cru
st
D22
-213
.014
.00.
93 5.1 1.3
1.1 0.53
0.71 2.3
0.69
0.35 5.5
25.3
0.98
37.0
2700
520
380
4000
860
260
1000
620
130
460
1200 12 2.4
200 - - - - -
BO
-22
Cru
st
D23
-1A
13.0
17.0
0.76 4.3 1.3
0.81
0.49
0.84 1.9
0.87
0.29 6.6
26.1
0.36
38.2
3300
1100
490
3800
1300
330
1200
1000
150
460
1300
6.3
11 190
440
<4 19 17 6.4
BO
-70
Cru
st
D23
-1B
,C14
.016
.00.
88 5.6
1.3
0.88
0.45
0.76 1.7
0.81
0.27 6.3
25.0
0.36
36.2
2300
640
430
3200
1100
300
1100
840
140
470
1400 11 2.0
200
150
<4 10 15 4.1
LO
-25
Cru
st
D23
-1D
11.0
20.0
0.55 3.0
1.0
0.71
0.51
0.87 2.1
0.96
0.29 6.7
27.5
0.35
39.9
4400
1800
570
4400
1500
360
1100
1200
140
430
1100
5.9
3.0
160
700
<4 27 20 8.6
L 25
-70
Cru
st
D23
-5A
13.0
19.0
0.68 1.6
1.1 0.30
0.32
0.66 5.3
0.89 1.4
6.9
24.3
0.84
36.5
2300
880
570
2300
2600
490
1600
1700
300
600
1900
5.7 1.5
180
520
<4 20 9.9
6.2
BO
^OC
rust
D25
-113
.017
.00.
76 3.6
1.4
0.66
0.47
0.70 1.8
0.86
0.27 6.8
26.0
0.33
39.0
3000
890
470
3600
1200
330
1100
990
160
500
1300
5.5
14 180 - - - - -
BO
-55
Cru
st
D25
-2A
11.0
14.0
0.79 5.6
2.0
1.6
0.85
0.75 1.8
0.82
0.27 6.9
23.1
0.31
35.6
2800
1200
430
3600
1100
240
910
840
140
430
1200 12 2.3
150 - - - - -
BO
-19
Cru
st
D25
-3A
13.0
18.0
0.72 3.5 1.3
0.76
0.48
0.86 2.0
0.93
0.30 6.8
26.5
0.34
39.0
3300
1100
500
3900
1300
340
1100
1100
160
460
1300 11 1.9
180
590
<4 24 16 7.1
BO
-83
Cru
st
D25
-3B
15.0
17.0
0.88 3.8
1.6
0.58
0.40
0.81 1.8
0.88
0.28 7.6
24.7
0.36
37.8
2400
600
450
3600
1100
340
1200
950
160
500
1400
7.2
2.4
210
. 12
0<4 8.
5 15 3.9
LO
-24
Cru
st
D25
-3C
10.0
21.0
0.48 3.0
1.0
0.79
0.53
0.94 11 0.96
0.27 8.0
27.2
0.32
40.1
4800
1800
570
4600
1400
380
1100
1100
150
420
930
23 19 140
650
<4 26 20 8.0
L 24
-46
Cru
st
D25
-3D
11.0
17.0
0.65 4.1 1.1 1.3
0.67
0.87 2.4
0.91
0.43 7.8
26.5
0.36
38.9
3500
1400
520
3000
1800
310
1100
1300
220
420
1200
18.0
1.8
140
1500
<4 55 20 13L
46-8
0C
rust
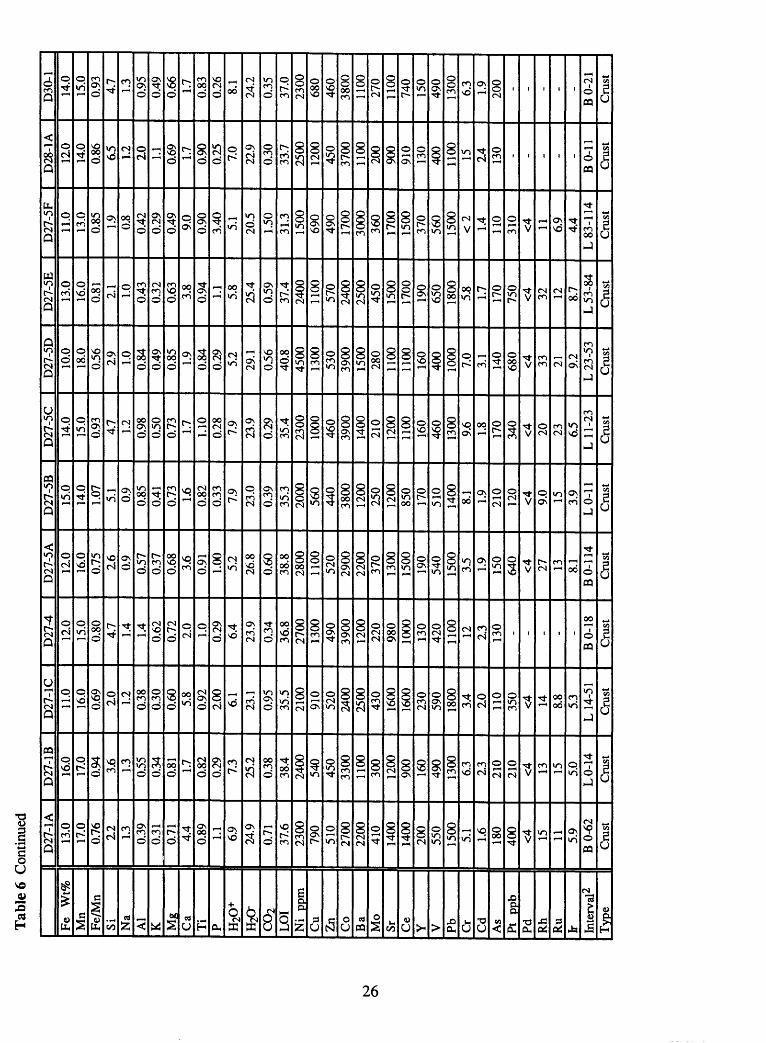
Tab
le 6
Con
tinue
d
II D
27-1
AF
e W
t%M
nF
e/M
nSi N
aA
lK M
gC
aT
iP H
20+
H20
-
CO
2L
OI
Ni
ppm
Cu
Zn
Co
Ba
Mo
Sr Ce
Y V Pb
Cr
Cd
As
Pt
ppb
Pd Rh
Ru
fr Inte
rval
2T
ype
13.0
17.0
0.76 12 1.3
0.39
0.31
0.71 4.4
0.89 1.1
6.9
24.9
0.71
37.6
2300
790
510
2700
2200
410
1400
1400
200
550
1500
5.1 1.6
180
400
<4 15 11 5.9
BO
-62
Cru
st
D27
-1B
16.0
17.0
0.94 3.6 1.3
0.55
0.34
0.81 1.7
0.82
0.29 7.3
25.2
0.38
38.4
2400
540
450
3300
1100
300
1200
900
160
490
1300
6.3
2.3
210
210
<4 13 15 5.0
LO
-14
Cru
st
D27
-1C
11.0
16.0
0.69 10 1.2
0.38
0.30
0.60 5.8
0.92
2.00 6.1
23.1
0.95
35.5
2100
910
520
2400
2500
430
1600
1600
230
590
1800
3.4
10 110
350
<4 14 8.8
5.3
L 1
4-51
Cru
st
D27
-412
.015
.00.
80 4.7
1.4
1.4
0.62
0.72 2.0
1.0
0.29 6.4
23.9
0.34
36.8
2700
1300
490
3900
1200
220
980
1000
130
420
1100 12 2.3
130 - - - - -
BO
-18
Cru
st
D27
-5A
12.0
16.0
0.75 2.6
0.9
0.57
0.37
0.68 3.6
0.91
1.00 5.2
26.8
0.60
38.8
2800
1100
520
2900
2200
370
1300
1500
190
540
1500
3.5 1.9
150
640
<4 27 13 8.1
BO
-114
Cru
st
D27
-5B
15.0
14.0
1.07 5.1
0.9
0.85
0.41
0.73 1.6
0.82
0.33 7.9
23.0
0.39
35.3
2000
560
440
3800
1200
250
1200
850
170
510
1400
8.1 1.9
210
120
<4 9.0 15 3.9
LO
-11
Cru
st
D27
-5C
14.0
15.0
0.93 4.7 1.2
0.98
0.50
0.73 1.7
1.10
0.28 7.9
23.9
0.29
35.4
2300
1000
460
3900
1400
210
1200
1100
160
460
1300
9.6
1.8
170
340
<4 20 23 6.5
LI
1-23
Cru
st
D27
-5D
10.0
18.0
0.56 2.9 1.0
0.84
0.49
0.85 1.9
0.84
0.29 5.2
29.1
0.56
40.8
4500
1300
530
3900
1500
280
1100
1100
160
400
1000
7.0
3.1
140
680
<4 33 21 9.2
L 23
-53
Cru
st
D27
-5E
13.0
16.0
0.81 2.1 1.0
0.43
0.32
0.63 3.8
0.94 1.1
5.8
25.4
0.59
37.4
2400
1100
570
2400
2500
450
1500
1700
190
650
1800
5.8 1.7
170
750
<4 32 12 8.7
L 53
-84
Cru
st
D27
-5F
11.0
13.0
0.85 1.9
0.8
0.42
0.29
0.49 9.0
0.90
3.40 5.1
20.5
1.50
31.3
1500
690
490
1700
3000
360
1700
1500
370
560
1500
<2 1.4
110
310
<4 11 6.9
4.4
L 8
3-11
4C
rust
D28
-1A
110
14.0
0.86 6.5 1.2
10 1.1 0.69 1.7
0.90
0.25 7.0
22.9
0.30
33.7
2500
1200
450
3700
1100
200
900
910
130
400
1100 15 14 130 - - - - -
BO
-11
Cru
st
D30
-114
.015
.00.
93 4.7
1.3
0.95
0.49
0.66 1.7
0.83
0.26 8.1
24.2
0.35
37.0
2300
680
460
3800
1100
270
1100
740
150
490
1300
6.3
1.9
200 - - - - -
BO
-21
Cru
st
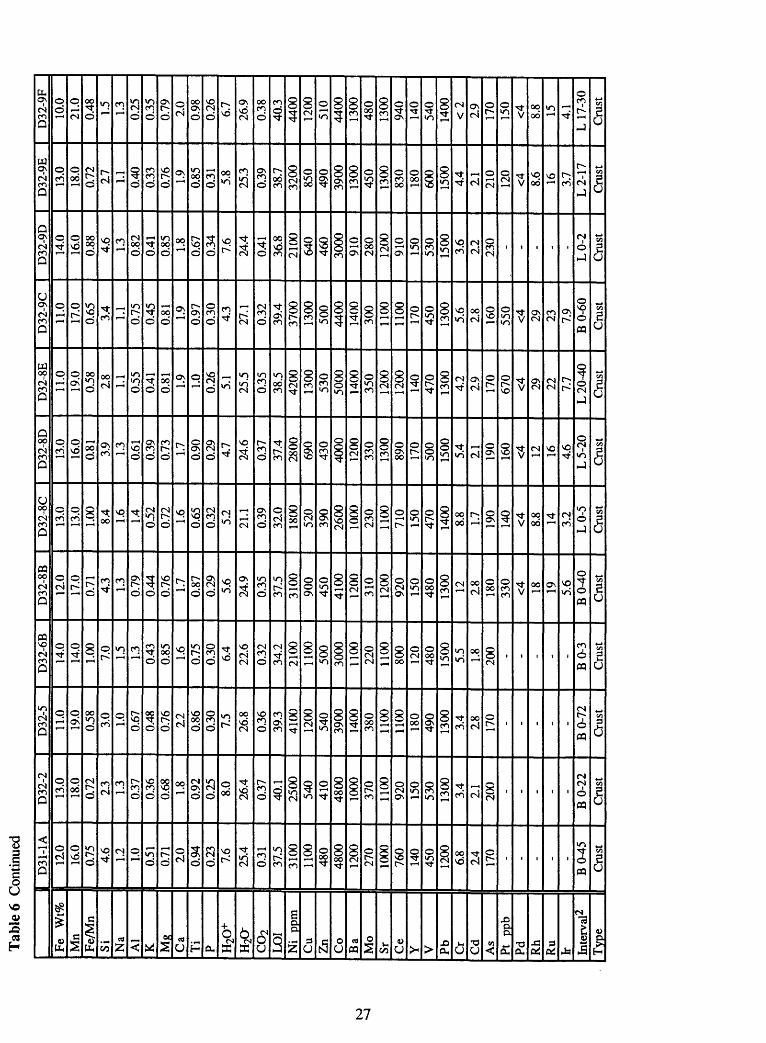
Tab
le 6
Con
tinue
d
Fe
Wt%
Mn
Fe/
Mn
Si
Na
Al
K Mg
Ca
Ti
P H20
+
H2a
C02
LO
IN
i pp
mC
uZ
nC
oB
aM
oSr C
eY V P
b Cr
Cd
As
Pt
ppb
Pd Rh
Ru
fr Inte
rval
^T
ype
D31
-1A
110
16.0
0.75 4.6
1.2
1.0
0.51
0.71 10 0.94
0.23 7.6
25.4
0.31
37.5
3100
1100
480
4800
1200
270
1000
760
140
450
1200
6.8
14 170 - - - - -
BO
-45
Cru
st
D32
-213
.018
.00.
72 2.3 1.3
0.37
0.36
0.68 1.8
0.92
0.25 8.0
26.4
0.37
40.1
2500
540
410
4800
1000
370
1100
920
150
530
1300
3.4
2.1
200 - - - - -
BO
-22
Cru
st
D32
-511
.019
.00.
58 3.0
1.0
0.67
0.48
0.76 12 0.86
0.30 7.5
26.8
0.36
39.3
4100
1200
540
3900
1400
380
1100
1100
180
490
1300
3.4
18 170 - - - - -
BO
-72
Cru
st
D32
-6B
14.0
14.0
1.00 7.0
1.5 1.3
0.43
0.85 1.6
0.75
0.30 6.4
22.6
0.32
34.2
2100
1100
500
3000
1100
220
1100
800
120
480
1500
5.5 1.8
200 - - - - -
BO
-3
Cru
st
D32
-8B
12.0
17.0
0.71 4.3 1.3
0.79
0.44
0.76 1.7
0.87
0.29 5.6
24.9
0.35
37.5
3100
900
450
4100
1200
310
1200
920
150
480
1300 12 2.8
180
330
<4 18 19 5.6
BO
^M)
Cru
st
D32
-8C
13.0
13.0
1.00 8.4
1.6
1.4
0.52
0.72 1.6
0.65
0.32 5.2
21.1
0.39
32.0
1800
520
390
2600
1000
230
1100
710
150
470
1400
8.8 1.7
190
140
<4 8.8 14 3.2
LO
-5
Cru
st
D32
-8D
13.0
16.0
0.81 3.9 1.3
0.61
0.39
0.73 1.7
0.90
0.29 4.7
24.6
0.37
37.4
2800
690
430
4000
1200
330
1300
890
170
500
1500
5.4
11 190
160
<4 12 16 4.6
L5-
20C
rust
D32
-8E
11.0
19.0
0.58 2.8 1.1 0.
550.
410.
81 1.9
1.0
0.26 5.1
25.5
0.35
38.5
4200
1300
530
5000
1400
350
1200
1200
140
470
1300
4.2
2.9
170
670
<4 29 22 7.7
L20
^M)
Cru
st
D32
-9C
11.0
17.0
0.65 3.4
1.1
0.75
0.45
0.81 1.9
0.97
0.30 4.3
27.1
0.32
39.4
3700
1300
500
4400
1400
300
1100
1100
170
450
1300
5.6
2.8
160
550
<4 29 23 7.9
BO
-60
Cru
st
D32
-9D
14.0
16.0
0.88 4.6
1.3
0.82
0.41
0.85 1.8
0.67
0.34 7.6
24.4
0.41
36.8
2100
640
460
3000
910
280
1200
910
150
530
1500
3.6
2.2
230 - - - - -
LO
-2
Cru
st
D32
-9E
13.0
18.0
0.72 17 1.1 0.40
0.33
0.76 1.9
0.85
0.31 5.8
25.3
0.39
38.7
3200
850
490
3900
1300
450
1300
830
180
600
1500
4.4
11 210
120
<4 8.6 16 3.7
L2-
17C
rust
D32
-9F
10.0
21.0
0.48 1.5
1.3
0.25
0.35
0.79 2.0
0.98
0.26 6.7
26.9
0.38
40.3
4400
1200
510
4400
1300
480
1300
940
140
540
1400
<2
2.9
170
150
<4 8.8 15 4.1
L 1
7-30
Cru
st
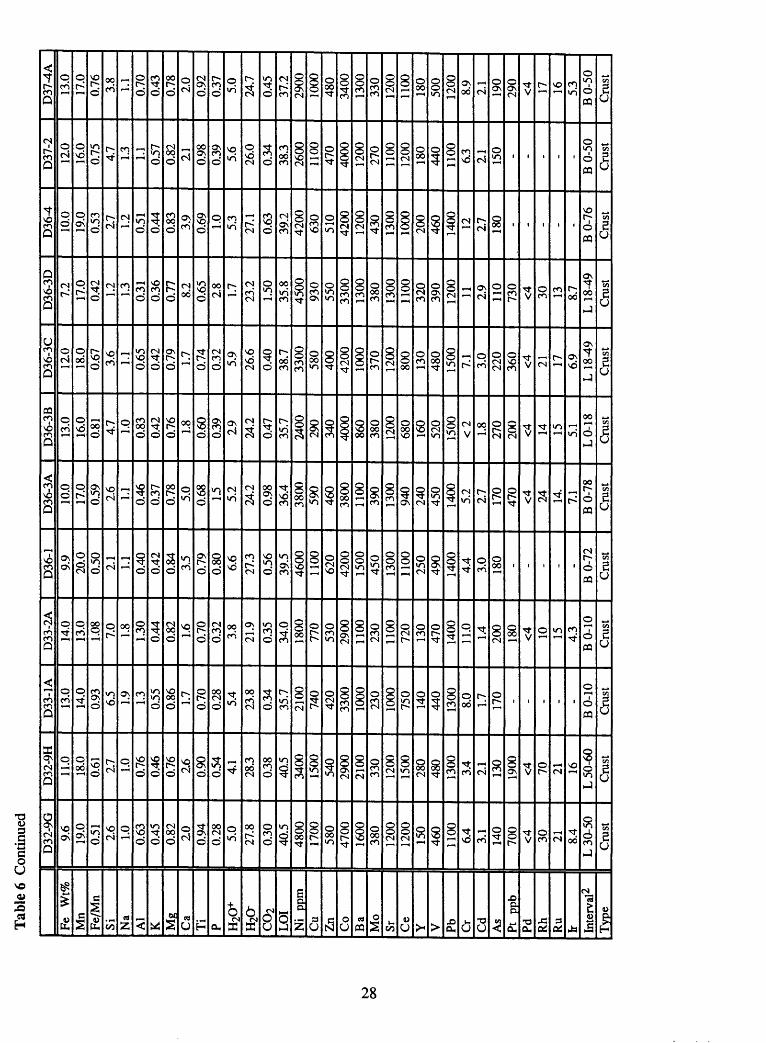
Tab
led
Con
tinue
d
II D
32-9
GFe
W
t%M
nFe
/Mn
Si Na
Al
K MR
Ca
Ti
P H20
+H
2O-
C02
LOI
Ni
ppm
Cu
Zn
Co
Ba
Mo
Sr Ce
Y V Pb Cr
Cd
As
Pt
ppb
Pd Rh
Ru
fr Inte
rval
^T
ype
9.6
19.0
0.51 2.6
1.0
0.63
0.45
0.82 2.0
0.94
0.28 5.0
27.8
0.30
40.5
4800
1700
580
4700
1600
380
1200
1200
150
460
1100
6.4
3.1
140
700
<4 30 21 8.4
L 3
0-50
Cru
st
D32
-9H
11.0
18.0
0.61 2.7 1.0
0.76
0.46
0.76 2.6
0.90
0.54 4.1
28.3
0.38
40.5
3400
1500
540
2900
2100
330
1200
1500
280
480
1300
3.4
2.1
130
1900
<4 70 21 16L
50-
60C
rust
D33
-1A
13.0
14.0
0.93 6.5 1.9
1.3
0.55
0.86 1.7
0.70
0.28 5.4
23.8
0.34
35.7
2100
740
420
3300
1000
230
1000
750
140
440
1300
8.0
1.7
170 - - - - -
BO
-10
Cru
st
D33
-2A
14.0
13.0
1.08 7.0
1.8
1.30
0.44
0.82 1.6
0.70
0.32 3.8
21.9
0.35
34.0
1800
770
530
2900
1100
230
1100
720
130
470
1400
11.0 1.4
200
180
<4 10 15 4.3
BO
-10
Cru
st
D36
-19.
920
.00.
50 2.1 1.1
0.40
0.42
0.84 3.5
0.79
0.80 6.6
27.3
0.56
39.5
4600
1100
620
4200
1500
450
1300
1100
250
490
1400
4.4
3.0
180 - - - - -
BO
-72
Cru
st
D36
-3A
10.0
17.0
0.59 2.6
1.1 0.46
0.37
0.78 5.0
0.68 1.5
5.2
24.2
0.98
36.4
3800
590
460
3800
1100
390
1300
940
240
450
1400
5.2
2.7
170
470
<4 24 14.
7.1
BO
-78
Cru
st
D36
-3B
13.0
16.0
0.81 4.7 1.0
0.83
0.42
0.76 1.8
0.60
0.39 19 24.2
0.47
35.7
2400
290
340
4000
860
380
1200
680
160
520
1500
<2 1.8
270
200
<4 14 15 5.1
LO
-18
Cru
st
D36
-3C
12.0
18.0
0.67 3.6
1.1
0.65
0.42
0.79 1.7
0.74
0.32 5.9
26.6
0.40
38.7
3300
580
400
4200
1000
370
1200
800
130
480
1500
7.1
3.0
220
360
<4 21 17 6.9
L18
^9C
rust
D36
-3D
7.2
17.0
0.42 1.2
1.3
0.31
0.36
0.77 8.2
0.65 2.8
1.7
23.2
1.50
35.8
4500
930
550
3300
1300
380
1300
1100
320
390
1200 11 2.9
110
730
<4 30 13 8.7
L 1
8-49
Cru
st
D36
^10
.019
.00.
53 2.7 1.2
0.51
0.44
0.83 3.9
0.69 1.0
5.3
27.1
0.63
39.2
4200
630
510
4200
1200
430
1300
1000
200
460
1400 12 2.7
180 - - - - -
BO
-76
Cru
st
D37
-212
.016
.00.
75 4.7 1.3
1.1 0.57
0.82 11 0.98
0.39 5.6
26.0
0.34
38.3
2600
1100
470
4000
1200
270
1100
1200
180
440
1100
6.3
11 150 - - - - -
BO
-50
Cru
st
D37
-4A
13.0
17.0
0.76 3.8
1.1
0.70
0.43
0.78 2.0
0.92
0.37 5.0
24.7
0.45
37.2
2900
1000
480
3400
1300
330
1200
1100
180
500
1200
8.9
2.1
190
290
<4 17 16 5.3
BO
-50
Cru
st
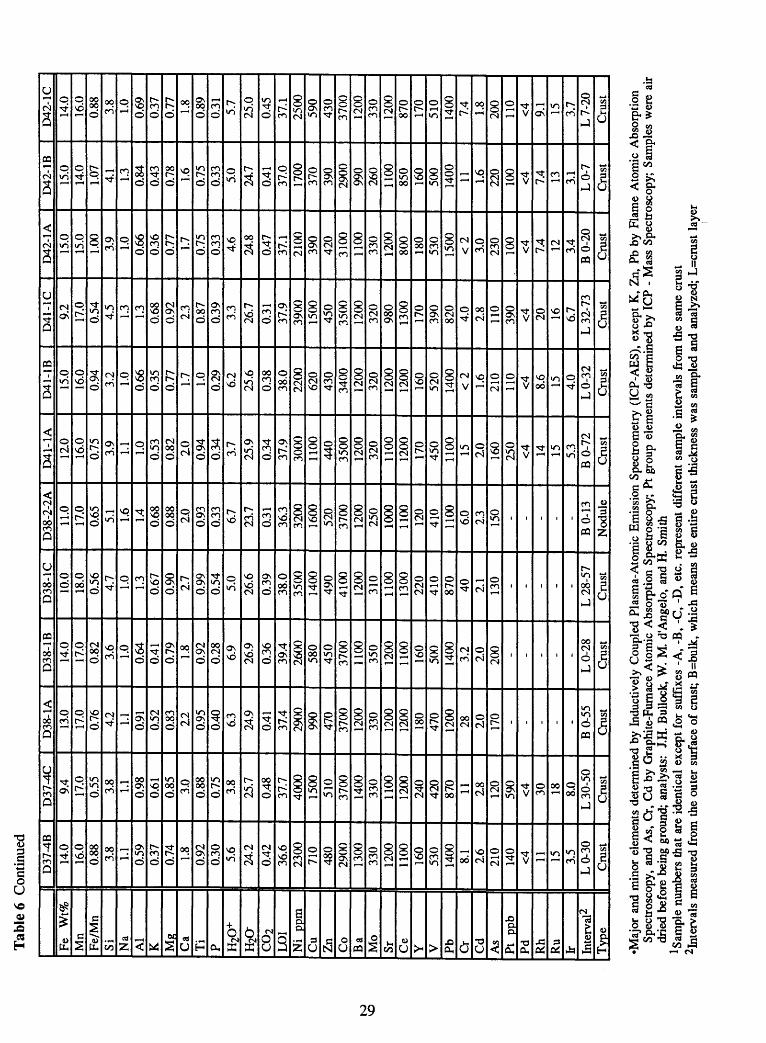
Tab
le 6
Con
tinue
d
H D
37-4
BFe
W
t%M
nF
e/M
nSi N
aA
lK M
gC
aT
iP H
20+
H2O
C0
2L
OI
Ni
ppm
Cu
Zn
Co
Ba
Mo
Sr Ce
Y V Pb Cr
Cd
As
Pt
ppb
Pd Rh
Ru
Ir Inte
rval
2T
ype
14.0
16.0
0.88 3.8 1.1 0.
590.
370.
74 1.8
0.92
0.30 5.6
24.2
0.42
36.6
2300
710
480
2900
1300
330
1200
1100
160
530
1400
8.1
2.6
210
140
<4 11 15 3.5
LO
-30
Cru
st
D37
-1C
9.4
17.0
0.55 3.8 1.1 0.
980.
610.
85 3.0
0.88
0.75 3.8
25.7
0.48
37.7
4000
1500
510
3700
1400
330
1100
1200
240
420
870 11 2.8
120
590
<4 30 18 8.0
L 3
0-50
Cru
st
D38
-1A
13.0
17.0
0.76 4.2 1.1 0.
910.
520.
83 12 0.95
0.40 6.3
24.9
0.41
37.4
2900
990
470
3700
1200
330
1200
1200
180
470
1200 28 2.0
170 - - - - -
BO
-55
Cru
st
D38
-1B
14.0
17.0
0.82 3.6
1.0
0.64
0.41
0.79 1.8
0.92
0.28 6.9
26.9
0.36
39.4
2600
580
450
3700
1100
350
1200
1100
160
500
1400
3.2
2.0
200 - - - - -
LO
-28
Cru
st
D38
-1C
10.0
18.0
0.56 4.7
1.0
1.3
0.67
0.90 2.7
0.99
0.54 5.0
26.6
0.39
38.0
3500
1400
490
4100
1200
310
1100
1300
220
410
870
40 2.1
130 - - - - -
L 2
8-57
Cru
st
D38
-2-2
A
11.0
17.0
0.65 5.1 1.6
1.4
0.68
0.88 2.0
0.93
0.33 6.7
23.7
0.31
36.3
3200
1600
520
3700
1200
250
1000
1100
120
410
1100
6.0
2.3
150 - - - - -
BO
-13
Nod
ule
D41
-1A
12.0
16.0
0.75 3.9
1.1 1.0
0.53
0.82 10 0.94
0.34 3.7
25.9
0.34
37.9
3000
1100
440
3500
1200
320
1100
1200
170
450
1100 15 10 160
250
<4 14 15 5.3
BO
-72
Cru
st
D41
-1B
15.0
16.0
0.94 3.2
1.0
0.66
0.35
0.77 1.7
1.0
0.29 6.2
25.6
0.38
38.0
2200
620
430
3400
1200
320
1200
1200
160
520
1400
<2 1.6
210
110
<4 8.6 15 4.0
LO
-32
Cru
st
D41
-1C
9.2
17.0
0.54 4.5 1.3
1.3
0.68
0.92 2.3
0.87
0.39 3.3
26.7
0.31
37.9
3900
1500
450
3500
1200
320
980
1300
170
390
820
4.0
2.8
110
390
<4 20 16 6.7
L 3
2-73
Cru
st
D42
-1A
15.0
15.0
1.00 3.9 1.0
0.66
0.36
0.77 1.7
0.75
0.33 4.6
24.8
0.47
37.1
2100
390
420
3100
1100
330
1200
800
180
530
1500
<2
3.0
230
. 10
0<4 7.
4 12 3.4
BO
-20
Cru
st
D42
-1B
15.0
14.0
1.07 4.1 1.3
0.84
0.43
0.78 1.6
0.75
0.33 5.0
24.7
0.41
37.0
1700
370
390
2900
990
260
1100
850
160
500
1400 11 1.6
220
100
<4 7.4 13 3.1
LO
-7
Cru
st
D42
-1C
14.0
16.0
0.88 3.8
1.0
0.69
0.37
0.77 1.8
0.89
0.31 5.7
25.0
0.45
37.1
2500
590
430
3700
1200
330
1200
870
170
510
1400
7.4
1.8
200
110
<4 9.1 15 3.7
L7-
20C
rust
Maj
or a
nd m
inor
ele
men
ts d
eter
min
ed b
y In
duct
ivel
y C
oupl
ed P
lasm
a-A
tom
ic E
mis
sion
Spe
ctro
met
ry (
ICP-
AE
S),
exce
pt K
, Z
n, P
b by
Fla
me
Ato
mic
Abs
orpt
ion
Spec
tros
copy
, an
d A
s, C
r, C
d by
Gra
phite
-Fur
nace
Ato
mic
Abs
orpt
ion
Spec
tros
copy
; Pt
gro
up e
lem
ents
det
erm
ined
by
ICP
- M
ass
Spec
tros
copy
; Sa
mpl
es w
ere
air
drie
d be
fore
bei
ng g
roun
d; a
naly
sts:
J.
H.
Bul
lock
, W
. M
. d'
Ang
elo,
and
H.
Smith
Sam
ple
num
bers
tha
t ar
e id
entic
al e
xcep
t for
suf
fixe
s -A
, -B
, -C
, -D
, et
c. r
epre
sent
dif
fere
nt s
ampl
e in
terv
als
from
the
sam
e cr
ust
2Int
erva
ls m
easu
red
from
the
out
er s
urfa
ce o
f cr
ust;
B=b
ulk,
whi
ch m
eans
the
ent
ire
crus
t th
ickn
ess
was
sam
pled
and
ana
lyze
d; L
=cru
st l
ayer
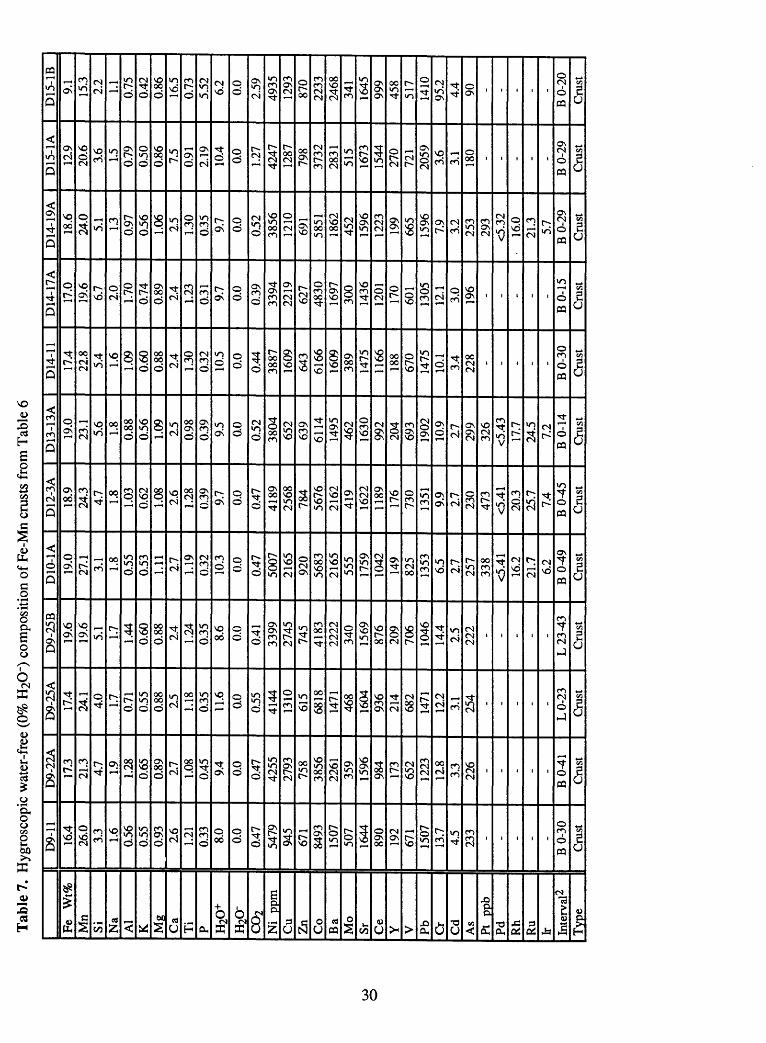
Tab
le 7
. H
ygro
scop
ic w
ater
-fre
e (0
% H
2O~)
com
posi
tion
of F
e-M
n cr
usts
fro
m T
able
6
II D
9-11
Fe
Wt%
Mn
Si Na
Al
K Mg
Ca
Ti
P H20
+H
2O-
CO
2N
i pp
mC
uZ
nC
oB
aM
oSr C
eY V P
bC
rC
dA
sPt
pp
bP
d Rh
Ru
Ir Inte
rval
2T
ype
16.4
26.0
3.3 1.6
0.56
0.55
0.93 16 1.21
0.33 8.0
0.0
0.47
5479
945
671
8493
1507
507
1644
890
192
671
1507
13.7
4.5
233 - - - - -
BO
-30
Cru
st
D9-
22A
17.3
21.3
4.7 1.9
1.28
0.65
0.89 2.7
1.08
0.45 9.4
0.0
0.47
4255
2793
758
3856
2261
359
1596
984
173
652
1223
12.8
3.3
226 - - - - -
BO
^lC
rust
D9-
25A
17.4
24.1
4.0 1.7
0.71
0.55
0.88 15 1.18
0.35 11.6
0.0
0.55
4144
1310
615
6818
1471
468
1604
936
214
682
1471
12.2
3.1
254 - - - - -
LO
-23
Cru
st
D9-
25B
19.6
19.6
5.1 1.7
1.44
0.60
0.88 2.4
1.24
0.35 8.6
0.0
0.41
3399
2745
745
4183
2222
340
1569
876
209
706
1046
14.4
2.5
222 - - - - -
L2
3^3
Cru
st
D10
-1A
19.0
27.1
3.1 1.8
0.55
0.53
1.11 2.7
1.19
0.32
10.3
0.0
0.47
5007
2165
920
5683
2165
555
1759
1042
149
825
1353
6.5
2.7
257
338
<5.4
116
.221
.76.
260^9
Cru
st
D12
-3A
18.9
24.3
4.7 1.8
1.03
0.62
1.08 2.6
1.28
0.39 9.7
0.0
0.47
4189
2568
784
5676
2162
419
1622
1189
176
730
1351
9.9
2.7
230
473
<5.4
120
.325
.77.
460^5
Cru
st
D13
-13A
19.0
23.1
5.6
1.8
0.88
0.56
1.09 15 0.98
0.39 9.5
0.0
0.52
3804
652
639
6114
1495
462
1630
992
204
693
1902
10.9
17 299
326
<5.4
317
.724
.57.
2B
O-1
4C
rust
D14
-11
17.4
22.8
5.4
1.6
1.09
0.60
0.88 2.4
1.30
0.32
10.5
0.0
0.44
3887
1609
643
6166
1609
389
1475
1166
188
670
1475
10.1
3.4
228 - - - - -
BO
-30
Cru
st
D14
-17A
17.0
19.6
6.7
2.0
1.70
0.74
0.89 2.4
1.23
0.31 9.7
0.0
0.39
3394
2219
627
4830
1697
300
1436
1201
170
601
1305
12.1
3.0
196 - - - - -
BO
-15
Cru
st
D14
-19A
18.6
24.0
5.1 1.3
0.97
0.56
1.06 2.5
1.30
0.35 9.7
0.0
0.52
3856
1210
691
5851
1862
452
1596
1223
199
665
1596
7.9
3.2
253
293
<5.3
216
.021
.35.
7B
O-2
9C
rust
D15
-1A
12.9
20.6
3.6 1.5
0.79
0.50
0.86 7.5
0.91
2.19
10.4
0.0
1.27
4247
1287
798
3732
2831
515
1673
1544
270
721
2059
3.6
3.1
180 - - - - -
BO
-29
Cru
st
D15
-1B
9.1
15.3
2.2
1.1 0.75
0.42
0.86
16.5
0.73
5.52 6.2
0.0
2.59
4935
1293
870
2233
2468
341
1645
999
458
517
1410
95.2
4.4 90 - - - - -
BO
-20
Cru
st
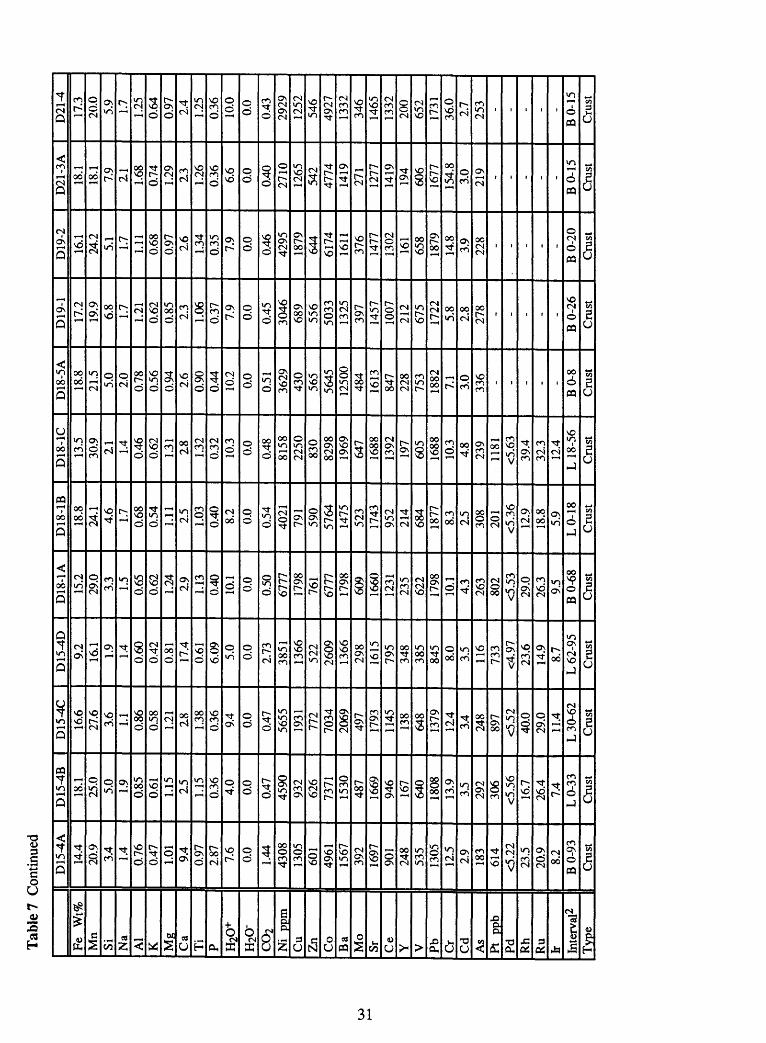
Tab
le?
Con
tinue
d
Fe
Wt%
Mn
Si Na
Al
K Mg
Ca
Ti
P H2O
+H
20-
CO
2N
i pp
mC
uZ
nC
oB
aM
oSr C
eY V P
bC
rC
dA
sPt
pp
bP
d Rh
Ru
fr Inte
rval
2T
ype
DIS
^A14
.420
.93.
41.
40.
760.
471.
01 9.4
0.97
2.87 7.6
0.0
1.44
4308
1305
601
4961
1567
392
1697
901
248
535
1305
12.5
2.9
183
614
<5.2
223
.520
.98.
2B
O-9
3C
rust
D15
-4B
18.1
25.0
5.0
1.9
0.85
0.61 1.15 2.5
1.15
0.36 4.0
0.0
0.47
4590
932
626
7371
1530
487
1669
946
167
640
1808
13.9
3.5
292
306
<5.5
616
.726
.47.
4L
O-3
3C
rust
D15
-4C
16.6
27.6
3.6
1.1 0.86
0.58 1.21 18 1.38
0.36 9.4
0.0
0.47
5655
1931
772
7034
2069
497
1793
1145
138
648
1379
12.4
3.4
248
897
<5.5
240
.029
.011
.4L
30-
62C
rust
D15
-4D
9.2
16.1 1.9
1.4
0.60
0.42
0.81 17.4
0.61
6.09 5.0
0.0
2.73
3851
1366
522
2609
1366
298
1615
795
348
385
845
8.0
3.5
116
733
<4.9
723
.614
.98.
7L
62-
95C
rust
D18
-1A
15.2
29.0
3.3
1.5
0.65
0.62
1.24 2.9
1.13
0.40
10.1
0.0
0.50
6777
1798
761
6777
1798
609
1660
1231
235
622
1798
10.1
4.3
263
802
<5.5
329
.026
.39.
5B
O-6
8C
rust
D18
-1B
18.8
24.1
4.6
1.7
0.68
0.54
1.11 2.5
1.03
0.40 8.2
0.0
0.54
4021
791
590
5764
1475
523
1743
952
214
684
1877
8.3
2.5
308
201
<5.3
612
.918
.85.
9L
O-1
8C
rust
D18
-1C
13.5
30.9
11 1.4
0.46
0.62
1.31 18 1.32
0.32
10.3
0.0
0.48
8158
2250
830
8298
1969
647
1688
1392
197
605
1688
10.3
4.8
239
1181
<5.6
339
.432
.312
.4L
18-
56C
rust
D18
-5A
18.8
21.5
5.0
2.0
0.78
0.56
0.94 2.6
0.90
0.44
10.2
0.0
0.51
3629
430
565
5645
1250
048
416
1384
722
875
318
827.
13.
033
6 - - - - -B
O-8
Cru
st
D19
-117
.219
.96.
81.
71.
210.
620.
85 2.3
1.06
0.37 7.9
0.0
0.45
3046
689
556
5033
1325
397
1457
1007
212
675
1722
5.8
2.8
278 - - - - -
BO
-26
Cru
st
D19
-216
.124
.25.
1 1.7
1.11
0.68
0.97 2.6
1.34
0.35 7.9
0.0
0.46
4295
1879
644
6174
1611
376
1477
1302
161
658
1879
14.8
3.9
228 -
.- - -
BO
-20
Cru
st
D21
-3A
18.1
18.1
7.9
11 1.68
0.74
1.29 13 1.26
0.36 6.6
0.0
0.40
2710
1265
542
4774
1419
271
1277
1419
194
606
1677
154.
83.
021
9 - - - - -B
O-1
5C
rust
D21
-417
.320
.05.
91.
71.
250.
640.
97 2.4
1.25
0.36
10.0
0.0
0.43
2929
1252
546
4927
1332
346
1465
1332
200
652
1731
36.0
2.7
253 - - - - -
BO
- 15
Cru
st
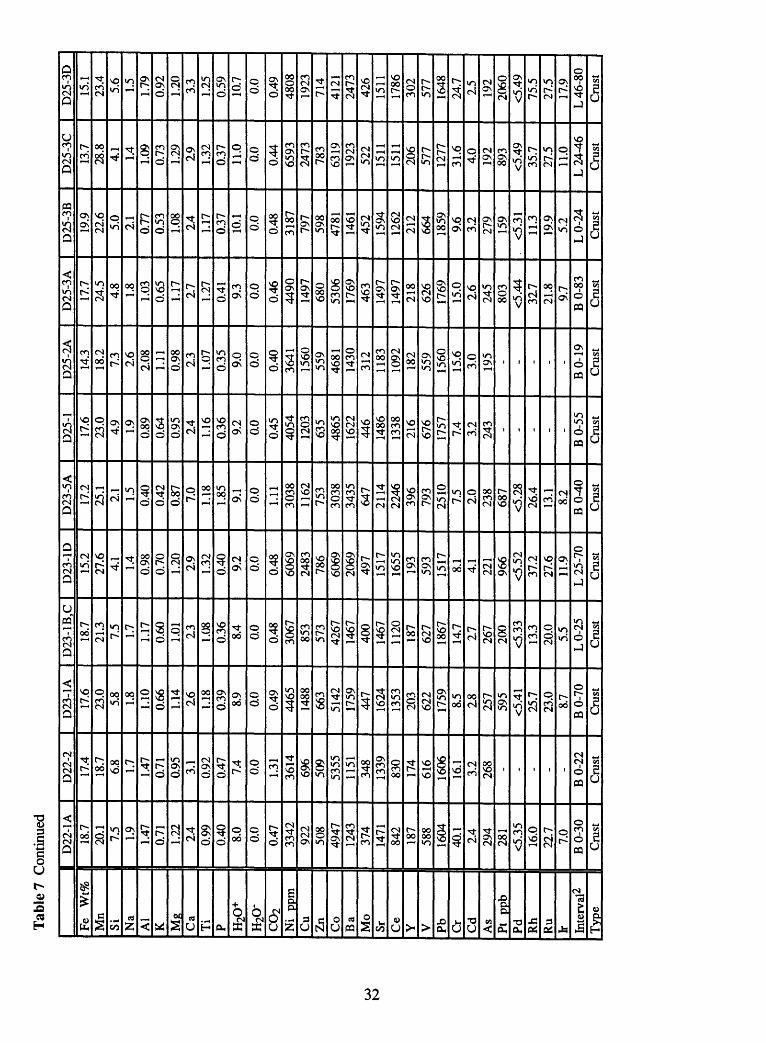
Tab
le?
Con
tinue
d
JL
D22
-1A
Fe
Wt%
Mn
Si Na
Al
K Mg
Ca
Ti
P H20
+H
20-
C02
Ni
ppm
Cu
Zn
Co
Ba
Mo
Sr Ce
Y V Pb
Cr
Cd
As
Pt
ppb
Pd Rh
Ru
fr Inte
rval
^T
ype
18.7
20.1
7.5 1.9
1.47
0.71 1.22 2.4
0.99
0.40 8.0
0.0
0.47
3342
922
508
4947
1243
374
1471
842
187
588
1604
40.1 2.4
294
281
<5.3
516
.022
.77.
0B
O-3
0C
rust
D22
-217
.418
.76.
8 1.7
1.47
0.71
0.95 3.1
0.92
0.47 7.4
0.0
1.31
3614
696
509
5355
1151
348
1339
830
174
616
1606
16.1
3.2
268 - - - - -
BO
-22
Cru
st
D23
-1A
17.6
23.0
5.8 1.8
1.10
0.66
1.14 16 1.18
0.39 8.9
0.0
0.49
4465
1488
663
5142
1759
447
1624
1353
203
622
1759 8.5
18 257
595
<5.4
125
.723
.08.
7B
O-7
0C
rust
D23
-1B
.C18
.721
.37.
5 1.7
1.17
0.60
1.01 13 1.08
0.36 8.4
0.0
0.48
3067
853
573
4267
1467
400
1467
1120
187
627
1867
14.7
2.7
267
200
<5.3
313
.320
.05.
5L
O-2
5C
rust
D23
-1D
15.2
27.6
4.1 1.4
0.98
0.70
1.20 2.9
1.32
0.40 9.2
0.0
0.48
6069
2483
786
6069
2069
497
1517
1655
193
593
1517
8.1
4.1
221
966
<5.5
237
.227
.611
.9L
25-
70C
rust
D23
-5A
17.2
25.1 2.1 1.5
0.40
0.42
0.87 7.0
1.18
1.85 9.1
0.0
1.11
3038
1162
753
3038
3435
647
2114
2246
396
793
2510 7.5
2.0
238
687
<5.2
826
.413
.18.
2B
O^O
Cru
st
D25
-117
.623
.04.
9 1.9
0.89
0.64
0.95 14 1.16
0.36 9.2
0.0
0.45
4054
1203
635
4865
1622
446
1486
1338
216
676
1757
7.4
3.2
243 - - - - -
BO
-55
Cru
st
D25
-2A
14.3
18.2
7.3
2.6
2.08
1.11
0.98 2.3
1.07
0.35 9.0
0.0
0.40
3641
1560
559
4681
1430
312
1183
1092
182
559
1560
15.6
3.0
195 - - - - -
BO
-19
Cru
st
D25
-3A
17.7
24.5
4.8 1.8
1.03
0.65
1.17 2.7
1.27
0.41 9.3
0.0
0.46
4490
1497
680
5306
1769
463
1497
1497
218
626
1769
15.0
2.6
245
803
<5.4
432
.721
.89.
7B
O-8
3C
rust
D25
-3B
19.9
22.6
5.0
2.1
0.77
0.53
1.08 2.4
1.17
0.37
10.1
0.0
0.48
3187
797
598
4781
1461
452
1594
1262
212
664
1859
9.6
3.2
279
159
. <5
.31
11.3
19.9
5.2
LO
-24
Cru
st
D25
-3C
13.7
28.8
4.1 1.4
1.09
0.73 1.29 19 1.32
0.37
11.0
0.0
0.44
6593
2473
783
6319
1923
522
1511
1511
206
577
1277
31.6
4.0
192
893
<5.4
935
.727
.511
.0L
24^6
Cru
st
D25
-3D
15.1
23.4
5.6
1.5
1.79
0.92
1.20 3.3
1.25
0.59
10.7
0.0
0.49
4808
1923
714
4121
2473
426
1511
1786
302
577
1648
24.7
2.5
192
2060
<5.4
975
.527
.517
.9L
46-
80C
rust
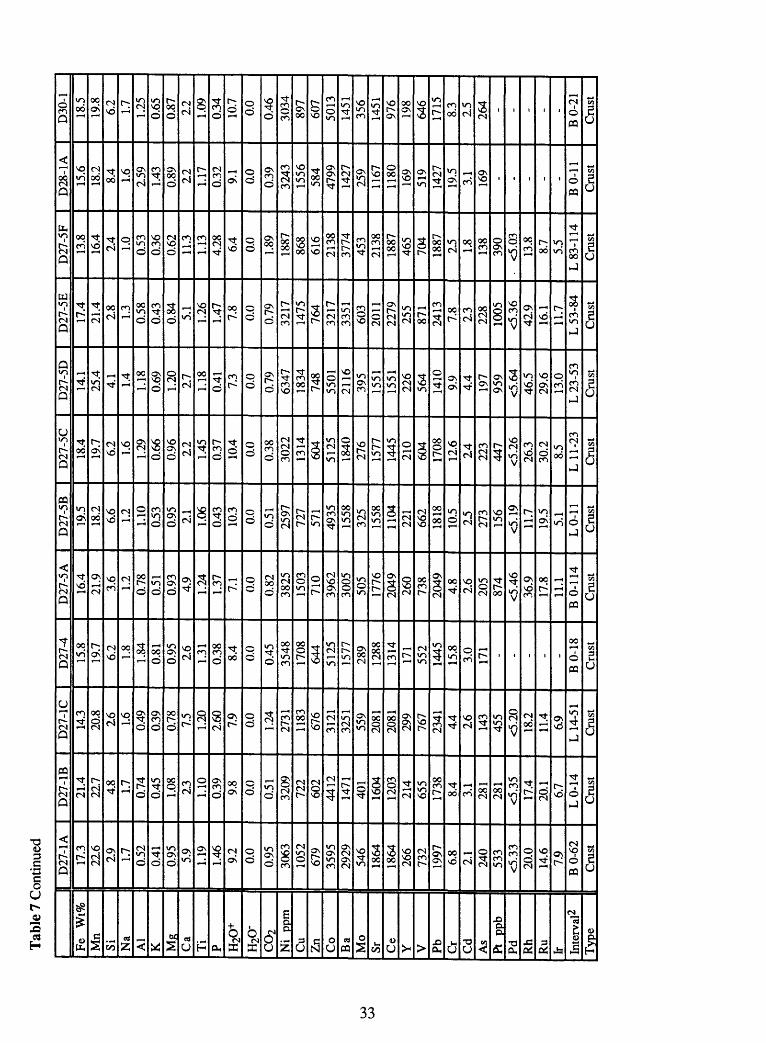
Tab
le 7
Con
tinue
d
|| D
27-1
AFe
W
t%M
nSi N
aA
lK M
gC
aT
iP H
2O+
H20
-
CO
2N
i pp
mC
uZ
nC
oB
aM
oSr C
eY V P
bC
rC
dA
sPt
pp
bPd R
hR
ufr In
terv
al2
Typ
e
17.3
22.6
2.9 1.7
0.52
0.41
0.95 5.9
1.19
1.46 9.2
0.0
0.95
3063
1052
679
3595
2929
546
1864
1864
266
732
1997
6.8
2.1
240
533
<5.3
320
.014
.67.
9B
O-6
2C
rust
D27
-1B
21.4
22.7
4.8 1.7
0.74
0.45 1.08 2.3
1.10
0.39 9.8
0.0
0.51
3209
722
602
4412
1471
401
1604
1203
214
655
1738
8.4
3.1
281
281
<5.3
517
.420
.16.
7L
O-1
4C
rust
D27
-1C
14.3
20.8
16 1.6
0.49
0.39
0.78 7.5
1.20
2.60 7.9
0.0
1.24
2731
1183
676
3121
3251
559
2081
2081
299
767
2341 4.4
16 143
455
<5.2
018
.211
.46.
9L
14-
51C
rust
D27
-415
.819
.76.
21.
81.
840.
810.
95 2.6
1.31
0.38 8.4
0.0
0.45
3548
1708
644
5125
1577
289
1288
1314
171
552
1445
15.8
3.0
171 - - - - -
BO
-18
Cru
st
D27
-5A
16.4
21.9
3.6
1.2
0.78
0.51
0.93 4.9
1.24
1.37 7.1
0.0
0.82
3825
1503
710
3962
3005
505
1776
2049
260
738
2049
4.8
2.6
205
874
<5.4
636
.917
.811
.1B
O-1
14C
rust
D27
-5B
19.5
18.2
6.6
1.2
1.10
0.53
0.95 2.1
1.06
0.43
10.3
0.0
0.51
2597
727
571
4935
1558
325
1558
1104
221
662
1818
10.5
2.5
273
156
<5.1
911
.719
.55.
1L
O-1
1C
rust
D27
-5C
18.4
19.7
6.2 1.6
1.29
0.66
0.96 12 1.45
0.37
10.4
0.0
0.38
3022
1314
604
5125
1840
276
1577
1445
210
604
1708
12.6
14 223
447
<5.2
626
.330
.28.
5L
I 1-
23C
rust
D27
-5D
14.1
25.4
4.1 1.4
1.18
0.69
1.20 2.7
1.18
0.41 7.3
0.0
0.79
6347
1834
748
5501
2116
395
1551
1551
226
564
1410
9.9
4.4
197
959
<5.6
446
.529
.613
.0L
23-
53C
rust
D27
-5E
17.4
21.4
2.8
1.3
0.58
0.43
0.84 5.1
1.26
1.47 7.8
0.0
0.79
3217
1475
764
3217
3351
603
2011
2279
255
871
2413
7.8
2.3
228
1005
<5.3
642
.916
.111
.7L
53-
84C
rust
D27
-5F
13.8
16.4
2.4
1.0
0.53
0.36
0.62
11.3
1.13
4.28 6.4
0.0
1.89
1887
868
616
2138
3774
453
2138
1887
465
704
1887
2.5 1.8
138
390
<5.0
313
.88.
75.
5L
83-
1 14
Cru
st
D28
-1A
15.6
18.2
8.4
1.6
2.59
1.43
0.89 12 1.17
0.32 9.1
0.0
0.39
3243
1556
584
4799
1427
259
1167
1180
169
519
1427
19.5
3.1
169 - - - - -
BO
-11
Cru
st
D30
-118
.519
.86.
21.
71.
250.
650.
87 2.2
1.09
0.34
10.7
0.0
0.46
3034
897
607
5013
1451
356
1451
976
198
646
1715
8.3
2.5
264 - - - - -
BO
-21
Cru
st
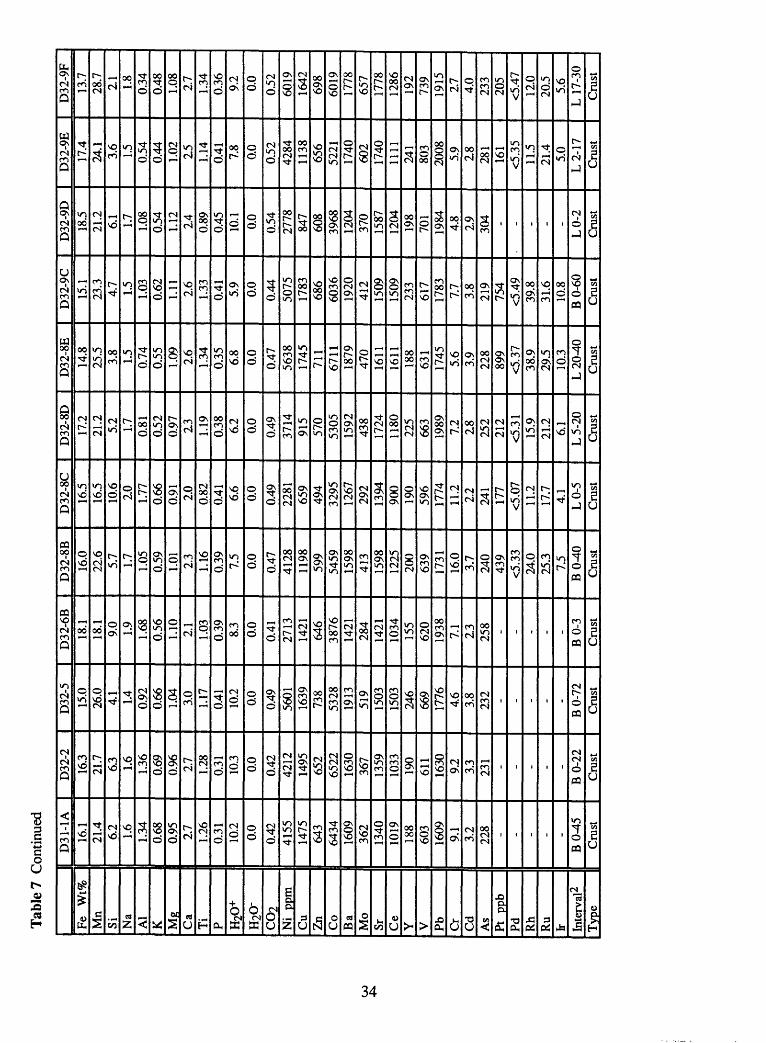
Tab
le?
Con
tinue
d
Fe
Wt%
Mn
Si Na
Al
K Mg
Ca
Ti P H2O
+H
2O-
CO
2N
i pp
mC
uZ
n Co
Ba
Mo
Sr Ce
Y V Pb Cr
Cd
As
Pt
ppb
Pd Rh
Ru
IT Inte
rval
2T
ype
D31
-1A
16.1
21.4
6.2
1.6
1.34
0.68
0.95 2.7
1.26
0.31 10.2
0.0
0.42
4155
1475
643
6434
1609
362
1340
1019
188
603
1609
9.1
3.2
228 - - - - -
BO
-45
Cru
st
D32
-216
.321
.76.
3 1.6
1.36
0.69
0.96 2.7
1.28
0.31 10.3
0.0
0.42
4212
1495
652
6522
1630
367
1359
1033
190
611
1630
9.2
3.3
231 - - - - -
BO
-22
Cru
st
D32
-515
.026
.04.
1 1.4
0.92
0.66
1.04 3.0
1.17
0.41 10.2
0.0
0.49
5601
1639
738
5328
1913
519
1503
1503
246
669
1776
4.6
3.8
232 - - - - -
BO
-72
Cru
st
D32
-6B
18.1
18.1
9.0
1.9
1.68
0.56
1.10 2.1
1.03
0.39 8.3
0.0
0.41
2713
1421
646
3876
1421
284
1421
1034
155
620
1938
7.1
2.3
258 - - - - -
BO
-3
Cru
st
D32
-8B
16.0
22.6
5.7
1.7
1.05
0.59
1.01 2.3
1.16
0.39 7.5
0.0
0.47
4128
1198
599
5459
1598
413
1598
1225
200
639
1731
16.0
3.7
240
439
<5.3
324
.025
.37.
5B
O-4
0C
rust
D32
-8C
16.5
16.5
10.6
2.0
1. 77
0.66
0.91 2.0
0.82
0.41 6.6
0.0
0.49
2281
659
494
3295
1267
292
1394
900
190
596
1774
11.2
2.2
241
177
<5.0
711
.217
.74.
1L
O-5
Cru
st
D32
-8D
17.2
21.2
5.2 1.7
0.81
0.52
0.97 13 1.19
0.38 6.2
0.0
0.49
3714
915
570
5305
1592
438
1724
1180
225
663
1989
7.2
18 252
212
<5.3
115
.921
.26.
1L
5-20
Cru
st
D32
-8E
14.8
25.5
3.8
1.5
0.74
0.55
1.09 2.6
1.34
0.35 6.8
0.0
0.47
5638
1745
711
6711
1879
470
1611
1611
188
631
1745
5.6
3.9
228
899
<5.3
738
.929
.510
.3L
20-
40C
rust
D32
-9C
15.1
23.3
4.7 1.5
1.03
0.62
1.11 2.6
1.33
0.41 5.9
0.0
0.44
5075
1783
686
6036
1920
412
1509
1509
233
617
1783
7.7
3.8
219
754
<5.4
939
.831
.610
.8B
O-6
0C
rust
D32
-9D
18.5
21.2
6.1 1.7
1.08
0.54
1.12 2.4
0.89
0.45
10.1
0.0
0.54
2778
847
608
3968
1204
370
1587
1204
198
701
1984
4.8
2.9
304 -
.- - -
LO
-2
Cru
st
D32
-9E
17.4
24.1
3.6 1.5
0.54
0.44
1.02 15 1.14
0.41 7.8
0.0
0.52
4284
1138
656
5221
1740
602
1740
1111
241
803
2008
5.9
18 281
161
<5.3
511
.521
.45.
0L
2-17
Cru
st
D32
-9F
13.7
28.7
2.1 1.8
0.34
0.48
1.08 2.7
1.34
0.36 9.2
0.0
0.52
6019
1642
698
6019
1778
657
1778
1286
192
739
1915
2.7
4.0
233
205
<5.4
712
.020
.55.
6L
17-
30C
rust
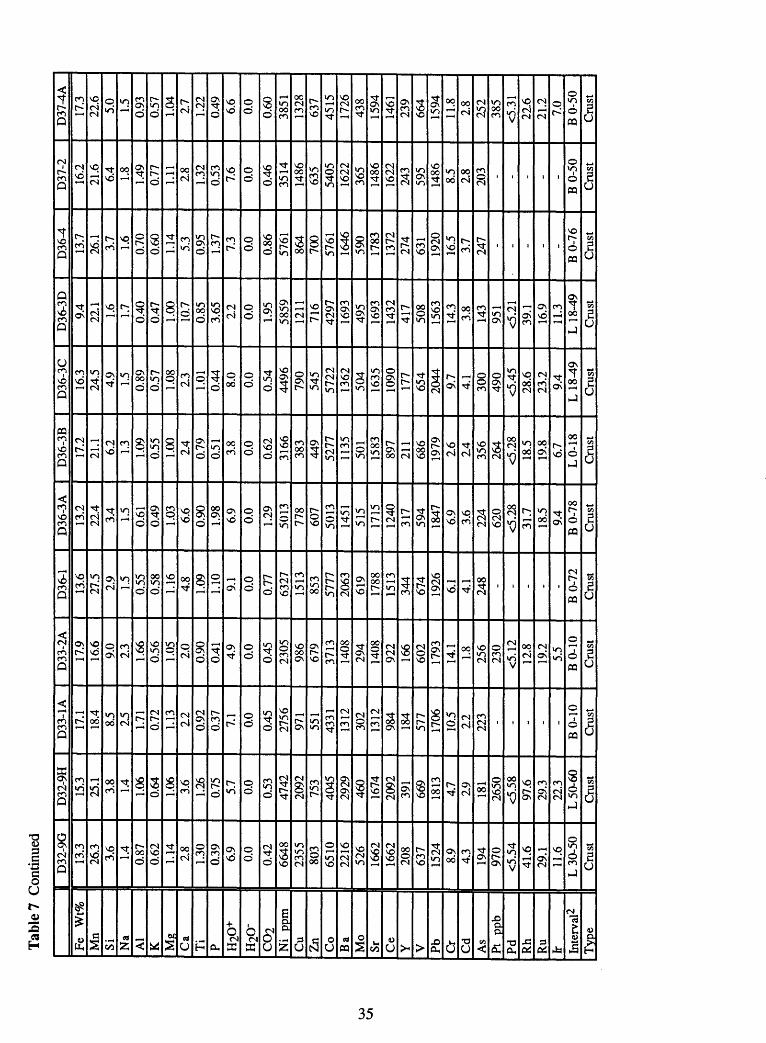
Tab
le?
Con
tinue
d
J| D
32-9
GFe
W
t%M
nSi N
aA
lK M
gC
aT
iP H
2O+
H20
-
CO
2N
i pp
mC
uZ
nC
oB
aM
oSr C
eY V Pb C
rC
dA
sPt
pp
bP
d Rh
Ru
fr Inte
rval
^T
ype
13.3
26.3
3.6
1.4
0.87
0.62
1.14 2.8
1.30
0.39 6.9
0.0
0.42
6648
2355
803
6510
2216
526
1662
1662
208
637
1524
8.9
4.3
194
970
<5.5
441
.629
.111
.6L
30-
50C
rust
D32
-9H
15.3
25.1 3.8 1.4
1.06
0.64 1.06 3.6
1.26
0.75 5.7
0.0
0.53
4742
2092
753
4045
2929
460
1674
2092
391
669
1813
4.7
2.9
181
2650
<5.5
897
.629
.322
.3L
50-
60C
rust
D33
-1A
17.1
18.4
8.5
2.5
1.71
0.72
1.13 2.2
0.92
0.37 7.1
0.0
0.45
2756
971
551
4331
1312
302
1312
984
184
577
1706
10.5
2.2
223 - - - - -
BO
-10
Cru
st
D33
-2A
17.9
16.6
9.0
2.3
1.66
0.56
1.05 2.0
0.90
0.41 4.9
0.0
0.45
2305
986
679
3713
1408
294
1408
922
166
602
1793
14.1 1.8
256
230
<5.1
212
.819
.25.
5B
O-1
0C
rust
D36
-113
.627
.52.
91.
50.
550.
581.
16 4.8
1.09
1.10 9.1
0.0
0.77
6327
1513
853
5777
2063
619
1788
1513
344
674
1926
6.1
4.1
248 - - - - -
BO
-72
Cru
st
D36
-3A
13.2
22.4
3.4
1.5
0.61
0.49
1.03 6.6
0.90
1.98 6.9
0.0
1.29
5013
778
607
5013
1451
515
1715
1240
317
594
1847
6.9
3.6
224
620
<5.2
831
.718
.59.
4B
O-7
8C
rust
D36
-3B
17.2
21.1
6.2 1.3
1.09
0.55 1.00 2.4
0.79
0.51 3.8
0.0
0.62
3166
383
449
5277
1135
501
1583
897
211
686
1979
2.6
2.4
356
264
<5.2
818
.519
.86.
7L
O-1
8C
rust
D36
-3C
16.3
24.5
4.9 1.5
0.89
0.57
1.08 2.3
1.01
0.44 8.0
0.0
0.54
4496
790
545
5722
1362
504
1635
1090
111
654
2044
9.7
4.1
300
490
<5.4
528
.623
.29.
4L
18^9
Cru
st
D36
-3D
9.4
22.1 1.6
1.7
0.40
0.47
1.00
10.7
0.85
3.65 2.2
0.0
1.95
5859
1211
716
4297
1693
495
1693
1432
417
508
1563
14.3
3.8
143
951
<5.2
139
.116
.911
.3L
18-
49C
rust
D36
^13
.726
.1 3.7
1.6
0.70
0.60
1.14 5.3
0.95
1.37 7.3
0.0
0.86
5761
864
700
5761
1646
590
1783
1372
274
631
1920
16.5
3.7
247 -
.- - -
BO
-76
Cru
st
D37
-216
.221
.66.
41.
81.
490.
771.
11 2.8
1.32
0.53 7.6
0.0
0.46
3514
1486
635
5405
1622
365
1486
1622
243
595
1486
8.5
2.8
203 - - - - -
BO
-50
Cru
st
D37
^A17
.322
.65.
01.
50.
930.
571.
04 2.7
1.22
0.49 6.6
0.0
0.60
3851
1328
637
4515
1726
438
1594
1461
239
664
1594
11.8
2.8
252
385
<5.3
122
.621
.27.
0B
O-5
0C
rust
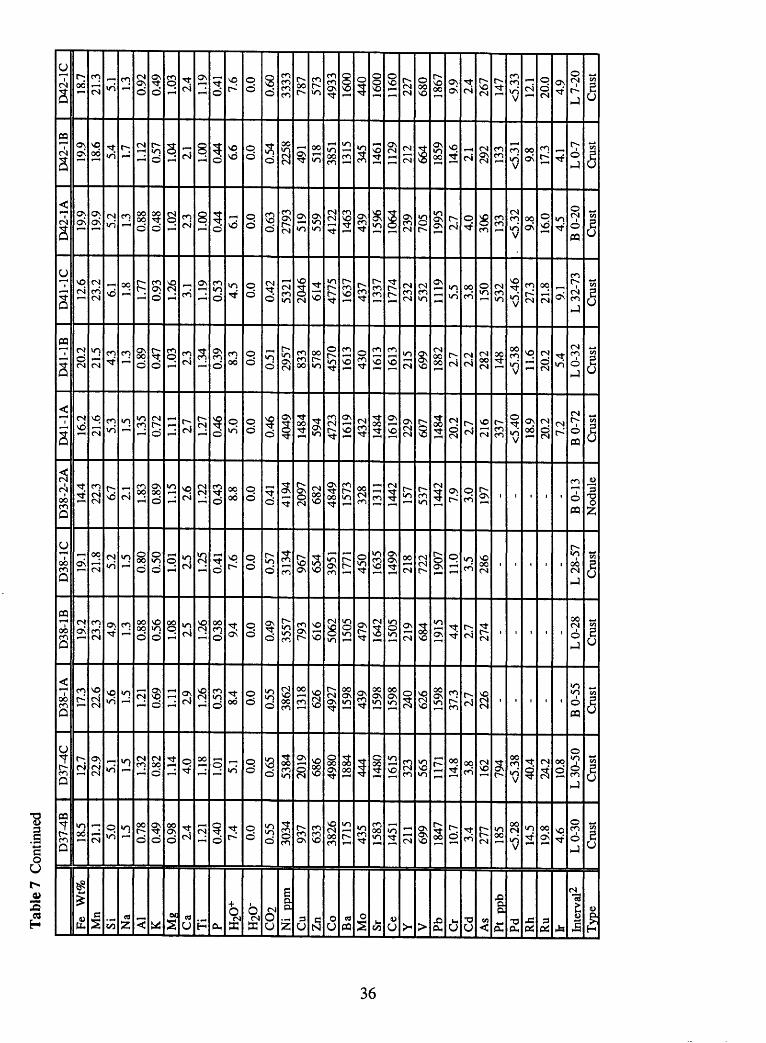
Tab
le?
Con
tinue
d
Fe
Wt%
Mn
Si Na
Al
K Mg
Ca
Ti
P H20
+H
20-
CO
2N
i pp
mC
uZ
nC
oB
aM
oSr C
eY V P
b Cr
Cd
As
Pt
ppb
Pd Rh
Ru
fr Inte
rval
^T
ype
D37
-4B
18.5
21.1
5.0
1.5
0.78
0.49
0.98 2.4
1.21
0.40 7.4
0.0
0.55
3034
937
633
3826
1715
435
1583
1451
211
699
1847
10.7
3.4
277
185
<5.2
814
.519
.84.
6L
O-3
0C
rust
D37
-4C
12.7
22.9
5.1 1.5
1.32
0.82
1.14 4.0
1.18
1.01 5.1
0.0
0.65
5384
2019
686
4980
1884
444
1480
1615
323
565
1171
14.8
3.8
162
794
<5.3
840
.424
.210
.8L
30-
50C
rust
D38
-1A
17.3
22.6
5.6 1.5
1.21
0.69
1.11 19 1.26
0.53 8.4
0.0
0.55
3862
1318
626
4927
1598
439
1598
1598
240
626
1598
37.3
17 226 - - - - -
BO
-55
Cru
st
D38
-1B
19.2
23.3
4.9
1.3
0.88
0.56
1.08 2.5
1.26
0.38 9.4
0.0
0.49
3557
793
616
5062
1505
479
1642
1505
219
684
1915
4.4
2.7
274 - - - - -
LO
-28
Cru
st
D38
-1C
19.1
21.8
5.2
1.5
0.80
0.50
1.01 2.5
1.25
0.41 7.6
0.0
0.57
3134
967
654
3951
1771
450
1635
1499
218
722
1907
11.0
3.5
286 - - - - -
L 2
8-57
Cru
st
D38
-2-2
A
14.4
22.3
6.7
2.1
1.83
0.89
1.15 2.6
1.22
0.43 8.8
0.0
0.41
4194
2097
682
4849
1573
328
1311
1442
157
537
1442
7.9
3.0
197 - - - - -
BO
-13
Nod
ule
D41
-1A
16.2
21.6
5.3 1.5
1.35
0.72
1.11 17 1.27
0.46 5.0
0.0
0.46
4049
1484
594
4723
1619
432
1484
1619
229
607
1484
20.2
17 216
337
<5.4
018
.920
.27.
2B
O-7
2C
rust
D41
-1B
20.2
21.5
4.3 1.3
0.89
0.47
1.03 2.3
1.34
0.39 8.3
0.0
0.51
2957
833
578
4570
1613
430
1613
1613
215
699
1882
2.7
2.2
282
148
<5.3
811
.620
.25.
4L
O-3
2C
rust
D41
-1C
12.6
23.2
6.1 1.8
1.77
0.93
1.26 3.1
1.19
0.53 4.5
0.0
0.42
5321
2046
614
4775
1637
437
1337
1774
232
532
1119
5.5
3.8
150
532
<5.4
627
.321
.89.
1L
32-
73C
rust
D42
-1A
19.9
19.9
5.2
1.3
0.88
0.48
1.02 2.3
1.00
0.44 6.1
0.0
0.63
2793
519
559
4122
1463
439
1596
1064
239
705
1995
2.7
4.0
306
133
. <5
.32
9.8
16.0
4.5
BO
-20
Cru
st
D42
-1B
19.9
18.6
5.4
1.7
1.12
0.57
1.04 11 1.00
0.44 6.6
0.0
0.54
2258
491
518
3851
1315
345
1461
1129
212
664
1859
14.6
2.1
292
133
<5.3
19.
817
.34.
1L
O-7
Cru
st
D42
-1C
18.7
21.3
5.1 1.3
0.92
0.49
1.03 2.4
1.19
0.41 7.6
0.0
0.60
3333
787
573
4933
1600
440
1600
1160
227
680
1867
9.9
2.4
267
147
<5.3
312
.120
.04.
9L
7-20
Cru
st
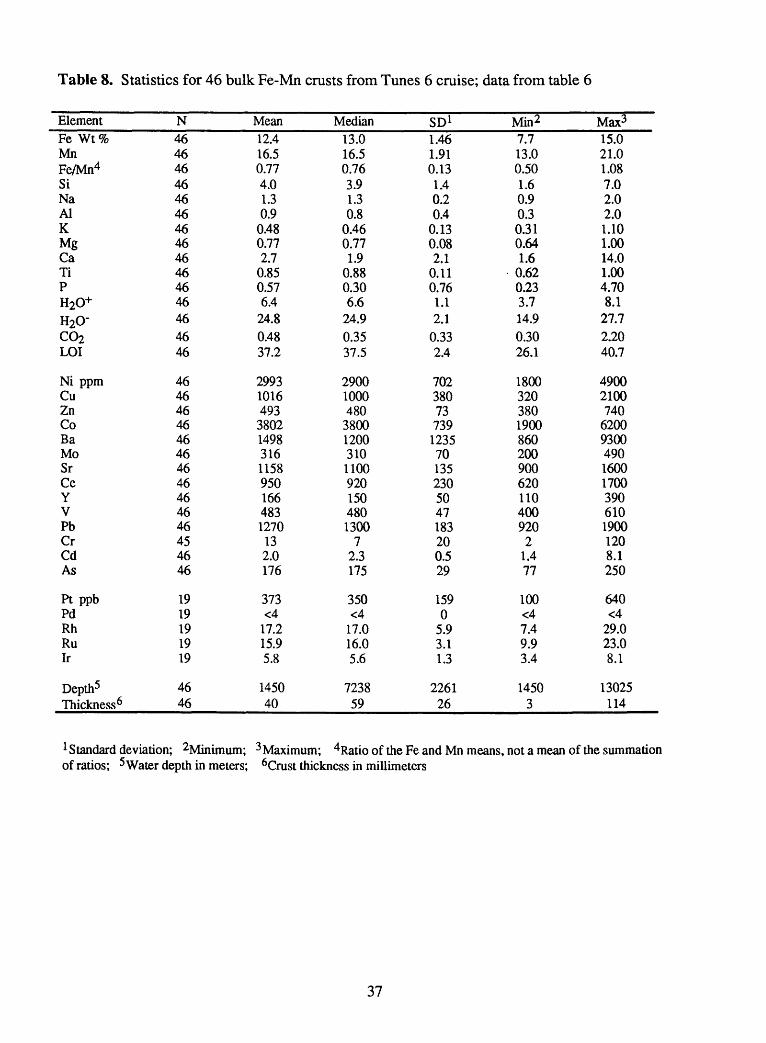
Table 8. Statistics for 46 bulk Fe-Mn crusts from Tunes 6 cruise; data from table 6
ElementFe Wt %MnFe/Mn4SiNaAlKMgCaTiPH20+H20-
C02LOI
Ni ppmCuZnCoBaMoSrCeYVPbCrCdAs
Pt ppbPdRhRuIr
Depth5Thickness**
N464646464646464646464646464646
4646464646464646464646454646
1919191919
4646
Mean12.416.50.774.01.30.90.480.772.70.850.576.424.80.4837.2
299310164933802149831611589501664831270132.0176
373<417.215.95.8
145040
Median13.016.50.763.91.30.80.460.771.90.880.306.624.90.3537.5
2900100048038001200310110092015048013007
2.3175
350<417.016.05.6
723859
SD1
1.461.910.131.40.20.40.130.082.10.110.761.12.10.332.4
702380737391235701352305047183200.529
15905.93.11.3
226126
Min2
7.713.00.501.60.90.30.310.641.60.620.233.714.90.3026.1
1800320380190086020090062011040092021.477
100<47.49.93.4
14503
Max3
15.021.01.087.02.02.01.101.0014.01.004.708.127.72.2040.7
49002100740620093004901600170039061019001208.1250
640<429.023.08.1
13025114
1 Standard deviation; 2Minimum; 3 Maximum; 4 Ratio of the Fe and Mn means, not a mean of the summation of ratios; 5 Water depth in meters; 6Crust thickness in millimeters
37
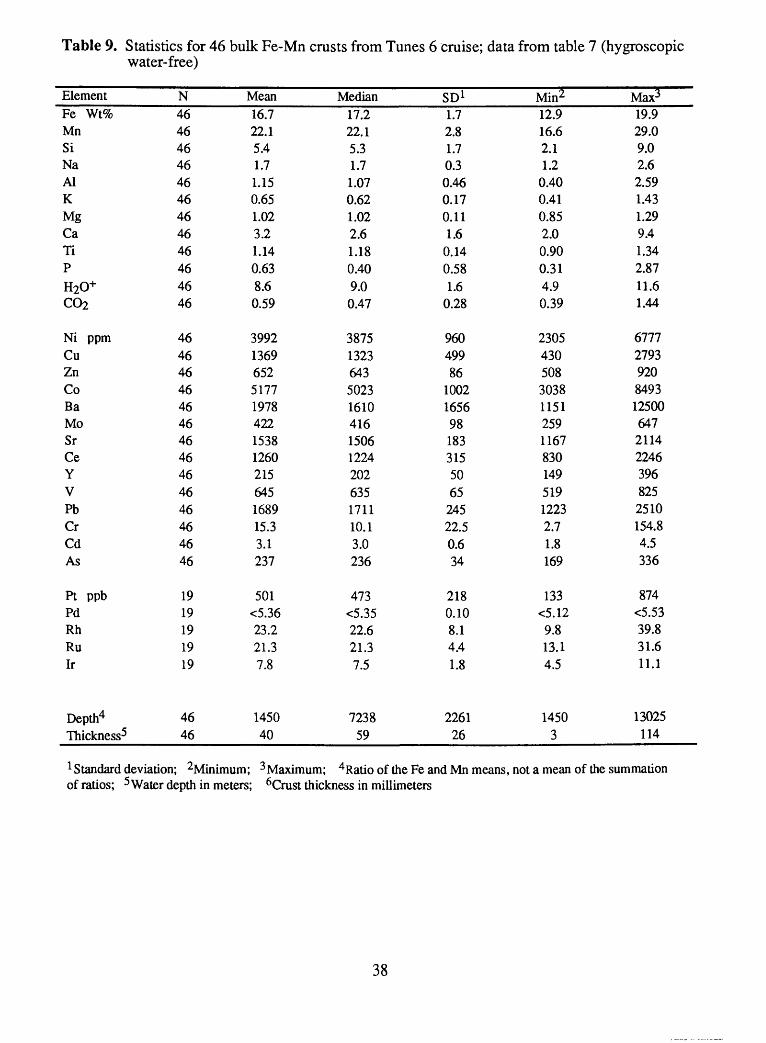
Table 9. Statistics for 46 bulk Fe-Mn crusts from Tunes 6 cruise; data from table 7 (hygroscopic water-free)
ElementFe Wt%MnSiNaAlKMgCaTiPH20+
C02
Ni ppmCuZnCoBaMoSrCeYVPbCrCdAs
Pt ppbPdRhRuIr
Depth4
Thickness5
N4646464646464646464646 46
4646464646464646464646464646
1919191919
4646
Mean16.722.15.41.71.150.651.023.21.140.638.6 0.59
399213696525177197842215381260215645168915.33.1237
501<5.3623.221.37.8
1450 40
Median17.222.15.31.71.070.621.022.61.180.409.0 0.47
387513236435023161041615061224202635171110.13.0236
473<5.3522.621.37.5
7238 59
SD1
1.72.81.70.30.460.170.111.60.140.581.6 0.28
960499861002165698183315506524522.50.634
2180.108.14.41.8
2261 26
Min2
12.916.62.11.20.400.410.852.00.900.314.9 0.39
230543050830381151259116783014951912232.71.8169
133<5.129.813.14.5
1450 3
Max3
19.929.09.02.62.591.431.299.41.342.8711.6 1.44
67772793920849312500647211422463968252510154.84.5336
874<5.5339.831.611.1
13025 114
1 Standard deviation; 2Minimum; 3 Maximum; 4Ratio of the Fe and Mn means, not a mean of the summation of ratios; 5 Water depth in meters; 6Crust thickness in millimeters
38
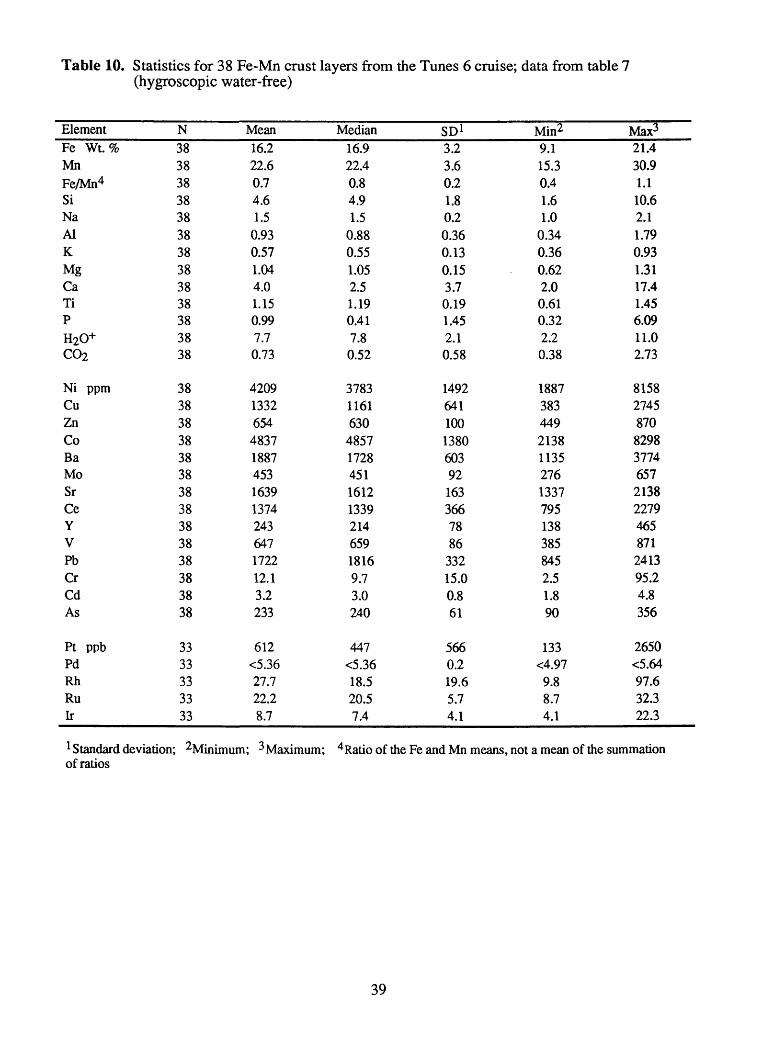
Table 10. Statistics for 38 Fe-Mn crust layers from the Tunes 6 cruise; data from table 7 (hygroscopic water-free)
ElementFe Wt. %MnFe/Mn4SiNaAlKMgCaTiPH20+C02
Ni ppmCuZnCoBaMoSrCeYVPbCrCdAs
Pt ppbPdRhRuIr
N38383838383838383838383838
3838383838383838383838383838
3333333333
Mean16.222.60.74.61.50.930.571.044.01.150.997.70.73
420913326544837188745316391374243647172212.13.2233
612<5.3627.722.28.7
Median16.922.40.84.91.50.880.551.052.51.190.417.80.52
37831161630485717284511612133921465918169.73.0240
447<5.3618.520.57.4
SD1
3.23.60.21.80.20.360.130.153.70.191.452.10.58
1492641100138060392163366788633215.00.861
5660.219.65.74.1
Min2
9.115.30.41.61.00.340.360.622.00.610.322.20.38
18873834492138113527613377951383858452.51.890
133<4.979.88.74.1
Max3
21.430.91.110.62.11.790.931.3117.41.456.0911.02.73
815827458708298377465721382279465871241395.24.8356
2650<5.6497.632.322.3
1 Standard deviation; 2Minimum; 3 Maximum; 4 Ratio of the Fe and Mn means, not a mean of the summation of ratios
39
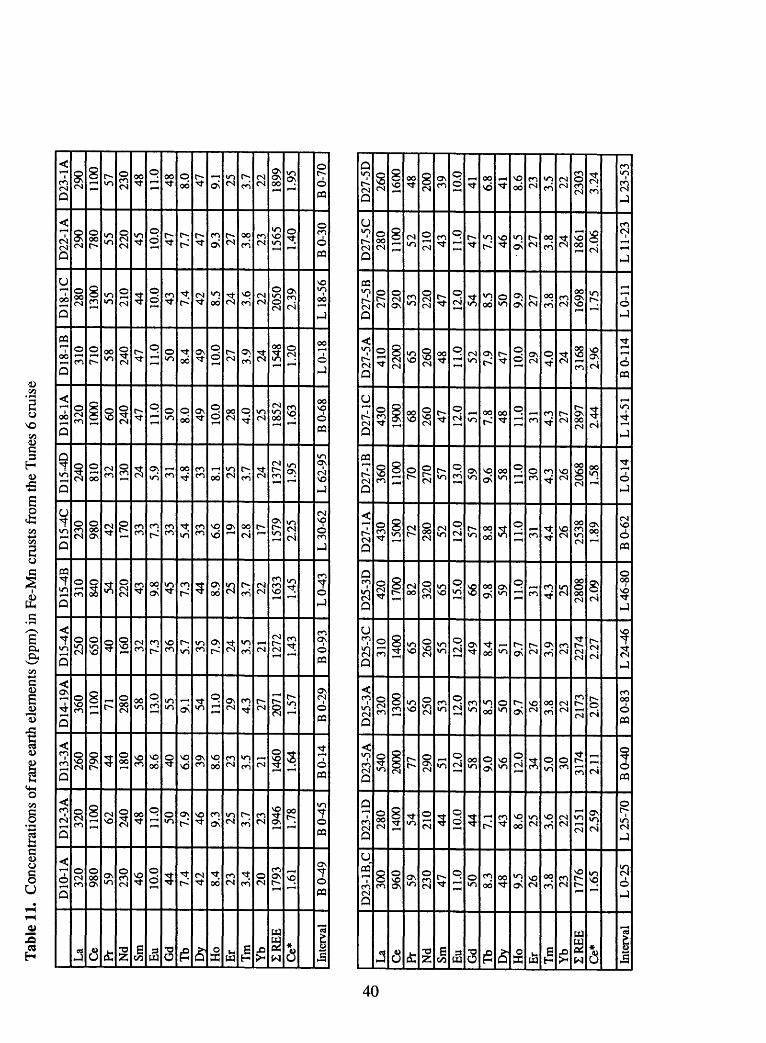
Tab
le 1
1. C
once
ntra
tions
of r
are
eart
h el
emen
ts (
ppm
) in
Fe-
Mn
crus
ts f
rom
the
Tun
es 6
cru
ise
La Ce
Pr Nd
Sm Eu
Gd
Tb
Dv
Ho
Er
Tm
Yb
2RE
EC
e*
Inte
rval
D10
-1A
320
980
59 230
46 10.0
44 7.4
42 8.4
23 3.4
20 1793
1.61
BO
-49
D 1
2-3 A
320
1100 62 240
48 11.0
50 7.9 46 9.3 25 3.7 23 1946
1.78
B0
^5
D13
-3A
260
790
44 180
36 8.6 40 6.6 39 8.6 23 3.5 21 1460
1.64
BO
- 14
D 1
4- 19
A36
011
00 71 280
58 13.0
55 9.1 54 11.0
29 4.3 27 2071
1.57
BO
-29
D15
^A25
065
040 16
032 7.
3 36 5.7 35 7.9 24 3.5 21 1272
1.43
BO
-93
D15
-4B
310
840
54 220
43 9.8 45 7.3 44 8.9 25 3.7 22 1633
1.45
L0
^3
D15
-4C
230
980
42 170
33 7.3 33 5.4 33 6.6 19 2.8 17 1579
2.25
L 3
0-62
D15
-4D
240
810
32 130
24 5.9 31 4.8 33 8.1 25 3.7 24 1372
1.95
L 6
2-95
D18
-1A
320
1000 60 240
47 11.0
50 8.0 49 10.0
28 4.0 25 1852
1.63
BO
-68
D18
-1B
310
710
58 240
47 11.0
50 8.4 49 10.0
27 3.9 24 1548
1.20
LO
-18
D18
-1C
280
1300 55 210
44 10.0
43 7.4
42 8.5
24 3.6
22 2050
2.39
L 1
8-56
D22
-1A
290
780
55 220
45 10.0
47 7.7 47 9.3 27 3.8 23 1565
1.40
BO
-30
D23
-1A
290
1100 57 230
48 11.0
48 8.0 47 9.1 25 3.7 22 1899
1.95
BO
-70
La
Ce
Pr Nd
Sm Eu
Gd
Tb
Dv
Ho
Er
Tm
Yb
2RE
EC
e*
Inte
rval
D23
-1B
.C30
096
059 23
047 11
.050 8.
348 9.
526 3.
823 17
761.
65
LO
-25
D23
-1D
280
1400 54 210
44 10.0
44 7.1 43 8.6 25 3.6 22 2151
2.59
L 2
5-70
D23
-5A
540
2000 77 290
51 12.0
58 9.0 56 12.0
34 5.0 30 3174
2.11
BO
-40
D25
-3A
320
1300 65 250
53 12.0
53 8.5 50 9.7 26 3.8 22 2173
2.07
BO
-83
D25
-3C
310
1400 65 260
55 12.0
49 8.4 51 9.7 27 3.9 23 2274
2.27
L 2
4-46
D25
-3D
420
1700 82 320
65 15.0
66 9.8 59 11.0
31 4.3 25 2808
2.09
L 4
6-80
D27
-1A
430
1500 72 280
52 12.0
57 8.8 54 11.0
31 4.4 26 2538
1.89
BO
-62
D27
-1B
360
1100 70 270
57 13.0
59 9.6 58 11.0
30 4.3 26 2068
1.58
LO
-14
D27
-1C
430
1900 68 260
47 12.0
51 7.8 48 11.0
31 4.3 27 2897
2.44
L 1
4-51
D27
-5A
410
2200 65 260
48 11.0
52 7.9 47 10.0
29 4.0 24 3168
2.96
BO
-114
D27
-5B
270
920
53 220
47 12.0
54 8.5
50 9.9
27 3.8
23 1698
1.75
LO-1
1
D27
-5C
280
1100
52 210
43 11.0
47 7.5 46 9.5 27 3.8 24 1861
2.06
LI
1-23
D27
-5D
260
1600 48 200
39 10.0
41 6.8 41 8.6 23 3.5 22 2303
3.24
L 2
3-53
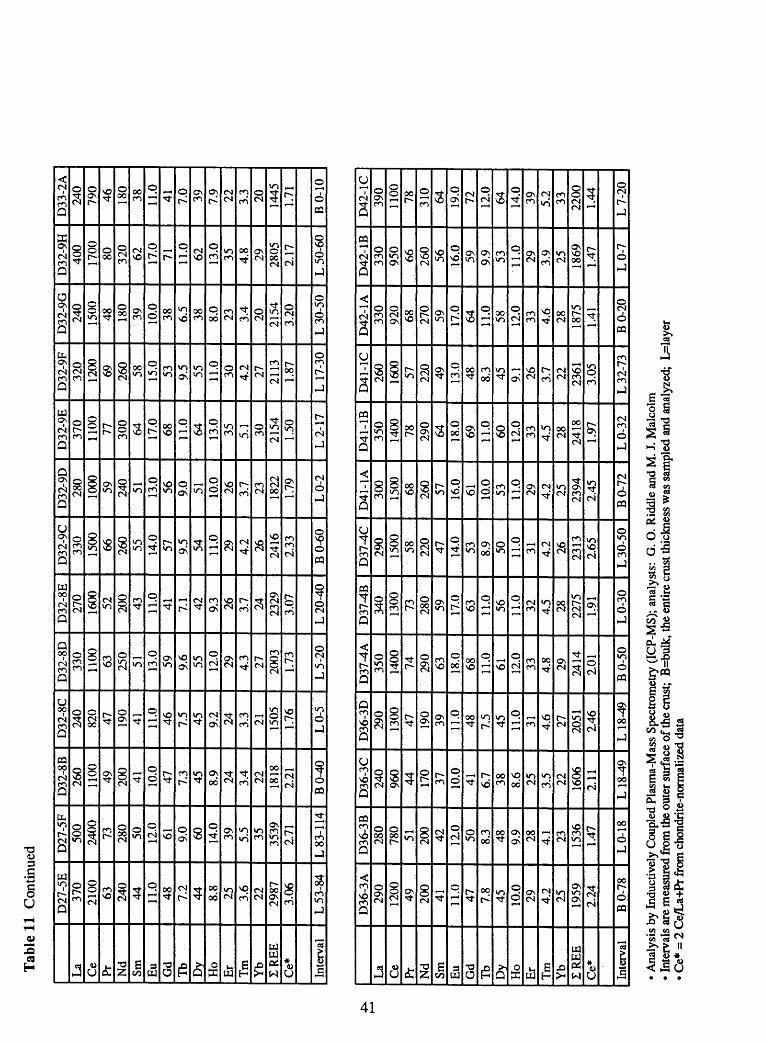
Tab
le 1
1 C
ontin
ued
La Ce
Pr Nd
Sm Eu Gd
Tb
Dv
Ho
Er
Tm
Yb
ZR
EE
Ce*
Inte
rval
D27
-5E
370
2100 63 240
44 11.0
48 7.2
44 8.8
25 3.6
22 2987
3.06
L 5
3-84
D27
-5F
500
2400 73 280
50 12.0
61 9.0 60 14.0
39 5.5 35 3539
2.71
L 83
- 114
D32
-8B
260
1100
49 200
41 10.0
47 7.3 45 8.9 24 3.4 22 1818
2.21
BO
^tt)
D32
-8C
240
820
47 190
41 11.0
46 7.5 45 9.2 24 3.3 21 1505
1.76
LO-5
D32
-8D
330
1100 63 250
51 13.0
59 9.6 55 12.0
29 4.3 27 2003
1.73
L5-
20
D32
-8E
270
1600 52 200
43 11.0
41 7.1 42 9.3 26 3.7 24 2329
3.07
L20
^M)
D32
-9C
330
1500 66 260
55 14.0
57 9.5 54 11.0
29 4.2 26 2416
2.33
BO
-60
D32
-9D
280
1000 59 240
51 13.0
56 9.0 51 10.0
26 3.7 23 1822
1.79
LO
-2
D32
-9E
370
1100 77 300
64 17.0
68 11.0
64 13.0
35 5.1 30 2154
1.50
L2-
17
D32
-9F
320
1200 69 260
58 15.0
53 9.5 55 11.0
30 4.2 27 2113
1.87
L 17
-30
D32
-9G
240
1500
48 180
39 10.0
38 6.5
38 8.0
23 3.4
20 2154
3.20
L 3
0-50
D32
-9H
400
1700 80 320
62 17.0
71 11.0
62 13.0
35 4.8 29 2805
2.17
L 5
0-60
D33
-2A
240
790
46 180
38 11.0
41 7.0 39 7.9 22 3.3 20 1445
1.71
BO
-10
La Ce
Pr Nd
Sm Eu
Gd
Tb
Dy
Ho
Er
Tm
Yb
ZR
EE
Ce*
Inte
rval
D36
-3A
290
1200
49 200
41 11.0
47 7.8
45 10.0
29 4.2
25 1959
2.24
BO
-78
D36
-3B
280
780
51 200
42 12.0
50 8.3 48 9.9 28 4.1 23 1536
1.47
LO
-18
D36
-3C
240
960
44 170
37 10.0
41 6.7 38 8.6 25 3.5 22 1606
2.11
L 1
8-49
D36
-3D
290
1300
47 190
39 11.0
48 7.5 45 11.0
31 4.6 27 2051
2.46
L1
8^9
D37
^A35
014
00 74 290
63 18.0
68 11.0
61 12.0
33 4.8 29 2414
2.01
BO
-50
D37
^B34
013
00 73 280
59 17.0
63 11.0
56 11.0
32 4.5 28 2275
1.91
LO
-30
D37
^C29
015
00 58 220
47 14.0
53 8.9 50 11.0
31 4.2 26 2313
2.65
L 3
0-50
D41
-1A
300
1500 68 260
57 16.0
61 10.0
53 11.0 29 4.2 25 2394
2.45
BO
-72
D41
-1B
350
1400 78 290
64 18.0
69 11.0
60 12.0
33 4.5 28 2418
1.97
LO
-32
D41
-1C
260
1600 57 220
49 13.0
48 8.3 45 9.1 26 3.7 22 2361
3.05
L 3
2-73
D42
-1A
330
920
68 270
59 17.0
64 11.0
58 12.0
33 4.6
28 1875
1.41
BO
-20
D42
-1B
330
950
66 260
56 16.0
59 9.9 53 11.0
29 3.9 25 1869
1.47
LO
-7
D42
-1C
390
1100 78 310
64 19.0
72 12.0
64 14.0
39 5.2 33 2200
1.44
L7-
20
Ana
lysi
s by
Ind
uctiv
ely
Cou
pled
Pla
sma-
Mas
s Sp
ectr
omet
ry (
ICP-
MS)
; an
alys
ts:
G. O
. Rid
dle
and
M. J
. Mal
colm
Inte
rval
s ar
e m
easu
red
from
the
oute
r sur
face
of t
he c
rust
; B
=bul
k, th
e en
tire
crus
t thi
ckne
ss w
as s
ampl
ed a
nd a
naly
zed;
L=l
ayer
Ce*
= 2
Ce/
La+
Pr fr
om c
hond
rite
-nor
mal
ized
dat
a
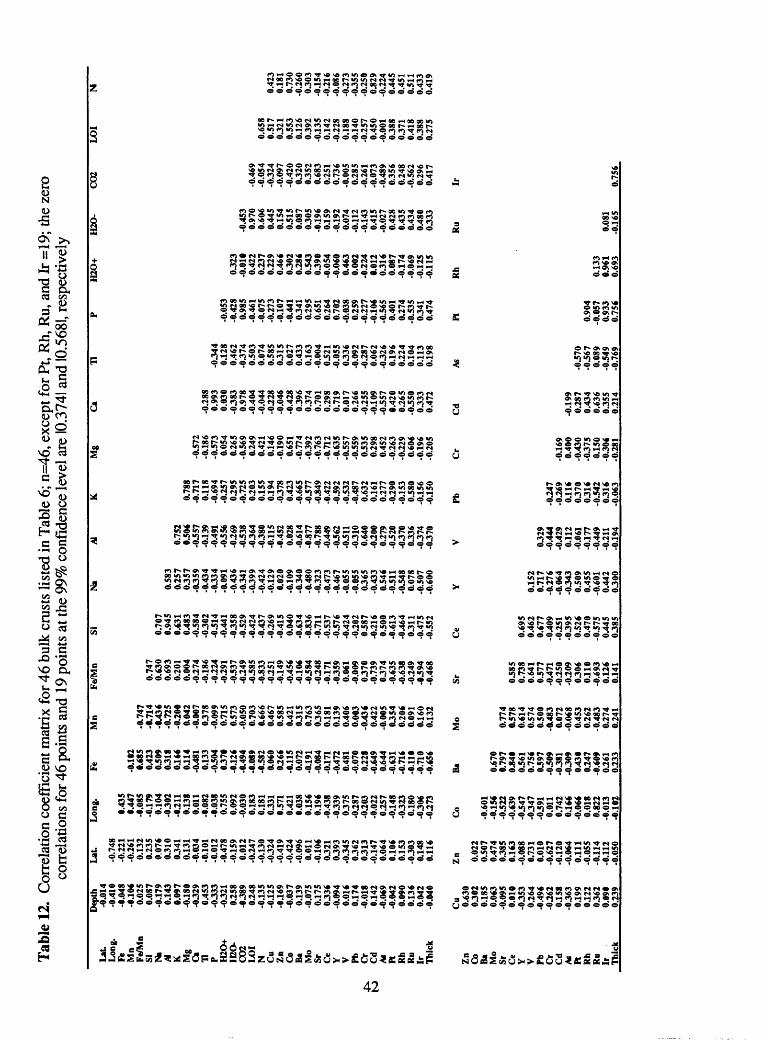
Tab
le 1
2. C
orre
latio
n co
effic
ient
mat
rix fo
r 46
bulk
cru
sts
liste
d in
Tab
le 6
; n=4
6, e
xcep
t for
Pt,
Rh,
Ru,
and
Ir =
19; t
he z
ero
corr
elat
ions
for 4
6 po
ints
and
19
poin
ts a
t the
99%
con
fiden
ce le
vel a
re 1
0.374
1 an
d 10
.5681
, res
pect
ivel
y
to
LaL Lon
g.Fe M
nFe
/Mn
Si Ni
At K Mg
Ca
Ti P H20
+m
o-cm L
OI
N Cu
Zn
Co Ba Mo
Sr Ce
Y V Pb Cr
Cd
As Pt Rh
Ru
Ir Thi
ck
Zn
Co Ba
Mo
Sr Ce Y V Pb Cr
Cd
As Pt Rh
Ru
Ir Thi
ck
Dep
th-0
.014
-0.4
10-0
.048
-0.1
060.
025
0.08
7-0
.179
0.14
39.
097
-0.1
80-0
329
0.45
3-0
333
-032
10.
258
-038
90.
248
-0.1
35-0
.125
-0.1
69-0
.037
0.13
9-0
.075
0.17
503
36-0
.094
0.01
60.
174
-0.0
180.
142
-0.0
69-0
.042
0.09
00.
136
0.04
2-0
.040
Cu 0.63
003
020.
185
0.06
3-0
.095
0.01
9-0
353
0.26
4-0
.496
-0.2
620.
158
-036
30.
199
0.12
203
620.
090
0.23
9
LaL -0.7
48-0
.221
-0.2
610.
132
0.23
50.
076
0310
0341
0.13
1-0
.034
-0.1
01-0
.012
-0.4
78-0
.159
0.01
2-0
.247
-0.1
30-0
324
-0.4
19-0
.424
-0.0
960.
011
-0.1
0603
2103
93-0
.345
0362
0313
-0.1
470.
064
0.10
60.
153
-0.3
030.
148
0.11
6
Zn 0.02
20.
507
0.47
40.
385
0.16
3-0
.088
0.73
10.
010
-0.6
27-0
.120
-0.0
640.
111
-0.0
55-0
.114
-0.1
12-0
.050
Lon
g.
0.43
50.
447
-0.0
85-0
.179
0.10
4-0
302
-0.2
110.
138
0.01
1-0
.082
-0.0
380.
755
0.09
2-0
.030
0.18
30.
181
0.33
10.
571
0.42
10.
038
0.15
60.
196
-0.4
38-0
339
0375
-0.2
87-0
.203
-0.0
220.
257
-0.1
48-0
323
0.18
0-0
306
-0.2
73
Co
-0.6
01-0
.156
-0.5
22-0
.639
-0.5
47-0
347
-0.5
910.
011
0.74
20.
166
-0.0
660.
018
0.82
2-0
.013
-0.1
02
Fe -0.1
029.
685
0.42
30.
509
0318
0.16
60.
114
-0.4
810.
133
-0.5
0403
79-0
.126
-0.4
94-0
.089
-0.5
820.
060
0.26
6-0
.115
0.07
2-0
.191
-0.0
84-0
.171
-0.4
720.
481
-0.0
700.
228
-0.6
490.
644
-0.6
31-0
.716
-0.1
10-0
.710
-0.6
56
Ba 0.67
00.
797
0.84
00.
561
0.75
60.
597
-0.5
09-0
381
-030
90.
430
0.24
7-0
.609
0.26
10.
233
Mn
-0.7
47-0
.714
-0.4
36-0
.725
-0.2
000.
042
-0.0
0703
78-0
.099
0.71
50.
573
-0.0
500.
703
0.66
60.
467
0.58
50.
421
0315
0.76
303
650.
181
0.13
90.
406
0.00
3-0
.436
0.42
2-0
.005
0354
0.20
60.
091
0.16
00.
132
Mo
0.77
40.
578
0.61
40.
574
0.50
0-0
.483
0.07
2-0
.068
0.45
30.
262
-0.4
830.
274
0.24
1
Fe/M
n
0.74
70.
630
0.69
30.
201
0.00
4 0
.274
-0.1
86-0
.224
-0.2
91-0
.537
-0.2
49-0
.585
-0.8
33-0
.251
-0.1
49-0
.456
-0.1
06-0
.584
-0.2
48-0
.171
-035
90.
061
-0.0
0903
70-0
.739
0374
-0.6
35-0
.638
-0.2
49-9
.594
-0.4
68
Sr 0.58
50.
738
0.64
10.
577
-0.4
71-0
.250
-0.2
0903
060.
110
-0.6
930.
126
0.14
1
Si 0.70
70.
945
0.63
10.
483
-0.5
84-0
302
-0.5
14-0
.441
-035
8-0
.529
-0.4
24-0
.437
-0.2
69-0
.415
0.04
0-0
.634
-0.8
36-0
.711
-0.5
37-0
.576
-0.4
24-0
.202
0.58
7-0
.216
0.50
0-0
.613
-0.4
6403
11-0
.475
-0.5
52
Ce 0.69
50.
462
0.67
7-0
.409
-0.2
51-0
395
0.52
60.
470
-0.5
750.
445
0385
Ma 0.58
30.
257
0357
-035
9-0
.434
-033
4-0
.091
-0.4
36-0
.341
-039
9-0
.424
-0.1
290.
020
-0.1
09-0
.340
-0.4
80-0
.323
-0.4
73-0
.467
-0.0
55-0
.055
0365
-0.4
330.
546
-0.5
11-0
.548
0.07
8-0
.507
-0.6
00
Y 0.15
20.
717
-0.2
76-0
.064
-034
30.
509
0.45
5-0
.601
0.44
20.
300
Al 0.75
20.
506
-0.5
57-0
.139
-0.4
91-0
356
-0.2
69-0
.538
-036
4-0
380
-0.1
15-0
.452
0.02
8-0
.614
-0.8
77-0
.788
-0.4
49-0
.562
-0.5
11-0
310
0.64
0-0
.200
0.27
9-0
.520
-037
003
36-0
374
-037
0
V 0329
-0.4
44-0
.429
0.11
2-0
.061
-0.1
77-0
.449
-0.2
11-0
.194
K 0.78
8-0
.717
0.11
8-0
.694
-0.2
570.
295
-0.7
250.
203
0.15
50.
194
-037
80.
423
-0.6
65-0
.577
-0.8
49-0
.422
-0.5
92-0
.532
-0.4
870.
632
0.16
10.
277
-0.2
90-0
.153
0.58
0-0
.156
-0.1
50
Pb -0.2
47-0
.269
0.11
603
7003
16-0
.542
0316
-0.0
63
Mg
-0.5
72-0
.186
-0.5
730.
054
0.26
5-0
.569
0.24
90.
421
0.14
6-0
.190
0.65
1-0
.774
-039
2-0
.763
-0.7
12-0
.635
-0.5
57-0
.559
0.53
50.
298
0.45
2-0
.263
-0.2
290.
606
-0.1
96-0
.205
Cr
-0.1
690.
400
-0.4
30-0
375
0.15
0-0
306
-0.2
81
Ca
-0.2
880.
993
0.03
0-0
383
0.97
8-0
.404
-0.0
44-0
.228
-0.0
46-0
.428
0.39
60.
374
0.70
10.
298
0.71
90.
017
0.26
6-0
.255
-0.1
09-0
.557
9.42
00.
265
-0.5
5003
330.
472
Cd
-0.1
990.
287
0.43
40.
636
0.35
50.
214
TI -034
40.
128
0.46
2-0
374
0.50
30.
074
0.58
503
150.
027
0.43
30.
163
-0.0
040.
521
-0.0
5503
36-0
.092
-0.2
870.
062
-032
60.
196
0.22
40.
104
0.11
30.
198
As -0.5
70-0
.567
0.08
9-0
.549
-0.7
69
P -0.0
53-0
.428
0.98
5-0
.461
-0.0
75-0
.273
-0.1
07-0
.441
0341
0.29
50.
651
0.26
40.
702
-0.0
380.
259
-0.2
27-0
.106
-0.5
650.
401
0.27
4-0
.535
0341
0.47
4
Pt 0.90
4-0
.057
0.93
30.
756
H2O
+
0.32
3-0
.019
0.42
20.
237
0.22
90.
466
0.30
20.
286
0.54
303
90-0
.054
-0.0
600.
463
0.00
2-0
.224
9.01
20.
316
0.08
7-0
.174
-0.0
69-0
.125
-0.1
15
Rh 0.13
39.
961
0.69
3
H2O
-
-0.4
530.
970
0.60
60.
445
0.15
40.
515
0.08
703
05-0
.196
0.15
9-0
.192
0.07
4-0
.112
-0.1
430.
415
-0.0
270.
428
0.43
50.
434
0.48
003
33
Ru 0.08
1-0
.165
CO
2
-0.4
69-0
.054
-032
4-0
.097
-0.4
2003
2003
520.
683
0.25
10.
736
-0.0
050.
285
-0.2
61-0
.073
-0.4
8903
560.
248
-0.5
620.
296
0.41
7
Ir 0.75
6
LO
I
0.65
80.
517
0.32
10.
553
0.12
60.
392
-0.1
350.
142
-0.2
280.
188
-0.1
40-0
.257
0.45
0-0
.001
0388
0.37
10.
418
0388
0.27
5
N 0.42
30.
181
0.73
0-0
.260
0303
-0.1
54-0
.216
-0.0
86-0
.273
-035
5-0
.250
0.82
9-0
.224
0.44
50.
451
0.51
10.
433
0.41
9
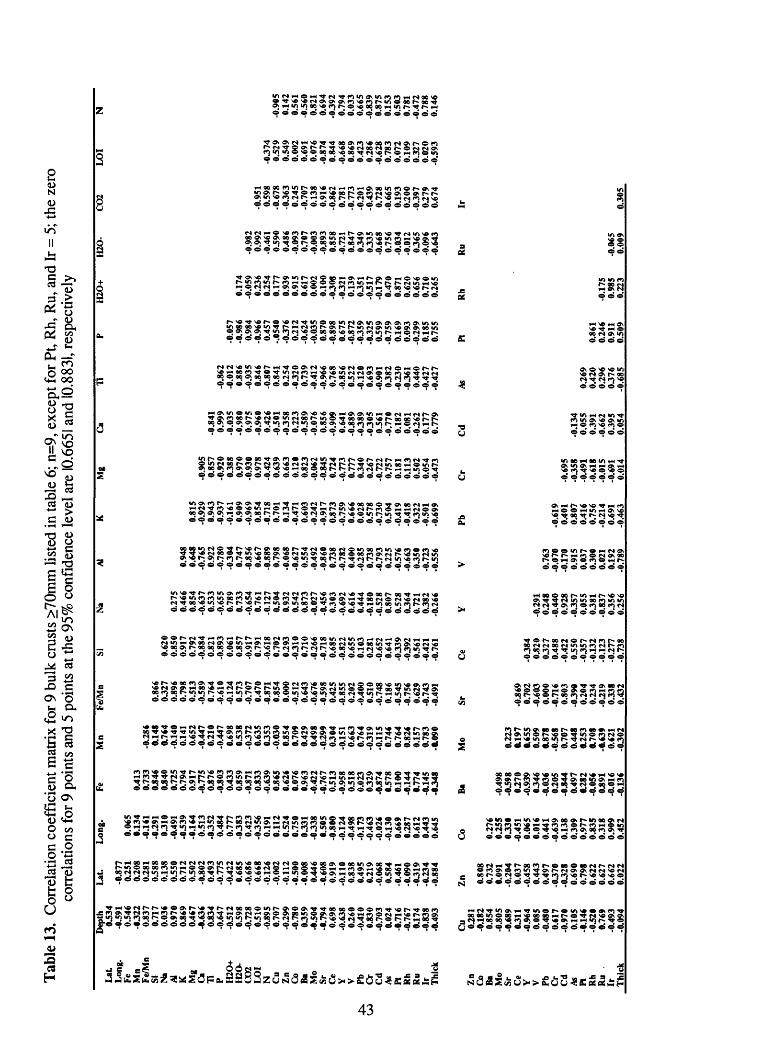
Tab
le 1
3. C
orre
latio
n co
effi
cien
t mat
rix
for 9
bul
k cr
usts
>70
mm
list
ed in
tabl
e 6;
n=9
, exc
ept f
or P
t, R
h, R
u, a
nd Ir
= 5
; the
zer
o co
rrel
atio
ns f
or 9
poi
nts
and
5 po
ints
at t
he 9
5% c
onfi
denc
e le
vel a
re 1
0.665
1 an
d 10
.883
1, re
spec
tivel
y
U)
LaL
Lon
g.Fe M
nFe
/Mn
Si Na
Al K Mg
Ca
Ti P H20
+H
2O-
CO
2L
OI
N Cu
Zn
Co
Ba
Mo
Sr
Ce
Y V Pb Cr
Cd
As Pt Rh
Ru
Ir Thi
ck
Zn
Co Ba
Mo
Sr Ce
Y V Pb Cr
Cd
As Pt Rh
Ru
Ir Thi
ck
Dep
th0.
534
-0.5
910.
546
-032
20.
837
0.71
70.
036
0.97
00.
869
0.46
7-0
.636
0.83
4-0
.647
-0.5
120.
598
-0.7
280.
510
-0.8
950.
707
-0.2
99-0
.780
0359
-0.5
04-0
.794
0.69
8-0
.638
0.26
0-0
.410
0.83
0-0
.703
0.02
4-0
.716
-0.7
670.
174
-0.8
38-0
.493
Cu 0.28
1-0
.182
0.85
4-0
.805
-0.6
8903
11-0
.964
0.08
5-0
.480
0.61
7.0
.970
0.10
5 0
.146
-0.5
200.
769
-0.4
93-0
.094
Lat
.
-0.8
770.
251
0.20
80.
281
0.58
80.
138
0.55
00.
712
0.50
2-0
.802
0.49
3-0
.775
-0.4
220.
685
-0.6
860.
668
-0.1
26-0
.002
-0.1
12-0
.500
-0.0
080.
446
-0.6
080.
919
-0.1
100.
838
0.49
50.
219
-0.0
680.
584
-0.4
61-0
.090
-031
9-0
.234
-0.8
84
Zn 0.80
80.
732
0.09
1-0
.204
0.03
7-0
.458
0.44
30.
497
-037
0.0
328
0.69
00.
798
0.62
20.
627
0.66
20.
022
Lon
g.
0.06
50.
134
-0.1
61-0
.291
0310
-0.4
91-0
.539
-0.1
640.
513
-035
20.
484
0.77
7-0
383
0.42
3-0
356
0.19
10.
112
0.52
40.
750
0331
-033
80.
505
-0.8
00-0
.124
-0.4
98-0
.173
-0.4
63-0
.026
-0.1
300.
669
0.28
70.
612
0.44
30.
645
Co 0.27
60.
255
0.33
0-0
.451
0.06
50.
016
0.44
1-0
.639
0.13
80.
309
0.97
70.
835
0.31
80.
909
0.45
2
Fe 0.41
30.
733
0.84
60.
840
0.72
50.
794
0.91
7-0
.775
0.87
6-0
.803
0.43
30.
859
-0.8
710.
833
-0.6
390.
865
0.62
60.
076
0.96
3-0
.422
-0.7
670.
513
-0.9
580.
518
0.02
303
29-0
.874
0.57
80.
100
-0.1
440.
774
-0.1
45-0
348
Ba
-0.4
98-0
.598
0.27
0-0
.939
0346
-0.0
360.
205
-0.8
440.
497
0.28
2-0
.056
0.89
1-0
.016
-0.1
36
Mn
-0.2
860.
148
0.76
4-0
.140
0.14
10.
652
-0.4
470.
210
-0.4
470.
698
0.53
8-0
372
0.63
503
53-0
.030
0.85
40.
709
0.42
90.
498
-0.2
9903
04-0
.151
0.66
30.
764
-031
9-0
.115
0.74
60.
764
0.82
60.
157
0.78
3-0
.090
Mo
0.22
30.
197
0.65
50.
509
0.87
8-0
.568
0.70
70.
448
0.25
30.
708
-0.6
390.
621
-030
2
Fe/M
n
0.86
603
270.
896
0.79
80.
513
-0.5
890.
764
-0.6
10-0
.124
0.57
3-0
.707
0.47
0-0
.871
0.85
40.
000
-0.5
120.
643
-0.6
76-0
.598
0.42
5-0
.855
0.20
2-0
.400
0.51
0-0
.748
0.18
6-0
.545
-0.7
560.
629
-0.7
43-0
.491
Sr
-0.8
690.
702
-0.6
030.
000
-0.7
160.
803
-039
00.
204
0.23
4-0
.219
0338
0.43
2
Si 0.62
00.
850
0.91
70.
792
-0.8
840.
821
-0.8
930.
061
0.85
7-0
.917
0.79
1-0
.618
0.70
20.
293
-031
00.
710
-0.2
66-0
.718
0.68
5-0
.822
0.65
50.
103
0.28
1-0
.652
0.64
1-0
339
-039
20.
561
-0.4
21-0
.761
Ce
-038
40.
820
0327
0.48
8-0
.422
0.55
0-0
357
-0.1
32-0
.123
-0.2
77-0
.738
Na 0.27
50.
466
0.85
4-0
.637
0.53
3-0
.655
0.78
90.
733
-0.6
540.
761
-0.1
270.
504
0.93
20.
542
0.87
3-0
.027
-0.4
5603
03-0
.692
0.61
60.
444
-0.1
80-0
.528
0.80
70.
528
0.36
40.
721
0.38
2-0
.266
Y -0.2
910.
248
-0.4
400.
928
-035
70.
055
0.38
1-0
.837
0.35
60.
256
Al 0.94
80.
648
-0.7
650.
922
-0.7
80-0
304
0.74
7-0
.856
0.66
7-0
.889
0.79
8-0
.068
-0.6
270.
554
-0.4
92-0
.860
0.73
8-0
.782
0.40
0-0
.285
0.73
8-0
.793
0.22
5-0
.576
-0.6
6303
50-0
.723
-0.5
56
V 0.76
3-0
.070
-0.1
700.
915
0.03
70.
300
0.02
10.
192
-0.7
89
K 0.81
5-0
.929
0.94
3-0
.937
-0.1
610.
909
-0.9
690.
854
-0.7
180.
701
0.13
4-0
.471
0.60
3-0
.242
-0.9
170.
873
-0.7
590.
666
0.02
80.
578
-0.7
300.
504
-041
9-0
.418
0322
-0.5
01-0
.699
Pb -0.6
190.
401
0.80
70.
416
0.75
6-0
.214
0.69
1-0
.463
Mg
-0.9
050.
857
-0.9
200.
388
0.97
0-0
.930
0.97
8-0
.424
0.63
90.
663
0.12
00.
823
-0.0
62-0
.845
0.72
4-0
.773
0.77
70.
340
0.26
7-0
.722
0.75
70.
181
0.11
30.
502
0.05
4-0
.473
Cr
-0.6
95-0
358
-0.4
91-0
.618
-0.0
15-0
.691
0.01
4
Ca
-0.8
410.
999
-0.0
35-0
.980
0.97
5-0
.960
0.42
6-0
.501
-035
80.
223
-0.5
89-0
.076
0.85
6-0
.909
0.64
1-0
.889
-038
9-0
305
0.56
1-0
.770
0.18
20.
081
-0.2
620.
177
0.77
9
Cd
-0.1
340.
055
0.39
1-0
.662
0.39
50.
054
TI -0.8
62-0
.012
0.88
6-0
.935
0.84
6-0
.807
0.84
10.
254
-032
00.
739
-0.4
12-0
.966
0.76
8-0
.856
0.52
2-0
.120
0.69
3-0
.901
0382
-0.2
30-0
361
0.44
0-0
.427
-042
7
As 0.26
904
200.
296
0376
-0.6
85
P -0.0
57-0
.986
0.98
4-0
.966
0.45
7-.0
540
-0.3
760.
212
-0.6
24-0
.035
0.87
0-0
.898
0.67
5-0
.872
-035
9-0
.325
0.59
9-0
.759
0.16
90.
093
-0.2
990.
185
0.75
5
Pt 0.86
10.
246
0.91
10.
509
H2O
+
0.17
4-0
.059
0.23
60.
254
0.17
70.
939
0.91
50.
617
0.00
20.
100
-030
8-0
321
0.13
903
51-0
.517
-0.1
790.
470
0.87
10.
620
0.65
60.
710
0.26
5
Rh
-0.1
750.
985
0.22
3
H2O
-
-0.9
820.
992
-0.4
610.
590
0486
-0.0
930.
707
-0.0
03-0
.893
0.85
8-0
.721
0.84
703
4903
35-0
.668
0.75
6-0
.034
-0.0
1203
65-0
.096
-0.6
43
Ru
-0.0
650.
009
C02 -0.9
510.
598
-0.6
78-0
.363
0.24
5-0
.707
0.13
80.
916
-0.8
620.
781
-0.7
73-0
.201
-0.4
390.
728
-0.6
650.
193
0.20
0-0
.397
0.27
90.
674
Ir 0.30
5
LO
I
-037
40.
529
0.54
90.
002
0.69
10.
076
-0.8
740.
844
-0.6
680.
869
0423
0.28
6-0
.628
0.78
30.
072
0.10
90.
327
0.02
0-0
.593
N -0.9
050.
142
0.56
1-0
.560
0.82
10.
694
-039
20.
794
0.03
30.
665
-0.8
390.
875
0.15
30.
503
0.78
1-0
472
0.78
80.
146
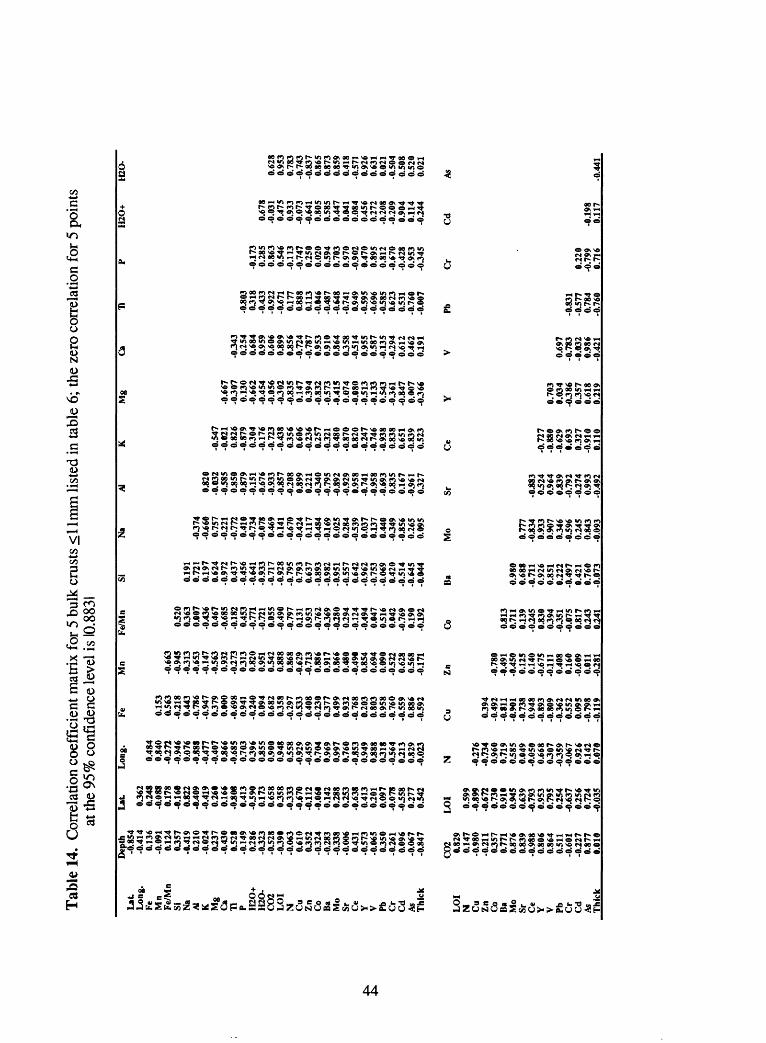
Tab
le 1
4. C
orre
latio
n co
effi
cien
t mat
rix f
or 5
bul
k cr
usts
<ll
mm
list
ed in
tabl
e 6;
the
zer
o co
rrel
atio
n fo
r 5 p
oint
s at
the
95%
con
fide
nce
leve
l is
10.88
31
Lat
Lon
g.Fe M
nFe
/Mn
Si Na
Al K Mg
Ca
Tl P H2O
+H
20-
C02
LO
IN C
uZ
nC
oB
aM
oS
r Ce
Y V Pb Cr
Cd
As Thi
ck
LO
IN C
uZ
nC
oB
aM
oSr C
eY V Pb C
rC
dAs T
hick
Dep
th-0
.854
-0.4
140.
136
-0.0
910.
124
0.35
7-0
.419
0.21
0-0
.024
0.23
7-0
.430
0.52
8-0
.149
0.28
6-0
.323
-0.5
28-0
.390
-0.0
630.
610
0.35
2-0
.324
-0.2
83-0
.338
-0.0
060.
431
-0.5
73-0
.065
0.35
0-0
.261
0.09
6-0
.067
-0.8
47
C02 0.
829
0.14
7-0
.980
-0.2
110.
357
0.77
10.
876
0.83
9-0
.988
0.80
60.
864
0.51
1-0
.601
-0.2
270.
877
0.01
0
LaL
0.36
20.
248
-0.0
880.
178
-0.1
600.
822
-0.4
09-0
.419
0.26
00.
166
-0.8
080.
413
-0.5
900.
173
0.65
80.
358
-OJ3
3-0
.670
-0.1
12-0
.060
0.14
20.
288
0.25
3-0
.638
0.41
30.
201
0.09
7-0
.078
-0.5
580.
277
0.54
2
LO
I
0.59
9-0
.899
-0.6
720.
730
0.91
00.
945
0.63
9-0
.793
0.95
30.
795
0.25
4-0
.637
0.25
60.
724
-0.0
35
Lon
g.
0.48
40.
840
0.2
72-0
.946
0.07
6-0
.888
-0.4
77-0
.407
0.86
6-0
.685
0.70
30.
396
0.85
50.
900
0.94
80.
558
-0.9
29-0
.459
0.70
40.
969
0.99
70.
760
-0.8
530.
949
0.88
8O
J18
-0.5
640.
213
0.82
9-0
.023
N -0.2
76-0
.734
0.96
00.
719
0.58
50.
049
-0.0
500.
668
0.30
7-0
.359
-0.0
670.
926
0.14
20.
070
Fe 0.15
30.
563
-0.2
180.
443
-0.7
86-0
.947
0.37
90.
000
-0.6
980.
941
-0.2
400.
094
0.68
20.
358
-0.2
97-0
.533
0.40
8-0
.230
0.37
70.
499
0.93
2-0
.768
0.20
30.
803
0.95
8-0
.760
-0.5
590.
886
-0.5
92
Cu 0.39
4-0
.492
-0.8
11-0
.901
-0.7
380.
948
-0.8
93-0
.809
-0.3
620.
552
0.09
5-0
.798
-0.1
19
Mn
-0.6
63-0
.945
-OJ1
3-0
.653
-0.1
47-0
.563
0.93
2-0
.273
0.31
30.
820
0.95
10.
542
0.88
80.
868
-0.6
29-0
.713
0.88
60.
917
0.86
60.
480
-0.4
900.
854
0.69
40.
090
-0.5
220.
628
0.56
8-0
.171
Zn
-0.7
80-0
.491
-0.4
500.
125
0.14
0-0
.675
-0.1
110.
408
0.16
0-0
.609
0.01
1-0
.281
Fe/M
n
0.52
00.
363
0.00
7-0
436
0.46
7-0
.685
-0.1
820.
453
-0.7
71-0
.721
0.05
5-0
.490
-0.7
970.
131
0.95
3-0
.762
-0.3
69-0
.280
0.29
4-0
.124
-0.4
940.
047
0.51
60.
042
-0.7
690.
190
-0.1
92
Co 0.81
30.
711
0.13
9-0
.245
0.83
00.
394
-OJ5
1-0
.075
0.81
70.
243
0.24
1
Si 0.19
10.
721
0.19
70.
624
-0.9
720.
437
-0.4
56-0
.641
-0.9
33-0
.717
-0.9
28-0
.795
0.79
30.
637
-0.8
93-0
.982
-0.9
51-0
.557
0.64
2-0
.962
-0.7
53-0
.069
0.42
0-0
.514
-0.6
45-0
.044
Ba 0.98
00.
688
-0.7
110.
926
0.85
10.
222
-0.4
970.
421
0.76
0-0
.073
Na
-OJ7
4-0
.660
0.75
7-0
.221
-0.7
720.
410
-0.7
34-0
.078
0.46
90.
141
-0.6
70-0
.424
0.11
7-0
.484
-0.1
690.
025
0.28
4-0
.539
0.03
70.
137
0.44
0-O
J49
-0.8
560.
265
0.09
5
Mo
0.77
7-0
.834
0.93
30.
907
0.34
6-0
396
0.24
50.
843
-0.0
93
Al 0.82
0-0
.032
-038
50.
850
-0.8
79-0
.151
-0.6
76-0
.933
-0.8
57-0
.208
0.89
90.
221
-034
0-0
.795
-0.8
92-0
.929
0.95
8-0
.741
-0.9
58-0
.693
0.83
50.
167
-0.9
610.
327
Sr -0.8
8303
240.
964
0.83
9-0
.792
-0.2
740.
993
-0.4
92
K -0.5
47-0
.021
0.82
6-0
.879
0.30
4-0
.176
-0.7
23-0
.438
0.35
60.
606
-0.2
360.
257
-0.3
21-0
.480
-0.8
700.
820
-0.2
47-0
.746
-0.9
380.
838
0.65
1-0
.839
0.52
3
Ce
-0.7
27-0
.880
-0.6
290.
693
0.32
7-0
.910
0.11
0
Mg
-0.6
67-O
J07
0.13
0-0
.662
-0.4
54-0
.056
-0.3
02-0
.835
0.14
70.
394
-0.8
32-0
.573
-0.4
150.
074
-0.0
80-0
.513
-0.1
330.
543
-OJ6
1-0
.847
0.00
7-0
.366
Y 0.70
30.
034
-0.3
860.
357
0.61
80.
219
Ca
-0.3
430.
254
0.68
40.
959
0.60
60.
899
0.85
6-0
.724
-0.7
870.
953
0.91
00.
864
0.35
8-0
.514
0.95
50.
587
-0.1
35-0
.294
0.61
20.
462
0.19
1
V 0.69
7-0
.783
-0.0
320.
986
-0.4
21
n -0.8
030.
318
-0.4
33-0
.922
-0.6
710.
177
0.88
80.
113
-0.0
46-0
.487
-0.6
48-0
.741
0.94
9-0
.595
-0.6
96-0
.585
0.62
30.
531
-0.7
60-0
.007
Pb -0.8
31-0
.577
0.78
4-0
.760
P -0.1
730.
285
0.86
30.
546
-0.1
13-0
.747
0.25
00.
020
0.59
40.
703
0.97
0-0
.902
0.47
00.
895
0.81
2-0
.670
-0.4
280.
953
-OJ4
5
Cr
0.22
0-0
.799
0.71
6
1120
+
0.67
8-0
.031
0.47
50.
933
-0.0
73-0
.641
0.80
50.
585
0.44
70.
041
0.08
40.
456
0.27
2-0
.208
-0.2
090.
904
0.11
4-0
.244
Cd
-0.1
980.
117
H2O
-
0.62
80.
953
0.78
3-0
.743
-0.8
370.
865
0.87
30.
859
0.41
8-0
.571
0.92
60.
631
0.02
1-0
.504
0.50
80.
520
0.02
1
As -0.4
41
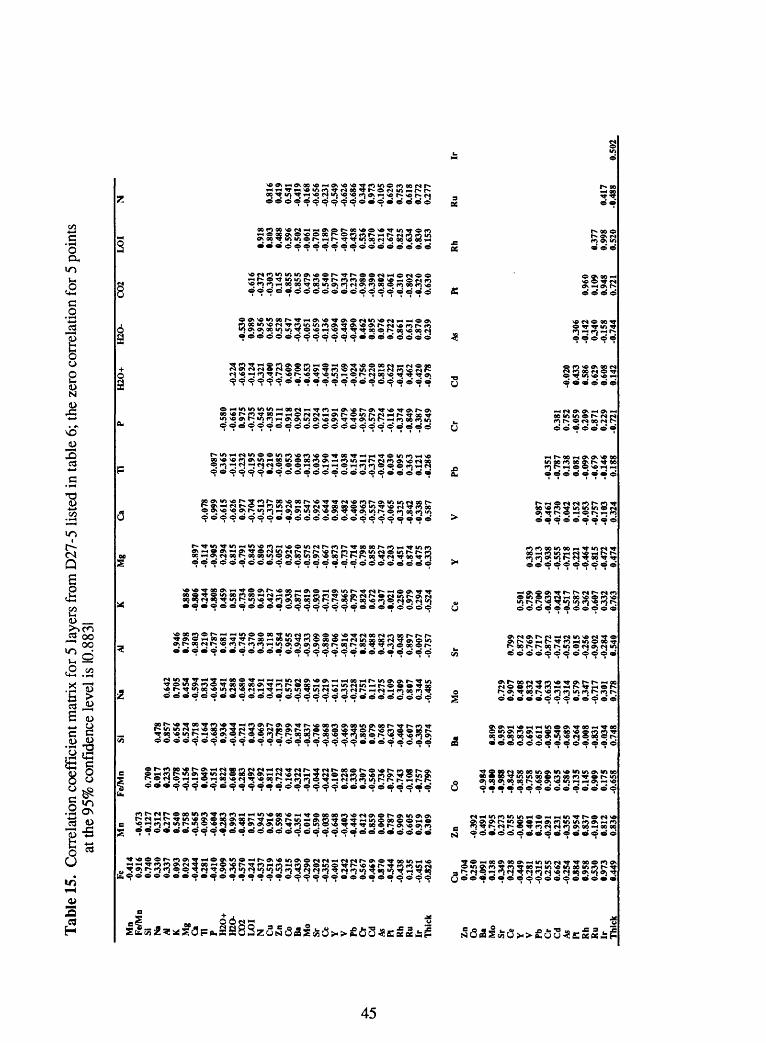
Tab
le 1
5. C
orre
latio
n co
effi
cien
t mat
rix
for
5 la
yers
from
D27
-5 l
iste
d in
tabl
e 6;
the
zero
cor
rela
tion
for
5 po
ints
at
the
95%
con
fide
nce
leve
l is
10.88
31
Mn
Fe/M
nSi N
a4 K M
gC
aTl P H
2O+
mo-
cm LO
IN C
uZ
nC
oB
aM
oSr C
eY V Pb C
rC
dAs ft R
hR
uIr T
hick
Zn
Co Ba
Mo
Sr Ce
Y V Pb Cr
Cd
As ft Rh
Ru
Ir Thi
ck
Fe -0.4
140.
916
0.74
003
300.
337
0.09
30.
029
-0.4
440.
281
-0.4
100.
909
-036
5-0
.570
-0.2
41-0
.537
-0.5
19-0
.536
0315
-0.4
39-0
.290
-020
2-0
352
-0.4
010.
242
0372
0.56
7-0
.469
0.87
0-0
.544
-0.4
380.
135
-0.4
51-0
426
Cu 0.70
402
50-0
.091
0.13
8-0
349
0.23
8-0
.449
-028
1-0
315
0255
0.66
2-0
254
0.88
40.
958
0.53
00.
973
0.44
9
Mn
-0.6
73-0
.127
0312
.277
0.54
00.
758
-0.5
65-0
.093
-0.6
04-
.283
0.99
3-0
.481
0.97
10.
945
0.91
60.
598
0.47
6-0
.351
0.01
4-0
.590
-0.0
38-0
.648
-0.4
03-0
.446
0.41
20.
859
0.00
0 .7
870.
909
0.60
50.
919
0.30
9
Zn
-0.3
920.
491
.795
0.27
30.
755
-0.0
050.
401
0.31
0-0
.291
0.23
1-0
355
0.95
40.
837
-0.1
900.
812
0.83
6
Fe/M
n
0.70
0 .0
17 .2
33-0
.078
-0.1
56-0
.197
0.04
9-0
.151
0.82
2-0
.608
-028
3-0
.492
-0.6
92-0
.811
-0.7
220.
164
-032
2-0
317
-0.0
44-0
.422
-0.1
070.
228
0.33
00.
307
-0.5
600.
736
-0.7
97-0
.743
-0.1
08-
.757
-0.7
99
Co
-0.9
84-0
.800
-0.9
88-0
.842
-0.8
58-0
.758
-0.6
850.
909
0.63
50.
586
-0.1
350.
145
0.90
90.
175
-0.6
58
Si 0.47
80.
857
0.65
60.
524
-0.7
180.
164
-0.6
830.
936
-0.0
44-0
.721
0.04
3-0
.069
-032
7-0
.789
0.79
9-0
.874
-0.8
37-0
.706
-0.8
68-0
.603
-0.4
69-0
348
0.80
50.
079
0.76
8-0
.637
-0.4
040.
607
-038
3-0
.974
Ba 0.80
90.
959
0.89
10.
836
0.69
10.
611
-0.9
05-0
.540
-0.6
8902
64-0
.008
-0.8
31-0
.034
0.74
8
Ma 0.64
20.
705
0.45
4-0
.594
0.83
1-0
.604
0.54
10.
288
-0.6
800.
284
0.19
10.
441
-0.1
310.
575
-0.5
02-0
.489
-0.5
16-0
.219
-0.6
11-0
351
-0.2
280.
751
0.11
70.
275
0.10
90.
309
0.80
70.
344
-0.4
85
Mo
0.72
90.
907
0.40
80.
832
0.74
4-0
.633
-031
6-0
314
0.57
90.
347
-0.7
170.
301
0.77
8
Al 0.94
60.
798
-0.8
030.
210
-0.7
870.
681
0.34
1-0
.745
0.37
00.
380
0.11
8-0
.584
0.95
5-0
.942
-0.9
33-0
.909
-0.8
80-0
.706
-0.8
16-0
.724
0.85
20.
488
0.48
2-0
323
-0.0
480.
897
-0.0
07-0
.757
Sr 0.79
90.
872
0.76
90.
717
-0.8
72-0
.741
-0.5
320.
015
-0.2
56-0
.902
-028
40.
540
K 0.88
6-0
.806
0244
-0.8
080.
459
0.58
1-0
.734
0.58
00.
619
0.42
7-0
316
0.93
8-0
.871
-0.8
19-0
.930
-0.7
31-0
.749
-0.8
65-0
.797
0.82
40.
672
0307
-0.0
2102
500.
979
0.29
4-0
.524
Ce 0.50
10.
759
0.70
0-0
.639
-042
4-0
.517
0.58
703
62-0
.607
0332
0.76
3
Mg
-0.8
97-0
.114
-0.9
050.
294
0.81
5-0
.791
0.84
50.
806
0.52
3-0
.051
0.92
6-0
.870
-0.5
75-0
.972
-0.6
67-0
.873
-0.7
37-0
.714
0.79
80.
858
0.42
70.
203
0.45
10.
874
0.47
5-0
333
Y 0383
0313
-0.9
38-0
.555
-0.7
18-0
.221
-0.4
64-0
.815
-0.4
720.
474
Ca
-0.0
780.
999
-0.6
15-0
.626
0.97
7-0
.704
-0.5
13-0
337
0.15
8-0
.926
0.91
80.
547
0.92
60.
644
0.98
40.
482
0.40
6-0
.963
-0.5
57-0
.749
-0.0
65-0
325
-0.8
42-0
338
0.58
7
V 0.98
7-0
.461
-0.7
300.
042
0.15
2-0
.053
-0.7
57-0
.103
0.32
4
Ti -0.0
8703
65-0
.161
-0.2
32-0
.195
-0.2
500.
210
-0.0
850.
053
0.00
6-0
.183
0.03
60.
190
-0.1
140.
038
0.15
403
11-0
371
-0.0
240.
030
0.09
503
630.
121
-0.2
86
Pb -035
1-0
.787
0.13
80.
081
-0.0
99-0
.679
-0.1
460.
188
P -0.5
80-0
.661
0.97
5-0
.735
-0.5
45-0
.385
0.11
1-0
.918
0.90
20.
521
0.92
40.
613
0.99
10.
479
0.40
6-0
.957
-0.5
79-0
.724
-0.1
16-0
.374
-0.8
49-0
.387
0.54
9
Cr
0.38
10.
752
-0.0
590.
209
0.87
10.
229
-0.7
21
H2O
+
-022
4-0
.693
-0.1
24-0
321
-0.4
00-0
.723
0.60
9-0
.700
-0.6
53-0
.491
-0.6
40-0
.531
-0.1
69-0
.024
0.75
6-0
220
0.81
8-0
.622
-0.4
310.
462
-0.4
20-0
.978
Cd
-0.0
200.
433
0.58
60.
629
0.60
80.
142
H2O
-
-0.5
300.
989
0.95
60.
865
0.52
80.
547
-0.4
34-0
.051
-0.6
59-0
.136
-0.6
94-0
.449
-0.4
900.
462
0.89
50.
076
0.72
20.
861
0.63
10.
870
0239
As -030
6-0
.142
0340
-0.1
58-0
.744
CO
2
-0.6
16-0
.372
-0.3
030.
145
-0.8
550.
855
0.47
90.
836
0.54
00.
977
0.33
40.
237
-0.9
80-0
.390
-0.8
02-0
.061
-0.3
10-0
.802
-032
00.
630
Pt 0.96
00.
109
0.94
80.
721
LO
I
0.91
80.
803
0.48
80.
596
-0.5
02-0
.061
-0.7
01-0
.189
-0.7
70-0
.407
-0.4
380.
536
0.87
00.
216
0.67
40.
825
0.63
40.
830
0.15
3
Rh 0.37
70.
998
0.52
0
N 0.81
60.
419
0.54
1-0
.419
-0.1
68-0
.656
-0.2
31-0
.549
-0.6
26-0
.686
0344
0.97
3-0
.105
0.62
00.
753
0.61
80.
772
0277
Ru
Ir
0.41
7-0
.488
0.
502
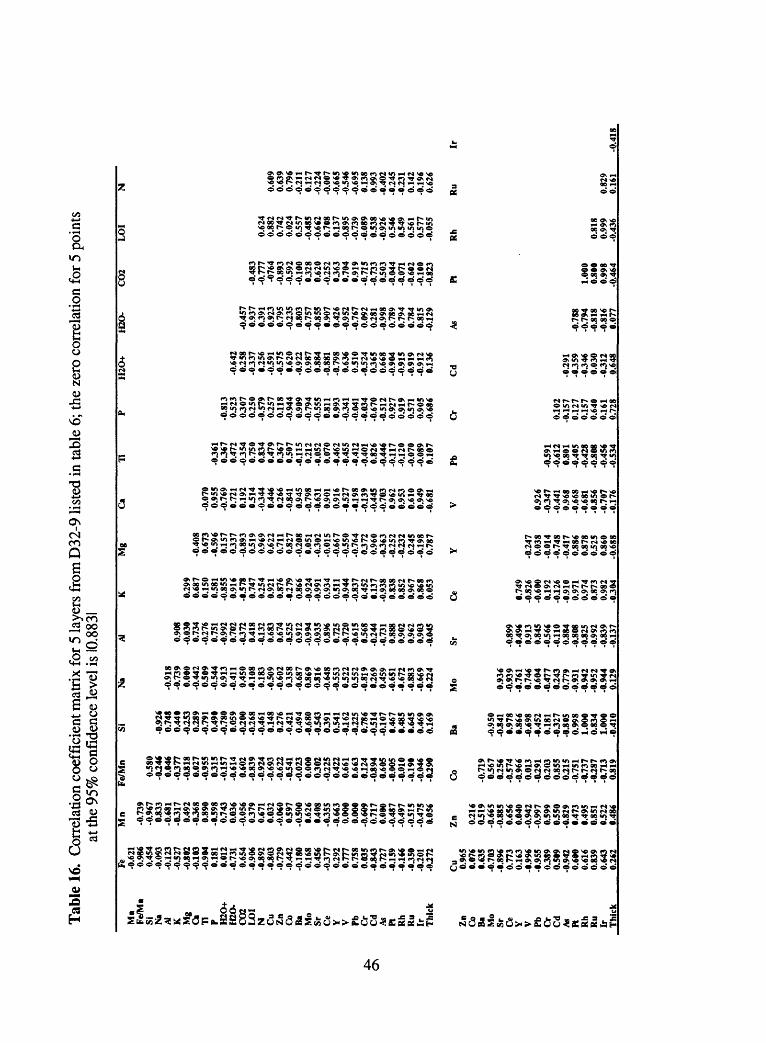
Tab
le 1
6. C
orre
latio
n co
effic
ient
mat
rix fo
r 5 la
yers
from
D32
-9 li
sted
in ta
ble
6; th
e ze
ro c
orre
latio
n fo
r 5 p
oint
s at
the
95%
con
fiden
ce le
vel i
s 10
.8831
ON
Mn
Fe/M
nSi N
aAl K M
gC
aTi P H
2O+
H2O
-C
O2
LO
IN C
uZ
nC
oB
aM
oS
rC
eY V Pb C
rC
dA
s Pt Rh
Ru
Ir Thi
ck
Zn
Co
Ba
Mo
Sr Ce
Y V Pb Cr
Cd
As Pt Rh
Ru
Ir Thi
ck
Fe -0.6
210.
986
0.45
4-0
.093
-0.1
23-0
.527
-0.8
02-0
.103
-0.9
040.
181
0.01
2-0
.731
0.65
4-0
.906
-0.8
92-0
.803
-0.7
29-0
.442
-0.1
800.
168
0.45
6-0
377
0.29
20.
777
0.75
80.
035
-0.8
430.
727
-0.1
59-0
.166
-035
0-0
.201
-0.2
72
Cu 0.96
50.
076
0.63
5-0
.703
-0.8
960.
773
0.16
3-0
.996
-0.9
5503
890.
509
-0.9
420.
600
0.61
60.
839
0.64
30.
262
Mn
-0.7
39-0
.967
0.83
3-0
.681
-031
70.
492
-036
80.
890
-0.5
980.
743
0.03
6-0
.056
0379
0.67
10.
032
-0.0
600.
597
-0.5
000.
626
0.40
8-0
355
-0.6
630.
000
0.00
0-0
.609
0.71
70.
000
-0.4
87-0
.497
-0.5
15-0
.475
0.05
6
Zn 0.21
60.
519
-0.6
65-0
.885
0.65
60.
040
-0.9
42-0
.997
0.59
90.
550
-0.8
290.
473
0.49
50.
851
0.52
20.
486
Fe/M
n
0.58
0-0
.246
0.04
6-0
377
-0.8
180.
027
-0.9
5503
15-0
.157
-0.6
140.
602
-0.8
39-0
.924
-0.6
93-0
.622
-0.5
41-0
.023
0.00
003
02-0
.225
0.42
20.
661
0.66
30.
124
-0.8
940.
605
-0.0
05-0
.010
-0.1
90-0
.046
-0.2
90
Co
-0.7
190.
567
0.25
6-0
.574
-0.9
660.
013
-0.2
910.
203
0.85
50.
215
-0.7
51-0
.737
0.2
87-0
.713
0.81
9
Si -0.9
260.
748
0.44
0 0
.253
0.28
9-0
.791
0.49
0-0
.780
0.05
9-0
.200
-0.2
68-0
.461
0.14
80.
276
-0.4
210.
494
-0.6
80-0
.543
0391
0.54
1-0
.162
-0.2
250.
786
-0.5
14-0
.107
0.46
70.
485
0.64
50.
469
0.16
9
Ba
-0.9
50-0
.841
0.97
80.
866
-0.6
98-0
.452
0.18
1-0
327
-0.8
050.
998
1.00
00.
834
1.00
0-0
.410
Na
-0.9
18-0
.739
0.00
0-0
.442
0.50
9-0
.544
0.91
3-0
.411
0.45
0-0
.108
0.18
3-0
.509
-0.6
0203
58-0
.687
0.86
90.
816
-0.6
48-0
.553
0.52
20.
552
0.8
190.
269
0.45
9-0
.651
-0.6
72-0
.883
-0.6
69-0
.224
Mo
0.93
6-0
.939
-0.7
610.
746
0.60
4-0
.477
0.24
30.
779
-0.9
31-0
.942
-0.9
52-0
.944
0.12
9
Al 0.90
8-0
.030
0.73
4-0
.276
0.75
1-0
.992
0.70
2-0
372
0.41
8-0
.132
0.68
30.
674
-0.5
250.
912
-0.9
94-0
.935
0.89
60.
725
-0.7
20-0
.615
0.56
8-0
.244
-0.7
310.
888
0.90
20.
962
0.90
3-0
.045
Sr -0.8
99-0
.496
0.91
30.
845
0.5
66-0
.110
0.88
4-0
.808
-0.8
25-0
.992
-0.8
39-0
.137
K 0.29
90.
687
0.15
00.
581
-0.8
550.
916
-0.5
780.
747
0.25
40.
921
0.87
6-0
.279
0.86
6-0
.924
-0.9
910.
934
0.51
1-0
.944
-0.8
370.
452
0.13
7-0
.938
0.83
80.
852
0.96
70.
868
0.05
3
Ce 0.74
9-0
.826
-0.6
000.
192
-0.1
26-0
.910
0.97
10.
974
0.87
30.
982
-030
4
Mg
-0.4
080.
673
-0.5
960.
157
0337
-0.8
930.
519
0.96
90.
622
0.71
10.
827
-0.2
080.
051
-0.3
02-0
.015
-0.6
67 0
.550
-0.7
6403
720.
960
-036
3-0
.252
-0.2
320.
245
-0.1
980.
787
Y -0.2
470.
038
-0.0
14-0
.748
-0.4
170.
886
0.87
80.
525
0.86
0-0
.688
Ca
-0.0
700.
955
-0.7
690.
721
0.19
20.
514
-034
40.
446
0.26
6-0
.841
0.94
5-0
.798
-0.6
310.
901
0.91
6-0
.527
-0.1
98-0
.139
-0.4
45-0
.703
0.96
20.
953
0.61
00.
949
-0.6
81
V 0.92
6-0
347
-0.4
410.
968
-0.6
68-0
.681
-0.8
56-0
.707
-0.1
76
Ti 036
103
670.
472
-035
40.
750
0.83
40.
479
0.36
70.
507
-0.1
150.
212
-0.0
520.
070
-0.4
62-0
.455
-0.4
12-0
.401
0.82
6-0
.446
-0.1
17-0
.120
-0.0
70-0
.089
0.10
7
Pb -0.5
91-0
.612
0.80
1-0
.405
-0.4
28-0
.808
-0.4
56-0
.534
P -0.8
130.
523
0307
0.25
0-0
.579
0.25
70.
118
-0.9
440.
909
-0.7
94-0
.555
0.81
10.
993
-0.3
41-0
.041
-0.0
34-0
.670
-0.5
120.
927
0.91
90.
571
0.90
5-0
.686
Cr
0.10
2-0
.157
0.12
70.
157
0.64
00.
161
0.72
8
H2O
+
-0.6
420.
258
-033
70.
256
-0.5
91-0
.575
0.62
0-0
.922
0.98
70.
884
-0.8
81-0
.798
0.63
60.
510
-0.5
2403
650.
668
-0.9
04-0
.915
-0.9
19-0
.912
0.13
6
Cd
-0.2
91-0
359
-034
60.
030
-031
20.
648
I12O
-
-0.4
570.
937
0.39
10.
923
0.79
5-0
.235
0.80
3-0
.757
-0.8
550.
907
0.42
6-0
.952
-0.7
670.
092
0.28
1-0
.998
0.78
90.
794
0.78
40.
815
-0.1
29
As
-0.7
88-0
.794
-0.8
18-0
.816
0.07
7
CO
2
-0.4
83-0
.777
-076
4-0
.893
-0.5
92-0
.100
0328
0.62
0-0
.252
0363
0.70
40.
919
-0.7
15-0
.733
0.50
3-0
.044
-0.0
71-0
.602
-0.1
00-0
.823
Pt 1.00
00.
800
0.99
8-0
.464
LO
I
0.62
40.
882
0.74
20.
024
0.55
7-0
.485
-0.6
620.
708
0.13
7-0
.895
-0.7
39-0
.089
0.53
8-0
.926
0.54
60.
549
0.56
10.
577
-0.0
55
Rh 0.81
80.
999
-0.4
36
N 0.60
90.
639
0.79
6-0
.211
0.12
7-0
.224
-0.0
07-0
.665
-0.5
46-0
.695
0.13
80.
993
-0.4
02-0
.245
-0.2
310.
142
-0.1
960.
626
Ru
Ir
0.82
90.
161
-0.4
18
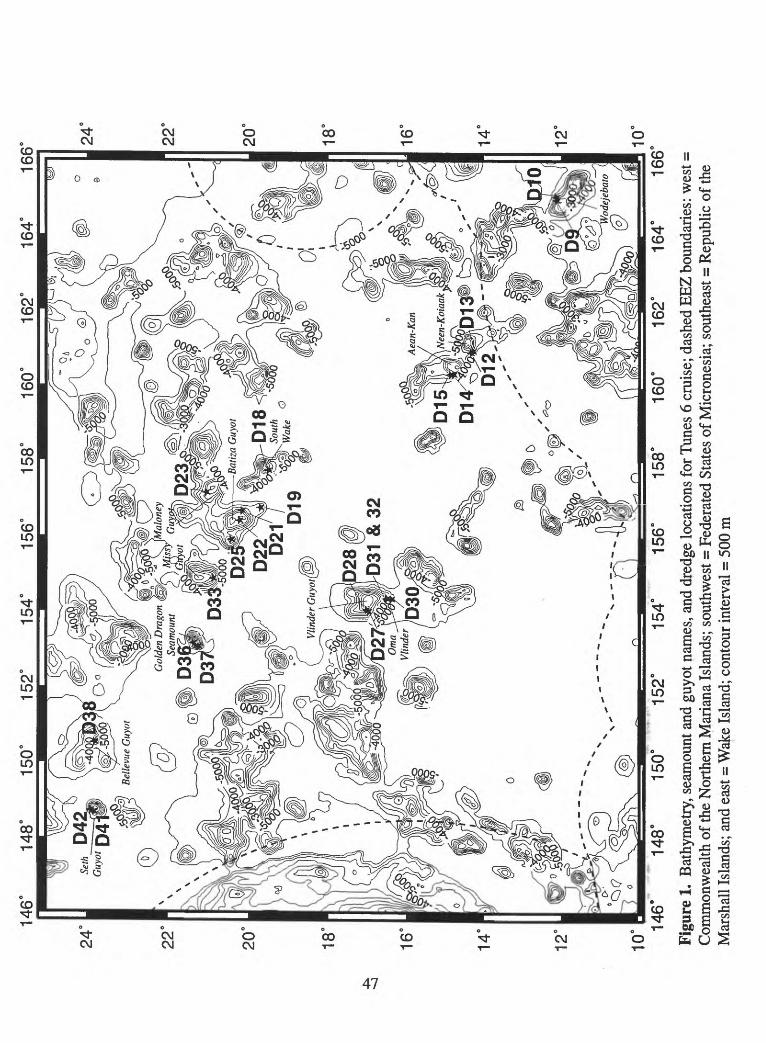
146'
148'
150'
152'
154'
156'
158'
160'
162'
164°
166°
24'
22
'
20
'
18'
16'
14°
12'
10'
24
'
22'
20
'
18e
16e
14'
12'
10'
146°
14
8°15
0°15
2°15
4'15
6'15
8'16
0°
162'
164
166°
Figu
re 1
. B
athy
met
ry, s
eam
ount
and
guy
ot n
ames
, and
dre
dge
loca
tions
for
Tun
es 6
cru
ise;
das
hed
EEZ
boun
darie
s: w
est =
C
omm
onw
ealth
of t
he N
orth
ern
Mar
iana
Isla
nds;
sou
thw
est =
Fed
erat
ed S
tate
s of
Mic
rone
sia;
sou
thea
st =
Rep
ublic
of t
he
Mar
shal
l Isl
ands
; and
eas
t = W
ake
Isla
nd; c
onto
ur in
terv
al =
500
m
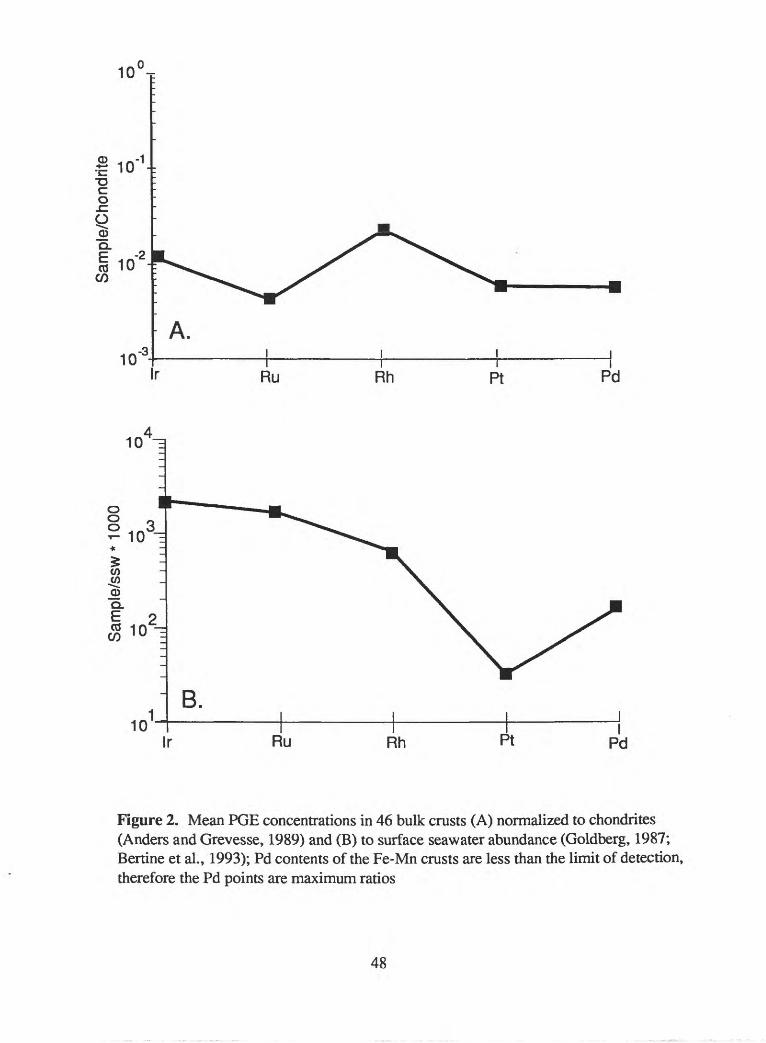
10Ir
10
Figure 2. Mean PGE concentrations in 46 bulk crusts (A) normalized to chondrites (Anders and Grevesse, 1989) and (B) to surface seawater abundance (Goldberg, 1987; Bertine et al., 1993); Pd contents of the Fe-Mn crusts are less than the limit of detection, therefore the Pd points are maximum ratios
48
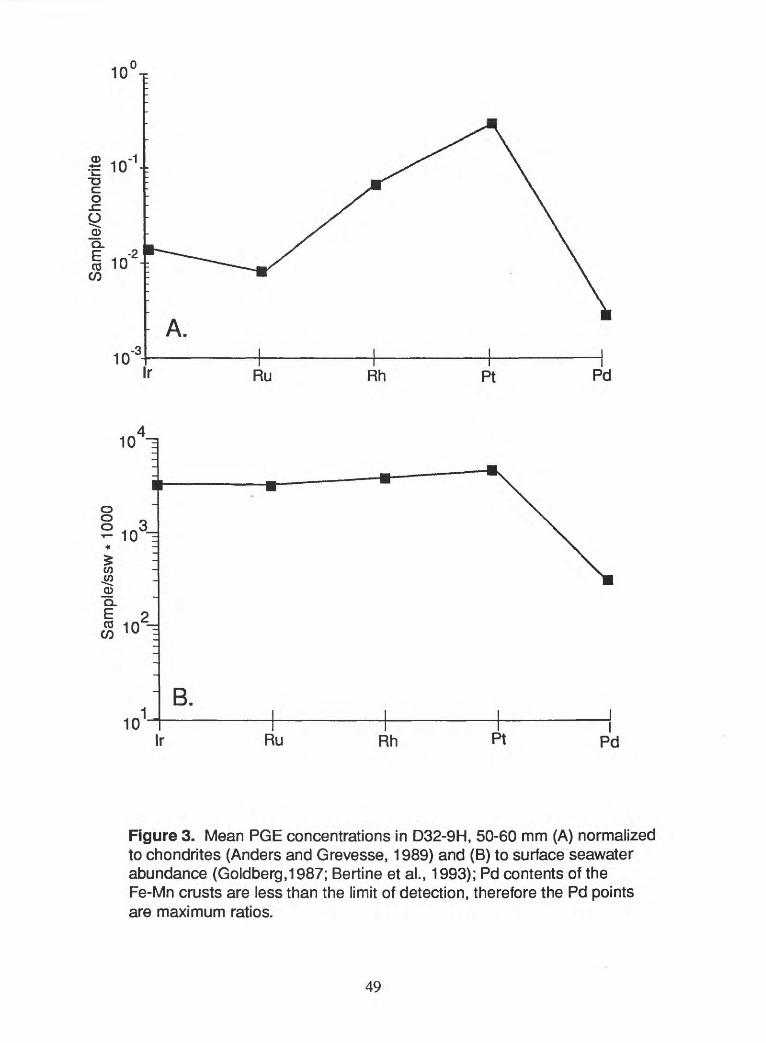
10
10r Ru Rh Pt
I Pd
Figure 3. Mean PGE concentrations in D32-9H, 50-60 mm (A) normalized to chondrites (Anders and Grevesse, 1989) and (B) to surface seawater abundance (Goldberg,1987; Bertine et al., 1993); Pd contents of the Fe-Mn crusts are less than the limit of detection, therefore the Pd points are maximum ratios.
49
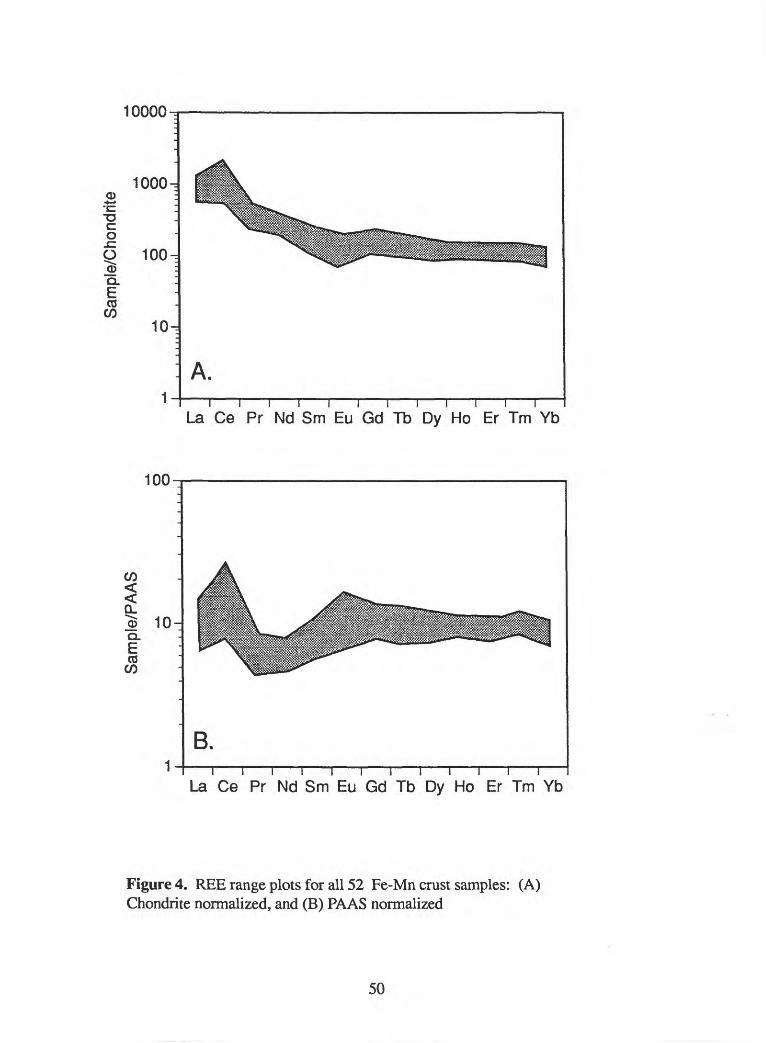
10000
1000-CD
c oO 100-_ CLE03
CO10-
A.
La Ce Pr Nd Sm Eu Gd Tb Dy Ho Er Tm Yb
100
CO
CLE03
CO
10-
B.
La Ce Pr Nd Sm Eu Gd Tb Dy Ho Er Tm Yb
Figure 4. REE range plots for all 52 Fe-Mn crust samples: (A) Chondrite normalized, and (B) PAAS normalized
50
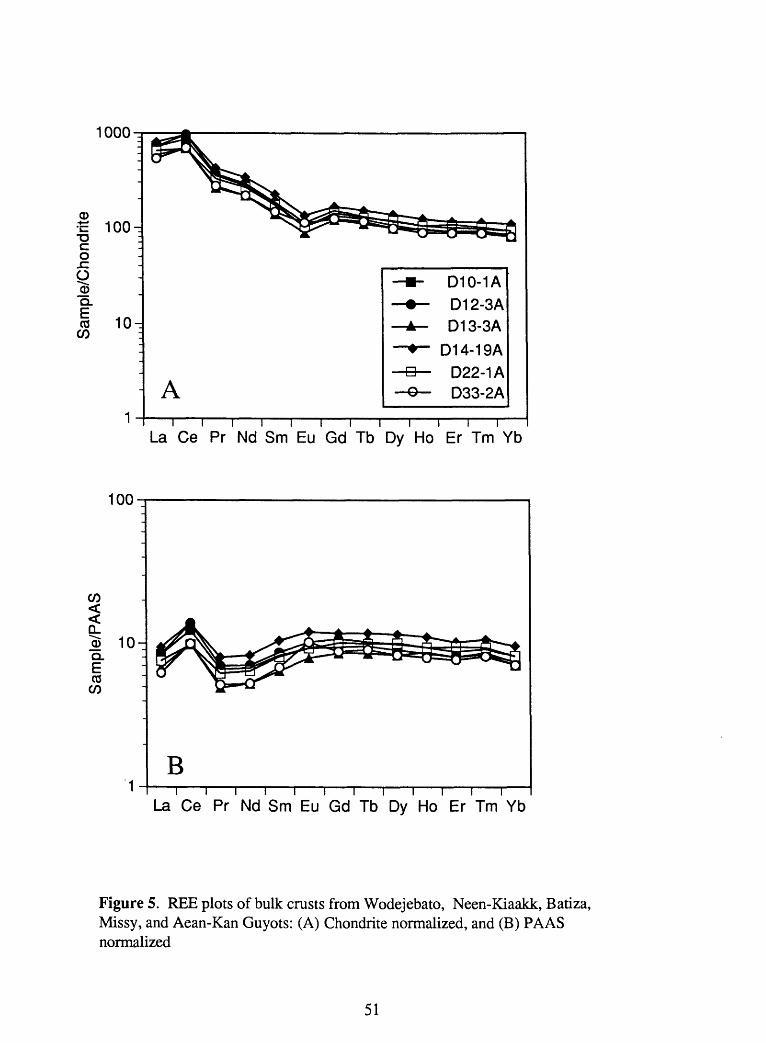
1000-q
0)
c oJZO
Q.
03 CO
100-
A
D10-1A
D12-3AD13-3A
D14-19A
D22-1AD33-2A
La Ce Pr Nd Sm Eu Gd Tb Dy Ho Er Tm Yb
100
CO
Q_
03 CO
10-
BLa Ce Pr Nd Sm Eu Gd Tb Dy Ho Er Tm Yb
Figure 5. REE plots of bulk crusts from Wodejebato, Neen-Kiaakk, Batiza, Missy, and Aean-Kan Guyots: (A) Chondrite normalized, and (B) PAAS normalized
51
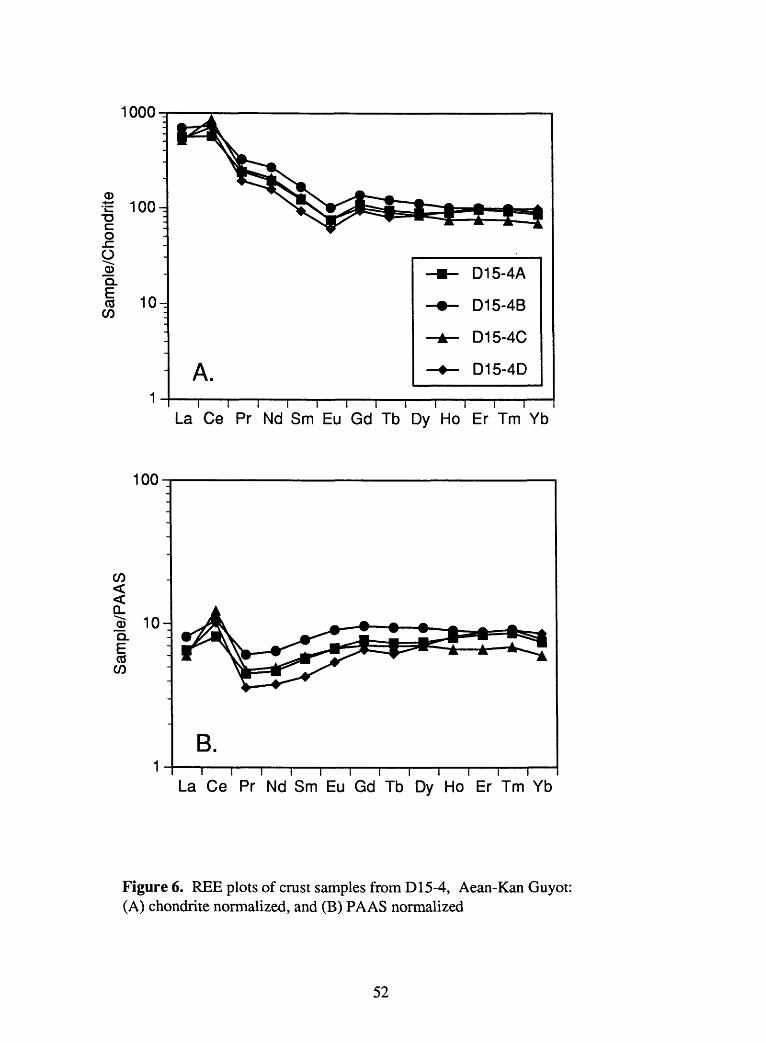
1000
d> e 100 Dc o
O
Q.
I 10 C/D
A.
D15-4A
D15-4B
D15-4C
D15-4D
La Ce Pr Nd Sm Eu Gd Tb Dy Ho Er Tm Yb
100
C/D
Q.
CO OD
10-
B.
La Ce Pr Nd Sm Eu Gd Tb Dy Ho Er Tm Yb
Figure 6. REE plots of crust samples from D15-4, Aean-Kan Guyot: (A) chondrite normalized, and (B) PAAS normalized
52
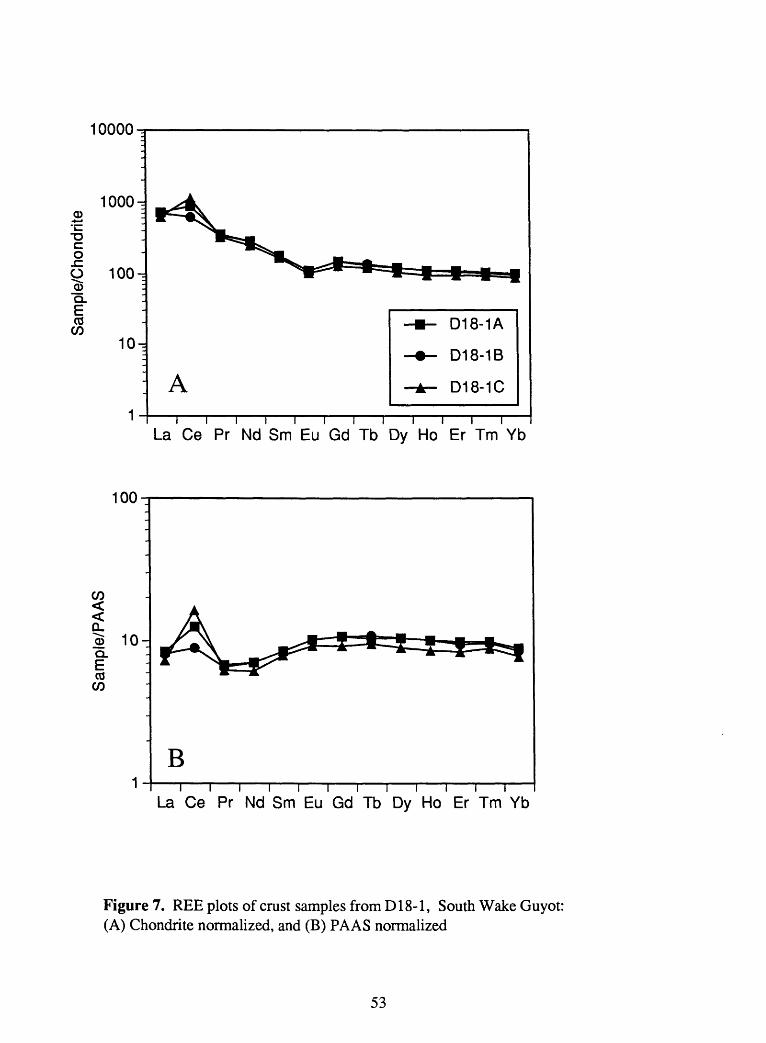
10000
1000-CD
c oO 100_CD QL
CO CO
10
A
D18-1A
D18-1B
D18-1C
La Ce Pr Nd Sm Eu Gd Tb Dy Ho Er Tm Yb
100
CO< < QLo>QLECO
CO
10-
B
La Ce Pr Nd Sm Eu Gd Tb Dy Ho Er Tm Yb
Figure 7. REE plots of crust samples from D18-1, South Wake Guyot: (A) Chondrite normalized, and (B) PAAS normalized
53
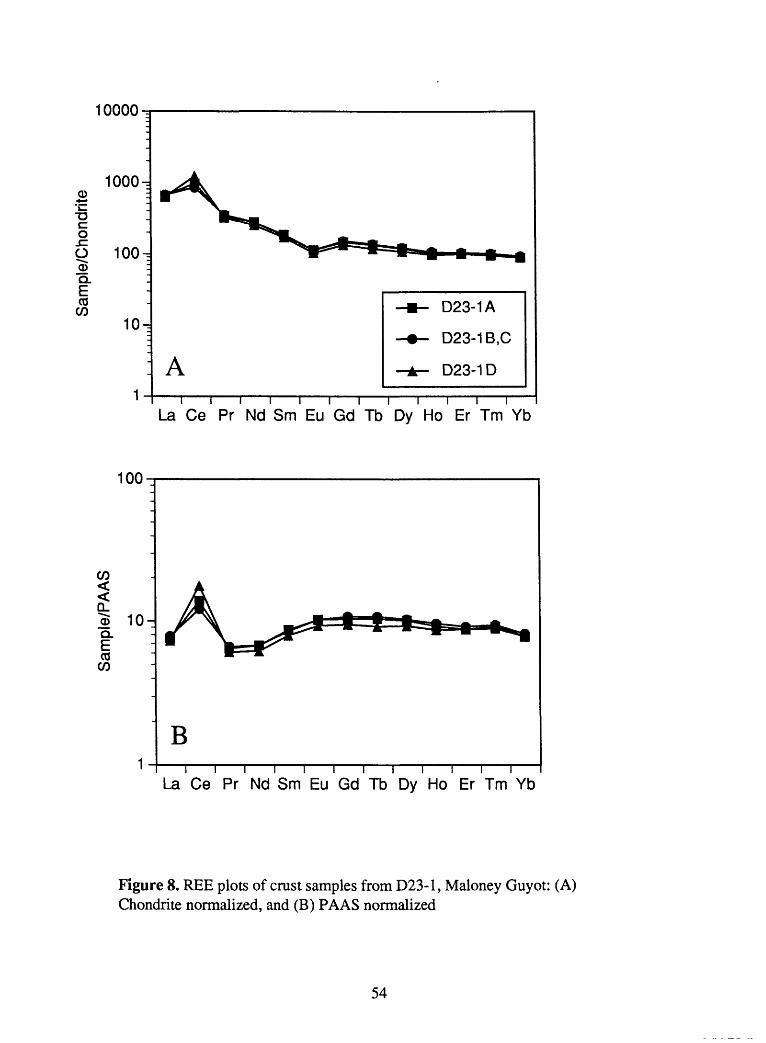
10000-q
100CHCD
Cop 100-
GL
CO CO
10-
A
D23-1A
D23-1 B,C
D23-1D
La Ce Pr Nd Sm Eu Gd Tb Dy Ho Er Tm Yb
100
CO
CL
CO CO
10-
B
La Ce Pr Nd Sm Eu Gd Tb Dy Ho Er Tm Yb
Figure 8. REE plots of crust samples from D23-1, Maloney Guyot: (A) Chondrite normalized, and (B) PA AS normalized
54
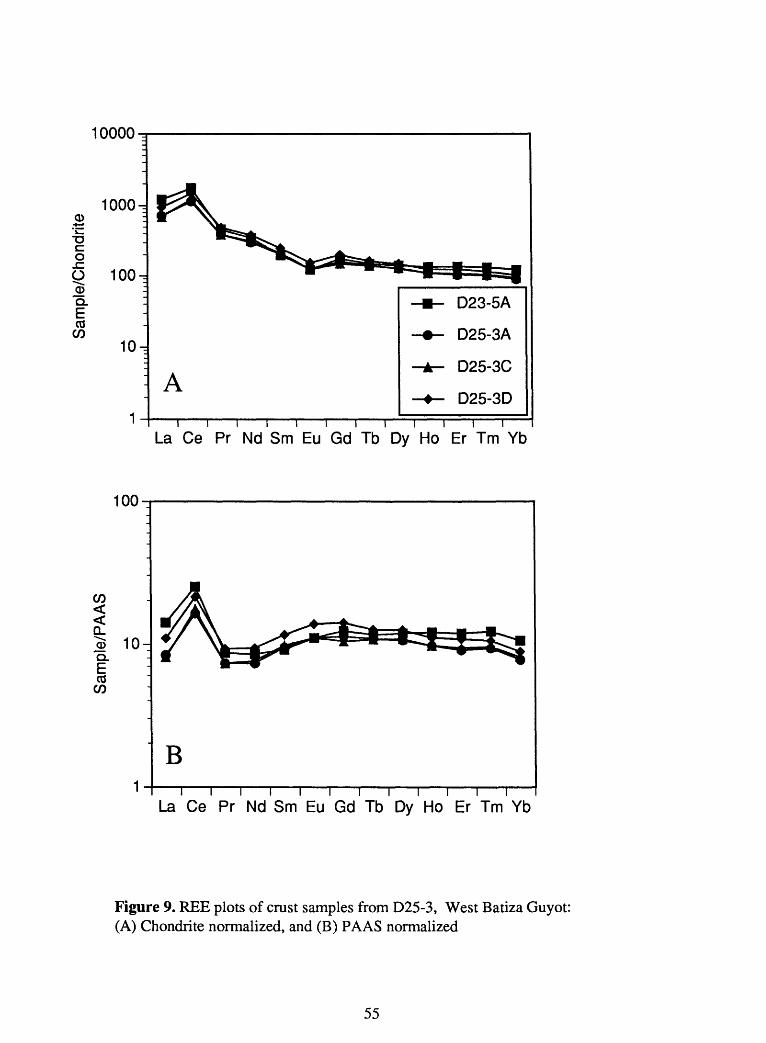
1000CH
1000-0)
c o
O 100-
Q.
OJCO
10-
A
D23-5A
D25-3A
D25-3C
D25-3D
La Ce Pr Nd Sm Eu Gd Tb Dy Ho Er Tm Yb
100
CO
o_ oQ.
OJCO
B
La Ce Pr Nd Sm Eu Gd Tb Dy Ho Er Tm Yb
Figure 9. REE plots of crust samples from D25-3, West Batiza Guyot: (A) Chondrite normalized, and (B) PA AS normalized
55
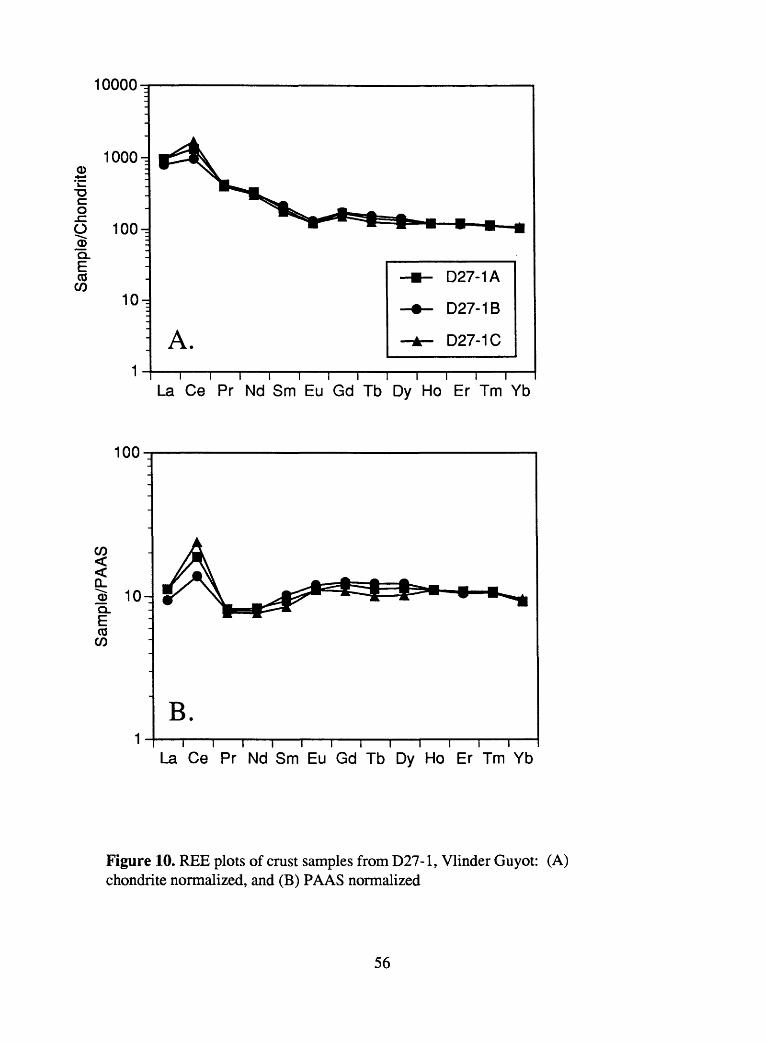
10000^
1000^CD
c oO 100
QL
CO CO
10^
A.
D27-1A
D27-1B
D27-1C
La Ce Pr Nd Sm Eu Gd Tb Dy Ho Er Tm Yb
100
CO
QL
CO CO
10-
B.
La Ce Pr Nd Sm Eu Gd Tb Dy Ho Er Tm Yb
Figure 10. REE plots of crust samples from D27-1, Vlinder Guyot: (A) chondrite normalized, and (B) PAAS normalized
56
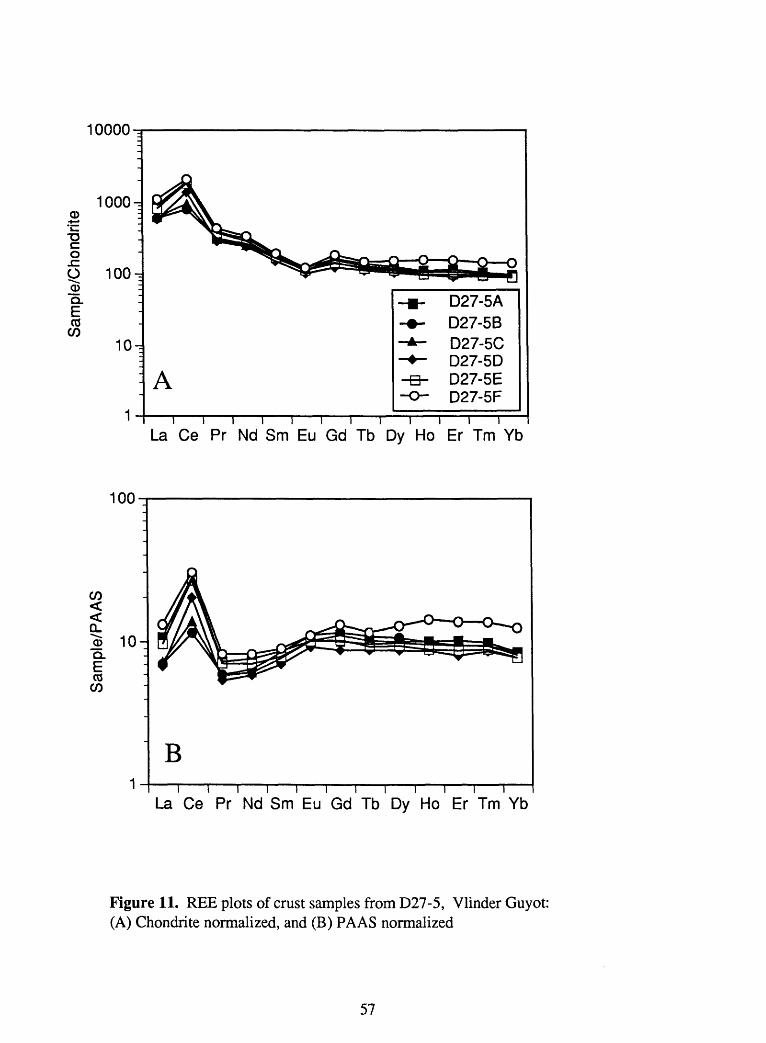
10000-,
1000-CD
O
0 100-_ Q.
CO CO
10-=
A
D27-5A D27-5BD27-5C D27-5D D27-5E D27-5F
La Ce Pr Nd Sm Eu Gd Tb Dy Ho Er Tm Yb
100
CO
Q_o 10Q.ECO
CO
B
La Ce Pr Nd Sm Eu Gd Tb Dy Ho Er Tm Yb
Figure 11. REE plots of crust samples from D27-5, Vlinder Guyot: (A) Chondrite normalized, and (B) PA AS normalized
57
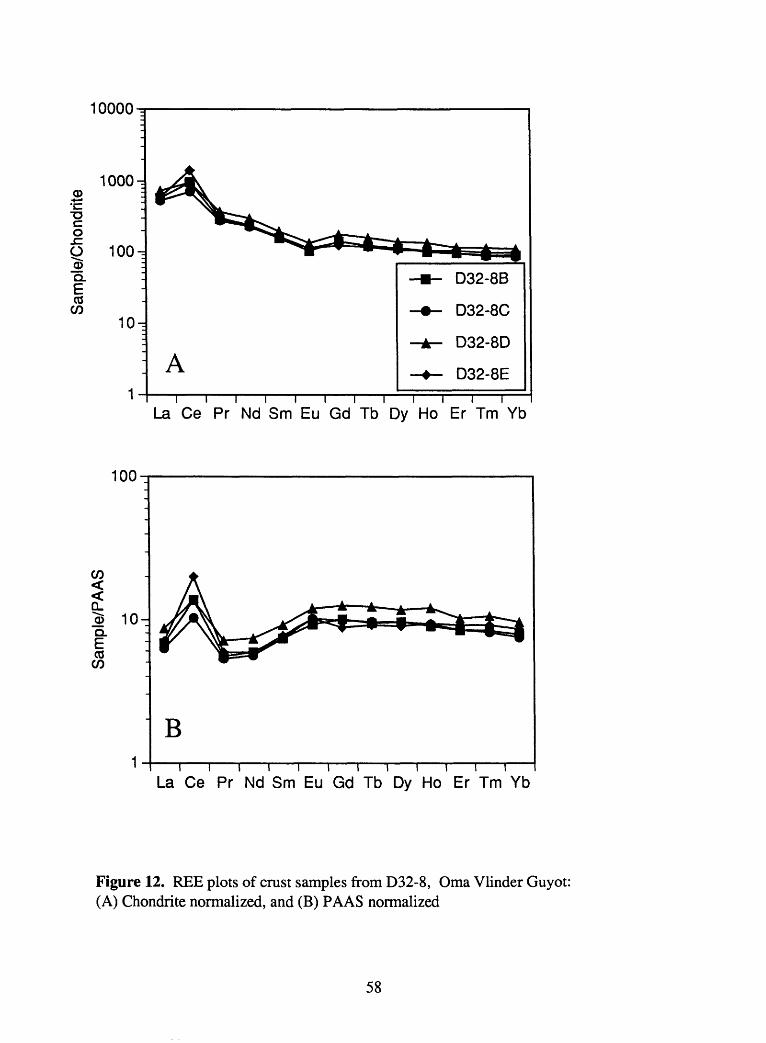
10000-r
100CHQ*
oO 100
CL
COCO
10-J
A
D32-8B
D32-8C
D32-8D
D32-8E
La Ce Pr Nd Sm Eu Gd Tb Dy Ho Er Tm Yb
100
CO
Q.
OJ CO
10-
B
La Ce Pr Nd Sm Eu Gd Tb Dy Ho Er Tm Yb
Figure 12. REE plots of crust samples from D32-8, Oma Vlinder Guyot: (A) Chondrite normalized, and (B) PAAS normalized
58
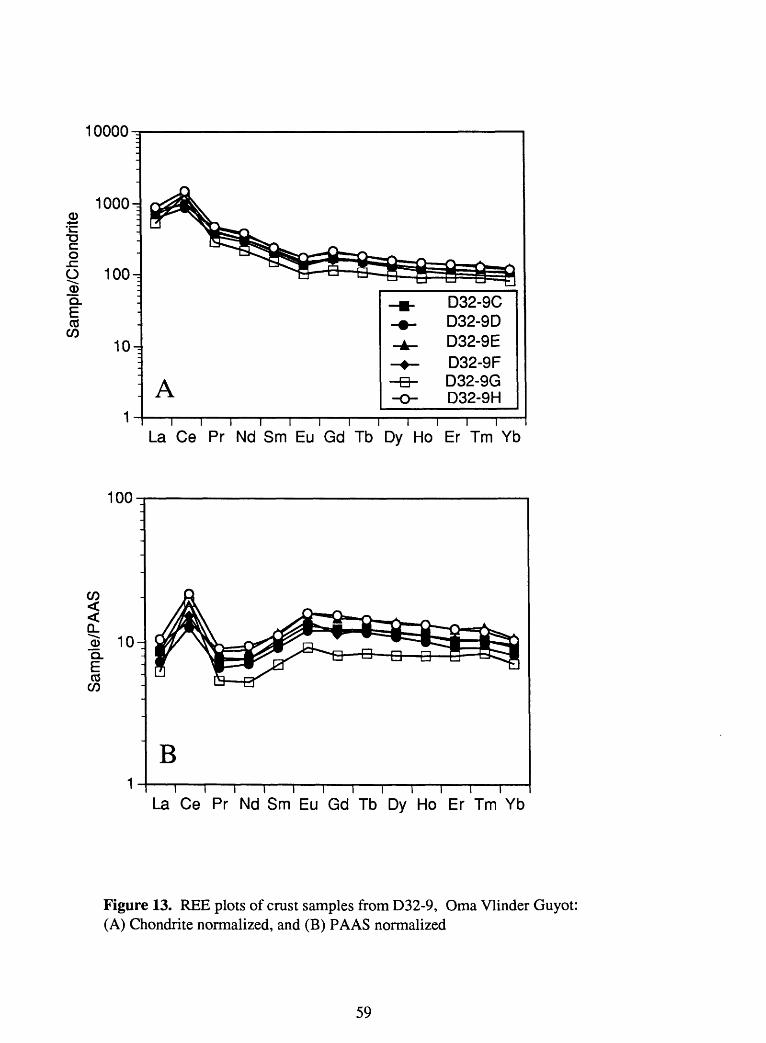
10000
1000-o>
o0 100-
CLE05
CO10-
A -B--o-
D32-9C D32-9D D32-9E D32-9F D32-9G D32-9H
La Ce Pr Nd Sm Eu Gd Tb Dy Ho Er Tm Yb
100
CO
CL
05 CO
10-
B
La Ce Pr Nd Sm Eu Gd Tb Dy Ho Er Tm Yb
Figure 13. REE plots of crust samples from D32-9, Oma Vlinder Guyot: (A) Chondrite normalized, and (B) PA AS normalized
59
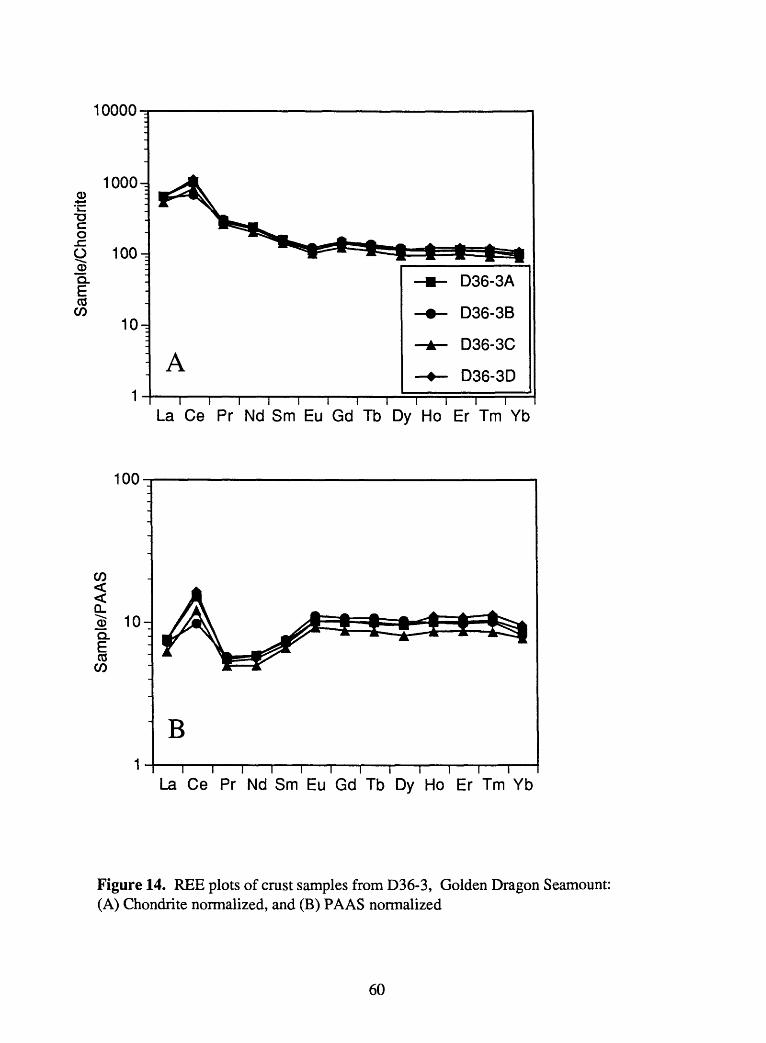
10000^
1000-0)
O
o
O 100-J"o.
03 CO
10-
A
D36-3A
D36-3B
D36-3C
D36-3D
La Ce Pr Nd Sm Eu Gd Tb Dy Ho Er Tm Yb
100
CO
Q.
CO CO
10-
B
La Ce Pr Nd Sm Eu Gd Tb Dy Ho Er Tm Yb
Figure 14. REE plots of crust samples from D36-3, Golden Dragon Seamount: (A) Chondrite normalized, and (B) PAAS normalized
60
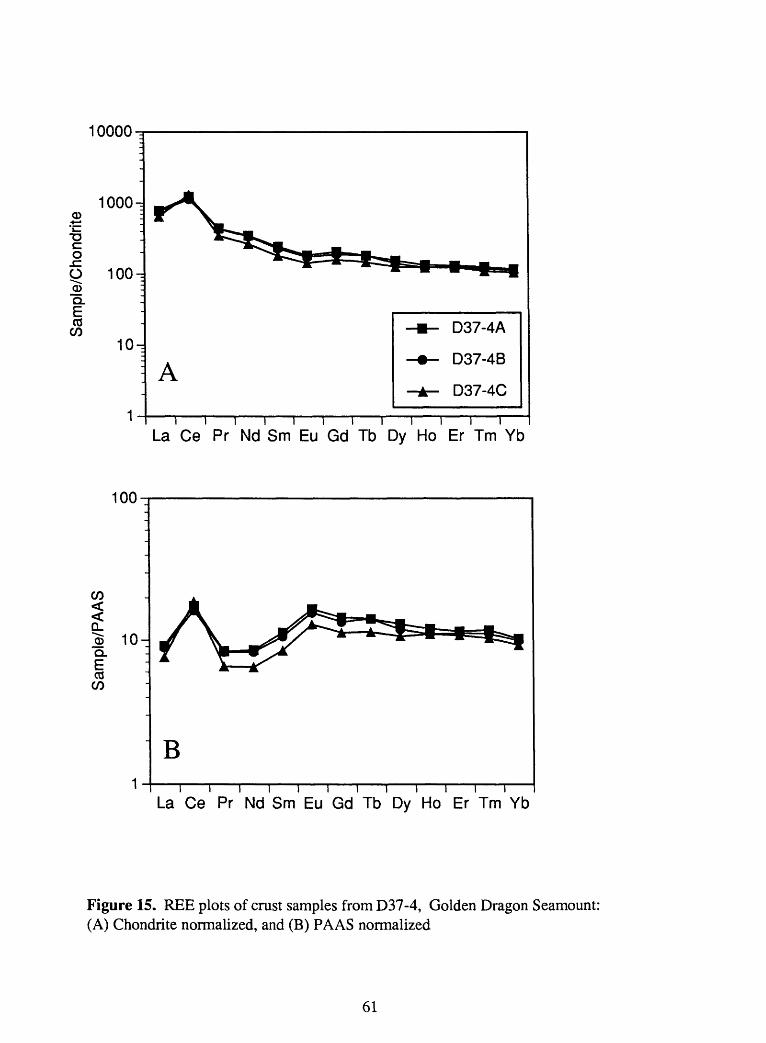
10000^
1000-CD
c oO 100^
Q.
CO CO 10-,
A
D37-4A
D37-4B
D37-4C
La Ce Pr Nd Sm Eu Gd Tb Dy Ho Er Tm Yb
100
CO< < CL1Q.
CO CO
10-
B
La Ce Pr Nd Sm Eu Gd Tb Dy Ho Er Tm Yb
Figure 15. REE plots of crust samples from D37-4, Golden Dragon Seamount: (A) Chondrite normalized, and (B) PAAS normalized
61
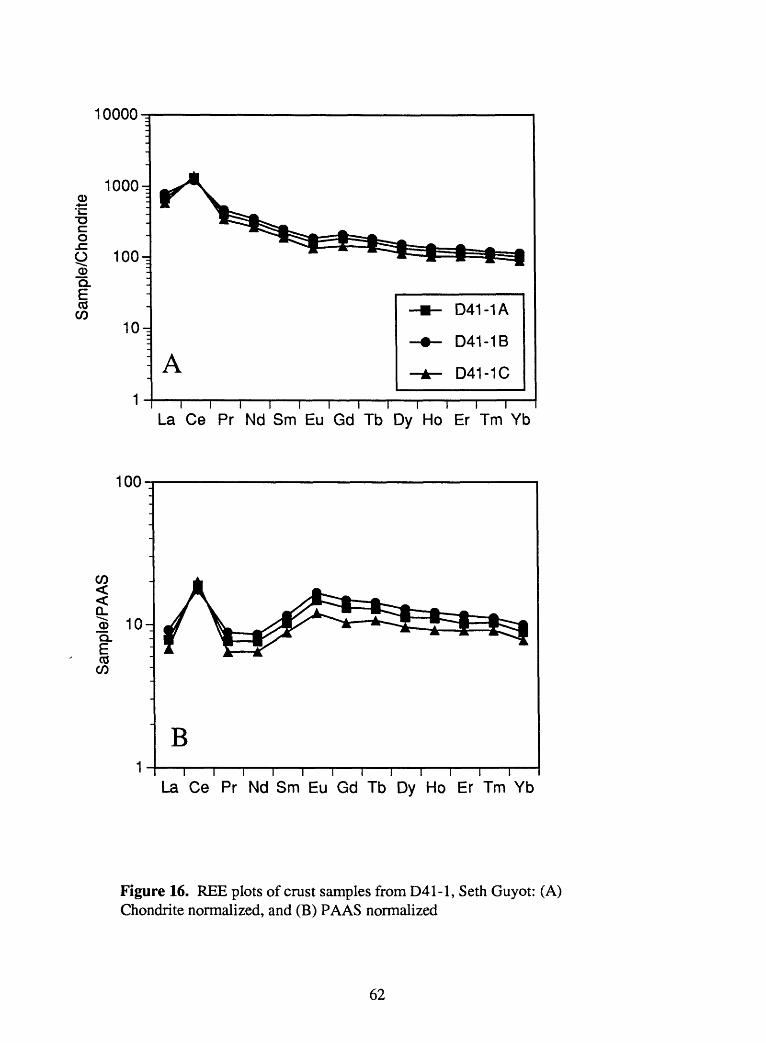
10000^
1000-1CD
c o
_ Q.
CO CO
100r
10.
A
D41-1A
D41-1B
D41-1C
La Ce Pr Nd Sm Eu Gd Tb Dy Ho Er Tm Yb
100
CO
Q.
CO CO
10-
B
La Ce Pr Nd Sm Eu Gd Tb Dy Ho Er Tm Yb
Figure 16. REE plots of crust samples from D41-1, Seth Guyot: (A) Chondrite normalized, and (B) PAAS normalized
62
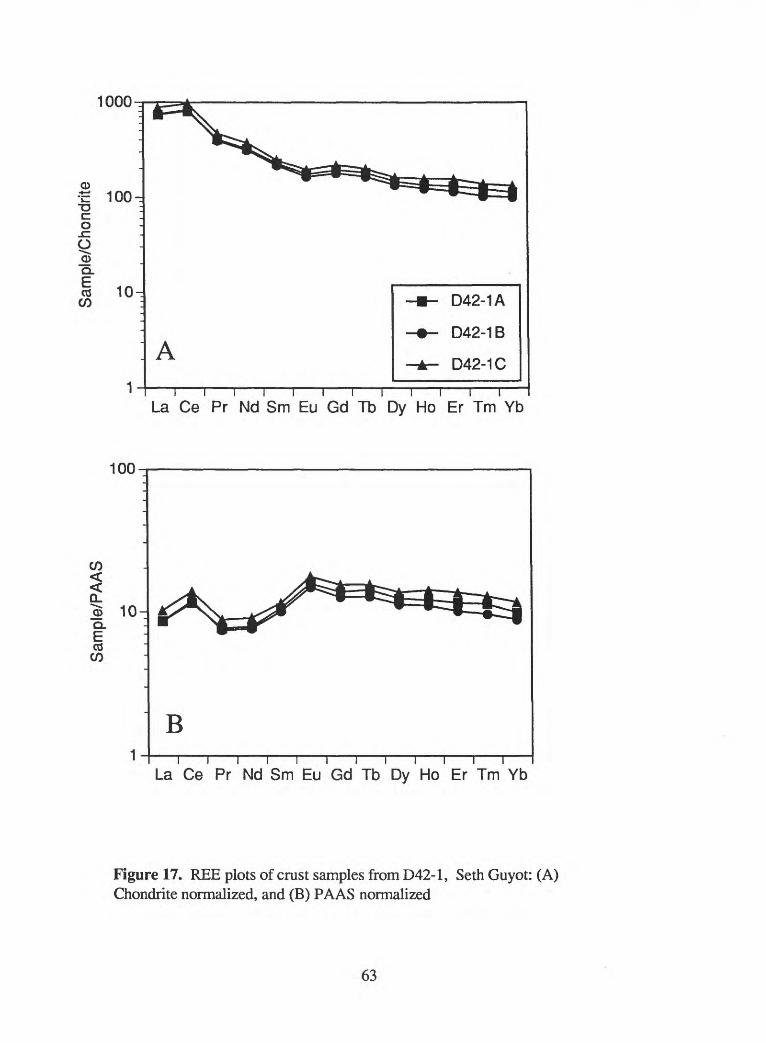
CD c 100T3c. o
O
CO10^
A
D42-1A
D42-1B
D42-1C
La Ce Pr Nd Sm Eu Gd Tb Dy Ho Er Tm Yb
100
CO
Q_
COCO
10-
B
La Ce Pr Nd Sm Eu Gd Tb Dy Ho Er Tm Yb
Figure 17. REE plots of crust samples from D42-1, Seth Guyot: (A) Chondrite normalized, and (B) PAAS normalized
63
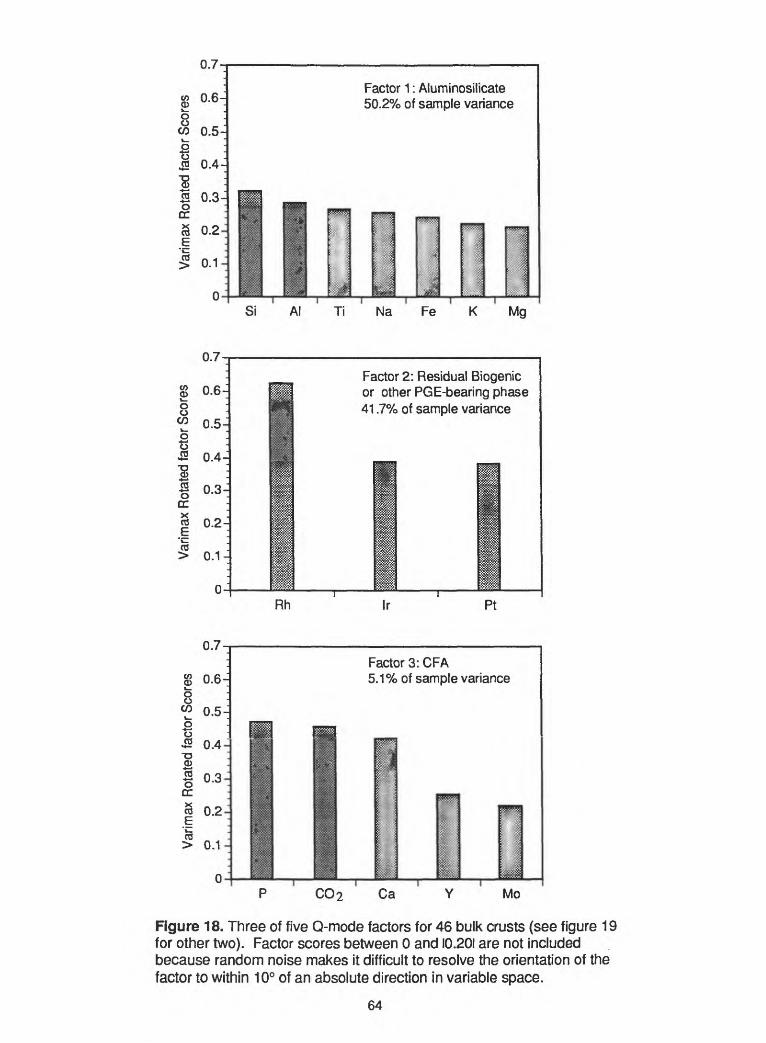
Factor 1: Aluminosilicate 50.2% of sample variance
o t*
0.7-
0.6-
0.5
0.4 g
| 0.3ccI 0.2
ra> 0.1
Factor 2: Residual Biogenic or other PGE-bearing phase 41.7% of sample variance
Rh Ir Pt
CO 2
Factor 3: CFA5.1% of sample variance
Ca Mo
Figure 18. Three of five Q-mode factors for 46 bulk crusts (see figure 19 for other two). Factor scores between 0 and I0.20I are not included because random noise makes it difficult to resolve the orientation of the factor to within 10° of an absolute direction in variable space.
64
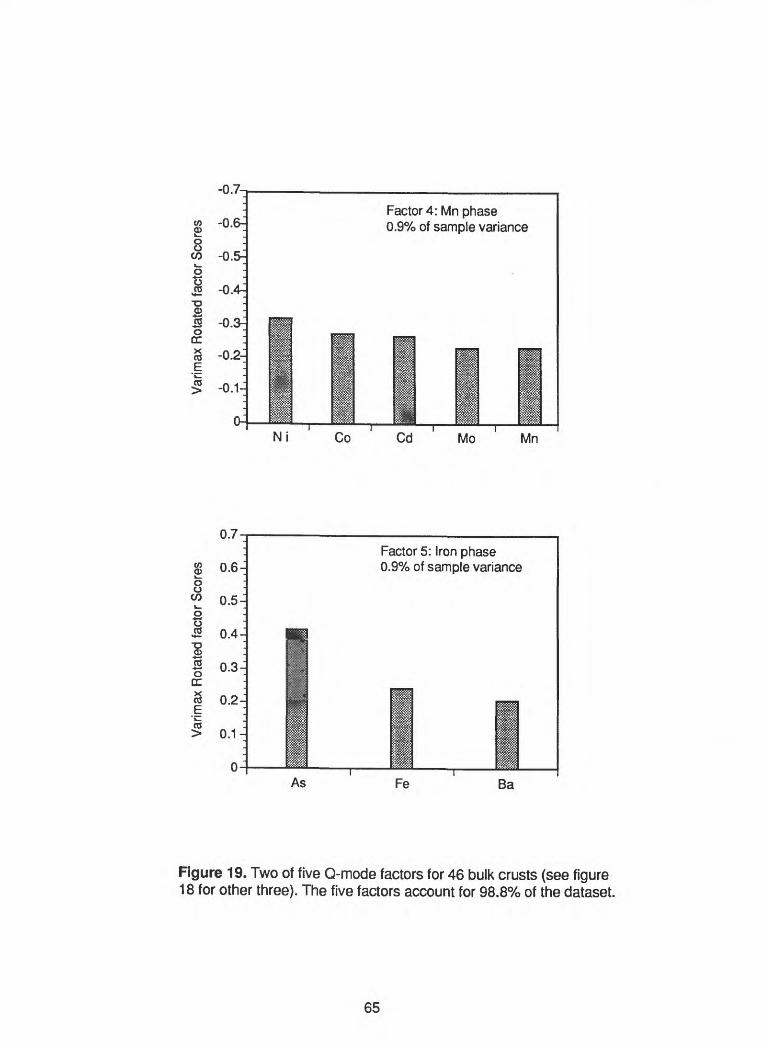
CD en
w (
Q fs i?
:si1
So
CD
o"r
" -*
>
-H 5
s *
=35 P
§
®
° £
W
O
-p
{D
O
<l>
§°
^
CD
-t
O"
CD
E
. 0
0 ?r
bo o
oo
^ c
^
CD
m
Varim
ax R
otat
ed fa
ctor
Sco
res
p
O
p
p
p
O
C
D^K
jC
OJ^C
JlO
)-*
: '
" fi
^^^^ -.
£A
.t ::
>;'<
:; x
rSi:?
: ;:;l^
^
P -
n
g 1
o
-«
* e
nCO
w
3
oT
3
3
CD
"O.
^'
CD
o
O
O O Q.
Varim
ax R
otat
ed fa
ctor
Sco
res
\.. .r
... V
... .y
. ..>
... .y
. ..>
....
o -
n CD
^^§
o -«
-* ^
CO
2
CD
P'
O
CD
CD
CD


