Embed Size (px)
Citation preview
M
DISTRIBUTION OF FLUORIDE -RICH GROUNDWATER IN THE
EASTERN AND MOGWASEREGIONS OF THE NORTHERN
AND NORTH - WEST PROVINCES
LP McCaffrey • JP Willis
WRC Report No 526/1/01
Disclaimer
This report emanates from a project financed by the Water Research Commission (WRC) and isapproved for publication. Approval does not signify that the contents necessarily reflect the viewsand policies of the WRC or the members of the project steering committee, nor does mention oftrade names or commercial products constitute endorsement or recommendation for use.
Vrywaring
Hierdie verslag spruit voort uit 'n navorsingsprojek wat deur die Waternavorsingskommissie(WNK) gefinansier is en goedgekeur is vir publikasie. Goedkeuring beteken nie noodwendig datdie inhoud die siening en beleid van die WNK of die lede van die projek-loodskomitee weerspiee'Jnie, of dat melding van handelsname of -ware deur die WNK vir gebruik goedgekeur of aanbeveelword nie.
DISTRIBUTION OF FLUORIDE-RICH GROUND WATERIN THE EASTERN AND MOGWASE REGIONS OF THE
NORTHERN AND NORTH-WEST PROVINCES
by
L p MCCAFFREY and j p WILLIS
Department of Geological SciencesUniversity of Cape Town
Rondebosch 7700, South Africa
Report to the Water Research Commission on the Project'Distribution of fluoride-rich ground water in the eastern and Mogwase regions of the
Northern and North-western Provinces: influence of bedrock and soils and constraints onutilisable drinking water supplies"
Head of Department: Professor A P le RoexProject Leader: Professor J P Willis
WRC Report No. 526/1/01ISBN 186845 694 3
TABLE OF CONTENTS
EXECUTIVE SUMMARY 11 Background and motivation to the study 2
1.1 Distribution and causes of high F" groundwater 22 Aims of the study 33 Field area 44 Geochemistry of Fluorine 75 Materials and Methods 8
5.1 Groundwater 85.2 Rocks and soils 95.3 Computer manipulation of spatial data 10
6 Main results 116.1 Fluorine in rocks and soils 116.2 Groundwater chemistry 13
6.2.1 Anions 156.2.2 Trace elements 156.2.3 Temporal variation 156.2.4 General 15
7 Conclusions 168 Recommendations 16
ACKNOWLEDGMENTS i
ABBREVIATIONS AND DEFINITIONS iii
1 INTRODUCTION 1.1
1.1 Purpose of this study 1.11.2 Structure of this report 1.31.3 Field area 1.3
1.3.1 Extent 1.31.3.2 Geography 1.31.3.3 Geology 1.5
1.3.3.1 Lithology 1.61.3.3.2 Structure 1.6
1.3.4 Meteorology 1.71.3.5 Hydrology 1.91.3.6 Geohydrology 1.9
1.4 Isotope Hydrogeochemistry 1.121.4.1 Introduction 1.12
1.4.1.1 Stable Isotopes of oxygen and hydrogen 1.131.4.1.2 Strontium isotopes 1.141.4.1.3 Radiocarbon 1.16
1.5 Workshop On Fluoride and Fluorosis 1.17
2 MATERIALS AND METHODS 2.12.1 Groundwater 2.1
- l -
2.1.1 Sampling and field tests 2.12.1.1.1 Sampling protocol 2.12.1.1.2 Field tests 2.1
2.1.2 Sample preparation 2.22.1.2.1 High Pressure Ion Chromatography (HPIC) 2.22.1.2.2 Fluoride ion selective electrode 2.22.1.2.3 Iodide 2.22.1.2.4 Stable isotopes 2.22.1.2.5 Radiocarbon 2.22.1.2.6 Strontium isotopes 2.2
2.1.3 Analysis 2.32.1.3.1 Fluoride ion selective electrode 2.32.1.3.2 Major ions 2.32.1.3.3 Iodide 2.32.1.3.4 Stable isotopes 2.32.1.3.5 Radiocarbon 2.32.1.3.6 Strontium isotopes 2.5
2.2 Rock and soil 2.52.2.1 Sampling 2.52.2.2 Sample preparation 2.5
2.2.2.1 Drying 2.52.2.2.2 Crushing and milling 2.52.2.2.3 XRFS briquettes 2.62.2.2.4 XRF fusion disks 2.62.2.2.5 XRD . 2.62.2.2.6 Electron microprobe 2.62.2.2.7 Stable isotopes 2.7
2.2.3 Analysis 2.72.2.3.1 X-Ray Fluorescence Spectrometry (XRFS) 2.72.2.3.2 X-Ray Diffraction (XRD) 2.72.2.3.3 Carbon dioxide (CO2) 2.72.2.3.4 Gas-source Mass Spectrometer 2.72.2.3.5 Solid-Source Mass Spectrometer 2.72.2.3.6 Electron microprobe 2.8
2.3 Leaching experiments 2.82.4 Data quality 2.10
2.4.1 Groundwater Data Quality 2.102.4.1.1 Ionic analysis 2.102.4.1.2 Overall quality of water analyses 2.152.4.1.3 Spatial distribution of water samples 2.17
2.4.2 Rock and soil data quality 2.182.4.2.1 Elemental analysis 2.182.4.2.2 Spatial distribution of rock and soil samples 2.18
2.5 Computer manipulation of spatial data 2.18
3 GEOCHEMISTRY OF ROCKS, SOILS AND MINERALS 3.13.1 Introduction 3.13.2 Chemical composition of rock samples 3.1
3.2.1 Major element Geochemistry 3.1
-li-
3.2.1.1 Previous Work 3.13.2.1.2 Present work 3.1
3.2.2 Fluorine in rock and soil samples 3.73.2.3 Spatial distribution of F in rock and soil 3.73.2.4 Leaching experiments 3.8
3.3 Isotopic composition of rock samples 3.93.3.1 "Sr/^Sr 3.9
3.3.1.1 Previous work 3.93.3.1.2 This study 3.9
3.4 Mineralogy 3.103.4.1 Mineralogy 3.103.4.2 Mineral chemistry 3.10
3.4.2.1 Mica 3.103.4.2.2 Amphibole 3.113.4.2.3 Apatite 3.12
3.4.3 Fluorine-bearing mineral abundances 3.133.4.3.1 Mineralogy 3.133.4.3.2 Quantitative estimation of F minerals 3.14
3.5 Composition, origin and significance of Pilanesberg fluorite ore 3.153.5.1 Introduction 3.153.5.2 Results 3.153.5.3 Discussion 3.17
GROUNDWATER CHEMISTRY 4.14.1 Introduction 4.14.2 Previous work 4.24.3 This work 4.24.4 Physico-chemical parameters 4.2
4.4.1 Electrical Conductivity (EC) and Total Dissolved Solids (TDS) 4.24.4.2 pH 4.5
4.5 Major elements - Anions 4.54.5.1 Fluoride 4.54.5.2 Chloride 4.74.5.3 Nitrate 4.94.5.4 Sulphate 4.9
4.6 Major elements - cations 4.94.6.1 Sodium 4.94.6.2 Calcium 4.94.6.3 Magnesium 4.114.6.4 Potassium 4.11
4.7 Trace elements 4.114.7.1 Zinc 4.114.7.2 Molybdenum 4.114.7.3 Barium 4.114.7.4 Lithium 4.124.7.5 Lead 4.124.7.6 Vanadium 4.124.7.7 Copper 4.134.7.8 Arsenic 4.13
-in-
4.7.9 Chromium 4.134.7.10 Cobalt, Cadmium and Nickel 4.134.7.11 Iodide 4.144.7.12 Strontium 4.154.7.13 Aluminium 4.16
4.8 Temporal variation 4.174.9 Results of isotopic analyses 4.18
4.9.1 Environmental Isotopes 4.204.9.1.1 Oxygen (518O) 4.204.9.1.2 Hydrogen (62H) 4.21
4.9.2 Radiogenic Isotopes 4.214.9.2.1 Carbon (14C) 4.214.9.2.2 Strontium ("Sr/^Sr) 4.22
5 DISCUSSION 5.15.1 Introduction 5.15.2 Fluorine Geochemistry And Health 5.1
5.2.1 Geochemical behaviour of Fluorine 5.15.2.1.1 Natural Waters 5.15.2.1.2 Fluorine in minerals 5.15.2.1.3 Magmatic systems 5.35.2.1.4 Metamorphic rocks 5.45.2.1.5 Sedimentary rocks 5.55.2.1.6 Fluorine in Soils 5.6
5.2.1.6.1 Mobility in soils 5.65.2.1.7 Biosphere 5.75.2.1.8 Mineral - aqueous fluoride interaction 5.7
5.2.1.8.1 Ionic compounds of F 5.75.2.1.8.2 Dissolution of F-bearing alumino-silicates 5.8
5.2.1.9 Review of the base exchange process 5.95.2.2 Distribution and causes of high F" concentration in groundwater 5.9
5.2.2.1 Global 5.95.2.2.2 Africa 5.105.2.2.3 South Africa 5.11
5.2.2.3.1 Bushveld area 5.115.2.3 Fluorine and Health 5.12
5.2.3.1 Metabolism of fluoride 5.125.2.3.2 Dental Fluorosis 5.13
5.2.3.2.1 Symptoms 5.145.2.3.2.2 Dental fluorosis in the field area 5.15
5.2.3.3 Other effects of F" on the human body 5.165.2.3.3.1 Skeletal fluorosis 5.165.2.3.3.2 Goitre 5.175.2.3.3.3 Cancer 5.175.2.3.3.4 Acute fluoride poisoning 5,175.2.3.3.5 Risk levels and optimal fluoride concentration in drinking water
5.185.2.4 Fluoride concentration and fluorosis risk 5.20
5.2.4.1 Magnitude of the problem 5.20
-IV-
5.2.4.2 Distribution of risk areas 5 - 2 0
5.2.5 Bunavailability and speciation 5.205.2.5.1 Speciation of F inside the human body 5.23
5.2.6 Other elements 5-2^5.2.6.1 Aluminium 5.255.2.6.2 Molybdenum 5.255.2.6.3 Zinc 5.26
5.3 Geochemical controls of ground water fluoride concentration 5.285.3.1 Whole Rock composition 5.285.3.2 Mineral solubility 5.28
5.3.2.1 Fluorite (CaF2) 5.285.3.2.2 Fluorapatite and hydroxyapatite 5.295.3.2.3 Micas and Amphiboles 5.29
5.3.3 Fluorite dissolution kinetics 5.305.3.4 Thermodynamic modelling of mineral controls on groundwater composition
5.315.3.4.1 Lebowa Granite 5.335.3.4.2 Nebo Granite 5.335.3.4.3 Pilanesberg 5.335.3.4.4 Rustenburg Layered Suite 5.345.3.4.5 Carbonatites 5.345.3.4.6 Groundwater in the Pretoria Saltpan area 5.35
5.3.5 Modelling Villiaumite (NaF) solubility 5.355.3.5.1 Application of Villiaumite saturation index 5.375.3.5.2 Comparison of saturation indices calculated by MINTEQA2 and JESS
5.375.3.6 Aqueous chemical control 5.39
5.3.6.1 pH 5.395.3.6.2 CaC03 precipitation and its effect on the Ca:F ratio in groundwater
5.405.3.6.3 Ion Exchange 5.415.3.6.4 Evaporation 5.43
5.3.7 Other factors controlling F concentration in groundwater 5.445.3.7.1 Volcanic exhalation 5.445.3.7.2 Industrial emissions 5.445.3.7.3 Fluoride in rainwater 5.455.3.7.4 Dissolution of atmospheric fluorine compounds 5.455.3.7.5 Temporal factors 5.455.3.7.6 Hydrological factors 5.455.3.7.7 Borehole depth 5.455.3.7.8 Leakage of fluid inclusions 5.465.3.7.9 Soil 5.47
5.4 Hydrogen and Oxygen Isotopes 5.475.4.1 Correlation with elevation and temperature 5.475.4.2 Isotopic signature of rock types 5.475.4.3 Isotopic difference between hail and rain 5.49
5.5 Radiogenic isotopes 5.495.5.1 Radiocarbon - 14C 5.50
5.5.1.1 Mean Residence Time 5.50
-v-
5.5.1.2 Estimation of Co 5.515.5.1.3 Variation of F with residence time 5.535.5.1.4 Variation of other ions with residence time 5.55
5.5.2 87Sr/B6Sr isotope ratios 5.555.5.2.1 Rainwater Sr 5.585.5.2.2 Mixing of groundwaters with differing ^Sr/^Sr and Sr concentrations
5.58
6 CONCLUSIONS 6.16.1 Introduction 6.16.2 Synthesis 6.1
6.2.1 Groundwater 6.26.2.2 F in rock, soil and minerais 6.36.2.3 Origins of high F" groundwaters 6.36.2.4 The possible extent of fluorosis 6.5
6.3 General 6.5
7 RECOMMENDATIONS 7.17.1 Recommendations for further work 7.1
7.1.1 Groundwater studies 7.17.1.2 Analysis of rock, soil and minerals 7.17.1.3 Groundwater isotopes 7.17.1.4 Geohydrology of the western Bushveld 7.27.1.5 General 7.2
8 REFERENCES 8.1
9 APPENDICES 9.19.1 Appendix Al. Groundwater sample site information 9.19.2 Appendix A2. Rock and soil sample locations 9.119.3 Appendix A3. XRF instrumental parameters 9.139.4 Appendix A4. Whole rock major element analyses 9.219.5 Appendix A5. Fluorine-bearing minerals in thin section 9.239.6 Appendix A6. Electron microprobe analyses of minerals from rock types in the
study area9.25
9.7 Appendix A7. Cation, anion, total alkalinity, pH, and TDS values for groundwatersamples collected in this study 9.30
9.8 Appendix A8. Histograms of analyte concentrations in groundwaters from 16major rock types in the study area 9.449.8.1 Electrical Conductivity 9.449.8.2 Total Dissolved Solids 9.459.8.3 pH 9.469.8.4 Sodium 9.479.8.5 Magnesium 9.489.8.6 Calcium 9.499.8.7 Chloride 9.509.8.8 Nitrate 9.519.8.9 Sulphate 9.52
-VI-
9.8.10 Total Alkalinity 9.539.8.11 Potassium 9.54
9.9 Appendix A9. Trace element analyses of acidified groundwater samples . . . . 9 . 5 59.10 Appendix A10. Iodide concentrations in selected groundwater samples . . . . 9.589.11 Appendix A l l . Sampling protocol for collection of water samples 9.599.12 Appendix A12. Workshop on Fluoride and Fluorosis 9.60
9.12.1 Abstracts 9.659.12.2 List of delegates 9.759.12.3 Paper by B. Mothusi, "Psychological Effects of Dental Fluorosis" . . 9.769.12.4 Paper by J.B. du Plessis, "What would be the maximum concentration of
fluoride in water that will not cause dental fluorosis?" 9.81
- V l l -
Executive Summary
EXECUTIVE SUMMARY
DISTRIBUTION OF FLUORIDE-RICH GROUNDWATER IN THE EASTERN ANDMOGWASE REGIONS OF THE NORTHERN AND NORTH-WEST PROVINCES
by
L p MCCAFFREY and J P WILLIS
Department of Geological SciencesUniversity of Cape Town
Rondebosch 7700, South Africa
Supplementary to the full report to the Water Research Commission on the Project
"Distribution of fluoride-rich groundwater in the eastern and Mogwase regions of theNorthern and North-western Provinces: influence of bedrock and soils and constraints on
utilisable drinking water supplies"
Head of Department: Professor A P le RoexProject Leader: Professor J P Willis
Executive Summary
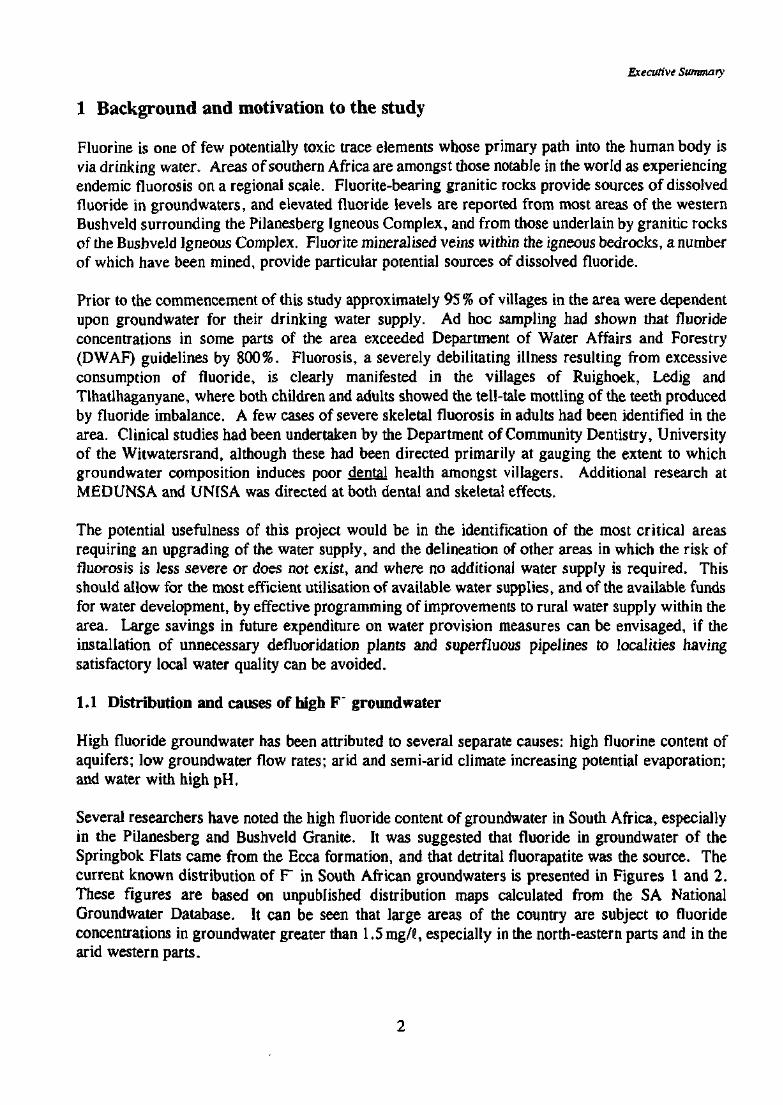
1 Background and motivation to the study
Fluorine is one of few potentially toxic trace elements whose primary path into the human body isvia drinking water. Areas of southern Africa are amongst those notable in the world as experiencingendemic fluorosis on a regional scale. Fluorite-bearing granitic rocks provide sources of dissolvedfluoride in groundwaters, and elevated fluoride levels are reported from most areas of the westernBushveld surrounding the Pilanesberg Igneous Complex, and from those underlain by granitic rocksof the Bushveld Igneous Complex. Fluorite mineralised veins within the igneous bedrocks, a numberof which have been mined, provide particular potential sources of dissolved fluoride.
Prior to the commencement of this study approximately 95 % of villages in the area were dependentupon groundwater for their drinking water supply. Ad hoc sampling had shown that fluorideconcentrations in some parts of the area exceeded Department of Water Affairs and Forestry(DWAF) guidelines by 800%. Fluorosis, a severely debilitating illness resulting from excessiveconsumption of fluoride, is clearly manifested in the villages of Ruighoek, Ledig andTlhatlhaganyane, where both children and adults showed the tell-tale mottling of the teeth producedby fluoride imbalance. A few cases of severe skeletal fluorosis in adults had been identified in thearea. Clinical studies had been undertaken by the Department of Community Dentistry, Universityof the Witwatersrand, although these had been directed primarily at gauging the extent to whichgroundwater composition induces poor dental health amongst villagers. Additional research atMEDUNSA and UNISA was directed at both dental and skeletal effects.
The potential usefulness of this project would be in the identification of the most critical areasrequiring an upgrading of the water supply, and the delineation of other areas in which the risk offluorosis is less severe or does not exist, and where no additional water supply is required. Thisshould allow for the most efficient utilisation of available water supplies, and of the available fundsfor water development, by effective programming of improvements to rural water supply within thearea. Large savings in future expenditure on water provision measures can be envisaged, if theinstallation of unnecessary defluoridation plants and superfluous pipelines to localities havingsatisfactory local water quality can be avoided.
1.1 Distribution and causes of high F" groundwater
High fluoride groundwater has been attributed to several separate causes: high fluorine content ofaquifers; low groundwater flow rates; arid and semi-arid climate increasing potential evaporation;and water with high pH.
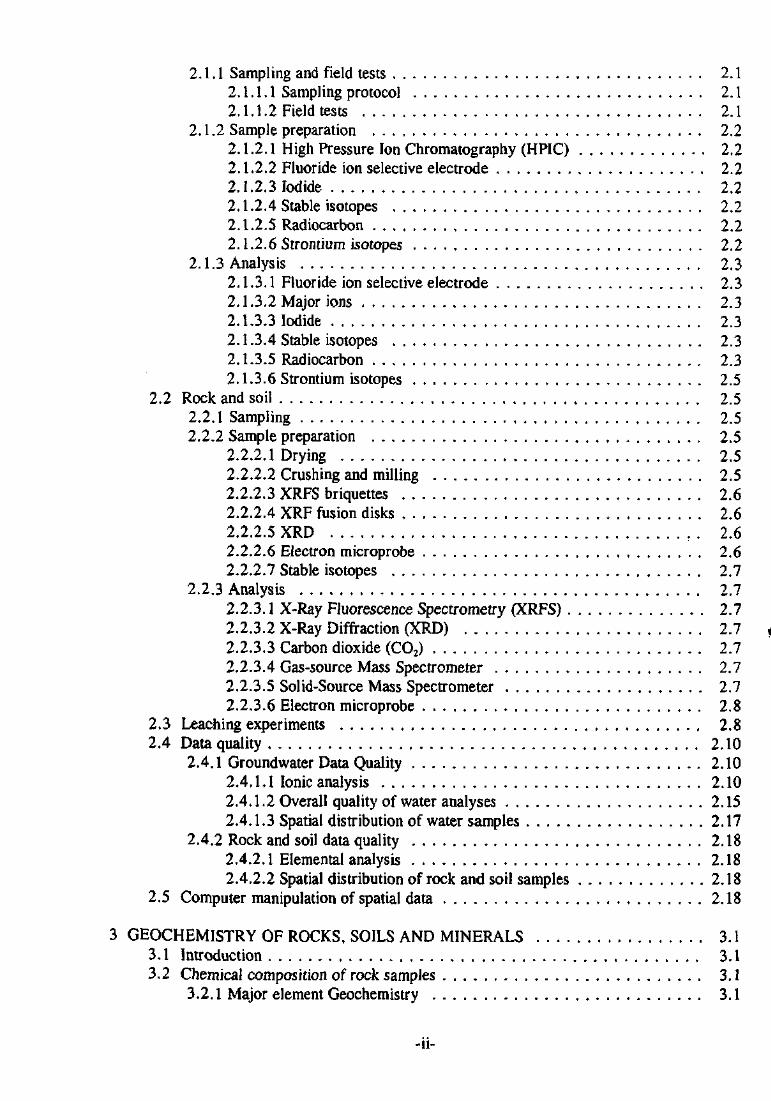
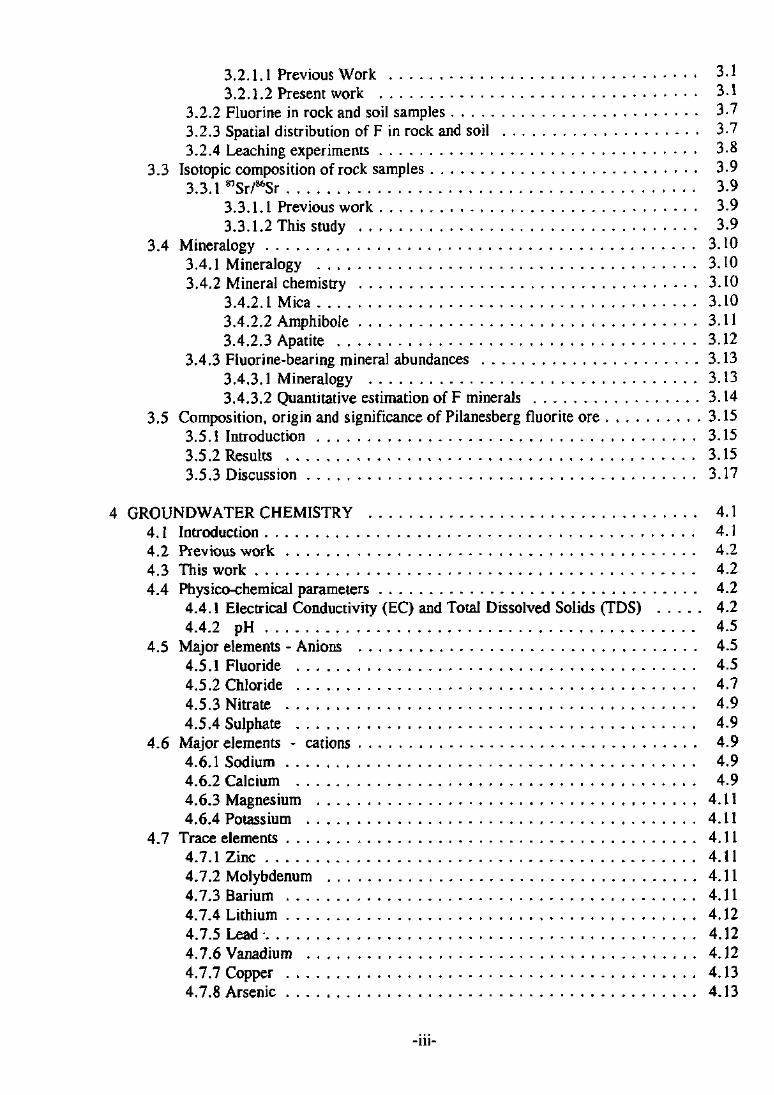
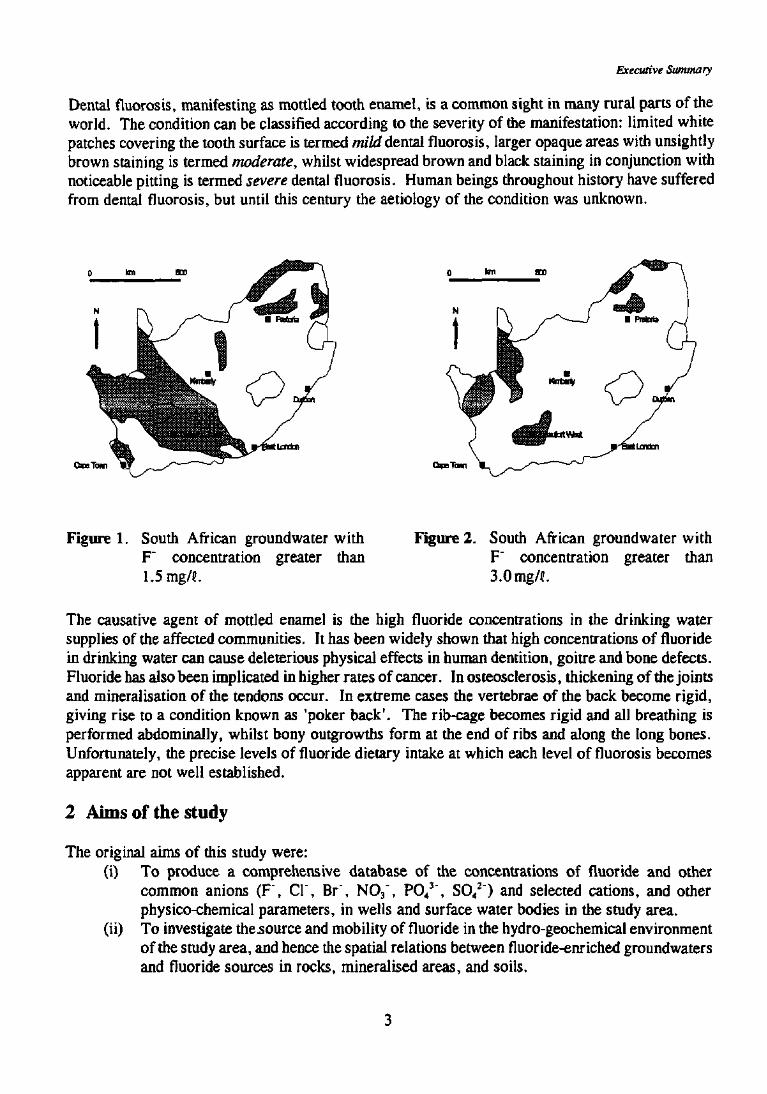
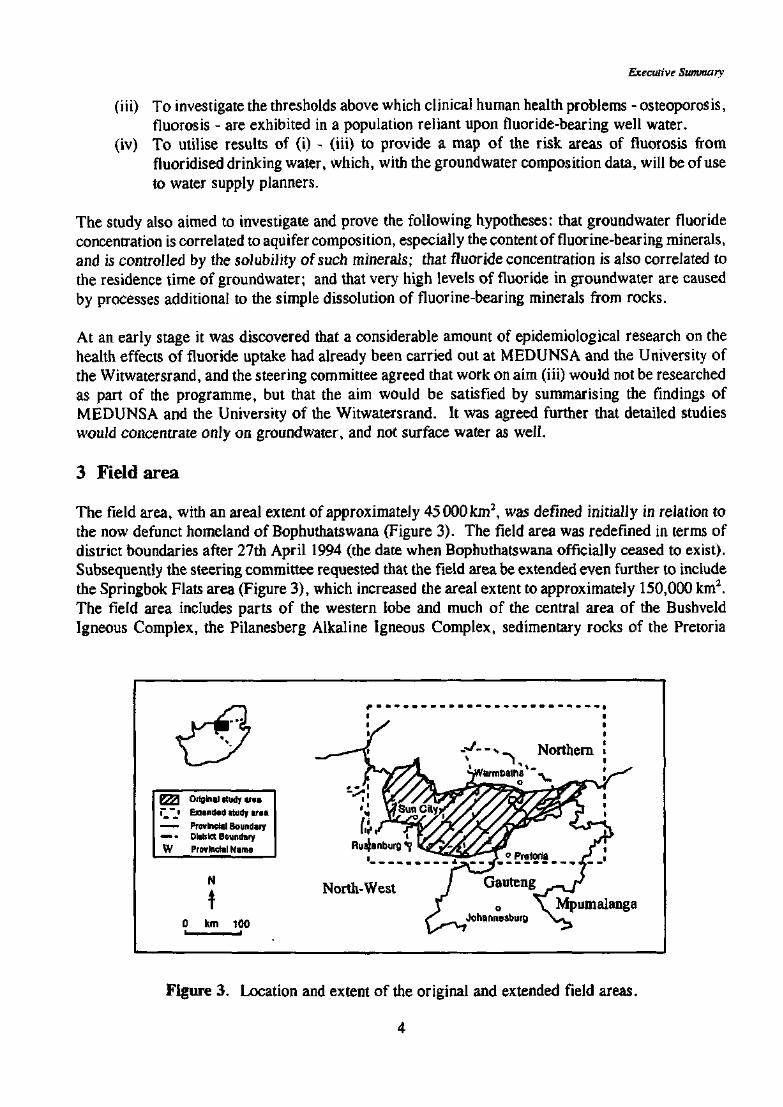
Several researchers have noted the high fluoride content of groundwater in South Africa, especiallyin the Pilanesberg and Bushveld Granite. It was suggested that fluoride in groundwater of theSpringbok Flats came from the Ecca formation, and that detrital fluorapatite was the source. Thecurrent known distribution of F in South African groundwaters is presented in Figures 1 and 2.These figures are based on unpublished distribution maps calculated from the SA NationalGroundwater Database. It can be seen that large areas of the country are subject to fluorideconcentrations in groundwater greater than 1.5 mg/e, especially in the north-eastern parts and in thearid western parts.
Executive Summary
Dental fluorosis, manifesting as mottled tooth enamel, is a common sight in many rural parts of theworld. The condition can be classified according to the severity of the manifestation: limited whitepatches covering the tooth surface is termed mild dental fluorosis, larger opaque areas with unsightlybrown staining is termed moderate, whilst widespread brown and black staining in conjunction withnoticeable pitting is termed severe dental fluorosis. Human beings throughout history have sufferedfrom dental fluorosis, but until this century the aetiology of the condition was unknown.
0 In EDO
Caps T o m QpcTw
Figure 1. South African groundwater withF' concentration greater than1.5mg/«.
Figure 2. South African groundwater withF' concentration greater than3.0mg/S.
The causative agent of mottled enamel is the high fluoride concentrations in the drinking watersupplies of the affected communities. It has been widely shown that high concentrations of fluoridein drinking water can cause deleterious physical effects in human dentition, goitre and bone defects.Fluoride has also been implicated in higher rates of cancer. In osteosclerosis, thickening of the jointsand mineralisation of the tendons occur. In extreme cases the vertebrae of the back become rigid,giving rise to a condition known as 'poker back'. The rib-cage becomes rigid and all breathing isperformed abdominally, whilst bony outgrowths form at the end of ribs and along the long bones.Unfortunately, the precise levels of fluoride dietary intake at which each level of fluorosis becomesapparent are not well established.
2 Aims of the study
The original aims of this study were:(i) To produce a comprehensive database of the concentrations of fluoride and other
common anions ( F \ Cl , Br", NO3~, PO43 , SO4
2") and selected cations, and otherphysico-chemical parameters, in wells and surface water bodies in the study area.
(ii) To investigate thcsource and mobility of fluoride in the hydro-geochemical environmentof the study area, and hence the spatial relations between fluoride-enriched groundwatersand fluoride sources in rocks, mineralised areas, and soils.
Executive Summary
(iii) To investigate the thresholds above which clinical human health problems - osteoporosis,fluorosis - are exhibited in a population reliant upon fluoride-bearing well water.
(iv) To utilise results of (i) - (iii) to provide a map of the risk areas of fluorosis fromfluoridised drinking water, which, with the groundwater composition data, will be of useto water supply planners.
The study also aimed to investigate and prove the following hypotheses: that groundwater fluorideconcentration is correlated to aquifer composition, especially the content of fluorine-bearing minerals,and is controlled by the solubility of such minerals; that fluoride concentration is also correlated tothe residence time of groundwater; and that very high levels of fluoride in groundwater are causedby processes additional to the simple dissolution of fluorine-bearing minerals from rocks.
At an early stage it was discovered that a considerable amount of epidemiological research on thehealth effects of fluoride uptake had already been carried out at MEDUNSA and the University ofthe Witwatersrand, and the steering committee agreed that work on aim (iii) would not be researchedas part of the programme, but that the aim would be satisfied by summarising the findings ofMEDUNSA and the University of the Witwatersrand. It was agreed further that detailed studieswould concentrate only on groundwater, and not surface water as well.
3 Field area
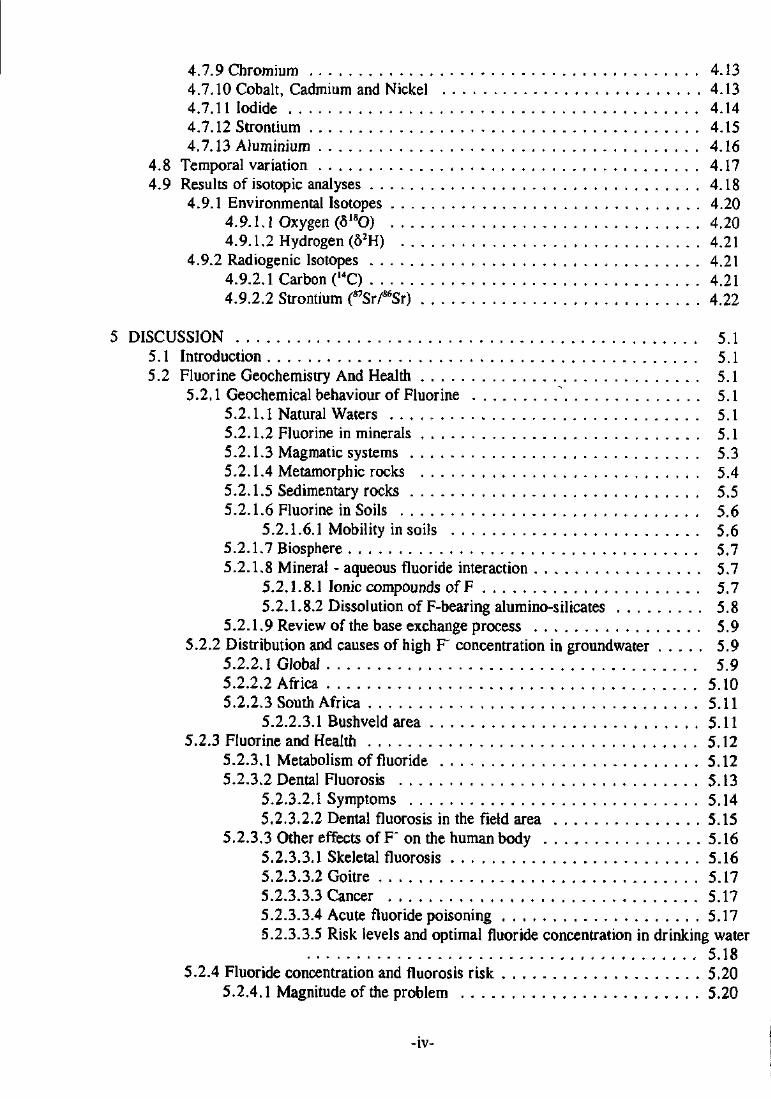
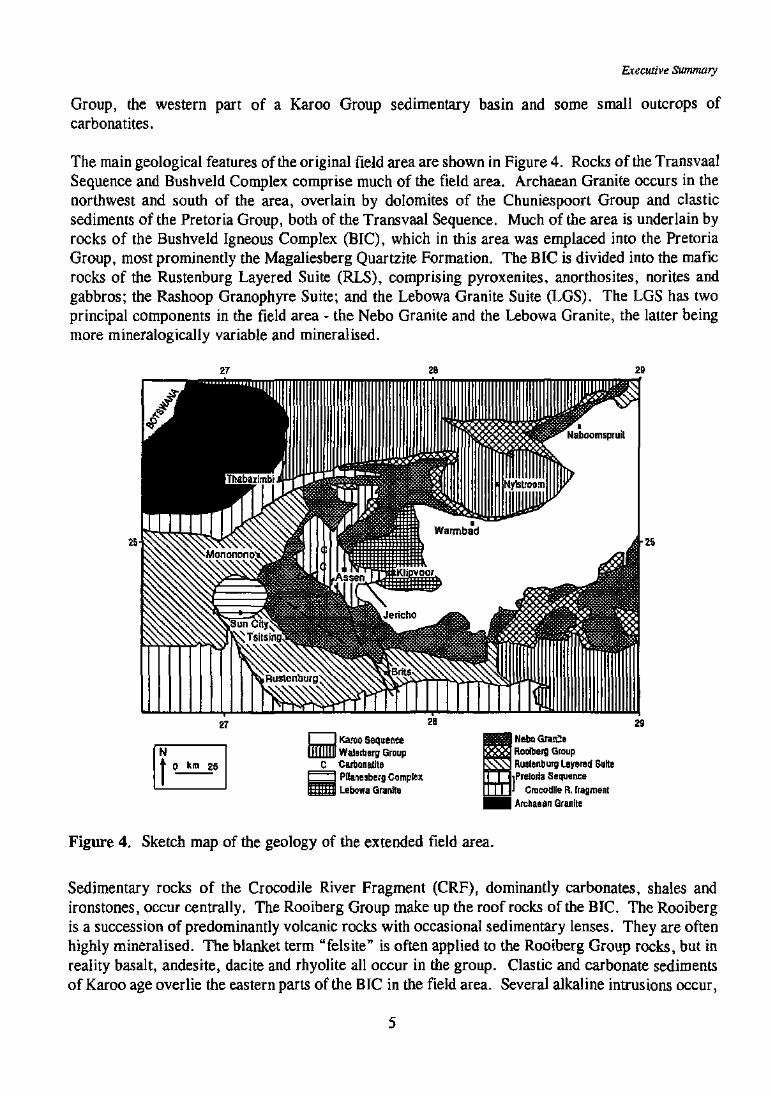
The field area, with an areal extent of approximately 45 000 km2, was defined initially in relation tothe now defunct homeland of Bophuthatswana (Figure 3). The field area was redefined in terms ofdistrict boundaries after 27th April 1994 (the date when Bophuthatswana officially ceased to exist).Subsequently the steering committee requested that the field area be extended even further to includethe Springbok Flats area (Figure 3), which increased the areal extent to approximately 150,000 km2.The field area includes parts of the western lobe and much of the central area of the BushveldIgneous Complex, the Pilanesberg Alkaline Igneous Complex, sedimentary rocks of the Pretoria
Original (tudy aros
~_~J Extended »tudy area
— Provincial Boundary
— - District Boundary
W Provincial Name
0 km 100
North-WestMpumalanga
Figure 3. Location and extent of the original and extended field areas.
4
Executive Summary
Group, the western part of a Karoo Group sedimentary basin and some small outcrops ofcarbonatites.
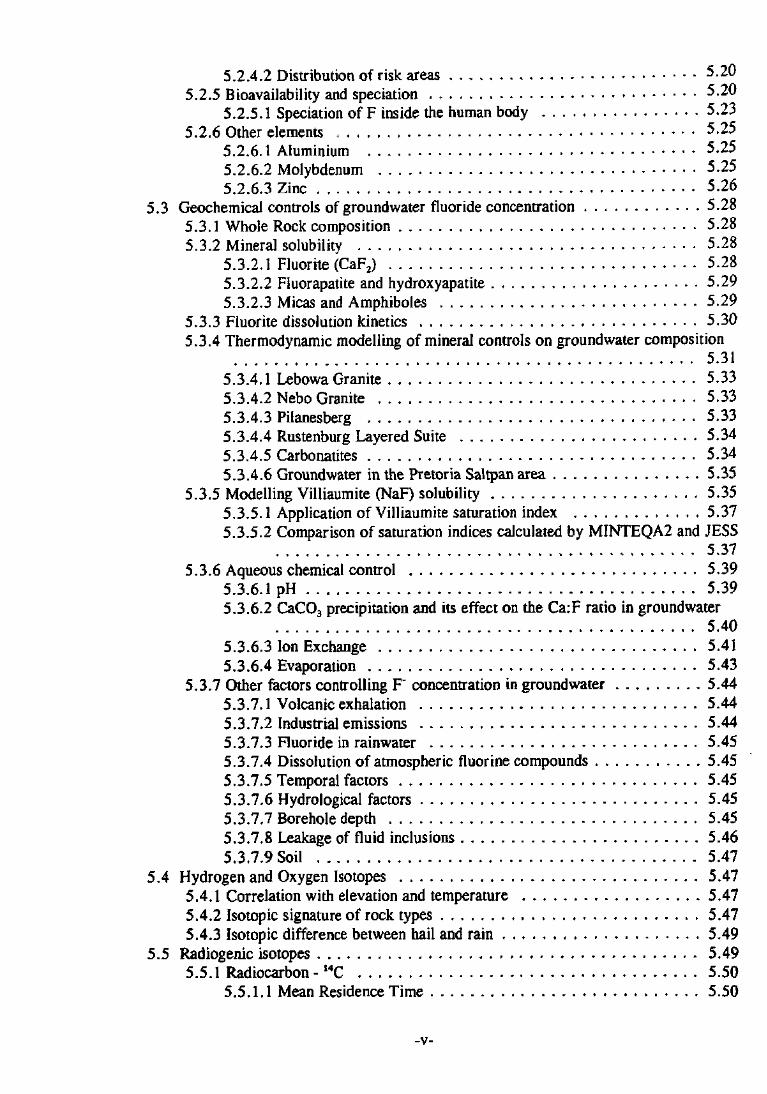
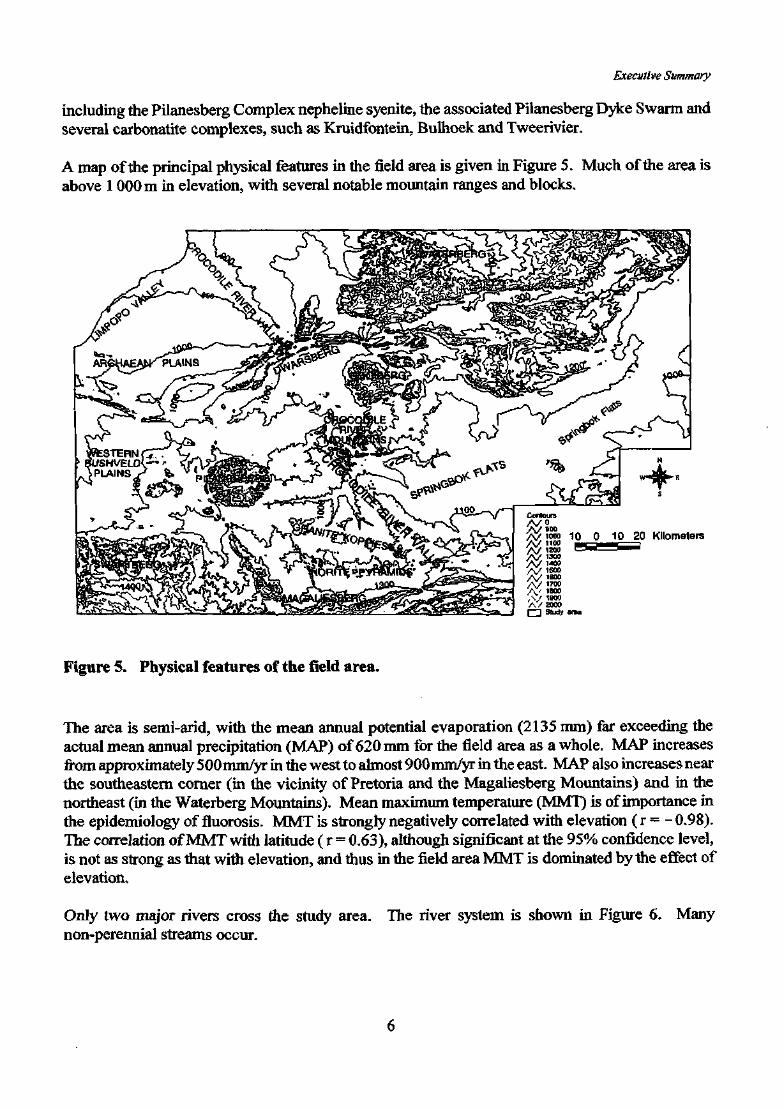
The main geological features of the original field area are shown in Figure 4. Rocks of the TransvaalSequence and Bushveld Complex comprise much of the field area. Archaean Granite occurs in thenorthwest and south of the area, overlain by dolomites of the Chuniespoort Group and clasticsediments of the Pretoria Group, both of the Transvaal Sequence. Much of the area is underlain byrocks of the Bushveld Igneous Complex (BIC), which in this area was emplaced into the PretoriaGroup, most prominently the Magaliesberg Quartzite Formation. The BIC is divided into the maficrocks of the Rustenburg Layered Suite (RLS), comprising pyroxenites, anorthosites, norites andgabbros; the Rashoop Granophyre Suite; and the Lebowa Granite Suite (LGS). The LGS has twoprincipal components in the field area - the Nebo Granite and the Lebowa Granite, the latter beingmore mineralogically variable and mineralised.
0 km 25
Karoo Sequence| Walerberg Group
CarbonatitePItanesberg ComplexLebowa Granfle
Rooiberg GroupRuslenburg Layered Suite
iPretoria SequenceCrocodile R. Fragment
I Archaean Granite
Figure 4. Sketch map of the geology of the extended field area.
Sedimentary rocks of the Crocodile River Fragment (CRF), dominantly carbonates, shales andironstones, occur centrally. The Rooiberg Group make up the roof rocks of the BIC. The Rooibergis a succession of predominantly volcanic rocks with occasional sedimentary lenses. They are oftenhighly mineralised. The blanket term "felsite" is often applied to the Rooiberg Group rocks, but inreality basalt, andesite, dacite and rhyolite all occur in the group. Clastic and carbonate sedimentsof Karoo age overlie the eastern parts of the BIC in the field area. Several alkaline intrusions occur,
Executive Summary
including the Pilanesberg Complex nepheline syenite, the associated Pilanesberg Dyke Swarm andseveral carbonatite complexes, such as Kruidfontein, Bulhoek and Tweerivier.
A map of the principal physical features in the field area is given in Figure 5. Much of the area isabove 1000 m in elevation, with several notable mountain ranges and blocks.
Kilometers
Figure 5. Physical features of the field area.
The area is semi-arid, with the mean annual potential evaporation (2135 mm) far exceeding theactual mean annual precipitation (MAP) of 620 mm for the field area as a whole. MAP increasesfrom approximately 500mm/yr in the west to almost 900mm/yr in the east. MAP also increases nearthe southeastern corner (in the vicinity of Pretoria and the Magaliesberg Mountains) and in thenortheast (in the Waterberg Mountains). Mean maximum temperature (MMT) is of importance inthe epidemiology of fluorosis. MMT is strongly negatively correlated with elevation (r = -0.98).The correlation of MMT with latitude (r = 0.63), although significant at the 95% confidence level,is not as strong as that with elevation, and thus in the field area MMT is dominated by the effect ofelevation.
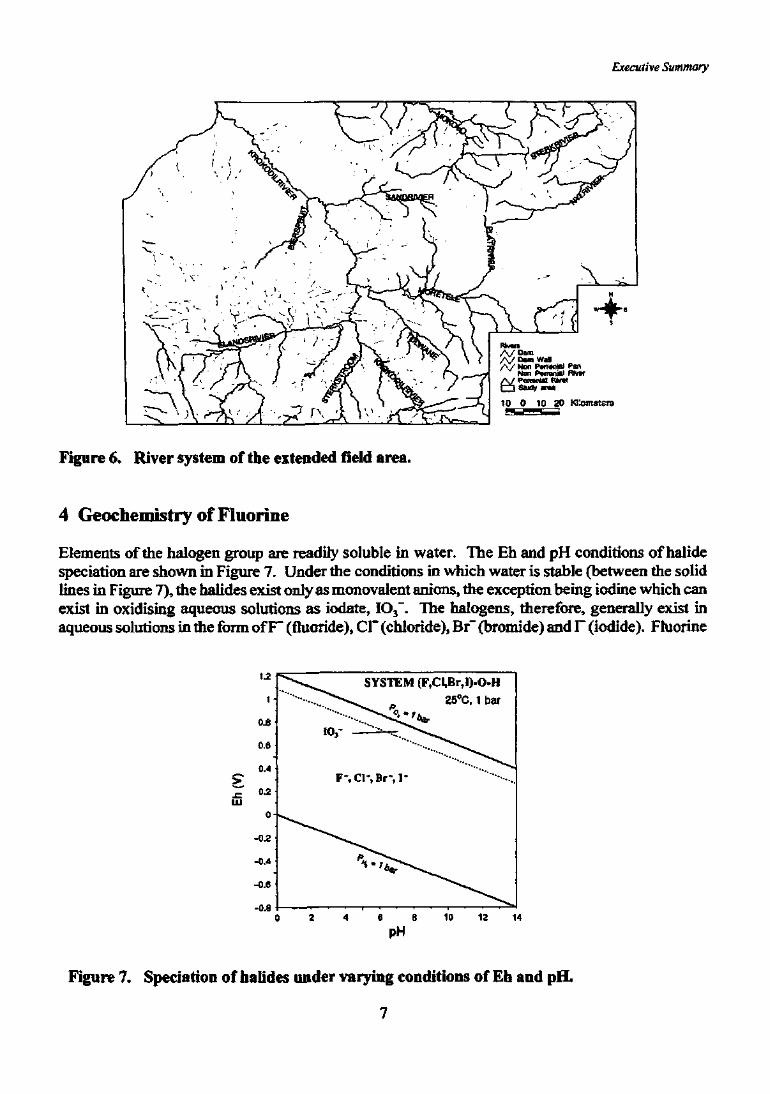
Only two major rivers cross (he study area,non-perennial streams occur.
The river system is shown in Figure 6. Many
Executive Summary
\
/ V Dun/v/Dam Wai/ V 1 N°n Pomnisl Pan
Nan PwreniBi RiverA / Pccnnia! RMtr n Swdy «nw
10 0 10 20 KJUwnstsro
Figure 6. River system of the extended field area.
4 Geochemistry of Fluorine
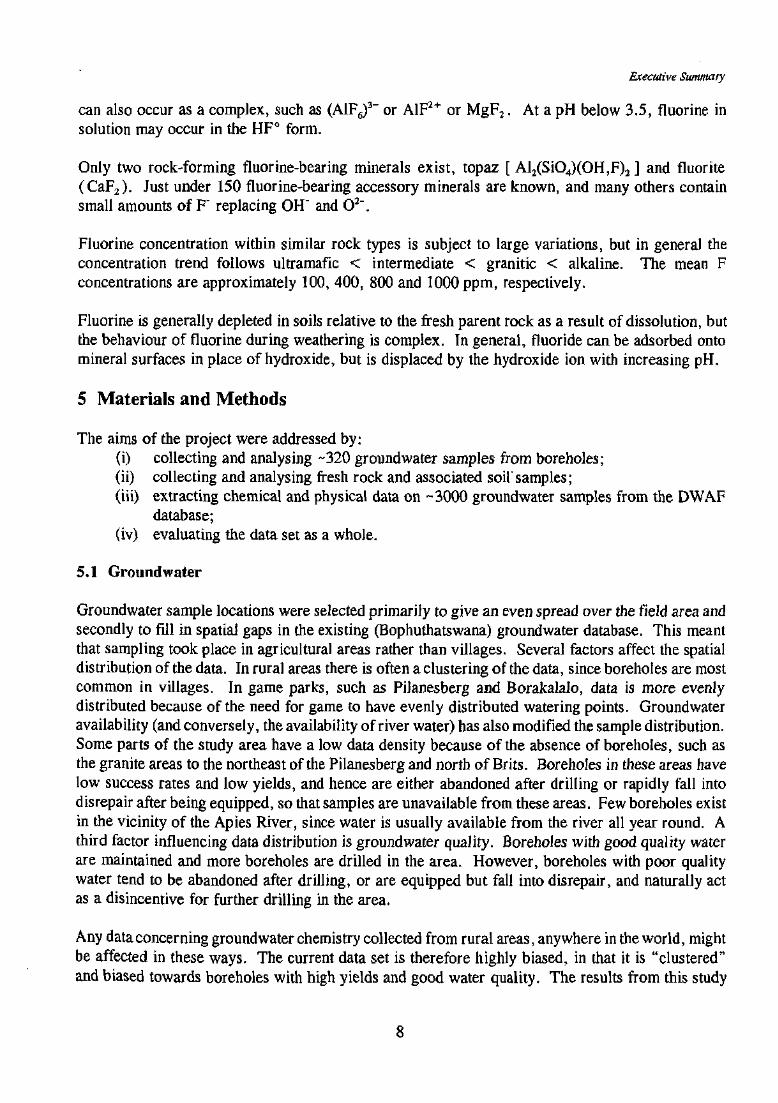
Elements of the halogen group are readily soluble in water. The Eh and pH conditions of halidespeciation are shown in Figure 7. Under the conditions in which water is stable (between the solidlines in Figure 7), the halides exist only as monovalent anions, the exception being iodine which canexist in oxidising aqueous solutions as iodate, IO3~. The halogens, therefore, generally exist inaqueous solutions in the form ofF" (fluoride), Cl" (chloride), Br" (bromide) and r (iodide). Fluorine
\2
1 •
o-e
0.6
0.4
0.2
o-
-0.2
-0.4
-0.6
-0.S
" * " \ ^ ^ SYSTEM (F,Cl,Br,I).O.H" • " - • • • x V . p 25°C, 1 bar
F- Cl- Br- 1- ^ O
0 2 4 6 8 10 12 14
PH
Figure 7. Speciation of halides under varying conditions of Eh and pH.
7
Executive Summary
can also occur as a complex, such as (A1F6)3~ or A1F2+ or MgF2. At a pH below 3.5, fluorine in
solution may occur in the HF° form.
Only two rock-forming fluorine-bearing minerals exist, topaz [ Al2(SiO4)(OH,F)2 ] and fluorite(CaF2). Just under 150 fluorine-bearing accessory minerals are known, and many others containsmall amounts of F" replacing OH" and O2".
Fluorine concentration within similar rock types is subject to large variations, but in general theconcentration trend follows ultramafic < intermediate < granitic < alkaline. The mean Fconcentrations are approximately 100, 400, 800 and 1000 ppm, respectively.
Fluorine is generally depleted in soils relative to the fresh parent rock as a result of dissolution, butthe behaviour of fluorine during weathering is complex. In general, fluoride can be adsorbed ontomineral surfaces in place of hydroxide, but is displaced by the hydroxide ion with increasing pH.
5 Materials and Methods
The aims of the project were addressed by:(i) collecting and analysing -320 groundwater samples from boreholes;(ii) collecting and analysing fresh rock and associated soil'samples;(iii) extracting chemical and physical data on -3000 groundwater samples from the DWAF
database;(iv) evaluating the data set as a whole.
5.1 Groundwater
Groundwater sample locations were selected primarily to give an even spread over the field area andsecondly to fill in spatial gaps in the existing (Bophuthatswana) groundwater database. This meantthat sampling took place in agricultural areas rather than villages. Several factors affect the spatialdistribution of the data. In rural areas there is often a clustering of the data, since boreholes are mostcommon in villages. In game parks, such as Pilanesberg and Borakalalo, data is more evenlydistributed because of the need for game to have evenly distributed watering points. Groundwateravailability (and conversely, the availability of river water) has also modified the sample distribution.Some parts of the study area have a low data density because of the absence of boreholes, such asthe granite areas to the northeast of the Pilanesberg and north of Brits. Boreholes in these areas havelow success rates and low yields, and hence are either abandoned after drilling or rapidly fall intodisrepair after being equipped, so that samples are unavailable from these areas. Few boreholes existin the vicinity of the Apies River, since water is usually available from the river all year round. Athird factor influencing data distribution is groundwater quality. Boreholes with good quality waterare maintained and more boreholes are drilled in the area. However, boreholes with poor qualitywater tend to be abandoned after drilling, or are equipped but fall into disrepair, and naturally actas a disincentive for further drilling in the area.
Any data concerning groundwater chemistry collected from rural areas, anywhere in the world, mightbe affected in these ways. The current data set is therefore highly biased, in that it is "clustered"and biased towards boreholes with high yields and good water quality. The results from this study
Executive Summary
are, therefore, of the "best scenario" type; the unbiased reality may show a much worse picture ofwater quality.
Groundwater was analysed in the field for pH, electrical conductivity (EC) and dissolved oxygen(DO) using solid state probes and a voltmeter. Total alkalinity was determined on-site by titrationwith HC1. Fluoride was measured each evening at the field base using a fluoride ion selectiveelectrode (FISE) with a total ionic strength adjustment buffer (TISAB). Fluoride was remeasuredat the University of Cape Town (UCT) using TISAB with and without CDTA. The CDTA was usedto dissociate any F" complexes that may have been present, and thus give a total F" analysis. It wasestablished that the use of the very expensive CDTA was unnecessary in determining F" in thegroundwaters of the study area.
A Dionex high pressure ion chromatograph (HPIC) was used to determine the concentrations of themajor ions (F', Cl~, Br~, NO3", PO4
3\ SO42\ Na+, K+, Mg2+ and Ca2+) in groundwater. Analysis
for iodide was conducted by the South African Institute for Medical Research using a Waters HighPressure Liquid Chromatograph, with a Ag electrode as a detector.
Stable isotopes (hydrogen and oxygen) were measured on a VG 602E gas-source mass spectrometerat UCT.
A gas-proportional counter was used to analyse for radiocarbon at the Schonland-CSIR ResearchCentre at the University of the Witwatersrand.
Strontium isotope analyses were carried out at UCT using a VG Sector solid-source massspectrometer, run in dynamic multi-collector mode. The measured ^Sr/^Sr values were normalisedto "Sr/^Sr = 0.1194, to correct for mass fractionation.
5.2 Rocks and soils
The objective was to collect at least three samples of each major rock type and associated soil in thearea, to provide an indication of the composition of each rock and soil type. Rock and soil sampleswere taken in pairs, with the samples usually located not more than 10m from each other. Forty tworock samples and 40 soil samples were collected. Difficulties were encountered in sampling Karoorocks, since they produce a flat relief with few rock outcrops. Only two samples from the KarooSequence were collected.
With a study area of -150 000 km2 and only -40 rock and soil samples, data density is very low.However, an evaluation of the Regional Geochemical Survey maps of the study area (Council forGeoscience, 1995) showed that the stream sediments and soil samples derived from a particularlithological unit have similar geochemical characteristics over their full areal extent. It is inferredfrom this that in the study area a small number of samples from a particular lithological formationcan be taken to be representative of the rock body as a whole. The main rock types were sampledat least three times, and the more important rock types (Pilanesberg foyaites and Lebowa granite)were sampled at least four times.
Major and trace element concentrations were measured using X-ray fluorescence spectrometry(XRFS) at UCT. Mineral phases were qualitatively determined using X-ray diffraction (XRD)
Executive Summary
analysis at UCT. The equivalent C02 contents of several samples were determined by reacting thespecimen with HCI and measuring the volume of CO2 gas given off. Stable isotope analyses wereconducted using gas-source mass spectrometry at UCT. Sr isotope ratios were determined using aVG Sector 7-collector thermal-ionisation mass spectrometer at the Radiogenic Isotope Facility atUCT. Chemical analysis of mineral phases was undertaken using a Camebax Microbeam electronmicroprobe at UCT. The solubility of fluoride bearing phases in rock and soil samples wasinvestigated using leaching experiments (96 hours) with weak carbonic acid.
Tight quality control of analyses was maintained at all times.
5.3 Computer manipulation of spatial data
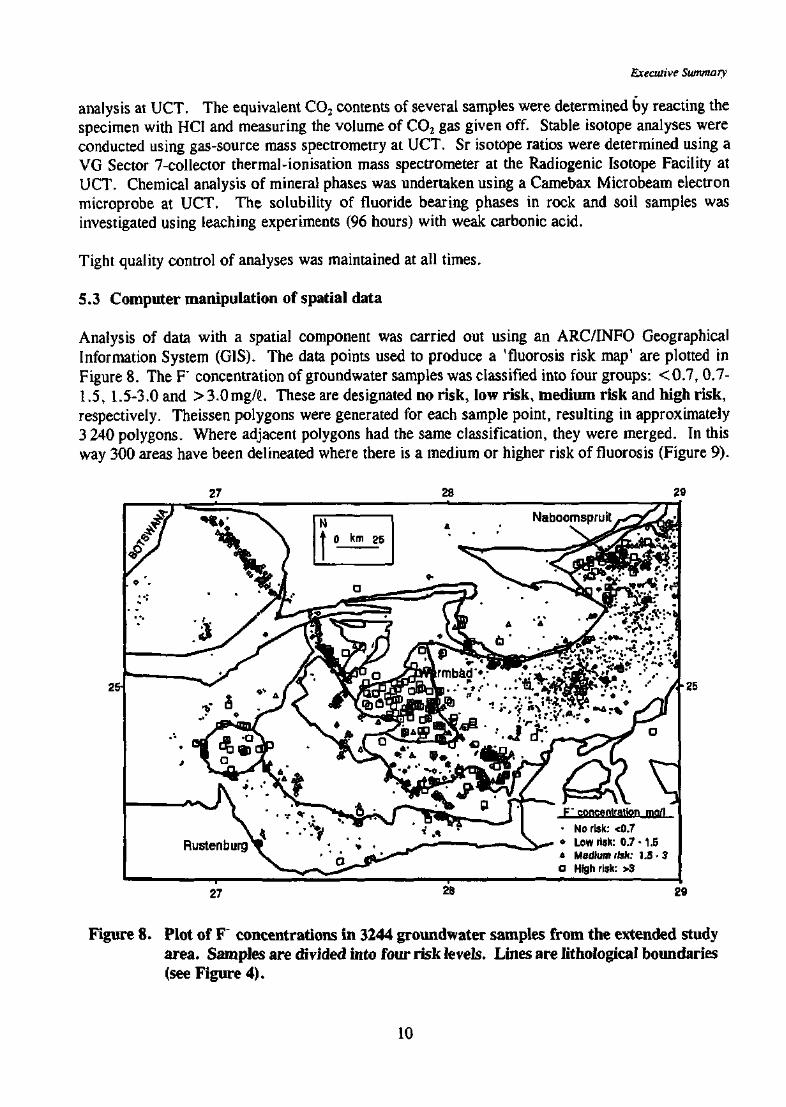
Analysis of data with a spatial component was carried out using an ARC/INFO GeographicalInformation System (GIS). The data points used to produce a 'fluorosis risk map' are plotted inFigure 8. The F" concentration of groundwater samples was classified into four groups: < 0.7, 0.7-1.5, 1.5-3.0and >3.0mg/C. These are designated no risk, low risk, medium risk and high risk,respectively. Theissen polygons were generated for each sample point, resulting in approximately3 240 polygons. Where adjacent polygons had the same classification, they were merged. In thisway 300 areas have been delineated where there is a medium or higher risk of fluorosis (Figure 9).
27 28 29
25H
V/.
• ° | ^WcJP
J \ • •
Rustenburg f
N
! ' -
A/ ^ ^ ^
^ v •
Km 25
•a
i * •
•' A "
Naboomspruit /-OjJ^/Jt
I F * concentration rpa/l
I • No risk: <0.7^ X ^ H - • Low risk: 0.7 -1.5
« Medium risk: 1.5-3• High risk: >3
27 28 29
Figure 8. Plot of F concentrations in 3244 groundwater samples from the extended studyarea. Samples are divided into four risk levels. Lines are lithological boundaries(see Figure 4).
10
Executive Summary
19 3d 57 76 95 114 Kllometere
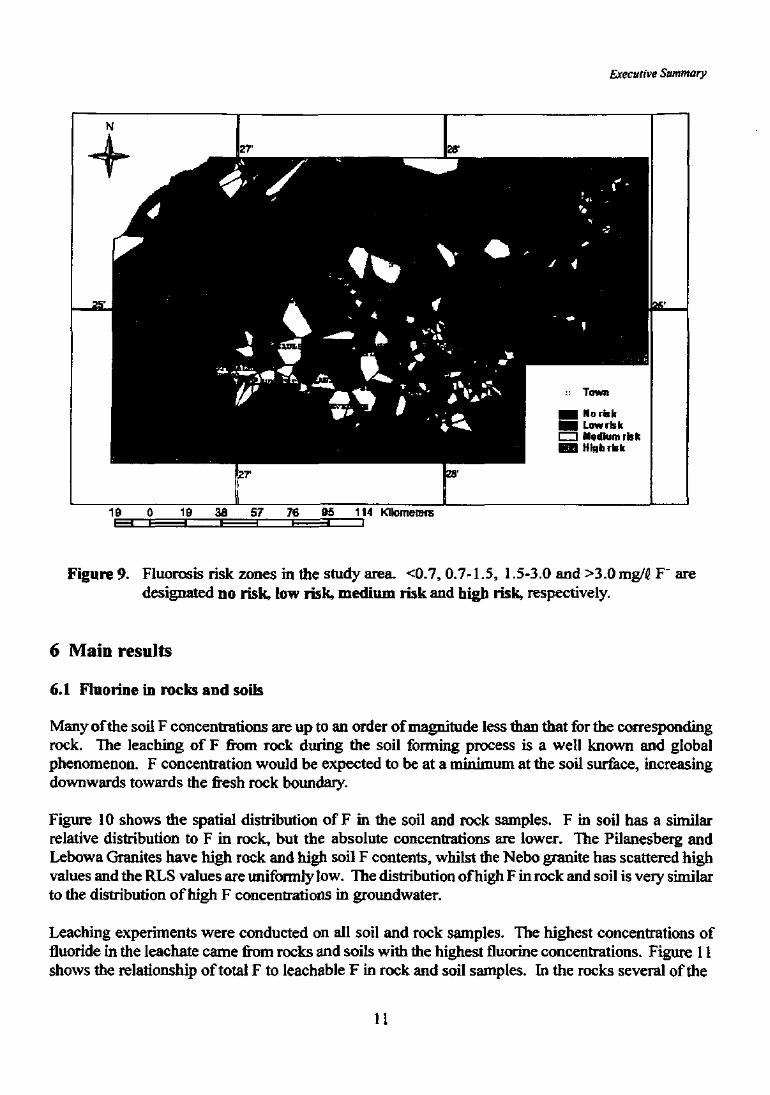
Figure 9. Fluorosis risk zones in the study area. <0.7, 0.7-1.5, 1.5-3.0 and >3.0 mg/H F aredesignated no risk, low risk, medium risk and high risk, respectively.
6 Main results
6.1 Fluorine in rocks and soils
Many of the soil F concentrations are up to an order of magnitude less than that for the correspondingrock. The leaching of F from rock during the soil forming process is a well known and globalphenomenon. F concentration would be expected to be at a minimum at the soil surface, increasingdownwards towards the fresh rock boundary.
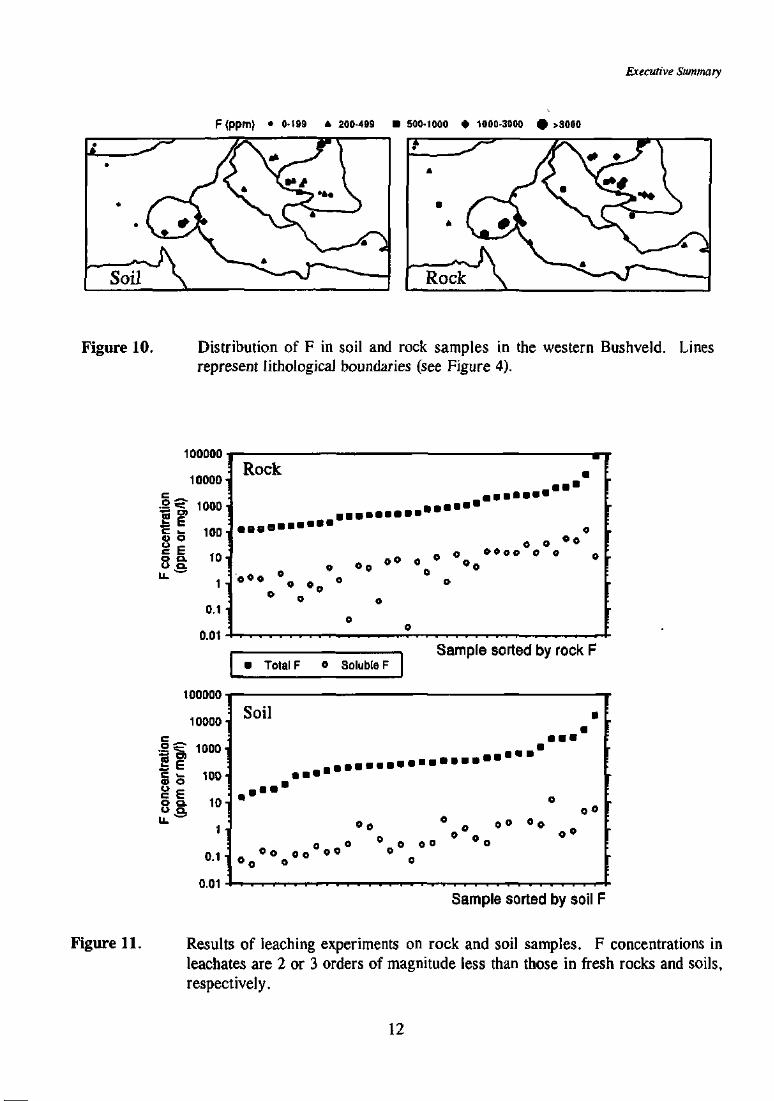
Figure 10 shows the spatial distribution of F in the soil and rock samples. F in soil has a similarrelative distribution to F in rock, but the absolute concentrations are lower. The Pilanesberg andLebowa Granites have high rock and high soil F contents, whilst the Nebo granite has scattered highvalues and the RLS values are uniformly low. Tlie distribution of high F in rock and soil is very similarto the distribution of high F concentrations in groundwater.
Leaching experiments were conducted on all soil and rock samples. The highest concentrations offluoride in the Ieachate came from rocks and soils with the highest fluorine concentrations. Figure 11shows the relationship of total F to leachable F in rock and soil samples. In the rocks several of the
11
Executive Summary
F<ppm) • 0-199 * 200-499 • 500-1000 • 1000-3000 # >3000
Figure 10. Distribution of F in soil and rock samples in the western Bushveld. Linesrepresent IithologicaJ boundaries (see Figure 4).
cg
I
cone
UL
'atio
n
1
one
u
1
o
[ppm
4
uuuuu•
10000-
1000-
100-
10-
1 •
0.1 •
1 UUL/UU '
or m
g/t)
Eo.3
10000-
1000-
100-
10-
1 •
0.1 •
0.01 •
Rockm
• • •• • • • • • •
• • •
e e s
o c
° a
• Total F
Soil
• •_ _ •
°° 00°o o
o o **°A oo o • % * * O < > ° • °
0
>0 ° °o
o0
Ramnlo cortoW hw rr\nir P
o Soluble F
•
• • •
oo©
• \0 o * o o o ° o" o o o
0
Sample sorted by soil F
Figure 11. Results of leaching experiments on rock and soil samples. F concentrations inleachates are 2 or 3 orders of magnitude less than those in fresh rocks and soils,respectively.
12
Executive Summary
samples had leachate with very high fluoride concentrations, and in general the leachate had aconcentration approximately 2 orders of magnitude less than the whole rock concentration. In thesoil leachates very low absolute concentrations of F were obtained, and leachable F is generally threeorders of magnitude less than total F in the soils. Most of the fluoride concentrations in the leachatederived from soil samples were below ~4mg/L
6.2 Ground water chemistry
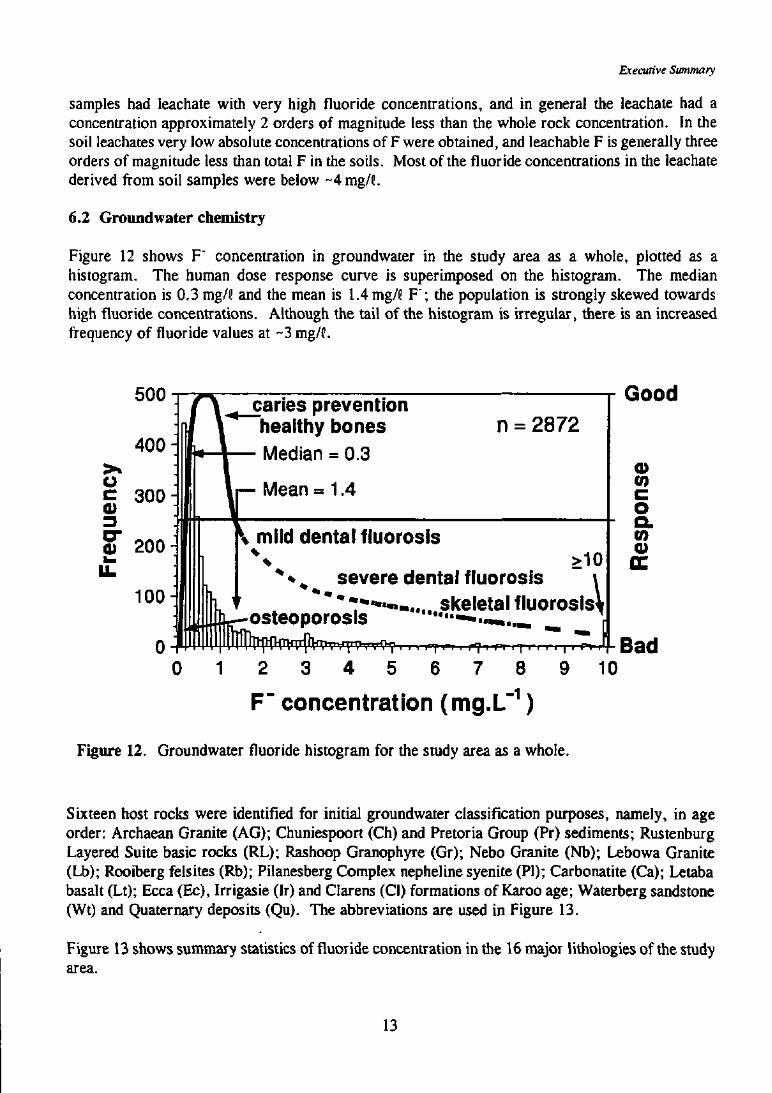
Figure 12 shows F" concentration in groundwater in the study area as a whole, plotted as ahistogram. The human dose response curve is superimposed on the histogram. The medianconcentration is 0,3 mg/0 and the mean is 1.4mg/f F"; the population is strongly skewed towardshigh fluoride concentrations. Although the tail of the histogram is irregular, there is an increasedfrequency of fluoride values at ~3 mg/C.
caries preventionhealthy bonesMedian = 0.3
Mean = 1.4
n = 2872
mild dental fluorosis
severe dental fluorosis
osteoporosis
\skeletal fluorosis^
Good
<ncoQ .CO
Bad1 2 3 4 5 6 7 8 9 10
F" concentration (rng.L"1)
Figure 12. Groundwater fluoride histogram for the study area as a whole.
Sixteen host rocks were identified for initial groundwater classification purposes, namely, in ageorder: Archaean Granite (AG); Chuniespoort (Ch) and Pretoria Group (Pr) sediments; RustenburgLayered Suite basic rocks (RL); Rashoop Granophyre (Gr); Nebo Granite (Nb); Lebowa Granite(Lb); Rooiberg felsites (Rb); Pilanesberg Complex nepheline syenite (PI); Carbonatite (Ca); Letababasalt (Lt); Ecca (Ec), Irrigasie (Ir) and Clarens (Cl) formations of Karoo age; Waterberg sandstone(Wt) and Quaternary deposits (Qu). The abbreviations are used in Figure 13.
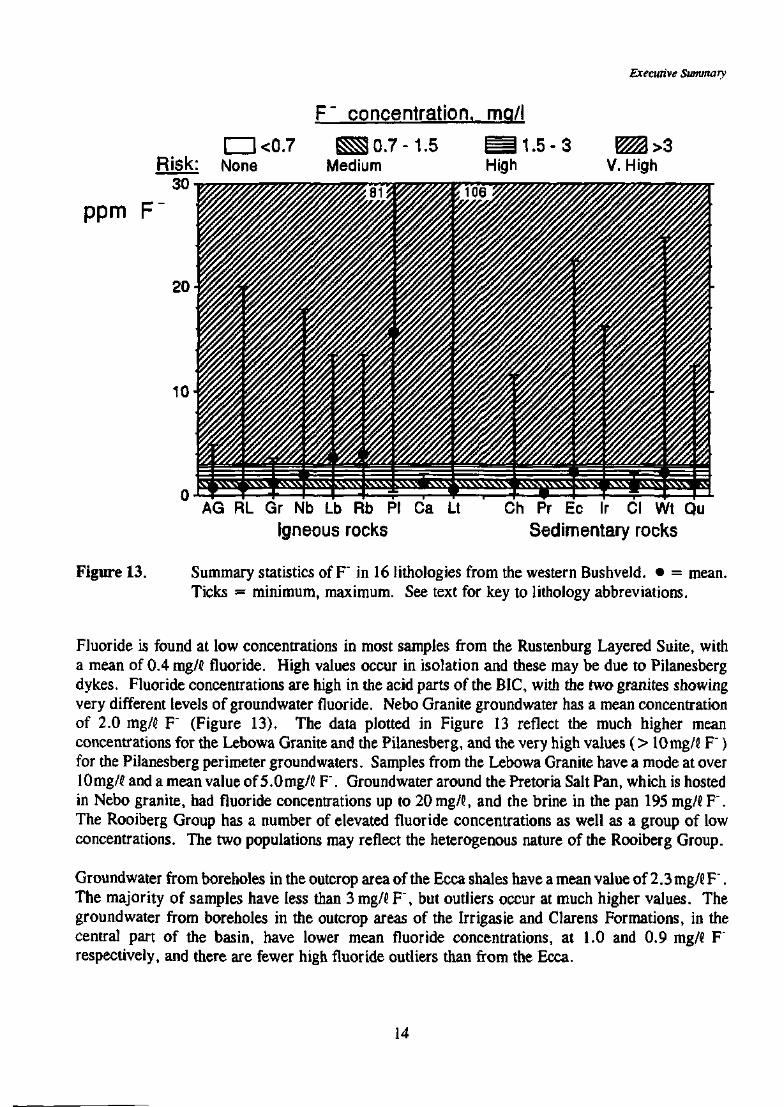
Figure 13 shows summary statistics of fluoride concentration in the 16 major lithologies of the studyarea.
13
Executive Summary
F" concentration, mq/l
I l<0.7None
ppm F
AG RL Gr Nb Lb Rb PIIgneous rocks
Lt Ch Pr Ec Ir Cl Wt QuSedimentary rocks
Figure 13. Summary statistics of F" in 16 lithologies from the western Bushveld. • = mean.Ticks = minimum, maximum. See text for key to lithology abbreviations.
Fluoride is found at low concentrations in most samples from the Rustenburg Layered Suite, witha mean of 0.4 mg/<> fluoride. High values occur in isolation and these may be due to Pilanesbergdykes. Fluoride concentrations are high in the acid parts of the BIC, with the two granites showingvery different levels of groundwater fluoride. Nebo Granite groundwater has a mean concentrationof 2.0 mg/fi F" (Figure 13). The data plotted in Figure 13 reflect the much higher meanconcentrations for the Lebowa Granite and the Pilanesberg, and the very high values (> 10mg/£ F')for the Pilanesberg perimeter groundwaters. Samples from the Lebowa Granite have a mode at over10mg/e and a mean value of 5.0mg/C F . Groundwater around the Pretoria Salt Pan, which is hostedin Nebo granite, had fluoride concentrations up to 20 mg/C, and the brine in the pan 195 mg/fi F \The Rooiberg Group has a number of elevated fluoride concentrations as well as a group of lowconcentrations. The two populations may reflect the heterogenous nature of the Rooiberg Group.
Groundwater from boreholes in the outcrop area of the Ecca shales have a mean value of 2.3 mg/d F".The majority of samples have less than 3 mg/C F", but outliers occur at much higher values. Thegroundwater from boreholes in the outcrop areas of the Irrigasie and Clarens Formations, in thecentral part of the basin, have lower mean fluoride concentrations, at 1.0 and 0.9 mg/d F"respectively, and there are fewer high fluoride outliers than from the Ecca.
14
Executive Summary
6.2.1 Anions
Only NO3 concentrations gave cause for concern. Mean values for ground waters in the RLS, Nebogranite, Pilanesberg Complex, carbonatites and Letaba basalt rocks were all above the high risk limitfor drinking water. This is most likely due to anthropogenic pollution by livestock and/or pitlatrines.
6.2.2 Trace elements
Groundwater samples from eight lithologies were analysed for trace elements. Only zinc andmolybdenum were enriched in the groundwaters sampled. Zinc occurs in appreciable quantities,especially in the Pilanesberg, where one sample was above the maximum safe drinking water limit(10 mg/{). Mo concentrations were generally at very low levels, close to the detection limit.However, Lebowa Granite groundwater had a mean concentration above the maximum safe drinkingwater limit of 0.2 rng/d Mo.
6.2.3 Temporal variation
A number of boreholes were resampled to determine possible temporal variation in chemicalcomposition. The major anions and cations vary considerably, but F" showed very little variationover two years.
6.2.4 General
The results summarised above showed that much of the study area is underlain by groundwaterhaving a F concentration above the optimum (-0.7 mg/S) and also above recommended maximumdrinking water concentrations (1.5 mg/d). Approximately 17000 km2 of the western Bushveld havegroundwaters with a F concentration >0.7 mg/C. Just over 540 of the 3000 groundwater sampleshave a F" concentration > 1.5 mg/{, and 82 000 to 109000 people are drinking groundwater whichmay induce fluorosis in the long term. 145 500 to 194 000 people are drinking water with F"concentrations higher than optimal.
For the purpose of effective planning of water supplies for the area it is essential to have a map ofareas in the western Bushveld where F concentrations in groundwater are above optimum levels.Figure 8 gave a detailed plot of borehole/risk value locations and Figure 9 showed a plot of Theissenpolygons classified into no risk (<0.7 mg/fl), low risk (0.7-1.5 mg/fi), medium risk(> 1.5-3.0 mg/«) and high risk (>3.0mg/fi).
Although many fluorite prospects occur in the Lebowa Granite Suite and Rooiberg felsite, few largeworking fluorite mines still exist in the study area. Major fluorite mines are still active in theMalmani Dolomite of the Chuniespoort Group, on the edge of the study area. The impact of dustgenerated by blasting and processing the ore is likely to be restricted to areas close to the mines, andno gaseous emissions are generated. Two other large fluorine-handling industries exist in the studyarea, namely the Atomic Energy Corporation's uranium enrichment plant at Pelindaba in the south(now closed), and a major ore smelter in the centre of the area. Industrial emissions of fluorine areunlikely to be a serious source of groundwater pollution, except perhaps on a very localised basis.
15
Executive Summary
7 Conclusions
All the aims of the project have been successfully addressed, namely:(i) a comprehensive database of the concentrations of F" and other common anions and
cations, together with data on pH, temperature, EC and alkalinity, has been produced fora further 323 groundwater sites over the study area. In addition F concentrations overthe extended area have been collated and evaluated.
(ii) The source and mobility of F in the hydro-geochemical environment of the study areawas established, and also the spatial relations between F-enriched groundwaters andfluoride sources in rocks, mineralised areas and soils,
(iii) Existing epidemiological information on the health related F effects have been reviewedand compiled in a F" concentration vs. effect plot.
(iv) The results have been successfully utilised to provide maps of areas of no risk, low risk,medium risk and high risk of fluorosis. These should be of use to engineers and plannersconcerned with the supply of drinking water to the rural population in the study area, andhopefully will result in considerable cost-savings in the future supply of water in the area.The results should bring about, over the next generation, a marked improvement in thedental and skeletal health of the local populace.
By implementing a very wide variety of analytical techniques to gain information on physical andgeochemical characteristics of both groundwaters and their host rocks, by interpreting the results ofchemical and isotopic analyses, and by the use of theoretical modelling calculations of elementspeciation, the project has both created and successfully integrated a huge database of knowledge ofthe study area. It is believed that the work has contributed significantly to the knowledge of fluoridein South African groundwaters, and that the results will be of use in studying groundwaters in otherparts of the country.
8 Recommendations
Technology transfer
1. There is a very high probability of groundwaters from the Pilanesberg Complex and theLebowa Granite having a F" concentration above the maximum safe limit for humanconsumption (1.5 mg/fi F ) . It is recommended that any further installation of boreholes by theDepartment of Water Affairs and Forestry in these areas should be accompanied by suitabledefluoridation procedures.
2. Since the start of this study the Pilanesberg area has been the subject of water qualityremediation measures, in the form of the Saulspoort pipeline scheme. The population in thisarea now have access to good quality water supplied from the Vaalkop Dam. The populationresident on the outcrop areas of the Lebowa Granite have had no such attention, and it isstrongly recommended that a district-wide alternative water supply scheme be instituted for theLebowa Granite area.
3. The Nebo Granite and parts of the Karoo sub-basin have scattered high fluoride concentrations.A district-wide alternative water supply scheme in these areas is not warranted, since good
16
Executive Summary
quality boreholes do exist in the area. It is recommended that poor quality boreholes are eitherclosed down or have borehole-scale defluoridation measures implemented on them. Goodquality boreholes have been identified and it is recommended that these boreholes be publiclyidentified, e.g. by being painted green, and developed as a primary source of human drinkingwater. Poor quality boreholes also should be publicly identified, e.g. by being painted red.
4. Understanding and awareness of the risk of fluorosis from the ingestion of high fluoridegroundwater is limited to a few specialists. The general population in the field area is almostentirely unaware of these problems, although the job-seeking population in the Pilanesberg areaare rapidly coming to realise that a smile spoilt by dental fluorosis can severely limit a person'sjob opportunities.
It is recommended that a 'technology transfer' programme be initiated. This should could takethe form of health education comics, talks, community meetings, perhaps even a short videoprogram. It is recommended that suitably qualified members of the local population be trainedto do this in a manner acceptable to the local populace. At these meetings it should beexplained exactly what the problem is, how it can be overcome, and what the local governmentis planning to do to solve the problem.
5. Where necessary and cost-effective, e.g. in areas of isolated boreholes, house-baseddefluoridation should be implemented, possibly through the utilisation of the 'clay pot' method,as developed in Scandinavia, or through more technologically advanced methods, as developedby the CSIR. House-based defluoridation should be encouraged, possibly through province-sponsored training sessions and the development of local clay resources. This would providemuch-needed job opportunities in rural areas. More research into the occurrence and suitabilityof local clay resources is needed. Lest the supposed high cost of defluoridation be regardedas a limiting factor, it must be emphasised that it is nnlv drinking water that requirestreatment. Water for general household use and gardening does not require treatment. For anaverage household of 8 people only about 205 of treated water are required daily.
6. Only small variations in groundwater F over time can be expected. However, it became clearfrom discussions with local village chiefs and headmen that the groundwater from manyboreholes had never been analysed since the boreholes were first installed. Even then theresults had never been communicated to the consumers- It would seem prudent to put in placea plan to monitor the F" content of boreholes every five to ten years. It would be even betterif a simple, rapid and cheap test, similar to a litmus paper test for pH, could be developed forthe determination of F" in groundwater. Suitable kits could be distributed to local authoritieswho could arrange for testing on a regular basis. In this way the consumers would developconfidence in the quality of their drinking water. If the water quality deteriorated, regulartesting would provide an early warning system, allowing remedial steps to be taken timeously.
7. Finally, it is recommended that this report be brought to the attention of all governmental,provincial and local authorities, and also to all non-governmental organisations, operative inthe area.
17
Executive Summary
Research recommendations
1. Water quality in the Lebowa Granite area has been shown to be of poor quality and to havelevels of molybdenum above the high risk limit for human consumption. It is recommendedthat further sampling and study of this area be undertaken.
18
Executive Summary
ACKNOWLEDGMENTS
The research in this report emanated from a project funded by the Water Research Commission andentitled "Distribution of fluoride-rich groundwater in the eastern and Mogwase regions of theNorthern and North-western Provinces: influence of bedrock and soils and constraints on utilisabledrinking water supplies"
The Steering Committee responsible for this project consisted from time to time of the followingpersons:
Mr H M du Pies sis Water Research Commission (Chairman)Mr D Huyser Water Research Commission (Secretary)Mr F P Marais Water Research Commission (Secretary)Mr A G Reynders Water Research CommissionMr Z M Dziembowski Department of Water Affairs and ForestryMr M Fayazi Department of Water Affairs and ForestryMr K U Pelpola Department of Water Affairs and ForestryMr F C van Zyl Department of Water Affairs and ForestryProf J B du Plessis MEDUNSAMr B Mothusi Department of Health, North West ProvinceProf A P le Roex University of Cape TownMr W van der Merwe Department of National HealthMr F S Viviers Department of National HealthDr J C Vogel CSIR
The critical and constructive contributions of the Steering Committee are gratefully acknowledged.
The authors wish to thank all the people who helped us logistically in the field, including ParamountChiefs Makapan and Mamogale, headmen, tribal policemen and officials, the interpreter Ms LillianPhiri, Mr Bruce 'Matches' Brockett, Ms Kate Parr, Mr Johnson Maoke and the staff of thePilanesberg National Park, Mr Sam Otto and family, the staff of Agricor, Mr Xu Yong Xin and MrFarouk Mangera.
The completion of the project was only possible with the co-operation of many other individuals andinstitutions. The authors wish to record their sincere thanks to the following:
Dr Andres Bartha of the Bophuthatswana Geological Survey who kindly carried out trace elementanalyses and is thanked for his enthusiasm and patience; Mr 'Jim' Dziembowski is specificallythanked for providing access to the S.A. National Groundwater Database; Prof John Kalk of theUniversity of the Witwatersrand Medical School organised and paid for the analysis of water samplesfor iodide; Prof Frank Hodgson of the University of the Orange Free State provided a copy ofHYDROBASE free of charge; Prof Balthazar Verhagen provided access to his laboratory and thehelp of his assistants.
Prof J B du Plessis and Ms Susanna Zietsman are thanked for general discussions and theirwillingness to share their extensive medical knowledge of the study area.
Executive Summary
The Computing Centre for Water Research at the University of Natal is thanked for providing a copyof MINTEQA2.
Mr Dan Wilson helped in implementing the project on ARC/INFO at UCT. Particular thanks aredue to the staff of the Department of Geological Sciences at UCT where most of the analyses werecarried out, specifically Dr Chris Harris for his time and patience with instructions for thepreparation and analysis of samples for stable isotopes; Dr Steve Richardson and Mr JustinUnderwood for preparing and analysing samples for Sr isotopes; Dr Martin Fey for instruction onthe use of MINTEQA2; Ms Nicky Grant for instructions on the use of the XRF preparationlaboratories; Mr Dick Rickard for ensuring smooth running of electron microprobe sessions; MrPatrick Sieas for his able assistance in the ion chromatography laboratory; and the general helpfulnessof Mr Leon Myburg, Mr Ernest Stout and Mr Neville Buchanan.
The original project proposal was finalised by Dr Ron Watkins, then at the Department of GeologicalSciences, University of Cape Town and now at the Department of Geological Sciences, CurtinUniversity, Perth, Australia. His continued enthusiasm and advice has been greatly appreciated.
u
Executive Summary
aBOPCDTA
Co
Cs
CRF
8
DWADWAFIon balance
ABBREVIATIONS AND DEFINITIONS
(alpha) Fractionation factor for a particular isotope between two phasesBophuthatswanal,2,Cyclohexylene Dinitrilo Tetraacetic Acid or l,2,Cyclohexane DiamineN,N,N,N-Tetraacetic Acid, known commercially as Titriplex IVinitial 14C activitymeasured 14C activity of a sampleCrocodile River fragment
(delta) Defined as, for example, 618O =
Department of Water AffairsDepartment of Water Affairs and ForestryCalculated using the equation
"" **standard
R1000
standard
% difference = cationt - Saniow.
+ 2cations anions
x 100
kgor
kyrsALGSLLDLOI8MMTMWLHgmgngPDBpmc
ppbppmRRLSS
cctjons
SMOW
TISABVAlB
wt%XXRF, XRFS
kilogramSolubility productSolubility product at 25°CKilo years, one thousand years or one millennium.(lambda) the decay constant of a radioactive substanceLebowa Granite Suitelower limit of detectionloss on ignitionlitreMean maximum temperaturemeteoric water linemicrogram (0.000001 g)milligram (0.001 g)nanogram (0.000000001 g)Peedee belemnitepercent modern Carbon, measured relative to wood grown in 1850 andrelated to 1950. The standard is taken to be 100 pmc.parts per billion or Hg/kg, solid equivalent to 1 \xg/H in solution.parts per million or mg/kg, solid equivalent to 1 mg/<! in solution.Ratio of atomic abundances of heavy isotope to light isotopeRustenburg Layered SuiteSum of cations or anions, as molar equivalents.Standard mean ocean waterTemperature, in °CHalf life of a radioactive substance.Total ionic strength adjustment buffer.Volumes of mixing groundwaters A and B.weight percentageMole fractionX-ray Fluorescence Spectrometry
in
Chapter J. Introduction
1 INTRODUCTION
1.1 Purpose of this study
The concentration of fluoride in groundwater has adversely affected the lives of millions of SouthAfricans. This happens through the action of the fluoride ion (F~) on teeth (causing dental fluorosis)and bones (causing skeletal fluorosis). The main source of F" in the human diet is drinking water.Numerous studies have shown that ingestion of drinking water with elevated concentrations of F"causes dental fluorosis (e.g. Driscoll eta!., 1983; Senewiratne et al., 1973). Examples of Africanstudies include those of Van Wyk et al. (1983); Ng'ang'a and Valderhaug (1993); Tobayiwa et al.
(1991);Manjie/a/. (1986); Mclnnese/a/. (1982). Very high concentrations of F in drinking waterhave been shown to cause skeletal fluorosis (e.g. Boyle and Chagnon, 1995; Felsenfeld and Roberts,1991). Excess F" in the diet has been implicated as one of the causes of goitre (Day and Powell-Jackson, 1972). One of the areas in South Africa where high F concentrations in drinking water hascaused dental and skeletal fluorosis in humans is the western Bushveld, the subject area of this study.
Although the prevalence of dental and skeletal fluorosis in the area was recognised much earlier this
century (Ockerse, 1941; Ockerse and Meyer, 1941), the implementation of the 'apartheid' system of
government, starting in 1947, ensured that scant research was undertaken on the mainly black
sufferers. Sporadic and small scale studies were undertaken by independent medical researchers (e.g.
Zietsman, 1991; Rudolph et al., 1995). Whilst a Government enquiry investigated fluoridation of
drinking water supplies (McKenzie et al., 1966), it was concerned only with urban (mainly white
residents) water supplies. The majority of dental fluorosis sufferers (mainly black) live in rural areas.
At the time of writing, no comprehensive survey of dental and skeletal fluorosis has been undertaken
or is planned in the region.
Epidemiological studies around the world have tended to concentrate on the prevalence and severity
of fluorosis, rather than study the distribution of high F" groundwater, the main etiological factor.
Without exception, previous studies of the distribution of high F" groundwater in the Bushveld have
relied on very few sampling sites. Zietsman (1991) evaluated the greatest number of boreholes (120)
in one study, but her study covered only 7 villages. The data which these researchers needed did
exist: routine sampling and analysis of groundwater has been undertaken for decades by Government
bodies. However, the area had been fragmented politically by the formation of the nominally
independent homeland of Bophuthatswana in 1977. Exchange of data between Bophuthatswana and
South Africa seldom took place, and the political boundaries limited and compromised studies which
excluded one or other of the countries. The amalgamation of Bophuthatswana back into South
Africa, beginning in practice in 1993, has allowed the present study to use the combined
hydrochemical data set for the 6rst time. The change of government in South Africa in 1994 has
given impetus to calls for the introduction of fluoridation in the country (Moola, 1996), and the
present study is of importance in determining areas which do not require further fluoridation.
1.1
Chapter I. Introduction
The study has had two main objectives: to delineate F" concentrations in groundwater in the studyarea, so that regions of high F" concentration may be identified; and to investigate the cause(s) of highF" groundwater. The study area covers all of the endemic fiuorosis areas in the region, and is notconstrained by artificial political boundaries. The study also aimed to investigate the followinghypotheses: that groundwater F concentration is correlated to aquifer composition, especially thecontent of fluorine-bearing minerals and is controlled by the solubility of these minerals; that Fconcentration is also correlated to the residence time of groundwater; and that very high levels of F~in groundwater are caused by processes in addition to simple dissolution of fluorine-bearing rock, forinstance ion exchange and evaporation.
In this study the distribution of high F" groundwater has been investigated by collection and analysis
of groundwater samples, and the integration of this new data with pre-existing databases.
Groundwater has been analysed for the major anions and cations as well as trace metals so that
correlations between those elements and F' can be evaluated, and so that fuiJ speciation calculations
can be performed on the analyses. Groundwater-mineral equilibria were modelled using a computer
program to clarify the mineral controls on water composition and possibly the extent of water-rock
interaction. A limited number of water samples were analysed for iodide, as parts of the study area
are afflicted with endemic goitre and it has been suggested that F interferes with thyroid function.
Iodide in groundwater was analysed to determine whether goitre was likely to be caused by low
iodide or high F concentrations in groundwaters. The causes of high F" groundwater have been
investigated by using chemical and mineralogical analyses of rocks, soils and minerals to ascertain the
F" content of these materials. Studies of the stable and radioactive isotopes present in groundwater
were used to try to define the origin, environmental history and residence time of the groundwater.
The completion of this study will yield numerous benefits. It will increase knowledge about one of
the world's largest areas of endemic fluorosis, and the processes which enrich F' in groundwaters.
For the first time in South Africa, areas of fluorosis risk will be accurately delineated. The study will
also estimate for the first time the number of people likely to be affected by fluorosis in the region,
highlighting the serious health consequences of high F" groundwaters. Health authorities and water
supply planners will now be able to take action to guard against dental fluorosis in these areas. The
study will add to the knowledge of the concentration and distribution of health-related trace elements
in Bushveld groundwaters. The increased knowledge of geohydrological and geohydrochemical
systems at work in the area will be of use in the planning of water supplies to a previously neglected
region, and will be of use in the exploration for low-F' groundwater supplies. The study will
contribute to knowledge of the stable and radioactive isotope systems at work in groundwaters of
the Bushveld area. It will show for the first time that the usefulness of strontium isotope studies of
groundwater may be limited by the natural variability of the source minerals, and that radiocarbon
studies of Bushveld groundwaters may provide information on mineral reaction rates.
1.2
Chapter I.
1.2 Structure of this report
Introduction
The report is divided into seven chapters. This introductory chapter contains an outline of the study;the reasons for, and benefits of, undertaking it; the social and human context in which it wasundertaken; and a review of previous work on the geology of the field area and its physicalcharacteristics. Chapter 1 also contains a review of the behaviour of the isotope systems used.Chapter 2 is a description of the methods used in the collection and analysis of materials. Chapters3 and 4 contain descriptions of the results of these analyses on rocks, soils and minerals, andgroundwater, respectively. Chapter 5 is a discussion of the data, including a review of thegeochemistry of fluorine and the effect that F has on human health, and puts the results into a humanhealth and geochemical perspective. Chapter 6 summarises the report and chapter 7 proposes furtherareas of research.
1.3 Field area
1.3.1 Extent
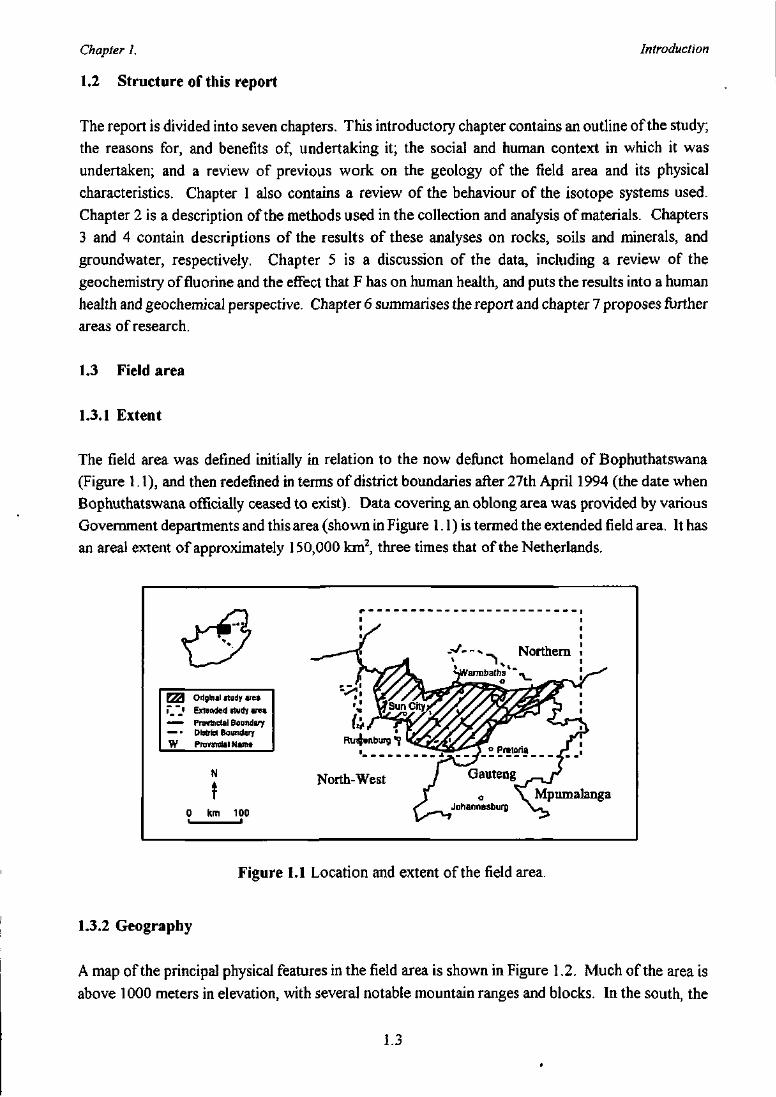
The field area was defined initially in relation to the now defunct homeland of Bophuthatswana(Figure 1.1), and then redefined in terms of district boundaries after 27th April 1994 (the date whenBophuthatswana officially ceased to exist). Data covering an oblong area was provided by variousGovernment departments and this area (shown in Figure 1.1) is termed the extended field area. It hasan area! extent of approximately 150,000 km2, three times that of the Netherlands.
Ezar "i——-w
Original tiudy are*
Extended study area
Provincial BoundaryDlsiria BoundaryProvincial Nun*
0 km 100
North-WestMpumalanga
Figure 1.1 Location and extent of the field area.
1.3.2 Geography
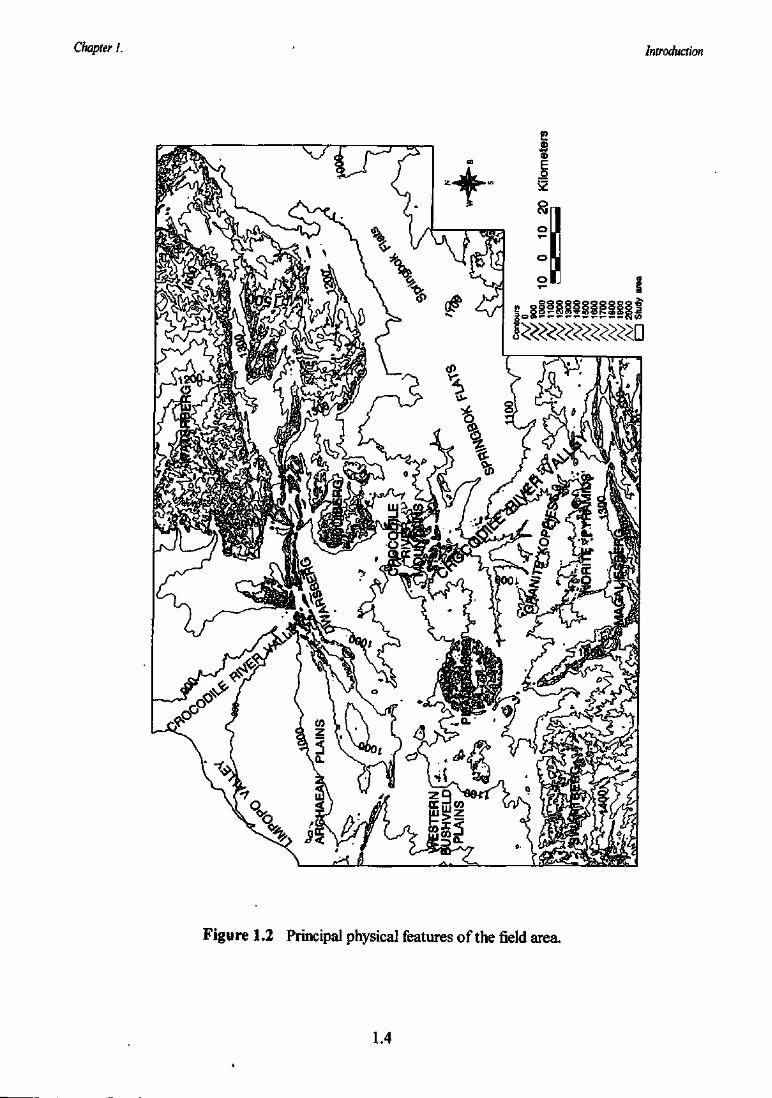
A map of the principal physical features in the field area is shown in Figure 1.2. Much of the area is
above 1000 meters in elevation, with several notable mountain ranges and blocks. In the south, the
1.3
Chapter 1. Introduction
Figure 1.2 Principal physical features of the field area.
1.4
Chapter I. Introduction
Magaliesberg range runs almost continuously from west of Rustenburg to the north of Pretoria. Thisis in effect the southern boundary of the field area. North of these hills are the flat plains of theBushveld, occasionally broken by isolated hillocks ('koppies'). A prominent line of koppies 10 kmnorth of the Magaliesberg, and running parallel to them, belongs to the Pyramid Gabbro-Noritemember. Further to the north are the rolling plains and subdued hills of the Nebo Granite. Prominentmountain blocks include the circular ring-complex of the Pilanesberg Complex and the oblongCrocodile River Fragment. Koppies occurring to the west of the Pilanesberg are subdued versionsof the Magaliesberg and are not as coherent in structure. The rolling landscape of the granites givesway in the east to the featureless plains of the Springbok Flats, which are broken occasionally bysmall sandstone knolls, seldom higher than 50 meters.
1.3.3 Geology
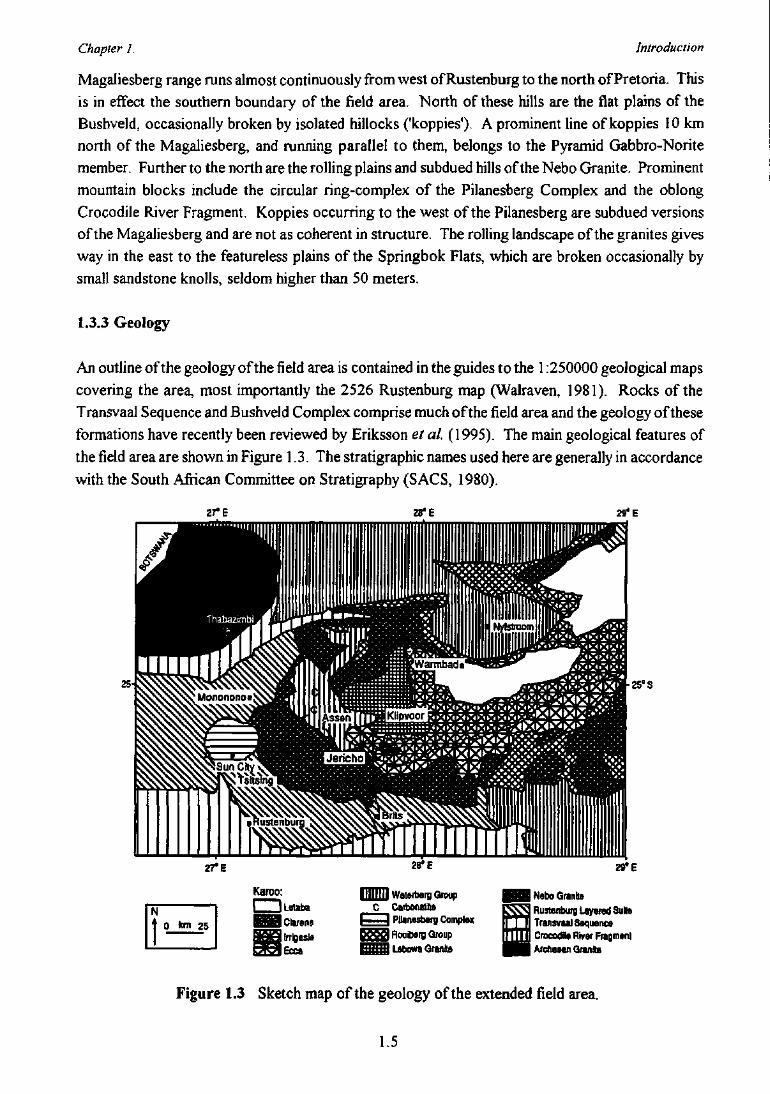
An outline of the geology of the field area is contained in the guides to the 1:250000 geological maps
covering the area, most importantly the 2526 Rustenburg map (Walraven, 1981). Rocks of the
Transvaal Sequence and Bushveld Complex comprise much of the field area and the geology of these
formations have recently been reviewed by Eriksson et ai (1995). The main geological features of
the field area are shown in Figure 1.3. The stratigraphic names used here are generally in accordance
with the South African Committee on Stratigraphy (SACS, 1980).
zrt ZS'E 29* E
-25°S
ZTE
0 km 25
Karoo:
l _ _ iLetabaI Clarens
IrrigaslsEcca
28'E
IIIIIIH Watertui? GroupC Carbonate
| Pilanesberg Complex) Rooiberg Group| Labowa Grants
29* E
| Nebo GraniteI Rustenburg Layered Suite
Transvaal SequenceI Crocodile River FragmentI Arctaeen Granite
Figure 1.3 Sketch map of the geology of the extended field area.
1.5
Chapter I. Introduction
1.3.3.1 Lithology
The geology of the area is complex and is covered in detail in many publications (e.g. Eriksson et al,1995). A simple summary is provided here, starting from the oldest rocks. Archaean Granite occursin the northwest and south of the area, overlain by dolomites of the Chuniespoort Group and clasticsediments of the Pretoria Group, both of the Transvaal Sequence.
Much of the area is underlain by rocks of the Bushveld Igneous Complex (BIC), which in this area
was emplaced into the Pretoria Group, most prominently the Magaliesberg Quartzite Formation. The
BIC is divided into the mafic rocks of the Rustenburg Layered Suite (RLS), comprising pyroxenites,
anorthosites, norites and gabbros; the Rashoop Granophyre Suite; and the Lebowa Granite Suite
(LGS). The LGS has most recently been reviewed by Hill et al. (1996). The LGS has two principal
components in the field area - the Nebo Granite and the Lebowa Granite, the latter being more
mineralogically variable and mineralised. The Lebowa Granite is also known as the Bobbejaankop
Granite. Sedimentary rocks of the Crocodile River Fragment (CRF), dominantly carbonates, shales
and ironstones, are located near Assen. The Rooiberg Group make up the roof rocks of the BIC.
They are predominantly siliciclastic volcanic rocks and are often highly mineralised with Zn, Sn and
F (Rozendaal etal, 1986; Schweitzer et al., 1995). Clastic and carbonate sediments of Karoo age
overlie the eastern parts of the BIC in the field area.
Several alkaline intrusions occur, including the Pilanesberg Complex nepheline syenite (Molengraaff,
1905; Humphrey, 1913; Shand, 1928; Retief, 1962 and 1963; Ferguson, 1973; Lurie, 1974), the
associated Pilanesberg Dyke Swarm and several carbonatite complexes, such as Kruidfontein,
Bulhoek and Tweerivier (Verwoerd, 1967 and 1993). Two kimberlite pipes have been found in and
around the Pilanesberg Complex (Cawthorn, 1988). Ferguson (1973) proposed the Pilanesberg
alkaline province. It consists of dykes, small plutonic bodies and the large Pilanesberg Complex
nepheline syenite pluton. Several intrusions belonging to the province are carbonatites or are
carbonatitic, e.g. those at Spitskop, Kruidfontein and Bulhoek (Harmer, 1992), yet the Pilanesberg
Complex has so far been described as being devoid of carbonatite (Verwoerd, 1993). Given the large
volume of undersaturated alkaline rocks (probably in excess of 500 km3), the highly evolved nature
of the Pilanesberg Complex, and the occurrence of carbonatite associated with many other southern
African nepheline syenites, e.g. those at Schiel, Lofdal and Okorusu (Verwoerd, 1993), it is unusual
that no carbonate rocks of igneous origin have been found in close association with the Pilanesberg.
1.3.3.2 Structure
The BIC occurs as a series of lobes of large dimensions, fed by postulated 'abyssal fractures'
(Ferguson, 1973). Hamilton (1970) suggested that the BIC was formed by meteorite impact,
although this has now been shown to be unlikely because of the absence of shock metamorphic effects
in the rocks underlying the Bushveld (French, 1990). Intrusion of the complex has resulted in
deformation of the Transvaal Sequence country rocks, so that dips of around 30° towards the centre
of the complex occur in the underlying sediments. An extension of the main BIC body is found to
1.6
Chapter 1. Introduction
the west of the Pilanesberg and is termed the 'western lobe'. The stratigraphy of the BIC is essentiallyconformable, with local unconformities. Granite overlies granophyre, which in turn overlies the RLS.Meyer and de Beer (1987) used deep resistivity methods to model the structure of the BIC. Theyconfirmed earlier models that the BIC is not one single lopolith, but is instead comprised of separatelobes. They concluded that the RLS directly overlies Transvaal Sequence rocks in the eastern andwestern Transvaal, but rests on Archaean Granite in the centre of the complex. Walraven (1976)showed that long-wavelength folding of the complex has occurred, with fold hinges trendingnorthwest-southeast in the area around Tsitsing. Faulted contacts of BIC and Pretoria Groupsediments occur occasionally, such as the large Rustenburg Fault and the Brits Graben. The contactof the Lebowa and Nebo Granites is obscured by younger Karoo rocks and the nature and locationof the contact is uncertain.
The Crocodile River Fragment, correlated in part with the Transvaal Sequence, occurs within thebody of the BIC and is variously interpreted as a mega-xenolith, as upfaulted floor rocks or as a roofpendant (Walraven, 1981). An extension of the Brits Graben to the northeast has been traced andappears to link up with the western edge of the Crocodile River Fragment (R. Holdsworth, Councilfor Geoscience,pers. comm.). The Karoo sediments in the area have their deepest extent near thevillage of Sephai, where they are approximately 430 m thick. The sediments are characterised by alack of outcrop and flat topography and there is a marked decrease in altitude across the LebowaGranite/Karoo contact. The Saltpan Crater 40 km northwest of Pretoria had previously been ascribeda volcanic origin (Wagner, 1920, 1922;Feuchtwanger, 1973; fudaii eta/., 1973), before a boreholepenetrating the structure gave unambiguous evidence for a meteoritic origin (Reimold et a}., 1991,1992). Brandt and Reimold (1995) showed that the fracture patterns in the Nebo Granite around thePretoria Saltpan impact structure were not significantly different from regional lineations. Thisindicates that the cratering process has not significantly overprinted the regional fracture system, oneof the most important of which has a horizontal to sub-horizontal orientation.
1.3.4 Meteorology
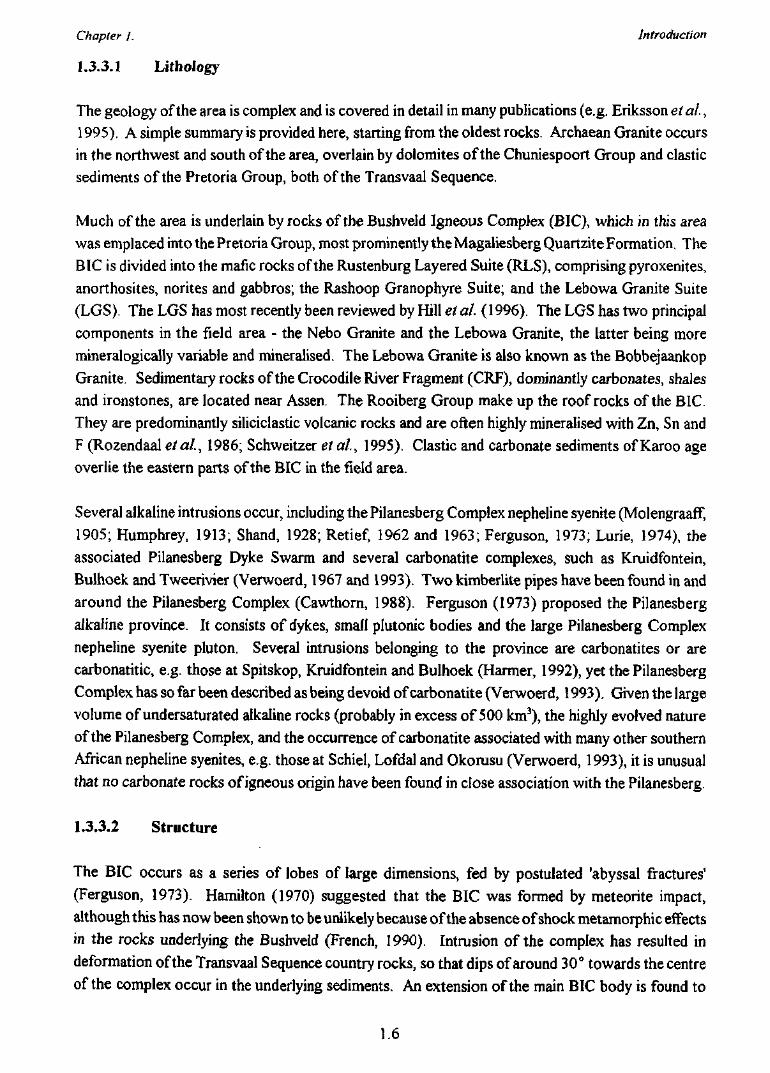
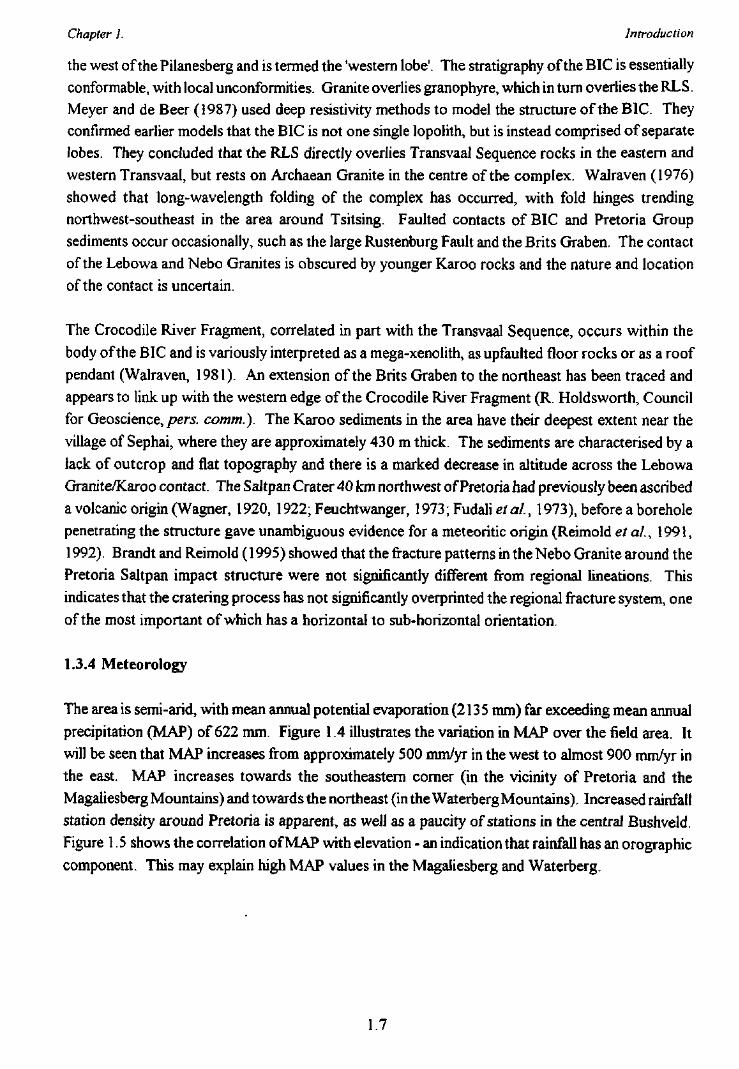
The area is semi-arid, with mean annual potential evaporation (2135 mm) far exceeding mean annualprecipitation (MAP) of 622 mm. Figure 1.4 illustrates the variation in MAP over the field area. Itwill be seen that MAP increases from approximately 500 mm/yr in the west to almost 900 mm/yr inthe east. MAP increases towards the southeastern corner (in the vicinity of Pretoria and theMagaliesberg Mountains) and towards the northeast (in the Waterberg Mountains). Increased rainfallstation density around Pretoria is apparent, as well as a paucity of stations in the central Bushveld.Figure 1.5 shows the correlation of MAP with elevation - an indication that rainfall has an orographiccomponent. This may explain high MAP values in the Magaliesberg and Waterberg.
1.7
Chapter 1. Introduction
Rain Gauge
Figure 1.4 Stereographic representation of mean annual precipitation (MAP) in the study area.
1000
o| 800
"o2- 600to
g(D
400 ^
200
— Regression lineRain gauge
r = 0.499
p = <0.0001
800 1000 1200 1400 1600 1800
Elevation (m)
Figure 1.5 Correlation of mean annual precipitation with elevation, indicating an orographicinfluence.
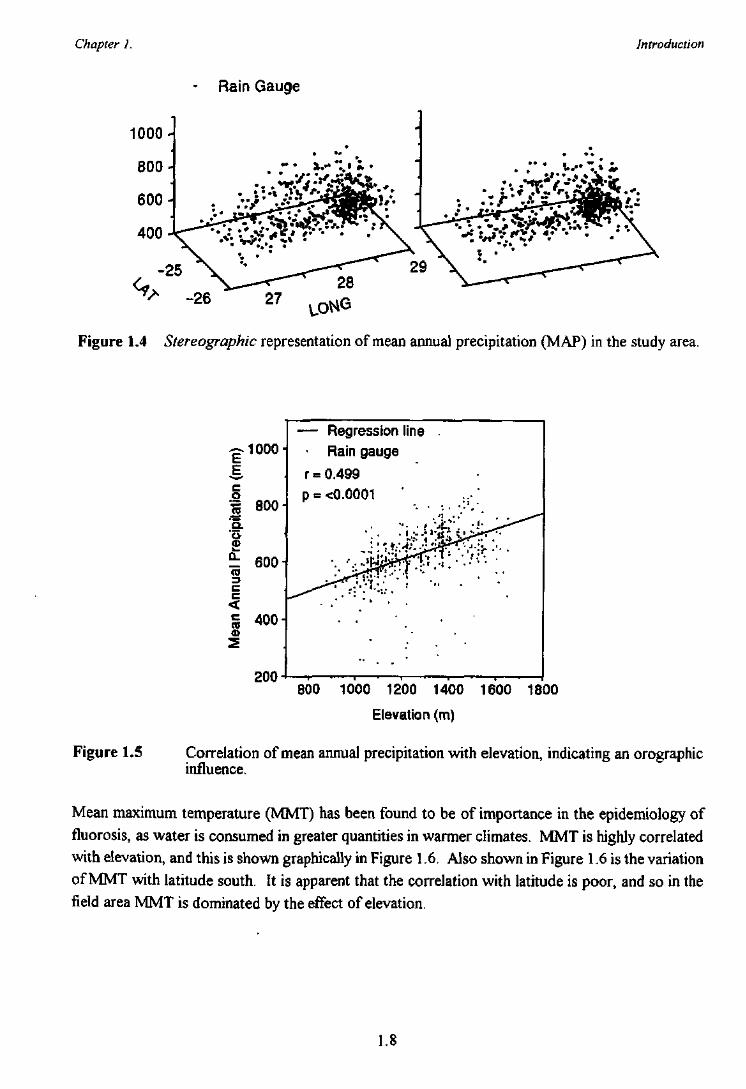
Mean maximum temperature (MMT) has been found to be of importance in the epidemiology of
fluorosis, as water is consumed in greater quantities in warmer climates. MMT is highly correlated
with elevation, and this is shown graphically in Figure 1.6. Also shown in Figure 1.6 is the variation
of MMT with latitude south. It is apparent that the correlation with latitude is poor, and so in the
field area MMT is dominated by the effect of elevation.
1.8
Chapter 1. Introduction
1500-
23 24 25 26 27 28 29T(°C)
24 25 26 27T(°C)
28 29
Figure 1.6 Correlation of mean maximum temperature (T) with elevation (in metres abovesea level: tnasl) and latitude (in decimal degrees South). Raw data obtainedfrom the Weather Bureau, Pretoria.
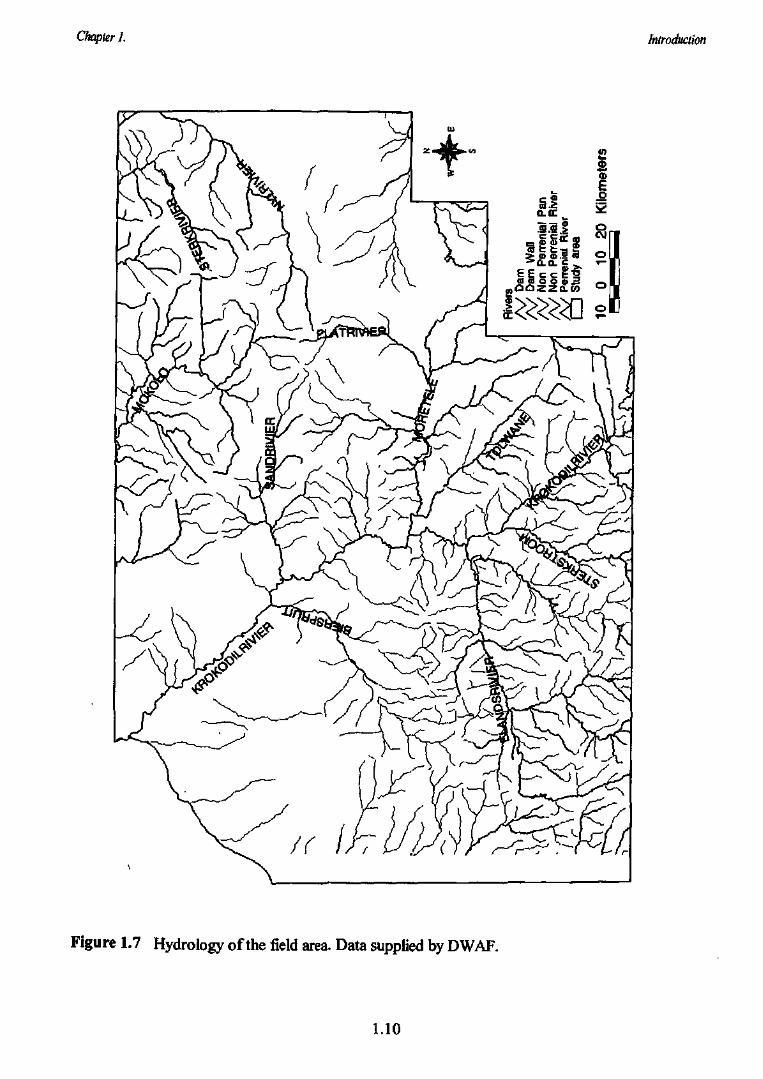
1.3.5 Hydrology
The river system is shown in Figure 1.7. Several perennial rivers cross the area, the Crocodile Riverbeing the largest, flowing south to north and eventually joining the Molopo river. Major tributariesof the Crocodile River include the Elands and Tolwane rivers. Many non-perennial streams occur.
1.3.6 Geohydrology
The geohydrology of the field area as a whole has been the subject of few academic studies, although
a wealth of unpublished raw data of mixed quality exists in government drilling records. Historically
the area had a higher water table than at present, as many of the farms are named after springs which
are long since dry. Frommurze (1937) analysed drilling records from the area and drew a series of
water yield - water depth curves for each lithology, but these curves are meaningless because of the
small number of boreholes which were studied for each lithology. McCaffrey (1993) described the
geohydrology of the Pilanesberg Complex as being characterised by surface weathering, fractures and
faults in igneous rock, permeable tuff aquifers and lava aquitards. The water table had steep gradients
because of the very low transmissivity of the rock mass as a whole.
The review of continental-scale groundwater flow processes by Garven (1995) is of interest.
Although based primarily on sedimentary basins, the review is applicable at times to large areas of
basement rock. He notes that topographic relief is the dominant mechanism of groundwater flow,
with a water table that is a subdued replica of the landscape. Convection cells may operate, driven
1.9
Chapter 1. Introduction
Figure 1.7 Hydrology of the field area. Data supplied by DWAF.
1.10
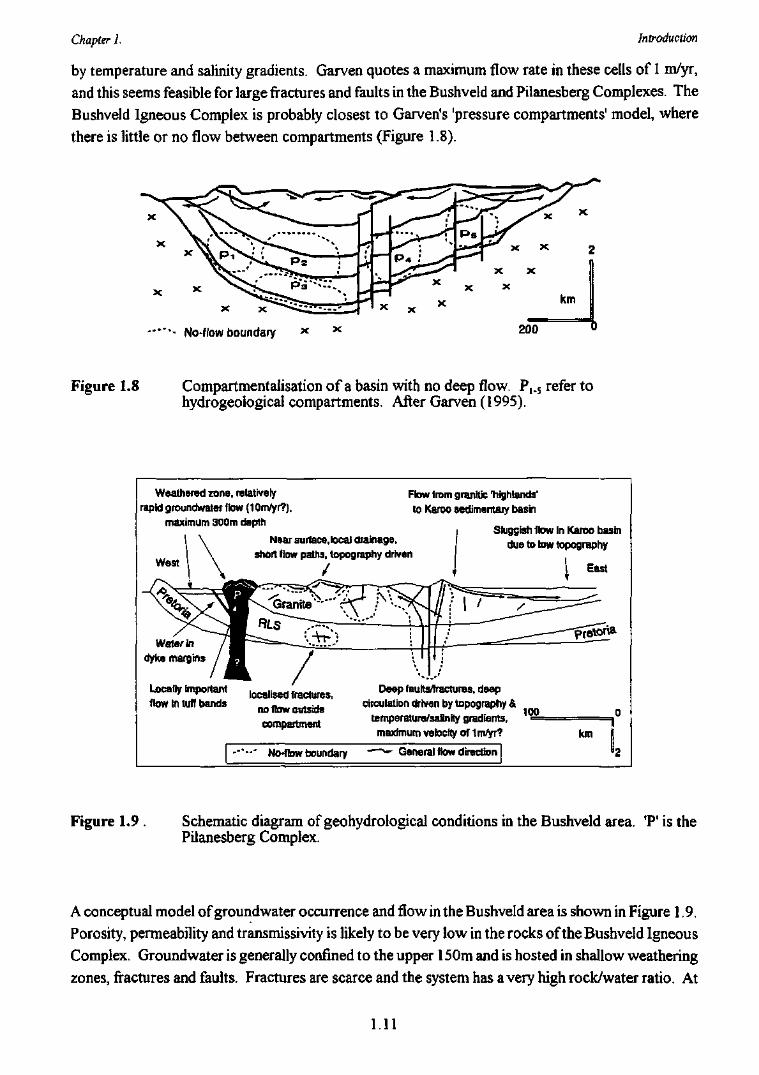
Chapter I. Introduction
by temperature and salinity gradients. Garven quotes a maximum flow rate in these cells of 1 m/yr,and this seems feasible for large fractures and faults in the Bushveld and Pilanesberg Complexes. TheBushveld Igneous Complex is probably closest to Garven's 'pressure compartments' model, wherethere is little or no flow between compartments (Figure 1.8).
— ' - No-flow boundary x 200
Figure 1.8 Compartmentalisation of a basin with no deep flow. P,_5 refer tohydrogeological compartments. After Garven (1995).
Weathered zone, relatively
rapid groundwater flow {"lOm/yr?),
maximum 300m depth
Near surface,local drainage,
short flow paths, topography drivenWest
Flow (ram granitic 'highlands'
to Karoo sedimentary basin
Sluggish flow in Karoo basin
due to bw topography
I East
Water in
dyke margins
Locally important
flow in tuff bandslocalised fractures,
no flow outside
compartment
Deep faults/fractures, deep
circulation driven by topography &
temperature/salinity gradients,
maximum velocity of 1m/yr?
100
No-flow boundary General flow direction
km
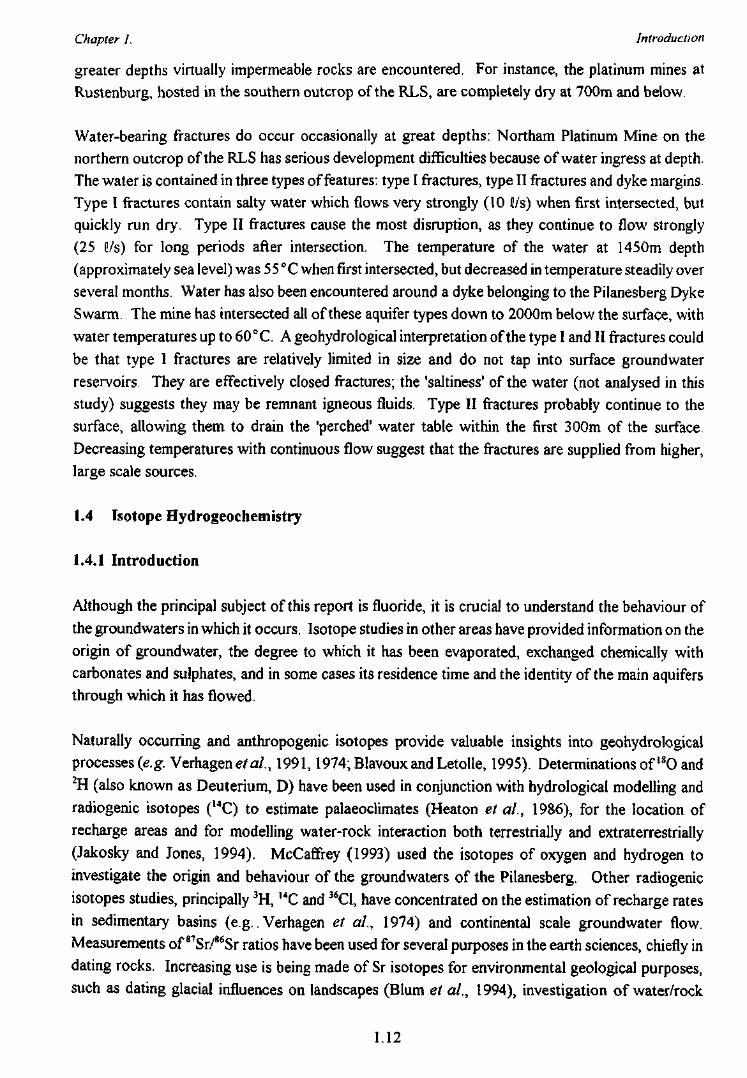
Figure 1.9 . Schematic diagram of geohydrological conditions in the Bushveld area. 'P' is thePilanesberg Complex.
A conceptual model of groundwater occurrence and flow in the Bushveld area is shown in Figure 1.9.Porosity, permeability and transmissivity is likely to be very low in the rocks of the Bushveld IgneousComplex. Groundwater is generally confined to the upper 150m and is hosted in shallow weatheringzones, fractures and faults. Fractures are scarce and the system has a very high rock/water ratio. At
1.11
Chapter 1. Introduction
greater depths virtually impermeable rocks are encountered. For instance, the platinum mines at
Rustenburg, hosted in the southern outcrop of the RLS, are completely dry at 700m and below.
Water-bearing fractures do occur occasionally at great depths: Northam Platinum Mine on the
northern outcrop of the RLS has serious development difficulties because of water ingress at depth.
The water is contained in three types of features: type I fractures, type II fractures and dyke margins.
Type I fractures contain salty water which flows very strongly (10 fi/s) when first intersected, but
quickly run dry. Type II fractures cause the most disruption, as they continue to flow strongly
(25 C/s) for long periods after intersection. The temperature of the water at 1450m depth
(approximately sea level) was 55 °C when first intersected, but decreased in temperature steadily over
several months. Water has also been encountered around a dyke belonging to the Pilanesberg Dyke
Swarm. The mine has intersected all of these aquifer types down to 2000m below the surface, with
water temperatures up to 60 °C. A geohydrological interpretation of the type I and II fractures could
be that type I fractures are relatively limited in size and do not tap into surface groundwater
reservoirs. They are effectively closed fractures; the 'saltiness' of the water (not analysed in this
study) suggests they may be remnant igneous fluids. Type II fractures probably continue to the
surface, allowing them to drain the 'perched' water table within the first 300m of the surface.
Decreasing temperatures with continuous flow suggest that the fractures are supplied from higher,
large scale sources.
1.4 Isotope Hydrogeochemistry
1.4.1 Introduction
Although the principal subject of this report is fluoride, it is crucial to understand the behaviour ofthe groundwaters in which it occurs. Isotope studies in other areas have provided information on theorigin of groundwater, the degree to which it has been evaporated, exchanged chemically withcarbonates and sulphates, and in some cases its residence time and the identity of the main aquifersthrough which it has flowed.
Naturally occurring and anthropogenic isotopes provide valuable insights into geohydrological
processes (e.g. Verhagene/a/., 1991, 1974; Blavoux and Letolle, 1995). Determinations of 18O and2H (also known as Deuterium, D) have been used in conjunction with hydrological modelling and
radiogenic isotopes (14C) to estimate palaeoclimates (Heaton et ai, 1986), for the location of
recharge areas and for modelling water-rock interaction both terrestrially and extraterrestrially
(Jakosky and Jones, 1994). McCaffrey (1993) used the isotopes of oxygen and hydrogen to
investigate the origin and behaviour of the groundwaters of the Pilanesberg. Other radiogenic
isotopes studies, principally 3H, 14C and 36C1, have concentrated on the estimation of recharge rates
in sedimentary basins (e.g.. Verhagen et ai, 1974) and continental scale groundwater flow.
Measurements of 87Sr/86Sr ratios have been used for several purposes in the earth sciences, chiefly in
dating rocks. Increasing use is being made of Sr isotopes for environmental geological purposes,
such as dating glacial influences on landscapes (Blum et ai, 1994), investigation of water/rock
1.12
Chapter 1. Introduction
interaction (Collerson et ai, ] 988; Dia et ai, 1995), nuclear waste safety studies (Stuckless, et ai,
1991) and for groundwateT provenance studies (Verdoux et al., 1995; Banner et al, 1994). Noreferences to strontium isotope studies of groundwaters from the Bushveld could be found in the
literature.
The use of 3H as a recharge rate indicator is now limited, due to the decrease in 3H activities, resultingfrom radioactive decay, to below natural background levels after the ending of atmosphericthermonuclear weapons testing in the 1960's. Blavoux and Letolle (1995) predict that anthropogenic36CI, produced during thermonuclear tests in atolls of the Pacific between the years of 1952 and 1958,will supersede tritium as the tracer of choice. This will be due mainly to the large amounts of 35CIproduced in these tests and the longevity of its half life (»300 kyrs). Although the analysis of 36C1may have proved useful, no arrangements exist for its determination in South Africa at present.
1.4.1.1 Stable Isotopes of oxygen and hydrogen
The constituent elements of water, hydrogen and oxygen, each have several naturally occurring
isotopes. They are used in this report as indicators of processes which have acted on surface and
ground water. Analyses of 18O and 2H analyses are expressed in terms of an international standard
known as Standard Mean Ocean Water (SMOW), as a 5 value in parts per thousand. For instance,
for 18O:
n — R5lsO = """ple sta"dard xlOOO (eq. 1.1)
standard
where R is the ratio of atomic abundances of 18O to I6O. Most water molecules have a relative atomic
mass of 18, composed of'H2I6O. The isotopes 1SO and 2H have significant natural abundances (0.2%
and 0.015%, respectively; Verhagen et ai, 1991) and so molecules of W H ^ O and 'H218O also occur.
Since these molecules have differing vapour pressures, enrichment of the lighter isotope will occur
in the most volatile phase during evaporation, condensation or sublimation. This fractionation effect
depends strongly on temperature, which gives rise to seasonal, altitudinal and latitudinal variations
in !8O and 2H content of precipitation. For IEO, the effect has been estimated to be between
0.28%o/°C and O.7O%o/°C (Suzuki and Endo, 1995; Yurtsever and Gat, 1981; Heaton et al, 1986;
Broecker, 1995). Global 5!8O and 52H values are linearly related in continental precipitation, as
described by the equation
(eg. 1.2)
where s is the slope of the line (with a value of 8 for continental rain) and d is the deuterium excess,
defined as the measured 52H value minus 8*518O and calculated to be between lO%o and 5%o (Craig,
1961; Taylor, 1974). The line describing average isotopic content of continental precipitation is
known as the meteoric water line (MWL). Most meteoric water has negative 8 values, since water
vapour is enriched in the lighter isotopes upon evaporation from the ocean surface. Upon
1.13
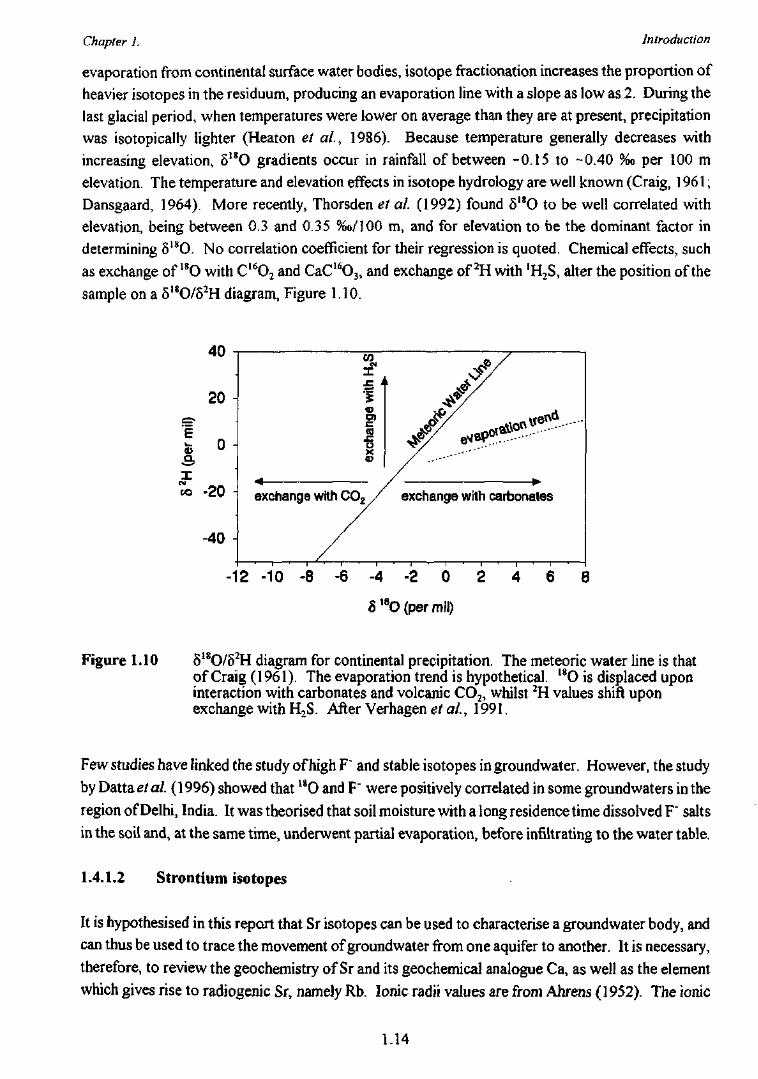
Chapter 1. Introduction
evaporation from continental surface water bodies, isotope fractionation increases the proportion ofheavier isotopes in the residuum, producing an evaporation line with a slope as low as 2. During thelast glacial period, when temperatures were lower on average than they are at present, precipitationwas isotopically lighter (Heaton et ai, 1986). Because temperature generally decreases withincreasing elevation, 51SO gradients occur in rainfall of between -0.15 to -0.40 %o per 100 melevation. The temperature and elevation effects in isotope hydrology are well known (Craig, 1961;Dansgaard, 1964). More recently, Thorsden et al (1992) found 5ISO to be well correlated withelevation, being between 0.3 and 0.35 %o/l 00 m, and for elevation to be the dominant factor indetermining 518O. No correlation coefficient for their regression is quoted. Chemical effects, suchas exchange of 18O with C16O2 and CaCI6O3, and exchange of 2H with 'H2S, alter the position of thesample on a 518O/52H diagram, Figure 1.10.
erm
i
a.xMCO
4U "
20 -
0 -
-20 -
-40 -
exchange
x"w
ith
with C O 2 /
/
//
exchange with
/
^-
carbonates
-12 -10 -8 -6 -4 -2 0
S18O(permi!)
8
Figure 1.10 518O/52H diagram for continental precipitation. The meteoric water line is thatof Craig (1961). The evaporation trend is hypothetical. l8O is displaced uponinteraction with carbonates and volcanic CO2, whilst 2H values shift uponexchange with H2S. After Verhagen et al., 1991.
Few studies have linked the study of high F~ and stable isotopes in groundwater. However, the study
by Dattae/a/. (1996) showed that 18O and F" were positively correlated in some groundwaters in the
region of Delhi, India. It was theorised that soil moisture with a long residence time dissolved F" salts
in the soil and, at the same time, underwent partial evaporation, before infiltrating to the water table,
1.4.1.2 Strontium isotopes
It is hypothesised in this report that Sr isotopes can be used to characterise a groundwater body, and
can thus be used to trace the movement of groundwater from one aquifer to another. It is necessary,
therefore, to review the geochemistry of Sr and its geochemical analogue Ca, as well as the element
which gives rise to radiogenic Sr, namely Rb. Ionic radii values are from Ahrens (1952). The ionic
1.14
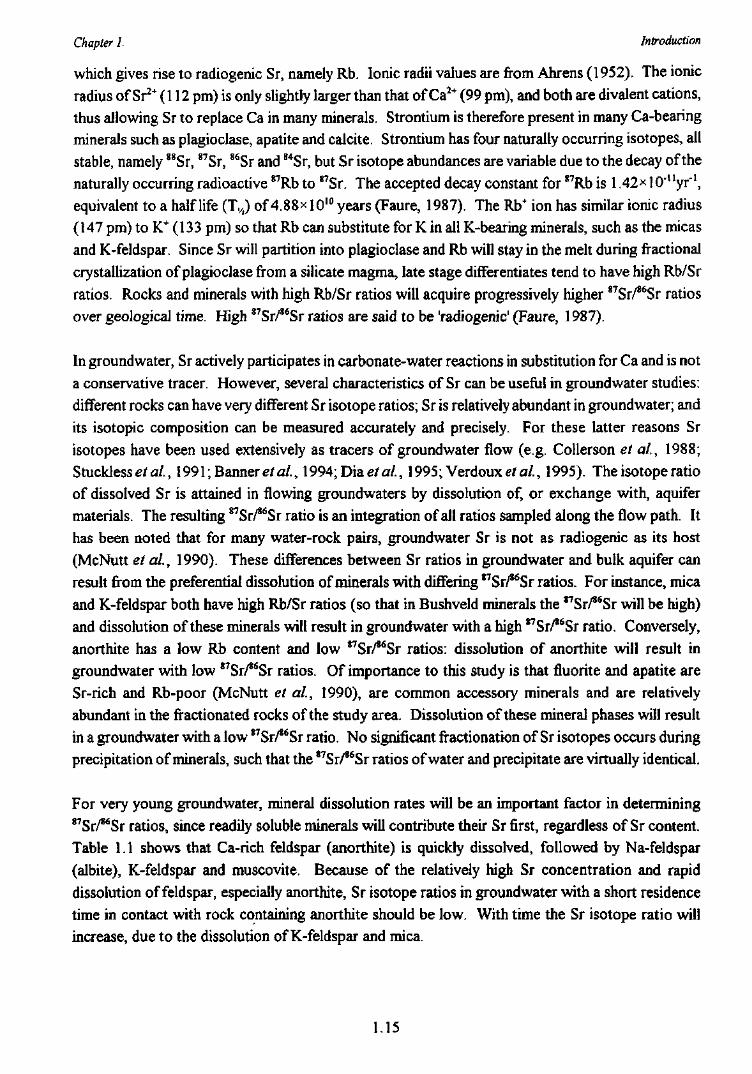
Chapter 1. Introduction
which gives rise to radiogenic Sr, namely Rb. Ionic radii values are from Ahrens (1952). The ionicradius of Sr2* (112 pm) is only slightly larger than that of Ca2+ (99 pm), and both are divalent cations,thus allowing Sr to replace Ca in many minerals. Strontium is therefore present in many Ca-bearingminerals such as plagioclase, apatite and calcite. Strontium has four naturally occurring isotopes, allstable, namely 88Sr, 87Sr, 86Sr and 84Sr, but Sr isotope abundances are variable due to the decay of thenaturally occurring radioactive 87Rb to 87Sr. The accepted decay constant for S7Rb is 1.42* 10'uyr~\equivalent to a half life (Tw) of 4.88* 1010 years (Faure, 1987). The Rb+ ion has similar ionic radius(147 pm) to K+ (133 pm) so that Rb can substitute for K in all K-bearing minerals, such as the micasand K-feldspar. Since Sr will partition into plagioclase and Rb will stay in the melt during fractionalcrystallization of plagioclase from a silicate magma, late stage differentiates tend to have high Rb/Srratios. Rocks and minerals with high Rb/Sr ratios will acquire progressively higher 87Sr/86Sr ratiosover geological time. High 87Sr/86Sr ratios are said to be 'radiogenic' (Faure, 1987).
In groundwater, Sr actively participates in carbonate-water reactions in substitution for Ca and is nota conservative tracer. However, several characteristics of Sr can be useful in groundwater studies:different rocks can have very different Sr isotope ratios; Sr is relatively abundant in groundwater; andits isotopic composition can be measured accurately and precisely. For these latter reasons Srisotopes have been used extensively as tracers of groundwater flow (e.g. Collerson et aL, 1988;Stucklesse/a/., 1991; Banneref aL, 1994; Dia et al., 1995; Verdoux <tf a/., 1995). The isotope ratioof dissolved Sr is attained in flowing groundwaters by dissolution of, or exchange with, aquifermaterials. The resulting 87Sr/86Sr ratio is an integration of all ratios sampled along the flow path. Ithas been noted that for many water-rock pairs, groundwater Sr is not as radiogenic as its host(McNutt et aL, 1990). These differences between Sr ratios in groundwater and bulk aquifer canresult from the preferential dissolution of minerals with differing "Sr/^Sr ratios. For instance, micaand K-feldspar both have high Rb/Sr ratios (so that in Bushveld minerals the 87Sr/*6Sr will be high)and dissolution of these minerals will result in groundwater with a high *7ST/*6ST ratio. Conversely,anorthite has a low Rb content and low 87Sr/*6Sr ratios: dissolution of anorthite will result ingroundwater with low 87Sr/*6Sr ratios. Of importance to this study is that fluorite and apatite areSr-rich and Rb-poor (McNutt et aL, 1990), are common accessory minerals and are relativelyabundant in the fractionated rocks of the study area. Dissolution of these mineral phases will resultin a groundwater with a low "Sr/^Sr ratio. No significant fractionation of Sr isotopes occurs duringprecipitation of minerals, such that the *7Sr/86Sr ratios of water and precipitate are virtually identical.
For very young groundwater, mineral dissolution rates will be an important factor in determining87Sr/86Sr ratios, since readily soluble minerals will contribute their Sr first, regardless of Sr content.Table 1.1 shows that Ca-rich feldspar (anorthite) is quickly dissolved, followed by Na-feldspar(albite), K-feldspar and muscovite. Because of the relatively high Sr concentration and rapiddissolution of feldspar, especially anorthite, Sr isotope ratios in groundwater with a short residencetime in contact with rock containing anorthite should be low. With time the Sr isotope ratio willincrease, due to the dissolution of K-feldspar and mica.
1.15
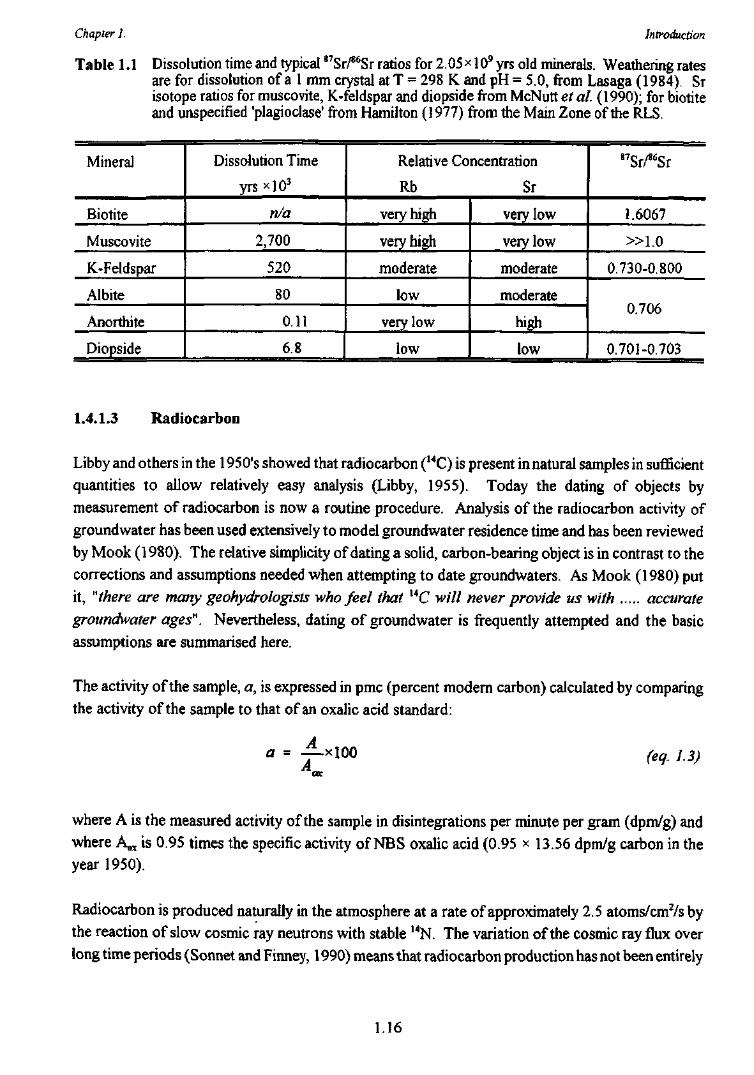
Chapter 1. Introduction
Table 1.1 Dissolution time and typical 87Sr/86Sr ratios for 2.05><109 yrs old minerals. Weathering ratesare for dissolution of a 1 mm crystal at T = 298 K and pH = 5.0, from Lasaga (1984). Srisotope ratios for muscovite, K-feldspar and diopside from McNutt et al. (1990); for biotiteand unspecified 'plagioclase1 from Hamilton (1977) from the Main Zone of the RLS.
Mineral
Biotite
Muscovite
K-Feldspar
Albite
Anorthite
Diopside
Dissolution Time
yrs xlO3
n/a
2,700
520
80
0.11
6.8
Relative Concentration
Rb Sr
very high
very high
moderate
low
very low
low
very low
very low
moderate
moderate
high
low
87Sr/*6Sr
1.6067
» 1 . 0
0.730-0.800
0.706
0.701-0.703
1.4.1.3 Radiocarbon
Libby and others in the 1950's showed that radiocarbon (14C) is present in natural samples in sufficient
quantities to allow relatively easy analysis (Libby, 1955). Today the dating of objects by
measurement of radiocarbon is now a routine procedure. Analysis of the radiocarbon activity of
groundwater has been used extensively to model groundwater residence time and has been reviewed
by Mook (1980). The relative simplicity of dating a solid, carbon-bearing object is in contrast to the
corrections and assumptions needed when attempting to date groundwaters. As Mook (1980) put
it, "there are many geohydrologists who feel that UC will never provide us with accurate
groundwater ages". Nevertheless, dating of groundwater is frequently attempted and the basicassumptions are summarised here.
The activity of the sample, a, is expressed in pmc (percent modern carbon) calculated by comparingthe activity of the sample to that of an oxalic acid standard:
a = —A
ox
(eq. 1.3)
where A is the measured activity of the sample in disintegrations per minute per gram (dpm/g) andwhere A^ is 0.95 times the specific activity of NBS oxalic acid (0.95 x 13.56 dpm/g carbon in theyear 1950).
Radiocarbon is produced naturally in the atmosphere at a rate of approximately 2.5 atoms/cm2/s bythe reaction of slow cosmic ray neutrons with stable 14N. The variation of the cosmic ray flux overlong time periods (Sonnet and Finney, 1990) means that radiocarbon production has not been entirely
1.16
Chapter I. Introduction
constant. For geohydrological studies, this variation is swamped by other uncertainties and can safely
be ignored.
Anthropogenic alteration of atmospheric radiocarbon activities has occurred. Firstly, combustion offossil fuels has reduced tropospheric 14C levels by about 10%. Secondly, since the 1960's,atmospheric thermonuclear weapons testing has radically increased the radiocarbon activity of theworld's atmosphere. Groundwater samples with greater than 100 pmc are now quite possible.
1.5 Workshop on Fluoride and Fluorosis
A one-and-a-half day workshop on the status of South African research on fluoride and fluorosis wasorganised by Mr L. McCaffrey as part of this project. The workshop was held on the 10-11* August,1995 at the Manyane Conference Centre, Pilanesberg National Park, North West Province. On thefirst day ten papers were presented on a very wide range of topics dealing with fluoride and fluorosis,and the meeting was attended by thirty-three delegates. On the 11th August a half-day field tripprovided delegates with an opportunity to visit sites of geochemical, geological and geohydrologicalinterest in the Pilanesberg National Park.
A copy of the programme, abstracts and a list of delegates is included in Appendix A12. Only two
of the authors (Mr B Mothusi and Dr JB du Plessis) submitted copies of their papers, and these are
also included in Appendix A12.
1.17
Chapter 2 Methodology
2 MATERIALS AND METHODS
This chapter describes the methods used in sampling, preparation and analysis of water, rock and soilsamples.
2.1 Groundwater
2.1.1 Sampling and field tests
Groundwater sampling took place during July and September 1993 and in October 1994. Samplelocations were selected primarily to give an even spread over the field area and secondly to fill inspatial gaps in the existing Department of Water Affairs of the former Bophuthatswana groundwaterdatabase. This effectively meant sampling took place in agricultural areas rather than villages.Because of the tribal system of government in the area, the Paramount Chief of each area had to beconsulted before moving into his territory. On two occasions a full tribal Kgotla was called, whichdelayed sampling for several days. A headman or tribal policeman was often assigned to help inlocating isolated boreholes and an interpreter was employed in the first field season to assist incommunication. A two-wheel-drive saloon car was used as transport.
2.1.1.1 Sampling protocol
A protocol for water sampling was formulated before entering the field and was adhered to as muchas possible. Details of the sampling protocol are given in Appendix A l l .
2.1.1.2 Field tests
Groundwater was analysed in the field for pH, Electrical Conductivity (EC) and Dissolved Oxygen(DO) using solid state probes and a voltmeter. A Corning 'general purpose combination electrode',a 'conductivity/TDS sensor' and 'DO sensor' probes connected to a Ciba-Corning 'Checkmate 90'portable millivoltmeter were used for pH, EC and DO measurement, respectively. Standards usedwere Ciba-Corning pH buffers at 4.00, 7.00 and 10.01; Corning 12.88 mS conductivity standard;and Ciba-Corning zero oxygen solution. Each day the pH probe was recalibrated using a 2 pointcalibration, the DO meter was calibrated whenever near fresh water, and the EC probe wasrecalibrated every morning. To measure pH, EC and DO, a 50 ml beaker was rinsed with deionisedwater, rinsed with groundwater in order to reduce cross-contamination, then filled with 50 ml ofgroundwater. Groundwater was prepared for temperature measurement by filling a 50 ml glassbeaker full of fresh, unfiltered ground water, allowing the glass of the beaker and thermometer toequilibrate to the water temperature, then refilling with fresh groundwater and quickly measuringtemperature, all out of direct sunlight. To measure total alkalinity, two drops of screened methylorange indicator were added to 50 ml of groundwater in a conical flask. The mixture was thentitrated to the green/purple colour change using an automatic levelling pipette filled with 0.1 Mhydrochloric acid. Fluoride was measured each evening at the field base (see sections 2.1.2.2 and2.1.3.1).
2.1
Chapter 2 Methodology
2.1.2 Sample preparation
2.1.2.1 High Pressure Ion Chromatography (HPIC)
Samples with a high EC, as determined from field measurements, were diluted so that their EC wasreduced to less than 200mS/m. This was done to prevent overloading of the analytical column andconductivity detector. Highly coloured samples were passed through a Dionex 'Onguard P' filterto remove organic acids which might degrade the column.
2.1.2.2 Fluoride ion selective electrode
A Total Ionic Strength Adjustment Buffer (TISAB) was used to bring all samples to approximatelythe same ionic strength and pH (Frant and Ross, 1968; Harwood, 1969; Campbell, 1987). TheTISAB used in the field contained 1 mg/S CDTA (l,2,Cyclohexylene Dinitrilo Tetraacetic Acid orl,2,Cyclohexane Diamine N,N,N,N-Tetraacetic Acid, known commercially as Titriplex IV) as achelating agent to break up aluminium fluoride complexes (Harwood, 1969). In later experimentsCDTA was omitted from the TISAB in order to gauge its effect (discussed in a later section). Theother components of the TISAB were 58.5 g/fi NaCl, 15 g/fi glacial acetic acid and 66g/C sodiumacetate.
2.1.2.3 Iodide
A 5 mi sample of the acidified water sample was put into sample-rinsed plastic 5 ml phials and sentto the South African Institute for Medical Research (SAIMR) for analysis.
2.1.2.4 Stable isotopes
Preparation took place in the stable isotope laboratory at UCT, supervised by Dr. Chris Harris. Thepreparation technique used for 0 was that of Socki et al. (1992). Approximately 1.5 ml of samplewas frozen into a pre-evacuated glass phial and then evacuated. The phial was then filled with 0.5atmospheres of CO2 and put into a water bath at 25 °C for 4 hours to allow equilibration between Oin the CO2 and H2O. The CO2 was then sub-sampled into a break-seal glass tube. Hydrogen wasobtained by reduction of 1 |il of water sample by Zn at 450°C for 30 minutes, and the resulting H2
sealed in a break-seal glass tube.
2.1.2.5 Radiocarbon
Preparation took place in the Schonland Nuclear Research Centre at Wits University, under thesupervision of Professor Bait Verhagen. The precipitate had to be converted to ethane, which iseasily ionised in the detectors. The BaCO3 in the precipitate was first converted to CO2 usingorthophosphoric acid. The gas was then converted to acetylene using lithium at 600°C. Acetylenewas catalysed to ethane by palladium metal and stored in large glass bulbs for analysis.
2.1.2.6 Strontium isotopes
All preparation took place in the clean laboratory in the radiogenic isotope facility at UCT, and wasperformed by Mr. Justin Underwood. The cations in the samples were converted to chloride saltsby repeated drying and dilution with 5 ml of 6.2N HC1. The dry residue was dissolved in 0.7 ml of2.5N HC1 and centrifuged to remove insoluble matter. Sr was separated from other cations by ion
2.2
Chapter 2 Methodology
chromatography. The separation of Sr from other cations had been calibrated using chloride salts.The resulting Sr chloride solution was converted to a nitrate solution by repeated drying and additionof 7M nitric acid. The solution was finally diluted with 0.5N phosphoric acid and 2% nitric acid andevaporated onto a tantalum filament.
2.1.3 Analysis
2.1.3.1 Fluoride ion selective electrode
Groundwater F concentration was measured every evening at the base camp, where a rudimentarylaboratory was established. A Corning fluoride ion selective electrode (FISE) was used (Frant andRoss, 1966), connected to a Corning 'Ion Analyser 2551 digital millivoltmeter. Fluoride wasremeasured at UCT using TISAB with and without CDTA.
2.1.3.2 Major ions
High pressure ion chromatography (HPIC) was used to determine the concentration of major ionsin groundwater. Tables 2.1 and 2.2 show the experimental conditions used for anions and cations,respectively. A Dionex DX300 ion chromatography system controlled by AI-450 software was used.The analytical column used for the majority of anion analyses was an AS4A separator column withAG4A guard column, supplemented on occasion by an AS 11 separator column, and recently replacedby an AS4AC column.
2.1.3.3 Iodide
Analysis for iodide was conducted by the South African Institute for Medical Research using aWaters High Pressure Liquid Chromatograph, with a Ag electrode as a detector. Standard stocksolution was lOOOppm I", prepared by dissolving 0.118 ± 0.001 g Nal in 100 ml Milli-Q water.
2.1.3.4 Stable isotopes
Stable isotopes were measured on a VG 602E gas-source mass spectrometer. The external standardsused were provided by Dr T. Venneman of the University of Michigan, and were deionised waterand snow from Michigan.
2.1.3.5 Radiocarbon
A gas-proportional counter was used to analyse for radiocarbon. Measurement of each sample tookplace on three occasions separated by approximately a week, to differentiate between disintegrationsdue to radiocarbon and those due to radon, which have the same energies. Since radon has a muchshorter half life than radiocarbon, the radon content is that part of the scintillation count whichmeasurably reduces over a month or two and can therefore be corrected for. Standards wereradiocarbon-free groundwater from dolomites in the Pretoria area.
2.3
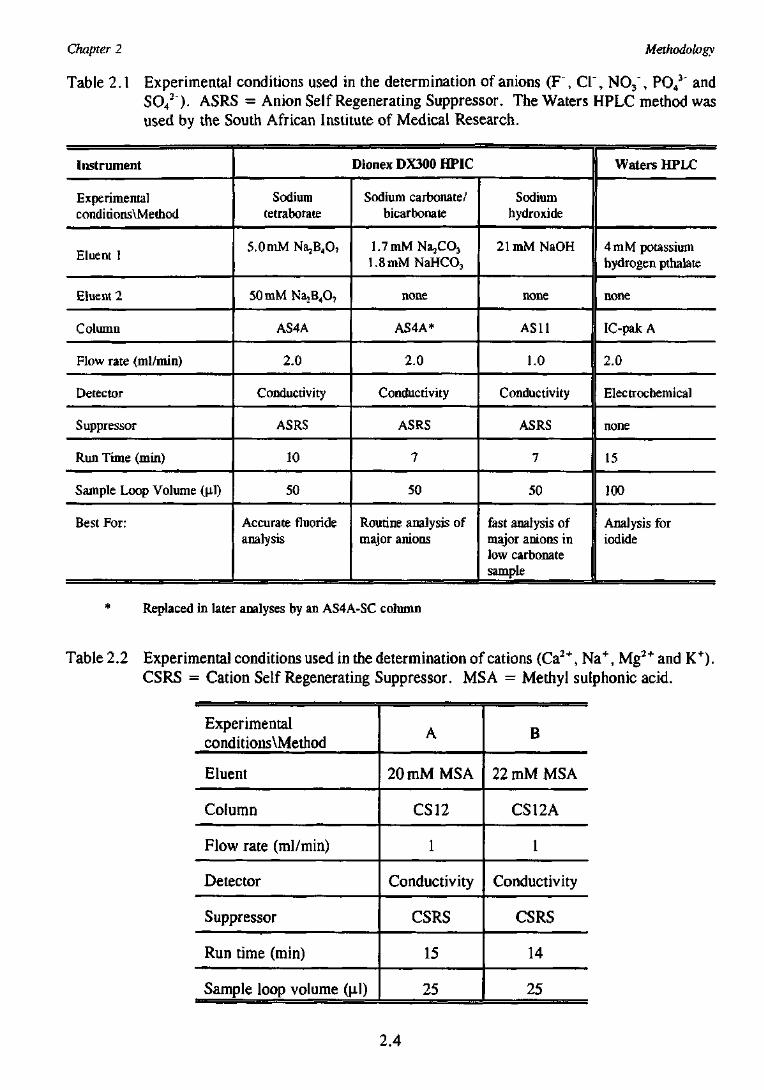
Chapter 2 Methodology
Table 2.1 Experimental conditions used in the determination of anions ( F \ Cl", NO3", PO43" and
SO42 ). ASRS = Anion Self Regenerating Suppressor. The Waters HPLC method was
used by the South African Institute of Medical Research.
Instrument
Experimentalconditions\Method
Eluent 1
Eluent 2
Column
Flow rate (ml/min)
Detector
Suppressor
Run Time (min)
Sample Loop Volume (\i\)
Best For:
Dionex DX300 HPIC
Sodiumtetraborate
5.0mM Na,B4OT
50 mM N a ^ O ,
AS4A
2.0
Conductivity
ASRS
10
50
Accurate fluorideanalysis
Sodium carbonate/bicarbonate
l.TmMNajCOj1.8mMNaHCO3
none
AS4A*
2.0
Conductivity
ASRS
7
50
Routine analysis ofmajor anions
Sodiumhydroxide
21mMNaOH
none
ASH
1.0
Conductivity
ASRS
7
50
fast analysis ofmajor anions inlow carbonatesample
Waters HPLC
4mM potassiumhydrogen pthalate
none
IC-pak A
2.0
Electrochemical
none
15
100
Analysis foriodide
* Replaced in later analyses by an AS4A-SC column
Table 2.2 Experimental conditions used in the determination of cations (Ca2+, Na+, Mg2+ and K+).CSRS = Cation Self Regenerating Suppressor. MSA = Methyl sulphonic acid.
Experimentalconditions\Method
Eluent
Column
Flow rate (ml/min)
Detector
Suppressor
Run time (min)
Sample loop volume (M-1)
A
20mMMSA
CS12
1
Conductivity
CSRS
15
25
B
22 mM MSA
CS12A
1
Conductivity
CSRS
14
25
2.4
Chapter 2 Methodology
2.1.3.6 Strontium isotopes
The isotopes of strontium were analysed using a VG Sector solid-source mass spectrometer, run indynamic multi-collector mode. The measured "Sr/^Sr values were normalised to8SSr/86Sr = 0.1194, to correct for mass firactionation.
2.2 Rock and soil
2.2.1 Sampling
Rock and soil sampling took place during June 1994. The objective was to collect at least threesamples of each major rock type and associated soil in the area, to provide an indication of thevariability of the lithology and geochemistry of each rock and soil type.
Rock and soil samples were taken in pairs, with the samples usually located not more than 10 m fromeach other. Whenever possible, samples from road-cut profiles were taken, so that soil directlyoverlying fresh rock could be taken. More often the soil sample was taken in the vicinity of a freshoutcrop of rock. At least 1 kg of rock sample was taken, and this was increased up to 5 kg when therock became coarse grained. A 5 kg sledgehammer and 'Estwing' geological hammer were used inthe field. The rocks were broken into pieces with long axes not greater than 20 cm and with allweathered surfaces trimmed off by hammer. Soils were sampled from the top 20 cm either by spadeor hand-held auger. No attempt was made to sample vertically. The rationale for taking a samplefrom the surface was that it would be the most easily accessible and the driest part of the soil. Thedisadvantage of taking a topsoil sample was that it is the part of the soil subject to the most transportand input of anthropogenic, aeolian and fluvial material (Schloemann, 1995). Forty two rocksamples and 40 soil samples were obtained by this method. Difficulties were encountered insampling Karoo rocks, since they produce a flat relief with few rock outcrops. Only two samplesfrom the Karoo Sequence were collected. Sample site details are shown in Appendix A2.
2.2.2 Sample preparation
2.2.2.1 Drying
The samples were taken in the middle of the Transvaal winter (the dry season), in the heat of the day,and were therefore thoroughly dry; no artificial drying took place before crushing. Indeed, to 'airdry' samples from so far inland at a coastal site may very well have caused gross contamination fromairborne salt particles. Contamination in this manner was guarded against for the duration of theanalyses.
2.2.2.2 Crushing and milling
Rock samples were first split into sub 2 cm chips using a hydraulic splitter, then crushed to sub 5 mmchips in a jaw crusher (Mn steel ribbed plates). Soil samples were generally fine grained and whenpebbles were present, they were broken into sub 5 mm pieces using a geological hammer. Both rockand soil samples were then milled for 3 minutes at high speed in either a carbon steel or Ni-Cr alloySiebtechnik swing mill. This reduced all grains to less than 50 u,m diameter. Problems wereexperienced with the milling of soil from sites 7 and 9, both of which are examples of 'black turf.
2.5
Chapter 2 Methodology
The plastic nature of these soils caused the mill to smear the material onto the side wall, rather thanto disaggregate it. The samples were therefore disaggregated manually with a geological hammer.
2.2.2.3 XRFS briquettes
For trace element analysis using X-ray fluorescence spectrometry, 6g of the powdered sample werepressed into a 30 mm diameter boric-acid backed briquette using a hydraulic press and 7-10 tonspressure on the ram. For sandy samples, which tended to disintegrate under vacuum, one drop ofa Mowiol solution (2% Hoechst Mowiol N 70-80 in distilled water) per gram of sample powder wasadded as a binder. The Mowiol solution was mixed thoroughly with the sample powder in an agatemortar and pestle before pressing. Before XRFS analysis all briquettes were placed under vacuumin a vacuum desiccator for at least an hour to both degas them and to induce failure in the desiccatorrather than inside the spectrometer. The soil briquettes were observed to be generally more waterabsorbent than the rock briquettes, as shown by the longer times taken for the vacuum in thespectrometer to reach the specified level.
2.2.2.4 XRFfusion disks
Fusion disks were prepared according to the method of Norrish and Hutton (1969). Approximatelytwo grams of the sample powder were weighed out accurately to 5 decimal places into a cleanweighed platinum crucible. To determine loss of adsorbed water (H2O~), the sample was dried at110°C for at least 4 hours, cooled, and the mass was measured again. To determine the combinedwater, CO2 and organic material lost on ignition (LOI), the crucible was then placed into a furnaceat 850°C overnight, cooled and the mass recorded. Other preparation schemes undertake the latterstep at 95O°C or 1000°C, but because several samples were syenitic with large amounts of fluorineand such samples melt at temperatures > 950°C, it was decided to roast all samples at temperaturesbelow the melting point of these rocks.
Duplicate fusion disks were made by mixing 0.28 ± 0.002 g of sample with 1.5 g (± 0.02 g) JohnsonMatthey Spectroflux 105 and 0.02 g NaNO3 (as oxidant). The mixture was fused for approximately10 minutes and thoroughly mixed in a platinum crucible before being poured onto a heated graphitemould and compressed with an aluminium plunger. Only sample RO19 required an extra long periodof fusion.
2.2.2.5 XRD
An excess of the -50 //m powdered sample was loaded onto an indented aluminium holder andpressed into place with a spatula. The excess was removed using the edge of the spatula, so that thepowder surface was level with that of the holder.
2.2.2.6 Electron microprobe
The rock was cut into thin sections, polished, then washed in soapy water, deionised water andacetone and air dried. Minerals of interest were identified using a petrographic microscope and werecircled with a technical drawing pen. A sketch of each section was made, identifying minerallocations. The section was then coated with carbon in an electric arc coater and mounted in aconducting frame for analysis.
2.6
Chapter 2 Methodology
2.2.2.7 Stable isotopes
Carbon and oxygen isotope ratio analyses of the bulk carbonate were made using the method ofMcCrea (1950). Powdered samples were reacted with orthophosphoric acid at 50°C overnight anda value of a^ .^ , , , of 1.009 was assumed (Al-Aasm et al., 1990). The oW-strontiamie would beexpected to be similar to Ucoi-aicut. given the geochemical similarity of the two minerals and thecloseness of the a vs. temperature curves for the two minerals equilibrium with water (Figure 13,Friedman and O'Neil, 1977). An internal standard (Namaqualand Marble) was used to normalisethe data to the V-SMOW and V-PDB scales (Coplen, 1995).
2.2.3 Analysis
2.2.3.1 X-Ray Fluorescence Spectrometry (XRFS)
Major and trace element concentrations were measured using a Siemens SRS3O3AS XRFspectrometer. Standard instrumental conditions (Willis, 1995, listed in Appendix A3) and in-houseand certified reference materials were used for calibration. A special calibration fusion diskcontaining 6 % SrO was prepared using SrCO3, NIM-G and the method outline above, for the analysisof the high Sr samples.
2.2.3.2 X-Ray Diffraction (XRD)
Mineral phases were qualitatively determined using a Philips PW1130/90 X-ray diffractometer usingCuKa radiation, a LiF(200) monochromator, a Nal scintillation counter, pulse height selection, andgenerator settings at 25 kV and 40 mA. The JCPDS PDF-2 computer database was used to identifymineral phases based on d-values and relative peak intensities.
2.2.3.3 Carbon dioxide (CO2)
The equivalent CO2 contents of several samples were determined using the "Karbonat-bombe"method of Birch (1981). Concentrated hydrochloric acid was added to a powdered rock sample inan airtight perspex pressure vessel, liberating CO2 from the carbonate minerals. The resultant CO2
pressure, measured within 1 minute of the addition of acid, is proportional to the CaCO3 and SrCO3
content of the sample. Dolomite [(CaMg)CO3], if present, reacts more slowly and so does notcontribute significantly to the initial pressure increase.
2.2.3.4 Gas-source Mass Spectrometer
Two different mass spectrometers were used: a VG602E gas source mass spectrometer with dualinlet and double collectors; and a Finnigan MAT252 multi-collector instrument.
2.2.3.5 Solid-Source Mass Spectrometer
The instrumentation used was a VG Sector 7-collector thermal-ionisation mass spectrometer, at theRadiogenic Isotope Facility at UCT, operated by Dr Steve Richardson and Justin Underwood. 200ratios were measured per bead (i.e. per sample) and approximately 170 ratios were accepted forcalculating the final Sr isotope ratios.
2.7
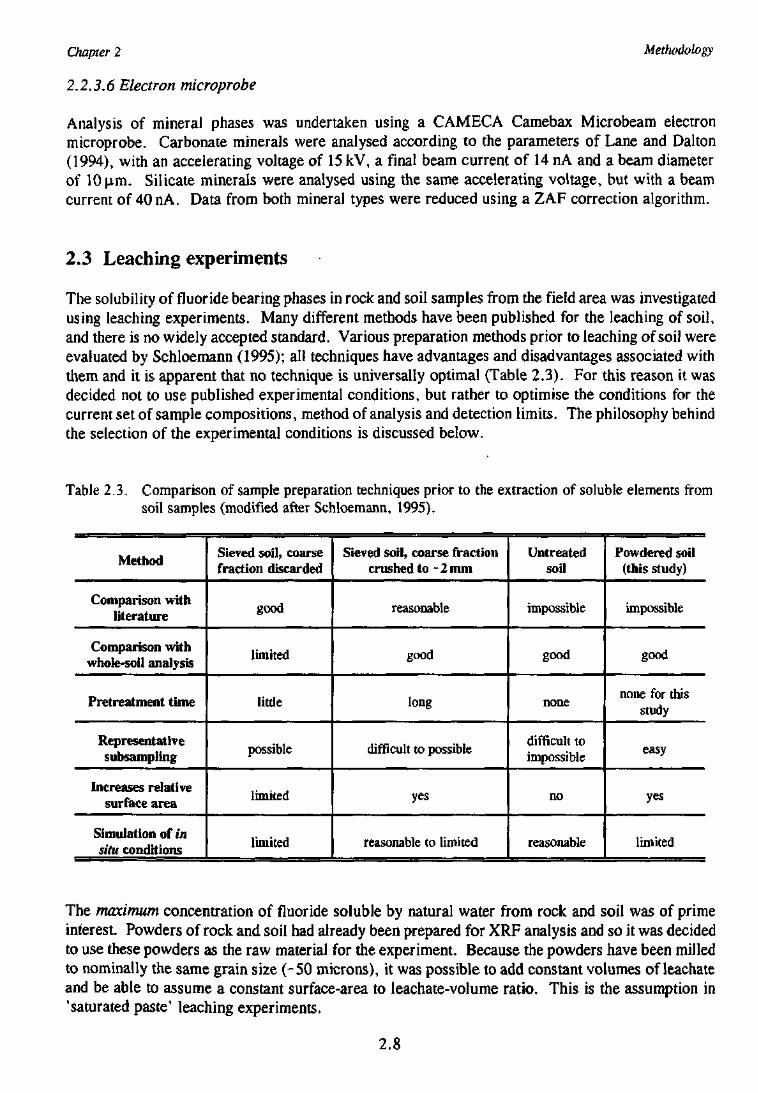
Chapter 2
2.2.3.6 Electron microprobe
Methodology
Analysis of mineral phases was undertaken using a CAMECA Camebax Microbeam electronmicroprobe. Carbonate minerals were analysed according to the parameters of Lane and Dalton(1994), with an accelerating voltage of 15 kV, a final beam current of 14 nA and a beam diameterof 10 |im. Silicate minerals were analysed using the same accelerating voltage, but with a beamcurrent of 40 nA. Data from both mineral types were reduced using a ZAF correction algorithm.
2.3 Leaching experiments
The solubility of fluoride bearing phases in rock and soil samples from the field area was investigatedusing leaching experiments. Many different methods have been published for the leaching of soil,and there is no widely accepted standard. Various preparation methods prior to leaching of soil wereevaluated by Schloemann (1995); all techniques have advantages and disadvantages associated withthem and it is apparent that no technique is universally optimal (Table 2.3). For this reason it wasdecided not to use published experimental conditions, but rather to optimise the conditions for thecurrent set of sample compositions, method of analysis and detection limits. The philosophy behindthe selection of the experimental conditions is discussed below.
Table 2.3, Comparison of sample preparation techniques prior to the extraction of soluble elements fromsoil samples (modified after Schloemann, 1995).
Method
Comparison withliterature
Comparison withwhole-soil analysis
Pretreatment time
Representativesubsampling
Increases relativesurface area
Simulation of insitu conditions
Sieved soil, coarsefraction discarded
good
limited
little
possible
limited
limited
Sieved soil, coarse fractioncrushed to - 2 mm
reasonable
good
long
difficult to possible
yes
reasonable to limited
Untreatedsoil
impossible
good
none
difficult toimpossible
no
reasonable
Powdered soil(this study)
impossible
good
none for thisstudy
easy
yes
limited
The maximum concentration of fluoride soluble by natural water from rock and soil was of primeinterest. Powders of rock and soil had already been prepared for XRF analysis and so it was decidedto use these powders as the raw material for the experiment. Because the powders have been milledto nominally the same grain size (-50 microns), it was possible to add constant volumes of leachateand be able to assume a constant surface-area to leachate-volume ratio. This is the assumption in'saturated paste' leaching experiments.
2.8
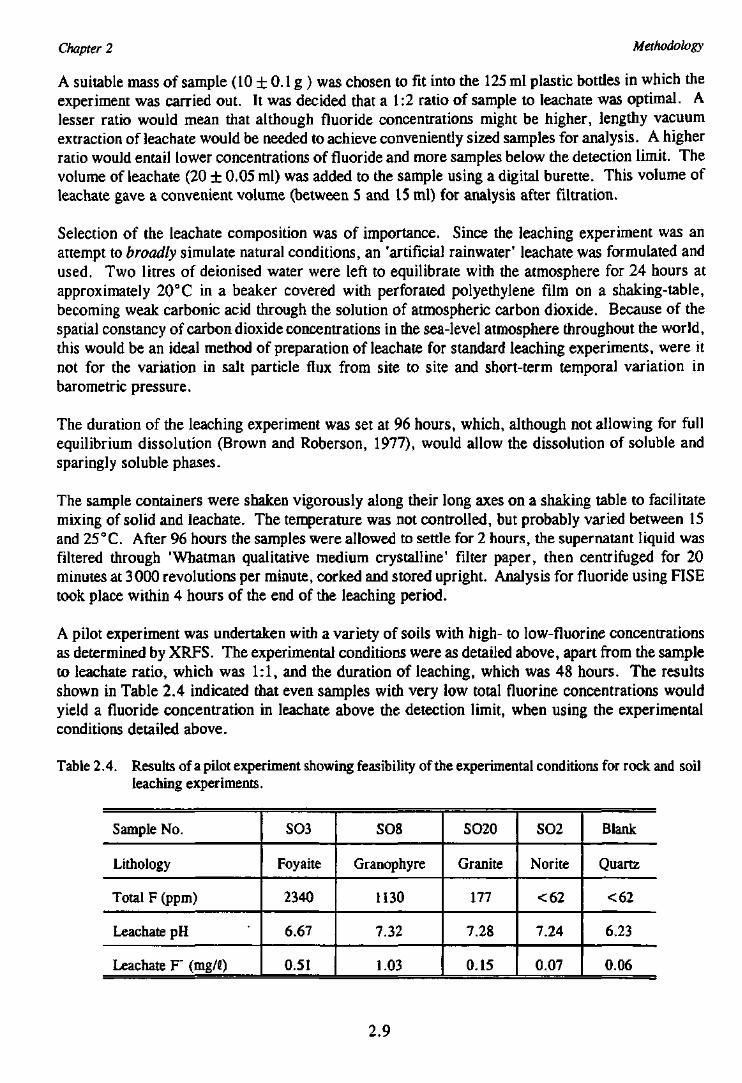
Chapter 2 Methodology
A suitable mass of sample (10 ± 0.1 g ) was chosen to fit into the 125 ml plastic bottles in which theexperiment was carried out. It was decided that a 1:2 ratio of sample to leachate was optimal. Alesser ratio would mean that although fluoride concentrations might be higher, lengthy vacuumextraction of leachate would be needed to achieve conveniently sized samples for analysis. A higherratio would entail lower concentrations of fluoride and more samples below the detection limit. Thevolume of leachate (20 ± 0.05 ml) was added to the sample using a digital burette. This volume ofleachate gave a convenient volume (between 5 and 15 ml) for analysis after filtration.
Selection of the leachate composition was of importance. Since the leaching experiment was anattempt to broadly simulate natural conditions, an 'artificial rainwater' leachate was formulated andused. Two litres of deionised water were left to equilibrate with the atmosphere for 24 hours atapproximately 20°C in a beaker covered with perforated polyethylene film on a shaking-table,becoming weak carbonic acid through the solution of atmospheric carbon dioxide. Because of thespatial constancy of carbon dioxide concentrations in the sea-level atmosphere throughout the world,this would be an ideal method of preparation of leachate for standard leaching experiments, were itnot for the variation in salt particle flux from site to site and short-term temporal variation inbarometric pressure.
The duration of the leaching experiment was set at 96 hours, which, although not allowing for fullequilibrium dissolution (Brown and Roberson, 1977), would allow the dissolution of soluble andsparingly soluble phases.
The sample containers were shaken vigorously along their long axes on a shaking table to facilitatemixing of solid and leachate. The temperature was not controlled, but probably varied between 15and 25°C. After 96 hours the samples were allowed to settle for 2 hours, the supernatant liquid wasfiltered through 'Whatman qualitative medium crystalline1 filter paper, then centrifuged for 20minutes at 3000 revolutions per minute, corked and stored upright. Analysis for fluoride using FISEtook place within 4 hours of the end of the leaching period.
A pilot experiment was undertaken with a variety of soils with high- to low-fluorine concentrationsas determined by XRFS. The experimental conditions were as detailed above, apart from the sampleto leachate ratio, which was 1:1, and the duration of leaching, which was 48 hours. The resultsshown in Table 2.4 indicated that even samples with very low total fluorine concentrations wouldyield a fluoride concentration in leachate above the detection limit, when using the experimentalconditions detailed above.
Table 2.4. Results of a pilot experiment showing feasibility of the experimental conditions for rock and soilleaching experiments.
Sample No.
Lithology
Total F (ppm)
Leachate pH
Leachate V (mg/G)
SO3
Foyaite
2340
6.67
0.51
SO8
Granophyre
1130
7.32
1.03
SO20
Granite
177
7.28
0.15
SO2
Norite
<62
7.24
0.07
Blank
Quartz
<62
6.23
0.06
2.9
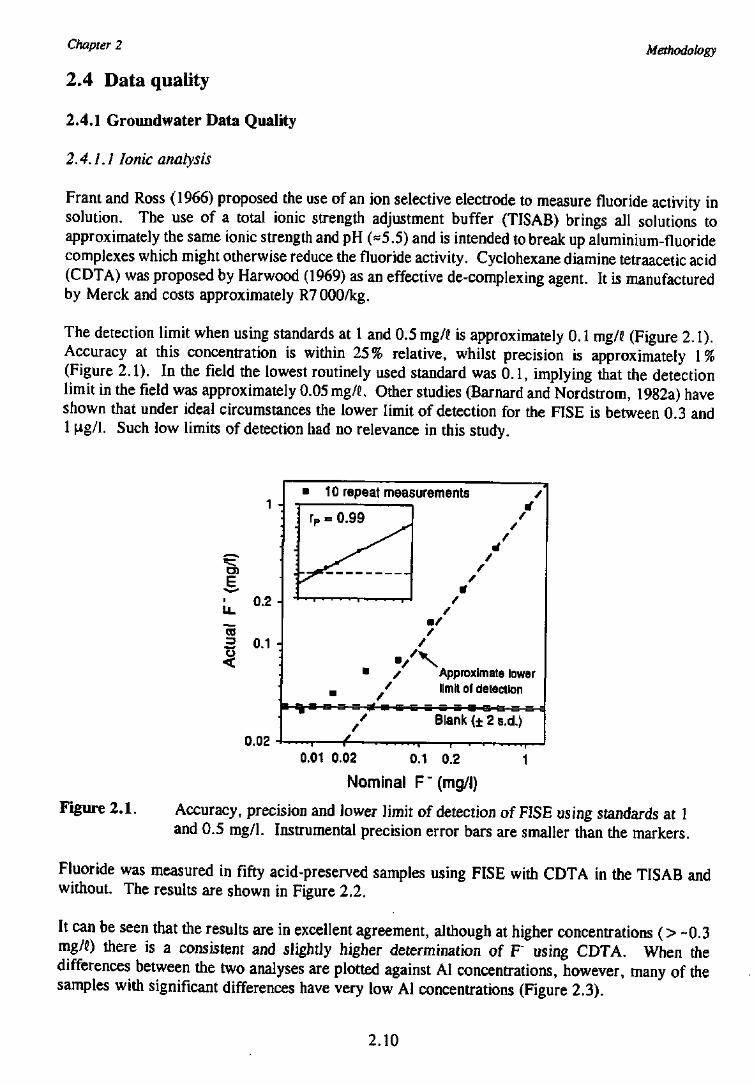
Chapter 2 Methodology
2.4 Data quality
2.4.1 Groundwater Data Quality
2.4.1,1 Ionic analysis
Frant and Ross (1966) proposed the use of an ion selective electrode to measure fluoride activity insolution. The use of a total ionic strength adjustment buffer (TISAB) brings all solutions toapproximately the same ionic strength and pH («5.5) and is intended to break up aluminium-fluoridecomplexes which might otherwise reduce the fluoride activity. Cyclohexane diamine tetraacetic acid(CDTA) was proposed by Harwood (1969) as an effective de-complexing agent. It is manufacturedby Merck and costs approximately R7000/kg.
The detection limit when using standards at 1 and 0.5 mg/J is approximately 0.1 mg/0 (Figure 2.1).Accuracy at this concentration is within 25% relative, whilst precision is approximately 1%(Figure 2.1). In the field the lowest routinely used standard was 0.1, implying that the detectionlimit in the field was approximately 0.05 mg/C, Other studies (Barnard and Nordstrom, 1982a) haveshown that under ideal circumstances the lower limit of detection for the FISE is between 0.3 and1 M-g/1- Such low limits of detection had no relevance in this study.
1 A
0.2 A
CO
0.02
10 repeat measurements
0.99
• /
Approximate lowerlimit of detection
s an n GJBlank {± 2 s.d.)
A
Figure 2 .1.
0.01 0.02 0,1 0.2 1
Nominal F"(mg/I)
Accuracy, precision and lower limit of detection of FISE using standards at 1and 0.5 mg/1. Instrumental precision error bars are smaller than the markers.
Fluoride was measured in fifty acid-preserved samples using FISE with CDTA in the TISAB andwithout. The results are shown in Figure 2.2.
It can be seen that the results are in excellent agreement, although at higher concentrations (> -0.3mg/C) there is a consistent and slightly higher determination of F" using CDTA. When thedifferences between the two analyses are plotted against Al concentrations, however, many of thesamples with significant differences have very low Al concentrations (Figure 2.3).
2.10
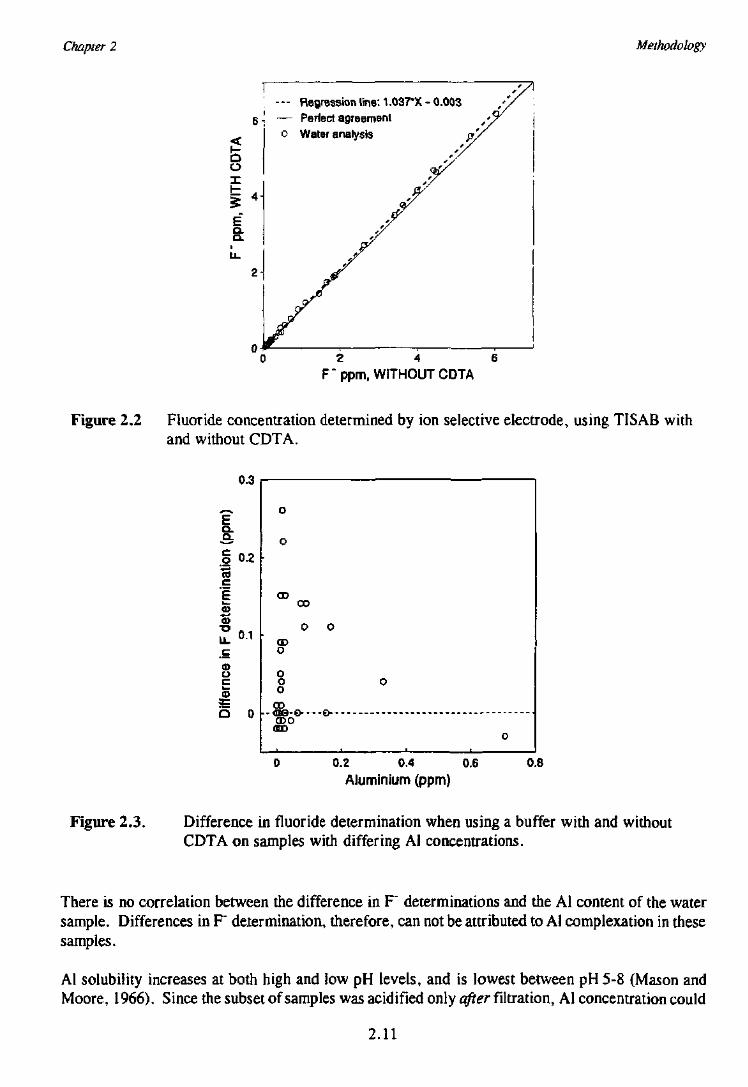
Chapter 2 Methodology
T- - - Regression line: 1.037*X - 0.003
6 •! — Perfect agreemento Water analysis
ao
2 4F"ppm, WITHOUT CDTA
Figure 2.2 Fluoride concentration determined by ion selective electrode, using TISAB withand without CDTA.
CLa.
o 0.2m
E<o(0
^ 01ca>uck .
3=
b o
o
o
cu00
0 O
CDo
ooo
CD
WO
0
0
0.2 0.4 0.6
Aluminium (ppm)0.8
Figure 2.3. Difference in fluoride determination when using a buffer with and withoutCDTA on samples with differing Al concentrations.
There is no correlation between the difference in F" determinations and the Al content of the watersample. Differences in F" determination, therefore, can not be attributed to Al complexation in thesesamples.
Al solubility increases at both high and low pH levels, and is lowest between pH 5-8 (Mason andMoore, 1966). Since the subset of samples was acidified only after filtration, Al concentration could
2.11
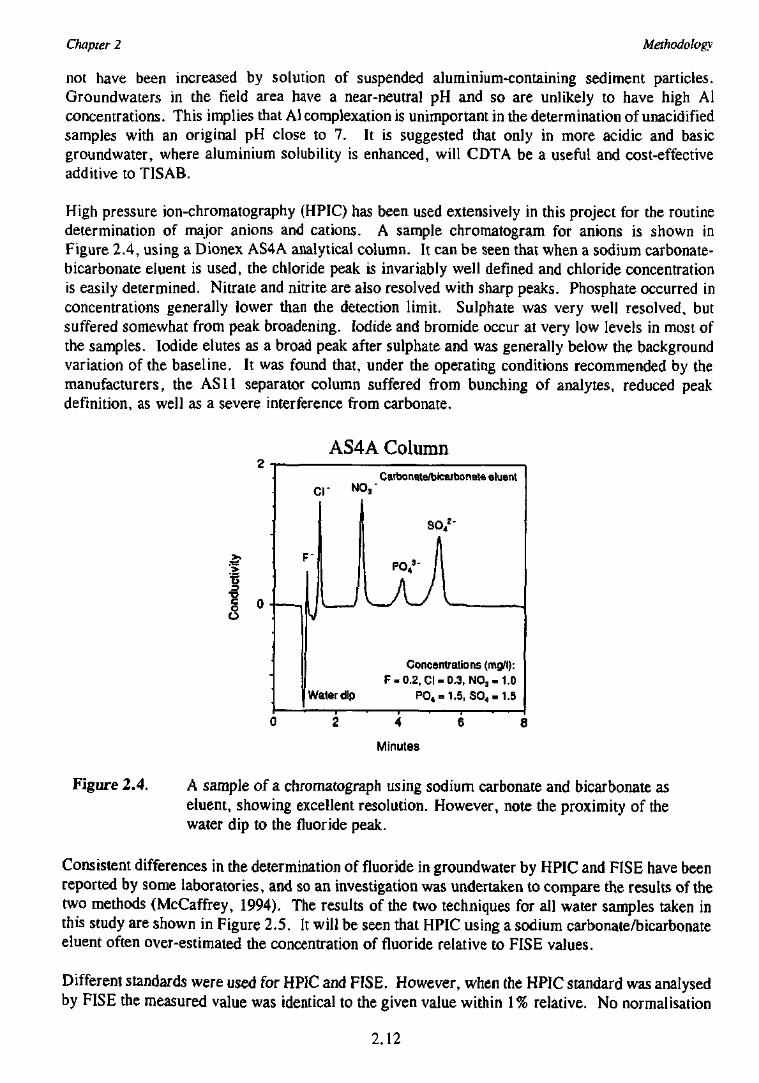
Chapter 2 Methodology
not have been increased by solution of suspended aluminium-containing sediment particles.Groundwaters in the field area have a near-neutral pH and so are unlikely to have high Alconcentrations. This implies that Al complexation is unimportant in the determination of unacidifiedsamples with an original pH close to 7. It is suggested that only in more acidic and basicgroundwater, where aluminium solubility is enhanced, will CDTA be a useful and cost-effectiveadditive to TISAB.
High pressure ion-chromatography (HPIC) has been used extensively in this project for the routinedetermination of major anions and cations. A sample chromatogram for anions is shown inFigure 2.4, using a Dionex AS4A analytical column. It can be seen that when a sodium carbonate-bicarbonate eluent is used, the chloride peak is invariably well defined and chloride concentrationis easily determined. Nitrate and nitrite are also resolved with sharp peaks. Phosphate occurred inconcentrations generally lower than the detection limit. Sulphate was very well resolved, butsuffered somewhat from peak broadening. Iodide and bromide occur at very low levels in most ofthe samples. Iodide elutes as a broad peak after sulphate and was generally below the backgroundvariation of the baseline. It was found that, under the operating conditions recommended by themanufacturers, the ASII separator column suffered from bunching of analytes, reduced peakdefinition, as well as a severe interference from carbonate.
AS4A Column
.f1T5
CI-
Water dip
Carbonate/bicarbonate eluent
Concentrations (mg/l):F-0.2, CI - 0.3, NO,-1.0
P04o1.5,SO,-1.5
2 4
Minutes
6
Figure 2.4. A sample of a chromatograph using sodium carbonate and bicarbonate aseluent, showing excellent resolution. However, note the proximity of thewater dip to the fluoride peak.
Consistent differences in the determination of fluoride in groundwater by HPIC and FISE have beenreported by some laboratories, and so an investigation was undertaken to compare the results of thetwo methods (McCaffrey, 1994). The results of the two techniques for all water samples taken inthis study are shown in Figure 2.5. It will be seen that HPIC using a sodium carbonate/bicarbonateeluent often over-estimated the concentration of fluoride relative to FISE values.
Different standards were used for HPIC and FISE. However, when the HPIC standard was analysedby FISE the measured value was identical to the given value within 1 % relative. No normalisation
2.12
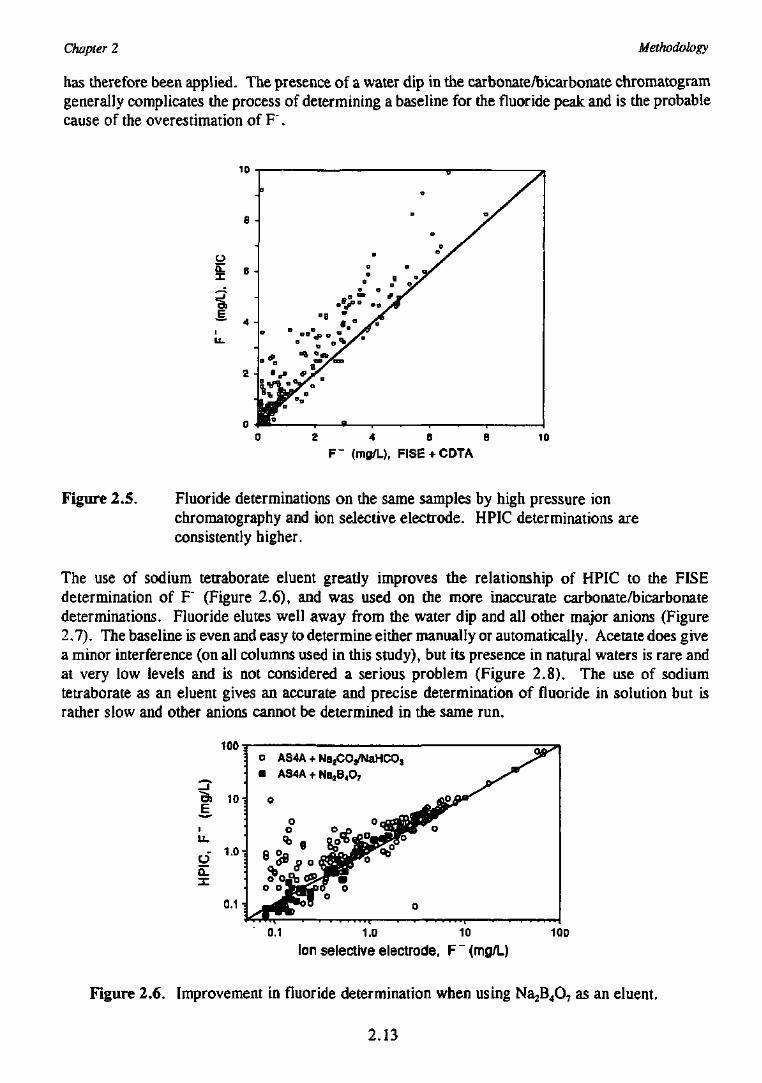
Chapter 2 Methodology
has therefore been applied. The presence of a water dip in the carbonatetoicarbonate chromatogramgenerally complicates the process of determining a baseline for the fluoride peak and is the probablecause of the overestimation of F \
10
e -
tJ
A -
2 4 B 8
F" (mg/L)F FISE + CDTA10
Figure 2.5. Fluoride determinations on the same samples by high pressure ionchromatography and ion selective electrode. HPIC determinations areconsistently higher.
The use of sodium tetraborate eluent greatly improves the relationship of HPIC to the FISEdetermination of F (Figure 2.6), and was used on the more inaccurate carbonate/bicarbonatedeterminations. Fluoride elutes well away from the water dip and all other major anions (Figure2.7). The baseline is even and easy to determine either manually or automatically. Acetate does givea minor interference (on all columns used in this study), but its presence in natural waters is rare andat very low levels and is not considered a serious problem (Figure 2.8). The use of sodiumtetraborate as an eluent gives an accurate and precise determination of fluoride in solution but israther slow and other anions cannot be determined in the same run.
0.1 1.0 10
Ion selective electrode, F~(mg/L)100
Figure 2.6. Improvement in fluoride determination when using Na2B4O7 as an eluent.
2.13
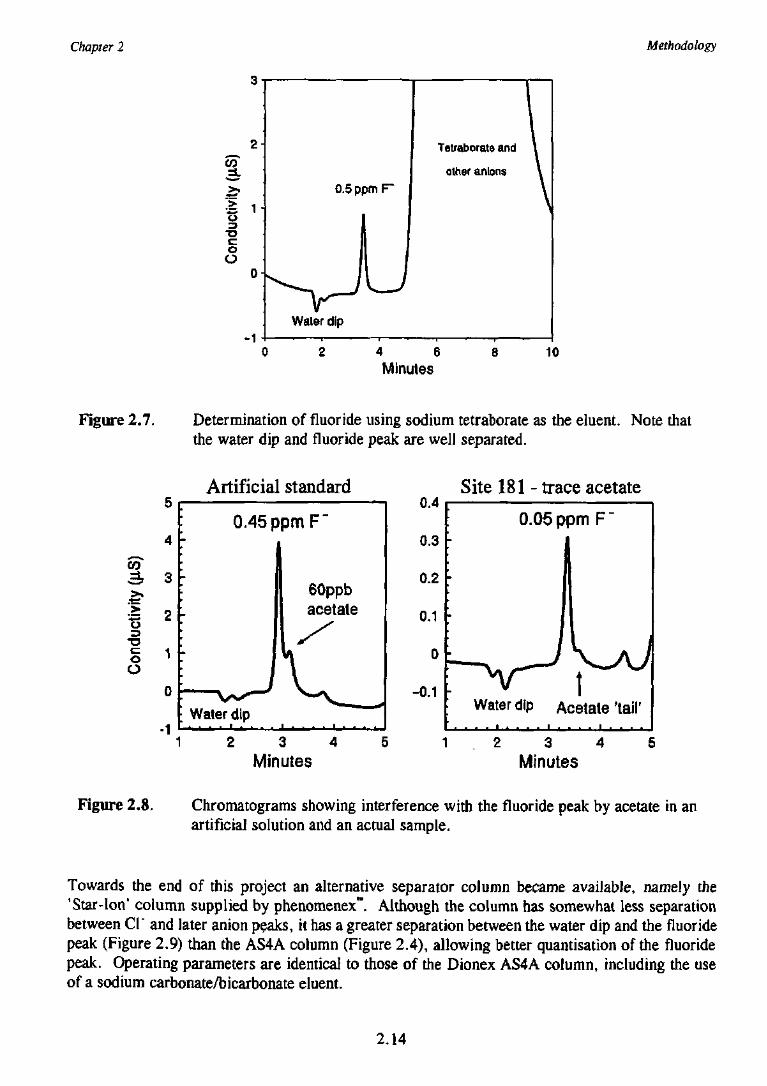
Chapter 2 Methodology
2-
>.
o
CoO
0-
0.5 ppm
IWater dip
F"
J
Tetraborate and IIother anions \
\
4 6Minutes
10
Figure 2.7. Determination of fluoride using sodium tetraborate as the eluent. Note thatthe water dip and fluoride peak are well separated.
CO
1o
Artificial standard
0.45 ppm F
60ppbacetate
Water dip
2 3 4Minutes
0.4
0.3
0.2
0.1
0
0.1
Site 181
0.
•
• —_
Water dip
- trace acetate
05 ppm F"
|
J\yJlAcetate 'tail'
2 3 4Minutes
Figure 2.8. Chromatograms showing interference with the fluoride peak by acetate in anartificial solution and an actual sample.
Towards the end of this project an alternative separator column became available, namely the'Star-Ion' column supplied by phenomenex™. Although the column has somewhat less separationbetween Cl" and later anion peaks, it has a greater separation between the water dip and the fluoridepeak (Figure 2.9) than the AS4A column (Figure 2.4), allowing better quantisation of the fluoridepeak. Operating parameters are identical to those of the Dionex AS4A column, including the useof a sodium carbonate/bicarbonate eluent.
2.14
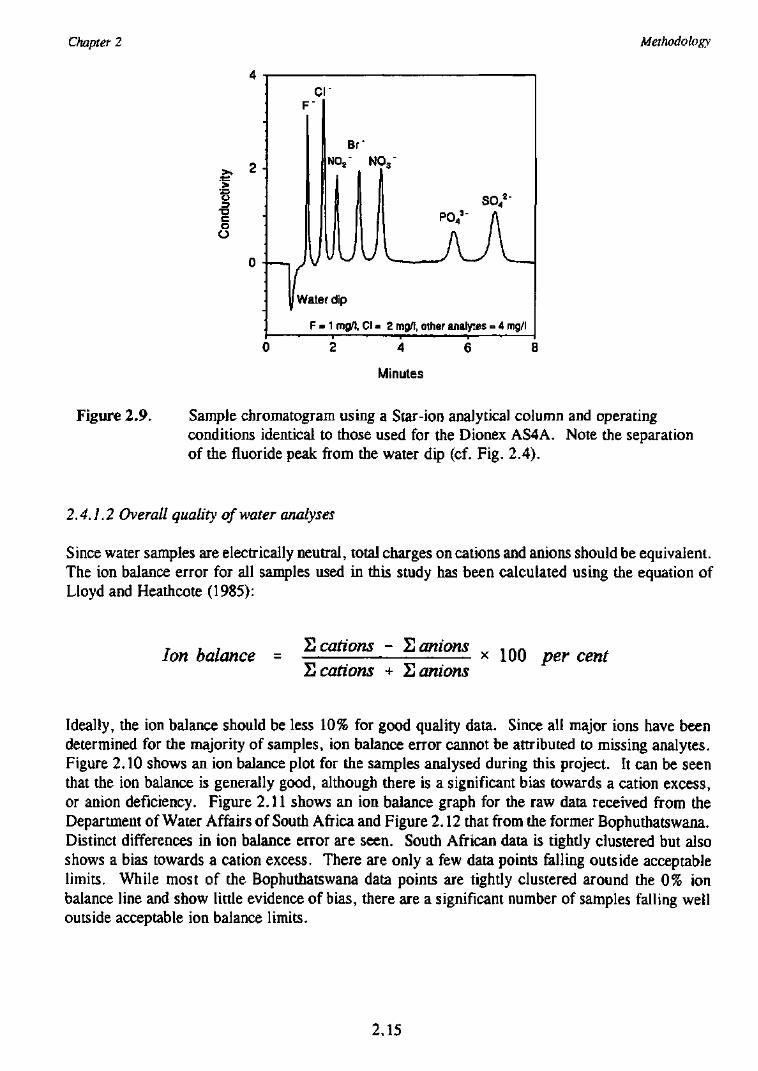
Chapter 2 Methodology
X5
oO
H •
2 -
•
0 -
CF'
i /
Br
N02"
i |
uU~Y v1/Water dip
F - 1 mg/l.
NOg
lCl= 2
-
mg/l,
SO,2"
T A
other analytes = 4 mg/l
2 4
Minutes
Figure 2.9. Sample chromatogram using a Star-ion analytical column and operatingconditions identical to those used for the Dionex AS4A. Note the separationof the fluoride peak from the water dip (cf. Fig. 2.4).
2.4.1.2 Overall quality of water analyses
Since water samples are electrically neutral, total charges on cations and anions should be equivalent.The ion balance error for all samples used in this study has been calculated using the equation ofLloyd and Heathcote (1985):
Ion balance = £ cations - S anionsS cations + 2 anions
100 per cent
Ideally, the ion balance should be less 10% for good quality data. Since all major ions have beendetermined for the majority of samples, ion balance error cannot be attributed to missing analytes.Figure 2.10 shows an ion balance plot for the samples analysed during this project. It can be seenthat the ion balance is generally good, although there is a significant bias towards a cation excess,or anion deficiency. Figure 2.11 shows an ion balance graph for the raw data received from theDepartment of Water Affairs of South Africa and Figure 2.12 that from the former Bophuthatswana.Distinct differences in ion balance error are seen. South African data is tightly clustered but alsoshows a bias towards a cation excess. There are only a few data points falling outside acceptablelimits. While most of the Bophuthatswana data points are tightly clustered around the 0% ionbalance line and show little evidence of bias, there are a significant number of samples falling welloutside acceptable ion balance limits.
2,15
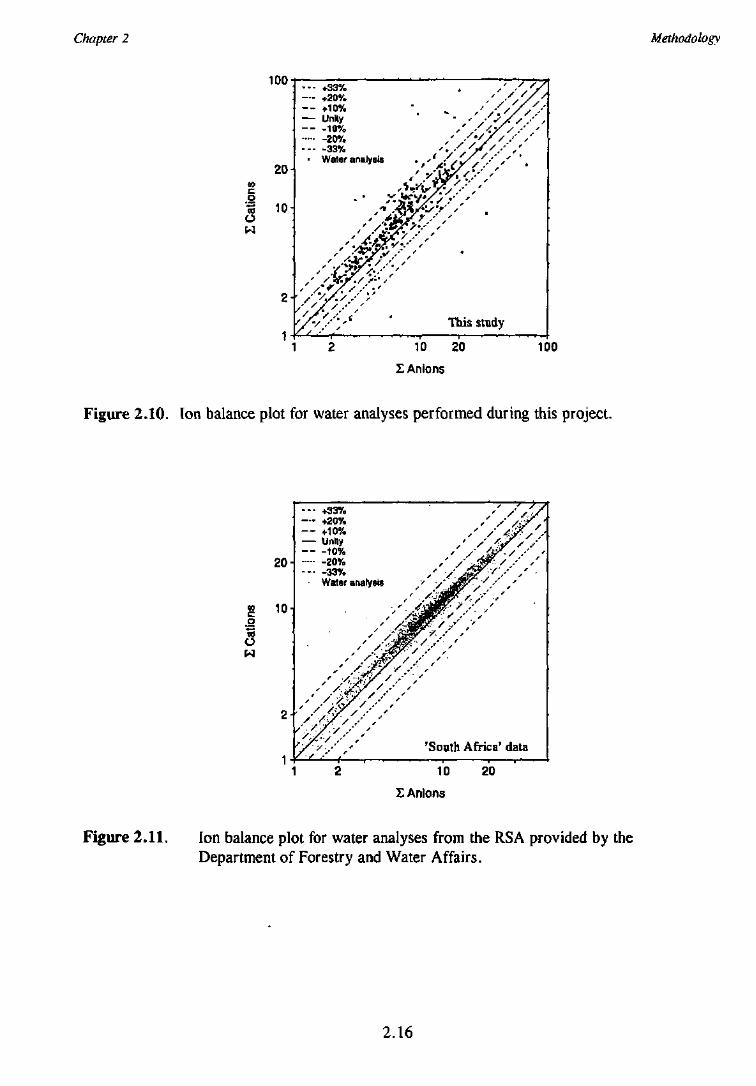
Chapter 2 Methodology
co
ati
ow
IUU-
20-
10:
2-
1-
- - • +33%— +20%— +10%— Unity- - -10%
-20%- - - -33%
• Water analysis . / ' '
* ?\
• * "*. *^y^/i ' '•&%/&
''.*$/.?// /•.*»*>•.'
' J* 'JZ**'' / /
y:£9?y //iiM'y
' / / / • • ' -
<' s//. ' / / / /
/ y y/y -'
/./yyy//*•<////' •
tyry's''/'y *' v"
s * ' ' '
s
•
This study
10 20
£ An Ions
100
Figure 2.10. Ion balance plot for water analyses performed during this project.
O
20-
10-
2-
1-
- - • +33%— +20%— +10%— Unity— -10%
-zo%- - -33%
- Water analysis
*s
--'4/ /Jy/ •'•?$/'
/ / . $ / / . •
' y >$y / •• '//y// /
V /l/y .•' 'y'••/••/•• '
*/•' •-•' y
/ / y.i?// / &y ••
/ / / / / / '
' y' Jif' ••' // sJ&-'/ '
/ y / /y y- ,'
**
'South Africa' data
10 20
X Anions
Figure 2.11. Ion balance plot for water analyses from the RSA provided by theDepartment of Forestry and Water Affairs.
2.16
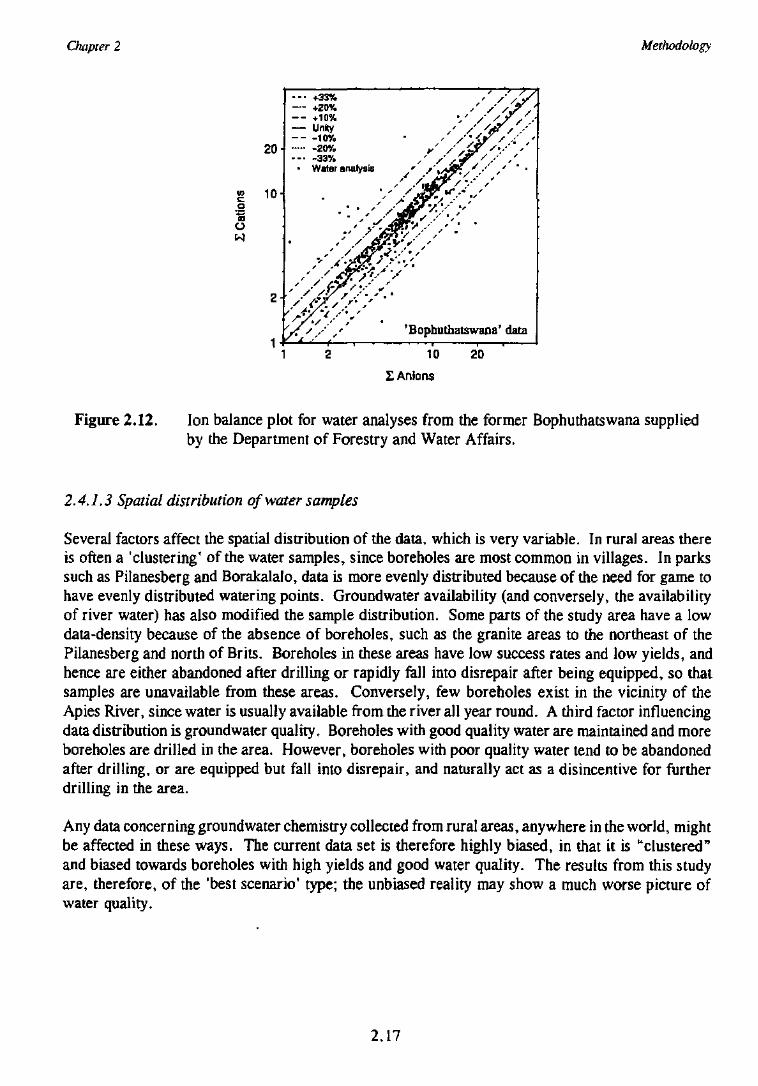
Chapter 2 Methodology
in
O
:ati
uw
20-
10-
2
1 .
- - • +33%— +20%- - +10%— Unity— -10%
20%- - • - 3 3 %
• Water analysis
• . • /
/ y',' / /
/ / '#
/ //•?'.-•/ sj#//,'/*&//<'
/ & & / ' • ' '
w£/>'<\ .v .• / •
t yS ' ya . y
y a
,-
'Bophuthatswana'
• /y'S/?'/f / ' *
/ S
/
ddta
10
Z Anions
20
Figure 2.12. Ion balance plot for water analyses from the former Bophuthatswana suppliedby the Department of Forestry and Water Affairs.
2.4.1.3 Spatial distribution of water samples
Several factors affect the spatial distribution of the data, which is very variable. In rural areas thereis often a 'clustering' of the water samples, since boreholes are most common in villages. In parkssuch as Pilanesberg and Borakalalo, data is more evenly distributed because of the need for game tohave evenly distributed watering points. Groundwater availability (and conversely, the availabilityof river water) has also modified the sample distribution. Some parts of the study area have a lowdata-density because of the absence of boreholes, such as the granite areas to the northeast of thePilanesberg and north of Brits. Boreholes in these areas have low success rates and low yields, andhence are either abandoned after drilling or rapidly fall into disrepair after being equipped, so thatsamples are unavailable from these areas. Conversely, few boreholes exist in the vicinity of theApies River, since water is usually available from the river all year round. A third factor influencingdata distribution is groundwater quality. Boreholes with good quality water are maintained and moreboreholes are drilled in the area. However, boreholes with poor quality water tend to be abandonedafter drilling, or are equipped but fall into disrepair, and naturally act as a disincentive for furtherdrilling in the area.
Any data concerning groundwater chemistry collected from rural areas, anywhere in the world, mightbe affected in these ways. The current data set is therefore highly biased, in that it is "clustered"and biased towards boreholes with high yields and good water quality. The results from this studyare, therefore, of the 'best scenario' type; the unbiased reality may show a much worse picture ofwater quality.
2.17
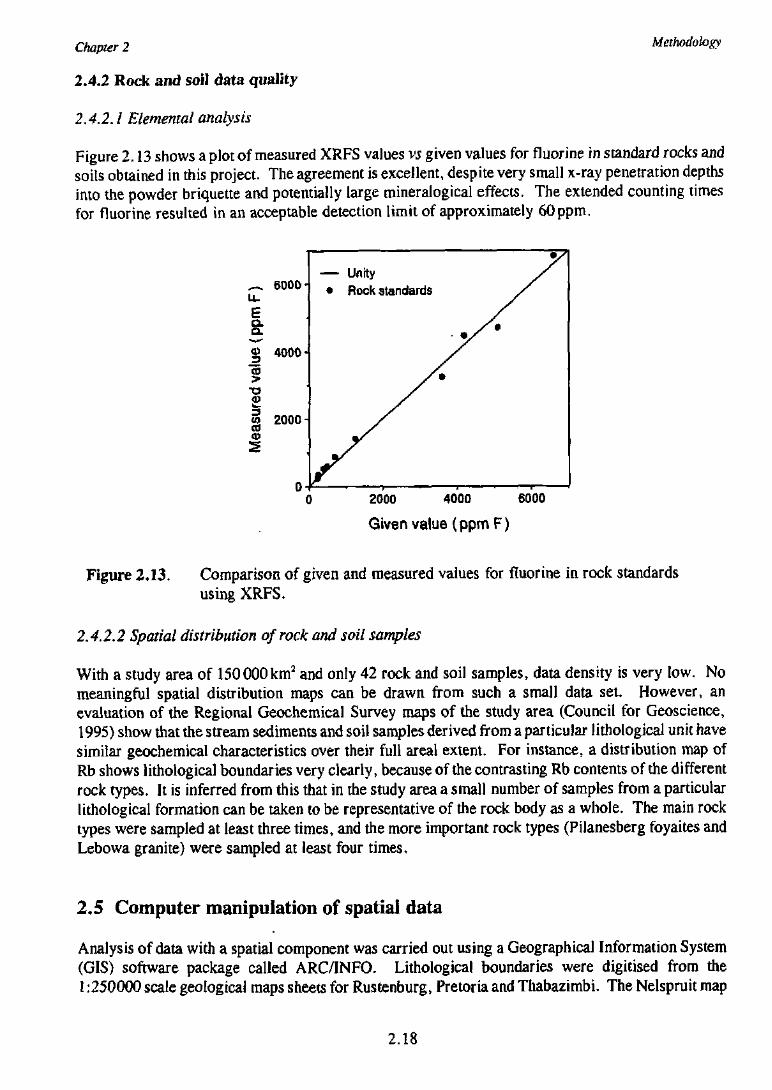
Chapter 2 Methodology
2.4.2 Rock and soil data quality
2.4.2.1 Elemental analysis
Figure 2.13 shows a plot of measured XRFS values vs given values for fluorine in standard rocks andsoils obtained in this project. The agreement is excellent, despite very small x-ray penetration depthsinto the powder briquette and potentially large mineralogical effects. The extended counting timesfor fluorine resulted in an acceptable detection limit of approximately 60ppm.
a?Q.
a.
jasu
red
val
s
6000-
4000-
2000-
0-c
— Unity /• Rock standards /
/
/ '
jr» 2000 4000 6000
Given value (ppm F)
Figure 2.13. Comparison of given and measured values for fluorine in rock standardsusing XRFS.
2.4.2.2 Spatial distribution of rock and soil samples
With a study area of 150000km2 and only 42 rock and soil samples, data density is very low. Nomeaningful spatial distribution maps can be drawn from such a small data set. However, anevaluation of the Regional Geochemical Survey maps of the study area (Council for Geoscience,1995) show that the stream sediments and soil samples derived from a particular lithological unit havesimilar geochemical characteristics over their full areal extent. For instance, a distribution map ofRb shows lithological boundaries very clearly, because of the contrasting Rb contents of the differentrock types. It is inferred from this that in the study area a small number of samples from a particularlithological formation can be taken to be representative of the rock body as a whole. The main rocktypes were sampled at least three times, and the more important rock types (Pilanesberg foyaites andLebowa granite) were sampled at least four times.
2,5 Computer manipulation of spatial data
Analysis of data with a spatial component was carried out using a Geographical Information System(GIS) software package called ARC/INFO. Lithological boundaries were digitised from the1 .-250000 scale geological maps sheets for Rustenburg, Pretoria and Thabazimbi. The Nelspruit map
2.18
Chapter 2 Methodology
was unavailable at the time of digitising and so this section of the map was obtained from the1:1 000 000 scale geological map of South Africa. Digital data on topographic contours, roads,major settlements and rivers were provided by the Department of Forestry and Water Affairs. Inorder to initially classify groundwater analyses in terms of surface geology, a 'spatial join' wasperformed between the analyses and the digitised geology. This is a rapid and accurate method ofperforming such a classification, given the large number of data points. With fewer data points,classification by hand plotting each borehole on a geologic map sheet would be more efficient, andGIS would not be needed.
To produce a 'fluorosis risk map', the F" concentration of groundwater samples was classified into4 groups: <0.7, 0.7-1.5, 1.5-3.0 and >3.0 mg/« (Figure 5.6, section 5.2.4.2). These aredesignated 'no risk', 'low risk', 'medium risk' and 'high risk', respectively. For the origin of thesedivisions, see Chapter 5. Theissen polygons were generated for each sample point, resulting inapproximately 3 000 polygons. Where adjacent polygons had the same classification, they weremerged. In this way 300 areas have been delineated where there is a medium or higher risk offluorosis. Theissen polygons admirably mirror human behaviour, in that people generally fetch waterfrom the nearest borehole: points within a given Theissen polygon are closer to the central point (theborehole) than to any other borehole.
One of the major advantages of this method is that people living within the area of the polygon willprobably receive their water from the boreholes within the area represented by the polygon. Afurther advantage of this method is that it avoids a visually confusing clutter of points, which resultsif the original 3 500 data points are not reduced in this way. A disadvantage is that geographicallyisolated boreholes result in very large polygons, which have a visual impact disproportionate to theirimportance. Borehole locations are given in Figure 4.1.
2.19
Chapter 3 Rocks, soils and minerals
3 GEOCHEMISTRY OF ROCKS, SOILS AND MINERALS
3.1 Introduction
This chapter discusses the geochemistry of selected rocks, soils and minerals from the field area.The western Bushveld is the main site of South Africa's platinum mining industry, and because ofthis the economic geology of the area has been intensively studied. However, much of this researchhas concentrated on elements of economic significance, such as the platinum group elements(PGE's), chromium and vanadium. Comparatively little work has been undertaken on thegeochemistry of the halogen elements. This chapter will therefore concentrate on the halogen groupof elements and especially fluorine. It will also discuss the geochemistry of elements which affectthe distribution of the halogens, in particular some of the alkali metals and the alkaline earth metals.The strontium and oxygen isotopic composition of selected rock samples will also be discussed.
3.2 Chemical composition of rock samples
This section will discuss the results of analyses of rock and soil samples undertaken during the studyusing the XRF facilities at UCT (Chapter 2).
3.2.1 Major element Geochemistry
3.2.1.1 Previous Work
The field area is one of the most intensively explored and mined areas in the world and a vast amountof geochemical work has been carried out, but very little of relevance to this study.
3.2.1.2 Present work
Rock and soil samples were taken from the field area during May and June 1994. The samplelocations are shown in Figure 3.1 in relation to the regional geology and details are listed inAppendix A2.
Despite being from a wide range of rock types, some general trends are still apparent and are shownin Figure 3.2, which shows bivariate plots for three of the four oxides which constitute major cationsin groundwater.
In the N a ^ vs MgO plot there are two populations: one which has a constant N a ^ concentrationand variable MgO, and the other which has a constant MgO but variable NajO concentrations. Thehigh MgO rocks come mainly from the Rooiberg suite.
Positive correlations occur for MgO with CaO; CaO with Loss On Ignition (LOI). The inversecorrelation of SiO2 with MgO, CaO and LOI, and of MgO with N a ^ is apparent. K2O shows aninverse correlation with CaO and MgO and a poor positive correlation with Na^O. The correlationof K2O with NajO in the Pilanesberg is good, but scattered for the other rock types (Figure 3.3).There is a general scatter when K2O is plotted against SiO2.
3.1
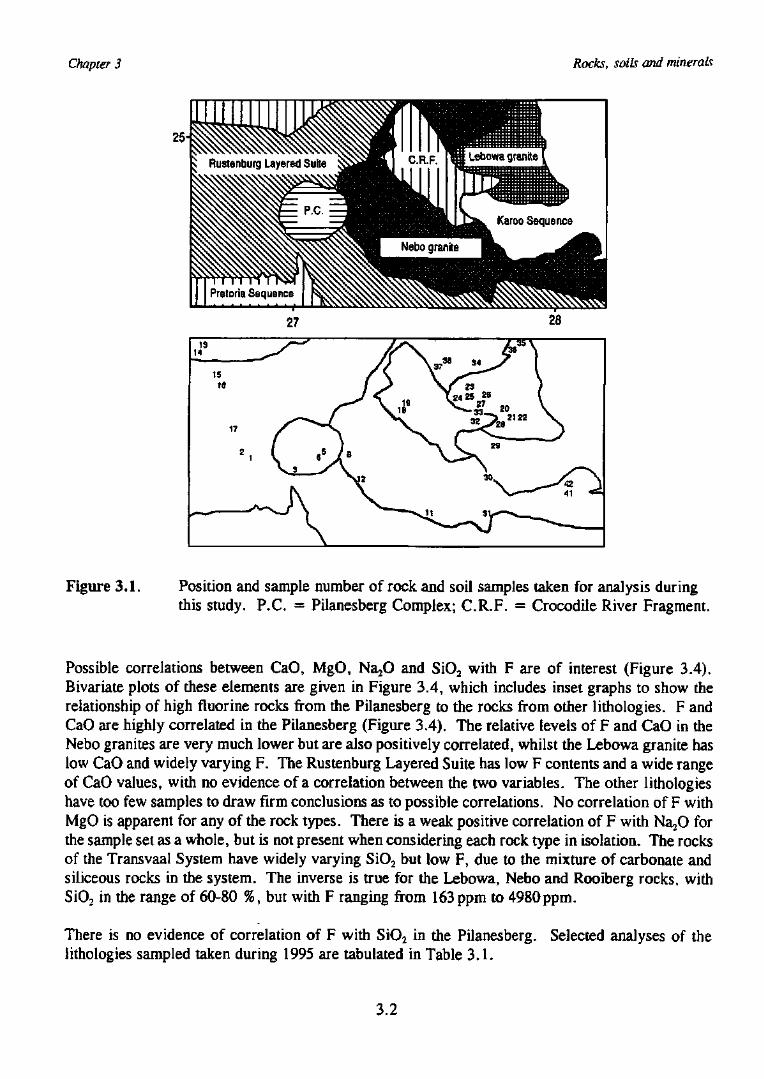
Chapter 3 Rocks, soib and minerals
s Rustenburg Layered Suite
Figure 3.1. Position and sample number of rock and soil samples taken for analysis duringthis study. P.C. = Pilanesberg Complex; C.R.F. = Crocodile River Fragment.
Possible correlations between CaO, MgO, Na^O and SiO2 with F are of interest (Figure 3.4).Bivariate plots of these elements are given in Figure 3.4, which includes inset graphs to show therelationship of high fluorine rocks from the Pilanesberg to the rocks from other lithologies. F andCaO are highly correlated in the Pilanesberg (Figure 3.4). The relative levels of F and CaO in theNebo granites are very much lower but are also positively correlated, whilst the Lebowa granite haslow CaO and widely varying F. The Rustenburg Layered Suite has low F contents and a wide rangeof CaO values, with no evidence of a correlation between the two variables. The other lithologieshave too few samples to draw firm conclusions as to possible correlations. No correlation of F withMgO is apparent for any of the rock types. There is a weak positive correlation of F with Na^O forthe sample set as a whole, but is not present when considering each rock type in isolation. The rocksof the Transvaal System have widely varying SiO2 but low F, due to the mixture of carbonate andsiliceous rocks in the system. The inverse is true for the Lebowa, Nebo and Rooiberg rocks, withSiO2 in the range of 60-80 %, but with F ranging from 163 ppm to 4980 ppm.
There is no evidence of correlation of F with S\O2 in the Pilanesberg. Selected analyses of theiithologies sampled taken during 1995 are tabulated in Table 3.1.
3.2
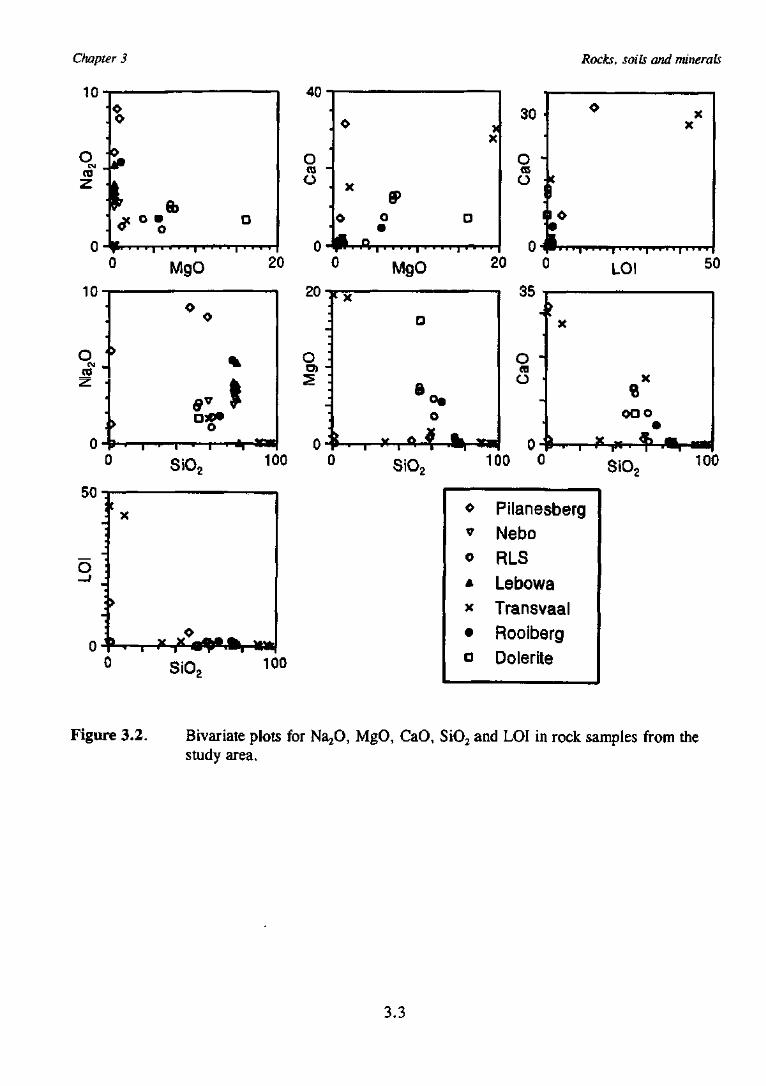
Rocks, soils and minerals
0 +SiO 100
ou -1
O :_J _;
•
0 :
f
X
>
SiO, 100
o Pilanesbergv Neboo RLSA Lebowax Transvaal• Rooiberg• Dolerite
Figure 3.2. Bivariate plots for NaA MgO, CaO, SiO2 and LOI in rock samples from thestudy area.
3.3
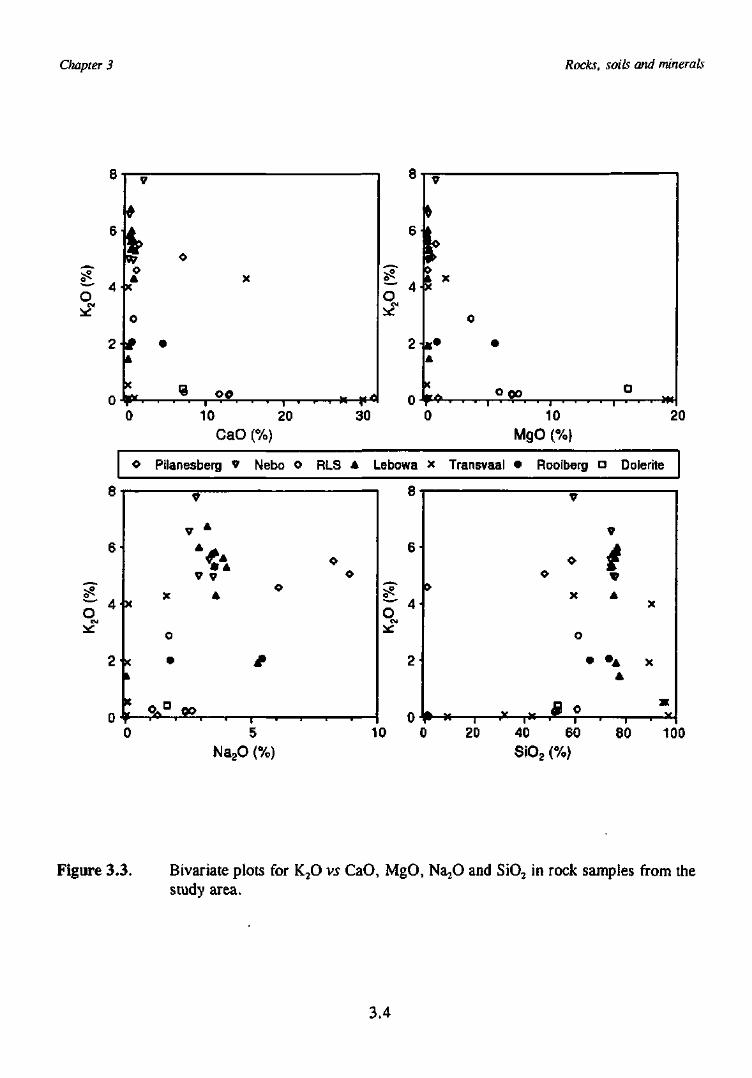
Chapter 3 Rocks, soils and minerals
r 4o
r 4fc X
Q Q O
30
CaO10
MgO (%)20
Pilanesberg v Nebo o RLS A Lebowa x Transvaal • Rooiberg • Doierite
80 100
Figure 3.3. Bivariate plots for K2O vs CaO, MgO, Na^O and SiO2 in rock samples from thestudy area.
3.4
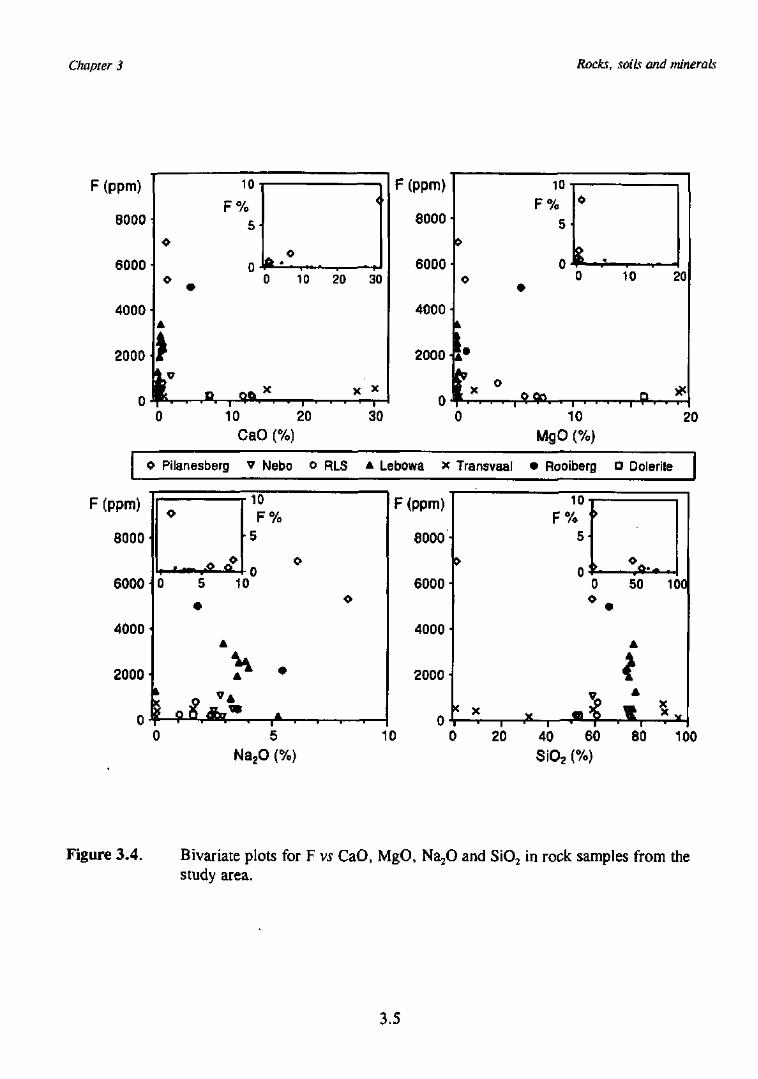
Chapter 3 Rocks, soils and mineraLs
F (ppm)
8000
6000
4000'
2000-
0-
o
i¥
10-
F%5-
0-»
D 96
<
0 10 20 30
x x x, . . . . 1
F (ppm)
8000-
6000-
4000-
2000-
0-
F°
0O tfn
^Q•
5-
0-
0
0 10 20
10 20 30CaO
10
MgO (%)20
o Pilanesberg v Nebo o RLS * Lebowa x Transvaal • Rooiberg Q Dolerite
F (ppm)
8000
6000
4000
2000'
0-
O
0
i
5
r 10
F%•5
0
10O
A
a —,*-,—,—,—,—
F (ppm)
8000-
6000-
4000'
2000-
0-
>
< X1 " 1
10'
F%5-
n '.
>
>
0
9
50
A
tA
100
10 20 40 60 80 100
SiO2 (%)
Figure 3.4. Bivariate plots for F w CaO, MgO, Na2O and SiO2 in rock samples from thestudy area.
3.5
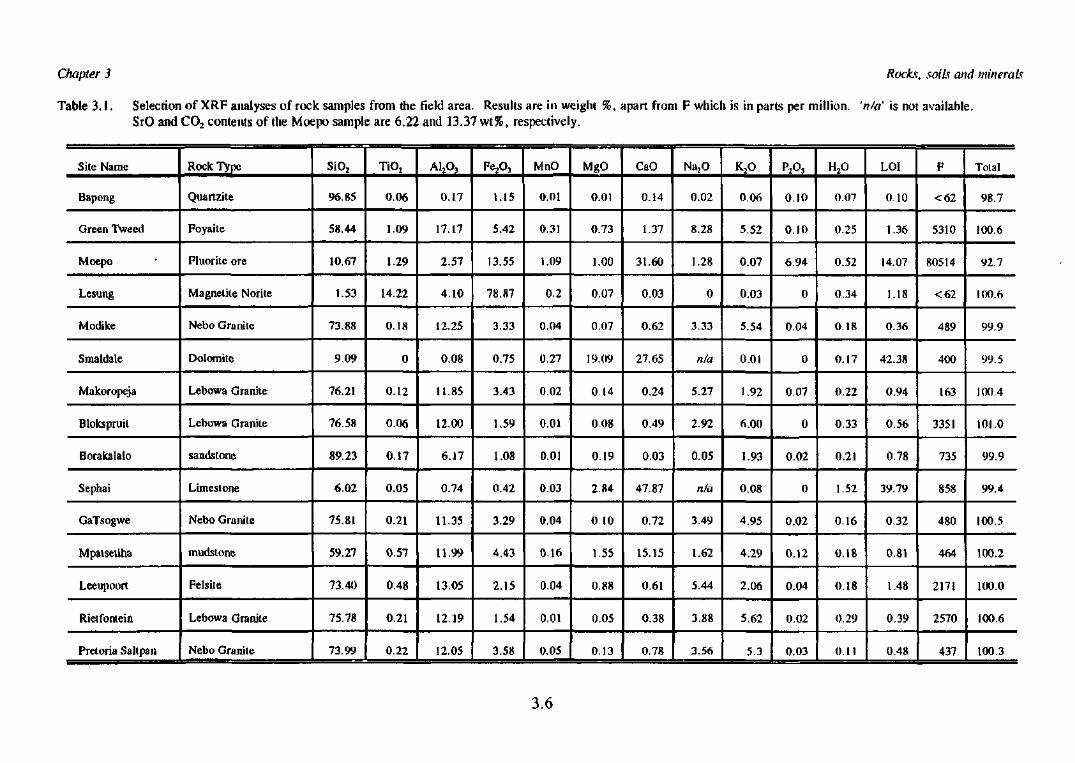
Chapter 3
Table 3.1. Selection of XRF analyses of rock samples from the field area. Results are in weightSrO and CO2 contents of the Moepo sample are 6.22 and 13.37 wt%, respectively.
Rocks, soils and minerals
I, apart from F which is in parts per million, 'n/a' is not available.
Site Name
Bapong
Green Tweed
Moepo
Lesung
Modike
Smaldale
Makoropeja
Blokspruit
Borakalalo
Sephai
GaTsogwe
Mpatsetlha
Leeupoort
Rietfoniein
Pretoria Saltpan
Rock Type
Quart zite
Foyaite
Pluorite ore
Magnetite Norite
Nebo Granite
Dolomite
Lebowa Granite
Lebowa Granite
sandstone
Limestone
Nebo Granite
mudstonc
Felsite
Lebowa Granite
Nebo Granite
SiOj
96.85
58.44
10.67
1.53
73.88
9.09
76.21
76.58
89.23
6.02
75.81
59.27
73.40
75.78
73.99
TiO2
0.06
1.09
1.29
14.22
0.18
0
0.12
0.06
0.17
0.05
0.21
0.57
0.48
0.21
0.22
A1A
0.17
17.17
2.57
4.10
12.25
0.08
11.85
12.00
6.17
0.74
11.35
11.99
13.05
12.19
12.05
FeA
1.15
5.42
13.55
78.87
3.33
0.75
3.43
1.59
1.08
0.42
3.29
4.43
2.15
1.54
3.58
MnO
0.01
0.31
1.09
0.2
0.04
0.27
0.02
0.01
0.01
0.03
0.04
0.16
0.04
0.01
0.05
MgO
0.01
0.73
1.00
0.07
0.07
19.09
0 14
0.08
0 19
2 8 4
0.10
1.55
0.88
0.05
0.13
CaO
0.14
1.37
31.60
0.03
0.62
27.65
0.24
0.49
0.03
47.87
0.72
15.15
0.61
0.38
0.78
NajO
0.02
8.28
1.28
0
3.33
n/a
5.27
2.92
0.05
n/a
3.49
1.62
5.44
3.88
3.56
K3O
0.06
5.52
0.07
0.03
5.54
0.01
1.92
6.00
1.93
0.08
4.95
4.29
2.06
5.62
5.3
P A
0.10
0.10
6.94
0
0.04
0
0.07
0
0.02
0
0.02
0.12
0.04
0.02
0.03
0.07
0.25
0.52
0.34
0.18
0.17
0.22
0.33
0.21
1.52
0.16
0.18
0.18
0.29
0.11
LOI
0.10
1.36
14.07
1.18
0.36
42.38
0.94
0.56
0.78
39.79
0.32
0.81
1.48
0.39
0.48
P
<62
5310
80514
< 6 2
489
400
163
3351
735
858
480
464
2171
2570
437
Total
98.7
100.6
92.7
100.6
99.9
99.5
100.4
101.0
99.9
99.4
100.5
100.2
100.0
100.6
100.3
3.6
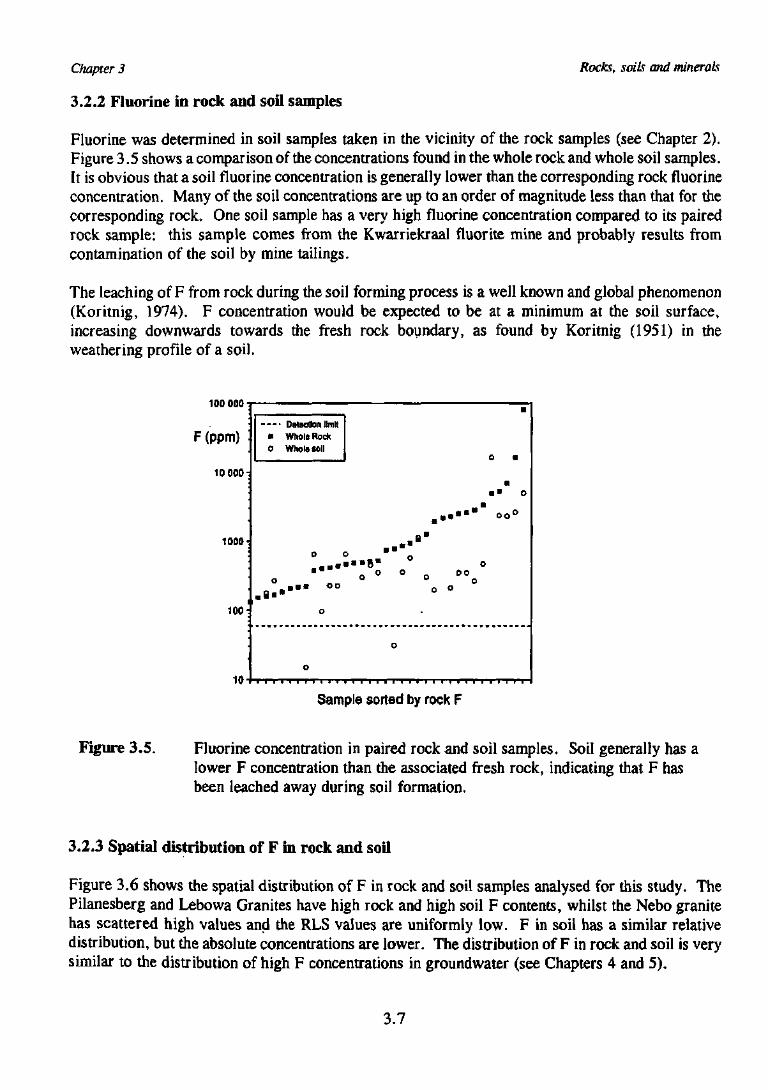
Chapter 3
'i.l.l Fluorine in rock and soil samples
Rocks, soils and minerals
Fluorine was determined in soil samples taken in the vicinity of the rock samples (see Chapter 2).Figure 3.5 shows a comparison of the concentrations found in the whole rock and whole soil samples.It is obvious that a soil fluorine concentration is generally lower than the corresponding rock fluorineconcentration. Many of the soil concentrations are up to an order of magnitude less than that for thecorresponding rock. One soil sample has a very high fluorine concentration compared to its pairedrock sample: this sample comes from the Kwarriekraal fluorite mine and probably results fromcontamination of the soil by mine tailings.
The leaching of F from rock during the soil forming process is a well known and global phenomenon(Koritnig, 1974). F concentration would be expected to be at a minimum at the soil surface,increasing downwards towards the fresh rock boundary, as found by Koritnig (1951) in theweathering profile of a soil.
100 000
F (ppm)
10 000-
1000
100
10
Detection limit
• Whole flock
o Whole soil
• « ' • " " oo°
00
• O 0
Sample sorted by rock F
Figure 3.5. Fluorine concentration in paired rock and soil samples. Soil generally has alower F concentration than the associated fresh rock, indicating that F hasbeen leached away during soil formation.
3.2.3 Spatial distribution of F in rock and soil
Figure 3.6 shows the spatial distribution of F in rock and soil samples analysed for this study. ThePilanesberg and Lebowa Granites have high rock and high soil F contents, whilst the Nebo granitehas scattered high values and the RLS values are uniformly low. F in soil has a similar relativedistribution, but the absolute concentrations are lower. The distribution of F in rock and soil is verysimilar to the distribution of high F concentrations in groundwater (see Chapters 4 and 5).
3.7
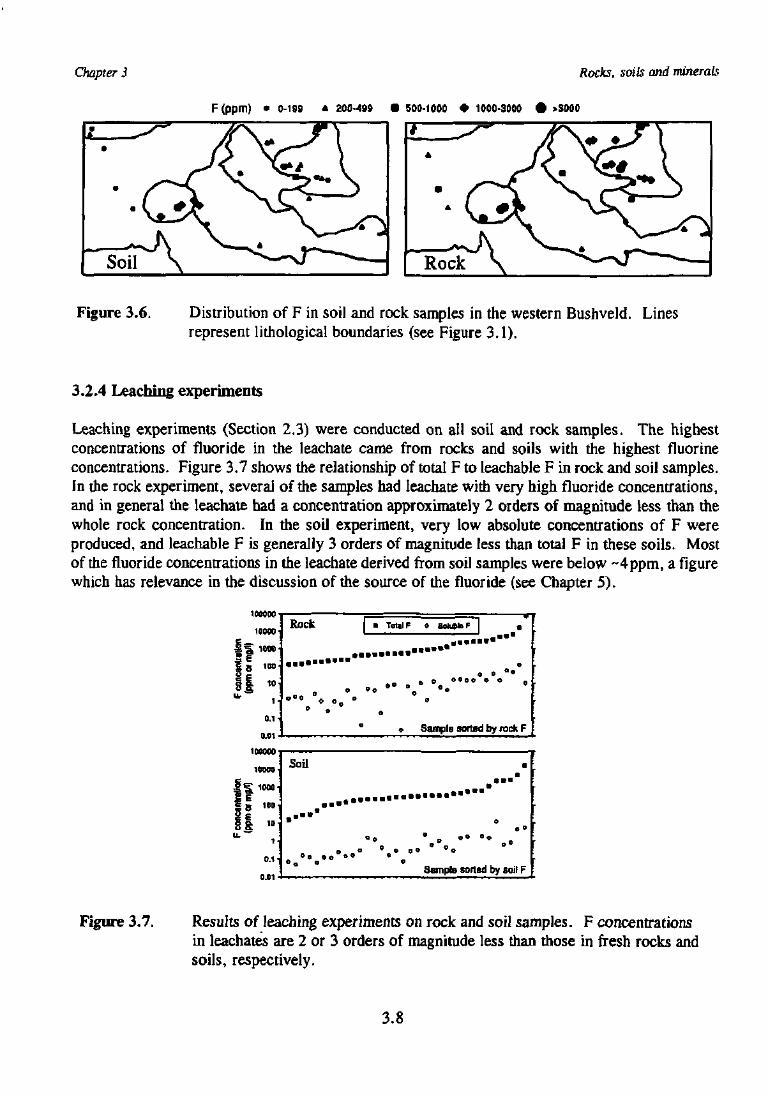
Chapter 3 Rocks, soils and minerals
F(ppm) • 0-196 * 200-499 • 500-1000 • 1000-3000 • >3000
Figure 3.6. Distribution of F in soil and rock samples in the western Bushveld. Linesrepresent lithological boundaries (see Figure 3.1).
3.2.4 Leaching experiments
Leaching experiments (Section 2.3) were conducted on all soil and rock samples. The highestconcentrations of fluoride in the leachate came from rocks and soils with the highest fluorineconcentrations. Figure 3.7 shows the relationship of total F to leachable F in rock and soil samples.In the rock experiment, several of the samples had leachate with very high fluoride concentrations,and in general the leachate had a concentration approximately 2 orders of magnitude less than thewhole rock concentration. In the soil experiment, very low absolute concentrations of F wereproduced, and leachable F is generally 3 orders of magnitude less than total F in these soils. Mostof the fluoride concentrations in the leachate derived from soil samples were below ~4ppm, a figurewhich has relevance in the discussion of the source of the fluoride (see Chapter 5).
laoooo
ioooo
5 6 1 M
I I. 10
0,1
Rock
o o " •
o°o
Sample sorted by rock F
100000
10000'
^ 1000-
3 loo-
I ,0-
1 -
D.t •
0.01 -
Soil
• • • •
. • • • "
° Q °
•
• « 1 " 1
0
o o
. . . ' • ' « . " °° °°g
Sample sorted by soil F
Figure 3.7. Results of leaching experiments on rock and soil samples. F concentrationsin leachates are 2 or 3 orders of magnitude less than those in fresh rocks andsoils, respectively.
3.8
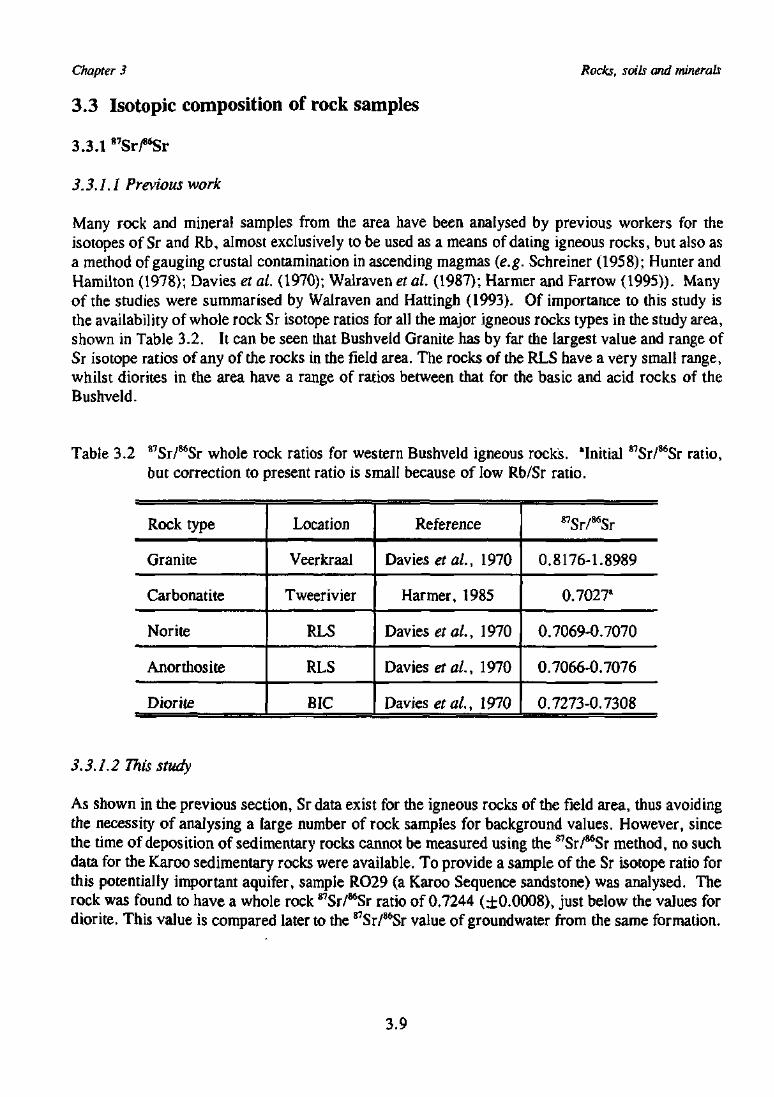
Chapter 3 Rocks, soils and minerals
3.3 Isotopic composition of rock samples
3.3.1 "WSr
3.3.1.1 Previous work
Many rock and mineral samples from the area have been analysed by previous workers for theisotopes of Sr and Rb, almost exclusively to be used as a means of dating igneous rocks, but also asa method of gauging crustal contamination in ascending magmas {e.g. Schreiner (1958); Hunter andHamilton (1978); Davies et at. (1970); Walraven et at. (1987); Harmer and Farrow (1995)). Manyof the studies were summarised by Walraven and Hattingh (1993). Of importance to this study isthe availability of whole rock Sr isotope ratios for all the major igneous rocks types in the study area,shown in Table 3.2. It can be seen that Bushveld Granite has by far the largest value and range ofSr isotope ratios of any of the rocks in the field area. The rocks of the RLS have a very small range,whilst diorites in the area have a range of ratios between that for the basic and acid rocks of theBushveld.
Table 3.2 ^Sr/^Sr whole rock ratios for western Bushveld igneous rocks. "Initial 87Sr/86Sr ratio,but correction to present ratio is small because of low Rb/Sr ratio.
Rock type
Granite
Carbonatite
Norite
Anorthosite
Diorite
Location
Veerkraal
Tweerivier
RLS
RLS
BIC
Reference
Davies etaL, 1970
Harmer, 1985
Davies etaL, 1970
Davies etaL, 1970
Davies etaL, 1970
87Sr/8SSr
0.8176-1.8989
0.7027a
0.7069-0.7070
0.7066-0.7076
0.7273-0.7308
3.3.1.2 This study
As shown in the previous section, Sr data exist for the igneous rocks of the field area, thus avoidingthe necessity of analysing a large number of rock samples for background values. However, sincethe time of deposition of sedimentary rocks cannot be measured using the 87Sr/86Sr method, no suchdata for the Karoo sedimentary rocks were available. To provide a sample of the Sr isotope ratio forthis potentially important aquifer, sample RO29 (a Karoo Sequence sandstone) was analysed. Therock was found to have a whole rock 87Sr/86Sr ratio of 0.7244 (±0.0008), just below the values fordiorite. This value is compared later to the s7Sr/86Sr value of groundwater from the same formation.
3.9
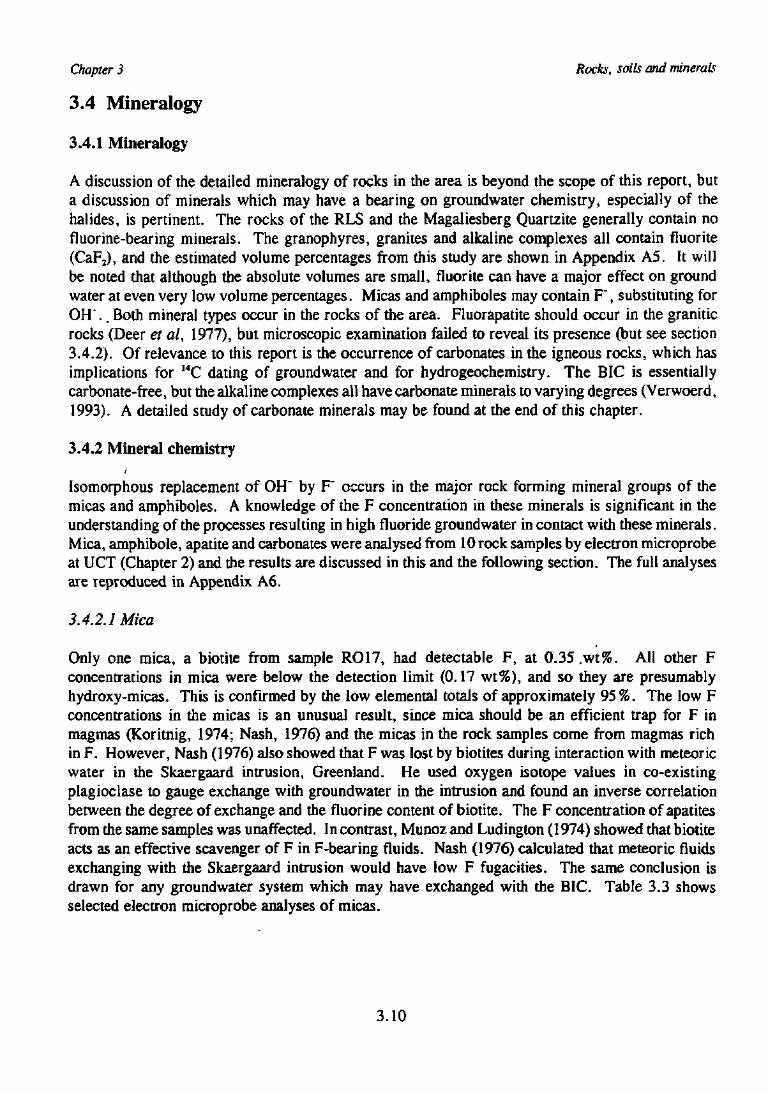
Chapter 3 Rocks, soils and minerals
3.4 Mineralogy
3.4.1 Mineralogy
A discussion of the detailed mineralogy of rocks in the area is beyond the scope of this report, buta discussion of minerals which may have a bearing on groundwater chemistry, especially of thehalides, is pertinent. The rocks of the RLS and the Magaliesberg Quartzite generally contain nofluorine-bearing minerals. The granophyres, granites and alkaline complexes all contain fluorite(CaF2), and the estimated volume percentages from this study are shown in Appendix A5. It willbe noted that although the absolute volumes are small, fluorite can have a major effect on groundwater at even very low volume percentages. Micas and amphiboles may contain F", substituting forOH .. Both mineral types occur in the rocks of the area. Fluorapatite should occur in the graniticrocks (Deer et al, 1977), but microscopic examination failed to reveal its presence (but see section3.4.2). Of relevance to this report is the occurrence of carbonates in the igneous rocks, which hasimplications for 14C dating of groundwater and for hydrogeochemistry. The BIC is essentiallycarbonate-free, but the alkaline complexes all have carbonate minerals to varying degrees (Verwoerd,1993). A detailed study of carbonate minerals may be found at the end of this chapter.
3.4.2 Mineral chemistry
Isomorphous replacement of OH" by F" occurs in the major rock forming mineral groups of themicas and amphiboles. A knowledge of the F concentration in these minerals is significant in theunderstanding of the processes resulting in high fluoride groundwater in contact with these minerals.Mica, amphibole, apatite and carbonates were analysed from 10 rock samples by electron microprobeat UCT (Chapter 2) and the results are discussed in this and the following section. The full analysesare reproduced in Appendix A6.
3.4.2.1 Mica
Only one mica, a biotite from sample RO17, had detectable F, at 0.35 ,wt%. All other Fconcentrations in mica were below the detection limit (0.17 wt%), and so they are presumablyhydroxy-micas. This is confirmed by the low elemental totals of approximately 95%. The low Fconcentrations in the micas is an unusual result, since mica should be an efficient trap for F inmagmas (Koritnig, 1974; Nash, 1976) and the micas in the rock samples come from magmas richin F. However, Nash (1976) also showed that F was lost by biotites during interaction with meteoricwater in the Skaergaard intrusion, Greenland. He used oxygen isotope values in co-existingplagioclase to gauge exchange with groundwater in the intrusion and found an inverse correlationbetween the degree of exchange and the fluorine content of biotite. The F concentration of apatitesfrom the same samples was unaffected. In contrast, Munoz and Ludington (1974) showed that biotiteacts as an effective scavenger of F in F-bearing fluids. Nash (1976) calculated that meteoric fluidsexchanging with the Skaergaard intrusion would have low F fugacities. The same conclusion isdrawn for any groundwater system which may have exchanged with the BIC. Table 3.3 showsselected electron microprobe analyses of micas.
3.10
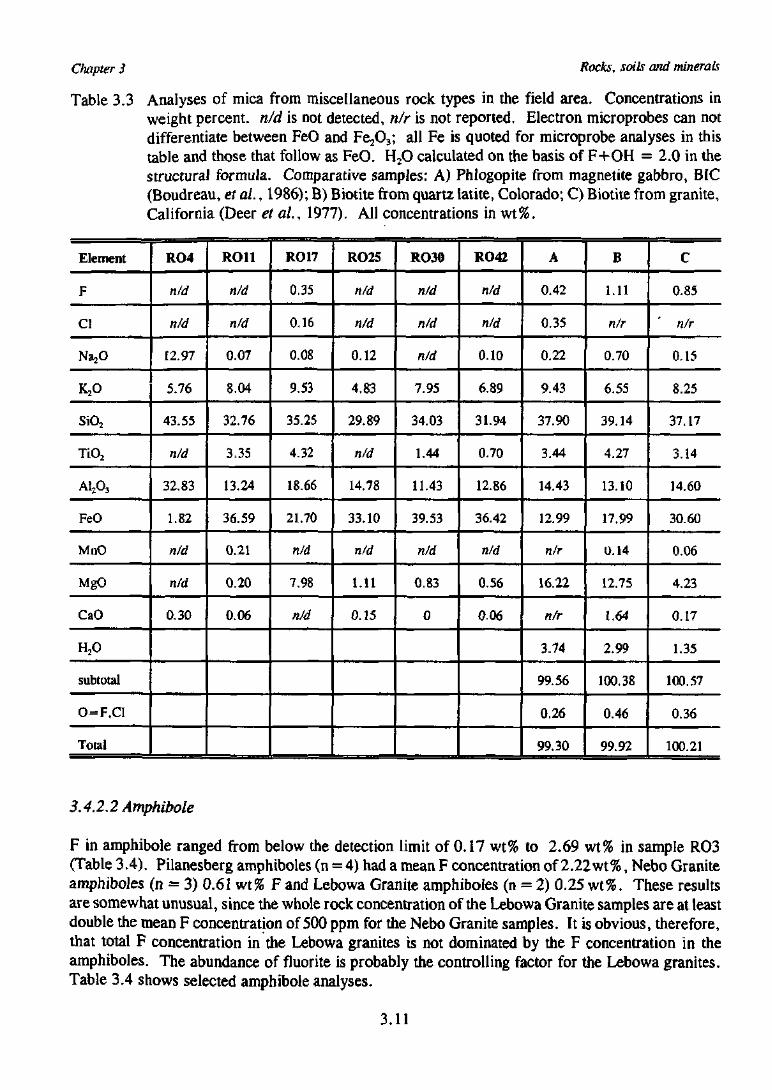
Chapter 3 Rocks, soils and minerals
Table 3.3 Analyses of mica from miscellaneous rock types in the field area. Concentrations inweight percent, n/d is not detected, n/r is not reported. Electron microprobes can notdifferentiate between FeO and Fe2O3; all Fe is quoted for microprobe analyses in thistable and those that follow as FeO. H2O calculated on the basis of F+OH = 2.0 in thestructural formula. Comparative samples: A) Phlogopite from magnetite gabbro, BIC(Boudreau, et al., 1986); B) Biotite from quartz latite, Colorado; C) Biotite from granite,California (Deer et al., 1977). All concentrations in wt%.
Element
F
Cl
Na^O
K2O
SiO2
TiO2
A12O3
FeO
MnO
MgO
CaO
H2O
subtotal
O = F,CI
Total
RO4
n/d
n/d
12.97
5.76
43.55
n/d
32.83
1.82
n/d
n/d
0.30
RO11
n/d
n/d
0.07
8.04
32.76
3.35
13.24
36.59
0.21
0.20
0.06
RO17
0.35
0.16
0.08
9.53
35.25
4.32
18.66
21.70
n/d
7.98
n/d
RO25
n/d
n/d
0.12
4.83
29.89
n/d
14.78
33.10
n/d
1.11
0.15
RO30
n/d
n/d
n/d
7.95
34.03
1.44
11.43
39.53
n/d
0.83
0
RO42
n/d
n/d
0.10
6.89
31.94
0.70
12.86
36.42
n/d
0.56
0.06
A
0.42
0.35
0.22
9.43
37.90
3.44
14.43
12.99
n/r
16.22
n/r
3.74
99.56
0.26
99.30
B
1.11
n/r
0.70
6.55
39.14
4.27
13.10
17.99
0.14
12.75
1.64
2.99
100.38
0.46
99.92
C
0.85
' n/r
0.15
8.25
37.17
3.14
14.60
30.60
0.06
4.23
0.17
1.35
100.57
0.36
100.21
3.4.2,2 Amphibole
F in amphibole ranged from below the detection limit of 0.17 wt% to 2.69 wt% in sample RO3(Table 3.4). Pilanesberg amphiboles (n = 4) had a mean F concentration of 2.22 wt%, Nebo Graniteamphiboles (n = 3) 0.61 wt% F and Lebowa Granite amphiboies (n = 2) 0.25 wt%. These resultsare somewhat unusual, since the whole rock concentration of the Lebowa Granite samples are at leastdouble the mean F concentration of 500 ppm for the Nebo Granite samples. It is obvious, therefore,that total F concentration in the Lebowa granites is not dominated by the F concentration in theamphiboles. The abundance of fluorite is probably the controlling factor for the Lebowa granites.Table 3.4 shows selected amphibole analyses.
3.11
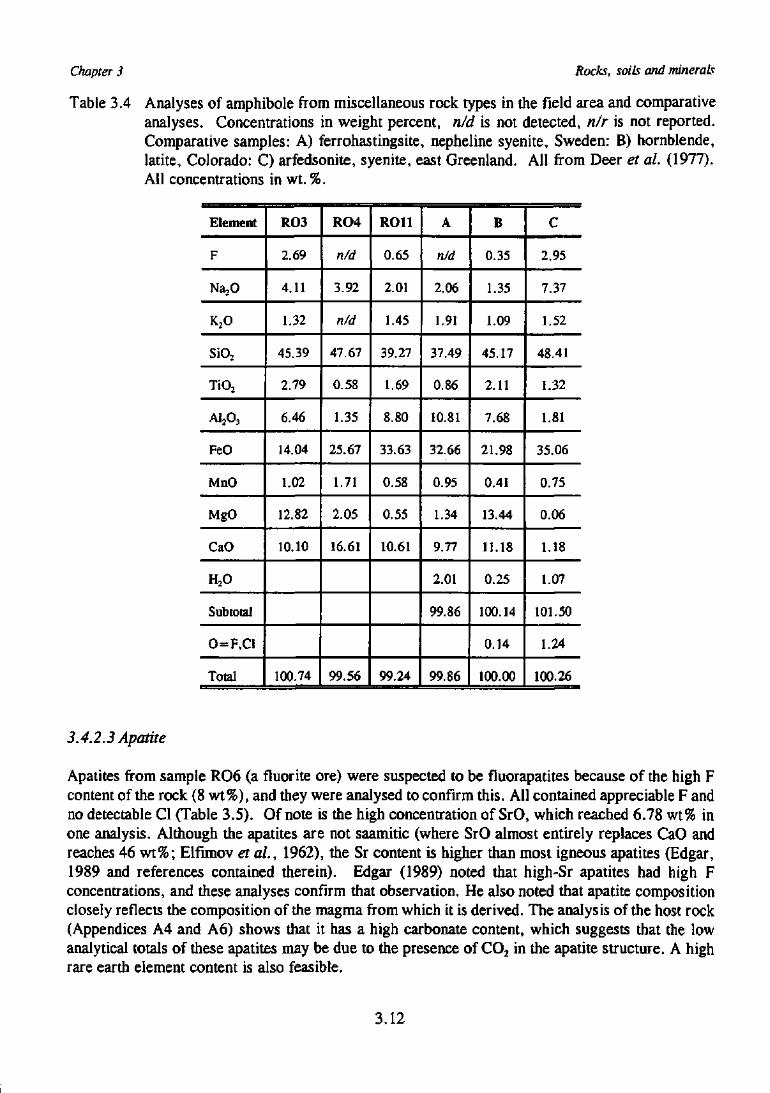
Chapter 3 Rocks, soils and minerals
Table 3.4 Analyses of amphibole from miscellaneous rock types in the field area and comparativeanalyses. Concentrations in weight percent, nld is not detected, n/r is not reported.Comparative samples: A) ferrohastingsite, nepheline syenite, Sweden: B) hornblende,latite, Colorado: C) arfedsonite, syenite, east Greenland. All from Deer et al. (1977).All concentrations in wt. %.
Element
F
Na^O
K2O
SiO7
TiO2
A1A
FeO
MnO
MgO
CaO
H:O
Subtotal
O=F,C1
Total
RO3
2.69
4.11
1.32
45.39
2.79
6.46
14.04
1.02
12.82
10.10
100.74
RO4
n/d
3.92
n/d
47.67
0.58
1.35
25.67
1.71
2.05
16.61
99.56
RO11
0.65
2.01
1.45
39.27
1.69
8.80
33.63
0.58
0.55
10.61
99.24
A
nld
2.06
1.91
37.49
0.86
10.81
32.66
0.95
1.34
9.77
2.01
99.86
99.86
B
0.35
1.35
1.09
45.17
2.11
7.68
21.98
0.41
13.44
11.18
0.25
100.14
0.14
100.00
c2.95
7.37
1.52
48.41
1.32
1.81
35.06
0.75
0.06
1.18
1.07
101.50
1.24
100.26
3.4.2.3 Apatite
Apatites from sample RO6 (a fluorite ore) were suspected to be fiuorapatites because of the high Fcontent of the rock (8 wt%), and they were analysed to confirm this. All contained appreciable F andno detectable Cl (Table 3.5). Of note is the high concentration of SrO, which reached 6.78 wt% inone analysis. Although the apatites are not saamitic (where SrO almost entirely replaces CaO andreaches 46 wt%; Elfimov et al., 1962), the Sr content is higher than most igneous apatites (Edgar,1989 and references contained therein). Edgar (1989) noted that high-Sr apatites had high Fconcentrations, and these analyses confirm that observation. He also noted that apatite compositionclosely reflects the composition of the magma from which it is derived. The analysis of the host rock(Appendices A4 and A6) shows that it has a high carbonate content, which suggests that the lowanalytical totals of these apatites may be due to the presence of CO2 in the apatite structure. A highrare earth element content is also feasible.
3.12
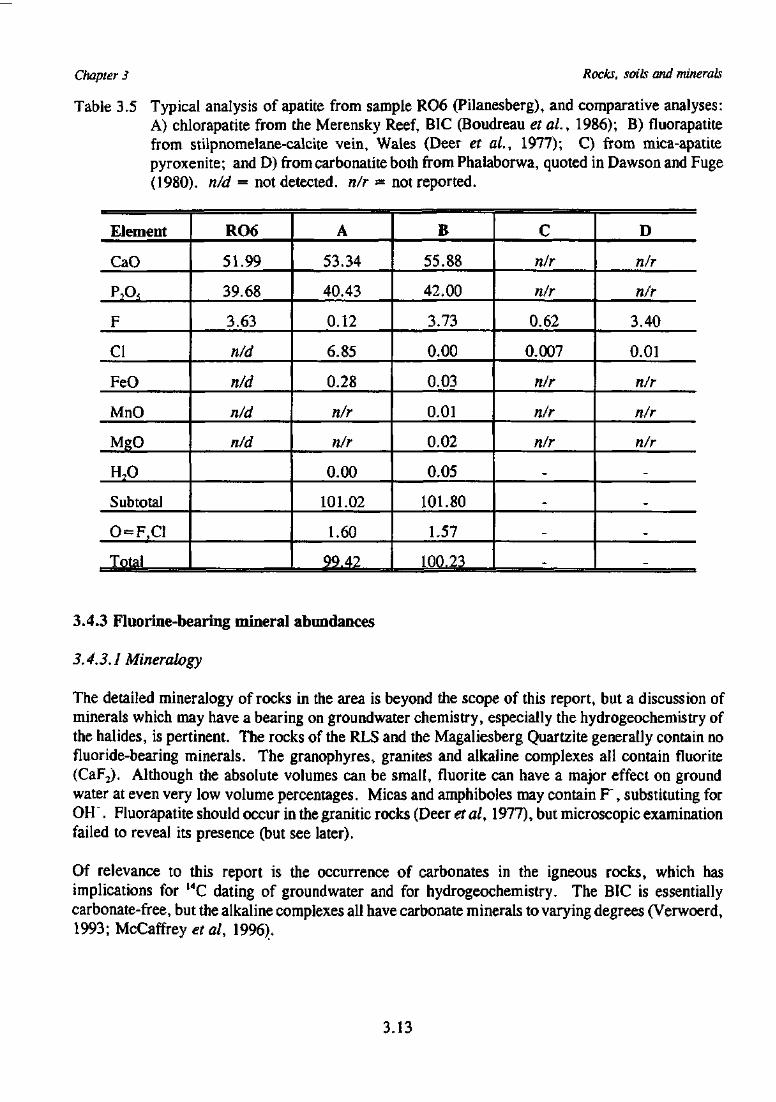
Chapter 3 Rocks, soils and minerals
Table 3.5 Typical analysis of apatite from sample RO6 (Pilanesberg), and comparative analyses:A) chlorapatite from the Merensky Reef, BIC (Boudreau etal., 1986); B) fluorapatitefrom stilpnomelane-calcite vein, Wales (Deer et al., 1977); C) from mica-apatitepyroxenite; and D) from carbonatite both from Phalaborwa, quoted in Dawson and Fuge(1980). n/d = not detected, n/r = not reported.
Element
CaO
P,O<
F
Cl
FeO
MnO
MgO
H7O
Subtotal
O=F,CI
Total
RO6
51.99
39.68
3.63
n/d
n/d
n/d
n/d
A
53.34
40.43
0.12
6.85
0.28
n/r
n/r
0.00
101.02
1.60
99.42
B
55.88
42.00
3.73
0.00
0.03
0.01
0.02
0.05
101.80
1.57
100.23
C
n/r
n/r
0.62
0.007
n/r
n/r
n/r
_
_
-
D
n/r
n/r
3.40
0.01
n/r
n/r
n/r
_
_
_
_
3.4.3 Fluorine-bearing mineral abundances
3.4.3.1 Mineralogy
The detailed mineralogy of rocks in the area is beyond the scope of this report, but a discussion ofminerals which may have a bearing on groundwater chemistry, especially the hydrogeochemistry ofthe halides, is pertinent. The rocks of the RLS and the Magaliesberg Quartzite generally contain nofluoride-bearing minerals. The granophyres, granites and alkaline complexes all contain fluorite(CaF2). Although the absolute volumes can be small, fluorite can have a major effect on groundwater at even very low volume percentages. Micas and amphiboles may contain F", substituting forOH . Fluorapatite should occur in the granitic rocks (Deer et al, 1977), but microscopic examinationfailed to reveal its presence (but see later).
Of relevance to this report is the occurrence of carbonates in the igneous rocks, which hasimplications for l4C dating of groundwater and for hydrogeochemistry. The BIC is essentiallycarbonate-free, but the alkaline complexes all have carbonate minerals to varying degrees (Verwoerd,1993; McCaffrey etal, 1996).
3.13
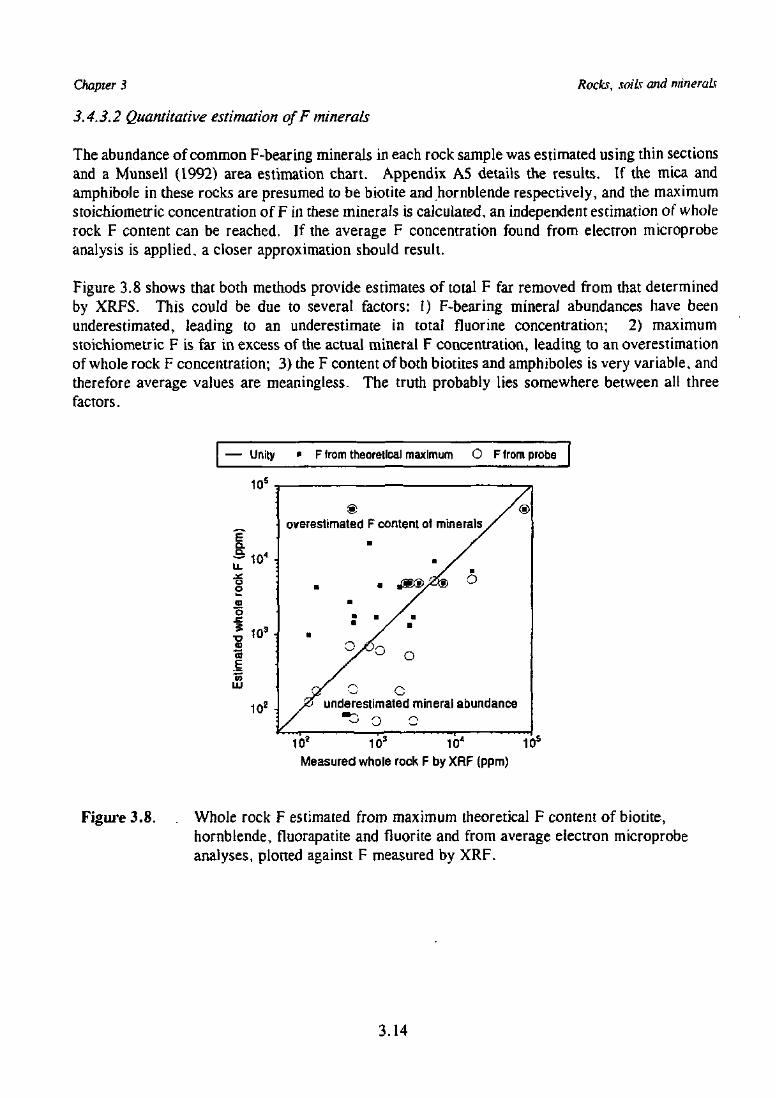
Chapter 3
3.4.3.2 Quantitative estimation ofF minerals
Rocks, soils and minerals
The abundance of common F-bearing minerals in each rock sample was estimated using thin sectionsand a Munsell (1992) area estimation chart. Appendix A5 details the results. If the mica andamphibole in these rocks are presumed to be biotite and hornblende respectively, and the maximumstoichiometric concentration of F in these minerals is calculated, an independent estimation of wholerock F content can be reached. If the average F concentration found from electron microprobeanalysis is applied, a closer approximation should result.
Figure 3.8 shows that both methods provide estimates of total F far removed from that determinedby XRFS. This could be due to several factors: 1) F-bearing mineral abundances have beenunderestimated, leading to an underestimate in total fluorine concentration; 2) maximumstoichiometric F is far in excess of the actual mineral F concentration, leading to an overestimationof whole rock F concentration; 3) the F content of both biotites and amphiboles is very variable, andtherefore average values are meaningless. The truth probably lies somewhere between all threefactors.
—
CL
uo<D
o
<U"5.E"55LU
Unity
10s
10 4 :
103-
10z -
« F from theoretical maximum O F from probe
overestimated F content oi minerals /
u• >
• j /
• • / •
/
or o cyK underestimated mineral
//
/
0
abundance
02 103 10*
Measured whole rock F by XRF (ppm)10s
Figure 3.8. . Whole rock F estimated from maximum theoretical F content of biotite,hornblende, fluorapatite and fluorite and from average electron microprobeanalyses, plotted against F measured by XRF.
3.14
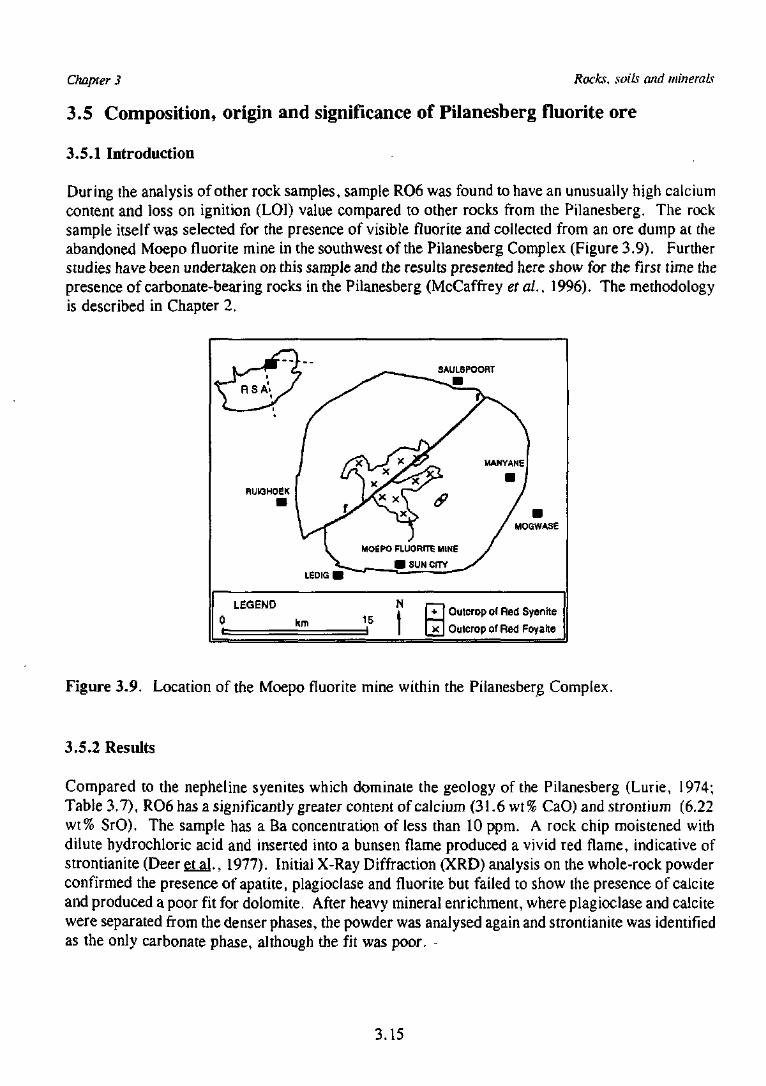
Chapter 3 Rocks, soils and minerals
3.5 Composition, origin and significance of Pilanesberg fluorite ore
3.5.1 Introduction
During the analysis of other rock samples, sample RO6 was found to have an unusually high calciumcontent and loss on ignition (LOI) value compared to other rocks from the Pilanesberg. The rocksample itself was selected for the presence of visible fluorite and collected from an ore dump at theabandoned Moepo fluorite mine in the southwest of the Pilanesberg Complex (Figure 3.9). Furtherstudies have been undertaken on this sample and the results presented here show for the first time thepresence of carbonate-bearing rocks in the Pilanesberg (McCaffrey et at., 1996). The methodologyis described in Chapter 2.
FtLJIQHOEK
LEGEND
0
}"
tV
LEDIG •
km
SAULSPOORT
v'y^ MANYANE
1
^ /
/ MOGWASG
MO6PO FLUORITE MINE /
^ _j_ • SUN CHY __,/
N
^ t | •*• f Outcrop of Red Syenite
[ x | Outcrop of Red Foyaite
Figure 3.9. Location of the Moepo fluorite mine within the Pilanesberg Complex.
3.5.2 Results
Compared to the nepheline syenites which dominate the geology of the Pilanesberg (Lurie, 1974;Table 3.7), RO6 has a significantly greater content of calcium (31.6 wt% CaO) and strontium (6.22wt% SrO). The sample has a Ba concentration of less than 10 ppm. A rock chip moistened withdilute hydrochloric acid and inserted into a bunsen flame produced a vivid red flame, indicative ofstrontianite (Deer eLal., 1977). Initial X-Ray Diffraction (XRD) analysis on the whole-rock powderconfirmed the presence of apatite, plagioclase and fluorite but failed to show the presence of calciteand produced a poor fit for dolomite. After heavy mineral enrichment, where plagioclase and calcitewere separated from the denser phases, the powder was analysed again and strontianite was identifiedas the only carbonate phase, although the fit was poor. -
3.15
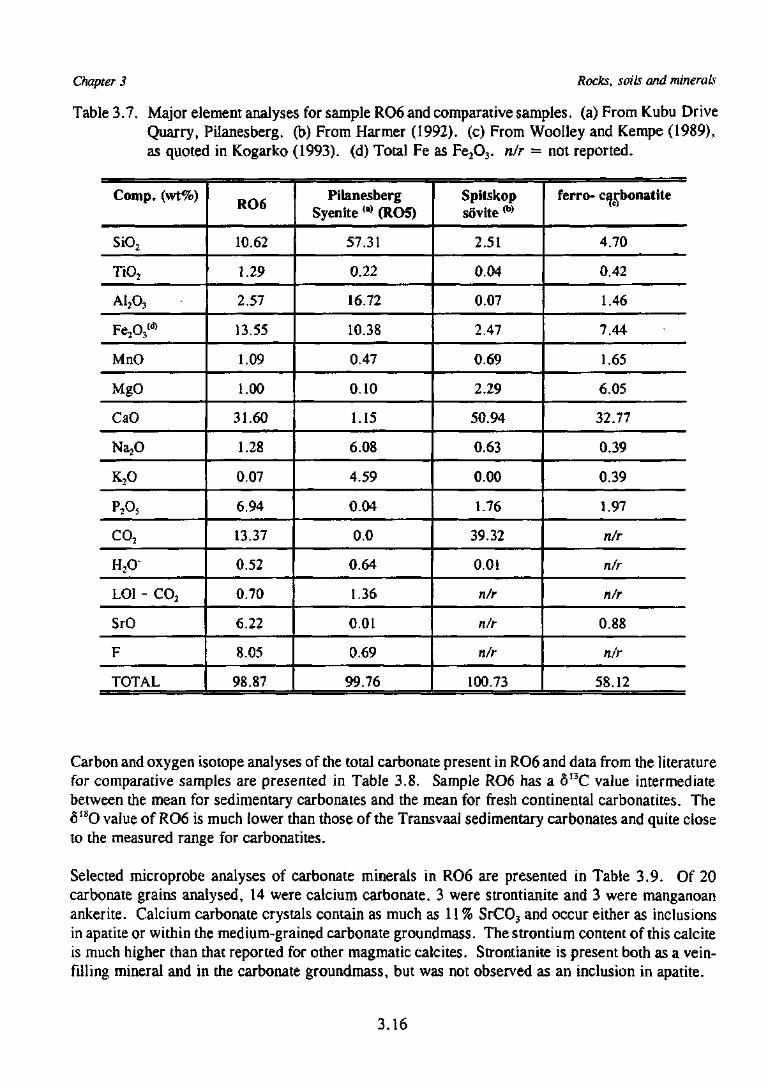
Chapter 3 Rocks, soils and minerals
Table 3.7. Major element analyses for sample R06 and comparative samples, (a) From Kubu DriveQuarry, Pilanesberg. (b) From Harmer (1992). (c) From Woolley and Kempe (1989),as quoted in Kogarko (1993). (d) Total Fe as Fe2O3. n/r — not reported.
Comp. (wt%)
SiO2
TiO2
AI3O3
Fe2O3(d)
MnO
MgO
CaO
Na^O
K,0
P,O5
CO,
H2O
LOI - CO2
SrO
F
TOTAL
RO6
10.62
1.29
2.57
13.55
1.09
1.00
31.60
1.28
0.07
6.94
13.37
0.52
0.70
6.22
8.05
98.87
PilanesbergSyenite <a) (RO5)
57.31
0.22
16.72
10.38
0.47
0.10
1.15
6.08
4.59
0.04
0.0
0.64
1.36
0.01
0.69
99.76
Spitskopsovite (b)
2.51
0.04
0.07
2.47
0.69
2.29
50.94
0.63
0.00
1.76
39.32
^ 0.01
n/r
n/r
n/r
100.73
ferro- carbonatite
4.70
0.42
1.46
7.44
1.65
6.05
32.77
0.39
0.39
1.97
n/r
n/r
n/r
0.88
n/r
58.12
Carbon and oxygen isotope analyses of the total carbonate present in RO6 and data from the literaturefor comparative samples are presented in Table 3.8. Sample RO6 has a 613C value intermediatebetween the mean for sedimentary carbonates and the mean for fresh continental carbonatites. The6S8O value of RO6 is much lower than those of the Transvaal sedimentary carbonates and quite closeto the measured range for carbonatites.
Selected microprobe analyses of carbonate minerals in RO6 are presented in Table 3.9. Of 20carbonate grains analysed, 14 were calcium carbonate. 3 were strontianite and 3 were manganoanankerite. Calcium carbonate crystals contain as much as 11 % SrCO3 and occur either as inclusionsin apatite or within the medium-grained carbonate groundmass. The strontium content of this calciteis much higher than that reported for other magmatic calcites. Strontianite is present both as a vein-filling mineral and in the carbonate groundmass, but was not observed as an inclusion in apatite.
3.16
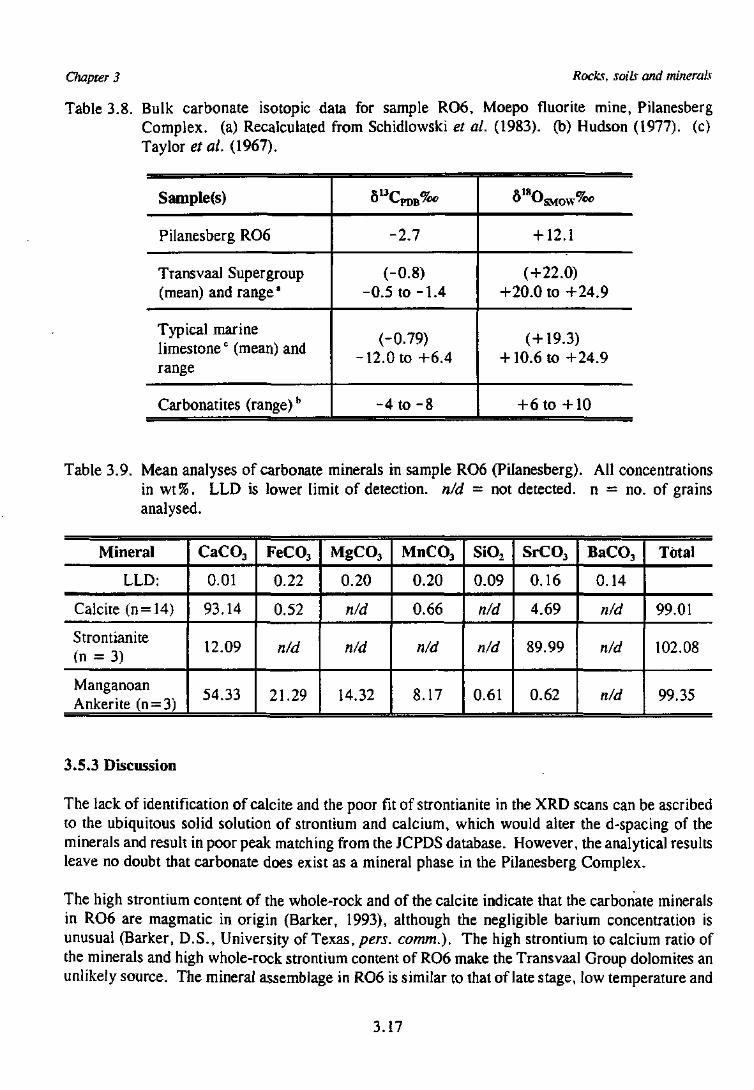
Chapter 3 Rocks, soils and minerals
Table 3.8. Bulk carbonate isotopic data for sample R06, Moepo fluorite mine, PilanesbergComplex, (a) Recalculated from Schidlowski et al. (1983). (b) Hudson (1977). (c)Taylor et al. (1967).
Sample(s)
Pilanesberg RO6
Transvaal Supergroup(mean) and range"
Typical marinelimestonec (mean) andrange
Carbonatites (range)b
-2.7
(-0.8)-0.5 to-1 .4
(-0.79)-12.0 to +6.4
-4 t o - 8
+ 12.1
(+22.0)+20.0 to +24.9
(+19.3)+ 10.6 to +24.9
+6 to +10
Table 3.9. Mean analyses of carbonate minerals in sample RO6 (Pilanesberg). All concentrationsin wt%. LLD is lower limit of detection, nld = not detected, n = no. of grainsanalysed.
Mineral
LLD:
Calcite (n = 14)
Strontianite(n = 3)
ManganoanAnkerite (n = 3)
CaCO3
0.01
93.14
12.09
54.33
FeCO3
0.22
0.52
nld
21.29
MgCO3
0.20
nld
nld
14.32
MnCO3
0.20
0.66
nld
8.17
SiO2
0.09
nld
nld
0.61
SrCO3
0.16
4.69
89.99
0.62
BaCO3
0.14
nld
nld
nld
Total
99.01
102.08
99.35
3.5.3 Discussion
The lack of identification of calcite and the poor fit of strontianite in the XRD scans can be ascribedto the ubiquitous solid solution of strontium and calcium, which would alter the d-spacing of theminerals and result in poor peak matching from the JCPDS database. However, the analytical resultsleave no doubt that carbonate does exist as a mineral phase in the Pilanesberg Complex.
The high strontium content of the whole-rock and of the calcite indicate that the carbonate mineralsin RO6 are magmatic in origin (Barker, 1993), although the negligible barium concentration isunusual (Barker, D.S., University of Texas, pen. comm.). The high strontium to calcium ratio ofthe minerals and high whole-rock strontium content of RO6 make the Transvaal Group dolomites anunlikely source. The mineral assemblage in RO6 is similar to that of late stage, low temperature and
3.17
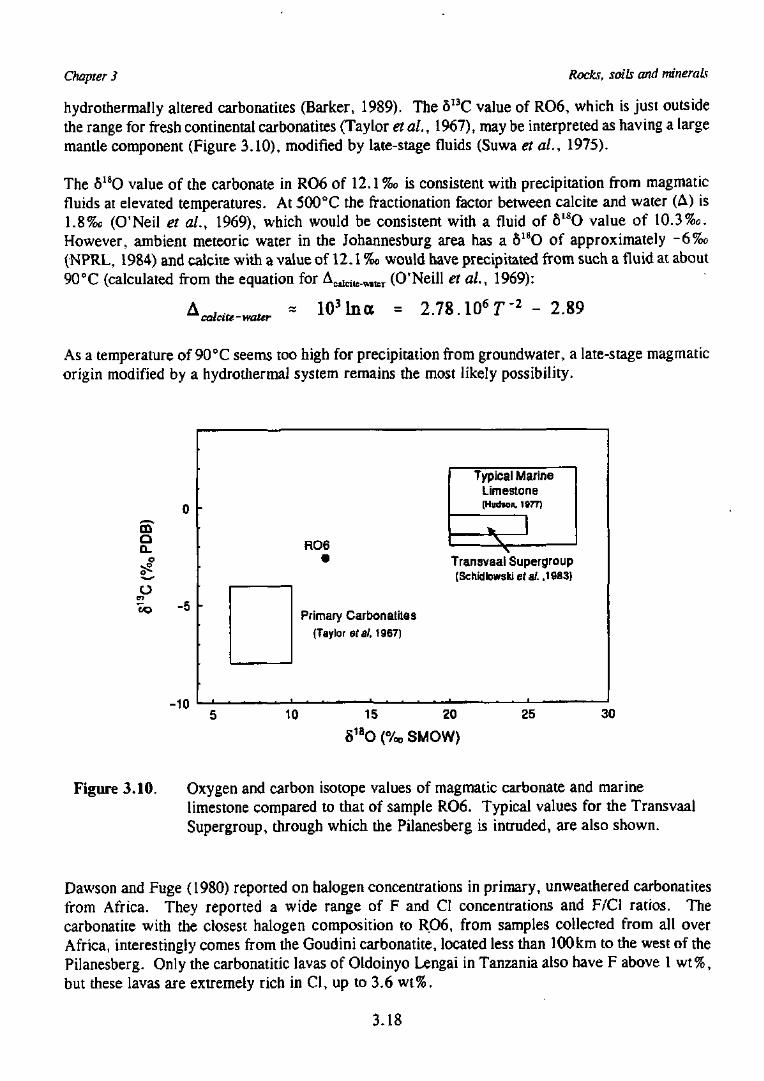
Chapter 3 Rocks, soils and minerals
hydrothermally altered carbonatites (Barker, 1989). The 5I3C value of R06, which is just outsidethe range for fresh continental carbonatites (Taylor etal., 1967), may be interpreted as having a largemantle component (Figure 3.10), modified by late-stage fluids (Suwa et al., 1975).
The 818O value of the carbonate in RO6 of 12.1 %0 is consistent with precipitation from magmaticfluids at elevated temperatures. At 500°C the fractionation factor between caicite and water (A) is1.8%o (O'Neil et al., 1969), which would be consistent with a fluid of 818O value of 10.3%c.However, ambient meteoric water in the Johannesburg area has a 818O of approximately -6%o(NPRL, 1984) and caicite with a value of 12.1 %c would have precipitated from such a fluid at about90°C (calculated from the equation for AeaBito.wa (O'Neill et al., 1969):
- 2.78.10T-2-2.89
As a temperature of 90 °C seems too high for precipitation from groundwater, a late-stage magmaticorigin modified by a hydrothermal system remains the most likely possibility.
0 •
aa.
o
o-5 -
-10
*
R06
Primary Carbonatites{Taylor et al, 1967)
Typical MarineLimestone(Hudson, 1S77)
. IV\
Transvaal Supergroup(Schidlowskiefa/. ,1983)
10 15 20
51BO (%, SMOW)
25 30
Figure 3.10. Oxygen and carbon isotope values of magmatic carbonate and marinelimestone compared to that of sample RO6. Typical values for the TransvaalSupergroup, through which the Pilanesberg is intruded, are also shown.
Dawson and Fuge (1980) reported on halogen concentrations in primary, unweathered carbonatitesfrom Africa. They reported a wide range of F and Cl concentrations and F/Cl ratios. Thecarbonatite with the closest halogen composition to RO6, from samples collected from all overAfrica, interestingly comes from the Goudini carbonatite, located less than 100 km to the west of thePilanesberg. Only the carbonatitic lavas of Oldoinyo Lengai in Tanzania also have F above 1 wt%,but these lavas are extremely rich in Cl, up to 3.6 wt%.
3.18
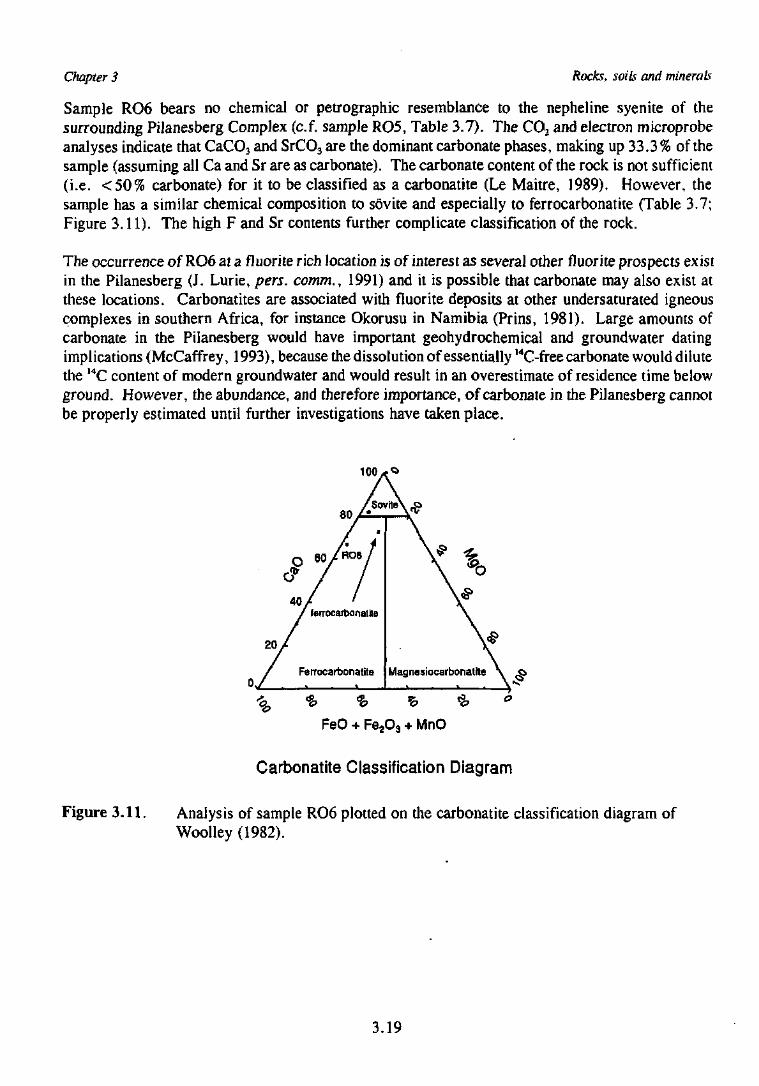
Chapter 3 Rocks, soils and minerah
Sample RO6 bears no chemical or petrographic resemblance to the nepheline syenite of thesurrounding Pilanesberg Complex (c.f, sample RO5, Table 3.7). The CO2 and electron microprobeanalyses indicate that CaCO3 and SrCO3 are the dominant carbonate phases, making up 33.3 % of thesample (assuming all Ca and Sr are as carbonate). The carbonate content of the rock is not sufficient(i.e. <50% carbonate) for it to be classified as a carbonatite (Le Maitre, 1989). However, thesample has a similar chemical composition to sovite and especially to ferrocarbonatite (Table 3.7;Figure 3.11). The high F and Sr contents further complicate classification of the rock.
The occurrence of RO6 at a fluorite rich location is of interest as several other fluorite prospects existin the Pilanesberg (J. Lurie, pen. comm., 1991) and it is possible that carbonate may also exist atthese locations. Carbonatites are associated with fluorite deposits at other undersaturated igneouscomplexes in southern Africa, for instance Okorusu in Namibia (Prins, 1981). Large amounts ofcarbonate in the Pilanesberg would have important geohydrochemical and groundwater datingimplications (McCaffrey, 1993), because the dissolution of essentially I4C-free carbonate would dilutethe l4C content of modern groundwater and would result in an overestimate of residence time belowground. However, the abundance, and therefore importance, of carbonate in the Pilanesberg cannotbe properly estimated until further investigations have taken place.
FeO + Fe2O3 + MnO
Carbonatite Classification Diagram
Figure 3.11. Analysis of sample RO6 plotted on the carbonatite classification diagram ofWoolley (1982).
3.19
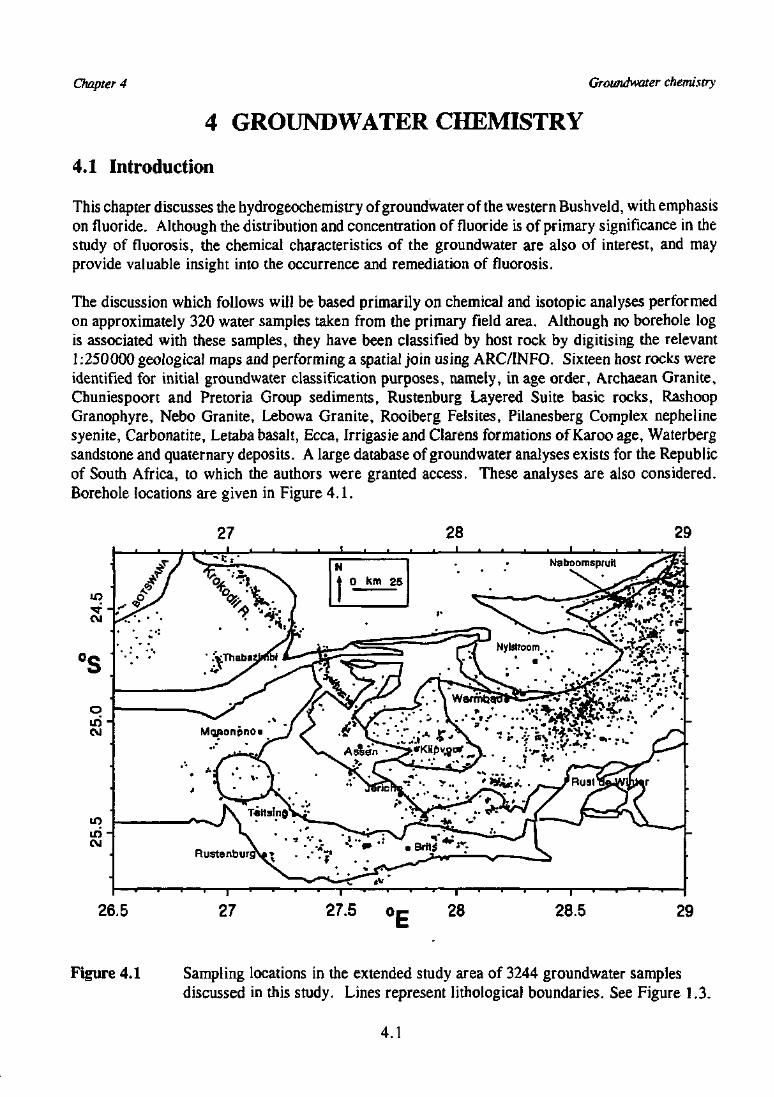
Chapter 4 Groundwater chemistry
4 GROUNDWATER CHEMISTRY
4.1 Introduction
This chapter discusses the hydrogeochemistry of groundwater of the western Bushveld, with emphasison fluoride. Although the distribution and concentration of fluoride is of primary significance in thestudy of fluorosis, the chemical characteristics of the groundwater are also of interest, and mayprovide valuable insight into the occurrence and remediation of fluorosis.
The discussion which follows will be based primarily on chemical and isotopic analyses performedon approximately 320 water samples taken from the primary field area. Although no borehole logis associated with these samples, they have been classified by host rock by digitising the relevant1:250000 geological maps and performing a spatial join using ARC/INFO. Sixteen host rocks wereidentified for initial groundwater classification purposes, namely, in age order, Archaean Granite,Chuniespoort and Pretoria Group sediments, Rustenburg Layered Suite basic rocks, RashoopGranophyre, Nebo Granite, Lebowa Granite, Rooiberg Felsites, Pilanesberg Complex nephelinesyenite, Carbonatite, Letaba basalt, Ecca, Irrigasie and Clarens formations of Karoo age, Waterbergsandstone and quaternary deposits. A large database of groundwater analyses exists for the Republicof South Africa, to which the authors were granted access. These analyses are also considered.Borehole locations are given in Figure 4.1.
in
Oin
toiriCM
26.5
Figure 4.1 Sampling locations in the extended study area of 3244 groundwater samplesdiscussed in this study. Lines represent Iithological boundaries. See Figure 1.3.
4.1
Chapter 4 Groundwater chemistry
4.2 Previous work
Bond (1947) undertook a major survey of groundwater chemistry in the Union of South Africa, andgenerally described groundwaters based on their host lithology. He noted that groundwaters fromthe Bushveld granites and felsites and from the Pilanesberg have similar chemical characteristics,although the granites and felsites have appreciably higher Cl concentrations than the Pilanesbergrocks. He presented 10 rock analyses and noted the high alkali content of the aforementionedlithologies. He asserted that high F is present in Pilanesberg groundwater as NaF. He conjecturedthat the water from the Warmbaths spring is magmatic in origin. He also compared the water of thePretoria Saltpan (PSP) crater with that in the surrounding rocks. The PSP water has similar ionicproportions to that of the country rocks, apart from the readily precipitated Ca, Mg and Si, but hasa greatly increased concentration overall, which he ascribed to evaporation of inflowing groundwaterfrom the Nebo Granite. Bond could find no fluorite in his rock samples and so ascribed F ingroundwater to the dissolution of apatite.
McCaffrey (1993) studied the hydrochemistry of major, trace, lanthanide and actinide elements, aswell as stable and radioactive environmental isotopes in the Pilanesberg Complex. It was postulatedthat two different water types exist in the complex, one with a long residence time and very highfluoride concentrations, the other with a shorter residence time and moderately elevated fluoridevalues.
4.3 This work
The results of the analyses obtained in this work are described element by element, with referenceto the host lithology where features of significance exist. The analyses have been divided into majoranions and cations, trace elements and isotopes. The results are discussed also in relation to the latestrecommended health guidelines for drinking water in South Africa (Table 4.1).
4.4 Physico-chemical parameters
A key to the abbreviations of the sixteen lithologies used in many of the following diagrams is givenin Figure 4.2.
4.4.1 Electrical Conductivity (EC) and Total Dissolved Solids (TDS)
EC and TDS are highly correlated (Figure 4.3), as is to be expected from electrochemical theory.Groundwater from the carbonatites has the highest mean EC, whilst the Archaean Granite, NeboGranite, Chuniespoort Group and Irrigasie formation have very high maximum EC. No lithologyhas a mean value above the low risk limit, but most have maximum EC values well above the highrisk limit (Figure 4.4). Apart from a sample from the Pretoria Saltpan, no brines (TDS > 10g/l) weresampled.
4.2
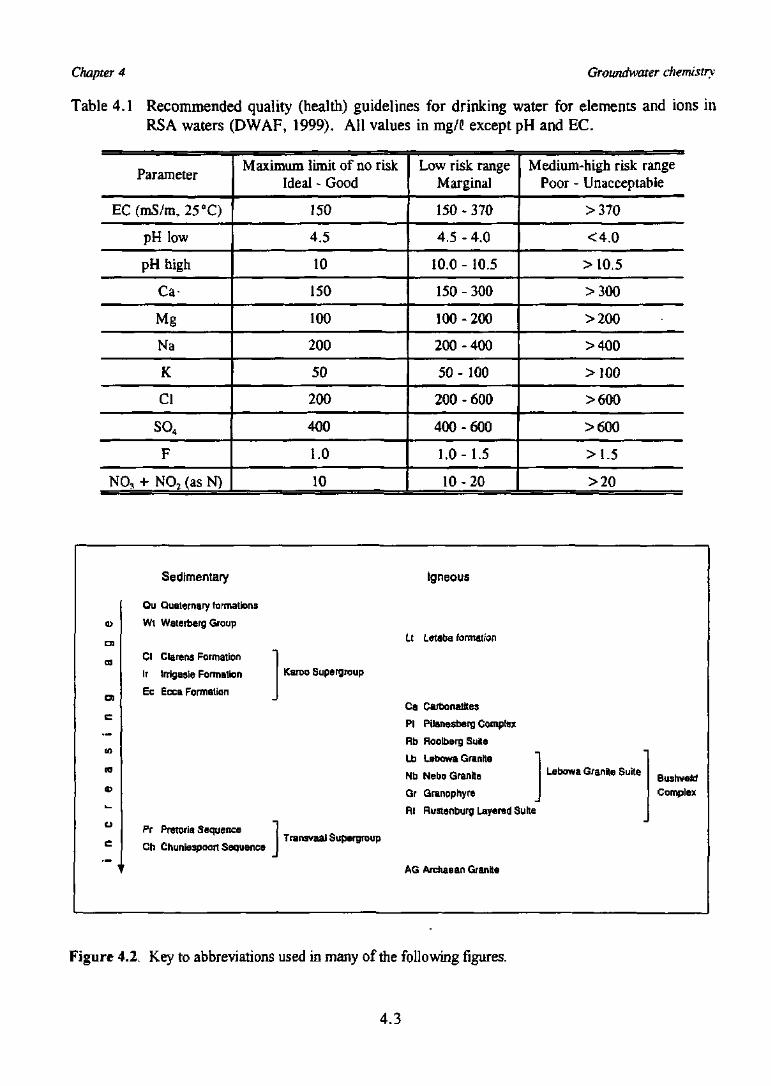
Chapter 4 Groundwater chemistry
Table 4.1 Recommended quality (health) guidelines for drinking water for elements and ions inRSA waters (DWAF, 1999). All values in rng/C except pH and EC.
Parameter
EC (mS/m, 25 °C)
pH low
pH high
Ca
Mg
Na
K
Cl
so4F
N03 + NO2 (as N)
Maximum limit of no riskIdeal - Good
150
4.5
10
150
100
200
50
200
400
i.O
10
Low risk rangeMarginal
150 - 370
4.5-4.0
10.0 - 10.5
150 - 300
100 - 200
200 - 400
50 - 100
200 - 600
400 - 600
1.0- 1.5
10-20
Medium-high risk rangePoor - Unacceptable
>370
<4.0
> 10.5
>300
>200
>400
>I00
>600
>600
>1.5
>20
o
en
to
ex
tn
CO
u
Sedimentary
Qu Quaternary formations
Wt Waterberg Group
Cl Clarens Formation
Ir Irrigasie Formation
Ec Ecca Formation
Karoo Supergroup
Pr Pretoria Sequence
Ch Chuniespoort SequenceTransvaal Supergroup
Igneous
Lt Letaba formation
Ca Carbonalites
PI Pilanesberg Complex
Rb Roolberg Suite
Lb Lebowa Granite
Nb Nebo Granite
Or Granophyre
Rl Rustenburg Layered Suite
AG Archaean Granite
Lebowa Granite SuiteBushveU
Complex
Figure 4.2. Key to abbreviations used in many of the following figures.
4.3
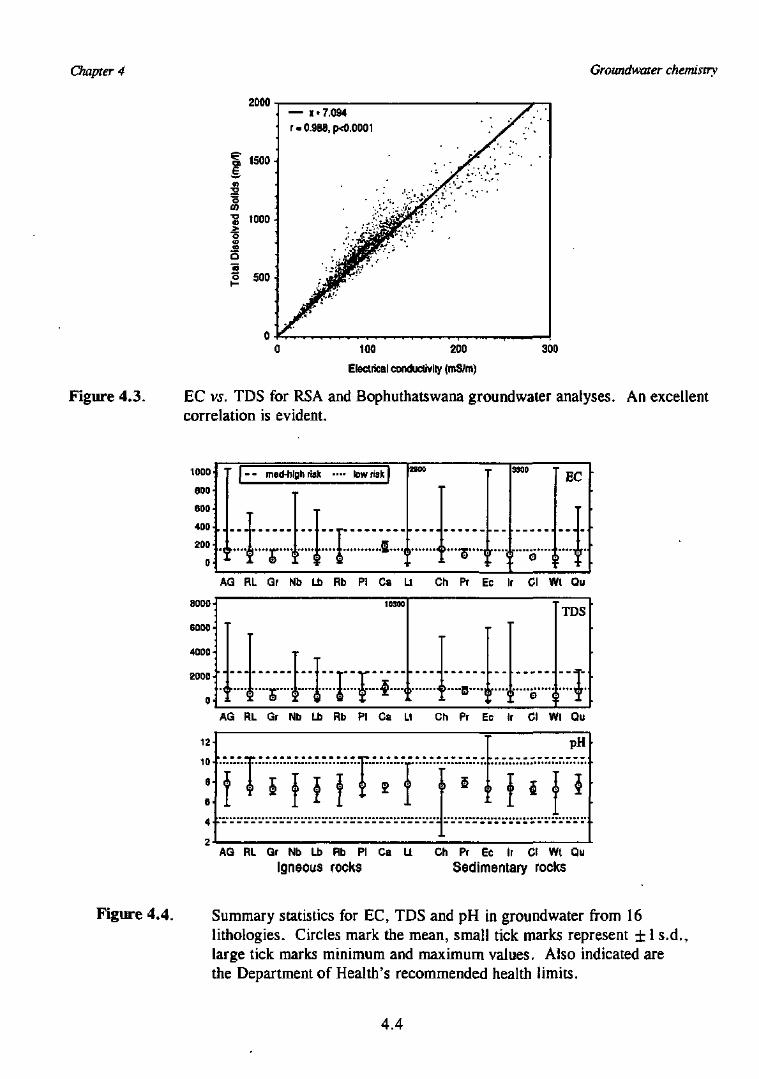
Chapter 4 Groundwater chemistry
2
led
So
lids
(iow(Q
Q
Tota
l
1500-
tooo-
500-
0-
— X'7.094 . X \r = 0.988, fx0.0001 ' '/'•'•>
• • . ' .
••' • ' / i s
100 200
Electrical conductivity (rnS/m)
300
Figure 4.3. EC vs. TDS for RSA and Bophuthatswana groundwater analyses. An excellentcorrelation is evident.
1000
eoo
600
400
200
0•*±—-t •»—o
3390EC
8000-
6D00-
4000-
2000-
0-
AG RL Gr Nb Lb Rb PI Ca Lt Ch Pr Ec Ir Cl Wt Qu
10300
I-T-.-^T r x
TDS
^...fl....^...^....g....J....J..AG RL Gr Nb Lb Rb PI Ca LI Ch Pr Ec Ir Cl Wt Qu
12-
10
6
e i 2 fpH
i I I
AG RL Gr Nb Lb Rb PI Ca Lt Ch Pr Ec Ir Cl Wt Qu
Igneous rocks Sedimentary rocks
Figure 4.4. Summary statistics for EC, TDS and pH in groundwater from 16lithologies. Circles mark the mean, small tick marks represent ± 1 s.d.,large tick marks minimum and maximum values. Also indicated arethe Department of Health's recommended health limits.
4.4
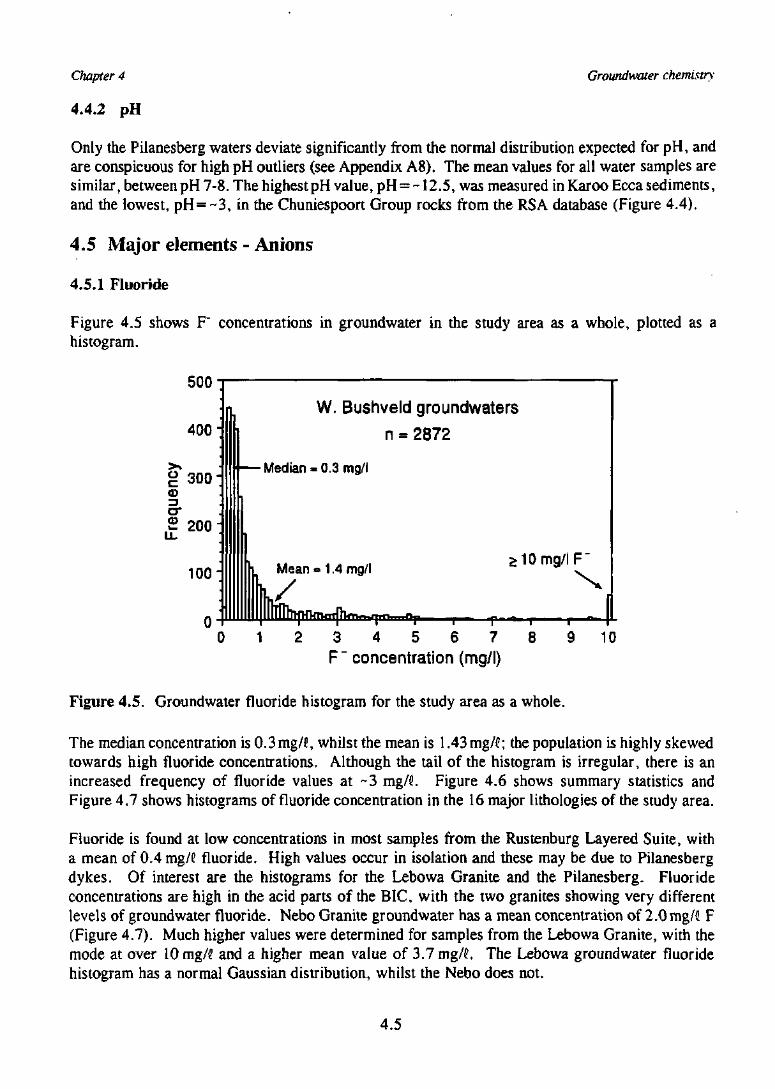
Chapter 4
4.4.2 pH
Groimdwater chemistry
Only the Pilanesberg waters deviate significantly from the normal distribution expected for pH, andare conspicuous for high pH outliers (see Appendix A8). The mean values for all water samples aresimilar, between pH 7-8. The highest pH value, pH = ~12.5, was measured in Karoo Ecca sediments,and the lowest, pH = ~3, in the Chuniespoort Group rocks from the RSA database (Figure 4.4).
4.5 Major elements - Anions
4.5.1 Fluoride
Figure 4.5 shows F' concentrations in groundwater in the study area as a whole, plotted as ahistogram.
500
400:
£ 300"o
| " 2 0 0 -
100 :
W. Bushveld ground waters
n = 2872
' Median = 0.3 mg/l
Mean = 1.4 mg/l> 10 mg/l F"
3 4 5 6 7 8F" concentration (mg/l)
10
Figure 4.5. Groundwater fluoride histogram for the study area as a whole.
The median concentration is 0.3mg/(!, whilst the mean is 1.43mg/C; the population is highly skewedtowards high fluoride concentrations. Although the tail of the histogram is irregular, there is anincreased frequency of fluoride values at ~3 mg/S. Figure 4.6 shows summary statistics andFigure 4.7 shows histograms of fluoride concentration in the 16 major lithologies of the study area.
Fluoride is found at low concentrations in most samples from the Rustenburg Layered Suite, witha mean of 0.4 mg/f fluoride. High values occur in isolation and these may be due to Pilanesbergdykes. Of interest are the histograms for the Lebowa Granite and the Pilanesberg. Fluorideconcentrations are high in the acid parts of the BIC, with the two granites showing very differentlevels of groundwater fluoride. Nebo Granite groundwater has a mean concentration of 2.0 mg/5 F(Figure 4.7). Much higher values were determined for samples from the Lebowa Granite, with themode at over 10 mg/5 and a higher mean value of 3.7 mg/(L The Lebowa groundwater fluoridehistogram has a normal Gaussian distribution, whilst the Nebo does not.
4.5
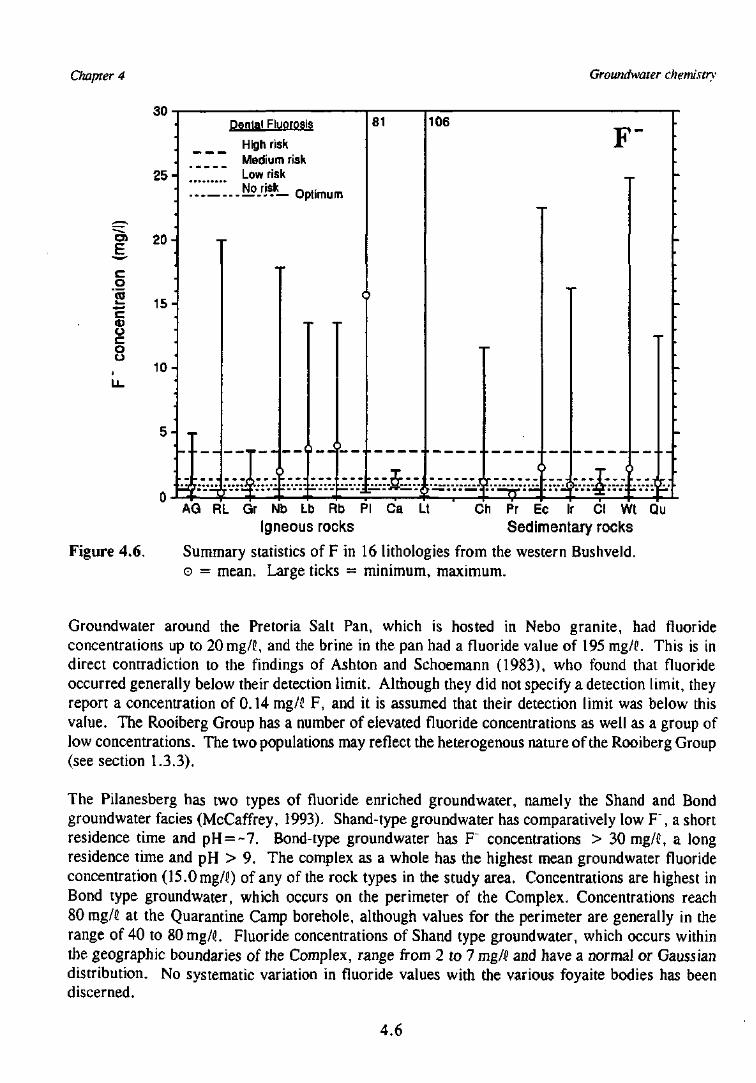
Chapter 4 Groundwater chemistry
en
Eoto
uuou
ow -
25 -
20-
15-
10 -
5-
0 -
P^Oifl' FJyorosis
High risk_ _ ~_ _ Medium risk
Low risk
Np/Js.k_ optimum
i^
(
s
81 106
F
j r . . . . . . . . . . . .
•
-
-
-
-
T.:
Figure 4.6.
AG RL Gr Nb Lb Rb PI Ca Lt Ch Pr Ec Ir Cl Wl
Igneous rocks Sedimentary rocks
Summary statistics of F in 16 lithologies from the western Bushveld.o = mean. Large ticks = minimum, maximum.
Qu
Groundwater around the Pretoria Salt Pan, which is hosted in Nebo granite, had fluorideconcentrations up to 20 mg/d, and the brine in the pan had a fluoride value of 195 mg/d. This is indirect contradiction to the findings of Ashton and Schoemann (1983), who found that fluorideoccurred generally below their detection limit. Although they did not specify a detection limit, theyreport a concentration of 0.14 mg/l! F, and it is assumed that their detection limit was below thisvalue. The Rooiberg Group has a number of elevated fluoride concentrations as well as a group oflow concentrations. The two populations may reflect the heterogenous nature of the Rooiberg Group(see section 1.3.3).
The Pilanesberg has two types of fluoride enriched groundwater, namely the Shand and Bondgroundwater facies (McCaffrey, 1993). Shand-type groundwater has comparatively low F", a shortresidence time and pH = ~7. Bond-type groundwater has F' concentrations > 30 mg/C, a longresidence time and pH > 9. The complex as a whole has the highest mean groundwater fluorideconcentration (15.0 mg/J) of any of the rock types in the study area. Concentrations are highest inBond type groundwater, which occurs on the perimeter of the Complex. Concentrations reach80 mg/e at the Quarantine Camp borehole, although values for the perimeter are generally in therange of 40 to 8Omg/5. Fluoride concentrations of Shand type groundwater, which occurs withinthe geographic boundaries of the Complex, range from 2 to 7 mg/H and have a normal or Gaussiandistribution. No systematic variation in fluoride values with the various foyaite bodies has beendiscerned.
4.6
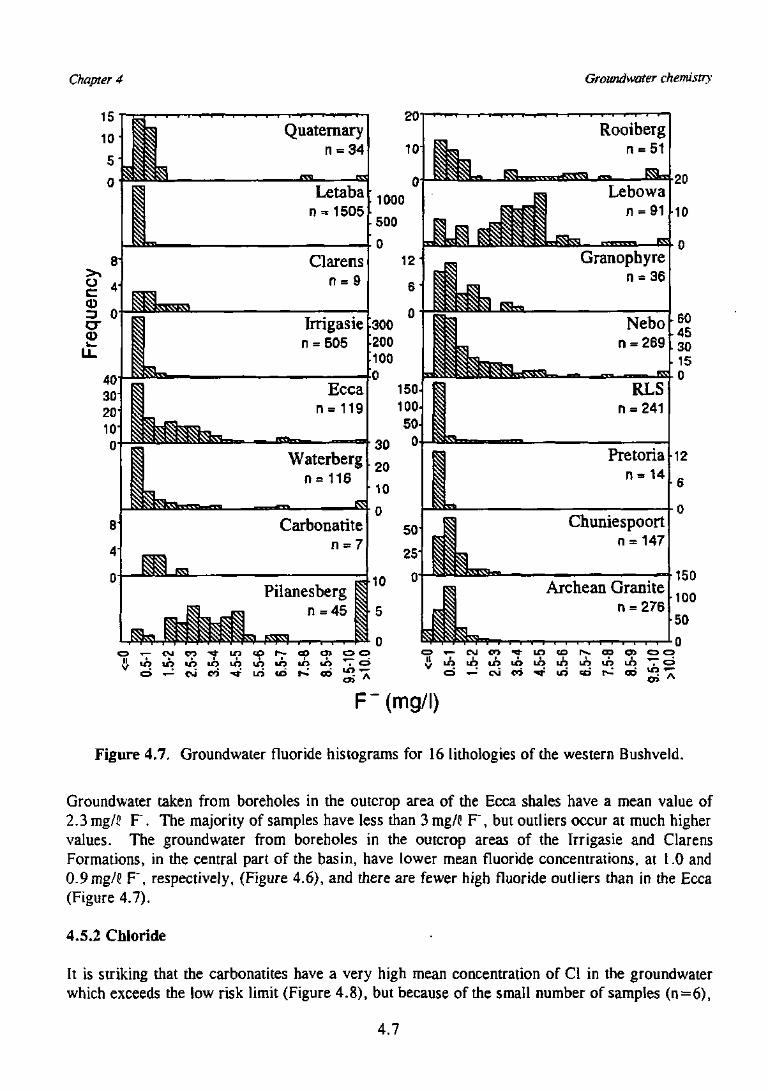
Chapter 4 Groundwater chemistry
15
10
5
0
<D
403020100
Quaternaryn = 34
Letaban = 15O5
S wJSJSK^—
Clarensn = 9
LIrrigasien = 505
Eccan = 119
Waterberg
Carbonatite
Pilanesbergn = 45 r
: A
Chuniespoort= 147
Archean Granite= 276
F"(mg/I)
Figure 4.7. Groundwater fluoride histograms for 16 lithologies of the western Bushveld.
Groundwater taken from boreholes in the outcrop area of the Ecca shales have a mean value of2.3 mg/0 F . The majority of samples have less than 3 mg/5 F , but outliers occur at much highervalues. The groundwater from boreholes in the outcrop areas of the Irrigasie and ClarensFormations, in the central part of the basin, have lower mean fluoride concentrations, at 1.0 and0.9mg/G F", respectively, (Figure 4.6), and there are fewer high fluoride outliers than in the Ecca(Figure 4.7).
4.5.2 Chloride
It is striking that the carbonatites have a very high mean concentration of Cl in the groundwaterwhich exceeds the low risk limit (Figure 4.8), but because of the small number of samples (n = 6),
4.7
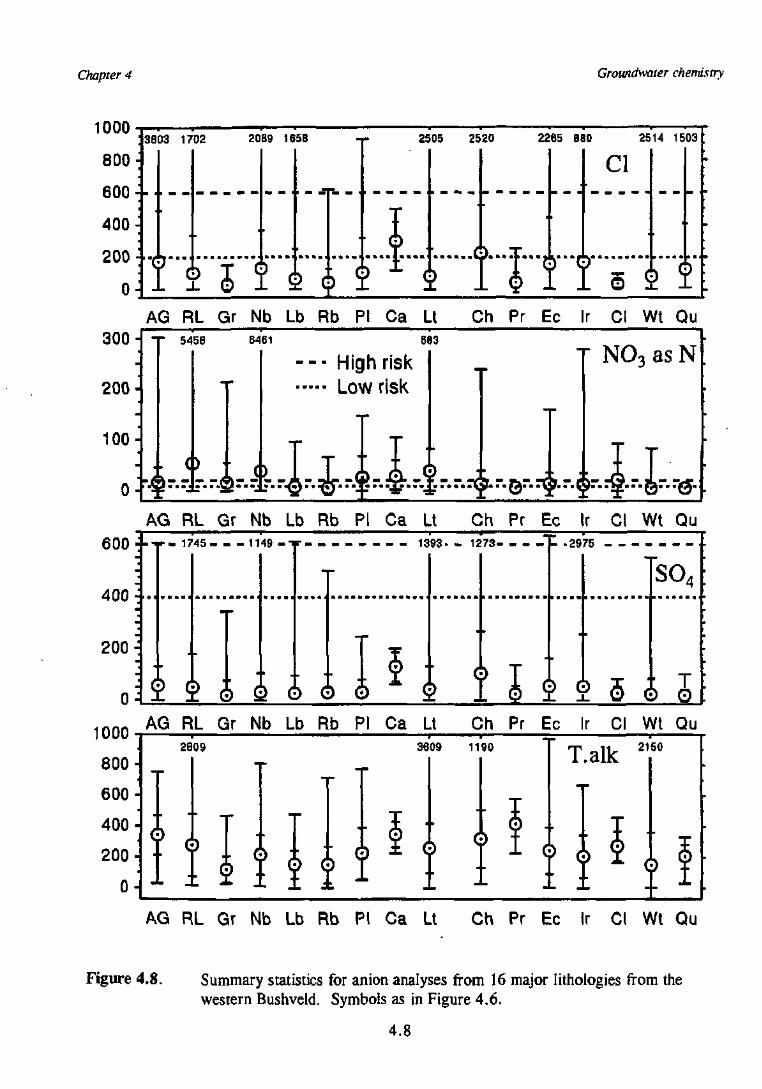
Chapter 4 Groundwater chemistry
1000
800-
600-I-
400 -j
200^
0 -
3803 1702 20B9 1658 2505 2520 2265 BBO 2514 1503
Cl
rrrrrnAG RL Gr Nb Lb Rb PI Ca Lt Ch Pr Ec Ir Cl Wt Qu
300-
200
100-
0-
X 5458 6461 6B3
-- High risk•••• Low risk
" ° " C) T T ) Jx <? • -I I•%^ * • • i • w m " > C 4 • • • ' * • • ^p\ * * * V * J ^ • * • • • • " j l j • • • j " • • • • * \ " y • • • f f l " • * \ fmmm C O w * • £ £ * " " p A • • • 4
NO3 as N
AG RL Gr Nb Lb Rb PI Ca Lt Ch Pr Ec Ir Ci Wt Qu
600 : -x- 1745
400-
200-
1393- - 1273- • 2975
1 U 9 5 i Q
SO,
AG RL Gr Nb Lb Rb PI Ca Lt Ch Pr Ec Ir Cl Wt Qu
AG RL Gr Nb Lb Rb PI Ca Lt Ch Pr Ec Ir Cl Wt Qu
Figure 4.8. Summary statistics for anion analyses from 16 major lithologies from thewestern Bushveld. Symbols as in Figure 4.6.
4.8
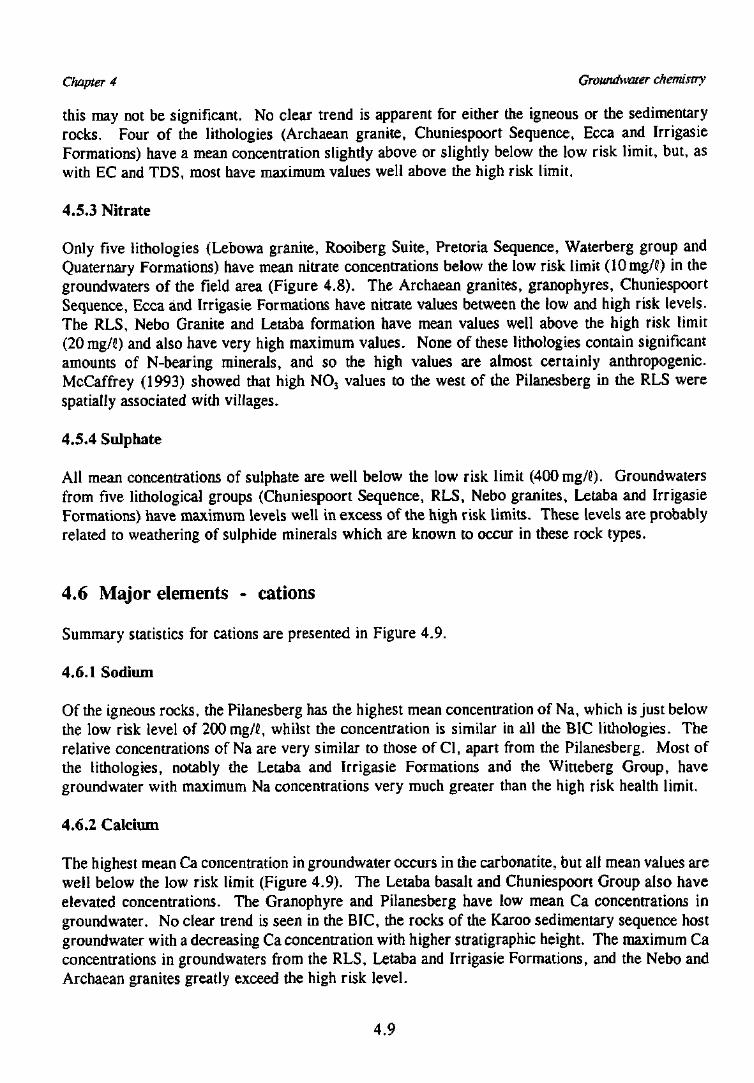
Chapter 4 Groundwater chemistry
this may not be significant. No clear trend is apparent for either the igneous or the sedimentaryrocks. Four of the lithologies (Archaean granite, Chuniespoort Sequence, Ecca and IrrigasieFormations) have a mean concentration slightly above or slightly below the low risk limit, but, aswith EC and TDS, most have maximum values well above the high risk limit.
4.5.3 Nitrate
Only five lithologies (Lebowa granite, Rooiberg Suite, Pretoria Sequence, Waterberg group andQuaternary Formations) have mean nitrate concentrations below the low risk limit (lOmg/d) in thegroundwaters of the field area (Figure 4.8). The Archaean granites, granophyres, ChuniespoortSequence, Ecca and Irrigasie Formations have nitrate values between the low and high risk levels.The RLS, Nebo Granite and Letaba formation have mean values well above the high risk limit(20 mg/fi) and also have very high maximum values. None of these lithologies contain significantamounts of N-bearing minerals, and so the high values are almost certainly anthropogenic.McCaffrey (1993) showed that high NO3 values to the west of the Pilanesberg in the RLS werespatially associated with villages.
4.5.4 Sulphate
All mean concentrations of sulphate are well below the low risk limit (400 mg/C)- Groundwatersfrom five lithological groups (Chuniespoort Sequence, RLS, Nebo granites, Letaba and IrrigasieFormations) have maximum levels well in excess of the high risk limits. These levels are probablyrelated to weathering of sulphide minerals which are known to occur in these rock types.
4.6 Major elements - cations
Summary statistics for cations are presented in Figure 4.9.
4.6.1 Sodium
Of the igneous rocks, the Pilanesberg has the highest mean concentration of Na, which is just belowthe low risk level of 200 mg/i, whilst the concentration is similar in all the BIC lithologies. Therelative concentrations of Na are very similar to those of Cl, apart from the Pilanesberg. Most ofthe Hthologies, notably the Letaba and Irrigasie Formations and the Witteberg Group, havegroundwater with maximum Na concentrations very much greater than the high risk health limit.
4.6.2 Calcium
The highest mean Ca concentration in groundwater occurs in the carbonatite, but all mean values arewell below the low risk limit (Figure 4.9). The Letaba basalt and Chuniespoort Group also haveelevated concentrations. The Granophyre and Pilanesberg have low mean Ca concentrations ingroundwater. No clear trend is seen in the BIC, the rocks of the Karoo sedimentary sequence hostgroundwater with a decreasing Ca concentration with higher stratigraphic height. The maximum Caconcentrations in groundwaters from the RLS, Letaba and Irrigasie Formations, and the Nebo andArchaean granites greatly exceed the high risk level.
4.9
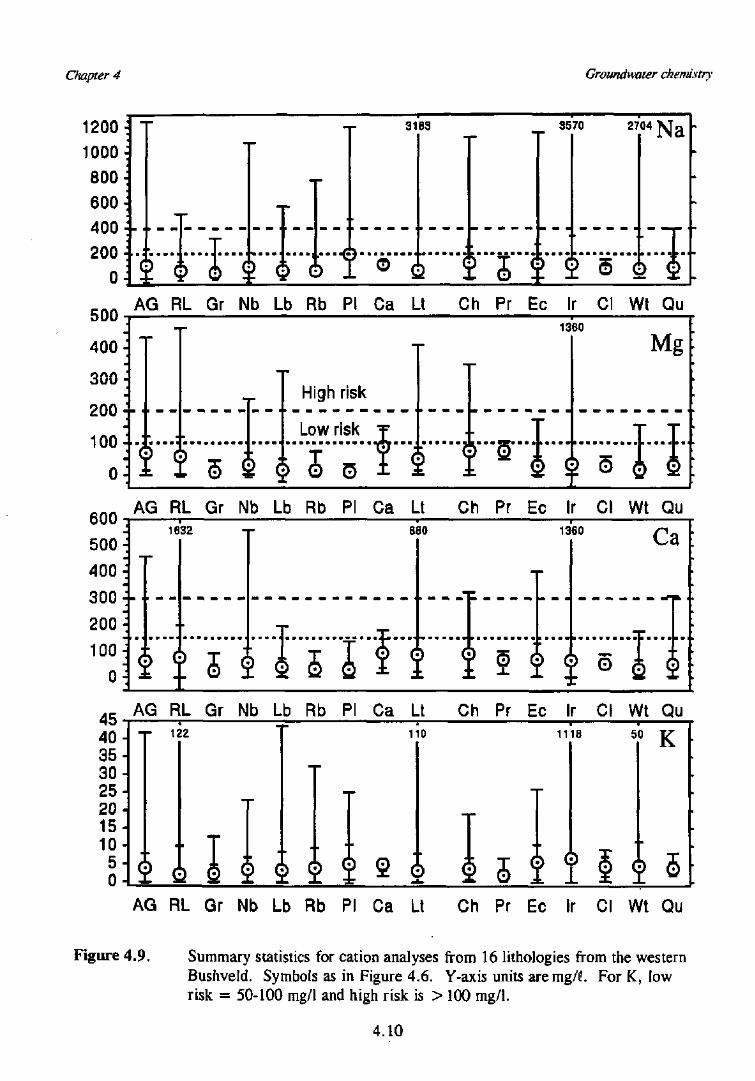
Chapter 4 Groundwater chemistry
120010008006004002000
500
400
300
200
100
0
6005004003002001000
454035302520151050
3163 3570 2704
* 4 • * • • • • • • m • • • • * • • • • • P • • # • n
2 S 2 2
Na
AG RL Gr Nb Lb Rb PI Ca Lt Ch Pr Ec Ir Cl Wt Qu1360
High risk
Low risk
5 AAG RL Gr Nb Lb Rb PI Ca Lt Ch Pr Ec Ir Cl Wt Qu
1632 8S0 1360
g t 5 s g s11 f g f g g
Ca
o
AG RL Gr Nb Lb Rb PI Ca Lt Ch Pr Ec Ir Ci Wt QuT 122 110 1118 50 K
g A A S S e S a S § 5 2 ! 1 g 5AG RL Gr Nb Lb Rb PI Ca Lt Ch Pr Ec Ir Cl Wt Qu
Figure 4.9. Summary statistics for cation analyses from 16 lithologies from the westernBushveld. Symbols as in Figure 4.6. Y-axis units aremg/0. For K, lowrisk = 50-100 mg/1 and high risk is > 100 mg/1.
4.10
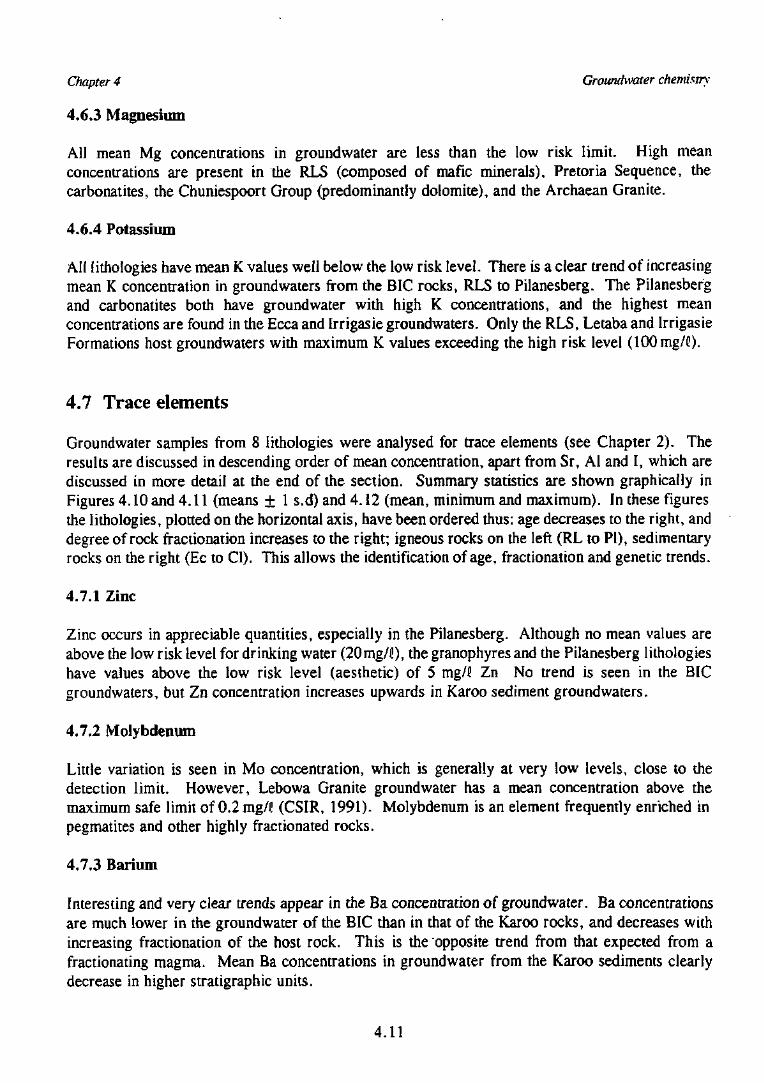
Chapter 4 Groundwater chemistry
4.6.3 Magnesium
All mean Mg concentrations in groundwater are less than the low risk limit. High meanconcentrations are present in the RLS (composed of mafic minerals), Pretoria Sequence, thecarbonatites, the Chuniespoort Group (predominantly dolomite), and the Archaean Granite.
4.6.4 Potassium
All lithologies have mean K values well below the low risk level. There is a clear trend of increasingmean K concentration in groundwaters from the BIC rocks, RLS to Pilanesberg. The Pilanesbergand carbonatites both have groundwater with high K concentrations, and the highest meanconcentrations are found in the Ecca and Irrigasie groundwaters. Only the RLS, Letaba and IrrigasieFormations host groundwaters with maximum K values exceeding the high risk level (lOOmg/d)-
4.7 Trace elements
Groundwater samples from 8 lithologies were analysed for trace elements (see Chapter 2). Theresults are discussed in descending order of mean concentration, apart from Sr, Al and I, which arediscussed in more detail at the end of the section. Summary statistics are shown graphically inFigures 4.10 and 4.11 (means ± 1 s.d) and 4.12 (mean, minimum and maximum). In these figuresthe lithologies, plotted on the horizontal axis, have been ordered thus: age decreases to the right, anddegree of rock fractionation increases to the right; igneous rocks on the left (RL to PI), sedimentaryrocks on the right (Ec to Cl). This allows the identification of age, fractionation and genetic trends.
4.7.1 Zinc
Zinc occurs in appreciable quantities, especially in the Pilanesberg. Although no mean values areabove the low risk level for drinking water (20mg/<!), the granophyres and the Pilanesberg lithologieshave values above the low risk level (aesthetic) of 5 mg/5 Zn No trend is seen in the BICgroundwaters, but Zn concentration increases upwards in Karoo sediment groundwaters.
4.7.2 Molybdenum
Little variation is seen in Mo concentration, which is generally at very low levels, close to thedetection limit. However, Lebowa Granite groundwater has a mean concentration above themaximum safe limit of 0.2mg/J (CSIR, 1991). Molybdenum is an element frequently enriched inpegmatites and other highly fractionated rocks.
4.7.3 Barium
Interesting and very clear trends appear in the Ba concentration of groundwater. Ba concentrationsare much lower in the groundwater of the BIC than in that of the Karoo rocks, and decreases withincreasing fractionation of the host rock. This is the "opposite trend from that expected from afractionating magma. Mean Ba concentrations in groundwater from the Karoo sediments clearlydecrease in higher stratigraphic units.
4.11
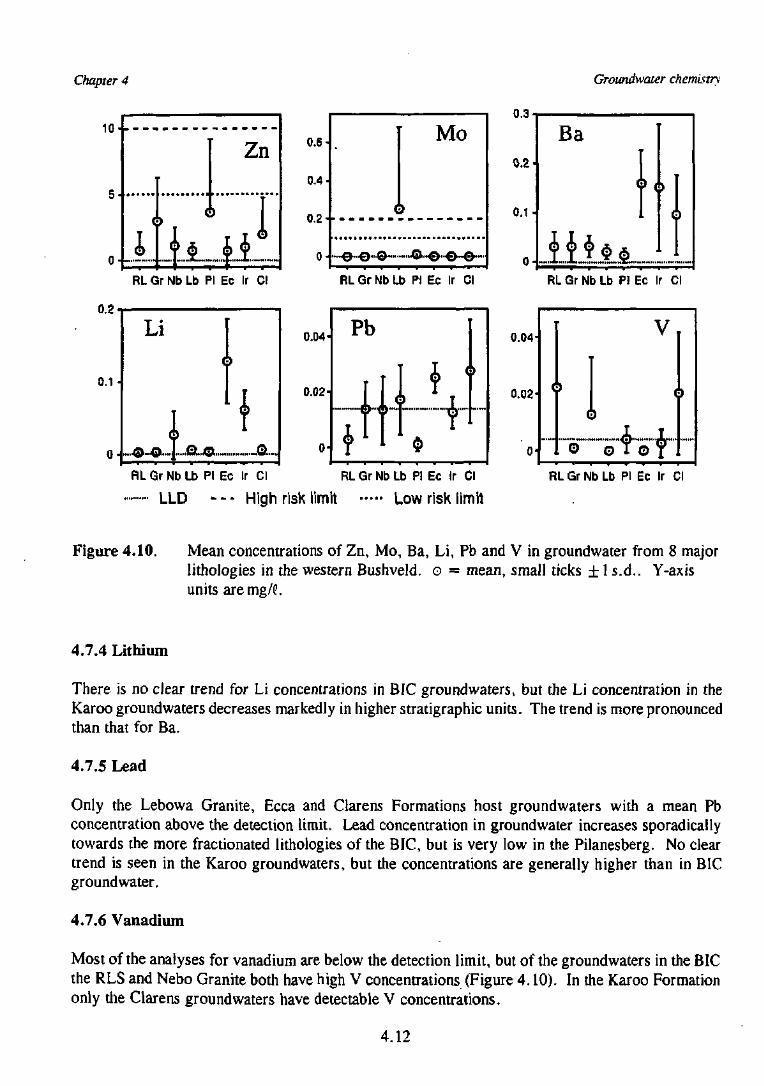
Chapter 4 Groundwaler chemistry
10-
5-
0-
<
i-
Zn
RL Gr Nb Lb PI Ec Ir Cf
0 . 1 •
0-
Li
,...©..o..|....o...©
>
a-
0.6-
0.4-
0.2-
0-
Mo
RL Gr Nb Lb PI Ec Ir Cl
0.04-
no?-
o-
Pb
T
p. i..
>
RL Gr Nb Lb PI Ec Ir Cl RL Gr Nb Lb P! Ec Ir Cl
LLD — High risk limit Low risk limit
0.2-
0.1 •
0-
B a
>
RLGrNbLb PI Ec Ir Cl
0.04-
0.02-
0'
( )
(
""o!).-..4....
01 0
V
,x....
>
RLGrNbLb PI Ec Ir Cl
Figure 4.10. Mean concentrations of Zn, Mo, Ba, Li, Pb and V in groundwater from 8 majorlithologies in the western Bushveld. o = mean, small ticks ± 1 s.d.. Y-axisunits aremg/L
4.7.4 Lithium
There is no clear trend for Li concentrations in BIC groundwaters, but the Li concentration in theKaroo groundwaters decreases markedly in higher stratigraphic units. The trend is more pronouncedthan that for Ba.
4.7.5 Lead
Only the Lebowa Granite, Ecca and Clarens Formations host groundwaters with a mean Pbconcentration above the detection limit. Lead concentration in groundwater increases sporadicallytowards the more fractionated lithologies of the BIC, but is very low in the Pilanesberg. No cleartrend is seen in the Karoo groundwaters, but the concentrations are generally higher than in BICgroundwater.
4.7.6 Vanadium
Most of the analyses for vanadium are below the detection limit, but of the groundwaters in the BICthe RLS and Nebo Granite both have high V concentrations (Figure 4.10). In the Karoo Formationonly the Clarens groundwaters have detectable V concentrations.
4.12
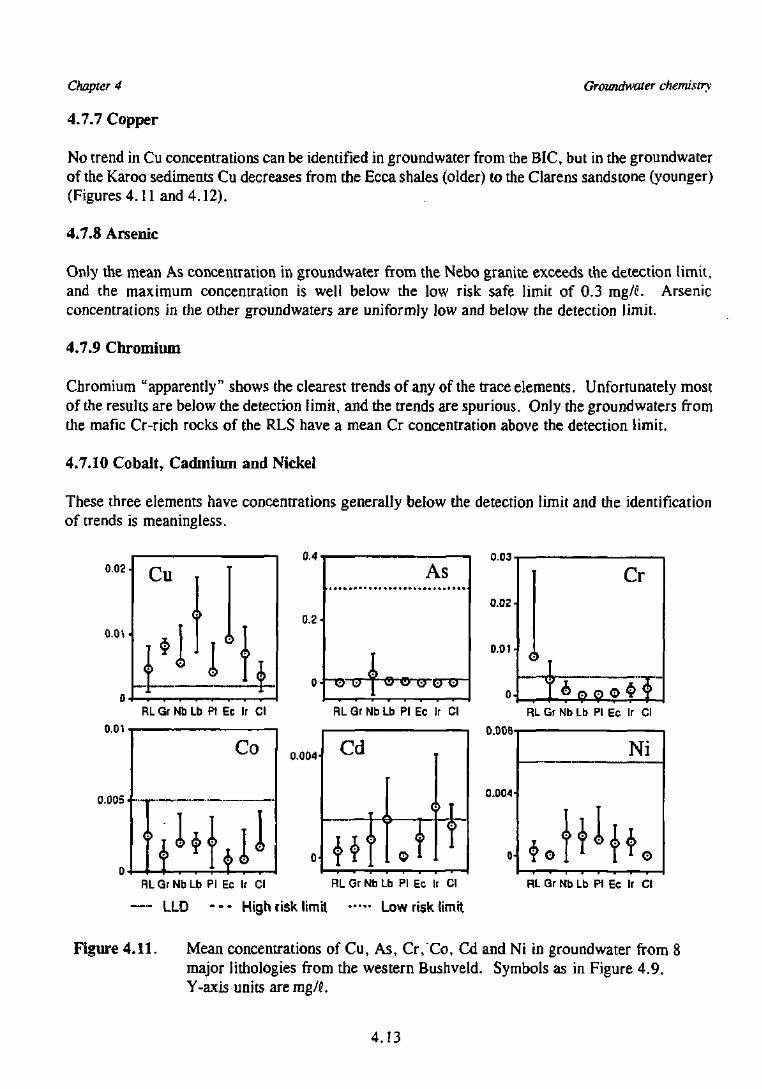
Chapter 4
4.7.7 Copper
Groundwater chemistry
No trend in Cu concentrations can be identified in groundwater from the BIC, but in the groundwaterof the Karoo sediments Cu decreases from the Ecca shales (older) to the Clarens sandstone (younger)(Figures 4.11 and 4.12).
4.7.8 Arsenic
Only the mean As concentration in groundwater from the Nebo granite exceeds the detection limit,and the maximum concentration is well below the low risk safe limit of 0.3 mg/C. Arsenicconcentrations in the other groundwaters are uniformly low and below the detection limit.
4.7.9 Chromium
Chromium "apparently" shows the clearest trends of any of the trace elements. Unfortunately mostof the results are below the detection limit, and the trends are spurious. Only the groundwaters fromthe mafic Cr-rich rocks of the RLS have a mean Cr concentration above the detection limit.
4.7.10 Cobalt, Cadmium and Nickel
These three elements have concentrations generally below the detection limit and the identificationof trends is meaningless.
0.02-
o.cn
RL Gr Nb Lb Pt Ec Ir Cl
0.01
0.005 • ~
0.004
0.03
0.02
0.01
RL Gr Nb Lb PI Ec Ir Cl RL Gr Nb Lb PI Ec Ir Cl
0.0087
0.004
RL Gr Nb Lb PI Ec Ir Cl RL Gr Nb Lb PI Ec Ir Cl RL Gr Nb Lb PI Ec Ir Cl
— LLD — High risk limit Low risk limit
Figure 4.11. Mean concentrations of Cu, As, Cr, Co, Cd and Ni in groundwater from 8major lithologies from the western Bushveld. Symbols as in Figure 4.9.Y-axis units are mg/C.
4.13
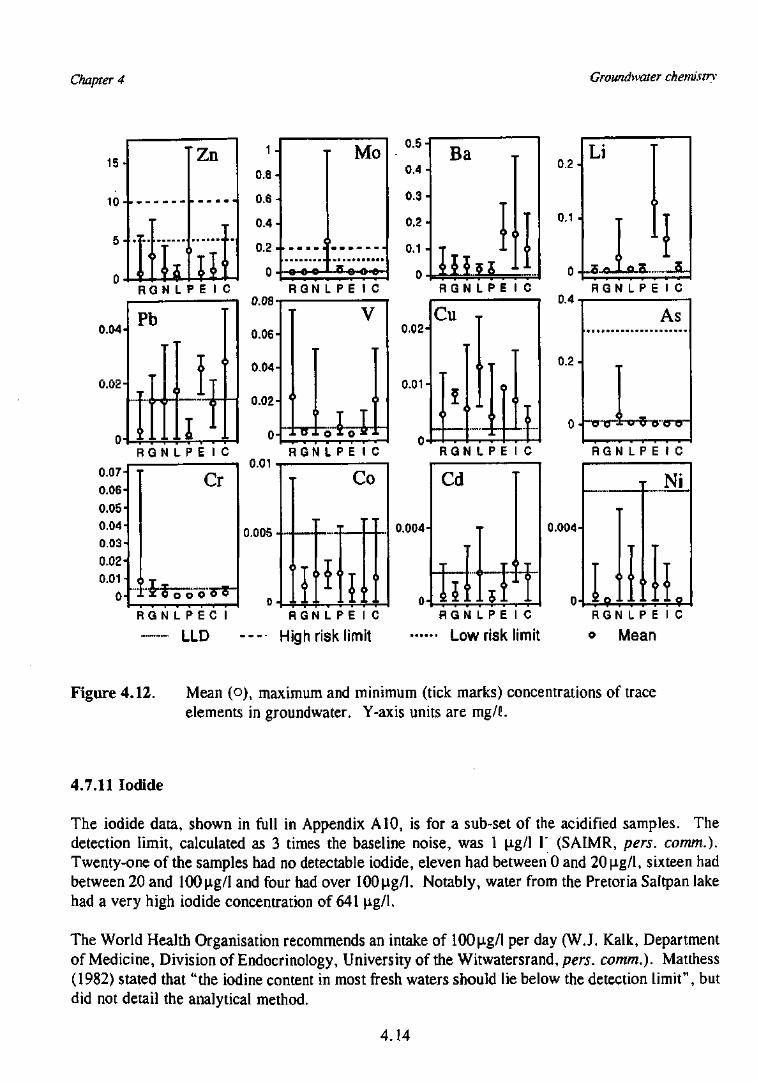
Chapter 4 Groundwater chemistry
15
10 +
5
0
0.04
0.02-|
Zn 1 .
0.8-
0.6-
0.4-
0.2-
0-
i
.•OIMV-
r Mo
i
R G N L P E I C R G N L P E I C0.08'
Pb
T
T i ,IIf T I14 .1.1-
OH •!• + -M
0.06-
0.04-
0.02-
0- : nrro™i'orBr: •
R G N L P E I C R G N L P E I C0.01
0.005
0 - m *•
0.07-
0.06-0.05-0.04-0.03-0.02-0.01-
0-
Cr
» T - 1
c
h
0
:.RG N L P E C I
LLDRGN L P E I C
High risk limit
0.5-
0.4-
0.3-
0.2-
0.1 -
Ba
1111I[1
0.2-
0.02-
0.01-
0.004-
0-
R G N L P E I C R G N L P E I C0.4.
0.2-
R G N L P E I C
0.004-
0- 1.:!l:r Ni
kH G N L P E \ C
• Low risk limit
RGN L P E I C
o Mean
Figure 4.12. Mean (o), maximum and minimum (tick marks) concentrations of traceelements in groundwater. Y-axis units are mg/L
4.7.11 Iodide
The iodide data, shown in full in Appendix A10, is for a sub-set of the acidified samples. Thedetection limit, calculated as 3 times the baseline noise, was 1 |J.g/l I" (SAIMR, pers. comm.).Twenty-one of the samples had no detectable iodide, eleven had between 0 and 20 p.g/1, sixteen hadbetween 20 and lOOp.g/1 and four had over 100|ig/l. Notably, water from the Pretoria Saltpan lakehad a very high iodide concentration of 641 jig/1.
The World Health Organisation recommends an intake of lOOp.g/1 per day (W.J. Kalk, Departmentof Medicine, Division of Endocrinology, University of the Witwatersrand.pm. comm.). Matthess(1982) stated that "the iodine content in most fresh waters should lie below the detection limit", butdid not detail the analytical method.
4.14
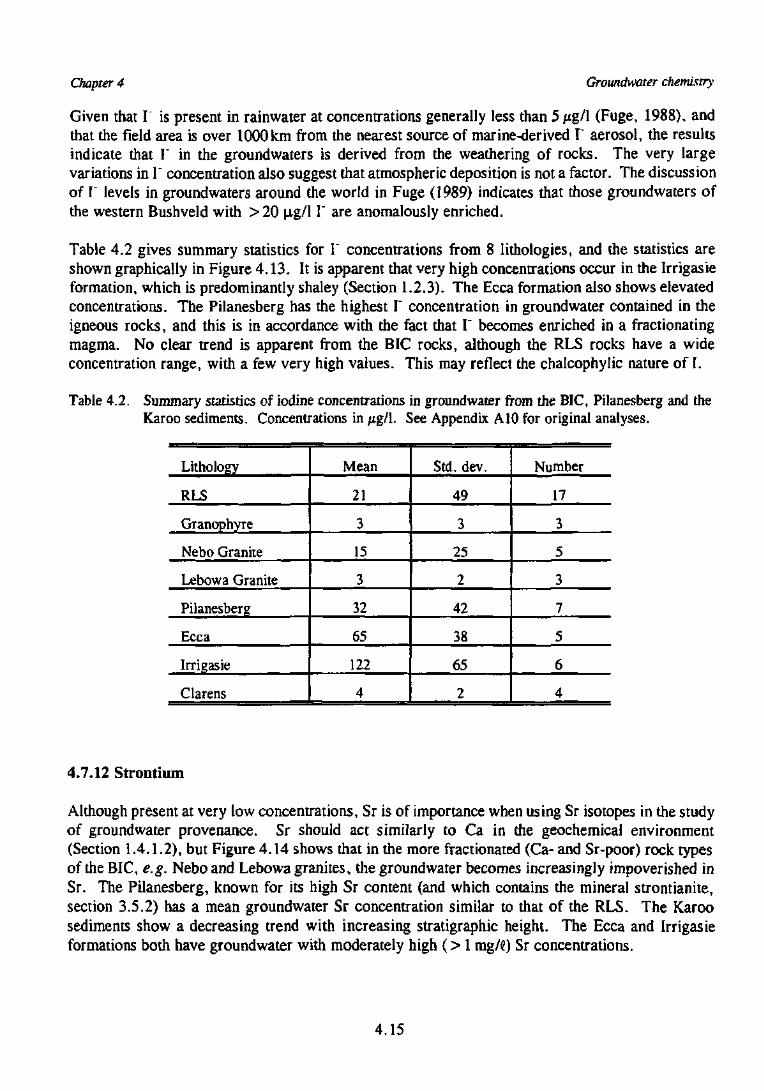
Chapter 4 Groundwater chemistry
Given that I is present in rainwater at concentrations generally less than 5 fig/\ (Fuge, 1988), andthat the field area is over 1000 km from the nearest source of marine-derived I" aerosol, the resultsindicate that I" in the groundwaters is derived from the weathering of rocks. The very largevariations in I" concentration also suggest that atmospheric deposition is not a factor. The discussionof I" levels in groundwaters around the world in Fuge (1989) indicates that those groundwaters ofthe western Bushveld with > 20 \ig/\ V are anomalously enriched.
Table 4.2 gives summary statistics for I" concentrations from 8 Iithologies, and the statistics areshown graphically in Figure 4.13. It is apparent that very high concentrations occur in the Irrigasieformation, which is predominantly shaley (Section 1.2.3). The Ecca formation also shows elevatedconcentrations. The Pilanesberg has the highest I" concentration in groundwater contained in theigneous rocks, and this is in accordance with the fact that I' becomes enriched in a fractionatingmagma. No clear trend is apparent from the BIC rocks, although the RLS rocks have a wideconcentration range, with a few very high values. This may reflect the chalcophylic nature of I.
Table 4.2. Summary statistics of iodine concentrations in groundwater from the BIC, Pilanesberg and theKaroo sediments. Concentrations in jig/1. See Appendix A10 for original analyses.
Lithology
RLS
Granophyre
Nebo Granite
Lebowa Granite
Pilanesberg
Ecca
Irrigasie
Clarens
Mean
21
3
15
3
32
65
122
4
Std. dev.
49
3
25
2
42
38
65
2
Number
17
3
5
3
7
5
6
4
4.7.12 Strontium
Although present at very low concentrations, Sr is of importance when using Sr isotopes in the studyof groundwater provenance. Sr should act similarly to Ca in die geochemical environment(Section 1.4.1.2), but Figure 4.14 shows that in the more fractionated (Ca- and Sr-poor) rock typesof the BIC, e.g. Nebo and Lebowa granites, the groundwater becomes increasingly impoverished inSr. The Pilanesberg, known for its high Sr content (and which contains the mineral strontianite,section 3.5.2) has a mean groundwater Sr concentration similar to that of the RLS. The Karoosediments show a decreasing trend with increasing stratigraphic height. The Ecca and Irrigasieformations both have groundwater with moderately high (> 1 mg/C) Sr concentrations.
4.15
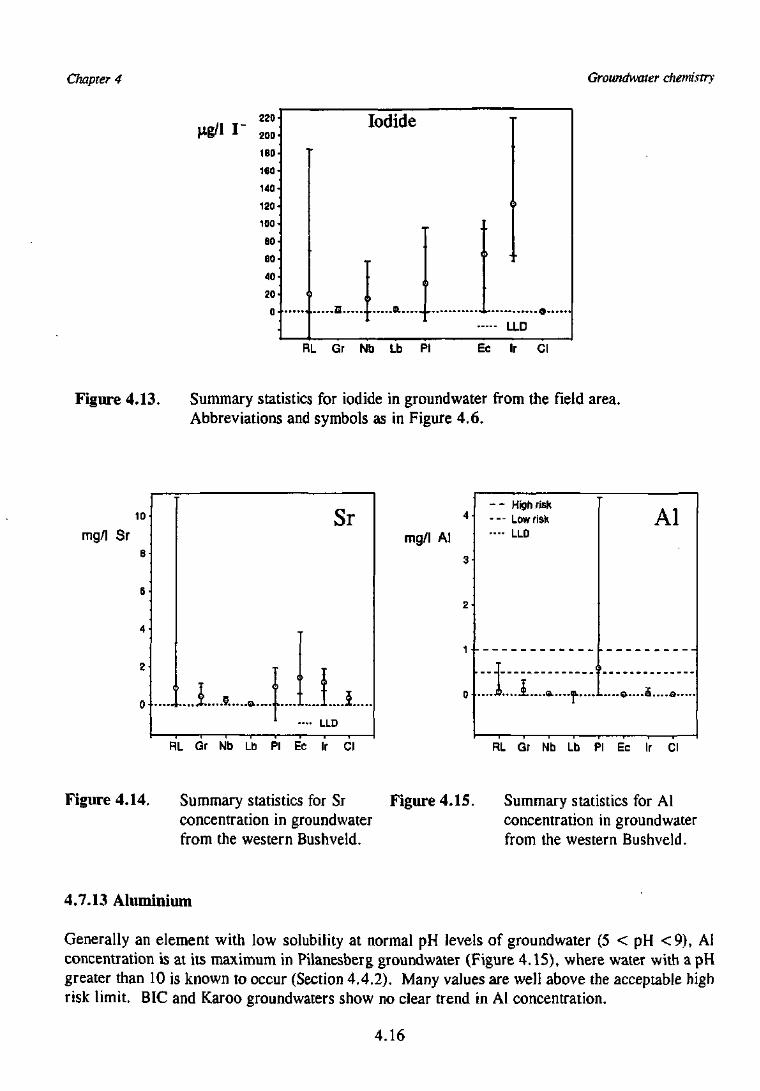
Chapter 4 Groundwater chemistry
220-
200-
180-
160-
140-
120-
100-
80-
60-
40-
20-nU
Iodide
T
1 <i
i
i
I
LLD
RL Gr Nb Lb PI Ec Ir Cl
Figure 4.13. Summary statistics for iodide in groundwater from the field area.Abbreviations and symbols as in Figure 4.6.
mg/l Sr
2-
mg/l Al
RL Gr Nb Lb PI Ec Ir Cl
- - High risk- - - Low risk—• LLD
1
-O.....S a. a. i
Al
n £
RL Gr Nb Lb PI Ec Ir Cl
Figure 4.14. Summary statistics for Sr Figure 4.15. Summary statistics for Alconcentration in groundwater concentration in groundwaterfrom the western Bushveld. from the western Bushveld.
4.7.13 Aluminium
Generally an element with low solubility at normal pH levels of groundwater (5 < pH <9), Alconcentration is at its maximum in Pilanesberg groundwater (Figure 4.15), where water with a pHgreater than 10 is known to occur (Section 4.4.2). Many values are well above the acceptable highrisk limit. BIC and Karoo groundwaters show no clear trend in Al concentration.
4.16
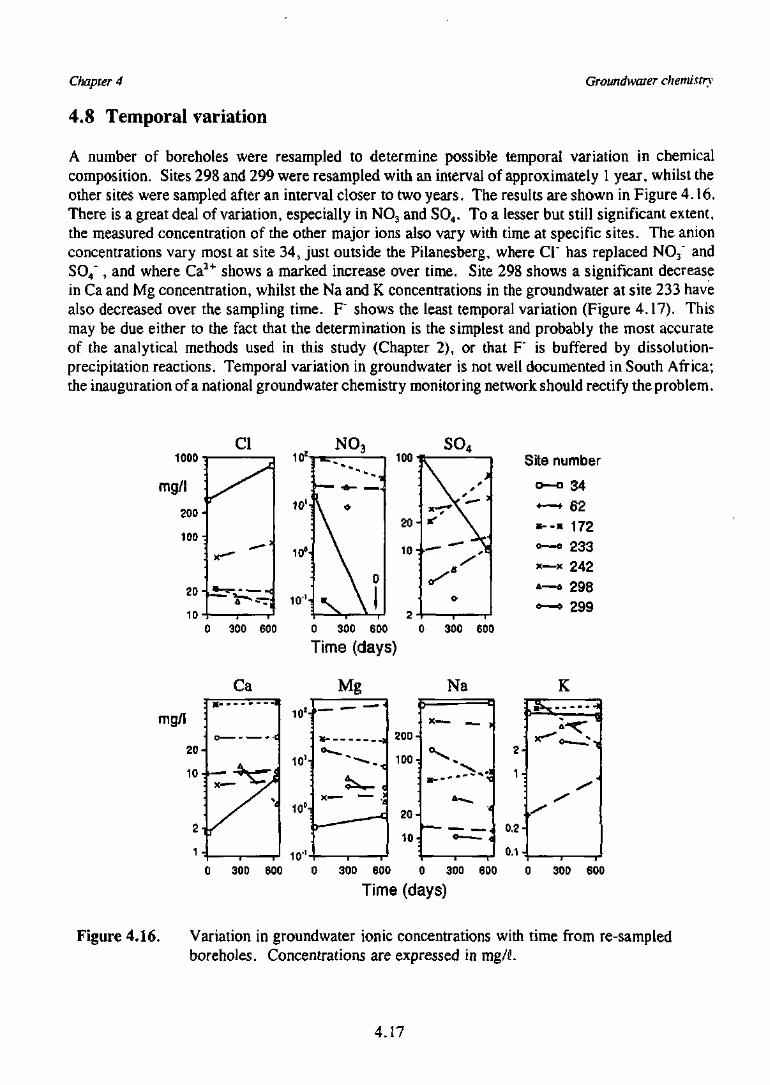
Chapter 4
4.8 Temporal variation
Groundwater chemistry
A number of boreholes were resampled to determine possible temporal variation in chemicalcomposition. Sites 298 and 299 were resampled with an interval of approximately 1 year, whilst theother sites were sampled after an interval closer to two years. The results are shown in Figure 4.16.There is a great deal of variation, especially in NO3 and SO4. To a lesser but still significant extent,the measured concentration of the other major ions also vary with time at specific sites. The anionconcentrations vary most at site 34, just outside the Pilanesberg, where Cl" has replaced NO3" andSO4", and where Ca2+ shows a marked increase over time. Site 298 shows a significant decreasein Ca and Mg concentration, whilst the Na and K concentrations in the groundwater at site 233 havealso decreased over the sampling time. F" shows the least temporal variation (Figure 4.17). Thismay be due either to the fact that the determination is the simplest and probably the most accurateof the analytical methods used in this study (Chapter 2), or that F" is buffered by dissolution-precipitation reactions. Temporal variation in groundwater is not well documented in South Africa;the inauguration of a national groundwater chemistry monitoring network should rectify the problem.
1000i 10!-
10'-
10',
10'-
NO3
^ • •
\ °
\
\ °
so4
20 -
1 0 :
2 -
Site number
o—a 34
<—* 62
• - - • 172o—° 233x—x 242»—* 298*^> 299
0 300 600 0 300 600 0 300 600
Time (days)
mg/l |
20-
10 :
2 1
1 -
Ca
10z:
10'-
Mg
200-
100:
20-
10-
Na
•---""*"-c
*—.t
2-
1-
0.2-
0.1 -I
K
A
0 300 600 0 300 600 0 30D 6D0 0 300 600
Time (days)
Figure 4.16. Variation in groundwater ionic concentrations with time from re-sampledboreholes. Concentrations are expressed in mg/SL
4.17
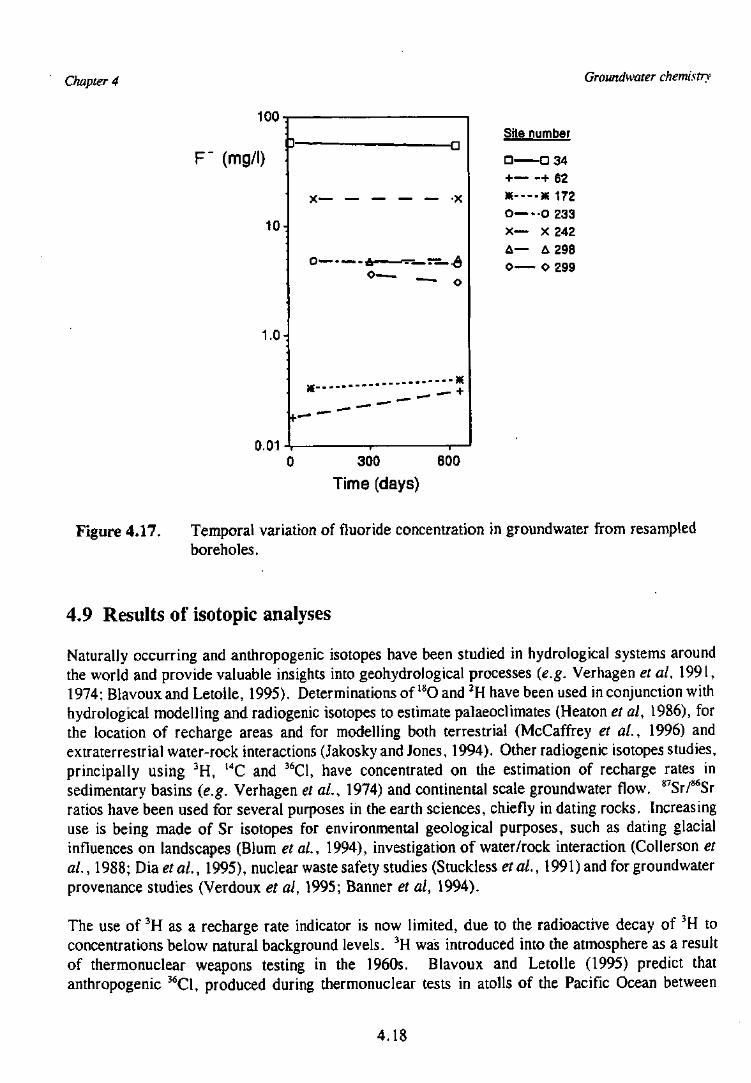
Chapter 4 Groundwater chemistry
F" (mg/l)
Site number
D d 34+ + 62* K 172O O 233X— X 242A— A 298© O 299
1.0-
0.01 A0 300 600
Time (days)
Figure 4.17. Temporal variation of fluoride concentration in groundwater from resampledboreholes.
4.9 Results of isotopic analyses
Naturally occurring and anthropogenic isotopes have been studied in hydrological systems aroundthe world and provide valuable insights into geohydrological processes (e.g. Verhagen et al, 1991,1974; Blavoux and Letolle, 1995). Determinations of 18O and 2H have been used in conjunction withhydrological modelling and radiogenic isotopes to estimate palaeoclimates (Heaton et al, 1986), forthe location of recharge areas and for modelling both terrestrial (McCaffrey et al., 1996) andextraterrestrial water-rock interactions (Jakosky and Jones, 1994). Other radiogenic isotopes studies,principally using 3H, 14C and 36C1, have concentrated on the estimation of recharge rates insedimentary basins (e.g. Verhagen et al., 1974) and continental scale groundwater flow. s7Sr/86Srratios have been used for several purposes in the earth sciences, chiefly in dating rocks. Increasinguse is being made of Sr isotopes for environmental geological purposes, such as dating glacialinfluences on landscapes (Blum et al., 1994), investigation of water/rock interaction (Collerson etal., 1988; Diaetal., 1995), nuclear waste safety studies (Stuckless et al., 1991) and for groundwaterprovenance studies (Verdoux et al, 1995; Banner et al, 1994).
The use of 3H as a recharge rate indicator is now limited, due to the radioactive decay of 3H toconcentrations below natural background levels. 3H was introduced into the atmosphere as a resultof thermonuclear weapons testing in the 1960s. Blavoux and Letolle (1995) predict thatanthropogenic 36C1, produced during thermonuclear tests in atolls of the Pacific Ocean between
4.18
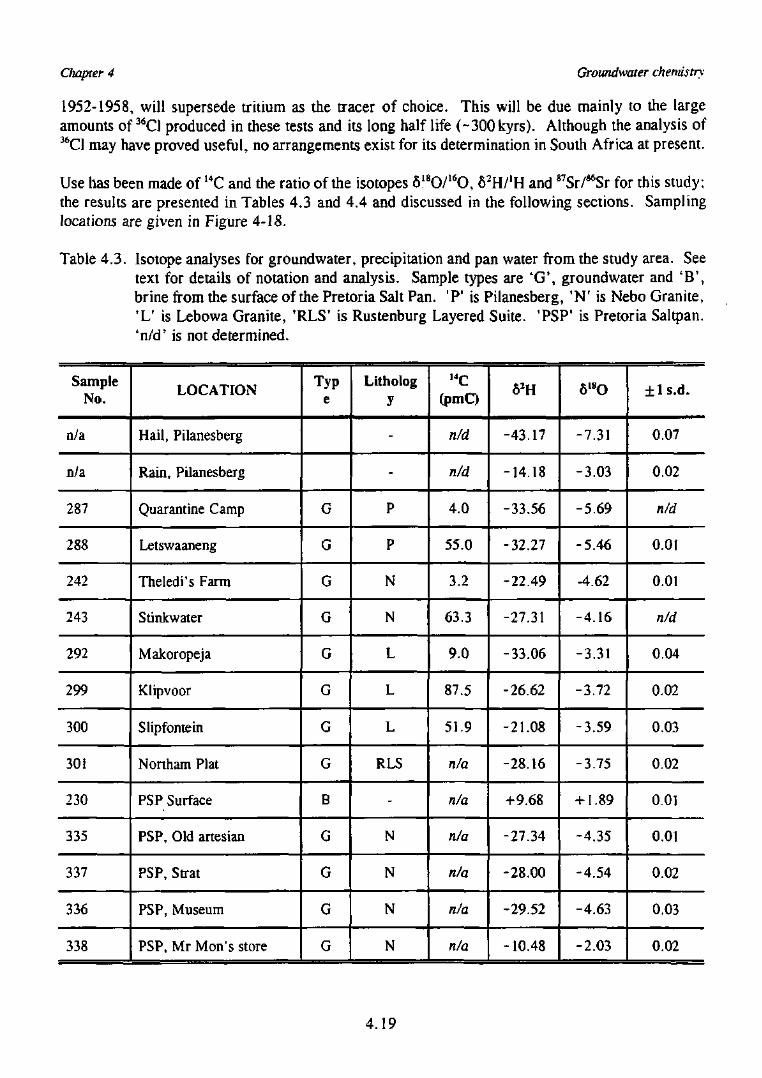
Chapter 4 Groundwater chemistry
1952-1958, will supersede tritium as the tracer of choice. This will be due mainly to the largeamounts of 36C1 produced in these tests and its long half life (~300kyrs). Although the analysis of35C1 may have proved useful, no arrangements exist for its determination in South Africa at present.
Use has been made of 14C and the ratio of the isotopes 818O/16O, 62H/'H and 87Sr/86Sr for this study;the results are presented in Tables 4.3 and 4.4 and discussed in the following sections. Samplinglocations are given in Figure 4-18.
Table 4.3. Isotope analyses for groundwater, precipitation and pan water from the study area. Seetext for details of notation and analysis. Sample types are 'G', groundwater and 'B' ,brine from the surface of the Pretoria Salt Pan. 'P' is Pilanesberg, 'N1 is Nebo Granite,'L' is Lebowa Granite, 'RLS' is Rustenburg Layered Suite. 'PSP' is Pretoria Saltpan,'n/d' is not determined.
SampleNo.
n/a
n/a
287
288
242
243
292
299
300
301
230
335
337
336
338
LOCATION
Hail, Pilanesberg
Rain, Pilanesberg
Quarantine Camp
Letswaaneng
Theledi's Farm
Stinkwater
Makoropeja
Klipvoor
Slipfontein
Northam Plat
PSP Surface
PSP, Old artesian
PSP, Strat
PSP, Museum
PSP, Mr Mon's store
Type
G
G
G
G
G
G
G
G
B
G
G
G
G
Lit ho logy
-
-
p
p
N
N
L
L
L
RLS
-
N
N
N
N
(pmQ
n/d
n/d
4.0
55.0
3.2
63.3
9.0
87.5
51.9
n/a
n/a
n/a
n/a
n/a
n/a
-43.17
-14.18
-33.56
-32.27
-22.49
-27.31
-33.06
-26.62
-21.08
-28.16
+9.68
-27.34
-28.00
-29.52
-10.48
618O
-7.31
-3.03
-5.69
-5.46
-4.62
-4.16
-3.31
-3.72
-3.59
-3.75
+ 1.89
-4.35
-4.54
-4.63
-2.03
+ ls.d.
0.07
0.02
n/d
0.01
0.01
n/d
0.04
0.02
0.03
0.02
0.01
0.01
0.02
0.03
0.02
4.19
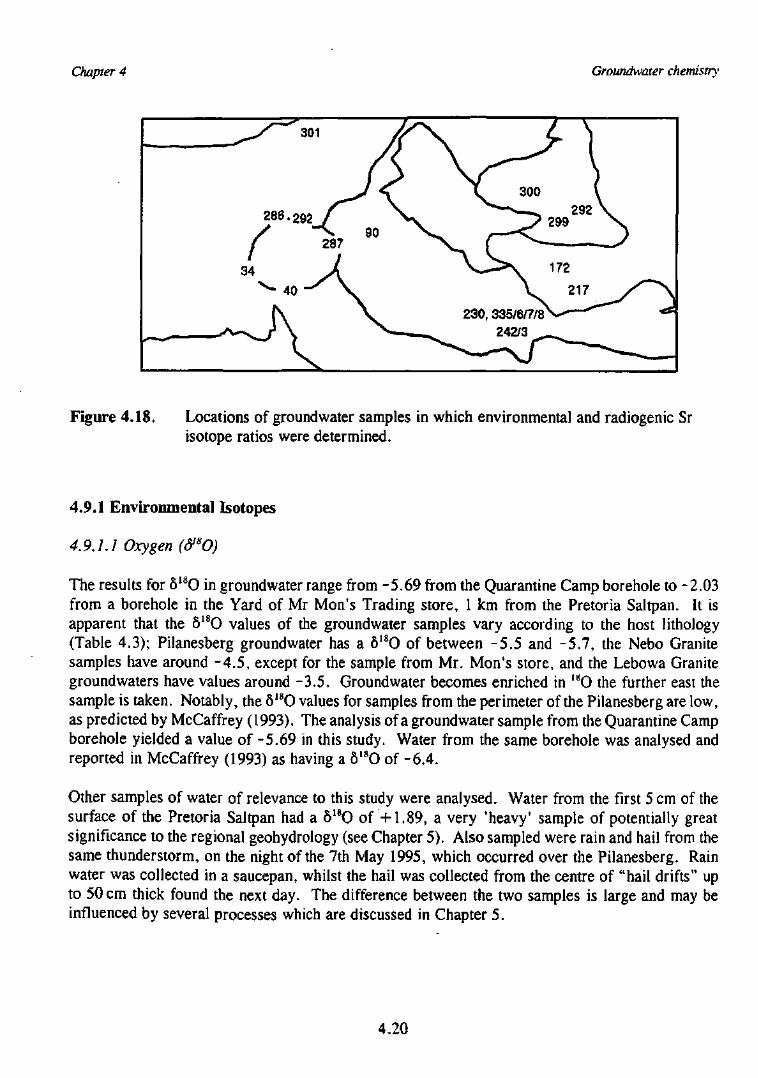
Chapter 4 Groundwater chemistry
Figure 4.18. Locations of groundwater samples in which environmental and radiogenic Srisotope ratios were determined.
4.9.1 Environmental Isotopes
4.9.1.1 Oxygen (&SO)
The results for 6I8O in groundwater range from -5.69 from the Quarantine Camp borehole to -2.03from a borehole in the Yard of Mr Mon's Trading store, 1 km from the Pretoria Saltpan. It isapparent that the 818O values of the groundwater samples vary according to the host lithology(Table 4.3); Pilanesberg groundwater has a 818O of between -5.5 and -5.7, the Nebo Granitesamples have around -4 .5 , except for the sample from Mr. Mon's store, and the Lebowa Granitegroundwaters have values around -3.5. Groundwater becomes enriched in ISO the further east thesample is taken. Notably, the 8I8O values for samples from the perimeter of the Pilanesberg are low,as predicted by McCaffrey (1993). The analysis of a groundwater sample from the Quarantine Campborehole yielded a value of -5.69 in this study. Water from the same borehole was analysed andreported in McCaffrey (1993) as having a 818O of -6.4.
Other samples of water of relevance to this study were analysed. Water from the first 5 cm of thesurface of the Pretoria Saltpan had a 518O of +1.89, a very 'heavy' sample of potentially greatsignificance to the regional geohydrology (see Chapter 5). Also sampled were rain and hail from thesame thunderstorm, on the night of the 7th May 1995, which occurred over the Pilanesberg. Rainwater was collected in a saucepan, whilst the hail was collected from the centre of "hail drifts" upto 50 cm thick found the next day. The difference between the two samples is large and may beinfluenced by several processes which are discussed in Chapter 5.
4.20
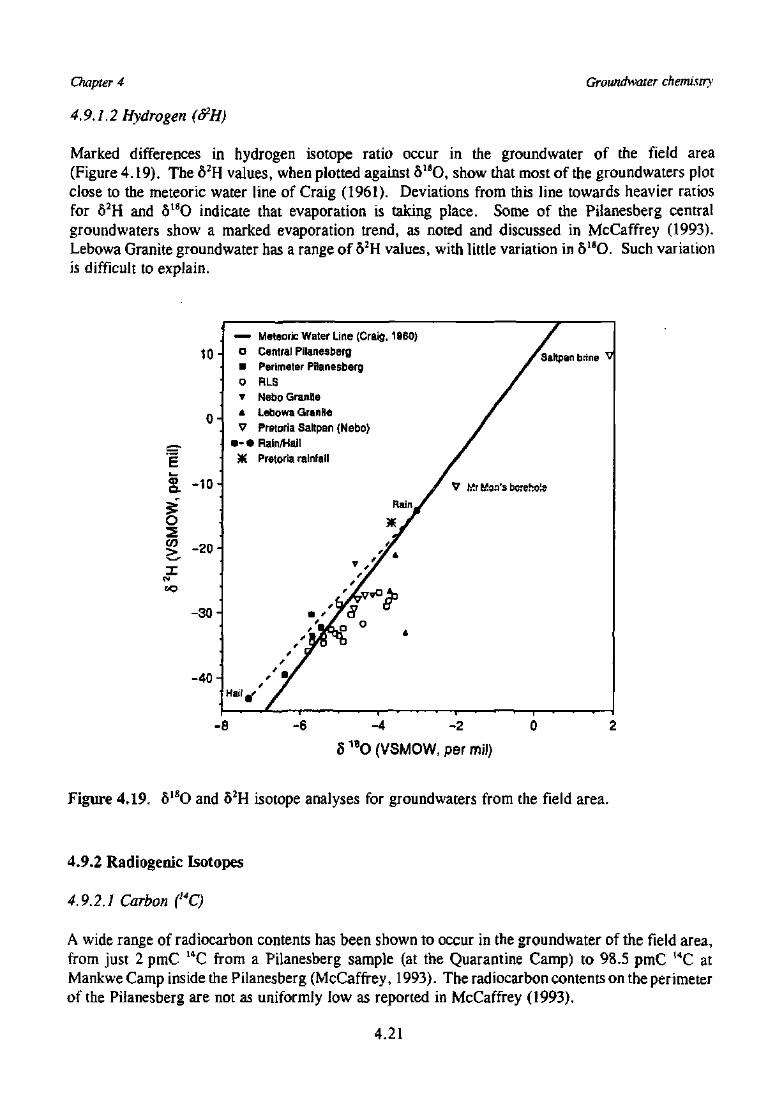
Chapter 4
4.9A.2 Hydrogen (&H)
Groundwater chemistry
Marked differences in hydrogen isotope ratio occur in the groundwater of the field area(Figure 4.19). The 62H values, when plotted against 618O, show that most of the groundwaters plotclose to the meteoric water line of Craig (1961). Deviations from this line towards heavier ratiosfor 62H and 8l8O indicate that evaporation is taking place. Some of the Pilanesberg centralgroundwaters show a marked evaporation trend, as noted and discussed in McCaffrey (1993).Lebowa Granite groundwater has a range of 62H values, with little variation in 618O. Such variationis difficult to explain.
10-
0-
S. -10
o| -20
XCM
-30-
-40-
_o
•o
A
V• - •
*
Hail #<-
Meteoric Water Line (Craig, 1960)Central Pilanesberg
Perimeter PilanesbergRLSNebo GraniteLebowa GranitePretoria Saltpan (Nebo)Rain/KailPretoria rainfall
T/
* * jrd
/ // . /
z y
//Saltpan brine V
//
//
/
/
* V Mr Men's bcreho!s
-8 -6 -2
S1BO (VSMOW, per mil)
Figure 4.19. 81SO and 82H isotope analyses for groundwaters from the field area.
4.9.2 Radiogenic Isotopes
4.9.2.1 Carbon (I4C)
A wide range of radiocarbon contents has been shown to occur in the groundwater of the field area,from just 2 pmC HC from a Pilanesberg sample (at the Quarantine Camp) to 98.5 pmC WC atMankwe Camp inside the Pilanesberg (McCaffrey, 1993). The radiocarbon contents on the perimeterof the Pilanesberg are not as uniformly low as reported in McCaffrey (1993).
4.21
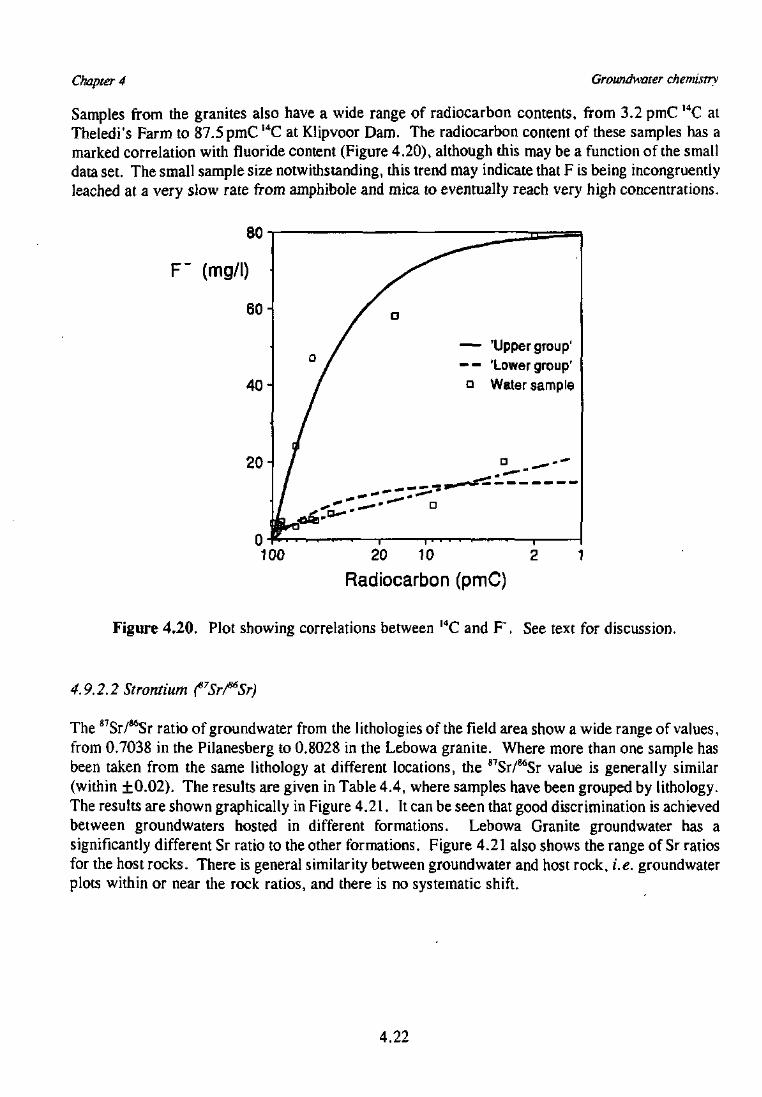
Chapter 4 Groundwater chemistn
Samples from the granites also have a wide range of radiocarbon contents, from 3.2 pmC I4C atTheledi's Farm to 87.5 pmC 14C at Klipvoor Dam. The radiocarbon content of these samples has amarked correlation with fluoride content (Figure 4.20), although this may be a function of the smalldata set. The small sample size notwithstanding, this trend may indicate that F is being incongruentlyleached at a very slow rate from amphibole and mica to eventually reach very high concentrations.
80 -i
F" (mg/l)
60-
40-
— 'Upper group'- - 'Lower group'• Water sample
20-
100 20 10
Radiocarbon (pmC)
Figure 4.20. Plot showing correlations between I4C and F \ See text for discussion.
4.9.2.2 Strontium f'Sr/^Sr)
The 87Sr/86Sr ratio of groundwater from the lithologies of the field area show a wide range of values,from 0.7038 in the Pilanesberg to 0.8028 in the Lebowa granite. Where more than one sample hasbeen taken from the same lithology at different locations, the 87Sr/86Sr value is generally similar(within ±0.02). The results are given in Table 4.4, where samples have been grouped by lithology.The results are shown graphically in Figure 4.21. It can be seen that good discrimination is achievedbetween groundwaters hosted in different formations. Lebowa Granite groundwater has asignificantly different Sr ratio to the other formations. Figure 4.21 also shows the range of Sr ratiosfor the host rocks. There is general similarity between groundwater and host rock, i.e. groundwaterplots within or near the rock ratios, and there is no systematic shift.
4.22
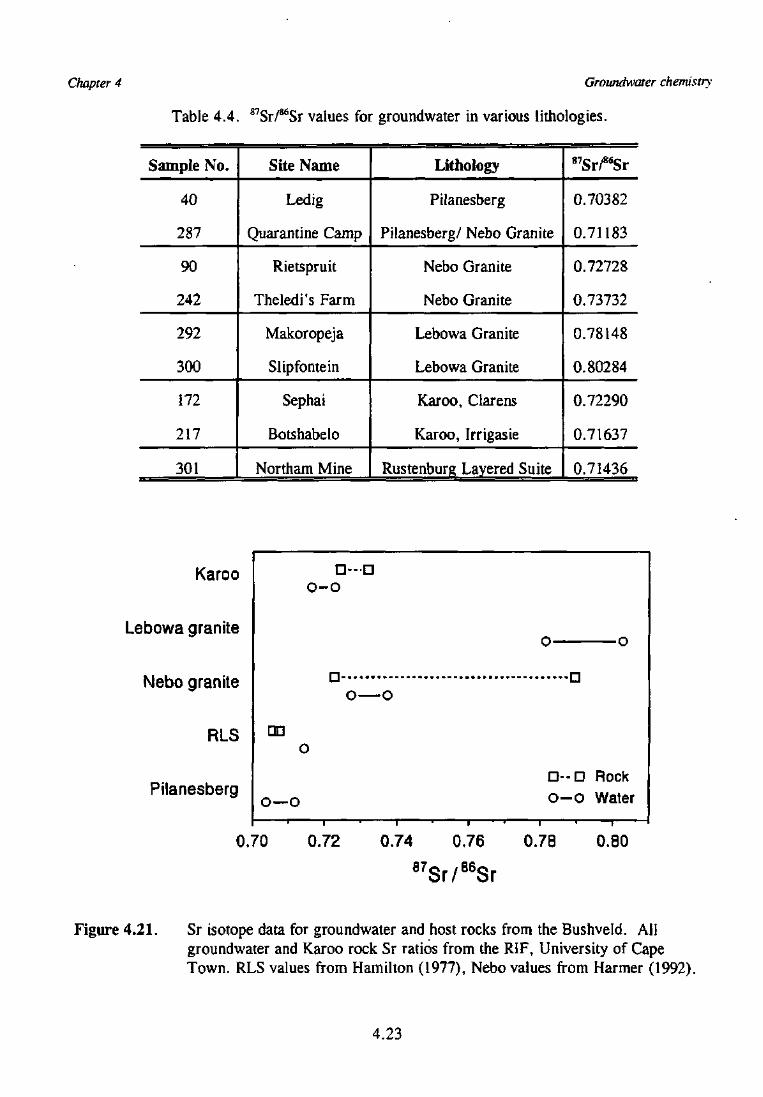
Chapter 4 Groundwater chemistry
Table 4.4. Sr/^Sr values for groundwater in various lithologies.
Sample No.
40
287
90
242
292
300
172
217
301
Site Name
Ledig
Quarantine Camp
Rietspruit
Theledi's Farm
Makoropeja
Slipfontein
Sephai
Botshabelo
Northam Mine
Lithology
Pilanesberg
Pilanesberg/ Nebo Granite
Nebo Granite
Nebo Granite
Lebowa Granite
Lebowa Granite
Karoo, Clarens
Karoo, Irrigasie
Rustenburg Layered Suite
87SrrSr
0.70382
0.71183
0.72728
0.73732
0.78148
0.80284
0.72290
0.71637
0.71436
Karoo
Lebowa granite
Nebo granite
RLS
Pilanesberg
o-
0
o—o
D--DO
no—o
i • i
•
D--DO-O
Rock
Water
i
0.70 0.72 0.74 0.76
87Sr/86Sr
0.78 0.80
Figure 4.21. Sr isotope data for groundwater and host rocks from the Bushveld. Allgroundwater and Karoo rock Sr ratios from the RIF, University of CapeTown. RLS values from Hamilton (1977), Nebo values from Harmer (1992).
4.23
Chapter 5 Discussion
5 DISCUSSION
5.1 Introduction
In this chapter the results presented in Chapters 3 and 4 will be discussed in relation to theirsignificance from several aspects:
1) the health related aspects of groundwater fluoride concentration and speciation;2) geochemical controls of fluoride concentration and speciation;3) the hydrochemical systems present in the western Bushveld.
Ions which have an affect on fluoride in groundwater are also discussed here.
5.2 Fluorine Geochemistry And Health
This section will review previous work on the geochemical behaviour of fluoride, the distribution andcauses of high fluoride groundwater, fluorosis, and some aspects of hydrochemistry. These topics areof relevance to arguments advanced later in the report.
5.2.1 Geochemical behaviour of Fluorine
Fluorine is the lightest element in the Halogen group and is the 14th most abundant element in thelithosphere. It is the most electronegative and reactive element known. Fluorine is rarely found inthe elemental state; usually it forms ionic bonds. Bonding with anions of groups VA, VIA and VIIA(apart from P, As, Sb and Bi) does not occur because of the high electronegativity of F.
5.2.1.1 Natural Waters
Most simple compounds of F are readily soluble in water. The Eh and pH conditions of F speciationare shown in Figure 5.1. It is noted that under conditions in which water is stable, F usually existsas the monovalent anion, F". At a pH below 3.5, F in solution may occur in the HF° form. The closesimilarity in size and the equivalence of charge of hydroxide and fluoride ions causes interferencewhen a fluoride ion selective electrode is used for water analysis. F can also occur as a complex,such as (A1F6)
3" or A1F2+. Formation of these complexes takes place rapidly (in the order of minutes)at the pH and temperature of typical temperate groundwaters, and their formation can be regardedin the hydrogeological context as an equilibrium process (Plankey and Patterson, 1986).
5.2.1.2 Fluorine in minerals
Fluorine is not an essential element in any of the common rock-forming minerals. Topaz(Al2[SiO4](OH,F)2) and fluorite (CaF2) are the only two common accessory minerals in which F isan essential element. Just under 150 fluorine-bearing accessory minerals are known, and many otherscontain small amounts of F" replacing OH" and O2" (Koritnig, 1974). Table 5.1 shows a comparisonof the ionic radius of F", with the other members of the halide group and the geochemical analoguesof F", OH and O2~. It is apparent that the F", OH" and O2" ions have similar ionic radii, with OH"
5.1
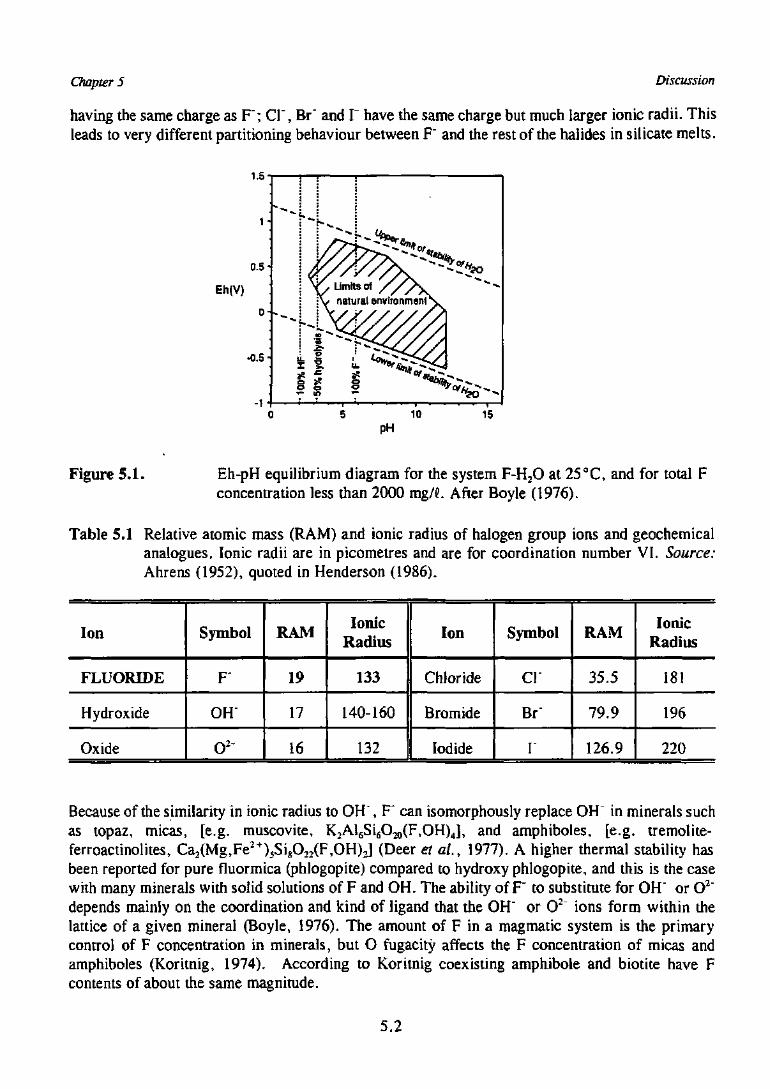
Chapter 5 Discussion
having the same charge as F ; CP, Br" and I" have the same charge but much larger ionic radii. Thisleads to very different partitioning behaviour between F" and the rest of the halides in silicate melts.
Eh(V)
-115
Figure 5.1. Eh-pH equilibrium diagram for the system F-H,0 at 25°C, and for total Fconcentration less than 2000 mg/L After Boyle (1976).
Table 5.1 Relative atomic mass (RAM) and ionic radius of halogen group ions and geochemicalanalogues. Ionic radii are in picometres and are for coordination number VI. Source:Ahrens (1952), quoted in Henderson (1986).
Ion
FLUORIDE
Hydroxide
Oxide
Symbol
F
OH
o2-
RAM
19
17
16
IonicRadius
133
140-160
132
Ion
Chloride
Bromide
Iodide
Symbol
cr
Br"
I
RAM
35.5
79.9
126.9
IonicRadius
181
196
220
Because of the similarity in ionic radius to OH", F can isomorphously replace OH in minerals suchas topaz, micas, [e.g. muscovite, KiAlgSigO^F.OHJJ, and amphiboles, [e.g. tremolite-ferroactinolites, Ca2(Mg,Fe2+)5SigO2:!(F,OH)2] (Deer et a/., 1977). A higher thermal stability hasbeen reported for pure fluormica (phlogopite) compared to hydroxy phlogopite, and this is the casewith many minerals with solid solutions of F and OH. The ability of F' to substitute for OH" or O2"depends mainly on the coordination and kind of ligand that the OH" or O2 ions form within thelattice of a given mineral (Boyle, 1976). The amount of F in a magmatic system is the primarycontrol of F concentration in minerals, but O fugacity affects the F concentration of micas andamphiboles (Koritnig, 1974). According to Koritnig coexisting amphibole and biotite have Fcontents of about the same magnitude.
5.2
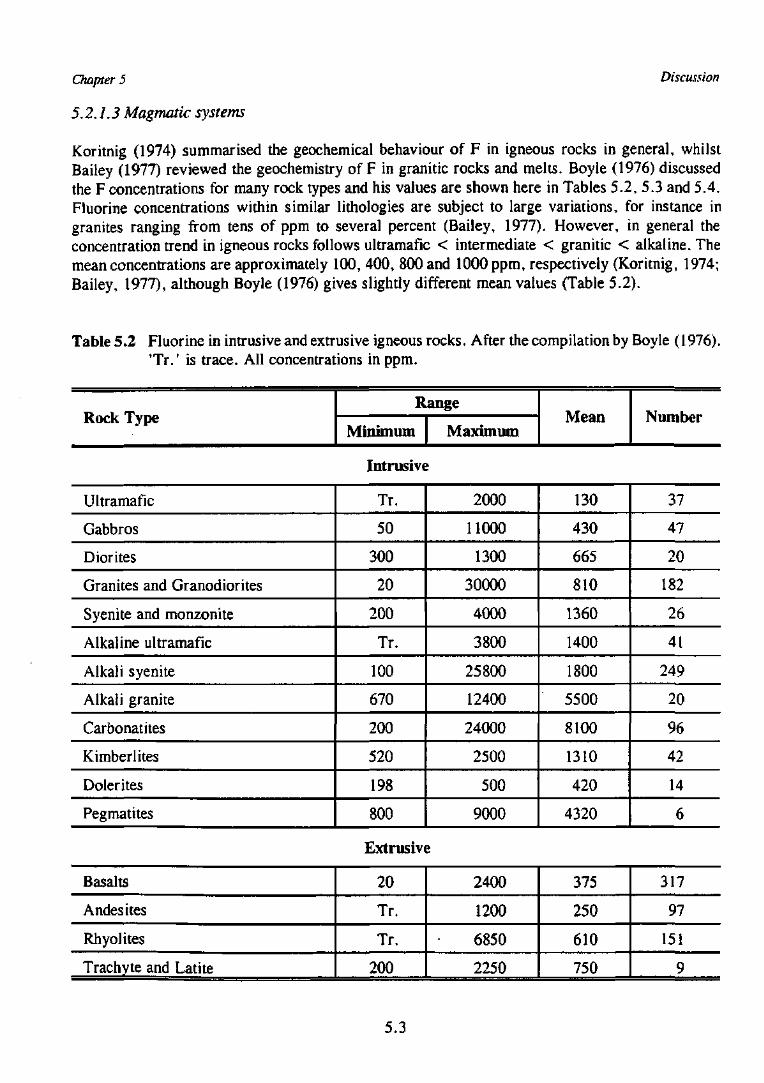
Chapter 5
5.2.1.3 Magmatic systems
Discussion
Koritnig (1974) summarised the geochemical behaviour of F in igneous rocks in general, whilstBailey (1977) reviewed the geochemistry of F in granitic rocks and melts. Boyle (1976) discussedthe F concentrations for many rock types and his values are shown here in Tables 5.2, 5.3 and 5.4.Fluorine concentrations within similar lithologies are subject to large variations, for instance ingranites ranging from tens of ppm to several percent (Bailey, 1977). However, in general theconcentration trend in igneous rocks follows ultramafic < intermediate < granitic < alkaline. Themean concentrations are approximately 100, 400, 800 and 1000 ppm, respectively (Koritnig, 1974;Bailey, 1977), although Boyle (1976) gives slightly different mean values (Table 5.2).
Table 5.2 Fluorine in intrusive and extrusive igneous rocks. After the compilation by Boyle (1976).Tr . ' is trace. All concentrations in ppm.
Rock TypeRange
Minimum MaximumMean Number
Intrusive
Ultramafic
Gabbros
Diorites
Granites and Granodiorites
Syenite and monzonite
Alkaline ultramafic
Alkali syenite
Alkali granite
Carbonatites
Kimberlites
Dolerites
Pegmatites
Tr.
50
300
20
200
Tr.
100
670
200
520
198
800
2000
11000
1300
30000
4000
3800
25800
12400
24000
2500
500
9000
130
430
665
810
1360
1400
1800
5500
8100
1310
420
4320
37
47
20
182
26
41
249
20
96
42
14
6
Extrusive
Basalts
Andes ites
Rhyolites
Trachyte and Latite
20
Tr.
Tr.
200
2400
1200
6850
2250
375
250
610
750
317
97
151
9
5.3
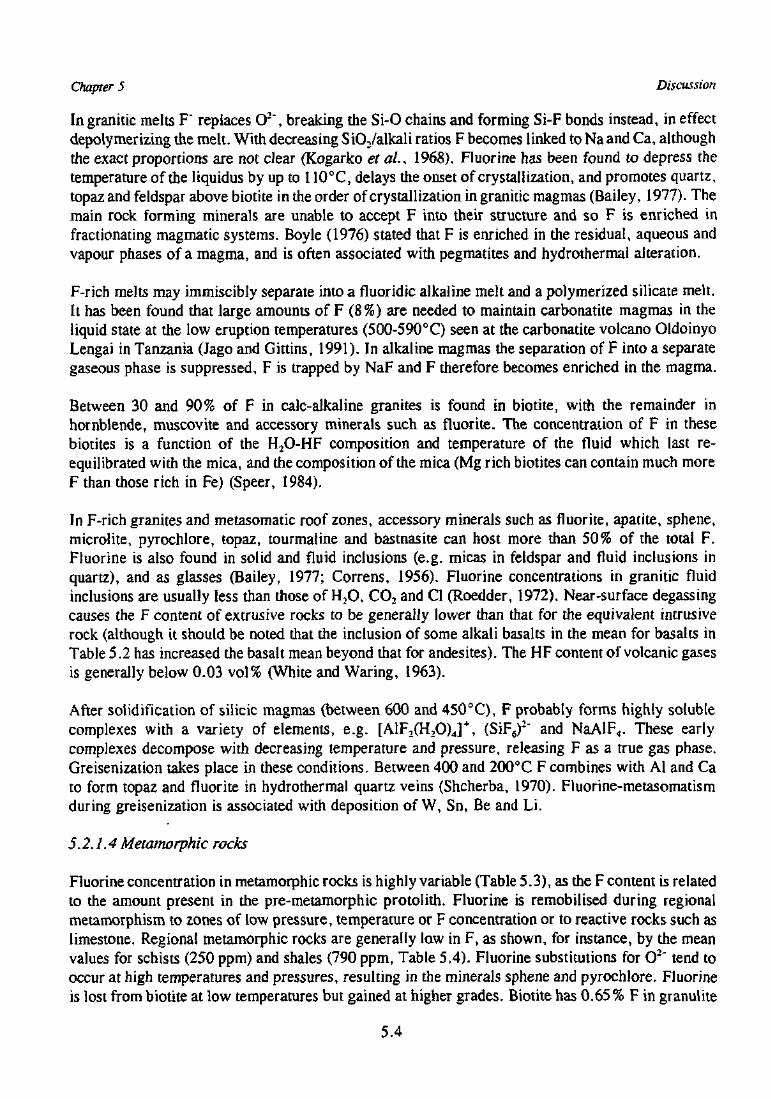
Chapter 5 Discussion
In granitic melts F" replaces O2", breaking the Si-0 chains and forming Si-F bonds instead, in effectdepolymerizing the melt. With decreasing SiOValkali ratios F becomes linked to Na and Ca, althoughthe exact proportions are not clear (Kogarko et ai, 1968). Fluorine has been found to depress thetemperature of the Iiquidus by up to 11O°C, delays the onset of crystallization, and promotes quartz,topaz and feldspar above biotite in the order of crystallization in granitic magmas (Bailey, 1977). Themain rock forming minerals are unable to accept F into their structure and so F is enriched infractionating magmatic systems. Boyle (1976) stated that F is enriched in the residual, aqueous andvapour phases of a magma, and is often associated with pegmatites and hydrothermal alteration.
F-rich melts may immiscibty separate into a fluoridic alkaline melt and a polymerized silicate melt.It has been found that large amounts of F (8%) are needed to maintain carbonatite magmas in theliquid state at the low eruption temperatures (500-590°C) seen at the carbonatite volcano OldoinyoLengai in Tanzania (Jago and Gittins, 1991). In alkaline magmas the separation of F into a separategaseous phase is suppressed, F is trapped by NaF and F therefore becomes enriched in the magma.
Between 30 and 90% of F in calc-alkaline granites is found in biotite, with the remainder inhornblende, muscovite and accessory minerals such as fluorite. The concentration of F in thesebiotites is a function of the H2O-HF composition and temperature of the fluid which last re-equilibrated with the mica, and the composition of the mica (Mg rich biotites can contain much moreF than those rich in Fe) (Speer, 1984).
In F-rich granites and metasomatic roof zones, accessory minerals such as fluorite, apatite, sphene,microlite, pyrochlore, topaz, tourmaline and bastnasite can host more than 50% of the total F.Fluorine is also found in solid and fluid inclusions (e.g. micas in feldspar and fluid inclusions inquartz), and as glasses (Bailey, 1977; Correns, 1956). Fluorine concentrations in granitic fluidinclusions are usually less than those of H-,0, CO, and Cl (Roedder, 1972). Near-surface degassingcauses the F content of extrusive rocks to be generally lower than that for the equivalent intrusiverock (although it should be noted that the inclusion of some alkali basalts in the mean for basalts inTable 5.2 has increased the basalt mean beyond that for andesites). The HF content of volcanic gasesis generally below 0.03 vol% (White and Waring, 1963).
After solidification of silicic magmas (between 600 and 450°C), F probably forms highly solublecomplexes with a variety of elements, e.g. [A1F2(H2O)4]
+, (SiF6):~ and NaAlF4. These early
complexes decompose with decreasing temperature and pressure, releasing F as a true gas phase.Greisenization takes place in these conditions. Between 400 and 200°C F combines with Al and Cato form topaz and fluorite in hydrothermal quartz veins (Shcherba, 1970). Fluorine-metasomatismduring greisenization is associated with deposition of W, Sn, Be and Li.
5.2.1.4 Metamorphic rocks
Fluorine concentration in metamorphic rocks is highly variable (Table 5.3), as the F content is relatedto the amount present in the pre-metamorphic protohth. Fluorine is remobilised during regionalmetamorphism to zones of low pressure, temperature or F concentration or to reactive rocks such aslimestone. Regional metamorphic rocks are generally law in F, as shown, for instance, by the meanvalues for schists (250 ppm) and shales (790 ppm, Table 5.4). Fluorine substitutions for O2~ tend tooccur at high temperatures and pressures, resulting in the minerals sphene and pyrochlore. Fluorineis lost from biotite at low temperatures but gained at higher grades. Biotite has 0.65 % F in granulite
5.4
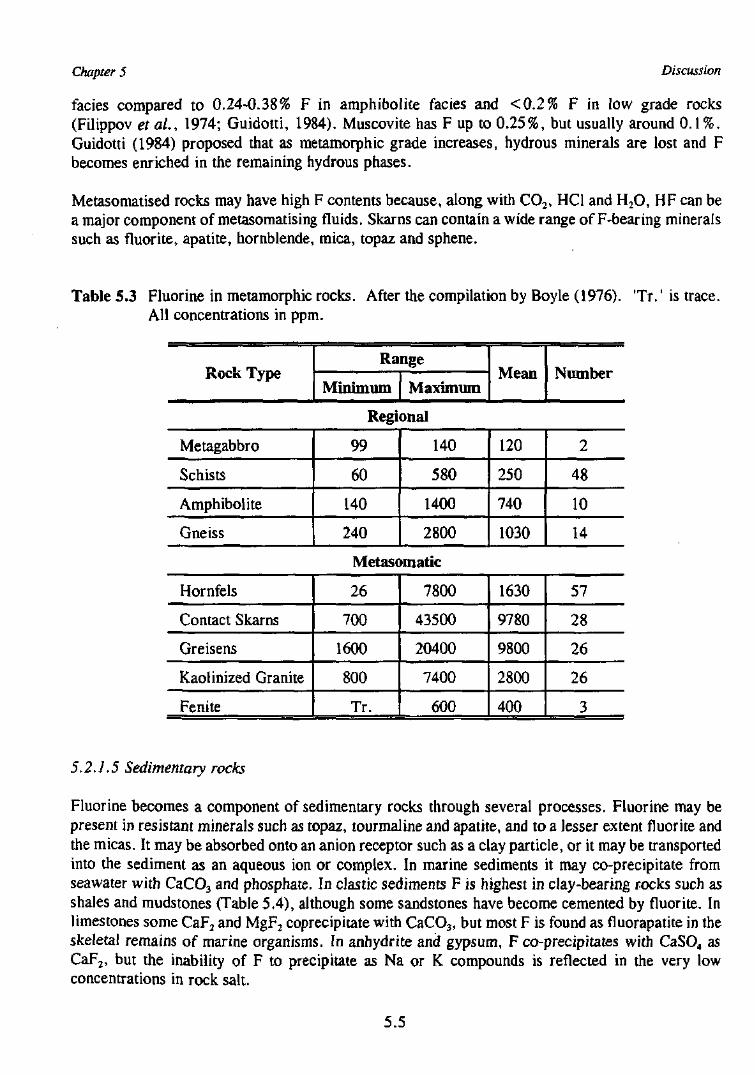
Chapter 5 Discussion
facies compared to 0.24-0.38% F in amphibolite facies and <0.2% F in low grade rocks(Filippov et al., 1974; Guidotti, 1984). Muscovite has F up to 0.25%, but usually around 0.1%.Guidotti (1984) proposed that as metamorphic grade increases, hydrous minerals are lost and Fbecomes enriched in the remaining hydrous phases.
Metasomatised rocks may have high F contents because, along with CO2, HC1 and H2O, HF can bea major component of metasomatising fluids. Skarns can contain a wide range of F-bearing mineralssuch as fluorite, apatite, hornblende, mica, topaz and sphene.
Table 5.3 Fluorine in metamorphic rocks. After the compilation by Boyle (1976). 'Tr.' is trace.All concentrations in ppm.
Rock TypeRange
Minimum MaximumMean Number
Regional
Metagabbro
Schists
Amphibolite
Gneiss
99
60
140
240
140
580
1400
2800
120
250
740
1030
2
48
10
14
Metasomatic
Hornfels
Contact Skarns
Greisens
KaoHnized Granite
Fenite
26
700
1600
800
Tr.
7800
43500
20400
7400
600
1630
9780
9800
2800
400
57
28
26
26
3
5.2.1.5 Sedimentary rocks
Fluorine becomes a component of sedimentary rocks through several processes. Fluorine may bepresent in resistant minerals such as topaz, tourmaline and apatite, and to a lesser extent fluorite andthe micas. It may be absorbed onto an anion receptor such as a clay particle, or it may be transportedinto the sediment as an aqueous ion or complex. In marine sediments it may co-precipitate fromseawater with CaCO3 and phosphate. In elastic sediments F is highest in clay-bearing rocks such asshales and mudstones (Table 5.4), although some sandstones have become cemented by fluorite. Inlimestones some CaF2 and MgF2 coprecipitate with CaCO3, but most F is found as fluorapatite in theskeletal remains of marine organisms. In anhydrite and gypsum, F co-precipitates with CaSO4 asCaF2, but the inability of F to precipitate as Na or K compounds is reflected in the very lowconcentrations in rock salt.
5.5
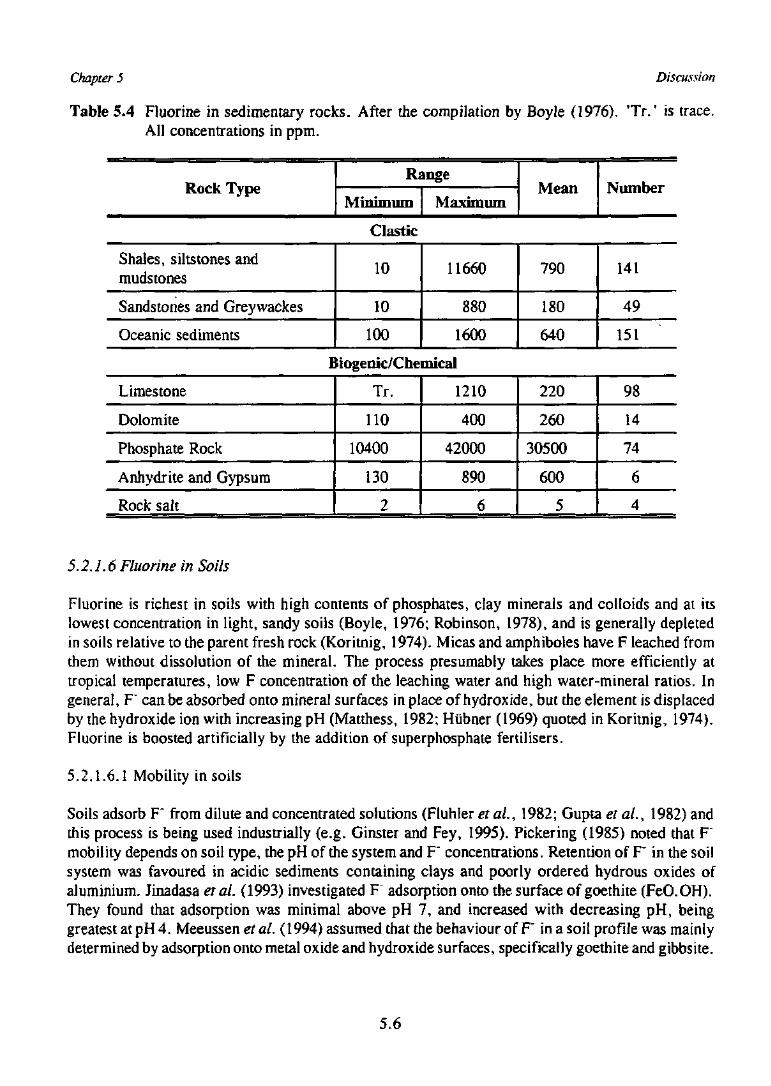
Chapter 5 Discussion
Table 5.4 Fluorine in sedimentary rocks. After the compilation by Boyle (1976). T r . ' is trace.All concentrations in ppm.
Rock TypeRange
Minimum MaximumMean Number
Clastic
Shales, siltstones andmudstones
Sandstones and Greywackes
Oceanic sediments
10
10
100
11660
880
1600
790
180
640
141
49
151
Biogenic/Chemical
Limestone
Dolomite
Phosphate Rock
Anhydrite and Gypsum
Rock salt
Tr.
110
10400
130
2
1210
400
42000
890
6
220
260
30500
600
5
98
14
74
6
4
5.2.1.6 Fluorine in Soils
Fluorine is richest in soils with high contents of phosphates, clay minerals and colloids and at itslowest concentration in light, sandy soils (Boyle, 1976; Robinson, 1978), and is generally depletedin soils relative to the parent fresh rock (Koritnig, 1974). Micas and amphiboles have F leached fromthem without dissolution of the mineral. The process presumably takes place more efficiently attropical temperatures, low F concentration of the leaching water and high water-mineral ratios. Ingeneral, F* can be absorbed onto mineral surfaces in place of hydroxide, but the element is displacedby the hydroxide ion with increasing pH (Matthess, 1982; Hubner (1969) quoted in Koritnig, 1974).Fluorine is boosted artificially by the addition of superphosphate fertilisers.
5.2.1.6.1 Mobility in soils
Soils adsorb F" from dilute and concentrated solutions (Fluhler et at., 1982; Gupta et al., 1982) andthis process is being used industrially (e.g. Ginster and Fey, 1995). Pickering (1985) noted that Fmobility depends on soil type, the pH of the system and F" concentrations. Retention of F' in the soilsystem was favoured in acidic sediments containing clays and poorly ordered hydrous oxides ofaluminium. Jinadasa et al. (1993) investigated F adsorption onto the surface of goethite (FeO.OH).They found that adsorption was minimal above pH 7, and increased with decreasing pH, beinggreatest at pH 4. Meeussen et al. (1994) assumed that the behaviour of F" in a soil profile was mainlydetermined by adsorption onto metal oxide and hydroxide surfaces, specifically goethite and gibbsite.
5.6
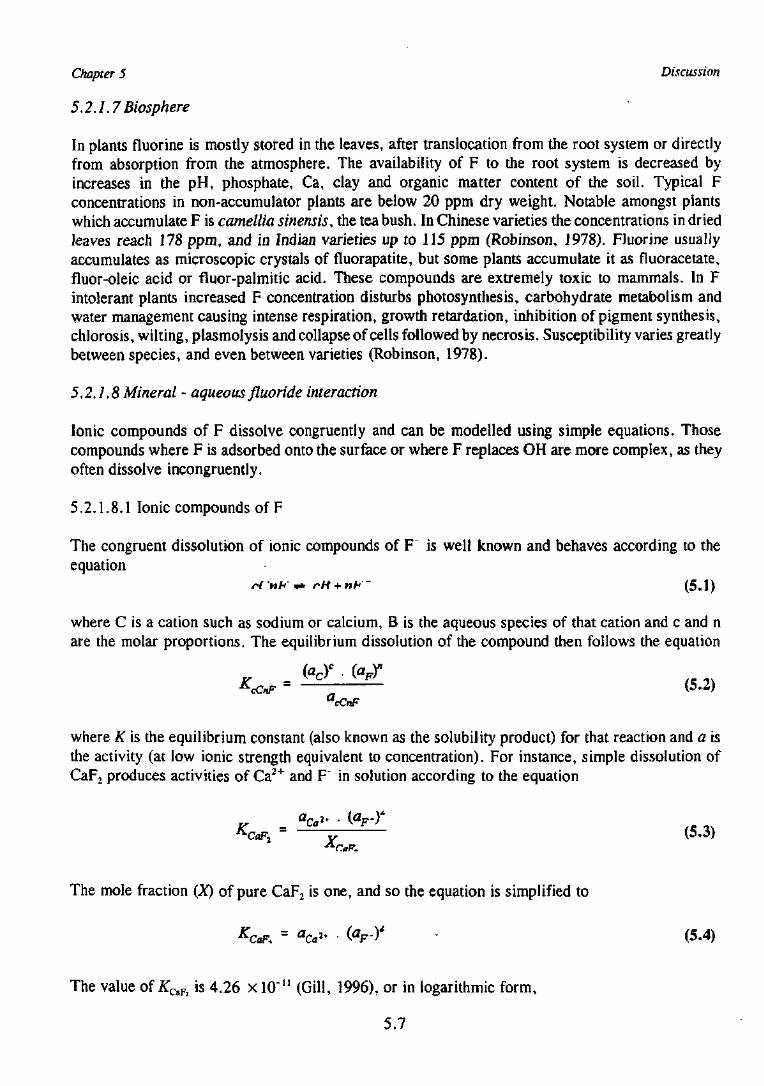
Chapter 5 Discussion
5.2. L 7 Biosphere
In plants fluorine is mostly stored in the leaves, after translocation from the root system or directlyfrom absorption from the atmosphere. The availability of F to the root system is decreased byincreases in the pH, phosphate, Ca, clay and organic matter content of the soil. Typical Fconcentrations in non-accumulator plants are below 20 ppm dry weight. Notable amongst plantswhich accumulate F is camellia sinensis, the tea bush. In Chinese varieties the concentrations in driedleaves reach 178 ppm, and in Indian varieties up to 115 ppm (Robinson, 1978). Fluorine usuallyaccumulates as microscopic crystals of fluorapatite, but some plants accumulate it as fluoracetate,fluor-oleic acid or fluor-palmitic acid. These compounds are extremely toxic to mammals. In Fintolerant plants increased F concentration disturbs photosynthesis, carbohydrate metabolism andwater management causing intense respiration, growth retardation, inhibition of pigment synthesis,chlorosis, wilting, piasmolysis and collapse of cells followed by necrosis. Susceptibility varies greatlybetween species, and even between varieties (Robinson, 1978).
5 J.I.8 Mineral - aqueous fluoride interaction
Ionic compounds of F dissolve congruently and can be modelled using simple equations. Thosecompounds where F is adsorbed onto the surface or where F replaces OH are more complex, as theyoften dissolve incongruently.
5.2.1.8.1 Ionic compounds of F
The congruent dissolution of ionic compounds of F" is well known and behaves according to theequation
rCnfr** rH + nh~ (5.1)
where C is a cation such as sodium or calcium, B is the aqueous species of that cation and c and nare the molar proportions. The equilibrium dissolution of the compound then follows the equation
* C F (52)acCnF
where K is the equilibrium constant (also known as the solubility product) for that reaction and a isthe activity (at low ionic strength equivalent to concentration). For instance, simple dissolution ofCaF2 produces activities of Ca2+ and F in solution according to the equation
(5.3)
The mole fraction (X) of pure CaF2 is one, and so the equation is simplified to
K (Y (5.4)
The value of KC!iFi is 4.26 x 10"11 (Gill, 1996), or in logarithmic form,
5.7
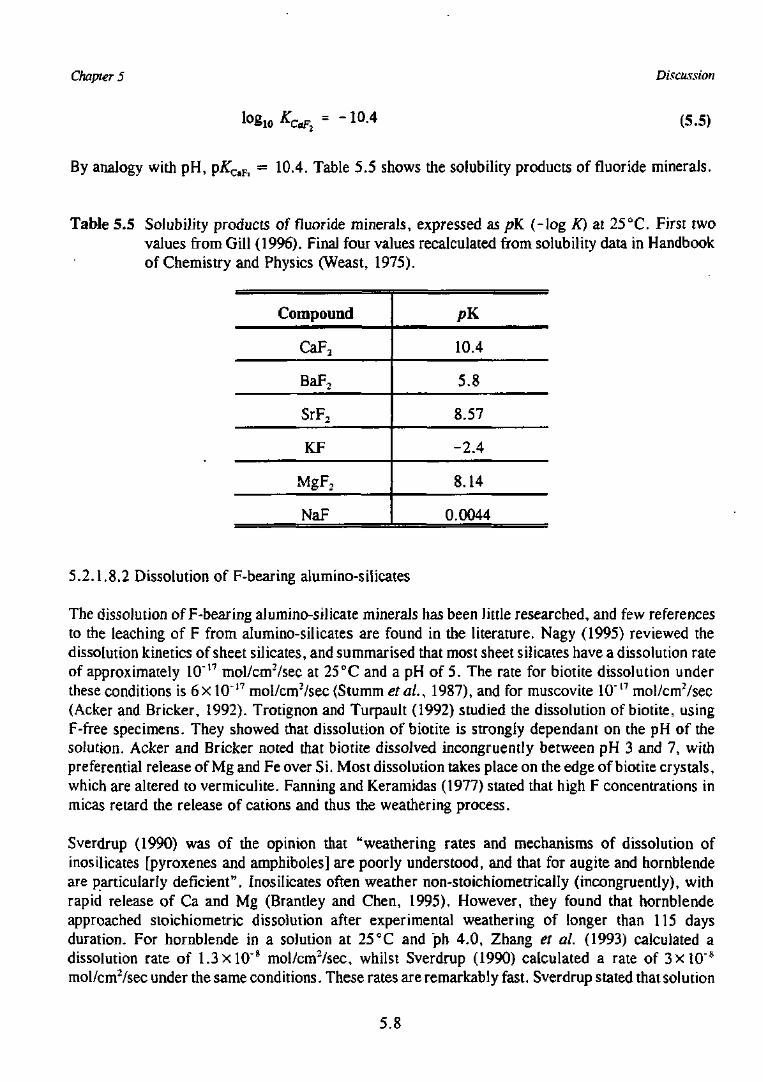
Chapter 5 Discussion
(5.5)
By analogy with pH, pA CaF] = 10.4. Table 5.5 shows the solubility products of fluoride minerals.
Table 5.5 Solubility products of fluoride minerals, expressed as pK (-log K) at 25°C. First twovalues from Gill (1996). Final four values recalculated from solubility data in Handbookof Chemistry and Physics (Weast, 1975).
Compound
CaF2
BaF2
SrF2
KF
MgF2
NaF
pK
10.4
5.8
8.57
-2.4
8.14
0.0044
5.2.1.8.2 Dissolution of F-bearing alumino-silicates
The dissolution of F-bearing alumino-silicate minerals has been little researched, and few referencesto the leaching of F from alumino-silicates are found in the literature. Nagy (1995) reviewed thedissolution kinetics of sheet silicates, and summarised that most sheet silicates have a dissolution rateof approximately 10"t7 mol/cnr/sec at 25°C and a pH of 5. The rate for biotite dissolution underthese conditions is 6x 10~17 mol/cmVsec (Stumm et al., 1987), and for muscovite 10"17 mol/cnrVsec(Acker and Bricker, 1992). Trotignon and Turpault (1992) studied the dissolution of biotite, usingF-free specimens. They showed that dissolution of biotite is strongly dependant on the pH of thesolution. Acker and Bricker noted that biotite dissolved incongruently between pH 3 and 7, withpreferential release of Mg and Fe over Si. Most dissolution takes place on the edge of biotite crystals,which are altered to vermiculite. Fanning and Keramidas (1977) stated that high F concentrations inmicas retard the release of cations and thus the weathering process.
Sverdrup (1990) was of the opinion that "weathering rates and mechanisms of dissolution ofinosilicates [pyroxenes and amphiboles] are poorly understood, and that for augite and hornblendeare particularly deficient". Inosilicates often weather non-stoichiometrically (incongruently), withrapid release of Ca and Mg (Brantley and Chen, 1995). However, they found that hornblendeapproached stoichiometric dissolution after experimental weathering of longer than 115 daysduration. For hornblende in a solution at 25CC and "ph 4.0, Zhang et al. (1993) calculated adissolution rate of 1.3 x l O 8 mol/cnr/sec, whilst Sverdrup (1990) calculated a rate of 3 x 10 s
mol/cnrVsec under the same conditions. These rates are remarkably fast. Sverdrup stated that solution
5.8
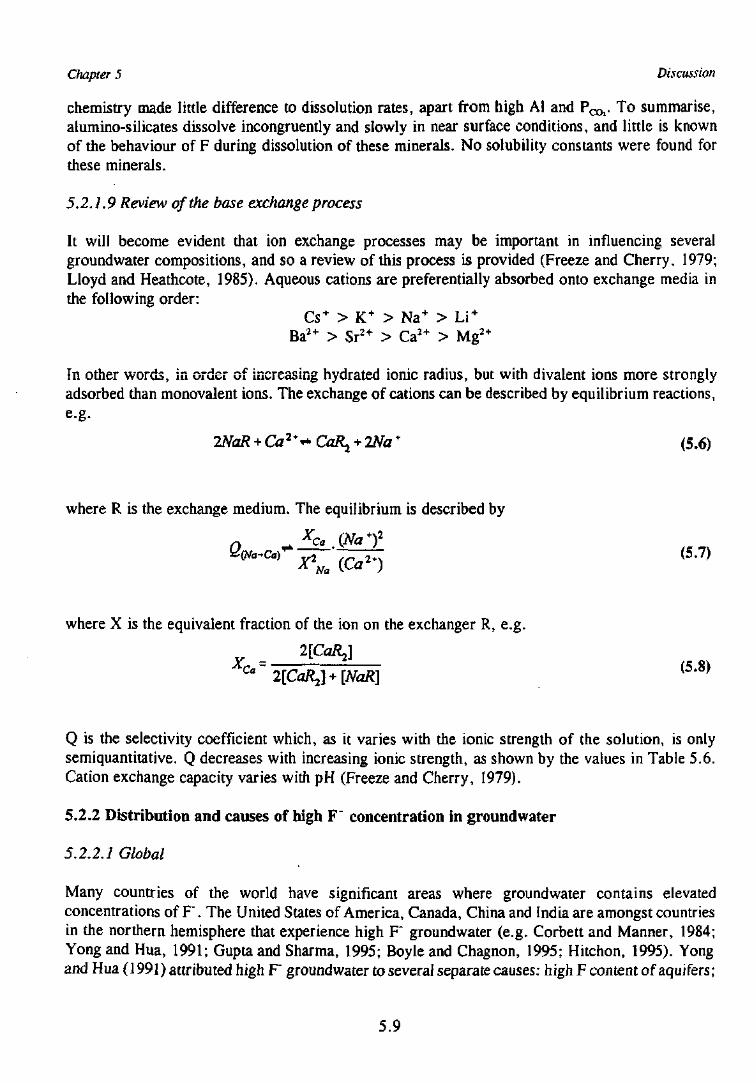
Chapter 5 Discussion
chemistry made little difference to dissolution rates, apart from high Al and P ^ . To summarise,alumino-silicates dissolve incongruently and slowly in near surface conditions, and little is knownof the behaviour of F during dissolution of these minerals. No solubility constants were found forthese minerals.
5.2.1.9 Review of the base exchange process
It will become evident that ion exchange processes may be important in influencing severalgroundwater compositions, and so a review of this process is provided (Freeze and Cherry, 1979;Lloyd and Heathcote, 1985). Aqueous cations are preferentially absorbed onto exchange media inthe following order:
Cs+ > K+ > Na+ > Li+
Ba2+ > Sr2+ > Ca2+ > Mg2+
In other words, in order of increasing hydrated ionic radius, but with divalent ions more stronglyadsorbed than monovalent ions. The exchange of cations can be described by equilibrium reactions,
(5.6)
where R is the exchange medium. The equilibrium is described by
^ r (5.7)Xca
Na
where X is the equivalent fraction of the ion on the exchanger R, e.g.
Ca ' 2[Gz/y + [NaR] (5*8)
Q is the selectivity coefficient which, as it varies with the ionic strength of the solution, is onlysemiquantitative. Q decreases with increasing ionic strength, as shown by the values in Table 5.6.Cation exchange capacity varies with pH (Freeze and Cherry, 1979).
5.2.2 Distribution and causes of high F" concentration in groundwater
5.2.2.1 Global
Many countries of the world have significant areas where groundwater contains elevatedconcentrations of F". The United States of America, Canada, China and India are amongst countriesin the northern hemisphere that experience high F" groundwater (e.g. Corbett and Manner, 1984;Yongand Hua, 1991; Gupta and Sharma, 1995; Boyle and Chagnon, 1995; Hitchon, 1995). Yongand Hua (1991) attributed high F groundwater to several separate causes: high F content of aquifers;
5.9
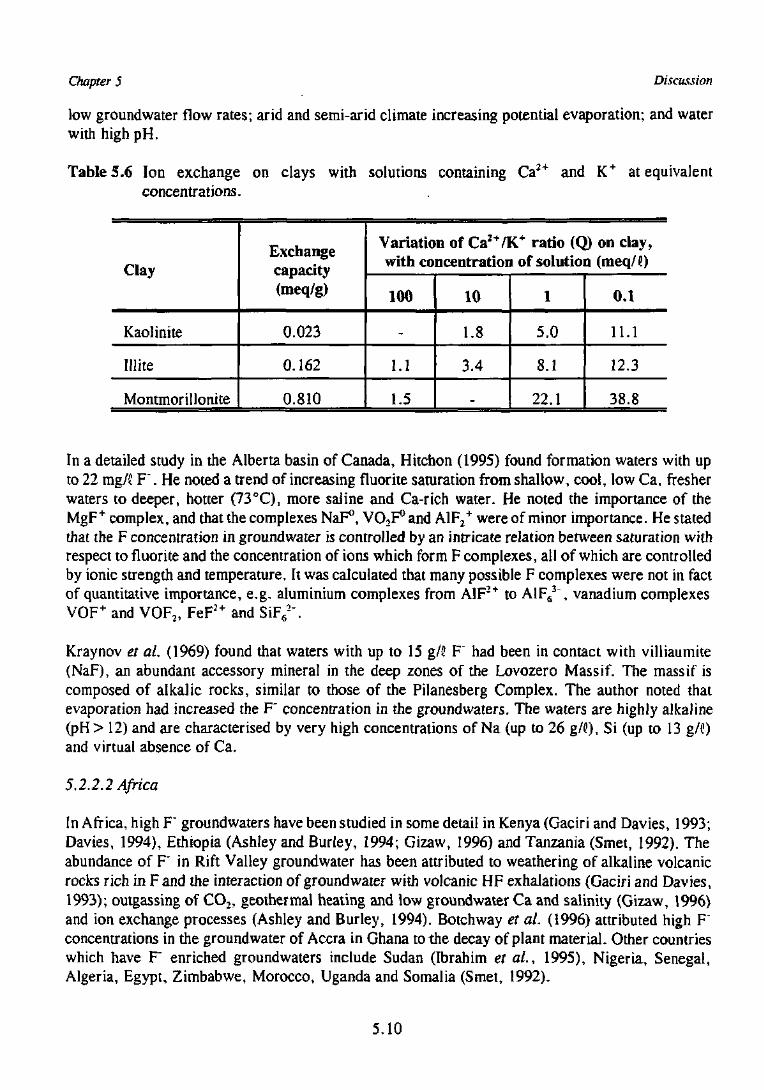
Chapter 5 Discussion
low groundwater flow rates; arid and semi-arid climate increasing potential evaporation; and waterwith high pH.
Table 5.6 Ion exchange on clays with solutions containing Ca2+ and K+ at equivalentconcentrations.
Clay
Kaolinite
Mite
Montmorillonite
Exchangecapacity(meq/g)
0.023
0.162
0.810
Variation of Ca2+/K+ ratio (Q) on clay,with concentration of solution (meq/d)
100
~
1.1
1.5
10
1.8
3.4
-
1
5.0
8.1
22.1
0.1
11.1
12.3
38.8
In a detailed study in the Alberta basin of Canada, Hitchon (1995) found formation waters with upto 22 mg/J F". He noted a trend of increasing fluorite saturation from shallow, cool, low Ca, fresherwaters to deeper, hotter (13°C), more saline and Ca-rich water. He noted the importance of theMgF+ complex, and that the complexes NaF°, VO2F° and A1F2
+ were of minor importance. He statedthat the F concentration in groundwater is controlled by an intricate relation between saturation withrespect to fluorite and the concentration of ions which form F complexes, all of which are controlledby ionic strength and temperature. It was calculated that many possible F complexes were not in factof quantitative importance, e.g. aluminium complexes from A1F2+ to A1FS
3 , vanadium complexesVOF+ and V0F2, FeF2+ and SiF6"\
Kraynov et al. (1969) found that waters with up to 15 g/C F had been in contact with villiaumite(NaF), an abundant accessory mineral in the deep zones of the Lovozero Massif. The massif iscomposed of alkalic rocks, similar to those of the Pilanesberg Complex. The author noted thatevaporation had increased the F" concentration in the groundwaters. The waters are highly alkaline(pH> 12) and are characterised by very high concentrations of Na (up to 26 g/C), Si (up to 13 g/C)and virtual absence of Ca.
5.2.2.2 Africa
In Africa, high F" groundwaters have been studied in some detail in Kenya (Gaciri and Davies, 1993;Davies, 1994), Ethiopia (Ashley and Burley, 1994; Gizaw, 1996) and Tanzania (Smet, 1992). Theabundance of F" in Rift Valley groundwater has been attributed to weathering of alkaline volcanicrocks rich in F and the interaction of groundwater with volcanic HF exhalations (Gaciri and Davies,1993); outgassing of CO2, geothermal heating and low groundwater Ca and salinity (Gizaw, 1996)and ion exchange processes (Ashley and Burley, 1994). Botchway et al. (1996) attributed high Fconcentrations in the groundwater of Accra in Ghana to the decay of plant material. Other countrieswhich have F" enriched groundwaters include Sudan (Ibrahim et al., 1995), Nigeria, Senegal,Algeria, Egypt, Zimbabwe, Morocco, Uganda and Somalia (Smet, 1992).
5.10
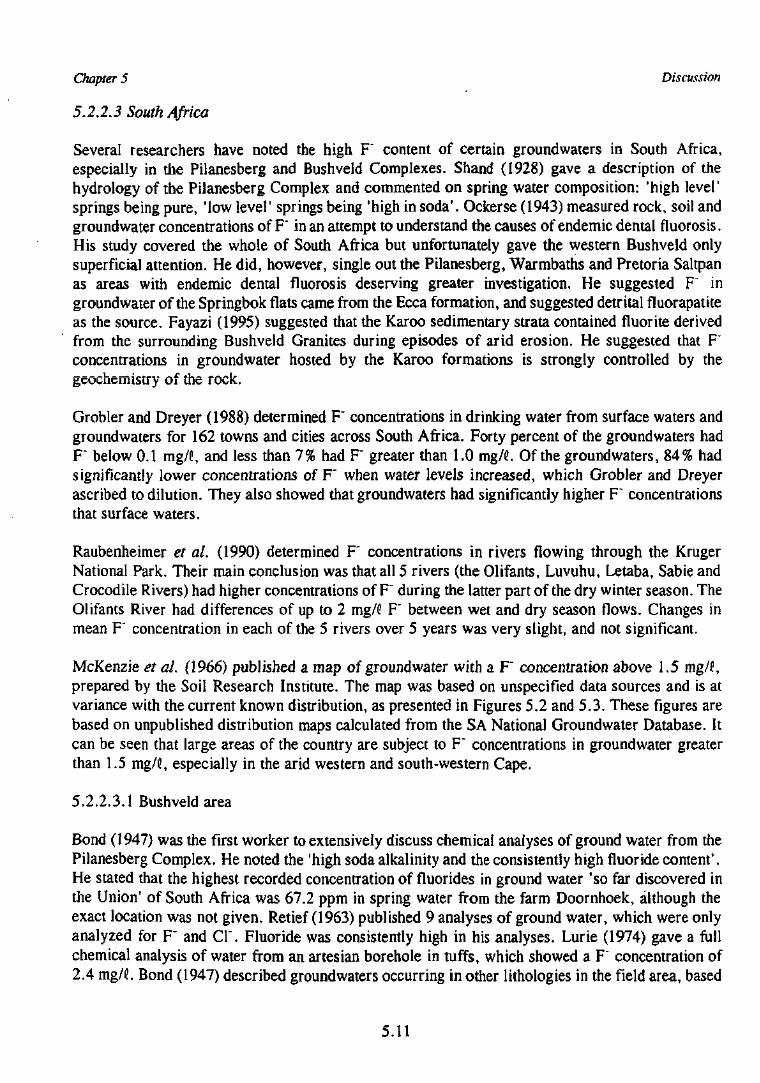
Chapter 5 Discussion
5.2.2.3 South Africa
Several researchers have noted the high F" content of certain groundwaters in South Africa,especially in the Pilanesberg and Bushveld Complexes. Shand (1928) gave a description of thehydrology of the Pilanesberg Complex and commented on spring water composition: 'high level'springs being pure, 'low level' springs being 'high in soda'. Ockerse (1943) measured rock, soil andgroundwater concentrations of F" in an attempt to understand the causes of endemic dental fluorosis.His study covered the whole of South Africa but unfortunately gave the western Bushveld onlysuperficial attention. He did, however, single out the Pilanesberg, Warmbaths and Pretoria Saltpanas areas with endemic dental fluorosis deserving greater investigation. He suggested F ingroundwater of the Springbok flats came from the Ecca formation, and suggested detntal fluorapatiteas the source. Fayazi (1995) suggested that the Karoo sedimentary strata contained fluorite derivedfrom the surrounding Bushveld Granites during episodes of arid erosion. He suggested that F"concentrations in groundwater hosted by the Karoo formations is strongly controlled by thegeochemistry of the rock.
Grobler and Dreyer (1988) determined F" concentrations in drinking water from surface waters andgroundwaters for 162 towns and cities across South Africa. Forty percent of the groundwaters hadF" below 0.1 mg/O, and less than 7% had F" greater than 1.0 mg/f. Of the groundwaters, 84% hadsignificantly lower concentrations of F" when water levels increased, which Grobler and Dreyerascribed to dilution. They also showed that groundwaters had significantly higher F~ concentrationsthat surface waters.
Raubenheimer et at. (1990) determined F" concentrations in rivers flowing through the KrugerNational Park. Their main conclusion was that all 5 rivers (the Olifants, Luvuhu, Letaba, Sabie andCrocodile Rivers) had higher concentrations of F" during the latter part of the dry winter season. TheOlifants River had differences of up to 2 mg/(! F" between wet and dry season flows. Changes inmean F" concentration in each of the 5 rivers over 5 years was very slight, and not significant.
McKenzie et al. (1966) published a map of groundwater with a F" concentration above 1.5 mg/H,prepared by the Soil Research Institute. The map was based on unspecified data sources and is atvariance with the current known distribution, as presented in Figures 5.2 and 5.3. These figures arebased on unpublished distribution maps calculated from the SA National Groundwater Database. Itcan be seen that large areas of the country are subject to F" concentrations in groundwater greaterthan 1.5 mg/l>, especially in the arid western and south-western Cape.
5.2.2.3.1 Bushveld area
Bond (1947) was the first worker to extensively discuss chemical analyses of ground water from thePilanesberg Complex. He noted the 'high soda alkalinity and the consistently high fluoride content'.He stated that the highest recorded concentration of fluorides in ground water 'so far discovered inthe Union' of South Africa was 67.2 ppm in spring water from the farm Doornhoek, although theexact location was not given. Retief (1963) published 9 analyses of ground water, which were onlyanalyzed for F" and Cl \ Fluoride was consistently high in his analyses. Lurie (1974) gave a fullchemical analysis of water from an artesian borehole in tuffs, which showed a F" concentration of2.4 mg/J>. Bond (1947) described groundwaters occurring in other lithologies in the field area, based
5.11
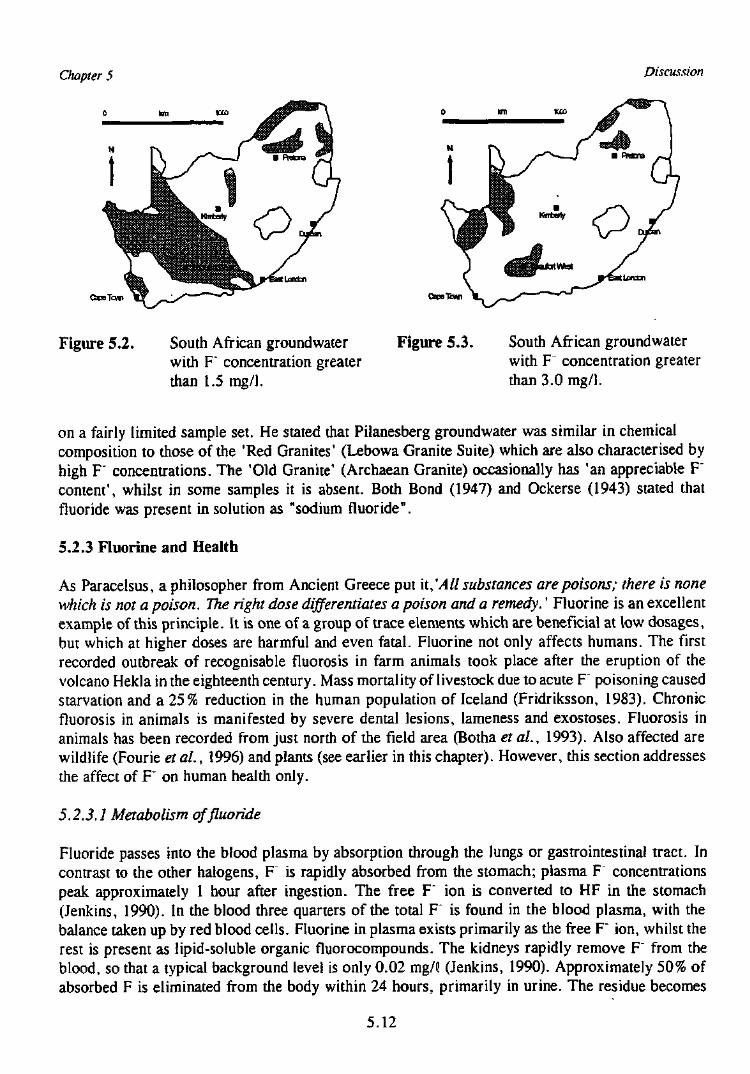
Chapter 5 Discussion
km w o
I • " » * "
Ops Taw
Figure 5.2. South African groundwaterwith F concentration greaterthan 1.5 mg/1.
Figure 5.3. South African groundwaterwith F" concentration greaterthan 3.0 mg/1.
on a fairly limited sample set. He stated that Pilanesberg groundwater was similar in chemicalcomposition to those of the 'Red Granites' (Lebowa Granite Suite) which are also characterised byhigh F" concentrations. The 'Old Granite' (Archaean Granite) occasionally has 'an appreciable F"content', whilst in some samples it is absent. Both Bond (1947) and Ockerse (1943) stated thatfluoride was present in solution as "sodium fluoride".
5.2.3 Fluorine and Health
As Paracelsus, a philosopher from Ancient Greece put it,1All substances are poisons; there is nonewhich is not a poison. The right dose differentiates a poison and a remedy.' Fluorine is an excellentexample of this principle. It is one of a group of trace elements which are beneficial at low dosages,but which at higher doses are harmful and even fatal. Fluorine not only affects humans. The firstrecorded outbreak of recognisable fluorosis in farm animals took place after the eruption of thevolcano Hekla in the eighteenth century. Mass mortality of livestock due to acute F poisoning causedstarvation and a 25% reduction in the human population of Iceland (Fridriksson, 1983). Chronicfluorosis in animals is manifested by severe dental lesions, lameness and exostoses. Fluorosis inanimals has been recorded from just north of the field area (Botha ex al., 1993). Also affected arewildlife (Fourie et al., 1996) and plants (see earlier in this chapter). However, this section addressesthe affect of F" on human health only.
5.2.3.1 Metabolism of fluoride
Fluoride passes into the blood plasma by absorption through the lungs or gastrointestinal tract. Incontrast to the other halogens, F is rapidly absorbed from the stomach; plasma F concentrationspeak approximately 1 hour after ingestion. The free F" ion is converted to HF in the stomach(Jenkins, 1990). In the blood three quarters of the total F" is found in the blood plasma, with thebalance taken up by red blood cells. Fluorine in plasma exists primarily as the free F" ion, whilst therest is present as liptd-soluble organic fluorocompounds. The kidneys rapidly remove F" from theblood, so that a typical background level is only 0.02 mg/C (Jenkins, 1990). Approximately 50% ofabsorbed F is eliminated from the body within 24 hours, primarily in urine. The residue becomes
5.12
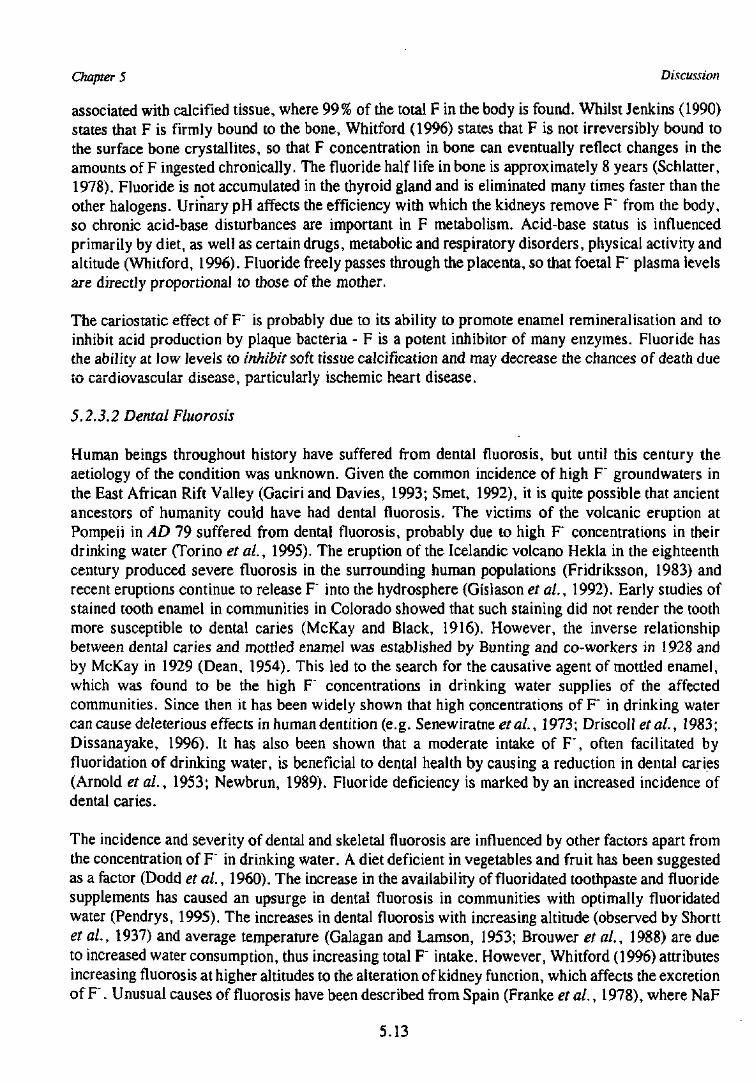
Chapter 5 Discussion
associated with calcified tissue, where 99% of the total F in the body is found. Whilst Jenkins (1990)states that F is firmly bound to the bone, Whitford (1996) states that F is not irreversibly bound tothe surface bone crystallites, so that F concentration in bone can eventually reflect changes in theamounts of F ingested chronically. The fluoride half life in bone is approximately 8 years (Schlatter,1978). Fluoride is not accumulated in the thyroid gland and is eliminated many times faster than theother halogens. Urinary pH affects the efficiency with which the kidneys remove F" from the body,so chronic acid-base disturbances are important in F metabolism. Acid-base status is influencedprimarily by diet, as well as certain drugs, metabolic and respiratory disorders, physical activity andaltitude (Whitford, 1996). Fluoride freely passes through the placenta, so that foetal F" plasma levelsare directly proportional to those of the mother.
The cariostatic effect of F" is probably due to its ability to promote enamel remineralisation and toinhibit acid production by plaque bacteria - F is a potent inhibitor of many enzymes. Fluoride hasthe ability at low levels to inhibit soft tissue calcification and may decrease the chances of death dueto cardiovascular disease, particularly ischemic heart disease.
5.2.3,2 Dental Fluorosis
Human beings throughout history have suffered from dental fluorosis, but until this century theaetiology of the condition was unknown. Given the common incidence of high F groundwaters inthe East African Rift Valley (Gaciri and Davies, 1993; Smet, 1992), it is quite possible that ancientancestors of humanity could have had dental fluorosis. The victims of the volcanic eruption atPompeii in AD 79 suffered from dental fluorosis, probably due to high F* concentrations in theirdrinking water (Torino et al,, 1995). The eruption of the Icelandic volcano Hekla in the eighteenthcentury produced severe fluorosis in the surrounding human populations (Fridriksson, 1983) andrecent eruptions continue to release F" into the hydrosphere (Gislason et al., 1992). Early studies ofstained tooth enamel in communities in Colorado showed that such staining did not render the toothmore susceptible to dental caries (McKay and Black, 1916). However, the inverse relationshipbetween dental caries and mottled enamel was established by Bunting and co-workers in 1928 andby McKay in 1929 (Dean, 1954). This led to the search for the causative agent of mottled enamel,which was found to be the high F concentrations in drinking water supplies of the affectedcommunities. Since then it has been widely shown that high concentrations of F" in drinking watercan cause deleterious effects in human dentition (e.g. Senewiratne etal., 1973; Driscoil et al., 1983;Dissanayake, 1996). It has also been shown that a moderate intake of F ' , often facilitated byfluoridation of drinking water, is beneficial to dental health by causing a reduction in dental caries(Arnold et al., 1953; Newbrun, 1989). Fluoride deficiency is marked by an increased incidence ofdental caries.
The incidence and severity of dental and skeletal fluorosis are influenced by other factors apart fromthe concentration of F" in drinking water. A diet deficient in vegetables and fruit has been suggestedas a factor (Dodd et al., 1960). The increase in the availability of fluoridated toothpaste and fluoridesupplements has caused an upsurge in dental fluorosis in communities with optimally fluoridatedwater (Pendrys, 1995). The increases in dental fluorosis with increasing altitude (observed by Shorttet al, 1937) and average temperature (Galagan and Lamson, 1953; Brouwer et al., 1988) are dueto increased water consumption, thus increasing total F" intake. However, Whitford (1996) attributesincreasing fluorosis at higher altitudes to the alteration of kidney function, which affects the excretionof F". Unusual causes of fluorosis have been described from Spain (Franke et al., 1978), where NaF
5.13
Chapter 5 Discussion
was added to wine to avoid abnormal fermentation, resulting in a form of skeletal fluorosis ("winefluorosis"), and China, where high F in tea has caused skeletal fluorosis in immigrant Tibetans (Caoet aL, 1996). Other effects of F are discussed in section 5.2.3.3.
5.2.3.2.1 Symptoms
Mottled tooth enamel is a common sight in many rural parts of the world. Until 1931 the term'mottled tooth enamel1 was common, but since the source of the condition has been traced to excessingestion of F , the term 'dental fluorosis1 has been adopted. The following descriptions of theclinical manifestations of dental fluorosis are summarised from Fejerskov et aL (1988). Normal toothenamel is a microporous solid comprised of highly ordered, tightly packed hydroxyapatite crystals.The surface of the enamel in normal teeth is translucent, smooth and glossy even when dry, with apale creamy white colour. Dental fluorosis is a developmental disturbance which increases with time.Therefore primary teeth are less severely affected man the permanent teeth, and those teeth whicherupt first (the incisors and first permanent molars) are less affected than those erupting later (thepremolars and other permanent molars).
The first signs of dental fluorosis {moderate dental fluorosis) are thin white lines running across theentire enamel surface and which can only be seen after drying of the tooth surface. This phenomenonis caused by air replacing saliva in enamel porosities, increasing opacity in the more porous areas.The porosity occurs at crystal boundaries and is caused by impairment of the final growth of thehydroxyapatite crystals. With more fluorosis these thin lines become broader, merge and may beclear without the need for drying. At slightly greater severity the tooth surface shows distinct,irregular, opaque or cloudy white areas, caused by increasing porosity of the tooth enamel. Thepatches may take up brown stains from food particles. Rarely, minute pits may occur in the cloudyareas. Moderate dental fluorosis is characterised by the entire tooth surface becoming chalky white.Such teeth can be damaged by mechanical wear in the mouth and by the probing of dentists.
In severe dental fluorosis pits occur in the now completely opaque enamel. The pits, of varyingdiameter, are scattered over the tooth surface to begin with, but merge to form a band across thetooth, often coincidental with the position of the top or bottom lip. The pits are caused byhypomineralized enamel breaking off, revealing normal enamel underneath. At no time is dentineexposed. Severely fluorotic teeth have an almost total loss of surface enamel, and become misshapenand are often stained brown or black. The staining, although common, depends entirely on the post-eruptive oral environment and is not an intrinsic feature of dental fluorosis.
Dental clinicians originally used the classification of dental fluorosis proposed by Dean etal. (1942),which used the descriptions normal, questionable, very mild, mild, moderate and severe. Morerecently, dentists have turned to the TF index, proposed by Thylstrup and Fejerskov (1978) whicharranged the severity of dental fluorosis into 10 classes, from 0 (equivalent to normal) to 9 (severe).Unfortunately, the precise levels of F" dietary intake at which each level of fluorosis becomesapparent are not well established (Brouwer et aL, 1988; Leung, 1988; White, 1988; Du Plessis,1995).
5.14
Chapter 5 Discussion
5.2.3.2.2 Dental fluorosis in the field area
Investigations of dental fluorosis in the field area are confined to village-based studies only. No fullscale census or survey has been carried out. Ockerse (1941 and 1943) and Ockerse and Meyer (1941)were the first workers to report on the occurrence of endemic dental and skeletal fluorosis in SouthAfrica. In the field area Ockerse (1943) found evidence of the condition in the Pilanesberg,Warmbaths, Kalkheuvel and Pretoria Saltpan areas. Not all occurrences were large; only 3 caseswere located around the Saltpan, and the cases at Kalkheuvel were found only in the workers of acertain quarry. However, he stated that the Pilanesberg was 'one of the worst affected endemicfluorosis areas in the Transvaal', and that 'some of the worst cases of mottled enamel are foundamong school children who were born and grew up in Warmbaths'. He stated that 144 endemic areashad been identified in the Transvaal, mostly in areas underlain by the Bushveld Igneous Complex.
The studies of Zietsman (1985, 1989 and 1991) have been methodical and illuminating, withsurprising and controversial conclusions. Her small study area encompassed several villages, in thecentre of the current author's field area. Most of the villages were situated on Nebo Granite andgranophyre, whilst one was situated on the edge of the Ecca Formation outcrop. Zietsman (1989)discussed the spatial variation of dental fluorosis in 7 villages, and attempted to correlate the variationto underlying geological causes and to the variation of F" concentrations in groundwaters. Shesampled 120 boreholes, and found much spatial variation of F" concentrations, ranging from 0.1 to5.5 mg/fi. Importantly, she found that 33% of children drinking groundwater with a F content of<0.5 mg/fi had dental fluorosis. Furthermore, she found the occurrence of different rock types didnor fully explain the spatial variation in groundwaters F" concentration. Her conclusions aresomewhat compromised in that, in her discussion of the geological setting of the village of Rietgat,whilst correctly stating that the village is within the outcrop area of the Ecca Formation, she ignoresthe fact that the village is on the very edge of the Karoo basin. Boreholes in the village in alllikelihood penetrate through the Ecca formation, into the underlying Nebo Granite. Geological logsof the boreholes would be needed to confirm this contention.
Zietsman (1991) further developed her ideas on spatial variation and fluorosis in the same study area.Each of the 3103 school pupils which were examined for dental fluorosis were linked to individualdrinking water sources, usually boreholes. The history of each source was known for up to 30 yearsbefore the study, and from this Zietsman based her conclusions. The positive correlation between F"concentration in the drinking water and the severity of dental fluorosis was statistically significant at95 % confidence limits, but the spatial variation in fluorosis was not fully explained by the variationin F" concentration. She could recommend no safe 'threshold level', as the severity of fluorosisformed a continuum at any F" concentration. She also found only 4% of the groundwaters exhibitedvariation in the F" concentration from dry to wet season, and that this variation was always less than30% of the mean value. If any criticism had to be levelled at this excellent paper, it would be thatchildren (with an ungauged and questionable sense of direction) were responsible for pointing out thelocation of their principal source of water.
Rudolph et al, (1995) have investigated dental fluorosis in four villages near the PilanesbergComplex. Two of the villages had high F" groundwater, whilst the two control villages had low F"groundwater. They found that severe dental fluorosis occurred in 28% of subjects drinkinggroundwater with a F" concentration of 7 to 8 mg/d, whilst 41 % had moderate dental fluorosis. Everyperson in the two villages with high F" groundwaters showed some evidence of dental fluorosis.
5.15
Chapter 5 Discussion
Only three people from the two villages with low F had dental fluorosis. In 1991, 95% of theinhabitants of Bophuthatswana received their drinking water from groundwater (Pelpola et al., 1992).
Dental fluorosis has been studied in several other parts of South Africa. The study by Lewis andChikte (1995) of school children in KwaNdebele showed that even at a drinking water Fconcentration of between 0.6 - 1.6 mg/5, 90% of the subjects had some sign of dental fluorosis,bringing into question the recommendations of the WHO (1984). Furthermore, Carstens etal. (1995)showed that children in the North Western Cape who drank water with a F concentration below theWHO recommendations still had a high incidence of dental fluorosis. They recommended a drinkingwater F" concentration of only 0.4 mg/(. According to du Plessis et al. (1995), race was found tobe a factor in the severity of dental fluorosis. They found that 39% of white school children in theBloemfontein area had evidence of dental fluorosis on the maxillary central incisors, compared to16% of black schoolchildren drinking water of the same F~ concentration (0.54 mg/d). Retief et al.(1979) showed that a positive association existed between F" concentration in tooth enamel and thedegree of fluorosis in the individuals of the town of Kenhardt in the northern Cape, supplied withhigh F' drinking water (3.2 mg/C)- The study of van der Merwe et al. (1977) reached similarconclusions.
5.2.3.3 Other effects ofK on the human body
5.2.3.3.1 Skeletal fluorosis
Fluorapatite is an order of magnitude less soluble than hydroxyapatite, the principal mineralconstituent of bone. The F" ion aggressively substitutes for the OH" ion, leading to a build up of Fin bone tissue with increasing age. A typical 55 year old human is expected to have between 2000and 2500 ppm F in their bones, although up to 6000 ppm F has been recorded with no pathologicalchange (Jenkins, 1990). Skeletal fluorosis often occurs in endemic dental fluorosis areas; generally,only villages with higher than average F' groundwater will also have cases of skeletal fluorosis.Asymptomatic skeletal fluorosis can be diagnosed most securely with X-Rays. This is due to theincreased bone density, especially in vertebrae (Meunier et al., 1989). Several studies, such as Riggset al. (1990) on women with postmenopausal osteoporosis, showed that with very high F"consumption, bone mass increases but skeletal fragility also increases.
The first symptoms of skeletal fluorosis are aching joints and muscles. Increasing severity producesstiffness of the lumbar, thoracic and cervical regions of the spine and restriction of head movement,caused by thickening of the joints and mineralisation of the tendons. In extreme cases the vertebraeof the back become rigid, giving rise to a condition known as 'poker back' or 'bamboo spine'. Thepatient is unable to stand erect, the rib-cage becomes rigid and all breathing is performedabdominally, whilst bony outgrowths form at the end of ribs and along the long bones (Shorn et al.,1937; Ockerse, 1941). Paraplegia, quadriplegia, wasting of the muscles and neurological disorder(radiculomyopathy) may finally ensue (Boyle and Chagnon, 1995; Goldman et al., 1971).
Artificial skeletal fluorosis was first described in Danish workers, who ingested large amounts of Fby accidental inhalation of cryolite dust (Na3AlF6; Moller and Gudjonsson, 1932). In parts of India,'notably Madras, where ingestion of water with a F" concentration greater than 8 mg/C has occurredfor more than 40 years, skeletal fluorosis is endemic (Shortt et al., 1937). Endemic skeletal fluorosis
5.16
Chapter 5 Discussion
has been reported in many countries (Lyth, 1946; Kilborn et al., 1950; Hamamoto, 1957; Zipkin etal., 1958; Odenthal and Wieneke, 1959; Felsenfeldand Roberts, 1991; Boyle and Chagnon, 1995).
Skeletal fluorosis has been reported from several areas of South Africa, Ockerse (1941) reported 6cases of confirmed skeletal fluorosis in workers at a cement factory north of Pretoria. The occurrencein Kenhardt in die Northern Cape Province (Dodd et aL, 1960) is unusual in that children have beenaffected; in other parts of the world skeletal fluorosis usually manifests itself after 20 to 40 years.The groundwater of the area is only moderately enriched in F", at 4.8 mg/C. The symptoms are alsounusual in that softening of the long bones occurred, causing bending. Fluoride in this case isprobably only one of several aetiological factors in the condition, another being malnutrition. Pettiforet al. (1989) suggested that low dietary calcium intakes may exacerbate the severity of bone lesionsin children living in areas of endemic fluorosis.
5.2.3.3.2 Goitre
It has been noted that endemic goitre is often found in the same area as high F" concentrations ingroundwaters, although it is unlikely that F is directly goitrogenic (Day and Powell-Jackson, 1972).Yang et al. (1994) investigated the effects of high iodine and F on children's intelligence. Althoughthey found the intelligence quotient was lowered in children with high F and iodine intakes, Yanget al. did not investigate which element was responsible. Parts of the current field area are iodinedeficient (Kalkefa/., 1997).
5.2.3.3.3 Cancer
Childhood osteosarcomas occur most frequently in the knees, ankles, shoulders and wrists, areasshowing a high response (osteoblast proliferation and bone formation) to F" (Schulz et aL, 1984).High F" drinking water was initially implicated in higher rates of osteosarcoma (Kinlen, 1975).However, more recent research (Oldham and Newell, 1977; Hrudey etal., 1990; Anderson, 1991;Mahoney et al., 1991; US Dept of Health and Human Services, 1991; Freni and Gaylor, 1992;Gelberg et al., 1995) has shown that F' is not osteocarcinogenic in humans.
5.2.3.3.4 Acute fluoride poisoning
Gessner et al. (1994) reported acute F" poisoning in a small community in Alaska. The incidentfollowed an accidental NaF overdose at a water treatment works. Initial symptoms include nausea,epigastric distress and vomiting. Excessive salivation, mucous discharge from the nose and mouth,headaches, sweating, diarrhoea and general weakness are sometimes present. Spasm of theextremities, tetany and convulsions develop in lethal doses, as well as failure of the cardiovascularsystem indicated by a weak pulse and cardiac arrhythmias. Renal function and respiration isdepressed causing respiratory and metabolic acidosis. Extreme disorientation is followed byunconsciousness and death.
Large amounts of F" must be ingested to induce acute F* poisoning, far more than is possible fromthe ingestion of almost all naturally fluoridated drinking-water. Gessner etal. (1994) reported deathafter ingestion of 18 mg/kg body weight, although other workers have quoted an LD100 (the dosewhich is 100% lethal to a specified group of subject, in this case human males of 70kg mass) of aquarter of this value.
5.17
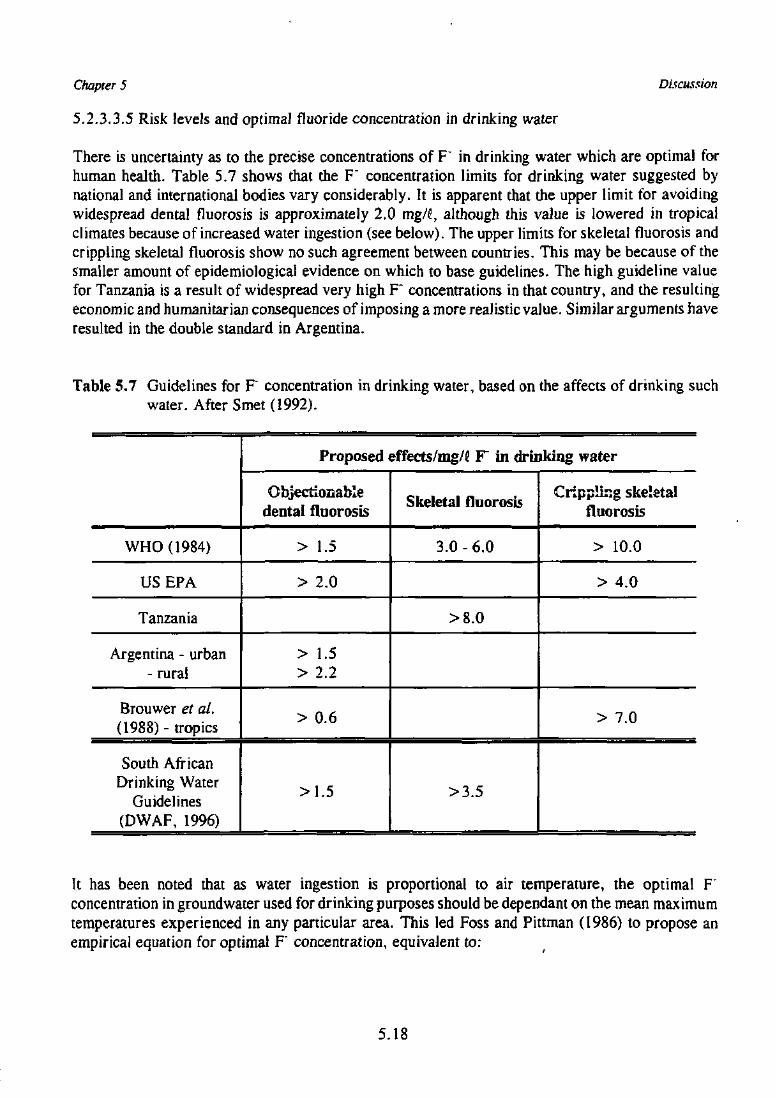
Chapter 5 Discussion
5.2.3.3.5 Risk levels and optimal fluoride concentration in drinking water
There is uncertainty as to the precise concentrations of F in drinking water which are optimal forhuman health. Table 5.7 shows that the F concentration limits for drinking water suggested bynational and international bodies vary considerably. It is apparent that the upper limit for avoidingwidespread dental fluorosis is approximately 2.0 mg/fi, although this value is lowered in tropicalclimates because of increased water ingestion (see below). The upper limits for skeletal fluorosis andcrippling skeletal fluorosis show no such agreement between countries. This may be because of thesmaller amount of epidemiological evidence on which to base guidelines. The high guideline valuefor Tanzania is a result of widespread very high F concentrations in that country, and the resultingeconomic and humanitarian consequences of imposing a more realistic value. Similar arguments haveresulted in the double standard in Argentina.
Table 5.7 Guidelines for F concentration in drinking water, based on the affects of drinking suchwater. After Smet (1992).
WHO (1984)
US EPA
Tanzania
Argentina - urban- rural
Brouwer et al.(1988) - tropics
South AfricanDrinking Water
Guidelines(DWAF, 1996)
Proposed effects/mg/fi F in drinking water
Objectionabledental fluorosis
> 1.5
> 2.0
> 1.5> 2.2
> 0.6
>1.5
Skeletal fluorosis
3.0-6.0
>8.0
>3.5
Crippling skeletalfluorosis
> 10.0
> 4.0
> 7.0
It has been noted that as water ingestion is proportional to air temperature, the optimal Fconcentration in groundwater used for drinking purposes should be dependant on the mean maximumtemperatures experienced in any particular area. This led Foss and Pittman (1986) to propose anempirical equation for optimal F concentration, equivalent to:
5.18
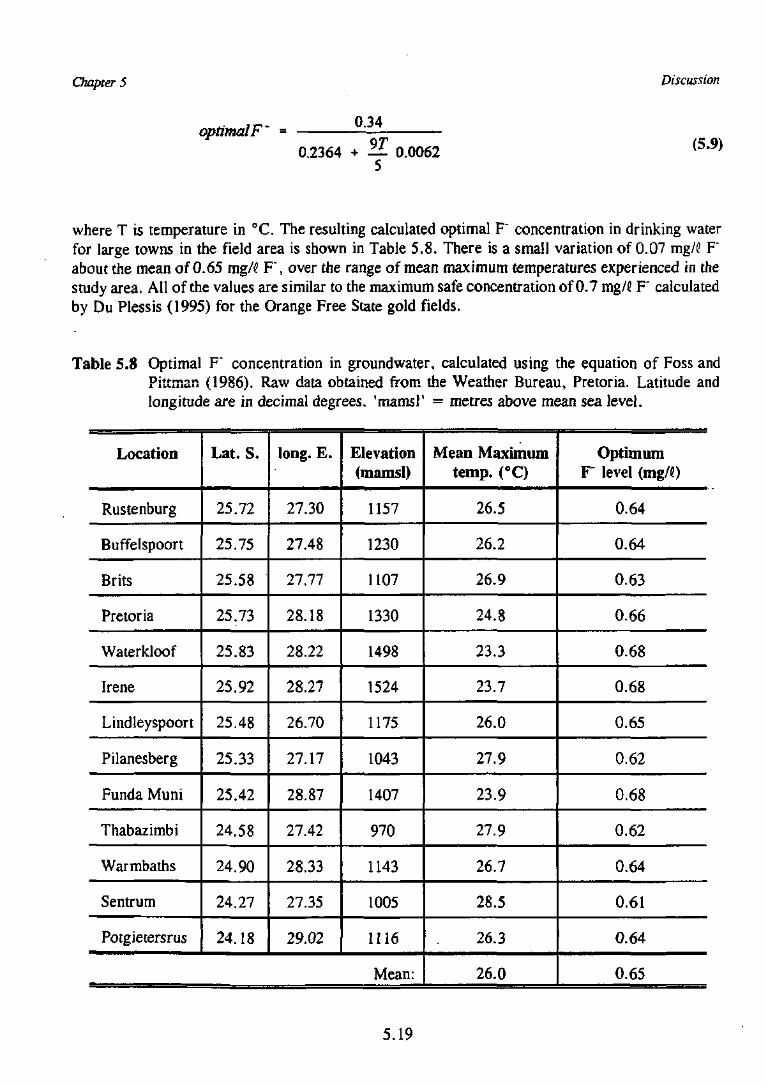
Chapter 5
optimal F~ = 0.34
0.2364 + — 0.0062
Discussion
(5.9)
where T is temperature in °C. The resulting calculated optimal F" concentration in drinking waterfor large towns in the field area is shown in Table 5.8. There is a small variation of 0.07 mg/C F"about the mean of 0.65 mg/£ F", over the range of mean maximum temperatures experienced in thestudy area. All of the values are similar to the maximum safe concentration of 0.7 mg/fi F" calculatedby Du Plessis (1995) for the Orange Free State gold fields.
Table 5.8 Optimal F* concentration in groundwater, calculated using the equation of Foss andPittrnan (1986). Raw data obtained from the Weather Bureau, Pretoria. Latitude andlongitude are in decimal degrees, 'mams!' = metres above mean sea level.
Location
Rustenburg
Buffelspoort
Brits
Pretoria
Waterkloof
Irene
Lindleyspoort
Pilanesberg
Funda Muni
Thabazimbi
Warmbaths
Sentrum
Potgietersrus
Lat. S.
25.72
25.75
25.58
25.73
25.83
25.92
25.48
25.33
25.42
24.58
24.90
24.27
24.18
long. E.
27.30
27.48
27.77
28.18
28.22
28.27
26.70
27.17
28.87
27.42
28.33
27.35
29.02
Elevation(mamsl)
1157
1230
1107
1330
1498
1524
1175
1043
1407
970
1143
1005
1116
Mean:
Mean Maximumtemp. (°C)
26.5
26.2
26.9
24.8
23.3
23.7
26.0
27.9
23.9
27.9
26.7
28.5
26.3
26.0
OptimumF" level (mg/0
0.64
0.64
0.63
0.66
0.68
0.68
0.65
0.62
0.68
0.62
0.64
0.61
0.64
0.65
5.19
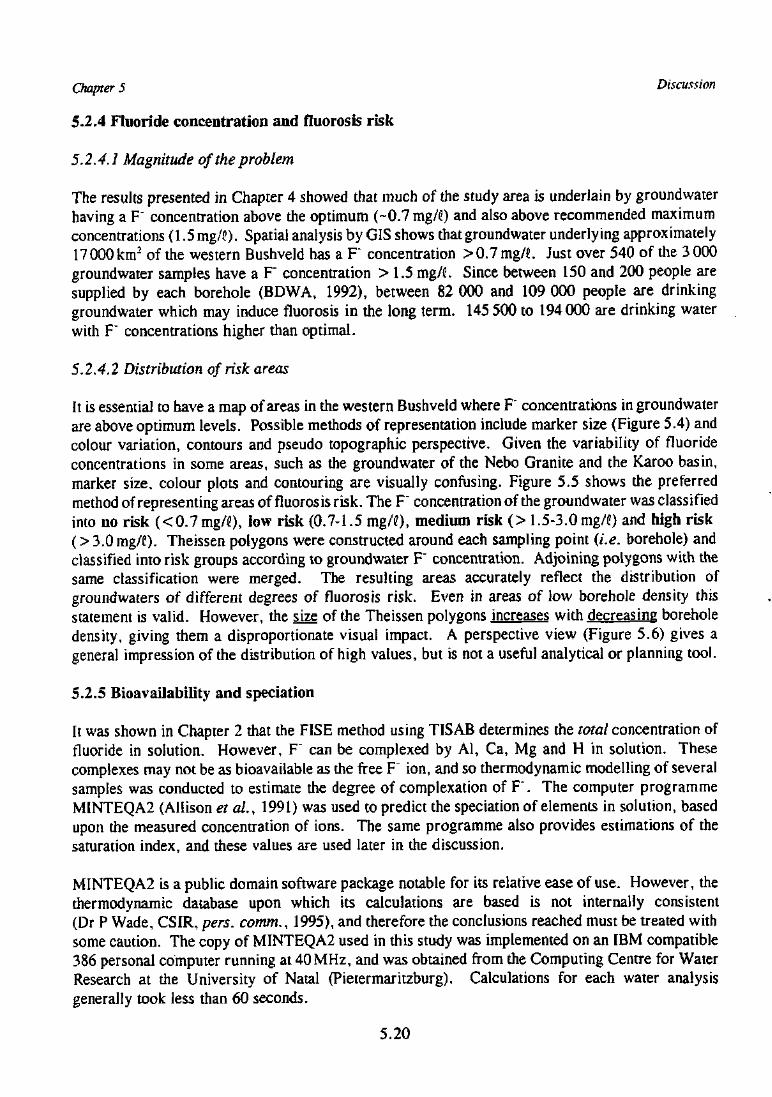
Chapter 5 Discussion
5.2.4 Fluoride concentration and fluorosis risk
5.2.4.1 Magnitude of the problem
The results presented in Chapter 4 showed that much of the study area is underlain by groundwaterhaving a F" concentration above the optimum (~0.7mg/C) and also above recommended maximumconcentrations (1.5mg/(>). Spatial analysis by GIS shows that groundwater underlying approximately17000 km- of the western Bushveld has a F concentration >0.7 mg/J>. Just over 540 of the 3 000groundwater samples have a F" concentration > 1.5 mg/J. Since between 150 and 200 people aresupplied by each borehole (BDWA, 1992), between 82 000 and 109 000 people are drinkinggroundwater which may induce fluorosis in the long term. 145 500 to 194000 are drinking waterwith F" concentrations higher than optimal.
5.2.4.2 Distribution of risk areas
It is essential to have a map of areas in the western Bushveld where F" concentrations in groundwaterare above optimum levels. Possible methods of representation include marker size (Figure 5.4) andcolour variation, contours and pseudo topographic perspective. Given the variability of fluorideconcentrations in some areas, such as the groundwater of the Nebo Granite and the Karoo basin,marker size, colour plots and contouring are visually confusing. Figure 5.5 shows the preferredmethod of representing areas of fluorosis risk. The F" concentration of the groundwater was classifiedinto no risk (<0.7mg/C), low risk (0.7-1.5 mg/«), medium risk (> 1.5-3.0 mg/() and high risk(> 3.0mg/f). Theissen polygons were constructed around each sampling point (i.e. borehole) andclassified into risk groups according to groundwater F" concentration. Adjoining polygons with thesame classification were merged. The resulting areas accurately reflect the distribution ofgroundwaters of different degrees of fluorosis risk. Even in areas of low borehole density thisstatement is valid. However, the size of the Theissen polygons increases with decreasing boreholedensity, giving them a disproportionate visual impact. A perspective view (Figure 5.6) gives ageneral impression of the distribution of high values, but is not a useful analytical or planning tool.
5.2.5 Unavailability and speciation
It was shown in Chapter 2 that the FISE method using TISAB determines the total concentration offluoride in solution. However, F can be complexed by Al, Ca, Mg and H in solution. Thesecomplexes may not be as bioavailable as the free F" ion, and so thermodynamic modelling of severalsamples was conducted to estimate the degree of complexation of F". The computer programmeMINTEQA2 (Allison et al., 1991) was used to predict the speciation of elements in solution, basedupon the measured concentration of ions. The same programme also provides estimations of thesaturation index, and tiiese values are used later in the discussion.
MINTEQA2 is a public domain software package notable for its relative ease of use. However, thethermodynamic database upon which its calculations are based is not internally consistent(Dr P Wade, CSIR, pers. comm., 1995), and therefore the conclusions reached must be treated withsome caution. The copy of MINTEQA2 used in this study was implemented on an IBM compatible386 personal computer running at 40 MHz, and was obtained from the Computing Centre for WaterResearch at the University of Natal (Pietermaritzburg). Calculations for each water analysisgenerally took less than 60 seconds.
5.20
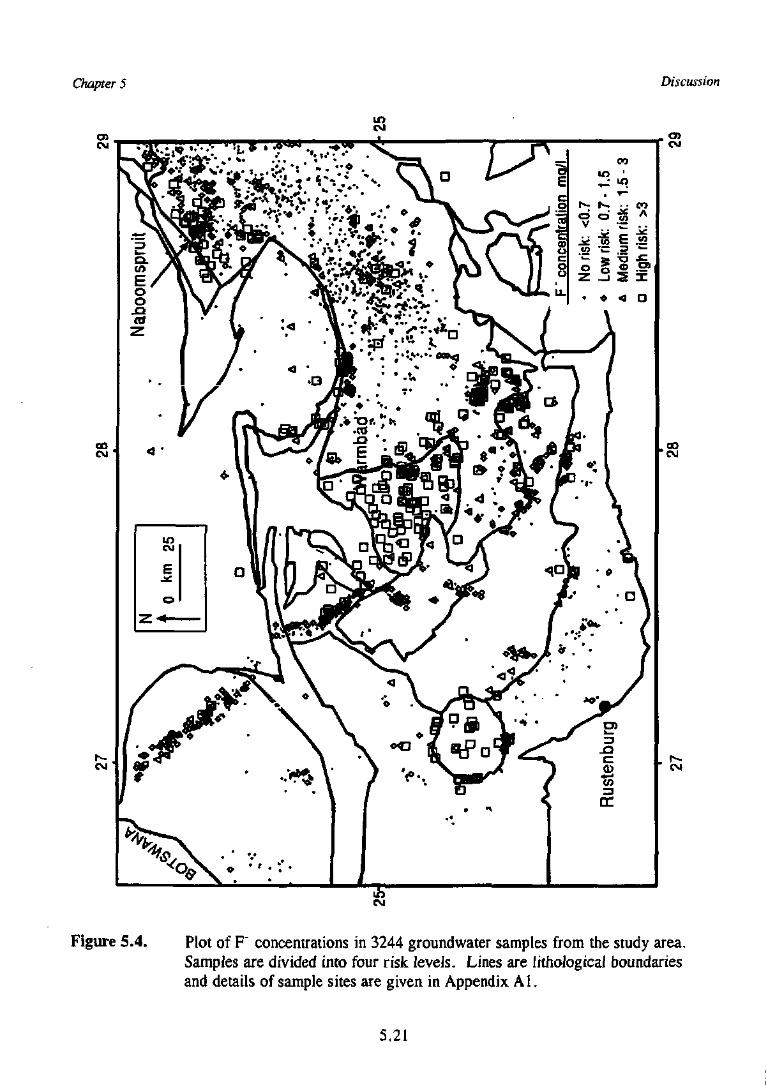
Chapter 5 Discussion
Figure 5.4. Plot of F" concentrations in 3244 groundwater samples from the study area.Samples are divided into four risk levels. Lines are lithological boundariesand details of sample sites are given in Appendix Al.
5.21
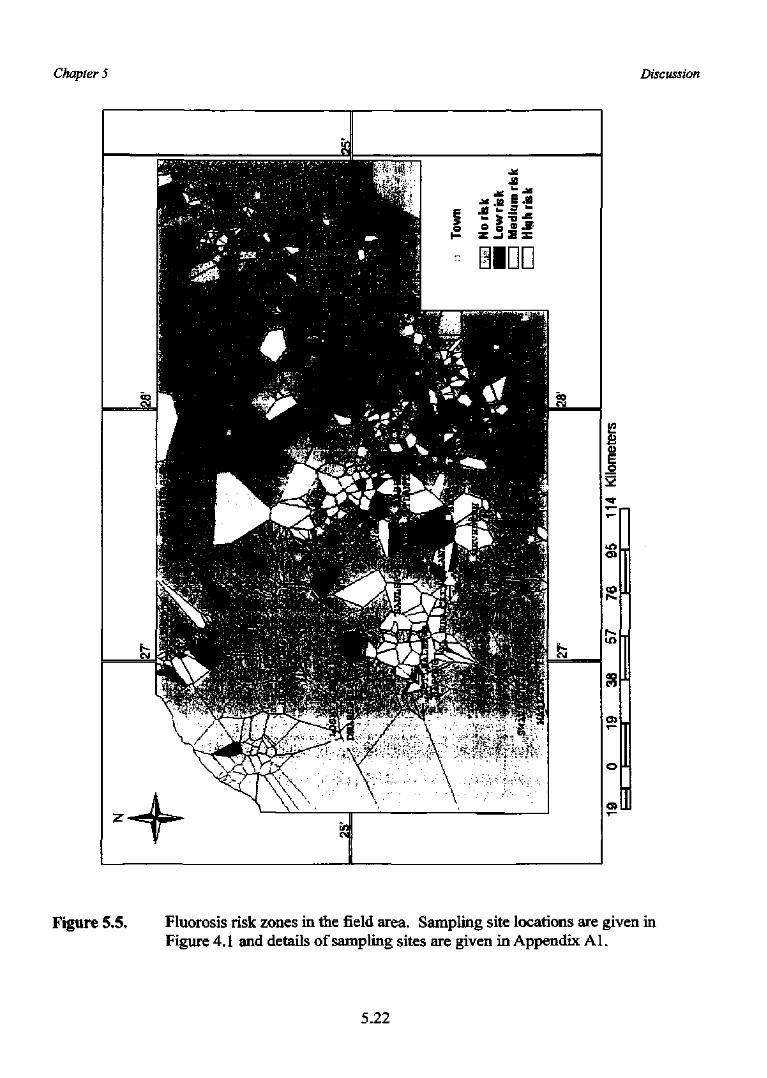
Chapter 5 Discussion
Figure 5.5. Fluorosis risk zones in the field area. Sampling site locations are given inFigure 4.1 and details of sampling sites are given in Appendix Al.
5.22
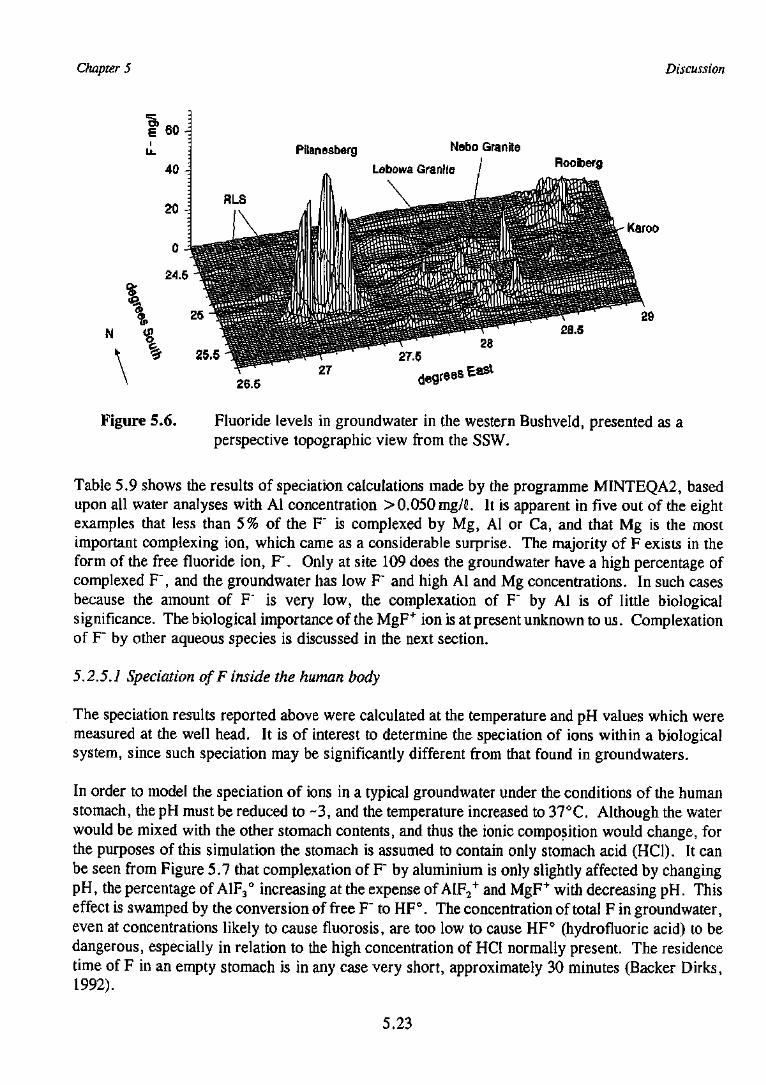
Chapter 5 Discussion
t40 ~
20 -I
Pilanesberg Nebo Granite
Lebowa GraniteRooiberg
RLS
Karoo
26.5
Figure 5.6. Fluoride levels in groundwater in the western Bushveld, presented as aperspective topographic view from the SSW.
Table 5.9 shows the results of speciation calculations made by the programme MINTEQA2, basedupon all water analyses with Al concentration > 0.050 mg/2. It is apparent in five out of the eightexamples that less than 5% of the F" is complexed by Mg, Al or Ca, and that Mg is the mostimportant complexing ion, which came as a considerable surprise. The majority of F exists in theform of the free fluoride ion, F". Only at site 109 does the groundwater have a high percentage ofcomplexed F", and the groundwater has low F" and high Al and Mg concentrations. In such casesbecause the amount of F" is very low, the complexation of F" by Al is of little biologicalsignificance. The biological importance of the MgF+ ion is at present unknown to us. Complexationof F" by other aqueous species is discussed in the next section.
5.2.5.1 Speciation ofF inside the human body
The speciation results reported above were calculated at the temperature and pH values which weremeasured at the well head. It is of interest to determine the speciation of ions within a biologicalsystem, since such speciation may be significantly different from that found in groundwaters.
In order to model the speciation of ions in a typical groundwater under the conditions of the humanstomach, the pH must be reduced to ~3, and the temperature increased to 37°C. Although the waterwould be mixed with the other stomach contents, and thus the ionic composition would change, forthe purposes of this simulation the stomach is assumed to contain only stomach acid (HC1). It canbe seen from Figure 5.7 that complexation of F" by aluminium is only slightly affected by changingpH, the percentage of A1F3° increasing at the expense of A1F2
+ and MgF+ with decreasing pH. Thiseffect is swamped by the conversion of free F ' to HF°. The concentration of total F in groundwater,even at concentrations likely to cause fluorosis, are too low to cause HF° (hydrofluoric acid) to bedangerous, especially in relation to the high concentration of HCI normally present. The residencetime of F in an empty stomach is in any case very short, approximately 30 minutes (Backer Dirks,1992).
5.23
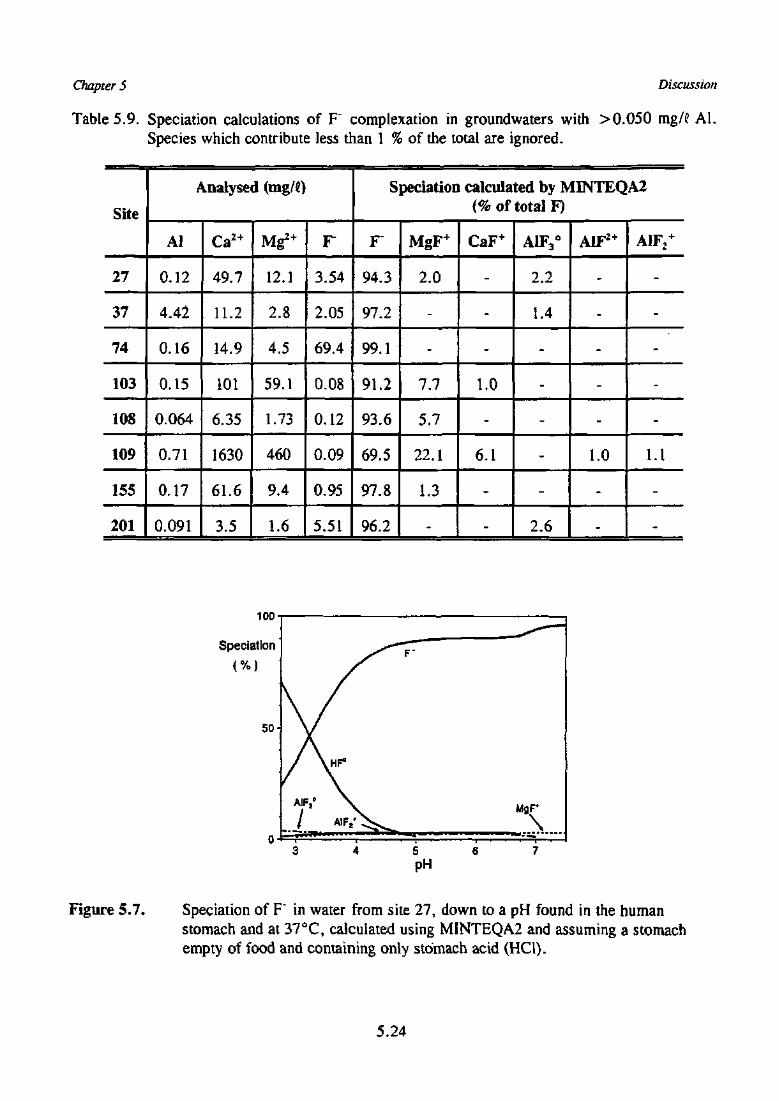
Chapter 5 Discussion
Table 5.9. Speciation calculations of F" complexation in groundwaters with >0.050 mg/<! Al.Species which contribute less than 1 % of the total are ignored.
Site
27
37
74
103
108
109
155
201
Analysed (mg/C)
Al
0.12
4.42
0.16
0.15
0.064
0.71
0.17
0.091
Ca2+
49.7
11.2
14.9
101
6.35
1630
61.6
3.5
Mg2+
12.1
2.8
4.5
59.1
1.73
460
9.4
1.6
F
3.54
2.05
69.4
0.08
0.12
0.09
0.95
5,51
Speciation calculated by MINTEQA2(% of total F)
F
94.3
97.2
99.1
91.2
93.6
69.5
97.8
96.2
MgF+
2.0
-
-
7.7
5.7
22.1
1.3
-
CaF+
-
-
-
1.0
-
6.1
-
-
A1F3°
2.2
1.4
-
-
-
-
-
2.6
A1F2+
-
-
-
-
-
1.0
-
-
A1F2+
-
-
-
-
-
1.1
-
-
Figure 5.7. Speciation of F in water from site 27, down to a pH found in the humanstomach and at 37°C, calculated using MINTEQA2 and assuming a stomachempty of food and containing only stomach acid (HCl).
5.24
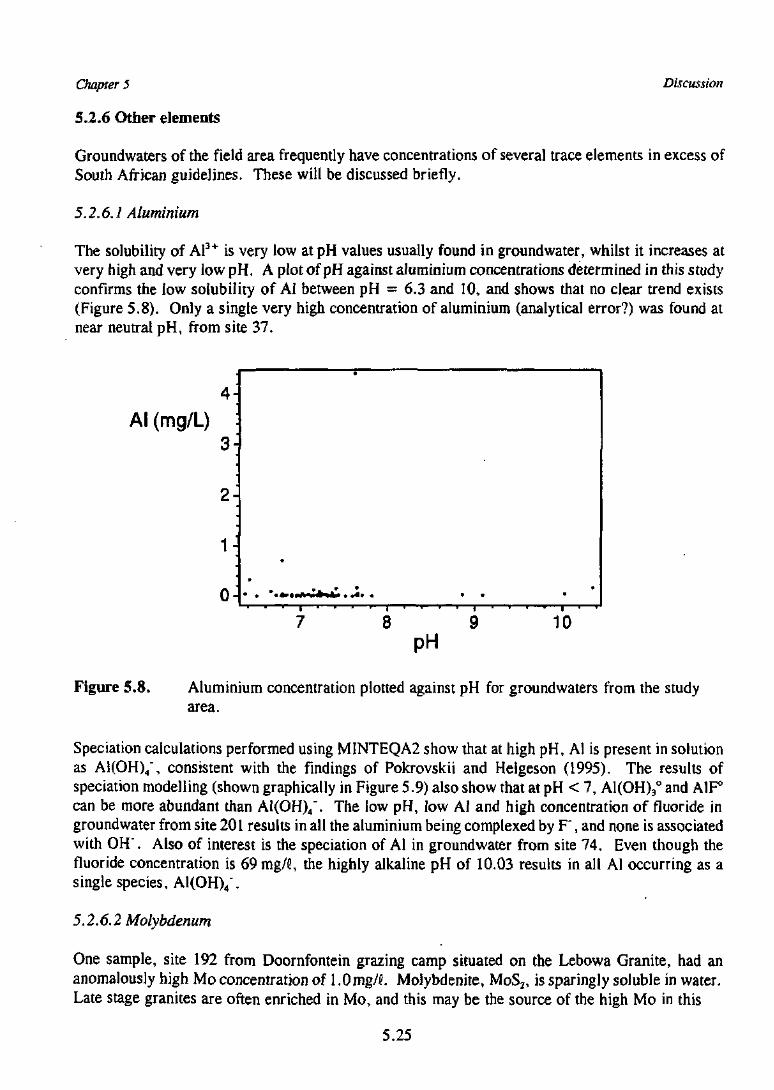
Chapter 5
5.2.6 Other elements
Discussion
Groundwaters of the field area frequently have concentrations of several trace elements in excess ofSouth African guidelines. These will be discussed briefly.
5.2.6.1 Aluminium
The solubility of Al3+ is very low at pH values usually found in groundwater, whilst it increases atvery high and very low pH. A plot of pH against aluminium concentrations determined in this studyconfirms the low solubility of Al between pH = 6.3 and 10, and shows that no clear trend exists(Figure 5.8). Only a single very high concentration of aluminium (analytical error?) was found atnear neutral pH, from site 37.
Al (mg/L)4-
3-
2-
1-
0-8 9
pH10
Figure 5.8. Aluminium concentration plotted against pH for groundwaters from the studyarea.
Speciation calculations performed using MINTEQA2 show that at high pH, Al is present in solutionas A1(OH)4", consistent with the findings of Pokrovskii and Helgeson (1995). The results ofspeciation modelling (shown graphically in Figure 5.9) also show that at pH < 7, A1(OH)3° and A1F°can be more abundant than A1(OH)4\ The low pH, low Al and high concentration of fluoride ingroundwater from site 201 results in all the aluminium being complexed by F", and none is associatedwith OH\ Also of interest is the speciation of Al in groundwater from site 74. Even though thefluoride concentration is 69 mg/5, the highly alkaline pH of 10.03 results in all Al occurring as asingle species, A1(OH)4".
5.2.6.2 Molybdenum
One sample, site 192 from Doornfontein grazing camp situated on the Lebowa Granite, had ananomalously high Mo concentration of l.Omg/C Molybdenite, MoS2, is sparingly soluble in water.Late stage granites are often enriched in Mo, and this may be the source of the high Mo in this
5.25
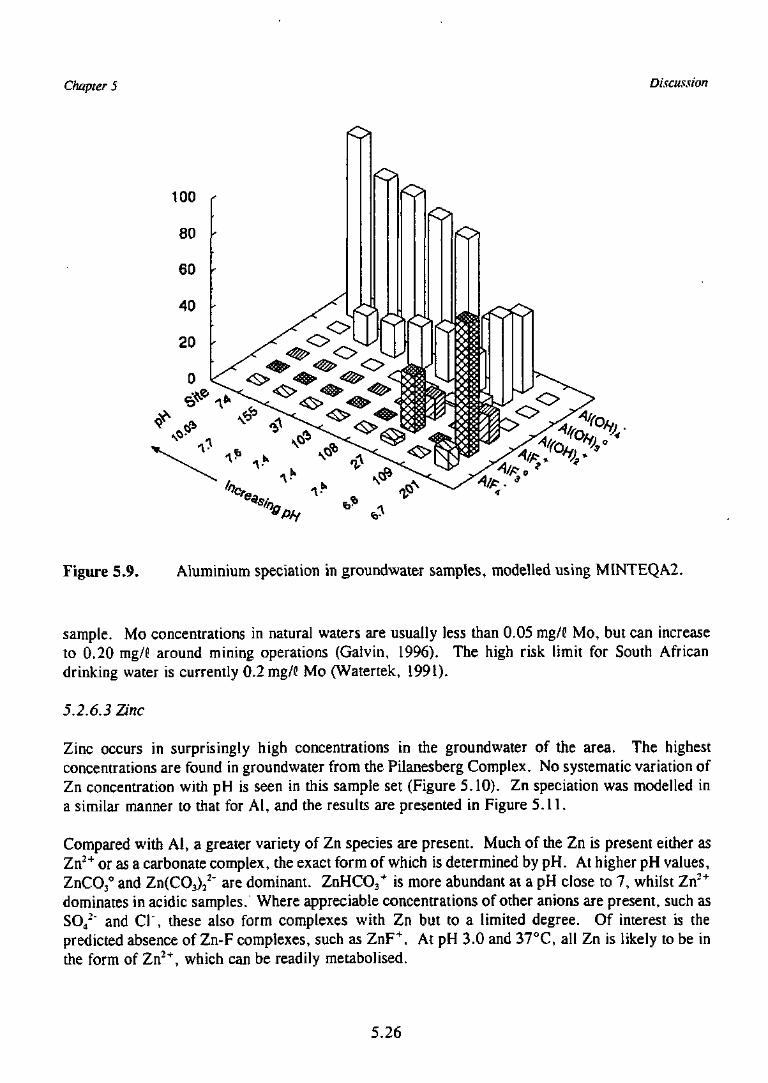
Chapter 5 Discussion
Figure 5.9. Aluminium speciation in groundwater samples, modelled using MINTEQA2.
sample. Mo concentrations in natural waters are usually less than 0.05 mg/C Mo, but can increaseto 0.20 mg/d around mining operations (Galvin, 1996). The high risk limit for South Africandrinking water is currently 0.2 mg/C Mo (Watertek, 1991).
5.2.6.3 Zinc
Zinc occurs in surprisingly high concentrations in the groundwater of the area. The highestconcentrations are found in groundwater from the Pilanesberg Complex. No systematic variation ofZn concentration with pH is seen in this sample set (Figure 5.10). Zn speciation was modelled ina similar manner to that for Al, and the results are presented in Figure 5.11.
Compared with Al, a greater variety of Zn species are present. Much of the Zn is present either asZn2+ or as a carbonate complex, the exact form of which is determined by pH. At higher pH values,ZnCO3° and Zn(CO3)2
2~ are dominant. ZnHCO3+ is more abundant at a pH close to 7, whilst Zn2+
dominates in acidic samples. Where appreciable concentrations of other anions are present, such asSO4
2" and C l \ these also form complexes with Zn but to a limited degree. Of interest is thepredicted absence of Zn-F complexes, such as ZnF+. At pH 3.0 and 37°C, all Zn is likely to be inthe form of Zn2+, which can be readily metabolised.
5.26
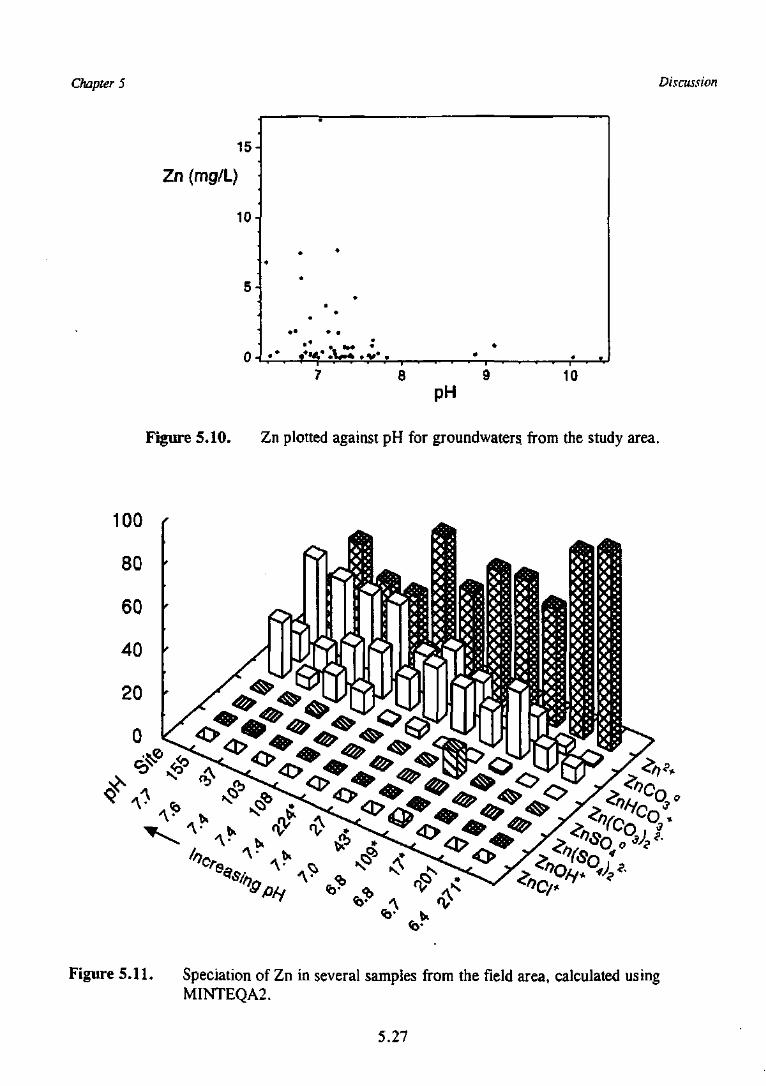
Chapter 5 Discussion
15-
Zn (mg/L)
10-
0-J10
Figure 5.10. Zn plotted against pH for groundwaters from the study area.
Figure 5.11. Speciation of Zn in several samples from the field area, calculated usingMINTEQA2.
5.27
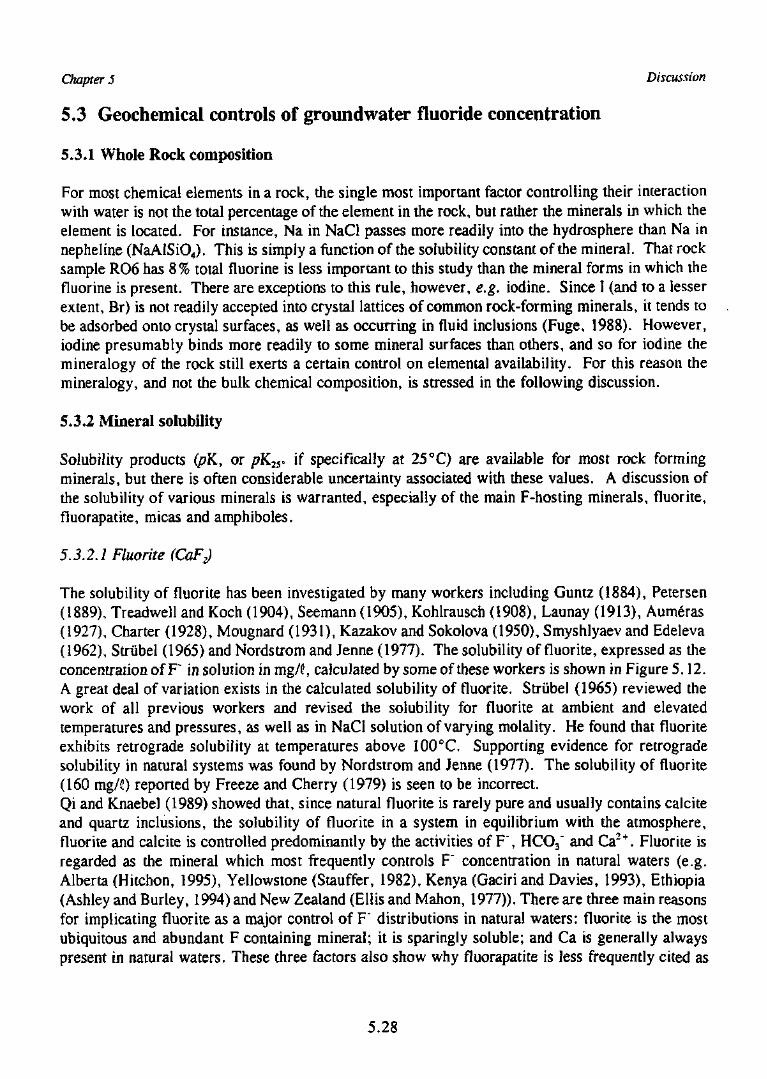
Chapter 5 Discussion
5.3 Geochemical controls of groundwater fluoride concentration
5.3.1 Whole Rock composition
For most chemical elements in a rock, the single most important factor controlling their interactionwith water is not the total percentage of the element in the rock, but rather the minerals in which theelement is located. For instance, Na in NaCl passes more readily into the hydrosphere than Na innepheline (NaAlSiO4). This is simply a function of the solubility constant of the mineral. That rocksample RO6 has 8% total fluorine is less important to this study than the mineral forms in which thefluorine is present. There are exceptions to this rule, however, e.g. iodine. Since I (and to a lesserextent, Br) is not readily accepted into crystal lattices of common rock-forming minerals, it tends tobe adsorbed onto crystal surfaces, as well as occurring in fluid inclusions (Fuge, 1988). However,iodine presumably binds more readily to some mineral surfaces than others, and so for iodine themineralogy of the rock still exerts a certain control on elemental availability. For this reason themineralogy, and not the bulk chemical composition, is stressed in the following discussion.
5.3.2 Mineral solubility
Solubility products (pK, or pK25, if specifically at 25 °C) are available for most rock formingminerals, but there is often considerable uncertainty associated with these values. A discussion ofthe solubility of various minerals is warranted, especially of the main F-hosting minerals, fluorite,fluorapatite, micas and amphiboles.
5.3.2.1 Fluorite (CaFJ
The solubility of fluorite has been investigated by many workers including Guntz (1884), Petersen(1889), Treadwell and Koch (1904), Seemann (1905), Kohlrausch (1908), Launay (1913), Aumeras(1927), Charter (1928), Mougnard (1931), Kazakov and Sokolova (1950), Smyshlyaev and Edeleva(1962), Strubel (1965) and Nordstrom and Jenne (1977). The solubility of fluorite, expressed as theconcentration of F" in solution in mg/C, calculated by some of these workers is shown in Figure 5.12.A great deal of variation exists in the calculated solubility of fluorite. Strubel (1965) reviewed thework of all previous workers and revised the solubility for fluorite at ambient and elevatedtemperatures and pressures, as well as in NaCi solution of varying molality. He found that fluoriteexhibits retrograde solubility at temperatures above 100°C. Supporting evidence for retrogradesolubility in natural systems was found by Nordstrom and Jenne (1977). The solubility of fluorite(160 mg/0 reported by Freeze and Cherry (1979) is seen to be incorrect.Qi and Knaebel (1989) showed that, since natural fluorite is rarely pure and usually contains calciteand quartz inclusions, the solubility of fluorite in a system in equilibrium with the atmosphere,fluorite and calcite is controlled predominantly by the activities of F", HCO3" and Ca2+. Fluorite isregarded as the mineral which most frequently controls F" concentration in natural waters (e.g.Alberta (Hitchon, 1995), Yellowstone (Stauffer, 1982), Kenya (Gaciri and Davies, 1993), Ethiopia(Ashley and Burley, 1994) and New Zealand (Ellis and Mahon, 1977)). There are three main reasonsfor implicating fluorite as a major control of F" distributions in natural waters: fluorite is the mostubiquitous and abundant F containing mineral; it is sparingly soluble; and Ca is generally alwayspresent in natural waters. These three factors also show why fluorapatite is less frequently cited as
5.28
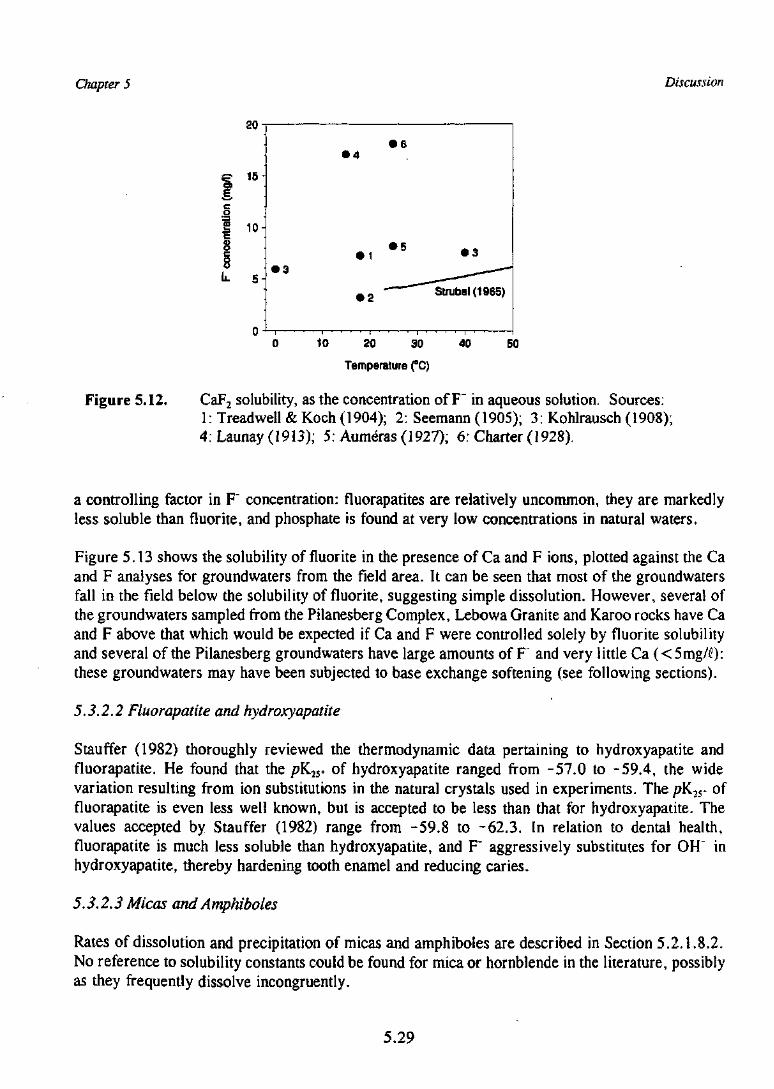
Chapter 5 Discussion
10 20 30 40
Temperature (°C)
50
Figure 5.12. CaF2 solubility, as the concentration of F in aqueous solution. Sources:1: Treadwell & Koch (1904); 2: Seemann (1905); 3: Kohlrausch (1908);4. Launay (1913); 5: Aumeras (1927); 6: Charter (1928).
a controlling factor in F" concentration: fluorapatites are relatively uncommon, they are markedlyless soluble than fluorite, and phosphate is found at very low concentrations in natural waters.
Figure 5.13 shows the solubility of fluorite in the presence of Ca and F ions, plotted against the Caand F analyses for groundwaters from the field area. It can be seen that most of the groundwatersfall in the field below the solubility of fluorite, suggesting simple dissolution. However, several ofthe groundwaters sampled from the Pilanesberg Complex, Lebowa Granite and Karoo rocks have Caand F above that which would be expected if Ca and F were controlled solely by fluorite solubilityand several of the Pilanesberg groundwaters have large amounts of F" and very little Ca (<5mg/0:these groundwaters may have been subjected to base exchange softening (see following sections).
5.3.2.2 Fluorapatite and hydroxyapatite
Stauffer (1982) thoroughly reviewed the thermodynamic data pertaining to hydroxyapatite andfluorapatite. He found that the pK25. of hydroxyapatite ranged from -57.0 to -59.4, the widevariation resulting from ion substitutions in the natural crystals used in experiments. The pK2r offluorapatite is even less well known, but is accepted to be less than that for hydroxyapatite. Thevalues accepted by Stauffer (1982) range from -59.8 to -62.3. In relation to dental health,fluorapatite is much less soluble than hydroxyapatite, and F" aggressively substitutes for OH" inhydroxyapatite, thereby hardening tooth enamel and reducing caries.
5.3.2.3 Micas and Amphiboles
Rates of dissolution and precipitation of micas and amphiboles are described in Section 5.2.1.8.2.No reference to solubility constants could be found for mica or hornblende in the literature, possiblyas they frequently dissolve incongruently.
5.29
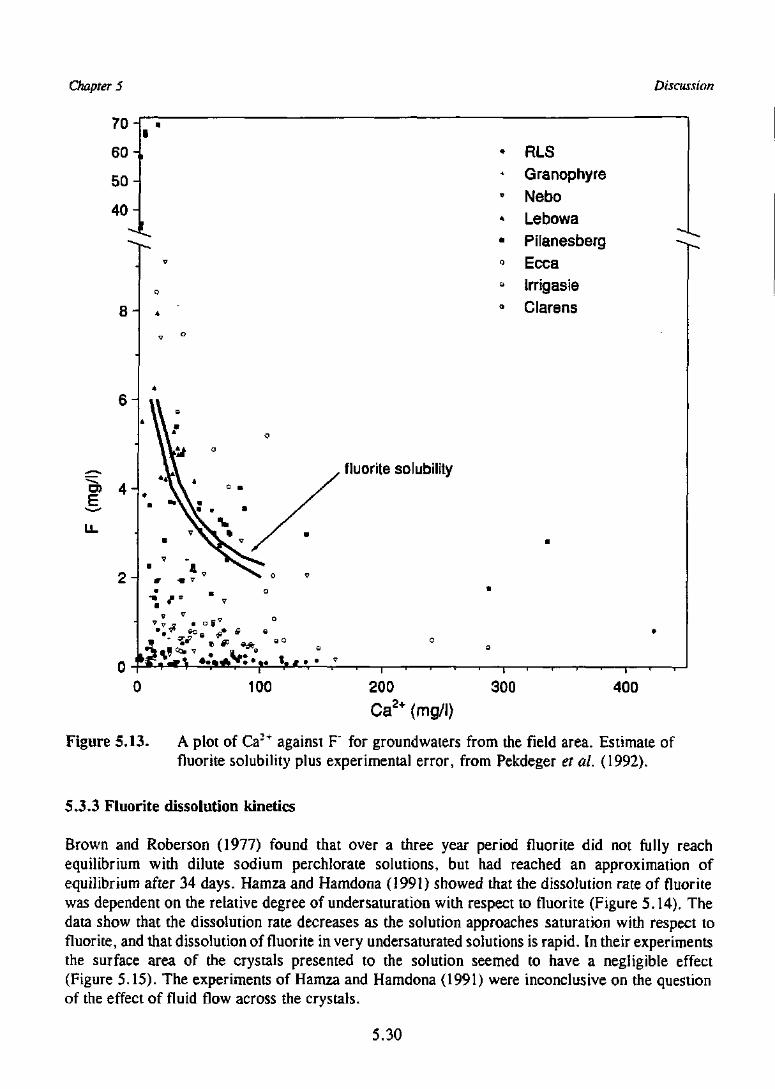
Chapter 5 Discussion
70-
60-
50-
40-
8 -
6 -
4 -
2 -
* RLS* Granophyre' Nebo* Lebowa• Pilanesberg0 Ecca° Irrigasie° Clarens
fluorite solubility
*
| * . v . a . = =
100 200 300 400
(mg/l)
Figure 5.13. A plot of Ca2+ against F" for groundwaters from the field area. Estimate offluorite solubility plus experimental error, from Pekdeger et ai. (1992).
5.3.3 Fluorite dissolution kinetics
Brown and Roberson (1977) found that over a three year period fluorite did not fully reachequilibrium with dilute sodium perchlorate solutions, but had reached an approximation ofequilibrium after 34 days. Hamza and Hamdona (1991) showed that the dissolution rate of fluoritewas dependent on the relative degree of under saturation with respect to fluorite (Figure 5.14). Thedata show that the dissolution rate decreases as the solution approaches saturation with respect tofluorite, and that dissolution of fluorite in very undersaturated solutions is rapid. In their experimentsthe surface area of the crystals presented to the solution seemed to have a negligible effect(Figure 5.15). The experiments of Hamza and Hamdona (1991) were inconclusive on the questionof the effect of fluid flow across the crystals.
5.30
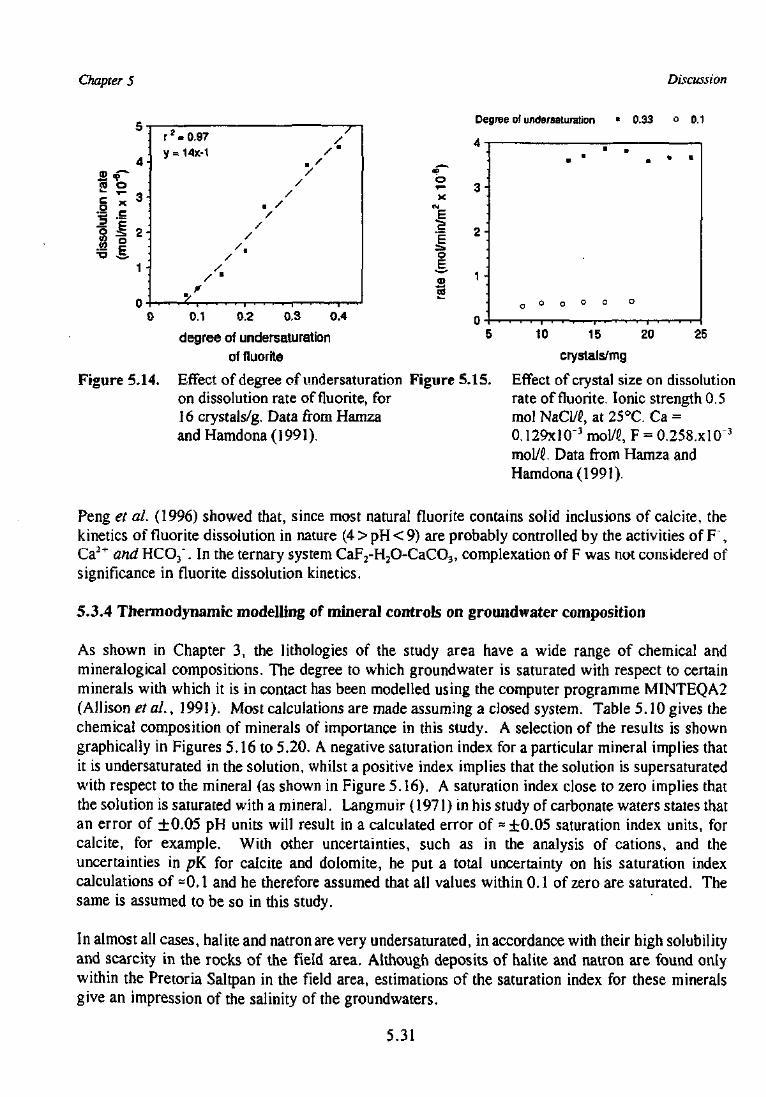
Chapter 5 Discussion
Degree of undersaturation
4
0.33 0.1
o
0.1 0.2 0,3 0.4
degree of undersaturation
of fluorite
2510 15 20
crystals/mg
Figure 5.14, Effect of degree of undersaturation Figure 5.15. Effect of crystal size on dissolutionon dissolution rate of fluorite, for rate of fluorite. Ionic strength 0.516 crystals/g. Data from Hamza mol NaCl/fi, at 25°C. Ca -and Hamdona (1991). 0.129xl0"3 mol/£, F - 0.258.xl0 3
mol/fi. Data from Hamza andHamdona (1991).
Peng et al. (1996) showed that, since most natural fluorite contains solid inclusions of calcite, thekinetics of fluorite dissolution in nature (4 > pH < 9) are probably controlled by the activities of F ,Ca2+ and HCO3 . In the ternary system CaF2-H2O-CaCO3, complexation of F was not considered ofsignificance in fluorite dissolution kinetics.
5.3.4 Thermodynamic modelling of mineral controls on groundwater composition
As shown in Chapter 3, the lithologies of the study area have a wide range of chemical andmineralogical compositions. The degree to which groundwater is saturated with respect to certainminerals with which it is in contact has been modelled using the computer programme MINTEQA2(Allison et al., 1991). Most calculations are made assuming a closed system. Table 5.10 gives thechemical composition of minerals of importance in this study. A selection of the results is showngraphically in Figures 5.16 to 5.20. A negative saturation index for a particular mineral implies thatit is undersaturated in the solution, whilst a positive index implies that the solution is supersaturatedwith respect to the mineral (as shown in Figure 5.16). A saturation index close to zero implies thatthe solution is saturated with a mineral. Langmuir (1971) in his study of carbonate waters states thatan error of ±0.05 pH units will result in a calculated error of ~ ±0.05 saturation index units, forcalcite, for example. With other uncertainties, such as in the analysis of cations, and theuncertainties in pK for calcite and dolomite, he put a total uncertainty on his saturation indexcalculations of =0.1 and he therefore assumed that all values within 0.1 of zero are saturated. Thesame is assumed to be so in this study.
In almost all cases, halite and natron are very undersaturated, in accordance with their high solubilityand scarcity in the rocks of the field area. Although deposits of halite and natron are found onlywithin the Pretoria Saltpan in the field area, estimations of the saturation index for these mineralsgive an impression of the salinity of the groundwaters.
5.31
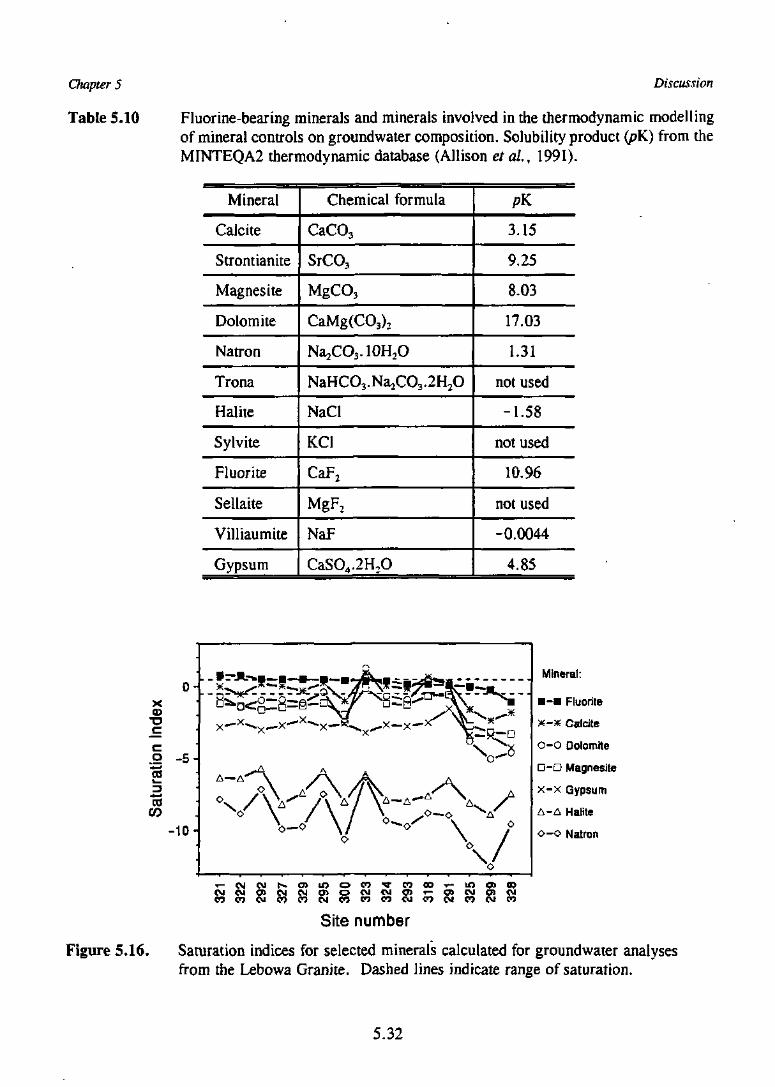
Chapter 5
Table 5.10
Discussion
Fluorine-bearing minerals and minerals involved in the thermodynamic modellingof mineral controls on groundwater composition. Solubility product (pK) from theMINTEQA2 thermodynamic database (Allison et al., 1991).
Mineral
Calcite
Strontianite
Magnesite
Dolomite
Natron
Trona
Halite
Sylvite
Fluorite
Sellaite
Villiaumite
Gypsum
Chemical formula
CaCO3
SrCO3
MgCO3
CaMg(CO3)2
NaXGvl0H2O
NaHCO3.Na2C03.2H2O
NaCl
KC1
CaF2
MgF2
NaF
CaSO4.2H3O
pK
3.15
9.25
8.03
17.03
1.31
not used
-1.58
not used
10.96
not used
-0.0044
4.85
x•a
0-
o -5
CO
-10-
_ i-JL-»»_
A—A
V\^f\-<^.so—o
x • °—o "A"
\
\ /
Mineral:
• - • Fluorile
x-x Calcite
O-O Dolomite
D - D Magnesite
x - x Gypsum
A - A Halite
o - o Natron
Site number
Figure 5.16. Saturation indices for selected minerals calculated for groundwater analysesfrom the Lebowa Granite. Dashed lines indicate range of saturation.
5.32
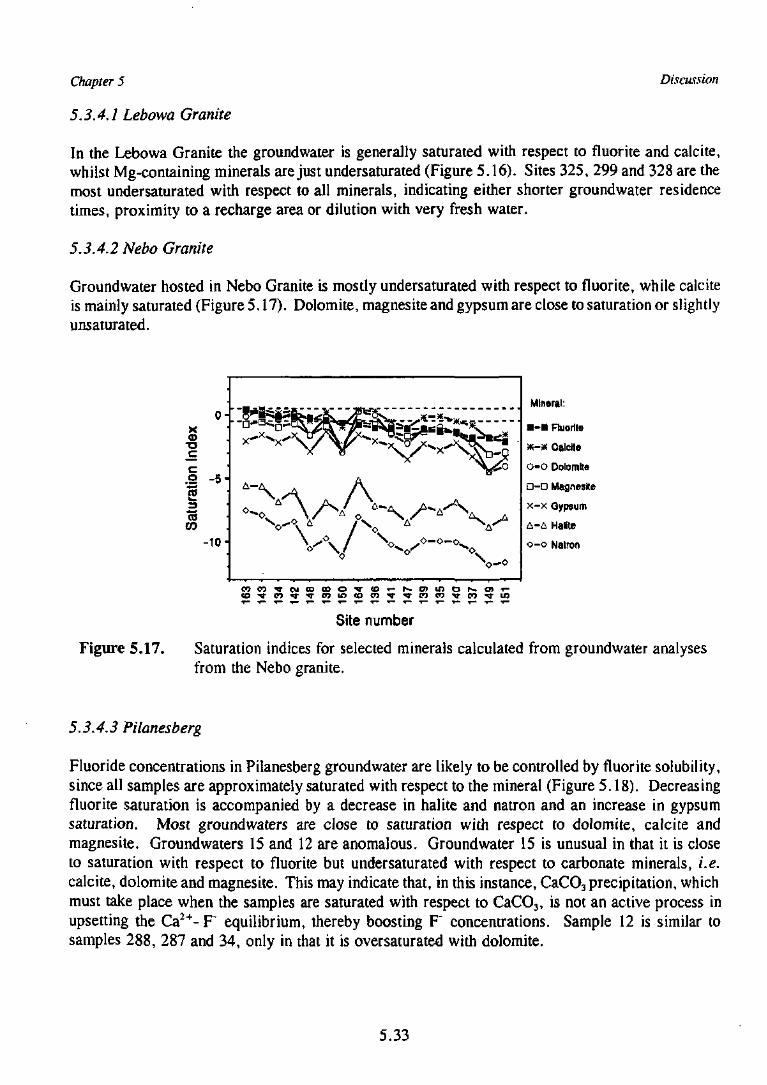
Chapter 5
5.3.4.1 Lebowa Granite
Discussion
In the Lebowa Granite the groundwater is generally saturated with respect to fluorite and calcite,whilst Mg-containing minerals are just undersaturated (Figure 5.16). Sites 325, 299 and 328 are themost undersaturated with respect to all minerals, indicating either shorter groundwater residencetimes, proximity to a recharge area or dilution with very fresh water.
5.3.4.2 Nebo Granite
Groundwater hosted in Nebo Granite is mostly undersaturated with respect to fluorite, while calciteis mainly saturated (Figure 5.17). Dolomite, magnesiteand gypsum are close to saturation or slightlyunsaturated.
Inde
xra
tion
Sat
u
o-
- 5 -
-10-
x ' x ^x- >
v AW v
Xo-o
Mineral:
• - • Fluorile
* - * Calcite
o-o Dolomlt*
D-D Magnesite
x-X Gypsum
A-A Halite
o-o Natron
Site number
Figure 5.17. Saturation indices for selected minerals calculated from groundwater analysesfrom the Nebo granite.
5.3.4.3 Pilanesberg
Fluoride concentrations in Pilanesberg groundwater are likely to be controlled by fluorite solubility,since all samples are approximately saturated with respect to the mineral (Figure 5.18). Decreasingfluorite saturation is accompanied by a decrease in halite and natron and an increase in gypsumsaturation. Most groundwaters are close to saturation with respect to dolomite, calcite andmagnesite. Groundwaters 15 and 12 are anomalous. Groundwater 15 is unusual in that it is closeto saturation with respect to fluorite but undersaturated with respect to carbonate minerals, i.e.calcite, dolomite and magnesite. This may indicate that, in this instance, CaCO3 precipitation, whichmust take place when the samples are saturated with respect to CaCO3, is not an active process inupsetting the Ca2+- F equilibrium, thereby boosting F" concentrations. Sample 12 is similar tosamples 288, 287 and 34, only in that it is oversaturated with dolomite.
5.33
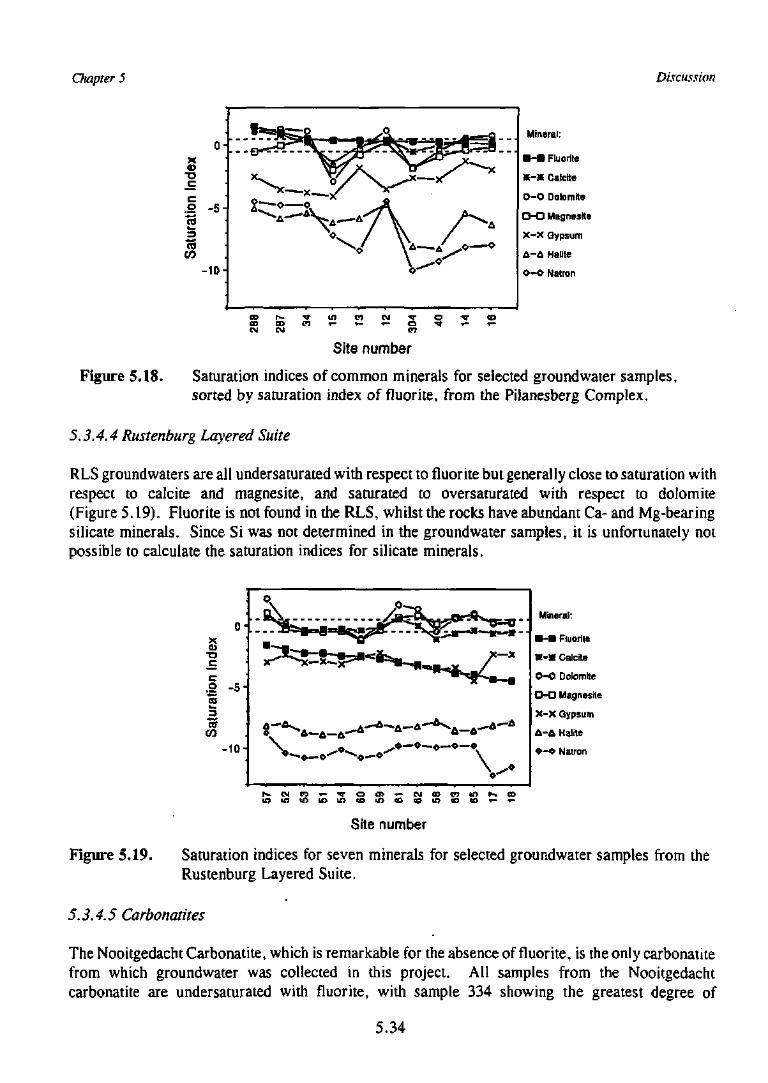
Chapter 5 Discussion
Mineral:
Fluorite
*-* Calcite
0 - 0 Dolomite
D-O Magnesite
X-X Gypsum
i - i Halite
Natron
Site number
Figure 5.18. Saturation indices of common minerals for selected groundwater samples,sorted by saturation index of fluorite, from the Pilanesberg Complex.
5.3.4.4 Rustenburg Layered Suite
RLS groundwaters are all undersaturated with respect to fluorite but generally close to saturation withrespect to calcite and magnesite, and saturated to oversaturated with respect to dolomite(Figure 5.19). Fluorite is not found in the RLS, whilst the rocks have abundant Ca- and Mg-bearingsilicate minerals. Since Si was not determined in the groundwater samples, it is unfortunately notpossible to calculate the saturation indices for silicate minerals.
Site number
Figure 5.19. Saturation indices for seven minerals for selected groundwater samples from theRustenburg Layered Suite.
5.3.4.5 Carbonatites
The NooitgedachtCarbonatite, which is remarkable for the absence of fluorite, is the only carbonatitefrom which groundwater was collected in this project. All samples from the Nooitgedachtcarbonatite are undersaturated with fluorite, with sample 334 showing the greatest degree of
5.34
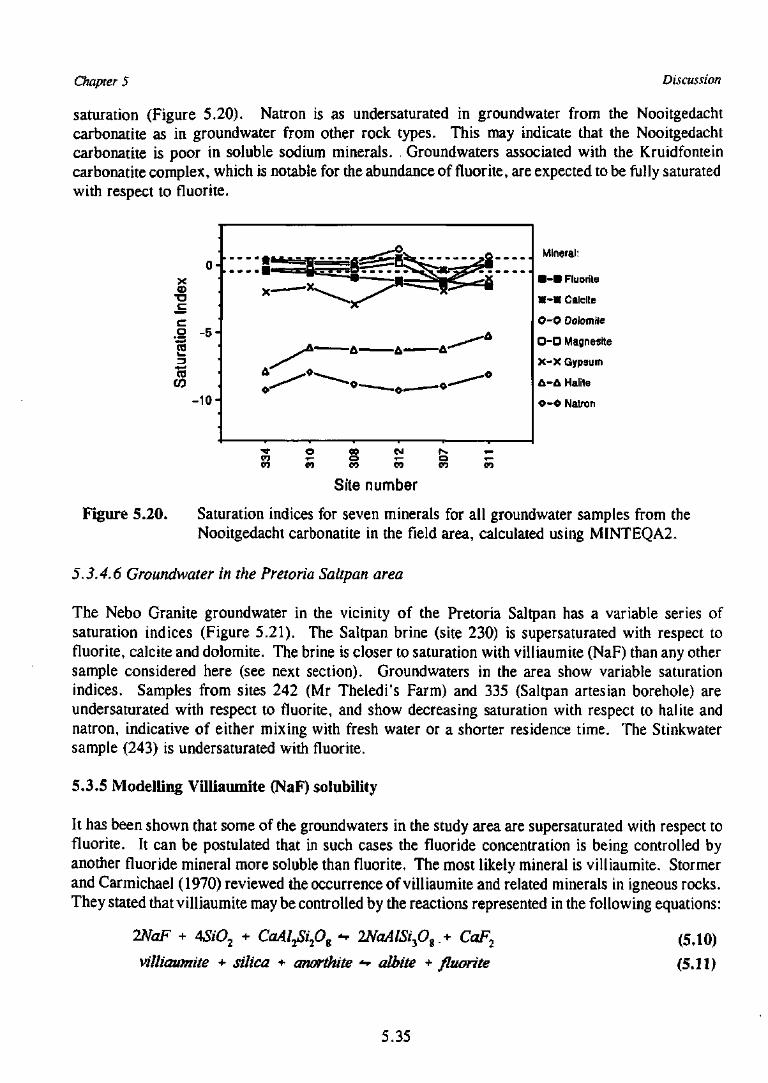
Chapter 5 Discussion
saturation (Figure 5.20). Natron is as undersaturated in groundwater from the Nooitgedachtcarbonatite as in groundwater from other rock types. This may indicate that the Nooitgedachtcarbonatite is poor in soluble sodium minerals. Groundwaters associated with the Kruidfonteincarbonatite complex, which is notable for the abundance of fluorite, are expected to be fully saturatedwith respect to fluorite.
Mineral:
• - • Fluorile
K-K Calcite
Q-O Dolomite
O-D Magnesite
X-X Gypsum
&-A Halite
O-O Natron
om
00
CO
Site
CM fv.___ f%vl vj
number
Figure 5.20. Saturation indices for seven minerals for all groundwater samples from theNooitgedacht carbonatite in the field area, calculated using MINTEQA2.
5.3.4.6 Groundwater in the Pretoria Saltpan area
The Nebo Granite groundwater in the vicinity of the Pretoria Saltpan has a variable series ofsaturation indices (Figure 5.21). The Saltpan brine (site 230) is supersaturated with respect tofluorite, calcite and dolomite. The brine is closer to saturation with villiaumite (NaF) than any othersample considered here (see next section). Groundwaters in the area show variable saturationindices. Samples from sites 242 (Mr Theledi's Farm) and 335 (Saltpan artesian borehole) areundersaturated with respect to fluorite, and show decreasing saturation with respect to halite andnatron, indicative of either mixing with fresh water or a shorter residence time. The Stinkwatersample (243) is undersaturated with fluorite.
5.3.5 Modelling Villiaumite (NaF) solubility
It has been shown that some of the groundwaters in the study area are supersaturated with respect tofluorite. It can be postulated that in such cases the fluoride concentration is being controlled byanother fluoride mineral more soluble than fluorite. The most likely mineral is villiaumite. Stormerand Carmichael (1970) reviewed the occurrence of villiaumite and related minerals in igneous rocks.They stated that villiaumite may be controlled by the reactions represented in the following equations:
2NaF + ASiO2 + CaAl^ip^ ** 2NaAlSi3Og.+ CaF2 (5,10)
villiaumite + silica + anorthite ** albite + fluorite (SAX)
5.35
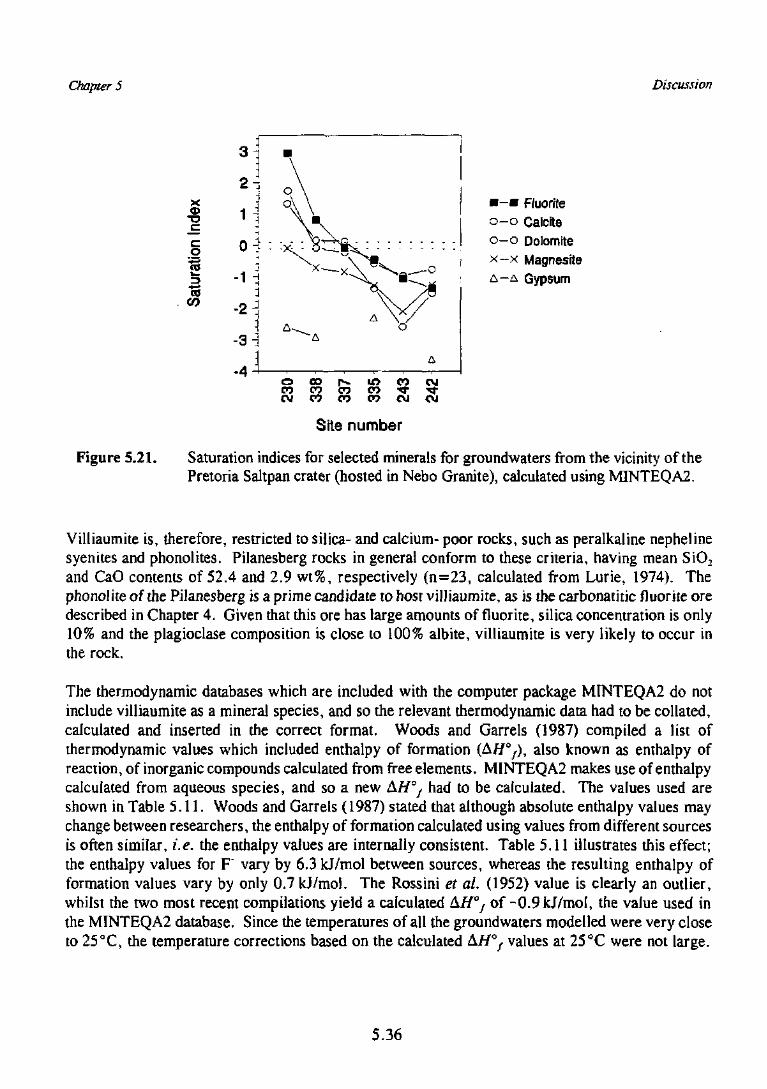
Chapter 5 Discussion
xT3
CO
• - • Fluoriteo - o Calciteo - o Dolomitex—x MagnesiteA - A Gypsum
o oo r m eo CMCO CO CO CO "«3" ^ "OJ co co co co OJ
Site number
Figure 5.21. Saturation indices for selected minerals for groundwaters from the vicinity of thePretoria Saltpan crater (hosted in Nebo Granite), calculated using MINTEQA2.
Villiaumite is, therefore, restricted to silica- and calcium- poor rocks, such as peralkaline nephelinesyenites and phonolites. Pilanesberg rocks in general conform to these criteria, having mean SiO,and CaO contents of 52.4 and 2.9 wt%, respectively (n=23, calculated from Lurie, 1974), Thephonolite of the Pilanesberg is a prime candidate to host villiaumite, as is the carbonatitic fJuorite oredescribed in Chapter 4. Given that this ore has large amounts of fluorite, silica concentration is only10% and the plagioclase composition is close to 100% albite, villiaumite is very likely to occur inthe rock.
The thermodynamic databases which are included with the computer package MINTEQA2 do notinclude villiaumite as a mineral species, and so the relevant thermodynamic data had to be collated,calculated and inserted in the correct format. Woods and Garrels (1987) compiled a list ofthermodynamic values which included enthalpy of formation (A//0^), also known as enthalpy ofreaction, of inorganic compounds calculated from free elements. MINTEQA2 makes use of enthalpycalculated from aqueous species, and so a new A / / ^ had to be calculated. The values used areshown in Table 5.11. Woods and Garrels (1987) stated that although absolute enthalpy values maychange between researchers, the enthalpy of formation calculated using values from different sourcesis often similar, i.e. the enthalpy values are internally consistent. Table 5.11 illustrates this effect;the enthalpy values for F vary by 6.3 kJ/mol between sources, whereas the resulting enthalpy offormation values vary by only 0.7 kJ/mol. The Rossini et al. (1952) value is clearly an outlier,whilst the two most recent compilations yield a calculated &H°f of -0.9 kJ/mol, the value used inthe MINTEQA2 database. Since the temperatures of all the groundwaters modelled were very closeto 25°C, the temperature corrections based on the calculated A//0^ values at 25°C were not large.
5.36
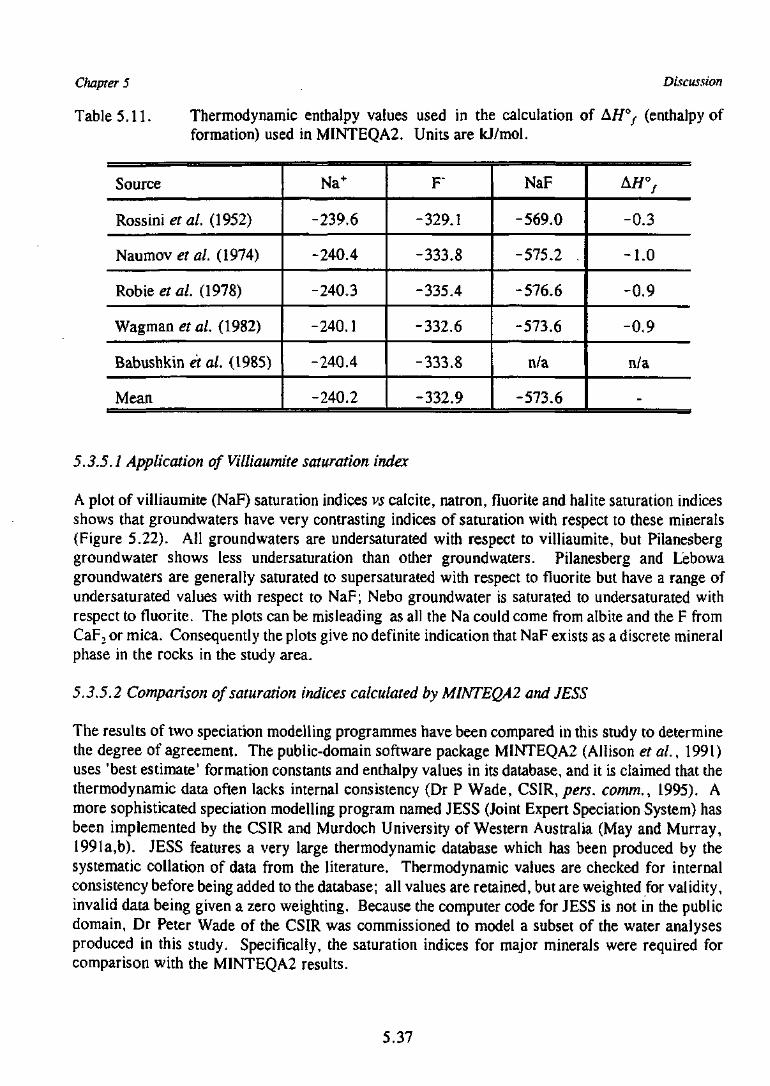
Chapter 5 Discussion
Table 5.11. Thermodynamic enthalpy values used in the calculation of AH°f (enthalpy offormation) used in MINTEQA2. Units are kJ/mol.
Source
Rossini et al. (1952)
Naumov et al. (1974)
Robie et al. (1978)
Wagman et al. (1982)
Babushkin et al. (1985)
Mean
Na+
-239.6
-240.4
-240.3
-240.1
-240.4
-240.2
F
-329.1
-333.8
-335.4
-332.6
-333.8
-332.9
NaF
-569.0
-575.2 .
-576.6
-573.6
n/a
-573.6
-0.3
-1.0
-0.9
-0.9
n/a
-
5.3.5.1 Application of Villiaumite saturation index
A plot of villiaumite (NaF) saturation indices vs calcite, natron, fluorite and halite saturation indicesshows that groundwaters have very contrasting indices of saturation with respect to these minerals(Figure 5.22). All groundwaters are undersaturated with respect to villiaumite, but Pilanesberggroundwater shows less undersaturation than other groundwaters. Pilanesberg and Lebowagroundwaters are generally saturated to supersaturated with respect to fluorite but have a range ofundersaturated values with respect to NaF; Nebo groundwater is saturated to undersaturated withrespect to fluorite. The plots can be misleading as all the Na could come from albite and the F fromCaF2 or mica. Consequently the plots give no definite indication that NaF exists as a discrete mineralphase in the rocks in the study area.
5.3.5.2 Comparison of saturation indices calculated by MINTEQA2 and JESS
The results of two speciation modelling programmes have been compared in this study to determinethe degree of agreement. The public-domain software package MINTEQA2 (Allison et al., 1991)uses 'best estimate' formation constants and enthalpy values in its database, and it is claimed that thethermodynamic data often lacks internal consistency (Dr P Wade, CSIR, pers. comm., 1995). Amore sophisticated speciation modelling program named JESS (Joint Expert Speciation System) hasbeen implemented by the CSIR and Murdoch University of Western Australia (May and Murray,1991a,b). JESS features a very large thermodynamic database which has been produced by thesystematic collation of data from the literature. Thermodynamic values are checked for internalconsistency before being added to the database; all values are retained, but are weighted for validity,invalid data being given a zero weighting. Because the computer code for JESS is not in the publicdomain, Dr Peter Wade of the CSIR was commissioned to model a subset of the water analysesproduced in this study. Specifically, the saturation indices for major minerals were required forcomparison with the MINTEQA2 results.
5.37
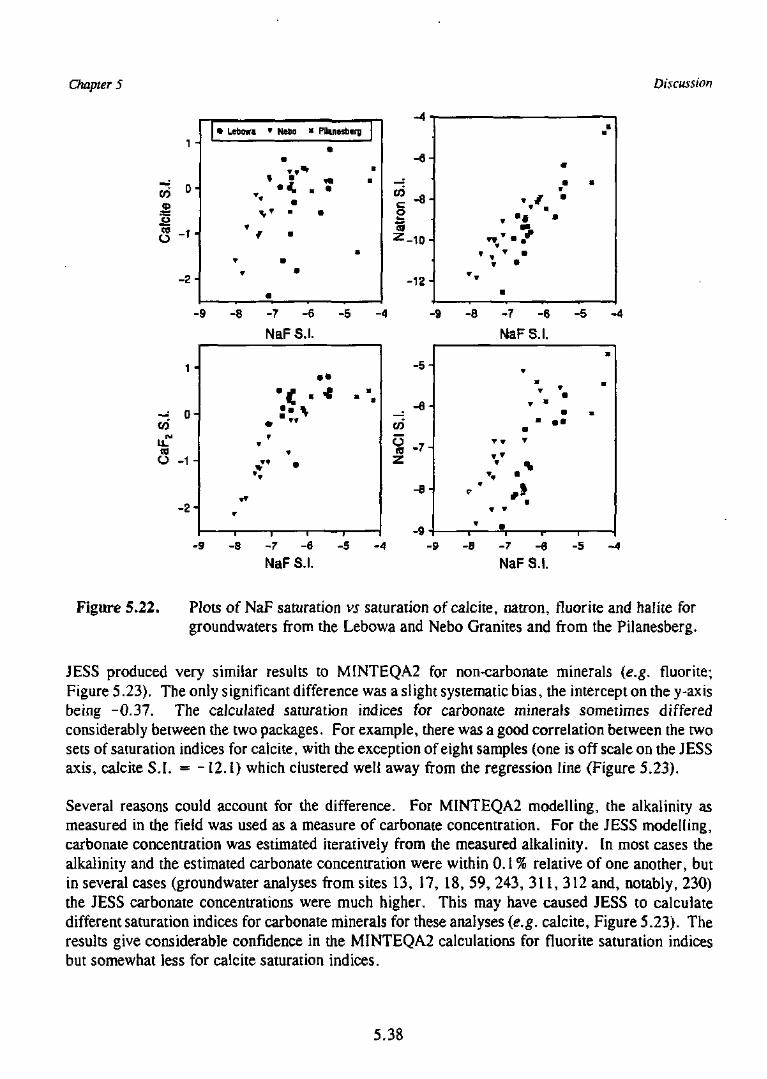
Chapter 5 Discussion
to
1 -
0 -
1 -
2 -
• Lebowa T
T
T
V
m
Nebo
•
•
••
• Pilanesberg |
•
•
• ocd
• - 1 0 -
-12-
o
-9
1 -
o-
-1 -
- 2 -
-8
T
-7 -6
NaFS.I.
•
r¥
-5
•
CO
NaC
I
-9
-5 -
- 6 -
- 7 -
- B -
- 9 -
-8 -7
NaFS
•
•T T T
T •
-6 -5
.1.•
_
• m
-8 -7 -6 -5NaFS.I.
- 9 - 8 - 7 - 6 - 5 - 4
NaFS.I.
Figure 5.22. Plots of NaF saturation vs saturation of calcite, natron, fluorite and halite forgroundwaters from the Lebowa and Nebo Granites and from the Pilanesberg.
JESS produced very similar results to MINTEQA2 for non-carbonate minerals (e.g. fluorite;Figure 5.23). The only significant difference was a slight systematic bias, the intercept on the y-axisbeing -0.37. The calculated saturation indices for carbonate minerals sometimes differedconsiderably between the two packages. For example, there was a good correlation between the twosets of saturation indices for calcite, with the exception of eight samples (one is off scale on the JESSaxis, calcite S.I. = -12.1) which clustered well away from the regression line (Figure 5.23).
Several reasons could account for the difference. For MINTEQA2 modelling, the alkalinity asmeasured in the field was used as a measure of carbonate concentration. For the JESS modelling,carbonate concentration was estimated iteratively from the measured alkalinity. In most cases thealkalinity and the estimated carbonate concentration were within 0.1 % relative of one another, butin several cases (groundwater analyses from sites 13, 17, 18, 59, 243, 311, 312 and, notably, 230)the JESS carbonate concentrations were much higher. This may have caused JESS to calculatedifferent saturation indices for carbonate minerals for these analyses (e.g. calcite, Figure 5.23). Theresults give considerable confidence in the MINTEQA2 calculations for fluorite saturation indicesbut somewhat less for calcite saturation indices.
5.38
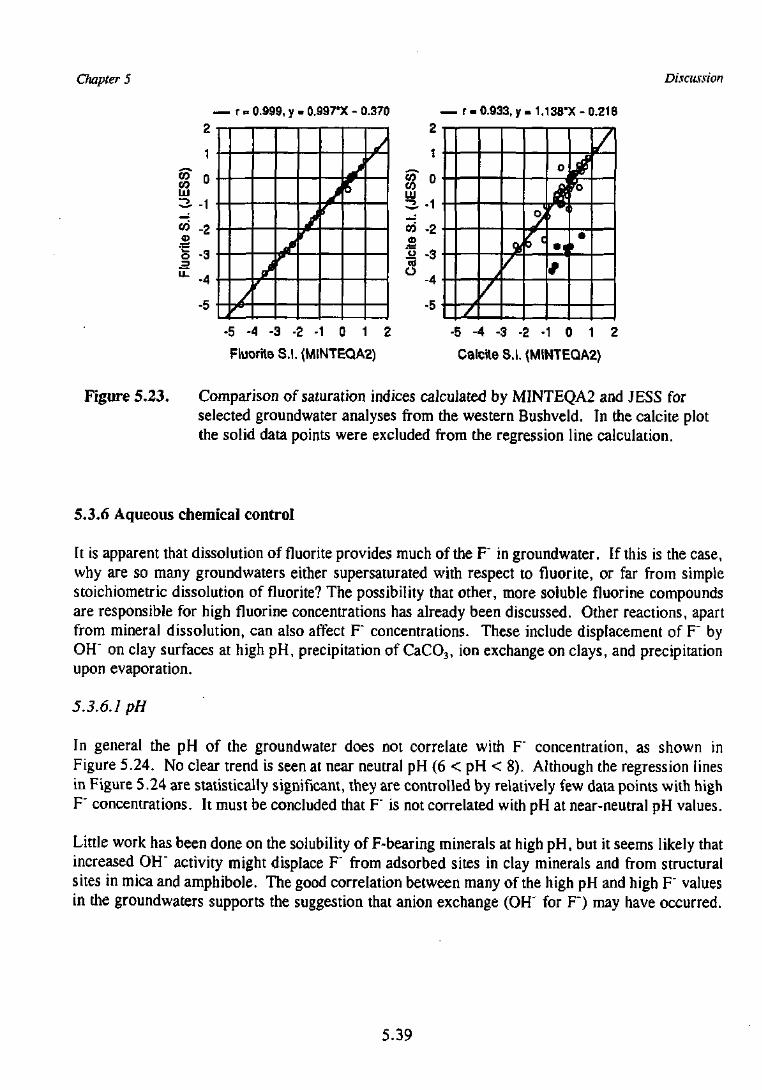
Chapter 5 Discussion
toUJ
co _
.2
1
1 •
3
4 •
5 • J
0.999, y
f
J
= bMTX. - C
/r
>r
r
(.370 — r= 0.933, y-1.13B'X- 0.2182
1
«" 0coUJ
3 -1eri -2
I//
1cffo
? I
/
/
-5 -4 - 3 - 2 - 1 0 1 2
Fluorite S.I. (MINTEQA2)
-5 -4 - 3 - 2 - 1 0 1 2
Calcite S.I. (MINTEQA2)
Figure 5.23. Comparison of saturation indices calculated by MINTEQA2 and JESS forselected groundwater analyses from the western Bushveld. In the calcite plotthe solid data points were excluded from the regression line calculation.
5.3.6 Aqueous chemical control
It is apparent that dissolution of fluorite provides much of the F" in groundwater. If this is the case,why are so many groundwaters either supersaturated with respect to fluorite, or far from simplestoichiometric dissolution of fluorite? The possibility that other, more soluble fluorine compoundsare responsible for high fluorine concentrations has already been discussed. Other reactions, apartfrom mineral dissolution, can also affect F" concentrations. These include displacement of F" byOH" on clay surfaces at high pH, precipitation of CaCO3, ion exchange on clays, and precipitationupon evaporation.
5.3,6.1 pH
In general the pH of the groundwater does not correlate with F" concentration, as shown inFigure 5.24. No clear trend is seen at near neutral pH (6 < pH < 8). Although the regression linesin Figure 5.24 are statistically significant, they are controlled by relatively few data points with highF" concentrations. It must be concluded that F" is not correlated with pH at near-neutral pH values.
Little work has been done on the solubility of F-bearing minerals at high pH, but it seems likely thatincreased OH" activity might displace F" from adsorbed sites in clay minerals and from structuralsites in mica and amphibole. The good correlation between many of the high pH and high F" valuesin the groundwaters supports the suggestion that anion exchange (OH' for F") may have occurred.
5.39
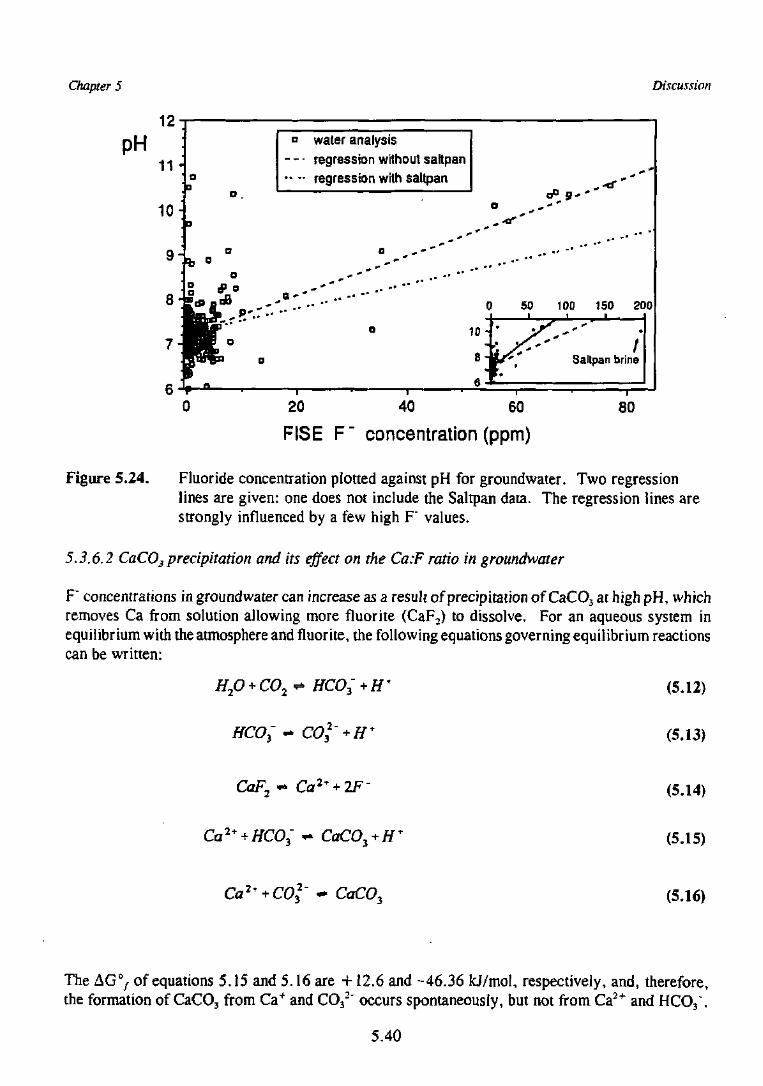
Chapter 5 Discussion
PH12
11
a water analysis— regression without saltpan- •• regression with saltpan
50 100 150 200
/Saltpan brine
20 40 60
FISE F" concentration (ppm)
80
Figure 5.24. Fluoride concentration plotted against pH for groundwater. Two regressionlines are given: one does not include the Salman data. The regression lines arestrongly influenced by a few high F values.
5.3.6.2 CaCO3 precipitation and its effect on the Ca.F ratio in groundwater
F" concentrations in groundwater can increase as a resuk of precipitation of CaCO3 at high pH, whichremoves Ca from solution allowing more fluorite (CaF2) to dissolve. For an aqueous system inequilibrium with the atmosphere and fluorite, the following equations governing equilibrium reactionscan be written:
+/r (5.12)
HCO; - co]' (5.13)
CaF2 ~ (5.14)
(5.15)
(5.16)
The AG^ of equations 5.15 and 5.16 are +12.6 and -46.36 kj/mol, respectively, and, therefore,the formation of CaCO3 from Ca+ and CO3
2" occurs spontaneously, but not from Ca2+ and HCO3\
5.40
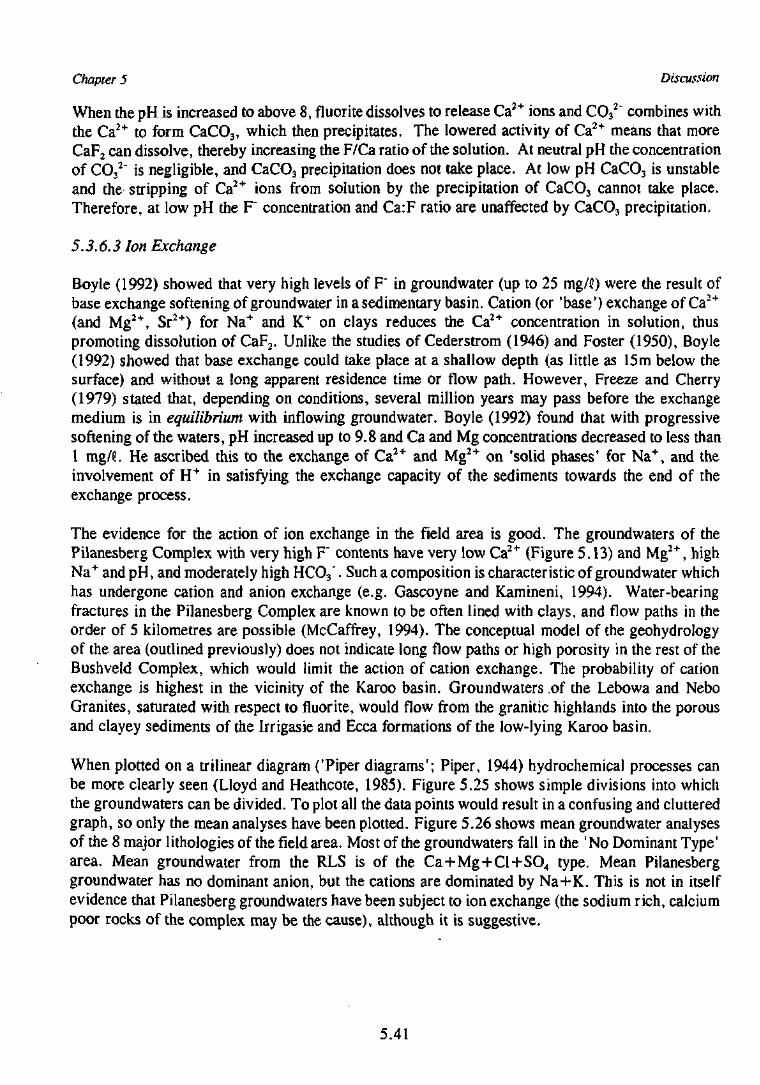
Chapter 5 Discussion
When the pH is increased to above 8, fluorite dissolves to release Ca2+ ions and CO32~ combines with
the Ca2+ to form CaCO3, which then precipitates. The lowered activity of Ca2+ means that moreCaF2 can dissolve, thereby increasing the F/Ca ratio of the solution. At neutral pH the concentrationof CO3
2~ is negligible, and CaCO3 precipitation does not take place. At low pH CaCO3 is unstableand the stripping of Ca2+ ions from solution by the precipitation of CaCO3 cannot take place.Therefore, at low pH the F" concentration and Ca:F ratio are unaffected by CaCO3 precipitation.
5.3.6.3 Ion Exchange
Boyle (1992) showed that very high levels of F" in groundwater (up to 25 mg/!!) were the result ofbase exchange softening of groundwater in a sedimentary basin. Cation (or 'base') exchange of Ca2+
(and Mg2+, Sr2+) for Na+ and K+ on clays reduces the Ca2+ concentration in solution, thuspromoting dissolution of CaF2. Unlike the studies of Cederstrom (1946) and Foster (1950), Boyle(1992) showed that base exchange could take place at a shallow depth (as little as 15m below thesurface) and without a long apparent residence time or flow path. However, Freeze and Cherry(1979) stated that, depending on conditions, several million years may pass before the exchangemedium is in equilibrium with inflowing groundwater. Boyle (1992) found that with progressivesoftening of the waters, pH increased up to 9.8 and Ca and Mg concentrations decreased to less than1 mg/t He ascribed this to the exchange of Ca2+ and Mg2+ on 'solid phases' for Na+, and theinvolvement of H+ in satisfying the exchange capacity of the sediments towards the end of theexchange process.
The evidence for the action of ion exchange in the field area is good. The groundwaters of thePilanesberg Complex with very high F" contents have very low Ca2+ (Figure 5.13) and Mg2+, highNa+ and pH, and moderately high HCO3". Such a composition is characteristic of groundwater whichhas undergone cation and anion exchange (e.g. Gascoyne and Kamineni, 1994). Water-bearingfractures in the Pilanesberg Complex are known to be often lined with clays, and flow paths in theorder of 5 kilometres are possible (McCaffrey, 1994). The conceptual model of the geohydrologyof the area (outlined previously) does not indicate long flow paths or high porosity in the rest of theBushveld Complex, which would limit the action of cation exchange. The probability of cationexchange is highest in the vicinity of the Karoo basin. Groundwaters of the Lebowa and NeboGranites, saturated with respect to fluorite, would flow from the granitic highlands into the porousand clayey sediments of the Irrigasie and Ecca formations of the low-lying Karoo basin.
When plotted on a trilinear diagram ('Piper diagrams'; Piper, 1944) hydrochemical processes canbe more clearly seen (Lloyd and Heathcote, 1985). Figure 5.25 shows simple divisions into whichthe groundwaters can be divided. To plot all the data points would result in a confusing and clutteredgraph, so only the mean analyses have been plotted. Figure 5.26 shows mean groundwater analysesof the 8 major lithologies of the field area. Most of the groundwaters fall in the 'No Dominant Type'area. Mean groundwater from the RLS is of the Ca + Mg+Cl+SO4 type. Mean Pilanesberggroundwater has no dominant anion, but the cations are dominated by Na+K. This is not in itselfevidence that Pilanesberg groundwaters have been subject to ion exchange (the sodium rich, calciumpoor rocks of the complex may be the cause), although it is suggestive.
5.41
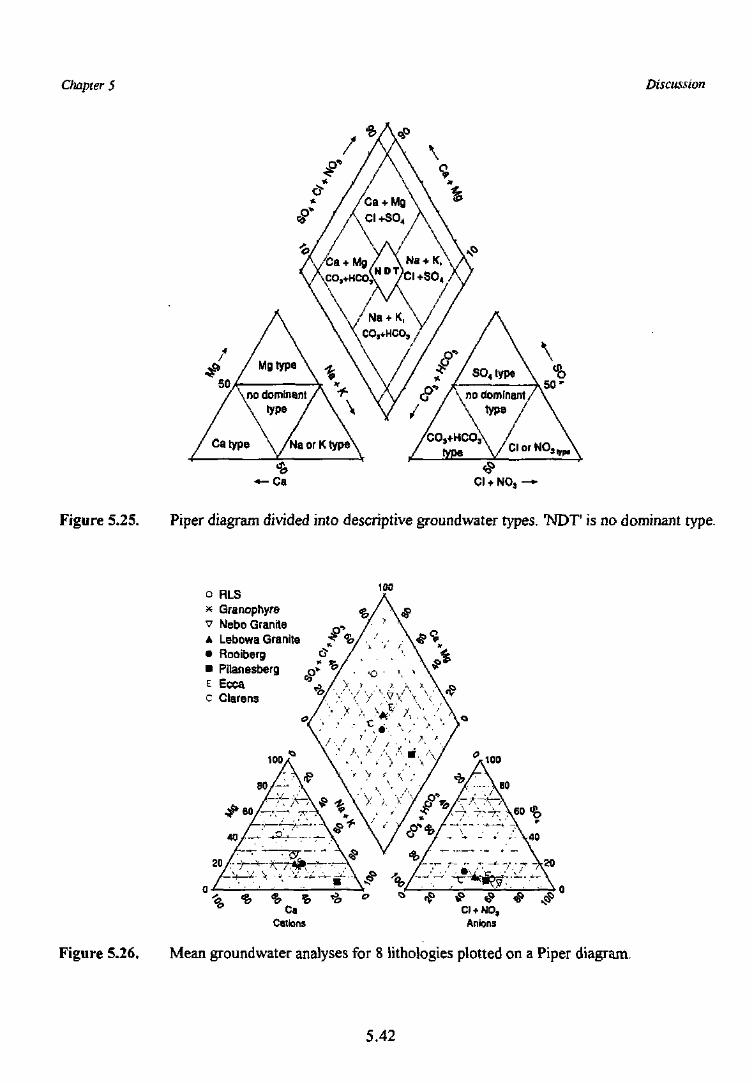
Chapter 5 Discussion
<P* / \ no dominant// / \ type '
Catype \/NaorKtyp6
Cl + NO,
Figure 5.25. Piper diagram divided into descriptive groundwater types. "NDT' is no dominant type.
o RLS* Granophyre <jv Nebo Granite o .A Lebowa Granite ^ %/• flooiberg c? / 1
• Pilanesberg o * V ^ .E Ecca P 3 * / ' ; f •c Clarens / Y '<
100A
/ ' \
\ ' ,\ \
•o • \ x
\ ••'• AV VVV v
Cl + NO,Anions
Figure 5.26. Mean groundwater analyses for 8 lithologies plotted on a Piper diagram.
5.42
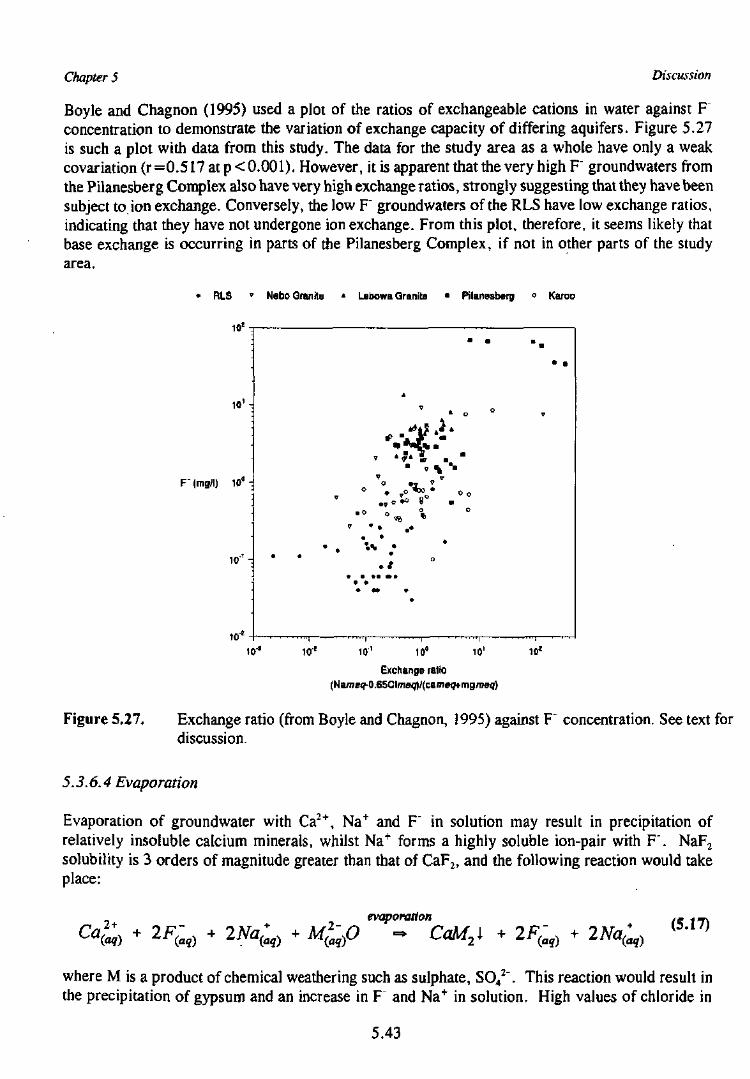
Chapter 5 Discussion
Boyle and Chagnon (1995) used a plot of the ratios of exchangeable cations in water against Fconcentration to demonstrate the variation of exchange capacity of differing aquifers. Figure 5.27is such a plot with data from this study. The data for the study area as a whole have only a weakcovariation (r=0.517atp<0.001). However, it is apparent that the very high F" groundwaters fromthe Pilanesberg Complex also have very high exchange ratios, strongly suggesting that they have beensubject to ion exchange. Conversely, the low F" groundwaters of the RLS have low exchange ratios,indicating that they have not undergone ion exchange. From this plot, therefore, it seems likely thatbase exchange is occurring in parts of the Pilanesberg Complex, if not in other parts of the studyarea.
RLS Nebo Granite * Lebowa Granite • Pilanesberg ° Karoo
F" (mg/l) 10° -
w10'! 101 10'
Exchange ratio
10'
Figure 5.27. Exchange ratio (from Boyle and Chagnon, 1995) against F concentration. See text fordiscussion.
5.3.6.4 Evaporation
Evaporation of groundwater with Ca2+, Na+ and F" in solution may result in precipitation ofrelatively insoluble calcium minerals, whilst Na+ forms a highly soluble ion-pair with F". NaF2
solubility is 3 orders of magnitude greater than that of CaF2, and the following reaction would takeplace:
evaporation (5.17)
where M is a product of chemical weathering such as sulphate, SO42". This reaction would result in
the precipitation of gypsum and an increase in F" and Na+ in solution. High values of chloride in
5.43
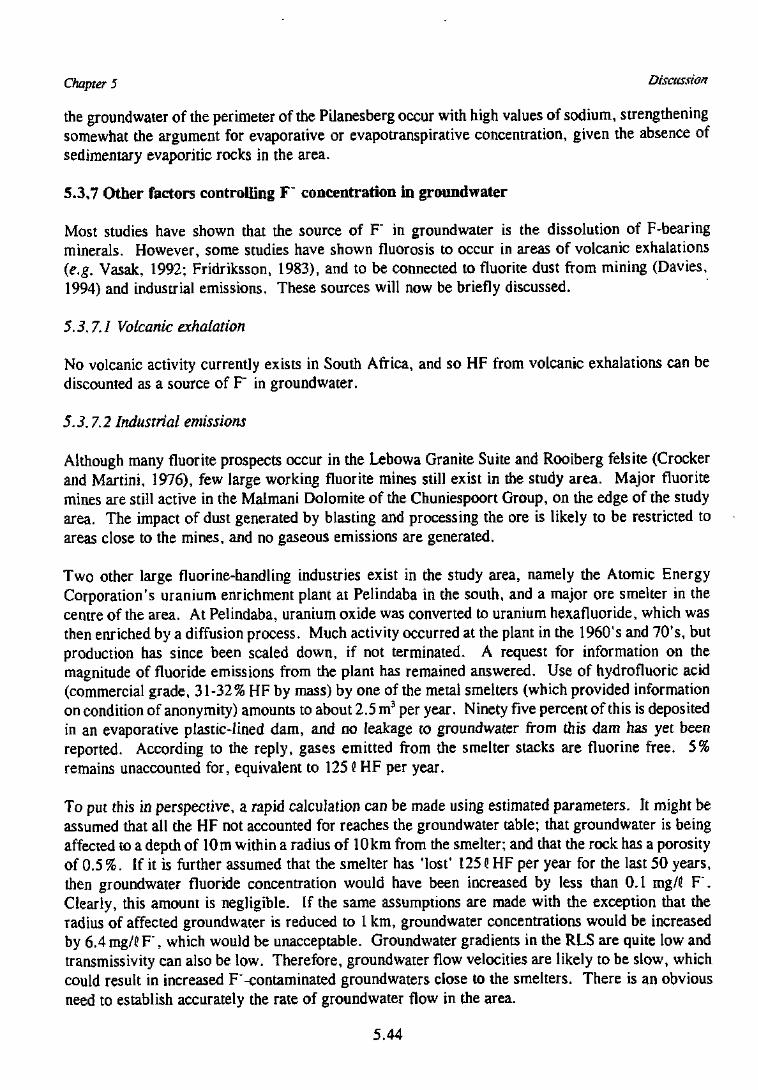
Chapter 5 Discussion
the groundwater of the perimeter of the Pilanesberg occur with high values of sodium, strengtheningsomewhat the argument for evaporative or evapotranspirative concentration, given the absence ofsedimentary evaporitic rocks in the area.
5.3.7 Other factors controlling F" concentration in groundwater
Most studies have shown that the source of F in groundwater is the dissolution of F-bearingminerals. However, some studies have shown fluorosis to occur in areas of volcanic exhalations{e.g. Vasak, 1992; Fridriksson, 1983), and to be connected to fluorite dust from mining (Davies,1994) and industrial emissions. These sources will now be briefly discussed.
5.3.7.1 Volcanic exhalation
No volcanic activity currently exists in South Africa, and so HF from volcanic exhalations can bediscounted as a source of F in groundwater.
5.3.7.2 Industrial emissions
Although many fluorite prospects occur in the Lebowa Granite Suite and Rooiberg felsite (Crockerand Martini, 1976), few large working fluorite mines still exist in the study area. Major fluoritemines are still active in the Malmani Dolomite of the Chuniespoort Group, on the edge of the studyarea. The impact of dust generated by blasting and processing the ore is likely to be restricted toareas close to the mines, and no gaseous emissions are generated.
Two other large fluorine-handling industries exist in the study area, namely the Atomic EnergyCorporation's uranium enrichment plant at Pelindaba in the south, and a major ore smelter in thecentre of the area. At Pelindaba, uranium oxide was converted to uranium hexafluoride, which wasthen enriched by a diffusion process. Much activity occurred at the plant in the 1960's and 10's, butproduction has since been scaled down, if not terminated. A request for information on themagnitude of fluoride emissions from the plant has remained answered. Use of hydrofluoric acid(commercial grade, 31-32% HF by mass) by one of the metal smelters (which provided informationon condition of anonymity) amounts to about 2.5 m3 per year. Ninety five percent of this is depositedin an evaporative plastic-lined dam, and no leakage to groundwater from this dam has yet beenreported. According to the reply, gases emitted from the smelter stacks are fluorine free. 5%remains unaccounted for, equivalent to 125 i HF per year.
To put this in perspective, a rapid calculation can be made using estimated parameters. It might beassumed that all the HF not accounted for reaches the groundwater table; that groundwater is beingaffected to a depth of 10m within a radius of 10km from the smelter; and that the rock has a porosityof 0.5 %. If it is further assumed that the smelter has 'lost' 125 e HF per year for the last 50 years,then groundwater fluoride concentration would have been increased by less than 0.1 mg/C F".Clearly, this amount is negligible. If the same assumptions are made with the exception that theradius of affected groundwater is reduced to 1 km, groundwater concentrations would be increasedby 6.4 mg/C F", which would be unacceptable. Groundwater gradients in the RLS are quite low andtransmissivity can also be low. Therefore, groundwater flow velocities are likely to be slow, whichcould result in increased F"-contaminated groundwaters close to the smelters. There is an obviousneed to establish accurately the rate of groundwater flow in the area.
5.44
Chapter 5 Discussion
5.3.7.3 Fluoride in rainwater
Fluoride occurs in rainwater at very low concentrations, between 2 and 20 ftg/C (Barnard andNordstrom, 1982a). The origin of F" in rainwater has been the subject of some controversy.Carpenter (1969) found that fluoride originated from the ocean and is injected into the atmosphereat the air-sea interface. The studies of Wilkniss and Bressan (1971, 1972) totally contradicted thisresult. Barnard and Nordstrom (1982b) found that the majority of fluoride in precipitation in theUnited States is anthropogenic in origin and that fluoride is not injected at the air-sea interface.
No rainwater samples suitable for fluoride analysis were taken for this study. However, it is likelythat, given the distance from the ocean and the absence of major fluorine-handling industries in thearea, fluoride concentration in rainfall would be near the background concentrations of 8 fig/H F"found by Barnard and Nordstrom (1982a).
5.3.7.4 Dissolution of atmospheric fluorine compounds
Fluorine exists in the atmosphere in the form of F2 at concentrations between <0.01 and 0.4/ng/m3
(Bowen, 1966; Oelschlager, 1966). Concentrations near industrial plants increase markedly (e.g.Machoy et al., 1991). In South African coal up to 90% of the fluorine is volatilised uponcombustion, either as HF, CaF2 or often combining with boron to form BF3. Most South Africancoals have F concentrations between 75 and 200 ppm (Kunstmann et al., 1963). It is possible thatF emitted into the atmosphere by the burning of South African coals could affect groundwaterconcentrations significantly. Values given in DMEA( 1995) indicate that in 1993, 130 million tonnes ofcoal were burnt each year in South Africa. This corresponds to between 8.775 x 10⁹ and 2.34 * 1010 gF released into the atmosphere each year. However, most of this coal is burnt on the Transvaal Highveld(approximately 300 km to the east of the study area), and with the prevailing wind systems coming fromthe southwest, is very unlikely to influence groundwater F" in the study area (Prof. H. Annegarn,Schonland Centre for Nuclear Research, University of the Witwatersrand, pers. comm.).
5.3.7.5 Temporal factors
Chemical analysis of repeat samples taken from boreholes after almost 2 years show great variationfor most major ions, but comparatively little variation in F" levels. This indicates that the F"concentration is effectively buffered by mineral-water equilibria during short term fluctuations.
5.3.7.6 Hydrological factors
Brown and Roberson (1977) found that over a three year period fluorite (CaF2) did not fully reachequilibrium with dilute sodium perchlorate solutions, but had reached approximate equilibrium after34 days. Infiltrating rainwater is undersaturated with respect to CaF2, and so actively recharginggroundwater will not to be in equilibrium with the mineral; it should reach approximate equilibriumwith fluorite-containing rocks within 34 days of reaching the water table.
5.3.7.7 Borehole depth
It was noted in Chapter 4 that the fluoride concentrations in groundwater from boreholes located inthe outcrop area of the Karoo sediments had a very varied spatial distribution. It is suggested that
5.45
Chapter 5 Discussion
this is due to the possibility that some boreholes penetrate the low fluoride Ecca shales and tap waterfrom the underlying high fluoride Nebo and Lebowa granites (shown schematically in Figure 5.28).The groundwaters in Karoo sediments in the central part of the basin, namely the Irrigasie andClarens Formations, have lower mean fluoride concentrations, 1.0 and 0.9mg/l! F", respectively,than the Ecca Formation (2.3 mg/C F", Chapter 4), and have fewer high fluoride outlier values thanthe Ecca shales. This suggests that boreholes in the areas of increased sediment thickness are notdeep enough to penetrate to the high F groundwaters in the underlying granites.
yssssss///T7-rr //77////77777///
Ctarens @ irrigasie B Ecca Nebo Granite Lebowa Granite
Figure 5.28. Schematic cross section of the geology of the Karoo basin, with boreholes ofvarying depths reaching the high fluoride groundwater of the underlyinggranites.
The absence of depth information associated with any of the groundwater samples is a majordisadvantage of the current data set. The deficiency all but prevents any speculation of the variationof F" concentration with depth. Whilst the data of Boyle (1992) appears to show little or nocorrelation of F" concentration with depth, Hitchon (1995) found that F' concentrations increased indeeper groundwaters. Salinisation is known to occur in most crystalline basement massifs at depthsbetween 500 and 1000 m below the earth's surface (e.g. Smalley et aL, 1988; Gascoyne andKamineni, 1994). If depth data could be supplemented to the current data set it would be reasonableto expect higher F" concentrations with depth.
5.3,7.8 Leakage of fluid inclusions
Waber and Nordstrom (1992) proposed that deep granitic groundwaters were geochemicallyinfluenced by the release of fluid from fluid inclusions. In saline, high pH waters with high F"concentrations, they found that up to 3.8% of ions may have been derived from fluid inclusions.However, their method of calculating the composition of fluid inclusions is flawed, being based ona circular argument involving fluid inclusion contribution to groundwater, and fluid inclusioncomposition based on groundwater chemistry (Waber and Nordstrom (1992) p244, paragraph 4).
The possibility that fluid inclusions contribute significant amounts of dissolved ionic species toBushveld groundwater cannot be ruled out. All of the samples collected had inclusion trails, mostnotably in quartz grains. However, no data on F concentrations in fluid inclusions exist for the area.
5.46
Chapter 5 Discussion
Although F' concentrations in fluid inclusions in the study area have not been measured, the F"concentrations are likely to be controlled by equilibration with fluorite, ubiquitous in these rocks(H. Frimmel, UCT, 1996, pers. comm.). Given the retrograde solubility of CaF2 above 100°C(Striibel, 1965), it is predicted that the medium to high temperature fluid inclusions present in rocksin the study area are not likely to contain more than about 5 mg/C F . To actually measure the F"concentration of fluid inclusions would be difficult and was not attempted in this project.
5.3.7.9 Soil
The leaching experiments described in Chapters 3 and 4 have confirmed that soil is a source of F",but that it contains an order of magnitude less soluble-F than associated fresh rock. Soil as a sourceof F* is therefore of proportionately less significance than the fresh rock of the host aquifer.However, if soil water is partially evaporated whilst in contact with F salts, higher concentrationsof F", as well as distinct stable isotope ratios, in groundwater may result.
5.4 Hydrogen and Oxygen Isotopes
The previous discussion has shown that evaporation is a potentially important process in increasingF" concentrations in groundwater. The study of the stable isotopes of H and O allows an estimationof the extent of any evaporation. The expense of isotope analysis constrained the number of sampleswhich could be analysed. The following discussion is therefore based on a limited sample set, andadditional analyses would help to clarify the relationships found here.
5.4.1 Correlation with elevation and temperature
The 52H and 618O values found in groundwater in this study are weakly correlated to sampling pointelevation (Figure 5.29), with considerable scatter around the calculated regression line. Thecorrelation of 8I8O with elevation is significant at the 95% confidence level, whilst for 62H it issignificant at the 99% level. The scatter may be due to variable vertical flow away from the rechargearea, which cannot as yet be quantified because of uncertainty about the location and elevation of therecharge areas of these groundwaters. The regressions shows that there is a decrease in 5l8O of0.2%o per 100 m increase in elevation. With a typical lapse rate in summer of 1°C per 100 m, theresultant relationship for 818Oof0.2%0/°C is comparable to the value of 0.4%o/°C found by Heatonet at, (1986) for groundwater along the southern coast of South Africa. The relationship of 52H totemperature for the study area is 3.6%o/°C.
5.4.2 Isotopic signature of rock types
The rock type with which groundwaters interact may control the oxygen and hydrogen stable isotopesignature of the water. A summary diagram plotting hydrogen and oxygen isotopes, in groupsaccording to their host rock, is shown in Figure 5.30. Although there is some overlap betweengroundwaters from different rock types, there is sufficient separation to allow groundwaters fromdifferent rock types to be distinguished from one another with a considerable degree of certainty onthe basis of their stable isotope composition. The Pilanesberg perimeter groundwaters and those ofthe Nebo Granite have very different 62H and 618O values. It should be possible to identify the
5.47
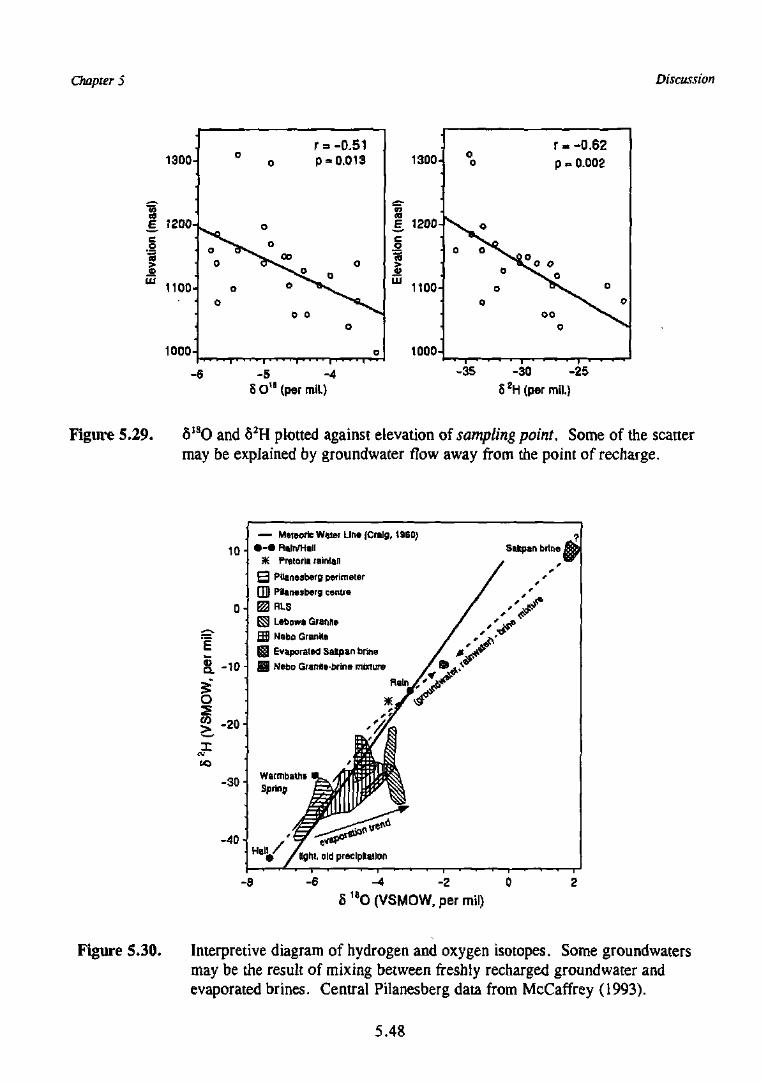
Chapter 5 Discussion
1300-
E 1200-
1100-
1000-
r = -0.62p = 0.002
o oo o
oo
-5 -45O1B(permil.)
-35 -30 -25
8 *H (per mil.)
Figure 5.29. 81SO and 62H plotted against elevation of sampling point. Some of the scattermay be explained by groundwater flow away from the point of recharge.
10-
0-
(I!
1 - 1 0 -5*o» -20-
-30-
-40-
— Metsorfc Water Line (Craig, 196D) ?• - • Rain/Hall Saltpan brine &fc
3K Pretoria rainfall y ^
S Pilanesbergperimster / f*
QB Pilanesberg cenue / , '
M R1-S / / ' ^^ Lebowa Granite / ^ * j p
ffil NabD Granite / ' -"^
^ Evaporated Saltpan brine / ^ ^
@ Nebo Granite-brine mixture / ® ^ >
I;Warmbaths ^ . / ''It'
\ I
H H • / l i g h t , old preclpltaiton
- 4 - 25 18O (VSMOW, per mil)
Figure 5.30. Interpretive diagram of hydrogen and oxygen isotopes. Some groundwatersmay be the result of mixing between freshly recharged groundwater andevaporated brines. Central Pilanesberg data from McCaffrey (1993).
5.48
Chapter 5 Discussion
Pilanesberg Perimeter groundwater type, if encountered in boreholes in the surrounding RLS or NeboGranite, based on its 'light' isotopic signature. The Nebo granite samples are tightly grouped around-4.4%o 6l8O and -27%o 82H, and any deviations from these values are considered significant.Central Pilanesberg groundwater has a much larger spread and shows evidence of having beensubjected to evaporation (McCaffrey, 1993).
The Pretoria Saltpan brine is isotopically very much heavier than the precipitation falling in the areaand has been subjected to large amounts of evaporation. One groundwater sample, taken from aborehole situated in Nebo Granite at Mr Mon's store close to the Pretoria Saltpan, has a significantlyheavier isotopic signature than other Nebo Granite water, and lies on a mixing line between Saltpanbrine and Nebo Granite groundwater and/or rain water. This is taken as evidence that the Saltpanbrines are somehow leaving the crater environs and mixing with local groundwater.
The analyses of rain and hail from the same thunderstorm highlight the variability of O and Hisotopes in precipitation, with respect to both time and elevation. The differences between rain andhail are unlikely to influence groundwater isotope composition, since no conceivable mechanismexists which would allow recharge by rainwater and not melted hail, at least in the current climate.Hail melts within minutes or hours of falling to the ground, and so effectively becomes part of therain recharge event. The slight delay in infiltration due to melting might conceivably lead todifferent layers of an infiltration front having different isotopic values, but they would be quicklymixed in the unsaturated zone.
5.4.3 Isotopic difference between hail and rain
The difference in 618O and 62H between rain and hail from the same thunderstorm, noted inChapter 4, may be due to several processes. The 18O fractionation factor (a) for ice in equilibriumwith water is 1.002 at 0°C (Faure, 1987); if hail formed in a simple one-step equilibrium freezingprocess from a large volume of water droplets, then the hail would have a 61&O of ~2%o relative torain. The measured difference of -4.3 %o could imply that, since the fractionation factors for 1KOand 2H become greater at lower temperatures, the hail formed from supercooled water vapour.Supercooled water vapour does occur in thunderclouds (Preston-Whyte and Tyson, 1988).
It was observed that the hail analysed in this study fell about 1 hour after the rain from the samestorm system. Fractionation of the water vapour in the cloud during that time, by preferentialremoval of the "heavier" molecules, would result in the remaining water vapour becomingisotopically lighter with time. Hence, the differences between hail and rain may be due either to thelarge fractionation factor at low temperature or to the "rainout effect".
5.5 Radiogenic isotopes
This section attempts firstly to use radiocarbon to gauge the mean residence time of groundwater,and thus the rate of reactions which affect groundwater composition. Secondly, the section includesan attempt to characterise groundwater from the field area using Sr isotopes.
5.49
Chapter 5 Discussion
5.5.1 Radiocarbon - UC
5.5.1.1 Mean Residence Time
The 14C results presented in Chapter 4 may be used simplistically as a chemical parameter to indicatea particular groundwater type (A. Issar, Ben-Gurion University, pers.comm., 1995). More usefully,14C may be used to calculate the mean residence time (T) of a groundwater flow unit.
Where the recharge area of a confined aquifer is of a similar cross sectional area to the flow path,and where 14C is not depleted by interaction with l4C-free aquifer material, or augmented by ongoingrecharge along the flow path, the mean residence time can be modelled with the equation:
Cs = Co(t - tu- T)e~Ht"*T) (5.18)
where Cs is the 14C activity at the time of sampling, Co is the input concentration (initial 14C activity),X the decay constant, T the mean residence time, t the time of sampling and ^ is the delay time inthe unsaturated zone (Verhagen et al., 1991). Mook (1980) and others use Ao to denote the originalspecific radioactivity of the sample, but the notation of Verhagen et al. (1991) is used here. Themodel is known as the 'piston flow' model. Equation 5.18 can be rearranged and simplified to:
(5.19)
where Co is the initial 14C activity and Cs is the activity at the time of sampling.
This simplified equation is valid when the delay time in the unsaturated zone is small (Verhagen etal., 1991). In the field area such conditions are probably only fulfilled in the tuff bands of thePilanesberg, which are confined on either side by impermeable syenite.
The open fracture system of the granitic rocks of the field area suggests that a discreet recharge areadoes not exist for these rocks. Rather, rainwater infiltrates over the entire outcrop and much of thesuboutcrop of the granite, mixing with groundwater on its way to the discharge area. The meanresidence time of a groundwater flow unit in such a system can be calculated using the equation:
- [~Co(t - tu - t*Jo
(5.20)
where t* is the transit time of a groundwater volume element (Verhagen, pers. comm.). Thisequation can be rearranged and simplified to:
5.50
Chapter 5 Discussion
c - c
where X is the decay constant of 14C, equal to 0.000121 and calculated from
(5.22)
The half life (Th) of radiocarbon used here is 5730 years (Faure, 1987).
5.5.1.2 Estimation of Co
Equations 5.18 to 5.21 assume that Co is known. In most hydrologic studies of 14C, soils derivedfrom aquifer material contain appreciable quantities of fossil C (12C), diluting the 14C activity ofinfiltrating rainwater. This reduces Co from 100 pmc to as low as to 50 pmc. However, most igneousrocks and the soil derived from them are comparatively free of carbonate. Therefore, at a firstapproximation it might be assumed that Co is between 90 and 100 pmc; McCaffrey (1993) assumedthat Co was 90 pmc for Pilanesberg groundwater. Although this study has shown for the first time(Chapter 3, Appendix A6) that carbonate minerals occur in the Pilanesberg, their distribution is likelyto be very limited and their importance in terms of their effect on i4C is therefore minimal. Severalsamples from the Pilanesberg have I4C above 90 pmc. McCaffrey (1993) explained this as due eitherto an absence of carbonate in the soils of the complex or to the influence of the increased atmospheric14C since the nuclear weapons tests of the 1960's.
To use the radiocarbon method as a means of dating groundwater, it must be possible to affirm that!4C has not been reduced by an increase in inorganic carbon content resulting from the dissolutionof carbonates contained within the aquifer, as opposed to within soil derived from aquifer material.Figure 5.31 shows that the total alkalinity of the sample is not correlated to I4C activity. Thisobservation suggests that the assumption implicit in equations 5.18 to 5.21, that 14C activity isreduced only by radioactive decay, is correct, and suggests that 14C can be used to estimate meanresidence time.
A method which has been used to gauge the initial activity of radiocarbon, Co, is that of isotopedilution correction (Mook, 1980). The quantitative use of 13C to gauge radiocarbon dilution is fraughtwith difficulties, and indeed its quantitative use is considered to be suspect when the hydrologicalparameters of a system are poorly known (Prof. B. Th. Verhagen, Schonland Centre for NuclearResearch, University of the Witwatersrand, pers. comm.). Typically, the extra parameters involvedin the isotope dilution correction equations introduce extra uncertainty and errors into calculationsof residence time, errors possibly greater than the actual correction. Isotope dilution corrections alsosometimes produce apparent negative residence times, which are obviously impossible. It is withthese limitations in mind that an isotope dilution correction is attempted here. In this method the 613C
5.51
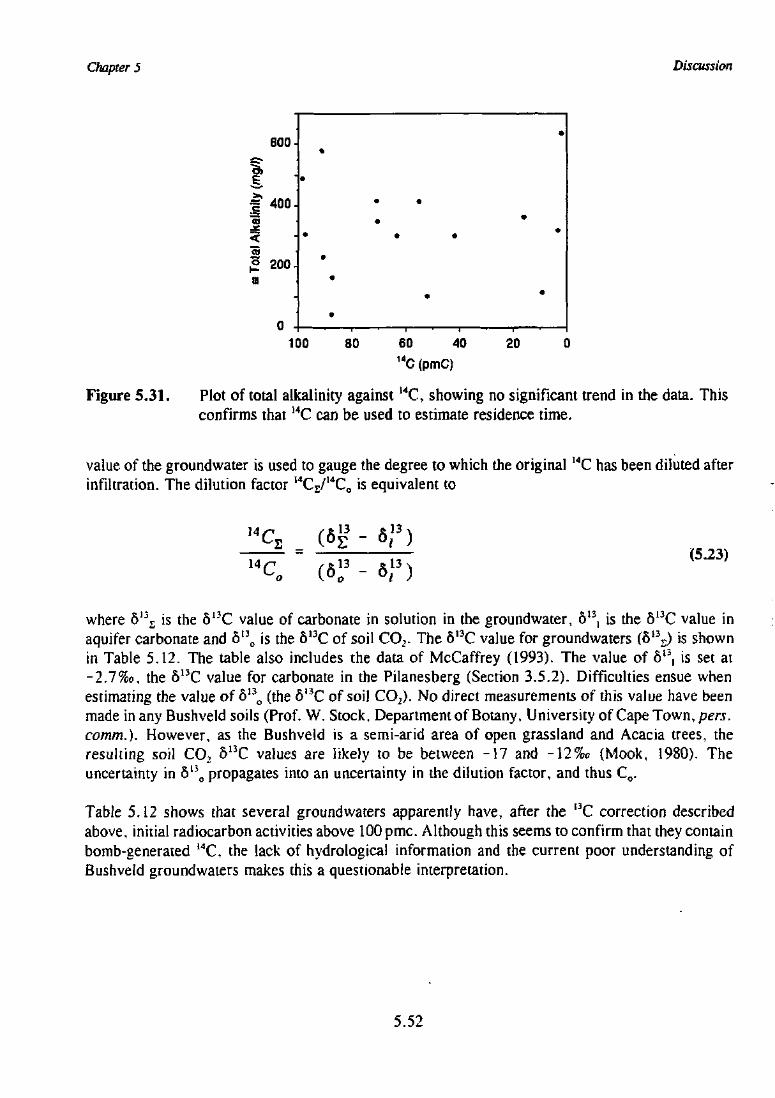
Chapter 5 Discussion
C (pmC)
Figure 5.31. Plot of total alkalinity against 14C, showing no significant trend in the data. Thisconfirms that 14C can be used to estimate residence time.
value of the groundwater is used to gauge the degree to which the original 14C has been diluted afterinfiltration. The dilution factor 14CS/
14CO is equivalent to
14, % - a,")14,
(«!' - 8,")(5.23)
where hv\ is the SUC value of carbonate in solution in the groundwater, 613, is the 813C value inaquifer carbonate and 8I3
O is the 813C of soil CO2. The 513C value for groundwaters (8'3S) is shownin Table 5.12. The table also includes the data of McCaffrey (1993). The value of 8i3, is set at-2.7%o, the 813C value for carbonate in the Pilanesberg (Section 3,5.2). Difficulties ensue whenestimating the value of oI3
o (the 6!3C of soil CO2). No direct measurements of this value have beenmade in any Bushveld soils (Prof. W. Stock. Department of Botany, University of Cape Town, pers.comm.). However, as the Bushveld is a semi-arid area of open grassland and Acacia trees, theresulting soil CO, 513C values are likely to be between -17 and -\2%o (Mook, 1980). Theuncertainty in 813
O propagates into an uncertainty in the dilution factor, and thus Co.
Table 5.12 shows that several groundwaters apparently have, after the I3C correction describedabove, initial radiocarbon activities above 100 pmc. Although this seems to confirm that they containbomb-generated 14C, the lack of hydrological information and the current poor understanding ofBushveld groundwaters makes this a questionable interpretation.
5.52
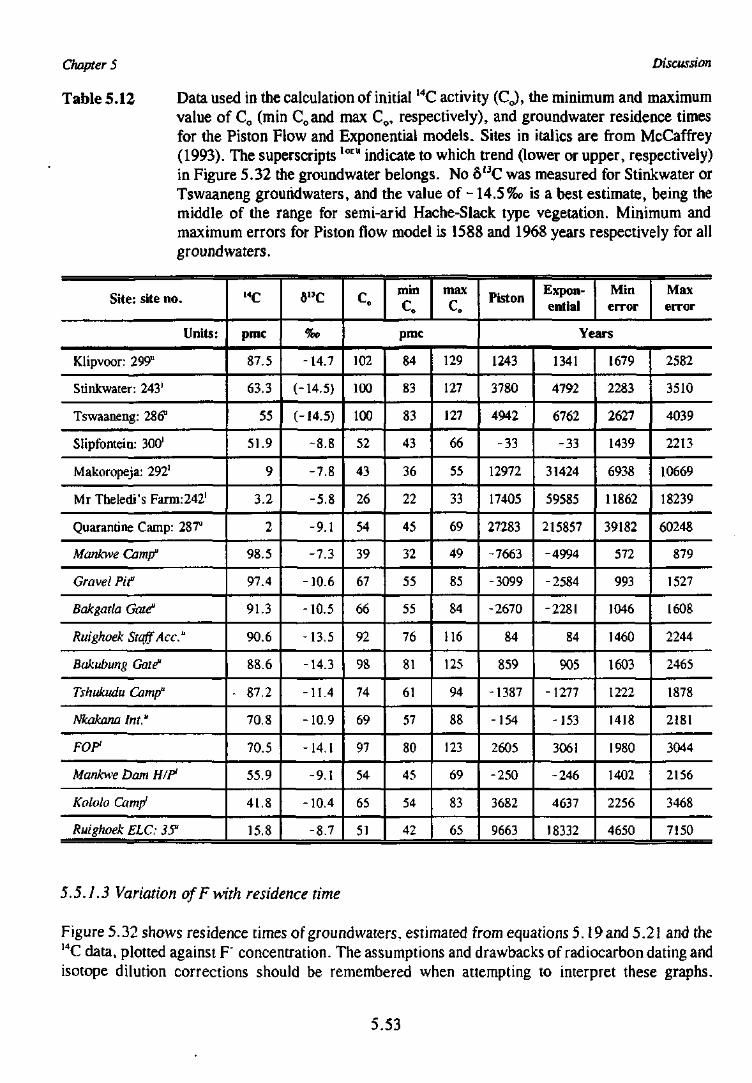
Chapter 5 Discussion
Table 5.12 Data used in the calculation of initial 14C activity (Co), the minimum and maximumvalue of Co (min Coand max Co, respectively), and groundwater residence timesfor the Piston Flow and Exponential models. Sites in italics are from McCaffrey(1993). The superscriptsloru indicate to which trend (lower or upper, respectively)in Figure 5.32 the groundwater belongs. No 8"C was measured for Stinkwater orTswaaneng groundwaters, and the value of -14.5%o is a best estimate, being themiddle of the range for semi-arid Hache-Slack type vegetation. Minimum andmaximum errors for Piston flow model is 1588 and 1968 years respectively for allgroundwaters.
Site: site no.
Units:
Klipvoor: 299U
Stinkwater: 243'
Tswaaneng: 286"
Slipfonteiti: 3001
Makoropeja: 2921
Mr Theledi's Farm:242'
Quarantine Camp: 2871
Mankwe Camp1
Gravel Pif
Bakgatla Gate"
Ruighoek Staff Ace."
Bakubung Gate"
Tshukudu Camp"
Nkakana Int."
FOP1
Mankwe Dam H/P1
Kololo Camp1
Ruighoek ELC: 35"
1 4 C
pmc
87.5
63.3
55
51.9
9
3.2
2
98.5
97.4
91.3
90.6
88.6
- 87.2
70.8
70.5
55.9
41.8
15.8
6»C
%c
-14.7
(-14.5)
(-14.5)
-8.8
-7.8
-5.8
-9.1
-7.3
-10.6
-10.5
-13.5
-14.3
-11.4
-10.9
-14.1
-9.1
-10.4
-8.7
c0min
ce
max
copmc
102
100
100
52
43
26
54
39
67
66
92
98
74
69
97
54
65
51
84
83
83
43
36
22
45
32
55
55
76
81
61
57
80
45
54
42
129
127
127
66
55
33
69
49
85
84
116
125
94
88
123
69
83
65
Piston Expon-ential
Minerror
Maxerror
Years
1243
3780
4942
-33
12972
17405
27283
-7663
-3099
-2670
84
859
-1387
-154
2605
-250
3682
9663
1341
4792
6762
-33
31424
59585
215857
-4994
-2584
-2281
84
905
-1277
-153
3061
-246
4637
18332
1679
2283
2627
1439
6938
11862
39182
572
993
1046
1460
1603
1222
1418
1980
1402
2256
4650
2582
3510
4039
2213
10669
18239
60248
879
1527
1608
2244
2465
1878
2181
3044
2156
3468
7150
5.5.1.3 Variation of F with residence time
Figure 5.32 shows residence times of groundwaters, estimated from equations 5.19and 5.21 and the14C data, plotted against F" concentration. The assumptions and drawbacks of radiocarbon dating andisotope dilution corrections should be remembered when attempting to interpret these graphs.
5.53
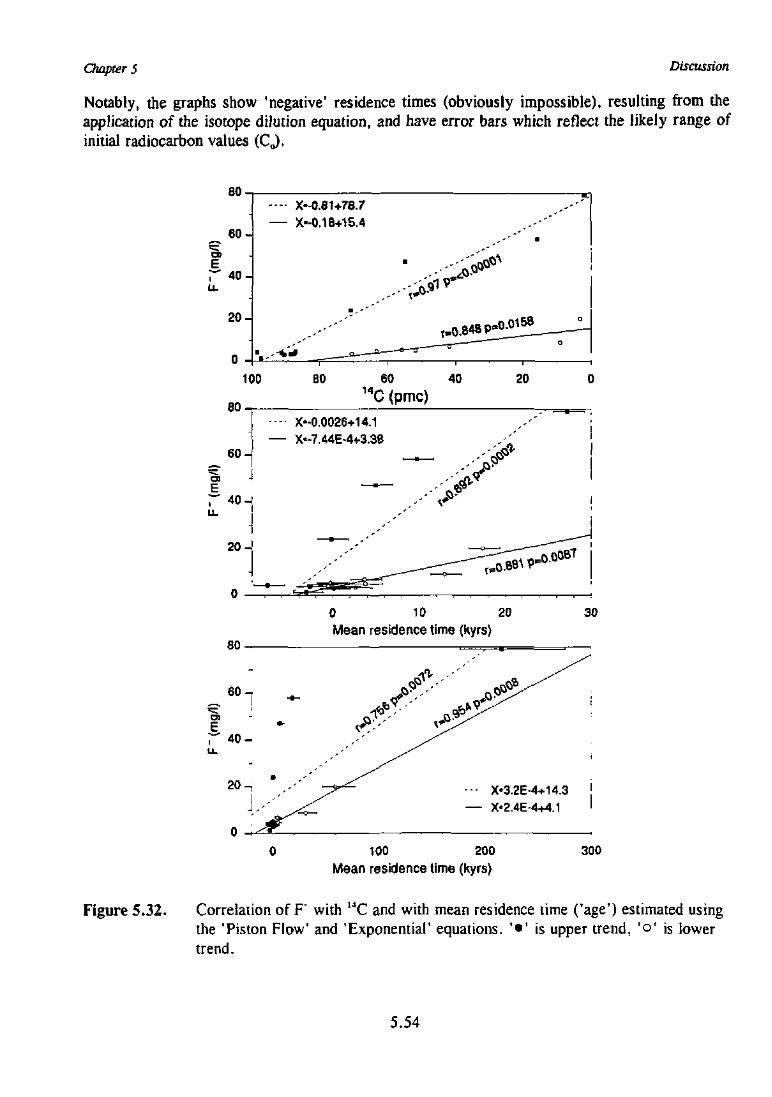
Chapter 5 Discussion
Notably, the graphs show 'negative' residence times (obviously impossible), resulting from theapplication of the isotope dilution equation, and have error bars which reflect the likely range ofinitial radiocarbon values (CJ.
80.
r2 0 -
-— X--0.81+78.7— X-0.18+15.4
0.848 P! ,0.0158
100
80.'C (pmc)
6 0 -
- • - X--0.0026+14.1
— X-7.44E-4v3.38
0 10 20Mean residence time (kyrs)
30
••• X*3.2E-4+14.3 j
— X«2.4E-4+4.1 I
100 200
Mean residence time (kyrs)300
Figure 5.32. Correlation of F" with i4C and with mean residence time ('age') estimated usingthe 'Piston Flow' and 'Exponential1 equations, ' • ' i s upper trend, ' o ' is lowertrend.
5.54
Chapter 5 Discussion
The upper plot in Figure 5.32 clearly shows that two trends are present; a high F' and a low F"trend. When 14C activity is used to estimate a mean residence time, it is possible to interpret the twotrends as two different rates for reactions which release F" into solution.
For piston type flow, the equations for the regression lines indicate that the slower reaction releases7.4 xlO"4 mg/fi/yr, whilst the faster reaction releases 2.6xlO'3 mg/S/yr F" into solution. Theintercept on the y axis of 3.4 mg/C is interpreted as the result of the dissolution of rapidly dissolving,relatively soluble F-bearing minerals. In the context of the long time period under consideration, thismay represent the dissolution of fluorite. The pK calculated from the intercept of the lower trend isvery close to thepK of -10.4 calculated for fluorite by Gill (1996), while thepK for the upper trendis an order of magnitude higher. When the 'exponential' equation is used to model residence time,
calculated for both trends is similar to those calculated using 'piston flow' conditions.
5.5.1.4 Variation of other ions with residence time
Several other chemical parameters (Na, pH, Ca and Mg) are correlated with 14C and mean residencetime, and bivariate plots of these components are shown in Figures 5.33 and 5.34. It has previouslybeen noted that Na, pH and Ca are involved in reactions which increase F" above the concentrationsexpected from the simple stoichiometric dissolution of CaF2. These reactions are either ion exchangereactions, where Ca in solution is removed by exchange with Na on clay, and the release of F" fromclay surfaces at high pH, or reactions which precipitate CaCO3 or gypsum. The regression equationsshown in Figures 5.33 and 5.34 show that Na+ in these groundwaters increases with residence timeten times faster than Ca2+ is removed, suggesting that a simple two-for-one swap of Na+ for Ca2+
on ion-exchanging clays is not the only mechanism for hydrochemical change in these groundwaters.In each case, the reaction or exchange rate calculated using the piston flow model is generally anorder of magnitude faster than that calculated from the exponential flow model.
Compared to the dissolution of fluorite, which in this time frame reaches equilibrium quickly, theprocesses operating here are very slow. Regressions calculated for these parameters are always moresignificant for the piston flow model than for the exponential flow model. The cation data isgenerally poorly correlated with residence time.
5.5.2 87Sr/MSr isotope ratios
The geohydrology of the Bushveld area is not known in any detail (Chapter 1), and the migration ofF" bearing groundwaters from one aquifer to another cannot be ruled out. The likeliest places wherethis may have occurred are from the Nebo and Lebowa Granites into the low lying Karoo sedimentsof the Springbok Flats, and from the Pilanesberg into the surrounding Nebo Granite and RLS. Thisstudy has attempted to characterise groundwater hosted in different rock types by their Sr isotoperatios, and to use these ratios to study hypothetical groundwater flow and provenance. Unfortunatelythe number of groundwater 87Sr/86Sr samples per rock type is very small, limiting the veracity of theconclusions. The samples were chosen for their geographic isolation from other rock types, so thatthe resulting Sr isotope values can be treated as a typical signature. Future workers will be able touse these signatures in studies on the provenance of groundwater along flow paths.
5.55
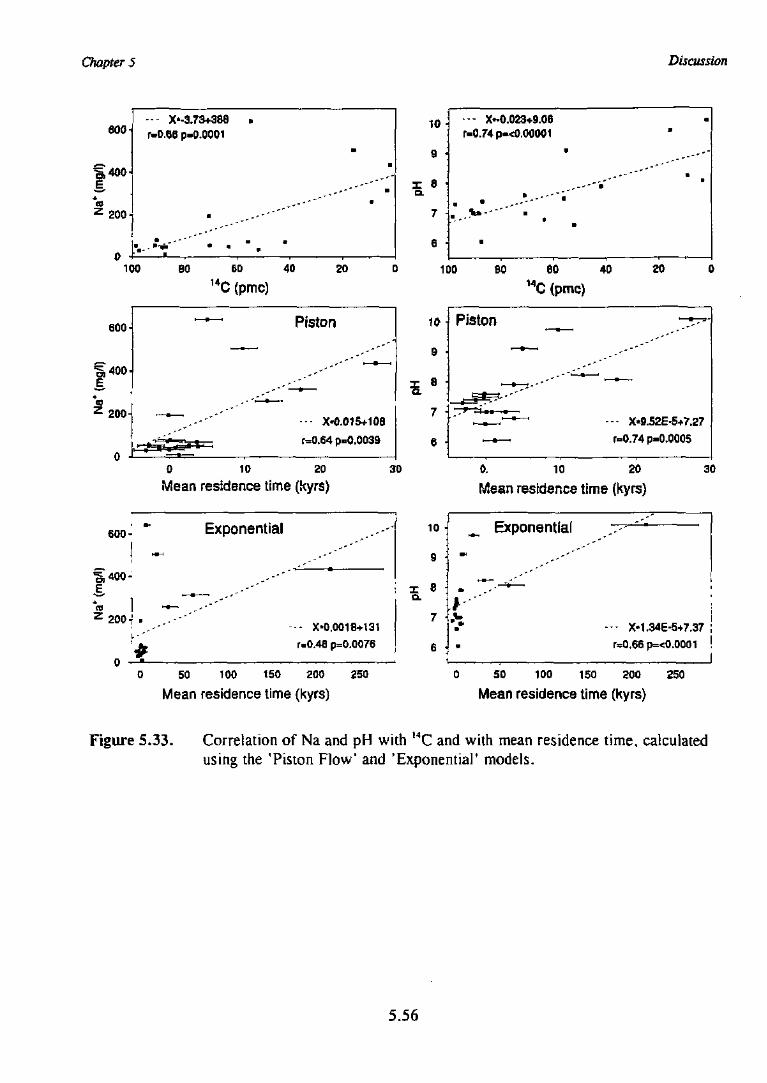
Chapter 5 Discussion
eoo-
,400-i
200 n
--- X*-3.73+388r=0.6B p-0.0001
10
9
8
7 i
6
- X-0.023+9.06r=0,74 p-<0.00001
100 80 60 40
) (pmc)
20 100 60 60 4014C (pmc)
20
600-
=5,400
200-
Piston
--- X-0.015+108
r=0.64 p=0.0039
600-
=5,400-
f !2 200-i
0 10 20 30
Mean residence time (kyrs)
Exponential
0. 10 20
Mean residence time (kyrs)
- X*0.0018+131
r=0.48 p=0.0076
10 -
9
^ Exponential
5; u-6 -
0 50 100 150 200 250
Mean residence time (kyrs)
- X-1.34E-5+7.37 |
r=0.66p=<0.0001 !I
0 50 100 150 200 250
Mean residence time (kyrs)
Figure 5.33. Correlation of Na and pH with 14C and with mean residence time, calculatedusing the 'Piston Flow" and 'Exponential' models.
5.56
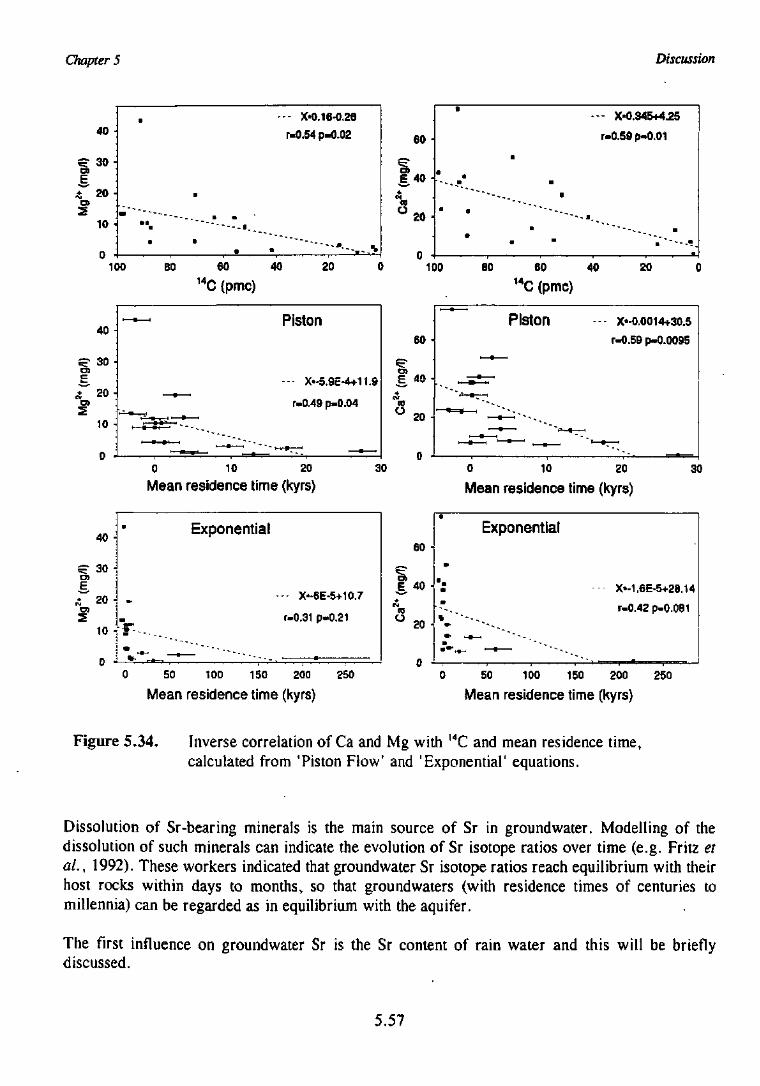
Chapter 5 Discussion
o>
40 -
3 0 •
20 -
10
0
40 •
30
20 -
10 -
0
40 •
30 J
CD
E j .
- X*0.16-0.26
r.0.54 p-0.02 60 •
° 20
- X-0.345+4.25
r-0.59 p-0.01
100 BO 60 4014C (pmc)
20 100 60 6014,
40 20
C (pmc)
Piston
X-5.9E-4+11
r-0.49 p.0.04
60
E 40
toO 20 -
Piston X-0,0014+30.5
r-0.59 p»0.0095
0 10 20
Mean residence time (kyrs)30 0 10 20
Mean residence time {kyrs)30
Exponential
• X--6E-5+10.7
r-0.31 p»0.2110 - *
60 •
«•
° 20 •
n .
•
Exponential
m
• -•
ft " " - - _• " - -
X*-1.6E-5+28.14
r-0.42 p-0.081
0 50 100 150 200 250
Mean residence time (kyrs)0 50 100 150 200 250
Mean residence time (kyrs)
Figure 5.34. Inverse correlation of Ca and Mg with 14C and mean residence time,calculated from 'Piston Flow' and 'Exponential' equations.
Dissolution of Sr-bearing minerals is the main source of Sr in groundwater. Modelling of thedissolution of such minerals can indicate the evolution of Sr isotope ratios over time (e.g. Fritz etai, 1992). These workers indicated that groundwater Sr isotope ratios reach equilibrium with theirhost rocks within days to months, so that groundwaters (with residence times of centuries tomillennia) can be regarded as in equilibrium with the aquifer.
The first influence on groundwater Sr is the Sr content of rain water and this will be brieflydiscussed.
5.57
Chapter 5 Discussion
5.5.2.1 Rainwater Sr
No rainwater 87Sr/86Sr ratios are available for the study area and it is therefore not possible tocalculate input into the groundwater system from that source. The ^Sr/^Sr ratio of modern seawateris 0.70906 (Faure, 1987); rainwater from New Mexico and Scotland had similar ratios, between0.70917 and 0.71042 (Grausteinand Armstrong, 1983; Bacon and Bain, 1995). However, Sr occursat very low concentrations in rainwater (e.g. Bacon and Bain (1995) found between 2 and210 Sr u,g/C in Scottish rainwater). Because of the very low Sr concentration in rainwater, the87Sr/86Sr ratio of the solution rapidly changes upon dissolution of Sr-bearing minerals in rock andsoil, and so the rainwater "Sr/^Sr input into groundwater can effectively be ignored.
5.5.2.2 Mixing of groundwaters with differing ^Sr^Sr and Sr concentrations
The s7Sr/86Sr ratio of a mixture of two groundwaters A and B (87Sr/86SrM) having Sr concentrationsSrA and SrB and Sr isotope ratios of ^Sr/^Sr* and 87Sr/86SrB is equivalent to (Faure, 1987):
87'Sr
87 rv.
A B , s,Sr(5.24)
86SrjM Sr^^rA-SrB) SrA- SrB
The parameter SrM (concentration of Sr in the mixture) is calculated from
SrM = SrJ + SrB(\ - / ) (5.25)
where/is equivalent to
/ = TTTV (5-26)
The parameters VA and VB are the volumes of each groundwater in a given mixture. Figure 5.35shows the application of these equations to the results presented at the end of Chapter 4, Table 4.4.
It should be stressed that the values for "Sr/^Sr in groundwater from each lithology in Figure 5.35are probably members of a continuum. Without further sampling and analysis it will not be possibleto assert whether the values analysed in the current study are 'end-members' or perhaps more centralto that continuum. In Figure 5.35, Pilanesberg groundwater, with high Sr concentration and low87Sr/86Sr ratio, retains a low Sr isotope ratio in mixtures with Nebo Granite groundwaters, becauseof the relatively low Sr concentration of Nebo Granite groundwater. In contrast, saline groundwaterfrom the perimeter of the Pilanesberg Complex (from a site known as the Quarantine Camp) readilyloses its Sr isotope signature when mixed with Nebo Granite groundwater, because of the low Srconcentration in Quarantine Camp groundwater. It is apparent from Figure 5.35a that QuarantineCamp groundwater does not result from the simple mixing of Nebo Granite and Pilanesberg
5.58
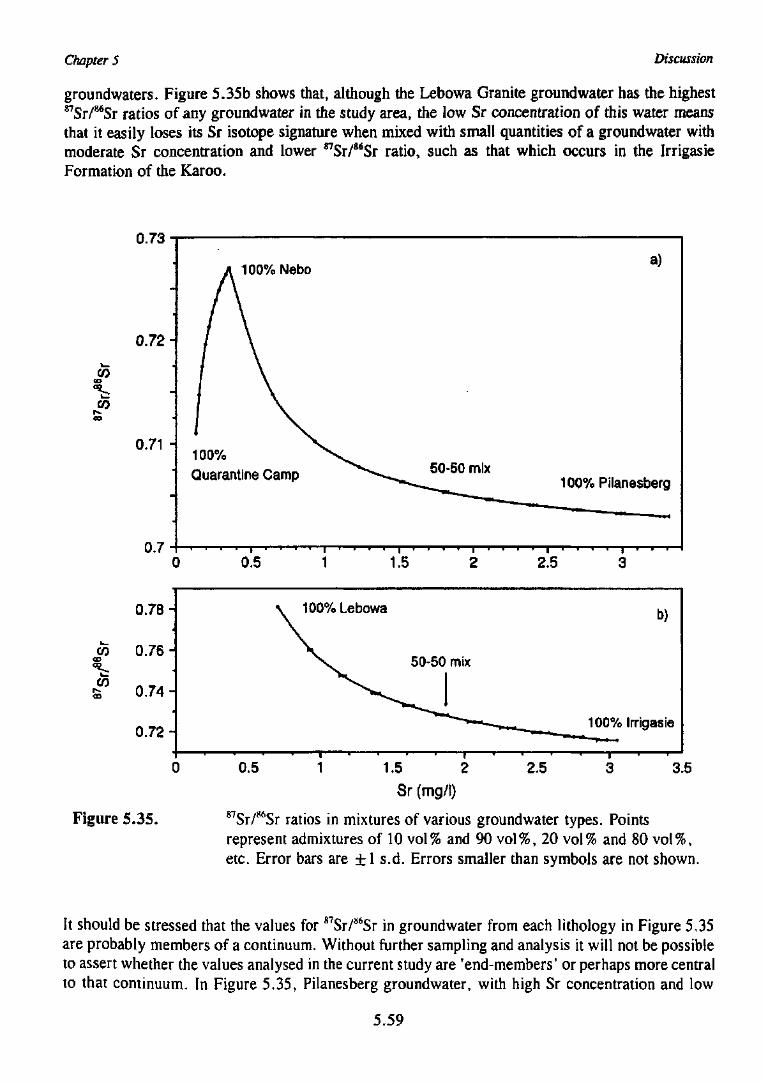
Chapter 5 Discussion
groundwaters. Figure 5.35b shows that, although the Lebowa Granite groundwater has the highest87Sr/86Sr ratios of any groundwater in the study area, the low Sr concentration of this water meansthat it easily loses its Sr isotope signature when mixed with small quantities of a groundwater withmoderate Sr concentration and lower "Sr/^Sr ratio, such as that which occurs in the IrrigasieFormation of the Karoo.
co
CO
U./3 "
0.72-
0.71 -
0.7-
A 100%Nebo
100% \ ^Quarantine Camp ^ 50-50 mix
a)
100%Pilanesberg
""
i . . . . . . . .
CO
COI"-oo
0.7B-
0.76-
0.74-
0.72-
Figure 5.35.
0.5 1.5 2.5
100% Lebowa b)
50-50 mix
100% Irrigasie
0.5 1 2.5 3.51.5 2
Sr (mg/i)
87Sr/86Sr ratios in mixtures of various groundwater types. Pointsrepresent admixtures of 10 vol% and 90 vol%, 20 vol% and 80 vo!%,etc. Error bars are ±1 s.d. Errors smaller than symbols are not shown.
It should be stressed that the values for 87Sr/s6Sr in groundwater from each lithology in Figure 5.35are probably members of a continuum. Without further sampling and analysis it will not be possibleto assert whether the values analysed in the current study are 'end-members1 or perhaps more centralto that continuum. In Figure 5.35, Pilanesberg groundwater, with high Sr concentration and low
5.59
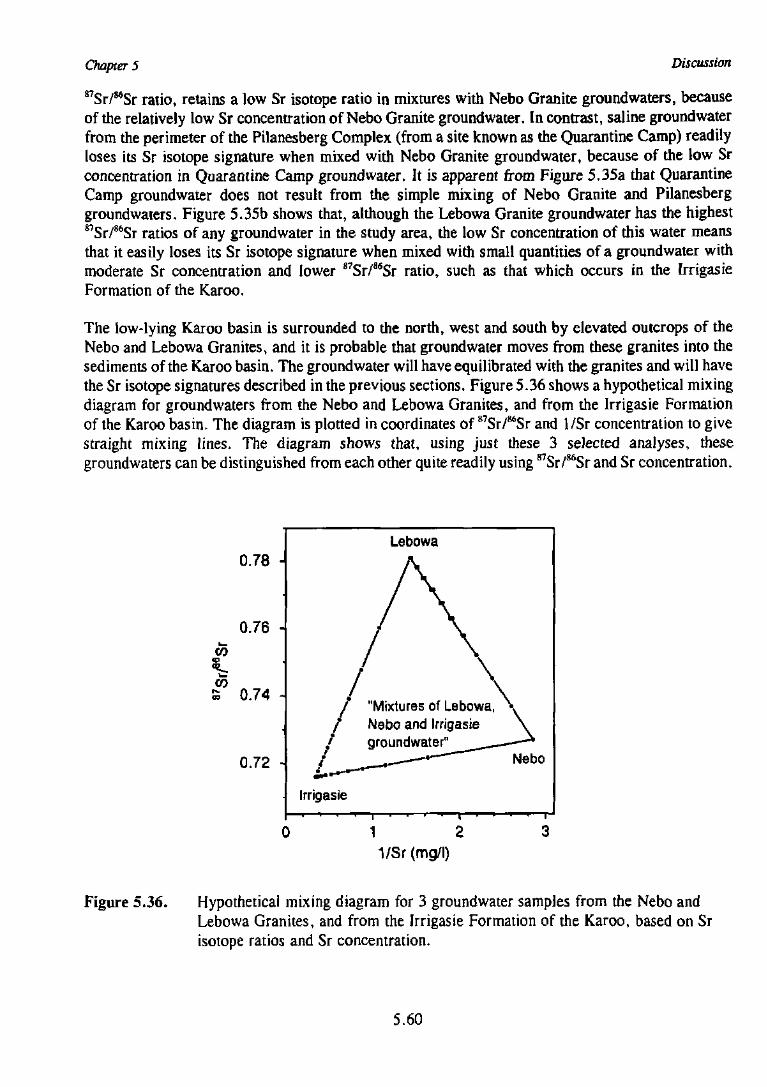
Chapter 5 Discussion
"Sr/^Sr ratio, retains a low Sr isotope ratio in mixtures with Nebo Granite groundwaters, becauseof the relatively low Sr concentration of Nebo Granite groundwater. In contrast, saline groundwaterfrom the perimeter of the Pilanesberg Complex (from a site known as the Quarantine Camp) readilyloses its Sr isotope signature when mixed with Nebo Granite groundwater, because of the low Srconcentration in Quarantine Camp groundwater. It is apparent from Figure 5.35a that QuarantineCamp groundwater does not result from the simple mixing of Nebo Granite and Pilanesberggroundwaters. Figure 5.35b shows that, although the Lebowa Granite groundwater has the highest87Sr/8*Sr ratios of any groundwater in the study area, the low Sr concentration of this water meansthat it easily loses its Sr isotope signature when mixed with small quantities of a groundwater withmoderate Sr concentration and lower 87Sr/8*Sr ratio, such as that which occurs in the IrrigasieFormation of the Karoo.
The low-lying Karoo basin is surrounded to the north, west and south by elevated outcrops of theNebo and Lebowa Granites, and it is probable that groundwater moves from these granites into thesediments of the Karoo basin. The groundwater will have equilibrated with the granites and will havethe Sr isotope signatures described in the previous sections. Figure 5.36 shows a hypothetical mixingdiagram for groundwaters from the Nebo and Lebowa Granites, and from the Irrigasie Formationof the Karoo basin. The diagram is plotted in coordinates of 87Sr/86Sr and 1/Sr concentration to givestraight mixing lines. The diagram shows that, using just these 3 selected analyses, thesegroundwaters can be distinguished from each other quite readily using 87Sr/86Sr and Sr concentration.
0.78 -
0.76 -
COCD
ES° 0 .74 -J
0.72 -
Lebowa
I "Mixtures of Lebowa,/* Nebo and Irrigasie
/ groundwater"/ — Nebo
i-Irrigasie
0 1 2 3VSr(mgfl)
Figure 5.36. Hypothetical mixing diagram for 3 groundwater samples from the Nebo andLebowa Granites, and from the Irrigasie Formation of the Karoo, based on Srisotope ratios and Sr concentration.
5.60
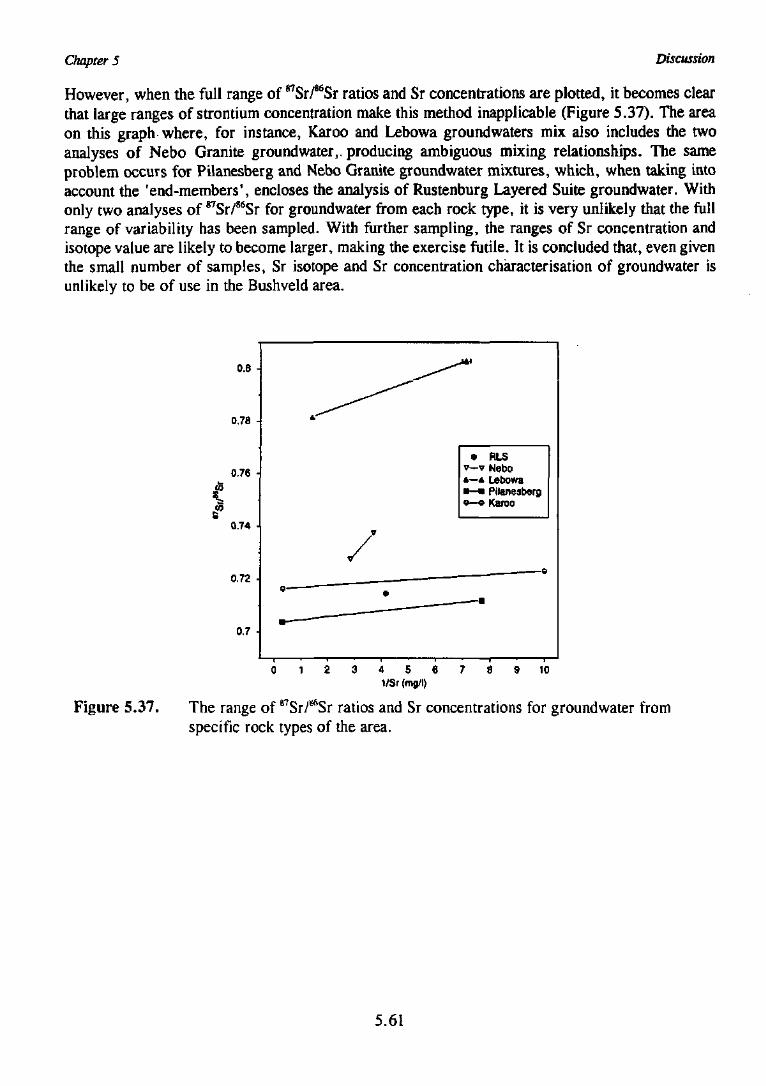
Chapter 5 Discussion
However, when the full range of "Sr/^Sr ratios and Sr concentrations are plotted, it becomes clearthat large ranges of strontium concentration make this method inapplicable (Figure 5.37). The areaon this graph where, for instance, Karoo and Lebowa groundwaters mix also includes the twoanalyses of Nebo Granite groundwater,. producing ambiguous mixing relationships. The sameproblem occurs for Pilanesberg and Nebo Granite groundwater mixtures, which, when taking intoaccount the 'end-members', encloses the analysis of Rustenburg Layered Suite groundwater. Withonly two analyses of "Sr/^Sr for groundwater from each rock type, it is very unlikely that the fullrange of variability has been sampled. With further sampling, the ranges of Sr concentration andisotope value are likely to become larger, making the exercise futile. It is concluded that, even giventhe small number of samples, Sr isotope and Sr concentration characterisation of groundwater isunlikely to be of use in the Bushveld area.
O.B -
0,78 •
0.76
• RLSv - v Nebo* — * Lebowa
PilanesbergKaroo
0.74
0.72 •
4 5 6l/Sr (mg/l)
9 10
Figure 5.37. The range of "Sr/^Sr ratios and Sr concentrations for groundwater fromspecific rock types of the area.
5.61
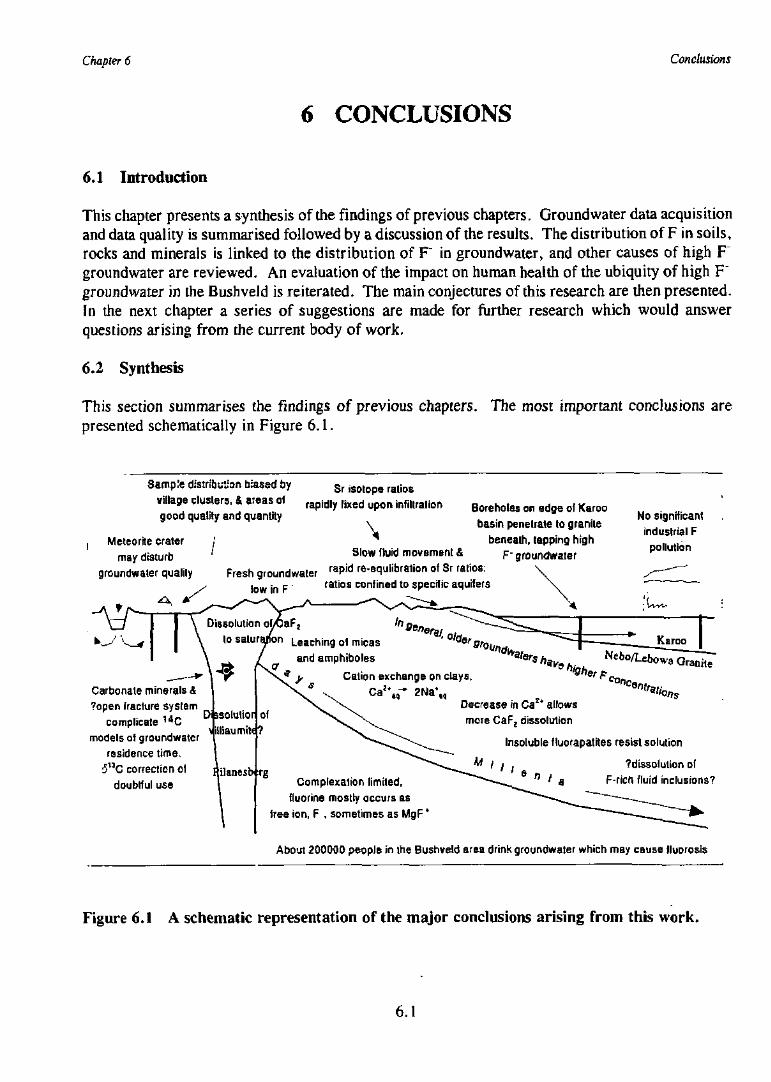
Chapter 6 Conclusions
6 CONCLUSIONS
6.1 Introduction
This chapter presents a synthesis of the findings of previous chapters. Groundwater data acquisitionand data quality is summarised followed by a discussion of the results. The distribution of F in soils,rocks and minerals is linked to the distribution of F" in groundwater, and other causes of high F"groundwater are reviewed. An evaluation of the impact on human health of the ubiquity of high F"groundwater in the Bushveld is reiterated. The main conjectures of this research are then presented.In the next chapter a series of suggestions are made for further research which would answerquestions arising from the current body of work.
6.2 Synthesis
This section summarises the findings of previous chapters.presented schematically in Figure 6.1.
The most important conclusions are
Meteorite crater
may disturb
groundwater quality
Sample distribution biased by S r j s o | o p e r a ( i o s
village clusters, & areas of r a p t d | y f i x e d u p o n i n f i , t r a , i t m
good quality and quantity
\
/ Slow fluid movement &
Boreholes or edge of Karoo
basin penetrate to granite
beneath, tapping highp- groundwater
Fresh groundwater r a P i d re-equiibration of Sr ratios:low in F ratios confined to specific aquifers
No significant
industrial F
pollution
Dissolution
to salur
aF,
Leaching of micas
and amphiboles
Cation exchange on clays,
Decrease in Camore CaFz dissolution
Insoluble fluorapatites resist solution
?dissolution of
F-rich fluid inclusions?Complexation limited,
fluorine mostly occurs as
free ion, F , sometimes as MgF *
Carbonate minerals &
?open Iracture system
complicate
models of groundwater
residence time.
i u C correction of
doubtful use
About 200000 people in the Bushveld area drink groundwater which may cause lluorosis
Figure 6.1 A schematic representation of the major conclusions arising from this work.
6.1
Chapter 6 Conclusions
6.2.1 Groundwater
It was shown that analysis of F* in groundwater using FISE with a standard buffer solution providedsatisfactory analyses of typical Bushveld groundwaters, with no significant interference from Al.However, using a carbonate/bicarbonate eluent with HPIC often over-estimates the concentration ofF" relative to FISE. The presence of a water dip in the carbonate^icarbonate chromatogramgenerally complicates the process of determining a baseline for the fluoride peak and is the probablecause of the overestimation, which is removed completely when a sodium tetraborate eluent is used.However, although using sodium tetraborate as an eluent gives an accurate and precise determinationof fluoride in solution, the method is slower and other anions cannot be determined in the same run.
Two pre-existing data sets were combined with the data obtained in this work; each had distinctdifferences in ion balance error. The combined data set is the largest available for F ' in theBushveld.
Several factors affect the spatial quality of the data, namely humanity, availability and quality ofgroundwater, and rivers. Firstly, there is a clustering of the data since boreholes are most commonin villages. Secondly, a low data density in some areas occurs because of the absence of boreholes,such as in the granite areas to the northeast of the Pilanesberg due to low success rates and lowyields. Thirdly, boreholes with 'good' quality water are maintained and more boreholes are drilledin the area. Boreholes with 'poor1 quality water tend to be abandoned after drilling, or are equippedbut fall into disrepair, and naturally act as a disincentive for further drilling in the area. Finally, fewboreholes exist in the vicinity of the perennial rivers, such as the Apies, since water is usuallyavailable from the river all year round.
Any data concerning groundwater chemistry collected from rural areas anywhere in the world mightbe affected in these ways. The current data set is, therefore, highly biased towards clusteredboreholes with high yields and good water quality. In this instance, 'good' quality water is measuredsolely by palatability, as many of the boreholes drilled by local people undergo no other quality testthan taste. The results from this study are of the 'best scenario' type.
The median concentration of F' in groundwater of the western Bushveld is 0.3 mg/C, whilst the meanis 1.43 mg/fi; the population is highly skewed towards low concentrations. Fluoride is found at lowconcentrations in most groundwaters from the RLS (mean of 0.4 mg/S F"). Groundwater F"concentrations are high in the acid intrusive phases of the BIC. Nebo Granite groundwater has amean concentration of 2.0 mg/C F", whilst that from the Lebowa Granite has a higher mean valueof 5.0 mg/C with a maximum over 10 mg/C.
The Pilanesberg complex has the highest mean groundwater F" concentration (15 mg/0-Concentrations around the perimeter of the Complex reach 80 mg/C, although values for theperimeter are generally in the range of 30 to 60 mg/S. Fluoride concentrations of groundwater withinthe geographic boundaries of the Complex range from 2 to 7 mg/C.
Bushveld groundwaters have concentrations of several trace elements often in excess of South Africandrinking water guidelines. Of these trace elements, Zn and Al are the likeliest to interact with F".Zinc occurs in surprisingly high concentrations in these groundwaters, with the highest concentrations
6.2
Chapter 6 Conclusions
in those of the Pilanesberg Complex. AtpH 3.0 and 37°C, representative of conditions in the humanstomach, all Zn is likely to be in the form Zn2+, which can be readily metabolised. No significantzinc-fluoride complexes are likely to form at the concentrations reported in these groundwaters, andcomplexation of F" by Al is of little biological significance in the field area. In most groundwaters,less than 5% of F ' is complexed by Al, Ca or Mg, but Mg is the usual complexing ion. Themajority of F exists in the form of the free fluoride ion, F".
6.2.2 F in rock, soil and minerals
High F concentrations occur in the Lebowa granite and Pilanesberg Complex, whilst the Nebo granitehas scattered high values. The RLS is uniformly low in fluorine and the sedimentary rocks of thearea generally have F concentrations well below 1000 ppm. The distribution of F in rock and soilis very similar to the distribution of F" concentrations in groundwater hosted in the rocks.
Fluorine was determined in paired rock and topsoil samples which showed that fluorineconcentrations in soils are generally lower than parental rock fluorine concentrations by up to anorder of magnitude. High F concentrations in soil have a similar distribution to high F in rock.Some contamination of soil by tailings has occurred in the vicinity of fluorite mines.
The rocks of the RLS and the Pretoria Group generally contain no major fluoride-bearing minerals.The granophyres, granites and alkaline complexes all contain fluorite (CaF2) which can have a majoreffect on groundwater at very low volume percentages. Fluorapatite should occur in the graniticrocks but microscopic examination failed to reveal its presence. Fluorapatites in fluorite ore fromthe Pilanesberg were shown to have an unusually high Sr concentration, up to 6.8 wt%.
All F concentrations in micas analysed from the Pilanesberg complex and Lebowa Granite werebelow the detection limit (0.17 wt%), and the micas are presumably hydroxy-micas. Fluorine inamphibole ranged from below the detection limit of 0.17 wt% in Lebowa Granite to 2.69 wt% in thePilanesberg Complex. Much of the F in the Lebowa Granite is contained in fluorite.
Leaching experiments were conducted on all rock and soil samples. The highest concentrations ofF" in the leachate came from rocks and soils with the highest fluorine concentrations. In the rockleaching experiment, several of the samples had leachate with very high F" concentrations(> 30 mg/f), but concentrations in leachate derived from soil samples was generally below =5 mg/C.Soluble F was approximately 1 % of the total F in rocks but only 0.1 % of the total in soils, indicatingthat the soils had been effectively leached of soluble F".
6.2.3 Origins of high F groundwaters
There are three main reasons why fluorite is of prime importance in controlling fluoride solubilitiesin natural waters: fluorite is the most ubiquitous and abundant fluoride containing mineral; it issparingly soluble: and Ca is generally always present in natural waters. These three factors alsoshow why fluorapatite is not frequently cited as a controlling factor in fluoride concentration, becausefluorapatites are relatively uncommon, they are insoluble and phosphate is found at very lowconcentrations in natural waters. The possibility that other, more.soluble fluorine minerals (such asvilliaumite, NaF) are responsible for very high fluoride concentrations (>30 mg/C) is strongly
6.3
Chapter 6 Conclusions
suggested by dissolution experiments on powdered rock samples. Pilanesberg and Lebowagroundwaters are generally saturated to supersaturated with respect to fluorite, while Nebo Granitegroundwater is generally less saturated. All groundwaters are under saturated with respect to NaF.
Speciation and saturation index calculations were undertaken using the thermodynamic modellingpackage JESS, designed and operated by the CSIR. The package produced very similar results toMINTEQA2, produced by the US EPA, for minerals not containing carbonate. Confidence isexpressed in the results of modelling by MINTEQA2.
Other reactions, apart from mineral dissolution, can also affect F concentrations. These include:anion exchange of F" by OH" on clay surfaces at high pH; precipitation of CaCO3; cation exchangeon clays (replacing Ca2+ with Na+), and precipitation of gypsum upon evaporation. The latter threeprocesses remove Ca2+ from solution and allow CaF2 to dissolve further, beyond stoichiometricdissolution. Strong evidence was found for the operation of ion exchange processes in some of thegroundwaters.
There is little anthropogenic addition of F to groundwater in the area. Few large working fluoritemines still exist in the Lebowa Granite Suite and Rooiberg felsite, but major fluorite mines are stillactive in the Malmani Dolomite of the Chuniespoort Group, on the edge of the study area. Theimpact of dust generated by blasting and processing the ore is likely to be local, and no gaseousemissions are generated. Two other large fluorine-handling industries exist in the study area; auranium enrichment plant in the south, and a major platinum ore smelter in the centre of the area.Neither of these facilities are likely to add significant F" concentrations to groundwaters of theregion.
Fluoride concentration in rainfall should be near the background concentrations of 8insignificant in terms of fluorosis risk. Infiltrating rainwater is under saturated with respect to CaF2,and so recharging groundwater will actively dissolve the mineral. Groundwater should reachequilibrium with fluorite within one month of infiltration.
Some workers have suggested an influence on groundwater compositions from the dissolution of fluidinclusions. Given the retrograde solubility of CaF2 above 100°C, it is predicted that medium to hightemperature fluid inclusions are not likely to contain more than about 5 mg/C F" and the contributionfrom weathering fluid inclusions is expected to be negligible.
The Pilanesberg perimeter groundwaters and those of the Nebo Granite have very different 82H and5ISO values, and it should be possible to identify the Pilanesberg perimeter groundwater type, ifencountered in boreholes in the RLS or Nebo Granite near the Pilanesberg, based on its 'light1
isotopic signature. Nebo granite groundwaters are tightly grouped isotopically, and deviations areconsidered significant. Central Pilanesberg groundwater has a much larger spread and showsevidence of being subjected to evaporation. The Pretoria Saltpan brine is isotopically much heavierthan the precipitation falling in the area and has been subject to large amounts of evaporation. Onegroundwater sampled in the vicinity has a significantly heavier isotopic signature than other NeboGranite waters, and lies on a mixing line between Saltpan brine and Nebo Granite groundwater. Thisis taken as evidence that the Saltpan brines are somehow leaving the crater environs and mixing withlocal groundwater.
6.4
Chapter 6 Conclusions
Radiocarbon (l4C) activity was used to estimate mean residence times for groundwaters, aftercorrection for variation in initial activities using an isotope dilution correction method. It is possibleto interpret the associated groundwater composition data as evidence for different rates for variouswater-mineral reactions. These reactions appear to increase F" concentrations in groundwater at twodifferent reaction rates. If piston type flow is assumed, the slowest reaction releases 7.4x10 4
mg/G/yr F", whilst the faster reaction liberates 2.6xlO~3 mg/U/yr F' into solution. An impliedsolubility of at least 3.4 mg/2 is interpreted as the dissolution of a rapidly dissolving, relativelysoluble F-bearing mineral. In the context of the long time period under consideration, this probablyrepresents the dissolution of fluorite. Two values of pK. may be calculated from the data, one ofwhich is very close to the pK of -10.4 calculated for fluorite by other workers.
The large range in Sr isotope ratios and Sr concentrations found in the few samples analysed suggeststhat natural variability will complicate further use of Sr in tracing groundwater provenance in theBushveld area. Based on the current Sr isotope data, groundwater from the Quarantine Camp, onthe perimeter of the Pilanesberg, with a F" concentration of 80 mg/4, does not result from a mixtureof 'typical' Nebo Granite and Pilanesberg Complex groundwaters.
6.2.4 The possible extent of fluorosis
The optimal F" concentration in drinking water for several of the towns within the field area wasestimated using an equation which related the optimal F" concentration to the maximum meantemperature. The variation in the value between towns is only 0.07 mg/C, and the mean optimumconcentration of 0.65 mg/U F" is almost identical to the maximum safe concentration of 0.7 mg/Scalculated by Du Plessis (1995) for the Free State goldfields.
Spatial analysis by GIS shows that groundwater underlying 17000 km2 of the western Bushveld hasa F" concentration >0.7 mg/C, the optimum fluoride concentration in drinking water for the area.Over 540 of the 3000 groundwater samples have a F concentration >0.7 mg/G. Since between 150and 200 people are supplied by each borehole, between 82 000 and 109 000 people are drinkinggroundwater which may induce fluorosis in the long term.
Using aThiessen polygon method, three hundred areas have been delineated where there is a mediumor higher risk of dental fluorosis. The resulting 'fluorosis risk map' will be of use to water supplyplanners.
6.3 General
The project was brought to a successful conclusion alid extended over a very large area ofapproximately 150,000 km2.
All the aims of the project have been successfully addressed, namely:
(i) a comprehensive database of the concentrations of F" and other common anions andcations, together with data on pH, temperature, EC and alkalinity, has been produced fora further 323 groundwater sites over the study area. In addition F" concentrations overthe extended area have been collated and evaluated.
6.5
Chapter 6 Conclusions
(ii) The source and mobility of F" in the hydro-geochemical environment of the study areawas established, and also the spatial relations between F"-enriched groundwaters andfluoride sources in rocks, mineralised areas and soils.
(iii) Existing epidemiological information on the health related F" effects have been reviewedand compiled in a F" concentration vs. effect plot.
(iv) The results have been successfully utilised to provide maps of areas of zero, low,medium, high and very high fluorosis risk. These should be of use to engineers andplanners concerned with the supply of drinking water to the rural population in the studyarea, and hopefully will result in considerable cost-savings in the future supply of waterin the study area. The results should bring about, over the next generation, a markedimprovement in the dental and skeletal health of the local populace.
By implementing a very wide variety of analytical techniques to gain information on physical andgeochemical characteristics of both groundwaters and their host rocks, by interpreting the results ofchemical and isotopic analyses, and by the use of theoretical modelling calculations of elementspeciation, the project has both created and successfully integrated a huge database of knowledge ofthe study area. It is believed that the work has contributed significantly to the knowledge of fluoridein South African groundwaters, and that the results will be of use in studying groundwaters in otherparts of the country.
6.6
Chapter 7 Recommendations
7 RECOMMENDATIONS
7.1 Recommendations for further work
7.1.1 Ground water studies
Spatial gaps still exist in the data base, especially in the areas underlain by Archaean Granite.Further groundwater sampling in these areas could be undertaken to improve data density.However, the cost-benefit relationship of further sampling would have to be carefully considered.Silica was not determined in this study, and the absence of silica data meant that saturation indicesfor silicate minerals could not be calculated. The analysis of a sub-set of samples for silica wouldimprove understanding of mineral-water interaction in the area. The extension of the study toinclude the rest of the South African groundwater database, which holds =45 000 groundwateranalyses, would enable further high F" areas to be delineated. The translation from the Chineseof the potentially important text by Fuhong et al. (1996) should be undertaken by a specialist.
7.1.2 Analysis of rock, soil and minerals
The lack of analyses for F in rocks from the field area is apparent, and the fact that the RegionalGeochemical Mapping Programme (RGMP) of the Council for Geoscience does not include theanalysis of F is regrettable. The analysis of F in just 1 % of the thousands of soil samples takenby the RGMP, which coincidentally covers most of the high groundwater fluoride areas shownin Figure 5.2, would provide a very valuable data set.
The Moepo Fluorite mine in the Pilanesberg has been shown to contain an unusual assemblage ofminerals and rare mineral types (high-Sr calcite and high Sr-apatite) which have not been reportedpreviously in South Africa. Additional mineralogical and geochemical investigation may producefurther interesting results.
The characterisation of clays and/or zeolites lining fractures in Bushveid Igneous Complex andPilanesberg Complex rocks would help to define possible cation exchange processes taking placein the groundwater regime. The use of XRD to identify the clays and the determination of cationexchange capacities would be of use in delimiting ion exchange processes in the area.
An investigation into the presence of NaF in rocks of the Pilanesberg Complex and LebowaGranite would test the theory that groundwater F" concentrations have been influenced bydissolution of this mineral.
7.1.3 Groundwater isotopes
The geohydrology of the hard rock aquifers of the western Bushveid has been comparativelypoorly researched. The area is, therefore, a prime target for the large scale application of isotopehydrology. The wide range of radiocarbon activities in the Pilanesberg and Lebowa Granite Suiteis still a conundrum, and the accurate estimation of groundwater residence time requires moreaccurate knowledge of the local geohydrology. Given the relative cheapness of oxygen and
7.1
Chapter 7 Recommendations
hydrogen isotope analyses, these parameters should be measured on the whole sample set to showregional trends, and possibly recharge/discharge areas. The uncertainty in recharge areas andgroundwater movement in the study area might be solved by the analysis of such stable isotopedata. Sr isotope analyses of a greater number of samples from groundwaters from the westernBushveld would help to show the range of natural variation in this parameter.
7.1.4 Geohydrology of the western Bushveld
The lack of water level and borehole depth data has been one of the major limitations of thisstudy. An analysis of all available water-table elevation data should delineate flow directions.The glimpse of the hydrological systems existing around a recent meteorite crater should befollowed up with a total hydro-census of the area, intensive sampling for major and traceelements, and stable isotopes, and computer modelling of the results.
7.1.5 General
It is clear from this study that there is a very high probability of groundwaters from thePilanesberg Complex and the Lebowa Granite having a F concentration above the maximum safelimit for human consumption (3 mg/d F . It is recommended that any further installation ofboreholes by the Department of Water Affairs and Forestry in these areas should beaccompanied by suitable defluoridation procedures.
Since the start of this study the Pilanesberg area has been the subject of water quality remediationmeasures, in the form of the Saulspoort pipeline scheme. The population in this area now haveaccess to good quality water supplied from the Vaalkop Dam. The population resident on theoutcrop areas of the Lebowa Granite have had no such attention. It is strongly recommendedthat a district-wide alternative water supply scheme be instituted for the Lebowa Granitearea.
The Nebo Granite and parts of the Karoo sub-basin have scattered high fluoride concentrations.A district-wide alternative water supply scheme in these areas is not required, since good qualityboreholes do exist in the area. It is recommended that poor quality boreholes are either closeddown or have borehole-scale defluoridation measures implemented on them. Good qualityboreholes have been identified and it is recommended that these boreholes be publicly identified,e.g. by being painted green, and developed as a primary source of human drinking water.
Understanding and awareness of the risk of fluorosis from the ingestion of high fluoridegroundwater is limited to a few specialists. The general population of the field area is almostentirely unaware of these problems, although the job-seeking population in the Pilanesberg areaare rapidly coming to realise that a smile spoilt by dental fluorosis can severely limit a person'sjob opportunities.
It is recommended that a 'technology transfer' programme be initiated. This should couldtake the form of health education comics, talks, community meetings and so on. It isrecommended that suitably qualified members of the local population be trained to do this in amanner acceptable to the local populace. At these meetings it should be explained exactly whatthe problem is, how it can be overcome, and what the local government is planning to do to solvethe problem.
7.2
Chapter 7 Recommendations
Where necessary and cost-effective, e.g. in areas of isolated boreholes, house-based defluoridationshould be implemented, possibly through the utilisation of the $clay pot' method, as developedin Scandinavia, or through more technologically advanced methods. House-based defluoridationshould be encouraged, possibly through Province-sponsored training sessions and thedevelopment of local clay resources. This would provide much-needed job opportunities in ruralareas. More research into the occurrence and suitability of local clay resources is needed.
It was apparent from the small variations in F' over a time scale of two years that there is likelyto be very little change in F with time. However, it became clear from discussions with localvillage chiefs and headmen that the groundwater from many boreholes had never bee analysedsince the boreholes were first installed. Even then the results had never been communicated tothe local populace. It would seem prudent to put in place a plan to monitor the F" content ofboreholes every five to ten years. It would be even better if a simple, rapid and cheap test,similar to a litmus paper test for pH, could be developed for the determination of F" ingroundwater. Suitable kits could be distributed to local authorities who could arrange for testingon a regular basis. When water quality was adequate, this would generate confidence in the localpopulace in the suitability of their drinking water. When the quality was unacceptable the regulartesting would provide an early warning system, allowing timely remedial steps to be taken.
Water quality in the Lebowa Granite area has been shown to be of poor quality and to have levelsof molybdenum above the high risk limit for human consumption. It is recommended thatfurther sampling and study of this area be undertaken.
Finally, it is recommended that this report be brought to the attention of all governmental,provincial and local authorities, and also to all non-governmental organisations, operative in thearea.
7.3
Chapter 8 References
8 REFERENCES
Acker, JG and Bricker OP (1992) The influence of pH on biotite dissolution and alterationkinetics at iow temperature. Geochim. Cosmochim. Ada, 56, 3073-3092.
Ahrens, LH (1952) The use of ionization potentials, Part 1: Ionic radii of the elements. Geochim.Cosmochim. Ada, 2, 155-169.
Al-Aasm, IS, Taylor, BE and South, B (1990) Stable isotope analysis of multiple carbonatesamples using selective acid extraction. Chemical Geology, 80, 119-125.
Allison, JD, Brown, DS and Novo-Gradac, KJ (1991) MINTEQA2/PRODEFA2, a geochemicalassessment model for environmental systems, version 3.0 users manual US EnvironmentalProtection Agency, Athens, Georgia. 106pp.
Allman, R and Koritnig, S (1974) Fluorine. In: Wedepohl, KH (ed.) Handbook of Geochemistry,Vol. II/l. Springer-Verlag, Berlin.
Anderson, C (1991) Fluoride given the all clear. Nature, 349, 732.
APHA [American Public Health Association] (1995) Standard methods for the examinationof 'water and wastewater, 19th edition. American Public Health Association, American WaterWorks Association and Water Environment Federation, Washington DC.
Arnold, FA Dean, HT and Knutson, JW (1953) Effect of fluoridated public water supplieson dental caries prevalence: results of the seventh year of study at Grand Rapids andMuskegon, Michigan. Public Health Report, 68, 141-148.
Ashley, RP and Burley, MJ (1994) Controls on the occurrence of fluoride in groundwaterin the Rift Valley of Ethiopia. 45-54 In: Nash, H and McCall, GJH (eds.) GroundwaterQuality 17th Special Report. Chapman and Hall, London. 204pp.
Ashton, PJ and Schoeman, FR (1983) Limnological studies on the Pretoria Salt Pan, a hypersalinemaar lake. Hydrobiologia, 99, 61-73.
Aumeras, M (1927) Etude de l'equilibre fluorure de calciu-acide chlorhydrique etendu - contributiona l'etude des equilibres ioniques.,/. Chim. Phys., 24, 548-571.
Babushkin, VI, Matveyev, GM and Mchedlov-Petrossyan, OP (1985) Thermodynamics ofsilicates. Springer Verlag, Berlin. 459pp.
Backer Dirks, O (1992) Biokinetics of fluoride in relation to dental and skeletal fluorosis.In: Frencken, JE {ed.) Endemic fluorosis in developing countries. Report of a symposiumheld in Delft, the Netherlands, April 27th, 1990, 20-30.
Bacon, JR and Bain, DC (1995) Characterization of environmental water samples using strontiumand lead stable isotope compositions. Environmental Geochemistry and Health, 17, 39-49.
8.1
Chapter 8 References
Bailey, JC (1977) Fluorine in granitic rocks and melts: a review. Chem. Geol., 19, 1-42.
Banner, JL, Musgrove, M and Capo, RC (1994) Tracing ground-water evolution in a limestoneaquifer using Sr isotopes: effects of multiple sources of dissolved ions and mineral-solutionreactions. Geology, 22, 687-690.
Barker, DS (1989) Field relations of carbonatites. In: Bell, K (ed.) Carbonatites: Genesis andEvolution. Unwin Hyman, 38-69.
Barker, DS (1993) Diagnostic magmatic features in carbonatites: implications for the originsof dolomite- and ankerite-rich carbonatites. SAfr. J. Geol., 96, 131-138.
Barnard, WR and Nordstrom, DK (1982a) Fluoride in precipitation - 1. Methodology with thefluoride-selective electrode. Atmospheric Environment, 16, 99-103.
Barnard, WR and Nordstrom, DK (1982b) Flouride [sic] in precipitation - 2. Implications for thegeochemical cycling of fluorine. Atmospheric Environment, 16, 105-111.
BDWA, [Bophuthatswana Department of Water Affairs] (1992) Moretele Water Plan. Unpubl.Report.
Birch, GF (1981). The Karbonat-Bombe: a precise, rapid and cheap instrument for determiningcalcium carbonate in sediments and rocks. S Afr. J. Geol., 84, 199-203.
Blavoux, B and Letolle, R (1995) Apports des techniques isotopiques a la connaissance deseaux souterraines. Ge'ochronique, 54, 12-15.
Blum, JD, Erel, Y and Brown, K (1994) S7Sr/85Sr ratios of Sierra Nevada stream waters: Implicationfor relative mineral weathering rates. Geochim. Cosmochim. Ada., 58, 5019-5025.
Bond, GW (1947) A Geochemical Survey of the Underground Water Supplies of the Unionof South Africa. Department of Mines, Geological Survey Memoir, 41. 203pp.
Botchway, CA, Ansa-Asare, OD and Antwi, LA (1996) Natural fluoride and trace metal levels ofground and surface waters in the greater Accra region of Ghana. West Afr. J. Med., 15, 204-209
Botha, CJ, Naude, TW, Minnaar, PP, Van Amstel, SR and Janse van Rensburg, SD. (1993)Two outbreaks of fluorosis in cattle and sheep. J.S.Afr. Vet. Assoc, 64, 165-168.
Boudreau, AE, Mathez, EA and McCallum, IS (1986) Halogen geochemistry of the Stillwater andBushveld Complexes: evidence for transport of the platinum-group elements by Cl-rich fluids.J. Petrology, 27, 967-986.
Bowen, HJM (1966) Trace elements in biochemistry. Academic Press, London.
Boyle, DR (1976) The geochemistry of fluorine and its applications in mineral exploration.PhD Thesis, Imperial College, University of London. 386pp.
8.2
Chapters References
Boyle, DR (1992) Effects of base exchange softening on fluoride uptake in groundwaters ofthe Moncton Sub-Basin, New Brunswick, Canada. In: Kharaka, YK and Maest, AS (eds.)Symposium on Water-Rock interaction, Volume 1. Balkema, Rotterdam. 771-774.
Boyle, DR and Chagnon, M (1995) An incidence of skeletal fluorosis associated with groundwatersof the maritime carboniferous basin, Gaspe region, Quebec, Canada. EnvironmentalGeochemistry and Health; \1', 5-12.
Brandt, D and Reimold, WU (1995) The geology of the Pretoria Saltpan impact structure and thesurrounding area. SAfr. J. Geoi, 98, 287-303..
Brantley, SL and Chen, Y (1995) Chemical weathering rates of pyroxenes and amphiboles.In: White, AF and Brantley, SL {eds.) Chemical weathering rates in silicate minerals. Reviewsin Mineralogy, 31, 119-172.
Broecker, WS (1995) Cooling the tropics. Nature, 376,212-213.
Brouwer, ID, Backer Dirks, 0, De Bruin, A and Hautvast, JGAJ (1988) Unsuitability of WorldHealth Organisation guidelines for fluoride concentrations in drinking water in Senegal. TheLancet, 1 (8579), 223-225.
Brown, DW, and Roberson, CE (1977) Solubility of natural fluorite at 25°C J, Res, US GeoiSurv.,5, 509-518.
Cameron, EN (1980) Evolution of the lower Critical Zone, central sector, eastern BushveldComplex, and its chromite deposits. Ecoti. Geoi., 75, 845-871.
Campbell, AD (1987) Determination of fluoride in various matrices. Pure and Appl. Chem.,59(5), 695-702.
Campbell, IH, Naldrett, AJ and Barnes, SJ (1983) A model for the origin of the platinum-rich sulfidehorizons in the Bushveld and Stillwater complexes../. Pet., 24, 133-165,
Cao, J, Bai, X, Zhao, Y, Liu, J, Zhou, D, Fang, S, Jia, M and Wu, J (1996) The relationshipof fluorosis and brick tea drinking in Chinese Tibetans. Environ. Health Perspect., 104,1340-1343.
Carpenter, R (1969) Factors controlling the marine geochemistry of fluorine. Geochim. Cosmochim.Ada, 33, 1153-1167.
Carstens, IL, Louw, AJ and Kruger, E. (1995) Dental status of rural school children in a sub-optimalfluoride area../ Dent. Assoc. S. Afr, 50, 405-411.
Cawthorn, RG (1988) The Geology of the Pilanesberg. National Parks Board of Bophuthatswana,Mafikeng. 24pp.
Cederstrom, DJ (1946) Genesis of groundwaters in the coastal plain of Virginia. EconomicGeology, 41, 218-245.
8.3
Chapters References
Charter, RH (1928) Solubilities of some inorganic fluorides in water at 25°C. Ind. Engng.Chem., 20,1195. In: Strubel, G(1965) Quantitative Untersuchungen iiber die hydrothermaleLoslichkeit van fluGspat (CaF2). NeuesJahr. Miner., 3, 83-95.
Chaumba, JB (in prep.) A stable isotope study of the northern limb of the Bushveld Complex.Unpubl. PhD thesis, University of Cape Town.
Collerson, KD, Ullman, WJ and Torgersen, T (1988) Ground waters with unradiogenic 87Sr/*6Srratios in the Great Artesian Basin, Australia. Geology, 16, 59-63.
Coplen, TB (1995) Discontinuance of SMOW and PDB. Nature, 375, 285.
Corbett, RG and Manner, BM (1984) Fluoride in the ground water of northeastern Ohio. GroundWater, 22, 13-17.
Correns, CW (1956) Geochemistry of the Halogens. Phys. Chem. Earth, 1, 181-233.
Craig, H (1961) Isotopic variations in meteoric waters. Science, 133, 1702-1703.
Crocker, IT and Martini, JEJ (1976) Fluorspar. In: Coetzee, CB (ed.) Mineral resources ofthe Republic of South Africa. The Government printer, Pretoria, 357-363.
CSIR [Centre for Scientific and Industrial Research] (1991) Recommendations to the Departmentof Water Affairs, Bophuthatswana on criteria for drinking water quality. Internal report10/8/4/3/32508, CSIR, Pretoria, 9pp.
Dansgaard, W (1964) Stable isotopes in precipitation. Tellus, 16, 436-468.
Datta, PS, Deb, DL and Tyagi, SK (1996) Stable isotope (18O) investigations on the processescontrolling fluoride contamintaion of groundwater. J. Contaminant Hydro!., 24, 85-96.
Davies, RD, Allsop, HL, Erlank, AJ and Manton, WI (1970) Sr-isotopic studies on various layeredmafic intrusions in Southern Africa. Geol. Soc. SAfr., Special publication, 1, 576-593.
Davies, TC (1994) Water quality characteristics associated with fluorite mining in the KerioValley area of western Kenya. Int../ Env. Health Res., 4, 165-175.
Dawson, JB and Fuge, R (1980) Halogen content of some African primary carbonatites. Lithos, 13,139-143.
Day, TK and Powell-Jackson, PR (1972) Fluoride, water hardness, and endemic goitre. TheLancet, 1 (7763), 1135-1138.
Dean. HT, Arnold FA and Elvove, E (1942) Domestic water and dental caries. V. Additional studiesof the relation of fluoride domestic waters to dental caries experience in 4,425 white childrenaged 12-14 years, of 13 cities in 4 states. Public Health Reports, 57, 1115-1179.
Dean, HT (1954) Fluorine in the control of dental caries: some aspects of the epidemiology of thefluorine-dental caries relationship. Int. Dent. J, 4, 311-326.
8.4
Chapter 8 References
Deer, WA, Howie, RA and Zussman, J (1977). An introduction to the rock forming minerals.Longman, London. 528pp.
Dia, AN, Castrec, M, Boulegue, J, and Boudou, JP (1995) Major and trace element and Srisotope constraints on fluid circulations in the Barbados accretionary complex. Part 1: Fluidorigin. Earth and Planetary Science Letters, 134, 69-85.
Dissanayake, CB (1996) Water quality and dental health in the Dry Zone of Sri Lanka. In:Applet on, JD, Fuge, R and McCall, GJH (eds.) Environmental geochemistry and health. Geol.Soc. Spec. PubL, 113, 131-140.
DMEA, [Department of Mineral and Energy Affairs, Eskom Marketing Intelligence] (1995)South African energy statistics 1950-1993, no. 2. Department ofMineral and Energy Affairs,Pretoria. 101pp.
Dodd, NF, Levy, DW, Jackson, WPU and Traut, ML (1960) Environmental bone disease hithertoundescribed type. S.A. Med. J. 606-611.
Driscoll, WS, Heifetz, SB, Horowitz, HS, Kingman, A, Meyers, RJ and Zimmerman, ER (1983)Prevalence of dental caries and dental fluorosis in areas with optimal and above-optimal waterfluoride concentrations.,/. Am. Dental Assoc., 107, 42-47.
Duncan, AR, Erlank, AJ and Betton, PJ (1984) Appendix 1: Analytical techniques and databasedescriptions. 389-395. In: Erlank, AJ (ed.) Petrogenesis of the volcanic rocks of the KarooProvince. Geol. Soc. S Afr., Spec. Publ, 13, 395pp.
Du Plessis, JB (1995) What would be the maximum concentration of fluoride in water thatwill not cause dental fluorosis. p4. In: McCaffrey, LP {ed.) Fluoride and fluorosis: the statusof South African research, Abstract volume of a Workshop held on 10th August 1995 in thePilanesberg National Park, South Africa. 1 lpp.
Du Plessis JB, van Rooyen JJ, Naude DA and van der Merwe CA (1995) Water fluoridationin South Africa: will it be effective?./. Dent. Assoc. S. Afr., 50, 545-549.
DWAF, [Department of Water Affairs and Forestry] (1996) Draft of South African WaterQuality Guidelines, Volume 1: Domestic Use (second edition). The Government Printer,Pretoria. 37pp.
Eales, HV, Botha, WJ, Hattingh, PJ, de Klerk, WJ, Maier, WD and Odgers, ATR (1993) The maficrocks of the Bushveld Complex: a review of emplacement and crystallization history, andmineralization, in the light of recent data.J. Afr. Earth Sci., 16, 121-142.
Edgar, AD (1989) Barium- and strontium-enriched apatites in lamproites from West Kimberley,Western Austrlia. Am. Miner., 74, 889-895.
Ehhalt, D (1967) Deuterium and tritium content of hailstones: additional information theirgrowth. Trans. Am. Geophys Union.
Elfimov, AS, Kravchenko, SM and Vasih'eva, ZV (1962) Strontium apatite: a new mineral.
8.5
Chapter 8 References
Akademiya Nauk SSSR Doklady, 142, 439-442.
Ellis, AJ and Mahon, WAJ (1977) Chemistry and Geothermal Systems. Academic Press, NewYork. 375pp.
Elrashidi, MA and Lindsay, WL (1986) Chemical equilibria of fluorine in soils: a theoreticaldevelopment. Soil Science, 141, 274-280.
Eriksson, PG, Hattingh, PJ and Altermann, W (1995) An overview of the geology of the TransvaalSequence and Bushveld Complex, South Africa. Mineralium Deposita, 30, 98-111.
Fanning, DS and Keramidas, VZ (1977) Micas. In: Dixon, JB and Weed, SB (eds.) Mineralsin Soil Environments. Soil Science Society of America, Wisconsin. 195-258.
Faure, G (1987). Principles of isotope geology. John Wiley and sons, New York. 589pp.
Fayazi, M (1995) Distribution of fluoride in groundwater of the northern Springblok Flats,pi. In: McCaffrey, LP (ed.) Fluoride and fluorosis: the status of South African research.Abstract volume of a Workshop held on 10th August 1995 in the Pilanesberg National Park,South Africa. 11pp.
Fejerskov, 0, Manji, F, Baelum, V and Moller, U (1988) Dental fluorosis - a handbook forhealth workers. Munksgaard, Copenhage. I23pp.
Felsenfeld, AJ and Roberts, MA (1991) A report of fluorosis in the United States secondaryto drinking well water. J. Am. Med. Assoc, 265, 486-488.
Ferguson, J (1973). The Pilanesberg Alkaline Igneous Complex. S Afr. J. Geol., 76, 249-270.
Feuchtwanger, T (1973) Zoutpan: carbonatite-alkaline volcano. Unpubl. Honours Thesis, Uni.Witwatersrand, 41pp.
Filippov, LV, Savimova, YN, Kapitonova, TA and Andreyeva, TP (1974) Fluorine in Mg-Femicas from granitoids of various magmatic formations in the folded belt of Central Asia.Geochemlnt., 11, 185-194.
FluhJer. H, Polomski, J and Balser, P (1982) Retention and movement of fluoride in soils. J. Environ.Quai, 11, 461-468.
Foss, PJ and Pittman, JM (1986) Efficacy of fluoride on dental caries reduction by means of acommunity water supply. J. Dent. Child., 53, 219-222.
Foster, MD (1950) The origin of high sodium bicarbonate waters in the Atlantic and Gulf CoastalPlains. Geochim. Cosmo. Ada, 1, 32-48.
Fourie, N, Basson, AT, Basson, KM, Ferreira, GC, van der Berg, H, Smith, JC and Labuschagne, L(1996) Poisoning of wildlife in South Africa. J. S. Afr Vet. Assoc. 50, 467-471.
Franke, J, Runge, H and Fengler, F (1978) Endemic and industrial fluorosis In: Courvoisier,
8.6
Chapter 8 References
B, Donath, A and Baud, CA (eds.) Fluoride and Bone. Hans Huber, Bern. 129-143.
Frant, MS and Ross, JW (1966) Electrode for sensing fluoride ion activity in solution. Science, 154,1553-1554.
Freeze, RA and Cherry, JA (1979) Groundwater. Prentice-Hall, New Jersey. 604pp.
French, BM (1990) Absence of shock-metamorphic effects in the Bushveld Complex, SouthAfrica: Results of an intensive search, Tectonophysics, 171, 287-301.
Freni, SC and Gaylor, DW (1992) International trends in the incidence of bone cancer are not relatedto drinking water fluoridation. Cancer, 70, 611-618.
Fridriksson, S (1983) Fluoride problems following volcanic eruptions. In: Sharpe, JL, Peterson, HBand Leone, NC {eds.) Fluorides - effects on vegetation, animals and humans. Paragon Press,Salt Lake City. 339-344.
Friedman, I and CNeil, JR (1977) Compilation of stable isotope fractionation factors of geochemicalinterest. In. Data of Geochemistry. US Geol. Surv. Prof. Paper 440-KK, 6th ed.
Fritz, B, Richard, L and McNutt, RH (1992) Geochemical modelling of Sr isotopic signatures in theinteraction between granitic rocks and natural solutions. In: Kharaka, YK and Maest, AS(eds.) Symposium on Water-Rock interaction, Volume 1. Balkema, Rotterdam. 927-930.
Fritz, P, Gale, JE and Reardon, EJ (1979) Comments on Carbon-14 dating of groundwatersfrom crystalline environments. Geoscience Canada, 6, 10-15.
Frommurze, HP (1937) The water bearing properties of the more important geological formationsin the Union of South Africa. Department of Mines, Geological Survey Memoir, 34. 252pp.
Fudali, RF, Gold, DP and Gurney, JJ (1973) The Pretoria Salt Pan: astrobleme or crypto volcano?./.Geol., 81, 495-507.
Fuge, R (1988) Sources of halogens in the environment, influences on human and animal health. Env.Geochem. and Health, 10, 51-61.
Fuge, R (1989) Iodine in waters: possible links with endemic goitre. Applied Geochemistry,4, 203-208.
Fuge, R (1996) Geochemistry of iodine in relation to iodine deficiency diseases. In: Appleton, JD,Fuge, R and McCall, GJH (eds.) Environmental geochemistry and health. Geol. Soc. Spec.PubL, 113,201-211.
Fuhong, R, Jianhui, Z, Wensheng, L and Cuiyun, Z (1996) Hydrogeochemical environmentof high fluorine groundwater and the relation between the speciation of fluorine and thediseased ratio of endemic fluorosis - a case study of the North China Plain. Ada GeoscientiaSinica, 17, 85-97.
Gaciri, SJ and Davies, TC (1993) The occurrence and geochemistry of fluoride in some natural
8.7
Chapters References
waters of Kenya. Journal of Hydrology, 143, 395-412.
Galagan, DJ and Lamson, GG (1953) Climate and endemic fluorosis. Publ. Health Report,68, 497-508.
Galvin, RM (1996) Occurrence of metals in waters: an overview. Water SA, 22, 7-18.
Garven, G (1995) Continental-scale groundwater flow and geological processes. Annu. Rev.Earth Planet. Set., 23, 89-117.
Gascoyne, M and Kamineni, DC (1994) The hydrogeochsmistry of fractured plutonic rocksin the Canadian Shield. Applied Hydrogeology, 2, 43-49.
Gat, JR (1980) The isotopes of hydrogen and oxygen in precipitation, 21-45 In: Fritz, P andFontes, JCh (eds.) Handbook of environmental isotope geochemistry. Volume 1A. Elsevier,Amsterdam.
Gelberg, KH, Fitzgerald, EF, Hwang, S and Dubrow, R (1995) Fluoride exposure and childhoodosteosarcoma: a case-control study. Am. J. Public Health, 85, 1678-1683.
Gessner, BD, Beller, M, Middaugh, JP and Whitford, GM (1994) Acute fluoride poisoningfrom a public water system. New Eng. J. Med., 330, 95-99.
Geyh, MA (1972) Basic studies in hydrology and 14C and 3H measurements. Proc. 24th Internatl.Geol. Conf, Montreal, 11, 227-234.
Gill, R (1996) Chemical fundamentals of geology. Chapman and Hall, London. 290pp.
Ginster, M and Fey, MV (1995) Soil and plant responses to irrigation with a fluoride-rich wate water.In: McCaffrey, LP (ed.) Fluoride and fluorosis: the status of South African research.Abstract volume of a Workshop held on 10th August 1995 in the Pilanesberg National Park,South Africa. 11pp.
Gislason, SR, Andresdottir, A, Andresdottir, AE, Oskarsson, N, Thordarson, Th, Torssander,P, N'ovak, M and Zak, K (1992) Local effects of volcanoes on the hydrosphere: example fromHekla, southern Iceland. In: Kharaka, YK and Maest, AS (eds.) Symposium on Water-RockInteraction, Volume 1. Balkema, Rotterdam. 477-481.
Gizaw, B (1996) The origin of high bicarbonate and fluoride concentrations in the waters of the MainEthiopian Rift Valley, East African Rift system ./. Afr. Earth Sci., 22, 391-402.
Goldman, SM, Sievers, ML and Templin, DW (1971) Radiculomyopathy in a southwesternIndian due to skeletal fluorosis. Arizona Medicine, 28, 32-48.
Graustein, WC and Armstrong, RL (1983) The use of K7Sr/S6Sr ratios to measure atmospherictransport into forested watersheds. Science, 219, 289-292.
Grobler; SR and Dreyer, AG (1988) Variations in the fluoride levels of drinking water in SouthAfrica - implications for fluoride supplemantation. S. Afr. Med. J., 73, 217-219.
Chapter 8 References
Guidotti, CV (1984) Micas in metamophic rocks. In: Bailey, SW (eds) Micas. Reviews inMineralogy, 13, 357-468.
Guntz, M (1884) Recherches thermiques sur les combinaisons du fluor. Ann. Chim. Phys. 6, p38. In:Striibel, G (1965) Quantitative Untersuchungen iiber die hydrothermale Loslichkeit vanfluBspat (CaF2). Neues Jahrbuch Mineralogie, 3, 83-95
Gupta, RK, Chhabra, R and Abrol, IP (1982) Fluorine adsorption behaviour in alkaline soils: relativeroles of pH and sodicity. SoilSci., 133, 364-368.
Gupta, SK and Sharma, P (1995) An approach to tackling fluoride problem [sic] in drinkingwater. Current Science, 68, 774.
Hamamoto, E (1957) On bone changes observed in in residents of a high fluorine zone. In:Utzino, S (ed.) Medico-Dental researches on fluorides, Japanese Society for Promotion ofScience, Tokyo. 118-130.
Hamilton, PJ (1977) Sr isotope and trace element studies of the Great Dyke and Bushveldmafic phase and their relation to early Proterozoic magma genesis in southern Africa. J.Petrology, 18, 24-52.
Hamilton, W (1970) Bushveld Complex - product of impacts? Geol. Soc. S. Afr. Spec. Pitbl,1, 3667-379.
Hamza SM and Hamdona, SK (1991) Kinetics of dissolution of calcium fluoride crystals insodium chloride solutions: influence of additives. J. Phys. Chem., 95, 3149-3152.
Harmer, RE (1985) A Sr isotope study of Transvaal carbonatites. Trans. Geol. Soc. S Afr.,88,471-472.
Harmer, RE (1992) The geochemistry of Spitskop and related alkaline intrusions. Unpubl.PhD thesis, Uni, Cape Town. 332pp.
Harmer, RE and Farrow, D (1995) An isotopic study on the volcanics of the Rooiberg Group, ageimplications and a potential exploration. Mimralium Deposita, 30, 188-195.
Harwood, IE (1969) The use of an ion-selective electrode for routine fluoride analyses onwater samples. Water Research, 3, 273-280.
Heaton, THE, Talma, AS and Vogel, JC (1986) Dissolved gas paleotemperatures and 1SOvariations derived from groundwater near Uitenhage, South Africa. Quaternary Research,79, 79-88.
Henderson, P (1986) Inorganic Geochemistry. Pergamon Press, Oxford, 353pp.
Hill, M, Barker, F, Hunter, D, Knight, R (1996) Geochemical characteristics and origin ofthe Lebowa Granite Suite, Bushveld Complex. Int. Geol. Rev., 38, 195-227.
Hitchon, B (1995) Fluorine in formation waters, Alberta Basin, Canada. Applied Geochemistry, 10,
8.9
Chapter 8 References
357-367.
Hrudey, SE, Soskolne, CL, Berkel, J and Fincham, S (1990) Drinking water fluoridation andosteosarcoma. Can. J. Public Health, 81, 415-416.
Hubner, M (1969) Geochemische Interpretation von Fluorid/Hydroxid-Austauschversuchenan Ton-mineralen. Freiberger Forschungsheft, C244.
Hudson, TD (1977) Stable isotopes and limestone lithification. J. Geol. Soc. Lond., 133, 637-660.
Humphrey, WA (1913) The Volcanic Rocks of the Pilanesberg. Trans. Geol. Soc. S.A., 15,100-106.
Hunter, DR and Hamilton, PJ (1978) The Bushveld Complex. In: Tarling, DH (ed) Evolution of theEarth's Crust. Academic Press, London, 107-173.
Ibrahim. YE. Affan, AA and Bjorvatn, K (1995) Prevalence of fental fluorosis in Sudanesechildren from two villages with 0.25 and 2.56 ppm fluoride in the drinking water. Int. J.Paediatr. Dent., 5, 223-229.
Jago, BC and Gittins, J (1991) The role of fluorine in carbonatite magma evolution. Nature,349, 56-58.
Jakosky, BM and Jones, JH (1994) Evolution of water on Mars. Nature, 370, 328-329.
Jenkins, GN (1990) The metabolism and effects of fluoride. In: Preist, ND and Van De Vyver, FL(eds) Trace metals and fluoride in bones and teeth, CRC press, Boca Raton. 142-173.
Jinadasa, KBPN, Dissanayake, CB, Weerasooriya, SVR and Senaratne, A (1993) Adsorptionof fluoride on goethite surfaces - implications on dental epidemiology. Environ. Geol., 21,251-255.
Kalk, WJ, Sitas, F and Patterson, AC (1997) Thyroid cancer in South Africa - an indicatorof regional iodine deficiency. S. Afr. Med. J., 87, 735-738.
Kazakov, AV and Sokolova, EE (1950) Conditions of formation of fluorite in sedimentaryrocks (the fluorite system). Akad. Nauk SSSR lust. Geol. Nauk Tr., 114, 22-64. In.Nordstrom, DK and Jenne, EA (1977) Fluorite solubility equilibria in selected geotherma!waters. Geochim. Cosmochim. Ada, 41, 175-188.
Kilborn, LG, Outerbridge, TS and Lei, HP (1950) Fluorosis with a report of an advanced case. Can.Med Ass. .I.,62, 135-141.
Kinlen, L (1975) Cancer incidence in relation to fluoride level in water supplies. Br. Dent../, 138, 221-224.
Kleeman, GJ and Twist, D (1989) The compositionally-zoned sheet-like granite pluton of theBushveld Complex: evidence bearing on the nature of A-type magmatism. J. Petr., 30,
8.10
Chapters References
1383-1414.
Kogarko, LN (1993) Geochemical characteristics of oceanic carbonatites from the Cape VerdeIslands. SAfr. J. GeoL, 96, 119-125.
Kogarko, LN, Krigman, LD and Sharudilo, NS (1968) Experimental investigations of the effect ofalkalinity of silicate melts on the separation of fluorine into the gas phase. Geochem. Int., 5,782-790.
Kohlrausch, GG (1908) Uber gesattigte wafirige losungen schwerloslicher salze II: Die gelostenmengen mit ihrem temperaturgang. Z Phys. Chem., 64, 129-169. In: Striibel, G (1965)Quantitative Untersuchungen iiber die hydrothermale Loslichkeit van flufispat (CaF2) NeuesJahrbuch Mineralogie, 3, 83-95.
Koritnig, S (1951) Ein Beitrag zur Geochemie des Fluor. Geochim. Cosmochim. Acta, 1, 89-100.
Koritnig, S (1974) Fluorine. In: Wedepohl, KH (ed) Handbook of Geochemistry Vol. 11/!.Springer-Verlag, Berlin.
Kraynov, SR, Mer'kov, AN, Petrova, NG, Baturinskaya, IV and Zharikova, VTVI (1969) Highlyalkaline (pH 12) fluorosilicate waters in the deeper zones of the Lovozero Massif.Geochemistry International, 6, 635-640.
Kunstmann, FH, Harris, JF, Bodenstein, LB and van den Berg, AM (1963) The occurrenceof boron and fluorine in South African coals and their behaviour during combustion. Bull.Fuel Res. Inst, 63, 45pp.
Lane, SJ and Dalton, JA (1994). Electron microprobe analysis of geological carbonates. AmericanMineralogist, 79, 745-749.
Langmuir, D (1971) The geochemistry of some carbonate ground waters in central Pennsylvania.Geochim. Cosmochim. Acta, 35, 1023-1045.
Lasaga, AC (1984) Chemical kinetics of water-rock interactions. J. Geophys. Res., B89, 4009-4025.
Launay, L (1913) Traite de Metallogenie: Gites mineraux et metaliiferes, Paris et Siege. Unknownpublisher. In: Strtibel, G (1965) Quantitative Untersuchungen iiber die hydrothermaleLoslichkeit van fluBspat (CaF2). Neues Jahrbuch Mineralogie, 3, 83-95.
Le Maitre, RW (1989). A classification of igneous rocks and glossary of terms. Recommendationsof the International Union of Geological Sciences Suhcommission on the syslematics ofIgneous Rocks. Blackwell, London, 193pp.
Leung, AKC (1988) Water standards for fluoride. The Lancet, 1 (8591), 935.
Lewis HA and Chikte UM (1995) Prevalence and severity of fluorosis in the primary and permanentdentition using the TSIF. J. Dent. Assoc. S. Afr., 50, 467-471.
Libby, WF (] 9 5 5) Radiocarbon Dating. University of Chicago Press, Chicago. 175pp.
8.11
Chapters References
Lloyd, JW and Heathcote, JA (1985) Natural inorganic hydrochemistry in relation to groundwater. Clarendon Press, Oxford. 294pp.
Lombaard, BV (1932) The felsites and their relations in the Bushveld Complex. Trans. Geol.Soc.S.Afr.,3S, 165-169.
Lurie, J (1974) The Pilanesberg: Geology, Rare Element Geochemistry and Economic Potential.Unpublished PhD thesis, Rhodes Univ.
Lyth, 0 (1946) Endemic fluorosis in Kweichow, China. Lancet, 1, 233.
Machoy, Z, Dabkowska, E and Nowicka, W (1991) Increased fluoride content in mandibularbones of deer living in industrialised regions of Poland. Env, Geochem. and Health, 13,161-163.
Mahoney, MC, Nasca, PC, Burnett, WS, Melius, JM (1991) Bone cancer incidence rates inNew York State: time trends and fluoridated drinking water. Am. J. Public Health, 81, 475-479.
Manji, F, Baelum, V and Fejerskov, 0 (1986) Dental fluorosis in an area of Kenya with 2 ppmfluoride in the drinking water. J. Dent. Res., 65, 659-662.
Mason, B and Moore, CB (1966) Principles of Geochemistry. John Wiley & Sons, New York.344pp.
Mathez, EA, Agrinier, P and Hutchinson, R (1994) Hydrogen isotope composition of the MerenskyReef and related rocks, Atok Section, Bushveld Complex. Econ. Geol., 89, 791-802.
Matthess, G (1982) The properties of Groundwater. John Wiley & Sons, New York.
May, PM and Murray, K (1991a) JESS, a joint expert speciation system - I: Raison d'etre.Talanta, 38, 1409-1417.
May, PM and Murray, K (1991b) JESS, a joint expert speciation system - II: the thermodynamicdatabase. Talanta, 38, 1419-1426.
Mazor, E and Verhagen, B Th (1983) Dissolved ions, stable and radioactive isotopes andnoble gases in thermal waters of South Africa../ Hydrology, 63, 3 1 5-329.
McCaffrey. LP (1993) The Geohydrology of the Pilanesberg. Unpubl. MSc dissertation, Univ.Witwatersrand, Johannesburg. 130pp.
McCaffrey, LP (1994) Fluoride electrode versus ion chromatograpic analyses of groundwater.Abstract volume, Analitika 94, Stellenbosch, 8-13 December 1994. 87pp.
McCaffrey, LP, Harris, C and Willis, JP (1996) An occurrence of calcite, stontianite and ankerite inthe Pilanesberg Complex, North West Province, South Africa. S. Afr. J. Geol, 99, 33-36.
8.12
Chapter 8 References
McCrea, JM, (1950). On the isotopic chemistry of carbonates and palaeo-temperature scale.Journal of Chemical Physics, 18, 849-857.
Mclnnes, PM, Richardson, BD and Cleaton-Jones, PE (1982) Comparison of dental fluorosisand caries in primary teeth of preschool-children living in arid high and low fluoride villages.Community Dentistry and Oral Epidemiology, 10, 182-186.
McKay FS and Black, GV (1916) An investigation of mottled teeth. Dental Cosmos, 58, 477-484.
McKenzie, WJ, Becker, BJP, Dreyer, CJ, du Toit, J, Dowdle, EBD, de Graad,' JW and vanDeventer, BJS (1966) Report of the commission of enquiry into fluoridation. TheGovernment Printe, Pretoria. 174pp.
McNutt, RH, Frape, SK, Fritz, P, Jones, MG and MacDonald, EM (1990) The 87Sr/86Sr values ofCandian Shield brines and fracture minerals with applications to groundwater mixing, fracturehistory, and geochronology. Geochimica et Cosmochimica Acta, 54, 205-215.
Meeussen, JCL, van Riemsdijk, WH, de Wilde, PGM, Aalbers, Th.G (1994) Modeling [sic]fluoride transport in soils using ion binding models for oxides. Transactions of the 15th WorldCongress of Soil Science, Acapulco, Mexico, July 10-16, 1994, 3a, 170-180.
Meunier, PJ, Femenias, M, Duboeuf, F, Chapuy, MC and Delmas, PD (1989) Increased vertebralbone density in heavy drinkers of mineral water rich in fluoride. The Lancet, 1 (8630), p 152.
Meyer, R and de Beer, JH (1987) Structure of the Bushveld Complex from resisitivity measurements.Nature, 352, 610-612.
Molengraaff, GAF (1905) Preliminary Note on the Geology of the Pilandsberg and a Portion of theRustenburg District. Trans. Geol. Soc. S.A.,8, 108-115.
Moller, PF and Gudjonsson, SV (1932) Massive fluorosis of bones and ligaments. Acta Radio/., 13,269-304.
Mook, WG (1980) Carbon-14 in hydrogeological studies. In: Fritz, P and Fontes, J Ch (eds.)Handbook of environmental isotope geochemistry: Volume 1, The Terrestrial environment.Elsevier, Amsterdam. 49-74.
Moola, MH (1996) Fluoridation in South Africa. Community and Dent. Health, 13, 51-55.
Mougnard, P (1931) Sur le dosage du fluor. Compt. Rend. 192, 1733-1735. In Nordstrom,DK and Jenne, EA (1977) Fluorite solubility equilibria in selected geotherma! waters.Geochim. Cosmochim. Acta, 41, 175-188.
Munoz, JL and Ludington, SD (1974) Fluoride-hydroxyl exchange in biotite. Am. J. Sci., 274,396-413.
Munsell (1992) Munsell soil color chart. Kollmorgen Instruments Corporation. New York.
8.13
Chapter 8 References
Nagy, KL (1995) Dissolution and precipitation kinetics of sheet silicates. In: White, AF andBrantley, SL {eds.) Chemical weathering rates in silicate minerals. Reviews in Mineralogy,31, 173-234.
Nash, WP (1976) Fluorine, chlorine and OH-bearing minerals in the Skaergaard Intrusion.Am. J. Set, 276, 546-57.
Naumov, GB, Ryzhenko, BN and Khodakovsky, IL (1974) Handbook of ihermodynamic data.Nat. Tech. Inf. Serv., Pb-226, 722/7GA, US Dept. Commerce, 328pp.
Newbrun, E (1989) Effectiveness of water fluoridation. J. Public Health Dentistry, 49, 279-289.
Ng'ang'a, PM and Valderhaug, J (1993) Prevalence and severity of dental fluorosis in primaryschoolchildren in Nairobi, Kenya. Community Dentistry and Oral Epidemiology, 21, 15-18.
Nicholson, K and Pasquier, C (1993) The determination of fluoride in water in the presenceof organic acids and iron using a fluoride-selective electrode. Env. Geochem. and Health, 15,185-186.
Nordstrom, DK and Jenne, EA (1977) Fluorite solubility equilibria in selected geothermal waters.Geochim. Cosmochim. Acta, 41, 175-188.
Norrish, K and Hutton, JT (1969) An accurate X-ray spectrometric method for the analysesof a wide range of geological samples. Geochim. Cosmochim. Acta., 33, 431-453.
NPRL, [National Physical Research Laboratory] (\9$4) Annual report. FIS 350, 71.
Ockerse, T (1941) Endemic fluorosis in the Pretoria district. S.A. Med. J., 15, 261-266.
Ockerse, T and Meyer, HP (1941) Endemic fluorosis in the Pilandsberg area. S.A. Dent. J,15, 62-72.
Ockerse, T (1943) Endemic fluorosis in South Africa. Department of Public Health, Pretoria.93 pp.
Odenthal, H and Wieneke, HL (1959) Chronische fiuorvergiftung und osteomyelosklerose.Deutsche Medizinische Wochenschrift, 84, 725-728.
Oldham, PD and Newel), DJ (1977) Fluoridation of water supplies and cancer - a possibleassociation'' Appl. Stat., 26, 125-135.
O'Neil, JR, Clayton, RN and Mayeda, TK (1969) Oxygen isotope fractionation in divalentmetal carbonates. J. Chem. Phys,, 51, 5547-5558.
O'Neil, JR and Taylor, HP (1967) The oxygen isotope and cation exchange chemistry of thefeldspars. Am. Mineral, 52, 1414-1437.
Pakalns, P and Farrar, YJ (1976) Effects of surfactants on the determination of fluoride in
8.14
Chapter 8 References
waters. Water Research, 10, 1087-1092.
Pekdeger, A, Ozgur, N and Schneider, HJ (1992) Hydrogeochemistry of fluorine in shallowaqueous systems of the Gblciik area, SW Turkey. In: Kharaka, YK and Maest, AS (eds.)Symposium on Water-Rock Interaction, Volume 1. Balkema, Rotterdam. 821-824.
Pelpola, KU, Pienaar, P and Xu, Y (1992) Development of groundwater resources inBophuthatswana. In: Proceedings of the 18th WEDC Conference, Kathmandu, Nepal, 30August - 3 September 1992.
Pendrys, DG (1995) Risk of fluorosis in a fluoridated population. J. Am. Dent. Ass., 126,1617-1624.
Peng, C, Qi, J and Rubin, AJ (1996) Use of fluorspar in water fluoridation. J. Env. Eng., 122,132-140.
Petersen, E (1889) Neutralisationswarme der fluoride. Z Phys. Chem., 4, 384-412, In: Striibel,G (1965) Quantitative Untersuchungen iiber die hydrothermale Loslichkeit van fluBspat(CaF2). Neves Jahrbuch Mineralogie, 3, 83-95.
Pettifor, JM, Schnitzler, CM, Ross, FP and Moodley, GP (1989) Endemic skeletal fluorosisin children: hypocalcemia and the presence of renal resistance to parathyroid hormone. BoneMiner., 7,275-288.
Pickering, WF (1985) The mobility of soluble fluoride in soils. Environ. Pollut., B9, 281-308.
Piper, AM (1944) A graphic procedure in the geochemical interpretion of water analyses. Trans. Am.Geophys. Union, 25, 914-923.
Plankey, BJ and Patterson, HH (1986) Kinetics of aluminium fluoride complexation in acidicwaters. Environ. Sci. Techno!., 20, 160-165.
Pokrovskii, VA and Helgeson, HC (1995) Thermodynamic properties of aqueous species andthe solubilities of minerals at high pressures and temperatures: the system AUCyH:O-NaCI.Am. J. Science, 295, 1255-1342.
Preston-Whyte, RA and Tyson, PD (1988) The Atmosphere and Weather of Southern Africa.Oxford University Press, Cape Town. 374pp.
Prins, P (1981) The geochemical evolution of the alkaline and carbonatite complexes of theDamaraland Igneous Province, South West Africa. Anna// Uni. Ste/Ienbosch, series Al, 3,145-278.
Qi, J and Knaebel, KS (1989) Dissolution equilibria and kinetics of fluorite and calcite mixtures. Am.Inst. Chem. Engin. J, 35, 1293-1303.
Raubenheimer, EJ, Okonska, ET, Dauth, J, Dreyer, MJ, Lourens, C, Bruwer, CA and de Vos, V(1990) Fluoride concentrations in the rivers of the Kruger National Park: a five year survey.S. Afr. J. Wildlife Res., 20, 127-129.
8.15
Chapter 8 References
Reimold, WU, Koeberl, C, Kerr, SJ and Partridge, TC (1991) The Pretoria Saltpan - the first firmevidence for an origin by impact. Lunar Planet. ScL, 22, 1117-1118.
Reimold, WU, Koeberl, C, Partridge, TC and Kerr, SJ (1992) Pretoria Saltpan crater: impact originconfirmed. Geology, 20, 1079-1082.
Retief, DH, Bradley, EL, Barbakow, FH, Friedman, M, van der Merwe, EH and Bischoff,Jl (1979) Relationships among fluoride concentration in enamel, degree of fiuorosis and cariesincidence in a community residing in a high fluoride area. J. Oral Pathol., 8, 224-236.
Retief, EA (1962) Preliminary observations on the feldspars from the Pilanesberg alkaline complex,Transvaal, South Africa. Norsk, geol. Tidskr., 42 (Feldspar-volume), 493-513.
Retief, EA (1963) Petrological and mineralogical studies in the southern part of the Pilanesbergalkaline complex, Transvaal, South Africa. Unpub. PhD thesis, Univ. of Oxford.
Riggs, RL, Hodgson, SF, O'Fallon, WM, Chao, EYS, Wahner, HW, Muhs, JM, Cede!, SLand Melton, LJ (1990) Effect of fluoride treatment on the fracture rate in postmenopausalwomen with osteoporosis. New England J. Med, 332, 802-809.
Roberson, CE and Hem, JD (1969) Solubility of aluminum in the presence of hydroxide, fluoride, andsulfate U.S. Geol. Surv. Water Supply Paper, 1827, C1-C37.
Robie, RA, Hemingway, BS and Fisher, JR (1978) Thermodynamic properties of mineralsand related substances at 298.15 K and 1 bar (105 Pascals) pressure and at highertemperatures. US Geol Surv. Bull., 1452, 456pp.
Robinson, JBD (1978) Fluorine: its occurrence, analysis, effects on plants, diagnosis and control.Commonwealth Bureau of Soils Spec. Pub!., 6.
Roedder, E (1972) Composition of fluid inclusions. In: Data of Geochemistry, 6th edition.U.S. Geol. Surv., Prof. Pap. 440-JJ, Ch.JJ, 164pp.
Rossini, FD, Wagman, DD, Evans, WH, Levine, S and Jaffe, I (1952) Selected values of chemicalthermodynamic properties. Nat. Bureau Standards Circ. 500, US Dept. Commerce,Washington DC.
Rozendaal, A. Toros, MS and Anderson, JR (1986) The Rooiberg tin deposits, West-CentralTransvaal. 1307-1327. In: Anhaeusser, CR and Maske, S (eds.) The mineral deposits ofSouthern Africa Volume II Geol Soc. S Afr., Johannesburg. 2335pp.
Rudolph, MJ, Molefe, M, and Chikte, UME (1995) Dental fiuorosis with varying levels offluoride in drinking water. Abstract, J. Dental Research, 74, 1012.
SACS, [South African Council for Stratigraphy] (1980) Stratigraphy of South Africa, Part 1(Comp. L.E. Kent), Lithostratigraphy of the Republic of South Africa, South WestAfrica/Namibia, and the Republics of Bophuthatswana, Transkei and Venda. Handb. Geol.Surv. S. Afr., 8, 690pp.
8.16
Chapter 8 References
Schidlowski, M, Hayes, JM and Kaplan, IR (1983). Isotopic inferences of ancient biochemistries:Carbon, sulfur, hydrogen, and nitrogen. In: Schopf, JW (ed.) Earth's earliest biosphere.Princeton University Press, Princeton. 543pp.
Schlatter, Ch (1978) Metabolism and toxicology of fluorides. In: Courvoisier, B, Donath, Aand Baud, CA (eds) Fluoride and Bone. Hans Huber, Bern. 1-21.
Schloemann, H (1995) The Geochemistry of some Western Cape soils (South Africa) withemphasis on toxic and essential elements. Unpubl. PhD Thesis, Uni. Cape Town, 300pp.
Schreiner, GDL (1958) Comparison of the 87Rb-86Sr ages of the red granite of the BushveldComplex from measurements on the total rock and seperated mineral fractions. Proc. Roy.Soc, A245, 112-117.
Schulz, EE, Libanati, CR and Farley, SM (1984) Skeletal scinitigraphic changes in osteoporosistreated with sodium fluoride: concise communication. J. Nucl. Med, 25, 651-655.
Schweitzer, JK, Hatton, CJ and de Waal, SA (1995) Regional lithochemical stratigraphy ofthe Rooiberg Group, upper Transvaal Supergroup: a proposed new subdivision. S Afr. J,Geol, 98, 245-255.
Seemann, F (1905) Studien iiber die quantitative bestimmung und trennung der Kieselsaureund des fluors. 2 Anal Chem., 44, 343-387. In: Striibel, G (1965) QuantitativeUntersuchungen iiber die hydrothermale Loslichkeit van flufispat (CaF2) Neues JahrbuchMineralogie, 3, 83-95.
Senewiratne, B, Senewiratne, K, Hettiarachchi, J and Thambipillai, S (1973) Assessment ofthe fluoride content of water in wells selected randomly and after examining schoolchildrenfor dental fluorosis. Bull. WH.O., 49, 419-422.
Shand, SJ (1928) The Geology of Pilansberg (Pilaan's Berg) in the Western Transvaal; A Study ofAlkaline Rocks and Ring-Intrusions. Trans. Geol. Soc. S.A., 31, 97-156.
Sharpe, MR (1985) Strontium isotope evidence for preserved density stratification in the Main Zoneof the Bushveld Complex, South Africa. Nature, 316, 119-126.
Shcherba, GN (1970) Greisens. Int. Geol. Rev., 12, 239-255.
Shortt, HE, McRobert, GR, Barnard, and Mannadi Nayar, AS (1937) Endemic Fluorosis inthe Madras Presidency, hid. J. Med. Res., 25, 553-568.
Smalley, PC, Blomqvist, R and Raheim, A (1988) Sr isotopic evidence for discrete saline componentsin stratified ground waters from crystalline bedrock, Outokumpu, Finland. Geology, 16,345-357.
Smet, J (1992) Fluoride in drinking water. In: Frencken, JE (ed.) Endemic fluorosis in developingcountries. Report of a symposium held in Delft, the Netherlands, April 27th 1990. 98pp.
Smyshlyaev, SI and Edeleva, NP (1962) Determination of solubility of minerals I: The solubility
8.17
Chapter 8 References
product of fluorite. Izv. Vysshikh Uchebn. Zavedenii Khim. Teknol, 5, 871. In: Nordstrom,DK and Jenne, EA (1977) Fluorite solubility equilibria in selected geothermal waters.Geochim. Cosmochim. Acta, 41, 175-188.
Socki, RA, Karlsson, HR and Gibson, EK (1992) Extraction Technique for the determination ofOxygen-18 in water using preevacuated glass vials. Anal Chem., 64, 829-931.
Sonnet, CP and Finney, SA (1990) The spectrum of radiocarbon. In: Pecker, J and Runcorn,SK {eds.) The Earth's climate and variability of the sun over recent millennia. Royal Society,London. 692pp.
Speer, JA (1984) Micas in igneous rocks. In: Bailey, SW (eds) Micas. Reviews in Mineralogy,13, 299-356.
StaufFer, RE (1982) Fluorapatite and fluorite solubility controls on geothermal waters in YellowstoneNational Park. Geochim. Cosmochim. Ada, 46, 465-474.
Stormer, JC and Carmichael, ISE (1970) Villiaumite and the occurrence of fluoride mineralsin igneous rocks. Am. Mineralogist, 55, 126-134.
Striibel, G (1965) Quantitative Untersuchungen iiber die hydrothermale Loslichkeit van fluBspat(CaF:). Neues Jahrbuch Mineralogie, 3, 83-95.
Stuckless, JS, Peterman, ZE and Muhs, DR (1991) U and Sr isotopes in ground water andcalcite, Yucca Mountain, Nevada: evidence against upwelling water. Science, 254, 551-554.
Stumm, W, Wehrli, B and Wieland, E (1987) Surface complexation and its impact on geochemicalkinetics. Croatica Chemica Acta, 60, 429-456.
Suwa, K, Oana, S, Wada, H and Osaki, S (1975) Isotope geochemistry and petrology of Africancarbonatites. Phys. and Chem. of the Earth, 9, 735-745.
Suzuki, K and Endo, Y (1995) Relation of Na* concentration and S' O in winter precipitation withweather conditions Gephys. Res. Lett., 22, 591-594.
Sverdrup, HU (1990) The kinetics of base cation release due to chemical weathering. LundUniv. Press.
Taylor, HP (1974) The application of oxygen and hydrogen isotope studies to problems ofhydrothermal alteration and ore deposition. Econ. Geol., 69, 843-883.
Taylor, HP, Frechen, J and Degens, ET (1967) Oxygen and carbon isotope studies of carbonatitesfrom the Laacher See district, West Germany, and the Alno district, Sweden. Geochim.Cosmochim. Acta. 31, 407-430.
Thiessen, AH (1911) Precipitation averages for large areas. Monthly Weather Rev., 39, 1082-1084.
Thorsden, JJ, Kharaka, YK, Mariner, RH and White, LD (1992) Controls on the distribution
8.18
Chapters References
of stable isotopes of meteoric water and snow in the greater Yellowstone National Parkregion, USA. In: Kharaka, YK and Maest, AS {eds.) Symposium on Water-Rock Interaction,Volume 1. Balkema, Rotterdam. 591-595. "
Thylstrup, A and Fejerskov, O (1978) Clinical appearance of dental fluorosis in permanentteeth in relation to histologic changes. Community Dentistry and Oral Epidemiology, 6, 315-328.
Tobayiwa, C, Musiyambiri, M, Chironga, L, Mazorodze, O and Sapahla, S (1991) Fluoridelevels and dental fluorosis in two districts in Zimbabwe. Central African J. Medicine, 37,355-361.
Torino, M, Rognini, M and Fornaciari, G (1995) Dental fluorosis in ancient Hercufaneum.The Lancet, 345, 1306.
Treadwell, FP and Koch, AA (1904) Uber die bestimmung von fluor in wein und bier. ZAnal Chem.,43, 114-115. In: Striibel, G (1965) Quantitative Untersuchungen iiber die hydrothermaleLoslichkeit van flufispat (CaF2) Neues Jahrbuch Mineralogie, 3, 83-95.
Trotignon, L and Turpault, MP (1992) The dissolution kinetics of biotite in dilute HNO3 at24°C In: Kharaka, YK and Maest, AS (eds.) Symposium on Water-Rock interaction, Volume1. Balkema, Rotterdam. 123-125.
US Dept of Health and Human Services (1991) Review of fluoride: benefits and risks. Reportof the Ad Hoc Subcommittee on fluoride of the Committee to Coordinate EnvironmentalHealth and Related Programs. Washington DC.
Van der Merwe, EH, Bischoff, Jl, Fatti, LP, Retief, DH, Barbakow, FH and Friedman, M.(1977) Relationships between fluoride in enamel, DMFT index and fluorosis in high- and low-fluoride areas in South Africa. Community Dent. Oral Epidemiol., 5, 61-64.
Van Wyk, PJ, Louw, AJ and Snyman, WD (1983) Dental fluorosis in two communities in SWA.(namibia)../. Denial Res., 62, 508.
Vasak, L (1992) Primary sources of fluoride. In: Frencken, JE (ed.) Endemic fluorosis in developingcountries. Report of a symposium held in Delft, the Netherlands, April 27th, 1990. 98pp,
Verdoux, P, Lancelot, J and Faillat, J (1995) Tracage de Vorigine des eaux karstiques en bordure d'unmassif cristallin a l'aide des isotopes du strontium: Exemple des causses lozeriens (France).CRAcad Set. Paris, 320, 387-394.
Verhagen, B Th., Geyh MA, Frohlich, K and Wirth, K (1991) Isotope hydrological methodsfor the quantitative evaluation of ground water resources in arid and semi-arid areas -Development of a methodology. Federal Ministry for Economic Co-operation, Bonn. 164pp.
Verhagen, B Th., Mazor, E and Sellschop, JPF (1974) Radiocarbon and tritium evidence for directrain recharge to ground waters in the northern Kalahari. Nature, 249, 643-644.
Verwoerd, WJ (1967) The carbonatites of South Africa and South West Africa. Department
8.19
Chapters References
of Mines, Geological Survey Handbook, 6.
Verwoerd, WJ (1993). Update on carbonatites of South Africa and Namibia. S Afr. J. Geol.,96, 75-95
Von Gruenewaldt, G, Hatton, CJ, Merkle, CJ and Gain, SB (1986) Platinum-group element- chromitite associations in the Bushveld Complex. Econ. Geol., 81, 1067-1079.
Waber, N and Nordstrom, DK (1992) Geochemical modeling of granitic ground waters atthe Stripa site (Sweden) using a mass balance approach. 243-246. In: Kharaka, YK andMaest, AS (eds.) Water-Rock interaction, Volume 1. Balkema, Rotterdam.
Wager, LR and Brown, GM (1968) Layered Igneous Rocks. Oliver and Boyd, Edinburgh.588pp.
Wagman, DD, Evans, WH, Parker, VB, Schumm, RH, Halow, I, Bailey, SM, Churney, KLand Nutall, RL (1982) The NBS tables of chemical thermodynamic properties: selected valuesfor inorganic and C, and C2 organic substances in SI units. J. Phys. andChem. Ref. data, 11,Supplement No. 2, 392pp.
Wagner, PA (1920) Note on the volcanic origin of the Salt Pan on the farm Zoutpan, No.467. Trans.Geol. Soc. S.A., 23, 52-58.
Wagner, PA (1922) The Pretoria Salt-Pan, a soda caldera. Geol. Surv. S.A. Memoir 20.
Walraven, F (1976) Notes on the late-stage history of the western Bushveld Complex. Trans.Geol. Soc. SAfr., 79, 13-21.
Walraven, F (1981) The Geology of (he Rustenburg area, explanation of sheet 2526. GeologicalSurvey of South Africa, Pretoria. 37pp.
Walraven, F (1987) Geochronological and isotopic studies of Bushveld Complex rocks fromthe Fairfield borehole at Moloto, northeast of Pretoria. S Afr../. Geol., 90, 352-360.
Walraven, F and Hattingh, E (1993) Geochronology of the Nebo Granite, Bushveld Complex. SAfr.J. Geol., 96, 31-41.
Warner, TB (1971) Electrode determination of fluoride in ill-characterized natural waters.Water Research, 5, 459-465.
Weast, RC (1975) Handbook of Chemistry and Physics, 56th Edition, CRC Press. Cleveland,Ohio.
White, SL (1988) Water standards for fluoride. The Lancet, 1 (8583), p475.
White, DE and Waring, GA (1963) Volcanic emanations In: Data of Geochemistry, 6thedition, U.S.Geol. Surv., Prof. Pap. 440-K, Ch.K, K1-K29.
Whitford, GM (1996) The metabolism and toxicity of fluoride. Karger, Basel. 156pp.
8.20
Chapter 8 References
WHO (1984) Guidelines for drinking water quality, volume 1: Recommendations. World healthOrganisation, Geneva.
WHO (1993) Guidelines for drinking water quality, volume 1: Recommendations. 2nd edition,volume 1. World health Organisation, Geneva.
Wilkniss, PE and Bressan, DJ (1971) Chemical processes at the air-sea interface: the behaviour offluorine. J. Geophys. Res., 76, 736-741.
Wilkniss, PE and Bressan, DJ (1972) Fractionation of the elements F, Cl, Na and K at the air-seainterface. J. Geophys. Res., 77, 5307-5315.
Willis, JP (1995) Instrumental parameters and data quality for routine major and trace elementdeterminations by WDXRFS. Department of Geological Sciences, University of Cape Town,information circular 14, 7pp.
Woods, TL and Garrels, RM (1987) Thermodynamic values at low temperature for naturalinorganic materials: an uncritical summary. Oxford University Press, New York. 242pp.
Woolley, AR (1982) A discussion of carbonatite evolution and nomenclature, and the generation ofsodic and potassic finites. Mineral. Mag., 46, 13-17.
Yang, Y, Wang, X and Guo, X (1994) Effects of high iodine and high fluorine on childrensintelligence and the metabolism of iodine and fluorine [Chinese], Chung Hua Liu HsingPingHsueh Tsa Chih, 15, 296-298.
Yong, L and Hua, ZW (1991) Environmental characteristics of regional groundwater in relation tofluoride poisoning in North China. Environ. Geol. and Water Sci., 18, 3-10,
Yurtsever, Y and Gat, JR (1981) Atmospheric Waters, In: Stable Isotope Hydrology, technicalreport series, 210. IAEA, Vienna.
Zhang, H, Bloom, PR and Nater, EA (1993) Change in surface area and dissolution rates duringhornblende dissolution at pH 4.0. Geochim. Cosmochim. Ada, 57, 1681-1689.
Zhu, C (1991) Biotite ((Mg,FE2',AlVI) (F,C1,OH) reciprocal mixing properties: evidence from thepartitioning of F-C1-OH between biotite and apatite. Abstract 5133, Geol. Soc. Amer.
Zhu, C and Sverjensky, DA (1992) F-CI-OH partitioning between biotite and apatite.Geochim. Cosmochim. Ada, 56, 3435-3467.
Zietsman, S (1985) Die verband tussen sekere fisies-geografiese veranderlikes en die voorkomsvan tandfluorose in die Odi I gebied. Unpubl. M.Sc. diss., Uni. S. Africa. 327pp.
Zietsman, S (1989) The relationship between the geological variation, the F" of the water and thespatial variation in the occurrence of dental fluorosis in an endemic area. S. Afr. Geog. J., 71,102-108.
Zietsman, S (1991) Spatial variation of fluorosis and fluoride content of water in an endemic
8.21
Chapter 8 References
area in Bophuthatswana. J. Dent. Ass. S. Afr., 46, 11-15.
Zipkin, I, McClure, FJ, Leone, NC and Lee, WA (1958) Fluoride deposition in human bones afterprolonged ingestion of fluoride in drinking water. Public Health Report, 73, 732-740.
8.22
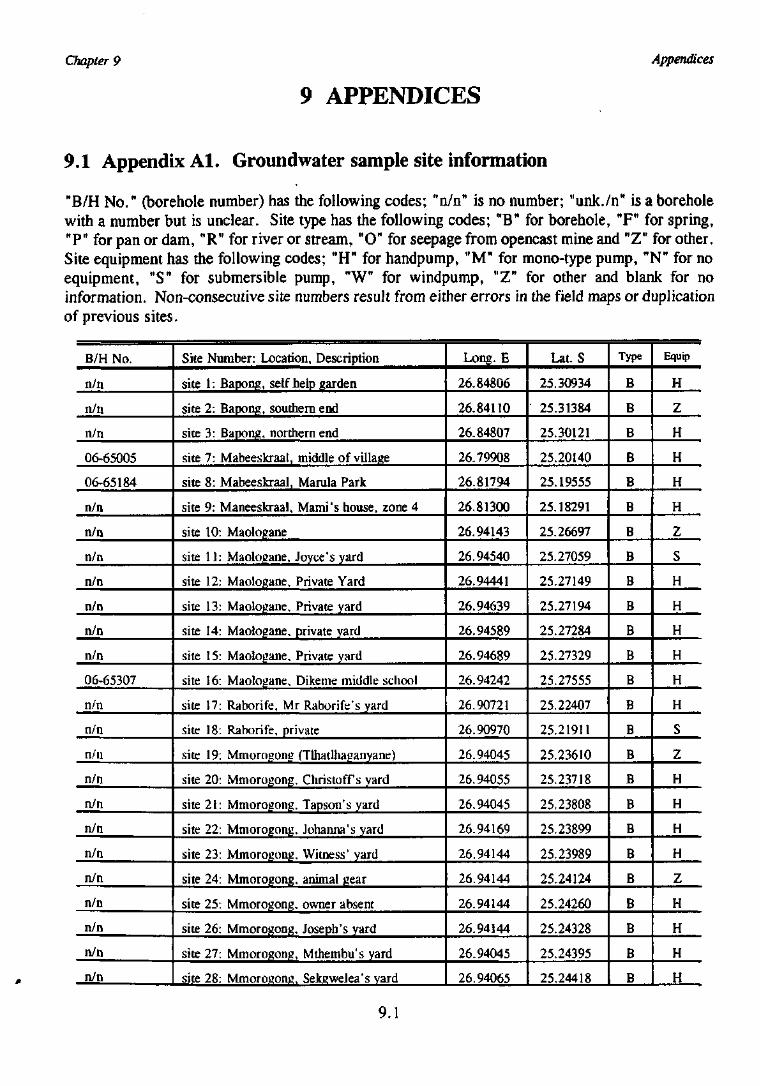
Chapter 9 Appendices
9 APPENDICES
9.1 Appendix Al. Ground water sample site information
"B/H No." (borehole number) has the following codes; "n/n" is no number; "unk./n" is a boreholewith a number but is unclear. Site type has the following codes; "B" for borehole, "F" for spring,"P" for pan or dam, "R" for river or stream, "O" for seepage from opencast mine and "Z" for other.Site equipment has the following codes; "H" for handpump, "M" for mono-type pump, "N" for noequipment, "S" for submersible pump, "W" for windpump, "Z" for other and blank for noinformation. Non-consecutive site numbers result from either errors in the field maps or duplicationof previous sites.
B/H No.
n/n
n/n
n/n
06-65005
06-65184
n/n
n/n
n/n
n/n
n/n
n/n
n/n
06-65307
n/n
n/n
n/n
n/n
n/n
n/n
n/n
n/n
n/n
n/n
n/n
n/n
Site Number: Location, Description
site 1: Bapong, self help garden
site 2: Bapong, southern end
site 3: Bapong, northern end
site 7: Mabeeskraat, middle of village
site 8: Mabeeskraal, Manila Park
site 9: Maneeskraal, Mami's house, zone 4
site 10: Maologane
site 11: Maologane, Joyce's yard
site 12: Maologane, Private Yard
site 13: Maologane, Private yard
site 14: Maologane, private yard
site 15: Maologane, Private yard
site 16: Maologane, Dikeme middle school
site 17: Raborife, Mr Raborife's yard
site 18: Raborife, private
site 19; Mmorogong (Tlhatlhaganyane)
site 20: Mmorogong, Christoff s yard
site 21: Mmorogong, Tapson's yard
site 22: Mmorogong, Johanna's yard
site 23: Mmorogong, Witness' yard
site 24: Mmorogong, animal gear
site 25: Mmorogong, owner absent
site 26: Mmorogong, Joseph's yard
site 27: Mmorogong, Mthembu's yard
site 28: Mmoroconi!, SekRwelea's yard
Long. E
26.84806
26.84110
26.84807
26.79908
26.81794
26.81300
26.94143
26.94540
26.94441
26.94639
26.94589
26.94689
26.94242
26.90721
26.90970
26.94045
26.94055
26.94045
26.94169
26.94144
26.94144
26.94144
26.94144
26.94045
26.94065
Lat. S
25.30934
25.31384
25.30121
25.20140
25.19555
25.18291
25.26697
25.27059
25.27149
25.27194
25.27284
25.27329
25.27555
25.22407
25.21911
25.23610
25.23718
25.23808
25.23899
25.23989
25.24124
25.24260
25.24328
25.24395
25.24418
Type
B
B
B
B
B
B
B
B
B
B
B
B
B
B
B
B
B
B
B
B
B
B
B
B
B
Equip
H
Z
H
H
H
H
Z
S
H
H
H
H
H
H
S
Z
H
H
H
H
Z
H
H
H
H
9.1
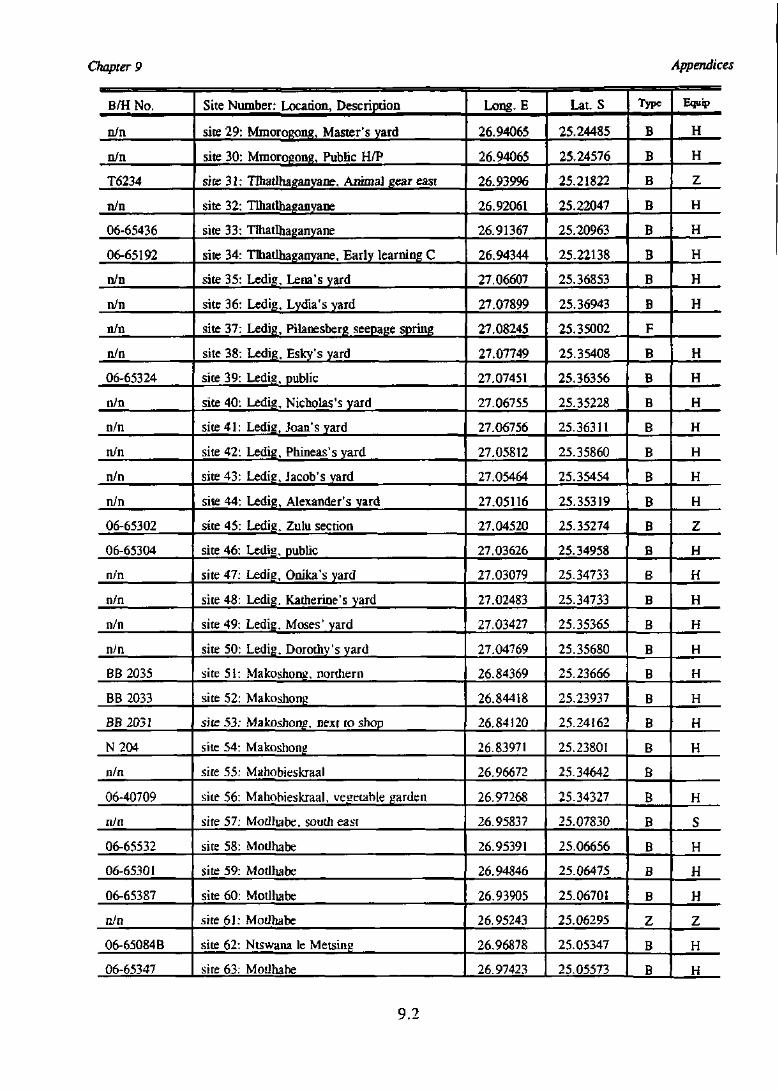
Chapter 9 Appendices
B/HNo.
n/n
n/n
T6234
n/n
06-65436
06-65192
n/n
n/n
n/n
n/n
06-65324
n/n
n/n
n/n
n/n
n/n
06-65302
06-65304
n/n
n/n
n/n
n/n
BB 2035
BB 2033
BB2031
N204
n/n
06-40709
n/n
06-65532
06-65301
06-65387
n/n
06-65084B
06-65347
Site Number: Location, Description
site 29: Mmorogong, Master's yard
site 30: Mmoropng, Public H/P
site 31: TBiatlhaganyane, Animal gear east
site 32: Tlhatlhaganyane
site 33: Tlhatlhaganyane
site 34: Tlhatlbaganyane, Early learning C
site 35: Ledig, Lena's yard
site 36: Ledig, Lydia's yard
site 37: Ledig, Pilanesberg seepage spring
site 38: Ledig, Esky's yard
site 39: Ledig, public
site 40: Ledig, Nicholas's yard
site 41: Ledig, Joan's yard
site 42: Ledig. Phineas's yard
site 43: Ledig, Jacob's yard
site 44: Ledig, Alexander's yard
site 45: Ledig, Zulu section
site 46: Ledig, public
site 47: Ledig, Onika's yard
site 48: Ledig. {Catherine's yard
site 49: Ledig, Moses' yard
site 50: Ledig, Dorothy's yard
site 51: Makoshong, northern
site 52: Makoshong
site 53: Makoshong, next to shop
site 54: Makoshong
site 55: Mahobieskraal
site 56: Mahobieskraal, vegetable garden
site 57: Motlhabe. south east
site 58: Motlhabe
site 59: Motlhabe
site 60: Motlhabe
site 61: Modhabe
site 62: Ntswana le Metsing
site 63: Motlhabe
Long. E
26.94065
26.94065
26.93996
26.92061
26.91367
26.94344
27.06607
27.07899
27.08245
27.07749
27.07451
27.06755
27.06756
27.05812
27.05464
27.05116
27.04520
27.03626
27.03079
27.02483
27.03427
27.04769
26.84369
26.84418
26.84120
26.83971
26.96672
26.97268
26.95837
26.95391
26.94846
26.93905
26.95243
26.96878
26.97423
Lat. S
25.24485
25.24576
25.21822
25.22047
25.20963
25.22138
25.36853
25.36943
25.35002
25.35408
25.36356
25.35228
25.36311
25.35860
25.35454
25.35319
25.35274
25.34958
25.34733
25.34733
25.35365
25.35680
25.23666
25.23937
25.24162
25.23801
25.34642
25.34327
25.07830
25.06656
25.06475
25.0670!
25.06295
25.05347
25.05573
Type
B
B
B
B
B
B
B
B
F
B
B
B
B
B
B
B
B
B
B
B
B
B
B
B
B
B
B
B
B
B
B
B
Z
B
B
Equip
H
H
Z
H
H
H
H
H
H
H
H
H
H
H
H
Z
H
H
H
H
H
H
H
H
H
H
S
H
H
H
Z
H
H
9.2
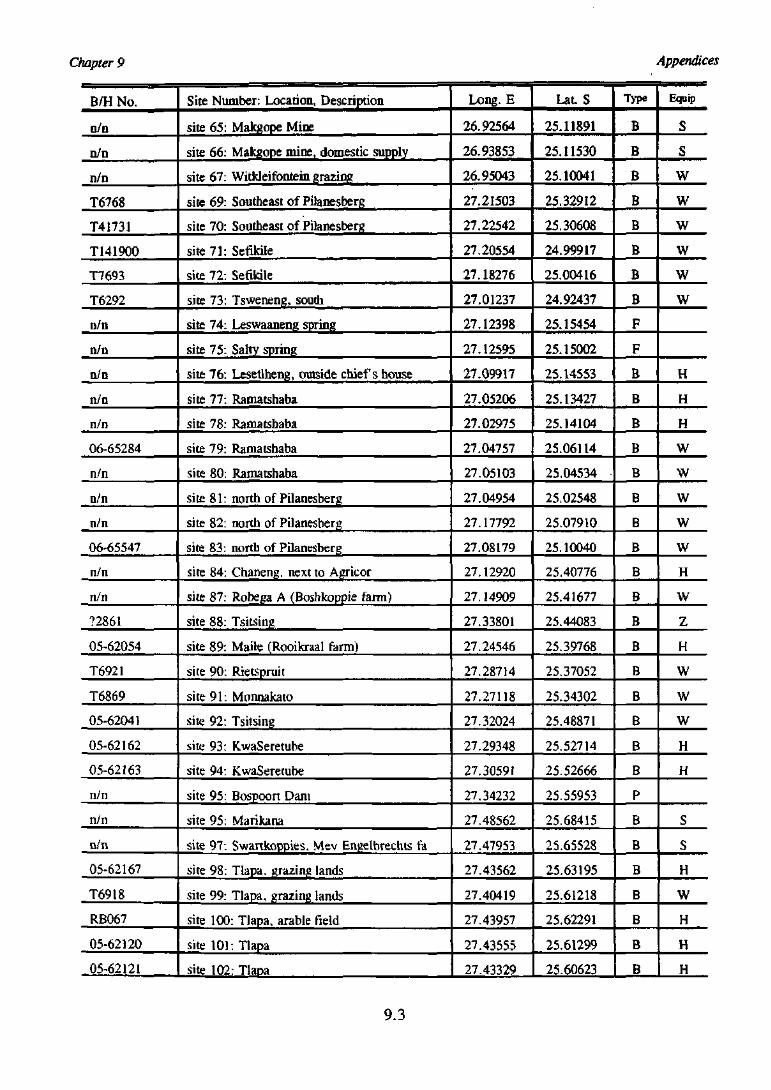
Chapter 9 Appendices
B/H No.
n/n
n/n
n/n
T6768
T41731
T141900
T7693
T6292
n/n
n/n
n/n
n/n
n/n
06-65284
n/n
n/n
n/n
06-65547
n/n
n/n
72861
05-62054
T6921
T6869
05-62041
05-62162
05-62163
n/n
n/n
n/n
05-62167
T6918
RB067
05-62120
05-62121
Site Number: Location, Description
site 65: Makgope Mine
site 66: Makgope mine, domestic supply
site 67: Witkleifontein grazing
site 69: Southeast of Pilanesberg
site 70: Southeast of Pilanesberg
site 71: Sefikile
site 72: Sefikile
site 73: Tsweneng, south
site 74: Leswaaneng spring
site 75: Salty spring
site 76: Lesetlheng, outside chief's house
site 77: Ramatshaba
site 78: Ramatshaba
site 79: Ramatshaba
site 80: Ramatshaba
site 81: north of Pilanesberg
site 82: north of Pilanesberg
site 83: north of Pilanesberg
site 84: Chaneng. next to Agricor
site 87: Robega A (Boshkoppie farm)
site 88: Tsitsing
site 89: Maile (Rooikraal farm)
site 90: Rietspmit
site 91: Monnakato
site 92; Tsitsing
site 93: KwaSeretube
site 94: KwaSeretube
site 95: Bospoort Dani
site 95: Marikana
site 97: Swartkoppies. Mev Engelbrechts fa
site 98: Tlapa. grazing lands
site 99: Tlapa, grazing lands
site 100: Tlapa, arable field
site 101: Tlapa
site 102: Tlapa
Long. E
26.92564
26.93853
26.95043
27.21503
27.22542
27.20554
27.18276
27.01237
27.12398
27.12595
27.09917
27.05206
27.02975
27.04757
27.05103
27.04954
27.17792
27.08179
27.12920
27.14909
27.33801
27.24546
27.28714
27.27118
27.32024
27.29348
27.30591
27.34232
27.48562
27.47953
27.43562
27.40419
27.43957
27.43555
27.43329
Lat. S
25.11891
25.11530
25.10041
25.32912
25.30608
24.99917
25.00416
24.92437
25.15454
25.15002
25.14553
25.13427
25.14104
25.06114
25.04534
25.02548
25.07910
25.10040
25.40776
25.41677
25.44083
25.39768
25.37052
25.34302
25.48871
25.52714
25.52666
25.55953
25.68415
25.65528
25.63195
25.61218
25.62291
25.61299
25.60623
Type
B
B
B
B
B
B
B
B
F
F
B
B
B
B
B
B
B
B
B
B
B
B
B
B
B
B
B
P
B
B
B
B
B
B
B
Equip
S
swwwwww
H
H
H
W
W
wwwH
W
Z
H
W
wwH
H
S
sH
W
H
H
H
9.3
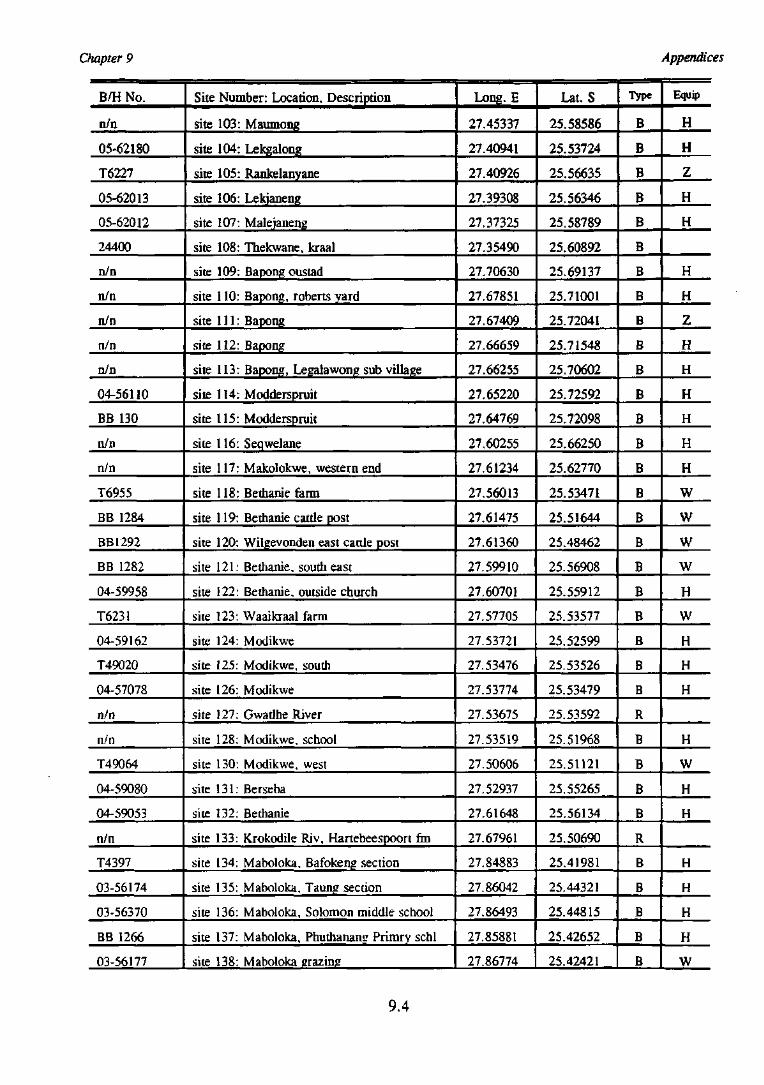
Chapter 9 Appendices
B/HNo.
n/n
05-62180
T6227
05-62013
05-62012
24400
n/n
n/n
n/n
n/n
n/n
04-56110
BB 130
n/n
n/n
T6955
BB 1284
BB1292
BB 1282
04-59958
T6231
04-59162
T49020
04-57078
n/n
n/n
T49064
04-59080
04-59053
n/n
T4397
03-56174
03-56370
BB 1266
03-56177
Site Number: Location, Description
site 103: Maumong
site 104: Lekgalong
site 105: Rankelanyane
site 106: Lekjaneng
site 107: Malejaneng
site 108: Thekwane, kraal
site 109: Bapong oustad
site 110: Bapong, roberts yard
site 111: Bapong
site 112: Bapong
site 113: Bapong, Legalawong sub village
site 114: Modderspruit
site 115: Modderspruit
site 116: Seqwelane
site 117: Makolokwe, western end
site 118: Bethanie farm
site 119: Bethanie cattle post
site 120: Wilgevonden east canle post
site 121: Bethanie. southeast
site 122: Bethanie, outside church
site 123: Waaikraal farm
site 124: Modikwe
site 125: Modikwe, south
site 126: Modikwe
site 127: Gwadhe River
site 128: Modikwe, school
site 130: Modikwe, west
site 131: Berseba
site 132: Bethanie
site 133: Krokodile Riv, Hartebeespoon rm
site 134: Maboloka. Bafokeng section
site 135: Maboloka, Taung section
site 136: Maboloka, Solomon middle school
site 137: Maboloka, Phuthananu Primry schl
site 138: Maboloka srazina
Long. E
27.45337
27.40941
27.40926
27.39308
27.37325
27.35490
27.70630
27.67851
27.67409
27.66659
27.66255
27.65220
27.64769
27.60255
27.61234
27.56013
27.61475
27.61360
27.59910
27.60701
27.57705
27.53721
27.53476
27.53774
27.53675
27.53519
27.50606
27.52937
27.61648
27.67961
27.84883
27.86042
27.86493
27.85881
27.86774
Ut . S
25.58586
25.53724
25.56635
25.56346
25.58789
25.60892
25.69137
25.71001
25.72041
25.71548
25.70602
25.72592
25.72098
25.66250
25.62770
25.53471
25.51644
25.48462
25.56908
25.55912
25.53577
25.52599
25.53526
25.53479
25.53592
25.51968
25.51121
25.55265
25.56134
25.50690
25.41981
25.44321
25.44815
25.42652
25.42421
Type
B
B
B
B
B
B
B
B
B
B
B
B
B
B
B
B
B
B
B
B
B
B
B
B
R
B
B
B
B
R
B
B
B
B
B
Equip
H
H
Z
H
H
H
H
Z
H
H
H
H
H
H
W
W
wwH
W
H
H
H
H
W
H
H
H
H
H
H
W
9.4
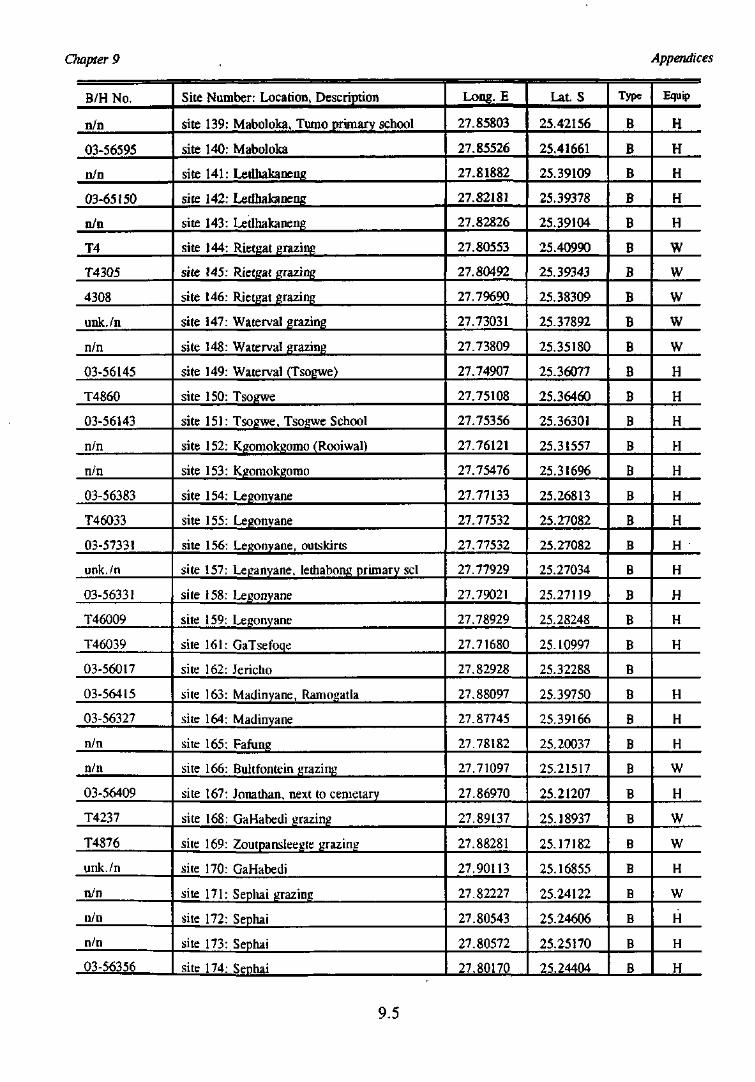
Chapter 9 Appendices
B/H No.
n/n
03-56595
n/n
03-65150
n/n
T4
T4305
4308
unk./n
n/n
03-56145
T4860
03-56143
n/n
n/n
03-56383
T46033
03-57331
unk./n
03-56331
T46009
T46039
03-56017
03-56415
03-56327
n/n
n/n
03-56409
T4237
T4876
unk./n
n/n
n/n
n/n
03-56356
Site Number: Location, Description
site 139: Maboloka, Tumo primary school
site 140: Maboloka
site 141: Letlhakaneng
site 142: Letlhakaneng
site 143: Letlhakaneng
site 144: Rietgat grazing
site 145: Rietgat grazing
site 146: Rietgat grazing
site 147: Waterval grazing
site 148: Waterval grazing
site 149: Waterval (Tsogwe)
site 150: Tsogwe
site 151: Tsogwe, Tsogwe School
site 152: Kgomokgomo (Rooiwal)
site 153: Kgomokgomo
site 154: Legonyane
site 155: Legonyane
site 156: Legonyane, outskirts
site 157: Leganyane, lethabong primary scl
site 158: Legonyane
site 159: Legonyane
site 161: GaTsefoqe
site 162: Jericho
site 163: Madinyane, Ramogatia
site 164: Madinyane
site 165: Fafung
site 166: Bultfontein grazing
site 167: Jonathan, next to cemetary
site 168: GaHabedi grazing
site 169: Zoutpansleegte grazing
site 170: GaHabedi
site 171: Sephai grazing
site 172: Sephai
site 173: Sephai
site 174: SeDhai
Long. E
27.85803
27.85526
27.81882
27.82181
27.82826
27.80553
27.80492
27.79690
27.73031
27.73809
27.74907
27.75108
27.75356
27.76121
27.75476
27.77133
27.77532
27.77532
27.77929
27.79021
27.78929
27.71680
27.82928
27.88097
27.87745
27.78182
27.71097
27.86970
27.89137
27.88281
27.90113
27.82227
27.80543
27.80572
27.80170
Lat. S
25.42156
25.41661
25.39109
25.39378
25.39104
25.40990
25.39343
25.38309
25.37892
25.35180
25.36077
25.36460
25.36301
25.31557
25.31696
25.26813
25.27082
25.27082
25.27034
25.27119
25.28248
25.10997
25.32288
25.39750
25.39166
25.20037
25.21517
25.21207
25.18937
25.17182
25.16855
25.24122
25.24606
25.25170
25.24404
Type
B
B
B
B
B
B
B
B
B
B
B
B
B
B
B
B
B
B
B
B
B
B
B
B
B
B
B
B
B
B
B
B
B
B
B
Equip
H
H
H
H
H
W
W
W
W
W
H
H
H
H
H
H
H
H
H
H
H
H
H
H
H
W
H
W
wH
W
H
H
H
9.5
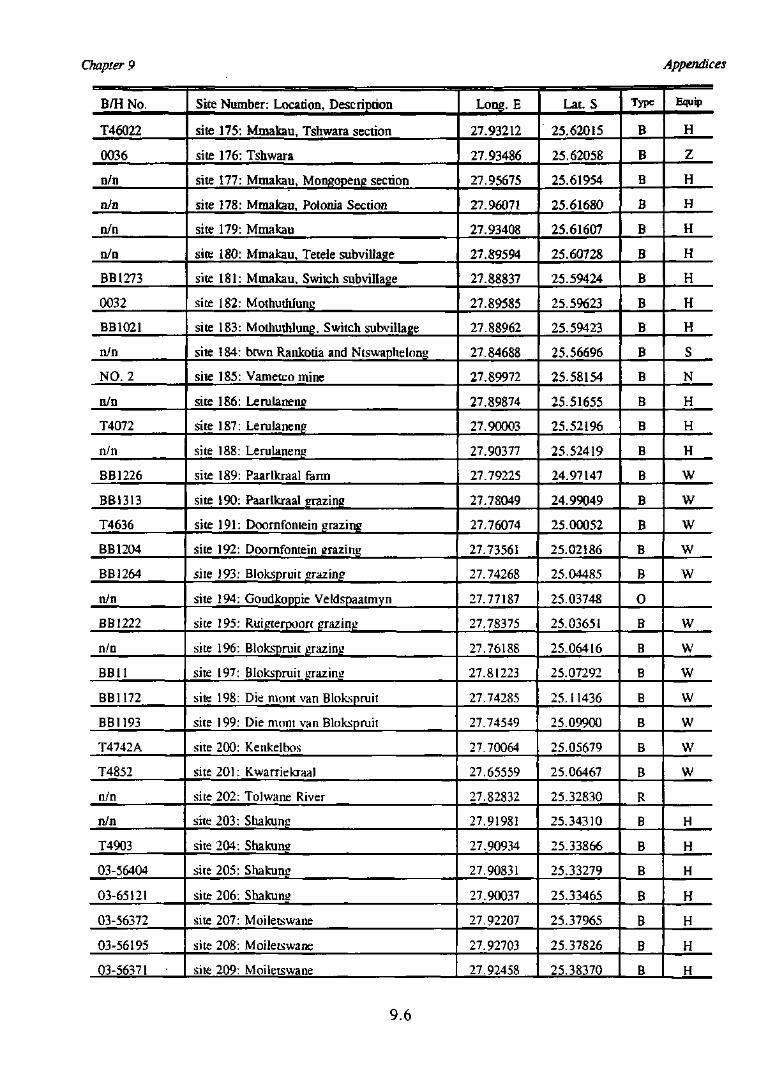
Chapter 9 Appendices
B/HNo.
T46022
0036
n/n
n/n
n/n
n/n
BB1273
0032
BB1021
n/n
NO. 2
n/n
T4072
n/n
BB1226
BB1313
T4636
BB1204
BB1264
n/n
BB1222
n/n
BB11
BB1172
BB1I93
T4742A
T4852
n/n
n/n
T4903
03-56404
03-65121
03-56372
03-56195
03-56371 •
Site Number: Location, Description
site 175: Mmakau, Tshwara section
site 176: Tshwara
site 177: Mmakau, Mongopeng section
site 178: Mmakau, Polonia Section
site 179: Mmakau
site 180: Mmakau, Tetele subvillage
site 181: Mmakau, Switch subvillage
site 182: Mothuthlung
site 183: Mothuthlung, Switch subvillage
site 184: btwn Rankotia and Ntswaphelong
site 185: Vametco mine
site 186: Lerulaneng
site 187: Leruianeng
site 188: Lerulaneng
site 189: Paarlkraal farm
site 190: Paarlkraal grazing
site 191: Doornfontein grazing
site 192: Doornfontein grazing
site 193: Blokspruit grazing
site 194: Goudkoppie Veldspaatmyn
site 195: Ruigterpoort grazing
site 196: Blokspruit grazing
site 197: Blokspruit grazing
site 198: Die mont van Blokspruit
site 199: Die mont van Blokspruit
site 200: Kenkelbos
site 20]: Kwarriekraal
site 202: Tolwane River
site 203: Shakunu
site 204: Shakune
site 205: Shakuni!
site 206: Shakuna
site 207: Moiletswane
site 208: Moiletswane
site 209: Moiletswane
Long. E
27.93212
27.93486
27.95675
27.96071
27.93408
27.89594
27.88837
27.89585
27.88962
27.84688
27.89972
27.89874
27.90003
27.90377
27.79225
27.78049
27.76074
27.73561
27.74268
27.77187
27.78375
27.76188
27.81223
27.74285
27.74549
27.70064
27.65559
27.82832
27.91981
27.90934
27.90831
27.90037
27.92207
27.92703
27.92458
Lat. S
25.62015
25.62058
25.61954
25.61680
25.61607
25.60728
25.59424
25.59623
25.59423
25.56696
25.58154
25.51655
25.52196
25.52419
24.97147
24.99049
25.00052
25.02186
25.04485
25.03748
25.03651
25.06416
25.07292
25.11436
25.09900
25.05679
25.06467
25.32830
25.34310
25.33866
25.33279
25.33465
25.37965
25.37826
25.38370
Type
B
B
B
B
B
B
B
B
B
B
B
B
B
B
B
B
B
B
B
O
B
B
B
B
B
B
B
R
B
B
B
B
B
B
B
Equip
H
Z
H
H
H
H
H
H
H
S
N
H
H
H
W
W
W
W
w
wwwwwww
H
H
H
H
H
H
H
9.6
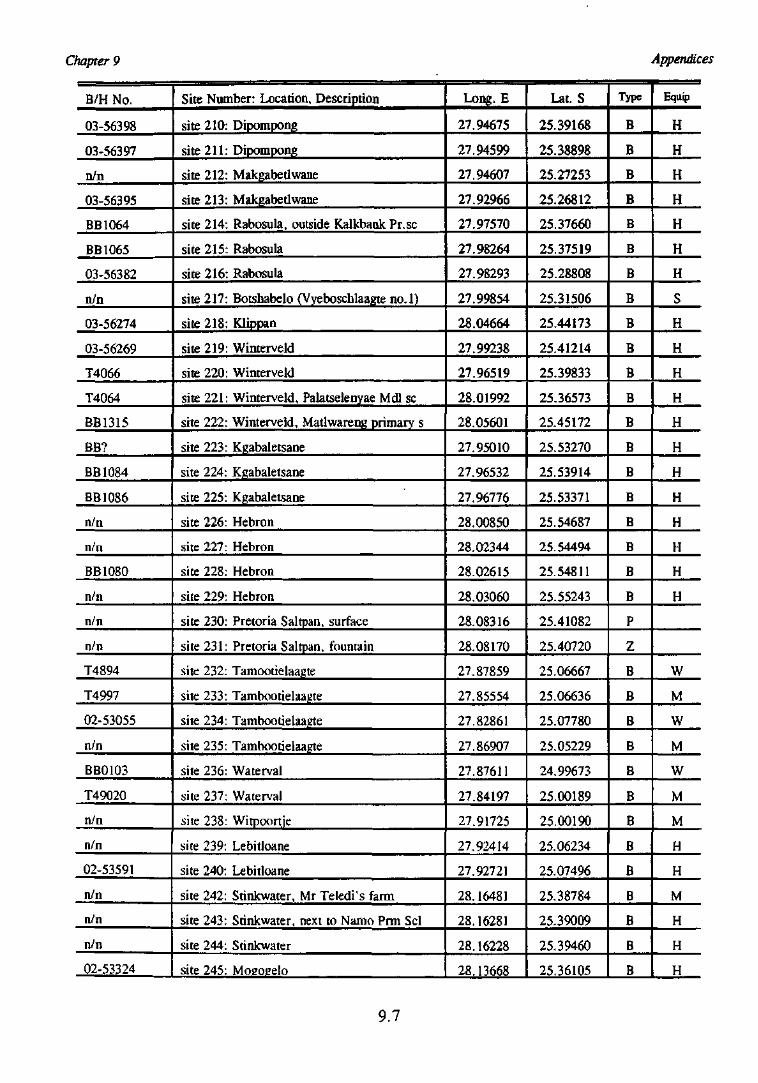
Chapter 9 Appendices
B/H No.
03-56398
03-56397
n/n
03-56395
BB1064
BB1065
03-56382
n/n
03-56274
03-56269
T4066
T4064
BB1315
BB?
BB1084
BB1086
n/n
n/n
BB1080
n/n
n/n
n/n
T4894
T4997
02-53055
n/n
BB0103
T49020
n/n
n/n
02-53591
n/n
n/n
n/n
02-53324
Site Number: Location, Description
site 210: Dipompong
site 211: Dipompong
site 212: Makgabetlwane
site 213: Makgabetlwane
site 214: Rabosula, outside Kalkbank Pr.sc
site 215: Rabosula
site 216: Rabosula
site 217: Botshabelo (Vyeboschlaagte no.l)
site 218: Klippan
site 219: Winterveld
site 220: Winterveld
site 221: Winterveld, Palatselenyae Mdl sc
site 222: Winterveld, Matlwareng primary s
site 223: Kgabaletsane
site 224: Kgabaletsane
site 225: Kgabaletsane
site 226: Hebron
site 227: Hebron
site 228: Hebron
site 229: Hebron
site 230: Pretoria Saltpan, surface
site 231: Pretoria Saltpan, fountain
site 232: Tamootielaagte
site 233: Tambootielaagte
site 234: Tambootielaagte
site 235: Tambootielaagte
site 236: Waterval
site 237: Waterval
site 238: Witpoortje
site 239: Lebitloane
site 240: Lebitloane
site 242: Stinkwater, Mr Teledi's farm
site 243: Stinkwater, next to Namo Prm Scl
site 244: Stinkwater
site 245: Moeoeelo
Long. E
27.94675
27.94599
27.94607
27.92966
27.97570
27.98264
27.98293
27.99854
28.04664
27.99238
27.96519
28.01992
28.05601
27.95010
27.96532
27.96776
28.00850
28.02344
28.02615
28.03060
28.08316
28.08170
27.87859
27.85554
27.82861
27.86907
27.87611
27.84197
27.91725
27.92414
27.92721
28.16481
28.16281
28.16228
28.13668
Ut. S
25.39168
25.38898
25.27253
25.26812
25.37660
25.37519
25.28808
25.31506
25.44173
25.41214
25.39833
25.36573
25.45172
25.53270
25.53914
25.53371
25.54687
25.54494
25.54811
25.55243
25.41082
25.40720
25.06667
25.06636
25.07780
25.05229
24.99673
25.00189
25.00190
25.06234
25.07496
25.38784
25.39009
25.39460
25.36105
Type
B
B
B
B
B
B
B
B
B
B
B
B
B
B
B
B
B
B
B
B
P
Z
B
B
B
B
B
B
B
B
B
B
B
B
B
Equip
H
H
H
H
H
H
H
S
H
H
H
H
H
H
H
H
H
H
H
H
W
M
W
M
W
M
M
H
H
M
H
H
H
9.7
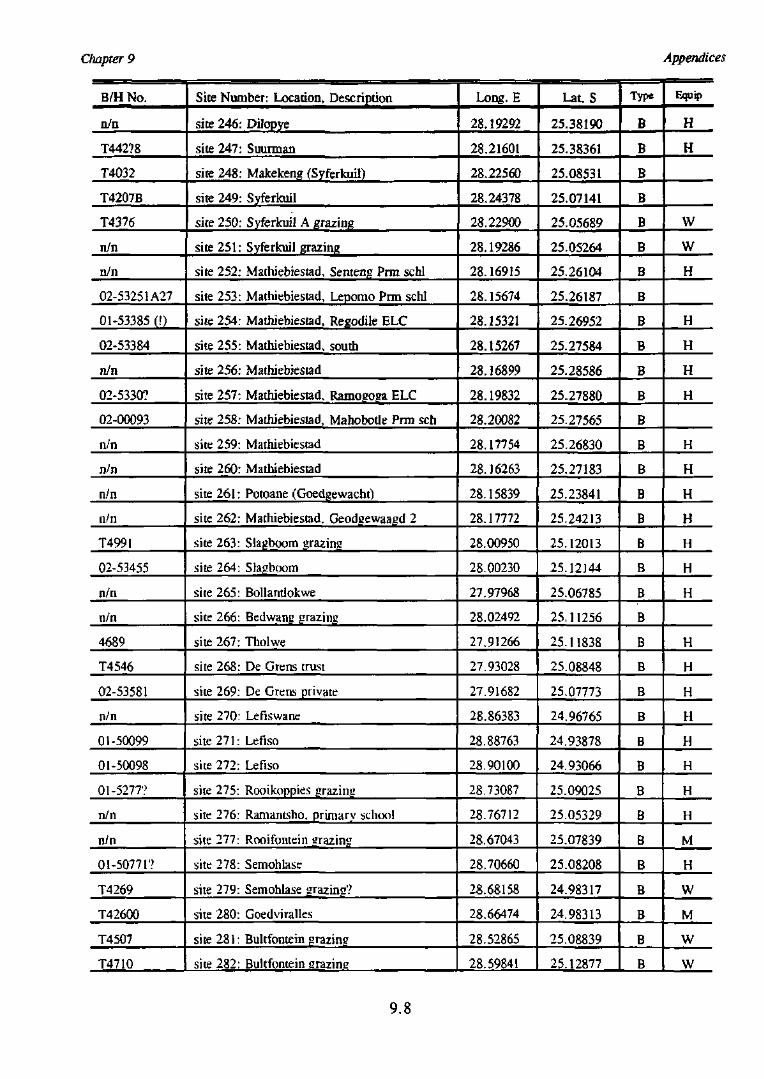
Chapter 9 Appendices
B/H No.
n/n
T44278
T4032
T4207B
T4376
n/n
n/n
02-53251A27
01-53385 (!)
02-53384
n/n
02-5330?
02-00093
n/n
n/n
n/n
n/n
T4991
02-53455
n/n
n/n
4689
T4546
02-53581
n/n
01-50099
01-50098
01-5277?
n/n
n/n
01-507717
T4269
T42600
T4507
T4710
Site Number: Location, Description
site 246: Dilopye
site 247: Suurman
site 248: Makekeng {Syferfcuil)
site 249: Syferkuil
site 250: Syferkuil A grazing
site 251: Syferkuil grazing
site 252: Mathiebiestad, Senteng Prm schl
site 253: Mathiebiestad, Lepomo Prm schl
site 254: Mathiebiestad, Regodile ELC
site 255: Mathiebiestad, south
site 256: Mathiebiestad
site 257: Mathiebiestad, Ramogoga ELC
site 258: Mathiebiestad, Mahobotle Prm sch
site 259: Mathiebiestad
site 260: Mathiebiestad
site 261: Potoane (Goedgewacht)
site 262: Mathiebiestad, Geodgewaagd 2
site 263: Slagboom grazing
site 264: Slagboom
site 265: Bollantlokwe
site 266: Bedwang grazing
site 267: Tholwe
site 268: De Grens trust
site 269: De Grens private
site 270: Lefiswane
site 271: Lefiso
site 272: Lefiso
site 275: Rooikoppies grazing
site 276: Ramantsho. primarv school
site 277: Rooifontein grazing
site 278: Semohlase
site 279: Semohlase grazing?
site 280: Goedviralles
site 281: Bultfontein grazing
site 282: Bultfontein erazine
Long. E
28.19292
28.21601
28.22560
28.24378
28.22900
28.19286
28.16915
28.15674
28.15321
28.15267
28.16899
28.19832
28.20082
28.17754
28.16263
28.15839
28.17772
28.00950
28.00230
27.97968
28.02492
27.91266
27.93028
27.91682
28.86383
28.88763
28.90100
28.73087
28.76712
28.67043
28.70660
28.68158
28.66474
28.52865
28.59841
Lat. S
25.38190
25.38361
25.08531
25.07141
25.05689
25.05264
25.26104
25.26187
25.26952
25.27584
25.28586
25.27880
25.27565
25.26830
25.27183
25.23841
25.24213
25.12013
25.12144
25.06785
25.11256
25.11838
25,08848
25,07773
24.96765
24.93878
24.93066
25.09025
25.05329
25.07839
25.08208
24.98317
24.98313
25.08839
25.12877
Type
B
B
B
B
B
B
B
B
B
B
B
B
B
B
B
B
B
B
B
B
B
B
B
B
B
B
B
B
B
B
B
B
B
B
B
Equip
H
H
W
wH
H
H
H
H
H
H
H
H
H
H
H
H
H
H
H
H
H
H
H
M
H
W
M
W
w
9.8
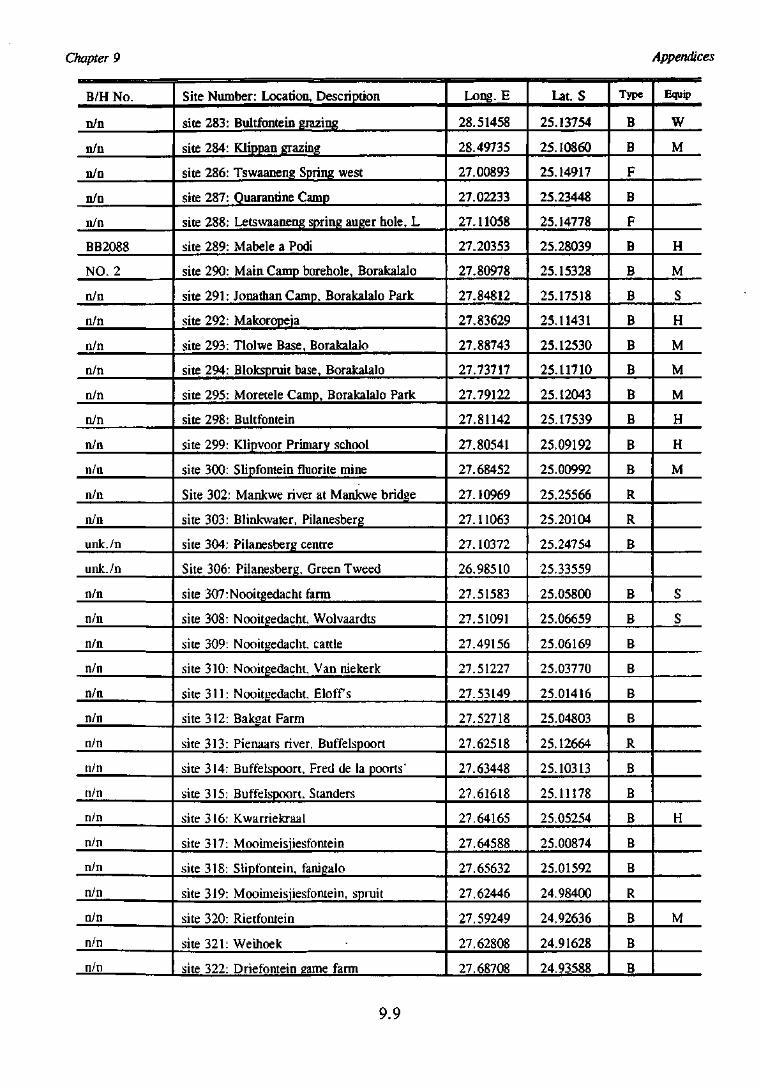
Chapter 9 Appendices
B/H No.
n/n
n/n
n/n
n/n
n/n
BB2088
NO. 2
n/n
n/n
n/n
n/n
n/n
n/n
n/n
n/n
n/n
n/n
unk./n
unk./n
n/n
n/n
n/n
n/n
n/n
n/n
n/n
n/n
n/n
n/n
n/n
n/n
n/n
n/n
n/n
n/n
Site Number: Location, Description
site 283: Bultfontein grazing
site 284: Klippan grazing
site 286: Tswaaneng Spring west
site 287: Quarantine Camp
site 288: Letswaaneng spring auger hole, L
site 289: Mabele a Podi
site 290: Main Camp borehole, Borakalalo
site 291: Jonathan Camp, Borakalalo Park
site 292: Makoropeja
site 293: Tlolwe Base, Borakalalo
site 294: Blokspruit base, Borakalalo
site 295: Moretele Camp, Borakalalo Park
site 298: Bultfontein
site 299: Klipvoor Primary school
site 300: Slipfontein fluorite mine
Site 302: Mankwe river at Mankwe bridge
site 303: Blinkwater, Pilanesberg
site 304: Pilanesberg centre
Site 306: Pilanesberg, Green Tweed
site 307:Nooitgedacht farm
site 308: Nooitgedacht, Wolvaardts
site 309: Nooitgedacht, cattle
site 310: Nooitgedacht, Van niekerk
site 311: Nooitgedacht, Eloffs
site 312: Bakeat Farm
site 313: Pienaars river, Buffelspoort
site 314: Buffelspoort, Fred de la poorts'
site 315: Buffelspoort. Standers
site 316: Kwarriekraal
site 317: Mooimeisjiesfontein
site 318: Slipfontein, fanigalo
site 319: Mooimeisjiesfontein, spruit
site 320: Rietfontein
site 321: Weihoek
site 322: Driefontein same farm
Long. E
28.51458
28.49735
27.00893
27.02233
27.11058
27.20353
27.80978
27.84812
27.83629
27.88743
27.73717
27.79122
27.81142
27.80541
27.68452
27.10969
27.11063
27.10372
26.98510
27.51583
27.51091
27.49156
27.51227
27.53149
27.52718
27.62518
27.63448
27.61618
27.64165
27.64588
27.65632
27.62446
27.59249
27.62808
27.68708
Lat. S
25.13754
25.10860
25.14917
25.23448
25.14778
25.28039
25.15328
25.17518
25.11431
25.12530
25.11710
25.12043
25.17539
25.09192
25.00992
25.25566
25.20104
25.24754
25.33559
25.05800
25.06659
25.06169
25.03770
25.01416
25.04803
25.12664
25.10313
25.11178
25.05254
25.00874
25.01592
24.98400
24.92636
24.91628
24.93588
Type
B
B
F
B
F
B
B
B
B
B
B
B
B
B
B
R
R
B
B
B
B
B
B
B
R
B
B
B
B
B
R
B
B
B
Equip
W
M
H
M
S
H
M
M
M
H
H
M
S
S
H
M
9.9
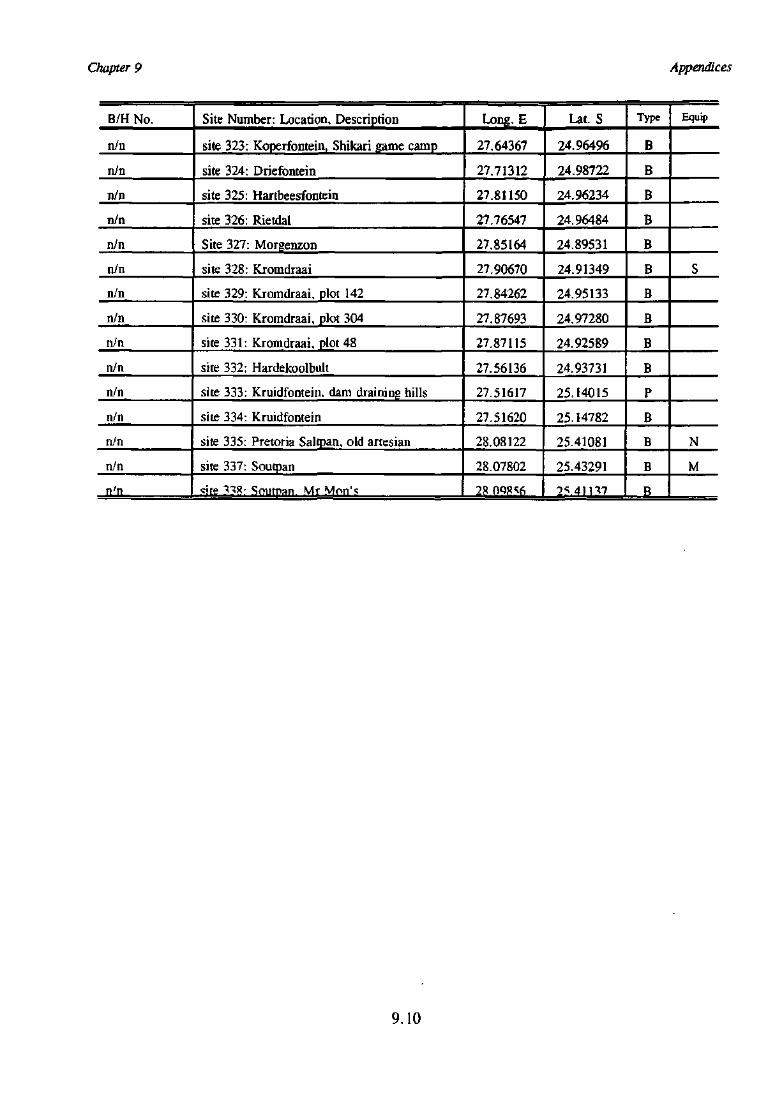
Chapter 9 Appendices
B/H No.
n/n
n/n
n/n
n/n
n/n
n/n
n/n
n/n
n/n
n/n
n/n
n/n
n/n
n/n
n'n
Site Number: Location, Description
site 323: Koperfontein, Shikari game camp
site 324: Driefontein
site 325: Hartbeesfontein
site 326: Rietdal
Site 327: Morgenzon
site 328: Kiomdraai
site 329: Kromdraai, plot 142
site 330: Kromdraai, plot 304
site 331: Kromdraai, plot 48
site 332: Hardekoolbult
site 333: Kruidfontein. dam draining hills
site 334: Kruidfontein
site 335: Pretoria Saltpan, old artesian
site 337: Soutpan
site ?3*?: Soutpan V(r Mon's
Long. E
27.64367
27.71312
27.81150
27.76547
27.85164
27.90670
27.84262
27.87693
27.87115
27.56136
27.51617
27.51620
28.08122
28.07802
28 0QPV>
Ut. S
24.96496
24.98722
24.96234
24.96484
24.89531
24.91349
24.95133
24.97280
24.92589
24.93731
25.14015
25.14782
25.41081
25.43291
- " 4 i n 7
Type
B
B
B
B
B
B
B
B
B
B
P
B
B
B
B
Equip
s
N
M
9.10
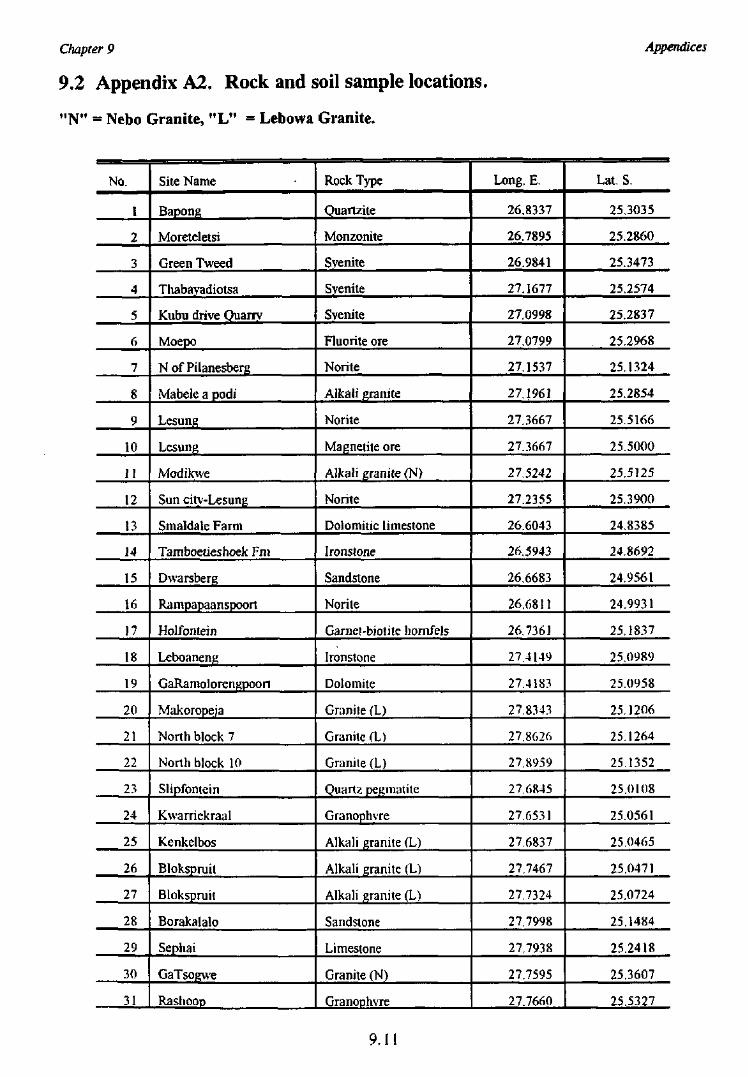
Chapter 9
9.2 Appendix A2. Rock and soil sample locations.
"N" = Nebo Granite, "L" = Lebowa Granite.
Appendices
No.
1
2
3
4
5
6
7
8
9
10
11
12
13
14
15
16
17
18
19
20
21
22
23
24
25
26
27
28
29
30
31
Site Name
Bapong
Moreteletsi
Green Tweed
Thabayadiotsa
Kubu drive Quarry
Moepo
N of Pilanesberg
Mabele a podi
Lesung
Lesung
Modikwe
Sun citv-Lesung
Smaldale Farm
Tamboetieshoek Fm
Dwarsberg
Rampapaanspoort
Holfontein
Leboaneng
GaRamolorengpoon
Makoropeja
Nonh block 7
North block 10
Slipfontein
Kwarriekraal
Kenkelbos
Blokspniit
Blokspmit
Borakalalo
Sephai
GaTsogwe
RashooD
Rock Type
Quartzite
Monzonite
Syenite
Syenite
Syenite
Fluorite ore
Norite
Alkali granite
Norite
Magnetite ore
Alkali granite (N)
Norite
Dolomitic limestone
Ironstone
Sandstone
Norite
Garnel-biotite liornfels
Ironstone
Dolomite
Granile (L)
Granite (L)
Granite (L)
Quartz pegmatite
Granophvre
Alkali granite (L)
Alkali granite (L)
Alkali granite (L)
Sandstone
Limestone
Granite (N)
Granophvre
Long. E.
26.8337
26,7895
26.9841
27.1677
27.0998
27.0799
27.1537
27.1961
27.3667
27.3667
27.5242
27.2355
26.6043
26.5943
26.6683
26.6811
26.7361
27.4149
27.4183
27.8343
27.8626
27.8959
27.6845
27.6531
27.6837
27.7467
27.7324
27.7998
27,7938
27.7595
27.7660
Lat. S.
25.3035
25.2860
25.3473
25.2574
25.2837
25.2968
25.1324
25.2854
25.5166
25.5000
25.5J25
25.3900
24.8385
24.8692
24.9561
24.9931
25,1837
25.0989
25.0958
25.1206
25.1264
25.1352
25,0108
25.0561
25.0465
25.0471
25.0724
25.1484
25.2418
25.3607
25.5327
9.1
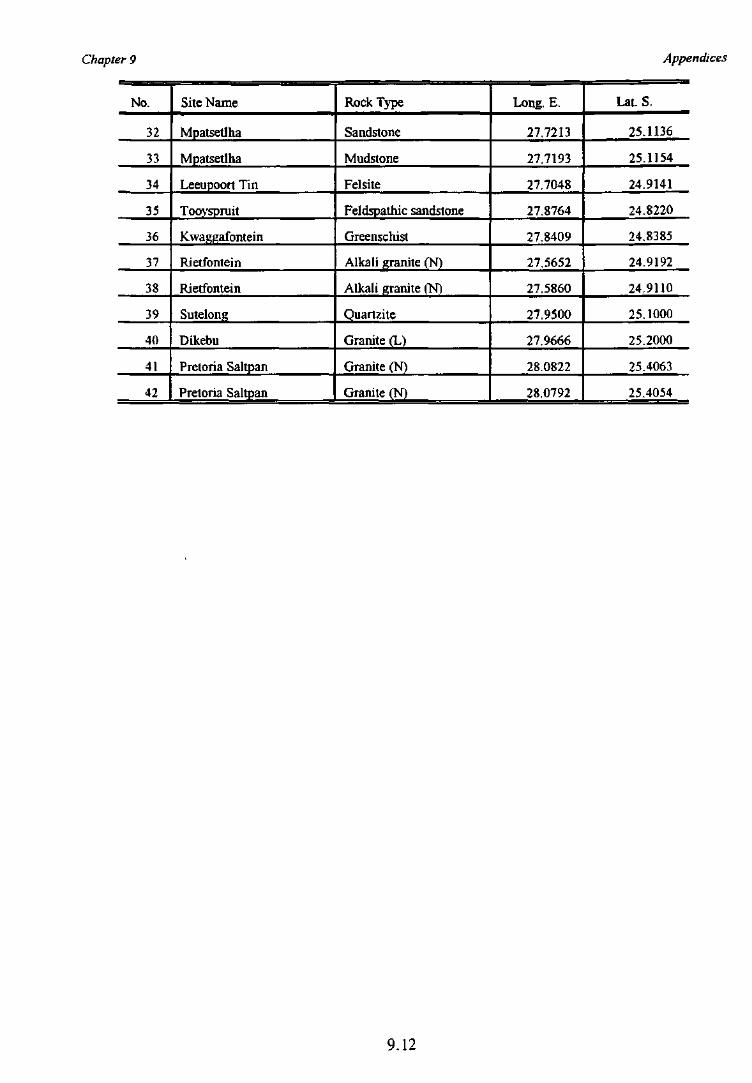
Chapter 9 Appendices
No.
32
33
34
35
36
37
38
39
40
41
42
Site Name
Mpatsetlha
Mpatsetlha
Leeupoort Tin
Tooyspruit
Kwaggafontein
Rietfontein
Rietfontein
Sutelong
Dikebu
Pretoria Saltpan
Pretoria Saltpan
Rock Type
Sandstone
Mudstone
Felsite
Feldspathic sandstone
Greenschist
Alkali granite (N)
Alkali granite (N)
Quartzite
Granite (L)
Granite (N)
Granite (N)
Long. E.
27.7213
27.7193
27.7048
27.8764
27.8409
27.5652
27.5860
27.9500
27.9666
28.0822
28.0792
Lat. S.
25.1136
25.1154
24.9141
24.8220
24.8385
24.9192
24.9110
25.1000
25.2000
25.4063
25.4054
9.12
Chapter 9
9.3 Appendix A3. XRF instrumental parameters
Appendices
DEPARTMENT OF GEOLOGICAL SCIENCES
UNIVERSITY OF CAPE TOWN
INSTRUMENTAL PARAMETERS AND DATA QUALITYFOR ROUTINE MAJOR AND TRACE ELEMENT
DETERMINATIONS BY WDXRFS
J P WILLIS
INFORMATION CIRCULAR No. 14
1995
9.13
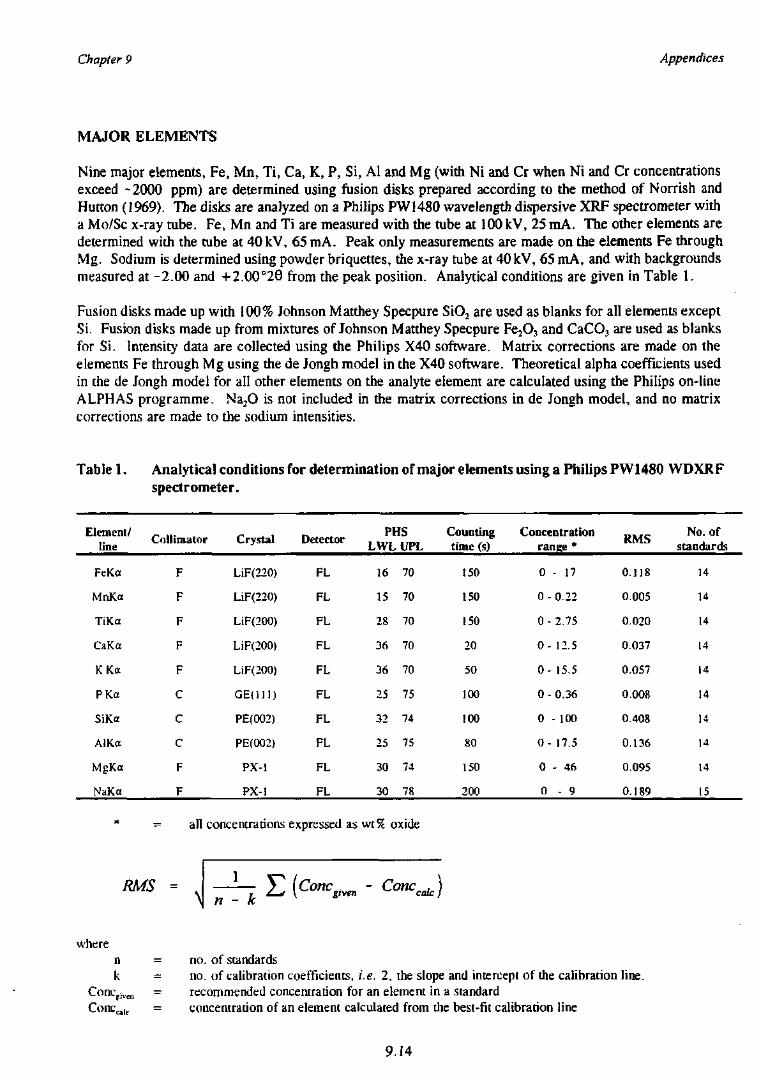
Chapter 9 Appendices
MAJOR ELEMENTS
Nine major elements, Fe, Mn, Ti, Ca, K, P, Si, Al and Mg (with Ni and Cr when Ni and Cr concentrationsexceed -2000 ppm) are determined using fusion disks prepared according to the method of Norrish andHutton (1969). The disks are analyzed on a Philips PW1480 wavelength dispersive XRF spectrometer witha Mo/Sc x-ray tube. Fe, Mn and Ti are measured with the tube at lOOkV, 25 mA. The other elements aredetermined with the tube at 40 kV, 65 mA. Peak only measurements are made on the elements Fe throughMg. Sodium is determined using powder briquettes, the x-ray tube at 40 kV, 65 mA, and with backgroundsmeasured at -2.00 and +2.00°28 from the peak position. Analytical conditions are given in Table 1.
Fusion disks made up with 100% Johnson Matthey Specpure SiO2 are used as blanks for all elements exceptSi. Fusion disks made up from mixtures of Johnson Matthey Specpure Fe:O3 and CaCO3 are used as blanksfor Si. Intensity data are collected using the Philips X40 software. Matrix corrections are made on theelements Fe through Mg using the de Jongh model in the X40 software. Theoretical alpha coefficients usedin the de Jongh model for all other elements on the analyte element are calculated using the Philips on-lineALPHAS programme. Na2O is not included in the matrix corrections in de Jongh model, and no matrixcorrections are made to the sodium intensities.
Table 1. Analytical conditions for determination of major elements using a Philips PW1480 WDXRFspectrometer.
Element/line
Collimator Crystal Detector PHSLWL UPL
Countingtime (s)
Concentrationrange *
RMSNo. of
standards
FeKo
MnKa
TiKa
CaKa
KKa
PKa
SiKa
AlKa
MgKa
NaKa
F
F
F
F
F
C
C
C
F
F
LiF(220)
LiF(220)
LiF(200)
LiF(200)
LiF(200)
GEUI1)
PE(0O2)
PE(002)
PX-1
PX-1
FL
FL
FL
FL
FL
FL
FL
FL
FL
FL
16
15
28
36
36
25
32
25
30
30
70
70
70
70
70
75
74
75
74
78
150
150
150
20
50
100
100
80
150
200
0 - 17
0 - 0.22
0-2 .75
0 - 12.5
0 - 15.5
0-0.36
0 - 100
0 - 17.5
0 - 46
0 - 9
0.118
0.005
0.020
0.037
0.057
0.008
0.408
0.136
0.095
0.189
14
14
14
14
14
14
14
14
14
15
all concentrations expressed as wt% oxide
RMS =\ n - k
~ C°nCcalc)
wherenk
ConcgiVH,Cone calc
no. of standardsno. of calibration coefficients, i.e. 2, the slope and intercept of the calibration line.recommended concentration for an element in a standardconcentration of an element calculated from the best-Fit calibration line
9.14
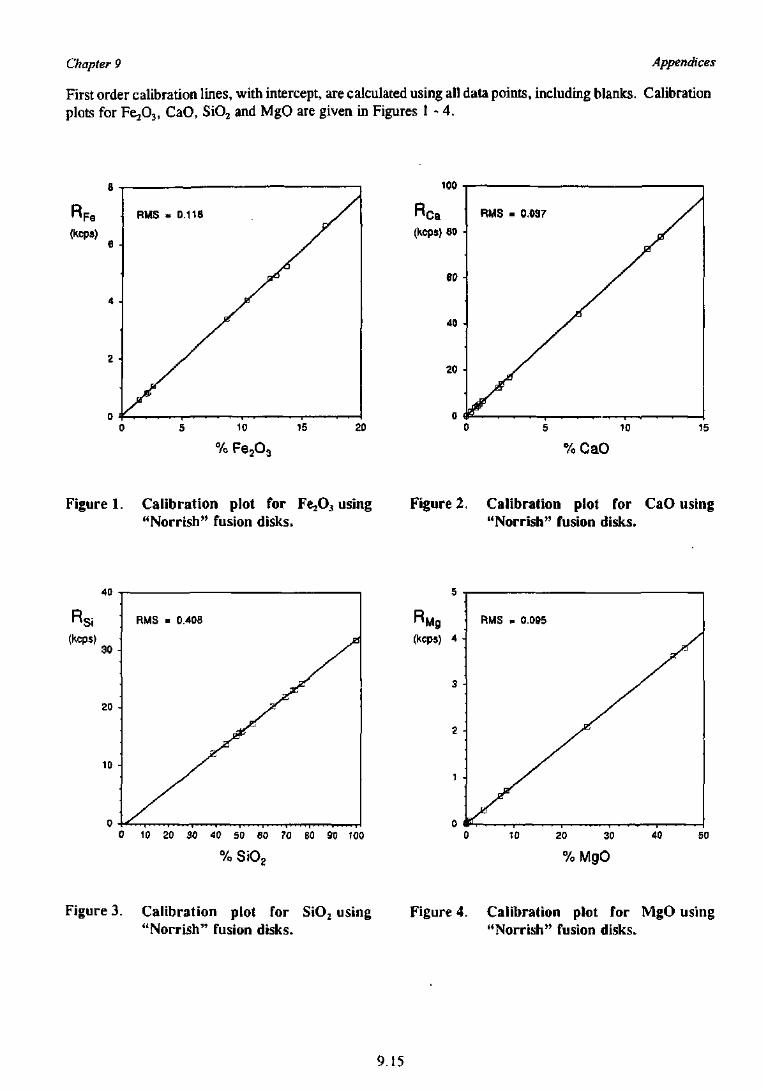
Chapter 9 Appendices
First order calibration lines, with intercept, are calculated using all data points, including blanks. Calibrationplots for F e ^ , CaO, SiO2 and MgO are given in Figures 1 - 4.
% Fe2O3
Figure 1. Calibration plot for Fe,O3 using Figure 2. Calibration plot for CaO using"Norrish" fusion disks. "Norrish" fusion disks.
40
(Kcps)30 -
2 0 •
10 -
RMS = 0.40B
0 10 20 30 40 50 60 70 B0 90 100
(kcps) 4 -
% SJO,
10 20 30 40
% MgO
Figure 3. Calibration plot for SiO2 using"Norrish" fusion disks.
Figure 4. Calibration plot for MgO using"Norrish" fusion disks.
9.15
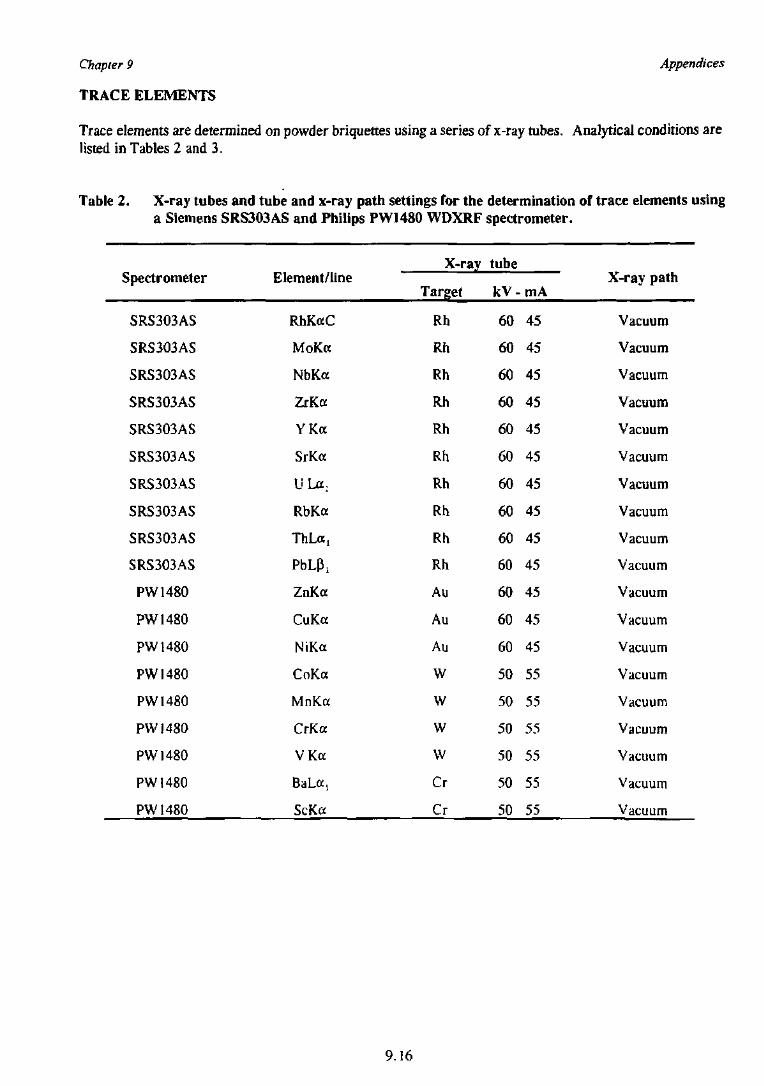
Chapter 9
TRACE ELEMENTS
Appendices
Trace elements are determined on powder briquettes using a series of x-ray tubes. Analytical conditions arelisted in Tables 2 and 3.
Table 2. X-ray tubes and tube and x-ray path settings for the determination of trace elements usinga Siemens SRS303AS and Philips PW1480 WDXRF spectrometer.
Spectrometer
SRS3O3AS
SRS3O3AS
SRS303AS
SRS303AS
SRS303AS
SRS303AS
SRS303AS
SRS303AS
SRS3O3AS
SRS303AS
PW1480
PW1480
PW1480
PW1480
PW1480
PW1480
PW1480
PW1480
PW1480
Element/line
RhKaC
MoKa
NbKa
ZrKa
YK«
SrKa
ULa:
RbKa
ThLa,
PbLp\
ZnKa
CuKa
NiKcc
CoKa
MnKa
CrKa
VKa
BaLc^
SCKK
X-ray
Target
Rh
Rh
Rh
Rh
Rh
Rh
Rh
Rh
Rh
Rh
Au
Au
Au
W
W
W
W
Cr
Cr
tube
k V - m A
60 45
60 45
60 45
60 45
60 45
60 45
60 45
60 45
60 45
60 45
60 45
60 45
60 45
50 55
50 55
50 55
50 55
50 55
50 55
X-ray path
Vacuum
Vacuum
Vacuum
Vacuum
Vacuum
Vacuum
Vacuum
Vacuum
Vacuum
Vacuum
Vacuum
Vacuum
Vacuum
Vacuum
Vacuum
Vacuum
Vacuum
Vacuum
Vacuum
9.16
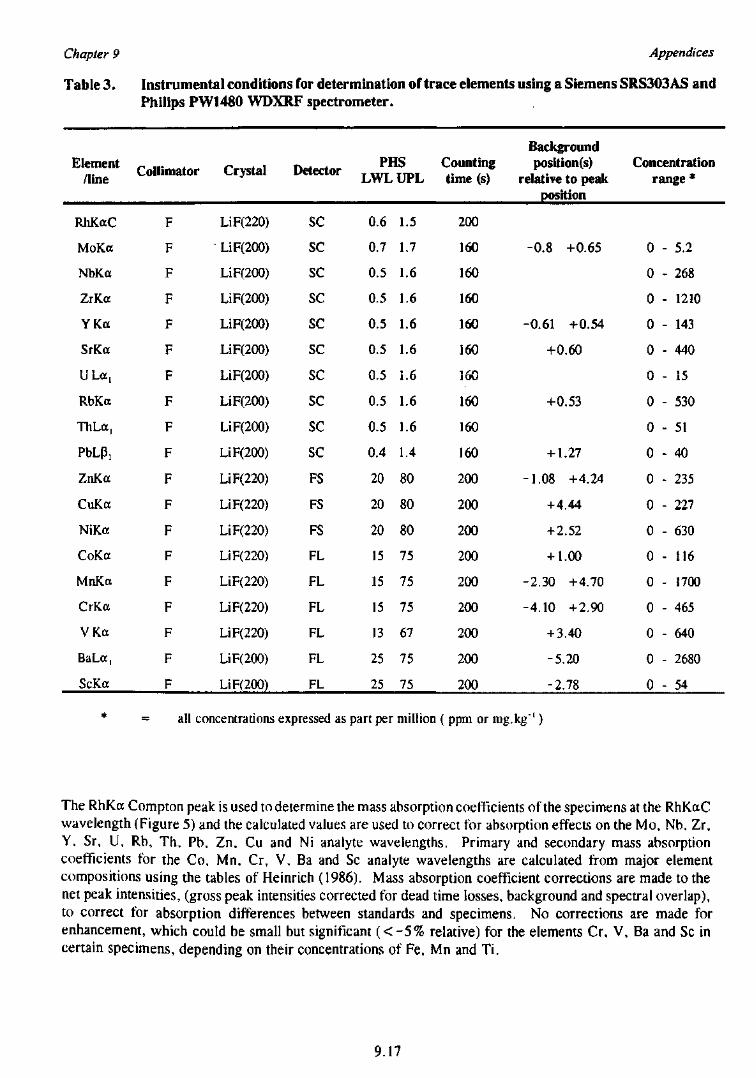
Chapter 9 Appendices
Table 3. Instrumental conditions for determination of trace elements using a Siemens SRS303AS andPhilips PW1480 WDXRF spectrometer.
Element/line
RhKaC
MoKa
NbKa
ZrKa
YKa
SrKa
ULa,
RbKa
ThLa,
PbLP,
ZnKa
CuKa
NiKa
CoKa
MnKa
CrKa
VKa
BaLa,
ScKa
*
Collimator
F
F
F
F
F
F
F
F
F
F
F
F
F
F
F
F
F
F
F
Crystal
LiF(220)
LiF{200)
LiF(200)
LiF(200)
LiF(200)
LiF(200)
LiF(200)
LiF(200)
LiF(200)
LiF(200)
LiF(220)
LiF(220)
LiF(220)
LiF(220)
LiF(220)
LiF(220)
LiF(220)
LiF(200)
LiF(200)
= all concentrations
Detector
SC
scSC
scscscscscscscFS
FS
FS
FL
FL
FL
FL
FL
FL
expressed as
PHSLWLUPL
0.6
0.7
0.5
0.5
0.5
0.5
0.5
0.5
0.5
0.4
20
20
20
15
15
15
13
25
25
part per
1.5
1.7
1.6
1.6
1.6
1.6
1.6
1.6
1.6
1.4
80
80
80
75
75
75
67
75
75
million
Countingtime (s)
200
160
160
160
160
160
i /rtIWJ
160
160
160
200
200
200
200
200
200
200
200
200
( ppm or mg.
Backgroundposition(s)
relative to peakposition
-0.8 +0.65
-0.61 +0.54
+0.60
+0.53
+ 1.27
-1.08 +4.24
+ 4.44
+ 2.52
+ 1.00
-2.30 +4.70
-4.10 +2.90
+ 3.40
-5.20
-2.78
kg"1)
Concentrationrange *
0 - 5.2
0 - 268
0 - 1210
0 - 143
0 - 440
0 - 15
0 - 530
0 - 51
0 - 40
0 - 235
0 - 227
0 - 630
0 - 116
0 - 1700
0 - 465
0 - 640
0 - 2680
0 - 54
The RhKa Compton peak is used to determine the mass absorption coefficients of the specimens at the RhKaCwavelength (Figure 5) and the calculated values are used to correct for absorption effects on the Mo, Nb, Zr,Y. Sr, U, Rb, Th, Pb, Zn, Cu and Ni analyte wavelengths. Primary and secondary mass absorptioncoefficients for the Co, Mn, Cr, V, Ba and Sc analyte wavelengths are calculated from major elementcompositions using the tables of Heinrich (1986). Mass absorption coefficient corrections are made to thenet peak intensities, (gross peak intensities corrected for dead time losses, background and spectral overlap),to correct for absorption differences between standards and specimens. No corrections are made forenhancement, which could be small but significant (< - 5 % relative) for the elements Cr, V, Ba and Sc incertain specimens, depending on their concentrations of Fe, Mn and Ti.
9.17
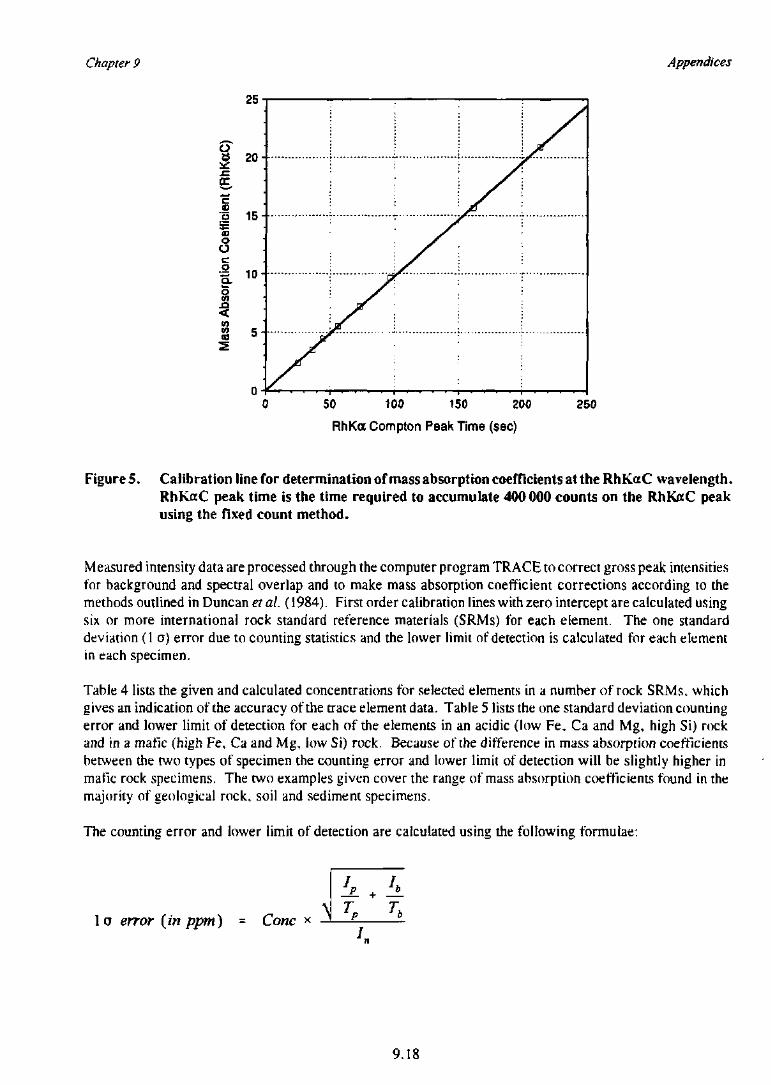
Chapter 9 Appendices
25
15-' a
"oSo
O
i «<0 1COCO U
l
50 100 150 200
RhKa Compton Peak Time (sec)
250
Figure 5. Calibration line for determination of mass absorption coefficients at the RhKaC wavelength.RhKaC peak time is the time required to accumulate 400000 counts on the RhKaC peakusing the fixed count method.
Measured intensity data are processed through the computer program TRACE to correct gross peak intensitiesfor background and spectral overlap and to make mass absorption coefficient corrections according to themethods outlined in Duncans al. (1984). First order calibration lines with zero intercept are calculated usingsix or more international rock standard reference materials (SRMs) for each element. The one standarddeviation (1 a) error due to counting statistics and the lower limit of detection is calculated for each elementin each specimen.
Table 4 lists the given and calculated concentrations for selected elements in a number of rock SRMs, whichgives an indication of the accuracy of the trace element data. Table 5 lists the one standard deviation countingerror and lower limit of detection for each of the elements in an acidic (low Fe, Ca and Mg, high Si) rockand in a mafic (high Fe, Ca and Mg, low Si) rock. Because of the difference in mass absorption coefficientsbetween the two types of specimen the counting error and lower limit of detection will be slightly higher inmafic rock specimens. The two examples given cover the range of mass absorption coefficients found in themajority of geological rock, soil and sediment specimens.
The counting error and lower limit of detection are calculated using the following formulae:
lo error {in ppm) = Cone x
9.18
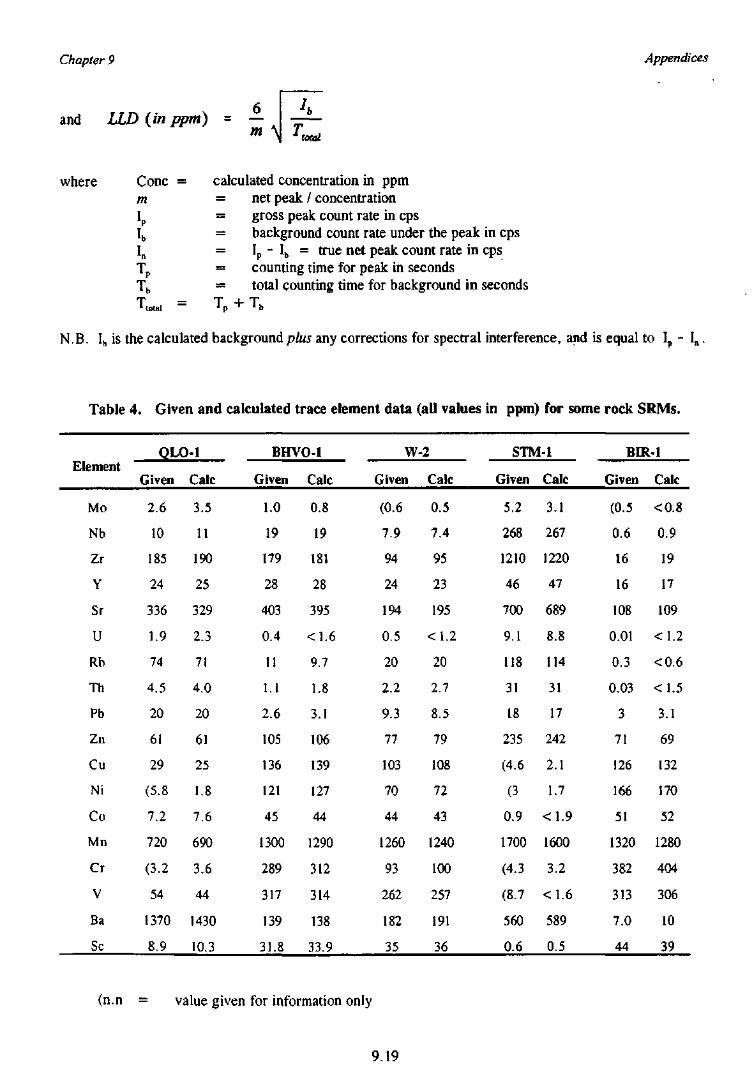
Chapter 9 Appendices
and LLD (in ppm) = —m \ total
where Cone = calculated concentration in ppmm = net peak / concentrationIp = gross peak count rate in cpsIb = background count rate under the peak in cpsIn = Ip - Ib = true net peak count rate in cpsTp = counting time for peak in secondsTb = total counting time for background in seconds
'total
N.B. Ib is the calculated background plus any corrections for spectral interference, and is equal to Ip - ln.
Table 4. Given and calculated trace element data (all values in ppm) for some rock SRMs.
Element
Mo
Nb
Zr
Y
Sr
U
Rb
Th
Pb
Zn
Cu
Ni
Co
Mn
Cr
V
Ba
Sc
QLO-1
Given
2.6
10
185
24
336
1.9
74
4.5
20
61
29
(5.8
7.2
720
(3.2
54
1370
8.9
Calc
3.5
11
190
25
329
2.3
71
4.0
20
61
25
1.8
7.6
690
3.6
44
1430
10.3
BHVO-1
Given
1.0
19
179
28
403
0.4
11
I.I
2.6
105
136
121
45
1300
289
317
139
31.8
Calc
0.8
19
181
28
395
<1.6
9.7
1.8
3.1
106
139
127
44
1290
312
314
138
33.9
W-2
Given
(0.6
7.9
94
24
194
0.5
20
2.2
9.3
77
103
70
44
1260
93
262
182
35
Calc
0.5
7.4
95
23
195
<1.2
20
2.7
8.5
79
108
72
43
1240
100
257
191
36
STM-1
Given
5.2
268
1210
46
700
9.1
118
31
18
235
(4.6
(3
0.9
1700
(4.3
(8.7
560
0.6
Calc
3.1
267
1220
47
689
8.8
114
31
17
242
2.1
1.7
<1.9
1600
3.2
<1.6
589
0.5
BIR-1
Given
(0.5
0.6
16
16
108
0.01
0.3
0.03
3
71
126
166
51
1320
382
313
7.0
44
Calc
<0.8
0.9
19
17
109
<1.2
<0.6
<1.5
3.1
69
132
170
52
1280
404
306
10
39
(n.n = value given for information only
9.19
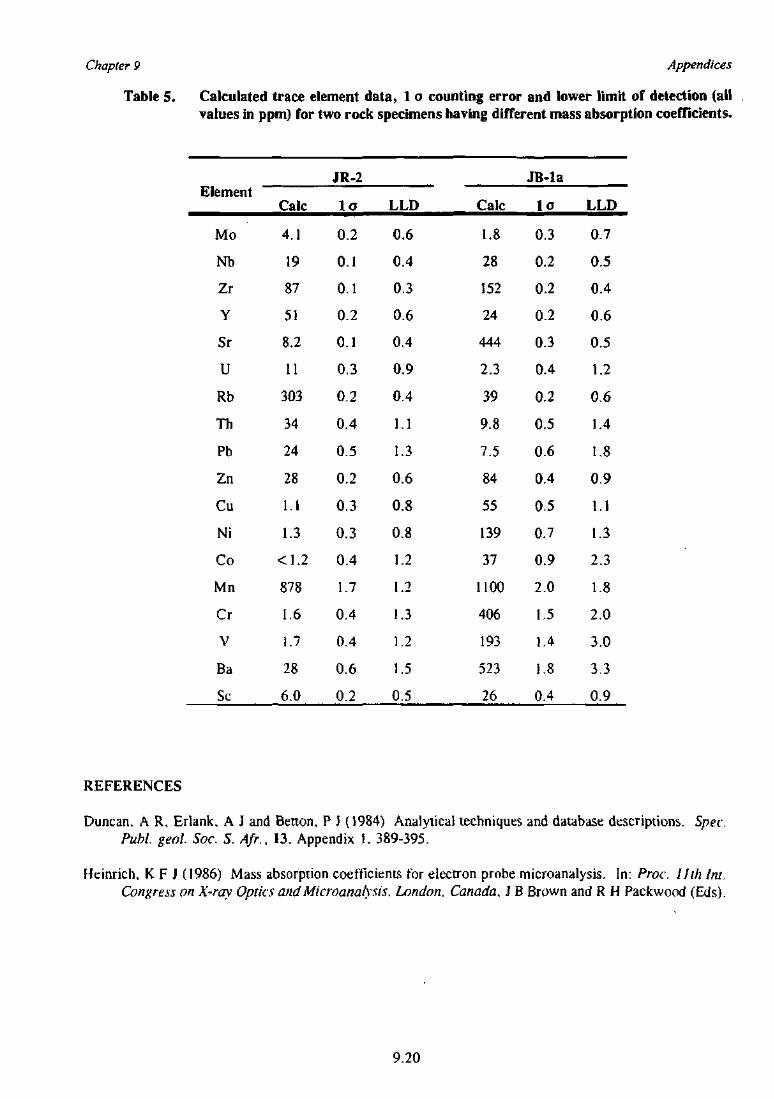
Chapter 9
Table 5.
Appendices
Calculated trace element data, 1 o counting error and lower limit of detection (allvalues in ppm) for two rock specimens having different mass absorption coefficients.
Element
Mo
Nb
Zr
Y
Sr
U
Rb
Th
Pb
Zn
Cu
Ni
Co
Mn
Cr
V
Ba
Sc
Calc
4.1
19
87
51
8.2
11
303
34
24
28
1.1
1.3
<1.2
878
1.6
1.7
28
6.0
JR-2
l a
0.2
0.1
0.1
0.2
0.1
0.3
0.2
0.4
0.5
0.2
0.3
0.3
0.4
1.7
0.4
0.4
0.6
0.2
LLD
0.6
0.4
0.3
0.6
0.4
0.9
0.4
1.1
1.3
0.6
0.8
0.8
1.2
1.2
1.3
1.2
1.5
0.5
Calc
1.8
28
152
24
444
2.3
39
9.8
7.5
84
55
139
37
1100
406
193
523
26
JB-la
l a
0.3
0.2
0.2
0.2
0.3
0.4
0.2
0.5
0.6
0.4
0.5
0.7
0.9
2.0
1.5
1.4
1.8
0.4
LLD
0.7
0.5
0.4
0.6
0.5
1.2
0.6
1.4
1.8
0.9
1.1
1.3
2.3
1.8
2.0
3.0
3.3
0.9
REFERENCES
Duncan. A R, Erlank, A J and Betton, P J (1984) Analytical techniques and database descriptions. Spec.Publ. geol. Soc. S. Afr,, 13. Appendix 1. 389-395.
Heinrich, K F J (1986) Mass absorption coefficients for electron probe microanalysis. In: Proc. 11th Int.Congress on X-ray Optics and Microanalysis, London, Canada, J B Brown and R H Packwood (Eds).
9.20
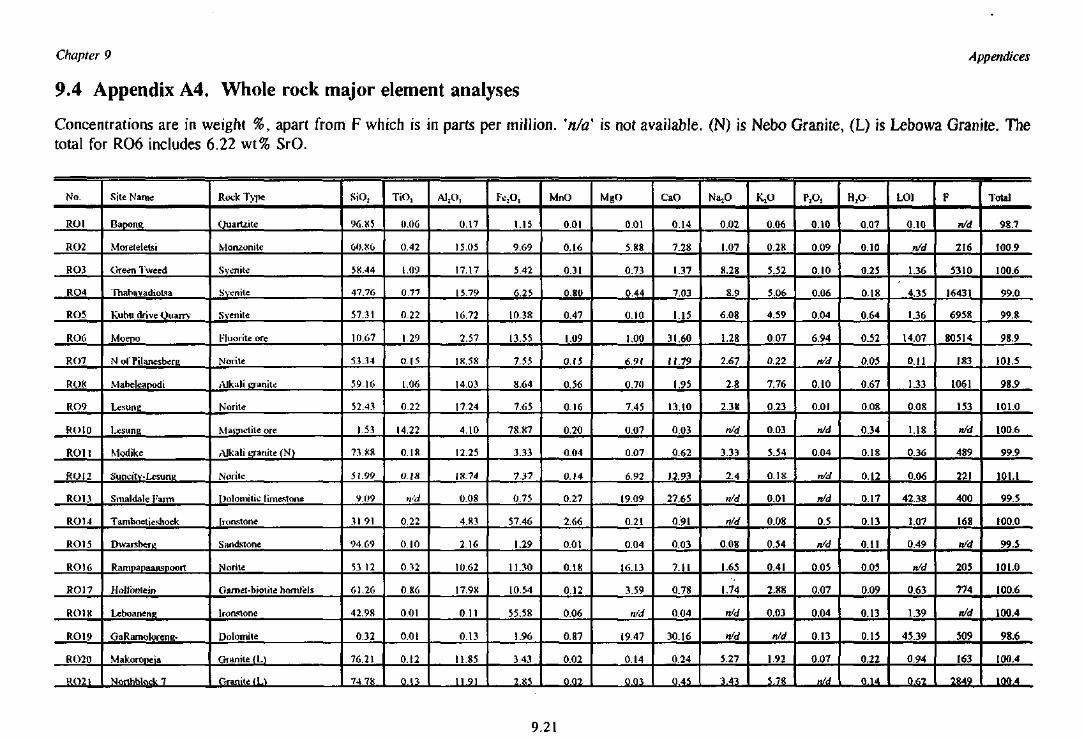
Chapter 9
9.4 Appendix A4. Whole rock major element analyses
Appendices
Concentrations are in weight %, apart from F which is in parts per million, 'n/a' is not available. (N) is Nebo Granite, (L) is Lebowa Granite. Thetotal for RO6 includes 6.22 wt% SrO.
No.
RO1
RO2
RO3
RO4
RO5
ROG
RO7
RO8
RO9
ROtO
ROM
ROI2
RO13
RO14
RO15
RO16
RO17
RO1K
ROI9
RO20
RO21
Site Name
Bapong
Moreteletsi
Green Tweed
Thabavadiutsa
Kubu drive Quarry
Moepo
N ol Pilanesberi;
Mabeleapodi
Lesuns;
Modike
Suncitv-Lcsune
Smaldale Farm
Tamboetieshoek
Dwarsbern
Rampapaanspoort
Holtbntdn
LeboanetiR
GaRamolorene-
Makoropeia
Northblock 7
Rock Type
(Juartzite
Monzonite
Syenite
Syenite
Syenite
Fluorile ore
Norite
Alkali granite
Norite
Magnetite ore
Alkali tjanite (N)
Norile
Dolomilie limestone
Ironstone
Sandstone
Norite
Gamel-biotite homleJs
Ironstone
Dolomite
Granite (L)
Granite f LI
SiO2
96.85
60.86
58.44
47.76
57.31
10.67
53.34
59.10
52.43
1.53
73.R8
51.99
9.09
31.91
94,69
53.12
61.26
42.98
0.32
76.21
74,78
TiO3
0.06
0.42
1.09
0.77
0.22
1.29
0.15
1.06
0.22
14.22
0.18
0.18
n'd
0,22
0.10
0.32
0X6
0.01
0.01
0.12
0.13
0.17
15.05
17.17
15.79
16.72
2.57
1K.5S
14.03
17.24
4.10
12.25
IS. 74
0.08
4.83
216
10.62
17.98
0 11
0.13
11.85
11.91
Fe2O,
1.15
9.69
5.42
G.25
10.3R
13.55
7.55
8.64
7.65
78.87
3.33
7.37
0.75
57.46
1.29
11.30
10.54
55.58
1.96
3.43
2.85
MnO
0.01
0.16
0.31
0.80
0.47
1.09
0.15
0.56
0.16
0.20
0.04
0.14
0.27
2.66
0.01
0.18
0.12
0.06
0.87
0.02
0.02
MgO
0.01
588
0.73
0.44
0.10
1.00
6 9 1
0.70
7.45
0.07
0.07
6.92
19.09
0.21
0.04
16.13
3.59
n/d
19.47
0.14
0.03
CaO
0.14
7.28
1.37
7.03
1.15
31.60
11.79
1.95
13.10
0.03
0.62
12.93
27.65
0.91
0.03
7.11
0.78
0.04
30.16
0.24
0.45
Na,O
0.02
1.07
8.28
8.9
6.08
1.28
2.67
2.8
2.3K
n/d
3.33
2.4
n/d
n/d
0.08
1.6S
1.74
n/d
n/d
5.27
3.43
KiO
0.06
0.28
5.52
5.06
4.59
0.07
0.22
7.76
0.23
0.03
5.54
0.18
0.01
0.08
0.54
0.41
2.88
0.03
n/d
1.92
5.78
PA
0.10
0.09
0.10
0.06
0.04
6.94
n/d
0.10
0.01
n/d
0.04
n/d
n/d
0.5
n/d
0.05
0.07
0.04
0.13
0.07
n/d
H,O-
O.07
0.10
0.25
0.18
0.64
0.52
0.05
0.67
0.08
0.34
0.18
0.12
0.17
0.13
0.11
0.05
0.09
0.13
0.15
0.22
0.14
LO1
0.10
n/d
1.36
4.35
1.36
14.07
0.11
1.33
0.08
1.18
0.36
0.06
42.38
1.07
0.49
n/d
0.63
1.39
45.39
0.94
0.62
F
n/d
216
5310
16431
6958
80514
183
1061
153
n/d
489
221
400
168
n/d
205
774
n/d
509
163
2849
Total
98.7
100.9
100.6
99.0
99.8
98.9
101.5
98.9
101.0
100.6
99.9
101.1
99.5
100.0
99.5
101.0
100.6
100.4
98.6
[00.4
100.4
9.21
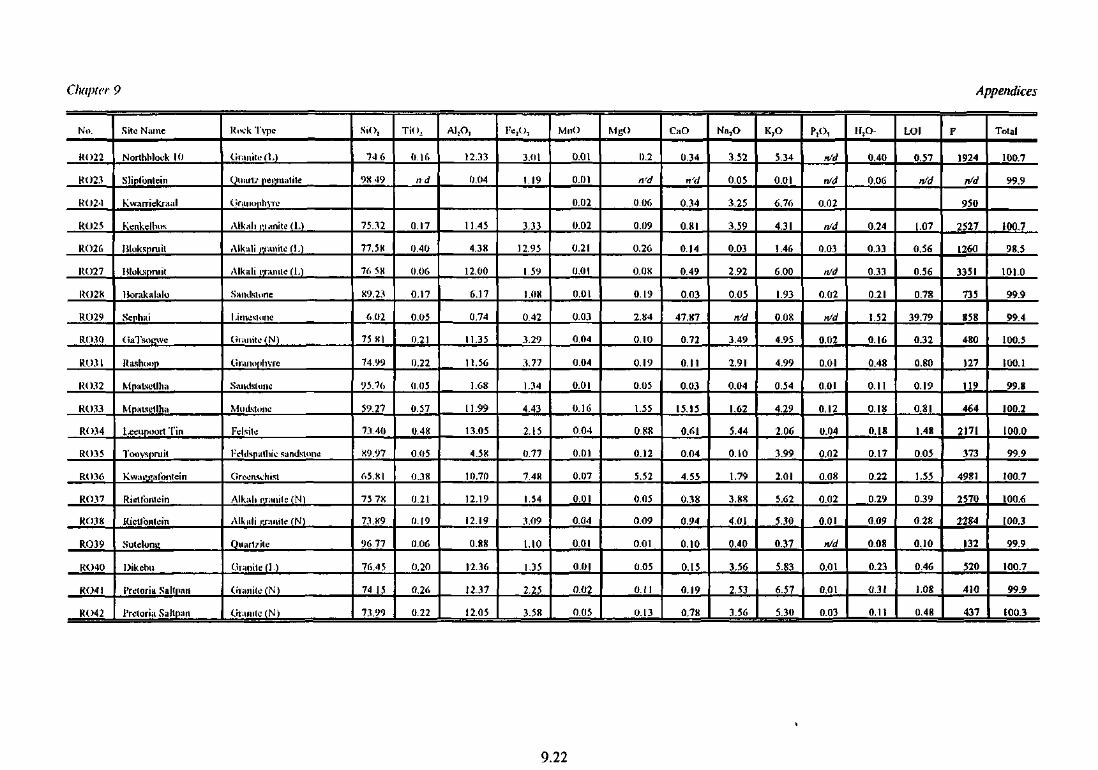
Chapter 9 Appendices
No.
RO22
RO23
RO24
RO25
RO26
RO27
RO2S
RO29
RO30
RO31
RO32
RO33
RO34
RO35
RO36
RO37
RO38
RO39
RO40
RO41
RO42
Site Niime
Northhlouk 10
Slipl'ontein
Kwamekraal
Kenkelbos
Uloksprutl
[ilokspniit
Horakstlalo
Sephai
(TaTsoi^ve
Rashnop
Mpatxcllha
Mpatsdlha
I .eeupoort Tin
Toovspruil
Kwaqfiufontein
Rictfoiitcin
Rietlbntein
Sulelonn
Dikebu
Pretoria Saltpan
Pretoria Saltpan
Rnok Tvpc
Granite ( U
QiiiiHy pegmatite
(>nimi|ihvre
Alknli r.iiinile (L)
Alkali i>,i'iinitc(L)
Alknli i<riuulc(l.)
Sutnlstune
Liiiifvliiri',1
C>r»niti>(N)
tirimophvre
S.iiulsluiic
MlltiKtlMlL1
Felsite
Feltispiilliic sandstiine
Crrcansthisl
Alkali i-j-aiiite (N)
Alknli KRtnite (N)
Quart/ile
CKiinilc (I.)
Ciianili." fN)
(.IHIIIIC (N)
SiO,
74 6
<JK W
75.12
77.5K
76 5K
K9.2.1
6.02
75 XI
74.9'J
95.76
59.27
7.1.40
K9.97
65.XI
75 7X
73.X9
96.77
76.45
74 15
7.1.99
Tin,
0,16
nd
0.17
(J.40
0.06
0.17
0.05
0.21
0.22
0.05
0.57
0.48
0.05
0.3X
0.21
0.19
0.06
0.20
0,26
0.22
AI:O,
12.33
0.04
11.45
4.38
12.00
6.17
0.74
11.35
11.56
1.G8
11.99
13.05
4.58
10.70
12.19
12.19
0.88
12.36
12.37
12.05
3.01
1.19
3.33
12.95
1 59
1.08
0.42
3.29
3.77
1.34
4.43
2.15
0.77
7.48
1.54
3.09
1.10
1.35
2.25
3.58
MnO
0.01
0.01
0.02
0.02
0.21
0.01
0.01
0.03
0,04
0.04
0.01
0.16
0.04
0.01
0.07
0.01
0.04
0.01
0.01
0,02
0.05
0.2
n'd
0.06
0.09
0.26
O.OX
0.19
2.S4
0.10
0.19
0.05
1.55
0.88
0.12
5.52
0.05
0.09
0.01
0.05
0.11
0.13
CaO
0.34
n'd
0.34
OKI
0.14
0.49
0.03
47.87
0.72
O i l
0.03
15.15
0.61
0.04
4.55
0.38
0.94
0.10
0.15
0.19
0.78
Na,O
3.52
0.05
3.25
3.59
0.03
2.92
0.05
n'd
3.49
2,91
0.04
1.62
5.44
0.10
1.79
3.88
4.01
0.40
3.56
2.53
3.56
K,O
5.34
0.01
6.76
4.31
1.46
6.00
1.93
0.08
4.95
4.99
0.54
4.29
2.06
3.99
2,01
5.62
5.30
0.37
5.83
6,57
5.30
ntd
nld
0.02
n/d
0.03
n/d
0.02
n/d
0.02
0,01
0.01
0.12
0.04
0.02
0.08
0.02
0.01
n/d
0.01
0,01
0.03
H2O
0.40
0.06
0.24
0.33
0.33
0.21
1.52
0,16
0.48
0.11
0.18
0.18
0.17
0.22
0.29
0.09
0.08
0.23
0.31
0.11
LOI
0.57
n/d
1.07
0.56
0,56
0.78
39.79
0.32
0.80
0.19
OKI
1.48
0.05
1.55
0.39
0.28
0.10
0.46
1.08
0.48
F
1924
n/d
950
2527
1260
3351
735
858
480
127
119
464
2171
373
4981
2570
2284
132
520
410
437
Total
100.7
99.9
100.7
98.5
101.0
99.9
99.4
100.5
100.1
99.8
100.2
100.0
99.9
100.7
100.6
100.3
99.9
100.7
99.9
100.3
9.22
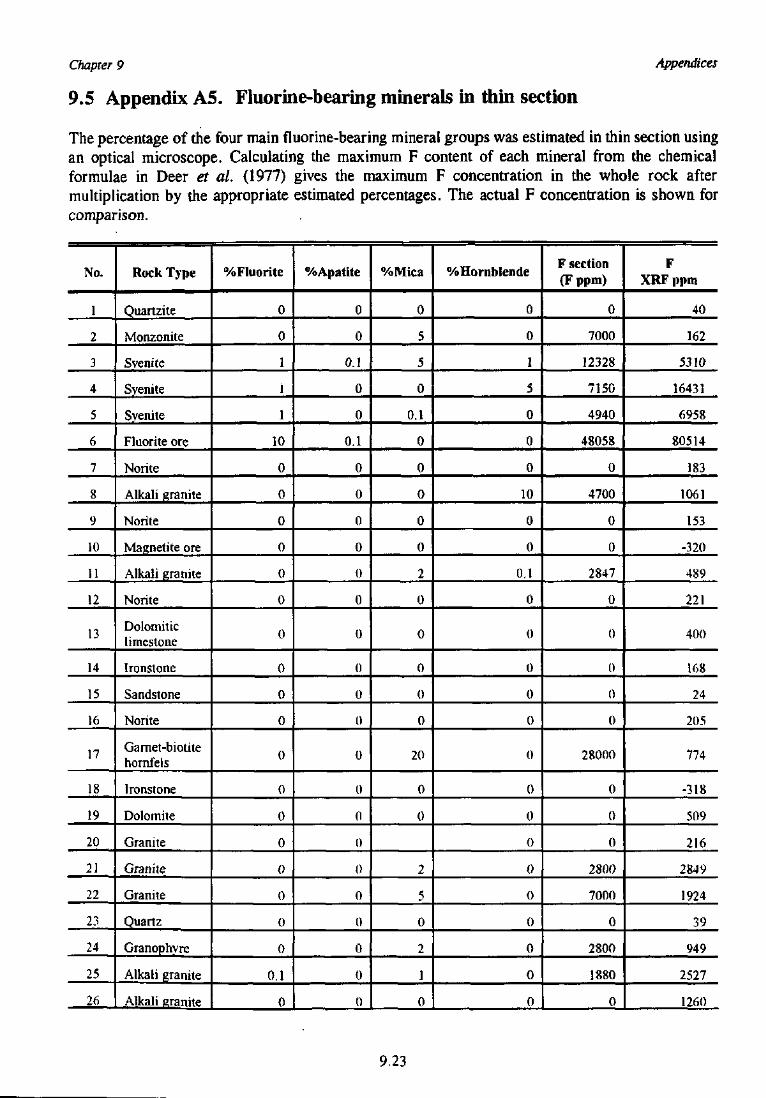
Chapter 9
9.5 Appendix A5. Fluorine-bearing minerals in thin section
Appendices
The percentage of the four main fluorine-bearing mineral groups was estimated in thin section usingan optical microscope. Calculating the maximum F content of each mineral from the chemicalformulae in Deer et al. (1977) gives the maximum F concentration in the whole rock aftermultiplication by the appropriate estimated percentages. The actual F concentration is shown forcomparison.
No.
1
2
3
4
5
6
7
8
9
10
11
12
13
14
15
16
17
18
19
20
21
22
23
24
25
26
Rock Type
Quartzite
Monzonite
Svenite
Syenite
Svenite
Fluorite ore
Norite
Alkali granite
Norite
Magnetite ore
Alkali granite
Norite
Dolomiticlimestone
Ironstone
Sandstone
Norite
Garnet-biotitehornfels
Ironstone
Dolomite
Granite
Granite
Granite
Quartz
Granophvre
Alkali granite
Alkali granite
% Fluorite
0
0
1
1
1
10
0
0
0
0
0
0
0
0
0
0
0
0
0
0
()
0
0
0
0.1
0
%Apatite
0
0
0.1
0
0
0.1
0
0
0
0
0
0
0
0
0
0
0
0
0
0
()
0
0
0
0
0
%Mica
0
5
5
0
0.1
0
0
0
0
0
2
0
0
0
0
0
20
0
0
2
5
0
2
1
0
% Hornblende
0
0
1
5
0
0
0
10
0
0
0.1
0
0
0
0
0
0
0
0
0
0
0
0
0
0
0
F section(Fppm)
0
7000
12328
7150
4940
48058
0
4700
0
0
2847
0
0
0
0
0
28000
0
0
0
2800
7000
0
2800
1880
0
FXRFppm
40
162
5310
16431
6958
80514
183
1061
153
-320
489
221
400
168
24
205
774
-318
509
216
2849
1924
39
949
2527
1260
9.23
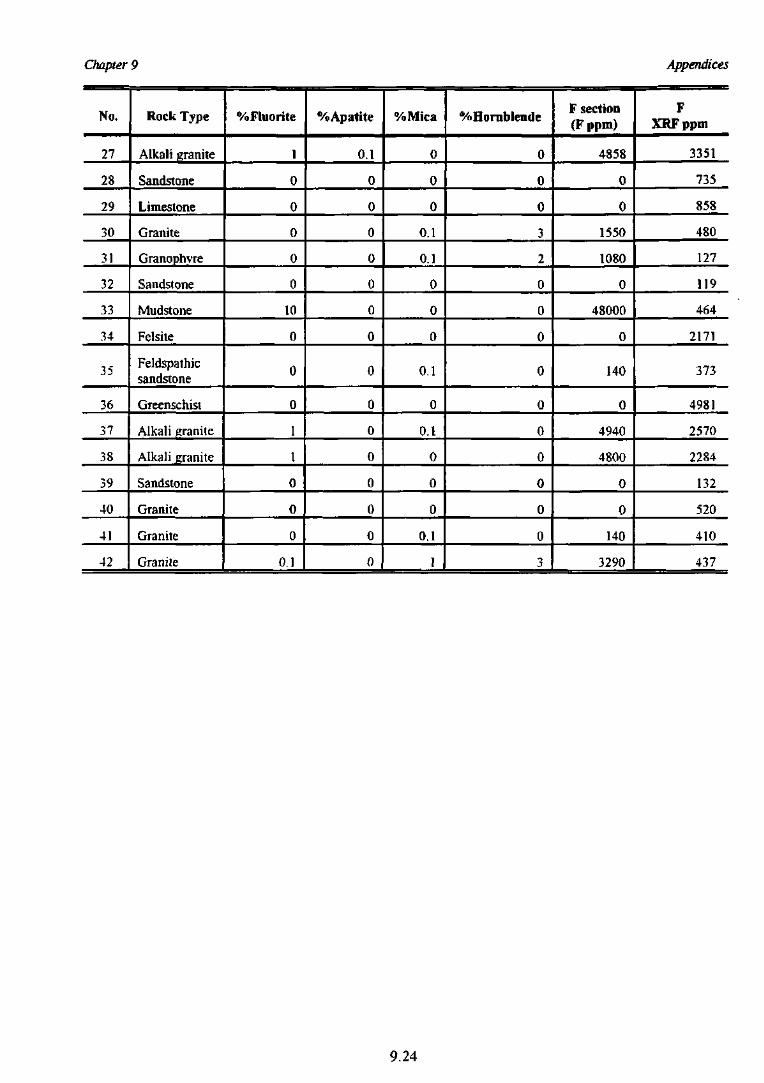
Chapter 9 Appendices
No.
27
28
29
30
31
32
33
34
35
36
37
38
39
40
41
42
Rock Type
Alkali granite
Sandstone
Limestone
Granite
Granophvre
Sandstone
Mudstone
Felsite
Feldspathicsandstone
Greenschist
Alkali granite
Alkali granite
Sandstone
Granite
Granite
Granite
%Fluorite
1
0
0
0
0
0
10
0
0
0
1
1
0
0
0
0.1
%Apatite
0.1
0
0
0
0
0
0
0
0
0
0
0
0
0
0
0
%Mica
0
0
0
0.1
0.1
0
0
0
0.1
0
0.1
0
0
0
0.1
1
%Hornblende
0
0
0
3
2
0
0
0
0
0
0
0
0
0
0
3
F section(Fppm)
4858
0
0
1550
1080
0
48000
0
140
0
4940
4800
0
0
140
3290
FXRFppm
3351
735
858
480
127
119
464
2171
373
4981
2570
2284
132
520
410
437
9.24
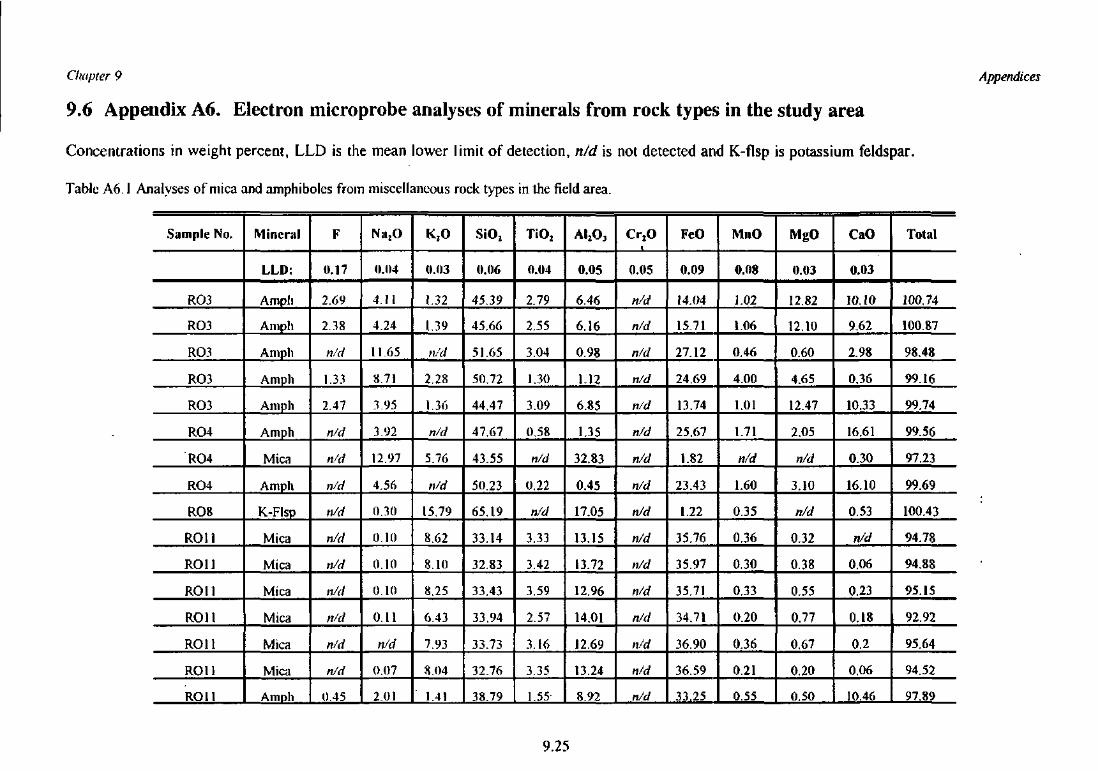
Chapter 9
9.6 Appendix A6. Electron microprobe analyses of minerals from rock types in the study area
Concentrations in weight percent, LLD is the mean lower limit of detection, n/d is not detected and K-flsp is potassium feldspar.
Table A6.1 Analyses of mica and amphiboles from miscellaneous rock types in the field area.
Appendices
Sample No.
RO3
RO3
RO3
RO3
RO3
RO4
RO4
RO4
RO8
ROtl
RO11
RO11
RO11
RO11
RO11
RO11
Mineral
LLD:
Ampli
Amph
Ampli
Amph
Amph
Amph
Mica
Amph
K-Flsp
Mica
Mica
Mica
Mica
Mica
Mica
AlTlDh
F
0.17
2.69
2.38
n/d
1.33
2.47
n/d
n/d
n/d
n/d
n/d
n/d
n/d
n/d
n/d
n/d
0.45
Na2O
0.04
4.11
4.24
11.65
8.71
3.95
3.92
12.97
4.56
0.30
0.10
0.10
0.10
0.11
n/d
0.07
2.01
K2O
(1.03
1.32
1.39
n/d
2.28
1.36
n/d
5.76
n/d
15.79
8.62
8.10
8.25
6.43
7.93
8.04
1.41
SiO2
0.06
45.39
45.66
51.65
50.72
44.47
47.67
43.55
50.23
65.19
33.14
32.83
33.43
33.94
33.73
32.76
38.79
TiO2
0.04
2.79
2.55
3.04
1.30
3.09
0.58
n/d
0.22
n/d
3.33
3.42
3,59
2.57
3.16
3.35
1.55
AI2O,
0.05
6.46
6.16
0.98
1.12
6.85
1.35
32.83
0.45
17.05
13.15
13.72
12.96
14.01
12.69
13.24
8.92
OjO
0.05
n/d
n/d
n/d
n/d
n/d
n/d
n/d
n/d
n/d
n/d
n/d
n/d
n/d
n/d
n/d
n/d
FeO
0.09
14.04
15.71
27.12
24,69
13.74
25.67
1.82
23.43
1.22
35.76
35.97
35.71
34.71
36.90
36.59
33.25
MnO
0.08
1.02
1.06
0.46
4.00
1.01
1.71
n/d
1.60
0.35
0.36
0.30
0.33
0.20
0.36
0.21
0.55
MgO
0.03
12.82
12.10
0.60
4.65
12.47
2.05
n/d
3.10
n/d
0.32
0.38
0.55
0.77
0.67
0.20
0.50
CaO
0.03
10.10
9.62
2.98
0.36
10.33
16.61
0.30
16.10
0.53
n/d
0.06
0.23
0.18
0.2
0.06
10.46
Total
100.74
100.87
98.48
99.16
99.74
99.56
97.23
99.69
100.43
94.78
94.88
95.15
92.92
95.64
94.52
97.89
9.25
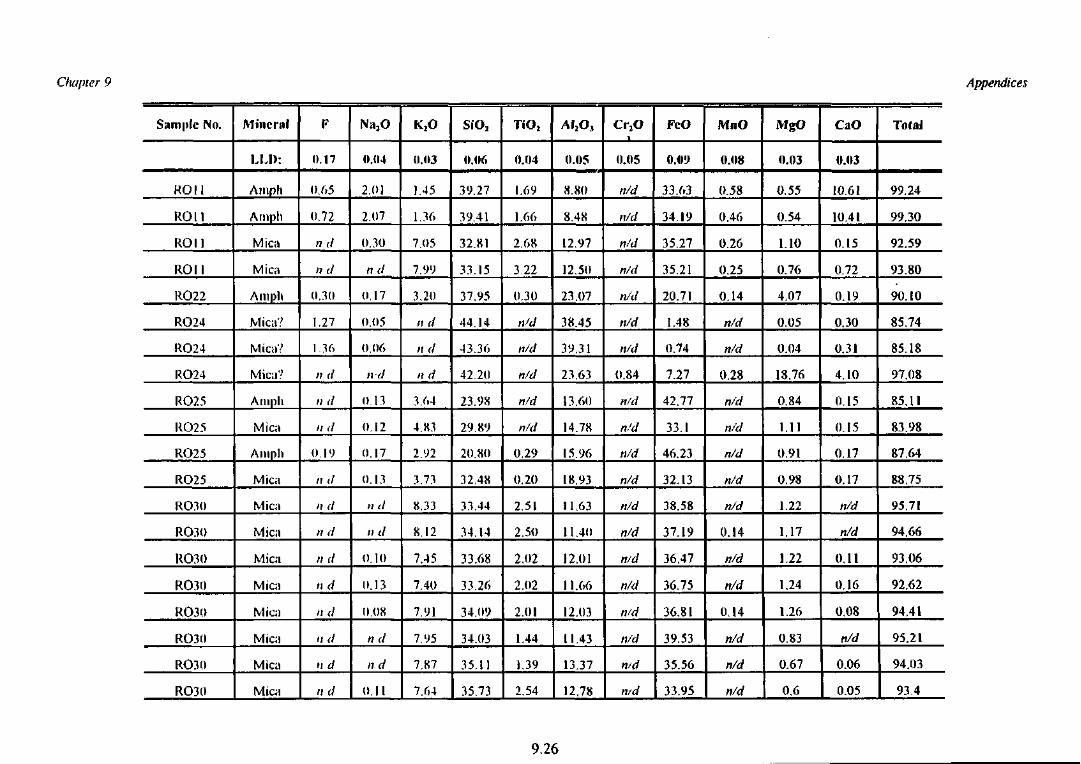
Chapter 9 Appendices
Sample No.
ROU
ROll
ROI1
ROll
RO22
RO24
RO24
RO24
RO25
RO25
RO25
RO25
RO.30
RO30
RO30
RO30
RO30
RO3(I
RO30
RO30
Mincn>l
LLI1:
Amph
Amph
Mica
Mica
Amph
Mien?
Mica?
Mica'.'
Amph
Mica
Amph
Mica
Mica
Mica
Mica
Mica
Mien
Mien
Mica
Mien
F
0.17
0.65
0.72
nd
nd
(1.30
1.27
1.36
nd
nd
nd
0.19
nd
nd
nd
nd
nd
nd
nd
nd
nd
Na2O
0.(14
2,01
2.07
0.30
nd
0.17
0.05
o.or>
nd
0.13
0.12
0.17
0.13
nd
nd
0.10
0.13
0.08
nd
nd
0.11
(1.03
1.45
1.36
7.05
7.99
3.20
nd
ltd
nd
3.64
4.K3
2.92
3.73
8.33
K 12
7.45
7.40
7.91
7.95
7.87
7.64
SiO,
0.06
39.27
39.41
32.81
33.15
37.95
44.14
43.36
42.20
23.98
29,89
20.80
32.48
33.44
34.14
33.68
33.26
34.09
34.03
35.11
35.73
TiOi
0.04
1.69
1.66
2.68
3.22
0,30
n/d
n/d
n/d
n/d
n/d
0.29
0.20
2.51
2.50
2.02
2.02
2.01
1.44
1.39
2.54
AI2O3
0.05
8.80
8.48
12.97
12.50
23.07
38.45
39,31
23.63
13.60
14.78
15.96
18.93
11,63
11.40
12.01
11.66
12.03
11.43
13.37
12.78
Cr2O
0.05
n/d
n/d
n/d
n/d
n/d
n/d
n/d
0.84
n/d
n/d
n/d
n/d
n/d
n/d
n/d
n/d
n/d
n/d
n/d
n/d
FeO
0.<l!>
33.63
34 19
35.27
35.21
20.71
1.48
0,74
7.27
42.77
33.1
46.23
32.13
38.58
37.19
36,47
36.75
36.81
39.53
35.56
33.95
MnO
0.08
0.58
0.46
0.26
0.25
0.14
n/d
n/d
0.28
n/d
n/d
n/d
n/d
n/d
0.14
n/d
n/d
0.14
n/d
n/d
n/d
MgO
0.03
0,55
0.54
1.10
0.76
4.07
0.05
0.04
18.76
0.84
1.11
0.91
0.98
1.22
1.17
1.22
1.24
1.26
0.83
0.67
0.6
CaO
0.03
10.61
10.41
0.15
0.72
0.19
0.30
0.31
4.10
0.15
0.15
0.17
0.17
n/d
n/d
0.11
0.16
0.08
n/d
0.06
0.05
Total
99.24
99.30
92.59
93.80
90.10
85.74
85.18
97.08
85.11
83.98
87.64
88.75
95.71
94.66
93.06
92.62
94.41
95.21
94.03
93.4
9.26
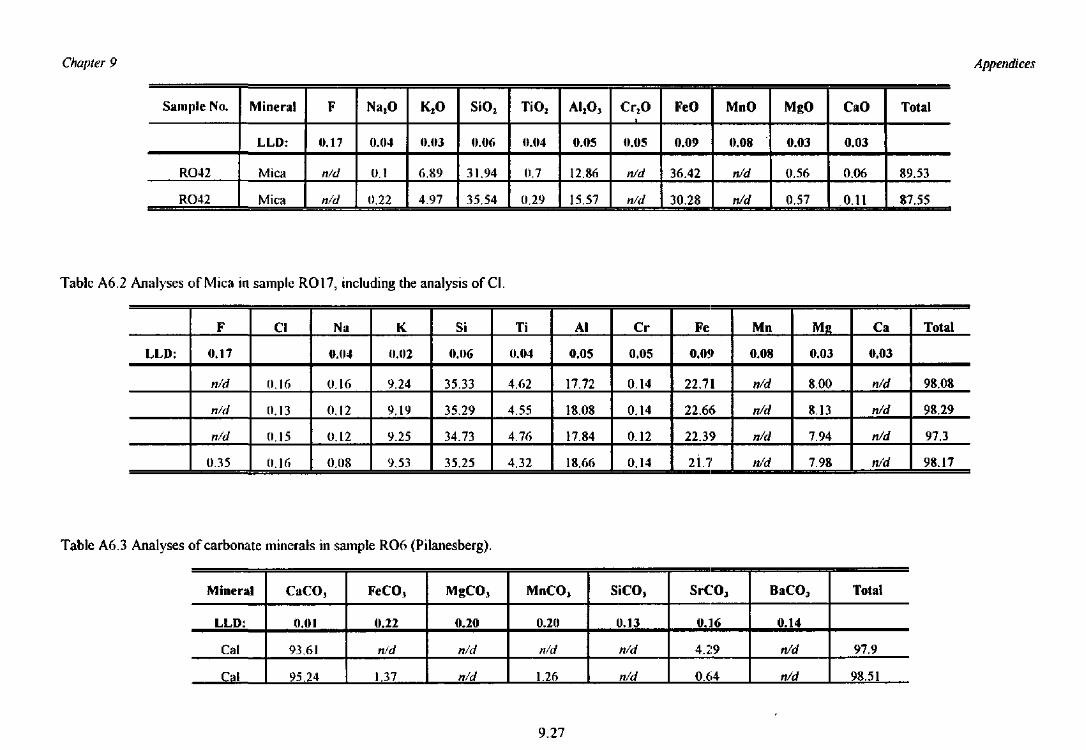
Chapter 9 Appendices
Sample No.
RO42
RO42
Mineral
LLD:
Mica
Mica
F
0.17
n/d
n/d
Na,O
0.04
0.1
0.22
0.03
6.89
4.97
SiO2
0.06
31.94
35.54
TiO,
0.04
0.7
0.29
A12O,
0.05
12.86
15.57
Cr2O
0.05
n/d
n/d
FeO
0.09
36.42
30.28
MnO
0.08
n/d
n/d
MgO
0.03
0.56
0.57
CaO
0.03
0.06
0.11
Total
89.53
87.55
Table A6.2 Analyses of Mica in sample RO17, including the analysis of Cl.
LLD:
F
0.17
n/d
n/d
n/d
0.35
Cl
0.16
0.13
0.15
0.16
Na
(MM
0.16
0.12
0.12
0.08
K
0.02
9.24
9.19
9.25
9.53
Si
0.06
35.33
35.29
34.73
35.25
Ti
0.04
4.62
4.55
4.76
4.32
Al
0.05
17.72
18.08
17.84
18.66
Cr
0.05
0.14
0.14
0.12
0.14
Fe
0.0!)
22.71
22.66
22.39
21.7
Mn
0.08
n/d
n/d
n/d
n/d
MR
0.03
8.00
8.13
7.94
7.98
Ca
0.03
n/d
n/d
n/d
n/d
Total
98.08
98.29
97.3
98.17
Table A6.3 Analyses of carbonate minerals in sample RO6 (Pilanesberg).
Mineral
LLD:
Cat
Cal
CaCOj
0.01
93.61
95.24
FeCOj
0.22
n/d
1.37
MgCO3
0.20
n/d
n/d
MnCOj
0.20
n/d
1.26
SiCO3
0.13
n/d
n/d
SrCO,
0.16
4.29
0.64
BaCO,
0.14
n/d
n/d
Total
97.9
98.51
9.27
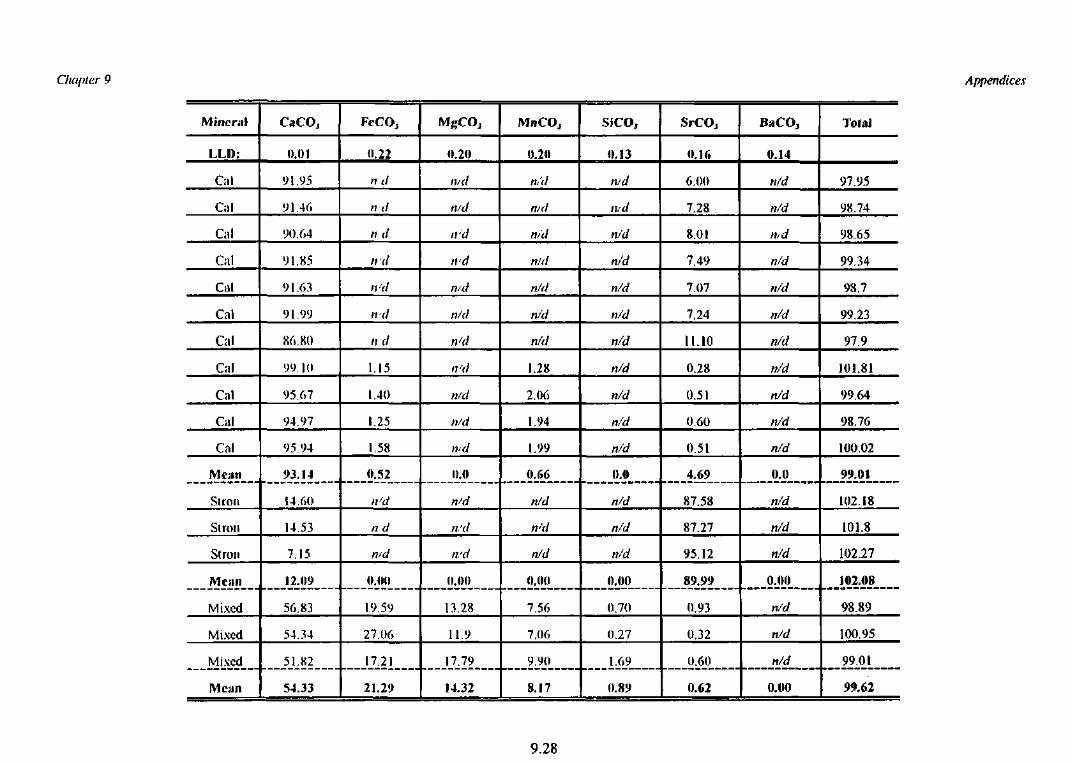
Chapter 9 Appendices
Mineral
LLI):
Cal
C;>l
Ciil
Cal
Cal
Cal
Cal
Oil
Ciil
Cal
Cal
Mean
Slron
Stron
Stron
Mean
Mixed
Mixed
Mixed
Mean
CaCOj
0.01
91.95
91.46
90.64
91.85
91.63
91.99
86.80
99.10
95.67
94.97
95.94
93.14
14.60
14.53
7,15
12.09
56.83
54.34
51.82
54.33
FeCOj
(1.22
nd
nd
nd
nd
n'd
nd
nd
1.15
1.40
1.25
1.58
0.52
n'd
nd
wd
0.0(1
19.59
27.06
17.21
21.29
M K C O J
(1.20
iv d
n/d
n/d
ivd
n/d
n/d
n/d
n'd
n/d
n/d
n'd
0.(1
n/d
n/d
n'd
0.00
13.28
11.9
17.79
14.32
MnCOj
0.211
n,'d
wd
n/d
n/d
n/d
n/d
n/d
1.28
2.06
1.94
1,99
0.66
n/d
n'd
n/d
0.0(1
7.56
7.06
9,90
8.17
SiCOj
0.13
n/d
n/d
n/d
n/d
n/d
n/d
n/d
n/d
n/d
n/d
n/d
0.0
n/d
n/d
n/d
0.00
0.70
0.27
1.69
0.8V
SrCOj
0.16
6.00
7.28
8.01
7.49
7.07
7.24
11.10
0.28
0.51
0.60
0.51
4.69
87.58
87.27
95.12
89.99
0.93
0.32
0.60
0.62
BaCOj
0.14
n/d
n/d
wd
n/d
n/d
n/d
n/d
n/d
n/d
n/d
n/d
0.0
n/d
n/d
n/d
0.00
n/d
n/d
n/d
0.00
Total
97.95
98.74
98.65
99.34
98.7
99.23
97.9
101.81
99.64
98.76
100.02
99.01
102.18
101.8
102.27
102.08
98.89
100.95
99.01
99.62
9.28
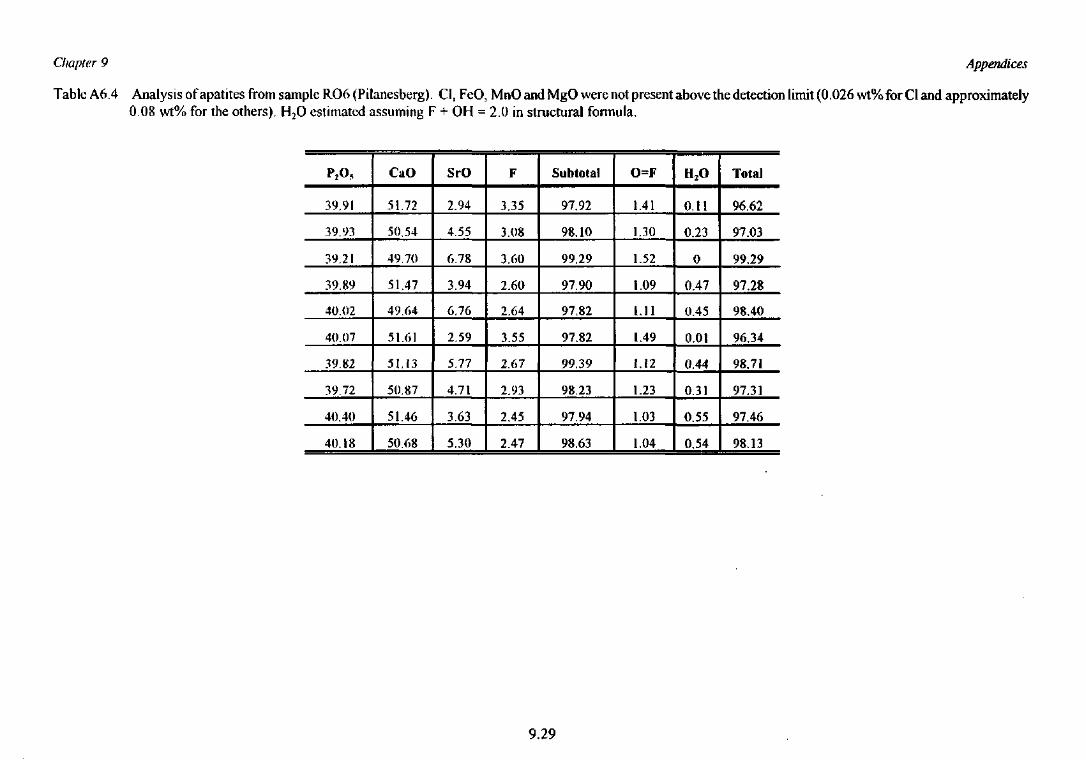
Chapter 9 Appendices
Table A6.4 Analysis of apatites from sample RO6 (Pilanesberg). C!: FeO. MnO and MgO were not present above the detection limit (0.026 wt%for Cl and approximately0.08 wt% for the others). H2O estimated assuming F + OH = 2.0 in structural formula.
P2OP
39.91
39.93
39.21
39.89
40.02
40.07
39.82
39.72
40.40
40.18
CaO
51.72
50.54
49.70
51.47
49.64
51.61
51.13
50.87
51.46
50.68
SrO
2.94
4.55
6.78
3.94
6.76
2.59
5.77
4.71
3.63
5.30
F
3.35
3.08
3.60
2.60
2.64
3.55
2.67
2.93
2.45
2.47
Subtotal
97.92
98.10
99.29
97.90
97.82
97.82
99.39
98.23
97.94
98.63
O=F
1.41
1.30
1.52
1.09
1.11
1.49
1.12
1.23
1.03
1.04
0.11
0.23
0
0.47
0.45
0.01
0.44
0.31
0.55
0.54
Total
96.62
97.03
99.29
97.28
98.40
96.34
98.71
97.31
97.46
98.13
9.29
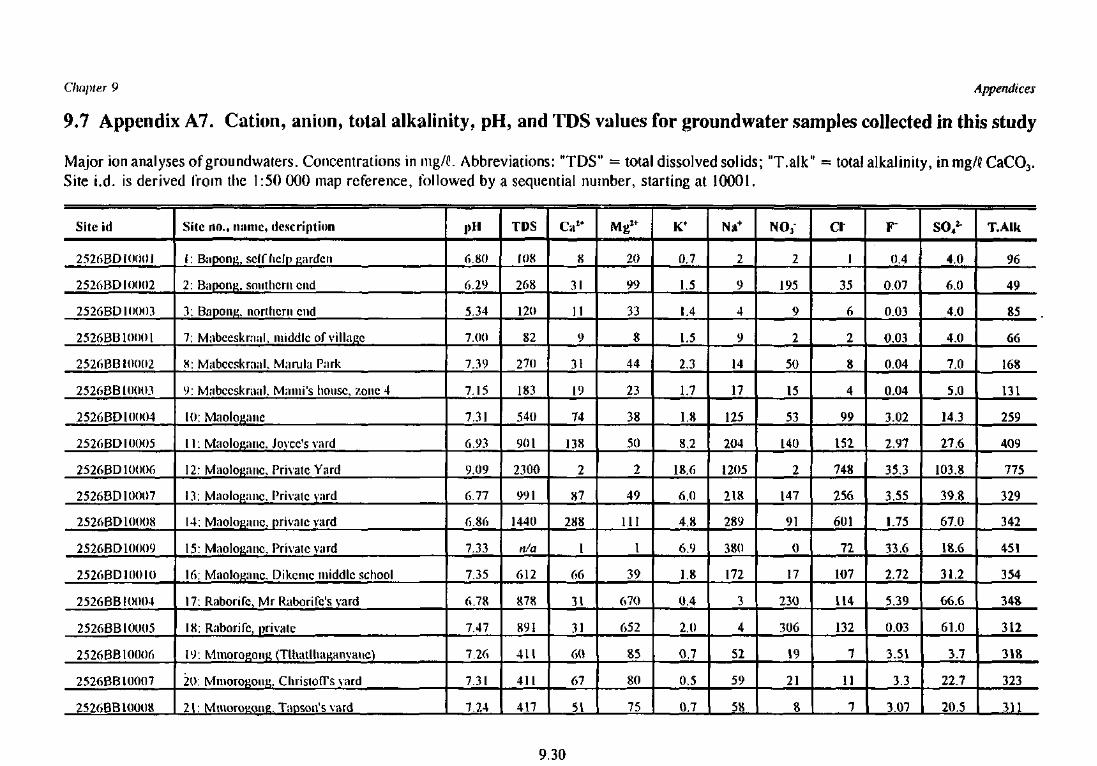
Chapter 9 Appendices
9.7 Appendix A7. Cation, anion, total alkalinity, pH, and TDS values for groundwater samples collected in this study
Major ion analyses ofgroundwaters. Concentrations in mg/C. Abbreviations: "TDS" = total dissolved solids; "T.alk" = total alkalinity, inmg/I> CaCO3.Site i.d. is derived from the 1:50 000 map reference, followed by a sequential number, starting at 10001.
Site id
2526BD10001
2526BDI0002
2526BD10003
2526BB10001
2526BB10002
2526BB10003
2526BD10004
2526BD10005
2526BD10006
2526BD10007
2526BD10008
2526BD10009
2526BD10010
2526BB10004
2526BB10005
2526BB10006
2526BB10007
2526BB10008
Site no., name, description
1: BciponK, self help garden
2: Bapong. southern end
3: Bapon^. northern end
7: Mtfbceskraal, middle of village
8: Miibceskniiil. Manila Piirk
9: Mabccskraal. Miimi's house, zone 4
10: Maolotfane
11: MaoloKauc. Joyce's yard
12: Maologanc, Private Yard
13: Maologanc, Private yard
14: Maologanc. private yard
15: Maologiinc. Private vard
16: Maolo^anc, Dikeine middle school
17: Raborifc, Mr Raborifc's yard
18: Raborifc, private
19: Mmorof>on!> (TUiatlha^anvaue)
20: MinoroKong. ChristofTs vard
21: MmoroKonR, Taoson's vard
pH
6.80
6.29
5.34
7.00
7.39
7.15
7.31
6.93
9.09
6.77
6.86
7.33
7.35
6.78
7.47
7.26
7.31
7.24
TDS
108
268
120
82
270
183
540
901
2300
991
1440
rt/ct
612
878
891
411
411
417
Ca1*
8
31
11
9
31
19
74
138
2
87
288
I
66
31
31
60
67
51
20
99
33
8
44
23
38
50
2
49
111
I
39
670
652
85
80
75
0.7
1.5
1.4
1.5
2.3
1.7
1.8
8,2
18.6
6,0
4.8
6.9
1.8
0.4
2.0
0.7
0.5
0.7
2
9
4
9
14
17
125
204
1205
218
289
380
172
3
4
52
59
58
NO,
2
195
9
2
50
15
53
140
2
147
91
0
17
230
306
19
21
8
a
I
35
6
2
8
4
99
152
748
256
601
72
107
114
132
7
11
7
F
0.4
0.07
0.03
0.03
0.04
0.04
3.02
2.97
35.3
3.55
1.75
33.6
2.72
5.39
0.03
3.51
3.3
3.07
SO4^
4.0
6.0
4.0
4,0
7.0
5.0
14.3
27.6
103.8
39.8
67.0
18.6
31.2
66.6
61.0
3.7
22.7
20.5
T.Alk
96
49
85
66
168
131
259
409
775
329
342
451
354
348
312
318
323
311
9.30
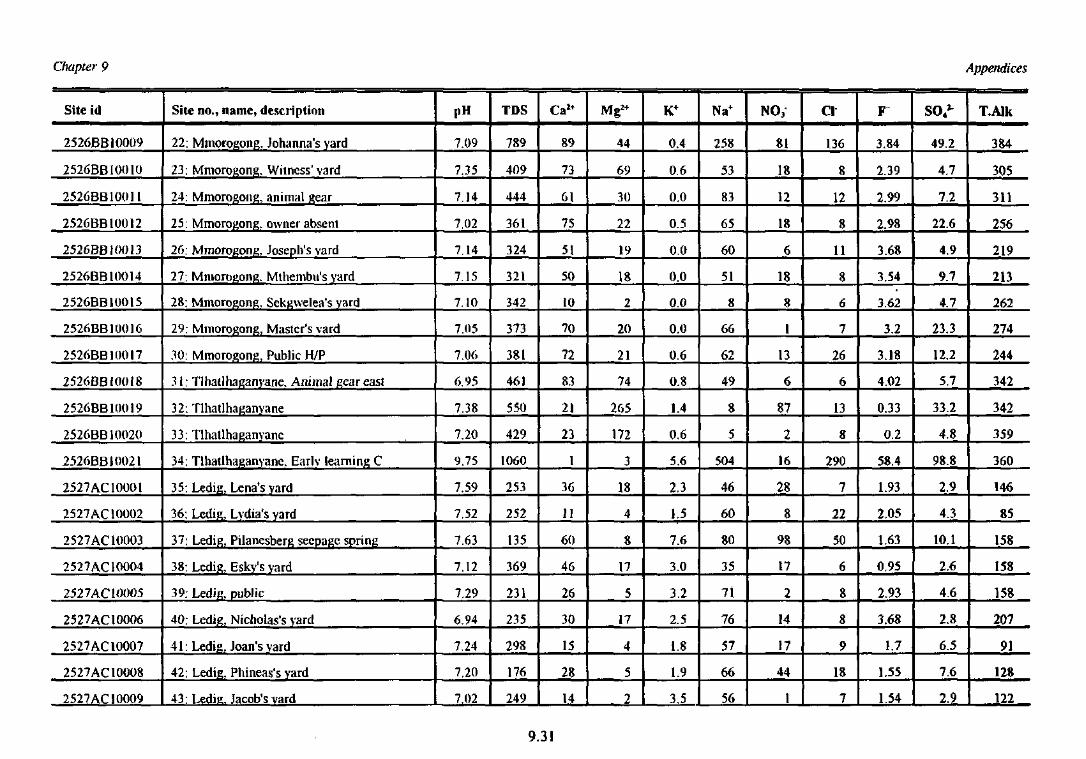
Chapter 9 Appendices
Site id
2526BB10009
2526BBIOO1O
2526BB1OO11
2526BB10012
2526BB1OO13
2526BB10O14
2526BB1OO15
2526BB10016
2526BB10017
2526BB10018
2526BB10019
2526BB10020
2526BB10021
2527 AC 10001
2527 AC 10002
2527 AC 10003
2527 AC 10004
2527AC1OOO5
2527AC10006
2527 AC 10007
2527AC10008
2527 AC 10009
Site no., name, description
22: Mmorogong, Johanna's yard
23; Mmorogong. Witness'yard
24: Mmorogong, animal gear
25: Mmorogong, owner absent
26: Mmorogong, Joseph's yard
27: Mmorogong, Mthembu's yard
28: Mmorogong. Sekgwelea's yard
29: Mmorogong, Master's vard
30: Mmorogong, Public H/P
31: Tlhatlhaganyane, Animal gear east
32: Tlhatlhaganyane
33: Tlhatlhaganvane
34: Tlhatlhaganyane, Early learning C
35: Ledig, Lena's yard
36: Ledig, Lvdia's yard
37: Ledig, Pilanesberg seepage spring
38: Ledig. Esky's yard
39: Ledig, public
40; Ledig, Nicholas's yard
41: Ledig. Joan's yard
42; Ledig, Phineas's yard
43: LediE. Jacob's vard
pH
7.09
7.35
7.14
7.02
7.14
7.15
7.10
7.05
7.06
6.95
7.38
7.20
9.75
7.59
7,52
7.63
7.12
7.29
6.94
7.24
7.20
7.02
TDS
789
409
444
361
324
321
342
373
381
46!
550
429
1060
253
252
135
369
231
235
298
176
249
Ca2+
89
73
61
75
51
50
10
70
72
83
21
23
1
36
11
60
46
26
30
15
28
14
Mg2+
44
69
30
22
19
18
2
20
21
74
265
172
3
18
4
8
17
5
17
4
5
2
K+
0.4
0.6
0.0
0.5
0.0
0.0
0.0
0.0
0.6
0.8
1.4
0.6
5.6
2.3
1.5
7.6
3.0
3.2
2.5
1.8
1.9
3.5
Na+
258
53
83
65
60
51
8
66
62
49
8
5
504
46
60
80
35
71
76
57
66
56
NO3
81
18
12
18
6
18
8
1
13
6
87
2
16
28
8
98
17
2
14
17
44
1
Cl
136
8
12
8
11
8
6
7
26
6
13
8
290
7
22
50
6
8
8
9
18
7
F'
3.84
2.39
2.99
2.98
3.68
3.54
3.62
3.2
3.18
4.02
0.33
0.2
58.4
1.93
2.05
1.63
0.95
2.93
3.68
1.7
1.55
1.54
so*1-
49.2
4.7
7.2
22.6
4.9
9.7
4.7
23.3
12.2
5.7
33.2
4.8
98.8
2.9
4.3
10.1
2.6
4.6
2.8
6.5
7.6
2.9
T.Alk
384
305
311
256
219
213
262
274
244
342
342
359
360
146
85
158
158
158
207
91
128
122
9.31
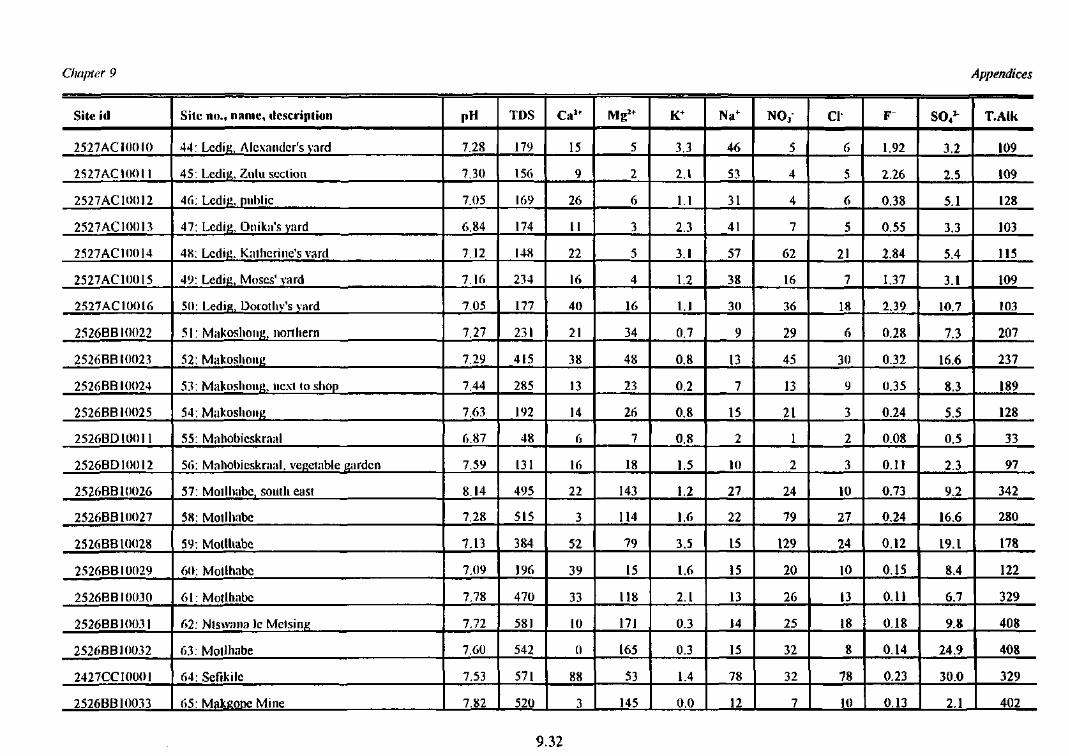
Chapter 9 Appendices
Site ill
2527 AC 10010
2527 AC 10011
2527AC1OO12
2527AC1OO13
2527AC10014
2527AC10015
2527AC1OOI6
2526BB10022
2526BB10023
2526BB10024
2526BB10025
2526BD10011
2526BD10012
2526BB10026
2526BB10027
2526BB10028
2526BB10029
2526BB10030
2526BB10031
2526BB10032
2427CCI00O1
2526BB10033
Site no., name, description
44: Ledis, Alexander's yard
45: LediK. Zulu section
46: Ledig, public
47: Ledig, Onikii's yard
48: Leditf. Kalherine's vard
49: Ledig, Moses' yard
50: Ledig, Dorothy's yard
51: Makosliong. northern
52: Makoslioug
53: Makoshong. next to shop
54: Makoshong
55: Mahobicskranl
56: Mahobicskraal, vegetable garden
57: Mollhabe, south east
58: Motlliabe
59: Motlhabe
60: Motlhabe
61: Motlliabe
f>2: Ntswana 1c Melsing
63: Motlhabe
64: Sefikilc
65: MaltfiODe Mine
PH
7.28
7.30
7.05
6.84
7.12
7.16
7.05
7.27
7.29
7.44
7.63
6.87
7.59
8.14
7.28
7,13
7.09
7.78
7.72
7.60
7.53
7.82
TDS
179
156
169
174
148
234
177
231
415
285
192
48
131
495
515
384
196
470
581
542
571
520
Ca2t
15
9
26
II
22
16
40
21
38
13
14
6
16
22
3
52
39
33
10
0
88
3
Mg1+
5
2
6
3
5
4
16
34
48
23
26
7
18
143
114
79
15
118
171
165
53
145
K+
3.3
2.1
1.1
2.3
3.1
1.2
1.1
0.7
0.8
0.2
0.8
0.8
1.5
1.2
1.6
3.5
1.6
2.1
0.3
0.3
1.4
0.0
Na+
46
53
31
41
57
38
30
9
13
7
15
2
10
27
22
15
15
13
14
15
78
12
N O /
5
4
4
7
62
16
36
29
45
13
21
1
2
24
79
129
20
26
25
32
32
7
ci-
6
5
6
5
21
7
18
6
30
9
3
2
3
10
27
24
10
13
18
8
78
10
F
1.92
2.26
0.38
0.55
2.84
1.37
2,39
0.28
0.32
0.35
0.24
0.08
0.11
0.73
0.24
0.12
0.15
0.11
0.18
0.14
0.23
0.13
SO4^
3.2
2.5
5.1
3.3
5.4
3.1
10.7
7.3
16.6
8.3
5.5
0.5
2.3
9.2
16.6
19.1
8.4
6.7
9.8
24.9
30.0
2.1
T.Alk
109
109
128
103
115
109
103
207
237
189
128
33
97
342
280
178
122
329
408
408
329
402
9.32
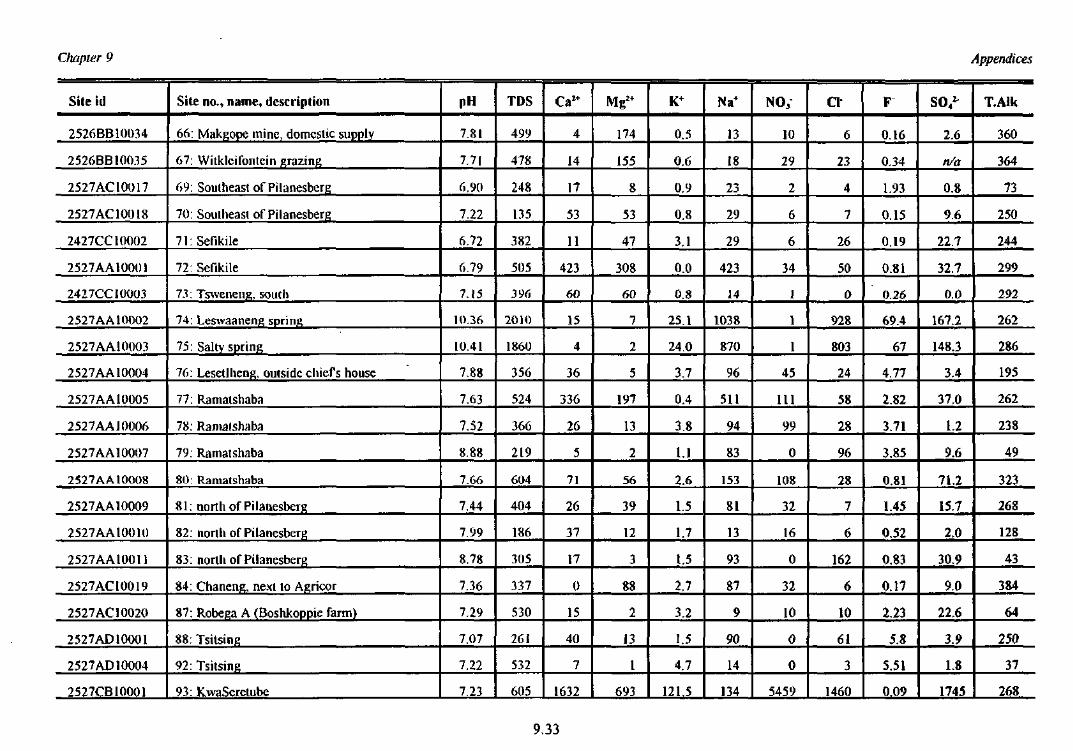
Chapter 9 Appendices
Site id
2526BB10034
2526BB10035
2527AC10017
2527AC10018
2427CC10002
2527AA10001
2427CCIOOO3
2527 AA10002
2527AA10003
2527AA10004
2527 A A10005
2527AA10006
2527AA10007
2527AA10008
2527AA10009
2527AA10010
2527AA10011
2527AC10019
2527AC10020
2527AD1OOO1
2527AD10004
2527CB10001
Site no., name, description
66: Makgope mine, domestic supply
67: Witkleifontein grazing
69: Southeast of Pilanesberg
70: Southeast of Pilanesberg
71: Sefikile
72: Sefikile
73: Tsweneng. south
74: Leswaaneng spring
75: Salty spring
76: Lesetlheng. outside chiefs house
77: Ramatsliaba
78: Ramafshaba
79: Ramatsliaba
80: Ramatshaba
81: north of Pilanesberg
82: north of Pilanesberg
83: north of Pilanesberg
84: Chaneng, next to Agricor
87: Robega A (Boshkoppie farm)
88: Tsitsing
92: Tsitsing
93: KwaSeretube
PH
7.81
7.71
6.90
7,22
6.72
6.79
7.(5
10.36
10.41
7.88
7.63
7.52
8.88
7.C6
7,44
7.99
8.78
7.36
7.29
7,07
7,22
7.23
TDS
499
478
248
135
382
505
396
2010
1860
356
524
366
219
604
404
186
305
337
530
261
532
605
Ca*+
4
14
17
53
11
423
60
15
4
36
336
26
5
71
26
37
17
0
15
40
7
1632
M g "
174
155
8
53
47
308
60
7
2
5
197
13
2
56
39
12
3
88
2
13
1
693
K+
0.5
0.6
0.9
0.8
3.1
0.0
0.8
25.1
24.0
3.7
0.4
3.8
1.1
2.6
1.5
1.7
1.5
2.7
3.2
1.5
4.7
121.5
Na+
13
18
23
29
29
423
14
1038
870
96
511
94
83
153
81
13
93
87
9
90
14
134
NO3
10
29
2
6
6
34
1
1
1
45
111
99
0
108
32
16
0
32
10
0
0
5459
ci-
6
23
4
7
26
50
0
928
803
24
58
28
96
28
7
6
162
6
10
61
3
1460
F
0.16
0.34
1.93
0.15
0.19
0.81
0.26
69.4
67
4.77
2.82
3.71
3.85
0.81
1.45
0.52
0.83
0.17
2.23
5.8
5.51
0.09
SO4^
2.6
n/a
0.8
9.6
22.7
32.7
0.0
167.2
148.3
3.4
37.0
1.2
9.6
71.2
15.7
2.0
30.9
9.0
22.6
3.9
1.8
1745
T.Alk
360
364
73
250
244
299
292
262
286
195
262
238
49
323
268
128
43
384
64
250
37
268
9.33
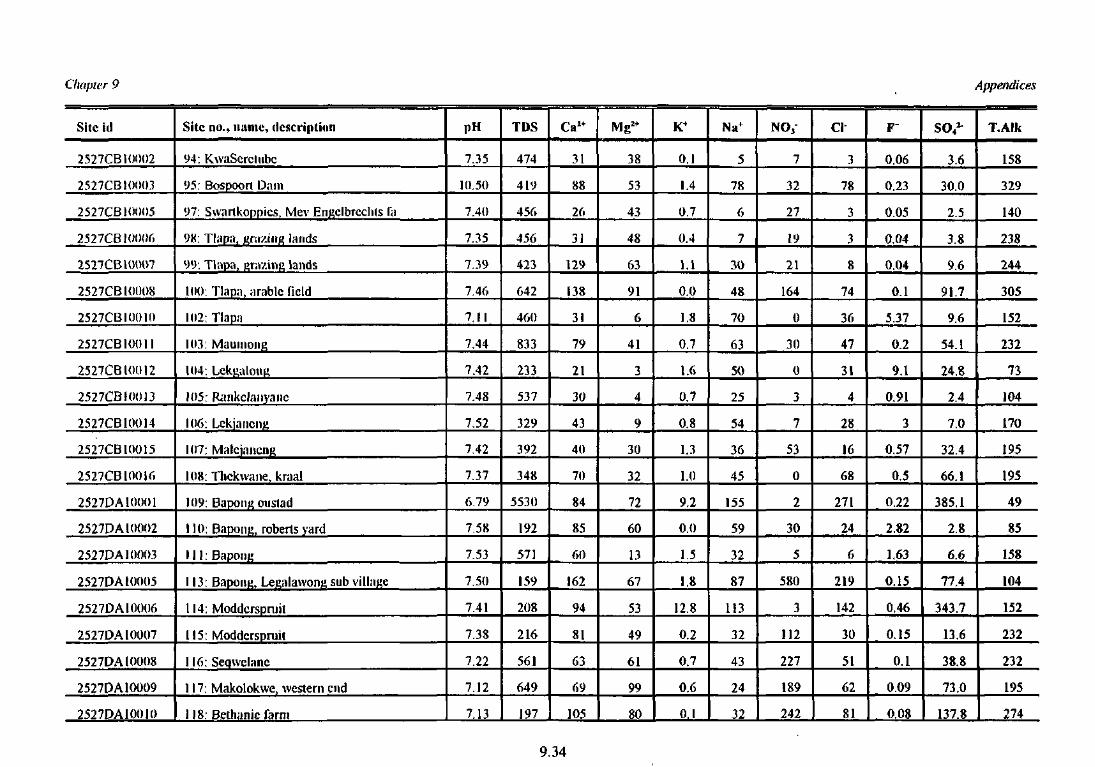
Chapter 9 Appendices
Site id
2527CB10002
2527CB1OOO3
2527CB10005
2527CB10006
2527CBKMO7
2527CB10008
2527CB1O010
2527CB1OO1I
2527CB1O012
2527CB1OOI3
2527CB10014
2527CB10015
2527CBl0()ir,
2527DA10001
2527DA1O002
2527DA10003
2527DA10005
2527DA10006
2527DA10007
2527DA10008
2527DA1OO09
2527DA100IO
Site no., Hiiine, description
94: KwaScrclubc
95: Bospoort Dam
97: Swartkoppics, Mev EiiKclbrcchts fa
98: Tliipa, KraziiiR lands
W: Tlapa, grazing lands
100: Tlapa, arable field
102: Tlapa
103: Mautnong
104: Leksalont;
105: Rankclanyanc
106: Lckjiincng
107: Malcjancng
108: Tlickwane, kraal
109: Bapon^ oustad
110: BapotiE, roberts yard
111: Bapoiin
113: Baponn, LegalawonK sub village
114: Moddcrspniit
115: Modderspruit
116: Seqwelauc
117: Makolokwe, western end
118: Bethanic farm
pH
7.35
10.50
7.40
7.35
7.39
7.46
7.11
7.44
7.42
7.48
7.52
7.42
7.37
6.79
7.58
7.53
7.50
7.41
7.38
7.22
7.12
7.13
TDS
474
419
456
456
423
642
460
833
233
537
329
392
348
5530
192
571
159
208
216
561
649
197
CaI+
31
88
26
31
129
138
31
79
21
30
43
40
70
84
85
60
162
94
81
63
69
105
Mg2+
38
53
43
48
63
91
6
41
3
4
9
30
32
72
60
13
67
53
49
61
99
80
K+
0.1
1.4
0.7
0.4
1.1
0.0
1.8
0.7
1.6
0.7
0.8
1.3
1.0
9.2
0.0
15
1.8
12.8
0.2
0.7
0.6
0.1
Na+
5
78
6
7
30
48
70
63
50
25
54
36
45
155
59
32
87
113
32
43
24
32
7
32
27
19
21
164
0
30
0
3
7
53
0
2
30
5
580
3
112
227
189
242
a
3
78
3
3
8
74
36
47
31
4
28
16
68
271
24
6
219
142
30
51
62
81
F"
0.06
0.23
0.05
0.04
0.04
0.1
5.37
0.2
9.1
0.91
3
0.57
0.5
0.22
2.82
1.63
0.15
0.46
0.15
0.1
0.09
0.08
SO4^
3.6
30.0
2.5
3.8
9.6
91.7
9.6
54.1
24.8
2.4
7.0
32.4
66.1
385.1
2.8
6.6
77.4
343.7
13.6
38.8
73.0
137.8
T.Alk
158
329
140
238
244
305
152
232
73
104
170
195
195
49
85
158
104
152
232
232
195
274
9.34
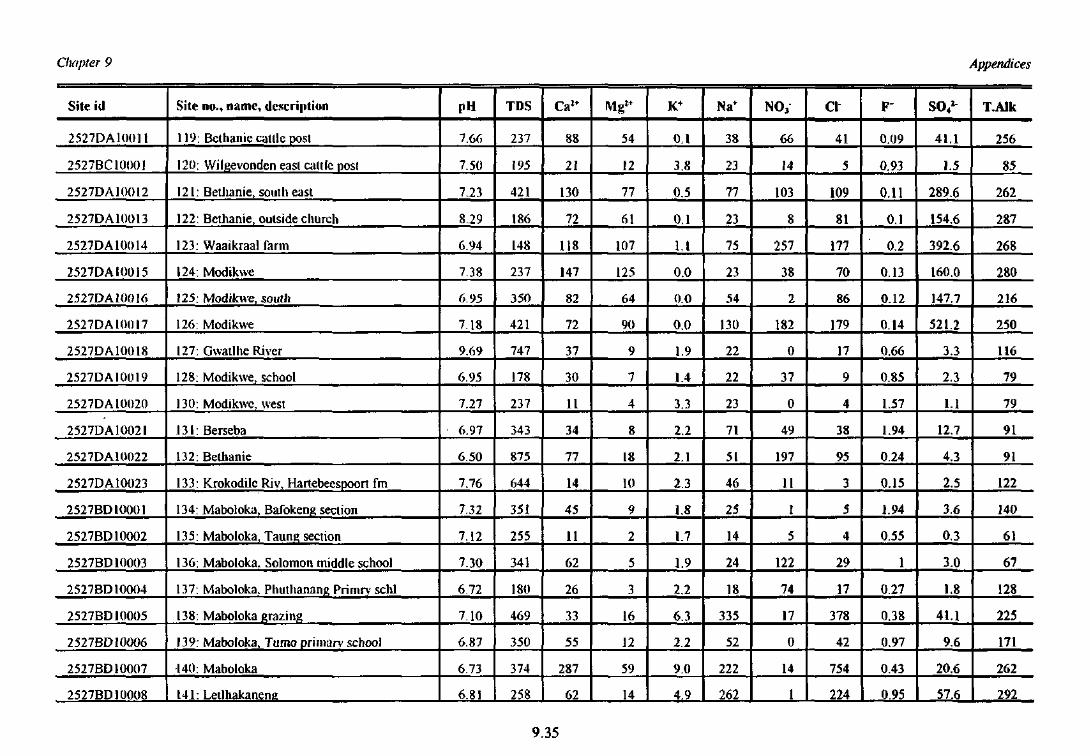
Chapter 9 Appendices
Site id
2527DA10O11
2527BC10001
2527DA10012
2527DA10O13
2527DA10014
2527DAI0015
2527DA10O16
2527DA10017
2527DA10O18
2527DA10019
2527DA10020
2527DA10021
2527DA10022
2527DA1OO23
2527BD10001
2527BD10002
2527BD10003
2527BD10004
2527BD10005
2527BD1OOO6
2527BD10007
2527BD10008
Site no., name, description
119: Bethanie cattle post
120; Wilgevonden east cattle posf
121: Bethanie, south east
122: Bethanie, outside church
123: Waaikraal farm
124: Modikwe
125. Modikwe, south
126: Modikwe
127: Gvvatlhe River
128: Modikwe, school
130: Modikwe, west
131: Berseba
132: Bethanie
133: Krokodile Rivi Hartebeespoort fm
134: Maboloka, Bafokeng section
135: Maboloka, Taung section
136: Maboloka. Solomon middle school
137: Maboloka, Phuthanang Primrv schl
138: Maboloka grazing
139. Maboloka, Tumo primary school
140: Maboloka
141: Letlhakanene
PH
7.66
7.50
7.23
8.29
6.94
7.38
6.95
7.18
9.69
6.95
7.27
6.97
6.50
7.76
7.32
7.12
7.30
6.72
7.10
6.87
6.73
6.81
TDS
237
195
421
186
148
237
350
421
747
178
237
343
875
644
351
255
341
180
469
350
374
258
Ca l+
88
21
130
72
118
147
82
72
37
30
11
34
77
14
45
11
62
26
33
55
287
62
Mg*+
54
12
77
61
107
125
64
90
9
7
4
8
18
10
9
2
5
3
16
12
59
14
K+
0.1
3.8
0.5
0.1
1.1
0.0
0.0
0.0
1.9
1.4
3.3
2.2
2.1
2.3
1.8
1.7
1.9
2.2
6.3
2.2
9.0
4.9
Na+
38
23
77
23
75
23
54
130
22
22
23
71
51
46
25
14
24
18
335
52
222
262
N O ,
66
14
103
8
257
38
2
182
0
37
0
49
197
11
1
5
122
74
17
0
14
1
cr
41
5
109
81
177
70
86
179
17
9
4
38
95
3
5
4
29
17
378
42
754
224
P
0.09
0.93
0.11
0.1
0.2
0.13
0.12
0.14
0.66
0.85
1.57
1.94
0.24
0.15
1.94
0.55
1
0.27
0.38
0.97
0.43
0.95
41.1
1.5
289.6
154.6
392.6
160.0
147.7
521.2
3.3
2.3
1.1
12.7
4.3
2.5
3.6
0.3
3.0
1.8
41.1
9.6
20.6
57.6
T.Alk
256
85
262
287
268
280
216
250
116
79
79
91
91
122
140
61
67
128
225
171
262
292
9.35
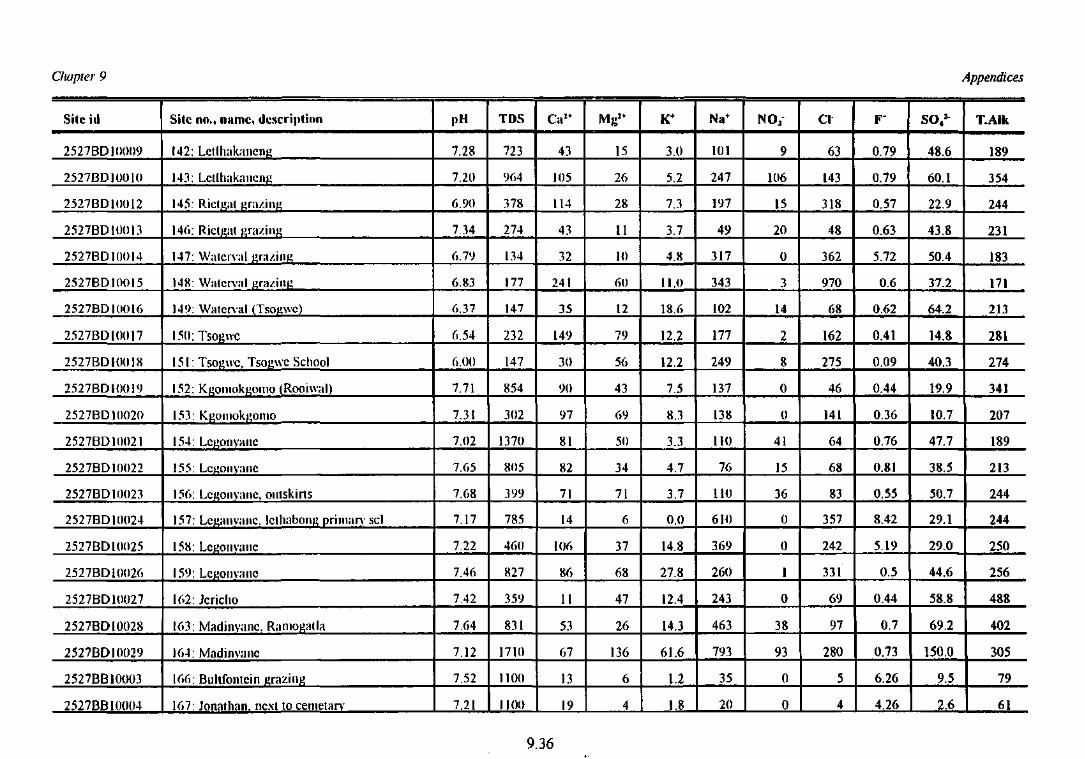
Chapter 9 Appendices
Site ill
2527BD10009
2527BD10010
2527BD10012
2527BD10OI3
2527BD10014
2527BD10015
2527BDIOOI6
2527BDI00I7
2527BDIOOIX
2527BDIOOI9
2527BDI0O20
2527BD10021
2527BD1OO22
2527BD10023
2527BD10024
2527BD10025
2527BD1002f>
2527BD10027
2527BD10028
2527BD10O29
2527BB10003
2527BB10004
Site no., name, description
142: Letlhakanentf
143: LctlhakanciiK
145: Rictgal grazing
146: Rictgiil grazing
147: Watcrval grazing
148: W;itcr\'al grazing
149: Waterval (Tsogwc)
150: Tsogwc
151: Tsog^vc. Tsogwc School
152: Kgomokgomo (Rooiwal)
153: Kgomokgomo
154: Legonyanc
155: Lcgonyanc
156: Legonyanc. outskirts
157: Leganvane, Iclhabong primary scl
158: Lcgoiivanc
159: Lcgonvaiic
162: Jericho
163: Madiiivanc, Ramogatla
164; Mad in vane
166: Bultfontcin grazing
167 Jonathan, next to cemetarv
pH
7.28
7.20
6.90
7.34
6.79
6.83
6.37
6.54
6.00
7.71
7.31
7.02
7.65
7,68
7.17
7.22
7.46
7.42
7.64
7.12
7.52
7.21
TDS
723
964
378
274
134
177
147
232
147
854
302
1370
805
399
785
460
827
359
831
1710
1100
1100
Ca1*
43
105
114
43
32
241
35
149
30
90
97
81
82
71
14
106
86
11
53
67
13
19
15
26
28
11
10
60
12
79
56
43
69
50
34
71
6
37
68
47
26
136
6
4
K+
3.0
5.2
7.3
3.7
4.8
11.0
18.6
12.2
12.2
7.5
8.3
3.3
4.7
3.7
0.0
14.8
27.8
12.4
14.3
61.6
1.2
1.8
Na+
101
247
197
49
317
343
102
177
249
137
138
110
76
110
610
369
260
243
463
793
35
20
NO,
9
106
15
20
0
3
14
2
8
0
0
41
15
36
0
0
1
0
38
93
0
0
a
63
143
318
48
362
970
68
162
275
46
141
64
68
83
357
242
331
69
97
280
5
4
F"
0.79
0.79
0.57
0.63
5.72
0.6
0.62
0.41
0.09
0.44
0.36
0.76
0.81
0.55
8.42
5.19
0.5
0.44
0.7
0.73
6.26
4.26
48.6
60.1
22.9
43.8
50.4
37.2
64.2
14.8
40.3
19.9
10.7
47.7
38.5
50.7
29.1
29.0
44.6
58.8
69.2
150.0
9.5
2.6
T.Alk
189
354
244
231
183
171
213
281
274
341
207
189
213
244
244
250
256
488
402
305
79
6]
9.36
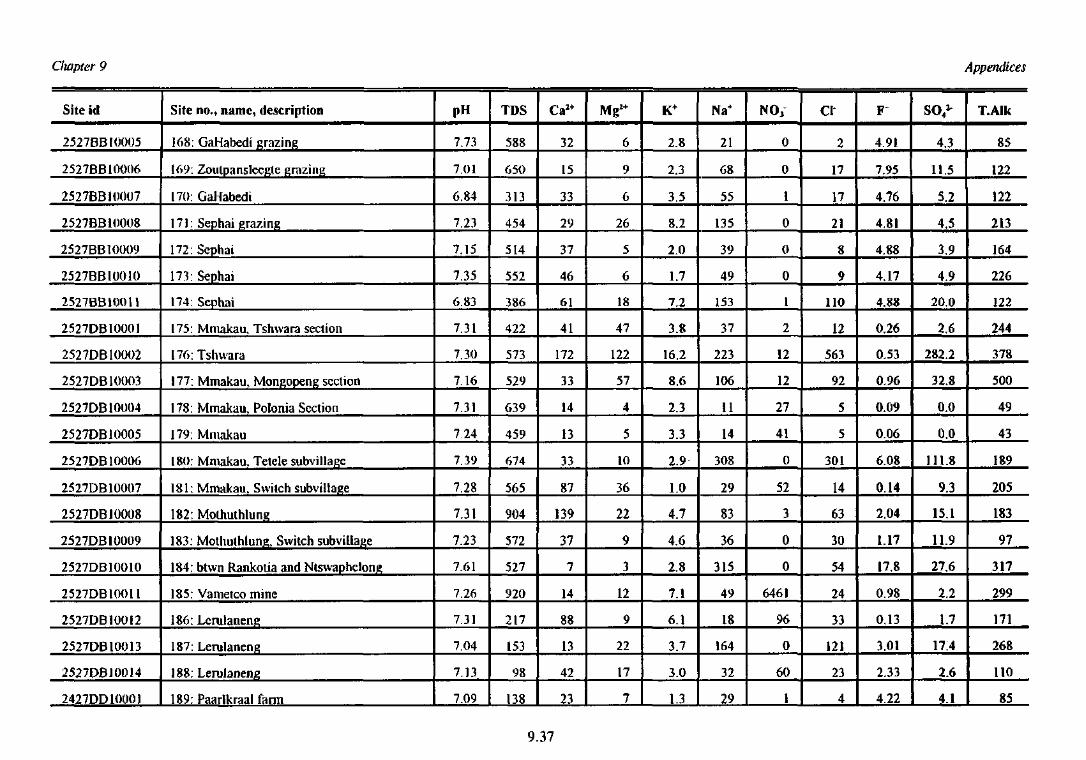
Giapter 9 Appendices
Site id
2527BB10005
2527BB10006
2527BB10007
2527BB10008
2527BB10009
2527BB1U010
2527BB100U
2527DB10001
2527DB10002
2527DB10003
2527DB10004
2527DB10005
2527DB10006
2527DB10007
2527DB10008
2527DB10009
2527DB10O10
2527DB1OO11
2527DB1O012
2527DB10013
2527DB10014
2427DD10001
Site no., name, description
168: GaHabedi grazing
169: Zoutpansleegte grazing
170: GaHabedi
171: Sephai grazing
172: Sephai
173: Sephai
174: Sephai
175: Mmakau, Tshwara section
176: Tshwara
177: Mmakau, Mongopeng section
178: Mmakau, Polonia Section
179: Mmakau
180: Mmakau. Tetele subvillage
181: Mmakau, Switch subvillage
182: Mothuthlung
183: Mothuthlung, Switch subvillage
184: btvvn Rankotia and Ntswaphelong
185: Vametco mine
186: Lerulaneng
187: Lerulaneng
188: Lerulaneng
189: Paarlkraal farm
pH
7.73
7.01
6.84
7.23
7.15
7.35
6.83
7.31
7.30
7,16
7.31
7.24
7.39
7.28
7.31
7.23
7.61
7.26
7.31
7.04
7.13
7.09
TDS
588
650
313
454
514
552
386
422
573
529
639
459
674
565
904
572
527
920
217
153
98
138
Ca I +
32
15
33
29
37
46
61
41
172
33
14
13
33
87
139
37
7
14
88
13
42
23
Mgz+
6
9
6
26
5
6
18
47
122
57
4
5
10
36
22
9
3
12
9
22
17
7
K+
2.8
2.3
3.5
8.2
2.0
1.7
7.2
3.8
16.2
8.6
2.3
3.3
2.9
1.0
4.7
4.6
2.8
7.1
6.1
3.7
3.0
1.3
Na+
21
68
55
135
39
49
153
37
223
106
11
14
308
29
83
36
315
49
18
164
32
29
NO,
0
0
1
0
0
0
1
2
12
12
27
41
0
52
3
0
0
6461
96
0
60
1
CI
2
17
17
21
8
9
110
12
563
92
5
5
301
14
63
30
54
24
33
121
23
4
F
4.91
7.95
4.76
4.81
4.88
4.17
4.88
0.26
0.53
0.96
0.09
0.06
6.08
0.14
2.04
1.17
17.8
0.98
0.13
3.01
2.33
4.22
S O ^
4.3
11.5
5.2
4.5
3.9
4.9
20.0
2.6
282.2
32.8
0.0
0.0
111.8
9.3
15.1
11.9
27.6
2.2
1.7
17.4
2.6
4.1
T.Alk
85
122
122
213
164
226
122
244
378
500
49
43
189
205
183
97
317
299
171
268
110
85
9.37
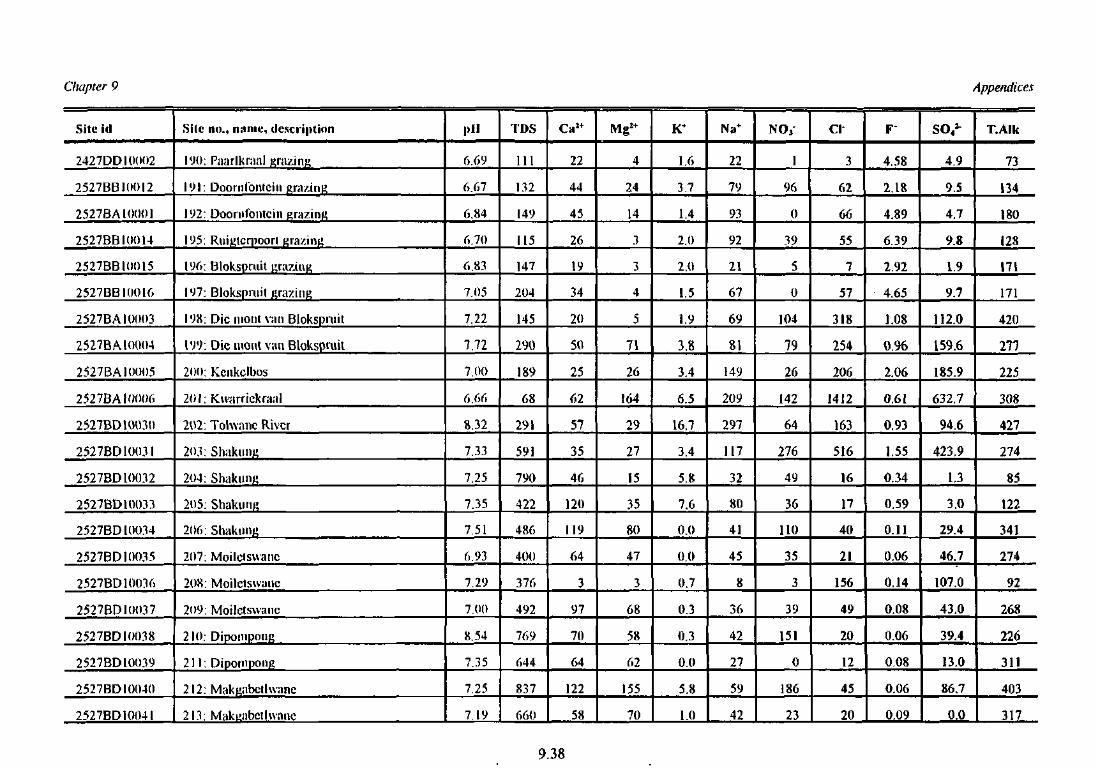
Chapter 9 Appendices
Site id
2427DD1OOO2
2527BBIOOI2
2527BAIOOO1
2527BBIOO14
2527BBIOO15
2527BB10016
2527BA1O0O3
2527BA1OOO4
2527BA10005
2527BA10006
2527BD10030
2527BD10031
2527BD10032
2527BD10033
2527BD10034
2527BD10035
2527BD10036
2527BDIOO37
2527BD10038
2527BD10039
2527BD10040
2527BD10041
Site no., inline, description
190: Paarlkraal ^razinjj
191: Doonilbnlcin grazing
192: Dooniiontcin grazing
195: RuiKtcrpoorl grazing
196; Blokspruit };r;i7.iu^
197: Blokspniil grazing
198: Die inont van Blokspmit
199. Die moiU van Blokspmit
200: Kenkclbos
201: Kwarriekraal
202. Tolwane River
20.1: ShakuiiK
204: Shaking
205: Shaking
206: Shaking
207: Moilclswanc
208: Moilelswanc
209: Moilctswanc
210: Dipompong
211: Dipoinpong
212: Makfiabctlwane
213: Makiza bet 1 wane
pl l
6.69
6.67
6.84
6.70
6.83
7.05
7.22
111
7.00
6.66
8.32
7.33
7.25
7.35
7.51
6,93
7.29
7.00
8.54
7.35
7.25
7.19
TDS
111
132
149
115
147
204
145
290
189
68
291
591
790
422
486
400
376
492
769
644
837
660
Ca1+
22
44
45
26
19
34
20
50
25
62
57
35
46
120
119
64
3
97
70
64
122
58
MgJ+
4
24
14
3
3
4
5
71
26
164
29
27
15
35
80
47
3
68
58
62
155
70
K+
1.6
3.7
1.4
2.0
2.0
1.5
1.9
3.8
3.4
6.5
16.7
3.4
5.8
7.6
0.0
0.0
0.7
0.3
0.3
0.0
5.8
1.0
Na+
22
79
93
92
21
67
69
81
149
209
297
117
32
80
41
45
8
36
42
27
59
42
N O /
1
96
0
39
5
0
104
79
26
142
64
276
49
36
110
35
3
39
151
0
186
23
Cl
3
62
66
55
7
57
318
254
206
1412
163
516
16
17
40
21
156
49
20
12
45
20
F"
4.58
2.18
4.89
6.39
2.92
4.65
1.08
0 %
2.06
0.61
0,93
1.55
0.34
0.59
0.11
0.06
0.14
0.08
0.06
0.08
0.06
0.09
4.9
9.5
4.7
9.8
1.9
9.7
112.0
159.6
185.9
632.7
94.6
423.9
1.3
3.0
29.4
46.7
107.0
43.0
39.4
13.0
86.7
0.0
T.AIk
73
134
180
128
171
171
420
277
225
308
427
274
85
122
341
274
92
268
226
311
403
317
9.38
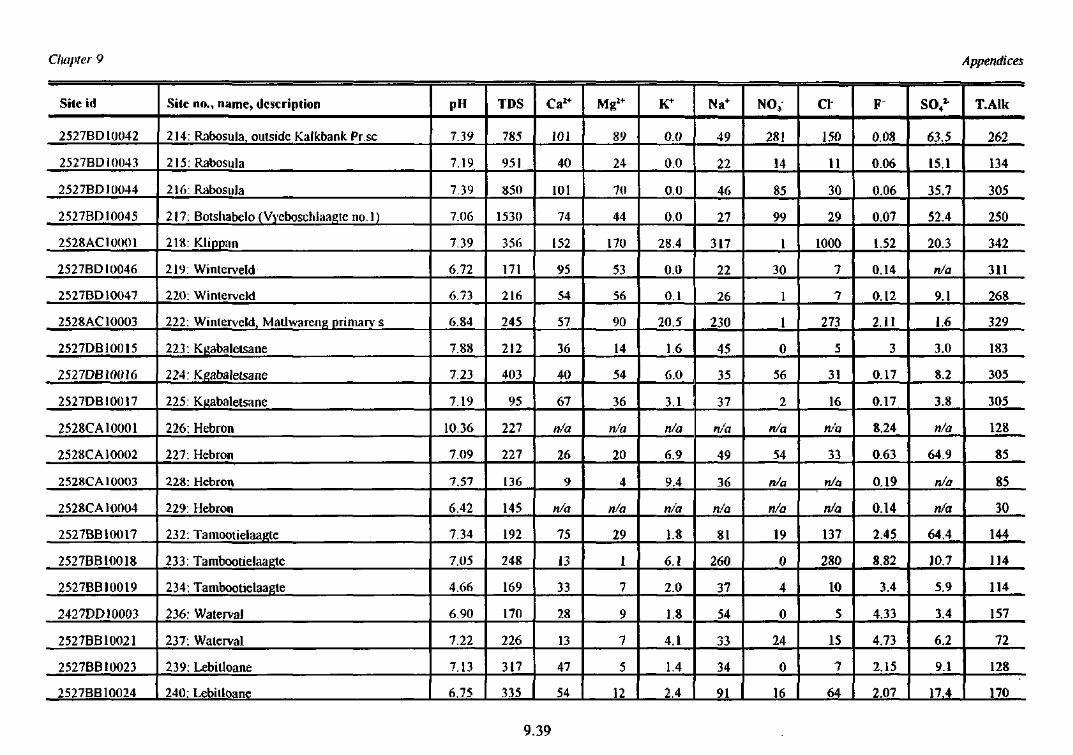
Chapter 9 Appendices
Site id
2527BD10042
2527BD10043
2527BD10044
2527BD10045
25 28 AC 10001
2527BD10046
2527BD10047
2528AC10003
2527DB1OO15
2527DB10016
2527DB10017
2528CA1O001
2528CA1OO02
2528CA10003
2528CA10004
2527BB10017
2527BB10018
2527BB10019
2427DD10003
2527BB10021
2527BB10023
2527BB10024
Site no., name, description
214: Rabosula, outside Kalkbank Pr.sc
215: Rabosula
216; Rabosula
217: Botshabelo {Vyeboschlaa^te no.l)
218:Klippan
219: Winterveld
220: Winterveld
222: Winterveld, Matlwareng primarv s
223: Kgabaietsane
224: Kgabaletsane
225: Kgabaletsane
226: Hebron
227: Hebron
228: Hebron
229: Hebron
232: Tamootielaagte
233: Tambootielaagte
234: Tambootielaagte
236: Waterval
237: Waterval
239: Lebitloane
240: Lebitloane
pH
7.39
7.19
7.39
7.06
7.39
6.72
6.73
6.84
7.88
7.23
7.19
10.36
7.09
7.57
6.42
7.34
7.05
4.66
6.90
7.22
7.13
6.75
TDS
785
951
850
1530
356
171
216
245
212
403
95
227
111
136
145
192
248
169
170
226
317
335
Ca2+
101
40
101
74
152
95
54
57
36
40
67
n/a
26
9
n/a
75
13
33
28
13
47
54
Mg>+
89
24
70
44
170
53
56
90
14
54
36
n/a
20
4
n/a
29
1
7
9
7
5
12
K+
0.0
0.0
0.0
0.0
28.4
0.0
0.1
20.5
1.6
6.0
3.1
n/a
6.9
9.4
n/a
1.8
6.1
2.0
1.8
4.1
1.4
2.4
Na+
49
22
46
27
317
22
26
230
45
35
37
n/a
49
36
n/a
81
260
37
54
33
34
91
NO,
281
14
85
99
1
30
1
1
0
56
2
n/a
54
n/a
n/a
19
0
4
0
24
0
16
Cl
150
11
30
29
1000
7
7
273
5
31
16
n/a
33
n/a
n/a
137
280
10
5
15
7
64
F
0.08
0.06
0.06
0.07
1.52
0.14
0.12
2.11
3
0.17
0.17
8.24
0.63
0.19
0.14
2.45
8.82
3.4
4.33
4.73
2.15
2.07
SO4^
63.5
15.1
35.7
52.4
20.3
n/a
9.1
1.6
3.0
8.2
3.8
n/a
64.9
n/a
n/a
64.4
10.7
5.9
3.4
6.2
9.1
17.4
T.Alk
262
134
305
250
342
311
268
329
183
305
305
128
85
85
30
144
114
114
157
72
128
170
9.39
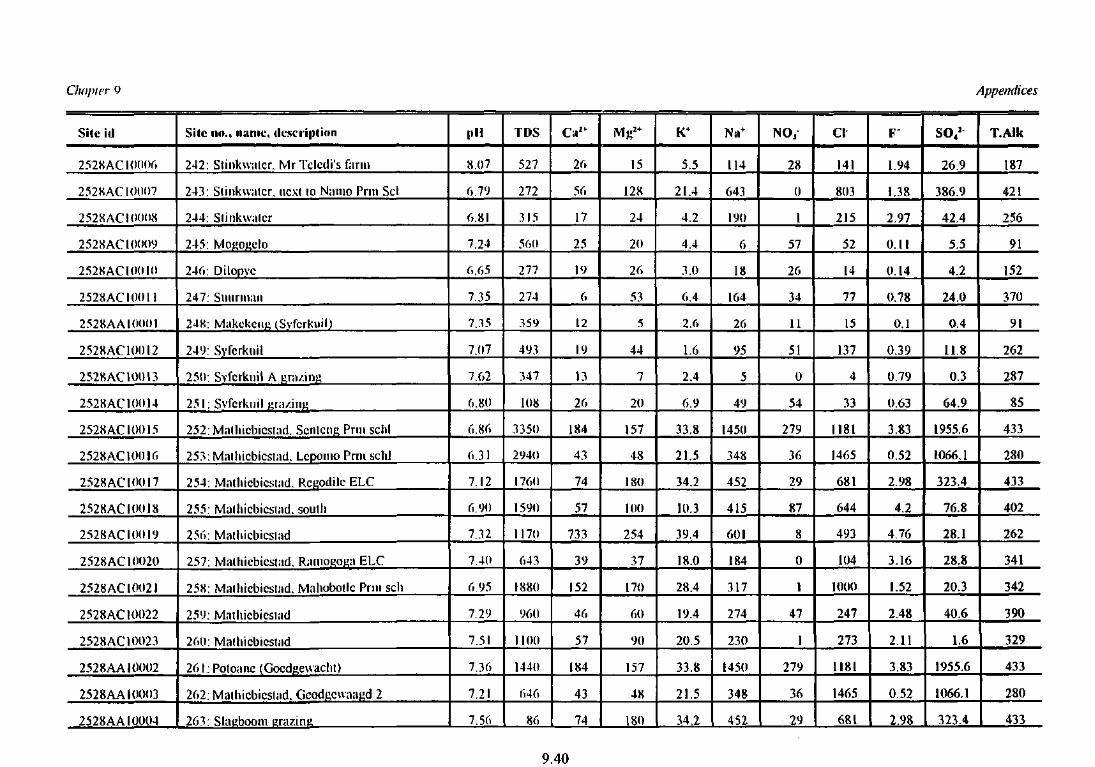
Chapter 9 Appendices
Site id
2528AC10006
2528AC10007
2528AC !()<)(>«
2528AC10009
2528ACIOOIO
2528AC1OOH
2528AA1OOO1
2528AC1OO12
2528AC10013
2528AC10014
2528ACI0OI5
2528 AC 10016
2528ACI00I7
2528AC10018
2528AC 10(119
2528AC10020
2528 AC 10021
2528 AC 10022
2528AC10023
2528AA10002
2528AA10003
2528 AA10004
Site no., iiiinic, description
242: Stinkwiilcr. MrTclcdi's farm
243: Stiitkwatcr, next to Namo Prm Set
244: Slinkwiilcr
245: Mo&ojjelo
246: Dilopvc
247: Suurmun
248: Makckcug (Svfcrkuil)
249: Svfcrkuil
250: Svferknil A Rra/.inj*
251: Svfcrkuil grazing
252: Malliiebicstad. Scntcng Prm sciil
253: Malliicbicstnd, Lcpomo Prm schl
254: Miitliiebicstad. Regodilc ELC
255: Malliicbicslad. soulh
256: Matliicbicsiad
257: Mathicbicstad. RiiinoKOga ELC
258: Malliicbicstnd. Maliobollc Prm sell
259: Matliicbicsiad
260: Matliicbicstad
261: Potoanc (Gocdgewacht)
262: Maihicbiestad. Geodgcwaa^d 2
263: Slagboom grazing.
|i H
8.07
6.79
6.81
7.24
6.65
7.35
7.35
7.07
7.62
6.80
6.86
6.3 1
7.12
6.90
7.32
7.40
6.95
7.29
7.51
7.36
7.21
7.56
TDS
527
272
315
560
277
274
359
493
347
108
3350
2940
1760
1590
1170
643
1880
960
1100
1440
646
86
Ca1*
26
56
17
25
19
6
12
19
13
26
184
43
74
57
733
39
152
46
57
184
43
74
15
128
24
20
26
53
5
44
7
20
157
48
180
100
254
37
170
60
90
157
48
180
K+
5.5
21.4
4.2
4.4
3.0
6.4
2.6
1.6
2.4
6.9
33.8
21.5
34.2
10.3
39.4
18.0
28.4
19.4
20.5
33.8
21.5
34.2
Na+
114
643
190
6
18
164
26
95
5
49
1450
348
452
415
601
184
317
274
230
1450
348
452
NO3
28
0
1
57
26
34
11
51
0
54
279
36
29
87
8
0
1
47
1
279
36
29
Cl
141
803
215
52
14
77
15
137
4
33
1181
1465
681
644
493
104
1000
247
273
1181
1465
681
F"
1.94
1.38
2.97
0.11
0.14
0.78
0.1
0.39
0.79
0.63
3.83
0.52
2.98
4.2
4.76
3.16
1.52
2.48
2.11
3.83
0.52
2.98
S O /
26.9
386.9
42.4
5.5
4.2
24.0
0.4
11.8
0.3
64.9
1955.6
1066.1
323.4
76.8
28.1
28.8
20.3
40.6
1.6
1955.6
1066.1
323.4
T.Alk
187
421
256
91
152
370
91
262
287
85
433
280
433
402
262
341
342
390
329
433
280
433
9.40
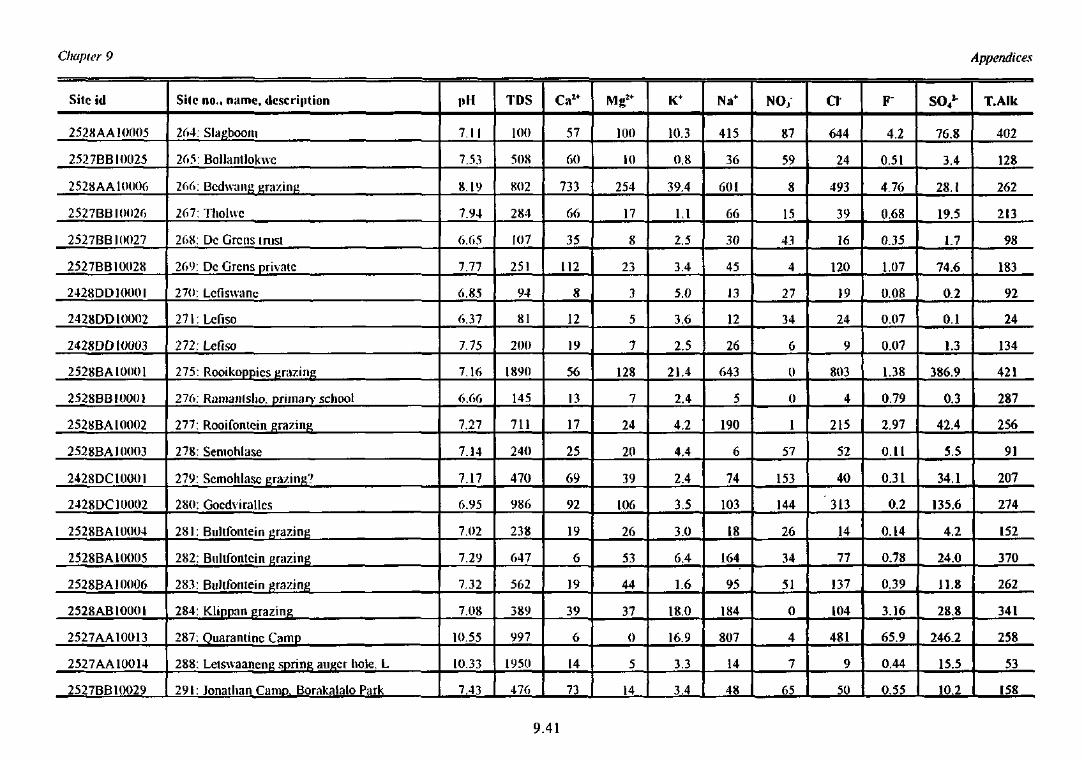
Chapter 9 Appendices
Site id
2 528 AA10005
2527BB10025
2528AA10006
2527BB10026
2527BB10027
2527BB10028
2428DD10001
2428DD10002
2428DD10003
2528BA10001
2528BB1000J
2528BA10002
2528BA10003
2428DC10OO1
2428DC10002
2528BA10004
2528BA1OO05
2528BA10006
25 28 AB10001
2527AA10O13
2527AA10014
2527BB10029
Site no., name, description
264: Slagboom
265: Bollantlokwc
266: Bcdwang grazing
267: Thohvc
268: Dc Grcns Inist
269: Dc Grens private
270: Lcfiswanc
271:Lcfiso
272. Lefiso
275: Rooikoppics grazing
276: Ranianlsho. primary school
277: Rooifontcin grazing
278: Semohlase
279: Semohlase grazing?
280: Gocdvirallcs
281: Bultfontein grazing
282: Bullfontein grazing
283: Bultfontein grazing
284: Klippan grazing
287; Quarantine Camp
288; Letswaaneng spring auger hole. L
291: Jonathan CaniD. Borakalalo Park
1>H
7.11
7.53
8.19
7.94
6.65
7.77
6.85
6.37
7.75
7.16
6.66
7.27
7.14
7.17
6.95
7.02
7.29
7.32
7.08
10.55
10.33
7.43
TDS
100
508
802
284
107
251
94
81
200
1890
145
711
240
470
986
238
647
562
389
997
1950
476
Ca2+
57
60
733
66
35
112
8
12
19
56
13
17
25
69
92
19
6
19
39
6
14
73
100
10
254
17
8
23
3
5
7
128
7
24
20
39
106
26
53
44
37
0
5
14
K+
10.3
0.8
39.4
1.1
2.5
3.4
5.0
3.6
2.5
21.4
2.4
4.2
4.4
2.4
3.5
3.0
6.4
1.6
18.0
16.9
3.3
3.4
Na+
415
36
601
66
30
45
13
12
26
643
5
190
6
74
103
18
164
95
184
807
14
48
NO,
87
59
8
15
43
4
27
34
6
0
0
1
57
153
144
26
34
51
0
4
7
65
Cl
644
24
493
39
16
120
19
24
9
803
4
215
52
40
313
14
77
137
104
481
9
50
F
4.2
0.51
4.76
0.68
0.35
1.07
0.08
0.07
0.07
1.38
0.79
2.97
0.11
0.31
0.2
0.14
0.78
0.39
3.16
65.9
0.44
0.55
SO4^
76.8
3.4
28.1
19.5
1.7
74.6
0.2
0.1
1.3
386.9
0.3
42.4
5.5
34.1
135.6
4.2
24.0
11.8
28.8
246.2
15.5
10.2
T.Alk
402
128
262
213
98
183
92
24
134
421
287
256
91
207
274
152
370
262
341
258
53
158
9.41
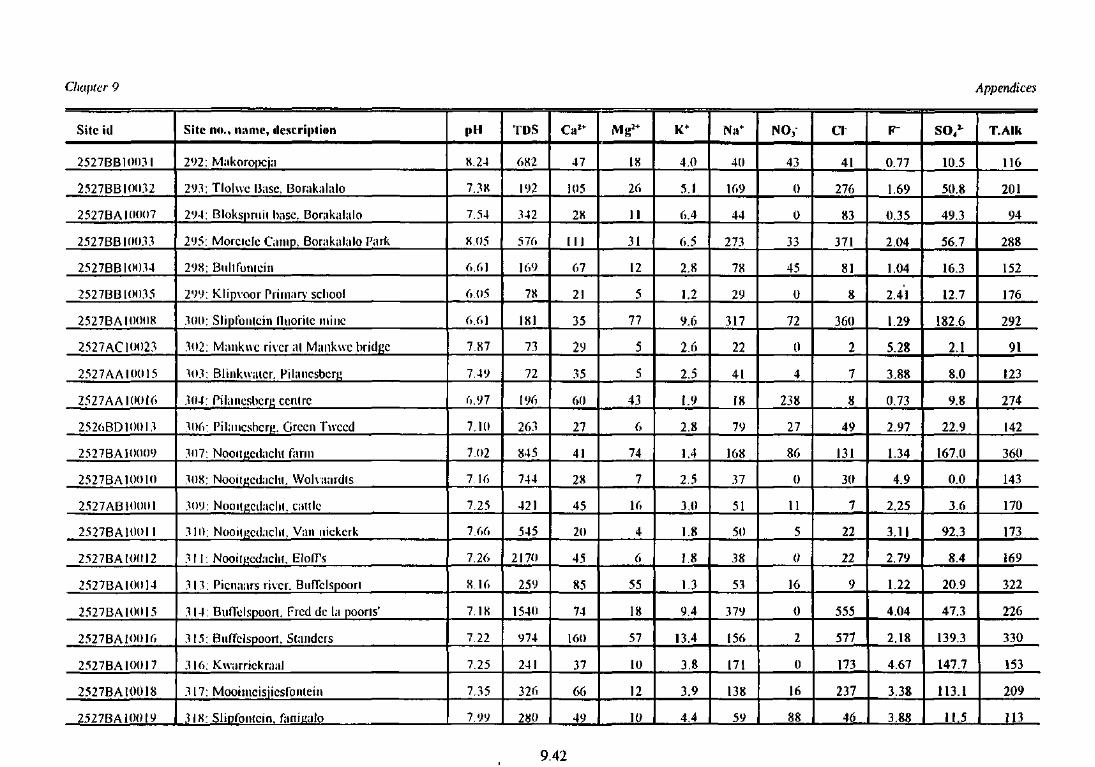
Chapter 9 Appendices
Site id
2527BB10031
2527BB10032
2527BA10007
2527BB10033
2527BB1OO34
2527BB10035
2527BA1OOO8
2527AC10023
252 7 AA HUM 5
2527AAIOOI6
2526BD1OOI3
2527BA10009
2527BA1OO1O
2527AB 10(101
2527BA10011
2527BA1OOI2
2527BA1OO14
2527BA1OOI5
2527BA10016
2527BA1O0I7
2527BA10OI8
2527BA10019
Site no., ititmc, tlcscriplion
292: Makoropcja
293: Tlohvc I3;isc. Bor;ik;ih>lo
294: Blokspniil h;isc. Bor;ika!;ilo
295: Morcielc Gimp. Borakalalo Park
298: Bnhfonlcin
299: Klipvoor Primary scliool
300: Slipibiilcin fluorilc mine
302: Miinkuc river ;il M;inkwc bridge
303: Bliiikualcr, Pilancsbcrj;
304: Pilancsbcru centre
306: Pil;incshcr|i. Green Tweed
307: NooitHcdaclit farm
308: Nooit^cdiiclu, Wolvaardls
309: NooitKcdachl, Ciiltle
310: NooitKCtiaclii. Van nickcrk
311: NooiiKcdaclil. ElofTs
313: Pienaars river. BufTclspoori
3 14: Bufl'clspoorl. Fred dc la poons1
315: Bufi'clspoort. Slanders
316: Kwarrickraal
317: Mooimcisiicsfoiitein
318: Slipfonlcin. faniuato
|»H
8.24
7.38
7.54
8.05
6.61
6.05
6.61
7.87
7.49
6.97
7.10
7.02
7 16
7.25
7.66
7.26
8 16
7.18
7.22
7.25
7.35
7,99
TDS
682
192
342
576
169
78
181
73
72
196
263
845
744
421
545
2170
259
1540
974
241
326
280
Ca1*
47
105
28
I I I
67
21
35
29
35
60
27
41
28
45
20
45
85
74
160
37
66
49
Mg2+
18
26
II
31
12
5
77
5
5
43
6
74
7
16
4
6
55
18
57
10
12
10
K+
4.0
5.1
6.4
6.5
2.8
1.2
9.6
2.6
2.5
1.9
2.8
1.4
2.5
3.0
1.8
1.8
13
9.4
13.4
3.8
3.9
4.4
Na+
40
169
44
273
78
29
317
22
41
18
79
168
37
51
50
38
53
379
156
171
138
59
NO3
43
0
0
33
45
0
72
0
4
238
27
86
0
11
5
0
16
0
2
0
16
88
Cl
41
276
83
371
81
8
360
2
7
8
49
131
30
7
22
22
9
555
577
173
237
46
F"
0.77
1.69
0.35
2.04
1.04
2.41
1.29
5.28
3.88
0.73
2.97
1.34
4.9
2.25
3.11
2.79
1.22
4.04
2.18
4.67
3.38
3.88
SO, 1
10.5
50.8
49.3
56.7
16.3
12.7
182.6
2.1
8.0
9.8
22.9
167.0
0.0
3.6
92.3
8.4
20.9
47.3
139.3
147.7
113.1
11.5
T.Alk
116
201
94
288
152
176
292
91
123
274
142
360
143
170
173
169
322
226
330
153
209
113
9.42
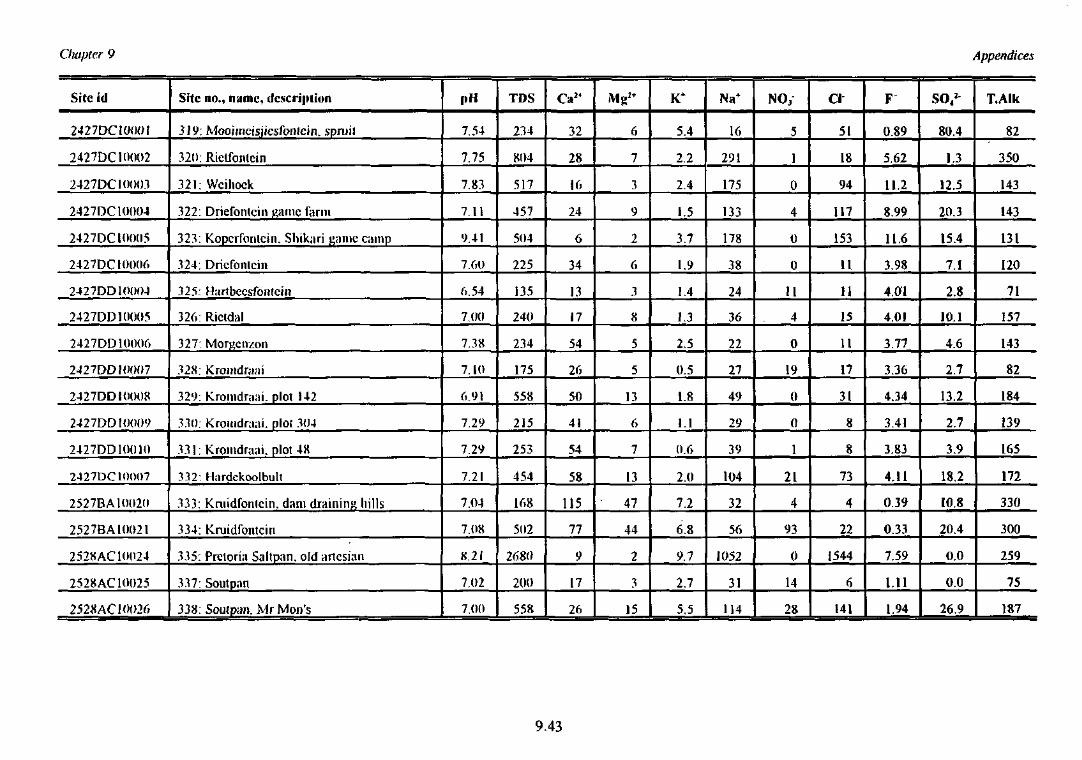
Chapter 9 Appendices
Site id
2427DC10001
2427DC10002
2427DC10003
2427DC10004
2427DC10005
2427DC10006
2427DD10004
2427DD10005
2427DD10006
2427DD10007
2427DDI0008
2427DD10009
2427DD1001O
2427DC10007
2527BA10O2O
2527BA1OO21
2528 AC 10024
2528 AC 10025
252SAC10026
Site no., name, description
319; Mooiineisjiesfonfein, spntil
320: RielfoiKein
321: Wcihock
322: Driefoiitcin game farm
323: Kopcrronlcin. Shikari gamcaimp
324: Dricfonlcin
325: Hartbeesfontcin
326: Rictdal
327: Morgcnzon
32S: Kronidr;i;ii
329: Kromdraai. plot 142
330: Kromdraai. plot 304
33 S: Kromdraai. plot 48
332: Hardckoolbult
333: Kniidfonlcin, dam draining hills
334: Kruidfontcin
335: Pretoria Saltpan, old artesian
337: Soutpan
338: Soulpan, Mr Mon's
pH
7.54
7.75
7.83
7.11
9.41
7.60
6.54
7.00
7.38
7.10
6.91
7.29
7.29
7.21
7.04
7.08
8.21
7.02
7.00
TDS
234
804
517
457
504
225
135
240
234
175
558
215
253
454
168
502
2680
200
558
Ca2+
32
28
16
24
6
34
13
17
54
26
50
41
54
58
115
77
9
17
26
Mg2+
6
7
3
9
2
6
3
8
5
5
13
6
7
13
• 4 7
44
2
15
K*
5.4
2.2
2.4
1.5
3.7
1.9
1.4
1.3
2.5
0.5
1.8
1.1
0.6
2.0
7.2
6,8
9.7
2.7
5.5
Na+
16
291
175
133
178
38
24
36
22
27
49
29
39
104
32
56
1052
31
114
NO,
5
1
0
4
0
0
11
4
0
19
0
0
1
21
4
93
0
14
28
Cl
51
18
94
117
153
11
11
15
11
17
31
8
8
73
4
22
1544
6
141
F
0.89
5.62
11.2
8.99
11.6
3.98
4.01
4.01
3.77
3.36
4.34
3.41
3.83
4.11
0.39
0.33
7.59
1.11
1.94
80.4
1.3
12.5
20.3
15.4
7.1
2.8
10.1
4.6
2.7
13.2
2.7
3.9
18.2
10.8
20.4
0.0
0.0
26.9
T.AIk
82
350
143
143
131
120
71
157
143
82
184
139
165
172
330
300
259
75
187
9.43
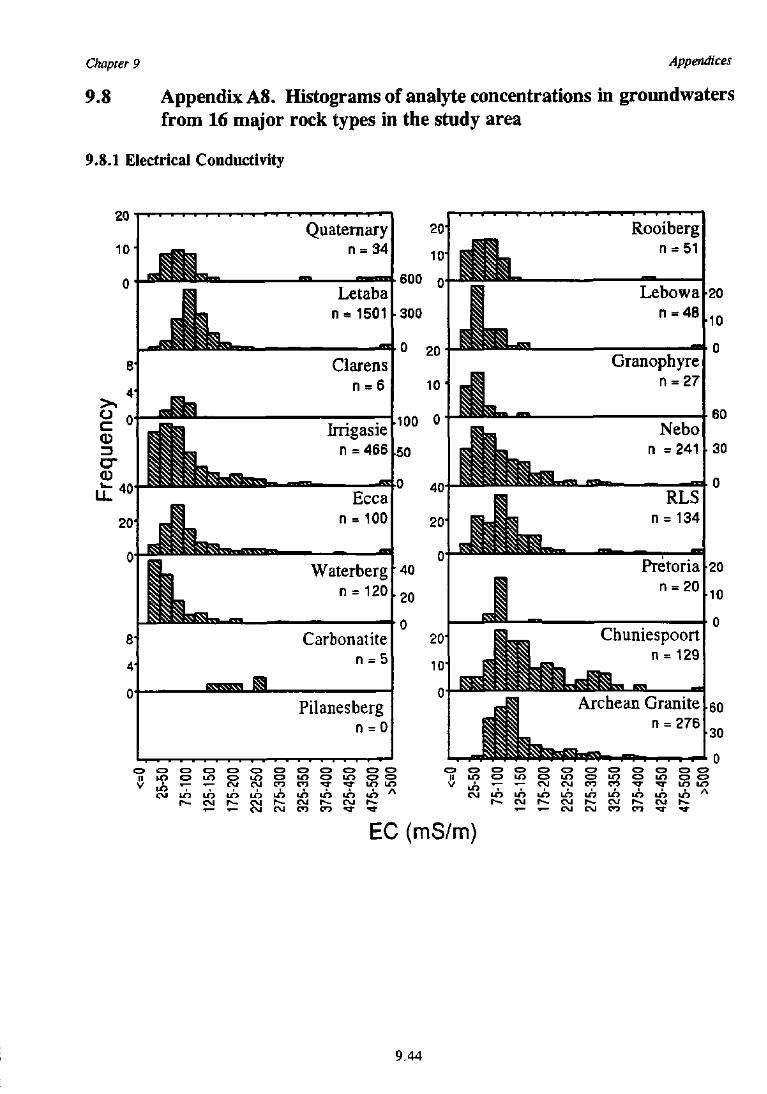
Chapter 9
9.8
Appendices
Appendix A8. Histograms of analyte concentrations in groiindwatersfrom 16 major rock types in the study area
9.8.1 Electrical Conductivity
Chumespoort= 129
Archean Granite= 276
cvi cvi CT) nCVI LO LO LO LO LO LOC V J I O L O L O L T J L O L O L O L O I O
EC (mS/m)
9.44
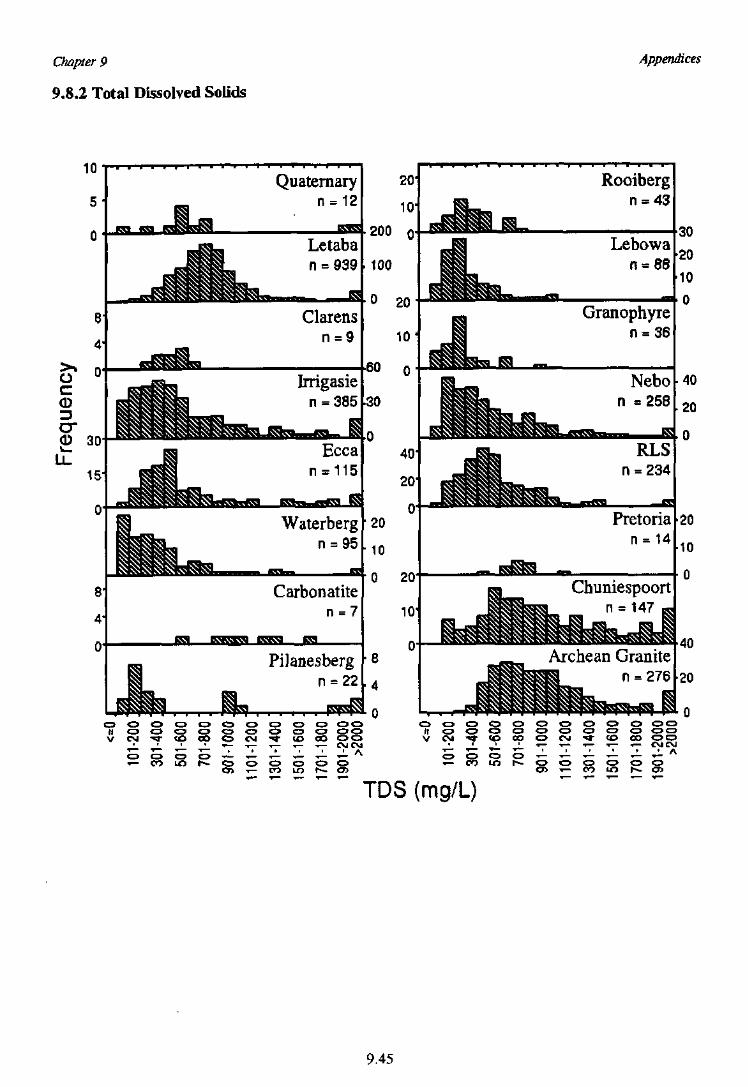
Chapter 9
9.8.2 Total Dissolved Solids
Appendices
10
5
0
i«£S§fLi
Quaternaryn = 12
IWWI
Letaban = 939
Clarensn = 9
Irrigasien = 385
Carbonatiten = 7
pgg M W J M P^TO pa
s§s
Pilanesbergn = 22
O O CJ Oi— CO IO 1^-
CVJOJ
Archean Granite= 276
V W i - i o r o o N i - t o o o
TDS (mg/L)
9.45
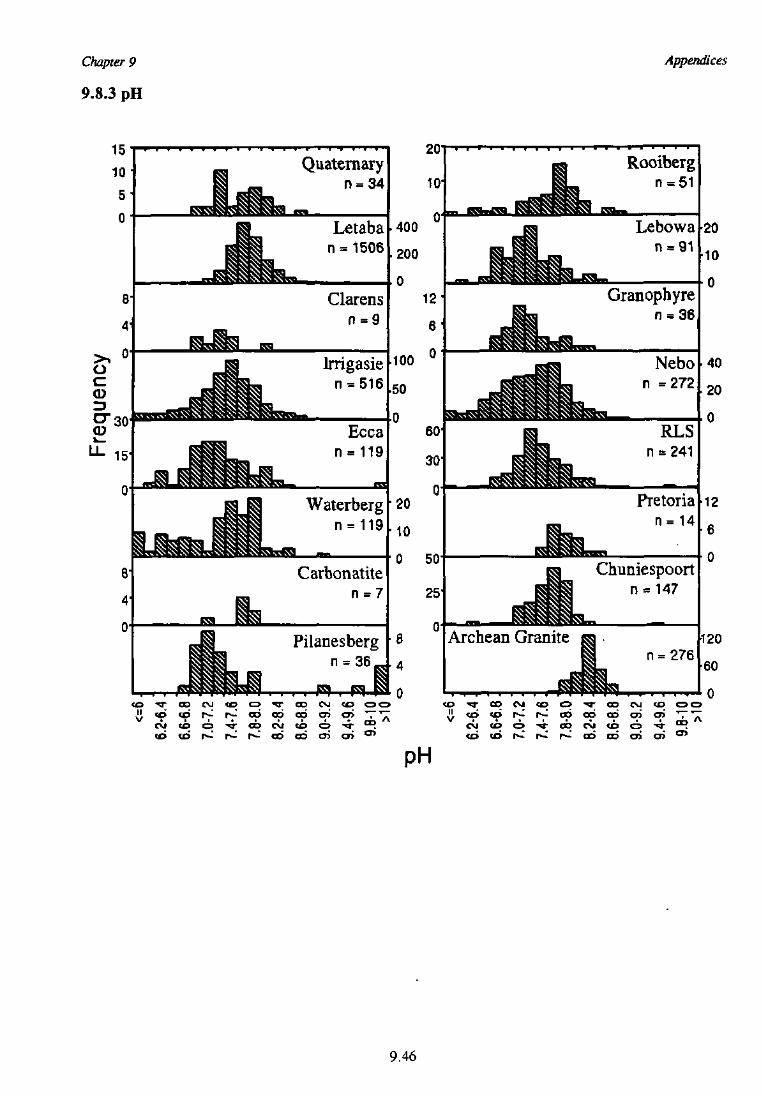
Chapter 9
9.8.3 pH
Appendices
9.46
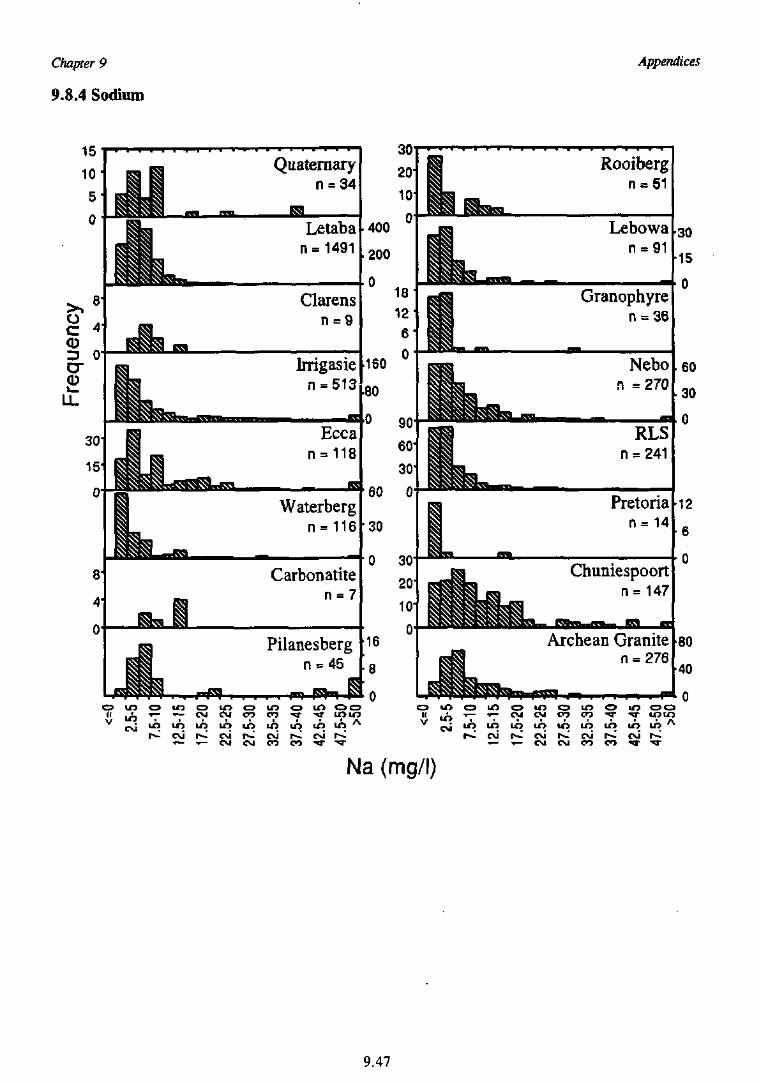
Chapter 9
9.8.4 Sodium
Appendices
Rooiberg= 51
Quaternary= 34
Letaba= 149i
Lebowa= 91
Granophyre= 36
Clarensn = 9
Nebon =270
Eccan = 118
Pretorian = 14
Waterbergn = 116
Chuniespoort= 147
Carbon atiten = 7
Archean Granite= 276
Pilanesberg
CVJ r -co -*a- •v
Na (mg/l)
9.47
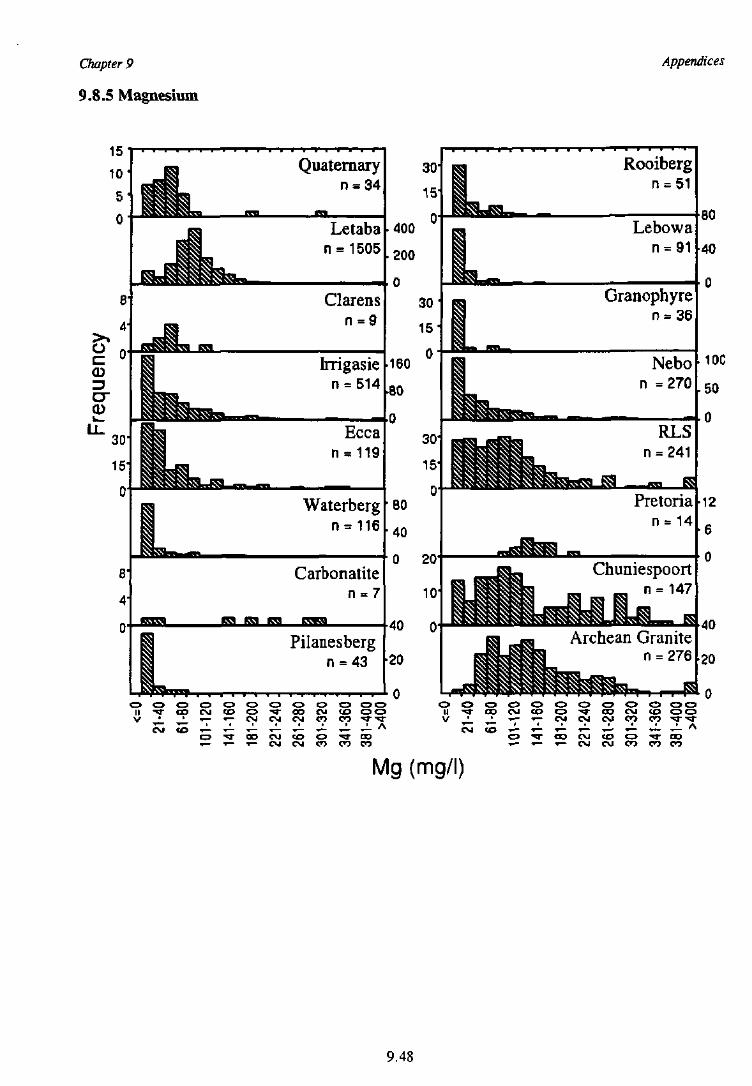
Chapter 9
9.8.5 Magnesium
Appendices
Nebon =270
Pretorian = 14
Carbonatite
Archean Graniten-276
O O O C J O OII - * J - C D C \ J C O O - a - C O C \ i U 3 O O
i— i— •.— C V I C M C 3 C O C O c r o c o O r x )i — T — »— C M C U C O C O C O
Mg (mg/l)
9.48
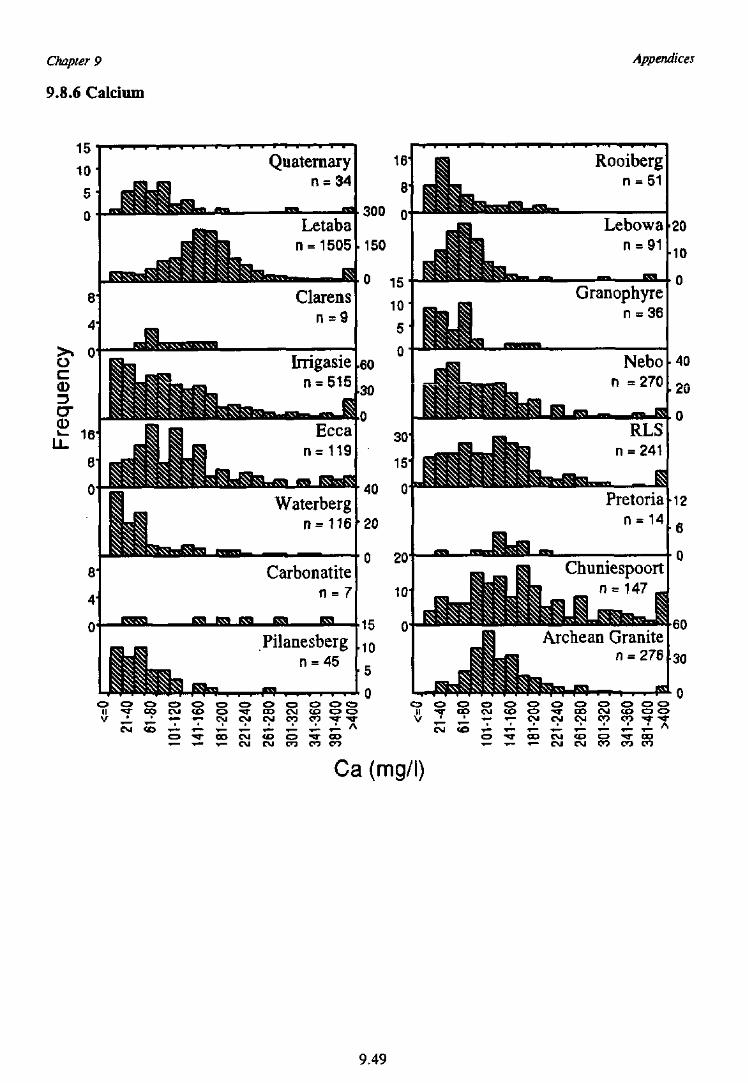
Chapter 9
9.8.6 Calcium
Appendices
15
10 1
5
0
Quaternaryn = 34
Letaban = 1505
Clarensn = 9
Irrigasien = 515
Carbonatiten = 7
Pilanesbergn = 45
Archean Granite= 276
r o o o o c 3i— T— i— CVJ C\J en o r o o r j o c r o o
Ca (mg/l)
9.49
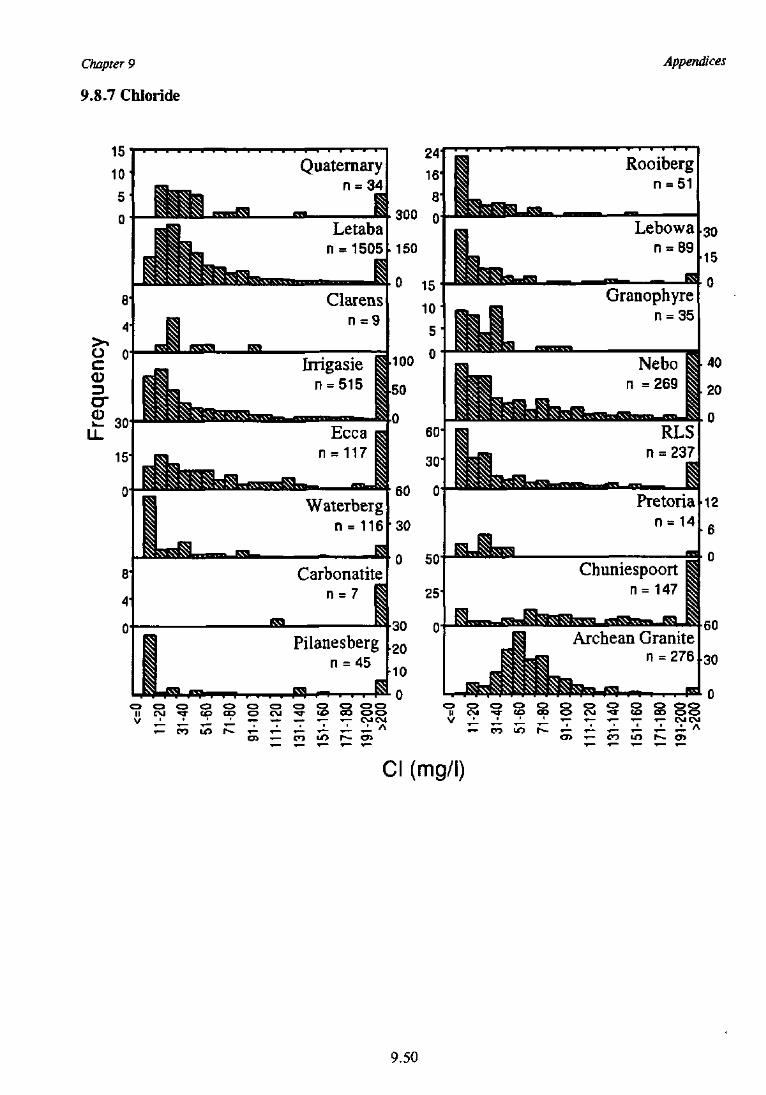
Chapter 9
9.8.7 Chloride
Appendices
Chuniespoortn= 147
i— CO
Cl (mg/l)
9.50
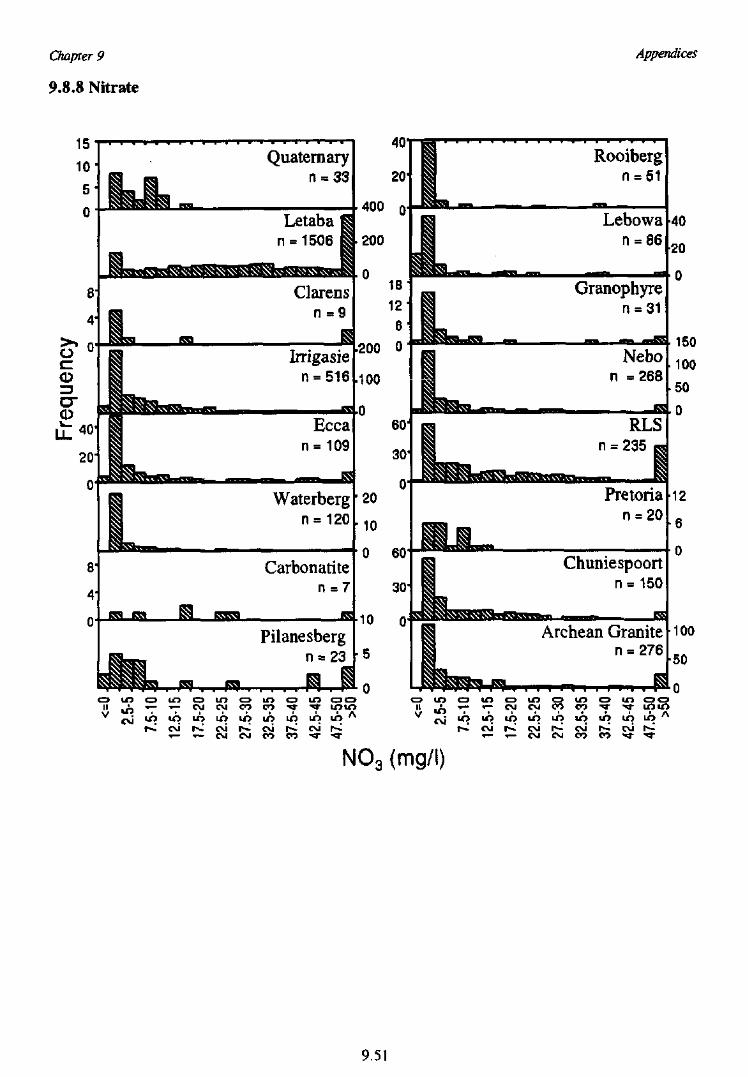
Chapter 9
9.8.8 Nitrate
Appendices
15
10
5
0
8
4
a °o
crCD 40
20
0
s
§ «
I
L_^8_fiS_
Quaternaryn = 33
Irrigasien = 516
Eccan = 109
R
Waterbergn = 120
Carbonatiten = 7
us
Pilanesbergn = 23
W • • W
40
20
400
200
1 8 '
12"61
200 0
100
20
10
10
II .A - -LOLO c> to ci> LO o m o oi— CJ CM oo co ir ^ IO IO
60
30'
II.1
Sf
^SfcSVn
Rooiberg
Lebowa
Granophyren = 3i
Nebon =268
Pretorian = 20
Chuniespoortn = 150
Archean Graniten = 276
M
40
20
150
100
50
12
6
100
50
o i r > C 3 L O ( = > L r > c 3 i A O i n o oLO
T-i— CM w n n <r t
N03 (mg/l)
9.51
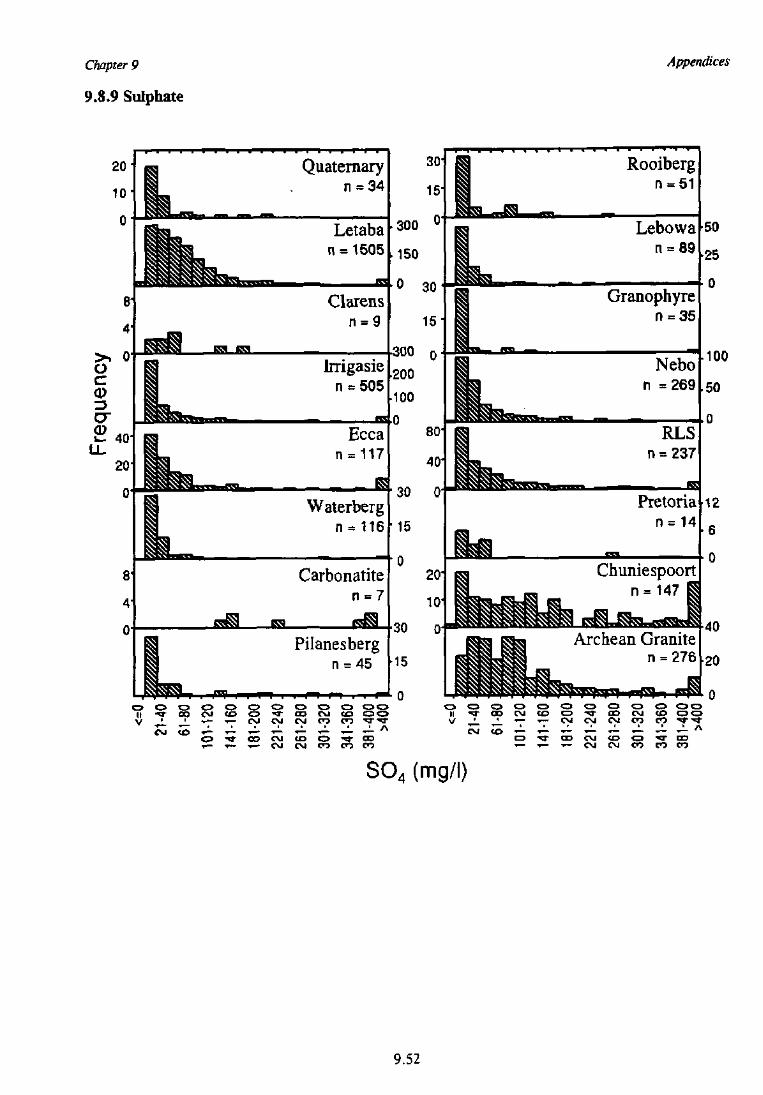
Chapter 9
9.8.9 Sulphate
Appendices
S04 (mg/l)
9.52
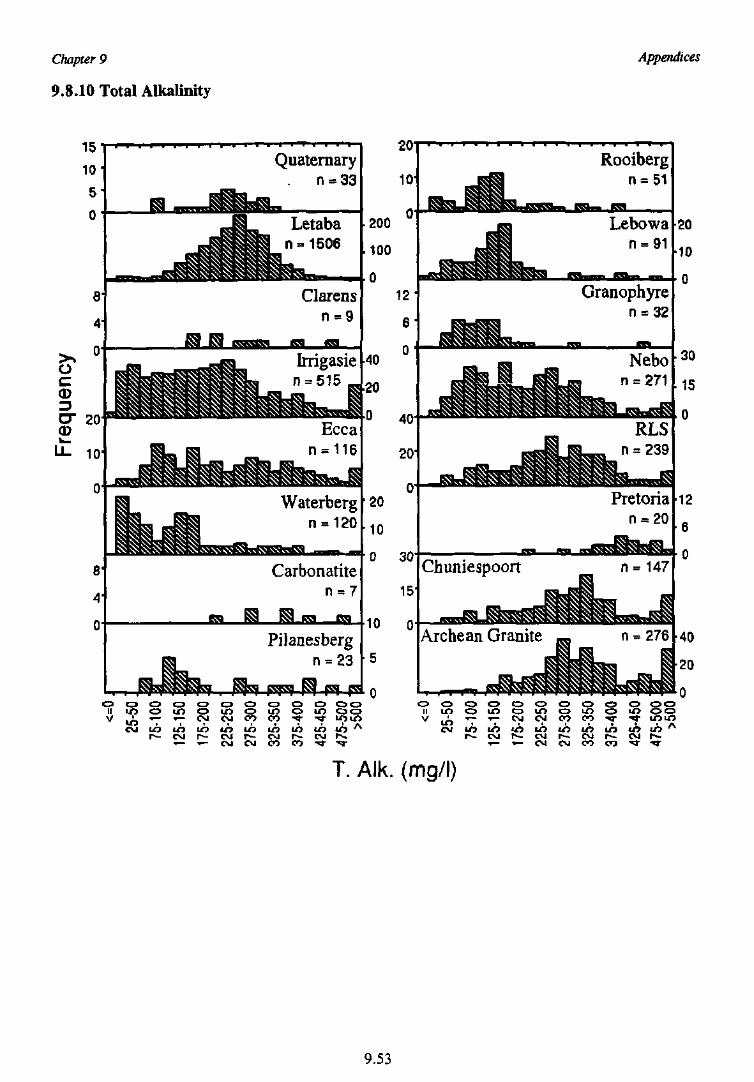
Chapter 9
9.8.10 Total Alkalinity
Appendices
Chuniespoort n = 147
Archean Granite .™ n = 276
T. Alk. (mg/l)
9.53
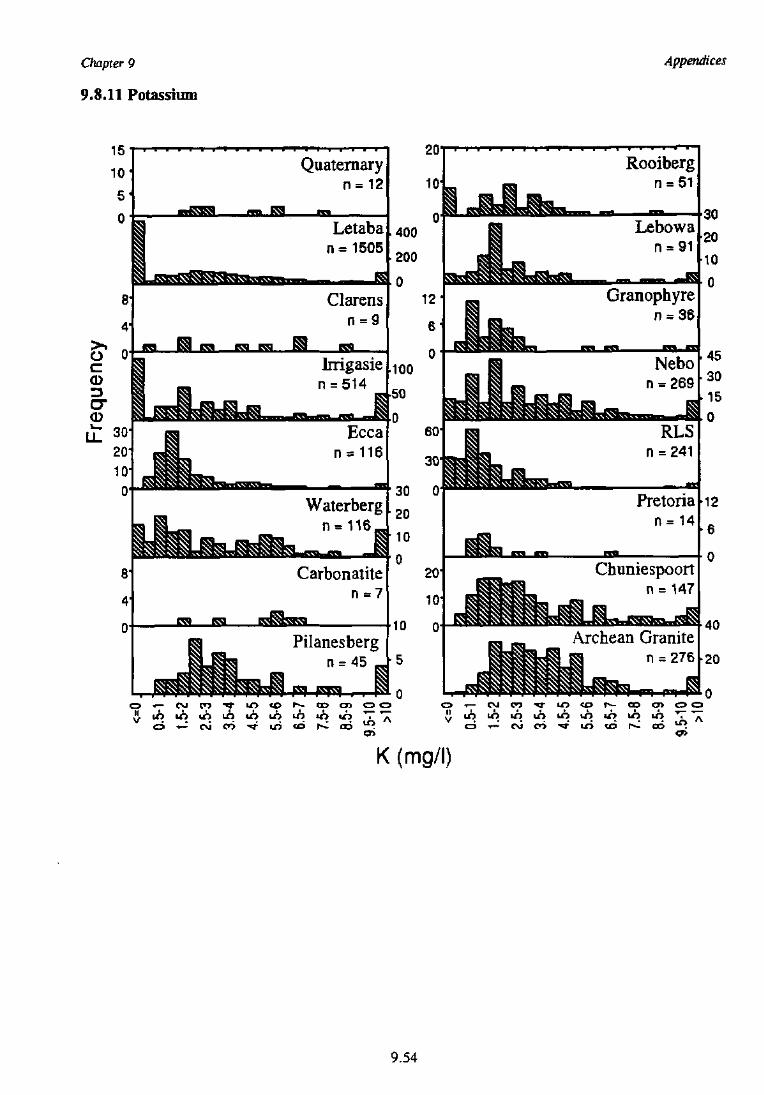
Chapter 9
9.8.11 Potassium
Appendices
Chuniespoortn = 147
K (mg/l)
9.54
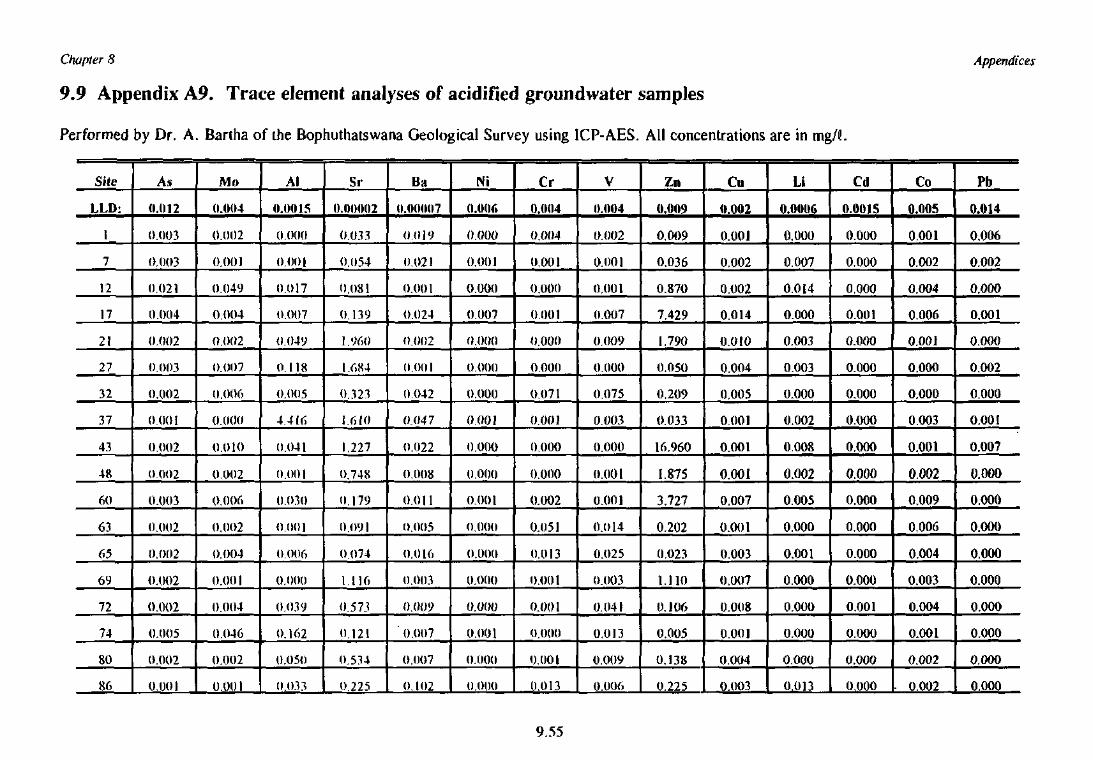
Chapter 8
9.9 Appendix A9. Trace element analyses of acidified groundwater samples
Performed by Dr. A. Bartha of the Bophuthatswana Geological Survey using ICP-AES. All concentrations are in mg/G.
Appendices
Site
LLD:
1
7
12
17
21
27
32
37
43
48
60
63
65
69
72
74
80
86
As
(1.012
0.003
0.003
0.021
0.004
0.002
0.003
0.002
0.001
0.002
0.002
0.003
0.002
0.002
0.002
0.002
0.005
0.002
0.001
Mo
(1.0(14
0.002
0.001
0.049
0.004
0.002
0.007
0.006
0.000
0.010
0.002
0.006
0.002
0.004
0.001
0.004
0.046
0.002
0.001
Al
(LOO 15
0.000
0.001
0.017
0.007
0.049
0.118
O.O05
4 416
0.041
0.O01
0.030
0.001
O.006
0,000
0.039
0.162
0.050
0.033
Sr
0.1)0002
0.033
0.054
0.081
0.139
I960
1.684
0.323
1,610
1.227
0.748
0.179
0.O9I
0.074
1.116
0.573
0.121
0.534
0.225
Ba
0.00007
(MM 9
0.021
0,001
0.024
0.002
0.001
0.042
(MM 7
0.022
0.008
0.011
0.005
0.016
0.003
0.009
' 0.007
0.007
0.102
Ni
O.OOfi
0.000
0.001
0.000
0.007
0.000
0.000
0.000
0.001
0.000
0.000
0.001
0.000
0.000
0.000
0.000
0.001
0.000
0.000
Cr
0.004
0.004
0.001
0.000
0.001
0,000
0.000
0.071
0.001
0.000
0.000
0.002
0.051
0.013
0.001
0.001
0.000
0.001
0.O13
V
0.004
0.002
0.001
0,001
0.007
0.009
0.000
0.075
0.003
0.000
0.001
0.001
0.014
0.025
0.003
0.04!
0,013
0.009
0.006
Zn
0.009
0.009
0.036
0.870
7.429
1.790
0.050
0.209
0.033
16.960
1.875
3.727
0.202
0.023
1.110
0.106
0.005
0.138
0.225
Cu
0.002
0.001
0,002
0.002
0.014
0.010
0.004
0.005
0.001
0.001
0.001
0.007
0.001
0.003
0.007
0.008
0.001
0.004
0.003
Li
0.0006
a ooo0.007
0.014
0.000
0.003
0.003
0.000
0.002
0.008
0.002
0.005
0.000
0.001
0.000
0.000
0.000
0.000
0.013
Cd
0.0015
0.000
0.000
0.000
0.001
0.000
0.000
0.000
0.000
0.000
0.000
0.000
0.000
0.000
0.000
0.001
0.000
0.000
0.000
Co
0.005
0.001
0.002
0.004
0.006
0.001
0.000
0.000
0.003
0.001
0.002
0.009
0.006
0.004
0.003
0.004
0.001
0.002
. 0.002
Pb
0.014
0.006
0.002
0.000
0.001
0.000
0.002
0.000
0.001
0.007
0.000
0.000
0.000
0.000
0.000
0.000
0.000
0.000
0.000
9.55
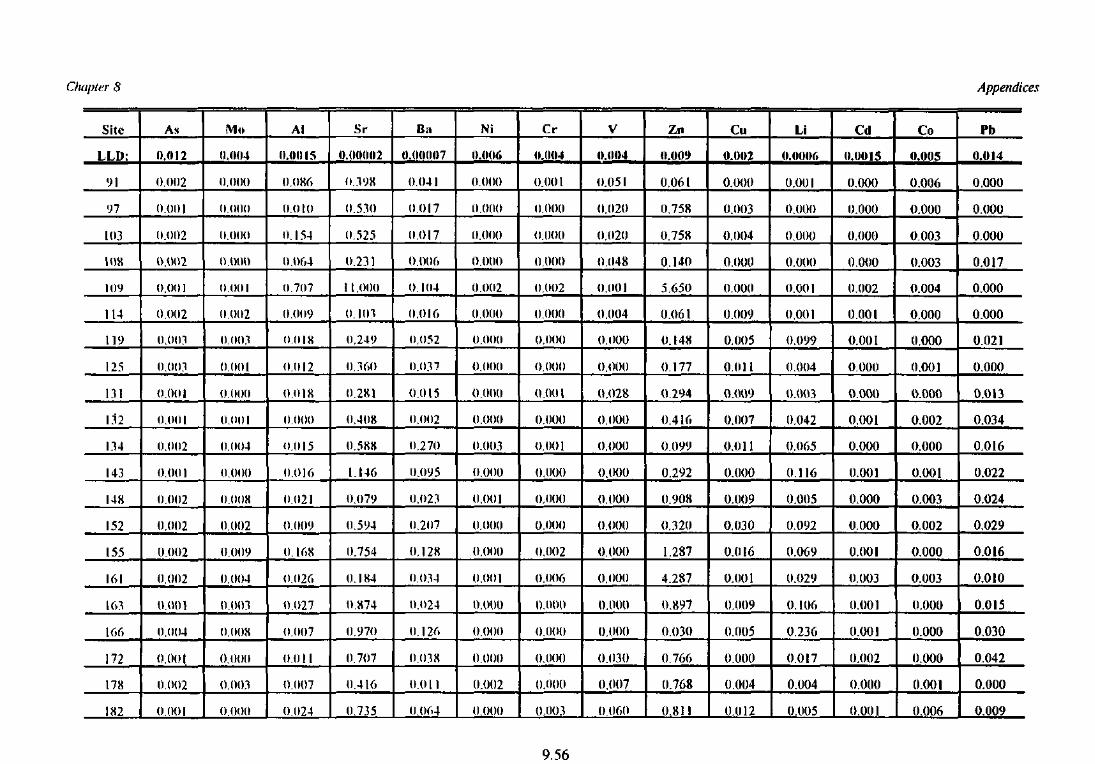
Chapter S Appendices
Site
LLD:
91
97
103
108
109
114
119
125
131
132
134
143
148
152
155
!f>l
163
166
172
178
182
As
0.(112
0.002
0.001
0.002
0.002
0.001
0.002
0.003
0.003
0.001
0.001
0.002
0.001
0.002
0.002
0.002
0.002
0.001
0.004
o.ooi
0.002
0.001
Mo
0.004
0.000
0.000
0.000
0.000
0.001
0.002
0.003
0.001
0.000
0.001
0.004
0.000
0.00«
0.002
0.009
0.004
0.003
0.008
0.00(1
0.003
0.000
Al
0.0015
0.086
o.oto
0.154
0.064
0.707
0.009
0.018
0.012
0.018
0.000
0.015
0.016
0.021
0.009
0.168
0.026
0.027
0.007
0.011
0.007
0.024
Sr
0.(1(1(102
0.398
0.530
0.525
0.231
It.000
0.101
0.249
0.360
0.281
0.408
0.588
1.146
0.079
0.594
0.754
0.184
0.874
0.970
0.707
0.416
0.735
B:t
0.(1(1007
0.041
0.017
0.017
0.006
0.104
0.016
0.052
0.037
0.015
0.002
0.270
0.095
0.023
0.207
0.128
0.034
0.024
0.126
0.038
0.011
0.064
Ni
0.(106
0.000
0.000
o.ooo
0.000
0.002
0.000
0.000
0.000
0.000
0.000
0.003
o.ooo
0.00]
0.000
0.000
0.00]
0.000
0.000
0.000
0.002
0.000
Cr
(1.0(14
0.001
0.000
0.000
0,000
0,002
0.000
0,000
0.000
0.001
0.000
0,001
0.000
0,000
0,000
0.002
0,006
0.000
o.ooo
o.ooo
0.000
0.003
V
0.(104
0.051
0.020
0,020
0.048
0.001
0.004
0.000
0.000
0.028
0,000
0.000
0.000
0.000
0.000
0.000
0.000
0.000
0,000
0.030
0.007
0.060
Zn
».o(»y
0.061
0.758
0.758
0.140
5.650
0.061
0.148
0.177
0.294
0.416
0.099
0.292
0.908
0.320
1.287
4.287
0.897
0.030
0.766
0.768
0.811
Cu
0.002
0.000
0.003
0.004
0.000
0.000
0.009
0.005
0.011
0.W19
0.007
0.011
0.000
0.009
0.030
0.016
0.001
0.009
0.005
0.000
0.004
0.U12
Li
o.ooor>
0.001
o.ooo
0.000
0.000
0.001
0.001
0.099
0.004
0.003
0.042
0.065
0.116
0.005
0.092
0.069
0.029
0.106
0.236
0.017
0.004
0.005
Cd
0.0015
0.000
0.000
0.000
0.000
0.002
0.001
0.001
0.000
0.000
0.001
0.000
0.001
0.000
0.000
0.001
0.003
0.001
0.001
0.002
0.000
0.001
Co
0.005
0.006
0.000
0.003
0.003
0.004
0.000
0.000
0.001
0.000
0.002
0.000
0.001
0.003
0.002
0.000
0.003
0.000
0.000
0.000
0.001
0.006
Pb
0.014
0.000
0.000
0.000
0.017
0.000
0.000
0.021
0.000
0.013
0.034
0.016
0.022
0.024
0.029
0.016
0.010
0.015
0.030
0.042
0.000
0.009
9.56
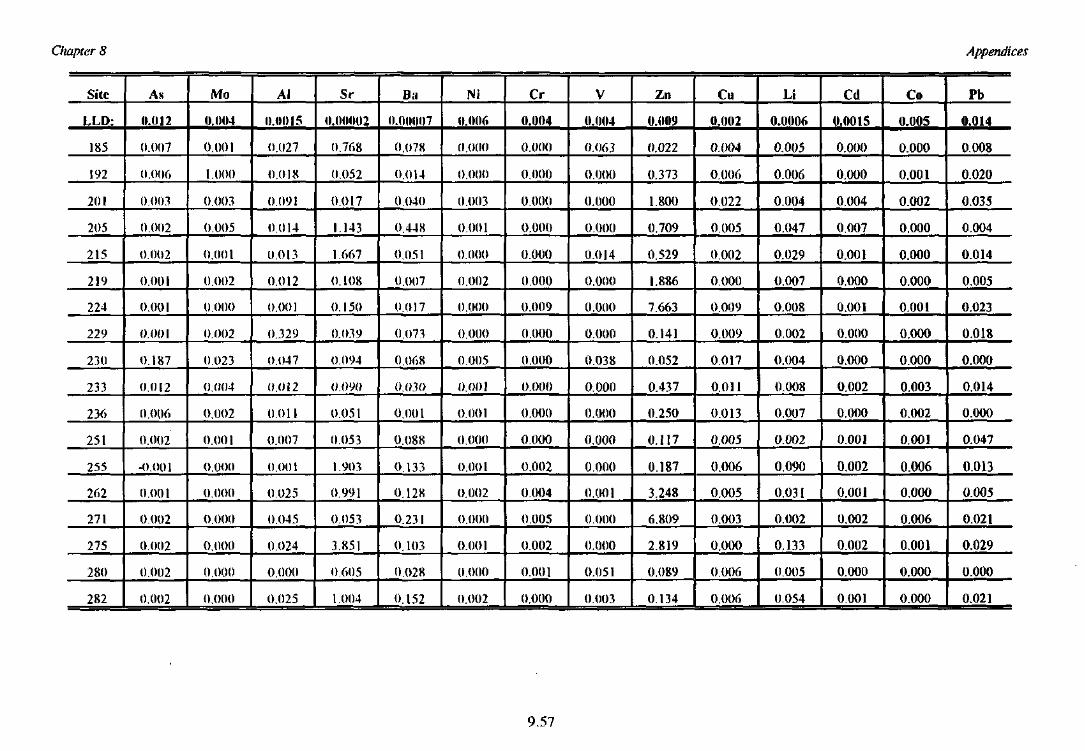
Chapter 8 Appendices
Site
LLD:
185
192
201
205
215
219
224
229
230
233
236
251
255
262
271
275
280
282
As
0.012
0.007
0.006
0.003
0.002
0.002
0.001
0.001
0.001
0.187
0.012
0.006
0.002
-0.001
0.001
0.002
0.002
0.002
0.002
Mo
0.004
0,001
1.000
0.003
0.005
0.001
0.002
0.000
0.002
0.023
0.004
0.002
0.001
0.000
0.000
0.000
0.000
0.000
0.000
Al
0.(1015
0.027
0.018
0.091
0.014
0.013
0.012
0.001
0.329
0.047
0,012
0.011
0.007
0.001
0.025
0.045
0.024
0.000
0.025
Sr
0.00002
0.768
0.052
0.017
1.143
1.667
0.108
0.150
0.039
0.094
0.090
0.051
0.053
1.903
0.991
0.053
3,851
0.605
1.004
Bn
11.(1111107
0.078
0.014
0.040
0.448
0.051
0.007
0.017
0.073
0.068
0.030
0.001
0,088
0.133
0.128
0.23 1
0.103
0.028
0.152
Ni
0.006
0.000
0.000
0.003
0.001
0.000
0.002
0.000
0.000
0.005
0.001
0.001
0.000
0.001
0.002
0.000
0.001
0.000
0.002
Cr
0.004
0.000
0.000
0.000
0.000
0.000
0.000
0.009
0.000
0.000
0.000
0.000
0.000
0.002
0.004
0.005
0.002
0.001
0.000
V
0.004
0.063
0.000
0.000
0.000
0.014
0.000
0.000
0.000
0.038
0.000
0.000
0.000
0.000
0.001
0.000
0.000
0.051
0.003
Zn
0.009
0.022
0.373
1.800
0.709
0.529
1.886
7.663
0.141
0.052
0.437
0.250
0.117
0.187
3.248
6.809
2.819
0.089
0.134
Cu
0.002
0.004
0.006
0.022
0.005
0.002
0.000
0.009
0.009
0.017
0.011
0.013
0.005
0.006
0.005
0.003
0.000
0.006
0.006
Li
0.0006
0.005
0.006
0.004
0.047
0.029
0.007
0.008
0.002
0.004
0.008
0,007
0.002
0,090
0.031
0.002
0.133
0.005
0.054
Cd
0.0015
0.000
0.000
0.004
0.007
0.001
0.000
0.001
0.000
0.000
0.002
0.000
0.001
0.002
0.001
0.002
0.002
0.000
0.001
Co
0.005
0.000
0.001
0.002
0.000
0.000
0.000
0.001
0.000
0.000
0.003
0.002
0.001
0.006
0.000
0.006
0.001
0.000
0.000
Pb
0.014
0.008
0.020
0.035
0.004
0.014
0.005
0.023
0.018
0.000
0.014
0.000
0.047
0.013
0.005
0.021
0.029
0.000
0.021
9.57
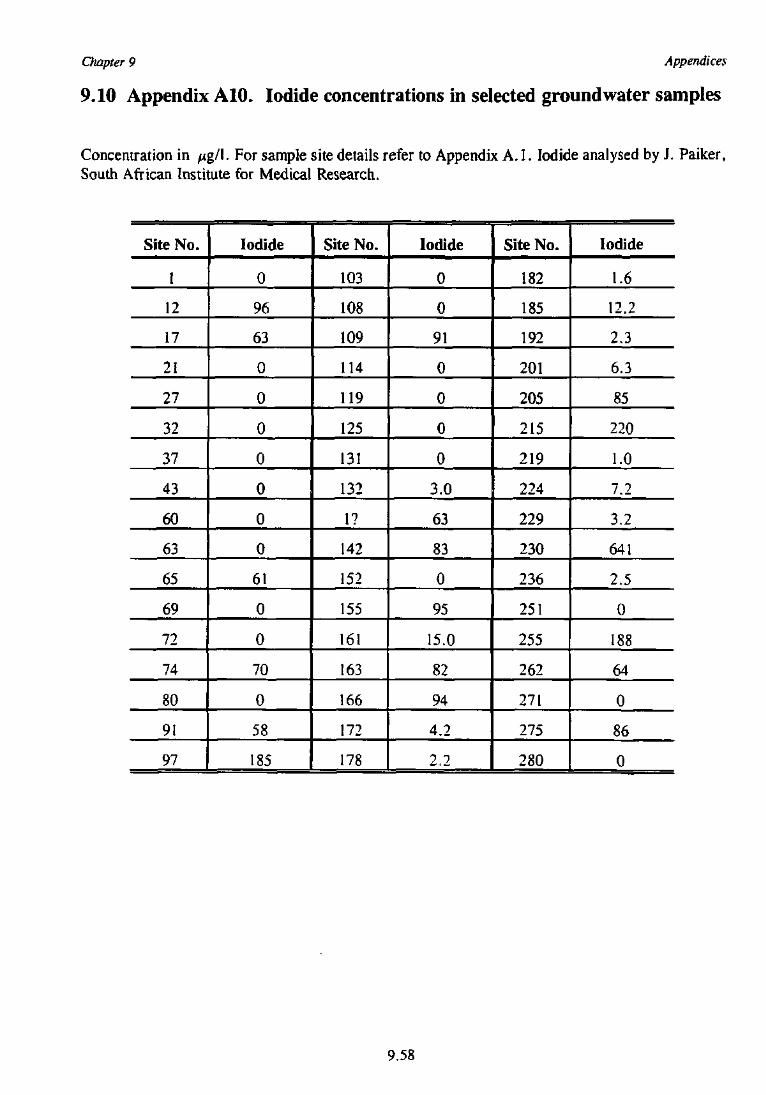
Chapter 9 Appendices
9.10 Appendix AlO. Iodide concentrations in selected groundwater samples
Concentration in figl\. For sample site details refer to Appendix A. 1. Iodide analysed by J. Paiker,South African Institute for Medical Research.
Site No.
1
12
17
21
27
32
37
43
60
63
65
69
72
74
80
91
97
Iodide
0
96
63
0
0
0
0
0
0
0
61
0
0
70
0
58
185
Site No.
103
108
109
114
119
125
131
132
1?
142
152
155
161
163
166
172
178
Iodide
0
0
91
0
0
0
0
3.0
63
83
0
95
15,0
82
94
4.2
2.2
Site No.
182
185
192
201
205
215
219
224
229
230
236
251
255
262
271
275
280
Iodide
1.6
12.2
2.3
6.3
85
220
1.0
7.2
3.2
641
2.5
0
188
64
0
86
0
9.58
Chapter 9 Appendices
9.11 Appendix A l l . Sampling protocol for collection of water samples
A protocol for water sampling was formulated before fieldwork commenced and was adhered to asmuch as possible. The sampling protocol comprised the following steps:1) Check that water can be obtained from the borehole (wind is blowing, machinery in working
order and permission has been obtained from farmer, owner or local chief)-2) Note the date, time, type and state of equipment, size and state of the borehole apron, possible
sources of contamination (e.g. kraals, pit latrines, industries, dams, oil soaks), topographicsetting, surrounding rocks/soiJ type and (if available) depth of borehole and water level.
3) If the borehole has been frequently used recently (i.e. wind has been blowing for several daysor a frequently used village handpump) take the samples immediately. If it is not frequentlyused, pump until no change in emerging water temperature and colour occurs.
4) Carry out the field tests (see below).5) Rinse the 'trace metal1 and 'major ion' sample bottles with groundwater. Filter approximately
400 mi of groundwater, using 0.45 \im Teflon filter papers. Although Teflon is a fluorinatedcompound, its extreme inertness ensured that no contamination of the samples took place. Fill2 x 100 ml 'major ion' bottles with unfiltered sample and 2 x 100 ml 'trace element' bottles withfiltered sample. Where bacterial contamination is suspected, or when cloudy or colouredsamples are obtained, filter the sample for the 'major ion' bottles.
6) Add 5 drops of 1 M nitric acid to the 'trace element' bottles. Check with universal indicatorpaper that the pH is below 2; if not add another 5 drops of acid and repeat. Seal the topstightly.
7) Mark the site and sample number with an indelible marking pen on the top and the sides of thebottles. Note in the field notebook the sample and site number, whilst marking the site numberon the 1:50000 map.
8) Pack all equipment securely. Scan the site for any equipment and rubbish.
The samples were stored in the dark and at approximately 4°C whenever possible, but the largenumber of samples and duplicates meant that not all bottles could be accommodated in refrigeratedstorage. Visual inspection at the time of major ion analysis at the University of Cape Town showedthat almost all of the samples were identical in appearance to the original: no precipitation ofminerals or growth of bacteria or algae had taken place.
Sample site details are listed in Appendix Al.
9.59
Chapter 9
9.12 Appendix A12. Workshop on Fluoride and Fluorosis
Appendices
ABSTRACT VOLUME
Fluorideand
FluorosisThe status of South African Research
9.60
Chapter 9 Appendices
ABSTRACT VOLUME
of a workshop on
Fluoride and Fluorosis:The Status of South African Research
held at
Manyane Centre, Pilanesberg National Park, North West Province
10th and 11th August 1995
Prepared by L P McCaffrey
Department of Geological Sciences, University of Cape Town
9.61
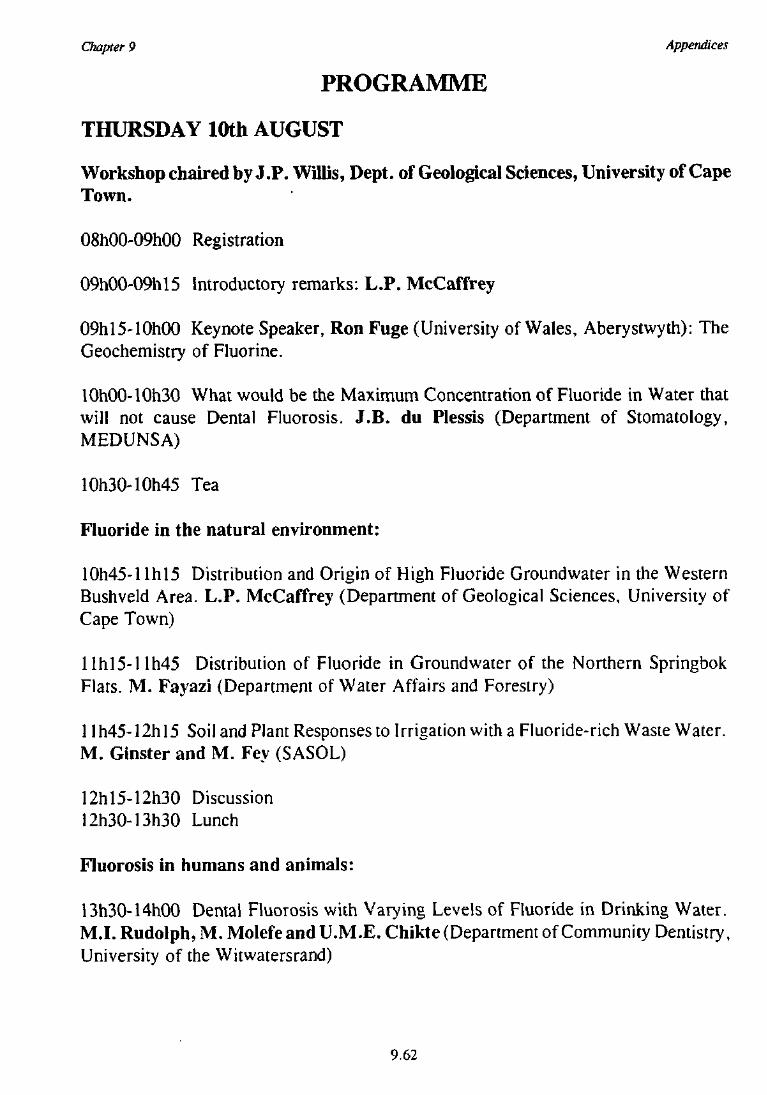
Chapter 9 Appendices
PROGRAMME
THURSDAY 10th AUGUST
Workshop chaired by J.P. Willis, Dept. of Geological Sciences, University of CapeTown.
08hOO-09hOO Registration
09h00-09hl5 Introductory remarks: L.P. McCaffrey
09hl5-10h00 Keynote Speaker, Ron Fuge (University of Wales, Aberystwyth): TheGeochemistry of Fluorine.
10h00-10h30 What would be the Maximum Concentration of Fluoride in Water thatwill not cause Dental Fluorosis. J.B. du Plessis (Department of Stomatology,MEDUNSA)
10h30-10h45 Tea
Fluoride in the natural environment:
10h45-l Ihl5 Distribution and Origin of High Fluoride Ground water in the WesternBushveld Area. L.P. McCaffrey (Department of Geological Sciences, University ofCape Town)
Ilhl5-llh45 Distribution of Fluoride in Groundwater of the Northern SpringbokFlats. M. Fayazi (Department of Water Affairs and Forestry)
1 Ih45-12hl5 Soil and Plant Responses to Irrigation with a Fluoride-rich Waste Water.M. Ginster and M. Fey (SASOL)
12hl5-12h30 Discussion12h3O13h30 Lunch
Fluorosis in humans and animals:
13h30-14h00 Dental Fluorosis with Varying Levels of Fluoride in Drinking Water.M.I. Rudolph, M. MolefeandU.M.E. Chikte (Department of Community Dentistry,University of the Witwatersrand)
9.62
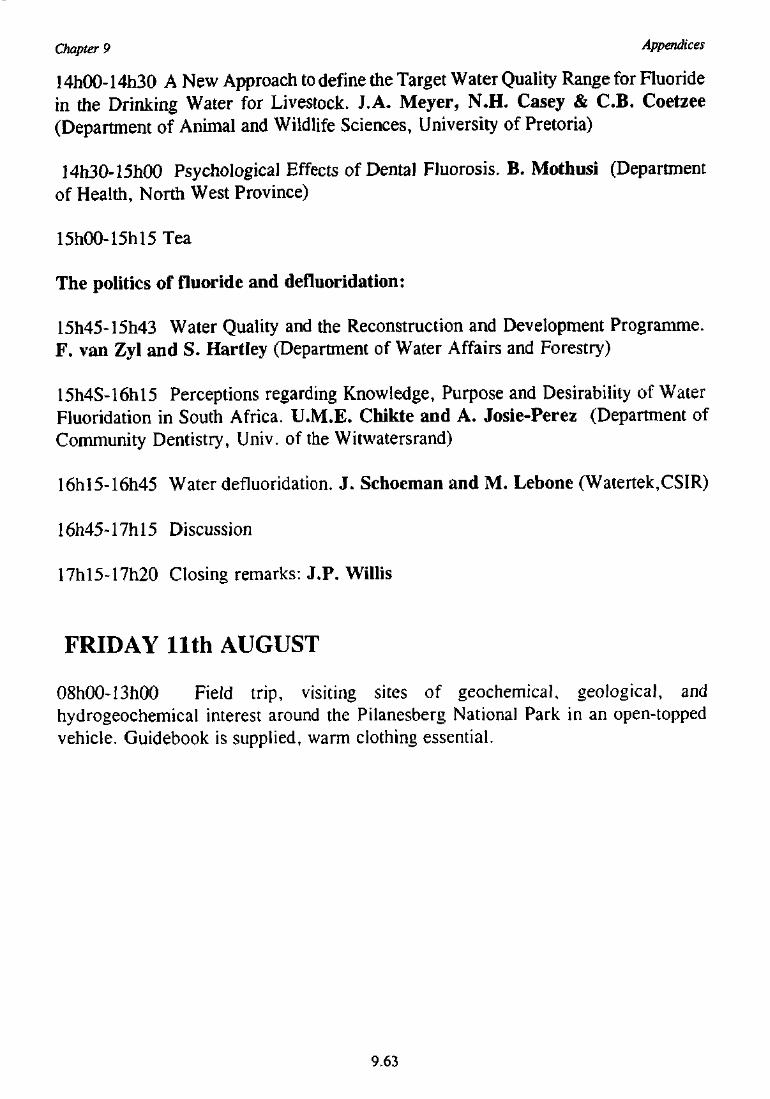
Chapter 9 Appendices
14h00-14h30 A New Approach to define the Target Water Quality Range for Fluoridein the Drinking Water for Livestock. J.A. Meyer, N.H. Casey & C.B. Coetzee(Department of Animal and Wildlife Sciences, University of Pretoria)
14h3O-15hOO Psychological Effects of Dental Fluorosis. B. Mothusi (Departmentof Health, North West Province)
15h00-15hl5Tea
The politics of fluoride and defluoridation:
15h45-15h43 Water Quality and the Reconstruction and Development Programme.F. van Zyl and S. Hartley (Department of Water Affairs and Forestry)
15h4S-16hl5 Perceptions regarding Knowledge, Purpose and Desirability of WaterFluoridation in South Africa. U.M.E. Chikte and A. Josie-Perez (Department ofCommunity Dentistry, Univ. of the Witwatersrand)
16hl5-16h45 Water defluoridation. J. Schoeman and M. Lebone (Watertek,CSIR)
16h45-17hl5 Discussion
17hl5~17h20 Closing remarks: J.P. Willis
FRIDAY 11th AUGUST
08h00-13h00 Field trip, visiting sites of geochemical, geological, andhydrogeochemical interest around the Pilanesberg National Park in an open-toppedvehicle. Guidebook is supplied, warm clothing essential.
9.63
Chapter 9 Appendices
CONTENTS
Author(s) Title Page
M. Fayazi Distribution of Fluoride in Groundwater 1of the Northern Springbok Flats.
L.P. McCaffrey Distribution and Origin of High Fluoride 2Groundwater in the Western Bushveld Area.
M.Ginster and M.V. FeySoil and Plant Responses to irrigation 3with a Fluoride-rich Waste Water.
J.B. du Plessis What would be the Maximum Concentration 4of Fluoride in Water that will not cause Dental Fluorosis.
M.I. Rudolph, M. Molefe & U.M.E. ChikteDental Fluorosis with Varying Levels of 5Fluoride in Drinking Water.
J.A. Meyer, N.H. Casey & C.B. CoetzeeA New Approach to define the Target Water 6Quality Range for Fluoride in the Drinking Water forLivestock.
B. Mothusi Psychological Effects of Dental Fluorosis. 7
F.van Zyt and S. HartleyWater Quality and the Reconstruction 8and Development Programme.
U.M.E.Chikte and A. Josie-PerezPerceptions regarding Knowledge, Purpose 9and Desirability of Water Fluoridation in South Africa.
J. Schoeman and M. LeboneWater defluoridation. 10
List of Delegates 11
9.64
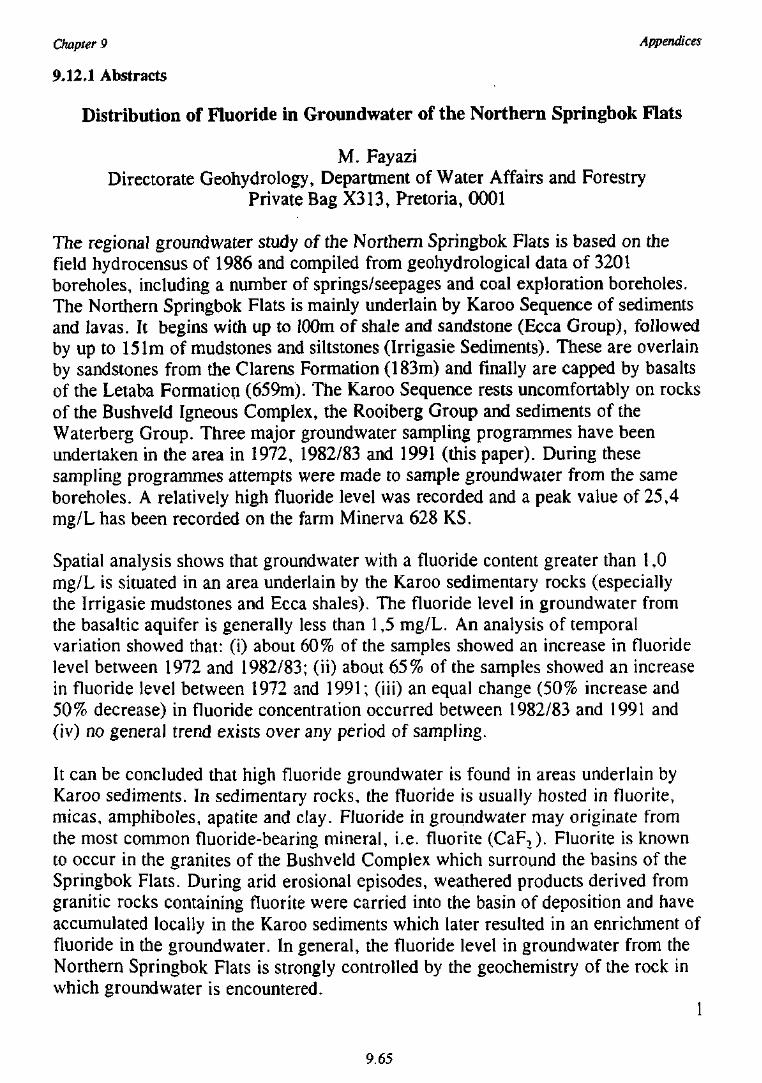
Chapter 9 Appendices
9.12.1 Abstracts
Distribution of Fluoride in Groundwater of the Northern Springbok Flats
M. FayaziDirectorate Geohydrology, Department of Water Affairs and Forestry
Private Bag X313, Pretoria, 0001
The regional groundwater study of the Northern Springbok Flats is based on thefield hydrocensus of 1986 and compiled from geohydrological data of 3201boreholes, including a number of springs/seepages and coal exploration boreholes.The Northern Springbok Flats is mainly underlain by Karoo Sequence of sedimentsand lavas. It begins with up to 100m of shale and sandstone (Ecca Group), followedby up to 151m of mudstones and siltstones (Irrigasie Sediments). These are overlainby sandstones from the Clarens Formation (183m) and finally are capped by basaltsof the Letaba Formation (659m). The Karoo Sequence rests uncomfortably on rocksof the Bushveld Igneous Complex, the Rooiberg Group and sediments of theWaterberg Group. Three major groundwater sampling programmes have beenundertaken in the area in 1972, 1982/83 and 1991 (this paper). During thesesampling programmes attempts were made to sample groundwater from the sameboreholes. A relatively high fluoride level was recorded and a peak value of 25,4mg/L has been recorded on the farm Minerva 628 KS.
Spatial analysis shows that groundwater with a fluoride content greater than 1,0mg/L is situated in an area underlain by the Karoo sedimentary rocks (especiallythe Irrigasie mudstones and Ecca shales). The fluoride level in groundwater fromthe basaltic aquifer is generally less than 1,5 mg/L. An analysis of temporalvariation showed that: (i) about 60% of the samples showed an increase in fluoridelevel between 1972 and 1982/83; (ii) about 65% of the samples showed an increasein fluoride level between 1972 and 1991; (iii) an equal change (50% increase and50% decrease) in fluoride concentration occurred between 1982/83 and 1991 and(iv) no general trend exists over any period of sampling.
It can be concluded that high fluoride groundwater is found in areas underlain byKaroo sediments. In sedimentary rocks, the fluoride is usually hosted in fluorite,micas, amphiboles, apatite and clay. Fluoride in groundwater may originate fromthe most common fluoride-bearing mineral, i.e. fluorite (CaF2). Fluorite is knownto occur in the granites of the Bushveld Complex which surround the basins of theSpringbok Flats. During arid erosional episodes, weathered products derived fromgranitic rocks containing fluorite were carried into the basin of deposition and haveaccumulated locally in the Karoo sediments which later resulted in an enrichment offluoride in the groundwater. In general, the fluoride level in groundwater from theNorthern Springbok Flats is strongly controlled by the geochemistry of the rock inwhich groundwater is encountered.
1
9.65
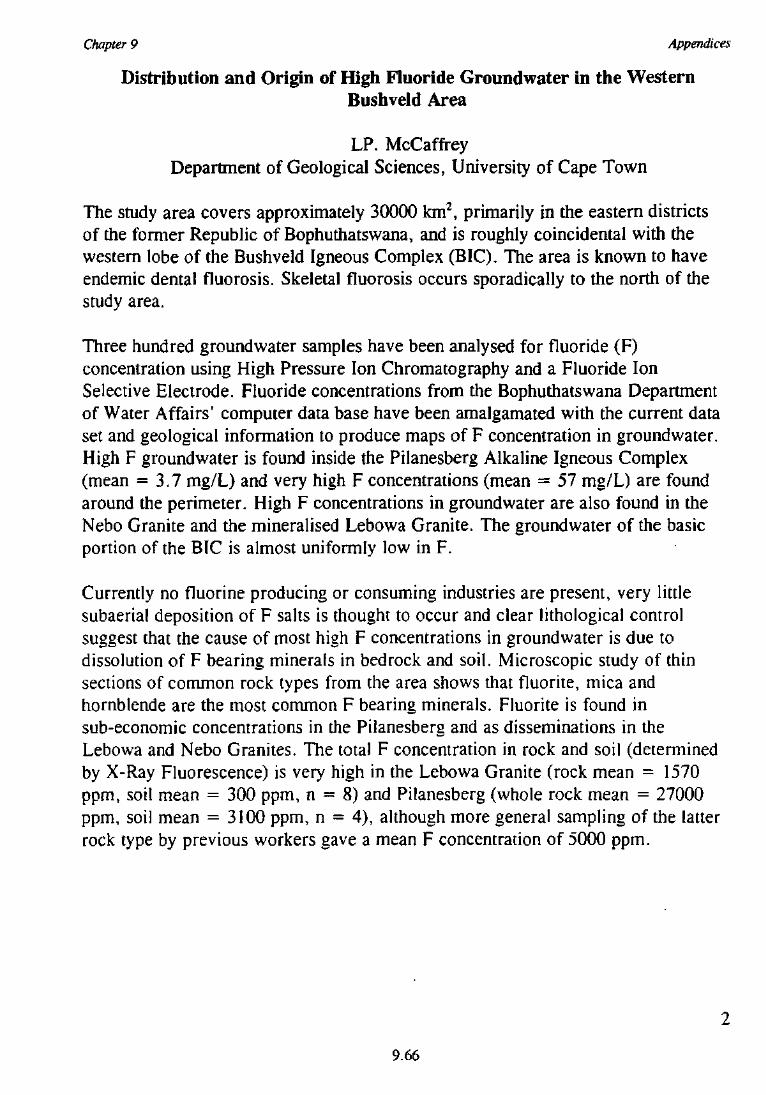
Chapter 9 Appendices
Distribution and Origin of High Fluoride Groundwater in the WesternBushveld Area
LP. McCaffreyDepartment of Geological Sciences, University of Cape Town
The study area covers approximately 30000 km2, primarily in the eastern districtsof the former Republic of Bophuthatswana, and is roughly coincidental with thewestern lobe of the Bushveld Igneous Complex (BIC). The area is known to haveendemic dental fluorosis. Skeletal fluorosis occurs sporadically to the north of thestudy area.
Three hundred groundwater samples have been analysed for fluoride (F)concentration using High Pressure Ion Chromatography and a Fluoride IonSelective Electrode. Fluoride concentrations from the Bophuthatswana Departmentof Water Affairs' computer data base have been amalgamated with the current dataset and geological information to produce maps of F concentration in groundwater.High F groundwater is found inside the Pilanesberg Alkaline Igneous Complex(mean = 3.7 mg/L) and very high F concentrations (mean - 57 mg/L) are foundaround the perimeter. High F concentrations in groundwater are also found in theNebo Granite and the mineralised Lebowa Granite. The groundwater of the basicportion of the BIC is almost uniformly low in F.
Currently no fluorine producing or consuming industries are present, very littlesubaerial deposition of F salts is thought to occur and clear lithological controlsuggest that the cause of most high F concentrations in groundwater is due todissolution of F bearing minerals in bedrock and soil. Microscopic study of thinsections of common rock types from the area shows that fluorite, mica andhornblende are the most common F bearing minerals. Fluorite is found insub-economic concentrations in the Pilanesberg and as disseminations in theLebowa and Nebo Granites. The total F concentration in rock and soil (determinedby X-Ray Fluorescence) is very high in the Lebowa Granite (rock mean = 1570ppm, soil mean = 300 ppm, n = 8) and Pilanesberg (whole rock mean = 27000ppm, soil mean = 3100 ppm, n = 4), although more genera! sampling of the latterrock type by previous workers gave a mean F concentration of 5000 ppm.
9.66
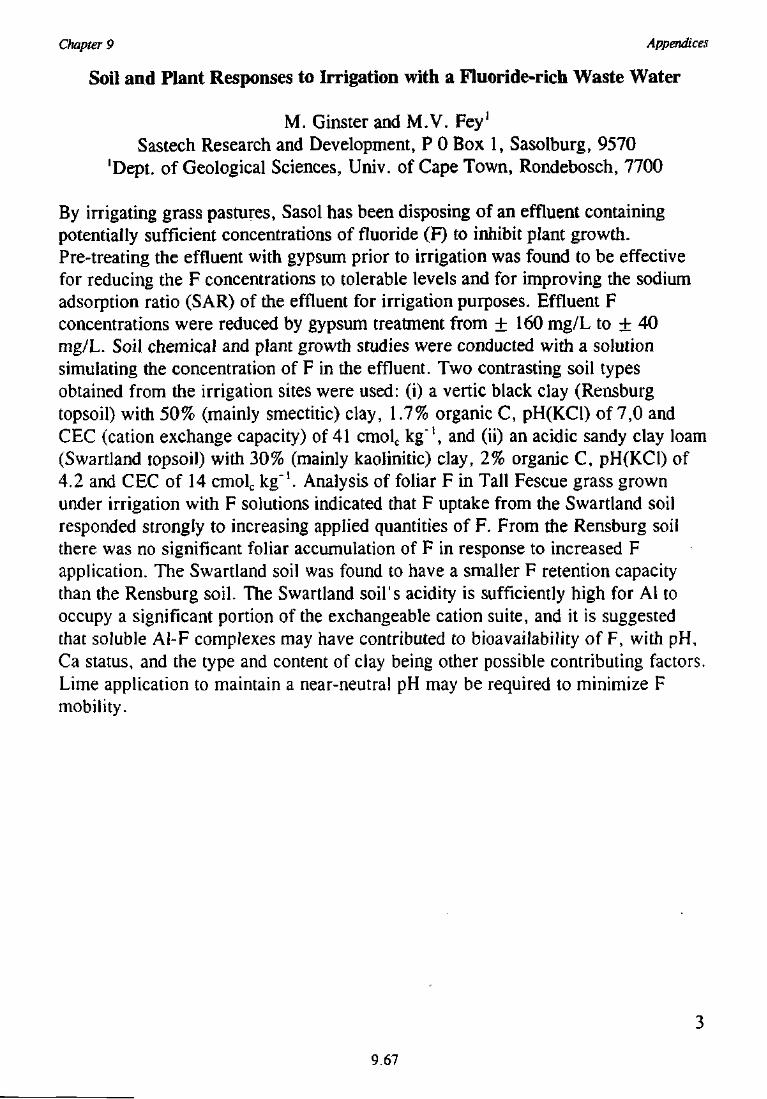
Chapter 9 Appendices
Soil and Plant Responses to Irrigation with a Fluoride-rich Waste Water
M. Ginster and M.V. FeyJ
Sastech Research and Development, P 0 Box 1, Sasolburg, 9570'Dept. of Geological Sciences, Univ. of Cape Town, Rondebosch, 7700
By irrigating grass pastures, Sasol has been disposing of an effluent containingpotentially sufficient concentrations of fluoride (F) to inhibit plant growth.Pre-treating the effluent with gypsum prior to irrigation was found to be effectivefor reducing the F concentrations to tolerable levels and for improving the sodiumadsorption ratio (SAR) of the effluent for irrigation purposes. Effluent Fconcentrations were reduced by gypsum treatment from ± 1 6 0 mg/L to ± 40mg/L. Soil chemical and plant growth studies were conducted with a solutionsimulating the concentration of F in the effluent. Two contrasting soil typesobtained from the irrigation sites were used: (i) a vertic black clay (Rensburgtopsoil) with 50% (mainly smectitic) clay, 1.7% organic C, pH(KCl) of 7,0 andCEC (cation exchange capacity) of 41 cmolc kg'1, and (ii) an acidic sandy clay loam(Swartland topsoil) with 30% (mainly kaolinitic) clay, 2% organic C, pH(KCl) of4.2 and CEC of 14 cmolc kg"1. Analysis of foliar F in Tall Fescue grass grownunder irrigation with F solutions indicated that F uptake from the Swartland soilresponded strongly to increasing applied quantities of F. From the Rensburg soilthere was no significant foliar accumulation of F in response to increased Fapplication. The Swartland soil was found to have a smaller F retention capacitythan the Rensburg soil. The Swartland soil's acidity is sufficiently high for Al tooccupy a significant portion of the exchangeable cation suite, and it is suggestedthat soluble Al-F complexes may have contributed to bioavailability of F, with pH,Ca status, and the type and content of clay being other possible contributing factors.Lime application to maintain a near-neutra! pH may be required to minimize Fmobility.
9.67
Chapter 9 Appendices
What would be the Maximum Concentration of Fluoride in Water that will notcause Dental Fluorosis?
J.B. Du PlessisDepartment of Stomatological Studies, MEDUNS A
Dental fluorosis is a sign of chronic fluoride poisoning in children under six toseven years of age. Unfortunately this is only seen years after the damage, which isirreversible, has been done. Because fluoride in the water is the main source offluoride to the human being, it is necessary to know the maximum concentration inthe water that will not cause dental fluorosis. The fluoride content of the watersupply to the Orange Free State (OFS) Goldfields varies between 0,4 and 0,9 ppmwith a mean value of 0,54 ppm. A survey to determine the prevalence of dentalfluorosis in the Black and White population groups in this area was conductedduring 1992. The results showed that the White population had significantly moredental fluorosis than the Black population. When comparing the results of this studywith the results from other studies in the USA it can be extrapolated that themaximum safe concentration of fluoride in the water for the OFS goldfields is 0,7ppm.
9.68
Chapter 9 Appendices
Dental Fluorosis with Varying Levels of Fluoride in Drinking Water.
M.J. Rudolph, M. Molefe, and U.M.E. ChikteDepartment of Community Dentistry, University of the Witwatersrand
Several studies have investigated the varying levels of naturally occurring fluoridein water and the resulting effect of fluorosis.
The purposes of this study were to determine the prevalence and compare levels ofdental fluorosis in children and adults from 4 villages with a range of fluoride inwater from 0.1 to 7-8 ppm. At each of the 4 villages, 30 individuals in age ranges6-7, 12-13 and 35-55 were randomly selected. Dean's and TSIF fluorosis indiceswere used. Statistical analysis was done using the U-test of Mann Whitney and theKruskal Wallis test. The highest severity using Dean's Index for 6-7 year olds wasfound at Village 4 (7- 8 ppm), as expected, with 28 per cent of subjects recordingsevere fluorosis and 41 per cent moderate. Early signs of questionable fluorosiswere identified even in a few subjects exposed to recommended safe levels (0.4 -0.9 ppm) and very low levels of fluoride in the drinking water. Similar findings ofsevere fluorosis were also found for the 12 year olds and adult group in the villageswith high fluoride content (3-6 ppm and 7-8 ppm). Every subject at the two villageswith high fluoride levels showed some degree of fluorosis. Using the TSIF forlabial and palatal surfaces of permanent anterior teeth for 6-7 year olds, no canineteeth exhibited signs of fluorosis. The prevalence of fluorosis was higher in themaxillary central incisors than the lateral incisors. The labial surfaces were moreaffected than the palatal surfaces. Signs of fluorosis on canine teeth were seen onthe 12-13 year old and adult groups. The differences between the percentage ofsubjects with fluorosis and the severity of fluorosis was highly significant betweenvillages 1 and 2 and villages 3 and 4. Questionable fluorosis was shown on 3subjects even at safe levels of fluoride in the water. This finding raises the questionof safe levels of fluoride in water. Subjects exposed to water containing high levelsof fluoride manifested with severe fluorosis which is a public health problem.
9.69
Chapter 9 Appendices
A New Approach to define the Target Water Quality Range for Fluoride in theDrinking Water for Livestock
J.A. Meyer, N.H. Casey & C.B. CoetzeeDepartment of Animal and Wildlife Sciences, University of Pretoria
An assessment of water samples from non hydrogauging water stations from theNorthern Transvaal, North West and Northern Cape provinces for potentiallyhazardous water quality constituents revealed fluoride (F), total dissolved solids,chloride, sulphate and nitrate to have the highest incidence of potential toxicity.
Biological trials were conducted investigating the effects of F on sheep, cattle andpoultry. In the first trial with South African Mutton Merino (SAMM) wethers, F at5 levels (< 1, 6, 10, 14 and 20 mg F/L) in the drinking water had no significantadverse effect (P<0.05) on growth or health over the 20 - 45 kg growth phase.Thyroid gland weight increased significantly with increasing F levels. No clinicalsigns of fluorosis were observed and no histopathological lesions were found.
Similar results were found in a second trial with 15 mg F/L using SAMM wethersand 20 mg F/L using Bonsmara steers over the growth phase from weaned tomarket weight. In both these trials a saline water treatment appeared to have abeneficial effect in terms of carcass masses as compared to control and Ftreatments. In the steers a saline water treatment had a significant negativecorrelation with metacarpal bone F concentration.
The effect of F in the drinking water over a 49 day growth phase of Ross Broilerhens to a level of 20 mg/L had a positive effect on weight gain and feed intake andno adverse effects on growth or health to slaughter weight. No significantdifferences were found between treatments (0-20 mg F/L) regarding performanceparameters over a 19-74 week laying period in Silver Hy-line layers.
Further research on different categories of exposure, weaning practices andplacental transfer are currently underway. The results thus far indicate that theTarget Water Quality Guideline Range for toxic water quality constituents is bestdefined in terms of a water quality index system based primarily on exposure timeand ingestion (mg/head/day) factors.
9.70
Chapter 9 Appendices
Psychological Effects of Dental Fluorosis
B. MothusiDepartment of Health, North West Province
Dental fluorosis is one of the major dental problems affecting the local inhabitantsof the North West Province, especially those in the Pilanesberg, Odi and Moreteleregions.
The economic development in the Pilanesberg has attracted many people, who flockto seek employment. This affects the other family members, as members of thefamily born in areas with low fluoride content have normal white teeth, while thoseborn in the abovementioned regions have fluorosed (brown-stained) teeth.
The aims and objectives of the paper are to strike a balance between fluoridationand de-fluoridation, and to show that fluorosed teeth have some effect on the self-esteem of the local people, especially adolescents. Most of the reviewed papersidentify the effects of fluoride in cavity reduction, but few indicate the effect ofexcessive amounts and none the psychological trauma caused by it.
The psychological effect in terms of the unsightly, brown-stained teeth has inducedthe adolescents, with fluorosed teeth, to demand that these teeth be extracted andreplaced with dentures. Thus it is imperative that when we advocate waterfluoridation, we should at the same time consider those regions with a high amountof fluoride causing dental fluorosis/brown-stained teeth.
When all is said and done, water fluoridation is the answer to tooth decay (dentalcaries) and it should be supported.
9.71
Chapter 9 Appendices
Water Quality and the Reconstruction and Development Programme
F. van Zyl and S. HartleyDepartment of Water Affairs and Forestry
The fundamental principle of good government is to ensure all its citizens haveaccess to quality of life.
Access to a supply of clean water is one of the key contributors to this fundamentalprinciple. In order to enact this statement it is therefore essential to determine whatis clean water. This paper discusses the philosophy of what is water quality, what isacceptable and the implications of accepting certain basic criteria and standards.Specific reference is made to the incorporation of water quality in the Water Supplyand Sanitation actions being implemented. Fluoride is one of the primaryconstituents that will be specifically addressed.
8
9.72
Chapter 9 Appendices
Perceptions regarding Knowledge, Purpose and Desirability of WaterFluoridation in South Africa
ILM.E. Chikte and A. Josie-PerezDepartment of Community Dentistry, University of Witwatersrand
The implementation of water fluoridation, defined as the controlled adjustment offluoride concentration in the drinking water to an optimum amount, is influenced bysocial, political, environmental and economic factors.
This paper reports on a national survey in South Mrica (n=2229) designed to assesspublic perceptions with regard to the knowledge, purpose and desirability of waterfluoridation.
Most of the respondents (66.4%) have not heard or read about water fluoridation.The sources of information for those who have heard or read about waterfluoridation (23.9%) are the community (33.1%), radio (22.3%), newspapers(19.2%) and television (17.2%). In response to the question on the purpose of waterfluoridation, most of the respondents (41.1 %) said that fluorides purify water, while25% said it protects teeth. In response to the question, "Do you think fluorideshould be added to water if it can reduce tooth decay?", 62.2% of the respondentssaid "Yes", while 13.5% said "No".
The lack of accurate knowledge about water fluoridation amongst the public needsto be addressed.
9.73
Chapter 9 Appendices
Water Defluoridation
J.J. Schoeman and M.L. LeboneWatertek, CSIR
Different water defluoridation methods and case studies for water defluoridationwill be presented. The following defluoridation methods will be discussed: (a)Methods based upon the addition of chemicals to cause precipitation orco-precipitation during coagulation; (b) Methods based upon ion-exchange oradsorption; and (c) Methods based upon membrane separation.
Case studies regarding treatment of groundwater (4 to 20 mg/L F) with theactivated alumina defluoridation and reverse osmosis processes will be presented.The economics of these processes for water defluoridation will also be considered.Both the activated alumina and reverse osmosis processes can be effectively appliedfor water defluoridation. Fluoride concentration levels in groundwater varyingbetween 4 and 20 mg/L can be reduced to less than 1 mg/L with both theseprocesses.
10
9.74
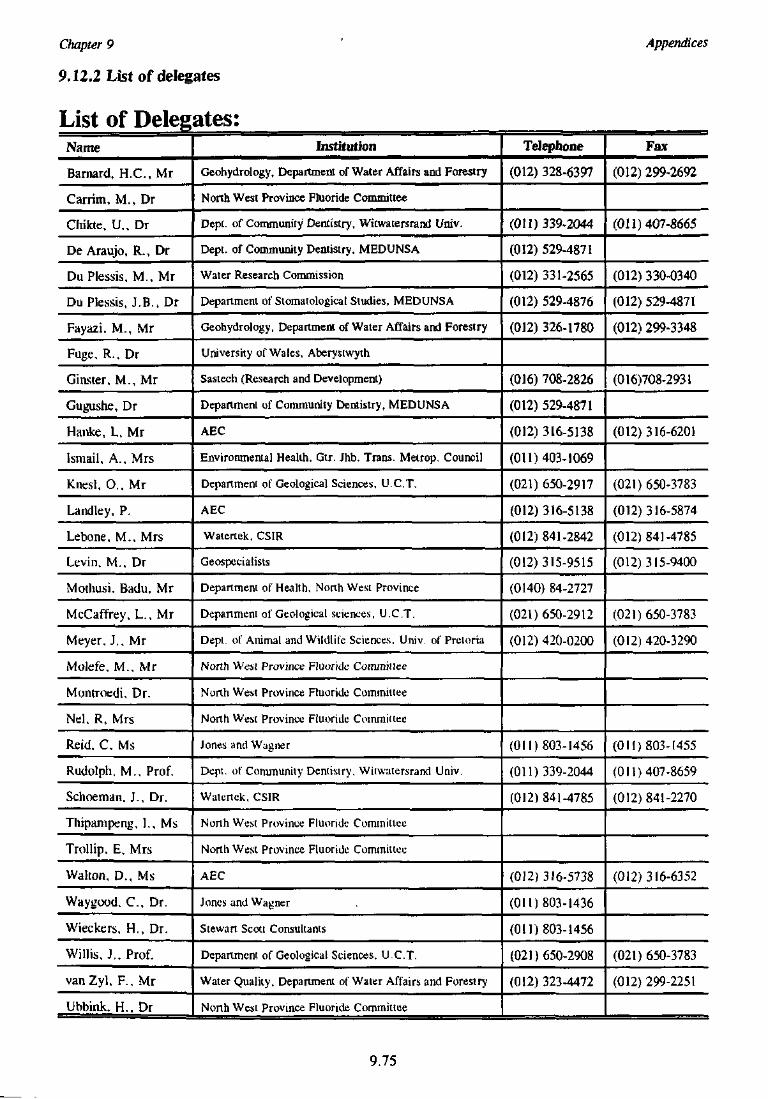
Chapter 9
9.12.2 List of delegates
List of Delegates:
Appendices
Name
Barnard, H.C., Mr
Carrim, M., Dr
Chikte, If., Dr
De Araujo, R., Dr
Du Plessis, M., Mr
Du Plessis, J.B., Dr
Fayazi, M., Mr
Fuge, R., Dr
Ginster, M., Mr
Gugushe, Dr
Hanke, L( Mr
Ismail, A., Mrs
KnesI, 0 . , Mr
Landley, P.
Lebone, M., Mrs
Levin, M., Dr
Mothusi, Badu. Mr
McCaffrey, L., Mr
Meyer, J,, Mr
Molefe, M.. Mr
Montroedi, Dr.
Nd. R, Mrs
Reid, C, Ms
Rudolph. M., Prof.
Schoeman. J., Dr.
Thipampeng, I., Ms
Trollip. E, Mrs
Walton, D., Ms
Waygood, C , Dr.
Wieckers, H., Dr.
Willis, J., Prof.
van Zyl, F., Mr
Ubbink, H., Dr
Institution
Geohydrology, Department of Water Affairs and Forestry
NorthWest Province Fluoride Committee
Depi. of Community Dentistry, Witwatersrand Univ.
Dept. of Community Dentistry, MEDUNSA
Water Research Commission
Department of Stomatological Studies, MEDUNSA
Geohydrology, Department of Water Affairs and Forestry
University of Wales, Aberystwyth
Sastech (Research and Development)
Departmenl of Community Dentistry, MEDUNSA
AEC
Environmental Health, Gtr. Jhb. Trans. Melrop. Council
Department of Geological Sciences, U.C.T.
AEC
Watertek, CSIR
Geospeciahsts
Department of Health, North West Province
Department of Geological sciences, U.C.T,
Depi. of Animal and Wildlife Sciences. Univ, of Pretoria
North Wesl Province Fluoride Commhlee
North West Province Fluoride Committee
North West Province Fluoride Committee
Jones and Wagner
Dept. of Community Dentistry. Witwatersrand Univ.
Watertek. CSIR
North West Province Fluoride Committee
North West Province Fluoride Commit Lee
AEC
Jones and Wagner
Stewart Scott Consultants
Department of Geological Sciences, U.C.T.
Water Quality. Department of Water Affairs and Forestry
North West Province Fluoride Committee
Telephone
(012) 328-6397
(Oil) 339-2044
(012) 529-4871
(012) 331-2565
(012) 529-4876
(012) 326-1780
(016) 708-2826
(012) 529-4871
(012) 316-5138
(011)403-1069
(021) 650-2917
(012)316-5138
(012)841-2842
(012)315-9515
(0140) 84-2727
(021)650-2912
(012) 420-0200
(011)803-1456
(011)339-2044
(012)841-4785
(012)316-5738
(011)803-1436
(011)803-1456
(021)650-2908
(012) 323-4472
Fax
(012) 299-2692
(011)407-8665
(012) 330-0340
(012) 529-4871
(012) 299-3348
(016)708-2931
(012)316-6201
(021) 650-3783
(012)316-5874
(012)841-4785
(012)315-9400
(021)650-3783
(012)420-3290
(011)803-1455
(011)407-8659
(012)841-2270
(012)316-6352
(021)650-3783
(012)299-2251
9.75
Chapter 9 Appendices
9.12.3 Paper by B. Mothusi, "Psychological Effects of Dental Fluorosis"
PSYCHOLOGICAL EFFECTS OF DENTAL FLUOROSIS
Badu MothusiDepartment of Health, North West Province
INTRODUCTION
It is significant to me, that the first Fluoride and Fluorosis workshop is held in the North WestProvince, not because I am from the Province, not because I am the Head of the Oral HealthServices but simply because it is ideal, it is appropriate and North West Province hasunfortunately the richest deposits of fluoride in the country (McCaffrey, 1994) .
Dental fluorosis is one of the major dental problems affecting the people in the North-WestProvince, especially those in the Pilanesburg, Odi and Moreteie regions (Zietsman 1988).
People in these regions are hard hit by brown-stained, that is mottled teeth due to an excessiveamount of fluoride in their drinking water.
The deveiopment in this area has attracted a lot of people, e.g. The Pilanesberg National Parkwhich is the fourth largest park in South Africa (North-West Parks Board, 1992).
The area also boasts of a complex of hotels, sporting and entertainment facilities that rise out ofrugged African bushes like an oasis (North West Parks Board, 1992).
These magnificent developments brought changes to the life style of the people in the region.What used to be normally brown-stained accepted teeth are now considered as abnormal andunwanted teeth.
The developments in the area have attracted many people, who flock to Pilanesberg to seekemployment. This affects the surrounding family members, as members of the family born inareas with low fluoride content have normal white teeth and while those born in these areas havefluorosed (brown-stained) teeth.
In this region there is a high demand for these fluorosed teeth to be removed and replaced withdentures. It would appear that having such teeth reduces the possibility that people mightpositively appraise themselves and/or might be positively appraised by others.
AIMS
The aims of the paper are:
To show that fluorosed teeth have some effects on the self esteem of the people especially
adolescents;To place de-fluoridation high on the priority list in areas where there is naturally high amount offluoride the drinking water.
9.76
Chapter 9 Appendices
According to the figures from the Department of Water Affairs, the Mankwe region, i.e. the SunCity Area, and Moretele Region (Hammanskraal) have exceptionally high amounts of fluoride,some areas had up to 13 parts per million parts fluoride in the water.
Some of the bore-holes in the area had to be closed because of the high amount of fluoride andunfortunately some of the these bore holes were in the school-yards.
OBJECTIVES
I believe in water fluoridation, I support fluoridation, I am an advocate of water fluoridation, amember of the National Task Team and we are preaching the Gospel of Water Fluoridation.
But 1 believe that as long as we preach water fluoridation, we should at the same time talk aboutwater de-fluoridation in areas with high contents of fluoride especially in the North WestProvince.
We need to strike a balance betweeen fluoridation and de-fluoridation. We need to adjust thelevel of fluoride in our drinking water.
FLUOROSED TEETH
Fluorosis is a mottling of teeth which in some cases can be unsightly, especially in this part ofour country, Pilanesberg. ft occurs especially when the levels of fluoride are too high.
Slide 1
Horowitz (1986) defines dental fluorosis as a hypoplasta or hypo-mineralisation of tooth enamel,due to the ingestion of excess amount of fluoride during the period when teeth are developing.
Leverett (1986) studied prevalence of dental fluorosis in fluoridated and non fluoridatedcommunities. In this area it proved that properly adjusted fluoride does not result in dentalfluorosis that has reached an objectionable level.
PSYCHOLOGICAL EFFECTS
Most of the information available to date describes effects of excessive amount of fluoride on theteeth.
Most of the reviewed papers indicate the effects of fluoride in caries reduction, but few indicatethe harmful effect of excessive amount of fluoride and none the psychological trauma caused byit.
SELF-CONCEPT / SELF ESTEEM
Self concept and self esteem will be used interchangeable in this paper to refer to the image thateach person has about himself.
9.77

Chapter 9 Appendices
Rungasamy (1979) talks about the incomprehensibility of trying to define self-esteem. He says themore one tries to grasp it the more it seems elusive. Like mercury, it slips and slides eluding thefingers of the mind. In other words self-esteem is not something tangible and static, on thecontrary self esteem is a dynamic mental picture that the person has about himself.
Burns (1984) says that the mouth and face are the focal points of a tremendous number ofemotional conflicts and that dentofacial deformities can constitute a source of emotional sufferingvarying from embarrassment to mental anguish.
Slide 2
Hall points out that people do not want to receive unfavourable information about themselves, forexample to be informed about bad teeth as this will make them fee! inferior and worthless,resulting in low self-esteem.
Slide 2
According to Penrod (1983), self esteem affects people's behaviour and the way they presentthemselves to others. He continues to say that people with low self esteem assume that otherpeople will not like them. Such people anticipate rejection at every encounter with others andthey are awkward and fearful in social situations.
Goldstein (1976) says that an individual sense of what is beautiful influences how he desires topresent himself to others, and that a desire to look well is no longer taken as a sign of vanity in asocially, economicallyand sexually competitive world. A pleasing appearance is literally anecessity. The physical aspect of one's self concept is stressed here within the social context inwhich one lives.
Slide 3
Vrey (quoted in Molefe,1985) states that "if personality is the radiant force emitted from the coreof the person, then self-concept is the lens focussing this force on personality traits". Molefe(1985) continues to say that positive or high self-esteem induces one to wear a happy facewherever one goes. He says the importance of acquiring a positive self-concept lies in the factthat it helps to promote self-actualisation provided the person is given essential educational help.
FACE
According to Patter (1985), the face is the most frequently used component in the physicalattractiveness research. The face is interesting, enduring and informative. He says that consistentuse of the face in evaluating physical attractiveness is justified, because of its unique andpowerful properties which appear to make it omnipotent and omnipresent. Thus people withfluorosed teeth keep on shielding their mouth thus hiding their faces.
Slide 4
According to Rubenstein (1983) "Abraham Lincoln once stated in a campaign speech that, basedon the appearance of his face, no one ever expected him to be president". Handsome/goodlooking people are perceived to be leaders.
9.78
Chapter 9 Appendices
THE EFFECTS OF FACIAL APPEARANCE IN EMPLOYMENT
Signal and Aronson (1969) suggest that it is more rewarding to please a physically attractiveperson than one who is not attractive. Waters(1985) suggests that attractive applicants are morefavourably perceived than unattractive applicants. Attractive applicants are attributed greateroverall employment potential than unattractive applicants. He found that physical appearanceplays an important role in the hiring process on all skills levels.
This is so true, as from to day observe Sun city receptionists.
FACIAL APPEARANCE IN ADVERTISING
In 1982 Joseph stated that advertisers believe that the beautiful are also credible, and thatphysically attractive sources can contribute to a communication's effectiveness.
Slide 5
Observe all our News presenters and People used for/in advertising.
Slide 6Slide 7Slide 8
CONCLUSION
The psychological effect in terms of unsightly brown stained teeth has induced the adolescentswith fluorosed teeth to demand that these teeth be extracted and replaced with dentures.
Slide 9
Their demand suggests that the unsightly brown teeth negatively affects their appearance and theirself concept.
Slide 10
Thus it is imperative that when we advocate water fluoridation, we should at the same timeconsider areas with high amount of fluoride causing dental fluorosisl brown teeth.
When all is said and done water fluoridation is the answer to tooth decay (dental caries) and itshould be supported.
REFERENCES
Burns, R.B. and Dobson, C.B. (1984). Introduction to Psychology. Langaster. M.T.P Press.
Goldstein, R.E. (1976). Esthecs in Dentistry, Esteem in children with special educational needs:Philadelphia. J.L Lippincot.
9.79

Chapter 9 Appendices
Hall, J. (19850. Psychology for nurses and health visitors: London. MacMillian.
Horowitz, H.S. (1986). Indexes for measuring dental fluorosis. Journal of Public HealthDentistry, vol 46 179-182.
Joseph, W. (1982). The credibility of physically attractive communications. A review. Journal ofAdvertising 11, 15-25.
McCaffrey, L.P. (1994). The Geohydrology of the Pilanesburg. Unpbl M.Sc. Diss. Wits.
Leverett, D. (1986). Prevalence of dental fluorosis in fluoridated and non fluoridatedcommunities, a preliminary investigation. Journal of Public Health Dentistry, 46, 184-187.
Molefe, R.D. (1987). The meaning of self-concept for the academic achievement of Tswanateacher-trainees. M.Sc. thesis. Univ. of Pretoria.
Patter, G.L. (1985). The physical attractiveness phenomena. New York. Plenum Press.
Rubenstein, C. (1983). The face psychology today.
Rungasamy, P. (1979). A study of the levels of depression in the physically ill. University ofDublin. Trinity College.
Penrod, S. (1983). Social psychology. Prentice Hall. Englewood Cliffs.
Signal, H. and Aronson, E. (1969). Liking for and evaluation as a function of her physicalattractive partner on person perception. Journal of Personlity and Social Psychology,31,410-414.
Waters, J. (1985). Cosmetic and the Job Market. In Graham J. and Kligman I.S. Psychology ofcosmetic treatment. New York. Pergamon.
Zietsman, S (1991). Spatial Variation of fluorosis and fluoride content of water in an endemicarea of Bophuthatswana. Journal of the Dental Association of South Africa, 46, 11-15.
9.80
Chapter 9 Appendices
9.12.4 Paper by J.B. du Plessis, "What would be the maximum concentration of fluoride inwater that will not cause dental fluorosis?"
WHAT WOULD BE THE MAXIMUM CONCENTRATION OF FLUORIDE IN WATERTHAT WILL NOT CAUSE DENTAL FLUOROSIS?
Dr J B du PlessisDepartment of Stomatological Studies, MEDUNSA
The optimum concentration of fluoride in the drinking water of any community is that concentrationwhich will give the maximum protection against dental caries, without causing aestheticallyunacceptable dental fluorosis.
During the nineteen thirties this concentration was epidemiologically determined to be 1 ppm forcountries with a temperate to cold climate. This concentration was also found to be influenced byother factors, of which the annual average daily maximum air temperature was the most important,because this is the main factor determining the amount of water consumed by the individuals in thatarea.
On the basis of this evidence the MacKenzie commission of 1966 recommended that the optimumconcentration of fluoride in the drinking water for Soll.th Africa should be 0,8 ppm.
Since the ear ly nineteen seventies, various fluoride supplements appeared on the market. Of thesefluoridated tooth pastes and fluoride tablets which had to be taken on a daily basis, had the greatestimpact on the amount of fluorides consumed by its users. Thus in most countries where waterfluoridation is implemented today, the optimum concentration was lowered to vary between 0,5 and0,8 ppm, depending on the climate.
The best way to determine the optimum concentration of fluoride in the water for South Africa wouldbe to study the epidemiological evidence that we have from areas with varying concentrations offluoride in its water, as it was done in the USA, Europe and other countries. We have data from themetropoli tan areas along our coastline where the fluoride concentration in the water is 0,05 ppm orless. This can be compared to the PWV area which had a fluoride concentration of 0,32 ppm,Bloemfontein with 0,35 ppm and the Free State Gold Fields with 0,55 ppm. We must note howeverthat this last 0,55 ppm is the long time average of the fluoride content, and that it does vary from 0,2to 0,9 ppm. Due to the particular circumstances these variations may occur over very short periods.According to Burt et a!. (1992) it is the long time average that gives protection against dental caries,while Meyers (1978) maintained that it is the high spikes in the fluoride concentration which aremainly responsible for dental fluorosis .
The caries experience of the Black children in these various areas show the dramatic effect of fluoridein preventing dental caries. In the primary dentition of the 6 year old children there is a 51%reduction from the coastal areas to the Free State Gold fields. In the permanent denti tion of the 12year old children the reduction is 84% and in the 15 year old children it is 85%. These resultscompare very favourably with the best resul ts obtained by water fluoridation prior to the introductionof other fluoride supplements as was reported by Murray and Rugg-Gunn in 1982.
In the White children the pattern of protection against caries compares favourably to what wasreported by Newbrun (1989) from water fluoridation studies after the introduction of fluoride
9.81
Chapter 9 Appendices
supplements. We see a 6% reduction in the caries experience in the primary dentition of 6 year oldchildren, 27% in the permanent dentition of the 12 year old children and 31 % in the 15 year oldchildren.
The exact prevalence of dental fluorosis in the coastal areas, the PWV and Bloemfontein is notknown. However the prevalence of dental fluorosis on the labial surfaces of the upper central incisorswas determined in the Free State Gold Fields. Comparing 15 year old Black and White children itis clear that the White children had much more fluorosis (31 % versus 17%).
In the 12 year old children this difference is even bigger (43% versus 17%). This indicates that thewhite children consumed more fluoride than their Black compatriots, despite the fact that both groupsused the same water supply.
If we look at the fluorosis prevalence in 12 and 15 year old black children we can see that there isvirtually no difference between the two age groups, indicating that they consumed the same amountof fluoride during the time when the labial surfaces of the upper central incisors were formed.
In the White children there is a big difference between the two age groups. This is particularly sofor scores 3 and 4, which are mild and moderate fluorosis. It is clear that the 12 year old groupconsumed more fluorides than the 15 year old age group. As these examinations were done during1992, it means, according to Evans and Stamm (1991). that the 12 year old children consumed morefluorides during 1982, when their central incisors were susceptible to fluorosis (22-26 months of age)than the 15 year old children during 1979 when their teeth were affected. This fits in with the patternof increasing use of fluoride supplements, as it became available during the late 1970s and early1980s.
Comparing the fluorosis prevalence in the Free State Gold Fields with the latest reports of fluorosisfrom optimally fluoridated areas in the USA as reported by the Centers for Disease Control in 1991,it is obvious that the White children in the Free State Gold Fields consume more fluorides than thechildren from the USA, while the Black children had about the same prevalence of fluorosis.
In another study in the USA Driscoll (1986) came to the same conclusions. He also found that inoptimally fluoridated areas, a fluorosis prevalence of about 14% can be expected. It must beremembered that most of this kind of very mild and mild fluorosis is aesthetically acceptable.
Thus local epidemiological evidence and the literature from abroad indicates that both Black andWhite children in the Free State Gold Fields get maximum protection against dental caries. Whatremains to be explained is why the Whi te children showed an unacceptable high prevalence of dentalfluorosis and the Black children not.
Ophaug et al. (1980) did a large dietary study and determined the amount of fluoride in the diet ofchildren using optimally fluoridated water. They found that an average 2 year old child weighing12,5 kg consumed 0.61 mg fluoride per day. This is equal to an average of 0,049 mg with a rangeof 0,04 to 0,06 mg per kg of body weight per day.
Pendrys and Stamm (1990) determined that the average 2 year old child, using fluoridated toothpasteswallows about 0,3 mg of fluoride per day. This is equal to 0,024 mg per kg of body weight.
Burt (1991) calculated that the optimum amount of fluoride for a child is 0,05 to 0,07 mg per kg ofbody weight. If the fluoride intake is between 0,071 and 0,089 mg per kg body weight, it can be
9.82
Chapter 9 Appendices
regarded as borderline safe, and a small percentage of children will develop mild fluorosis. A dietcontaining more than 0,09 mg per kg body weight per day during tooth formation will definitely giverise to dental fluorosis with a significant percentage developing moderate and severe fluorosis.
If we now stick to our previous conclusion that the Black children in the Free State Gold Fields getmaximum protection against dental caries and show no signs of problems with dental fluorosis, wemust then assume that their diet provided about 0,05 mg of fluoride per kg of body weight when thelabial surfaces of their upper central incisors were formed during the years 1979 and 1982. This iswithin the optimum range of fluoride intake as determined by Burt. At that stage they had little orno access to fluoride supplements. Thus it can be concluded that this was their total fluoride intakewhich they got almost totally from the water containing 0,55 ppm fluoride. On the other hand thewhite children already had access to fluoridated tooth pastes and other fluoride supplements. Usingonly the fluoride from tooth paste it can be calculated that the White children consumedapproximately 0,074 mg per kg of body weight. This places them in the lower range of the borderline dosage of fluoride, and one would not expect to find serious problems with dental fluorosis.Only a few cases of very mild and mild fluorosis might occur.
Using these calculations as a basis it can now further be calculated that if the fluoride content of thewater should rise to 0,7 ppm the Black children would have consumed 0.062 mg per kg body weightwhich is still within the optimum range. On the other hand their White compatriots would haveconsumed 0.086 mg per kg of body weight. This is at the upper limit of the marginal range andshould still not give rise to cases of moderate to severe dental fluorosis.
As was said earlier, the fluoride content of the water in the Free State Gold Fields often rises to ashigh as 0,9 ppm. In such a case the Biack children would have consumed 0.08 mg per kg of bodyweight, which is still in the marginal range, and only some cases of very mild and mild fluorosis willbe seen. In the white children however the consumption of fluoride would have been 0,104 mg perkg of body weight, which places them in the dangerous range where cases of moderate and severefluorosis will be seen.
Because the results of these calculations fit in so well with what was found during the survey in theFree State Gold Fields it can be concluded that the optimum concentration of fluoride in the drinkingwater for the Free State Gold Fields and other comparable areas is 0,55 ppm. At the same time it canbe concluded that the maximum fluoride content of the drinking water that will not give rise toaesthetically unacceptable dental fluorosis in the Free State Gold Fields and other comparable areasis 0.7 ppm.
REFERENCES
Angelillo, IF, Romano, F, Fortunate L & Montanaro, D (1990) Prevalence of dental caries andenamel defects in children living in areas with different water fluoride concentrations. CommunityDental Health. 7, 229-236.
Brunelle, JA & Carlos. JP (1990) Recent trends in dental caries in U.S. children and the effect ofWater fluoridation. Journal of Dental Research. 69, 723-727.
Burt, BA (1992) The changing patterns of systemic fluoride intake. Journal of Dental Research, 71,1228-1237.
9.83
Chapter 9 Appendices
Burt, BA, Ekland, SA & Lewis, DW (1992) Dentistry. Dental Practice, and the Community, 4th ed.,Ch. 12, pp 157-158 Philadelphia: W.B. Saunders.
Centers for Disease Control. (1991) Morbidity and Mortality Weekly Report Recommendations andReports: Public Health Service Report on Fluoride Benefits and Risks. Vol 40, No RR-7 pp 1-8.Atlanta: Department of Health and Human Services, USA.
Clark, DC (1994) Trends in prevalence of dental fluorosis in North America. Community Dentistryand Oral Epidemiology. 22. 148-152.
Dreyer, AG & Grobler, SR (1984) Die fluoried gehalte in die drinkwater van Suid-Afrika enSuidwes-Afrika. Journal of the Dental Association of South Africa. 39, 793-797.
Du Plessis, JB, Carstens, IL, Rossouw, LM & Olivier, I (1994) The Dental caries status of the urbanpopulation in the major metropolitan areas of South Africa. In National Oral Health Survey. SouthAfrica 1988-89. Ed.: van Wyk, PJ, pp 24-32 Pretoria: Department of National Health andPopulation Development.
Du Plessis, JB, Louw, AJ & van der Merwe, CA (1994) Calibration of examiners for the NationalOral Health survey: Caries and periodontal diseases. In National Oral Health Survey. South Africa1988-89. Ed: van Wyk PJ, pp 15-23 Pretoria: Department of National Health and PopulationDevelopment.
Du Plessis, JB, van Rooyen, JJC, Naude, DA and van der Merwe, CA (1995) Water ftuoridationin South Africa: Will it be effective? Journal of the Dental Association of South Africa.
Evans. RW & Stamm, JW (1991) An epidemiologic estimate of the critical period during whichhuman central incisors are most susceptible to fluorosis. Journal of Public Health Dentistry. 51, 251-259.
Feyerskov, O, Manji, F & Baelum, V (1990) The nature and mechanisms of dental fluorosis in man.Journal of Dental Research. 69, 692-700.
Glass, RL (1982) The first international conference on the declining prevalence of dental caries.Journal of Dental Research. 61. 1301-1383.
Grobler, SR & Dreyer. AG (1988) Variations in the fluoride levels of drinking water in SouthAfrica. South African Medical Journal. 73, 217-219.
Horowitz. HS (1990) The future of water fluoridation and other systemic fluorides. Journal of DentalResearch, 69. 760-764.
Levy, SM (1994) Review of fluoride exposures and ingestion. Community Dentistry and OralEpidemiology. 22. 173-180.
Lewis, DW &. Banting. DW (1994) Water fluoridation: current effectiveness and dental fluorosis.Community Dentistry and Oral Epidemiology. 22, 153-158.
MacKenzie, WJ (1966) Report of the Commission of inquiry into Fluoridation. Ch VII, pp 113-115.Pretoria: The Government Printer.
9.84
Chapter 9 Appendices
Meyers, HM (1978) Fluorides and dental fluorosis. Monographs in Oral Science, 7 pp 1-74 Basel:S Karger.
Murray, JJ, Breckon, JA, Reynolds, PJ & Nunn, JH (1991) The effect of residence and social classon dental caries experience in 15-16-year-old children living in three towns (natural fluoride, adjustedfluoride and low fluoride) in the north east of England. British Dental Journal. 171, 319-322.
Murray, JJ & Rugg-Gunn, AJ (1982) Fluorides in caries prevention. Ch II pp 31-43 and Ch IV pp58-63 London: Wright.
Newbrun, E (1989) Effectiveness of water fluoridation. Journal of Public Health Dentistry. 49, 279-289.
Nicholson, K & Duff, EJ (1981) Fluoride determination in water. Analytical Letters. 14, 493-517.
Ophaug, RH, Singer, L & Harland, BF (1980) Estimated fluoride intake of average two year oldchildren in four dietary regions of the United States. Journal of Dental Research. 59, 777-781
Pendrys, DG & Stamm, JW (1990) Relationship of total fluoride intake to beneficial effects andenamel fluorosis. Journal of Dental Research. 69, 529-538.
Riordan, PJ and Banks, JA (1991) Dental fluorosis and fluoride exposure in Western Australia.Journal of Dental Research. 70, 1022-1028.
Segretto, VA, Collins, EM, Camann, D & Smith, CT (1984) A current study of mottled enamel inTexas. Journal of the American Dental Association. 108, 56-59.
South African Weather Bureau. (1986) Klimaat statistiek. WB 40. Pretoria: SA Weather Bureau.
Speirs, RL (1981) Fluorides: Systemic balance and cariostatic mechanisms. In Dental Caries.Aetiology. Pathology and Prevention. Ed: Silverstone, LM, Johnson, NW Hardie, JM & Williams,RAD. Ch 10, pp 239-248. Hong Kong. Macmillan.
Szpunar, SM & Burt, BA (1988) Dental caries, fluorosis, and fluoride exposure in Michiganschoolchildren. Journal of Dental Research. 67, 802-806.
Van Wyk, PJ (1994) Study methodology. National Oral Health Survey. South Africa 1988-1989. pp4-12. Pretoria. Department of National Health and Population Development.
WHO. (1987) Oral health surveys: Basic Methods. 3rd ed. Geneva. World Health Organisation.
WHO. (1994) Fluorides and oral health. WHO Technical Report Series. 846, pp 16-19. Geneva:World Health Organisation.
Woolfolk, MW, Faja, BW & Bagramian, RA (1989) Relation of sources of systemic fluoride toprevalence of dental fluorosis. Journal of Public Health Dentistry. 49, 78-82.
9.85
*v
^ ^ ^ ^ ^ i S r
W a 1 e r K e s c ;i i- c h C o in in i s s i t> n
PO BON 824. P Soiuli i
lei: +27 12 330 (1340. Fax: -t-27 12 331 25(\
Web: hiin:/Av\vw:wrt'.orii./ii


