Embed Size (px)
Citation preview
Macromol. Chem. Phys. 2001, 202, 2461–2478 2461
Compatibility Studies in Binary Blends of PA6 andULDPE-graft-DEM
AngØlica Sµnchez,1 Carmen Rosales,1 Estrella Laredo,2 Alejandro J. Müller,* 3 Mariano Pracella4
1 Grupo de Polímeros USB, Departamento de Mecµnica, Universidad Simón Bolívar, Caracas 1080-A, Venezuela2 Grupo de Polímeros USB, Departamento de Física, Universidad Simón Bolívar, Caracas 1080-A, Venezuela3 Grupo de Polímeros USB, Departamento de Ciencia de los Materiales, Universidad Simón Bolívar,
Caracas 1080-A, VenezuelaE-mail: [email protected]
4 Consiglio Nazionale delle Ricerche, Centro di Studi Sui Materiali Macromolecolari Polifasici e Biocompatibili,Via Diotisalvi 2, Pisa, Italy
IntroductionIn recent years progress has been made in the develop-ment of new polymeric materials by combining well-known polymers in the form of polyblends; several goalshave been achieved and further growth is expected inforthcoming years.[1, 2] In this research field it is necessaryto know how the blend or alloy components interact, inorder to have an idea of the expected properties. Polyole-fins and polar polymers like polyamides, polyesters, acry-
lonitrile/butadiene/styrene terpolymer (ABS), styrene/acrylonitrile (SAN) and polycarbonate, have been muchstudied since they are considered to be pairs of polymerswith desirable matching properties.[4, 5]
In the case of PA6, high-temperature stability, barrierproperties, high elastic modulus, and strength resistanceare among the desirable qualities. On the other hand,ULDPE, a considerably new technological developmentin the polyolefins field, has properties like hydrophobi-
Full Paper: In order to study the compatibility promotedin polyamide 6 (PA6) and ultra low-density polyethylene(ULDPE) blends by grafting polar groups into theULDPE, several blend compositions were prepared in atwin screw extruder. The grafting agent was diethylmale-ate (DEM), and the blend compositions prepared were 0,20, 50, 80 and 100 wt.-% of PA6. The compatibility wasevaluated by studying the rheological, thermal, morpholo-gical, and spectroscopic (infrared and dielectric) proper-ties of the blends. The formation of a copolymer wasobserved by infrared spectroscopy after selective extrac-tion of the components, presumably by the interaction ofterminal NH2 groups of PA6 and carbonyl groups ofULDPE-graft-DEM. Thermal properties showed changesdue to compatibilization. For instance, fractionated crys-tallization of the PA6 component was observed when itformed the dispersed phase in reactive blends in view ofthe enhanced dispersion. Nucleation of the ULDPE com-ponent by the PA6 component was observed for reactiveand non-reactive blends. The DSC melting results showedthe presence of two crystalline forms of the PA6 in theblends. These were the less stable c-form, predominantover the more stable a-form, in reactive blends, especiallyfor the 20/80 and 50/50 wt.-% blend compositions.Dynamic rheological experiments provided data for fittingthe Carreau viscosity model; the results revealed thatlonger characteristic times are obtained for compatibilizedsystems. This was reinforced by the more elastic behavior
that such systems presented in G9-G99 plots, as comparedto the non-reactive ones. Dielectric spectroscopy revealeda noticeable shifting of the a-mode of the PA6 to lowertemperatures for the 50/50-g, together with an enhance-ment of the b over the c-mode which indicates the pre-sence of tightly bound water. The Tg depression could bedue to the plasticization effect resulting from the substitu-tion of intramolecular PA6 H-bonds by either water mole-cules or physical interactions across the interphases.
Macromol. Chem. Phys. 2001, 202, No. 11 i WILEY-VCH Verlag GmbH, D-69451 Weinheim 2001 1022-1352/2001/1107–2461$17.50+.50/0
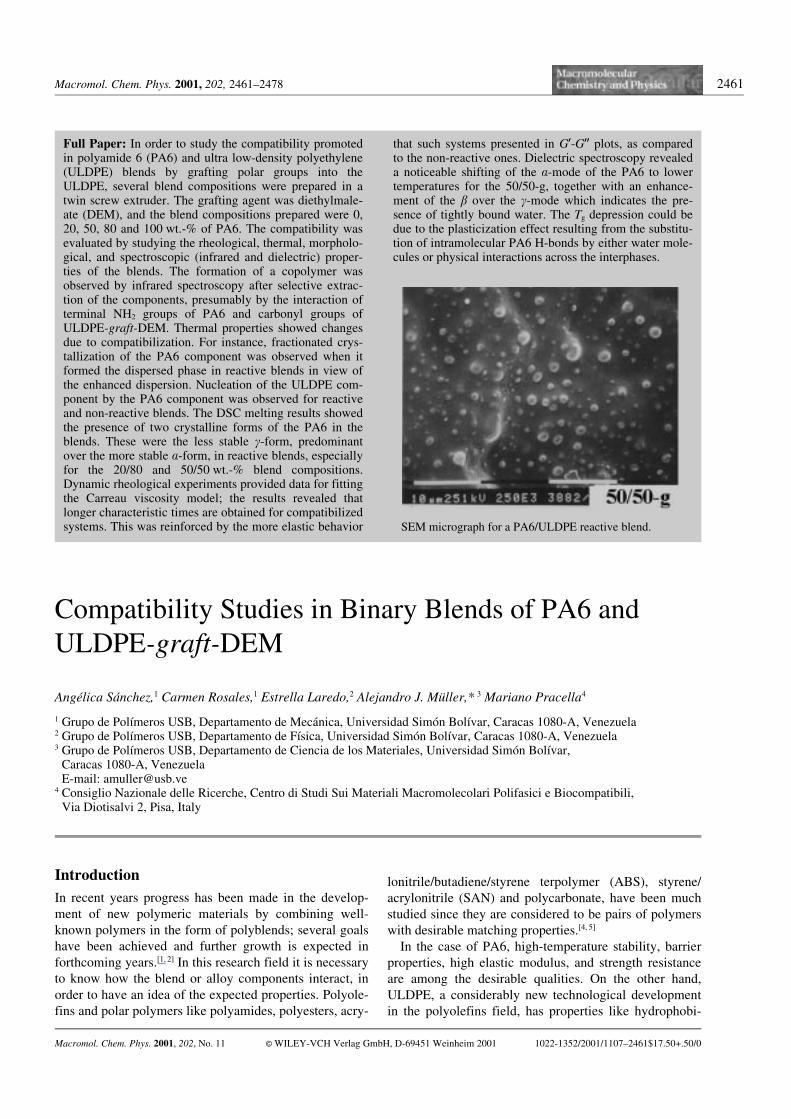
SEM micrograph for a PA6/ULDPE reactive blend.
2462 A. Sµnchez, C. Rosales, E. Laredo, A. J. Müller, M. Pracella
city, low modulus and high tensile elongation (desirableproperties for toughening fragile materials like PA6 atlow temperatures), good impact and tear resistance prop-erties (desirable in the packaging industry), and chemicalinertness. Nevertheless, these two polymers have no com-patibility if they are mixed without a properly selectedcompatibilizer.
The objective of the present work is to examine thecompatibility that can be attained in PA6/ULDPE usingthe functionalization approach of grafting polar groups toULDPE. A wide range of experimental techniques hasbeen employed to address the characterization of compat-ibility between blend components.
The literature suggests schemes of possible reactionsbetween functionalized polyolefins (with different func-tional monomers) and their respective blend compo-nents.[5–8] In blends of PA6 and low density polyethylene(LDPE) with butyl acrylate grafted LDPE as a compatibi-lizer,[7] the reaction of the ester group of butyl acrylatewith terminal NH2 groups of the PA6 was detected and asa result a grafted copolymer, which locates at the inter-phase between PA6 and LDPE was formed. Additionally,water absorption and dispersed phase size decreasedwhen the compatibilizer was added.
Serpe and co-workers[5] studied the influence of pro-cessing conditions on the morphology of PA6 and poly-ethylene blends. They proposed that if an ethylene-methyl acrylate (EMA) copolymer is added to the system,specific interactions between PA6 terminal NH2 groupsand EMA ester groups occur and succinimide groups canbe formed. However, not only chemical but also physicalinteractions have been proposed in the previously men-tioned systems. In this respect, Pillon and Utracki,[8] sug-gested hydrogen bonding type interactions in blends ofpolyethylene terephthalate and polyamide 6,6 as a way ofphysical compatibility.
In heterogeneous polymer blends, the variables thatcan affect their final properties are numerous. Han etal[3, 9, 10] suggested that depending on the preparationmethod and intensity of the blending, the morphology,i.e., the state of dispersion, domain sizes and its distribu-tion could be controlled. On the other hand, the rheologi-cal properties will determine the processing conditions ofthe blend and these in turn the final properties of the arti-cle. Majumdar et al.[11] found for blends of PA 6,6 and a
copolymer of styrene-ethylene-butylene-styrene graftedwith maleic anhydride (SEBS-graft-MAH), that co-rotat-ing twin screw extruders are more effective than single-screw ones when good states of dispersion is needed.Padwa[12] studied the rheological response of 50/50 PA6and high-density polyethylene (HDPE) blends withHDPE-graft-MAH as compatibilizer. He observed anincrease in storage modulus (G9) when the compatibilizerwas added to the blend, additionally, the extensibility ofcompatibilized blends decreased for higher contents ofHDPE-graft-MAH. This effect was attributed to the highmolecular weight of the compatibilizer and the interac-tions occurring between reactive groups.
The literature points out that highly reactive groups,such as MAH, are the best compatibilizers for polyolefinand PA6 blends, as compared to diethylmaleate, glycidylmethacrylate and ethylene-vinylacetate. However, it isinteresting that in our case the blends will be compared asa binary system and not as a ternary one, so thatindependent effects due to the nature of each materialwill be minimized. Additionally, conventional processingequipment like twin screw extruders will be employed asthe reactor in the preparation of the compatibilizer.
Experimental Part
Materials
The materials used in this study were: a Polyamide 6 (PA6),Snia ADS40, supplied by Sniamid, and an Ultra Low DensityPolyethylene (ULDPE), NULD2, from Enichem Polimeri.This ULDPE is a terpolymer of ethylene (76.6 mol-%), 1-butene (8.3 mol-%), and propylene (15.1 mol-%); it was pro-duced by means of a modified high-pressure polymerizationprocess, and using Ziegler-Natta catalysis. Table 1 containsthe main characteristics of these polymers.
Grafting Procedure
Grafting of ULDPE was performed by means of reactiveextrusion. The functional monomer employed was diethyl-maleate (DEM), analysis grade (Sigma Aldrich), and theradicals' initiator was dicumyl peroxide (DCP), 99% purity(Sigma Aldrich). A ratio of 10.0/0.5 by weight of DEM/DCPwas employed.
The grafting reaction was conducted in two steps, accord-ing to previous works.[13, 14] A Berstorff ECS (2E25) co-rotat-
Table 1. Characteristics of the materials employed in the study.
Material Densityg=cm3
MFIdg=min
Melting temperature8C
c) Crystallization temperature8C
c)
Polyamide 6 (PA6) 1.12 2.8 l 0.2a) 220.6 l 0.5 184.3 l 0.4Ultra low-density polyethylene (ULDPE) 0.885 1.26 l 0.04b) 110.3 l 0.8 90.8 l 0.4
a) Determined with vacuum dried samples at 230 8C and 2.16 kg.b) Determined at 190 8C and 2.16 kg.c) Measured in a DSC7, Perkin-Elmer at 10 8C/min.
Compatibility Studies in Binary Blends of PA6 and ULDPE-graft-DEM 2463
ing twin screw extruder was employed as a continuous reac-tor. During the first step, the diethylmaleate was physicallymelt mixed with the ULDPE into the extruder; the tempera-ture in the extruder was increased from 1108C at the feedingzone, to 1508C at the metering zone. After this step an“ULDPE/DEM concentrate” was obtained. In the secondstep, the previously prepared concentrate was fed into theextruder. The temperatures were 150 and 1808C, at the feed-ing and metering zone, respectively, and the flow rate wasmaintained in order to produce 7 g/min. This constant flowrate guaranteed the addition of the initiator took place insteady state conditions, and at the same time, the totaldecomposition of DCP could be reached. A degassing portallowed the in-line extraction of unreacted DEM and DCP. Itis also important to mention that prior to any use, theULDPE-graft-DEM was carefully washed in acetone inorder to extract residual DEM and initiator.
Characterization of the ULDPE-graft-DEM
The grafting degree (GD) of ULDPE-graft-DEM was meas-ured by means of proton NMR spectroscopy (1H NMR).These experiments were performed with an Eclipse Jeol 270NMR Spectrometer in solutions prepared in ortho-dichloro-benzene (10 wt.-%). The temperature was 1208C, a Butter-worth type filter was applied in order to eliminate the solventsignal. The GD was then obtained by taking the ratio ofareas corresponding to methylene protons attached to theoxygen of the ester group (signals of 2-diethyl-succinategroup grafted to the polymer), which appear at d = 4 ppm,and the signal of methylene and methyne protons of theULDPE, which are located at d = 1 ppm (see Figure 1).
Blending Procedure
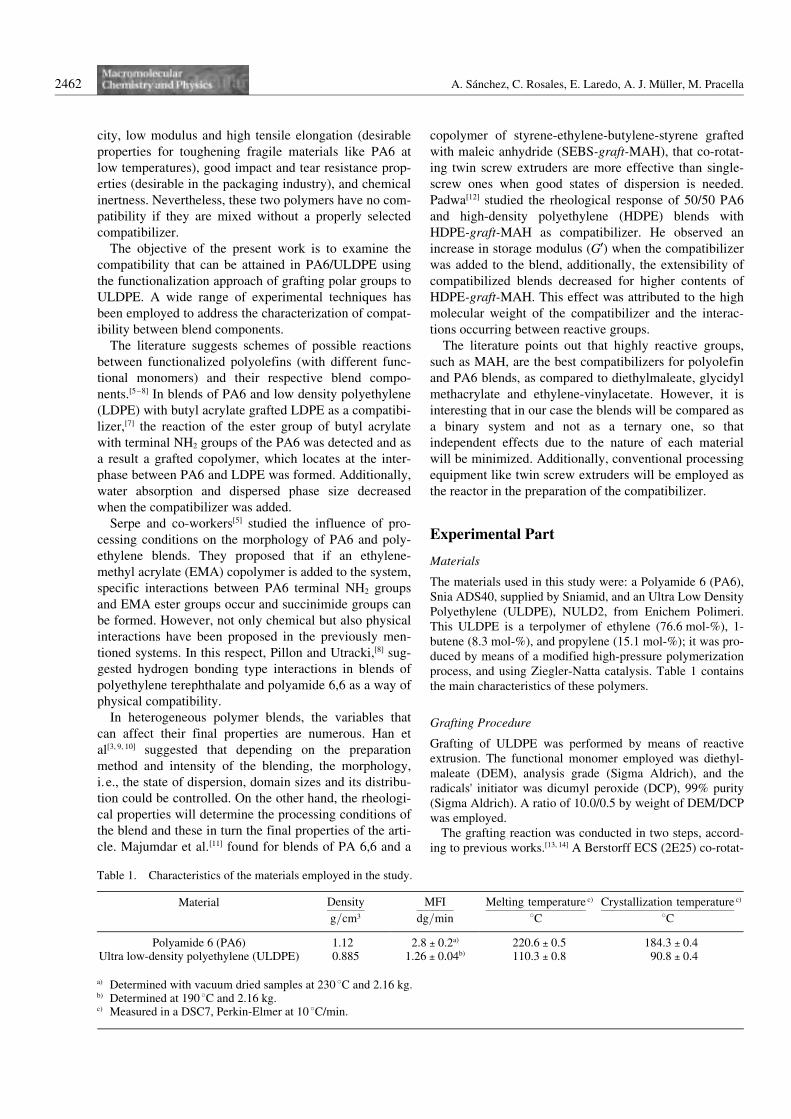
Blending of pre-dried materials (858C, 16 h) was performedin a co-rotating twin screw extruder, W&P ZSK-30. Thetemperature profile was fixed at 2258C at the metering zone,and the screw speed was 110 rpm. The effective screw lengthfor this extruder is 0.707 m, and the screw diameter is30.7 mm. Figure 2 shows the screw extruder configuration,that includes helical transport, compression elements, andkneading blocks.
The compositions of prepared non-reactive and reactivePA6/ULDPE blends were 20/80, 50/50, 80/20 (wt/wt.-%). Inorder to insure that neat polymers had the same thermal andmechanical history, they were also extruded under the same
conditions mentioned previously. Blends containing ULDPEas the secondary component will be referred to as “non-reac-tive blends” and individual compositions will be labeledwith a “p” (for pure ULDPE), e.g., 20/80-p. Those blendscontaining ULDPE-graft-DEM as the secondary componentwill be referred to as “reactive blends”, and individual com-positions will be labeled with the letter “g” (for graftedULDPE), e.g., 20/80-g.
Characterization of the Blends
Infrared Spectroscopy (IR)
The IR spectra were recorded by a Fourier TransformedInfrared Spectrometer (FT-IR), Nicolet Magna 750, ontoKBr pellets with a concentration of 2.5 wt.-% of milledblends. A number of 32 scans were recorded with a resolu-tion of 4 cm–1.
Differential Scanning Calorimetry (DSC)
DSC experiments of pre-dried samples were performed in aDSC7 Perkin Elmer under Nitrogen atmosphere. Onset melt-ing temperatures of Indium and Tin were employed as cali-bration standards. Dynamic heating and cooling scans werecarried out at 108C/min from 25 to 2508C. In all cases sec-ond heating scans were employed for analysis.
Self-nucleation (SN) was performed on the samples. Abrief description of this thermal treatment follows but theinterested reader is referred to the litereature.[15–19] Theexperiments of self-nucleation and annealing using DSCwere originally conceived by Fillon et al.[19] The detailedprocedure is described by the following steps:
a) Erasure of previous thermal history: the sample waskept at a temperature of 2508C for 3 min. The initial meltingat this maximum temperature leaves only temperature-resis-tant heterogeneous nuclei of unknown nature in the sample.(b) Creation of the initial “standard” state: the sample wascooled at a rate of 108C/min down to 258C, so crystalliza-tion during the controlled cooling should have taken place.Then, the sample is held for 1 min at that minimum tempera-ture. (c) Self-nucleation: the sample was heated at 108C/min
Figure 1. Chemical structure of the ULDPE-graft-DEM. Pro-tons that appear at d = 4 ppm are underlined.
Figure 2. Screw configuration elements for the twin-screwextruder W&P ZSK-30.
2464 A. Sµnchez, C. Rosales, E. Laredo, A. J. Müller, M. Pracella
up to a selected self-seeding temperature (that we shall termTs) located in the final melting temperature range of the sam-ple, and held at that temperature for 5 min. This isothermaltreatment at Ts results in partial melting and, depending onTs , in the annealing of unmelted crystals, while some of themelted species may isothermally crystallize (after being self-nucleated by the unmelted crystals). (d) Final crystallization:subsequent cooling at 108C/min from Ts down to the chosenminimum temperature. During this cooling the initially mol-ten fraction of the polymer at Ts will crystallize during cool-ing using the unmelted crystal fragments produced by partialmelting in step “c” as self-nuclei. (e) Final melting: subse-quent heating at 108C/min.
Dynamic Rheometry
Compression moulded samples of pre-dried blends wereemployed for rheological experiments. The geometryemployed was that of 25 mm diameter parallel plates. Fre-quency sweep experiments at 2308C were performed in arange of 0.1 to 100 rad/s. In all cases the experiments wereperformed within the linear viscoelastic range of strain.
Scanning Electron Microscopy (SEM)
Cryogenically fractured surfaces of reactive and non-reactiveblends were observed in a scanning electron microscope,Phillips 505, after coating them with gold. The beam inten-sity was 12.6 kV.
Solubility Tests
Solutions of reactive and non-reactive blends in formic acid(analysis grade) were prepared by adding 0.2 g of the blendin 10 ml of solvent. An additional “physical blend”, consist-ing of pure components in the required compositions, wasalso prepared as a reference blend.
Selective extraction of the copolymer: In order to bettercharacterize the copolymer, selective extraction of the blendcomponents was conducted as follows: the solid phaseobtained from previous dissolution in formic acid wasrepeatedly washed with the solvent and then dried. This
dried material was re-dissolved in o-dichlorobenzene andhot-filtered twice, and the residue was vacuum dried at 508Cfor 16 h for further FT-IR analysis.
Dielectric Spectroscopy
Broad band dielectric spectroscopy (BBDS) was used in afrequency interval ranging from 10–2 to 36106 Hz with aConcept Twelve (Novocontrol GmbH) integrating an Impe-dance/Gain Phase Analyzer (Solartron SI 1260, Schlumber-ger) and a Broad Band Dielectric Converter. Isothermalmeasurements were performed under a nitrogen flow and thetemperature controller insured a stability of better than0.18C. The isothermal runs were performed by heating thesample to 858C and then decreasing the temperature by stepsof 58C to –1408C. The measurements were repeated from–1408C to 858C. The sample (disc shaped, 330 lm thick)with gold sputtered electrodes was placed between two goldplated-brass electrodes, 30 mm in diameter, and a slight pres-sure was applied to guarantee a good electrical contact. Thein-phase and out of phase components of the dielectricresponse were recorded at each temperature as a function ofthe frequency. Isothermal or isochronal plots can be obtainedfor the real, e9, and imaginary part, e99, of the dielectricresponse of the material. Also the variation of the tangent ofthe loss angle, tg(d) e99
e9, can be obtained as a function of tem-
perature at different frequencies.
Results and Discussion
Characterization of the Blends by FT-IR Spectroscopy
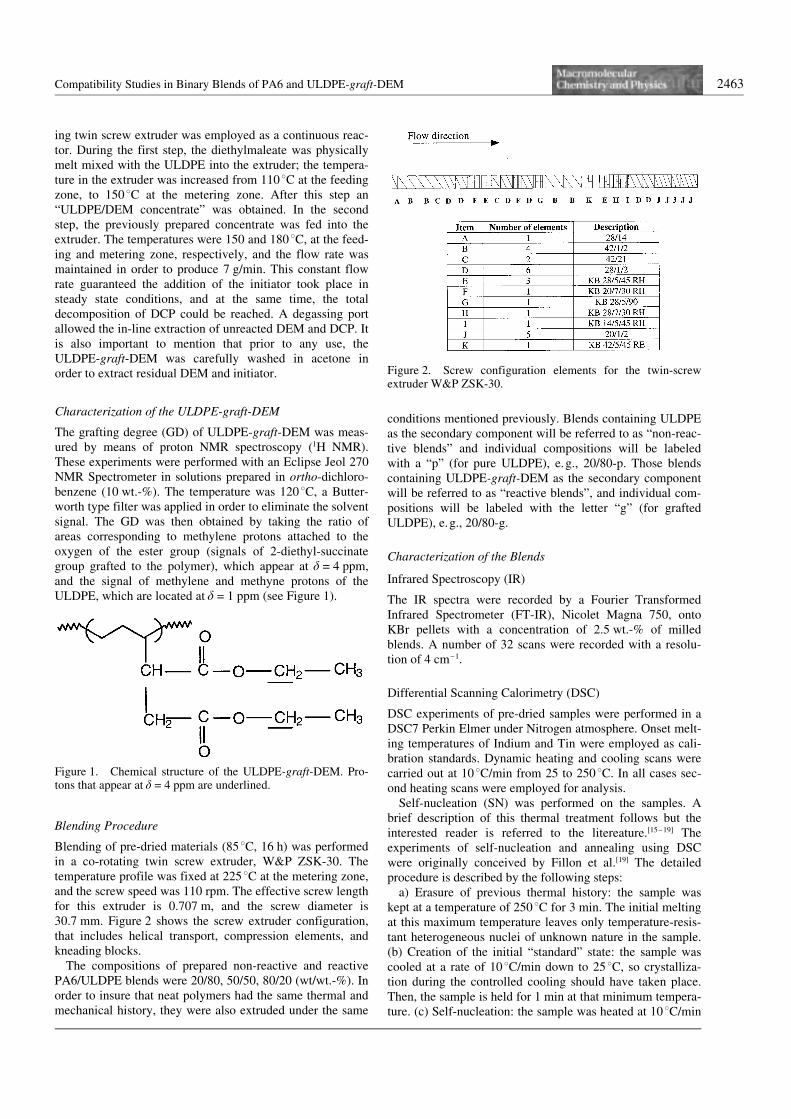
Figure 3 shows the results obtained by FT-IR spectro-scopy for both unreactive (Figure 3a) and reactive (Fig-ure 3b) PA6/ULDPE blends, and Table 2 lists the assign-ments of the main signals observed.
The main difference between reactive and non-reactivematerials is the presence of a weak band located near1737 cm–1 in the reactive blends, which cannot beobserved for non-reactive systems (see Figure 3). Accord-ing to the assignments of Table 2, this signal corresponds
Figure 3. FT-IR spectra for PA6/ULDPE: a) Non-reactive blends, and b) reactive blends.
Compatibility Studies in Binary Blends of PA6 and ULDPE-graft-DEM 2465
to the carbonyl stretching vibration of 2-diethylsuccinate(DES) group grafted to the ULDPE during its functionali-zation.[20, 21] The fact that this group appears only in thecase of reactive systems is not evidence of compatibilityin the blends, because this band was also observed whentheoretical spectra were constructed. In this case multi-plying each blend component spectrum by its correspon-dent weight fraction in the blend, and then adding bothresulting spectra was the method employed for the con-struction of theoretical spectra.
On the other hand, the chemical groups that areinvolved in possible reactions between PA6 and ULDPE-graft-DEM might originate new bands, which overlapwith the original components. This means that signalsdue to hydrogen bonding between carbonyl groups ofDES and 1NH groups of PA6, would be observed at thesame position (3300 cm–1) as that from hydrogen-bonded1NH groups of PA6 (see Figure 4). The neighboring
atom of the carbonyl group in DES is oxygen, and in thecase of PA6, the neighboring atom is nitrogen; theseatoms have lone electron pairs, which confers themalmost the same polarity. Additionally, the extent ofchemical reaction and/or physical interaction occurringduring blending might not be so large as to highly modifythe spectra of reactive blends.
Previous works on compatibility of polyamides andpolyethers[22] and on the formation of hydrogen bonds inamorphous polyamides[23] have reported that the bandscorresponding to 1NH stretching in polyamides (at3100–3300 cm–1), and amide I and II vibrations (locatedat 1640 and 1545 cm–1, respectively) offer informationabout hydrogen bonding strength. In the case of poly-ethers and polyamide blends, Hu et al.[23] suggested that ifsignificant molecular mixing occurs, the fraction of car-bonyl groups present at a particular temperature,increases over and above that due to self-association,reflecting a decrease in the average hydrogen-bonded“chain” length. In this case, for immiscible systems, nochanges in amide I region were observed, but when sig-nificant molecular mixing (not necessarily a single phase)was present, a dominant “free” band appeared.[23]
Table 2. Assignments of FT-IR absorption bands for PA6/ULDPE blends, reactive and non-reactive.
Wavenumbercmÿ1
Characteristic group Assignment
3444 N1H stretching H-Free PA63300 N1H stretching
H-bondedPA6
2930 Asymmetric stretchingof CH2 (aliphatic)
PA6, ULDPE,ULDPE-graft-DEM
2850 Symmetric stretchingof CH2 (aliphatic)
PA6, ULDPE,ULDPE-graft-DEM
1740 Carbonyl Stretching,C2O
ULDPE-graft-DEM
1670 Carbonyl Stretching,Free-C2O
PA6
1640 Amide I, C2OC1N stretchingC1C1N deformation
PA6
1545 Amide II, N1Hin-plane deformation
PA6
1465 C1H deformation PA6, ULDPE,ULDPE-graft-DEM
720 (1CH21)n rocking,n A 4
PA6, ULDPE,ULDPE-graft-DEM
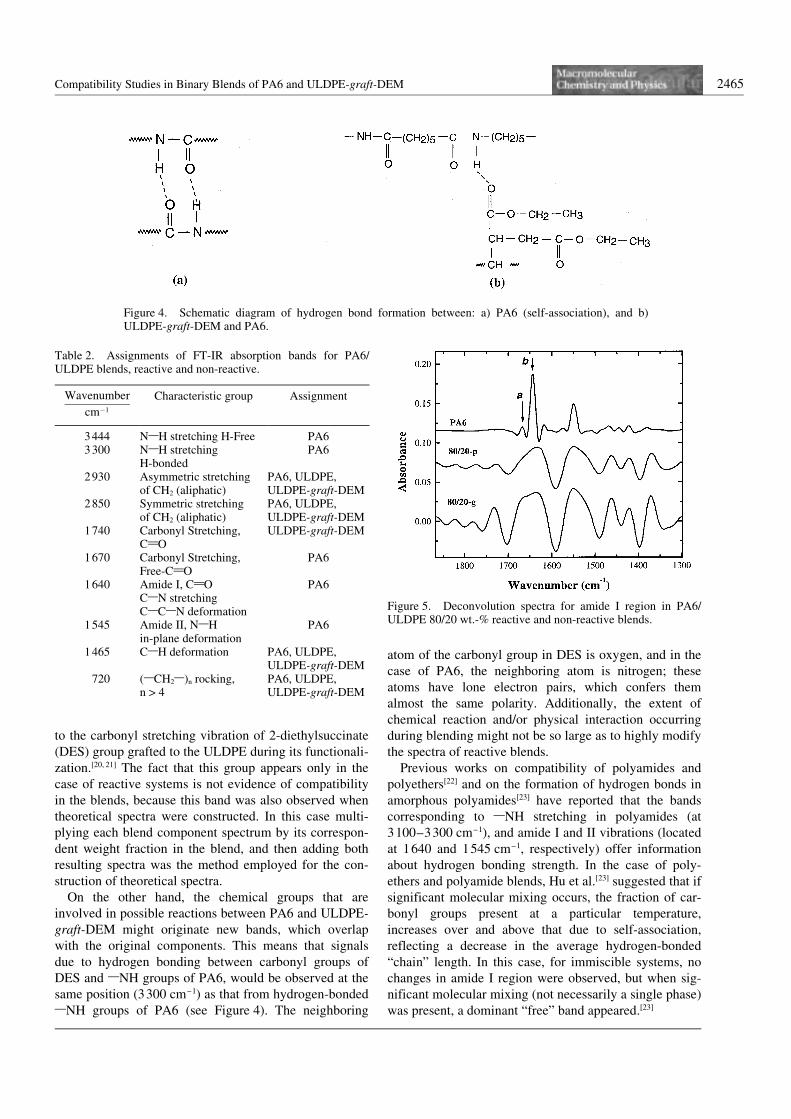
Figure 4. Schematic diagram of hydrogen bond formation between: a) PA6 (self-association), and b)ULDPE-graft-DEM and PA6.
Figure 5. Deconvolution spectra for amide I region in PA6/ULDPE 80/20 wt.-% reactive and non-reactive blends.
2466 A. Sµnchez, C. Rosales, E. Laredo, A. J. Müller, M. Pracella
Taking into account these observations, Figure 5 showsthe amide I region spectra for the PA6/ULDPE 80/20 wt.-% (80/20-p), and PA6/ULDPE-graft-DEM 80/20 wt.-% (80/20-g) systems. The signal identified with theletter “a” corresponds to “free” (non-hydrogen bonded)amide carbonyl groups, and the signal identified as “b” hasbeen attributed to hydrogen-bonded amide carbonylgroups.[22, 23] As can be seen, for the reactive blend (80/20-g) the signal of “free” carbonyl groups seems to be slightlymore noticeable than in the non-reactive blend (80/20-p),or at least the ratio of the signals “a” and “b” is differentfor reactive blends as compared to non-reactive ones. Thismay indicate that hydrogen bonding of PA6 in reactiveblends has changed, presumably by the presence of newcarbonyl groups of DES in ULDPE-graft-DEM. The sametrend was observed for all other blend compositions.
Regarding chemical interactions, which can beexpected to occur mainly between terminal 1NH2 of PA6and the carbonyl group of ULDPE-graft-DEM, a cyclic
imide has been reported to form.[5] This group generallyappears at 1720 cm–1 but from the previous spectra (seeFigure 5), this change is difficult to observe because ofthe presence of a broad and strong signal near this wave-number.
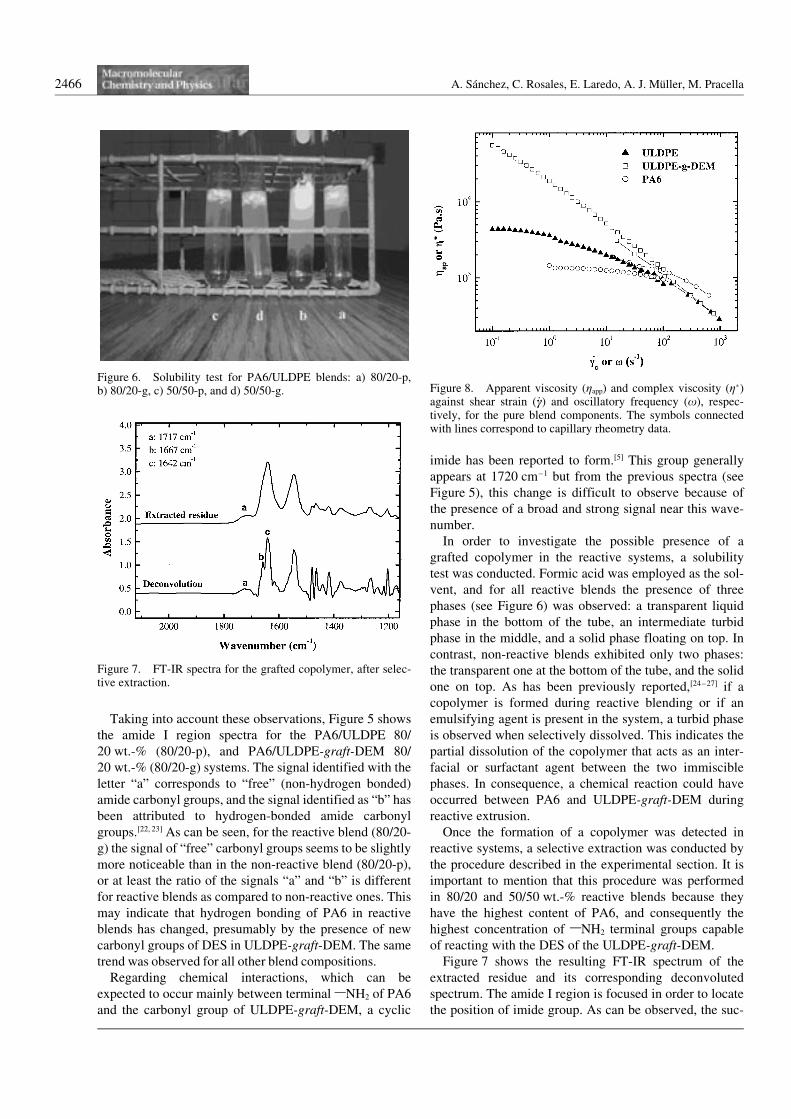
In order to investigate the possible presence of agrafted copolymer in the reactive systems, a solubilitytest was conducted. Formic acid was employed as the sol-vent, and for all reactive blends the presence of threephases (see Figure 6) was observed: a transparent liquidphase in the bottom of the tube, an intermediate turbidphase in the middle, and a solid phase floating on top. Incontrast, non-reactive blends exhibited only two phases:the transparent one at the bottom of the tube, and the solidone on top. As has been previously reported,[24–27] if acopolymer is formed during reactive blending or if anemulsifying agent is present in the system, a turbid phaseis observed when selectively dissolved. This indicates thepartial dissolution of the copolymer that acts as an inter-facial or surfactant agent between the two immisciblephases. In consequence, a chemical reaction could haveoccurred between PA6 and ULDPE-graft-DEM duringreactive extrusion.
Once the formation of a copolymer was detected inreactive systems, a selective extraction was conducted bythe procedure described in the experimental section. It isimportant to mention that this procedure was performedin 80/20 and 50/50 wt.-% reactive blends because theyhave the highest content of PA6, and consequently thehighest concentration of 1NH2 terminal groups capableof reacting with the DES of the ULDPE-graft-DEM.
Figure 7 shows the resulting FT-IR spectrum of theextracted residue and its corresponding deconvolutedspectrum. The amide I region is focused in order to locatethe position of imide group. As can be observed, the suc-
Figure 6. Solubility test for PA6/ULDPE blends: a) 80/20-p,b) 80/20-g, c) 50/50-p, and d) 50/50-g.
Figure 7. FT-IR spectra for the grafted copolymer, after selec-tive extraction.
Figure 8. Apparent viscosity (gapp) and complex viscosity (g�)against shear strain ( _cc) and oscillatory frequency (x), respec-tively, for the pure blend components. The symbols connectedwith lines correspond to capillary rheometry data.
Compatibility Studies in Binary Blends of PA6 and ULDPE-graft-DEM 2467
cinimide group corresponding to the previously proposedreaction is now evident at 1717 cm–1. The deconvolutionof the spectrum shows that the copolymer formed alsohas more carbonyl groups because the band at 1667 cm–1
appears well defined with respect to those of PA6 and thenon-reactive blends.
Reactive Blending and Morphology
In order to try to obtain the best possible dispersion dur-ing blending, an optimal ratio of viscosity and elasticity
between the components should be achieved.[28] In thissense, viscosity and elasticity ratios near unity have beensuggested.[29, 30]
Figure 8 shows the results of dynamic and capillaryrheometry for pure polymers. The values obtained bythese two different techniques were adjusted by the Cox-Merz rule,[31] which suggests a relationship between shearviscosity (g) and complex viscosity (g�) through Equa-tion (1):
gð _ccÞ ¼ g�ðxÞ ð1Þ
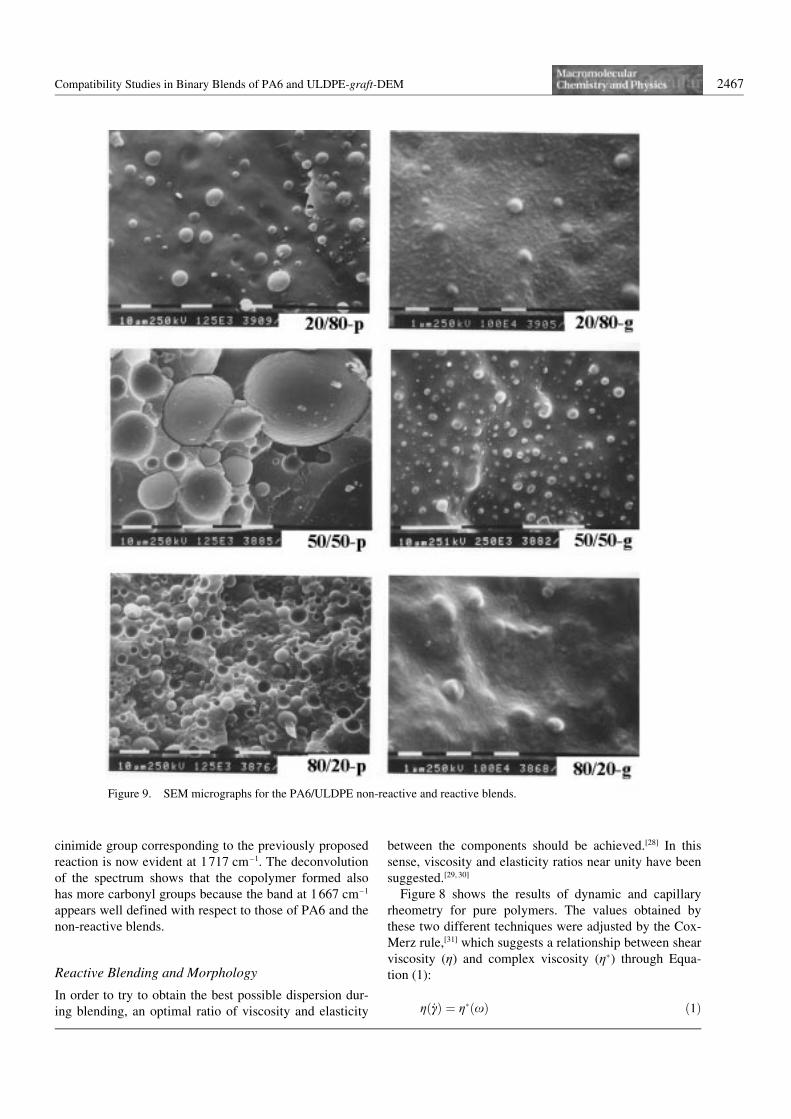
Figure 9. SEM micrographs for the PA6/ULDPE non-reactive and reactive blends.
2468 A. Sµnchez, C. Rosales, E. Laredo, A. J. Müller, M. Pracella
It is important to mention that this relationship fits theexperimental data if the oscillating amplitude is small indynamic experiments, and the shear strain rate isexpressed in s–1 for steady experiments and in rad/s fordynamic experiments. However, matching is not alwaysobserved, like for PA6 (see Figure 8); exceptions havebeen reported for rigid polymers or thermally susceptiblematerials (like PA6).[32]
As can be observed from Figure 8, the viscosity of thehomopolymers are very similar at shear rates near 89 s–1,which corresponded to the nominal shear rate in theextruder at 110 rpm. This calculation was made consider-ing drag and pressure flow in a cup-type channel for thetransport elements and kneading blocks of the screw.[33, 34]
Viscosity ratios (VR) for all blend compositions areshown in Table 3. The VR values were obtained bymeans of Equation (2)
VR ¼ gd
gm
ð2Þ
where gd is the viscosity of dispersed phase and gm is theviscosity of the matrix phase.
Table 3 shows that in all cases the VR ratios are nearunity, which excludes or minimizes the effect of viscosityover the blend dispersion. In this way, the study could befocused on reactive blending and the occurrence of speci-fic interactions between the phases. On the other hand, aswill be mentioned below, numerous works have reportedthis VR range, as the optimum for a good dispersiongrade when mixing immiscible polymer blends.[30–32]
Apart from VR, the elastic forces of the blend compo-nents should be considered, in view of the viscoelasticnature of polymeric materials.
Figure 9 shows SEM micrographs of compressionmoulded samples after cryogenic fracture, and Table 3shows the particle sizes obtained from those micrographsafter measuring approximately 200 particles. Equation
(3) was employed in calculations of the number-averagediameter (Dn)
Dn ¼
Xi
DiXi
ni
ð3Þ
where Di was the measured particle diameter, and ni thenumber of particles.
The results of particle size measurements by SEM indi-cate several facts. Firstly, the particle size of dispersedphase (Dn) for reactive blends was smaller than that ofnon-reactive ones. Secondly, in all cases, except for 50/50-p blend, the morphology consisted of spherical parti-cles immersed in a continuous matrix. Finally, when PA6was the major component in the blends, the particle sizeswere lower than when ULDPE or ULDPE-graft-DEMwas the matrix.
The first observation indicates that the presence of 2-diethyl-succinate (DES) in the ULDPE-graft-DEM couldcause a reduction in the interfacial tension, and conse-quently a smaller dispersed phase size.[30–32, 35–36] This facthas also been attributed to a coalescence reduction causedby the reaction between the phases, in such a way thatsmall particles, formed during blending, are stabilized bythe previously proposed reaction against coalescence.[37]
This possibility will be further explored below.The second observation regarding the SEM results
indicates that the system is immiscible. All blends exhib-ited a dispersed phase morphology except for the 50/50-p, which showed a co-continuous morphology that ischaracteristic of blends with a high concentration of bothcomponents and a considerably high interfacial tensionbetween them. These conditions restrict the stabilizationof droplets in the system. Additionally, the fact that theother blends (reactive and non-reactive) showed a mor-phology consisting of spherical particles, may be due tothe previously mentioned effect of viscosity ratios (VR).
The last observation suggests as was previously pointedout, that elastic forces should be also considered due to thedifference in sizes observed from one composition toanother in each specific system (reactive or non-reactive).The elastic modulus of the pure polymers (G9) can beemployed to estimate the first normal stress difference(N1). This can be approximated by N1 = 2G9, at low shearrates and low frequencies.[32] In this case, as can be seen inTable 3, the order found in G9 was the following: ULDPE-graft-DEM A ULDPE A PA6. This suggests that this dif-ference could affect the morphology of the blends, becausethe other variables like interfacial tension and shear rate,remained the same for each composition, so that elasticrestoring forces could be important as compared to thematrix shear force in deforming the droplets. When shearrate is increased, the matrix viscosity decreases and thedroplets elasticity increases and as a consequence, the dro-
Table 3. Viscosity ratio (VR), Storage moduli ratio (G9d /G9m),and number-average diameter (Dn), for the PA6/ULDPE reactiveand non-reactive blends.
PA6=ULDPEwt:-%
VRc) G9d /G9m Dn
lm
20/80-p (s)a) 1.28 0.6 3 l 220/80-g (s) 1.03 0.3 0.6 l 0.250/50-p (s) 1.28 1.6 10 l 550/50-g (s) 1.03 0.3 1.0 l 0.580/20-p (s) 0.78 1.6 5 l 280/20-g (s) 0.97 3.4 0.7 l 0.480/20-p (f)b) 0.78 1.6 3.8 l 0.380/20-g (f) 0.97 3.4 1.3 l 0.2
a) Measured from moulded sheets.b) Measured from extruded filaments.c) Measured at an average shear rate in the extruder of 89 s–1.
Compatibility Studies in Binary Blends of PA6 and ULDPE-graft-DEM 2469
plets resist deformation to a greater extent. In the case ofblends with PA6 as dispersed phase, the particles are lessresistant to deformation than if ULDPE or ULDPE-graft-DEM is the dispersed phase (see G9d /G9m ratio values inTable 3), and as a consequence a small Dn was obtainedfor blends containing PA6 as the matrix.
Besides the size and shape of the minor phase in theblends, Table 3 also shows measurements obtained fromextruded filaments for 80/20-g and 80/20-p blends. If acomparison is made between the values obtained fromfilaments and sheets, the reactive blend shows no signifi-cant variation after post-moulding. On the other hand, forthe non-reactive system, a change in Dn and in its stan-dard deviation value has occurred.
The incorporation of a reactive group like DEM toULDPE promoted, through physical and/or chemicalinteractions (as evidenced from FT-IR analysis), not onlya reduction of interfacial tension, but also a change in thesusceptibility to coalescence in post-moulding operations.In view of the lower viscosity and elasticity of PA6,which conformed the matrix in the 80/20 PA6/ULDPEblends, (as compared to the viscosity of ULDPE andULDPE-graft-DEM) a higher tendency to experiencecoalescence could have been expected for the reactivesystem, however the opposite occurred. This result canalso be explained by a reduction in interfacial mobilitycaused by the reactive blend interactions and a preventionof coalescence via steric stabilization instead of a reduc-tion in the interfacial tension may be postulated.[35]
Nevertheless, the reduction in the interfacial tension can-not be ruled out, since the reactive blends showed, for allcompositions, a lower Dn value than non-reactive blends.
According to the results previously discussed, the mor-phology development in the PA6/ULDPE reactive blendscould take place in the same way as that in the PA6/ULDPE non-reactive blends. However, the particlesformed during the initial mixing steps could be stabilizedagainst coalescence by the reaction between PA6 andDES. This result is in agreement with the suggestions ofSundararaj et al[38] for reactive and non-reactive systems.
In order to confirm a reduction of interfacial tensionfor reactive systems, the breaking thread method wasemployed to estimate this value.[37] For the non-reactivesystem at 2308C a value of 1.4 l 0.8610–1 mN/m wasobtained, however for the reactive system, the threadremained stable (without any instability) for a long time.This confirms that a reduction in the interfacial tensionwas obtained, and at the same time suggests that themethod seems to be not useful in this case in view of thelong experimental times (more than an hour), whichcould cause degradation. Additionally, the presence ofdifferent additives in these commercial materials, couldalso affect the experimental value, since it is far fromthose reported in the literature, which are between 8.9and 11.3 mN/m.[26]
Analysis of Thermal Properties
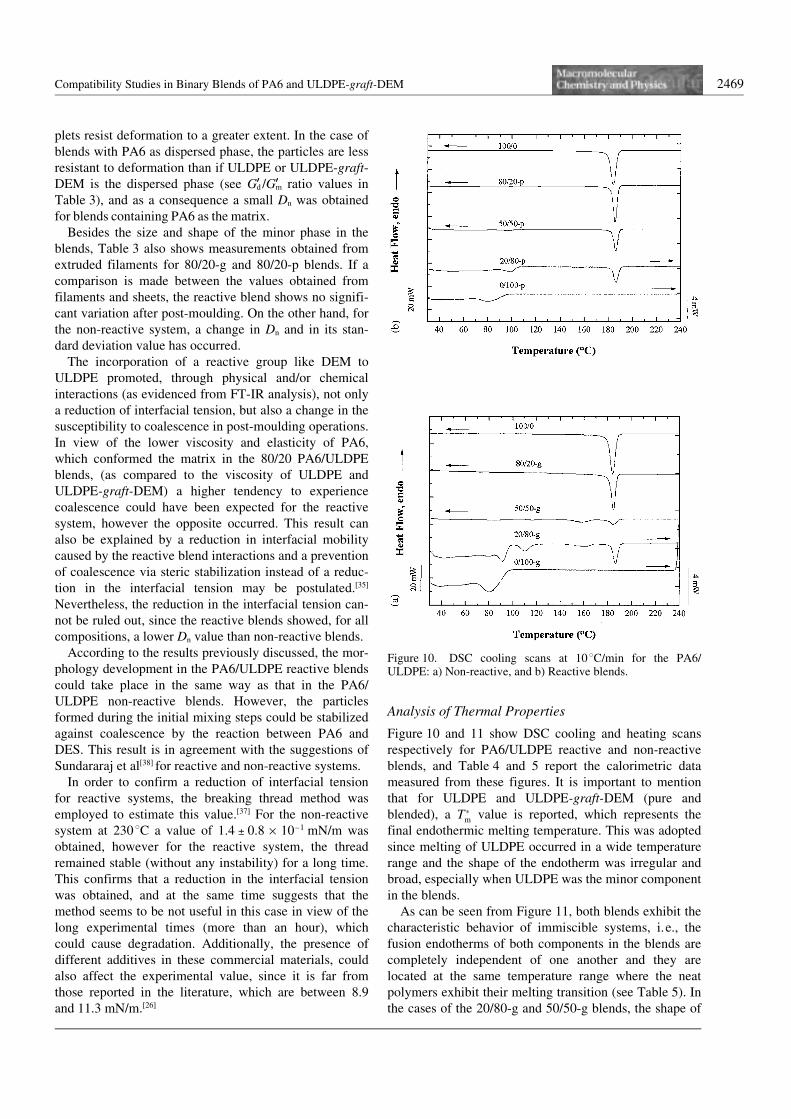
Figure 10 and 11 show DSC cooling and heating scansrespectively for PA6/ULDPE reactive and non-reactiveblends, and Table 4 and 5 report the calorimetric datameasured from these figures. It is important to mentionthat for ULDPE and ULDPE-graft-DEM (pure andblended), a T�m value is reported, which represents thefinal endothermic melting temperature. This was adoptedsince melting of ULDPE occurred in a wide temperaturerange and the shape of the endotherm was irregular andbroad, especially when ULDPE was the minor componentin the blends.
As can be seen from Figure 11, both blends exhibit thecharacteristic behavior of immiscible systems, i.e., thefusion endotherms of both components in the blends arecompletely independent of one another and they arelocated at the same temperature range where the neatpolymers exhibit their melting transition (see Table 5). Inthe cases of the 20/80-g and 50/50-g blends, the shape of
Figure 10. DSC cooling scans at 10 8C/min for the PA6/ULDPE: a) Non-reactive, and b) Reactive blends.
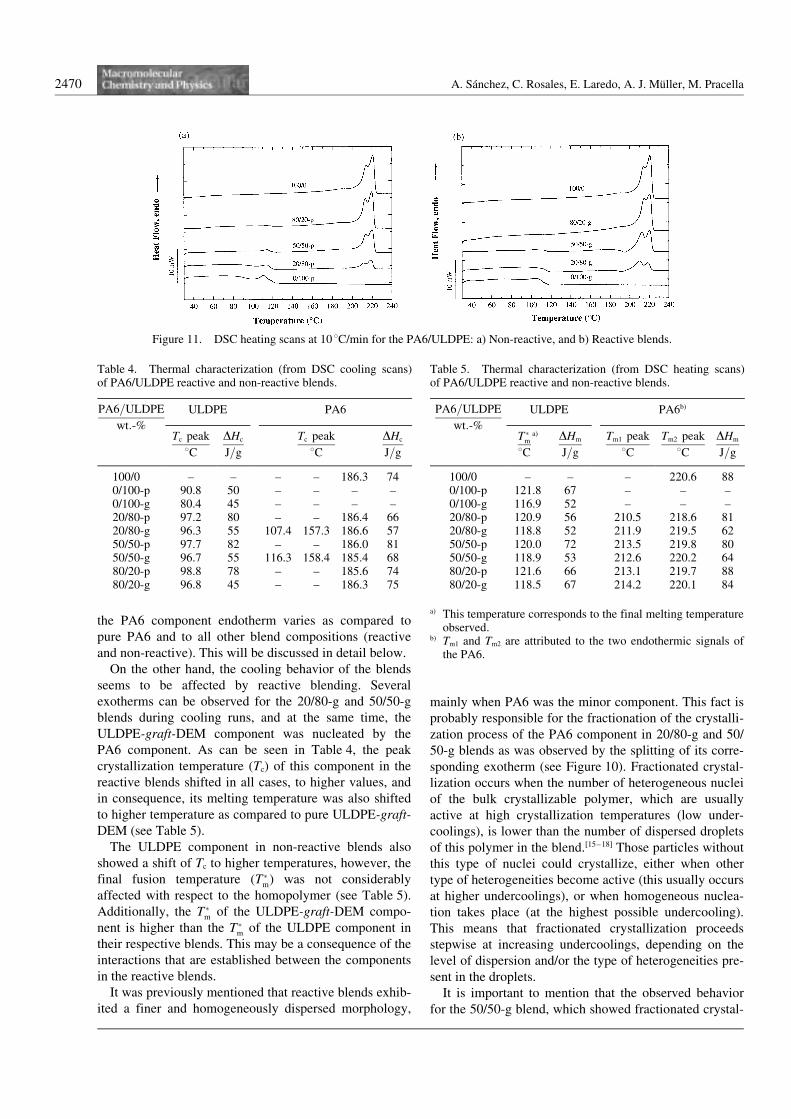
2470 A. Sµnchez, C. Rosales, E. Laredo, A. J. Müller, M. Pracella
the PA6 component endotherm varies as compared topure PA6 and to all other blend compositions (reactiveand non-reactive). This will be discussed in detail below.
On the other hand, the cooling behavior of the blendsseems to be affected by reactive blending. Severalexotherms can be observed for the 20/80-g and 50/50-gblends during cooling runs, and at the same time, theULDPE-graft-DEM component was nucleated by thePA6 component. As can be seen in Table 4, the peakcrystallization temperature (Tc) of this component in thereactive blends shifted in all cases, to higher values, andin consequence, its melting temperature was also shiftedto higher temperature as compared to pure ULDPE-graft-DEM (see Table 5).
The ULDPE component in non-reactive blends alsoshowed a shift of Tc to higher temperatures, however, thefinal fusion temperature (T�m) was not considerablyaffected with respect to the homopolymer (see Table 5).Additionally, the T�m of the ULDPE-graft-DEM compo-nent is higher than the T�m of the ULDPE component intheir respective blends. This may be a consequence of theinteractions that are established between the componentsin the reactive blends.
It was previously mentioned that reactive blends exhib-ited a finer and homogeneously dispersed morphology,
mainly when PA6 was the minor component. This fact isprobably responsible for the fractionation of the crystalli-zation process of the PA6 component in 20/80-g and 50/50-g blends as was observed by the splitting of its corre-sponding exotherm (see Figure 10). Fractionated crystal-lization occurs when the number of heterogeneous nucleiof the bulk crystallizable polymer, which are usuallyactive at high crystallization temperatures (low under-coolings), is lower than the number of dispersed dropletsof this polymer in the blend.[15–18] Those particles withoutthis type of nuclei could crystallize, either when othertype of heterogeneities become active (this usually occursat higher undercoolings), or when homogeneous nuclea-tion takes place (at the highest possible undercooling).This means that fractionated crystallization proceedsstepwise at increasing undercoolings, depending on thelevel of dispersion and/or the type of heterogeneities pre-sent in the droplets.
It is important to mention that the observed behaviorfor the 50/50-g blend, which showed fractionated crystal-
Table 5. Thermal characterization (from DSC heating scans)of PA6/ULDPE reactive and non-reactive blends.
PA6=ULDPEwt:-%
ULDPE PA6b)
T�m8C
a) DHm
J=gTm1 peak
8CTm2 peak
8CDHm
J=g
100/0 – – – 220.6 880/100-p 121.8 67 – – –0/100-g 116.9 52 – – –20/80-p 120.9 56 210.5 218.6 8120/80-g 118.8 52 211.9 219.5 6250/50-p 120.0 72 213.5 219.8 8050/50-g 118.9 53 212.6 220.2 6480/20-p 121.6 66 213.1 219.7 8880/20-g 118.5 67 214.2 220.1 84
a) This temperature corresponds to the final melting temperatureobserved.
b) Tm1 and Tm2 are attributed to the two endothermic signals ofthe PA6.
Figure 11. DSC heating scans at 10 8C/min for the PA6/ULDPE: a) Non-reactive, and b) Reactive blends.
Table 4. Thermal characterization (from DSC cooling scans)of PA6/ULDPE reactive and non-reactive blends.
PA6=ULDPEwt:-%
ULDPE PA6
Tc peak8C
DHc
J=gTc peak
8CDHc
J=g
100/0 – – – – 186.3 740/100-p 90.8 50 – – – –0/100-g 80.4 45 – – – –20/80-p 97.2 80 – – 186.4 6620/80-g 96.3 55 107.4 157.3 186.6 5750/50-p 97.7 82 – – 186.0 8150/50-g 96.7 55 116.3 158.4 185.4 6880/20-p 98.8 78 – – 185.6 7480/20-g 96.8 45 – – 186.3 75
Compatibility Studies in Binary Blends of PA6 and ULDPE-graft-DEM 2471
lization of its PA6 phase, indicates that the minor phasemust be the PA6 and should be very well dispersed. Onthe contrary, the 50/50-p blend does not exhibit fractio-nated crystallization, so in this case either the PA6 con-forms the matrix or the dispersion is not fine. Figure 9shows that for the 50/50-p blend the morphology is amixture of co-continuous and big particles of both com-ponents.
In order to have an idea of the achieved level of disper-sion during blending, the average particle number percm3 (Ni) for PA6/ULDPE reactive and non-reactiveblends was estimated by means of Equation (3) and thefollowing equations[17]
Xv ¼
Xw
qd
Xw
qd
þ 1ÿ Xw
qm
� � ð4Þ
Ni ¼Xvð1 cm3Þ
p
6ðD3nÞ
� � ð5Þ
where ni is the number of particles of diameter “i”; Xv isthe volume fraction of the dispersed phase; Xw is theweight fraction of the dispersed phase, and qd and qm , arethe density of dispersed and matrix phases, respectively.
Table 6 reports the calculations of Ni and Xv for thePA6/ULDPE reactive and non-reactive blends: 20/80 and50/50 wt.-%. The heterogeneous nuclei density in PA6reported in the literature, falls between 0.2 and261012 nuclei/cm3,[18] and the number density of dis-persed droplets (Ni) in 20/80-g and 50/50-g blends, havethe same order of magnitude, therefore the conditions forfractionated crystallization are met for the reactiveblends.[17]
It should be mentioned that fractionated crystallizationprocess in PA6/ULDPE 20/80-g and 50/50-g blends,seems not to be due to compatibilization, but a conse-quence of the dispersion level of the minor phase. Thiswas ascertained because the same effect was observed insome samples of the 20/80-p blend.
In order to verify whether the fractionated crystalliza-tion was due to the high level of dispersion achieved inthe reactive blends, or to chemical interactions between
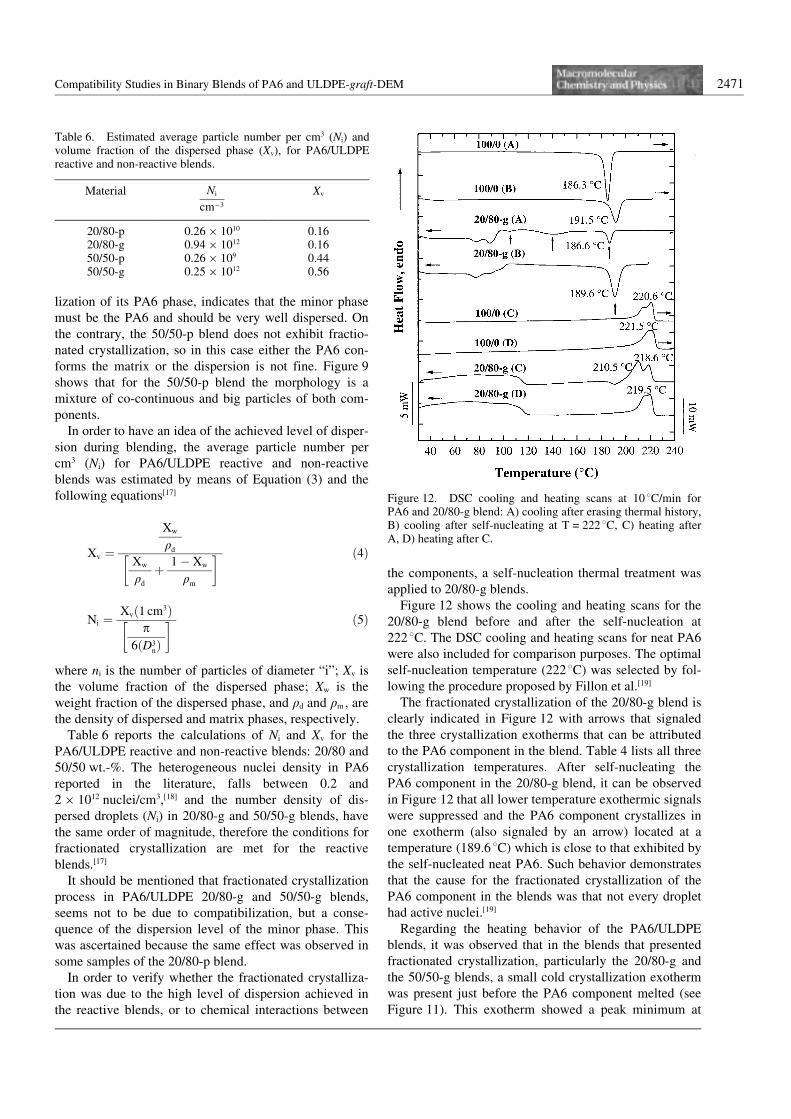
the components, a self-nucleation thermal treatment wasapplied to 20/80-g blends.
Figure 12 shows the cooling and heating scans for the20/80-g blend before and after the self-nucleation at2228C. The DSC cooling and heating scans for neat PA6were also included for comparison purposes. The optimalself-nucleation temperature (2228C) was selected by fol-lowing the procedure proposed by Fillon et al.[19]
The fractionated crystallization of the 20/80-g blend isclearly indicated in Figure 12 with arrows that signaledthe three crystallization exotherms that can be attributedto the PA6 component in the blend. Table 4 lists all threecrystallization temperatures. After self-nucleating thePA6 component in the 20/80-g blend, it can be observedin Figure 12 that all lower temperature exothermic signalswere suppressed and the PA6 component crystallizes inone exotherm (also signaled by an arrow) located at atemperature (189.68C) which is close to that exhibited bythe self-nucleated neat PA6. Such behavior demonstratesthat the cause for the fractionated crystallization of thePA6 component in the blends was that not every droplethad active nuclei.[19]
Regarding the heating behavior of the PA6/ULDPEblends, it was observed that in the blends that presentedfractionated crystallization, particularly the 20/80-g andthe 50/50-g blends, a small cold crystallization exothermwas present just before the PA6 component melted (seeFigure 11). This exotherm showed a peak minimum at
Table 6. Estimated average particle number per cm3 (Ni) andvolume fraction of the dispersed phase (Xv), for PA6/ULDPEreactive and non-reactive blends.
Material Ni
cmÿ3
Xv
20/80-p 0.2661010 0.1620/80-g 0.9461012 0.1650/50-p 0.266109 0.4450/50-g 0.2561012 0.56
Figure 12. DSC cooling and heating scans at 10 8C/min forPA6 and 20/80-g blend: A) cooling after erasing thermal history,B) cooling after self-nucleating at T = 222 8C, C) heating afterA, D) heating after C.
2472 A. Sµnchez, C. Rosales, E. Laredo, A. J. Müller, M. Pracella
1958C. Some authors like Kim et al.,[39] and Khanna etal.,[40] have attributed this behavior, named “sub-Tm”exotherm, to partial melting and recrystallization duringthe heating run. Some other explanations have beenoriented toward an energy relaxation process, whichstored during processing.[41] In this last work, the authorsuggested that thermomechanical stresses, which are pro-duced after quenching from the melt, freeze and block thehydrogen bonds, so that they could remain frozen at tem-peratures below the glass transition, and latter, duringheating they relax prior to melting when molecular mobi-lity is higher.[41]
In our specific case, it was demonstrated that interac-tions in reactive blends (occurring between DES andPA6), could be due to hydrogen bonding. These hydrogenbonds may be able to relax at the sub-Tm region and inprinciple could be the possible cause of the exotherm.
On the other hand, it is well known that when animmiscible blend component undergoes fractionatedcrystallization because it is in the form of small droplets,the extend of crystallization during cooling from the meltis usually lower than that of the bulk polymer.[15–17] Inthis case, the PA6 component forms small droplets in 20/80-g and 50/50-g blends, and under this condition boththe fractionated crystallization and hydrogen bondingwill reduce the extent of crystallization during cooling (ahint of such behavior could be gathered in Table 4).Therefore, reordering during heating is plausible, and thisreordering could be occurring at this sub-Tm region. It isnoticeable however, that in the 20/80-p-blend, the sub-Tm
exotherm cannot be observed, even in those blends thatshowed fractionated crystallization. This encourages us tointerpret that this sub-Tm exotherm is attributable at leastin part to interactions between the PA6 component andDES occurring in reactive blends.
Regarding the intensity of the two melting peaks of thePA6 component (see Figure 11), there is a differencebetween the 20/80-g, 50/50-g, and the equivalent non-reactive 20/80-p, and 50/50-p blends. The intensity ratioof the two PA6 melting peaks is different. Figure 11shows that for the 20/80-g blend, the height of the PA6lower melting temperature peak (Tm1 l 2118C) is slightlyhigher than the height of the high temperature peak(Tm2 l 2198C). On the contrary, the melting peaks ofPA6 in the 80/20-g blend, in all non-reactive blends, andin neat PA6, the opposite trend is always observed (i.e.,the height of the Tm2 peak is greater than that of the Tm1
peak, see Figure 11).Previous works[40, 41, 43–46] have attributed the double
melting peak of the PA6 to the presence of a bimodal dis-tribution of crystalline morphologies, which seems toform at standard cooling rates (typically 108C/min). Thetwo usually reported crystalline morphologies under theseconditions are the alpha (a)-form, and the gamma (c)-form. The a-form posses a higher stability and melts at
2258C approximately, while the c-form is less stable andshows its melting at 2158C.[41, 44] According to this, thefractionation of the crystallization in reactive blends con-taining 20 and 50 wt.-% of PA6, promotes a higheramount of the less stable c-form under the confining con-ditions at which they are formed. These crystals mayhave the ability to reorganize themselves during the stan-dard heating run in the sub-Tm exotherm (see Figure 10),or if the material is self-nucleated (Figure 12) most of thePA6 component will crystallize in the more stable a-form. Additionally, when the a-form crystals predominatein the blend, reorganization during the heating run is notobserved.
In addition to DSC measurements, wide angle X-rayscattering (WAXS) experiments were performed to thesamples but are not shown here. The WAXS spectrum ofthe ULDPE does not differ whether the material is func-tionalized or not. PA6 presents the features of the a-crys-talline form in the homopolymer as well as in the PA6/ULDPE blends, either reactive or non-reactive blends.However a careful examination shows that in the reactiveblends, the PA6 component presents some slight changesin the intermediate region between the (200) and the(002) reflections due to the a-structure of PA6.[46] In thisintermediate region, 218 a 2h a 238, the correspondingreflections for the c-form are located. It was found that inboth blend compositions, the PA6 component of the reac-tive blend presented a less pronounced valley betweenthe two a-form reflections, thus indicating a possibleweak growth of the c-form of the PA6 when it wasblended with ULDPE-graft-DEM.
Crystallization and melting enthalpy values (DHc andDHm , respectively) for the PA6/ULDPE blends are pre-sented in Table 4 and 5. There are no appreciable differ-ences between DHc and DHm for neat PA6, the non-reac-tive blends, and the 80/20-g blend. However, for thosereactive blends, which had presented fractionated crystal-lization, the DHc and DHm values were lower than thosefor the other blends, and besides in these blends the DHc
are lower than DHm for the same blend. The first resultcould be due, as previously mentioned, to the confine-ment into droplets of the PA6 phase. Additionally, thephysical interaction between PA6 and ULDPE-graft-DEM in 20/80-g and 50/50-g blends, may also interfereby means of steric hindrance (via hydrogen bonding, likethose indicated in Figure 4), the ability of PA6 moleculesto form crystals.
As regards the discrepancies reported in Table 4 and 5between DHc and DHm values for the blends that exhibitfractionated crystallization, these may arise from intrinsicerrors of the measurements of enthalpies in sampleswhose crystal content may be changing during the run. Ithas been reported[40] that PA6 with a high amorphous con-tent, can “silently” crystallize between its glass transitiontemperature (Tg) and its melting temperature (Tm). In our
Compatibility Studies in Binary Blends of PA6 and ULDPE-graft-DEM 2473
case, this process is masked by the presence of theULDPE phase melting in this Tg – Tm region, whichmakes impossible to separate the contributions of eachmaterial. In this sense, Khanna et al.[40] suggest that DSCcannot be used for crystallinity measurements of a poly-amide when it is blended with a component that melts inthe Tg – Tm range of the PA6, like in our case. We suggestthat these DH values should therefore be treated with cau-tion.
Analysis of Rheological Properties
The rheological properties of the components in immisci-ble polymer blends affect their morphology and processa-bility, as was pointed out above. At the same time,through a detailed study of the rheological properties ofimmiscible blends, a compatibility criterion can be estab-lished. In such blends having separated phases, as shownin our case by the morphological observations and ther-mal properties, it is important to consider the influence ofthis morphology on the rheological properties of the sys-tems, moreover, in a compatibilized system that couldhave a third phase with its own rheological characteris-tics.
The rheological properties of the blends were evaluatedby means of dynamic rheometry, since it has beendemonstrated that this type of measurement does notaffect or modify the morphology obtained during mix-ing.[47]
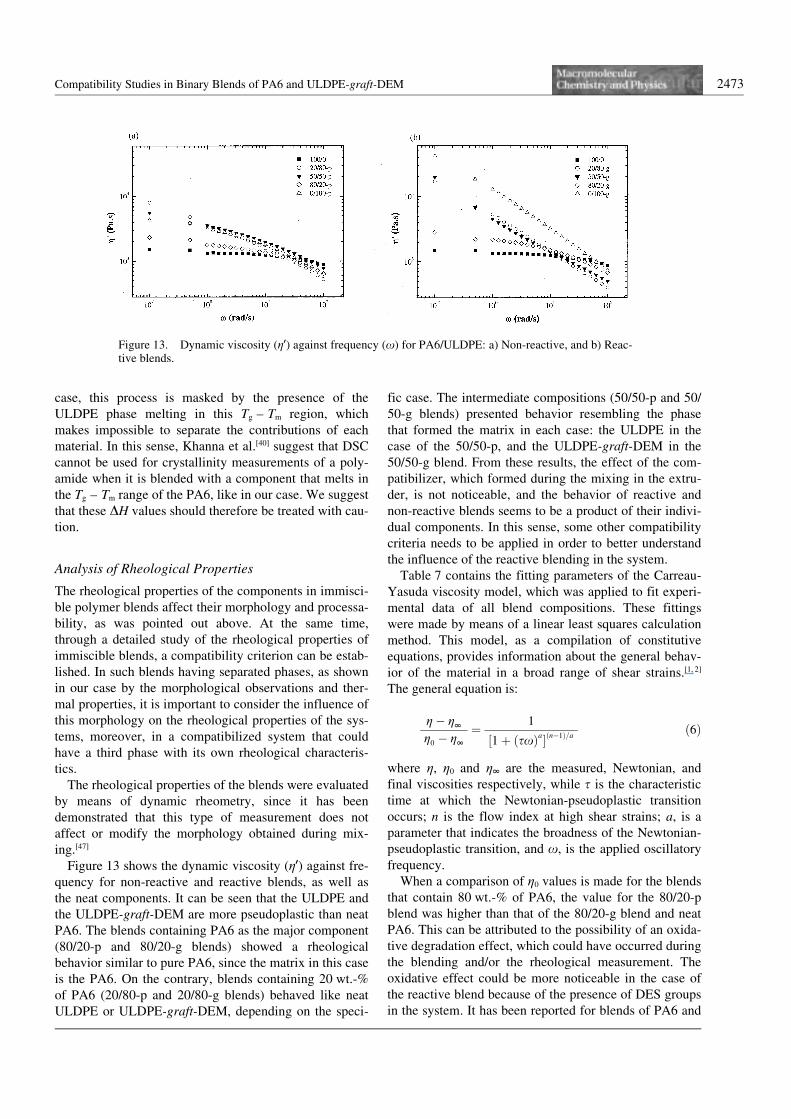
Figure 13 shows the dynamic viscosity (g9) against fre-quency for non-reactive and reactive blends, as well asthe neat components. It can be seen that the ULDPE andthe ULDPE-graft-DEM are more pseudoplastic than neatPA6. The blends containing PA6 as the major component(80/20-p and 80/20-g blends) showed a rheologicalbehavior similar to pure PA6, since the matrix in this caseis the PA6. On the contrary, blends containing 20 wt.-%of PA6 (20/80-p and 20/80-g blends) behaved like neatULDPE or ULDPE-graft-DEM, depending on the speci-
fic case. The intermediate compositions (50/50-p and 50/50-g blends) presented behavior resembling the phasethat formed the matrix in each case: the ULDPE in thecase of the 50/50-p, and the ULDPE-graft-DEM in the50/50-g blend. From these results, the effect of the com-patibilizer, which formed during the mixing in the extru-der, is not noticeable, and the behavior of reactive andnon-reactive blends seems to be a product of their indivi-dual components. In this sense, some other compatibilitycriteria needs to be applied in order to better understandthe influence of the reactive blending in the system.
Table 7 contains the fitting parameters of the Carreau-Yasuda viscosity model, which was applied to fit experi-mental data of all blend compositions. These fittingswere made by means of a linear least squares calculationmethod. This model, as a compilation of constitutiveequations, provides information about the general behav-ior of the material in a broad range of shear strains.[1, 2]
The general equation is:
gÿ gv
g0 ÿ gv
¼ 1
½1þ ðsxÞa�ðnÿ1Þ=að6Þ
where g, g0 and gv are the measured, Newtonian, andfinal viscosities respectively, while s is the characteristictime at which the Newtonian-pseudoplastic transitionoccurs; n is the flow index at high shear strains; a, is aparameter that indicates the broadness of the Newtonian-pseudoplastic transition, and x, is the applied oscillatoryfrequency.
When a comparison of g0 values is made for the blendsthat contain 80 wt.-% of PA6, the value for the 80/20-pblend was higher than that of the 80/20-g blend and neatPA6. This can be attributed to the possibility of an oxida-tive degradation effect, which could have occurred duringthe blending and/or the rheological measurement. Theoxidative effect could be more noticeable in the case ofthe reactive blend because of the presence of DES groupsin the system. It has been reported for blends of PA6 and
Figure 13. Dynamic viscosity (g9) against frequency (x) for PA6/ULDPE: a) Non-reactive, and b) Reac-tive blends.
2474 A. Sµnchez, C. Rosales, E. Laredo, A. J. Müller, M. Pracella
Polyethylene (PE), which have been exposed to photo-oxidation,[24] that degradation begins in the PA6, and thenthe oxygenated radicals can react with the PE chains, pro-moting in that way, the degradation of this phase. As inour case, the ULDPE phase in the reactive blend, hasgroups with the ability to react with pre-formed radicals,an acceleration of the degradation may be possible. As aconsequence, due to oxidative degradation, a reduction inthe viscosity of the blend could be observed in this case.The degradation effect on the viscosity reduction is morenoticeable for 80/20 blends, due to the high content ofPA6, a material more susceptible to reduce its viscosityby scission of molecular chains.[48]
On the other hand, if the copolymer locates at the inter-phase as “PA6-graft-ULDPE-graft-DEM”, it can act asan agent that is able to transmit the imposed strainbetween the phases of the blend. This implies that theywill be hydrodynamically similar and would deform as acontinuum.[33] When the matrix is the PA6, the wholeviscosity would be near to that of neat PA6 viscosity.
On the other hand, the characteristic time (s) estimatedfrom the Carreau model, is higher for reactive blendsthan for the non-reactive ones (see Table 7). This indi-cates that the Newtonian-pseudoplastic transition in thereactive system occurs at much lower frequencies withrespect to the non-reactive system. Based on these results,it can be said that interactions between the phases in thereactive systems can increase the characteristic time (s)of the materials that have an enhanced dispersion. Theprevious results were nearly alike for all reactive blendsas compared to the non-reactive ones and their respectivepure components.
In the case of the 50/50-g blend, the material exhibitedthe highest zero-shear viscosity and the longest character-istic time compared to all other samples. This result mayindicate that for this blend composition the interactionswere particularly favored, resulting in a highly compatibi-lized material from the rheological point of view. In this
respect, it is important to mention that delaminating afterblending or moulding did not occur for this blend, whilefor the 50/50-p delamination was commonly observedafter moulding.
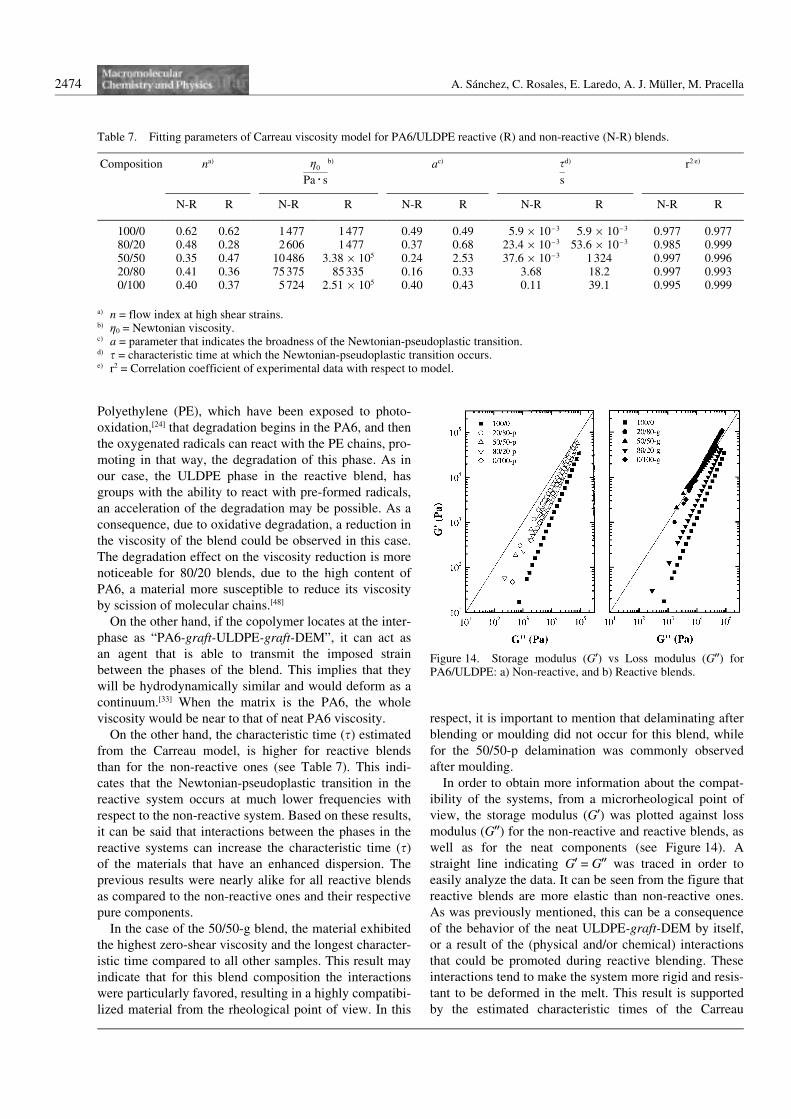
In order to obtain more information about the compat-ibility of the systems, from a microrheological point ofview, the storage modulus (G9) was plotted against lossmodulus (G99) for the non-reactive and reactive blends, aswell as for the neat components (see Figure 14). Astraight line indicating G9 = G99 was traced in order toeasily analyze the data. It can be seen from the figure thatreactive blends are more elastic than non-reactive ones.As was previously mentioned, this can be a consequenceof the behavior of the neat ULDPE-graft-DEM by itself,or a result of the (physical and/or chemical) interactionsthat could be promoted during reactive blending. Theseinteractions tend to make the system more rigid and resis-tant to be deformed in the melt. This result is supportedby the estimated characteristic times of the Carreau
Figure 14. Storage modulus (G9) vs Loss modulus (G99) forPA6/ULDPE: a) Non-reactive, and b) Reactive blends.
Table 7. Fitting parameters of Carreau viscosity model for PA6/ULDPE reactive (R) and non-reactive (N-R) blends.
Composition na) g0
Pa N s
b) ac) s
s
d) r2 e)
N-R R N-R R N-R R N-R R N-R R
100/0 0.62 0.62 1477 1477 0.49 0.49 5.9610–3 5.9610–3 0.977 0.97780/20 0.48 0.28 2606 1477 0.37 0.68 23.4610–3 53.6610–3 0.985 0.99950/50 0.35 0.47 10486 3.386105 0.24 2.53 37.6610–3 1324 0.997 0.99620/80 0.41 0.36 75375 85335 0.16 0.33 3.68 18.2 0.997 0.9930/100 0.40 0.37 5724 2.516105 0.40 0.43 0.11 39.1 0.995 0.999
a) n = flow index at high shear strains.b) g0 = Newtonian viscosity.c) a = parameter that indicates the broadness of the Newtonian-pseudoplastic transition.d) s = characteristic time at which the Newtonian-pseudoplastic transition occurs.e) r2 = Correlation coefficient of experimental data with respect to model.
Compatibility Studies in Binary Blends of PA6 and ULDPE-graft-DEM 2475
model, because when the elasticity in the melt is higher,the flow response (i.e., the participation of the viscouscomponent) is delayed.
The literature[9] suggests that these G9 – G99 plots can beused to determine the rheological compatibility of poly-mer blends. For compatibilized blends, like the onesemployed in this work, Han et al[9] suggest that the differ-ences observed in the G9 – G99 plots between the blendsand their components, are due to the presence of a dis-persed phase having a small particle size and difficulty tobe deformed, more so if the particles are coated by a com-patibilizer. If the blend is compatible, the relationbetween G9 and G99 should be independent on blend com-position and should reflect the elasticity contributionfrom each individual component. Figure 14 shows thatthe values of the reactive blends containing 20 and50 wt.-% of PA6 form almost a single line, while for thenon-reactive ones, differences among the compositionsare better observed. With regards to these results, theDES groups present in the ULDPE-graft-DEM could beeffectively acting as a compatibilizer from a rheologicalpoint of view, at least at the employed oscillation fre-quencies and strains. Additionally, Figure 14 shows thatthe high elasticity of reactive blends is also evidentbecause of the shifting of the reactive blends values to therubbery region (high values of G9 and G99) with respect tothe non-reactive ones.
Dielectric Spectroscopy Results
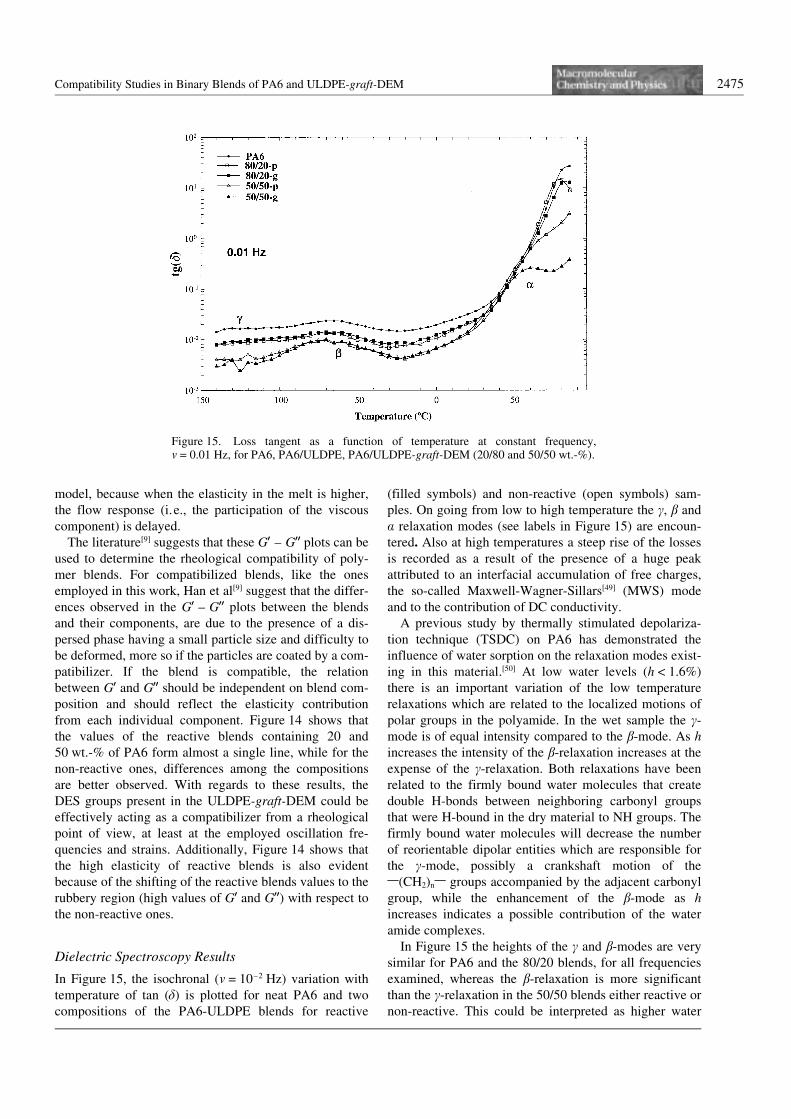
In Figure 15, the isochronal (m = 10–2 Hz) variation withtemperature of tan (d) is plotted for neat PA6 and twocompositions of the PA6-ULDPE blends for reactive
(filled symbols) and non-reactive (open symbols) sam-ples. On going from low to high temperature the c, b anda relaxation modes (see labels in Figure 15) are encoun-tered. Also at high temperatures a steep rise of the lossesis recorded as a result of the presence of a huge peakattributed to an interfacial accumulation of free charges,the so-called Maxwell-Wagner-Sillars[49] (MWS) modeand to the contribution of DC conductivity.
A previous study by thermally stimulated depolariza-tion technique (TSDC) on PA6 has demonstrated theinfluence of water sorption on the relaxation modes exist-ing in this material.[50] At low water levels (h a 1.6%)there is an important variation of the low temperaturerelaxations which are related to the localized motions ofpolar groups in the polyamide. In the wet sample the c-mode is of equal intensity compared to the b-mode. As hincreases the intensity of the b-relaxation increases at theexpense of the c-relaxation. Both relaxations have beenrelated to the firmly bound water molecules that createdouble H-bonds between neighboring carbonyl groupsthat were H-bound in the dry material to NH groups. Thefirmly bound water molecules will decrease the numberof reorientable dipolar entities which are responsible forthe c-mode, possibly a crankshaft motion of the1(CH2)n1 groups accompanied by the adjacent carbonylgroup, while the enhancement of the b-mode as hincreases indicates a possible contribution of the wateramide complexes.
In Figure 15 the heights of the c and b-modes are verysimilar for PA6 and the 80/20 blends, for all frequenciesexamined, whereas the b-relaxation is more significantthan the c-relaxation in the 50/50 blends either reactive ornon-reactive. This could be interpreted as higher water
Figure 15. Loss tangent as a function of temperature at constant frequency,m = 0.01 Hz, for PA6, PA6/ULDPE, PA6/ULDPE-graft-DEM (20/80 and 50/50 wt.-%).
2476 A. Sµnchez, C. Rosales, E. Laredo, A. J. Müller, M. Pracella
content in the 50/50 blends than in the other composi-tions.
Moreover, among the two blend compositions there isanother difference as to the position of the a-mode, whichis the dielectric manifestation of the glass transition ofthe amorphous phase of the PA6 component. For the PA6component of the 80/20-p blend, the maximum of the a-peak is located very near the corresponding relaxation inthe homopolymer. In the case of the reactive blend (80/20-g), the enhanced interactions between blend compo-nents detected in previous sections do not seem to dis-place this mode in the temperature axis.
However, for the 50/50-g blend there is a clear shift ofthe a-peak towards lower temperatures when compared toall other compositions, even the 50/50-p. This shift of thea-mode can be related to the plasticization of the materialby the introduction of water molecules, which disrupt theexisting H-bonds between NH and CO neighboring groupsin the dry material. In a previous work[50] shifts as high as–80 K for water contents of 10% in weight have beenreported. This relaxation is the most affected by the pre-sence of water molecules and the shift to lower tempera-tures observed in the 50/50-g blend could confirm the indi-cations given by the low temperature modes in this samesample, where the firmly bound water is the most abun-dant. However, another source of disruption of intramole-cular hydrogen bonds in PA6 may also be present in the50/50-g sample, since alternate hydrogen bonds can beformed between the PA6 component and the ULDPE-graft-DEM (as indicated above in the FT-IR results) andbetween the copolymer and the PA6 component.
An attempt to calculate the relaxation time variationsas a function of temperature in order to evidence the tem-perature dependence of s (T) is made by fitting the experi-mental profile e99(x) to a sum of Cole-Cole distributionswhich best describes the distribution of relaxation timesin semi-crystalline polymers[51] as the shape of the a-mode in these materials is symmetrically broadened. Theexpression used for the fitting of the imaginary part of thedielectric constant is:[52]
e99ðxÞ ¼ DeðxsccÞa sinðpa=2Þ1þ 2ðxsccÞa cosðpa=2Þ þ ðxsccÞ2a
ð7Þ
where a is the broadening parameter, which is equal to 1in a Debye process and a a 1 when there exists a distribu-tion of relaxation time.
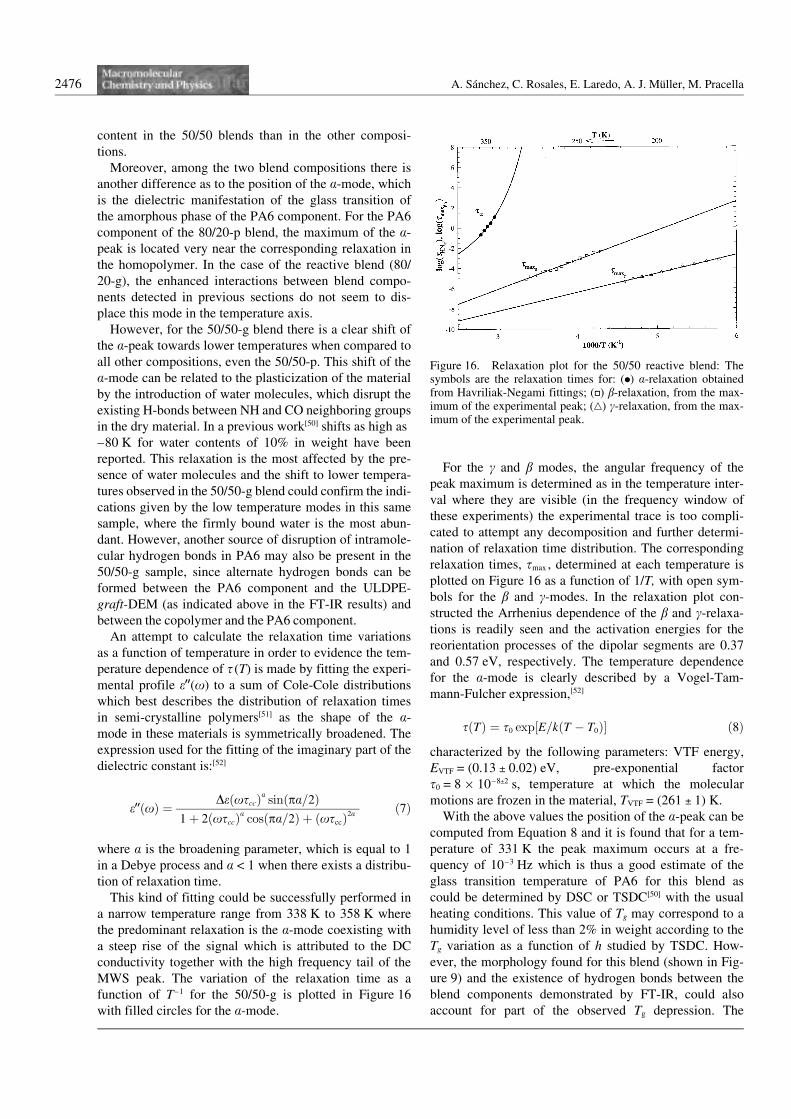
This kind of fitting could be successfully performed ina narrow temperature range from 338 K to 358 K wherethe predominant relaxation is the a-mode coexisting witha steep rise of the signal which is attributed to the DCconductivity together with the high frequency tail of theMWS peak. The variation of the relaxation time as afunction of T–1 for the 50/50-g is plotted in Figure 16with filled circles for the a-mode.
For the c and b modes, the angular frequency of thepeak maximum is determined as in the temperature inter-val where they are visible (in the frequency window ofthese experiments) the experimental trace is too compli-cated to attempt any decomposition and further determi-nation of relaxation time distribution. The correspondingrelaxation times, smax , determined at each temperature isplotted on Figure 16 as a function of 1/T, with open sym-bols for the b and c-modes. In the relaxation plot con-structed the Arrhenius dependence of the b and c-relaxa-tions is readily seen and the activation energies for thereorientation processes of the dipolar segments are 0.37and 0.57 eV, respectively. The temperature dependencefor the a-mode is clearly described by a Vogel-Tam-mann-Fulcher expression,[52]
sðTÞ ¼ s0 exp½E=kðT ÿ T0Þ� ð8Þ
characterized by the following parameters: VTF energy,EVTF = (0.13 l 0.02) eV, pre-exponential factors0 = 8610–8l2 s, temperature at which the molecularmotions are frozen in the material, TVTF = (261 l 1) K.
With the above values the position of the a-peak can becomputed from Equation 8 and it is found that for a tem-perature of 331 K the peak maximum occurs at a fre-quency of 10–3 Hz which is thus a good estimate of theglass transition temperature of PA6 for this blend ascould be determined by DSC or TSDC[50] with the usualheating conditions. This value of Tg may correspond to ahumidity level of less than 2% in weight according to theTg variation as a function of h studied by TSDC. How-ever, the morphology found for this blend (shown in Fig-ure 9) and the existence of hydrogen bonds between theblend components demonstrated by FT-IR, could alsoaccount for part of the observed Tg depression. The
Figure 16. Relaxation plot for the 50/50 reactive blend: Thesymbols are the relaxation times for: (0) a-relaxation obtainedfrom Havriliak-Negami fittings; (F) b-relaxation, from the max-imum of the experimental peak; (H) c-relaxation, from the max-imum of the experimental peak.
Compatibility Studies in Binary Blends of PA6 and ULDPE-graft-DEM 2477
observed intensities in the low temperature region agreewell with the presence of water, as the b-peak is moreintense than the c one for the 50/50-g blend. In this com-position the functionalization enhances the capability ofwater sorption, which is firmly bound to the PA6 chains.
ConclusionsThe compatibilization of PA6 and ULDPE was success-fully achieved by reactive blending the PA6 with pre-viously funtionalized ULDPE-graft-DEM. The formationof a copolymer was observed by infrared spectroscopyafter selective extraction of the components, presumablyby the interaction of terminal NH2 groups of PA6 and car-bonyl groups of ULDPE-graft-DEM.
The thermal properties showed some changes due tocompatibilization. In particular, fractionated crystalliza-tion of the PA6 component was observed when it formedthe dispersed phase in reactive blends promoted by theenhanced dispersion. Nucleation of the ULDPE compo-nent by the PA6 component was observed for reactiveand non-reactive blends.
The DSC melting results showed the presence of twocrystalline forms of the PA6 in the blends. These werethe less stable c-form, predominant over the more stablea-form, in reactive blends, especially for the 20/80 and50/50 wt.-% blend compositions.
Dynamic rheological experiments provided data for fit-ting the Carreau viscosity model; the results revealed thatlonger characteristic times are obtained for compatibi-lized systems. This was reinforced by the more elasticbehavior that such systems exhibited in G9 – G99 plots, ascompared to the non-reactive ones.
Dielectric spectroscopy revealed a noticeable shiftingof the a-mode of the PA6 to lower temperatures, for the50/50-g, together with an enhancement of the b over thec-mode, which indicates the presence of tightly boundwater in this blend. The Tg depression could be due to theplasticization effect resulting from the substitution ofintramolecular PA6 H-bonds by either water molecules orphysical interactions across the interphases.
Acknowledgement: This work was made possible by the gen-erous funding of the Consejo Nacional de Investigaciones Cien-tíficas y Tecnológicas, CONICIT, through grant G97-000594.Exchange visits between Italy and Venezuela were funded by anInternational Co-operation Grant financed by CONICIT (Vene-zuela, grant no. PI-97002900) and CNR (Italy).
Received: August 9, 2000Revised: October 11, 2000
[1] L. Utracki, “Polymer Alloys and Blends. Thermodynamicsand Rheology”, Hanser Publishers, Munich 1989.
[2] “Polymer Blends and Alloys”, M. Folkes, P. Hope, Eds.,Blackie Academic and Professional, Great Britain 1993.
[3] Y. Kim, C. Han, B. Song, E. Kovassi, J. Appl. Polym. Sci.1984, 29, 2359.
[4] Ch. Wu, J. Kuo, Ch. Chen, Polym. Eng. Sci. 1993, 33, 20,1329.
[5] G. Serpe, J. Jarrin, F. Dawans, Polym. Eng. Sci. 1990, 30,9, 553.
[6] H. Raval, S. Devi, Y. P. Singh, M. H. Mehta, Polymer1991, 32, 493.
[7] F. Ide, A. Hasegawa, J. Appl. Polym. Sci. 1974, 8, 963.[8] J. Pillon, L. Utracki, Polym. Eng. Sci. 1987, 27, 562.[9] Ch. Han, H.-K. Chuang, J. Appl. Polym. Sci. 1985, 30,
4431.[10] C. Han, Y. Kim, J. Appl. Polym. Sci. 1974, 18, 2589.[11] B. Majumdar, H. Keskkula, D. R. Paul, J. Appl. Polym.
Sci. 1994, 54, 339.[12] A. Padwa, Polym. Eng. Sci. 1992, 32, 22.[13] C. Rosales, L. Mµrquez, J. Gonzµlez, R. Perera, B. Rojas,
M. Vivas, Polym. Eng. Sci. 1996, 36, 2247.[14] C. Rosales, R. Perera, M. Ichazo, J. Gonzµlez, H. Rojas, A.
Sµnchez, A. Díaz Barrios, J. Appl. Polym. Sci. 1998, 70,161.
[15] O. O. Santana, A. J. Müller, Polym. Bull. 1994, 32, 471.[16] R. A. Morales, M. L. Arnal, A. J. Müller, Polym. Bull.
1995, 35, 379.[17] M. L. Arnal, M. E. Matos, R. A. Morales, O. O. Santana,
A. J. Müller, Macromol. Chem. Phys. 1998, 199, 2275.[18] H. Frensch, B.-J. Jungnickel, Colloid. Polym. Sci. 1989,
264, 16.[19] B. Fillon, J. C. Wittman, B. Lotz, A. Thierry, J. Polym Sci.,
Part B: Polym. Phys. 1998, 36, 133.[20] E. Passaglia, M. Marruci, G. Ruggeri, M. Aglietto, Gaz-
zetta Chimica Italiana 1997, 127, 91.[21] A. Sµnchez, C. Rosales, A. J. Müller, SPE's Proceedings
ANTEC '97, 1997, 3761.[22] J. Hu, P. Painter, M. Coleman, T. Krizan, J. Polym. Sci.,
Part B: Polym. Phys. 1990, 28, 149.[23] D. Skrovanek, S. Howe, P. Painter, M. Coleman, Macro-
molecules 1985, 18, 1676.[24] M. Nocilla, F. P. La Mantia, Polym. Degrad. Stab. 1990,
29, 331.[25] G. E. Molau, J. Appl. Polym. Sci. 1965, A3, 1267.[26] A. Luciani, M. F. Champagne, L. A. Utracki, Polym. Net-
works Blends 1996, 6, 2, 51.[27] M. Geppi, C. Forte, E. Passaglia, B. Mendez, Macromol.
Chem. Phys. 1998, 199, 1957.[28] S. Wu, Polym. Eng. Sci. 1987, 27, 5, 335.[29] M. Kozlowski, Polym. Networks Blends 1993, 3, 4, 213.[30] B. Favis, J. Chalifoux, Polym. Eng. Sci. 1987, 27, 20,
1951.[31] W. P. Cox, E. H. Merz, J. Polym. Sci. 1958, 28, 619.[32] R. M. Schulken, R. H. Cox, L. A. Minnick, J. Appl. Polym.
Sci. 1980, 25, 1341.[33] W. Michaeli, A. Grefenstain, V. Berghaus, Polym. Eng.
Sci. 1995, 19, 1485.[34] S. V. Kao, G. R. Allison, Polym. Eng. Sci. 1984, 9, 645.[35] U. Sundararaj, C..W. Macosko, Macromolecules 1995, 28,
2647.[36] U. Sundararaj, C. W. Macosko, Ch. Shih, Polym. Eng. Sci.
1996, 36, 13, 1774.[37] D. C. Chappelear, Polym. Prep. 1964, 5, 363.[38] U. Sundararaj, Y. Dori, C. W. Macosko, Polymer 1995, 36,
10, 1957.
2478 A. Sµnchez, C. Rosales, E. Laredo, A. J. Müller, M. Pracella
[39] H. G. Kim, R. Robertson, J. Polym Sci., Part B: Polym.Phys. 1998, 36, 133.
[40] Y. P. Khanna, W. P. Kuhn, J. Polym Sci., Part B: Polym.Phys. 1997, 35, 2219.
[41] Y. P. Khanna, Macromolecules 1992, 25, 3298.[42] H. Frensch, P. Harischfeger, B.-J. Jungnickel. “Fractio-
nated Crystallization in Incompatible Polymer Blends”, in:Multiphase Polymers: Blends and Ionomers, L. A. Utracki,R. A. Weiss, Eds., American Chemical Society, USA1989, Chap. 5, pp. 101–125.
[43] M. Stolp, R. Androsch, H.-J. Radusch, Polym. NetworksBlends 1996, 6, 4, 141.
[44] N. S. Murthy, S. Aharoni, A. Szollosi, J. Polym Sci., PartB: Polym. Phys. 1985, 23, 2549.
[45] P. Hornsby, J. F. Tung, J. Appl. Polym. Sci. 1994, 54, 899.[46] M. Psarski, M. Pracella, A. Galeski, Polymer 2000, 41,
4923.[47] Y. Germain, B. Ernst, O. Genelot, L. Dhamani, J. Rheol.
1994, 38, 3, 681.[48] S. V. Levchik, E. D. Weil, M. Lewin, Polym. Int. 1999, 48,
532.[49] M. C. Hernµndez, E. Laredo, M. Grimau, A. Bello, Poly-
mer 2000, 41, 7223.[50] E. Laredo, M. C. Hernµndez, J. Polym. Sci., Part B: Polym.
Phys. 1997, 35, 2879.[51] R. H. Boyd, Polymer 1985, 26, 323.[52] A. Bello, E. Laredo, M. Grimau, Phys. Rev. B. 2000, 60,
12764.


![MotionInOneDimension [Compatibility Mode]](https://img.dokumen.tips/doc/110x75/6321f138ae0f5e819105ac57/motioninonedimension-compatibility-mode.jpg)


![“Organizational Commitment thesis [Compatibility Model]”](https://img.dokumen.tips/doc/110x75/63474187391b5ca53f0d61d9/organizational-commitment-thesis-compatibility-model.jpg)


![SEJARAH OLAHRAGA [Compatibility Mode]](https://img.dokumen.tips/doc/110x75/631f15353b43b66d3c0f9a14/sejarah-olahraga-compatibility-mode.jpg)


![Organizational Commitment thesis [Compatibility Model]](https://img.dokumen.tips/doc/110x75/634741b1494dcf875e0453d8/organizational-commitment-thesis-compatibility-model-1699579116.jpg)
![06-Wireless Configuration [Compatibility Mode]](https://img.dokumen.tips/doc/110x75/631cc620c2fddc4819082535/06-wireless-configuration-compatibility-mode.jpg)

![Penelitian Deskriptif.ppt [Compatibility Mode]](https://img.dokumen.tips/doc/110x75/635d0314a3fa66b45c0e313c/penelitian-deskriptifppt-compatibility-mode.jpg)

![cjc 2021.02.03[Compatibility Mode]](https://img.dokumen.tips/doc/110x75/631345ddaca2b42b580d1e73/cjc-20210203compatibility-mode.jpg)