Embed Size (px)
Citation preview
ORIGINAL PAPER
Aromatic/Aliphatic Polyester Blends
A. C. Quental • F. P. de Carvalho • M. L. Rezende •
D. S. Rosa • M. I. Felisberti
Published online: 23 April 2010
� Springer Science+Business Media, LLC 2010
Abstract Blends of poly(3-hydroxybutyrate) (PHB) and
poly(ethylene terephthalate-co-1,4-cyclohexenedimethanol
terephthalate) (PETG) were prepared in a batch mixer and
in a twin screw extruder and characterized by differential
scanning calorimetry (DSC), dynamic mechanical analysis
(DMA), field emission scanning electron microscopy (FE
SEM), flexural tests, biodegradation tests in soil compost
and in an enzymatic medium. The torque data showed that
the addition of PETG to PHB improved its processability.
DSC, DMA and FE SEM showed that the polymers are
immiscible with morphology dependent on the processing
conditions. A fine dispersion of PETG in the PHB matrix
was observed for extruded and injection molded blends.
Flexural modulus for blends was higher for blends in
comparison with PHB, while the impact resistance of
blends containing 20 wt% and 30 wt% of PETG is com-
parable to the value for PHB. PHB is biodegradable, while
PETG did not degrade either in simulated soil or in the
a-amylase medium. On the other hand, the PHB phase of
the blends degrades under these aging conditions. Thus, the
addition of PETG to PHB results in advantage such as
improving of processability and Young0s modulus without
significant changes in the impact resistance while keeping
the biodegradability of PHB.
Keywords Blends � Biodegradability � PHB � PETG �Processing
Introduction
In general, commercially available biodegradable polymers
are either expensive or present poor physical properties,
compared with conventional thermoplastics like polyeth-
ylene and poly(ethylene terephthalate). Poly(3-hydroxy-
butyrate), PHB, is one of more interesting biodegradable
polymers because it is obtained by bacterial fermentation
from renewable resources [1–3]. However, PHB presents
some drawbacks like thermal instability at temperatures
close to its melting point and a relatively low impact
resistance. PHB molar mass decreases proportionately with
some processing parameters like time and temperature. In
spite of its narrow processing window PHB with high
molar mass can be processed like other thermoplastics if
adequate processing parameters are used [4, 5].
Two efforts, among others, have been used to change
PHB properties: biosynthesis and blending. Since blends
are a cheaper and faster method to improve polymer
properties than synthesis, blends have often been used to
improve mechanical properties and processability of PHB.
A variety of polymers having different chemical, physical
and mechanical characteristics, biodegradable and non-
biodegradable, amorphous or crystalline have been blended
with PHB and its copolymers [5–9].
Complete biodegradable PHB blends have been
obtained with poly(ethylene glycol) (PEG) [10], polyoxy-
ethylene (PEO) [11–14], polycaprolactone (PCL) [15, 16],
A. C. Quental � F. P. de Carvalho � M. I. Felisberti (&)
Instituto de Quımica, Universidade Estadual de Campinas,
UNICAMP, P.O. Box 6154, Campinas, SP 13083-900, Brazil
e-mail: [email protected]
M. L. Rezende � D. S. Rosa
Programa de Pos Graduacao em Engenharia e Ciencias dos
Materiais, Universidade Sao Francisco, Rua Alexandre
Rodrigues Barbosa, 45, Centro, Itatiba, SP CEP 13251-900,
Brazil
D. S. Rosa
e-mail: [email protected]
123
J Polym Environ (2010) 18:308–317
DOI 10.1007/s10924-010-0183-2
polydioxanone (PDS) [17], poly(lactic acid) (PLA) [18,
19], cellulose [20] and cellulose derivatives [21–24],
among others. Partially biodegradable blends have been
formed with poly(epichlorohydrin) (PECH) [25–27],
poly(vinyl acetate) (PVAc) [28–30], poly(vinyl chloride)
(PVC) [31], poly(methyl methacrylate) (PMMA) [32–35],
poly(ethylene-co-vinyl acetate) (EVA) [36], poly(vinyl
phenol) (PVPh) [37, 38], terpolymer of acrylonitrile-g-
(ethylene-co-propylene-co-diene)-g-styrene (AES) [39],
polyethylene [40].
Poly(ethylene terephthalate) (PET) is a semicrystalline
polyester obtained by polycondensation of ethylene glycol
and terephthalic acid. By replacing some of the ethylene
glycol with secondary glycols, the crystallization of the
polyester can be slowed. For example, replacing a fraction
of ethylene glycol by 1,4-cyclohexanedimethanol the
poly(ethylene terephthalate-co-1,4-cyclohexanedimethanol-
terephthalate), PETG, an amorphous copolyester, is obtained
[41, 42].
PETG is not able to crystallize and offers a larger range
of processing parameters than equivalent aromatic semi-
crystalline polyesters. PETG combines good toughness
even at low temperatures with film clarity and melt
strength. While mechanical properties of the PET reduce
with annealing due to embrittlement, PETG does not
present any change in these properties [41, 42]. Since
PETG is an amorphous polymer the processing temperature
profile can be lower in comparison with the usual pro-
cessing conditions for PET. Thus, the mechanical blending
of PETG and PHB appears to be possible in the processing
window of the PHB. The mostly PHB blends described in
the literature were obtained by casting from polymer
solutions in order to avoid the thermal degradation of PHB.
The present paper investigates the miscibility and com-
patibility of PHB/PETG blends obtained by mechanical
mixture in the melted state.
Experimental
The polymers used in this study were obtained from
commercial sources. The PHB was supplied by PHB
Industrial (Serrana, Brazil) with a molar mass of
450.000 g/mol. The PETG was supplied by Eastman
Chemical Company (Kingsport, TN). It consists of a
copolymer of 1,4-cyclohexanedimethanol, ethylene glycol
and terephthalic acid with a molar ratio of approximately
1:2:3 as determined by 1H and 13C NMR [43]. Polymer
blends containing 20, 40, 50, 60 and 80 wt% of PETG were
prepared by melt mixing in a model 600 Haake Rheomix
batch mixer (Karlsruhe, Germany) equipped with roller
blades and a mixing head with a volumetric capacity of
69 cm3. The mixing conditions were 80 rpm, 180 �C and
5 min of processing time. Polymers in pellets were pre-
mixed before being fed into the mixer. The pure polymers
were also subjected to the same procedure.
Blends containing 50, 60, 70, 80 and 90 wt% of PETG
were also prepared in a co-rotating, intermeshing twin
screw APV 2000 extruder (Aylesbury, England), with four
zones under barrel temperatures of 165 �C, 175 �C, 175 �C
and 185 �C from the hopper to die, and a screw speed of
100 rpm. The polymers were dried at 80 �C for 4 h before
processing.
The crystallization, melting and glass transition tem-
peratures of the pure polymers and their blends were
determined using a DSC 2910 from TA Instruments (New
Castle, DE). The following program was used for DSC
analysis: the samples were melted at 200 �C, held iso-
thermally for 2 min, then cooled to -20 �C and heated to
200 �C again. For some experiments the second step was
modified introducing an isothermal step at 70 �C for
20 min to allow the crystallization of PHB followed by
cooling to -20 �C and heating to 200 �C (third heating
scan). The heating and cooling rates were 10 �C/min under
nitrogen atmosphere. The crystallinity of PHB was calcu-
lated from the ratio between the melting enthalpy (DHm)
determined from the second scan of the DSC analysis and
the melting enthalpy of the 100% crystalline phase (DHo)
from the literature. For PHB, DHm value of 149 J/g was
used [44]. All DSC curves shown in this work were nor-
malized with respect to sample mass and shifted from each
other to allow better visualization of the transitions.
The dynamic mechanical analysis (DMA) was con-
ducted using a Rheometric Scientific DMTA V equipment
(Piscataway, NJ). The samples obtained from the batch
mixer were compression molded in sheets with 1 mm
thickness in a Marconi 098/A hydraulic press (Piracicaba,
Brazil) under a pressure of 1.10 MPa and temperature of
180 �C for 5 min, followed by cooling in water. The mean
dimensions for the sample between the clamps in the DMA
equipment were 1 mm of thickness, 5 mm of width and
10 mm of length. The analyses were carried out in the
temperature scan mode from -50 �C to 200 �C, at a fre-
quency of 1 Hz, 0.05 of strain and a heating rate of 2 �C/min.
A JEOL JSM-6340F field emission scanning electron
microscope (Middleton, WI) was used to examine the
morphology of the blends. The microscope operated at a
voltage of 3 kV. Batch mixed blends, extruded blends and
injection molded specimens were analyzed. Samples were
cryogenically fractured and the fractured surfaces were
sputtered with carbon and gold in a BAL-TEC MED 020
equipment (Principality of Liechtenstein).
Flexural tests were performed according to ASTM D790
using an EMIC model DL-2000 (Sao Jose dos Pinhais,
Brazil) at a cross head speed of 5 mm/min. Izod impact
properties were evaluated using an EMIC model AIC-1
J Polym Environ (2010) 18:308–317 309
123
(Sao Jose dos Pinhais, Brazil) with a pendulum energy of
2,7 J and notched specimens, according to ASTM 256. The
flexural and impact test specimens were prepared by
injection molding in a Arburg Allrounder model 221 M
250-55 (Lossburg, Germany). All samples were condi-
tioned prior to testing for 48 h at 50% humidity and a
constant temperature of 23 �C. The testing was performed
under the same conditions. At least ten specimens were
used for each test.
Biodegradation tests were conducted in soil compost
and in an enzymatic media. For enzymatic biodegradation
tests samples were placed in a vial filled with 10 mL of
0.05 mol/L acetate buffer, pH 6.0, containing 2.7 mg of
a-amylase, according to the Corn Products protocol, to
reduce the activation energy. The vials were placed in a
water bath at 60 �C. Every 48 h the samples were removed,
washed with distilled water, wiped dry, and weighed before
being returned to the incubation media. Controls consisted
of 10 mL of acetate buffer without enzyme.
Soil compost containing 23% loamy silt, 23% organic
matter (cow manure), 23% sand and 31% distilled water
(all w/w) was used for other biodegradation tests. Calcium
hydroxide was added to obtain a soil compost of pH 11.
The samples were weighed and buried in the soil compost,
in triplicate in containers of 30 9 30 9 40 cm. The sam-
ples were buried maintaining one distance of 15 cm of the
soil surface. The biodegradability was monitored by mass
variation after specified periods in the soil compost. The
buried samples were retrieved, washed with distilled water
and dried in air before being weighed. The samples were
buried again in their respective trays after weighing.
Results and Discussion
In order to investigate processability, pure polymers and
blends were processed in a Haake Rheomix 600 batch
mixer. Batch mixers are important and useful equipment to
prepare blends at lower quantities and to provide infor-
mation about torque and temperature as a function of the
processing time. Due to the small dimensions of the mixing
chamber, torque data measured by the torque meter are
reasonably representative of the actual torque exerted on
the polymer melt and is proportional to viscosity of the
polymers [45, 46].
Lee and Han [47, 48] studied the morphology evolution
of several polymer blends in a batch mixer using differ-
ent pairs of polymers: crystalline/crystalline; amorphous/
amorphous and crystalline/amorphous. The authors intro-
duced the concept of critical flow temperature (Tcf) as the
effective plasticizing temperature of an amorphous poly-
mer. Amorphous polymers at Tg \ T \ Tcf may be regar-
ded as rubbers and at T C Tcf may be regarded as liquids
(and be considered to flow). Tcf may be considered the real
plasticization temperature of an amorphous polymer or the
equivalent melting point of a crystalline polymer. For
polystyrene and polycarbonate the following relation
between Tcf and Tg was found: Tcf & Tg ? 55 �C.
According to this equation, the mechanical processing of
PETG is possible at temperatures used to prepare PHB/
PETG blends, around 180 �C, since the glass transition
temperature of this polymer is around 80 �C.
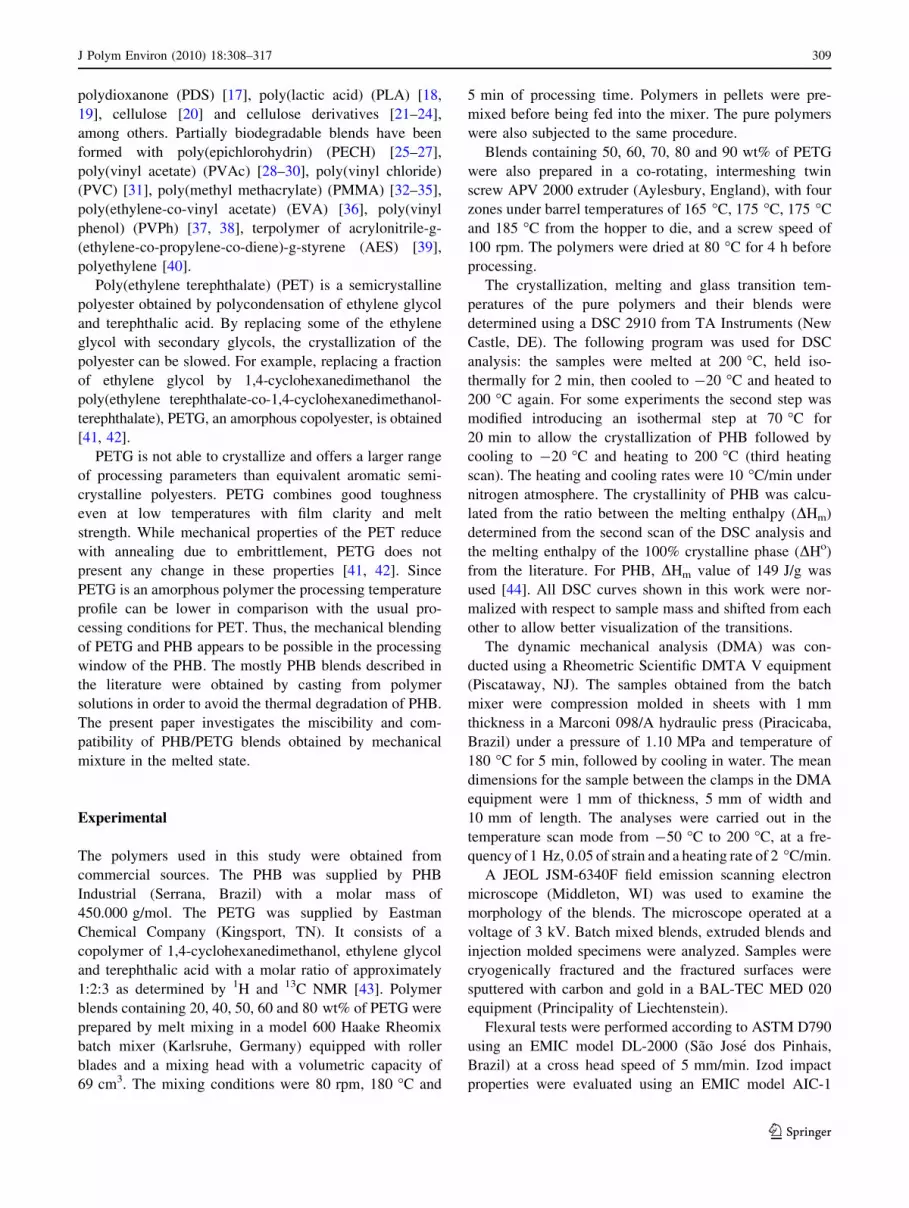
Figure 1 shows the temperature and torque as a function
of PETG content in the blends after 5 min of mixing. The
initial temperature in the mixer chamber was 180 �C,
however the final temperature is quite different and
depends on the composition of the mixtures, as can be seen
in Fig. 1. PHB shows a torque value of 3 Nm at the end of
the processing (T = 193 �C), while PETG had a value of
14 Nm (T = 231 �C), significantly higher than PHB.
The disadvantage of processing PETG at this tempera-
ture range (180–230 �C) is its higher viscosity. Despite of
this, our results showed that it is possible to mix PETG
with PHB, which acts as a plasticizer, decreasing the vis-
cosity and, consequently, the final temperature of the PHB/
PETG blends (Fig. 1). For example, blends containing up
to 50 wt% of PHB are processed at temperatures lower
than 200 �C. Under this condition the degradation of PHB
is minimized or avoided, making PETG a good partner to
mix with PHB.
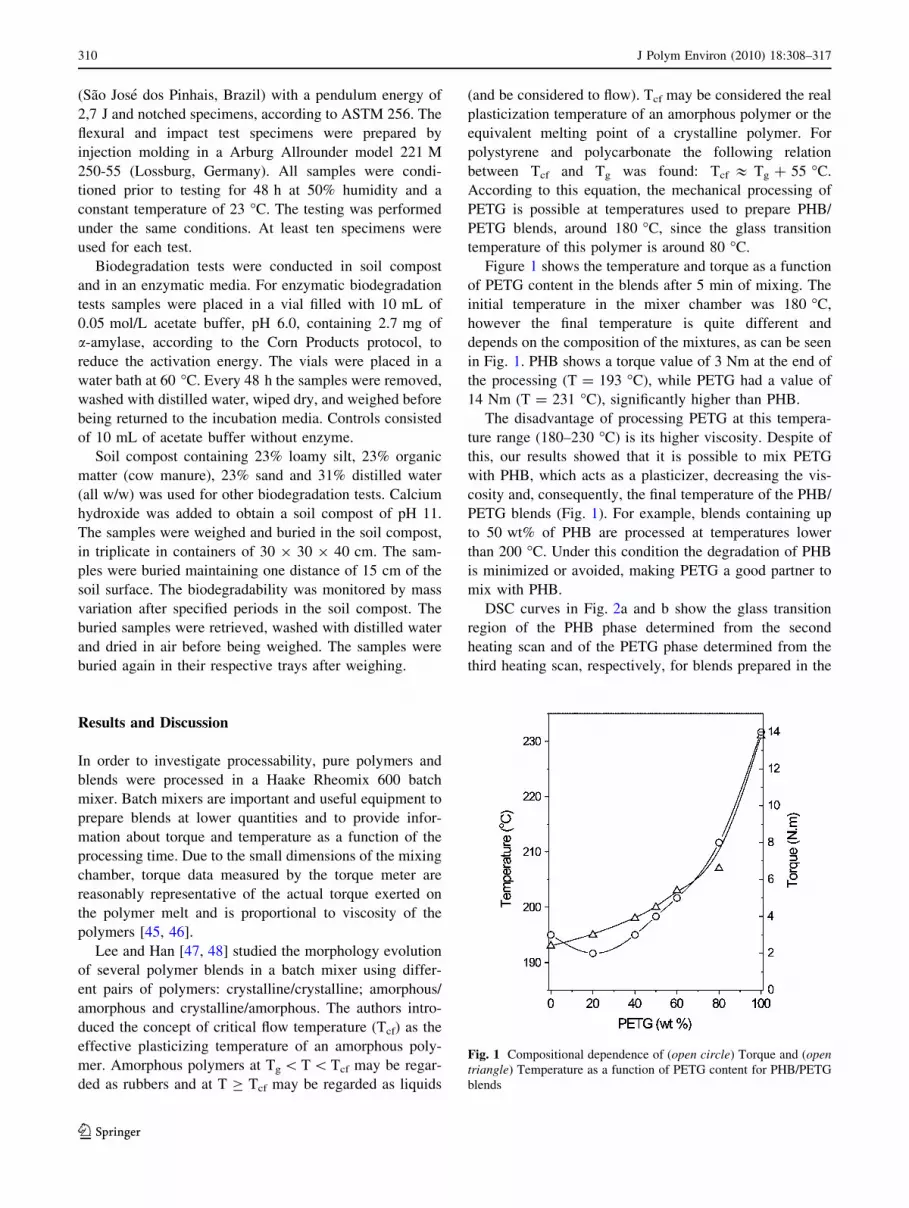
DSC curves in Fig. 2a and b show the glass transition
region of the PHB phase determined from the second
heating scan and of the PETG phase determined from the
third heating scan, respectively, for blends prepared in the
Fig. 1 Compositional dependence of (open circle) Torque and (opentriangle) Temperature as a function of PETG content for PHB/PETG
blends
310 J Polym Environ (2010) 18:308–317
123
batch mixer. PHB shows a cold crystallization during the
second heating scan at temperatures near the PETG glass
transition. Thus, the glass transition of the PETG phase in
the blends can be better observed if the PHB phase is
previously crystallized. As described in the ‘‘Experimen-
tal’’ section, the isothermal crystallization of PHB was
conducted at 70 �C for 20 min and after this the samples
were cooled to -20 �C and heated again to 200 �C (third
heating scan shown in Fig. 2b). The blends presented two
glass transitions for all blend compositions, at the same
temperatures as the pure polymers, meaning that these
blends are immiscible.
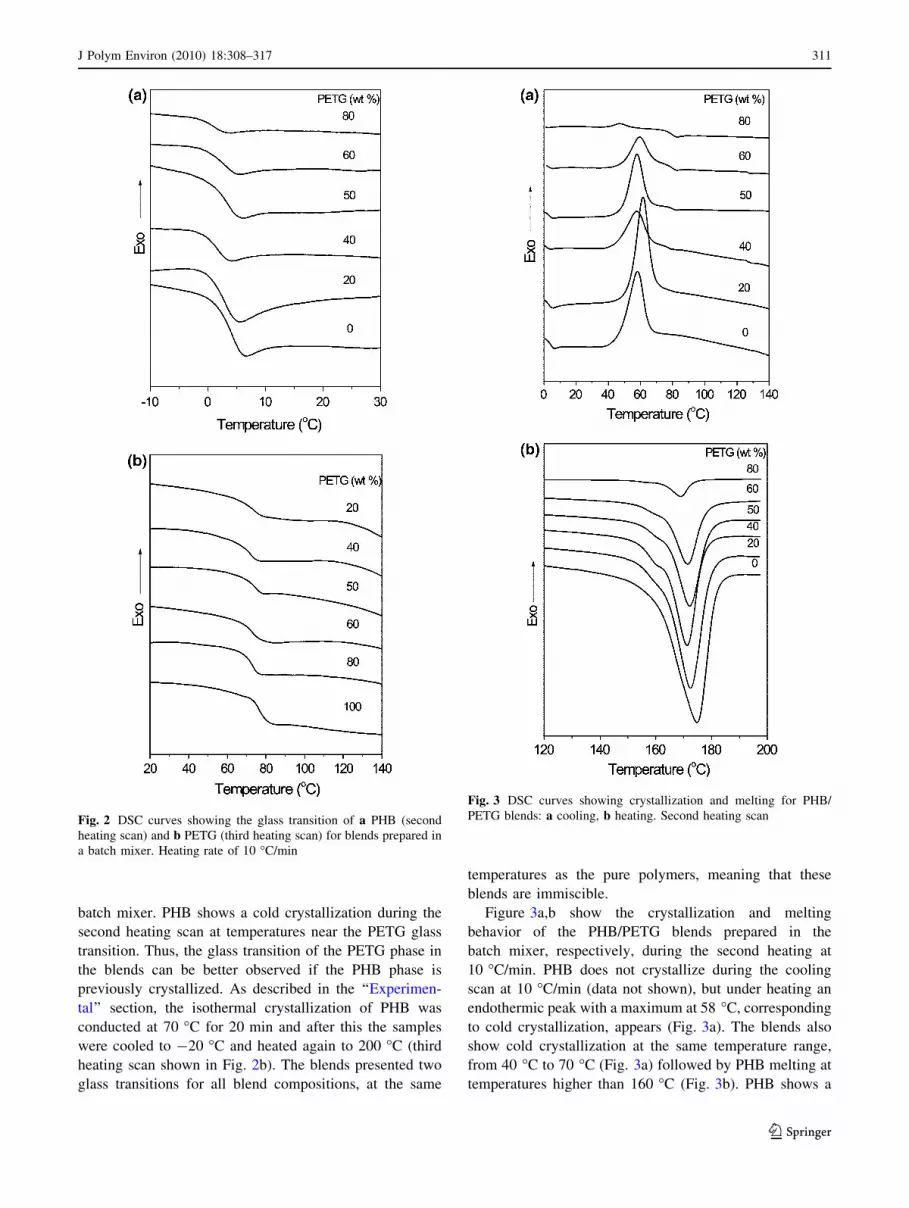
Figure 3a,b show the crystallization and melting
behavior of the PHB/PETG blends prepared in the
batch mixer, respectively, during the second heating at
10 �C/min. PHB does not crystallize during the cooling
scan at 10 �C/min (data not shown), but under heating an
endothermic peak with a maximum at 58 �C, corresponding
to cold crystallization, appears (Fig. 3a). The blends also
show cold crystallization at the same temperature range,
from 40 �C to 70 �C (Fig. 3a) followed by PHB melting at
temperatures higher than 160 �C (Fig. 3b). PHB shows a
Fig. 2 DSC curves showing the glass transition of a PHB (second
heating scan) and b PETG (third heating scan) for blends prepared in
a batch mixer. Heating rate of 10 �C/min
Fig. 3 DSC curves showing crystallization and melting for PHB/
PETG blends: a cooling, b heating. Second heating scan
J Polym Environ (2010) 18:308–317 311
123

broad and asymmetric exothermic peak with a minimum at
175 �C. This peak shifts to lower temperatures as the PETG
content increases and a shoulder at lower temperature
appears. Since the blends are immiscible the shift of the
melting temperature of the PHB can be attributed to kinetics
and morphological effects. Moreover, the shift of the
melting temperature is in the range of 2–6 �C, therefore the
degradation of PHB can be considered insignificant [27].
Table 1 summarizes the crystallization (Tc), melting
(Tm), glass transition temperatures (Tg) and melting
enthalpy (DHm) obtained from DSC curves. The melt-
ing enthalpy of the PHB phase is practically independent of
the blend composition showing that PETG phase does not
influence the PHB crystallization.
Figure 4a,b show the storage and the loss moduli as a
function of temperature, respectively, for PHB, PETG and
their blends. The PHB storage modulus is practically
constant and around 4 9 109 Pa until 10 �C. At this tem-
perature a small drop is verified due to a glass transition
followed by a quite intense drop at 180 �C due to melting.
PETG is amorphous and its storage modulus presents a
quite intense drop at 80 �C due to its glass transition. The
loss modulus curves show peaks corresponding to the same
relaxation described above. PETG glass transition relaxa-
tion is observed as a quite intense peak, located in the
temperature range from 70 to 90 �C. PHB glass transition
relaxation is located in the temperature range from 0 to
30 �C and a rearrangement of the crystalline phase occurs
above 75 �C. The viscoelastic properties of PHB suffer the
influence of a physical aging process, which induces a
depression of the glass transition peak intensity [49, 50].
Table 1 Thermal behavior of PHB, PETG and their blends obtained
from DSC analysis
PHB PETG
% PETG Tc (�C) Tm (�C) Tg (�C) DHm (J/g) Tg (�C)
0 58 175 4 82 –
20 62 173 3 81 74
40 58 171 2 83 73
50 58 172 3 81 74
60 60 171 3 84 73
80 47 169 1 83 73
100 – – – – 77
Fig. 4 a Storage modulus (E0) and b loss modulus (E0 0) as a function
of temperature for PHB/PETG blends. PETG: 0 (filled square), 20
(down-pointing triangle), 40 (plus), 50 (open square), 60 (opentriangle), 80 (open circle), 100 (wt%) (closed circle)
Fig. 5 Storage modulus as a function of PETG content at 130 �C for
PHB/PETG blends
312 J Polym Environ (2010) 18:308–317
123
Loss modulus curves of the blends present peaks related to
the glass transition of PHB and PETG, confirming
immiscibility over the whole composition range.
The analysis of storage modulus curves allows us to
predict PHB/PETG morphology. For example, PETG at
130 �C is a viscous liquid and the modulus assumes values
of 4 9 106 Pa. On the other hand, PHB at 130 �C is present
as a liquid and a crystalline phase and the modulus is still
around 109 Pa. In this case the crystalline phase is
responsible for maintaining the stiffness of PHB. The
blends are immiscible and at this temperature three phases
should coexist: PETG liquid phase, PHB liquid phase and
crystalline phase. The modulus of the blends at 130 �C
(Fig. 5) is almost constant (and near the value found for
PHB, &5 9 108 Pa) until 50 wt% of PETG suggesting that
PHB is the matrix. For blends containing 60 and 80 wt% of
PETG the modulus drops abruptly indicating that PETG is
the matrix. So, phase inversion should take place at PETG
contents between 50 wt% and 60 wt%. This conclusion
will be confirmed by microscopy images, as described
below.
The factors affecting phase dispersion and blend mor-
phology during the mixing process are: (i) temperature,
(ii) mixing time in an internal mixer or the residence time
in a twin-screw extruder, (iii) the intensity of mixing (rotor
or screw speed), (iv) blend composition, (v) viscosity ratio,
and (vi) interfacial tension [47, 48]. The mechanical pro-
cessing of PHB is not trivial because the thermal degra-
dation starts at temperatures close to melting. Thus, mixing
conditions, i.e., temperature, time and intensity of mixing
in a batch mixer and extruder have narrow possibilities,
different from other thermoplastics [51, 52]. The viscosity
ratio is one of the most important factors affecting blend
morphology. The viscosity ratio of PETG and PHB can be
considered equal to the torque ratio, that is, around 4.
Consequently the dispersion of one component in the other
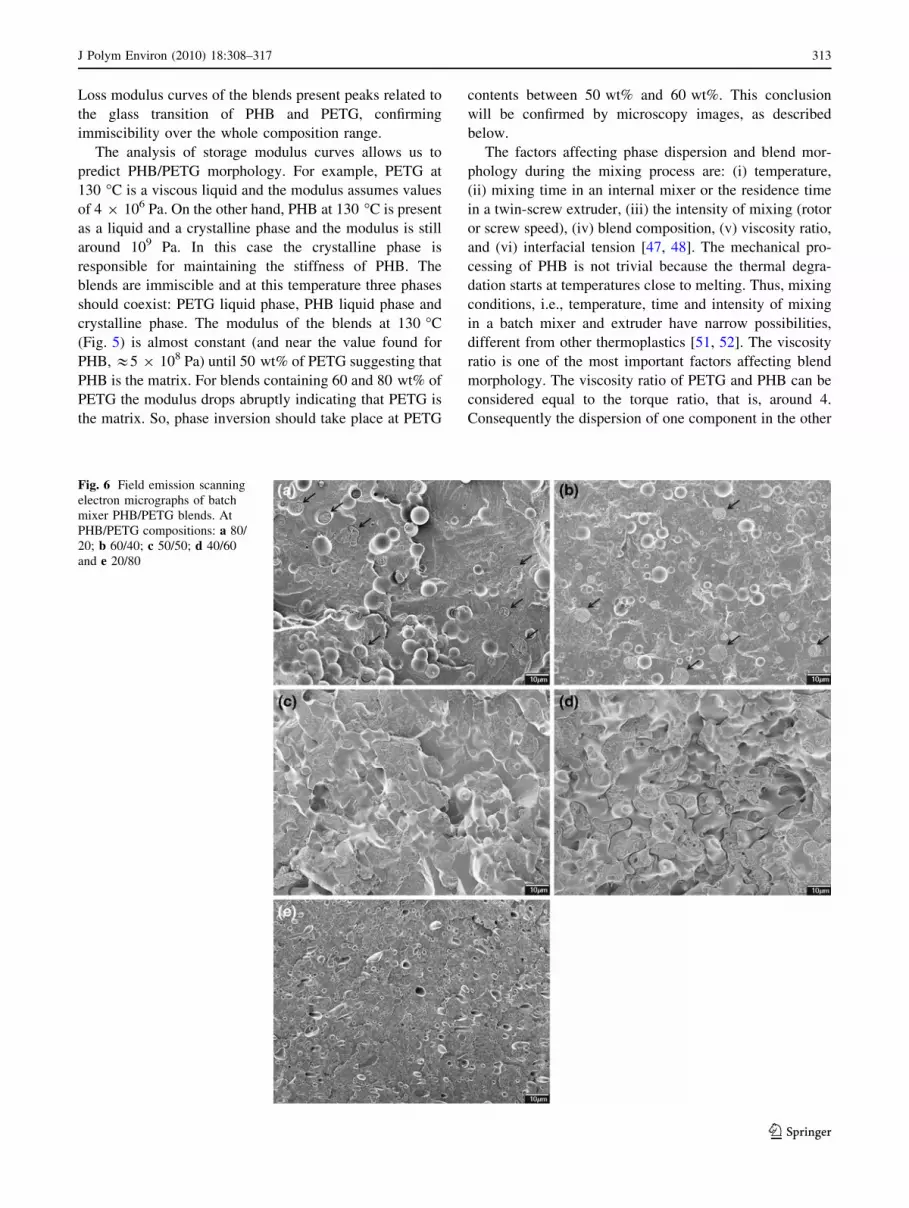
Fig. 6 Field emission scanning
electron micrographs of batch
mixer PHB/PETG blends. At
PHB/PETG compositions: a 80/
20; b 60/40; c 50/50; d 40/60
and e 20/80
J Polym Environ (2010) 18:308–317 313
123

should occur under high shear. Since both PETG and PHB
are polyesters, interfacial tension should not be high.
Figure 6 shows the micrographs of PHB/PETG blends
obtained in the batch mixer. The micrographs of blends
containing 20 wt% (Fig. 6a), 40 wt% (Fig. 6b) and 80 wt%
PETG (Fig. 6e) show a disperse phase in a matrix. For
blends containing 20 wt% and 40 wt% of PETG the matrix
is PHB, while for the blend containing 80 wt% of PETG the
matrix is PETG. For these blends equatorial fracture of the
disperse domains (arrows on the micrographs) as well as
entire particles can be observed. In blends containing
50 wt% and 60 wt% of PETG (Fig. 6c, d, respectively), no
Fig. 7 Field emission scanning
electron micrographs for blends
containing 10 (a and b), 20 (cand d), 30 (e and f) and 40 wt%
of PETG (g and h). Micrographs
a, c, e and g correspond to
blends prepared in a twin screw
extruder. Micrographs b, d, fand h corresponding to injection
molded blends
314 J Polym Environ (2010) 18:308–317
123
spherical domains can be seen. Probably, this composition
range is close to the phase inversion and a co-continuous
morphology is developed.
Figure 7 shows the micrographs of PHB/PETG blends
obtained in the twin screw extruder (Fig. 7a,c,e and g) and
submitted to injection molding (Fig. 7b, d, f and h).
The morphology of the blends obtained in the twin
screw extruder is quite different from those with compa-
rable composition obtained in the batch mixer. Blends
obtained in the twin screw extruder show a finer dispersion
of PETG in the PHB matrix, in comparison with the same
blends after injection molding or obtained in a batch mixer.
Blends prepared by extrusion as well as blends prepared in
an internal mixer and containing 20, 40 and 80 wt% of
PETG show a relatively smooth fracture surfaces without
significant deformation of the PHB and PETG phases.
Furthermore, the debonded interfaces between PHB/PETG
are very smooth. These results indicate that very little
energy was dissipated by ductile deformation. Table 2
presents the size of dispersed domains of blends obtained
in a twin screw extruder and submitted to injection mold-
ing. The coalescence of the dispersed phases of PETG took
place during the injection molding process, increasing the
size of the PETG domains.
Table 3 shows the flexural and impact resistance prop-
erties to PHB/PETG blends as a function of the PETG
content. The flexural modulus of the blends is higher in
comparison with the modulus of PHB and of PETG. The
modulus achieves the maximum values at PETG concen-
tration of 20 and 30 wt%. The impact strength of PHB and
blends containing 20 and 30 wt% of PETG is close and
about 5 times lower than the value found for PETG. Thus,
the addition of PETG to PHB results in material with
higher modulus and, depending on the composition, with-
out significant changes in impact resistance in relation to
pure PHB. The mechanical behavior of the PHB/PETG
blends with the composition is characteristic of mixtures
with low interfacial adhesion.
Table 2 Sizes of the dispersed phase in several blend compositions
(%) PETG Dispersed
phase
Diameter of dispersed phase (lm)
Extrusion Injection
10 PETG 0.3–1.0 2–10.0
20 PETG 0.3–1.0 2–10.0
30 PETG 0.2–1.0 2–16.0
40 PETG 0.2–2.0 1–11.0
Table 3 Tensile strength, flexural modulus and impact strength of
PHB/PETG blends
PETG
(%)
Tensile strength
(MPa)
Flexural modulus
(MPa)
Impact strength
(J/m)
0 58 ± 1 3067 ± 34 24 ± 3
10 49 ± 2 3566 ± 62 13 ± 2
20 42 ± 2 3634 ± 105 22 ± 2
30 33 ± 1 3127 ± 38 27 ± 3
40 33 ± 1 3164 ± 33 15 ± 3
100 70 ± 4 2100 ± 40 122 ± 6
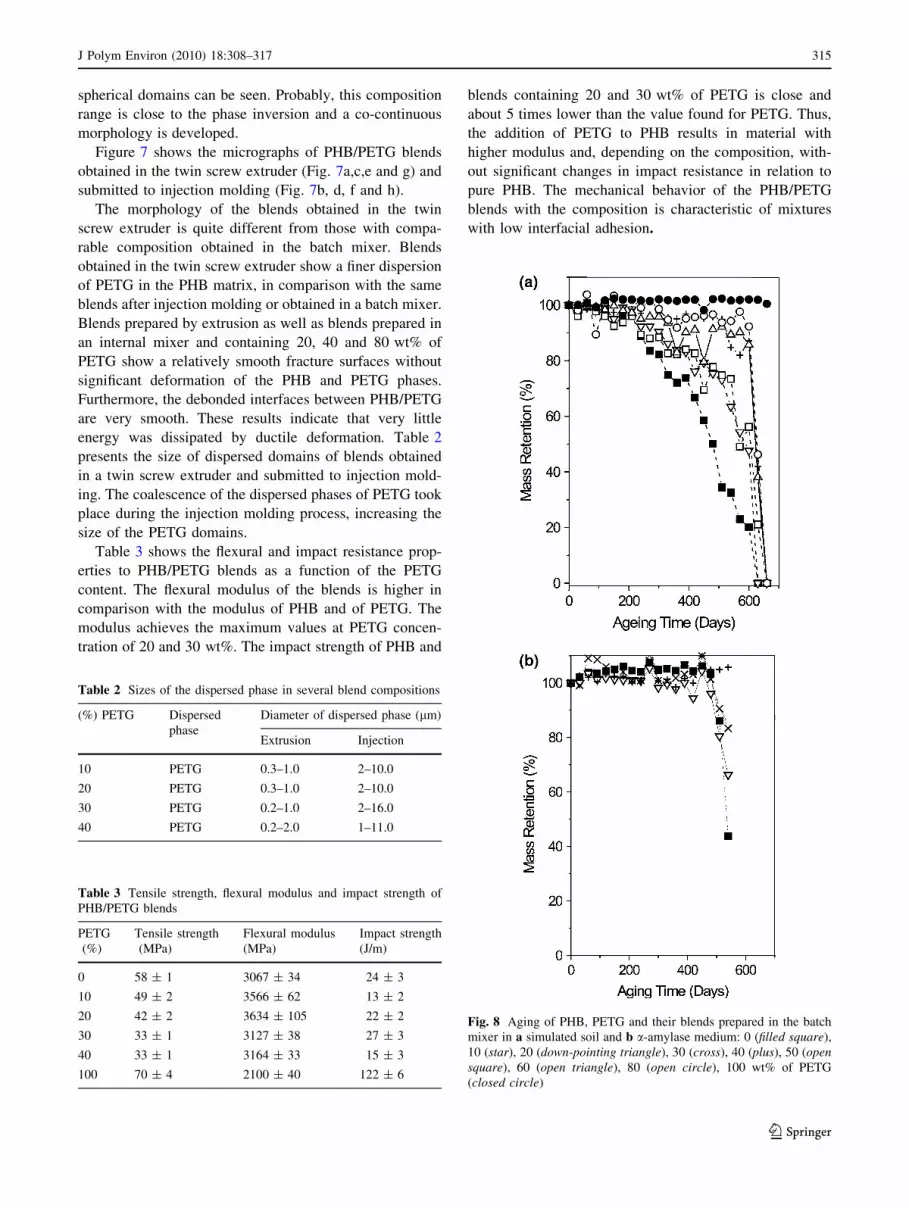
Fig. 8 Aging of PHB, PETG and their blends prepared in the batch
mixer in a simulated soil and b a-amylase medium: 0 (filled square),
10 (star), 20 (down-pointing triangle), 30 (cross), 40 (plus), 50 (opensquare), 60 (open triangle), 80 (open circle), 100 wt% of PETG
(closed circle)
J Polym Environ (2010) 18:308–317 315
123
Biodegradable polymers are able to degrade via enzy-
matic and hydrolytic mechanisms [53]. The extent of
polymer environmental degradation depends on the kind of
environment in which the experiment is conducted, for
example, sea and river water, compost or soil. Besides
factors such as pH, UV radiation, temperature and the
presence of specific microorganism affect the degradation
process.
Figure 8 shows the mass retention of the pure polymers
and their blends during aging in simulated soil and in
enzymatic media. PHB showed a total mass loss in simu-
lated soil after 600 days of aging. On the other hand, PETG
did not show any mass change during the test, leading to
the conclusion that PETG is inert to the attack of micro-
organism presents in the soil. However, the mass loss is
also complete for all the blends (Fig. 8a). Since the blends
present low interfacial adhesion, PHB could have degraded
and the PETG phase could have fallen out during the
washing step. The data of aging in enzymatic a-amylase
media (Fig. 8b) show a significant degradation for PHB,
followed by blends containing 60 wt%, 50 wt% and
20 wt% of PHB.
Conclusions
PETG is an amorphous aromatic polyester with a process-
ing window wider in comparison with crystalline aromatic
polyesters. This characteristic allows mixing it with PHB in
the melted state independent of the mixture method: batch
mixer or twin screw extruder. Moreover, the injection
molding parameters of PETG/PHB blends is more constant
during the injection process, in comparison with the injec-
tion molding parameters of pure PHB. The PHB/PETG
blends are immiscible throughout the entire composition
blend and their morphology depends on the composition
and the processing conditions used to prepare them.
Extrusion resulted in finer dispersions of PETG in the PHB
matrix. The fracture morphology of the samples suggests
poor interfacial adhesion. The addition of PETG to PHB
results in material with higher moduli and, depending on the
composition, without significant changes in the impact
resistance in comparison to PHB. PETG is not biodegrad-
able in simulated soil as well in enzymatic media under the
studied conditions. However, the biodegradability of the
PHB phase of the blends is maintained.
Acknowledgements The authors would like to thank FAPESP
(Proc.: 01/07841-3; no. 00/10063-0; 2004/15084-6; 2003/09926-1;
04/13723-1) for financial support, PHB Industrial and Eastman for
supplying the polymers and Profa. Dra. Carol Hollingworth Collins for
manuscript revision.
References
1. Schroeter J (1998) Polym Degrad Stab 59:377
2. Hanggi UJ (1995) FEMS Microbiol Rev 16:213
3. Nonato RV, Mantelatto PE, Rossell CEV (2001) Appl Microbiol
Biotechnol 57:1
4. Kunioka M, Doi Y (1990) Macromolecules 23:1933
5. Avella M, Martuscelli E, Raimo M (2000) J Mater Sci 35:523
6. Ha C-S, Cho W-J (2002) Prog Polym Sci 27:759
7. Okada M (2002) Prog Polym Sci 27:87
8. Braunegg G, Lefebvre G, Genser KF (1998) J Biotechnol 65:127
9. Sudesh K, Abe H, Doi Y (2000) Prog Polym Sci 25:1503
10. Cai ZJ, Wen ZH (2007) J Mater Sci 42:5886
11. Kumagai Y, Doi Y (1992) Polym Degrad Stab 35:87
12. Avella M, Martuscelli E (1988) Polymer 29:1731
13. Avella M, Martuscelli E, Raimo M (1993) Polymer 34:3234
14. Avella M, Martuscelli E, Greco P (1991) Polymer 32:1647
15. Grassner F, Owen AJ (1994) Polymer 35:2233
16. Kim BO, Woo SI (1998) Polym Bull 41:707
17. Dias M, Antunes MCM, Santos AR Jr, Felisberti MI (2008)
J Mater Sci: Mater Med 19:3535
18. Focarete ML, Scandola M, Dobrzynski P (2002) Macromolecules
35:8472
19. Blumm E, Owen AJ (1995) Polymer 36:4077
20. Cyras VP, Commiso MS, Mauri AN, Vazquez A (2007) J Appl
Polym Sci 106:749
21. Ceccorulli G, Pizzoli M, Scandola M (1993) Macromolecules
26:6722
22. Scandola M, Ceccorulli G, Pizzoli M (1992) Macromolecules
25:6441
23. Scandola M, Ceccorulli G, Pizzoli M (1994) Macromolecules
27:4755
24. Buchanan CM, Gedon SC, White AW, Wood MD (1993) Mac-
romolecules 25:7373
25. Sadocco P, Canetti M, Seves A, Martuscelli E (1993) Polymer
34:3368
26. Paglia ED, Beltrame PL, Canetti M, Seves A, Mercandalli B,
Martuscelli E (1993) Polymer 34:996
27. Lima JA, Felisberti MI (2006) Eur Polym J 42:602
28. Shafee EE (2001) Eur Polym J 37:451
29. Hay JN, Sharma L (2000) Polymer 41:5749
30. An YX, Dong LS, Li LX (1999) Eur Polym J 35:365
31. Choe S, Cha YJ, Lee HS, Yoon JS, Choi HJ (1995) Polymer
36:4977
32. Lotti N, Pizzoli M, Ceccorulli G, Scandola M (1993) Polymer
34:4935
33. Cimmino S, Iodice P, Martuscelli E, Silvestre C (1998) Ther-
mochim Acta 32:89
34. Cimmino S, Iodice P, Silvestre C, Karasz FE (2000) J Appl
Polym Sci 75:746
35. Siciliano A, Seves A, De Marco T, Cimminino S, Martuscelli E,
Silvestre C (1995) Macromolecules 28:8065
36. Yoon JS, Oh SH, Kim MN (1998) Polymer 39:2479
37. Iriondo P, Iruin JJ, Fernandez-Berridi MJ (1996) Macromolecules
29:5605
38. Xing P, Dong L, An Y, Feng Z, Avella M, Martuscelli E (1997)
Macromolecules 30:2726
39. de Carvalho FP, Quental AC, Felisberti MI (2008) J Appl Polym
Sci 110:880
40. Rosa DS, Guedes CGF, Oliveira CM, Felisberti MI (2008)
J Polym Envirom 16:230
41. Kattan M, Dargent E, Ledru J, Grenet J (2001) J Appl Polym Sci
81:3405
42. Papadopoulou CP, Kalfoglou NK (1997) Polymer 38:631
316 J Polym Environ (2010) 18:308–317
123
43. Quental AC (2004) Ph. D. Thesis, Universidade Estadual de
Campinas. Campinas, Sao Paulo, Brazil
44. Barham PJ, Keller A, Otun EL, Holmes PA (1984) J Mater Sci
19:2781
45. Bousmina M, Ait-Kadi A, Faisant JB (1999) J Rheol 43:415
46. Quental AC, Felisberti MI (2006) J Appl Polym Sci 100:1255
47. Lee JK, Han CD (1999) Polymer 40:6277
48. Lee JK, Han CD (2000) Polymer 41:1799
49. De Koning GJM, Scheeren AHC, Lemstra PJ, Peeters M,
Reynaers H (1994) Polymer 35:4598
50. El-Radi A, Schnabel R, Straube E, Muller G, Henning S (2002)
Polym Test 21:665
51. Renstad R, Karlsson S, Albertsson AC (1997) Polym Int 43:201
52. Verhoogt H, Ramsay BA, Favis BD, Ramsay BA (1996) J Appl
Polym Sci 61:87
53. Rychter P, Biczak R, Herman B, Smylla A, Kurcok P, Adamus G,
Kowalczuk M (2006) Biomacromolecules 7:3125
J Polym Environ (2010) 18:308–317 317
123


