Embed Size (px)
Citation preview
ABSTRACT
Between June 2000 and September 2008 the University of North Florida, Institute of Police Technology and Management (UNF, IPTM) performed over 200 deceleration tests on over 70 commercial vehicles in a variety of configurations including various vehicle types, load conditions, and tests with and without the ABS system activated. The vehicle types tested were tractor w/van type trailer, tractor only (bobtail), straight box/service trucks, dump trucks, fire trucks, concrete mixing trucks, double trailers, articulated tankers, school and metro buses and articulated flatbeds.
Vehicles were instrumented to record selected system performance parameters such as brake canister pressure rise, vehicle speed, position at brake pedal application, vehicle acceleration, etc.
This paper reviews and summarizes the stopping distance data from these tests and provides insight into commercial vehicle stopping distance, drag factor for all of the tested vehicles and configurations. It will also look at how vehicle type, load condition, and ABS affect stopping distances. This information will be of value to accident investigators, regulators, and vehicle designers, as it will provide significant data regarding the braking performance of these vehicles.
INTRODUCTION
The University Of North Florida (UNF) Institute of Police Technology and Management (IPTM) provides training in accident reconstruction and analysis. The primary instructors for these classes were Mr. David Brill and Mr. Walter Dobson,
both adjunct professors for IPTM. One of the unique aspects of this program was that live testing was performed to allow participants to gain experience in analysis of many issues related to accident analysis and truck braking system performance and evaluation. For each of the Basic and Advanced Commercial Vehicle Accident Reconstruction training classes taught from June 2000 through September 2008 one or more commercial vehicles were instrumented and a series of skid tests were performed. It was felt that having students observe a commercial vehicle skid test was the best method to assist in training students to perform speed calculations from roadway evidence.
The calculated friction factors for the vehicles tested herein are meant to assist with calculating vehicle speed from roadway evidence. Caution should be exercised when using this data as differences between these test skids and other vehicle skids need to be fully understood and explained in order for these friction factors to produce a reliable vehicle speed determination.
TYPICAL TEST PROTOCOL
Prior to testing the commercial vehicle, a passenger car was skidded/decelerated to a stop multiple times in the location where the truck tests would be performed. In some cases, the passenger vehicle skid distance was measured and radar was used to attain initial speed. In some cases, the Vericom 3000 was used to attain average deceleration during the passenger vehicle skid. In all cases, the ABS on the passenger vehicle was disabled prior to the test and the test was performed between 30-35 mph. The data from these tests was then used as a baseline of the available passenger car roadway friction at the test location. As classes were taught anywhere a law
Commercial Vehicle Skid Distance Testing and Analysis
2013-01-0771
Published04/08/2013
Kevin Bedsworth, Robert Butler, Gary Rogers, Kevin Breen, William FischerEngineering Systems, Inc.
Copyright © 2013 SAE International
doi:10.4271/2013-01-0771
THIS DOCUMENT IS PROTECTED BY U.S. AND INTERNATIONAL COPYRIGHT.It may not be reproduced, stored in a retrieval system, distributed or transmitted, in whole or in part, in any form or by any means.
Downloaded from SAE International by Kevin Bedsworth, Monday, April 01, 2013 03:00:14 PM
enforcement department requested, the data was gathered over multiple locations throughout the US in varied temperature conditions.
A complete test protocol for the commercial vehicle included the following:
1. Weight was documented by axle
2. Wheelbase and track width was documented
3. The type and configuration of the braking system was documented
4. A shot marker was placed on the front bumper to locate point of brake activation on the test surface
5. An appropriate location where tests could be performed on dry level asphalt was selected. If the surface was not level, the slope was measured and the resultant drag factor was adjusted to equivalent level surface conditions
6. Vehicle speed at brake application was typically between 30 and 45 mph
7. A radar gun was used to record vehicle speed
8. A Vericom 3000 was installed and air pressure sensors were installed on multiple axles and connected to the Vericom to record pressure rise profiles
9. Distance was measured from shot marker to point of first visible front wheel skid mark
10. Skid/deceleration mark lengths were recorded from all distinguishable axles and averaged to get the total skid distance.
11. The vehicle was photo documented
12. Videos of the skid tests were taken
Following each skid test, students and instructors collectively located the perceptible point of brake application from the roadway markings for all axles. For the data included herein, all wheel's brake systems had to be functioning properly and skid mark origin on common axles had to be within 5% of each other. The origin of all axle skid marks had to be within one wheelbase length of the vehicle being tested. Data from tests that did not meet these criteria was red flagged and not included.
The individual wheel skid mark lengths were then averaged to calculate a single skid distance. The individual wheel skid lengths were not retained or provided to the authors. The average skid distance was then used with the vehicle speed at the point of brake application taken from the radar unit, a Kustom Signals Falcon 24.15 GHz that displays to 0.1 mph to calculate the vehicles overall drag factor using f = S*S/(30*d) where S = speed in mph and d = average skid di
Using this method to calculate a drag factor assumes that any braking provided from point of brake application to the point a wheel leaves a perceptible skid mark is negligible, which may not be the case. However, since the speed of the vehicle at point of brake application was documented, using the friction factors calculated herein combined with average skid distances from roadway evidence would provide a vehicle speed that took pre-perceptible skid mark braking into account. stance in feet [1].
Not all of the tests contained all of the steps provided above. The data presented in this paper was extracted from the stored electronic files provided by UNF IPTM. The data was not published for vehicles where data was not sufficient to calculate a drag factor for the vehicle on a dry roadway. In several cases the same vehicle would be used in multiple configurations. A typical articulated tractor trailer may have been tested with full ABS, ABS on the tractor and not on the trailer (partial ABS), as a bobtail with ABS as a bobtail with ABS, to the drives disabled (Partial ABS), and as a bobtail without ABS. For bobtails with Partial ABS, the ABS to the drives axels was disabled by disconnecting the rear wheel speed sensor. Though the ABS fault light was illuminated by this step, in each case, the ABS to the steer axle still functioned as evidence by the skid marks and the sound of the modulator actuating during the skid. Flatbed trailers that had removable loads, (backhoes, etc.) may have been tested with and without the load.
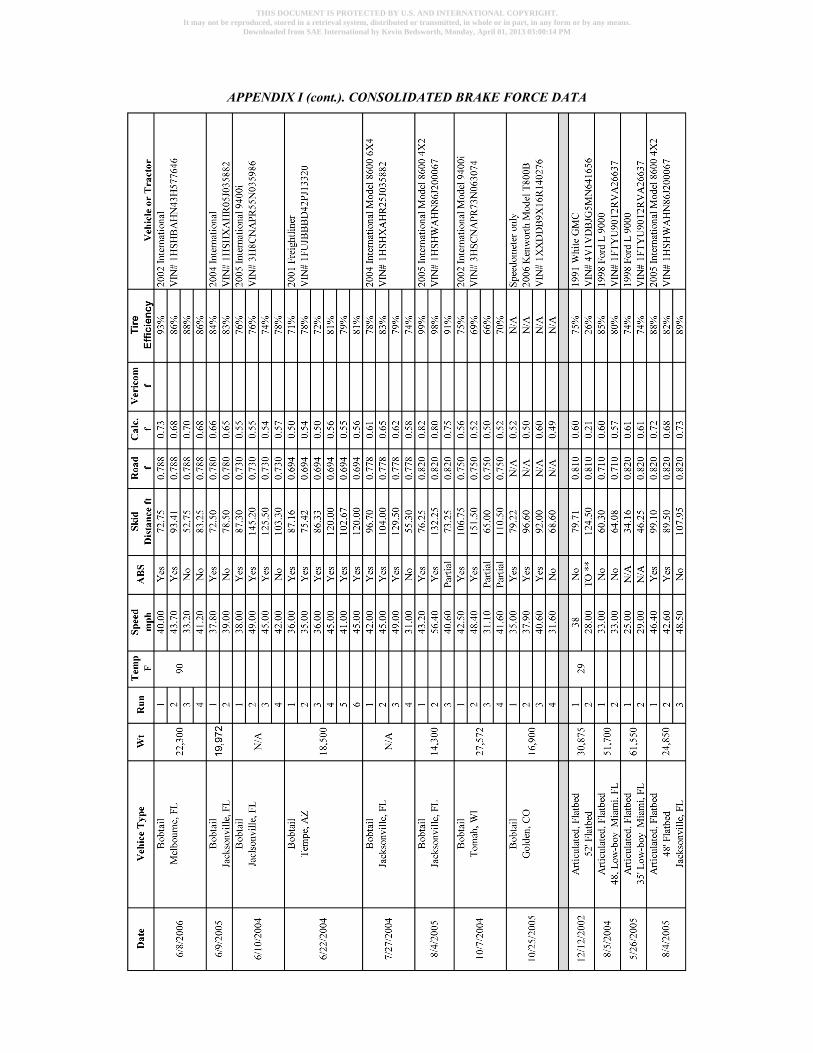
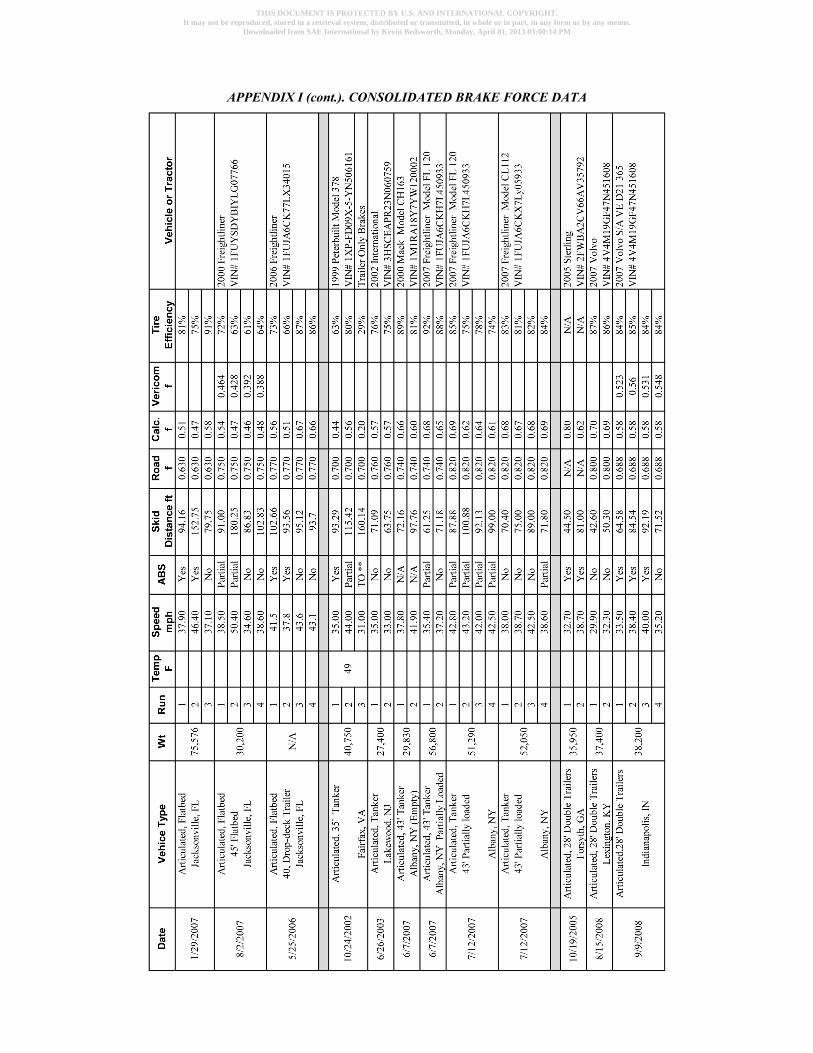
The vehicles used in this testing were either rentals or fleet vehicles provided by local commercial operators. All of the photos provided herein are of tested vehicles. The vehicles were inspected for brake system condition prior to the testing and any deficiencies were noted. Data collected from vehicles that had out of service brake system conditions was not included herein. A spreadsheet with all of the relevant extracted raw data and calculated friction factors is provided as Appendix A.
A listing of the types of vehicles tested, number of tests and mean drag factor (f) is provided in Table 1.
THIS DOCUMENT IS PROTECTED BY U.S. AND INTERNATIONAL COPYRIGHT.It may not be reproduced, stored in a retrieval system, distributed or transmitted, in whole or in part, in any form or by any means.
Downloaded from SAE International by Kevin Bedsworth, Monday, April 01, 2013 03:00:14 PM
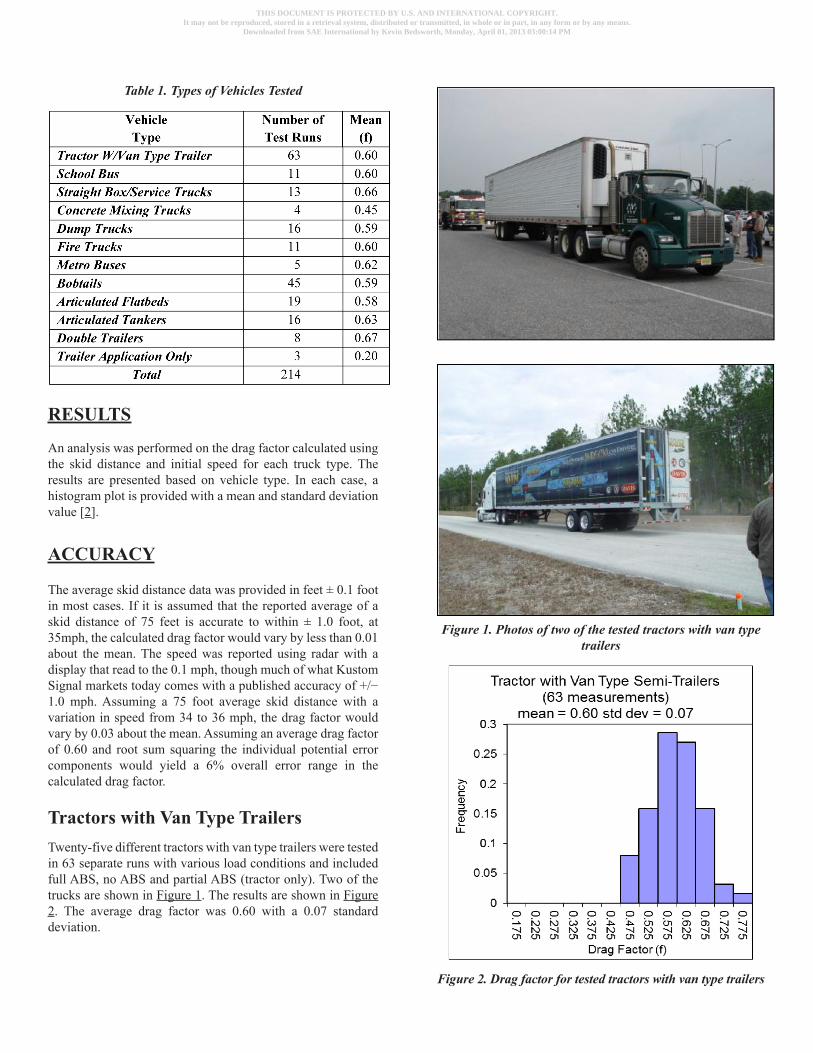
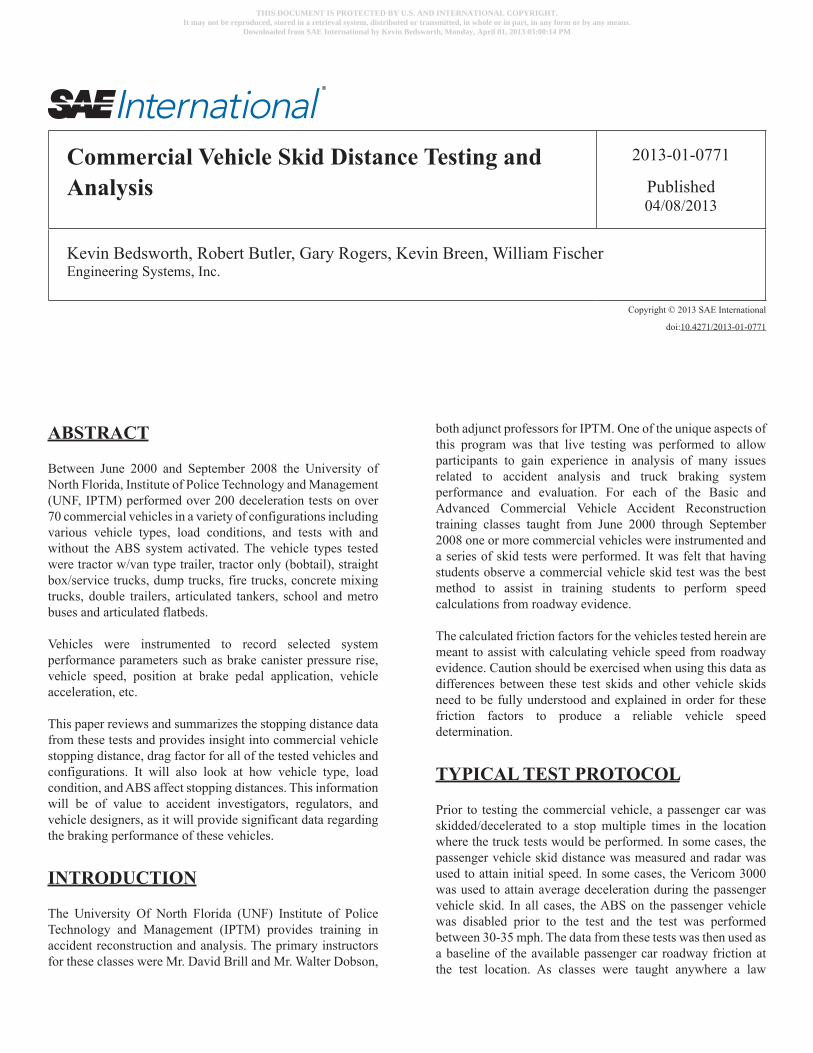
Table 1. Types of Vehicles Tested
RESULTS
An analysis was performed on the drag factor calculated using the skid distance and initial speed for each truck type. The results are presented based on vehicle type. In each case, a histogram plot is provided with a mean and standard deviation value [2].
ACCURACY
The average skid distance data was provided in feet ± 0.1 foot in most cases. If it is assumed that the reported average of a skid distance of 75 feet is accurate to within ± 1.0 foot, at 35mph, the calculated drag factor would vary by less than 0.01 about the mean. The speed was reported using radar with a display that read to the 0.1 mph, though much of what Kustom Signal markets today comes with a published accuracy of +/− 1.0 mph. Assuming a 75 foot average skid distance with a variation in speed from 34 to 36 mph, the drag factor would vary by 0.03 about the mean. Assuming an average drag factor of 0.60 and root sum squaring the individual potential error components would yield a 6% overall error range in the calculated drag factor.
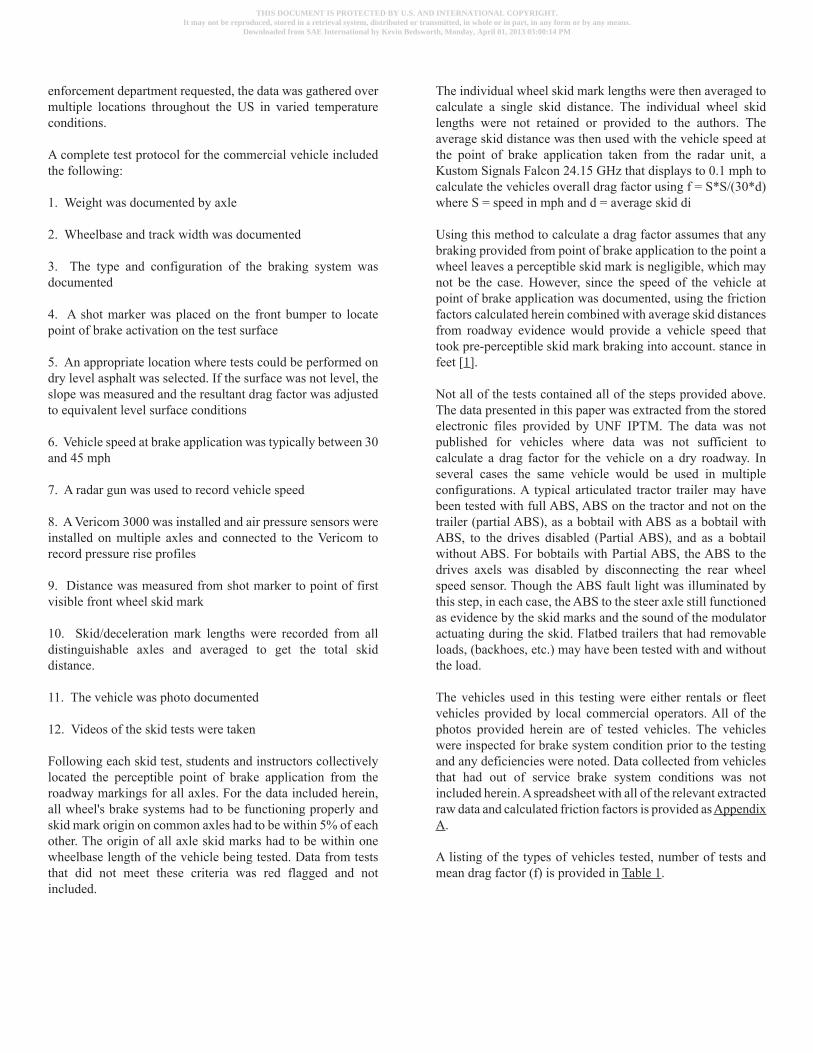
Tractors with Van Type TrailersTwenty-five different tractors with van type trailers were tested in 63 separate runs with various load conditions and included full ABS, no ABS and partial ABS (tractor only). Two of the trucks are shown in Figure 1. The results are shown in Figure 2. The average drag factor was 0.60 with a 0.07 standard deviation.
Figure 1. Photos of two of the tested tractors with van type trailers
Figure 2. Drag factor for tested tractors with van type trailers
THIS DOCUMENT IS PROTECTED BY U.S. AND INTERNATIONAL COPYRIGHT.It may not be reproduced, stored in a retrieval system, distributed or transmitted, in whole or in part, in any form or by any means.
Downloaded from SAE International by Kevin Bedsworth, Monday, April 01, 2013 03:00:14 PM
School Busses
Figure 3. Photos of two of the tested schools buses
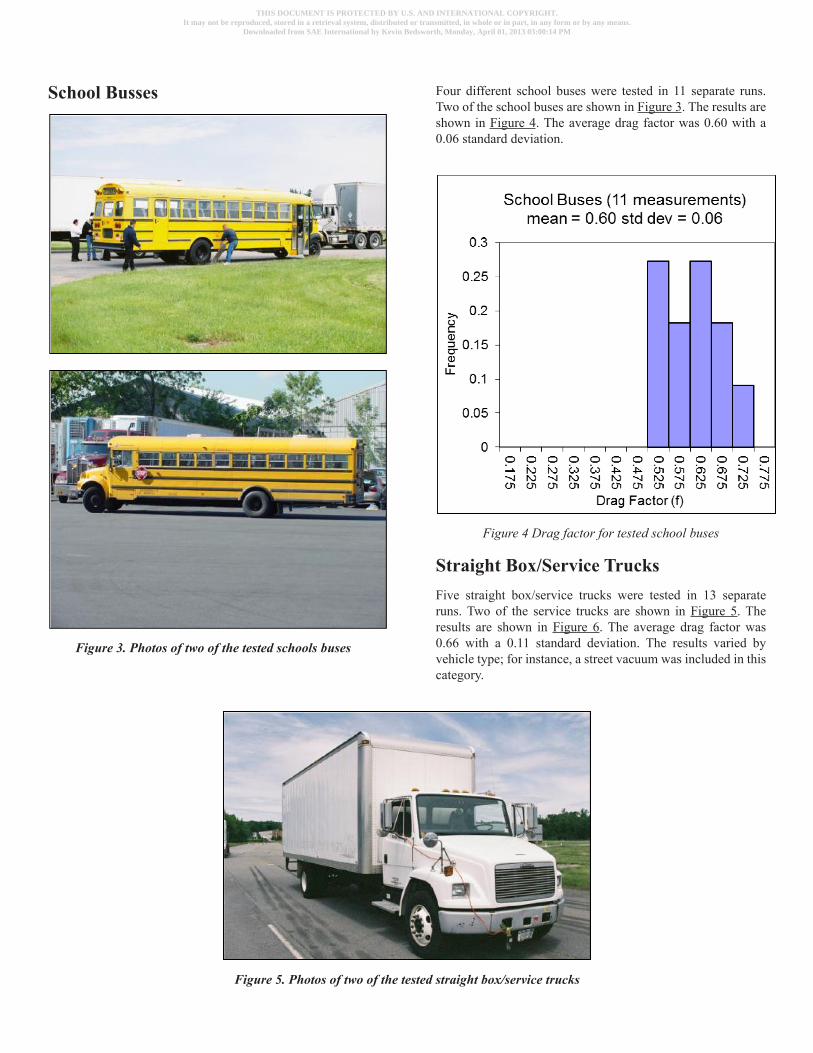
Four different school buses were tested in 11 separate runs. Two of the school buses are shown in Figure 3. The results are shown in Figure 4. The average drag factor was 0.60 with a 0.06 standard deviation.
Figure 4 Drag factor for tested school buses
Straight Box/Service TrucksFive straight box/service trucks were tested in 13 separate runs. Two of the service trucks are shown in Figure 5. The results are shown in Figure 6. The average drag factor was 0.66 with a 0.11 standard deviation. The results varied by vehicle type; for instance, a street vacuum was included in this category.
Figure 5. Photos of two of the tested straight box/service trucks
THIS DOCUMENT IS PROTECTED BY U.S. AND INTERNATIONAL COPYRIGHT.It may not be reproduced, stored in a retrieval system, distributed or transmitted, in whole or in part, in any form or by any means.
Downloaded from SAE International by Kevin Bedsworth, Monday, April 01, 2013 03:00:14 PM
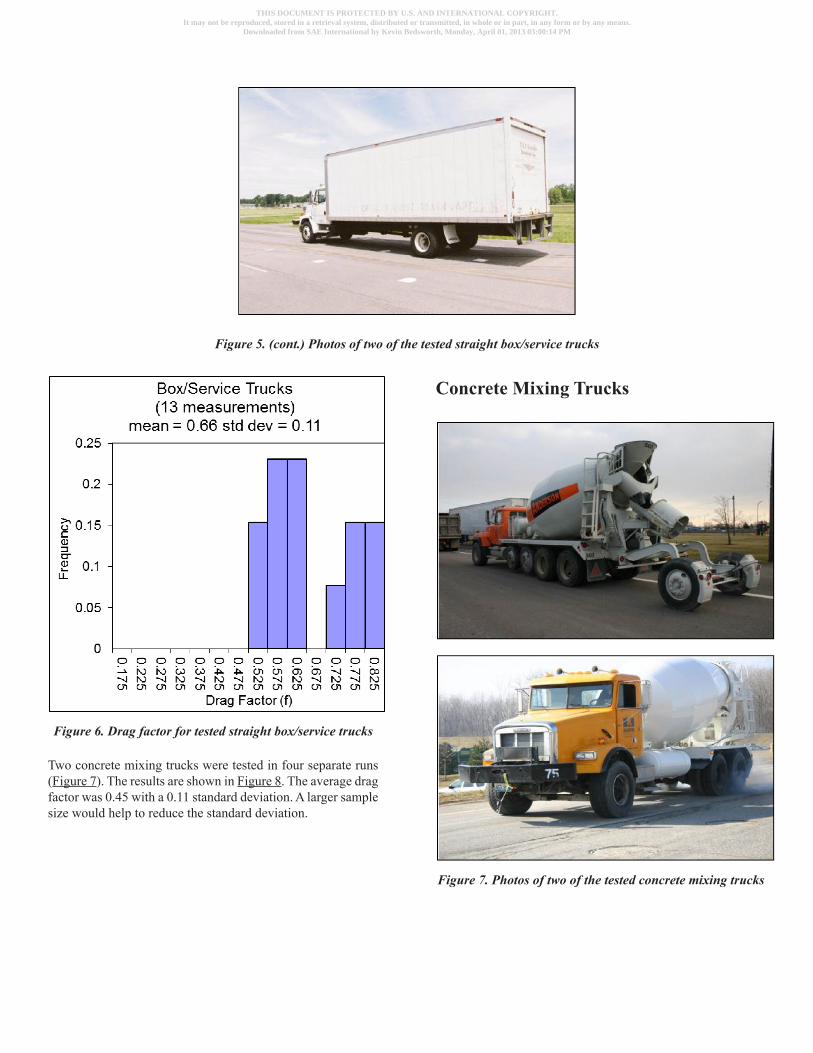
Figure 5. (cont.) Photos of two of the tested straight box/service trucks
Figure 6. Drag factor for tested straight box/service trucks
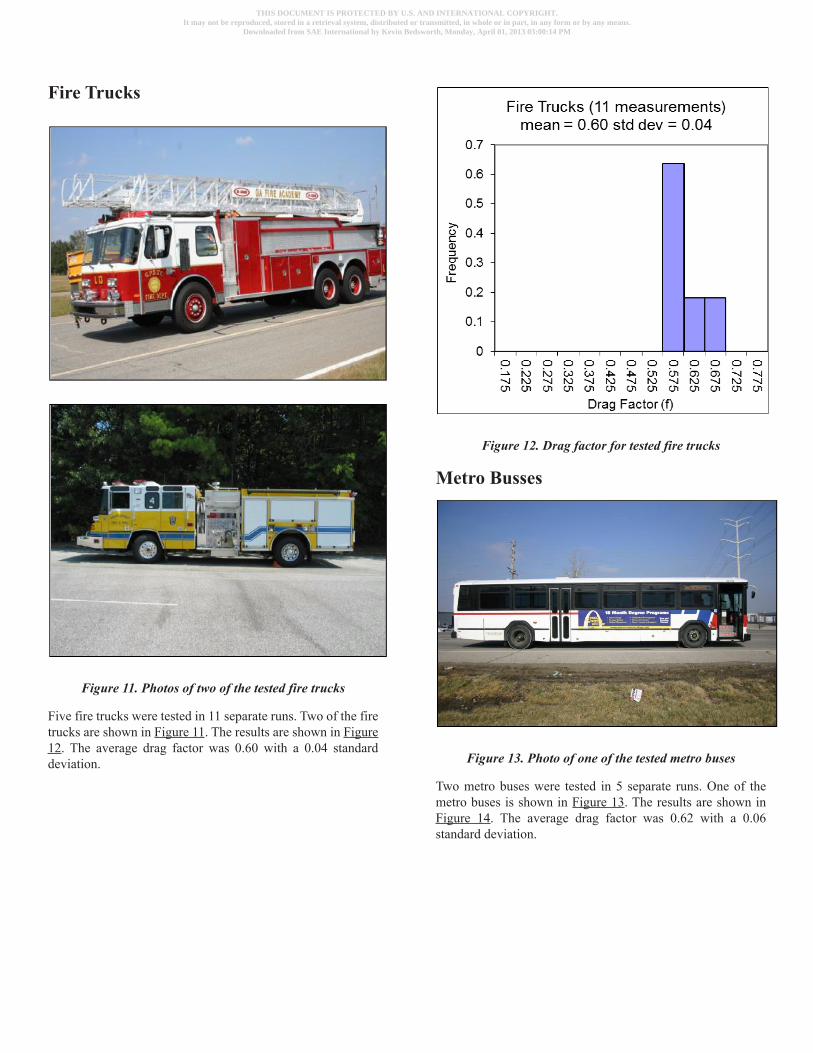
Two concrete mixing trucks were tested in four separate runs (Figure 7). The results are shown in Figure 8. The average drag factor was 0.45 with a 0.11 standard deviation. A larger sample size would help to reduce the standard deviation.
Concrete Mixing Trucks
Figure 7. Photos of two of the tested concrete mixing trucks
THIS DOCUMENT IS PROTECTED BY U.S. AND INTERNATIONAL COPYRIGHT.It may not be reproduced, stored in a retrieval system, distributed or transmitted, in whole or in part, in any form or by any means.
Downloaded from SAE International by Kevin Bedsworth, Monday, April 01, 2013 03:00:14 PM
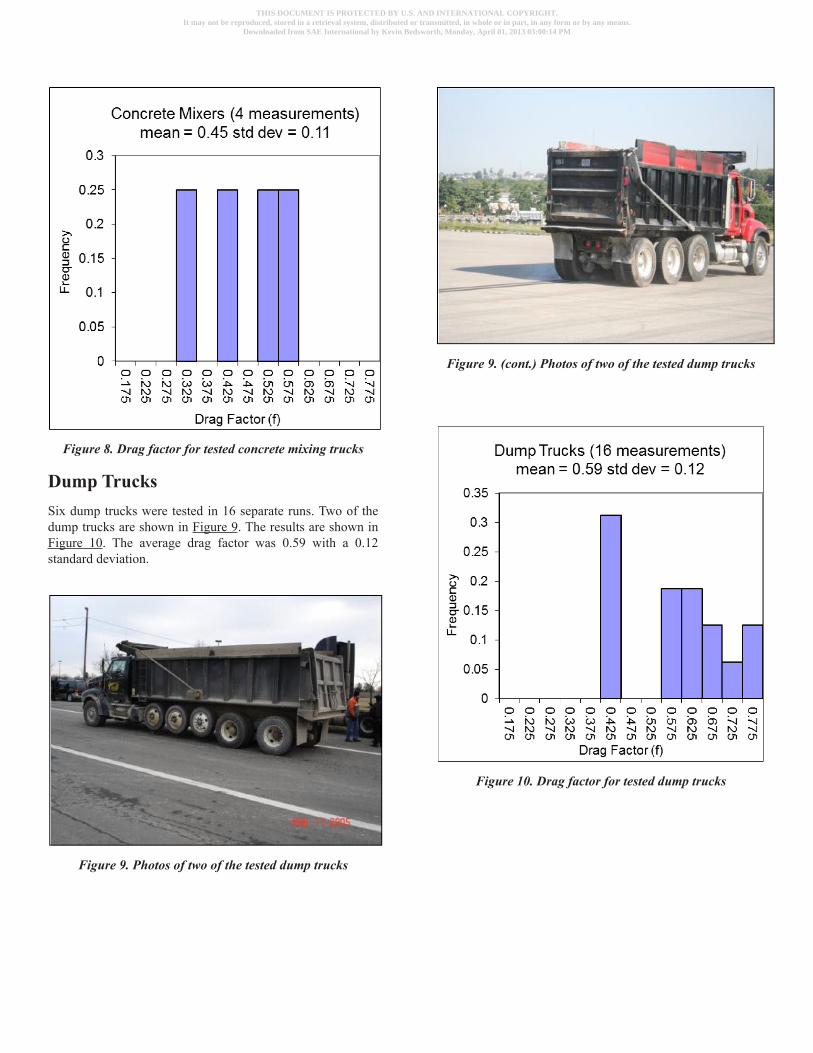
Figure 8. Drag factor for tested concrete mixing trucks
Dump TrucksSix dump trucks were tested in 16 separate runs. Two of the dump trucks are shown in Figure 9. The results are shown in Figure 10. The average drag factor was 0.59 with a 0.12 standard deviation.
Figure 9. Photos of two of the tested dump trucks
Figure 9. (cont.) Photos of two of the tested dump trucks
Figure 10. Drag factor for tested dump trucks
THIS DOCUMENT IS PROTECTED BY U.S. AND INTERNATIONAL COPYRIGHT.It may not be reproduced, stored in a retrieval system, distributed or transmitted, in whole or in part, in any form or by any means.
Downloaded from SAE International by Kevin Bedsworth, Monday, April 01, 2013 03:00:14 PM
Fire Trucks
Figure 11. Photos of two of the tested fire trucks
Five fire trucks were tested in 11 separate runs. Two of the fire trucks are shown in Figure 11. The results are shown in Figure 12. The average drag factor was 0.60 with a 0.04 standard deviation.
Figure 12. Drag factor for tested fire trucks
Metro Busses
Figure 13. Photo of one of the tested metro buses
Two metro buses were tested in 5 separate runs. One of the metro buses is shown in Figure 13. The results are shown in Figure 14. The average drag factor was 0.62 with a 0.06 standard deviation.
THIS DOCUMENT IS PROTECTED BY U.S. AND INTERNATIONAL COPYRIGHT.It may not be reproduced, stored in a retrieval system, distributed or transmitted, in whole or in part, in any form or by any means.
Downloaded from SAE International by Kevin Bedsworth, Monday, April 01, 2013 03:00:14 PM
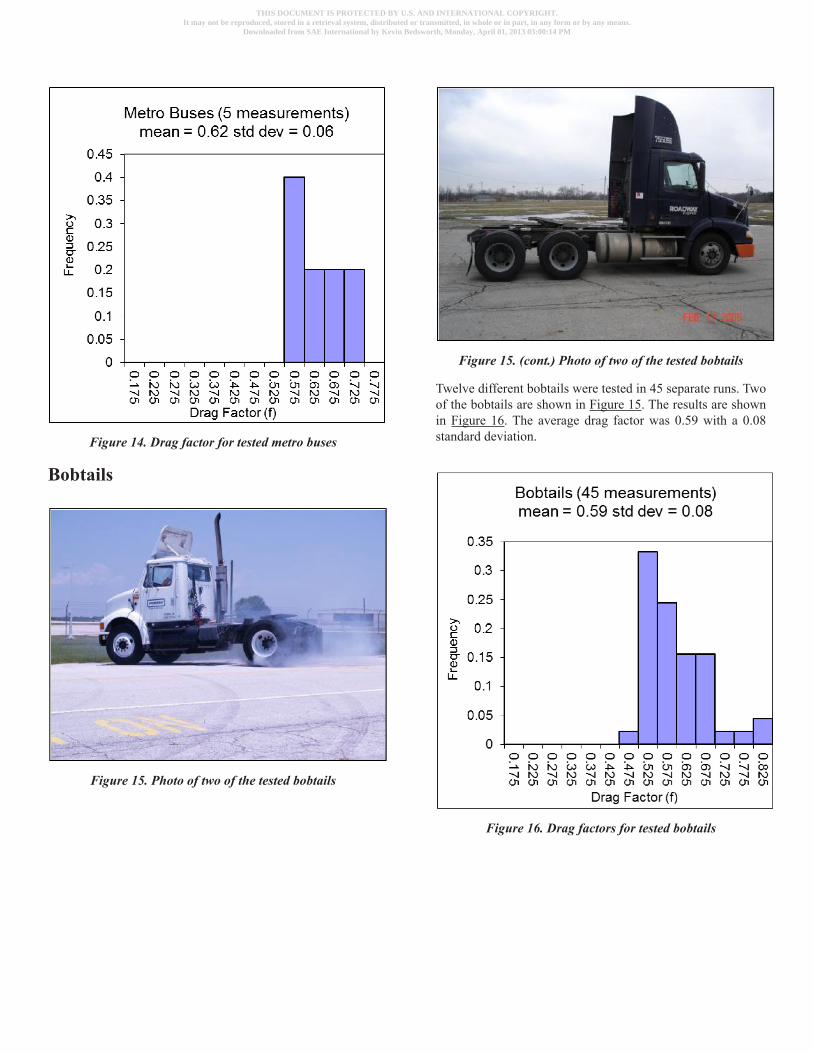
Figure 14. Drag factor for tested metro buses
Bobtails
Figure 15. Photo of two of the tested bobtails
Figure 15. (cont.) Photo of two of the tested bobtails
Twelve different bobtails were tested in 45 separate runs. Two of the bobtails are shown in Figure 15. The results are shown in Figure 16. The average drag factor was 0.59 with a 0.08 standard deviation.
Figure 16. Drag factors for tested bobtails
THIS DOCUMENT IS PROTECTED BY U.S. AND INTERNATIONAL COPYRIGHT.It may not be reproduced, stored in a retrieval system, distributed or transmitted, in whole or in part, in any form or by any means.
Downloaded from SAE International by Kevin Bedsworth, Monday, April 01, 2013 03:00:14 PM
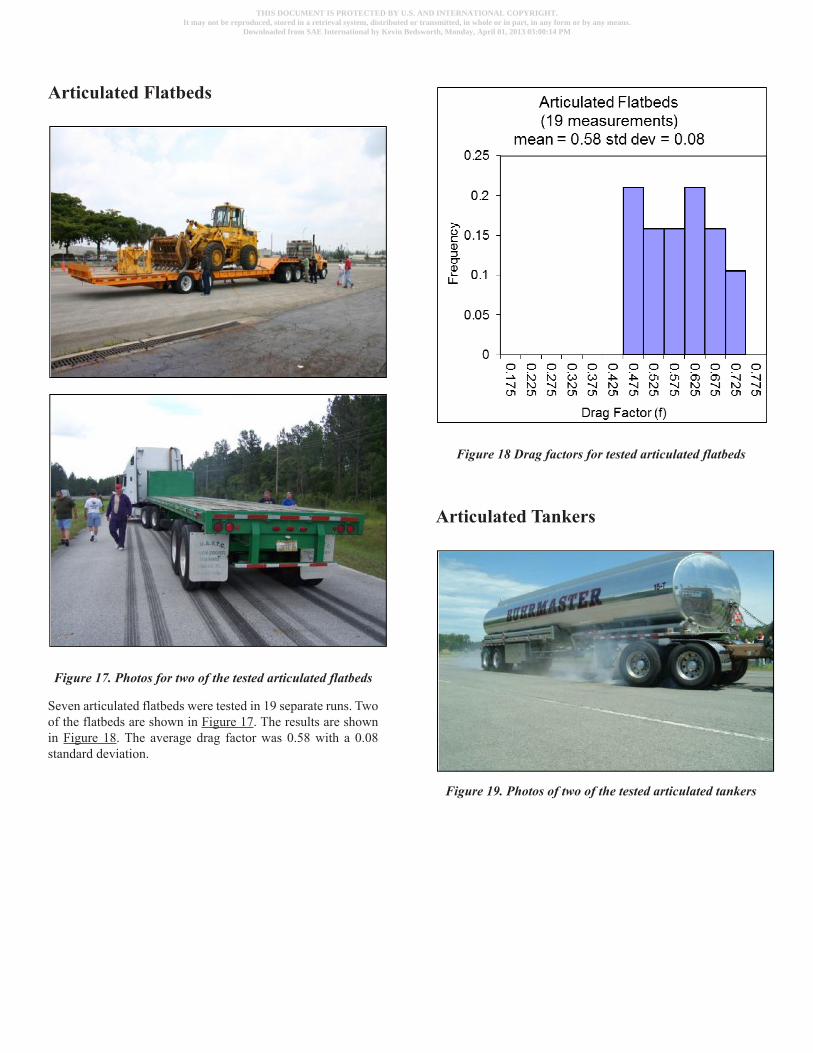
Articulated Flatbeds
Figure 17. Photos for two of the tested articulated flatbeds
Seven articulated flatbeds were tested in 19 separate runs. Two of the flatbeds are shown in Figure 17. The results are shown in Figure 18. The average drag factor was 0.58 with a 0.08 standard deviation.
Figure 18 Drag factors for tested articulated flatbeds
Articulated Tankers
Figure 19. Photos of two of the tested articulated tankers
THIS DOCUMENT IS PROTECTED BY U.S. AND INTERNATIONAL COPYRIGHT.It may not be reproduced, stored in a retrieval system, distributed or transmitted, in whole or in part, in any form or by any means.
Downloaded from SAE International by Kevin Bedsworth, Monday, April 01, 2013 03:00:14 PM
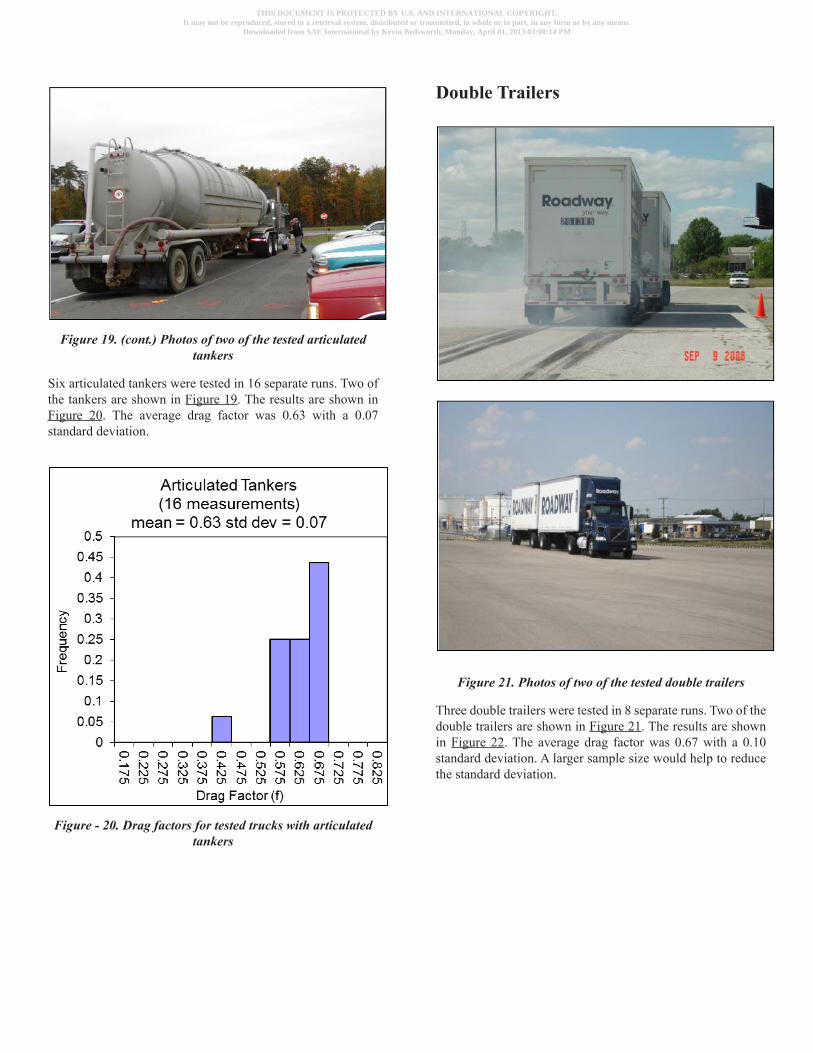
Figure 19. (cont.) Photos of two of the tested articulated tankers
Six articulated tankers were tested in 16 separate runs. Two of the tankers are shown in Figure 19. The results are shown in Figure 20. The average drag factor was 0.63 with a 0.07 standard deviation.
Figure - 20. Drag factors for tested trucks with articulated tankers
Double Trailers
Figure 21. Photos of two of the tested double trailers
Three double trailers were tested in 8 separate runs. Two of the double trailers are shown in Figure 21. The results are shown in Figure 22. The average drag factor was 0.67 with a 0.10 standard deviation. A larger sample size would help to reduce the standard deviation.
THIS DOCUMENT IS PROTECTED BY U.S. AND INTERNATIONAL COPYRIGHT.It may not be reproduced, stored in a retrieval system, distributed or transmitted, in whole or in part, in any form or by any means.
Downloaded from SAE International by Kevin Bedsworth, Monday, April 01, 2013 03:00:14 PM
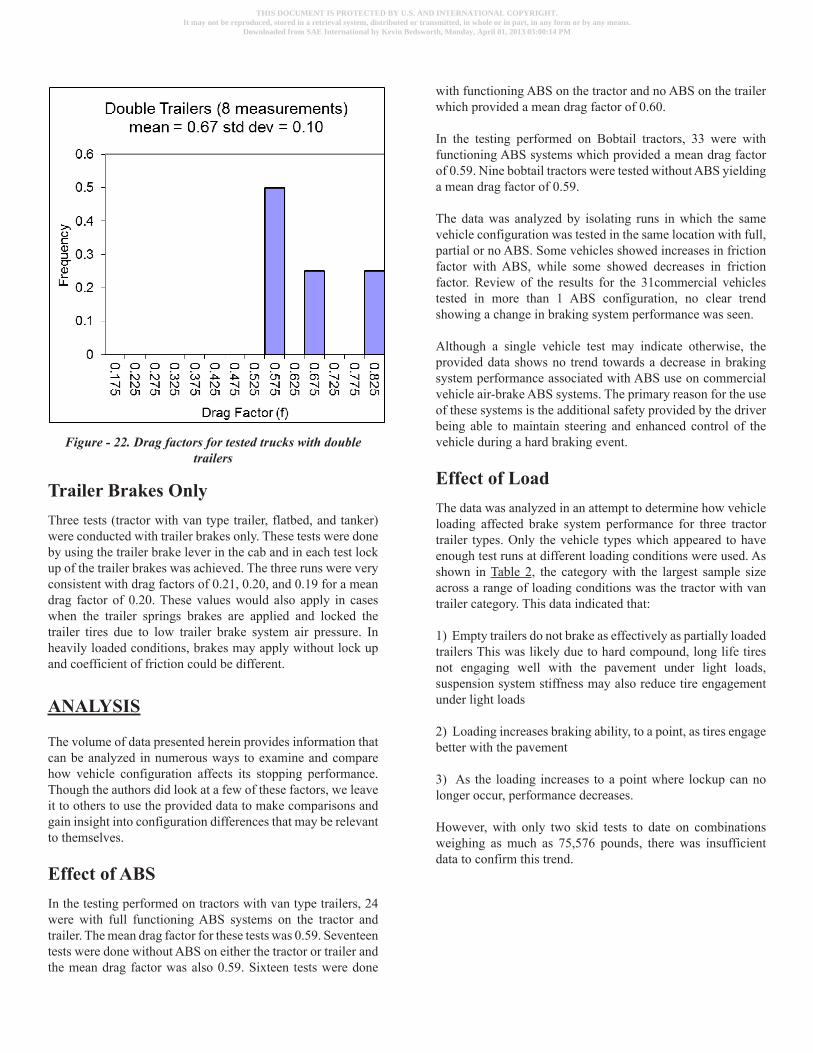
Figure - 22. Drag factors for tested trucks with double trailers
Trailer Brakes OnlyThree tests (tractor with van type trailer, flatbed, and tanker) were conducted with trailer brakes only. These tests were done by using the trailer brake lever in the cab and in each test lock up of the trailer brakes was achieved. The three runs were very consistent with drag factors of 0.21, 0.20, and 0.19 for a mean drag factor of 0.20. These values would also apply in cases when the trailer springs brakes are applied and locked the trailer tires due to low trailer brake system air pressure. In heavily loaded conditions, brakes may apply without lock up and coefficient of friction could be different.
ANALYSIS
The volume of data presented herein provides information that can be analyzed in numerous ways to examine and compare how vehicle configuration affects its stopping performance. Though the authors did look at a few of these factors, we leave it to others to use the provided data to make comparisons and gain insight into configuration differences that may be relevant to themselves.
Effect of ABSIn the testing performed on tractors with van type trailers, 24 were with full functioning ABS systems on the tractor and trailer. The mean drag factor for these tests was 0.59. Seventeen tests were done without ABS on either the tractor or trailer and the mean drag factor was also 0.59. Sixteen tests were done
with functioning ABS on the tractor and no ABS on the trailer which provided a mean drag factor of 0.60.
In the testing performed on Bobtail tractors, 33 were with functioning ABS systems which provided a mean drag factor of 0.59. Nine bobtail tractors were tested without ABS yielding a mean drag factor of 0.59.
The data was analyzed by isolating runs in which the same vehicle configuration was tested in the same location with full, partial or no ABS. Some vehicles showed increases in friction factor with ABS, while some showed decreases in friction factor. Review of the results for the 31commercial vehicles tested in more than 1 ABS configuration, no clear trend showing a change in braking system performance was seen.
Although a single vehicle test may indicate otherwise, the provided data shows no trend towards a decrease in braking system performance associated with ABS use on commercial vehicle air-brake ABS systems. The primary reason for the use of these systems is the additional safety provided by the driver being able to maintain steering and enhanced control of the vehicle during a hard braking event.
Effect of LoadThe data was analyzed in an attempt to determine how vehicle loading affected brake system performance for three tractor trailer types. Only the vehicle types which appeared to have enough test runs at different loading conditions were used. As shown in Table 2, the category with the largest sample size across a range of loading conditions was the tractor with van trailer category. This data indicated that:
1) Empty trailers do not brake as effectively as partially loaded trailers This was likely due to hard compound, long life tires not engaging well with the pavement under light loads, suspension system stiffness may also reduce tire engagement under light loads
2) Loading increases braking ability, to a point, as tires engage better with the pavement
3) As the loading increases to a point where lockup can no longer occur, performance decreases.
However, with only two skid tests to date on combinations weighing as much as 75,576 pounds, there was insufficient data to confirm this trend.
THIS DOCUMENT IS PROTECTED BY U.S. AND INTERNATIONAL COPYRIGHT.It may not be reproduced, stored in a retrieval system, distributed or transmitted, in whole or in part, in any form or by any means.
Downloaded from SAE International by Kevin Bedsworth, Monday, April 01, 2013 03:00:14 PM
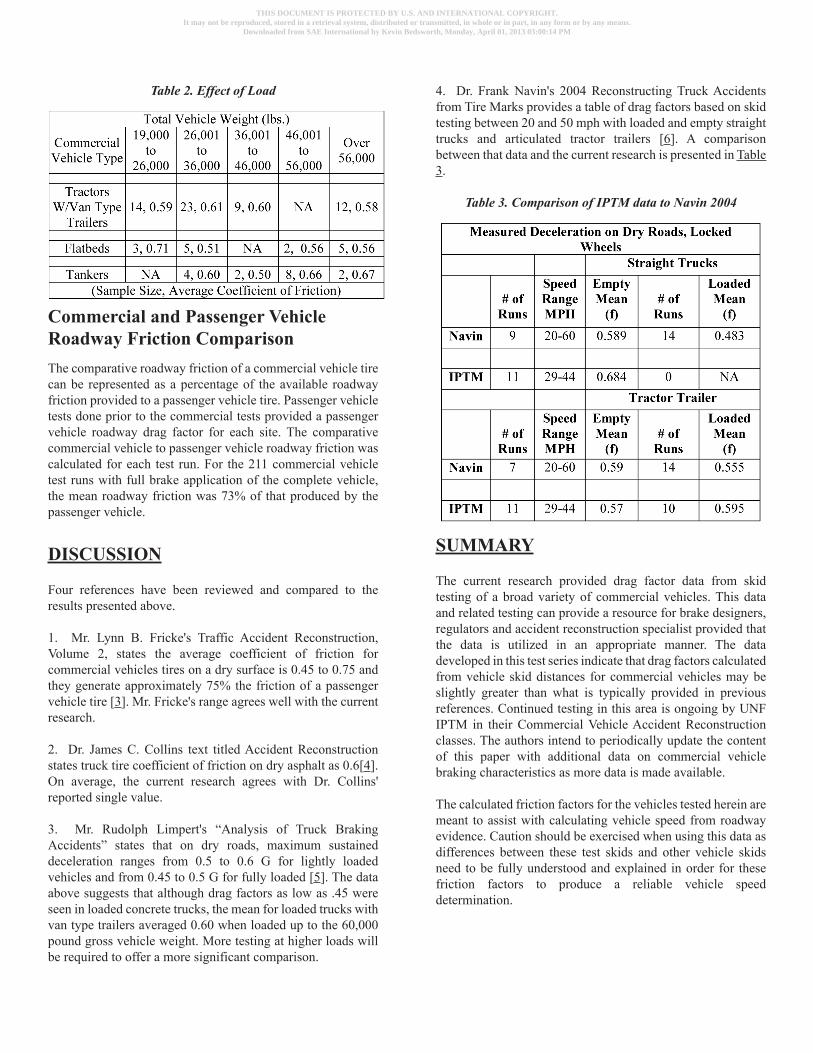
Table 2. Effect of Load
Commercial and Passenger Vehicle Roadway Friction ComparisonThe comparative roadway friction of a commercial vehicle tire can be represented as a percentage of the available roadway friction provided to a passenger vehicle tire. Passenger vehicle tests done prior to the commercial tests provided a passenger vehicle roadway drag factor for each site. The comparative commercial vehicle to passenger vehicle roadway friction was calculated for each test run. For the 211 commercial vehicle test runs with full brake application of the complete vehicle, the mean roadway friction was 73% of that produced by the passenger vehicle.
DISCUSSION
Four references have been reviewed and compared to the results presented above.
1. Mr. Lynn B. Fricke's Traffic Accident Reconstruction, Volume 2, states the average coefficient of friction for commercial vehicles tires on a dry surface is 0.45 to 0.75 and they generate approximately 75% the friction of a passenger vehicle tire [3]. Mr. Fricke's range agrees well with the current research.
2. Dr. James C. Collins text titled Accident Reconstruction states truck tire coefficient of friction on dry asphalt as 0.6[4]. On average, the current research agrees with Dr. Collins' reported single value.
3. Mr. Rudolph Limpert's “Analysis of Truck Braking Accidents” states that on dry roads, maximum sustained deceleration ranges from 0.5 to 0.6 G for lightly loaded vehicles and from 0.45 to 0.5 G for fully loaded [5]. The data above suggests that although drag factors as low as .45 were seen in loaded concrete trucks, the mean for loaded trucks with van type trailers averaged 0.60 when loaded up to the 60,000 pound gross vehicle weight. More testing at higher loads will be required to offer a more significant comparison.
4. Dr. Frank Navin's 2004 Reconstructing Truck Accidents from Tire Marks provides a table of drag factors based on skid testing between 20 and 50 mph with loaded and empty straight trucks and articulated tractor trailers [6]. A comparison between that data and the current research is presented in Table 3.
Table 3. Comparison of IPTM data to Navin 2004
SUMMARY
The current research provided drag factor data from skid testing of a broad variety of commercial vehicles. This data and related testing can provide a resource for brake designers, regulators and accident reconstruction specialist provided that the data is utilized in an appropriate manner. The data developed in this test series indicate that drag factors calculated from vehicle skid distances for commercial vehicles may be slightly greater than what is typically provided in previous references. Continued testing in this area is ongoing by UNF IPTM in their Commercial Vehicle Accident Reconstruction classes. The authors intend to periodically update the content of this paper with additional data on commercial vehicle braking characteristics as more data is made available.
The calculated friction factors for the vehicles tested herein are meant to assist with calculating vehicle speed from roadway evidence. Caution should be exercised when using this data as differences between these test skids and other vehicle skids need to be fully understood and explained in order for these friction factors to produce a reliable vehicle speed determination.
THIS DOCUMENT IS PROTECTED BY U.S. AND INTERNATIONAL COPYRIGHT.It may not be reproduced, stored in a retrieval system, distributed or transmitted, in whole or in part, in any form or by any means.
Downloaded from SAE International by Kevin Bedsworth, Monday, April 01, 2013 03:00:14 PM
A significant volume of field test data has been presented to provide the drag factor for specific commercial vehicle types, load conditions and brake system configurations. It can be seen that vehicle type and load condition can affect the drag factor and stopping distances for commercial vehicles.
REFERENCES
1. Baker, J. S., “Traffic Accident Investigation Manual,” The Traffic Institute, Northwestern University, Illinois, ISBN 0-912642-01-7, 1975
2. Holman, J. P., “Experimental Methods for Engineers,” Fifth Edition, McGraw Hill, New York, ISBN 0-07-029622-7: 41, 1989
3. Fricke, L.B., “Traffic Accident Reconstruction,” Northwestern University Traffic Institute, Illinois, ISBN 0-912642-07-6:78-22, 1990
4. Collins, J.C.,” Accident Reconstruction,” Charles C Thomas, Illinois:187, 1979
5. Limpert, R. and Andrews, D., “Analysis of Truck Braking Accidents,” SAE Technical Paper 870504, 1987, doi: 10.4271/870504.
6. Navin, F., “Reconstructing Truck Accidents from Tire Marks,” Institute of Police Technology and Management, Florida, ISBN 1-884566-59-6:50, 2004
CONTACT INFORMATION
For further information please contact Kevin Bedsworth through ESI Miami, FL. At 305-599-2262 or by email at [email protected]
ACKNOWLEDGMENTS
The authors would especially like to recognize Mr. David Brill, Mr. Walt Dobson, and the University of North Florida Institute for Police Technology and Management for their efforts in the collection of this data. The data for this paper was collected through the Commercial Vehicle Accident Reconstruction course taught at UNF IPTM by Mr. Brill and Mr. Dobson as adjunct professors. We also wish to thank Mr. Kevin Driscoll, a research assistant who initially consolidated the data presented herein.
THIS DOCUMENT IS PROTECTED BY U.S. AND INTERNATIONAL COPYRIGHT.It may not be reproduced, stored in a retrieval system, distributed or transmitted, in whole or in part, in any form or by any means.
Downloaded from SAE International by Kevin Bedsworth, Monday, April 01, 2013 03:00:14 PM
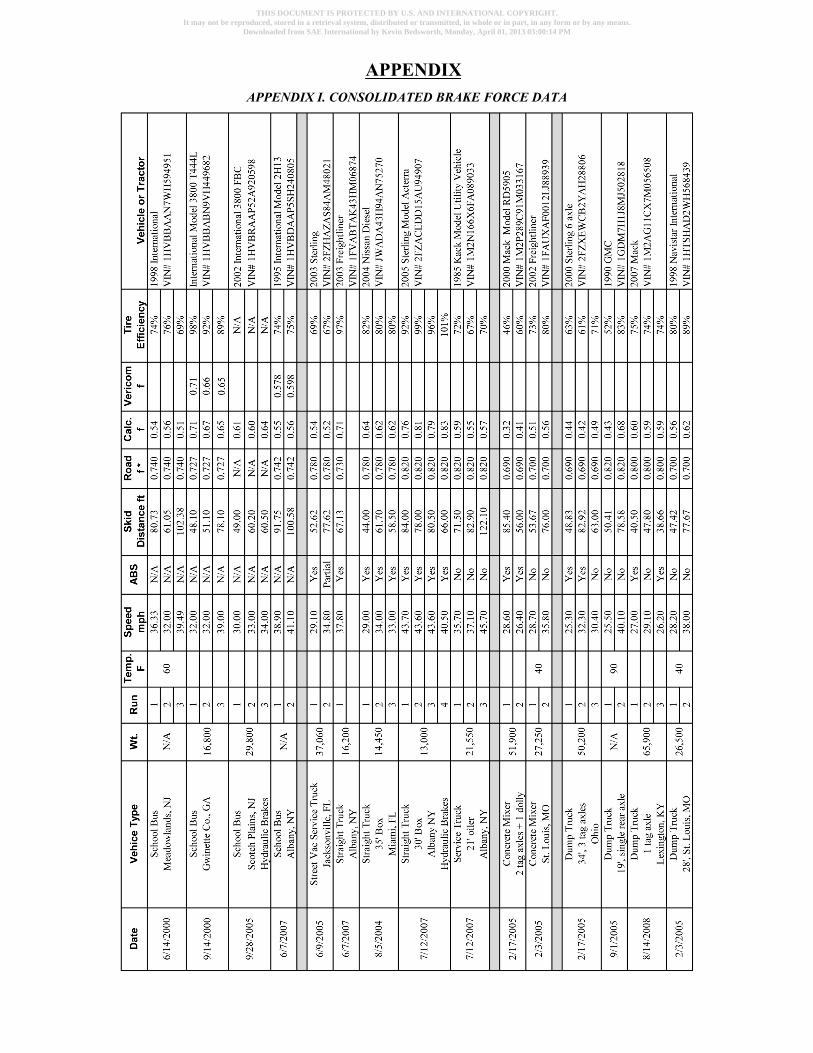
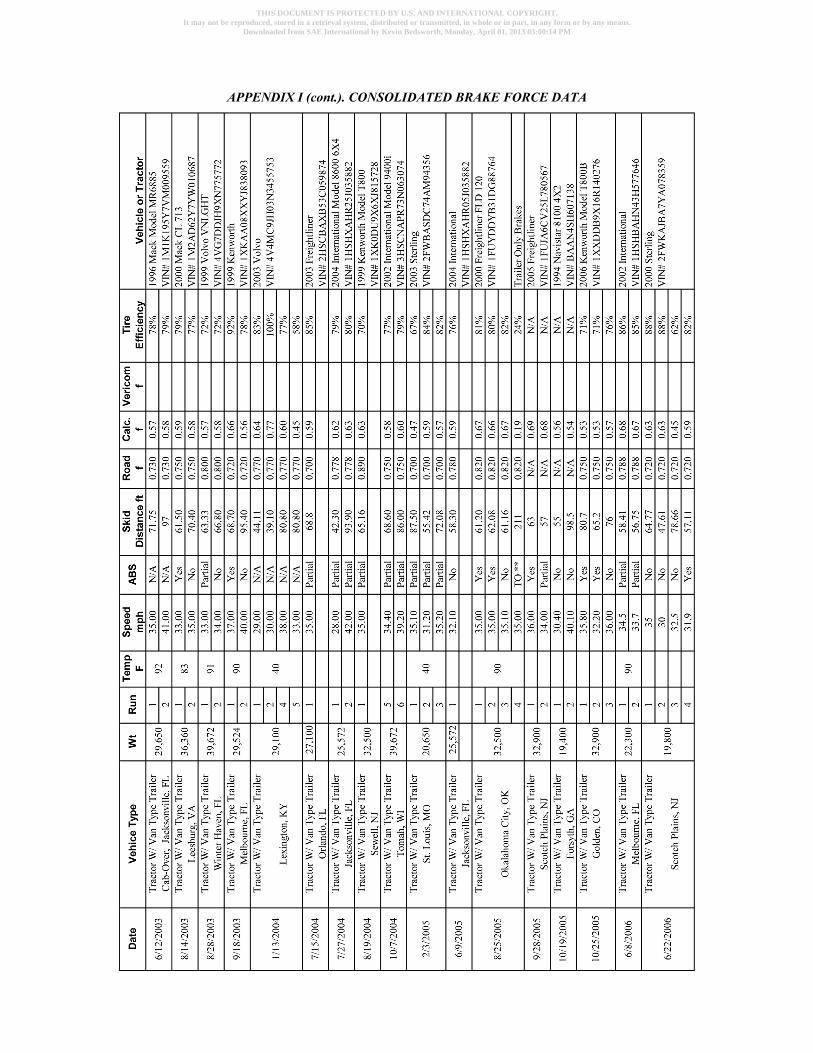
APPENDIX I. CONSOLIDATED BRAKE FORCE DATA
APPENDIX
THIS DOCUMENT IS PROTECTED BY U.S. AND INTERNATIONAL COPYRIGHT.It may not be reproduced, stored in a retrieval system, distributed or transmitted, in whole or in part, in any form or by any means.
Downloaded from SAE International by Kevin Bedsworth, Monday, April 01, 2013 03:00:14 PM

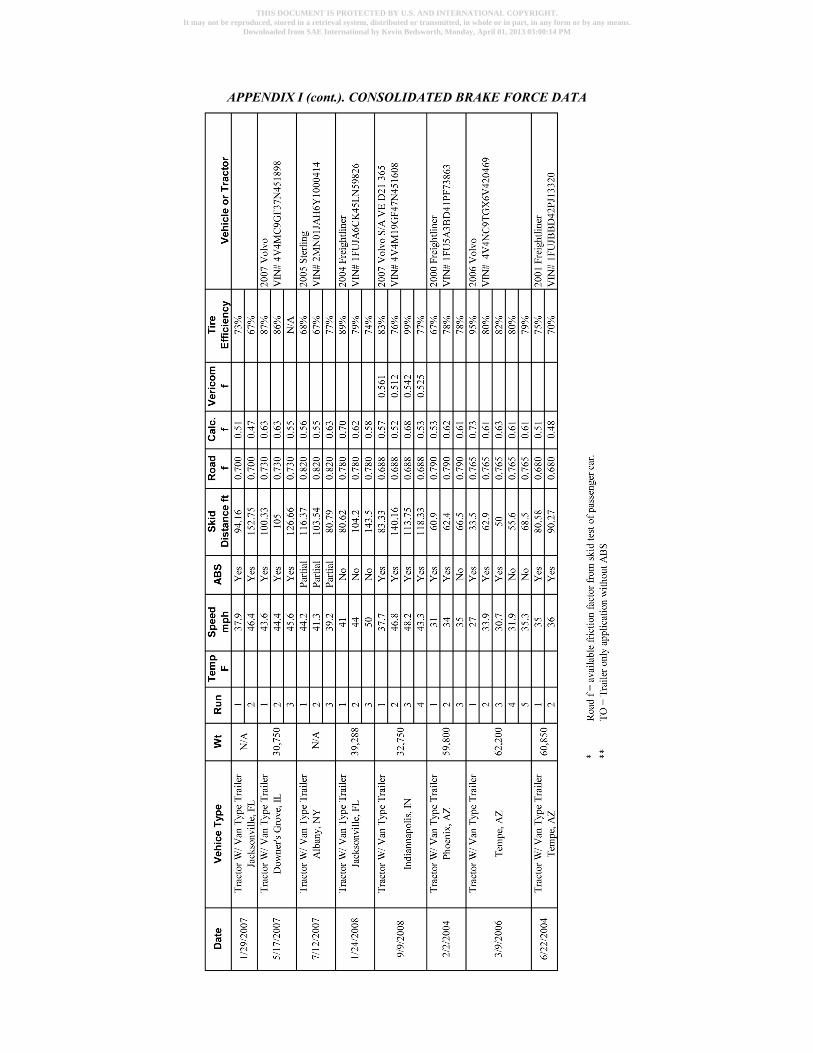
APPENDIX I (cont.). CONSOLIDATED BRAKE FORCE DATA
THIS DOCUMENT IS PROTECTED BY U.S. AND INTERNATIONAL COPYRIGHT.It may not be reproduced, stored in a retrieval system, distributed or transmitted, in whole or in part, in any form or by any means.
Downloaded from SAE International by Kevin Bedsworth, Monday, April 01, 2013 03:00:14 PM

The Engineering Meetings Board has approved this paper for publication. It hassuccessfully completed SAE's peer review process under the supervision of the sessionorganizer. This process requires a minimum of three (3) reviews by industry experts.
All rights reserved. No part of this publication may be reproduced, stored in aretrieval system, or transmitted, in any form or by any means, electronic, mechanical,photocopying, recording, or otherwise, without the prior written permission of SAE.
ISSN 0148-7191
Positions and opinions advanced in this paper are those of the author(s) and notnecessarily those of SAE. The author is solely responsible for the content of the paper.
SAE Customer Service:Tel: 877-606-7323 (inside USA and Canada)Tel: 724-776-4970 (outside USA)Fax: 724-776-0790Email: [email protected] Web Address: http://www.sae.orgPrinted in USA
THIS DOCUMENT IS PROTECTED BY U.S. AND INTERNATIONAL COPYRIGHT.It may not be reproduced, stored in a retrieval system, distributed or transmitted, in whole or in part, in any form or by any means.
Downloaded from SAE International by Kevin Bedsworth, Monday, April 01, 2013 03:00:14 PM


