Embed Size (px)
Citation preview
REL 2015–053
The National Center for Education Evaluation and Regional Assistance (NCEE) conducts unbiased large-scale evaluations of education programs and practices supported by federal funds; provides research-based technical assistance to educators and policymakers; and supports the synthesis and the widespread dissemination of the results of research and evaluation throughout the United States.
October 2014
This report was prepared for the Institute of Education Sciences (IES) under Contract ED-IES-12-CO-0006 by Regional Educational Laboratory Mid-Atlantic administered by ICF International. The content of the publication does not necessarily reflect the views or policies of IES or the U.S. Department of Education nor does mention of trade names, commercial products, or organizations imply endorsement by the U.S. Government.
This REL report is in the public domain. While permission to reprint this publication is not necessary, it should be cited as:
Howley, C., Johnson, J., Passa, A., & Uekawa, K. (2014). College enrollment and persistence in rural Pennsylvania schools. (REL 2015–053). Washington, DC: U.S. Department of Education, Institute of Education Sciences, National Center for Education Evaluation and Regional Assistance, Regional Educational Laboratory Mid-Atlantic. Retrieved from http://ies.ed.gov/ncee/edlabs.
This report is available on the Regional Educational Laboratory website at http://ies.ed.gov/ ncee/edlabs.
Summary
This study analyzes average rates of college enrollment and first- to second-year college persistence among rural and nonrural regular public high schools in Pennsylvania for the 2009/10 and 2010/11 high school graduation cohorts. It describes the association of student-, school-, and college-level factors with enrollment and persistence outcomes.
Key findings include: •
•
•
•
Rural schools had higher average college enrollment and persistence rates than city schools but lower rates than suburban and town schools. Rural–fringe schools had higher average college enrollment and persistence rates than rural–distant or rural–remote schools. Most graduates of high schools in all locales went to public four-year colleges and in-state colleges. Rural schools with a larger population of economically disadvantaged students had lower college enrollment and persistence rates than rural schools serving a smaller population of economically disadvantaged students—even after controlling for other factors.
i
Contents
Summary i
Why this study? 1
Study findings 3 How do college enrollment and persistence rates and characteristics of rural Pennsylvania
schools compare with those of city, suburban, and town schools and between high school cohorts? 3
How do college enrollment rates by type of college vary across rural Pennsylvania schools, and how do these rates compare with those of city, suburban, and town schools? 6
What characteristics of rural Pennsylvania districts are associated with higher and lower school-level college enrollment and persistence rates? 7
Implications and suggestions for further research 9 Rural Pennsylvania schools had lower college enrollment and persistence rates than town and
suburban schools but higher rates than city schools 9 Rural–fringe schools had higher college enrollment and persistence rates than rural–distant
and rural–remote schools 9 Among rural schools, being economically disadvantaged appears to be associated with lower
rural college enrollment and persistence rates 9 Across school locales the 2009/10 and 2010/11 cohorts differed in college enrollment and
immediate enrollment rates 10
Study limitations 10
Appendix A. Literature review A-1 Appendix B. Data and methodology B-1 Appendix C. College enrollment in Pennsylvania Association of Rural and Small Schools districts C-1 Appendix D. Detailed data D-1
Notes Notes-1
References Ref-1
Box 1 Study methodology 2
Map 1 Pennsylvania Association of Rural and Small Schools members, 2013 1
Tables 1 College enrollment and first- to second-year persistence rates of Pennsylvania public high
school students, by school rural and nonrural subgroup locale, 2009/10 and 2010/11 cohorts 4 2 College enrollment and first- to second-year persistence rates of Pennsylvania public high
school students, by school nonrural and rural subgroup locale, 2009/10 and 2010/11 cohorts 5 3 Type of college enrolled in by Pennsylvania public high school students, by school locale,
2009/10 and 2010/11 cohorts 6
ii
B1 Original and analytical samples for the 2009/10 and 2010/11 high school graduating cohorts in Pennsylvania B-2
B2 Descriptive statistics for logistic regression analysis predicting college enrollment among students from Pennsylvania Association of Rural and Small Schools districts B-6
B3 Descriptive statistics for logistic regression analysis predicting first- to second-year college persistence among students from Pennsylvania Association of Rural and Small Schools districts B-7
C1 College enrollment and first- to second-year persistence rates of public high school students in Pennsylvania Association of Rural and Small Schools districts, by rural and nonrural subgroup locale, 2009/10 and 2010/11 cohorts C-2
C2 College enrollment and first- to second-year persistence rates of public high school students in Pennsylvania Association of Rural and Small Schools districts, by nonrural and rural subgroup locale, 2009/10 and 2010/11 cohorts C-2
C3 Type of college enrolled in by public high school students in Pennsylvania Association of Rural and Small Schools districts, by school locale, 2009/10 and 2010/11 cohorts C-3
D1 Pennsylvania public high schools, by locale, 2009/10 and 2010/11 D-1 D2 Demographic characteristics, on-time graduation rates, and dropout rates of
Pennsylvania public high school students, by school locale, 2009/10 cohort D-1 D3 Demographic characteristics, on-time graduation rates, and dropout rates of
Pennsylvania public high school students, by school locale, 2010/11 cohort D-2 D4 College enrollment and first- to second-year persistence rates of Pennsylvania public
high school students, by school locale and poverty category, 2009/10 and 2010/11 cohorts D-2 D5 College enrollment and first- to second-year persistence rates of Pennsylvania public
high school students, by school locale and racial/ethnic minority population, 2009/10 and 2010/11 cohorts D-3
D6 Characteristics of schools in rural districts, by college enrollment rate quartile, 2009/10 cohort D-4
D7 Characteristics of schools in rural districts, by college enrollment rate quartile, 2010/11 cohort D-5
D8 Summary of regression analysis for variables predicting immediate enrollment rates of students in rural schools, 2009/10 cohort D-6
D9 Summary of regression analysis for variables predicting immediate enrollment rates of students in rural schools, 2010/11 cohort D-6
D10 Summary of regression analysis for variables predicting first- to second-year persistence rates of students in rural schools, 2009/10 cohort D-7
D11 Summary of regression analysis for variables predicting first- to second-year persistence rates of students in rural schools, 2010/11 cohort D-7
D12 Public high schools in Pennsylvania Association of Rural and Small Schools districts, by locale, 2009/10 and 2010/11 D-8
D13 Demographic characteristics, on-time graduation rates, and dropout rates of public high school students in Pennsylvania Association of Rural and Small Schools districts, by school locale, 2009/10 cohort D-8
D14 Demographic characteristics, on-time graduation rates, and dropout rates of public high school students in Pennsylvania Association of Rural and Small Schools districts, by school locale, 2010/11 cohort D-9
D15 College enrollment and first- to second-year persistence rates of public high school students in Pennsylvania Association of Rural and Small Schools districts, by school locale and poverty category, 2009/10 and 2010/11 cohorts D-10
iii
D16 College enrollment and first- to second-year persistence rates of public high school students in Pennsylvania Association of Rural and Small Schools districts, by school locale and racial/ethnic minority population, 2009/10 and 2010/11 cohorts D-10
D17 Characteristics of rural districts, by college enrollment rate quartile, including the lowest and highest 5 percent, 2009/10 cohort D-11
D18 Characteristics of rural districts, by college enrollment rate quartile, including the lowest and highest 5 percent, 2010/11 cohort D-12
D19 Summary of logistic regression analysis for variables predicting immediate enrollment among public high school students from Pennsylvania Association of Rural and Small Schools districts D-13
D20 Summary of logistic regression analysis for variables predicting college persistence among public high school students from Pennsylvania Association of Rural and Small Schools districts D-14
iv
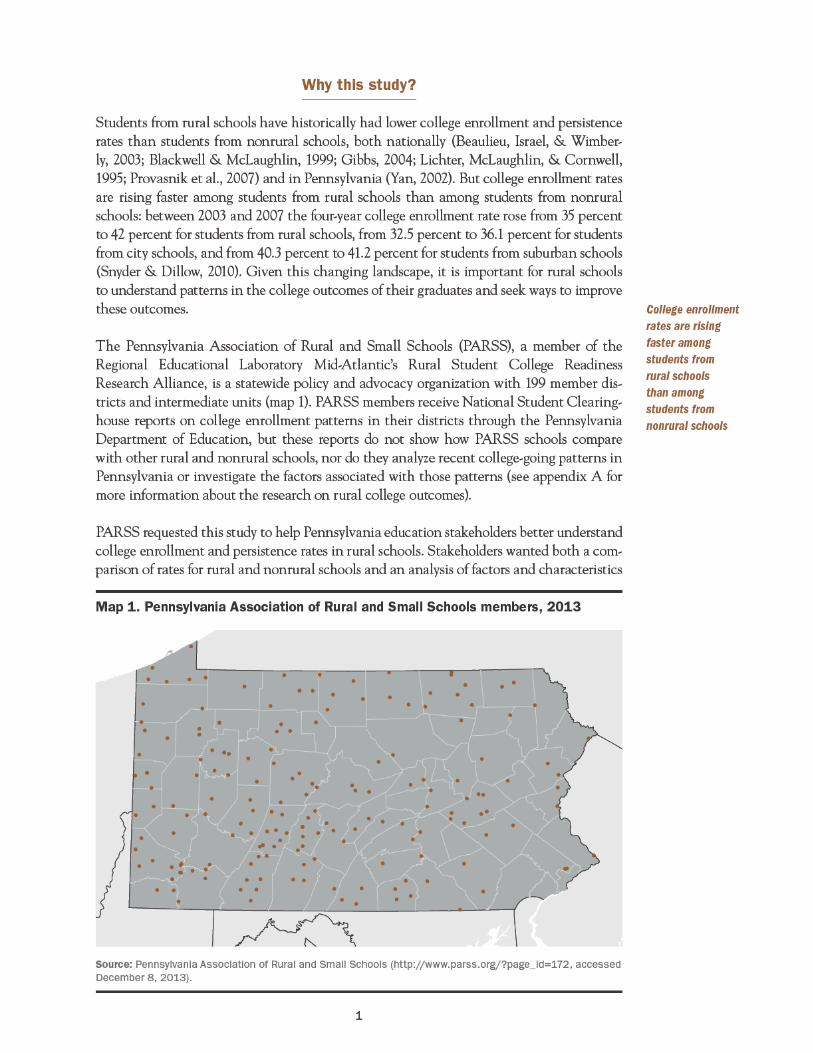
associated with those rates. This information would help stakeholders consider additional research on the rural schools with the highest college enrollment rates, such as analyses of school strategies to prepare students for college.
This study examined college-going trends in rural Pennsylvania schools and the factors associated with these trends. Through analyses of data from the Pennsylvania Department of Education and the National Student Clearinghouse, the study sought to answer four research questions:
•
•
•
•
How do college enrollment and persistence rates and characteristics of rural Pennsylvania schools compare with those of city, suburban, and town schools and between high school cohorts? How do college enrollment rates by type of college vary across rural Pennsylvania schools, and how do these rates compare with those of city, suburban, and town schools? What characteristics of rural Pennsylvania districts are associated with higher and lower school-level college enrollment and persistence rates? How do college enrollment rates, persistence rates, and the types of postsecondary institutions in which students enroll vary among schools in PARSS districts?
Box 1 summarizes the methods used to answer these questions, and appendix B provides further detail. Appendix C replicates these analyses with schools in PARSS districts only.
Box 1. Study methodology
The Pennsylvania Department of Education provided student demographic, graduation, and
college data for two high school graduation cohorts (2009/10 and 2010/11) from the more
than 600 regular public high schools in Pennsylvania (see table D1 in appendix D). Student
demographic and graduation data from the Pennsylvania Information Management System were
linked to college enrollment and persistence data from the National Student Clearinghouse,
along with school- and district-level Pennsylvania Information Management System and National
Center for Education Statistics variables. For students with National Student Clearinghouse
college enrollment data, four key measures were calculated at the school and district levels:
•
•
•
•
College enrollment rate, the sum of the immediate enrollment rate and the delayed enroll
ment rate, which indicates the overall share of high school graduates who attended college
within one year of graduating.
Immediate enrollment rate, defined as the proportion of students enrolling in college in the
same calendar year as their high school graduation.
Delayed enrollment rate, defined as the proportion of students enrolling in college within
one year of, but not in the same calendar year as, their high school graduation.
First- to second-year persistence rate, defined as the percentage of first-year college stu
dents who reregister for courses in their second year.
This study entailed three phases. Phase I, which addresses the first research question,
was a descriptive review of average college enrollment rates, average immediate and delayed
enrollment rates, and average first- to second-year persistence rates of rural and nonrural
schools and of the two study cohorts; the characteristics of the student populations in these
schools; and variations in the type of college in which students enrolled. Nonrural schools
(continued)
This study of
college-going
trends in rural
Pennsylvania
schools and the
factors associated
with these trends
could help
stakeholders
consider additional
research on the
rural schools with
the highest college
enrollment rates
2
Box 1. Study methodology (continued)
were located in city, suburban, or town locales, as categorized by National Center for Education
Statistics Common Core of Data locale codes. For example, in Pennsylvania, schools in Allen
town and Philadelphia are coded as in a city, those in Mt. Lebanon and Upper Darby are coded
as in a suburb, and those in Newcastle and Shippensburg are coded as in a town. Approxi
mately 33 percent of the schools analyzed were rural, 14 percent were in cities, 36 percent
were suburban, and 17 percent were in towns (see table D1 in appendix D). The analysis of
rural schools was further broken down into three subgroups: rural–fringe (46 percent of rural
schools), rural–distant (47 percent), and rural–remote (8 percent). Rural–fringe locales are
rural areas near an urban area, rural–distant locales are rural areas between 5 and 25 miles
of an urban area, and rural–remote locales are rural areas more than 25 miles from an urban
area. Descriptive statistics were not subjected to tests of statistical significance.
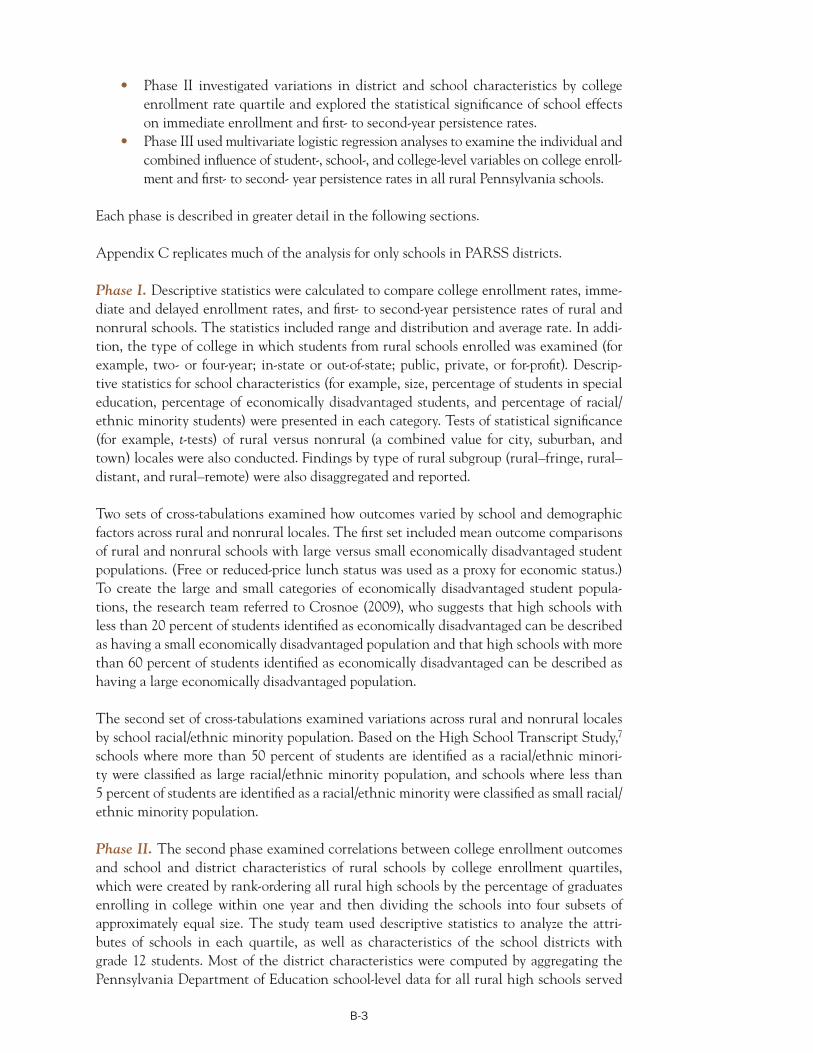
Phase II investigated variations in district and school characteristics by college enrollment
rate quartile and explored the statistical significance of school effects on immediate enroll
ment and first- to second-year persistence rates. Differences among rural schools and districts
falling into college enrollment quartiles were tested for statistical significance.
Phase III used multivariate logistic regression analyses to examine the individual and com
bined influence of student-, school-, and college-level variables on college enrollment and first-
to second-year persistence rates in all rural Pennsylvania schools.
The analyses were then repeated for schools in PARSS districts only. These findings are
reported in appendix C.
See appendix B for a more detailed description of variables and study methods.
Study findings
This section details the results of the analyses of average college enrollment rates and first- to second-year college persistence rates among rural and nonrural regular public high schools in Pennsylvania for the 2009/10 and 2010/11 high school graduation cohorts. It describes the association of student-, school-, and college-level factors with enrollment and persistence outcomes.
How do college enrollment and persistence rates and characteristics of rural Pennsylvania schools compare with those of city, suburban, and town schools and between high school cohorts?
Rural Pennsylvania schools had lower college enrollment rates than suburban and town schools and higher rates than city schools. College persistence rates for rural schools were similar to those for suburban and town schools and higher than those for city schools. Among rural schools, those closer to nonrural areas had higher enrollment and persistence rates. Rural high-poverty schools and rural schools with a large population of racial/ethnic minority students1 had higher enrollment and persistence rates than nonrural high-poverty schools and nonrural schools with a large population of racial/ethnic minority students. All schools sent the majority of their college enrollees to public four-year colleges.
Rural Pennsylvania schools shared characteristics with suburban and town schools but had lower college enrollment rates. Rural, suburban, and town schools had similar demographics, dropout rates, and on-time high school graduation rates. Among the 2009/10 cohort the graduation rate was 90.0 percent for rural schools, 90.4 percent for suburban
Rural Pennsylvania
schools had
lower college
enrollment rates
than suburban
and town schools
and higher rates
than city schools
3
Cohort Variable Rural
Nonrural
City Suburban Town
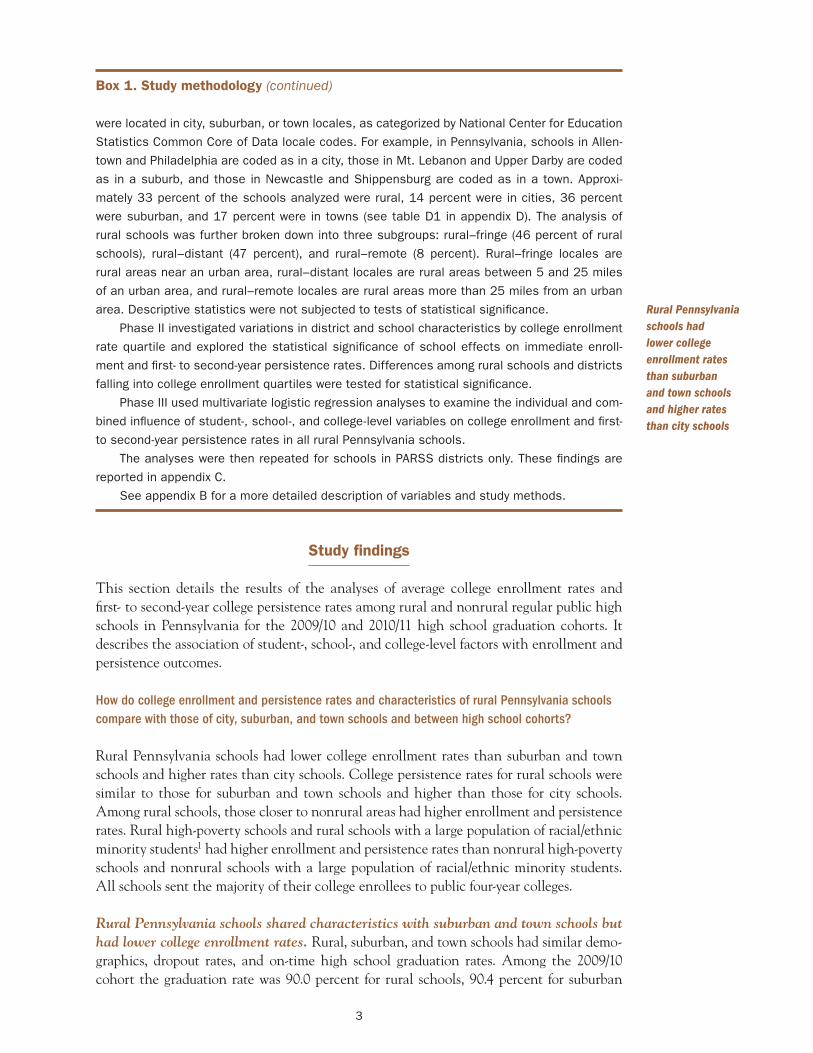
2009/10 College enrollment rate 57.9 53.2 68.5 60.4 (n = 80,021) Immediate enrollment rate 52.5 44.1 62.7 55.2
Delayed enrollment rate 5.4 9.1 5.8 5.2
First- to second-year persistence rate 81.0 66.8 83.2 80.2
2010/11 College enrollment rate 59.1 55.2 70.4 60.2 (n = 80,757) Immediate enrollment rate 51.0 43.1 60.5 50.8
Delayed enrollment rate 8.1 12.1 9.9 9.4
First- to second-year persistence rate 80.1 63.0 79.8 77.8
schools, and 87.2 percent for town schools, compared with 67.7 percent for city schools (see table D2 in appendix D). The relationships were similar among the 2010/11 cohort (see table D3 in appendix D).
The percentages of English language learner students, economically disadvantaged students, and racial/ethnic minority students were all higher for city schools than for rural schools. Some 2.1 percent of students in rural schools among the 2009/10 cohort were Black, compared with 58.6 percent of students in city schools (see table D2 in appendix D). The patterns were similar among the 2010/11 cohort (see table D3 in appendix D).
Despite similar demographics and graduation rates, college enrollment rates were lower for rural schools than for suburban and town schools. Among the 2009/10 cohort the college enrollment rate was 57.9 percent for rural schools, compared with 68.5 percent for suburban schools and 60.4 percent for town schools (table 1).
The 2010/11 cohort had higher college enrollment rates but lower immediate enrollment rates than the 2009/10 cohort. The college enrollment rate for rural, city, and suburban schools averaged 1.7 percentage points higher for the 2010/11 cohort than for the 2009/10 cohort (for town schools the rate was 0.2 percentage point lower). But the immediate enrollment rate for all locales averaged 2.3 percentage points lower for the 2010/11 cohort than for the 2009/10 cohort.
First- to second-year persistence rates for rural schools were similar to those for suburban and town schools among both the 2009/10 and 2010/11 cohorts. Among the 2009/10 cohort the rate was 81.0 percent for rural schools, 83.2 percent for suburban schools, and 80.2 percent for town schools, compared with 66.8 percent for city schools.
Students from rural–fringe schools had college enrollment rates and immediate enrollment rates similar to or higher than students from nonrural schools, but students from rural–distant and rural–remote schools had lower rates. Among the 2009/10 cohort 63.1 percent of students from rural–fringe schools (schools in a rural area near an urban area, such as in the Pleasant Valley School District of Monroe County) enrolled in college,
Table 1. College enrollment and first- to second-year persistence rates of Pennsylvania public high school students, by school rural and nonrural subgroup locale, 2009/10 and 2010/11 cohorts (percent)
First- to second-
year persistence
rates for rural
schools were
similar to those
for suburban and
town schools
among both the
2009/10 and
2010/11 cohorts
Source: Authors’ analysis based on data from the Pennsylvania Information Management System, National Center for Education Statistics Common Core of Data, and National Student Clearinghouse.
4
Rural
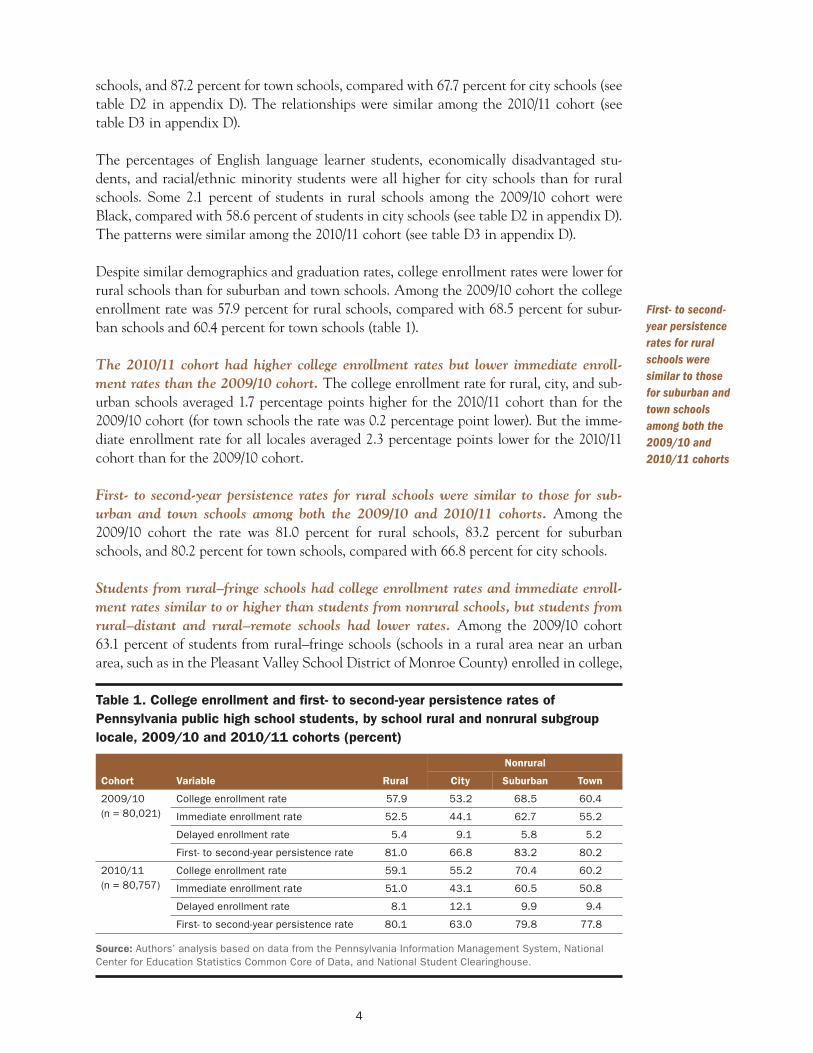
Cohort Variable Nonrural Fringe Distant Remote
2009/10 College enrollment rate 63.2 63.1 54.3 48.2 (n = 80,021) Immediate enrollment rate 56.9 57.6 49.1 43.0
Delayed enrollment rate 6.3 5.5 5.2 5.2
First- to second-year persistence rate 79.0 83.3 79.2 79.4
2010/11 College enrollment rate 64.7 63.6 55.6 53.1 (n = 80,757) Immediate enrollment rate 54.5 54.7 48.0 46.8
Delayed enrollment rate 10.2 8.9 7.6 6.2
First- to second-year persistence rate 75.8 81.7 78.7 78.6
Table 2. College enrollment and first- to second-year persistence rates of Pennsylvania public high school students, by school nonrural and rural subgroup locale, 2009/10 and 2010/11 cohorts (percent)
Among high-
poverty schools
and schools with
a large population
of racial/ethnic
minority students,
students from rural
schools had higher
college enrollment
and first- to
second-year
persistence rates
than students from
nonrural schools
Note: Percentages may not sum to 100 because of rounding.
Source: Authors’ analysis based on data from the Pennsylvania Information Management System, National Center for Education Statistics Common Core of Data, and National Student Clearinghouse.
compared with 54.3 percent of students from rural–distant schools (schools in a rural area between 5 and 25 miles of an urban area, such as in the Fort LeBoeuf School District of Erie County) and 48.2 percent of students from rural–remote schools (schools in a rural area more than 25 miles from an urban area, such as in the Keystone Central School District of Clinton County; table 2). Immediate enrollment rates followed a similar pattern: among both cohorts rates for rural–fringe students were comparable to those for nonrural schools and higher than those for rural–distant and rural–remote schools.
Among the 2009/10 cohort a similar percentage of students from rural–distant, rural– fringe, and rural–remote schools delayed college enrollment—and at a slightly lower rate than students from nonrural schools. Among the 2010/11 cohort the percentage of students who delayed enrollment was higher for rural–fringe schools than for rural–distant and rural–remote schools.
Among both cohorts students from rural–fringe schools had a higher first- to second-year persistence rate than students from schools in other rural locales and students from non-rural schools.
Among high-poverty schools and schools with a large population of racial/ethnic minority students, students from rural schools had higher college enrollment and first- to second-year persistence rates than students from nonrural schools. Among high-poverty schools the percentage of students who enrolled in college was higher for rural schools than for nonrural schools (see table D4 in appendix D). Among the 2009/10 cohort the percentage was 57.1 percent for rural high-poverty schools, compared with 44.8 percent for nonrural high-poverty schools.
Among the 2009/10 cohort the percentage of students who persisted from their first to their second year of college was 90.9 pe rcent for rural high-poverty schools, compared with 60.7 percent for nonrural high-poverty schools. The disparity is not as large among the 2010/11 cohort, where the percentage was 59.1 pe rcent for rural high-poverty schools, compared with 55.2 percent for nonrural high-poverty schools.
5
Nonrural
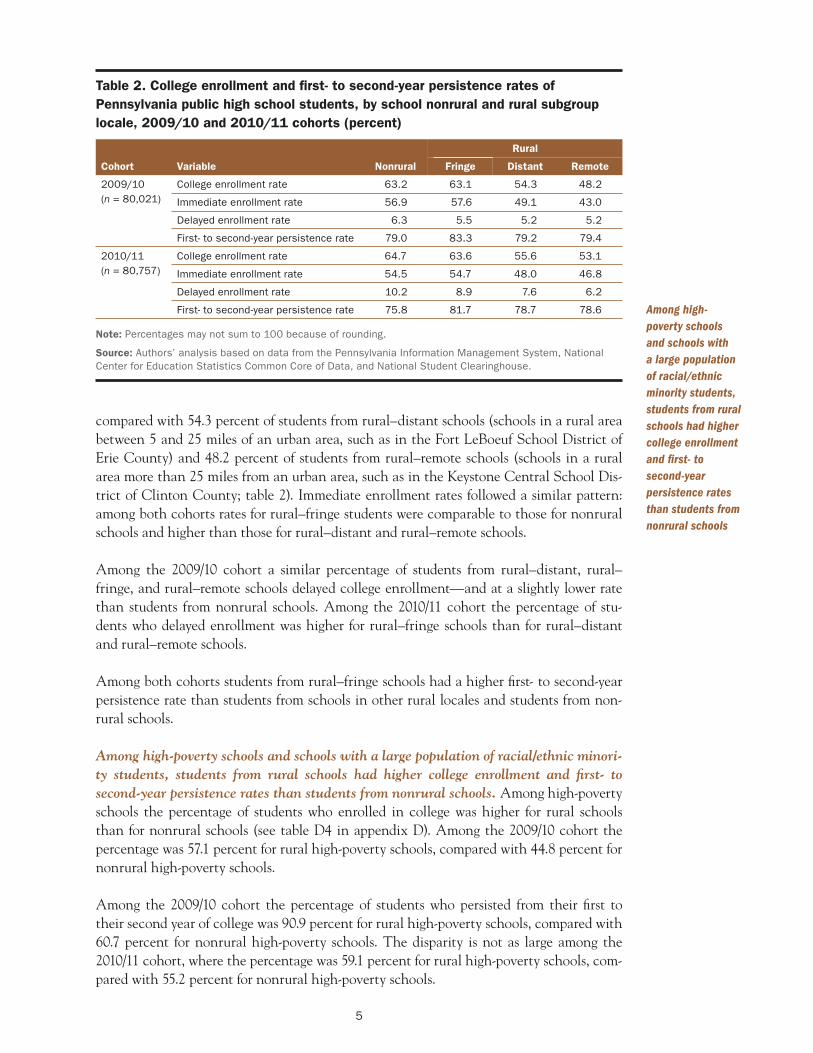
Cohort College type Rural City Suburban Town
2009/10 (n = 80,021)
Public four-year
Public two-year
51.6
21.2
36.8
36.5
44.5
26.6
56.1
16.8
Private four-year 22.6 22.6 26.6 22.6
Private two-year 4.5 3.8 2.2 4.4
In-state 84.4 88.9 84.3 87.1
2010/11 (n = 80,757)
Public four-year
Public two-year
52.8
20.7
36.9
34.6
44.5
26.2
57.0
15.6
Private four-year 23.3 23.2 26.5 24.9
Private two-year 3.1 4.2 1.8 2.5
In-state 83.7 86.3 82.2 86.2
Between the 2009/10 and 2010/11 cohorts the persistence rate rose only for students from rural low-poverty schools. The persistence rate for students from rural high-poverty schools fell dramatically, from 90.9 percent among the 2009/10 cohort to 59.1 percent among the 2010/11 cohort. Analyses indicate that this variability is an artifact of the small number of rural high-poverty schools—that is, because there are few rural high-poverty schools, minor changes in the number of students persisting in college can have a large effect on the overall persistence rate for that group.
Rural schools with a large population of racial/ethnic minority students also had higher college enrollment and persistence rates than their nonrural counterparts (table D5 in appendix D). Among the 2009/10 cohort the college enrollment rate was 64.9 pe rcent for rural schools with a large population of racial/ethnic minority students, compared with 49.5 percent for nonrural schools with a large population of racial/ethnic minority students.
Among the 2009/10 cohort the percentage of students who persisted from their first to their second year of college was higher for nonrural schools with a large population of racial/ethnic minority students (63.3 percent) than for rural schools with a large population of racial/ethnic minority students (66.4 percent). The gap widened among the 2010/11 cohort: 76.4 percent of students from rural schools with a large population of racial/ethnic minority students and 57.9 percent of students from nonrural schools with a large population of racial/ethnic minority students.
How do college enrollment rates by type of college vary across rural Pennsylvania schools, and how do these rates compare with those of city, suburban, and town schools?
Pennsylvania high schools sent the majority of their college enrollees to public four-year colleges and in-state colleges. Across all school locales public four-year colleges had the highest percentage of college enrollees among both the 2009/10 and 2010/11 cohorts (table 3). More than 50 percent of college enrollees from rural and town schools enrolled in public
Table 3. Type of college enrolled in by Pennsylvania public high school students, by school locale, 2009/10 and 2010/11 cohorts (percent)
Rural schools with
a large population
of racial/ethnic
minority students
had higher college
enrollment and
persistence rates
than their nonrural
counterparts
Note: The denominator for all calculations is the number of students who enrolled in college. Percentages may not sum to 100 because of rounding.
Source: Authors’ analysis based on data from the Pennsylvania Information Management System, National Center for Education Statistics Common Core of Data, and National Student Clearinghouse.
6
four-year colleges. Town schools sent the highest percentages of students to public four-year colleges, and cities sent the lowest. Higher percentages of students from city schools enrolled in public two-year colleges than did students from other locales. Rural, city, and town schools enrolled similar percentages of students in private four-year colleges. All locales saw the vast majority of their college-going students enroll in in-state colleges. Rural and suburban schools sent slightly higher percentages of their graduates to out-of-state colleges.
What characteristics of rural Pennsylvania districts are associated with higher and lower school-level college enrollment and persistence rates?
Rural districts in the quartile with the highest school-level college enrollment rates had smaller proportions of rural schools, and the rural schools they included were closer to urban areas.2 These districts also had lower poverty rates, lower percentages of students in special education, higher percentages of English language learner students, and greater racial/ethnic diversity. The percentage of economically disadvantaged students in rural schools was associated with persistence rates among the 2009/10 and 2010/11 cohorts and with immediate enrollment rates among the 2009/10 cohort. No school characteristics predicted immediate enrollment rates among the 2010/11 cohort.
Rural districts with the highest school-level college enrollment rates had fewer rural schools and were closer to urban areas than rural districts with lower college enrollment rates. Rural districts with the highest college enrollment rates3 had smaller proportions of rural schools, and the rural schools they included were closer to urban areas (see tables D6 and D7 in appendix D). These districts were, in effect, less rural. Among the 2009/10 cohort, 76.6 percent of students from rural districts in the quartile with the highest college enrollment rates were enrolled in rural schools. All three district quartiles with lower college enrollment rates had a higher percentage of students from rural schools. The quartile with the smallest percentage of rural–distant schools was the one with the highest college enrollment rates, and rural–remote schools accounted for 1 percent of rural schools in that quartile. Among both the 2009/10 and 2010/11 cohorts the percentage of rural schools that were rural–distant was significantly lower in that quartile than in the two quartiles with the lowest college enrollment rates.
Rural districts with the highest school-level college enrollment rates had lower dropout rates and higher on-time high school graduation rates than rural districts with lower school-level college enrollment rates. Among the 2009/10 cohort the dropout rate was significantly lower in the quartile with the highest college enrollment rates (4.2 percent) than in both the lowest (6.3 percent) and second lowest quartiles (6.4 percent). Among the 2010/11 cohort the dropout rate was significantly lower in the quartile with the highest college enrollment rates (4.0 percent) than in the three other quartiles (6.4 percent for the lowest, 5.6 percent for the second lowest, and 6.0 percent for the second highest). In addition, rural districts with the highest school-level college enrollment rates had somewhat higher on-time high school graduation rates than rural districts with lower college enrollment rates. For example, the on-time high school graduation rate for the 2009/10 cohort in rural districts with the highest school-level college enrollment rates was 91.5 percent, compared with 89.3 percent in rural districts with the lowest school-level college enrollment rates. The gap was wider among the 2010/11 cohort, with an on-time high school graduation rate of 92.7 percent in rural districts with the highest college enrollment rates and 88.8 percent in rural districts with the lowest school-level college enrollment rates.
Rural districts
with the highest
school-level
college enrollment
rates had fewer
rural schools and
were closer to
urban areas than
rural districts
with lower college
enrollment rates
7
Rural districts with the highest school-level college enrollment rates had lower percentages of students in special education, higher percentages of English language learner students, lower poverty rates, and greater racial/ethnic diversity. Among the 2009/10 cohort the percentage of students in special education was significantly lower in the quartile with the highest college enrollment rates (14.5 percent) than in the quartile with the lowest (17.1 percent). The English language learner student population was small across all quartiles, but the difference in the percentage between the districts with the highest (0.8 percent) and lowest (0.2 percent) college enrollment rates was statistically significant. The percentages of economically disadvantaged students was significantly lower in the quartile with the highest college enrollment rates than in the other three quartiles.
Among the 2009/10 cohort statistically significant differences in racial/ethnic diversity were found between the quartiles with the highest and lowest college enrollment rates for Asian (1.7 pe rcent and 0.3 percent), Black (3.3 pe rcent and 1.4 percent), Hispanic (2.7 percent and 1.0 percent), and White students (91.5 percent and 96.9 percent). The percentage of Asian students was also significantly higher in the highest quartile than in the middle two quartiles (0.5 pe rcent and 0.6 percent). With few exceptions, these patterns were similar among the 2010/11 cohort.
In rural districts the percentage of economically disadvantaged students was the only school characteristic associated with immediate enrollment rates among the 2009/10 cohort, and no school characteristics were associated with immediate enrollment rates among the 2010/11 cohort. Schools with higher percentages of economically disadvantaged students had lower immediate enrollment rates among the 2009/10 cohort (see table D8 in appendix D). Associations between college enrollment rates and all other school characteristics were not statistically significant. Among the 2010/11 cohort, associations between immediate enrollment rates and school characteristics included in the analysis were not statistically significant (see table D9 in appendix D).
However, neither model explained more than 6.2 percent of the variance in college enrollment rates. Other variables, such as student-level demographics and prior achievement, may therefore play a far larger role than school-level characteristics in predicting rural college enrollment.
In rural districts the percentages of economically disadvantaged students and of Hispanic students together were both associated with first- to second-year persistence rates among the 2009/10 cohort, but only the percentage of economically disadvantaged students was associated with persistence rates among the 2010/11 cohort. Rural schools with higher percentages of economically disadvantaged students and of Hispanic students had lower first- to second-year college persistence rates among the 2009/10 cohort (see table D10 in appendix D). Associations between persistence rates and all other school characteristics were not statistically significant. The model explained 12.6 percent of the variance in college enrollment rates. Among the 2010/11 cohort, rural schools with higher percentages of economically disadvantaged students had lower first- to second-year college persistence rates (see table D11 in appendix D). Associations between persistence rates and all other school characteristics were not statistically significant. The model explained 6.7 percent of the variance in college enrollment rates.
In rural districts
the percentage
of economically
disadvantaged
students was
the only school
characteristic
associated
with immediate
enrollment
rates among the
2009/10 cohort,
and no school
characteristics
were associated
with immediate
enrollment
rates among the
2010/11 cohort
8
Implications and suggestions for further research
This study’s findings suggest several areas for further investigation and strategy development to improve college outcomes.
Rural Pennsylvania schools had lower college enrollment and persistence rates than town and suburban schools but higher rates than city schools
Rural schools in Pennsylvania were found to be demographically similar to town and suburban high schools but to have lower college enrollment and first- to second-year persistence rates, as some previous research also found (for example, Blackwell & McLaughlin, 1999; Gibbs, 2004; Provasnik et al., 2007). These differences merit further investigation to identify factors associated with persistence, such as high school course-taking patterns, high school grade point averages, achievement scores, and college credit accumulation patterns. Additional research might also focus on identifying the college preparation practices and programs used by rural schools with high college enrollment and persistence rates, examining the relationship between college distance from students’ hometowns and persistence or analyzing the characteristics of rural high school students who appear to be strong candidates for college but do not enroll.
Rural–fringe schools had higher college enrollment and persistence rates than rural–distant and rural–remote schools
College enrollment outcomes varied among the subgroups of rural Pennsylvania schools. Although enrollment and first- to second-year persistence rates for rural–fringe schools were similar to those for nonrural schools, rural–distant and rural–remote schools had lower rates. This finding suggests that proximity to cities, suburbs, or towns may offer students from rural–fringe schools access to resources and supports that are less available in rural–distant and rural–remote schools. Further research could investigate factors associated with persistence among these rural subgroups.
Among rural schools, being economically disadvantaged appears to be associated with lower rural college enrollment and persistence rates
Rural high-poverty and rural schools with a large population of racial/ethnic minority students had higher college enrollment and first- to second-year persistence rates than did their nonrural counterparts. As earlier research has suggested, such schools may leverage community social resources and strong teacher–student relationships to encourage college enrollment (Byun, Meece, & Irvin, 2012; Griffin, Hutchins, & Meece, 2011).
However, once other factors were controlled for, rural schools with high percentages of economically disadvantaged students had lower college enrollment and first- to second-year persistence rates than rural schools with lower percentages of such students. Analyses of rural districts with the highest and lowest college enrollment rates revealed a similar pattern: rural districts with the highest college enrollment rates had lower poverty rates than those with the lowest enrollment rates. These findings corroborate earlier research indicating significant associations between school poverty levels and poor college outcomes among students from rural schools (Byun et al., 2012; National Student Clearinghouse, 2013).
Rural schools
in Pennsylvania
were found to be
demographically
similar to town
and suburban
high schools but
to have lower
college enrollment
and first- to
second-year
persistence rates
9
This suggests that the relative poverty of rural areas, rather than a rural location itself, may compromise college enrollment and persistence. In fact, economically disadvantaged students are less likely to enroll and persist in college wherever they may live, particularly if they attend high-poverty schools (National Center for Education Statistics, 2013; National Student Clearinghouse, 2013; Wolniak & Engberg, 2010). Rural schools serving a large population of economically disadvantaged students may thus want to consider implementing research-based college access and success strategies targeting economically disadvantaged youth.
Across school locales the 2009/10 and 2010/11 cohorts differed in college enrollment and immediate enrollment rates
For rural, city, and suburban schools the college enrollment rate was higher among the 2010/11 cohort than among the 2009/10 cohort, but the immediate enrollment rate was lower among the 2010/11 cohort than among the 2009/10 cohort. Further research is warranted to determine whether this finding indicates a trend with implications for policy and practice.
Study limitations
This descriptive study is a snapshot of patterns and variations in rural Pennsylvania college enrollment. These data can provide useful information for educators and education leaders, but readers should not draw causal conclusions that are not supported by the study design.
The National Student Clearinghouse does not include all colleges. Although roughly 93 percent of public colleges are covered by the database, private, for-profit colleges are underrepresented (National Student Clearinghouse Research Center, 2012).
The association
between school
poverty levels
and poor college
outcomes among
students from
rural schools
suggests that the
relative poverty
of rural areas,
rather than a rural
location itself,
may compromise
college enrollment
and persistence
10
Appendix A. Literature review
Much of the literature exploring college enrollment factors and characteristics focuses on variables that are not included in the current study (primarily because data are unavailable). Nevertheless, this literature does suggest reasons to examine the relationship between certain district and school characteristics and college enrollment and persistence.
Students from rural schools have historically had lower college enrollment and completion rates than students from nonrural schools (Beaulieu et al., 2003; Blackwell & McLaughlin, 1999; Gibbs, 2004; Lichter et al., 1995; Provasnik et al., 2007). But college enrollment rates are rising faster among students from rural schools than among students from nonrural schools: between 2003 and 2007 college enrollment rose from 35 percent to 42 percent for students from rural schools, from 32.5 percent to 36.1 percent for students from city schools, and from 40.3 percent to 41.2 percent for students from suburban schools (Snyder & Dillow, 2010).
Several factors contribute to weaker college outcomes among rural youth. Black students from rural schools and students whose parents have limited education and who are from rural schools are less likely to pursue college (Irvin, Byun, Meece, Farmer, & Hutchins, 2012). Schools also play an important role: low student–teacher ratios and positive school experiences are associated with stronger college aspirations, once socioeconomic factors are controlled for (Irvin, Meece, Byun, Farmer, & Hutchins, 2011).
Unfortunately, very few national comparisons of rural and nonrural college enrollment rates and investigations of the factors and characteristics associated with these rates are available. A notable exception is a recently released study from the National Student Clearinghouse (2013), which finds that high-poverty rural high schools across the country have the lowest average college enrollment and persistence rates, even when compared with high-poverty, city schools with a large population of racial/ethnic minority students.
The factors that influence college enrollment and completion may differ between populations in rural and nonrural schools (Byun et al., 2012; Griffin et al., 2011). For instance, students in nonrural schools have more access than their counterparts in nonrural schools to community social resources (for example, parent relationships with the parents of children’s friends, student participation in religious activities). That access in turn is associated with “a small but significant increase in the likelihood of college degree attainment, especially bachelor’s degree completion, even after controlling for individual family background, demographic background, and academic preparation” (Byun et al., 2012, p. 431). Parent academic discussions and expectations exert a positive influence on college participation—even after controlling for students’ academic preparation (for example, high school grade point average, standardized test scores).
Students in rural schools are also more likely than students in town schools to talk with teachers about their plans after high school and to report that teachers are the most helpful source of information about college options (Griffin et al., 2011).
Nonetheless, comparisons of rural and nonrural college trends suggest that poverty and other demographic factors, rather than rurality, may account for different outcomes. For example, students from rural schools are less likely than students from nonrural schools to
A-1
enroll in and complete college in large part because they tend to come from lower socioeconomic backgrounds (Byun et al., 2012). And the odds of college enrollment are not significantly different for students from rural schools than for those from nonrural schools after controlling for a variety of student-, family-, and school-level variables (Engberg & Wolniak, 2010).
Findings from national studies of rural student data samples collectively suggest that school-based factors (specifically, instruction and guidance practices and student supports, along with supportive policies) greatly influence students’ college aspirations and enrollment (Engberg & Wolniak, 2010; Irvin et al., 2011). The high school experience builds the human, social, and cultural capital that is associated with a college education, and teachers, counselors, and administrators facilitate this experience (Engberg & Wolniak, 2010). Both policy-driven school characteristics (for example, student–teacher ratios) and school experience shaped by practices and student supports (for example, a sense of school valuing and belonging) influence rural students’ college aspirations (Irvin et al., 2011).
In Pennsylvania specifically, the influence of demographics on rural college enrollment is unclear, although school factors appear to play an important role:
•
•
•
Rural college enrollment and persistence (based on status in 1992 and 1994) are significantly related to both demographic (for example, gender and socioeconomic status) and school characteristics (for example, enrollment in high school science courses and aspirations of peers; Yan, 2002). A comparison of rural high school students in 1995 and 2005 found a significant rise in the college enrollment plans of three groups: students from rural schools overall, students from rural schools with parents who did not have a college education, and lower middle-class students from rural schools (Legutko, 2008). Contrary to the findings of research on urban youth, family income and relationships with parents show minimal association with college enrollment rates for rural schools. However, school-related factors are strongly associated with the college aspirations of students in rural schools. According to this research, school factors are “the strongest predictors of postsecondary enrollment” and the role of schools in rural areas is “central to future educational engagement, perhaps more central than [that of] schools in other areas” (Demi, Coleman-Jensen, & Snyder, 2010, p. 16).
A-2
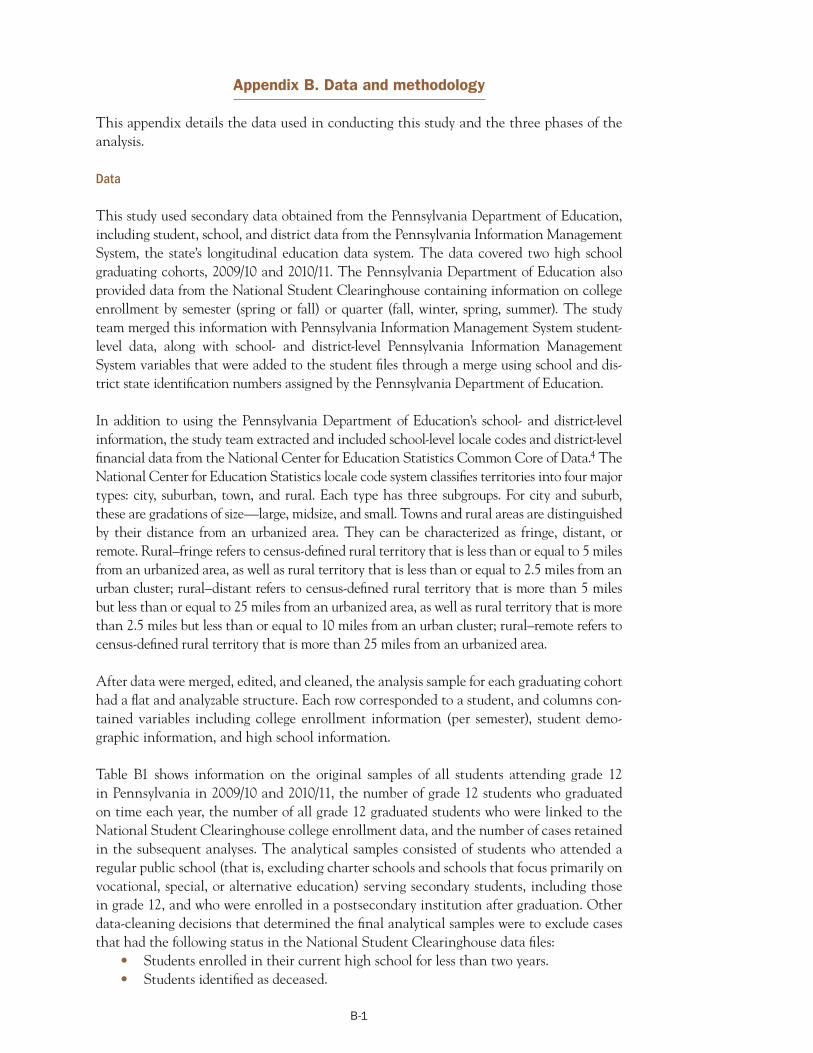
Appendix B. Data and methodology
This appendix details the data used in conducting this study and the three phases of the analysis.
Data
This study used secondary data obtained from the Pennsylvania Department of Education, including student, school, and district data from the Pennsylvania Information Management System, the state’s longitudinal education data system. The data covered two high school graduating cohorts, 2009/10 and 2010/11. The Pennsylvania Department of Education also provided data from the National Student Clearinghouse containing information on college enrollment by semester (spring or fall) or quarter (fall, winter, spring, summer). The study team merged this information with Pennsylvania Information Management System student-level data, along with school- and district-level Pennsylvania Information Management System variables that were added to the student files through a merge using school and district state identification numbers assigned by the Pennsylvania Department of Education.
In addition to using the Pennsylvania Department of Education’s school- and district-level information, the study team extracted and included school-level locale codes and district-level financial data from the National Center for Education Statistics Common Core of Data.4 The National Center for Education Statistics locale code system classifies territories into four major types: city, suburban, town, and rural. Each type has three subgroups. For city and suburb, these are gradations of size—large, midsize, and small. Towns and rural areas are distinguished by their distance from an urbanized area. They can be characterized as fringe, distant, or remote. Rural–fringe refers to census-defined rural territory that is less than or equal to 5 miles from an urbanized area, as well as rural territory that is less than or equal to 2.5 miles from an urban cluster; rural–distant refers to census-defined rural territory that is more than 5 miles but less than or equal to 25 miles from an urbanized area, as well as rural territory that is more than 2.5 miles but less than or equal to 10 miles from an urban cluster; rural–remote refers to census-defined rural territory that is more than 25 miles from an urbanized area.
After data were merged, edited, and cleaned, the analysis sample for each graduating cohort had a flat and analyzable structure. Each row corresponded to a student, and columns contained variables including college enrollment information (per semester), student demographic information, and high school information.
Table B1 shows information on the original samples of all students attending grade 12 in Pennsylvania in 2009/10 and 2010/11, the number of grade 12 students who graduated on time each year, the number of all grade 12 graduated students who were linked to the National Student Clearinghouse college enrollment data, and the number of cases retained in the subsequent analyses. The analytical samples consisted of students who attended a regular public school (that is, excluding charter schools and schools that focus primarily on vocational, special, or alternative education) serving secondary students, including those in grade 12, and who were enrolled in a postsecondary institution after graduation. Other data-cleaning decisions that determined the final analytical samples were to exclude cases that had the following status in the National Student Clearinghouse data files:
• •
Students enrolled in their current high school for less than two years. Students identified as deceased.
B-1
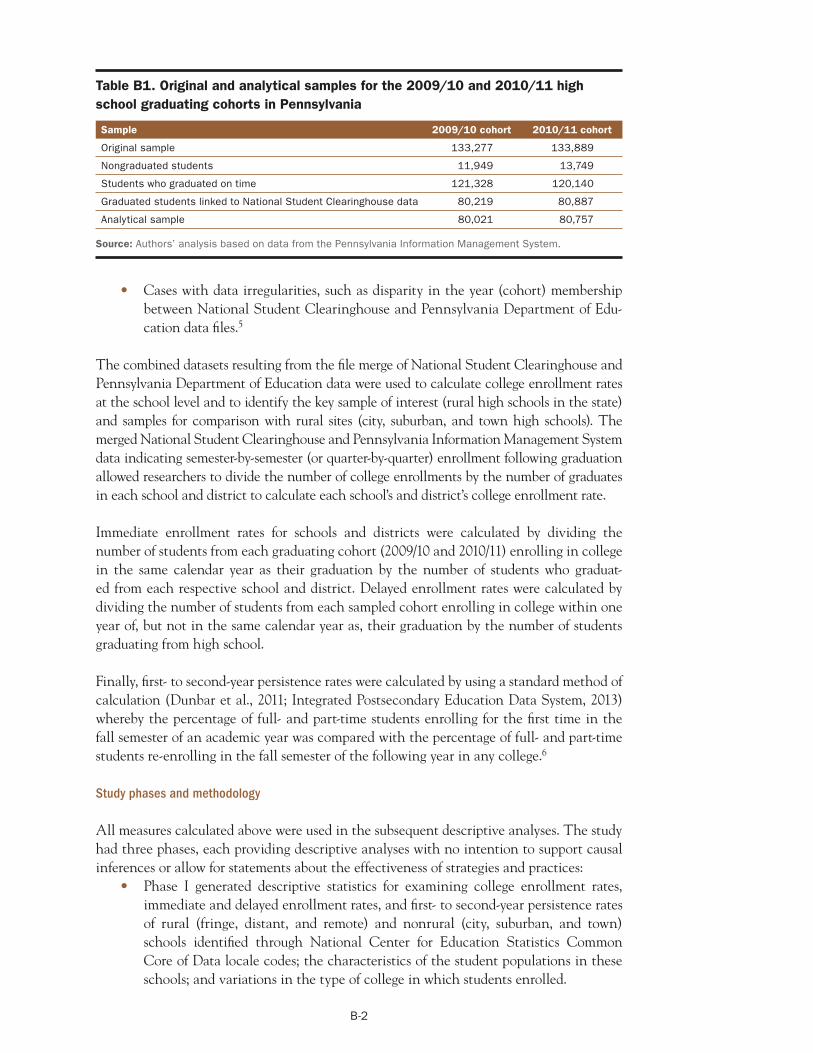
Sample 2009/10 cohort 2010/11 cohort
Original sample 133,277 133,889
Nongraduated students 11,949 13,749
Students who graduated on time 121,328 120,140
Graduated students linked to National Student Clearinghouse data 80,219 80,887
Analytical sample 80,021 80,757
Table B1. Original and analytical samples for the 2009/10 and 2010/11 high school graduating cohorts in Pennsylvania
Source: Authors’ analysis based on data from the Pennsylvania Information Management System.
• Cases with data irregularities, such as disparity in the year (cohort) membership between National Student Clearinghouse and Pennsylvania Department of Education data files.5
The combined datasets resulting from the file merge of National Student Clearinghouse and Pennsylvania Department of Education data were used to calculate college enrollment rates at the school level and to identify the key sample of interest (rural high schools in the state) and samples for comparison with rural sites (city, suburban, and town high schools). The merged National Student Clearinghouse and Pennsylvania Information Management System data indicating semester-by-semester (or quarter-by-quarter) enrollment following graduation allowed researchers to divide the number of college enrollments by the number of graduates in each school and district to calculate each school’s and district’s college enrollment rate.
Immediate enrollment rates for schools and districts were calculated by dividing the number of students from each graduating cohort (2009/10 and 2010/11) enrolling in college in the same calendar year as their graduation by the number of students who graduated from each respective school and district. Delayed enrollment rates were calculated by dividing the number of students from each sampled cohort enrolling in college within one year of, but not in the same calendar year as, their graduation by the number of students graduating from high school.
Finally, first- to second-year persistence rates were calculated by using a standard method of calculation (Dunbar et al., 2011; Integrated Postsecondary Education Data System, 2013) whereby the percentage of full- and part-time students enrolling for the first time in the fall semester of an academic year was compared with the percentage of full- and part-time students re-enrolling in the fall semester of the following year in any college.6
Study phases and methodology
All measures calculated above were used in the subsequent descriptive analyses. The study had three phases, each providing descriptive analyses with no intention to support causal inferences or allow for statements about the effectiveness of strategies and practices:
• Phase I generated descriptive statistics for examining college enrollment rates, immediate and delayed enrollment rates, and first- to second-year persistence rates of rural (fringe, distant, and remote) and nonrural (city, suburban, and town) schools identified through National Center for Education Statistics Common Core of Data locale codes; the characteristics of the student populations in these schools; and variations in the type of college in which students enrolled.
B-2
•
•
Phase II investigated variations in district and school characteristics by college enrollment rate quartile and explored the statistical significance of school effects on immediate enrollment and first- to second-year persistence rates. Phase III used multivariate logistic regression analyses to examine the individual and combined influence of student-, school-, and college-level variables on college enrollment and first- to second- year persistence rates in all rural Pennsylvania schools.
Each phase is described in greater detail in the following sections.
Appendix C replicates much of the analysis for only schools in PARSS districts.
Phase I. Descriptive statistics were calculated to compare college enrollment rates, immediate and delayed enrollment rates, and first- to second-year persistence rates of rural and nonrural schools. The statistics included range and distribution and average rate. In addition, the type of college in which students from rural schools enrolled was examined (for example, two- or four-year; in-state or out-of-state; public, private, or for-profit). Descriptive statistics for school characteristics (for example, size, percentage of students in special education, percentage of economically disadvantaged students, and percentage of racial/ ethnic minority students) were presented in each category. Tests of statistical significance (for example, t-tests) of rural versus nonrural (a combined value for city, suburban, and town) locales were also conducted. Findings by type of rural subgroup (rural–fringe, rural– distant, and rural–remote) were also disaggregated and reported.
Two sets of cross-tabulations examined how outcomes varied by school and demographic factors across rural and nonrural locales. The first set included mean outcome comparisons of rural and nonrural schools with large versus small economically disadvantaged student populations. (Free or reduced-price lunch status was used as a proxy for economic status.) To create the large and small categories of economically disadvantaged student populations, the research team referred to Crosnoe (2009), who suggests that high schools with less than 20 percent of students identified as economically disadvantaged can be described as having a small economically disadvantaged population and that high schools with more than 60 percent of students identified as economically disadvantaged can be described as having a large economically disadvantaged population.
The second set of cross-tabulations examined variations across rural and nonrural locales by school racial/ethnic minority population. Based on the High School Transcript Study,7
schools where more than 50 percent of students are identified as a racial/ethnic minority were classified as large racial/ethnic minority population, and schools where less than 5 percent of students are identified as a racial/ethnic minority were classified as small racial/ ethnic minority population.
Phase II. The second phase examined correlations between college enrollment outcomes and school and district characteristics of rural schools by college enrollment quartiles, which were created by rank-ordering all rural high schools by the percentage of graduates enrolling in college within one year and then dividing the schools into four subsets of approximately equal size. The study team used descriptive statistics to analyze the attributes of schools in each quartile, as well as characteristics of the school districts with grade 12 students. Most of the district characteristics were computed by aggregating the Pennsylvania Department of Education school-level data for all rural high schools served
B-3
within each district (for example, number of rural schools, total enrollment) with district information extracted from National Center for Education Statistics district databases (for example, expenditure per student, district locale). An F-test was conducted for each school and district variable to explore all possible pairwise comparisons of the four quartiles of schools. When the assumption of homogeneity of variance was not met, Welch’s analysis of variance was used to test for differences between group means.
Analysis based on broad groups of schools may not pay adequate attention to schools exhibiting extremely high or extremely low college enrollment rates. As a supplemental analysis, the top 5 percent and bottom 5 percent were examined to better understand the profiles of these schools. And to explore the statistical significance of school effects on immediate enrollment and persistence, the school variables that emerged as statistically significant in the individual analyses of variance were entered in a multiple regression model.
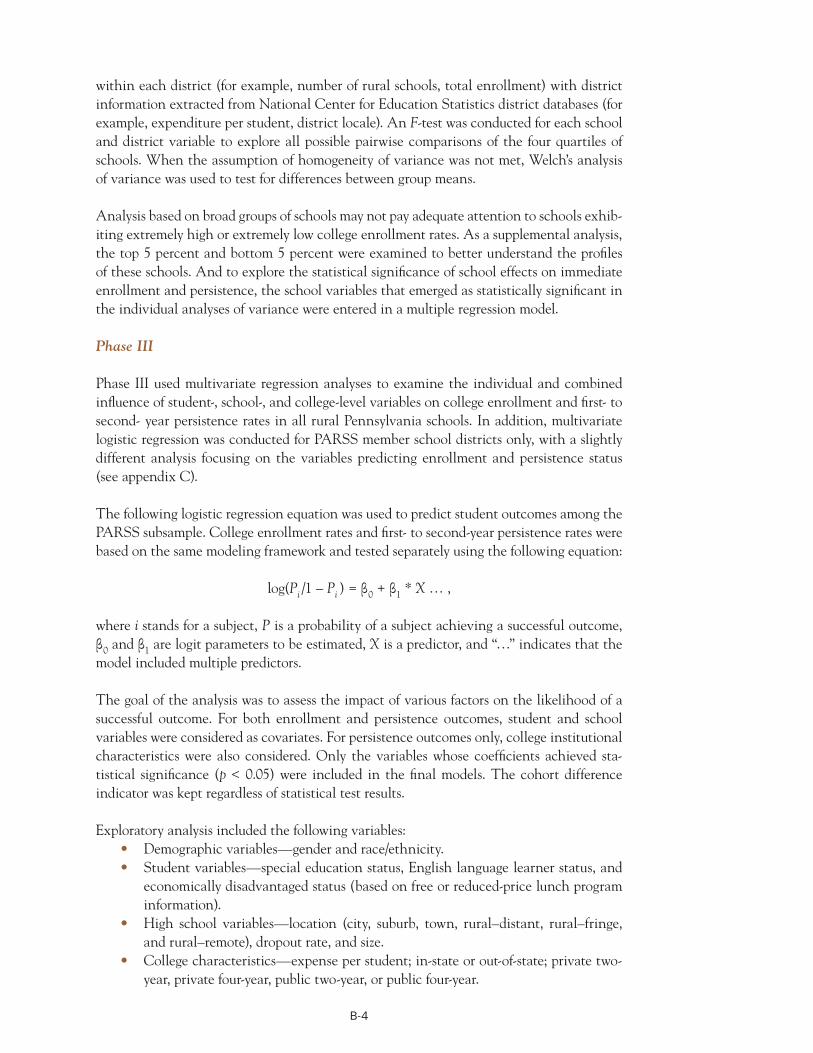
Phase III
Phase III used multivariate regression analyses to examine the individual and combined influence of student-, school-, and college-level variables on college enrollment and first- to second- year persistence rates in all rural Pennsylvania schools. In addition, multivariate logistic regression was conducted for PARSS member school districts only, with a slightly different analysis focusing on the variables predicting enrollment and persistence status (see appendix C).
The following logistic regression equation was used to predict student outcomes among the PARSS subsample. College enrollment rates and first- to second-year persistence rates were based on the same modeling framework and tested separately using the following equation:
log(Pi /1 – Pi ) = β0 + β1 * X … ,
where i stands for a subject, P is a probability of a subject achieving a successful outcome, β0 and β1 are logit parameters to be estimated, X is a predictor, and “…” indicates that the model included multiple predictors.
The goal of the analysis was to assess the impact of various factors on the likelihood of a successful outcome. For both enrollment and persistence outcomes, student and school variables were considered as covariates. For persistence outcomes only, college institutional characteristics were also considered. Only the variables whose coefficients achieved statistical significance (p < 0.05) were included in the final models. The cohort difference indicator was kept regardless of statistical test results.
Exploratory analysis included the following variables: • •
•
•
Demographic variables—gender and race/ethnicity. Student variables—special education status, English language learner status, and economically disadvantaged status (based on free or reduced-price lunch program information). High school variables—location (city, suburb, town, rural–distant, rural–fringe, and rural–remote), dropout rate, and size. College characteristics—expense per student; in-state or out-of-state; private two-year, private four-year, public two-year, or public four-year.
B-4
To assist the interpretation of logit parameters (βs), corresponding odds ratios were reported. Odds ratios for dichotomous variables (such as gender) compared the likelihood in the two groups of one outcome over the other (for example, enrolled versus not enrolled), holding all other variables constant. For example, female PARSS students’ odds ratio for immediate enrollment was 1.69 (see table D19 in appendix D). This means that female students were 1.69 times more likely than male students to enroll in college immediately. For continuous variables, standardized odds ratios were reported. They compared the likelihood of two groups: one whose predictor value was the average and one whose predictor value was one standard deviation above the average. For example, the odds ratio for high school size in predicting immediate enrollment was 1.04 (see table D19 in appendix D). This compared students from the average-sized high school with students from a school whose size was one standard deviation larger. Students from the larger school were 1.04 times more likely to enroll in college immediately.
Analysis of schools in Pennsylvania Association of Rural and Small Schools districts only
Data from the Pennsylvania Information Management System and the National Student Clearinghouse helped define the analysis sample, which included two cohorts of students from the 2009/10 and 2010/11 high school graduating classes in schools in PARSS districts. The analysis sample included all students who graduated from high schools in PARSS districts in 2010 and 2011. College enrollment rate, immediate enrollment rate, delayed enrollment rate, and first- to second-year persistence rate were all defined the same way as in phases I–III.
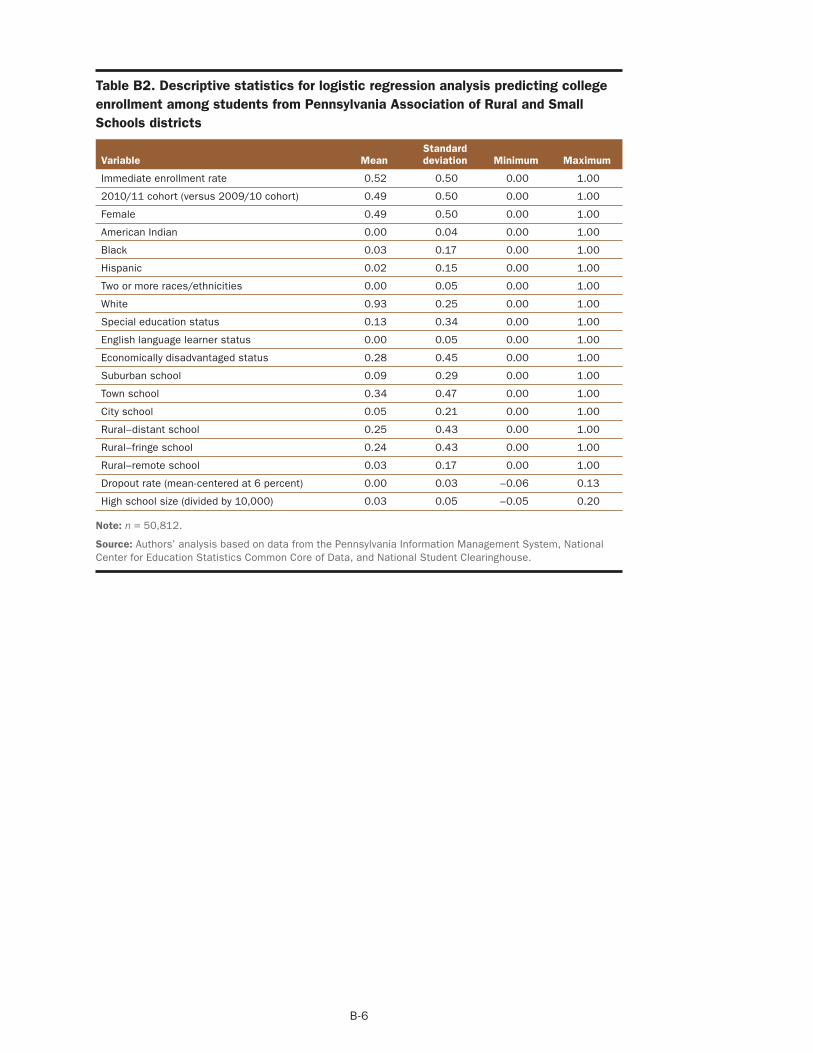
Tables B2 and B3 report descriptive and first- to second-year persistence rate statistics for the two regression models used for schools in PARSS districts only.
B-5
Variable Mean Standard deviation Minimum Maximum
Immediate enrollment rate 0.52 0.50 0.00 1.00
2010/11 cohort (versus 2009/10 cohort) 0.49 0.50 0.00 1.00
Female 0.49 0.50 0.00 1.00
American Indian 0.00 0.04 0.00 1.00
Black 0.03 0.17 0.00 1.00
Hispanic 0.02 0.15 0.00 1.00
Two or more races/ethnicities 0.00 0.05 0.00 1.00
White 0.93 0.25 0.00 1.00
Special education status 0.13 0.34 0.00 1.00
English language learner status 0.00 0.05 0.00 1.00
Economically disadvantaged status 0.28 0.45 0.00 1.00
Suburban school 0.09 0.29 0.00 1.00
Town school 0.34 0.47 0.00 1.00
City school 0.05 0.21 0.00 1.00
Rural–distant school 0.25 0.43 0.00 1.00
Rural–fringe school 0.24 0.43 0.00 1.00
Rural–remote school 0.03 0.17 0.00 1.00
Dropout rate (mean-centered at 6 percent) 0.00 0.03 –0.06 0.13
High school size (divided by 10,000) 0.03 0.05 –0.05 0.20
Table B2. Descriptive statistics for logistic regression analysis predicting college enrollment among students from Pennsylvania Association of Rural and Small Schools districts
Note: n = 50,812.
Source: Authors’ analysis based on data from the Pennsylvania Information Management System, National Center for Education Statistics Common Core of Data, and National Student Clearinghouse.
B-6
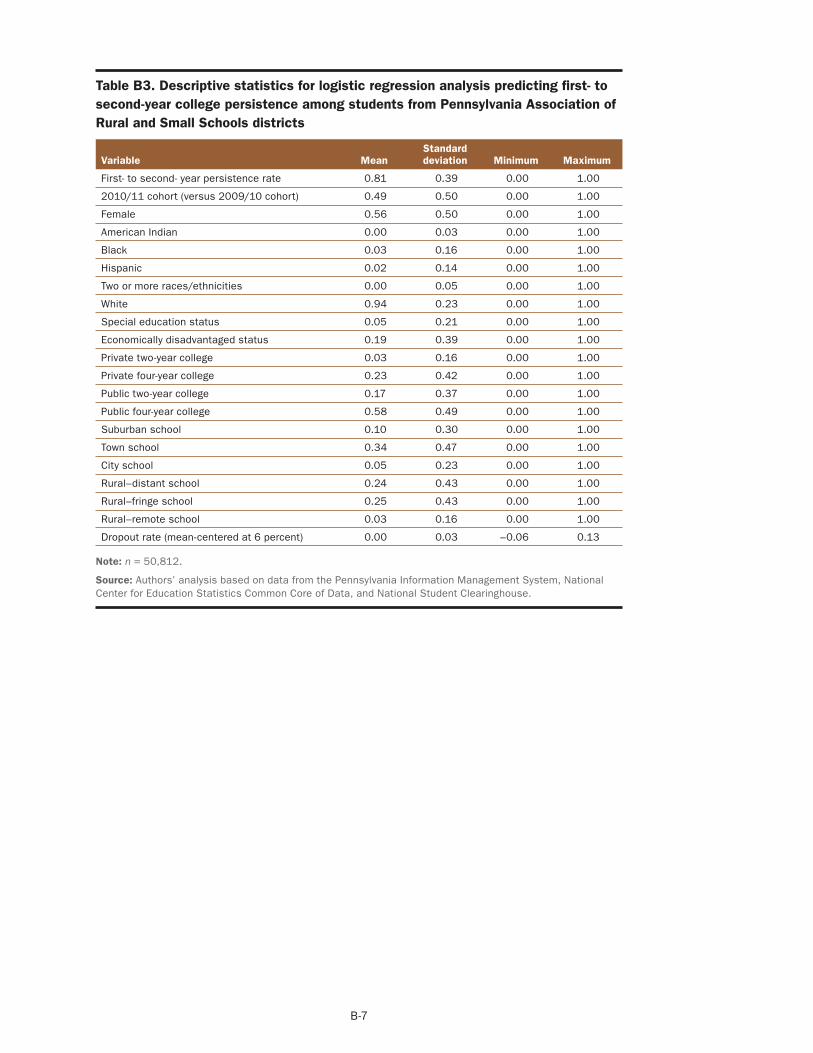
Note: n = 50,812.
Source: Authors’ analysis based on data from the Pennsylvania Information Management System, National Center for Education Statistics Common Core of Data, and National Student Clearinghouse.
Variable Mean Standard deviation Minimum Maximum
First- to second- year persistence rate 0.81 0.39 0.00 1.00
2010/11 cohort (versus 2009/10 cohort) 0.49 0.50 0.00 1.00
Female 0.56 0.50 0.00 1.00
American Indian 0.00 0.03 0.00 1.00
Black 0.03 0.16 0.00 1.00
Hispanic 0.02 0.14 0.00 1.00
Two or more races/ethnicities 0.00 0.05 0.00 1.00
White 0.94 0.23 0.00 1.00
Special education status 0.05 0.21 0.00 1.00
Economically disadvantaged status 0.19 0.39 0.00 1.00
Private two-year college 0.03 0.16 0.00 1.00
Private four-year college 0.23 0.42 0.00 1.00
Public two-year college 0.17 0.37 0.00 1.00
Public four-year college 0.58 0.49 0.00 1.00
Suburban school 0.10 0.30 0.00 1.00
Town school 0.34 0.47 0.00 1.00
City school 0.05 0.23 0.00 1.00
Rural–distant school 0.24 0.43 0.00 1.00
Rural–fringe school 0.25 0.43 0.00 1.00
Rural–remote school 0.03 0.16 0.00 1.00
Dropout rate (mean-centered at 6 percent) 0.00 0.03 –0.06 0.13
Table B3. Descriptive statistics for logistic regression analysis predicting first- to second-year college persistence among students from Pennsylvania Association of Rural and Small Schools districts
B-7
Appendix C. College enrollment in Pennsylvania Association of Rural and Small Schools districts
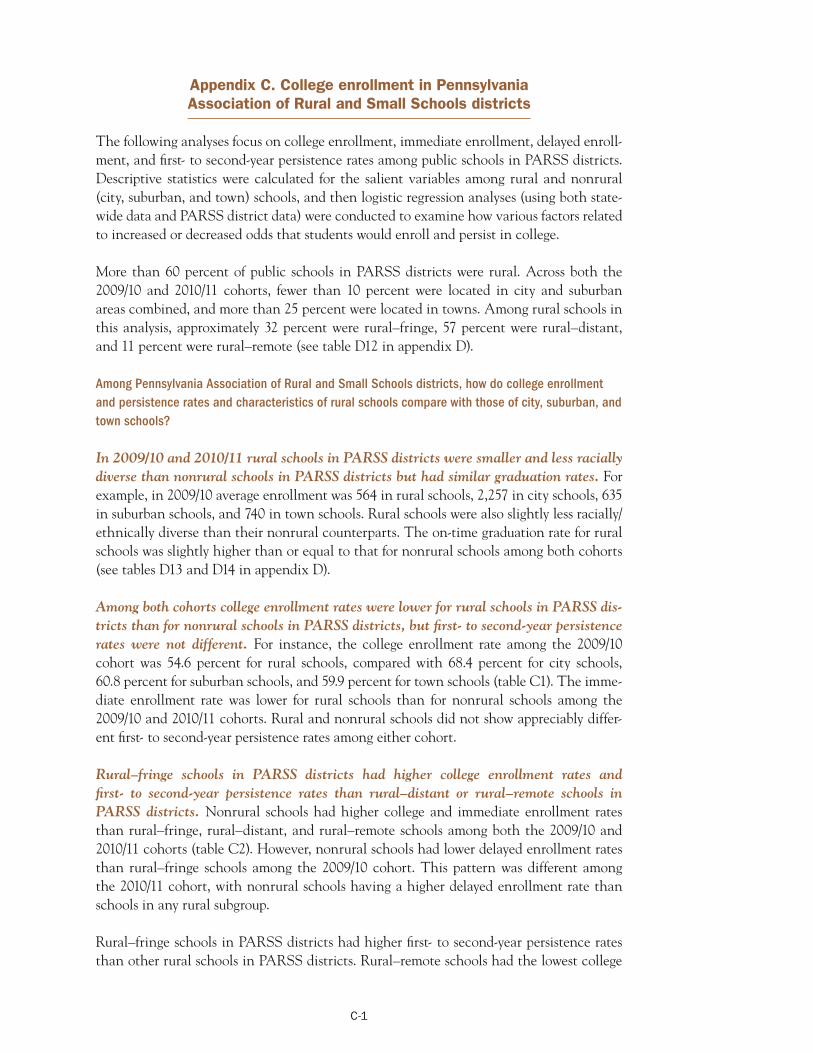
The following analyses focus on college enrollment, immediate enrollment, delayed enrollment, and first- to second-year persistence rates among public schools in PARSS districts. Descriptive statistics were calculated for the salient variables among rural and nonrural (city, suburban, and town) schools, and then logistic regression analyses (using both statewide data and PARSS district data) were conducted to examine how various factors related to increased or decreased odds that students would enroll and persist in college.
More than 60 percent of public schools in PARSS districts were rural. Across both the 2009/10 and 2010/11 cohorts, fewer than 10 percent were located in city and suburban areas combined, and more than 25 percent were located in towns. Among rural schools in this analysis, approximately 32 percent were rural–fringe, 57 percent were rural–distant, and 11 percent were rural–remote (see table D12 in appendix D).
Among Pennsylvania Association of Rural and Small Schools districts, how do college enrollment and persistence rates and characteristics of rural schools compare with those of city, suburban, and town schools?
In 2009/10 and 2010/11 rural schools in PARSS districts were smaller and less racially diverse than nonrural schools in PARSS districts but had similar graduation rates. For example, in 2009/10 average enrollment was 564 in rural schools, 2,257 in city schools, 635 in suburban schools, and 740 in town schools. Rural schools were also slightly less racially/ ethnically diverse than their nonrural counterparts. The on-time graduation rate for rural schools was slightly higher than or equal to that for nonrural schools among both cohorts (see tables D13 and D14 in appendix D).
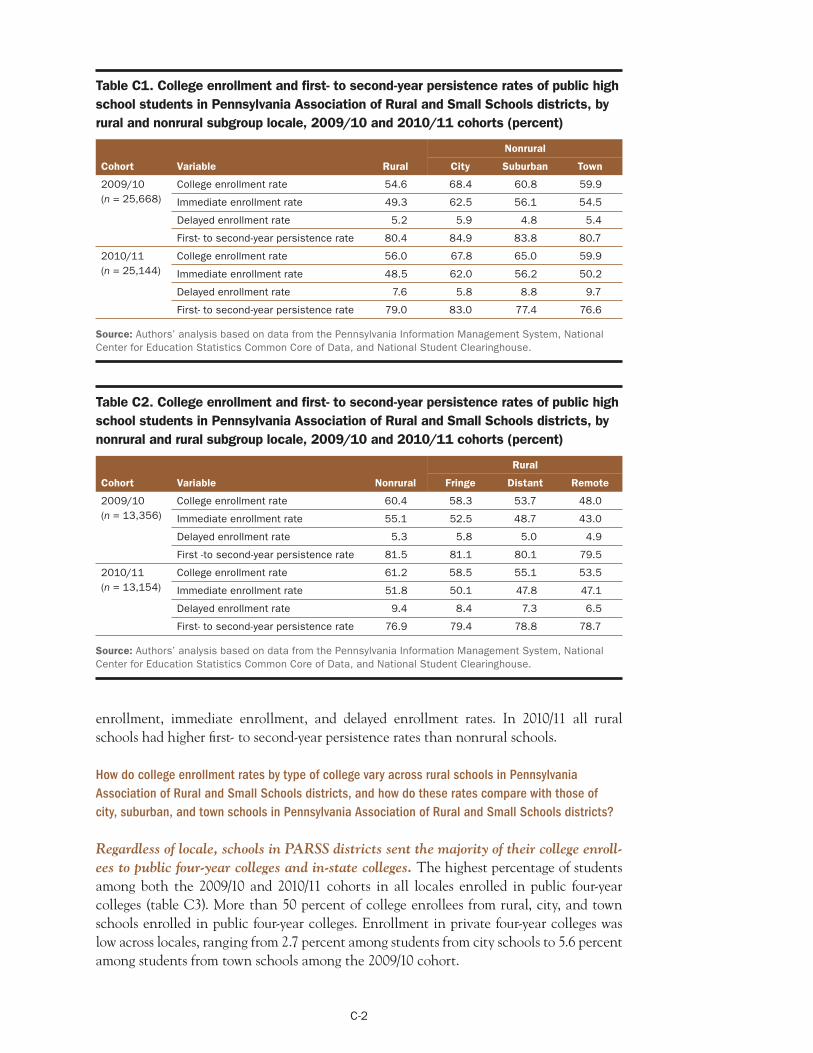
Among both cohorts college enrollment rates were lower for rural schools in PARSS districts than for nonrural schools in PARSS districts, but first- to second-year persistence rates were not different. For instance, the college enrollment rate among the 2009/10 cohort was 54.6 pe rcent for rural schools, compared with 68.4 pe rcent for city schools, 60.8 percent for suburban schools, and 59.9 percent for town schools (table C1). The immediate enrollment rate was lower for rural schools than for nonrural schools among the 2009/10 and 2010/11 cohorts. Rural and nonrural schools did not show appreciably different first- to second-year persistence rates among either cohort.
Rural–fringe schools in PARSS districts had higher college enrollment rates and first- to second-year persistence rates than rural–distant or rural–remote schools in PARSS districts. Nonrural schools had higher college and immediate enrollment rates than rural–fringe, rural–distant, and rural–remote schools among both the 2009/10 and 2010/11 cohorts (table C2). However, nonrural schools had lower delayed enrollment rates than rural–fringe schools among the 2009/10 cohort. This pattern was different among the 2010/11 cohort, with nonrural schools having a higher delayed enrollment rate than schools in any rural subgroup.
Rural–fringe schools in PARSS districts had higher first- to second-year persistence rates than other rural schools in PARSS districts. Rural–remote schools had the lowest college
C-1
Nonrural
Cohort Variable Rural City Suburban Town
2009/10 College enrollment rate 54.6 68.4 60.8 59.9 (n = 25,668) Immediate enrollment rate 49.3 62.5 56.1 54.5
Delayed enrollment rate 5.2 5.9 4.8 5.4
First- to second-year persistence rate 80.4 84.9 83.8 80.7
2010/11 College enrollment rate 56.0 67.8 65.0 59.9 (n = 25,144) Immediate enrollment rate 48.5 62.0 56.2 50.2
Delayed enrollment rate 7.6 5.8 8.8 9.7
First- to second-year persistence rate 79.0 83.0 77.4 76.6
Rural
Cohort Variable Nonrural Fringe Distant Remote
2009/10 College enrollment rate 60.4 58.3 53.7 48.0 (n = 13,356) Immediate enrollment rate 55.1 52.5 48.7 43.0
Delayed enrollment rate 5.3 5.8 5.0 4.9
First -to second-year persistence rate 81.5 81.1 80.1 79.5
2010/11 College enrollment rate 61.2 58.5 55.1 53.5 (n = 13,154) Immediate enrollment rate 51.8 50.1 47.8 47.1
Delayed enrollment rate 9.4 8.4 7.3 6.5
First- to second-year persistence rate 76.9 79.4 78.8 78.7
Table C1. College enrollment and first- to second-year persistence rates of public high school students in Pennsylvania Association of Rural and Small Schools districts, by rural and nonrural subgroup locale, 2009/10 and 2010/11 cohorts (percent)
Source: Authors’ analysis based on data from the Pennsylvania Information Management System, National Center for Education Statistics Common Core of Data, and National Student Clearinghouse.
Table C2. College enrollment and first- to second-year persistence rates of public high school students in Pennsylvania Association of Rural and Small Schools districts, by nonrural and rural subgroup locale, 2009/10 and 2010/11 cohorts (percent)
Source: Authors’ analysis based on data from the Pennsylvania Information Management System, National Center for Education Statistics Common Core of Data, and National Student Clearinghouse.
enrollment, immediate enrollment, and delayed enrollment rates. In 2010/11 all rural schools had higher first- to second-year persistence rates than nonrural schools.
How do college enrollment rates by type of college vary across rural schools in Pennsylvania Association of Rural and Small Schools districts, and how do these rates compare with those of city, suburban, and town schools in Pennsylvania Association of Rural and Small Schools districts?
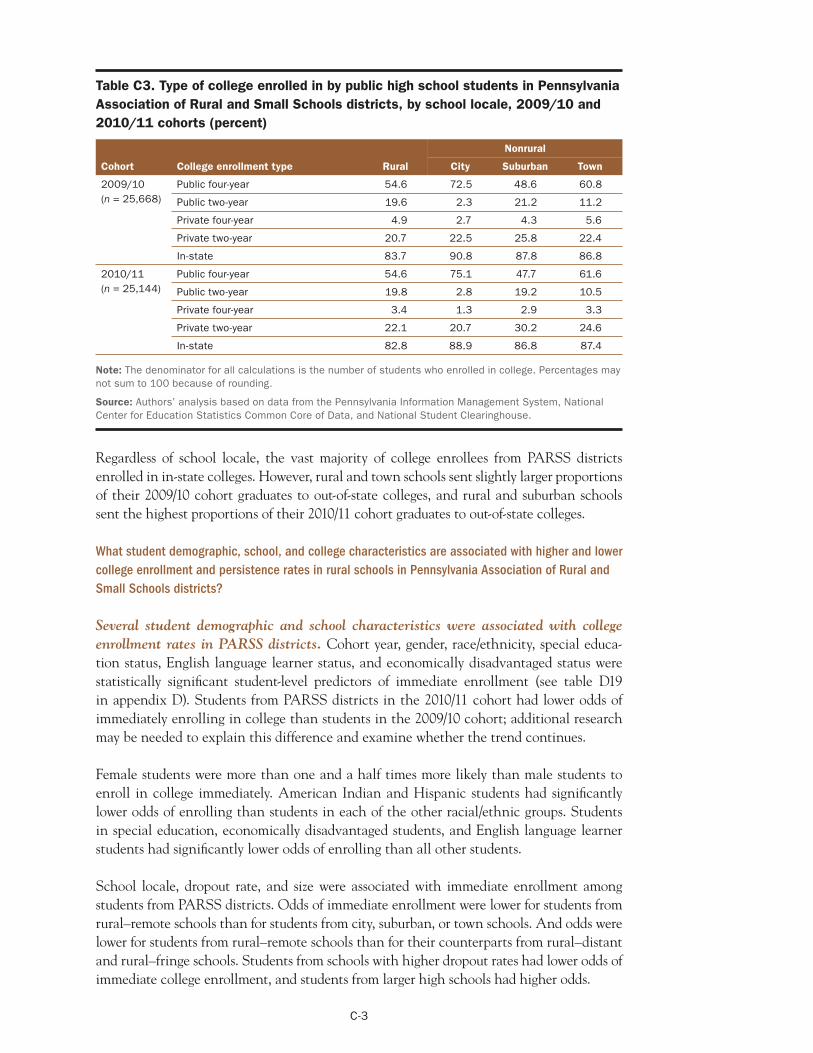
Regardless of locale, schools in PARSS districts sent the majority of their college enrollees to public four-year colleges and in-state colleges. The highest percentage of students among both the 2009/10 and 2010/11 cohorts in all locales enrolled in public four-year colleges (table C3). More than 50 percent of college enrollees from rural, city, and town schools enrolled in public four-year colleges. Enrollment in private four-year colleges was low across locales, ranging from 2.7 percent among students from city schools to 5.6 percent among students from town schools among the 2009/10 cohort.
C-2
Nonrural
Cohort College enrollment type Rural City Suburban Town
2009/10 (n = 25,668)
Public four-year
Public two-year
54.6
19.6
72.5
2.3
48.6
21.2
60.8
11.2
Private four-year 4.9 2.7 4.3 5.6
Private two-year 20.7 22.5 25.8 22.4
In-state 83.7 90.8 87.8 86.8
2010/11 (n = 25,144)
Public four-year
Public two-year
54.6
19.8
75.1
2.8
47.7
19.2
61.6
10.5
Private four-year 3.4 1.3 2.9 3.3
Private two-year 22.1 20.7 30.2 24.6
In-state 82.8 88.9 86.8 87.4
Table C3. Type of college enrolled in by public high school students in Pennsylvania Association of Rural and Small Schools districts, by school locale, 2009/10 and 2010/11 cohorts (percent)
Note: The denominator for all calculations is the number of students who enrolled in college. Percentages may not sum to 100 because of rounding.
Source: Authors’ analysis based on data from the Pennsylvania Information Management System, National Center for Education Statistics Common Core of Data, and National Student Clearinghouse.
Regardless of school locale, the vast majority of college enrollees from PARSS districts enrolled in in-state colleges. However, rural and town schools sent slightly larger proportions of their 2009/10 cohort graduates to out-of-state colleges, and rural and suburban schools sent the highest proportions of their 2010/11 cohort graduates to out-of-state colleges.
What student demographic, school, and college characteristics are associated with higher and lower college enrollment and persistence rates in rural schools in Pennsylvania Association of Rural and Small Schools districts?
Several student demographic and school characteristics were associated with college enrollment rates in PARSS districts. Cohort year, gender, race/ethnicity, special education status, English language learner status, and economically disadvantaged status were statistically significant student-level predictors of immediate enrollment (see table D19 in appendix D). Students from PARSS districts in the 2010/11 cohort had lower odds of immediately enrolling in college than students in the 2009/10 cohort; additional research may be needed to explain this difference and examine whether the trend continues.
Female students were more than one and a half times more likely than male students to enroll in college immediately. American Indian and Hispanic students had significantly lower odds of enrolling than students in each of the other racial/ethnic groups. Students in special education, economically disadvantaged students, and English language learner students had significantly lower odds of enrolling than all other students.
School locale, dropout rate, and size were associated with immediate enrollment among students from PARSS districts. Odds of immediate enrollment were lower for students from rural–remote schools than for students from city, suburban, or town schools. And odds were lower for students from rural–remote schools than for their counterparts from rural–distant and rural–fringe schools. Students from schools with higher dropout rates had lower odds of immediate college enrollment, and students from larger high schools had higher odds.
C-3
Rural–remote schools in PARSS districts had the lowest college enrollment rates. Students from rural–remote schools in PARSS districts had significantly lower odds of enrolling in college than students from city, suburban, town, rural–fringe, and rural–distant schools. Remoteness from cities, suburbs, or towns may deprive rural–remote students of access to resources or college access programs that are available in other locations. PARSS members may want to explore any such disparities and determine whether these resources and programs enhance rural college enrollment. If so, PARSS members may want to plan ways to ensure more equitable distribution of support.
There were no clear patterns in college enrollment and first- to second-year persistence rates for rural and nonrural high-poverty schools in PARSS districts. Among the 2009/10 cohort rural high-poverty schools had a lower college enrollment rate (57.1 percent) than nonrural high-poverty schools (62.4 percent; see table D15 in appendix D). But among the 2010/11 cohort the college enrollment rate was slightly higher for rural high-poverty schools (52.2 percent) than for nonrural high-poverty schools (51.2 percent). First- to second-year persistence rates were higher for rural high-poverty schools than for nonrural high-poverty schools among the 2009/10 cohort but lower among the 2010/11 cohort. There were no rural schools with a large racial/ethnic minority population in PARSS districts (see table D16 in appendix D), so rates cannot be compared between rural and nonrural schools.
Several student demographic, school, and college characteristics were associated with first- to second-year persistence rates among students from PARSS districts. Cohort year, gender, race/ethnicity, special education status, and economically disadvantaged status were significantly associated with persistence rates (see table D20 in appendix D). Students in the 2010/11 cohort had lower odds of persisting than students in the 2009/10 cohort. Additional research would be required to explore whether this trend continues.
Female and American Indian students from PARSS districts had significantly higher odds of persisting in college. In fact, American Indian students were nearly twice as likely as other students to persist. This finding is of further interest because American Indian students were less likely to enroll in college (see table D19 in appendix D). However, as with Black students, the percentage of American Indian students is very small, 0.1–0.2 percent of the 2009/10 cohort (see table D13 in appendix D).
Black students, students in special education, and economically disadvantaged students had significantly lower odds of persisting in college than other students. However, the percentage of Black students compared with other groups is small (ranging from 1.6 percent in rural schools to 6.6 percent in suburban schools in 2009/10; see table D13 in appendix D), so findings for this group may be unstable. In addition, the odds ratio for Black students was small, indicating that they were approximately 20 percent less likely than other students to persist.
PARSS districts may thus want to focus college access and success strategies on male students, Black students, students in special education, and economically disadvantaged students. Further research should also be conducted to explore whether Black students in subsequent cohorts continue to experience diminished odds of college persistence and whether and why American Indian students continue to have lower odds of college enrollment but higher odds of college persistence.
C-4
School locale and school dropout rate were significantly associated with first- to sec-ond-year college persistence rates among students from PARSS districts. After controlling for other factors, both rural–distant and rural–fringe PARSS students were significantly more likely to persist than rural–remote students (see table D20 in appendix D). Students from more remote schools in PARSS districts thus had significantly lower odds of persisting than students from less remote rural schools in PARSS districts. Students from PARSS districts with higher dropout rates were less likely to persist than students from PARSS districts with lower dropout rates. Given scarce resources, rural schools may prefer to focus on strategies to help their students finish high school. Improved high school completion rates could facilitate improved college persistence.
Public versus private and two-year versus four-year college characteristics were significantly associated with first- to second-year college persistence rates among students from PARSS districts. Students in private two-year colleges had lower odds of persisting than students in public two-year colleges, and students in four-year colleges had significantly higher odds of persisting than students in public two-year institutions. Students in private four-year colleges were approximately four times more likely to persist than students in public two-year colleges, and students in public four-year colleges were nearly three times more likely to persist than students in public two-year colleges (see table D20 in appendix D).
C-5
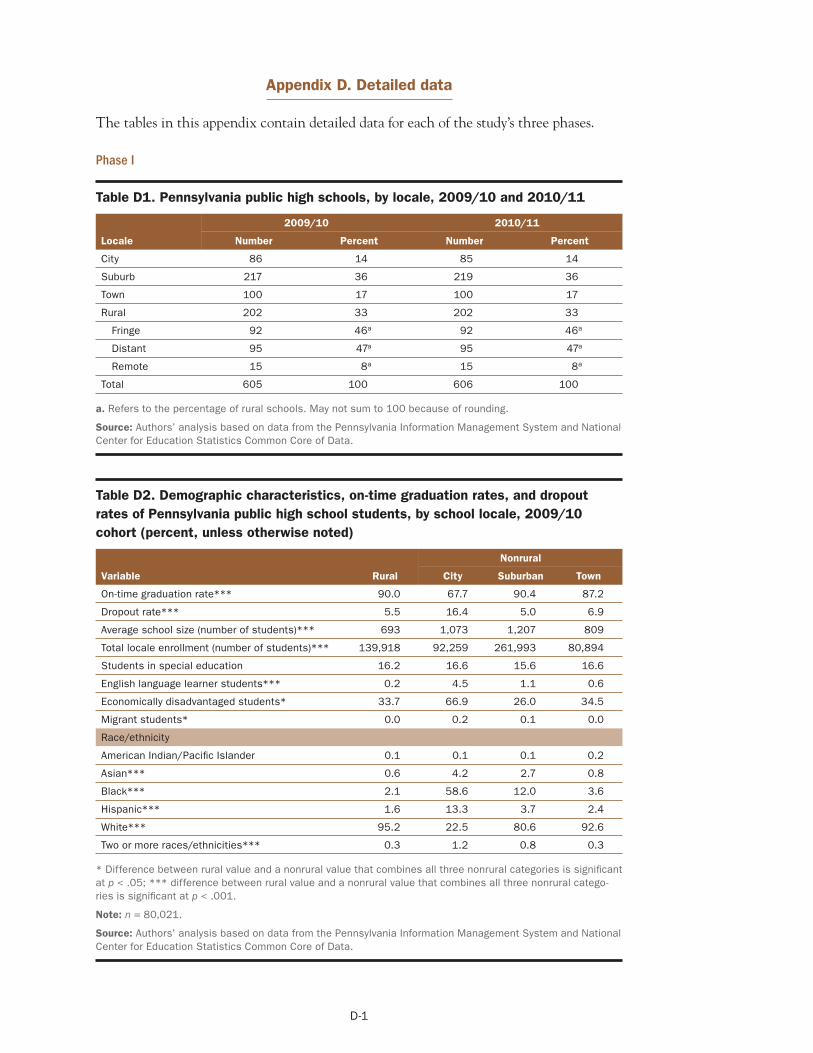
Nonrural
Variable Rural City Suburban Town
On-time graduation rate*** 90.0 67.7 90.4 87.2
Dropout rate*** 5.5 16.4 5.0 6.9
Average school size (number of students)*** 693 1,073 1,207 809
Total locale enrollment (number of students)*** 139,918 92,259 261,993 80,894
Students in special education 16.2 16.6 15.6 16.6
English language learner students*** 0.2 4.5 1.1 0.6
Economically disadvantaged students* 33.7 66.9 26.0 34.5
Migrant students* 0.0 0.2 0.1 0.0
Race/ethnicity
American Indian/Pacific Islander 0.1 0.1 0.1 0.2
Asian*** 0.6 4.2 2.7 0.8
Black*** 2.1 58.6 12.0 3.6
Hispanic*** 1.6 13.3 3.7 2.4
White*** 95.2 22.5 80.6 92.6
Two or more races/ethnicities*** 0.3 1.2 0.8 0.3
* Difference between rural value and a nonrural value that combines all three nonrural categories is significant at p < .05; *** difference between rural value and a nonrural value that combines all three nonrural categories is significant at p < .001.
Note: n = 80,021.
Source: Authors’ analysis based on data from the Pennsylvania Information Management System and National Center for Education Statistics Common Core of Data.
Locale Number
2009/10
Percent Number
2010/11
Percent
City
Suburb
86
217
14
36
85
219
14
36
Town 100 17 100 17
Rural 202 33 202 33
Fringe
Distant
92
95
46a
47a
92
95
46a
47a
Remote 15 8a 15 8a
Total 605 100 606 100
Appendix D. Detailed data
The tables in this appendix contain detailed data for each of the study’s three phases.
Phase I
Table D1. Pennsylvania public high schools, by locale, 2009/10 and 2010/11
a. Refers to the percentage of rural schools. May not sum to 100 because of rounding.
Source: Authors’ analysis based on data from the Pennsylvania Information Management System and National Center for Education Statistics Common Core of Data.
Table D2. Demographic characteristics, on-time graduation rates, and dropout rates of Pennsylvania public high school students, by school locale, 2009/10 cohort (percent, unless otherwise noted)
D-1
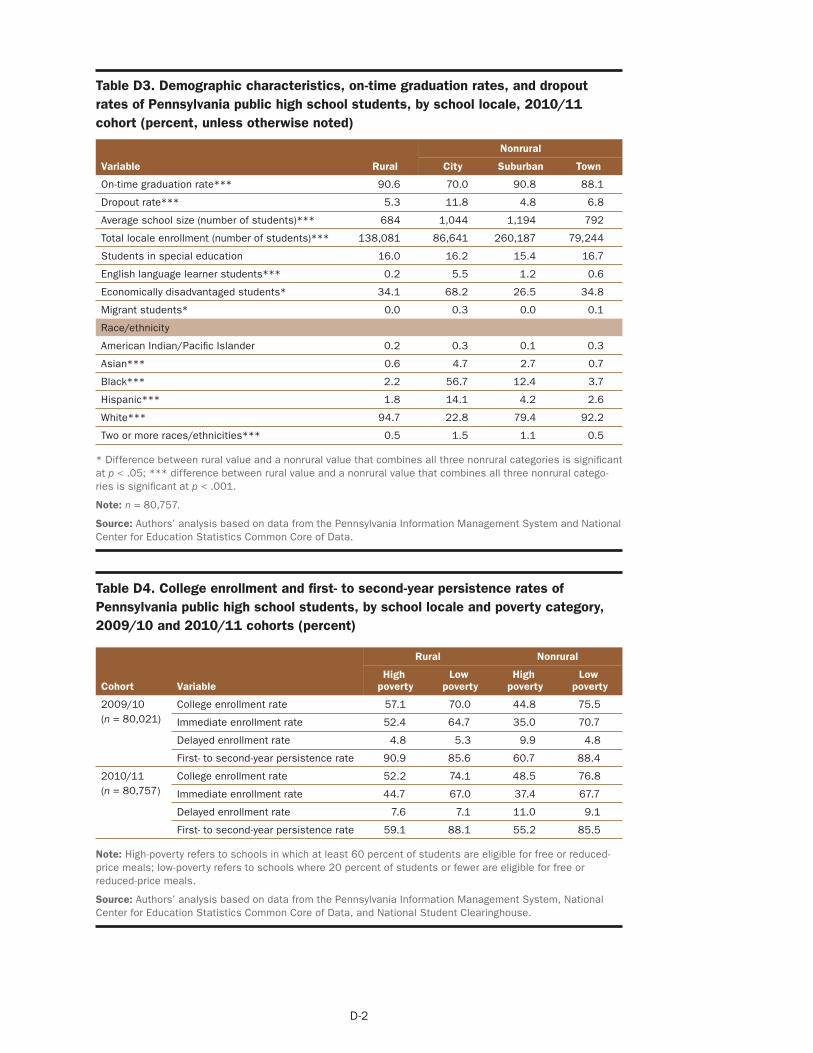
Nonrural
Variable Rural City Suburban Town
On-time graduation rate*** 90.6 70.0 90.8 88.1
Dropout rate*** 5.3 11.8 4.8 6.8
Average school size (number of students)*** 684 1,044 1,194 792
Total locale enrollment (number of students)*** 138,081 86,641 260,187 79,244
Students in special education 16.0 16.2 15.4 16.7
English language learner students*** 0.2 5.5 1.2 0.6
Economically disadvantaged students* 34.1 68.2 26.5 34.8
Migrant students* 0.0 0.3 0.0 0.1
Race/ethnicity
American Indian/Pacific Islander 0.2 0.3 0.1 0.3
Asian*** 0.6 4.7 2.7 0.7
Black*** 2.2 56.7 12.4 3.7
Hispanic*** 1.8 14.1 4.2 2.6
White*** 94.7 22.8 79.4 92.2
Two or more races/ethnicities*** 0.5 1.5 1.1 0.5
Rural Nonrural
High Low High Low Cohort Variable poverty poverty poverty poverty
2009/10 College enrollment rate 57.1 70.0 44.8 75.5 (n = 80,021) Immediate enrollment rate 52.4 64.7 35.0 70.7
Delayed enrollment rate 4.8 5.3 9.9 4.8
First- to second-year persistence rate 90.9 85.6 60.7 88.4
2010/11 College enrollment rate 52.2 74.1 48.5 76.8 (n = 80,757) Immediate enrollment rate 44.7 67.0 37.4 67.7
Delayed enrollment rate 7.6 7.1 11.0 9.1
First- to second-year persistence rate 59.1 88.1 55.2 85.5
* Difference between rural value and a nonrural value that combines all three nonrural categories is significant at p < .05; *** difference between rural value and a nonrural value that combines all three nonrural categories is significant at p < .001.
Note: n = 80,757.
Source: Authors’ analysis based on data from the Pennsylvania Information Management System and National Center for Education Statistics Common Core of Data.
Table D3. Demographic characteristics, on-time graduation rates, and dropout rates of Pennsylvania public high school students, by school locale, 2010/11 cohort (percent, unless otherwise noted)
Table D4. College enrollment and first- to second-year persistence rates of Pennsylvania public high school students, by school locale and poverty category, 2009/10 and 2010/11 cohorts (percent)
Note: High-poverty refers to schools in which at least 60 percent of students are eligible for free or reduced-price meals; low-poverty refers to schools where 20 percent of students or fewer are eligible for free or reduced-price meals.
Source: Authors’ analysis based on data from the Pennsylvania Information Management System, National Center for Education Statistics Common Core of Data, and National Student Clearinghouse.
D-2
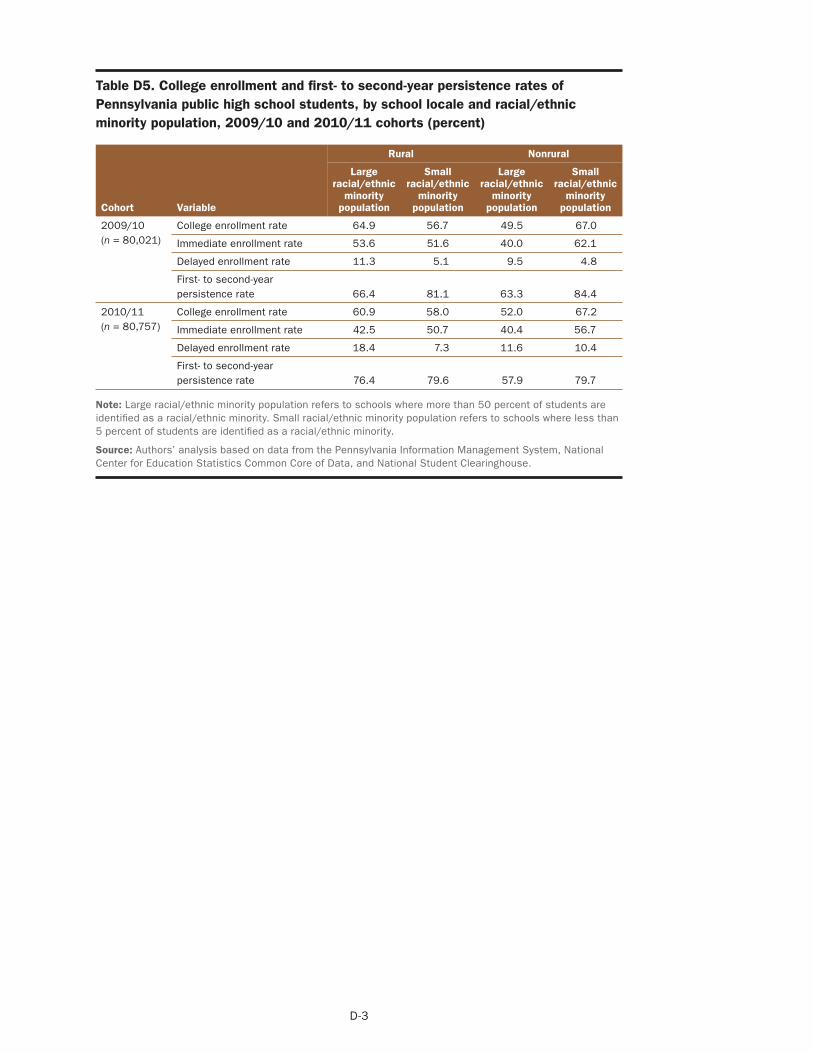
Rural Nonrural
Large Small Large Small racial/ethnic racial/ethnic racial/ethnic racial/ethnic
minority minority minority minority Cohort Variable population population population population
2009/10 College enrollment rate 64.9 56.7 49.5 67.0 (n = 80,021) Immediate enrollment rate 53.6 51.6 40.0 62.1
Delayed enrollment rate 11.3 5.1 9.5 4.8
First- to second-year persistence rate 66.4 81.1 63.3 84.4
2010/11 College enrollment rate 60.9 58.0 52.0 67.2 (n = 80,757) Immediate enrollment rate 42.5 50.7 40.4 56.7
Delayed enrollment rate 18.4 7.3 11.6 10.4
First- to second-year persistence rate 76.4 79.6 57.9 79.7
Table D5. College enrollment and first- to second-year persistence rates of Pennsylvania public high school students, by school locale and racial/ethnic minority population, 2009/10 and 2010/11 cohorts (percent)
Note: Large racial/ethnic minority population refers to schools where more than 50 percent of students are identified as a racial/ethnic minority. Small racial/ethnic minority population refers to schools where less than 5 percent of students are identified as a racial/ethnic minority.
Source: Authors’ analysis based on data from the Pennsylvania Information Management System, National Center for Education Statistics Common Core of Data, and National Student Clearinghouse.
D-3
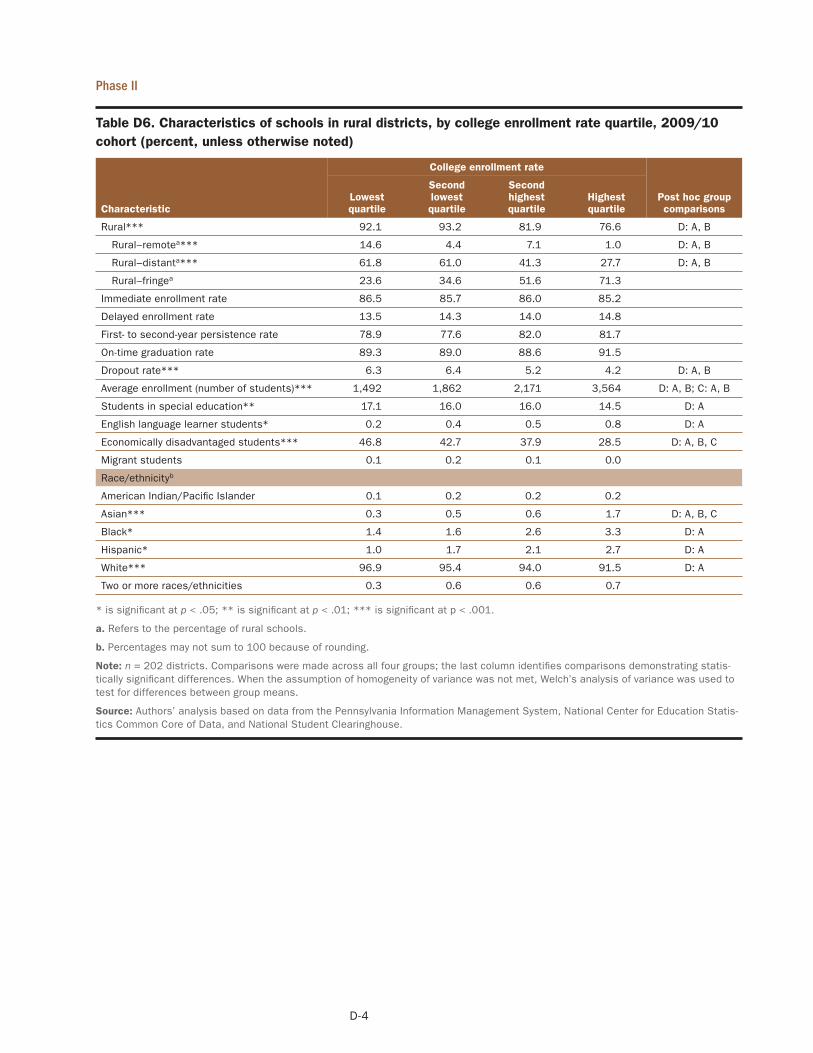
College enrollment rate
Second Second Lowest lowest highest Highest Post hoc group
Characteristic quartile quartile quartile quartile comparisons
Rural*** 92.1 93.2 81.9 76.6 D: A, B
Rural–remotea*** 14.6 4.4 7.1 1.0 D: A, B
Rural–distanta*** 61.8 61.0 41.3 27.7 D: A, B
Rural–fringea 23.6 34.6 51.6 71.3
Immediate enrollment rate 86.5 85.7 86.0 85.2
Delayed enrollment rate 13.5 14.3 14.0 14.8
First- to second-year persistence rate 78.9 77.6 82.0 81.7
On-time graduation rate 89.3 89.0 88.6 91.5
Dropout rate*** 6.3 6.4 5.2 4.2 D: A, B
Average enrollment (number of students)*** 1,492 1,862 2,171 3,564 D: A, B; C: A, B
Students in special education** 17.1 16.0 16.0 14.5 D: A
English language learner students* 0.2 0.4 0.5 0.8 D: A
Economically disadvantaged students*** 46.8 42.7 37.9 28.5 D: A, B, C
Migrant students 0.1 0.2 0.1 0.0
Race/ethnicityb
American Indian/Pacific Islander 0.1 0.2 0.2 0.2
Asian*** 0.3 0.5 0.6 1.7 D: A, B, C
Black* 1.4 1.6 2.6 3.3 D: A
Hispanic* 1.0 1.7 2.1 2.7 D: A
White*** 96.9 95.4 94.0 91.5 D: A
Two or more races/ethnicities 0.3 0.6 0.6 0.7
Phase II
Table D6. Characteristics of schools in rural districts, by college enrollment rate quartile, 2009/10 cohort (percent, unless otherwise noted)
* is significant at p < .05; ** is significant at p < .01; *** is significant at p < .001.
a. Refers to the percentage of rural schools.
b. Percentages may not sum to 100 because of rounding.
Note: n = 202 districts. Comparisons were made across all four groups; the last column identifies comparisons demonstrating statistically significant differences. When the assumption of homogeneity of variance was not met, Welch’s analysis of variance was used to test for differences between group means.
Source: Authors’ analysis based on data from the Pennsylvania Information Management System, National Center for Education Statistics Common Core of Data, and National Student Clearinghouse.
D-4
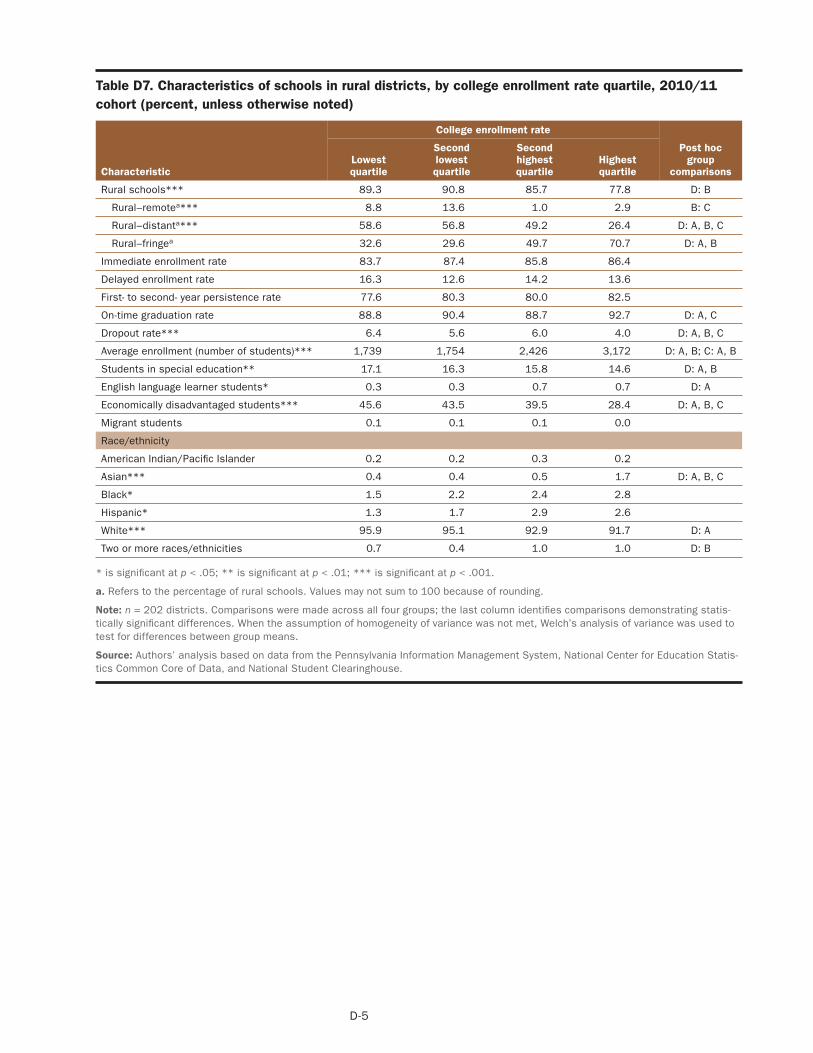
College enrollment rate
Second lowest quartile
Second highest quartile
Post hoc group
comparisons Lowest quartile
Highest quartile Characteristic
Rural schools*** 89.3 90.8 85.7 77.8 D: B
Rural–remotea*** 8.8 13.6 1.0 2.9 B: C
Rural–distanta*** 58.6 56.8 49.2 26.4 D: A, B, C
Rural–fringea 32.6 29.6 49.7 70.7 D: A, B
Immediate enrollment rate 83.7 87.4 85.8 86.4
Delayed enrollment rate 16.3 12.6 14.2 13.6
First- to second- year persistence rate 77.6 80.3 80.0 82.5
On-time graduation rate 88.8 90.4 88.7 92.7 D: A, C
Dropout rate*** 6.4 5.6 6.0 4.0 D: A, B, C
Average enrollment (number of students)*** 1,739 1,754 2,426 3,172 D: A, B; C: A, B
Students in special education** 17.1 16.3 15.8 14.6 D: A, B
English language learner students* 0.3 0.3 0.7 0.7 D: A
Economically disadvantaged students*** 45.6 43.5 39.5 28.4 D: A, B, C
Migrant students 0.1 0.1 0.1 0.0
Race/ethnicity
American Indian/Pacific Islander 0.2 0.2 0.3 0.2
Asian*** 0.4 0.4 0.5 1.7 D: A, B, C
Black* 1.5 2.2 2.4 2.8
Hispanic* 1.3 1.7 2.9 2.6
White*** 95.9 95.1 92.9 91.7 D: A
Two or more races/ethnicities 0.7 0.4 1.0 1.0 D: B
Table D7. Characteristics of schools in rural districts, by college enrollment rate quartile, 2010/11 cohort (percent, unless otherwise noted)
* is significant at p < .05; ** is significant at p < .01; *** is significant at p < .001.
a. Refers to the percentage of rural schools. Values may not sum to 100 because of rounding.
Note: n = 202 districts. Comparisons were made across all four groups; the last column identifies comparisons demonstrating statistically significant differences. When the assumption of homogeneity of variance was not met, Welch’s analysis of variance was used to test for differences between group means.
Source: Authors’ analysis based on data from the Pennsylvania Information Management System, National Center for Education Statistics Common Core of Data, and National Student Clearinghouse.
D-5
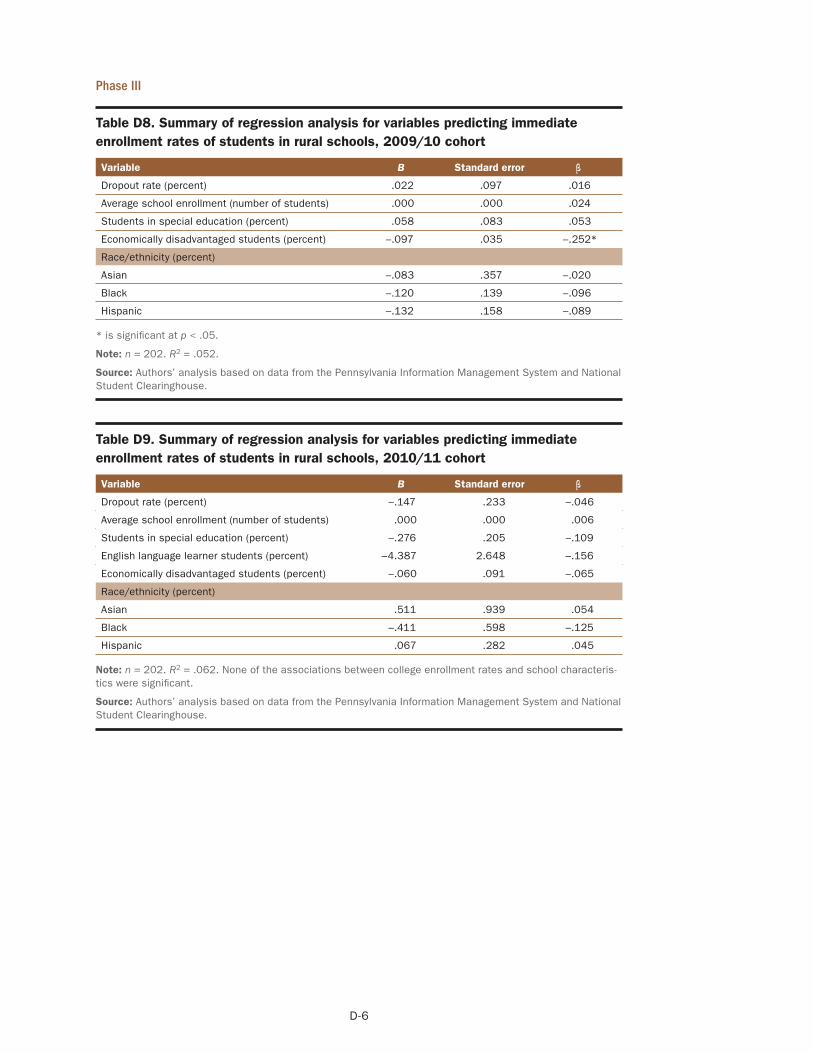
Variable B Standard error β
Dropout rate (percent)
Average school enrollment (number of students)
Students in special education (percent)
Economically disadvantaged students (percent)
Race/ethnicity (percent)
Asian
.022
.000
.058
–.097
–.083
.097
.000
.083
.035
.357
.016
.024
.053
–.252*
–.020
Black –.120 .139 –.096
Hispanic –.132 .158 –.089
Variable B Standard error β
Dropout rate (percent) –.147 .233 –.046
Average school enrollment (number of students) .000 .000 .006
Students in special education (percent) –.276 .205 –.109
English language learner students (percent) –4.387 2.648 –.156
Economically disadvantaged students (percent) –.060 .091 –.065
Race/ethnicity (percent)
Asian .511 .939 .054
Black –.411 .598 –.125
Hispanic .067 .282 .045
Phase III
Table D8. Summary of regression analysis for variables predicting immediate enrollment rates of students in rural schools, 2009/10 cohort
* is significant at p < .05.
Note: n = 202. R2 = .052.
Source: Authors’ analysis based on data from the Pennsylvania Information Management System and National Student Clearinghouse.
Table D9. Summary of regression analysis for variables predicting immediate enrollment rates of students in rural schools, 2010/11 cohort
Note: n = 202. R2 = .062. None of the associations between college enrollment rates and school characteristics were significant.
Source: Authors’ analysis based on data from the Pennsylvania Information Management System and National Student Clearinghouse.
D-6
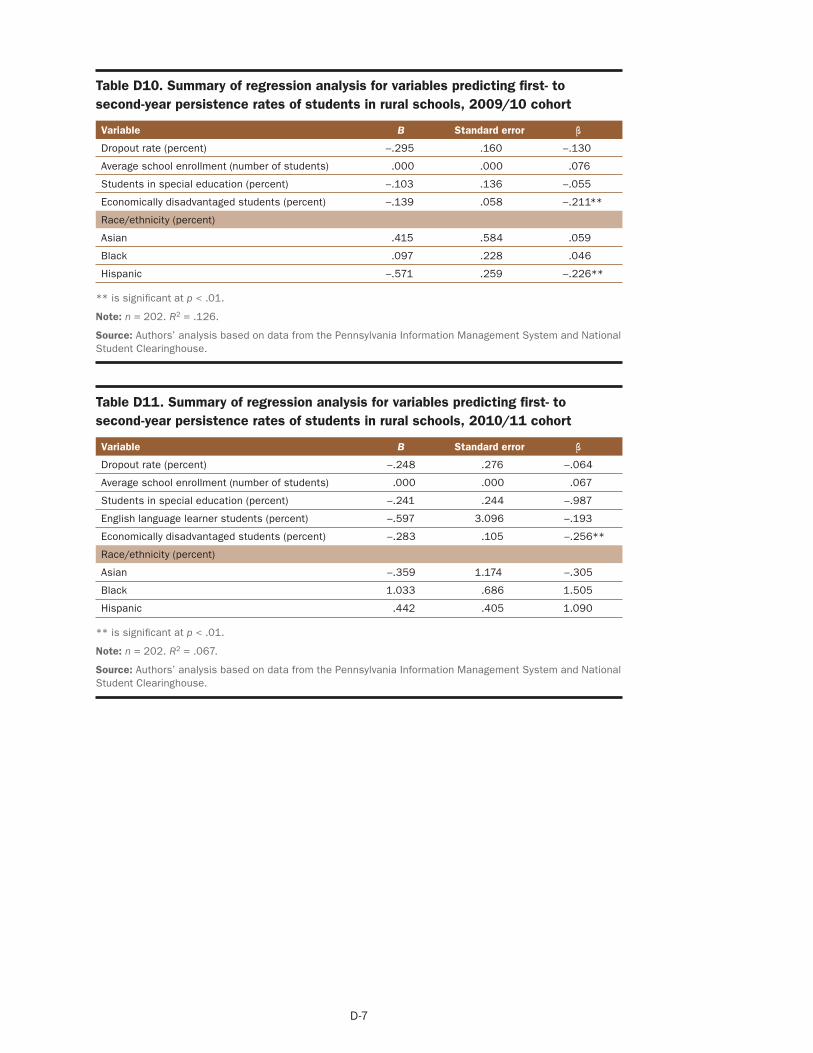
Variable B Standard error β
Dropout rate (percent)
Average school enrollment (number of students)
Students in special education (percent)
Economically disadvantaged students (percent)
Race/ethnicity (percent)
Asian
–.295
.000
–.103
–.139
.415
.160
.000
.136
.058
.584
–.130
.076
–.055
–.211**
.059
Black .097 .228 .046
Hispanic –.571 .259 –.226**
Variable B Standard error β
Dropout rate (percent) –.248 .276 –.064
Average school enrollment (number of students) .000 .000 .067
Students in special education (percent) –.241 .244 –.987
English language learner students (percent) –.597 3.096 –.193
Economically disadvantaged students (percent) –.283 .105 –.256**
Race/ethnicity (percent)
Asian –.359 1.174 –.305
Black 1.033 .686 1.505
Hispanic .442 .405 1.090
Table D10. Summary of regression analysis for variables predicting first- to second-year persistence rates of students in rural schools, 2009/10 cohort
** is significant at p < .01.
Note: n = 202. R2 = .126.
Source: Authors’ analysis based on data from the Pennsylvania Information Management System and National Student Clearinghouse.
Table D11. Summary of regression analysis for variables predicting first- to second-year persistence rates of students in rural schools, 2010/11 cohort
** is significant at p < .01.
Note: n = 202. R2 = .067.
Source: Authors’ analysis based on data from the Pennsylvania Information Management System and National Student Clearinghouse.
D-7
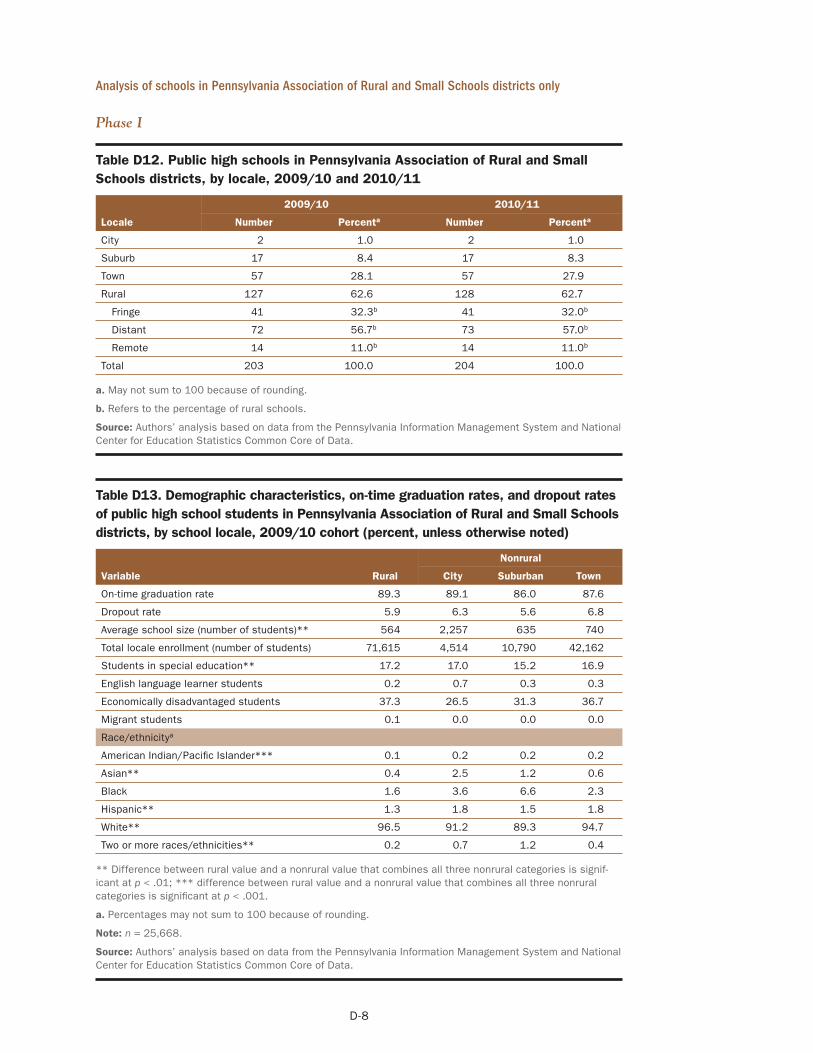
a. May not sum to 100 because of rounding.
b. Refers to the percentage of rural schools.
Source: Authors’ analysis based on data from the Pennsylvania Information Management System and National Center for Education Statistics Common Core of Data.
Locale Number
2009/10
Percenta Number
2010/11
Percenta
City
Suburb
2
17
1.0
8.4
2
17
1.0
8.3
Town 57 28.1 57 27.9
Rural 127 62.6 128 62.7
Fringe
Distant
41
72
32.3b
56.7b
41
73
32.0b
57.0b
Remote 14 11.0b 14 11.0b
Total 203 100.0 204 100.0
Nonrural
Variable Rural City Suburban Town
On-time graduation rate 89.3 89.1 86.0 87.6
Dropout rate 5.9 6.3 5.6 6.8
Average school size (number of students)** 564 2,257 635 740
Total locale enrollment (number of students) 71,615 4,514 10,790 42,162
Students in special education** 17.2 17.0 15.2 16.9
English language learner students 0.2 0.7 0.3 0.3
Economically disadvantaged students 37.3 26.5 31.3 36.7
Migrant students 0.1 0.0 0.0 0.0
Race/ethnicitya
American Indian/Pacific Islander*** 0.1 0.2 0.2 0.2
Asian** 0.4 2.5 1.2 0.6
Black 1.6 3.6 6.6 2.3
Hispanic** 1.3 1.8 1.5 1.8
White** 96.5 91.2 89.3 94.7
Two or more races/ethnicities** 0.2 0.7 1.2 0.4
Analysis of schools in Pennsylvania Association of Rural and Small Schools districts only
Phase I
Table D12. Public high schools in Pennsylvania Association of Rural and Small Schools districts, by locale, 2009/10 and 2010/11
Table D13. Demographic characteristics, on-time graduation rates, and dropout rates of public high school students in Pennsylvania Association of Rural and Small Schools districts, by school locale, 2009/10 cohort (percent, unless otherwise noted)
** Difference between rural value and a nonrural value that combines all three nonrural categories is significant at p < .01; *** difference between rural value and a nonrural value that combines all three nonrural categories is significant at p < .001.
a. Percentages may not sum to 100 because of rounding.
Note: n = 25,668.
Source: Authors’ analysis based on data from the Pennsylvania Information Management System and National Center for Education Statistics Common Core of Data.
D-8
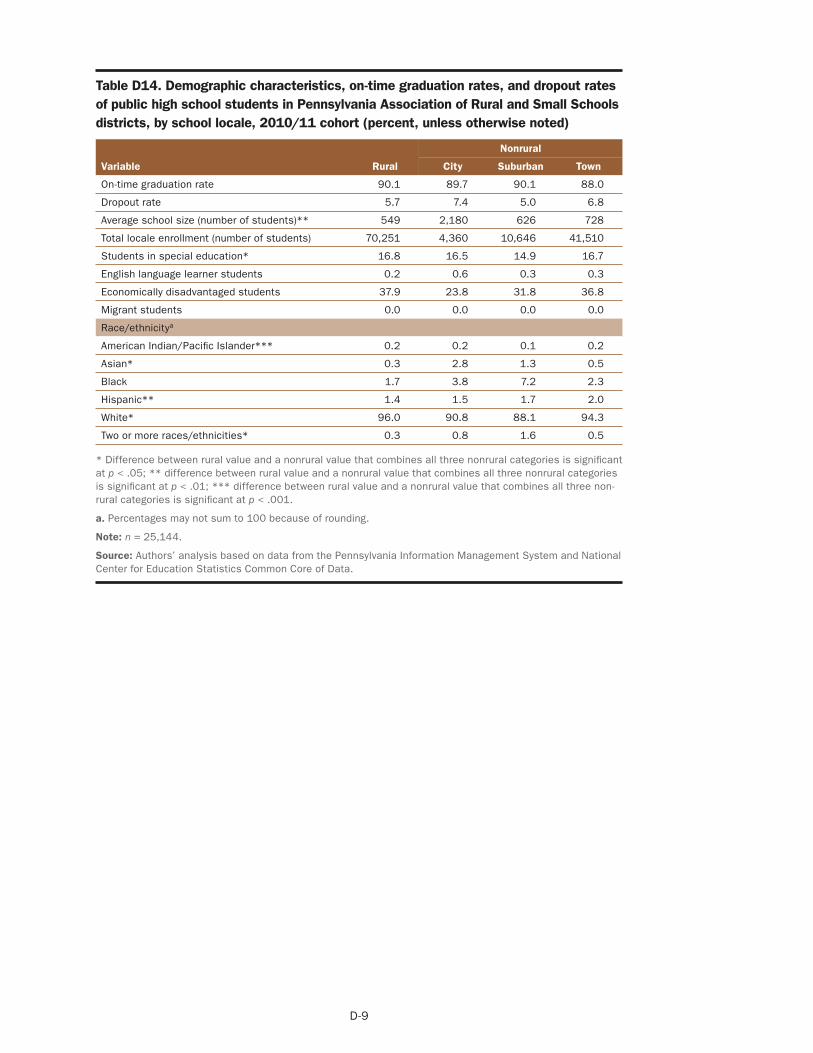
Nonrural
Variable Rural City Suburban Town
On-time graduation rate 90.1 89.7 90.1 88.0
Dropout rate 5.7 7.4 5.0 6.8
Average school size (number of students)** 549 2,180 626 728
Total locale enrollment (number of students) 70,251 4,360 10,646 41,510
Students in special education* 16.8 16.5 14.9 16.7
English language learner students 0.2 0.6 0.3 0.3
Economically disadvantaged students 37.9 23.8 31.8 36.8
Migrant students 0.0 0.0 0.0 0.0
Race/ethnicitya
American Indian/Pacific Islander*** 0.2 0.2 0.1 0.2
Asian* 0.3 2.8 1.3 0.5
Black 1.7 3.8 7.2 2.3
Hispanic** 1.4 1.5 1.7 2.0
White* 96.0 90.8 88.1 94.3
Two or more races/ethnicities* 0.3 0.8 1.6 0.5
Table D14. Demographic characteristics, on-time graduation rates, and dropout rates of public high school students in Pennsylvania Association of Rural and Small Schools districts, by school locale, 2010/11 cohort (percent, unless otherwise noted)
* Difference between rural value and a nonrural value that combines all three nonrural categories is significant at p < .05; ** difference between rural value and a nonrural value that combines all three nonrural categories is significant at p < .01; *** difference between rural value and a nonrural value that combines all three non-rural categories is significant at p < .001.
a. Percentages may not sum to 100 because of rounding.
Note: n = 25,144.
Source: Authors’ analysis based on data from the Pennsylvania Information Management System and National Center for Education Statistics Common Core of Data.
D-9
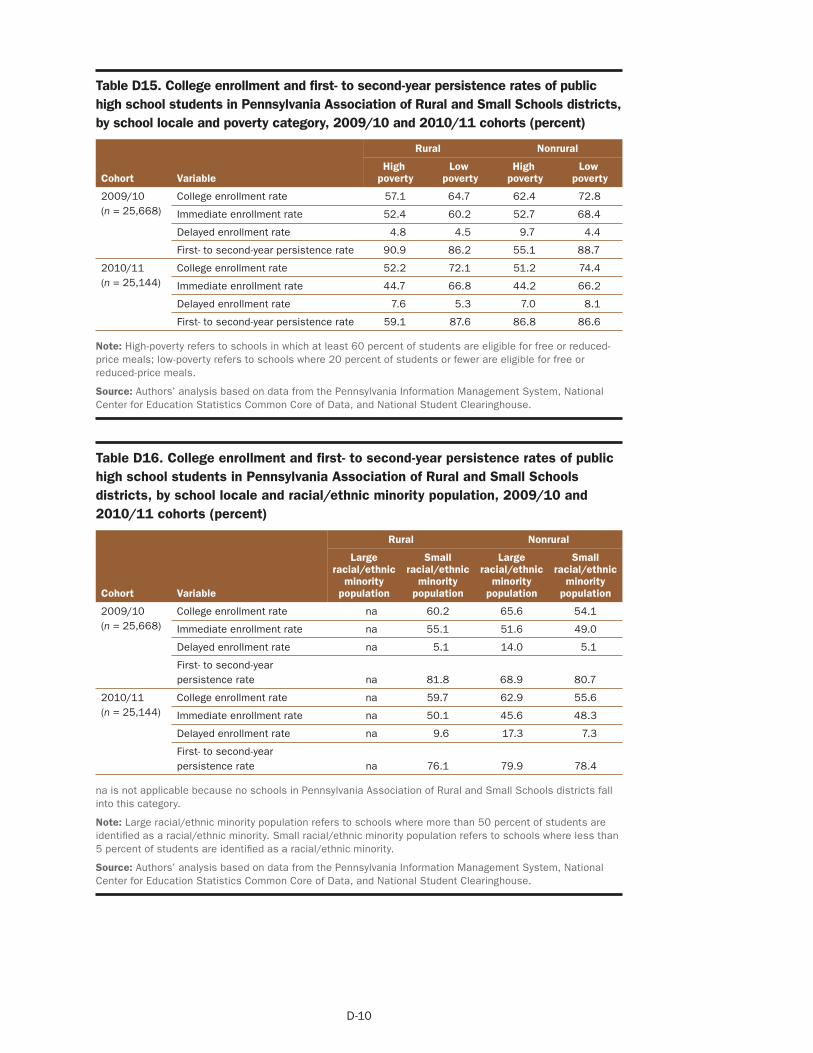
Rural Nonrural
High Low High Low Cohort Variable poverty poverty poverty poverty
2009/10 College enrollment rate 57.1 64.7 62.4 72.8 (n = 25,668) Immediate enrollment rate 52.4 60.2 52.7 68.4
Delayed enrollment rate 4.8 4.5 9.7 4.4
First- to second-year persistence rate 90.9 86.2 55.1 88.7
2010/11 College enrollment rate 52.2 72.1 51.2 74.4 (n = 25,144) Immediate enrollment rate 44.7 66.8 44.2 66.2
Delayed enrollment rate 7.6 5.3 7.0 8.1
First- to second-year persistence rate 59.1 87.6 86.8 86.6
Rural Nonrural
Large racial/ethnic
minority population
Small racial/ethnic
minority population
Large racial/ethnic
minority population
Small racial/ethnic
minority population Cohort Variable
2009/10 College enrollment rate na 60.2 65.6 54.1 (n = 25,668) Immediate enrollment rate na 55.1 51.6 49.0
Delayed enrollment rate na 5.1 14.0 5.1
First- to second-year persistence rate na 81.8 68.9 80.7
2010/11 College enrollment rate na 59.7 62.9 55.6 (n = 25,144) Immediate enrollment rate na 50.1 45.6 48.3
Delayed enrollment rate na 9.6 17.3 7.3
First- to second-year persistence rate na 76.1 79.9 78.4
Table D15. College enrollment and first- to second-year persistence rates of public high school students in Pennsylvania Association of Rural and Small Schools districts, by school locale and poverty category, 2009/10 and 2010/11 cohorts (percent)
Note: High-poverty refers to schools in which at least 60 percent of students are eligible for free or reduced-price meals; low-poverty refers to schools where 20 percent of students or fewer are eligible for free or reduced-price meals.
Source: Authors’ analysis based on data from the Pennsylvania Information Management System, National Center for Education Statistics Common Core of Data, and National Student Clearinghouse.
Table D16. College enrollment and first- to second-year persistence rates of public high school students in Pennsylvania Association of Rural and Small Schools districts, by school locale and racial/ethnic minority population, 2009/10 and 2010/11 cohorts (percent)
na is not applicable because no schools in Pennsylvania Association of Rural and Small Schools districts fall into this category.
Note: Large racial/ethnic minority population refers to schools where more than 50 percent of students are identified as a racial/ethnic minority. Small racial/ethnic minority population refers to schools where less than 5 percent of students are identified as a racial/ethnic minority.
Source: Authors’ analysis based on data from the Pennsylvania Information Management System, National Center for Education Statistics Common Core of Data, and National Student Clearinghouse.
D-10
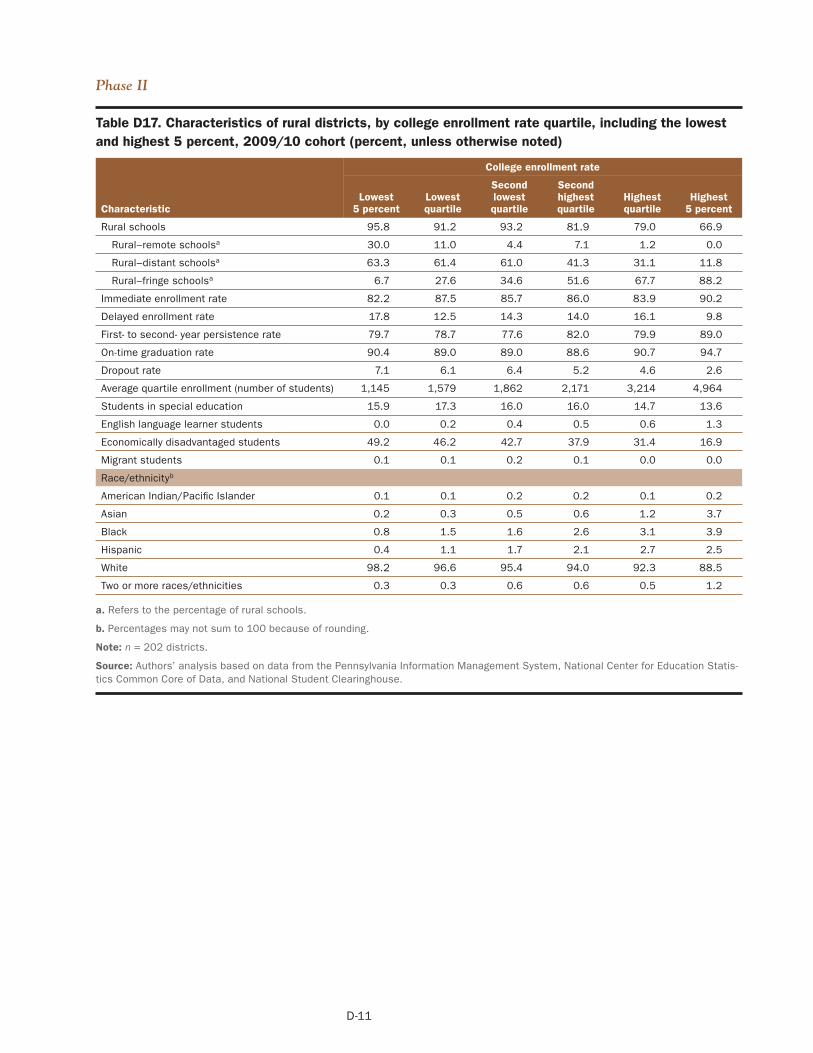
College enrollment rate
Second lowest quartile
Second highest quartile
Lowest 5 percent
Lowest quartile
Highest quartile
Highest 5 percent Characteristic
Rural schools 95.8 91.2 93.2 81.9 79.0 66.9
Rural–remote schoolsa 30.0 11.0 4.4 7.1 1.2 0.0
Rural–distant schoolsa 63.3 61.4 61.0 41.3 31.1 11.8
Rural–fringe schoolsa 6.7 27.6 34.6 51.6 67.7 88.2
Immediate enrollment rate 82.2 87.5 85.7 86.0 83.9 90.2
Delayed enrollment rate 17.8 12.5 14.3 14.0 16.1 9.8
First- to second- year persistence rate 79.7 78.7 77.6 82.0 79.9 89.0
On-time graduation rate 90.4 89.0 89.0 88.6 90.7 94.7
Dropout rate 7.1 6.1 6.4 5.2 4.6 2.6
Average quartile enrollment (number of students) 1,145 1,579 1,862 2,171 3,214 4,964
Students in special education 15.9 17.3 16.0 16.0 14.7 13.6
English language learner students 0.0 0.2 0.4 0.5 0.6 1.3
Economically disadvantaged students 49.2 46.2 42.7 37.9 31.4 16.9
Migrant students 0.1 0.1 0.2 0.1 0.0 0.0
Race/ethnicityb
American Indian/Pacific Islander 0.1 0.1 0.2 0.2 0.1 0.2
Asian 0.2 0.3 0.5 0.6 1.2 3.7
Black 0.8 1.5 1.6 2.6 3.1 3.9
Hispanic 0.4 1.1 1.7 2.1 2.7 2.5
White 98.2 96.6 95.4 94.0 92.3 88.5
Two or more races/ethnicities 0.3 0.3 0.6 0.6 0.5 1.2
Phase II
Table D17. Characteristics of rural districts, by college enrollment rate quartile, including the lowest and highest 5 percent, 2009/10 cohort (percent, unless otherwise noted)
a. Refers to the percentage of rural schools.
b. Percentages may not sum to 100 because of rounding.
Note: n = 202 districts.
Source: Authors’ analysis based on data from the Pennsylvania Information Management System, National Center for Education Statistics Common Core of Data, and National Student Clearinghouse.
D-11

a. Refers to the percentage of rural schools.
b. Percentages may not sum to 100 because of rounding.
Note: n = 202 districts.
Source: Authors’ analysis based on data from the Pennsylvania Information Management System, National Center for Education Statistics Common Core of Data, and National Student Clearinghouse.
College enrollment rate
Second lowest quartile
Second highest quartile
Lowest 5 percent
Lowest quartile
Highest quartile
Highest 5 percent Characteristic
Rural schools 88.1 89.6 90.8 85.7 82.2 60.4
Rural–remote schoolsa,b 4.3 10.4 13.6 1.0 3.5 0.0
Rural–distant schools a,b 59.6 58.2 56.8 49.2 32.2 0.0
Rural–fringe schools a,b 36.2 31.3 29.6 49.7 64.3 100.0
Immediate enrollment rate 82.5 84.0 87.4 85.8 85.2 91.0
Delayed enrollment rate 17.5 16.0 12.6 14.2 14.8 9.0
First- to second- year persistence rate 80.7 76.9 80.3 80.0 80.8 89.5
On-time graduation rate 87.8 89.1 90.4 88.7 92.0 95.2
Dropout rate 7.9 6.0 5.6 6.0 4.2 2.8
Average quartile enrollment (number of students) 1,965 1,683 1,754 2,426 2,686 5,118
Students in special education 16.8 17.2 16.3 15.8 15.2 12.1
English language learner students 0.2 0.3 0.3 0.7 0.5 1.3
Economically disadvantaged students 50.7 44.3 43.5 39.5 31.1 17.3
Migrant students 0.1 0.1 0.1 0.1 0.0 0.0
Race/ethnicityb
American Indian/Pacific Islander 0.2 0.2 0.2 0.3 0.2 0.2
Asian 0.2 0.4 0.4 0.5 1.1 4.1
Black 1.4 1.5 2.2 2.4 2.5 3.9
Hispanic 1.0 1.4 1.7 2.9 2.5 3.2
White 96.5 95.7 95.1 92.9 92.9 87.0
Two or more races/ethnicities 0.6 0.8 0.4 1.0 0.8 1.7
Table D18. Characteristics of rural districts, by college enrollment rate quartile, including the lowest and highest 5 percent, 2010/11 cohort (percent, unless otherwise noted)
D-12
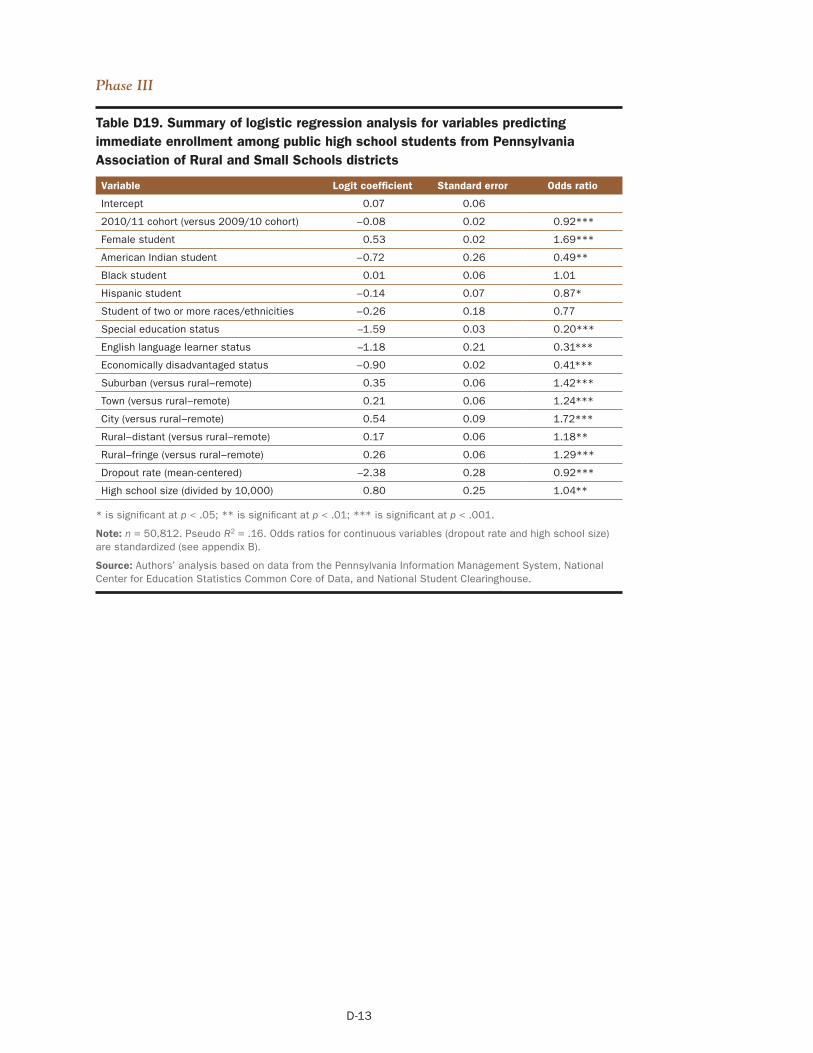
* is significant at p < .05; ** is significant at p < .01; *** is significant at p < .001.
Note: n = 50,812. Pseudo R2 = .16. Odds ratios for continuous variables (dropout rate and high school size) are standardized (see appendix B).
Source: Authors’ analysis based on data from the Pennsylvania Information Management System, National Center for Education Statistics Common Core of Data, and National Student Clearinghouse.
Variable Logit coefficient Standard error Odds ratio
Intercept 0.07 0.06
2010/11 cohort (versus 2009/10 cohort) –0.08 0.02 0.92***
Female student 0.53 0.02 1.69***
American Indian student –0.72 0.26 0.49**
Black student 0.01 0.06 1.01
Hispanic student –0.14 0.07 0.87*
Student of two or more races/ethnicities –0.26 0.18 0.77
Special education status –1.59 0.03 0.20***
English language learner status –1.18 0.21 0.31***
Economically disadvantaged status – 0.90 0.02 0.41***
Suburban (versus rural–remote) 0.35 0.06 1.42***
Town (versus rural–remote) 0.21 0.06 1.24***
City (versus rural–remote) 0.54 0.09 1.72***
Rural–distant (versus rural–remote) 0.17 0.06 1.18**
Rural–fringe (versus rural–remote) 0.26 0.06 1.29***
Dropout rate (mean-centered)
High school size (divided by 10,000)
–2.38
0.80
0.28
0.25
0.92***
1.04**
Phase III
Table D19. Summary of logistic regression analysis for variables predicting immediate enrollment among public high school students from Pennsylvania Association of Rural and Small Schools districts
D-13
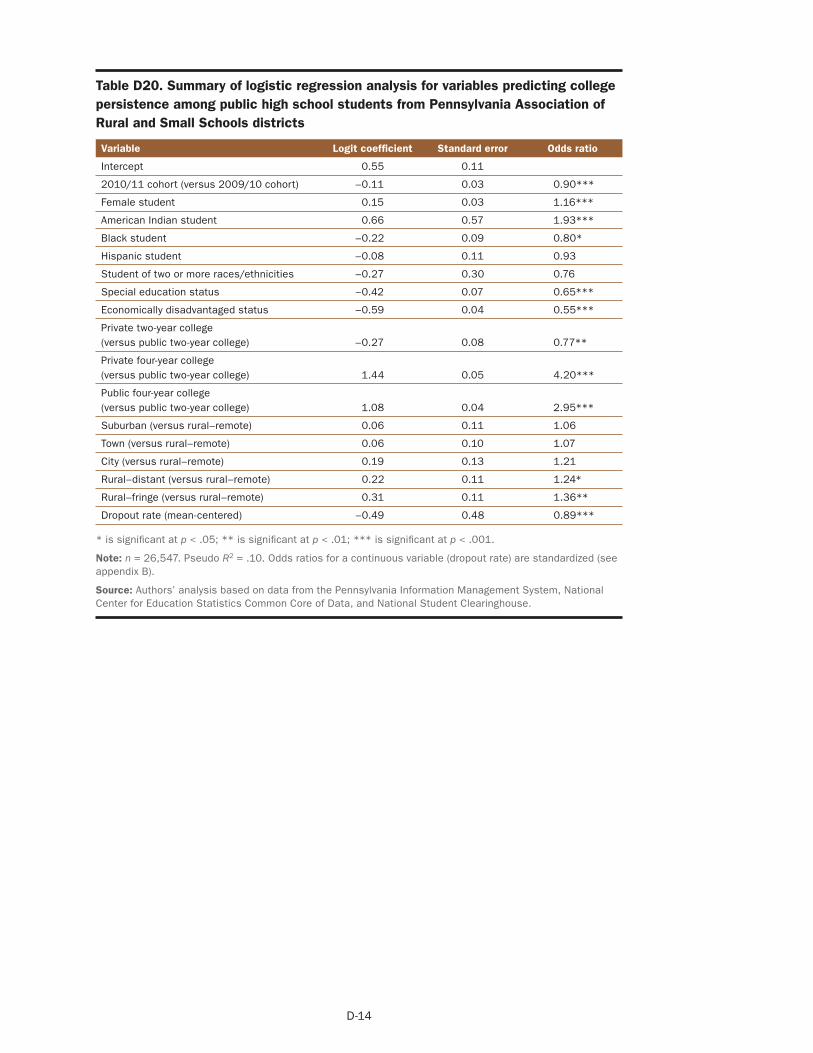
* is significant at p < .05; ** is significant at p < .01; *** is significant at p < .001.
Note: n = 26,547. Pseudo R2 = .10. Odds ratios for a continuous variable (dropout rate) are standardized (see appendix B).
Source: Authors’ analysis based on data from the Pennsylvania Information Management System, National Center for Education Statistics Common Core of Data, and National Student Clearinghouse.
Variable Logit coefficient Standard error Odds ratio
Intercept 0.55 0.11
2010/11 cohort (versus 2009/10 cohort) –0.11 0.03 0.90***
Female student 0.15 0.03 1.16***
American Indian student 0.66 0.57 1.93***
Black student –0.22 0.09 0.80*
Hispanic student –0.08 0.11 0.93
Student of two or more races/ethnicities –0.27 0.30 0.76
Special education status –0.42 0.07 0.65***
Economically disadvantaged status –0.59 0.04 0.55***
Private two-year college (versus public two-year college) –0.27 0.08 0.77**
Private four-year college (versus public two-year college) 1.44 0.05 4.20***
Public four-year college (versus public two-year college) 1.08 0.04 2.95***
Suburban (versus rural–remote) 0.06 0.11 1.06
Town (versus rural–remote) 0.06 0.10 1.07
City (versus rural–remote) 0.19 0.13 1.21
Rural–distant (versus rural–remote) 0.22 0.11 1.24*
Rural–fringe (versus rural–remote) 0.31 0.11 1.36**
Dropout rate (mean-centered) – 0.49 0.48 0.89***
Table D20. Summary of logistic regression analysis for variables predicting college persistence among public high school students from Pennsylvania Association of Rural and Small Schools districts
D-14
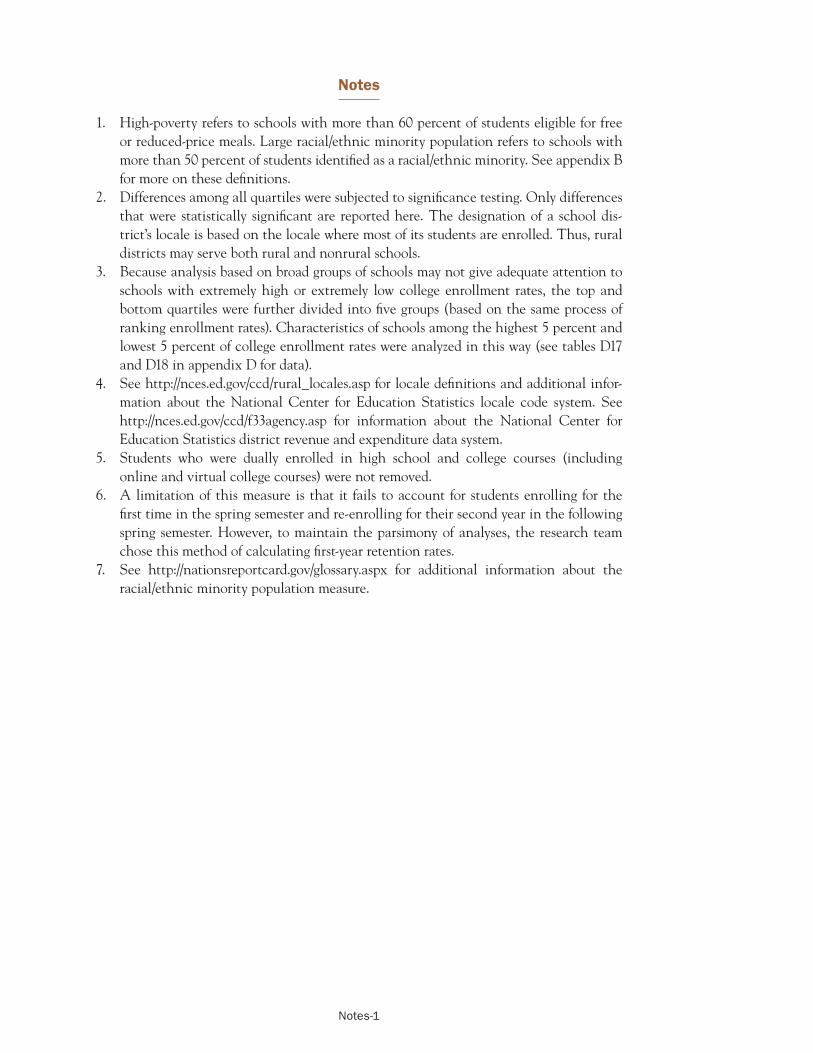
Notes
1. High-poverty refers to schools with more than 60 percent of students eligible for free or reduced-price meals. Large racial/ethnic minority population refers to schools with more than 50 percent of students identified as a racial/ethnic minority. See appendix B for more on these definitions.
2. Differences among all quartiles were subjected to significance testing. Only differences that were statistically significant are reported here. The designation of a school district’s locale is based on the locale where most of its students are enrolled. Thus, rural districts may serve both rural and nonrural schools.
3. Because analysis based on broad groups of schools may not give adequate attention to schools with extremely high or extremely low college enrollment rates, the top and bottom quartiles were further divided into five groups (based on the same process of ranking enrollment rates). Characteristics of schools among the highest 5 percent and lowest 5 percent of college enrollment rates were analyzed in this way (see tables D17 and D18 in appendix D for data).
4. See http://nces.ed.gov/ccd/rural_locales.asp for locale definitions and additional information about the National Center for Education Statistics locale code system. See http://nces.ed.gov/ccd/f33agency.asp for information about the National Center for Education Statistics district revenue and expenditure data system.
5. Students who were dually enrolled in high school and college courses (including online and virtual college courses) were not removed.
6. A limitation of this measure is that it fails to account for students enrolling for the first time in the spring semester and re-enrolling for their second year in the following spring semester. However, to maintain the parsimony of analyses, the research team chose this method of calculating first-year retention rates.
7. See http://nationsreportcard.gov/glossary.aspx for additional information about the racial/ethnic minority population measure.
Notes-1
References
Beaulieu, L. J., Israel, G. D., & Wimberly, R. C. (2003). Promoting educational achievement: A partnership of families, schools, and communities. In D. L. Brown & L. E. Swanson (Eds.), Challenges for rural America in the twenty-first century. University Park, PA: The Pennsylvania State University Press.
Blackwell, D. L., & McLaughlin, D. K. (1999). Do rural youth attain their educational goals? Rural Development Perspectives, 12(2), 37–44. http://eric.ed.gov/?id=EJ584517
Byun, S., Meece, J.L., & Irvin, M.J. (2012). Rural-nonrural disparities in postsecondary educational attainment revisited. American Educational Research Journal, 49(3), 412– 437. http://eric.ed.gov/?id=EJ968047
Crosnoe, R. (2009). Low-income students and the socioeconomic composition of public high schools. American Sociological Review, 74(5), 709–730. http://eric.ed.gov/?id=EJ889356
Demi, M., Coleman-Jensen, A., & Snyder, A. (2010). The rural context and post-secondary school enrollment: An ecological systems approach. Journal of Research in Rural Education, 25(7). Retrieved February 12, 2012, from http://jrre.psu.edu/articles/25–7.pdf.
Dunbar, A., Hossler, D., Shapiro, D., Chen, J., Martin, S., Torres, V., et al. (2011). National postsecondary enrollment trends before, during, and after the Great Recession. Signature Report. Herndon, VA: National Student Clearinghouse Research Center. Retrieved February 12, 2012, from http://nscresearchcenter.org/signaturereport1/.
Engberg, M., & Wolniak, G. (2010). Examining the effects of high school contexts on postsecondary enrollment. Research in Higher Education, 51(2), 132–153. http://eric. ed.gov/?id=EJ869641
Gibbs, R. (2004). Rural education at a glance (RDRR-98). Washington, DC: U.S. Department of Agriculture, Economic Research Service. Retrieved February 12, 2012, from http://www.ers.usda.gov/publications/rdrr-rural-development-research-report/rdrr98.aspx.
Griffin, D., Hutchins, B. C., & Meece, J. L. (2011). Where do rural high school students go to find information about their futures? Journal of Counseling and Development, 89(2), 172–181. http://eric.ed.gov/?id=EJ930514
Integrated Postsecondary Education Data System. (2013). Glossary. National Center for Education Statistics. Retrieved February 12, 2012, from http://nces.ed.gov/ipeds/ glossary/?charindex=R.
Irvin, M. J., Byun, S., Meece, J. L., Farmer, T. W., & Hutchins, B. B. (2012). Educational barriers of rural youth: Relation of individual and contextual difference variables. Journal of Career Assessment, 20(1), 71–87. http://eric.ed.gov/?id=EJ954088
Irvin, M. J., Meece, J. L., Byun, S., Farmer, T. W., & Hutchins, B. C. (2011). Relationship of school context to rural youth’s educational achievement and aspirations. Journal of Youth and Adolescence, 40(9), 1225–1242. http://eric.ed.gov/?id=EJ933407
Ref-1
Legutko, R. S. (2008). A decade’s difference: Research revisited on family influence of rural high school students’ postsecondary decisions. Rural Educator, 29(2), 4–7. http://eric. ed.gov/?id=EJ869287
Lichter, D. T., McLaughlin, D. K., & Cornwell, G. T. (1995). Migration and the loss of human resources in rural America (pp. 235–256). In L. J. Beaulieu & D. Mulkey (Eds.), Investing in people: The human capital needs of rural America. Boulder, CO: Westview.
National Center for Education Statistics. (2013). Immediate transition to college. Washington, DC: U.S. Department of Education, National Center for Education Statistics. Retrieved February 12, 2012, from http://nces.ed.gov/programs/coe/indicator_cpa.asp.
National Student Clearinghouse Research Center. (2012). Transfer and mobility: A national view of pre-degree student movement in postsecondary institutions. Herndon, VA: National Student Clearinghouse. Retrieved February 12, 2012, from http://nscresearchcenter. org/wp-content/uploads/NSC_Signature_Report_2.pdf.
National Student Clearinghouse (2013, October 15). National college progression rates: For high schools participating in the National Student Clearinghouse StudentTracker service. Herndon, VA: Author. Retrieved February 12, 2012, from http://nscresearchcenter.org/ wp-content/uploads/HighSchoolBenchmarks2013.pdf.
Provasnik, S., Kewal Ramani, A., Coleman, M. M., Gilbertson, L., Herring, W., & Xie, Q. (2007). Status of education in rural America (NCES 2007–040). Washington, DC: U.S. Department of Education, National Center for Education Statistics. Retrieved February 12, 2012, from http://nces.ed.gov/pubs2007/2007040.pdf.
Snyder, T. D., and Dillow, S. A. (2010). Digest of education statistics 2009 (NCES 2010– 013). Washington, DC: U.S. Department of Education, National Center for Education Statistics. Retrieved February 12, 2012, from http://nces.ed.gov/pubs2010/2010013.pdf.
Wolniak, G.C., and Engberg, M.E. (2010). Academic achievement in the first year of college: Evidence of the pervasive effects of the high school context. Research in Higher Education, 51(5), 451–467. http://eric.ed.gov/?id=EJ891378
Yan, W. (2002). Postsecondary enrollment and persistence of students from rural Pennsylvania. Harrisburg, PA: Center for Rural Pennsylvania. http://eric.ed.gov/?id=ED459986
Ref-2
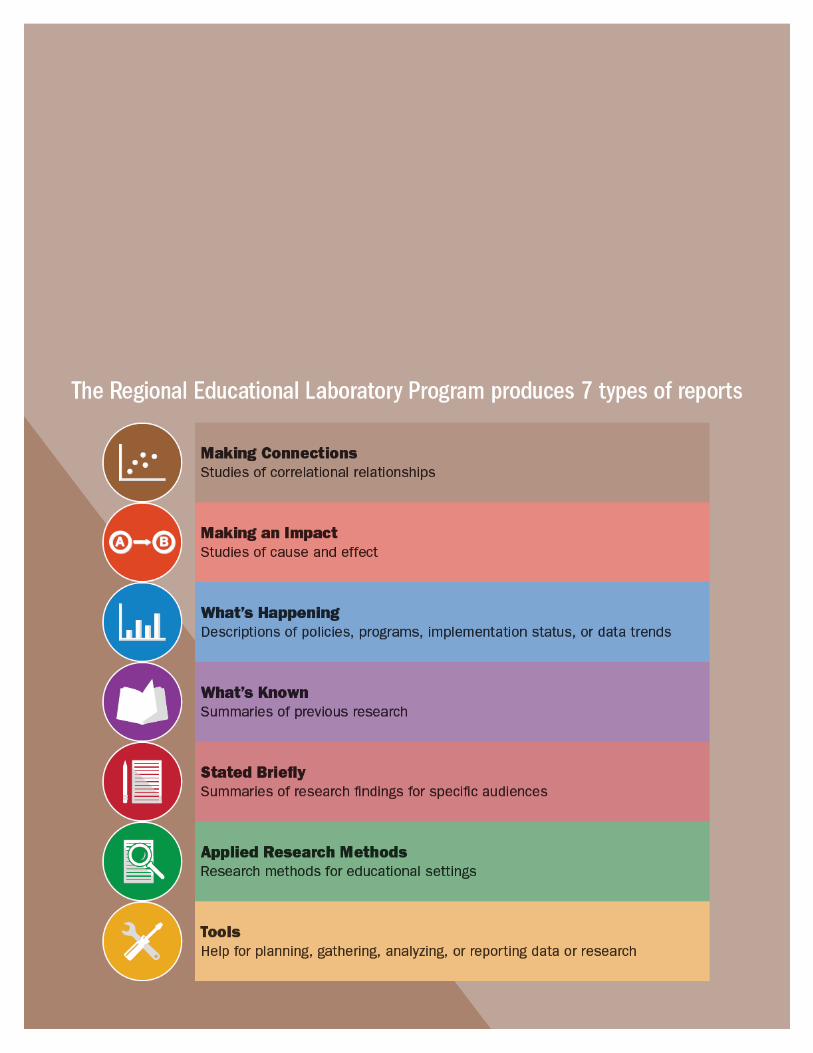


![[Pennsylvania county histories]](https://img.dokumen.tips/doc/110x75/63359360d2b728420307fa00/pennsylvania-county-histories.jpg)


