Embed Size (px)
Citation preview
Available online at www.sciencedirect.com
www.elsevier.com/locate/pnsc
Progress in Natural Science 19 (2009) 1773–1779
Climatic regionalization mapping of the Murrumbidgee IrrigationArea, Australia
Demin Zhou a,b,*, Shahbaz Khan c,*, Akhtar Abbas d, Tariq Rana e, Haiying Zhang b,Yun Chen d
a Key Laboratory of Resource, Environment and GIS in Beijing, Capital Normal University, Beijing 100037, Chinab Northeast Institute of Geography and Agro-ecology, Chinese Academy of Sciences, Changchun 130012, China
c Sustainable Water Resources Development and Management Section, Division of Water Sciences, UNESCO, 1, rue Miollis, 75015 Paris, Franced CSIRO Land and Water University, Canberra, ACT, Australia
e Murray Darling Basin Authority, Canberra, ACT, Australia
Received 21 May 2009; received in revised form 10 July 2009; accepted 21 July 2009
Abstract
In this study, spatial analysis techniques were used to generate climatic zoning maps of the East Murrumbidgee Irrigation Area (MIA),Australia. Long term climate data were used to analyze and assess regional climatic variation by cluster analysis in a GIS environment.Based on thermal and moisture factors, four variables were chosen to develop climate zones. These variables include annual average rain-falls, annual average ETc, annual average Growing Day Degree (GDD) and daily average temperature generated from daily climate dataof 36 years (1971–2006) on 12 local weather stations as the fundamental elements of regional climate characteristics. GIS-based spatialanalysis models are used to map climate sub-regions from sets of climatic parameters derived from regional climate data sources. Twoclimate zoning schemes are presented by integration of spatial interpolation, spatial cluster analysis and climate indices methods. Onescheme comes with the two climate zones of the West and the East based on spatial cluster analysis according to selected climatic variables,and the other comes with the three comprehensive hydro-thermal zones and the six hydro-thermal balance zones.� 2009 National Natural Science Foundation of China and Chinese Academy of Sciences. Published by Elsevier Limited and Science inChina Press. All rights reserved.
Keywords: Agro-climatic regionalization; Regional climatic variation; Climatic zone mapping; Murrumbidgee Irrigation Area; GIS
1. Introduction
Climatic regionalization within a specific region (in thescale of thousands of square kilometers) is crucial due tothe extensive requirements for resource management,agro-climatic regionalization and the assessment of regio-nal development [1]. Like soils, climate variables also con-tribute to the general production potential of a region.Their spatial variations can be mapped at different scales
1002-0071/$ - see front matter � 2009 National Natural Science Foundation o
and Science in China Press. All rights reserved.
doi:10.1016/j.pnsc.2009.07.007
* Corresponding authors. Tel.: +86 010 6898 0798; fax: +86 010 68980798 (D. Zhou), Tel.: +33 1 45 68 45 69; fax: +33 1 45 68 58 11 (S. Khan).
E-mail addresses: [email protected] (D. Zhou), [email protected] (S. Khan).
[2]. Scientific strategies supported by well-identified naturalresources can help to optimize available resources, and therational distribution of natural resources can help toimprove agricultural productivity [3].
Most of the currently reported climatic or ecologicalresearch works were conducted by using expert evaluationand qualitative analysis of a site data. Such traditional meth-ods of manual regional delineation (regionalization) aretime-consuming and laborious processes [4]. When multipledata layers are needed to define regions for a more compre-hensive scope, the judgement of boundary locations oftenbecomes very complex and results in subjective and possiblyundocumented decisions that may not be reproducible [5,6].Hence, some of the climatic zoning maps for a specific crop,
f China and Chinese Academy of Sciences. Published by Elsevier Limited
1774 D. Zhou et al. / Progress in Natural Science 19 (2009) 1773–1779
or a specific purpose, have recently been published [4–10].Most of these results exhibited very coarse spatial details,and few research works focused on a comprehensive agro-climatic zoning study within a fine scale.
Most important studies on climatic zoning were under-taken on a large study area, such as world wide, continentlyand nationally. They represented earlier climatic regionali-zation [2]. However, there are few research reports on the cli-mate zoning on a small spatial scale, though some localadministration units match their regional resources unit verywell in a small spatial unit. Hence, climate zoning at such ascale is very useful research work [11]. One key reason forcausing this situation is lack of detailed climate data for asmall area. The other reason is that the climatic variationwithin a small spatial scale is not obvious for such regional-ization by traditional research methods. However, the rapidprogress of the Geographical Information System (GIS) pro-vides the functionality for fine-scale spatial studies. Spatialanalysis integrated with statistical methods is automatedand efficient for climatic regionalization by reducing thejudgement biases and uncertainty of manual analyses [10].
One of the main differences between the present study andtraditional analyses is to present a map describing the regio-nal climate with local detailed variation. The generalizedmap represents a unique multi-purpose utility for evaluatingregional climate resources [8]. Development of spatial analy-sis models integrated with statistical methods provides a newand useful approach to climatic zone mapping for resourcemanagers and researchers [12,13]. Therefore, the objectiveof this research is to develop quantitative, multivariateregionalization models that are capable of delineating cli-matic zones at multiple levels from long term climate data.
2. Study area and materials
2.1. Study area
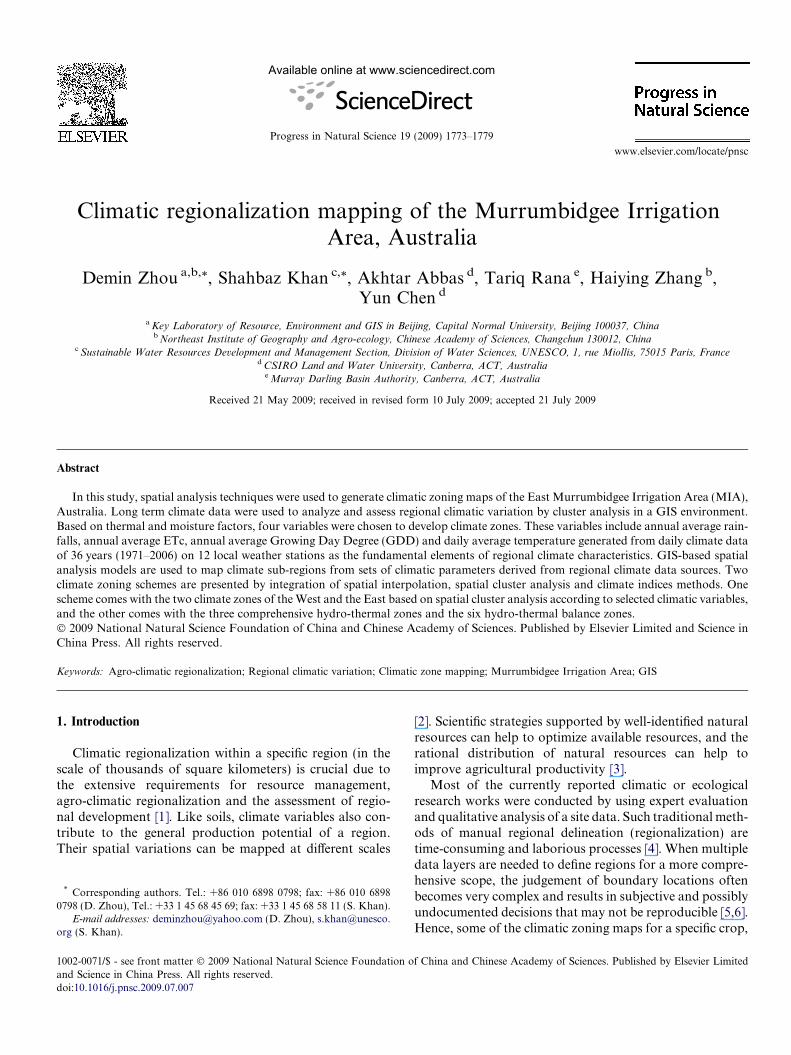
Located in the interior of New South Wales in SoutheastAustralia (Fig. 1), the Murrumbidgee Irrigation Area (MIA)is a fluvial plain formed by the Murrumbidgee River, the thirdlargest river (1690 km) in Australia. The area is divided into thewestern part and the eastern part according to different physi-cally regional environments. The eastern MIA has a continen-tal climate with mean monthly air temperatures ranging from7.1 to 29.1 �C (Griffith) and precipitation ranging from350 mm in the West (Gunbar) to 438 mm in the East (Yanda).Hence, the climatic conditions are extremely diverse despite thesmall size of the study area. The total area of the East MIA is156,605 ha, and over 150,000 ha of land, or 95% of the studyarea, has been cultivated for agricultural purposes. The mainagricultural products are rice, grapes, citrus, and vegetables.Irrigation plays a key role in supporting local farms.
2.2. Materials
Climate has long been recognized as the primary dynamicforce shaping the patterns of vegetation, soils, and cropping
systems in East MIA. The climate data sources were derivedfrom 13 weather stations within or nearby the study area thathad available daily data from 1961 to 2006 (Fig. 1). Only 12weather stations were used for this study due to data problemsfrom the Griffith airport weather station. The long term dataare supported from the national weather system named SILOin Australia. The SILO data set provides as many as nine cli-mate parameters. They are daily data including maximum tem-perature, minimum temperature, rainfall, estimated relativehumidity, calculated potential evapotranspiration, etc. (rela-tive humidity is estimated based on temperatures; potentialevapotranspiration is calculated by using the FAO Penman-Monteith formula [14]).
Four variables for agro-climatic regionalization werechosen to represent fundamental aspects of regional mois-ture and radiation energy availability. They are annual aver-age rainfalls, annual average ETc, annual average GrowingDay Degree (GDD) and daily average temperature. Theywere generated from daily data. The two climatic parameterswhich best quantify the spatial variation of thermal energyare daily average temperature and growing degree day totals.The former is a parameter to present the potential of radia-tion, and the latter applies to regional ecology in generalbased on 10 �C (50 �F), which is a parameter of an effectivepart of radiation regionally. The two climatic parameterswhich best quantify the spatial variation of moisture areannual average rainfalls and ETc. The former reflects thepotential of precipitation available regionally, and the link-age of both parameters will define an annual water balance(AWB), which best quantify an effective part of surface waterregionally. The balance of these two variables will generate acomprehensive variable to express the surface water avail-ability in a region.
3. Methods and results
3.1. Spatial interpolation and spatial variation of individual
climatic elements
The four parameters were captured individually as digi-tal maps from ArcGIS 9.2 by using spatial interpolationmethods to quantify the spatial variation of regional cli-mates. Each of them presents a fundamental aspect of cli-mate with the different factors of the regional climate.And these four parameters show different characteristicsof spatial variance. The selection of these variables resultedin some representative and efficient parameters for thecomprehensive climatic regionalization models.
Kriging interpolation is a widespread method of spatialanalysis, which has been developed presently for multiplefunctions to describe spatial variation [3]. An advance ofthe Kriging method is the Best Linear Unbiased Estimator(BLUE) for the statistical samples. In this study, we use theSimple Kriging method for spatial interpolation on fourclimatic variables after evaluating the statistical character-istics. Because the annual average rainfall is not subject tonormal distribution, we changed the data set into a log
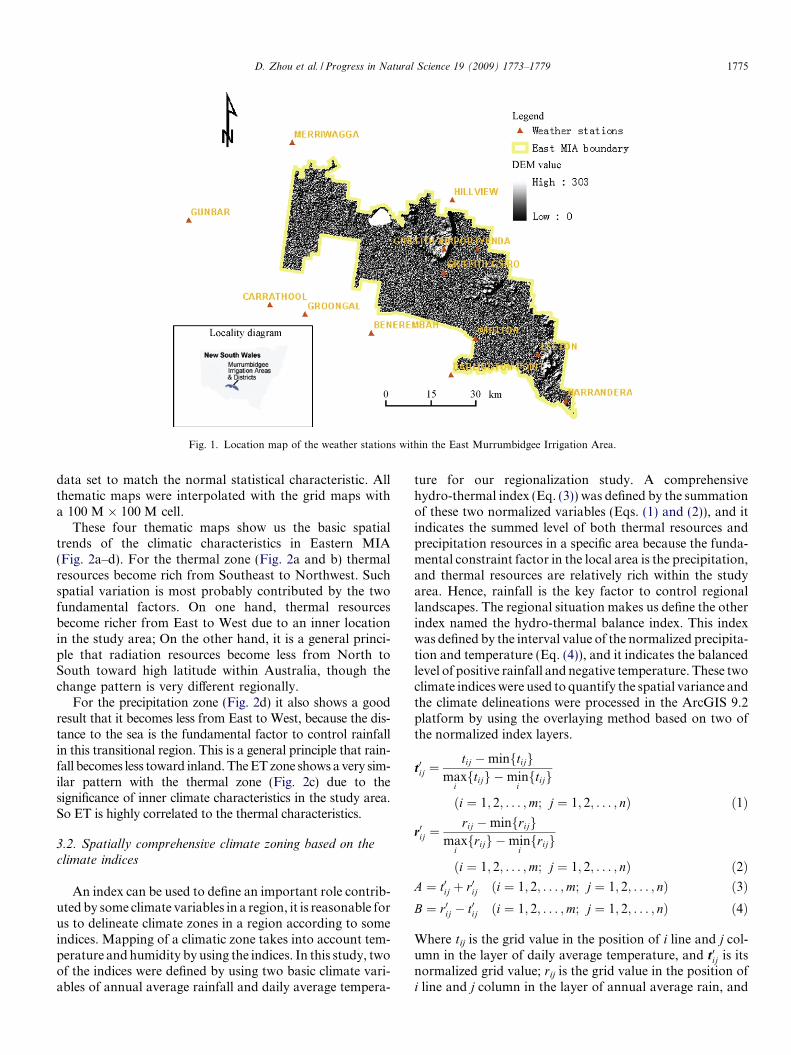
Fig. 1. Location map of the weather stations within the East Murrumbidgee Irrigation Area.
D. Zhou et al. / Progress in Natural Science 19 (2009) 1773–1779 1775
data set to match the normal statistical characteristic. Allthematic maps were interpolated with the grid maps witha 100 M � 100 M cell.
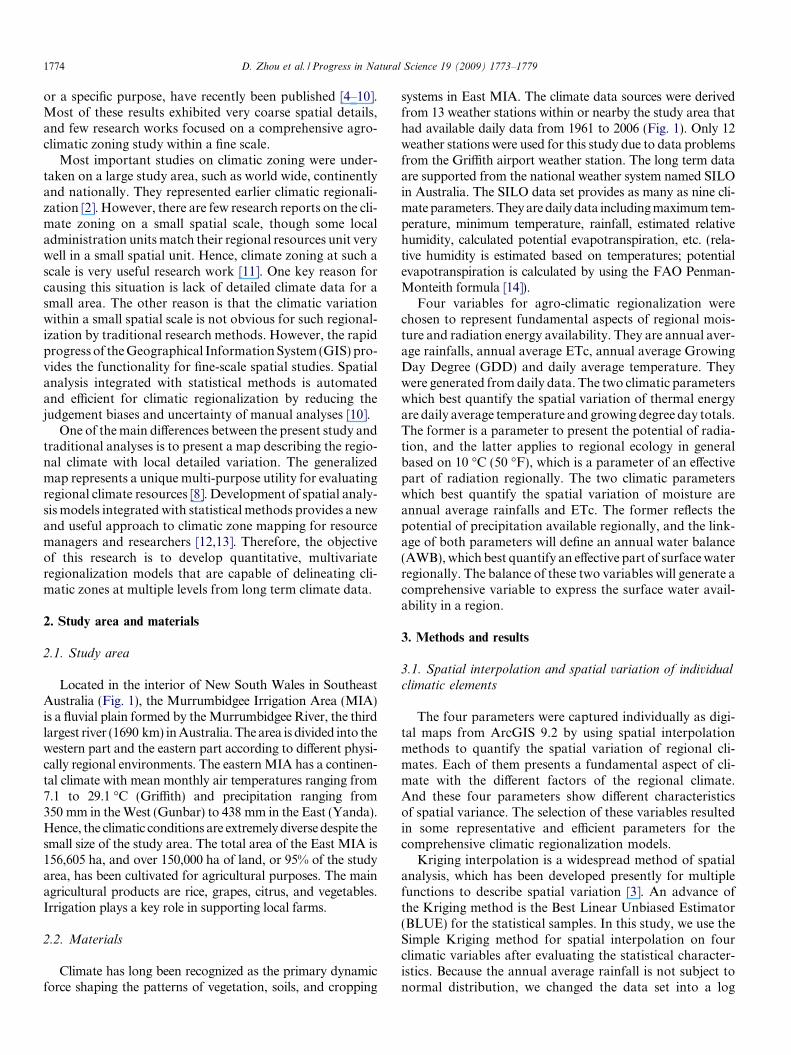
These four thematic maps show us the basic spatialtrends of the climatic characteristics in Eastern MIA(Fig. 2a–d). For the thermal zone (Fig. 2a and b) thermalresources become rich from Southeast to Northwest. Suchspatial variation is most probably contributed by the twofundamental factors. On one hand, thermal resourcesbecome richer from East to West due to an inner locationin the study area; On the other hand, it is a general princi-ple that radiation resources become less from North toSouth toward high latitude within Australia, though thechange pattern is very different regionally.
For the precipitation zone (Fig. 2d) it also shows a goodresult that it becomes less from East to West, because the dis-tance to the sea is the fundamental factor to control rainfallin this transitional region. This is a general principle that rain-fall becomes less toward inland. The ET zone shows a very sim-ilar pattern with the thermal zone (Fig. 2c) due to thesignificance of inner climate characteristics in the study area.So ET is highly correlated to the thermal characteristics.
3.2. Spatially comprehensive climate zoning based on the
climate indices
An index can be used to define an important role contrib-uted by some climate variables in a region, it is reasonable forus to delineate climate zones in a region according to someindices. Mapping of a climatic zone takes into account tem-perature and humidity by using the indices. In this study, twoof the indices were defined by using two basic climate vari-ables of annual average rainfall and daily average tempera-
ture for our regionalization study. A comprehensivehydro-thermal index (Eq. (3)) was defined by the summationof these two normalized variables (Eqs. (1) and (2)), and itindicates the summed level of both thermal resources andprecipitation resources in a specific area because the funda-mental constraint factor in the local area is the precipitation,and thermal resources are relatively rich within the studyarea. Hence, rainfall is the key factor to control regionallandscapes. The regional situation makes us define the otherindex named the hydro-thermal balance index. This indexwas defined by the interval value of the normalized precipita-tion and temperature (Eq. (4)), and it indicates the balancedlevel of positive rainfall and negative temperature. These twoclimate indices were used to quantify the spatial variance andthe climate delineations were processed in the ArcGIS 9.2platform by using the overlaying method based on two ofthe normalized index layers.
t0ij ¼tij �minftijg
maxiftijg �min
iftijg
ði ¼ 1; 2; . . . ;m; j ¼ 1; 2; . . . ; nÞ ð1Þ
r0ij ¼rij �minfrijg
maxifrijg �min
ifrijg
ði ¼ 1; 2; . . . ;m; j ¼ 1; 2; . . . ; nÞ ð2ÞA ¼ t0ij þ r0ij ði ¼ 1; 2; . . . ;m; j ¼ 1; 2; . . . ; nÞ ð3ÞB ¼ r0ij � t0ij ði ¼ 1; 2; . . . ;m; j ¼ 1; 2; . . . ; nÞ ð4Þ
Where tij is the grid value in the position of i line and j col-umn in the layer of daily average temperature, and t0ij is itsnormalized grid value; rij is the grid value in the position ofi line and j column in the layer of annual average rain, and
1776 D. Zhou et al. / Progress in Natural Science 19 (2009) 1773–1779
r0ij is its normalized grid value; A is the comprehensive hy-dro-thermal index, and B is the hydro-thermal balanceindex.
Fig. 2. Spatial interpolation analysis of individual climatic variables in theEastern MIA.
Based on the value of the comprehensive hydro-thermalindex, our study area could be divided into three equallygradient sub-regions from Northeast to Southwest accord-ing to the spatial variance of the regional hydro-thermallevel. These three climate zones have almost equal areas(Fig. 3a). Based on the value of the hydro-thermal balanceindex, our study area could be delineated into six sub-regions from Southeast to Northwest with an equally gra-dient value (Fig. 3b). The spatial variance of the climatezones is smaller in the Southeast and become larger inthe Northwest due to the decreased hydro-thermal balancecondition toward the Northwest.
3.3. Spatial cluster integrating with multiple variables for
comprehensive climate zoning
Based on over 30 year’s climate variables from the 12local climate stations, we attempted to delineate the climatezones by using the spatial cluster method. The cluster anal-ysis was executed in the platform of the SPSS 12.0, and thedelineation work of the climate zone was carried out in the
Fig. 3. Maps of the climate zones based on the defined climate indices.
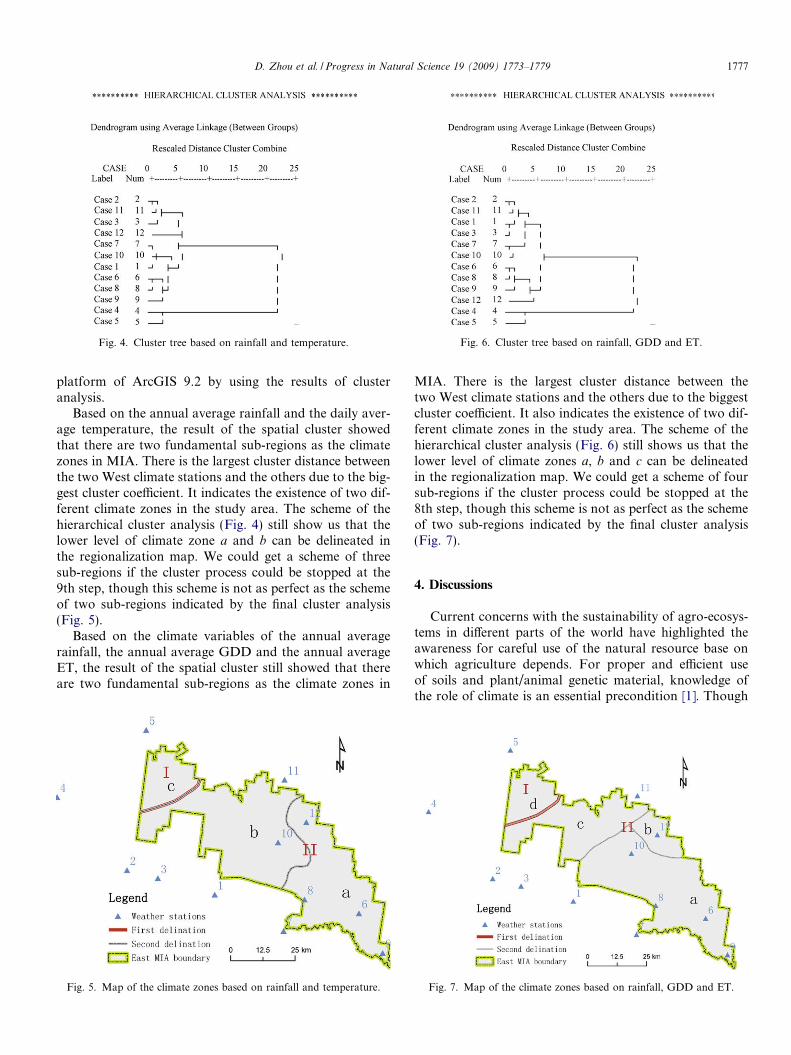
Fig. 4. Cluster tree based on rainfall and temperature. Fig. 6. Cluster tree based on rainfall, GDD and ET.
D. Zhou et al. / Progress in Natural Science 19 (2009) 1773–1779 1777
platform of ArcGIS 9.2 by using the results of clusteranalysis.
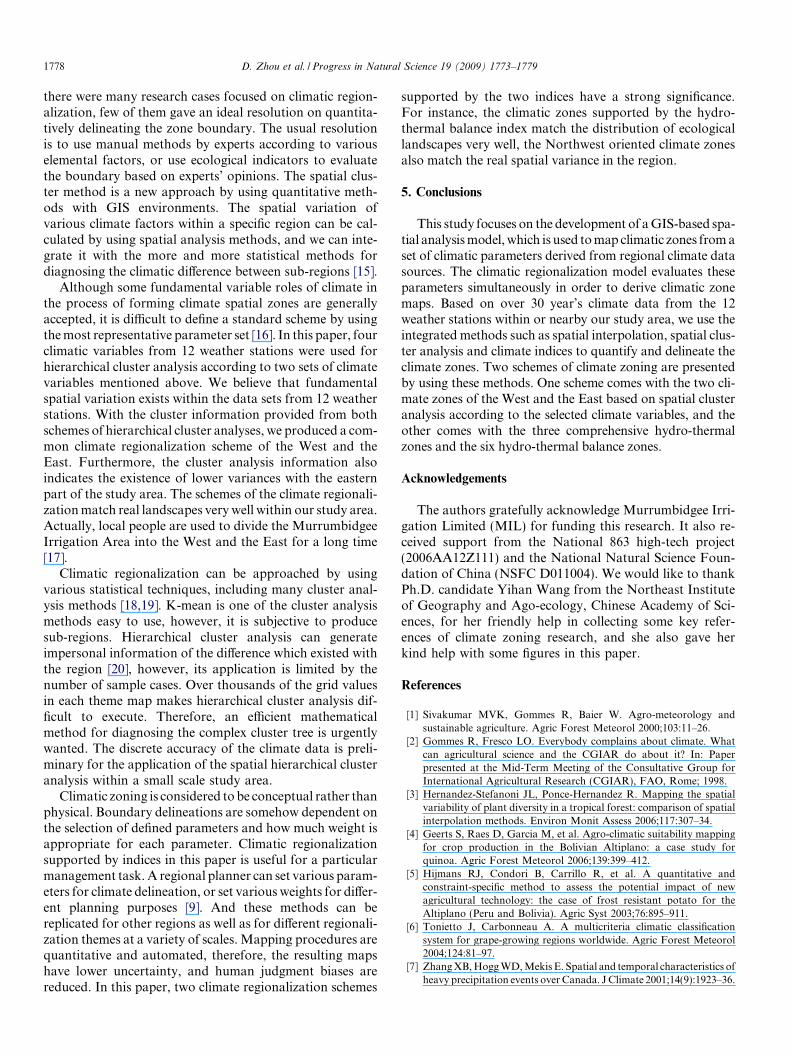
Based on the annual average rainfall and the daily aver-age temperature, the result of the spatial cluster showedthat there are two fundamental sub-regions as the climatezones in MIA. There is the largest cluster distance betweenthe two West climate stations and the others due to the big-gest cluster coefficient. It indicates the existence of two dif-ferent climate zones in the study area. The scheme of thehierarchical cluster analysis (Fig. 4) still show us that thelower level of climate zone a and b can be delineated inthe regionalization map. We could get a scheme of threesub-regions if the cluster process could be stopped at the9th step, though this scheme is not as perfect as the schemeof two sub-regions indicated by the final cluster analysis(Fig. 5).
Based on the climate variables of the annual averagerainfall, the annual average GDD and the annual averageET, the result of the spatial cluster still showed that thereare two fundamental sub-regions as the climate zones in
Fig. 5. Map of the climate zones based on rainfall and temperature.
MIA. There is the largest cluster distance between thetwo West climate stations and the others due to the biggestcluster coefficient. It also indicates the existence of two dif-ferent climate zones in the study area. The scheme of thehierarchical cluster analysis (Fig. 6) still shows us that thelower level of climate zones a, b and c can be delineatedin the regionalization map. We could get a scheme of foursub-regions if the cluster process could be stopped at the8th step, though this scheme is not as perfect as the schemeof two sub-regions indicated by the final cluster analysis(Fig. 7).
4. Discussions
Current concerns with the sustainability of agro-ecosys-tems in different parts of the world have highlighted theawareness for careful use of the natural resource base onwhich agriculture depends. For proper and efficient useof soils and plant/animal genetic material, knowledge ofthe role of climate is an essential precondition [1]. Though
Fig. 7. Map of the climate zones based on rainfall, GDD and ET.
1778 D. Zhou et al. / Progress in Natural Science 19 (2009) 1773–1779
there were many research cases focused on climatic region-alization, few of them gave an ideal resolution on quantita-tively delineating the zone boundary. The usual resolutionis to use manual methods by experts according to variouselemental factors, or use ecological indicators to evaluatethe boundary based on experts’ opinions. The spatial clus-ter method is a new approach by using quantitative meth-ods with GIS environments. The spatial variation ofvarious climate factors within a specific region can be cal-culated by using spatial analysis methods, and we can inte-grate it with the more and more statistical methods fordiagnosing the climatic difference between sub-regions [15].
Although some fundamental variable roles of climate inthe process of forming climate spatial zones are generallyaccepted, it is difficult to define a standard scheme by usingthe most representative parameter set [16]. In this paper, fourclimatic variables from 12 weather stations were used forhierarchical cluster analysis according to two sets of climatevariables mentioned above. We believe that fundamentalspatial variation exists within the data sets from 12 weatherstations. With the cluster information provided from bothschemes of hierarchical cluster analyses, we produced a com-mon climate regionalization scheme of the West and theEast. Furthermore, the cluster analysis information alsoindicates the existence of lower variances with the easternpart of the study area. The schemes of the climate regionali-zation match real landscapes very well within our study area.Actually, local people are used to divide the MurrumbidgeeIrrigation Area into the West and the East for a long time[17].
Climatic regionalization can be approached by usingvarious statistical techniques, including many cluster anal-ysis methods [18,19]. K-mean is one of the cluster analysismethods easy to use, however, it is subjective to producesub-regions. Hierarchical cluster analysis can generateimpersonal information of the difference which existed withthe region [20], however, its application is limited by thenumber of sample cases. Over thousands of the grid valuesin each theme map makes hierarchical cluster analysis dif-ficult to execute. Therefore, an efficient mathematicalmethod for diagnosing the complex cluster tree is urgentlywanted. The discrete accuracy of the climate data is preli-minary for the application of the spatial hierarchical clusteranalysis within a small scale study area.
Climatic zoning is considered to be conceptual rather thanphysical. Boundary delineations are somehow dependent onthe selection of defined parameters and how much weight isappropriate for each parameter. Climatic regionalizationsupported by indices in this paper is useful for a particularmanagement task. A regional planner can set various param-eters for climate delineation, or set various weights for differ-ent planning purposes [9]. And these methods can bereplicated for other regions as well as for different regionali-zation themes at a variety of scales. Mapping procedures arequantitative and automated, therefore, the resulting mapshave lower uncertainty, and human judgment biases arereduced. In this paper, two climate regionalization schemes
supported by the two indices have a strong significance.For instance, the climatic zones supported by the hydro-thermal balance index match the distribution of ecologicallandscapes very well, the Northwest oriented climate zonesalso match the real spatial variance in the region.
5. Conclusions
This study focuses on the development of a GIS-based spa-tial analysis model, which is used to map climatic zones from aset of climatic parameters derived from regional climate datasources. The climatic regionalization model evaluates theseparameters simultaneously in order to derive climatic zonemaps. Based on over 30 year’s climate data from the 12weather stations within or nearby our study area, we use theintegrated methods such as spatial interpolation, spatial clus-ter analysis and climate indices to quantify and delineate theclimate zones. Two schemes of climate zoning are presentedby using these methods. One scheme comes with the two cli-mate zones of the West and the East based on spatial clusteranalysis according to the selected climate variables, and theother comes with the three comprehensive hydro-thermalzones and the six hydro-thermal balance zones.
Acknowledgements
The authors gratefully acknowledge Murrumbidgee Irri-gation Limited (MIL) for funding this research. It also re-ceived support from the National 863 high-tech project(2006AA12Z111) and the National Natural Science Foun-dation of China (NSFC D011004). We would like to thankPh.D. candidate Yihan Wang from the Northeast Instituteof Geography and Ago-ecology, Chinese Academy of Sci-ences, for her friendly help in collecting some key refer-ences of climate zoning research, and she also gave herkind help with some figures in this paper.
References
[1] Sivakumar MVK, Gommes R, Baier W. Agro-meteorology andsustainable agriculture. Agric Forest Meteorol 2000;103:11–26.
[2] Gommes R, Fresco LO. Everybody complains about climate. Whatcan agricultural science and the CGIAR do about it? In: Paperpresented at the Mid-Term Meeting of the Consultative Group forInternational Agricultural Research (CGIAR), FAO, Rome; 1998.
[3] Hernandez-Stefanoni JL, Ponce-Hernandez R. Mapping the spatialvariability of plant diversity in a tropical forest: comparison of spatialinterpolation methods. Environ Monit Assess 2006;117:307–34.
[4] Geerts S, Raes D, Garcia M, et al. Agro-climatic suitability mappingfor crop production in the Bolivian Altiplano: a case study forquinoa. Agric Forest Meteorol 2006;139:399–412.
[5] Hijmans RJ, Condori B, Carrillo R, et al. A quantitative andconstraint-specific method to assess the potential impact of newagricultural technology: the case of frost resistant potato for theAltiplano (Peru and Bolivia). Agric Syst 2003;76:895–911.
[6] Tonietto J, Carbonneau A. A multicriteria climatic classificationsystem for grape-growing regions worldwide. Agric Forest Meteorol2004;124:81–97.
[7] Zhang XB, Hogg WD, Mekis E. Spatial and temporal characteristics ofheavy precipitation events over Canada. J Climate 2001;14(9):1923–36.
D. Zhou et al. / Progress in Natural Science 19 (2009) 1773–1779 1779
[8] Castino F, Rusca L, Solari G. Wind climate micro-zoning: a pilotapplication to Liguria Region (North Western Italy). J Wind Eng IndAerodyn 2003;91:1353–75.
[9] Erell E, Portnov AB, Yair E. Mapping the potential for climate-conscious design of buildings. Build Environ 2003;38:271–81.
[10] Diabate L, Blanc P, Wald L. Solar radiation climate in Africa. SolarEnergy 2004;76:733–44.
[11] Hansen JW, Jones JW. Scaling-up crop models for climate variabilityapplications. Agric Syst 2000;65:43–72.
[12] Smith M. The application of climatic data for planning andmanagement of sustainable rained and irrigated crop production.Agric Forest Meteorol 2000;103:99–108.
[13] Zhou DM, Gong HL, Liu ZL. Integrated wetland ecologic assess-ment of environmental condition in water catchments: linking hydro-ecological modeling and Geo-information techniques. Ecol Model2008;214:411–20.
[14] Allen RG, Pereira LS, Raes D, et al. Crop evapotranspiration –guidelines for computing crop water requirements – FAO Irrigationand Drainage paper 56, Rome; 1998. Available from: http://www.fao.org/docrep/X0490E/X0490E00.htm.
[15] Daily C, Neilson RP, Phillips DL. A statistical-topographic modelfor mapping climatological precipitation over mountainous terrain. JAppl Meteorol 1993;33:140–58.
[16] Zhou YC, Narumalani S, Waltman JW, et al. A GIS-based spatialpattern analysis model for eco-region mapping and characterization.Int J Geogr Inf Sci 2003;17(5):445–62.
[17] Khan S, Rana T, Carroll J, et al. Managing climate, irrigation andground water interactions using a numerical model: a case study ofthe Murrumbidgee Irrigation Area. CSIRO Land and WaterTechnical Report 2003. Available online: http://www.clw.csiro.au/publications/technical2004/tr13-04.pdf.
[18] Gerstengarbe FW, Werner PC, Fraedrich K. Applying non-hierar-chical cluster analysis algorithms to climate classification: someproblems and their solution. Theor Appl Climatol 1999;64:143–50.
[19] Ramos MC. Divisive and hierarchical clustering techniques toanalyze variability of rainfall distribution patterns in a Mediterraneanregion. Atmos Res 2001;57:123–38.
[20] Zhou DM, Xu JC, Radke J, et al. A spatial cluster method supportedby GIS for urban–suburban–rural classification. Chin Geogr Sci2004;14(4):337–42.
![Capítol 5. Regionalització i canvi organitzatiu [ Regionalization and Organizational Change]](https://img.dokumen.tips/doc/110x75/6350b36bf55d98549a09e172/capitol-5-regionalitzacio-i-canvi-organitzatiu-regionalization-and-organizational.jpg)


![Regionalization amidst 'State-Shrinkage' [p.p. 5-28]](https://img.dokumen.tips/doc/110x75/631b937b3e8acd9977057dea/regionalization-amidst-state-shrinkage-pp-5-28.jpg)


