Embed Size (px)
Citation preview
GLOBAL CHANGE ECOLOGY
Russell K. Monson Æ Jed P. Sparks Æ Todd N. Rosenstiel
Laura E. Scott-Denton Æ Travis E. Huxman
Peter C. Harley Æ Andrew A. Turnipseed
Sean P. Burns Æ Brant Backlund Æ Jia Hu
Climatic influences on net ecosystem CO2 exchange duringthe transition from wintertime carbon source to springtime carbonsink in a high-elevation, subalpine forest
Received: 15 February 2005 / Accepted: 18 May 2005 / Published online: 10 August 2005� Springer-Verlag 2005
Abstract The transition between wintertime net carbonloss and springtime net carbon assimilation has animportant role in controlling the annual rate of carbonuptake in coniferous forest ecosystems. We studied thecontributions of springtime carbon assimilation to thetotal annual rate of carbon uptake and the processes in-volved in the winter-to-spring transition across a range ofscales from ecosystem CO2 fluxes to chloroplast photo-chemistry in a coniferous, subalpine forest. We observednumerous initiations and reversals in the recovery ofphotosynthetic CO2 uptake during the initial phase ofspringtime recovery in response to the passage of alter-nating warm- and cold-weather systems. Full recovery ofecosystem carbon uptake, whereby the 24-h cumulativesum of NEE (NEEdaily) was consistently negative, did notoccur until 3–4 weeks after the first signs of photosyn-thetic recovery. A key event that preceded full recovery
was the occurrence of isothermality in the vertical profileof snow temperature across the snow pack; thus, provid-ing consistent daytime percolation of melted snow waterthrough the snow pack. Interannual variation in thecumulative annual NEE (NEEannual) was mostly ex-plained by variation in NEE during the snow-melt period(NEEsnow-melt), not variation inNEEduring the snow-freepart of the growing season (NEEsnow-free). NEEsnow-melt
was highest in those years when the snow melt occurredlater in the spring, leading us to conclude that in thisecosystem, years with earlier springs are characterized bylower rates of NEEannual, a conclusion that contrasts withthose from past studies in deciduous forest ecosystems.Using studies on isolated branches we showed that therecovery of photosynthesis occurred through a series ofcoordinated physiological and biochemical events.Increasing air temperatures initiated recovery through theupregulation of PSII electron transport caused in part bydisengagement of thermal energy dissipation by thecarotenoid, zeaxanthin. The availability of liquid waterpermitted a slightly slower recovery phase involving in-creased stomatal conductance. The most rate-limitingstep in the recovery processwas an increase in the capacityfor the needles to use intercellular CO2, presumably due toslow recovery ofRubisco activity. Interspecific differenceswere observed in the timingof photosynthetic recovery forthe dominant tree species. The results of our study provide(1) a context for springtime CO2 uptake within thebroader perspective of the annual carbon budget in thissubalpine forest, and (2) a mechanistic explanation acrossa range of scales for the coupling between springtime cli-mate and the carbon cycle of high-elevation coniferousforest ecosystems.
Keywords Conifers Æ AmeriFlux ÆRocky Mountains Æ Eddy Æ Turbulent Æ Fir Æ Pine ÆSpruce Æ Hydrology Æ Carboxylation efficiency ÆQuantum Yield Æ Chlorophyll fluorescence ÆXanthophyll
Communicated by Jim Ehleringer
R. K. Monson (&) Æ J. P. Sparks Æ T. N. RosenstielL. E. Scott-DentonT. E. Huxman Æ P. C. HarleyA. A. Turnipseed Æ S. P. Burns Æ B. Backlund Æ J. HuDepartment of Ecology and Evolutionary Biology,University of Colorado, Boulder, CO 80309-0334, USAE-mail: [email protected].: +1-303-4926319Fax: +1-303-4928699
R. K. MonsonCooperative Institute for Research in Environmental Science,University of Colorado, Boulder, CO 80309, USA
P. C. Harley Æ A. A. Turnipseed Æ S. P. BurnsNational Center for Atmospheric Research,Boulder, CO 80301, USA
Present address: J. P. SparksDepartment of Ecology and Evolutionary Biology,Cornell University, Ithaca, NY, USA
Present address: T. E. HuxmanDepartment of Ecology and Evolutionary Biology,University of Arizona, Tucson, AZ 85721-0088, USA
Oecologia (2005) 146: 130–147DOI 10.1007/s00442-005-0169-2
Introduction
Climate transitions between the winter and spring exert aprincipal control over the photosynthetic dynamics ofconiferous forest ecosystems (Troeng and Linder 1982;Leverenz and Oquist 1987; Lundmark et al. 1998; Lawet al. 2000; Lloyd et al. 2002; Monson et al. 2002; Hux-man et al. 2003; Tanja et al. 2003; Ensminger et al. 2004).One of the advantages of the evergreen coniferous growthform is the rapid upregulation of photosynthetic activitiesduring the spring warm-up, which allows trees to capi-talize quickly on favorable weather conditions. This‘‘quick start’’ extends the length of the growing seasonand minimizes the canopy developmental constraint toseasonal photosynthesis that is often exhibited by decid-uous trees (e.g., Goulden et al. 1996b; Black et al. 2000;Barr et al. 2002). Despite the obvious advantage of rapidspringtime recovery in coniferous trees, and a significantvolume of research on the biochemical and biophysicalprocesses involved in the springtime upregulation ofphotosynthesis (see Oquist and Huner 2003 for a review),only limited insight has been uncovered about the influ-ence of the springtime recovery on the annual rate ofecosystem carbon uptake and the coupling of the recov-ery process to transitions in specific climate variables.
Air and soil temperatures have been most widely ci-ted as the dominant controls over springtime photo-synthetic recovery. In northern Sweden, Bergh andLinder (1999) used beneath-soil heating cables to dem-onstrate that soil temperature had a key role in trig-gering the seasonal recovery. Tanja et al. (2003) used astatistical analysis of site-to-site variation in the timingof spring CO2 uptake to deduce that air temperature hada primary role in triggering photosynthetic recovery inboreal forests in Finland, while beneath-snow soil tem-perature had no significant role. In a study of the effectsof spring air temperatures on the photochemical com-ponents of photosynthesis in Scots pine trees in centralSiberia, Ensminger et al. (2004) found that warmweather triggers rapid upregulation of photosynthesis,but that subsequent cold weather can reverse the pho-tosynthetic cues. Thus, there is growing consensus thatair temperature is a primary cue that regulates seasonalswitches in the carbon cycling of coniferous forests fromcold climates.
Studies of the components of the photosyntheticapparatus that respond to increases in air temperaturehave focused on the photochemical processes (see Oquistand Huner 2003). Ottander and Oquist (1991) studiedseveral pine species and reported that photosyntheticquantum yields were low at the end of winter, butrecovered within 3 days when trees or branches weretransferred to a warm laboratory setting. Verhoevenet al. (1996, 1998, 1999) have shown that wintertimedownregulation of photosynthesis in a number of dif-ferent species involves sustained engagement of xan-thophyll-cycle energy dissipation from photosystem II(PSII), and that in two coniferous species from cold
montane environments, the recoveries of PSII and thexanthophyll cycle occur within a few days after warm-ing. Ensminger et al. (2004) have shown that in Scotspine needles during winter, downregulation of photo-synthesis is accompanied by similar changes in thexanthophyll-cycle, as well as reductions in the amount oftotal chlorophyll, D1 protein of the PSII reaction center,and PSII light harvesting complexes. In late spring, withthe onset of warmer air temperatures, Ensminger et al.(2004) observed recovery of PSII activity, increasedlevels of chloroplast protein synthesis, and rearrange-ments of pigment complexes. Insight into the springtimerecovery of other components of the photosyntheticapparatus (e.g., stomatal conductance, Rubisco activity)remains rudimentary. Past studies have shown that thefull recovery of CO2 assimilation and stomatal conduc-tance is dependent on soil thaw, warm air temperaturesand adequate water uptake (Smith 1985; Jurik et al.1988; Day et al. 1989), but the timing of this recovery inrelation to the natural seasonal transition of ecosystemCO2 exchange, and its relationship to the recovery of thephotochemical components of photosynthesis, has yet tobe determined.
We report the results from a 5-year study in a sub-alpine coniferous forest in the Rocky Mountains ofColorado, USA. We aim to provide greater insight intothe importance of springtime net ecosystem CO2 ex-change (NEE) to the overall, annual rate of NEE, andidentify the mechanisms that force the transition in theforest from being a wintertime CO2 source to a spring-time CO2 sink. Our observations span the range fromecosystem CO2 flux to chloroplast photochemistry andfocus on four specific issues: (1) the difficulties sur-rounding a precise definition of the time of transitionfrom winter net ecosystem CO2 loss to spring net eco-system CO2 gain (i.e. the forest ‘turn-on date’), (2) thequantitative relationship between interannual variationin the rate of carbon uptake during spring snow meltand interannual variation in the rate of total annualcarbon uptake, (3) the environmental variables that aremost important in triggering the forest turn-on date, and(4) the physiological processes that are most limiting tothe springtime upregulation of photosynthetic CO2
assimilation. This insight has relevance to not only thesuite of biochemical and physiological adaptations thathave evolved in these trees, but also to the potential forfuture climate warming to shift the seasonal transition inCO2 exchange, and thus influence dynamics in the globalcarbon cycle.
Materials and methods
The study site
The studies were conducted at the Niwot RidgeAmeriFlux site located at 3,050 m above sea level in asubalpine forest just below the Continental Divide nearNederland, Colorado (40� 1¢ 58¢¢N; 105� 32¢ 47¢¢W). The
131
secondary forest surrounding the site is �100 years old,having regrown after early twentieth-century logging.The forest is dominated by subalpine fir (Abies lasio-carpa, 46% of the mean tree density), Engelmann spruce(Picea engelmannii, 28% of the mean tree density), andlodgepole pine (Pinus contorta, 26% of the mean treedensity). The understory is relatively sparse, containingtree seedlings from all three species and patches ofVaccinium myrtillus (25% average understory coverage).The forest slopes gently (6–7%) and uniformly,decreasing from west to east. Maximum (late-summer)leaf area index (LAI) for the forest is estimated to be4.2 m2 m�2, canopy gap fraction is 17%, canopy heightis 11.4 m, displacement height is 7.6 m, and roughnesslength is 1.79 m. Annual precipitation for the site aver-ages 800 mm (approximately 65% falling as snow) andthe mean annual temperature is 1.5�C. General charac-teristics of turbulent fluxes of CO2, H2O and sensibleheat were reported in Turnipseed et al. (2003, 2004) andenergy budget characteristics were reported in Turnip-seed et al. (2002). Overall dynamics in forest carbonuptake have been previously reported for 1999 and 2000in Monson et al. (2002).
Eddy covariance measurements
Turbulent fluxes were measured at 21.5 m from ascaffolding-type tower. Details of the flux measure-ments have been reported previously (Monson et al.2002; Turnipseed et al. 2002, 2003, 2004). Briefly, theeddy covariance method was used to measure the eddyflux for CO2, H2O and temperature (see Baldocchi 2003for a review of the eddy covariance method). Windvelocity was measured with a 3-dimensional sonicanemometer (model CSAT-3, Campbell Scientific, Lo-gan) and CO2 concentration was measured with aclosed-path infrared gas analyzer (model 6262, LiCor,Inc., Lincoln). Density corrections due to changes inH2O vapor concentrations were made according toWebb et al. (1980). Wind coordinates were rotatedaccording to Kaimal and Finnigan (1994) for the dataof 1999–2001, and according to Wilczak et al. (2001)for the data of 2002–2003, to force the mean crosswindand vertical wind speeds to zero. We have conductedextensive analyses of these coordinate rotation methodsat our site, compared them to other rotation methods,and estimated potential errors in the calculated eddyflux due to low-frequency filtering, all of which is re-ported in a previous publication (Turnipseed et al.2003). The storage of CO2 within the canopy wasmeasured using a vertical profile system as described inMonson et al. (2002). The change in stored CO2 wasadded to the calculated eddy flux of CO2 to provide netecosystem CO2 exchange (NEE) as described byGoulden et al. (1996a). By convention, NEE is con-sidered negative in sign when the net CO2 flux is fromthe atmosphere to the forest and positive when the netflux is from the forest to the atmosphere.
Soil and snow measurements
Soil temperatures were measured using cross-calibrated,copper-constantan thermocouples for a single level(5 cm) in the soil and platinum resistance thermometerswith integrated temperature for the upper 10 cm of thesoil. Soil moisture was measured using water contentreflectometers (model CS615, Campbell Scientific, Lo-gan). The probes were inserted so as to measure theintegrated soil moisture in the top 15 cm of soil. Snowtemperature profiles were made in one of two ways;manually (2001) by digging a snow pit and using ahandheld copper-constantan thermocouple inserted intothe undisturbed wall of the pit (�10 cm) at differentheights or automatically (2002) using one 100-cm andtwo 200-cm long polycarbonate wands (model TP101,Measurement Research Corporation, Gig Harbor), withthermistors (accuracy of ±0.1�C from �40 to 80�C)embedded at 10-cm intervals and connected to datal-oggers (model CR10, Campbell Scientific, Logan).When deployed in the field, the lower 20 cm of eachwand was buried in the soil during the summer and leftin place during the winter. As snow buried the wands,the vertical profile in snow temperature, at 10-cmintervals, was obtained. We evaluated the snow-tem-perature profile only using thermistor readings that werelocated between, and including, the nearest thermistor to10-cm below the upper snow surface and 10-cm abovethe ground surface, in order to avoid boundary effectsdue to solar heating from above or ground heating frombelow. Calibration of the wands against a precisionmercury thermometer was accomplished in the labora-tory, prior to installation in the field, using a controlled-temperature water bath. All of the climatic, snow andsoil measurements were made within a 30·30 m plotlocated approximately 50 m northwest of the eddycovariance tower.
Branch-level experiments
We conducted two different branch-level experiments tostudy the recovery of photosynthetic capacity aftertransfer from the cold wintertime condition to a warmerand/or hydrated springtime condition. One experimentwas conducted during the third week of March, 2000(Experiment 1) and one was conducted during the firstweek of April, 2004 (Experiment 2). In Experiment 1,branches from four adult lodgepole pine trees werecollected in the field (diameter at breast height >15 cm),at mid-canopy on March 15, 2000. Greater than 1 m ofsnow fell on the study site during the week immediatelyprior to the branch collections. All branches were har-vested before dawn, needle water potentials (Yw) andchlorophyll fluorescence patterns were measured (seebelow for methods) in an instrument trailer located atthe site, and needles were collected for later pigmentanalysis. Branches were then transported (total transittime of 1 h) in opaque plastic bags kept on ice to
132
laboratory facilities at the University of Colorado,Boulder. One branch from each of the four trees wasrandomly placed into one of the following treatments:(1) low light with no hydration (referred to as low-lightdry or LLD) with a 14 h photoperiod and a photosyn-thetic (400–700 nm) photon flux density (PPFD) of10 lmol m�2 s�1 at 25�C; (2) low light with photoperiodand temperature as above, but stems were re-cut undertap water and the cut end was placed in tap water forfurther hydration (referred to as low-light, hydrated orLLH), and (3) temperature as above and hydration asabove, but kept under high light in a glasshouse (maxi-mum PPFD of 1,800 lmol m�2 s�1) and natural pho-toperiod (approximately 12.4 h) supplemented withartificial light from metal-halide lamps to produce atotal photoperiod of 14 h (referred to as high-light, hy-drated or HLH). Branches were randomly chosen fromthe treatments for sampling of physiological and bio-chemical traits over the subsequent 5 days of recovery.
In Experiment#2, branches from subalpine fir andlodgepole pine trees were harvested before dawn onMarch 31, 2004 from trees with diameter at breastheight >15 cm at mid-canopy height. In this case, theweek prior to the harvest was characterized by war-mer-than-normal temperatures (mean temperature of2.7�C compared to �2.1±0.8�C for this same weekduring the previous 5 years). Needles were immediatelymeasured for Yw and fluorescence, and transported tothe laboratory, as described above. Once at the labo-ratory, the branches were placed into one of four dif-ferent treatments: (1) a warm growth chamber (modelE-15, Conviron, Inc., Toronto) (20/15�C day/night,300 lmol m�2 s�1 PPFD, 14-h photoperiod) withoutsubsequent re-hydration (referred to as warm, dry orWD), (2) a cold growth chamber (1.5/0.5�C day/night,300 lmol m�2 s�1, 14 h photoperiod) without sub-sequent re-hydration (referred to as cold, dry or CD),(3) the same warm growth chamber described above,but with re-hydration (referred to as warm, wet orWW), and (4) the same cold growth chamber describedabove, but with re-hydration (referred to as cold, wetor CW). Once again, branches were randomly chosenfrom the treatments for measurement, in this caseduring a subsequent 7-day recovery period.
Branch and needle measurements
Needle water potentials were determined using a Scho-lander-type pressure chamber (PMS Inc, Corvallis) withN2 as the pressurization gas. Stomatal conductance (gs)was measured with an open-flow gas exchange system(model 6400, LiCor Inc., Lincoln). Chamber temperaturewas held at 25�C and relative humidity was maintainedbetween 20–40%. All measurements were made withsaturating light (PPFD=1,500 lmol m�2 s�1; modelLS-2 halogen light source, Hansatech, King’s Lynn)using the factory-provided conifer cuvette system. Fivemeasurements of gas-exchange were made and averaged
over a one-minute period after the cuvette conditions hadstabilized. Total needle surface area was determined foreach experimental branch using the volume displacementmethod described by Chen et al. (1997).
The relationship between net CO2 assimilation rate(A) and the intercellular CO2 concentration (Ci) (re-ferred to as the A�Ci response) was initiated at ambientCO2 concentration (365 lmol mol�1). Chamber CO2
concentration (Ca) was then reduced to 200 lmol mol�1
for 5 min to stimulate stomatal opening. Assimilationrate was determined at this value, then Ca was reducedto 75 lmol mol�1, followed by incremental increases to150, 250, 350, 550, 700, 800, 900, 1200, and2000 lmol mol�1. The data from the A�Ci responseswere analyzed using Photosynthesis Assistant (DundeeScientific Ver. 1.1.2; Dundee) and photosyntheticparameters (e.g., VCmax, Jmax, Rd, TPU) were calculatedas in Harley et al. (1992).
Chlorophyll fluorescence emissions were measuredusing a portable pulse amplitude-modulated fluorometer(model PAM-2000, Walz, Effeltrich) as described inDemmig-Adams et al. (1996). In all treatments, needleswere briefly dark adapted (5 min) before determining theintrinsic PSII efficiency, calculated as Fv/Fm (the ratio ofvariable fluorescence to maximum fluorescence). Nee-dles to be used in pigment analysis were frozen in liquidnitrogen, freeze-dried, and stored under a N2 atmo-sphere at �80�C until processing. Chlorophylls andcarotenoids were extracted according to Adams andDemmig-Adams (1992) and analyzed using the HPLCcolumn and gradient system described by Gilmore andYamamoto (1991).
Statistical analysis
Differences among means for the branch-level recoveryexperiment were evaluated using repeated measuresANOVA. In cases where interactions among variableswere not of interest, we used repeated measures one-wayANOVA. In this case, we tested for significant differ-ences among measurement means for each speciesindependently at different times during the experimentor for differences between species at specific times. Incases where interactions among variables were of inter-est, we used a repeated measures, three-way, split-plot,ANOVA, in this case testing for the significance of time,recovery treatment type, and their interaction. To eval-uate the A�Ci response, data were compared acrosstreatments and time by the use of non-linear regressionof the gas exchange data (Huxman et al. 1998). The non-linear regression model (Jacob et al. 1995) was fitthrough the complete data set (all times and treatments),then individually (each treatment and time point sepa-rately) and F-statistics were constructed from the resid-ual sum of squares from each regression line followingPotvin et al. (1990). In comparing mean values of pho-tosynthesis rate and photosystem II efficiency in bran-ches of fir and pine allowed to recover for 7 days in a
133
cold regime or warm regime (i.e., in Table 4 last twocolumns for each species), we used the Student’s t-testfor independent samples. Linear and non-linear regres-sion analyses were conducted using the RegressionWizard found in SigmaPlot ver. 6.10 (SPSS, Inc). Sig-nificance of regression models was tested using ANO-VA. We tested all regressions for normality of residualsusing the Kolmogorov-Smirnov test and constancy ofvariance using the Levene Median test at P<0.05. In theanalysis of the relationship between daytime meanNEE and daytime mean temperature (i.e., reported inTable 2), not all regressions passed these tests. We havedecided to report the regressions, nonetheless, withappropriate notation of which tests were failed, for tworeasons: (1) because the ANOVA used to test for thesignificance of regressions is robust with regard to failureof these tests (Pedhazur 1997), and (2) our purpose inpresenting the regressions is not to develop specificmodels of variable dependence, but rather to heuristi-cally probe the potential for variable relationships atdifferent times of the year.
In those analyses involving the calculation of daily,seasonal or annual cumulative NEE, we used flux datathat included gap-filled values. This was required be-cause cumulative data is sensitive to the total number ofsummed intervals. In these cases, we used data from all‘‘flag’’ categories, with gap-filling accomplished as de-scribed in the Niwot Ridge AmeriFlux data archive(http://urquell.colorado.edu/data_ameriflux/). In thoseanalyses where we assessed 30-min averaged NEE as afunction of temperature or season (i.e., Figs. 1, 4, 5,Table 2) we eliminated flux data from the analysis thathad been derived from the various gap-filling proce-dures. This means that we only used flux values that hadbeen flagged with the value ‘‘1’’ in the Niwot RidgeAmeriFlux data record. In those cases, the inclusion ofgap-filled data would have compromised the analysis asmany of the ‘‘filled data’’ are derived from the rela-tionship between NEE and temperature, the same rela-tionship being probed in the analyses. Averaged data isnot sensitive to the total number of averaged intervals,facilitating our decision to use only non gap-filled data.
Results
Date of transition from CO2 source to CO2 sinkand duration of spring snow melt
Although we observed evidence of daytime, 30-minaveraged NEE values (NEE30-min) that were negative insign (reflecting apparent net CO2 uptake) throughoutthe winter, these observations were infrequent, positivelycorrelated to air temperature, and relatively small inmagnitude until the month of April; all of which sug-gests that these values did not reflect photosyntheticrecovery. For example, during the mid-winter months ofJanuary and February negative NEE values were ob-served for only 16% of the total non gap-filled, 30-min
averaging periods across all 5 years. Of those negativeNEE30-min that were observed in January and Februaryacross all 5 years, 69% were near zero (i.e., between 0and �0.5 lmol m�2 s�1). A significant correlation wasobserved between negative NEE30-min values in Januaryand February (pooled across all 5 years) and air tem-perature (y=0.0.81 x=�6.33, R2=0.01, F=20.42;df=1,525; P<0.0001). However, this correlation waspositive in sign, indicating that as air temperature in-creased, NEE30-min values became less negative, notmore negative; this reflects a response of respiration totemperature, not photosynthesis. It is possible that thecomplex topography of the site and non-ideal wind flowpatterns result in small errors in the NEE30-min duringcertain winter conditions. However, the low frequencyof these observations, their low magnitude and the po-sitive correlation with air temperature indicate that theyprobably do not reflect true photosynthetic recovery.
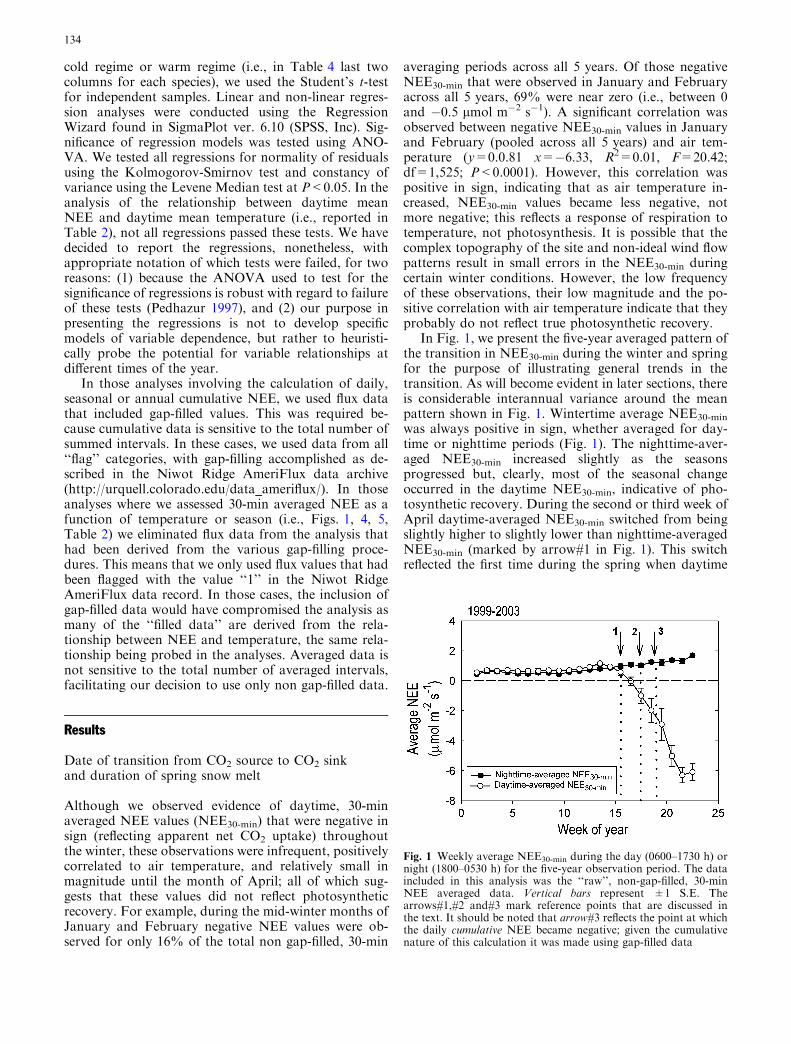
In Fig. 1, we present the five-year averaged pattern ofthe transition in NEE30-min during the winter and springfor the purpose of illustrating general trends in thetransition. As will become evident in later sections, thereis considerable interannual variance around the meanpattern shown in Fig. 1. Wintertime average NEE30-min
was always positive in sign, whether averaged for day-time or nighttime periods (Fig. 1). The nighttime-aver-aged NEE30-min increased slightly as the seasonsprogressed but, clearly, most of the seasonal changeoccurred in the daytime NEE30-min, indicative of pho-tosynthetic recovery. During the second or third week ofApril daytime-averaged NEE30-min switched from beingslightly higher to slightly lower than nighttime-averagedNEE30-min (marked by arrow#1 in Fig. 1). This switchreflected the first time during the spring when daytime
Fig. 1 Weekly average NEE30-min during the day (0600–1730 h) ornight (1800–0530 h) for the five-year observation period. The dataincluded in this analysis was the ‘‘raw’’, non-gap-filled, 30-minNEE averaged data. Vertical bars represent ±1 S.E. Thearrows#1,#2 and#3 mark reference points that are discussed inthe text. It should be noted that arrow#3 reflects the point at whichthe daily cumulative NEE became negative; given the cumulativenature of this calculation it was made using gap-filled data
134
periods of net photosynthetic CO2 uptake were of highenough magnitude and frequency to offset the late-spring bias toward slightly higher ecosystem respirationrates during the day, compared to the night. The switchis presumably a response to the slow warming ofspringtime conditions. Even after this switch, however,daytime rates of NEE30-min that reflect net CO2 uptakewere relatively weak in magnitude and not consistent intheir frequency of occurrence; in fact, the daytime-averaged NEE30-min remained positive in sign at the timeof the switch. Within 1 or 2 weeks after this initialswitch, we observed a date when daytime NEE30-min
values were consistently negative in sign (reflecting netCO2 uptake) and relatively consistent in frequency ofoccurrence and magnitude (we used the un-averageddata from this analysis to apply the arbitrary metric thatNEE30-min had to be <�3 lmol m�2 s�1 for at leastthree consecutive half-hour averaging periods for at leastthree consecutive days) (marked by arrow#2 in Fig. 1).Finally, within 1 or 2 weeks following this second step inforest recovery, we observed the first day when the daily(24-h) cumulative NEE (NEEdaily) switched from beingpositive in sign to being consistently negative in sign (weused the NEE30-min data to create 24-h averages for thisanalysis) (marked by arrow#3 in Fig. 1). Thus, the timeof photosynthetic recovery (reflected in arrows#1 or#2,depending on how one defines ‘‘recovery’’), occurs wellbefore the time of ecosystem carbon balance recovery(reflected in arrow#3). Among the 5 years, we found thelength of time between photosynthetic recovery (takenas arrow#2 in Fig. 1) and ecosystem carbon balancerecovery (taken as arrow#3 in Fig. 1) to consistently be9–11 days (significant correlation between the two vari-ables; R2=0.80, F=11.70; df=1,3; P=0.042). Clearly,there are several possible ways to define the date ofspringtime photosynthetic recovery. From this pointforward, we will refer to the ‘forest turn-on date’ as thedate of recovery in ecosystem carbon balance; i.e. thatdate when NEEdaily first became consistently negative insign (i.e. arrow#3 in Fig. 1).
Measurements of daily cumulative net ecosystem CO2
exchange during the spring snow melt
The length of the ‘‘snowmelt period’’ (time from the forestturn-on date to the date when diurnal fluctuations in soiltemperature indicated disappearance of the snow pack)each spring was variable among years (Table 1). At oneextreme, the entire snowmelt lasted only 6 days followingthe forest turn-on in 2002. This was the year with theshallowest spring snow pack recorded for this site in over50 years of continuous measurements (http://culter.col-orado.edu/Niwot/NiwotRidgeData/C1.html), and re-sulted in completely snow-free conditions by the end ofApril. At the other extreme, the snow melt persisted for36 days following the forest turn-on in 1999, a year with adeeper-than-average spring snow pack. During1999, a 55% increase in the snow pack was observed for
the late-springmonth of April alone (Table 1, Column 4),and the snow melt period lasted well into the month ofJune.
Cumulative NEE during the snow melt period(NEEsnow-melt, defined as the sum of NEEdaily betweenthe date when NEEdaily first switched to negative valuesand the end of snow melt) ranged from 3% to 42% ofthe total growing-season NEE [defined as NEEsnow-melt
plus the cumulative NEE during the snow-free part ofthe growing season (NEEsnow-free)] (Table 1). Despitebeing confined to a shorter time interval (6–36 days), theinterannual range of NEEsnow-melt (7.7 mol m�2) wasover two times the range of NEEsnow-free (3.5 mol m�2),despite the latter lasting several months longer. Year-to-year variation in the length of the snow-free part of thegrowing season was determined more by variation in thelength of snow melt in the spring (which varied by a totalof 30 days), than variation in the date of growing seasonclosure in the fall (which varied by a total of 13 days, seeTable 1 footnote ‘‘g’’). Cumulative wintertime NEE(NEEwinter) exhibited the least amount of variation fromyear to year, with the total range of variation being only2.6 mol m�2. The amount of cumulative warming (de-gree-days) from February 1 to the first day of photo-synthetic recovery (arrow # 2 in Fig. 1) varied amongyears, whether assessed above a threshold of 0�C or 5�C(Table 1). There was no common temperature thresholdamong years leading up to the first day of photosyn-thetic recovery.
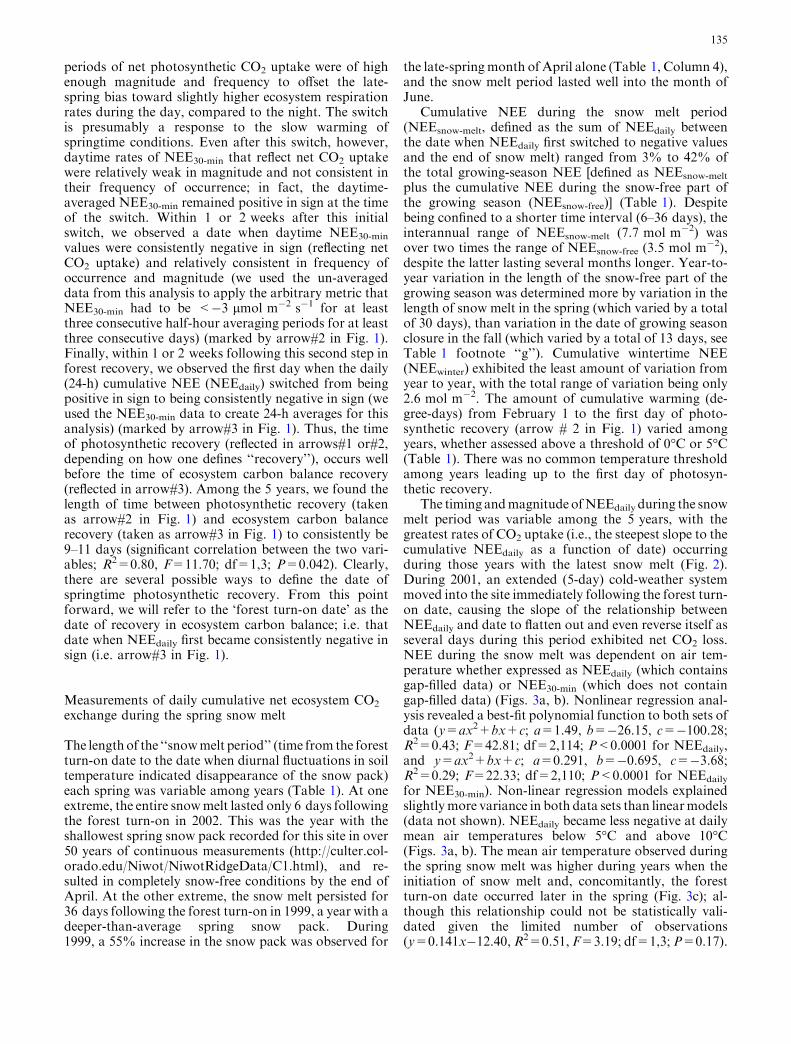
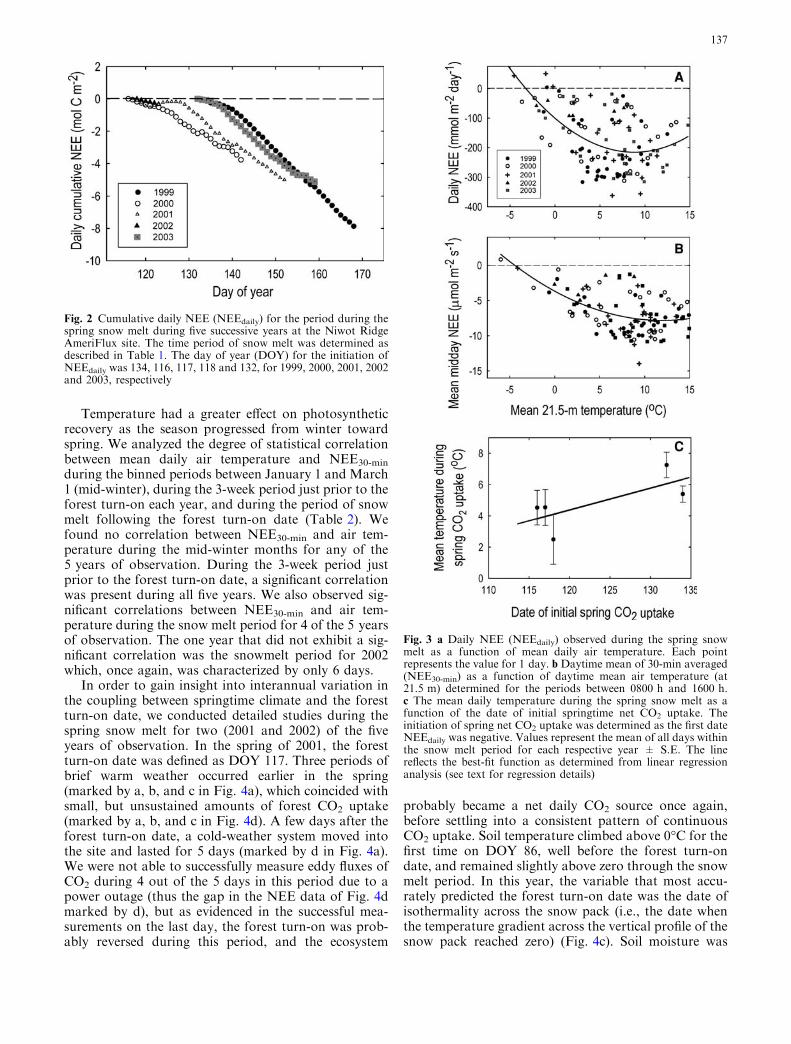
The timing andmagnitude ofNEEdaily during the snowmelt period was variable among the 5 years, with thegreatest rates of CO2 uptake (i.e., the steepest slope to thecumulative NEEdaily as a function of date) occurringduring those years with the latest snow melt (Fig. 2).During 2001, an extended (5-day) cold-weather systemmoved into the site immediately following the forest turn-on date, causing the slope of the relationship betweenNEEdaily and date to flatten out and even reverse itself asseveral days during this period exhibited net CO2 loss.NEE during the snow melt was dependent on air tem-perature whether expressed as NEEdaily (which containsgap-filled data) or NEE30-min (which does not containgap-filled data) (Figs. 3a, b). Nonlinear regression anal-ysis revealed a best-fit polynomial function to both sets ofdata (y=ax2+bx+c; a=1.49, b=�26.15, c=�100.28;R2=0.43; F=42.81; df=2,114; P<0.0001 for NEEdaily,and y=ax2+bx+c; a=0.291, b=�0.695, c=�3.68;R2=0.29; F=22.33; df=2,110; P<0.0001 for NEEdaily
for NEE30-min). Non-linear regression models explainedslightlymore variance in both data sets than linearmodels(data not shown). NEEdaily became less negative at dailymean air temperatures below 5�C and above 10�C(Figs. 3a, b). The mean air temperature observed duringthe spring snow melt was higher during years when theinitiation of snow melt and, concomitantly, the forestturn-on date occurred later in the spring (Fig. 3c); al-though this relationship could not be statistically vali-dated given the limited number of observations(y=0.141x�12.40,R2=0.51, F=3.19; df=1,3; P=0.17).
135

Table
1Springtimeclim
ate,snow
andcumulativeNEEdata
fortheNiwotRidgeAmeriFluxsite
duringfiveconsecutiveyears
Yeara
Springsnow
duration
(days)b
SWE
(cm)c
DSWE
(%)d
Meanannual
temperature
(�C)e
Snow-m
elt
NEE(N
EEsnow-m
elt)
(molC
m�2)f
Snow-freeNEE
(NEEsnow-free)
(molC
m�2)g
WinterNEE
(NEEwinter)
(molC
m�2)h
AnnualNEE
(NEEannual)
(molC
m�2)i
Springtime
percentageofgrowing
seasonNEE
(%)j
Degreedays>
0�C
tofirstdate
ofmidday
net
CO
2uptakek
Degreedays>
5�C
tofirstdate
of
middaynet
CO
2
uptakek
1999
36
36.2
+55
1.9±
0.1
�8.03
�10.89
12.21
�6.71
42
81
33
2000
27
31.4�38
3.5±
0.1
�3.51
�13.31
12.02
�4.80
21
54
22
2001
26
25.4�9
2.3±
0.1
�3.35
�13.73
11.44
�5.64
20
67
41
2002
619.2�100
2.4±
0.1
�0.33
�10.38
9.58
�1.13
368
32
2003
28
42.6�14
2.6±
0.1
�5.10
�10.22
10.07
�5.05
33
89
49
aTheperiodin
anyoneyearusedformeasurementofnet
ecosystem
CO
2exchange(N
EE)in
thisstudyspansfrom
Novem
ber
1–October
31.Thus,thefirstdate
oftheNEEtimeseries
beganonNovem
ber
1,1998
bThelength
ofspringtimesnowcover
determined
asthetimebetweenthefirstdate
when
NEEdailywasnegativeandthedate
when
thecombinationofsoiltemperature
andsoilheatflux
measurements
revealedasnow-freesurface
(see
Figs.4,5forexamplesofthesudden
rise
insoiltemperature
atthetimeofsnow
melt)
c Themaxim
um
annualsnow-w
aterequivalentmeasuredduringthespringofeach
year.Thelong-term
(1988–1998)meanmaxim
um
SWEis46.3±
5.6
cm(range=
25.4�88.9
cm)
dThepercentagechangein
theSWEbetweenMarch31andApril30.Thisvalueisincluded
toindicate
thetendency
forsnow
toappearordisappearfrom
thesnowpack
duringthe
criticalspringmonth
ofApril
e Meanannualtemperature
at21.5
mheightfortheperiodbetweenNovem
ber
1andOctober
31each
year.Values
are
mean±
S.E.oftheannual30-m
intemperature
means.Thelong-
term
(1952–2000)meanannualtemperature
is1.5±
0.2
�Cforthissite
f Thecumulative(cum)NEEfortheforestduringthesnowmeltperiodtaken
from
thefirstdate
duringthespringthatNEEdailyexhibited
anegativevalueto
thedate
thecombinationof
soiltemperature
andsoilheatfluxmeasurements
revealedasnow-freesurface
gThecumulative(cum)NEEfortheforestduringthesnowfree
partofthegrowingseasondetermined
asthetimebetweenthefirstspringdate
when
thecombinationofsoiltemperature
andsoilheatfluxmeasurements
indicatedasnow-freesurface
andthefirstautumndate
when
NEEdailywaspositivein
value(D
OY
289,300,296,296,287for1999,2000,2001,2002,
2003,respectively)
hThecumulative(cum)NEEfortheforest
from
thefirstautumnaldate
when
NEEdailywaspositiveto
thefirstspringdate
when
NEEdailywasnegative
i Thetotalannualcumulative(cum)NEEfortheentire
yeardesignatedasin
‘‘a’’above
j Thevaluein
column6(‘‘f’’)asafractionof(column6+
column7)(‘‘f’’+
‘‘g’’)
kThenumber
ofcumulativedegreedaysabove0�C
or5�C
fortheperiodfrom
February
1to
thefirstdate
when
middayNEE30-m
inwas<�
3lm
olm�2s�
1for3consecutiveaveraging
periodsfor3consecutivedays;thisarbitrarily
chosenthershold
wasassumed
tobedriven
primarily
bychanges
ingross
photosynthesisrate
andthusreflectaphysiologically-relevant
response
tocumulativewarm
ing
136
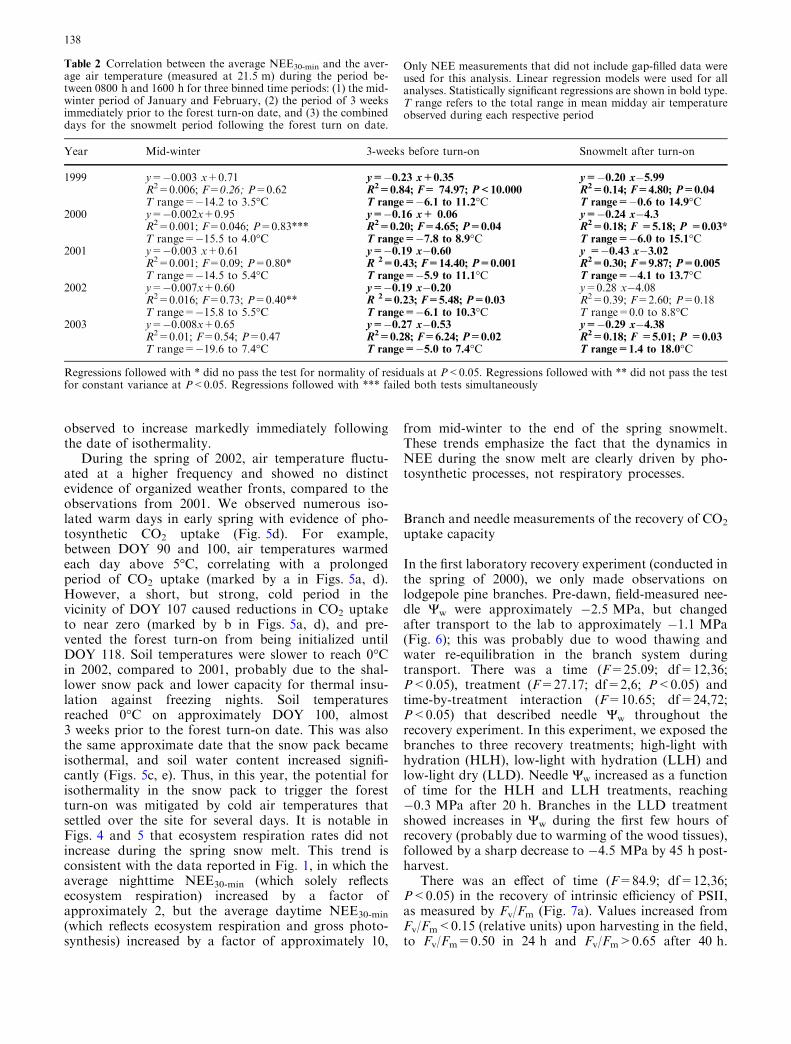
Temperature had a greater effect on photosyntheticrecovery as the season progressed from winter towardspring. We analyzed the degree of statistical correlationbetween mean daily air temperature and NEE30-min
during the binned periods between January 1 and March1 (mid-winter), during the 3-week period just prior to theforest turn-on each year, and during the period of snowmelt following the forest turn-on date (Table 2). Wefound no correlation between NEE30-min and air tem-perature during the mid-winter months for any of the5 years of observation. During the 3-week period justprior to the forest turn-on date, a significant correlationwas present during all five years. We also observed sig-nificant correlations between NEE30-min and air tem-perature during the snow melt period for 4 of the 5 yearsof observation. The one year that did not exhibit a sig-nificant correlation was the snowmelt period for 2002which, once again, was characterized by only 6 days.
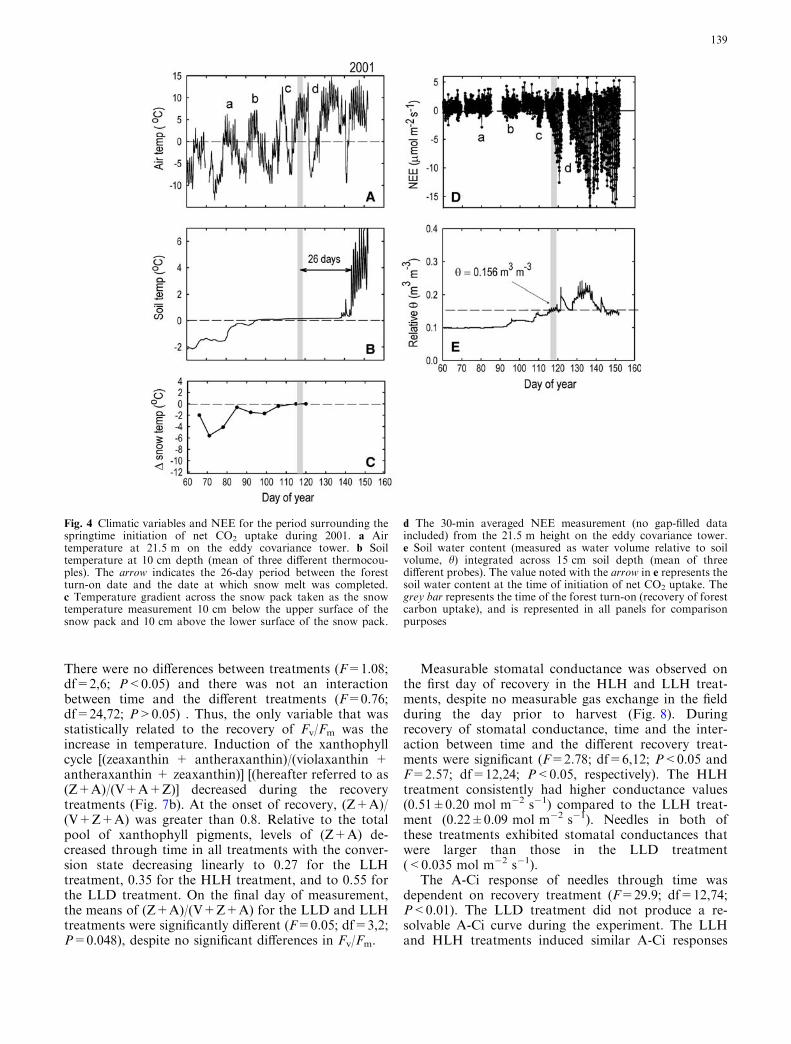
In order to gain insight into interannual variation inthe coupling between springtime climate and the forestturn-on date, we conducted detailed studies during thespring snow melt for two (2001 and 2002) of the fiveyears of observation. In the spring of 2001, the forestturn-on date was defined as DOY 117. Three periods ofbrief warm weather occurred earlier in the spring(marked by a, b, and c in Fig. 4a), which coincided withsmall, but unsustained amounts of forest CO2 uptake(marked by a, b, and c in Fig. 4d). A few days after theforest turn-on date, a cold-weather system moved intothe site and lasted for 5 days (marked by d in Fig. 4a).We were not able to successfully measure eddy fluxes ofCO2 during 4 out of the 5 days in this period due to apower outage (thus the gap in the NEE data of Fig. 4dmarked by d), but as evidenced in the successful mea-surements on the last day, the forest turn-on was prob-ably reversed during this period, and the ecosystem
probably became a net daily CO2 source once again,before settling into a consistent pattern of continuousCO2 uptake. Soil temperature climbed above 0�C for thefirst time on DOY 86, well before the forest turn-ondate, and remained slightly above zero through the snowmelt period. In this year, the variable that most accu-rately predicted the forest turn-on date was the date ofisothermality across the snow pack (i.e., the date whenthe temperature gradient across the vertical profile of thesnow pack reached zero) (Fig. 4c). Soil moisture was
Fig. 3 a Daily NEE (NEEdaily) observed during the spring snowmelt as a function of mean daily air temperature. Each pointrepresents the value for 1 day. b Daytime mean of 30-min averaged(NEE30-min) as a function of daytime mean air temperature (at21.5 m) determined for the periods between 0800 h and 1600 h.c The mean daily temperature during the spring snow melt as afunction of the date of initial springtime net CO2 uptake. Theinitiation of spring net CO2 uptake was determined as the first dateNEEdaily was negative. Values represent the mean of all days withinthe snow melt period for each respective year ± S.E. The linereflects the best-fit function as determined from linear regressionanalysis (see text for regression details)
Fig. 2 Cumulative daily NEE (NEEdaily) for the period during thespring snow melt during five successive years at the Niwot RidgeAmeriFlux site. The time period of snow melt was determined asdescribed in Table 1. The day of year (DOY) for the initiation ofNEEdaily was 134, 116, 117, 118 and 132, for 1999, 2000, 2001, 2002and 2003, respectively
137
observed to increase markedly immediately followingthe date of isothermality.
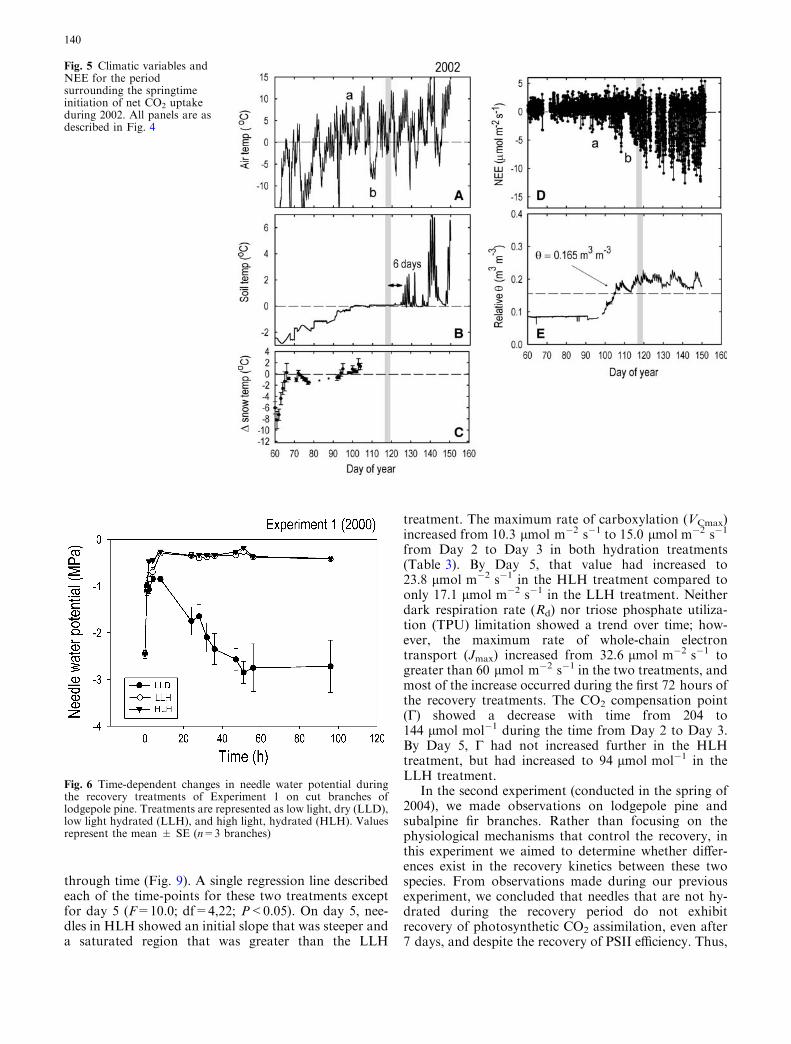
During the spring of 2002, air temperature fluctu-ated at a higher frequency and showed no distinctevidence of organized weather fronts, compared to theobservations from 2001. We observed numerous iso-lated warm days in early spring with evidence of pho-tosynthetic CO2 uptake (Fig. 5d). For example,between DOY 90 and 100, air temperatures warmedeach day above 5�C, correlating with a prolongedperiod of CO2 uptake (marked by a in Figs. 5a, d).However, a short, but strong, cold period in thevicinity of DOY 107 caused reductions in CO2 uptaketo near zero (marked by b in Figs. 5a, d), and pre-vented the forest turn-on from being initialized untilDOY 118. Soil temperatures were slower to reach 0�Cin 2002, compared to 2001, probably due to the shal-lower snow pack and lower capacity for thermal insu-lation against freezing nights. Soil temperaturesreached 0�C on approximately DOY 100, almost3 weeks prior to the forest turn-on date. This was alsothe same approximate date that the snow pack becameisothermal, and soil water content increased signifi-cantly (Figs. 5c, e). Thus, in this year, the potential forisothermality in the snow pack to trigger the forestturn-on was mitigated by cold air temperatures thatsettled over the site for several days. It is notable inFigs. 4 and 5 that ecosystem respiration rates did notincrease during the spring snow melt. This trend isconsistent with the data reported in Fig. 1, in which theaverage nighttime NEE30-min (which solely reflectsecosystem respiration) increased by a factor ofapproximately 2, but the average daytime NEE30-min
(which reflects ecosystem respiration and gross photo-synthesis) increased by a factor of approximately 10,
from mid-winter to the end of the spring snowmelt.These trends emphasize the fact that the dynamics inNEE during the snow melt are clearly driven by pho-tosynthetic processes, not respiratory processes.
Branch and needle measurements of the recovery of CO2
uptake capacity
In the first laboratory recovery experiment (conducted inthe spring of 2000), we only made observations onlodgepole pine branches. Pre-dawn, field-measured nee-dle Yw were approximately �2.5 MPa, but changedafter transport to the lab to approximately �1.1 MPa(Fig. 6); this was probably due to wood thawing andwater re-equilibration in the branch system duringtransport. There was a time (F=25.09; df=12,36;P<0.05), treatment (F=27.17; df=2,6; P<0.05) andtime-by-treatment interaction (F=10.65; df=24,72;P<0.05) that described needle Yw throughout therecovery experiment. In this experiment, we exposed thebranches to three recovery treatments; high-light withhydration (HLH), low-light with hydration (LLH) andlow-light dry (LLD). Needle Yw increased as a functionof time for the HLH and LLH treatments, reaching�0.3 MPa after 20 h. Branches in the LLD treatmentshowed increases in Yw during the first few hours ofrecovery (probably due to warming of the wood tissues),followed by a sharp decrease to �4.5 MPa by 45 h post-harvest.
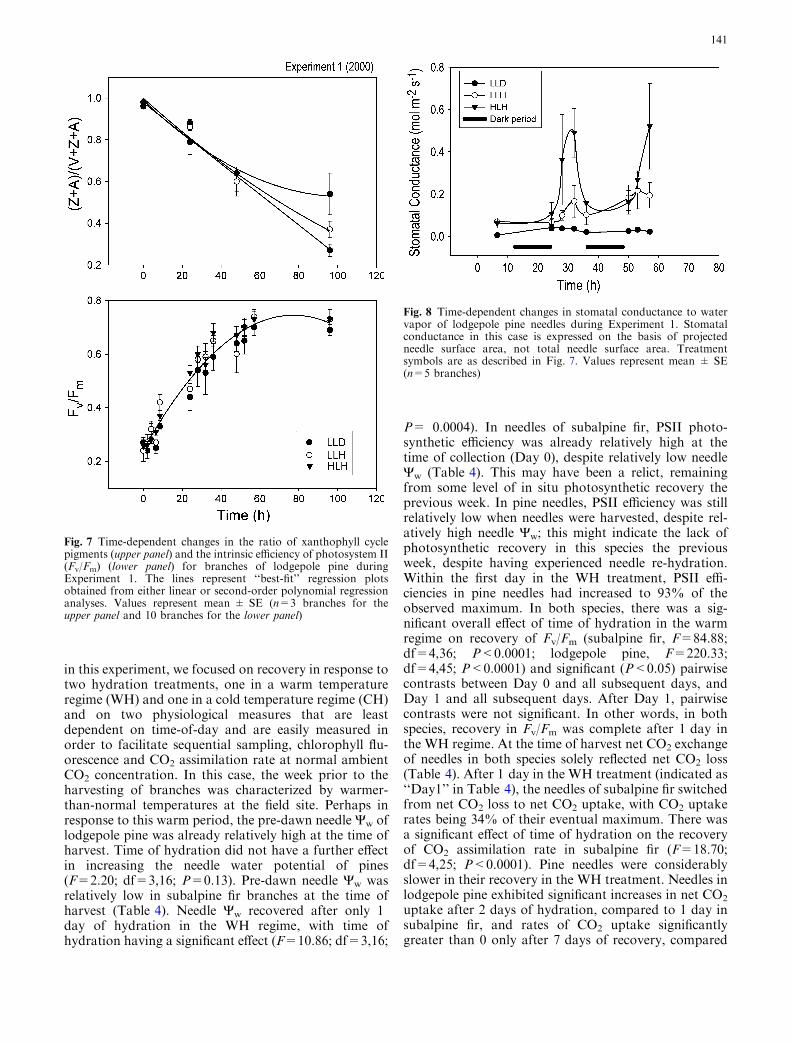
There was an effect of time (F=84.9; df=12,36;P<0.05) in the recovery of intrinsic efficiency of PSII,as measured by Fv/Fm (Fig. 7a). Values increased fromFv/Fm<0.15 (relative units) upon harvesting in the field,to Fv/Fm=0.50 in 24 h and Fv/Fm>0.65 after 40 h.
Table 2 Correlation between the average NEE30-min and the aver-age air temperature (measured at 21.5 m) during the period be-tween 0800 h and 1600 h for three binned time periods: (1) the mid-winter period of January and February, (2) the period of 3 weeksimmediately prior to the forest turn-on date, and (3) the combineddays for the snowmelt period following the forest turn on date.
Only NEE measurements that did not include gap-filled data wereused for this analysis. Linear regression models were used for allanalyses. Statistically significant regressions are shown in bold type.T range refers to the total range in mean midday air temperatureobserved during each respective period
Year Mid-winter 3-weeks before turn-on Snowmelt after turn-on
1999 y=�0.003 x+0.71 y=�0.23 x+0.35 y=�0.20 x�5.99R2=0.006; F=0.26; P=0.62 R2=0.84; F= 74.97; P<10.000 R2
=0.14; F=4.80; P=0.04T range=�14.2 to 3.5�C T range=�6.1 to 11.2�C T range=�0.6 to 14.9�C
2000 y=�0.002x+0.95 y=�0.16 x+ 0.06 y=�0.24 x�4.3R2=0.001; F=0.046; P=0.83*** R2
=0.20; F=4.65; P=0.04 R2=0.18; F =5.18; P =0.03*
T range=�15.5 to 4.0�C T range=�7.8 to 8.9�C T range=�6.0 to 15.1�C2001 y=�0.003 x+0.61 y=�0.19 x�0.60 y =�0.43 x�3.02
R2=0.001; F=0.09; P=0.80* R 2=0.43; F=14.40; P=0.001 R2
=0.30; F=9.87; P=0.005T range=�14.5 to 5.4�C T range=�5.9 to 11.1�C T range=�4.1 to 13.7�C
2002 y=�0.007x+0.60 y=�0.19 x�0.20 y=0.28 x�4.08R2=0.016; F=0.73; P=0.40** R 2
=0.23; F=5.48; P=0.03 R2=0.39; F=2.60; P=0.18T range=�15.8 to 5.5�C T range=�6.1 to 10.3�C T range=0.0 to 8.8�C
2003 y=�0.008x+0.65 y=�0.27 x�0.53 y=�0.29 x�4.38R2=0.01; F=0.54; P=0.47 R2
=0.28; F=6.24; P=0.02 R2=0.18; F =5.01; P =0.03
T range=�19.6 to 7.4�C T range=�5.0 to 7.4�C T range=1.4 to 18.0�C
Regressions followed with * did no pass the test for normality of residuals at P<0.05. Regressions followed with ** did not pass the testfor constant variance at P<0.05. Regressions followed with *** failed both tests simultaneously
138
There were no differences between treatments (F=1.08;df=2,6; P<0.05) and there was not an interactionbetween time and the different treatments (F=0.76;df=24,72; P>0.05) . Thus, the only variable that wasstatistically related to the recovery of Fv/Fm was theincrease in temperature. Induction of the xanthophyllcycle [(zeaxanthin + antheraxanthin)/(violaxanthin +antheraxanthin + zeaxanthin)] [(hereafter referred to as(Z+A)/(V+A+Z)] decreased during the recoverytreatments (Fig. 7b). At the onset of recovery, (Z+A)/(V+Z+A) was greater than 0.8. Relative to the totalpool of xanthophyll pigments, levels of (Z+A) de-creased through time in all treatments with the conver-sion state decreasing linearly to 0.27 for the LLHtreatment, 0.35 for the HLH treatment, and to 0.55 forthe LLD treatment. On the final day of measurement,the means of (Z+A)/(V+Z+A) for the LLD and LLHtreatments were significantly different (F=0.05; df=3,2;P=0.048), despite no significant differences in Fv/Fm.
Measurable stomatal conductance was observed onthe first day of recovery in the HLH and LLH treat-ments, despite no measurable gas exchange in the fieldduring the day prior to harvest (Fig. 8). Duringrecovery of stomatal conductance, time and the inter-action between time and the different recovery treat-ments were significant (F=2.78; df=6,12; P<0.05 andF=2.57; df=12,24; P<0.05, respectively). The HLHtreatment consistently had higher conductance values(0.51±0.20 mol m�2 s�1) compared to the LLH treat-ment (0.22±0.09 mol m�2 s�1). Needles in both ofthese treatments exhibited stomatal conductances thatwere larger than those in the LLD treatment(<0.035 mol m�2 s�1).
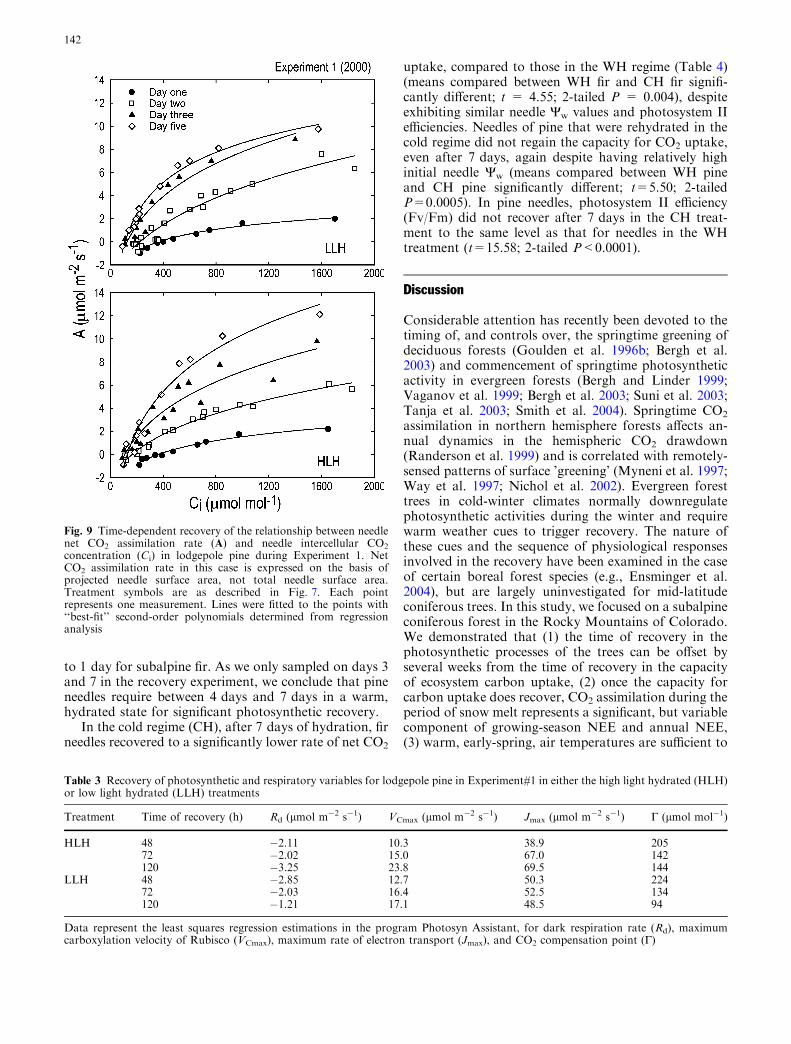
The A-Ci response of needles through time wasdependent on recovery treatment (F=29.9; df=12,74;P<0.01). The LLD treatment did not produce a re-solvable A-Ci curve during the experiment. The LLHand HLH treatments induced similar A-Ci responses
Fig. 4 Climatic variables and NEE for the period surrounding thespringtime initiation of net CO2 uptake during 2001. a Airtemperature at 21.5 m on the eddy covariance tower. b Soiltemperature at 10 cm depth (mean of three different thermocou-ples). The arrow indicates the 26-day period between the forestturn-on date and the date at which snow melt was completed.c Temperature gradient across the snow pack taken as the snowtemperature measurement 10 cm below the upper surface of thesnow pack and 10 cm above the lower surface of the snow pack.
d The 30-min averaged NEE measurement (no gap-filled dataincluded) from the 21.5 m height on the eddy covariance tower.e Soil water content (measured as water volume relative to soilvolume, h) integrated across 15 cm soil depth (mean of threedifferent probes). The value noted with the arrow in e represents thesoil water content at the time of initiation of net CO2 uptake. Thegrey bar represents the time of the forest turn-on (recovery of forestcarbon uptake), and is represented in all panels for comparisonpurposes
139
through time (Fig. 9). A single regression line describedeach of the time-points for these two treatments exceptfor day 5 (F=10.0; df=4,22; P<0.05). On day 5, nee-dles in HLH showed an initial slope that was steeper anda saturated region that was greater than the LLH
treatment. The maximum rate of carboxylation (VCmax)increased from 10.3 lmol m�2 s�1 to 15.0 lmol m�2 s�1
from Day 2 to Day 3 in both hydration treatments(Table 3). By Day 5, that value had increased to23.8 lmol m�2 s�1 in the HLH treatment compared toonly 17.1 lmol m�2 s�1 in the LLH treatment. Neitherdark respiration rate (Rd) nor triose phosphate utiliza-tion (TPU) limitation showed a trend over time; how-ever, the maximum rate of whole-chain electrontransport (Jmax) increased from 32.6 lmol m�2 s�1 togreater than 60 lmol m�2 s�1 in the two treatments, andmost of the increase occurred during the first 72 hours ofthe recovery treatments. The CO2 compensation point(G) showed a decrease with time from 204 to144 lmol mol�1 during the time from Day 2 to Day 3.By Day 5, G had not increased further in the HLHtreatment, but had increased to 94 lmol mol�1 in theLLH treatment.
In the second experiment (conducted in the spring of2004), we made observations on lodgepole pine andsubalpine fir branches. Rather than focusing on thephysiological mechanisms that control the recovery, inthis experiment we aimed to determine whether differ-ences exist in the recovery kinetics between these twospecies. From observations made during our previousexperiment, we concluded that needles that are not hy-drated during the recovery period do not exhibitrecovery of photosynthetic CO2 assimilation, even after7 days, and despite the recovery of PSII efficiency. Thus,
Fig. 5 Climatic variables andNEE for the periodsurrounding the springtimeinitiation of net CO2 uptakeduring 2002. All panels are asdescribed in Fig. 4
Fig. 6 Time-dependent changes in needle water potential duringthe recovery treatments of Experiment 1 on cut branches oflodgepole pine. Treatments are represented as low light, dry (LLD),low light hydrated (LLH), and high light, hydrated (HLH). Valuesrepresent the mean ± SE (n=3 branches)
140
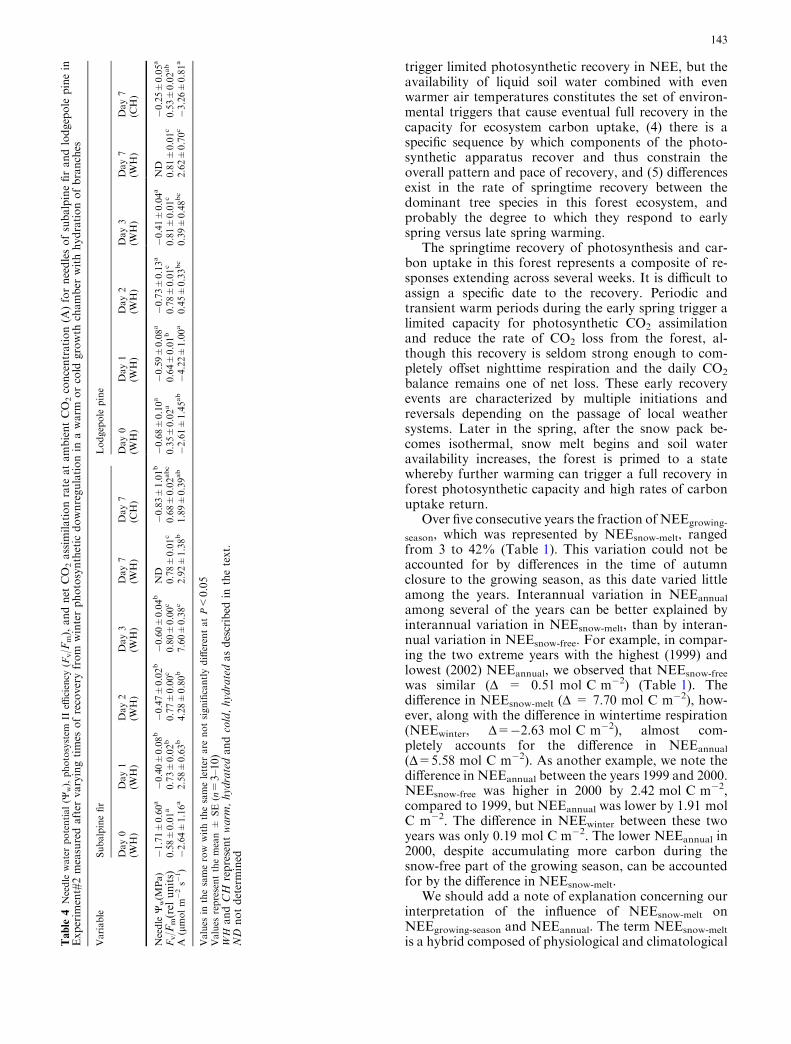
in this experiment, we focused on recovery in response totwo hydration treatments, one in a warm temperatureregime (WH) and one in a cold temperature regime (CH)and on two physiological measures that are leastdependent on time-of-day and are easily measured inorder to facilitate sequential sampling, chlorophyll flu-orescence and CO2 assimilation rate at normal ambientCO2 concentration. In this case, the week prior to theharvesting of branches was characterized by warmer-than-normal temperatures at the field site. Perhaps inresponse to this warm period, the pre-dawn needle Yw oflodgepole pine was already relatively high at the time ofharvest. Time of hydration did not have a further effectin increasing the needle water potential of pines(F=2.20; df=3,16; P=0.13). Pre-dawn needle Yw wasrelatively low in subalpine fir branches at the time ofharvest (Table 4). Needle Yw recovered after only 1day of hydration in the WH regime, with time ofhydration having a significant effect (F=10.86; df=3,16;
P= 0.0004). In needles of subalpine fir, PSII photo-synthetic efficiency was already relatively high at thetime of collection (Day 0), despite relatively low needleYw (Table 4). This may have been a relict, remainingfrom some level of in situ photosynthetic recovery theprevious week. In pine needles, PSII efficiency was stillrelatively low when needles were harvested, despite rel-atively high needle Yw; this might indicate the lack ofphotosynthetic recovery in this species the previousweek, despite having experienced needle re-hydration.Within the first day in the WH treatment, PSII effi-ciencies in pine needles had increased to 93% of theobserved maximum. In both species, there was a sig-nificant overall effect of time of hydration in the warmregime on recovery of Fv/Fm (subalpine fir, F=84.88;df=4,36; P<0.0001; lodgepole pine, F=220.33;df=4,45; P<0.0001) and significant (P<0.05) pairwisecontrasts between Day 0 and all subsequent days, andDay 1 and all subsequent days. After Day 1, pairwisecontrasts were not significant. In other words, in bothspecies, recovery in Fv/Fm was complete after 1 day inthe WH regime. At the time of harvest net CO2 exchangeof needles in both species solely reflected net CO2 loss(Table 4). After 1 day in the WH treatment (indicated as‘‘Day1’’ in Table 4), the needles of subalpine fir switchedfrom net CO2 loss to net CO2 uptake, with CO2 uptakerates being 34% of their eventual maximum. There wasa significant effect of time of hydration on the recoveryof CO2 assimilation rate in subalpine fir (F=18.70;df=4,25; P<0.0001). Pine needles were considerablyslower in their recovery in the WH treatment. Needles inlodgepole pine exhibited significant increases in net CO2
uptake after 2 days of hydration, compared to 1 day insubalpine fir, and rates of CO2 uptake significantlygreater than 0 only after 7 days of recovery, compared
Fig. 7 Time-dependent changes in the ratio of xanthophyll cyclepigments (upper panel) and the intrinsic efficiency of photosystem II(Fv/Fm) (lower panel) for branches of lodgepole pine duringExperiment 1. The lines represent ‘‘best-fit’’ regression plotsobtained from either linear or second-order polynomial regressionanalyses. Values represent mean ± SE (n=3 branches for theupper panel and 10 branches for the lower panel)
Fig. 8 Time-dependent changes in stomatal conductance to watervapor of lodgepole pine needles during Experiment 1. Stomatalconductance in this case is expressed on the basis of projectedneedle surface area, not total needle surface area. Treatmentsymbols are as described in Fig. 7. Values represent mean ± SE(n=5 branches)
141
to 1 day for subalpine fir. As we only sampled on days 3and 7 in the recovery experiment, we conclude that pineneedles require between 4 days and 7 days in a warm,hydrated state for significant photosynthetic recovery.
In the cold regime (CH), after 7 days of hydration, firneedles recovered to a significantly lower rate of net CO2
uptake, compared to those in the WH regime (Table 4)(means compared between WH fir and CH fir signifi-cantly different; t = 4.55; 2-tailed P = 0.004), despiteexhibiting similar needle Yw values and photosystem IIefficiencies. Needles of pine that were rehydrated in thecold regime did not regain the capacity for CO2 uptake,even after 7 days, again despite having relatively highinitial needle Yw (means compared between WH pineand CH pine significantly different; t=5.50; 2-tailedP=0.0005). In pine needles, photosystem II efficiency(Fv/Fm) did not recover after 7 days in the CH treat-ment to the same level as that for needles in the WHtreatment (t=15.58; 2-tailed P<0.0001).
Discussion
Considerable attention has recently been devoted to thetiming of, and controls over, the springtime greening ofdeciduous forests (Goulden et al. 1996b; Bergh et al.2003) and commencement of springtime photosyntheticactivity in evergreen forests (Bergh and Linder 1999;Vaganov et al. 1999; Bergh et al. 2003; Suni et al. 2003;Tanja et al. 2003; Smith et al. 2004). Springtime CO2
assimilation in northern hemisphere forests affects an-nual dynamics in the hemispheric CO2 drawdown(Randerson et al. 1999) and is correlated with remotely-sensed patterns of surface ’greening’ (Myneni et al. 1997;Way et al. 1997; Nichol et al. 2002). Evergreen foresttrees in cold-winter climates normally downregulatephotosynthetic activities during the winter and requirewarm weather cues to trigger recovery. The nature ofthese cues and the sequence of physiological responsesinvolved in the recovery have been examined in the caseof certain boreal forest species (e.g., Ensminger et al.2004), but are largely uninvestigated for mid-latitudeconiferous trees. In this study, we focused on a subalpineconiferous forest in the Rocky Mountains of Colorado.We demonstrated that (1) the time of recovery in thephotosynthetic processes of the trees can be offset byseveral weeks from the time of recovery in the capacityof ecosystem carbon uptake, (2) once the capacity forcarbon uptake does recover, CO2 assimilation during theperiod of snow melt represents a significant, but variablecomponent of growing-season NEE and annual NEE,(3) warm, early-spring, air temperatures are sufficient to
Fig. 9 Time-dependent recovery of the relationship between needlenet CO2 assimilation rate (A) and needle intercellular CO2
concentration (Ci) in lodgepole pine during Experiment 1. NetCO2 assimilation rate in this case is expressed on the basis ofprojected needle surface area, not total needle surface area.Treatment symbols are as described in Fig. 7. Each pointrepresents one measurement. Lines were fitted to the points with‘‘best-fit’’ second-order polynomials determined from regressionanalysis
Table 3 Recovery of photosynthetic and respiratory variables for lodgepole pine in Experiment#1 in either the high light hydrated (HLH)or low light hydrated (LLH) treatments
Treatment Time of recovery (h) Rd (lmol m�2 s�1) VCmax (lmol m�2 s�1) Jmax (lmol m�2 s�1) G (lmol mol�1)
HLH 48 �2.11 10.3 38.9 20572 �2.02 15.0 67.0 142120 �3.25 23.8 69.5 144
LLH 48 �2.85 12.7 50.3 22472 �2.03 16.4 52.5 134120 �1.21 17.1 48.5 94
Data represent the least squares regression estimations in the program Photosyn Assistant, for dark respiration rate (Rd), maximumcarboxylation velocity of Rubisco (VCmax), maximum rate of electron transport (Jmax), and CO2 compensation point (G)
142
trigger limited photosynthetic recovery in NEE, but theavailability of liquid soil water combined with evenwarmer air temperatures constitutes the set of environ-mental triggers that cause eventual full recovery in thecapacity for ecosystem carbon uptake, (4) there is aspecific sequence by which components of the photo-synthetic apparatus recover and thus constrain theoverall pattern and pace of recovery, and (5) differencesexist in the rate of springtime recovery between thedominant tree species in this forest ecosystem, andprobably the degree to which they respond to earlyspring versus late spring warming.
The springtime recovery of photosynthesis and car-bon uptake in this forest represents a composite of re-sponses extending across several weeks. It is difficult toassign a specific date to the recovery. Periodic andtransient warm periods during the early spring trigger alimited capacity for photosynthetic CO2 assimilationand reduce the rate of CO2 loss from the forest, al-though this recovery is seldom strong enough to com-pletely offset nighttime respiration and the daily CO2
balance remains one of net loss. These early recoveryevents are characterized by multiple initiations andreversals depending on the passage of local weathersystems. Later in the spring, after the snow pack be-comes isothermal, snow melt begins and soil wateravailability increases, the forest is primed to a statewhereby further warming can trigger a full recovery inforest photosynthetic capacity and high rates of carbonuptake return.
Over five consecutive years the fraction of NEEgrowing-
season, which was represented by NEEsnow-melt, rangedfrom 3 to 42% (Table 1). This variation could not beaccounted for by differences in the time of autumnclosure to the growing season, as this date varied littleamong the years. Interannual variation in NEEannual
among several of the years can be better explained byinterannual variation in NEEsnow-melt, than by interan-nual variation in NEEsnow-free. For example, in compar-ing the two extreme years with the highest (1999) andlowest (2002) NEEannual, we observed that NEEsnow-free
was similar (D = 0.51 mol C m�2) (Table 1). Thedifference in NEEsnow-melt (D = 7.70 mol C m�2), how-ever, along with the difference in wintertime respiration(NEEwinter, D=�2.63 mol C m�2), almost com-pletely accounts for the difference in NEEannual
(D=5.58 mol C m�2). As another example, we note thedifference in NEEannual between the years 1999 and 2000.NEEsnow-free was higher in 2000 by 2.42 mol C m�2,compared to 1999, but NEEannual was lower by 1.91 molC m�2. The difference in NEEwinter between these twoyears was only 0.19 mol C m�2. The lower NEEannual in2000, despite accumulating more carbon during thesnow-free part of the growing season, can be accountedfor by the difference in NEEsnow-melt.
We should add a note of explanation concerning ourinterpretation of the influence of NEEsnow-melt onNEEgrowing-season and NEEannual. The term NEEsnow-melt
is a hybrid composed of physiological and climatologicalTable
4Needle
waterpotential(Y
w),photosystem
IIeffi
ciency
(Fv/F
m),andnet
CO
2assim
ilationrate
atambientCO
2concentration(A
)forneedlesofsubalpinefirandlodgepole
pinein
Experim
ent#2measuredafter
varyingtimes
ofrecoveryfrom
winterphotosynthetic
downregulationin
awarm
orcold
growth
chamber
withhydrationofbranches
Variable
Subalpinefir
Lodgepole
pine
Day0
(WH)
Day1
(WH)
Day2
(WH)
Day3
(WH)
Day7
(WH)
Day7
(CH)
Day0
(WH)
Day1
(WH)
Day2
(WH)
Day3
(WH)
Day7
(WH)
Day7
(CH)
Needle
Yw(M
Pa)�1.71±
0.60a�0.40±
0.08b�0.47±
0.02b�0.60±
0.04b
ND
�0.83±
1.01b�0.68±
0.10a�0.59±
0.08a�0.73±
0.13a�0.41±
0.04a
ND
�0.25±
0.05a
Fv/F
m(rel
units)
0.58±
0.01a
0.73±
0.02b
0.77±
0.00c
0.80±
0.00c
0.78±
0.01c
0.68±
0.02abc
0.35±
0.02a
0.64±
0.01b
0.78±
0.01c
0.81±
0.01c
0.81±
0.01c
0.53±
0.02ab
A(lmolm�2s�
1)�2.64±
1.16a
2.58±
0.63b
4.28±
0.80b
7.60±
0.38c
2.92±
1.38b
1.89±
0.39ab�2.61±
1.45ab�4.22±
1.00a
0.45±
0.33bc
0.39±
0.48bc
2.62±
0.70c�3.26±
0.81a
Values
inthesamerow
withthesameletter
are
notsignificantlydifferentatP<
0.05
Values
representthemean±
SE
(n=
3–10)
WH
andCH
representwarm
,hydratedandcold,hydratedasdescribed
inthetext.
ND
notdetermined
143
components. It is marked at the early-spring boundary bythe time at which the trees recover physiologically and areable to use the snow-melt water, and at the late-springboundary by the climatologically-determined end of thesnow melt itself. Use of the melted snow water will nodoubt continue for some time after the disappearance ofthe snow pack, although this cannot be determined solelyby measurements of NEE and soil moisture. It would beinformative to determine interanual variation in theparameter NEEsnow-melt defined solely in physiologicalterms (i.e., with the late-spring boundary defined as thetime when the trees cease using snow melt water). Studiesare in progress to develop this insight using the stableisotope signatures of winter snow versus summer rainwater. Nonetheless, the term NEEsnow-melt does haveinherent relevance to analyses of ecosystem carbon bud-gets. As defined in this study, NEEsnow-melt represents thetime between when the ecosystem begins to sequestercarbon in the early spring and the time when the disap-pearance of snow in the late spring causes soil respirationrates to increase significantly (see Monson et al. 2002).Thus, this is the interval when the forest reaches its highestgross photosynthesis/respiration ratio, and thus itsgreatest potential to sequester carbon. Additionally, wenote that as defined in this study NEEsnow-melt reflects aconservative estimate of the influence of the snow meltperiod on interannual NEE dynamics. If anything, thecontribution of NEEsnow-melt to growing-season and an-nual NEE will increase once we know the actual extent oflate-spring forest usage of snow-melt water.
During those years when the forest turn-on occurredearlier in the spring, NEEsnow-melt and NEEannual werelowest (Fig. 2, Table 1). This relationship was due totwo effects. First, we observed a springtime tempera-ture dependence of NEE reflecting a low temperatureconstraint during the earliest part of the recovery(Fig. 3); this result is consistent with the statistical pathanalysis conducted by Huxman et al. (2003), whichshowed that cooler spring periods have a negativeinfluence on NEE. Second, during those years withearlier springs the depth of the snow pack at the forestturn-on date was lower; thus, earlier springs coincidedwith less snowmelt water to drive CO2 uptake. Onehypothesis that does not receive support from ourobservations concerns the question of whether an earlyspring with a low snow pack influences NEE during thesubsequent snow-free part of the growing season; inother words, does less snow in the spring lead to astronger moisture constraint the following summer?The anecdotal evidence from our study does not sup-port this hypothesis. For example, the spring snowpacks of 1999 and 2002 reflected the high and lowextremes observed during our study, yet NEE duringthe snow-free periods of these two years were nearlyequal. It is likely that summer rains have greater con-trol over summertime NEE than snow water from theprevious spring. There is clearly room for further re-search into the coupling between spring and summerhydrological regimes and their influence on NEE.
Our conclusion that earlier springs are correlatedwith lower rates of annual NEE has important ramifi-cations for predicting the effects of future climate changeon the terrestrial carbon cycle. In general, earlier springwarming is predicted to enhance forest NPP, especiallyin sites with cold winter climates (White et al. 1999;Arain et al. 2002; Bergh et al. 2003). In deciduous forestecosystems of the eastern U.S. and southern Canada,earlier springs were correlated with higher annual ratesof carbon uptake (Goulden et al. 1996b; Black et al.2000; Barr et al. 2002). In a deciduous forest ecosystem,annual CO2 uptake is highly constrained by the fractionof the growing season during which newly-formed leavesare expanding and forest leaf-area index (LAI) is belowits seasonal maximum; normally, an earlier spring re-duces this fraction and increases the time during whichthe forest can assimilate CO2 at its maximum LAI. In anevergreen forest the seasonal constraint on CO2 uptakecaused by LAI is small compared to the various envi-ronmental constraints that affect NEE, particularlythose associated with temperature and moisture. In anevergreen forest, an earlier spring will only have a po-sitive influence on annual NEE if these additional con-straints are relieved; a condition that we did not observeduring our 5 years of observations.
The environmental triggers that facilitate the switchfrom a winter phase of net CO2 loss to a spring phase ofnet CO2 gain include both isothermality of the snowpack and the occurrence of favorable air temperatures.Although we observed multiple initiations and reversalsof CO2 uptake in the NEE30-min data depending on thepassage of local warm and cold weather systems (Figs. 4and 5), we never observed consistent cumulative dailyCO2 uptake prior to isothermality in the snow pack. Instudies of photosynthetic recovery in boreal forestconifers, Ensminger et al. (2004) observed similardynamics with regard to reversible stretches of warmweather and its influence on PSII activity. In an exam-ination of five boreal forest sites, Tanja et al. (2003)found a strong correlation between the forest turn-ondate and the mean air temperature during the few dayspreceding the date (also see Hadley and Schedlbauer2002; Suni et al. 2003). Thus, there is broad support forthe role of air temperature in controlling some level ofrecovery in the photosynthetic systems of the forest.There is less support for the role of soil moisture. In thestudies of Tanja et al. (2003) soil moisture availabilitywas poorly correlated with the forest turn-on date.Clearly, there are differences in the nature of the envi-ronmental triggers between high-latitude boreal forestswhere seasonal thaw of the permafrost occurs well intothe growing season and lower latitude subalpine forestswhere there is no permafrost.
The downregulation of photosynthesis in evergreenconifers during the winter months has been attributed tolow temperature induced photoinhibition of PSII(Oquist and Huner 2003; Yamazaki et al. 2003).However, studies to date have not simultaneously con-sidered recovery in the photochemical, diffusive and
144
carboxylation components of the photosynthetic appa-ratus. We argue that only by considering the responsesof all of the primary components of the photosyntheticapparatus, can we build a complete understanding ofspringtime recovery. Our studies showed that recoveryof photosynthesis from wintertime downregulation oc-curred in a series of events involving all of these physi-ological processes. Recovery of stomatal conductance(gs) and the intrinsic efficiency of PSII (Fv/Fm) occurredrapidly and in parallel (Figs. 7 and 8). Fv/Fm has beendocumented to achieve near-full recovery in less than70 h for conifer species in response to an increase intemperature (Verhoeven et al. 1998). In the presentstudy, recovery in lodgepole pine was even faster,recovering to near-maximal values within 48 h. Fur-thermore, the recovery of Fv/Fm in lodgepole pine nee-dles was not dependent on needle Y w, only warmtemperature, as has been shown previously (Ensmingeret al. 2004). In contrast to the pattern for Fv/Fm, (Z+A)/(V+Z+A) was dependent on needle Yw, in addition totemperature (Fig. 7). Perhaps due to these different re-sponses, PSII recovery and the xanthophyll cycle did notshow concurrent recovery in all cases, as has been seen inPinus ponderosa and Pseudotsuga menziesii (Verhoevenet al. 1996). In our study, the well described relationshipbetween PSII efficiency and (Z+A) pools was observedin all cases except the non-hydrated recovery treatment.Although it remains uncertain why the reconversion ofZ+A to V was incomplete in this case, several recentstudies have shown that additional photosynthetic pro-teins (PsbS for example; see Li et al. 2000) are importantfor zeaxanthin-dependent energy quenching; this furthercomplicates the relationship between PSII efficiency andZ+A pools (also see Adams et al. 2001). Given thepotential for multiple factors to influence the couplingbetween PSII recovery and Z+A pool size, it is possiblethat the springtime recovery of PSII function occursdespite the existence of high Z+A pools under someconditions.
The recovery of photosynthetic carboxylationcapacity occurred at the slowest rate of those processesthat we studied, as evidenced by the slow recovery ofthe initial slope of the A:Ci response (Fig. 9). We didnot observe recovery of the A:Ci relationship in needleskept in the LLD treatment. The maximum carboxyla-tion rate of Rubisco (VCmax) reached a maximum in theHLH treatment as compared to the LLH treatment(Table 3), suggesting that in addition to water, light isimportant for the upregulation of Rubisco activity. Theslow pace at which VCmax was up-regulated and itsreliance on several environmental variables suggeststhat recovery from winter downregulation requires notonly changes in the activation state of Rubisco, butalso de novo synthesis of Rubisco protein. The recoveryof Vcmax occurred at a different rate than that forwhole-chain electron transport, as reflected in the esti-mated Jmax, suggesting a lack of biochemical coordi-nation between these two processes during springtimeup-regulation.
When all processes are considered within a sequentialcontext, it appears as though photosynthetic recovery is(1) initiated by response to warm air temperaturesthrough the inductive up-regulation of PSII caused inpart by disengagement of thermal energy dissipation byzeaxanthin and in part by the upregulation of whole-chain electron transport rate, (2) continued during soilwarming as water is provided to the hydraulic systemand the stomata begin to exhibit greater amplitude intheir diurnal dynamics, and (3) completed as Rubiscoenzyme is reactivated, re-synthesized, and/or re-allo-cated from storage pools to provide recovery of thecarboxylation potential of the chloroplasts. Recovery ofmaximal springtime rates of forest net CO2 uptake ap-pears to occur only after all three of these stages arecompleted.
We observed interspecific differences in the timing ofphotosynthetic recovery. Subalpine fir needles recoverednear-maximal photosynthetic capacities within 3 daysafter being rehydrated at a warmer temperature (Ta-ble 4). Needles of lodgepole pine required at least4 days, and perhaps as many as 7 days, for photosyn-thetic recovery. The ecological and adaptive reasons forthese differences are not clear at the current time.However, in general, pines tend to occupy drier habitatscompared to firs (Rebertus et al. 1991; DeLucia et al.2000; Martinez-Vilalta et al. 2004). It might be that thesuite of photosynthetic adaptations that facilitatedrought tolerance in pines, includes a slow, generallyconservative response to transitions from dry to wetconditions. The differential responses of fir and pine mayexplain our observation of limited photosyntheticrecovery early in the spring, with a full recovery incarbon uptake occurring much later. Rapid but partialphotosynthetic recovery of fir trees in response to tran-sient warm periods, and concomitant partial thawing ofwater in the branches and bole, may explain the weaksignal in forest CO2 uptake that we observed early in thespring. Recovery of pine may require the initiation ofsnow melt and longer, sustained periods of warm airtemperature, such as occur later in the spring. A researchinvestigation into the in situ patterns of photosyntheticrecovery during the early and late spring in these twospecies, as well as the third important species, Engle-mann spruce, is clearly justified.
Our results show that the timing of the transitionbetween wintertime down regulation and springtimeupregulation of net CO2 uptake has an important role incontrolling the rate of annual forest carbon uptake inthis subalpine, coniferous forest. This conclusion isconsistent with the many other past reports that earliersprings have a significant effect on annual NEE in forestecosystems. However, from these past studies, we con-clude that it is more rare to observe a negative influenceof an early spring on annual NEE, as we have shownhere, than a positive influence. The issue as to whetherfuture climate warming, and concomitantly earliersprings, will enhance CO2 uptake in cold-climate forestsshould continue to be viewed as unresolved. The envi-
145
ronmental triggers that control the transition fromwinter net CO2 loss to spring net CO2 gain appear to beconsistent at both the needle and ecosystem scales; i.e.,both liquid water and warm air temperatures are re-quired for recovery at both scales. With a deeperunderstanding of how specific physiological and bio-chemical processes interact with these triggers, weshould be able to improve our predictions of how futureclimate change, and particularly the onset of earliersprings, will influence ecosystem, and even global,dynamics in surface-atmosphere carbon exchange. Thedevelopment of these predictions will likely require dif-ferent approaches for deciduous and evergreen, conif-erous forests. However, given that there are discernablemechanistic controls, that these mechanisms tightlycouple springtime NEE to the prevailing environment,and that these mechanisms appear to be consistentacross scales of observation, the problem of prediction isa tractable one.
Acknowledgements We are grateful for the research contributionsof many students and colleagues, including Kimberley Sparks, BillBaugh, Dr. Chuixiang Yi, Sarah Schliemann, Andy McNown,Nathan Monson, Greg Monson, John Munch, Thomas Zukow-ski, and Wumesh Khatri. We are grateful to Mark Williams,Mark Loesleben and Andy O’Reilly who provided valuableguidance to making the snow temperature measurements. Wethank Dr. Bill Bowman (University of Colorado Mountain Re-search Station) for providing valued logistical support in estab-lishing and maintaining the Niwot Ridge AmeriFlux site andaccess to an additional gas exchange system. We thank GordonMaclean and Tony Delany (National Center for AtmosphericResearch) for their long-standing commitment to help with alltypes of technical issues surrounding the instrumentation at theNiwot Ridge AmeriFlux tower. We thank Dr. William Adamsand Barbara Demmig-Adams for providing valuable access to theHPLC system used in the pigment analysis and to the chlorophyllfluorescence system used in the first recovery experiment. Thiswork was financially supported by a grant from the South CentralSection of the National Institute for Global EnvironmentalChange (NIGEC) through the US Department of Energy (BERProgram) (Cooperative Agreement No. DE-FC03-90ER61010).Any opinions, findings and conclusions or recommendations ex-pressed in this publication are those of the authors and do notnecessarily reflect the views of the DOE.
References
Adams WW, Demmig-Adams B (1992) Operation of the xantho-phyll cycle in higher plants in response to diurnal changes inincident sunlight. Planta 189:390–398
Adams WW, Demmig-Adams B, Rosenstiel TN, Ebbert V (2001)Dependence of photosynthesis and energy dissipation activityupon growth form and light environment during the winter.Photosyn Res 67:51–62
Arain MA, Black TA, Barr AG, Jarvis PG, Massheder JM,Verseghy DL, Nesic Z (2002) Effects of seasonal and interan-nual climate variability on net ecosystem productivity of borealdeciduous and conifer forests. Can J For res 32:878–891
Baldocchi DD (2003) Assessing the eddy covariance technique forevaluating carbon dioxide exchange rates of ecosystems: past,present and future. Global Change Biol 9:479–492
Barr AG, Griffis TJ, Black TA, Lee X, Staebler RM, Fuentes JD,Chen Z, Morgenstern K (2002) Comparing the carbon budgetsof boreal and temperate deciduous forest stands. Can J For Res5:813–822
Bergh J, Linder S (1999) Effects of soil warming during spring onphotosynthetic recovery in boreal Norway spruce stands. Glo-bal Change Biol 5:245–253
Bergh J, Freeman M, Sigurdsson B, Kellomaki S, Laitinen K,Niinisto S, Peltola H, Linder S (2003) Modelling the short-term effects of climate change on the productivity of selectedtree species in Nordic countries. For Ecol Manag 183:327–340
Black TA, Chen WJ, Barr AG, Arain MA, Chen Z, Nesic Z, HoggEH, Neumann HH, Yang PC (2000) Increased carbon seques-tration by a boreal deciduous forest in years with a warmspring. Geophys Res Lett 27:1271–1274
Chen JM, Rich PM, Gower ST, Norman JM, Plummer S (1997)Leaf area index of boreal forests: Theory, techniques andmeasurements. J Geophys Res 102:29429–29443
Day TA, DeLucia EH, Smith WK (1989) Influence of cold soil andsnowcover on photosynthesis and leaf conductance in twoRocky Mountain Conifers. Oecologia 80:546–552
DeLucia EH, Maherali H, Carey EV (2000) Climate-drivenchanges in biomass allocation in pines. Global Change Biol6:587–593
Demmig-Adams B, Adams W, Barker DH, Logan BA, VerhoevenAS, Bowling DR (1996) Using chlorophyll fluorescence to as-sess the allocation of absorbed light to thermal dissipation ofexcess excitation. Physiol Plant 98:253–264
Ensminger I, Sveshnikov D, Campbell DA, Funk C, Jansson S,Lloyd J, Shibistova O, Oquist G (2004) Intermittent low tem-peratures constrain spring recovery of photosynthesis in borealScots pine forests. Global Change Biol 10:995–1008
Gilmore AM, Yamamoto HY (1991) Resolution of lutein andzexanthin using a nonendcapped, lightly carbon-loaded C18high-performance liquid chromatographic column. J Chrom543:137–145
Goulden ML, Munger JW, Fan S-M, Daube BC, Wofsy SC(1996a) Measurements of carbon sequestration by long-termeddy covariance: Methods and a critical evaluation of accuracy.Global Change Biol 2:169–182
Goulden ML, Munger JW, Fan S-M, Daube BC, Wofsy SC(1996b) CO2 exchange by a deciduous forest: response to in-terannual climate variability. Science 271:1576–1578
Hadley JL, Schedlbauer JL (2002) Carbon exchange of an old-growth eastern hemlock (Tsuga canadensis) forest in centralNew England. Tree Physiol 22:1079–1092
Harley PC, Thomas RB, Reynolds JF, Strain BR (1992) Modellingphotosynthesis of cotton grown in elevated CO2. Plant, Cell &Environ 15:271–282
Huxman TE, Hamerlynck EP, Moore BD, Smith SD, Jordan DN,Zitzer SF, Nowak RS, Coleman J, Seemann JR (1998) Photo-synthetic down-regulation in Larrea tridentata exposed to ele-vated atmospheric CO2: interaction with drought underglasshouse and field (FACE) exposure. Plant, Cell & Environ21:1153–1161
Huxman TE, Turnipseed AA, Sparks JP, Harley PC, MonsonRK (2003) Temperature as a control over ecosystem CO2
fluxes in a high-elevation, subalpine forest. Oecologia134:537–546
Jacob J, Greitner C, Drake BG (1995) Acclimation of photo-synthesis in relation to Rubisco and non-structural carbohy-drate contents and in situ carboxylase activity in Scirpus olneyigrown at elevated CO2 in the field. Plant, Cell & Environ18:875–884
Jurik TW, Briggs GM, Gates DM (1988) Springtime recovery ofphotosynthetic activity of white pine in Michigan. Can J Bot66:138–141
Kaimal JC, Finnigan JJ (1994) Atmospheric boundary layer flows:their structure and measurement. Oxford University Press, Ox-ford
Law BE, Williams M, Anthoni PM, Baldocchi DD, UnsworthMH (2000) Measuring and modelling seasonal variation ofcarbon dioxide and water vapour exchange of a Pinus pon-derosa forest subject to soil water deficit. Global Change Biol6:613–630
146
Leverenz JW, Oquist G (1987) Quantum yields of photosynthesis attemperatures between 2 degrees and 35 degrees C in a cold-tolerant C3 plant (Pinus sylvestris) during the course of oneyear. Plant Cell Environ 10:287–295
Li S-P, Bjorkman O, Shih C, Grossman AR, Rosenquist M,Jansson S, Niyogi KK (2000) A pigment-binding proteinessential for regulation of photosynthetic light harvesting.Nature 403:391–395
Lloyd J, Langenfelds RL, Francey RJ, Gloor M, Tchebakova NM,Zolotoukhine D, Brand WA, Werner RA, Jordan A, AllisonCA, Zrazhewske V, Shibistova O, Schulze ED (2002) A trace-gas climatology above Zotino, central Siberia. Tellus (Ser B)54:749–767
Lundmark T, Bergh J, Strand M, Koppel A (1998) Seasonal var-iation of maximum photochemical efficiency in boreal Norwayspruce stands. TREES-Struc Func 13:63–67
Martinez-Vilalta J, Sala A, Pinol J (2004) The hydraulic architec-ture of Pinaceae-a review. Plant Ecol 171:3–13
Monson RK, Turnipseed AA, Sparks JP, Harley PC, Scott-DentonLE, Sparks K, Huxman TE (2002) Carbon sequestration in ahigh-elevation, subalpine forest. Global Change Biol 8:459–478
Myneni RB, Keeling CD, Tucker CJ, Asrar G, Nemani RR (1997)Increased plant growth in the northern high latitudes from 1981to 1991. Nature 386:698–702
Nichol CJ, Lloyd J, Shibistova O, Arneth A, Roser C, Knohl A,Matsubara S, Grace J (2002) Remote sensing of photosynthetic-light-use efficiency of a Siberian boreal forest. Tellus (Ser B)54:677–687
Oquist G, Huner NPA (2003) Photosynthesis of overwinteringevergreen plants. Ann Rev Plant Biol 54:329–355
Ottander C, Oquist G (1991) Recovery of photosynthesis in winter-stressed Scots pine. Plant, Cell Environ 14:345–349
Pedhazur EJ (1997) Multiple regression in behavioral research, 3rdedn. Harcourt Brace College Publishers, New York
Potvin C, Lechowicz MJ, Tardif S (1990) The statistical analysis ofecophysiological response curves obtained from experimentsinvolving repeated measures. Ecology 71:1389–1400
Randerson JT, Field CB, Fung IY, Tans PP (1999) Increases inearly season ecosystem uptake explain recent changes in theseasonal cycle of atmospheric CO2 at high northern latitudes. JGeophys Res 26:2765–2768
Rebertus AJ, Burns BR, Veblen TT (1991) Stand dynamics of Pi-nus-flexilis-dominated sub-alpine forests in the Colorado FrontRange. J Veg Sci 2:445–458
Smith WK (1985) Environmental limitations on leaf conductancein central Rocky Mountain conifers, USA. In: Turner H,Tranquillini W (eds) Establishment and tending of subalpineforest: research and management. Eidg Anst Forstl VersuchswBer 270, pp 95–101
Smith NV, Saatchi SS, Randerson JT (2004) Trends in highnorthern latitude soil freeze and thaw cycles from 1988 to 2002.J Geophys Res 109:Art. No. D12101
Suni T, Berninger F, Markkanen T, Keronen P, Rannik U, VesalaT (2003) Interannual variability and timing of growing-season
CO2 exchange in a boreal forest. J Geophys Res 108(D9):ArtNo. 4265
Tanja S, Berninger F, Vesala T, Markkanen T, Hari P, Makela A,Ilvesniemi H, Hanninen H, Nikinmaa E, Huttula T, Laurila T,Aurela M, Grelle A, Lindroth A, Arneth A, Shibistova O,Lloyd J (2003) Air temperature triggers the recovery of ever-green boreal forest photosynthesis in spring. Global ChangeBiol 9:1410–1426
Troeng E, Linder S (1982) Gas-exchange in a 20-year oldstand of Scots pine. 1. Net photosynthesis of current andone-year old shoots within and between seasons. PhysiolPlant 54:7–14
Turnipseed AA, Blanken PD, Anderson DE, Monson RK (2002)Energy budget above a high-elevation subalpine forest incomplex topography. Agric For Meteorol 110:177–201
Turnipseed AA, Anderson DE, Blanken PD, Baugh WM, MonsonRK (2003) Airflows and turbulent flux measurements inmountainous terrain Part 1. Canopy and local effects. Agric ForMeteorol 119:1–21
Turnipseed AA, Anderson DE, Blanken PD, Burns S, Monson RK(2004) Airflows and turbulent flux measurements in moun-tainous terrain Part 2. Mesoscale effects. Agric For Meteorol (inpress)
Vaganov EA, Hughes MK, Kirdyanov AV, Schweingruber FH,Silkin PP (1999) Influence of snowfall and melt timing on treegrowth in subarctic Eurasia. Nature 400:149–151
Verhoeven AS, Adams WW, Demmig-Adams B (1996) Closerelationship between the state of the xanthophyll cycle pigmentsand photosystem II efficiency during recovery from winterstress. Physiol Plant 96:567–576
Verhoeven AS, Adams WW, Demmig-Adams B (1998) Two formsof sustained xanthophyll cycle-independent energy dissipationin overwintering Euonymus kiautchovicus. Plant Cell Environ21:893–903
Verhoeven AS, Adams WW, Demmig-Adams B (1999) The xan-thophyll cycle and acclimation of Pinus ponderosa and Malvaneglecta to winter stress. Oecologia 118:277–287
Way J, Zimmermann R, Rignot E, McDonald K, Oren R (1997)Winter and spring thaw as observed with imaging radar atBOREAS. J Geophys Res 102:29673–29684
Webb EK, Pearman GI, Leuning R (1980) Correction of fluxmeasurements for density effects due to heat and water vaportransfer. Quart J Roy Meteorol Soc 106:85–100
White MA, Running SW, Thornton PE (1999) The impact ofgrowing-season length variability on carbon assimilation andevapotranspiration over 88 years in the eastern US deciduousforest. Intl J Biometeorol 42:139–145
Wilczak JM, Oncley SP, Stage SA (2001) Sonic anemometer tiltcorrection algorithms. Bound Lay Meteor 99:127–150
Yamazaki J, Ohashi A, Hashimoto Y, Negishi E, Kumagai S,Kubo T, Oikawa T, Maruta E, Kamimura Y (2003) Effects ofhigh light and low temperature during harsh winter on needlephotodamage of Abies mariesii growing at the forest limit onMt. Norikura in Central Japan. Plant Sci 165:257–264
147


