Embed Size (px)
Citation preview

5.1 SOLUTIONS 315
CHAPTER FIVE
Solutions for Section 5.1
Exercises
1. (a) Lower estimate = (45)(2) + (16)(2) + (0)(2) = 122 feet.Upper estimate = (88)(2) + (45)(2) + (16)(2) = 298 feet.
(b)
2 4 6
20
40
60
80
t
v
2. (a) Since the velocity is decreasing, for an upper estimate, we use a left sum. With n = 5,we have ∆t = 2. Then
Upper estimate = (44)(2) + (42)(2) + (41)(2) + (40)(2) + (37)(2) = 408.
(b) For a lower estimate, we use a right sum, so
Lower estimate = (42)(2) + (41)(2) + (40)(2) + (37)(2) + (35)(2) = 390.
3. (a) (i) Since the velocity is increasing, for an upper estimate we use a right sum. Using n = 4, we have ∆t = 3, so
Upper estimate = (37)(3) + (38)(3) + (40)(3) + (45)(3) = 480.
(ii) Using n = 2, we have ∆t = 6, so
Upper estimate = (38)(6) + (45)(6) = 498.
(b) The answer using n = 4 is more accurate as it uses the values of v(t) when t = 3 and t = 9.(c) Since the velocity is increasing, for a lower estimate we use a left sum. Using n = 4, we have ∆t = 3, so
Lower estimate = (34)(3) + (37)(3) + (38)(3) + (40)(3) = 447.
4. (a) With n = 4, we have ∆t = 2. Then
t0 = 15, t1 = 17, t2 = 19, t3 = 21, t4 = 23 and f(t0) = 10, f(t1) = 13, f(t2) = 18, f(t3) = 20, f(t4) = 30
(b)
Left sum = (10)(2) + (13)(2) + (18)(2) + (20)(2) = 122
Right sum = (13)(2) + (18)(2) + (20)(2) + (30)(2) = 162.
(c) With n = 2,we have ∆t = 4. Then
t0 = 15, t1 = 19, t2 = 23 and f(t0) = 10, f(t1) = 18, f(t2) = 30
(d)
Left sum = (10)(4) + (18)(4) = 112
Right sum = (18)(4) + (30)(4) = 192.

316 Chapter Five /SOLUTIONS
5. (a) With n = 4, we have ∆t = 4. Then
t0 = 0, t1 = 4, t2 = 8, t3 = 12, t4 = 16 and f(t0) = 25, f(t1) = 23, f(t2) = 22, f(t3) = 20, f(t4) = 17
(b)
Left sum = (25)(4) + (23)(4) + (22)(4) + (20)(4) = 360
Right sum = (23)(4) + (22)(4) + (20)(4) + (17)(4) = 328.
(c) With n = 2,we have ∆t = 8. Then
t0 = 0, t1 = 8, t2 = 16 and f(t0) = 25, f(t1) = 22, f(t2) = 17
(d)
Left sum = (25)(8) + (22)(8) = 376
Right sum = (22)(8) + (17)(8) = 312.
6. Using ∆t = 2,
Lower estimate = v(0) · 2 + v(2) · 2 + v(4) · 2= 1(2) + 5(2) + 17(2)
= 46
Upper estimate = v(2) · 2 + v(4) · 2 + v(6) · 2= 5(2) + 17(2) + 37(2)
= 118
Average =46 + 118
2= 82
Distance traveled ≈ 82 meters.
7. Using ∆t = 0.2, our upper estimate is
1
1 + 0(0.2) +
1
1 + 0.2(0.2) +
1
1 + 0.4(0.2) +
1
1 + 0.6(0.2) +
1
1 + 0.8(0.2) ≈ 0.75.
The lower estimate is1
1 + 0.2(0.2) +
1
1 + 0.4(0.2) +
1
1 + 0.6(0.2) +
1
1 + 0.8(0.2)
1
1 + 1(0.2) ≈ 0.65.
Since v is a decreasing function, the bug has crawled more than 0.65 meters, but less than 0.75 meters. We average thetwo to get a better estimate:
0.65 + 0.75
2= 0.70 meters.
8. Just counting the squares (each of which has area 10), and allowing for the broken squares, we can see that the area underthe curve from 0 to 6 is between 140 and 150. Hence the distance traveled is between 140 and 150 meters.
9. Figure 5.1 shows the graph of f(t). The region under the graph of f(t) from t = 0 to t = 10 is a triangle of base 10seconds and height 50 meter/sec. Then
Distance traveled = Area of triangle =1
2· 10 · 50 = 250 meters.
Thus the distance traveled is 250 meters.
10
50
f(t) = 5t
t
Figure 5.1
5.1 SOLUTIONS 317
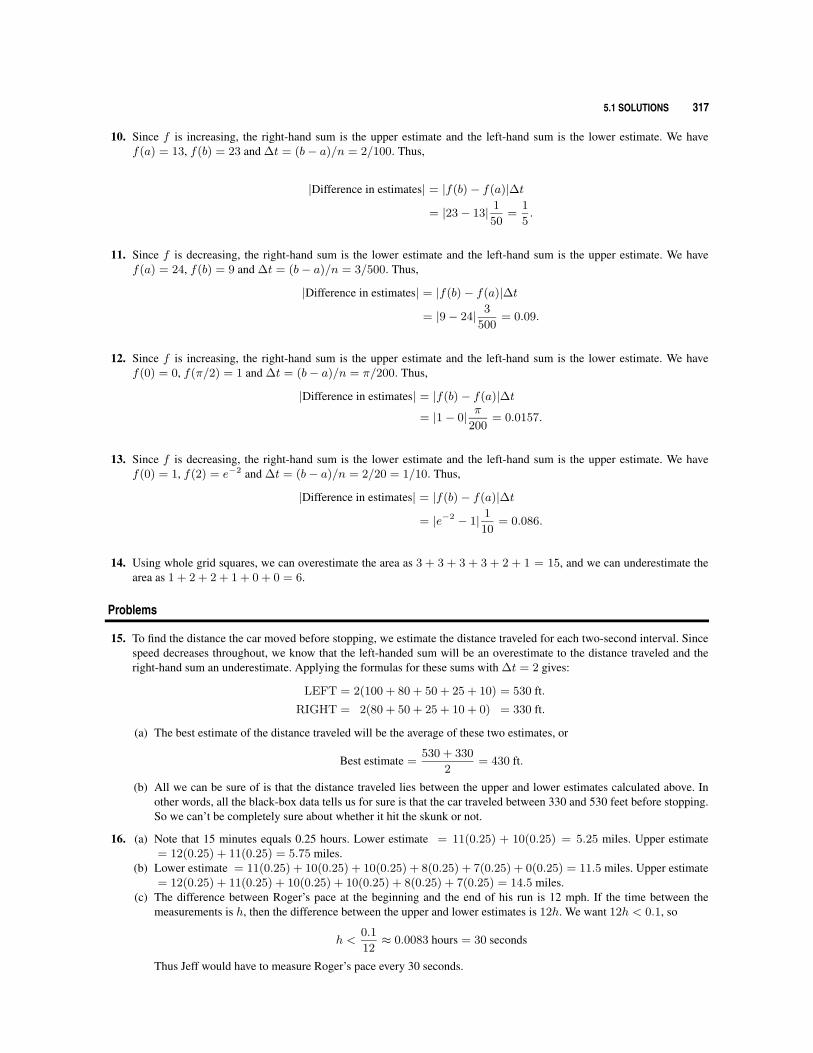
10. Since f is increasing, the right-hand sum is the upper estimate and the left-hand sum is the lower estimate. We havef(a) = 13, f(b) = 23 and ∆t = (b− a)/n = 2/100. Thus,
|Difference in estimates| = |f(b)− f(a)|∆t
= |23− 13| 1
50=
1
5.
11. Since f is decreasing, the right-hand sum is the lower estimate and the left-hand sum is the upper estimate. We havef(a) = 24, f(b) = 9 and ∆t = (b− a)/n = 3/500. Thus,
|Difference in estimates| = |f(b)− f(a)|∆t
= |9− 24| 3
500= 0.09.
12. Since f is increasing, the right-hand sum is the upper estimate and the left-hand sum is the lower estimate. We havef(0) = 0, f(π/2) = 1 and ∆t = (b− a)/n = π/200. Thus,
|Difference in estimates| = |f(b)− f(a)|∆t= |1− 0| π
200= 0.0157.
13. Since f is decreasing, the right-hand sum is the lower estimate and the left-hand sum is the upper estimate. We havef(0) = 1, f(2) = e−2 and ∆t = (b− a)/n = 2/20 = 1/10. Thus,
|Difference in estimates| = |f(b)− f(a)|∆t
= |e−2 − 1| 1
10= 0.086.
14. Using whole grid squares, we can overestimate the area as 3 + 3 + 3 + 3 + 2 + 1 = 15, and we can underestimate thearea as 1 + 2 + 2 + 1 + 0 + 0 = 6.
Problems
15. To find the distance the car moved before stopping, we estimate the distance traveled for each two-second interval. Sincespeed decreases throughout, we know that the left-handed sum will be an overestimate to the distance traveled and theright-hand sum an underestimate. Applying the formulas for these sums with ∆t = 2 gives:
LEFT = 2(100 + 80 + 50 + 25 + 10) = 530 ft.
RIGHT = 2(80 + 50 + 25 + 10 + 0) = 330 ft.
(a) The best estimate of the distance traveled will be the average of these two estimates, or
Best estimate =530 + 330
2= 430 ft.
(b) All we can be sure of is that the distance traveled lies between the upper and lower estimates calculated above. Inother words, all the black-box data tells us for sure is that the car traveled between 330 and 530 feet before stopping.So we can’t be completely sure about whether it hit the skunk or not.
16. (a) Note that 15 minutes equals 0.25 hours. Lower estimate = 11(0.25) + 10(0.25) = 5.25 miles. Upper estimate= 12(0.25) + 11(0.25) = 5.75 miles.
(b) Lower estimate = 11(0.25) + 10(0.25) + 10(0.25) + 8(0.25) + 7(0.25) + 0(0.25) = 11.5 miles. Upper estimate= 12(0.25) + 11(0.25) + 10(0.25) + 10(0.25) + 8(0.25) + 7(0.25) = 14.5 miles.
(c) The difference between Roger’s pace at the beginning and the end of his run is 12 mph. If the time between themeasurements is h, then the difference between the upper and lower estimates is 12h. We want 12h < 0.1, so
h <0.1
12≈ 0.0083 hours = 30 seconds
Thus Jeff would have to measure Roger’s pace every 30 seconds.

318 Chapter Five /SOLUTIONS
17. The velocity is constant and negative, so the change in position is −3 · 5 cm, that is 15 cm to the left.
18. From t = 0 to t = 3 the velocity is constant and positive, so the change in position is 2 · 3 cm, that is 6 cm to the right.From t = 3 to t = 5, the velocity is negative and constant, so the change in position is −3 · 2 cm, that is 6 cm to the left.Thus the total change in position is 0. The particle moves 6 cm to the right, followed by 6 cm to the left, and returns towhere it started.
19. From t = 0 to t = 5 the velocity is positive so the change in position is to the right. The area under the velocity graphgives the distance traveled. The region is a triangle, and so has area (1/2)bh = (1/2)5 · 10 = 25. Thus the change inposition is 25 cm to the right.
20. From t = 0 to t = 4 the velocity is positive so the change in position is to the right. The area under the velocity graphgives the distance traveled. The region is a triangle, and so has area (1/2)bh = (1/2)4 · 8 = 16. Thus the change inposition is 16 cm to the right for t = 0 to t = 4. From t = 4 to t = 5, the velocity is negative so the change in position isto the left. The distance traveled to the left is given by the area of the triangle, (1/2)bh = (1/2)1 · 2 = 1. Thus the totalchange in position is 16− 1 = 15 cm to the right.
21. The change in position is calculated from the area between the velocity graph and the t-axis, with the region below theaxis corresponding to negatives velocities and counting negatively.
Figure 5.2 shows the graph of f(t). From t = 0 to t = 3 the velocity is positive. The region under the graph of f(t)is a triangle with height 6 cm/sec and base 3 seconds. Thus, from t = 0 to t = 3, the particle moves
Distance moved to right =1
2· 3 · 6 = 9 centimeters.
From t = 3 to t = 4, the velocity is negative. The region between the graph of f(t) and the t-axis is a triangle with height2 cm/sec and base 1 second, so in this interval the particle moves
Distance moved to left =1
2· 1 · 2 = 1 centimeter.
Thus, the total change in position is 9− 1 = 8 centimeters to the right.
3
4
−2
6
Motion to right: 9 cm
�
Motion to left: 1 cm
f(t)
t
y
Figure 5.2
22. (a) See Figure 5.3.(b) The peak of the flight is when the velocity is 0, namely t = 3. The height at t = 3 is given by the area under the
graph of the velocity from t = 0 to t = 3; see Figure 5.3. The region is a triangle of base 3 seconds and altitude 96ft/sec, so the height is (1/2)3 · 96 = 144 feet.
(c) The velocity is negative from t = 3 to t = 5, so the motion is downward then. The distance traveled downward canbe calculated by the area of the triangular region which has base of 2 seconds and altitude of −64 ft/sec. Thus, thebaseball travels (1/2)2 · 64 = 64 feet downward from its peak height of 144 feet at t = 3. Thus, the height at timet = 5 is the total change in position, 144− 64 = 80 feet.
3 6
−96
96
v(t)
t
Figure 5.3

5.1 SOLUTIONS 319
23. (a) See Figure 5.4.(b) The distance traveled is the area under the graph of the velocity in Figure 5.4. The region is a triangle of base 5
seconds and altitude 50 ft/sec, so the distance traveled is (1/2)5 · 50 = 125 feet.(c) The slope of the graph of the velocity function is the same, so the triangular region under it has twice the altitude and
twice the base (it takes twice as long to stop). See Figure 5.5. Thus, the area is 4 times as large and the car travels 4times as far.
5
50
v(t)
t
Figure 5.4
5 10
50
100
v(t)
t
Figure 5.5
24. The graph of her velocity against time is a straight line from 0 mph to 60 mph; see Figure 5.6. Since the distance traveledis the area under the curve, we have
Shaded area =1
2· t · 60 = 10 miles
Solving for t gives
t =1
3hr = 20 minutes .
60
velocity (mph)
time (hr)
Area = 10�
t
Figure 5.6
25. (a) Car A has the largest maximum velocity because the peak of car A’s velocity curve is higher than the peak of B’s.(b) Car A stops first because the curve representing its velocity hits zero (on the t-axis) first.(c) Car B travels farther because the area under car B’s velocity curve is the larger.
26. (a) Since car B starts at t = 2, the tick marks on the horizontal axis (which we assume are equally spaced) are 2 hoursapart. Thus car B stops at t = 6 and travels for 4 hours.Car A starts at t = 0 and stops at t = 8, so it travels for 8 hours.
(b) Car A’s maximum velocity is approximately twice that of car B, that is 100 km/hr.(c) The distance traveled is given by the area of under the velocity graph. Using the formula for the area of a triangle, the
distances are given approximately by
Car A travels =1
2· Base · Height =
1
2· 8 · 100 = 400 km
Car B travels =1
2· Base · Height =
1
2· 4 · 50 = 100 km.

320 Chapter Five /SOLUTIONS
Solutions for Section 5.2
Exercises
1.
2 4 6 8
8
16
24
32
t
f(t)
Figure 5.7: Left Sum, ∆t = 4
2 4 6 8
8
16
24
32
t
f(t)
Figure 5.8: Right Sum, ∆t = 4
(a) Left-hand sum = 32 · 4 + 24 · 4 = 224.(b) Right-hand sum = 24 · 4 + 0 · 4 = 96.
2 4 6 8
8
16
24
32
t
f(t)
Figure 5.9: Left Sum, ∆t = 2
2 4 6 8
8
16
24
32
t
f(t)
Figure 5.10: Right Sum, ∆t = 2
(c) Left-hand sum = 32 · 2 + 30 · 2 + 24 · 2 + 14 · 2 = 200.(d) Right-hand sum = 30 · 2 + 24 · 2 + 14 · 2 + 0 · 2 = 136.
2.∫ 3
0
f(x) dx is equal to the area shaded. We estimate the area by counting shaded rectangles. There are 3 fully shaded
and about 4 partially shaded rectangles, for a total of approximately 5 shaded rectangles. Since each rectangle represents4 square units, our estimated area is 5(4) = 20. We have
∫ 3
0
f(x) dx ≈ 20.
1 2 3
4
8
12
16
x
f(x)
Figure 5.11
5.2 SOLUTIONS 321
3. We know that ∫ 15
−10
f(x)dx = Area under f(x) between x = −10 and x = 15.
The area under the curve consists of approximately 14 boxes, and each box has area (5)(5) = 25. Thus, the area underthe curve is about (14)(25) = 350, so ∫ 15
−10
f(x)dx ≈ 350.
4. With ∆x = 5, we have
Left-hand sum = 5(0 + 100 + 200 + 100 + 200 + 250 + 275) = 5625,
Right-hand sum = 5(100 + 200 + 100 + 200 + 250 + 275 + 300) = 7125.
The average of these two sums is our best guess for the value of the integral;∫ 20
−15
f(x) dx ≈ 5625 + 7125
2= 6375.
5. The graph given shows that f is positive for 0 ≤ t ≤ 1. Since the graph is contained within a rectangle of height 100 andlength 1, the answers −98.35 and 100.12 are both either too small or too large to represent
∫ 1
0f(t)dt. Since the graph of
f is above the horizontal line y = 80 for 0 ≤ t ≤ 0.95, the best estimate is 93.47 and not 71.84.
6. We estimate∫ 40
0f(x)dx using left- and right-hand sums:
Left sum = 350 · 10 + 410 · 10 + 435 · 10 + 450 · 10 = 16,450.
Right sum = 410 · 10 + 435 · 10 + 450 · 10 + 460 · 10 = 17,550.
We estimate that ∫ 40
0
f(x)dx ≈ 16450 + 17550
2= 17,000.
In this estimate, we used n = 4 and ∆x = 10.
7. We take ∆x = 3. Then:
Left-hand sum = 50(3) + 48(3) + 44(3) + 36(3) + 24(3)
= 606
Right-hand sum = 48(3) + 44(3) + 36(3) + 24(3) + 8(3)
= 480
Average =606 + 480
2= 543.
So, ∫ 15
0
f(x) dx ≈ 543.
8. With ∆x = 3, we haveLeft-hand sum = 3(32 + 22 + 15 + 11) = 240,
Right-hand sum = 3(22 + 15 + 11 + 9) = 171.
The average of these two sums is our best guess for the value of the integral;∫ 12
0
f(x) dx ≈ 240 + 171
2= 205.5.
9. We use a calculator or computer to see that∫ 3
0
2xdx = 10.0989.
10. We use a calculator or computer to see that∫ 1
0
sin(t2)dt = 0.3103.
322 Chapter Five /SOLUTIONS
11. We use a calculator or computer to see that∫ 1
−1
e−x2
dx = 1.4936.
12. Since cos t ≥ 0 for 0 ≤ t ≤ π/2, the area is given by
Area =
∫ π/2
0
cos t dt = 1.
The integral was evaluated on a calculator.
13. A graph of y = 6x3 − 2 shows that this function is nonnegative on the interval x = 5 to x = 10. Thus,
Area =
∫ 10
5
(6x3 − 2) dx = 14,052.5.
The integral was evaluated on a calculator.
14. A graph of y = lnx shows that this function is non-negative on the interval x = 1 to x = 4. Thus,
Area =
∫ 4
1
lnx dx = 2.545.
The integral was evaluated on a calculator.
15. Since cos√x > 0 for 0 ≤ x ≤ 2, the area is given by
Area =
∫ 2
0
cos√x dx = 1.106.
The integral was evaluated on a calculator.
16. A graph of y = 2 cos t/10 shows that this function is nonnegative on the interval t = 5 to 2 = 10. Thus,
Area =
∫ 2
1
2 cost
10dt = 1.977.
The integral was evaluated on a calculator.
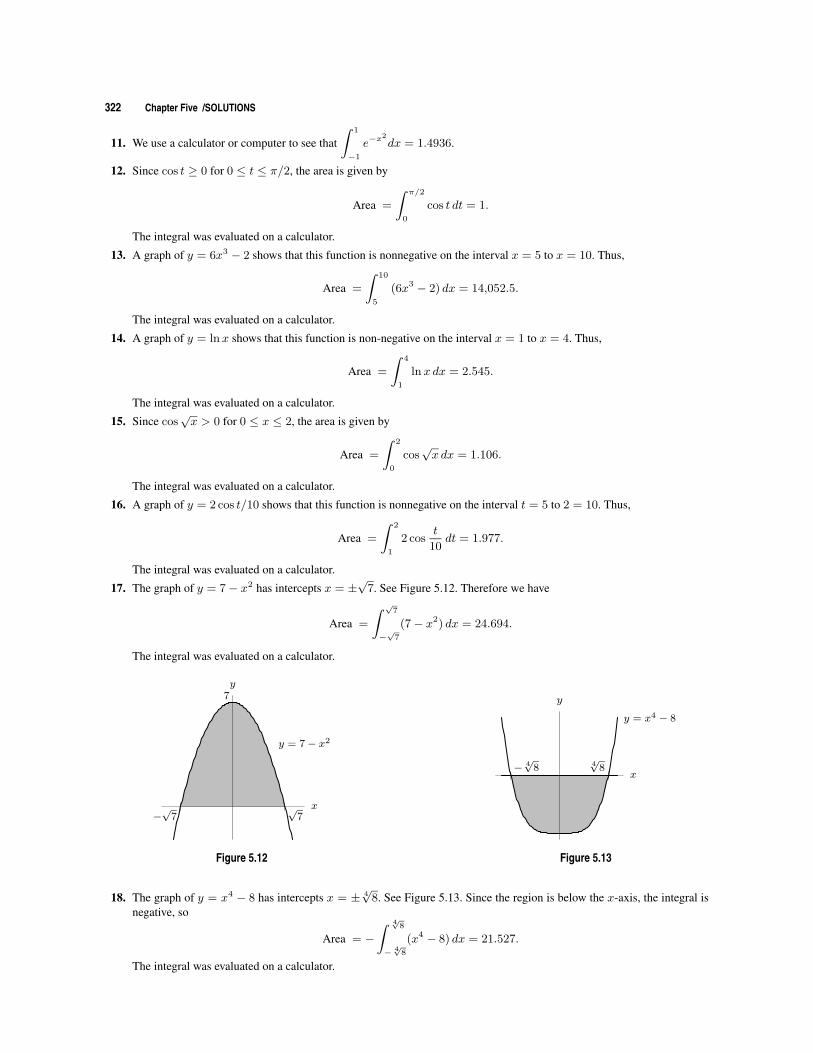
17. The graph of y = 7− x2 has intercepts x = ±√
7. See Figure 5.12. Therefore we have
Area =
∫ √7
−√
7
(7− x2) dx = 24.694.
The integral was evaluated on a calculator.
−√
7√
7
7
x
y
y = 7− x2
Figure 5.12
− 4√
8 4√
8
y = x4 − 8
x
y
Figure 5.13
18. The graph of y = x4 − 8 has intercepts x = ± 4√
8. See Figure 5.13. Since the region is below the x-axis, the integral isnegative, so
Area = −∫ 4√8
− 4√8
(x4 − 8) dx = 21.527.
The integral was evaluated on a calculator.

5.2 SOLUTIONS 323
Problems
19. (a) See Figure 5.14.
Left sum = f(1)∆x+ f(1.5)∆x = (ln1)0.5 + ln(1.5)0.5 = (ln1.5)0.5.
(b) See Figure 5.15.Right sum = f(1.5)∆x+ f(2)∆x = (ln1.5)0.5 + (ln2)0.5.
(c) Right sum is an overestimate, left sum is an underestimate.
1.5 21x
lnx
Figure 5.14: Left sum
1.5 21x
lnx
Figure 5.15: Right sum
20. (a)∫ 6
0
(x2 + 1) dx = 78
3 6
20
40
x
y
y = x2 + 1
(b) Using n = 3, we have
Left-hand sum = f(0) · 2 + f(2) · 2 + f(4) · 2 = 1 · 2 + 5 · 2 + 17 · 2 = 46.
This sum is an underestimate. See Figure 5.16.
3 6
20
40
x
y
y = x2 + 1
Figure 5.16
3 6
20
40
x
y
y = x2 + 1
Figure 5.17
(c)
Right-hand sum = f(2) · 2 + f(4) · 2 + f(6) · 2 = 5 · 2 + 17 · 2 + 37 · 2 = 118.
This sum is an overestimate. See Figure 5.17.

324 Chapter Five /SOLUTIONS
21. Left-hand sum gives: 12(1/4) + (1.25)2(1/4) + (1.5)2(1/4) + (1.75)2(1/4) = 1.96875.Right-hand sum gives: (1.25)2(1/4) + (1.5)2(1/4) + (1.75)2(1/4) + (2)2(1/4) = 2.71875.
We estimate the value of the integral by taking the average of these two sums, which is 2.34375. Since x2 is mono-tonic on 1 ≤ x ≤ 2, the true value of the integral lies between 1.96875 and 2.71875. Thus the most our estimate couldbe off is 0.375. We expect it to be much closer. (And it is—the true value of the integral is 7/3 ≈ 2.333.)
22. We have ∆x = 2/500 = 1/250. The formulas for the left- and right-hand Riemann sums give us that
Left = ∆x[f(−1) + f(−1 + ∆x) + ...+ f(1− 2∆x) + f(1−∆x)]
Right = ∆x[f(−1 + ∆x) + f(−1 + 2∆x) + ...+ f(1−∆x) + f(1)].
Subtracting these yields
Right− Left = ∆x[f(1)− f(−1)] =1
250[6− 2] =
4
250=
2
125.
23. (a)
−2 1
2
x
yy = f(x)
A1
A2
(b) A1 =
∫ 0
−2
f(x) dx = 2.667.
A2 = −∫ 1
0
f(x) dx = 0.417.
So total area = A1 +A2 ≈ 3.084. Note that while A1 and A2 are accurate to 3 decimal places, the quoted value forA1 +A2 is accurate only to 2 decimal places.
(c)∫ 1
−2
f(x) dx = A1 −A2 = 2.250.
24.∫ 4
0
cos√x dx = 0.80 = Area A1 – Area A2. See Figure 5.18.
(π2
)2
4x
cos√x
A1
A2
?
1
−1
Figure 5.18
π 2πx
A1
A2
?
e−x sinx
Figure 5.19
25. Looking at the graph of e−x sinx for 0 ≤ x ≤ 2π in Figure 5.19, we see that the area,A1, below the curve for 0 ≤ x ≤ πis much greater than the area, A2, above the curve for π ≤ x ≤ 2π. Thus, the integral is
∫ 2π
0
e−x sinx dx = A1 −A2 > 0.

5.2 SOLUTIONS 325
26. (a) See Figure 5.20.(b) Since each of the triangular regions in Figure 5.20 have area 1/2, we have
∫ 2
0
f(x) dx =1
2+
1
2= 1.
(c) Using ∆x = 1/2 in the 4-term Riemann sum shown in Figure 5.21, we have
Left hand sum = f(0)∆x+ f(0.5)∆x+ f(1)∆x+ f(1.5)∆x
= 1(
1
2
)+
1
2
(1
2
)+ 0(
1
2
)+
1
2
(1
2
)= 1.
We notice that in this case the approximation is exactly equal to the exact value of the integral.
1 2
1f(x)
x
Figure 5.20
12
1 32
2
1f(x)
x
Figure 5.21
27. (a) The area between the graph of f and the x-axis between x = a and x = b is 13, so∫ b
a
f(x) dx = 13.
(b) Since the graph of f(x) is below the x-axis for b < x < c,∫ c
b
f(x) dx = −2.
(c) Since the graph of f(x) is above the x-axis for a < x < b and below for b < x < c,∫ c
a
f(x) dx = 13− 2 = 11.
(d) The graph of |f(x)| is the same as the graph of f(x) except that the part below the x-axis is reflected to be above it.See Figure 5.22. Thus ∫ c
a
|f(x)| dx = 13 + 2 = 15.
a b c
|f(x)|
Area = 13
Area = 2
x
Figure 5.22
28. The region shaded between x = 0 and x = 2 appears to have approximately the same area as the region shaded betweenx = −2 and x = 0, but it lies below the axis. Since
∫ 0
−2f(x)dx = 4, we have the following results:
(a)∫ 2
0f(x)dx ≈ −
∫ 0
−2f(x)dx = −4.
(b)∫ 2
−2f(x)dx ≈ 4− 4 = 0.
(c) The total area shaded is approximately 4 + 4 = 8.

326 Chapter Five /SOLUTIONS
29. (a)∫ 0
−3
f(x) dx = −2.
(b)∫ 4
−3
f(x) dx =
∫ 0
−3
f(x) dx+
∫ 3
0
f(x) dx+
∫ 4
3
f(x) dx = −2 + 2− A
2= −A
2.
30. The statement is rarely true. The graph of almost any non-linear monotonic function, such as x10 for 0 < x < 1, shouldprovide convincing geometric evidence. Furthermore, if the statement were true, then (LHS+RHS)/2 would always givethe exact value of the definite integral. This is not true.
31. As illustrated in Figure 5.23, the left- and right-hand sums are both equal to (4π) · 3 = 12π, while the integral is smaller.Thus we have: ∫ 4π
0
(2 + cosx) dx < Left-hand sum = Right-hand sum.
2π 4π
1
2
3
x
y
Figure 5.23: Integral vs. Left- andRight-Hand Sums
a b
y
x
Figure 5.24: Integral vs. Left- andRight-Hand Sums
32. See Figure 5.24.
33. We have∆x =
4
3=b− an
and n = 3, so b− a = 4 or b = a+ 4.
The function, f(x), is squaring something. Since it is a left-hand sum, f(x) could equal x2 with a = 2 and b = 6 (notethat 2 + 3( 4
3) gives the right-hand endpoint of the last interval). Or, f(x) could possibly equal (x + 2)2 with a = 0 and
b = 4. Other answers are possible.
34. (a) If the interval 1 ≤ t ≤ 2 is divided into n equal subintervals of length ∆t = 1/n, the subintervals are given by
1 ≤ t ≤ 1 +1
n, 1 +
1
n≤ t ≤ 1 +
2
n, . . . , 1 +
n− 1
n≤ t ≤ 2.
The left-hand sum is given by
Left sum =
n−1∑
r=0
f(
1 +r
n
)1
n=
n−1∑
r=0
1
1 + r/n· 1
n=
n−1∑
r=0
1
n+ r
and the right-hand sum is given by
Right sum =
n∑
r=1
f(
1 +r
n
)1
n=
n∑
r=1
1
n+ r.
Since f(t) = 1/t is decreasing in the interval 1 ≤ t ≤ 2, we know that the right-hand sum is less than∫ 2
11/t dt and
the left-hand sum is larger than this integral. Thus we haven∑
r=1
1
n+ r<
∫ t
1
1
tdt <
n−1∑
r=0
1
n+ r.
(b) Subtracting the sums givesn−1∑
r=0
1
n+ r−
n∑
r=1
1
n+ r=
1
n− 1
2n=
1
2n.
(c) Here we need to find n such that1
2n≤ 5× 10⁻⁶, so n ≥ 1
10× 106 = 105.

5.3 SOLUTIONS 327
Solutions for Section 5.3
Exercises
1. The units of measurement are dollars.
2. The units of measurement are meters per second (which are units of velocity).
3. The units of measurement are foot-pounds (which are units of work).
4. The integral∫ 3
1v(t) dt represents the change in position between time t = 1 and t = 3 seconds; it is measured in meters.
5. The integral∫ 6
0a(t) dt represents the change in velocity between times t = 0 and t = 6 seconds; it is measured in km/hr.
6. The integral∫ 2004
2000f(t) dt represents the change in the world’s population between the years 2000 and 2004. It is measured
in billions of people.
7. The integral∫ 5
0s(x) dx represents the change in salinity (salt concentration) in the first 5 cm of water; it is measured in
gm/liter.
8. (a) One small box on the graph corresponds to moving at 750 ft/min for 15 seconds, which corresponds to a distance of187.5 ft. Estimating the area beneath the velocity curves, we find:Distance traveled by car 1 ≈ 5.5 boxes = 1031.25 ft.Distance traveled by car 2 ≈ 3 boxes = 562.5 ft.
(b) The two cars will have gone the same distance when the areas beneath their velocity curves are equal. Since the twoareas overlap, they are equal when the two shaded regions have equal areas, at t ≈ 1.6 minutes. See Figure 5.25.
1.6t
v ft/min
Car 1
Car 2
Figure 5.25
9. Average value =1
2− 0
∫ 2
0
(1 + t) dt =1
2(4) = 2.
10. Average value =1
10− 0
∫ 10
0
et dt =1
10(22025) = 2202.5
11. Sketch the graph of f on 1 ≤ x ≤ 3. The integral is the area under the curve, which is a trapezoidal area. So the averagevalue is
1
3− 1
∫ 3
1
(4x+ 7) dx =1
2· 11 + 19
2· 2 =
30
2= 15.
12. Since the average value is given by
Average value =1
b− a
∫ b
a
f(x) dx,
the units for dx inside the integral are canceled by the units for 1/(b − a) outside the integral, leaving only the units forf(x). This is as it should be, since the average value of f should be measured in the same units as f(x).
13. For any t, consider the interval [t, t+ ∆t]. During this interval, oil is leaking out at an approximately constant rate of f(t)gallons/minute. Thus, the amount of oil which has leaked out during this interval can be expressed as
Amount of oil leaked = Rate× Time = f(t) ∆t
and the units of f(t) ∆t are gallons/minute × minutes = gallons. The total amount of oil leaked is obtained by addingall these amounts between t = 0 and t = 60. (An hour is 60 minutes.) The sum of all these infinitesimal amounts is theintegral
Total amount ofoil leaked, in gallons
=
∫ 60
0
f(t) dt.

328 Chapter Five /SOLUTIONS
14. (a) The amount leaked between t = 0 and t = 2 is∫ 2
0
R(t) dt.
(b)
1 2
1
2
R(t)
(0, 2)
(1, 1.6)
(2, 1)
t
(c) The rectangular boxes on the diagram each have area 116
. Of these 45 are wholly beneath the curve, hence the areaunder the curve is certainly more than 45
16> 2.81. There are 9 more partially beneath the curve, and so the desired
area is completely covered by 54 boxes. Therefore the area is less than 5416< 3.38.
These are very safe estimates but far apart. We can do much better by estimating what fractions of the brokenboxes are beneath the curve. Using this method, we can estimate the area to be about 3.2, which corresponds to 3.2gallons leaking over two hours.
Problems
15. (a) An overestimate is 7 tons. An underestimate is 5 tons.(b) An overestimate is 7 + 8 + 10 + 13 + 16 + 20 = 74 tons. An underestimate is 5 + 7 + 8 + 10 + 13 + 16 = 59 tons.(c) If measurements are made every ∆t months, then the error is |f(6)− f(0)| ·∆t. So for this to be less than 1 ton, we
need (20 − 5) · ∆t < 1, or ∆t < 1/15. So measurements every 2 days or so will guarantee an error in over- andunderestimates of less than 1 ton.
16. (a) Quantity used =∫ 5
0f(t) dt.
(b) Using a left sum, our approximation is
32e0.05(0) + 32e0.05(1) + 32e0.05(2) + 32e0.05(3) + 32e0.05(4) = 177.27.
Since f is an increasing function, this represents an underestimate.(c) Each term is a lower estimate of one year’s consumption of oil.
17. (a) The integral∫ 50
0f(t)dt represents the total emissions of nitrogen oxides, in millions of metric tons, during the period
1940 to 1990.(b) We estimate the integral using left- and right-hand sums:
Left sum = (6.9)(10) + (9.4)(10) + (13.0)(10) + (18.5)(10) + (20.9)(10) = 687.
Right sum = (9.4)(10) + (13.0)(10) + (18.5)(10) + (20.9)(10) + (19.6)(10) = 814.
We average the left- and right-hand sums to find the best estimate of the integral:∫ 50
0
f(t)dt ≈ 687 + 814
2= 750.5 million metric tons.
Between 1940 and 1990, about 750.5 million metric tons of nitrogen oxides were emitted.
18. The total number of “worker-hours” is equal to the area under the curve. The total area is about 14.5 boxes. Since eachbox represents (10 workers)(8 hours) = 80 worker-hours, the total area is 1160 worker-hours. At $10 per hour, the totalcost is $11,600.
19. The time period 9am to 5pm is represented by the time t = 0 to t = 8 and t = 24 to t = 32. The area under the curve,or total number of worker-hours for these times, is about 9 boxes or 9(80) = 720 worker-hours. The total cost for 9am to5pm is (720)(10) = $7200. The area under the rest of the curve is about 5.5 boxes, or 5.5(80) = 440 worker-hours. Thetotal cost for this time period is (440)(15) = $6600. The total cost is about 7200 + 6600 = $13,800.
20. The area under the curve represents the number of cubic feet of storage times the number of days the storage was used.This area is given by
Area under graph = Area of rectangle + Area of triangle
= 30 · 10,000 +1
2· 30(30,000− 10,000)
= 600,000.
5.3 SOLUTIONS 329
Since the warehouse charges $5 for every 10 cubic feet of storage used for a day, the company will have to pay(5)(60,000) = $300,000.
21. Since W is in tons per week and t is in weeks since January 1, 2000, the integral∫ 52
0Wdt gives the amount of waste, in
tons, produced during the year 2000.
Total waste during the year =
∫ 52
0
3.75e−0.008tdt = 159.5249 tons.
Since waste removal costs $15/ton, the cost of waste removal for the company is 159.5249 · 15 = $2392.87.
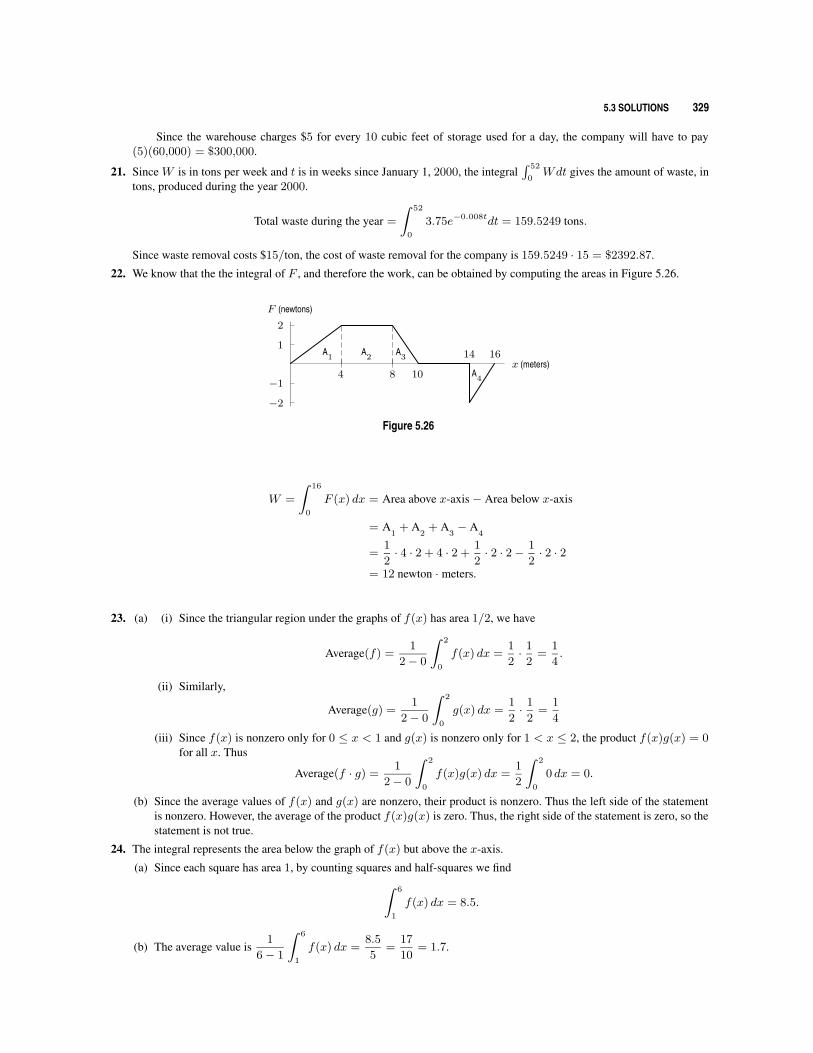
22. We know that the the integral of F , and therefore the work, can be obtained by computing the areas in Figure 5.26.
4 8 10
14 16
−2
−1
1
2
A1
A2
A3
A4
x (meters)
F (newtons)
Figure 5.26
W =
∫ 16
0
F (x) dx = Area above x-axis− Area below x-axis
= A1
+ A2
+ A3− A
4
=1
2· 4 · 2 + 4 · 2 +
1
2· 2 · 2− 1
2· 2 · 2
= 12 newton · meters.
23. (a) (i) Since the triangular region under the graphs of f(x) has area 1/2, we have
Average(f) =1
2− 0
∫ 2
0
f(x) dx =1
2· 1
2=
1
4.
(ii) Similarly,
Average(g) =1
2− 0
∫ 2
0
g(x) dx =1
2· 1
2=
1
4
(iii) Since f(x) is nonzero only for 0 ≤ x < 1 and g(x) is nonzero only for 1 < x ≤ 2, the product f(x)g(x) = 0for all x. Thus
Average(f · g) =1
2− 0
∫ 2
0
f(x)g(x) dx =1
2
∫ 2
0
0 dx = 0.
(b) Since the average values of f(x) and g(x) are nonzero, their product is nonzero. Thus the left side of the statementis nonzero. However, the average of the product f(x)g(x) is zero. Thus, the right side of the statement is zero, so thestatement is not true.
24. The integral represents the area below the graph of f(x) but above the x-axis.
(a) Since each square has area 1, by counting squares and half-squares we find∫ 6
1
f(x) dx = 8.5.
(b) The average value is1
6− 1
∫ 6
1
f(x) dx =8.5
5=
17
10= 1.7.

330 Chapter Five /SOLUTIONS
25. (a) The integral is the area above the x-axis minus the area below the x-axis. Thus, we can see that∫ 3
−3f(x) dx is about
−6 + 2 = −4 (the negative of the area from t = −3 to t = 1 plus the area from t = 1 to t = 3.)(b) Since the integral in part (a) is negative, the average value of f(x) between x = −3 and x = 3 is negative. From the
graph, however, it appears that the average value of f(x) from x = 0 to x = 3 is positive. Hence (ii) is the largerquantity.
26. (a) Average value of f = 15
∫ 5
0f(x) dx.
(b) Average value of |f | = 15
∫ 5
0|f(x)| dx = 1
5(∫ 2
0f(x) dx−
∫ 5
2f(x) dx).
27. We’ll show that in terms of the average value of f ,
I > II = IV > III
Using the definition of average value and the fact that f is even, we have
Average valueof f on II
=
∫ 2
0f(x)dx
2=
12
∫ 2
−2f(x)dx
2
=
∫ 2
−2f(x)dx
4
= Average value of f on IV.
Since f is decreasing on [0,5], the average value of f on the interval [0, c], where 0 ≤ c ≤ 5, is decreasing as afunction of c. The larger the interval the more low values of f are included. Hence
Average value of fon [0, 1]
>Average value of fon [0, 2]
>Average value of fon [0, 5]
28. (a) Since f(x) = sinx over [0, π] is between 0 and 1, the average of f(x) must itself be between 0 and 1. Furthermore,since the graph of f(x) is concave down on this interval, the average value must be greater than the average heightof the triangle shown in the figure, namely, 0.5.
π
1
x
y
y = sinx
(b) Average =1
π − 0
∫ π
0
sinx dx = 0.64.
29. (a) Average value =
∫ 1
0
√1− x2 dx = 0.79.
(b) The area between the graph of y = 1− x and the x-axis is 0.5. Because the graph of y =√
1− x2 is concave down,it lies above the line y = 1− x, so its average value is above 0.5. See figure below.
1
0.5
0.79
1
x
y =√
1− x2
6
?
Average value
Area = 0.5
5.3 SOLUTIONS 331
30. Since t = 0 in 1965 and t = 35 in 2000, we want:
Average Value =1
35− 0
∫ 35
0
225(1.15)tdt
=1
35(212,787) = $6080.
31. Change in income =∫ 12
0r(t) dt =
∫ 12
040(1.002)t dt = $485.80
32. (a) Since t = 0 to t = 31 covers January:
Average number ofdaylight hours in January
=1
31
∫ 31
0
[12 + 2.4 sin(0.0172(t− 80))] dt.
Using left and right sums with n = 100 gives
Average ≈ 306
31≈ 9.9 hours.
(b) Assuming it is not a leap year, the last day of May is t = 151(= 31 + 28 + 31 + 30 + 31) and the last day of Juneis t = 181(= 151 + 30). Again finding the integral numerically:
Average number ofdaylight hours in June
=1
30
∫ 181
151
[12 + 2.4 sin(0.0172(t− 80))] dt
≈ 431
30≈ 14.4 hours.
(c)
Average for whole year =1
365
∫ 365
0
[12 + 2.4 sin(0.0172(t− 80))] dt
≈ 4381
365≈ 12.0 hours.
(d) The average over the whole year should be 12 hours, as computed in (c). Since Madrid is in the northern hemisphere,the average for a winter month, such as January, should be less than 12 hours (it is 9.9 hours) and the average for asummer month, such as June, should be more than 12 hours (it is 14.4 hours).
33. (a) Over the interval [−1, 3], we estimate that the total change of the population is about 1.5, by counting boxes betweenthe curve and the x-axis; we count about 1.5 boxes below the x-axis from x = −1 to x = 1 and about 3 above fromx = 1 to x = 3. So the average rate of change is just the total change divided by the length of the interval, that is1.5/4 = 0.375 thousand/hour.
(b) We can estimate the total change of the algae population by counting boxes between the curve and the x-axis. Here,there is about 1 box above the x-axis from x = −3 to x = −2, about 0.75 of a box below the x-axis from x = −2to x = −1, and a total change of about 1.5 boxes thereafter (as discussed in part (a)). So the total change is about1− 0.75 + 1.5 = 1.75 thousands of algae.
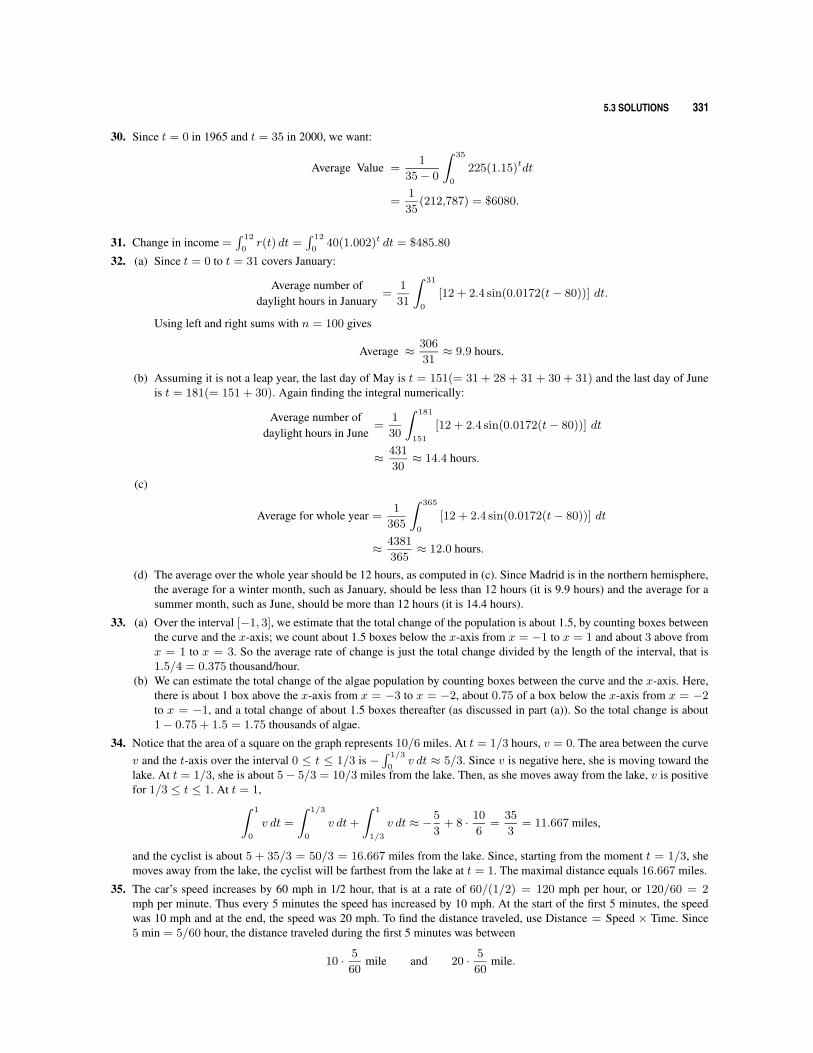
34. Notice that the area of a square on the graph represents 10/6 miles. At t = 1/3 hours, v = 0. The area between the curvev and the t-axis over the interval 0 ≤ t ≤ 1/3 is −
∫ 1/3
0v dt ≈ 5/3. Since v is negative here, she is moving toward the
lake. At t = 1/3, she is about 5− 5/3 = 10/3 miles from the lake. Then, as she moves away from the lake, v is positivefor 1/3 ≤ t ≤ 1. At t = 1,
∫ 1
0
v dt =
∫ 1/3
0
v dt+
∫ 1
1/3
v dt ≈ −5
3+ 8 · 10
6=
35
3= 11.667 miles,
and the cyclist is about 5 + 35/3 = 50/3 = 16.667 miles from the lake. Since, starting from the moment t = 1/3, shemoves away from the lake, the cyclist will be farthest from the lake at t = 1. The maximal distance equals 16.667 miles.
35. The car’s speed increases by 60 mph in 1/2 hour, that is at a rate of 60/(1/2) = 120 mph per hour, or 120/60 = 2mph per minute. Thus every 5 minutes the speed has increased by 10 mph. At the start of the first 5 minutes, the speedwas 10 mph and at the end, the speed was 20 mph. To find the distance traveled, use Distance = Speed × Time. Since5 min = 5/60 hour, the distance traveled during the first 5 minutes was between
10 · 5
60mile and 20 · 5
60mile.

332 Chapter Five /SOLUTIONS
Since the speed was between 10 and 20 mph during this five minute period, the fuel efficiency during this period isbetween 15 mpg and 18 mpg. So the fuel used during this period is between
1
18· 10 · 5
60gallons and
1
15· 20 · 5
60gallons.
Thus, an underestimate of the fuel used is
Fuel =(
1
18· 10 +
1
21· 20 +
1
23· 30 +
1
24· 40 +
1
25· 50 +
1
26· 60)
5
60= 0.732 gallons.
An overestimate of the fuel used is
Fuel =(
1
15· 20 +
1
18· 30 +
1
21· 40 +
1
23· 50 +
1
24· 60 +
1
25· 70)
5
60= 1.032 gallons.
36. (a) The black curve is for boys, the colored one for girls. The area under each curve represents the change in growth incentimeters. Since men are generally taller than women, the curve with the larger area under it is the height velocityof the boys.
(b) Each square below the height velocity curve has area 1 cm/yr · 1 yr = 1 cm. Counting squares lying below the blackcurve gives about 43 cm. Thus, on average, boys grow about 43 cm between ages 3 and 10.
(c) Counting squares lying below the black curve gives about 23 cm growth for boys during their growth spurt. Countingsquares lying below the colored curve gives about 18 cm for girls during their growth spurt.
(d) We can measure the difference in growth by counting squares that lie between the two curves. Between ages 2 and12.5, the average girl grows faster than the average boy. Counting squares yields about 5 cm between the colored andblack curves for 2 ≤ x ≤ 12.5. Counting squares between the curves for 12.5 ≤ x ≤ 18 gives about 18 squares.Thus, there is a net increase of boys over girls by about 18− 5 = 13 cm.
37. On the interval a ≤ t ≤ b, we haveAverage value
of v(t)=
1
b− a
∫ b
a
v(t) dt.
Since v(t) = s′(t), by the Fundamental Theorem of Calculus, we get:
1
b− a
∫ b
a
v(t) dt =1
b− a (s(b)− s(a)) = Average velocity.
Solutions for Section 5.4
Exercises
1. (a) A graph of f ′(x) = sin(x2) is shown in Figure 5.27. Since the derivative f ′(x) is positive between x = 0 andx = 1, the change in f(x) is positive, so f(1) is larger than f(0). Between x = 2 and x = 2.5, we see that f ′(x) isnegative, so the change in f(x) is negative; thus, f(2) is greater than f(2.5).
1 2 3
−1
1
x
Figure 5.27: Graph of f ′(x) = sin(x2)

5.4 SOLUTIONS 333
(b) The change in f(x) between x = 0 and x = 1 is given by the Fundamental Theorem of Calculus:
f(1)− f(0) =
∫ 1
0
sin(x2)dx = 0.310.
Since f(0) = 2, we havef(1) = 2 + 0.310 = 2.310.
Similarly, since
f(2)− f(0) =
∫ 2
0
sin(x2)dx = 0.805,
we havef(2) = 2 + 0.805 = 2.805.
Since
f(3)− f(0) =
∫ 3
0
sin(x2)dx = 0.774,
we havef(3) = 2 + 0.774 = 2.774.
The results are shown in the table.
x 0 1 2 3
f(x) 2 2.310 2.805 2.774
2. We find the changes in f(x) between any two values of x by counting the area between the curve of f ′(x) and the x-axis.Since f ′(x) is linear throughout, this is quite easy to do. From x = 0 to x = 1, we see that f ′(x) outlines a triangle ofarea 1/2 below the x-axis (the base is 1 and the height is 1). By the Fundamental Theorem,
∫ 1
0
f ′(x) dx = f(1)− f(0),
so
f(0) +
∫ 1
0
f ′(x) dx = f(1)
f(1) = 2− 1
2=
3
2
Similarly, between x = 1 and x = 3 we can see that f ′(x) outlines a rectangle below the x-axis with area −1, sof(2) = 3/2 − 1 = 1/2. Continuing with this procedure (note that at x = 4, f ′(x) becomes positive), we get the tablebelow.
x 0 1 2 3 4 5 6
f(x) 2 3/2 1/2 −1/2 −1 −1/2 1/2
3. Since F (0) = 0, F (b) =∫ b
0f(t) dt. For each b we determine F (b) graphically as follows:
F (0) = 0F (1) = F (0) + Area of 1× 1 rectangle = 0 + 1 = 1F (2) = F (1) + Area of triangle ( 1
2· 1 · 1) = 1 + 0.5 = 1.5
F (3) = F (2) + Negative of area of triangle = 1.5− 0.5 = 1F (4) = F (3) + Negative of area of rectangle = 1− 1 = 0F (5) = F (4) + Negative of area of rectangle = 0− 1 = −1F (6) = F (5) + Negative of area of triangle = −1− 0.5 = −1.5The graph of F (t), for 0 ≤ t ≤ 6, is shown in Figure 5.28.
1 2 3 4 5 6
−1.5−1
11.5
t
F (t)
Figure 5.28

334 Chapter Five /SOLUTIONS
4. The graph of y = ex is above the line y = 1 for 0 ≤ x ≤ 2. See Figure 5.29. Therefore
Area =
∫ 2
0
(ex − 1) dx = 4.389.
The integral was evaluated on a calculator.
2
y = 1
y = ex
y
x
Figure 5.29
3 5
y = 5 ln(2x)
y = 3
x
y
Figure 5.30
5. The graph of y = 5 ln(2x) is above the line y = 3 for 3 ≤ x ≤ 5. See Figure 5.30. Therefore
Area =
∫ 5
3
(5 ln(2x)− 3) dx = 14.688.
The integral was evaluated on a calculator.
6. Since x3 ≤ x2 for 0 ≤ x ≤ 1, we have
Area =
∫ 1
0
(x2 − x3) dx = 0.083.
The integral was evaluated on a calculator.
7. Since x1/2 ≤ x1/3 for 0 ≤ x ≤ 1, we have
Area =
∫ 1
0
(x1/3 − x1/2) dx = 0.0833.
The integral was evaluated on a calculator.
8. The graph of y = sinx+ 2 is above the line y = 0.5 for 6 ≤ x ≤ 10. See Figure 5.31. Therefore
Area =
∫ 10
6
sinx+ 2− 0.5 dx = 7.799.
The integral was evaluated on a calculator.
6 10
y = sinx+ 2
y = 0.5
x
y
Figure 5.31
π/4 π
y = cosx
y = sinxx
y
Figure 5.32

5.4 SOLUTIONS 335
9. The graph of y = cos t is above the graph of y = sin t for 0 ≤ t ≤ π/4 and y = cos t is below y = sin t forπ/4 < t < π. See Figure 5.32. Therefore, we find the area in two pieces:
Area =
∫ π/4
0
(cos t− sin t) dt+
∫ π
π/4
(sin t− cos t) dt = 2.828.
The integral was evaluated on a calculator.
10. We have f(t) = F ′(t) = 2t, so by the Fundamental Theorem of Calculus,∫ 3
1
2t dt = F (3)− F (1) = 9− 1 = 8.
11. We have f(t) = F ′(t) = 1/t, so by the Fundamental Theorem of Calculus,∫ 5
1
1
tdt = F (5)− F (1) = ln 5− ln 1 = ln 5.
12. We have f(t) = F ′(t) = cos t, so by the Fundamental Theorem of Calculus,
∫ π/2
0
cos t dt = F (π/2)− F (0) = 1− 0 = 1.
13. We have f(t) = F ′(t) = 4t3, so by the Fundamental Theorem of Calculus,∫ 1
−1
4t3 dt = F (1)− F (−1) = 1− 1 = 0.
Notice in this case the integral is 0 because the function being integrated, f(t) = 4t3, is odd: the negative contribution tothe integral from a = −1 to b = 1 exactly cancels the positive.
Problems
14. Note that∫ bag(x) dx =
∫ bag(t) dt. Thus, we have
∫ b
a
(f(x) + g(x)) dx =
∫ b
a
f(x) dx+
∫ b
a
g(x) dx = 8 + 2 = 10.
15. Note that∫ baf(z) dz =
∫ baf(x) dx. Thus, we have
∫ b
a
cf(z) dz = c
∫ b
a
f(z) dz = 8c.
16. Note that∫ ba
(g(x))2 dx =∫ ba
(g(t))2 dt. Thus, we have
∫ b
a
((f(x))2 − (g(x))2
)dx =
∫ b
a
(f(x))2 dx−∫ b
a
(g(x))2 dx = 12− 3 = 9.
17. We have ∫ b
a
(f(x))2 dx−(∫ b
a
f(x) dx
)2
= 12− 82 = −52.
336 Chapter Five /SOLUTIONS
18. We write∫ b
a
(c1g(x) + (c2f(x))2
)dx =
∫ b
a
(c1g(x) + c22(f(x))2
)dx
=
∫ b
a
c1g(x) dx+
∫ b
a
c22(f(x))2 dx
= c1
∫ b
a
g(x) dx+ c22
∫ b
a
(f(x))2 dx
= c1(2) + c22(12) = 2c1 + 12c22.
19. The graph of y = f(x − 5) is the graph of y = f(x) shifted to the right by 5. Since the limits of integration have alsoshifted by 5 (to a+ 5 and b+ 5), the areas corresponding to
∫ b+5
a+5f(x− 5) dx and
∫ baf(x) dx are the same. Thus,
∫ b+5
a+5
f(x− 5) dx =
∫ b
a
f(x) dx = 8.
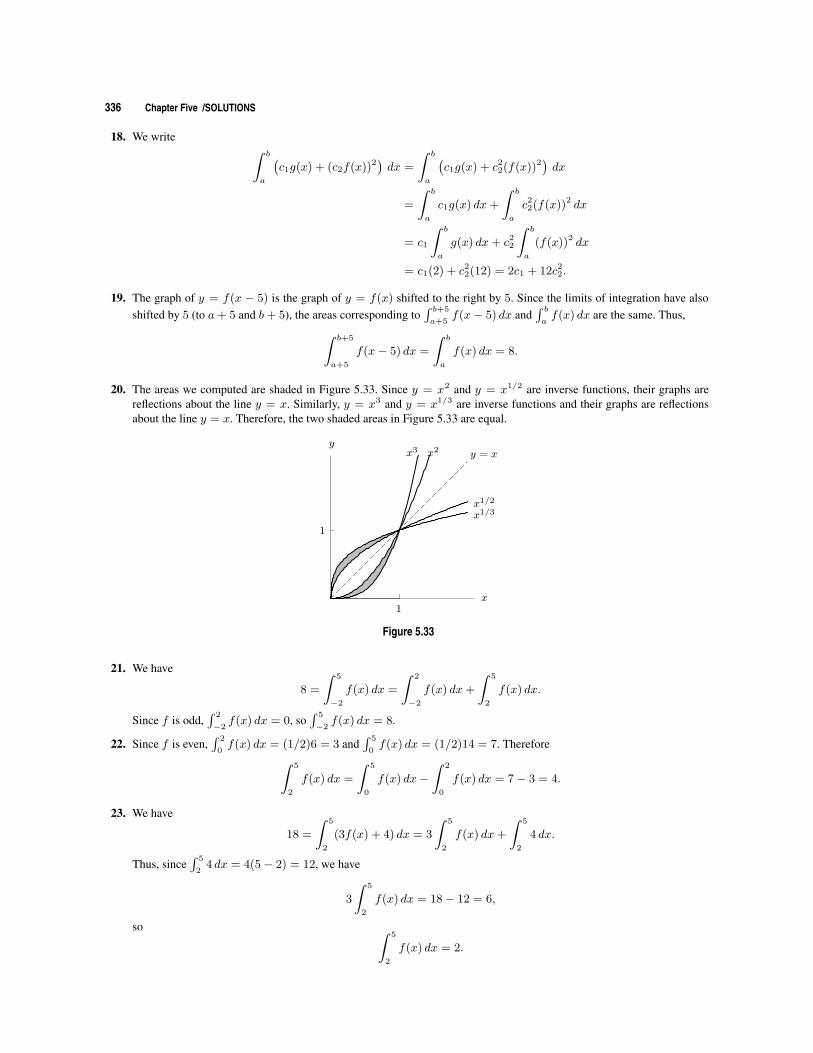
20. The areas we computed are shaded in Figure 5.33. Since y = x2 and y = x1/2 are inverse functions, their graphs arereflections about the line y = x. Similarly, y = x3 and y = x1/3 are inverse functions and their graphs are reflectionsabout the line y = x. Therefore, the two shaded areas in Figure 5.33 are equal.
1
1
x2x3
x1/2
x1/3
y = x
x
y
Figure 5.33
21. We have
8 =
∫ 5
−2
f(x) dx =
∫ 2
−2
f(x) dx+
∫ 5
2
f(x) dx.
Since f is odd,∫ 2
−2f(x) dx = 0, so
∫ 5
−2f(x) dx = 8.
22. Since f is even,∫ 2
0f(x) dx = (1/2)6 = 3 and
∫ 5
0f(x) dx = (1/2)14 = 7. Therefore
∫ 5
2
f(x) dx =
∫ 5
0
f(x) dx−∫ 2
0
f(x) dx = 7− 3 = 4.
23. We have
18 =
∫ 5
2
(3f(x) + 4) dx = 3
∫ 5
2
f(x) dx+
∫ 5
2
4 dx.
Thus, since∫ 5
24 dx = 4(5− 2) = 12, we have
3
∫ 5
2
f(x) dx = 18− 12 = 6,
so ∫ 5
2
f(x) dx = 2.

5.4 SOLUTIONS 337
24. We have∫ 4
2f(x) dx = 8/2 = 4 and
∫ 5
4f(x) dx = −
∫ 4
5f(x) dx = −1. Thus
∫ 5
2
f(x) dx =
∫ 4
2
f(x) dx+
∫ 5
4
f(x) dx = 4− 1 = 3.
25. (a) See Figure 5.34. Since the shaded region lies within a rectangle of area 1, the area is less than 1.(b) Since the area is given by the integral
Area =
∫ 1
0
e−x2/2 dx = 0.856.
0 1
1
x
y
y = e−x2/2
Figure 5.34
26. (a) 0, since the integrand is an odd function and the limits are symmetric around 0.(b) 0, since the integrand is an odd function and the limits are symmetric around 0.
27. (a)∫ 1
−1
ex2
dx > 0, since ex2
> 0, and∫ 1
−1
ex2
dx represents the area below the curve y = ex2
.
(b) Looking at Figure 5.35, we see that∫ 1
0ex
2
dx represents the area under the curve. This area is clearly greater thanzero, but it is less than e since it fits inside a rectangle of width 1 and height e (with room to spare). Thus
0 <
∫ 1
0
ex2
dx < e < 3.
1
1
ey = ex
2
x
y
Figure 5.35
2
1
3y = 3
y = 1
f(x) =√
1 + x3
x
y
Figure 5.36
28. Notice that f(x) =√
1 + x3 is increasing for 0 ≤ x ≤ 2, since x3 gets bigger as x increases. This means that f(0) ≤f(x) ≤ f(2). For this function, f(0) = 1 and f(2) = 3. Thus, the area under f(x) lies between the area under the liney = 1 and the area under the line y = 3 on the interval 0 ≤ x ≤ 2. See Figure 5.36. That is,
1(2− 0) ≤∫ 2
0
√1 + x3 dx ≤ 3(2− 0).
29. (a) The integrand is positive, so the integral cannot be negative.(b) The integrand ≥ 0. If the integral = 0, then the integrand must be identically 0, which is not true.

338 Chapter Five /SOLUTIONS
30. We know that we can divide the integral up as follows:∫ 3
0
f(x) dx =
∫ 1
0
f(x) dx+
∫ 3
1
f(x) dx.
The graph suggests that f is an even function for −1 ≤ x ≤ 1, so∫ 1
−1f(x) dx = 2
∫ 1
0f(x) dx. Substituting this in to
the preceding equation, we have∫ 3
0
f(x) dx =1
2
∫ 1
−1
f(x) dx+
∫ 3
1
f(x) dx.
31. (a) For 0 ≤ x ≤ 3, we have
Average value =1
3− 0
∫ 3
0
f(x)dx =1
3(6) = 2.
(b) If f(x) is even, the graph is symmetric about the x-axis. For example, see Figure 5.37. By symmetry, the area betweenx = −3 and x = 3 is twice the area between x = 0 and x = 3, so
∫ 3
−3
f(x)dx = 2(6) = 12.
Thus for −3 ≤ x ≤ 3, we have
Average value =1
3− (−3)
∫ 3
−3
f(x)dx =1
6(12) = 2.
The graph confirms that the average value between x = −3 and x = 3 is the same as the average value betweenx = 0 and x = 3, which is 2.
−3 −1 1 3x
Figure 5.37
−3 −1 1 3x
Figure 5.38
(c) If f(x) is odd, then the graph is symmetric about the origin. For example, see Figure 5.38. By symmetry, the areaabove the x-axis cancels out the area below the x-axis, so
∫ 3
−3
f(x)dx = 0.
Thus for −3 ≤ x ≤ 3, we have
Average value =1
3− (−3)
∫ 3
−3
f(x)dx =1
3(0) = 0.
The graph confirms that the average value between x = −3 and x = 3 is zero.
32. (a) Since the function is odd, the areas above and below the x-axis cancel. Thus,∫ 0
−3
xe−x2
dx = −∫ 3
0
xe−x2
dx,
so ∫ 3
−3
xe−x2
dx =
∫ 0
−3
xe−x2
dx+
∫ 3
0
xe−x2
dx = 0.

5.4 SOLUTIONS 339
(b) For 0 ≤ x ≤ 3 with n = 3, we have x0 = 0, x1 = 1, x2 = 2, x3 = 3, and ∆x = 1. See Figure 5.39. Thus,
Left sum = f(x0)∆x+ f(x1)∆x+ f(x2)∆x = 0e−02 · 1 + 1e−12 · 1 + 2e−22 · 1 = 0.4045.
(c) For −3 ≤ x ≤ 0, with n = 3, we have x0 = −3, x1 = −2, x2 = −1, x3 = 0, and ∆x = 1. See Figure 5.39. Thus,
Left sum = f(x0)∆x+ f(x1)∆x+ f(x2)∆x = −3e−(−3)2 · 1− 2e−(−2)2 · 1− 1e−(−1)2 · 1 = −0.4049.
(d) No. The rectangles between −3 and 0 are not the same size as those between 0 and 3. See Figure 5.39. There arethree rectangles with nonzero height on [−3, 0] and only two on [0, 3].
−3 −2 −1
1 2 3x
Figure 5.39
33. (a) Yes.(b) No, because the sum of the left sums has 20 subdivisions. The result is the left sum approximation with 20 subdivi-
sions to∫ 3
1f(x) dx.
34. By the Fundamental Theorem,
f(1)− f(0) =
∫ 1
0
f ′(x) dx,
Since f ′(x) is negative for 0 ≤ x ≤ 1, this integral must be negative and so f(1) < f(0).
35. First rewrite each of the quantities in terms of f ′, since we have the graph of f ′. IfA1 andA2 are the positive areas shownin Figure 5.40:
f(3)− f(2) =
∫ 3
2
f ′(t) dt = −A1
f(4)− f(3) =
∫ 4
3
f ′(t) dt = −A2
f(4)− f(2)
2=
1
2
∫ 4
2
f ′(t) dt = −A1 +A2
2
Since Area A1 > Area A2,
A2 <A1 +A2
2< A1
so−A1 < −A1 +A2
2< −A2
and therefore
f(3)− f(2) <f(4)− f(2)
2< f(4)− f(3).
1
2 3 4x
y = f ′(x)
y
A1 A2
Figure 5.40

340 Chapter Five /SOLUTIONS
36. See Figure 5.41.
a b
f(x)
6
?
f(b)− f(a)
x
Figure 5.41
a b
R
Slope= f(b)−f(a)b−a f(x)
6
?
f(b)− f(a)
x
Figure 5.42
37. See Figure 5.42.
38. See Figure 5.43.
a b
f(x)
x
Figure 5.43
a b
f(x)
6
?
F (b)−F (a)b−a
x
Figure 5.44
39. See Figure 5.44. Note that we are using the interpretation of the definite integral as the length of the interval times theaverage value of the function on that interval, which we developed in Section 5.3.
40. (a) Splitting the integral in order to make use of the values in the table gives:
1√2π
∫ 3
1
e−x2/2 dx =
1√2π
∫ 3
0
e−x2/2 dx− 1√
2π
∫ 1
0
e−x2/2 dx = 0.4987− 0.3413 = 0.1574.
(b) Using the symmetry of ex2/2, we have
1√2π
∫ 3
−2
e−x2/2 dx =
1√2π
∫ 0
−2
e−x2/2 dx+
1√2π
∫ 3
0
e−x2/2 dx
=1√2π
∫ 2
0
e−x2/2 dx+
1√2π
∫ 3
0
e−x2/2 dx
= 0.4772 + 0.4987 = 0.9759.
41. By the given property,∫ a
a
f(x) dx = −∫ a
a
f(x) dx, so 2
∫ a
a
f(x) dx = 0. Thus∫ a
a
f(x) dx = 0.
42. We know that the average value of v(x) = 4, so
1
6− 1
∫ 6
1
v(x) dx = 4, and thus∫ 6
1
v(x) dx = 20.
Similarly, we are told that1
8− 6
∫ 8
6
v(x) dx = 5, so∫ 8
6
v(x) dx = 10.
The average value for 1 ≤ x ≤ 8 is given by
Average value =1
8− 1
∫ 8
1
v(x) dx =1
7
(∫ 6
1
v(x) dx+
∫ 8
6
v(x) dx
)=
20 + 10
7=
30
7.
SOLUTIONS to Review Problems for Chapter Five 341
Solutions for Chapter 5 Review
Exercises
1. (a) Suppose f(t) is the flowrate in m3/hr at time t. We are only given two values of the flowrate, so in making ourestimates of the flow, we use one subinterval, with ∆t = 3/1 = 3:
Left estimate = 3[f(6 am)] = 3 · 100 = 300 m3 (an underestimate)
Right estimate = 3[f(9 am)] = 3 · 280 = 840 m3 (an overestimate).
The best estimate is the average of these two estimates,
Best estimate =Left + Right
2=
300 + 840
2= 570 m3.
(b) Since the flowrate is increasing throughout, the error, i.e., the difference between over- and under-estimates, is givenby
Error ≤ ∆t [f(9 am)− f(6 am)] = ∆t[280− 100] = 180∆t.
We wish to choose ∆t so that the the error 180∆t ≤ 6, or ∆t ≤ 6/180 = 1/30. So the flowrate gauge should beread every 1/30 of an hour, or every 2 minutes.
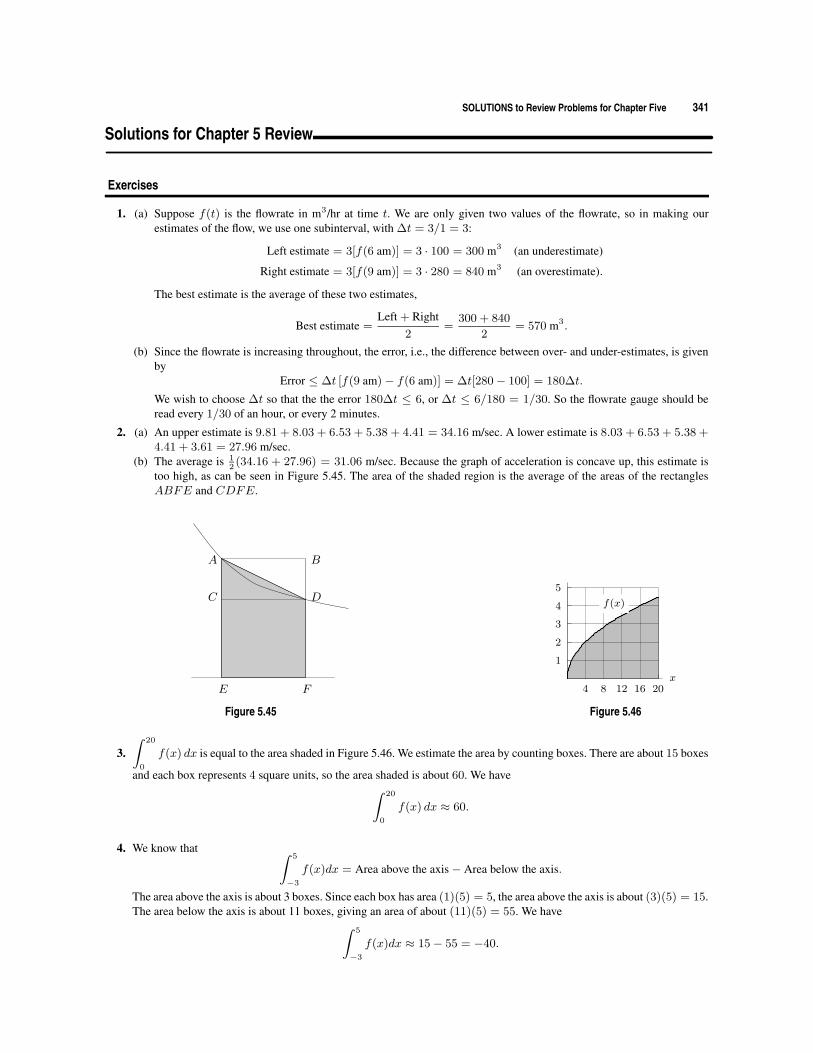
2. (a) An upper estimate is 9.81 + 8.03 + 6.53 + 5.38 + 4.41 = 34.16 m/sec. A lower estimate is 8.03 + 6.53 + 5.38 +4.41 + 3.61 = 27.96 m/sec.
(b) The average is 12(34.16 + 27.96) = 31.06 m/sec. Because the graph of acceleration is concave up, this estimate is
too high, as can be seen in Figure 5.45. The area of the shaded region is the average of the areas of the rectanglesABFE and CDFE.
C
A
D
B
E F
Figure 5.45
4 8 12 16 20
1
2
3
4
5
x
f(x)
Figure 5.46
3.∫ 20
0
f(x) dx is equal to the area shaded in Figure 5.46. We estimate the area by counting boxes. There are about 15 boxes
and each box represents 4 square units, so the area shaded is about 60. We have∫ 20
0
f(x) dx ≈ 60.
4. We know that ∫ 5
−3
f(x)dx = Area above the axis− Area below the axis.
The area above the axis is about 3 boxes. Since each box has area (1)(5) = 5, the area above the axis is about (3)(5) = 15.The area below the axis is about 11 boxes, giving an area of about (11)(5) = 55. We have
∫ 5
−3
f(x)dx ≈ 15− 55 = −40.
342 Chapter Five /SOLUTIONS
5. We take ∆t = 20. Then:
Left-hand sum = 1.2(20) + 2.8(20) + 4.0(20) + 4.7(20) + 5.1(20)
= 356.
Right-hand sum = 2.8(20) + 4.0(20) + 4.7(20) + 5.1(20) + 5.2(20)
= 436.∫ 100
0
f(t) dt ≈ Average =356 + 436
2= 396.
6. (a) The total area between f(x) and the x-axis is the sum of the two given areas, so
Area = 7 + 6 = 13.
(b) To find the integral, we note that from x = 3 to x = 5, the function lies below the x-axis, and hence makes a negativecontribution to the integral. So
∫ 5
0
f(x) dx =
∫ 3
0
f(x)dx+
∫ 5
3
f(x)dx = 7− 6 = 1.
7. The x intercepts of y = 4 − x2 are x = −2 andx = 2, and the graph is above the x-axis on theinterval [−2, 2].
Area =
∫ 2
−2
(4− x2) dx = 10.667.
The integral was evaluated on a calculator.
−2 2
4
x
y
y = 4− x2
8. The x intercepts of y = x2 − 9 are x = −3 andx = 3, and since the graph is below the x axis onthe interval [−3, 3].
Area = −∫ 3
−3
(x2 − 9) dx = 36.
The integral was evaluated on a calculator.
−3 3
−9
x
y
y = x2 − 9
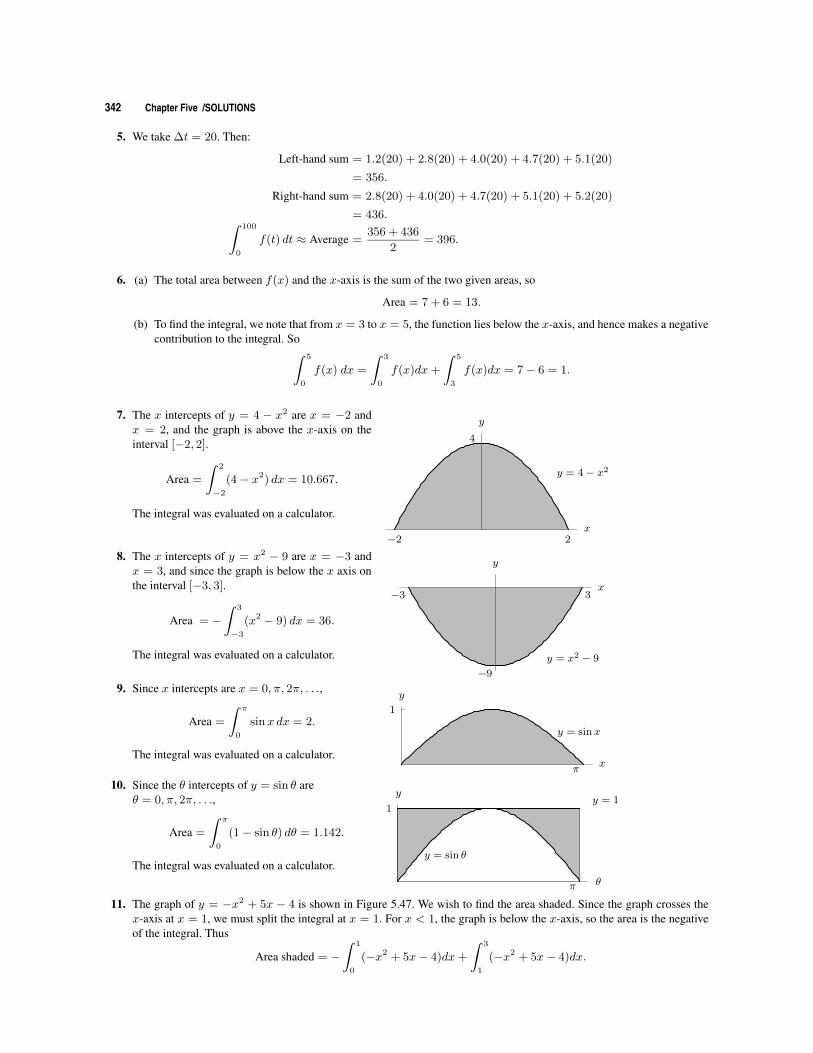
9. Since x intercepts are x = 0, π, 2π, . . .,
Area =
∫ π
0
sinx dx = 2.
The integral was evaluated on a calculator.π
1
x
y
y = sinx
10. Since the θ intercepts of y = sin θ areθ = 0, π, 2π, . . .,
Area =
∫ π
0
(1− sin θ) dθ = 1.142.
The integral was evaluated on a calculator.
π
1
θ
yy = 1
y = sin θ
11. The graph of y = −x2 + 5x − 4 is shown in Figure 5.47. We wish to find the area shaded. Since the graph crosses thex-axis at x = 1, we must split the integral at x = 1. For x < 1, the graph is below the x-axis, so the area is the negativeof the integral. Thus
Area shaded = −∫ 1
0
(−x2 + 5x− 4)dx+
∫ 3
1
(−x2 + 5x− 4)dx.

SOLUTIONS to Review Problems for Chapter Five 343
Using a calculator or computer, we find∫ 1
0
(−x2 + 5x− 4)dx = −1.8333 and∫ 3
1
(−x2 + 5x− 4)dx = 3.3333.
Thus,Area shaded = 1.8333 + 3.3333 = 5.167.
(Notice that∫ 3
0f(x)dx = −1.8333 + 3.333 = 1.5, but the value of this integral is not the area shaded.)
1 2 3
−5
5
x
y
Figure 5.47
12. The graph of y = cosx+ 7 is above y = ln(x− 3) for 5 ≤ x ≤ 7. See Figure 5.48. Therefore
Area =
∫ 7
5
cosx+ 7− ln(x− 3) dx = 13.457.
The integral was evaluated on a calculator.
5 7
y = cosx+ 7
y = ln(x− 3)
x
y
Figure 5.48
2
y = −ex + e2(x−1)
x
y
Figure 5.49
13. The graph of y = −ex + e2(x−1) has intercepts where ex = e2(x−1), or where x = 2(x− 1), so x = 2. See Figure 5.49.Since the region is below the x-axis, the integral is negative, so
Area = −∫ 2
0
−ex + e2(x−1) dx = 2.762.
The integral was evaluated on a calculator.
14. (a) We calculate the right- and left-hand sums as follows:
Left = 2[80 + 52 + 28 + 10] = 340 ft.
Right = 2[52 + 28 + 10 + 0] = 180 ft.
Our best estimate will be the average of these two sums,
Best =Left + Right
2=
340 + 180
2= 260 ft.

344 Chapter Five /SOLUTIONS
(b) Since v is decreasing throughout,
Left− Right = ∆t · [f(0)− f(8)]
= 80∆t.
Since our best estimate is the average of Left and Right, the maximum error is (80)∆t/2. For (80)∆t/2 ≤ 20, wemust have ∆t ≤ 1/2. In other words, we must measure the velocity every 0.5 second.
15. By counting squares and fractions of squares, we find that the area under the graph appears to be around 310 (miles/hour)sec, within about 10. So the distance traveled was about 310
(52803600
)≈ 455 feet, within about 10
(52803600
)≈ 15 feet. (Note
that 455 feet is about 0.086 miles)
16. Since v(t) ≥ 0 for 0 ≤ t ≤ 3, we can find the total distance traveled by integrating the velocity from t = 0 to t = 3:
Distance =
∫ 3
0
ln(t2 + 1) dt
= 3.4 ft, evaluating this integral by calculator.
17. Distance traveled =∫ 1.1
0
sin(t2) dt ≈ 0.40 miles.
Problems
18. Using properties of the definite integral, we have:∫ 5
2
(2f(x) + 3) dx = 17
2
∫ 5
2
f(x) dx+ 3
∫ 5
2
1 dx = 17
2
∫ 5
2
f(x) dx+ 3 · 3 = 17
2
∫ 5
2
f(x) dx = 8
∫ 5
2
f(x) dx = 4.
19. We have
30 =
∫ 3
−2
f dx =
∫ 2
−2
f(x) dx+
∫ 3
2
f(x) dx.
Since f is odd,∫ 2
−2f(x) dx = 0, so
∫ 3
2f(x) dx = 30.
20. We have
8 =
∫ 2
−2
(f(x)− 3) dx =
∫ 2
−2
f(x) dx− 3
∫ 2
−2
1 dx.
Thus∫ 2
−2f(x) dx = 8 + 3(2− (−2)) = 20. Since f is even,
∫ 2
0f(x) dx = (1/2)20 = 10.
21. On the interval 2 ≤ x ≤ 5,
Average valueof f
=1
5− 2
∫ 5
2
f(x) dx = 4,
so ∫ 5
2
f(x) dx = 12.
Thus ∫ 5
2
(3f(x) + 2) dx = 3
∫ 5
2
f(x) dx+ 2
∫ 5
2
1 dx = 3(12) + 2(5− 2) = 42.

SOLUTIONS to Review Problems for Chapter Five 345
22. This integral represents the area of two triangles, each of base 1 and height 1. See Figure 5.50. Therefore:∫ 1
−1
|x| dx =1
2· 1 · 1 +
1
2· 1 · 1 = 1.
−1 1
1 |x|
x
Figure 5.50
−π4
π4
x3 cosx2
x
Figure 5.51
23. This integral is 0 because the function x3 cos(x2) is odd (meaning f(−x) = −f(x)), and so the negative contribution tothe integral from −π
4< x < 0 exactly cancels the positive contribution from 0 < x < π
4. See Figure 5.51.
24. (a) Clearly, the points where x =√π,√
2π,√
3π,√
4π are where the graph intersects the x-axis because f(x) =sin(x2) = 0 where x is the square root of some multiple of π.
(b) Let f(x) = sin(x2), and let A, B, C, and D be the areas of the regions indicated in the figure below. Then we seethat A > B > C > D.
−1
1
A
B
C
D
x
Note that ∫ √π
0
f(x) dx = A,
∫ √2π
0
f(x) dx = A−B,
∫ √3π
0
f(x) dx = A−B + C, and∫ √4π
0
f(x) dx = A−B + C −D.
It follows that ∫ √π
0
f(x) dx = A >
∫ √3π
0
f(x) dx = A− (B − C) = A−B + C >
∫ √4π
0
f(x) dx = A−B + C −D >
∫ √2π
0
f(x) dx = (A−B) > 0.
And thus the ordering is n = 1, n = 3, n = 4, and n = 2 from largest to smallest. All the numbers are positive.
25. (a) TrainA starts earlier than TrainB, and stops later. At every moment TrainA is going faster than TrainB. Both trainsincrease their speed at a constant rate through the first half of their trip and slow down during the second half. Bothtrains reach their maximum speed at the same time. The area under the velocity graph for Train A is larger than thearea under the velocity graph for Train B, meaning that Train A travels farther—as would be expected, given that itsspeed is always higher than B’s.
(b) (i) The maximum velocity is read off the vertical axis. The graph for Train A appears to go about twice as high asthe graph for Train B; see Figure 5.52. So
Maximum velocity of Train AMaximum velocity of Train B
=vAvB≈ 2.
346 Chapter Five /SOLUTIONS
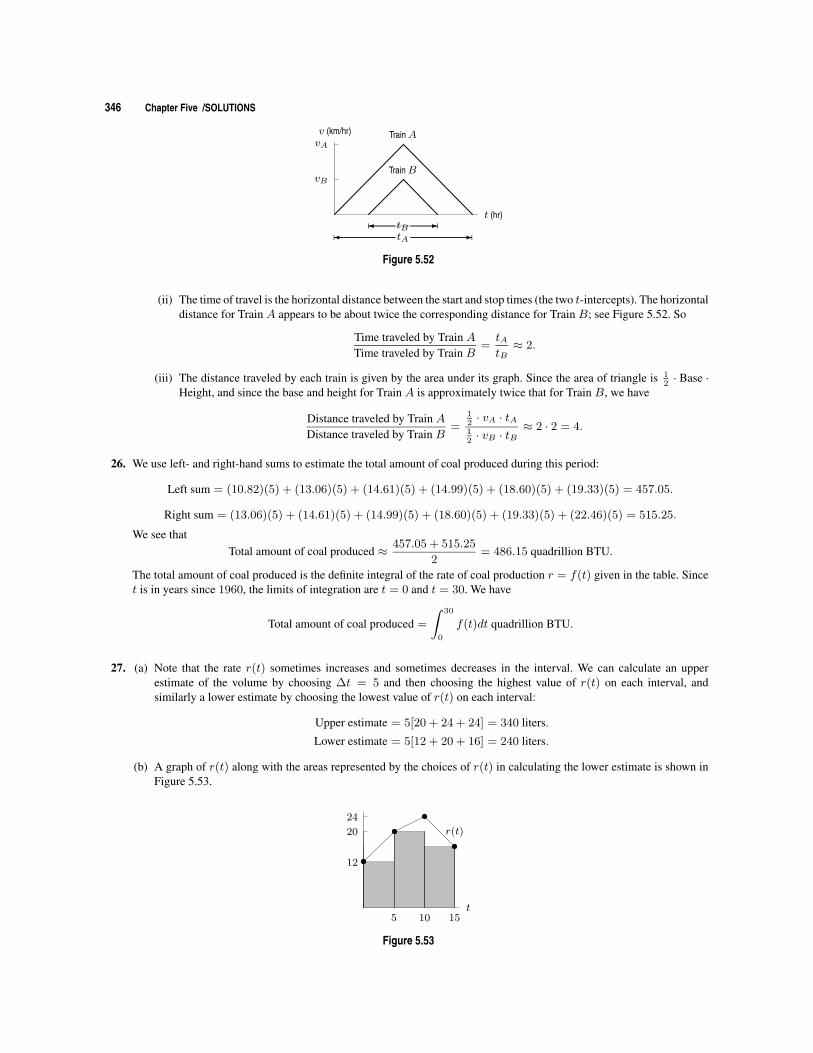
-� tB -� tA
vB
vATrainA
TrainB
t (hr)
v (km/hr)
Figure 5.52
(ii) The time of travel is the horizontal distance between the start and stop times (the two t-intercepts). The horizontaldistance for Train A appears to be about twice the corresponding distance for Train B; see Figure 5.52. So
Time traveled by Train ATime traveled by Train B
=tAtB≈ 2.
(iii) The distance traveled by each train is given by the area under its graph. Since the area of triangle is 12· Base ·
Height, and since the base and height for Train A is approximately twice that for Train B, we have
Distance traveled by Train ADistance traveled by Train B
=12· vA · tA
12· vB · tB
≈ 2 · 2 = 4.
26. We use left- and right-hand sums to estimate the total amount of coal produced during this period:
Left sum = (10.82)(5) + (13.06)(5) + (14.61)(5) + (14.99)(5) + (18.60)(5) + (19.33)(5) = 457.05.
Right sum = (13.06)(5) + (14.61)(5) + (14.99)(5) + (18.60)(5) + (19.33)(5) + (22.46)(5) = 515.25.
We see thatTotal amount of coal produced ≈ 457.05 + 515.25
2= 486.15 quadrillion BTU.
The total amount of coal produced is the definite integral of the rate of coal production r = f(t) given in the table. Sincet is in years since 1960, the limits of integration are t = 0 and t = 30. We have
Total amount of coal produced =
∫ 30
0
f(t)dt quadrillion BTU.
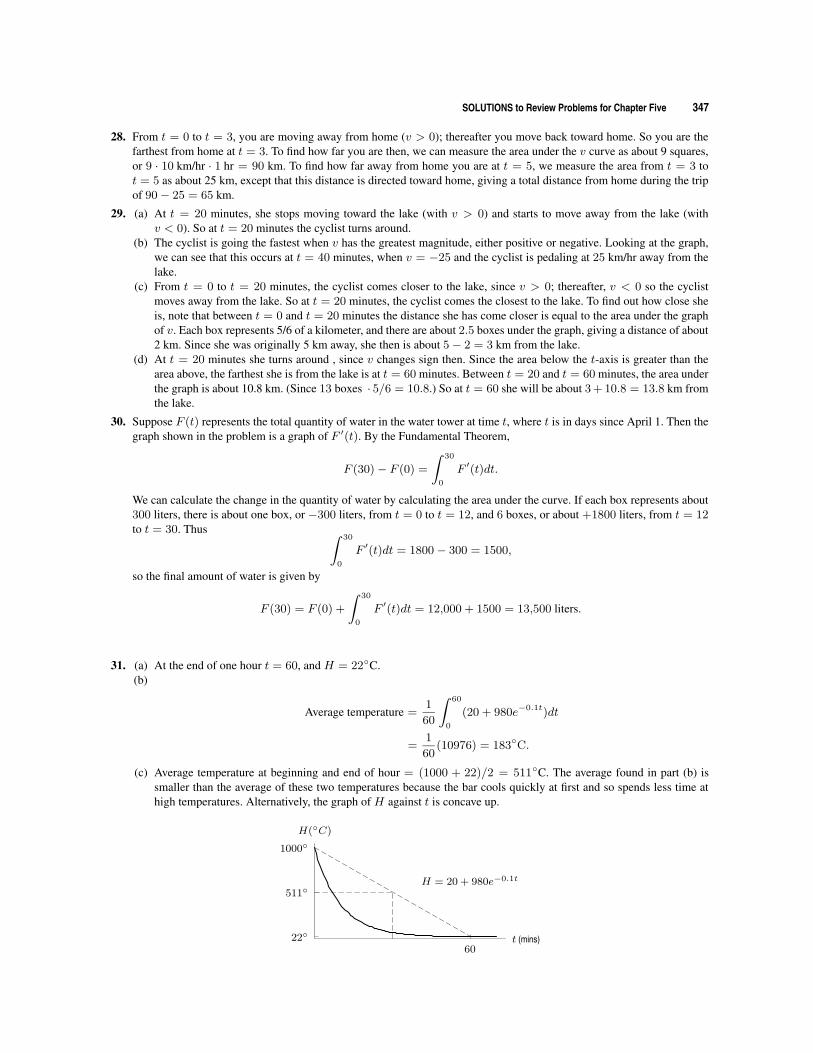
27. (a) Note that the rate r(t) sometimes increases and sometimes decreases in the interval. We can calculate an upperestimate of the volume by choosing ∆t = 5 and then choosing the highest value of r(t) on each interval, andsimilarly a lower estimate by choosing the lowest value of r(t) on each interval:
Upper estimate = 5[20 + 24 + 24] = 340 liters.
Lower estimate = 5[12 + 20 + 16] = 240 liters.
(b) A graph of r(t) along with the areas represented by the choices of r(t) in calculating the lower estimate is shown inFigure 5.53.
5 10 15
12
20
24
t
r(t)
Figure 5.53
SOLUTIONS to Review Problems for Chapter Five 347
28. From t = 0 to t = 3, you are moving away from home (v > 0); thereafter you move back toward home. So you are thefarthest from home at t = 3. To find how far you are then, we can measure the area under the v curve as about 9 squares,or 9 · 10 km/hr · 1 hr = 90 km. To find how far away from home you are at t = 5, we measure the area from t = 3 tot = 5 as about 25 km, except that this distance is directed toward home, giving a total distance from home during the tripof 90− 25 = 65 km.
29. (a) At t = 20 minutes, she stops moving toward the lake (with v > 0) and starts to move away from the lake (withv < 0). So at t = 20 minutes the cyclist turns around.
(b) The cyclist is going the fastest when v has the greatest magnitude, either positive or negative. Looking at the graph,we can see that this occurs at t = 40 minutes, when v = −25 and the cyclist is pedaling at 25 km/hr away from thelake.
(c) From t = 0 to t = 20 minutes, the cyclist comes closer to the lake, since v > 0; thereafter, v < 0 so the cyclistmoves away from the lake. So at t = 20 minutes, the cyclist comes the closest to the lake. To find out how close sheis, note that between t = 0 and t = 20 minutes the distance she has come closer is equal to the area under the graphof v. Each box represents 5/6 of a kilometer, and there are about 2.5 boxes under the graph, giving a distance of about2 km. Since she was originally 5 km away, she then is about 5− 2 = 3 km from the lake.
(d) At t = 20 minutes she turns around , since v changes sign then. Since the area below the t-axis is greater than thearea above, the farthest she is from the lake is at t = 60 minutes. Between t = 20 and t = 60 minutes, the area underthe graph is about 10.8 km. (Since 13 boxes · 5/6 = 10.8.) So at t = 60 she will be about 3 + 10.8 = 13.8 km fromthe lake.
30. Suppose F (t) represents the total quantity of water in the water tower at time t, where t is in days since April 1. Then thegraph shown in the problem is a graph of F ′(t). By the Fundamental Theorem,
F (30)− F (0) =
∫ 30
0
F ′(t)dt.
We can calculate the change in the quantity of water by calculating the area under the curve. If each box represents about300 liters, there is about one box, or −300 liters, from t = 0 to t = 12, and 6 boxes, or about +1800 liters, from t = 12to t = 30. Thus ∫ 30
0
F ′(t)dt = 1800− 300 = 1500,
so the final amount of water is given by
F (30) = F (0) +
∫ 30
0
F ′(t)dt = 12,000 + 1500 = 13,500 liters.
31. (a) At the end of one hour t = 60, and H = 22◦C.(b)
Average temperature =1
60
∫ 60
0
(20 + 980e−0.1t)dt
=1
60(10976) = 183◦C.
(c) Average temperature at beginning and end of hour = (1000 + 22)/2 = 511◦C. The average found in part (b) issmaller than the average of these two temperatures because the bar cools quickly at first and so spends less time athigh temperatures. Alternatively, the graph of H against t is concave up.
60
1000◦
511◦
22◦ t (mins)
H(◦C)
H = 20 + 980e−0.1t

348 Chapter Five /SOLUTIONS
32. If H(t) is the temperature of the coffee at time t, by the Fundamental Theorem of Calculus
Change in temperature = H(10)−H(0) =
∫ 10
0
H ′(t) dt =
∫ 10
0
−7e−0.1t dt.
Therefore,
H(10) = H(0) +
∫ 10
0
−7(0.9t) dt ≈ 90− 44.2 = 45.8◦C.
33. The change in the amount of water is the integral of rate of change, so we have
Number of liters pumped out =
∫ 60
0
(5− 5e−0.12t)dt = 258.4 liters.
Since the tank contained 1000 liters of water initially, we see that
Amount in tank after one hour = 1000− 258.4 = 741.6 liters.
34. All the integrals have positive values, since f ≥ 0. The integral in (ii) is about one-half the integral in (i), due to theapparent symmetry of f . The integral in (iv) will be much larger than the integral in (i), since the two peaks of f 2 rise to10,000. The integral in (iii) will be smaller than half of the integral in (i), since the peaks in f 1/2 will only rise to 10. So
∫ 2
0
(f(x))1/2 dx <
∫ 1
0
f(x) dx <
∫ 2
0
f(x) dx <
∫ 2
0
(f(x))2 dx.
35. In Figure 5.54 the area A1 is largest, A2 is next, and A3 is smallest. We have
I =
∫ b
a
f(x) dx = A1, II =
∫ c
a
f(x) dx = A1 −A2, III =
∫ e
a
f(x) dx = A1 −A2 +A3,
IV =
∫ e
b
f(x) dx = −A2 +A3, V =
∫ c
b
f(x) dx = −A2.
The relative sizes of A1, A2, and A3 mean that I is positive and largest, III is next largest (since −A2 + A3 is negative,but less negative than −A2), II is next largest, but still positive (since A1 is larger than A2). The integrals IV and V areboth negative, but V is more negative. Thus
V < IV < 0 < II < III < I.
a b c e
f(x)
A1
A2
A3 x
Figure 5.54
36. (a) For−2 ≤ x ≤ 2, f is symmetrical about the y-axis, so∫ 0
−2f(x) dx =
∫ 2
0f(x) dx and
∫ 2
−2f(x) dx = 2
∫ 2
0f(x) dx.
(b) For any function f ,∫ 2
0f(x) dx =
∫ 5
0f(x) dx−
∫ 5
2f(x) dx.
(c) Note that∫ 0
−2f(x) dx = 1
2
∫ 2
−2f(x) dx, so
∫ 5
0f(x) dx =
∫ 5
−2f(x) dx−
∫ 0
−2f(x) dx =
∫ 5
−2f(x) dx− 1
2
∫ 2
−2f(x) dx.
SOLUTIONS to Review Problems for Chapter Five 349
37. (a) We know that∫ 5
2f(x) dx =
∫ 5
0f(x) dx−
∫ 2
0f(x) dx. By symmetry,
∫ 2
0f(x) dx = 1
2
∫ 2
−2f(x) dx, so
∫ 5
2f(x) dx =∫ 5
0f(x) dx− 1
2
∫ 2
−2f(x) dx.
(b)∫ 5
2f(x) dx =
∫ 5
−2f(x) dx−
∫ 2
−2f(x) dx =
∫ 5
−2f(x) dx− 2
∫ 0
−2f(x) dx.
(c) Using symmetry again,∫ 2
0f(x) dx = 1
2
(∫ 5
−2f(x) dx−
∫ 5
2f(x) dx
).
38. (a) V, since the slope is constant.(b) IV, since the net area under this curve is the most negative.(c) III, since the area under the curve is largest.(d) II, since the steepest ascent at t = 0 occurs on this curve.(e) III, since average velocity is (total distance)/5, and III moves the largest total distance.
(f) I, since average acceleration is1
5
∫ 5
0
v′(t) dt =1
5(v(5)− v(0)), and in I, the velocity increases the most from start
(t = 0) to finish (t = 5).
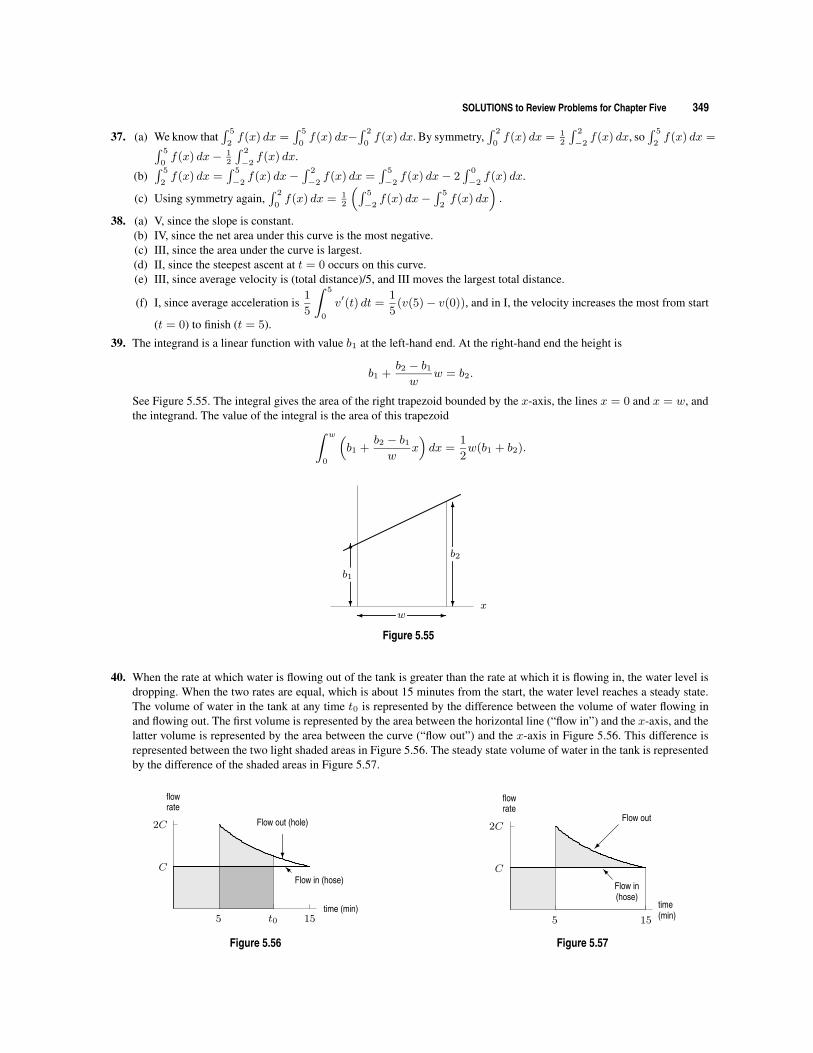
39. The integrand is a linear function with value b1 at the left-hand end. At the right-hand end the height is
b1 +b2 − b1w
w = b2.
See Figure 5.55. The integral gives the area of the right trapezoid bounded by the x-axis, the lines x = 0 and x = w, andthe integrand. The value of the integral is the area of this trapezoid
∫ w
0
(b1 +
b2 − b1w
x)dx =
1
2w(b1 + b2).
6
?
b1
6
?
b2
-� wx
Figure 5.55
40. When the rate at which water is flowing out of the tank is greater than the rate at which it is flowing in, the water level isdropping. When the two rates are equal, which is about 15 minutes from the start, the water level reaches a steady state.The volume of water in the tank at any time t0 is represented by the difference between the volume of water flowing inand flowing out. The first volume is represented by the area between the horizontal line (“flow in”) and the x-axis, and thelatter volume is represented by the area between the curve (“flow out”) and the x-axis in Figure 5.56. This difference isrepresented between the two light shaded areas in Figure 5.56. The steady state volume of water in the tank is representedby the difference of the shaded areas in Figure 5.57.
5 t0 15
C
2C
IFlow in (hose)
?
Flow out (hole)
time (min)
flowrate
Figure 5.56
5 15
C
2C
IFlow in(hose)
Flow out
time(min)
flowrate
Figure 5.57

350 Chapter Five /SOLUTIONS
41. (a) Looking at the graph, it appears that the graph of B is above F = 10 between t = 2.3 and t = 4.2, or for about 1.9seconds.
(b) The total impulse of each rocket is represented by the area under its thrust curve. From t = 0 to t = 2, the graph ofA looks like a triangle with base 2 and height 12, for an area of 12. From t = 2 to t = 4, the graph of A looks atrapezoid with base 2 and heights 13 and 6, for an area of 19. From t = 4 to t = 16, A is approximately a rectanglewith height 5.8 and width 12, for an area of 69.6. Finally, from t = 16 to t = 17, A looks like a triangle with base 1and height 5.8, for an area of 2.9. So
A′s total impulse = Area under A’s thrust curve = 12 + 19 + 69.6 + 2.9 = 103.5 newton-seconds.
(c) Note that when we calculated the impulse in part (b), we multiplied height, measured in newtons, by width, measuredin seconds. So the units of impulse are newton-seconds.
(d) The graph ofB’s thrust looks like a triangle with base 6 and height 22, for a total impulse of about 66 newton-seconds.So rocket A, with total impulse 103.5 newton-seconds, has a larger total impulse than rocket B.
(e) As we can see from the graph, rocket B reaches a maximum thrust of 22, whereas A only reaches a maximum thrustof 13. So rocket B has the largest maximum thrust.
42. (a) About 300 meter3/sec.(b) About 250 meter3/sec.(c) Looking at the graph, we can see that the 1996 flood reached its maximum just between March and April, for a high
of about 1250 meter3/sec. Similarly, the 1957 flood reached its maximum in mid-June, for a maximum flow rate of3500 meter3/sec.
(d) The 1996 flood lasted about 1/3 of a month, or about 10 days. The 1957 flood lasted about 4 months.(e) The area under the controlled flood graph is about 2/3 box. Each box represents 500 meter3/sec for one month. Since
1 month = 30days
month· 24
hoursday
· 60minutes
hour· 60
secondsminute
= 2.592 · 106 ≈ 3 · 106seconds,
each box represents
Flow ≈ (500 meter3/sec) · (2.6 · 106 sec) = 13 · 108 meter3of water.
So, for the artificial flood,
Additional flow ≈ 2
3· 13 · 108 = 9 · 108 meter3 ≈ 109 meter3.
(f) The 1957 flood released a volume of water represented by about 12 boxes above the 250 meter/sec baseline. Thus,for the natural flood,
Additional flow ≈ 12 · 15 · 108 = 1.8 · 1010 ≈ 2 · 1010 meter3.
So, the natural flood was nearly 20 times larger than the controlled flood and lasted much longer.
43. (a) The acceleration is positive for 0 ≤ t < 40 and for a tiny period before t = 60, since the slope is positive over theseintervals. Just to the left of t = 40, it looks like the acceleration is approaching 0. Between t = 40 and a moment justbefore t = 60, the acceleration is negative.
(b) The maximum altitude was about 500 feet, when t was a little greater than 40 (here we are estimating the area underthe graph for 0 ≤ t ≤ 42).
(c) The acceleration is greatest when the slope of the velocity is most positive. This happens just before t = 60, wherethe magnitude of the velocity is plunging and the direction of the acceleration is positive, or up.
(d) The deceleration is greatest when the slope of the velocity is most negative. This happens just after t = 40.(e) After the Montgolfier Brothers hit their top climbing speed (at t = 40), they suddenly stopped climbing and started
to fall. This suggests some kind of catastrophe—the flame going out, the balloon ripping, etc. (In actual fact, in theirfirst flight in 1783, the material covering their balloon, held together by buttons, ripped and the balloon landed inflames.)
(f) The total change in altitude for the Montgolfiers and their balloon is the definite integral of their velocity, or the totalarea under the given graph (counting the part after t = 42 as negative, of course). As mentioned before, the total areaof the graph for 0 ≤ t ≤ 42 is about 500. The area for t > 42 is about 220. So subtracting, we see that the balloonfinished 280 feet or so higher than where it began.
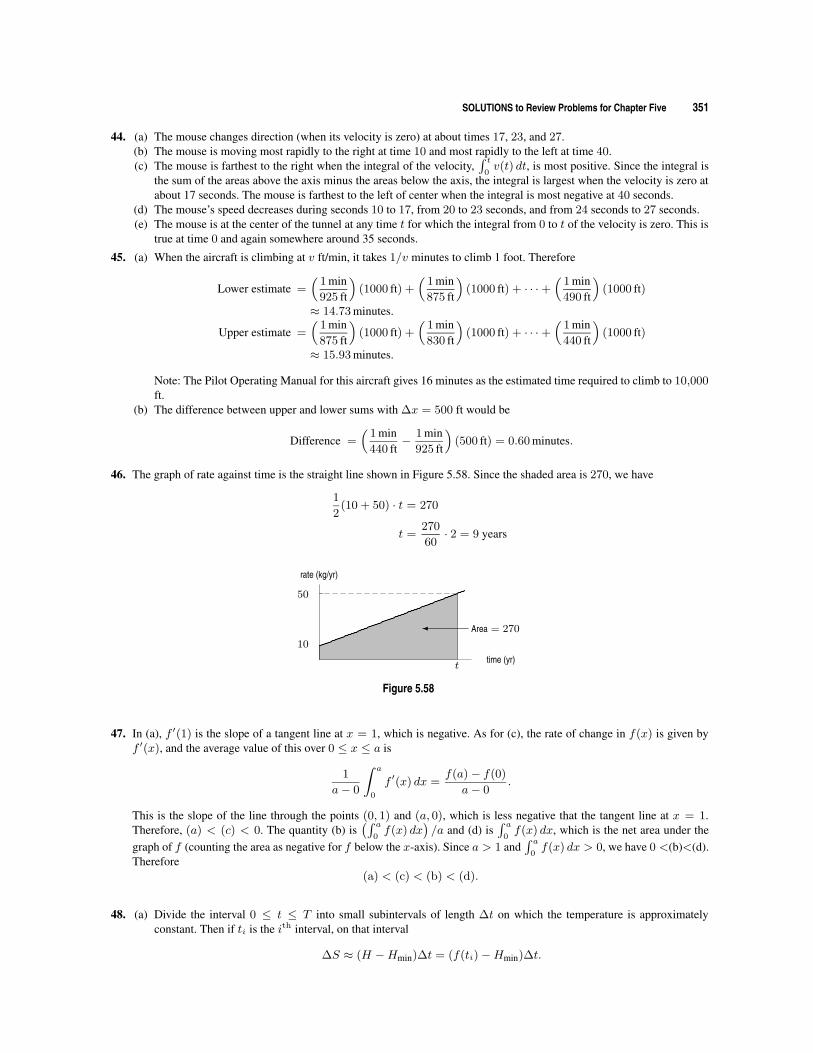
SOLUTIONS to Review Problems for Chapter Five 351
44. (a) The mouse changes direction (when its velocity is zero) at about times 17, 23, and 27.(b) The mouse is moving most rapidly to the right at time 10 and most rapidly to the left at time 40.(c) The mouse is farthest to the right when the integral of the velocity,
∫ t0v(t) dt, is most positive. Since the integral is
the sum of the areas above the axis minus the areas below the axis, the integral is largest when the velocity is zero atabout 17 seconds. The mouse is farthest to the left of center when the integral is most negative at 40 seconds.
(d) The mouse’s speed decreases during seconds 10 to 17, from 20 to 23 seconds, and from 24 seconds to 27 seconds.(e) The mouse is at the center of the tunnel at any time t for which the integral from 0 to t of the velocity is zero. This is
true at time 0 and again somewhere around 35 seconds.
45. (a) When the aircraft is climbing at v ft/min, it takes 1/v minutes to climb 1 foot. Therefore
Lower estimate =(
1 min925 ft
)(1000 ft) +
(1 min875 ft
)(1000 ft) + · · ·+
(1 min490 ft
)(1000 ft)
≈ 14.73 minutes.
Upper estimate =(
1 min875 ft
)(1000 ft) +
(1 min830 ft
)(1000 ft) + · · ·+
(1 min440 ft
)(1000 ft)
≈ 15.93 minutes.
Note: The Pilot Operating Manual for this aircraft gives 16 minutes as the estimated time required to climb to 10,000ft.
(b) The difference between upper and lower sums with ∆x = 500 ft would be
Difference =(
1 min440 ft
− 1 min925 ft
)(500 ft) = 0.60 minutes.
46. The graph of rate against time is the straight line shown in Figure 5.58. Since the shaded area is 270, we have
1
2(10 + 50) · t = 270
t =270
60· 2 = 9 years
10
50
rate (kg/yr)
time (yr)
Area = 270�
t
Figure 5.58
47. In (a), f ′(1) is the slope of a tangent line at x = 1, which is negative. As for (c), the rate of change in f(x) is given byf ′(x), and the average value of this over 0 ≤ x ≤ a is
1
a− 0
∫ a
0
f ′(x) dx =f(a)− f(0)
a− 0.
This is the slope of the line through the points (0, 1) and (a, 0), which is less negative that the tangent line at x = 1.Therefore, (a) < (c) < 0. The quantity (b) is
(∫ a0f(x) dx
)/a and (d) is
∫ a0f(x) dx, which is the net area under the
graph of f (counting the area as negative for f below the x-axis). Since a > 1 and∫ a
0f(x) dx > 0, we have 0 <(b)<(d).
Therefore(a) < (c) < (b) < (d).
48. (a) Divide the interval 0 ≤ t ≤ T into small subintervals of length ∆t on which the temperature is approximatelyconstant. Then if ti is the ith interval, on that interval
∆S ≈ (H −Hmin)∆t = (f(ti)−Hmin)∆t.

352 Chapter Five /SOLUTIONS
Thus, the total number of degree-days is approximated by
S ≈n∑
i=1
(f(ti)−Hmin)∆t.
As n→∞, we have
S =
∫ T
0
(f(t)−Hmin) dt.
(b) Since Hmin = 15◦C and S = 125 degree-days, the formula in part (a) gives
125 =
∫ T
0
(f(t)− 15)dt.
We approximate the definite integral using a Riemann sum:
∫ T
0
(f(t)− 15)dt =
n∑
i=1
(f(ti)− 15)∆t.
In the table, we have ∆t = 1. We want to find how many terms in the sum are required to (approximately) equal therequired number of degree-days, S = 125. From the table, we have
2∑
i=1
(f(ti)− 15)∆t = (20− 15)1 + (22− 15)1 = 12,
so the sum of degree-days over a two-day period is much smaller than the required sum of 125. Likewise, the sumover a three-day period is only 24:
3∑
i=1
(f(ti)− 15)∆t = (20− 15)1 + (22− 15)1 + (27− 15)1 = 24.
Summing over a ten-day period and an eleven-day period, we find, respectively, that
10∑
i=1
(f(ti)− 15)∆t = (20− 15)1 + (22− 15)1 + (27− 15)1 + (28− 15)1 + (27− 15)1 + (31− 15)1
+(29− 15)1 + (30− 15)1 + (28− 15)1 + (25− 15)1 = 11711∑
i=1
(f(ti)− 15)∆t = (20− 15)1 + (22− 15)1 + (27− 15)1 + (28− 15)1 + (27− 15)1 + (31− 15)1
+(29− 15)1 + (30− 15)1 + (28− 15)1 + (25− 15)1 + (24− 15)1 = 126.
Thus, the sum reaches 125 degree-days somewhere just short of T = 11 days.
CAS Challenge Problems
49. (a) We have ∆x = (1− 0)/n = 1/n and xi = 0 + i ·∆x = i/n. So we get
Right-hand sum =
n∑
i=1
(xi)4∆x =
n∑
i=1
(i
n
)4 ( 1
n
)=
n∑
i=1
i4
n5.
(b) The CAS gives
Right-hand sum =
n∑
i=1
i4
n5=
6n4 + 15n3 + 10n2 − 1
30n4.
(The results may look slightly different depending on the CAS you use.)

SOLUTIONS to Review Problems for Chapter Five 353
(c) Using a CAS or by hand, we get
limn→∞
6n4 + 15n3 + 10n2 − 1
30n4= limn→∞
6n4
30n4=
1
5.
The numerator is dominated by the highest power term, which is 6n4, so when n is large, the ratio behaves like6n4/30n4 = 1/5 as n→∞. Thus we see that
∫ 1
0
x4dx =1
5.
50. (a) A Riemann sum with n subdivisions of [0, 1] has ∆x = 1/n and xi = i/n. Thus,
Right-hand sum =
n∑
i=1
(i
n
)5 ( 1
n
)=
n∑
i=1
i5
n6.
(b) A CAS gives
Right-hand sum =
n∑
i=1
i5
n6=
2n4 + 6n3 + 5n2 − 1
12n4.
(c) Taking the limit by hand or using a CAS gives
limn→∞
2n4 + 6n3 + 5n2 − 1
12n4= limn→∞
2n4
12n4=
1
6.
The numerator is dominated by the highest power term, which is 2n4, so the ratio behaves like 2n4/12n4 = 1/6, asn→∞. Thus we see that ∫ 1
0
x5dx =1
6.
51. (a) Since the length of the interval of integration is 2 − 1 = 1, the width of each subdivision is ∆t = 1/n. Thus theendpoints of the subdivision are
t0 = 1, t1 = 1 + ∆t = 1 +1
n, t2 = 1 + 2∆t = 1 +
2
n, . . . ,
ti = 1 + i∆t = 1 +i
n, . . . , tn−1 = 1 + (n− 1)∆t = 1 +
n− 1
n.
Thus, since the integrand is f(t) = t,
Left-hand sum =
n−1∑
i=0
f(ti)∆t =
n−1∑
i=0
ti∆t =
n−1∑
i=0
(1 +
i
n
)1
n=
n−1∑
i=0
n+ i
n2.
(b) The CAS finds the formula for the Riemann sum
n−1∑
i=0
n+ i
n2=
(−1+n)n2
+ n2
n2=
3
2− 1
2n.
(c) Taking the limit as n→∞
limn→∞
(3
2− 1
2n
)= limn→∞
3
2− limn→∞
1
2n=
3
2+ 0 =
3
2.
(d) The shape under the graph of y = t between t = 1 and t = 2 is a trapezoid of width 1, height 1 on the left and 2 onthe right. So its area is 1 · (1 + 2)/2 = 3/2. This is the same answer we got by computing the definite integral.
354 Chapter Five /SOLUTIONS
52. (a) Since the length of the interval of integration is 2 − 1 = 1, the width of each subdivision is ∆t = 1/n. Thus theendpoints of the subdivision are
t0 = 1, t1 = 1 + ∆t = 1 +1
n, t2 = 1 + 2∆t = 1 +
2
n, . . . ,
ti = 1 + i∆t = 1 +i
n, . . . , tn−1 = 1 + (n− 1)∆t = 1 +
n− 1
n.
Thus, since the integrand is f(t) = t2,
Left-hand sum =
n−1∑
i=0
f(ti)∆t =
n−1∑
i=0
t2i∆t =
n−1∑
i=0
(1 +
i
n
)2 1
n=
n−1∑
i=0
(n+ i)2
n3.
(b) Using a CAS to find the sum, we get
n−1∑
i=0
(n+ i)2
n3=
(−1 + 2n) (−1 + 7n)
6n2=
7
3+
1
6n2− 3
2n.
(c) Taking the limit as n→∞
limn→∞
(7
3+
1
6n2− 3
2n
)= limn→∞
7
3+ limn→∞
1
6n2− limn→∞
3
2n=
7
3+ 0 + 0 =
7
3.
(d) We have calculated∫ 2
1t2 dt using Riemann sums. Since t2 is above the t-axis between t = 1 and t = 2, this integral
is the area; so the area is 7/3.
53. (a) Since the length of the interval of integration is π, the width of each subdivision is ∆x = π/n. Thus the endpointsof the subdivision are
x0 = 0, x1 = 0 + ∆x =π
n, x2 = 0 + 2∆x =
2π
n, . . . ,
xi = 0 + i∆x =iπ
n, . . . , xn = 0 + n∆x =
nπ
n= π.
Thus, since the integrand is f(x) = sinx,
Right-hand sum =
n∑
i=1
f(xi)∆x =
n∑
i=1
sin(xi)∆x =
n∑
i=1
sin(iπ
n
)π
n.
(b) If the CAS can evaluate this sum, we get
n∑
i=1
sin(iπ
n
)π
n=π cot(π/2n)
n=π cos(π/2n)
n sin(π/2n).
(c) Using the computer algebra system, we find that
limn→∞
π cos(π/2n)
n sin(π/2n)= 2.
(d) The computer algebra system gives ∫ π
0
sinx dx = 2.
54. (a) A CAS gives ∫ b
a
sin(cx) dx =cos(ac)
c− cos(bc)
c.
(b) If F (x) is an antiderivative of sin(cx), then the Fundamental Theorem of Calculus says that∫ b
a
sin(cx) dx = F (b)− F (a).

CHECK YOUR UNDERSTANDING 355
Comparing this with the answer to part (a), we see that
F (b)− F (a) =cos(ac)
c− cos(bc)
c=
(−cos(cb)
c
)−(−cos(ca)
c
).
This suggests that
F (x) = − cos(cx)
c.
Taking the derivative confirms this:d
dx
(−cos(cx)
c
)= sin(cx).
55. (a) Different systems may give different answers. A typical answer is
∫ c
a
x
1 + bx2dx =
ln
( ∣∣c2b+ 1∣∣∣∣a2b+ 1∣∣)
2b.
Some CASs may not have the absolute values in the answer; since b > 0, the answer is correct without the absolutevalues.
(b) Using the properties of logarithms, we can rewrite the answer to part (a) as
∫ c
a
x
1 + bx2dx =
ln∣∣c2b+ 1
∣∣− ln∣∣a2b+ 1
∣∣2b
=ln∣∣c2b+ 1
∣∣2b
−ln∣∣a2b+ 1
∣∣2b
.
If F (x) is an antiderivative of x/(1 + bx2), then the Fundamental Theorem of Calculus says that∫ c
a
x
1 + bx2dx = F (c)− F (a).
Thus
F (c)− F (a) =ln∣∣c2b+ 1
∣∣2b
−ln∣∣a2b+ 1
∣∣2b
.
This suggests that
F (x) =ln∣∣1 + bx2
∣∣2b
.
(Since b > 0, we know∣∣1 + bx2
∣∣ = 1 + bx2.) Taking the derivative confirms this:
d
dx
(ln(1 + b x2)
2 b
)=
x
1 + b x2.
CHECK YOUR UNDERSTANDING
1. False. The units of the integral are the product of the units for f(x) times the units for x.
2. True. Since f is increasing, each term in the left-hand sum is less than the corresponding term in the right-hand sum.
3. True. The difference between the left and right sums = (f(a) − f(b))∆t, where the interval is a ≤ t ≤ b. Since ∆t ishalved when the number of subdivisions is doubled, the difference is halved also.
4. False. For example, for a constant function, the difference does not get smaller, since it is always 0. Another example isf(x) = x2 on the interval −1 ≤ x ≤ 1. By the symmetry of the graph, the difference is always 0.
5. False. The integral is the change in position from t = q to t = b. If the velocity changes sign in the interval, the totaldistance traveled and the change in position will not be the same.
6. True, since∫ 2
0(f(x) + g(x))dx =
∫ 2
0f(x)dx+
∫ 2
0g(x)dx.
7. False. It is possible that∫ 2
0(f(x) + g(x))dx = 10 and
∫ 2
0f(x)dx = 4 and
∫ 2
0g(x)dx = 6, for instance. For example,
if f(x) = 5x− 3 and g(x) = 3, then∫ 2
0(f(x) + g(x)) dx =
∫ 2
05x dx = 10, but
∫ 2
0f(x) dx = 4 and
∫ 2
0g(x) dx = 6.

356 Chapter Five /SOLUTIONS
8. False. We know that∫ 4
0f(x)dx =
∫ 2
0f(x)dx+
∫ 4
2f(x)dx, but it is not true that
∫ 4
2f(x)dx must be the same value as∫ 2
0f(x)dx. For example, if f(x) = 3x, then
∫ 2
0f(x) dx = 6, but
∫ 4
0f(x) dx = 24.
9. True, since∫ 2
02f(x)dx = 2
∫ 2
0f(x)dx.
10. False. This would be true if h(x) = 5f(x). However, we cannot assume that f(5x) = 5f(x), so for many functionsthis statement is false. For example, if f is the constant function f(x) = 3, then h(x) = 3 as well, so
∫ 2
0f(x) dx =∫ 2
0h(x) dx = 6.
11. True. If a = b, then ∆x = 0 for any Riemann sum for f on the interval [a, b], so every Riemann sum has value 0. Thus,the limit of the Riemann sums is 0.
12. False. For example, let a = −1 and b = 1 and f(x) = x.Then the areas bounded by the graph of f and the x-axis on thetwo halves of the interval [−1, 1] cancel with each other and make
∫ 1
−1f(x) dx = 0. See Figure 5.59.
−1
1
f(x) = x
x
Figure 5.59
13. False. Let f(x) = 7 and g(x) = 9 for all x.Then
∫ 2
1f(x) dx+
∫ 3
2g(x) dx = 7 + 9 = 16, but
∫ 3
1(f(x) + g(x)) dx =
∫ 3
116 dx = 32.
14. False. If the graph of f is symmetric about the y-axis, this is true, but otherwise it is usually not true. For example, iff(x) = x+ 1 the area under the graph of f for −1 ≤ x ≤ 0 is less than the area under the graph of f for 0 ≤ x ≤ 1, so∫ 1
−1f(x) dx < 2
∫ 1
0f(x) dx. See Figure 5.60.
−1 1
f(x) = x+ 1
x
Figure 5.60
15. False. Any function f(x) that is negative between x = 2 and x = 3 has∫ 3
2f(x)dx < 0, so
∫ 2
0f(x)dx >
∫ 3
0f(x)dx.
16. True. Since∫ 2
0f(x)dx is a number, if we use the variable t instead of the variable x in the function f , we get the same
number for the definite integral.
17. False. Let f(x) = x and g(x) = 5. Then∫ 6
2f(x) dx = 16 and
∫ 6
2g(x) dx = 20, so
∫ 6
2f(x) dx ≤
∫ 6
2g(x) dx, but
f(x) > g(x) for 5 < x < 6.
18. True, by Theorem 5.4 on Comparison of Definite Integrals:
1
b− a
∫ b
a
f(x) dx ≤ 1
b− a
∫ b
a
g(x) dx.
19. True. We have
Average value of f on [0, 10] =1
10− 0
∫ 10
0
f(x) dx

CHECK YOUR UNDERSTANDING 357
=1
10
(∫ 5
0
f(x) dx+
∫ 10
5
f(x) dx
)
=1
2
(1
5
∫ 5
0
f(x) dx+1
5
∫ 10
5
f(x) dx
)
=The average of the average value of f on [0, 5] andthe average value of f on [5, 10].
20. False. If the values of f(x) on the interval [c, d] are larger than the values of f(x) in the rest of the interval [a, b], then theaverage value of f on the interval [c, d] is larger than the average value of f on the interval [a, b]. For example, suppose
f(x) =
{0 x < 1 or x > 2
1 1 ≤ x ≤ 2.
Then the average value of f on the interval [1, 2] is 1, whereas the average value of f on the interval [0, 3] is (1/(3 −0))∫ 3
0f(x)dx = 1/3.
21. True. We have by the properties of integrals in Theorem 5.3,∫ 9
1
f(x)dx =
∫ 4
1
f(x)dx+
∫ 9
4
f(x)dx.
Since (1/(4− 1))∫ 4
1f(x)dx = A and (1/(9− 4))
∫ 9
4f(x)dx = B, we have
∫ 9
1
f(x)dx = 3A+ 5B.
Dividing this equation through by 8, we get that the average value of f on the interval [1, 9] is (3/8)A+ (5/8)B.
22. True. By the properties of integrals in Theorem 5.3, we have:∫ b
a
(f(x) + g(x))dx =
∫ b
a
f(x)dx+
∫ b
a
g(x)dx.
Dividing both sides of this equation through by b − a, we get that the average value of f(x) + g(x) is average value off(x) plus the average value of g(x):
1
b− a
∫ b
a
(f(x) + g(x)) dx =1
b− a
∫ b
a
f(x) dx+1
b− a
∫ b
a
g(x) dx.
23. False. A counterexample is given by
f(x) ={
3 0 ≤ x ≤ 10 1 < x ≤ 2
and g(x) ={
0 0 ≤ x ≤ 13 1 < x ≤ 2.
Since f(x) is nonzero for 0 ≤ x < 1 and g(x) is nonzero for 1 < x ≤ 2, the product f(x)g(x) = 0 for all x. Thus theaverage values of f(x) and g(x) are nonzero, but the average of the product is zero.
Specifically, on [0, 2] we have
Average(f) =1
2− 0
∫ 2
0
f(x) dx =3
2
Average(g) =1
2− 0
∫ 2
0
g(x) dx =3
2
Average(f · g) =1
2− 0
∫ 2
0
f(x)g(x) dx =1
2
∫ 2
0
0 dx = 0.
butAverage(f) · Average(g) =
3
2· 3
2=
9
4.
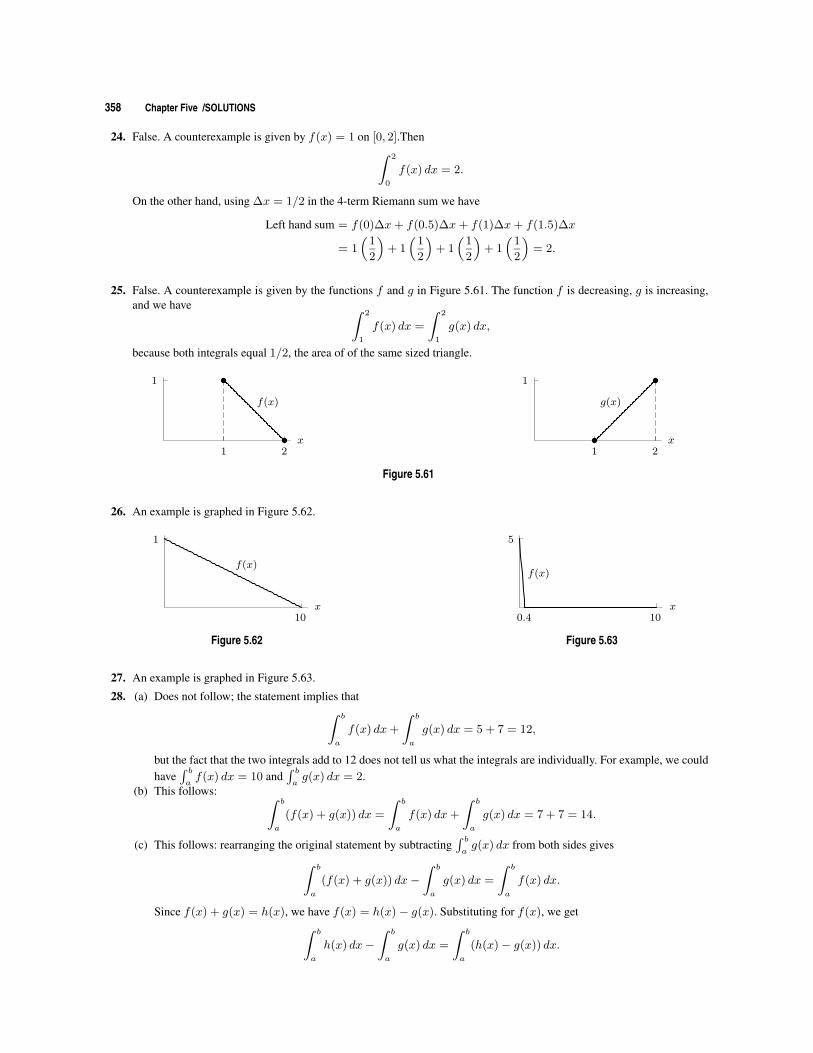
358 Chapter Five /SOLUTIONS
24. False. A counterexample is given by f(x) = 1 on [0, 2].Then∫ 2
0
f(x) dx = 2.
On the other hand, using ∆x = 1/2 in the 4-term Riemann sum we have
Left hand sum = f(0)∆x+ f(0.5)∆x+ f(1)∆x+ f(1.5)∆x
= 1(
1
2
)+ 1(
1
2
)+ 1(
1
2
)+ 1(
1
2
)= 2.
25. False. A counterexample is given by the functions f and g in Figure 5.61. The function f is decreasing, g is increasing,and we have ∫ 2
1
f(x) dx =
∫ 2
1
g(x) dx,
because both integrals equal 1/2, the area of of the same sized triangle.
1 2
1
f(x)
x1 2
1
g(x)
x
Figure 5.61
26. An example is graphed in Figure 5.62.
10
1
f(x)
x
Figure 5.62
0.4 10
5
f(x)
x
Figure 5.63
27. An example is graphed in Figure 5.63.
28. (a) Does not follow; the statement implies that∫ b
a
f(x) dx+
∫ b
a
g(x) dx = 5 + 7 = 12,
but the fact that the two integrals add to 12 does not tell us what the integrals are individually. For example, we couldhave
∫ baf(x) dx = 10 and
∫ bag(x) dx = 2.
(b) This follows: ∫ b
a
(f(x) + g(x)) dx =
∫ b
a
f(x) dx+
∫ b
a
g(x) dx = 7 + 7 = 14.
(c) This follows: rearranging the original statement by subtracting∫ bag(x) dx from both sides gives
∫ b
a
(f(x) + g(x)) dx−∫ b
a
g(x) dx =
∫ b
a
f(x) dx.
Since f(x) + g(x) = h(x), we have f(x) = h(x)− g(x). Substituting for f(x), we get∫ b
a
h(x) dx−∫ b
a
g(x) dx =
∫ b
a
(h(x)− g(x)) dx.

PROJECTS FOR CHAPTER FIVE 359
PROJECTS FOR CHAPTER FIVE
1. (a) For Operation 1, we have the following:(i) A plot of current use versus time is given in Figure 5.64.
15 30 45 60 75 90
10
20
30
t, time (minutes)
battery current (amperes)
Figure 5.64: Operation 1
The battery current function is given by the formulas
D(t) =
10 sin2πt
300 ≤ t ≤ 15
0 15 ≤ t ≤ 60
30 60 ≤ t ≤ 90.
(ii) The battery current function gives the rate at which the current is flowing. Thus, the total discharge isgiven by the integral of the battery current function:
Total discharge =
∫ 90
0
D(t) dt =
∫ 15
0
10 sin2πt
30dt+
∫ 60
15
0 dt+
∫ 90
60
30 dt
≈ 95.5 + 900
= 995.5 ampere-minutes = 16.6 ampere-hours.
(iii) The battery can discharge up to 40% of 50 ampere-hours, which is 20 ampere-hours, without damage.Since Operation 1 can be performed with just 16.6 ampere-hours, it is safe.
(b) For Operation 2, we have the following:(i) The total battery discharge is given by the area under the battery current curve in Figure 5.65. The
area under the right-most portion of the curve, (when the satellite is shadowed by the earth), is easilycalculated as 30 amps· 30 minutes = 900 ampere-minutes = 15 ampere-hours. For the other partwe estimate by trapezoids, which are the average of left and right rectangles on each subinterval.Estimated values of the function are in Table 5.1.
Table 5.1 Estimated values of the battery current
Time 0 5 10 15 20 25 30
Current 5 16 18 12 5 12 0
Using ∆t = 5, we see
Total discharge =1
2(5 + 16) · 5 +
1
2(16 + 18) · 5 +
1
2(18 + 12) · 5
+1
2(12 + 5) · 5 +
1
2(5 + 12) · 5 +
1
2(12 + 0) · 5
≈ 330 ampere-minutes = 5.5 ampere-hours.

360 Chapter Five /SOLUTIONS
The total estimated discharge is 20.5 ampere-hours.
15 30 45 60 75 90
10
20
30
900 amp-min
t, time (minutes)
battery current (amperes)
Figure 5.65: Operation 2
(ii) Since the estimated discharge appears to be an underestimate, Operation 2 probably should not beperformed.
2. (a) The volume of the cylindrical tank is π · ( d2 )2 · l. The volume of the rectangular tank is w · d · l. Settingthese two volumes equal to each other gives w = π·d
4 .If the gas is at a depth of h in the rectangular tank, then the tank is exactly h/d full, since
Volume left in rectangular tankTotal volume of rectangular tank
=w · h · lw · d · l =
h
d.
(b) For the same height h in the two tanks, (see Figure 5.66), the error is given by
Error =Fraction of cylindrical
tank which is full − h
d
=A1l
π(d/2)2l− hπ(d/4)l
dπ(d/4)l
=A1l
π(d/2)2l− A2l
π(d2/4)l
=A1 −A2
π(d2/4)
Since the length has canceled out, we can ignore it in calculating the error.
6
?
h
-� d
A1
6
?
d
-� πd/4
6
?
hA2
Figure 5.66
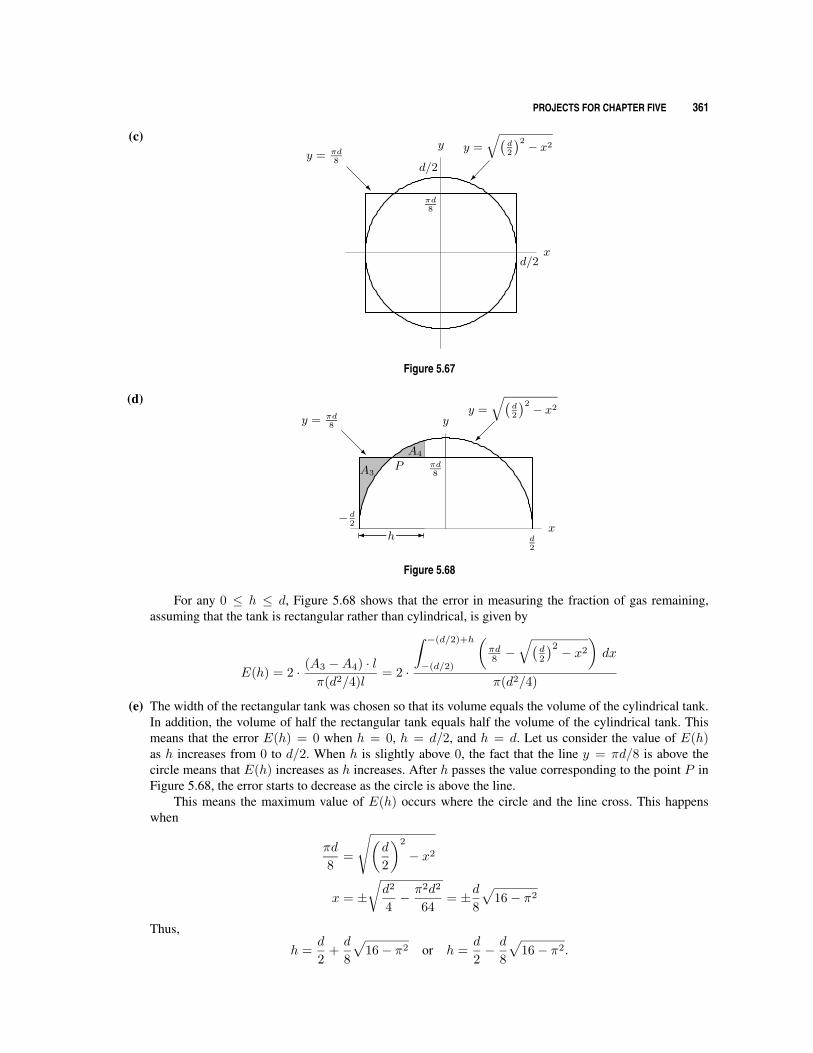
PROJECTS FOR CHAPTER FIVE 361
(c)
d/2
d/2
πd8
y =
√(d2
)2 − x2
x
y
R
y = πd8
Figure 5.67
(d)
− d2
d2
πd8A3
A4
-� h
y =
√(d2
)2 − x2
x
y
PR
y = πd8
Figure 5.68
For any 0 ≤ h ≤ d, Figure 5.68 shows that the error in measuring the fraction of gas remaining,assuming that the tank is rectangular rather than cylindrical, is given by
E(h) = 2 · (A3 −A4) · lπ(d2/4)l
= 2 ·
∫ −(d/2)+h
−(d/2)
(πd8 −
√(d2
)2 − x2
)dx
π(d2/4)
(e) The width of the rectangular tank was chosen so that its volume equals the volume of the cylindrical tank.In addition, the volume of half the rectangular tank equals half the volume of the cylindrical tank. Thismeans that the error E(h) = 0 when h = 0, h = d/2, and h = d. Let us consider the value of E(h)as h increases from 0 to d/2. When h is slightly above 0, the fact that the line y = πd/8 is above thecircle means that E(h) increases as h increases. After h passes the value corresponding to the point P inFigure 5.68, the error starts to decrease as the circle is above the line.
This means the maximum value of E(h) occurs where the circle and the line cross. This happenswhen
πd
8=
√(d
2
)2
− x2
x = ±√d2
4− π2d2
64= ±d
8
√16− π2
Thus,
h =d
2+d
8
√16− π2 or h =
d
2− d
8
√16− π2.