Embed Size (px)
Citation preview
GOVERNMENT OF MEGHALAYA
FIFTH FIVE YEAR PLAN
DRAFT PROPOSALS
VOLUM E-1
PLANNING DEPARTMENT
FIFTH FIVE-YEAR P^AN
DRAFT PROPOSALS—V OLU M E—I
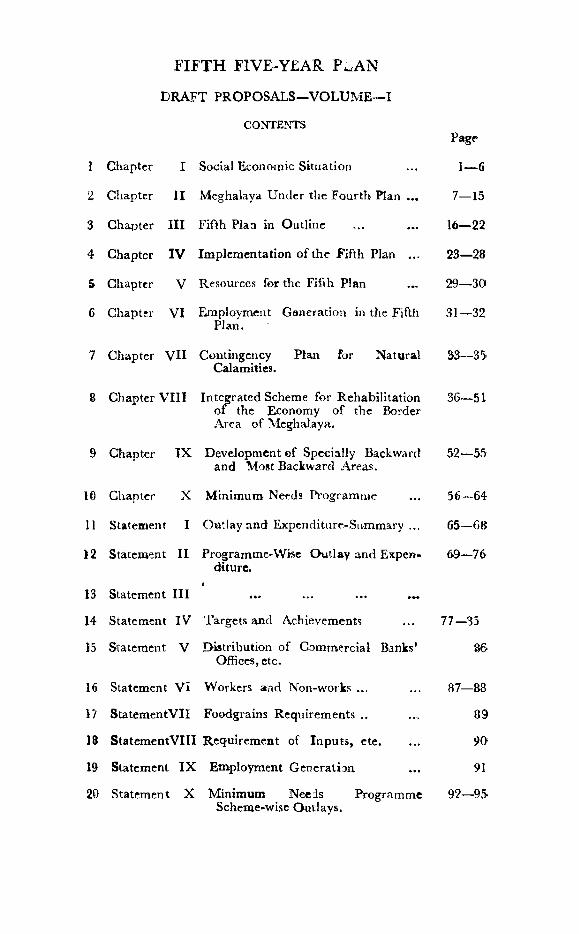
CONTENTSPagr
1 Chapter I Social Economic Situation 1-~ 6
2 Chapter II Meghalaya Under the Fourth Plan ... 7 - -15
3 Chapter II I Fifth Plan in Outline 16--22
4 Chapter IV Implem entation of the Fifth Plan ... 23--28
S Chapter V Resources for the Fifth Plan 29--30
6 Chapter VI Employment Generation in the Fifth Plan.
31--32
7 Chapter V II Contingency Plan for Natural Calamities.
53--35
8 Chapter V III Integrated Scheme for Rehabilitation of the Economy of the Border Area of Meghalaya.
36--51
9 Chapter IX Development of Specially Backward and Most Backward Areas.
52--55
10 Chapter X Minimum Needs Piogram nie 56--^64
11 Statement I Outlay and Expenditure-Summary ... 65--68
12 Statement II Programme>Wise Outlay and Expenditure.
69--76
13 Statement I I I
14 Statement IV Targets and Achievements ... 77—35
15 Statement V Distribution of Commercial Banks* 86Offices,etc.
16 Statement VI Workers and Non-works ... ... 87-—88
17 Statem entV II Foodgrains Requirements .. ... 89
18 Statem entV III Requirem ent of Inputs, etc. ... 90
19 Statement IX Employment Generation ... 91
20 Statement X Minimum Needs Programme 92—9SScheme-wise Outlays.

SOCIO ECONOMIC SITUATION
Introduction
Physical background: location.
The State lies between 25°5" and 26’10" north latitudes and between 98°47" and 97°47" east longitudes and consists of 3 districts, namely, Khasi Hills, Jaintia Hills and Garo Hills and contains hills which at the w estern end attain a height of 1,400 m etres in the Peak of Nokrek in Garo Hills and in the eastern end a height of 1950 m etres in the Shillong Peak. It is surrounded by six districts of Assam on three sides except in the south, on which side it has common boundary with Bangladesh. It is bounded on the north by Goalpara, K am rup and Now- gong districts, on the west by Goalpara district of Assam and part of Bangladesh, on the south by Cachar district of Assam and Bangladesh, and on the east by Mikir Hills and North Cachar Hills Districts. The State has its opening through Assam to the rest of India which is fu rther connected w ith other parts of the country by a narrow corridor .which runs for about 50 kilometres below the foot hills Of Bhutan and Sikkim.
CHAPTER 1
Meghalaya covers a land surface of approxim ately 22,500 sq kms, of which the Garo Hills account forapproximately 8,100 sq. kms.; Khasi Hills for 10,500 sq.kms. and Jaintia Hills for 3,900 sq. kms. The State comprises of a mountainous region w ith asharp terrain wedged between the B rahm aputra Valley in the north and the Surma Valley in the south. TheHills start abruptly from the Plains strip in the west and continue rising gradually eastward from 300 m etres in the Garo Hills and to 1800 m etres and more in Khasi Hills and then drop down gently into the Jain tia Hills and continue further eastward to join the North Cachar Hills ranges of Assam,
2. The Physico-geographical divisions of the States.—The State has the following physico-geographical divisions :—
(1) Central Plateau.—Its highest region is between 900 and 1,800 m etres elevation above m ean-sea level.It serves as a catchm ent area or w atershed for rivers and stream s flowing through the State.
(2) Border Areas.—This region begins where the Central Plateau ends at about 900 m etres elevation and stretches downward towards the plains of Bangladesh. It is the region where the highest rainfall occurs.
(3) Sub“Montane Region.—Linked with the Border area, this region also forms a portion of the Central P lateau, till it gradually descends tow ards the plains of Assam. But unlike the Border areas, which are generally steep and abrupt in certain places, the slopes in this region are gentle. This region gets com paratively less rain-fall.
By and large, the soil in the State is acidic in nature and com paratively rich in organic m atter and nitrogen but poor in phosphorus. Due to heavy rain, the soil of the border areas tends to be sandy. The State contains places of heaviest rainfall: Mawsynram-Cherrapunji-Pynursla belt in the Khasi Hills, recording the precipitation of rain of 1,000 cms. to 1,5000 cms. a year; the highest in the world.
3. Natural Resources.—The State is rich in natural resources. To sta rt w ith the m ineral resources, the total recorded reserves of coal in the S tate have been estim ated to be 1197 million tonnes of which 35 million tonnes are in the districts of the Khasi Hills and Jaintia Hills and 1162 million tonnes in Garo Hills district. The total known reserves of lime-stones are estimated at21,000 million tonnes. The State has a reserve of over five lakh tonnes of sillimanite, accurring in the Sonapahar- Nongper-Nongbari area of Khasi Hills.
The reserve of clay, which can be used for various industrial purposes including the m anufacturing of potteries is estim ated at 10 million tonnes. The other deposits occurring in commercially exploitable quantities include Kaolin, Feldsper, glass-sand etc. The forest resources of the State are also considerable. The forests in the State cover a land surface of 8510 sq. kilometers.
i.e., about 37.5 per cent of th-e total area of the State. The total output of various categories of tim ber has been estim ated at 20 million cubic metres of logs, poles and sawn timber.
The climate and soil conditions of M eghalaya offer ideal conditions for horticultural activities. On the basis of a tentative survey, 5827 hectares are covered by pineapple cultivation, 7849 hectares of area is covered by orange cultivation and 2832 hectares are under banana cultivation. Besides, 4614 hectares are under various other fruits. W ith such a rich inventory of resources, the prospects of development in M eghalaya are immense.
4. Demographic patterns.—The population of Meghalaya, according to the 1971 census is 1,011,699. During the decade 1961-71 the population recorded a grow th rate of 32.02 per cent as against 25.97 per cent in the preceding decade and the average all-India growth ra te of 24.57 per cent. The density of population per square kilom etres in 1971 was 45, having risen from 33 in 1961. Due to the hilly terrain, the State is sparsely populated and has a density lower than the A ll-India average of 182 persons per sq. km. However, it is comparable to other hilly areas, e.g. : M anipur w ith 48 persons p er sq. km., Himachal Pradesh w ith 62 persons per sq. km. and Nagaland w ith 38 persons per sq. km.
Rural and Urban Population:
5. The population in the State is predom inantly rural. There are 6 towns in the State w ith a population of 1,47,170 which forms 14.5 per cent of the S tate’s population according to the 1971 Census. The ru ra l population consists of about 8,64,529 persons and account for 85.46 p e r cent of the S ta te’s population. The num ber of inhabited villages in the State is 4582 w ith the population of 864,529, the average population per village being 186 persons.
6. Percentage of Literacy in Meghalaya.—According to the 1971 Census, 29.48 per cent of the S tate’s population is literate against the All-India average of 29.35 per cent. The percentage of Tribals in the S ta te’s population is (80.84 and tha t of Scheduled Castes is 0.38. The workers percentage ratio in Meghalaya is 44.92 according to the
3
277,186 53.2 169,642 34.6
176,144 63.5 132,834 78.3
25,894 9.3 18,237 10.8
8,593 3.1 3,292 1.9
501 0.2 168 0.1
3,120 1.1 • 1,754 1.0
5,043 1.8 602 0.4
3,960 1.4 280 0.2
1971 Census. The percentage of w orkers engaged in various occupations, etc., is shown in the statem ent below.
Male Per cent Female Per cent
T otal workers
1. Cultivators . .
2* Agricultural Labourers
3. Livestock etc.
4. Mining etc.
5. (a) Manufacturing House holdIndustry
(b) Non House hold Industry
6. Gonstruction
It would appear that 82 per cent of the workers are traditionally engaged in agriculture, either as cultivators or agricultural labourers. This indicates, the extent to which the State is dependent on agriculture. The employment opportunities outside the agriculture sector are low due to the backward economic situation of the State and lack of industrialisation.
7. Conclusion:
On the basis of the socio economic factors and physi- co-geographical considerations outlined in this chapter, the following relevant considerations emerge which have to be taken into consideration for evolving a suitable plan frame-work for the State.
(1) Pre-dominance of the Tribal Population and Backwardness.—Due to predominance of the tribal population in the State, it is extrem ely backward and needs special attention.
(2) Shifting Cultivation.—Due to the past history and customs, and nature of the terrain, about 75 percent of the cultivatable area in the State is under shifting p.ultivatipn. The jjractice of shifting cultivation i§ ba&ed
on jhum m ing and cutting of forests. The Plan for the State has to provide for weaning away of the population from shifting cultivation.
(3) Density and sparseness of population.—Thenumber of villages in the S tate is very large and these are sparsely populated, some of them having only very few households. W ith a view to reaching the benefits of planned development to the population of the State, a programme for grouping of villages in compact settled villages w ith a sizeable population is necessary. No plan for the development of the State can be taken up w ithout inclusion of the project for grouping of villages.
(4) Border Areas.—The Area of the State bordering Bangladesh needs special attention due to physio- geographical factors indicated above, as well as in view of the fact tha t the development needs of the area have not been m et so far. The fifth five year plan for the State will have to provide for accelerating the development process in this area.
(5) Strategic considerations.—In view of the Physi-co-geographical location of the State and its nearness to another country, the development of the State is necessary on the strategic considerations also. In the changing pattern of international politics, the development of the States like Meghalaya bordering w ith other foreign countries is a m atter of utm ost strategic importance. In view of these considerations, Meghalaya deserves adequate consideration in allocation of financial resources for planning.
Estimate of Population living below the Poverty Line inMeghalaya
8. The number of people living below the poverty line in Meghalaya is very large compared to other States in the country. A comparative estimate of the backwardness of M eghalaya in the light of economic indicators is contained in subsequent chapters. On a tentative estimate, taking M eghalaya’s per capita income as 60 per cent of the per capita income in Assam, the per capita income in Meghalaya during 1969-70 works out at Rs.327. It has been estim ated that a consumption level of Rs.20 per capita per mensem is necessary to ensure a
reasonable economic standard. In light of the present day prices, the figures is to be m ultiplied by a factor of 1.86. On this calculation, the per capita income should be Rs.446 to ensure a reasonable m inimum standard above the poverty line. To this, further addition should be made in view of the higher prices in Meghalaya due to higher transport charges and various other .factors. As against this, per capita income in M eghalaya is only Rs.327. This shoves the extrem ely low level of per capita income in Meghalaya and is an indicator tha t the m ajority of the population in Meghalaya is living below the poverty line.
6
M eghalaya became an Autonomous State on the 2nd of April, 1970 and attained full Statehood on 21st January, 1972. One of the main reasons for the creation of Meghalaya as a State has been to accelerate the process of development in the backward hill areas constituting the State. It needs no reiteration that Meghalaya is one of the most backward States in the country. The Commission on the Hill areas of Assam (PATASKAR COMMISSION) appointed by the Government of India, observed as follows regarding the Hill Districts which now form Meghalaya,
"Despite the progress already made, the economic difficulties continue to be particularly severe in the Hill Districts. It is not unnatural that because of the past neglect, a considerable percentage of outlay in the hills had, in the beginning, to be incurred on non-income generating (or less income generating) schemes. Due to sparse population and lack of the means of communication, the benefits tha t have accrued have also not yetcreated a full impact on the people................................ thedifficulties created by the Partition have not yet found a satisfactory solution. In respect of some of their pressing needs, the progress too has been unsatisfactory (Pages 28 of the Report of the Commission on the Hill Areas of Assam— 1965-66)”
A similar observation was made by the Joint Centre-S ta te S tudy Team (1966) set up under the leadership of Shri Tarlok Singh, the then Member, Planning Commission.
"The Hill D istricts of Assam have acute economic and social problems which could be only resolved through rapid and accelerated development.”
In his address to the members of the Legislative Assembly of the composite State of Assam on March 3, 1966, Shri Tarlok Singh observed as fo l lo w s -
“It is true that increasing efforts have been made by the State Government during the three plans to give attention to the special problems of these districts. But it will be doing no injustice either to the Centre or to the State to admit that so far even the
OHiA'PTER II
MEGHALAYA UNDER THE FOURTH PLAN
surface of the peoblems of development has not been scratched. It is true that in many directions earnest efforts have been made to open up these districts, to expand education and to bring social services to the people. But the size of the problem and its nature are both complex and enormous.”
6
2. Hill Areas Plan.—In the light of the above recom* m endations of the Joint Centre-State Study Team, the separate plan for development of the hill areas v^as taken up as integral part of the Plan of the State of Assam. On the constitution of Meghalaya as an autonomous state on 2nd April 1970, the fourth Plan of Meghalaya for the rem aining years of the Plan was carved out of the Hill areas plan of the composite State of Assam. How^ever, it did not take into considerations the special requirements of Meghalaya, on account of State level schemes, as well as the special schemes such as the project for integrated development of border areas, improvement of towns and removal of slums, etc. The progress of plan in the Fourth Plan period in Meghalaya has to be assessed in the light of the following fac to rs :
(1) The State embarked on its programme of development w ith a huge backlog of under-developed economy. This was due to lack of due attention on various sectors of development under the earlier plans and difficulty of accelarating development in the area of the State due to difficult terrain, lack of communications, etc. The various deficiencies in the process of development felt in the country have manifested themselves in Meghalaya in a more acute form.
(2) As already pointed out, the Plan allocation of M eghalaya has been extrem ely in-adequate and did not take into account the requirem ents of Meghalaya on account of State level schemes, as well as special schemes, such as integrated development of border areas, im provement of towns and removal of slums, etc.
(3) As the State of Meghalaya came into being only on 2nd April, 1970, and attained full Statehood on the 21st January, 1972, the process of building up the administrative and technical m achinery for the purpose of
implementing the plan schemes has not been adequate, judged in term s of requirem ents. The m achinery is being set up and it is estimated tha t the lack of adequate personnel in certain vital sectors of the development will disappear diiring the Vth Plan Period.
(4) This initial handicap retarded the achievement of financial and physical targets of the Plan during the initial years of the setting up of the State. Moreover due to the heavy influx of about seven lakhs of evacuees from Bangladesh during 1971-72, the adm inistrative machinery was overstrained and its efforts had to be d iverted from development activities to the extension of relief to the evacuees. In spite of the handicaps, the total expenditure under the 4th Plan of the State including the expenditure for 1969-70 under the Assam Governm ent will be Rs.40 Crores approxim ately.
3 Special Problems of Meghalaya.—Apart from the administrative and other problems indicated above, the following other factors while contributing to the lack of development in the State have continued to persist as the main problems, peculiar to Meghalaya, and the plan for Meghalaya has to take special account of these :—
(1) Problem of Shifting Cultivation.—According to tentative estimates, 42 per cent of the tribal population of the State (approxim ately 3.50 lakhs) is dependent upon shifting cultivation or jhumming. Due to constraint of resources, no effective programmes for tackling this problem could be taken up during the Fourth Plan period.
(2) The problem of the Border Areas.—The State has a very large area on the border w ith Bangladesh, the economy of which has traditionally depended upon Bangladesh. The border areas of Meghalaya comprise the southern slopes of the State and the adjoining narrow strip of plains along the Bangladesh border. The border runs over a length of approxim ately 496 kms from Dona M alidhar in Jairitia Hills in the east, to M ahendraganj in Garo Hills in the west and thence northw ard for some distance towards Mankachar. In the Khasi and Jaintia Hills, the border areas cover a land surface of about 6,100 sq. kms. and comprise a population of 97,000.
In the Garo Hills District, it comprises a land area of about 2,050 sq. kms. w ith 1.32 lakh of population. Thus 36 per cent of the S ta te’s to ta l area and 23 per cent of the population is closely linked and had traditional association w ith the economy of Bangladesh. The requ irement for the development of the area has not been m et adequately. A balanced F ifth Plan for the State of Meghalaya will have to make adequate provision for the development in the border areas.
(3) Transport Bottle-neck.—The transport and communications system in the State is extrem ely underdeveloped. This results in pushing up the costs of execution of development schemes and the amounts spent on Plan schemes do not result in producing the same impact on the economy as would be the case in the rest of the country.
10
(4) Lack of Central Sector Projects.—The State has no Central sector project inspite of its being rich in m ineral and other resources and horticu ltu ral products.It is in the interest of the policy of dispersal of industries and accelerating of industrial development in backward areas tha t Central sector projects of sufficient importance and size depending upon the mineral and other natural resources of the State be located in Meghalaya. Whatever investm ent in the C entral sector projects has taken place so far, it has gone to areas in Assam and not to Meghalaya.
(5) Lack of assistance from Centra! Financing Institutions and Nationalised Banks.—The State has received very little benefit from the Nationalised Banks and financing institutions such as IDBI, A gricultural Refinance Corporation, etc. In the Garo Hills D istrict in the State, one office of a Bank serves a population of 2 lakhs which is very large compared to the all-India average. The advances of the Nationalised Banks have also not been sufficient to meet the requirem ents. The State Governm ent has already initiated action on the basis of the Tal- w ar Committee Report for facilitating the operation of Nationalised Banks.
(6) Price I^evel.—The data relating lo the price indices has not been system atically collected so far for Meghalaya. The trends in the price situation in Assam have shown that the indices of the whole-sale prices and retail prices
in the State are quite high compared to All India averages. In Meghalaya, the prices are still h igher due to insufficient facilities of transport and communication. The high prices prevailing in the State have depressed the standard of living and neutralised the impact of the rise in the State per capita income.
(7) Private Investment.—Due to backward economy, the investm ent in the private sector has also not been forth-coming. Though the statistics relating to the p rivate investm ent during the previous plans and the cu rren t plan is not available, it is clear th a t the lack of private investm ent accounts to a large extent for the low level of development in the State.
11
Comptnrative assessment oi Planned Progress in Meghalaya inAll-India context
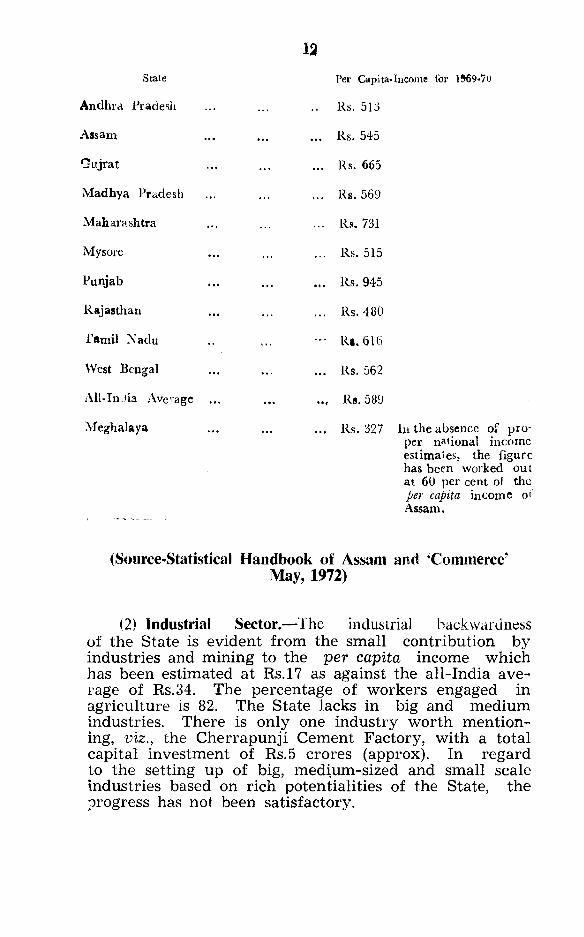
Per capita Income.—Due to lack ot‘ a properly organised m achinery for the collection of statistics and assessm ent of the national income, the estim ate of the per capita income of the State have been made on an ad-hoc basis assuming the per capita\ income of M eghalaya to be 60 per cent of the income of Assam. This assum ption has been based on the following considerations ;
(i) The level of development in the areas constitu ting M eghalaya is considerably lower compared to the areas constituting Assam.
(ii) A considerable percentage of the income of Assam is derived from tea and oil industries which are non-existent in Meghalaya.
(iii) Due to lack of industrial activity, the income from industrial sector is almost negligible in the State.
M eghalaya is extrem ely backward judged from most of the accepted indicators of economic development ais compared not only with the States of the country but even to the States of the north -eastern region. The following table would show the com parative position regarding the per capita income.
12State Per Capita-Income ibr 1969-70
Andhra Fradesji Rs. 513
Assam ... Rs. 545
Giijrat ... Rs. 665
M adhya Pradesh ... Rs. 569
M aharashtra ... Rs. 731
Mysore ... Rs. 515
Punjab ... Rs. 945
Rajasthan ... Rs. 480
Tamil Nadu ••• R i.616
West Bengal ... Rs. 562
Ali-InJia Average Rs. 589
Meghalaya ... Rs. 327 In the absence ofper national income estimates, the figure has been worked out at 60 per cent of the per capita income o* Assam.
(Source-Statistical Handbook of Assam and ‘Commerce’May, 1972)
(2) Industrial Sector.—The industrial backwardness of the State is evident from the small contribution by industries and mining to the per capita income which has been estimated at Rs.l7 as against the all-India average of Rs.34. The percentage of workers engaged in agriculture is 82. The State lacks in big and medium industries. There is only one industry w orth m entioning, viz., the C herrapunji Cement Factory, w ith a total capital investm ent of Rs.5 crores (approx). In regard to the setting up of big, medium-sized and small scale industries based on rich potentialities of the State, the progress has not been satisfactory.
(3) Agriculture.—In the sphere of agriculture much remains to be done. The area under shifting cultivation is about 75 per cent of the cultivated area. The area sown more than once is very low forming a sm all percentage of the total cultivated area. The yield rate in the wet paddy cultivation has shown improvem ent by 20 per cent from 1,137 kg. per hectare to 1,369 kg. per hectart but «till it is below the all-India average. The yield rate in the areas under shifting cultivation has shown a decline by 12.6 per cent from 818 kg. to 715 kg. There has been a shortfall in the achievement of to tal food production which will reach the level of 1.50 lakh tonnes to 1.60 lakh tonnes at the end of the Fourth Plan.
(4) Transport Bottleneck.—The problem of transport and communications which is acute in the entire northeastern region is felt in its w orst form in Meghalaya. M eghalaya does not have even a single kilom etre of railw ay line. None of the places in the State are connected with rail. The nearest rail points from Meghalaya are Gauhati from Khasi Hills on one side and D hubri from Garo Hills on the other.
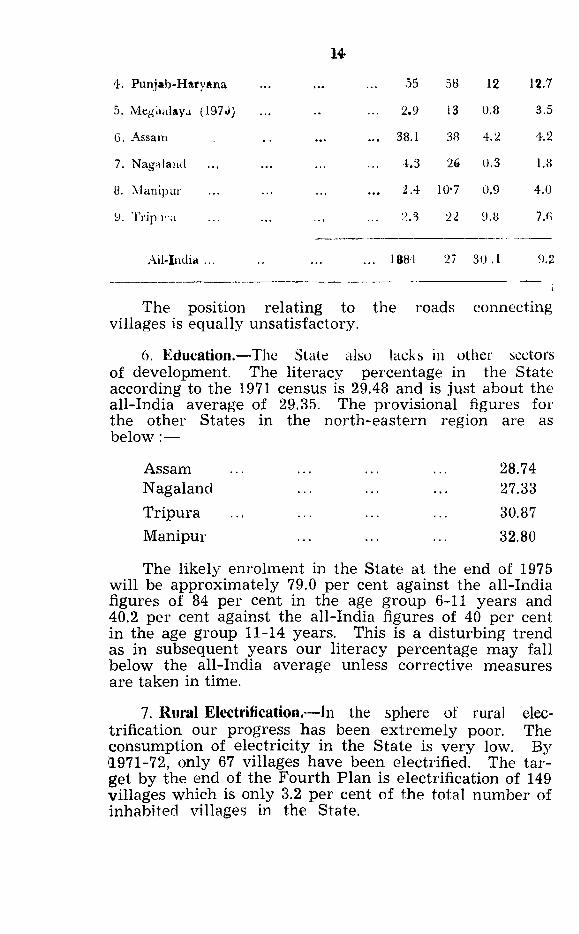
(5) Roads.—The rate of road development had also been extrem ely poor. There were only 13 kms. of road per 100 sq. km. of area in 1970. The State is expected to have 6,289 kms. of m otorable road by 1981 according to the A ll-India Road Plan as against the 3,323 kms. of roads constructed upto March, 1972. This would involve construction of 260 kms. of road on an average annually. The following table indicates the position of Meghalaya as compared to other States and the all-India average
All Roads Roads during 1966-67
Surface Road/——— - ____ / ------
13
())1. M aharashtra
2. West Bengal
3. Tam il Nadu
^ ' a c
S o V oI ^
Ipp
oS
(2) ( ) (4) (5)
54 18 30 9*7
S3 60 16 !8.1
01 46 41 30.5
u
4, Punjab-HarvAna 55 58 12 12.7
5. Meg'italaya (1970) ... 2.9 13 0.8 3.5
6. Assam ... 38.1 38 4.2 4.2
7. Nagaland ... 1.3 26 0.3 1.8
8. Manipur 2.4 10*7 0.9 4.0
9. Trip ir.i 2.3 22 9.8 7.6
,'\ll-Iudia ... ... 1884 27 30 .1 9.2
The position relating to the roads connecting villages is equally unsatisfactory.
6. Education.—The Slate also lacks in other sectors of development. The literacy percentage in the State according to the 1971 census is 29.48 and is just about the all-India average of 29.35. The provisional figures for the other States in the north-eastern region are as b e low :—
AssamNagalandTripuraM anipur
28.7427.3330.8732.80
The likely enrolm ent in the State at the end of 1975 will be approxim ately 79.0 per cent against the all-India figures of 84 per cent in the age group 6-11 years and 40.2 per cent against the all-India figures of 40 per cent in the age group 11-14 years. This is a disturbing trend as in subsequent years our literacy percentage may fall below the all-India average unless corrective measures are taken in time.
7. Rural Electrification.—In the sphere of rural electrification our progress has been extrem ely poor. The consumption of electricity in the S tate is very low. By 1971-72, only 67 villages have been electrified. The ta r get by the end of the Fourth P lan is electrification of 149 villages which is only 3.2 per cent of the total num ber of inhabited villages in the State.
Public Health, Medical, etc. - In regard to water supply also we are lagging behind and it is expected that by the end of the Fourth Plan approxim ately 1.5 lakhs of rural population only will be covered under the scheme for supply of drinking w ater leaving uncovered 80 per cent or so of the ru ra l population. The doctor population ratio in the State at present is 1 : 10,000 as against the all-India average of 1 : 5,150 in 1968. Similar position prevails in regard to prim ary health centres. There is a large backlog of the housing programmes both in iirban and rural areas. The progress in regard to urban development, removal of slum areas, etc., has also not been satisfactory. A small beginning has been made in regard to urban development by taking up a few schemes for im provem ent of m arkets and improvement o-f slum areas, etc. But much has to be done in this sphere.
CHAPTER III
FIFTH PLAN IN OUTLINE
The Vth Plan for the State has been drawn up keeping in view the objectives of the National Plan as w ell as the special requirem ents of the State. A part from the National objectives of elimination of poverty, generation of m axim um employment and the objective of progressive attainment of self-reliance, the Vth Plan for Meghalaya is based on the following special considerations :
(1) The necessity for m aintaining and accelerating the process of development in the State in the light of its extreme backwardness judged from the accepted economic indicators ;
(2) the requirem ent of ensuring an adequate development of roads net-w ork and stepping up of ag ricultu ral production w ith a view to meeting the requ ire m ents of the State and attainm ent of self-reliance ;
(3) the special requirem ent of accelerating development in the areas of the State bordering Bangladesh ;
(4) the requirement for control of jhnmming or shifting cultivation and grouping of villages ;
(5) the requirem ent of meeting the needs of filling up the gap in development in various sectors in the “specially backward” and “most backward” areas of the State.
(6) The higher rate of investm ent for development necessary in the State due to the transport bottle-neck, higher prices and higher labour costs.
In this connection it may be mentioned that the investm ents in financial term s in Meghalaya m ay not be comparable w ith the proportionate investm ent in the other States of the country in term s of results. Due to the factors pointed out above, a given amount of investm ent in Meghalaya will not have the same impact on the economy as may be achieved in other States. For example, the cost of construction of one kilom eter of road in Meghalala is Rs.1.50 lakhs as against Rs.0.80 lakhs in the plains portion of Assam,
16
2. Ii volution of Plan tramework—alternatives:
While considering the developing of a Plan Model tor the State, the following alternatives were considered •
(i) The ideal fram ework for the Plan would haveto be evolved on the basis of perspective Plan for the development of the State in the next decade and providing for the rate and pattern of growth based upon the various relevant factors. The State G o\eiiim ent are seriously handicapped in evolving such a model for tiie Vth Plan due to the fact that the reliable data which would form the pre-requisite for the fram ing of such a model are not available for the State. The Departm ent of Economics and Statistics of the State Government is still in the process of being built up. The full data relating to the assessment of State income are yet to be collected and compiled. Most of the areas in the State have not been covered by cadestral survey and the figures relating to agricu ltu ral production as well as area of cultivationunder various crops are based on ad-hoc estimates. Due to a ll these handicaps, it has not been possible to evolve a model for the Vth Plan, which coald meet the requirem ents of a proper scrutiny in term s of various socioeconomic factors and projected requirem ents for a pattern of future growth of the State.
(ii) The other alternative considered in this con*nection related to the evolving of a framework according to the suggested outlay for the State based upon '‘twicethe I Vth Plan” size of the Vth Plan for the State. This va rian t does not suit the requirem ents in the State due to the following reasons, briefly :
(a) Unlike other States in the country, Meghalaya did not have a IVth Plan of its own as on its being constituted as an Autonomous State on 2nd April, 1970, it got only an ad-hoc allocation, carved out of the Hill Areas Plan of thecomposite State of Assam.
(c) The ad-hoc IVth Plan of the State also did not take into consideration the requirem ent for State level schemes and State level institutions necessary for m aintaining the tempo of development in the State. _
17
(c) The adJwc iVth Plan of the State also did notprovide for the adequate development needs of the border areas of the State.
(d) About 42 per cent of the tribal population of theState num bering approxim ately 3.50 lakhs is dependent on j humming or shifting cultivation and any programme of reaching the minimum needs to this section of the population would presuppose for its successful implementation, the grouping of the existing villages into compact villages with sizeable population and settling the cultivators in these villages.
In view of these considerations, the . suggested approach of the Planning Commission could not be adhered to.
(iii) In the absence of the data and m aterials for working out a model for the Vth Plan taking into account the quantified relevant factors, "the per capita income approach” was tried. The main feature of this approach was to build a model for the Vth Plan on the basis of reaching a level of per capita income which will be equal to the national average at the end of the F ifth Five-Year Plan. The Approach Paper of the Planning Commission did not stipulate w hat should be the target of the per Capita income by the end of the Vth Plan. It has only incucaad ihat the m onthly per capita consumption of the jO'vvest or the population at 1971-72 prices as estimated for 1973-74 at Rs.23.24 for the country as a whole will be raised substantially reducing the gap witli the consumption figure for the richest 30 per cent of population. In the Fourth Plan document, the target of per capita income was to be Rs.884 by 1981 which is to b achieved by doubling the national income during the 12- year period from 1968-69. If the per capita income is to reach tha t level, it should grow at the rate of 4.4 per cent per annumx and should be Rs.770 by 1978-79, i.e.,the end of the F ifth Plan. The average per capita income in India during 1969-70 was Rs.589.3 at current prices. This was, how w er, 38 per cent higher than Rs.426.1 which was the per capita average income for the country at the end of the Third Plan. This gives an average grov/th rate of 9.5 per cent per annum. If this rate can be m aintained, the average per capita income of the country should be Rs. 1,149 at the end of the F ifth Plan. The per Capita income of Meghalaya was Rs.327 for 1969-70 and is
18
expected to be Rs.400 for 1973-74, the base year of the Fifth Plan. If the per capita income of Meghalaya by 1978-79 is to be Rs. 1,149, the rate of growth is to be 37.4 per cent per annum. This points to the large investm ent which is to be put in if M eghalaya’s per capita income is to be braught at the level of average national per capita income during the next 5 years.
(iv) Preferred Mode! r—
19
The model for the Vth Plan of the State has been worked out on the basis of a combination of all the various alternatives. It takes into account the requirements of investment in various sectors of development in the light of the broad objectives indicated above. The calculation of the requirements has been projected in tinancial terms on the basis of the targets fixed for various sectors. The requirements for the special problems of Meghalaya which have been indicated in the previous paragraphs have also been kept in consideration while working out the Plan model.
3. Growth Rates.—The annua! rate of growth or 8 per cenit to 9 per cent has been envisaged for the agricultural sector. The objective will be the* extension of the area as well as intensification of the improved Eigricultural practice and better land utilisation and water management by provision of irrigation facilities and extensive soil conservation measures. This would require shifting of the cultivators from jhumming areas according to a phased and time-bound programme. The cropping pattern will also be suitably changed with a view to maximising production and ensuring a balance between cereals, horticu ltu ral crops and cash crops
In regard to industrial sector, a growth rate of 8 to 10 per cent has been envisaged. The growth rate in the industrial sector would depend upon the setting up of medium and large projects based on the utilisation of inineral and other natural resources of the State. In view of the various competing alter- natiives, the exact pattern of industrial growth cannot be spelt out- However, as we are starting with a low-base of industrial production, the grov/th rate in this sector can be considerably high, especially in view of the richness of mineral and other resources.
$0
I. SIZE OF t h e f i f t h FIVE-YEAR PLAN
On the basis of various considerations outlined in the foregoing paragraphs, the size of the Fiftli Plan is proposed as follows.—
Rb. crorcs
1. Outlay on State Plan Schemes 203-62
(including the Outlay on the scheme for the control of shifting cultivation and groupmg of villages).
IT. Outlay on Genual Scctoi'Programmes
(а) Scheme for Integrated Development of Border Areas 13*10
(б) P lan for “ Specially Backwav'd” and “ Most Back* 8*00ward*' Areas.
(c) Crush Scheme for Rural Employment ... ... 5’0(1
(r/‘ Accelerated water supply schemes ... I'OU
Total—Central Sector Schemes ... ... 27'Ifi
111. Outlay on Centrally Sponsored Schcme Proposed by State Government)—
(a I Agriculture(/-') Animal Husbandry ... *(c) Forests(d) Community Development(e) Co-operation
( / ) Roads(^) Education{fi) Health ....................(e) W ater Supply...Cj ) Welfare of Backward Classes (A-) Soil Conservation
Statistics
■Jotal—Centrally Sponsored Schemes
GRAND TOTAL FOR FIFTH PLANT
♦Included also in State Plan.
Rs. crore.s
6 * 12 0-73 0-3};
1-620-30
0-330-19
9*67
240-47
The outlay for the completion of the schemes continuing from the Fourth Plan would amount to Rs. eleven crorc* (approximate).
SECTORAL ALLOCATIONS
The soctoral distribution of outlays will be as follows:—
(Rs. ci’Ores)Scctors
21
). Agricultural aud Allied Programme2. Co-operation and Community Development3. Irrigation and Power ...4. Industry and Mining ...5 . Transport a n d C o m m u n io a tio T i . ..6. Social Services7. VIiscellaneous ...
Total ...
.\iiticipated Ex O utlay forpenditure under the Fifth
F ourth Plan Plan
7-69 33-092-25 3-27T-85 38-282-29 15-32
U-94 48958-62 60-442-35 4-27
39-99 203-«2
Physical Targets
A detailed iudication of the physical targets projected for the Fifth Five Year Plan has been given in the write-up contained in the various chapters on different scctors. The following table gives an indication of the principal targets of certain selected items:—
Physical targets o f selected item s
Fourlli rJan Fifth Plan 1969-74 1974-79
(ach ie »^emeu I) ■ pr opo.sed)
1. Agriculture—Foodgrains Prcducfion i^oiential 160 250
( ’GOO tonnes).2. Agricultural Cre.iit (Ks. lakhs)—
Short-term (through co-operatives) ... 75 200
3. Power—
Rural electrihcation, Town/Villages 103 1,800electrified (Nos).
4. Roads—
Total (Kms) ... ... 3,385 5,885
Surl'acctl Reads (Kuis.) ... 096 1,396
Knsiirfaced (Kms.) ... ... 2,889 4,489
5. Kducation—Additional Enrolment; (in thousands)
(a) Cks^es I—V ..................................... 11 122
(b) Classes V I—V II I .................... 5 53
(c) Classes IX —X I .................... 11 18
6. Health—
(a) Hospitais, Di.spcnsaiies and Heahh 78 88Centres (Nos).
(b) Beds (Nos) ... .. ... 138 410
7. Water Supply—
(a') Rural Water Sup])ly—Villages 179 620coveted (N. s).
5. Self-Reliance.—The national objective of achieving scif-reliancc has been accepted as one of the objectives in the State Plan. However, in view of the circumstances of the State, the self-reliance in the context of IVfeghalaya would mean stepping up of agricultural production with a view to ineeting the deficit in food-grains and stepping up the production of protected protein foods like eggs, meat, milk, fish, vegetables, etc. It would also mean the improving of the production of horticultural and cash crops like jute, betelnuts, etc. It has been estimated that with a view to achieving self-sufli- ciency in food-grains, the State will have to reach the food- grains production target of roughly 1 lakh 88 thousand tonnes. However, the target has been put at 2.50 lakh tonnes with a view to providing adequate surplus and it matches with the projected growth rate of 8 to 9 per cent annually.
riie inipiemeiitation of the Fiaii and the fullilment of the targets envisaged for tJie achievement of objectives set forth under the plan would call for niaxinnini eiioi ts from the administration and co-operation and participation from the people. The process of re-organisation of the administrative structare and its functioning in the light of the recommendations of Administrative Reforms Commission and the team of the Administrative Reforms Department of the Government of India which visited the State and made detailed recommendations, for Meghalaya has already been undertaken, ft is proposed to make changes in the administrative structure and clearly delinc and demarcate the functions of the various kvels of adn\inis- tration with a view to ensuring the successful implementation of the Plan.
Price Stability.—2. The successful implementation of the Plan would to a large extent depend iipon the stability in prices and on taking measures for avoiding steep iluctuaiions. A> the State depends for the supply of essential commodities on import from the other parts of the country and the major action for regulating the course of prices lies with the Central Government, the role of the State Government in this regard is considerably limited. It is proposed to streamline the system of distribution of food grains and basic consumer goods and rely on an increasing scale on the co-operatives and fair price shops.
Tlie State Government would give active support to the co-operative institutions and other institutions of development and will utilise them as the active centres of development.
Re-orgaiiisatioii of the Development Administration.—3.In the light of the experience gained in the working of the schemes under the Fourth Plan, it is proposed to make changes in the structure of development administration in the State. The effort in this direction will be based on the following lines :—
(1) A State Planning Board has already been set up. Thiswill be suitably strengthened and its functioning will be activised so that it could play its adequate role in planning.
(2) The State Planning and Development Advisory Council has already been set up. The assistance of the
CHAPTER IV
Implementation of the Fittli Plan
Council would be taken in increasing measure, with a view to enlisting peoples’ co-operation in successful implementation of the Plan.
(3) District Planning Boards are also being set up which are expected to play important role in framing of District Plans in accordance with the local felt needs of the area and in the broad pers]>ective of the development of the State as a whole.
(‘■1) District Planning and Developinent Advisory C o u n c ils licive also been set up which contain representatives from various sections of the population apart from educationists, economists, etc.
(5) The cxisling Block Level Advisory Connnillees m\\ be re-organised with a view to making them elective in accelerating development in the Block areas.
In each District a District Planning Officer is being appointed with nvcessarv contingent of stalT who would look after planning and supervise the implemejitation of the schemes at District level under the over-all guidance and supervision of Deputy Commissiojiers and in consultation with the District Heads of Developn.icnt Departments.
Re-organisatioii oi the State-level Acimiiiistration—4, VVitli a view to improving the supervision over the implementatioji of Plan Schemes, the following arrangements will be made
(1) Machinery for collection of statistics under the Directorate of Economics and Statistics will be suitiibly strengthened.
(2) At the State-level a Moniloring-cuni-Evaluation Cell will function under the Planni'ng Department with a view to collecting essential data timely regarding the performance in key sectors of development.
(3) Adequate arrangements for man-power planning willbe made. A Man-Power unit is being set up under an Officer of adequate seniority with a view to ensuring the assessment of man-power requirements and the availability of various categories of personnel as w«U as for watching the employment generation under .various sectors in the Plan.
Tnter-Sectoral balance.—5. The necessity for inter-sectoral balance under the Plan has been recognised. While formulating the Draft Proposals, the requirements for inter-sectoral adjustments have been kept into consideration in the following manner:—
(a) While preparing the plan for development of road- net-work in the State, the requirement of communications for various purposes, e.g., the requirement for carriage and marketing of agricultural produces, the requirement for improving communication and for generation of power and expansion of industries, etc., have been taken into consideration.
(b) It is proposed to periodically review the requirementof inputs in consultation with the concerned Departments and to assess their demand and supply position and take corrective measures.
25 ,
For the purpose of Plan formulation the requirement of essential inputs has been broadly examined. The State has a cement factory of a daily production capacity of 250 tons which is being increased to 950 tons during next one year or so. It is felt that the State may not feel the scarcity of cement if it is allowed to draw upon its requirement from the existing plant. In regard to iron, the State Government will have to depend on outside supply which will have to be considerably stepped up. If the State is given its proper share in the increased output based on the projected growth in the production of iron materials as envisaged in the approach to the national Fifth Plan, the State will be able to put through its programme. The arrangements for tools and plant and drilling rigs, etc., will require constant vigilance and periodical review. The increased requirement of fertilisers, seeds and pesticides are envisaged to be met provided the existing arrangements relating to their supplies are continued and the quantities are stepped up providing for the adequate share of the State in the projected increased output for the Fifth Plan Period. The requirement of the State in regard to these agricultural inputs forms a very minor part of the total production of the country.
The position as indicated above will be b ro a ^ . revt^dd- and periodical assessment made with a view scarcities and correcting imbalances.
Ihe role of financing institutions, etc.—6. The achievement of the targets for agricultural production as well as the setting up of industries as envisaged under the Vth Plan will depend upon the Centre’s initiative as well as the support to be extended by the Central Financing Institutions, Nationalised Banks,I. D. B. I., I F. C., State Financing Corporation, etc. At this stage when the Draft Proposals for the Fifth Five Year Plan are being formulated, it is not possible to lay down in exact terms the targets for them. On the basis of. a broad estimate as well as the survey conducted by the State Bank of India under Lead Bank Scheme it has been assessed that the existing requirement of financial credit for agriculture, medium industries, small-scale and cottage industries, etc., amounts to Rs.22 to 23 crores annually. As against this, existing flow of credit from the financing institutions including the Co-operative banks does not exceed even Rs. two crores. With the taking up of the various schemes under the Fifth-Five Year Plan, the demand is likely to increase. On a modest estimate the requirement of finance from the nationalised banks, financing institutions and Co-operative system for agricultural credit, medium, small-scale and cottage industries, etc., would approximately be of the order of Rs.150 crores in the minimum. Apart from this, the Central financing institutions will have to extend financial support for the major industries envisaged under the Plan. The assistance from the L. 1. C. for the power projects and housing sector as well as for transport schemes will have to be continued at a rate twice the existing rate in the minimum. The Housing and Urban Development Corporation will also have to extend its activities in the State. The LIC.’s loan assistance for power projects will also have to continue.
Due to the low level of economy, the investment in the private sector has not been forthcoming in Meghalaya. In the absence of suitable machinery, the statistics relating to the private investment during the previous Plans and the Fourth Plan period as well as the projections for the Fifth Plan could not be made. It is, however, clear that the private investment during the Fifth Plan cannot be very large and we will have to depend almost to the full extent on public sector investment and investment from Central Financing Institutions and nationalised Banks.
Role of the Central Government.—7. In case of a backward State like Meghalaya, the Centre will have to play its due role. There has been no Central investment on industrial or power
26
projects in the State. Apart from providing for greater investment on industrial projects in tlie State the Centre will have to step up the availability of incentives for industriaUsation in the State. In accordance with the decisions of the N. D. C. based on ihe recommendations of the Pande Committee and the Wan- choo Committee, the Government of India have undertaken the scheme for providing incentives in the backward areas for industrialisation. The experience in Meghalaya has shown that tliese incentives have not been sufficient to accelerate industrialisation. The matter has to be further examined with a view to increasing the number of incentives and making them broad- based and more effective. The grant of transport subsidy for raw materials and finished products from and upto Siliguri does not meet the requirements as the growth of communications and the infra-structure for facilitating the operation of the transport subsidy scheme has been slow and halting. The concessions in terms and conditions of loans granted by the financing institutions are not adequate and require further liberalisation.
The Central Governm ent have also to play a m ajor role regarding the development of communications system in the State. The following proposals are made in this regard :
(1) Development of Railway System.—As has already been stated earlier, none of the places in the State are connected w^ith Rail. The im plementation of the following suggestions will help in rationalisation and proper development of railw ay system in the State.
(ii) The construction of a railw ay line from Gauhati to Burnihat in Meghalaya.
(iii) The extension of the railw ay line from Jogighopa to the southern bank of the Brahm aputra upto a point in the plains portion of the Garo Hills District subject to a provision for the ultim ate extension of the railw ay line to Baghm ara via Siju.
(2) The program m e relating to the construction of roads in sensitive border areas of the State has to be taken up by the C entral Government on a priority basis. The level of expenditure on building up of the roads in the border areas should be kept at the level as envisaged earlier.
21
(3) The Centre should either finance fully or take up a few schemes for power generation in Meghalaya in view of the vast potential of the State for the generation of the electricity and the necessity of stepping up power generation to make up for the over-all shortage and m eet the increasing requirem ents in this regard.
A part from these programmes the Central Governm ent should also ensure that out of the funds earm arked for the development of the north-eastern region, Meghalaya should get adequate share depending upon its requir<="ments'^ and potentialities.
8
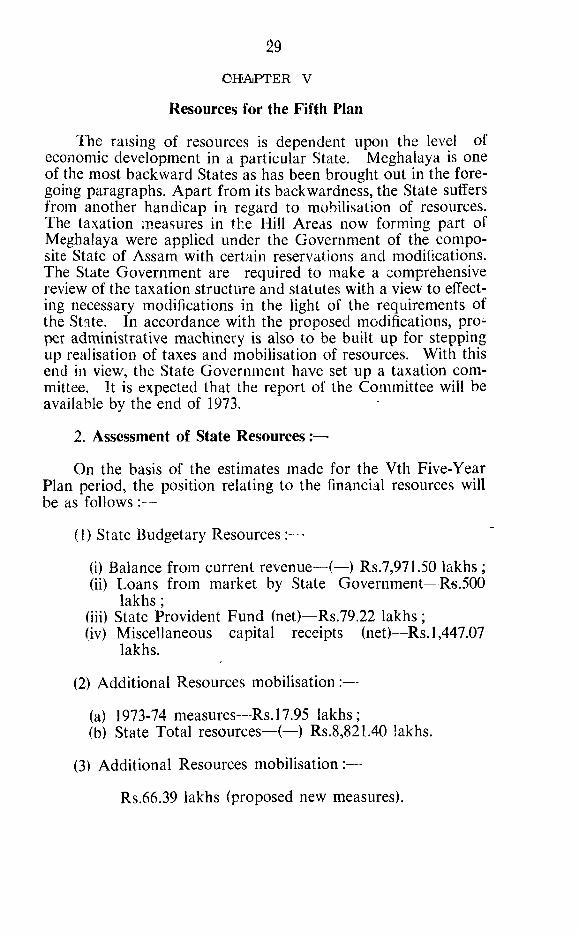
The raising of resources is dependent upon the level of economic development in a particular State. Meghalaya is one of the most backward States as has been brought out in the foregoing paragraphs. Apart from its backw^ardness, the State suffers from another handicap in regard to mobilisation of resources. The taxation measures in the Hill Areas now forming part of Meghalaya were applied under the Government of the composite State of Assam with certain reservations and modifications. The State Government are required to make a comprehensive review of the taxation structure and statutes with a view to effecting necessary modifications in the light of the requirements of the State. In accordance with the proposed modifications, proper administrative machinery is also to be built up for stepping up realisation of taxes and mobilisation of resources. With this end in viev/, the State Government have set up a taxation committee. It is expected that the report of the Committee will be available by the end of 1973.
2. Assessment of State Resources;—
On the basis of the estimates made for the Vth Five-Year Plan period, the position relating to the financial resources will be as follows :—
(1) State Budgetary Resources:—
(i) Balance from current revenue—(—) Rs.7,971.50 lakhs ;(ii) Loans from market by State Government—Rs.500
lakhs;(iii) State Provident Fund (net)—Rs.79.22 lakhs;(iv) Miscellaneous capital receipts (net)—Rs. 1,447.07
lakhs.
(2) Additional Resources mobilisation :—
(a) 1973-74 measures—Rs. 17.95 lakhs;(b) State Total resources—(—) Rs.8,82l.40 lakhs.
(3) Additional Resources mobilisation :—
Rs.66.39 lakhs (proposed new measures).
9
CHiAPTER VResources for the Fifth Plan
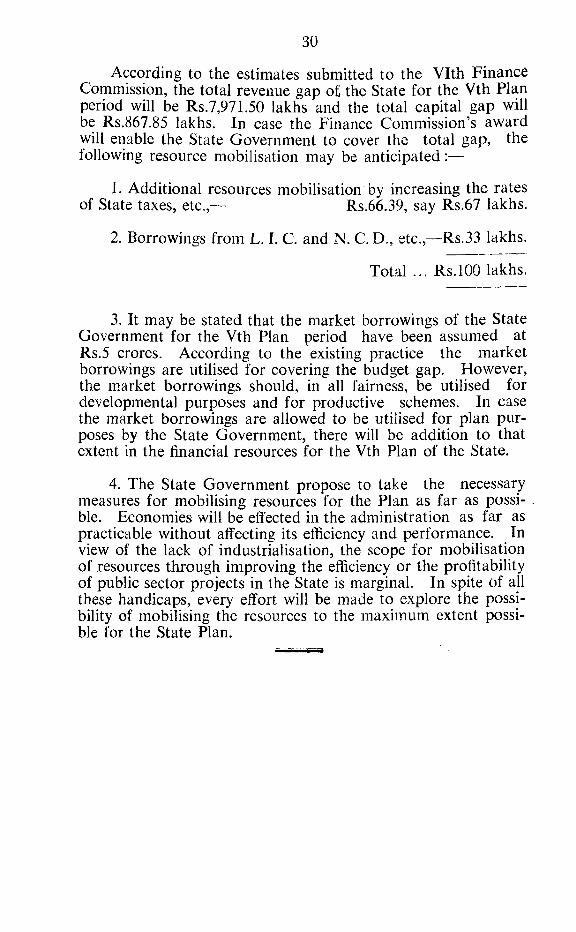
According to the estimates submitted to the YIth Finance Commission, the total revenue gap ot the State for the Vth Plan period will be Rs.7,971.50 lakhs and the total capital gap will be Rs.867.85 lakhs. In case the Finance Commission’s award will enable the State Government to cover the total gap, the following resource mobilisation may be anticipated:—
1. Additional resources mobilisation by increasing the ratesof State taxes, etc.,— Rs.66.39, say Rs.67 lakhs.
2. Borrowings from L. I. C. and N. C. D., etc.,—Rs.33 lakhs.
Total ... Rs.lOO lakhs.
30
3. It may be stated that the market borrowings of the State Government for the Vth Plan period have been assumed at Rs.5 crores. According to the existing practice the market borrowings are utilised for covering the budget gap. However, the m.arket borrowings should, in all fairness, be utilised for developmental purposes and for productive schemes. In case the market borrowings are allowed to be utilised for plan purposes by the State Government, there will be addition to that extent in the financial resources for the Vth Plan of the State.
4. The State Government propose to take the necessary measures for mobilising resources for the Plan as far as possible. Economies will be eilected in the administration as far as practicable without affecting its efficiency and performance. In view of the lack of industrialisation, the scope for mobilisation of resources through improving the efficiency or the profitability of public sector projects in the State is marginal. In spite Of all these handicaps, every effort will be made to explore the possibility of mobilising the resources to the maximum extent possible for the State Plan.
The increased generation of employment opportunities is necessary with a view to elimination of poverty and raising the level of living of the poorer section of the population. Various schemes were undertaken under the Fourth Five Year Plan with a view to relieving un-employment in the rural areas as well as for benefitting the educated un-employed. It has been estimated that at the existing level of expenditure the Crash Schemes for rural employment are providing employment for8,000 persons for 3 months in the year. The special employment programme is providing employment for 760 persons for 3 months. The bevAefits of the schemes covered under these categories are available in the rural areas. The programme taken up in the State under the “Half-A-Million Jobs Programme” for educated un-employed is likely to provide employment for 1,668 persons in all including 1,257 educated unemployed persons. It will be necessary to continue these schemes and to increase outlays on them with a view to making available employment opportunities at an increased basis under these schemes.
2. The statistics relating to un-employment in the State are not available in Meghalaya. Workers constitute 44.16 per cent of the population according to the Census of 1971. The strength of the labour force in 1971 was estimated at 4.5 lakhs. Addition to the labour force during the Fifth Plan is estimated at 0.61 lakh. If the back-log of un-employment is taken roughly at one lakh the additional employment generation will have to be about 1.61 lakhs.
3. The employment generation in the Fifth Plan will be ensured by undertaking employment oriented schemes for all sectors of development, viz., agriculture, soil conservation, irrigation, rural water-supply, roads, small-scale and cottage industries. In the urban areas, employment generation will depend upon the setting up and extension of industries, trade and coiiimerce. The Government sector will provide employment by way of creation of jobs for technical as well as general administrative and ministerial personnel. It has been estimated that the State will not face the problem of un-employment of technical personnel and the technically qualified personnel in agricultural sciences, veterinary, engineering, etc., will be absorbed by
31
CHAPTER VI
Employment generation in the Fifth Plan
the anticipated expansion of the departments of the Government during the fifth plan period. The main brunt of unemployment will be faced by the educated un-employed with general education, under-Matriculates and the agricultural labourers as well as other in ua-employed categories of persons in the rural areas. Apart from maximissing employment directly as well as indirectly under the various development schemes, the following other measures will be taken during the Fifth Five Year Plan—
(1) The administrative machinery dealing with assessmentof employment and placement of personnel will be re-organised and strengthened.
(2) A man-power unit will be set up in the State underan Officer of a sufficiently high status. The Directorate will function in regard to making periodic assessment of man-power requirements and supply and suggest corrective measures. The unit will also be entrusted with the function of maintaining liaison with the various Government departments, industrial units and private industrial entrepreneurs with a view to ensuring maximum utilisation of employment opportunities.
Emphasis on utilisation of local man-power resources:
4. It is one of the main points of State policy to ensure that the available man-power resources of the State are suitably utilised by the various industrial units which are already existing or are likely to be set up under the Fifth Five Year Plan. The employment of local personnel for various Central Government Offices, nationalised banks and other organisations will be helpful in solving the problem of un-employment in the State and will also facilitate the functioning of these institutions in the State. Government propose to take necessary measures for ensuring the fulfilment of this objective.
32
C H A PTER VII
Contingency Plan for Natural Calamities
From the past experience of the working of the deve-» lopment programmes, it has been found tha t the occurrence of natural calamities upset the balance of economy considerably leading to a serious jolt to the grow th rate. In view of these considerations, the Governm ent of India have proposed the preparation of a Contingency P lan for na tu ra l calamites for each State. This Chapter contains a brief description and the m ain guidelines for such » Plan.
Strategy
2. M eghalaya is susceptible to the following types of na tu ra l calam ities:
(a) The plains areas of Garo Hills and flat lands of Khasi Hills and Ja in tia Hills bordering Bangla Desh suffer from recurrence of floods.
(b) In certain pockets in the hilly areas, droughtoccurs.
(c) In the areas under shifting cultivation, considerable distress is caused every year due to crop failure. As cultivation in these areas depends entirely on rain, even the delay of one week in the tim ely onset of rains leads to crop failure and consequent prevalence of distress.
(d) Due to the houses in the towns as well as inthe ru ra l areas being constructed on the traditional p a tte rn w ith tim ber, thatch Cl sheets, etc., extensive damage from fire is also caused in certain areas.
W ith a view to m eeting the requirem ents of thesituation, the following action is proposed.
(i) In each district and for each subdibision, theDistrict authorities will draw a P lan for im m ediate m easures in case of the occurrence of any of these calamities. The D istrict authorities, will identify the areas of occurrence of the various types of calamities and draw up alternative Plans for various purposes for meeting the requirem ent of situation in case of the occurrence of these calamities. The scheme will be put into operation im m ediately
33
on occurrence of any of these calam ities. Officers will be ear-m arked in the District and Subdivisions who will be made responsible for these Plans in advance and who would be required constantly to visit the ir areas a t periodic intervals w ith a view to anticipating the occurrence of na tu ra l calam ities and
bringing theirof operation Plans up-to-date,
(ii) On the occurrence of na tu ra l calamities, relief schemes will be put into operation. The relief schemes envisage evacuation operations as well as the distribution of food grains, cash doles, etc., and building up or location of p ro per shelters.
(iii) In case of intense natu ra l calamities, rehab ilitation benefits will have to be extended. The Plan would provide for extension of such benefits also to the affected sections of population.
Financing of the Contingency Plan for natural calamities:
3. At present, the extension of relief and rehab ilita tion m easures at the times of na tu ra l calamities is being financed through the norm al resources ‘of the States at the first instance. On the request of the State G overnments, a C entral Team visits the States and makes assessment of financial requirements which are given on loan- cum -grant basis. The present system is unsatisfactory as apart from increasing the burden for loan re-paym ent on the part of the State Governments, delay occurs in assessm ent of the requirem ent for na tu ra l calamities w ith the result tha t in certain cases the State Governments are not able to take adequate m easures due to their difficult ways and means position. The Vlth Finance Commission is considering the various proposals in regard to the arrangem ents for financing of the requirem ents for n a tu ral calamities. Action will be taken in the light of the recom mendations of the Finance Commission and the decisions of the Government of Indian on them. The State Governm ents’ requirem ent for taking m easures in case of na tu ra l calamities have been placed before the Finance Commission. It has been estim ated that the total requirem ent of the State on this account would come to Rs.l75 lakhs.
34
As regards the rehabilitation benefits, it is felt that the financing will have to be done by the nationalised banks by way of extension of loans. In necessary cases, the State Governm ent m ay pi*ovide funds for covering the m argin or giving outright grants based upon the merits of each case of the persons affected by natu ra l calamities. The assistance by the banking institutions will have to be on the basis of soft loans on concessional terms.
35
CHAPTER V III
Integrated Scheme for Rehabilitation o f the Econoxniy of the Border Areas
1. The border areas of Meghalaya comprise the southern slopes and the adjoining strips of the State along the Bangladesh area. The border area runs laterally, approximately 496 kms. from Dona-Malidhar area in the Jaintia Hills to Ma- hendraganj in the Garo Hills and thence northwards for some distance to Mankachar In the Khasi Hills, and Jaintia Hills the border covers a land surface of about 6,100 sq. km. and. comprises the population of 97,000 (based on the 1971 census). In the Garo Hills it comprises a land area of about 2,050 sq. km. and about 1,32,000 population. The total population of the State living in the border areas according to 1971 census has been assessed at 2’30 lakhs. The areas is about 1,150 sq. km. These figures amount approximately to 36 per cent of the State’s total area and 23 per cent of the population.
2. These areas have traditionally grown such produces as oranges, pan leaves and pine-apples. These perishable produce of the border areas as well as forest produce like bamboo, timber, etc. were sent to the adjoining districts in the then East Pakistan where they were transported by land and river routes toother areas. The value of goods exported to East Pakistan from the United Khasi and Jaintia Hills District alone during pre-partition days was estimated to be approximately Rs.2 •5 crores. In their turn, the border areas depended on the supply of essential requirements like food-grains, fish, salt, kero- sine oil, etc., from the neighbouring districts of the then East Pakistan.
Conditions after Partition
3. After the partition, the border trade was restarted on a restricted scale However, the straining of relations and outbreak of hostility or border firing, etc., between two countries and even during the normal years, the custom restrictions and e,g., shortage of foreign exchange, banking facilities and other factors have, to a large extent, limited the usefulness of this trade between the two countries. The position deteriorated with the straining of relations between India and Pakistan. With the emergence of Bangla Desh it was expected that there would be improvement in the situation but this has not materialised so far.
S6
The Necessary of Development o f Border Areas
4. The factors indicated in the foregoing paragraphs have brought to the lime-light the problem of development of the alternative sources for disposal of border produces and supply of essential commodities. Even if the trade with Bangla Desh becomes fully effective, it would be worthwhile to continue the efforts with a view to diversification of channels of trade and from the point of view of benefiting the country as a whole. This is also important from the strategic point of view as strengthening of economic Unks with the border people is necessary on security reasons and with a view to giving them a sense of full participation in the economic life of the country.
REPORTS OF THE VARIOUS COMMITTEES, ETC.
5. The problem of the border areas has been examined by several Committees from time to time. Immediately after the Partition, at the request of the State (Assam) Government a high- powered Committee headed by Shri H. V. R. lengar, the then Secretary of the Ministry of Home Affairs was appointed in 1952. The Committee recommended the construction of a network of roads to facilitate the transportation of the agricultural produces of the border areas as also subsidising the foodstuffs. The Lall Singh Committee which looked into this question in 1954 suggested the setting up of fruit preservation-(;«7/?-cann- ing plants and linking them to a number of juice extracting plaints located in the Border Areas where orchards are situated. The Assam Government also appointed three Committees consisting of officials and non-officials in 1959 to make recommendations for rehabilitation of the economy of the border areas.
OBSERVATIONS ON THE WORKING OF THE PROGRAMMES UNDER ASSAM GOVERNMENT
6. The programmes undertaken on the suggestions of these Committees did not meet with success due to the following reasons:—
(1) The financial allocation for the purpose was insufficient and hence the desired objectives could not be achieved.
(3) The programme of a long-term nature like diversification of agriculture, taking up terracing, improvement of orchards and introduction of alternative crops, etc., was not taken up adequately.
37
7. The conditions in the border areas at present remain as before and these areas lag behind in regard to the various sectors of development. With a view to solving the problem of the border areas the Meghalaya Government had earlier submitted a scheme for undertaking the rehabilitation of the economy of these areas. The programme as now drawn up contains the profile of the schemes to be undertaken as a co-ordinated project for the development of the border areas. The main points of strategy in regard to the development of border areas briefly will be as follows :—
38
(1) The development of the road communications in the area will l e given utmost priority. The development of the road communication will be designed vvith the Dbject of improving the communications in the border areas as well as connecting the border areas with the rest of the State and the country with a view to achieving the objective of the diversification of channels of trade for the produces of these areas.
(2) Due emphasis will be given on the improvement of the existing horticultural crops of the area. Since a long time past, the people in the border areas have been cultivating these horticultural crops and have gathered experience. With proper guidance, supply of inputs and extension of the results of modern technological and research developments, these areas could be turned into useful sources of supply of the horticultural produce not only to ^angla Desh but for the country as a whole.
(3j Side by side with the development of the traditional horticultural crops in the areas it is necessary to introduce new crops. The introduction of food crops, e. g., paddy and wheat, etc., is necessary with a view to making the area self-sufficient in food grains.
<'4) The development of both the traditional horticultural crops and the new crops in the area would require development of irrigation facilities and supply of necessary inputs and machinery for land development.
39
(5) Traditionally the cultivation in these areas has remained confined to the lands which could easily be cultivated. Apart from extension of irrigation facilities, new areas could be brought into cultivation by reclamation and terracing of the slopes. The programme aims at achievement of this objective also.
ASPECTS OF THE PROBLEM—SHORT-TERM MEASURES
8. It is felt that the development programme for the border areas of the State has to be taken up on (a) short term and (b) long term basis. As a short term measure an emergency scheme has to be taken up. This scheme will be executed in a manner as to serve the requeirements of the situation in the border areas for the next five years and will also dove-tail with the long-term programme for the development of the area. The emergency scheme based upon the short-term measures in the area will consist of the following:—
(1) Scheme for generation of em ploym ent in the border area :—Due to suspension of border trade and closure of border markets, etc., acute scarcity prevails in the area. With a view to relieving the distress, the State Government propose to under-take schemes for improving employment opportunities in the area by taking up projects like construction of village feeder roads, irrigation channels, terracing, etc. During the current year the State Government have already earmarked Rs. 20 lakhs for the purpose of suchschemes. Much larger amounts would be needed to makeavailable the facilities for increased employment opportunities to the people in the border area as the long term measuresvs ould take time to materialise.
(2) Scheme for foodstuff supply in the border areas :—As has been pointed out in the foregoing paragraphs the border areas were not self-sufficient in regard to the foodcrops. Apart from the fact that the traditional crops culti vated in these areas consisted of horticultural crops, thQ cultivation of thQ

food crops like paddy, wheat, etc., was not possible due to the lack of irrigation facilities and terracing of slopes, etc. The extension of the food crops in the area will proceed simultaneously with the extension of irrigation facilities, building up of terraces, etc. It is felt that these measures will improve the position gradually and the supply of foodstuffs and essential consumer articles in the area will have to be continued on a subsidised basis for the period of Fifth Plan. The scheme provides for the requirements in this regard.
40
(3) Marketing-6:Mm-Agro Industrial Development Corporation Due to the closure of border markets and lack of progress in implementation of the trade agreement with Bangla Desh, the marketing facilities for border produce need augmentation. With a view to making suitable arrangement for marketing of border produce it is felt necessary to set up a Marketing-CM;72-Agro Industrial Development Corporation. The Corporation will function through marketing co-operative societies to be set up in selected border areas and will purchase the border produce. The Corporation would arrange for the marketing of these produce both inside as well as outside the State. The Corporation will also perform the function of organising, buying and processing of these produce and for setting up of agro-industries. The marketing operations will be done through marketing societies. These will be selected out of the existing marketing societies or by organising new societies, if necessary. The scheme provides for grant of share-capital contribution, managerial subsidies to these societies, provision for trucKs, etc. As the border produce are perishable and market trends erratic it is proposed to set up a price fluctuation fund at 10 per cent of the tot;^l value of the produce handled by the Corporation which will be maintained both at the Corporation and the Marketing Societies’ level.
LONG TERM MEASURES
9. The long term programme for the rehabilitation of the economy of the border areas has been drawn up on the basis of the objectives already indicated above. The essential features of the schemes are given below:
(1) Communications.—As already indicated above the development of communications is of supreme importance for
the integration of the economy of the border areas with the rest (£ the State and the country and for the diversification of the trade in border produce.
(2) Agro-Industries.—The development of agro-industries is essential from the point of view of ensuring remunerative return for the horticultural crops produced in the area. The schemes in this sector include the setting up of three fruit preservation units, two supari drying units, timber logging and saw-milling and other units based on local skill and raw naaterials.
(3) Agricultural Development.—The schemes envisaged in this sector relate to reclamation of land, improvement of the existing horticultural plantations, taking up of new horticultural plantations, introduction of new food crops, reclamation of land, development of irrigation facilities, undertaking of intensive demonstration plots in the light of the strategy outlined in the foregoing paragraphs and supply of inputs such as fertilisers, seeds etc., at subsidised rates in view of the peculiar conditions in the border areas and the high cost of transport of the inputs.
(4r) Animal Husbandry.—The scheme in this sectors aims a t control of diseases by providing for veterinary aid centres, mobile dispensaries and immunization facilities. As a part of the long-term scheme, the aim is also to diversify the border area economy by encouraging piggery, sheep and goat and poultry rearin.e which would yield quick return to the farmers. Improvement of the cattle breed in the border area would also be undertaken by introducing improved breeds of bulls and heifers.
(5) Fisheries.—The Border Area is the main source of fi;sh supply in the State as well as a valuable source of earnings to the border people. Under the scheme, the aim is to increase the production by encouraging crcation of pond and tank fisheries as well as by improving the catch by providing for assistance for nets, boats and better marketing facilities.
(6) Co-operation.—The co-operative movements has made a good beginning in the border area. Sub-area cooperatives, marketing societies and service co-operatives have
been functioning and offer good prospects of development inthe circumstances prevailing in the border areas. But as elsewhere in the State and in this region, much remains to be done. The principal areas of effort are in marketing of produce and supply of consumer goods. Larger-sized and viable co-operatives would have to be organized in nine or ten principal produce collection centres and at the same time, the existing co operatives will have to be re-organized and strengthened by liquidation and merging into viable units. In order to sustain their growth, these societies will have to be assisted adequately in the initial stage towards share- capital, working capital and storage requirements as well as in managerial subsidy to enable them having full time office bearers. In order to ensure smooth functioning of the various border area co-opcratives and enable adequate attention to the needs r.f the border area, a Marketing-cwm-Development corporation, referred to earlier, would be set up. This corporation would function as an apex organisation of the co-operative movement in the border areas and would arrange for marketing of the produce elsewhere in the State and outside on the one hand and ensure mo\ement of essential supplies to the Border areas on the other. The Corporation would have branches to attend to the needs of the co-operatives la the border areas of each of the districts and would operate a Risk Fund insuring against unforeseen set-backs in marketing and border trade.
42
(7) Sericulture.—The aim is to develop the potential of the border area of the districts so that in the long run the border area economy becomes diversified. With friendly relation with Bangla Desh this potential is tremendous. Even on the strength of the internal market alone, there is adequate scope for development of sericulture in this area.
(8) Communications.—The compelling circumstances of communication needs of the Border area have already been dealt in the foregoing paragraphs. The short term measures include feeder roads, improvement of foot tracks, link roads and means of river crossing designed to facilitate better use of the existing facilities. As part of a long-term scheme, inacessible areas will have to be opened up by constructioii of a number of “arterial roads” to such areas. Schemes as now proposed arc small individually, but taken together the cost of schemcs adds up to a sizeable figure which speaks of the magnitude of the problem. Bigger schemes would be taken up under the State Plan.
(9) Special Employment and M i s c e l l a n e o u 8 Schemes.—To relieve the acute unemployment prevailing in the Border Area due to closure or rcbtriction of border trade, it is necessary to take up schemes that would quickly generate employment suited to the skills and attitude of the Border people. Recent experience suggests that stereotyped employment schemes suitable elsewhere may not be suicablc for this area of the State.
The border people of the State have a long experience in trade and any scheme that could be related to it would, therefore, has greater chance of success. Improvement of the border markets is one of such scheme. Besides generating employment, the scheme would provide for assistance to various local authorities to improve the market areas. Under the proposed scheme, 9 border market centres would be developed. Development of these centres would be dove-tailed with other schemes for marketing and supplies referred in the foregoing paragraphs.
10. In order to enable drawing up a comprehensive and integrated plan for development of the border area, it is also proposed to carry out a detailed survey of the different aspects of the problems and potentials of the area and its people, A special cell will be created to carry out the survey in course of next three years.
FINANCIAL IMPLICATION
11. The integrated programme as now drawn up involves an outlay of Rs. 13T0 crores for five years as summarized at the end of this note. It may be noted that no schemes are proposed under the integrated programme for sectors like education, health, water supply, rural electrification and mineral development. Likewise, bigger road schemes, missing road links and roads of strategic importance have not been included in the integrated scheme development in these sectors
. is also essential for the rehabilitation of the border area economy and for the successful implementation of the schemes under the integrated programme. Work under some of these sectors is expected to be taken up under the normal State Plan which underlines the necessity for the provision of the sufficient funds for the State Plan. The programme outlined here has also to be supplemented with the construction of roads and bridges under the Border Roads Programme executed by the Border RoacJ Organisation of the Government of India,
43
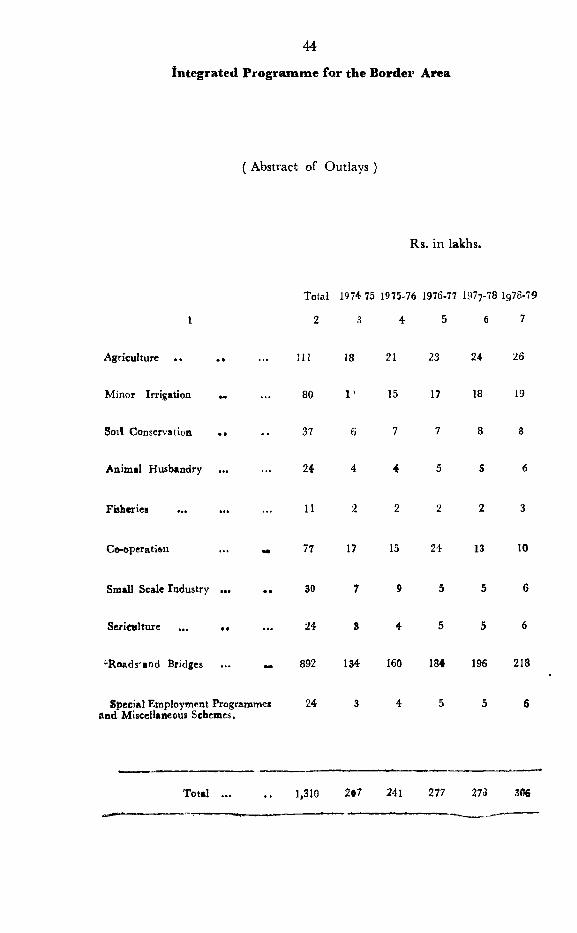
Integrated Program m e for the Border Area
44
( Abstract of Outlays )
Rs. in lakhs.
Total 1974-73 1975-76 1976-77 1977-78 1978-79
2 3 4 5 6 7
Agriculture . . I l l 18 21 23 24 26
Minor Irrigation 80 15 17 18 19
Soil Conservation 37 8 8
Animal Husbandry 24
Fisheries 11
Go-operatien
Snaall Scale Industry
Seriettlture ... . .
^•Roads'and Bridges
77 17 15 24 13 10
30
24
« 892 134 160 184 196 218
Special Employment Programmes 24 3 4 5 5 6&nd Miscellaneous Schemes.
T o t a l .................. 1,310 2«7 24l 277 273 306
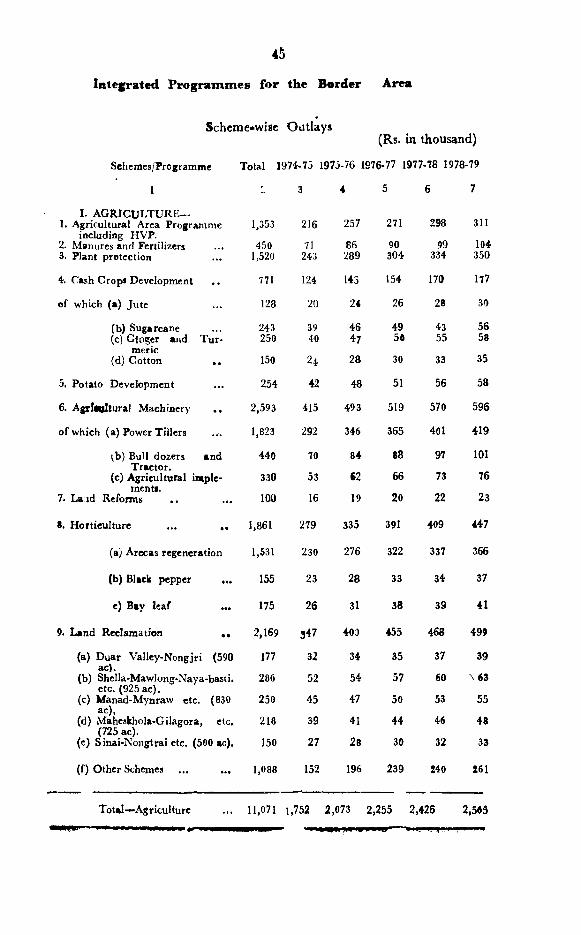
45
Integrated Programmes for the Border Area
Scheme-wise Outlays
Schemes/Pfcgramme
1
I. AGRICULTURE—1. Agricultural Area Programme
including HVP.2. M anures and Fertilizers3. Plant protection
4. Cash Crops Development
of which (a) Jute
(b) Sugarcane(c) Ginger «i\d Tur
meric(d) Cotton
5. Potato Development
6. Agrltoltural Machinery . .
of which (a) Power Tillers
^b) Bull dozers and Tractor.
(c) Agricultural implement!.
7. La id Reforms
*. Horticulture ... ,«
(a) Arccas regeneration
(b) Black pepper ...
e) Bay leaf ...
9. Land Reclamation . .
(a) Duar Valley-Nongjri (590 ac).
(b) Shella-Mawlong-Naya-basti. etc. (925ac).
(c) Manad-Mynraw etc. (830 ac),
(d) Maheskhola-Gilagora, etc.(725 ac).
(e) Sinai-Nongtrai etc. (500 ac).
(f) Other Schemes ... ...
(Rs. in thousand)
Total 1974-75 1973-76 1976-77 1977-78 1978-79
Total—Agriculture
- 3 4 5 6 7
1,353 216 257 271 298 311
450 71 86 90 99 1041,520 243 289 304 334 350
771 124 143 154 170 177
128 20 24 26 28 30
243 39 46 49 43 56250 40 47 50 55 58
150 24 28 30 33 35
254 42 48 51 56 58
2,593 415 493 519 570 596
1,823 292 345 365 401 419
440 70 84 88 97 101
330 53 62 66 73 76
100 16 19 20 22 23
1,861 279 335 391 409 447
1,531 230 276 322 337 366
155 23 28 33 34 37
175 26 31 38 39 41
2,169 347 40D 455 468 499
177 32 34 35 37 39
286 52 54 57 60 ^63
250 45 47 50 53 55
218 39 41 44 46 48
150 27 28 30 32 33
1,088 152 196 239 240 261
11,071 1.752 2,073 2,255 2,426 2,565
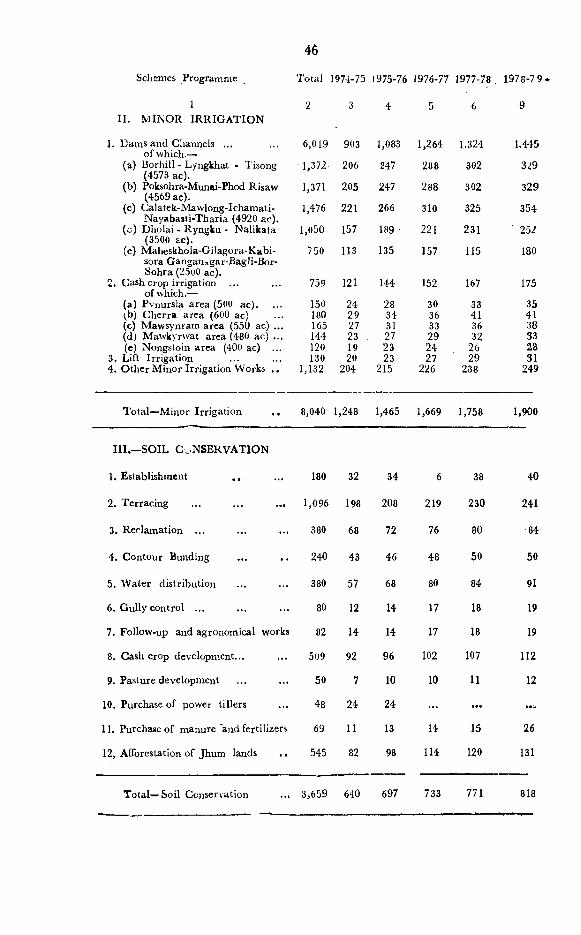
46
Schemes Program m e
1I I . M IN O R IR R IG A T IO N
T o ta l 1974-75 1975-76 1976-77 1977-78. 1978-79
Dam s and Channels ... 6,019 903 1,083 1,264 1.324 1.445of which.—
(a) Borhill - Lyngkhat - Tisong 1,372 206 247 2 8 8 302 3^9(4573 ac).
(b) Poksohra-M unai-Phod Risaw 1,371 205 247 2 8 8 302 329(4569 ac).
(c) Calatek-M awlong-Icham ati- 1,476 2 2 1 266 310 325 354N ayabasti-Tharia (4920 ac).
(cj) Dholai - Ryngku - N alikata 1,050 157 189 22 1 231 252(3500 ac).
(e) M aheskhola-G ilagora-K abi- 750 113 135 157 115 180sora Ganganagar-Bagli-Bor-Sohra (2500 ac).
Cash crop irrigation ... 759 121 144 152 167 175of which.—
(a) Pvnursla a rea (500 ac). 150 24 28 30 33 35\,b) C h erra a rea (600 ac) 180 29 34 36 41 41(c) M awsynram area (550 ac) ... 165 27 31 33 36 38(d) M awkyrwat area (480 ac) ... 144 23 27 29 32 33(e) Nongstoin a rea (400 ac) ... 120 19 23 24 26 28
Lift Irrigation 130 2 0 23 27 29 31O ther M inor Irrigation W orks . . 1,132 204 215 226 238 249
T o ta l—M inor Irrig atio n 8,040 1,248 1,465 1,669 1,758- 1,900
I I I .—SO IL C .-N SE R V A T IO N
1 . Establishm ent 180 32 34 6 38 40
2 . T erracing 1,096 198 2 0 8 219 230 241
3. R eclam ation ... 380 68 72 76 8 0 84
4. C ontour Bunding 240 43 46 48 50 50
5. W ater d istribu tion 380 57 68 80 84 91
6 . G ully control ... 80 12 14 17 18 19
7. Follow-up and agronom ical works 82 14 14 17 18 19
8 . Cash crop developm ent... 509 92 96 102 107 112
9. Pasture developm ent 50 7 10 10 11 12
10. Purchase of power tillers 48 24 24 • •• . . .
11. Purchase of m a n u re 'a n d fertilizers 69 11 13 14 15 26
12, Afforestation of Jhum lands 545 82 98 114 120 131
T o ta l— Soil Conservation 3,659 640 697 733 771 818
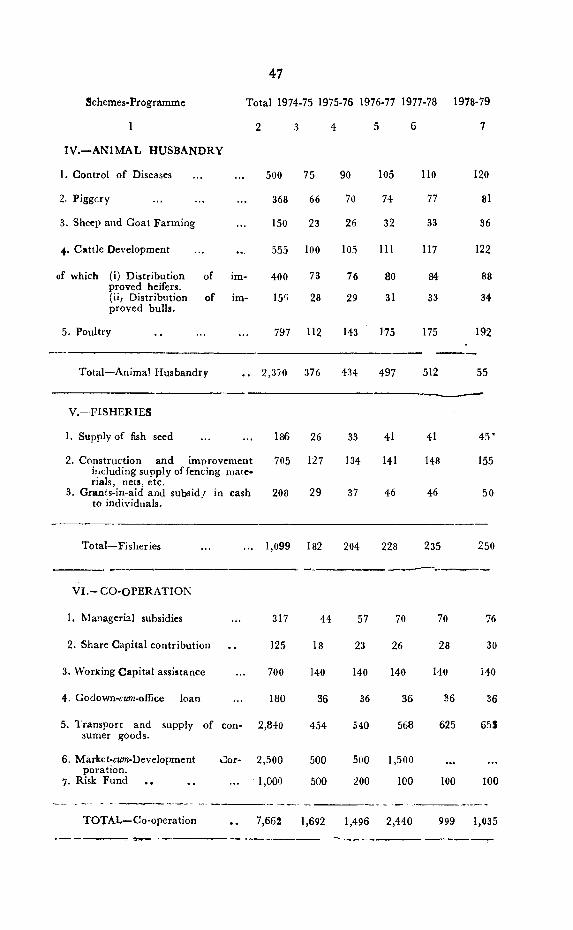
Schemes-Programme
1
IV .— A N IM A L H U SB A N D R Y
47
T ota l 1974-75 1975-76 1976-77 1977-78 1978-79
1. C ontrol o f Diseases . . . 500 75 90 105 110 120
2. Piggery . . . 368 66 70 74 77 81
3. Sheep and G oat Farm ing 150 23 26 32 33 36
4 . C attle Development . . . 555 100 105 111 117 122
of which (i) D istribution of proved heifers.(ii> D istribution of p roved bulls.
im-
im-
400
15"
73
28
76
29
80
31
84
33
88
34
5. Poultry 797 112 143 175 175 192
T o ta l—Anim al H usbandry •• 2,370 376 434 497 512 55
V.—FIS H E R IE S
1. Supply of fish seed . . . 186 26 33 41 41 4 5 '
2. C onstruction and im provem entincluding supply of fencing m aterials, nets, etc.
3, G rants-in-aid and subsidy in cashto individuals.
705
208
127
29
134
37
141
46
148
46
155
50
T otal—Fisheries 1,099 182 204 2 2 8 235 250
V I.-C O -O P E R A T IO N
1. M anagerial subsidies 317 44 57 70 70 76
2. Share C apital con tribu tion •• 125 18 23 26 2 8 30
3. W orking C ap ita l assistance 700 140 140 140 140 140
4. Godown-ctflw-ofBce loan 180 36 36 36 S6 36
5. I 'ra n sp o rt and supply o f sum er goods.
con- 2,840 454 540 568 625 65S
6 . Market-c«m-Development Corporation .
7 . Risk Fund
2,500
1 ,0 0 0
500
500
500
2 0 0
1,500
1 00 100 1 0 0
TO TA L—C o-operation •• 7,662 1,692 1,496 2,440 999 1,035
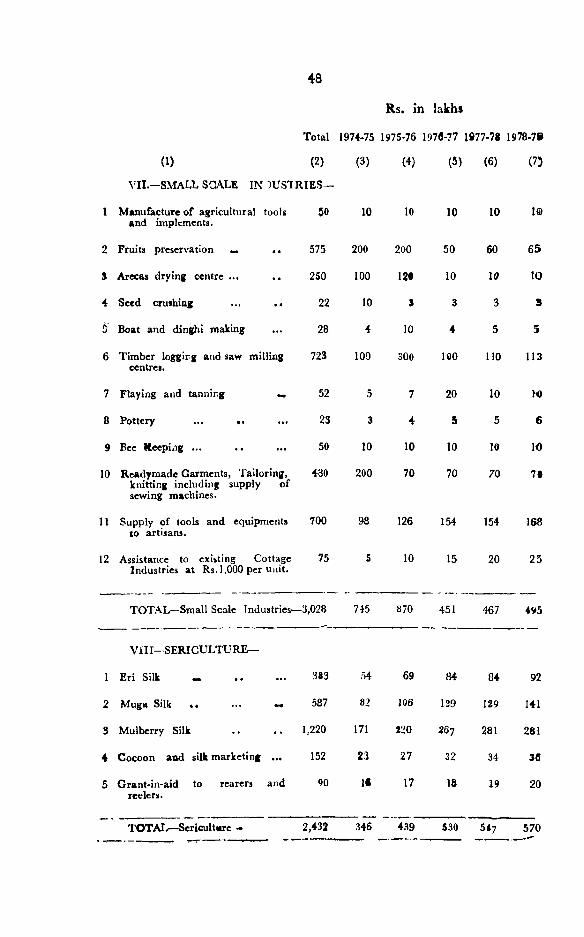
48
Rs. in lakhs
Total 1974-75 1975-76 197C-77 1977-78 1978-7i
(1)
1 Manufacture of agricultural toolsand implements.
2 Fruits preservation ^ . .
S Arecas drying centre ... . .
4 Seed crushing ... ••
5 Boat and dinghi making
6 Timber loggirg and saw millingcentres.
7 Flaying and tannirg
8 Pottery ... ••
9 Bee Keeping ...
10 Readymade Garments, Tailoring,knitting including supply of sewing machines.
11 Supply of tools and equipmentsto artisans.
12 Assistance to existing CottageIndustries a t Rs. 1,000 per un it.
(2)
[ES—
(3) (4) (5) (6) (7)
50 10 10 10 10 10
575 200 200 50 60 65
250 100 12# 10 \0 10
22 10 S 3 3 S
28 4 10 4 5 5
723 100 300 100 110 113
52 5 7 20 10
23 3 4 5 5 6
50 10 10 10 10 10
430 200 70 70 70 7§
700 98 126 154 154 168
75
TOTAL—Small Scale Industries—3,028 745
V i l l —S E R IC U L T U R E -
10
870
15
451
20
467
25
495
1 Eri Silk ^ .................... 383 54 69 84 84 92
2 Muga Silk . . ... 587 82 106 129 129 141
3 Mulberry Silk . . . . 1,220 171 220 267 281 281
4 Cocoon and silk marketing ... 152 23 27 32 34 36
5 Grant-in-aid to rearers and reelers.
90 1C 17 18 19 20
TOTAI.—Sericult«re - 2,432 346 439 530 5*7 570
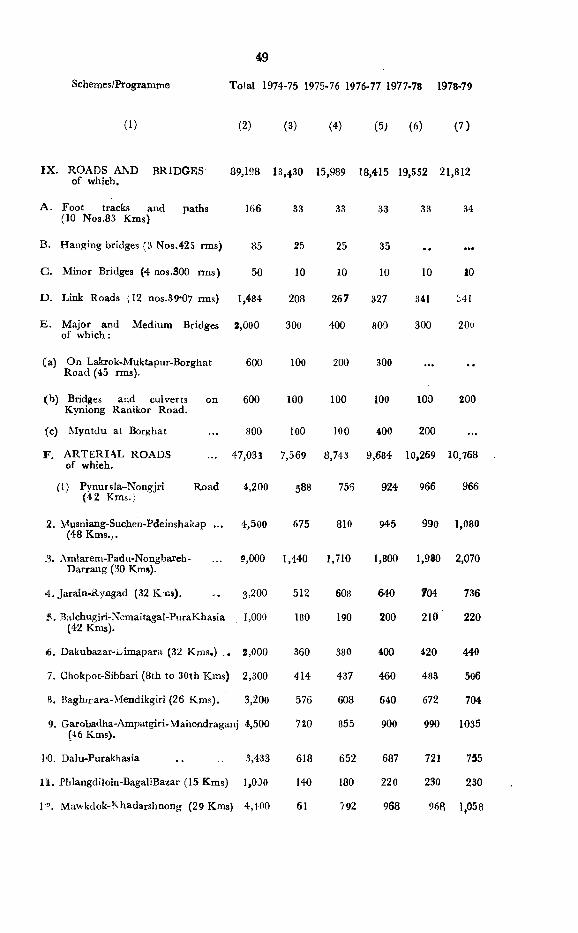
Schemes/Programme T otal 1974-75 1975-76 1976-77 1977-78 1978-79
49
( 1) (2 ) (3) (4) (5; (6 ) (7 )
IX . ROADS AND BR ID G ES 89,198 of which.
13,430 15,989 18,415 19,552 21,812
A . Foot tracks and paths (10 N os.83 Kms)
166 33 33 33 33 34
B. H anging bridges (3 N os.425 rm s) 85 25 25 35 • •
C . M inor Bridges (4 nos.300 rm s) 50 10 10 10 10 10
D . Link Roads (12 nos.39*07 mas) 1,484 208 267 327 341 S41
E . M ajor and M edium Bridges of w h ic h :
2 ,0 0 0 300 400 800 300 2 0 0
(a) O n Lakrok-M uktapur-Borghat R oad (45 rms).
600 100 20 0 300 ... ••
(b ) Bridges and culverts on Kyniong R anikor R oad.
600 1 0 0 100 100 1 0 0 2 0 0
(c) M yntdu at Borghat 800 100 10 0 400 2 0 0
F . A r t e r i a l r o a d sof which.
47,033 7,569 8,743 9,684 10,269 10,768
( 1) Pynur«la-N ongjri R oad (4 2 Kms.;
4,200 5 8 8 756 924 966 966
2. M usniang-Suchen-Pdeinshakap ... (48 K m s.;.
4,500 675 810 945 990 1,080
3. Am larem-Padu-Nongbareh- D arrang (30 Kms).
9,000 1,440 1,710 1,800 1,980 2,070
4 . Jarain-R yngad (32 K ns). 3^200 512 608 640 704 736
5 . Balchugiri-Nem aitagal-PuraK hasia (42 Kms).
, 1,000 180 190 200 210 220
6. Dakubazar-jLimapara (32 Kms.) 2,000 360 380 400 420 440
7. Chokpot-Sibbari (8th to 30th Km s) 2,300 414 437 460 483 506
8. B aghrrara-M endikgiri (26 K m s). 3,200 576 608 640 672 704
9. Garobadha-Ampatgiri-N/lahendraganj 4,500 (46 Km s).
720 855 900 990 1035
10. Dalu-Purakhasia 3,433 618 652 687 721 755
Itt. Phlangdiloin-BagaliBazar (15 Km s) 1,0 JO 140 180 220 230 230
r^ . M aw kdok-K hadarshnong (29 Kms)1 4,100 61 /92 968 968 1,058
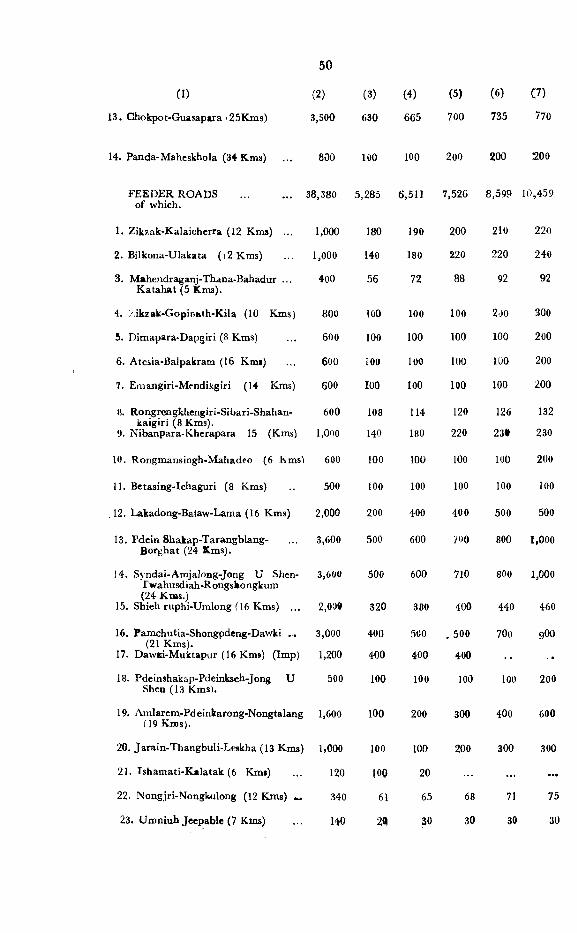
50
(1) (2) (3) (4) (5) (6) C7)
13. Chokpot-G uasapara '25K m s) 3,500 630 665 700 735 770
14. Panda-M aheskhola (34 Kms) 800 100 100 200 200 200
FE E D E R ROADS .................... ,o f which.
38,380 5,285 6,511 7,526 8,59P 10,459
1. Z ik?.ak-Kalaicherra (12 Kms) ... 1,000 180 190 200 210 220
2. B ilkona-U lakata ( i2 K m s) 1,000 140 180 220 220 240
3, M ahendraganj-Thana-B ahadur ... K a tah a t (5 Km s).
400 56 72 88 92 92
4. > ,ikzak-G opinath-K ila (10 Kms) 800 JOO 100 100 2.J0 300
5. D im apara-D apgiri (8 Kms) 600 100 100 100 100 200
6. A tesia-Balpakram (16 Kms) 600 100 100 100 lUO 200
7. Em angiri-M endikgiri (14 Kms) 600 100 100 100 100 200
8. R ongrengkhcngiri- Si ba ri-Shahan-kaig iri (8 Kms).
9. N ibanpara-K herapara 15 (Kms)
600
1,000
108
140
114
180
120
220
126
23®
132
230
10. Rongm ansingh-M ahadeo (6 Kms'i 600 100 100 100 100 200
11. B etasing-Ichaguri (8 Kms) 500 100 100 100 100 100
, 12. Lakadong-Bataw-Lam a (16 Km s) 2,000 200 400 400 500 500
13. Pdein Shakap-T arangblang- B orghat (24 Kms).
3,600 500 600 ■/oo 800 1,000
14. Syndai-A m jalong-Jong U Shen-r wahusd iah-R ongsko n gkum (24 Kms.)
15. Shieh ruphi-U m long f 16 Kms) ...
3,600
2,09®
500
320
600
380
710
400
800
440
1,000
460
16. Pam chutia-Shongpdeng-Dawki . .(21 Km s).
17. Dawfci-M uktapur (16 Kms) (Imp)
3,000
1,200
400
400
5C0
400
. 500
400
700 900
18. Pdeinshakap-Pdeinksch-Jong U Shen (13 Kms).
500 100 100 100 100 200
19. Am larem -Pd einkarong-N ongtalang (19 K ids).
1,600 100 200 300 400 600
20. Jarain-T hangbuli-L eskha (13 Kms) 1,000 100 100 200 300 300
21. Ish am ati-K ala tak (6 Kms) 120 100 20 . . . • ••
22. N ongjri-N ongbulong (12 Kms) « 340 61 65 68 71 75
23* U n )n iu h Jc ep a b le (7 K m s) 140 2Q 30 30 30 30
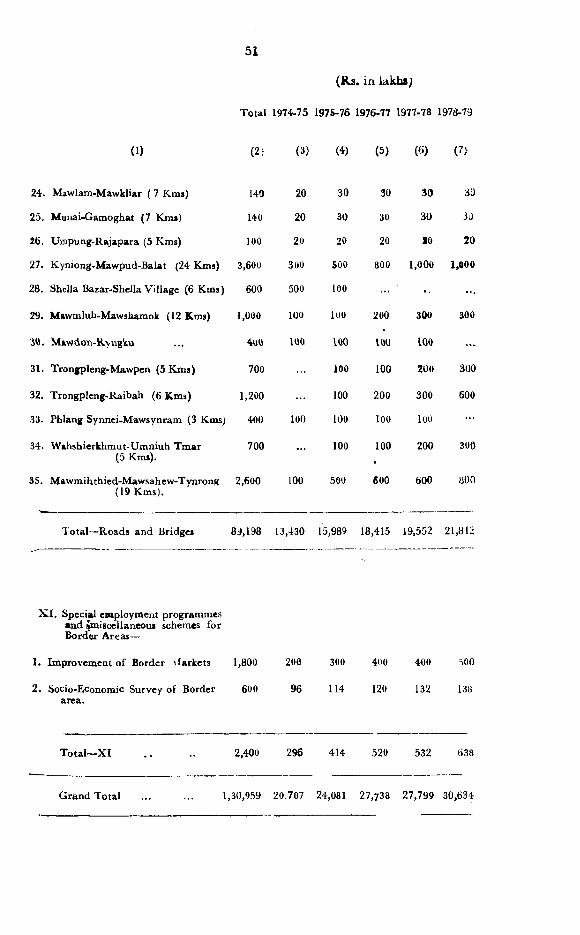
51
(R s . in iak bs)
T otal 1974-75 1975-76 1976-77 1977-78 1978-79
(1) (2; (3) (4) (5) (6) (7>
24. M awlam-M awkliar ( 7 Kms) 140 20 30 30 30 30
25. M unai-Gam oghat (7 Kms) 140 20 30 30 30 3J
26. U m pung-R ajapara (5 Kms) 100 20 20 20 20 20
27. K yniong.M aw pud-B alat (24 Kms) 3,600 3i»0 500 800 1,000 1,000
28. Shclla Bazar-Shella V illage (6 Km s) 600 500 100 - ...
29. Mawmluh-Mawshamok (12 Kms) 1,000 100 100 200 300 300
iO. M tw dori-K vugku 100 100 VOU 100 . ..
31. Trongpleng-M awpen (5 K m s) 700 100 100 200 300
32. T rongpleng-R aibah (6 K m s) 1,200 100 200 300 600
33. Fhlang Synnei-M awsynram (3 Kms) 400 100 100 100 100
34. W ahshierkhm ut-U m niuh T m ar (5 Kms).
700 ... 100 100 200 300
35. M aw m ihthied-M aw sahew -Tynrong (19 K m s).
2,600 100 500 600 600 800
I 'o ta l—R oads and Bridges 89,198 13,430 15,989 18,415 19,552 21,812_______
X I . Special employm ent program m es «nd im iscellaneoui schemes for Border Areas—
1. Im provem ent o f B order vlarkets 1,800 200 300 400 400 ^00
2. Socio-Economic Survey of Border 600 96 114 120 132 138area.
T o ta l—X I . . .. 2,400 296 414 520 532 <>38
G ran d T o ta l .................... 1,30,959 20,707 24,081 27,738 27,799 30,634

52
CHAPTER IX
Development o f Specially Backward and M ost Backward Areas
1. The Scheduled Tribes constitute about 85 per c«nt of the total population of Meghalaya. On consideration of the high predominance of the tribal population in the State as well as from the poijit of view of backwardness determined on the basis of the accepted economic indicators, the entire area of Meghalaya is backward and qualifies for special treatment. T he factors accounting for the backwardjiess of the State have been explained in the previous Chapters.
2. While the entire State is backward, there are ar<eas which are considered to be “Specially Backward” in the State. A List of these backward areas is attached at Annexure. Out of these areas, the areas with asterisk are the “Most Backward Areas” on the basis of the available data. A special Project Plan is, therefore, essential for accelerating development in these areas. The outlay for the Project Plan and the guide-lines being followed in this connection are briefly indicated below—
(1) The strategy followed in regard to the execution of the Project Plan will be based on the taking up of a special programme for the purpose of accelerating development ia these areas. The effort will be concentrated on corrective action regarding the assessed gaps in various development sectors in those areas noticed so far.
(2) A more detailed and acurate assessment will be made of the gaps in development in these areas. A machinery for collection of statistical and other data will be set up to enable preparing detailed project reports. Action programmes will be drawn up for these areas based on the gaps identified and needs as well as the resources available and potentialities of these areas. The machinery set-up for the purpose will also be responsible for establishing base-line data in these project areas to enable assessing periodically the progress in accelerating development and filling up of the gaps in different sectors of developmeat.
D3
(3) With a view to facilitating the execution of projects in these areas, it is proposed that the expenditure on the Project PhiU should be met out of the funds specially earmarked in the Fifth Plan of the State. This will facilitate proper ov^erseeing and execution for the attainment of financial and physical targets in the backward areas by concentration of attention aud effort and by proper monitoring follow up and feed back system specifically built ^br these areas.
Strategy for development
3. It is proposed to take up 13 to 16 special projects for accelerating development in the “ Specially Backward” and the “Most Backward” areas. The main features ofthese projects will be as follows:—
(1) The allocation for each project for the five year period will be about Rs.50 lakhs. These projects will be super-imposed over TD Blocks. Funds available under TD Blocks and other sources will be supplemented by the allocation indicated above.
(2) The staff component for the execution of the projects would be kept; to the minimum. It is proposed to implement the 'project through the help of the existing BDOs who would be designated Project Officers for the purpose. The additional staff to be appointed for the project would be kept to the barest minimum and the Extension Officers and staff already available would be utilised for the programme.
4. As indicated earlier, each project will be drawn up on the basis of the gap in development as a result of a careful assessment and survey of each of the area. No schematic pattern or rigid format can be laid down for these projects as the need of each of these project areas is not expected to be uniform. The formulation and execution of the project plans will be done in consultation with the Block Development Advisory Committees and other representatives of the public opinion of the project areas. Other measures for ensuring full involvement of the people of the area will also be taken.
5. Financial requirement
5. The financial requirements of the programme in different areas have been shown in the Annexure. On the basis of data available, estimates of the requirements for the Fifth Five Year Plan period come to Rs.8‘00 crores. An area-wise phasing of the expenditure has also been shown in the Annexure. The sector-wise allocation of the outlays will be determined on the basis of the assessment of the needs of each of the project areas according to the necessity for accelerating development in sectors to wipe out the back log noticed as a result of the detailed survey. The drawing of the specific project reports with concrete details will be taken up once the programme is approved in principle.
ANNEXURE
A tentative List of Specially Backward and M ost Backward Areas in Meghalaya
Khasi H ills—
*1. The northern portion ofNongstoin Development Block adjoining the Assam Plains.
*2. The area of Bhoi Development Block excluding a belt along the G. S. Road (National High Way-40).
*3. The northern portion of Mawryngkneng Development Block adjoining Bhoi Thalangso Subdivsion of the Mikir Hills District of Assam State.
4. The eastern portion of Pynursla Development Block adjoining the Jaintia Hills comprising the watershed of the Umngot (Pyian) river.
5. The northern portion of Mairang Development Block.
Jaintia Hills-^
*6. The eastern and south-eastern area of Saipung-Darrang Block adioinine North Gachar Hills district of Assam State.
*7. The area covered by Mynso-Raliang Block.
*8. The northern tips of the Jowai Development Block adjoining Bhoi Thalangso Sub-Division of Assam State.
54
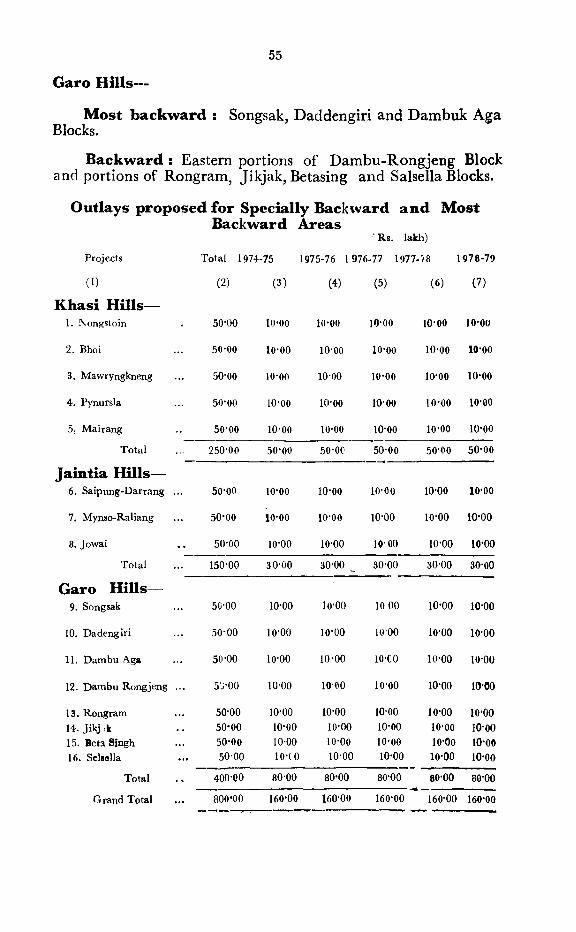
55
Garo H i l l s -
Most backward : Songsak, Daddengiri and Dambuk Aga Blocks.
Backward : Eastern portions of Dambu-Rongjeng Block and portions of Rongram, Jikjak, Betasing and Salsella Blocks.
Outlays proposed for Specially Backward and Most Backward Areas
•R s. lakh)
Projects T otal 1974-75 1975-76 1 976-77 1977-78 1978-79
(1) (2) (3) (4) (5) (6) (7)
Khasi H ills—1. Nongstoin 50-00 10-00 10-00 10-00 10-00 10-00
2. Bhoi 50-00 lo-oo 10-00 10-00 10-00 10-00
3. Mawryngkneng 50-00 10-00 10-00 10*00 10-00 10-00
4. Pynursla 50-00 10-00 10-00 10-00 10-00 10-00
5, Mai rang 50-00 10-00 10-00 10-00 10-00 10-00
T ota l 250-00 50-00 50-00 50-00 50-00 50-00
Jaintia Hills6. Saipung-D arrang 50-00 10-00 10-00 10-00 10-00 10-00
7. Mynso-Raliang 50*00 10-00 10-00 10-00 10-00 10-00
8. Jow ai 50-00 10-00 10-00 10-00 10-00 10-00
T otal 150-00 30-00 30-00 30-00 30-00 30-00
Garo Hills-9. Songsak 5C-00 10-00 10-00 10 00 10-00 10-00
10. D adengiri 50-00 10-00 10-00 10 00 10-00 10-00
11. D am bu Aga 50-00 10-00 10-00 lO-CO 10-00 10-00
12. D am bu Rongjeng ... 5.;-00 10-00 10-00 10-00 10-00 lo-eo
13. Rongram 50-00 10-00 10-00 10-00 10-00 10-0014. J ik jik 50-00 10-00 10-00 10-00 10-00 10-0015. Beta Singh 50-00 1000 10-00 10-00 10-00 10-0016. Selsella 50-00 10-(0 10-00 10-00 10-00 10-00
T otal . . 400-00 80-00 80-00 80-00 80-00 80-00
G rand Total 800-00 160-00 160-00 160-00 160-00 160-00
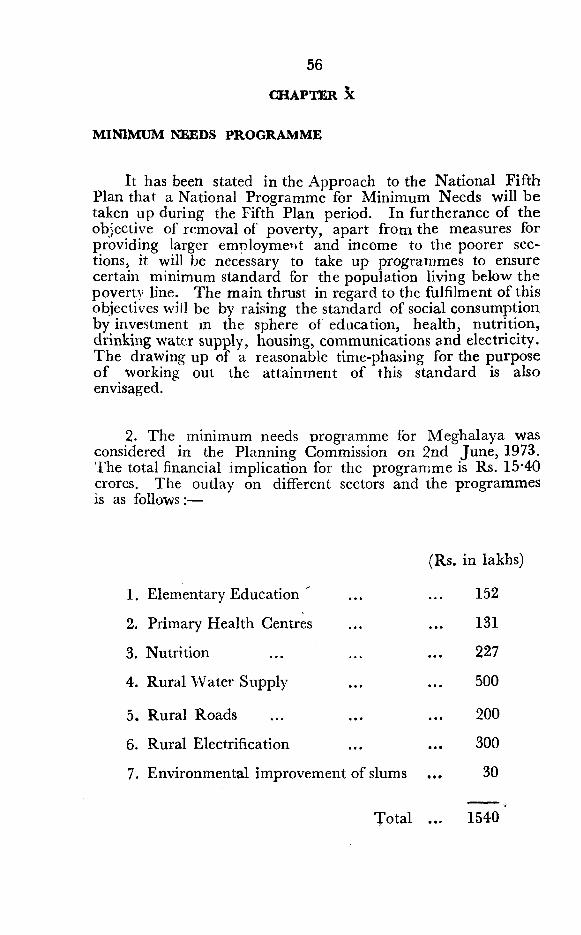
CHAPTER X
56
MINIMUM NEEDS PROGRAMME
It has been stated in the Approach to the National Fifth Plan that a National Programme for Minimum Needs will be taken up during the Fifth Plan period. In furtherance of the objective of removal of poverty, apart from the measures for providing larger employment and income to the poorer sections, it will be necessary to take up programmes to ensure certain minimum standard for the population living below the poverty line. The main thrust in regard to the fulfilment of this objectives will be by raising the standard of social consumption by investment m the sphere of education, health, nutrition, drinking water supply, housing, communications and electricity. The drawing up of a reasonable time-phasing for the purpose of working out the attainment of this standard is also envisaged.
2. The minimum needs programme for Meghalaya was considered in the Planning Commission on 2nd June, 1973. The total financial implication for the programme is Rs. 15*40 crores. The outlay on different sectors and the programmes is as follows:—
1. Elementary Education "
2. Primary Health Centres
3. Nutrition
4. Rural Water Supply
5. Rural Roads
6. Rural Electrification
7. Environmental improvement of slums
(Rs. in lakhs)
152
131
227
500
200
300
30
Total . 1540
1. ELEMENTARY EDUCATION
According to the 1971 Census, the children population of the age group of 6—11 is estimated at 1’76 lakhs and that of 11—14, at 0’70 lakhs. The enrolment figure in the State of the age group of 6—11 in 1971 was 1'36 lakhs or 77'3 per cent of the age group. In respect of the age group of 11—14 enrolment is about 0-18 lakhs or 25*7 per cent of the children population of the age group. The likely enrolment in the State at the end of the Fourth Plan period,/, e., by 1974 will be approximately 81*2 percent in the age group 6—11 against all- India average of 88 per cent and 40-2 per cent in the age group 11—14 against all India average of 40 per cent. Compared to the all India average, the achievement so far, by and large, is satisfactory. The State, however, is lagging much behind from tlie target of universalising the education for the age group 6—14. Various factors like economic backwardness of the people, shifting of villages due to the practice of shifting agriculture, 3cattered villages, hilly and difficult terrain, lack of staff quarters for leachers, etc., have contributed to the slow progress in the matter of educational development. The objective decided upon at the national level envisages 100 per cent facilities for children of age group 6—11 and 60 per cent for the age group 11—14 (both full and part-time) during the Fifth Plan period. To reach this level, large and concentrated efforts under acceleralcd development programmes have to be made.
57
Enrolm ent in Schools
2. During the Fifth Plan, about 1*46 lakhs additional students in the age group 6—11 years and about 24,000 additional students in the age group 11—14 years will have to be brought i;i the fold of elementary education to reach the national target. Enrolment of these students will have to be made in a phased manner. The Minimum Needs Programme for elementary education has been alloted Rs. 152 lakhs in the Fifth Plan for the following schemes.
Num ber o f Schools
3. The national objective is to have a Primary School within 1'5 km. and a Middle School within 5 kms. of each village. By this standard, Meghalaya should have 2 primary schools for every three villages and one middle school for every 16 villages. This norm cannot be applied strictly in this State due to the difficult terrain and sparseness of population.
It has been estimated that the total number of Primary Schools should be approximately 3,600 and 300 Middle Schools against 2,372 and 211 respectively existing now. On this l>asis, 1,200 new Primary Schools and 89 Middle Schools will have to be opened during the course of the Fifth Plan. A substantial part of this will have to be in the minimum needs programme.
58
R equirem ent o f Teachers
4. The propframmc of expansion and qualitative impro vement of education would involve recruitment of adequate number of additional teachers. The existing number of teachers is 4,564. According to the teacher pupil ratio of 1 : 35 for the age group 6—11 and 1 : 20 for the age group 11—14, the number of additional teachers to be entertained works out to 1,714 and1,250 respectively. The minimum need programme in this regard will receive a priority in areas where the need is acutely felt.
Incentives to Students
5. The main factor for low enrolment of students, particularly of the age group 11—14 has been lower enrolment of girls and lower enrolment from the economically backward rural people particularly from the children of the migrating shifting agriculturists. The second factor is the wastage and stagnation at difl’erent levels of primary education. Another factor is the lack of physical facilities in the backward pockets w^here a group of villages is served mostly by one-teacher-one- room schools.
6. With a view to overcoming these drawbacks in the matter of elementary education in the State, it is proposed to undertake the following programmes during the Fifth Plan.
(i) construction of school buildings ;
(ii) for the sparsely population areas, “Ashram Schools’’ will be started. Hostels facilities will be provided to the schools situated in the midst of small villages ;
(iii) supply of free text books, uniforms and other materials like slates, pencils, etc., will be introduced ;
(iv) mid-day meals would be provided as part ofNutrition programme;
(v) arrangement of part time education for the childrenwho cannot attend school on a whole-time basis will be made for groups of such students ; and
(vi) grants of stipends and scholarship will be enlarged.
5 9
II. NUTRITION
As elsewhere in the country, malnutrition is an acute problem in Meghalaya also. Under-nourishment due to poverty and inbalanced diet are common forms of malnutrition in the State. These problems are related and in fact, one leads to the other. The problem among the pregnant women, infants and children of young age has a far reaching implication on the growing generations.
Improvement of nutritional standard?^ calls for effort on many points. Besides the increase in general food supply, there has to be increased production of nutritious foods. Training of personnel and mass education have to be undertaken for the programme to make impact. I t is also essential to carry out periodic surveys to locate areas of malnutrition and nutrition deficiencies.
Under the MNP an amount of Rs. 227 lakhs has bten provided in the Fifth Plan. The programme would cover the pregnant mothers and infants and mid-day meals for the pupils of the younger age groups.
m . RURAL WATER SUPPLY
According to 1971 Census, Meghalaya had a rural population of 8*64 lakhs which is 85*37 per cent of the total population. 80’49 per cent of population belongs to the category of Scheduled Tribes mostly residing in rural areas. In order to assess the nature and magnitude of the problem of providing drinking water supply in rural areas, preliminary investigation was carried out. Out of the 4,629 villages in the State, 3,306 villages or about 71 per eent of the villages suffer from water scarcity during the dry season or get unhygienic and unclean water during the rains. In most of the villages the source of water is m^ainly natural streams or springs and located more than half a kilometre or so away from the
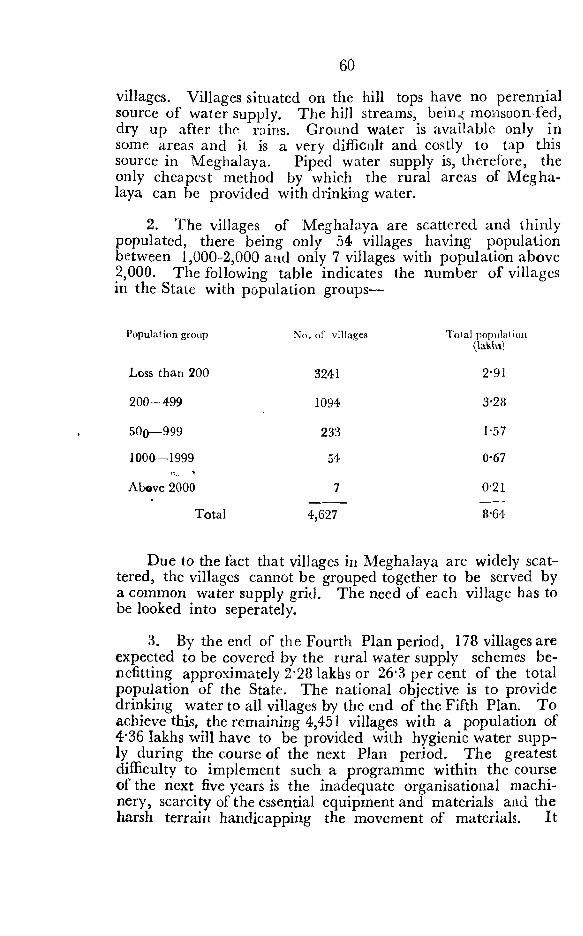
villages. Villages situated on the hill tops have no perennial source of water supply. The hill streams, bein^ monsoon-fed, dry up after the rains. Ground water is available only in some areas and it is a very difficult and costly to tap this source in Meghalaya. Piped water supply is, therefore, the only cheapest method by which the rural areas of Meghalaya can be provided with drinking water.
2. The villages of Meghalaya are scattered and thinly populated, there being only 54 villages having population between 1,000-2,000 and only 7 villages with population above 2,000. The following table indicates the number of villages in the State with population groups—
60
Population group No. of villages Tola! population
Loss than 200 3241 2-91
200—499 1094 3-28
500—999 233 1-57
1000— 1999 54 0*67
Above 2000 7 0-21' — .—.
Total 4,627 8-64
Due to the fact that villages in Meghalaya are widely scattered, the villages cannot be grouped together to be served by a common water supply grid. The need of each village has to be looked into seperately.
3. By the end of the Fourth Plan period, 178 villages are expected to be covered by the rural water supply schemes be- nefitting approximately 2‘28 lakhs or 26’3 per cent of the total population of the State. The national objective is to provide drinking water to all villages by the end of the Fifth Plan. To achieve this, the remaining 4,451 villages with a population of 4’36 lakhs will have to be provided with hygienic water supply during the course of the next Plan period. The greatest difficulty to implement such a programme within the course of the next five years is the inadequate organisational machinery, scarcity of the essential equipment and materials and the harsh terrain handicapping the movement of materials. It
may not therefore, be possible to cover the entire rural population of the State during the Fifth Plan period. This task will have to spill over to the Sixth Plan also. In the Fifth Plan, the highest priority will be to villages belonging to the “ most- scarcity” group and then to others. About 600 villages covering a population of 2 30 lakhs have been identified for the Fifth Plan and the remaining villages are to be taken up during the subsequent Plans. In a number of these villages, dove tailing of the schemes with eletrification and irrigation would be undertaken. The most ‘^scarcity group” villages wdll come under the MNP.
IV. ROADS
1. The number of villages connected by motorable roads is 1918 or 42 per cent of the total number of villages. As many as 2,711 villages are not connected by these roads. Of the bigger villages with population of 1,000 and above, 28 villages have been connectcd by metalled roads and another 30 villages by gravelled roads.
2. The norm of connecting all villages with 1,500 or more population with motorable roads may not be possible to be achieved in Meghalaya due to the topography of the hill areas. The aim of the Fifth Plan Minimum Road Programme would be to connect cluster of villages of this size-group to all weather roads and market centres and growth points by all weather roads.
61
V. RURAL ELECTRIFICATION
1. There are 4,629 inhabited villages in Meghalaya. O f these, about 103 villages are expected to be electrified by the end of the Fourth Plan. This is only about 2.2. per cent of the inhabited villages in the State. For the country as a whole, 1*58 lakhs villages are expected to be electrified by the end of the Fourth Plan. This is about 26*1 percent cf the towns and villages with a population of less than ten thousand.
2. The objective of the national Fifth Plan is to extend the electricity to at least 30-40 per cent of the rural population in every State in order to provide adequate infrastructure for development and to ensure progress towards improving tne (quality of life. If the State is to keep in step with the
rest of India, a minimum of 1,800 villages covering a population of 3’36 lakhs (186 persons per village on the average) will have to be electrified and 1,800 electrict pump sets installed during the Fifth Plan. If this target is achieved, about 41 per cent of the villages of Meghalaya will have been electrified by 1979. On the basis of this target, fund requirement comes to Rs.15'43 crores. The priority areas of this programme would be taken up under the MNP for which a sum of Rs.3 crores has been provided for the Fifth Plan.
65
VI. ENVIRONMENTAL IMPROVEMENT OF SLUMS
The MNP provides Rs.0’30 crores for environmental improvements of slums. No part of Shillong, the State capital, is any longer free from Slums. Environmental improvement under the MNP would be undertaken in areas where the slum conditions have become very acute. These areas are Bara Bazar Area, Polo Bazar. Qualapati and parts of Mawkhar, Laban and Malki in that order.
VII. PRIMARY HEALTH CENTRES
In Meghalaya there is glaring imbalance of medical care facilities between urban and rural areas. The medical services are still confined only within the periphery of urbanised areas. Rural areas in the State are still deficient in many respects which fact needs to be given continued attention in formulating plan programmes relating to health services.
2. In the State, there are at present 72 Government hospitals and dispensaries of which 2 hospitals and 9 PH G S and 53 dispensaries are in the rural areas. The number of medical personnel on 1st April, 1972 in the State was:
Doctors.................................................. 104
N urses.................................................. 169
ANMs and Midwives ............. 95
According to the above figures, the doctor population ratio * in the State is 1:9730 as against the likely all-India average of 1:4300 by the end of the Fourth Plan. The doctor- pop ulation ratio in the rural area of the State works out to 1:21,625 and in urban areas the ratio is one doctor for every 2,297 persons. Similarly, the proportion of other paramedical personnel to the population in the rural aieas is extremely poor. The number of hospital beds on 1st April, 1972 in the State was 575 in urban areas and only 159 in rural areas. On an average, there is one hospital (Government) bed for a population of 5,440 in rural areas as against 255 in the urban areas. These ratios suggest that considerable efforts would be necessary to reach the level of the norms prescribed in these regards.
3. There are 24 CD Blocks in the State of which only 9 blocks have Primary Health Centres (PHG). By the end of the Fourth Plan the number of PHCs is expected to be 14. At present there are 54 sub-centres in the State of which 34 arc under medical and 20 under Family Planning. The sub-centres have not been established in all the blocks and consequently, the coverage of medical care in the rural areas is inadequate. The State faces a serious shortage of doctors in the rural areas. A number of Primary Health Centres need medical equipments and major repair of buildings.
4. As stated earlier, 15 blocks are without a primary health centre There are 34 Primary Health Sub-centres in the State. The main objective of the MNP in the Fifth Plan is to intensify the health services in the tribal areas. In this regard, the FHC has a vital role to play. In the rural areas all health services—curative and preventive—centre round the PHC and radiate from it. It is, therefore, proposed to suitably strengthen the PHCs to provide for diagnostic services, control of communicable diseases, improvement of nutritional standards, etc.
5. Because of the sparsity of population in the Hill Areas, the ncrm of 80,000 or one lakh population per PHC has to be reduced to 25,000 to 30,000. For Meghalaya, the existing pattern is one PHC for one block. As the area of a block 2nd the number of villages covered by the block vary substantially, more than one PHC is necessary for more sparsely^ opulated blocks. Also, establishment of more sub- centres is necessary so that patients are not required to walk a
63
long distance to reach the health centre. According to the guidelines for the minimum needs programme, there should be one sub-centre for every 8 to 10 thousand population in the rural areas. On this norm, the number of sub-centres necessary for rural areas of Meghalaya works out to about 86. As against this, there are only 34 sub-centres in the State. Further, the above norm for sub-centres cannot be strictly applied in the tribal areas in view of the same factor of sparsity of population and difficulty of terrain. It is, therefore, necessary to have at least 100 sub-centres in the State to cater to the needs of the people. This means establishment of an additional number of at least 64 sub-centres during the Fifth Flan period.
64
6. One of the deficiencies in the functioning of the existing primary heaUh centres iu the State is the absence of proper buildings for the centres. Out of the 9 existing PHCs, 5 centres were without proper buildings. Almost all the centres are without any staff quarters and this act as a disincentive to the staff to take up the posts. The position in respect of the sub-centres is also the same. In view of this, construction of buildings and staff' quarters will have to be given top priority under the minimum needs programme in the rural areas in the Fifth Flan period.
7. In regard to supply of medicines to the FHGs in the rural areas, the present state leaves much to be desired. Lack of sufficient fund is the main reason for this state of affair. Further, the economic condition of the tribal people does not permit them to pay for the medicines prescribed. If the objective of the minimum needs programme is to be fulfilled, the PHCs should have sufficient stock of es.sential medicines which should be distributed free of cost to the patients.
8. At present, the PHCs are equipped with one jeep' for movement of staff which also serves as an ambulance for movement of patients to district hospitals. Considering the sparsity of population in the hill areas, one Jeep is quite inadequate to the needs and at least one ambulance van is necessary for the PHC. This ambulance van can also be used as a mobile dispensary for the inaccessible areas.
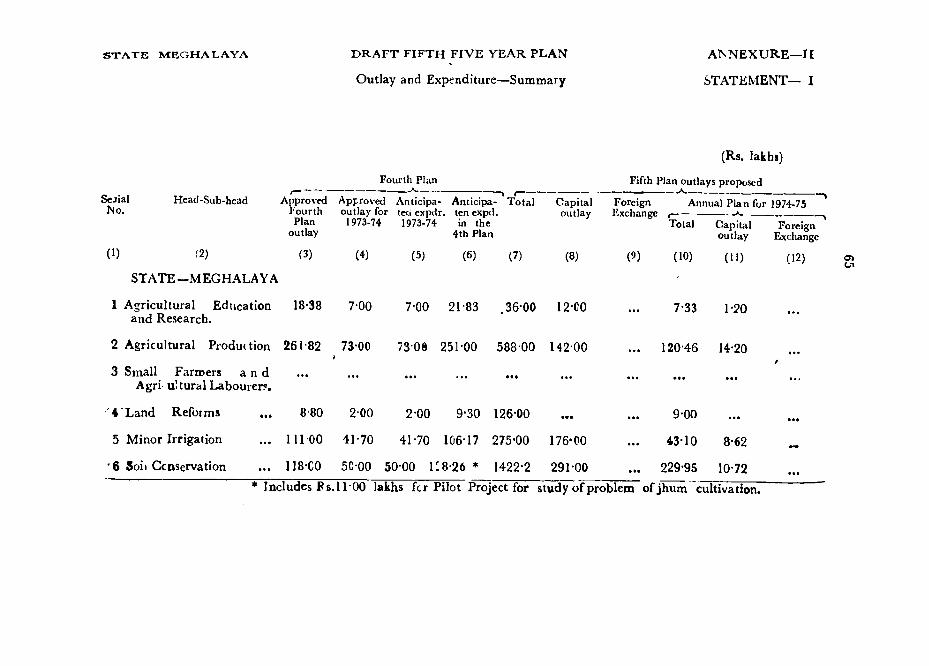
STATE MEGHALAYA D R A F T F IF T H F IV E Y E A R P L A N A N N E X U R E — IE
Outlay and Expenditure—Summary STATEMENT— I
(Rs. lakhs)
Fourtl^Plan Fifth Plan outlays proposed
SeJial Head-Siib-head Approved Approved Anticipa- Anticipa- Total Capital Foreign Annual Plan for 1974-75F o u rth outlay for teri cxpdr. ten expd. outlay Exchange t_____________________________Plan 1973-74 1973-74 in the Total Capital Foreign
outlay 4th Plan outlay Excliange
( ' ) (2) (3) (4) (5) (6) (7) (8) (9) (10) (11) (i2 )
STATE - M EGH ALA Y A
1 Agricultural Education 18-38 700 7*00 21 83 .36-00 12-00 ... 7-33 1-20and Research.
2 Agricultural Prodm tion 26182 73-00 73 0e 251-00 588 00 142 00 ... 120*46 14-20
3 Small Farmers a n d ... ... ... ... ...A griu !tu ra l Labourer?.
'4 Land Reforms ... 8 80 2 00 2*00 9*30 126-00 ... ... 9-00
5 Minor Irrigation ... 1 11 00 41-70 41-70 106-17 275*00 176*00 ... 43-10 8-62
‘6 Soil Ccnservation ... 118-CO 5C-00 50 00 i :8 26 * 1422-2 291-00 ... 229-95 10*72* Includes F s. 11-00 lakhs for Pilot Project for study of problem ofjhum cultivation.
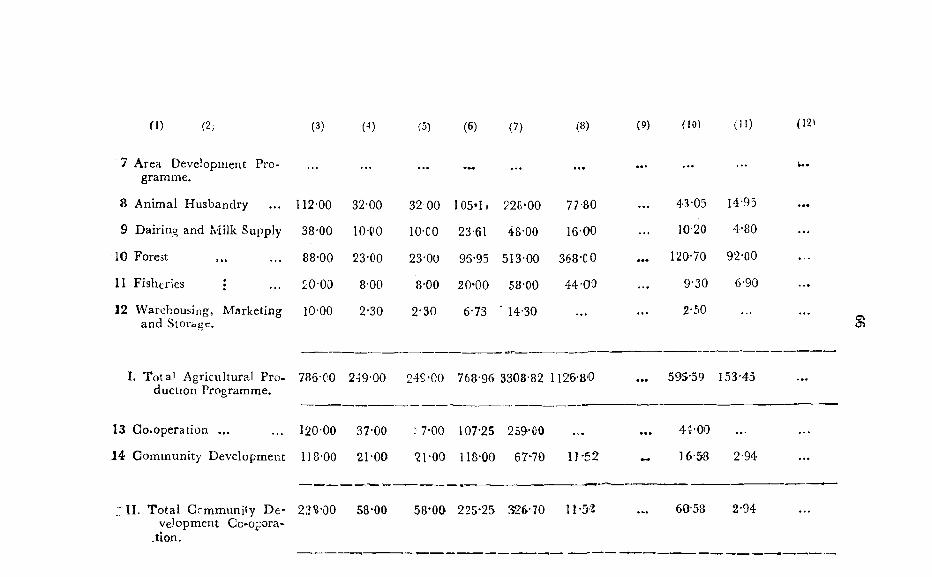
n ) (2; (3) ( ) (5) (6) (7) (8) (9) (10) (H) (12\
7 Area Development Px'o- gramme.
... ... ... ... ... ... ...
8 Animal Husbandry 112-00 32-00 32 00 105*1. 228-00 77-80 ... 43-05 14-95 • ••
9 Dairing and fviilk Supply 38-00 lO-PO lO-CO 23-61 48-00 16-00 ... 10-20 4-80 ...
10 Forest ,,, 88-00 23-00 23-00 95-95 513-00 368-CO • •• 120-70 92-00 ...
11 Fisheries • 1000 8-00 8-00 20-00 58-00 44-00 ... 9-30 6-90 ...
12 Warehousing, Marketing and Storage.
10-00 2-30 2-30 6-73 ■ 14-30 ... ... 2-50 ... ...
I. Total Agricultural Production Programme.
786-GO 249-00 24S-00 768-96 3308-82 1126-80 595-59 153-45 ...
13 Go.operation ... 120-00 37-00 : 7-00 107-25 259-00 • •• 4^00 ...
,14 Community Development 118-00 21-00 21-00 118-00 67^70 11'52 - 16-58 2-94 ...
':;IL T otal Community D evelopment Cc-opara-
.tion.
2,?S-00 58-00 58-00 225*25 326-70 11-^2 ... 60-58 2-94 ...
Ov
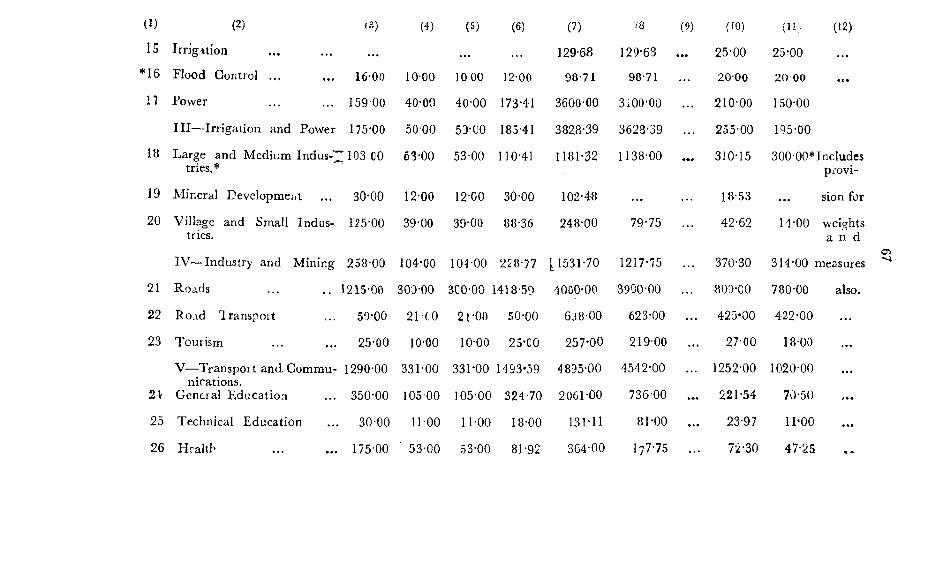
( 1) (2)
15 Irrigation
*16 Flood Control ...
17 Power
I I I —Irrigation and Power
18 Large and Medium Indus-|^tries.*
19 Mineral Development
20 Village and Small Industries.
.3)
16-00
159 00
175-00
103 CO
30-00
125-00
(4) (5) (6) (7)
129-68
/8
129-63
10-00 10 00 12-00 98-71 98-71
40-00 40-00 173-41 3600-00 3i00-00
50 00 53-00 185-41 382.8-39 3623-39
53-00 53-00 110-41 1181-32 1138-00
12-00 12-00 30-00 102-48
39-00 39-00 88-36 248-00 79-75
(9) flO) ( i r : (12)
25-00 25-00
20-00 20 00... 210-00 150-00
... 255-00 195-00
310-15 300-00*Includcs provi-
18 53 ... sion for
42-62 14-00 weightsa n d
also.
IV—Industry and Mining 258-00 104-00 104-00 228-77 [1531-70 1217-75 ... 370-30 314-00 r
21 Roads 1215-00 300-00 3C0-00 :1418-59 4000-00 3900-00 ... 800-00 780-00
22 Ro.id Iran sp o it 50-00 21C0 2 1 -00 50-00 638-00 623-00 ... 425-00 422-00
23 Tourism 25-00 10-00 10-00 25’CO 257-00 219-00 27-00 18-00
V—Transport and Communications.
1290-00 331-00 331^00 1493-59 4895-00 4542-00 ... 1252-00 1020-00
General Education 350-00 105 00 105-00 324-70 2061-00 736-00 ... 221-54 70-50
25 Technical Education 30-00 11-00 11-00 18-00 131-11 81-00 23-97 11-00
26 Health .................... 175 00 53-00 53-00 81-92 364-00 177-75 72-30 47-25
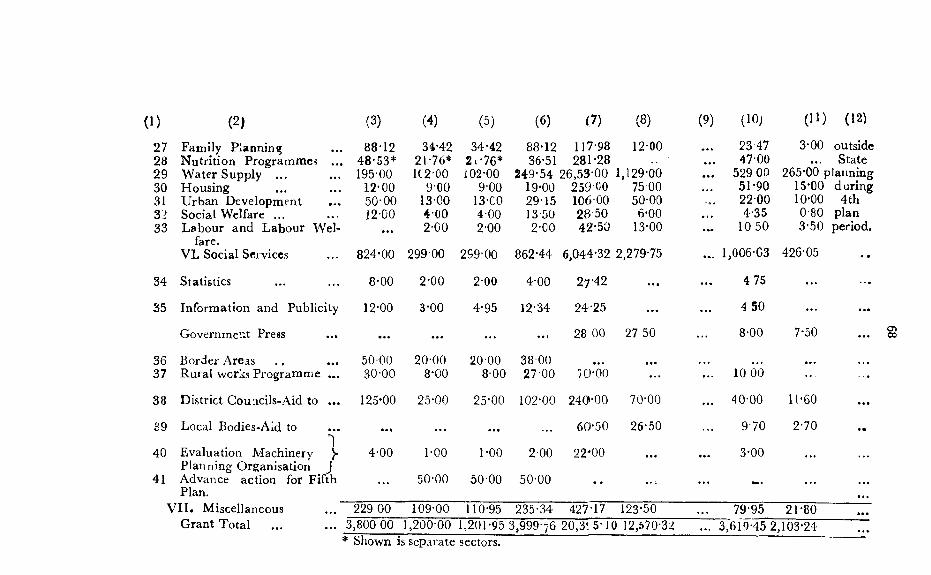
( 1) (2)27 Family Planning28 N utrition Programmes ...29 W ater Supply ...30 Housing31 Urban Development32 Social Welfare ...33 Labour and Labour Wel
fare.VL Social Services
34 Statistics
35 Information and Publicity
Governmer*t Press
36 Border Areas37 Rural works Programme ...
38 District Cou:icils-Aid to ...
39 Local Bodies-Aid to
40 Evaluation Machinery Planning Organisation J
41 Advance action for Fifth Plan.
V II . Miscellaneous Grant Total
(3) (4) (5) (6) (7) (8) (9) (10; (11) (12)
. 88-12
. 48-53* , 195-00
I2 ‘00 50-00 12-00
34-4221-76*1C200
9-0013-004-002-GO
34-42 2 >-76* 102-00
9-00 13-CO 4-00 2 00
88-12 117-98 36-51 281-28
249-54 26,53-00 19-00 259-00 29-15 106-00 13-50 28-50 2-00 42*50
12-00
1,129-00 75 00 50-00 6-00
13-00
2347 47-00
... 529 oa 51-90 22-00 4-35
10 50
3-00 outside State
265-00 planning 15-00 during 10-00 4th 0'80 plan 3-50 period.
824-00 299 00 299-00 862-44 6,044-32 2,279-75 ... 1,006-03 426-05• •
8-00 2-00 2-00 4-00 27*42 . . . 475 . . . . . .
12-00 3-00 4-95 12-34 24-25 . . . 4 50 . . . . . .
• • • . . . . . . 28 00 27 50 8-00 7-50 . . .
500030-00
20-008-00
20-008-00
38 00 27-00 yo-ob
. . .
... 10 00. . . . . .
125-00 25-00 25-00 102-00 240»-00 70-00 ... 40-00 11*60 . . .
. . . . . . . . . . . . 60-50 26-50 9-70 2-70
4-00 1-00 1-00 200 22'00 . . . 3-00 . . . . . .
. . . 50-00 50 00 50-00 • • . . . . . . . . .
229 00 109-00 110-95 235-34 427-17 123-50 79-95 21-80 . . .
3,800 00 1,200 00 1,201-95 3,999-76 20,3'. 5-iO 12,570-3^0 C V t / a
... 3,619-45 2,103-24 . . .
o>CO
STATE—Ivi EGHALA YADRAFT FIFTH FIVE YEAR PLAN
PROGRAM M E-W ISE OUTLAY AND EXPEN D ITU REANN EXURF— l i STATEM ENT— H
Serial Program m e F ourth Plan A pproved Likely ex- Likely ex
P.upees in lakhs
F ilth Plan A nnual PlanNo. approved o u t outlay for p en d itu r penditu re T otal out ‘ 974-75 out
(0 (2)
lay.
(3)
1973-74.
(4)
1973-74.
(5)
during Fourih Plan.
(6)
lay.
(7)
lay.
(8)1.
1
Agricultural Programmes (i) Agricultural Education and Research
Ag icultural Education 1-38 1-00 10?, 1-81 500 1-002 Agricultural Research 1700 6 0 0 6 -0 0 2 0 -0 2 31-00 6-33
Total— 1 and 2 ••• 18-33 7 00 7 00 21-83 3600 7-33
1(ii) Agriculture
Extension. Training and Farmers’ Educa 41*02 8 27 8-27 3i-69 93 66
Y-- -- -
■ 24-73
2tion.
Improved Seed Programme ... 21-16 4 83 4-83 18 68 32-19 6 113 Manures and Fertilizers 1900 11-16 11-16 29-91 58-28 11-084 Plant Protection 7-43 2-30 2-30 9-69 17 66 3025 Agricultural Implements and Machinery 25-40 6-77 6-77 20‘89 79-0,5 13 91
6
including Agro—Industries Corporation.
A-gnculture Statistics 0-11 1-48 1-48 1-67 11-95 2 397 HVP. lADP. Multiple cropping and other 11-89 2-20 2-20 12 23 23-40 3-52
8intensive cultivation Programmes.
Land Development 18-28 11-31 11-31 37-43 82-20 16 249 Land Reforms (including consolidat'on of 8 80 2-00 2-00 9-30 126 00 9 0 0
10holdings).
Others 117-53 24-68 24-68 85-81 189 6! 39-56
Total—(I to 10) .................... 270-62 75-00 75-00 260-30 714 00 129-76
( 1) (2 )
(iii) Minor Irrigation(iv) Soil Conservation (vj \" ta . Development ...
(vi) Animal Husbandry ...(v'ii) D.iirying and Milk Supply
(viii) Fotests(ix) Fisheries(x) Warehousing and Storage
(xi) Marke'inff ... ... J(xii) Small Farmers and Agri. Labour
(3) N (4) (5) (6) (7) (8)
111-00 41-70 41-70 106-17 275-00 43-10118-00 50-00 50-00 128-26 1422-52 229-95
112-00 32'0() 32-00 105-11 22'8-00 43 *0538-00 10-00 10-00 23-61 48-00 10-2088-00 23-00 23-00 96-95 513-00 120-7020-00 8.00 8-00 20-00 58-00 9-30
10-00 ^2-30 2-30 6-73 14-30 2-50
(xiii) Go-operatlon—(1) Agricultural Credit(2) Marketing(3) Pi o^essing other than sugar
factories and large p.oces- sing units.
(4) Go*o;j. Sugar Factories ...(5) Go-3p. Farming(6) U rban Consumer Co-ops.(7) Co-op. Storage ...(8) Additional Deptt. Staff(9) O thers...
43-671 21-53 I
•88
. . . ^4-00 )
10-15 I 3 -70 I
32-07J
3 7 00 37-00
38-6124-48
4-S5
3-1010072-35
2409
95-GO'l 61-00 j n - c o I
:::20-0) I 13-00 I 10-00 I 49-OOJ
44*00
-Jo
T o til (1 to 9) 120-00 37-00 37-00 107-25 259 00 44-00
(xiv) Community Development(xv) Panchayats
118-00 21-00 21 00 118-00 16-58
Total (il lo (.Kv) 1€24 00 307-CO 307-(0' 994-20 3635-52 656-17
' ( 1 ) (2) (3) (4) i5. (6) (7) (8)
I I Ii rigation and Power —
(i) Irligation
(1) CoLtiiming
(a) M ajor (Project-wise)
(b) M edium
(2) New ... ... ... ... 123-66 23-00
(3) luvc tigaiion and Research ... •• ... ... 6-02 2-00
Total ... ... 129-68 25-00
(ii) Power—
(1) Generation ... ... ... ... ... ...
(2) Transmission and Distribu 120-00'! • • * 900-00tion- 1
(a) Rural Elettrificalion ... 142-50 y 40 00 40-00 173-41 1500-00 • • •(b) Investigations 1 . • • 100 00 • • •(c) Miscellaneous 4-50J ... ... 1100-00 ...
Total 159-00 ■ 40-00 40-00 173-41 3600-00 210-00
(1) (2)I I I . Industry and Mining—
(i) Large and Medium Indu tries—1. State Industrial Projects2. Industrial Areas3. Industrial Development Cojporation ...4. State Finance Corporation ...5. Bcsearcn, Demcnstrat'on and Pilot
Projet IS.6. Others
(3)
TO-CO11-0070-00
5-tVo
7’GO
(4)
17-506-00
19-CO
3 00
7-50
(5) '
17-506-00
19-00
3-00
7-50
(6)
45-516-00
44-ro
5-32
8-78
(7)
260-00lO-CO
850-00
10*00
51-22
(8)
180-00 4 00
110-00
2-CO
14-15
To al (1 to 6) 103-00 53-00 53-00 110-41 1I81-22 310-15
(ii) Village and Small Industries—1. Handloom Industry 10-00 4-00 4-00 8-42 40 00 8-162. Power Looms • • « ...3. Small Scale Iixdustries 72-40 19-50 19-50 49-29 150-00 22-354. Industrial Estates ... • •• • •• • • • • •• • ••
fa) Rural(b) Semi-urban : and .. ^ 6-60 3-00 3-0«0 3-00 10-00 2-00(c) Urban ... J
5. Handicri'.ffts ... ... 4*00 3-50 3-5'0 3-50 800 1-006. Sericulture 30-00 8-00 8 0>0 22-15 35-00 7-117. Goir Industry • •• ....8. Khadi and Village Industries ... 2-00 1-00 10(0 20 0 5-00 1-00
Others ••• ••• ... ... ... • •• • «•
Total (1 to 9j ... 125-00 39-00 39-00 8836 248 00 41*62
(i’i) Min ral Development 30-00 12-00 12-00 30-00 102-48 18-53
Total (i to iii) 238-00 10400 104 00 228-77 1531-70 370-30
S3
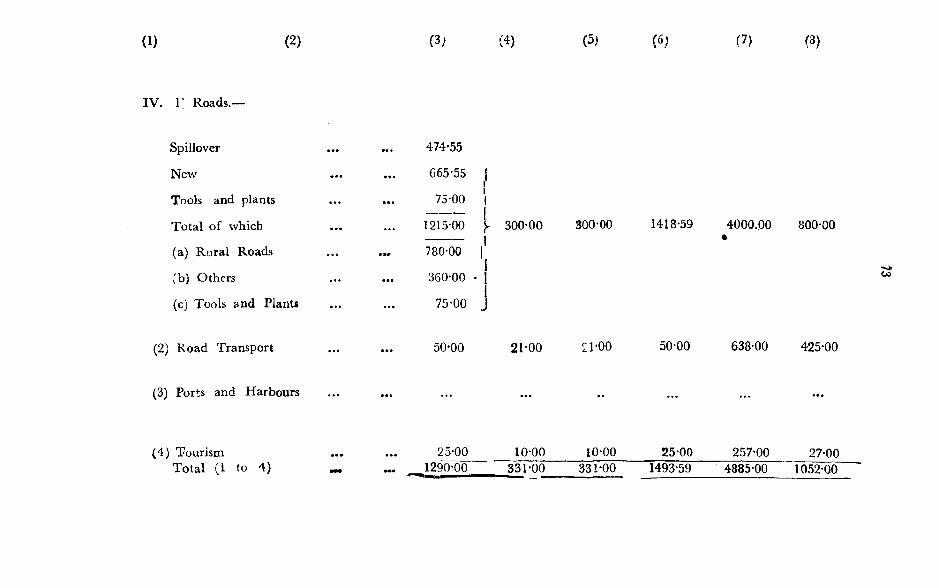
( 1) (2) (4) (5) (7) (8)
IV . r Roads.-
Spillover
New
Tools and plants
Total of which
(a) Rural Roads
(b) Others
(c) Tools and Piants
474-55
665-55
75-00
1215-00
780-00
360-00
75-00
300-00 300-00 1418-59 4000.00 800-00
(2) Road Transport 50-00 21-00 ;i-00 50-00 638-00 425-00
(3) Ports and Harbours
(4) TourismT otal (1 to 4)
25-001290-00
10-00331-00
10-00331-00
25-00 257*001493-59
27-004885-00 1052-00
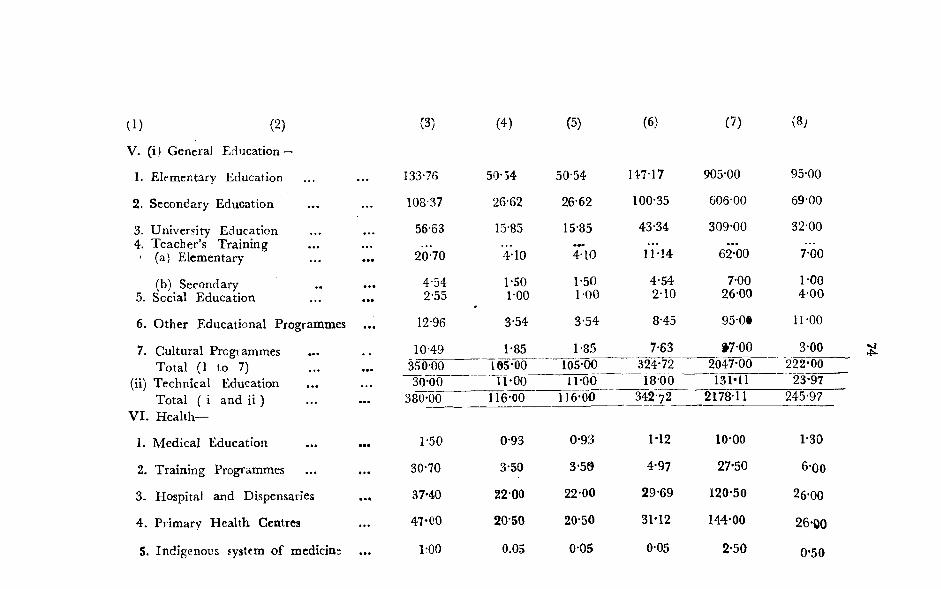
(1) (2) (3) (4) (5) (6) rn (8;
V. (i) Geneial Education—
1. Elementary Education ... 133-76 50-34 50-54 147-17 905-00 95-00
2. Secondary Education ... 108-37 26-62 26-62 100-35 606-00 69-00
3. University Education 56-63 15-85 15-85 43-34 309-00 32-004. Teacher’s Training • • • ... ... ...' (a) Elementary • •• 20-70 ’4-10 4-10 11-14 62-00 7-00
(b) Secondary 4-54 1-50 1-50 4-54 7-00 1-005. Social Education • •• 2-55 1-00 100 2-10 26-00 4-00
6. O ther Educational Programmes ... 12-96 3-54 3-54 8-45 95-0® 11-00
7. Cultural Programmes 10-49 1-85 1-85 7-63 »7-00 3-00Total (1 to 7) • •• 350-00 105-00 105-00 324-72 2047-00 222-00
(ii) Technical Education • • • 30-00 U-00 11-00 1800 13l»ll 23-97Total ( i and ii ) • •• 380-00 116-00 116-00 342-72 2178-11 245-97
V I. Health—
I. M edical Education ••• 1-50 0-93 0-93 M 2 10-00 1-30
2. Training Programmes ... 30-70 3-50 3-5a 4-97 27-50 6-00
3. Hospital and Dispensaries • •• 37-40 22-00 22-00 29-69 120-50 26-00
4. Primary H ealth Centres ... 47-CO 20*50 20-50 31'12 144-00 26-00
5. Indigenous system of medicins • •• 1-00 0.05 0-05 0-05 2-50 0-50
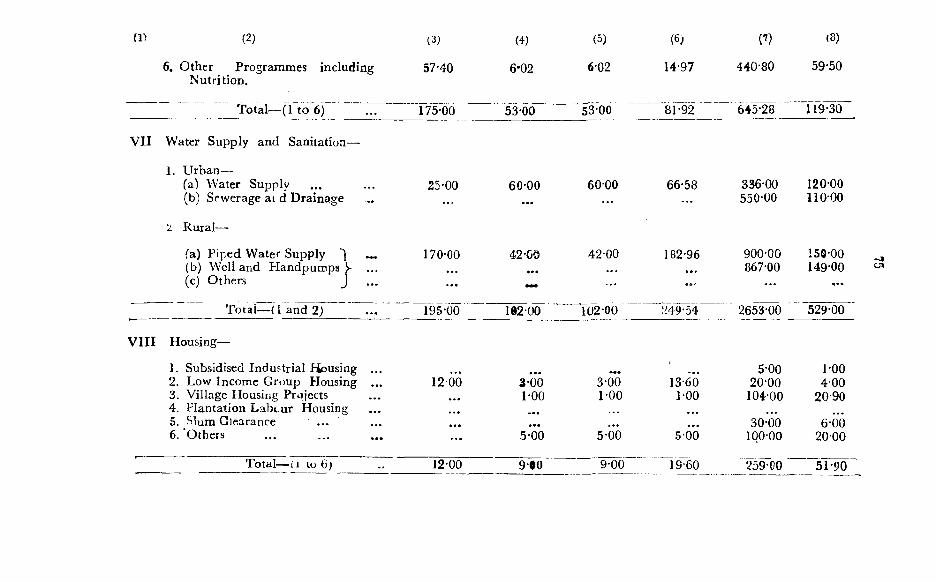
iV (2) (3) (4) (5) (6) (7) (8)
6. Other Programmes including 57-40 6*02 6-02 14-97 440-80 59-50Nutrition.
Total— (1 to 6) 175-00 53-00 53-00 81-92 645-28 119-30
V II Water Supply and Sanitation—
1, U rban—fa) Water Supply 25-00 60-00 6000 66-58 336-00 120-00(b) Sewerage at d Drainage ... ... ... ... 550-00 110-00
2 Rural—
fa) Piped Water Supply ^ 170-00 42-0& 42-00 182-96 900-00 150-00(b) Well and Handpumps W ... • •• 867-00 149-00(c) Others J ... - ... ... ... ...
Total— ( la n d 2) 195-00 102-00 102-00 :e49-54 2653-00 529-00
V III Housing—
1. Subsidised Industrial Housing ... • •• 5-00 1-002. Low Income Group Housing ... 12-00 3-00 3-00 13-60 20-00 4-003. Village Housing Projects ... 1-00 1-00 1-00 10400 20-904. Plantation Labour Housing • • • ... ... ...5. Slum Giearance • •• • •• • •• • •• 30-00 6-bo6. Others ... 5-00 5-00 5-00 100-00 20-00
Total— I'l lo 6) 12-00 9-®0 9-00 19-60 259-00 51-90
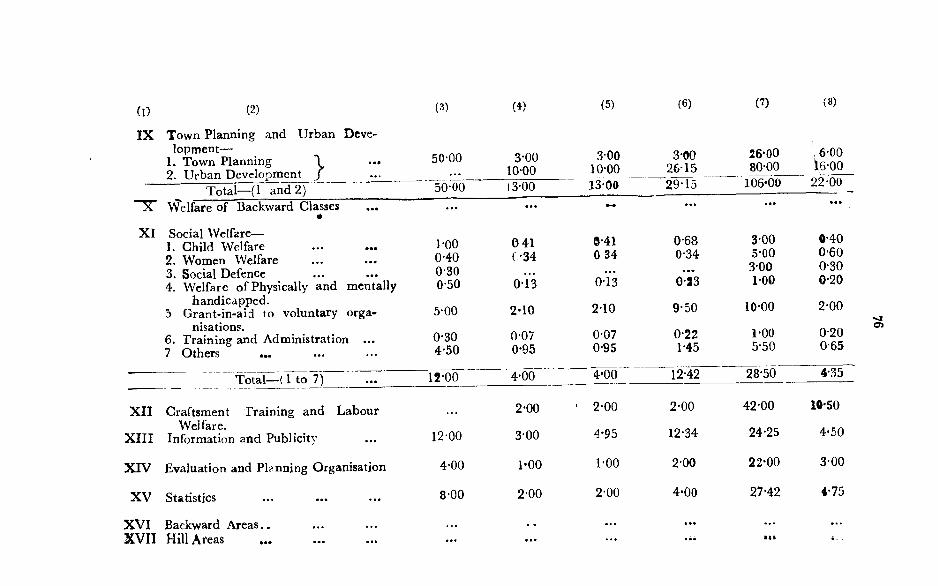
(I) (2)
IX Town Planning and U rban Deve-
(3) (4) (5) (6) C?) (8)
} ::: ..... S-------------- 5000 13-00 13-00 29-15 1Q6»00 22 00Total—(1 and 2)
X \Velfare of Backward Classes*X I Social Welfare—
1. Child Welfare ....................2. Women Welfare ....................3. Social Defence4. Welfare of Physically and mentally
handicapped.5 Grant-in-aid to voluntary orga
1-00 6 41 ©-410-40 (.-34 0 340-30 * • • ...0-50 0-13 0-13
5-00 2*10 2-10
0-30 0-07 0-074-50 0-95 0-95
nisations. ___ ^ ^ n.ort6. Training and Administration ...7 Others •••
0-68 3-00 0-400-34 5-00 0-60
... 3-00 0-300-23 1-00 0-20
9-50 10-00 2-00
0-22 1-00 0-201-45 5-50 0-65
Total— (1 to 7) . . . ________1 ^ 0 0 _______4-00________ ^*00_______ 12-42_______ 28-50_______
X II Craftsment Training and Labour Welfare.
X II I Information and Publicity
X IV Evaluation and Planning Organisation
XV Statistics
X V I Backward A reas..X V II Hill Areas .....................................
. . . 2-00 ‘ 2-00 2-00 42-00 10*50
12-00 3-00 4-95 12-34 24-25 4-50
4-00 1-00 1-00 2-00 22-00 3-00
8-00 2-00 2-00 4*00 27-42 4-75
•Vj
State—MEGHALAYA:
STATEMENT IV
DRAFT FIFT H FIVE-YEAR P L A N
Physical P rogram m es—Targets and A chievem ents
10£0F o u rth Plan
LevelExpented
during1973-74
Fifth P lan Targets
SerialNo.
Item s U nit LevelT arg e t Likely
achievem ent
r~-/
T otal 1974-75
( n (2) (3) (4) (5) (6) (7) (8) (9)
11. Agriculture and Irrigation—
Area under forests :
1 Area under quick, growing species ... ThousaQdhectares.
0-06 0-17 0-17 0-23 2-00 0-40
o Area under economic p lanta tion for Industria l com m ercial uses.
and Thousandhectares.
0-44 0-92 0-92 1-46 3-00 0-60
3 Area under Fuel P lantations ... Thousandhectares.
0-24 0-24 0-24 0-75 0-15
4 O thers ... Thousandhectares.
0-32 0-93 0-93 1-25 0-004 0-001
T otal—A rea u nder forests •• Thousandhectares.
0-82 2-26 2-26 3-18 5-75 1*15
2. A gricultural Production—1 H igh yield ing varieties—
fa) Paddy •• ’000hectares.
... 15-00 3-50 3-50 18-00 6-00
(b) W heat ... . . Do ... 2-00 1-50 T50 5-00 2-30(c) Afaize • • Do . * 5-00 4-00 4-00 10-00 5-50
2 M ultiple C ropping • • Do • • TOO 0-60 0-60 3-00 1-50
( 1) (2 )
3 Consum ption of fertilizers—
(a) N j ......................................
(b) P^Oo . . ■> , ,Vc) K2O ^
4 P lant P rotection 1.
C rop Production Targets and Achievements-
(5.)
'000tonnes.
L oDo
’000hectares.
(4) (5) (6) (7) (8) (9)
3-00 2-00 2-00 8-00 4-00
3-00 2-00 2-00 5-00 2-902-25 0 ’50 0-50 4-00 1*50
30-00 32-00 32-00 60-00 83-00
1 Food grains . . ... ’000 tonnes ... 200-00 160-00 160-00 250-00 178-00
2 Sugar cane ... . . . , Do ... 2-39 0-73 0-73 3-00 1-23
3 O il Seeds . . . .. , , Do 9-52 2-75 2-75 10-00 4-50
4 Cotton . . ... ... '000 bales • •• 8'Oi 4-30 4-30 15-00 7-005 Ju te . . ... . .. . . . ^ Do 55-00 54-00 54-00 65-00 56-503 Soil C onservation on A gricultural land ’000 2-88 6-07 7-14 1-90 16-00 1-08
4. Anim al H usbandry—(i) V eterinary hospitals, dispensaries . .
hectares.
(Nos; 30 ... 2 31 6 1
(ii) Intensive C attle Developm ent Blocks Do • •• 1 1 I 1 1(iii) Artificial Insem ination Centres . . . . Do • •• J 1 1 1 I(iv) Stockman Centres Do 3 34 30 33 63 10(v) A rea under fodder crops ... . . ’000 40 30 30 200 . 40
(vi) Key V illage Blocks— (a) Establishm ent(hectares).
(Nos) 1 1 1 1 1(b) Expanded (Nos) • • 1 1 1 1 1
(vii) C a ttle Breeding Farm s established ... Do 1 1 1
(viii) Seed Breeding Farm s established Do ... 1 1 1 1 i(ix) Sheep and Wool Extension Centres . . Do • . 1 1 1 1
(x) Sheep rearing , G rad ing an d M arketing Do ... . . - ... ..
00
(xij Production of Animal Products; (Tonnes)(a) Milk/MllL Products • •• Do 3,800 42,000 41,000 41,000 52,500 44,500(b) M eat • •• Do • • ... • • 18,400 16,480(c) Wool ...................................... • • ... Do 3 2 5 5 5 1(xii) N o, of Poultry farm ers tra ined ... •• (Nos.) ... 1-00 80 80 2*00 40
Fisheries—1. Fingerlings distributed M illion 0 0 4 0-18 0-18 0-18 8-00 0-10
2. No. o f fish seed farms established ... ... (No.) 1 3 2 3 7 23. Fish ProQuction (In land) ... ’000 tonnes 90 570 570 250 2000 400
C o-operation—(i) Prim ary C o-operative Societies (A gricultural
Credit) —N um ber ... ... . . . . . (Nos.) 800 600 600 1000 200
M em bership . . • . . . ' Lakhs 0-50 0-30 0-30 3-00 0-40
Share C apital of members ... • • (Rs. crores) N ot available
Deposits of m embers . . ... ... (Rs. crores) N o t available(ii) A gricultural C red it—
(a) Short and M edium t;rm A di'ances during the year.
Amour, t outstanding a t t he end o f the
(Rs. croresy
(Rs. crores)
•• 0-80
N ot
0-75
available
0-75 2-00 0-50
year.(b) Long term . . . . ••• (Rs. crores) , , 0-25 0-05
Advances du rin g the year ... ... . . . . ••• • •A m ount outstanding a t the end of the year ... ... ... . .. . . . .
(iii) P rim ary M arketing Societies ... (Nos) 30 30 30 • •(iv) Processing Societies—
(a) Rice M ills ••• (Nos.) . . --Business handled ... (Rs. lakhs) . . ...
(b) Sugar factories . . ... (No.) ... ... ...Production ... (Rs. lakhs) ... ... ...
(c) C otton ginning and pressing ... (No.) 1 I *
•<r.C£5'
Pow er—(i) Insta lled capacity (000 M W ) 0-146 0'206 0*176 01 7 6 0-266 0-03a
(ii) E lectricity generated ... (000 MW ) 0-2S6 0-750 0 -5 7 6 0-576 1-537 0-650
(iii) E lectricity sold 000 MW ) 0-179 0'600 0-479 0-479 1-280 0-550
(iv) R ural Electrification— (a) * Villages electrified (Nos.) 52 167 *167 219 1800 180
* Should correspond to Census Villages
(b) Pum p sets energised by electricity (Nos.) ... 18 18 13 1000 100
(c) Tubewells energised by electricity (Nos.) ... ••• — ... ...
T ransport—
1. Roads—T otal R oads—
(a) Surfaced ... ... Kms. 1 2649 335'j 996 40f> 75
(b) UnSurfaced ... „ [ ...1
1110 y 726 2389 2100 325
(c) Total 2649 1445 j 736 3385 2500 400
2. Vehicles owned by S ta te T ransport U n d ertaking C orporation—(a) Trucks ... (Nos) 5 5 5 340 300
(b) Buses ... 35 35 35 45 2®
o
M jB .—Figure fo r generation, etc., is same for M eghalaya and \ssam . Installed capacity in M eghalaya alone is 65 MW. No record o f electricity generated and sold i? m aintained separately for Megha*aya by the ASEB.^Includes 12 villages financed by the R ural Electriflcation Corporationi.
9 G e n e ra l E ducation : E n ro lm en t—
(i) Classes I—V :
(a) Boys . . ‘000 No. 72 •• •• ... ••
(b) G i r l s ....................................................... . . 63 • # •• ... ... ••
T o ta l . . « . . 135 . . . 146 146 346 ••
(ii) Classes V I—V I I I ;
(a) Boys . . ?000 No. 11 • # •• ... • •
(b) G i r l s ....................................................... ... 8 - •• •• ••
T o ta l ••• 19 . . 24 24 92 ••
(iii) Classes IX —X I :
(a) Boys . . ’000 No. 9 ... ... . .
(b) G i r l s ....................................................... .. 5 ... •• •• •• ...
T otal .. 14 •• 25 25 43
University/Collegiate enrolm ent (000) •• » • •• •• -
Total (Arts, Science and Com merce) ... .. 7 •• 11 11 20
CO
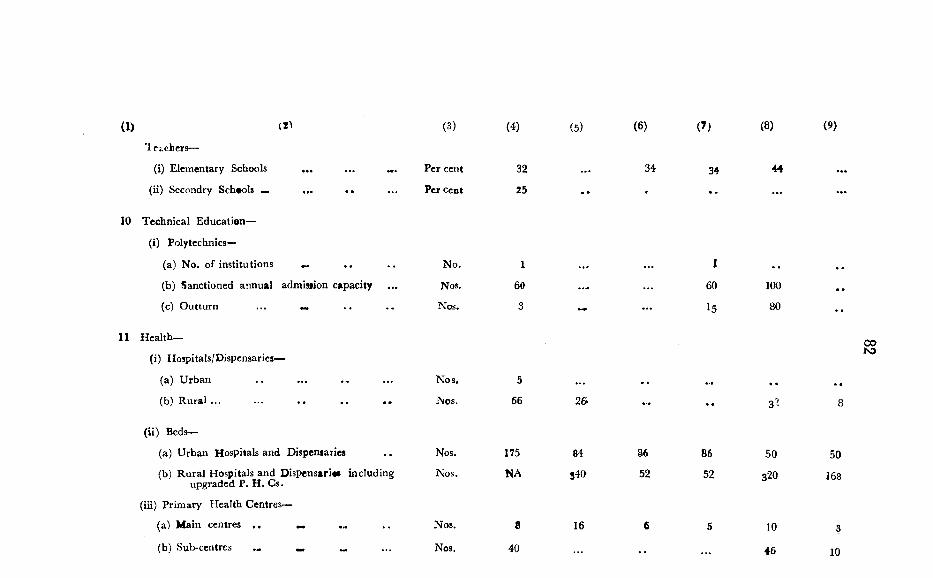
(1) (21'lc i.chcrs—
(i) Elem entary Schools . . . . ..
(ii) Secondry Schools . .. . .
10 T echnical E ducation—
(i) Polytechnics—
(a) No. o f institu tions
(b) Sanctioned annual adm isiion capacity
(c) O u ttu rn ...
11 H ealth—
(i) Hospitals/D ispensaries—
(a) U rb an
(b) R u ra l ... . .. . . . . . .
(ii) Beds—
(a) U rban Hospitals and D ispeniaricj
(b) R u ra l H ospitals and Dispens»ri«« includingupgraded P. H . Cs.
(iii) P rim ary H ealth C entres—
(a) M ain centres . .
(b) Sub-centres ...
(3)
P er cent
Per cent
(4) (5) (6) (f) (8) (9)
No.
Nos.
Nos.
Nos.
Nos.
Nos.
Nos.
Nos.
Nos.
32
25
1
60
3
5
66
175
NA
26
84
16
34
52
34
1
60
l5
86
52
44
100
80
40
3
50
320
10
46
COK>
50
168
3
10
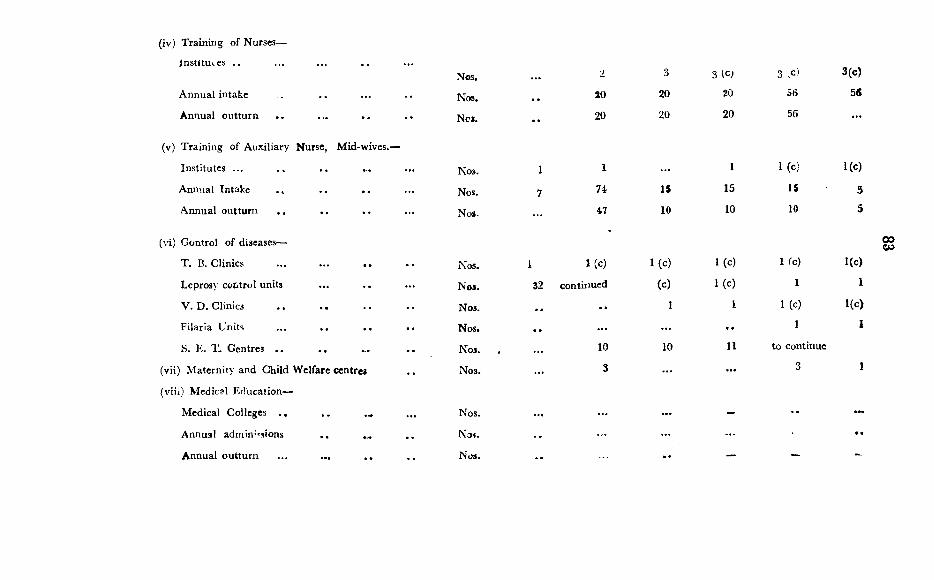
(iv) T rain ing of Nurses—
lnstjtui.esNos. ... 2 3 3 (c; 3 vC) 3(c)
A nnual intake • • ... Nos. , * 20 20 20 56 55
Annual o u ttu rn • • • * Noi. •• 20 20 20 56 ...
(v) T rain ing of A uxiliary Nurse, M id-wives.—
Institu tes ... • • . . Nos. 1 1 ... 1 1 (c ) 1(c)
Annual Intake * • . . Nos. 7 74 IS 15 IS 5
A nnual ou ttu rn .................... Noi. ... 47 10 10 10 5
(vi) C ontrol o f diseases—
T . B. Clinics ... . . Nos. I 1 (c) 1 (c ) 1 (c) I (c) 1(c)
Leprosy control units ... . . Nos. 32 continued (c) 1(c ) 1 I
V . D . Clinics ... Nos. • • • • 1 1 1 (c) 1(c)
F ilaria U nits . . . . Nos. • • . .. ... • • 1 1
S. E. T . C entres . . • . N o3. , ... 10 10 11 to continue
(vii) M atern ity and C hild W elfare centres Nos. ... 3 ... . .. 3 1
(viii) M edical E ducation—
M edical Colleges • • N os. . .. . .. ... - •••
Annual adm in’^sions . . ... Nos. • • ... ... . ..
A nnual o u ttu rn • •• • • • . Nos. . . — — -
00w
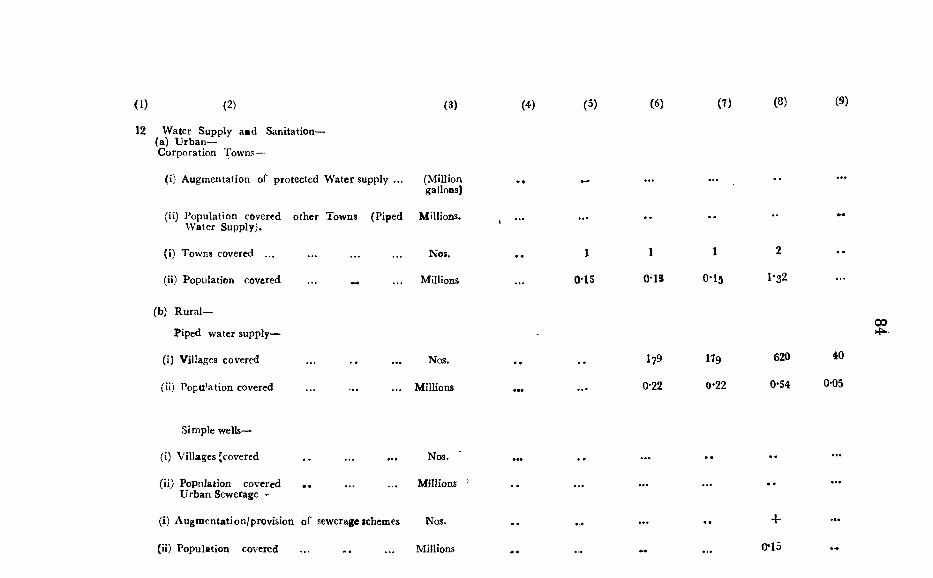
( 1) ( 2) (3) (4) (5) (6) (7) (8) (9)
12 Water Supply aad Sanitation—(a) U rb an —C orporation Tow ns—
(i) A ugm entation of pro tected W ater supply ... (M illiongallons)
(ii) P opulation covered o th er Towns (P iped M illions. W ater Supply).
(i) Towns covered ...
(ii) Population covered
(b) R u ra l—
Piped w ater supply—
(ij Villages covered
(ii) Population covered
Nos,
Millions
Nos.
M illions
1 1 1 2
0*15 0*15 0 -l5 1*32
179
0-22
179
0-22620
0-54
C»
40
0-05
Sim ple wells—
(i) V illages [covered . . ... . .. Nos.
(ii) Population covered •• ... . .. M illionsU rb an Sewerage—
(i) A ugm entation/provision o f sewerage ichem es Nos.
(ii) Population covered ... . . ... Millions
4-
0*15
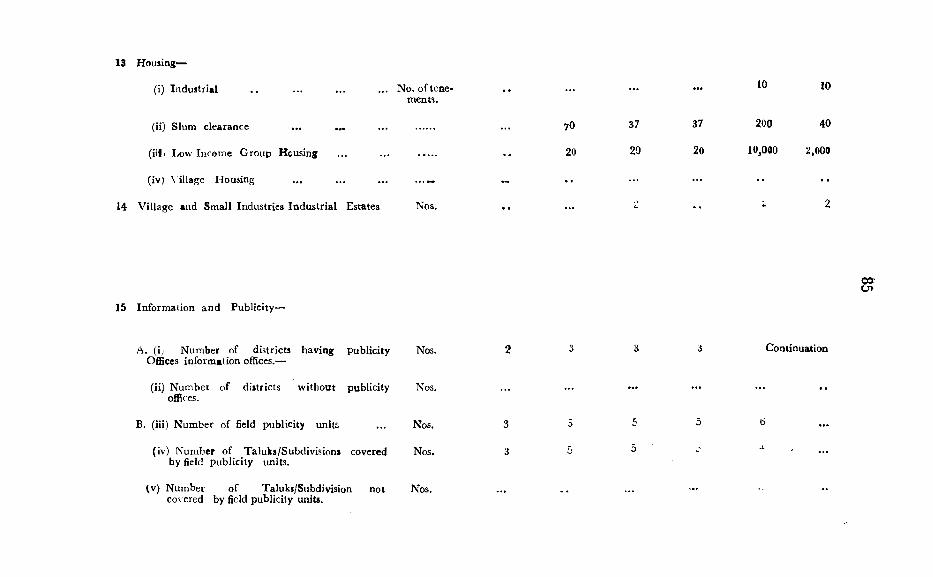
13 Housing—
(i) Industrial ... No. oftene* m ents.
(ii) Slum clearance
(illI Low Incom e G roup Housing
(iv) \ illage Housing
14 V illage and Sm all Industries In d u stria l Estates Nos.
70
20
37
20
37
20
200
10,000
10
40
2,000
10
15 Inform ation a n d Publicity—
oa
A. (i; N um ber of districts having publicity Nos.Offices inform ation offices.—
(ii) N um bet o f districts w ithou t publicity Nos.offices.
B. (iii) N um ber of field publicity units ... Nos.
(iv) N'umber o f Taluks/Subdivisioni covered Nos.by field publicity units.
(v) N um ber o f Taluks/Subdivision not Nos.covered by field publicity units.
C ontinuation
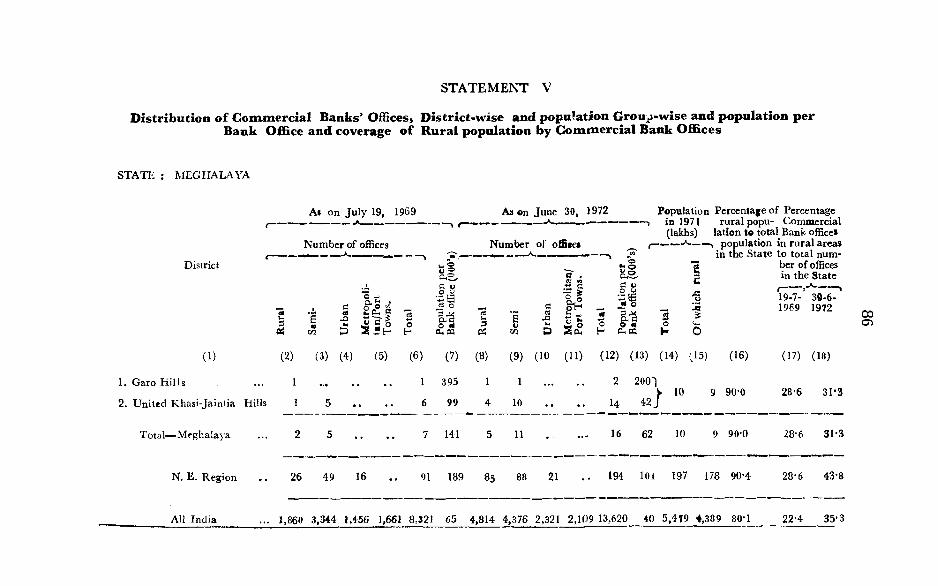
STATEM ENT V
Distribution of Commercial Banks’ Offices, District-wise and population Grou^i-wise and population per Bank OfiBce and coverage of Rural population by Commercial Bank Ofl&ces
STA TE ; M EGHALAYA
District
Ai on Ju ly 19,--------- ^____N um ber o f oflBces
1969 As on Ju n e 30, 1972 ____ ^ ——
N um ber of oflBcei__A---- ---- -Oh®,
Hi-sai
1 - .S o o E2
1 III 3
a V o uCJ oCL,a o mOioa
73
Pi
ccsSio 1
(1) (2) (3) (4) (5) (6) (7) (8) (9) (10 (11)
1. G aro H ills 1 ... .. 1 395 1 1 ...
2. U n ited K hasi-Ja in tia Hills 1 5 .. 6 99 4 10 • • . .
Tota 1— Megh alaya 2 5 .. 7 141 5 11 ...
N. E . R egion 26 49 16 91 189 85 88 21 • •
*• oaS- a cjf °
Population Percentage o f Percentage in 1971 ru ra l popu- Com m ercial(lakhs) lation to total Bank office*
population in ru ra l areas in the S ta te to to ta l num -
TS ber of offices
2
14200 ')
4210
I (16)
9 90-0
16 62 10 9 90-0
194 101 197 178 90-4
in the S tateI----- — — '19-7- 30-6- 1969 1972
(17) (18)
28-6 31-3
28-6 31-3
28*6 43-8
All In d ia ... 1,860 3,344 1,456 1,661 8,321 65 4,814 4,376 2,321 2,109 13,620 40 5.479 4,389 80-1 22 4 35-3
COOi
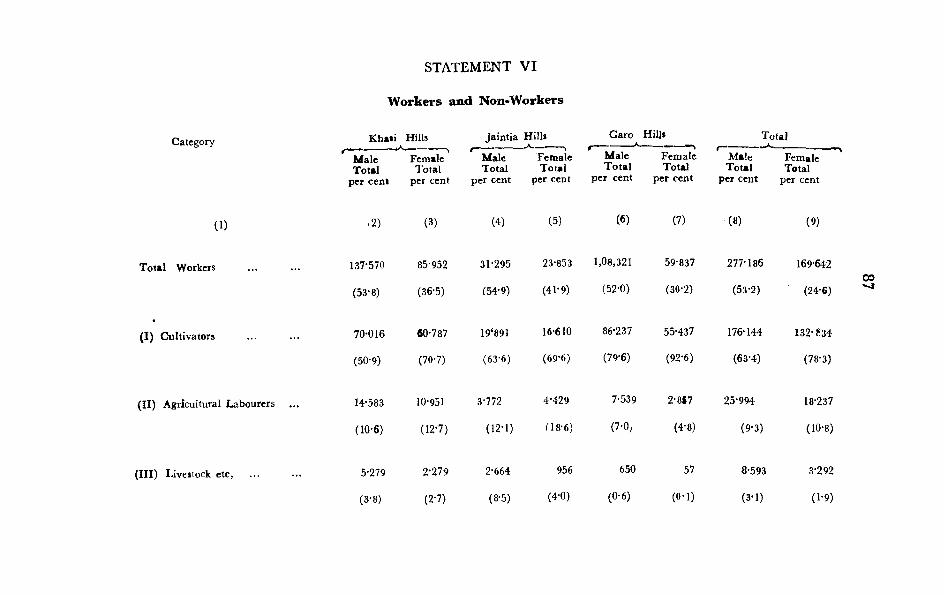
Category
STATEM ENT V I
Workers and Non-Workers
K hati Hills_____kA.------
Ja in tia H ills
M aleT o ta l
FemaleT otal
MaleT otal
Fem aleT o ta l
G aro Hill*
M aleT o ta l
FeinalcT otal
TotalM aleT o ta l
Fem aleT otal
per cen i per cent per cent per cent per cent per cent per cent per cent
(1) -2 ) (3) (4) (5) (6 ) (7) ( 8) (9)
T o ta l W orkers 137-570
(53-8)
85-952 31-295 23-853 1,08,321 59-837 277-186 169*642
(36-5) (54-9) (41-9) (52-0) (30-2) (53-2) (24-6)00
( I ) C ultivators 70-016
(50-9)
60-787
(70-7)
19‘891
(63-6)
16-610
(69-6)
86-237
(79-6)
55-437
(92-6)
176-144
(63-4)
132*834
(78-3)
( I I ) Agricultural Labourers 14-583
( 10-6)
10-951
(12-7)
3-772
( 12- 1)
4*429
ns-6)
7-539
(7-0;
2-817
(4-8)
25-994
(9-3)
18-237
( 10 -8)
( I I I ) Livestock etc, 5-279
(3-8)
2-279
(2-7)
2-664
(8-5)
956
(4-0)
650
( 0 -6)
57
(0 - 1)
8-593
(3-1)
3-292
(1-9)
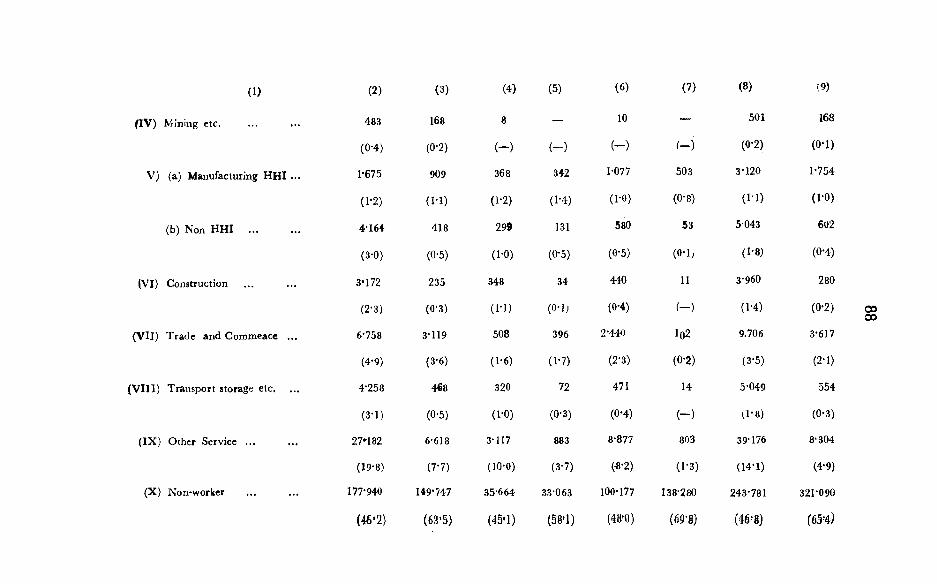
(IV ) \4 ining etc.
V) (a) M anufacturing H H I ...
(b) N on H H I ....................
(VI) Construction
(V II) T rade and Com m eace ...
( V I lI ) T ransport storage etc. ...
(1)
(IX ) O ther Service ...
(X) Non-worker
(2) (3) (4) (5) (6) (7) (8) -!9)
483 168 8 — 10 — 501 168
(0-4) (0-2) ( - ) ( - ) ( - ) ( - ) (0-2) (0-1)
1*675 909 368 342 1-077 503 3-120 1-754
(1-2) (1-1) (1-2) (1-4) (1-0) (0-8) (M ) (1-0)
4-164 418 299 131 580 53 5-043 602
(3-0) (0-5) (1-0) (0-5) (0-5) (0-1; (1-8) (0-4)
3*172 235 348 34 440 11 3-960 280
(2-3) (0-3) (1-1) (o-i; (0-4) ( - ) (1-4) (0-2)
6-758 3-119 508 396 2-440 l02 9.706 3-617
(4-9) (3-6) (1-6) (1-7) (2-3) (0-2) (3-5) (2-1)
4-258 468 320 72 471 14 5-049 554
(3-1) (0-5) (1-0) (0-3) (0-4) ( - ) (1*8) (0-3)
27-182 6-618 3-117 883 8-877 803 39-176 8-304
(19-8) (7-7) (10-0) (3-7) (•8-2) (1-3) (14-1) (4-9)
177-940 149-747 35-664 33-063 100-177 138-280 243-781 321-090
(4€ '2) (63*5) (45*1) (58’1) (48^0) (69-8) (46^8) t m )
0000
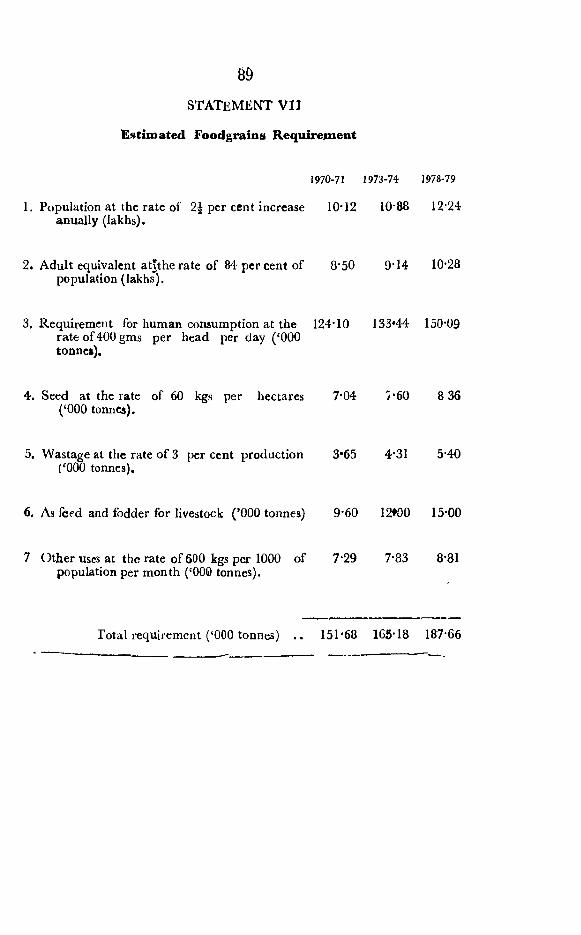
STATEMEiS[T V II
Estimated Foodgrains Requirement
1970-71 1973-74 1978-79
L Population at the rate of 2 | per cent increase 10*12 10 88 12-24anually (lakhs).
2. Adult equivalent atlthe rate of 84 per cent of 8*50 9’14 10’28population (lakhs).
3. Requirement for human consumption at the 124*10 133*44 150*09rate o f400 gms per head per day (‘000 tonnes).
4. Seed at the rate of 60 kgs per hectares 7*04 7‘60 8 36(‘000 tonnes).
5. Wastage at the rate of 3 per cent production 3*65 4*31 5*40(‘000 tonnes).
6. As feed and fodder for livestock ( ’000 tonnes) 9*60 12*00 15*00
7 O ther uses at the rate of 600 kgs per 1000 of 7*29 7*83 8*81population per month (‘000 tonnes).
Total requirement (‘000 tonnes) . . 151*68 165*18 187*66
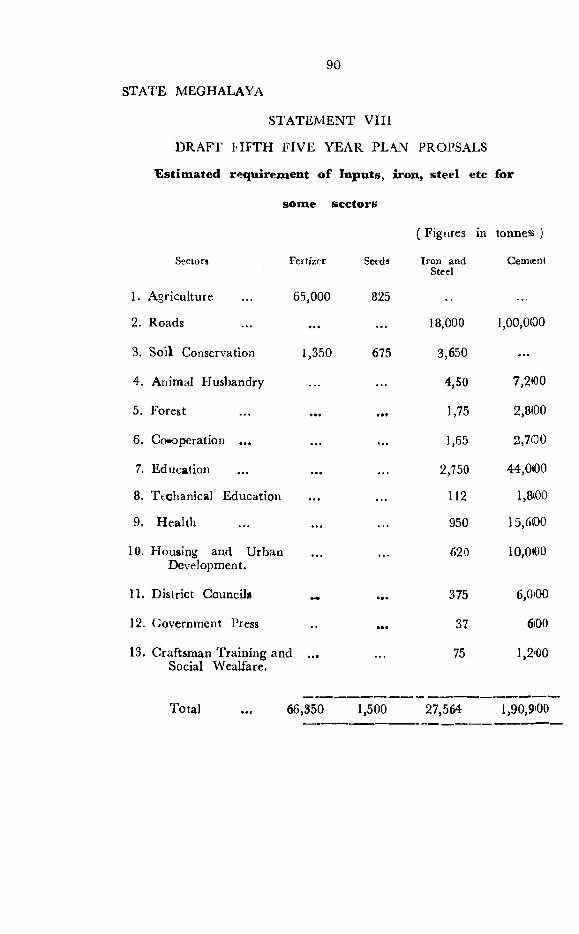
9 0
STATE MEGHALAYA
STATEM ENT V III
DRAFT H F T H FIVE YEAR PLAN PROPSALS
Estimated r<iquirement o f Inputs, iron, steel etc
some scctors
for
Sectors Fcrt/zer
1. Agriculture ... 65,000
2. Roads
3. Soil Conservation 1,350
4. Animal Husbandry
5. Forest
6. Co-operation ...
7. Education
8. Ttchanical Education
9. Health
10. Housing and UrbanDevelopment.
11. District Councils
12. Covernment Press
13. Craftsman Training andSocial Wealfare.
Seeds
825
675
( Figures in tonnes )
Iro n and Cem<entSteel
18,000
3,650
4,50
1,75
1,65
2,750
112
950
620
375
37
75
1,00,0(00
7,2<00
2,8(00
2,7(00
44,0(00
1,8(0015,6(00
10,0(00
6,0«00
6t00
l,2-00
Total 66,350 1,500 27,564 1,90,9*00
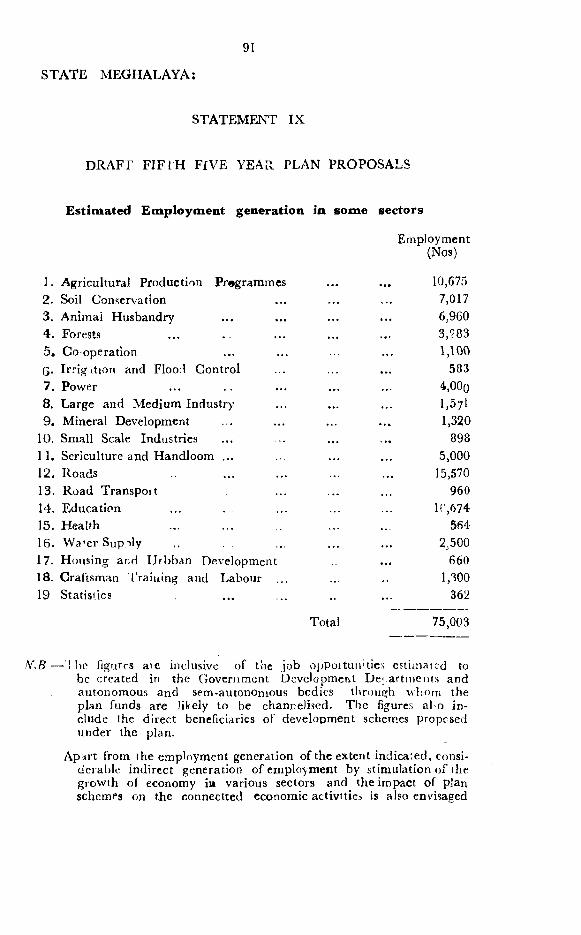
91
STATE MEGHALAYA;
STATEMENT IX
DRAFT FIFT H FIVE YEAR PLAN PROPOSALS
Estimated Etnployment generation in some sectors
1.2 .
3.4.
5.6.7.
8. 9.
10. 11. 12.13.14.15.16.
17.18. 19
Agricultural Production Pr#grammcsSoil ConservationAnimal HusbandryForestsCooperationIrrig ition and Flood Control PowerLarge and Medium Industry Mineral Development Small Scale Industries ... Sericulture and Handloom ...RoadsRoad TransportEducationHealthWa’er Supply
Housing and IJrbban Development Craftsman Traiuing and Labour ... Statistics
Employment(Nos)
10,6757,0176,9603,9831,100
5834.0001,5711,320
8985.000
15,570960
1(\674564
2,500660
1,300362
Total 75,003
N,B — Tbc figures ate inclusive of the job oj>poituii'tics esliinatcd to be created in the Government Development Dei artinents and autonomous and sem-autonomous bodies throu8[h wliom the plan funds are likely to be channelised. The figures al o include the direct beneficiaries of development schemes proposed under the plan.
Ap;irt from the employment generation of the extent indicated, considerable indirect generation of employment by stimulation of the growth of economy ia various sectors and the impact of plan schemep on the connectted economic activttiei is also envisaged
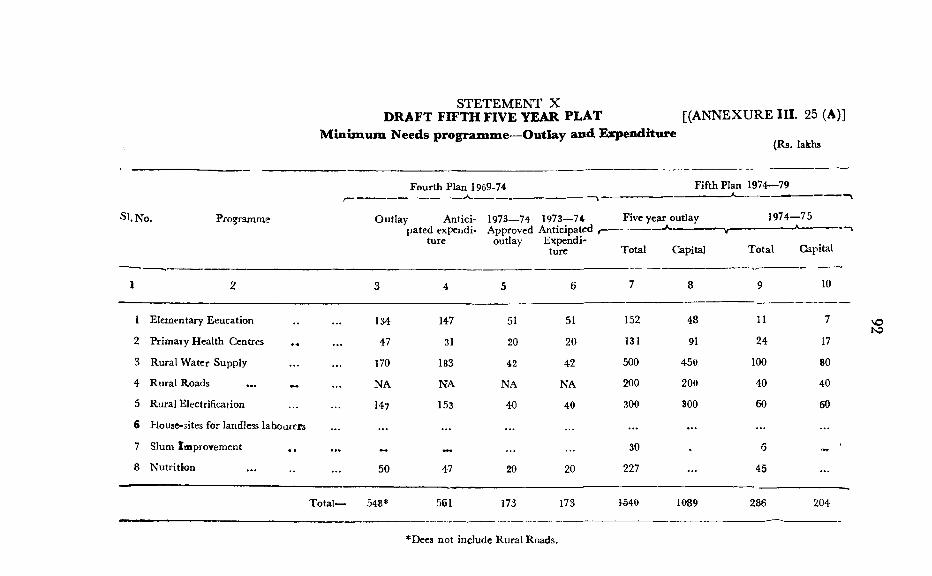
STETEM ENT X D RAFT FIFTH FIVE YEAR PLA T
Minimum Needs programme—Outlay and Expenditure[(ANNEXURE III. 25 (A)]
(Rs. lakhs
SI. No. Programme
Fourth Plan 1969-74 F ifth Plan 1974—79
O utlay Antici- 1973— 74 1973—74 Five year outlaypated expendi- Approved Anticipated f------------------ --------------
tu re outlay Expenditure T otal Capital
1974—75
T ota l Capital
1 2 3 4 5 6 7 8 9 10
1 Elementary Eeucation ... 134 147 51 51 152 48 11 7
2 Prim ary H ealth Centres . . 47 31 20 20 131 91 24 17
3 R ural W ater Supply 170 183 42 42 500 450 100 80
4 R ural Roads NA NA NA NA 200 200 40 40
5 R ural Electrification 147 153 40 40 300 300 60 60
€ House-sites for landless labourers ... ... ... ... ... ...
7 Slum Im provem ent . . 30 - 6 •« '
8 N utrition 50 47 20 20 227 45 ...
T otal— 548* 561 173 173 t540 1089 286 204
VON3
*Dees not include R ural Roads,
D R A FT F IIT fl FIVE \!EAR PLAN M inim um Needs Programme—Physical targets
Fourth Plan
ANNEXURE III. 25 fB)
SerialNo.
Program m e
( 2 )1 E iem entary Education—
6-11 age group—
(a) Additional enrolm ent in term s o f num bers—
(i) Boys(ii) G irls
Total
(b) In term s o f percentage coverage—
(i) Boys(ii) G irls
T otal
11-14 age-group—(a) Additional enrolm ent i r term s o f num bers—
Fifth Plan
U nit T arget
(3) (4)
I in 0 0 0
1>■ PercentJ
Likely achi- Likely 1973- F ive y ear T arg e t for evem ent 74 achieve- target-1974- 1974-75
m ent 79
(5)
146
81*2
(6)
146
81-2
(7 )
122
100
(8)
10
VO
(i) Boys(ii) G irls
T otal
(b) In term s o f percentage coverage—
(i) Boys(ii) Girls
Total
in 000
Percent
24
40-2
24
40-2
53
75
(1) (2)
P rim ary H ealth Centres—(a) Nos. .(b) Population covered
Sub-Centres—(a) Nos. . .(b) Population covered
f . VR eferral hospitals—
(a )N o s . _(b) Population covered
.'3)No
No
jS o
(4)15
(5)
5
(6) (7;
10
46 10
3 R ural W ater Supply' (a) No. of target villages covered ...
(bj Population covered . .
1 R u ra l R oads—(a) New constructions—Km s.(b) Im provem ents—Kms. ...(c) IS um ber of target villages
5 R ’lral Electrification—num ber o f villages electrified—
NoM illions
No
No
1790-22
102 114 29
6200*24
1800
400.05
180
C£>
6 House sites for landless labour—
(a) Population covered(h) N um ber of house-sites allotted ... • ■ ■(c) No. of homesteads on which rights includings security of
tenure proposed to be conferred.
7 Slum Im provem ent—
(a) Towns covered w ith names of towns ...(b) Population covered ...(c) C ontruction of tem em ents, if any. Nos.
’0001 ('Shillong') 1
30 ■
,\NNEXURE III 25 (B)—
SerialNo.
Program me
(J) (2 '
8 N utrition—A pplied N u tritio n Program m e-
U n it Fourth P lan F ifth Plan
Targe: L ikely Likely 1973-74 F ive year T argetachievem ent ach ievem ent target- fo r
1974-79 1974-75
(3) (4) (5) (6) (7) (&)
V ulnerab le groups to be catered fo r—
(a) P reg n an t women (No.) "j
(b) L actating m others (No.) J
'■ ' r, ■' ' " '. '" '- 'V jfc ^ C ^ ld re n in the age group of 0—6 (No.)
f O p ^'' ' / H
I ^ ) j j ^ d ^ l - g o i n g children of the weaker sections (No.)
UFental I ceding Program m es—
1,0G0 900
3.000 3,000
22.000 20,000
2,000
6.600
40f0t)0
o».
(a ) Special N utrition feeding program m e
G . P. (P&D) N o. 1/73— 2,000— 16—7— 1973
34,000 30,000 50.000


