Embed Size (px)
Citation preview
ABSTRACT
Patricia L. Martin, A PRELIMINARY EXAMINATION OF THE INTENDED PURPOSE,
ACTUAL USE, AND PERCEIVED BENEFIT OF DISTRICT-LED INTERIM
ASSESSMENTS ON STUDENT ACHIEVEMENT IN NORTH CAROLINA SCHOOLS
(Under the direction of Dr. Kermit Buckner). Department of Educational Leadership, November
2012.
This study examined the intended purposes, actual uses, and perceived benefits of interim
assessments on student achievement from the perspectives of district leaders, school
administrators, and classroom teachers. Quantitative research methodologies were utilized to
describe the phenomena of interim assessment use in a sample of North Carolina school districts.
Responses from an online survey were analyzed in order to categorize respondents’ interim
assessment use as Instructional, Predictive, Evaluative, or Multiple and to compare the dominant
categories of district leaders, school administrators, and classroom teachers (Perie et al., 2009).
The findings reveal that interim assessments are given for Instructional purposes, using
Instructional data analysis methods, and have Instructional benefits for students. When results
were parsed by district, several endorsed the “Multiple” category suggesting a wide variety of
purposes, uses, and benefits within the same district. When results were compared across roles, a
statistically significant difference was found between district leaders, school administrators and
classroom teachers. The results indicate that within the sample population surveyed, a person’s
response to questions regarding the purpose, use, and benefit of interim assessments is related to
their role within the district.
The findings from the study espouse two main recommendations. First, it is vital that
district and state educational leaders make careful and informed decisions about the purpose and
use of interim assessments prior to implementation. Second, districts need to develop and
communicate a coherent implementation plan that is aligned to the selected purpose and
consistent across various roles within the district. Future research studies on the use of interim
assessments may build a more comprehensive picture of and offer a more in-depth explanation
for the phenomena revealed in this study. Such research could include a qualitative study on data
analysis methods that are aligned to a specific interim assessment purpose, a case study
showcasing schools in North Carolina that are using interim assessments for various purposes,
and a quantitative study to determine whether interim assessments can be correlated to improved
student achievement.
A PRELIMINARY EXAMINATION OF THE INTENDED PURPOSE, ACTUAL USE, AND
PERCEIVED BENEFIT OF DISTRICT-LED INTERIM ASSESSMENTS ON STUDENT
ACHIEVEMENT IN NORTH CAROLINA SCHOOLS
A Dissertation
Presented to
The Faculty of the Department of Educational Leadership
East Carolina University
In Partial Fulfillment
of the Requirements for the Degree
Doctor of Education
by
Patricia L. Martin
November, 2012

© Copyright 2012
Patricia L. Martin
A PRELIMINARY EXAMINATION OF THE INTENDED PURPOSE, ACTUAL USE, AND
PERCEIVED BENEFIT OF DISTRICT-LED INTERIM ASSESSMENTS ON STUDENT
ACHIEVEMENT IN NORTH CAROLINA SCHOOLS
by
Patricia L. Martin
APPROVED BY:
DIRECTOR OF DISSERTATION__________________________________________________
Kermit Buckner
COMMITTEE MEMBER:________________________________________________________
William Grobe
COMMITTEE MEMBER:________________________________________________________
Marjorie Ringler
COMMITTEE MEMBER:________________________________________________________
James McDowelle
COMMITTEE MEMBER:________________________________________________________
Adrienne Smith
INTERIM CHAIR OF THE DEPARTMENT OF EDUCATIONAL LEADERSHIP:
_________________________________________________________
William Rouse, Jr.
DEAN OF THE GRADUATE SCHOOL:
_________________________________________________________
Paul Gemperline
TABLE OF CONTENTS
LIST OF TABLES............................................................................................................... x
LIST OF FIGURES............................................................................................................. xii
CHAPTER ONE: INTRODUCTION.................................................................................. 1
Background................................................................................................................ 1
Purpose of the Study.................................................................................................. 5
Research Questions.................................................................................................... 5
Theoretical/Conceptual Framework........................................................................... 6
Interim Assessment Validity Framework........................................................ 6
The PELP Coherence Framework.................................................................... 7
Methodology.............................................................................................................. 8
Analysis...................................................................................................................... 10
Significance of the Study........................................................................................... 10
Definition of Terms.................................................................................................... 12
Limitations of the Study............................................................................................. 14
CHAPTER TWO: LITERATURE REVIEW...................................................................... 15
Introduction................................................................................................................ 15
Policy Catalysts for Implementing Interim Assessments.......................................... 15
No Child Left Behind Act of 2001................................................................... 15
Race to the Top................................................................................................ 17
State Accountability......................................................................................... 18
Local Response................................................................................................ 18
Perie’s Three Intended Purposes of Interim Assessment........................................... 20
Instructional..................................................................................................... 20
Evaluative......................................................................................................... 21
Predictive......................................................................................................... 22
Multiple Purposes............................................................................................ 24
Recommendations for Interim Assessment Use........................................................ 25
Instruments....................................................................................................... 25
Interim Assessment Instruments in North Carolina......................................... 27
Data Use........................................................................................................... 32
Professional Development............................................................................... 34
Discussion and Summary........................................................................................... 37
CHAPTER THREE: METHODOLOGY............................................................................ 38
Purpose....................................................................................................................... 38
Research Questions.................................................................................................... 39
Research Perspective.................................................................................................. 39
Context....................................................................................................................... 40
Population.................................................................................................................. 40
Recruited Sample....................................................................................................... 41
County Demographics...................................................................................... 42
Student Ethnic and Socio-Economic Diversity................................................ 42
School Quality.................................................................................................. 45
Participants................................................................................................................. 47
Measures.................................................................................................................... 48
Analysis...................................................................................................................... 51
CHAPTER FOUR: RESULTS............................................................................................ 54
Response Rates.......................................................................................................... 54
Research Question 1................................................................................................... 57
Research Question 2................................................................................................... 59
Research Question 3................................................................................................... 70
Research Question 4................................................................................................... 77
Intended Purpose........................................................................................................ 81
District Leader and School Administrator....................................................... 84
District Leader and Classroom Teacher........................................................... 84
School Administrator and Classroom Teacher................................................ 84
Actual Use.................................................................................................................. 85
District Leader and School Administrator....................................................... 85
District Leader and Classroom Teacher........................................................... 88
School Administrator and Classroom Teacher................................................ 88
Perceived Benefit....................................................................................................... 88
District Leader and School Administrator....................................................... 90
District Leader and Classroom Teacher........................................................... 90
School Administrator and Classroom Teacher................................................ 92
Summary of Findings................................................................................................. 92
CHAPTER FIVE: SUMMARY AND DISCUSSION........................................................ 94
Research Question 1................................................................................................... 94
Research Question 2................................................................................................... 97
Research Question 3................................................................................................... 100
Research Question 4................................................................................................... 102
Intended Purpose: District Leaders vs. Classroom Teachers........................... 102
Actual Use: School Administrators vs. Classroom Teachers.......................... 103
Perceived Benefit: District Leaders vs. Classroom Teachers.......................... 104
Implications................................................................................................................ 106
The Mixed-Up Chameleon Effect.................................................................... 106
Making Careful Decisions about the Purpose for Interim Assessments.......... 107
Lost in Transition............................................................................................. 108
Communicating a Clear, Coherent Implementation Plan................................ 110
Limitations of the Research Study............................................................................. 113
Recommendations for Further Research.................................................................... 113
Conclusion................................................................................................................. 115
REFERENCES.................................................................................................................... 117
APPENDIX A: QUESTIONNAIRE................................................................................... 142
APPENDIX B: QUESTIONNAIRE ANALYSIS..............................................................
APPENDIX C: FIGURES...................................................................................................
148
149
APPENDIX D: INSTITUTIONAL REVIEW BOARD APPROVAL............................... 154
LIST OF TABLES
1. Interim Assessment Instruments..................................................................................... 28
2. County Demographics.................................................................................................... 43
3. Student Ethnic and Socio-Economic Diversity.............................................................. 44
4. School Quality................................................................................................................ 46
5. Analysis Summary.......................................................................................................... 52
6. Response Rate by District............................................................................................... 55
7. Percent of Completeness by Role................................................................................... 56
8. Percent of Completeness by Question Type................................................................... 58
9. Intended Purpose Summary............................................................................................ 60
10. Intended Purpose by Answer Options.......................................................................... 61
11. Intended Purpose by District........................................................................................ 62
12. Act Use Summary......................................................................................................... 63
13. Actual Use: Frequency of Administration.................................................................... 65
14. Actual Use: Reporting Time......................................................................................... 66
15. Actual Use: Reporting Level........................................................................................ 67
16. Actual Use: Data Analysis............................................................................................ 69
17. Actual Use: Professional Development Offerings........................................................ 71
18. Actual Use by District.................................................................................................. 72
19. Perceived Benefits Summary........................................................................................ 74
20. Perceived Benefits by Answer Options........................................................................ 75
21. Perceived Benefits by District...................................................................................... 76
22. Intended Purpose by Role............................................................................................. 78
23. Actual Use by Role....................................................................................................... 79
24. Perceived Benefits by Role........................................................................................... 80
25. Chi-Square Analysis for Intended Purpose and Role................................................... 82
26. Additional Chi-Square Analysis for Intended Purpose between Three Roles.............. 83
27. Chi-Square Analysis for Actual Use and Role............................................................. 86
28. Additional Chi-Square Analysis for Actual Use between Three Roles........................ 87
29. Chi-Square Analysis for Perceived Benefit and Role.................................................. 89
30. Additional Chi-Square Analysis for Perceived Benefit between Three Roles............. 91

LIST OF FIGURES
1. The PELP Coherence Framework (PELP, 2006)............................................................. 112
CHAPTER ONE: INTRODUCTION
Background
In response to high-stakes accountability measures set forth by the No Child Left Behind
(NCLB) legislation, state educational agencies are increasing the pressure on schools to improve
student performance through rigorous statewide summative assessments (NCLB, 2002). The
current NCLB law requires that states administer annual reading, math, and science assessments
to all students in grades 3–8 and once in grades 10–12 (Pinkus, 2009). These summative
assessments measure students’ attainment of the state content knowledge and skills as defined by
proficiency cut scores set by the U.S. Department of Education in an effort to raise expectations
regarding academic performance in American schools (Perie, Marion, & Gong, 2009). Schools
must show Adequate Yearly Progress (AYP) toward 100% proficiency among all subgroups of
students by 2013-14. Those schools that consistently perform poorly can be ultimately forced to
close or reconstitute. Thus, the stakes are enormously high for schools and for their staffs to meet
expected proficiency levels (Bancroft, 2006).
While many had hoped that the required state end-of-year tests would provide
instructionally useful information, educators and others have come to recognize that this is not
the case (Perie et al., 2009). Educators are quick to note that annual standardized test scores have
only limited usefulness in the classroom because results are not timely and often not available
until after students have moved on to another teacher (Young & Kim, 2010). So in addition to
the state summative assessments, district leaders have implemented a variety of local testing
programs, products, and systems aimed at informing instruction and improving student
achievement in the hopes of avoiding potential district and school take-over or closure (Council
of Chief State School Officers [CCSSO], 2008). Educators and policymakers have realized that
2
other forms of assessments are necessary to inform instruction during the school year. As one
principal framed the problem, “It is hard to go from the end of one year to the end of the next
year looking at an individual child’s achievement unless you do something in between…because
otherwise how do you assess if what you are doing is working?” (Supovitz & Klein, 2003, p .1).
Subsequently, schools and districts have added new levels of testing that include benchmark,
interim, and common assessments to meet the demand for assessments that inform instruction as
it is occurring (Chappius, 2010). Specifically, there has been a rapid growth in the use of interim
assessment- sometimes called benchmarks- to improve instructional practice (Buckley et al.,
2010; Goertz, Olah, & Riggan, 2009). Interim assessments can be defined as tests administered
more than once during the school year for predicting student performance on summative
accountability tests, identifying student strengths and weaknesses, tracking student progress
toward “proficiency,” or identifying students for remedial instruction (Lai, 2009).
Over 70% of superintendents interviewed from a national sample indicated that they
administer periodic district-wide assessments (Olson, 2005). However, research findings on the
use of interim assessment data to guide instruction for improved student achievement are limited
(Lai, 2009). Much of the belief in the potential of interim assessment comes, instead, from the
previous research on the use of formative assessment. Formative assessment can be defined as
information collected by teachers in the classroom to modify instruction and provide feedback to
students within the classroom setting to improve the quality of instruction and raise student
performance (Black & Wiliam, 1998; Goertz et al., 2009). Unlike interim assessment, strong
empirical evidence does exist on the use of formative assessment as a means for improving
student learning (Black & Wiliam, 1998). Many educators are mistakenly assuming that the
benefits of formative assessment are identical to those of interim assessment, when in fact they
3
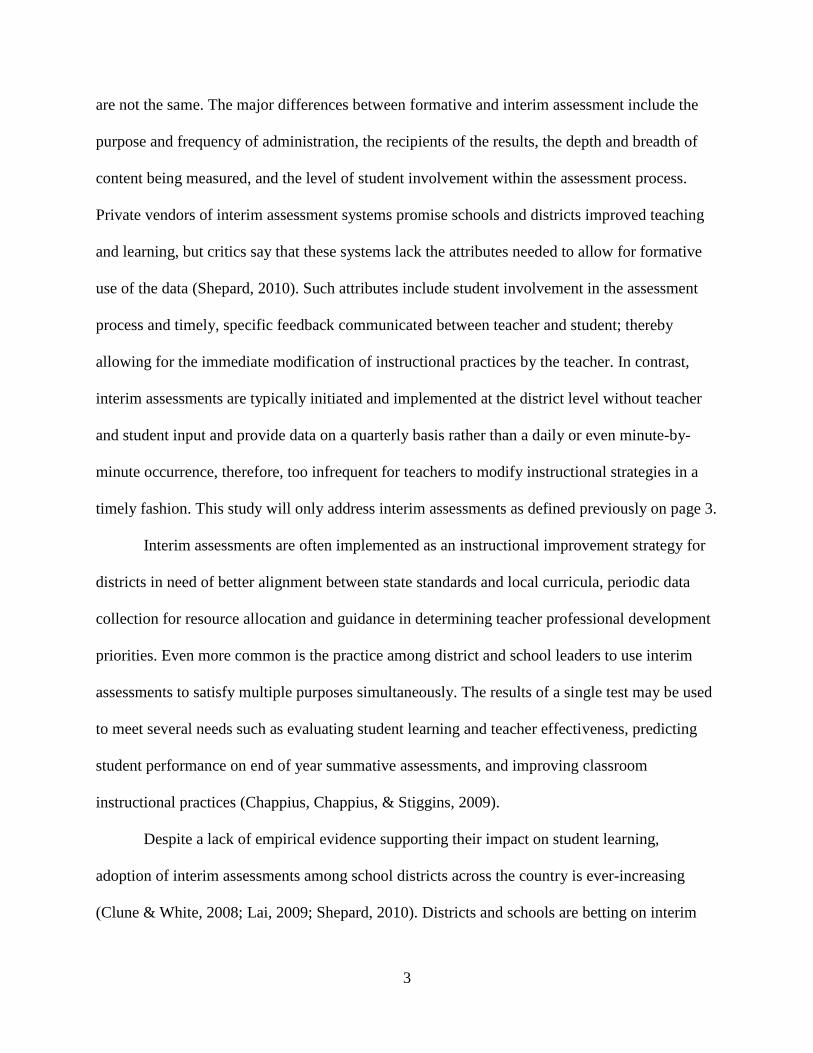
are not the same. The major differences between formative and interim assessment include the
purpose and frequency of administration, the recipients of the results, the depth and breadth of
content being measured, and the level of student involvement within the assessment process.
Private vendors of interim assessment systems promise schools and districts improved teaching
and learning, but critics say that these systems lack the attributes needed to allow for formative
use of the data (Shepard, 2010). Such attributes include student involvement in the assessment
process and timely, specific feedback communicated between teacher and student; thereby
allowing for the immediate modification of instructional practices by the teacher. In contrast,
interim assessments are typically initiated and implemented at the district level without teacher
and student input and provide data on a quarterly basis rather than a daily or even minute-by-
minute occurrence, therefore, too infrequent for teachers to modify instructional strategies in a
timely fashion. This study will only address interim assessments as defined previously on page 3.
Interim assessments are often implemented as an instructional improvement strategy for
districts in need of better alignment between state standards and local curricula, periodic data
collection for resource allocation and guidance in determining teacher professional development
priorities. Even more common is the practice among district and school leaders to use interim
assessments to satisfy multiple purposes simultaneously. The results of a single test may be used
to meet several needs such as evaluating student learning and teacher effectiveness, predicting
student performance on end of year summative assessments, and improving classroom
instructional practices (Chappius, Chappius, & Stiggins, 2009).
Despite a lack of empirical evidence supporting their impact on student learning,
adoption of interim assessments among school districts across the country is ever-increasing
(Clune & White, 2008; Lai, 2009; Shepard, 2010). Districts and schools are betting on interim
4
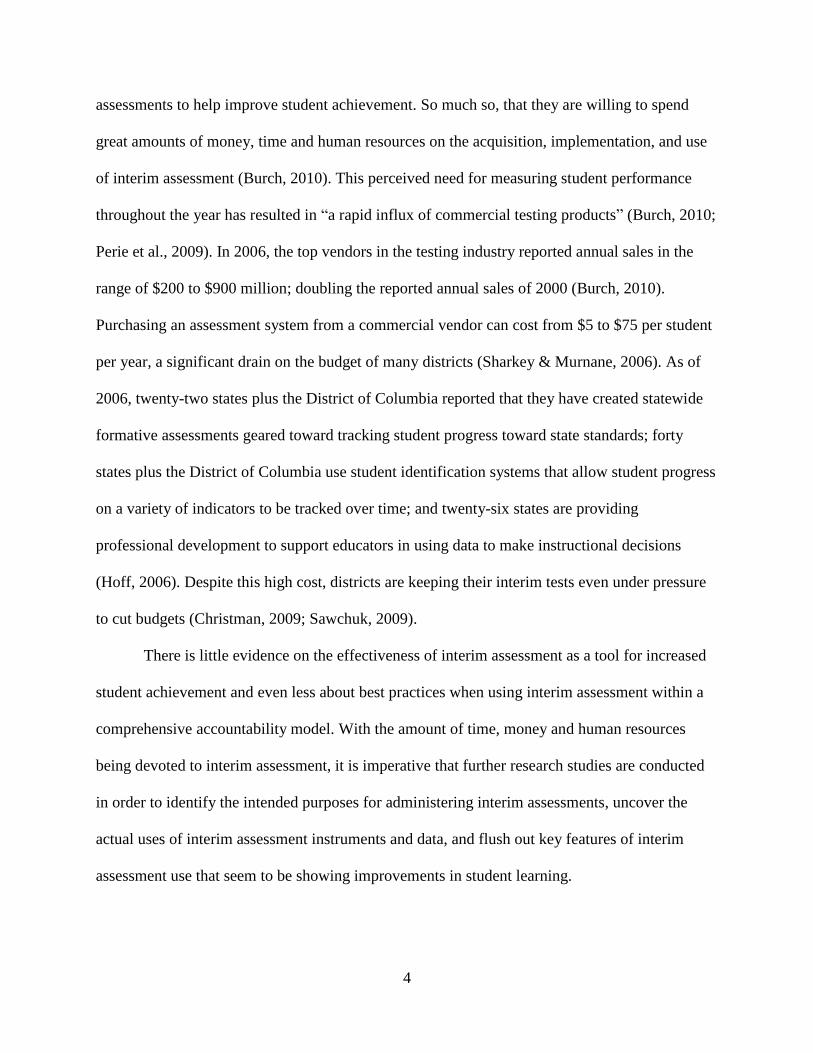
assessments to help improve student achievement. So much so, that they are willing to spend
great amounts of money, time and human resources on the acquisition, implementation, and use
of interim assessment (Burch, 2010). This perceived need for measuring student performance
throughout the year has resulted in “a rapid influx of commercial testing products” (Burch, 2010;
Perie et al., 2009). In 2006, the top vendors in the testing industry reported annual sales in the
range of $200 to $900 million; doubling the reported annual sales of 2000 (Burch, 2010).
Purchasing an assessment system from a commercial vendor can cost from $5 to $75 per student
per year, a significant drain on the budget of many districts (Sharkey & Murnane, 2006). As of
2006, twenty-two states plus the District of Columbia reported that they have created statewide
formative assessments geared toward tracking student progress toward state standards; forty
states plus the District of Columbia use student identification systems that allow student progress
on a variety of indicators to be tracked over time; and twenty-six states are providing
professional development to support educators in using data to make instructional decisions
(Hoff, 2006). Despite this high cost, districts are keeping their interim tests even under pressure
to cut budgets (Christman, 2009; Sawchuk, 2009).
There is little evidence on the effectiveness of interim assessment as a tool for increased
student achievement and even less about best practices when using interim assessment within a
comprehensive accountability model. With the amount of time, money and human resources
being devoted to interim assessment, it is imperative that further research studies are conducted
in order to identify the intended purposes for administering interim assessments, uncover the
actual uses of interim assessment instruments and data, and flush out key features of interim
assessment use that seem to be showing improvements in student learning.
5
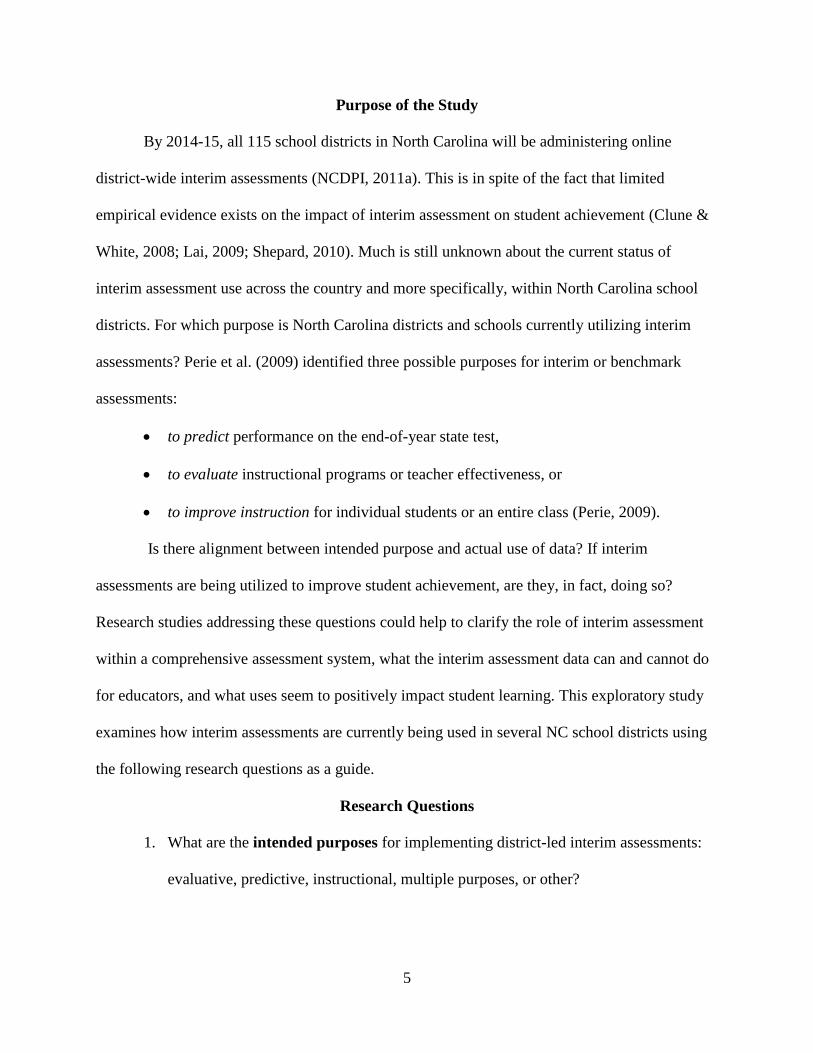
Purpose of the Study
By 2014-15, all 115 school districts in North Carolina will be administering online
district-wide interim assessments (NCDPI, 2011a). This is in spite of the fact that limited
empirical evidence exists on the impact of interim assessment on student achievement (Clune &
White, 2008; Lai, 2009; Shepard, 2010). Much is still unknown about the current status of
interim assessment use across the country and more specifically, within North Carolina school
districts. For which purpose is North Carolina districts and schools currently utilizing interim
assessments? Perie et al. (2009) identified three possible purposes for interim or benchmark
assessments:
to predict performance on the end-of-year state test,
to evaluate instructional programs or teacher effectiveness, or
to improve instruction for individual students or an entire class (Perie, 2009).
Is there alignment between intended purpose and actual use of data? If interim
assessments are being utilized to improve student achievement, are they, in fact, doing so?
Research studies addressing these questions could help to clarify the role of interim assessment
within a comprehensive assessment system, what the interim assessment data can and cannot do
for educators, and what uses seem to positively impact student learning. This exploratory study
examines how interim assessments are currently being used in several NC school districts using
the following research questions as a guide.
Research Questions
1. What are the intended purposes for implementing district-led interim assessments:
evaluative, predictive, instructional, multiple purposes, or other?
6
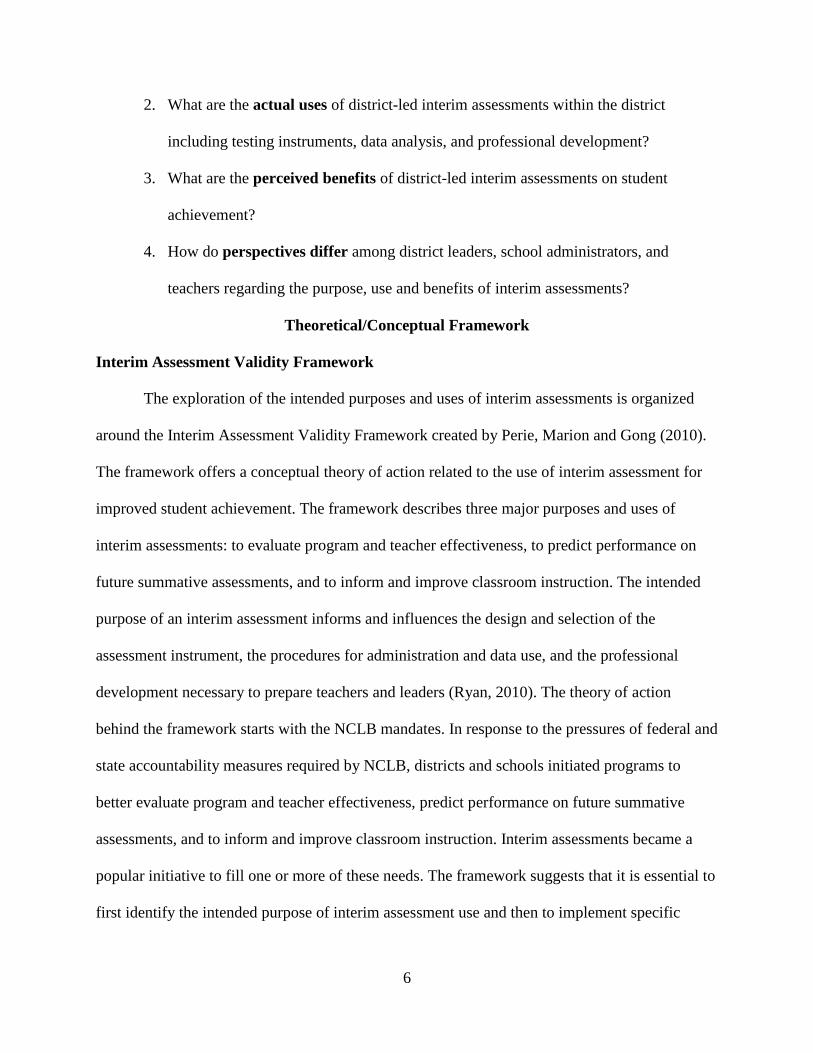
2. What are the actual uses of district-led interim assessments within the district
including testing instruments, data analysis, and professional development?
3. What are the perceived benefits of district-led interim assessments on student
achievement?
4. How do perspectives differ among district leaders, school administrators, and
teachers regarding the purpose, use and benefits of interim assessments?
Theoretical/Conceptual Framework
Interim Assessment Validity Framework
The exploration of the intended purposes and uses of interim assessments is organized
around the Interim Assessment Validity Framework created by Perie, Marion and Gong (2010).
The framework offers a conceptual theory of action related to the use of interim assessment for
improved student achievement. The framework describes three major purposes and uses of
interim assessments: to evaluate program and teacher effectiveness, to predict performance on
future summative assessments, and to inform and improve classroom instruction. The intended
purpose of an interim assessment informs and influences the design and selection of the
assessment instrument, the procedures for administration and data use, and the professional
development necessary to prepare teachers and leaders (Ryan, 2010). The theory of action
behind the framework starts with the NCLB mandates. In response to the pressures of federal and
state accountability measures required by NCLB, districts and schools initiated programs to
better evaluate program and teacher effectiveness, predict performance on future summative
assessments, and to inform and improve classroom instruction. Interim assessments became a
popular initiative to fill one or more of these needs. The framework suggests that it is essential to
first identify the intended purpose of interim assessment use and then to implement specific
7
instruments, processes and professional development explicitly aligned to this purpose. Only
then can the interim assessment be evaluated as effective or not in improving student
achievement. If the assessment uses do not match the intended purpose, then an evaluation of the
impact of the assessment is not possible.
The PELP Coherence Framework
The analysis of a coherent relationship between district leaders, school administrators,
and classroom teachers regarding the purpose, use and impact of interim assessments is
conducted using the PELP Coherence Framework. Adapted from Tushman and O’Reilly’s
Congruence Model (2002), the PELP Coherence Framework helps leaders to identify the key
elements that support a district-wide improvement strategy and to bring these elements into a
coherent and integrated relationship. District leaders can utilize this framework to create
strategies that support improving student performance across the entire district (PELP, 2006).
Viewing interim assessment use through the PELP lens during the study provides a common
language with which to discuss key elements that are present or missing from the strategy
implementation across the district. These elements include:
the alignment between the use of interim assessment and the instructional core
containing teacher’s knowledge, students’ engagement, and content,
the belief in the theory of change that will occur when implementing interim
assessments in the district,
the coherence within and across the actions taken to implement interim assessment,
the norms, values, and attitudes that drive behavior across the district,
the structures and system in place that determine how things get done across the
district,
8
the available resources necessary to implement interim assessments, and,
external factors that may impact the performance of the interim assessments.
Methodology
Quantitative research methodologies are utilized in this study. Specifically, this study
follows a cross-sectional descriptive research design in order to describe the phenomena of
interim assessment use in a sample of North Carolina school districts. A descriptive research
approach is used because it allows for an in-depth description of the characteristics of a
population by directly examining samples of that population (Glattorn, 1998). As interim
assessment use has only recently become widespread across the U.S. and specifically in North
Carolina in the last decade, this phenomenon is in the early stages of implementation. According
to Glattorn (1998), this makes a descriptive approach an appropriate research method for
addressing the research questions for this study. Further, a cross-sectional research design is
intended to capture the attitudes, behaviors, and opinions of various subgroups of a population
(Fitzpatrick, Sanders, & Worthen, 2011). According to Fitzpatrick et al. (2011), this type of
research design typically includes the use of surveys to describe trends within and across various
subgroups.
The study includes a recruited sample of 13 out of 115 school districts in North Carolina.
The recruited sample population represents a region of North Carolina known as the Greater
Triangle Area. This geographic area of the state was selected because the districts comprising the
region are representative of the overall state population in regards to county demographics,
student ethnic and socio-economic diversity, school performance, and educator quality. District
leaders include the Superintendent or Assistant Superintendent and the Directors of Testing,
Curriculum/Instruction, Professional Development, and/or specific content areas. School leaders
9
include Principals, Assistant Principals, Testing Coordinators, Instructional Resource Teachers,
Department Chairs and/or Team Leaders. Classroom teachers include those who have
administered interim assessments to students in which they directly instruct in the classroom in
grades 3 through 12.
All districts participating in the study have implemented district-led interim assessments
during the 2011-12 school year. Districts are using a variety of interim assessment systems to
deliver tests in both online and paper-pencil formats. Of the thirteen recruited sample districts in
the study, ten districts are using the ClassScape Assessment System from NC State University’s
Center for Urban Affairs and Community Services in an online delivery format. The other three
districts, Wake, Durham, and Johnston, utilize testing products from Case 21, Global Scholar,
and Thinkgate to create paper-pencil interim assessments for their districts. The interim
assessments being implemented in the study districts are given in quarterly or semester intervals
in grades 3-12. The majority of assessments being given measure areas that are tested on the
summative, End-of-Grade/End-of-Course state assessments; specifically, grades 3-8 reading, 3-8
math, grades 5 and 8 science, English 10, Algebra 1, and Biology.
A questionnaire was utilized to collect information on the intended purpose, actual use,
and perceived benefits of interim assessments in order to address research question 1 — 3. The
questionnaire also gathered preliminary data to address research question 4 on how responses
differ across various roles within the sample districts. The questionnaire being used in the study
was adapted from the interview questions in a recent study done by Davidson and Frohbeiter in
2011 on district-led interim assessments (Davidson & Frohbeiter, 2011, pp. 16, 20). The
questionnaire was administered to district leaders, school administrators, and classroom teachers
as an online survey through email (see the full questionnaire in Appendix A).
10
Analysis
Survey responses were collected, categorized, and organized into tables in preparation for
statistical analysis. Each question response was labeled as instructional, predictive, evaluative, or
other using a pre-made answer key (see Appendix B). The open-ended responses were
categorized based on key words denoting a specific category of interim assessment purpose and
use. Composite scores were created by combining question responses addressing a similar theme
in the survey. Descriptive statistics summarized the overall trends in the survey data collected to
address research questions 1, 2, and 3. The scores were separated into three groups: district
leader, school administrator, and classroom teacher. As the variables in this study are categorical,
a cross-tabulation was conducted using a Chi-Square test to address research question 4
regarding the differences between the three groups. The Chi-Square test determined if the
observed frequencies are different from the expected frequencies thereby suggesting a
relationship between the independent and dependent variables.
Significance of the Study
A gap exists among the current literature regarding the reasons for and uses of interim
assessments in North Carolina schools. This is in spite of the fact that they are currently being
implemented in 90% of North Carolina districts and will be mandatory statewide during the
2014-15 school year. Addressing the research questions in this study may help in identifying the
reasons why North Carolina districts are investing time, money and human resources into
implementing the interim assessments. This may assist state level leaders involved with
developing the next generation of assessments (NGA) by providing baseline data on current
practices and understandings in order to better move districts from a disjointed pattern of use to a
11
common, research-based plan for use. This will improve coherence across districts and among
schools within the district during the mandatory roll-out of online interim assessments.
The results of this study could also provide state and district leaders in North Carolina
with a deeper understanding of what “works” when developing a strong, clearly-defined plan for
implementing mandatory statewide interim assessments if the overall goal is improved academic
performance. By moving districts toward a common purpose and assisting with best practices for
use of interim assessments, it may improve the likelihood that interim assessments are used as
they were intended; thereby increasing the validity of their use as a measurable means of
improved student achievement.
Information collected in this study may be useful at a variety of levels including state,
district, and within the classroom. At the state level, the findings of this study could inform
policy and practice for the use of state interim assessments within the planned Instructional
Improvement System (IIS) in 2014-15. This could include the parameters for the architecture,
design and features available within the assessment delivery system, best practices for building
district interim assessments such as the depth and breadth of the content being measured,
frequency of assessments, and level of security, and professional development modules made
available to districts, schools and teachers.
Research findings could be utilized at the district level to develop a more coherent
strategy for identifying and communicating the purpose for using interim assessments, selecting
appropriate products, administering the assessments, and providing appropriate professional
development for teachers. More importantly, the findings could inform districts on the
limitations of interim assessment tools and the importance of utilizing multiple methods of
student assessment to meet various purposes.
12
This study could be important to classroom teachers in understanding the connection
between interim assessments and student learning, to see the relationship between the assessment
and the NC SCOS, and how to best utilize student achievement data to inform instruction and
provide feedback to students and parents regarding academic progress and performance.
Definition of Terms
Summative assessments: given one time at the end of the semester or school year to
evaluate students’ performance against a defined set of content standards. These assessments are
typically given statewide (but can be national or district) and are usually used as part of an
accountability program or to otherwise inform policy. They could also be teacher-administered
end-of-unit or end-of-semester tests that are used solely for grading purposes. They are the least
flexible of the assessments (Perie, Marion, & Gong, 2007).
Interim assessments: Assessments administered during instruction to evaluate students’
knowledge and skills relative to a specific set of academic goals in order to inform policymaker
or educator decisions at the classroom, school, or district level. The specific interim assessment
designs are driven by the purposes and intended uses, but the results of any interim assessment
must be reported in a manner allowing aggregation across students, occasions, or concepts (Perie
et al., 2007).
Formative assessments: used by classroom teachers to diagnose where students are in
their learning, where gaps in knowledge and understanding exist, and how to help teachers and
students improve student learning. The assessment is embedded within the learning activity and
linked directly to the current unit of instruction (Perie et al., 2007).
13
Evaluative Purposes: to provide information to help the teacher, school administrator,
curriculum supervisor, or district policymaker learn about curricular or instructional choices and
take specific action to improve the program, affecting subsequent teaching
and thereby, presumably, improving the learning (Perie et al., 2009).
Predictive Purposes: designed to determine each student’s likelihood of meeting some
criterion score on the end-of-year tests (Perie, Marion, & Gong, 2009).
Instructional Purposes: Interim assessments designed to serve instructional purposes
should provide results that enable educators to adapt instruction and curriculum to better meet
student needs (Perie, Marion, & Gong, 2009).
Race to the Top- (RTTT) - a competitive grant program designed to encourage and
reward States that are creating the conditions for education innovation and reform and achieving
significant improvement in student outcomes, included as part of a new law, the American
Recovery and Reinvestment Act of 2009 (ARRA), which provided $4.35 billion dollars for the
Race to the Top (RTT) program (USDE, 2010).
NCLB- No Child Left Behind, formerly the Elementary and Secondary Education Act
(ESEA), the federal bipartisan reform law passed in 2001 to raise student achievement across
among all students (U.S. Department of Education, 2004).
AYP- Adequate Yearly Progress, used to gauge a state, district or school’s level of growth
and performance as measured by annual state summative tests across all subgroups of students in
order to implement school improvement and other consequences set forth by NCLB (U.S.
Department of Education, 2004).
14
Assessment Validity- the extent to which an assessment actually measures what it is
intended to measure and provides sound information supporting the purpose(s) for which it is
used (Perie, Marion, & Gong, 2009).
Instructional Sensitivity- the extent to which an assessment informs classroom instruction
(Popham, 2006a).
Limitations of the Study
Because this study will not be making a case for causality, the findings cannot be
generalized to the population. However, the information gleaned from this study could provide
preliminary data on the current purpose and use of interim assessments and the perceived
benefits within North Carolina schools as a starting point. Further studies could collect data from
a broader sample within North Carolina in order to generalize at the state and national level.
Also, this study will not offer definitive conclusions on the merit of interim assessments due to
small sample size and limited geographic representation.
CHAPTER TWO: LITERATURE REVIEW
Introduction
In this chapter, an in-depth review of the literature is presented in an effort to explore the
use of interim assessment as a means for improved student achievement. First, the role of federal
and state accountability policies as a catalyst for increased interim assessment use is examined in
order to determine the perceived need for implementation and continued use of interim
assessment across North Carolina. Next, a discussion of the research regarding specific purposes
for interim assessment use is presented; specifically, how purpose and use relate to test validity,
as a means for analyzing the level of alignment between purpose and interim assessment use.
Finally, research studies regarding the findings on best practices for interim assessment is
offered; including testing instruments, data use, and professional development, in order to
identify key elements of successful interim assessment use that may be impacting student
achievement.
Policy Catalysts for Implementing Interim Assessments
No Child Left Behind Act of 2001
According to Herman (2010), the No Child Left Behind Act of 2001 (NCLB) has
produced an “explosion of interest in the use of assessment to measure and improve student
learning”. After attempting to utilize summative assessment data for this purpose, educators soon
realized that the test results came too late and without enough detail to identify students who
were falling behind and why (Herman, 2010). The use of district interim and benchmark
assessments grew dramatically in response to NCLB’s demands to gather data and raise test
scores (Shepard, 2010). One notable effect of the NCLB legislation has been an increasing focus
on the collection and use of student achievement data for both accountability decisions and for
16
improving school performance (Lai, 2009) This effect is evidenced by increases in the amount of
student data collected, maintained, and tracked over time; in the investments in technological
infrastructure necessary to store and report longitudinal data on student achievement; and in the
professional developments aimed at improving educators’ capacity to interpret and use the
growing mountain of student data now routinely collected (Hoff, 2006).
Although interim testing is not federally required, it has become a key tool both to
prepare children as successful “test takers” and to guide staff in preparing students so that there
will be no surprises when students confront the official annual tests and staff receive the
consequent data (Lai & Waltman, 2008). NCLB is based on the theory of negative incentives—
organizations will be motivated to improve based on the fear of in need of improvement status
being reported to the public (Haertel, 2009). Failing to make test score targets carries significant
consequences including over time more audits, school take-over and school closure. Thus, in this
regard, the design of interim assessment technologies reflects and reinforces the principles of
NCLB (Burch 2010). Assessment vendors are marketing benchmark assessments to districts with
promises of improving student performance and helping schools and districts meet the federal
NCLB requirements (Perie et al., 2009) These private firms are developing products and services
organized to help schools comply with accountability schemes outlined in the NCLB legislation
such as alignment to common standards and compliance with reporting requirements. In fact,
“sixty-nine percent of the districts stated that they had purchased the technology since the
passage of NCLB even though they are not required explicitly by NCLB to do so” (Burch, 2010).
17
Race to the Top
The U.S. Department of Education is using its Race to the Top (RTTT) program to
encourage school districts to develop formative or interim assessments as part of comprehensive
state assessment systems (Goertz, 2009). In an effort to raise international competitiveness and
further support the rigorous expectations within NCLB, President Obama signed into law the
American Recovery and Reinvestment Act of 2009 (ARRA), which provided $4.35 billion
dollars for the Race to the Top (RTT) program (USDE, 2010). According to the Race to the Top
Program Executive Summary, RTT is
"…a competitive grant program designed to encourage and reward States that are
creating the conditions for education innovation and reform; achieving significant
improvement in student outcomes . . . ; and implementing ambitious plans in four core
education reform areas. In general, the grants are to be used for implementing plans
which adopt standards and assessments that prepare students to succeed in post-
secondary education and the workplace; build data systems that measure student success;
recruit, develop, and reward effective teachers and principals; and turn around the lowest-
achieving schools.” (USDE, 2010)
Currently, there are two assessment consortia, PARCC and SMARTER Balanced, each
composed of several dozen states that have received substantial federal funding to create assess-
ments that can determine the degree to which students have mastered the intended learning
outcomes embodied in the CCSS (Popham, 2011). The interim assessments are designed to
provide a measure of progress toward the summative goals and to help identify learning gaps and
guide instruction (Rabinowitz, 2009). Consequently, interim assessments will be developed to
zero in on a student’s current level of understanding in each learning progression in English
18
language arts and mathematics. Learning progressions are empirically validated descriptions of
how learning typically unfolds within a curricular domain or area of knowledge and skill
(Darling-Hammond & Pecheone, 2010).
State Accountability
North Carolina is one of only 12 recipients of the 2010 federal Race to the Top (RTTT)
grants, bringing nearly $400 million to the state's public school system for use over the next four
years (NC DPI, 2011b) Along with receiving these significant funds, North Carolina must
commit to the adoption of new national curricular standards. Forty-four states and the District of
Columbia have adopted Common Core State Standards in mathematics and English language arts
developed by the National Governors Association and the Council of Chief State School Officers
(Gewertz, 2011). As a RTTT grant award recipient, the North Carolina Department of Public
Instruction must also participate in one of two assessment consortia which require the use of
shared assessments with specific criteria including computer adaptive interim/benchmark
assessments—reflecting learning progressions or content clusters—that provide more in-depth
and/or mid-course information about what students know and can do in relation to the CCSS
(USDE, 2010)
Local Response
North Carolina is among the top twelve states with the most severe consequences written
into their K–12 testing policies. It leads the nation in incidences of school closures, school
interventions, state takeovers, teacher/administrator dismissals, etc., and this has occurred, at
least in part, because of low test scores (Amrein & Berliner, 2002). In an effort to avoid these
severe consequences, local school districts are looking to North Carolina Department of Public
Instruction (NC DPI), for assistance. As a part of the NC RTT grant, each local school district
19
receives a portion of the money from the RTT grant to implement programs and practices to
improve student achievement in their schools (NCDPI, 2011c). In order to receive RTT funding
and support from NC DPI, local school districts are required to create and submit a Detailed
Scope of Work which outlined specific plans to use the RTT funds within their schools. Districts
must comply with the overall state RTT plan by agreeing to work toward over 30 specific
objectives; many of which are specific to formative and interim assessment actions. In particular,
local districts must show evidence of progress on creating a transition plan for schools and LEAs
to begin using the online Instructional Improvement System (IIS) to use formative, diagnostic
and interim data to improve instruction, enhancing school and LEA/Charter technology
infrastructure to facilitate online real‐time assessments at each school, and utilizing EVAAS and
assessment data for instructional and program decision‐making (NCDPI, 2012).
The majority of districts in North Carolina are utilizing some form of interim assessments
in their schools. It is evident that this use will continue as part of the mandated RTTT initiatives
in North Carolina. However, little has been provided on the reason why North Carolina is
requiring the use of interim assessments and how districts should plan to use the data generated
from these assessments. As stated previously in Chapter 1, the research of Perie et al. offers a
perspective on why other states and districts across the country are implementing interim
assessments and how they are utilizing the resulting data. Perie et al. divides these common
purposes and uses into three distinct categories: Instructional, Evaluative, and Predictive. Perie et
al. also discuss the phenomena of multiple, simultaneous purposes for using interim assessments.
20
Perie’s Three Intended Purposes of Interim Assessment
Instructional
Districts implement interim assessments for instructional purposes with the belief that the
data can be used much like formative assessment to yield high rates of improvement in student
learning (Li, Marion, Perie, & Gong, 2010; Goertz, Olah, & Riggan, 2008; Wiliam & Black,
1998). Similar to formative assessment, interim assessments that are used for instructional
purposes inform teaching and learning by identifying student and classroom strengths and
weaknesses toward curricular objectives, and to determine effectiveness of classroom teaching
practices and strategies (CCSSO, 2008). By collecting student achievement data periodically
throughout the year, it is the assumption that teachers can use the data formatively to make
informed decisions, improve their instructional practices and ultimately increase student
performance (Cizek, 2007; Pellegrino & Goldman, 2008; Perie, Marion, Gong, & Wurtzel, 2007;
Perie et al., 2009). According to Chappius et al. (2009), in order to inform sound decisions,
assessments need to satisfy five key standards of quality: (1) clear purpose; (2) clear learning
targets; (3) sound assessment design; (4) effective communication of results; and (5) student
involvement in the assessment process.
Perie et al. (2007) echo past research findings that interim assessments used for
instructional purposes will have varied item formats (Black & Wiliam, 1998; Popham, 2006),
provide results that offer qualitative feedback and insights into the conceptual understandings of
the student (Black & Wiliam, 1998; Cowie & Bell, 1999; Popham, 2006; Wiliam & Thompson,
2008); refer to specific instructional improvements that go beyond item-by-item re-teaching
(Bloom et al., 1971; Brookhart, 2008; Crooks, 1998; Guskey, 2007; Harlen & Winter, 2007;
Heritage, 2007; Kluger & DeNisi, 1996; Shepard, 2008; Stiggins, 2002) be explicitly aligned to
21
content standards and instructional units (Black & Wiliam, 1998; Harlen & Winter, 2007;
Herman & Baker, 2005; Sadler, 1989; Schunk, 1996; Shepard, 2008; Stiggins, 2007; Wiliam et
al., 2004) be integrated into the curriculum instead of constituting an interruption to regular
teaching; and accompanied by professional development to ensure effective use of results (Perie
et al., 2007).
Studies have shown that the intended instructional use of interim assessments do not
always come to fruition. According to a 2007 study by the U.S. Department of Education, the use
of student data to plan and individualize instruction appears less common than the use of the
systems to inform parents or keep track of accountability measures (USDE, 2007). In a 2007
study, the ways in which teachers use the data systems were found to be greatly influenced by
the types of data and data functions in the systems available to teachers (Wayman et al., 2004).
Evaluative
In contrast to instructional uses, evaluative interim assessments are employed as a means
for judging the effectiveness of classroom teachers, evaluating the quality of the curriculum, or
analyzing the success of a program. In a recent study by Davidson and Frohbeiter in 2011, 80%
of district and school leaders claimed that they use interim assessments for evaluative purposes
(Davidson & Frohbeiter, 2011). Evaluative interim assessment data is used to determine if an
instructional initiative is worth keeping based on student achievement results. Other evaluative
uses of interim assessments may include monitoring the pacing of the content in light of the
instructional calendar, developing grading standards, and evaluating the effectiveness of a
program, strategy or teacher (Perie et al., 2010) With the addition of the Race to the Top Great
Teachers and Leaders component, the use of interim assessment to evaluate teacher effectiveness
is becoming more likely. According to a 2011 USDE report, Race to the Top award states are
22
“rethinking the ways they evaluate teachers by improving the processes and the tools they use
for assessing teachers, in particular by making student performance a significant criterion among
multiple measures of teacher effectiveness” (USDE, 2011, p. 3).
In the Davidson and Frohbeiter (2011) study, one principal responded to questions
regarding interim assessment results and teacher evaluation by stating, “I'm evaluated as a
principal based on my data... We use this as part of the evaluation process. If we have a teacher
that's showing 32% targeted gains, there's a good chance that that teacher – for second- and third-
year teachers, they'll be non-renewed” (Davidson & Frohbeiter, 2011, p. 23).
When teachers were asked during a recent 2011 study why they were giving interim
assessments, they reported that the district leaders were holding them accountable for the
progress of their students by providing them with data on student concept attainment and
measuring student improvement over the year (Lombardi, 2011). However, in a study done with
Denver City Schools in 2011, researchers found that interim assessments may not always be
providing valid information to drive aspects of accountability and reforms such as evaluating
teacher effectiveness (Diaz-Bilello, 2011).
Predictive
Unlike instructional or evaluative purposes, interim assessment data used for predictive
purposes are geared toward the future rather than the past or the present. An assessment designed
for predictive purposes is expected to gauge a student’s likelihood of passing an annual
summative high-stakes test. Using data from the assessment, statistical analyses are used to
forecast a student’s future academic performance. In a recent study by Davidson and Frohbeiter
in 2011, one in six districts selected “predictive” as their main reason for implementing interim
assessments with a focus specifically on the alignment of standards taught in the classroom and
23
those assessed on the annual state test (Davidson & Frohbeiter, 2011). According to Li et al.
(2010), districts choosing to give interim assessments for predictive purposes need to make sure
that:
“the items and the whole test should be aligned with state content standards; correlations
between interim assessment scores and statewide assessment scores should be relatively
high; and the scores report should focus on predicted proficiency levels on statewide
assessments to identify at-risk students and provide strategies for intervention to help
students meet the state standards.”
If the predictive interim assessment results provide a discouraging calculation on the future
performance of the student, educators will likely react to this information with additional
academic supports and remediation (Perie et al., 2010). However, the ability for predictive
interim assessment results to provide feedback to teachers and students sufficient for improving
teaching and learning is low. The nature of the test design may be to blame considering that the
summative test in which it mirrors is meant to assess a broad range of standards rather than a
small amount of content and specific skills typically taught each day in the classroom. So, to
become more instructionally sensitive and provide feedback at the level of instruction, the
predictive validity of the test is often sacrificed. In a study done on the predictive validity of
interim assessments among Mid-Atlantic Regional school systems, researchers found that “while
the commonly used benchmark assessments in the Mid-Atlantic Region jurisdictions may
possess strong internal psychometric characteristics, evidence is generally lacking of their
predictive validity with respect to the required summative assessments” (Brown & Coughlin,
2007, p. 4). This could be due, in part, because testing companies are attempting to fill multiple
purposes with one test.
24
Multiple Purposes
As with most products or systems, higher rates of success are seen when educational
strategies or programs are used as they were intended. When faced with limited resources, it
would make sense that educational leaders attempt to utilize one product or strategy for as many
purposes as possible. However, one common belief in educational measurement is that “when an
assessment system is designed to fulfill too many purposes—especially disparate purposes—it
rarely fulfills any purpose well” (Perie et al., 2007). This in turn, has an impact on the validity of
the educational measurement. Benchmark assessments themselves are not valid or invalid rather
that validity resides in the evidence underlying an assessment’s specific use (Herman,
Osmundson, & Dietel, 2010). According to Brown and Coughlin (2007),
“…assessments have to be judged against their intended uses. There is no absolute
criterion for judging assessments. It is not possible to say, for example, that a given
assessment is good for any and all purposes; it is only possible to say, based on evidence,
that the assessment has evidence of validity for specific purposes. Furthermore,
professional assessment standards require that assessments be validated for all their
intended uses. A clear statement of assessment purposes also provides essential guidance
for test and assessment item developers. Different purposes may require different content
coverage, different types of items, and so on. Thus, it is critical to identify how
assessment information is to be used and to validate the assessments for those uses…”
(Brown & Coughlin, 2007, p. 3).
25
Recommendations for Interim Assessment Use
Instruments
Educational accountability systems are modeled around the belief that if a school is
performing poorly on the test, then it is a direct result of poor teaching. Naturally, those
educators will try to improve their student test scores by teaching better. Therefore, it is
necessary for the test being administered to provide results that distinguish between effective and
ineffective instructional practices. The degree to which an assessment is able to do this is called
instructional sensitivity (Popham, 2006). A key feature of highly effective interim assessment
instruments is a high degree of instructional sensitivity in order to provide teachers with specific
feedback on the effectiveness of their instruction. Four major recommendations emerge on how
to design an interim assessment instrument with instructional sensitivity.
First, it is vital that district leaders communicate clearly the goals of the test including the
purpose of the test and the learning objectives to be measured (Marshall, 2008; Sharkey &
Murnane, 2006). It is recommended that the assessor communicate to all stakeholders a clear
picture of why the assessment is being conducted, who will use the results to inform decisions,
and which decisions will be informed (Chappuis, Chappuis, & Stiggins, 2009). The assessor may
also precede the assessment with a clear description of the curricular objectives, knowledge,
reasoning and performance skill targets being assessed on the test. This helps to improve
alignment between what is taught in the classroom and what is measured on the test (Chappuis et
al., 2009; Popham, 2006).
Second, it is critical that the interim assessment instrument be developed using sound
assessment design principles and includes items measuring curricular objectives that mirror the
objectives that have been taught in the classroom (Perie et al., 2009). It is necessary for the
26
number of items per objective on the test align with the amount of time allocated for instruction
of that objective in the classroom (Chappuis et al., 2009; Popham, 2006). The type of assessment
item chosen to measure an objective needs to be the best match for clearly showing proficiency
of the skill or set of knowledge within that objective. As stated by Shepard (2006), the interim
assessment should “do more than simplistic alignment, it should embody learning goals.” Test
items ought to be free from bias toward students from a certain socioeconomic status or level of
academic aptitude (Chappuis et al., 2009; Popham, 2006). Third, the assessment instrument will
allow for flexibility of administration to ensure that the timing of the test is instructionally-linked
to classroom teaching (Shepard, 2006), determined by the individual schools rather than the
district office (Sharkey & Murnane, 2006), and uses the least amount of instructional time
necessary (Shepard, 2006).
Last, it is important that the assessment instrument produce results that can be effectively
communicated to all stakeholders in a meaningful way. It is recommended that the results of the
assessment be sensitive to the different levels of skill and knowledge among teachers regarding
assessment practice and data analysis (Sharkey & Murnane, 2006), easily link to best practices in
teaching (Shepard, 2006), and provide appropriate feedback to various stakeholders including
district and school leaders, teachers, parents and most importantly, students (Chappuis et al.,
2009; Marshall, 2008).
Additionally, it is recommended that interim assessment results enable teachers to
identify students’ conceptual understanding of the content and skills being taught and measured.
Goertz et al. (2009) found that “teachers who assessed for conceptual understanding were more
likely to use instructional change strategies than those who did not.” In order to serve
instructional purposes, interim assessments intended to support diagnosis of students’
27
understanding and misconceptions should include high quality open-ended tasks. All items,
whether open-ended or multiple-choice, should be developed so that useful information about
students’ understanding and cognition can be gleaned from specific incorrect answers (Perie et
al., 2009) and provide qualitative insights about understandings and misconceptions rather than
just a numeric score (Shepard, 2006). More often, however, interim assessment results appeared
to be used item-by-item to re-teach steps in problems that were missed without attending to
underlying concepts or gaining diagnostic insights (Shepard, 2009).
Interim Assessment Instruments in North Carolina
Districts in North Carolina are using a variety of interim assessment instruments to
deliver tests in both online and paper-pencil formats. Of the thirteen districts in the study, ten
districts are using the ClassScape Assessment System from NC State University’s Center for
Urban Affairs and Community Services in an online delivery format (ClassScape, 2012). The
other three counties, Wake, Durham, and Johnston, utilize testing products from Case 21, Global
Scholar, and Thinkgate to create paper-pencil interim assessments for their districts (Case 21,
2012; Global Scholar, 2012; Thinkgate, 2012). The interim assessments being implemented in
the study districts are given in quarterly or semester intervals in grades 3-12. The majority of
assessments being given measure areas that are tested on the summative, End-of-Grade/End-of-
Course state assessments; specifically, grades 3-8 reading, 3-8 math, grades 5 and 8 science,
English 10, Algebra 1, and Biology (NCDPI, 2011a).
Table 1 provides an overview of the interim assessment instruments currently being used
by the districts in the study. The features presented in Table 1 mirror the recommendations from
the literature regarding the quality of interim assessment instruments. The categories of quality
include the goal of the instrument, the design of the test items, the flexibility of administration,
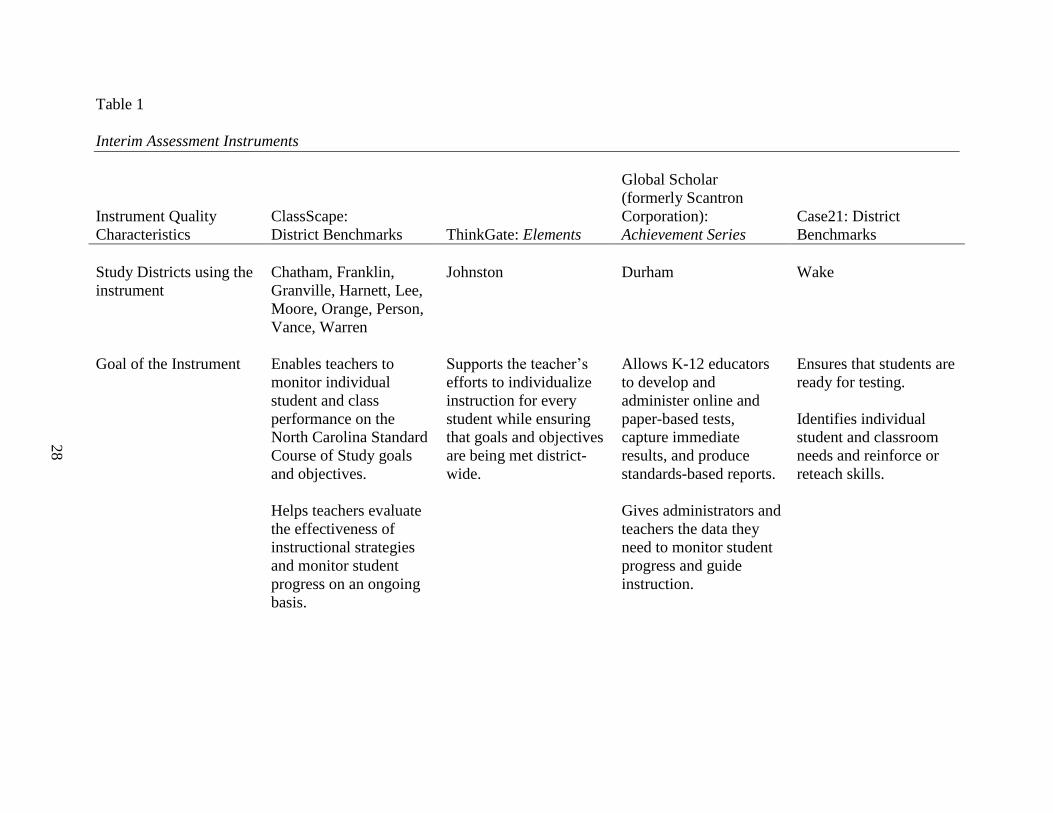
Table 1
Interim Assessment Instruments
Instrument Quality
Characteristics
ClassScape:
District Benchmarks
ThinkGate: Elements
Global Scholar
(formerly Scantron
Corporation):
Achievement Series
Case21: District
Benchmarks
Study Districts using the
instrument
Chatham, Franklin,
Granville, Harnett, Lee,
Moore, Orange, Person,
Vance, Warren
Johnston Durham Wake
Goal of the Instrument Enables teachers to
monitor individual
student and class
performance on the
North Carolina Standard
Course of Study goals
and objectives.
Helps teachers evaluate
the effectiveness of
instructional strategies
and monitor student
progress on an ongoing
basis.
Supports the teacher’s
efforts to individualize
instruction for every
student while ensuring
that goals and objectives
are being met district-
wide.
Allows K-12 educators
to develop and
administer online and
paper-based tests,
capture immediate
results, and produce
standards-based reports.
Gives administrators and
teachers the data they
need to monitor student
progress and guide
instruction.
Ensures that students are
ready for testing.
Identifies individual
student and classroom
needs and reinforce or
reteach skills.
28
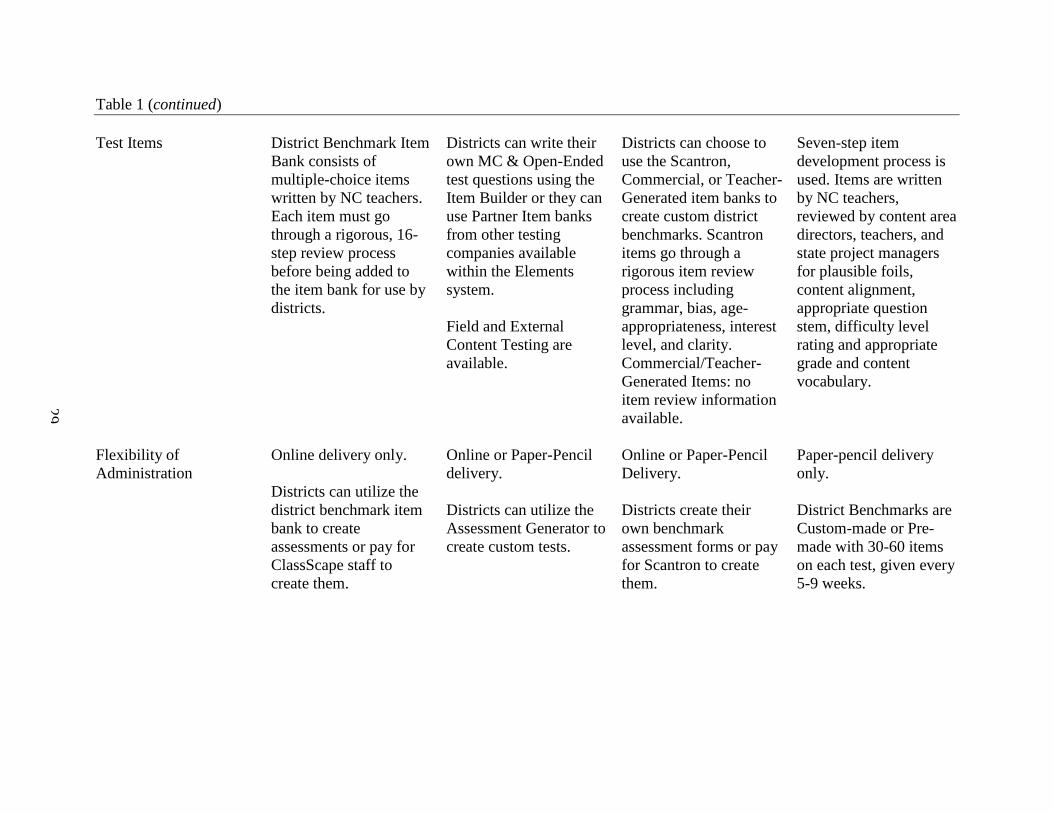
Table 1 (continued)
Test Items District Benchmark Item
Bank consists of
multiple-choice items
written by NC teachers.
Each item must go
through a rigorous, 16-
step review process
before being added to
the item bank for use by
districts.
Districts can write their
own MC & Open-Ended
test questions using the
Item Builder or they can
use Partner Item banks
from other testing
companies available
within the Elements
system.
Field and External
Content Testing are
available.
Districts can choose to
use the Scantron,
Commercial, or Teacher-
Generated item banks to
create custom district
benchmarks. Scantron
items go through a
rigorous item review
process including
grammar, bias, age-
appropriateness, interest
level, and clarity.
Commercial/Teacher-
Generated Items: no
item review information
available.
Seven-step item
development process is
used. Items are written
by NC teachers,
reviewed by content area
directors, teachers, and
state project managers
for plausible foils,
content alignment,
appropriate question
stem, difficulty level
rating and appropriate
grade and content
vocabulary.
Flexibility of
Administration
Online delivery only.
Districts can utilize the
district benchmark item
bank to create
assessments or pay for
ClassScape staff to
create them.
Online or Paper-Pencil
delivery.
Districts can utilize the
Assessment Generator to
create custom tests.
Online or Paper-Pencil
Delivery.
Districts create their
own benchmark
assessment forms or pay
for Scantron to create
them.
Paper-pencil delivery
only.
District Benchmarks are
Custom-made or Pre-
made with 30-60 items
on each test, given every
5-9 weeks.
29
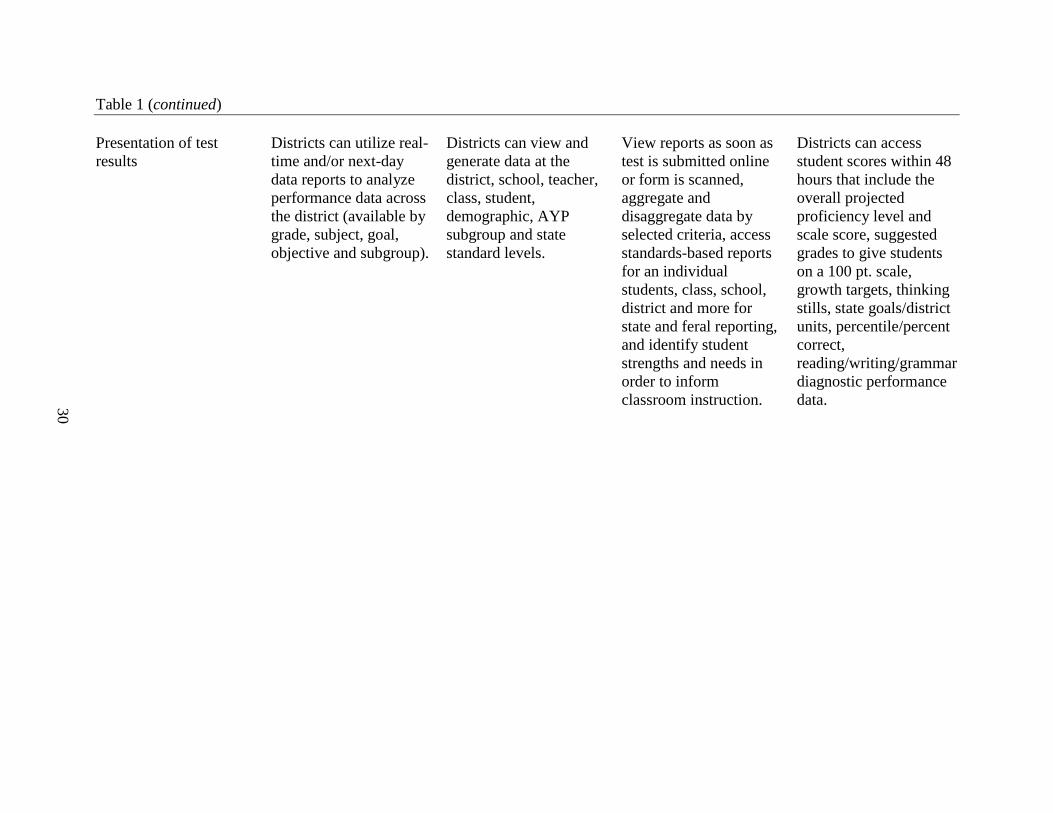
Table 1 (continued)
Presentation of test
results
Districts can utilize real-
time and/or next-day
data reports to analyze
performance data across
the district (available by
grade, subject, goal,
objective and subgroup).
Districts can view and
generate data at the
district, school, teacher,
class, student,
demographic, AYP
subgroup and state
standard levels.
View reports as soon as
test is submitted online
or form is scanned,
aggregate and
disaggregate data by
selected criteria, access
standards-based reports
for an individual
students, class, school,
district and more for
state and feral reporting,
and identify student
strengths and needs in
order to inform
classroom instruction.
Districts can access
student scores within 48
hours that include the
overall projected
proficiency level and
scale score, suggested
grades to give students
on a 100 pt. scale,
growth targets, thinking
stills, state goals/district
units, percentile/percent
correct,
reading/writing/grammar
diagnostic performance
data.
30
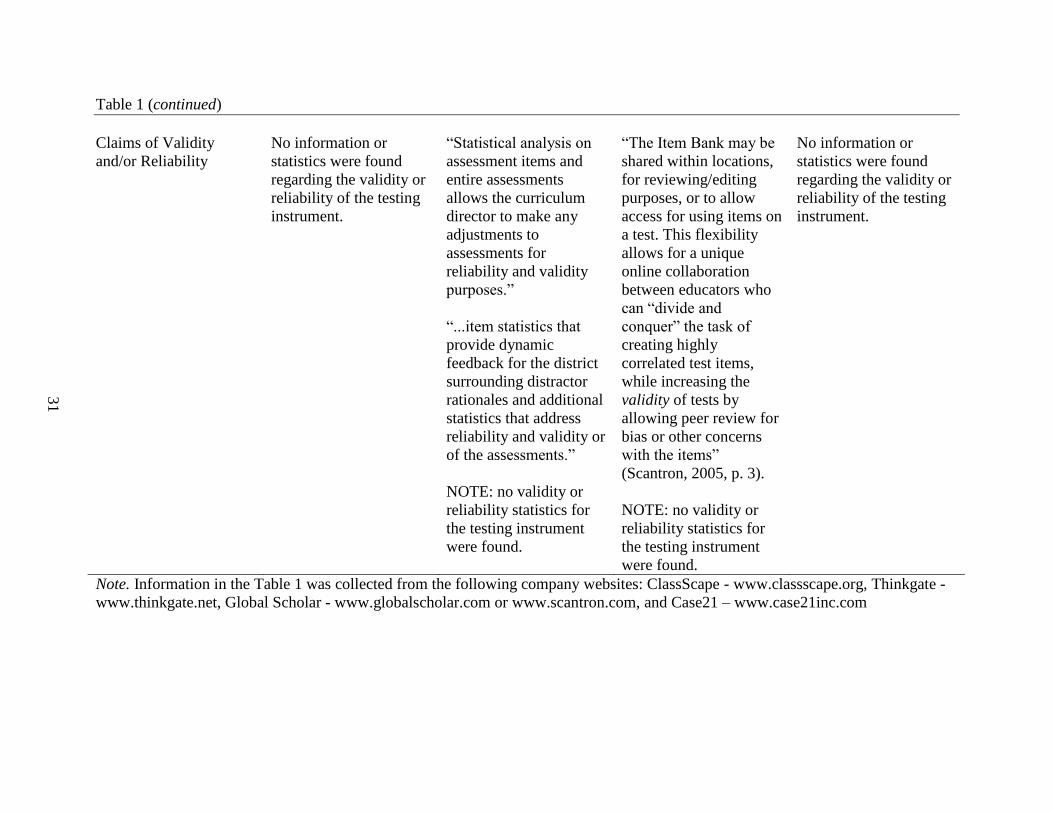
Table 1 (continued)
Claims of Validity
and/or Reliability
No information or
statistics were found
regarding the validity or
reliability of the testing
instrument.
“Statistical analysis on
assessment items and
entire assessments
allows the curriculum
director to make any
adjustments to
assessments for
reliability and validity
purposes.”
“...item statistics that
provide dynamic
feedback for the district
surrounding distractor
rationales and additional
statistics that address
reliability and validity or
of the assessments.”
NOTE: no validity or
reliability statistics for
the testing instrument
were found.
“The Item Bank may be
shared within locations,
for reviewing/editing
purposes, or to allow
access for using items on
a test. This flexibility
allows for a unique
online collaboration
between educators who
can “divide and
conquer” the task of
creating highly
correlated test items,
while increasing the
validity of tests by
allowing peer review for
bias or other concerns
with the items”
(Scantron, 2005, p. 3).
NOTE: no validity or
reliability statistics for
the testing instrument
were found.
No information or
statistics were found
regarding the validity or
reliability of the testing
instrument.
Note. Information in the Table 1 was collected from the following company websites: ClassScape - www.classscape.org, Thinkgate -
www.thinkgate.net, Global Scholar - www.globalscholar.com or www.scantron.com, and Case21 – www.case21inc.com
31
32
and the presentation of test results. The information presented for each testing instrument reflects
the company’s viewpoint on each category as expressed on their websites. The table also
includes claims made by each company regarding the validity and reliability of the testing
instrument.
Data Use
A common thread emerging in the literature regarding the uses of interim assessment data
is the utilization of continuous improvement cycles, often called “cycles of inquiry”, to inform
and improve instruction (McLaughlin & Mitra, 2003). Districts and schools who are considered
“advanced” in their implementation of “cycles of inquiry” use data from interim assessments to
inform instructional practices, focus professional development efforts, and form distributed
leadership structures in a continuous effort to improve student achievement (Supovitz & Klein,
2003). With so much emphasis on interim assessment within the “cycle of inquiry”, it becomes
even more important to examine and apply research findings on how these data are being used
effectively to improve instruction. A few key features of effective use of interim assessments
include making interim assessment data analysis a high priority for district and school leaders,
utilizing specific data analysis strategies, providing sufficient time for the analysis of results and
planning for remediation and identifying students’ conceptual understanding from the data.
The analysis of interim assessment results needs to be made a high priority in schools
with district and school leaders touting the importance of thoughtful, collaborative analysis of
student assessment results and the exchange of ideas for improvement. Copland (2002) asserts
that “leaders in key roles catalyzed change at schools embarking on an inquiry-based school
reform effort.” Supovitz and Klein (2003) similarly find that “virtually every example of
innovative data use in [their] study came from the initiative and enterprise of an individual who
33
had the vision and persistence to turn a powerful idea into action” (as cited in Young & Kim,
2010).
Specific data analysis strategies need to be implemented as part of the school
improvement process. Kerr, Marsh, Ikemoto, Darilek, and Barney (2006) studied the strategies
that three districts pursued to support teachers’ and schools’ use of data for instruction. The
strategies they identified included “the development of interim assessments and
technology/systems for housing, analyzing, and reporting data; the provision of professional
development and/or technical assistance on how to interpret and use student test results; the
revamping of school improvement planning processes; the encouragement of structured review
of student work, and the use of a classroom observation protocol to assess the quality of
classroom instruction” (Kerr et al., 2006). Teachers need sufficient time to analyze their data in
order to make the connection back to the curriculum and to their teaching. In a research study on
the use of benchmark (interim) assessments in Philadelphia, teachers taught in six-week cycles
with the first five weeks used for instruction and the sixth week for remediation and extension.
This extra week provided teachers with time to analyze their data and offered the opportunity for
benchmarks to serve instructional purposes by providing teachers with formative information
that could guide their follow-up with students (Christman et al., 2009). According to Blanc et al.
(2003), “Interim assessment data will contribute to changes in teaching and learning only if it is
situated within a feedback system in which the practitioners access and organize data, interpret
data to identify problems and solutions, try out solutions in their classrooms, and modify their
solutions based on new assessments.” As found in his “Ten Guidelines for Using Interim
Assessment Data Effectively”, Marshall (2008) recommends that school leaders schedule
assessments and time for immediate follow-up, involve teachers in making sense of the
34
assessments, display data effectively, hold candid data meetings and plan for immediate action.
The research on the need for data analysis training for teachers is important because it offers best
practices for professional development relating to interim assessment. As told by several
research study contributors, without training, the teachers will be giving assessments without
knowing what to do with the results. This in turn may lower the likelihood that interim
assessments will be viewed as beneficial for the classroom teacher.
Professional Development
The desired effects of interim assessment on student achievement require significant
investments in the professional development of teachers (Clune & White, 2008). A commitment
of time, money and human resources is often a reality if teachers are expected to make major
changes in their instructional practices. Research findings on effective teacher professional
development practices in which there is a direct impact on student learning include opportunities
for teachers to improve their content knowledge and instructional delivery, their data analysis
skills and their involvement with students as learning partners (Heritage, 2007; McManus, 2008;
Young & Kim, 2010). By applying these components to professional development for teachers
when using interim assessments, we are raising the likelihood that teachers will utilize the
interim assessment data to modify instructional methods necessary for student achievement
which is a key feature of the formative use of assessment data (Lai, 2009).
Interim assessment results can provide rich feedback to teachers and district leaders
regarding student performance on specific curricular objectives. To make this feedback useful,
teachers need to know how it relates back to their instruction, student learning progressions, and
the specific content being measured (Goertz et al., 2009; Heritage, 2007). Studies have found
that teachers who have strong content knowledge can flexibly adapt to a student’s place in his or
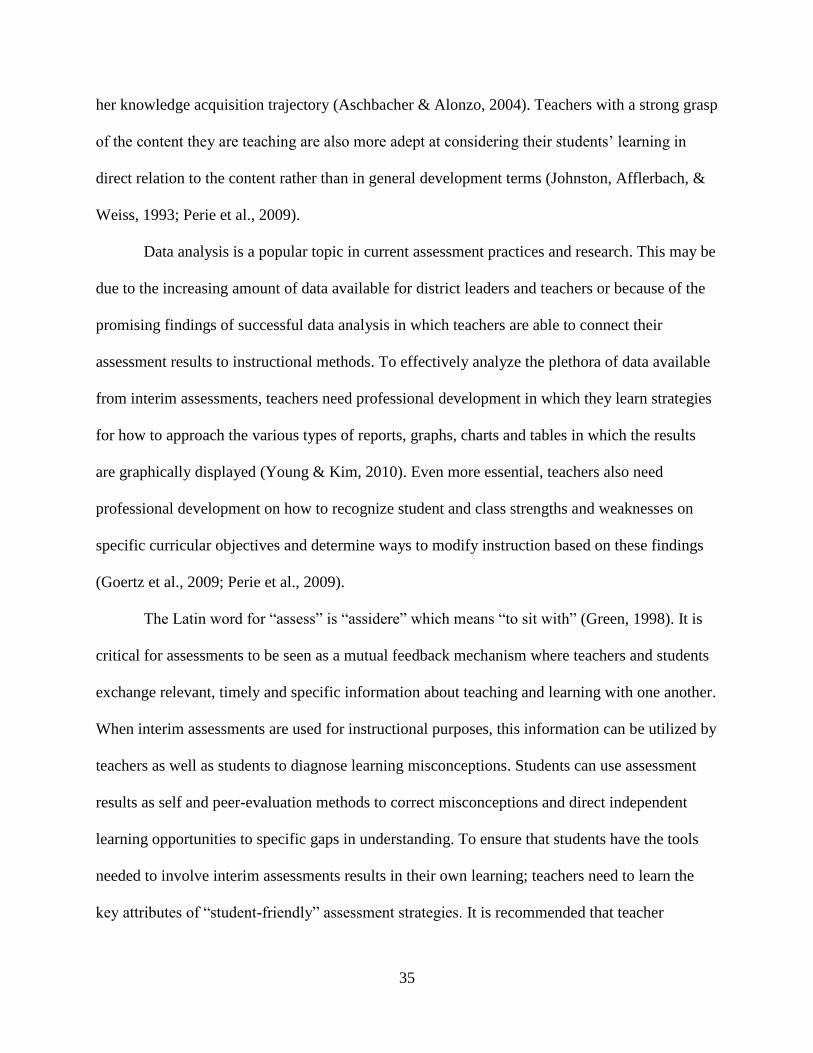
35
her knowledge acquisition trajectory (Aschbacher & Alonzo, 2004). Teachers with a strong grasp
of the content they are teaching are also more adept at considering their students’ learning in
direct relation to the content rather than in general development terms (Johnston, Afflerbach, &
Weiss, 1993; Perie et al., 2009).
Data analysis is a popular topic in current assessment practices and research. This may be
due to the increasing amount of data available for district leaders and teachers or because of the
promising findings of successful data analysis in which teachers are able to connect their
assessment results to instructional methods. To effectively analyze the plethora of data available
from interim assessments, teachers need professional development in which they learn strategies
for how to approach the various types of reports, graphs, charts and tables in which the results
are graphically displayed (Young & Kim, 2010). Even more essential, teachers also need
professional development on how to recognize student and class strengths and weaknesses on
specific curricular objectives and determine ways to modify instruction based on these findings
(Goertz et al., 2009; Perie et al., 2009).
The Latin word for “assess” is “assidere” which means “to sit with” (Green, 1998). It is
critical for assessments to be seen as a mutual feedback mechanism where teachers and students
exchange relevant, timely and specific information about teaching and learning with one another.
When interim assessments are used for instructional purposes, this information can be utilized by
teachers as well as students to diagnose learning misconceptions. Students can use assessment
results as self and peer-evaluation methods to correct misconceptions and direct independent
learning opportunities to specific gaps in understanding. To ensure that students have the tools
needed to involve interim assessments results in their own learning; teachers need to learn the
key attributes of “student-friendly” assessment strategies. It is recommended that teacher
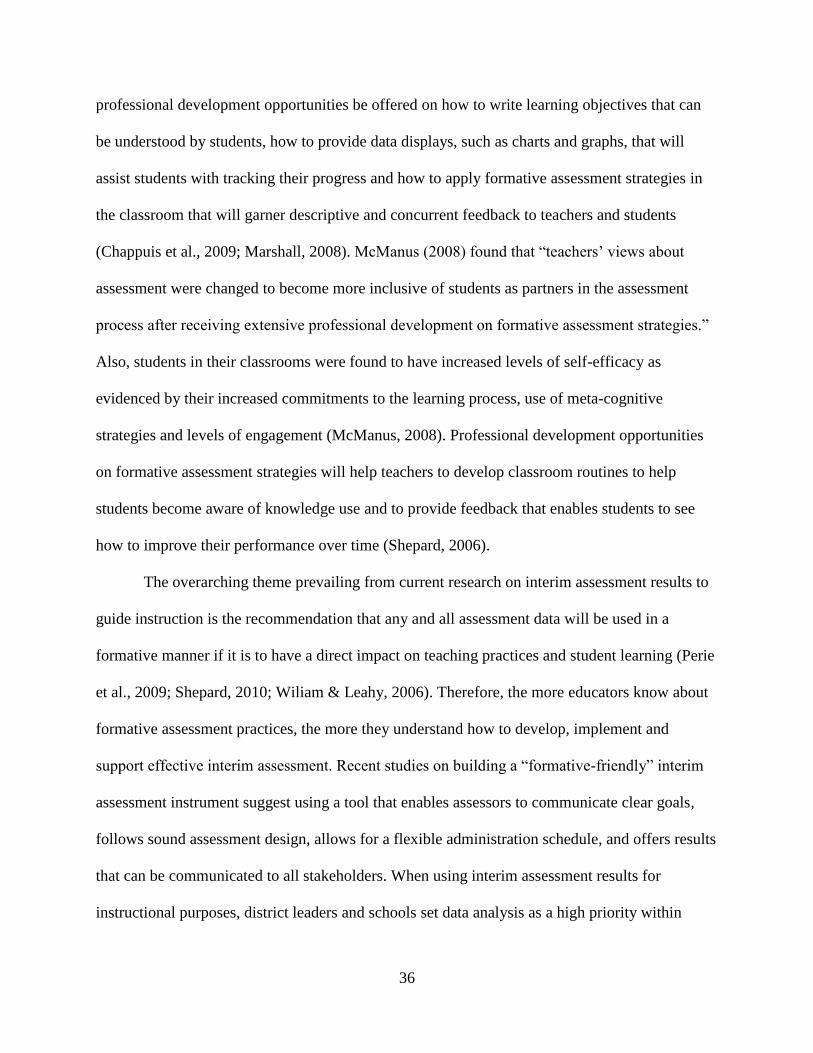
36
professional development opportunities be offered on how to write learning objectives that can
be understood by students, how to provide data displays, such as charts and graphs, that will
assist students with tracking their progress and how to apply formative assessment strategies in
the classroom that will garner descriptive and concurrent feedback to teachers and students
(Chappuis et al., 2009; Marshall, 2008). McManus (2008) found that “teachers’ views about
assessment were changed to become more inclusive of students as partners in the assessment
process after receiving extensive professional development on formative assessment strategies.”
Also, students in their classrooms were found to have increased levels of self-efficacy as
evidenced by their increased commitments to the learning process, use of meta-cognitive
strategies and levels of engagement (McManus, 2008). Professional development opportunities
on formative assessment strategies will help teachers to develop classroom routines to help
students become aware of knowledge use and to provide feedback that enables students to see
how to improve their performance over time (Shepard, 2006).
The overarching theme prevailing from current research on interim assessment results to
guide instruction is the recommendation that any and all assessment data will be used in a
formative manner if it is to have a direct impact on teaching practices and student learning (Perie
et al., 2009; Shepard, 2010; Wiliam & Leahy, 2006). Therefore, the more educators know about
formative assessment practices, the more they understand how to develop, implement and
support effective interim assessment. Recent studies on building a “formative-friendly” interim
assessment instrument suggest using a tool that enables assessors to communicate clear goals,
follows sound assessment design, allows for a flexible administration schedule, and offers results
that can be communicated to all stakeholders. When using interim assessment results for
instructional purposes, district leaders and schools set data analysis as a high priority within
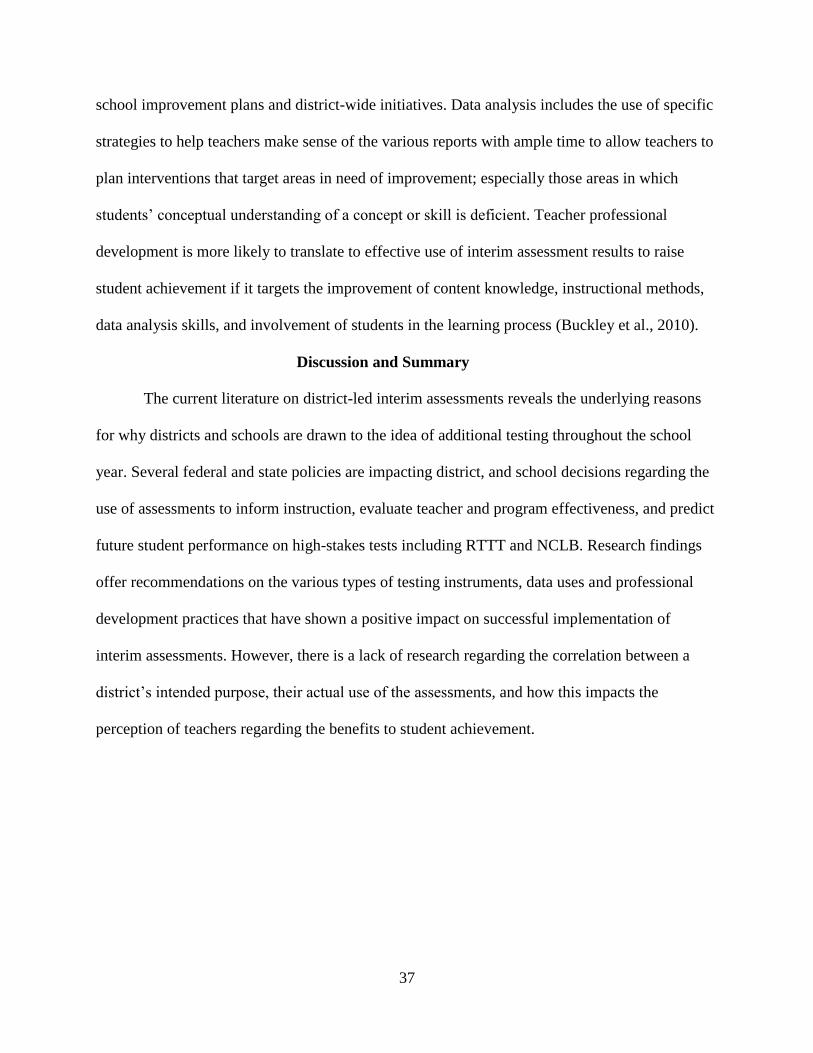
37
school improvement plans and district-wide initiatives. Data analysis includes the use of specific
strategies to help teachers make sense of the various reports with ample time to allow teachers to
plan interventions that target areas in need of improvement; especially those areas in which
students’ conceptual understanding of a concept or skill is deficient. Teacher professional
development is more likely to translate to effective use of interim assessment results to raise
student achievement if it targets the improvement of content knowledge, instructional methods,
data analysis skills, and involvement of students in the learning process (Buckley et al., 2010).
Discussion and Summary
The current literature on district-led interim assessments reveals the underlying reasons
for why districts and schools are drawn to the idea of additional testing throughout the school
year. Several federal and state policies are impacting district, and school decisions regarding the
use of assessments to inform instruction, evaluate teacher and program effectiveness, and predict
future student performance on high-stakes tests including RTTT and NCLB. Research findings
offer recommendations on the various types of testing instruments, data uses and professional
development practices that have shown a positive impact on successful implementation of
interim assessments. However, there is a lack of research regarding the correlation between a
district’s intended purpose, their actual use of the assessments, and how this impacts the
perception of teachers regarding the benefits to student achievement.
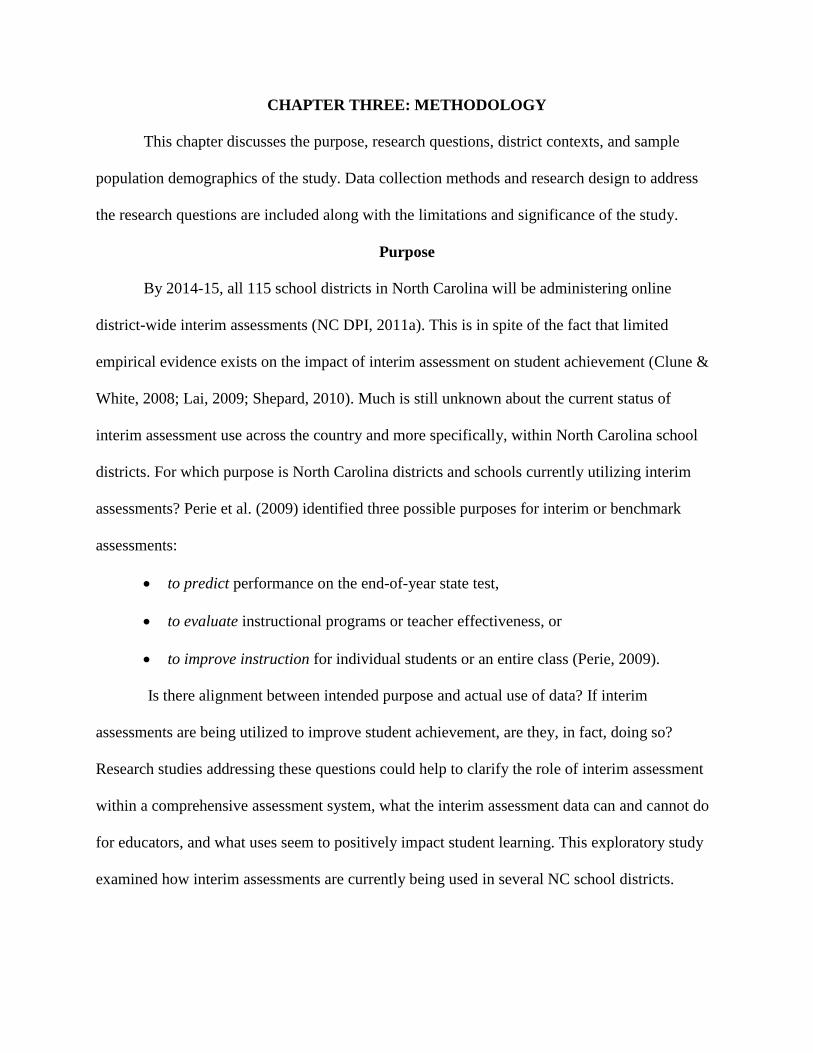
CHAPTER THREE: METHODOLOGY
This chapter discusses the purpose, research questions, district contexts, and sample
population demographics of the study. Data collection methods and research design to address
the research questions are included along with the limitations and significance of the study.
Purpose
By 2014-15, all 115 school districts in North Carolina will be administering online
district-wide interim assessments (NC DPI, 2011a). This is in spite of the fact that limited
empirical evidence exists on the impact of interim assessment on student achievement (Clune &
White, 2008; Lai, 2009; Shepard, 2010). Much is still unknown about the current status of
interim assessment use across the country and more specifically, within North Carolina school
districts. For which purpose is North Carolina districts and schools currently utilizing interim
assessments? Perie et al. (2009) identified three possible purposes for interim or benchmark
assessments:
to predict performance on the end-of-year state test,
to evaluate instructional programs or teacher effectiveness, or
to improve instruction for individual students or an entire class (Perie, 2009).
Is there alignment between intended purpose and actual use of data? If interim
assessments are being utilized to improve student achievement, are they, in fact, doing so?
Research studies addressing these questions could help to clarify the role of interim assessment
within a comprehensive assessment system, what the interim assessment data can and cannot do
for educators, and what uses seem to positively impact student learning. This exploratory study
examined how interim assessments are currently being used in several NC school districts.
39
Research Questions
1. What are the intended purposes for implementing district-led interim assessments:
evaluative, predictive, instructional, multiple purposes, or other?
2. What are the actual uses of district-led interim assessments within the district
including testing instruments, data analysis, and professional development?
3. What are the perceived benefits of district-led interim assessments on student
achievement?
4. How do perspectives differ among district leaders, school administrators, and teachers
regarding the purpose, use and benefits of interim assessments?
Research Perspective
Quantitative research methodologies were utilized in this study. Specifically, this study
follows a cross-sectional descriptive research design in order to describe the phenomena of
interim assessment use in a sample of North Carolina school districts. A descriptive research
approach is used because it allows for an in-depth description of the characteristics of a
population by directly examining samples of that population (Glattorn, 1998). As interim
assessment use has only recently become widespread across the U.S. and specifically in North
Carolina in the last decade, this phenomenon is in the early stages of implementation. According
to Glattorn (1998), this makes a descriptive approach an appropriate research method for
addressing the research questions for this study. Further, a cross-sectional research design is
intended to capture the attitudes, behaviors, and opinions of various subgroups of a population
(Fitzpatrick, Sanders, & Worthen, 2011). According to Fitzpatrick et al. (2011), this type of
research design typically includes the use of surveys to describe trends within and across various
subgroups.
40
Context
All districts participating in the study have implemented district-led interim assessments
during the 2011-12 school year. Districts are using a variety of interim assessment systems to
deliver tests in both online and paper-pencil formats. Of the thirteen recruited districts in the
study, ten districts are using the ClassScape Assessment System from NC State University’s
Center for Urban Affairs and Community Services in an online delivery format. The other three
counties, Wake, Durham, and Johnston, utilize testing products from Case 21, Global Scholar,
and Thinkgate to create paper-pencil interim assessments for their districts. Specific information
about the testing products used within the sample population can be found in Chapter 2.
The interim assessments being implemented in the recruited districts are given in
quarterly or semester intervals in grades 3-12. The majority of assessments being given measure
areas that are tested on the summative, End-of-Grade/End-of-Course state assessments;
specifically, grades 3-8 reading, 3-8 math, grades 5 and 8 science, English 10, Algebra 1, and
Biology.
Population
North Carolina is a mid-size state with different types of communities consisting of rural
and urban regions covering 48,617 square miles of land, making it the 28th
largest state in
America (U.S. Census Bureau, 2012). Within the United States, NC ranks 10 out of 51 states
plus the District of Columbia in regards to the size of the student population. As of 2011, North
Carolina is divided into115 school districts containing 2,512 schools which serve 1,436,162
public school students (NCDPI, 2011c). North Carolina school districts contain a diverse student
population consisting of 54.2% white, 31.2% black, 10.7% Hispanic, 2.5% Asian, and 1.4%
American Indian, about half of whom – more than 700,000 – are classified as being from
41
economically disadvantaged homes (NC DPI, 2011c). North Carolina is comprised of a few large
urban school districts and many small districts. The two largest LEAs, Wake County and
Charlotte-Mecklenburg, each serve more than 133,000 students. Each of the other 98 counties in
NC also comprises an LEA, with 85 of these counties classified as rural. In addition, there are 15
towns that serve as their own LEAs, for a total of 115 LEAs statewide. According to the National
Center for Education Statistics, NC contains 1,100 schools in rural areas and 354 schools in
small towns (NAEP, 2012).
Historically, North Carolina has ranked low in student achievement, but over time has
seen marked improvement in the educational system. For example, according to the National
Assessment of Educational Progress, North Carolina Grade 4 Math scores have increased by 32
scale score points from 1992 to 2011. In fact, North Carolina students scored at or above the
national average in 2011 for proficiency in Grades 4 and 8 Reading, Math, Science and Writing
(NAEP, 2012). North Carolina school system makes for an interesting state to study because it
serves a large population of students, contains urban and rural communities, involves students
from many different ethnic backgrounds, and is showing improvement in student achievement
which may or may not be linked to assessment strategies like the widespread use of interim
assessments.
Recruited Sample
This study included a recruited sample of 13 out of 115 school districts in North Carolina.
The recruited sample population represents a region of North Carolina known as the Greater
Triangle Area. This geographic area of the state was selected because the districts within the
region are representative of the overall state population in regards to county demographics,
student ethnic and socio-economic diversity, and school effectiveness and educator quality.
42
County Demographics
The counties recruited in the study differ widely in regards to population size, from
19,545 to 828,759 residents (see Table 2). The average population size in the recruited sample is
slightly higher than the average county size in North Carolina due in part to the inclusion of
Wake County, one of the largest in the state. Of the thirteen recruited counties in the study, three
are classified as urban, and ten are rural; 76% rural and 24% urban. These percentages are highly
comparable to the state averages of 85% rural and 15% urban. Educational attainment among the
residents of each district varied from 71% to 91% earning a high school diploma and 12% to
48% earning a bachelor’s degree, with a sample average of 81 % with a high school diploma and
23% with a bachelor’s degree or higher. This average is highly comparable to the state average
of 84% and 26%, respectively.
Student Ethnic and Socio-Economic Diversity
The student population ranged from approximately 2,500 students to over 140,000 with
the number of schools in each district ranging from 8 to 163 (see Table 3). The mean student
population of the recruited sample is 22,467, slightly higher than the state district average of
14,361, again due to the inclusion of Wake County students. The racial composition among
students in the participating districts consisted of White, Black and Hispanic as the major racial
groups with some districts at 18% White and 67% Black and others at 14% Black and 67%
White. The Hispanic population ranged from 6% to 30% of the student makeup of the district
(see Table 3). The recruited sample contained a mean of 48% White, 32% Black, and 15%
Hispanic, nearly identical to the state means at 54% White, 31% Black, and 11% Hispanic.
Poverty levels across the sample districts ranged from 9% in Wake County to 27% in Vance
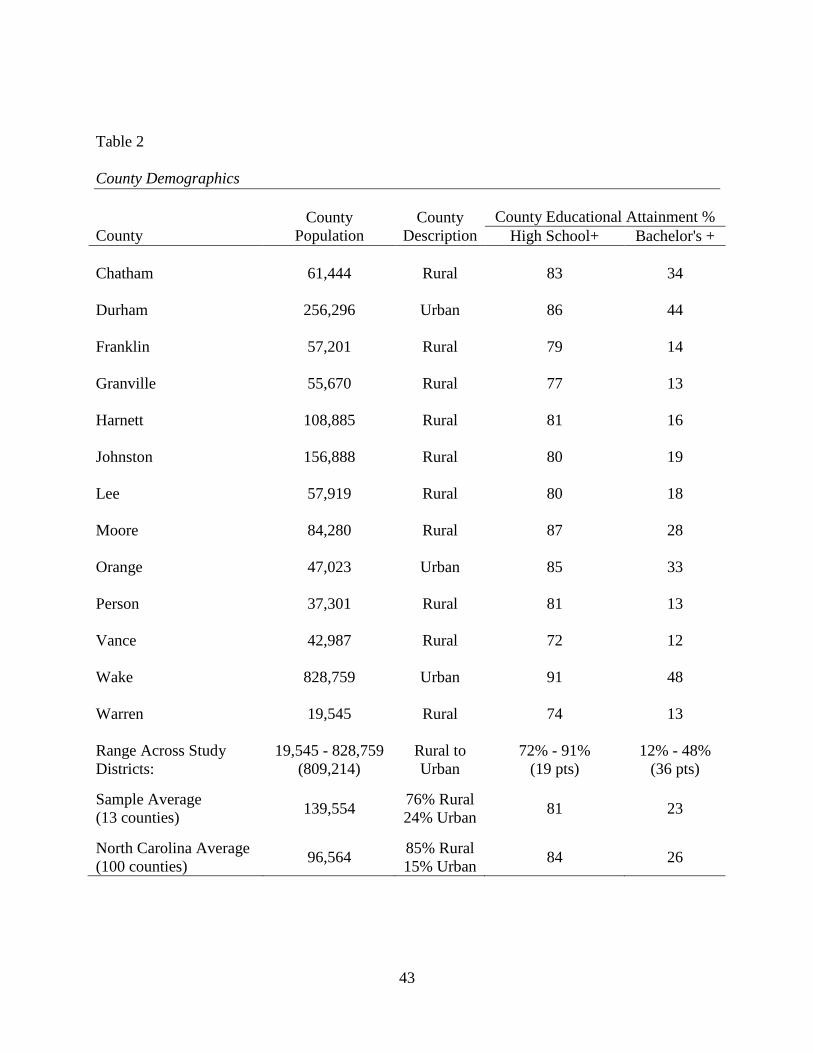
43
Table 2
County Demographics
County
County
Population
County
Description
County Educational Attainment %
High School+ Bachelor's +
Chatham 61,444 Rural 83 34
Durham 256,296 Urban 86 44
Franklin 57,201 Rural 79 14
Granville 55,670 Rural 77 13
Harnett 108,885 Rural 81 16
Johnston 156,888 Rural 80 19
Lee 57,919 Rural 80 18
Moore 84,280 Rural 87 28
Orange 47,023 Urban 85 33
Person 37,301 Rural 81 13
Vance 42,987 Rural 72 12
Wake 828,759 Urban 91 48
Warren 19,545 Rural 74 13
Range Across Study
Districts:
19,545 - 828,759
(809,214)
Rural to
Urban
72% - 91%
(19 pts)
12% - 48%
(36 pts)
Sample Average
(13 counties) 139,554
76% Rural
24% Urban 81 23
North Carolina Average
(100 counties) 96,564
85% Rural
15% Urban 84 26
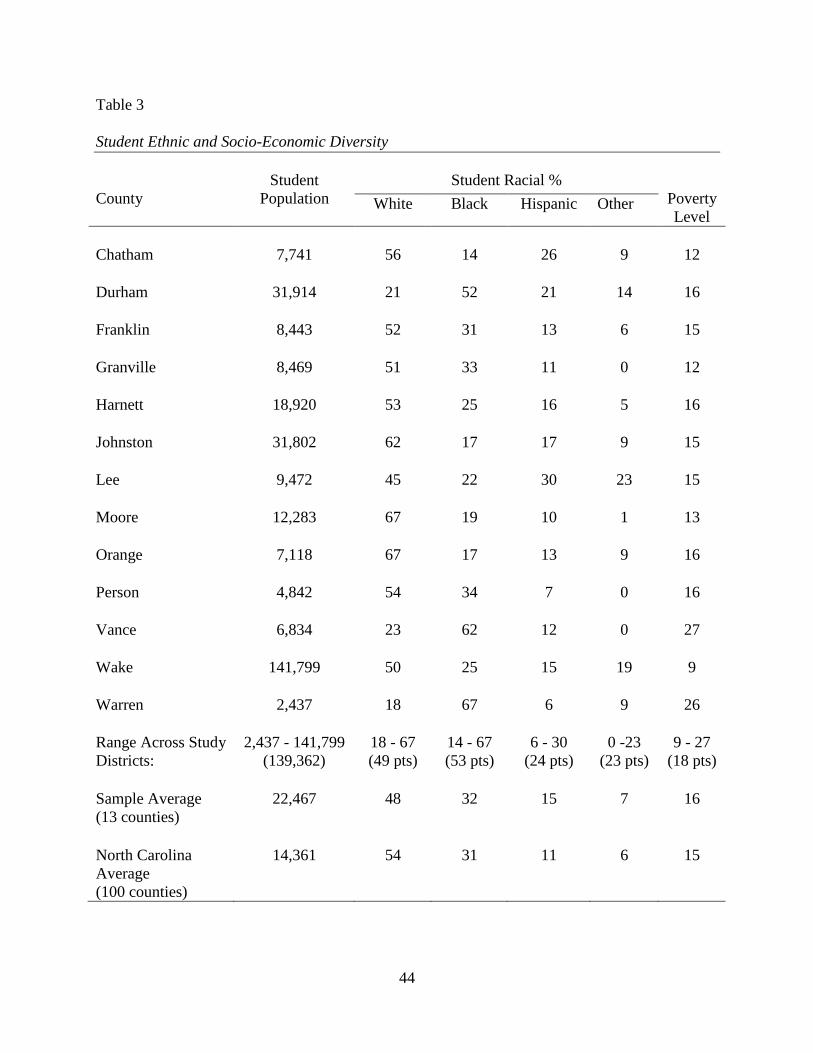
44
Table 3
Student Ethnic and Socio-Economic Diversity
County
Student
Population
Student Racial %
Poverty
Level White Black Hispanic Other
Chatham 7,741 56 14 26 9 12
Durham 31,914 21 52 21 14 16
Franklin 8,443 52 31 13 6 15
Granville 8,469 51 33 11 0 12
Harnett 18,920 53 25 16 5 16
Johnston 31,802 62 17 17 9 15
Lee 9,472 45 22 30 23 15
Moore 12,283 67 19 10 1 13
Orange 7,118 67 17 13 9 16
Person 4,842 54 34 7 0 16
Vance 6,834 23 62 12 0 27
Wake 141,799 50 25 15 19 9
Warren 2,437 18 67 6 9 26
Range Across Study
Districts:
2,437 - 141,799
(139,362)
18 - 67
(49 pts)
14 - 67
(53 pts)
6 - 30
(24 pts)
0 -23
(23 pts)
9 - 27
(18 pts)
Sample Average
(13 counties)
22,467 48 32 15 7 16
North Carolina
Average
(100 counties)
14,361 54 31 11 6 15
45
County. The mean poverty level of the recruited sample and that of the state only differed by 1
percentage point, at 16% and 15% respectively.
School Quality
The North Carolina Department of Public Instruction has implemented a method for
communicating the performance of its schools to the public via an online reporting tool called
the NC Public Schools Report Card (NC Report Card, 2012). This online report provides the
public with yearly updates on district and school demographics and school quality. Several
measures of school quality are currently being used within the report including student academic
performance on state tests and educator qualifications.
Within the recruited sample, student academic proficiency levels for 2011 range from
55% to 77% in reading, 71% to 88% in math, and 66% to 86% in all high school End of Course
(EOC) exams combined (see Table 4). The sample mean in reading is 67% compared with the
state mean of 71%. In math, the mean score for the sample differed from that of the state by only
3 percentage points, at 80% and 83% respectively. Even more similar were the mean scores of
the sample and the state for all high school EOC’s combined, with only 1 percentage point
difference between the sample’s 78% mean and the state’s 79% mean.
In regards to educator qualifications, the percentage of teacher’s with a master’s degree
or higher in the recruited sample ranged from 19% to 38%, with a mean of 27%. Across the
state, the mean was nearly the same at 28% of teachers have a master’s or above. The percentage
of school principal’s with an advanced degree (Education Specialist or Doctorate) within the
recruited sample ranged from 0% to 46%, with a mean of 18%. The state mean in this category
was similar, with 21% of principals earning above a master’s degree.
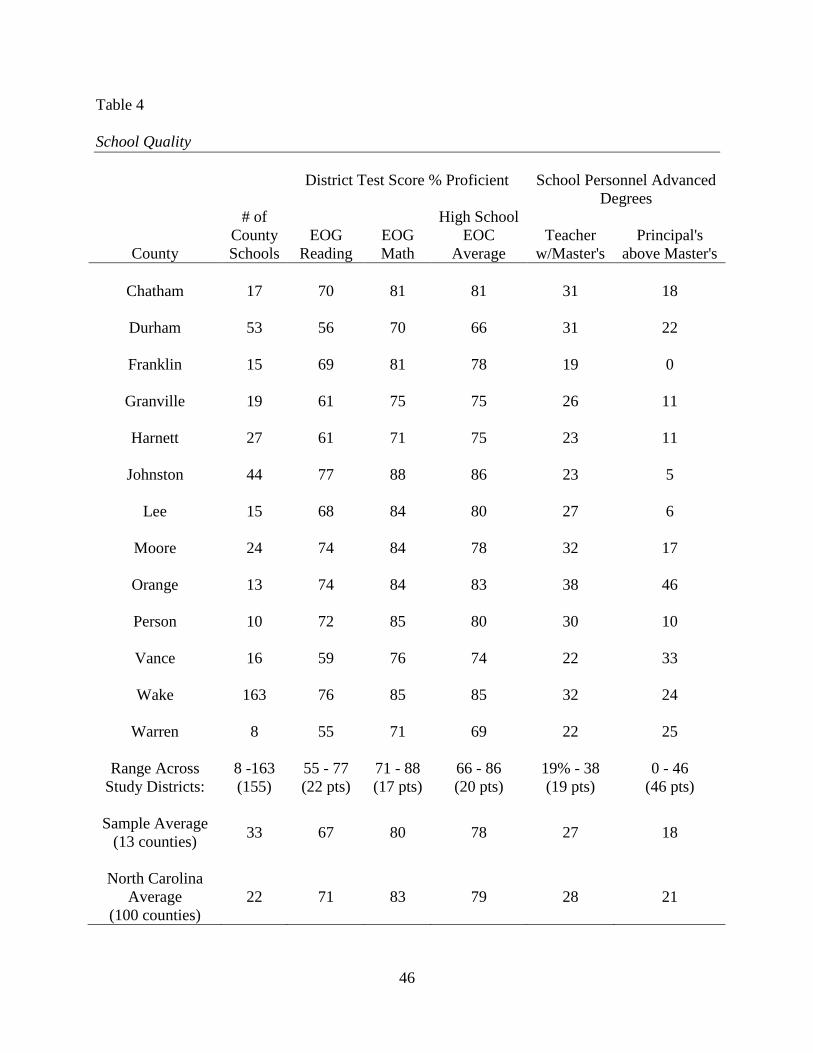
46
Table 4
School Quality
County
# of
County
Schools
District Test Score % Proficient
School Personnel Advanced
Degrees
EOG
Reading
EOG
Math
High School
EOC
Average
Teacher
w/Master's
Principal's
above Master's
Chatham 17 70 81 81 31 18
Durham 53 56 70 66 31 22
Franklin 15 69 81 78 19 0
Granville 19 61 75 75 26 11
Harnett 27 61 71 75 23 11
Johnston 44 77 88 86 23 5
Lee 15 68 84 80 27 6
Moore 24 74 84 78 32 17
Orange 13 74 84 83 38 46
Person 10 72 85 80 30 10
Vance 16 59 76 74 22 33
Wake 163 76 85 85 32 24
Warren 8 55 71 69 22 25
Range Across
Study Districts:
8 -163
(155)
55 - 77
(22 pts)
71 - 88
(17 pts)
66 - 86
(20 pts)
19% - 38
(19 pts)
0 - 46
(46 pts)
Sample Average
(13 counties) 33 67 80 78 27 18
North Carolina
Average
(100 counties)
22 71 83 79 28 21
47
Participants
District leaders, school administrators, and classroom teachers within the Greater
Triangle Area of North Carolina were invited to participate in the study. Because district leaders
often make the final decisions regarding the use of specific assessment tools and methods within
the school district, the district staff members were included in the study. The inclusion of district
leaders offered an essential perspective on the intended purpose of interim assessment adoption
and a district-wide view of the perceived benefits on student achievement across the district. For
this study, district leaders include Superintendent or Assistant Superintendent and the Directors
of Testing, Curriculum/Instruction, Professional Development, and/or specific content areas.
School administrators were recruited to participate in the study in order to explore the
specific uses and implementation of interim assessments within their particular schools.
Although the decision to use interim assessments may lie outside of the role of a school
administrator, principals and other school leaders provide important information on the actual
use of interim assessment data by the teachers within their schools as well as a school level
perspective on the benefits of the assessments on their students’ academic progress. School
leaders include Principals, Assistant Principals, Testing Coordinators, and Instructional Resource
Teachers. Finally, classroom teachers were included in the study to offer a firsthand account of
how interim assessments are actually being utilized by those who have the closest relationship to
the students each day. By including classroom teachers, the researcher has the greatest
opportunity to gather information about how interim assessments are perceived by the teacher
and the student and the specific benefits on student learning. Classroom teachers include those
who have administered interim assessments to students in which they directly instruct in the
classroom in grades 3 through 12.
48
By including a variety of educators at various roles within the district, the information
collected in the study offers a broader, more comprehensive perspective on why and how interim
assessments are being used in schools. The inclusion of all roles helps in addressing research
questions 1-3 as well as research question 4, which seeks to explore the differences that may
exist among the responses from the various roles within and across the recruited sample.
Measures
A questionnaire was utilized to collect information on the intended purpose, actual use,
and perceived benefits of interim assessments in order to address research question 1 — 3. The
questionnaire gathered preliminary data to address research question 4 on how responses differ
across various roles within the sample districts. The questionnaire used in the study was adapted
from the interview questions in a previous study done by Davidson and Frohbeiter in 2011 on
district-led interim assessments (pp. 16, 20). The questionnaire was administered to district
leaders, school administrators, and classroom teachers in the recruited sample as an online
survey provided as a link through email (see the full questionnaire in Appendix A).
Participants were asked to respond to a variety of selected response and open-ended
questions within the questionnaire. The selected response questions were based on common
themes collected from recent literature and interview responses reported in previous studies
involving interim assessment use for improved student achievement. Specifically, the statements
were drawn from the themes presented in the research findings of Davidson and Frohbeiter in
2011. These themes were also used heavily to craft the selected response options included in the
questionnaire. Each selected response question included three options for each of the four
categories of purpose, use, and benefit to increase the reliability of the instrument. Also included
in each of the selected response questions was an “Other” option to allow participants to add
49
their own responses, thereby capturing any unique purposes, uses, and benefits of interim
assessments not previously stated. Open-ended questions were utilized within the survey in
order to offer the participant an opportunity to provide anecdotal feedback on the broader topics
of the study. This type of feedback uncovered unique ideas and perspectives not originally
collected in the Davidson and Frohbeiter study and therefore, served to enrich the research base
on interim assessment use.
In order to determine if the instrument performed as expected, a Cronbach Alpha
Reliability test was performed to check the reliability of the items for each of the categories.
Additionally, a small pilot of the questionnaire was conducted prior to its use in the study to
validate the quality of the questions. The pilot included a small group of adults in the education
field who were familiar with the terminology used in the questionnaire but did not participate in
the actual study. By piloting the questionnaire in advance of the study, a sense of the reliability
of the instrument and an assessment of its potential for future use was possible. A subset of the
pilot sample also participated in cognitive interviews by answering the questions and describing
what they were thinking. This helped to determine if the questions were being interpreted by the
sample participants as intended.
In preparation for the administration of the survey, a personal email was sent to district
central office personnel requesting permission to administer the questionnaire. District and
school leader email addresses were acquired using the North Carolina Department of Education
NC Education Directory (EDDIE). The survey was administered through a link within an email
describing the goals of the research study and requesting their participation by completing the
survey. In order to recruit teachers for participation in the study, the survey included a section
where school administrators could recommend three to five classroom teachers from his or her
50
school who could best answer the questions on the survey. The questionnaire was then forwarded
to the teachers identified by the school administrator. The anticipated number of participants
completing the questionnaire was 350, with an expected response from 3 district leaders, 6
school administrators, and 18 classroom teachers (those recommended by the principal) from
each of the 13 recruited districts in the sample.
Respondents were asked to identify their district and their position within the district
and/or school. No names were collected in the survey. Each survey respondent was assigned a
random ID to ensure participants’ confidentiality. The key that matched district names and
positions with survey respondent IDs was stored in a separate location from the online survey
data collection file. A graphical application available within the online survey tool was used to
generate visual graphics for comparison purposes and spreadsheets for calculation purposes.
The open-ended questions in the survey were designed to elicit responses that yield
sufficient data to address the research questions. A pilot of the survey provided insight into the
level of depth and richness of the open-ended responses. If given all of these steps, the
qualitative responses were not adequate enough for analytic purposes, short telephone interview
questions were prepared. Only those respondents who agreed to further contact by the researcher,
as requested at the end of the survey, were eligible for participation in the telephone interviews.
Analysis
Survey responses from the stratified random sample were coded using the following
method: Each question response (checkbox) could earn a total of one point for one of the four
categories: instructional, predictive, evaluative, or other using a pre-made answer key (see
Appendix B). The total points earned were calculated out of the total possible points for that
particular category. The sum of the scores for each category was compared and a dominant
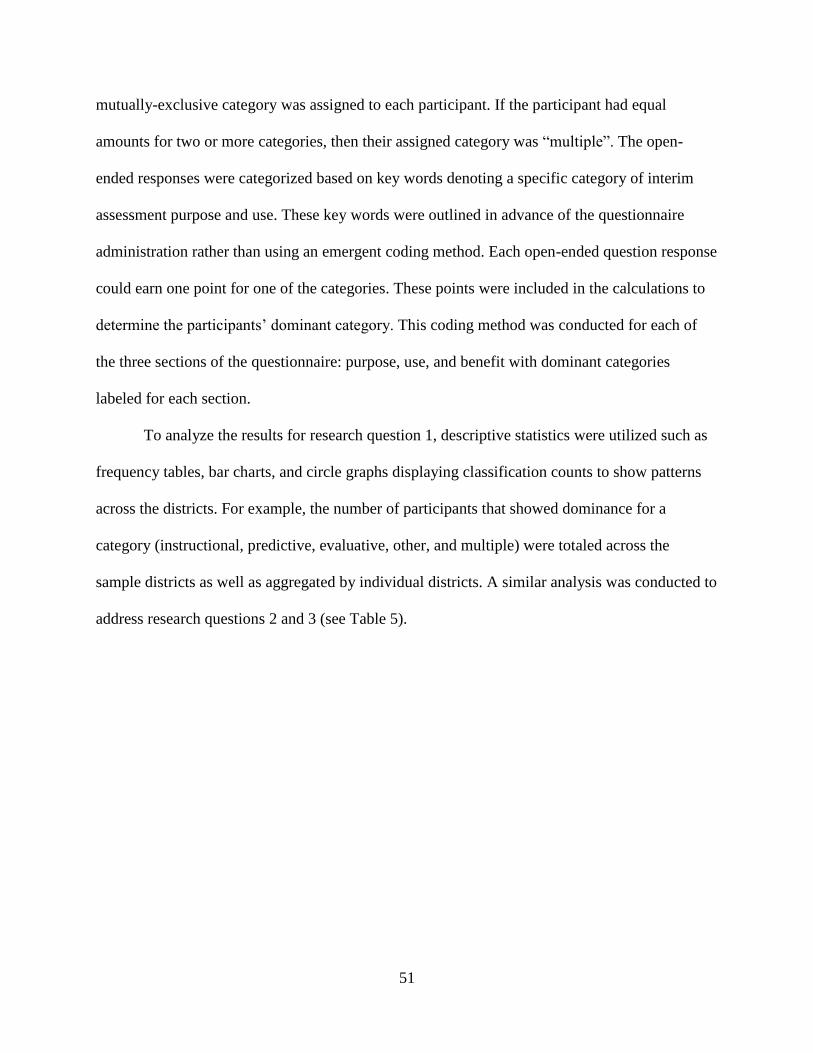
51
mutually-exclusive category was assigned to each participant. If the participant had equal
amounts for two or more categories, then their assigned category was “multiple”. The open-
ended responses were categorized based on key words denoting a specific category of interim
assessment purpose and use. These key words were outlined in advance of the questionnaire
administration rather than using an emergent coding method. Each open-ended question response
could earn one point for one of the categories. These points were included in the calculations to
determine the participants’ dominant category. This coding method was conducted for each of
the three sections of the questionnaire: purpose, use, and benefit with dominant categories
labeled for each section.
To analyze the results for research question 1, descriptive statistics were utilized such as
frequency tables, bar charts, and circle graphs displaying classification counts to show patterns
across the districts. For example, the number of participants that showed dominance for a
category (instructional, predictive, evaluative, other, and multiple) were totaled across the
sample districts as well as aggregated by individual districts. A similar analysis was conducted to
address research questions 2 and 3 (see Table 5).
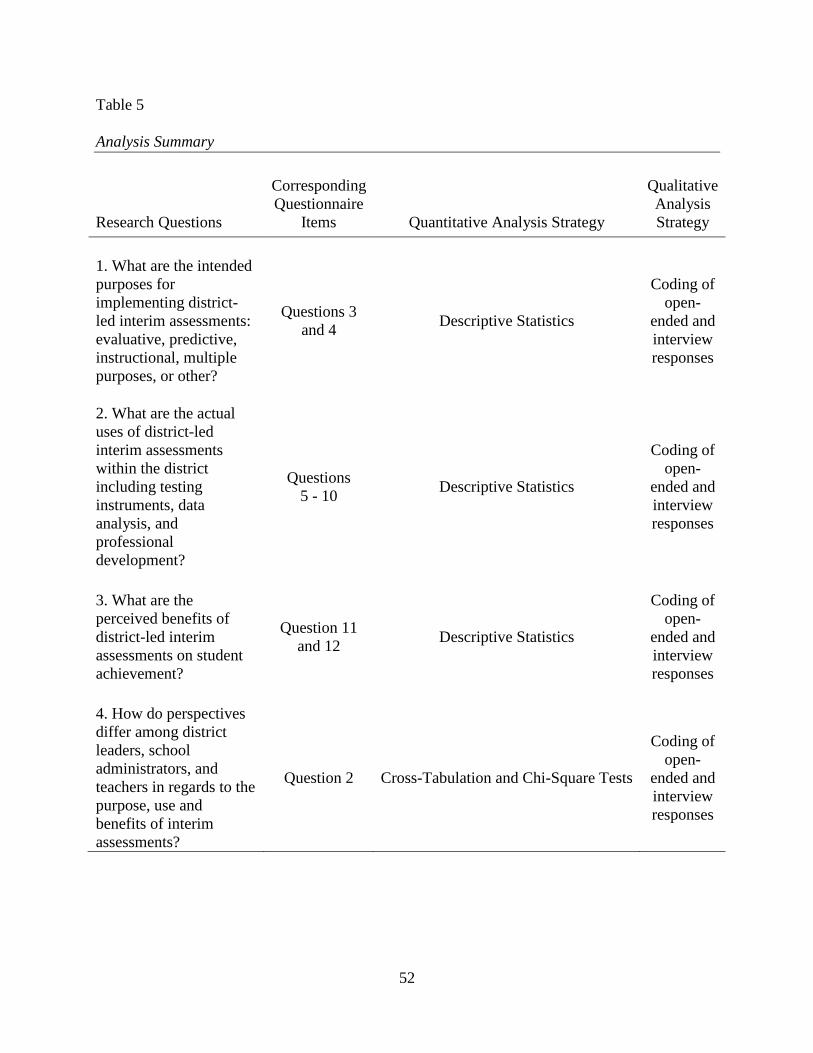
52
Table 5
Analysis Summary
Research Questions
Corresponding
Questionnaire
Items
Quantitative Analysis Strategy
Qualitative
Analysis
Strategy
1. What are the intended
purposes for
implementing district-
led interim assessments:
evaluative, predictive,
instructional, multiple
purposes, or other?
Questions 3
and 4 Descriptive Statistics
Coding of
open-
ended and
interview
responses
2. What are the actual
uses of district-led
interim assessments
within the district
including testing
instruments, data
analysis, and
professional
development?
Questions
5 - 10 Descriptive Statistics
Coding of
open-
ended and
interview
responses
3. What are the
perceived benefits of
district-led interim
assessments on student
achievement?
Question 11
and 12 Descriptive Statistics
Coding of
open-
ended and
interview
responses
4. How do perspectives
differ among district
leaders, school
administrators, and
teachers in regards to the
purpose, use and
benefits of interim
assessments?
Question 2 Cross-Tabulation and Chi-Square Tests
Coding of
open-
ended and
interview
responses
53
To analyze the results for research question 4, the scores were separated into three
groups: district leader, school administrator, and classroom teacher. As the variables in this study
were categorical, a cross-tabulation was conducted using a series of Chi-Square tests to address
the differences between the three groups. The Chi-Square test determined if the observed
frequencies were different from the expected frequencies thereby suggesting a relationship
between the independent and dependent variables. If a significant difference was found, then
pairs of groups were compared in an attempt to identify which groups were significantly
different from one another. Because of the additional Chi-Square testing, the study analysis
becomes sensitive to Type 1 errors where the differences may be a result of chance rather than
actual differences between two groups. For these follow-up tests, the False Discovery Rate
control test was applied to correct for multiple comparisons.
CHAPTER FOUR: RESULTS
The purpose of this study was to collect preliminary data on the use of interim
assessments in North Carolina schools. Specifically, the study addressed the intended purposes,
actual uses, and perceived benefits of interim assessments on student achievement from the
perspectives of district leaders, school administrators, and classroom teachers. As stated in
Chapter 3, an online survey was utilized to collect responses, results were analyzed through
quantitative methods, and findings were presented using descriptive statistics.
Response Rates
The online survey was sent through electronic mail to 350 district and school personnel
across 13 districts. Of the thirteen districts recruited, eight participated in the study (see Table 6).
After three weeks, completed surveys were received by 50 participants. To encourage greater
participation, a follow-up email with a link to the electronic survey was sent to all recruited
participants thanking those who completed the survey and requesting that those who did not
please do so as soon as possible. After six weeks, 103 participants submitted the online survey;
resulting in an overall response rate of 29%. Although the respondents represented the majority
of the districts recruited, the actual sample and the intended sample differed in the proportion of
respondents by role. The intended sample included 3 district leaders, 6 school administrators, and
18 classroom teachers per district. When adjusted to reflect the actual number of districts
participating, the intended sample should have included 216 respondents, with 24 districts
leaders (11%), 48 school administrators (22%), and 144 classroom teachers (67%). The actual
numbers were much lower, with only 13 district leaders (13%) and 30 classroom teachers (29%)
responding. The number of school administrators who completed the survey was higher than
intended, with 60 respondents (58%) completing the survey (see Table 7). Almost all
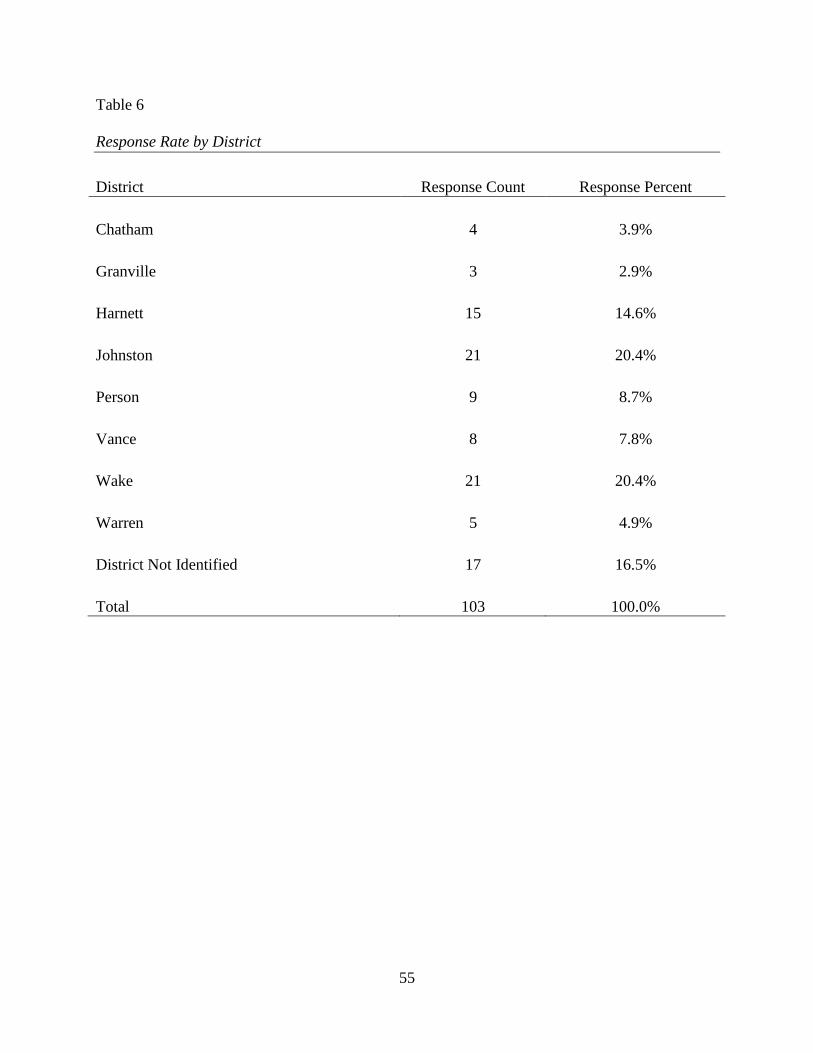
55
Table 6
Response Rate by District
District Response Count Response Percent
Chatham 4 3.9%
Granville 3 2.9%
Harnett 15 14.6%
Johnston 21 20.4%
Person 9 8.7%
Vance 8 7.8%
Wake 21 20.4%
Warren 5 4.9%
District Not Identified 17 16.5%
Total 103 100.0%
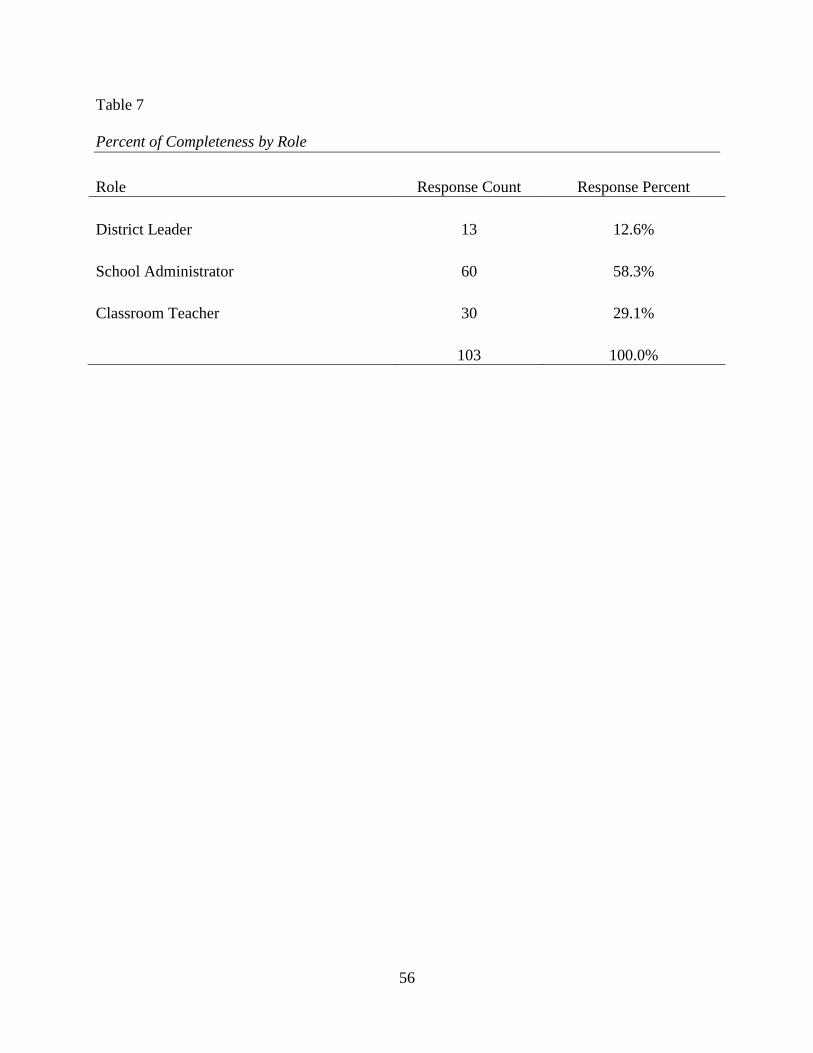
56
Table 7
Percent of Completeness by Role
Role Response Count Response Percent
District Leader 13 12.6%
School Administrator 60 58.3%
Classroom Teacher 30 29.1%
103 100.0%
57
respondents submitted answers to the multiple-choice questions and over half submitted
responses to the open-ended responses (see Table 8); therefore, providing sufficient data for each
research question and making follow-up interviews unnecessary.
The remainder of this chapter is organized in terms of the findings on the four specific
research questions posed in Chapter 1. It first reports the intended purposes of interim
assessments. It next explores the uses of interim assessment data. It then states the perceived
benefits of interim assessments on student achievement. Finally, it compares the responses from
the first three research questions across three different roles: district leaders, school
administrators, and classroom teachers.
Research Question 1
What are the intended purposes for implementing district-led interim assessments:
evaluative, predictive, instructional, multiple purposes, or other?
This section presents the results from the study regarding research question 1 which
reports on the intended purpose of interim assessments. Participants selected from a list of
answer options as a method for identifying the category that best represents their intended
purpose for using interim assessments as Instructional, Evaluative, or Predictive. The Multiple
category was applied to a participant that showed equal dominance in more than one category.
Cronbach’s alpha was calculated as the reliability statistic for the answer options (items)
representing the Instructional, Evaluative, and Predictive categories (subscales). The
Instructional subscale consisted of 3 items (α = .76), the Evaluative subscale consisted of 3 items
(α = .92), and the Predictive subscale consisted of 3 items (α = .95).Therefore, the scale for
identifying participant’s dominant category for Intended Purpose was found to be highly reliable
(9 items; α = .88).
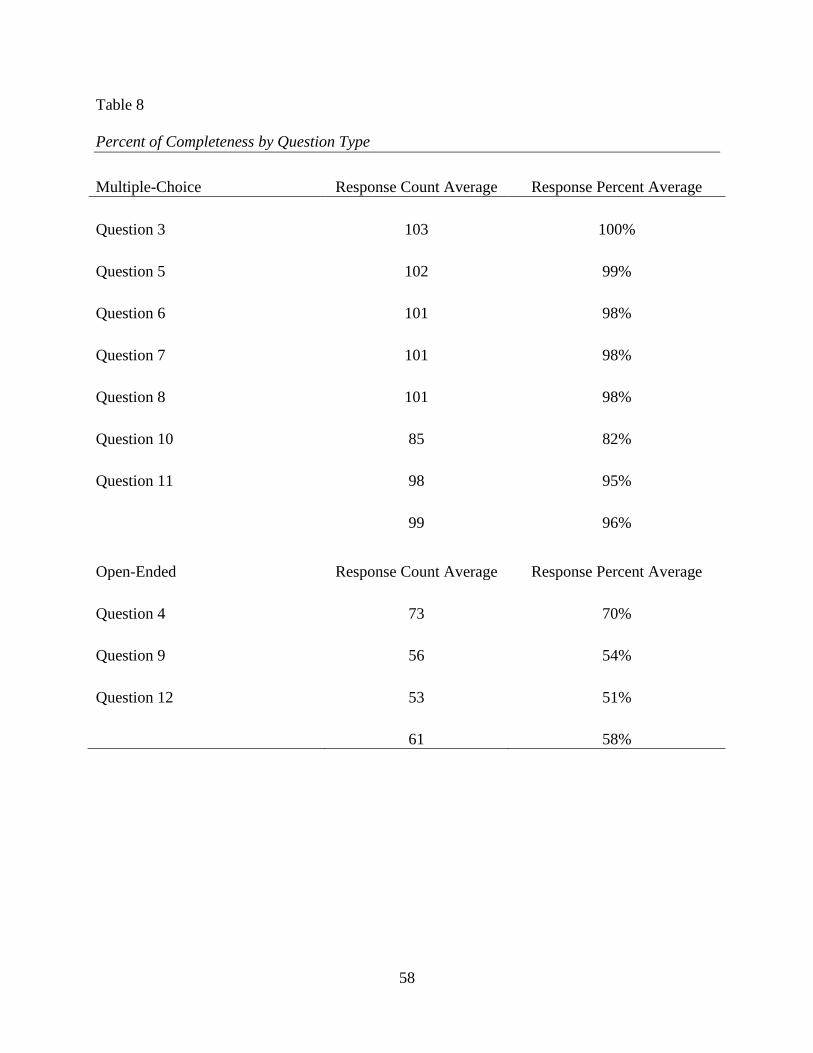
58
Table 8
Percent of Completeness by Question Type
Multiple-Choice Response Count Average Response Percent Average
Question 3 103 100%
Question 5 102 99%
Question 6 101 98%
Question 7 101 98%
Question 8 101 98%
Question 10 85 82%
Question 11 98 95%
99 96%
Open-Ended Response Count Average Response Percent Average
Question 4 73 70%
Question 9 56 54%
Question 12 53 51%
61 58%
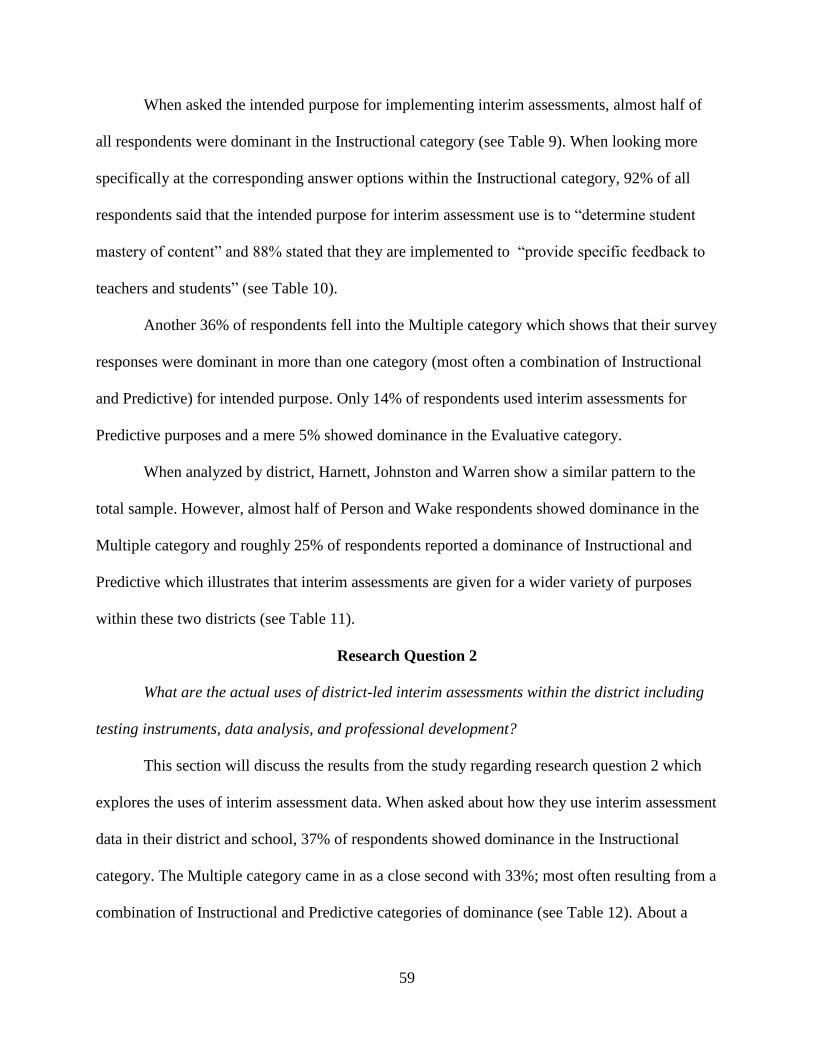
59
When asked the intended purpose for implementing interim assessments, almost half of
all respondents were dominant in the Instructional category (see Table 9). When looking more
specifically at the corresponding answer options within the Instructional category, 92% of all
respondents said that the intended purpose for interim assessment use is to “determine student
mastery of content” and 88% stated that they are implemented to “provide specific feedback to
teachers and students” (see Table 10).
Another 36% of respondents fell into the Multiple category which shows that their survey
responses were dominant in more than one category (most often a combination of Instructional
and Predictive) for intended purpose. Only 14% of respondents used interim assessments for
Predictive purposes and a mere 5% showed dominance in the Evaluative category.
When analyzed by district, Harnett, Johnston and Warren show a similar pattern to the
total sample. However, almost half of Person and Wake respondents showed dominance in the
Multiple category and roughly 25% of respondents reported a dominance of Instructional and
Predictive which illustrates that interim assessments are given for a wider variety of purposes
within these two districts (see Table 11).
Research Question 2
What are the actual uses of district-led interim assessments within the district including
testing instruments, data analysis, and professional development?
This section will discuss the results from the study regarding research question 2 which
explores the uses of interim assessment data. When asked about how they use interim assessment
data in their district and school, 37% of respondents showed dominance in the Instructional
category. The Multiple category came in as a close second with 33%; most often resulting from a
combination of Instructional and Predictive categories of dominance (see Table 12). About a

60
Table 9
Intended Purpose Summary
PURPOSE %
INSTRUCTIONAL 45
MULTIPLE 36
EVALUATIVE 5
PREDICTIVE 14
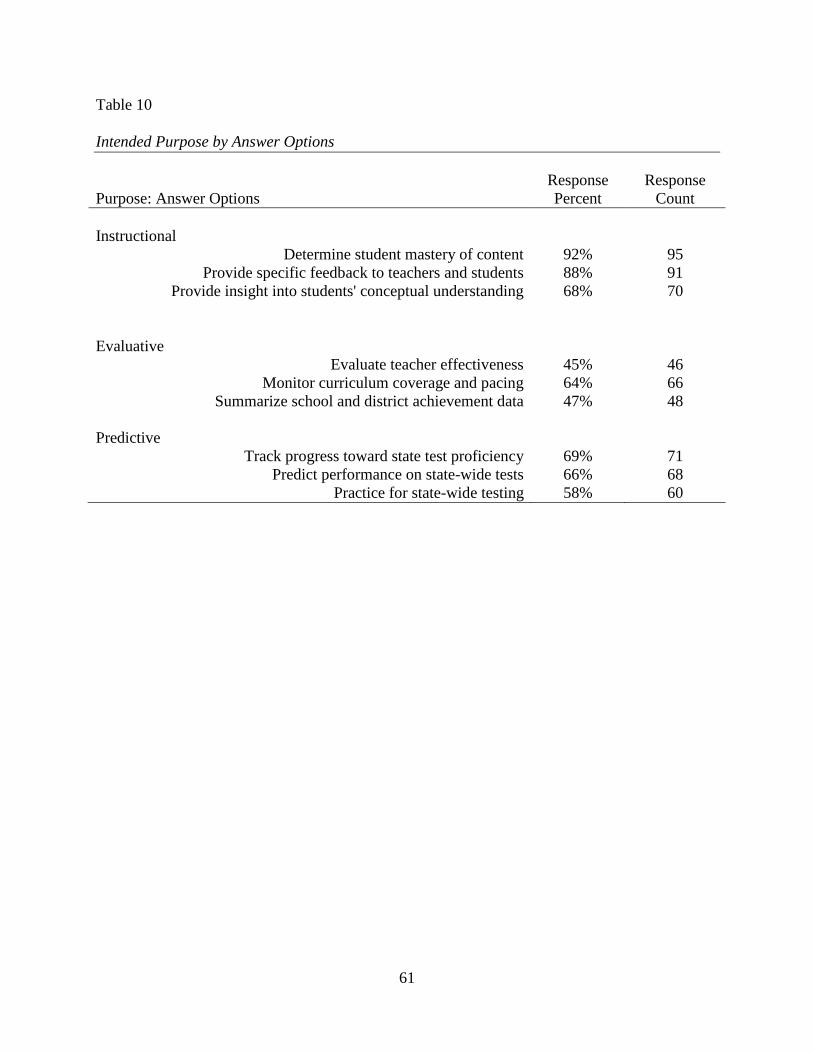
61
Table 10
Intended Purpose by Answer Options
Purpose: Answer Options
Response
Percent
Response
Count
Instructional
Determine student mastery of content 92% 95
Provide specific feedback to teachers and students 88% 91
Provide insight into students' conceptual understanding 68% 70
Evaluative
Evaluate teacher effectiveness 45% 46
Monitor curriculum coverage and pacing 64% 66
Summarize school and district achievement data 47% 48
Predictive
Track progress toward state test proficiency 69% 71
Predict performance on state-wide tests 66% 68
Practice for state-wide testing 58% 60
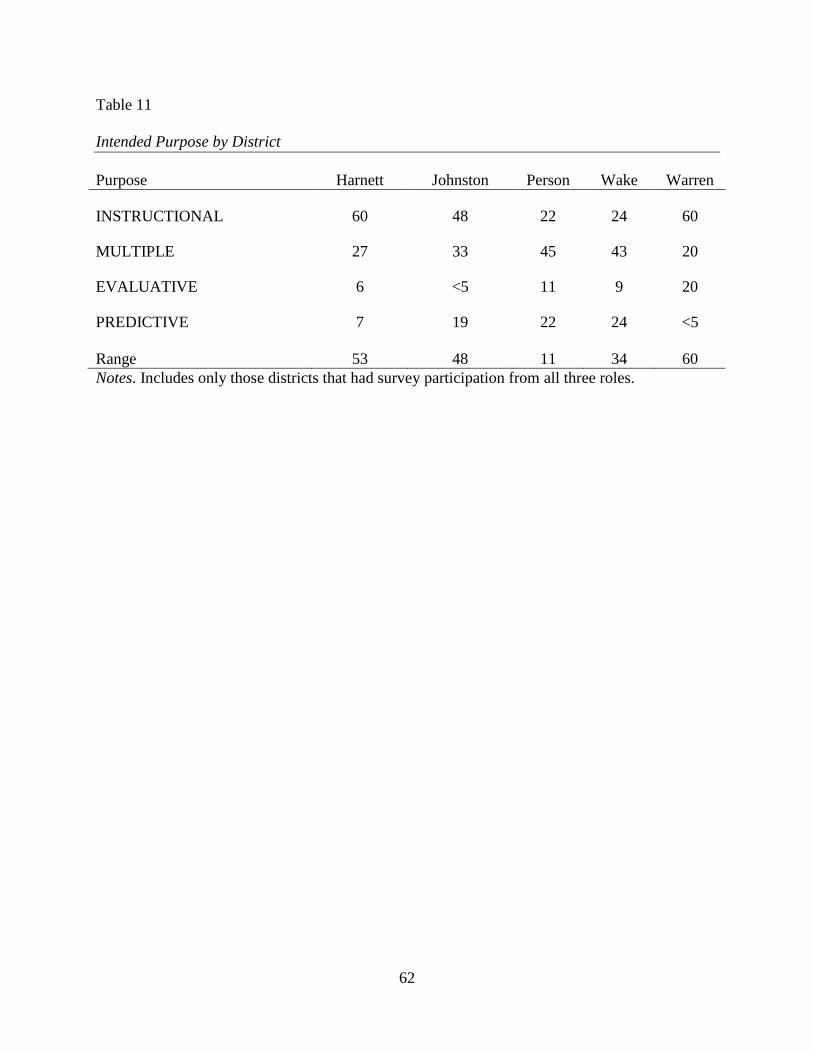
62
Table 11
Intended Purpose by District
Purpose Harnett Johnston Person Wake Warren
INSTRUCTIONAL 60 48 22 24 60
MULTIPLE 27 33 45 43 20
EVALUATIVE 6 <5 11 9 20
PREDICTIVE 7 19 22 24 <5
Range 53 48 11 34 60
Notes. Includes only those districts that had survey participation from all three roles.
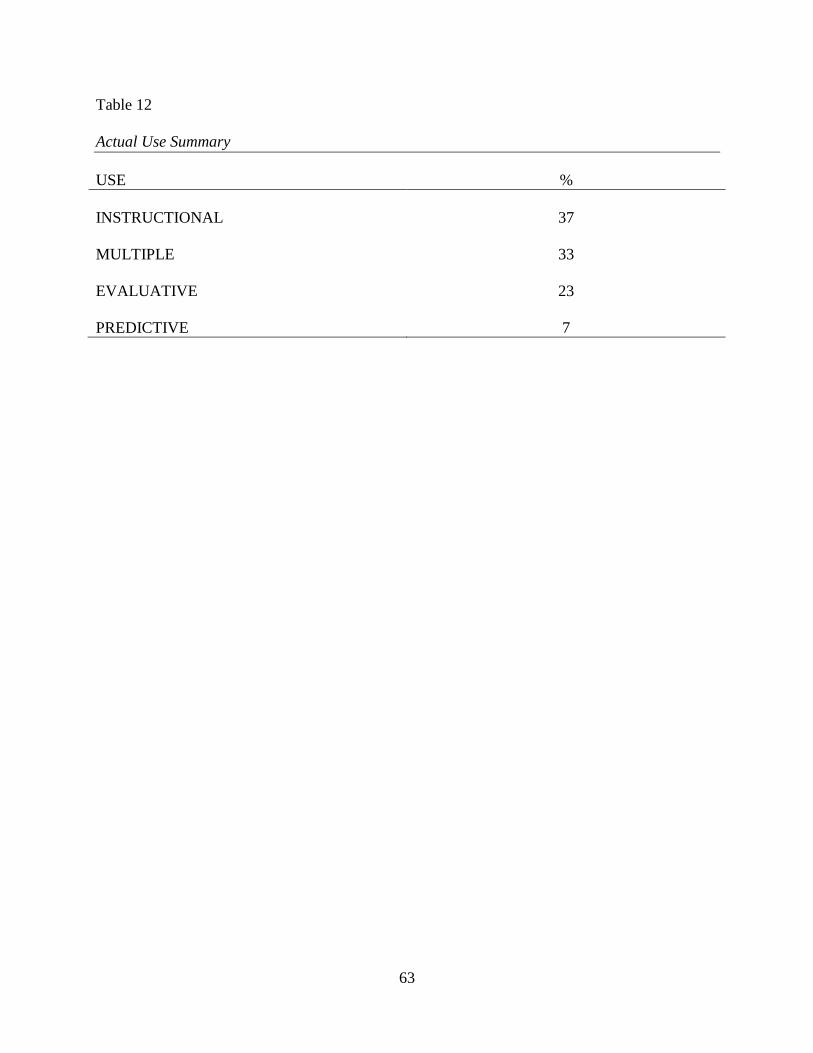
63
Table 12
Actual Use Summary
USE %
INSTRUCTIONAL 37
MULTIPLE 33
EVALUATIVE 23
PREDICTIVE 7
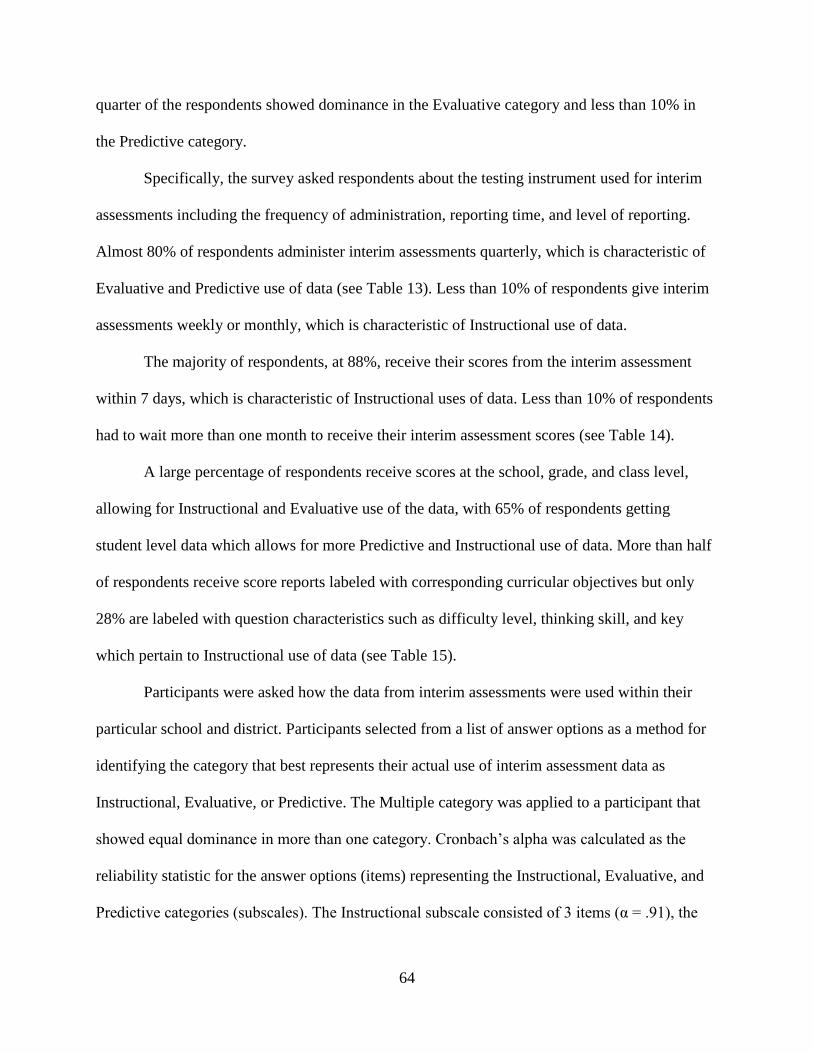
64
quarter of the respondents showed dominance in the Evaluative category and less than 10% in
the Predictive category.
Specifically, the survey asked respondents about the testing instrument used for interim
assessments including the frequency of administration, reporting time, and level of reporting.
Almost 80% of respondents administer interim assessments quarterly, which is characteristic of
Evaluative and Predictive use of data (see Table 13). Less than 10% of respondents give interim
assessments weekly or monthly, which is characteristic of Instructional use of data.
The majority of respondents, at 88%, receive their scores from the interim assessment
within 7 days, which is characteristic of Instructional uses of data. Less than 10% of respondents
had to wait more than one month to receive their interim assessment scores (see Table 14).
A large percentage of respondents receive scores at the school, grade, and class level,
allowing for Instructional and Evaluative use of the data, with 65% of respondents getting
student level data which allows for more Predictive and Instructional use of data. More than half
of respondents receive score reports labeled with corresponding curricular objectives but only
28% are labeled with question characteristics such as difficulty level, thinking skill, and key
which pertain to Instructional use of data (see Table 15).
Participants were asked how the data from interim assessments were used within their
particular school and district. Participants selected from a list of answer options as a method for
identifying the category that best represents their actual use of interim assessment data as
Instructional, Evaluative, or Predictive. The Multiple category was applied to a participant that
showed equal dominance in more than one category. Cronbach’s alpha was calculated as the
reliability statistic for the answer options (items) representing the Instructional, Evaluative, and
Predictive categories (subscales). The Instructional subscale consisted of 3 items (α = .91), the
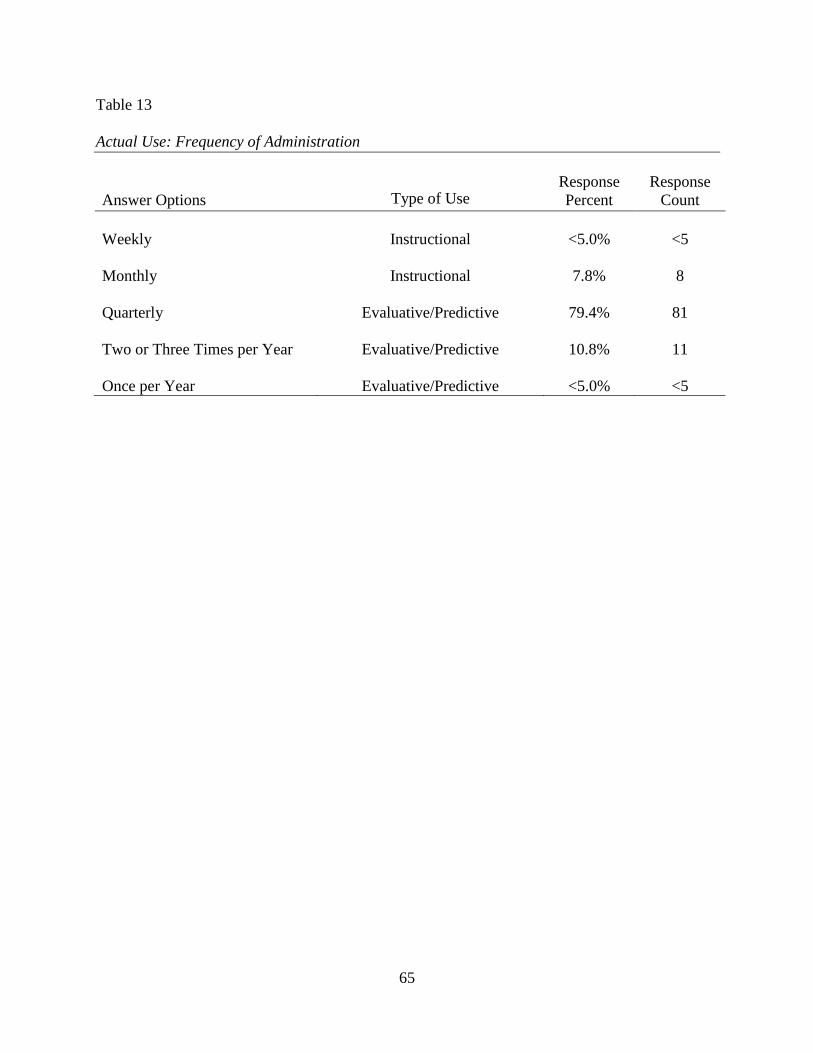
65
Table 13
Actual Use: Frequency of Administration
Answer Options
Type of Use Response
Percent
Response
Count
Weekly Instructional <5.0% <5
Monthly Instructional 7.8% 8
Quarterly Evaluative/Predictive 79.4% 81
Two or Three Times per Year Evaluative/Predictive 10.8% 11
Once per Year Evaluative/Predictive <5.0% <5
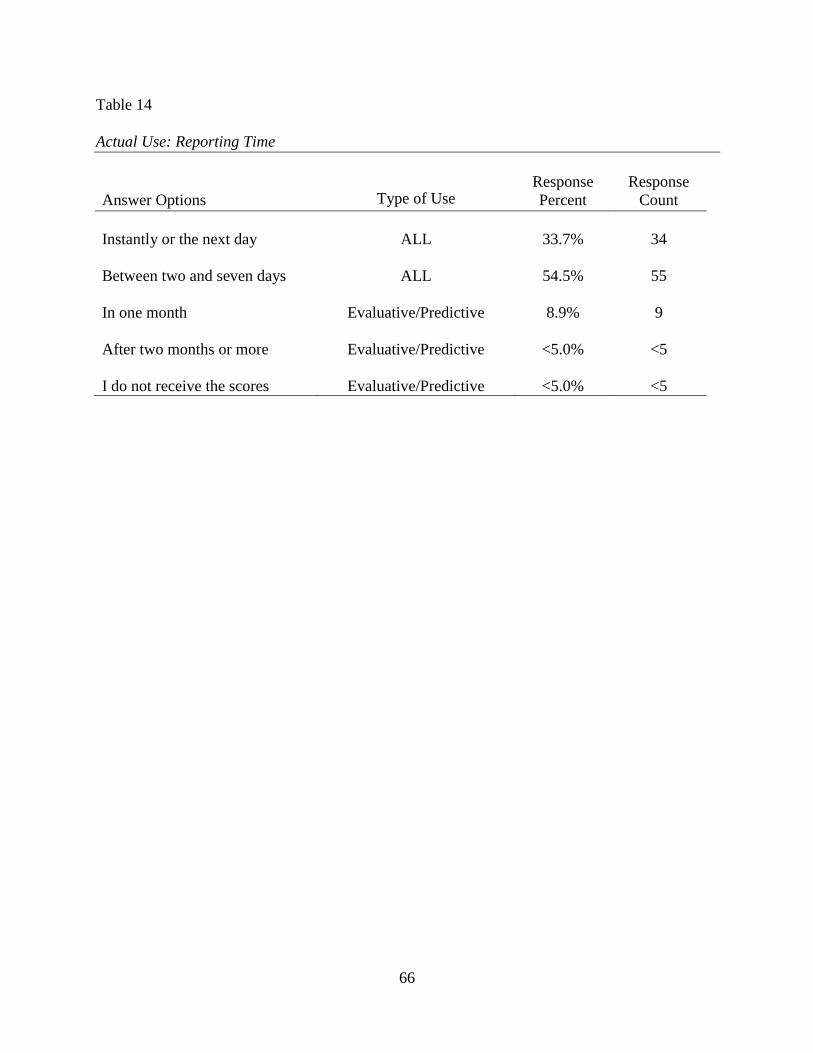
66
Table 14
Actual Use: Reporting Time
Answer Options
Type of Use Response
Percent
Response
Count
Instantly or the next day ALL 33.7% 34
Between two and seven days ALL 54.5% 55
In one month Evaluative/Predictive 8.9% 9
After two months or more Evaluative/Predictive <5.0% <5
I do not receive the scores Evaluative/Predictive <5.0% <5
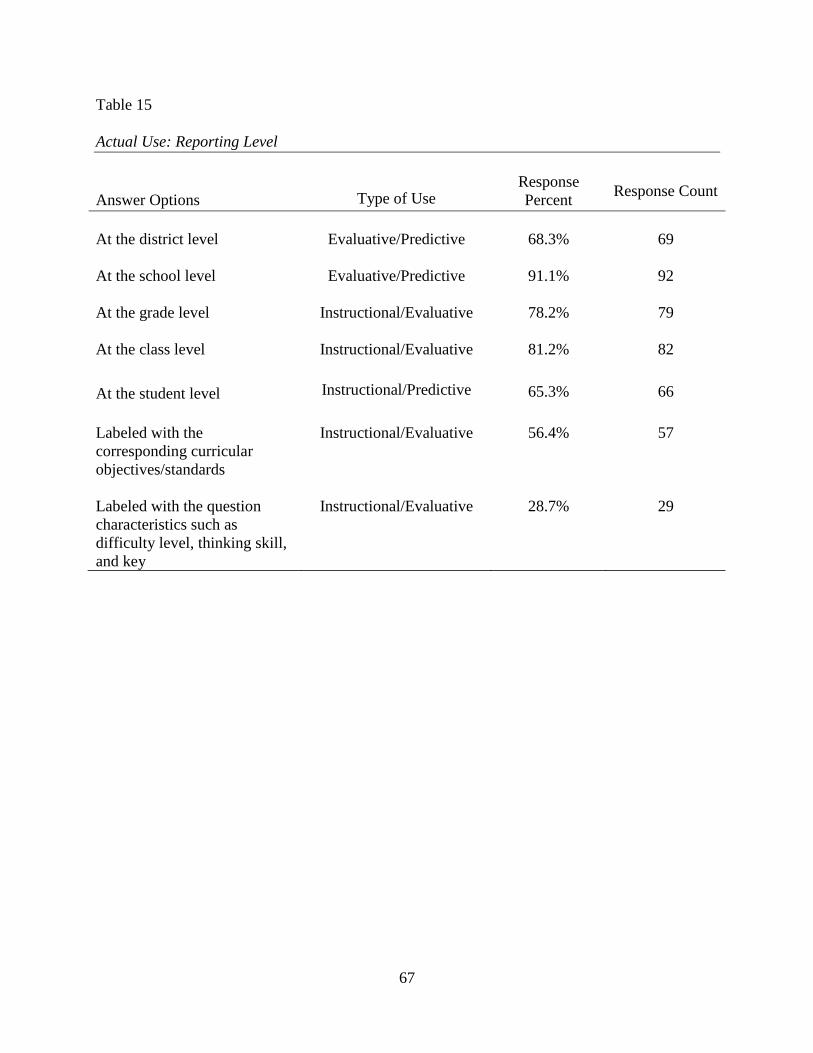
67
Table 15
Actual Use: Reporting Level
Answer Options
Type of Use Response
Percent Response Count
At the district level Evaluative/Predictive 68.3% 69
At the school level Evaluative/Predictive 91.1% 92
At the grade level Instructional/Evaluative 78.2% 79
At the class level Instructional/Evaluative 81.2% 82
At the student level Instructional/Predictive 65.3% 66
Labeled with the
corresponding curricular
objectives/standards
Instructional/Evaluative 56.4%
57
Labeled with the question
characteristics such as
difficulty level, thinking skill,
and key
Instructional/Evaluative 28.7%
29
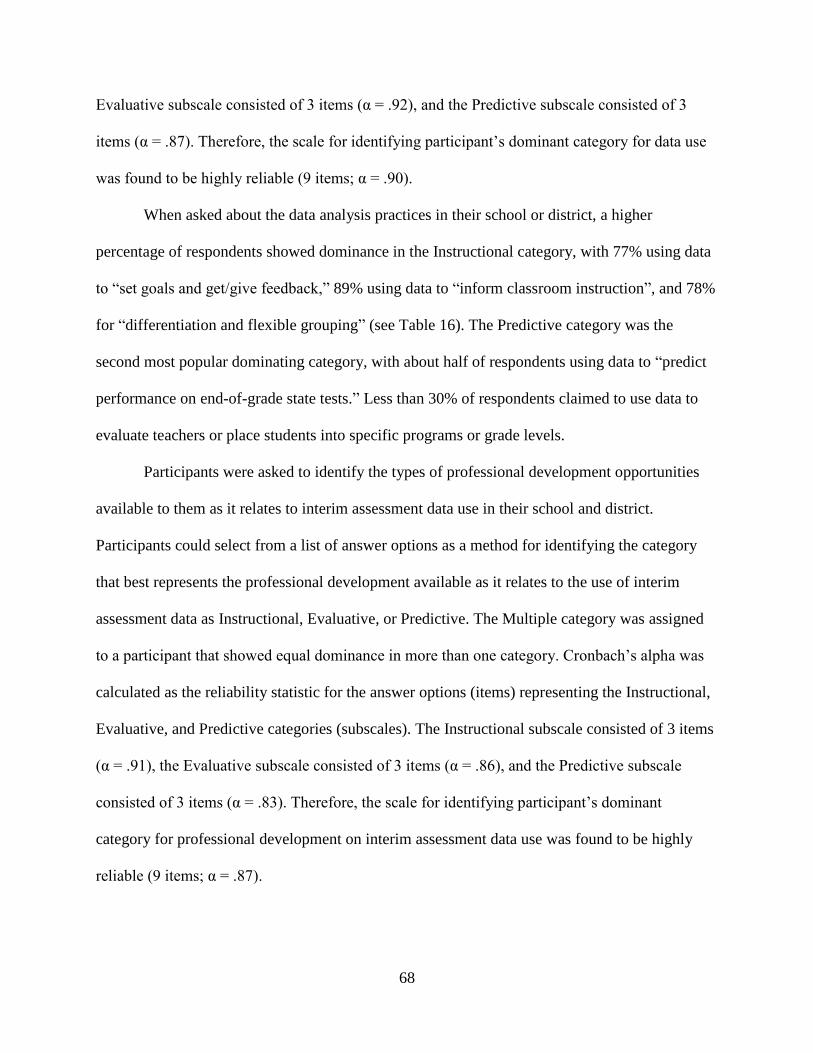
68
Evaluative subscale consisted of 3 items (α = .92), and the Predictive subscale consisted of 3
items (α = .87). Therefore, the scale for identifying participant’s dominant category for data use
was found to be highly reliable (9 items; α = .90).
When asked about the data analysis practices in their school or district, a higher
percentage of respondents showed dominance in the Instructional category, with 77% using data
to “set goals and get/give feedback,” 89% using data to “inform classroom instruction”, and 78%
for “differentiation and flexible grouping” (see Table 16). The Predictive category was the
second most popular dominating category, with about half of respondents using data to “predict
performance on end-of-grade state tests.” Less than 30% of respondents claimed to use data to
evaluate teachers or place students into specific programs or grade levels.
Participants were asked to identify the types of professional development opportunities
available to them as it relates to interim assessment data use in their school and district.
Participants could select from a list of answer options as a method for identifying the category
that best represents the professional development available as it relates to the use of interim
assessment data as Instructional, Evaluative, or Predictive. The Multiple category was assigned
to a participant that showed equal dominance in more than one category. Cronbach’s alpha was
calculated as the reliability statistic for the answer options (items) representing the Instructional,
Evaluative, and Predictive categories (subscales). The Instructional subscale consisted of 3 items
(α = .91), the Evaluative subscale consisted of 3 items (α = .86), and the Predictive subscale
consisted of 3 items (α = .83). Therefore, the scale for identifying participant’s dominant
category for professional development on interim assessment data use was found to be highly
reliable (9 items; α = .87).
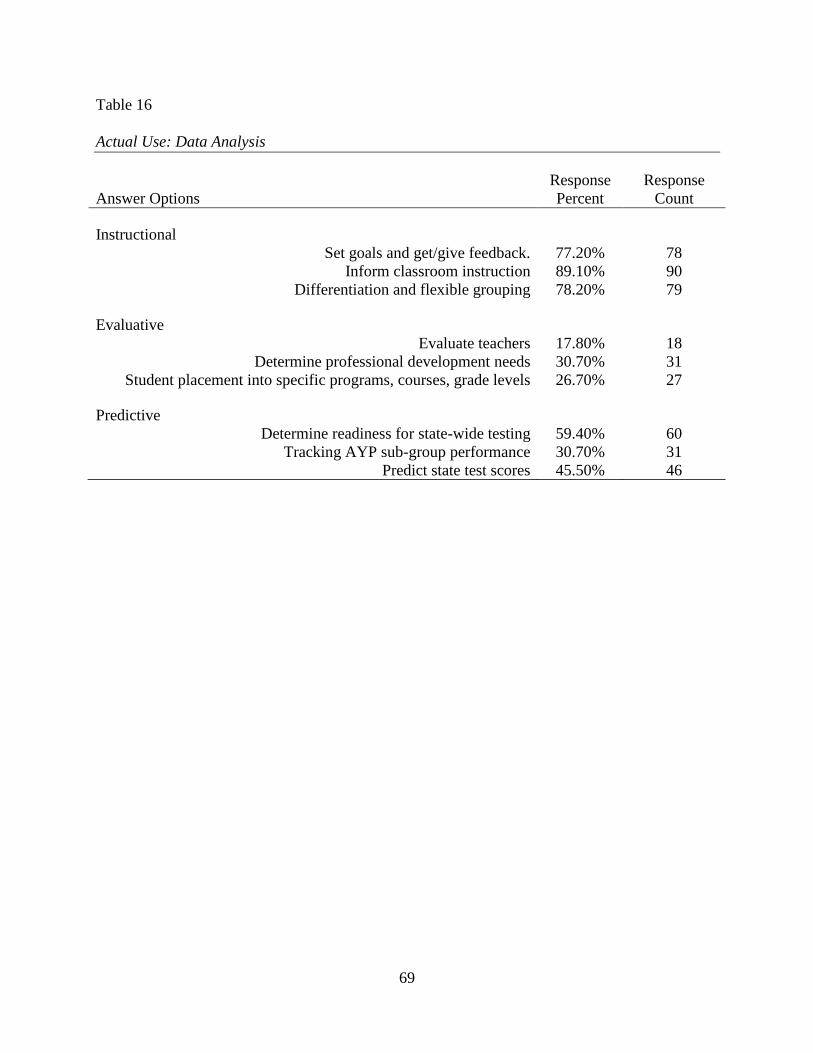
69
Table 16
Actual Use: Data Analysis
Answer Options
Response
Percent
Response
Count
Instructional
Set goals and get/give feedback. 77.20% 78
Inform classroom instruction 89.10% 90
Differentiation and flexible grouping 78.20% 79
Evaluative
Evaluate teachers 17.80% 18
Determine professional development needs 30.70% 31
Student placement into specific programs, courses, grade levels 26.70% 27
Predictive
Determine readiness for state-wide testing 59.40% 60
Tracking AYP sub-group performance 30.70% 31
Predict state test scores 45.50% 46
70
Respondents were asked about the professional development opportunities available in
their district or school in relation to interim assessments (see Table 17). Over 70% of
respondents receive professional development on how to analyze test data to identify learning
gaps and almost 60% receive training on how to determine student readiness for state-wide
testing. However, less than half of respondents are provided with training on how to set
academic goals for individual students or how to improve instructional strategies and content
knowledge which are characteristic of Instructional data use.
When analyzing the results for data use by district, the majority reported Instructional and
Evaluative use of data in their districts and schools (see Table 18). In fact, Warren County
participants overwhelmingly reported using data in ways that fell into these two categories.
Wake County and Harnett County displayed several different uses of data within their districts,
with a small range of 28 and 29 respectively across the four categories as compared with
Johnston at 33, Person at 45, and Warren at 60.
Research Question 3
What are the perceived benefits of district-led interim assessments on student
achievement?
This section reports on the results from the study regarding research question 3 which
investigates the perceived benefits of interim assessment on student achievement. Participants
were asked to identify the benefits of interim assessments on student achievement in their
particular school and district. Participants selected from a list of answer options as a method for
identifying the category that best represents their perceptions on the benefits of interim
assessments as Instructional, Evaluative, or Predictive. The Multiple category was applied to a
participant that showed equal dominance in more than one category. Cronbach’s alpha was
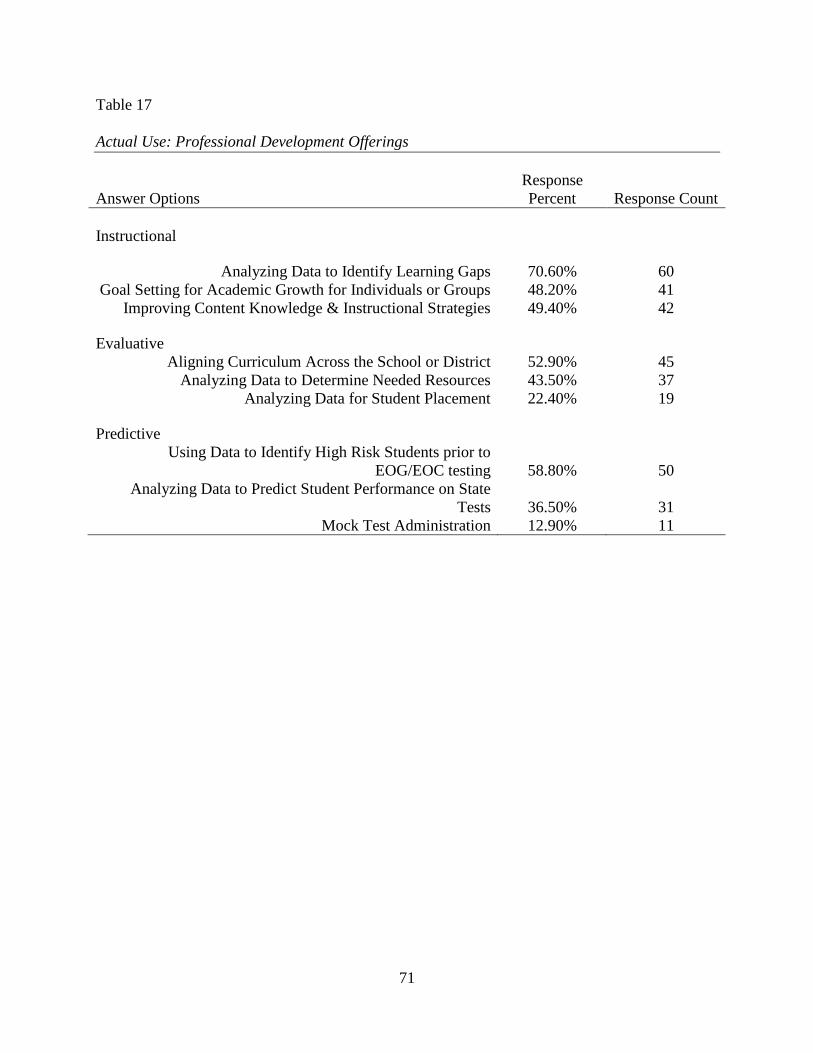
71
Table 17
Actual Use: Professional Development Offerings
Answer Options
Response
Percent Response Count
Instructional
Analyzing Data to Identify Learning Gaps 70.60% 60
Goal Setting for Academic Growth for Individuals or Groups 48.20% 41
Improving Content Knowledge & Instructional Strategies 49.40% 42
Evaluative
Aligning Curriculum Across the School or District 52.90% 45
Analyzing Data to Determine Needed Resources 43.50% 37
Analyzing Data for Student Placement 22.40% 19
Predictive
Using Data to Identify High Risk Students prior to
EOG/EOC testing 58.80% 50
Analyzing Data to Predict Student Performance on State
Tests 36.50% 31
Mock Test Administration 12.90% 11
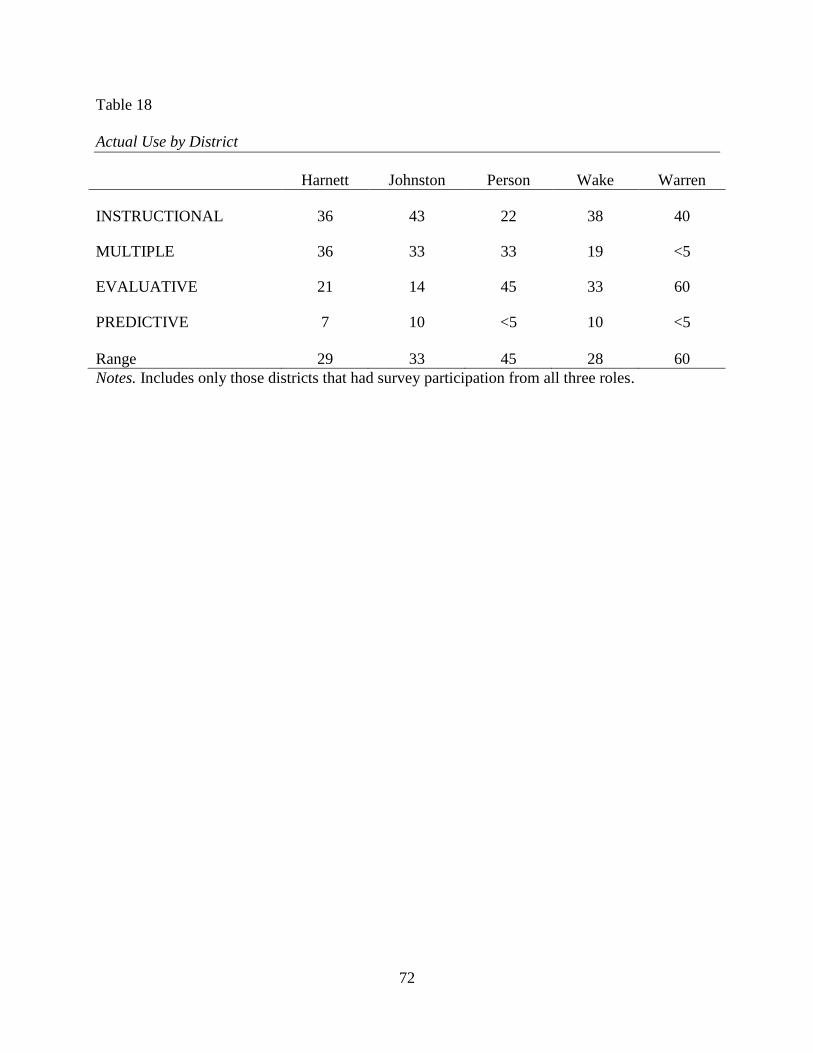
72
Table 18
Actual Use by District
Harnett Johnston Person Wake Warren
INSTRUCTIONAL 36 43 22 38 40
MULTIPLE 36 33 33 19 <5
EVALUATIVE 21 14 45 33 60
PREDICTIVE 7 10 <5 10 <5
Range 29 33 45 28 60
Notes. Includes only those districts that had survey participation from all three roles.
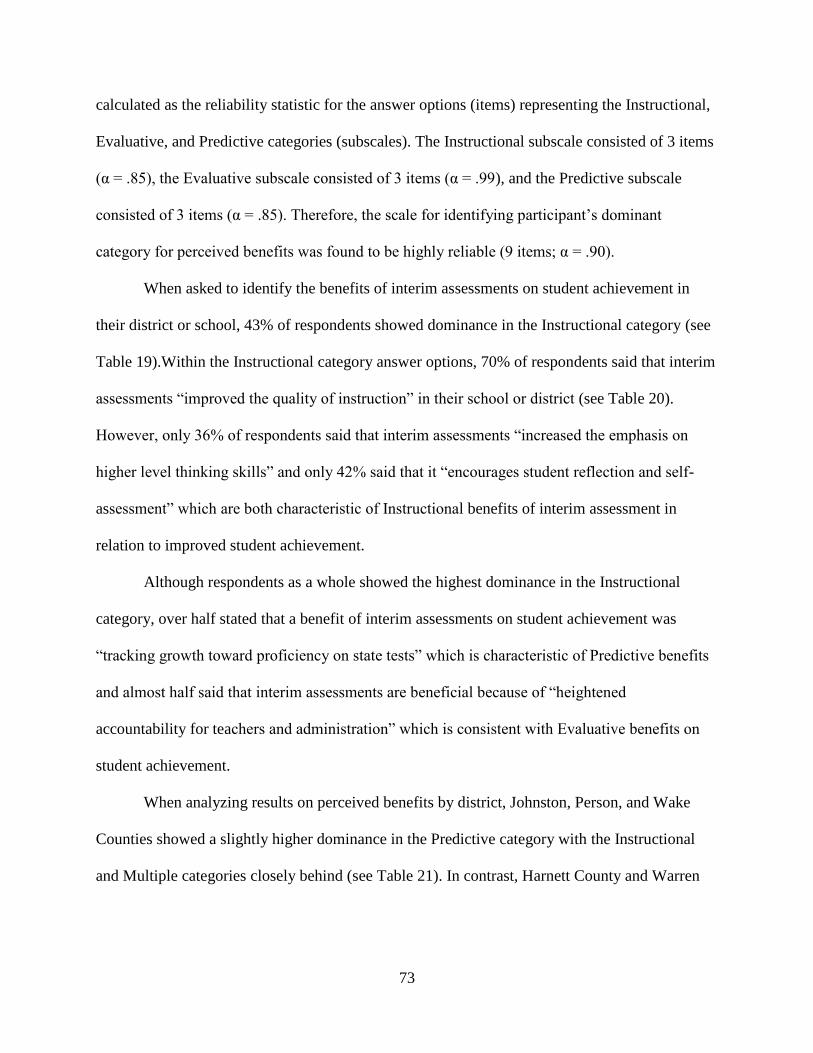
73
calculated as the reliability statistic for the answer options (items) representing the Instructional,
Evaluative, and Predictive categories (subscales). The Instructional subscale consisted of 3 items
(α = .85), the Evaluative subscale consisted of 3 items (α = .99), and the Predictive subscale
consisted of 3 items (α = .85). Therefore, the scale for identifying participant’s dominant
category for perceived benefits was found to be highly reliable (9 items; α = .90).
When asked to identify the benefits of interim assessments on student achievement in
their district or school, 43% of respondents showed dominance in the Instructional category (see
Table 19).Within the Instructional category answer options, 70% of respondents said that interim
assessments “improved the quality of instruction” in their school or district (see Table 20).
However, only 36% of respondents said that interim assessments “increased the emphasis on
higher level thinking skills” and only 42% said that it “encourages student reflection and self-
assessment” which are both characteristic of Instructional benefits of interim assessment in
relation to improved student achievement.
Although respondents as a whole showed the highest dominance in the Instructional
category, over half stated that a benefit of interim assessments on student achievement was
“tracking growth toward proficiency on state tests” which is characteristic of Predictive benefits
and almost half said that interim assessments are beneficial because of “heightened
accountability for teachers and administration” which is consistent with Evaluative benefits on
student achievement.
When analyzing results on perceived benefits by district, Johnston, Person, and Wake
Counties showed a slightly higher dominance in the Predictive category with the Instructional
and Multiple categories closely behind (see Table 21). In contrast, Harnett County and Warren
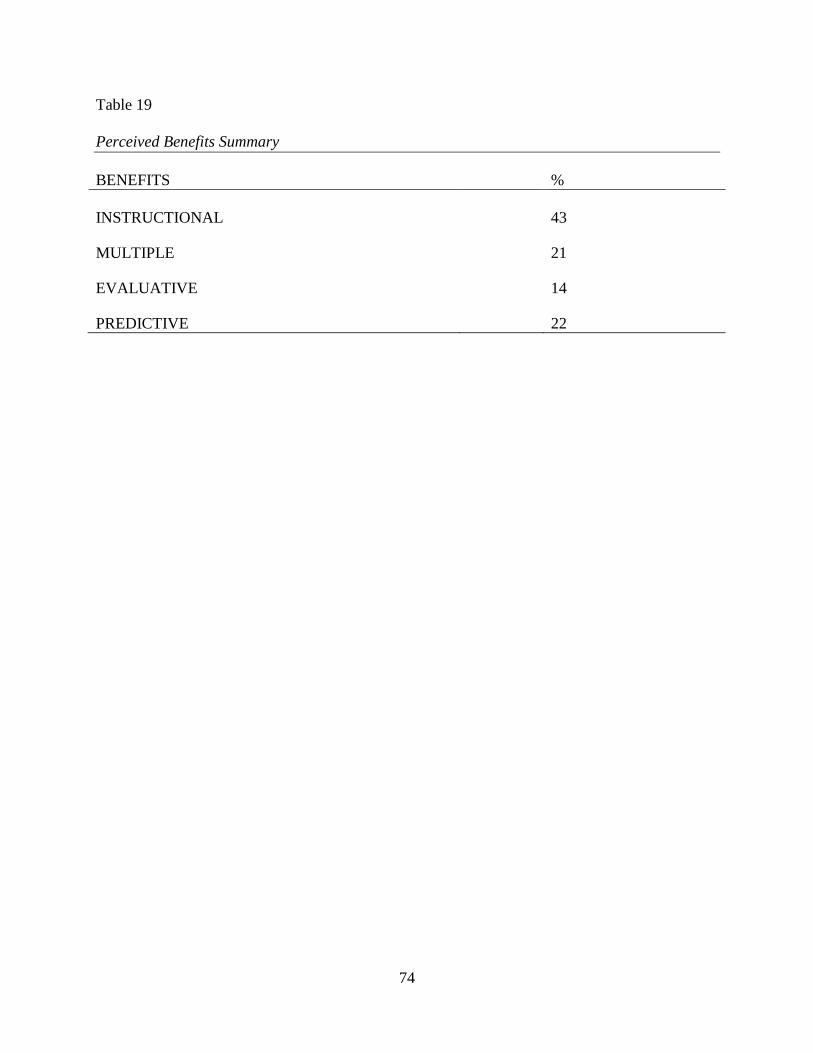
74
Table 19
Perceived Benefits Summary
BENEFITS %
INSTRUCTIONAL
43
MULTIPLE
21
EVALUATIVE
14
PREDICTIVE
22
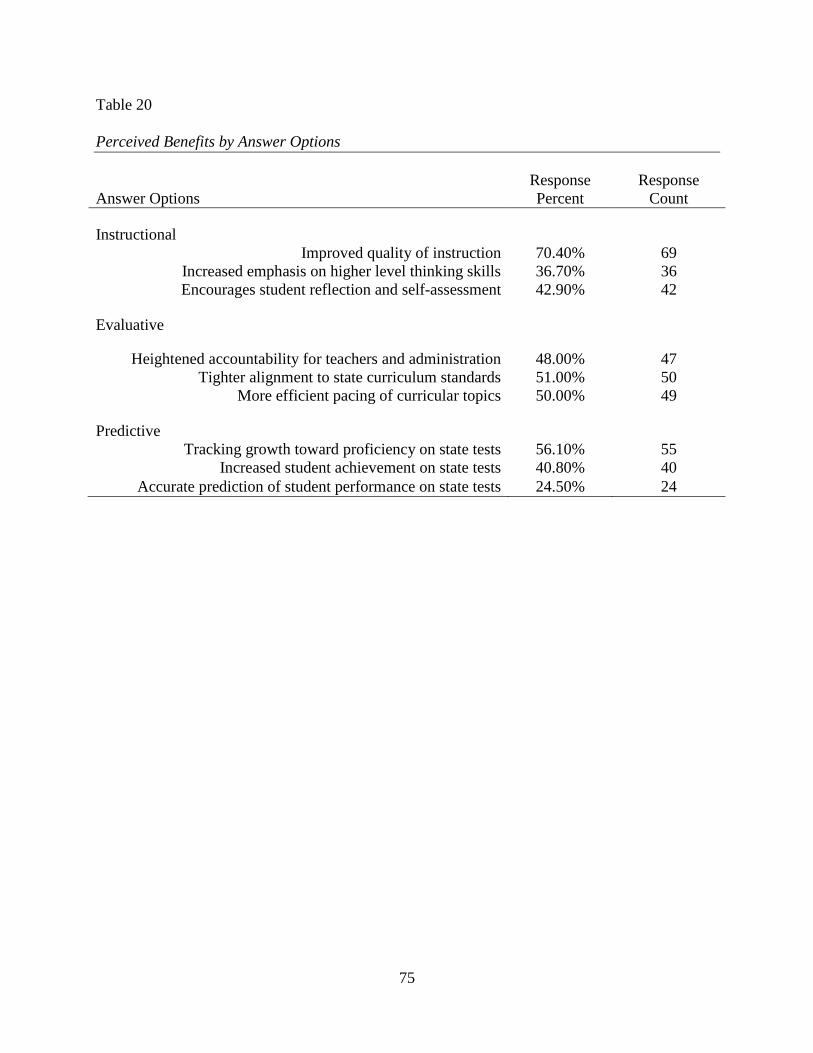
75
Table 20
Perceived Benefits by Answer Options
Answer Options
Response
Percent
Response
Count
Instructional
Improved quality of instruction 70.40% 69
Increased emphasis on higher level thinking skills 36.70% 36
Encourages student reflection and self-assessment 42.90% 42
Evaluative
Heightened accountability for teachers and administration 48.00% 47
Tighter alignment to state curriculum standards 51.00% 50
More efficient pacing of curricular topics 50.00% 49
Predictive
Tracking growth toward proficiency on state tests 56.10% 55
Increased student achievement on state tests 40.80% 40
Accurate prediction of student performance on state tests 24.50% 24
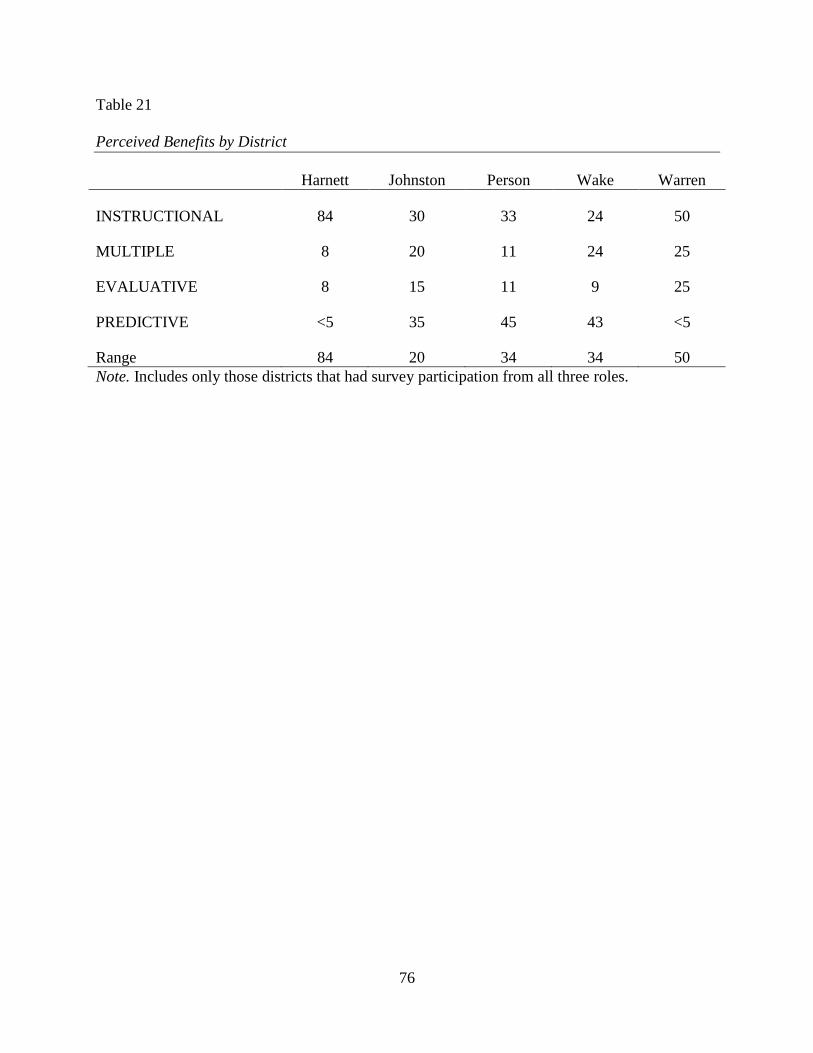
76
Table 21
Perceived Benefits by District
Harnett Johnston Person Wake Warren
INSTRUCTIONAL 84 30 33 24 50
MULTIPLE 8 20 11 24 25
EVALUATIVE 8 15 11 9 25
PREDICTIVE <5 35 45 43 <5
Range 84 20 34 34 50
Note. Includes only those districts that had survey participation from all three roles.
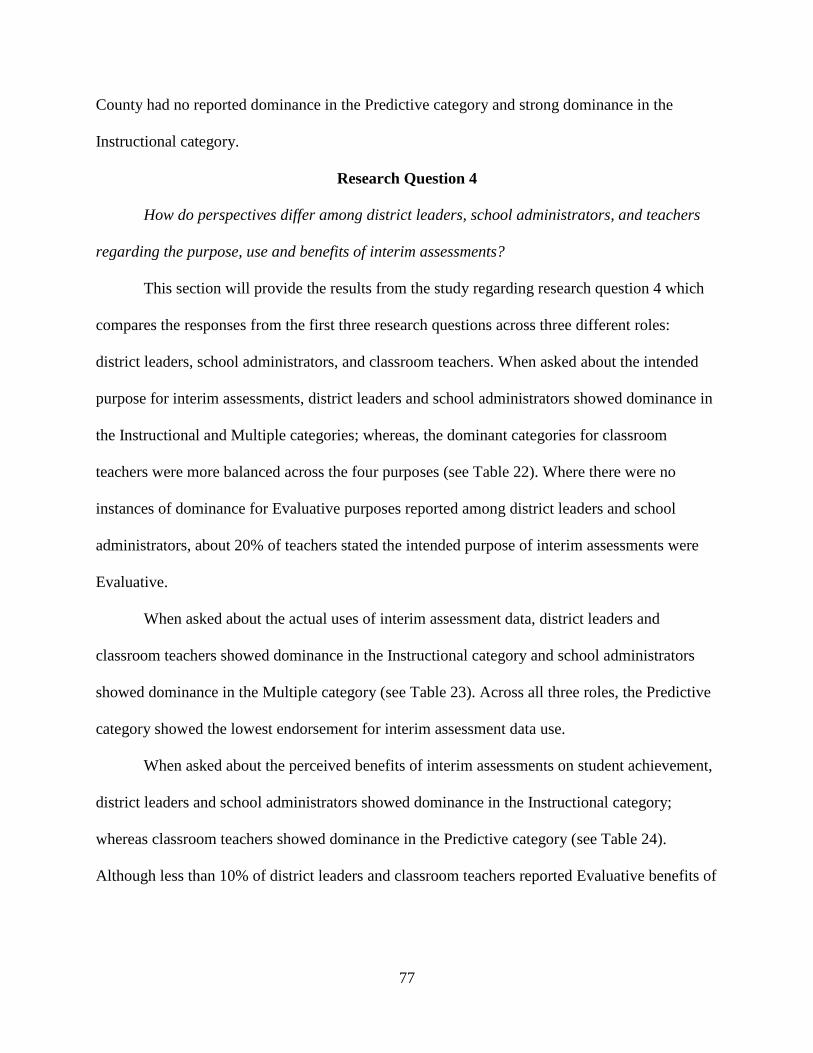
77
County had no reported dominance in the Predictive category and strong dominance in the
Instructional category.
Research Question 4
How do perspectives differ among district leaders, school administrators, and teachers
regarding the purpose, use and benefits of interim assessments?
This section will provide the results from the study regarding research question 4 which
compares the responses from the first three research questions across three different roles:
district leaders, school administrators, and classroom teachers. When asked about the intended
purpose for interim assessments, district leaders and school administrators showed dominance in
the Instructional and Multiple categories; whereas, the dominant categories for classroom
teachers were more balanced across the four purposes (see Table 22). Where there were no
instances of dominance for Evaluative purposes reported among district leaders and school
administrators, about 20% of teachers stated the intended purpose of interim assessments were
Evaluative.
When asked about the actual uses of interim assessment data, district leaders and
classroom teachers showed dominance in the Instructional category and school administrators
showed dominance in the Multiple category (see Table 23). Across all three roles, the Predictive
category showed the lowest endorsement for interim assessment data use.
When asked about the perceived benefits of interim assessments on student achievement,
district leaders and school administrators showed dominance in the Instructional category;
whereas classroom teachers showed dominance in the Predictive category (see Table 24).
Although less than 10% of district leaders and classroom teachers reported Evaluative benefits of
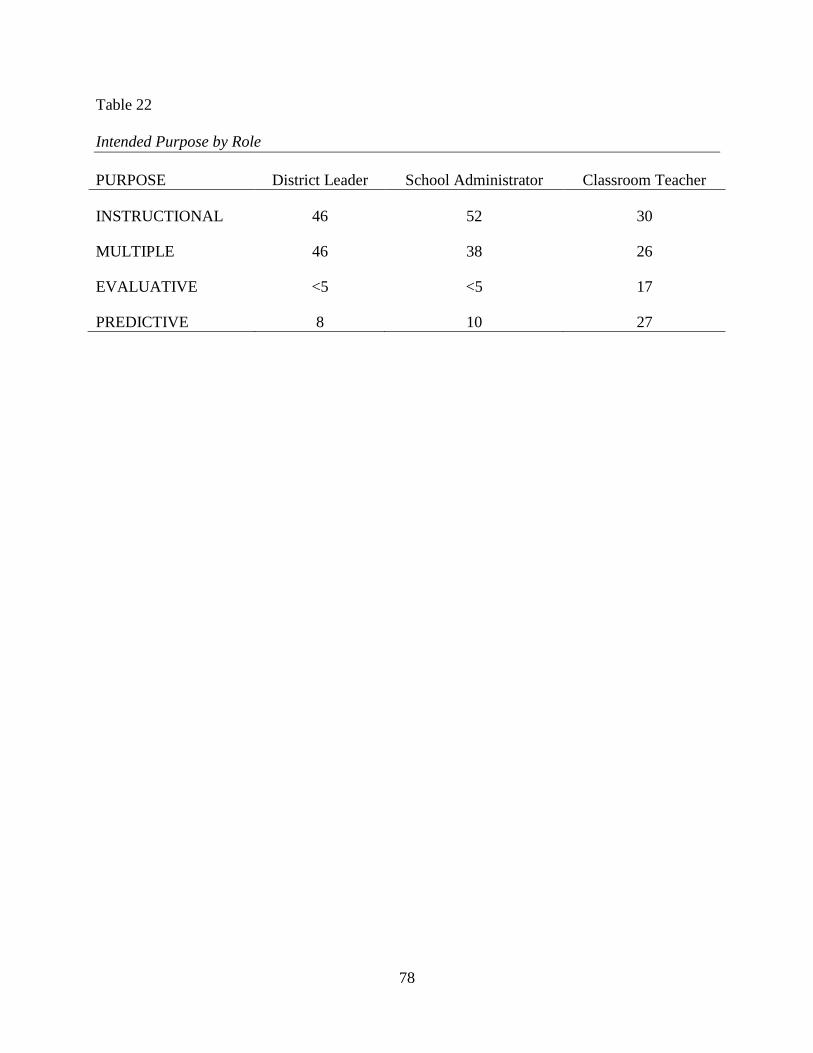
78
Table 22
Intended Purpose by Role
PURPOSE District Leader School Administrator Classroom Teacher
INSTRUCTIONAL 46 52 30
MULTIPLE 46 38 26
EVALUATIVE <5 <5 17
PREDICTIVE 8 10 27
79
Table 23
Actual Use by Role
USE District Leader School Administrator
Classroom
Teacher
INSTRUCTIONAL 42 33 43
MULTIPLE 25 43 17
EVALUATIVE 25 17 33
PREDICTIVE 8 7 7
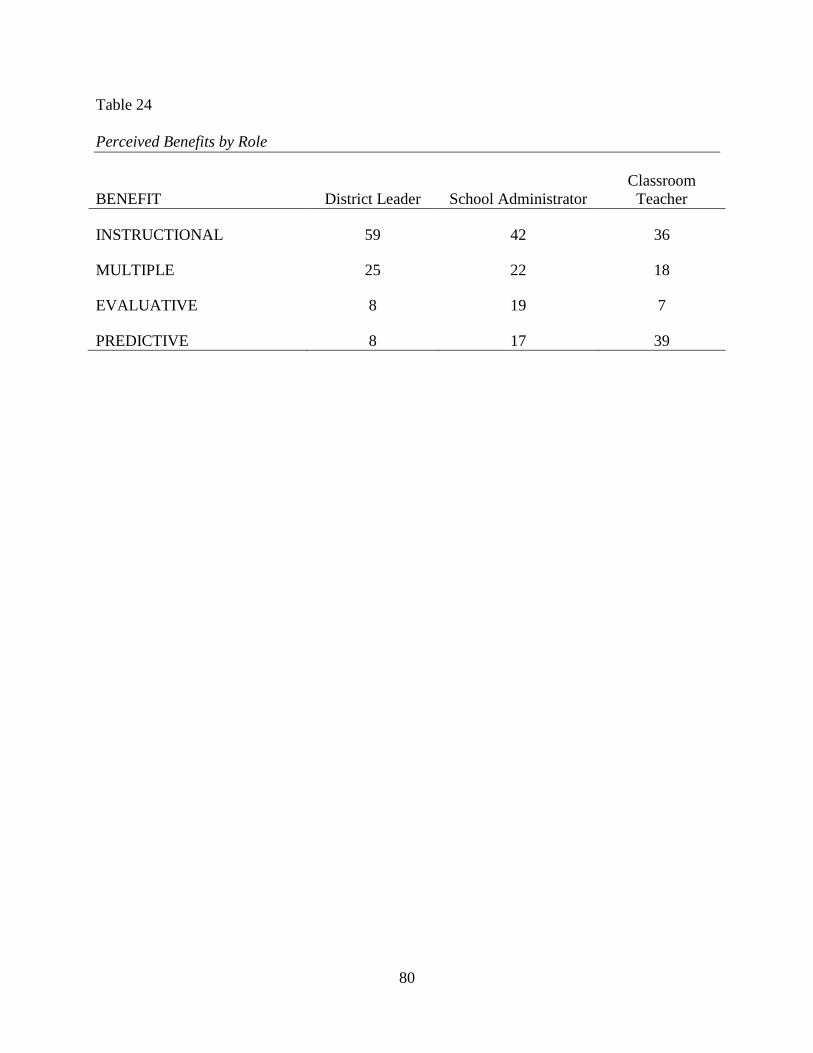
80
Table 24
Perceived Benefits by Role
BENEFIT District Leader School Administrator
Classroom
Teacher
INSTRUCTIONAL 59 42 36
MULTIPLE 25 22 18
EVALUATIVE 8 19 7
PREDICTIVE 8 17 39
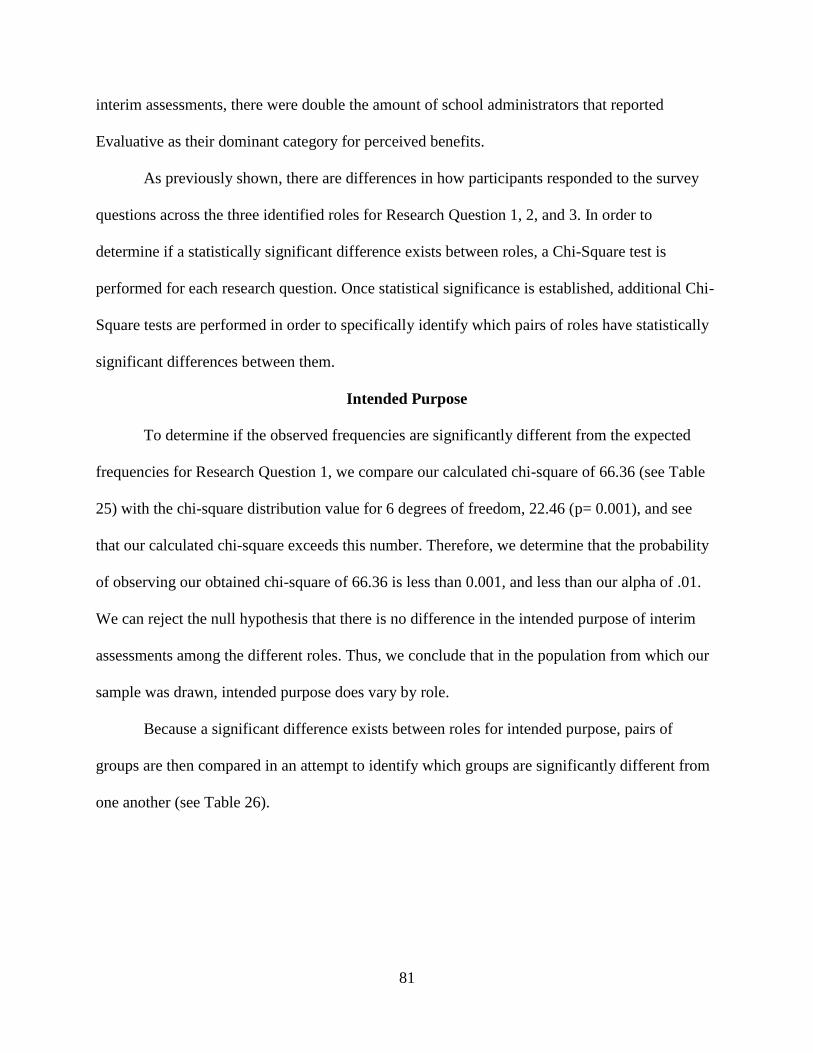
81
interim assessments, there were double the amount of school administrators that reported
Evaluative as their dominant category for perceived benefits.
As previously shown, there are differences in how participants responded to the survey
questions across the three identified roles for Research Question 1, 2, and 3. In order to
determine if a statistically significant difference exists between roles, a Chi-Square test is
performed for each research question. Once statistical significance is established, additional Chi-
Square tests are performed in order to specifically identify which pairs of roles have statistically
significant differences between them.
Intended Purpose
To determine if the observed frequencies are significantly different from the expected
frequencies for Research Question 1, we compare our calculated chi-square of 66.36 (see Table
25) with the chi-square distribution value for 6 degrees of freedom, 22.46 (p= 0.001), and see
that our calculated chi-square exceeds this number. Therefore, we determine that the probability
of observing our obtained chi-square of 66.36 is less than 0.001, and less than our alpha of .01.
We can reject the null hypothesis that there is no difference in the intended purpose of interim
assessments among the different roles. Thus, we conclude that in the population from which our
sample was drawn, intended purpose does vary by role.
Because a significant difference exists between roles for intended purpose, pairs of
groups are then compared in an attempt to identify which groups are significantly different from
one another (see Table 26).
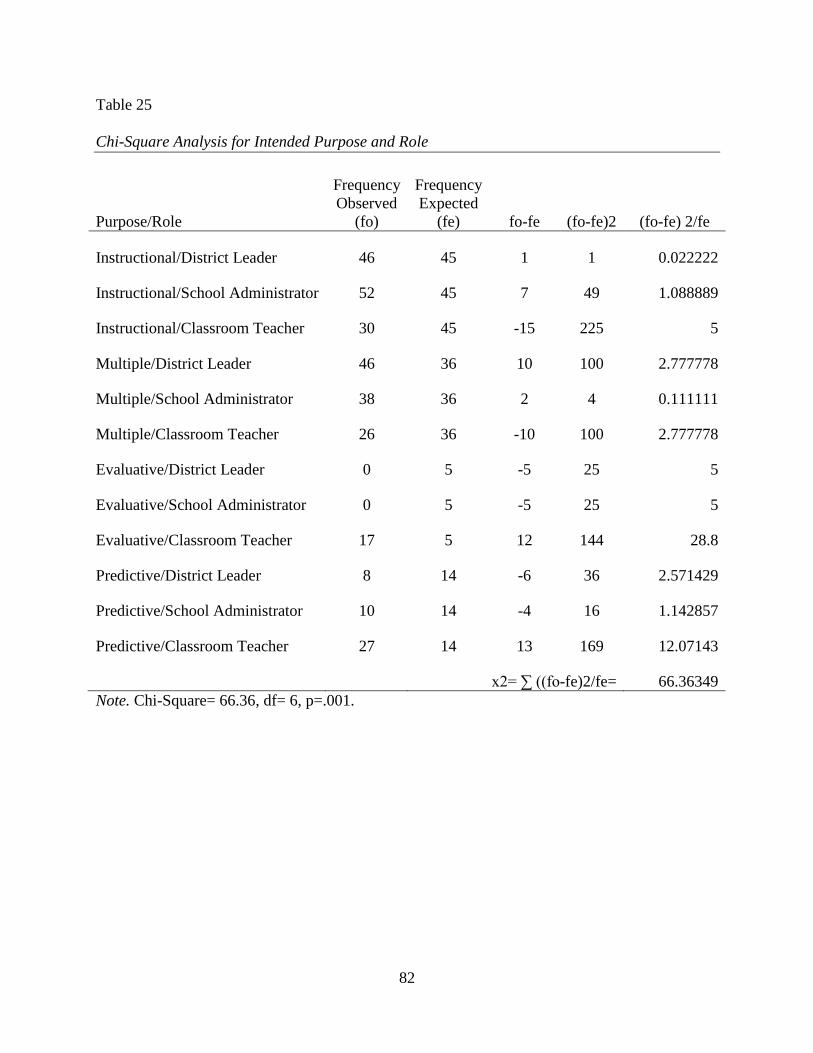
82
Table 25
Chi-Square Analysis for Intended Purpose and Role
Purpose/Role
Frequency
Observed
(fo)
Frequency
Expected
(fe) fo-fe (fo-fe)2 (fo-fe) 2/fe
Instructional/District Leader 46 45 1 1 0.022222
Instructional/School Administrator 52 45 7 49 1.088889
Instructional/Classroom Teacher 30 45 -15 225 5
Multiple/District Leader 46 36 10 100 2.777778
Multiple/School Administrator 38 36 2 4 0.111111
Multiple/Classroom Teacher 26 36 -10 100 2.777778
Evaluative/District Leader 0 5 -5 25 5
Evaluative/School Administrator 0 5 -5 25 5
Evaluative/Classroom Teacher 17 5 12 144 28.8
Predictive/District Leader 8 14 -6 36 2.571429
Predictive/School Administrator 10 14 -4 16 1.142857
Predictive/Classroom Teacher 27 14 13 169 12.07143
x2= ∑ ((fo-fe)2/fe= 66.36349
Note. Chi-Square= 66.36, df= 6, p=.001.
83
Table 26
Additional Chi-Square Analysis for Intended Purpose between Three Roles
Research Question Role Chi-Square df p-value
Research Question
1: Intended Purpose
District Leader and School Administrator 17.71429 3 0.001
District Leader and Classroom Teacher 59.02063 3 0.001
School Administrator and Classroom Teacher 55.99206 3 0.001
Note. The False Discovery Rate adjustment was applied. All p-values were significant even with
the more stringent criteria.
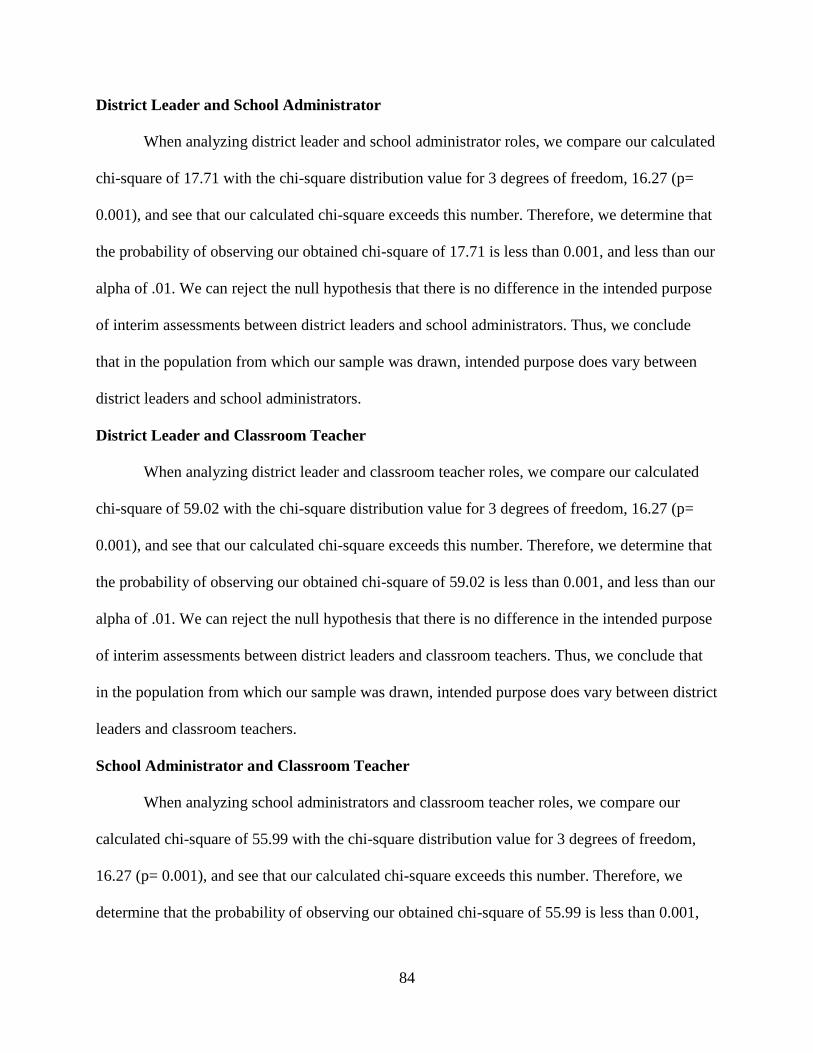
84
District Leader and School Administrator
When analyzing district leader and school administrator roles, we compare our calculated
chi-square of 17.71 with the chi-square distribution value for 3 degrees of freedom, 16.27 (p=
0.001), and see that our calculated chi-square exceeds this number. Therefore, we determine that
the probability of observing our obtained chi-square of 17.71 is less than 0.001, and less than our
alpha of .01. We can reject the null hypothesis that there is no difference in the intended purpose
of interim assessments between district leaders and school administrators. Thus, we conclude
that in the population from which our sample was drawn, intended purpose does vary between
district leaders and school administrators.
District Leader and Classroom Teacher
When analyzing district leader and classroom teacher roles, we compare our calculated
chi-square of 59.02 with the chi-square distribution value for 3 degrees of freedom, 16.27 (p=
0.001), and see that our calculated chi-square exceeds this number. Therefore, we determine that
the probability of observing our obtained chi-square of 59.02 is less than 0.001, and less than our
alpha of .01. We can reject the null hypothesis that there is no difference in the intended purpose
of interim assessments between district leaders and classroom teachers. Thus, we conclude that
in the population from which our sample was drawn, intended purpose does vary between district
leaders and classroom teachers.
School Administrator and Classroom Teacher
When analyzing school administrators and classroom teacher roles, we compare our
calculated chi-square of 55.99 with the chi-square distribution value for 3 degrees of freedom,
16.27 (p= 0.001), and see that our calculated chi-square exceeds this number. Therefore, we
determine that the probability of observing our obtained chi-square of 55.99 is less than 0.001,
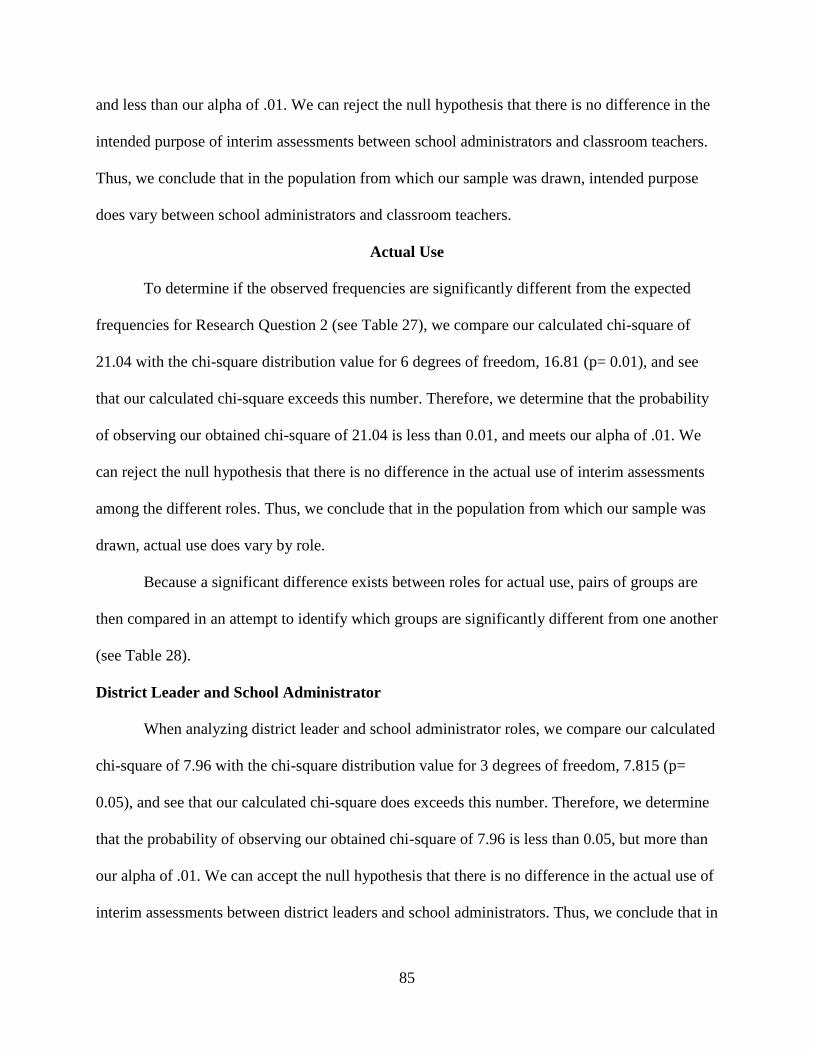
85
and less than our alpha of .01. We can reject the null hypothesis that there is no difference in the
intended purpose of interim assessments between school administrators and classroom teachers.
Thus, we conclude that in the population from which our sample was drawn, intended purpose
does vary between school administrators and classroom teachers.
Actual Use
To determine if the observed frequencies are significantly different from the expected
frequencies for Research Question 2 (see Table 27), we compare our calculated chi-square of
21.04 with the chi-square distribution value for 6 degrees of freedom, 16.81 (p= 0.01), and see
that our calculated chi-square exceeds this number. Therefore, we determine that the probability
of observing our obtained chi-square of 21.04 is less than 0.01, and meets our alpha of .01. We
can reject the null hypothesis that there is no difference in the actual use of interim assessments
among the different roles. Thus, we conclude that in the population from which our sample was
drawn, actual use does vary by role.
Because a significant difference exists between roles for actual use, pairs of groups are
then compared in an attempt to identify which groups are significantly different from one another
(see Table 28).
District Leader and School Administrator
When analyzing district leader and school administrator roles, we compare our calculated
chi-square of 7.96 with the chi-square distribution value for 3 degrees of freedom, 7.815 (p=
0.05), and see that our calculated chi-square does exceeds this number. Therefore, we determine
that the probability of observing our obtained chi-square of 7.96 is less than 0.05, but more than
our alpha of .01. We can accept the null hypothesis that there is no difference in the actual use of
interim assessments between district leaders and school administrators. Thus, we conclude that in
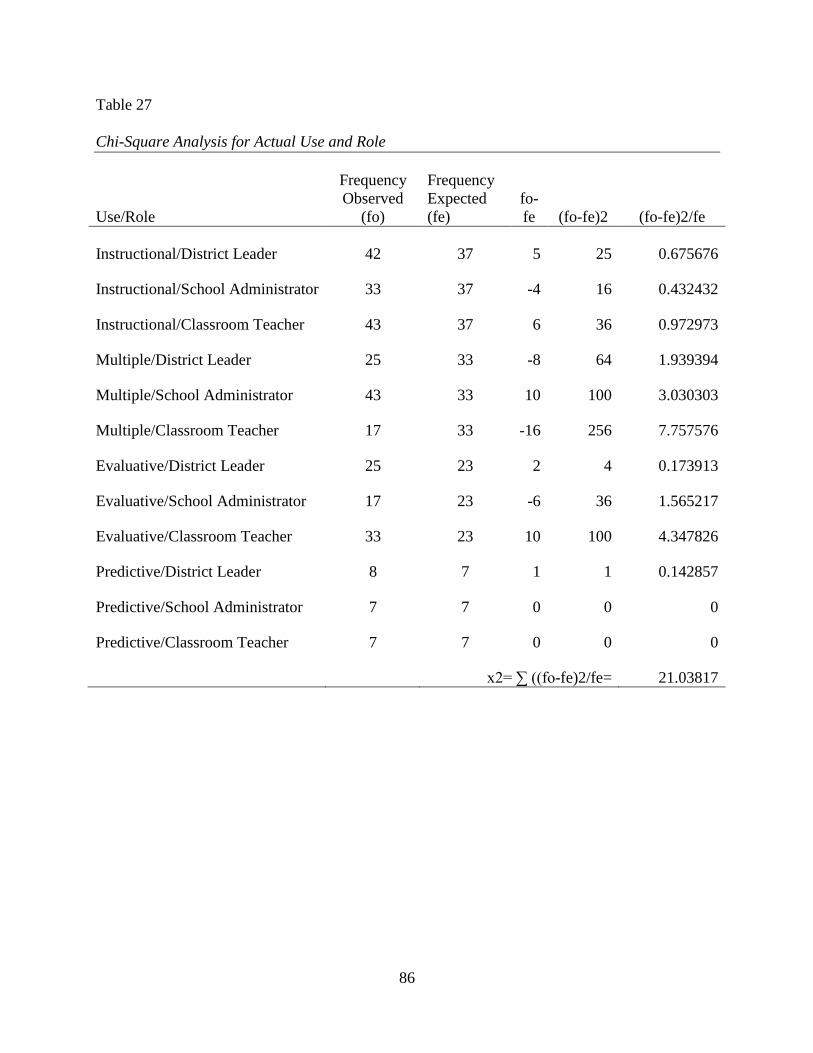
86
Table 27
Chi-Square Analysis for Actual Use and Role
Use/Role
Frequency
Observed
(fo)
Frequency
Expected
(fe)
fo-
fe (fo-fe)2 (fo-fe)2/fe
Instructional/District Leader 42 37 5 25 0.675676
Instructional/School Administrator 33 37 -4 16 0.432432
Instructional/Classroom Teacher 43 37 6 36 0.972973
Multiple/District Leader 25 33 -8 64 1.939394
Multiple/School Administrator 43 33 10 100 3.030303
Multiple/Classroom Teacher 17 33 -16 256 7.757576
Evaluative/District Leader 25 23 2 4 0.173913
Evaluative/School Administrator 17 23 -6 36 1.565217
Evaluative/Classroom Teacher 33 23 10 100 4.347826
Predictive/District Leader 8 7 1 1 0.142857
Predictive/School Administrator 7 7 0 0 0
Predictive/Classroom Teacher 7 7 0 0 0
x2= ∑ ((fo-fe)2/fe= 21.03817
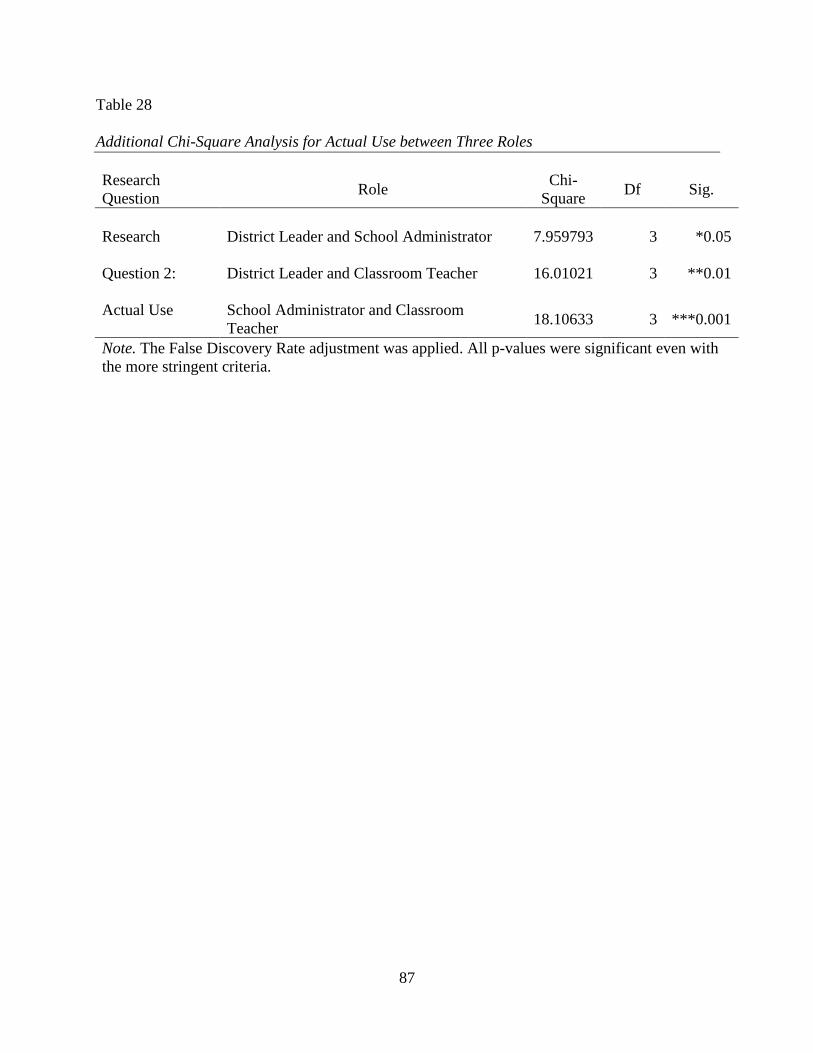
87
Table 28
Additional Chi-Square Analysis for Actual Use between Three Roles
Research
Question Role
Chi-
Square Df Sig.
Research
Question 2:
Actual Use
District Leader and School Administrator 7.959793 3 *0.05
District Leader and Classroom Teacher 16.01021 3 **0.01
School Administrator and Classroom
Teacher 18.10633 3 ***0.001
Note. The False Discovery Rate adjustment was applied. All p-values were significant even with
the more stringent criteria.
88
the population from which our sample was drawn, actual use does not vary between district
leaders and school administrators.
District Leader and Classroom Teacher
When analyzing district leader and classroom teacher roles, we compare our calculated
chi-square of 16.01 with the chi-square distribution value for 3 degrees of freedom, 11.34 (p =
0.01), and see that our calculated chi-square exceeds this number. Therefore, we determine that
the probability of observing our obtained chi-square of 16.01 is less than 0.01, and equal to our
alpha of .01. We can reject the null hypothesis that there is no difference in the actual use of
interim assessments between district leaders and classroom teachers. Thus, we conclude that in
the population from which our sample was drawn, actual use does vary between district leaders
and classroom teachers.
School Administrator and Classroom Teacher
When analyzing school administrators and classroom teacher roles, we compare our
calculated chi-square of 18.11 with the chi-square distribution value for 3 degrees of freedom,
16.27 (p= 0.001), and see that our calculated chi-square exceeds this number. Therefore, we
determine that the probability of observing our obtained chi-square of 18.11 is less than 0.001,
and less than our alpha of .01. We can reject the null hypothesis that there is no difference in the
actual use of interim assessments between school administrators and classroom teachers. Thus,
we conclude that in the population from which our sample was drawn, actual use does vary
between school administrators and classroom teachers.
Perceived Benefit
To determine if the observed frequencies are significantly different from the expected
frequencies for Research Question 3 (see Table 29), we compare our calculated chi-square of
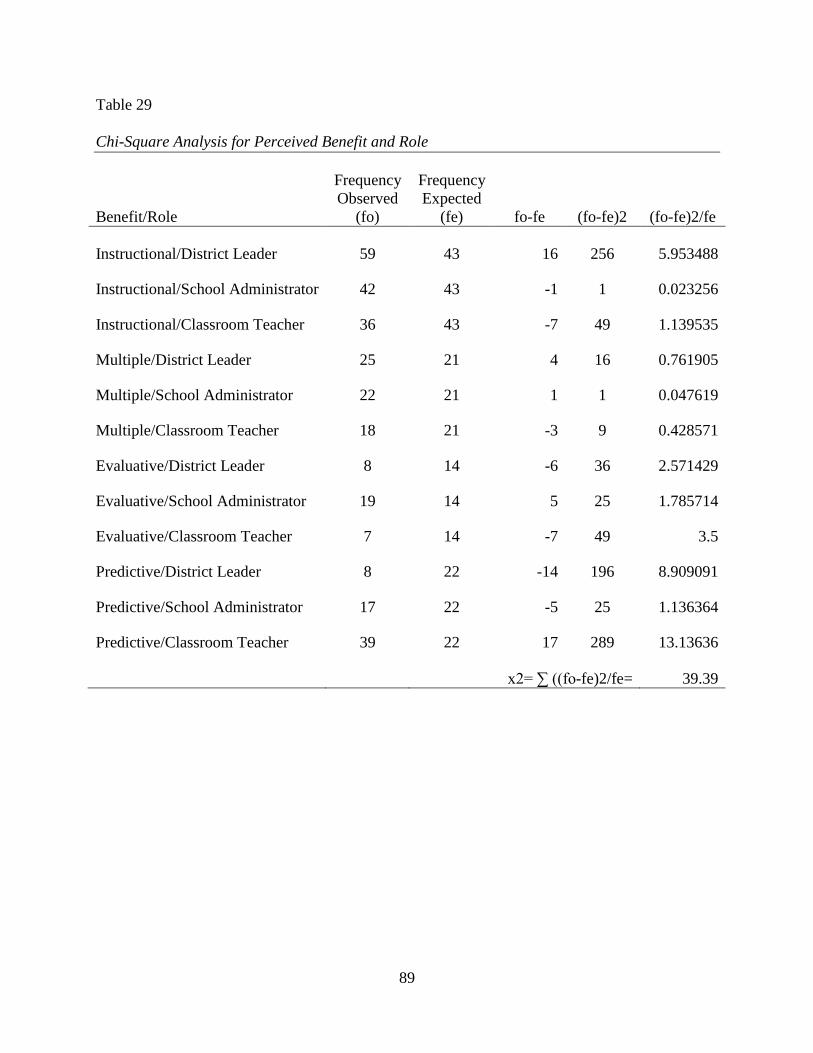
89
Table 29
Chi-Square Analysis for Perceived Benefit and Role
Benefit/Role
Frequency
Observed
(fo)
Frequency
Expected
(fe) fo-fe (fo-fe)2 (fo-fe)2/fe
Instructional/District Leader 59 43 16 256 5.953488
Instructional/School Administrator 42 43 -1 1 0.023256
Instructional/Classroom Teacher 36 43 -7 49 1.139535
Multiple/District Leader 25 21 4 16 0.761905
Multiple/School Administrator 22 21 1 1 0.047619
Multiple/Classroom Teacher 18 21 -3 9 0.428571
Evaluative/District Leader 8 14 -6 36 2.571429
Evaluative/School Administrator 19 14 5 25 1.785714
Evaluative/Classroom Teacher 7 14 -7 49 3.5
Predictive/District Leader 8 22 -14 196 8.909091
Predictive/School Administrator 17 22 -5 25 1.136364
Predictive/Classroom Teacher 39 22 17 289 13.13636
x2= ∑ ((fo-fe)2/fe= 39.39
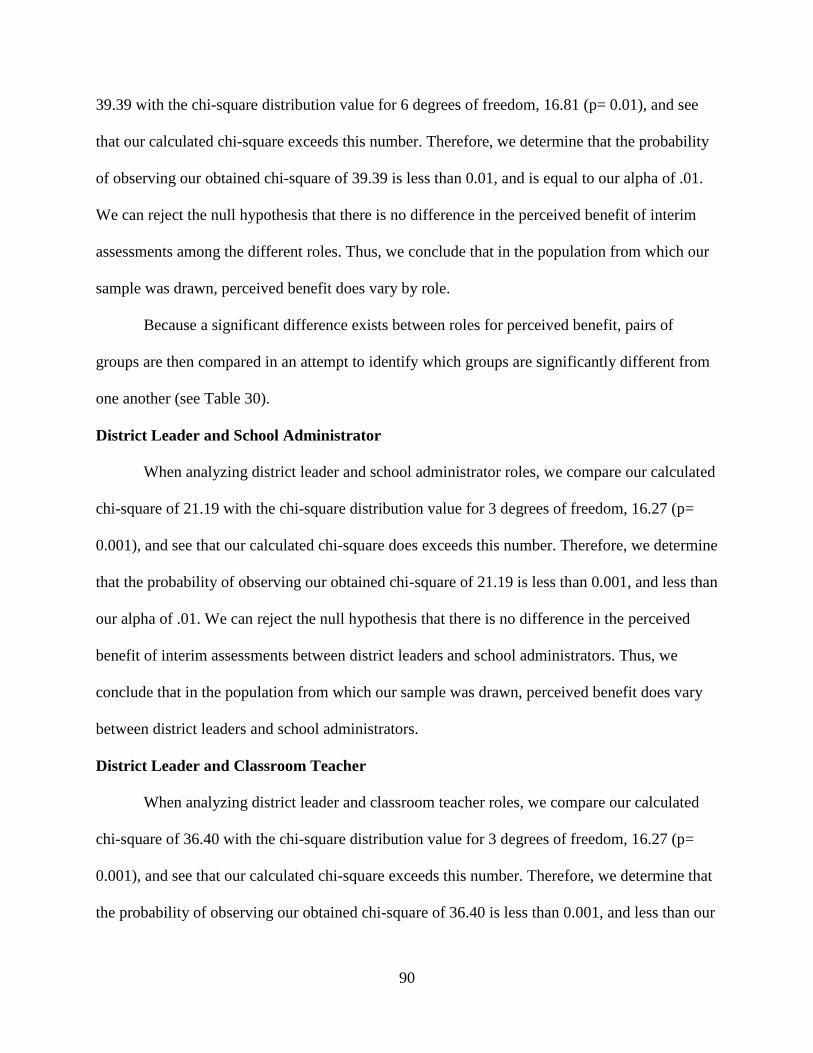
90
39.39 with the chi-square distribution value for 6 degrees of freedom, 16.81 (p= 0.01), and see
that our calculated chi-square exceeds this number. Therefore, we determine that the probability
of observing our obtained chi-square of 39.39 is less than 0.01, and is equal to our alpha of .01.
We can reject the null hypothesis that there is no difference in the perceived benefit of interim
assessments among the different roles. Thus, we conclude that in the population from which our
sample was drawn, perceived benefit does vary by role.
Because a significant difference exists between roles for perceived benefit, pairs of
groups are then compared in an attempt to identify which groups are significantly different from
one another (see Table 30).
District Leader and School Administrator
When analyzing district leader and school administrator roles, we compare our calculated
chi-square of 21.19 with the chi-square distribution value for 3 degrees of freedom, 16.27 (p=
0.001), and see that our calculated chi-square does exceeds this number. Therefore, we determine
that the probability of observing our obtained chi-square of 21.19 is less than 0.001, and less than
our alpha of .01. We can reject the null hypothesis that there is no difference in the perceived
benefit of interim assessments between district leaders and school administrators. Thus, we
conclude that in the population from which our sample was drawn, perceived benefit does vary
between district leaders and school administrators.
District Leader and Classroom Teacher
When analyzing district leader and classroom teacher roles, we compare our calculated
chi-square of 36.40 with the chi-square distribution value for 3 degrees of freedom, 16.27 (p=
0.001), and see that our calculated chi-square exceeds this number. Therefore, we determine that
the probability of observing our obtained chi-square of 36.40 is less than 0.001, and less than our
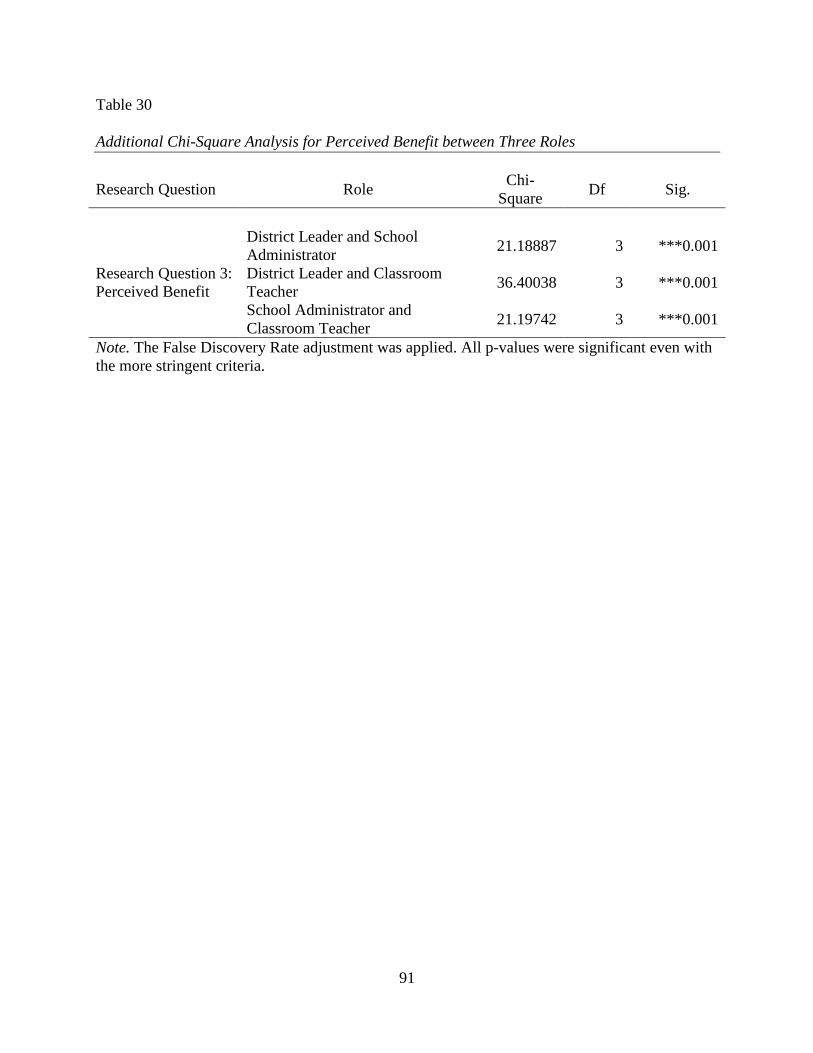
91
Table 30
Additional Chi-Square Analysis for Perceived Benefit between Three Roles
Research Question Role Chi-
Square Df Sig.
Research Question 3:
Perceived Benefit
District Leader and School
Administrator 21.18887 3 ***0.001
District Leader and Classroom
Teacher 36.40038 3 ***0.001
School Administrator and
Classroom Teacher 21.19742 3 ***0.001
Note. The False Discovery Rate adjustment was applied. All p-values were significant even with
the more stringent criteria.
92
alpha of .01. We can reject the null hypothesis that there is no difference in the perceived benefit
of interim assessments between district leaders and classroom teachers. Thus, we conclude that
in the population from which our sample was drawn, perceived benefit does vary between
district leaders and classroom teachers.
School Administrator and Classroom Teacher
When analyzing school administrators and classroom teacher roles, we compare our
calculated chi-square of 21.20 with the chi-square distribution value for 3 degrees of freedom,
16.27 (p= 0.001), and see that our calculated chi-square exceeds this number. Therefore, we
determine that the probability of observing our obtained chi-square of 21.20 is less than 0.001,
and less than our alpha of .01. We can reject the null hypothesis that there is no difference in the
actual use of interim assessments between school administrators and classroom teachers. Thus,
we conclude that in the population from which our sample was drawn, actual use does vary
between school administrators and classroom teachers.
Summary of Findings
As a collective group, survey respondents showed dominance in the Instructional
category for intended purpose, actual use, and perceived benefit of interim assessments on
student achievement. However, when results were parsed by district, additional dominant
categories emerged. For example, though most districts showed dominance in one category,
specifically Instructional, respondents in Wake and Person County showed dominance across all
four categories for intended purposes for using interim assessments. While most districts showed
dominance for Instructional use of interim assessment data, respondents in Person and Warren
showed strong dominance for Evaluative uses of data including the evaluation of teacher quality.
Between 50 and 80% of Harnett and Warren County respondents showed strong dominance for

93
Instructional benefits for using interim assessments, whereas several other districts felt that
interim assessments offered more Predictive and Evaluative benefits to their schools.
When results were compared across roles, a statistically significant difference was found
between the responses of district leaders, school administrators and classroom teachers. The
results clearly indicate that within the sample population surveyed, a person’s response to
questions regarding the intended purpose, actual use, and perceived benefit of interim assessment
is related to their role within the district or school. The next chapter will include an interpretation
of the findings and the conclusions and implications of those findings.
CHAPTER FIVE: SUMMARY AND DISCUSSION
The purpose of this study was to examine how district-led interim assessments are
currently being used in several North Carolina school districts. Specifically, the study explored
the intended purpose, actual use, and perceived benefit of interim assessments on student
achievement. In addition, this study looked at how people serving in specific roles within a
district differed in their views of interim assessment purposes, use, and benefits. The previous
chapter presented the results of the statistical analysis of data collected via an online survey of
103 respondents from 8 districts in North Carolina. This chapter summarizes the findings of the
study and the meaning of the results for each research question and then discusses their
implications for state educational policymakers and school district leadership. This chapter
concludes with suggestions for future research.
Research Question 1
What are the intended purposes for implementing district-led interim assessments:
evaluative, predictive, instructional, multiple purposes, or other?
Based on the study results, the majority of North Carolina school districts in the study are
using interim assessments for instructional purposes with an expectation of using the test results
to inform teaching and learning by identifying student and classroom strengths and weaknesses
toward curricular objectives, and to determine the effectiveness of classroom teaching practices
and strategies (CCSSO, 2008). The findings from this study were consistent with previous
research studies cited in Chapter 2 wherein interim assessments used for instructional purposes
should provide results that are aligned to content standards and instructional units and refer to
specific instructional improvements. As one classroom teacher responded in the survey,
95
“We use interim assessments in order to assess what skills are mastered, and what
students need remediation. It is also used by our grade level to discern what teachers are
using methods that are more effective. These teachers often lead remediation planning
and share their lesson ideas and strategies. It allows us to pinpoint our student strengths
and weaknesses in a format similar to end of the year assessments, and provide additional
interventions.” (CT 80)
Although reported less often than other subscale measures within the Instructional
category, the study found that districts also expect interim assessments to offer insights into the
conceptual understandings of the students. This supports best practices for instructional use of
interim assessments as Goertz et al. (2009) found that “teachers who assessed for conceptual
understanding were more likely to use instructional change strategies than those who did not
(Goertz et al., 2009).” As reflected by a classroom teacher in the survey,
“If students perform well then you know what is being taught is also being learned. If
assessments do not reflect that students have mastered the content then it allows for
teachers to evaluate what was taught and why students may not have gotten it.” (CT 75)
The study revealed that interim assessments were often given for two or more purposes
simultaneously. Particularly common was the use of interim assessments for both Instructional
and Predictive reasons. For example, several respondents in the study stated that they implement
interim assessments to predict performance on the End-of-Grade summative state tests and to
give teachers data to help modify instructional strategies and interventions. As one school
administrator stated,
“Interim assessments are designed to give teachers, the school, and the school system
information about students' academic progress and if they are "on track" in being
96
prepared for summative testing. This information may be used by the teachers to inform
their instruction, although it is not actually designed for that purpose.” (SA 18)
As stated by a district leader,
“Teachers can then use the results to adjust their instruction and pacing. Teachers can
also compare their students' performance with that of other teachers' students and have
conversations about teaching methods that are more or less effective for students. Of
course, we also use this information to know whether or not students are on track toward
success with state end-of-grade or end-of-course tests.” (DL 46)
The survey results revealed some instances where districts were using interim assessments for
three or more purposes. For example, one classroom teacher stated,
“Interim assessments (benchmarks) are used in our county for various reasons. Reasons
include: assess student mastery, ensuring pacing is right, practice for standardized state
testing, and ranking purposes in terms of how well over all each school performed
compared to others within the district and the district as a whole. In some instances,
interim assessments are also used to evaluate teacher performances depending on
administrative roles and who has fullfilled those roles.” (CT 91)
Experts agree that the trend for utilizing one assessment for multiple purposes is on the
rise due to budget and time constraints within the school year (Burch, 2010). However, experts
also warn that “the assessment may only fulfill secondary purposes if certain factors associated
with a primary purpose do not constrain other uses (Perie et al., 2009).” This may impact the
predictive validity of the interim assessment instrument if the test is not designed intentionally
for a particular purpose. An important additional step, as recommended by Perie et al., is “to
97
check not only whether the assessment is being used for its intended purposes, but to check the
quality with which it meets those purposes.”
Research Question 2
What are the actual uses of district-led interim assessments within the district including
testing instruments, data analysis, and professional development?
Based on the results of the study, most districts report Instructional or a combination of
Instructional and Predictive uses of interim assessment data. As reported by one classroom
teacher,
“Data from interim assessments is used to track student progress on specific objectives, to
form Team Time groups to provide extension and re-teaching of a skill, as well as to
predict a student's performance on the End of Grade test.” (CT 88)
The testing instruments utilized by the study districts appear to support the use of interim
assessment data in Instructional and Predictive ways. Test results are received quickly (within a
week or sooner) and scores are reported at the appropriate level for use by classroom teachers to
modify instruction (student, class, and grade level scores). However, interim assessments among
the study districts are given almost exclusively as quarterly benchmarks, with administration
only 3 to 4 times per school year. This low frequency of administration can lessen the impact of
“cycles of instructional inquiry” due to the large duration of time between the delivery of
instruction and that of the assessment (Hamilton, Halverson, Jackson, Mandinach, Supovitz, &
Wayman, 2009).
Several study districts reported the Instructional use of data through collaborative work
sessions in Professional Learning Communities (PLC) where teachers and school administrators
meet to analyze interim assessment results, identify academic areas of concern, and plan
98
interventions at the school, grade, class, and student levels. As one school administrator stated,
“We are able to target specific interventions based on the data and re-group when necessary to
improve student outcomes.” (SA 74) As one district leader quoted, “Teachers and administrators
are able to track student progress and determine the effectiveness of daily instruction.” (DL 12)
In addition to Instructional use, over half of all respondents stated that they use interim
assessment data for Predictive purposes to “determine readiness for state-wide testing.”
Consistent with the findings for Research Question 1, districts are expecting one set of interim
assessment results to serve multiple uses. When this expectation exists, there is a more likely
chance that an assessment will be used for something other than what it was built to do. For
example, an assessment built for predictive purposes must go through strict statistical analyses to
ensure a high rate of predictive validity. According to a 2010 technical study on interim
assessments, Li et al stated,
“Correlations between interim assessment scores and statewide assessment scores should
be relatively high; and the scores report should focus on predicted proficiency levels on
statewide assessments (Li et al., 2010).”
If an assessment meets the needed predictive criteria, it will most likely fall short in providing
teachers with in-depth information regarding performance on specific curricular objectives; a key
component to addressing the learning needs of struggling students. The study results support this
notion as less than half of all study districts provide classroom teachers with score reports
“labeled with the corresponding curricular objectives/standards” or the “question characteristics
such as difficulty level, thinking skill, and key.”
Results of the study show that the professional development opportunities provided to
classroom teachers in relation to interim assessments are consistent with Instructional uses. The
99
majority of respondents received training on how to analyze data to identify learning gaps. These
findings are supported by the recommendations cited in Chapter 2 regarding the importance of
providing professional development for teachers on how to analyze data to improve student
learning. Young and Kim (2010) found that in order to effectively analyze the plethora of data
available from interim assessments, teachers need professional development in which they learn
strategies for how to approach the various types of reports, graphs, charts and tables in which the
results are graphically displayed. Without this training, teachers may be unable to access the
information necessary to clearly see the connection between the data and how it can impact their
daily classroom practices. As stated by one teacher in the study,
“Last year, no one really used the assessment data. The administration talked about it in a
brief Leadership Team meeting, but nothing further was done. Though we are told to use
it, teachers receive no training on how to use that data to inform classroom instruction.”
(CT 85)
To make this feedback useful, teachers need to know how it relates back to their
instruction, student learning progressions, and the specific content being measured (Goertz et al.,
2009; Heritage, 2007). One district leader in the study provided this example of connecting data
directly to instruction:
“We at the district level review the interim assessment results more globally to consider
which specific goals are weakest for considerations about professional development. For
example, we noticed that district-wide, students were struggling with number sense in
math and with inferencing in reading. In response, we've brought that trend to teachers'
attentions and provided them with instructional resources such as sample video lessons
that get at these skills.” (DL 46)
100
Research Question 3
What are the perceived benefits of district-led interim assessments on student
achievement?
The districts who participated in the study are seeing a variety of benefits from interim
assessments on student achievement. The majority of these benefits are Instructional, with
respondents claiming that interim assessments are helping to improve the quality of instruction.
Several districts credit interim assessments with creating large student achievement gains as
measured on state summative tests. One district leader said,
“The primary benefits are improved instruction and greater student achievement. In
schools that have fully embraced using data in professional learning communities, we
have seen amazing growth in student achievement.” (DL 46)
Other interim assessment benefits reported in the study fell into the Multiple category,
with a blend of Instructional and Predictive benefits as well as Instructional and Evaluative
benefits. These findings suggest that districts are seeing side effects of interim assessments that
were not intended as the primary purpose. For example, those districts reporting a combination
of Instructional and Predictive benefits typically used the interim assessments to monitor
progress and predict student performance on End-of-Grade tests but then took advantage of
access to the data to help struggling students in areas of need. As one school administrator
quoted,
“Since teachers and administrators have had indicators that give us an accurate reflection
of how our students are performing and how they may perform on the state tests, we have
been able to use such assessments to follow-up on student needs throughout the year.”
(SA 39)
101
As stated previously, it is challenging for districts to create a test that can be beneficial
for informing instruction as well as providing an accurate prediction of summative testing
performance. Often, one purpose for building an assessment interferes with the ability for an
assessment to perform effectively for a secondary purpose and side effects will surface when
assessments are utilized beyond their intended purpose. When an assessment system “purports to
fulfill too many purposes—especially disparate purposes—it rarely fulfills any purpose well
(Perie et al., 2009).” This dilemma was evident in one school administrator’s comments:
“It can give an accurate prediction of how a student will perform on the EOG. However, I
don't think some teachers use the time to analyze the data in a way that can benefit the
students. Results aren't immediate, and it takes a great deal of time. When assessments
are shorter and given more frequently, results can be more meaningful.” (SA 30)
Along with the Instructional benefits previously mentioned, evaluative benefits were also
reported in the study by almost half of the respondents. Specifically, districts found that
heightened accountability for teachers and administrators, tightened alignment to state curricular
standards, and more efficient pacing of curricular topics were beneficial Evaluative outcomes of
interim assessments. As reported by one district leader,
“Interim assessments contribute to the effective use of district pacing guides, help district
and school administrators support the needs of individual schools/teachers, inform
parents of student progress, and improve the overall teaching and learning process.” (DL,
22)
102
Research Question 4
How do perspectives differ among district leaders, school administrators, and teachers
regarding the purpose, use and benefits of interim assessments?
Perhaps the most dramatic findings from this study surfaced when participant responses
were compared based on their roles within the district. When results were analyzed across roles,
a statistically significant difference was found between the responses of district leaders, school
administrators and classroom teachers. The results clearly indicate that within the sample
population surveyed, a person’s response to questions regarding the intended purpose, actual use,
and perceived benefit of interim assessment is related to their role within the district or school.
Intended Purpose: District Leaders vs. Classroom Teachers
When asked about their intended purpose for implementing interim assessments, the
largest difference was seen between district leaders and classroom teachers. The results showed
that while district leaders clearly intended for interim assessments to be utilized for Instructional
purposes, results were spread across all four categories for purpose among classroom teachers.
The findings suggest that while district leaders are definitive in their intentions for interim
assessments to inform and improve instruction, classroom teachers are less confident in their
understanding of the reasons why interim assessments are mandated in their districts. As one
district leader stated,
“Interim assessments are used in our county as formative assessments to measure student
progress on curriculum objectives. The data provided from these assessments allow
teachers to assess their instructional success and to develop remediation plans for
students who are not at mastery level on identified objectives.” (DL 21)
As stated here in one teacher’s comments:
103
“Interim assessments (benchmarks) are used within our district for various reasons.
Reasons include: assess student mastery, ensuring pacing is right, practice for
standardized state testing, and ranking purposes in terms of how well over all each school
performed compared to others within the district and the district as a whole. In some
instances, interim assessments are also used to evaluate teacher performances depending
on administrative roles and who has fulfilled those roles.” (CT 91)
This shows a lack of coherence among the various stakeholders involved in the
successful implementation of a district initiative such as interim assessment administration.
Having a strong theory of action that includes a coherent plan for implementation will ensure
that the structures and systems that determine how things get done across the district are in place
and the norms, values, and attitudes that drive behavior across the district are fully recognized
(PELP, 2006).
Actual Use: School Administrators vs. Classroom Teachers
When questioned about how they use interim assessment data, the most significant
difference was found between school administrators and classroom teachers. Classroom teachers
utilize interim assessment results to inform their instruction and provide targeted interventions.
For example, one teacher said, “I use benchmark data to set goals, allow for differentiation, and
to group students for guided reading or math groups.” (CT 75)
In contrast, school administrators as well as district leaders reported using interim
assessment data for Instructional, Predictive, and Evaluative purposes. A school administrator
stated that interim assessment data is often analyzed in order to “track students' progress, to
determine next steps, and to predict/establish trajectories.” (SA 18) As stated by a district leader,
“Sometimes it's a "wake up call" for teachers on their effectiveness in the classroom.” (DL 27)
104
Teacher comments collected during the study revealed their perceptions on how school
administrators use interim assessment data. From the viewpoint of one classroom teacher,
“The school I currently am teaching at has had benchmarks the last 3 years of my
employment, and I have seen two different administrative viewpoints as to how they are
used in terms of teacher effectiveness. One administrator felt your classroom data
represented YOU as a teacher and how effective or ineffective you are. My current
administrator holds a different view in that your data is to be used to help improve areas
students need work in, but does not necessarily mean you are an ineffective teacher if it is
lower than expected (thank goodness)!” (CT 91)
In response to the same question, a different teacher stated,
“We as teachers are now being held accountable for our interim assessments, which I
believe to be interesting since it is supposed to help and guide instruction within the
classroom. It used to be used only to see where your students needed extra help, but has
now turned into a resource for evaluating teachers.” (CT 96)
Perceived Benefit: District Leaders vs. Classroom Teachers
When asked to identify the benefits of interim assessments on student achievement, the
greatest difference was discovered between district leaders and classroom teachers. The majority
of district leaders endorsed Instructional and Multiple benefits of interim assessments; with a
combination of Instructional and Evaluative benefits making up the Multiple category. As one
district leader mentioned,
“For the last five years we have seen a steady increase in proficiency across our district.
Administrators are making more decisions based on our results from district and state
assessments when it comes to teacher placement and retention.”(DL 26)
105
Another district leader quoted,
“The interim assessments have a standards-based approach which allows teachers,
students, schools, and districts, to identify gaps in curriculum and instruction. Targeted
corrective instruction can be provided to students with gaps in learning.” (DL 16)
In contrast, classroom teachers touted the Predictive benefits of interim assessments.
Specifically, teachers felt that interim assessments helped the students to prepare for the End-of-
Grade tests given at the state level for summative, high-stakes purposes. One teacher stated,
“Interim assessments give them a "preview" as to how the EOG will be (especially
important for upcoming 3rd graders who will take it for the first time). The data is
beneficial in tracking and monitoring student progress so that teachers, students,
administrators, and parents are aware of their academic ability and what specific areas
students show strengths and weaknesses in.” (CT 91)
A different classroom teacher endorsed interim assessments because “students are able to see the
type of questions and the format of the state tests so they are more comfortable with testing. (CT
76)” Another teacher quoted, “It helps student to practice the stamina component of the test
taking process. (CT 89)”
In summary, the findings strongly suggest a lack of coherence across the different roles
regarding the purpose, use, and benefit of interim assessments on student achievement. Also, the
results show that interim assessments are expected to fulfill multiple purposes, the data is being
used in a variety of ways, and the perceptions of how they benefit students vary greatly within
and across the various districts in North Carolina. The next section of this chapter provides a
discussion of the implications of these findings.
106
Implications
The findings from this study have two major implications relevant to district leaders and
state educational policymakers: the importance of making careful decisions about the purpose
and use of interim assessments and the need for communicating a clear, coherent implementation
plan consistent with the purpose.
The Mixed-Up Chameleon Effect
Eric Carle wrote a children’s book called “The Mixed-Up Chameleon” (Carle, 1984). In
this book, the chameleon wants to be just like his animal friends like the elephant, flamingo, and
giraffe instead of just a green chameleon. His wish comes true and he becomes all of these
animals, rolled into one strange beast. Unfortunately, because he is trying to be all of these things
all at the same time, he cannot do what he was intended to do, which is simply to be green and
eat flies. From this study, the findings reveal that interim assessments are much like the mixed-
up chameleon. By trying to be all types of assessments (formative, interim, summative), for all
types of purposes (instructional, evaluative, predictive), it cannot do what it was intended to do
with much success (improve student achievement). Unfortunately, the misuse of interim
assessments is a reality in many districts in North Carolina, as evidenced by the results of this
study. For example, within one North Carolina district, the interim assessment was given for the
purpose of informing instruction, but the data was used to evaluate the pacing guides, and the
benefits were viewed as optimal for preparing students for the EOG. This is a clear example of
why it is necessary for districts to develop a clear theory of action for the use of interim
assessments.
107
Making Careful Decisions about the Purpose for Interim Assessments
The Interim Assessment Validity Framework created by Perie, Marion, and Gong (2010)
offers a conceptual theory of action related to the use of interim assessment for improved student
achievement. The framework suggests that it is essential to first identify the intended purpose of
interim assessment use and then to implement specific instruments, processes and professional
development explicitly aligned to this purpose. The testing instrument must be built with a
purpose in mind in order to have construct validity. In other words, does it appropriately measure
the desired content, knowledge, or skill set? Without a clear understanding of what needs to be
measured in a testing instrument, it is impossible to create a valid test. Having a clear purpose
will also ensure that the data is utilized in such a way that the results can be accessed and
understood by the audience for which it was intended.
If it is to be used by teachers to inform classroom instruction, then the purpose of the
assessment needs to be considered during the test creation to ensure that the test items measure
content that has already been taught. The test results should then communicate performance on
these content standards in such a way that the teacher can connect the data back to specific
conceptual understandings and modify instruction accordingly. If it is to be used by school
administrators to evaluate teacher effectiveness, then a growth model will need to be developed
along with a set of summative interim assessments to determine the extent of student progress
while under the instruction of a particular classroom teacher. If various roles in the district wish
for an assessment that can predict student performance on the end-of-year state summative tests,
then the interim assessments must be constructed with a high level of predictive validity and
showing a strong correlation between the interim assessment test forms and the summative
instrument. However, the trade-off for having an interim assessment with high predictive validity
108
is that data will be displayed in broad, global terms rather than in a specific, instructionally-
sensitive manner desired by those with instructional intentions. Therefore, it is recommended
that district leaders and state educational policymakers spend adequate time and resources
discussing the reasons for interim assessment implementation. If the reasons fall beyond what an
interim assessment can do with great success, then an alternate strategy might be more
appropriate.
If the reason for implementation can be realistically accomplished through interim
assessment administration, then the next step would be to determine the process for data analysis,
including the audience, time allotted, analysis methods, and the necessary professional
development. In addition, it is essential for district leaders and state educational policymakers to
include an evaluation tool within the implementation process in order to determine if the
instrument and program elements performed as expected. An effective evaluation in the current
state of interim assessment usage would be difficult because the testing instruments are not used
as they were intended. Therefore, it is critical to determine the sole purpose for interim
assessment use and then actively encourage the appropriate use of the instrument and resulting
data through strong communication and aligned professional development opportunities. Only
then can the interim assessment be evaluated as effective or not in improving student
achievement.
Lost in Translation
A popular children’s game, “Telephone,” is played to show how one message can change
as it is being passed from one person to another. With each person, the message gets increasingly
modified until the last person reports a message that is completely different from the original.
This game illustrates how messages can be “lost in translation.” The incidence of translation loss
109
is increased by the number of people involved and the varying ability for those involved to
understand and interpret what they are hearing. The “telephone” phenomenon exists in the world
of education each day as new initiatives are created at the state level, mandated at the district
level, enforced at the school level, and implemented at the classroom level. Along the way, many
of the ideas and theories of improvement are “lost in translation” from one role to another. The
implementation of interim assessments is a good example of an initiative spawned by the State
Board of Education, mandated at the district level, and then expected to be fully realized at the
school and classroom level. As clearly indicated in findings for Research Question 4 of this
study, the message was significantly changed along the way. There are two culprits for this
changed message and they are similar to the “telephone” game. First, as more people are added
to the line of communication, the message becomes more vulnerable to misinterpretation.
Second, those involved have varying abilities and experiences that can impact understanding and
interpretation of the message. This research study revealed a break down in the correct
interpretation of the mandate to include interim (benchmark) assessments as one of several
district initiatives to improve student achievement. The problem was not in the concept of
interim assessment but rather in the loose interpretation of what an interim assessment should do,
how it can be done, and what to expect when it is done. With no solid definition for interim
assessments, a wide-open policy for adopting several different types of assessment instruments, a
plethora of data streams coming into the schools, and a vague understanding of how to use the
data, schools were left to their own interpretation of what the mandate would look like in their
own buildings. Therefore, each school used the interim assessment results in different ways, both
across the various districts and within their own districts and schools. In order to salvage the idea
of interim assessments as a method for improving student achievement in North Carolina
110
schools, it is apparent that state educational policymakers and district leaders need to come
together to create a plan for how to implement them in a more coherent manner. This plan needs
to be a high-priority item because in 2014-15, all 115 school districts in North Carolina will be
administering online district-wide interim assessments (NCDPI, 2011a). With 1.4 million
students, 95,000 teachers, 2,500 principals, and 1,000 district leaders, the NC DPI has a long line
of people to help carry the correct message.
Communicating a Clear, Coherent Implementation Plan
Adapted from Tushman and O’Reilly’s Congruence Model (2002), the PELP Coherence
Framework helps leaders to identify the key elements that support a district-wide improvement
strategy and to bring these elements into a coherent and integrated relationship. District leaders
can utilize this framework to create strategies that support improving student performance across
the entire district (PELP, 2006). Viewing interim assessment use through the PELP lens can
provide a common language with which to discuss key elements that are present or missing from
the strategy implementation across the district. Three important elements should be thoroughly
discussed when developing a strategy for implementing interim assessments: the alignment
between the use of interim assessment and the instructional core containing teacher’s knowledge,
students’ engagement, and content, the belief in the theory of change that will occur when
implementing interim assessments in the district, and the coherence within and across the actions
taken to implement interim assessment.
State and district leaders should connect the use of interim assessment with the
instructional core which includes teacher’s knowledge, students’ engagement, and content. A
theory of action should be created and shared so that stakeholders know the causal relationship
between the actions and the desired outcomes. In this case, districts should develop a theory of
111
action showing clear alignment between strategy and outcome. By connecting to the instructional
core, everyone is on the same page because the goal of all educational stakeholders should center
on strong instruction, high levels of learning, and rigorous curriculum.
By developing a theory of action (sometimes called a theory of change) and sharing it
with all stakeholders, belief in the strategy is strengthened because those involved can clearly see
the connection. Once a strategy is developed, then the activities and programs used to implement
the strategy must also be in alignment. In the case of interim assessments, districts should work
with stakeholders to decide which testing instrument, data analysis methods, and evaluation tools
should be adopted. Each stakeholder also needs to know their role throughout the
implementation process. Districts need to select effective communication methods that will
ensure that principals and teachers from every school understand and embrace the plan for
interim assessment implementation. Also, district should consider the norms, values, and
attitudes that drive behavior across the district, the structures and system in place that determine
how things get done across the district, the available resources necessary to implement interim
assessments, and external factors that may impact the performance of the interim assessments.
In summary, the implications of this study for state educational policymakers and district
leadership highlight the importance of carefully selecting one purpose, developing activities and
programs that support this purpose, and communicating with stakeholders in a coherent manner
throughout the implementation process. By following these recommendations, interim
assessments may prove to be a powerful strategy for increasing student achievement. At
minimum, it will allow for a fair evaluation of interim assessments as a viable tool for school
improvement.
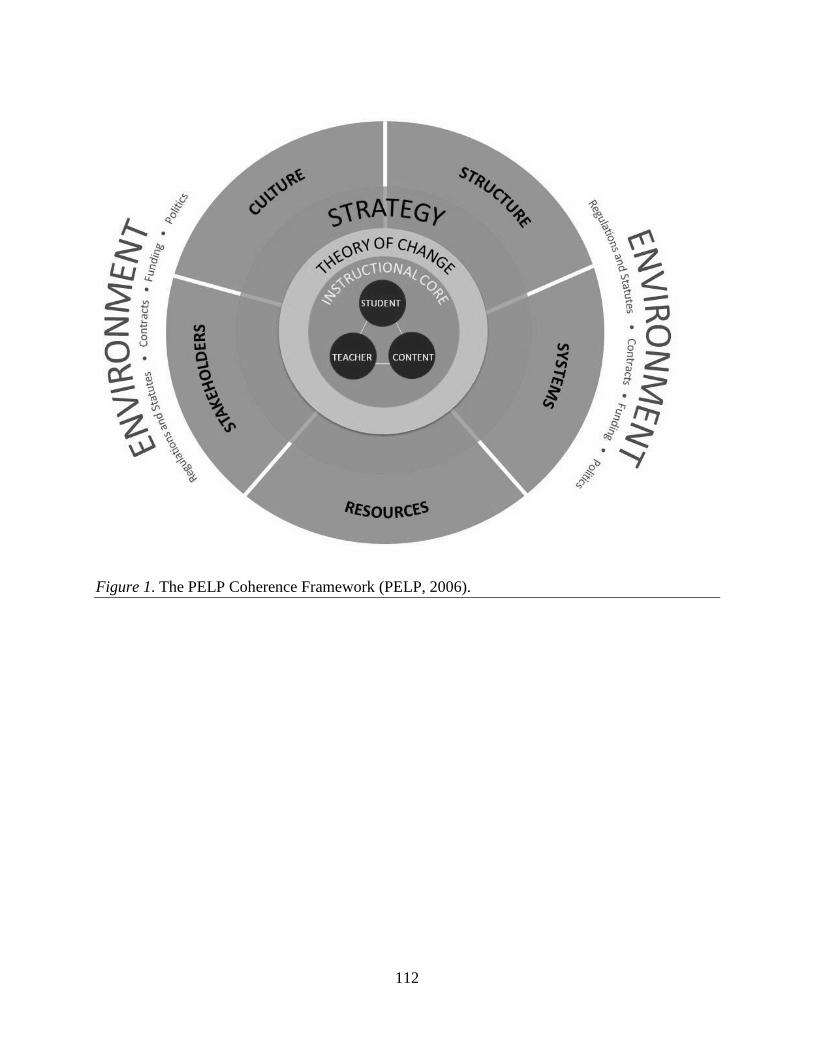
112
Figure 1. The PELP Coherence Framework (PELP, 2006).
113
Limitations of the Research Study
This study provided preliminary data on the use of interim assessments in North Carolina
schools. From this study, we can conclude that the majority of districts in North Carolina are
using interim assessments for Instructional purposes, implementing interim assessment
instruments that support Instructional uses, and seeing Instructional benefits from the
implementation of interim assessments. Because this study only surveyed 8 of the 115 school
districts in North Carolina, the findings cannot be generalized to the greater population of
districts in the state. Of the eight districts that participated in the study, only five districts had
representation from all three roles. Therefore, a full comparison of all districts was not possible.
An additional limitation of the research study is the low response rate to the online survey
utilized for data collection. Out of 350, only 103 respondents, or 29% of the recruited sample,
submitted a completed survey. Although the respondents represented the majority of the districts
recruited, the actual sample and the intended sample differed in the proportion of respondents by
role. The intended sample included 3 district leaders, 6 school administrators, and 18 classroom
teachers per district. When adjusted to reflect the actual number of districts participating, the
intended sample should have included 216 respondents, with 24 districts leaders (11%), 48
school administrators (22%), and 144 classroom teachers (67%). The actual numbers were much
lower, with only 13 district leaders (13%) and 30 classroom teachers (29%) responding. The
number of school administrators who completed the survey was higher than intended, with 60
respondents (58%) completing the survey.
Recommendations for Further Research
Additional research studies are needed in order to address other pertinent elements of
interim assessment use. In addition to finding the differences across three roles in a district, it
114
would be helpful to compare the responses from one individual regarding their intended purpose,
actual use, and perceived benefits using similar statistical tests such as Chi-Square. This
information would validate findings from this study regarding the lack of coherence during
implementation of interim assessments.
Qualitative research to delve deeper into teachers’ data analysis practices using interim
assessment data from a variety of purposes would be an important addition to the research base
as it would show how different purposes for interim assessments require different types of data
analysis. Teacher interviews, observations of data team meetings, and artifacts of data analysis
methods would give a clear picture of these practices which could be replicated by other districts
using interim assessments for similar purposes.
Case study research to highlight interim assessment practices in one or two North
Carolina schools would allow for a more thorough and connected view of interim assessment use
in action. This type of evidence may be useful if a district is looking for ways to implement
interim assessments in their own school without having to use trial and error. Having a model to
use will increase the likelihood of replicating best practices and avoiding potential pitfalls.
There is limited empirical evidence on the impact of interim assessments on student
achievement. This type of research would help to answer the question of whether or not interim
assessments are a valid strategy for improved student achievement. However, this research
question poses several challenges including the issue of external variables interfering with
finding statistical independence or correlation. External variables include instructional
interventions, teacher effectiveness, and testing instrument variations. With exemplary research
design and control of external variables, there is sufficient evidence to suggest that this type of
115
research could be conducted in North Carolina schools due to the high usage of interim
assessments across the state.
Conclusion
This study provided preliminary data on the use of interim assessments in North Carolina
schools. Specifically, the study addressed the intended purposes, actual uses, and perceived
benefits of interim assessments on student achievement from the perspectives of district leaders,
school administrators, and classroom teachers. Quantitative research methodologies were used in
order to describe the phenomena of interim assessment use in a sample of North Carolina school
districts. An online survey was utilized to collect responses, results were analyzed through
quantitative methods, and findings were presented using descriptive statistics.
The findings revealed that interim assessments were given for Instructional purposes,
data analysis supported Instructional use, and the benefits of interim assessments were
Instructional in nature. However, when results were parsed by district, additional dominant
categories emerged. Specifically, several districts showed dominance in the Multiple category
suggesting a wide variety of purposes, uses, and benefits within the same district. When results
were compared across roles, a statistically significant difference was found between the
responses of district leaders, school administrators and classroom teachers. The results clearly
indicate that within the sample population surveyed, a person’s response to questions regarding
the intended purpose, actual use, and perceived benefit of interim assessment is related to their
role within the district or school.
The findings from this study have two major implications relevant to district leaders and
state educational policymakers: the importance of making careful decisions about the purpose
and use of interim assessments and the need for communicating a clear, coherent implementation
116
plan consistent with the purpose. Future research studies on the use of interim assessments could
include a comparison of responses from one individual regarding their intended purpose, actual
use, and perceived benefits, qualitative research on data analysis methods aligned to specific
purposes, case studies showcasing schools in North Carolina using interim assessments for a
variety of purposes, and quantitative research studies to determine whether interim assessments
can be correlated to improved student achievement.
REFERENCES
Amrein, A. L., & Berliner, D. C. (2002). High stakes testing, uncertainty, and student learning.
Education Policy Analysis Archives [Electronic version], 10(18). Retrieved from
http://epaa.asu.edu/epaa/v10n18
Archer, J. (2005). Guiding hand. Education Week, 25(3), S4-S10.
Arter, J., & Stiggins, R. (2005). Formative assessment as assessment for learning. National
Council on Measurement Education Newsletter, 13(3). Retrieved from
http://www.ncme.org/pubs/pdf/news0905.pdf
Aschbacher, P., & Alonzo, A. (2004, April). Using science notebooks to assess students'
conceptual understanding. Paper presented at the Annual Meeting of the American
Educational Research Association, San Diego, CA.
Ball, D. L., & Rowan, B. (2004). Introduction: Measuring instruction. The Elementary School
Journal, 105(1), 3-10.
Bambrick-Santoyo, P. (2008). Data in the driver's seat. Educational Leadership, 65(4), 43-46.
Barnes, C. R. (2011). "Race to the top" only benefits big government. Journal of Law &
Education, 40(2), 393-402.
Beauchamp, A. (2007). Not all benchmark assessments are created equal. The California Science
Project Connection, 8(2). Retrieved from
http://csmp.ucop.edu/downloads/csp/newsletters/newsletter11_2007.pdf
Black, P., & Wiliam, D. (1998). Inside the black box: Raising standards through classroom
assessment. Phi Delta Kappan, 80(2), 139-148
118
Black, P., & Wiliam, D. (1998). Assessment and classroom learning. Assessment in Education:
Principles, Policy & Practice, 5(1), 7-75.
Black, P., Harrison, C., Lee, C., Marshall, B., & Wiliam, D. (2004). Working inside the black
box: Assessment for learning in the classroom [Electronic Version]. Phi Delta Kappan,
86(1), 9-21.
Blackmore, C. (2005). Learning to appreciate learning systems for environmental decision
making: A 'work-in-progress' perspective [Electronic Copy]. Systems Research and
Behavioral Science, 22(4), 329-341.
Blanc, S., Christman, J., Liu, R., Mitchell, C., Travers, E., & Bulkley, K. (2010). Learning to
learn from data: Benchmarks and instructional communities. Peabody Journal of
Education (0161956X), 85(2), 205-225.
Bloom, B. (1968). Learning for mastery. Evaluation Comment, 1(2), 1-10.
Bloom, B. S., Hastings, J. T., & Madaus, G. F. (1971). Handbook on formative and summative
evaluation of student learning. New York: McGraw Hill.
Borja, R. R. (2006). District initiative. Education Week, 25(35), 24-31.
Brookhart, S. M. (1997). Effects of the classroom assessment environment on math and
science achievement. The Journal of Educational Research, 90(6), 323-330.
Brookhart, S. M. (2003). Developing measurement theory for classroom assessment
purposes and uses. Educational Measurement: Issues and Practice, 22(4), 5-12.
Brookhart, S. M. (2007). Expanding views about formative classroom assessment: A
review of the literature. In J. H. McMillan (Ed.), Formative classroom assessment:
Theory into practice (pp. 43-62). New York: Teachers College Press.
Brookhart, S. M. (2008). Feedback that fits. Educational Leadership, 65(4), 54-59.
119
Brookhart, S. M. (2010). Editorial: Special issue on the validity of formative and interim
assessment. Educational Measurement: Issues and Practice, 28(3), 1-3.
Brown, R. S., & E. Coughlin. (2007). The predictive validity of selected benchmark assessments
used in the Mid-Atlantic Region (Issues & Answers Report, REL 2007–No. 017).
Washington, DC: U.S. Department of Education, Institute of Education Sciences,
National Center for Education Evaluation and Regional Assistance, Regional Educational
Laboratory Mid Atlantic. Retrieved from http://ies.ed.gov/ncee/edlabs
Bulkley, K. E., Christman, J. B., Goertz, M. E., & Lawrence, N. R. (2010). Building with
benchmarks: The role of the district in Philadelphia’s Benchmark Assessment System.
Peabody Journal of Education, 85(2), 186-204.
Business Wire. (2003). Vantage learning delivers benchmark and ongoing assessments for the
school district of Philadelphia. Retrieved from
http://findarticles.com/p/articles/mi_m0EIN/is_2003_Dec_16/ai_111295134
Carle, E. (1984). The mixed-up chameleon. New York: Crowell.
Case21Inc. (2012). Benchmark testing. Retrieved from http://www.case21inc.com/products-and-
services/benchmark-testing
Chappuis, S., & Chappuis, J. (2007). The best value in formative assessment [Electronic
Version]. Educational Leadership, 65(4), 14-18.
Chappuis, S., Chappuis, J., & Stiggins, R. (2009). The quest for quality. Educational Leadership,
67(3), 14-19.
Christman, J., Neild, R., Bulkley, K., Blanc, S., Liu, R., Mitchell, C., & Travers, E. (2009).
Making the most of interim assessment data. Lessons from Philadelphia. Philadelphia,
PA: Research for Action.
120
Chudowsky, N., & Pellegrino, J. W. (2003). Large-scale assessments that support learning: What
will it take? [Electronic Version]. Theory into Practice, 42(1), 75-83.
Cizek, G. J. (2007). Formative classroom and large-scale assessment: Implications for
future research and development. In J. H. McMillan (Ed.), Formative classroom
assessment: Theory into practice (pp. 99-115). New York: Teachers College Press.
Cizek, G. J., Fitzgerald, S. M., & Rachor, R. A. (1996). Teachers' assessment practices:
Preparation, isolation, and the kitchen sink. Educational Assessment, 3(2), 159.
Clare, L., & Aschbacher, P. R. (2004). Exploring the technical quality of using
assignments and student work as indicators of classroom practice. Educational
Assessment, 7(1), 39-59.
ClassScape. (2012). ClassScape Assessment System. Retrieved from
http://www.classscape.org/ClassScape3/
Clune, W. H., & White, P. A. (2008). Policy effectiveness of interim assessments in Providence
Public Schools (WCER Working Paper No. 2008-10). Madison, WI: University of
Wisconsin-Madison, Wisconsin Center for Education Research.
Copland, M. (2002). Leadership of inquiry: Building and sustaining capacity for school
improvement in the Bay Area School Reform Collaborative. Stanford, CA: Center for
Research on the Context of Teaching, Stanford University.
Cowie, B., & Bell, B. (1999). A model of formative assessment in science education.
Assessment in Education: Principles, Policy & Practice, 6(1), 101.
Council of Chief State School Officers. (2008). Interim assessment practices and avenues for
state involvement. TILSA SCASS Interim Assessment Subcommittee [Electronic
Version]. Washington, DC: Council of Chief State School Officers.
121
Creswell, J. W. (2012). Educational research—Planning, conducting, and evaluating
quantitative and qualitative research (4th
ed.). New Delhi, India: PHI Learning Private
Limited.
Crooks, T. J. (1988). The impact of classroom evaluation practices on students. Review of
Educational Research, 58(4), 438-481.
Crooks, T. (2001). The validity of formative assessments. Paper presented at the British
Educational Research Association Annual Conference, University of Leeds, Leeds,
England, September 2001.
Darling-Hammond, L. (2004). From "separate but equal" to "no child left behind": The
collision of new standards and old inequalities. In D. Meier & G. Wood (Eds.), Many
children left behind: How the No Child Left Behind Act is damaging our children and our
schools (pp. 3-32). Boston: Beacon Press.
Davidson, K. L., & Frohbieter, G. (2011). District adoption and implementation of interim and
benchmark assessments. (CRESST Report 806). Los Angeles, CA: University of
California, National Center for Research on Evaluation, Standards, and Student Testing
(CRESST).
Delisio, E. (2007a). Mapping instruction with interim assessments. Education World. Retrieved
from http://www.education-world.com/a_admim/admin/admin496.shtml
Delisio, E. (2007b). More (short) tests can help learning. Education World. Retrieved from
http://www.educationworld.com/a_admin/admin/admin471.shtml
Diaz-Bilello, E. K. (2011). A validity study of interim assessments in an urban school district.
PhD dissertation, University of Colorado at Boulder, United States--Colorado. Retrieved
from Dissertations & Theses: Full Text. Publication No. 3453701.
122
DuFour, R. (2007). Common formative assessments. Retrieved from ttp://www.allthingsplc.info/
Fleming, M., & Chambers, B. (1983). Teacher-made tests: Windows to the classroom.
In W. E. Hathaway (Ed.), Testing in the schools (pp. 29-47). San Francisco,
CA: Jossey-Bass.
Fitzpatrick, J. L., Sanders, J. R., & Worthen, B. R. (2011) Program evaluation: Alternative
approaches and practical guidelines. Upper Saddles River, NJ: Pearson Education, Inc.
Floden, R. E., & Shepard, L. (2007). Formative assessment as an approach to improving
education. Retrieved from http://www.hewlett.org/NR/rdonlyres/CCC2B32A-8F4B-
464C-836CBB5E5372472A/0/FormAssessmentevaluation2007ExecSumm.htm
Frey, B. B., & Schmitt, V. L. (2007). Coming to terms with classroom assessment.
Journal of Advanced Academics, 18(3), 402-423.
Fuchs, L. S., & Fuchs, D. (1986). Effects of systematic formative evaluation: A meta-analysis.
Exceptional Children, 53(3), 199-208.
Furtak, E. M., Ruiz-Primo, M. A., Shemwell, J. T., Ayala, C. C., Brandon, P., Shavelson,
R. J., & Yin, Y. (2008). On the fidelity of implementing embedded formative
assessments and its relation to student learning. Applied Measurement in
Education, 21(4), 360-389.
Gallucci, C. (2008). District-wide instructional reform: Using socio-cultural theory to link
professional learning to organizational support [Electronic Version]. American Journal of
Education, 114(4), 541-581.
Glattorn, A. A. (1998). Writing the winning dissertation: A step-by-step guide. Thousand Oaks,
CA: Corwin Press, Inc.
123
Global Scholar. (2012). Achievement series web-based assessment. Retrieved from
http://www.globalscholar.com/Products/achievement/
Goertz, M., Oláh, L., & Riggan, M. (2009, December). Can interim assessments by used for
instructional change? CPRE Policy Briefs RB-51. Philadelphia: Consortium for Policy
Research in Education.
Green, J. (1999). Constructing the way forward for all students. Education Canada, 39(3), 8.
Guskey, T. R. (2007). Formative classroom assessment and Benjamin S. Bloom: Theory,
research and practice. In J. H. McMillan (Ed.), Formative classroom assessment:
Theory into practice (pp. 63-78). New York: Teachers College Press.
Haertel, E. H. (2009). Reflections on educational testing: Problems and opportunities. Retrieved
from http://www.opportunityequation.org/resources/commissionedpapers/haertel/
Hamilton, L., Halverson, R., Jackson, S., Mandinach, E., Supovitz, J., & Wayman, J.
(2009). Using student achievement data to support instructional decision making
(NCEE 2009-4067). Washington, DC: National Center for Education Evaluation and
Regional Assistance, Institute of Education Sciences, U.S. Department of Education.
Hamilton, L. S., McCaffrey, D. F., Stecher, B. M., Klein, S. P., Robyn, A., & Bugliari, D.
(2003). Studying large-scale reforms of instructional practice: An example from math
and science. Educational Evaluation and Policy Analysis, 25(1), 1-29.
Harlen, W., & Winter, J. (2004). The development of assessment for learning: Learning
from the case of science and mathematics. Language Testing, 21(3), 390-408.
Hattie, J., & Timperley, H. (2007). The power of feedback. Review of Educational Research,
77(1), 81-112.
124
Henderson, S., Petrosino, A., Guckenburg, S., & Hamilton, S. (2008). REL Technical Brief-a
second follow-up year for? Measuring how benchmark assessments affect student
achievement" (REL Technical Brief, REL Northeast and Islands 2007-No. 002).
Washington, DC: U.S. Department of Education, Institute of Education Sciences,
National Center for Education Evaluation and Regional Assistance, Regional Educational
Laboratory Northeast and Islands.
Heritage, M. (2007). Formative assessment: What do teachers need to know and do? Phi Delta
Kappan, 89(2), 140-145.
Heritage, M., Jinok, K., Vendlinski, T., & Herman, J. (2009). From evidence to action: A
seamless process in formative assessment? Educational Measurement: Issues and
Practice, 28(3), 24-37.
Herman, J. L., & Baker, E. L. (2005). Making benchmark testing work. Educational
Leadership, 63(3), 48-54.
Herman, J. L., Klein, D. C. D., & Abedi, J. (2000). Assessing students' opportunity to
learn: Teacher and student perspectives. Educational Measurement: Issues and
Practice, 19(4), 16-24.
Herman, J. L., Osmundson, E., Ayala, C., Schneider, S., & Timms, M. (2006). The nature and
impact of teachers' formative assessment practices. National Center for Research on
Evaluation, Standards, and Student Testing (CRESST), Center for the Study of
Evaluation Technical Report 703, University of California, Los Angeles, CA. Retrieved
from http://www.cse.ucla.edu/products/reports/R703.pdf
Herman, J. L., Osmundson, E., & Dietel, R. (2010). Benchmark assessments for improved
learning (AACC Policy Brief). Los Angeles, CA: University of California.
125
Heubert, J. P., & Hauser, R. (Eds.). (1999). High Stakes: Testing for tracking, promotion, and
graduation. Washington, DC: National Academy Press, National Research Council,
Committee on Appropriate Test Use, Commission Behavioral and Social Sciences and
Education.
Hill, H. C. (2005). Content across communities: Validating measures of elementary math
instruction. Educational Policy, 19(3), 447-475.
Hills, J. R. (1991). Apathy concerning grading and testing. Phi Delta Kappan, 72, 540-545
Hoff, D. J. (2006). Delving into data. Education Week, 25(35), 12-22.
Honawar, V. (2006). Tip of their fingers. Education Week, 25(35), 38-39.
Honig, M. (2008). District central offices as learning organizations: How socio-cultural and
organizational learning theories elaborate district central office administrators'
participation in teaching and learning improvement efforts [Electronic Version].
American Journal of Education, 114(4), 627-664.
Honig, M. I., Copland, M. A., Rainey, L., Lorton, J. A., & Newton, M. (2010, April). School
district central office transformation for teaching and learning improvement. A report to
the Wallace Foundation. Seattle, WA: The Center for the Study of Teaching and Policy.
Houghton, L. (2009). Generalization and systemic epistemology: Why should it make sense?
[Electronic Version]. Systems Research and Behavioral Science, 26(1), 99-108.
Illinois State Board of Education. (2006a). Accountability workbook. Retrieved from
http://isbe.state.il.us/nclb/pdfs/accountability_workbook10.pdf
Illinois State Board of Education. (2006b). ISAT vertical scale and cut scores. Retrieved from
http://isbe.net/assessment/pdfs/ISAT_Scale_Cut_Scores.pdf
126
Illinois State Board of Education. (n.d). No child left behind / adequate yearly progress.
Retrieved from http://www.isbe.state.il.us/ayp/htmls/glossary.htm
Impara, J. C., Plake, B. S., & Fager, J. J. (1993). Teachers' assessment background and
attitudes toward testing. Theory into Practice, 32(2), 113.
Johnston, P. H., Afferblach, P., & Weiss, P. B. (1993). Teachers’ assessment of the teaching and
learning of literacy. Educational Assessment, 1(2), 91–117.
Jones, L., Gueorguieva, J., & Bishop, S. (2005). Some perspectives on the recent expansion in
the use of assessments for formative purposes. National Council on Measurement
Education Newsletter, 13(3). Retrieved from
http://www.ncme.org/pubs/pdf/news0905.pdf
Kerr, K. A., Marsh, J. A., Ikemoto, G. S., Darilek, H., & Barney, H. (2006). Strategies to
promote date use for instructional improvement: Actions, outcomes, and lessons from
three urban districts. American Journal of Education, 112(4), 496–520.
Kluger, A. N., & DeNisi, A. (1996). Effects of feedback intervention on performance.
Psychological Bulletin, 119(2), 254-284.
Knapp, M. S. (2008). How can organizational and sociocultural learning theories shed light on
district instructional reform [Electronic Version]? American Journal of Education,
114(4), 521-539.
Lai, E. R., & Waltman, K. (2008a). The impact of NCLB on instruction: A comparison of
results from 2004-05 to 2006-07. Paper presented at the annual meeting of the
National Council on Measurement in Education, New York City.
Lai, E. R., & Waltman, K. (2008b). Test preparation: Examining teacher perceptions and
practices. Educational Measurement: Issues and Practice, 27(2), 28-45.
127
Lai, E. (2009). Interim assessment use in Iowa elementary schools. Ph.D. dissertation, The
University of Iowa, United States -- Iowa. Retrieved from Dissertations & Theses: Full
Text.(Publication No. AAT 3390174).
Lanahan, L., Scotchmer, M., & McLaughlin, M. (2004). Methodological critique of
current NCES survey measures of instructional practices. Paper presented at the
Annual Meeting of the American Educational Research Association, San Diego, CA.
Leahy, S., Lyon, C., Thompson, M., & Wiliam, D. (2005). Classroom assessment minute by
minute, day by day [Electronic Version]. Educational Leadership, 63(3), 18-24.
Li, Y., Marion, S., Perie, M., & Gong, B. (2010). An approach for evaluating the technical
quality of interim assessments. Peabody Journal of Education, 85(2), 163-185.
Linn, R. L. (2007). Benchmark assessment: Promise or peril? Paper presented at the
Annual Meeting of the American Educational Research Association, Chicago, IL.
Lombardi, K. A. (2011). Testing the limits: The purposes and effects of additional, external
elementary mathematics assessment. University of Kansas, 2011, 164 pp.
Louis, K. (2008). Learning to support improvement-next steps for research on district practice
[Electronic Version]. American Journal of Education, 114(4), 681-689.
Lutz-Doemling, C. (2007). An examination of the Pennsylvania 4Sight benchmark assessments
as predictors of Pennsylvania system of school assessment performance. Doctoral
dissertation, Lehigh University, Pennsylvania.
MacLellan, E. (2001). Assessment for learning: The differing perceptions of tutors and
students. Assessment & Evaluation in Higher Education, 26(4), 307-318.
128
Madaus, G., West, M., Harmon, M., Lomax, R., & Viator, K. (1992). The influence of
testing on teaching math and science in grades 4-12. Boston: Center for the Study of
Testing, Evaluation, and Educational Policy, Boston College.
MalmsjÖ, A., & Övelius, E. (2003). Factors that induce change in information systems
[Electronic version]. Systems Research and Behavioral Science, 20(3), 243-253.
Martin, R. A. (2006). Wake-up call brings a jolt of alignment to the curriculum. National Staff
Development Council, 27(1). Retrieved from
http://www.nsdc.org/members/jsd/martin271.pdf
Marshall, K. (2008). Interim assessments: A user's guide. Phi Delta Kappan, 90(1), 64-68.
Marzano, R. J. (2003). What works in schools: Translating research into action. Alexandria,
VA: Association for Supervision and Curriculum Development.
Marzano, R. J. (2006). Classroom assessment and grading that work. Alexandria, VA:
Association for Supervision and Curriculum Development.
Marzano, R. J., Waters, T., & Mid-continent Research for Education and Learning (2009).
District leadership that works: Striking the right balance. Bloomington, IN: Solution
Tree Press.
Matsumura, L. C., Garnier, H., Pascal, J., & Valdés, R. (2002). Measuring instructional
quality in accountability systems: Classroom assignments and student achievement.
Educational Assessment, 8(3), 207-229.146
McLaughlin, M. W., & Mitra, D. (2003). The cycle of inquiry as the engine of school reform:
Lessons from the Bay Area School Reform Collaborative. Stanford, CA: Center for
Research on the Context of Teaching.
129
McManus, S. (2010). A study of formative assessment and high stakes testing: Issues of student
efficacy and teacher views in the mathematics classroom. Ph.D. dissertation, North
Carolina State University, United States -- North Carolina. Retrieved from Dissertations
& Theses: Full Text.(Publication No. AAT 3306610).
McMillan, J. H. (2001). Classroom assessment: Principles and practice for effective instruction
(2nd
ed.). Needham Heights, MA: Allyn & Bacon.
McMillan, J. H. (2003). Understanding and improving teachers' classroom assessment
decision making: Implications for theory and practice. Educational Measurement:
Issues and Practice, 22(4), 34-43.
McMillan, J. H. (2007). Formative classroom assessment: The key to improving student
achievement. In J. H. McMillan (Ed.), Formative classroom assessment: Theory into
practice (pp. 1-7). New York: Teachers College Press.
Meadows, D. H. (2008). Thinking in systems: A primer (D.Wright, Ed.). White River Junction,
VT: Chelsea Green.
Meier, D., & Wood, G. H. (2004). Many children left behind: How the no child left behind act is
damaging our children and our schools. Boston: Beacon Press.
Meisels, S. J., Atkins-Burnett, S., Xue, Y., Bickel, D. D., & Son, S. H. (2003). Creating a
system of accountability: The impact of instructional assessment on elementary
children's achievement test scores. Education Policy Analysis Archives, 11(9).
Mintrom, M. (1997). Policy entrepreneurs and the diffusion of innovation. American Journal of
Political Science, 41(3), 738-770
Moss, P. A. (2003). Reconceptualizing validity for classroom assessment. Educational
Measurement: Issues and Practice, 22(4), 13-25.
130
Mullens, J. E. (1995). Classroom instructional practices: A review of existing
measurement approaches and their applicability for teacher followup survey. (NCES
Working Paper #95-15). Washington, DC: Policy Studies Associates.
Mullens, J. E., Gayler, K., Goldstein, D., Hildreth, J., Rubenstein, M., Spiggle, T.,
Walking Eagle, K., & Welsh, M. (1999). Measuring classroom instructional
processes: Using survey and case study field test results to improve item construction.
(NCES Working Paper #8). Washington, DC: Policy Studies Associates.
NCES. (2012a). National Center for Educational Statistic’s Search for Public School Districts.
Retrieved from http://nces.ed.gov/ccd/districtsearch/
NAEP. (2012b). National Assessment of Educational Progress (NAEP): Summary of NAEP
Results for North Carolina. Retrieved from http://nces.ed.gov/nationsreportcard/states/
National Commission on Excellence in Education. (1983). A nation at risk: The imperative for
educational reform: A report to the nation and the Secretary of Education. United States
Department of Education, Washington, DC: National Commission on Excellence in
Education.
National Literacy Trust. (2008). Formative assessment/assessment for learning. Retrieved from
http://www.literacytrust.org.uk/Database/assessment.html
New Horizons for Learning. (2002, September). Assessment terminology: A glossary of useful
terms. Retrieved from http://www.newhorizons.org
Nichols, P. D., Meyers, J. L., & Burling, K. S. (2009). A framework for evaluating and
planning assessments intended to improve student achievement. Educational
Measurement: Issues and Practice, 28(3), 14-23.
NO CHILD LEFT BEHIND ACT OF 2001, Pub. L. No. 107-110, § 115 Stat. 1425 (2002).
131
Nolen, S. B., Haladyna, T. M., and Haas, N. S. (1992). Uses and abuses of achievement test
scores. Educational Measurement: Issues and Practice, 11(4), 9-15.
North Carolina Court of Appeals Reports. (2004). Retrieved from
http://www.aoc.state.nc.us/www/public/sc/opinions/2004/530-02-1.htm
North Carolina Department of Public Instruction. (2011a). Retrieved from
http://www.ncpublicschools.org/acre/assessment/online/
North Carolina Department of Public Instruction. (2011b). Retrieved from
http://www.ncpublicschools.org/rttt/
North Carolina Department of Public Instruction. (2011c). Retrieved from
http://www.ncpublicschools.org/docs/rttt/state/plan/success-factors.pdf
North Carolina Department of Public Instruction. (2012). Retrieved from
http://www.ncpublicschools.org/docs/rttt/state/monitoring/monitor-plan.pdf
NC Report Card. (2012). North Carolina Public Schools Report Card. Retrieved from
http://www.ncreportcards.org/src/
Olson, L. (2004). NCLB law bestows bounty on test industry. Education Week, 24(14),
1-19.
Olson, L. (2005a). Benchmark assessments offer regular checkups on student achievement.
Education Week, 25(13), 13-14.
Olson, L. (2005b). Not all teachers keen on periodic tests. Education Week, 25(13), 13.
Olson, L. (2005c). In sharp focus. Education Week, 25(3), S18-S22.
Olson, A. (2007). Growth measures for systemic change. School Administrator, 64(1), 10-16.
132
Oregon University System, Oregon State Department of Education, & Oregon Department of
Community Colleges and Workforce Development. (2003). The first year: Student
performance on 10th grade benchmark standards and subsequent performance in the first
year of college (2001-02). ERIC Document Reproduction Service No. ED481709.
Parent, R., Roy, M., & St-Jacques, D. (2007) A systems-based dynamic knowledge transfer
capacity model [Electronic version]. Journal of Knowledge Management, 11(6) 81-93.
Pellegrino, J., Chudowsky, N., & Glaser, R. (Eds.). (2001). Knowing what students know:
The science and design of educational assessment. National Research Council
Committee on the Foundations of Assessment. Washington, DC: National Academy
Press.
Pellegrino, J. W., & Goldman, S. R. (2008). Beyond rhetoric: Realities and complexities
of integrating assessment into classroom teaching and learning. In C. A. Dwyer (Ed.),
The future of assessment: Shaping teaching and learning (pp. 7-52). New York:
Lawrence Erlbaum Associates.
PELP Public Education Leadership Project. (2006). The PELP Coherence Framework, Harvard
University. Retrieved from http://www.hbs.edu/pelp/framework.html
Perie, M., Gong, B., & Marion, S. (2006). A framework for considering interim assessments.
Paper developed for the Formative Assessment for Students and Teachers (FAST) State
Collaborative on Assessment and Student Standards (SCASS) Meeting, Austin, TX,
October 2006.
Perie, M., Marion, S., & Gong, B. (2006). Interim assessments. Presentation at the Formative
Assessment for Students and Teachers (FAST) State Collaborative on Assessment and
Student Standards (SCASS) Meeting, Austin, TX, October 2006.
133
Perie, M., Marion, S., & Gong, B. (2007). The role of interim assessments in a comprehensive
assessment system: A policy brief. Retrieved October 1, 2011 from
www.achieve.org/files/TheRoleofInterimAssessments.pdf.
Perie, M., Marion, S., & Gong, B. (2009). Moving toward a comprehensive assessment system:
A framework for considering interim assessments. Educational Measurement: Issues &
Practice, 28(3), 5-13.
Popham, J. W. (2000). Big change questions "Should large-scale assessment be used for
accountability?" Answer: Depends on the assessment, silly! Journal of Educational
Change, 1, 283-289
Popham, W. J. (2006a, June). Determining the instructional sensitivity of accountability tests.
Paper presented at the Large-Scale Assessment conference, Council of Chief State School
Officers, San Francisco, CA.
Popham, W. J. (2006b). Phony formative assessments: Buyer beware! Educational
Leadership, 64(3), 86-87.
Popham, W. J. (2006c). Defining and enhancing formative assessment. Paper presented
at the October 10-13, 2006 CCSSO State Collaborative on Assessment and Student
Standards FAST meeting, Austin TX.
Popham, J. W. (2008). Seven stepping stones to success [Electronic Version]. Principal
Leadership, 9(1), 16-20.
Popham, W. J. (2009). Unlearned lessons: Six stumbling blocks to our schools’ success.
Cambridge, MA: Harvard Education Press.
134
Potteiger, C. A. (2008). Correlational study of the Pennsylvania system of school mathematics
assessment with the 4Sight Mathematics Assessment. Doctoral dissertation, Widener
University, Pennsylvania.
The Princeton Review. (n.d.). Interim assessment with instructional impact: How to use the
formative, low-stakes testing system to support teaching and learning in New York City.
Retrieved from http://schools.nyc.gov/daa/InterimAssessments/ela-
math/NYC%20Interim%20Assessment.pdf
Protheroe, N. (2001, Summer). Improving teaching and learning with data-based decisions:
Asking the right questions and acting on the answers. ERS Spectrum. Arlington, VA:
Educational Research Service.
Proximity One. (2012). North Carolina School District demographic profiles. Retrieved from
http://proximityone.com/nc_sdc.htm
Rabinowitz, S., & Ananda, S. (2001). Balancing local assessment with statewide testing:
Building a program that meets student needs. San Francisco, CA: WestEd. Retrieved
from http://www.wested.org/online_pubs/kn-01-01.pdf
Rice, D., Delagardelle, M., Buckton, M., Jons, C., Lueders, W., Vens, M. J., et al. (2001). The
lighthouse inquiry: School Board/Superintendent team behaviors in school districts with
extreme differences in student achievement. Paper presented at the Annual Meeting of
the American Educational Research Association, Seattle, WA.
Rodriguez, M. C. (2004). The role of classroom assessment in student performance on
TIMSS. Applied Measurement in Education, 17(1), 1-24.
135
Rothman, R. (2006). (In)formative assessments: New tests and activities can help teachers guide
student learning. Harvard Education Letter, November/December 2006. Retrieved from
http://www.timeoutfromtesting.org/0519_article_harvard.php
Rowan, B., Correnti, R., & Miller, R. J. (2002). What large-scale, survey research tells us
about teacher effects on student achievement: Insights from the Prospects study of
elementary schools. Teachers College Record, 104(8), 1525-1567.
Rutherford County Schools. (2007). Common formative assessments. Rutherford County
Schools, Murfreesboro, TN. Retrieved from
http://www.rcs.k12.tn.us/rc/instruction/plc/common_formative_assessments.html
Sadler, D. R. (1989). Formative assessment and the design of instructional systems. Instructional
Science, 18(2), 119-144.
Sawchuk, S., & Cain, J. (2009). Testing faces ups and downs amid recession. Education Week,
28(31), 1-17. Retrieved from Education Research Complete database.
Scantron Corporation. (2005). No School Left Behind: Applying technology to achieve and
sustain Adequate Yearly Progress (AYP). (White paper). Retrieved from
http://www.scantron.com/downloads/Achievement_Series_White_Paper.pdf
Scantron Corporation. (2012). Achievement series: Common core item bank. Retrieved from
http://www.scantron.com/achievementseries/
Scriven, M. (1991). Beyond formative and summative evaluation In G. W. McLaughlin
& D. C. Phillips (Eds.), Evaluation and education: At quarter century. Chicago, IL:
Sharkey, N., & Murnane, R. (2006). Tough choices in designing a formative assessment system.
American Journal of Education, 112(4), 572-588.
136
Shanahan, T., Hyde, K., Mann, V., & Manrique, C. (2005). Integrating curriculum guides,
quarterly benchmark assessments, and professional development to improve student
Learning in Mathematics. Paper presented at the Mathematics and Science Partnerships
(MSP) Evaluation Summit: Evidence-Based Findings from the MSPs, Minneapolis, MN,
September 2005.
Shepard, L. A. (1995). Using assessment to improve learning. Educational Leadership,
52(5), 38.
Shepard, L. A. (2000). The role of assessment in a learning culture. Educational Researcher,
29(7), 4-14.
Shepard, L. A. (2005). Linking formative assessment to scaffolding. Educational Leadership,
63(3), 70-15.
Shepard, L. A. (2006a). Classroom assessment. In R. L. Brennan (Ed.), Educational
Measurement (pp. 623-646). Westport, CT: Praeger Publishers.
Shepard, L. (2006b, June). Can benchmark assessments be formative?: Distinguishing Formative
assessment from formative program evaluation. Paper presented at the Large-Scale
Assessment Conference, Council of Chief State School Officers, San Francisco, CA.
Shepard, L. A. (2008). Formative classroom assessment: Caveat emptor. In C. A. Dwyer
(Ed.), The future of assessment: Shaping teaching and learning (pp. 279-303). New
York: Lawrence Erlbaum Associates.
Shepard, L. A. (2009). Commentary: Evaluating the validity of formative and interim
assessment. Educational Measurement: Issues and Practice, 28(3), pp.32-37.
Shepard, L. (2010). What the marketplace has brought us: Item-by-item teaching with little
instructional insight. Peabody Journal of Education (0161956X), 85(2), 246-257.
137
Smith, J. K. (2003). Reconsidering reliability in classroom assessment and grading.
Educational Measurement: Issues and Practice, 22(4), 26-33.
Smithson, J. L., & Porter, A. C. (1994). Measuring classroom practice: Lessons learned
from efforts to describe the enacted curriculum-the Reform Up Close Study. (CPRE
Research Report Series, Report #31). New Brunswick, NJ: Consortium for Policy
Research in Education.
Solution Tree. (2007). The power of common assessments. Retrieved from
http://www.whiteriver.wednet.edu/SCHOOLS/PLC/powerpoint/CommonFormativeAsses
sment.ppt
Starkman, N. (2006). Formative assessment: Building a better student. Technological Horizons
in Education Journal, 33(14). Retrieved from
http://www.thejournal.com/articles/19174_5
Stiggins, R. J., Griswold, M. M., & Wikelund, K. R. (1989). Measuring thinking skills
through classroom assessment. Journal of Educational Measurement, 26(3), 233-
Stiggins, R. J. (1991). Relevant classroom assessment training for teachers. Educational
Measurement: Issues and Practice, 10(1), 7-12.
Stiggins, R. J. (2002). Assessment crisis: The absence of assessment FOR learning. Phi
Delta Kappan, 83(10), 758.
Stiggins, R. J. (2004). New assessment beliefs for a new school mission. Phi Delta Kappan,
86(1), 22-27.
138
Stiggins, R. (2005a). Assessment for learning defined. Paper written for the ETS/Assessment
Training Institute's International Conference: Promoting Sound Assessment in Every
Classroom, Portland, OR, September, 2005. Retrieved from
http://www.assessmentinst.com/AFLDefined.pdf
Stiggins, R. (2005b). From formative assessment to assessment for learning: A path to success in
standards-based schools. Phi Delta Kappan, 87(4), 324-328.
Stiggins, R. J., Arter, J. A., Chappuis, J., & Chappuis, S. (2006). Classroom assessment for
student learning: Doing it right - using it well. Portland, OR: Educational Testing
Service.
Stiggins, R. J. (2008, April) Assessment manifesto: A call for the development of balance
assessment systems. A position paper published by the ETS Assessment Training
Institute, Portland, Oregon. Retrieved from http://www.assessmentinst.com/papers
Stiggins, R., & Chappuis, J. (2008). Enhancing student learning. Retrieved from http://
www.districtadministration.com/viewarticlepf.aspx?articleid=1362
Supovitz, J., & Klein, V. (2003). Mapping a course for improved student learning: How
innovative schools systematically use student performance data to guide improvement.
Philadelphia: Consortium for Policy Research in Education.
Taylor, G., Shepard, L., Kinner, F., & Rosenthal, J. (2003, February). A survey of
teachers' perspectives on high stakes testing in Colorado: What gets taught, what
gets lost (CSE Tech. Rep. No. 588). Los Angeles: University of California, Center
for Research on Evaluation, Standards, and Student Testing.
139
Thinkgate. (2012). Elements™ Assessment Management System. Retrieved from
http://thinkgate.net/thinkgate-advantage/assessment-ams-assessment-management-
system/
Turner, J. R. (2003). Ensuring what is tested is taught: Curriculum coherence and alignment.
Informed Educator Series. Arlington, VA: Educational Research Service.
U.S. Census Bureau. (2012). U.S. Census Bureau: State and County QuickFacts. Retrieved from
http://quickfacts.census.gov/qfd/states/37000.html
U.S. Department of Education. (2004). A guide to education and no child left behind.
Retrieved from http://purl.access.gpo.gov/GPO/LPS57879
U.S. Department of Education. (2010). Retrieved from http://www.ed.gov/news/press-
releases/nine-states-and-district-columbia-win-second-round-race-top-grants
U.S. Department of Education. (2011). Great teachers and leaders: State considerations on
building systems of educator effectiveness. Retrieved from
http://www2.ed.gov/programs/racetothetop/great-teachers.doc
Vendlinski, T. P., Nagashima, S., & Herman, J. L. (2007). Creating accurate science benchmark
assessments to inform instruction. National Center for Research on Evaluation,
Standards, and Student Testing (CRESST) Report 730, University of California, Los
Angeles, CA. Retrieved from http://www.cse.ucla.edu/products/reports/R730.pdf
Walker, J. L. (1969). The diffusion of innovations among the American states. American
Political Science Review, 67, 1174 – 1185.
Wayman, J. C., Cho, V., & Shaw, S. M. (2009). First-year results from an efficacy study of the
Acuity data system. Austin, TX: The University of Texas.
140
Wayman, J. C., Jimerson, J. B., & Cho, V. (2010, October). District policies for the effective use
of student data. Paper presented at the 2010 Annual Convention of the University Council
for Educational Administration, New Orleans LA.
Wenglinsky, H. (2003). Using large-scale research to gauge the impact of instructional
practices on student reading comprehension: An exploratory study. Education Policy
Analysis Archives, 11(19).
Wiggins, G. (2006). Healthier testing made easy: The idea of authentic assessment. Edutopia.
Retrieved from www.edutopia.org/healthier-testing-made-easy
Wiliam, D., Lee, C., Harrison, C., & Black, P. (2004). Teachers developing assessment for
learning: Impact on student achievement [Electronic Copy]. Assessment in Education
Principles Policy and Practice, 11(1), 49-65.
Wiliam, D., & Leahy, S. (2006, April). A theoretical foundation for formative assessment. Paper
presented at the American Educational Research Association and the National Council
on Measurement in Education, San Francisco, CA.
Wiliam, D. (2007). Changing classroom practice [Electronic version]. Educational Leadership,
65(4; 4), 36-42.
Wiliam, D. (2007). What does research say the benefits of formative assessment are? National
Council of Teachers of Mathematics Assessment Research Brief. Retrieved from
http://www.nctm.org/uploadedFiles/Research_Issues_and_News/Briefs_and_Clips/brief_
form_assessment.pdf
Wiliam, D., & Thompson, M. (2008). Integrating assessment into learning: What will it
take to make it work? In C. A. Dwyer (Ed.), The future of assessment: Shaping
teaching and learning (pp. 53-82). New York: Lawrence Erlbaum Associates.
141
Wilson, M., & Draney, K. (2004). Some links between large-scale and classroom
assessments: The case of the BEAR assessment system. In M. Wilson (Ed.), Towards
coherence between classroom assessment and accountability (pp. 132-154). Chicago:
University of Chicago Press.
Wireless Generation. (2007). The role of formative assessment in pre-k through second grade
classrooms. Retrieved from http://www.wirelessgeneration.net/pdf/Formative
Assessment White Paper Perk-2 8.7.07.pdf
Wood, G. (2004). A view from the field: NCLB's effects on classrooms and schools. In D. Meier
& G. Wood (Eds.). Many children left behind: How the No Child Left Behind act is
damaging our children and our schools (pp.33-50). Boston, Beacon Press
Yin, Y., Shavelson, R. J., Ayala, C. C., Ruiz-Primo, M. A., Brandon, P., Furtak, E. M.,
Tomita, M.K., & Young, D.B. (2008). On the impact of formative assessment on
student motivation, achievement, and conceptual change. Applied Measurement in
Education, 21(4), 335-359.
Young, V. M., & Kim, D. H. (2010). Using assessments for instructional improvement:
a literature review. Education Policy Analysis Archives, 18(19).
Zehr, M. A. (2006). Monthly checkups. Education Week, 25(35), 36-37.

APPENDIX A: QUESTIONNAIRE
ECU Doctoral Research Study: Interim Assessment Questionnaire
Thank you for participating in this study. Your responses will be confidential and used
exclusively for research purposes. Your responses are very important so please answer each
question thoroughly and thoughtfully. I appreciate your input!
* Required question
1) Please select the school district where you are currently employed. * Check one
Chatham
Durham
Franklin
Granville
Harnett
Johnston
Lee
Moore
Orange
Person
Vance
Wake
Warren
2) Which best describes your current role? * Check one
District Leader (i.e. Superintendent, Assistant Superintendent, Director, Coordinator)
School Administrator (i.e. Principal, Assistant Principal, Instructional Coach)
Classroom Teacher (i.e. 4th grade teacher, Algebra teacher)
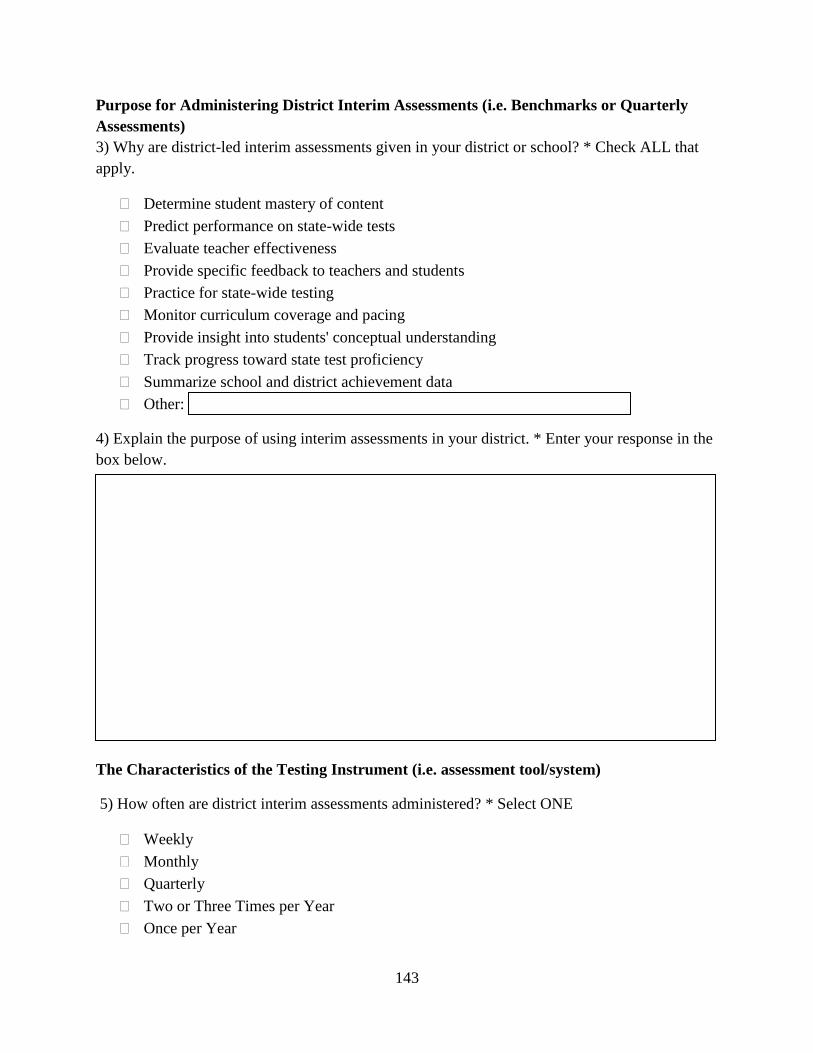
143
Purpose for Administering District Interim Assessments (i.e. Benchmarks or Quarterly
Assessments)
3) Why are district-led interim assessments given in your district or school? * Check ALL that
apply.
Determine student mastery of content
Predict performance on state-wide tests
Evaluate teacher effectiveness
Provide specific feedback to teachers and students
Practice for state-wide testing
Monitor curriculum coverage and pacing
Provide insight into students' conceptual understanding
Track progress toward state test proficiency
Summarize school and district achievement data
Other:
4) Explain the purpose of using interim assessments in your district. * Enter your response in the
box below.
The Characteristics of the Testing Instrument (i.e. assessment tool/system)
5) How often are district interim assessments administered? * Select ONE
Weekly
Monthly
Quarterly
Two or Three Times per Year
Once per Year
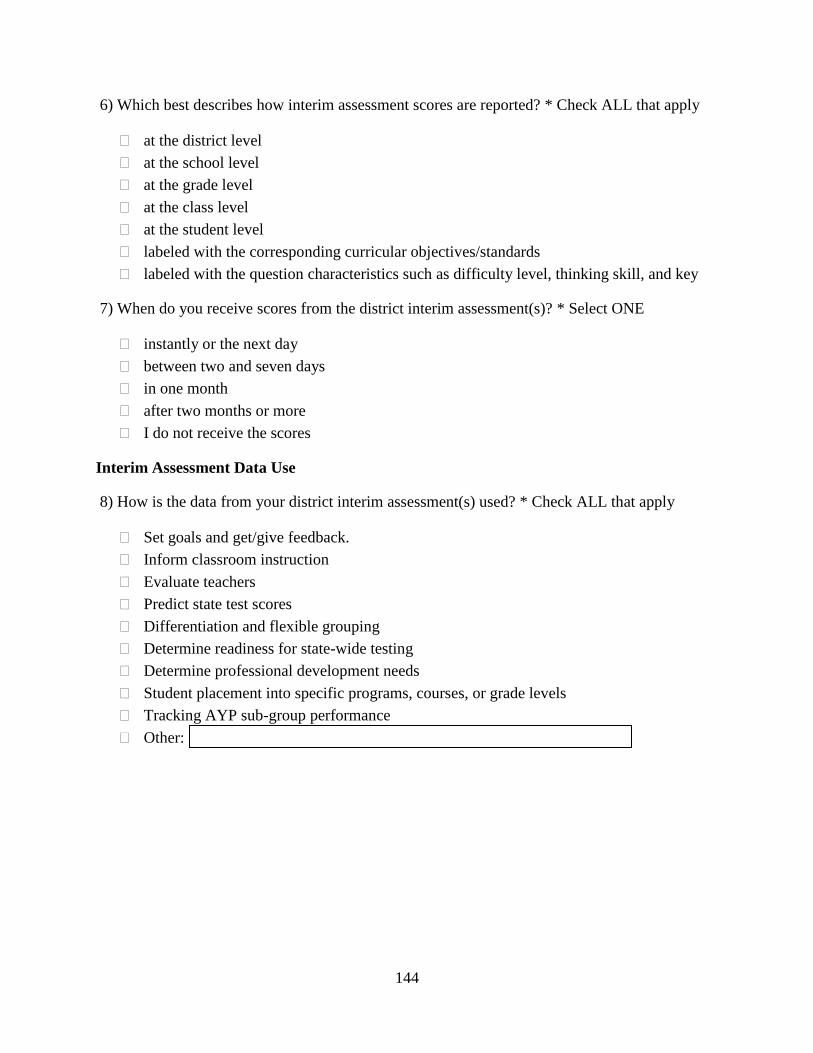
144
6) Which best describes how interim assessment scores are reported? * Check ALL that apply
at the district level
at the school level
at the grade level
at the class level
at the student level
labeled with the corresponding curricular objectives/standards
labeled with the question characteristics such as difficulty level, thinking skill, and key
7) When do you receive scores from the district interim assessment(s)? * Select ONE
instantly or the next day
between two and seven days
in one month
after two months or more
I do not receive the scores
Interim Assessment Data Use
8) How is the data from your district interim assessment(s) used? * Check ALL that apply
Set goals and get/give feedback.
Inform classroom instruction
Evaluate teachers
Predict state test scores
Differentiation and flexible grouping
Determine readiness for state-wide testing
Determine professional development needs
Student placement into specific programs, courses, or grade levels
Tracking AYP sub-group performance
Other:
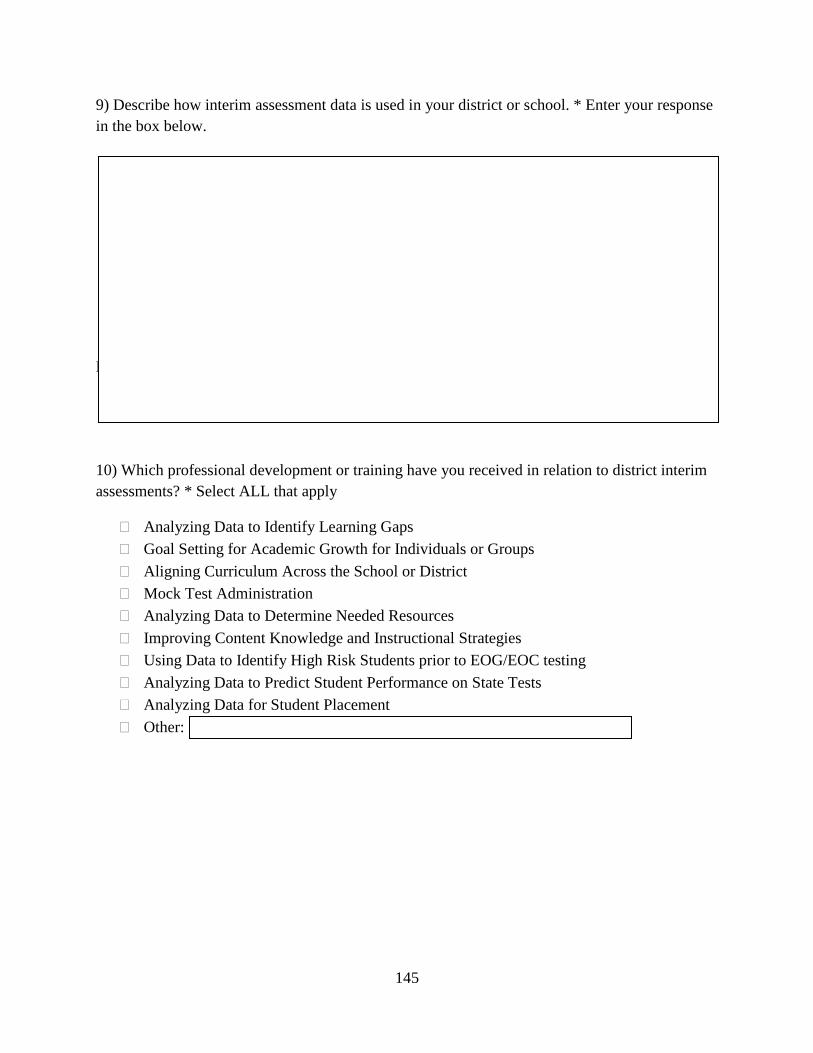
145
9) Describe how interim assessment data is used in your district or school. * Enter your response
in the box below.
Professional Development Relating to Interim Assessments
10) Which professional development or training have you received in relation to district interim
assessments? * Select ALL that apply
Analyzing Data to Identify Learning Gaps
Goal Setting for Academic Growth for Individuals or Groups
Aligning Curriculum Across the School or District
Mock Test Administration
Analyzing Data to Determine Needed Resources
Improving Content Knowledge and Instructional Strategies
Using Data to Identify High Risk Students prior to EOG/EOC testing
Analyzing Data to Predict Student Performance on State Tests
Analyzing Data for Student Placement
Other:
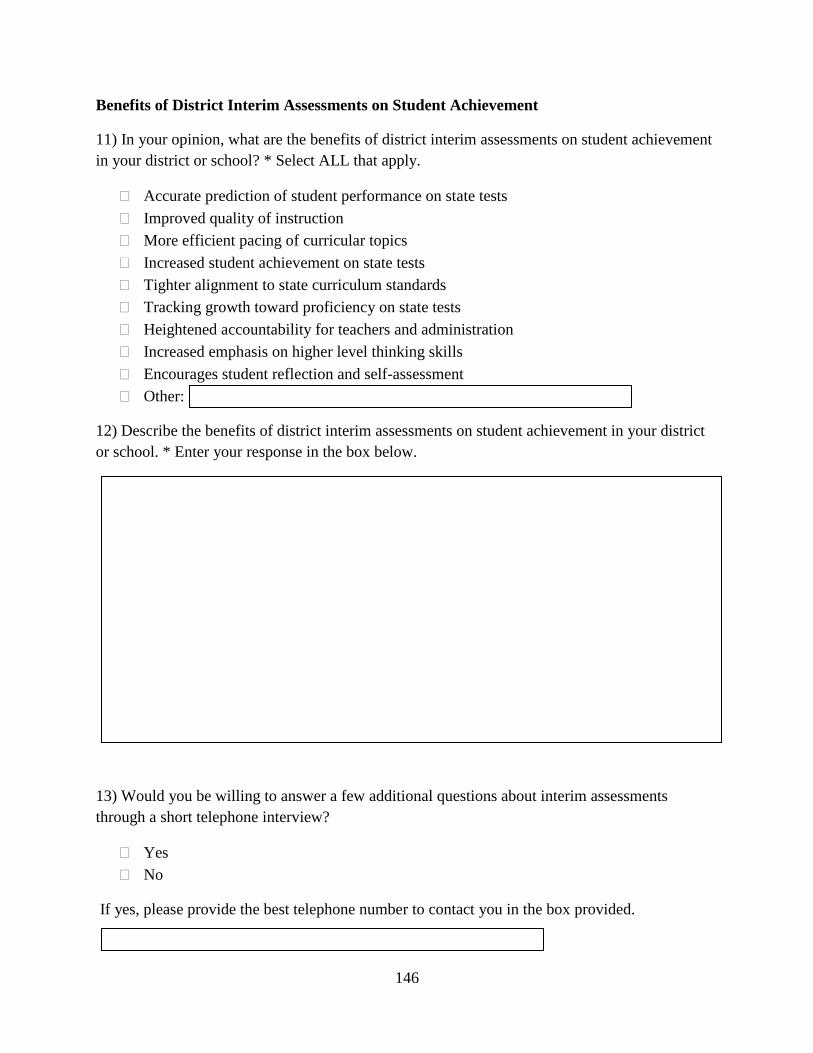
146
Benefits of District Interim Assessments on Student Achievement
11) In your opinion, what are the benefits of district interim assessments on student achievement
in your district or school? * Select ALL that apply.
Accurate prediction of student performance on state tests
Improved quality of instruction
More efficient pacing of curricular topics
Increased student achievement on state tests
Tighter alignment to state curriculum standards
Tracking growth toward proficiency on state tests
Heightened accountability for teachers and administration
Increased emphasis on higher level thinking skills
Encourages student reflection and self-assessment
Other:
12) Describe the benefits of district interim assessments on student achievement in your district
or school. * Enter your response in the box below.
13) Would you be willing to answer a few additional questions about interim assessments
through a short telephone interview?
Yes
No
If yes, please provide the best telephone number to contact you in the box provided.
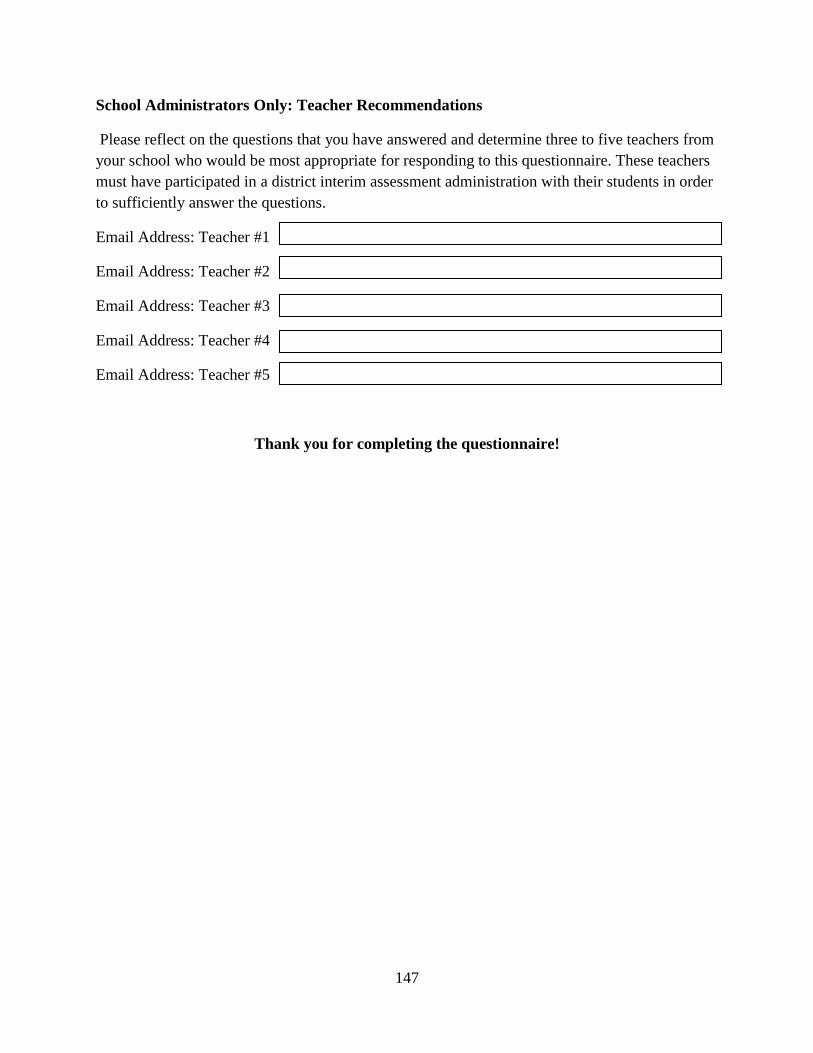
147
School Administrators Only: Teacher Recommendations
Please reflect on the questions that you have answered and determine three to five teachers from
your school who would be most appropriate for responding to this questionnaire. These teachers
must have participated in a district interim assessment administration with their students in order
to sufficiently answer the questions.
Email Address: Teacher #1
Email Address: Teacher #2
Email Address: Teacher #3
Email Address: Teacher #4
Email Address: Teacher #5
Thank you for completing the questionnaire!
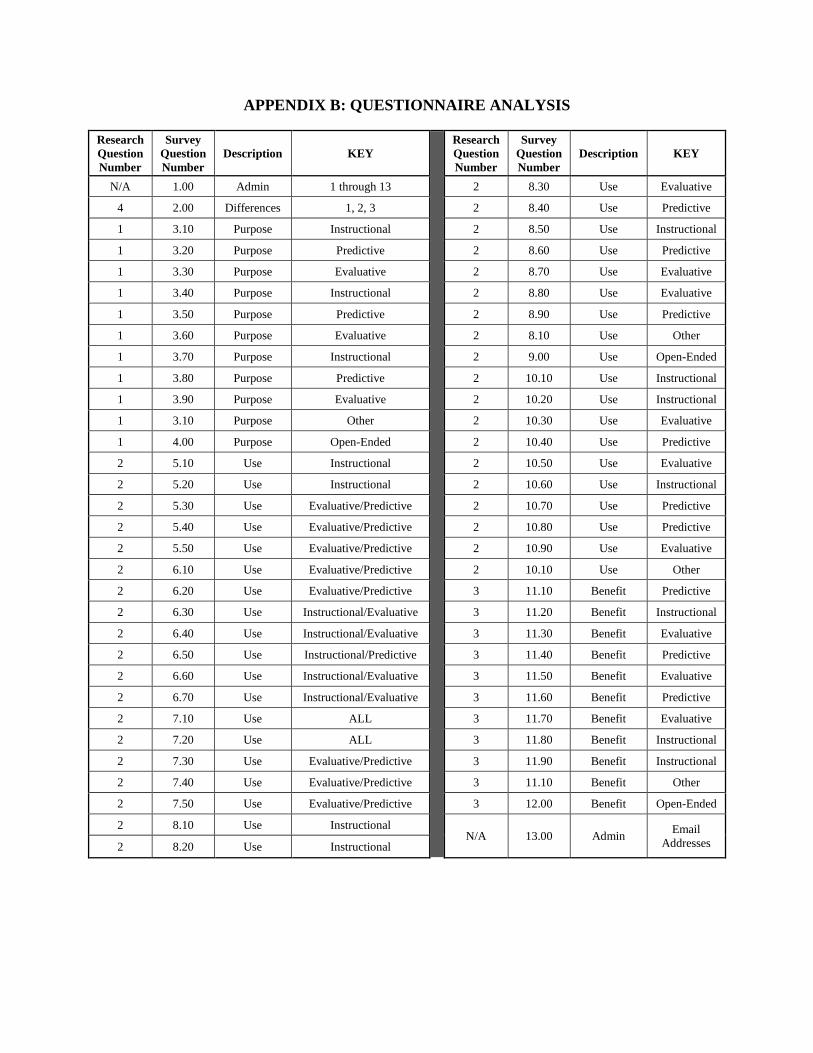
APPENDIX B: QUESTIONNAIRE ANALYSIS
Research
Question
Number
Survey
Question
Number
Description KEY
Research
Question
Number
Survey
Question
Number
Description KEY
N/A 1.00 Admin 1 through 13 2 8.30 Use Evaluative
4 2.00 Differences 1, 2, 3 2 8.40 Use Predictive
1 3.10 Purpose Instructional 2 8.50 Use Instructional
1 3.20 Purpose Predictive 2 8.60 Use Predictive
1 3.30 Purpose Evaluative 2 8.70 Use Evaluative
1 3.40 Purpose Instructional 2 8.80 Use Evaluative
1 3.50 Purpose Predictive 2 8.90 Use Predictive
1 3.60 Purpose Evaluative 2 8.10 Use Other
1 3.70 Purpose Instructional 2 9.00 Use Open-Ended
1 3.80 Purpose Predictive 2 10.10 Use Instructional
1 3.90 Purpose Evaluative 2 10.20 Use Instructional
1 3.10 Purpose Other 2 10.30 Use Evaluative
1 4.00 Purpose Open-Ended 2 10.40 Use Predictive
2 5.10 Use Instructional 2 10.50 Use Evaluative
2 5.20 Use Instructional 2 10.60 Use Instructional
2 5.30 Use Evaluative/Predictive 2 10.70 Use Predictive
2 5.40 Use Evaluative/Predictive 2 10.80 Use Predictive
2 5.50 Use Evaluative/Predictive 2 10.90 Use Evaluative
2 6.10 Use Evaluative/Predictive 2 10.10 Use Other
2 6.20 Use Evaluative/Predictive 3 11.10 Benefit Predictive
2 6.30 Use Instructional/Evaluative 3 11.20 Benefit Instructional
2 6.40 Use Instructional/Evaluative 3 11.30 Benefit Evaluative
2 6.50 Use Instructional/Predictive 3 11.40 Benefit Predictive
2 6.60 Use Instructional/Evaluative 3 11.50 Benefit Evaluative
2 6.70 Use Instructional/Evaluative 3 11.60 Benefit Predictive
2 7.10 Use ALL 3 11.70 Benefit Evaluative
2 7.20 Use ALL 3 11.80 Benefit Instructional
2 7.30 Use Evaluative/Predictive 3 11.90 Benefit Instructional
2 7.40 Use Evaluative/Predictive 3 11.10 Benefit Other
2 7.50 Use Evaluative/Predictive 3 12.00 Benefit Open-Ended
2 8.10 Use Instructional N/A 13.00 Admin
Addresses 2 8.20 Use Instructional
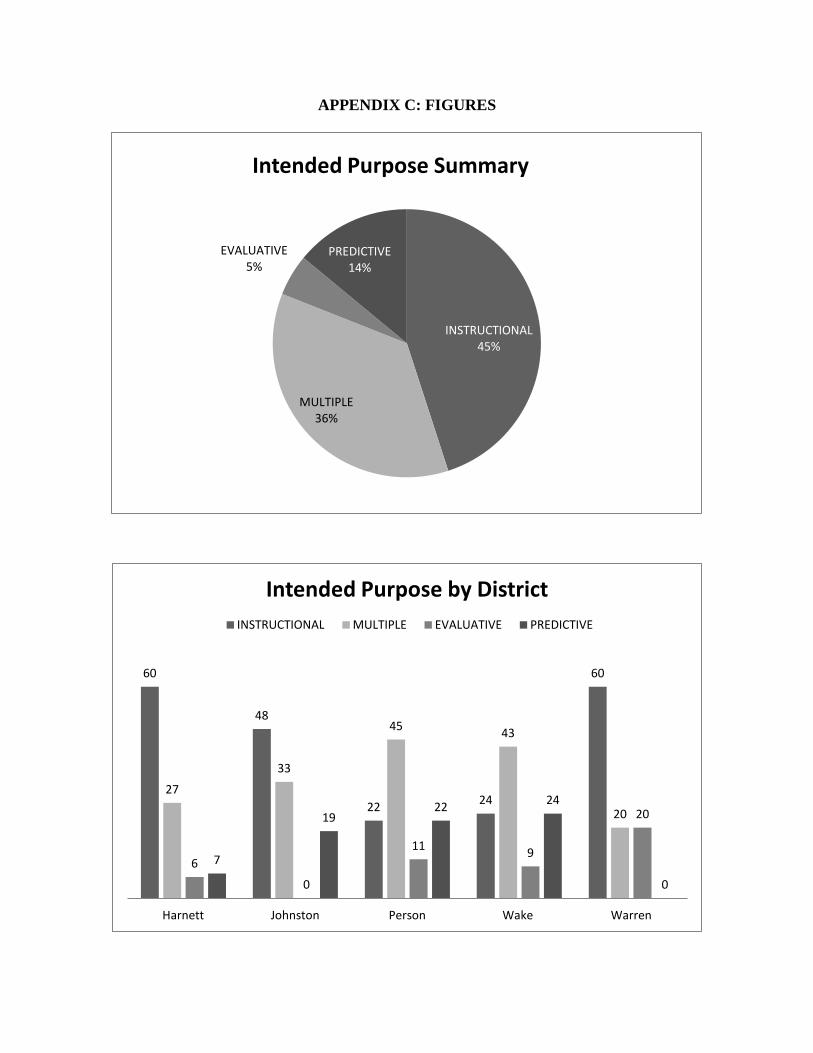
APPENDIX C: FIGURES
INSTRUCTIONAL 45%
MULTIPLE 36%
EVALUATIVE 5%
PREDICTIVE 14%
Intended Purpose Summary
60
48
22 24
60
27
33
45 43
20
6
0
11 9
20
7
19 22
24
0
Harnett Johnston Person Wake Warren
Intended Purpose by District
INSTRUCTIONAL MULTIPLE EVALUATIVE PREDICTIVE
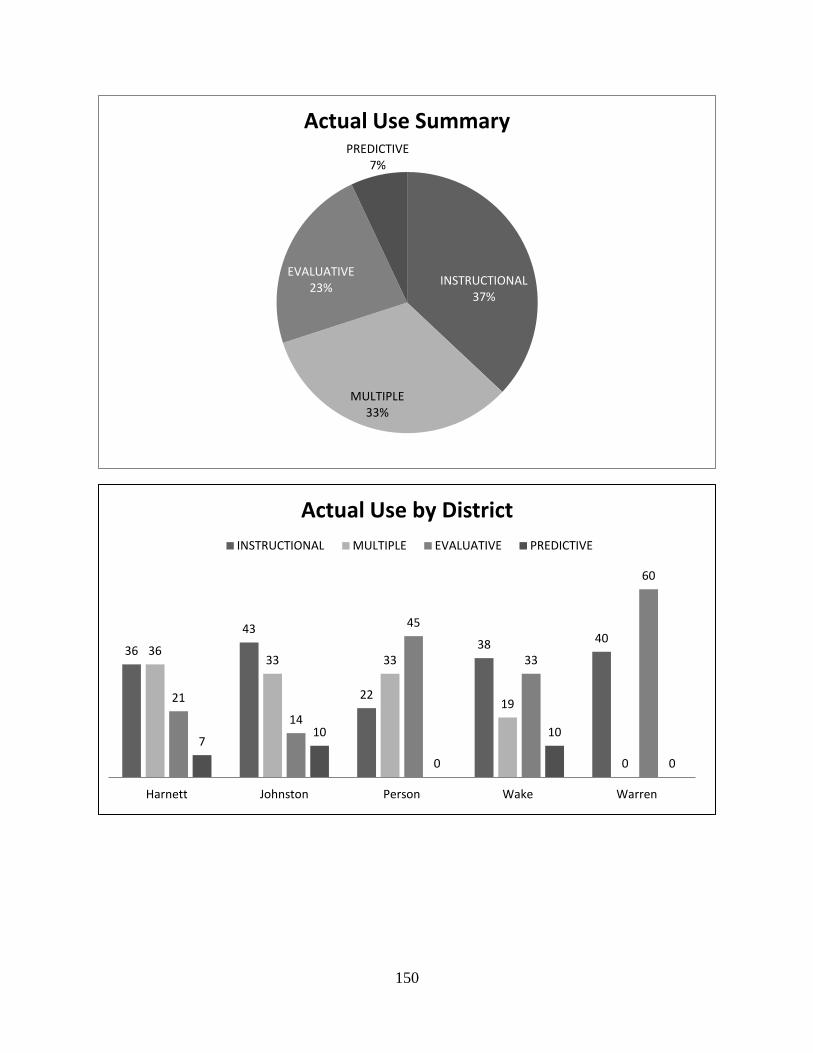
150
INSTRUCTIONAL 37%
MULTIPLE 33%
EVALUATIVE 23%
PREDICTIVE 7%
Actual Use Summary
36
43
22
38 40 36
33 33
19
0
21
14
45
33
60
7 10
0
10
0
Harnett Johnston Person Wake Warren
Actual Use by District
INSTRUCTIONAL MULTIPLE EVALUATIVE PREDICTIVE
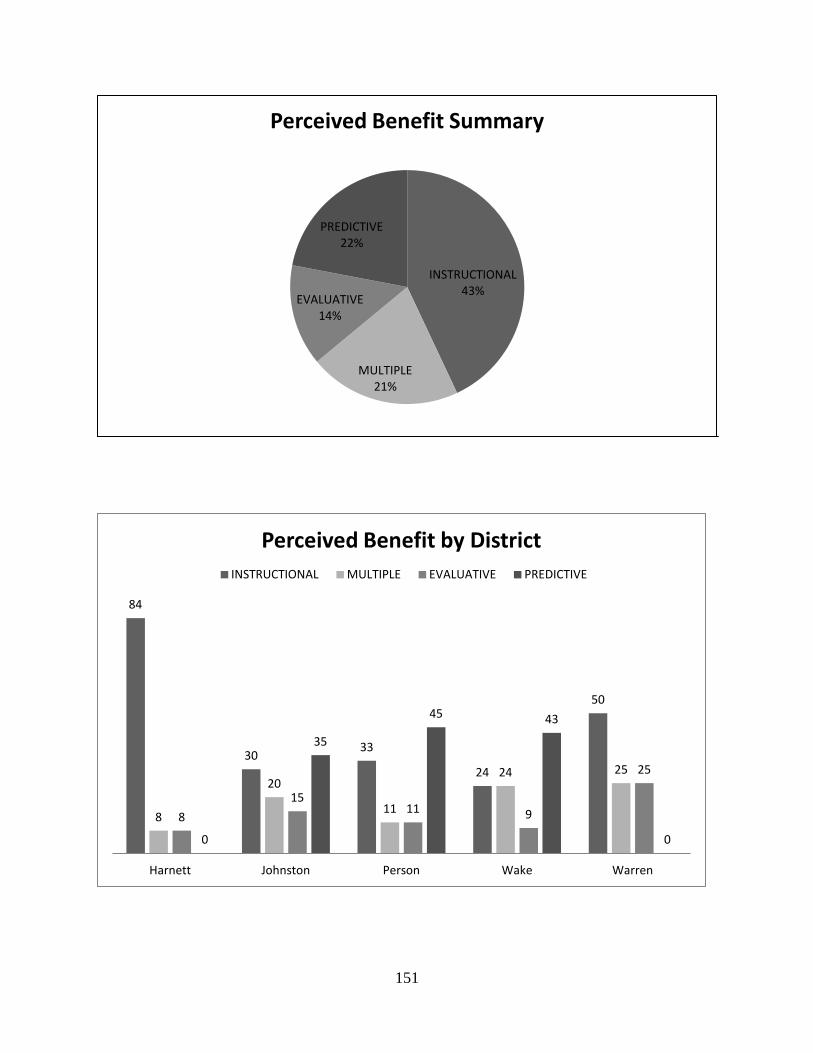
151
INSTRUCTIONAL 43%
MULTIPLE 21%
EVALUATIVE 14%
PREDICTIVE 22%
Perceived Benefit Summary
84
30 33
24
50
8
20
11
24 25
8
15 11 9
25
0
35
45 43
0
Harnett Johnston Person Wake Warren
Perceived Benefit by District
INSTRUCTIONAL MULTIPLE EVALUATIVE PREDICTIVE
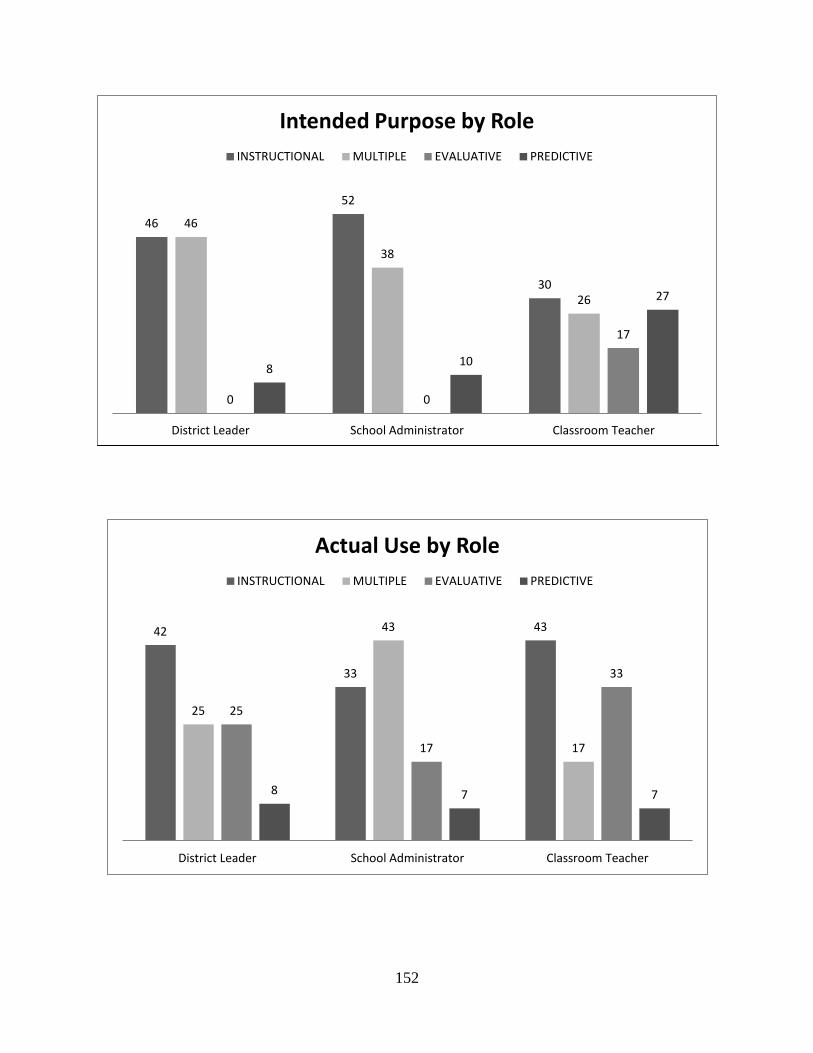
152
46
52
30
46
38
26
0 0
17
8 10
27
District Leader School Administrator Classroom Teacher
Intended Purpose by Role
INSTRUCTIONAL MULTIPLE EVALUATIVE PREDICTIVE
42
33
43
25
43
17
25
17
33
8 7 7
District Leader School Administrator Classroom Teacher
Actual Use by Role
INSTRUCTIONAL MULTIPLE EVALUATIVE PREDICTIVE
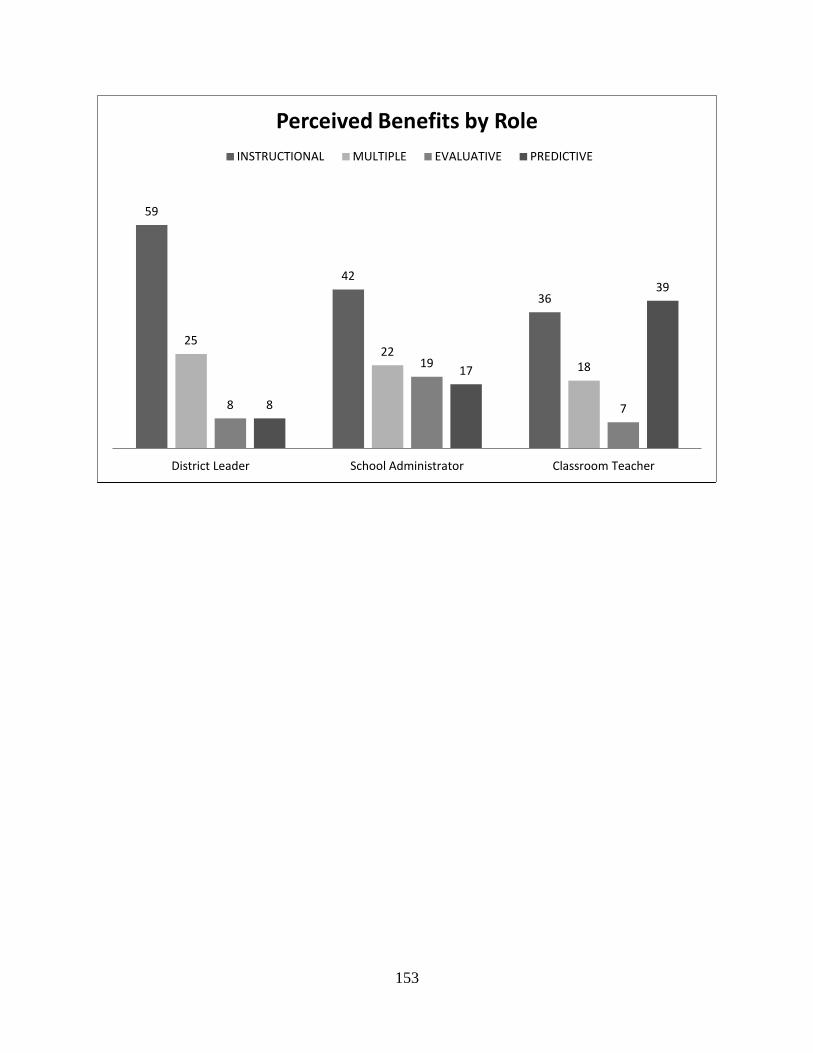
153
59
42
36
25 22
18
8
19
7 8
17
39
District Leader School Administrator Classroom Teacher
Perceived Benefits by Role
INSTRUCTIONAL MULTIPLE EVALUATIVE PREDICTIVE
APPENDIX D: INSTITUTIONAL REVIEW BOARD APPROVAL
EAST CAROLINA UNIVERSITY
University & Medical Center Institutional Review Board Office
4N-70 Brody Medical Sciences Building· Mail Stop 682
600 Moye Boulevard · Greenville, NC 27834
Office 252-744-2914 · Fax 252-744-2284 · www.ecu.edu/irb
Notification of Exempt Certification
From: Social/Behavioral IRB
To: Patricia Martin
CC:
Bill Grobe
Date: 8/15/2012
Re: UMCIRB 12-001397
District-Led Interim Assessments in North Carolina Schools
I am pleased to inform you that your research submission has been certified as exempt on
8/14/2012. This study is eligible for Exempt Certification under category #2.
It is your responsibility to ensure that this research is conducted in the manner reported in your
application and/or protocol, as well as being consistent with the ethical principles of the Belmont
Report and your profession.
This research study does not require any additional interaction with the UMCIRB unless there
are proposed changes to this study. Any change, prior to implementing that change, must be
submitted to the UMCIRB for review and approval. The UMCIRB will determine if the change
impacts the eligibility of the research for exempt status. If more substantive review is required,
you will be notified within five business days.
The UMCIRB office will hold your exemption application for a period of five years from the
date of this letter. If you wish to continue this protocol beyond this period, you will need to
submit an Exemption Certification request at least 30 days before the end of the five year period.
The Chairperson (or designee) does not have a potential for conflict of interest on this study.
--------------------------------------------------------------------------------
IRB00000705 East Carolina U IRB #1 (Biomedical) IORG0000418
IRB00003781 East Carolina U IRB #2 (Behavioral/SS) IORG0000418 IRB00004973


