Embed Size (px)
Citation preview

Report of the Central Board of Directors on the working of the Reserve Bank of India
for the year ended June 30, 2009 submitted to the Central Government in terms of
Section 53(2) of the Reserve Bank of India Act, 1934
RESERVE BANK OF INDIA ANNUAL REPORT2008-09

GOVERNOR
D. Subbarao
DEPUTY GOVERNORS
Shyamala Gopinath
Usha Thorat
K.C. Chakrabarty
DIRECTORS NOMINATED UNDERSECTION 8 (1) (b) OF THE RBI ACT, 1934
Y.H. Malegam
Suresh D. Tendulkar
U.R. Rao
Lakshmi Chand
DIRECTORS NOMINATED UNDERSECTION 8 (1) (c) OF THE RBI ACT, 1934
H. P. Ranina
Ashok S. Ganguly
Azim Premji
Kumar Mangalam Birla
Shashi Rajagopalan
Suresh Neotia
A. Vaidyanathan
Man Mohan Sharma
D. Jayavarthanavelu
Sanjay Labroo
DIRECTOR NOMINATED UNDERSECTION 8 (1) (d) OF THE RBI ACT, 1934
Ashok Chawla
MEMBERS OF LOCAL BOARDS
WESTERN AREA
Y.H. Malegam
K. Venkatesan
Dattaraj V. Salgaocar
Jayantilal B. Patel
EASTERN AREA
Suresh D. Tendulkar
A. K. Saikia
Sovan Kanungo
NORTHERN AREA
U.R. Rao
Mitha Lal Mehta
Ram Nath
Pritam Singh
SOUTHERN AREA
Lakshmi Chand
C. P. Nair
M. Govinda Rao
Devaki Jain
CENTRAL BOARD / LOCAL BOARDS
AS ON JUNE 30, 2009
PRINCIPAL OFFICERS
(As on June 30, 2009)
EXECUTIVE DIRECTORS .......................................................... V.K. Sharma.......................................................... C. Krishnan.......................................................... Anand Sinha.......................................................... V.S. Das.......................................................... G. Gopalakrishna.......................................................... H.R. Khan.......................................................... D.K. Mohanty
CENTRAL OFFICEDepartment of Administration and Personnel Management ................ Prabal Sen, Principal Chief General ManagerCustomer Service Department ............................................................. G. Jaganmohan Rao, Chief General ManagerDepartment of Banking Operations and Development ......................... P. Vijaya Bhaskar, Chief General Manager-in-ChargeDepartment of Banking Supervision ..................................................... S. Karuppasamy, Chief General Manager-in-ChargeDepartment of Communication ............................................................. A.I. Killawala, Press Relations Officer (Gr. F)Department of Currency Management ................................................. U.S. Paliwal, Chief General ManagerDepartment of Economic Analysis and Policy ...................................... -Department of Expenditure and Budgetary Control ............................. Deepa Srivastava, Chief General ManagerDepartment of External Investments and Operations .......................... Meena Hemachandra, Chief General Manager-in-ChargeDepartment of Government and Bank Accounts .................................. S.V. Raghavan, Chief General Manager-in-ChargeDepartment of Information Technology ................................................. A.M. Pedgaonkar, Chief General Manager-in-ChargeDepartment of Non-Banking Supervision ............................................. P. Krishnamurthy, Chief General Manager-in-ChargeDepartment of Payment and Settlement Systems ............................... G. Padmanabhan, Chief General ManagerDepartment of Statistics and Information Management ....................... A.K. Ray, Principal AdviserFinancial Markets Department ............................................................. Chandan Sinha, Chief General ManagerForeign Exchange Department ............................................................. Salim Gangadharan, Chief General Manager-in-ChargeHuman Resources Development Department ...................................... Deepak Singhal, Chief General ManagerInspection Department ......................................................................... Karunasagar, Chief General ManagerInternal Debt Management Department ............................................... K.V. Rajan , Chief General ManagerLegal Department ................................................................................. K.D. Zacharias, Legal Adviser-in-ChargeMonetary Policy Department ................................................................ Janak Raj, Adviser-in-ChargePremises Department ........................................................................... S. Venkatachalam, Chief General ManagerRajbhasha Department ......................................................................... Phulan Kumar, Chief General ManagerRural Planning and Credit Department ................................................ -Secretary’s Department ........................................................................ Grace E. Koshie, Chief General Manager & SecretaryUrban Banks Department ..................................................................... A.K. Khound, Chief General Manager
COLLEGES PRINCIPALS/CHIEF GENERAL MANAGERCentre for Advanced Financial Learning, Mumbai ............................... -College of Agricultural Banking, Pune .................................................. Sandip GhoseReserve Bank Staff College, Chennai .................................................. S. Ganesh
OFFICES REGIONAL DIRECTORSChennai ................................................................................................ K. R. AnandaKolkata .................................................................................................. F.R. JosephMumbai ................................................................................................. A.N. RaoNew Delhi ............................................................................................. R. Gandhi
BRANCHESAhmedabad .......................................................................................... A. K. BeraBangalore ............................................................................................. B. SrinivasBhopal ................................................................................................... Rajesh VermaBhubaneswar ........................................................................................ Kaza SudhakarChandigarh ........................................................................................... J. SadakkadullaGuwahati ............................................................................................... Sewali ChoudhuryHyderabad ............................................................................................ N. Krishna MohanJaipur .................................................................................................... B.P. KanungoJammu .................................................................................................. -Kanpur .................................................................................................. J.B. BhoriaLucknow ................................................................................................ D.P.S. RathoreNagpur .................................................................................................. C.C. MitraPatna ..................................................................................................... K.K. VohraThiruvananthapuram ............................................................................. S. Ramaswamy
OFFICERS-IN-CHARGEBelapur ................................................................................................. -Dehradun .............................................................................................. Manoj Sharma, General ManagerKochi ..................................................................................................... E. Madhavan, General ManagerPanaji .................................................................................................... M.A.R. Prabhu, Deputy General ManagerRaipur ................................................................................................... A.K. Sharma, General ManagerRanchi ................................................................................................... Rabi N. Mishra, General ManagerShimla ................................................................................................... S.K. Bal, General Manager
i
PART ONE : THE ECONOMY: REVIEW AND PROSPECTS
I. ASSESSMENT AND PROSPECTS....................................................................................... 1
Assessment of 2008-09 .......................................................................................................... 5
Prospects for 2009-10 ............................................................................................................ 11
Policy Challenges ................................................................................................................... 27
II. ECONOMIC REVIEW
Macroeconomic Policy Environment............................................................................ 30
Real Sector Policies ......................................................................................................... 31
Fiscal Policy ...................................................................................................................... 35
Monetary Policy Measures ............................................................................................... 44
Credit Delivery .................................................................................................................. 46
Financial Sector Policies .................................................................................................. 46
Real Economy ................................................................................................................. 50
Aggregate Supply ............................................................................................................. 51
Aggregate Demand .......................................................................................................... 76
Money, Credit and Prices ............................................................................................... 83
Reserve Money ................................................................................................................ 84
Monetary Survey .............................................................................................................. 87
Price Situation .................................................................................................................. 95
Government Finances .................................................................................................... 113
Central Government Finances ......................................................................................... 114
State Government Finances ............................................................................................ 121
Combined Government Budgetary Position of Centre and States .................................. 122
Fiscal Outlook ................................................................................................................... 124
Financial Markets ........................................................................................................... 135
International Financial Markets ........................................................................................ 136
Domestic Financial Markets ............................................................................................. 138
Money Market ................................................................................................................... 139
Foreign Exchange Market ................................................................................................ 144
Government Securities (Secondary) Market .................................................................... 146
Credit Market .................................................................................................................... 148
Equity and Debt Markets .................................................................................................. 149
External Sector ............................................................................................................... 157
International Developments.............................................................................................. 157
India’s Balance of Payments ............................................................................................ 162
External Debt .................................................................................................................... 182
Foreign Exchange Reserves ............................................................................................ 184
International Investment Position ..................................................................................... 186
CONTENTS
Page No.

ii
PART TWO: THE WORKING AND OPERATIONS OF THE RESERVE BANK OF INDIA
III. MONETARY POLICY OPERATIONS .................................................................................... 188
Monetary Policy Operations: 2008-09 .................................................................................... 189
Monetary Policy Operations: 2009-10 .................................................................................... 196
Liquidity Management ............................................................................................................ 201
IV. CREDIT DELIVERY ............................................................................................................... 210
Priority Sector Lending ........................................................................................................... 211
Micro Finance ......................................................................................................................... 221
Financial Inclusion .................................................................................................................. 222
Financial Literacy and Credit Counselling .............................................................................. 226
Export Credit ........................................................................................................................... 227
Extension of Collateral Facility – Savings Bonds ................................................................... 229
Non-banking Financial Companies ........................................................................................ 229
Scheduled Commercial Banks ............................................................................................... 230
V. DEVELOPMENT AND REGULATION OF FINANCIAL MARKETS ..................................... 231
Money Market ......................................................................................................................... 232
Government Securities Market ............................................................................................... 233
Foreign Exchange Market ...................................................................................................... 235
VI. FINANCIAL REGULATION AND SUPERVISION ................................................................. 241
Regulatory Framework for the Indian Financial System ........................................................ 243
Committee on Financial Sector Assessment ......................................................................... 245
Commercial Banks ................................................................................................................. 247
Urban Co-operative Banks ..................................................................................................... 257
Rural Co-operatives ................................................................................................................ 259
Regional Rural Banks ............................................................................................................. 260
All India Financial Institutions (AIFIs) ..................................................................................... 262
Non-Banking Financial Companies ........................................................................................ 263
Deposit Insurance and Credit Guarantee Corporation of India .............................................. 266
Macro-Prudential Indicators Review....................................................................................... 268
VII. PUBLIC DEBT MANAGEMENT ............................................................................................ 276
Central Government ............................................................................................................... 277
State Governments ................................................................................................................. 286
VIII. CURRENCY MANAGEMENT ................................................................................................ 293
Banknotes in Circulation ......................................................................................................... 293
Coins in Circulation ................................................................................................................. 294
Currency Operations .............................................................................................................. 295
Page No.
CONTENTS

iii
IX. PAYMENT AND SETTLEMENT SYSTEMS AND INFORMATION TECHNOLOGY ............ 302
Payment and Settlement Systems ......................................................................................... 302
Developments in Payments and Settlement Systems ............................................................ 304
Developments in Use of Information Technology ................................................................... 312
X. HUMAN RESOURCES DEVELOPMENT AND ORGANISATIONAL MATTERS ................ 316
Human Resource Initiatives.................................................................................................... 316
Other Initiatives ....................................................................................................................... 321
Research Activities ................................................................................................................. 337
Central Board and its Committees ......................................................................................... 345
XI. THE RESERVE BANK’S ACCOUNTS FOR 2008-09 ........................................................... 348
Income and Expenditure......................................................................................................... 348
Balance Sheet ........................................................................................................................ 352
Significant Accounting Policies and Notes to the Accounts for 2008-09 ................................ 358
Annex I : List of Speeches by Governor and Deputy Governors ................................ 362
Annex II : List of Reports of Groups/Committees ......................................................... 364
Annex III : List of Publications by the Staff of the Reserve Bank:June 2008 to July 2009 .................................................................................... 365
Annex IV : Visits of Foreign Delegations to The Reserve Bank .................................... 368
Annex V : Chronology of Major Policy Announcements: April 2008-July 2009 .......... 369
BOXES
II.1 Counter-Cyclical Fiscal Policy in the Current Economic Scenario ................................... 37
II.2 Fiscal Transparency at the State Level ............................................................................ 42
II.3 Permanent and Transitory Output Loss ............................................................................ 51
II.4 Growth Cycles in India: Recent Evidence of Cyclical Slowdown ..................................... 52
II.5 Rationalisation of MSP Computation ............................................................................... 56
II.6 Global Agricultural Outlook .............................................................................................. 60
II.7 Global Climate Change: Emerging Challenges for Indian Agriculture ............................. 62
II.8 Performance of the Electricity Sector ............................................................................... 68
II.9 Industrial Performance – Select Economies .................................................................... 71
II.10 Global Recession and the Services Sector ..................................................................... 73
II.11 Effects of Global Recession on Unemployment in India .................................................. 75
II.12 Financial Crisis and Economic Growth: An Inter-temporal Perspective ........................... 78
II.13 The Management of Economic Slowdown: Rebalancing of Growth ................................ 79
II.14 Report of the High Level Committee on Estimation of Saving andInvestment ........................................................................................................................ 81
Page No.
CONTENTS
iv
II.15 Adjusted Reserve Money and Money Multiplier ............................................................... 85
II.16 The Deflation Perceptions ................................................................................................ 102
II.17 Pass-through of Exchange Rate Movements to Inflation in India .................................... 105
II.18 WPI and CPIs : Divergence in Inflation ............................................................................ 108
II.19 CPI for the Urban and Rural Population: The Approach .................................................. 109
II.20 Wealth Effects of Corrections in Stock Prices in India ..................................................... 110
II.21 House Price Index: Recent Developments ....................................................................... 111
II.22 Housing Start-Up Index in India ....................................................................................... 112
II.23 Fiscal Stimulus Measures: Cross-Country Evidence ....................................................... 118
II.24 Role of Automatic Fiscal Stabilisers ................................................................................. 119
II.25 Fiscal Stimulus and Debt Sustainability in India .............................................................. 123
II.26 Implementation of Fiscal Responsibility Laws atState Level –Recent Developments ................................................................................. 130
II.27 Policy Response of the Reserve Bank since mid-September 2008 ................................ 140
II.28 Turmoil in Global Financial Markets – Impact on Indian Capital Market .......................... 152
II.29 Mutual Funds Industry in India - Current Issues .............................................................. 155
II.30 Globalisation and the Pattern of World Growth: Issues of Decoupling ............................ 160
II.31 Impact of the Global Crisis on India’s Exports ................................................................. 165
II.32 The Export Demand Function for India: Some Inferences onthe Impact of the Global Recession on India ................................................................... 168
II.33 Software Exports: Outlook and Prospects ....................................................................... 172
II.34 Impact of Global Slowdown on Remittances ................................................................... 175
II.35 Global Financial Crisis and Capital Flows ........................................................................ 178
II.36 Trade Credit ...................................................................................................................... 181
III.1 Changing Stance of Monetary Policy in India .................................................................. 200
III.2 Central Banks’ Unconventional Policy Measures - InternationalExperience on Liquidity Support to Non-banking Financial Entities ................................ 205
IV.1 Augmentation of the Resource Base of SIDBI, NHB and NABARD ................................ 212
IV.2 Draft Report of the High Level Committee to Review the Lead Bank Scheme ............... 219
IV.3 Financial Inclusion: Policy Prescriptions .......................................................................... 223
IV.4 Implementation of Recommendations of the Working Groups onImprovement of Banking Services in Different States/Union Territories .......................... 225
IV.5 Technical Group for Review of Legislation on Money Lending ........................................ 226
IV.6 Financial Literacy and Credit Counselling Centres – Model Scheme.............................. 228
V.1 Separate Trading of Registered Interest and Principal ofSecurities (STRIPS) – Operational Guidelines ................................................................ 234
V.2 Inter-Regulatory Coordination .......................................................................................... 239
VI.1 Global Financial Crisis and the Indian Banking System:An Assessment of MTM Losses....................................................................................... 244
Page No.
CONTENTS
v
Page No.
CONTENTS
VI.2 Major Recommendations of the Committee on FinancialSector Assessment (CFSA) ............................................................................................. 246
VI.3 Risk Management: Role of Stress Testing ....................................................................... 249
VI.4 Committee on Customer Services ................................................................................... 255
VI.5 Merger and Amalgamation of UCBs ................................................................................ 260
VI.6 Revival of Co-operative Credit Structure .......................................................................... 261
VI.7 Liquidity Crisis – Implications for NBFCs ......................................................................... 265
VI.8 Evolving Regulatory Changes in Response to the Crisis: The Indian Position ................ 267
VII.1 Debt Management and the Global Financial Crisis ......................................................... 279
VII.2 Private Placement of Sovereign Debt with the Central Banks –Cross-country Practices ................................................................................................... 283
VIII.1 Steps taken by the Reserve Bank to curb currency counterfeiting .................................. 300
IX.1 Mobile Banking : Select Country Experiences ................................................................. 310
IX.2 Pre-paid Payment Instruments in India ............................................................................ 311
IX.3 Work Flow and Knowledge Management ........................................................................ 313
IX.4 Virtual Private Networks: Safety and Efficiency Parameters ........................................... 314
X.1 Commemoration of Reserve Bank’s Platinum Jubilee Year ............................................. 328
X.2 ISO Certifications in the Bank .......................................................................................... 332
X.3 IS Audit Policy ................................................................................................................... 333
X.4 Major Decisions of the Central Information Commission (CIC) ....................................... 336
X.5 Expert Committee on Research Funding Policy .............................................................. 341
CHARTS
II.1 Inter-Temporal Progress of Monsoon ............................................................................... 54
II.2 Spatial Distribution of Monsoon ....................................................................................... 54
II.3 Performance of 17 Two-Digit Manufacturing IndustriesDuring Slowdown in the Past ........................................................................................... 64
II.4 Performance of 17 Two-Digit Industries DuringSlowdown in 2007-08 and 2008-09 .................................................................................. 65
II.5 Growth in Six Infrastructure Industries ............................................................................. 67
II.6 Growth Trend in Services Sector ...................................................................................... 72
II.7 Services Exports and GDP Originating from Services Sector ......................................... 74
II.8 Gross Domestic Saving .................................................................................................... 80
II.9 Reserve Money Growth .................................................................................................... 84
II.10 Important Sources of Reserve Money Variation .............................................................. 87
II.11 Broad Money Growth ....................................................................................................... 87
II.12 Currency in Circulation and WPI Inflation ........................................................................ 89
II.13 Fortnightly Variation in Currency in Circulation ................................................................ 89

vi
Page No.
CONTENTS
II.14 Time Deposits Growth Rates ........................................................................................... 89
II.15 Time Deposits and Small Savings ................................................................................... 90
II.16 Non-Food Credit Growth .................................................................................................. 91
II.17 Bank Credit and Investment in Government Securities ................................................... 92
II.18 Income Velocity of Money ................................................................................................. 92
II.19 SLR Investment by Scheduled Commercial Banks ......................................................... 94
II.20 Global Inflation ................................................................................................................. 95
II.21 Volatility in CPI Inflation .................................................................................................... 97
II.22 Increase in International Commodity Prices (year-on-year) ............................................ 99
II.23 Annual WPI Inflation ......................................................................................................... 103
II.24 Food Price Inflation .......................................................................................................... 103
II.25 Asset Price Movements .................................................................................................... 109
II.26 Deficit Indicators of the Central Government ................................................................... 115
II.27 Debt Service Burden of the Central Government ............................................................ 120
II.28 Major Deficit Indicators of the State Governments .......................................................... 121
II.29 Indicators of Global Financial Market Developments ....................................................... 137
II.30 Movement of the LAF and Call Money Rate .................................................................... 142
II.31 Volumes and Rates in the Money Market ........................................................................ 142
II.32 Movement of WADR of CD and Average Call Money Rate ............................................. 144
II.33 Movement of WADR of CPs and Average Call Money Rate ............................................ 144
II.34 Nominal and Real Exchange Rates of Indian Rupee ...................................................... 145
II.35 Rupee-US Dollar Forward Premia ................................................................................... 146
II.36 Average Daily Turnover in the Foreign Exchange Market ................................................ 146
II.37 Yield on Government Bonds ............................................................................................ 147
II.38 Yield and Trading Turnover in Government Securities ..................................................... 148
II.39 Resource Mobilisation in Primary Market ........................................................................ 151
II.40 Key Global Indicators ....................................................................................................... 159
II.41 Key Balance of Payments Indicators ................................................................................ 163
II.42 External Demand and India’s Export Growth ................................................................... 164
II.43 Exports Growth of India vis-a-vis Advanced Economies andEMEs during October 2008-April 2009 ............................................................................ 166
II.44 India’s Export Growth - Principal Commodities (April-February) ..................................... 166
II.45 India’s Import Growth - Principal Commodities (April-February) ..................................... 167
II.46 Monthly Movements in Exports, Imports and Trade Balance ........................................... 169
II.47 India’s Gross Invisible Receipts ....................................................................................... 169
II.48 Growth of India's Software Services Exports ................................................................... 171
II.49 Movements in Oil Price and Remittance Inflows to India ................................................. 174
vii
Page No.
CONTENTS
II.50 Movements in Monthly FDI and Net Portfolio Inflows ...................................................... 179
III.1 Cash Reserve Ratio ......................................................................................................... 201
III.2 MSS Buyback and Issuance of Central Government Securities...................................... 204
III.3 Outstanding LAF, MSS and GOI Balance ........................................................................ 206
III.4 Report(+)/Reverse Repo(-) Under LAF ............................................................................ 206
VI.1 Extension of Protection Accorded to the Depositors ....................................................... 266
VI.2 Frequency Distribution of CRAR of Reporting NBFCs .................................................... 269
VII.1 Weighted Average Yield of Primary Issues of Dated Securities ...................................... 280
VII.2 Primary Market Yields of Treasury Bills ............................................................................ 284
VII.3 Cash Balances of the Central Government ..................................................................... 285
VII.4 Weighted Average Yield on SDLs and Yield to Maturity (YTM) on10-year Central Government Security .............................................................................. 288
VIII.1 Currency and Major Aggregates ...................................................................................... 294
VIII.2 Banknotes in Circulation : End-March 2009 ..................................................................... 295
IX.1 Share of Paper-based versus Electronic Transactions .................................................... 306
IX.2 Trends in Real time Gross Settlement (RTGS) Transactions ........................................... 308
X.1 Total Staff Strength of the Reserve Bank ......................................................................... 324
XI.1 Sources of Income ........................................................................................................... 349
XI.2 Major Items of Expenditure .............................................................................................. 352
XI.3 Trends in Foreign Currency and Domestic Assets (as at end of June) ........................... 354
TEXT TABLES
2.1 Growth Rates of Real GDP .............................................................................................. 50
2.2 Agricultural Production ..................................................................................................... 53
2.3 Season-wise Agricultural Production ............................................................................... 53
2.4 Gross Capital Formation in Agriculture ............................................................................ 57
2.5 Management of Food Stocks ........................................................................................... 59
2.6 Growth Performance of Industrial Sector based onIndex of Industrial Production (IIP) ................................................................................... 63
2.7 Phases of Slowdown in Indian Industry ........................................................................... 63
2.8 Index of Industrial Production: Sectoral and Use-basedClassification of Industries ............................................................................................... 65
2.9 Trends in Growth of Consumer Goods ............................................................................. 66
2.10 Capacity Utilisation ........................................................................................................... 67
2.11 Targets and Achievements of Infrastructure Industries .................................................... 69
2.12 Performance of Central Sector Projects ........................................................................... 69
2.13 Industrial Investment Proposals ....................................................................................... 70
viii
CONTENTS
Page No.
2.14 Performance of Micro, Small and Medium Enterprises.................................................... 71
2.15 Performance of the Services Sector ................................................................................ 74
2.16 Indicators of Services Sector Activity ............................................................................... 74
2.17 Demand Side of GDP-Shares .......................................................................................... 76
2.18 Demand Side of GDP - Growth Rates ............................................................................. 77
2.19 Gross Capital Formation .................................................................................................. 80
2.20 Household Saving in Financial Assets ............................................................................. 82
2.21 Reserve Money – Variations ............................................................................................ 86
2.22 Monetary Indicators .......................................................................................................... 88
2.23 Operations of Scheduled Commercial Banks .................................................................. 90
2.24 Credit Flow from Scheduled Commercial Banks ............................................................. 91
2.25 Non-food Bank Credit - Sectoral Deployment .................................................................. 92
2.26 Flow of Resources to Commercial Sector ........................................................................ 93
2.27 Scheduled Commercial Banks’ Non-SLR Investments .................................................... 94
2.28 Global Inflation Indicators ................................................................................................. 97
2.29 Nominal and Real Policy Rates : Select Countries .......................................................... 98
2.30 International Commodity Prices ....................................................................................... 98
2.31 Key Commodity Price Movements – Global vis-à-vis Domestic ...................................... 100
2.32 Wholesale Price Inflation in India ..................................................................................... 104
2.33 Consumer Price Inflation - Major Groups......................................................................... 107
2.34 Major Fiscal Indicators: Combined Finances ................................................................... 114
2.35 Major Fiscal Indicators of the Central Government ......................................................... 115
2.36 Subsidies of the Centre .................................................................................................... 116
2.37 Key Deficit Indicators of the Centre for 2008-09 - Provisional Accounts ......................... 120
2.38 Average Interest Rates on Outstanding Domestic Liabilities of the Centre ..................... 120
2.39 Indicators of Combined Finances of the Centre and States ............................................ 122
2.40 Combined Liabilities of the Centre and States ................................................................. 123
2.41 Outstanding Government Guarantees ............................................................................. 124
2.42 Decomposition of the GFD of the Central Government .................................................. 125
2.43 Revenue Position of the Central Government .................................................................. 126
2.44 Gross Tax Revenues of the Central Government ............................................................. 126
2.45 Expenditure Pattern of the Central Government .............................................................. 127
2.46 Expenditure on Select Development Heads of the Central Government ......................... 127
2.47 Financing Pattern of Gross Fiscal Deficit of the Central Government ............................. 128
2.48 Eleventh Plan Projections for the Central Government vis-à-vis the Budget Estimates .. 128
2.49 Deficit and Debt Indicators of the Central Government-Select Countries ....................... 128
2.50 Major Deficit Indicators of the State Governments .......................................................... 129
ix
CONTENTS
Page No.
2.51 Aggregate Receipts of the State Governments ............................................................... 131
2.52 Expenditure Pattern of the State Governments ............................................................... 132
2.53 Decomposition and Financing Pattern of Gross Fiscal Deficit of States ......................... 133
2.54 Measures of Deficit of the Central and State Governments ............................................ 133
2.55 Combined Receipts and Disbursement of the Centre and States ................................... 134
2.56 Financing of Gross Fiscal Deficit of the Centre and States ............................................. 134
2.57 Combined Expenditure of the Centre and States on Social Sector ................................. 135
2.58 International Stock Markets .............................................................................................. 138
2.59 Appreciation (+)/Depreciation (-) of the US dollar vis-à-vis other Currencies ................. 138
2.60 Domestic Markets at a Glance ......................................................................................... 141
2.61 Activity in Money Market Segments ................................................................................. 143
2.62 Commercial Paper-Major Issuers ..................................................................................... 144
2.63 Purchase and Sales of US dollar by the Reserve Bank .................................................. 145
2.64 Movements in Deposit and Lending Rate ........................................................................ 148
2.65 Changes in Deposit and Lending Rates .......................................................................... 149
2.66 Mobilisation of Resources from the Primary Market ........................................................ 150
2.67 Indian Equity Markets - Key Indicators ............................................................................. 153
2.68 BSE Sectoral Stock Indices.............................................................................................. 153
2.69 Trends in Institutional Investments ................................................................................... 153
2.70 Resource Mobilisation by Mutual Funds .......................................................................... 154
2.71 Funds Mobilised by Mutual Funds - Type of Schemes .................................................... 156
2.72 Resources Raised by way of Bonds/Debentures by Select All-India FIs ......................... 156
2.73 Direction of India’s Exports .............................................................................................. 166
2.74 Direction of India’s Imports ............................................................................................... 167
2.75 Balance of Payments : Key Indicators .............................................................................. 170
2.76 Structure of India’s Service Exports ................................................................................. 171
2.77 India’s Share in World Exports of Goods and Services ................................................... 171
2.78 Computer & Information Services Exports ....................................................................... 173
2.79 Foreign Tourists Arrival in India and Outbound Tourist Traffic .......................................... 173
2.80 Non-Software Miscellaneous Receipts & Payments ........................................................ 173
2.81 Composition of Private Transfers to India......................................................................... 174
2.82 Migrant Remittances: Top Recipients ............................................................................... 174
2.83 Trade and Current Account Balances in Select Countries ............................................... 176
2.84 Gross Capital Inflows and Outflows ................................................................................. 177
2.85 Foreign Investment Flows to India ................................................................................... 179
2.86 Foreign Direct Investment Flows to India: Country-wise and Industry-wise .................... 180
2.87 India’s Direct Investment Abroad ..................................................................................... 180
x
CONTENTS
Page No.
2.88 India’s Grants and Loans to Foreign Governments ......................................................... 182
2.89 Balances under NRI Deposit Schemes ............................................................................ 182
2.90 Ceiling Interest rates on NRI Deposits ............................................................................. 182
2.91 India’s External Debt ........................................................................................................ 183
2.92 External Debt Service Payments ..................................................................................... 183
2.93 International Comparison of Top Ten Debtor Countries, 2007 ......................................... 184
2.94 Sources of Variation in Foreign Exchange Reserves ....................................................... 184
2.95 Foreign Exchange Reserves of the Major EMEs ............................................................. 185
2.96 Deployment Pattern of Foreign Currency Assets ............................................................. 186
2.97 International Investment Position of India ........................................................................ 186
3.1 Movement in Key Policy Rates and Reserve Requirements ............................................ 192
3.2 Reserve Bank’s Liquidity Management Operations ......................................................... 202
3.3 Monthly Primary Liquidity Flows and Open Market Operations ....................................... 202
3.4 Indicators of Liquidity ........................................................................................................ 204
3.5 Reserve Bank’s Holdings of Central Government Dated Securities ................................ 207
3.6 Reverse Repo/Repo Bids under LAF ............................................................................... 208
4.1 Priority Sector Advances .................................................................................................. 213
4.2 Disbursements under Special Agricultural Credit Plans .................................................. 214
4.3 Targets and Actual Disbursement to Agriculture by Banks .............................................. 214
4.4 Outstanding Agricultural Advances .................................................................................. 215
4.5 Public Sector Banks – Recovery of Direct Agricultural Advances ................................... 215
4.6 Proposed Reimbursement ................................................................................................ 216
4.6 Outstanding Credit to Micro and Small Enterprises ......................................................... 217
4.7 Credit to Sick Micro and Small Enterprises ..................................................................... 217
4.8 Bank Credit to Minority Communities by SCBs under Priority Sector Advances ............ 221
4.9 Bank Loans Outstanding against SHGs as on March 31, 2008 ...................................... 221
6.1 Health of Scheduled Commercial Banks in India ............................................................. 242
6.2 Offices of Indian Banks Opened Abroad – Between July 2008 and June 2009 .............. 247
6.3 Offices of Foreign Banks Opened in India – Between July 2008 and June 2009 ............ 248
6.4 Timeframe for Implementation of Advanced Approaches in India ................................... 248
6.5 Resolution of NPAs ........................................................................................................... 250
6.6 Frauds in the Banking Sector ........................................................................................... 257
6.7 Utilisation of Refinance Facilities ...................................................................................... 263
6.8 Select Financial Indicators ............................................................................................... 268
6.9 Scheduled Commercial Banks – Frequency Distribution of CRAR ................................. 269
6.10 CRAR and Net NPAs of Select Financial Institutions (End-March 2009) ........................ 269
xi
CONTENTS
Page No.
6.11 Scheduled Commercial Banks - Performance Indicators ................................................ 270
6.12 Net NPA to Net Advances of Scheduled Commercial Banks ........................................... 271
6.13 Net NPAs to Net Advances of SUCBs.............................................................................. 271
6.14 Scheduled Commercial Banks – Cost of Funds and Return on Funds ........................... 272
6.15 Operational Results of Scheduled Commercial Banks – Key Ratios ............................... 272
6.16 Operational Results of Scheduled Commercial Banks: 2008-09 ..................................... 273
6.17 Operational Results of SUCBs – Key Ratios ................................................................... 273
7.1 Gross and Net Market Borrowings of the Central Government ....................................... 278
7.2 Central Government’s Market Loans- A Profile ................................................................ 281
7.3 Primary Cut-Off Yield and Prevailing Secondary Market Yield ........................................ 281
7.4 Maturity Profile of Central Government Dated Securities ................................................ 282
7.5 Treasury Bills in the Primary Market ................................................................................ 284
7.6 Annual Market Borrowings of State Governments ........................................................... 286
7.7 Yield on State Government Securities ............................................................................. 287
7.8 Month-wise Market Borrowings of State Governments ................................................... 287
7.9 Weighted Average Spreads during 2008-09 .................................................................... 288
7.10 Frequency Distribution of Tranches of Auctions during 2008-09...................................... 288
7.11 Maturity Profile of Outstanding State Development Loans and Power Bonds ................. 289
7.12 WMA/Overdrafts of the State Governments .................................................................... 290
7.13 State-wise Availment of WMA/Overdraft .......................................................................... 290
7.14 Investments of the State Governments/UT ...................................................................... 291
8.1 Banknotes in Circulation .................................................................................................. 294
8.2 Coins in Circulation .......................................................................................................... 295
8.3 Currency Chests ............................................................................................................... 295
8.4 Small Coin Depots ............................................................................................................ 296
8.5 Volume of Banknotes Indented and Supplied .................................................................. 296
8.6 Value of Banknotes Indented and Supplied ..................................................................... 297
8.7 Supply and Cost of Banknotes ......................................................................................... 297
8.8 Indent and Supply of Coins (Volume) ............................................................................... 298
8.9 Indent and Supply of Coins (Value) .................................................................................. 298
8.10 Disposal of Soiled Notes and Supply of Fresh Banknotes............................................... 299
8.11 Counterfeit Notes Detected .............................................................................................. 299
8.12 Number of Counterfeit Notes Detected at the Reserve Bank and Bank Branches ......... 299
9.1 Payment System Indicators - Annual Turnover ................................................................ 304
9.2 Retail Electronic Funds Transfer Systems........................................................................ 307
xii
Page No.
CONTENTS
9.3 Card-Based Payment Transactions .................................................................................. 307
9.4 Evaluation of Critical IT Implementation: 2008-09 ........................................................... 314
10.1 Reserve Bank Training Establishments - Programmes Conducted ................................. 317
10.2 Select Programmes/ Seminars/ Workshops Conducted byTraining Colleges during 2008-09 .................................................................................... 318
10.3 Number of Officers Trained in External Training Institutions in India and Abroad ............ 319
10.4 Courses Conducted under Joint India- IMF Training Programme-Pune .......................... 319
10.5 Recruitment by the Reserve Bank - 2008 ........................................................................ 323
10.6 Staff Strength of Reserve Bank ....................................................................................... 324
10.7 Category-wise Actual Staff Strength (As on December 31, 2008) .................................. 325
10.8 Department-wise Staff Strength of the Reserve Bank ..................................................... 326
10.9 Reserve Bank’s Office-wise Strength of Staff .................................................................. 327
10.10 Right to Information Act, 2005 – Requests Received and Resolved during the year ...... 335
11.1 Trends in Gross Income, Expenditure and Net Disposable Income ................................ 348
11.2 Gross Income ................................................................................................................... 349
11.3 Contingency and Asset Development Reserves andSurplus Transfer to the Government ................................................................................ 350
11.4 Earnings from Foreign Sources ....................................................................................... 350
11.5 Earnings from Domestic Sources .................................................................................... 351
11.6 Expenditure ...................................................................................................................... 351
11.7 Balances in Currency and Gold Revaluation Account andExchange Equalisation Account ....................................................................................... 353
11.8 Balances in Contingency Reserve and Asset Development Reserve ............................. 354
11.9 Outstanding Foreign Currency and Domestic Assets ...................................................... 354
11.10 Investments in Shares of Subsidiaries/Associate Institutions .......................................... 354
APPENDIX TABLES
1 Select Macroeconomic and Financial Indicators.............................................................. 399
2 Growth Rates and Sectoral Composition ofReal Gross Domestic Product (At 1999-2000 prices) ...................................................... 400
3 Quarterly Growth Rates and Composition of Real Gross Domestic Product(At 1999-2000 prices) ....................................................................................................... 401
4 Agricultural Production ..................................................................................................... 402
5 Procurement, Off-take and Stocks of Foodgrains ............................................................ 403
6 Trends in Index of Industrial Production (Base: 1993-94=100) ........................................ 404
7 Growth in Index of Seventeen Major Industry Groups of Manufacturing Sector(Base : 1993-94=100) ....................................................................................................... 405
8 Frequency Distribution of Growth Rates of Seventeen Major IndustryGroup of Manufacturing Sector - 2004-05 to 2008-09 ..................................................... 406
xiii
9 Use-Based Classification of Industrial Production (Base: 1993-94=100) ........................ 407
10 Growth of Six Infrastructure Industries (Base: 1993-94=100) ......................................... 408
11 Gross Domestic Saving and Investment .......................................................................... 409
12 Financial Saving of the Household Sector (Gross) .......................................................... 410
13 Variations in Reserve Money ........................................................................................... 411
14 Reserve Bank of India (RBI) Survey ................................................................................ 412
15 Variations in Money Stock ................................................................................................ 413
16 New Monetary Aggregates ............................................................................................... 414
17 Liquidity Aggregates ......................................................................................................... 415
18 Important Banking Indicators - Scheduled Commercial Banks ....................................... 416
19 Commercial Bank Survey ................................................................................................. 417
20 Sectoral Deployment of Gross Bank Credit ..................................................................... 418
21 Industry-Wise Deployment of Gross Bank Credit ............................................................ 419
22 Reserve Bank’s Accommodation to Scheduled Commercial Banks ................................ 420
23 Variations in Index Numbers of Wholesale Prices ........................................................... 421
24 Variations in Wholesale Prices - Weighted Contributions ................................................ 422
25 Variations in Price Indices (Year-on-Year) ........................................................................ 423
26 Measures of deficit of the Central Government ............................................................... 424
27 Major Items of Receipts and Expenditures of the Central Government .......................... 425
28 Financing of Gross Fiscal Deficit of the Central Government .......................................... 426
29 Outstanding Liabilities of the Central Government .......................................................... 427
30 Budgetary Operations of the State Governments ............................................................ 428
31 Financing of Gross Fiscal Deficit andOutstanding Liabilities of State Governments .................................................................. 429
32 Direct and Indirect Tax Revenues of the Central and the State Governments ................ 430
33 Combined Receipts and Disbursements of the Central and State Governments ........... 431
34 Market Borrowings of the Central and State Governments ............................................. 432
35 Repo/Reverse Repo Auctions Under Liquidity Adjustment Facility ................................. 433
36 Issue of Certificates of Deposit by Scheduled Commercial Banks .................................. 441
37 Commercial Paper ............................................................................................................ 442
38 Indices of Real Effective Exchange Rate (REER) andNominal Effective Exchange Rate (NEER) of the Indian Rupee ..................................... 443
39 Inter-Bank and Merchant Transactions in the Foreign Exchange Market ........................ 444
40 Secondary Market Transactions in Government Securities ............................................. 446
41 Interest Rate Structure of Scheduled Commercial Banks ............................................... 446
Page No.
CONTENTS
xiv
42 New capital Issues by Non-Government Public Limited Companies ............................... 447
43 Domestic Stock Indices .................................................................................................... 448
44 Major Indicators of Domestic Equity Markets................................................................... 449
45 Turnover in the Equity Derivatives Market ........................................................................ 450
46 Assistance Sanctioned and Disbursed by Financial Institutions ...................................... 451
47 Select Economic Indicators - World ................................................................................. 452
48 India’s Foreign Trade ........................................................................................................ 453
49 India’s Exports of Principal Commodities ......................................................................... 454
50 India’s Imports of Principal Commodities ......................................................................... 455
51 India’s Overall Balance of Payments ................................................................................ 456
52 Invisibles by Category of Transactions ............................................................................. 457
53 Composition of Capital Flows (Net).................................................................................. 458
54 External Assistance .......................................................................................................... 459
55 India’s External Debt (As at end-March) .......................................................................... 460
56 India’s Foreign Exchange Reserves ................................................................................. 462
57 Interest Rates on Export Credit ........................................................................................ 463
58 Profile of Central Government Dated Securities .............................................................. 464
59 Issuances of Central Government Dated Securities ........................................................ 465
60 Additional Issuance of Treasury Bills during 2008-09 ...................................................... 467
61 Profile of Treasury Bills ..................................................................................................... 468
62 Market Borrowings Programme of the State Governments/Union Territories - 2008-09 . 469
63 Weighted Average Yields and Spreads in Auction of SDLs during 2008-09 .................... 470
64 Market Borrowings of the State Governments/U.T. Raised Through Auctions ................ 471
65 Maturity Profile of Outstanding Securities of State Governments/U.T. ............................ 475
66 Normal WMA Limits of States/UT .................................................................................... 476
Page No.
CONTENTS
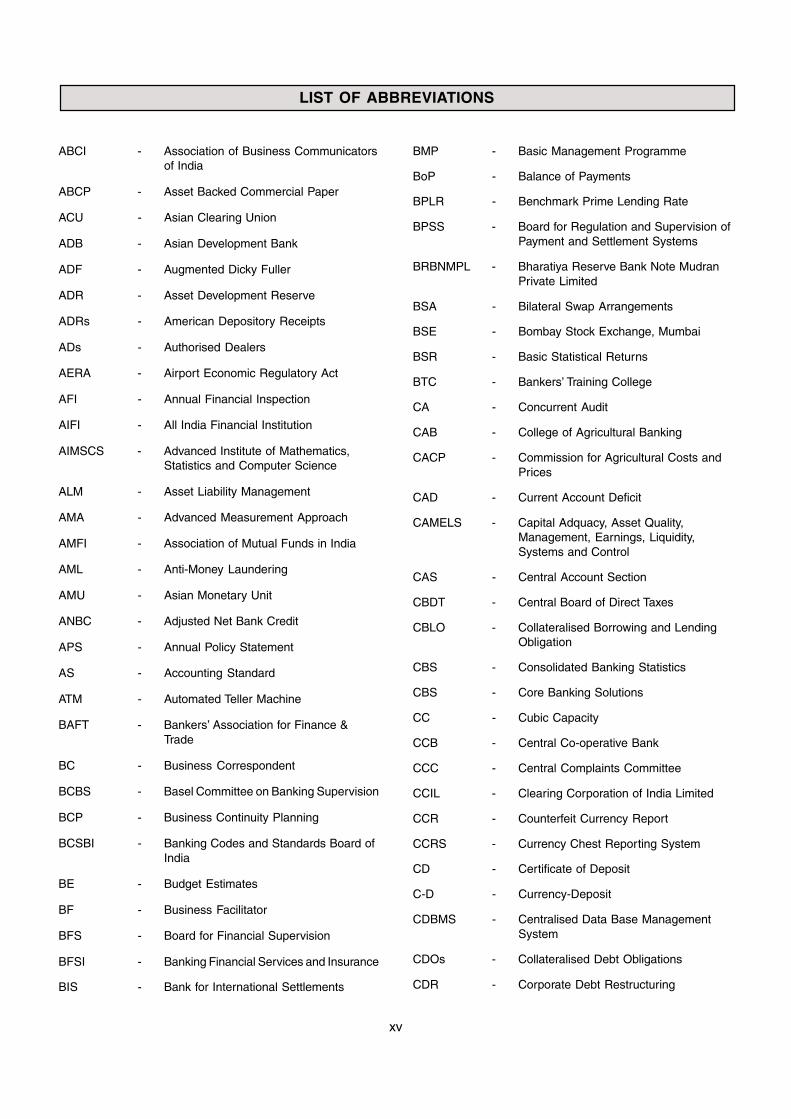
LIST OF ABBREVIATIONS
xv
ABCI - Association of Business Communicatorsof India
ABCP - Asset Backed Commercial Paper
ACU - Asian Clearing Union
ADB - Asian Development Bank
ADF - Augmented Dicky Fuller
ADR - Asset Development Reserve
ADRs - American Depository Receipts
ADs - Authorised Dealers
AERA - Airport Economic Regulatory Act
AFI - Annual Financial Inspection
AIFI - All India Financial Institution
AIMSCS - Advanced Institute of Mathematics,Statistics and Computer Science
ALM - Asset Liability Management
AMA - Advanced Measurement Approach
AMFI - Association of Mutual Funds in India
AML - Anti-Money Laundering
AMU - Asian Monetary Unit
ANBC - Adjusted Net Bank Credit
APS - Annual Policy Statement
AS - Accounting Standard
ATM - Automated Teller Machine
BAFT - Bankers’ Association for Finance &Trade
BC - Business Correspondent
BCBS - Basel Committee on Banking Supervision
BCP - Business Continuity Planning
BCSBI - Banking Codes and Standards Board ofIndia
BE - Budget Estimates
BF - Business Facilitator
BFS - Board for Financial Supervision
BFSI - Banking Financial Services and Insurance
BIS - Bank for International Settlements
BMP - Basic Management Programme
BoP - Balance of Payments
BPLR - Benchmark Prime Lending Rate
BPSS - Board for Regulation and Supervision ofPayment and Settlement Systems
BRBNMPL - Bharatiya Reserve Bank Note MudranPrivate Limited
BSA - Bilateral Swap Arrangements
BSE - Bombay Stock Exchange, Mumbai
BSR - Basic Statistical Returns
BTC - Bankers’ Training College
CA - Concurrent Audit
CAB - College of Agricultural Banking
CACP - Commission for Agricultural Costs andPrices
CAD - Current Account Deficit
CAMELS - Capital Adquacy, Asset Quality,Management, Earnings, Liquidity,Systems and Control
CAS - Central Account Section
CBDT - Central Board of Direct Taxes
CBLO - Collateralised Borrowing and LendingObligation
CBS - Consolidated Banking Statistics
CBS - Core Banking Solutions
CC - Cubic Capacity
CCB - Central Co-operative Bank
CCC - Central Complaints Committee
CCIL - Clearing Corporation of India Limited
CCR - Counterfeit Currency Report
CCRS - Currency Chest Reporting System
CD - Certificate of Deposit
C-D - Currency-Deposit
CDBMS - Centralised Data Base ManagementSystem
CDOs - Collateralised Debt Obligations
CDR - Corporate Debt Restructuring

LIST OF ABBREVIATIONS
xvi
CDS - Credit Default Swap
CENVAT - Central Value Added Tax
CFMS - Centralised Funds Management System
CFSA - Committee on Financial SectorAssessment
CFT - Combating Financing of Terrorism
CGFTMSE - Credit Guarantee Fund Trust for Microand Small Enterprises
CGRA - Currency & Gold Revaluation Account
CIC - Central Information Commission
CICs - Credit Information Companies
CIS - Commonwealth of Independent States
CMCPS - Compulsorily and MandatorilyConvertible Preference Shares
CMIS - Currency Management InformationSystem
CoBoSAC - Corporate Bonds and SecuritisationAdvisory Committee
CODs - Central Office Departments
CoR - Certificate of Registration
CP - Commercial Paper
CPADS - Centralised Public Accounts DepartmentSystem
CPC - Cheque Processing Centre
CPDO - Centralised Public Debt Office
CPFF - Commercial Paper Funding Facility
CPI - Consumer Price Index
CPI-AL - Consumer Price Index-Agricultural Labourers
CPI-RL - Consumer Price Index-Rural Labourers
CPI-IW - Consumer Price Index for IndustrialWorkers
CPIO - Central Public Information Officer
CPIs - Consumer Price Indices
CPMG - Corporate Performance MonitoringGroup
CPPC - Central Pension Payment Cell
CPSEs - Central Public Sector Enterprises
CR - Contingency Reserve
CRAR - Capital to Risk-Weighted Assets Ratio
CRCS - Central Registar of Co-operativeSocieties
CRR - Cash Reserve Ratio
CSAA - Control Self Assessment Audit
CSD - Customer Services Department
CSF - Consolidated Sinking Fund
CSGL - Constituant Subsidiary General Ledger
CSO - Central Statistical Organisation
CTR - Cash Transaction Receipt
CTS - Cheque Truncation System
CTS - Complaint Tracking System
CVD - Countervailing Duty
CVPS - Currency Verification and ProcessingSystem
CWC - Central Water Commission
DAD - Deposit Accounts Department
DAP - District Agricultural Plan
DAPM - Department of Administration andPersonnel Management
DBOD - Department of Banking Operations andDevelopment
DBS - Department of Banking Supervision
DCC - District Consultative Committee
DCCB - District Central Cooperative Bank
DCM - Department of Currency Management
DEAP - Department of Economic Analysis andPolicy
DEBC - Department of Expenditure andBudgetary Control
DEIO - Department of External Investments andOperations
DEPB - Duty Entitlement Pass Book
DGBA - Department of Government and BankAccounts
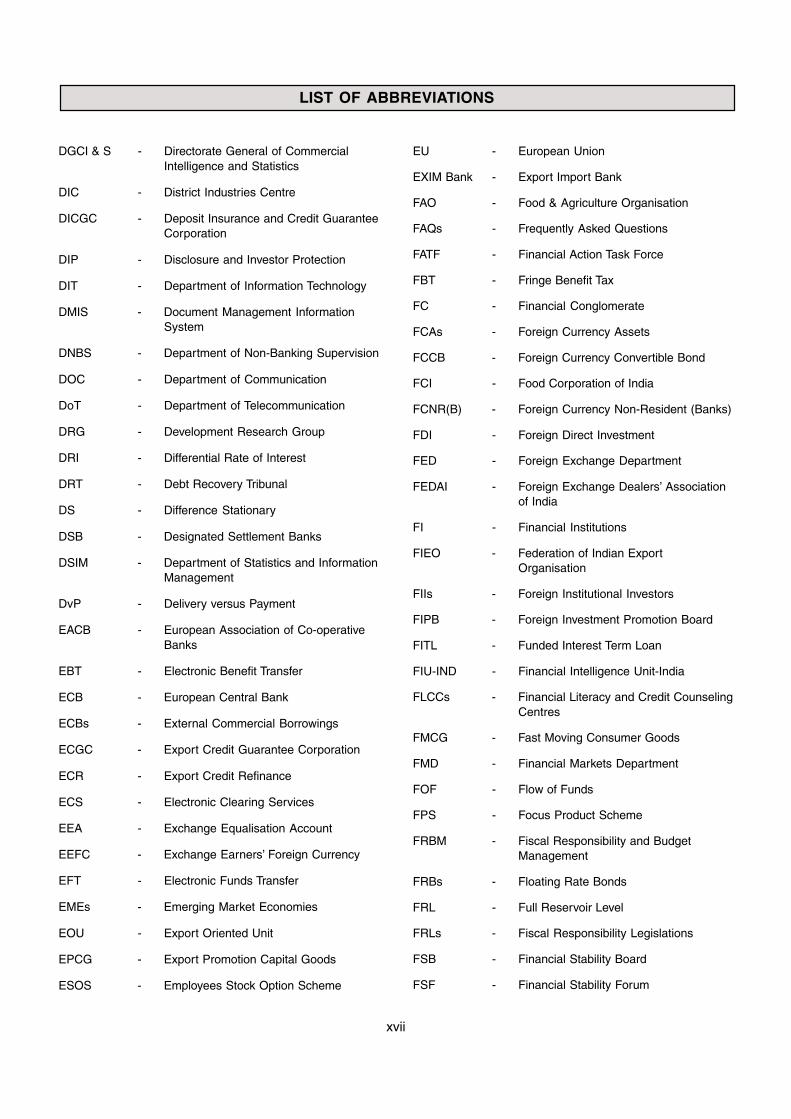
LIST OF ABBREVIATIONS
xvii
DGCI & S - Directorate General of CommercialIntelligence and Statistics
DIC - District Industries Centre
DICGC - Deposit Insurance and Credit GuaranteeCorporation
DIP - Disclosure and Investor Protection
DIT - Department of Information Technology
DMIS - Document Management InformationSystem
DNBS - Department of Non-Banking Supervision
DOC - Department of Communication
DoT - Department of Telecommunication
DRG - Development Research Group
DRI - Differential Rate of Interest
DRT - Debt Recovery Tribunal
DS - Difference Stationary
DSB - Designated Settlement Banks
DSIM - Department of Statistics and InformationManagement
DvP - Delivery versus Payment
EACB - European Association of Co-operativeBanks
EBT - Electronic Benefit Transfer
ECB - European Central Bank
ECBs - External Commercial Borrowings
ECGC - Export Credit Guarantee Corporation
ECR - Export Credit Refinance
ECS - Electronic Clearing Services
EEA - Exchange Equalisation Account
EEFC - Exchange Earners’ Foreign Currency
EFT - Electronic Funds Transfer
EMEs - Emerging Market Economies
EOU - Export Oriented Unit
EPCG - Export Promotion Capital Goods
ESOS - Employees Stock Option Scheme
EU - European Union
EXIM Bank - Export Import Bank
FAO - Food & Agriculture Organisation
FAQs - Frequently Asked Questions
FATF - Financial Action Task Force
FBT - Fringe Benefit Tax
FC - Financial Conglomerate
FCAs - Foreign Currency Assets
FCCB - Foreign Currency Convertible Bond
FCI - Food Corporation of India
FCNR(B) - Foreign Currency Non-Resident (Banks)
FDI - Foreign Direct Investment
FED - Foreign Exchange Department
FEDAI - Foreign Exchange Dealers’ Associationof India
FI - Financial Institutions
FIEO - Federation of Indian ExportOrganisation
FIIs - Foreign Institutional Investors
FIPB - Foreign Investment Promotion Board
FITL - Funded Interest Term Loan
FIU-IND - Financial Intelligence Unit-India
FLCCs - Financial Literacy and Credit CounselingCentres
FMCG - Fast Moving Consumer Goods
FMD - Financial Markets Department
FOF - Flow of Funds
FPS - Focus Product Scheme
FRBM - Fiscal Responsibility and BudgetManagement
FRBs - Floating Rate Bonds
FRL - Full Reservoir Level
FRLs - Fiscal Responsibility Legislations
FSB - Financial Stability Board
FSF - Financial Stability Forum
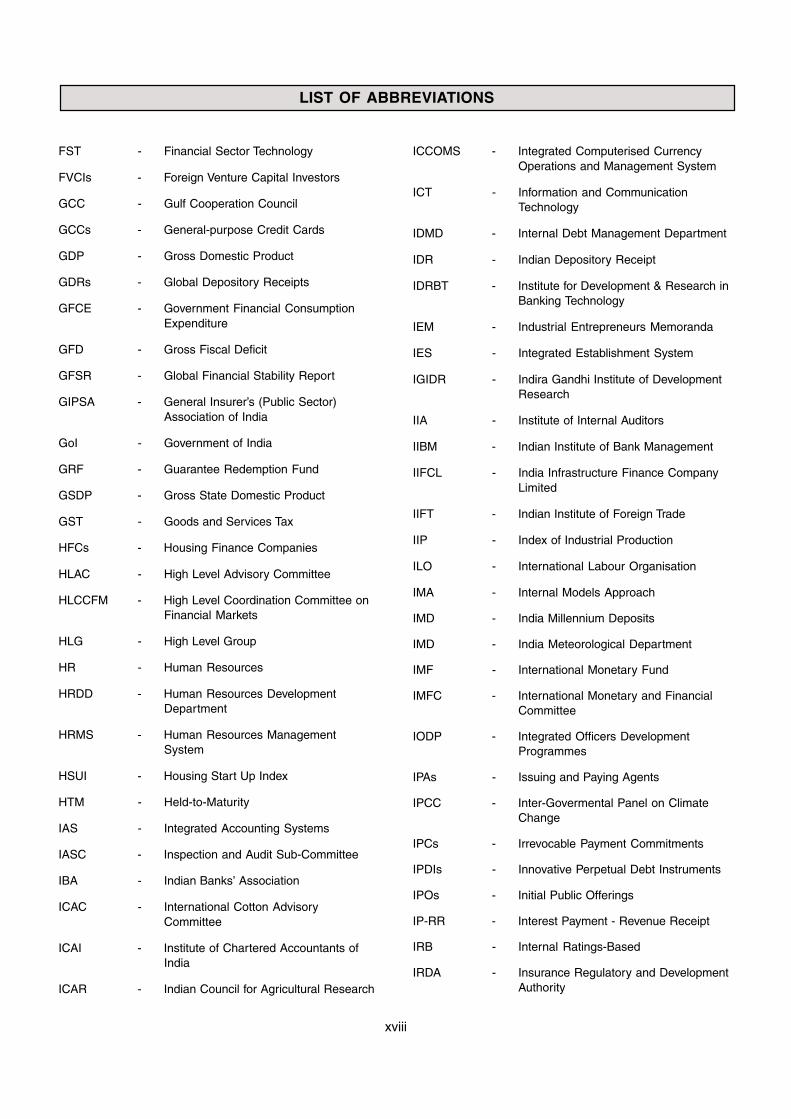
LIST OF ABBREVIATIONS
xviii
FST - Financial Sector Technology
FVCIs - Foreign Venture Capital Investors
GCC - Gulf Cooperation Council
GCCs - General-purpose Credit Cards
GDP - Gross Domestic Product
GDRs - Global Depository Receipts
GFCE - Government Financial ConsumptionExpenditure
GFD - Gross Fiscal Deficit
GFSR - Global Financial Stability Report
GIPSA - General Insurer’s (Public Sector)Association of India
GoI - Government of India
GRF - Guarantee Redemption Fund
GSDP - Gross State Domestic Product
GST - Goods and Services Tax
HFCs - Housing Finance Companies
HLAC - High Level Advisory Committee
HLCCFM - High Level Coordination Committee onFinancial Markets
HLG - High Level Group
HR - Human Resources
HRDD - Human Resources DevelopmentDepartment
HRMS - Human Resources ManagementSystem
HSUI - Housing Start Up Index
HTM - Held-to-Maturity
IAS - Integrated Accounting Systems
IASC - Inspection and Audit Sub-Committee
IBA - Indian Banks’ Association
ICAC - International Cotton AdvisoryCommittee
ICAI - Institute of Chartered Accountants ofIndia
ICAR - Indian Council for Agricultural Research
ICCOMS - Integrated Computerised CurrencyOperations and Management System
ICT - Information and CommunicationTechnology
IDMD - Internal Debt Management Department
IDR - Indian Depository Receipt
IDRBT - Institute for Development & Research inBanking Technology
IEM - Industrial Entrepreneurs Memoranda
IES - Integrated Establishment System
IGIDR - Indira Gandhi Institute of DevelopmentResearch
IIA - Institute of Internal Auditors
IIBM - Indian Institute of Bank Management
IIFCL - India Infrastructure Finance CompanyLimited
IIFT - Indian Institute of Foreign Trade
IIP - Index of Industrial Production
ILO - International Labour Organisation
IMA - Internal Models Approach
IMD - India Millennium Deposits
IMD - India Meteorological Department
IMF - International Monetary Fund
IMFC - International Monetary and FinancialCommittee
IODP - Integrated Officers DevelopmentProgrammes
IPAs - Issuing and Paying Agents
IPCC - Inter-Govermental Panel on ClimateChange
IPCs - Irrevocable Payment Commitments
IPDIs - Innovative Perpetual Debt Instruments
IPOs - Initial Public Offerings
IP-RR - Interest Payment - Revenue Receipt
IRB - Internal Ratings-Based
IRDA - Insurance Regulatory and DevelopmentAuthority
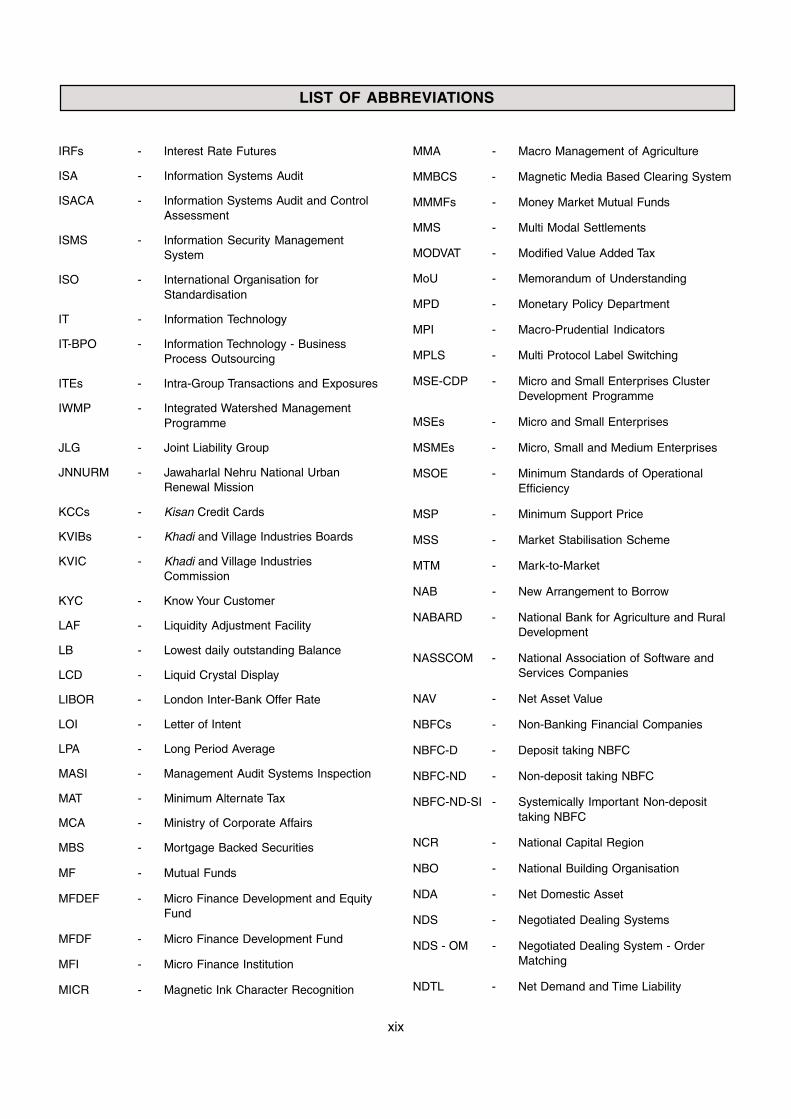
LIST OF ABBREVIATIONS
xix
IRFs - Interest Rate Futures
ISA - Information Systems Audit
ISACA - Information Systems Audit and ControlAssessment
ISMS - Information Security ManagementSystem
ISO - International Organisation forStandardisation
IT - Information Technology
IT-BPO - Information Technology - BusinessProcess Outsourcing
ITEs - Intra-Group Transactions and Exposures
IWMP - Integrated Watershed ManagementProgramme
JLG - Joint Liability Group
JNNURM - Jawaharlal Nehru National UrbanRenewal Mission
KCCs - Kisan Credit Cards
KVIBs - Khadi and Village Industries Boards
KVIC - Khadi and Village IndustriesCommission
KYC - Know Your Customer
LAF - Liquidity Adjustment Facility
LB - Lowest daily outstanding Balance
LCD - Liquid Crystal Display
LIBOR - London Inter-Bank Offer Rate
LOI - Letter of Intent
LPA - Long Period Average
MASI - Management Audit Systems Inspection
MAT - Minimum Alternate Tax
MCA - Ministry of Corporate Affairs
MBS - Mortgage Backed Securities
MF - Mutual Funds
MFDEF - Micro Finance Development and EquityFund
MFDF - Micro Finance Development Fund
MFI - Micro Finance Institution
MICR - Magnetic Ink Character Recognition
MMA - Macro Management of Agriculture
MMBCS - Magnetic Media Based Clearing System
MMMFs - Money Market Mutual Funds
MMS - Multi Modal Settlements
MODVAT - Modified Value Added Tax
MoU - Memorandum of Understanding
MPD - Monetary Policy Department
MPI - Macro-Prudential Indicators
MPLS - Multi Protocol Label Switching
MSE-CDP - Micro and Small Enterprises ClusterDevelopment Programme
MSEs - Micro and Small Enterprises
MSMEs - Micro, Small and Medium Enterprises
MSOE - Minimum Standards of OperationalEfficiency
MSP - Minimum Support Price
MSS - Market Stabilisation Scheme
MTM - Mark-to-Market
NAB - New Arrangement to Borrow
NABARD - National Bank for Agriculture and RuralDevelopment
NASSCOM - National Association of Software andServices Companies
NAV - Net Asset Value
NBFCs - Non-Banking Financial Companies
NBFC-D - Deposit taking NBFC
NBFC-ND - Non-deposit taking NBFC
NBFC-ND-SI - Systemically Important Non-deposittaking NBFC
NCR - National Capital Region
NBO - National Building Organisation
NDA - Net Domestic Asset
NDS - Negotiated Dealing Systems
NDS - OM - Negotiated Dealing System - OrderMatching
NDTL - Net Demand and Time Liability
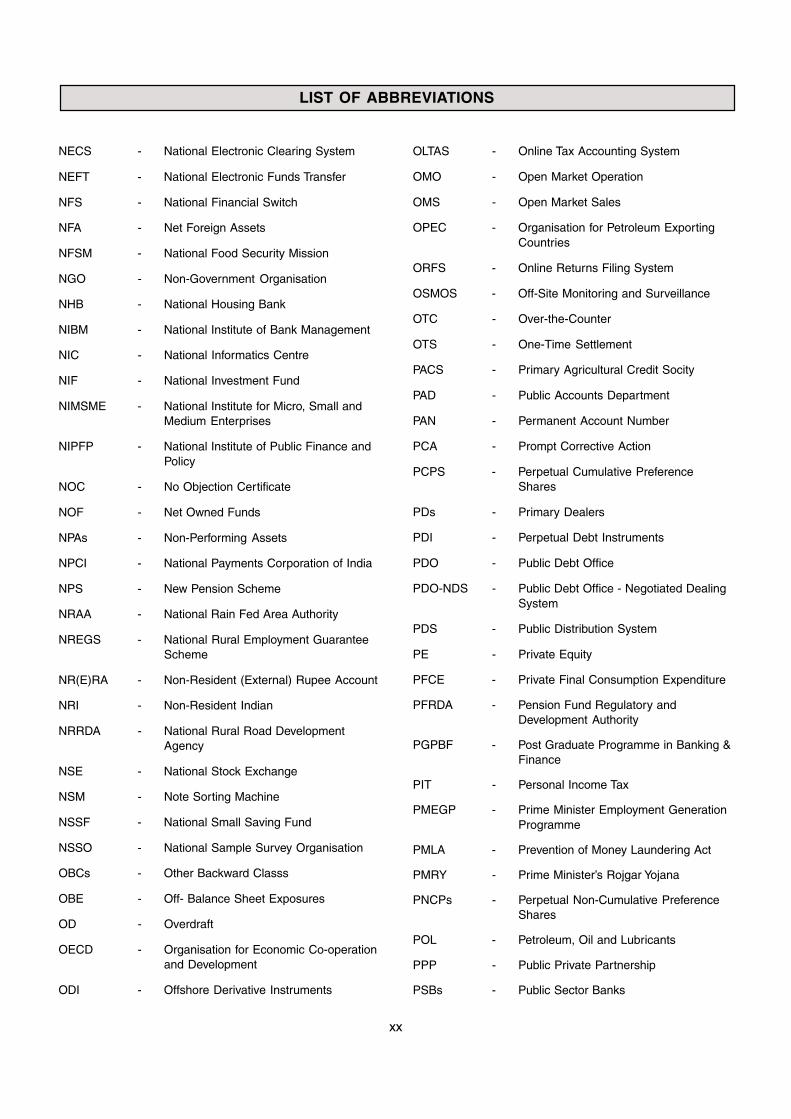
LIST OF ABBREVIATIONS
xx
NECS - National Electronic Clearing System
NEFT - National Electronic Funds Transfer
NFS - National Financial Switch
NFA - Net Foreign Assets
NFSM - National Food Security Mission
NGO - Non-Government Organisation
NHB - National Housing Bank
NIBM - National Institute of Bank Management
NIC - National Informatics Centre
NIF - National Investment Fund
NIMSME - National Institute for Micro, Small andMedium Enterprises
NIPFP - National Institute of Public Finance andPolicy
NOC - No Objection Certificate
NOF - Net Owned Funds
NPAs - Non-Performing Assets
NPCI - National Payments Corporation of India
NPS - New Pension Scheme
NRAA - National Rain Fed Area Authority
NREGS - National Rural Employment GuaranteeScheme
NR(E)RA - Non-Resident (External) Rupee Account
NRI - Non-Resident Indian
NRRDA - National Rural Road DevelopmentAgency
NSE - National Stock Exchange
NSM - Note Sorting Machine
NSSF - National Small Saving Fund
NSSO - National Sample Survey Organisation
OBCs - Other Backward Classs
OBE - Off- Balance Sheet Exposures
OD - Overdraft
OECD - Organisation for Economic Co-operationand Development
ODI - Offshore Derivative Instruments
OLTAS - Online Tax Accounting System
OMO - Open Market Operation
OMS - Open Market Sales
OPEC - Organisation for Petroleum ExportingCountries
ORFS - Online Returns Filing System
OSMOS - Off-Site Monitoring and Surveillance
OTC - Over-the-Counter
OTS - One-Time Settlement
PACS - Primary Agricultural Credit Socity
PAD - Public Accounts Department
PAN - Permanent Account Number
PCA - Prompt Corrective Action
PCPS - Perpetual Cumulative PreferenceShares
PDs - Primary Dealers
PDI - Perpetual Debt Instruments
PDO - Public Debt Office
PDO-NDS - Public Debt Office - Negotiated DealingSystem
PDS - Public Distribution System
PE - Private Equity
PFCE - Private Final Consumption Expenditure
PFRDA - Pension Fund Regulatory andDevelopment Authority
PGPBF - Post Graduate Programme in Banking &Finance
PIT - Personal Income Tax
PMEGP - Prime Minister Employment GenerationProgramme
PMLA - Prevention of Money Laundering Act
PMRY - Prime Minister’s Rojgar Yojana
PNCPs - Perpetual Non-Cumulative PreferenceShares
POL - Petroleum, Oil and Lubricants
PPP - Public Private Partnership
PSBs - Public Sector Banks
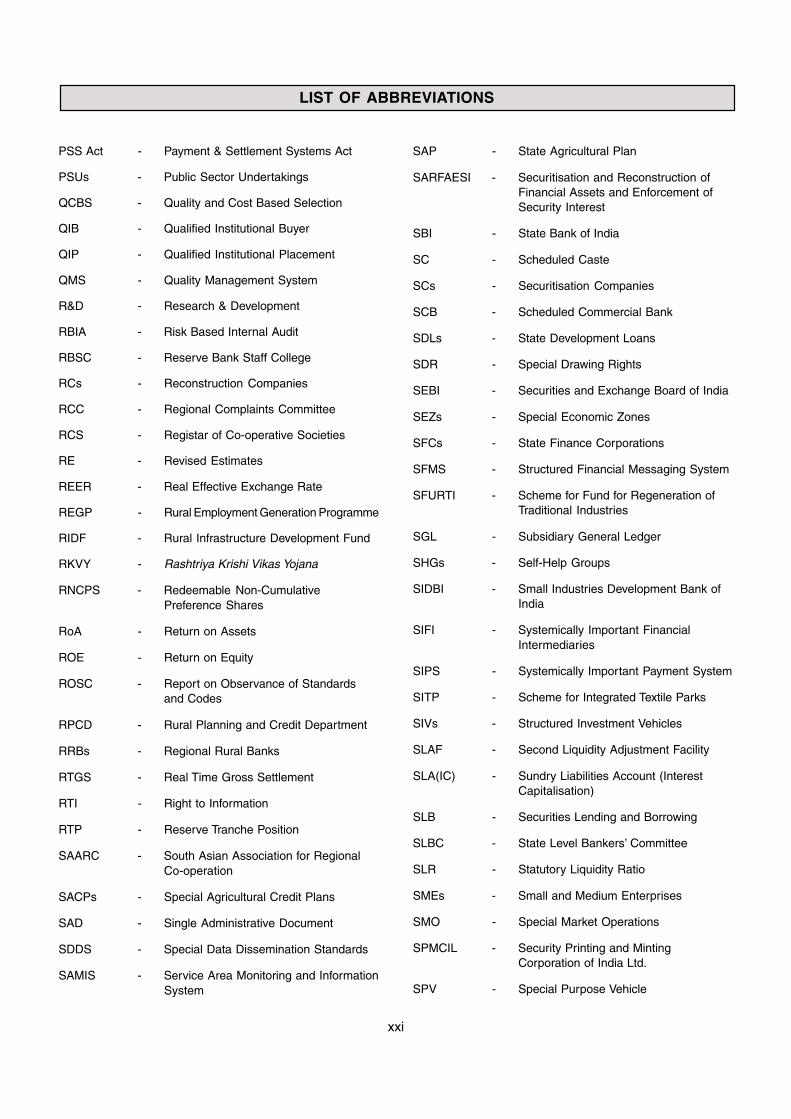
LIST OF ABBREVIATIONS
xxi
PSS Act - Payment & Settlement Systems Act
PSUs - Public Sector Undertakings
QCBS - Quality and Cost Based Selection
QIB - Qualified Institutional Buyer
QIP - Qualified Institutional Placement
QMS - Quality Management System
R&D - Research & Development
RBIA - Risk Based Internal Audit
RBSC - Reserve Bank Staff College
RCs - Reconstruction Companies
RCC - Regional Complaints Committee
RCS - Registar of Co-operative Societies
RE - Revised Estimates
REER - Real Effective Exchange Rate
REGP - Rural Employment Generation Programme
RIDF - Rural Infrastructure Development Fund
RKVY - Rashtriya Krishi Vikas Yojana
RNCPS - Redeemable Non-CumulativePreference Shares
RoA - Return on Assets
ROE - Return on Equity
ROSC - Report on Observance of Standardsand Codes
RPCD - Rural Planning and Credit Department
RRBs - Regional Rural Banks
RTGS - Real Time Gross Settlement
RTI - Right to Information
RTP - Reserve Tranche Position
SAARC - South Asian Association for RegionalCo-operation
SACPs - Special Agricultural Credit Plans
SAD - Single Administrative Document
SDDS - Special Data Dissemination Standards
SAMIS - Service Area Monitoring and InformationSystem
SAP - State Agricultural Plan
SARFAESI - Securitisation and Reconstruction ofFinancial Assets and Enforcement ofSecurity Interest
SBI - State Bank of India
SC - Scheduled Caste
SCs - Securitisation Companies
SCB - Scheduled Commercial Bank
SDLs - State Development Loans
SDR - Special Drawing Rights
SEBI - Securities and Exchange Board of India
SEZs - Special Economic Zones
SFCs - State Finance Corporations
SFMS - Structured Financial Messaging System
SFURTI - Scheme for Fund for Regeneration ofTraditional Industries
SGL - Subsidiary General Ledger
SHGs - Self-Help Groups
SIDBI - Small Industries Development Bank ofIndia
SIFI - Systemically Important FinancialIntermediaries
SIPS - Systemically Important Payment System
SITP - Scheme for Integrated Textile Parks
SIVs - Structured Investment Vehicles
SLAF - Second Liquidity Adjustment Facility
SLA(IC) - Sundry Liabilities Account (InterestCapitalisation)
SLB - Securities Lending and Borrowing
SLBC - State Level Bankers’ Committee
SLR - Statutory Liquidity Ratio
SMEs - Small and Medium Enterprises
SMO - Special Market Operations
SPMCIL - Security Printing and MintingCorporation of India Ltd.
SPV - Special Purpose Vehicle

LIST OF ABBREVIATIONS
xxii
SREP - Supervisory Review and EvaluationProcess
SRMS - Self Employment Scheme forRehabilitation of Manual Scavangers
SSS - Securities Settlement System
ST - Scheduled Tribe
StCB - State Co-operative Bank
STCRC - Short-Term Co-operative Rural Credit
STOs - State Treasury Offices
STR - Suspicious Transaction Report
STRIPS - Separate Trading for Registered Interestand Principal of Securities
TAC - Technical Advisory Committee
TAFCUBs - Task Force for Urban Co-operativeBanks
TAG - Technical Advisory Group
TALF - Term Asset-Backed Securities LoanFacility
TFC - Twelfth Finance Commission
TFCI - Tourism Finance Corporation of India
TFP - Total Factor Productivity
TFTS - Trade for Trade Settlement
TIN - Tax Information Network
TMSM - Training Methods and Skills forManagers
TMT - Thermo Mechanically Treated
ToRs - Terms of References
TS - Trend Stationary
TUFS - Technology Upgraded Fund Scheme
UBD - Urban Banks Department
UCBs - Urban Cooperative Banks
UCNs - Uniform Code Numbers
UNDP - United Nations DevelopementProgramme
UNICO - Umbrella Organisation for LargeCooperative Banks in Europe
UNDP - United Nations DevelopmentProgramme
UNIDO - United Nations Industrial DevelopmentOrganisation
UNME - Urban Non-Manual Employees
UTs - Union Territories
VAR - Vector Autoregression
VaR - Value at Risk
VKGUY - Vishesh Krishi Gram Udyog Yojana
VPN - Virtual Private Network
WADR - Weighted Average Discount Rate
WEO - World Economic Outlook
WMA - Ways and Means Advances
WPI - Wholesale Price Index
WSS - Weekly Statistical Supplement
WTO - World Trade Organisation
XBRL - eXtensible Business ReportingLanguage
XML - Extensible Markup Language
Y-o-Y - Year-on-Year
ZTC - Zonal Training Centre
This Report can also be accessed on Internet
URL : www.rbi.org.in

1
ASSESSMENT AND PROSPECTSI
THE ANNUAL REPORT ON THE WORKING OF THE RESERVE BANK OF INDIA
For the Year July 1, 2008 to June 30, 2009*
PART ONE : THE ECONOMY - REVIEW AND PROSPECTS
* : While the Reserve Bank of India’s accounting year is July-June, data on a number of variables are available on a financial year basis,i.e., April-March, and hence, the data are analysed on the basis of the financial year. Where available, the data have been updatedbeyond March 2009. For the purpose of analysis and for providing proper perspective on policies, reference to past years as alsoprospective periods, wherever necessary, has been made in this Report.
The Indian economy exhibited significant resilience in 2008-09 in the face of an intense globalfinancial crisis and the subsequent severe global recession. The contagion from the global crisis,however, posed the challenge of responding to the evolving risks and heightened uncertainties, whichwarranted swift and appropriate use of fiscal and monetary policy measures with a view to ensuringorderly functioning of the markets, preserving financial stability, and moderating the dampeningeffects on growth. For the Government, this involved temporary deviation from the fiscal consolidationprocess embodied in the Fiscal Responsibility and Budget Management (FRBM) Act. The ReserveBank had to contend with the challenges over two distinct phases during the year, which requiredcontrasting monetary policy responses. In the first half of the year, inflation firmed up under thepressure of hardening international commodity and food prices, which necessitated an anti-inflationary policy response. In the second half, however, restoring orderly conditions in the marketand subsequently supporting the growth momentum emerged as the key challenges. This requiredadoption of accommodative monetary policy stance, which was reflected in the provision of ampleliquidity at lower interest rates. Consequently, the financial system functioned without disruptionsand credit conditions did not operate as a constraint to growth.
Reverting to the high growth trajectory at the earliest remains the key policy challenge in the nearto medium-term. The sustained expansionary fiscal and monetary policy stances, however, entailthe risk of aiding inflationary pressures in the near-term and constraining the growth process inthe medium-run. Timely exit from the current policy stance, thus, would be critical, given theemerging signs of inflationary pressures. Credible action plan on fiscal consolidation, with anemphasis on the quality of fiscal adjustment driven by rationalisation of expenditure and efficiencyof public services would be necessary to revert to the high growth trajectory. The adverse impact ofdeficient monsoon on growth, inflation and social security needs to be carefully managed. Policiesconducive to high domestic savings and promoting the role of innovations, technology and reformsin enhancing the productivity of investment may have to receive greater attention. The financialstability framework would need to be strengthened further taking into account the lessons fromthe global financial crisis.
2
ANNUAL REPORT
I.1 The Indian economy witnessed moderationin growth in 2008-09 in comparison with the robustgrowth performance in the preceding five years. Thedeceleration in growth was broad based acrossthree major constituent segments of GDP, i.e.agriculture, industry and services. Moreover,deceleration in industry and services sector alsopersisted over four consecutive quarters of the year.Reflecting the contraction in global demand,exports declined. Domestic aggregate demand alsomoderated due to sharp deceleration in the growthof private consumption demand. Reflecting theexpansionary f iscal pol icy response to theslowdown in growth, government consumptiondemand increased by 20.2 per cent, and thecontr ibution of government consumptionexpenditure to overall growth accordingly increasedto 32.5 per cent from an average contribution of5.9 per cent in the preceding five years. Corporateperformance remained dampened, with significantfall in sales growth in the second half of the year,and decline in profits in last three consecutivequarters of the year. In 2009-10 so far, emergingsigns of recovery are yet to indicate any clear trend,and the deficient monsoon and the depressedexport performance have to be seen along with theimproving growth in core infrastructure sector,recovering industrial production and more optimisticbusiness outlook. Recognising the balance of risksto growth, the First Quarter Review of MonetaryPolicy for 2009-10 placed the projection for GDPgrowth at 6.0 per cent, with an upward bias. Theinflation environment remained highly volatile during2008-09; WPI inflation rose to a high of 12.9 percent in August 2008 and declined sharply thereafterto below 1 per cent by the end of the year, beforeturning negative since June 2009. The currentlyobserved negative inflation essentially reflects theimpact of the high base of the previous year, andthis transitory trend may not persist beyond fewmonths. Within WPI, essential commoditiescontinue to exhibit high inflation. Moreover, inflationexpectations have not abated as much as theoverall decline in WPI inflation, and inflation as perdifferent consumer price indices remain stubbornlyhigh. The adverse impact of the deficient monsoon
on food pr ices, notwithstanding the recordfoodgrains production in 2008-09 and the highbuffer stocks, also indicates upside risks to inflation,besides the evidence from the Reserve Bank’sSurvey of inflation expectations suggestingincrease in inflation over the coming three monthsto one year. The First Quarter Review of MonetaryPolicy for 2009-10 took into account the emergingoutlook on inflation and revised the inflationprojection upwards from the earlier 4.0 per cent to5.0 per cent, while reiterating 3.0 per cent as themedium term inflation objective.
I.2 The Indian economy exhibited f ivesuccessive years of high growth with moderateinflation and macroeconomic stability during 2003-08, before encountering the contagion from theglobal economic crisis in 2008-09. The averageGDP growth of 8.8 per cent achieved during thisphase was not only the highest ever recorded inIndia’s post independence economic history, butalso one of the highest in the world in the recentperiod. More importantly, inflation in India averagedat about 5.3 per cent during this period. Themacroeconomic environment remained stable andresilient to external shocks, despite rising degreeof openness and significant reforms. India’s ascentas a major emerging market economy with highpotential for sustained robust growth was reflectedin surges in capital inflows, which were in excessof the external financing needs as conditioned bythe country’s prudent emphasis on sustainablecurrent account deficit as a means to stable growth.The impetus for growth emanated from the upsurgein the domestic savings rate from 23.5 per cent ofGDP in 2001-02 to 37.7 per cent in 2007-08, whichfacilitated the step up in investment rate from 22.8per cent to 39.1 per cent during the correspondingper iod. Fiscal consolidation and reformsunshackled the constraints to realisation ofproductivity and efficiency driven growth. Before theemergence of the global economic crisis in 2008-09, the high growth trajectory was generally seenas the sustainable cr i t ical threshold, andaccordingly the policy focus was primarily shiftingto address the growing infrastructure deficit and
3
ASSESSMENT AND PROSPECTS
make progress on remaining areas of reforms, whilealso ensuring that the growth process becomesmore inclusive.
I.3 The Indian economy confronted one of theseverest external shocks in 2008-09 in the form ofan intense global financial crisis coupled with aglobal recession, but exhibited notable resilience,with GDP growth at 6.7 per cent. Orderly conditionsprevailed in various segments of the financialsystem during the year. The cyclical growthdeceleration witnessed in the first half of 2008-09got amplified in the second half of the year onaccount of the dampening effects of the globalrecession. This happened notwithstanding thepolicy driven moderation in the adverse effects ofthe contagion on the economy. When the globalmarkets turned dysfunctional in September 2008,with intense scramble for liquidity and subsequentcredit freeze under the pressure of deleveraging,the Indian markets reverberated the shock, whichwas seen in the form of higher volatility in allsegments of the financial markets and sharpcorrections in stock prices. The macro-financialconditions remained exceptionally challenging fromthe stand point of the conduct of Reserve Bank’spolicies, as it had to respond to multiple challenges,starting from containment of inflation in the first halfof the year to containing the deceleration in growth,preserving the soundness of the banks andfinancial institutions, ensuring normal functioningof the credit market and maintaining orderlyconditions in the financial markets in the secondhalf. At times, the Bank had to operate on multiplefronts simultaneously, and in constant consultationand coordination with the Government, with theoverriding objective of limiting the adverse effectsof the global crisis to the extent possible.
I.4 Global developments prominentlyinfluenced domestic developments in 2008-09.There were two distinct phases during which thetransmission of global shocks posed different butsignificant challenges for the Reserve Bank. In thefirst half of the year, the world experiencedsimultaneous increase in both food and commodity
prices, and there was a return of inflation after aphase of “great moderation”. Dealing with supplyside sources of inf lat ion posed signif icantchallenges for the conduct of Reserve Bank’smonetary policy, particularly in the face of emergingsigns of cyclical slowdown on the one hand andthe risk of spiralling headline inflation affectinginflation expectations on the other. In the secondhalf of the year, the global financial crisis and thesubsequent global recession changed dramaticallythe nature of the challenge emanating fromglobalisation. The sharp swings in global conditionswithin the year were reflected in the fast slide ofthe world economy into a deep recession from aphase of high growth over the preceding fourconsecutive years. There was a sudden plunge todysfunctional markets from a phase of growingmarket bubbles that had brought down r iskpremiums to historic low levels. Post-September2008, developments in the financial systems ofadvanced countries revealed that irrespective of thedegree of globalisation of a country and thesoundness of its domestic policies, a global crisiscould spread to every economy. The contagioncould transmit through sagging consumer andbusiness confidence, which, in the current context,is turning out to be more critical than the contagiontransmitted through trade and capital flows. Theinternational transmission of liquidity shocks wasfast and unprecedented; while falling asset pricesand uncertainty about valuation of the tradedinstruments affected market liquidity, failure ofleading global f inancial institutions and thedeleveraging process tightened the market forfunding liquidity. Given the growing risk of illiquiditycascading into solvency problems, l iquiditymanagement acquired priority in most centralbanks, since it was critical for preserving normalcyin financial markets, and thereby avoiding the riskof snowballing effects of financial stress on the realeconomy.
I.5 The Reserve Bank could restore normalcyin the financial markets over a short time periodthrough its liquidity operations in both domesticcurrency and foreign currency; the absence of any
4
ANNUAL REPORT
direct exposure of the Indian banks and financialinstitutions to the troubled assets and failingfinancial institutions in the advanced countrieshelped in the avoidance of any serious stress inthe financial system. The financial crisis in theadvanced countries, however, precipitated into anintense synchronised global recession, whichimpacted the growth prospects of all countriesthrough contraction in aggregate demand. With theearlier perception of decoupling fast turning out tobe a myth, moderating the adverse effects of thecontagion on growth emerged as a majorglobalisation-induced challenge in the second halfof the year. The severity of the external shock hademerged as a test for the capacity of public policiesto ensure soft landing in the face of persistentadverse global economic conditions.
I.6 India’s capacity to withstand the globalshock better than many other emerging marketeconomies was partly on account of the soundmacroeconomic and f inancial sector policyenvironment that had been put in place in the post-reform period by careful assessment of theopportunities and risks associated with reforms.After the balance of payments crisis in the early1990s, as a matter of concerted policy effort, theextent of dependence on external finance forfinancing domestic growth has been limited to thesustainable level of the current account deficit, andcapital flows in excess of the financing needs haveresulted in comfortable foreign exchange reserves.The reserve management policy also assumesimportance in the context of the market determinedexchange rate regime where the Reserve Bankaims at containing undue volatility, recognising theadverse effects of a volatile exchange rate on trade,investment and growth. Despite significantpressures on India’s balance of payments in thethird quarter of the year, the foreign exchangereserves facilitated Reserve Bank’s operations inthe foreign exchange market to preserve orderlyconditions, notwithstanding a phase of high volatilityover a short period of time. The gradual andsequential approach to liberalisation of the capitalaccount also prevented leveraging of the Indian
financial system for taking positions in the troubledassets in the advanced economies. Despitesignificant financial sector reforms, adequateregulatory precautions have ensured that complexstructures like synthetic securitisations do notcontaminate the Indian markets, and prudentialmeasures also limit the exposure of the bankingsystem to sensitive sectors and asset price bubbles.Absence of structured products that could maskrisk exposures, hide interconnectivity of marketoperators and allow excessive use of leveragedspeculation has been a notable aspect of theReserve Bank’s prudence in regulation. ReserveBank’s mandatory SLR requirement of 25 per cent(now reduced to 24 per cent) also appearedrelevant in the context of sharp deterioration inasset quality that was experienced by the leadinginternational banks and financial institutions. Moreimportantly, appropriate countercyclical regulationsand provisioning requirements also contributed topreventing development of asset price bubbles inIndia.
I.7 The Reserve Bank had taken measures tomodulate the monetary overhang that was buildingon account of sustained expansion in moneygrowth; the withdrawal of monetary accommodationhad in fact started in 2004 with gradual increase inboth repo and reverse repo rates. Since April 2005the Bank had also been expressing its concernsover the fast growth in credit, and the overdrawnstate of the banking system to sustain the creditdisbursement, given the mismatches betweensources and uses of funds, and the associatedincrease in the credit-deposit ratios for certainbanks. Recognising the unprecedented creditgrowth to the real estate sector during 2004-07,the provisioning requirements and risk weightswere increased to prevent a build up of assetbubble. Absence of any sovereign issue in theinternational markets for financing the deficit of theGovernment has also helped in limiting the effectsof adverse external shocks on the macroeconomicpolicy environment of the country. A large domesticmarket, reliance on domestic demand and domesticsavings for growth, comfortable foreign exchange
5
ASSESSMENT AND PROSPECTS
reserves, prudent management of the capitalaccount and a sound and resilient domesticfinancial system, thus, represent the key factors thathelped in moderating the impact of the contagionon India in relation to many other countries aroundthe world.
I.8 The deceleration in growth from an averageof 8.8 per cent during 2003-08 to 6.7 per cent in2008-09, however, warranted swift andcomprehensive policy response, given theoverriding policy focus of maintaining a growth rateof around 9 per cent as the key means to ensurehigher living standards for all in an inclusive growthprocess. As the post-September 2008 globaldevelopments affected the Indian markets throughthe global liquidity spiral and sharp spurt in riskaversion, the Reserve Bank had to operate inseveral markets simultaneously, with the use ofconventional and unconventional measures, giventhe overriding aim of restoring orderly marketconditions and preserving smooth flow of credit forall productive purposes.
ASSESSMENT OF 2008-09
Economic Growth
I.9 The deceleration in growth, which startedwith the cyclical slowdown in the first half of2008-09, got magnified in the second half due tothe contagion from the global crisis. Decelerationin growth to 5.8 per cent in two successive quartersin the second half of 2008-09 represented theweakest growth in recent period; more importantly,while industrial growth turned negative in the lastquarter, the deceleration in services persisted inall successive quarters of the year. The sharpmoderation in GDP growth warranted appropriatefiscal and monetary policy response, which wasdelivered swiftly, that too in a forward lookingmanner in the second half of the year, in anticipationof the adverse ramifications of the global crisis onthe domestic growth. The significant decelerationin private consumption demand and the slowdownin investment demand, and the associatedcontraction in output necessitated expansion in
public sector demand, both consumption andinvestment, to ensure a credible deterrent todeceleration in growth. Due to the global recession,contracting external demand also affected exportgrowth, which first decelerated, and then declined.The moderation in growth in 2008-09 was thusbroad-based, spread across all three sectors (i.e.agriculture, industry and services) of the economy.The decline in growth in agriculture and industry,however, was more prominent compared toservices. A major cause for policy concern wasdampened growth in the Index of Industr ialProduction (IIP) since November 2008 withnegative growth in one month, besides thesustained fall in exports since October 2008.Reflecting the demand augmenting policy, thegrowth in government f inal consumptionexpenditure increased sharply by 20.2 per cent in2008-09 as compared with 7.4 per cent in 2007-08. The contribution of the government consumptiondemand to growth, as a result, increased from 8.0per cent in 2007-08 to as high as 32.5 per cent in2008-09.
The Fiscal Stance
I.10 The unprecedented magnitude andcomplexity of the challenge necessitated temporarydeviation from the fiscal consolidation processembodied in the Fiscal Responsibility and BudgetManagement (FRBM) Act. The deviation from thefiscal consolidation path was evident from therevision to the Centre’s fiscal deficit target from 2.5per cent of GDP in the budget presented for 2008-09 in February 2008 to 6.0 per cent in the interimbudget presented in February 2009 before thegeneral elections and further to 6.2 per cent in theprovisional accounts for 2008-09. In addition,special bonds amounting to 1.8 per cent of GDPwere issued to oil marketing companies andfertiliser companies during 2008-09 to cover fortheir under-recover ies in the face of highinternational prices and lower administered prices,which had become necessary to contain thespiralling of inflation in the first half of the year.Besides the deterioration in the fiscal parameters
6
ANNUAL REPORT
of the Centre under the compelling needs of fiscalst imulus, the f iscal deficits of the StateGovernments also witnessed some deterioration.The fiscal correction and consolidation process ofthe State Governments that was progressing duringthe previous few years was halted during 2008-09,although the consolidated revenue account of theState Governments continued to remain in modestsurplus. Implementation of the Sixth Pay Commissionaward by some of the State Governments did exertpressures on the revenue expenditure of the States.The consolidated gross fiscal deficit (GFD) of Statesbased on the revised estimates rose to 2.7 per centof GDP from 2.1 per cent in the budget estimateson account of lower revenue surplus and non-debtcapital receipts coupled with higher capital outlay.The combined fiscal deficit (Centre and States),including the special securities issued to oilmarketing and fertiliser companies, thus, reached10.7 per cent of GDP in 2008-09.
Financing of Fiscal Deficit
I.11 The challenge associated with financing ofhigher deficits emerged in the form of managinglarge borrowing programmes of the Governmentswithout disrupting the markets, and moreimportantly, without exerting upward pressures onthe interest rates. Significant moderation in inflationin the second half of the year; the deceleration indemand for non-food credit, reflecting the slowdownin growth; and the decline in non-bank sources offunding for the commercial sector created theheadroom for smoother management of theborrowing programme. The net market borrowingsof the Centre and the States jumped to Rs.4,02,302crore (7.5 per cent of GDP) in 2008-09 fromRs.1,66,895 crore (3.5 per cent of GDP) in 2007-08; special securities outside the market borrowingprogramme increased to Rs.95,942 crore in 2008-09 from Rs.38,050 crore in 2007-08.
The Monetary Stance
I.12 The high growth in credit and broad moneyin 2004-08 was taken cognisance of by the Reserve
Bank and its policy response gradually turned tomodulating the monetary overhang, withoutrestricting the growth in credit and money that wasnecessary for sustaining the high growth. Reflectingthe cautious monetary stance, the repo and reverserepo rates were raised gradually since September2004, along with higher reserve requirements. Thetightening stance had to be pursued moreaggressively in the first half of 2008-09 to containthe building inflationary pressures. Reflecting themoderation in growth in the second half and thecontraction in aggregate demand, non-food bankcredit, which was growing at 29.4 per cent inOctober 2008 (year-on-year basis) fell to 17.5 percent by end-March 2009. Part of the high growth incredit up to October 2008 reflected the shift in thepattern of resource mobilisation by the corporatesin the face of emerging global credit squeeze. Theexternal funding was partly substituted by resort todomestic credit. Moreover, there was a sharpincrease in credit to oil marketing companies whichreflected the rising international oil prices and highcost of impor ted crude. After October 2008,however, with sharp fall in international oil prices,the demand from oil companies came down at thesame pace. Moreover, decline in commodity prices,need for clearing the inventories accumulated athigh cost in the face of falling demand and fallingprices, as well as weakening business confidencecontributed to the sharp drop in credit growth. Creditextended by private and foreign banks exhibitedmuch sharper deceleration in growth in relation tothe nationalised banks. More importantly, flow ofresources from non-banking avenues (such as fromthe capital market, non-banking finance companies,ECBs, FCCBs, ADRs/GDRs and FDI) also fell byabout 20 per cent over the level in the previous year.Relaxing all constraints on the expansion in creditat lower cost without dilution of the emphasis onasset quality emerged as a major challenge for theReserve Bank. Many Central Banks around theworld had to confront with the challenge ofunfreezing the credit market; in India, however, thecredit market functioned normally, and thedeceleration in credit growth reflected slowdown inreal activity. The Reserve Bank ensured ample
7
ASSESSMENT AND PROSPECTS
surplus liquidity in the system to ensure flow of creditto productive sectors, within the prudence necessaryfor preserving the asset quality of the banks.
Liquidity Management
I.13 The monetary aggregates – both broadmoney and reserve money – evolved during theyear reflecting the fast changing inflation and growthoutcomes, as well as swings in domestic andinternational liquidity conditions. This was reflectedin sharp shifts in the composition of monetaryaggregates on both sources and components sides.In recent years up to the first half of 2008-09,increase in net foreign assets of the Reserve Bank,reflecting the surges in capital flows, had becomethe dominant source for expansion of base money.In the third quarter of 2008-09, however, thebalance of payments came under pressure, and thereserve drawdown that became necessary tofinance the deficit in capital inflows, led tocorresponding contraction in base money. TheReserve Bank had to more than offset thecontraction in reserve money by expanding its netdomestic assets (NDA) so as to ensure necessarygrowth in money supply consistent with the needsof economic growth, besides the provision of ampleliquidity to alleviate any fear of liquidity shortage inthe Indian markets. The Reserve Bank ensuredthe necessary expansion in NDA throughconventional open market operations (OMOs)involving outr ight purchase of governmentsecurities in the secondary market, as well asprovision of l iquidity through acquisit ion ofsecur it ies by repos under the LAF. Anotherinstrument which allowed the Reserve Bank toexpand liquidity was the unwinding of the MSSsecur it ies. MSS secur it ies had become animportant instrument of sterilisation to par tlyneutralise the expansionary effects of surges incapital flows in the earlier years. While dealing withthe challenge of expanding the NDA to offset theimpact of contracting NFA on reserve money, theunwinding of MSS balances not only created thescope for adequate liquidity expansion by theReserve Bank without expanding its balance sheet,
but the timing of the unwinding could also bemodulated in such a way that the large borrowingprogramme of the Government was managedsmoothly without exerting any market stress. Thereduction in CRR from 9 per cent to 5 per centrepresented release of large liquidity to the bankingsystem. The monetary operations of the ReserveBank, in the wake of addressing the impact of thecrisis, thus, were significantly different from theexperience of many central banks of the advancedeconomies, even though the ultimate objective wasalmost the same, which was to ensure adequateliquidity in the banking system.
I.14 The reduction in CRR by 4 percentagepoints released Rs.1,60,000 crore of liquidity to thebanking system. While the first round immediateimpact of a reduction in the CRR leads tocorresponding fall in the reserve money, it implieshigher money multiplier, which leads to higherincrease in broad money. Since moderation inreserve money growth was the result of a deliberateexpansionary policy action, the Bank had toemphasise the “adjusted reserve money” indicatorto communicate the monetary developments to thepublic.
Monetary Transmission
I.15 Despite persisting with the expansionarymonetary policy stance in the post-September2008 period, which was reflected in 400 basispoints reduction in CRR, 4.25 percentage pointreduction in the repo rate, 2.75 percentage pointreduction in reverse repo rate and several otherconventional as well as non-conventional windowsfor access to liquidity (resulting in the availabilityof more than Rs.4,00,000 crore of additionalactual/potential liquidity to the system by the endof the year), the transmission of monetary policybecame a matter of concern. The completetransmission of monetary policy takes place withlong and variable lags. But in the midst of a suddenreversal in risk perception, the risk premium couldincrease significantly to often more than offset themagnitude of fall in the policy rates. As a result,
8
ANNUAL REPORT
the cost of funds may not decline for the customers,or may even increase, despite significant fall in thepolicy rates. This was experienced in severaladvanced economies, where the yield spreadsincreased significantly at some stage, reflectingheightened risk aversion. In India, whilereassessment of risk was one of the factorsconstraining the transmission of monetary policy,there were several other structural factors inoperation as well. First, the administered interest ratestructure for small savings restricts flexibility ondeposit rates for the banks, as small savings couldpotentially compete with deposits depending onthe relative difference in the interest rates offeredon both savings instruments. Second, depositorsoften lock their deposits at the high interest ratefor longer term during a high interest rate phase;as a result, banks face the constraint of reducingthe cost of lending in a phase of economicslowdown since their cost of funds remains highbecause of term deposits contracted earlier athigher rates. Till the term deposits become due formaturity, at which stage the deposits could berenewed at the lower rate, the banks experiencestructural rigidity in their balance sheet. Third,several concessional administered loans to sectorslike agriculture and exports are linked to the BPLR,which works as a disincentive to revise the BPLRdownwards even in the face of falling policyinterest rates and use of moral suasion by theReserve Bank to emphasise the need for lowerlending rates as one of the means to supportrecovery in growth. Fourth, banks often competeto mobilise bulk/wholesale deposits, and they haveto prevent shifting of such deposits to other banks,which creates the associated pressure to delaythe revision in interest rate to the extent possible.In the conduct of its policies, the Reserve Bank,as a public institution, has to also remain sensitiveto the interest of the depositors, given particularlythe role of high domestic savings in India in thehigh growth phase of 2003-08 and the relativelyhigher degree of insulation of Indian growth comparedto most other countries during 2008-09. Despitesignificant moderation in WPI inflation to below 1 percent by the end of 2008-09 and then to sub-zero level,
CPI inflation at the retail level continues to be high,and inflation expectations also have not recededat the same pace as the WPI inflation. In view ofthese reasons, monetary policy effectivenesscontinues to remain a challenge, which though is auniversal concern and not specific only to India.Since the last quarter of 2008-09, however, thedeposit and lending rates have started to moderatein response to the significant reduction in policyrates and sustained ample liquidity in the system,besides the Reserve Bank’s constant emphasis onbetter policy transmission in the credit market.
Inflation Divergence
I.16 Headline inflation, as measured by year-on-year variations in the WPI, declined sharply to 0.84per cent by end March 2009 from the peak of 12.91per cent on August 02, 2008. The spurt in volatilityin WPI inflation needs to be seen in the context ofthe behaviour of global commodity prices duringthe year. Reflecting the sharp increase in oil andmetal prices in the global markets, WPI inflationhad risen to double digits in June 2008 andremained elevated till October 2008. As the globalcommodity prices moderated from their peak levels,domestic prices also adjusted sharply thereafter.Excluding the volatile fuel and metals componentsin WPI, however, the WPI inflation was less volatile,in the range of 10.2 per cent in August 2008 to 4.8per cent in March 2009. The pass-through of globalcommodity prices to domestic prices wasincomplete because of administered pricemechanism and fiscal interventions for severalcommodities, which helped in moderating the pricepressures and containing the volatility in inflation.The prices of food articles, however, continued torule high, as a result of which the consumer priceindices (CPIs) remained firm near double digitlevels, given the higher weight of food articles inCPIs. The Reserve Bank’s Annual Policy Statementin April 2009 recognised the emerging significantdivergences between inflation in WPI and CPIs andemphasised that for policy purposes it continuouslymonitors the full array of price indicators.

9
ASSESSMENT AND PROSPECTS
External Contagion and Financial Markets
I.17 In the post-September 2008 period, themajor concern for the Reserve Bank was to dealwith the knock-on effects of the global financialcrisis. With sharp increase in the overnight call ratein India to 13 per cent on September 16, 2008 andfurther to a peak of 19.8 per cent on October 10,2008, the volume under the LAF repo window ofthe Reserve Bank (which is used on a day-to-daybasis by the banks for accessing liquidity) increasedfrom around Rs.12,500 crore in the first half ofSeptember 2008 to Rs.68,000 crore in the secondhalf of the month, and further to Rs.90,000 crore inearly October 2008. Demand for liquidity hadincreased from many quarters, that too suddenly.Corporates had increased the demand for credit athome as a substitute for external financing in theface of global credit squeeze. Access to trade creditwas becoming difficult, and the cost also had goneup. NBFCs and mutual funds, given the nature oftheir sources of funds, also faced major liquidityshortage. In view of the capital outflows and thepressures on the balance of payments in the thirdquarter of the year, the exchange rate came underpressure, which warranted intervention operationsby the Reserve Bank to restore orderly conditionsin the foreign exchange market. This, in turn, impliedcorresponding contraction in rupee liquidity in thebanking system. The Reserve Bank, thus, had toensure supply of adequate rupee as well as foreigncurrency liquidity to restore the call money ratewithin the LAF corridor and also to contain volatilityin the exchange rate.
Reserve Bank’s Responses to the Contagion
I.18 For enhancing the availability of domesticliquidity, besides the usual reduction in CRR,greater access under the LAF through repos, andunwinding of the MSS securities, several otherconventional as well as unconventional instrumentswere also used depending on the nature andexpected magnitude of the demand for liquidity,such as a second LAF window providing access to
liquidity in the afternoon as against the normal LAFaccess in the morning, special 14 days repo facilityusing SLR eligible securities up to 1.5 per cent ofNDTL for meeting the liquidity needs of NBFCs,housing finance companies and mutual funds,advance release of money at the request of theGovernment to the banks towards Agricultural DebtWaiver and Debt Relief Scheme, increase in exportcredit refinance limit for commercial banks, andspecial refinance facilities for specialised financialinstitutions such as the SIDBI, NHB and EXIM Bank.The additional liquidity that was made availableexceeded Rs.4,00,000 crore (by the end of theyear), which is unprecedented and amounted to 7.9per cent of GDP.
I.19 For dealing with the excess demandconditions in the foreign exchange market, givenparticularly the objective of containing excessivelarge volatility, a number of measures were initiatedto ease the supply situation by partly assuringgreater access to the Reserve Bank’s foreignreserves and partly by improving the inflows inresponse to specific measures. Besides the actualintervention sales in the foreign exchange market,the Reserve Bank also opened the forex swapfacility for the banks. To ease the demand pressurefrom oil importing companies during the high andrising phase of international prices, the Bank hadalready started special market operations in thesecondary market through commercial banksinvolving direct supply of forex liquidity against theoil bonds of the public sector oil marketingcompanies. The policy measures that aimed atimproving the supply of forex liquidity includedpermitting banks to borrow from their overseasbranches within prudential limits, relaxing furtherthe external commercial borrowing policy, includingallowing NBFCs and housing finance companiesto borrow in foreign currency, and raising theinterest rates on NRI deposits. Notwithstanding thedemand pressure in the forex market, in view ofdepressed international asset pr ices, thecorporates were permitted to prematurely buy backtheir FCCBs at prevailing discounted rates.

10
ANNUAL REPORT
I.20 Recognising the difficult challenges in thecredit market, the Reserve Bank had to balancethe priorities of credit quality and improved creditdelivery. As counter cyclical regulatory measures,the Reserve Bank reduced to normal levels theprovisioning requirement for standard assets andrisk weights for certain asset classes, which hadbeen increased earlier during the period of rapidcredit growth. With a view to further strengtheningthe domestic banking sector, the Reserve Bank alsoundertook a number of other regulatory initiatives,which include: (i) review of prudential frameworkfor off balance sheet exposures of banks coveringissues like risk weights, provisioning and creditconversion factors; (ii) strengthening of systemsfor monitoring large un-hedged foreign exchangeexposure of corporates; (iii) enhancing cross bordersupervision and consolidated supervision of bankled conglomerates; (iv) reviewing supervisoryframework for monitoring the activities of SpecialPurpose Vehicles(SPVs) and trusts set up by banks;(v) reviewing the appropriateness of the currentsupervisory framework for monitoring the overseasoperations of Indian banks; (vi) issuing guidelineson managing maturity mismatch for addressingliquidity risks in the very short run; (vii) discouragingthe practice of excessive reliance on call moneyborrowing by linking the borrowings to banks’capital; and (viii) modifications to guidelines onrestructuring of advances. Despite the risk ofcontagion from the global financial crisis, the Indianbanking system remained sound and resilient, asevident from the soundness indicators like capitaladequacy, asset quality and profitability for 2008-09.While the capital adequacy level for the bankingsystem was at 13.2 per cent at the end of the year,each individual bank was above the minimum 9 percent capital adequacy requirement prescribed bythe Reserve Bank. Stress-testing findings of theCommittee on Financial Sector Assessment(CFSA) also suggested the resilience of thefinancial system and the adequacy of capital levels.
Impact of the Reserve Bank’s Actions
I.21 Responding to the large and comprehensivedomestic liquidity measures, the inter-bank call rate
reverted to within the LAF corridor or around theceiling by the end of October 2008 and the LAFwindow also moved from net injection to netabsorption mode, indicating the surplus liquidityconditions in the system since November 2008.Reflecting the measures taken for improving theavailability of forex liquidity, the average exchangerate of the rupee which had depreciated sharplyfrom Rs.40.02 per US dollar at the beginning of April2008 to Rs.51.23 per US dollar in March 2009, hasappreciated since then to around Rs.48.0 per USdollar in the first half of August 2009. The 10-yearbenchmark government securities yield alsosoftened from the October 2008 levels by the endof the year, despite significant increase in marketborrowings in the second half of the year. Thus,the transmission of the Reserve Bank’s policiesto the money, forex and the government securitiesmarkets has been effective, thereby ensuringspeedy restoration of orderly conditions over a shorttime span.
The Resilient External Sector
I.22 The external sector of the economyexhibited resilience despite significant pressureson the balance of payments through the trade andcapital flows channels, particularly in the thirdquarter of the 2008-09, when the reserve loss(excluding valuation) was US$ 18 billion in just onequarter. While net capital flows remained negativeeven in the fourth quarter of the year, the reserveloss was negligible because of surplus in the currentaccount. For the year as a whole, the currentaccount deficit widened to 2.6 per cent of GDP in2008-09 from 1.5 per cent of GDP in 2007-08, witha total loss of reserves of US$ 20.1 billion (net ofvaluation). Overall, there was substantial decline innet capital inflows from US$ 108 billion in 2007-08to US$ 9.1 billion in 2008-09, with last two quartersof the year showing net outflows. The financialchannel of the contagion from the global financialcrisis, thus, was distinctly felt in the form of reversalin capital flows, which affected the domesticfinancial markets, in particular, the stock marketand the forex market. The signif icance ofmaintaining comfor table foreign exchange
11
ASSESSMENT AND PROSPECTS
reserves, even with a largely flexible exchange rateregime, thus, became evident during the year whenone of the severest external shocks could bemanaged without any exceptional measures tomodulate the specific transactions in the currentand capital accounts.
Managing Macroeconomic Challenges
I.23 The management of the macroeconomicenvironment during 2008-09, thus, was exceptionallychallenging for the Reserve Bank, as the magnitudeand pace of the external contagion had the potentialto cause severe disruptions to critical segments ofthe economy. Preventing a liquidity scare, withample provision of liquidity, both domestic andforeign currency, was the immediate challenge inthe post September 2008 period, and both moneymarket and forex market returned to normalconditions within two months in response toReserve Bank’s actions. With a sound bankingsystem, the liquidity of non-banks like NBFCs, mutualfunds and housing finance companies were also metto avoid the failure of any financial institution onaccount of lack of access to liquidity. In the wake ofnet capital outflows and difficult conditions foraccess to international markets, while assuring themarket to provide the needed liquidity from thecomfortable foreign exchange reserves, steps weretaken to make certain inflows more attractive. Giventhe overr iding impor tance of containing themoderation in flow of credit to the private sector forsustaining the growth momentum, counter cyclicalprudential regulations were used to encouragebanks to lend. The policy rates were also broughtdown significantly so as to lower the cost of fundsand thereby spur consumption and investmentdemand. The fiscal stimulus, that involved significantincrease in the government borrowing programme,posed the challenge of smooth completion of theborrowings without disrupting the markets.
I.24 Notwithstanding the Reserve Bank’sactions that prevented the financial system fromstress and thereby avoided any risk to the growthprocess from the financial system, the slowdown
in domestic aggregate demand on account of theapprehensions spilling over to the consumers andinvestors from the severe global recession emergedas the key challenge to sustained high growth. In2008-09, management of high inflation in the firsthalf and preserving the soundness and resilienceof the financial system in the second half were thekey policy challenges. By the beginning of 2009-10 the major policy concerns were slow recoveryin growth despite use of large fiscal stimulus andaccommodative monetary stance, global recessionweakening the export prospects, less than expectedcorrection in real estate prices constraining arecovery in housing demand, high food andconsumer price inflation and the risk of inflationarypressures firming up further due to the impact ofsustained recovery-focused fiscal-monetary policystance, implications of protracted growth slowdownfor asset quality of banks, and the increasingpossibility of large borrowing programmes limitingthe options for monetary policy by potentiallyexerting upward pressures on market interest ratesand competing with the credit demand from theprivate sector, and thereby constraining the returnto the high growth path in the medium-term.
PROSPECTS FOR 2009-10
The Uncertain Global Outlook
I.25 The external economic environment isunlikely to remain congenial for supporting a fasterrecovery in India, because despite improvedfinancial market conditions and thaw in the pace ofcontraction in global activity, the recession inadvanced countries is widely perceived to persistin 2009. The IMF’s outlook released in July 2009suggests that global growth would contract by 1.4per cent in 2009, and the volume of world tradewould also decline by 12.1 per cent. The recoveryis widely perceived to be gradual, and even withthe upward revision to the IMF’s growth outlook for2010 at 2.5 per cent, that would represent just abouthalf of the growth achieved in 2007. Moreover,despite diminishing uncertainty and improvingconfidence as well as receding financial stress,
12
ANNUAL REPORT
bank lending conditions remain tight, housingmarkets are yet to bottom out, and banks’ balancesheets need to be cleansed further. In the secondquarter of 2009, while the rate of contraction in theUS and Euro-area GDP slowed down significantly,Japan, Hong Kong, Germany and France recoveredfrom the recession, and China and Korea exhibitedacceleration in growth. Emerging signs ofimprovement in the global macro-f inancialconditions, however, need to gain roots for ensuringa sustained global recovery. According to theGlobal Development Finance of the World BankJune 2009, the industr ial production in r ichcountries has declined by 15 percent since August2008, and that in developing countries (excludingChina) the decline has been by 10 percent. Theexternal financing conditions for the developingcountries has been viewed to remain difficult in2009, with private capital flows expected to declinefrom US$ 707 billion in 2008 to US$ 363 billion in2009. The IIF’s June 2009 projections for capitalflows to EMEs suggest that net flows could fallsharply to about US$ 141 billion in 2009 from US$392 billion in 2008. According to the July 2009estimates of the World Bank, remittance flows todeveloping countries could decline to US$ 304billion in 2009 from US$ 328 billion in 2008,suggesting that the impact on remittance receivingcountries may not be as strong as the trade andcapital flows channels. Rising unemployment,however, entails the risk of tighter immigrationpolicies. The assessments of international agenciesindicate that trade, capital flows and remittancesmay take some time to revive to normal levels andcontribute to growth. If the protectionist responseof some countries continues, global recovery maynot immediately lead to corresponding revival inworld trade. Moreover, rebalancing of the globalgrowth to correct the accumulated globalimbalances of the past years may also affect thegrowth prospects of many countries.
Return to the High Growth Trajectory
I.26 Reverting to the high growth path at theearliest and ensuring an inclusive growth process
represent the overarching priori t ies of theGovernment, and the macroeconomic policyenvironment has to respond to this broad overallobjective. As external demand operates as a majordrag on the recovery, growth impulses have todepend even more on domestic demand than inthe past and public expenditure has to take the leadin boosting aggregate demand in the face ofdeceleration in private consumption demand andinvestment demand. This realisation is reflected inthe increase in government expenditure by 33.1 percent in 2008-09 and by 13.3 per cent over the highbase of the previous year, as budgeted for 2009-10.
I.27 The relatively higher resilience of Indiangrowth to the global economic crisis was onaccount of the dominant role of domestic demandand domestic saving. The increase in savings ratefrom 23.5 per cent in 2001-02 to 37.7 per cent in2007-08 largely allowed a sustainable investmentdriven high average growth of 8.8 per cent over2003-08, besides the congenial productivityenhancing influence of reforms. In the process ofreverting to the high growth path, same level ofsupport from domestic saving may be required,which, however, may be difficult in the immediaterun due to the operation of two factors, which wouldhave dampened the performance on the savingfront. Public sector savings, which had beenshowing signs of improvement in recent yearsreflecting the disciplining influence of the FRBM,is expected to register some deterioration due tohigher fiscal deficits as the outcome of usingappropriate fiscal stimulus to contain the slowdownin growth, besides the expected subduedperformance of the public sector enterprises in aphase of economic slowdown. Depressedcorporate earnings associated with deceleration inaggregate demand could also lead to some erosionin savings of the private sector. The growth inoverall domestic savings, thus, could be expectedto decline modestly in 2009-10. This, however, maynot operate as a constraint to growth in the short-run, since in relation to the aggregate demandadequate liquidity is available in the bankingsystem. Moreover, during the phase of economic

13
ASSESSMENT AND PROSPECTS
slowdown, corporates could have undertakeneff ic iency enhancing restructur ing of theproduction processes, which otherwise might havebeen difficult to implement in the preceding phaseof high growth. This could help in strengtheningthe growth momentum once the recovery sets in.Inventory levels, which would have declined duringthe slowdown, may also support a faster revivalwhen aggregate demand recovers. In the medium-run, as the fiscal stimulus is withdrawn graduallyand the fiscal policy stance reverts to the path ofconsolidation and discipline, return to the samelevel of domestic savings that could be consistentwith the sustainable growth level of 9 per centwould be feasible.
Aggregate Demand
I.28 The composition of aggregate demand hadto tilt in favour of government demand, on accountof the use of fiscal stimulus to contain the growthslowdown. In view of the payments made under theFarmer Debt Waiver Scheme, Sixth PayCommission and fiscal stimulus measures, theshare of government final consumption increasedto over 11.1 per cent of GDP in 2008-09 from 9.8per cent of GDP in the previous year. The revival inprivate consumption demand, however, is essentialto not only stimulate investment demand but alsoto facilitate faster fiscal consolidation. In thiscontext, promoting rural demand assumessignificance not only in view of the higher share ofrural consumption in aggregate pr ivateconsumption but also because of greatervulnerability of rural consumption in an environmentof deficient monsoon as well as high food articlesinflation, both of which could erode rural disposableincome. The share of rural consumption in totalhousehold consumption has remained consistentlyin the range of 55 per cent to 60 per cent in lastone decade, and is expected to grow at a fasterpace with rising inter-linkages and catching up withthe urban life style. Recognising the importance ofrural demand in moderating the impact of theslowdown, the Union Budget for 2009-10 increasedoutlays under several schemes significantly that
could benefit the rural households directly, besidesthe income enhancing/supporting policiesassociated with the increase in MSPs and foodsubsidies.
Agricultural and Allied Activities
I.29 The agricultural growth prospects in 2009-10have to be assessed taking into account the outputimpact of deficient monsoon. With almost 60 percent of the agricultural land being rain-fed, Indianagriculture is still dependent on the performanceof the monsoon, par ticularly the South-Westmonsoon. Dur ing the last ten years, largecumulative deficiency in rainfall was observedduring 2002 (-19 per cent) and 2004 (-13 per cent).On both these occasions, there was an adverseimpact on foodgrains production. While agriculturalproduction had contracted by 7.2 per cent in 2002,the production level in 2004 had held up at the samelevel as in the previous year due to the robust growthin allied activities. The past experience, thus,suggests that the spatial and temporal distributionof the rainfall is critical in influencing the overalloutcome for agriculture. According to the August2009 revised monsoon rainfall projections of theIndia Meteorological Department (IMD), the rainfalldeficiency in 2009 (during June-September) couldbe about 13 per cent. The actual position up to thesecond week of August 2009 shows that thecumulative shortage of rainfall is about 29 per centin relation to the normal levels. Moreover,production weighted rainfall index of the ReserveBank shows a shortfall of 36 per cent, which ishigher than what is indicated by the cumulativerainfall pattern. Crop sowing position as on August13, 2009 indicates that sowing of most pulses andcoarse cereals are higher than last year’s levels,though paddy sowing has been substantially lower,i.e. about 19 per cent below last year’s level. Giventhe fact that kharif paddy contributes about 86 percent of total rice production and 36 per cent of totalfoodgrains production in India, foodgrainsproduction in 2009-10 could be adversely affectedbecause of the deficiency in rainfall. According tothe Food and Agriculture Organization (FAO),
14
ANNUAL REPORT
India’s paddy output in 2009-10 may decline by2.5 per cent. Rainfall deficiency entails theaddit ional r isk of shor tfal l in hydro powergeneration, which may also add to the existinginfrastructure constraint to growth, particularly whenthe energy demand increases with the recovery.
I.30 The rainfall deficiency during the kharifseason, thus, could affect the growth and inflationoutlook, besides rural disposable income. Ruraldemand that had remained buoyant so far onaccount of record food grains production last year,may also experience some moderation, which inturn could influence the recovery prospects ofcertain industries that benefited earlier from therobust rural demand. FMCG sector could beparticularly affected, and the stock markets havealready responded to the monsoon related outlookfor different sectors as well as the overall economy.Notwithstanding the macroeconomic concernsassociated with the rainfall deficiency, one needsto recognise the progress on effective diversificationof Indian agriculture towards horticulture, livestockand fisheries, and their rising shares in the totaloutput of the agricultural sector. Horticulture,livestock and fisheries contribute close to 60 percent of the GDP originating from “agriculture andallied activities”, and “cereals, pulses and oilseeds”grown during kharif account for only 20 per cent ofthe total agricultural output. As in the previous year,improved Rabi performance may also help inmoderating the output effects of monsoon duringthe kharif, which though would depend on therainfall pattern in the remaining phase of the SouthWest monsoon as well as precipitation during NorthEast monsoon. While the record foodgrainsproduction in 2008-09 and comfortable bufferstocks of rice and wheat have enhanced thecapacity to deal with price pressures in 2009-10on account of the deficient rainfall, enhancing theagricultural output, driven by higher yield anddiversification of crops, assumes importance.Higher investment backed by sustained researchand extension activities could be critical foraugmenting yield. Besides the policy focus on usinghigher MSP to generate supply response and
public investment on expanding the irrigationpotential, improving the market structure foragricultural commodities ensuring competitivepricing, hedging options for management of cropuncertainty, adequate warehouse facilities andimproved rural roads enhancing better connectivitywith urban markets also must receive greater policyattention. Better water management with anemphasis on water harvesting would be importantfor moderating the impact of below normal monsoonon farm output.
Industrial Sector
I.31 Despite positive growth and signs ofrecovery in the first quarter of 2009-10, the growthoutlook for the industrial sector remains mixed. Thepace of industrial output in a number of emergingand industrial economies had declined by doubledigit levels during the second half of 2008-09. InIndia also, the IIP registered a growth of 2.7 percent in 2008-09, which is the lowest since 1992-93, with negative growth in one month of the year.The unregistered manufactur ing sector hasgenerally moved in l ine with the registeredmanufacturing sector, and the performance couldbe expected to have been equally subdued thanthe organised sector as micro and small enterprises(MSEs) often depend on large enterprises throughforward and backward linkages. The concernrelating to flow of credit to the SMEs also needs tobe addressed. In view of the prevail inguncertainties, the Reserve Bank has set up anIndustry Monitoring Group drawing members fromexternal agencies as well as from concerneddepar tments of the Bank in Apr i l 2009 toperiodically assess the developments in Industryin relation to changes taking place in the globaleconomy and the financial sector.
I.32 The manufacturing sector’s performancein a competitive environment and in the face of risksof rising protectionism could encounter severalchallenges. Despite the advantages of a largedomestic market, abundant availability of skilledlabour force, and the proximity to the fast growing
15
ASSESSMENT AND PROSPECTS
Asian markets, productivity growth needs to catchup with the Asian economies, including China. Thisrequires greater emphasis on quality, betteradoption of technology, more flexible labour laws,significantly improved infrastructure and a policyenvironment supportive of the SMEs sector. Theindustry-education linkages must be strengthenedvigorously. The technological breakthrough forproduct development, including patent protection,has often acted as a deterrent to attract sizeableinvestment into R&D in many industries, notablythe drugs and pharmaceuticals. Persistentproblems like delayed payments after delivery,frequent disruptions in the availability of power, andlack of stable demand also affect the performanceof the manufacturing sector. The strong inter-linkage with the performance of the export sectorhas been a factor in affecting the industrial growthin the face of contracting external demand.
Services Sector
I.33 The underlying impetus of high growth inIndia has been the sustained robust performanceof the services sector. This sector has not onlyexhibited minimum growth of 9 per cent in the recentfive years, but its share in aggregate GDP has alsoincreased to about 64.5 per cent. The significantprogress made by the services sector has beenpartly possible because of the strong growth inservices exports. The contribution of servicesexports in overall value added accelerated sharplyfrom 6.9 per cent in 2000-01 to 21.6 per cent during2008-09. Indian services sector has competitiveedge in several knowledge based servicessegments viz., software, business processing andhealthcare, while in the remaining areas, India mayhave to gain the competitive edge; the availabilityof modern physical infrastructure along with qualityhuman resources would be important to spur thegrowth impulses in the services sector.
I.34 Histor ical ly, the services sector hasconsistently showed resilience since 1990-91, andremained largely unaffected by the past instancesof external crises such as the Gulf crisis in 1991,
East-Asian crisis in 1997 and the technologymeltdown in 2000. The current global economiccrisis being unprecedented in the recent history interms of the magnitude of the impact as well itsduration, the past resilience of the services sectorcould be tested in 2009-10. Unlike the impact onmanufacturing that started in the second half of2008-09, the impact on services may be felt with alag, since the use of services as input to outputgrowth in organised manufacturing has been risingin the past. The services sector competition alsothrives on labour productivity as well as intensity,which is important in the context of the demographyof India in favour of the young population as wellas the need to absorb the surplus labour availablecurrently in the agriculture sector. The directcontribution of global factors to the services outputhas been rising since 2001, with increasing globalintegration in services trade under the multilateralframework, favourable terms-of-trade andcommunication revolution providing strong fillip toboth on and off-shore outsourcing of businessprocesses, activit ies and knowledge. Theprotectionist tendencies in some of the countriesaffected by the ongoing economic crisis havecreated concerns for the prospects of externaldemand for Indian services , but India’s comparativeadvantage continues to be strong.
I.35 Notwithstanding the high growth andresilience of the services sector in the recent past,the sector faces multiple challenges for sustainedgrowth over the years. A number of services whereIndia enjoys comparative advantages experiencelack of clear policy thrust. For instance, despite thehigh quality of healthcare services, it attracts anumber of regulations. Similarly, in education,multiple regulation points and lack of credibleaccreditation systems hamper the growth potential.Given the medium to long-term contribution ofinvestments on education and health to growth andproductivity, availability of these services ataffordable cost while enhancing their globalcompetitiveness must form part of the priority inIndia’s development process. A number of servicesin India are either predominantly associated with

16
ANNUAL REPORT
the Government or not liberalised enough to ensuregrowth through organised private initiatives.Services l ike professional, legal, postal,accountancy and insurance need fur therliberalisation to harness their potential.
Growth Outlook
I.36 The Reserve Bank’s survey of professionalforecasters conducted in June 2009 indicated anupward revision in the median growth outlook to6.5 per cent from the earlier outlook of 5.7 per centas per the previous Survey conducted in March2009. Currently available projections of growth forIndia in 2009-10 generated by various internationaland domestic organisations suggest a range of 4.8per cent to 7.5 per cent. Taking into account theglobal developments as well as the developmentsin domestic aggregate demand and the recentoutput outlook for the three broad constituentcomponents of GDP (i.e. agriculture, industry andservices), the first quarterly review of the monetarypolicy for 2009-10 conducted on July 28, 2009placed GDP growth for 2009-10 at “6.0 per centwith an upward bias”. Since the presentation of thepolicy statement, while the extent of rainfalldeficiency associated with the South West monsoonhas increased, the IIP figures for June 2009released in August 2009 show significant recoveryin Industrial output.
Inflation Outlook
I.37 In 2008-09, India witnessed large volatilityin headline inflation, which exceeded 12 per centat one point and then fell to below 1 per cent by theend of the year. Since June 2009, year-on-year WPIinflation has remained negative, primarily reflectingthe high base effect of the previous year thatresulted from significant increases in the prices offood and international commodities in the first halfof 2008-09. The base effect could be expected tofade gradually and then disappear by October 2009,after which the positive WPI inflation will becomevisible. While WPI inflation has turned negative,other indicators of inflation based on CPI for June2009 (point-to-point) continue to remain high at 11.5
per cent (for CPI-AL), 11.3 per cent (for CPI-RL),9.6 per cent (for CPI-UNME) and 9.3 per cent (forCPI-IW). The significant divergent behaviour of theinflation is largely on account of the differences inthe coverage of items and their weights in the WPIand CPI. At the disaggregated level, even withinthe WPI, inflation in food articles and essentialcommodities remain close to the inflation as perdifferent indices of CPI. The divergent inflationpattern as per the WPI and CPI indices hasincreased the complexity in the assessment ofinflation, and for policy purposes, the Reserve Bankmonitors the full array of price indicators. Moreover,inflation expectations have not declined as muchas the fall in WPI inflation and expansionary fiscalstance with an accommodative monetary policymay not lead to sobering of inflation expectations,even if the headline inflation remains negative forfew months.
I.38 The steady increase in the WPI over its end-March 2009 level indicates the persisting upwardmomentum in inflation, and trends in globalcommodity prices in the first quarter of 2009-10suggest that upside risks to inflation could persistfrom rebound in global commodity prices ahead ofglobal recovery. Increase in Minimum Support Price(MSP), that may be seen as a measure to supportthe farmers in a below normal monsoon year couldstoke inflation. More importantly, the deficientmonsoon could affect the inflation outlook morethan the growth prospects. The first quarter reviewof monetary policy conducted in July 2009 revisedthe inflation projection for the end of the year to 5per cent from 4 per cent projected in April 2009,recognising the imminent signs of inflationarypressures, while highlighting the medium-termobjective of 3.0 per cent inflation.
I.39 The divergent t rends in inf lat ion asmeasured by the WPI and CPIs have warranted acloser relook at the measurement issues as wellas the choice of an appropriate price index formonitoring changes in price levels at the nationallevel that could be used as the reference indicatorfor conduct of policies. In the absence of anationwide single inflation indicator based on
17
ASSESSMENT AND PROSPECTS
consumer prices covering the entire population,the wholesale price index (WPI) has been usedas the headline inflation indicator as it is morerepresentative and provides information on priceson a weekly basis with the minimum lag. Thecurrent WPI series (with base year 1993-94) doesnot completely capture the nature of transactionsin the economy, as considerable structuralchanges have occurred in the economy since then.In this context, the Government’s decision to revisethe base year to 2004-05 is expected to improvethe representativeness of WPI, as more numberof products, including from the unorganised sector,is proposed to be covered in the new series, alongwith reassigning of weights. The ongoing effortsfor compiling nationwide consumer price indicesfor both rural and urban areas by the CentralStatistical Organisation (CSO), as per therecommendation of the National StatisticalCommission, would also improve the informationbase on price movements.
The External Sector Outlook
I.40 The outlook for the external sectorsuggests that despite persistence of the globalrecession in 2009, the external sector is unlikely tocause concern for growth and stability in India. Thelatest available trends for 2009-10 indicate thatcurrent account deficit as percentage of GDP wouldbe lower than that in 2008-09. Both exports andimports continued to decline in the first quarter of2009-10, but the decline in imports has beensharper than the decline in exports, resulting in anarrowing down of trade deficit. However, globaloil prices have increased in recent months, which,if sustained, may put some pressure on the tradeand current account deficits. The relative stabilityin the software services expor ts and inwardworkers’ remittances, as witnessed in the previousyear, could impart resilience to the current accountin 2009-10. Even though net capital flows to EMEsare expected to decline during 2009, capital flowsto India may increase because of better medium-term growth and faster recovery prospects. Earlyindications for the first quarter of 2009-10 suggest
that NRI deposits, FII portfolio inflows and inwardFDI flows have generally been strong, as againstthe net capital outflows witnessed in the last twoquarters of 2008-09. The liberalised externalpayments regime has been facilitating the processof acquisition of foreign companies by Indiancorporates, both in the manufacturing and servicessectors, with the objectives of reaping economiesof scale, improving access to technologicalknowhow and increasing strategic presence inoffshore markets to face the global competition.Besides the lower current account deficit ,reasonable debt sustainability indicators andcomfortable foreign exchange reserves wouldensure external stability, notwithstanding thepersistent adverse global economic conditions.
I.41 The strong export growth of India in recentyears before the global recession started has beendriven by the productivity changes underway inthe Indian industry. The import intensity of exports,however, has also been steadily rising as domesticentities have expanded access to internationallyavailable raw materials and intermediate goodsas wel l as qual i ty inputs for providing thecompetitive edge to domestic production andenhance export capabilities. The prospects forrecovery in exports have to be seen in the contextof low external demand due to the global recessionand the resultant pressure on export prices andmargins, protectionist measures adopted byseveral countries, significant stimulus given byIndia’s competitor countries to their exporters, anduncertainty faced by exporters about timely receiptof payments. For improving the prospects forexports on a more sustainable basis the emphasisshould be on diversification, in terms of bothmarkets and export items, and competitiveness,without making the sector to remain dependenton incentives like tax breaks, lower excise andcustoms duties on inputs used for exports, andconcessional interest rates on financing forexporters, even though such incentives may benecessary in a phase of contraction in globaldemand as a temporary support to the export sector.Incentive dependent exports could hamper the

18
ANNUAL REPORT
progress on productivity as the durable means tohigher exports. South–South trade may also have tobe recognised for its potential in augmenting exportsgrowth in future.
I.42 The experience relating to surges in capitalflows for successive years, followed by sharpreversals in the second half of 2008-09 highlightthe importance of management of capital flows,given their ramifications for the exchange rate andthe conduct of monetary policy, and moreimportantly, for the overall macroeconomic andfinancial stability. A diversified capital account, witha hierarchical preference for FDI over debt flows,and for long-term flows over short-term flows,should be the focus of external sector policy. Fullercapital account liberalisation remains a medium-term objective, recognising the growingineffectiveness of micro controls in a world ofgrowing trade and financial integration.
Fiscal Consolidation
I.43 The fiscal stance of the Government in theface of deteriorating global conditions and weakeningdomestic growth impulses was guided by the needfor preventing a sharp contraction in growth in both2008-09 and 2009-10, while recognising the needto revert to the path of fiscal consolidation as soonas possible. The fiscal consolidation during 2003-04to 2007-08, driven by revenue buoyancy during thehigh growth phase, had created some fiscal spaceto activate discretionary counter-cyclical fiscal policy.The Union Budget for 2009-10 envisages furtherdeceleration in revenue collection due to theeconomic slowdown, as also partly due to tax cutsthat were undertaken earlier to support growth. Theexpenditure, in turn, was increased to supportaggregate demand by enhancing allocation for thecrucial sectors such as infrastructure in rural andurban areas, education and health, rural employmentprogrammes and schemes for the weaker sections.On the taxation front, the changes in both direct andindirect taxes have been envisaged to address theconcerns of growth and equity. The gross tax-GDPratio is budgeted to decline to 10.9 per cent during2009-10 from a peak of 12.6 per cent in 2007-08.
I.44 The quality of fiscal consolidation has tobe given priority attention in view of the fact thateven the post FRBM improvements in key deficitindicators were possible primarily on account of therevenue buoyancy. On account of the FRBM Act,revenue deficit and fiscal deficit came down from2.5 per cent and 4.0 per cent of GDP in 2004-05 to1.1 per cent and 2.7 per cent of GDP, respectively,in 2007-08. These improvements in fiscal indicatorswere largely revenue led. The revenue buoyancyimproved signif icantly as a result of highereconomic growth during this period and also dueto deliberate policy action towards improvement intax administration through computer isedinformation system and institution of tax informationnetwork (TIN). The revenue receipts to GDP ratioincreased from 9.7 per cent in 2004-05 to 11.5 percent in 2007-08, which accordingly contributed toreduction in fiscal deficit to GDP ratio by 1.8percentage points. On the other hand, contributionfrom compression in aggregate expenditure toreduction in fiscal deficit at 0.7 percentage pointsof GDP was much smaller. Decline in non-debtcapital receipts ( i .e. recovery of loans anddisinvestment proceeds) by 1.2 per cent of GDP,however, led to partial offsetting of the positiveimpact of revenue buoyancy and expenditurecompression on fiscal deficit. Not only thatexpenditure compression had the lowestcontribution to fiscal consolidation, but even thecomposition of increase in expenditure tilted againstcapital expenditure. While the revenue expenditureto GDP ratio increased by 0.4 percentage points,that of capital expenditure declined by 1.1percentage points, reflecting lack of focus onexpenditure management in contributing to thequality of fiscal consolidation.
I.45 While the fiscal measures undertaken torevive growth have led to deviation in fiscal targetsenvisaged under the FRBM Act during 2008-09 and2009-10, the Government has committed to returnto FRBM mandate in the next two years. Thoughthe stance of long-term fiscal policy beyond 2010-11 would emerge later this year when the ThirteenthFinance Commission presents its report, there are
19
ASSESSMENT AND PROSPECTS
several factors which could enable the Governmentin returning to the FRBM path. Expenditure onaccount of payment of Sixth Pay Commissionarrears and farm loan waivers would be paid outby 2009-10. Frontloading of the plan expenditureapproved for the Eleventh Five Year Plan as fiscalstimulus measures would also imply lower planexpenditure in the remaining years. As taxcollections, particularly direct taxes are cyclical innature, revenue buoyancy is expected to rise againwith the pickup in growth momentum. TheGovernment could also reverse the indirect tax cutswith the revival of the economy. Goods and servicestax (GST) proposed to be introduced from April2010 could also be expected to improve the revenuebuoyancy. In this regard, the Government has alsorecognised the importance of institutional reformmeasures encompassing all aspects of budget suchas subsidies, taxes, expenditure and disinvestment.
I.46 The fiscal consolidation path may have toinvolve considerable and careful rationalisation ofexpenditure. The capital outlay to GDP ratio hasbeen around 1.5 percent for last several years.Capital outlay, which is budgeted at 1.7 per cent ofGDP during 2009-10 would need to be stepped upsignificantly over time. Non-plan expenditure wouldhave to be checked. During 2009-10, non-planrevenue expenditure consisting mainly of interestpayments, defence expenditure, subsidies, wagesand pensions and grants to States appropriatedover 60 per cent of the total expenditure (about 10per cent of GDP). In the near future interestpayments, which represent a major non-discretionary component of expenditure, couldappropriate over one-third of total revenue receipts.This underpins the need for fiscal consolidation.The quality of fiscal consolidation, based onsuccessful international experience, suggests thatit should be driven by expenditure rationalisation/compression. A ceiling on the share of non-planexpenditure in total expenditure may be integratedinto a medium-term plan for enhancing the qualityof fiscal consolidation. Moreover, improving theproductivity of public expenditure and quality of thepublic service should also be emphasised as an
important part of the initiatives on expenditure ledfiscal consolidation.
I.47 On the revenue front, introduction of goodsand services tax (GST) is an important policyreform. The GST would facilitate greater verticalequity in fiscal federalism and reduce the cascadingnature of commodity taxes, since the base forassessment would be the value addition. In theUnion Budget for 2009-10 it has been indicated thatthe broad contour of the GST model would be dualGST, comprising Central GST and State GST. TheCentre and States will legislate, levy and administerthe Central GST and State GST, respectively. TheCentral Government has reiterated its commitmentto facilitate the introduction of GST by April 1, 2010,after consultations with all stake holders. The shareof services sector in total tax revenue is notcommensurate with its share in GDP, although theservices tax collections have witnessed animpressive growth during the period 2003-04 to2008-09, from 0.3 per cent of GDP in 2003-04 to1.2 per cent and budgeted at 1.1 per cent of GDPin 2009-10. Within gross tax revenue, the share ofservices has increased from 3.1 per cent in 2003-04 to 10.4 per cent in 2008-09 and budgeted at10.1 per cent for 2009-10. With the introduction ofGST, more number of services would also bebrought into the tax net and consequently taxcontribution from the services sector could beexpected to increase substantially.
I.48 The fiscal consolidation process entails therisk of affecting social sector spending as much asinfrastructure spending. The expenditure incurredon education and health in recent years as per centto GDP showed marginal improvement from 0.4per cent and 0.2 per cent in 2003-04 to 0.6 percent and 0.3 per cent, respectively, in 2008-09.These are budgeted at 0.7 per cent and 0.4 percent for 2009-10. Compared to other emergingmarket economies, expenditure on health andeducation is low in India. Given the already low levelof expenditure on these crucial sectors, as aminimum, there is a need to maintain the gradualupward momentum witnessed in recent years. The
20
ANNUAL REPORT
process of fiscal consolidation, therefore, shouldnot be achieved at the cost of cut backs inexpenditure towards these sectors.
Disinvestment
I.49 In the context of options for faster return tothe fiscal consolidation path, mobilisation ofresources through disinvestment has beenhighlighted in some quarters. The experience withdisinvestment programme in recent years indicatethat proceeds from disinvestment were the highestin 2003-04, amounting to Rs.16,953 crore, and nosubsequent momentum has been achieved sincethen. With the setting up of National Investment Fund(NIF), all the proceeds from disinvestment of CentralPublic Sector Enterprises (CPSEs) are required tobe routed to it, which is maintained outside theConsolidated Fund of India. The Fund is managedprofessionally to provide sustainable returns to theGovernment, that too without any depletion of thecorpus. Only the annual income of the Fund can bespent, with 75 per cent for financing select socialsector schemes in the field of education, health andemployment and the balance 25 per cent for meetingthe capital investment requirements of profitable andrevivable CPSEs. There is a need to step updisinvestment for greater resources mobilisation.
Subsidies
I.50 Management of subsidy has posed apersistent policy challenge. The high fertiliser pricesprevailing in global commodity markets during thefirst half of 2008-09 and the enhanced minimumsupport price for wheat and rice led to sharpincreases in fertiliser and food subsidies in 2008-09(RE) by Rs.44,863 crore and Rs.10,960 crore,respectively, over the budget estimates. Apart fromthese subsidies, which are explicitly provided for inthe Budget, implicit subsidies provided for by wayof issue of special securities to oil and fertilisercompanies amounted to Rs.75,849 crore andRs.20,000 crore, respectively, in 2008-09 so as tocompensate for under recoveries. This has addedto the subsidy burden of the Government, as the
interest payments on these securities will impingeon the revenue deficit of the Government. The UnionBudget for 2009-10 has lowered the provisions forfertiliser subsidy in 2009-10 by 34 per cent overthe revised estimates for 2008-09, assuming thatthe prevailing lower prices of fertilisers will continuein the international markets. Food subsidies havebeen raised by 20 per cent in order to ensure foodsecurity for BPL families. Together with the provisionfor special securities to oil marketing companies,the total provision for major subsidies is budgetedto be around 2 per cent of GDP for 2009-10, asagainst 4.2 per cent of GDP in 2008-09. Moreover,expenditure by the States on subsidies has beenat around 0.4 to 0.5 per cent of GDP in recent years.This order of subsidy of the Centre and States takentogether is high for a country where budgetaryresources have competing demands and whichhave stronger potential for contributing to growthand development. Without explicit mandatedprovisions to cap expenditure on subsidies, needsfor greater public investment in infrastructure, bothphysical and social, could be sacrificed as anoutcome associated with higher subsidies.
I.51 As regards fertiliser subsidies, the movetowards nutr ient based subsidy regime asannounced in the Union Budget 2009-10 couldensure balanced application at reasonable prices.Furthermore, the move towards a system of directtransfer of subsidy to the farmers in due coursewill ease the pressure on fertiliser subsidies asleakages could be reduced. Over time, fertiliserprices need to be decontrolled. As irrigation is acritical factor determining the use of fertilisers, andhas a significant impact on foodgrain production,public investment in irrigation could be a moreefficient policy instrument rather than subsidy.
Infrastructure
I.52 India’s high growth trajectory has exertedsignificant pressures on the available physicalinfrastructure, and infrastructure deficit is widelyrecognised as a major constraint to attractingforeign investment and promoting efficiency in
21
ASSESSMENT AND PROSPECTS
production in India. The Eleventh Five Year Planenvisages stepping up of the gross capital formationin infrastructure from 5 per cent of GDP in 2006-07to 9 per cent of GDP by end of the Plan period in2011-12, and this could be critical to achieve the 9per cent growth. The large financing requirementthat is necessary to almost double the investmentin infrastructure has to be also seen in the contextof challenges for investment in both public andprivate sectors. Public investment continues todominate the infrastructure sector in India and whenthe Government is expected to go through an exitphase to revert to the fiscal consolidation path,accelerating the pace of public expenditure forinfrastructure could become difficult. In attractingprivate investment to infrastructure projects, thechallenge is to make the investment attractiveenough in terms of expected return on capital whilealso being fair to the consumers and actual usersof the infrastructure. Moreover, besides the currentfocus on growth, improving the quality of life throughprovision of modern physical and socialinfrastructure should also be given greaterimportance. During the implementation stage of theprojects, more rigorous mechanism must be put inplace to enhance the quality of the infrastructure.Development of infrastructure is the key to asustainable high and inclusive growth process andis necessary for connecting producers to markets,lowering transaction costs and also providing alarger section of the population access to serviceslike communication, education, and healthcare.India’s rapid industr ial isation and growingurbanisation continue to put pressure oninfrastructure demand; as infrastructure projectsare capital intensive with long gestation period, thereturn is uncertain and low in risk adjusted terms,which warrants provision of special preferentialincentives in the policy framework for generatingthe desired supply response.
I.53 Addressing the growing infrastructure gapwould be critical for both sustaining higher growthas well as improving the quality of life. The EleventhFive Year Plan has estimated an investmentrequirement of US$ 502.88 billion (Rs.20, 11,521
crore) in infrastructure; financing this level ofinvestment, however, remains a challenge ahead.Several new initiatives have been initiated in therecent years focussing particularly on the ruralinfrastructure development. To stimulate publicinvestment in infrastructure, a special purposevehicle - India Infrastructure Finance CompanyLimited (IIFCL) was set up for providing long-termfinancial assistance to infrastructure projects. TheUnion Budget for 2009-10 announced that IIFCLwould, in consultation with banks, evolve a ‘takeout financing’ scheme (which would address assetliability mismatch of commercial banks arising outof infrastructure financing) to facilitate incrementallending to the infrastructure sector. In recent years,some progress is discernible in attracting privateinvestment in infrastructure sectors such astelecommunications, power generation, airports,ports, roads and the railways through public privatepartnerships (PPPs).
I.54 PPPs have grown in popularity around theworld with governments otherwise finding it difficultto finance infrastructure investments throughconventional revenue raising mechanisms liketaxation or borrowings. In financing large-scale PPPprogrammes, there could be the constraint in termsof mobilisation of long-term funds. PPPs in Indiarely on commercial banks for funding, which bynature cannot be for very long-period. Bankfinancing for PPP projects exposes the banks torisk concentration, besides refinancing uncertaintyat maturity, and the risk of changing interest ratesand credit conditions over time. An active bondmarket could diversify risks, besides elongating theduration of finance. The financing challengessuggest the need for greater Government support,ranging from direct equity contribution to use ofgovernment guarantees and extension of taxbreaks. To ease the financing constraints forinfrastructure projects under the PPP mode, theGovernment has decided that IIFCL wouldrefinance 60 per cent of commercial bank loans forPPP projects in critical areas over the next fifteento eighteen months. The IIFCL was authorised toraise Rs.10,000 crore through Government

22
ANNUAL REPORT
guaranteed tax free bonds by the end of 2008-09and an additional Rs.30,000 crore on the samebasis as per the requirement in 2009-10. Therefinancing option is expected to leverage bankfinancing for PPP programmes to the extent ofabout Rs.1,00,000 crore.
Technology and Innovations
I.55 For sustaining the high growth, there hasto be signif icant emphasis on raising theproductivity levels, for which innovations andadoption of technology would be critical. Anycontribution to growth that emanates from factorsother than labour and capital is generally seen asthe contribution of technology in growth accounting,which is broadly captured under “total factorproductivity (TFP)”. International as well asdomestic empirical evidences recognise the roleof technological progress in economic growththrough increase in TFP. Factors ranging fromeducation, rule of law, openness to trade and capitalflows and institutional reforms could contribute totechnological progress, besides innovations andadoption of new technology. For enhancingproductivity, thus, expenditure on primary health,education, vocational training and R & D may beraised, besides facilitating larger flow of credit.Entrepreneurship needs to be incentivised forpromotion of innovation and growth of old and newbusinesses. Enhanced credit availability to businessstart-ups is one of the measures to facilitate thegrowth of entrepreneurship. Start-ups are expectedto have a higher failure rate, which may have to berecognised in the regulatory norms relating to assetquality. Innovations in areas in which India hasgained expertise and competitive edge (e.g. ICT,pharmaceuticals and biotechnology) also need tobe encouraged. FDI often brings with it moderntechnology and other practices which contribute toproductivity; there is, therefore, a need for a moreliberal FDI policies. In view of the low yield in Indianagriculture, productivity enhancing technologies areparticularly required for more inclusive high growthand rural development. Entrepreneurs are generallyinnovators and known for their development and
adaptation skills. They are creative and are driven bythe animal spirit of making profits. They are also risktakers. Hence, a special Government funded schemefor providing necessary opportunities to existing andpotential entrepreneurs could be appropriate.
Food and Energy Security
I.56 The global developments on the food andenergy fronts in 2008 highlighted the importanceof food and energy security for ensuring sustainableand inclusive high growth in India. Insulating thecommon man from the vulnerability associated withhigh food price inflation warrants a more robust foodsecurity system in India, which could allow highgrowth in agriculture without depressing the pricestoo much while also preventing escalation in foodprices in the eventuality of production shortfalls. Theextent of volati l i ty that was witnessed ininternational food prices in 2008-09, and thespecific measures that the Government of India hadto undertake in terms of banning export of certainitems and reducing the prices of certain importeditems through lower tariffs, also highlight that Indiamay have to put in place a more comprehensivefood management system that is consistent withhigh growth and low inflation objectives while alsoensuring adequate supply of food articles at thelowest possible prices to the vulnerable sectionsof the society. This is particularly relevant onaccount of the fact that a large segment of theIndian population has no access to any assuredsocial safety fall back options. The current bufferstock policy may have to be better aligned to thegoal of stabil ising food pr ice inflation whilesimultaneously promoting higher growth inagricultural output, so that despite the costsinvolved, surplus production could be absorbed inyears of good agricultural production to avoid anysharp fall in prices, while also releasing adequatestocks from the available buffer stock during periodsof shortfall in domestic production in relation todemand. Other growth enhancing measures couldinclude higher public investment in agriculture,better crop balancing, research and extensionservices, and prevention of degradation in soil
23
ASSESSMENT AND PROSPECTS
productivity while enhancing the sustainability ofavailable ground water for agricultural use. Theemphasis should be also on diversification ofagriculture, from rain-fed to dry land farming, fromfood crops to non-food cash crops, and fromdependence on agriculture as the sole source ofliving to non-farm rural employment. Climatechange related issues wil l assume greaterprominence over time, and could potentially disturbthe rainfall pattern in future; there could be gradualinternational consensus over time on emissionlimits for countries, which in turn would requirelarger public investment on clean technology.
I.57 Besides food security, energy security isanother challenge, and the behaviour of energyprices in 2008-09 only highlights the urgency thatshould be assigned to this issue. Significantdependence on imports for ensuring assuredsupply of POL products in the domestic marketwarrants adequate strategic policies to contain anypotential risk to future growth path arising frompossible emergence of sudden deficits in energyavailability. Incentives to private investment andhigher public investment on exploration andproduction of crude and natural gas would benecessary. Any fiscal measures to moderate theimpact of high oil prices over a sustained periodcould drag the fiscal position to unsustainablelevels. Decontrol of prices for all POL products bylinking the pricing directly to international prices,and delivering subsidies explicitly as a cash outgoaffecting the budget deficit contemporaneously,instead of through oil bonds, could be the first steptowards promoting energy security. The nextimportant steps could involve provision of sufficientfiscal incentives for promoting energy conservationand efficient use, for attracting private investmentin generation and conservation of power, and moreimportantly, research and extension activities onnon-conventional clean energy.
Employment
I.58 The employment effects of the globaleconomic recession have been a key driving factorbehind the use of large stimulus packages all over
the world. The May 2009 ILO Update on GlobalEmployment Trends projects addit ionalunemployment of over 50 million (in the worst casescenario) as a fallout of the global economic crisisin 2009. While no information is available at themacro-level in India on the unemployment scenarioarising from the slowdown in growth, unemploymentvery much remains a concern, and there areevidences of some increase in unemployment incertain sectors. The Ministry of Labour in India hadconducted two quick quarterly surveys for theperiod October-December 2008 and January-March 2009 in select business segments to assessthe impact of the global contagion and domesticslowdown on employment. The survey found adecline in overall employment growth in industrieslike textiles, metals, automobiles, gems andjewellery, transport and IT/BPO by 1.0 per cent (or0.5 million job losses) during the third quarter of2008-09, with the gems and jewellery and transportsegments showing (-8.6 per cent) and (-4.0 per cent)change in employment. While export oriented unitsexhibited pressure on employment, non-exportingunits experienced modest employment growth.
I.59 The employment situation in the fourthquarter of 2008-09, however, improved, even incertain export-oriented segments, particularlytextiles, IT/BPO, automobiles, gems and jewelleryand handloom/powerloom; the employmentsituation though deteriorated in other exportoriented sectors like leather, metals and transport,where employment remained below the September2008 levels. The Reserve Bank’s Industrial OutlookSurvey conducted in April-May 2009 showed thatas per expectations about employment in July-September 2009, there would be net hiring in themanufacturing sector.
I.60 The Government has undertaken severalmeasures to promote growth in the sectors facingslowdown, and thereby prevent increase inunemployment. Prominent among these areestablishment of two new mega clusters forhandlooms and carpets, interest subvention on pre-shipment credit for labour intensive export oriented
24
ANNUAL REPORT
sectors, enhanced ECGC cover, and reduction inbasic customs duty and service tax exemption toselect exports. Enhanced resource allocation in2009-10 for national flagship schemes such asNational Rural Employment Guarantee Scheme(NREGS) (rise by144 per cent), Bharat Nirman (riseby 45 per cent), National Highway DevelopmentProgramme (rise by 23 per cent), Jawaharlal NehruUrban Renewal Mission (JNNURM) (rise by 87 percent) could help in generating addit ionalemployment, particularly in the un-organisedsector, both in rural and urban areas during 2009-10. There have been reports of reverse migration– from urban industrial clusters to the rural areaswithin India – and the protectionist response ofseveral countries in terms of tighter immigrationpolicies on account of their own deterioratingemployment conditions.
Urbanisation
I.61 Approximately 30 per cent of India’spopulation resides in urban areas currently. Theproportion of people living in urban areas is goingto increase at a faster pace in the next thirty yearson account of organic growth as well as thecontinued rural-urban migration. Considering theimportant role that urbanisation has played ineconomic development more recently in South-EastAsia and China, the role of proper urban planningand management cannot be overemphasised.Focus is required not just on hard infrastructuresuch as water, sanitation, sewerage, urbantransportation, power and communication, but alsoon softer areas such as education (primary,secondary, higher and vocational) and health.Traditionally, provision of public goods and servicesis financed by tax flows and public borrowings whilethat of private goods and services is financedthrough user charges. In India, the importance ofuser charges in developing and sustaining theurban infrastructure is well recognised. TheJawahar lal Nehru Urban Renewal Mission(JNNURM), launched in 2005-06, is by far the mostambitious programme aimed at improving the civicservice levels in identified mission cities over a
period of seven years. While sanctioning projectsutilising the additional central assistance under theJNNURM, priority has been given to projects suchas water supply, sanitation and storm waterdrainage, which benefit the common man and theurban poor. This process needs to be furtherstrengthened.
Financial Sector Reforms
I.62 While India’s financial sector remainedresilient in the face of global shocks, there are anumber of areas where the reforms would beneeded to promote stability and generate growthimpulses for the real economy. An importantchallenge is to channelise more savings to thefinancial system, particularly in rural areas and fromthe urban informal sector. This would need furtherpenetration of the banking system. The ReserveBank’s emphasis on financial inclusion is importantin attaining this objective over time. There is alsoenormous potential for expanding financial servicesin semi-urban and rural areas for productiveactivities, which may require strengthening thebanking correspondent relationship, simultaneouslyenhancing the r isk assessment and r iskmanagement capacities in order to maintain creditquality and sustain the credit growth in the informalsector. Further reduction in the cost of bankingservices may require greater competition amongproduct lines, improved delivery mechanisms andincreasing use of information technology. With aview to ensuring that domestic savings couldfinance long-term investment in projects havinglong gestation lags, the insurance and pensionsectors, would be critical, due to the very natureof their liabilities, as well as a vibrant bond market.This may, however, require a number of reforms inthe insurance sector such as increasing flexibilityfor the insurance companies to raise capital andbring in greater competition and enhance depth inthe insurance and pension funds markets. Deepand l iquid domestic markets with var iedparticipation can absorb overall risk better andreduce the excessive volatility that often addsuncertainty to the investment climate. From this
25
ASSESSMENT AND PROSPECTS
perspective, the corporate bond market in India haslagged behind in comparison with other financialmarket segments, owing to many structural factors.Rationalising the primary issuance procedure,facilitating exchange trading, increasing thedisclosure and transparency standards andstrengthening the clear ing and sett lementmechanisms in the secondary market arenecessary in this regard. Cross-border banking, inthe post crisis period, has to be examined withgreater caution, and future reforms in this area mustbe guided by progress on adequate mechanismsand systems to prevent the possibility of suddenand large external contagion creating systemic risksfor the domestic financial system. For sustainingthe high growth path, improving the investmentclimate and enhancing the absorptive capacitywould be critical. In this context, financial sectorreforms have to emphasise promoting financialinclusion, ensuring wide and deep financial marketsand facilitating the growth of strong, competitive andsound financial institutions.
Financial Stability Architecture
I.63 The post-cr isis revamping of thearchitecture for promoting financial stability as aprecondit ion to growth could encompassmacroeconomic policy issues as well as financialregulation and supervision. In the sphere ofmonetary policy, alongside the predominantemphasis on inflation, asset price bubbles drivenby credit boom and excessive use of leverage hasto receive greater attention, notwithstanding thecurrent lack of clarity on how does monetary policyrespond to asset prices? The fiscal policy stancehas to recognise the limits of pro-cyclical fiscalstance, and the importance of adequate fiscalconsolidation and sustainability as a necessarystimulus to high growth and stability. In the Indiancontext, inherent rigidities that constrain fasterconsolidation has to be taken into account;adequate fiscal space has to be built up as acushion over time to deal with future shocks to thegrowth process. Leverage driven or export/capitalf lows dependent growth could increase the
amplitude of the business cycle and the real costsof an external or financial sector shock could bedisproportionately high. In the sphere of regulatoryand supervisory architecture, alongside the currentemphasis on the soundness of individual banks andinstitutions as a means to ensure systemic stability,increasing emphasis has to be laid on macro-prudential regulation that could promote andstrengthen systemic stability.
I.64 In India, elements of macro-prudentialregulation were visible even before the global crisisstarted, in terms of counter-cyclical use of risk-weights and provisioning norms. Macro-prudentialanalysis could provide the early warnings fortimely identification of systemic risks, while macro-prudential regulation could prevent the emergenceof systemic risk in the financial system. In view ofthe interconnectedness between banks andinstitutions, financial markets, and the economy,systemic risk analysis would involve interpretingthe changing dynamics between these threesegments on a continuous basis. Any vulnerabilityin any small segment of these broad areas couldamplify and become systemic in view of the stronginter-linkages.
I.65 The international initiatives that could leadthe process for strengthening the global financialsystems would involve significant coordinationamong national regulators, besides revamping ofnational stability frameworks reflecting the globaltrends and country specific requirements. Theongoing international init iat ives indicate amultipronged approach, covering several importantaspects of stability: (a) introducing automaticstabilisers into the regulatory framework byadopting counter-cyclical capital charge, so thatadequate cushion could be built up during thebooming phase of the business cycle which couldbe used to deal with the asset quality problems thatmay arise during the waning phase of the businesscycle; (b) adequacy and quality of capital as perBasel-II r isk based capital framework, andsimultaneous use of simpler measures such as theleverage ratio; (c) capital requirements forreputational and other r isks in respect of

26
ANNUAL REPORT
securitisation activities and activities undertakenby the sponsored or connected conduits/shadowbanks; (d) capital treatment for trading bookexposures, and the need for supplementing value-at-risk approach with incremental risk charge soas to minimise the incentive for regulatory arbitragebetween banking books and trading books, (e)strengthened Pillar 2 supervision, focusing on riskconcentration, off-balance sheet exposures,valuations of financial instruments, access tofunding liquidly during hypothetical possibility of afinancial crisis, stress test practices adopted inbanks and system level stress-tests and theirintegration into capital and liquidity planning; and(f) promotion of market discipline under Pillar 3through better disclosure and clarity on the riskassociated with exposure to certain instruments. Theinternational deliberations have also highlightedother important issues like the risk associated withdistorted incentive structures for the market players,the inadequacy of self regulation for rating agencies,the deficiencies of models for risk analysis andmeasurement, and the need for improving marketstructure for derivatives. The emerging internationalstandards and best practices would have to becarefully examined from the stand point of theirrelevance to India, while further strengthening thedomestic financial stability framework to avoidsystemic stress on the financial system.
I.66 As on March 31, 2009, all Indian banks,including the foreign banks, have migrated to theBasel II standardised approaches, and hence, theywill be subject to the Supervisory Review andEvaluation Process (SREP) under Pillar 2 of BaselII for assessing the capital requirement as also thecapital adequacy of each bank vis-a-vis its riskprofile and the standard of its internal controlssystem and r isk management practices.Consolidated supervision mechanism for thebanking group with bank as parent entity has beenput in place. Financial Conglomerate MonitoringMechanism already is in vogue since June 2004 inIndia. Steps are being taken to strengthen CrossBorder Supervisory Co-operation. With a view tostrengthening and formalising a comprehensive
financial stability framework, supporting pillars havebeen laid out through special exercises likeperiodical reviews of the banking sector, microprudential reviews, interest rate sensitivity analysis,and vulnerability assessment. Tools such as stresstesting and scenario analysis are also used,depending on the evolving financial/economicenvironment in the country. The counter cyclicalapproach to supervision, that is being highlightedinternationally as a post-crisis reaction to revampthe architecture for financial stability, where theprudential requirements like build up of capital and/ or provisions is enhanced during the good times,to meet the stress on the asset quality duringfinancial downturns has been implemented in Indiaeven before the onset of the crisis.
I.67 The macro-prudential dimension ofsystemic risk assessment has become particularlyimportant in the context of the current globalf inancial cr isis. Since r isk assessment is acontinuous process and stress tests need to beconducted taking into account the macroeconomiclinkages as also the second round effects andcontagion risks, consequent to the announcementin the Annual Monetary Policy Statement of 2009-10, an inter-disciplinary Financial Stability Unit hasbeen set up to monitor and address systemicvulnerabilities. In addition to applying stress teststo the portfolios of individual institutions at the microlevel, stress-testing in macro-prudential analysis isbecoming more relevant for systemic risk analysis.The main objective of an economy and financialsystem level stress test is to help public authoritiesidentify those structural vulnerabilities and overallrisk exposures that could potential lead to systemicproblems. The principles enunciated by BCBS onstress testing as per its final guidelines issued inMay 2009 emphasize the importance of macro levelforward looking stress testing for assessing theadequacy of capital and liquidity. The Reserve Bankis in the process of revising guidelines on stresstesting and liquidity risk management taking intoaccount the new guidance issued by BCBS. It isalso considering to lay down a risk managementand capital adequacy framework for bank
27
ASSESSMENT AND PROSPECTS
sponsored private pools of capital (e.g. privateequity funds / venture capital funds), especially inview of the reputational r isk ar ising fromundertaking such activities.
I.68 There is a perception that the impact of thegrowth slowdown experienced in the second halfof 2008-09 could be seen in the form of pressureson banks’ asset quality during 2009-10, particularlyif the recovery gets delayed. Restructuring ofaccounts permitted by the Reserve Bank in 2008-09 has also been highlighted as a factor thattemporarily delayed the emergence of asset qualityproblems. It may have to be recognised that theobjective of restructuring is to take a swift actionbased on detection of the weaknesses in viableentities which may be facing temporary cash flowproblems due to internal or external factors, so asto preserve their economic and productive value. The exceptional regulatory treatment was notextended ear l ier to commercial real estateexposures as well as to capital market exposuresand personal/ consumer loans in view of thepossibility of fuelling asset price bubbles. Therestructuring of accounts allowed up to June 30,2009 aim at preserving economic value of units andnot ever-greening of problem accounts. Banks,therefore, have to use their judgement beforeagreeing to restructure, so as to ensure thatrestructuring is undertaken only for viable units.
POLICY CHALLENGES
I.69 The macroeconomic conditions in 2009-10so far, and the expected outlook for growth andinflation suggest that there are clear policychallenges for the Reserve Bank as well as for theeconomy as a whole. A major challenge for theReserve Bank is to deal with the unpleasantcombination of subdued growth with emerging riskof high inflation, which poses a complex dilemmaon the appropriate stance of monetary policy. Insuch conditions, while withdrawal of monetaryaccommodation entails the risk of weakeningrecovery impulses, sustained accommodation andthe associated protracted phase of high money
growth can only increase inflation in future.Secondly, large borrowing programmes and highfiscal deficits complicate the challenge even furtherby accentuating inflationary expectations, whichcould worsen the actual inflation situation over timewhile also putting upward pressure on interest rates.Subdued growth with high inflation erodes thedisposable income of the masses, and as a result,the recovery becomes even more difficult becauseof sustained depression in aggregate demand. Lowinflation is an essential precondition to spur privatedemand, and monetary accommodation of the largefiscal stimulus could support recovery in growth onlyin a low inflation environment. Thirdly, for any earlysigns of recovery to gain momentum, private sectorcredit must grow. Better monetary policy transmissionthat could enhance the demand for credit is a keychallenge, notwithstanding the usual dynamics of anycredit market which may not respond to monetarypolicy actions. Finally, with the return of capital inflowsto the pre-crisis period and revival in demand forcredit from the private sector, the costs of any delayin withdrawal of monetary accommodation and fiscalconsolidation could increase.
I.70 The emerging inflation outlook and themedium-term consequences of sustainedaccommodative monetary stance for inflationsuggest that timing and pace of exit from the currentaccommodative monetary policy stance would bea major challenge for the Reserve Bank. If thestimulus is sustained longer, the imbalances left inthe system could create market induced pressures,besides engendering the inflation situation, whichmay work against the recovery. The exit options forfiscal policy have to be seen in the context of thefact that economic recovery in itself could allow theautomatic stabilisers to operate, by raising therevenues, and creating scope for reduction in publicexpenditure. What would be more impor tant,however, is the discretionary unwinding measuresto ensure reverting to the fiscal consolidation pathas an essential requirement for returning to the highgrowth path. This cannot happen throughexpenditure compression alone, because ofassociated growth implications; hence part of the
28
ANNUAL REPORT
adjustment has to come through revenue buoyancy,higher tax base and better compliance. For themonetary policy, which has to be primarily guidedby the assessment of the likely path of the businesscycle and the inflation cycle, balancing the goalsof supporting growth and containing emerginginflationary pressures could become increasinglychallenging over 2009-10, in the face of anexpansionary fiscal stance.
I.71 For the Reserve Bank, thus, besides thenear term challenges of emerging inflationarypressures, management of large borrowingprogrammes and the associated potential conflictbetween monetary and fiscal policy, there are othermedium-term issues associated with globalisationas well international initiatives on revamping thearchitecture for promoting financial stability. Whileopenness offers a number of benefits, it increasesthe risks from external demand and capital flows.Swings in capital flows and sudden stops can havea significant impact on exchange rates, domesticmonetary and liquidity conditions and overallmacroeconomic and financial stability. Globalgrowth and monetary conditions, therefore, havean influence on domestic policies.
I.72 The single mandate linked to inflationobjective has often been highlighted as a necessityfor ensuring a better inflation environment, butgiven the importance of other objectives for acountry of India’s size and diverse needs, theoperational relevance of an inflation-centr icmandate has to be examined carefully. Supplydriven large volatility in WPI inflation that waswitnessed in 2008-09 could erode credibility of anyinflation-centric monetary policy. Moreover, theWPI inflation has been quite different from the CPIbased inflation in India in the recent period, andas a result which measure of inflation may be themost appropriate reference for conduct of monetarypolicy has also been an issue. The Reserve Bankoperates with multiple objectives of price stability,growth and financial stability. In the pursuit ofmultiple goals, the available instruments are usedoptimally with a mix of interest rate changes,quantitative l iquidity adjustment, prudential
regulations and credit policy measures. Forpromoting financial stability, the new internationalinitiatives in response to the global financial crisishave to be monitored and examined, with anemphasis on country specific relevance, and thefuture approach to financial sector reforms may haveto be based on lessons from the recent crisis.
I.73 For the economy as a whole, the mostcritical challenge is to revert to the high growth path,which would be possible only with a faster recovery.The longer the growth impulses remain dampened,the fiscal policy will exhaust any available fiscalspace, and the costs of large fiscal stimulus willalso increase with time. Secondly, deficientmonsoon and the possible adverse effects onagricultural output may not only put pressure onfood prices but also increase the demand for moresubsidies and relief measures. The pressure on thefiscal situation could only increase if drought relatedpolicy response involves further expansion ingovernment expenditure, and the additional costsassociated with possible impor t of essentialcommodit ies to improve domestic supplyconditions. Given the fact that food prices remainhigh, despite low overall WPI inflation, and that allCPI indices exhibit little moderation in inflation, thesupply side of food management would assumecritical significance for the Government. Thirdly, theunemployment effects of a long phase of economicslowdown, with weakly developed social securitysystem, suggest that the Government’spreparedness for dealing with situations as in 2008-09 should be strengthened, which must includecounter-cyclical fiscal stance allowing build up ofsignificant cushion during periods of high growth.But despite the FRBM, fiscal consolidation processremained slow. More impor tantly, the publicexpenditure was also not reoriented to addressconstraints to high growth, such as physical andsocial infrastructure.
I.74 The macroeconomic outlook for 2009-10,in terms of expected gradual recovery in growthand the emergence of inflation pressures by theend of the year pose difficult challenge for the
29
ASSESSMENT AND PROSPECTS
conduct of policy, in terms of balancing the two keyobjectives. While the fiscal stance has clearly tiltedtowards the growth objective, the associatedaccommodative monetary policy stance, i fsustained longer, entails the risk of higher inflation,which in itself may become a constraint to highergrowth in the medium-run. In India, globalisationcertainly had the associated benefits, directly interms of exports and capital inflows, and indirectlyin terms of global perceptions of India as a majoremerging economic power. The manner in whichIndian policies could manage the contagion fromthe global crisis would have only further improvedthe global perception of India. The global crisis,when it started to spread, did not differentiatecountries on the basis of soundness of their
macroeconomic policies. In a globalised world,consumers’ and investors’ perceptions could oftenbe influenced by global developments, and hence,strengthened multilateral surveillance and effectiveglobal action to prevent the emergence of majorglobal imbalances would have to be ensured so asto allow national policies the space for pursuingand achieving the high and sustainable growthobjectives. Overall, Indian growth continues to bedriven by domestic demand and domestic saving,with foreign capital supplementing within theprudent approach to sustainable current accountdeficit. Thus, return to 9 percent growth trajectorywould largely be determined by the country’sstructural fundamentals and the responsive macropolicy environment.
I. MACROECONOMIC POLICY ENVIRONMENT
II.1.1 The environment for pol icy makingremained exceptionally challenging during 2008-09,as global recession and unsettling conditions inthe global financial markets warranted institutionof swift and appropriate policy measures to containthe adverse ramifications for the Indian economy.The domestic macroeconomic conditions alsochanged dramatically during the year; from the firsthalf concerns relating to building inflationarypressures and some evidence of cycl icalslowdown to the second half apprehensionsar ising from reversal of capital inflows andpressure on financial markets on account of furtherdeepening of the global economic crisis and theconsequent moderation in growth. Notwithstandingthe benefits of globalisation experienced by theworld economy in terms of a four-year phase ofhigh growth and low inflation, the crisis in 2008-09brought to the fore the associated r isks of
30
globalisation for national economies, not only interms of the speed and magnitude of the contagion,but also in terms of the limitations on the nationalpolicies to deal with the challenges in the face ofa persistent adverse external environment. Formost of the countries around the world, highinternational food and commodity prices createdchallenges for the conduct of anti-inflationarypolicies in the first half of the year. In the secondhalf of the year, global credit squeeze, stressedfinancial institutions, dysfunctional markets, andabove all, fall ing global output, investment,employment and trade, posed testing conditionsfor the use of national policies to counter growthmoderation and to preserve financial stability.
II.1.2 India, in the midst of a severe globalrecession, could still contain the moderation ingrowth, preserve financial stability and ensurenormal funct ioning of the markets. Themacroeconomic policy framework of India and the
The domestic macroeconomic conditions changed significantly during the course of the year reflectingsharp deterioration in global economic conditions. In the first half, the policy challenge was to dealwith high inflation and emerging signs of cyclical slowdown; in the second half, however, containingthe adverse effects of the contagion from global economic crises necessitated coordinated monetaryand fiscal policy actions with a view to moderating the pace of slowdown in growth, preserving thesoundness of domestic banks and financial institutions, and maintaining orderly and well functioningmarkets. The growth supportive fiscal stance led to deviations from the fiscal consolidation path andthe fiscal deficit rose accordingly. The monetary policy stance remained accommodative; the ReserveBank ensured ample liquidity in the system while reducing the cost of liquidity significantly byappropriate reduction in policy interest rates. The sharp decline in WPI inflation in the second halfof the year created some space for pursuing accommodative monetary policy. Indian banks andfinancial institutions largely escaped the heat of the global contagion because of strong fundamentalsand no direct exposure to the troubled assets and stressed institutions in the advanced countries.The Reserve Bank's swift and necessary responses ensured orderly functioning of the markets. Thus,the conditions in the financial system did not operate as a constraint to growth in India, unlike inthe advanced countries. Deceleration in demand, however, emerged as a major concern in thesecond half of the year, because of its dampening effects on growth.
ECONOMIC REVIEWII

approach to regulation and supervision of financialinstitutions and markets clearly contributed tosoften the impact of the global financial crisis onthe domestic economy. In a globalised world,however, the natural process of transmission ofcontagion operating through the trade, capitalflows and confidence channels have affected thedomestic economic and financial conditions. RealGDP growth, which had averaged at 8.8 per centduring 2003-08, decelerated to 6.7 per cent in2008-09. Trade and capital flows channels exertedpressures on the balance of payments. Thesedevelopments along with the confidence channelof contagion affected the financial markets.Despite resilience of the banking system, thedemand for liquidity, both domestic and in foreigncurrency magnif ied. In consultat ion andcoordination with the Government of India, theReserve Bank had to take a range ofcomprehensive policy measures covering theeconomy, the markets and the financial institutions.A detailed analysis of the developments in eachcr it ical sector of the economy is presentedseparately in various sections of Part I, while thecontext against/rationale for which specific policymeasures were introduced are outlined in therespective chapters in Part II. This section offersan outline of all the major policy measures takenin India in the real, fiscal, monetary, financial andexternal sectors of the economy during 2008-09.
REAL SECTOR POLICIES
Agriculture and Allied Activities
II.1.3 Given the importance of the agriculturesector in the Indian economy in terms of itscontribution to the GDP, employment, food securityand the need for ensuring inclusive growth, theUnion Government has been supplementing andcomplementing the effor ts of the StateGovernments through several policy measures toenhance agricultural income and productivity.Several significant schemes have been initiated bythe Government in recent years, particularly in2007-08, to enhance the agriculture growth and to
find sustainable solutions for strengthening thefarmers’ l ivelihood and income. The notableschemes such as the National Food SecurityMission (NFSM), the Rashtriya Krishi Vikas Yojana(RKVY) and National Rural Employment GuaranteeScheme (NREGS) were further strengthened in2008-09.
II.1.4 The NFSM, launched in 2007 with anobjective to increase the production of rice, wheatand pulses by 10, 8 and 2 mil l ion tonnes,respectively, by the end of the Eleventh Five-YearPlan period, is being implemented in 312 identifieddistricts across 17 States. The Mission aims atincreasing production of the above crops througharea expansion and yield improvement in thetargeted districts having high potential but relativelylow level of productivity performance at present.During 2008-09, an amount of Rs.883 crore wasreleased under the Programme. As an importantstep towards inclusive development, the UnionBudget 2009-10 has proposed to put forth the draftNational Food Security Bill on the website of theDepartment of Food and Public Distribution forcomments.
II.1.5 The RKVY launched in August 2007 withan allocation of Rs.25,000 crore for the EleventhFive-Year Plan is a participatory programme withthe State Governments to boost investment inagriculture. The access to resources under RKVYdepended, inter alia, on formulation of districtagricultural plans (DAP)/State agricultural plans(SAP) by the State Governments. During 2008-09,an amount of Rs.2,887 crore was released to theeligible States. The allocation under the RKVY hasbeen increased by around 30 per cent in the UnionBudget 2009-10.
II.1.6 In the backdrop of launching NFSM andRKVY in 2007, the Macro Management ofAgriculture (MMA) Scheme, launched in 2000-01by integrating 27 centrally sponsored schemes, wasrevised in July 2008. Accordingly, the role of thescheme has been redefined to avoid overlappingand duplication of efforts and to make it morerelevant to the present agriculture scenario in the
31
ECONOMIC REVIEW

32
ANNUAL REPORT
States in order to achieve the basic objective offood security and to improve the livelihood of ruralmasses. The allocation criteria for making fundsavailable to the States has also been revised tofacilitate higher resource allocation to the Stateshaving larger cropped area and also largerconcentration of small and marginal farmers.
II.1.7 Bharat Nirman launched in 2005-06 forbuilding rural infrastructure, has six componentsnamely, rural roads, rural telephony, irrigation,dr inking water supply, rural housing andelectrification. Specific targets have been set undereach of these goals. There has been all roundprogress in the implementation of this programme.Almost the entire budgetary provision of Rs.7,300crore for 2008-09 was utilised during the year. TheUnion Budget 2009-10 has allocated Rs.12,000crore for this programme.
II.1.8 Under the ongoing National RuralEmployment Guarantee Scheme (NREGS) a sumof Rs. 16,000 crore was allocated for 2008-09.Subsequent allocations in the supplementarydemands for grants raised the total allocation forthe programme during 2008-09 to Rs.30,000 crore.During 2008-09, over 44.7 million households wereprovided employment as compared with 33.9 millionhouseholds in 2007-08. Since its inception theprogramme has generated around 3,718 millionperson-days of employment, of which around 2,156million person days were during 2008-09. Theimplementation of this programme has resulted inincreased wage employment, enhanced wageearnings and improved equity with significantbenefits flowing to Scheduled Caste/ScheduledTribe (SC/ST) and women. This has also led toincreased demand for and consumption of wagegoods. The Union Budget for 2009-10 proposed anallocation of Rs.39,100 crore for this scheme duringthe year.
II.1.9 The Union Budget for 2008-09 had set atarget of Rs.2,80,000 crore for total agriculturalcredit; the actual disbursement of agricultural creditby the banking system exceeded the target andamounted to Rs. 2,87,000 crore. The Union Budget
for 2009-10 has set a target of Rs.3,25,000 crorefor total agricultural credit during the year and hasproposed to continue providing interest subventionof 2 per cent per annum for short-term crop loansup to Rs.3 lakh to farmers at the interest rate of 7per cent per annum. The Government has alsoproposed to pay an additional subvention of 1 percent as an incentive to those farmers who repaytheir short term crop loans on schedule.
II.1.10 To strengthen the short-term co-operativecredit structure, the Government is implementing arevival package in 25 States involving a financialassistance of Rs.13,596 crore. The CentralGovernment and State Governments have alsoreached an agreement on the content of the packagefor reviving the long-term co-operative credit structure.The cost of the package is estimated at Rs.3,074crore, of which the Central Government’s share willbe Rs.2,642 crore or 86 per cent of the total burden.
II.1.11 In order to restore access to institutionalcredit for indebted farmers, the Governmentintroduced a scheme of debt waiver and relief tofarmers, the modalities of which were finalised bythe Government in consultation with the ReserveBank and the National Bank for Agriculture andRural Development (NABARD). The schemeprovides for waiver of the entire amount of directagricultural loans (fulfilling certain eligibility criteria)extended to small and marginal farmers byscheduled commercial banks (SCBs), regional ruralbanks (RRBs), co-operative credit institutions andlocal area banks. Farmers having more than twohectares of land were offered a one-time settlement(OTS) scheme under which they will be given arebate of 25 per cent of 'eligible amount' providedthat they pay 75 per cent of their overdues in threeinstallments by June 30, 2009. Due to the delay inthe South-West monsoon, the Union Budget 2009-10 has proposed to extend this period by six monthsup to December 31, 2009. The Budget alsoproposed to set up a Taskforce to look into the issueof farmers not covered under the loan waiverscheme and had taken loans from money lenders,particularly in some regions of Maharashtra, inorder to help the distressed farmers.
33
ECONOMIC REVIEW
II.1.12 One major factor contributing to the declinein marginal productivity of soil in relation toapplication of fer ti l isers is the skewed NPK(Nitrogen, Phosphorous, Potassium) applicationratio i.e., comparatively higher application ofstraight fertilisers like urea, DAP (Di-ammoniumphosphate) and MOP (Murate of Potash) as againstthe complex fertilisers (NPKs) which are consideredto be agronomically better and more balancedfertiliser products. The Union Budget 2009-10 hasproposed to move towards a nutrient based subsidyregime instead of the current product pricingregime. Besides enhancing productivity, it will leadto availability of innovative fertiliser products in themarket at reasonable prices. This unshackling ofthe fertiliser manufacturing sector is expected toattract fresh investments in this sector. In duecourse the Government intends to move to a systemof direct transfer of subsidy to the farmers.
II.1.13 The National Rain Fed Area Authority(NRAA) has been functioning since 2006 to provideknowledge inputs towards systematic upgradationand enhancing productivity of the dry, non-irrigatedrainfed areas. NRAA has published the commonguidelines for watershed development projects thatwould provide an enabling framework for theplanning, design, management and implementationof all watershed development projects in thecountry. Under these common guidelines, theBudget 2009-10 proposes to implement theIntegrated Watershed Management Programme(IWMP) in the current financial year.
Industry
II.1.14 During 2008-09, the Government of Indiacontinued to undertake sector-specific measuresand other programmes on an on-going basis. Inorder to minimise the adverse impact of the globalrecession on the domestic industry and also toactivate domestic demand, the Government of Indiaalso undertook a series of measures in the form ofindirect tax cuts and infrastructure spending, withcommensurate support from the Reserve Bankthrough easing of liquidity and interest rates,
besides encouraging banks to extend credit toindustries, particularly small industries.
II.1.15 The phased de-reservation of items fromthe list of reserved items for the Micro, Small andMedium Enterprises (MSMEs) continued in 2008with the Government deleting 14 items from thislist during the year. The Credit Guarantee schemefor MSMEs has been modified. The revisionsinclude reduction in one time guarantee fee andannual service fee to 1.0 per cent and 0.5 per cent,respectively, for loans up to Rs. 5 lakh; increase inloan limit from Rs.50 lakh to Rs.1 crore with aguarantee cover of 50 per cent; increase inguarantee cover from 80 per cent to 85 per cent forloans up to Rs. 5 lakh; and reduction in lock-inperiod for preferring claims from 24 to 18 months.In order to provide some relief to the MSMEs reelingunder the global economic crisis, the Union Budget2009-10 exempted small businesses with an annualturnover of Rs.40 lakh from advance tax. In orderto facilitate the flow of credit at reasonable rates toMSEs, the Union Budget has proposed a specialfund out of Rural Infrastructure Development Fund(RIDF) to Small Industries Development Bank ofIndia (SIDBI). This fund of Rs.4,000 crore willincentivise Banks and State Finance Corporations(SFCs) to lend to MSEs by refinancing 50 per centof incremental lending to MSEs during the currentfinancial year.
II.1.16 In the pharmaceutical sector, theGovernment of India, along with central publicsector under takings, has launched the JanAushadhi Campaign with the aim of providingquality medicines at affordable prices to themasses. The Government has proposed to set upJan Aushadhi stores in every district for the sale ofgeneric unbranded drugs which are equivalent inquality to branded drugs. The first such store wasopened in Amritsar in November 2008.
II.1.17 Major tax concessions given in 2008-09 toboost aggregate demand and revive industrialgrowth include reductions in CENVAT rate andservice tax rate. Countervailing duty and additionalcustoms duty at the rate of 4 per cent was imposed
34
ANNUAL REPORT
on imported cement. Government of India removedthe export duty on pig iron, iron and steel ingots,bars and rods, reintroduced import duty of 5 percent on steel, restored DEPB benefits partially,reduced excise duty to 8 per cent, placed hot rod(HR) imports on the restricted list and withdrew theexemption from countervailing duty on import ofTMT bars and structurals.
II.1.18 The textiles and garments industry whichcontributes substantially to expor ts receivedimpetus through reduction in duties on cottontextile and textile articles, interest subvention topre-shipment and post-shipment export credit andexpansion of Focus Market Scheme throughinclusion of 10 more countries. An additionalallocation of Rs.1,400 crore has been made toclear the entire backlog in Technology UpgradationFund Scheme (TUFS) during 2008-09. UnderScheme for Integrated Textile Parks (SITP), 40integrated textiles parks of international standards,cover ing weaving, knitt ing, processing andgarmenting sectors with project proposals worth Rs.4,199 crore (of which assistance from theGovernment is Rs.1,438 crore) have beensanctioned. Four textile parks were inauguratedduring 2008-09.Government also announcedaccelerated depreciation of 50 per cent forcommercial vehicles.
II.1.19 The Union Budget 2009-10 acknowledgedthe problems faced by individual industries andproposed various industry specific measures. Inorder to support the construction industry, theBudget announced full excise duty exemption forgoods manufactured at the construction site. Toarrest the deteriorating growth in commercialvehicles industry, the Budget has reduced exciseduty on petrol driven trucks to 8 per cent from 20per cent to equate the duty with similar vehiclesrun on diesel. Ad valorem duty on large cars andutility vehicles with engines capacity of above 2000cubic capacity (CC) has been reduced toRs.15,000 from the Rs.20,000. As a boost to thehandlooms industry, the Union Budget for 2009-10proposed one handloom mega cluster each in
West Bengal and Tamil Nadu and one powerloommega cluster in Rajasthan. Further, new megaclusters for ‘carpets’ have been added in Srinagar(Jammu and Kashmir) and Mirzapur (UttarPradesh). With a view to support the informationtechnology industry which has been hit hard bythe slowdown in advanced economies, the UnionBudget 2009-10 has extended the 10-year taxholiday by one more year and exempted the valueattributable to the transfer of the right to usepackaged software from excise and countervailingduties. Among the long-term reform measures forthe industry, the Budget proposed to create analternative dispute resolution mechanism withinthe Income Tax Department for the resolution oftransfer pricing disputes. The Government hasalso envisaged establishment of a NationalKnowledge Network, which wil l connect al luniversit ies, research institutions, l ibrar ies,laboratories, hospitals and agricultural institutionsacross the country. The initial phase of the networkwas inaugurated in April 2009.
II.1.20 In view of the uncertain prospects forindustrial production in the face of the globaleconomic crisis, and the critical role of industrialgrowth in shaping the growth and inflation outcomein India, the Reserve Bank has set up an IndustryMonitoring Group, drawing members from externalagencies as well as from concerned departmentsof the Bank in April 2009 to periodically assess thedevelopments in Indian industry in relation tochanges taking place in the global economy andthe financial sector. The terms of reference of theMonitoring Group, inter alia, focused on analysingemerging scenar io in the industr ial sector,monitoring the trends in industrial sector growth ata disaggregated level and suggest policy measures.The Group had its first meeting on April 15, 2009,to discuss the pressure points faced by the industryand the likely course of revival of the same fromthe stand point of requirements for formulation ofmonetary policy. The Group, in its second meetingon July 16, 2009 had reassessed the current stateof the industries as well as prospects.
35
ECONOMIC REVIEW
Infrastructure
II.1.21 Infrastructure sector received an impetusin the Government’s policy package, which includesmeasures such as permission to IndiaInfrastructure Financing Company (IIFCL) forraising tax free bonds, removal of interest ceilingon external commercial borrowings (ECB),enhancing of cap on FII investment in corporatedebt market, easy refinancing from the ReserveBank and creation of Special Purpose Vehicle(SPV) to lend to non-bank finance companies.
II.1.22 With a view to enhancing the competitivenessof the domestic industry by providing qualityinfrastructure through public-private partnership(PPP) in select functional clusters/locations whichhave the potential to become globally competitive,the Government of India has recast the IndustrialInfrastructure Upgradation Scheme (IIUS). Thesalient features of this scheme include creation ofquality infrastructure in existing industrial clusters/locations with high growth potential requiringstrategic interventions in providing common facilitiesfor transport, road, power supply, effluent treatmentand solid waste disposal, information andcommunication technology (ICT) and such otherphysical infrastructures. Under the recast scheme,10-15 clusters/locations will be taken up fordevelopment during the Eleventh Five-Year Planperiod. The scheme will be implemented throughspecial purpose vehicles (SPVs) so as to ensure afocused, time-bound and sustainable pattern ofindustrial infrastructure development in the PPP mode.
II.1.23 In view of the difficulties faced in arranginglong-term financing for a large number ofinfrastructure projects under the PPP mode, theIIFCL was authorised to raise Rs.10,000 crorethrough Government guaranteed tax free bonds bythe end of 2008-09 and additional Rs.30,000 croreon the same basis as per the requirement in 2009-10. The capital so raised will be used by IIFCL torefinance bank lending of longer maturity to eligibleinfrastructure projects. This initiative is expected toresult in leveraging bank financing to PPPprogrammes of about Rs.100 thousand crore over aperiod of 15-18 months.
II.1.24 In the power sector, the Central ElectricityRegulatory Commission has issued new Inter-StateTrading Regulations in February 2009. Theregulations aim to tighten the terms and conditionsfor grant of trading licenses so as to encourageonly serious players. In pursuance of this, thedefinition of inter-state trading has been revisedto include electricity imported for sale, number ofcategories of licenses reduced from 6 to 3 andthe net worth requirement increased to the rangeof Rs.5-50 crore. Among the initiatives to promotealternative energy sources, under the NationalGas Hydrate Programme, a Memorandum ofUnderstanding (MoU) was signed between theDirectorate General of Hydrocarbons and the USGeological Survey for exchange of scientificknowledge and technical personnel to exploit thepotential of gas hydrate in India. The Union Budgetfor 2009-10 extended the tax holiday to natural gasto facilitate the energy security.
II.1.25 The Airport Economic Regulatory Act, 2008(AERA) has been notified with effect from January01, 2009. AERA calls for fixing, reviewing andapproving tariff structure for the aeronauticalservices and users fees which may be levied bythe service providers for airport development andmonitoring prescribed performance standards.
FISCAL POLICY
II.1.26 The Union Budget for 2008-09 waspresented in the backdrop of five consecutive yearsof impressive growth, which translated into highrevenue buoyancy, faci l i tat ing the f iscalconsolidation process under the FiscalResponsibility and Budget Management (FRBM)Act, 2003. The Budget had envisaged thecontinuance of the revenue led process of fiscalconsolidation while focusing on the outcomes andimproving the allocative efficiency of publicexpenditure. The focus of the tax policy during2008-09 was to follow an appropriate policyintervention coupled with improvement in thequali ty, eff iciency and effectiveness of taxadministration to raise revenue. The policy strategy
36
ANNUAL REPORT
was to move towards moderate and fewer tax rates,removal of exemptions and broadening of the taxbase. In the case of tax administration, emphasiswas placed on recovery of tax arrears, improvementin service delivery to the tax payers andenhancement of deterrence levels. Conforming withthis strategy, the corporate tax rates were keptunchanged, while the threshold limit of exemptionfor Personal Income Tax (PIT) was raised and thefour slabs of tax were revised upwards. With regardto indirect taxes, the Budget announced reductionin general CENVAT on all goods from 16 per centto 14 per cent with a view to providing stimulus tothe manufacturing sector.
II.1.27 The finances of the Central Government,however, came under severe pressure due toseveral unanticipated post-budget developments,par ticular ly the signif icant slowdown of theeconomy as a fall out of the unprecedented globalfinancial crisis. The Government undertook fiscalmeasures by way of indirect tax cuts and increasein subsidies during the first half of 2008-09 tocontain inflation pressures emanating from sharprise in international prices of commodity andpetroleum products. While implementing thesemeasures to contain inflation, there was, however,no conscious move at that point of time to deviatefrom the path of fiscal consolidation. In the secondhalf of 2008-09, however, the f iscal stancecompletely altered with the activation ofdiscretionary fiscal policy measures to contain theeconomic slowdown. This shift in the fiscal policystance was part of an international trend in termsof general response to the real effects of the globalcrisis and also consistent with the mainstreamviews at the international level that in situations ofdeep and prolonged economic downturn, as in thepresent context, fiscal policy could play a leadingrole in stabilisation. To contain the economicslowdown, discretionary fiscal policy has beenactivated in a large number of countries, bothdeveloped and developing, notwithstanding theknown challenges for timely unwinding and, hence,the need for an appropriate exit strategy. Whiledesigning the fiscal stimulus package, however, it
is important to ensure that it is timely, well targetedand temporary so that the impact is felt at the righttime, has the maximum and does not lead to concernover debt sustainability in the medium-term (Box II.1).
II.1.28 In the Indian context, the role of fiscal policyin stimulating aggregate demand in the currentdownturn may have to be distinguished from theearlier episodes of economic slowdown. Themoderation in growth in 2008-09 was largelyconditioned and continues to be influenced by theglobal recession and the resultant loss ofconfidence which has led to substantial fall inprivate sector demand. Therefore, the role of fiscalpolicy in the current context may be different fromthe previous episodes of normal businessdownturns. In the case of India, the fiscal stimulusprovided so far has been a mixture of cut in indirecttaxes and increase in both investment andconsumption expenditure, with the latter accountingfor a major share. The general CENVAT rate wasfurther reduced by 4.0 percentage points and 2.0percentage points in December 2008 and February2009, respectively, to 8 per cent, leading to anestimated revenue loss of 0.2 per cent of GDP in2008-09. Additional expenditure amounting to 3.0per cent of GDP was provided through threesupplementary demands for grants during October-December 2008 and February 2009. Of theexpenditure measures, revenue expenditureconstituted around 84 per cent and the capitalcomponent accounted for the rest. On the whole, thefiscal stimulus measures appear to have given moreemphasis to supporting consumption demand ratherthan investment demand. The fiscal deficit increasedto 6.2 per cent of GDP in 2008-09 (ProvisionalAccounts) from 2.7 per cent of GDP in 2007-08.
Union Budget 2009-10
II.1.29 The Union Budget for 2009-10 waspresented in the backdrop of moderation of growthin the economy and signs of stabilisation in globaleconomy. The Budget has proposed to address threeimportant challenges in the short and medium term,viz., revive the economy to attain a growth of 9 per
37
ECONOMIC REVIEW
For several decades since the Great Depression, discretionaryfiscal policy involving either increase in public expenditureincluding transfers or cuts in tax rates or both was activelyused for the purpose of macroeconomic stabilisation. By the1980s, however, it got discredited due to a number of politicaland administrative challenges and substantial changes in themethod of policy making. It was increasingly accepted thatfiscal policy is ineffective or the fiscal multiplier is low, as themarginal propensity to save (consume) out of temporary taxcuts is high (low), while raising aggregate demand throughincreased government expenditure could get nullified due toinduced rise in long term interest rates. Besides, fiscal policyinvolves a number of lags viz., recognition lags,implementation lags and lags in the effect on aggregatedemand, which lead to uncertainty in the magnitude of theimpact and thereby increase the risk of destabilising theeconomy. Concomitantly, monetary policy gained ascendancyas the prime policy option for economic stabilisation due toits amenability to quicker adjustments; better ability to judgethe timing and the magnitudes of the needed stimulus; andincreasing use of rule based policy that limited the scope fordiscretion (Taylor, 2000). Thus, the stabilisation role of fiscalpolicy was confined to the operation of automatic stabilisersonly (see Box II.24 of Section IV of this chapter).
Discretionary fiscal policy, however, has been advocated insituations of sustained economic downturn with low aggregatedemand and interest rates, and falling prices (Feldstein, 2002).In rapidly deteriorating economic conditions, a well-crafteddiscretionary fiscal stimulus has the potential advantage ofboosting economic activity much faster relative to monetarystimulus. Furthermore, during a deep recession, monetarypolicy may also become ineffective not only due to policy ratenearing zero at some stage but also due to higher levels ofdisconnect in the monetary policy transmission mechanism(Elmendorf and Furman, 2008). During the global economiccrisis, it was realised that the sudden increase in risk premiummay more than offset the impact of falling policy rates,weakening thereby the transmission process significantly. Theproblem of decision lags involved in effecting discretionaryfiscal policy also becomes less binding when the economicdownturn is deep and prolonged. The design of the policy,however, is crucial. At least three criteria have been suggested.First, it should be timely, given the urgent need for action.Second, it should be well targeted to ensure that the impactis the maximum. Third, it should be temporary so that thecondition of debt sustainability in the medium to long-term isnot violated. In the context of current global slowdowndiscretionary policy should also be: i) large enough since thedrop in demand is large; ii) lasting since the recession isexpected to last longer; iii) diversified as there is uncertaintyregarding the effectiveness of particular fiscal measures; iv)contingent on actual progress to indicate that further actionwill be taken if needed; and v) collective among countriesgiven the severity and global nature of the downturn(Freedman et al, 2009).
Box II.1Counter-Cyclical Fiscal Policy in the Current Economic Scenario
The impact of the policy or the magnitude of the multiplier,however, would depend on the channels through which thestimulus is provided, the degree of monetary policyaccommodation and the structure of the economy. Themultiplier would normally be smaller for small and openeconomies, and in countries which are more susceptible tofinancial markets constraints and subject to offsettingmonetary policy. When there is loss of confidence during acrisis, government spending measures are likely to providethe maximum short-run impact on aggregate demand thantax cuts or lump-sum transfers due to increased propensityto save. If tax cuts are to be implemented, it should be targetedto those facing liquidity constraints. It has been observed thattargeted transfers to poorer households have higher multipliersthan lump-sum transfers and multipliers are larger in emergingAsia and other developing countries due to higher share ofpoorer households (Freedman, et al, 2009).
The long term sustainability of debt is an importantconsideration for the success of fiscal policy measures in short-term stabilisation (see Box II.25 in Section II.IV of this Chapter).When the debt related concerns of the market participantsare significant – particularly in terms of servicing challengesfor the future, discretionary fiscal stimulus could lead to risein interest rates and resultant fall in aggregate demand,thereby making the fiscal multiplier potentially negative andhence counterproductive. The magnitude of the fiscal stimulusand the concerns on debt sustainability may largely dependon the initial fiscal situations or the available fiscal space. Onaccount of limited fiscal space and debt concerns in EMEs,fiscal stimulus had limited impact on growth in the past crises,and hence, they pursued less aggressive countercyclical fiscalpolicy (IMF, 2008). Thus, fiscal stimulus should be accompaniedby credible commitments to scale it back or even reverse itonce recovery takes place by laying out a medium-term fiscalframework. In view of the possibility that unwinding of fiscalstimulus in itself may slowdown the pace of recovery, therecould be challenges in crafting an appropriate exit strategy.
References
1. Elmendorf Douglas W. And Jason Furman (2008), “If,When, How: A Primer on Fiscal Stimulus”, The HamiltonProject, Strategy Paper, January.
2. Feldstein Martin (2002), “The Role for Discretionary FiscalPolicy in a Low Interest Rate Environment”, NBERWorking Paper 9203.
3. Freedman C., M. Kumhof, D. Laxton and J. Lee (2009)“The Case for Global Fiscal Stimulus”, IMF Staff PositionNote, March 6.
4. International Monetary Fund (IMF) (2008), WorldEconomic Outlook, September.
5. Taylor John B. (2000), “Reassessing Discretionary FiscalPolicy”, Journal of Economic Perspectives, AmericanEconomic Association, Vol. 14(3), 21-36.
38
ANNUAL REPORT
cent per annum at the earliest, deepen and broadenthe agenda for inclusive development and re-energisegovernment and improve delivery mechanisms.The Budget proposed to enhance allocation for thecrucial sectors such as infrastructure, educationand health, rural employment and empowermentof disadvantaged sections of the population. TheGovernment has reiterated the importance ofreverting back to the path of fiscal consolidation atthe earliest and as soon as the negative effects ofthe global crisis on Indian economy have beenovercome. In order to attain the medium-termsustainability, the Government has recognised theimportance of institutional reforms encompassingall aspects of the Budget such as subsidies, taxes,expenditure and disinvestment.
II.1.30 The thrust of the reforms over the last fewyears has been to improve the efficiency and equityof the tax system by eliminating distortions in thetax structure, introducing moderate levels of taxrates and expanding the base. The Government hasproposed to pursue structural changes in the directtaxes by releasing the “Direct Taxes Code” for publicdiscussion on August 12, 2009 and accelerate theprocess for the smooth introduction of the goodsand services tax (GST) with effect from April 1,2010. In order to improve the efficiency in taxadministration, it has been proposed to merge thetwo Authorities for advanced rulings on direct andindirect taxes by amending the relevant Acts. Thedirect tax measures in the Union Budget 2009-10 areexpected to be revenue neutral while indirect taxesare estimated to make a gain of Rs.2,000 crore.
II.1.31 On direct taxes front, corporate tax ratesand surcharge on them were kept unchanged. Onthe PIT front, the threshold limit of exemption wasraised by Rs.15,000 to Rs.2,40,000 for seniorcitizens while it was raised by Rs.10,000 each forwomen and all other categories of individual taxpayers to Rs.1,90,000 and Rs.1,60,000,respectively. An additional deduction of Rs.25,000was allowed under Section 80 D from the presentlimit of Rs.75,000 to an individual who pays formaintenance including medical treatment of a
dependant with severe disability. The surcharge onpersonal income tax was eliminated. In order to tideover the slowdown in exports, the Governmentextended the sunset clauses for one more year,i.e., 2010-11. The income of the New PensionSystem (NPS) Trust was proposed to be exemptedfrom income tax and any dividend paid to this Trusthas been exempted from dividend distributiontax. All purchase and sale of equity shares andderivatives by the NPS Trust were also exemptedfrom the securities transaction tax.
II.1.32 The imposition of fringe benefit tax (FBT)was considered as compliance burden, andtherefore, it was abolished. In order to incentivisethe corporate sector to undertake research anddevelopment, it was proposed to extend the scopeof the current provision of weighted deduction of150 per cent on expenditure incurred on in-houseresearch and development (R&D) to al lmanufacturing businesses except for a smallnegative list. To incentivise businesses, it wasproposed to extend investment-linked tax incentivesto the businesses of setting up and operating ‘coldchain’, warehousing facilities for storing agriculturalproduce and the business of laying and operatingcross country natural gas or crude or petroleum oilpipeline network for distribution on common carrierprinciple. With a view to address the issue ofinequity in taxation of corporates, the rate ofminimum alternate tax (MAT) was increased from10 per cent of book profits to 15 per cent. As ameasure of relief, however, it was proposed toextend the period allowed to carry forward the taxcredit under MAT from seven years to ten years.
II.1.33 In the case of indirect taxes, rationalisationmeasures were taken in both customs and centralexcise in respect of some sectors. In order toencourage domestic value addition, a nominal basiccustoms duty of 5 per cent on set top boxes wasimposed. Similarly, the basic customs duty on liquidcrystal display (LCD) panels was reduced from 10per cent to 5 per cent to support indigenousproduction. The accessories, parts and componentsimported for the manufacture of mobile phones

39
ECONOMIC REVIEW
were exempted from countervailing duty (CVD) of4 per cent for another year. For encouraging value-addition and exports, full exemption was providedto rough corals from basic customs duty. Thecustoms duty was reduced from 10 per cent to 5per cent on influenza vaccine and nine specifiedlife saving drugs used for the treatment of breastcancer, hepatitis-B, rheumatic arthritis and on bulkdrugs used for the manufacture of such drugs.Customs duty was increased from Rs. 100 toRs.200 per ten grams for gold bars and from Rs.250 to Rs. 500 per ten grams for other forms ofgold (excluding jewellery), and on silver (excludingjewellery), duty was increased from Rs.500 per kgto Rs.1,000 per kg due to manifold rise in the pricesof these metals in international market.
II.1.34 The proposed measures relating to exciserates include: differential rates between the cottontextile sector and the manmade fibre sector;restoration of the erstwhile optional rate of 4 percent for cotton textiles beyond the fibre stage;restoration of 8 per cent duty on manmade fibreand yarn on a mandatory basis and on stagesbeyond fibre and yarn at that rate on optional basis;full exemption of petro-diesel blended with bio-diesel from excise duty; and reduction of basiccustoms duty on bio-diesel from 7.5 per cent to 2.5per cent - at par with petro-diesel in order toencourage the use of this environment friendly fueland augment its availabil i ty. In the case ofconstruction industry, full exemption to goodsmanufactured at site was restored, including pre-fabricated concrete slabs or blocks. Excise duty onpetrol driven trucks was reduced from 20 per centto 8 per cent.
II.1.35 Services received by exporters from goodstransport agents and commission agents, wherethe liability to pay service tax is ab initio on theexporter, was exempted from service tax. For otherservices received by exporters, the exemptionwould be operated through the existing refundmechanism based on self-cer tification of thedocuments where such refund is below 0.25 percent of fob value, and certification of documentsby a chartered accountant for value of refund
exceeding the above limit. In order to provide a levelplaying field in the goods transport sector, the levyof service tax was extended to goods carried byIndian railways or those carried as coastal cargoor through inland waterways. The advice,consultancy or technical assistance provided in thefield of law was brought into the gamut of servicestax. However, this tax would not be applicable incase the service provider or the service receiver isan individual.
II.1.36 To facilitate the objective of introducinggoods and services tax (GST), both at the nationaland State level, through convergence of centralexcise duty rates to a mean rate of 8 per cent, theexcise rate was increased to 8 per cent on manyitems barring food items, drugs, pharmaceuticalsand other articles. With regard to the introductionof GST, the Government has indicated that therehas been an agreement on the basic structure inkeeping with the principles of fiscal federalismenshrined in the Constitution. The GST Model wouldbe a dual model comprising of a Central GST anda State GST. The Centre and the States would eachlegislate, levy and administer the Central GST andState GST, respectively.
II.1.37 The Government had taken a consciousdecision to increase the public expenditure in selectsectors in order to continue the momentum ofgrowth, with a focus on intended outcomes. Themajor focus in expenditure management would bereform of governance for effective delivery of publicservices. The initiatives that are being taken by theGovernment to achieve the above objective include:establishing mechanisms for performancemonitor ing and performance evaluation ingovernment on a regular basis; strengthening thepublic accountability of flagship programmes by thecreation of an Independent Evaluation Office at anarm’s distance from the Government which willconcurrently evaluate the impact of theseprogrammes and place it in the public domain; andputting up a public data policy to place allinformation covering non-strategic areas in thepublic domain which will help citizens to challengethe data and engage directly in governance reform.

40
ANNUAL REPORT
II.1.38 The al location of expenditure toinfrastructure, health and education, ruralemployment and other flagship programmes of theGovernment has been enhanced. Keeping in viewthe critical role of infrastructure in the growth ofthe economy, the allocation to national highwaydevelopment programme and urban infrastructurehas been increased considerably during 2009-10.In order to make the development process moreinclusive, the government has undertaken initiativeson several areas while strengthening the existingprogrammes. The Swarna Jayanti Gram SwarozgarYojna is proposed to be restructured as NationalRural Livelihood Mission to make it universal in itsapplication, focussed in approach and time boundfor poverty alleviation by 2014-15. The Budget hasstated that enrolment of at least 50 per cent of allrural women as members of the Self Help Groups(SHGs) over the next five years and linking theseSHGs to banks would be an important objective.The corpus of Rashtriya Mahila Kosh was proposedto be raised to Rs.500 crore for credit support topoor women. In order to provide access to highereducation for weaker sections, provision of studentloans was proposed with total interest subsidyduring the period of moratorium and an estimated5 lakh students are estimated to benefit from thisscheme. The allocation for the welfare of minoritieswas enhanced. A new project for modernisation ofemployment exchanges in public-pr ivatepartnership was visualised so that a job seeker canregister on-line from anywhere and approach anyemployment exchange. The allocation for healthand education was increased considerably in theBudget 2009-10. Keeping in view the demographicadvantage, the provision for the scheme ‘Missionin Education through ICT’ was increasedsubstantially. The Government also made anallocation to establish central university in eachuncovered State. In order to improve the deliveryof public services, the Government allocated anamount of Rs.120 crore to the Unique IdentificationAuthority of India.
State Governments1
II.1.39 The State Governments’ efforts at fiscalcorrection and consolidation in terms of the pathof fiscal restructuring prescribed by the TwelfthFinance Commission (TFC) and targets fixed undertheir respective Fiscal Responsibility Legislation(FRL) suffered some setback during 2008-09. Thiswas on account of the change in fiscal priority thatbecame necessary to accommodate additionalexpenditures to support fiscal stimulus in the faceof shortfalls in revenue on account of the overalleconomic slowdown. In order to accommodateadditional expenditures having direct impact on thedeficit targets, three states, viz., Karnataka, Keralaand Rajasthan proposed to amend their FRLs.
II.1.40 The States, while presenting their budgetsfor 2009-10, announced a number of policy initiativesaimed at directing expenditure towards economicrevival. Kerala announced a Rs.10,000 crore stimuluspackage to be implemented over two years forundertaking infrastructure development. As a reformmeasure, it proposed formation of a special cell tomonitor non-tax revenue mobilisation measures andanother cell for undertaking preparatory work onGST. Haryana launched an economic stimuluspackage for undertaking specific projects in variousinfrastructure sectors during the next two years, withan emphasis on upgradation of hospitals, sewerageand water supply systems, and construction ofhouses for industrial workers. Some other policyinitiatives like upgradation of bus stands are beingtaken on PPP basis. Utilisations under NREGS wereproposed to be stepped up by the States (Karnatakaand Haryana). Karnataka announced reductions inseveral taxes, including luxury tax, profession tax,entertainment tax, and stamp duty on all immovableproperties, including agricultural land, in order toprovide a boost to the economy. It also proposed toconstitute an Expenditure Review Commission toreview the expenditure incurred on governmentprogrammes and to reduce expenditure on lessproductive programmes.
1 Based on the budget documents of twenty-seven State Governments, of which two are Vote on Account.
41
ECONOMIC REVIEW
II.1.41 Allocations for housing for weaker sectionswere proposed to be raised by Andhra Pradesh. Ithas proposed to expand the coverage of socialsecurity pensions, besides a one-time write-off ofloans sanctioned to the weavers’ co-operativesocieties and individual weavers. Allocations foreducation and upgradation of technical institutionsare proposed to be raised by Karnataka, Haryanaand Gujarat. States have also proposed higherallocations for the various infrastructure sectors,including transport, power and development ofmajor cities. Agriculture and irrigation would be thepriority areas for States like Karnataka, HimachalPradesh and Andhra Pradesh. Karnataka proposedto provide crop loans to farmers up to Rs.50,000 atthe concessional rate of 3 per cent.
II.1.42 The Sixth Pay Commission constituted bythe Government of India for Central Governmentemployees submitted its Report on March 24, 2008.A number of States including Bihar, Chhattisgarh,Gujarat, Haryana, Arunachal Pradesh, HimachalPradesh, Jharkhand, Maharashtra, Rajasthan,Uttar Pradesh, Uttarakhand and Orissa haveannounced their decision to fol low therecommendations of the Sixth Pay Commission.Andhra Pradesh, West Bengal, and Assam decidedto constitute separate Pay Commissions forreviewing the salaries and other benefits for theiremployees. Karnataka and Kerala have alreadyrevised pay scales for their employees based onpay commissions constituted by them while PunjabGovernment has accepted the recommendationsof their Fifth State Pay Commission.
II.1.43 The Committee on Financial SectorAssessment constituted by the Reserve Bank,which submitted its Report in March 2009, hadcarried out an assessment of fiscal transparencyat the level of State Governments (Box II.2).
External Sector Policies
II.1.44 India’s export sector was directly affectedby the contagion in global output and trade, withnegative growth since October 2008. In response,the export sector was extended a plethora of
incentives such as interest subvention of 2 per centfor pre-shipment and post-shipment credit;Government back-up guarantee for export creditguarantee corporation (ECGC); credit line ofRs.5,000 crore for the EXIM Bank; and dutydrawback benefits on certain items such as knittedfabrics, bicycles, agricultural hand tools andspecified categories of yarn. A Committee ofSecretaries has also been constituted to addressprocedural problems faced by exporters and tospeed up various clearances.
II.1.45 The Annual Supplement to India’s ForeignTrade Policy (2004-09), which was announced bythe Government of India on February 26, 2009against the backdrop of the ongoing globaleconomic crisis and its impact on India’s tradeperformance, contained several measures. Exportobligation period against advance authorisationswas extended up to 36 months. Under the EPCGscheme, in case the decline in expor ts of aproduct(s) is more than 5 per cent, export obligationfor all exporters of that product(s) is reducedproportionately. This provision has been extendedfor the year 2009-10, for exports undertaken during2008-09. Threshold limit for obtaining recognitionas premier trading house was reduced to Rs. 7,500crore from the existing Rs. 10,000 crore. Duty creditscrips under duty entitlement passbook (DEPB)scheme were permitted to be issued without waitingfor realisation of export proceeds. For advancelicences issued pr ior to Apr i l 1, 2002, therequirement of MODVAT/CENVAT certificate wasdispensed with in certain cases. Duty entitlementpass book (DEPB)/Duty Credit Scrip utilisation wasextended for payment of duty for import of restricteditems also. Value cap applicable under DEPB wasrevised upwards for two products. Sector-specificschemes to strengthen exports included specialpackage for leather and textiles sector; extendedcoverage of Focus Product Scheme (FPS); removalof import restrictions on worked corals; and allowingthe personal carriage of gold up to 10 kilograms ina financial year to gems and jewellery units inExport Oriented Units (EOU) for the gems andjewellery sector.

42
ANNUAL REPORT
Fiscal transparency involves providing ready access toreliable, comprehensive, timely, understandable, andinternationally comparable information on Governmentactivities, so that the electorate and financial markets couldaccurately and easily assess the Government’s financialposition as well as the true costs and benefits of its activities(Kopits and Craig 1998). Fiscal transparency fosters better-informed public debate, as well as greater governmentaccountability and credibility. The IMF brought out “Codeof Good Practices” and “Manual on Fiscal Transparency” toencourage greater fiscal transparency, which were updatedin 2007. This comprehensive framework for fiscaltransparency focuses on clear roles and responsibilities,transparent budget processes, public availability ofinformation, and assurances of integrity. Despite the effortsof international financial institutions to strengthen fiscaltransparency, about one third of the world’s population doesnot have full access to information on the fiscal operationsof public bodies (Chand, 2008).
In the case of India, fiscal transparency was first assessedby an Advisory Group Report and the Report on Observanceof Standards and Codes (ROSC) in 2001 and a Review Reportin 2004. These assessments mainly covered the CentralGovernment finances. Fiscal transparency at the aggregatedState level has been assessed explicitly for the first time in aReport by the Committee on Financial Sector Assessment(CFSA) (Chairman: Dr. Rakesh Mohan) released in March2009. The Report found that the fiscal transparency at theState level in India generally lags behind the standardsachieved at the Central Government level. Although there isno mandatory requirement for the States to adhere to suchtransparency standards, adoption of such practices could helpState Governments in explaining the rationale of various policydecisions to the public. Furthermore, as several States havebeen increasingly accessing the market for meeting theirborrowing programmes, enhancement of such transparencypractices will be beneficial to them. The enactment of FiscalResponsibility Legislations (FRLs) by all States (exceptingWest Bengal and Sikkim) has brought about someimprovement in fiscal transparency at the State level.
The compliance to the IMF Code by the State Governmentswas observed to be relatively lower as compared to the CentralGovernment, but still a significant number of 28 out of 45practices were either ‘Fully’ or ‘Broadly Observed’. The ‘PartlyObserved’ practices numbered 15 and non-observance wasassessed against two practices in respect of Pillar III (PublicAvailability of Information). Overall, the current status ofcompliance leaves scope for substantial improvement that isneeded for greater transparency (Table A).
The state of fiscal transparency at the State Government levelis reflected in lack of availability of information, consistencyin the available information and uniformity in data reporting.Beside these, State budgets also lack clarity and uniformityin terms of methodology to define certain variables which
Box II.2Fiscal Transparency at the State Level
leads to mismatch of data provided by the State Governments,Union Government, Comptroller and Auditor General of India,and Controller General of Accounts. Data dissemination isparticularly poor with regard to outstanding guarantees, off-budget borrowings, financing pattern of gross fiscal deficit,revenue arrears, subsidies, interest rates and maturity profileof negotiated loans. A few State Governments do not providedetailed information on ‘Discharge of Internal Debt’ in theirrespective budgets. Likewise, disaggregated fiscal data forthe accounts year are not available for some States. In thiscontext, the CFSA observed that while it would be difficult toresolve completely such differences, the actual accountingfigures cannot, in principle, differ. The CFSA endorsed theAdvisory Panel recommendation that a Working Group needsto be set up to sort out such discrepancies in fiscal datareported. It also recommended that all States set up StateFinance Commissions (SFCs), ensure timely submission ofReports and report compliance with the rationale for rejectingany of the recommendations. The Report pointed out that theState Governments’ relationship with publicly-ownedcorporations is not always governed by MoUs. In most of thecases, cover for losses of State PSUs is extended throughequity contributions from the capital account, instead ofsubsidies through the revenue account. Such non-transparenttransactions need to be curbed. Transfers of funds for theperformance of functions devolved to local level should bereported in a transparent manner, separately for rural andurban local bodies. The CFSA highlighted the need toreconcile discrepancies in the fiscal data reported by variousdata disseminating agencies and also to restructure andrationalise the structure for reporting expenditures. In short,States need to improve transparency levels with regard totheir finances so that credibility and integrity of informationprovided in public domain is enhanced.
References:
1. Chand, Prem (2008), “Fiscal Transparency”,Encyclopedia of Public Administration and Public Policy,Second Edition.
2. Kopits, G. and J. Craig (1998), “Transparency inGovernment Operations”, IMF Occasional Paper No. 158.
3. Reserve Bank of India (2009), Report of the Committeeon Financial Sector Assessment, March 2009.
Table A: Fiscal Transparency: Assessment of States
O BO PO NO
I. Clarity of Roles and Responsibilities 6 1 3 -II. Open Budget Processes 4 4 1 -III. Public Availability of Information 4 - 7 2IV. Assurances of Integrity 8 1 4 -
O – Observed; BO – Broadly Observed; PO – Partly Observed; NO – Not Observed.Source : Report of Committee on Financial Sector Assessment,
March 2009.
43
ECONOMIC REVIEW
II.1.46 Bhilwada and Surat were recognised astowns of expor t excellence, for texti les anddiamonds, respectively. Several other facilitationmeasures were taken such as establishment ofelectronic message transfer facility for advanceauthorisation and EPCG scheme; allowing re-creditof 4 per cent Single Administrative Document (SAD)for Vishesh Krishi Gram Udyog Yojana (VKGUY);simplification of procedure for claiming dutydrawback refund and refund of terminal excise dutyand admissibility of reimbursement of additionalexcise duty levied on fuel, in respect of EOUs.
II.1.47 As a relief to exporters, the Union Budget2009-10 has announced extension of interestsubvention scheme for select industries till March2010, extension of the benefits of the adjustmentassistance scheme to provide enhanced ExportCredit and Guarantee Corporation cover for badlyhit sectors till March 2010, increased allocation forthe ‘Market Development Assistance Scheme’ inorder to enable exporters to identify and develop newmarkets and simplified service tax refund proposals.
II.1.48 The Reserve Bank also introduced severalmeasures to support the export sector, whichinclude extension of the period of entitlement ofthe first slab of pre-shipment and post-shipmentrupee export credit; raising of the aggregate limitof expor t credit refinance (ECR) facil i ty forscheduled commercial banks (excluding RRBs);extension of prescribed interest rate as applicableto post-shipment rupee export credit to overdue billsup to 180 days; raising of the ceiling rate on exportcredit in foreign currency and raising the limit ofthe standing liquidity facility to banks in terms ofexport credit refinance.
Foreign Exchange Transactions2
II.1.49 During 2008-09, despite the severity of theexternal shock associated with the global economiccrisis, the Reserve Bank continued to undertake
measures to simplify and liberalise the externalpayments regime. The momentum of capitalaccount l iberal isation, however, remainedconsistent with the cautious, gradual and need-based approach that has been adopted by India.The Reserve Bank even advanced the phasedliberal isation measures suggested by theCommittee on Fuller Capital Account Convertibility.The regulations governing capital flows have beenliberalised substantially in the past three yearstaking into account the macroeconomic conditions,state of the financial sector developments, riskmanagement capabilities of financial institutionsand depth of financial markets.
II.1.50 In keeping with the preferred hierarchicalapproach to liberalisation of inflows in favour ofequity flows rather than debt flows, measuresundertaken during 2008-09 to strengthen inflowsunder the equity route include expansion ofcoverage of foreign direct investment (FDI) to creditinformation companies and commodity exchanges;and widening the access of foreign firms to localequity markets. In order to accord flexibility toallocate their investments, restriction on the ratioof equity to debt in the investment portfolio of FIIswas removed. The specific measures taken during2008-09 to liberalise outbound investment includeraising the investment limits of Indian corporatesand mutual funds registered with the SEBI andpermitting registered trusts and societies engagedin manufacturing/educational/hospital sector tomake investment in the same sector(s) in a jointventure or wholly owned subsidiary outside India.
II.1.51 The ECB policy, which was tightened in2007 in view of the then prevailing macroeconomicconditions, was relaxed in 2008-09 following theslowdown in capital inflows, drying up of resourcesin domestic capital market and the continuingpressure on credit spreads in the internationalmarkets. Measures taken in this direction includeexpanding the coverage of ECB to the services
2 A detailed discussion of policies relating to foreign exchange transactions is presented in Chapter V (Development and Regulation ofFinancial Markets) of the Report.
44
ANNUAL REPORT
sectors, viz., hotels, hospitals and softwarecompanies; permitt ing non-banking f inancecompanies (NBFCs) involved exclusively ininfrastructure financing to access ECB; broadeningthe definition of infrastructure sector for the purposeof accessing ECB to include mining, exploration andrefinery sector in the country; increasing the ECBlimits for infrastructure sector; removal of restrictionson rupee expenditure for permissible end-use; anddispensing with the all–in-cost interest rate ceilingsfor ECBs under the approval route. Furthermore,taking into account the depressed asset pricesinternationally, buyback of foreign currencyconvertible bonds (FCCBs) by Indian companies wasallowed both under the approval and automaticroutes, subject to certain conditions.
II.1.52 Specific measures were taken to improveforeign exchange liquidity in the domestic marketin response to uncertainty in the global financialmarkets that has affected capital flows. Theseinclude, raising the interest rate ceilings onFCNR(B) and NR(E)RA deposits and on lines ofcredit with overseas banks; allowing Indian banksto borrow more funds from their overseas branchesand correspondent banks; and permitt ingsystemically important non-deposit taking non-banking financial companies (NBFCs-ND-SI) andHousing Finance Companies (HFCs) to raise short-term foreign currency borrowings.
II.1.53 In view of the slowdown in exports as a fallout of the synchronised global recession, the periodof realisation and repatriation to India of proceedsfrom goods or software exports was enhanced fromsix months to twelve months from the date of export,subject to review after one year. Similarly, as ameasure of relief to importers, the limit for directreceipt of impor t bil ls/documents from theiroverseas suppliers was enhanced from US$ 100,000to US$ 300,000 in the case of import of roughdiamonds, rough precious and semi-preciousstones by non-status holder exporters enablingthem to reduce transaction costs. Accordingly,
authorised dealers (AD) Category-I banks havebeen permitted to make remittances for imports,where the import bills/documents have beenreceived directly by the importer from the overseassupplier and the value of import bill does not exceedUS$ 300,000 subject to certain conditions.
MONETARY POLICY MEASURES3
II.1.54 The fast changing conditions relating toinflation, growth and financial markets posedsignificant challenges for the conduct of monetarypolicy during 2008-09. The monetary policy during2008-09 witnessed two distinct phases. The firstphase during April-September 2008 witnessed aperiod of monetary tightening reflecting theresponse to rising inflation expectations. Thesecond phase since mid-September 2008witnessed a period of monetary policy easing inresponse to the knock-on effects of the globalf inancial cr isis on the Indian economy andsignificant moderation in inflation pressures.
II.1.55 The Annual Policy Statement for 2008-09noted that there had been significant shifts in bothglobal and domestic developments in relation toinitial assessments for 2007-08 and the dangers ofglobal recession had increased. Against thisbackdrop, the Annual Policy Statement for 2008-09 emphasised the overreaching policy challengesto mitigate inflationary pressure and globaluncer tainties while maintaining the growthmomentum of the economy.
II.1.56 The intensity of global financial crisis sinceSeptember 2008, however, reinforced theimpor tance of placing special emphasis onpreserving financial stability and stimulating growth.The Mid-Term Review highlighted that while prudentregulatory surveillance and effective supervisionensured that India’s financial sector remains stableand continues to be robust, the global financialturmoil warranted special emphasis on preservingfinancial stability. The monetary policy challenge,
3 A detailed discussion of monetary management is presented in Chapter III (Monetary Policy Operations) of the Report.
45
ECONOMIC REVIEW
accordingly, was to strike an optimal balancebetween preserving financial stability, maintainingprice stability, anchoring inflation expectations, andsustaining the growth momentum, with the use ofboth conventional and unconventional tools.
II.1.57 The Third Quarter Review of MonetaryPolicy 2008-09 was set in the context of furtherdeterioration in global economic outlook andheightened uncertainty about the global financialsector. The Indian economy, which hadexperienced a cyclical moderation in growthaccompanied by high inflation in the first half of2008-09, exhibited a distinct evidence of furtherslowdown as a consequence of the globaldownturn. The knock-on effects of the globalfinancial crisis affected the Indian economy inseveral ways: capital flows declined; capital marketvaluations remained low; industrial productiongrowth slackened; export growth turned negative;and overall business sentiment deteriorated. Onthe posi t ive side, the headl ine inf lat iondecelerated, though consumer price inflation didnot show any moderation. The domestic financialmarkets also continued to function normally,except for a short phase of high volatility. Althoughbank credit growth was higher than in the previousyear, the flow of overall financial resources to thecommercial sector between Apr i l 2008 andJanuary 2009 declined marginally as comparedwith the previous year. This was on account ofdecline in other sources of funding such asresource mobilisation from the capital market andexternal commercial borrowings (ECBs). Based onthe assessment of the global scenar io anddomestic economy, particularly the outlook ongrowth and inflation, the Reserve Bank maintainedits monetary pol icy stance of provision ofcomfortable liquidity to meet the required creditgrowth consistent with the overall projection ofeconomic growth. The Reserve Bank expressedits resolve to respond swiftly and effectively withall possible measures as warranted by the evolvingglobal and domestic situation impinging on growthand financial stability. Furthermore, it committedto ensure a monetary and interest rate
environment consistent with price stability, well-anchored inflation expectations and order lyconditions in financial markets.
II.1.58 The Annual Policy Statement for 2009-10observed that there was scope for the overallinterest rate structure to move down within thepolicy rate easing already effected by the ReserveBank. Based on the overall assessment of themacroeconomic situation, the stance of monetarypolicy emphasised the need to ensure a policyregime that will enable credit expansion at viablerates while preserving credit quality so as to supportthe return of the economy to a high growth path.
II.1.59 The Annual Policy Statement for 2009-10highlighted several immediate challenges that theIndian economy was facing, which needed to beaddressed. These were: supporting the drivers ofaggregate demand to enable the economy to returnto its high growth path; restoring credit flow to allthe productive sectors; unwinding fiscal stimulusover time in an orderly manner and return to a pathof credible fiscal consolidation; preserving financialstability in the face of a severe global economiccrisis; and withdrawal of the large liquidity injectionsin an orderly manner in order to avoid possible risksof upward inflationary pressures and asset pricebubbles; and finally addressing the key challengeof ensuring an interest rate environment thatsupports revival of investment demand. The FirstQuarter Review of the Monetary Policy 2009-10reiterated that the Reserve Bank would maintainthe accommodative monetary stance until there aredefinite and robust signs of recovery. Recognisingthat the Reserve Bank would have to reverse theexpansionary measures over time so as to anchorinflationary expectations and subdue inflationarypressures while preserving the growth momentum,the Review stated that “the exit strategy will bemodulated in accordance with the evolvingmacroeconomic developments.”
II.1.60 Reflecting the overal l pol icy stanceannounced in the quarterly policy statements, theReserve Bank shifted its policy stance frommonetary tightening in response to the elevated

46
ANNUAL REPORT
inflationary pressures in the first half of 2008-09 tomonetary easing in the background of moderationof growth engendered by the crisis and easinginflationary pressures. The changing stance ofpolicy needs to be viewed in the context of theprevious per iod of graduated withdrawal ofaccommodation from September 2004 till August2008 during which repo/reverse repo rates wereincreased by 300/150 basis points and the cashreserve ratio (CRR) for commercial banks wasraised by 450 basis points. General provisioningrequirements for standard advances and riskweights were raised in the case of specific sectors.In the second half of 2008-09, reflecting theemerging needs of the economy, the Reserve Bankreduced the CRR by 400 basis points duringSeptember-March 2008-09. During the sameperiod, the repo rate was reduced by 400 basispoints and the reverse repo rate was reduced by250 basis points. The repo and reverse repo rateswere further brought down by 25 basis points each,to 4.75 per cent and 3.25 per cent, respectively, onApril 21, 2009. Use of macro-prudential measuresalong with monetary policy measures remained aunique feature of the Reserve Bank’s policyapproach of ensuring financial stability whilebalancing the objectives of growth and inflationduring 2008-09.
CREDIT DELIVERY4
II.1.61 Dur ing a per iod when the advancedeconomies encountered an intense credit freeze,in India, the credit market functioned normally,notwithstanding the decline in demand for crediton account of the economic slowdown. The ReserveBank continued to place emphasis on improvingcredit delivery mechanisms and took variousmeasures for enhancing the flow of credit to thosesectors of the economy, which were relatively moreseverely affected due to the synchronised globalrecession and also to the employment-intensive
sectors. Wide ranging initiatives were also taken inthe areas of financial inclusion, employmentgeneration in rural and unorganised sectors,financial literacy and credit counselling. Theseinclude strengthening of rural co-operatives andregional rural banks which cater predominantly tothe rural areas; liberalisation of branch licensingpolicies of RRBs; encouraging multiple channelsof lending such as the self-help groups (SHGs),micro-finance institutions (MFIs) and adoption ofbanking facilitator/banking correspondent (BC)model; simplif ication of the procedures andprocesses for lending to agriculture and micro,small and medium enterprises (MSME) sectors andencouraging the adoption of ICT solutions to notonly increase the outreach but also to reducetransaction costs.
FINANCIAL SECTOR POLICIES5
II.1.62 The resilience of the Indian financial sectorin the face of the unprecedented global financialcrisis to a large extent reflected the soundness ofthe Reserve Bank’s regulatory and supervisorypolicies and the country’s approach to financialreforms to suppor t economic growth anddevelopment. The Reserve Bank’s regulatory andsupervisory initiatives during 2008-09 includechanges in prudential regulations and measuresto improve customer service, promote financialinclusion and strengthen anti-money laundering inthe banking sector. Prudential regulations, whichwere earlier stepped up during the economic boomphase through counter-cyclical use of risk weightsand provisioning on standard assets were broughtdown to the normal levels to create enablingconditions for preventing sharp moderation in creditgrowth during the economic slowdown. Initiativeswere also taken for meeting country-specificrequirements in the convergence with internationalbest practices; strengthening the supervisoryframework in terms of cross-border supervision;
4 A detailed discussion of policies relating to credit delivery is presented in Chapter IV (Credit Delivery) of the Report.5 A detailed discussion of financial sector policies is presented in Chapter V (Development and Regulation of Financial Markets) and
Chapter VI (Financial Regulation and Supervision) of the Report.
47
ECONOMIC REVIEW
risk-based supervision and bank-led conglomerates;and strengthening the off-site monitoring systemfurther for surveillance over bank’s credit portfolios.
II.1.63 The Reserve Bank continued to takemeasures in 2008-09 to strengthen the urban co-operative banks (UCBs) in line with the VisionDocument. Some of the important measures takenduring the year include liberalisation of branchlicensing norms for UCBs; permission to issuepreference shares and long-term deposits; financialrestructuring; and dynamic provisioning andrestructuring of assets to address the stress createdby economic slowdown. The process ofconsolidation of the sector through merger withstronger UCBs was further strengthened by layingdown the guidelines for such mergers, includingpayment to depositors, financial contribution by thetransferee bank and sacrifice by large depositors.
II.1.64 The Reserve Bank, on a review of theexperience with the regulatory framework for non-banking financial companies in place since April2007, enhanced the capital adequacy requirementfor systemically important non-banking financialcompanies (NBFCs-ND-SI) and put in placeguidelines for liquidity management and reporting,with specified norms for disclosures in October2008. The implementation of capital to risk weightedasset ratio (CRAR) of 12 per cent by March 31,2009 and 15 per cent by March 31, 2010 for theseNBFCs was, however, deferred by one year,respectively, in view of the difficulty in raising equitycapital in a market, which was depressed in thesecond half of the year in line with the sharpdownward correction in asset prices globally. Takinginto consideration the need for adequate access tofunds for meeting business and regulatoryrequirements, NBFCs-ND-SI were permitted toissue perpetual debt instruments. To addressproblems of liquidity and ALM mismatch in thecurrent economic scenario, the Reserve Bankpermitted NBFCs-ND-SI to raise short term foreigncurrency borrowings under the approval route as atemporary measure, subject to certain conditionsand also provided liquidity support to eligible
NBFCs-ND-SI through a special purpose vehicle(SPV).
Policies for Financial Markets
II.1.65 The contagion from the global cr isisoperating through the trade, capital flows andconfidence channels created pressures andenhanced volatility in the financial markets of India,in particular the foreign exchange market, thecapital market and the money market. The ReserveBank’s timely measures restored orderly conditionsin the money and foreign exchange markets over ashor t period. All markets, more impor tantly,functioned normally throughout the year. Besidesthe specific measures to address the stress levelsin the markets, several measures were taken tosustain the process of ensuring deeper andcompetitive markets.
II.1.66 Important measures to improve activity inthe Government securities market during 2008-09include: (i) new issuance structure for issue off loating rate bonds (FRBs); ( i i) operationalreadiness for introduction of separate trading forregistered interest and principal of securities(STRIPS); ( i i i ) revision of repo accountingguidelines; (iv) clearing and settlement of over thecounter (OTC) derivatives; and (v) new settlementmechanism in government securities market for thenon-current account holders.
II.1.67 During 2008-09, the Securities ExchangeBoard of India (SEBI) as the regulator for capitalmarket, continued to take measures to furtherdevelop the market. Specific measures were alsotaken in the wake of the global financial crisis, tostrengthen the Indian capital market, ensure marketsafety and safeguard the interest of investors.
II.1.68 SEBI operationalised the securities lendingand borrowing (SLB) with effect from April 21, 2008.Pursuant to feedback received from marketparticipants, National Stock Exchange (NSE) andBombay Stock Exchange (BSE), SEBI has madecertain changes in the SLB mechanism such asincrease in the tenure of SLB to 30 days from 7
48
ANNUAL REPORT
days, extending the time for SLB session from onehour (10 am to 11 am) to the normal trade timingsof 9.55 am to 3.30 pm and advising the stockexchanges to follow the common risk managementpractices.
II.1.69 In order to improve the efficiency of the useof the margin capital by market participants, SEBIin December 2008 revised the existing facility ofcross margining and extended it across cash andderivatives segments to all categories of marketparticipants. The extent to which positions of clientsin both the cash and derivatives segments offseteach other shall be considered for the purpose ofcross margining.
II.1.70 Effective August 6, 2008, trading in currencyfutures was permitted at recognised exchanges forIndian entities, including banks. With a view torationalising the eligibility criteria for introduction ofderivatives, SEBI in October 2008 advised stockexchanges to introduce derivatives on shares fulfillingthe prescribed criteria, irrespective of their date oflisting and/or size of issue.
II.1.71 SEBI revised the position limit applicablefor client and trading member for exchange tradedcurrency derivatives as per the recommendationsof the RBI-SEBI Standing Technical Committee. Theposition limits shall be specific to an exchange andnot to the exchange traded currency derivativesmarket as a whole. On June 17, 2009, RBI and SEBIjointly brought out norms enabling exchange-tradedinterest rate futures (IRFs).
II.1.72 The cumulative debt investment limit forFIIs' investments in corporate debt was enhancedfrom US$ 6 billion to US$ 15 billion. Following this,US$ 8 billion has been allocated to the marketpar ticipants in an open bidding platform. Allbiddings for the limits would be through the stockexchanges and the window for bidding wouldremain open for two hours. The existing tradingmembers would have access to the biddingplatform. FIIs or the sub-accounts have to routethrough the existing trading members, who in turnshall bid for the limits.
II.1.73 On review of certain restrictions imposedon issuance of par ticipatory notes/offshorederivative instruments (ODIs) by FIIs/sub-accountsin 2007 in October 2008, SEBI decided to relaxrestrictions imposed on issue of participatory notesby FIIs against securities, including derivatives asunderlying. Furthermore, the foreign investmentpromotion board (FIPB) decided that foreigninvestment could flow into private equity fundsregistered as trusts, thus opening up anotherwindow of funds for private equity players andventure capital funds registered as trusts.Applicants seeking registration as Foreign VentureCapital Investors (FVCIs) with SEBI, have to obtainfirm commitment from their investors in the form ofa minimum contribution of US $ 1 million at the timeof submission of application. FIIs and NRIs havebeen permitted in July 2009 to invest in IndianDepository Receipts (IDRs) subject to specifiedconditions.
II.1.74 SEBI amended the SEBI (DIP) Guidelines,2000 with respect to reduction in timelines for rightsissue; definition of qualified institutional buyers(QIBs) and eligibility and pricing norms of qualifiedinstitutions placement (QIP). With a view toencourage participation of institutional buyers in thecapital market, QIBs were allowed to subscribe tothe combined offer ing of non-conver tibledebentures (NCDs) with warrants or to individualinstruments issued by a listed company. With theamendment of SEBI (DIP) guidelines and theListing Agreement, the time duration for a rightsissue was reduced, which meant a reduction in themarket risk faced by an issuer besides fasterturnaround of money for investors.
II.1.75 Considering the importance of systemsaudit in a highly technology-driven securitiesmarket, all exchanges were advised in July 2008to conduct, on an annual basis, comprehensiveaudit of their systems and processes by a reputedindependent auditor. In order to boost investorconfidence in the wake of concerns relating tocorporate governance in certain companies, SEBI hasset up a panel of audit firms to begin peer review ofaudit reports for firms listed in the stock market for
49
ECONOMIC REVIEW
2008-09 and for the first three quarters of 2009-10.SEBI guidelines were amended to align theaccounting standards of employee stock optionscheme with the accounting norms prescribed by theInstitute of Chartered Accountants of India (ICAI).
II.1.76 In order to enhance disclosures regardingshareholding pattern in a listed company and alsoto bring more transparency and efficiency in thegovernance of a listed company, SEBI amendedcertain clauses in the Equity Listing Agreement inApril 2009. These amendments included, inter alia,providing a uniform procedure for dealing withunclaimed shares; reducing the notice period;uniformity in dividend declaration by l istedcompanies on ‘per share’ basis; and disclosure ofshareholding pattern for each class of shares andvoting rights pattern.
II.1.77 With a view to bringing about uniformity indisclosure by the mutual funds, SEBI in consultationwith Association of Mutual Funds in India (AMFI),prescribed a new format of abridged scheme-wiseannual report in July 2008. In order to furtherstrengthen the framework for close-endedschemes, all close-ended schemes (except EquityLinked Savings Schemes) launched on or afterDecember 12, 2008 were required to bemandatorily listed and net asset value (NAV)computed and published on a daily basis.
II.1.78 In order to bring about greater transparencyto the market, SEBI decided that the position ofthe securities lent by foreign institutional investors(FIIs) and their sub-accounts abroad shall bedisseminated on a consolidated basis twice a weeki.e., on Tuesday and Friday of every week.
Legislative Measures
II.1.79 The Payment and Settlement Systems Act,2007, which was notified on December 20, 2007came into effect from August 12, 2008. The ReserveBank has, in exercise of the powers conferred underthe Act, framed two regulations, i.e., Board forRegulation and Supervision of Payment andSettlement Systems Regulations, 2008 and thePayment and Settlement Systems Regulations,
2008. The Act has designated the Reserve Bankas the authority to regulate and supervise thepayment systems in the country, including thoseoperated by non-banks such as the CCIL, cardcompanies, other payment system providers andall prospective organisations for payments. Thenetting procedure and settlement finality, earliergoverned by contractual agreement(s), have beenaccorded legal recognition under the Act. Entitiesthat want to/ continue to operate a payment systemare required to apply to the Reserve Bank forauthorisation. The other powers vested with theReserve Bank under the Act include laying downoperational and technical standards for the variouspayment systems; calling for information andreturns/documents from the service providers andimposing fines on failure to do so or on providingfalse information. The Reserve Bank is alsoempowered to issue directions and guidelines tothe system providers, prescribe the duties to beperformed by them and audit and inspect theirsystems/premises. The Payment and SettlementSystems Regulations, 2008 cover: (a) authorisationof payment systems including the form and mannerof submission of application for authorisation ofcommencement/continuation of a payment systemand grant of authorisation certificate; (b) paymentinstructions and determination of standards; (c)furnishing of returns, documents and otherinformation; and (d) furnishing of accounts andbalance sheets.
II.1.80 The macroeconomic policies taken during2008-09 by the Government and the Reserve Bankkept pace with the dynamically changing globalenvironment and its repercussions on the domesticeconomy. The policies that were formulated inresponse to the evolving developments aimed atcushioning the economy from the adverse impactof high global commodity and fuel prices ondomestic inflation during the first half of the yearand from the knock-on effect of the global financialcrisis on economic growth during the second half.The overall policy thrust, however, continued tofocus on non-inflationary high growth that isinclusive and is based on efficient use of resourcesin a liberalised policy environment.
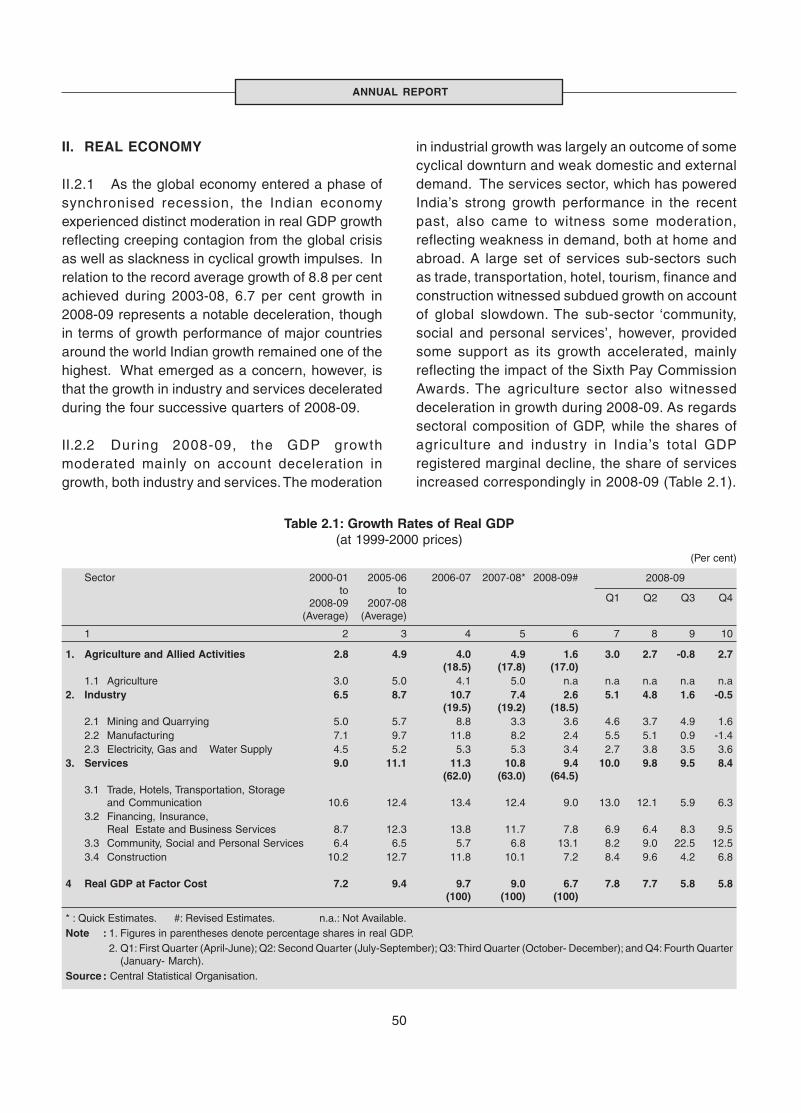
50
ANNUAL REPORT
II. REAL ECONOMY
II.2.1 As the global economy entered a phase ofsynchronised recession, the Indian economyexperienced distinct moderation in real GDP growthreflecting creeping contagion from the global crisisas well as slackness in cyclical growth impulses. Inrelation to the record average growth of 8.8 per centachieved during 2003-08, 6.7 per cent growth in2008-09 represents a notable deceleration, thoughin terms of growth performance of major countriesaround the world Indian growth remained one of thehighest. What emerged as a concern, however, isthat the growth in industry and services deceleratedduring the four successive quarters of 2008-09.
II.2.2 Dur ing 2008-09, the GDP growthmoderated mainly on account deceleration ingrowth, both industry and services. The moderation
in industrial growth was largely an outcome of somecyclical downturn and weak domestic and externaldemand. The services sector, which has poweredIndia’s strong growth performance in the recentpast, also came to witness some moderation,reflecting weakness in demand, both at home andabroad. A large set of services sub-sectors suchas trade, transportation, hotel, tourism, finance andconstruction witnessed subdued growth on accountof global slowdown. The sub-sector ‘community,social and personal services’, however, providedsome support as its growth accelerated, mainlyreflecting the impact of the Sixth Pay CommissionAwards. The agriculture sector also witnesseddeceleration in growth during 2008-09. As regardssectoral composition of GDP, while the shares ofagriculture and industry in India’s total GDPregistered marginal decline, the share of servicesincreased correspondingly in 2008-09 (Table 2.1).
Table 2.1: Growth Rates of Real GDP(at 1999-2000 prices)
(Per cent)
Sector 2000-01 2005-06 2006-07 2007-08* 2008-09#to to
Q1 Q2 Q3 Q42008-09 2007-08(Average) (Average)
1 2 3 4 5 6 7 8 9 10
1. Agriculture and Allied Activities 2.8 4.9 4.0 4.9 1.6 3.0 2.7 -0.8 2.7(18.5) (17.8) (17.0)
1.1 Agriculture 3.0 5.0 4.1 5.0 n.a n.a n.a n.a n.a2. Industry 6.5 8.7 10.7 7.4 2.6 5.1 4.8 1.6 -0.5
(19.5) (19.2) (18.5)2.1 Mining and Quarrying 5.0 5.7 8.8 3.3 3.6 4.6 3.7 4.9 1.62.2 Manufacturing 7.1 9.7 11.8 8.2 2.4 5.5 5.1 0.9 -1.42.3 Electricity, Gas and Water Supply 4.5 5.2 5.3 5.3 3.4 2.7 3.8 3.5 3.6
3. Services 9.0 11.1 11.3 10.8 9.4 10.0 9.8 9.5 8.4(62.0) (63.0) (64.5)
3.1 Trade, Hotels, Transportation, Storageand Communication 10.6 12.4 13.4 12.4 9.0 13.0 12.1 5.9 6.3
3.2 Financing, Insurance,Real Estate and Business Services 8.7 12.3 13.8 11.7 7.8 6.9 6.4 8.3 9.5
3.3 Community, Social and Personal Services 6.4 6.5 5.7 6.8 13.1 8.2 9.0 22.5 12.53.4 Construction 10.2 12.7 11.8 10.1 7.2 8.4 9.6 4.2 6.8
4 Real GDP at Factor Cost 7.2 9.4 9.7 9.0 6.7 7.8 7.7 5.8 5.8(100) (100) (100)
* : Quick Estimates. #: Revised Estimates. n.a.: Not Available.Note : 1. Figures in parentheses denote percentage shares in real GDP.
2. Q1: First Quarter (April-June); Q2: Second Quarter (July-September); Q3: Third Quarter (October- December); and Q4: Fourth Quarter(January- March).
Source : Central Statistical Organisation.
2008-09
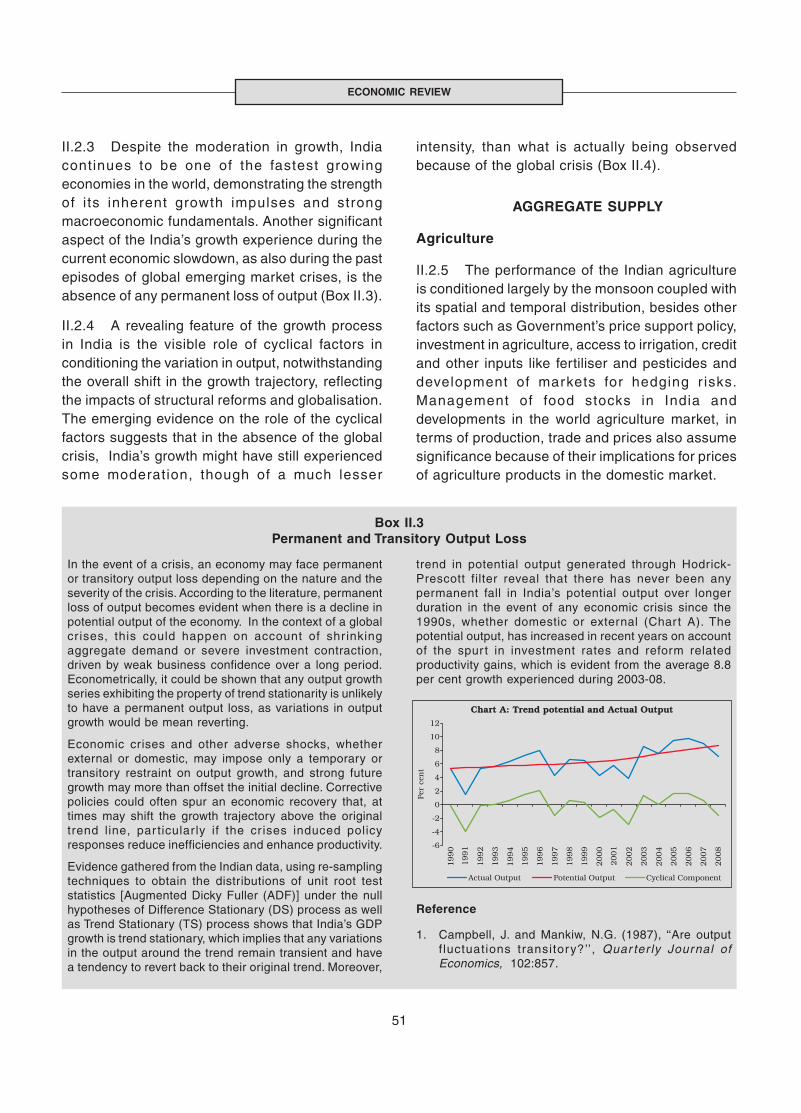
51
ECONOMIC REVIEW
II.2.3 Despite the moderation in growth, Indiacontinues to be one of the fastest growingeconomies in the world, demonstrating the strengthof i ts inherent growth impulses and strongmacroeconomic fundamentals. Another significantaspect of the India’s growth experience during thecurrent economic slowdown, as also during the pastepisodes of global emerging market crises, is theabsence of any permanent loss of output (Box II.3).
II.2.4 A revealing feature of the growth processin India is the visible role of cyclical factors inconditioning the variation in output, notwithstandingthe overall shift in the growth trajectory, reflectingthe impacts of structural reforms and globalisation.The emerging evidence on the role of the cyclicalfactors suggests that in the absence of the globalcrisis, India’s growth might have still experiencedsome moderation, though of a much lesser
In the event of a crisis, an economy may face permanentor transitory output loss depending on the nature and theseverity of the crisis. According to the literature, permanentloss of output becomes evident when there is a decline inpotential output of the economy. In the context of a globalcr ises, this could happen on account of shr inkingaggregate demand or severe investment contraction,driven by weak business confidence over a long period.Econometrically, it could be shown that any output growthseries exhibiting the property of trend stationarity is unlikelyto have a permanent output loss, as variations in outputgrowth would be mean reverting.
Economic crises and other adverse shocks, whetherexternal or domestic, may impose only a temporary ortransitory restraint on output growth, and strong futuregrowth may more than offset the initial decline. Correctivepolicies could often spur an economic recovery that, attimes may shift the growth trajectory above the originaltrend line, par ticular ly if the cr ises induced policyresponses reduce inefficiencies and enhance productivity.
Evidence gathered from the Indian data, using re-samplingtechniques to obtain the distributions of unit root teststatistics [Augmented Dicky Fuller (ADF)] under the nullhypotheses of Difference Stationary (DS) process as wellas Trend Stationary (TS) process shows that India’s GDPgrowth is trend stationary, which implies that any variationsin the output around the trend remain transient and havea tendency to revert back to their original trend. Moreover,
Box II.3Permanent and Transitory Output Loss
trend in potential output generated through Hodrick-Prescott filter reveal that there has never been anypermanent fall in India’s potential output over longerduration in the event of any economic crisis since the1990s, whether domestic or external (Chart A). Thepotential output, has increased in recent years on accountof the spur t in investment rates and reform relatedproductivity gains, which is evident from the average 8.8per cent growth experienced during 2003-08.
Reference
1. Campbell, J. and Mankiw, N.G. (1987), ‘‘Are outputf luctuations transitory?’’, Quar ter ly Journal ofEconomics, 102:857.
intensity, than what is actually being observedbecause of the global crisis (Box II.4).
AGGREGATE SUPPLY
Agriculture
II.2.5 The performance of the Indian agricultureis conditioned largely by the monsoon coupled withits spatial and temporal distribution, besides otherfactors such as Government’s price support policy,investment in agriculture, access to irrigation, creditand other inputs like fertiliser and pesticides anddevelopment of markets for hedging r isks.Management of food stocks in India anddevelopments in the world agriculture market, interms of production, trade and prices also assumesignificance because of their implications for pricesof agriculture products in the domestic market.
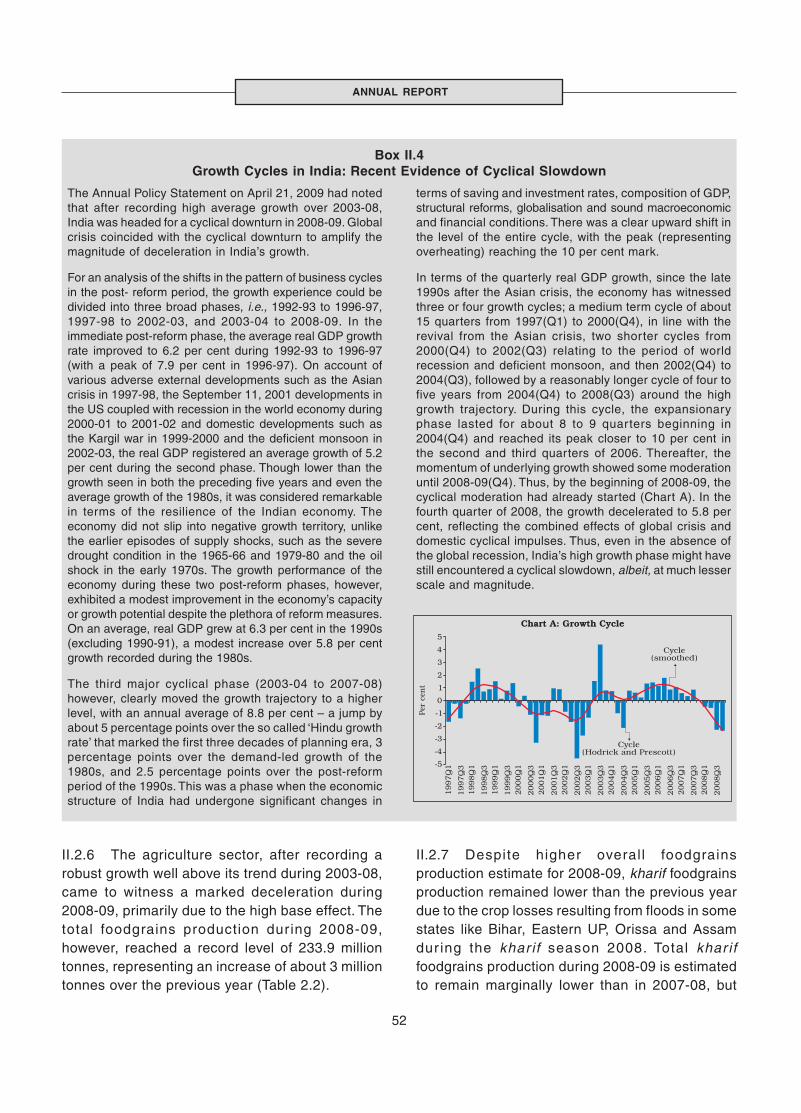
52
ANNUAL REPORT
The Annual Policy Statement on April 21, 2009 had notedthat after recording high average growth over 2003-08,India was headed for a cyclical downturn in 2008-09. Globalcrisis coincided with the cyclical downturn to amplify themagnitude of deceleration in India’s growth.
For an analysis of the shifts in the pattern of business cyclesin the post- reform period, the growth experience could bedivided into three broad phases, i.e., 1992-93 to 1996-97,1997-98 to 2002-03, and 2003-04 to 2008-09. In theimmediate post-reform phase, the average real GDP growthrate improved to 6.2 per cent during 1992-93 to 1996-97(with a peak of 7.9 per cent in 1996-97). On account ofvarious adverse external developments such as the Asiancrisis in 1997-98, the September 11, 2001 developments inthe US coupled with recession in the world economy during2000-01 to 2001-02 and domestic developments such asthe Kargil war in 1999-2000 and the deficient monsoon in2002-03, the real GDP registered an average growth of 5.2per cent during the second phase. Though lower than thegrowth seen in both the preceding five years and even theaverage growth of the 1980s, it was considered remarkablein terms of the resilience of the Indian economy. Theeconomy did not slip into negative growth territory, unlikethe earlier episodes of supply shocks, such as the severedrought condition in the 1965-66 and 1979-80 and the oilshock in the early 1970s. The growth performance of theeconomy during these two post-reform phases, however,exhibited a modest improvement in the economy’s capacityor growth potential despite the plethora of reform measures.On an average, real GDP grew at 6.3 per cent in the 1990s(excluding 1990-91), a modest increase over 5.8 per centgrowth recorded during the 1980s.
The third major cyclical phase (2003-04 to 2007-08)however, clearly moved the growth trajectory to a higherlevel, with an annual average of 8.8 per cent – a jump byabout 5 percentage points over the so called ‘Hindu growthrate’ that marked the first three decades of planning era, 3percentage points over the demand-led growth of the1980s, and 2.5 percentage points over the post-reformperiod of the 1990s. This was a phase when the economicstructure of India had undergone significant changes in
Box II.4Growth Cycles in India: Recent Evidence of Cyclical Slowdown
terms of saving and investment rates, composition of GDP,structural reforms, globalisation and sound macroeconomicand financial conditions. There was a clear upward shift inthe level of the entire cycle, with the peak (representingoverheating) reaching the 10 per cent mark.
In terms of the quarterly real GDP growth, since the late1990s after the Asian crisis, the economy has witnessedthree or four growth cycles; a medium term cycle of about15 quarters from 1997(Q1) to 2000(Q4), in line with therevival from the Asian crisis, two shorter cycles from2000(Q4) to 2002(Q3) relating to the period of worldrecession and deficient monsoon, and then 2002(Q4) to2004(Q3), followed by a reasonably longer cycle of four tofive years from 2004(Q4) to 2008(Q3) around the highgrowth trajectory. During this cycle, the expansionaryphase lasted for about 8 to 9 quarters beginning in2004(Q4) and reached its peak closer to 10 per cent inthe second and third quarters of 2006. Thereafter, themomentum of underlying growth showed some moderationuntil 2008-09(Q4). Thus, by the beginning of 2008-09, thecyclical moderation had already started (Chart A). In thefourth quarter of 2008, the growth decelerated to 5.8 percent, reflecting the combined effects of global crisis anddomestic cyclical impulses. Thus, even in the absence ofthe global recession, India’s high growth phase might havestill encountered a cyclical slowdown, albeit, at much lesserscale and magnitude.
II.2.6 The agriculture sector, after recording arobust growth well above its trend during 2003-08,came to witness a marked deceleration during2008-09, primarily due to the high base effect. Thetotal foodgrains production dur ing 2008-09,however, reached a record level of 233.9 milliontonnes, representing an increase of about 3 milliontonnes over the previous year (Table 2.2).
II.2.7 Despite higher overall foodgrainsproduction estimate for 2008-09, kharif foodgrainsproduction remained lower than the previous yeardue to the crop losses resulting from floods in somestates like Bihar, Eastern UP, Orissa and Assamdur ing the khar if season 2008. Total khar iffoodgrains production during 2008-09 is estimatedto remain marginally lower than in 2007-08, but

53
ECONOMIC REVIEW
Table 2.2: Agricultural Production
(Million tonnes)
Crop 2005-06 2006-07 2007-08 2008-09#
1 2 3 4 5
a. Foodgrains 208.6 217.3 230.8 233.9i. Rice 91.8 93.4 96.7 99.2ii. Wheat 69.4 75.8 78.6 80.6iii. Coarse Cereals 34.1 33.9 40.8 39.5iv. Pulses 13.4 14.2 14.8 14.7
b. Non-foodgrains i. Oilseeds++ 28.0 24.3 29.8 28.2ii. Sugarcane 281.2 355.5 348.2 271.3iii. Cotton@ 18.5 22.6 25.9 23.2iv. Jute and Mesta+ 10.8 11.3 11.2 10.4v. Tea* 946.0 981.8 944.7 980.8vi. Coffee* 274.0 280.0 262.0 277.0
# : Fourth Advance Estimates as on July 21, 2009++ : For nine oilseeds out of eleven in all.+ : Million bales of 180 kg. each.@ : Million bales of 170 kg. each.* : Million kilograms and data for tea on a calendar year basis.Source: Ministry of Agriculture, Government of India.
Table 2.3: Season-wise Agricultural Production(Million tonnes)
Kharif Rabi
Crop 2006-07 2007-08 2008-09 AE 2006-07 2007-08 2008-09 AE
1 2 3 4 5 6 7
Rice 80.2 82.7 84.6 13.2 14.0 14.6
Wheat - - - 75.8 78.6 80.6
Coarse Cereals 25.6 31.9 28.3 8.3 8.9 11.1
Pulses 4.8 6.4 4.8 9.4 8.4 9.9
Total Foodgrains 110.6 121.0 117.7 106.7 109.8 116.2
Oilseeds 14.0 20.7 17.9 10.3 9.0 10.3
Sugarcane 355.5 348.2 271.3 - - -
Cotton* 22.6 25.9 23.2 - - -
Jute & Mesta** 11.3 11.2 10.4 - - -
- : Not Applicable. AE: Fourth Advance Estimates as on July 21, 2009.* : In million bales of 170 kilograms each. ** : In million bales of 180 kilograms eachSource: Ministry of Agriculture, Government of India.
significantly higher than in 2006-07 (Table 2.3). Therabi production, however, was higher than thatrecorded in the previous year and compensated forthe loss in kharif output. Overall, the total rice andwheat production increased, while the production
of coarse cereals, pulses, oilseeds, showed someslippage and the output of sugarcane and cottonexhibited a marked decline over the previous year.Growth in the allied sector is expected to remainstrong during 2008-09.
Behaviour of Monsoon
II.2.8 The performance of South West monsoonduring 2008 (June 1 to September 30) wassatisfactory with cumulative rainfall being twopercentage points below normal. The South-Westmonsoon arrived over Kerala on May 31, a dayahead of the normal date. The monsoon coveredthe entire country by July 10, nearly 5 days aheadof the normal schedule. The progress of South-Westmonsoon was, however, uneven with rainfall beingdeficient in most of the weeks during sowing monthsof July and August 2008. The temporal distributionshows that precipitation was above normal in June,while it was below normal during July, August andSeptember (Chart II.1). Nonetheless, the spatialdistribution of rainfall was satisfactory with majorityof meteorological sub-divisions recording excess/normal6 rainfal l and only few sub-divisionsregistering deficient/scanty/no rains (Chart II.2).
6 Excess: + 20 per cent or more; Normal: + 19 per cent to -19 per cent; Deficient: -20 per cent to - 59 per cent; Scanty: -60 per cent to -99 percent; No Rain: -100 per cent (All with respect to the Long Period Average).

54
ANNUAL REPORT
II.2.9 Among the four broad homogeneousregions, while the South-West monsoon seasonalrainfall was above normal in the North-West India,it was below normal in the South Peninsula, CentralIndia and North-East India. The uneven temporalrainfall distribution caused flood situation in manystates. The water storage in the major reservoirs inthe country was 74 per cent of the Full Reservoir Level(FRL) at the end of the South-West monsoon season(October, 2008), which although was lower than theprevious year (79 per cent) but remained higherthan the average of last 10 years (66 per cent).
II.2.10 The North-East monsoon (October 1 toDecember 31, 2008) rains commenced over thePeninsular India on October 15, 2008. Thecumulative position of North-East monsoon wasdeficient with rainfall being 31 per cent belownormal, almost the same as recorded in the
previous year. The cumulative rainfall was excess/normal only in few sub-divisions, while most of themrecorded deficient/scanty/no rains.
Progress of South West Monsoon during 2009-10(so far)
II.2.11 According to the latest monsoon forecastreleased by the IMD in August 2009, the rainfallduring the South-West monsoon season 2009, forthe country as a whole is likely to be below normal,viz., 87 per cent of the LPA with a model error of+/- 4 per cent. The cumulative rainfall during theSouth West monsoon season for 2009-10 so far(up to August 12) has been less than satisfactory,with rainfall over the entire country being 29 percent below normal as against 2 per cent abovenormal during the corresponding period of theprevious year. The foodgrains production weighted
55
ECONOMIC REVIEW
rainfall index7 stood at 64 as on August 12, 2009as against 114 during the corresponding periodof the previous year. As on August 18, 2009, 10states viz., Assam, Bihar, Himachal Pradesh,Jharkhand, Madhya Pradesh, Manipur, Nagaland,Karnataka, Maharashtra and Uttar Pradesh havedeclared drought, partly or wholly, in the state.
Agricultural Price policy
II.2.12 The fundamental objective of agricultureprice policy in India has been to evolve a balancedand integrated price structure to meet the overallneeds of the economy while protecting, in particular,the interests of the producers and the consumers.Keeping in view the interests of the farmers as alsothe need for self reliance, the Government has beenfixing the Minimum Support Prices (MSP) for 24major crops. Recently, based on therecommendations of the Expert Committee toexamine methodological issues in fixing MSP(Chairman: Prof. Y.K. Alagh), the Governmentapproved the inclusion of three more variables inthe calculations done by the Commission onAgricultural Costs and Prices (CACP) to arrive atthe minimum support price. The Government hasfurther raised the MSP for rabi crops of 2008-09season with a view to incentivise crop productionand to ensure remunerative prices to the farmers(Box II.5).
Investment in Agriculture
II.2.13 Investment in agriculture as a proportion ofoverall GDP has remained stagnant in recent years.Gross capital formation in agriculture relative toGDP in this sector, however, has been improvingcontinuously from 11.1 per cent in 2003-04 to 14.2per cent in 2007-08 (Table 2.4). This needs to beraised to 16 per cent during the Eleventh Planperiod to achieve the target growth rate of 4 percent for agriculture.
II.2.14 The private sector in India has taken thelead in investment on agricultural research andmade significant contribution to Bt cotton and otherhybrid varieties of rice, maize and sunflower.Significant step up in investments is critical toensure the much needed structural break that couldlift the Indian agriculture to a higher level ofsustainable growth. Nevertheless, the compositionof investments, the quality of facilities created bythem and the efficacy with which these facilities aremanaged will also hold a key for agriculturalperformance and the growth of rural incomes.
Allied sector
II.2.15 In recent years, r ising incomes,urbanisation and globalisation have opened up newopportunities for diversification of agriculture. Cropdiversification is increasingly perceived as a riskmanagement strategy in the farm sector to shieldthe farmers from generally volatile agriculturalprices. Greater diversification of agriculture towardshighly lucrative horticultural crops coupled withother allied activities like livestock, bio-tech, foodprocessing and others have contributed to higheragricultural growth in last few years. The growth inallied sector, viz., hor ticulture, livestock andfisheries is expected to have remained strong inthe range of 5 to 6 per cent during 2008-09.
II.2.16 Horticulture provides ample opportunitiesfor sustaining large number of agro-basedindustr ies, which could generate substantialemployment opportunities. Although the horticulturesector accounts for only 10 per cent of agriculturalacreage, it contributes around 28 per cent toagricultural GDP. Horticulture production has grownat an average rate of 5 per cent during 2002-2008.India produced 207 million tonnes of horticulturalcrops during 2007-08. India is the second largestproducer of fruits and vegetables in the world afterChina.
7 The foodgrains production weighted index (PRN) is constructed based on the weighted average of actual rainfall received by the states whereweights are taken as the average share of food grains production by the particular states in overall foodgrains production. A PRN of 100indicates normal rainfall, where normal represents average of last 10 years’ weighted rainfall.
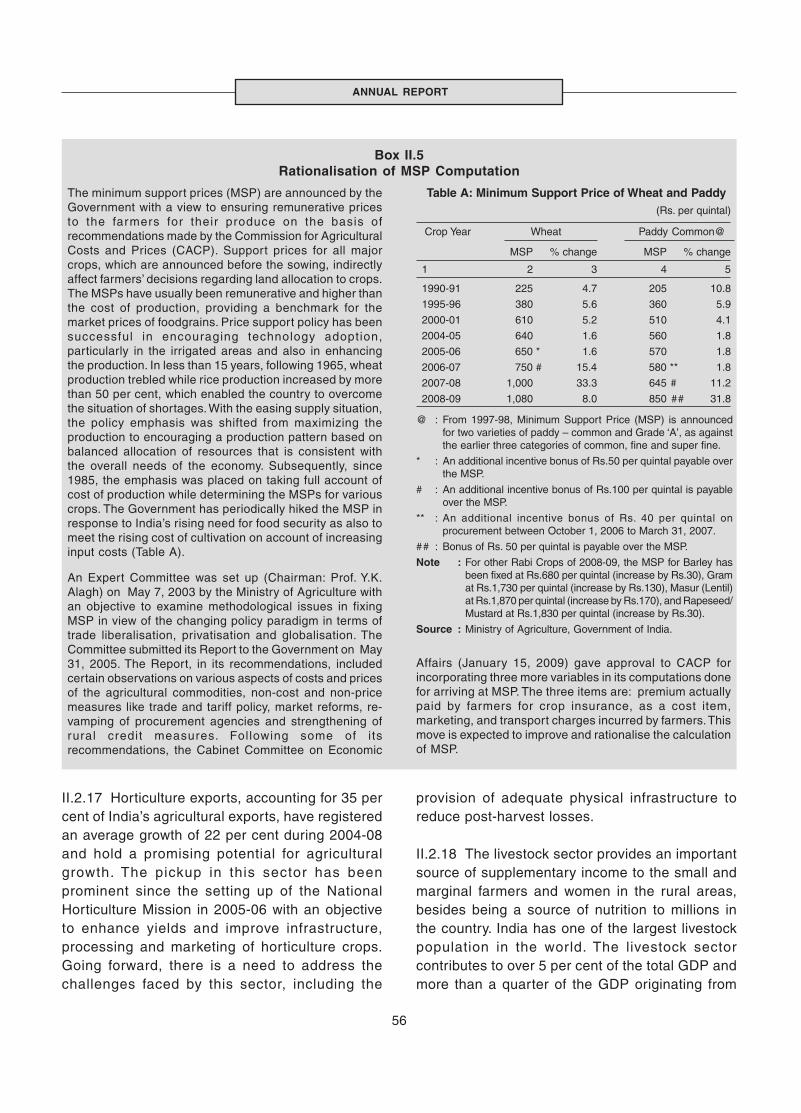
56
ANNUAL REPORT
The minimum support prices (MSP) are announced by theGovernment with a view to ensuring remunerative pricesto the farmers for their produce on the basis ofrecommendations made by the Commission for AgriculturalCosts and Prices (CACP). Support prices for all majorcrops, which are announced before the sowing, indirectlyaffect farmers’ decisions regarding land allocation to crops.The MSPs have usually been remunerative and higher thanthe cost of production, providing a benchmark for themarket prices of foodgrains. Price support policy has beensuccessful in encouraging technology adoption,particularly in the irrigated areas and also in enhancingthe production. In less than 15 years, following 1965, wheatproduction trebled while rice production increased by morethan 50 per cent, which enabled the country to overcomethe situation of shortages. With the easing supply situation,the policy emphasis was shifted from maximizing theproduction to encouraging a production pattern based onbalanced allocation of resources that is consistent withthe overall needs of the economy. Subsequently, since1985, the emphasis was placed on taking full account ofcost of production while determining the MSPs for variouscrops. The Government has periodically hiked the MSP inresponse to India’s rising need for food security as also tomeet the rising cost of cultivation on account of increasinginput costs (Table A).
An Expert Committee was set up (Chairman: Prof. Y.K.Alagh) on May 7, 2003 by the Ministry of Agriculture withan objective to examine methodological issues in fixingMSP in view of the changing policy paradigm in terms oftrade liberalisation, privatisation and globalisation. TheCommittee submitted its Report to the Government on May31, 2005. The Report, in its recommendations, includedcertain observations on various aspects of costs and pricesof the agricultural commodities, non-cost and non-pricemeasures like trade and tariff policy, market reforms, re-vamping of procurement agencies and strengthening ofrural credit measures. Following some of i tsrecommendations, the Cabinet Committee on Economic
Box II.5Rationalisation of MSP Computation
Affairs (January 15, 2009) gave approval to CACP forincorporating three more variables in its computations donefor arriving at MSP. The three items are: premium actuallypaid by farmers for crop insurance, as a cost item,marketing, and transport charges incurred by farmers. Thismove is expected to improve and rationalise the calculationof MSP.
Table A: Minimum Support Price of Wheat and Paddy(Rs. per quintal)
Crop Year Wheat Paddy Common@
MSP % change MSP % change
1 2 3 4 5
1990-91 225 4.7 205 10.8
1995-96 380 5.6 360 5.9
2000-01 610 5.2 510 4.1
2004-05 640 1.6 560 1.8
2005-06 650 * 1.6 570 1.8
2006-07 750 # 15.4 580 ** 1.8
2007-08 1,000 33.3 645 # 11.2
2008-09 1,080 8.0 850 ## 31.8
@ : From 1997-98, Minimum Support Price (MSP) is announcedfor two varieties of paddy – common and Grade ‘A’, as againstthe earlier three categories of common, fine and super fine.
* : An additional incentive bonus of Rs.50 per quintal payable overthe MSP.
# : An additional incentive bonus of Rs.100 per quintal is payableover the MSP.
** : An additional incentive bonus of Rs. 40 per quintal onprocurement between October 1, 2006 to March 31, 2007.
## : Bonus of Rs. 50 per quintal is payable over the MSP.
Note : For other Rabi Crops of 2008-09, the MSP for Barley hasbeen fixed at Rs.680 per quintal (increase by Rs.30), Gramat Rs.1,730 per quintal (increase by Rs.130), Masur (Lentil)at Rs.1,870 per quintal (increase by Rs.170), and Rapeseed/Mustard at Rs.1,830 per quintal (increase by Rs.30).
Source : Ministry of Agriculture, Government of India.
II.2.17 Horticulture exports, accounting for 35 percent of India’s agricultural exports, have registeredan average growth of 22 per cent during 2004-08and hold a promising potential for agriculturalgrowth. The pickup in this sector has beenprominent since the setting up of the NationalHorticulture Mission in 2005-06 with an objectiveto enhance yields and improve infrastructure,processing and marketing of horticulture crops.Going forward, there is a need to address thechallenges faced by this sector, including the
provision of adequate physical infrastructure toreduce post-harvest losses.
II.2.18 The livestock sector provides an importantsource of supplementary income to the small andmarginal farmers and women in the rural areas,besides being a source of nutrition to millions inthe country. India has one of the largest livestockpopulation in the world. The livestock sectorcontributes to over 5 per cent of the total GDP andmore than a quarter of the GDP originating from
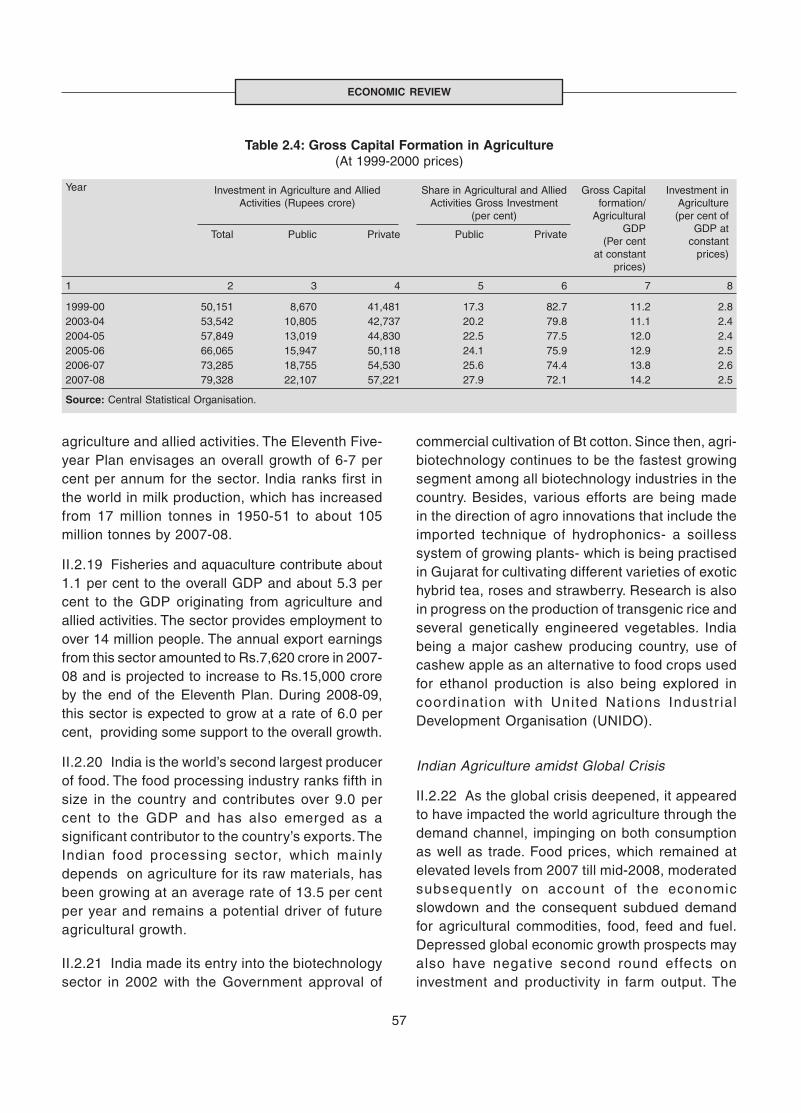
57
ECONOMIC REVIEW
Table 2.4: Gross Capital Formation in Agriculture(At 1999-2000 prices)
Year
Total Public Private Public Private
1 2 3 4 5 6 7 8
1999-00 50,151 8,670 41,481 17.3 82.7 11.2 2.82003-04 53,542 10,805 42,737 20.2 79.8 11.1 2.42004-05 57,849 13,019 44,830 22.5 77.5 12.0 2.42005-06 66,065 15,947 50,118 24.1 75.9 12.9 2.52006-07 73,285 18,755 54,530 25.6 74.4 13.8 2.62007-08 79,328 22,107 57,221 27.9 72.1 14.2 2.5
Source: Central Statistical Organisation.
Investment in Agriculture and AlliedActivities (Rupees crore)
Share in Agricultural and AlliedActivities Gross Investment
(per cent)
Gross Capitalformation/
AgriculturalGDP
(Per centat constant
prices)
Investment inAgriculture(per cent of
GDP atconstant
prices)
agriculture and allied activities. The Eleventh Five-year Plan envisages an overall growth of 6-7 percent per annum for the sector. India ranks first inthe world in milk production, which has increasedfrom 17 million tonnes in 1950-51 to about 105million tonnes by 2007-08.
II.2.19 Fisheries and aquaculture contribute about1.1 per cent to the overall GDP and about 5.3 percent to the GDP originating from agriculture andallied activities. The sector provides employment toover 14 million people. The annual export earningsfrom this sector amounted to Rs.7,620 crore in 2007-08 and is projected to increase to Rs.15,000 croreby the end of the Eleventh Plan. During 2008-09,this sector is expected to grow at a rate of 6.0 percent, providing some support to the overall growth.
II.2.20 India is the world’s second largest producerof food. The food processing industry ranks fifth insize in the country and contributes over 9.0 percent to the GDP and has also emerged as asignificant contributor to the country’s exports. TheIndian food processing sector, which mainlydepends on agriculture for its raw materials, hasbeen growing at an average rate of 13.5 per centper year and remains a potential driver of futureagricultural growth.
II.2.21 India made its entry into the biotechnologysector in 2002 with the Government approval of
commercial cultivation of Bt cotton. Since then, agri-biotechnology continues to be the fastest growingsegment among all biotechnology industries in thecountry. Besides, various efforts are being madein the direction of agro innovations that include theimported technique of hydrophonics- a soillesssystem of growing plants- which is being practisedin Gujarat for cultivating different varieties of exotichybrid tea, roses and strawberry. Research is alsoin progress on the production of transgenic rice andseveral genetically engineered vegetables. Indiabeing a major cashew producing country, use ofcashew apple as an alternative to food crops usedfor ethanol production is also being explored incoordination with United Nations Industr ialDevelopment Organisation (UNIDO).
Indian Agriculture amidst Global Crisis
II.2.22 As the global crisis deepened, it appearedto have impacted the world agriculture through thedemand channel, impinging on both consumptionas well as trade. Food prices, which remained atelevated levels from 2007 till mid-2008, moderatedsubsequently on account of the economicslowdown and the consequent subdued demandfor agricultural commodities, food, feed and fuel.Depressed global economic growth prospects mayalso have negative second round effects oninvestment and productivity in farm output. The

58
ANNUAL REPORT
financial crunch could lower availability of capitalat a time when accelerated investment in agricultureis urgently needed. While policy attention amidstthe financial crisis has generally shifted to othersectors, focused attention on agriculture and ruraldevelopment has been par t of the stimuluspackages designed in many countries, which aimat stepping up rural infrastructure expenditure inmany emerging economies such as China, Malaysiaand Indonesia and providing subsidised loans tofarmers in countries like Thailand and Vietnam.
II.2.23 In the Indian context, the crisis does notseem to have impacted the agricultural sector. Theoverall satisfactory precipitation during South-Westmonsoon season in 2008 and availability ofadequate food stocks have provided key cushionfor the farm sector. Besides, the agricultural alliedsector in India is also growing at a robust pace andcould be expected to impart some resilience andstability to overall growth. Furthermore, becauseof India’s mandated pr ior ity sector lending,institutional credit for agriculture remains unaffectedby the global credit squeeze. The farm loan waiverpackage implemented by the Government alsoworked like a forward looking stimulus, as a matterof coincidence, to insulate the farm sector from thefinancial crisis. The social sector programmes suchas National Rural Employment Guarantee Scheme(NREGS) could be expected to suppor t thelivelihood of the rural poor and the returning migrantworkers under the impact of the global crisis.
II.2.24 Through the trade channel, the globaleconomic slowdown may have some adverseimpact on the agriculture sector. India’s exportsfrom labour intensive sectors, including agriculturaland allied products, have registered deceleratedgrowth under the impact of global demandrecession, mainly in the developed regions, viz.,the US and the EU. However, the overall impactseems to be muted in the case of agriculture sectoras India’s exports of agriculture commoditiesaccount for only about 1.5 per cent of GDP.
II.2.25 The policy initiatives of the Governmentsuch as the Agricultural Debt Waiver scheme,together with enhanced outlays under various ruraldevelopment schemes such as NREGS, BharatNirman Programme, National Food Secur ityMission, Integrated Watershed ManagementProgramme of the National Rainfed Area Authority,Rural Infrastructure Development Fund (RIDF) andlarge increase in fertiliser and food subsidies implya larger transfer of purchasing power to the farmersand the rural sector, which could help in stimulatingrural demand and compensating for any fall in ruralincomes on account of deficit monsoons. Ruralspending in sectors like fast moving consumer goods(FMCG), telecom, education, health care and lifeinsurance are generally expected to remain strongin coming years and the Indian corporate sector isgradually recognising the potential for growth indemand in rural areas8. Given the rising backwardand forward linkages between farm and non-farmsectors, farm sector could be expected to supportthe rest of the economy during the current crisis.
Food Management
II.2.26 The procurement of foodgrains (rice andwheat) during 2008-09 was higher than that in thecorresponding period of the previous year largelydue to more than two-fold increase in wheatprocurement (Table 2.5). The off-take of foodgrains(rice and wheat) during 2008-09 was higher ascompared to corresponding period of the previousyear. With procurement remaining higher than off-take during 2008-09, the total stocks of foodgrainswith the Food Corporation of India (FCI) and otherGovernment agencies at end-March 2009registered an increase of nearly 80 per cent overthe previous year. Total foodgrain stock was placedat 51.0 million tonnes as on August 1, 2009. Thestocks of both rice and wheat are now higher thantheir buffer stock norms.
II.2.27 Despite effective food management, pricesof primary articles remained highly volatile during
8 Rural Marketing Association of India, McKinsey Global Institute.
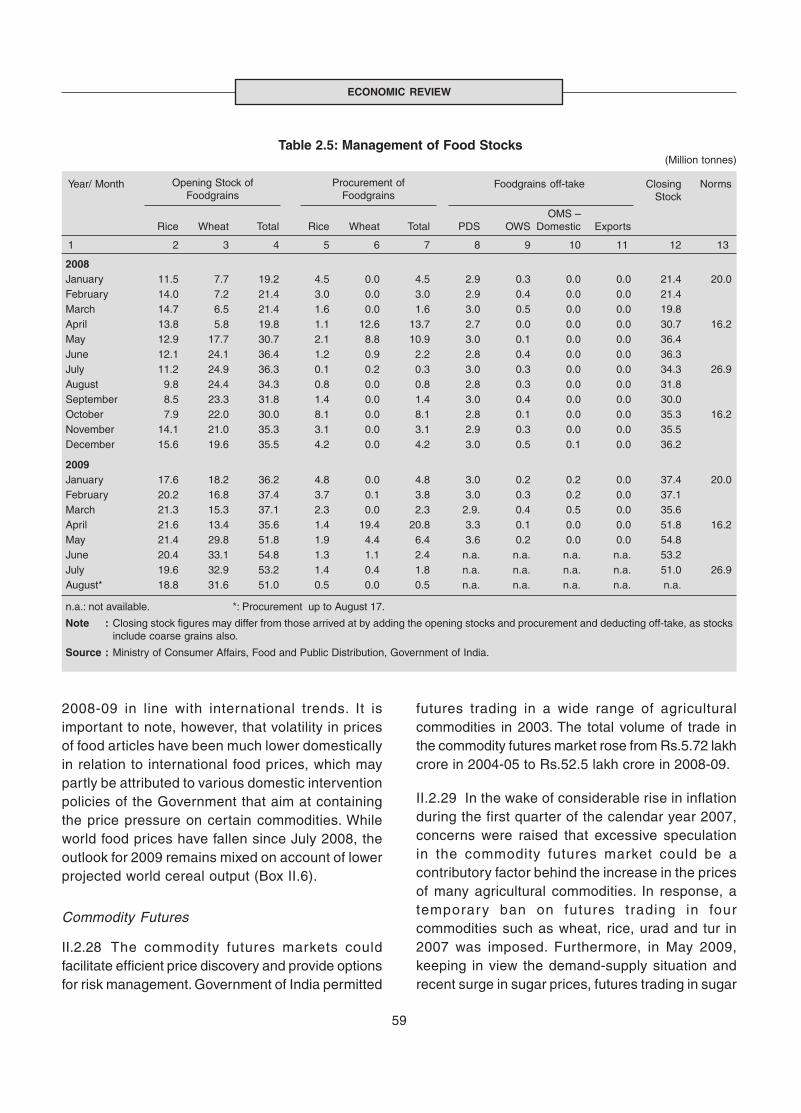
59
ECONOMIC REVIEW
Table 2.5: Management of Food Stocks (Million tonnes)
Year/ Month Closing Norms
OMS –
Stock
Rice Wheat Total Rice Wheat Total PDS OWS Domestic Exports
1 2 3 4 5 6 7 8 9 10 11 12 13
2008 January 11.5 7.7 19.2 4.5 0.0 4.5 2.9 0.3 0.0 0.0 21.4 20.0February 14.0 7.2 21.4 3.0 0.0 3.0 2.9 0.4 0.0 0.0 21.4March 14.7 6.5 21.4 1.6 0.0 1.6 3.0 0.5 0.0 0.0 19.8April 13.8 5.8 19.8 1.1 12.6 13.7 2.7 0.0 0.0 0.0 30.7 16.2May 12.9 17.7 30.7 2.1 8.8 10.9 3.0 0.1 0.0 0.0 36.4June 12.1 24.1 36.4 1.2 0.9 2.2 2.8 0.4 0.0 0.0 36.3July 11.2 24.9 36.3 0.1 0.2 0.3 3.0 0.3 0.0 0.0 34.3 26.9August 9.8 24.4 34.3 0.8 0.0 0.8 2.8 0.3 0.0 0.0 31.8September 8.5 23.3 31.8 1.4 0.0 1.4 3.0 0.4 0.0 0.0 30.0October 7.9 22.0 30.0 8.1 0.0 8.1 2.8 0.1 0.0 0.0 35.3 16.2November 14.1 21.0 35.3 3.1 0.0 3.1 2.9 0.3 0.0 0.0 35.5December 15.6 19.6 35.5 4.2 0.0 4.2 3.0 0.5 0.1 0.0 36.2
2009January 17.6 18.2 36.2 4.8 0.0 4.8 3.0 0.2 0.2 0.0 37.4 20.0February 20.2 16.8 37.4 3.7 0.1 3.8 3.0 0.3 0.2 0.0 37.1March 21.3 15.3 37.1 2.3 0.0 2.3 2.9. 0.4 0.5 0.0 35.6April 21.6 13.4 35.6 1.4 19.4 20.8 3.3 0.1 0.0 0.0 51.8 16.2May 21.4 29.8 51.8 1.9 4.4 6.4 3.6 0.2 0.0 0.0 54.8June 20.4 33.1 54.8 1.3 1.1 2.4 n.a. n.a. n.a. n.a. 53.2July 19.6 32.9 53.2 1.4 0.4 1.8 n.a. n.a. n.a. n.a. 51.0 26.9August* 18.8 31.6 51.0 0.5 0.0 0.5 n.a. n.a. n.a. n.a. n.a.
n.a.: not available. *: Procurement up to August 17.
Note : Closing stock figures may differ from those arrived at by adding the opening stocks and procurement and deducting off-take, as stocksinclude coarse grains also.
Source : Ministry of Consumer Affairs, Food and Public Distribution, Government of India.
Foodgrains off-takeOpening Stock ofFoodgrains
Procurement ofFoodgrains
2008-09 in line with international trends. It isimportant to note, however, that volatility in pricesof food articles have been much lower domesticallyin relation to international food prices, which maypartly be attributed to various domestic interventionpolicies of the Government that aim at containingthe price pressure on certain commodities. Whileworld food prices have fallen since July 2008, theoutlook for 2009 remains mixed on account of lowerprojected world cereal output (Box II.6).
Commodity Futures
II.2.28 The commodity futures markets couldfacilitate efficient price discovery and provide optionsfor risk management. Government of India permitted
futures trading in a wide range of agriculturalcommodities in 2003. The total volume of trade inthe commodity futures market rose from Rs.5.72 lakhcrore in 2004-05 to Rs.52.5 lakh crore in 2008-09.
II.2.29 In the wake of considerable rise in inflationduring the first quarter of the calendar year 2007,concerns were raised that excessive speculationin the commodity futures market could be acontributory factor behind the increase in the pricesof many agricultural commodities. In response, atemporary ban on futures trading in fourcommodities such as wheat, rice, urad and tur in2007 was imposed. Furthermore, in May 2009,keeping in view the demand-supply situation andrecent surge in sugar prices, futures trading in sugar
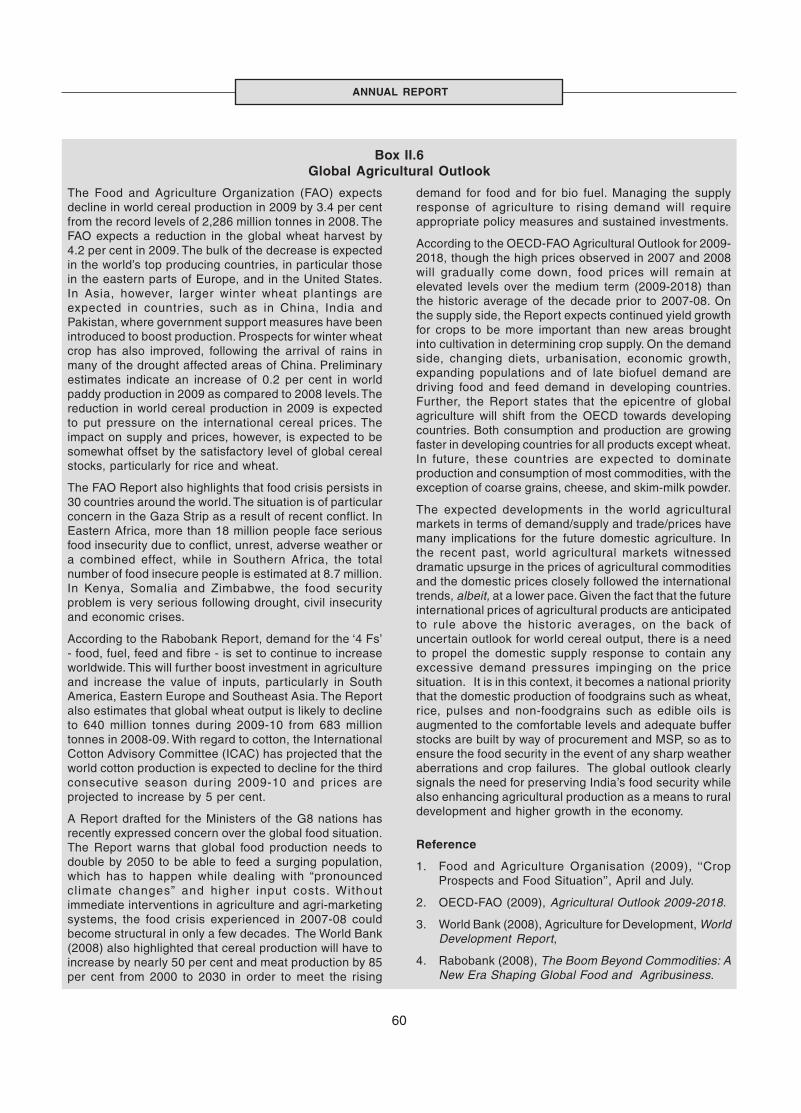
60
ANNUAL REPORT
The Food and Agriculture Organization (FAO) expectsdecline in world cereal production in 2009 by 3.4 per centfrom the record levels of 2,286 million tonnes in 2008. TheFAO expects a reduction in the global wheat harvest by4.2 per cent in 2009. The bulk of the decrease is expectedin the world’s top producing countries, in particular thosein the eastern parts of Europe, and in the United States.In Asia, however, larger winter wheat plantings areexpected in countr ies, such as in China, India andPakistan, where government support measures have beenintroduced to boost production. Prospects for winter wheatcrop has also improved, following the arrival of rains inmany of the drought affected areas of China. Preliminaryestimates indicate an increase of 0.2 per cent in worldpaddy production in 2009 as compared to 2008 levels. Thereduction in world cereal production in 2009 is expectedto put pressure on the international cereal prices. Theimpact on supply and prices, however, is expected to besomewhat offset by the satisfactory level of global cerealstocks, particularly for rice and wheat.
The FAO Report also highlights that food crisis persists in30 countries around the world. The situation is of particularconcern in the Gaza Strip as a result of recent conflict. InEastern Africa, more than 18 million people face seriousfood insecurity due to conflict, unrest, adverse weather ora combined effect, while in Southern Africa, the totalnumber of food insecure people is estimated at 8.7 million.In Kenya, Somalia and Zimbabwe, the food securityproblem is very serious following drought, civil insecurityand economic crises.
According to the Rabobank Report, demand for the ‘4 Fs’- food, fuel, feed and fibre - is set to continue to increaseworldwide. This will further boost investment in agricultureand increase the value of inputs, particularly in SouthAmerica, Eastern Europe and Southeast Asia. The Reportalso estimates that global wheat output is likely to declineto 640 million tonnes during 2009-10 from 683 milliontonnes in 2008-09. With regard to cotton, the InternationalCotton Advisory Committee (ICAC) has projected that theworld cotton production is expected to decline for the thirdconsecutive season during 2009-10 and prices areprojected to increase by 5 per cent.
A Report drafted for the Ministers of the G8 nations hasrecently expressed concern over the global food situation.The Report warns that global food production needs todouble by 2050 to be able to feed a surging population,which has to happen while dealing with “pronouncedclimate changes” and higher input costs. Withoutimmediate interventions in agriculture and agri-marketingsystems, the food crisis experienced in 2007-08 couldbecome structural in only a few decades. The World Bank(2008) also highlighted that cereal production will have toincrease by nearly 50 per cent and meat production by 85per cent from 2000 to 2030 in order to meet the rising
Box II.6Global Agricultural Outlook
demand for food and for bio fuel. Managing the supplyresponse of agriculture to rising demand will requireappropriate policy measures and sustained investments.
According to the OECD-FAO Agricultural Outlook for 2009-2018, though the high prices observed in 2007 and 2008will gradually come down, food prices will remain atelevated levels over the medium term (2009-2018) thanthe historic average of the decade prior to 2007-08. Onthe supply side, the Report expects continued yield growthfor crops to be more important than new areas broughtinto cultivation in determining crop supply. On the demandside, changing diets, urbanisation, economic growth,expanding populations and of late biofuel demand aredriving food and feed demand in developing countries.Further, the Report states that the epicentre of globalagriculture will shift from the OECD towards developingcountries. Both consumption and production are growingfaster in developing countries for all products except wheat.In future, these countries are expected to dominateproduction and consumption of most commodities, with theexception of coarse grains, cheese, and skim-milk powder.
The expected developments in the world agriculturalmarkets in terms of demand/supply and trade/prices havemany implications for the future domestic agriculture. Inthe recent past, world agricultural markets witnesseddramatic upsurge in the prices of agricultural commoditiesand the domestic prices closely followed the internationaltrends, albeit, at a lower pace. Given the fact that the futureinternational prices of agricultural products are anticipatedto rule above the historic averages, on the back ofuncertain outlook for world cereal output, there is a needto propel the domestic supply response to contain anyexcessive demand pressures impinging on the pricesituation. It is in this context, it becomes a national prioritythat the domestic production of foodgrains such as wheat,rice, pulses and non-foodgrains such as edible oils isaugmented to the comfortable levels and adequate bufferstocks are built by way of procurement and MSP, so as toensure the food security in the event of any sharp weatheraberrations and crop failures. The global outlook clearlysignals the need for preserving India’s food security whilealso enhancing agricultural production as a means to ruraldevelopment and higher growth in the economy.
Reference
1. Food and Agriculture Organisation (2009), ‘‘CropProspects and Food Situation’’, April and July.
2. OECD-FAO (2009), Agricultural Outlook 2009-2018.
3. World Bank (2008), Agriculture for Development, WorldDevelopment Report,
4. Rabobank (2008), The Boom Beyond Commodities: ANew Era Shaping Global Food and Agribusiness.
61
ECONOMIC REVIEW
was suspended till December 31, 2009. Earlier, theGovernment had also appointed a Committee(Chairman: Prof. Abhijit Sen) to study the impact, ifany, of futures trading on agricultural commodityprices. The Report of the Committee, noted thatthere was no clear evidence of futures tradinghaving either reduced or increased volatility of spotprices. Furthermore, the Committee gave wideranging recommendations such as enabling widerparticipation of farmers in the futures market;expediting reforms in agricultural marketing; anddesigning appropriate contracts to serve theobjective of risk management. The Committee alsonoted that for many commodities, the accelerationof domestic prices post introduction of commodityfutures has been from a depressed base andhence, cannot be attributed directly or solely tofutures trading.
II.2.30 The prices of agricultural commodities inIndia, after the introduction of futures, need to beseen in relation to a range of factors that affect suchprices, viz., domestic production, buffer stock levels,Government intervention in food markets throughprocurement policies and minimum support prices,agricultural commodities exports, international foodprices scenario and domestic supply and demanddynamics. The market regulator, i.e., the ForwardMarkets Commission, has also been monitoring thefutures prices of sensitive commodities. In order tocurb volatility and speculation in prices in the futuresmarket, margin requirements were imposed onsensitive commodities, as in the case of sugar,potato and soyabean during 2009.
Weather Insurance
II.2.31 The global climate change entails the riskof Indian agriculture being affected adversely in thelong-run due to heat, erratic weather, and reducedavailability of irrigation facilities. Imparting resilienceto agriculture in the face of climate change is achallenge which requires adopting climate-resilientcrop varieties and animal breeds as well as moreprudent management of crops, animals and naturalresources. One important option for managing risk
involves innovative weather insurance schemeslinked to climate data, together with better modelsfor predicting weather. Recent initiatives in thisdirection need to be carried forward (Box II.7).
Industrial Performance
II.2.32 The industrial production, which was on arobust growth trajectory during 2003-08, with anaverage growth of 8.7 per cent, witnessed asignificant moderation thereafter to 2.7 per cent in2008-09, on the back of heightened uncertainty andweak domestic and external demand (Table 2.6).The moderation in growth (year-on-year) that beganin the first quarter of 2007-08, turned out to be oneof the longest spell in the recent past. The growthexperience of Indian industry since the mid-1990sreveals that there were three distinct phases ofslowdown, all coinciding with adverse globaldevelopments of one form or the other, althoughthe slowdown might not necessarily have beencaused entirely by global factors (Table 2.7).
II.2.33 The industrial slowdown during 1996-97and 2000-01 coincided with global economicdownturn, but domestic factors such as excesscapacity in some sectors, infrastructural bottlenecksin power, transport and communication, low levelsof productivity in the industry due to inability to reapeconomies of scale, outdated technology,restrictive labour laws and demand fluctuations insome cyclical industries such as cement, steel andautomobiles largely contributed to the slippage inindustrial growth. With the growing share of exportsin India’s GDP (from 13.0 per cent in 2000-01 to23.4 per cent in 2008-09 based on national incomestatistics published by CSO) and liberalisation ofthe capital account, the impact of globaldevelopments on Indian industry has becomesomewhat more pronounced over time. Owing tothe unprecedented scale of global uncertaintysurrounding the current crisis, the intensity of thecurrent growth slowdown in industrial productionseems to be higher. Growth in industrial output lostits momentum by the second half of 2008-09 inconjunction with a sharp fall in external demand.
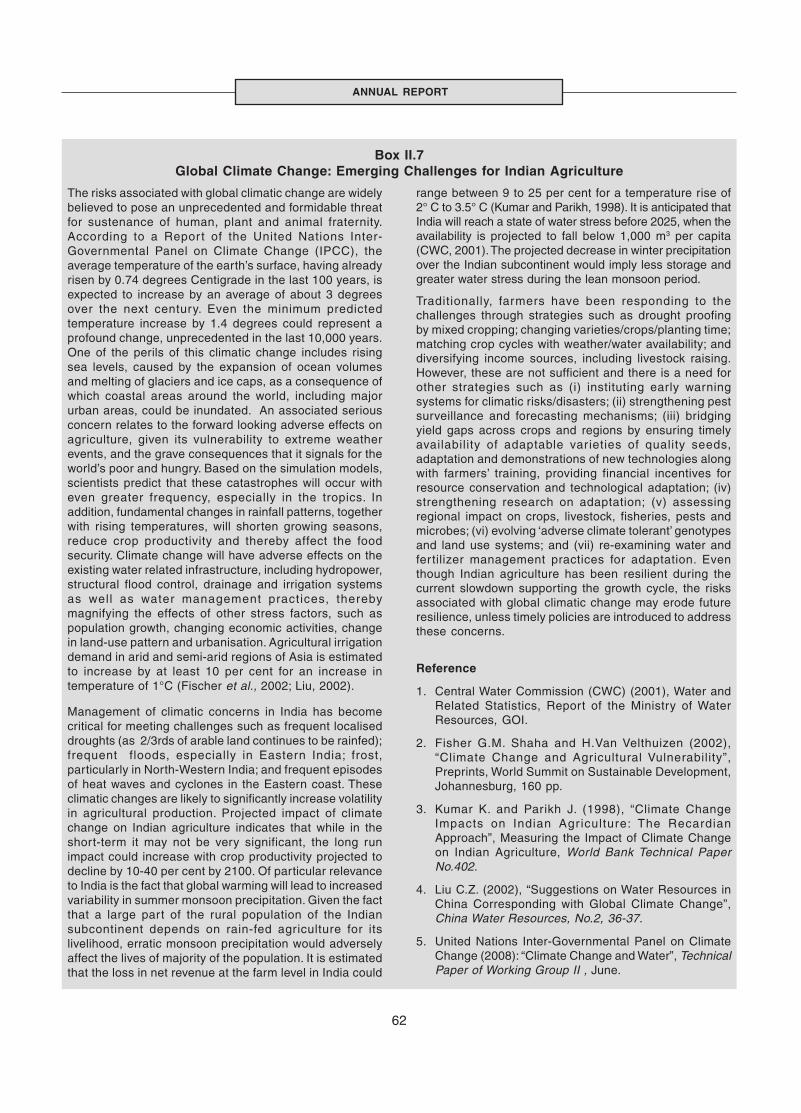
62
ANNUAL REPORT
The risks associated with global climatic change are widelybelieved to pose an unprecedented and formidable threatfor sustenance of human, plant and animal fraternity.According to a Repor t of the United Nations Inter-Governmental Panel on Climate Change (IPCC), theaverage temperature of the earth’s surface, having alreadyrisen by 0.74 degrees Centigrade in the last 100 years, isexpected to increase by an average of about 3 degreesover the next century. Even the minimum predictedtemperature increase by 1.4 degrees could represent aprofound change, unprecedented in the last 10,000 years.One of the perils of this climatic change includes risingsea levels, caused by the expansion of ocean volumesand melting of glaciers and ice caps, as a consequence ofwhich coastal areas around the world, including majorurban areas, could be inundated. An associated seriousconcern relates to the forward looking adverse effects onagriculture, given its vulnerability to extreme weatherevents, and the grave consequences that it signals for theworld’s poor and hungry. Based on the simulation models,scientists predict that these catastrophes will occur witheven greater frequency, especially in the tropics. Inaddition, fundamental changes in rainfall patterns, togetherwith rising temperatures, will shorten growing seasons,reduce crop productivity and thereby affect the foodsecurity. Climate change will have adverse effects on theexisting water related infrastructure, including hydropower,structural flood control, drainage and irrigation systemsas well as water management practices, therebymagnifying the effects of other stress factors, such aspopulation growth, changing economic activities, changein land-use pattern and urbanisation. Agricultural irrigationdemand in arid and semi-arid regions of Asia is estimatedto increase by at least 10 per cent for an increase intemperature of 1°C (Fischer et al., 2002; Liu, 2002).
Management of climatic concerns in India has becomecritical for meeting challenges such as frequent localiseddroughts (as 2/3rds of arable land continues to be rainfed);frequent floods, especially in Eastern India; frost,particularly in North-Western India; and frequent episodesof heat waves and cyclones in the Eastern coast. Theseclimatic changes are likely to significantly increase volatilityin agricultural production. Projected impact of climatechange on Indian agriculture indicates that while in theshort-term it may not be very significant, the long runimpact could increase with crop productivity projected todecline by 10-40 per cent by 2100. Of particular relevanceto India is the fact that global warming will lead to increasedvariability in summer monsoon precipitation. Given the factthat a large part of the rural population of the Indiansubcontinent depends on rain-fed agriculture for itslivelihood, erratic monsoon precipitation would adverselyaffect the lives of majority of the population. It is estimatedthat the loss in net revenue at the farm level in India could
Box II.7Global Climate Change: Emerging Challenges for Indian Agriculture
range between 9 to 25 per cent for a temperature rise of2° C to 3.5° C (Kumar and Parikh, 1998). It is anticipated thatIndia will reach a state of water stress before 2025, when theavailability is projected to fall below 1,000 m3 per capita(CWC, 2001). The projected decrease in winter precipitationover the Indian subcontinent would imply less storage andgreater water stress during the lean monsoon period.
Traditionally, farmers have been responding to thechallenges through strategies such as drought proofingby mixed cropping; changing varieties/crops/planting time;matching crop cycles with weather/water availability; anddiversifying income sources, including livestock raising.However, these are not sufficient and there is a need forother strategies such as (i) instituting early warningsystems for climatic risks/disasters; (ii) strengthening pestsurveillance and forecasting mechanisms; (iii) bridgingyield gaps across crops and regions by ensuring timelyavailability of adaptable varieties of quality seeds,adaptation and demonstrations of new technologies alongwith farmers’ training, providing financial incentives forresource conservation and technological adaptation; (iv)strengthening research on adaptation; (v) assessingregional impact on crops, livestock, fisheries, pests andmicrobes; (vi) evolving ‘adverse climate tolerant’ genotypesand land use systems; and (vii) re-examining water andfertilizer management practices for adaptation. Eventhough Indian agriculture has been resilient during thecurrent slowdown supporting the growth cycle, the risksassociated with global climatic change may erode futureresilience, unless timely policies are introduced to addressthese concerns.
Reference
1. Central Water Commission (CWC) (2001), Water andRelated Statistics, Report of the Ministry of WaterResources, GOI.
2. Fisher G.M. Shaha and H.Van Velthuizen (2002),“Climate Change and Agricultural Vulnerability”,Preprints, World Summit on Sustainable Development,Johannesburg, 160 pp.
3. Kumar K. and Parikh J. (1998), “Climate ChangeImpacts on Indian Agr iculture: The RecardianApproach”, Measuring the Impact of Climate Changeon Indian Agriculture, World Bank Technical PaperNo.402.
4. Liu C.Z. (2002), “Suggestions on Water Resources inChina Corresponding with Global Climate Change”,China Water Resources, No.2, 36-37.
5. United Nations Inter-Governmental Panel on ClimateChange (2008): “Climate Change and Water”, TechnicalPaper of Working Group II , June.

63
ECONOMIC REVIEW
Table 2.6: Growth Performance of Industrial Sector based on Index of Industrial Production (IIP)(Per cent)
Month/year Mining & Quarrying Manufacturing Electricity General
2007-08 2008-09 2007-08 2008-09 2007-08 2008-09 2007-08 2008-09
1 2 3 4 5 6 7 8 9
April 2.6 6.1 12.4 6.7 8.7 1.4 11.3 6.2
May 3.8 5.5 11.3 4.5 9.4 2.0 10.6 4.4
June 1.5 0.1 9.7 6.1 6.8 2.6 8.9 5.4
July 3.2 2.8 8.8 6.9 7.5 4.5 8.3 6.4
August 14.7 2.8 10.7 1.7 9.2 0.8 10.9 1.7
September 4.9 5.8 7.4 6.2 4.5 4.4 7.0 6.0
October 5.1 3.2 13.8 -0.6 4.2 4.4 12.2 0.1
November 6.3 0.7 4.7 2.7 5.8 2.6 4.9 2.5
December 5.0 2.2 8.6 -0.6 3.8 1.6 8.0 -0.2
January 2.9 0.7 6.7 1.0 3.7 1.8 6.2 1.0
February 7.9 -0.2 9.6 0.2 9.8 0.7 9.5 0.2
March 4.9 1.9 5.7 -0.3 3.7 6.3 5.5 0.3
April-March 5.1 2.6 9.0 2.7 6.3 2.8 8.5 2.7
Source: Central Statistical Organisation, Government of India.
Table 2.7: Phases of Slowdown in Indian Industry
Beginning End Length
1 2 3 4
1996-97 1996-97: Q2 1997-98: Q1 4 quarters
2000-01 2000-01: Q2 2001-02: Q3 7 quarters
2007-08 2007-08: Q1 2008-09: Q4 8 quarters
The growth in Index of Industrial Production (IIP),which was at a monthly average rate of 5.0 per centin the first half 2008-09, decelerated sharply to 0.6per cent in the second half, with negative growthrates in December 2008. It has generally beenobserved that the onset of industrial slowdown inIndia coincides with the weakening of domesticdemand – investment demand in particular, whiledepressed external demand operating throughweak export and dampened business confidencehas amplified the industrial growth decelerationdur ing the current global cr isis. Empir icalrelationships provide some evidence that the IIPexhibits signif icant posit ive correlation withdomestic consumption demand, expor ts anddomestic capital formation, and inverse relationshipwith imports (signifying the fact that imports partlycompete with domestic substitutes).
II.2.34 A notable aspect of the deceleration in IIPgrowth during 2008-09 is that it was broad based,affecting all the three sectors, viz., mining,manufacturing and electricity. The deceleration wasrelatively sharp in the manufacturing sector(Appendix Table 6). The growth in mining sector alsodecelerated, mirroring the downtrend in the growthof crude petroleum and products, despite a sizeablegrowth in coal production. Electricity generationremained subdued throughout the year due toslowdown in power generation in both thermal andhydro-power plants, with nuclear power plantsshowing the sharpest decline during the year.
II.2.35 The manufactur ing sector, which hadpowered the industrial growth beginning in 2002-03, turned sluggish since 2007-08. Apart from thetrend in the headline industrial growth based onIIP, the behavioural pattern of the disaggregated17 two-digit manufacturing industries provide someinformation based on past trends about the groups,which exhibit early recovery, late recovery andrecovery with significant lag during the currentdownturn phase (Chart II.3).
II.2.36 The current slowdown is more broad-basedas fifteen out of 17 two-digit manufacturing industry
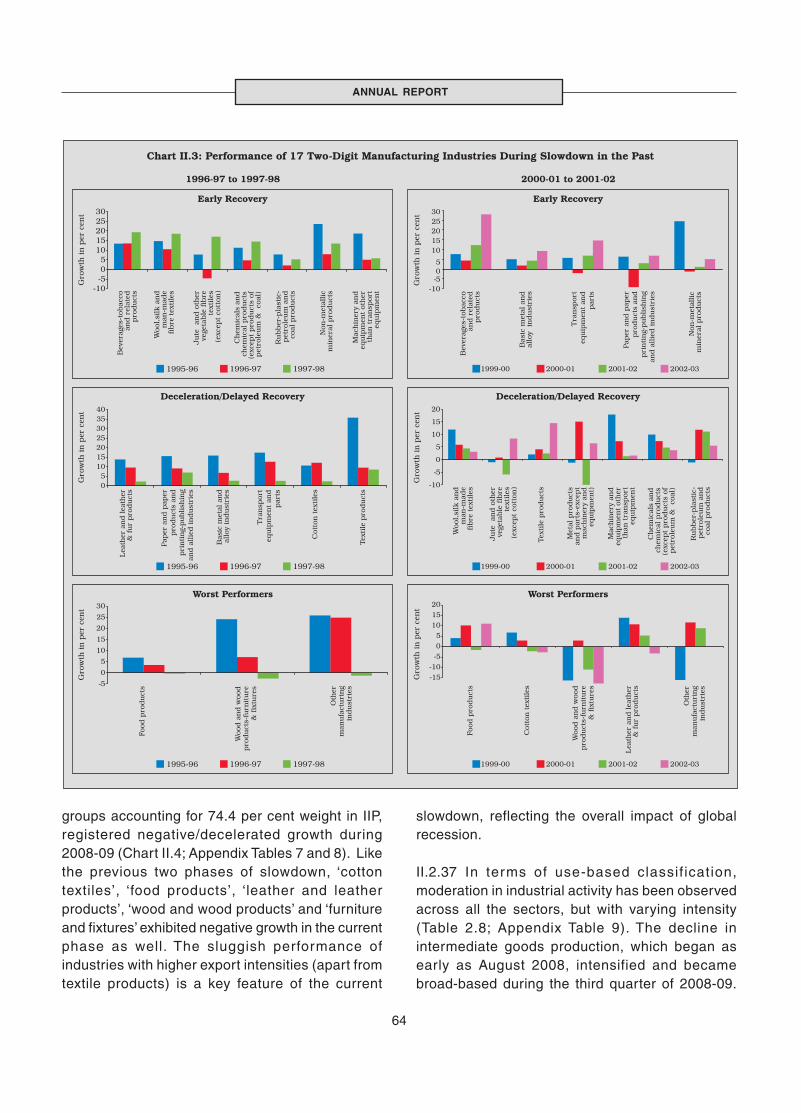
64
ANNUAL REPORT
groups accounting for 74.4 per cent weight in IIP,registered negative/decelerated growth during2008-09 (Chart II.4; Appendix Tables 7 and 8). Likethe previous two phases of slowdown, ‘cottontextiles’, ‘food products’, ‘leather and leatherproducts’, ‘wood and wood products’ and ‘furnitureand fixtures’ exhibited negative growth in the currentphase as well. The sluggish performance ofindustries with higher export intensities (apart fromtextile products) is a key feature of the current
slowdown, reflecting the overall impact of globalrecession.
II.2.37 In terms of use-based classif ication,moderation in industrial activity has been observedacross all the sectors, but with varying intensity(Table 2.8; Appendix Table 9). The decline inintermediate goods production, which began asearly as August 2008, intensified and becamebroad-based during the third quarter of 2008-09.

65
ECONOMIC REVIEW
Table 2.8: Index of Industrial Production: Sectoraland Use-based Classification of Industries
(Per cent)
Industry Group Growth Rate WeightedContribution
2007-08 2008-09 2007-08 2008-09
Sectoral Classification Mining 5.1 2.6 4.2 6.3Manufacturing 9.0 2.6 89.5 85.3Electricity 6.3 2.8 6.3 8.3
Use-Based ClassificationBasic Goods 7.0 2.6 24.8 32.2Capital Goods 18.0 7.3 25.1 38.2Intermediate Goods 8.9 -1.9 27.5 -31.6Consumer Goods (a+b) 6.1 4.7 23.0 59.1a) Consumer Durables -1.0 4.5 -1.0 14.3b) Consumer Non-durables 8.5 4.8 24.1 44.7General 8.5 2.7 100 100
Source: Central Statistical Organisation.
Overall, the sector posted negative year-on-yeargrowth in seven out of the twelve months. Therewas a perceptible decline in growth in sectorsproducing intermediate inputs for the expor toriented industries. Similarly, the slump in thedomestic automobile industry impinged on theperformance of 'auto ancillary and parts' as wellas ‘metal products and par ts industry’. The
deceleration in the construction industry impactedheavily on the production of non-metallic mineralinputs such as ceramic tiles, stone chips/polishedgranite and cement sheets.
II.2.38 Basic goods started losing momentum inthe second half of the year. Deceleration inelectricity, negative growth in basic chemicals andchemical products, nitrogenous and phosphaticfertilisers, rubber, plastic, petroleum, coal andaluminium products led to lower growth in basicgoods. The moderation in the capital goods sectorwas spread across ‘machinery and equipment’,' texti le machinery', ' refr igerators and aircondit ioning', 'machine tools', 'air and gascompressors' and ‘transport equipment and parts’,manifesting slowdown in the investment demand.Consumer goods sector experienced a relativelymoderate deceleration, reflecting slackening of theoverall pr ivate consumption demand in theeconomy. The slowdown in consumer goodsindustry emanated primarily from the decline inconsumer non-durables. Consumer durable,however, performed better during 2008-09 than ayear ago, albeit, with high inter-month volatility(Table 2.9). These gains in consumer durables maybe partly attributed to sustained rural demandarising from good harvests in the last three yearsand agriculture debt waiver.
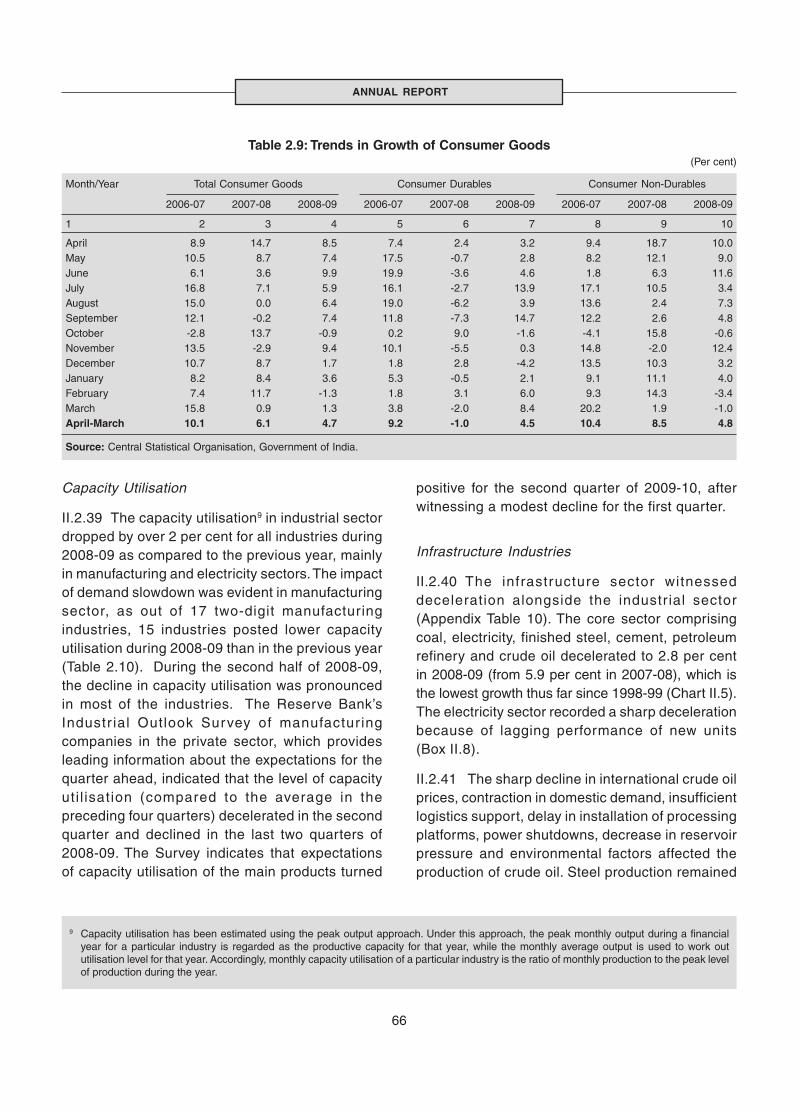
66
ANNUAL REPORT
Capacity Utilisation
II.2.39 The capacity utilisation9 in industrial sectordropped by over 2 per cent for all industries during2008-09 as compared to the previous year, mainlyin manufacturing and electricity sectors. The impactof demand slowdown was evident in manufacturingsector, as out of 17 two-digit manufacturingindustries, 15 industries posted lower capacityutilisation during 2008-09 than in the previous year(Table 2.10). During the second half of 2008-09,the decline in capacity utilisation was pronouncedin most of the industries. The Reserve Bank’sIndustr ial Outlook Survey of manufactur ingcompanies in the private sector, which providesleading information about the expectations for thequarter ahead, indicated that the level of capacityuti l isation (compared to the average in thepreceding four quarters) decelerated in the secondquarter and declined in the last two quarters of2008-09. The Survey indicates that expectationsof capacity utilisation of the main products turned
positive for the second quarter of 2009-10, afterwitnessing a modest decline for the first quarter.
Infrastructure Industries
II.2.40 The infrastructure sector witnesseddeceleration alongside the industr ial sector(Appendix Table 10). The core sector comprisingcoal, electricity, finished steel, cement, petroleumrefinery and crude oil decelerated to 2.8 per centin 2008-09 (from 5.9 per cent in 2007-08), which isthe lowest growth thus far since 1998-99 (Chart II.5).The electricity sector recorded a sharp decelerationbecause of lagging performance of new units(Box II.8).
II.2.41 The sharp decline in international crude oilprices, contraction in domestic demand, insufficientlogistics support, delay in installation of processingplatforms, power shutdowns, decrease in reservoirpressure and environmental factors affected theproduction of crude oil. Steel production remained
Table 2.9: Trends in Growth of Consumer Goods(Per cent)
Month/Year Total Consumer Goods Consumer Durables Consumer Non-Durables
2006-07 2007-08 2008-09 2006-07 2007-08 2008-09 2006-07 2007-08 2008-09
1 2 3 4 5 6 7 8 9 10
April 8.9 14.7 8.5 7.4 2.4 3.2 9.4 18.7 10.0May 10.5 8.7 7.4 17.5 -0.7 2.8 8.2 12.1 9.0June 6.1 3.6 9.9 19.9 -3.6 4.6 1.8 6.3 11.6July 16.8 7.1 5.9 16.1 -2.7 13.9 17.1 10.5 3.4August 15.0 0.0 6.4 19.0 -6.2 3.9 13.6 2.4 7.3September 12.1 -0.2 7.4 11.8 -7.3 14.7 12.2 2.6 4.8October -2.8 13.7 -0.9 0.2 9.0 -1.6 -4.1 15.8 -0.6November 13.5 -2.9 9.4 10.1 -5.5 0.3 14.8 -2.0 12.4December 10.7 8.7 1.7 1.8 2.8 -4.2 13.5 10.3 3.2January 8.2 8.4 3.6 5.3 -0.5 2.1 9.1 11.1 4.0February 7.4 11.7 -1.3 1.8 3.1 6.0 9.3 14.3 -3.4March 15.8 0.9 1.3 3.8 -2.0 8.4 20.2 1.9 -1.0April-March 10.1 6.1 4.7 9.2 -1.0 4.5 10.4 8.5 4.8
Source: Central Statistical Organisation, Government of India.
9 Capacity utilisation has been estimated using the peak output approach. Under this approach, the peak monthly output during a financialyear for a particular industry is regarded as the productive capacity for that year, while the monthly average output is used to work oututilisation level for that year. Accordingly, monthly capacity utilisation of a particular industry is the ratio of monthly production to the peak levelof production during the year.
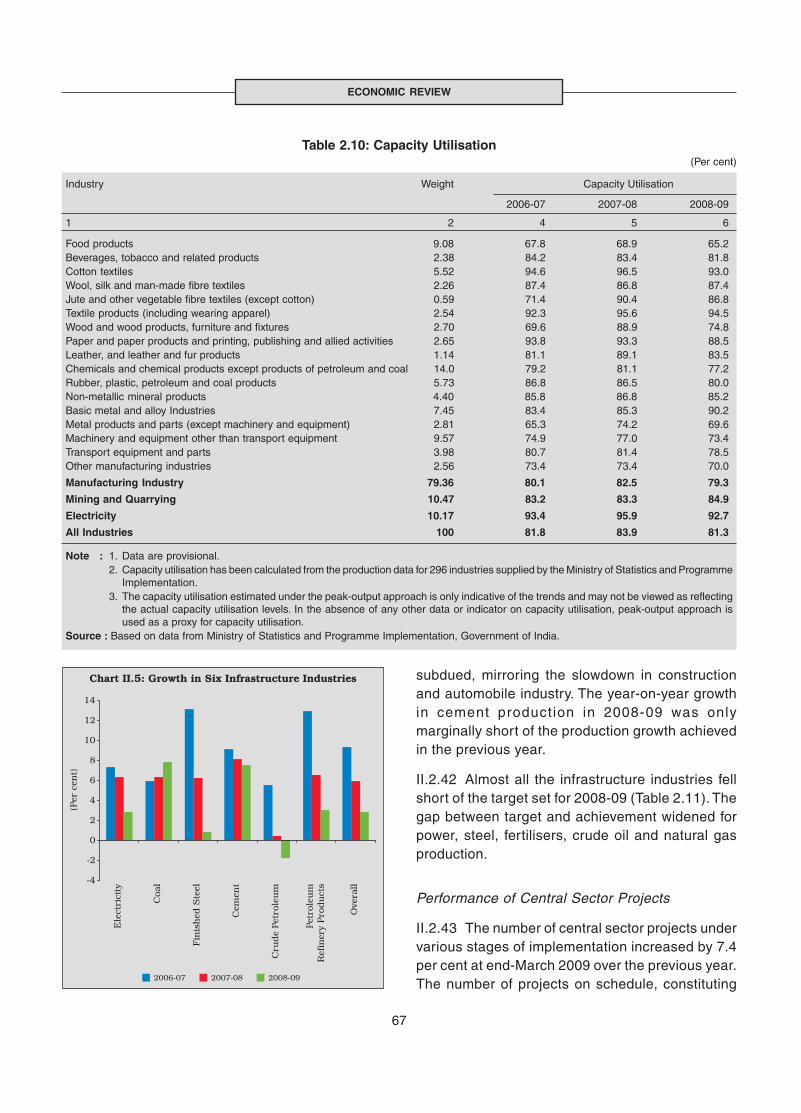
67
ECONOMIC REVIEW
subdued, mirroring the slowdown in constructionand automobile industry. The year-on-year growthin cement production in 2008-09 was onlymarginally short of the production growth achievedin the previous year.
II.2.42 Almost all the infrastructure industries fellshort of the target set for 2008-09 (Table 2.11). Thegap between target and achievement widened forpower, steel, fertilisers, crude oil and natural gasproduction.
Performance of Central Sector Projects
II.2.43 The number of central sector projects undervarious stages of implementation increased by 7.4per cent at end-March 2009 over the previous year.The number of projects on schedule, constituting
Table 2.10: Capacity Utilisation(Per cent)
Industry Weight Capacity Utilisation
2006-07 2007-08 2008-09
1 2 4 5 6
Food products 9.08 67.8 68.9 65.2Beverages, tobacco and related products 2.38 84.2 83.4 81.8Cotton textiles 5.52 94.6 96.5 93.0Wool, silk and man-made fibre textiles 2.26 87.4 86.8 87.4Jute and other vegetable fibre textiles (except cotton) 0.59 71.4 90.4 86.8Textile products (including wearing apparel) 2.54 92.3 95.6 94.5Wood and wood products, furniture and fixtures 2.70 69.6 88.9 74.8Paper and paper products and printing, publishing and allied activities 2.65 93.8 93.3 88.5Leather, and leather and fur products 1.14 81.1 89.1 83.5Chemicals and chemical products except products of petroleum and coal 14.0 79.2 81.1 77.2Rubber, plastic, petroleum and coal products 5.73 86.8 86.5 80.0Non-metallic mineral products 4.40 85.8 86.8 85.2Basic metal and alloy Industries 7.45 83.4 85.3 90.2Metal products and parts (except machinery and equipment) 2.81 65.3 74.2 69.6Machinery and equipment other than transport equipment 9.57 74.9 77.0 73.4Transport equipment and parts 3.98 80.7 81.4 78.5Other manufacturing industries 2.56 73.4 73.4 70.0
Manufacturing Industry 79.36 80.1 82.5 79.3
Mining and Quarrying 10.47 83.2 83.3 84.9
Electricity 10.17 93.4 95.9 92.7
All Industries 100 81.8 83.9 81.3
Note : 1. Data are provisional.2. Capacity utilisation has been calculated from the production data for 296 industries supplied by the Ministry of Statistics and Programme
Implementation.3. The capacity utilisation estimated under the peak-output approach is only indicative of the trends and may not be viewed as reflecting
the actual capacity utilisation levels. In the absence of any other data or indicator on capacity utilisation, peak-output approach isused as a proxy for capacity utilisation.
Source : Based on data from Ministry of Statistics and Programme Implementation, Government of India.

68
ANNUAL REPORT
The Indian electricity sector has exhibited significantproduction and efficiency gains in the post-reforms period.The installed generation capacity has more than doubledto 1,47,965 MW as at end-March 2009 (from 71,750 MWas at end-March 1990). Electricity generation by powerutilities has increased by over 150 per cent to 662 billionKWH in 2007-08 (from 264 billion KWH in 1990-91). Plantload factor, which is a powerful indicator of operationalefficiency in thermal power plants during excess demandhas increased from 53.8 in 1990 to 77.2 in 2006-07. Theefforts of the Government towards accelerating ruralelectrification have made access to electricity moreextensive and inclusive. According to the Central ElectricityAuthority, as at end-February 2009, 4,87,338 or 82.1 percent of the villages in India had access to electricity. Theannual per capita consumption of electricity in India hasalso grown overtime from 566.7 KWH in 2002-03 to 704.2KWH in 2007-08.
Despite notable progress, the electricity supply could notkeep pace with the rapid growth in demand in theeconomy. In terms of energy availability, the deficit inpower supply has expanded from 8.5 per cent in 1992 to12.0 per cent in 2008-09. The average growth rate inelectricity generation has, in fact, decelerated from 6.8 percent in the second half of 1990’s to 4.7 per cent sincethen (Chart A).
Box II.8 Performance of the Electricity Sector
Only 4.4 per cent of the targeted capacity was actuallyrealized in 2008-09.
Pr ivate investment in the power sector has beenconstrained by the presence of cer tain peculiarcharacteristics such as high cross subsidisation andconsequent low realisation of power cost and highaggregate transmission and commercial losses (AT&C).Total electricity subsidies amounted to Rs.42,607 croreduring 2007-08. In 2006-07, against a cost of supply ofRs.2.76 per unit, the realisation was only Rs.2.27 per unitincluding agriculture. Realisation from the agriculturesector alone was as low as Rs.0.71 per unit.
Despite central schemes like Accelerated Power Reformsand Development Programme introduced in 2000, AT&Closses have exhibited downward rigidity primarily due toinadequate metering, power theft and low collectionefficiency. In order to increase competition and improveaccess to power, reforms need to be accelerated with afocus on development of ultra mega power projects andmerchant power plants, private sector participation in hydropower development, power trading, operationalisation ofopen access in inter-state transmission and adoption ofinformation technology in the areas of energy accountingto improve the efficiency of transmission and distributionof power.
Reference
1. Central Electricity Authority (2009), Highlights of theSector.
2. Central Electricity Authority (2008), Highlights of theSector.
3. Central Electr icity Author ity (2008), Electr icityGeneration Review, April-January.
4. Government of India (2009), Economic Survey –2008-09.
The increasing supply constraints could be attributed toinadequate capacity additions, high aggregate andtransmission losses, poor inter-regional transmissionlinks and fuel supply bottlenecks. Shortfall in capacityadditions in generation has been acute in the thermalsegment for the past three years (Chart B). While 66.4per cent of the targeted capacity was added during theTenth plan, during the first two years of the EleventhPlan (2007-08 and 2008-09), a meagre 16.2 per cent ofthe targeted capacity addition (78,700 MW) was achieved.
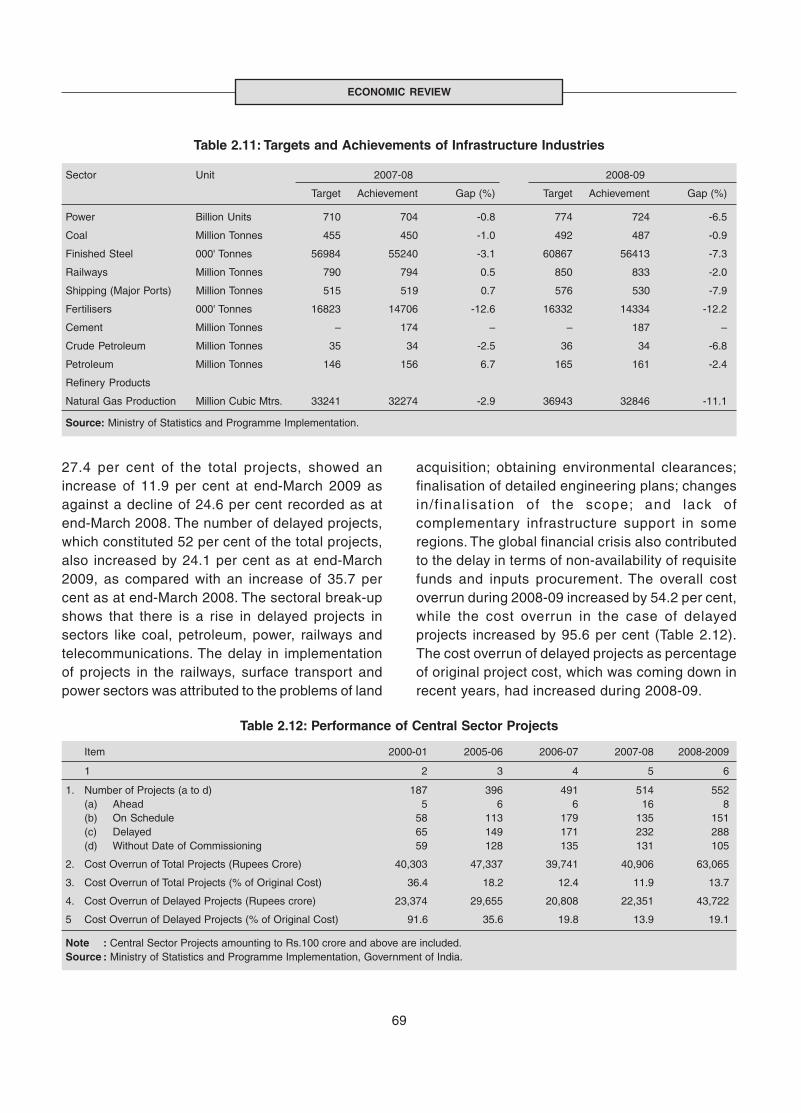
69
ECONOMIC REVIEW
27.4 per cent of the total projects, showed anincrease of 11.9 per cent at end-March 2009 asagainst a decline of 24.6 per cent recorded as atend-March 2008. The number of delayed projects,which constituted 52 per cent of the total projects,also increased by 24.1 per cent as at end-March2009, as compared with an increase of 35.7 percent as at end-March 2008. The sectoral break-upshows that there is a rise in delayed projects insectors like coal, petroleum, power, railways andtelecommunications. The delay in implementationof projects in the railways, surface transport andpower sectors was attributed to the problems of land
acquisition; obtaining environmental clearances;finalisation of detailed engineering plans; changesin/f inal isation of the scope; and lack ofcomplementary infrastructure support in someregions. The global financial crisis also contributedto the delay in terms of non-availability of requisitefunds and inputs procurement. The overall costoverrun during 2008-09 increased by 54.2 per cent,while the cost overrun in the case of delayedprojects increased by 95.6 per cent (Table 2.12).The cost overrun of delayed projects as percentageof original project cost, which was coming down inrecent years, had increased during 2008-09.
Table 2.11: Targets and Achievements of Infrastructure Industries
Sector Unit 2007-08 2008-09
Target Achievement Gap (%) Target Achievement Gap (%)
Power Billion Units 710 704 -0.8 774 724 -6.5
Coal Million Tonnes 455 450 -1.0 492 487 -0.9
Finished Steel 000' Tonnes 56984 55240 -3.1 60867 56413 -7.3
Railways Million Tonnes 790 794 0.5 850 833 -2.0
Shipping (Major Ports) Million Tonnes 515 519 0.7 576 530 -7.9
Fertilisers 000' Tonnes 16823 14706 -12.6 16332 14334 -12.2
Cement Million Tonnes – 174 – – 187 –
Crude Petroleum Million Tonnes 35 34 -2.5 36 34 -6.8
Petroleum Million Tonnes 146 156 6.7 165 161 -2.4
Refinery Products
Natural Gas Production Million Cubic Mtrs. 33241 32274 -2.9 36943 32846 -11.1
Source: Ministry of Statistics and Programme Implementation.
Table 2.12: Performance of Central Sector Projects
Item 2000-01 2005-06 2006-07 2007-08 2008-2009
1 2 3 4 5 6
1. Number of Projects (a to d) 187 396 491 514 552(a) Ahead 5 6 6 16 8(b) On Schedule 58 113 179 135 151(c) Delayed 65 149 171 232 288(d) Without Date of Commissioning 59 128 135 131 105
2. Cost Overrun of Total Projects (Rupees Crore) 40,303 47,337 39,741 40,906 63,065
3. Cost Overrun of Total Projects (% of Original Cost) 36.4 18.2 12.4 11.9 13.7
4. Cost Overrun of Delayed Projects (Rupees crore) 23,374 29,655 20,808 22,351 43,722
5 Cost Overrun of Delayed Projects (% of Original Cost) 91.6 35.6 19.8 13.9 19.1
Note : Central Sector Projects amounting to Rs.100 crore and above are included.Source : Ministry of Statistics and Programme Implementation, Government of India.
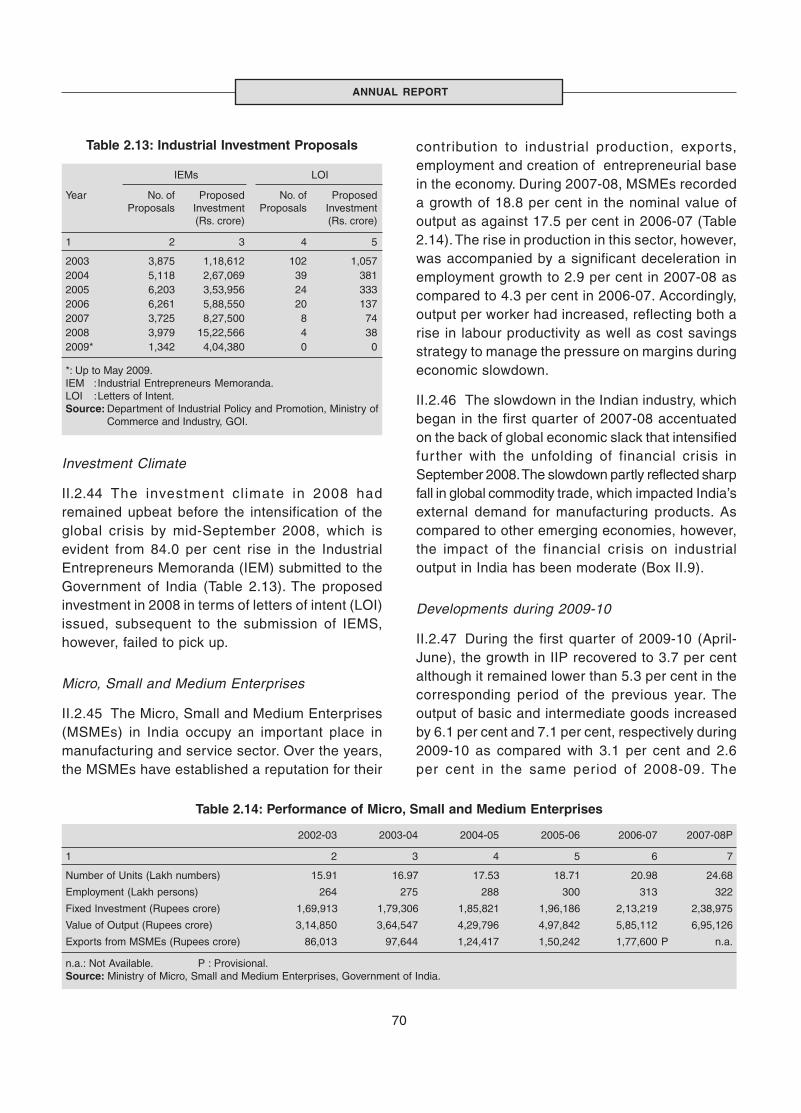
70
ANNUAL REPORT
Table 2.13: Industrial Investment Proposals
IEMs LOI
Year No. of Proposed No. of ProposedProposals Investment Proposals Investment
(Rs. crore) (Rs. crore)
1 2 3 4 5
2003 3,875 1,18,612 102 1,0572004 5,118 2,67,069 39 3812005 6,203 3,53,956 24 3332006 6,261 5,88,550 20 1372007 3,725 8,27,500 8 742008 3,979 15,22,566 4 382009* 1,342 4,04,380 0 0
*: Up to May 2009.IEM :Industrial Entrepreneurs Memoranda.LOI :Letters of Intent.Source: Department of Industrial Policy and Promotion, Ministry of
Commerce and Industry, GOI.
Table 2.14: Performance of Micro, Small and Medium Enterprises
2002-03 2003-04 2004-05 2005-06 2006-07 2007-08P
1 2 3 4 5 6 7
Number of Units (Lakh numbers) 15.91 16.97 17.53 18.71 20.98 24.68
Employment (Lakh persons) 264 275 288 300 313 322
Fixed Investment (Rupees crore) 1,69,913 1,79,306 1,85,821 1,96,186 2,13,219 2,38,975
Value of Output (Rupees crore) 3,14,850 3,64,547 4,29,796 4,97,842 5,85,112 6,95,126
Exports from MSMEs (Rupees crore) 86,013 97,644 1,24,417 1,50,242 1,77,600 P n.a.
n.a.: Not Available. P : Provisional.Source: Ministry of Micro, Small and Medium Enterprises, Government of India.
contribution to industrial production, exports,employment and creation of entrepreneurial basein the economy. During 2007-08, MSMEs recordeda growth of 18.8 per cent in the nominal value ofoutput as against 17.5 per cent in 2006-07 (Table2.14). The rise in production in this sector, however,was accompanied by a significant deceleration inemployment growth to 2.9 per cent in 2007-08 ascompared to 4.3 per cent in 2006-07. Accordingly,output per worker had increased, reflecting both arise in labour productivity as well as cost savingsstrategy to manage the pressure on margins duringeconomic slowdown.
II.2.46 The slowdown in the Indian industry, whichbegan in the first quarter of 2007-08 accentuatedon the back of global economic slack that intensifiedfur ther with the unfolding of financial crisis inSeptember 2008. The slowdown partly reflected sharpfall in global commodity trade, which impacted India’sexternal demand for manufacturing products. Ascompared to other emerging economies, however,the impact of the financial crisis on industrialoutput in India has been moderate (Box II.9).
Developments during 2009-10
II.2.47 During the first quarter of 2009-10 (April-June), the growth in IIP recovered to 3.7 per centalthough it remained lower than 5.3 per cent in thecorresponding period of the previous year. Theoutput of basic and intermediate goods increasedby 6.1 per cent and 7.1 per cent, respectively during2009-10 as compared with 3.1 per cent and 2.6per cent in the same period of 2008-09. The
Investment Climate
II.2.44 The investment cl imate in 2008 hadremained upbeat before the intensification of theglobal crisis by mid-September 2008, which isevident from 84.0 per cent rise in the IndustrialEntrepreneurs Memoranda (IEM) submitted to theGovernment of India (Table 2.13). The proposedinvestment in 2008 in terms of letters of intent (LOI)issued, subsequent to the submission of IEMS,however, failed to pick up.
Micro, Small and Medium Enterprises
II.2.45 The Micro, Small and Medium Enterprises(MSMEs) in India occupy an important place inmanufacturing and service sector. Over the years,the MSMEs have established a reputation for their
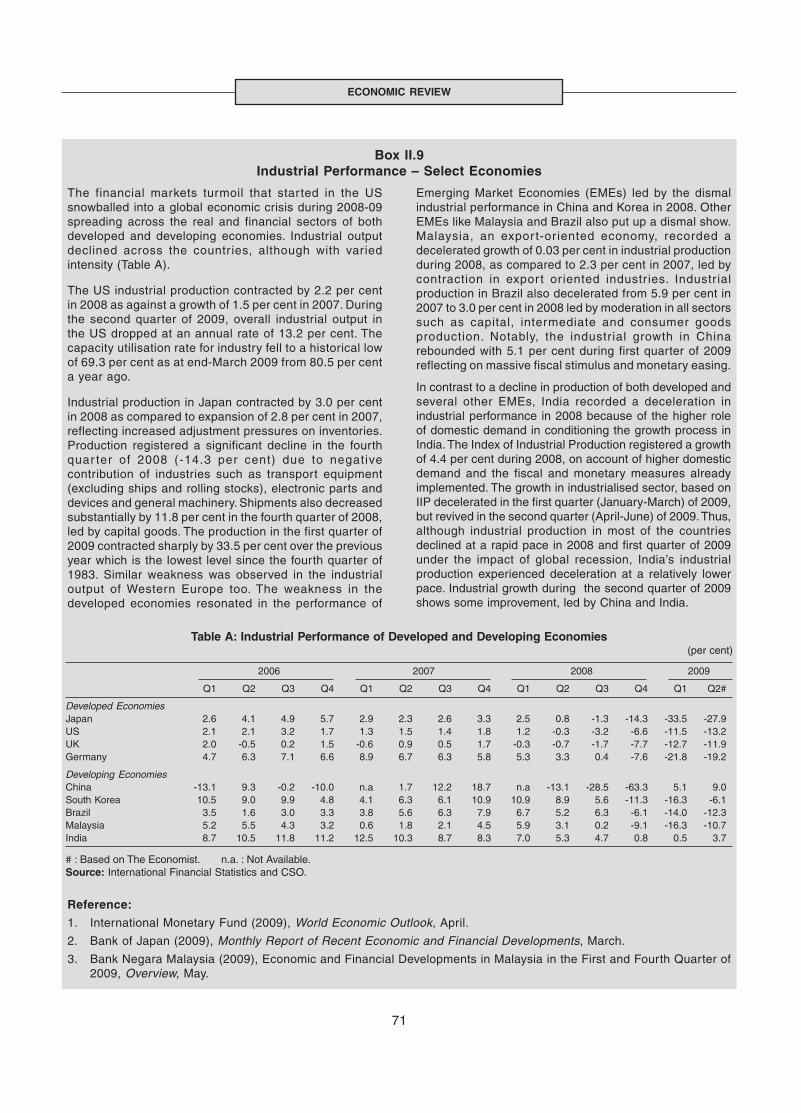
71
ECONOMIC REVIEW
The financial markets turmoil that started in the USsnowballed into a global economic crisis during 2008-09spreading across the real and financial sectors of bothdeveloped and developing economies. Industrial outputdeclined across the countr ies, although with variedintensity (Table A).
The US industrial production contracted by 2.2 per centin 2008 as against a growth of 1.5 per cent in 2007. Duringthe second quarter of 2009, overall industrial output inthe US dropped at an annual rate of 13.2 per cent. Thecapacity utilisation rate for industry fell to a historical lowof 69.3 per cent as at end-March 2009 from 80.5 per centa year ago.
Industrial production in Japan contracted by 3.0 per centin 2008 as compared to expansion of 2.8 per cent in 2007,reflecting increased adjustment pressures on inventories.Production registered a significant decline in the fourthquar ter of 2008 (-14.3 per cent) due to negativecontribution of industries such as transport equipment(excluding ships and rolling stocks), electronic parts anddevices and general machinery. Shipments also decreasedsubstantially by 11.8 per cent in the fourth quarter of 2008,led by capital goods. The production in the first quarter of2009 contracted sharply by 33.5 per cent over the previousyear which is the lowest level since the fourth quarter of1983. Similar weakness was observed in the industrialoutput of Western Europe too. The weakness in thedeveloped economies resonated in the performance of
Box II.9Industrial Performance – Select Economies
Emerging Market Economies (EMEs) led by the dismalindustrial performance in China and Korea in 2008. OtherEMEs like Malaysia and Brazil also put up a dismal show.Malaysia, an expor t-or iented economy, recorded adecelerated growth of 0.03 per cent in industrial productionduring 2008, as compared to 2.3 per cent in 2007, led bycontraction in expor t or iented industr ies. Industr ialproduction in Brazil also decelerated from 5.9 per cent in2007 to 3.0 per cent in 2008 led by moderation in all sectorssuch as capital, intermediate and consumer goodsproduction. Notably, the industr ial growth in Chinarebounded with 5.1 per cent during first quarter of 2009reflecting on massive fiscal stimulus and monetary easing.
In contrast to a decline in production of both developed andseveral other EMEs, India recorded a deceleration inindustrial performance in 2008 because of the higher roleof domestic demand in conditioning the growth process inIndia. The Index of Industrial Production registered a growthof 4.4 per cent during 2008, on account of higher domesticdemand and the fiscal and monetary measures alreadyimplemented. The growth in industrialised sector, based onIIP decelerated in the first quarter (January-March) of 2009,but revived in the second quarter (April-June) of 2009. Thus,although industrial production in most of the countriesdeclined at a rapid pace in 2008 and first quarter of 2009under the impact of global recession, India’s industrialproduction experienced deceleration at a relatively lowerpace. Industrial growth during the second quarter of 2009shows some improvement, led by China and India.
Table A: Industrial Performance of Developed and Developing Economies(per cent)
2006 2007 2008 2009
Q1 Q2 Q3 Q4 Q1 Q2 Q3 Q4 Q1 Q2 Q3 Q4 Q1 Q2#
Developed Economies Japan 2.6 4.1 4.9 5.7 2.9 2.3 2.6 3.3 2.5 0.8 -1.3 -14.3 -33.5 -27.9US 2.1 2.1 3.2 1.7 1.3 1.5 1.4 1.8 1.2 -0.3 -3.2 -6.6 -11.5 -13.2UK 2.0 -0.5 0.2 1.5 -0.6 0.9 0.5 1.7 -0.3 -0.7 -1.7 -7.7 -12.7 -11.9Germany 4.7 6.3 7.1 6.6 8.9 6.7 6.3 5.8 5.3 3.3 0.4 -7.6 -21.8 -19.2
Developing Economies China -13.1 9.3 -0.2 -10.0 n.a 1.7 12.2 18.7 n.a -13.1 -28.5 -63.3 5.1 9.0South Korea 10.5 9.0 9.9 4.8 4.1 6.3 6.1 10.9 10.9 8.9 5.6 -11.3 -16.3 -6.1Brazil 3.5 1.6 3.0 3.3 3.8 5.6 6.3 7.9 6.7 5.2 6.3 -6.1 -14.0 -12.3Malaysia 5.2 5.5 4.3 3.2 0.6 1.8 2.1 4.5 5.9 3.1 0.2 -9.1 -16.3 -10.7India 8.7 10.5 11.8 11.2 12.5 10.3 8.7 8.3 7.0 5.3 4.7 0.8 0.5 3.7
# : Based on The Economist. n.a. : Not Available.Source: International Financial Statistics and CSO.
Reference:
1. International Monetary Fund (2009), World Economic Outlook, April.
2. Bank of Japan (2009), Monthly Report of Recent Economic and Financial Developments, March.
3. Bank Negara Malaysia (2009), Economic and Financial Developments in Malaysia in the First and Fourth Quarter of2009, Overview, May.

72
ANNUAL REPORT
consumer goods output contracted by (-)0.1 percent during the first quarter of 2009-10 as comparedwith a growth of 8.6 per cent dur ing thecorresponding period of the previous year due tothe substantial decline in the production ofconsumer non-durables. The production ofconsumer durables increased by 15.0 per cent ascompared with 3.5 per cent a year ago. The capitalgoods production increased by 1.0 per cent in April-June 2009 as compared with 7.9 per cent growthin April-June 2008. The core infrastructure sectorrecorded a higher growth of 4.8 per cent duringApril-June 2009 as compared with 3.5 per cent inthe corresponding period of previous year. Variousleading indicators of industrial production, bothquantitative and qualitative, suggest that thedownturn has been arrested and a pick-up is onthe way forward.
Services Sector
II.2.48 The services sector, which made rapidstrides in growth in the Indian economy over thepast few years, witnessed moderate slowdown ingrowth during 2008-09, owing to the contagion fromthe global economic downturn. Historically, servicessector showed resilience during periods of overallgrowth slowdown in India since 1990-91. Thegrowth in services sector has remained consistentlyhigher than the overall growth in the economyexcept for two years. More impor tantly, ascompared with rest of the economy, the servicessector appears to have been less affected by theglobal financial crisis (Chart II.6).
II.2.49 The robust expansion in services outputsince 2004-05 has also been driven by servicesexports. While the direct contribution of global factorsto the services sector output in India came from step-up in external demand for Indian services, the indirectcontribution came through increasing globalisationand the resultant pressure on cost efficiency, whichexpanded the scope for outsourcing of businessprocesses, activities and knowledge. ReflectingIndia’s comparative advantage in the outsourcingmarket, the ratios of both gross and net servicesexports (service exports minus service imports) to
services sector GDP accelerated significantly since2004-05 with moderate decline in 2007-08 (Box II.10and Chart II.7).
II.2.50 According to the estimates released by theCSO, the growth in real GDP originating fromservices sector moderated to 9.4 per cent during2008-09 from 10.8 per cent in 2007-08. Whileservices sector’s share in GDP improved marginallyfrom 63.0 per cent in 2007-08 to 64.5 per cent during2008-09, its relative contribution to GDP growthincreased significantly from 74.1 per cent to 88.2per cent during the same period (Table 2.15).
II.2.51 The slowdown in global demand affectsoutput of services sector, especially in emergingeconomies like India, through various channels (BoxII.10). Moderation in the services sector growth during2008-09 was largely confined to construction, trade,hotels, transport and communication, financing,insurance, real estate and business services. Thesluggish condition in the real estate market,contraction in household disposable income andslowdown in project execution in the private sectoroperated as a drag on construction activities. Trade,hotels, transport and communication services wereaffected by global slowdown through reduced trafficrelated to business, commerce and tourism. In fact,the lower growth in commercial vehicles production,
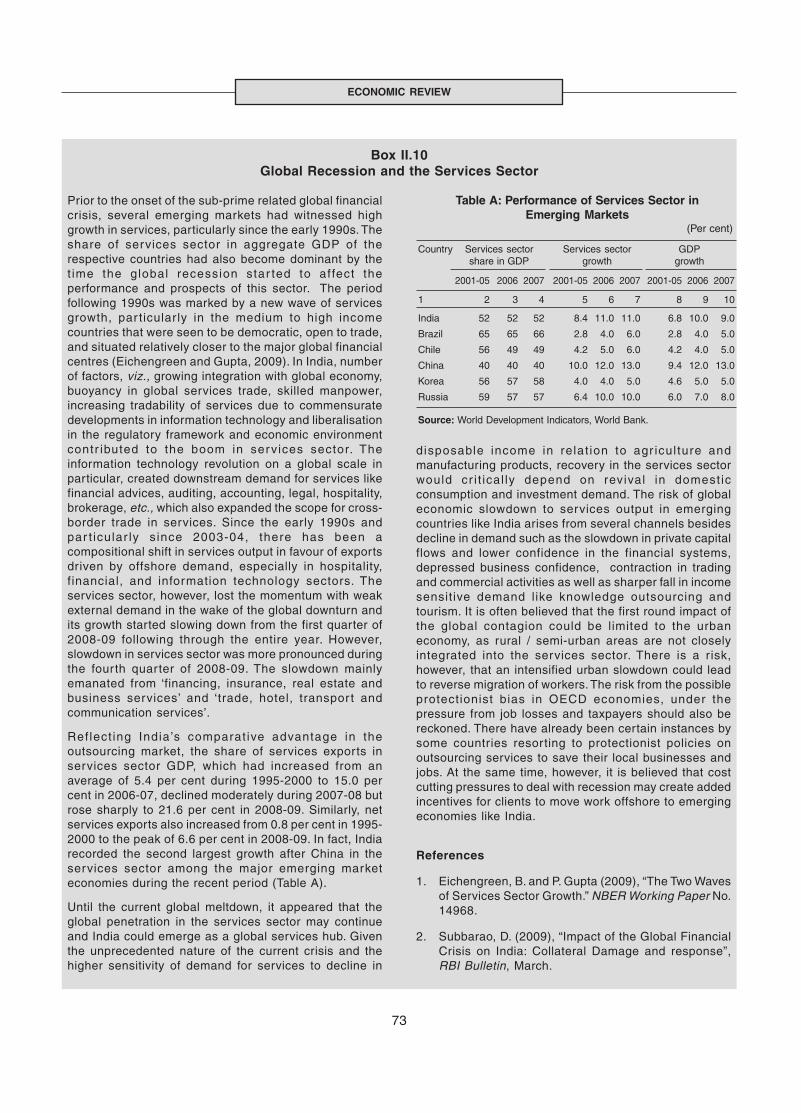
73
ECONOMIC REVIEW
Prior to the onset of the sub-prime related global financialcrisis, several emerging markets had witnessed highgrowth in services, particularly since the early 1990s. Theshare of services sector in aggregate GDP of therespective countries had also become dominant by thet ime the global recession star ted to affect theperformance and prospects of this sector. The periodfollowing 1990s was marked by a new wave of servicesgrowth, par ticularly in the medium to high incomecountries that were seen to be democratic, open to trade,and situated relatively closer to the major global financialcentres (Eichengreen and Gupta, 2009). In India, numberof factors, viz., growing integration with global economy,buoyancy in global services trade, skilled manpower,increasing tradability of services due to commensuratedevelopments in information technology and liberalisationin the regulatory framework and economic environmentcontr ibuted to the boom in services sector. Theinformation technology revolution on a global scale inparticular, created downstream demand for services likefinancial advices, auditing, accounting, legal, hospitality,brokerage, etc., which also expanded the scope for cross-border trade in services. Since the early 1990s andpar t icular ly since 2003-04, there has been acompositional shift in services output in favour of exportsdriven by offshore demand, especially in hospitality,financial, and information technology sectors. Theservices sector, however, lost the momentum with weakexternal demand in the wake of the global downturn andits growth started slowing down from the first quarter of2008-09 following through the entire year. However,slowdown in services sector was more pronounced duringthe fourth quarter of 2008-09. The slowdown mainlyemanated from ‘financing, insurance, real estate andbusiness services’ and ‘trade, hotel, transpor t andcommunication services’.
Ref lect ing India’s comparat ive advantage in theoutsourcing market, the share of services exports inservices sector GDP, which had increased from anaverage of 5.4 per cent during 1995-2000 to 15.0 percent in 2006-07, declined moderately during 2007-08 butrose sharply to 21.6 per cent in 2008-09. Similarly, netservices exports also increased from 0.8 per cent in 1995-2000 to the peak of 6.6 per cent in 2008-09. In fact, Indiarecorded the second largest growth after China in theservices sector among the major emerging marketeconomies during the recent period (Table A).
Until the current global meltdown, it appeared that theglobal penetration in the services sector may continueand India could emerge as a global services hub. Giventhe unprecedented nature of the current crisis and thehigher sensitivity of demand for services to decline in
Box II.10Global Recession and the Services Sector
disposable income in relat ion to agr icul ture andmanufacturing products, recovery in the services sectorwould cr i t ical ly depend on revival in domest icconsumption and investment demand. The risk of globaleconomic slowdown to services output in emergingcountries like India arises from several channels besidesdecline in demand such as the slowdown in private capitalflows and lower confidence in the financial systems,depressed business confidence, contraction in tradingand commercial activities as well as sharper fall in incomesensitive demand like knowledge outsourcing andtourism. It is often believed that the first round impact ofthe global contagion could be limited to the urbaneconomy, as rural / semi-urban areas are not closelyintegrated into the services sector. There is a risk,however, that an intensified urban slowdown could leadto reverse migration of workers. The risk from the possibleprotectionist bias in OECD economies, under thepressure from job losses and taxpayers should also bereckoned. There have already been certain instances bysome countries resorting to protectionist policies onoutsourcing services to save their local businesses andjobs. At the same time, however, it is believed that costcutting pressures to deal with recession may create addedincentives for clients to move work offshore to emergingeconomies like India.
References
1. Eichengreen, B. and P. Gupta (2009), “The Two Wavesof Services Sector Growth.” NBER Working Paper No.14968.
2. Subbarao, D. (2009), “Impact of the Global FinancialCrisis on India: Collateral Damage and response”,RBI Bulletin, March.
Table A: Performance of Services Sector inEmerging Markets
(Per cent)
Country Services sector Services sector GDPshare in GDP growth growth
2001-05 2006 2007 2001-05 2006 2007 2001-05 2006 2007
1 2 3 4 5 6 7 8 9 10
India 52 52 52 8.4 11.0 11.0 6.8 10.0 9.0
Brazil 65 65 66 2.8 4.0 6.0 2.8 4.0 5.0
Chile 56 49 49 4.2 5.0 6.0 4.2 4.0 5.0
China 40 40 40 10.0 12.0 13.0 9.4 12.0 13.0
Korea 56 57 58 4.0 4.0 5.0 4.6 5.0 5.0
Russia 59 57 57 6.4 10.0 10.0 6.0 7.0 8.0
Source: World Development Indicators, World Bank.

74
ANNUAL REPORT
railway revenue earning freight traffic, cargo handledat major ports and most of the indicators in the civilaviation sector reflects depressed internal andinternational trade during 2008-09 compared toprevious year.
II.2.52 Despite having no direct exposure to thetroubled assets in the advanced economies, thefinancing, insurance, real estate and businessservices exhibited sluggish performance, mainly onaccount of indirect effect of the financial crisis.Financial services recorded steep decline mainlydue to significant correction in the capital market,following the international trends, heightened
Table 2.16: Indicators of Services Sector Activity(Growth rates in per cent)
Sub-sector 2006-07 2007-08 2008-09
1 2 3 4
Tourist arrivals 13.0 12.2 -2.5Commercial vehicles production# 33.0 4.8 -24.0Railway revenue earning freight traffic 9.2 9.0 4.9New cell phone connections 85.4 38.3 44.8Cargo handled at major ports 9.5 11.9 2.1Civil aviationExport cargo handled 3.6 7.5 3.4Import cargo handled 19.4 19.7 -5.7Passengers handled atinternational terminals 12.1 11.9 3.8Passengers handled atdomestic terminals 34.0 20.6 -12.1Cement ** 9.1 7.8 7.5Steel ** 13.1 6.8 0.6
# : Leading Indicator for transportation.** : Leading indicators for constructionSource : Ministry of Tourism; Ministry of Commerce and Industry;
Ministry of Statistics and Programme Implementation; ReserveBank of India; and Centre for Monitoring Indian Economy.
economic uncertainties and market expectations ofa sluggish performance by the corporates. On theother hand, the growth in community, social andpersonal services accelerated, reflecting counter-cycl ical f iscal measures and the Sixth PayCommission payouts. All the major segments ofservices activity, with the exception of new cellphone connections, showed deceleration in growthor declined in 2008-09 (Table 2.16).
II.2.53 One of the most discernible fallout of currentglobal meltdown is the contraction in industrial andservices sectors, and the resultant significant loss
Table 2.15: Performance of the Services Sector(Per cent)
Sub-sector Growth Rate 2008-09
2002-03 2003-04 2004-05 2005-06 2006-07 2007-08 (RE)
1 2 3 4 5 6 7 8
Trade, Hotels, Transport and Communication 9.4 12.0 10.7 12.1 12.8 12.4 9.0Financing, Insurance, Real Estate and Business Services 8.0 5.6 8.7 11.4 13.8 11.7 7.8Community, Social and Personal Services 3.9 5.4 6.9 7.0 5.7 6.8 13.1Construction 7.9 12.0 16.1 16.2 11.8 10.1 7.2Services Sector 7.5 8.8 9.9 11.2 11.3 10.8 9.4
Memo:
Shares of Services in GDP 58.7 58.9 60.2 61.1 62.0 63.0. 64.5 Relative Contribution to GDP growth 111.1 60.9 77.7 70.8 70.8 74.1 88.2
RE: Revised estimates.Source: Central Statistical Organisation.
75
ECONOMIC REVIEW
One of the serious ramifications of the global recessionhas been the rising unemployment and heighteneduncertainty in the labour markets, particularly in theadvanced countries. This has set off a vicious circle,whereby contraction in aggregate demand leads to higherunemployment and job market uncertainty, which in turnamplifies the rate of contraction in aggregate demand. InIndia, due to the dependence of a large section of thelabour force on the agriculture sector for employment, thenegative employment effect has been relatively moderatedue to the resilient agricultural sector during 2008-09, butthe adverse employment effects of a growth slowdownremains a policy concern. This explains the magnitudeand nature of the stimulus measures already delivered bythe Government, despite concerns about the availablefiscal space in India.
Available scattered reports suggest that the employmentintensive SMEs have been affected by the crisis and thereis reverse migration from the urban to rural areas, therebyaccentuating the vulnerabilities of rural population.Internationally, migrant workers’ remittances are falling,contributing to a further deterioration in income/employmentin remittance receiving economies. As the labour marketrecovery comes with considerable lags even after outputpicks up, a weak recovery of the global economy only in2010 as projected by the IMF suggests grave implicationsfor the employment scenario, with serious social and politicalconsequences (ILO, April 2009).
According to the International Labour Office’s (ILO) ‘GlobalEmployment Trends Report’ released in May 2009, in allprobabilities, there will be a sharp increase in the globalunemployment in 2009, particularly in developing countriesengaged in labour-intensive exports. Unemployment rateis estimated to rise up to 6.5 per cent in 2009 as comparedwith 5.7 per cent in 2007. In a worst case scenario it couldrise up to 7.1 per cent (or 50 million people). The Reportalso estimated that the proportion of people in vulnerableemployment could rise considerably in the worst casescenario to reach a level of 53 percent of the employedpopulation. The unemployment level in South Asia wasestimated at 32.2 million and it may vary between 32.6-32.1 million in 2009 depending upon the extent ofslowdown. The Report also noted that over 2009 and 2010,an estimated 20.3 million additional jobs would be neededto absorb India’s growing labour force. Women and younglabour force could be affected the most. In fact, Indianworkers in sectors with high exposure to the global marketand which employ millions of women workers have alreadyfaced job cuts, particularly in civil aviation, textiles, leatherand gems and jewellery sectors. The Report underlined
Box II.11Effects of Global Recession on Unemployment in India
the importance of public spending programmes that havehigh multiplier effect on employment.
In order to assess the unemployment situation in thecontext of the economic slowdown, the Ministry of Labourconducted two quick quarterly surveys for the periodOctober-December 2008 and January-March, 2009covering 21 centres (10 states/ UTs) and sectors such asmining, textiles, metals, gems and jewellery, automobiles,transport and IT/BPO covering more than 60 per cent ofthe GDP. The Reports observed that about half a millionworkers lost their jobs during October-December 2008while employment increased by about half a quarter millionduring January-March 2009. The estimated employmentin all the sectors declined from 16.2 million duringSeptember 2008 to 15.7 million in December 2008. Theemployment growth rate was placed at (-) 3.03 per centduring the third quar ter of 2008-09 which improvedsomewhat during the quarter January-March 2009. Sector-wise, the decline in employment was observed in all thesectors, except for the IT/ BPO during October-December2008 whereas sector like gems and jewellery, textiles, IT/BPO, handloom/power-loom and automobiles posted risein employment in January-March 2009.
The Government has undertaken several measures topromote growth in the sectors facing slowdown. Prominentamong these are establishment of two new mega clustersfor handlooms and carpets, interest subvention on pre-shipment credit for labour intensive export oriented sectors,enhanced ECGC cover and reduction in basic customsduty and service tax exemption to select exports. Enhancedallocation of resources for national flagship schemes suchas National Rural Employment Guarantee Scheme(NREGS) (rise by144 per cent), Bharat Nirman (rise by 45per cent), National Highway Development Programme (riseby 23 per cent), Jawaharlal Nehru Urban Renewal Mission(JNNURM) (rise by 87 per cent) is also likely to generateadditional employment, particularly in unorganised sectors,both in rural and urban areas during 2009-10.
Reference:
1. Government of India (2008), Report on Effect ofEconomic Slowdown on Employment in India. October-December.
2. Government of India (2008), Report on Effect ofEconomic Slowdown on Employment in India. January-March.
3. International Labour Organisation (2009), GlobalEmployment Trends. January.
of employment amidst growing uncertainty in thelabour markets. If the recovery is delayed asanticipated by the IMF, scenario for the labour
markets could be further disconcerting. The adverseemployment effects of global slowdown remains aclear downside risk and a policy concern (Box II.11).
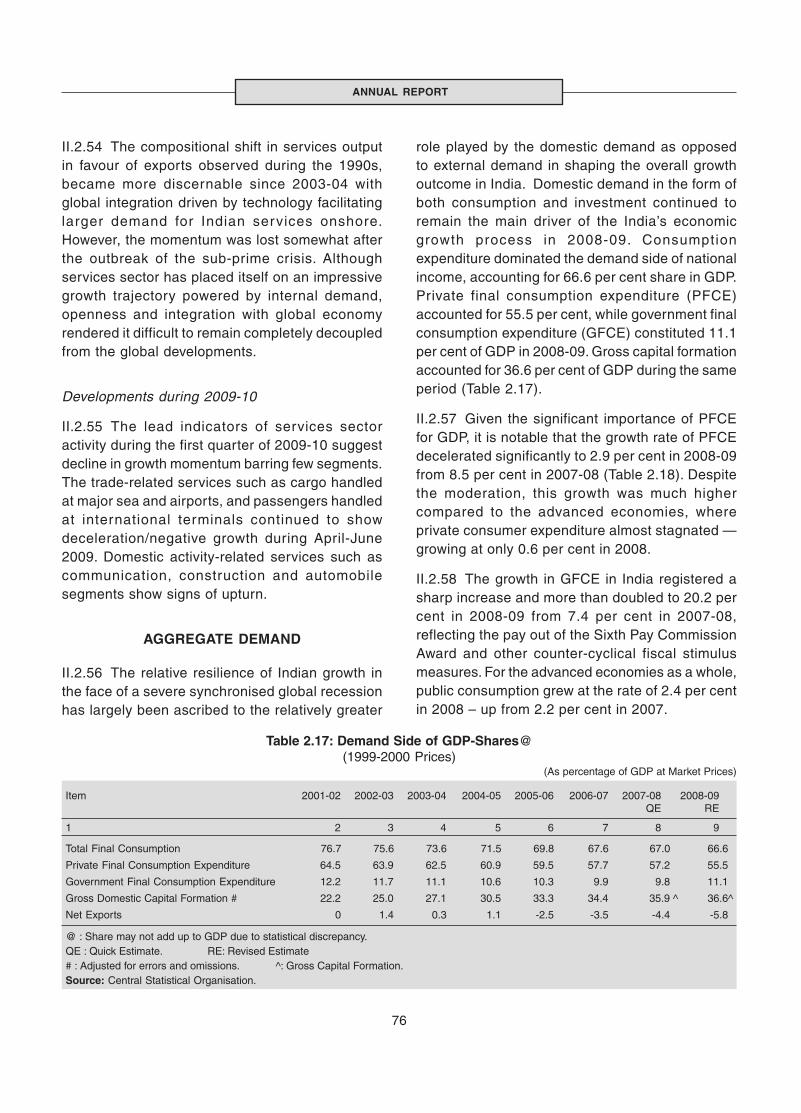
76
ANNUAL REPORT
Table 2.17: Demand Side of GDP-Shares@(1999-2000 Prices)
(As percentage of GDP at Market Prices)
Item 2001-02 2002-03 2003-04 2004-05 2005-06 2006-07 2007-08 2008-09QE RE
1 2 3 4 5 6 7 8 9
Total Final Consumption 76.7 75.6 73.6 71.5 69.8 67.6 67.0 66.6
Private Final Consumption Expenditure 64.5 63.9 62.5 60.9 59.5 57.7 57.2 55.5
Government Final Consumption Expenditure 12.2 11.7 11.1 10.6 10.3 9.9 9.8 11.1
Gross Domestic Capital Formation # 22.2 25.0 27.1 30.5 33.3 34.4 35.9 ^ 36.6^
Net Exports 0 1.4 0.3 1.1 -2.5 -3.5 -4.4 -5.8
@ : Share may not add up to GDP due to statistical discrepancy.QE : Quick Estimate. RE: Revised Estimate# : Adjusted for errors and omissions. ^: Gross Capital Formation.Source: Central Statistical Organisation.
II.2.54 The compositional shift in services outputin favour of exports observed during the 1990s,became more discernable since 2003-04 withglobal integration driven by technology facilitatinglarger demand for Indian services onshore.However, the momentum was lost somewhat afterthe outbreak of the sub-prime crisis. Althoughservices sector has placed itself on an impressivegrowth trajectory powered by internal demand,openness and integration with global economyrendered it difficult to remain completely decoupledfrom the global developments.
Developments during 2009-10
II.2.55 The lead indicators of services sectoractivity during the first quarter of 2009-10 suggestdecline in growth momentum barring few segments.The trade-related services such as cargo handledat major sea and airports, and passengers handledat international terminals continued to showdeceleration/negative growth during April-June2009. Domestic activity-related services such ascommunication, construction and automobilesegments show signs of upturn.
AGGREGATE DEMAND
II.2.56 The relative resilience of Indian growth inthe face of a severe synchronised global recessionhas largely been ascribed to the relatively greater
role played by the domestic demand as opposedto external demand in shaping the overall growthoutcome in India. Domestic demand in the form ofboth consumption and investment continued toremain the main driver of the India’s economicgrowth process in 2008-09. Consumptionexpenditure dominated the demand side of nationalincome, accounting for 66.6 per cent share in GDP.Private final consumption expenditure (PFCE)accounted for 55.5 per cent, while government finalconsumption expenditure (GFCE) constituted 11.1per cent of GDP in 2008-09. Gross capital formationaccounted for 36.6 per cent of GDP during the sameperiod (Table 2.17).
II.2.57 Given the significant importance of PFCEfor GDP, it is notable that the growth rate of PFCEdecelerated significantly to 2.9 per cent in 2008-09from 8.5 per cent in 2007-08 (Table 2.18). Despitethe moderation, this growth was much highercompared to the advanced economies, whereprivate consumer expenditure almost stagnated —growing at only 0.6 per cent in 2008.
II.2.58 The growth in GFCE in India registered asharp increase and more than doubled to 20.2 percent in 2008-09 from 7.4 per cent in 2007-08,reflecting the pay out of the Sixth Pay CommissionAward and other counter-cyclical fiscal stimulusmeasures. For the advanced economies as a whole,public consumption grew at the rate of 2.4 per centin 2008 – up from 2.2 per cent in 2007.
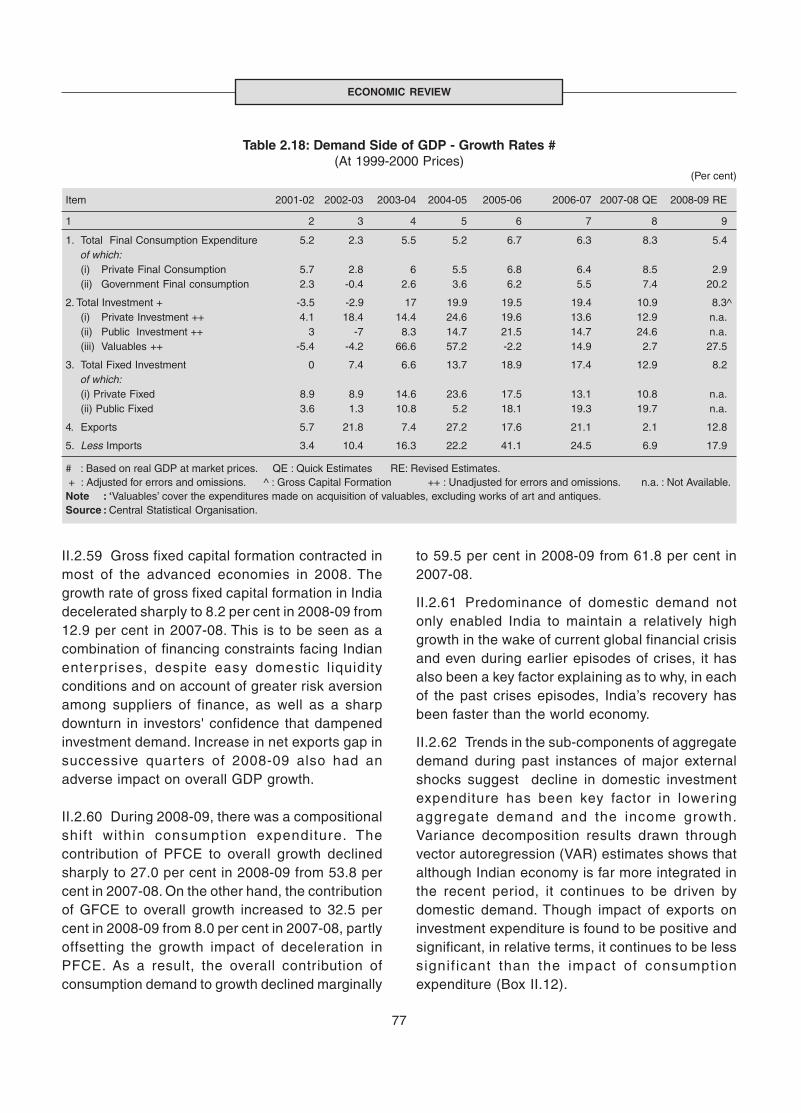
77
ECONOMIC REVIEW
II.2.59 Gross fixed capital formation contracted inmost of the advanced economies in 2008. Thegrowth rate of gross fixed capital formation in Indiadecelerated sharply to 8.2 per cent in 2008-09 from12.9 per cent in 2007-08. This is to be seen as acombination of financing constraints facing Indianenterpr ises, despite easy domestic l iquidityconditions and on account of greater risk aversionamong suppliers of finance, as well as a sharpdownturn in investors' confidence that dampenedinvestment demand. Increase in net exports gap insuccessive quar ters of 2008-09 also had anadverse impact on overall GDP growth.
II.2.60 During 2008-09, there was a compositionalshift within consumption expenditure. Thecontribution of PFCE to overall growth declinedsharply to 27.0 per cent in 2008-09 from 53.8 percent in 2007-08. On the other hand, the contributionof GFCE to overall growth increased to 32.5 percent in 2008-09 from 8.0 per cent in 2007-08, partlyoffsetting the growth impact of deceleration inPFCE. As a result, the overall contribution ofconsumption demand to growth declined marginally
Table 2.18: Demand Side of GDP - Growth Rates #(At 1999-2000 Prices)
(Per cent)
Item 2001-02 2002-03 2003-04 2004-05 2005-06 2006-07 2007-08 QE 2008-09 RE
1 2 3 4 5 6 7 8 9
1. Total Final Consumption Expenditure 5.2 2.3 5.5 5.2 6.7 6.3 8.3 5.4 of which:
(i) Private Final Consumption 5.7 2.8 6 5.5 6.8 6.4 8.5 2.9(ii) Government Final consumption 2.3 -0.4 2.6 3.6 6.2 5.5 7.4 20.2
2. Total Investment + -3.5 -2.9 17 19.9 19.5 19.4 10.9 8.3^(i) Private Investment ++ 4.1 18.4 14.4 24.6 19.6 13.6 12.9 n.a.(ii) Public Investment ++ 3 -7 8.3 14.7 21.5 14.7 24.6 n.a.(iii) Valuables ++ -5.4 -4.2 66.6 57.2 -2.2 14.9 2.7 27.5
3. Total Fixed Investment 0 7.4 6.6 13.7 18.9 17.4 12.9 8.2 of which:
(i) Private Fixed 8.9 8.9 14.6 23.6 17.5 13.1 10.8 n.a.(ii) Public Fixed 3.6 1.3 10.8 5.2 18.1 19.3 19.7 n.a.
4. Exports 5.7 21.8 7.4 27.2 17.6 21.1 2.1 12.8
5. Less Imports 3.4 10.4 16.3 22.2 41.1 24.5 6.9 17.9
# : Based on real GDP at market prices. QE : Quick Estimates RE: Revised Estimates. + : Adjusted for errors and omissions. ^ : Gross Capital Formation ++ : Unadjusted for errors and omissions. n.a. : Not Available.Note : ‘Valuables’ cover the expenditures made on acquisition of valuables, excluding works of art and antiques.Source : Central Statistical Organisation.
to 59.5 per cent in 2008-09 from 61.8 per cent in2007-08.
II.2.61 Predominance of domestic demand notonly enabled India to maintain a relatively highgrowth in the wake of current global financial crisisand even during earlier episodes of crises, it hasalso been a key factor explaining as to why, in eachof the past crises episodes, India’s recovery hasbeen faster than the world economy.
II.2.62 Trends in the sub-components of aggregatedemand during past instances of major externalshocks suggest decline in domestic investmentexpenditure has been key factor in loweringaggregate demand and the income growth.Variance decomposition results drawn throughvector autoregression (VAR) estimates shows thatalthough Indian economy is far more integrated inthe recent period, it continues to be driven bydomestic demand. Though impact of exports oninvestment expenditure is found to be positive andsignificant, in relative terms, it continues to be lesssignif icant than the impact of consumptionexpenditure (Box II.12).
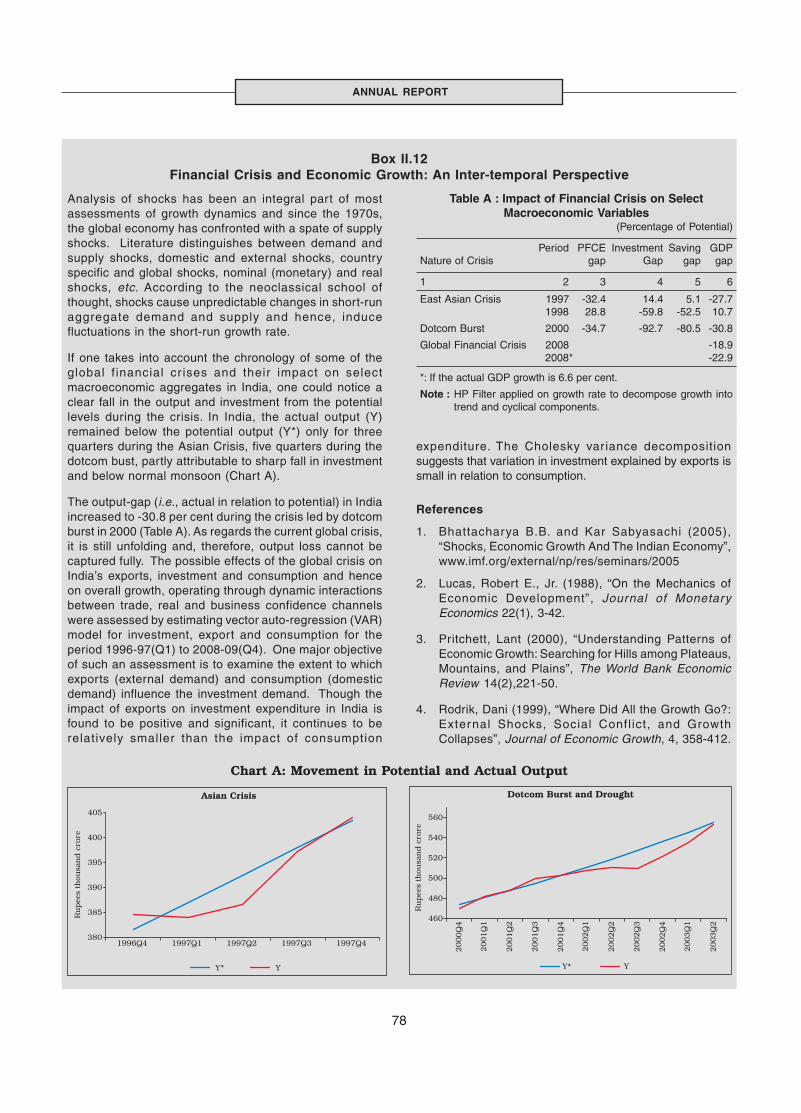
78
ANNUAL REPORT
Table A : Impact of Financial Crisis on SelectMacroeconomic Variables
(Percentage of Potential)
Period PFCE Investment Saving GDPNature of Crisis gap Gap gap gap
1 2 3 4 5 6
East Asian Crisis 1997 -32.4 14.4 5.1 -27.71998 28.8 -59.8 -52.5 10.7
Dotcom Burst 2000 -34.7 -92.7 -80.5 -30.8
Global Financial Crisis 2008 -18.9 2008* -22.9
*: If the actual GDP growth is 6.6 per cent.Note : HP Filter Applied on Growth rate to decompose trend and
cyclical growth.
Table B: Average(during 10 period) VarianceDecomposition of Investment Shock
1997(1)-2008(3) Export Investment Consumption
12.2 57.8 30.0
Analysis of shocks has been an integral part of mostassessments of growth dynamics and since the 1970s,the global economy has confronted with a spate of supplyshocks. Literature distinguishes between demand andsupply shocks, domestic and external shocks, countryspecific and global shocks, nominal (monetary) and realshocks, etc. According to the neoclassical school ofthought, shocks cause unpredictable changes in short-runaggregate demand and supply and hence, inducefluctuations in the short-run growth rate.
If one takes into account the chronology of some of theglobal f inancial cr ises and their impact on selectmacroeconomic aggregates in India, one could notice aclear fall in the output and investment from the potentiallevels during the crisis. In India, the actual output (Y)remained below the potential output (Y*) only for threequarters during the Asian Crisis, five quarters during thedotcom bust, partly attributable to sharp fall in investmentand below normal monsoon (Chart A).
The output-gap (i.e., actual in relation to potential) in Indiaincreased to -30.8 per cent during the crisis led by dotcomburst in 2000 (Table A). As regards the current global crisis,it is still unfolding and, therefore, output loss cannot becaptured fully. The possible effects of the global crisis onIndia’s exports, investment and consumption and henceon overall growth, operating through dynamic interactionsbetween trade, real and business confidence channelswere assessed by estimating vector auto-regression (VAR)model for investment, export and consumption for theperiod 1996-97(Q1) to 2008-09(Q4). One major objectiveof such an assessment is to examine the extent to whichexports (external demand) and consumption (domesticdemand) influence the investment demand. Though theimpact of exports on investment expenditure in India isfound to be positive and significant, it continues to berelatively smaller than the impact of consumption
Box II.12Financial Crisis and Economic Growth: An Inter-temporal Perspective
expenditure. The Cholesky variance decompositionsuggests that variation in investment explained by exports issmall in relation to consumption.
References
1. Bhattacharya B.B. and Kar Sabyasachi (2005),“Shocks, Economic Growth And The Indian Economy”,www.imf.org/external/np/res/seminars/2005
2. Lucas, Robert E., Jr. (1988), “On the Mechanics ofEconomic Development”, Journal of MonetaryEconomics 22(1), 3-42.
3. Pritchett, Lant (2000), “Understanding Patterns ofEconomic Growth: Searching for Hills among Plateaus,Mountains, and Plains”, The World Bank EconomicReview 14(2),221-50.
4. Rodrik, Dani (1999), “Where Did All the Growth Go?:External Shocks, Social Confl ict, and GrowthCollapses”, Journal of Economic Growth, 4, 358-412.
Table A : Impact of Financial Crisis on SelectMacroeconomic Variables
(Percentage of Potential)
Period PFCE Investment Saving GDPNature of Crisis gap Gap gap gap
1 2 3 4 5 6
East Asian Crisis 1997 -32.4 14.4 5.1 -27.71998 28.8 -59.8 -52.5 10.7
Dotcom Burst 2000 -34.7 -92.7 -80.5 -30.8
Global Financial Crisis 2008 -18.9 2008* -22.9
*: If the actual GDP growth is 6.6 per cent.
Note : HP Filter applied on growth rate to decompose growth intotrend and cyclical components.
Chart A: Movement in Potential and Actual Output

79
ECONOMIC REVIEW
II.2.63 Growing global imbalances had beenclearly recognised as a source of risk to the worldeconomy much before the onset of the crisis, andpost-crisis period may necessitate a seriousrethinking on rebalancing the growth strategiestaking into account the lessons from the crisis,without reversing the globalisation process. Theneed for rebalancing growth in several countriesthrough appropriate policies could be necessaryto enhance the resilience of countries to suchshocks in future (Box II.13).
Saving and Capital Formation
II.2.64 The Indian economy has been witnessingan increasing trend in gross domestic saving since2002-03, which reached a peak level by 2007-08,with improved performance of the private corporatesector and enhanced contribution of public sector,due to the progress made in fiscal consolidation.Gross domestic saving as per cent of GDP atcurrent market prices increased from 35.7 per centin 2006-07 to 37.7 per cent in 2007-08. The private
Prolonged global imbalances have been at the root of thecurrent crisis. While inappropriate policies and regulatoryframeworks in some countries contributed to the crisis,saving glut in some countries in the face of inadequateabsorption capacity, and excessive consumption andinvestment in relation to domestic saving in some otheralso contributed to the imbalances. There is a broademerging consensus now that rebalancing of growth isrequired in several countries to tackle the global crisis,overcome its adverse effects and also strengthen theresilience of the countries to future shocks. In the midstof the crisis, surplus countries in particular, could leadrebalancing the growth through higher expenditure topromote domestic demand growth. Country specificconditions like size of the domestic market, expor tdependence and potentials, f iscal space, incomeinequality, underlying causes of the current account statusin balance of payments and several other economic factorscould decide the path and speed of rebalancing.
In its Asian Development Outlook 2009, the ADBsuggested the fol lowing set of rebalancing policymeasures for Asian countries to build strong demand anduse resources more efficiently:
• Strengthening domestic consumption requires policieswhich transfer more corporate saving to households,as well as policies, which reduce the precautionarymotive for saving among households.
• Governments should give priority to improving theinvestment climate rather than quantitative expansionof investment.
• A more active fiscal policy can mitigate weak externaldemand in the short-run as well as lay the foundationfor a more robust domestic demand beyond the shortrun.
• Supply-side policies, which promote small andmedium-sized enterprises and services industries, will
Box II.13The Management of Economic Slowdown: Rebalancing of Growth
increase the relative importance of production thatcaters to domestic demand.
• Policies pertaining to financial development andexchange rate will ease the adjustment of both supplyand demand towards a more balanced structure.
Prasad (2009) noted that there are other aspects ofpotential growth imbalances that also need to beconsidered. For instance, whether the economy is drivenby consumption or by investment determines the kind ofmeasures that would be required for rebalancing growth.This has implications for growth in household labourincome, employment and the overall welfare. Measuresto rebalance growth suggested by Prasad include:(a) increasing spending on social safety nets and othergovernment insurance mechanisms to reduceprecautionary saving and boost consumption; (b) financialmarket development for more efficient risk sharing, inter-temporal smoothing of consumption and diversification ofopportunities across income and assets; (c) improvingfinancial system efficiency for optimal allocation of capitaland eff icient r isk shar ing which would promoteentrepreneurial activity and employment; (d) enhancingfinancial inclusion for better consumption and savingpatterns; (e) more flexible exchange rate regime that allowsthe exchange rate to respond to productivity growthdifferentials relative to trading partners, which couldgenerate positive wealth effects through favourable termsof trade changes.
References:
1. Asian Development Bank (2009), Asian DevelopmentOutlook.
2. Prasad, Eswar (2009), Rebalancing Growth in Asia.
3. Blanchard, Olivier J and Giavazzi Francesco (2006),Rebalancing Growth In China: A Three-HandedApproach, CEPR Discussion Paper No. 5403.
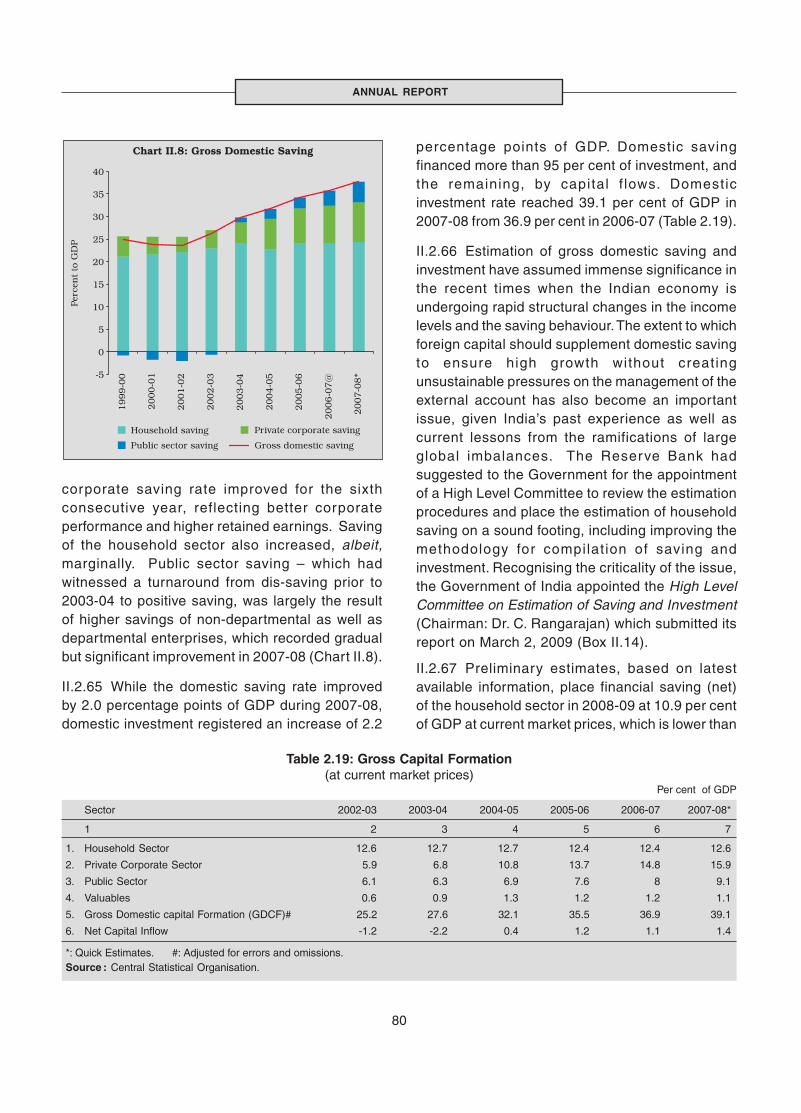
80
ANNUAL REPORT
Table 2.19: Gross Capital Formation(at current market prices)
Per cent of GDP
Sector 2002-03 2003-04 2004-05 2005-06 2006-07 2007-08*
1 2 3 4 5 6 7
1. Household Sector 12.6 12.7 12.7 12.4 12.4 12.6
2. Private Corporate Sector 5.9 6.8 10.8 13.7 14.8 15.9
3. Public Sector 6.1 6.3 6.9 7.6 8 9.1
4. Valuables 0.6 0.9 1.3 1.2 1.2 1.1
5. Gross Domestic capital Formation (GDCF)# 25.2 27.6 32.1 35.5 36.9 39.1
6. Net Capital Inflow -1.2 -2.2 0.4 1.2 1.1 1.4
*: Quick Estimates. #: Adjusted for errors and omissions.Source : Central Statistical Organisation.
corporate saving rate improved for the sixthconsecutive year, reflecting better corporateperformance and higher retained earnings. Savingof the household sector also increased, albeit,marginally. Public sector saving – which hadwitnessed a turnaround from dis-saving prior to2003-04 to positive saving, was largely the resultof higher savings of non-departmental as well asdepartmental enterprises, which recorded gradualbut significant improvement in 2007-08 (Chart II.8).
II.2.65 While the domestic saving rate improvedby 2.0 percentage points of GDP during 2007-08,domestic investment registered an increase of 2.2
percentage points of GDP. Domestic savingfinanced more than 95 per cent of investment, andthe remaining, by capital f lows. Domesticinvestment rate reached 39.1 per cent of GDP in2007-08 from 36.9 per cent in 2006-07 (Table 2.19).
II.2.66 Estimation of gross domestic saving andinvestment have assumed immense significance inthe recent times when the Indian economy isundergoing rapid structural changes in the incomelevels and the saving behaviour. The extent to whichforeign capital should supplement domestic savingto ensure high growth without creatingunsustainable pressures on the management of theexternal account has also become an importantissue, given India’s past experience as well ascurrent lessons from the ramifications of largeglobal imbalances. The Reserve Bank hadsuggested to the Government for the appointmentof a High Level Committee to review the estimationprocedures and place the estimation of householdsaving on a sound footing, including improving themethodology for compilat ion of saving andinvestment. Recognising the criticality of the issue,the Government of India appointed the High LevelCommittee on Estimation of Saving and Investment(Chairman: Dr. C. Rangarajan) which submitted itsreport on March 2, 2009 (Box II.14).
II.2.67 Preliminary estimates, based on latestavailable information, place financial saving (net)of the household sector in 2008-09 at 10.9 per centof GDP at current market prices, which is lower than
81
ECONOMIC REVIEW
Background
At a time when Indian economy was going through a phaseof robust economic growth, backed by rising domesticsaving and investment as well as surge in capital inflows,the High Level Committee on Estimation of Saving andInvestment (HLC) was constituted on December 12, 2007under the Chairmanship of Dr. C. Rangarajan. TheCommittee addressed long list of Terms of References(ToRs) encompassing various compilation methodologyand data issues. The HLC examined the feasibility ofdirectly estimating household saving through integratedincome and expenditure surveys; improvements in themethods and procedures used in the estimation ofcorporate investment and saving; new data bases, if any,to be devised/built-up for improving the reliability orchecking validity of the estimates, etc.
Approach
The HLC fol lowed a sector-wise approach andrecommended shift to the extent possible from sample-based estimates of saving and investment to a censusbased estimates. The HLC also undertook discussions withapex institutions and the National Sample SurveyOrganisation (NSSO) and worked out trial estimates forsome of the changes recommended. This was a contrastfrom the approach followed by the earlier Committees.
Major Recommendations
1. Household Saving
• The existing practice of indirect method of estimation ofhousehold saving may continue due to non-availabilityof an acceptable, practical and alternative method.
• Since households sector is a conglomerate entityconsisting of both consumer and producer householdswith significant structural changes in its savingbehaviour, the approach adopted by the HLC was topave way for eventual introduction of periodicalcomprehensive income-expenditure surveys for thehousehold sector.
• Combined with Enterprise Surveys, it is expected toprovide direct estimation of household saving for theconsumer households as is the practice in a numberof advanced countries and also help in cross-validationof the present residual based estimates.
Box II.14Report of the High Level Committee on Estimation of Saving and Investment
(Chairman: Dr. C. Rangarajan)
2. Private Corporate Sector Saving
• To replace the presently followed sample-basedmethodology of estimation of saving and investmentusing blow up factors by a census-based procedure.
• HLC in this regard is entering into an understanding withthe Ministry of Corporate Affairs (MCA) to share theirdatabase under an E-Governance arrangement (MCA21) on a regular basis to substantially improve the qualityof the private corporate sector saving and investment.
• The HLC recommended that saving and investmentestimates from the year 2010-11 may be made usingMCA21 data for all companies, dispensing with theblow up factor method.
3. Public Sector Saving
• In the case of public sector saving, the HLC suggestedfor separate estimates of GDP, consumption expenditure,saving and capital formation for the Local Bodies andquasi/autonomous Government bodies by the CSO.
• The HLC’s recommendation that a mechanism needsto be instituted to capture the annual accounts of thePPPs would ensure that the saving and investmentestimates from these ventures are adequately captured.
Other Related Issues
• The HLC recommended compilation of flow-of-fundsdata in a more timely manner to consider differentratios including the ratio of households’ cash holdingon a more realistic basis. In view of the emergingimportance of farmers and institutions like Non-Government Organisations (NGOs) and self-helpgroups (SHGs) in the financial system and also fromthe perspective of policy issues, the HLCrecommended that such unincorporated non-profitinstitutions be treated as separate categories underhouseholds. Accordingly, there is need to capturethese entities in the returns for deposits provided bybanks to the Reserve Bank.
• In view of the inadequate provision made for manningthe statistical wings with adequate number and qualityof technical staff, the Committee has recommendedstrengthening of staff positions in the statistical wingsof the Department of Company Affairs, the Departmentof Industrial Policy and Promotion and in the CSO, asalso in the Reserve Bank, SEBI and NABARD.
the estimates for 2007-08 at 11.5 per cent (Table 2.20).Decline in the household investments in shares anddebentures were the main factors responsible for
the lower household financial saving in 2008-09. Inaddition, moderation in the overall growth rate inthe economy in 2008-09 vis-à-vis the previous
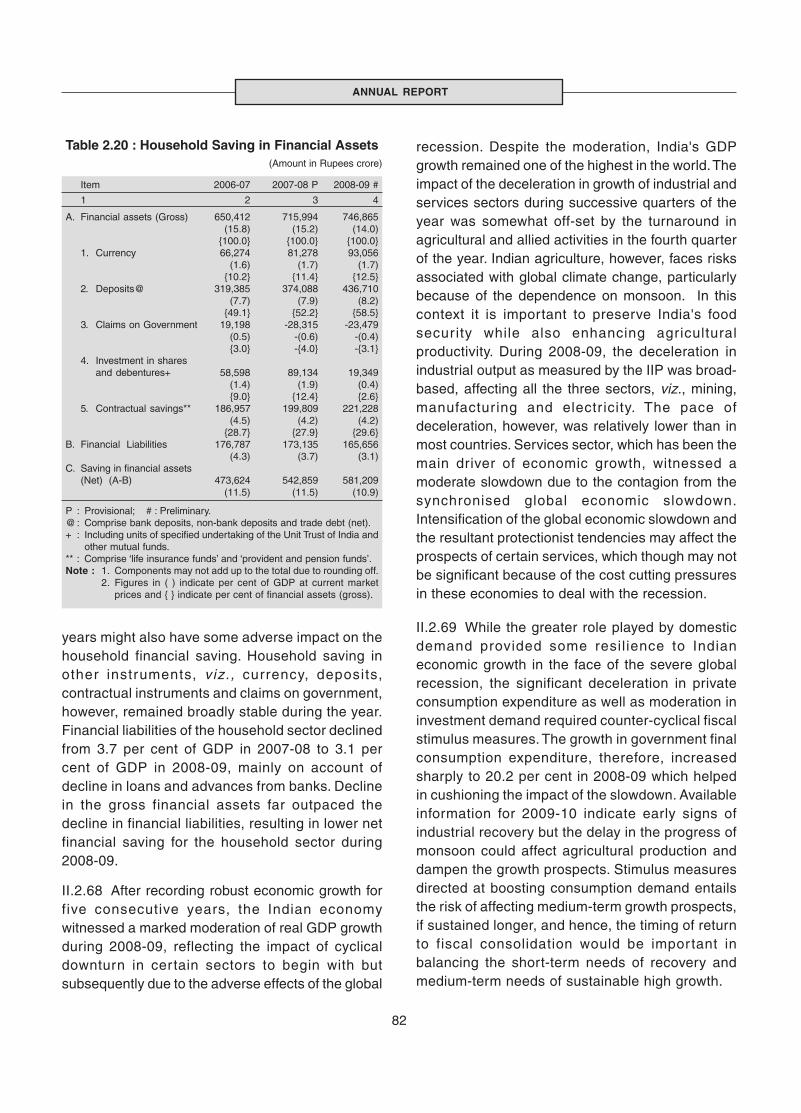
82
ANNUAL REPORT
Table 2.20 : Household Saving in Financial Assets (Amount in Rupees crore)
Item 2006-07 2007-08 P 2008-09 #
1 2 3 4
A. Financial assets (Gross) 650,412 715,994 746,865(15.8) (15.2) (14.0)
{100.0} {100.0} {100.0}1. Currency 66,274 81,278 93,056
(1.6) (1.7) (1.7) {10.2} {11.4} {12.5}
2. Deposits@ 319,385 374,088 436,710(7.7) (7.9) (8.2)
{49.1} {52.2} {58.5}3. Claims on Government 19,198 -28,315 -23,479
(0.5) -(0.6) -(0.4){3.0} -{4.0} -{3.1}
4. Investment in sharesand debentures+ 58,598 89,134 19,349
(1.4) (1.9) (0.4){9.0} {12.4} {2.6}
5. Contractual savings** 186,957 199,809 221,228(4.5) (4.2) (4.2)
{28.7} {27.9} {29.6}B. Financial Liabilities 176,787 173,135 165,656
(4.3) (3.7) (3.1)C. Saving in financial assets
(Net) (A-B) 473,624 542,859 581,209(11.5) (11.5) (10.9)
P : Provisional; # : Preliminary.@: Comprise bank deposits, non-bank deposits and trade debt (net).+ : Including units of specified undertaking of the Unit Trust of India and
other mutual funds.** : Comprise ‘life insurance funds’ and ‘provident and pension funds’.Note : 1. Components may not add up to the total due to rounding off.
2. Figures in ( ) indicate per cent of GDP at current marketprices and { } indicate per cent of financial assets (gross).
years might also have some adverse impact on thehousehold financial saving. Household saving inother instruments, viz., currency, deposits,contractual instruments and claims on government,however, remained broadly stable during the year.Financial liabilities of the household sector declinedfrom 3.7 per cent of GDP in 2007-08 to 3.1 percent of GDP in 2008-09, mainly on account ofdecline in loans and advances from banks. Declinein the gross financial assets far outpaced thedecline in financial liabilities, resulting in lower netfinancial saving for the household sector during2008-09.
II.2.68 After recording robust economic growth forfive consecutive years, the Indian economywitnessed a marked moderation of real GDP growthduring 2008-09, reflecting the impact of cyclicaldownturn in certain sectors to begin with butsubsequently due to the adverse effects of the global
recession. Despite the moderation, India's GDPgrowth remained one of the highest in the world. Theimpact of the deceleration in growth of industrial andservices sectors during successive quarters of theyear was somewhat off-set by the turnaround inagricultural and allied activities in the fourth quarterof the year. Indian agriculture, however, faces risksassociated with global climate change, particularlybecause of the dependence on monsoon. In thiscontext it is important to preserve India's foodsecurity while also enhancing agriculturalproductivity. During 2008-09, the deceleration inindustrial output as measured by the IIP was broad-based, affecting all the three sectors, viz., mining,manufactur ing and electr icity. The pace ofdeceleration, however, was relatively lower than inmost countries. Services sector, which has been themain driver of economic growth, witnessed amoderate slowdown due to the contagion from thesynchronised global economic slowdown.Intensification of the global economic slowdown andthe resultant protectionist tendencies may affect theprospects of certain services, which though may notbe significant because of the cost cutting pressuresin these economies to deal with the recession.
II.2.69 While the greater role played by domesticdemand provided some resil ience to Indianeconomic growth in the face of the severe globalrecession, the significant deceleration in privateconsumption expenditure as well as moderation ininvestment demand required counter-cyclical fiscalstimulus measures. The growth in government finalconsumption expenditure, therefore, increasedsharply to 20.2 per cent in 2008-09 which helpedin cushioning the impact of the slowdown. Availableinformation for 2009-10 indicate early signs ofindustrial recovery but the delay in the progress ofmonsoon could affect agricultural production anddampen the growth prospects. Stimulus measuresdirected at boosting consumption demand entailsthe risk of affecting medium-term growth prospects,if sustained longer, and hence, the timing of returnto fiscal consolidation would be important inbalancing the short-term needs of recovery andmedium-term needs of sustainable high growth.
83
ECONOMIC REVIEW
III. MONEY, CREDIT AND PRICES
II.3.1 The monetary and credit conditions in Indiashowed phases of sharp shifts during 2008-09,reflecting the volatile developments in growth,inflation and financial markets, and the consequentpolicy responses. During 2008-09, while growthdecelerated significantly in the second half of 2008-09,WPI inflation scaled above the 12 per cent level byAugust 2008 to subsequently decline sharply tobelow one per cent level by the end of the year, eventhough CPI inflation continued to remain firm. Duringthe third quarter of 2008-09, the liquidity needs ofthe financial markets and financial institutions testedthe liquidity management operations of the ReserveBank. Reflecting the moderation in growth andassociated subdued aggregate demand, creditgrowth also decelerated considerably by the endof the year. The nature and scale of thesedevelopments got reflected in the pattern of growthin monetary and credit aggregates during 2008-09.
II.3.2 In the early part of the year, the previouslyexperienced pattern in terms of increase in netforeign assets of the Reserve Bank as a primarydriver of expansion in reserve money continued.As capital outflows and the resultant interventionsin the foreign exchange market led to contractionin net foreign assets of the Reserve Bank in thesecond half of the financial year, the impact onliquidity had to be more than offset by expansion innet domestic assets of the Reserve Bank, whichbecame necessary to meet the growing demandfor liquidity in the face of trickling contagion fromthe global financial crisis.
II.3.3 During 2008-09, net Reserve Bank credit tothe Government became the key source for expandingthe net domestic assets, and this option also coincidedwith a time when large fiscal stimulus had becomenecessary to contain the economic slowdown.Besides the policy induced compositional shifts onthe asset side of the Reserve Bank’s balance sheet,on the liability side also there were major policy drivenchanges, on account of reduction in reserverequirement and unwinding of Government’s depositsunder market stabilisation scheme (MSS) with the
Reserve Bank. While both these measures expandedthe liquidity available to the banking system and theGovernment, the combined effect amounted tocontraction in Reserve Bank’s balance sheet. Thus,unlike in many other countries where expansion inthe central bank balance sheet size became thesymbol of quantitative easing, the behaviour of theReserve Bank’s balance sheet reflected the policydriven expansion in liquidity through lower reserverequirements and unwinding of MSS on the liabilitiesside and increase in domestic assets to offset theimpact of the contracting foreign assets on the assetsside of the balance sheet.
II.3.4 The evolution of monetary aggregates inIndia during 2008-09, thus, has been consistentwith the policy stance of the Reserve Bank andreflects the outcome of operations of the ReserveBank on several fronts, aimed at ensuring adequateliquidity in the system, restoring orderly conditionsin the markets and supporting faster recovery ofgrowth in the face of subdued inflation.
Monetary Conditions in India
II.3.5 The large and exogenous capital inflowsthat remained the major driver of liquidity duringthe preceding years exhibited a notable turnaroundin 2008-09 with the intensification of the globalfinancial crisis. The expansion in bank credit in Indiaalso receded, reflecting the moderation in growthmomentum from the third quarter of 2008-09.Accordingly, growth in monetary and liquidityaggregates during 2008-09 witnessed somemoderation. Broad money growth during the lastquarter of 2008-09 moderated reflecting slowdownin growth and aggregate demand. Expansion inbank credit to the commercial sector remainedstrong up to October 2008 in the backdrop of dryingup of other sources of funds to industry, butdecelerated subsequently and remained below theReserve Bank’s Third Quarter Review (January 2009)projection of 24.0 per cent for the year 2008-09.The contractionary impact of decline in net foreignexchange assets on reserve money and domesticliquidity was offset by purchases under open market
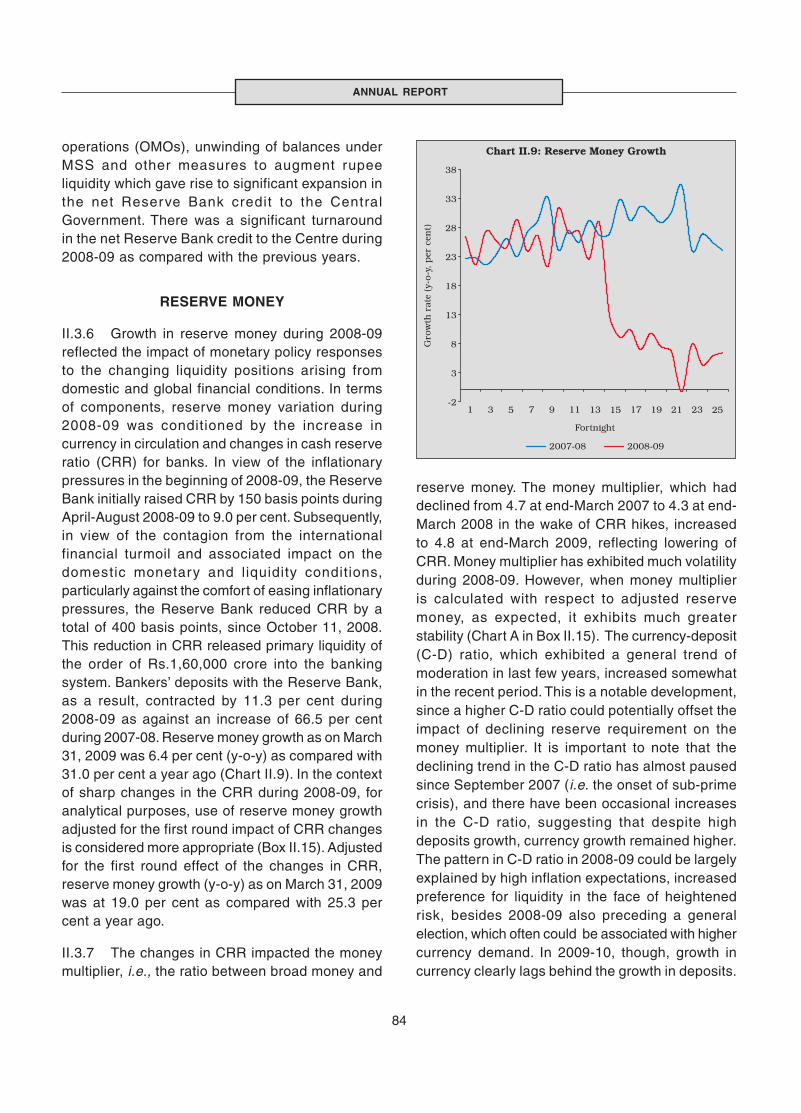
84
ANNUAL REPORT
operations (OMOs), unwinding of balances underMSS and other measures to augment rupeeliquidity which gave rise to significant expansion inthe net Reserve Bank credit to the CentralGovernment. There was a significant turnaroundin the net Reserve Bank credit to the Centre during2008-09 as compared with the previous years.
RESERVE MONEY
II.3.6 Growth in reserve money during 2008-09reflected the impact of monetary policy responsesto the changing liquidity positions arising fromdomestic and global financial conditions. In termsof components, reserve money variation during2008-09 was conditioned by the increase incurrency in circulation and changes in cash reserveratio (CRR) for banks. In view of the inflationarypressures in the beginning of 2008-09, the ReserveBank initially raised CRR by 150 basis points duringApril-August 2008-09 to 9.0 per cent. Subsequently,in view of the contagion from the internationalfinancial turmoil and associated impact on thedomestic monetary and liquidity conditions,particularly against the comfort of easing inflationarypressures, the Reserve Bank reduced CRR by atotal of 400 basis points, since October 11, 2008.This reduction in CRR released primary liquidity ofthe order of Rs.1,60,000 crore into the bankingsystem. Bankers’ deposits with the Reserve Bank,as a result, contracted by 11.3 per cent during2008-09 as against an increase of 66.5 per centduring 2007-08. Reserve money growth as on March31, 2009 was 6.4 per cent (y-o-y) as compared with31.0 per cent a year ago (Chart II.9). In the contextof sharp changes in the CRR during 2008-09, foranalytical purposes, use of reserve money growthadjusted for the first round impact of CRR changesis considered more appropriate (Box II.15). Adjustedfor the first round effect of the changes in CRR,reserve money growth (y-o-y) as on March 31, 2009was at 19.0 per cent as compared with 25.3 percent a year ago.
II.3.7 The changes in CRR impacted the moneymultiplier, i.e., the ratio between broad money and
reserve money. The money multiplier, which haddeclined from 4.7 at end-March 2007 to 4.3 at end-March 2008 in the wake of CRR hikes, increasedto 4.8 at end-March 2009, reflecting lowering ofCRR. Money multiplier has exhibited much volatilityduring 2008-09. However, when money multiplieris calculated with respect to adjusted reservemoney, as expected, it exhibits much greaterstability (Chart A in Box II.15). The currency-deposit(C-D) ratio, which exhibited a general trend ofmoderation in last few years, increased somewhatin the recent period. This is a notable development,since a higher C-D ratio could potentially offset theimpact of declining reserve requirement on themoney multiplier. It is important to note that thedeclining trend in the C-D ratio has almost pausedsince September 2007 (i.e. the onset of sub-primecrisis), and there have been occasional increasesin the C-D ratio, suggesting that despite highdeposits growth, currency growth remained higher.The pattern in C-D ratio in 2008-09 could be largelyexplained by high inflation expectations, increasedpreference for liquidity in the face of heightenedrisk, besides 2008-09 also preceding a generalelection, which often could be associated with highercurrency demand. In 2009-10, though, growth incurrency clearly lags behind the growth in deposits.

85
ECONOMIC REVIEW
Commercial banks' deposits with the Reserve Bank not onlydetermine the size of the reserve money, but also serve as abase for multiple expansion of money in the banking system. Bychanging the reserve requirement, which is a conventionalmonetary policy tool, both reserve money and the moneymultiplier could be changed, though with opposite effects on thebroad money. High or low growth in reserve money is often viewedwith concern, even though such growth in reserve money mighthave been deliberately engineered through changes in thereserve requirement. Once the effects of policy induced changesin the reserve money are adjusted, the growth in adjusted reservemoney may not appear significantly volatile. That has been thecase in India in 2008-09, when the Reserve Bank first increasedCRR by 150 basis points up to August 2008 and reducedthereafter by 400 basis points, leading to large fluctuation in thereserve money. As a result, while the reserve money exhibited ahigh growth of 34.1 per cent as on October 3, 2008 the growthrate fell sharply to 6.4 percent by the end March 2009. But forthe policy driven changes to the reserve requirement, the reservemoney growth would have been conditioned by the non-policyrelated factors such as the currency growth and the excessreserves, which depend on the behaviour of the public and thecommercial banks, respectively. Adjusted reserve money, as aconcept, thus makes the money multiplier invariant to changesin the reserve requirement. When such concept of adjustedreserve money is used, the multiplier should also be adjustedcorrespondingly by taking only factors other than the reserverequirement in arriving at the multiplier.
The adjusted reserve money could be defined as:
Adjusted RM: RM – (rt – r0) NDTL
Where rt is current CRR, r0 is initial benchmark CRR and NDTLis net demand and time liabilities relevant for the purpose ofcomputation of CRR. If CRR is changed over a period of timein bi-directional way, then a judgement about the initialbenchmark CRR would be required.
Box II.15Adjusted Reserve Money and Money Multiplier
According to the behavioural definition of broad money multiplier(m), it is a function of CRR (r) and currency-deposits (c) ratio[m = (1+c)/(c + r)]. Though CRR, as a policy variable, iscontrolled by the central bank, the ‘c’ is a behavioural ratio andcould be expected, in the short run, to be influenced by income,interest rate, risk perception of the investors, and in the longrun, by institutional factors like monetisation of the economyand development of non-money substitutes in the form of liquidfinancial assets as well as non-cash substitutes in the form ofdebit/credit cards. In the Indian context, the ‘c’ ratio haswitnessed a secular declining trend since 1970s. However, inrecent years, currency growth has been somewhat higher thanthe high deposits growth and therefore the ‘c’ ratio has recordedsome increase since August 2007, although with some variation.Since the multiplier is inversely related to both ‘r’ and ‘c’, whenc increases somewhat in the face of policy drawn reduction in‘r’ that could partly offset the expansionary effects of the policyon broad money. The secular decline in ‘c’ ratio since 1970,with the change in banking habits of the people after banknationalisation and financial deepening have resulted in a highermoney multiplier in India.
The panel chart A in this box presents the behaviour of themultiplier (m) during 2008-09, which is quite volatile. Themultiplier with the adjustment for the first round effect of CRRchanges in the reserve money, however, exhibits higher stabilityand explains the need for the use of adjusted reserve moneyfor analytical purposes. This result also reveals the crucial roleof the ‘c’ ratio in monetary management that could alter bothreserve money and the multiplier.
Reference
1. Reserve Bank of India (1998), The Report of the ThirdWorking Group on “Money Supply: Analytics andMethodology of Compilation”. Mumbai, June.
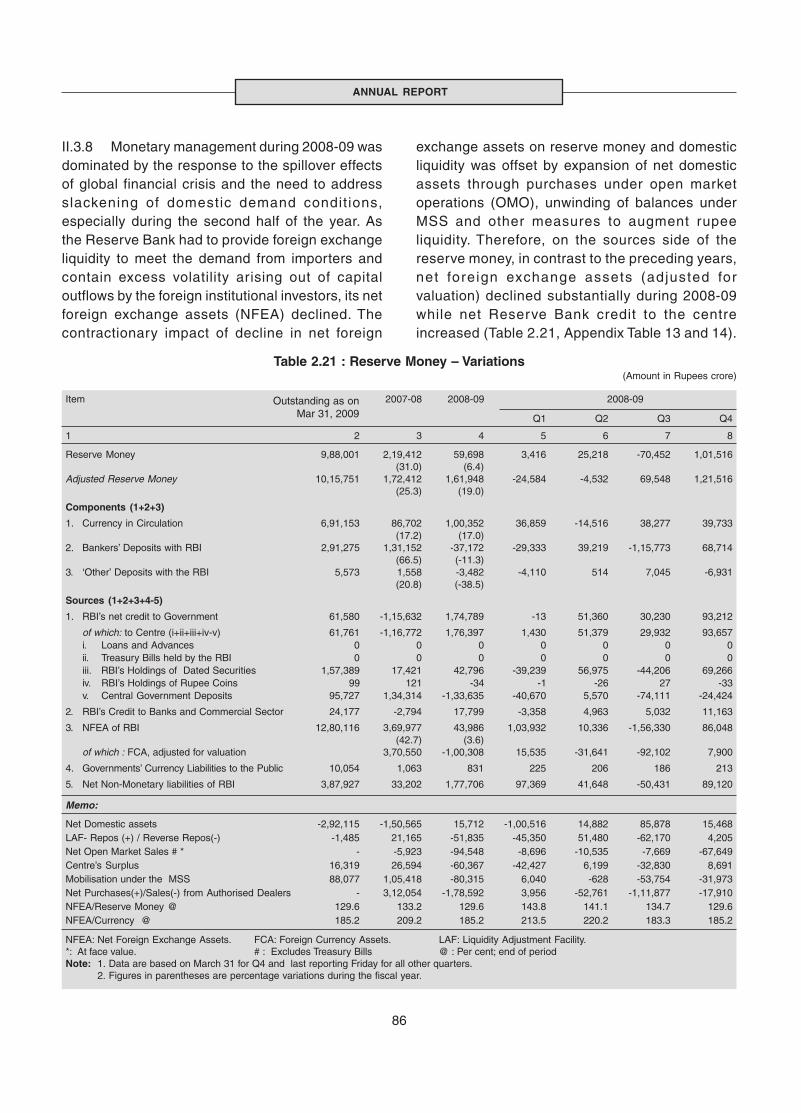
86
ANNUAL REPORT
II.3.8 Monetary management during 2008-09 wasdominated by the response to the spillover effectsof global financial crisis and the need to addressslackening of domestic demand condit ions,especially during the second half of the year. Asthe Reserve Bank had to provide foreign exchangeliquidity to meet the demand from importers andcontain excess volatility arising out of capitaloutflows by the foreign institutional investors, its netforeign exchange assets (NFEA) declined. Thecontractionary impact of decline in net foreign
exchange assets on reserve money and domesticliquidity was offset by expansion of net domesticassets through purchases under open marketoperations (OMO), unwinding of balances underMSS and other measures to augment rupeeliquidity. Therefore, on the sources side of thereserve money, in contrast to the preceding years,net foreign exchange assets (adjusted forvaluation) declined substantially during 2008-09while net Reserve Bank credit to the centreincreased (Table 2.21, Appendix Table 13 and 14).
Table 2.21 : Reserve Money – Variations(Amount in Rupees crore)
Item 2007-08 2008-09 2008-09
Q1 Q2 Q3 Q4
1 2 3 4 5 6 7 8
Reserve Money 9,88,001 2,19,412 59,698 3,416 25,218 -70,452 1,01,516(31.0) (6.4)
Adjusted Reserve Money 10,15,751 1,72,412 1,61,948 -24,584 -4,532 69,548 1,21,516(25.3) (19.0)
Components (1+2+3)
1. Currency in Circulation 6,91,153 86,702 1,00,352 36,859 -14,516 38,277 39,733(17.2) (17.0)
2. Bankers’ Deposits with RBI 2,91,275 1,31,152 -37,172 -29,333 39,219 -1,15,773 68,714(66.5) (-11.3)
3. ‘Other’ Deposits with the RBI 5,573 1,558 -3,482 -4,110 514 7,045 -6,931(20.8) (-38.5)
Sources (1+2+3+4-5)
1. RBI’s net credit to Government 61,580 -1,15,632 1,74,789 -13 51,360 30,230 93,212
of which: to Centre (i+ii+iii+iv-v) 61,761 -1,16,772 1,76,397 1,430 51,379 29,932 93,657i. Loans and Advances 0 0 0 0 0 0 0ii. Treasury Bills held by the RBI 0 0 0 0 0 0 0iii. RBI’s Holdings of Dated Securities 1,57,389 17,421 42,796 -39,239 56,975 -44,206 69,266iv. RBI’s Holdings of Rupee Coins 99 121 -34 -1 -26 27 -33v. Central Government Deposits 95,727 1,34,314 -1,33,635 -40,670 5,570 -74,111 -24,424
2. RBI’s Credit to Banks and Commercial Sector 24,177 -2,794 17,799 -3,358 4,963 5,032 11,163
3. NFEA of RBI 12,80,116 3,69,977 43,986 1,03,932 10,336 -1,56,330 86,048(42.7) (3.6)
of which : FCA, adjusted for valuation 3,70,550 -1,00,308 15,535 -31,641 -92,102 7,900
4. Governments’ Currency Liabilities to the Public 10,054 1,063 831 225 206 186 213
5. Net Non-Monetary liabilities of RBI 3,87,927 33,202 1,77,706 97,369 41,648 -50,431 89,120
Memo:
Net Domestic assets -2,92,115 -1,50,565 15,712 -1,00,516 14,882 85,878 15,468LAF- Repos (+) / Reverse Repos(-) -1,485 21,165 -51,835 -45,350 51,480 -62,170 4,205Net Open Market Sales # * - -5,923 -94,548 -8,696 -10,535 -7,669 -67,649Centre’s Surplus 16,319 26,594 -60,367 -42,427 6,199 -32,830 8,691Mobilisation under the MSS 88,077 1,05,418 -80,315 6,040 -628 -53,754 -31,973Net Purchases(+)/Sales(-) from Authorised Dealers - 3,12,054 -1,78,592 3,956 -52,761 -1,11,877 -17,910NFEA/Reserve Money @ 129.6 133.2 129.6 143.8 141.1 134.7 129.6NFEA/Currency @ 185.2 209.2 185.2 213.5 220.2 183.3 185.2
NFEA: Net Foreign Exchange Assets. FCA: Foreign Currency Assets. LAF: Liquidity Adjustment Facility.*: At face value. # : Excludes Treasury Bills @ : Per cent; end of periodNote: 1. Data are based on March 31 for Q4 and last reporting Friday for all other quarters.
2. Figures in parentheses are percentage variations during the fiscal year.
Outstanding as onMar 31, 2009
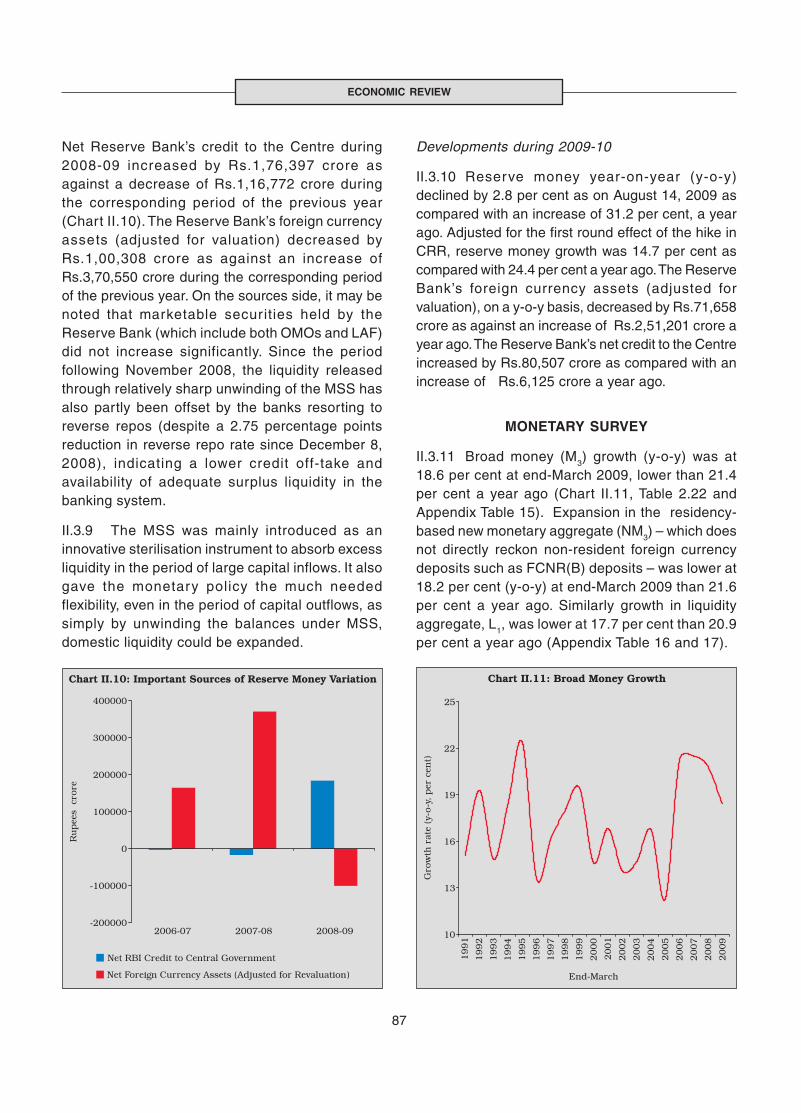
87
ECONOMIC REVIEW
Net Reserve Bank’s credit to the Centre during2008-09 increased by Rs.1,76,397 crore asagainst a decrease of Rs.1,16,772 crore duringthe corresponding period of the previous year(Chart II.10). The Reserve Bank’s foreign currencyassets (adjusted for valuation) decreased byRs.1,00,308 crore as against an increase ofRs.3,70,550 crore during the corresponding periodof the previous year. On the sources side, it may benoted that marketable securities held by theReserve Bank (which include both OMOs and LAF)did not increase significantly. Since the periodfollowing November 2008, the liquidity releasedthrough relatively sharp unwinding of the MSS hasalso partly been offset by the banks resorting toreverse repos (despite a 2.75 percentage pointsreduction in reverse repo rate since December 8,2008), indicating a lower credit off-take andavailability of adequate surplus liquidity in thebanking system.
II.3.9 The MSS was mainly introduced as aninnovative sterilisation instrument to absorb excessliquidity in the period of large capital inflows. It alsogave the monetary policy the much neededflexibility, even in the period of capital outflows, assimply by unwinding the balances under MSS,domestic liquidity could be expanded.
Developments during 2009-10
II.3.10 Reserve money year-on-year (y-o-y)declined by 2.8 per cent as on August 14, 2009 ascompared with an increase of 31.2 per cent, a yearago. Adjusted for the first round effect of the hike inCRR, reserve money growth was 14.7 per cent ascompared with 24.4 per cent a year ago. The ReserveBank’s foreign currency assets (adjusted forvaluation), on a y-o-y basis, decreased by Rs.71,658crore as against an increase of Rs.2,51,201 crore ayear ago. The Reserve Bank’s net credit to the Centreincreased by Rs.80,507 crore as compared with anincrease of Rs.6,125 crore a year ago.
MONETARY SURVEY
II.3.11 Broad money (M3) growth (y-o-y) was at18.6 per cent at end-March 2009, lower than 21.4per cent a year ago (Chart II.11, Table 2.22 andAppendix Table 15). Expansion in the residency-based new monetary aggregate (NM3) – which doesnot directly reckon non-resident foreign currencydeposits such as FCNR(B) deposits – was lower at18.2 per cent (y-o-y) at end-March 2009 than 21.6per cent a year ago. Similarly growth in liquidityaggregate, L1, was lower at 17.7 per cent than 20.9per cent a year ago (Appendix Table 16 and 17).
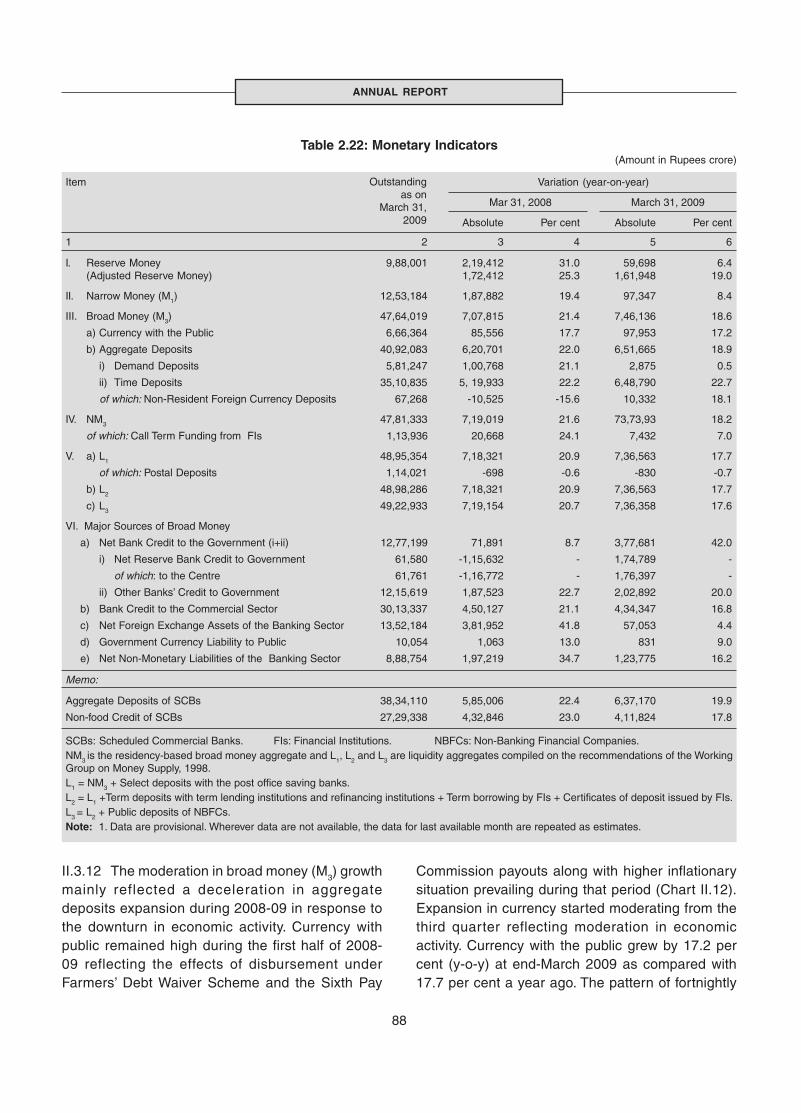
88
ANNUAL REPORT
II.3.12 The moderation in broad money (M3) growthmainly reflected a deceleration in aggregatedeposits expansion during 2008-09 in response tothe downturn in economic activity. Currency withpublic remained high during the first half of 2008-09 reflecting the effects of disbursement underFarmers’ Debt Waiver Scheme and the Sixth Pay
Commission payouts along with higher inflationarysituation prevailing during that period (Chart II.12).Expansion in currency started moderating from thethird quarter reflecting moderation in economicactivity. Currency with the public grew by 17.2 percent (y-o-y) at end-March 2009 as compared with17.7 per cent a year ago. The pattern of fortnightly
Table 2.22: Monetary Indicators(Amount in Rupees crore)
Item Variation (year-on-year)
Mar 31, 2008 March 31, 2009
Absolute Per cent Absolute Per cent
1 2 3 4 5 6
I. Reserve Money 9,88,001 2,19,412 31.0 59,698 6.4(Adjusted Reserve Money) 1,72,412 25.3 1,61,948 19.0
II. Narrow Money (M1) 12,53,184 1,87,882 19.4 97,347 8.4
III. Broad Money (M3) 47,64,019 7,07,815 21.4 7,46,136 18.6
a) Currency with the Public 6,66,364 85,556 17.7 97,953 17.2
b) Aggregate Deposits 40,92,083 6,20,701 22.0 6,51,665 18.9
i) Demand Deposits 5,81,247 1,00,768 21.1 2,875 0.5
ii) Time Deposits 35,10,835 5, 19,933 22.2 6,48,790 22.7
of which: Non-Resident Foreign Currency Deposits 67,268 -10,525 -15.6 10,332 18.1
IV. NM3 47,81,333 7,19,019 21.6 73,73,93 18.2
of which: Call Term Funding from FIs 1,13,936 20,668 24.1 7,432 7.0
V. a) L1 48,95,354 7,18,321 20.9 7,36,563 17.7
of which: Postal Deposits 1,14,021 -698 -0.6 -830 -0.7
b) L2 48,98,286 7,18,321 20.9 7,36,563 17.7
c) L3 49,22,933 7,19,154 20.7 7,36,358 17.6
VI. Major Sources of Broad Money
a) Net Bank Credit to the Government (i+ii) 12,77,199 71,891 8.7 3,77,681 42.0
i) Net Reserve Bank Credit to Government 61,580 -1,15,632 - 1,74,789 -
of which: to the Centre 61,761 -1,16,772 - 1,76,397 -
ii) Other Banks’ Credit to Government 12,15,619 1,87,523 22.7 2,02,892 20.0
b) Bank Credit to the Commercial Sector 30,13,337 4,50,127 21.1 4,34,347 16.8
c) Net Foreign Exchange Assets of the Banking Sector 13,52,184 3,81,952 41.8 57,053 4.4
d) Government Currency Liability to Public 10,054 1,063 13.0 831 9.0
e) Net Non-Monetary Liabilities of the Banking Sector 8,88,754 1,97,219 34.7 1,23,775 16.2
Memo:
Aggregate Deposits of SCBs 38,34,110 5,85,006 22.4 6,37,170 19.9
Non-food Credit of SCBs 27,29,338 4,32,846 23.0 4,11,824 17.8
SCBs: Scheduled Commercial Banks. FIs: Financial Institutions. NBFCs: Non-Banking Financial Companies.NM3 is the residency-based broad money aggregate and L1, L2 and L3 are liquidity aggregates compiled on the recommendations of the WorkingGroup on Money Supply, 1998.L1 = NM3 + Select deposits with the post office saving banks.L2 = L1 +Term deposits with term lending institutions and refinancing institutions + Term borrowing by FIs + Certificates of deposit issued by FIs.L3 = L2 + Public deposits of NBFCs.Note: 1. Data are provisional. Wherever data are not available, the data for last available month are repeated as estimates.
Outstandingas on
March 31,2009
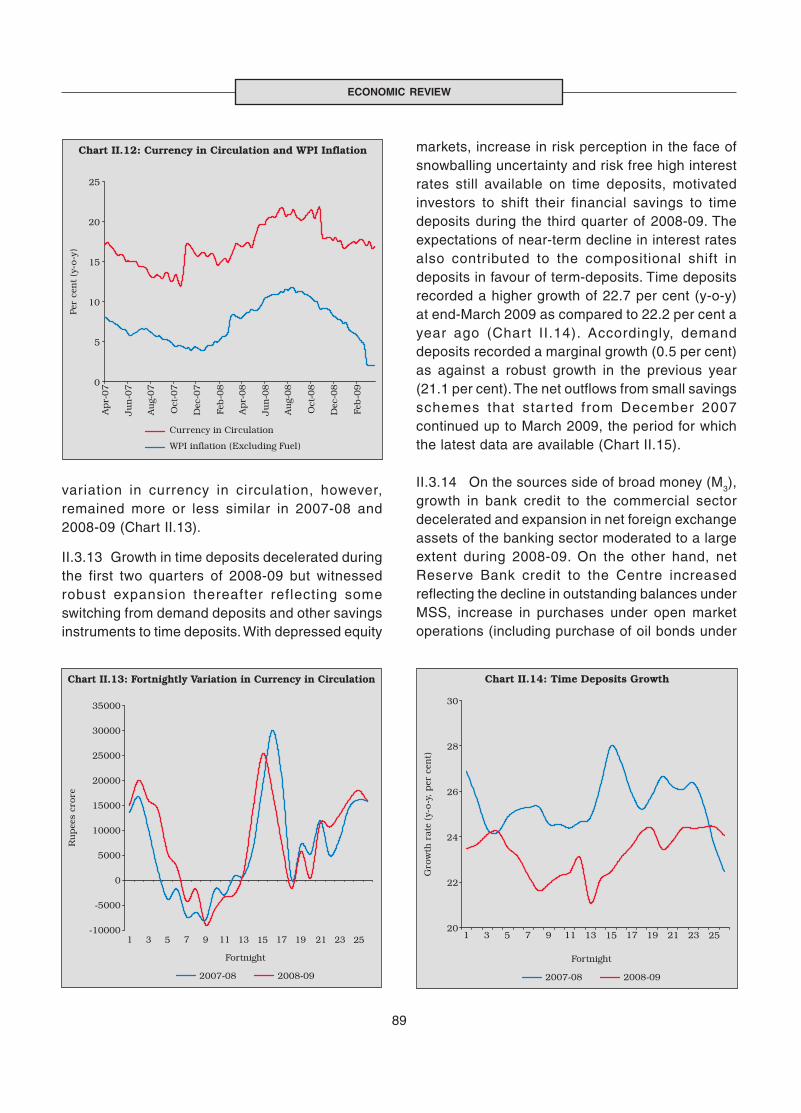
89
ECONOMIC REVIEW
variation in currency in circulation, however,remained more or less similar in 2007-08 and2008-09 (Chart II.13).
II.3.13 Growth in time deposits decelerated duringthe first two quarters of 2008-09 but witnessedrobust expansion thereafter reflecting someswitching from demand deposits and other savingsinstruments to time deposits. With depressed equity
markets, increase in risk perception in the face ofsnowballing uncertainty and risk free high interestrates still available on time deposits, motivatedinvestors to shift their financial savings to timedeposits during the third quarter of 2008-09. Theexpectations of near-term decline in interest ratesalso contributed to the compositional shift indeposits in favour of term-deposits. Time depositsrecorded a higher growth of 22.7 per cent (y-o-y)at end-March 2009 as compared to 22.2 per cent ayear ago (Char t II.14). Accordingly, demanddeposits recorded a marginal growth (0.5 per cent)as against a robust growth in the previous year(21.1 per cent). The net outflows from small savingsschemes that star ted from December 2007continued up to March 2009, the period for whichthe latest data are available (Chart II.15).
II.3.14 On the sources side of broad money (M3),growth in bank credit to the commercial sectordecelerated and expansion in net foreign exchangeassets of the banking sector moderated to a largeextent during 2008-09. On the other hand, netReserve Bank credit to the Centre increasedreflecting the decline in outstanding balances underMSS, increase in purchases under open marketoperations (including purchase of oil bonds under
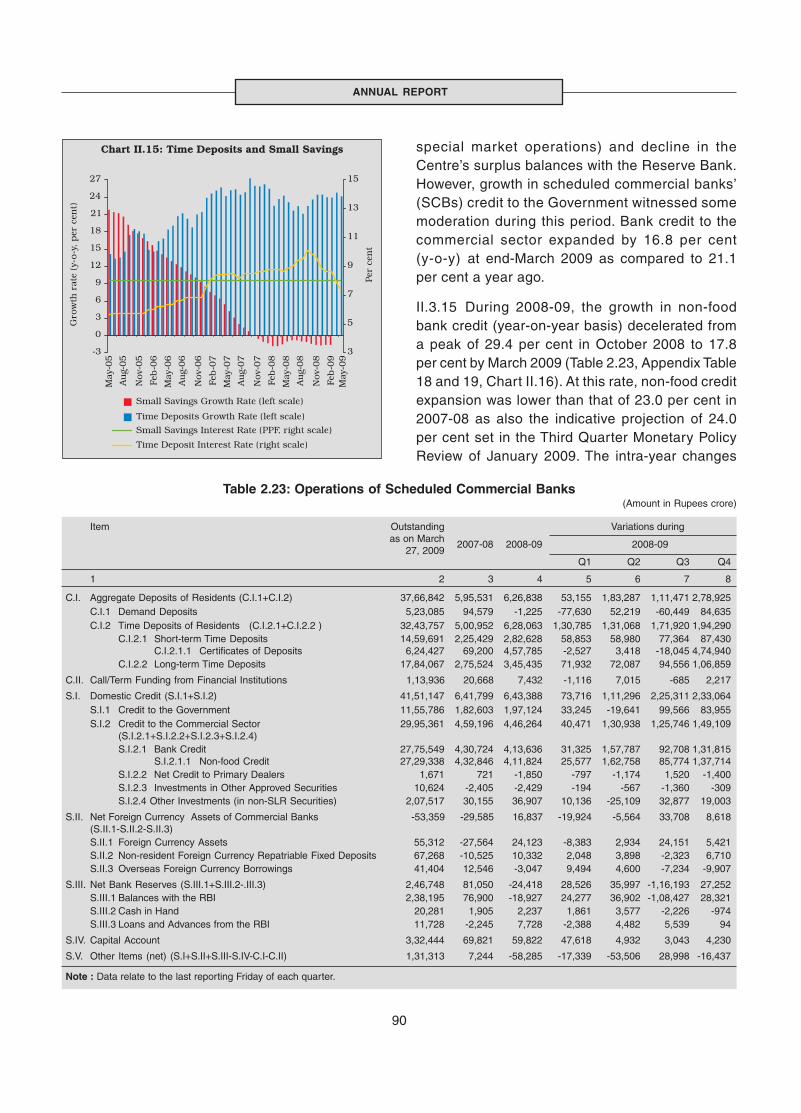
90
ANNUAL REPORT
special market operations) and decline in theCentre’s surplus balances with the Reserve Bank.However, growth in scheduled commercial banks’(SCBs) credit to the Government witnessed somemoderation during this period. Bank credit to thecommercial sector expanded by 16.8 per cent(y-o-y) at end-March 2009 as compared to 21.1per cent a year ago.
II.3.15 During 2008-09, the growth in non-foodbank credit (year-on-year basis) decelerated froma peak of 29.4 per cent in October 2008 to 17.8per cent by March 2009 (Table 2.23, Appendix Table18 and 19, Chart II.16). At this rate, non-food creditexpansion was lower than that of 23.0 per cent in2007-08 as also the indicative projection of 24.0per cent set in the Third Quarter Monetary PolicyReview of January 2009. The intra-year changes
Table 2.23: Operations of Scheduled Commercial Banks(Amount in Rupees crore)
Item Outstanding Variations duringas on March 2007-08 2008-09 2008-09
27, 2009Q1 Q2 Q3 Q4
1 2 3 4 5 6 7 8
C.I. Aggregate Deposits of Residents (C.I.1+C.I.2) 37,66,842 5,95,531 6,26,838 53,155 1,83,287 1,11,471 2,78,925C.I.1 Demand Deposits 5,23,085 94,579 -1,225 -77,630 52,219 -60,449 84,635C.I.2 Time Deposits of Residents (C.I.2.1+C.I.2.2 ) 32,43,757 5,00,952 6,28,063 1,30,785 1,31,068 1,71,920 1,94,290
C.I.2.1 Short-term Time Deposits 14,59,691 2,25,429 2,82,628 58,853 58,980 77,364 87,430C.I.2.1.1 Certificates of Deposits 6,24,427 69,200 4,57,785 -2,527 3,418 -18,045 4,74,940
C.I.2.2 Long-term Time Deposits 17,84,067 2,75,524 3,45,435 71,932 72,087 94,556 1,06,859
C.II. Call/Term Funding from Financial Institutions 1,13,936 20,668 7,432 -1,116 7,015 -685 2,217
S.I. Domestic Credit (S.I.1+S.I.2) 41,51,147 6,41,799 6,43,388 73,716 1,11,296 2,25,311 2,33,064S.I.1 Credit to the Government 11,55,786 1,82,603 1,97,124 33,245 -19,641 99,566 83,955S.I.2 Credit to the Commercial Sector 29,95,361 4,59,196 4,46,264 40,471 1,30,938 1,25,746 1,49,109
(S.I.2.1+S.I.2.2+S.I.2.3+S.I.2.4)S.I.2.1 Bank Credit 27,75,549 4,30,724 4,13,636 31,325 1,57,787 92,708 1,31,815
S.I.2.1.1 Non-food Credit 27,29,338 4,32,846 4,11,824 25,577 1,62,758 85,774 1,37,714S.I.2.2 Net Credit to Primary Dealers 1,671 721 -1,850 -797 -1,174 1,520 -1,400S.I.2.3 Investments in Other Approved Securities 10,624 -2,405 -2,429 -194 -567 -1,360 -309S.I.2.4 Other Investments (in non-SLR Securities) 2,07,517 30,155 36,907 10,136 -25,109 32,877 19,003
S.II. Net Foreign Currency Assets of Commercial Banks -53,359 -29,585 16,837 -19,924 -5,564 33,708 8,618(S.II.1-S.II.2-S.II.3)S.II.1 Foreign Currency Assets 55,312 -27,564 24,123 -8,383 2,934 24,151 5,421S.II.2 Non-resident Foreign Currency Repatriable Fixed Deposits 67,268 -10,525 10,332 2,048 3,898 -2,323 6,710S.II.3 Overseas Foreign Currency Borrowings 41,404 12,546 -3,047 9,494 4,600 -7,234 -9,907
S.III. Net Bank Reserves (S.III.1+S.III.2-.III.3) 2,46,748 81,050 -24,418 28,526 35,997 -1,16,193 27,252S.III.1 Balances with the RBI 2,38,195 76,900 -18,927 24,277 36,902 -1,08,427 28,321S.III.2 Cash in Hand 20,281 1,905 2,237 1,861 3,577 -2,226 -974S.III.3 Loans and Advances from the RBI 11,728 -2,245 7,728 -2,388 4,482 5,539 94
S.IV. Capital Account 3,32,444 69,821 59,822 47,618 4,932 3,043 4,230
S.V. Other Items (net) (S.I+S.II+S.III-S.IV-C.I-C.II) 1,31,313 7,244 -58,285 -17,339 -53,506 28,998 -16,437
Note : Data relate to the last reporting Friday of each quarter.
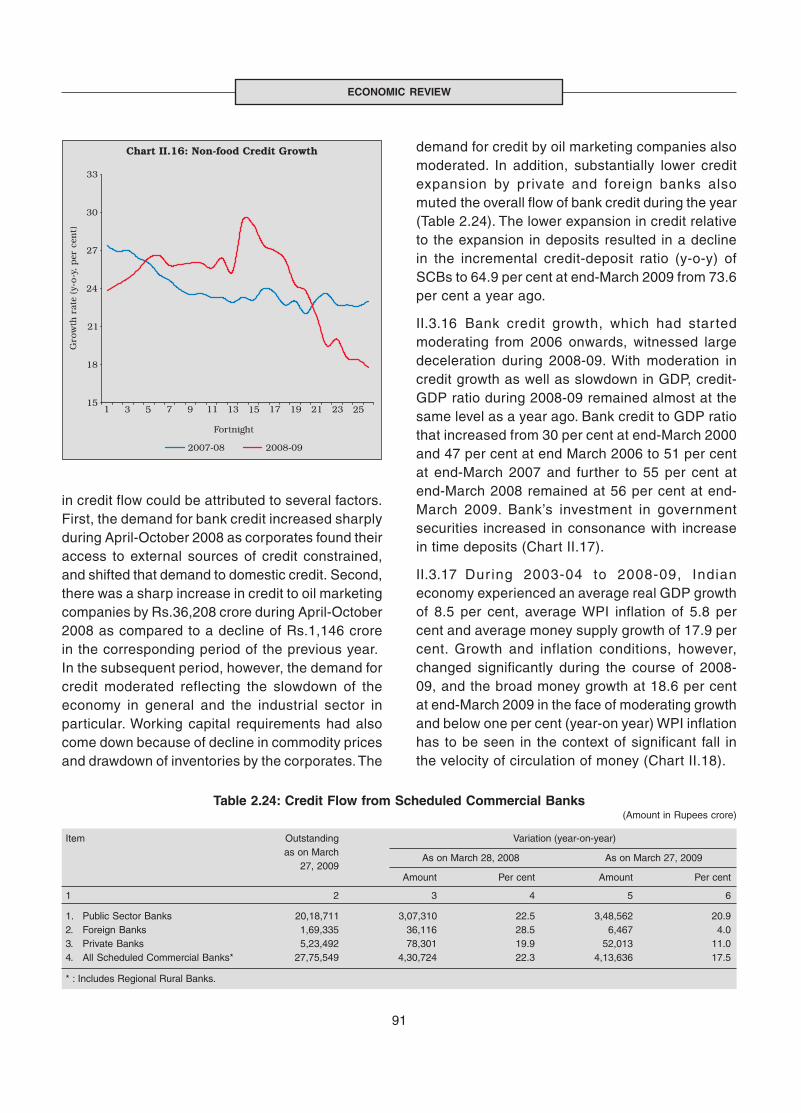
91
ECONOMIC REVIEW
in credit flow could be attributed to several factors.First, the demand for bank credit increased sharplyduring April-October 2008 as corporates found theiraccess to external sources of credit constrained,and shifted that demand to domestic credit. Second,there was a sharp increase in credit to oil marketingcompanies by Rs.36,208 crore during April-October2008 as compared to a decline of Rs.1,146 crorein the corresponding period of the previous year. In the subsequent period, however, the demand forcredit moderated reflecting the slowdown of theeconomy in general and the industrial sector inparticular. Working capital requirements had alsocome down because of decline in commodity pricesand drawdown of inventories by the corporates. The
demand for credit by oil marketing companies alsomoderated. In addition, substantially lower creditexpansion by private and foreign banks alsomuted the overall flow of bank credit during the year(Table 2.24). The lower expansion in credit relativeto the expansion in deposits resulted in a declinein the incremental credit-deposit ratio (y-o-y) ofSCBs to 64.9 per cent at end-March 2009 from 73.6per cent a year ago.
II.3.16 Bank credit growth, which had startedmoderating from 2006 onwards, witnessed largedeceleration during 2008-09. With moderation incredit growth as well as slowdown in GDP, credit-GDP ratio during 2008-09 remained almost at thesame level as a year ago. Bank credit to GDP ratiothat increased from 30 per cent at end-March 2000and 47 per cent at end March 2006 to 51 per centat end-March 2007 and further to 55 per cent atend-March 2008 remained at 56 per cent at end-March 2009. Bank’s investment in governmentsecurities increased in consonance with increasein time deposits (Chart II.17).
II.3.17 Dur ing 2003-04 to 2008-09, Indianeconomy experienced an average real GDP growthof 8.5 per cent, average WPI inflation of 5.8 percent and average money supply growth of 17.9 percent. Growth and inflation conditions, however,changed significantly during the course of 2008-09, and the broad money growth at 18.6 per centat end-March 2009 in the face of moderating growthand below one per cent (year-on year) WPI inflationhas to be seen in the context of significant fall inthe velocity of circulation of money (Chart II.18).
Table 2.24: Credit Flow from Scheduled Commercial Banks(Amount in Rupees crore)
Item Outstanding Variation (year-on-year)as on March As on March 28, 2008 As on March 27, 2009
27, 2009Amount Per cent Amount Per cent
1 2 3 4 5 6
1. Public Sector Banks 20,18,711 3,07,310 22.5 3,48,562 20.92. Foreign Banks 1,69,335 36,116 28.5 6,467 4.03. Private Banks 5,23,492 78,301 19.9 52,013 11.04. All Scheduled Commercial Banks* 27,75,549 4,30,724 22.3 4,13,636 17.5
* : Includes Regional Rural Banks.

92
ANNUAL REPORT
II.3.18 Provisional data on sectoral deployment ofnon-food bank credit indicate deceleration in creditgrowth to services sector and personal loans in2008-09. Credit to commercial real estate continuedto grow fast and its share in total non-food creditalso increased during 2008-09. The share of credit
to agriculture in total non-food credit increased to13.0 per cent during the year (Table 2.25, AppendixTable 20 and 21).
II.3.19 Apart from banks, the commercial sectormobilised resources from a variety of other sources
Table 2.25: Non-food Bank Credit - Sectoral Deployment (Amount in Rupees crore)
Sector/Industry Outstanding Year-on-Year Variationsas on March
2007-08 2008-0927, 2009Absolute Per cent Absolute Per cent
1 2 3 4 5 6
Non-food Gross Bank Credit (1 to 4) 26,02,290 4,01,650 22.3 3,99,400 18.1
1. Agriculture and Allied Activities 3,38,656 44,966 19.5 63,313 23.0
2. Industry (Small, Medium and Large) 10,54,390 1,69,536 24.3 1,87,515 21.6of which: Small Enterprises 2,57,027 76,932 65.2 62,185 31.9
3. Personal Loans 5,62,479 54,730 12.1 54,991 10.8Housing 2,76,957 26,802 11.6 19,165 7.4Advances against Fixed Deposits 48,676 4,170 10.2 3,671 8.2Credit Cards 28,000 8,094 44.2 1,607 6.1Education 28,579 5,324 35.0 8,047 39.2Consumer Durables 8,187 -390 -4.2 -612 -7.0
4. Services 6,46,765 1,32,419 31.5 93,580 16.9Transport Operators 39,302 9,486 33.5 1,484 3.9Professional & Other Services 45,373 3,201 13.4 18,240 67.2Trade 1,44,377 17,059 16.0 20,656 16.7Real Estate Loans 91,575 19,235 43.6 28,261 44.6Non-Banking Financial Companies 98,853 30,094 61.5 19,835 25.1
Note : 1. Data are provisional and relate to select scheduled commercial banks.2. Data also include figures of Bharat Overseas Bank, American Express Bank and State Bank of Saurashtra which were merged with Indian
Overseas Bank, Standard Chartered Bank and State Bank of India, respectively.
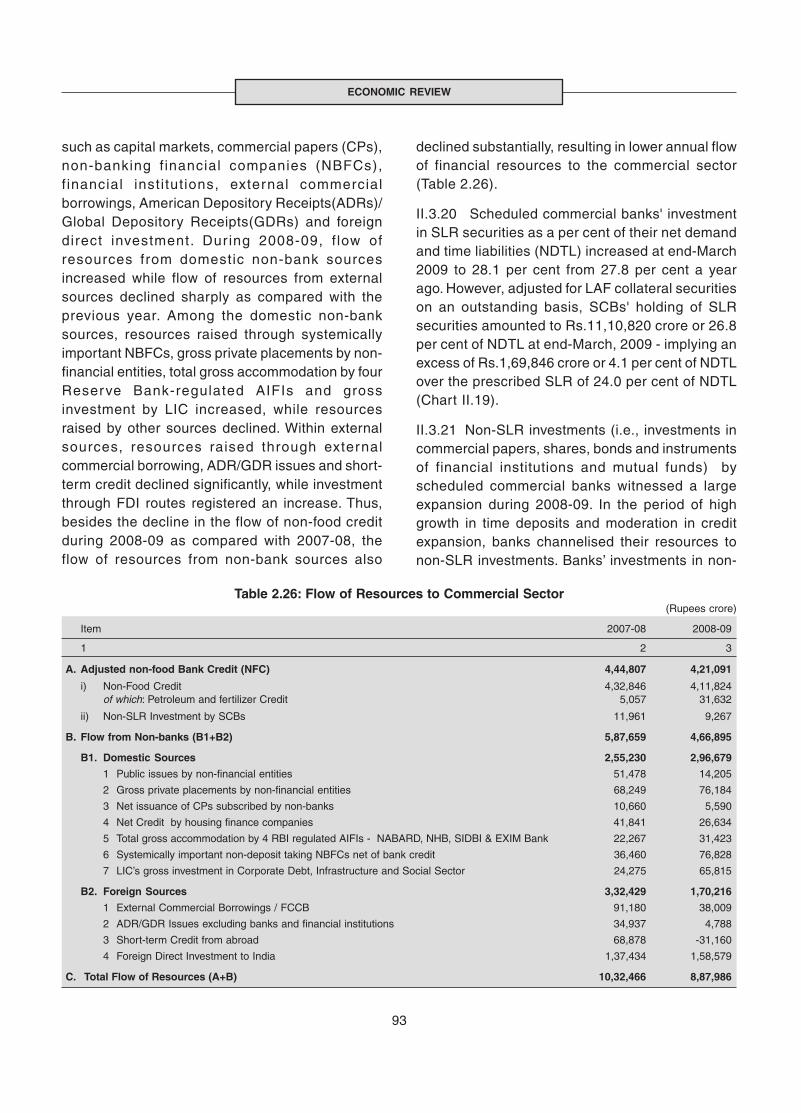
93
ECONOMIC REVIEW
such as capital markets, commercial papers (CPs),non-banking f inancial companies (NBFCs),f inancial insti tut ions, external commercialborrowings, American Depository Receipts(ADRs)/Global Depository Receipts(GDRs) and foreigndirect investment. Dur ing 2008-09, f low ofresources from domestic non-bank sourcesincreased while flow of resources from externalsources declined sharply as compared with theprevious year. Among the domestic non-banksources, resources raised through systemicallyimportant NBFCs, gross private placements by non-financial entities, total gross accommodation by fourReserve Bank-regulated AIFIs and grossinvestment by LIC increased, while resourcesraised by other sources declined. Within externalsources, resources raised through externalcommercial borrowing, ADR/GDR issues and short-term credit declined significantly, while investmentthrough FDI routes registered an increase. Thus,besides the decline in the flow of non-food creditduring 2008-09 as compared with 2007-08, theflow of resources from non-bank sources also
declined substantially, resulting in lower annual flowof financial resources to the commercial sector(Table 2.26).
II.3.20 Scheduled commercial banks' investmentin SLR securities as a per cent of their net demandand time liabilities (NDTL) increased at end-March2009 to 28.1 per cent from 27.8 per cent a yearago. However, adjusted for LAF collateral securitieson an outstanding basis, SCBs' holding of SLRsecurities amounted to Rs.11,10,820 crore or 26.8per cent of NDTL at end-March, 2009 - implying anexcess of Rs.1,69,846 crore or 4.1 per cent of NDTLover the prescribed SLR of 24.0 per cent of NDTL(Chart II.19).
II.3.21 Non-SLR investments (i.e., investments incommercial papers, shares, bonds and instrumentsof financial institutions and mutual funds) byscheduled commercial banks witnessed a largeexpansion during 2008-09. In the period of highgrowth in time deposits and moderation in creditexpansion, banks channelised their resources tonon-SLR investments. Banks’ investments in non-
Table 2.26: Flow of Resources to Commercial Sector(Rupees crore)
Item 2007-08 2008-09
1 2 3
A. Adjusted non-food Bank Credit (NFC) 4,44,807 4,21,091
i) Non-Food Credit 4,32,846 4,11,824of which: Petroleum and fertilizer Credit 5,057 31,632
ii) Non-SLR Investment by SCBs 11,961 9,267
B. Flow from Non-banks (B1+B2) 5,87,659 4,66,895
B1. Domestic Sources 2,55,230 2,96,679
1 Public issues by non-financial entities 51,478 14,205
2 Gross private placements by non-financial entities 68,249 76,184
3 Net issuance of CPs subscribed by non-banks 10,660 5,590
4 Net Credit by housing finance companies 41,841 26,634
5 Total gross accommodation by 4 RBI regulated AIFIs - NABARD, NHB, SIDBI & EXIM Bank 22,267 31,423
6 Systemically important non-deposit taking NBFCs net of bank credit 36,460 76,828
7 LIC’s gross investment in Corporate Debt, Infrastructure and Social Sector 24,275 65,815
B2. Foreign Sources 3,32,429 1,70,216
1 External Commercial Borrowings / FCCB 91,180 38,009
2 ADR/GDR Issues excluding banks and financial institutions 34,937 4,788
3 Short-term Credit from abroad 68,878 -31,160
4 Foreign Direct Investment to India 1,37,434 1,58,579
C. Total Flow of Resources (A+B) 10,32,466 8,87,986
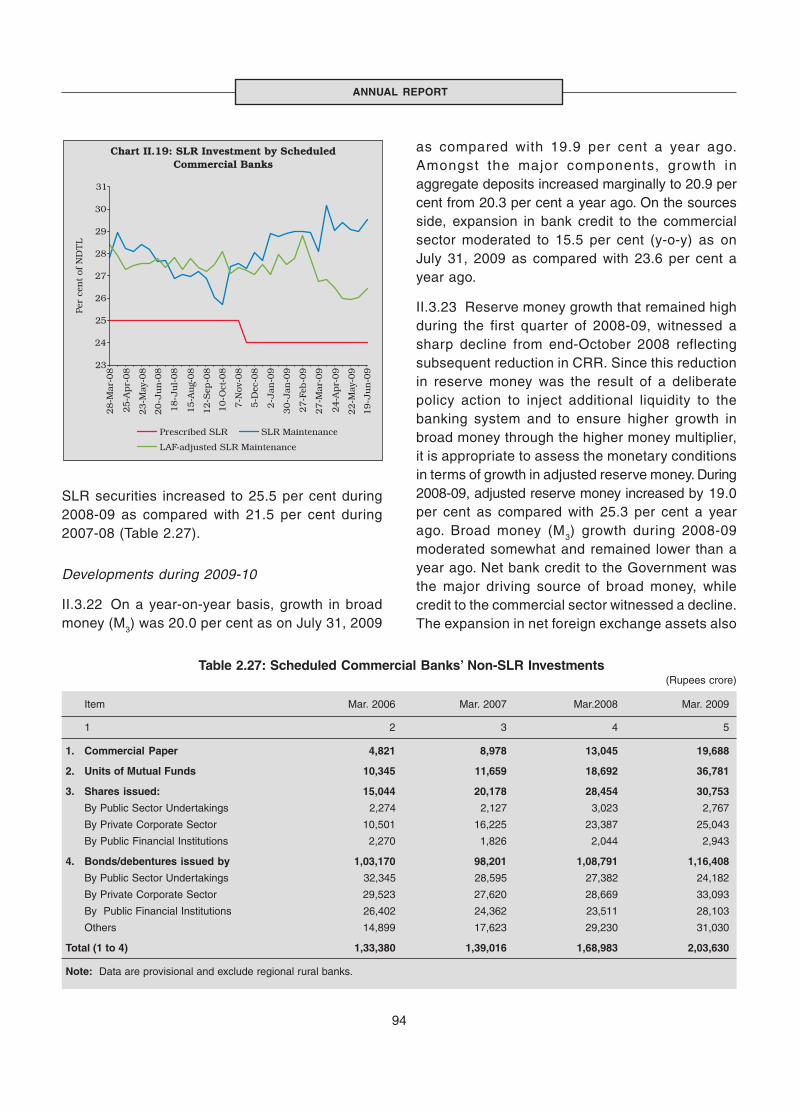
94
ANNUAL REPORT
Table 2.27: Scheduled Commercial Banks’ Non-SLR Investments(Rupees crore)
Item Mar. 2006 Mar. 2007 Mar.2008 Mar. 2009
1 2 3 4 5
1. Commercial Paper 4,821 8,978 13,045 19,688
2. Units of Mutual Funds 10,345 11,659 18,692 36,781
3. Shares issued: 15,044 20,178 28,454 30,753
By Public Sector Undertakings 2,274 2,127 3,023 2,767
By Private Corporate Sector 10,501 16,225 23,387 25,043
By Public Financial Institutions 2,270 1,826 2,044 2,943
4. Bonds/debentures issued by 1,03,170 98,201 1,08,791 1,16,408
By Public Sector Undertakings 32,345 28,595 27,382 24,182
By Private Corporate Sector 29,523 27,620 28,669 33,093
By Public Financial Institutions 26,402 24,362 23,511 28,103
Others 14,899 17,623 29,230 31,030
Total (1 to 4) 1,33,380 1,39,016 1,68,983 2,03,630
Note: Data are provisional and exclude regional rural banks.
SLR securities increased to 25.5 per cent during2008-09 as compared with 21.5 per cent during2007-08 (Table 2.27).
Developments during 2009-10
II.3.22 On a year-on-year basis, growth in broadmoney (M3) was 20.0 per cent as on July 31, 2009
as compared with 19.9 per cent a year ago.Amongst the major components, growth inaggregate deposits increased marginally to 20.9 percent from 20.3 per cent a year ago. On the sourcesside, expansion in bank credit to the commercialsector moderated to 15.5 per cent (y-o-y) as onJuly 31, 2009 as compared with 23.6 per cent ayear ago.
II.3.23 Reserve money growth that remained highduring the first quarter of 2008-09, witnessed asharp decline from end-October 2008 reflectingsubsequent reduction in CRR. Since this reductionin reserve money was the result of a deliberatepolicy action to inject additional liquidity to thebanking system and to ensure higher growth inbroad money through the higher money multiplier,it is appropriate to assess the monetary conditionsin terms of growth in adjusted reserve money. During2008-09, adjusted reserve money increased by 19.0per cent as compared with 25.3 per cent a yearago. Broad money (M3) growth during 2008-09moderated somewhat and remained lower than ayear ago. Net bank credit to the Government wasthe major driving source of broad money, whilecredit to the commercial sector witnessed a decline.The expansion in net foreign exchange assets also

95
ECONOMIC REVIEW
witnessed a decline. Commercial banks' investmentin non-SLR securities expanded. Besides thedecline in non-food credit, flow of non-bankresources to commercial sector during 2008-09also declined as compared with 2007-08.
PRICE SITUATION
II.3.24 The significant volatility in inflation that waswitnessed in India during the course of 2008-09 isunprecedented, and different contrasting phaseswithin the year had different dynamics in terms ofthe underlying factors explaining the inflationprocess, posing equally contrasting policychallenges. The external and supply side factorshad a dominant role during the first phase ofaccelerating inflation to double digit level as wellas during the subsequent sharp slowing down tobelow one per cent by the end of the fiscal year.Mirroring global trends, WPI inflation in India
reached an intra-year peak of 12.9 per cent inAugust 2008 but declined subsequently to 0.8 percent by end-March 2009. Accordingly, the monetarypolicy stance of the Reserve Bank during the firsthalf of 2008-09 was primarily conditioned by theurgency to contain inflationary expectations,whereas in the second half, fading inflationconcerns allowed the balance of policy focus toclearly shift towards preventing deceleration ingrowth and preserving orderly conditions in thefinancial markets.
Global Inflationary Conditions and MonetaryPolicy Responses
II.3.25 Inflation pressures across the globe, whichbegan to firm up during the second half of 2007-08,magnified during the first half of 2008-09, largelydriven by the increase in international commoditypr ices (Char t I I .20). Though the advanced
96
ANNUAL REPORT
economies had star ted to exper ience somemoderation in aggregate demand pressures duringthe first half of 2008-09 itself, following the graduallyunfolding ramifications of the sub-prime crisis,sustained pressures from international commodityprices kept the headline inflation rising to higherlevels. Emerging market economies, on the otherhand, witnessed inflationary pressures not onlyfrom the increasing international commodity pricesbut also from the demand pressures following theirstronger growth. The inflationary impact of higherfood and fuel commodities in the internationalmarket, though, was much higher in emergingmarket economies as compared to the advancedeconomies, as food and fuel items have higherweights in the consumption baskets in the case ofemerging economies. Most countries that operatewith inflation targeting frameworks also witnessedtheir headline inflation diverging significantly fromthe targets during the first half of 2008-09.
II.3.26 The monetary policy responses to emerginginflationary pressures during the first half of 2008-09 were mixed in view of growth implications of anti-inflationary monetary policy stance, in the face ofgrowing concerns of growth deceleration onaccount of the snowballing effects of the globalfinancial crisis. Most central banks in advancedeconomies were faced with the difficult trade-offarising from the combination of slowing economicactivity and heightened inflationary pressures.Central banks of the developed countries such asthe US, the UK and Canada, which had reducedpolicy rate in early 2008, paused subsequently. Onthe other hand, many central banks in emergingeconomies continued with pre-emptive monetarytightening to contain inflation and inflationaryexpectations up to September 2008, as the generalperception till that time was that the impact of theUS sub-prime crisis on the real economy of mostdeveloping countries could be minimal.
II.3.27 Inflationary pressures star ted abatingsignificantly in major economies from August 2008as international commodity prices declined sharplyunder the pressure of contracting global demand.
The decline in inflation during the second half of2008-09 in the advanced economies turned out tobe much sharper than in the emerging economies,reflecting the more serious contraction in demandin advanced economies. Moreover, as the emergingeconomies had taken specific measures to limit thefull pass-through of international commodity andfood pr ices to domestic inflation during theincreasing phase of international commodity prices,the significant decline in international commodityprices also correspondingly did not translate intoan equal decline in domestic inflationary pressuresin the developing countries. Contrary to earlierperceptions about possible decoupling, however,emerging/developing countries also faced almostthe same combination of outcome in terms ofslowing growth alongside minimal inflation risk,which significantly widened the scope for adoptionof easy monetary policy stance. Monetary policyconcerns during the second half of 2008-09, thus,were largely oriented towards mitigating theadverse impact of global f inancial cr isis oneconomic growth and employment. Hence, mostcentral banks in developed as well as emergingeconomies reduced their policy rates substantiallysince September 2008 (Table 2.28).
II.3.28 One of the major challenges that mostcentral banks encountered during 2008-09 was thesharp volatility in inflation experienced within oneyear. The volatility, as measured by coefficient ofvariation, which was declining since 2003 increasedsignificantly from 2007 onwards. It could also beseen that the volatility in inflation has been muchhigher in advanced economies as compared toemerging economies (Chart II.21), notwithstandingthe fact that inflation rates in emerging economieshave been consistently above the levelsexperienced in advanced economies.
II.3.29 As inflation fell to near zero levels, andeven entered the negative zone temporarily, therewas a growing concern about policy options to dealwith deflation. Deflation could pose severechallenges to the scope and effectiveness ofmonetary policy. The policy rates in many advanced

97
ECONOMIC REVIEW
Table 2.28: Global Inflation Indicators(Per cent)
Country/ Region Key Policy Rate Policy Rate Changes in Policy Rates CPI Inflation(As on Aug. 20, 2009) (basis points) (y-o-y)
Mar 08- Sept 08- Since end- Jul. Mar. Jul.Sept 08 Mar 09 Mar 09 2008 2009 2009
1 2 3 4 5 6 7 8 9
Developed economies Australia Cash Rate 3.00 (Apr.8, 2009) 25 (-) 400 (-) 25 4.5 Q2 2.5 Q1 1.5 Q2
Canada Overnight Rate 0.25 (Apr.21, 2009) (-)100 (-) 250 (-) 25 3.4 1.2 -0.9Euro area Interest Rate on Main 1.00 (May 13, 2009) 25 (-) 275 (-) 50 4.0 0.6 -0.6
Refinancing OperationsJapan Uncollateralised Overnight 0.10 (Dec.19, 2008) 0 (-) 40 0 2.0 * -0.3 -1.8 *
Call RateUK Official Bank Rate 0.50 (Mar. 5, 2009) (-)25 (-) 450 0 4.4 2.9 1.8US Federal Funds Rate 0.00 to 0.25 (Dec.16, 2008) (-)25 (-) 200 0 5.6 -0.4 -2.1
Developing economies Brazil Selic Rate 8.75 (July 23, 2009) 250 (-) 250 (-) 250 6.4 5.6 4.5India Reverse Repo Rate 3.25 (Apr. 21, 2009) 0 (-) 250 (-) 25 7.7 * 8.0 9.3 *
Repo Rate 4.75 (Apr. 21, 2009) 125 (-) 400 (-) 25(150) (-) 400 0
China Benchmark 1-year Lending Rate 5.31 (Dec. 23, 2008) 0 (-) 216 0 6.3 -1.2 -1.8 (200) (-300) 0
Indonesia Bank Indonesia (BI) Rate 6.50 (Aug. 5, 2009) 100 (-) 150 (-) 125 11.9 7.9 -2.7Israel Key Rate 0.50 (Apr.1, 2009) 50 (-) 350 (-) 25 4.8 3.6 3.5Korea Base Rate 2.00 (Feb. 12, 2009) 25 (-) 325 0 5.9 3.9 1.6Philippines Reverse Repo Rate 4.00 (July 9, 2009) 100 (-) 125 (-) 75 12.3 6.4 0.2Russia Refinancing Rate 10.75 (Aug. 10, 2009) 50 200 (-) 225 14.7 14.0 12.0South Africa Repo Rate 7.00 (Aug. 4, 2009) 100 (-) 250 (-) 250 12.2 * 8.5 6.9 *Thailand 1-day Repurchase Rate 1.25 (Apr. 8, 2009) 50 (-) 225 (-) 25 9.2 -0.2 -4.4
* : June.Note : 1. For India, data on inflation pertain to CPI for Industrial Workers.
2. Figures in parentheses in column (3) indicate the dates when the policy rates were last revised. 3. Figures in parentheses in column (4)indicate the variation in the cash reserve ratios during the period.
Source : International Monetary Fund, websites of respective central banks and The Economist.
countries having already been brought down tonear zero levels, persistence of deflationaryconditions could imply that the monetary policymay not ensure required reduction in the realinterest rate that may be necessary to contestdeflationary head winds. If deflationary symptomspersist, they could give rise to even more seriousdebt-deflation i.e., an increase in debt burden inreal terms. This could trigger widespread defaultsand further amplify the negative causal feedbackrunning from the real economy to the financialsector, which, over time could mutually reinforceeach other to increase the intensity of the crisis.The real policy rate in most countr ies havedeclined since September 2008 (excluding a few),indicating the aggressive monetary easing stanceadopted by central banks (Table 2.29).

98
ANNUAL REPORT
Table 2.29: Nominal and Real Policy Rates : Select Countries(Per cent)
Country Nominal Policy Rate Real Policy Rate
March 2008 Sept. 2008 March 2009 March 2008 Sept. 2008 March 2009
1 2 3 4 5 6 7
Developed EconomiesUS 2.25 2.00 0.25 -1.75 -2.90 0.05UK 5.25 5.00 0.50 2.75 0.20 -2.50Euro area 4.00 4.25 1.50 0.40 0.65 0.30
Developing EconomiesBrazil 11.25 13.75 11.25 6.55 7.45 5.65China 7.47 7.20 5.31 -0.83 2.60 6.91India 7.75 9.00 5.00 -0.15 -0.80 -3.00
(0.00) (-3.10) (4.16)Indonesia 8.00 9.25 7.75 1.70 -2.85 -0.15Israel 3.75 4.25 0.75 0.05 -1.25 -2.85Korea 5.00 5.25 2.00 1.10 0.15 -1.90Phillipines 5.00 6.00 4.75 -1.40 -5.90 -1.65Russia 10.25 11.00 13.00 -3.05 -5.10 -1.00South Africa 11.00 12.00 9.50 0.40 -1.10 0.90Thailand 3.25 3.75 1.50 -2.05 -2.25 1.70
Note : 1. Real policy rate is the policy rate less year-on-year consumer price inflation. For India, repo rate is taken as the policy rate, while inflation refersto that for CPI-Industrial Workers.
2. Figures in parentheses for India are based on wholesale price inflation.Source : International Monetary Fund, The Economist and official websites of respective central banks.
Table 2.30: International Commodity Prices
Commodity Unit 2004 Index (2004=100) Variation (Per cent)Market 2005 2006 2007 2008-09 Mar.09 Mar.09
Price over overMar. Jun. Sep. Dec Mar Mar. 08 Jul.08
1 2 3 4 5 6 7 8 9 10 11 12 13
EnergyCoal $/mt 53.0 90 93 124 223 302 283 149 115 -48.4 -66.1Crude oil (Average) $/bbl 37.7 142 170 188 270 349 264 110 124 -54.2 -64.9
Non-Energy CommoditiesPalm oil $/mt 471.3 90 101 165 265 257 164 107 127 -52.2 -47.1Soybean oil $/mt 616.0 88 97 143 240 250 199 120 118 -50.9 -52.0Soybeans $/mt 306.5 90 88 125 188 203 166 117 123 -34.3 -40.4Rice $/mt 237.7 120 128 137 250 318 288 224 247 -1.0 -19.6Wheat $/mt 156.9 97 122 163 280 222 188 140 147 -47.5 -29.6Maize $/mt 111.8 88 109 146 210 257 209 142 147 -29.8 -38.0Sugar c/kg 15.8 138 206 141 184 169 189 164 187 1.5 -5.8Cotton A Index c/kg 136.6 89 93 102 129 124 119 90 83 -35.8 -33.4Aluminium $/mt 1716.0 111 150 154 175 172 147 87 78 -55.5 -56.5Copper $/mt 2866.0 128 235 248 294 288 244 107 131 -55.6 -55.4Gold $/toz 409.2 109 148 170 237 217 203 199 226 -4.6 -1.6Silver c/toz 669.0 110 173 200 287 255 182 154 196 -31.8 -27.4Steel cold-rolled coilsheet $/mt 607.1 121 114 107 132 181 181 181 148 12.5 -18.2Steel hot-rolled coilsheet $/mt 502.5 126 119 109 149 199 199 199 159 6.7 -20.0Tin c/kg 851.3 87 103 171 233 261 216 132 125 -46.1 -53.9Zinc c/kg 104.8 132 313 309 240 181 166 105 116 -51.5 -34.3
$ : US dollar. c : US cent. bbl : barrel. mt : metric tonne. kg : Kilogram. toz : troy oz.Source: Based on World Bank’s actual commodity price data. The year 2004 has been taken as the base to better exhibit price trends over the relevant period.
Global Commodity Prices
II.3.30 During 2008-09, international commodityprices witnessed sharp increases up to July 2008,
but declined thereafter at a fast pace (Table 2.30and Chart II.22).
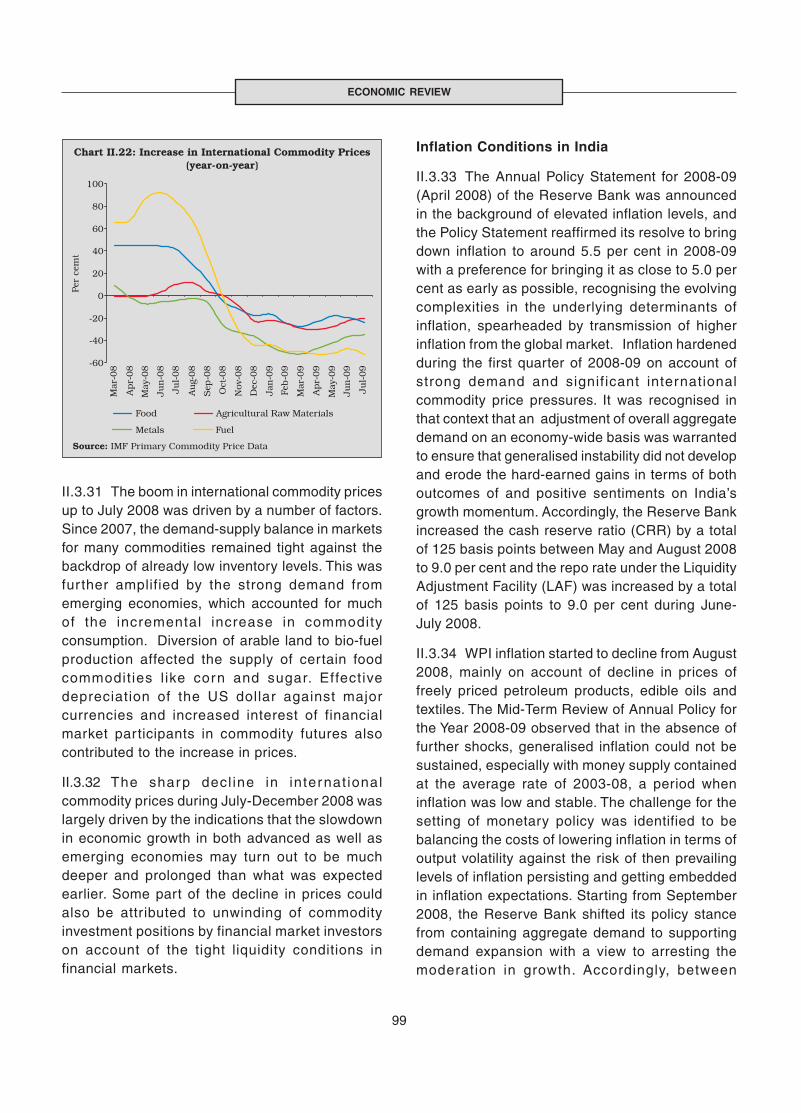
99
ECONOMIC REVIEW
II.3.31 The boom in international commodity pricesup to July 2008 was driven by a number of factors.Since 2007, the demand-supply balance in marketsfor many commodities remained tight against thebackdrop of already low inventory levels. This wasfur ther amplified by the strong demand fromemerging economies, which accounted for muchof the incremental increase in commodityconsumption. Diversion of arable land to bio-fuelproduction affected the supply of certain foodcommodit ies l ike corn and sugar. Effectivedepreciation of the US dollar against majorcurrencies and increased interest of financialmarket participants in commodity futures alsocontributed to the increase in prices.
II.3.32 The sharp decl ine in internat ionalcommodity prices during July-December 2008 waslargely driven by the indications that the slowdownin economic growth in both advanced as well asemerging economies may turn out to be muchdeeper and prolonged than what was expectedearlier. Some part of the decline in prices couldalso be attributed to unwinding of commodityinvestment positions by financial market investorson account of the tight liquidity conditions infinancial markets.
Inflation Conditions in India
II.3.33 The Annual Policy Statement for 2008-09(April 2008) of the Reserve Bank was announcedin the background of elevated inflation levels, andthe Policy Statement reaffirmed its resolve to bringdown inflation to around 5.5 per cent in 2008-09with a preference for bringing it as close to 5.0 percent as early as possible, recognising the evolvingcomplexities in the underlying determinants ofinflation, spearheaded by transmission of higherinflation from the global market. Inflation hardenedduring the first quarter of 2008-09 on account ofstrong demand and significant internationalcommodity price pressures. It was recognised inthat context that an adjustment of overall aggregatedemand on an economy-wide basis was warrantedto ensure that generalised instability did not developand erode the hard-earned gains in terms of bothoutcomes of and positive sentiments on India’sgrowth momentum. Accordingly, the Reserve Bankincreased the cash reserve ratio (CRR) by a totalof 125 basis points between May and August 2008to 9.0 per cent and the repo rate under the LiquidityAdjustment Facility (LAF) was increased by a totalof 125 basis points to 9.0 per cent during June-July 2008.
II.3.34 WPI inflation started to decline from August2008, mainly on account of decline in prices offreely priced petroleum products, edible oils andtextiles. The Mid-Term Review of Annual Policy forthe Year 2008-09 observed that in the absence offurther shocks, generalised inflation could not besustained, especially with money supply containedat the average rate of 2003-08, a period wheninflation was low and stable. The challenge for thesetting of monetary policy was identified to bebalancing the costs of lowering inflation in terms ofoutput volatility against the risk of then prevailinglevels of inflation persisting and getting embeddedin inflation expectations. Starting from September2008, the Reserve Bank shifted its policy stancefrom containing aggregate demand to supportingdemand expansion with a view to arresting themoderation in growth. Accordingly, between
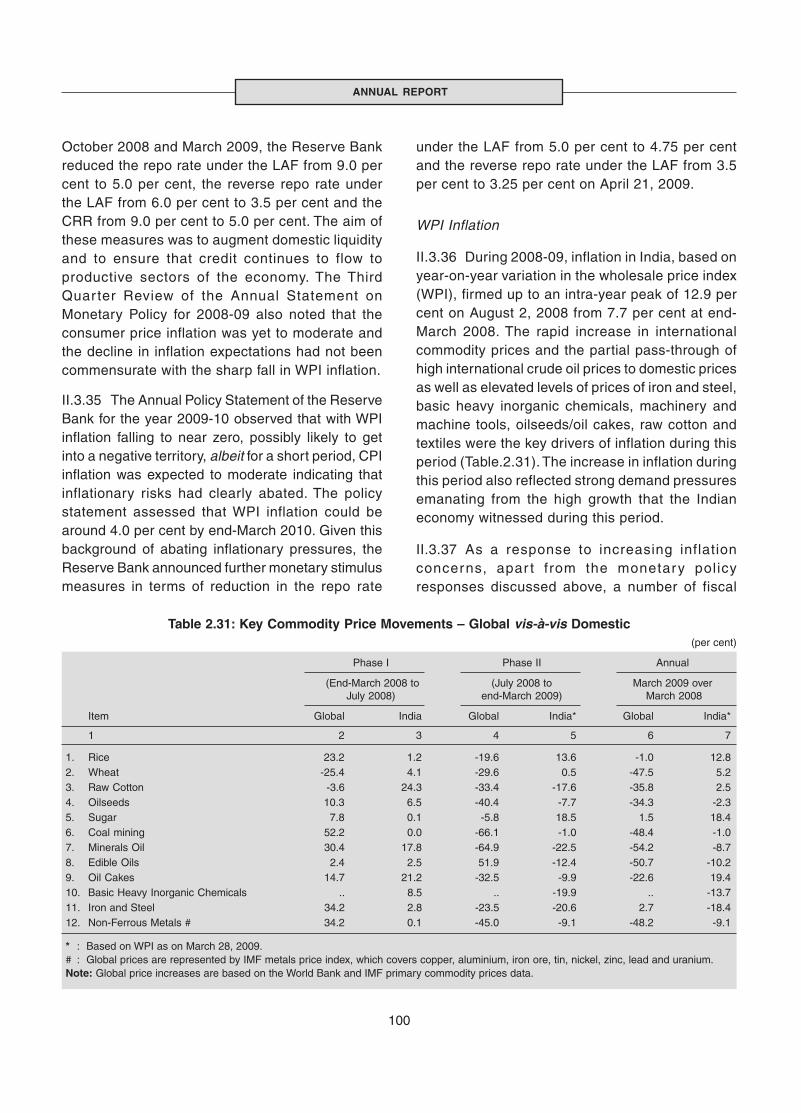
100
ANNUAL REPORT
October 2008 and March 2009, the Reserve Bankreduced the repo rate under the LAF from 9.0 percent to 5.0 per cent, the reverse repo rate underthe LAF from 6.0 per cent to 3.5 per cent and theCRR from 9.0 per cent to 5.0 per cent. The aim ofthese measures was to augment domestic liquidityand to ensure that credit continues to flow toproductive sectors of the economy. The ThirdQuar ter Review of the Annual Statement onMonetary Policy for 2008-09 also noted that theconsumer price inflation was yet to moderate andthe decline in inflation expectations had not beencommensurate with the sharp fall in WPI inflation.
II.3.35 The Annual Policy Statement of the ReserveBank for the year 2009-10 observed that with WPIinflation falling to near zero, possibly likely to getinto a negative territory, albeit for a short period, CPIinflation was expected to moderate indicating thatinflationary risks had clearly abated. The policystatement assessed that WPI inflation could bearound 4.0 per cent by end-March 2010. Given thisbackground of abating inflationary pressures, theReserve Bank announced further monetary stimulusmeasures in terms of reduction in the repo rate
under the LAF from 5.0 per cent to 4.75 per centand the reverse repo rate under the LAF from 3.5per cent to 3.25 per cent on April 21, 2009.
WPI Inflation
II.3.36 During 2008-09, inflation in India, based onyear-on-year variation in the wholesale price index(WPI), firmed up to an intra-year peak of 12.9 percent on August 2, 2008 from 7.7 per cent at end-March 2008. The rapid increase in internationalcommodity prices and the partial pass-through ofhigh international crude oil prices to domestic pricesas well as elevated levels of prices of iron and steel,basic heavy inorganic chemicals, machinery andmachine tools, oilseeds/oil cakes, raw cotton andtextiles were the key drivers of inflation during thisperiod (Table.2.31). The increase in inflation duringthis period also reflected strong demand pressuresemanating from the high growth that the Indianeconomy witnessed during this period.
II.3.37 As a response to increasing inflationconcerns, apar t from the monetary policyresponses discussed above, a number of fiscal
Table 2.31: Key Commodity Price Movements – Global vis-à-vis Domestic(per cent)
Phase I Phase II Annual
(End-March 2008 to (July 2008 to March 2009 overJuly 2008) end-March 2009) March 2008
Item Global India Global India* Global India*
1 2 3 4 5 6 7
1. Rice 23.2 1.2 -19.6 13.6 -1.0 12.82. Wheat -25.4 4.1 -29.6 0.5 -47.5 5.23. Raw Cotton -3.6 24.3 -33.4 -17.6 -35.8 2.54. Oilseeds 10.3 6.5 -40.4 -7.7 -34.3 -2.35. Sugar 7.8 0.1 -5.8 18.5 1.5 18.46. Coal mining 52.2 0.0 -66.1 -1.0 -48.4 -1.07. Minerals Oil 30.4 17.8 -64.9 -22.5 -54.2 -8.78. Edible Oils 2.4 2.5 51.9 -12.4 -50.7 -10.29. Oil Cakes 14.7 21.2 -32.5 -9.9 -22.6 19.410. Basic Heavy Inorganic Chemicals .. 8.5 .. -19.9 .. -13.711. Iron and Steel 34.2 2.8 -23.5 -20.6 2.7 -18.412. Non-Ferrous Metals # 34.2 0.1 -45.0 -9.1 -48.2 -9.1
* : Based on WPI as on March 28, 2009.# : Global prices are represented by IMF metals price index, which covers copper, aluminium, iron ore, tin, nickel, zinc, lead and uranium.Note: Global price increases are based on the World Bank and IMF primary commodity prices data.
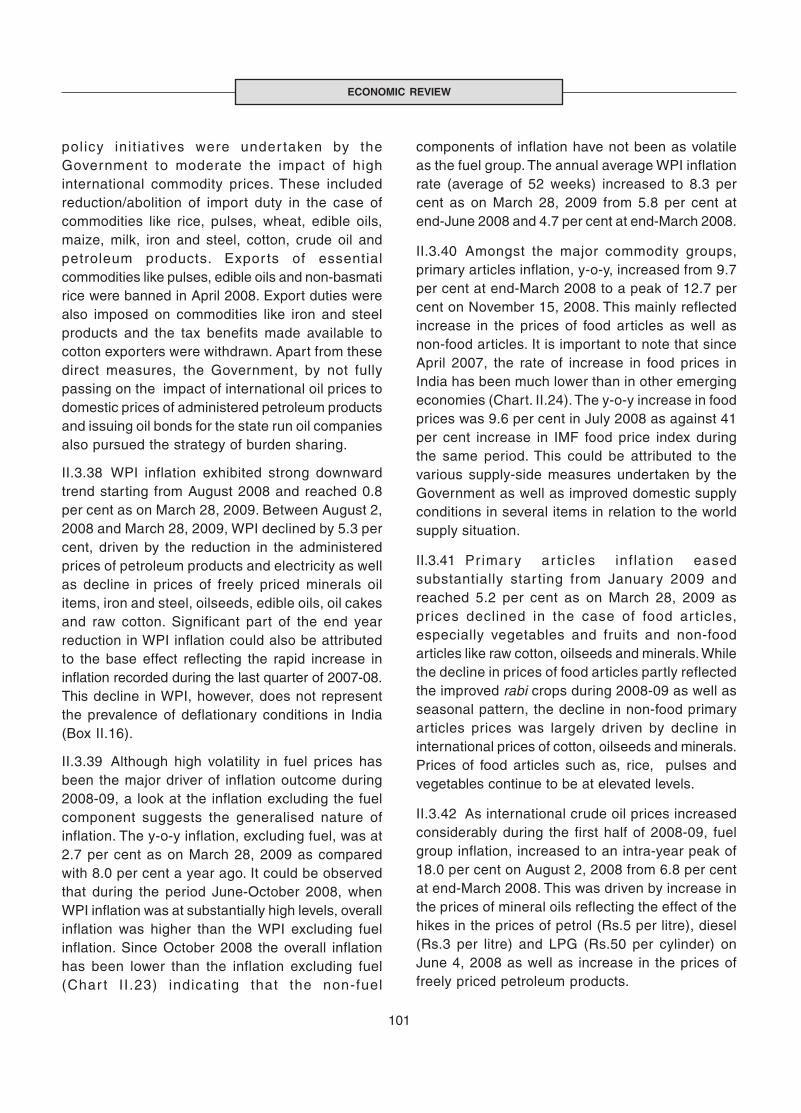
101
ECONOMIC REVIEW
policy init iat ives were under taken by theGovernment to moderate the impact of highinternational commodity prices. These includedreduction/abolition of import duty in the case ofcommodities like rice, pulses, wheat, edible oils,maize, milk, iron and steel, cotton, crude oil andpetroleum products. Expor ts of essentialcommodities like pulses, edible oils and non-basmatirice were banned in April 2008. Export duties werealso imposed on commodities like iron and steelproducts and the tax benefits made available tocotton exporters were withdrawn. Apart from thesedirect measures, the Government, by not fullypassing on the impact of international oil prices todomestic prices of administered petroleum productsand issuing oil bonds for the state run oil companiesalso pursued the strategy of burden sharing.
II.3.38 WPI inflation exhibited strong downwardtrend starting from August 2008 and reached 0.8per cent as on March 28, 2009. Between August 2,2008 and March 28, 2009, WPI declined by 5.3 percent, driven by the reduction in the administeredprices of petroleum products and electricity as wellas decline in prices of freely priced minerals oilitems, iron and steel, oilseeds, edible oils, oil cakesand raw cotton. Significant part of the end yearreduction in WPI inflation could also be attributedto the base effect reflecting the rapid increase ininflation recorded during the last quarter of 2007-08.This decline in WPI, however, does not representthe prevalence of deflationary conditions in India(Box II.16).
II.3.39 Although high volatility in fuel prices hasbeen the major driver of inflation outcome during2008-09, a look at the inflation excluding the fuelcomponent suggests the generalised nature ofinflation. The y-o-y inflation, excluding fuel, was at2.7 per cent as on March 28, 2009 as comparedwith 8.0 per cent a year ago. It could be observedthat during the period June-October 2008, whenWPI inflation was at substantially high levels, overallinflation was higher than the WPI excluding fuelinflation. Since October 2008 the overall inflationhas been lower than the inflation excluding fuel(Char t I I .23) indicating that the non-fuel
components of inflation have not been as volatileas the fuel group. The annual average WPI inflationrate (average of 52 weeks) increased to 8.3 percent as on March 28, 2009 from 5.8 per cent atend-June 2008 and 4.7 per cent at end-March 2008.
II.3.40 Amongst the major commodity groups,primary articles inflation, y-o-y, increased from 9.7per cent at end-March 2008 to a peak of 12.7 percent on November 15, 2008. This mainly reflectedincrease in the prices of food articles as well asnon-food articles. It is important to note that sinceApril 2007, the rate of increase in food prices inIndia has been much lower than in other emergingeconomies (Chart. II.24). The y-o-y increase in foodprices was 9.6 per cent in July 2008 as against 41per cent increase in IMF food price index duringthe same period. This could be attributed to thevarious supply-side measures undertaken by theGovernment as well as improved domestic supplyconditions in several items in relation to the worldsupply situation.
II.3.41 Pr imary ar t icles inf lat ion easedsubstantially starting from January 2009 andreached 5.2 per cent as on March 28, 2009 asprices declined in the case of food ar ticles,especially vegetables and fruits and non-foodarticles like raw cotton, oilseeds and minerals. Whilethe decline in prices of food articles partly reflectedthe improved rabi crops during 2008-09 as well asseasonal pattern, the decline in non-food primaryarticles prices was largely driven by decline ininternational prices of cotton, oilseeds and minerals.Prices of food articles such as, rice, pulses andvegetables continue to be at elevated levels.
II.3.42 As international crude oil prices increasedconsiderably during the first half of 2008-09, fuelgroup inflation, increased to an intra-year peak of18.0 per cent on August 2, 2008 from 6.8 per centat end-March 2008. This was driven by increase inthe prices of mineral oils reflecting the effect of thehikes in the prices of petrol (Rs.5 per litre), diesel(Rs.3 per litre) and LPG (Rs.50 per cylinder) onJune 4, 2008 as well as increase in the prices offreely priced petroleum products.

102
ANNUAL REPORT
In India, the inflation rate dropped from a high of 12.9 percent on August 02, 2008 to below one per cent by end-March, 2009, with the outlook at that point suggesting thepossibi l i ty of inf lat ion dropping to sub-zero leveltemporarily, or even for a longer period, giving rise to theemerging perceptions of a deflation. The year-on-year WPIinflation turned negative since the first week of June 2009.Despite growing concerns, however, there was neither anytechnical deflation, nor any visible evidence of the severeadverse effects that often accompany a deflation.
According to Bernanke (2002), “Deflation is defined as ageneral decline in prices, with emphasis on the word‘general’.” Thus, price declines in specific sectors, cannotbe considered as deflation. Decline in a representativewide-spread broad based index of prices alone could signaldeflation. Moreover, the falling prices must be sustainedover some time to be seen as a deflation.
The primary causative factor behind a deflation is thecollapse of aggregate demand even though deflation couldalso result from a sudden, large expansion in aggregatesupply because of rapid gains in productivity and sharplydeclining costs. Supply-side deflation though could bemore rare.
In the context of the technical definition and the primaryfactor causing deflation, it could be seen that India’s WPIdeclined over a period of close to six months betweenSeptember 2008 to February 2009, not on account of anysharp contraction in domestic aggregate demand norbecause of a strong favourable domestic supply shock,but because of a sharp correction in international prices.Moreover, the CPI based inflation continued to remainedhigh at around 9 per cent when the WPI inflation washovering around zero.
The sudden contraction in aggregate demand could resultfrom a bursting of an asset-price bubble, sudden changein over-optimistic growth and productivity expectations, orincrease in uncertainty associated with geopolitical or otherreasons. None of these factors were present in the caseof India, and as against contraction in output alongsidenegative inflation, despite some deceleration in growth,the output actually expanded by 6.7 per cent in 2008-09,which was one of the highest in the world.
Notwithstanding the fact that India never experienced anydeflation, it is, however, important to recognise the severeadverse effects of a deflation and the policies that couldbe used to counter the deflationary forces. Deflationinvariably leads to a situation where a central bankexhausts its conventional policy tool, as the interest ratedrops to zero in the process of containing falling aggregatedemand. The “liquidity trap” associated with “zero bound”nominal interest rate constraint gives rise to positive realrates, which become worse when falling prices createexpectations of even more decline in inflation in future.
Box II.16The Deflation Perceptions
This scenario not only encourages postponement ofconsumption, particularly credit financed consumption, butmay also give rise to a severe “debt deflation”. Besidesthe loss in output and employment, the debt deflation couldlead to rising default, which in turn may degenerate fast tocause a financial crisis. Preventing a deflation is often viewed,therefore, as even more important than containing inflation.
Despite the general perception that a central bank runsout of instruments when it confronts a zero-bound limit onits interest rate actions, Bernanke (2002) viewed that acentral bank “definitely (does) not run out of ammunition.… a central bank, either alone or in cooperation with otherparts of the government, retains considerable power toexpand aggregate demand and economic activity evenwhen its accustomed policy rate is at zero”. According toBernanke, a healthy, well capitalised banking system andsmoothly functioning capital markets constitute animportant line of defence against deflationary shocks.Nominal wage flexibility, i.e. wages falling more than thedrop in inflation could also help in dealing with a deflation.Svensson (2003) suggested specific options to counterdeflationary forces: (a) money financed fiscal expansion,(b) a depreciation of the currency, (c) a tax on money (toescape the zero-bound constraint), (d) expand money base(till it raises inflation expectations), and (e) announce apositive (credible) inflation target.
In India, the policy rates are nowhere in the “zero bound”trap, and the banking system is sound and resilient, andthe financial markets also remain orderly. There is noevidence of any debt deflation as a source of vulnerabilityto the banks. Moreover, despite the decline in WPI inflation,inflation expectations do not seem to have come down atthe same rate. The transmission lag from lower policy ratesto lower lending rates and the possibility of some pressureon asset quality of the banks because of the currentslowdown are issues of some concern; but that is notbecause of the presence of any deflationary forces in India.As noted in the Annual Policy Statement of the ReserveBank for 2009-10, negative inflation “...should not beinterpreted as deflation for policy purposes. This expectednegative inflation in India has only statistical significanceand is not a reflection of demand contraction as is thecase in advanced economies”.
References:
1. Bernanake, Ben S. (2002), “Deflation: Making Sure itDoesn’t Happen Here”, Remarks before that NationalEconomists Club, Washington DC, November 21, 2002.
2. Svensson, Lars E O. (2003), “Escaping from a LiquidityTrap and Deflation: The Foolproof Way and Others”,Journal of Economic Perspectives 17, 145-166.
3. Reserve Bank of India (2009), Annual Policy Statementfor the Year 2009-10, April, 21, 2009.
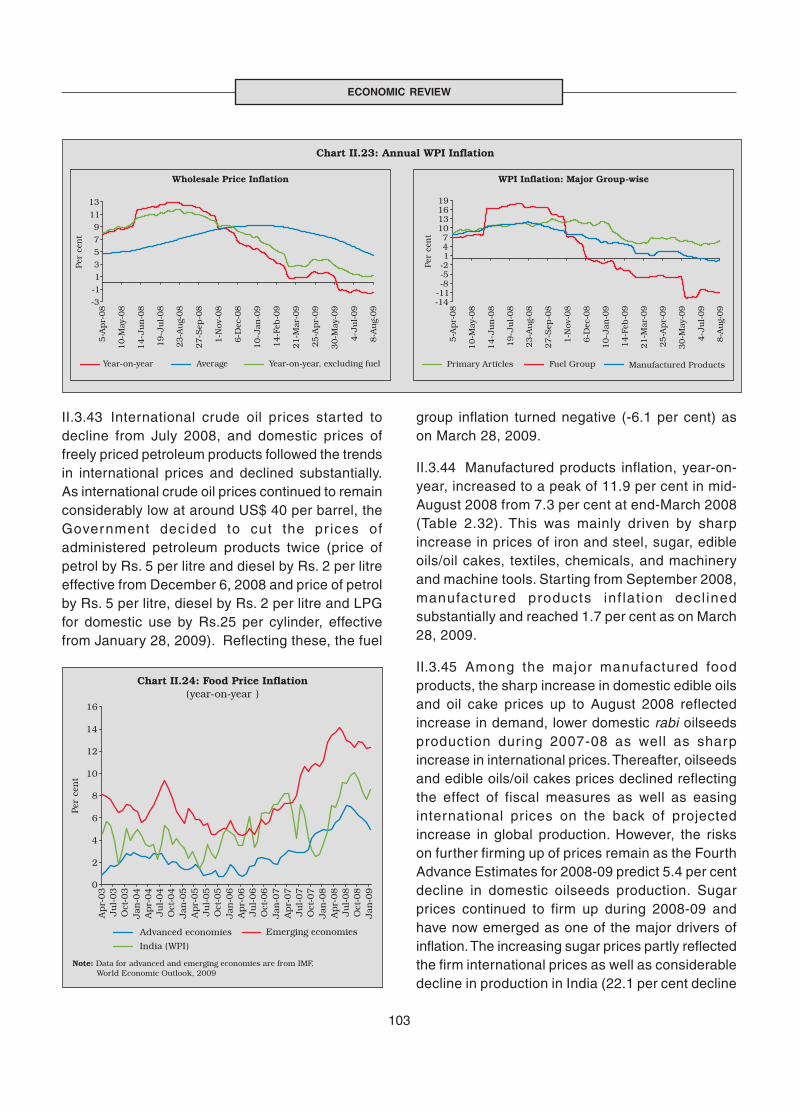
103
ECONOMIC REVIEW
II.3.43 International crude oil prices started todecline from July 2008, and domestic prices offreely priced petroleum products followed the trendsin international prices and declined substantially.As international crude oil prices continued to remainconsiderably low at around US$ 40 per barrel, theGovernment decided to cut the pr ices ofadministered petroleum products twice (price ofpetrol by Rs. 5 per litre and diesel by Rs. 2 per litreeffective from December 6, 2008 and price of petrolby Rs. 5 per litre, diesel by Rs. 2 per litre and LPGfor domestic use by Rs.25 per cylinder, effectivefrom January 28, 2009). Reflecting these, the fuel
group inflation turned negative (-6.1 per cent) ason March 28, 2009.
II.3.44 Manufactured products inflation, year-on-year, increased to a peak of 11.9 per cent in mid-August 2008 from 7.3 per cent at end-March 2008(Table 2.32). This was mainly driven by sharpincrease in prices of iron and steel, sugar, edibleoils/oil cakes, textiles, chemicals, and machineryand machine tools. Starting from September 2008,manufactured products inf lat ion decl inedsubstantially and reached 1.7 per cent as on March28, 2009.
II.3.45 Among the major manufactured foodproducts, the sharp increase in domestic edible oilsand oil cake prices up to August 2008 reflectedincrease in demand, lower domestic rabi oilseedsproduction during 2007-08 as well as sharpincrease in international prices. Thereafter, oilseedsand edible oils/oil cakes prices declined reflectingthe effect of fiscal measures as well as easinginternational prices on the back of projectedincrease in global production. However, the riskson further firming up of prices remain as the FourthAdvance Estimates for 2008-09 predict 5.4 per centdecline in domestic oilseeds production. Sugarprices continued to firm up during 2008-09 andhave now emerged as one of the major drivers ofinflation. The increasing sugar prices partly reflectedthe firm international prices as well as considerabledecline in production in India (22.1 per cent decline

104
ANNUAL REPORT
as per the Fourth Advance Estimates for 2008-09).Responding to the price pressures, on May 26,2009, the Forwards Markets Commission bannedfutures trading in sugar.
II.3.46 Metal prices were one of the key drivers ofinflation in India during 2008-09. Domestic iron and
steel prices inflation had reached 36 per cent, y-o-y,by end-August 2008 reflecting sharp increases inglobal prices. Since then, iron and steel prices haveshown a decline and y-o-y change has turnednegative (-18.4 per cent as on March 28, 2009).This decline in domestic iron and steel prices couldbe attributed to declining global prices, expected
Table 2.32: Wholesale Price Inflation in India (year-on-year)(Per cent)
Commodity 2007-08 2008-09 2009-10(March 29) (March 28) (Aug. 8)P
Weight Inflation WC Inflation WC Inflation WC
1 2 3 4 5 6 7 8
All Commodities 100.0 7.7 100.0 0.8 100.0 -1.5 100.0
1. Primary Articles 22.0 9.7 28.2 5.2 141.4 5.8 85.7
Food Articles 15.4 6.5 13.2 7.0 128.9 10.5 104.1i. Rice 2.4 9.1 2.5 14.9 38.7 15.4 20.8ii. Wheat 1.4 5.1 1.0 4.5 7.7 3.6 3.2iii. Pulses 0.6 -1.9 -0.2 9.4 7.4 17.6 7.6iv. Vegetables 1.5 14.2 2.3 -5.2 -8.2 39.7 37.6v. Fruits 1.5 4.1 1.0 5.9 12.4 -0.5 -0.5vi. Milk 4.4 8.7 4.7 7.0 35.6 4.2 11.2vii. Eggs, Fish and Meat 2.2 2.4 0.8 3.2 8.9 8.7 12.8
Non-Food Articles 6.1 11.4 8.8 0.1 1.0 -1.5 -6.3i. Raw Cotton 1.4 14.0 2.0 2.5 3.5 -10.8 -9.5ii. Oilseeds 2.7 20.3 6.7 -1.6 -5.6 -1.1 -2.0iii. Sugarcane 1.3 -0.4 -0.1 0.0 0.0 0.0 0.0
Minerals 0.5 49.9 6.2 7.2 11.6 -14.4 -12.4
2. Fuel, Power, Light and Lubricants 14.2 6.8 18.9 -6.1 -155.7 -11.1 -162.3i. Coal Mining 1.8 9.8 2.5 -1.0 -2.4 -1.0 -1.2ii. Minerals Oil 7.0 9.3 15.1 -8.7 -132.8 -16.1 -150.6iii. Electricity 5.5 1.5 1.4 -2.6 -21.1 -2.6 -10.8
3. Manufactured Products 63.7 7.3 52.8 1.7 114.0 -0.6 -22.4i. Food Products 11.5 9.4 12.4 8.8 108.7 9.6 63.6
of which: Sugar 3.6 1.1 0.4 18.4 52.8 34.3 51.1Edible Oils 2.8 20.0 5.5 -7.6 -21.6 -9.9 -14.5Oil Cakes 1.4 27.2 5.6 19.3 43.2 6.3 8.6
ii. Cotton Textiles 4.2 -6.8 -2.8 16.2 53.5 -0.7 -1.5iii. Man -made Fibres 4.4 2.8 0.7 -1.5 -3.2 -6.1 -7.4iv. Chemicals and Products 11.9 6.0 8.7 2.0 26.4 1.9 13.5
of which : Fertilisers 3.7 5.1 2.0 4.8 17.5 -0.5 -1.0v. Non-Metallic Mineral Products 2.5 6.4 2.0 1.9 5.4 4.5 6.7
of which: Cement 1.7 5.1 1.1 2.2 4.4 3.4 3.5vi. Basic Metals, Alloys and Metal Products 8.3 20.3 25.2 -12.2 -155.9 -15.0 -101.5
of which: Iron and Steel 3.6 34.2 20.1 -18.4 -124.4 -21.1 -75.1vii. Machinery and Machine Tools 8.4 3.5 2.9 2.6 18.9 -2.5 -9.9
of which: Electrical Machinery 5.0 4.8 2.0 1.1 4.2 -4.6 -9.4viii. Transport Equipment and Parts 4.3 3.9 1.7 3.1 12.0 -0.1 -0.1
Memo:
Food Items (Composite) 26.9 7.7 25.6 7.7 237.6 10.2 167.7WPI Excluding Food 73.1 7.8 74.4 -1.6 -137.6 -5.5 -267.7WPI Excluding Fuel 85.8 8.0 81.1 2.7 255.7 1.2 62.3
WC : Weighted Contribution. P : Provisional.Source: Office of the Economic Adviser, Ministry of Commerce and Industry, Government of India.
105
ECONOMIC REVIEW
deceleration in demand, both domestic andexternal, as well as various fiscal measures in theform of reductions in customs duties and impositionof export duties on various steel items announcedby the Government since April 2008. Overall, thus,changes in the prices of minerals oil, iron and steel,edible oils/oilseeds and oilcakes, cotton and sugaralong with primary food articles were the key driversof the WPI inflation trend in India during 2008-09.
II.3.47 One of the notable features of inflationtrends during 2008-09 has been its relationship withthe movements in the exchange rate of the rupee.Inflation increased significantly in India duringNovember 2007-August 2008, a period when theexchange rate underwent appreciation largely onaccount of increased inflows of foreign capital,which should have benefitted inflation managementthrough favourable pass-through effects. Since
August 2008, inflationary pressures subsidedconsiderably even though the exchange ratedepreciated. While this might have enhanced theprice competitiveness of Indian exports at a timewhen external demand was contracting, the pass-through effects on domestic inflationary conditionsshould have worked towards moderating the rapiddecline in prices. A prima facie observation of thetrends in the behaviour of the nominal exchangerate and inflation may suggest that the exchangerate pass-through effects on prices were workingin the opposite direction in relation to the expectednormal behaviour. However, in view of the leadsand lags in transmission of effects from exchangerate to inflation, as also the unprecedented volatilityseen in the primary determinants of inflation during2008-09, empirical evidence on pass-through hasto be seen as a dynamic process (Box II.17).
Exchange rate pass-through, as a concept, refers to thedegree of change in domestic prices that may result inresponse to movements in exchange rates of the domesticcurrency. The degree of pass-through from exchange ratemovements to import prices and subsequently to generalprice level in the economy may depend on a number ofmicroeconomic and macroeconomic factors.Microeconomic factors include price discrimination byproducers, mark-up adjustments, local distribution costs,non-tariff barriers, the degree of returns to scale, and theprice elasticity of demand for impor ted goods. Themacroeconomic factors include the level of inflation,perception about the nature of exchange rate movements(temporary or permanent), invoicing pattern of trade, tariffsstructure, the size and openness of an economy, and themonetary policy environment. The interactions amongthese host of factors often give rise to incomplete pass-through, suggesting that domestic prices do not changeexactly in the same magnitude as the rate of change inthe nominal exchange rate.
Available empirical findings in the Indian context providebroadly similar results as suggested in the literature,although the size of the pass-through coefficient differs.An analysis of exchange rate pass-through to domesticprices for the period 1970 to 2004, found the coefficient ofexchange rate pass-through to be in the range of 8-17basis points for different price indices (RBI, 2004). Thesame study using a different methodology for the period1993-2004 found that a 10 per cent depreciation of the
Box II. 17Pass-through of Exchange Rate Movements to Inflation in India
exchange rate increases wholesale prices by 0.4 per cent.Almost 60 per cent of this pass-through takes place withinone year while 80 per cent of the pass-through iscompleted within two years of a shock to the exchangerate. With regard to the sensitivity of inflation to exchangerate movements, it was estimated that an increase of 10per cent in import price inflation raises domestic inflationby up to 1.1 percentage points. The effect is the minimumfor CPI inflation (0.5 percentage points) followed by GDPdeflator (0.8 percentage points) and wholesale inflation(1.1 percentage points). These differences could be onaccount of the varied significance of imported goods inthe respective baskets. Covering the period 1980-2005,Ghosh and Rajan (2006) found evidence of stronger pass-through in the post-reform period. Using Nominal EffectiveExchange Rate (NEER), however, the pass-throughcoefficient was found to be statistically not significant.Moreover, estimated results from the Error CorrectionModels (ECM) showed little evidence of short run pass-through, whether for nominal Rupee-US Dollar or NEER.
The above results were also corroborated in the study byKhundrakpam (2007) for the post-reform period (August1991 to March 2005). The study estimated the pass-through coefficients and found that a 10 per cent changein exchange rate leads to change in final prices by about0.6 per cent in the short-run and 0.9 per cent in the long-run. The statistical tests on temporal behaviour of pass-
(Contd....)
106
ANNUAL REPORT
through obtained from rolling regressions showed that,unlike in many countries, there was no evidence of declinein pass-through. A recent BIS study by Mihaljek and Klau(2008) provides estimates of the pass through fromexchange rate and foreign price changes to inflation in 14emerging market countries for the period 1994 to mid-2006.For India, this study suggests that 10 per cent change inexchange rate could lead to change in inflation to up to 2per cent. Using recursive VAR models, Samantaraya (2009)found modest exchange rate pass-through to CPI inflationduring the study period April 1993 to March 2008. Contraryto expectations, the exchange rate appreciation was foundto be associated with rising WPI inflation in India, whichcould be attributed to several factors, like, administeredfuel prices, progressive reduction of import tariffs andgovernment incentives to domestic exporters in the faceof the exchange rate appreciation.
To sum up, the various empirical studies for India showevidence of incomplete exchange rate pass-through todomestic prices. Since November 2007, both variableshave moved in the same direction (i.e., inflation increasedwhen exchange rate was appreciating and inflationdeclined when exchange rate was depreciating). This couldbe attributed to the dominating effects of sharp internationalcommodity price movements on domestic inflation, whichmight have more than swamped the pass-through effects ofexchange rate changes. In an extremely volatile inflation
(....Concld.)
environment, particularly in the face of equally volatileinternational commodity prices and exchange rates,empirical estimates of pass-through may turn out to be noisy,and even misleading, unless the estimates of pass-throughcontrol for the variations in other sources of inflation,including international commodity prices.
References:
1. Ghosh Amit and R. Rajan (2006), “How High isExchange Rate Pass-through in India, Has it Changedover Time?t”, www.freewebs.com/rrajan01/Indiaerpt.pdf.
2. Khundrakpam, J.K. (2007). “Economic Reforms andExchange Rate Pass-through to Domestic Prices inIndiat”, BIS Working Paper No. 225.
3. Mihaljek, D. and Klau, M. (2008), “Exchange RatePass-through in Emerging Market Economies: Whathas changes and Why?t”, BIS Working Papers No. 35.
4. Samantaraya, Amaresh (2009), “An Empir icalAnalysis of Exchange Rate Pass-Through in India :Relevance for Inflation Management”, The ICFAIUniversity Journal of Monetary Economics, Vol. VII,No. 2
5. Reserve Bank of India (2004) Report on Currency andFinance 2003-04.
International commodity prices increased at a muchfaster rate than the rate of appreciation in theexchange rate during the first phase and, as a result,the net effect on inflation through import prices stillremained positive and strong. Similarly, since August2008, the decline in global commodity prices hasbeen much sharper than the exchange ratedepreciation, causing the net effect on import coststo be negative and significant.
Consumer Price Inflation
II.3.48 Inflation, based on y-o-y variations inconsumer price indices (CPIs), increased startingfrom June 2008, mainly due to increase in the pricesof food, fuel and services (represented by the‘miscellaneous’ group). Various measures ofconsumer price inflation remained high in the rangeof 8.0-9.7 per cent in March 2009 as compared with7.3-8.8 per cent in June 2008 and 6.0-7.9 per centin March 2008 (Table 2.33). The higher order of
increase in consumer price inflation as comparedto WPI inflation in recent months could be attributedto higher weight of food articles in CPIs and higherprices of food articles.
II.3.49 The recent divergence between inflation, asmeasured by wholesale price index and consumerprice indices has been viewed in many quarters asa challenge for the conduct of monetary policy. Inview of the large difference between WPI and CPIinflation, and inflation expectations not tracking theWPI inflation Reserve Bank uses full array ofavailable information on inflation. For the conductof policy, any index providing lead information andwhich is more representative could meet thenecessary requirements of a price series. Animportant statistical issue of relevance to policy hasbeen to examine why divergences between differentprice indices become large and particularly, if thedivergences persist longer, then what are the lagsin the transmission of wholesale price changes toretail prices (Box II.18).

107
ECONOMIC REVIEW
Asset Prices
II.3.50 Asset pr ice cycles regained renewedinterest in the aftermath of the sub-prime crisis, withincreasing realisation that asset price cycles couldlead and even to some extent condition the courseof the business cycle. Despite the absence of anyone convergent view on the monetary policyresponse to asset price cycles, asset prices clearly
Table 2.33 : Consumer Price Inflation - Major Groups
(Year-on-year variation in per cent)
CPI Measure Weight Mar-07 Mar-08 Jun-08 Sep-08 Dec-08 Mar-09 Apr-09 May-09 Jun-09
1 2 3 4 5 6 7 8 9 10 11
CPI-IW (Base: 2001=100)
General 100.0 6.7 7.9 7.7 9.8 9.7 8.0 8.7 8.6 9.3Food Group 46.2 12.2 9.3 10.5 13.1 13.1 10.6 10.4 11.7 –Pan, Supari etc. 2.3 4.4 10.9 7.1 7.8 8.5 8.3 6.7 7.5 –Fuel and Light 6.4 3.2 4.6 8.4 9.1 9.7 7.4 6.6 5.9 –Housing 15.3 4.1 4.7 4.7 3.8 3.8 6.0 6.0 6.0 –Clothing, Bedding etc. 6.6 3.7 2.6 2.5 2.5 4.2 5.0 4.2 4.1 –Miscellaneous 23.3 3.3 6.3 6.2 7.6 8.3 7.4 7.4 7.4 –
CPI-UNME (Base: 1984-85=100)
General 100.0 7.6 6.0 7.3 9.5 9.8 9.3 8.8 9.7 9.6Food Group 47.1 10.9 7.8 9.6 13.2 13.4 12.2 11.1 12.9 13.6Fuel and Light 5.5 6.4 4.6 5.3 6.2 7.7 5.9 6.7 5.8 1.3Housing 16.4 5.6 4.0 3.8 3.5 3.5 5.8 6.0 6.0 6.0Clothing, Bedding etc. 7.0 3.6 4.3 3.4 3.1 2.7 3.3 4.2 4.2 4.2Miscellaneous 24.0 4.4 4.8 6.6 8.4 9.3 8.6 7.6 8.1 7.3
CPI-AL (Base: 1986-87=100)
General 100.0 9.5 7.9 8.8 11.0 11.1 9.5 9.1 10.2 11.5Food Group 69.2 11.8 8.5 9.6 12.0 11.9 9.7 9.1 11.2 12.4Pan, Supari etc. 3.8 5.7 10.4 11.2 12.8 13.7 15.3 14.5 14.4 14.2Fuel and Light 8.4 6.9 8.0 8.9 10.2 11.3 11.5 10.9 10.6 11.0Clothing, Bedding etc. 7.0 3.5 1.8 3.1 6.0 7.0 7.4 7.9 7.6 8.3Miscellaneous 11.7 6.8 6.1 6.5 7.1 7.0 6.5 6.2 6.6 6.1
CPI-RL (Base: 1986-87=100)
General 100.0 9.2 7.6 8.7 11.0 11.1 9.7 9.1 10.2 11.3Food Group 66.8 11.5 8.2 9.6 12.0 11.9 10.0 9.1 11.2 12.4Pan, Supari etc. 3.7 5.7 10.6 10.9 12.5 13.4 15.0 14.0 14.1 14.1Fuel and Light 7.9 6.9 8.0 8.9 10.5 11.3 11.5 10.9 10.6 11.0Clothing, Bedding etc. 9.8 3.1 2.8 4.1 6.5 7.3 8.2 8.4 8.3 8.8Miscellaneous 11.9 6.3 6.2 6.8 7.4 7.5 6.7 6.2 6.4 6.2
Memo:
WPI Inflation (end of period) 5.9 7.7 12.0 12.1 5.9 0.8 1.7 0.9 -1.6
GDP Deflator based Inflation* 5.5 4.9 8.0 10.6 8.3 7.8 – – –
* : Data for March pertain to full year.IW : Industrial Workers. UNME : Urban Non-Manual Employees. AL : Agricultural Labourers. RL : Rural Labourers.Source : Ministry of Commerce and Industry, Labour Bureau and Central Statistical Organisation, Government of India.
represent lead indicators of growth and inflationoutcome, even though the exact magnitude of theimpact of asset price cycles on inflation and growthand the timing and duration of the impact could becountry specific and empirical in nature. In thecontext of India, the wealth effect associated withthe significant correction in stock prices during theglobal crisis could be viewed as not very significant(Box II.20).

108
ANNUAL REPORT
WPI based inflation has been generally considered as themeasure of headline inflation in India, even though theReserve Bank monitors the full set of available price indicesfor its overall macroeconomic assessment. Apart from WPI,four different consumer price indices targeting at differentsections of the labour force viz., industrial workers (IW),urban non-manual employees (UNME), agriculturallabourer (AL) and rural labourer (RL) are also availablein India.
In the recent period, the large difference between WPIbased and CPI based inflation has raised some confusionabout the information proper ties of such data formeaningful economic analysis. The differences in CPI andWPI inflation could emerge, to a large extent, on accountof the differences in the coverage of commodities/targetgroups in the different indicators (Table A).
The WPI and CPIs differ in terms of their weighting pattern.While food items get the maximum weight ranging from46 per cent in CPI-IW to 69 per cent in CPI-AL, food articlesin the primary group and food products in the manufacturedgroup in the WPI series together have a weight of only 27per cent. The CPIs are, therefore, more sensitive tochanges in prices of food articles. The fuel group on theother hand gets a much higher weight in the WPI series(14.23) than the CPIs (ranging from 5.5 to 8.4). Whileservices do not come under the ambit of present WPI, thecoverage of non-agricultural products or tradable items isbetter in WPI than CPI.
The prices of primary food articles remained high both inWPI and CPIs during 2008-09. As CPIs have higherweights, prices of food articles dominated the currentinflation more in CPI than that of WPI. In addition, the fallin the prices of manufactured food products thoughcontributed to a part of the decline in WPI during the
Box II.18WPI and CPIs : Divergence in Inflation
second half of 2008-09, it did not get reflected with thesame impact in CPI due its lower weight. The CPI fuelgroup continued to register inflation in the range of 9 percent due to the high prevailing price of LPG. It may bementioned that even after the recent downward revision(from the increase of Rs.50 to Rs.25 per cylinder) of LPGprice, it is still higher than the levels a year ago.
The CPI inflation generally tends to lag behind the WPIinflation, and the lag pattern is not static. Some part ofthe divergence between CPI and WPI may also beattributed to actual price differences at the wholesale andretail levels. As the retail market receives commoditiesfrom wholesale market, it is expected that the changesin the wholesale prices will be reflected in retail pricesafter some time lag.
Econometric evidence indicates that the divergencebetween CPI-IW and WPI is a stationary series (i.e.,deviations are around the mean) with zero mean implyingthat there exists no secular upward or downward movementin the difference between CPI and WPI. Thecontemporaneous correlation between WPI and CPIscontinue to be high and statistically significant. Theirassociation, though, is gradually falling over the years. Thusit is the differences between the commodity baskets andthe weights which largely explain the difference betweenthe WPI and CPI based inflation in India. Moreover, thepast empirical behaviour suggests that with a lag, the CPIexhibits better correlation with the WPI. As the headlineinflation, WPI continues to be relevant indicator of inflationin India, though persistent divergence between differentprice series, when observed, could weaken the case foruse of WPI alone for price analyses. In this context, theplans to generate data on two new price series, namely,CPI(Rural) and CPI(Urban) could be useful (Box II.19).
Table A: Salient features of price indices
Sr.No. Item CPI-UNME* CPI-IW CPI-AL CPI-RL WPI
1 2 3 4 5 6
1 Weights allocated on the basis of Consumer Expenditure Survey
First:1958-59 First:1958-59 First:1956-57 First:1983
Latest: 1982-83 Latest: 2001 Latest: 1983 Latest: 1983
2 Base year of the current series 1984-85 2001 1986-87 1986-87 1993-94
3 No. of items/commodities in basket 146-365 120-160 260 260 435
4 No. of centres/villages/quotations 59 76 600 600 1918
5 Time lag of the index 2 Weeks 1 month 3 weeks 3 weeks 2 weeks
6 Frequency Monthly Monthly Monthly Monthly Weekly
* : Price collection for CPI-UNME was discontinued with effect from April 2008 and CPI-UNME is now compiled based on ratio method after aggregatingthe subgroup level indices of CPI-IW using CPI-UNME weights at group/sub-group level for all India.
Source : Government of India, Economic Survey 2006-07.
Weights allocated basedon wholesale transactions
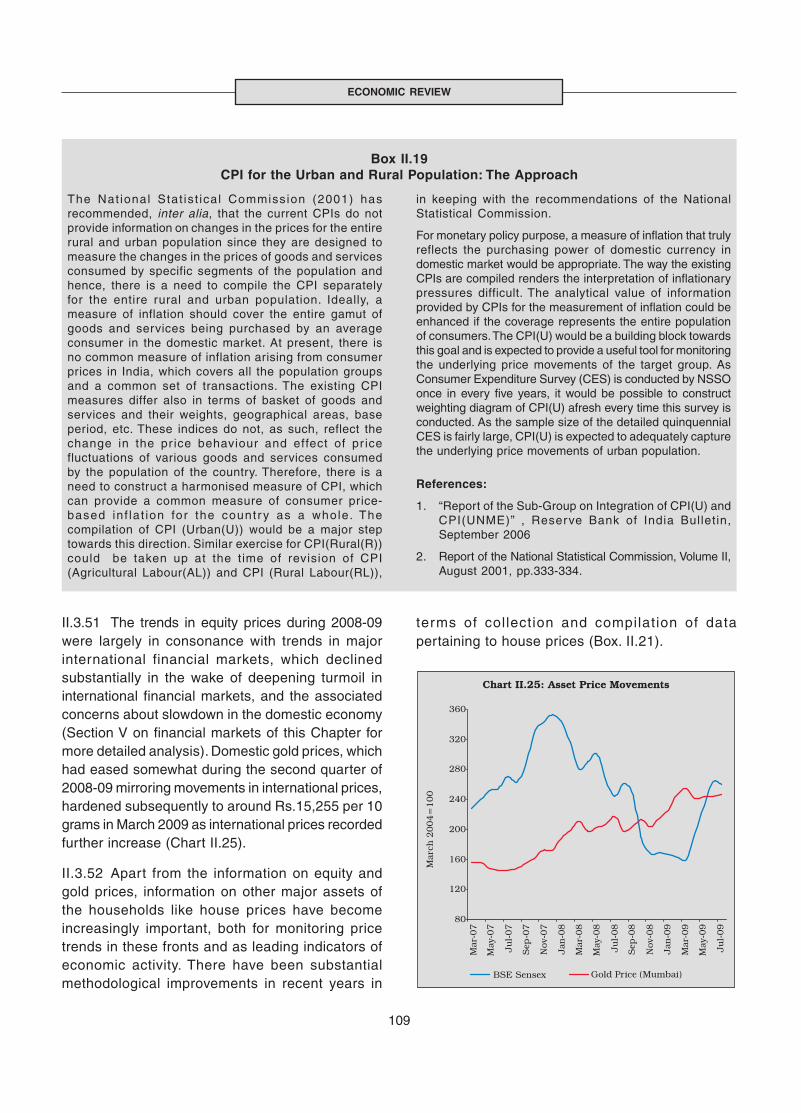
109
ECONOMIC REVIEW
The Nat ional Stat ist ical Commission (2001) hasrecommended, inter alia, that the current CPIs do notprovide information on changes in the prices for the entirerural and urban population since they are designed tomeasure the changes in the prices of goods and servicesconsumed by specific segments of the population andhence, there is a need to compile the CPI separatelyfor the entire rural and urban population. Ideally, ameasure of inflation should cover the entire gamut ofgoods and services being purchased by an averageconsumer in the domestic market. At present, there isno common measure of inflation arising from consumerprices in India, which covers all the population groupsand a common set of transactions. The existing CPImeasures differ also in terms of basket of goods andservices and their weights, geographical areas, baseperiod, etc. These indices do not, as such, reflect thechange in the pr ice behaviour and effect of pr icefluctuations of various goods and services consumedby the population of the country. Therefore, there is aneed to construct a harmonised measure of CPI, whichcan provide a common measure of consumer price-based inf la t ion for the countr y as a whole. Thecompilation of CPI (Urban(U)) would be a major steptowards this direction. Similar exercise for CPI(Rural(R))could be taken up at the time of revision of CPI(Agricultural Labour(AL)) and CPI (Rural Labour(RL)),
Box II.19CPI for the Urban and Rural Population: The Approach
in keeping with the recommendations of the NationalStatistical Commission.
For monetary policy purpose, a measure of inflation that trulyreflects the purchasing power of domestic currency indomestic market would be appropriate. The way the existingCPIs are compiled renders the interpretation of inflationarypressures difficult. The analytical value of informationprovided by CPIs for the measurement of inflation could beenhanced if the coverage represents the entire populationof consumers. The CPI(U) would be a building block towardsthis goal and is expected to provide a useful tool for monitoringthe underlying price movements of the target group. AsConsumer Expenditure Survey (CES) is conducted by NSSOonce in every five years, it would be possible to constructweighting diagram of CPI(U) afresh every time this survey isconducted. As the sample size of the detailed quinquennialCES is fairly large, CPI(U) is expected to adequately capturethe underlying price movements of urban population.
References:
1. “Report of the Sub-Group on Integration of CPI(U) andCPI(UNME)” , Reserve Bank of India Bulletin,September 2006
2. Report of the National Statistical Commission, Volume II,August 2001, pp.333-334.
II.3.51 The trends in equity prices during 2008-09were largely in consonance with trends in majorinternational financial markets, which declinedsubstantially in the wake of deepening turmoil ininternational financial markets, and the associatedconcerns about slowdown in the domestic economy(Section V on financial markets of this Chapter formore detailed analysis). Domestic gold prices, whichhad eased somewhat during the second quarter of2008-09 mirroring movements in international prices,hardened subsequently to around Rs.15,255 per 10grams in March 2009 as international prices recordedfurther increase (Chart II.25).
II.3.52 Apart from the information on equity andgold prices, information on other major assets ofthe households like house prices have becomeincreasingly important, both for monitoring pricetrends in these fronts and as leading indicators ofeconomic activity. There have been substantialmethodological improvements in recent years in
terms of collection and compilation of datapertaining to house prices (Box. II.21).
110
ANNUAL REPORT
Since the onset of the global crisis, stock markets aroundthe world have delivered significant negative wealth effects,and in country specific conditions the associated effectson aggregate demand, particularly consumption demand,could have been varied. Transmission of assert price cyclesto business cycles and even to headline inflation cyclesthrough the wealth effect is an issue which has assumedenormous policy significance in the aftermath of the sub-prime crisis.
A stock market boom may increase consumption demand,whereas a decline in stock market wealth may eithercontribute to a slowdown in economic activity or acceleratean existing slowdown (Deaton, 1992). Estimates of stockmarket wealth effects for a 10 per cent change in equityprices range from 0.15 to 0.30 per cent in Japan and 0.1to 0.3 per cent in various European countries to 0.3 to 0.7per cent in the United States (IMF, 2002).
This issue of stock market wealth effect in India is relevantin the context of a sharp upswing in stock prices betweenApril 2003 and November 2008, followed by an equallysteep decline. The BSE Sensex average monthly indexdeclined by about 55 per cent between December 2007(the peak) and March 2009 (the trough), from 19,827 to8,966. Such a large swing in stock prices could haveresulted in substantial erosion of household wealth, withassociated implications for the consumption demand,which may be relevant for the countercyclical demandmanagement policies.
In a structural VAR model, four variables are used forexamining the impact of changes in stock market wealtheffect on consumption demand, i.e., y = real income, c =real consumption demand, r = short-term interest rate, andw = real stock price. These are the key variables whichcould influence real consumption demand; nominal interestrate has the combined effects of inflation and real interestrate, both of which may influence consumption demand inopposite directions. Data for the period 1996:Q2 to 2008:Q4were used, i.e., the period coinciding with significant changesobserved in the Indian stock price cycles.
The estimated model shows that a positive real incomeshock causes a persistent increase in real consumptiondemand. The magnitude of the shock reveals that one percent increase in real income causes on an average 0.57per cent increase in the real consumption demand. Thestock price shock, signifying the stock market wealth effect,has only short-run and marginal effect on consumptiondemand. The estimates suggest that a 10 per cent positiveshock (increase) to stock prices raises consumptiondemand by 0.44 per cent in the next quarter. There doesnot seem to be any long-run effect of stock market wealtheffect on consumption demand. The var iancedecomposition analysis explains the contribution of variousfactor specific shocks to overall fluctuation in realconsumption demand. It is the real income shocks that
Box II.20Wealth Effects of Corrections in Stock Prices in India
explain the movement of real consumption demand overthe medium to long-run horizon (Table A). Short run interestrate and stock wealth shocks explain only marginalfluctuations in real consumption demand.
Table A: Percentage Variance of Consumption DemandExplained by Various Shocks
Quarter Income Interest Stock Consumptionshock rate wealth demand shock
1 13.1 0.0 0.0 86.94 29.8 4.4 5.9 59.98 46.9 3.8 6.5 42.912 57.4 3.1 7.4 32.116 63.9 2.7 8.2 25.220 68.5 2.5 8.7 20.4
Note: Shocks to real consumption demand itself explains the role ofmissing variables (which may include housing wealth as well), andthe aggregation of variation in consumption demand on accountof all factors should add to 100 (i.e., the total for each row).
Leverage could have a critical role in magnifying andpropagating the adverse effects of a major asset pricecorrection, and in the Indian stock market, possibleabsence of large leveraged positions (unlike in developedcountries) could be one of the main factors that could yieldweak effects on consumption demand. When leverage isused to build assets, correction in asset prices could entailnegative wealth effects, but the contractual liabilities haveto be serviced at the contracted rate. Such eventualitiescould have two major ramifications of significance to acentral bank: (a) with lower asset prices (implying lowervalue of the collaterals), the capacity of the borrowers toborrow would be constrained on the one hand, and on theother, banks may also tighten the credit standards (in termsof asking for more margins and collaterals, since banksaddress the problem of information asymmetry to a largeextent through collaterals), which together could furtherdampen credit growth, and (b) to offset the negative effectof wealth erosion arising from asset price correction, publicin general may save more from current income anddeleverage as well, which could delay the recoveryprocess. For explaining the pace and timing of recoveryfrom a slowdown, the wealth effects associated with assetprice cycles could be useful.
References:
1. Deaton, A. (1992), Understanding Consumption,Cambridge University Press
2. IMF(2002), “Three Essays on How Financial MarketsAffect Real Activity,” World Economic Outlook,Washington D.C, April.
3. Slacalek, J. (2006), “International Wealth Effects”, DIWDiscussion Paper No.596, German Institute ofEconomic Research, Berlin.
111
ECONOMIC REVIEW
In recent years, many countries have experienced wide swingsin the housing prices. In the context of the sub-prime crisis,collection of representative data on house price indices andanalytical interpretation of the dynamics of house pricechanges in relation to the macroeconomic conditions of acountry has assumed critical significance for conduct ofpolicies. Housing serves as a major source of individualwealth. Hence, changes in its value may influence consumerspending and saving decisions, in turn, could affect the overalleconomic activity. Changes in housing prices could also bothimpact and reflect the health of the residential investmentsector, which is a major source for employment generation.Furthermore, house prices represent one of the keydeterminants of housing affordability, which is an importantpublic policy goal in many countries. To understand thebehavior of housing prices and their influence on the economy,it is crucial to have an accurate measure of aggregate housingprices. In practice, however, it is difficult to develop such ameasure. Housing is an extremely heterogeneous good, andhouses are sold only infrequently. Heterogeneity makes itdifficult to distinguish between aggregate and individual pricevariations. The infrequency of sales implies that, in any timeperiod, prices are not observed for most houses.
Academic research shows that a house price index shouldbe estimated using the finest disaggregation of time variableas possible. There is an obvious benefit of building an indexat a higher frequency level, for facilitating empirical researchand conduct of policies. A timely and frequently reported indexcould unsmooth the true price movements and tend to betteraddress market efficiency questions. Two criteria have to betaken into account, however, when using a small data set ata higher frequency level for index reporting. The first criterionis the index’s stability at various sample sizes. The secondcriterion is the index’s consistency when updated. In otherwords, what the overall index’s volatility could be when thenext period’s sales or previous period’s late sales getrecognised and updated.
From a statistical point of view, shortening the data collectiontime could imply that: a smaller sample size (sub-sample)will have to be used; and such a collected sub-sample will atbest represent the sample population only. The sample sizeis related to the precision of the estimate (usually precision isinversely proportional to the square root of the sample size).Often it uses a confidence interval to express the precision.The other thing which one needs to be concerned about, whena small sample size is used, is that whether we can assumenormality of the population. Asymptotic normality is assumedfor many econometric estimators but it only holds if the samplecontains large number of observations. How “large” a samplesize should be for asymptotic analysis to be appropriatedepends on the underlying population distribution. Obviously,there is a balance between the sample size and temporalaggregation in real estate index construction.
In the face of such challenges, three methodologies have beendeveloped to measure the aggregate price of housing. One
Box II.21House Price Index: Recent Developments
approach takes a simple average of all house prices observedin a period—usually a mean or median. Doing so essentiallyignores the problems raised by heterogeneity and infrequentsales. The benefit is that price series employing this averagemethodology can often summarise an immense number oftransactions on a timely basis. A second approach—the repeatsales methodology—focuses on houses that have been soldmore than once. So long as the quality of the houses remainunchanged, their rate of price appreciation is expected to bethe same as the rate of aggregate house price appreciation.Price data employing the repeat sales methodology do a verygood job of controlling for heterogeneity, while providingaggregate price estimates for numerous geographies. A thirdapproach the hedonic methodology—uses statisticaltechniques to control for differences in quality. In particular,correlations between the sale price of homes and theirattributes are used to estimate “prices” for various attributes,which are then used to calculate the sum total price of arepresentative bundle of attributes. Unfortunately, properlyimplementing the hedonic approach requires more detaileddata attributes than are typically available. Nevertheless, aleading series employing the hedonic approach does anexcellent job in pricing an approximately constant-physical-quality new house over time.
Which of these measures could provide the best estimatesmay very much depend on one’s purpose. One possiblepurpose relevant to policy is to estimate the increase inhomeowners’ wealth from increase in house prices. Toestimate such an aggregate price rise, the repeat sales indexis best; it does a reasonably good job of controlling forvariations in the quality houses. The main caveat is that thetypical rate of price change as per this measure could besomewhat overstated, due both to the failure to control forhome improvement and the unrepresentative nature of homeswith repeat sales. A second related purpose could be toestimate the aggregate change in household net worth dueto the increase in house prices. In other words, rather thanestimating the typical gain, this purpose seeks to estimatethe total gain. A third possible purpose could be to gauge thehealth of the residential construction sector. Rising prices arean obvious stimulant to residential investment. On the onehand, developers have a greater incentive to build. On theother, owners of existing homes could extract equity andengage in home improvement. A fourth possible purpose forestimating the aggregate price of housing could be to gaugeaverage affordability.
References:
1. Meese, R., Wallace, N., 1997. The construction ofresidential housing price indices: a comparison ofrepeated sales , hedonic regression, and hybridapproaches. Journal of Real Estate Finance andEconomics. 14, 51-74.
2. Weeken, O. (2004), “Asset pricing and the housingmarket”, Bank of England Quarterly Bulletin, Spring.

112
ANNUAL REPORT
Information on housing start ups is considered to be oneof the leading economic indicators. As high financial outlaysare included in new construction projects, that couldsymbolises the outlook for investment, business andconsumer confidence. Trends in the housing start ups mayalso provide valuable clues to homebuilders, banks,lenders, and home furnishings companies.
Keeping in mind the importance of such an indicator for CentralBanks, Reserve Bank of India constituted a Technical AdvisoryGroup on Development of Housing Start Up Index (TAG onHSUI) under the Chairmanship of Prof. Amitabh Kundu,Jawaharlal Nehru University, New Delhi. The TAG comprisedtop officials from RBI, CSO, NSSO, NHB, NBO, HUDCO, SBI,4 state DES and renowned academicians in the field. TheGroup submitted its Report in the final meeting of the TAG onHSUI, held on 3rd March 2009. The major recommendationsof the Group are summarised as follows:
The HSUI may be constructed based on two sets of data:(a) The start up coefficients reflecting the recent experienceof conversion of housing permits into housing starts and (b)the number of permits issued during the last two years orso. The Group observed that the present system of datacollection, as reported by National Building Organisation(NBO), Ministry of Housing and Urban Poverty Alleviation,GoI along with its formats may be fine tuned to obtain therequisite data on building permits on a quarterly basis.Conducting a field survey with adequate coverage of theurban centres that can be representative of the country asa whole would be the first step in institutionalising a systemfor regular release of HSUI. The Group recommended thatthe survey may be conducted once in three years forestimating/updating the start rate matrices for each of theselected centres. The Group recommended that as an initialeffort, the HSUI may be launched in six Metros and a selectsample of Class I towns. The field survey for estimating thestart rate matrices can be done in two phases. In the firstphase, the data on building permits can be collected in theselected centres using Survey on Building Permits (SBP).The SBP can be conducted by collecting the details of allpermits issued for new residential construction from permitissuing authorities of the selected centres. In the secondphase, a Survey on the Housing Starts (SHS) based on asample of permits issued for new residential buildings canbe identified. The follow-up of this sample permits can bedone by canvassing a Schedule.
Box II.22Housing Start-Up Index in India
Based on this data corresponding to each quarter of any year,9 start rates (1 for the quarter in which permits are issued + 7for the 7 succeeding quarters + 1 for all the starts after 2years) corresponding to 4 different quarters of a year can beworked out and a 4x9 matrix of start rates (coefficients) canbe obtained. These start rate (coefficient) matrices can beused to obtain the housing starts for the selected Metros andClass I towns for which the regular data on building permitscan be obtained on quarterly basis. For All India level Indexthe formulae given below can be used to estimate the HSUIfor the quarter t.
Where n is the number of centres, Ai0 is the average FSA ofthe ith centre in the base period; Sit is the number of housingstarts in the tth quarter in ith centre; Si0 is the number of housingstarts in the base period in the ith centre.
The Group recommended a Standing Committee to be setup by the Reserve Bank of India to launch the initiative, monitorits progress, commission and overview the surveys forconstructing start up matrices and consider increasing thescope and coverage of HSUI over time. It also suggestedconstituting an Advisory Committee on HSUI to be formed atthe NBO to guide and oversee the entire process ofcompilation of housing permit data from concerned localbodies and the Department of Economics and Statistics ofthe state governments on a regular basis.
References:
1. Reserve Bank of India, “Report of the Technical AdvisoryGroup on Development of Housing Start-Up Index inIndia” Available at http://www.rbi.org.in/scripts/PublicationReportDetails.aspx?FromDate=03/05/2009
2. U.S. Census Bureau, “New Residential Construction”,Available at http://www.census.gov/const/www/newresconstdoc.html.
3. Statistics Canada, “Building Permits Survey”, Availableat http://www.statcan.ca/cgi-bin/imdb/p2SV.pl?Function=getSurvey&SDDS=2802 &lang=en&db=imdb&adm=8&dis=2#2
II.3.53 Information on other asset prices likehousing has not been available in India on acont inuous basis. The Economic Survey,Government of India, in recent years presentsdetails of house price indices of select cities inIndia. To improve the data availability on house
prices the Reserve Bank constituted a TechnicalAdvisory Group (TAG) on Development of HousingStart Up Index (HSUI). The details of the recentdevelopments in initiatives for constructing ahouse price index as well as recommendations ofthe TAG are given in Box II.22.
113
ECONOMIC REVIEW
Developments during 2009-10
II.3.54 WPI inflation (y-o-y) declined further from0.8 per cent at end-March 2009 and turned negativein June 2009 and continued to remain negativesince then (-1.5 per cent as on August 8, 2009)largely reflecting the base effect of sharp increasein prices recorded during the first half of 2008-09.During 2009-10 (up to August 8, 2009), however,the WPI has increased by 3.8 per cent indicatingthe existence of price pressures. Consumer priceinflation, as reflected in various consumer priceindices, increased further and remained in therange of 9.3-11.5 per cent in June 2009.
II.3.55 To sum up, the large volatility in inflationconditions during 2008-09, which was drivenlargely by non-monetary factors, posed complexchallenges for the conduct of monetary policy inIndia. Significant divergence between CPI and WPIbased inflation and major corrections in assetprices added to the complexity of the challenges.Before the ramifications of the financial crisisbecame visible, global commodity and food priceshad escalated to crisis proportions, which fellequally sharply in the second half of the year asthe global recession deepened. In both phases ofthe cycles, the transmission of the global inflationto Indian inflation was fast and signif icant,notwithstanding the fiscal measures taken toreduce import costs of certain price sensitive itemsand the l imited pass-through because ofadministered pricing of certain commodities. Thestance of monetary policy also shifted the balanceof focus from containing inflation in the first halfof the year to arresting slowdown in growth andpreserving financial stability in the second half ofthe year. During 2009-10, year-on-year WPIinflation has remained low and turned negativesince June 2009, which is on account of the highbase of sharp increases in prices during the firsthalf of 2008-09. Thus, the low WPI inflation reflectsmostly a statistical phenomenon, and should notbe interpreted as structural deflation arising fromdemand contraction.
IV. GOVERNMENT FINANCES
II.4.1 The stabilising role of fiscal policy assumedcentre stage in the face of a slowing economyconfronted with a decline in external demand aswell as domestic private demand. This necessitatedsignificant and swift change in the fiscal stance fromgradual consolidation in the previous years toproactive counter-cyclical expansion in 2008-09,which led to considerable deviation from the recenttrends in all deficit parameters.
II.4.2 The concern over high inflation in the firsthalf of the year was addressed by appropriate fiscalmeasures in the form of tax cuts and subsidies.During the second half, concerns relating to growthslowdown and associated widespread demand forgovernment support gave rise to use of a fiscalstrategy combining both higher expenditure and taxcuts, the aggregate magnitude of which turned outto be significant at 3.1 per cent of GDP (includingsubsidies and agricultural debt waiver). In aglobalised world facing synchronised recession,appropriate use of discretionary fiscal stabilisationhas been a common response across severalcountries, even though the magnitude and contentof measures have varied, depending on countryspecific needs and conditions.
II.4.3 The combined finances of the Central andState Governments deteriorated considerably in therevised estimates (RE) for 2008-09 owing to theimpact of global economic slowdown and fiscalstimulus measures by way of indirect tax cuts andaddit ional expenditure through threesupplementary demands for grants undertaken bythe Central Government to suppor t growth.Consequently, revenue buoyancy dippedsubstantially resulting in lower revenue receipts toGDP ratio, while total expenditure to GDP ratioincreased sharply (Table 2.34). As a result, the keydeficit indicators, viz., gross fiscal deficit (GFD),revenue deficit and primary deficit in 2008-09 (RE)widened substantially from the budgeted levels, andwere higher than those of 2007-08 by 4.2-4.8percentage points of GDP. It may be noted that the
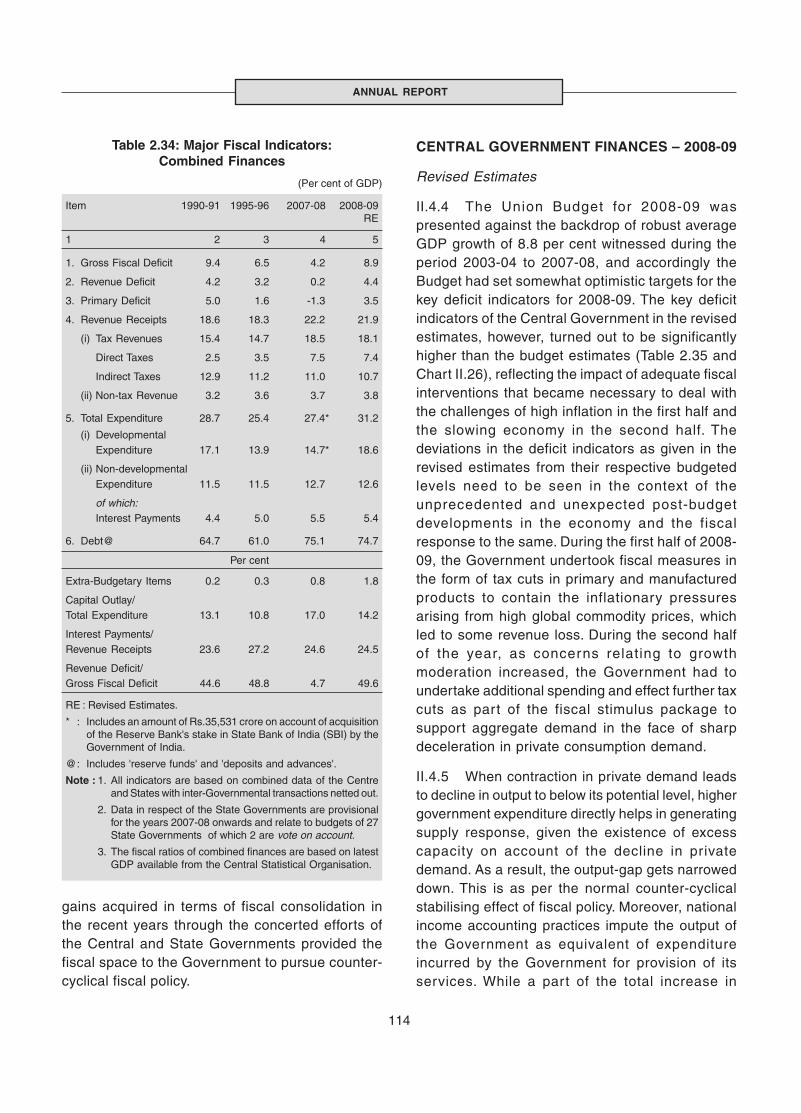
114
ANNUAL REPORT
gains acquired in terms of fiscal consolidation inthe recent years through the concerted efforts ofthe Central and State Governments provided thefiscal space to the Government to pursue counter-cyclical fiscal policy.
CENTRAL GOVERNMENT FINANCES – 2008-09
Revised Estimates
II.4.4 The Union Budget for 2008-09 waspresented against the backdrop of robust averageGDP growth of 8.8 per cent witnessed during theperiod 2003-04 to 2007-08, and accordingly theBudget had set somewhat optimistic targets for thekey deficit indicators for 2008-09. The key deficitindicators of the Central Government in the revisedestimates, however, turned out to be significantlyhigher than the budget estimates (Table 2.35 andChart II.26), reflecting the impact of adequate fiscalinterventions that became necessary to deal withthe challenges of high inflation in the first half andthe slowing economy in the second half. Thedeviations in the deficit indicators as given in therevised estimates from their respective budgetedlevels need to be seen in the context of theunprecedented and unexpected post-budgetdevelopments in the economy and the fiscalresponse to the same. During the first half of 2008-09, the Government undertook fiscal measures inthe form of tax cuts in primary and manufacturedproducts to contain the inflationary pressuresarising from high global commodity prices, whichled to some revenue loss. During the second halfof the year, as concerns relating to growthmoderation increased, the Government had toundertake additional spending and effect further taxcuts as part of the fiscal stimulus package tosupport aggregate demand in the face of sharpdeceleration in private consumption demand.
II.4.5 When contraction in private demand leadsto decline in output to below its potential level, highergovernment expenditure directly helps in generatingsupply response, given the existence of excesscapacity on account of the decline in privatedemand. As a result, the output-gap gets narroweddown. This is as per the normal counter-cyclicalstabilising effect of fiscal policy. Moreover, nationalincome accounting practices impute the output ofthe Government as equivalent of expenditureincurred by the Government for provision of itsservices. While a part of the total increase in
Table 2.34: Major Fiscal Indicators:Combined Finances
(Per cent of GDP)
Item 1990-91 1995-96 2007-08 2008-09RE
1 2 3 4 5
1. Gross Fiscal Deficit 9.4 6.5 4.2 8.9
2. Revenue Deficit 4.2 3.2 0.2 4.4
3. Primary Deficit 5.0 1.6 -1.3 3.5
4. Revenue Receipts 18.6 18.3 22.2 21.9
(i) Tax Revenues 15.4 14.7 18.5 18.1
Direct Taxes 2.5 3.5 7.5 7.4
Indirect Taxes 12.9 11.2 11.0 10.7
(ii) Non-tax Revenue 3.2 3.6 3.7 3.8
5. Total Expenditure 28.7 25.4 27.4* 31.2
(i) DevelopmentalExpenditure 17.1 13.9 14.7* 18.6
(ii) Non-developmentalExpenditure 11.5 11.5 12.7 12.6
of which:Interest Payments 4.4 5.0 5.5 5.4
6. Debt@ 64.7 61.0 75.1 74.7
Per cent
Extra-Budgetary Items 0.2 0.3 0.8 1.8
Capital Outlay/Total Expenditure 13.1 10.8 17.0 14.2
Interest Payments/Revenue Receipts 23.6 27.2 24.6 24.5
Revenue Deficit/Gross Fiscal Deficit 44.6 48.8 4.7 49.6
RE : Revised Estimates.
* : Includes an amount of Rs.35,531 crore on account of acquisitionof the Reserve Bank's stake in State Bank of India (SBI) by theGovernment of India.
@: Includes 'reserve funds' and 'deposits and advances'.
Note : 1. All indicators are based on combined data of the Centreand States with inter-Governmental transactions netted out.
2. Data in respect of the State Governments are provisionalfor the years 2007-08 onwards and relate to budgets of 27State Governments of which 2 are vote on account.
3. The fiscal ratios of combined finances are based on latestGDP available from the Central Statistical Organisation.
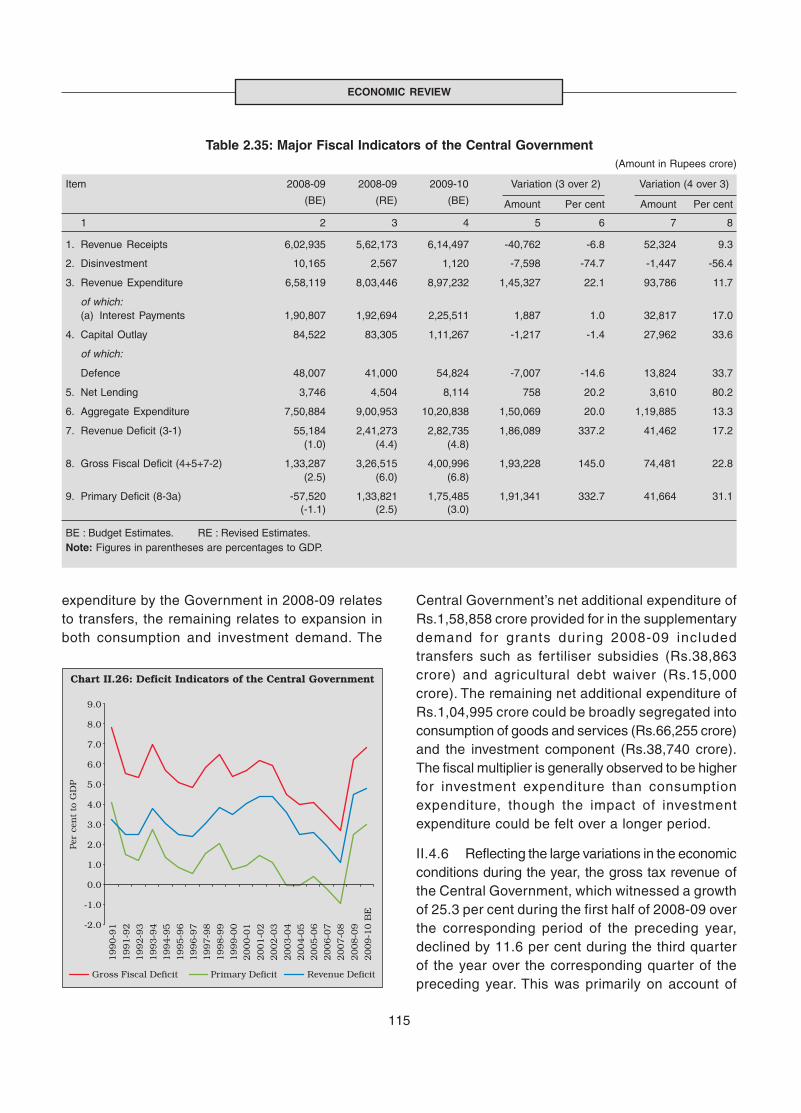
115
ECONOMIC REVIEW
expenditure by the Government in 2008-09 relatesto transfers, the remaining relates to expansion inboth consumption and investment demand. The
Table 2.35: Major Fiscal Indicators of the Central Government(Amount in Rupees crore)
Item 2008-09 2008-09 2009-10 Variation (3 over 2) Variation (4 over 3)
(BE) (RE) (BE) Amount Per cent Amount Per cent
1 2 3 4 5 6 7 8
1. Revenue Receipts 6,02,935 5,62,173 6,14,497 -40,762 -6.8 52,324 9.3
2. Disinvestment 10,165 2,567 1,120 -7,598 -74.7 -1,447 -56.4
3. Revenue Expenditure 6,58,119 8,03,446 8,97,232 1,45,327 22.1 93,786 11.7
of which:(a) Interest Payments 1,90,807 1,92,694 2,25,511 1,887 1.0 32,817 17.0
4. Capital Outlay 84,522 83,305 1,11,267 -1,217 -1.4 27,962 33.6
of which:
Defence 48,007 41,000 54,824 -7,007 -14.6 13,824 33.7
5. Net Lending 3,746 4,504 8,114 758 20.2 3,610 80.2
6. Aggregate Expenditure 7,50,884 9,00,953 10,20,838 1,50,069 20.0 1,19,885 13.3
7. Revenue Deficit (3-1) 55,184 2,41,273 2,82,735 1,86,089 337.2 41,462 17.2(1.0) (4.4) (4.8)
8. Gross Fiscal Deficit (4+5+7-2) 1,33,287 3,26,515 4,00,996 1,93,228 145.0 74,481 22.8(2.5) (6.0) (6.8)
9. Primary Deficit (8-3a) -57,520 1,33,821 1,75,485 1,91,341 332.7 41,664 31.1(-1.1) (2.5) (3.0)
BE : Budget Estimates. RE : Revised Estimates.Note: Figures in parentheses are percentages to GDP.
Central Government’s net additional expenditure ofRs.1,58,858 crore provided for in the supplementarydemand for grants dur ing 2008-09 includedtransfers such as fertiliser subsidies (Rs.38,863crore) and agricultural debt waiver (Rs.15,000crore). The remaining net additional expenditure ofRs.1,04,995 crore could be broadly segregated intoconsumption of goods and services (Rs.66,255 crore)and the investment component (Rs.38,740 crore).The fiscal multiplier is generally observed to be higherfor investment expenditure than consumptionexpenditure, though the impact of investmentexpenditure could be felt over a longer period.
II.4.6 Reflecting the large variations in the economicconditions during the year, the gross tax revenue ofthe Central Government, which witnessed a growthof 25.3 per cent during the first half of 2008-09 overthe corresponding period of the preceding year,declined by 11.6 per cent during the third quarterof the year over the corresponding quarter of thepreceding year. This was primarily on account of
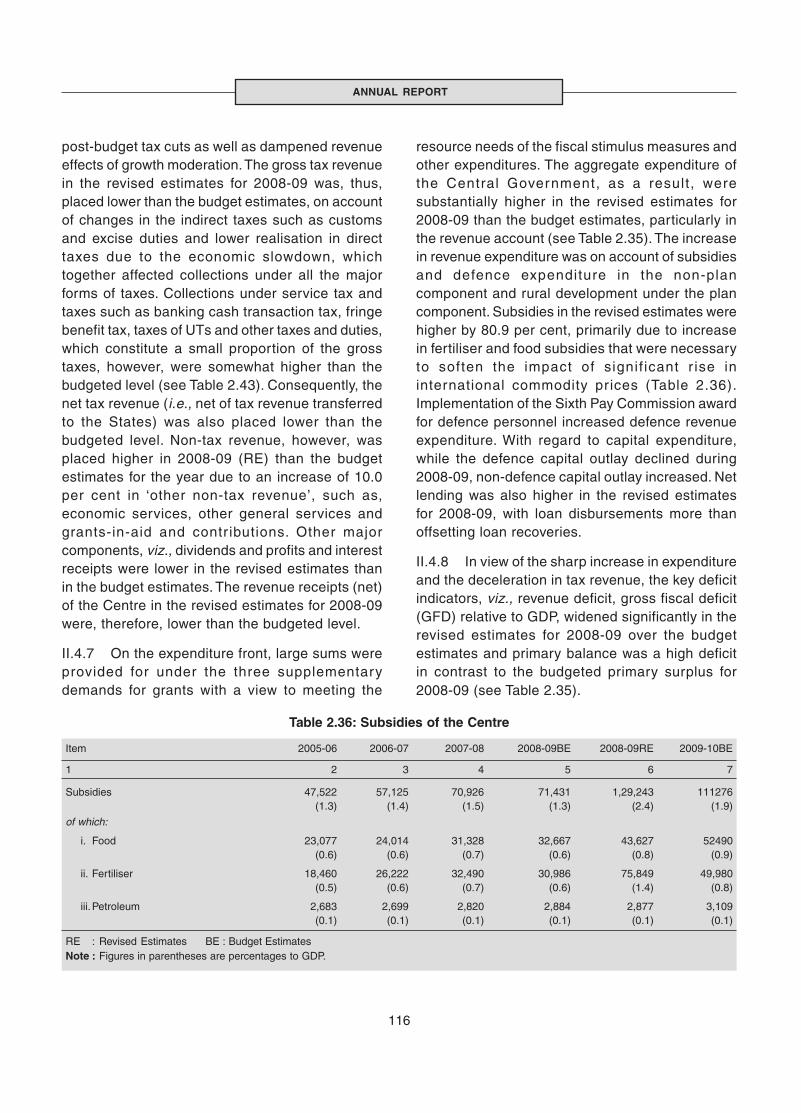
116
ANNUAL REPORT
post-budget tax cuts as well as dampened revenueeffects of growth moderation. The gross tax revenuein the revised estimates for 2008-09 was, thus,placed lower than the budget estimates, on accountof changes in the indirect taxes such as customsand excise duties and lower realisation in directtaxes due to the economic slowdown, whichtogether affected collections under all the majorforms of taxes. Collections under service tax andtaxes such as banking cash transaction tax, fringebenefit tax, taxes of UTs and other taxes and duties,which constitute a small proportion of the grosstaxes, however, were somewhat higher than thebudgeted level (see Table 2.43). Consequently, thenet tax revenue (i.e., net of tax revenue transferredto the States) was also placed lower than thebudgeted level. Non-tax revenue, however, wasplaced higher in 2008-09 (RE) than the budgetestimates for the year due to an increase of 10.0per cent in ‘other non-tax revenue’, such as,economic services, other general services andgrants-in-aid and contr ibutions. Other majorcomponents, viz., dividends and profits and interestreceipts were lower in the revised estimates thanin the budget estimates. The revenue receipts (net)of the Centre in the revised estimates for 2008-09were, therefore, lower than the budgeted level.
II.4.7 On the expenditure front, large sums wereprovided for under the three supplementarydemands for grants with a view to meeting the
resource needs of the fiscal stimulus measures andother expenditures. The aggregate expenditure ofthe Central Government, as a result, weresubstantially higher in the revised estimates for2008-09 than the budget estimates, particularly inthe revenue account (see Table 2.35). The increasein revenue expenditure was on account of subsidiesand defence expenditure in the non-plancomponent and rural development under the plancomponent. Subsidies in the revised estimates werehigher by 80.9 per cent, primarily due to increasein fertiliser and food subsidies that were necessaryto soften the impact of signif icant r ise ininternational commodity prices (Table 2.36).Implementation of the Sixth Pay Commission awardfor defence personnel increased defence revenueexpenditure. With regard to capital expenditure,while the defence capital outlay declined during2008-09, non-defence capital outlay increased. Netlending was also higher in the revised estimatesfor 2008-09, with loan disbursements more thanoffsetting loan recoveries.
II.4.8 In view of the sharp increase in expenditureand the deceleration in tax revenue, the key deficitindicators, viz., revenue deficit, gross fiscal deficit(GFD) relative to GDP, widened significantly in therevised estimates for 2008-09 over the budgetestimates and primary balance was a high deficitin contrast to the budgeted primary surplus for2008-09 (see Table 2.35).
Table 2.36: Subsidies of the Centre
Item 2005-06 2006-07 2007-08 2008-09BE 2008-09RE 2009-10BE
1 2 3 4 5 6 7
Subsidies 47,522 57,125 70,926 71,431 1,29,243 111276(1.3) (1.4) (1.5) (1.3) (2.4) (1.9)
of which:
i. Food 23,077 24,014 31,328 32,667 43,627 52490(0.6) (0.6) (0.7) (0.6) (0.8) (0.9)
ii. Fertiliser 18,460 26,222 32,490 30,986 75,849 49,980(0.5) (0.6) (0.7) (0.6) (1.4) (0.8)
iii.Petroleum 2,683 2,699 2,820 2,884 2,877 3,109(0.1) (0.1) (0.1) (0.1) (0.1) (0.1)
RE : Revised Estimates BE : Budget EstimatesNote : Figures in parentheses are percentages to GDP.

117
ECONOMIC REVIEW
II.4.9 Reflecting the financing needs of anenlarged fiscal deficit, the net market borrowingswere over two and a half times the budgeted levelsand financed over four-fifths of the GFD in therevised estimates as compared with the budgetedfinancing of about three-fourths of the GFD during2008-09. Short-term borrowings financed aboutone-fifth of GFD in the revised estimates (9.3 percent in the budget estimates). Draw down of cashbalances financed nearly a tenth of GFD (5.4 percent in budget estimates). Contribution to GFDfinancing from ‘deposit and advances’ and ‘externalassistance’ were less in the revised estimatesthan in the budget estimates (see Table 2.47).
II.4.10 The widening of key fiscal deficit indicatorsduring 2008-09 has been the result of the combinedeffect of the operation of automatic stabilisers dueto economic slowdown and the discretionary policymeasures to contain the slowdown. Thus, while theeconomic slowdown has widened the deficitindicators through direct effects in terms ofcompressing revenue receipts, the fiscal responseto the slowdown has been manifested in the formof higher expenditure and tax cuts, which togetherhave contributed to wider deficits. In the cross-country context, the size of discretionary fiscalstimulus appears to have been determined partlyby the magnitude of economic slowdown, as in theG-20 countries, and partly by the size of automaticstabilisers, as in the OECD countries (Box II.23).Despite India being one of the least affectedcountries in relation to the other G-20 countries interms of the scale of growth deceleration, the fiscalstimulus used by India has been one of the largestas percentage of GDP.
II.4.11 As against the large dose of discretionarystimulus, the size of automatic stabilisers in Indiacould be at around 0.5 per cent of GDP in 2008-09.This may appear to be on the lower side whencompared with those in the advanced economies
but is comparable with those in EMEs such as Brazil,China, Indonesia, and South Africa (Box II.24).
Provisional accounts
II.4.12 The provisional accounts for 2008-09released by the Controller General of Accountsindicate that the revenue deficit and the GFDrelative to GDP deteriorated by 0.2 percentagepoints each vis-à-vis the revised estimates mainlyon account of lower revenue receipts (Table 2.36).It may be noted that although total expenditure inthe provisional accounts was lower than the revisedestimates by Rs.19,484 crore, it is the deteriorationin revenue receipts (by Rs.17,522 crore), recoveryof loans (by Rs.3,540 crore) and other receipts (byRs.2,021 crore), which led to further widening ofdeficit indicators.
Debt Position of the Central Government
II.4.13 The outstanding domestic liabilities of theCentral Government comprising of internal debt andother liabilities such as National Small Savings Fund(NSSF), state provident funds, other accounts,reserve funds and deposits declined to 56.6 per centof GDP at end-March 2009 (RE) from 57.7 per centat end-March 2008. The reduction in debt to GDP ratio,despite the sharp increase in Governmentborrowings to finance the higher deficits andincreased recourse to extra-budgetary liabilities suchas special securities to oil marketing and fertilisercompanies, was enabled by a higher nominal GDPgrowth relative to the growth in domestic liabilitiesand a sharp reduction in government’s liabilitiesunder the MSS. Internal debt continues to be thelargest component of the outstanding liabilities of theCentral Government (64.2 per cent of the total debtat end-March 2009) followed by liabilities on accountof NSSF and other accounts (15.2 per cent and 10.2per cent, respectively).
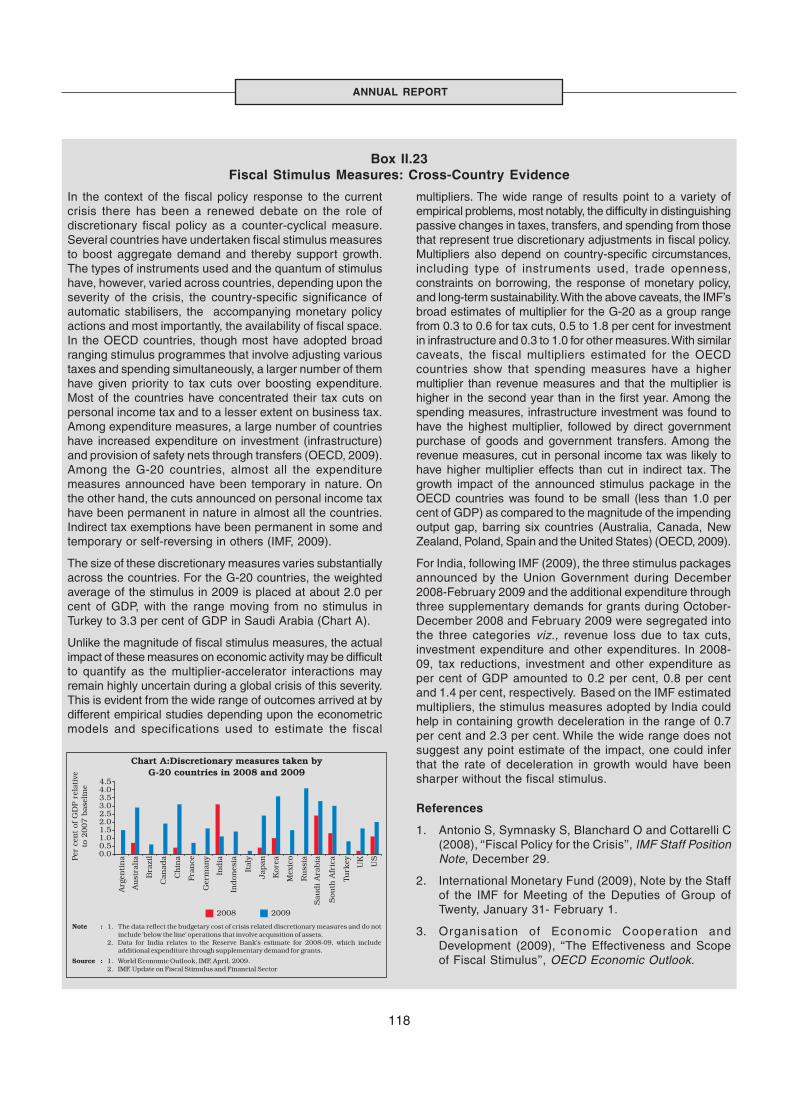
118
ANNUAL REPORT
In the context of the fiscal policy response to the currentcrisis there has been a renewed debate on the role ofdiscretionary fiscal policy as a counter-cyclical measure.Several countries have undertaken fiscal stimulus measuresto boost aggregate demand and thereby support growth.The types of instruments used and the quantum of stimulushave, however, varied across countries, depending upon theseverity of the crisis, the country-specific significance ofautomatic stabilisers, the accompanying monetary policyactions and most importantly, the availability of fiscal space.In the OECD countries, though most have adopted broadranging stimulus programmes that involve adjusting varioustaxes and spending simultaneously, a larger number of themhave given priority to tax cuts over boosting expenditure.Most of the countries have concentrated their tax cuts onpersonal income tax and to a lesser extent on business tax.Among expenditure measures, a large number of countrieshave increased expenditure on investment (infrastructure)and provision of safety nets through transfers (OECD, 2009).Among the G-20 countries, almost all the expendituremeasures announced have been temporary in nature. Onthe other hand, the cuts announced on personal income taxhave been permanent in nature in almost all the countries.Indirect tax exemptions have been permanent in some andtemporary or self-reversing in others (IMF, 2009).
The size of these discretionary measures varies substantiallyacross the countries. For the G-20 countries, the weightedaverage of the stimulus in 2009 is placed at about 2.0 percent of GDP, with the range moving from no stimulus inTurkey to 3.3 per cent of GDP in Saudi Arabia (Chart A).
Unlike the magnitude of fiscal stimulus measures, the actualimpact of these measures on economic activity may be difficultto quantify as the multiplier-accelerator interactions mayremain highly uncertain during a global crisis of this severity.This is evident from the wide range of outcomes arrived at bydifferent empirical studies depending upon the econometricmodels and specifications used to estimate the fiscal
Box II.23Fiscal Stimulus Measures: Cross-Country Evidence
multipliers. The wide range of results point to a variety ofempirical problems, most notably, the difficulty in distinguishingpassive changes in taxes, transfers, and spending from thosethat represent true discretionary adjustments in fiscal policy.Multipliers also depend on country-specific circumstances,including type of instruments used, trade openness,constraints on borrowing, the response of monetary policy,and long-term sustainability. With the above caveats, the IMF’sbroad estimates of multiplier for the G-20 as a group rangefrom 0.3 to 0.6 for tax cuts, 0.5 to 1.8 per cent for investmentin infrastructure and 0.3 to 1.0 for other measures. With similarcaveats, the fiscal multipliers estimated for the OECDcountries show that spending measures have a highermultiplier than revenue measures and that the multiplier ishigher in the second year than in the first year. Among thespending measures, infrastructure investment was found tohave the highest multiplier, followed by direct governmentpurchase of goods and government transfers. Among therevenue measures, cut in personal income tax was likely tohave higher multiplier effects than cut in indirect tax. Thegrowth impact of the announced stimulus package in theOECD countries was found to be small (less than 1.0 percent of GDP) as compared to the magnitude of the impendingoutput gap, barring six countries (Australia, Canada, NewZealand, Poland, Spain and the United States) (OECD, 2009).
For India, following IMF (2009), the three stimulus packagesannounced by the Union Government during December2008-February 2009 and the additional expenditure throughthree supplementary demands for grants during October-December 2008 and February 2009 were segregated intothe three categories viz., revenue loss due to tax cuts,investment expenditure and other expenditures. In 2008-09, tax reductions, investment and other expenditure asper cent of GDP amounted to 0.2 per cent, 0.8 per centand 1.4 per cent, respectively. Based on the IMF estimatedmultipliers, the stimulus measures adopted by India couldhelp in containing growth deceleration in the range of 0.7per cent and 2.3 per cent. While the wide range does notsuggest any point estimate of the impact, one could inferthat the rate of deceleration in growth would have beensharper without the fiscal stimulus.
References
1. Antonio S, Symnasky S, Blanchard O and Cottarelli C(2008), ‘‘Fiscal Policy for the Crisis’’, IMF Staff PositionNote, December 29.
2. International Monetary Fund (2009), Note by the Staffof the IMF for Meeting of the Deputies of Group ofTwenty, January 31- February 1.
3. Organisation of Economic Cooperation andDevelopment (2009), ‘‘The Effectiveness and Scopeof Fiscal Stimulus’’, OECD Economic Outlook.
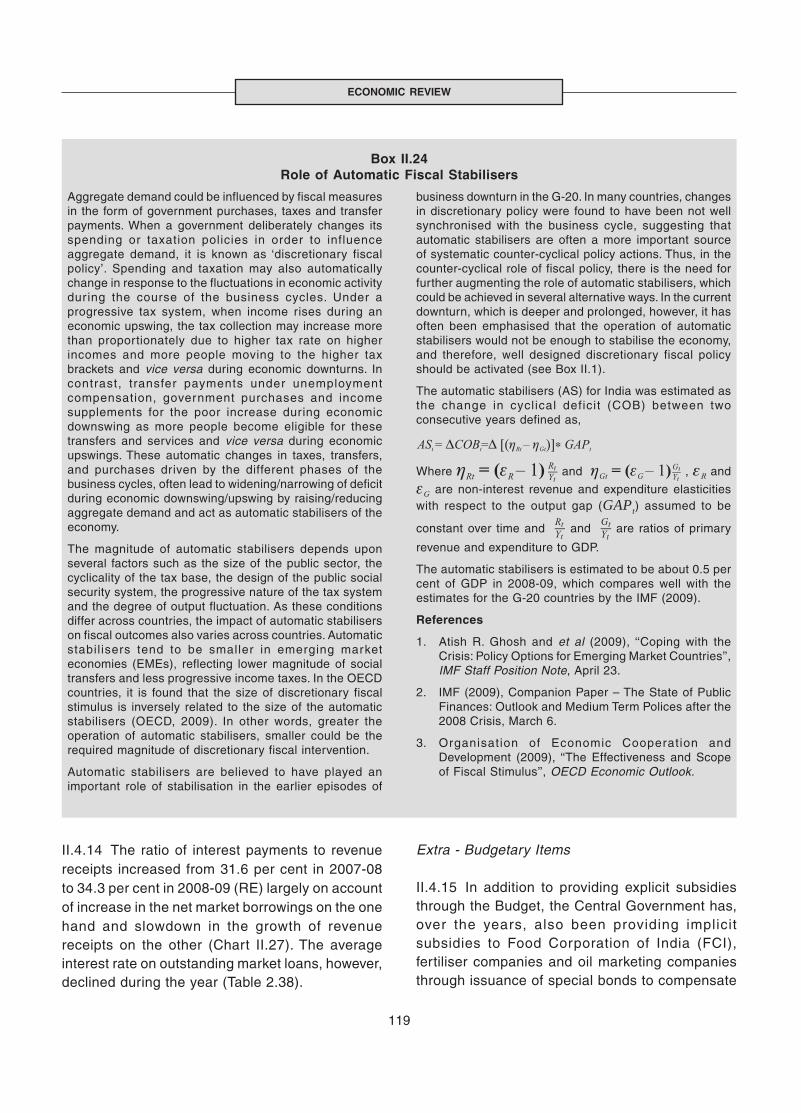
119
ECONOMIC REVIEW
II.4.14 The ratio of interest payments to revenuereceipts increased from 31.6 per cent in 2007-08to 34.3 per cent in 2008-09 (RE) largely on accountof increase in the net market borrowings on the onehand and slowdown in the growth of revenuereceipts on the other (Chart II.27). The averageinterest rate on outstanding market loans, however,declined during the year (Table 2.38).
Extra - Budgetary Items
II.4.15 In addition to providing explicit subsidiesthrough the Budget, the Central Government has,over the years, also been providing implicitsubsidies to Food Corporation of India (FCI),fertiliser companies and oil marketing companiesthrough issuance of special bonds to compensate
Aggregate demand could be influenced by fiscal measuresin the form of government purchases, taxes and transferpayments. When a government deliberately changes itsspending or taxation policies in order to influenceaggregate demand, it is known as ‘discretionary fiscalpolicy’. Spending and taxation may also automaticallychange in response to the fluctuations in economic activityduring the course of the business cycles. Under aprogressive tax system, when income rises during aneconomic upswing, the tax collection may increase morethan proportionately due to higher tax rate on higherincomes and more people moving to the higher taxbrackets and vice versa during economic downturns. Incontrast, transfer payments under unemploymentcompensation, government purchases and incomesupplements for the poor increase during economicdownswing as more people become eligible for thesetransfers and services and vice versa during economicupswings. These automatic changes in taxes, transfers,and purchases driven by the different phases of thebusiness cycles, often lead to widening/narrowing of deficitduring economic downswing/upswing by raising/reducingaggregate demand and act as automatic stabilisers of theeconomy.
The magnitude of automatic stabilisers depends uponseveral factors such as the size of the public sector, thecyclicality of the tax base, the design of the public socialsecurity system, the progressive nature of the tax systemand the degree of output fluctuation. As these conditionsdiffer across countries, the impact of automatic stabiliserson fiscal outcomes also varies across countries. Automaticstabil isers tend to be smaller in emerging marketeconomies (EMEs), reflecting lower magnitude of socialtransfers and less progressive income taxes. In the OECDcountries, it is found that the size of discretionary fiscalstimulus is inversely related to the size of the automaticstabilisers (OECD, 2009). In other words, greater theoperation of automatic stabilisers, smaller could be therequired magnitude of discretionary fiscal intervention.
Automatic stabilisers are believed to have played animportant role of stabilisation in the earlier episodes of
Box II.24Role of Automatic Fiscal Stabilisers
business downturn in the G-20. In many countries, changesin discretionary policy were found to have been not wellsynchronised with the business cycle, suggesting thatautomatic stabilisers are often a more important sourceof systematic counter-cyclical policy actions. Thus, in thecounter-cyclical role of fiscal policy, there is the need forfurther augmenting the role of automatic stabilisers, whichcould be achieved in several alternative ways. In the currentdownturn, which is deeper and prolonged, however, it hasoften been emphasised that the operation of automaticstabilisers would not be enough to stabilise the economy,and therefore, well designed discretionary fiscal policyshould be activated (see Box II.1).
The automatic stabilisers (AS) for India was estimated asthe change in cyclical deficit (COB) between twoconsecutive years defined as,
Where and , and
are non-interest revenue and expenditure elasticitieswith respect to the output gap (GAPt) assumed to be
constant over time and and are ratios of primary
revenue and expenditure to GDP.
The automatic stabilisers is estimated to be about 0.5 percent of GDP in 2008-09, which compares well with theestimates for the G-20 countries by the IMF (2009).
References
1. Atish R. Ghosh and et al (2009), ‘‘Coping with theCrisis: Policy Options for Emerging Market Countries’’,IMF Staff Position Note, April 23.
2. IMF (2009), Companion Paper – The State of PublicFinances: Outlook and Medium Term Polices after the2008 Crisis, March 6.
3. Organisation of Economic Cooperation andDevelopment (2009), ‘‘The Effectiveness and Scopeof Fiscal Stimulus’’, OECD Economic Outlook.

120
ANNUAL REPORT
for under-recoveries arising from keeping retailprices below the input costs. These bonds areconsidered to be fiscal deficit neutral since they donot involve immediate cash outflow and are,therefore, not treated as par t of budgetaryexpenditure/receipts. However, these bonds havefiscal implications as they carry repaymentobligations at a later date and, hence, add to thefiscal liabilities of the Government. Furthermore, asinterest payments on such bonds are treated aspart of the revenue expenditure, they affect therevenue deficit and, thereby, the fiscal deficit. During2008-09, special bonds amounting to Rs.75,942crore and Rs.20,000 crore were issued to oilmarketing companies and fertiliser companies,
respectively, together accounting for 1.8 per centof GDP. Along with explicit subsidies provided forfood, fertiliser and petroleum in the Budget, thetotal subsidy burden of the Central Government in2008-09 was about 4.2 per cent of GDP.
Table 2.37 : Key Deficit Indicators of the Centre for 2008-09 - Provisional Accounts(Rupees crore)
Indicator Budget Revised Provisional Variation (per cent)Estimates Estimates Accounts Col. 4 over Col.3 Col.4 over Col.2
1 2 3 4 5 6
Revenue Deficit 55,184 2,41,273 2,47,046 2.4 347.7(1.0) (4.4) (4.6)
Gross Fiscal Deficit 1,33,287 3,26,515 3,30,114 1.1 147.7(2.5) (6.0) (6.2)
Primary Deficit -57,520 1,33,821 1,39,629 4.3 -342.7(-1.1) (2.5) (2.6)
Note: Figures in parentheses are percentages to GDP.
Table 2.38: Average Interest Rates on OutstandingDomestic Liabilities of the Centre
(Per cent)
Year Market Small State SpecialLoans Savings / Provident Deposits
NSSF Funds
1 2 3 4 5
1990-91 to1994-95(Average) 10.86 10.85 11.63 11.53
1995-96 to1999-2000(Average) 12.39 11.62 11.62 10.93
2000-01 12.99 11.6 10.54 9.87
2001-02 12.83 11.61 9.09 10.5
2002-03 12.11 11.56 8.53 8.82
2003-04 11.11 10.88 7.39 7.94
2004-05 9.87 9.37 7.99 7.65
2005-06 10.07 8.90 7.46 7.25
2006-07 8.90 8.91 7.63 6.85
2007-08 9.89 8.37 7.26 5.60
2008-09(RE) 9.14 8.86 8.04 4.73
RE : Revised Estimates.
Note: 1. Market loans represent dated securities.
2. Small savings represent small saving deposits, certificatesand public provident fund. Since 1999-2000, interest onsmall savings represents interest on Central GovernmentSpecial Securities issued to the National Small SavingsFund (NSSF).
3. The Government notified the freezing of the corpus of theSpecial Deposit Scheme as on June 30, 2003.
4. The interest rate for each component is computed bydividing the interest payments in a year by the outstandingliabilities at the end of the preceding year.
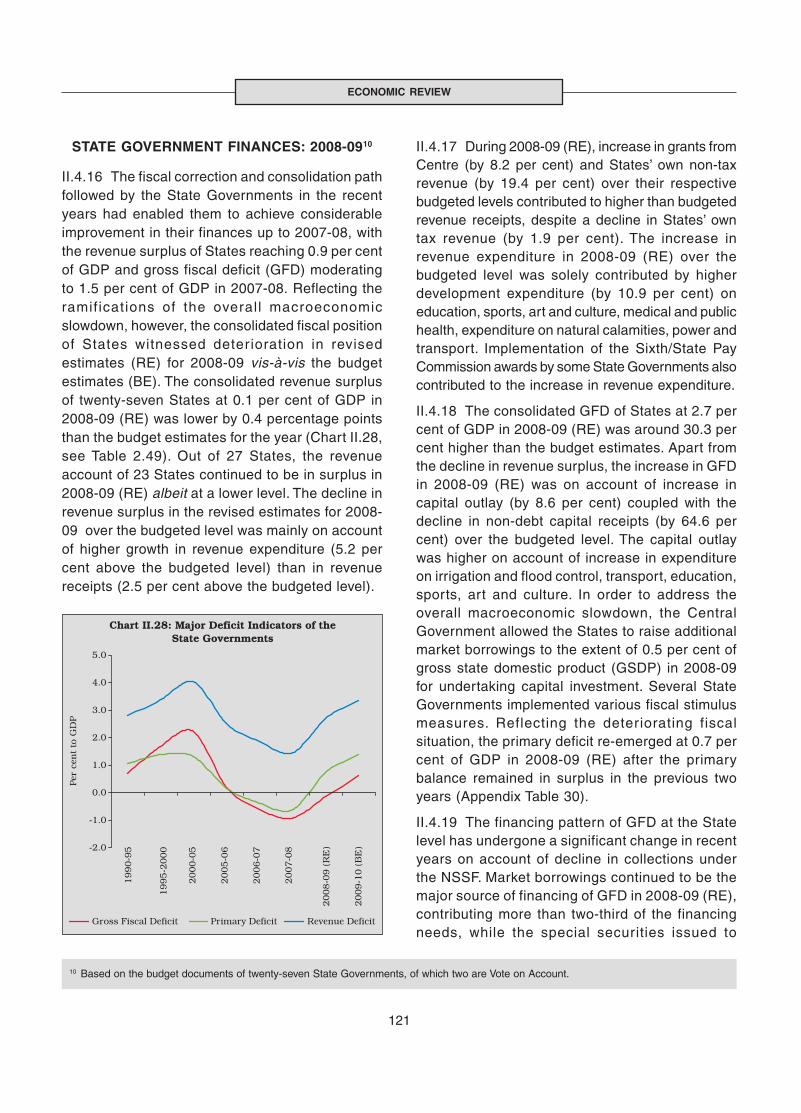
121
ECONOMIC REVIEW
STATE GOVERNMENT FINANCES: 2008-0910
II.4.16 The fiscal correction and consolidation pathfollowed by the State Governments in the recentyears had enabled them to achieve considerableimprovement in their finances up to 2007-08, withthe revenue surplus of States reaching 0.9 per centof GDP and gross fiscal deficit (GFD) moderatingto 1.5 per cent of GDP in 2007-08. Reflecting theramifications of the overall macroeconomicslowdown, however, the consolidated fiscal positionof States witnessed deterioration in revisedestimates (RE) for 2008-09 vis-à-vis the budgetestimates (BE). The consolidated revenue surplusof twenty-seven States at 0.1 per cent of GDP in2008-09 (RE) was lower by 0.4 percentage pointsthan the budget estimates for the year (Chart II.28,see Table 2.49). Out of 27 States, the revenueaccount of 23 States continued to be in surplus in2008-09 (RE) albeit at a lower level. The decline inrevenue surplus in the revised estimates for 2008-09 over the budgeted level was mainly on accountof higher growth in revenue expenditure (5.2 percent above the budgeted level) than in revenuereceipts (2.5 per cent above the budgeted level).
II.4.17 During 2008-09 (RE), increase in grants fromCentre (by 8.2 per cent) and States’ own non-taxrevenue (by 19.4 per cent) over their respectivebudgeted levels contributed to higher than budgetedrevenue receipts, despite a decline in States’ owntax revenue (by 1.9 per cent). The increase inrevenue expenditure in 2008-09 (RE) over thebudgeted level was solely contributed by higherdevelopment expenditure (by 10.9 per cent) oneducation, sports, art and culture, medical and publichealth, expenditure on natural calamities, power andtransport. Implementation of the Sixth/State PayCommission awards by some State Governments alsocontributed to the increase in revenue expenditure.
II.4.18 The consolidated GFD of States at 2.7 percent of GDP in 2008-09 (RE) was around 30.3 percent higher than the budget estimates. Apart fromthe decline in revenue surplus, the increase in GFDin 2008-09 (RE) was on account of increase incapital outlay (by 8.6 per cent) coupled with thedecline in non-debt capital receipts (by 64.6 percent) over the budgeted level. The capital outlaywas higher on account of increase in expenditureon irrigation and flood control, transport, education,sports, art and culture. In order to address theoverall macroeconomic slowdown, the CentralGovernment allowed the States to raise additionalmarket borrowings to the extent of 0.5 per cent ofgross state domestic product (GSDP) in 2008-09for undertaking capital investment. Several StateGovernments implemented various fiscal stimulusmeasures. Reflecting the deteriorating fiscalsituation, the primary deficit re-emerged at 0.7 percent of GDP in 2008-09 (RE) after the primarybalance remained in surplus in the previous twoyears (Appendix Table 30).
II.4.19 The financing pattern of GFD at the Statelevel has undergone a significant change in recentyears on account of decline in collections underthe NSSF. Market borrowings continued to be themajor source of financing of GFD in 2008-09 (RE),contributing more than two-third of the financingneeds, while the special securities issued to
10 Based on the budget documents of twenty-seven State Governments, of which two are Vote on Account.

122
ANNUAL REPORT
NSSF financed merely 1.5 per cent of GFD(Appendix Table 31).
COMBINED GOVERNMENT BUDGETARYPOSITION OF CENTRE AND STATES - 2008-09
II.4.20 The combined finances of the Central andState Governments in terms of the key deficitindicators showed significant deterioration during2008-09 (RE) as compared with the budgetestimates due to decline in revenue receiptscoupled with sharp increase in expenditure (Table2.39). The tax receipts in the revised estimates asper cent to GDP declined due to the combinedimpact of economic slowdown and fiscal stimulusmeasures in terms of tax cuts to support growth.Aggregate expenditure was higher than budgetestimates mainly on account of addit ionalexpenditure incurred by the Central Governmentfor the implementation of Sixth Pay Commission
Award, agricultural debt waiver scheme, ruralemployment programme and infrastructure. Someof the State Governments also announced themeasures akin to the Central Government andeffected pay revisions consequent upon theimplementation of Sixth Pay Commission by theCentral Government.
Combined Debt
II.4.21 The combined outstanding liabilities as aproportion of GDP at 74.7 per cent showed amarginal decline over end-March 2008 despite thesubstantial increase in fiscal deficit. This was mainlydue to the growth in nominal GDP surpassing thegrowth in liabilities (Table 2.40).
II.4.22 Rising deficits associated with counter-cyclical expansionary fiscal policy and the revenueloss arising from economic slowdown could impinge
Table 2.39: Indicators of Combined Finances of the Centre and States(Amount in Rupees crore)
Items 1990-91 1995-96 2000-01 2007-08 2008-09 2008-09 VariationBE RE (RE over BE)
Amount Per cent
1 2 3 4 5 6 7 8 9
Gross Fiscal Deficit [II-IA-IB(a)] 53,580 77,671 1,99,852 1,97,037 2,42,273 4,71,520 2,29,247 94.6(9.4) (6.5) (9.5) (4.2) (4.6) (8.9)
Revenue Deficit [II1-IA] 23,871 37,932 1,38,803 9,163 30,147 2,33,938 2,03,791 676.0(4.2) (3.2) (6.6) (0.2) (0.6) (4.4)
Primary Deficit 28,585 18,598 75,035 -60,495 -43,604 1,86,034 2,29,638 -526.6(5.0) (1.6) (3.6) (-1.3) (-0.8) (3.5)
I. Total Receipts(A+B) 1,51,593 2,96,629 5,94,804 13,11,589 14,70,354 16,42,815 1,72,461 11.7A. Revenue Receipts (1+2) 1,05,757 2,17,526 3,78,817 10,48,406 11,93,487 11,66,470 -27,017 -2.3
1. Tax Receipts (a+b) 87,564 1,74,851 3,05,374 8,73,779 10,12,456 9,65,102 -47,354 -4.7a) Direct Taxes 14,267 41,603 80,215 3,55,929 4,08,571 3,93,060 -15,511 -3.8b) Indirect Taxes 73,297 1,33,248 2,25,159 5,17,850 6,03,885 5,72,042 -31,843 -5.3
2. Non-Tax Receipts 18,193 42,675 73,443 1,74,627 1,81,031 2,01,368 20,337 11.2B. Capital Receipts 45,836 79,102 2,15,987 2,63,183 2,76,867 4,76,345 1,99,478 72.0
a) Non Debt Capital Receipts 3,531 6,968 12,591 50,460 32,267 21,119 -11,148 -34.5b) Debt Capital Receipts 42,305 72,134 2,03,396 2,12,723 2,44,600 4,55,226 2,10,626 86.1
II. Aggregate Expenditure(1+2+3 = 4+5) 1,62,868 3,02,166 5,91,258 12,95,903 14,68,027 16,59,109 1,91,082 13.01. Revenue Expenditure 1,29,628 2,55,457 5,17,618 10,57,569 12,23,634 14,00,408 1,76,774 14.42. Capital Outlay 21,353 32,594 55,875 2,19,853 2,24,159 2,34,906 10,747 4.83. Loans and Advances 11,887 14,115 17,766 18,481 20,234 23,795 3,561 17.64. Development Expenditure 97,149 1,65,361 3,08,546 6,96,200 8,22,517 9,88,513 1,65,996 20.25. Non-Development Expenditure 65,719 1,36,805 2,82,712 5,99,703 6,45,510 6,70,596 25,086 3.9
RE : Revised Estimates. BE : Budget EstimatesNotes: 1. Inter-Governmental transactions have been netted out.
2. Figures in parentheses are percentages to GDP.3. Data in respect of States are provisional from 2007-08 onwards and relate to 27 States of which 2 are vote on account.

123
ECONOMIC REVIEW
Table 2.40: Combined Liabilities of theCentre and States
End- Outstanding Liabilities Debt-GDP RatioMarch (Rupees crore) (per cent)
Centre States Combined Centre States Combined
1 2 3 4 5 6 7
1990-91 3,14,558 1,28,155 3,68,824 55.2 22.5 64.71995-96 6,06,232 2,49,535 7,26,854 50.9 20.9 61.02000-01 11,68,541 5,94,147 14,84,106 55.6 28.3 70.62005-06 22,60,145 11,67,866 28,79,705 63.0 32.6 80.32006-07 25,38,596 12,50,819 31,90,698 61.5 30.3 77.32007-08 28,37,425 13,14,355 35,47,790 60.1 27.8 75.12008-09 RE 31,36,075 14,44,165 39,73,203 58.9 27.1 74.72009-10 BE 34,95,452 16,12,377 44,85,955 59.7 27.5 76.6
RE : Revised Estimates. BE : Budget Estimates.Note: 1. Data in respect of the States are provisional from 2007-08 onwards
and relate to 27 States of which 2 are vote on account.2. Under ‘combined liabilities’, inter-governmental transactions are
netted out.3. Data include ‘reserve funds’ and ‘deposits and advances’.
and may, thereby, render the fiscal stimulus partlycounterproductive. The steady state debt dynamicsshow that the debt sustainability condition in termsof maintaining debt-GDP ratio constant wascomfor tably satisfied in 2007-08, even afterincluding all off-budget borrowings but this conditionwould be significantly violated in 2008-09. The debtservice burden in terms of the ratio of interestpayments to revenue receipts which hadcontinuously declined since 2001-02 has alsoreversed during 2008-09. Therefore, there wouldbe a need for reverting to fiscal consolidation asoutlined in the Fiscal Responsibility and BudgetManagement (FRBM) Act, 2003 in the medium-term. In India, progress on fiscal consolidation hasbeen associated with higher growth momentum andonce the recovery from the current phase ofslowdown becomes visible, consolidation may haveto be pursued with renewed focus (Box II.25).
11 An adjusted debt stock concept removing those components not related to the size of fiscal deficit from the total outstanding has beenconsidered. The components are National Small Savings Fund (NSSF) utilised by the States and the outstanding stock of marketstabilisation bonds (MSS). NSSF utilised by the States is already reflected in the outstanding debt stock of the State Governments andthe interest dues are also met by the States. MSS is backed by a corresponding equivalent amount of cash balances with the ReserveBank and has no direct relationship with the movement in fiscal deficit. To make the exercise consistent, interest payment on MSS wasexcluded from the total interest payments.
Fiscal solvency requires that government debt should not slipto an explosive path. The substantial widening of deficitindicators due to fiscal stimulus could be expected to alteradversely the debt sustainability conditions, which mustreverse with the return to normalcy in economic situation.Taking into account the debt position, nominal GDP growthand nominal interest on debt for the years 2007-08 and2008-09 (RE), the required primary balance to keep the debt-GDP ratio constant for these two years could be estimatedusing the following steady state identity.
(1)
Where D is the debt stock11 , Y is GDP, r is the nominal interestrate, g is the nominal growth rate, pb is the primary fiscalbalance as a share of GDP, and ∆ indicates a change overthe previous year. From (1) it can be derived that the debtratio is constant when
= pb (2)
The primary balance was inclusive of all off-budget borrowingssuch as oil and fertiliser bonds, as these borrowings are
Box II.25Fiscal Stimulus and Debt Sustainability in India
included in the outstanding liabilities. The estimates suggestthat, for 2007-08, given the excess of nominal growth overnominal interest rate, a primary deficit of 2.72 per cent ofGDP could keep the debt–GDP ratio constant. The debtsustainability condition was comfortably satisfied, with theprimary balance recording a surplus of 0.1 per cent of GDP.For 2008-09, however, the recorded primary deficit of 4.3 percent of GDP would be significantly higher than the thresholdprimary deficit of 2.73 per cent of GDP to keep the debt-GDPratio constant.
Another indicator of debt sustainability is the debt serviceburden measured in terms of interest payments to revenuereceipts ratio. It indicates the extent of pre-emption ofgovernment’s current receipts by its past fiscal actions. Thisratio, which had fallen continuously since 2001-02, also showsa reversal during 2008-09 that may continue during 2009-10.
Therefore, debt sustainability parameters, measured in termsof the actual primary balance relative to required primarybalance to keep debt-GDP ratio constant and also in termsof the ratio of interest payments to revenue receipts, indicatesome deterioration in 2008-09.
on the sustainability of debt in the near term. Thiscould potentially lead to adverse market reactions
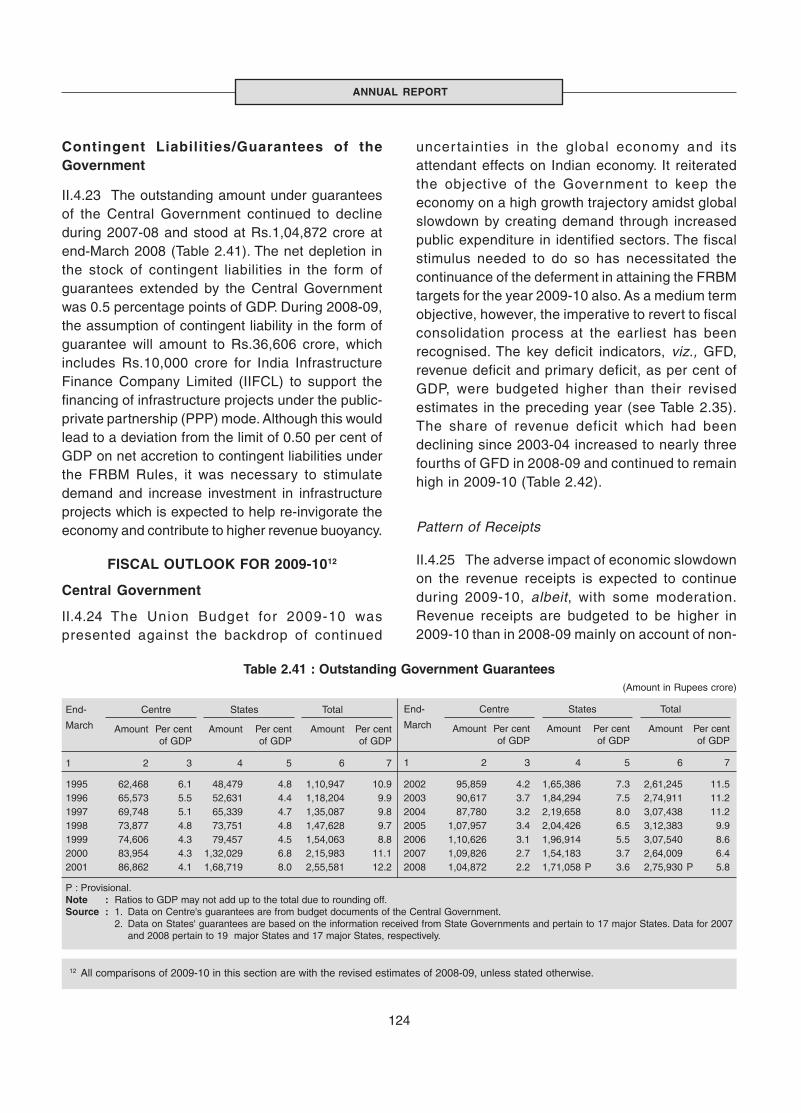
124
ANNUAL REPORT
Contingent Liabilities/Guarantees of theGovernment
II.4.23 The outstanding amount under guaranteesof the Central Government continued to declineduring 2007-08 and stood at Rs.1,04,872 crore atend-March 2008 (Table 2.41). The net depletion inthe stock of contingent liabilities in the form ofguarantees extended by the Central Governmentwas 0.5 percentage points of GDP. During 2008-09,the assumption of contingent liability in the form ofguarantee will amount to Rs.36,606 crore, whichincludes Rs.10,000 crore for India InfrastructureFinance Company Limited (IIFCL) to support thefinancing of infrastructure projects under the public-private partnership (PPP) mode. Although this wouldlead to a deviation from the limit of 0.50 per cent ofGDP on net accretion to contingent liabilities underthe FRBM Rules, it was necessary to stimulatedemand and increase investment in infrastructureprojects which is expected to help re-invigorate theeconomy and contribute to higher revenue buoyancy.
FISCAL OUTLOOK FOR 2009-1012
Central Government
II.4.24 The Union Budget for 2009-10 waspresented against the backdrop of continued
uncer tainties in the global economy and itsattendant effects on Indian economy. It reiteratedthe objective of the Government to keep theeconomy on a high growth trajectory amidst globalslowdown by creating demand through increasedpublic expenditure in identified sectors. The fiscalstimulus needed to do so has necessitated thecontinuance of the deferment in attaining the FRBMtargets for the year 2009-10 also. As a medium termobjective, however, the imperative to revert to fiscalconsolidation process at the earliest has beenrecognised. The key deficit indicators, viz., GFD,revenue deficit and primary deficit, as per cent ofGDP, were budgeted higher than their revisedestimates in the preceding year (see Table 2.35).The share of revenue deficit which had beendeclining since 2003-04 increased to nearly threefourths of GFD in 2008-09 and continued to remainhigh in 2009-10 (Table 2.42).
Pattern of Receipts
II.4.25 The adverse impact of economic slowdownon the revenue receipts is expected to continueduring 2009-10, albeit, with some moderation.Revenue receipts are budgeted to be higher in2009-10 than in 2008-09 mainly on account of non-
12 All comparisons of 2009-10 in this section are with the revised estimates of 2008-09, unless stated otherwise.
Table 2.41 : Outstanding Government Guarantees(Amount in Rupees crore)
1995 62,468 6.1 48,479 4.8 1,10,947 10.91996 65,573 5.5 52,631 4.4 1,18,204 9.91997 69,748 5.1 65,339 4.7 1,35,087 9.81998 73,877 4.8 73,751 4.8 1,47,628 9.71999 74,606 4.3 79,457 4.5 1,54,063 8.82000 83,954 4.3 1,32,029 6.8 2,15,983 11.12001 86,862 4.1 1,68,719 8.0 2,55,581 12.2
End- Centre States Total
March Amount Per cent Amount Per cent Amount Per centof GDP of GDP of GDP
1 2 3 4 5 6 7
2002 95,859 4.2 1,65,386 7.3 2,61,245 11.52003 90,617 3.7 1,84,294 7.5 2,74,911 11.22004 87,780 3.2 2,19,658 8.0 3,07,438 11.22005 1,07,957 3.4 2,04,426 6.5 3,12,383 9.92006 1,10,626 3.1 1,96,914 5.5 3,07,540 8.62007 1,09,826 2.7 1,54,183 3.7 2,64,009 6.42008 1,04,872 2.2 1,71,058 P 3.6 2,75,930 P 5.8
End- Centre States Total
March Amount Per cent Amount Per cent Amount Per centof GDP of GDP of GDP
1 2 3 4 5 6 7
P : Provisional.Note : Ratios to GDP may not add up to the total due to rounding off.Source : 1. Data on Centre's guarantees are from budget documents of the Central Government.
2. Data on States' guarantees are based on the information received from State Governments and pertain to 17 major States. Data for 2007and 2008 pertain to 19 major States and 17 major States, respectively.
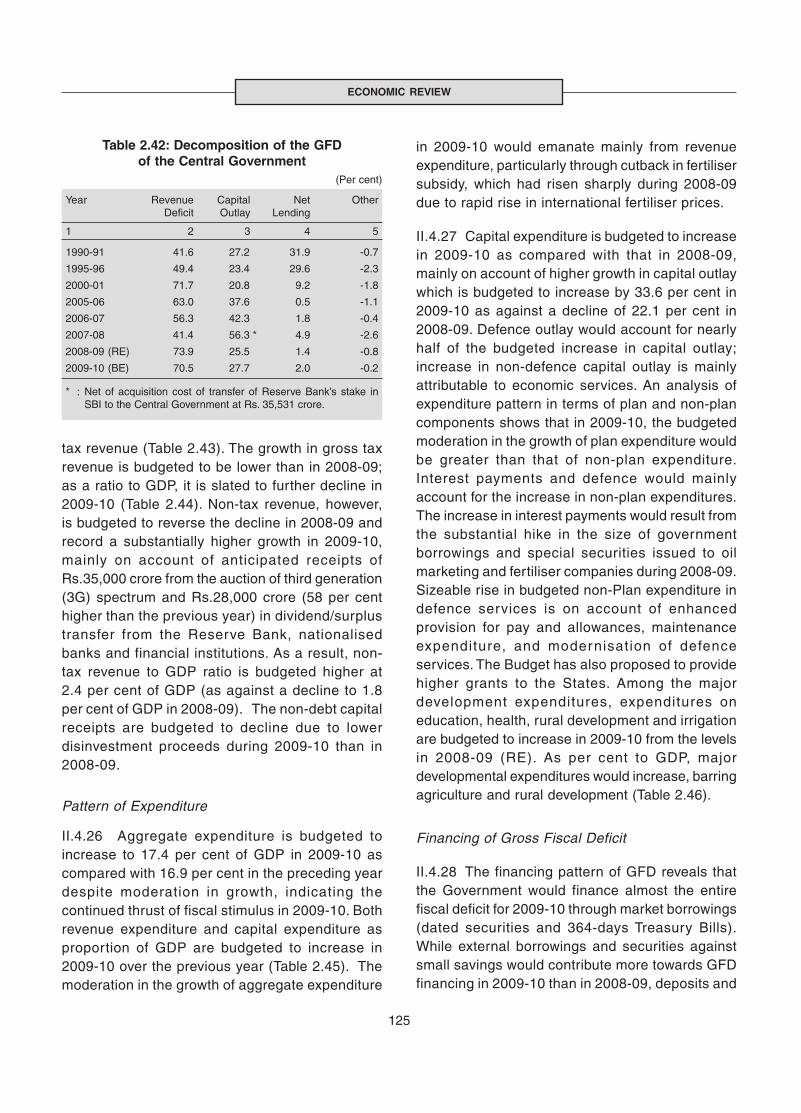
125
ECONOMIC REVIEW
Table 2.42: Decomposition of the GFDof the Central Government
(Per cent)
Year Revenue Capital Net OtherDeficit Outlay Lending
1 2 3 4 5
1990-91 41.6 27.2 31.9 -0.7
1995-96 49.4 23.4 29.6 -2.3
2000-01 71.7 20.8 9.2 -1.8
2005-06 63.0 37.6 0.5 -1.1
2006-07 56.3 42.3 1.8 -0.4
2007-08 41.4 56.3 * 4.9 -2.6
2008-09 (RE) 73.9 25.5 1.4 -0.8
2009-10 (BE) 70.5 27.7 2.0 -0.2
* : Net of acquisition cost of transfer of Reserve Bank’s stake inSBI to the Central Government at Rs. 35,531 crore.
in 2009-10 would emanate mainly from revenueexpenditure, particularly through cutback in fertilisersubsidy, which had risen sharply during 2008-09due to rapid rise in international fertiliser prices.
II.4.27 Capital expenditure is budgeted to increasein 2009-10 as compared with that in 2008-09,mainly on account of higher growth in capital outlaywhich is budgeted to increase by 33.6 per cent in2009-10 as against a decline of 22.1 per cent in2008-09. Defence outlay would account for nearlyhalf of the budgeted increase in capital outlay;increase in non-defence capital outlay is mainlyattributable to economic services. An analysis ofexpenditure pattern in terms of plan and non-plancomponents shows that in 2009-10, the budgetedmoderation in the growth of plan expenditure wouldbe greater than that of non-plan expenditure.Interest payments and defence would mainlyaccount for the increase in non-plan expenditures.The increase in interest payments would result fromthe substantial hike in the size of governmentborrowings and special securities issued to oilmarketing and fertiliser companies during 2008-09.Sizeable rise in budgeted non-Plan expenditure indefence services is on account of enhancedprovision for pay and allowances, maintenanceexpenditure, and modernisation of defenceservices. The Budget has also proposed to providehigher grants to the States. Among the majordevelopment expenditures, expenditures oneducation, health, rural development and irrigationare budgeted to increase in 2009-10 from the levelsin 2008-09 (RE). As per cent to GDP, majordevelopmental expenditures would increase, barringagriculture and rural development (Table 2.46).
Financing of Gross Fiscal Deficit
II.4.28 The financing pattern of GFD reveals thatthe Government would finance almost the entirefiscal deficit for 2009-10 through market borrowings(dated securities and 364-days Treasury Bills).While external borrowings and securities againstsmall savings would contribute more towards GFDfinancing in 2009-10 than in 2008-09, deposits and
tax revenue (Table 2.43). The growth in gross taxrevenue is budgeted to be lower than in 2008-09;as a ratio to GDP, it is slated to further decline in2009-10 (Table 2.44). Non-tax revenue, however,is budgeted to reverse the decline in 2008-09 andrecord a substantially higher growth in 2009-10,mainly on account of anticipated receipts ofRs.35,000 crore from the auction of third generation(3G) spectrum and Rs.28,000 crore (58 per centhigher than the previous year) in dividend/surplustransfer from the Reserve Bank, nationalisedbanks and financial institutions. As a result, non-tax revenue to GDP ratio is budgeted higher at2.4 per cent of GDP (as against a decline to 1.8per cent of GDP in 2008-09). The non-debt capitalreceipts are budgeted to decline due to lowerdisinvestment proceeds during 2009-10 than in2008-09.
Pattern of Expenditure
II.4.26 Aggregate expenditure is budgeted toincrease to 17.4 per cent of GDP in 2009-10 ascompared with 16.9 per cent in the preceding yeardespite moderation in growth, indicating thecontinued thrust of fiscal stimulus in 2009-10. Bothrevenue expenditure and capital expenditure asproportion of GDP are budgeted to increase in2009-10 over the previous year (Table 2.45). Themoderation in the growth of aggregate expenditure
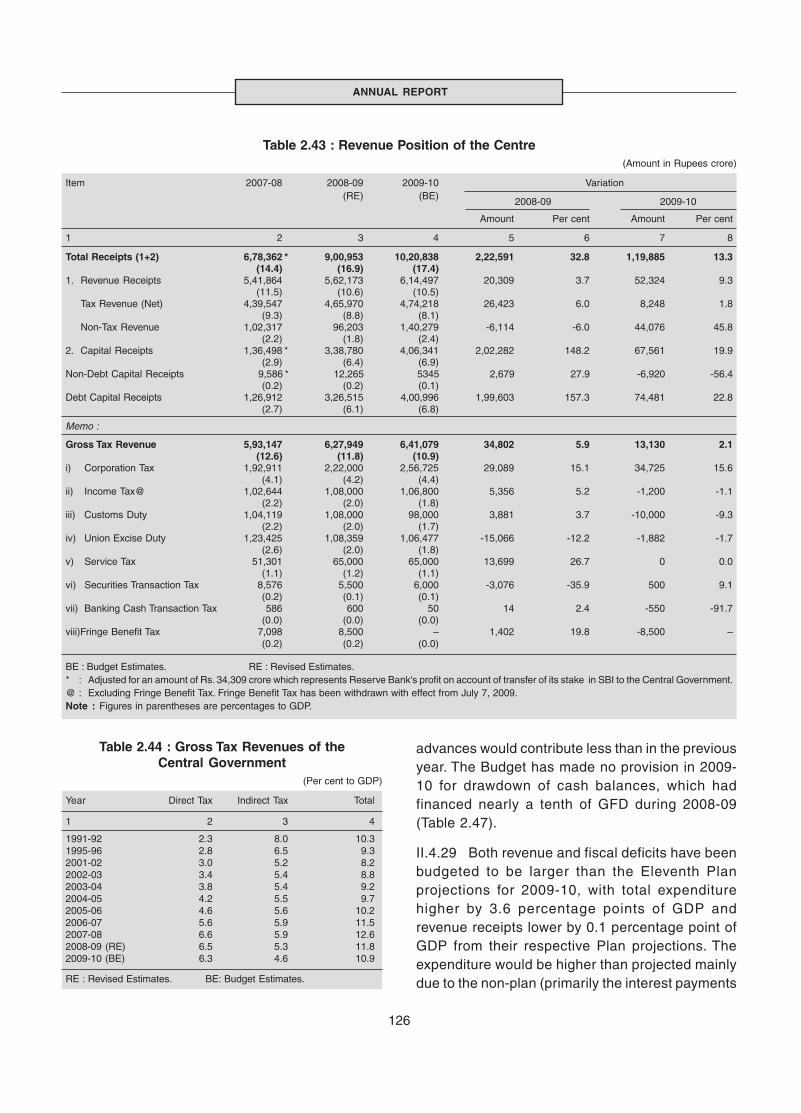
126
ANNUAL REPORT
Table 2.44 : Gross Tax Revenues of theCentral Government
(Per cent to GDP)
Year Direct Tax Indirect Tax Total
1 2 3 4
1991-92 2.3 8.0 10.31995-96 2.8 6.5 9.32001-02 3.0 5.2 8.22002-03 3.4 5.4 8.82003-04 3.8 5.4 9.22004-05 4.2 5.5 9.72005-06 4.6 5.6 10.22006-07 5.6 5.9 11.52007-08 6.6 5.9 12.62008-09 (RE) 6.5 5.3 11.82009-10 (BE) 6.3 4.6 10.9
RE : Revised Estimates. BE: Budget Estimates.
Table 2.43 : Revenue Position of the Centre(Amount in Rupees crore)
Item 2007-08 2008-09 2009-10 Variation(RE) (BE) 2008-09 2009-10
Amount Per cent Amount Per cent
1 2 3 4 5 6 7 8
Total Receipts (1+2) 6,78,362 * 9,00,953 10,20,838 2,22,591 32.8 1,19,885 13.3(14.4) (16.9) (17.4)
1. Revenue Receipts 5,41,864 5,62,173 6,14,497 20,309 3.7 52,324 9.3(11.5) (10.6) (10.5)
Tax Revenue (Net) 4,39,547 4,65,970 4,74,218 26,423 6.0 8,248 1.8(9.3) (8.8) (8.1)
Non-Tax Revenue 1,02,317 96,203 1,40,279 -6,114 -6.0 44,076 45.8(2.2) (1.8) (2.4)
2. Capital Receipts 1,36,498 * 3,38,780 4,06,341 2,02,282 148.2 67,561 19.9(2.9) (6.4) (6.9)
Non-Debt Capital Receipts 9,586 * 12,265 5345 2,679 27.9 -6,920 -56.4(0.2) (0.2) (0.1)
Debt Capital Receipts 1,26,912 3,26,515 4,00,996 1,99,603 157.3 74,481 22.8(2.7) (6.1) (6.8)
Memo :
Gross Tax Revenue 5,93,147 6,27,949 6,41,079 34,802 5.9 13,130 2.1(12.6) (11.8) (10.9)
i) Corporation Tax 1,92,911 2,22,000 2,56,725 29,089 15.1 34,725 15.6(4.1) (4.2) (4.4)
ii) Income Tax@ 1,02,644 1,08,000 1,06,800 5,356 5.2 -1,200 -1.1(2.2) (2.0) (1.8)
iii) Customs Duty 1,04,119 1,08,000 98,000 3,881 3.7 -10,000 -9.3(2.2) (2.0) (1.7)
iv) Union Excise Duty 1,23,425 1,08,359 1,06,477 -15,066 -12.2 -1,882 -1.7(2.6) (2.0) (1.8)
v) Service Tax 51,301 65,000 65,000 13,699 26.7 0 0.0(1.1) (1.2) (1.1)
vi) Securities Transaction Tax 8,576 5,500 6,000 -3,076 -35.9 500 9.1(0.2) (0.1) (0.1)
vii) Banking Cash Transaction Tax 586 600 50 14 2.4 -550 -91.7(0.0) (0.0) (0.0)
viii)Fringe Benefit Tax 7,098 8,500 – 1,402 19.8 -8,500 –(0.2) (0.2) (0.0)
BE : Budget Estimates. RE : Revised Estimates.* : Adjusted for an amount of Rs. 34,309 crore which represents Reserve Bank's profit on account of transfer of its stake in SBI to the Central Government.@ : Excluding Fringe Benefit Tax. Fringe Benefit Tax has been withdrawn with effect from July 7, 2009.Note : Figures in parentheses are percentages to GDP.
advances would contribute less than in the previousyear. The Budget has made no provision in 2009-10 for drawdown of cash balances, which hadfinanced nearly a tenth of GFD during 2008-09(Table 2.47).
II.4.29 Both revenue and fiscal deficits have beenbudgeted to be larger than the Eleventh Planprojections for 2009-10, with total expenditurehigher by 3.6 percentage points of GDP andrevenue receipts lower by 0.1 percentage point ofGDP from their respective Plan projections. Theexpenditure would be higher than projected mainlydue to the non-plan (primarily the interest payments

127
ECONOMIC REVIEW
Table 2.45 : Expenditure Pattern of the Central Government ( Amount in Rupees crore)
Item 2007-08 2008-09 2009-10 VariationRE BE 2008-09 2009-10
Amount Per cent Amount Per cent
1 2 3 4 5 6 7 8
Total Expenditure (A+B=1+2) 6,77,140 * 9,00,953 10,20,838 2,23,813 33.1 1,19,885 13.3(14.3) (16.9) (17.4)
A. Revenue Expenditure 5,94,433 8,03,446 8,97,232 2,09,013 35.2 93,786 11.7(12.6) (15.1) (15.3)
B. Capital Expenditure 82,707 * 97,507 1,23,606 14,800 17.9 * 26,099 26.8(1.8) (1.8) (2.1)
1. Non-Plan Expenditure 4,72,058 * 6,17,996 6,95,689 1,45,938 30.9 77,693 12.6(10.0) (11.6) (11.9)
i) Interest Payments 1,71,030 1,92,694 2,25,511 21,664 12.7 32,817 17.0(3.6) (3.6) (3.9)
ii) Defence Expenditure 91,681 1,14,600 1,41,703 22,919 25.0 27,103 23.7(1.9) (2.2) (2.4)
iii) Subsidies 70,926 1,29,243 1,11,276 58,317 82.2 -17,967 -13.9(1.5) (2.4) (1.9)
iv) Grants to States 35,769 38,421 48,570 2,652 7.4 10,149 26.4(0.8) (0.7) (0.8)
v) Other non-Plan Expenditure 1,02,652 * 1,43,038 1,68,629 4,0386 39.3 * 25,591 17.9(2.2) (2.7) (2.9)
2. Plan Expenditure 2,05,082 2,82,957 3,25,149 77,875 38.0 42,192 14.9(4.3) (5.3) (5.6)
i) Budgetary Support to Central Plan 1,48,669 2,04,129 2,39,840 55,460 37.3 35,711 17.5(3.1) (3.8) (4.1)
ii) Central Assistance for State and 61,614 78,828 85,309 17,214 27.9 6,481 8.2UT Plans (1.3) (1.5) (1.5)
Memo:
Grants 1,09,978 1,26,132 1,46,147 16,154 14.7 20,015 15.9Loans 11,298 14,202 12,339 2,904 25.7 -1,863 -13.1
BE : Budget Estimate. RE : Revised Estimate.* : Excludes acquisition cost of Reserve Bank's stake in SBI at Rs. 35,531crore.Note : Figures in parentheses are percentages to GDP.
Table 2.46 : Expenditure on Select DevelopmentHeads of the Central Government
(Amount in Rupees crore)
Item 2008-09(RE) 2009-10(BE)
1 2 3
Agriculture 1,23,038 1,07,441(2.3) (1.8)
Education 34,429 42,339(0.6) (0.7)
Health 16,277 22,733(0.3) (0.4)
Rural Development 40,799 43,554(0.8) (0.7)
Irrigation 579 664(0.0) (0.0)
Note: Figures in parentheses are percentages to GDP.
and subsidies). Even though, plan expenditure orthe gross budgetary support to Plan would also behigher than the Eleventh Plan projections, therevenue component would be far higher than theprojected, implying major shortfall in the capitalcomponent of plan expenditure (Table 2.48).
II.4.30 The fiscal deficit and debt of the CentralGovernment in India continued to be higher thanseveral other emerging market economies in Asiain 2008 (Table 2.49). The deterioration in the deficitposition for India also appeared to be the sharpest,reflecting the large size of India’s fiscal stimulus.
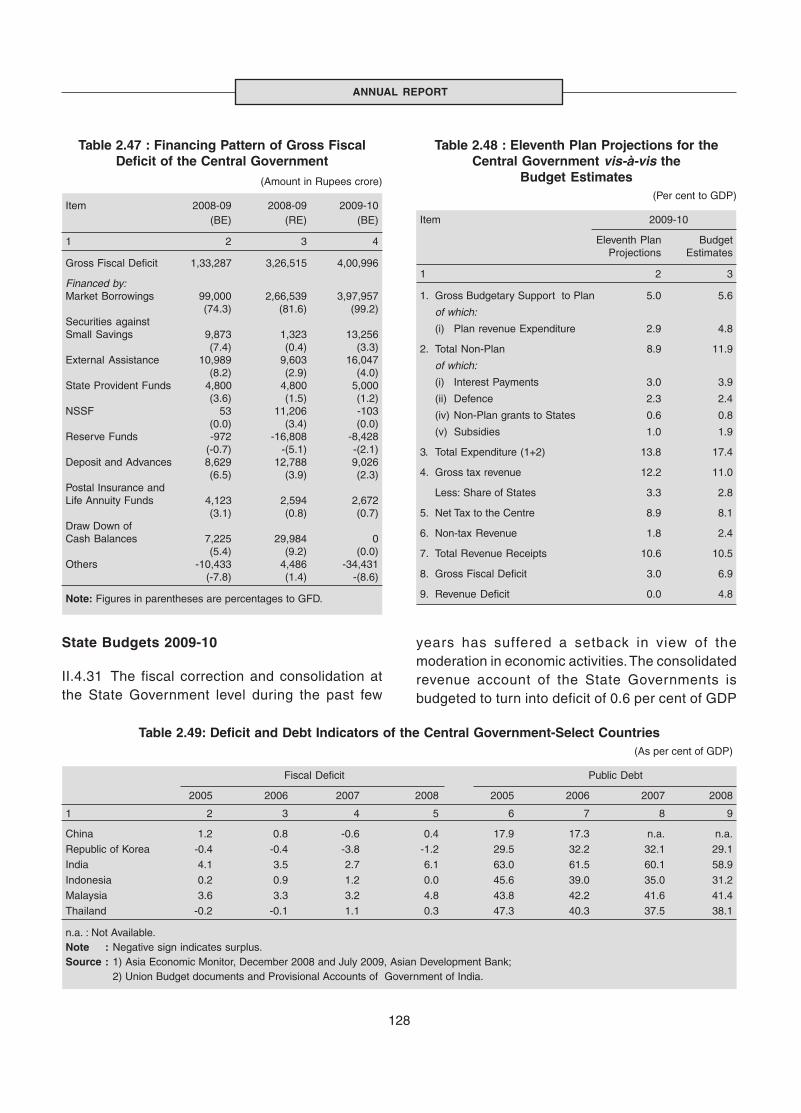
128
ANNUAL REPORT
Table 2.48 : Eleventh Plan Projections for theCentral Government vis-à-vis the
Budget Estimates(Per cent to GDP)
Item 2009-10
Eleventh Plan BudgetProjections Estimates
1 2 3
1. Gross Budgetary Support to Plan 5.0 5.6
of which:
(i) Plan revenue Expenditure 2.9 4.8
2. Total Non-Plan 8.9 11.9
of which:
(i) Interest Payments 3.0 3.9
(ii) Defence 2.3 2.4
(iv) Non-Plan grants to States 0.6 0.8
(v) Subsidies 1.0 1.9
3. Total Expenditure (1+2) 13.8 17.4
4. Gross tax revenue 12.2 11.0
Less: Share of States 3.3 2.8
5. Net Tax to the Centre 8.9 8.1
6. Non-tax Revenue 1.8 2.4
7. Total Revenue Receipts 10.6 10.5
8. Gross Fiscal Deficit 3.0 6.9
9. Revenue Deficit 0.0 4.8
Table 2.49: Deficit and Debt Indicators of the Central Government-Select Countries(As per cent of GDP)
Fiscal Deficit Public Debt
2005 2006 2007 2008 2005 2006 2007 2008
1 2 3 4 5 6 7 8 9
China 1.2 0.8 -0.6 0.4 17.9 17.3 n.a. n.a.
Republic of Korea -0.4 -0.4 -3.8 -1.2 29.5 32.2 32.1 29.1
India 4.1 3.5 2.7 6.1 63.0 61.5 60.1 58.9
Indonesia 0.2 0.9 1.2 0.0 45.6 39.0 35.0 31.2
Malaysia 3.6 3.3 3.2 4.8 43.8 42.2 41.6 41.4
Thailand -0.2 -0.1 1.1 0.3 47.3 40.3 37.5 38.1
n.a. : Not Available.Note : Negative sign indicates surplus.Source : 1) Asia Economic Monitor, December 2008 and July 2009, Asian Development Bank;
2) Union Budget documents and Provisional Accounts of Government of India.
State Budgets 2009-10
II.4.31 The fiscal correction and consolidation atthe State Government level during the past few
Table 2.47 : Financing Pattern of Gross FiscalDeficit of the Central Government
(Amount in Rupees crore)
Item 2008-09 2008-09 2009-10(BE) (RE) (BE)
1 2 3 4
Gross Fiscal Deficit 1,33,287 3,26,515 4,00,996
Financed by:Market Borrowings 99,000 2,66,539 3,97,957
(74.3) (81.6) (99.2)Securities againstSmall Savings 9,873 1,323 13,256
(7.4) (0.4) (3.3)External Assistance 10,989 9,603 16,047
(8.2) (2.9) (4.0)State Provident Funds 4,800 4,800 5,000
(3.6) (1.5) (1.2)NSSF 53 11,206 -103
(0.0) (3.4) (0.0)Reserve Funds -972 -16,808 -8,428
(-0.7) -(5.1) -(2.1)Deposit and Advances 8,629 12,788 9,026
(6.5) (3.9) (2.3)Postal Insurance andLife Annuity Funds 4,123 2,594 2,672
(3.1) (0.8) (0.7)Draw Down ofCash Balances 7,225 29,984 0
(5.4) (9.2) (0.0)Others -10,433 4,486 -34,431
(-7.8) (1.4) -(8.6)
Note: Figures in parentheses are percentages to GFD.
years has suffered a setback in view of themoderation in economic activities. The consolidatedrevenue account of the State Governments isbudgeted to turn into deficit of 0.6 per cent of GDP
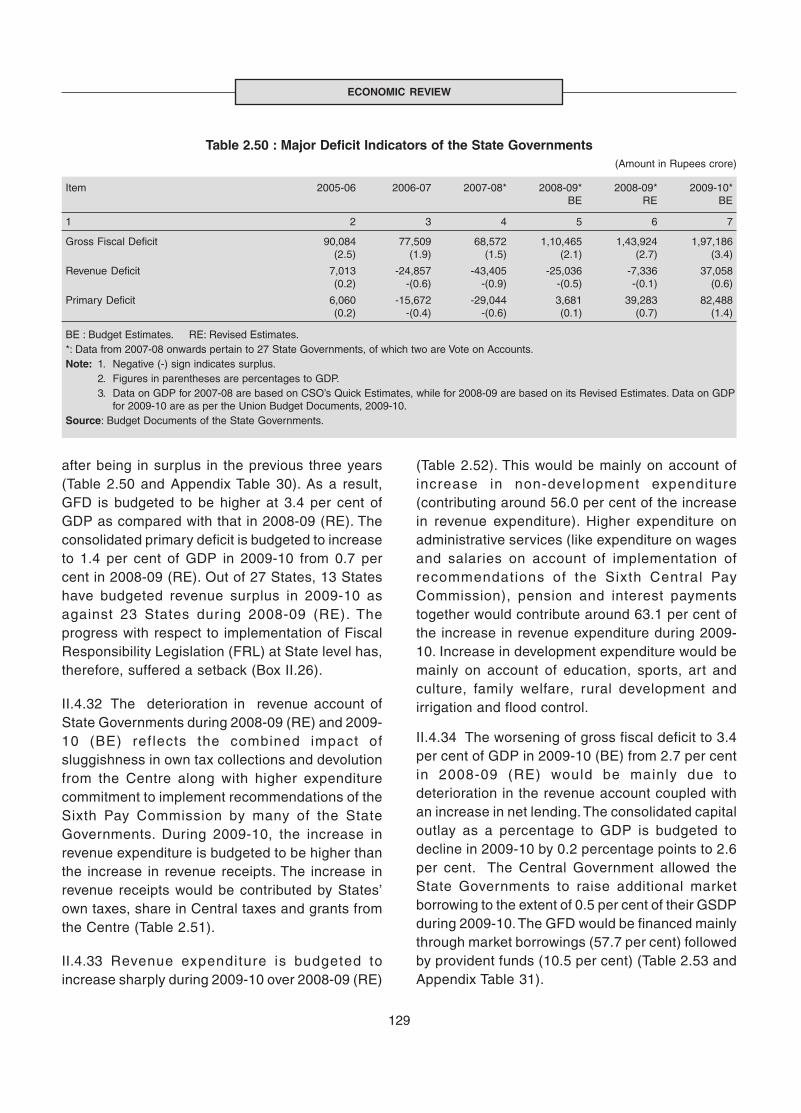
129
ECONOMIC REVIEW
after being in surplus in the previous three years(Table 2.50 and Appendix Table 30). As a result,GFD is budgeted to be higher at 3.4 per cent ofGDP as compared with that in 2008-09 (RE). Theconsolidated primary deficit is budgeted to increaseto 1.4 per cent of GDP in 2009-10 from 0.7 percent in 2008-09 (RE). Out of 27 States, 13 Stateshave budgeted revenue surplus in 2009-10 asagainst 23 States during 2008-09 (RE). Theprogress with respect to implementation of FiscalResponsibility Legislation (FRL) at State level has,therefore, suffered a setback (Box II.26).
II.4.32 The deterioration in revenue account ofState Governments during 2008-09 (RE) and 2009-10 (BE) reflects the combined impact ofsluggishness in own tax collections and devolutionfrom the Centre along with higher expenditurecommitment to implement recommendations of theSixth Pay Commission by many of the StateGovernments. During 2009-10, the increase inrevenue expenditure is budgeted to be higher thanthe increase in revenue receipts. The increase inrevenue receipts would be contributed by States’own taxes, share in Central taxes and grants fromthe Centre (Table 2.51).
II.4.33 Revenue expenditure is budgeted toincrease sharply during 2009-10 over 2008-09 (RE)
(Table 2.52). This would be mainly on account ofincrease in non-development expenditure(contributing around 56.0 per cent of the increasein revenue expenditure). Higher expenditure onadministrative services (like expenditure on wagesand salaries on account of implementation ofrecommendations of the Sixth Central PayCommission), pension and interest paymentstogether would contribute around 63.1 per cent ofthe increase in revenue expenditure during 2009-10. Increase in development expenditure would bemainly on account of education, sports, art andculture, family welfare, rural development andirrigation and flood control.
II.4.34 The worsening of gross fiscal deficit to 3.4per cent of GDP in 2009-10 (BE) from 2.7 per centin 2008-09 (RE) would be mainly due todeterioration in the revenue account coupled withan increase in net lending. The consolidated capitaloutlay as a percentage to GDP is budgeted todecline in 2009-10 by 0.2 percentage points to 2.6per cent. The Central Government allowed theState Governments to raise additional marketborrowing to the extent of 0.5 per cent of their GSDPduring 2009-10. The GFD would be financed mainlythrough market borrowings (57.7 per cent) followedby provident funds (10.5 per cent) (Table 2.53 andAppendix Table 31).
Table 2.50 : Major Deficit Indicators of the State Governments(Amount in Rupees crore)
Item 2005-06 2006-07 2007-08* 2008-09* 2008-09* 2009-10*BE RE BE
1 2 3 4 5 6 7
Gross Fiscal Deficit 90,084 77,509 68,572 1,10,465 1,43,924 1,97,186(2.5) (1.9) (1.5) (2.1) (2.7) (3.4)
Revenue Deficit 7,013 -24,857 -43,405 -25,036 -7,336 37,058(0.2) -(0.6) -(0.9) -(0.5) -(0.1) (0.6)
Primary Deficit 6,060 -15,672 -29,044 3,681 39,283 82,488(0.2) -(0.4) -(0.6) (0.1) (0.7) (1.4)
BE : Budget Estimates. RE: Revised Estimates.*: Data from 2007-08 onwards pertain to 27 State Governments, of which two are Vote on Accounts.Note: 1. Negative (-) sign indicates surplus.
2. Figures in parentheses are percentages to GDP.3. Data on GDP for 2007-08 are based on CSO’s Quick Estimates, while for 2008-09 are based on its Revised Estimates. Data on GDP
for 2009-10 are as per the Union Budget Documents, 2009-10.Source: Budget Documents of the State Governments.
130
ANNUAL REPORT
The enactment of Fiscal Responsibility Legislations(FRLs) at the State level has been one of the majorinstitutional reforms undertaken for promoting rule-basedfiscal policy. Karnataka was the first State to implementFRL in August 2002, followed by Tamil Nadu, Kerala andPunjab in 2003. Following the recommendations of theTwelf th Finance Commission (TFC), which hadincentivised adoption of fiscal responsibility frameworkby the State Governments by l inking debt rel iefmechanism to enactment of FRL, 22 more States enactedthe FRLs in subsequent years. Although there arevariations across States in the choice of target and thetime frame for achieving the target, most of the FRLsstipulated elimination of revenue deficit by March 31, 2009and reduction in GFD as per cent of gross state domesticproduct (GSDP) to 3 per cent by March 31, 2010, in linewith the targets prescribed by the TFC. In addition, severalStates targeted to reduce their liabilities.
Progressive enactment of FRLs by the States (exceptSikkim and West Bengal) provided impetus to the processof attaining fiscal sustainability. The movements in the keydeficit indicators show that at the consolidated level, Statesmade considerable progress in bringing down their deficitst i l l 2007-08. Despite the overall improvement inconsolidated fiscal position of the States, wide variationsacross the State Governments with regard to fiscalperformance were observed. While some StateGovernments were able to achieve the TFC targets withregard to several indicators well ahead of the time frame,there were some other States where the fiscal correctionwas slow.
Despite the fact that the enactment of FRLs by most ofthe States has ushered in a rule-based fiscal policyframework at the State level, the fiscal position of Stateshas come under strain in view of the ongoing global turmoil.Given the moderation in economic growth in 2008-09, therevenue buoyancy achieved up to 2007-08 may not berealised. Thus, the pace of f iscal correction andconsolidation which was witnessed in recent years is likelyto pause or even suffer a setback on account of the growthdeceleration and most States could overshoot the targetof maintaining GFD-GSDP ratio within 3 per cent. Statesare also under pressure to increase both their revenueand capital expenditure in order to boost the demand inthe economy. In fact, the Central Government allowed theStates to raise additional market borrowings to the extentof 0.5 per cent of GSDP during 2008-09 and increase thelimit of fiscal deficit to 3.5 per cent of GSDP for undertakingcapital expenditure, thereby providing them additionalfiscal space. In Union Budget 2009-10, States have beenallowed to raise additional market borrowings of 0.5 percent of GSDP, thus increasing the limit of GFD to 4.0 percent of GSDP during 2009-10.
Box II.26Implementation of Fiscal Responsibility Laws at State Level – Recent Developments
The impact of the overall macroeconomic slowdown onState finances is discernible from the deterioration in deficitindicators across the States. In majority of the Statesrevenue surplus as percentage to GSDP has shown adecline in 2008-09 (RE) over 2007-08, resulting anincrease in GFD. Out of 27 States, 18 States recordedGFD-GSDP ratio higher than 3.0 per cent in 2008-09 (RE).The fiscal position of the States is budgeted to deterioratefurther in 2009-10. Out of 27, 13 States have presentedbudgets with revenue deficit for 2009-10. This indicatesthat some States may have to amend their respective FRLsto accommodate slippages in deficit targets.
Once the economic recovery gathers momentum, theforemost task for the State Governments should be torevert back to the path of fiscal correction. The design ofpost-FRL framework at the State level, therefore, has toaim at regaining and sustaining the fiscal correction. TheFRL regime of State Governments since 2003-04 has beenassociated with a phase of high GDP growth. The resultanthigh growth in their own tax revenues and higher Centraltransfers, aided to some extent by reduction in revenueexpenditure, enabled the States to bring about reductionin deficits and step up capital outlay and developmentalexpenditure. In the absence of such conducive economicconditions, States may need to place greater emphasison expenditure rationalisation to curb wasteful expenditureand expenditure reorientation towards more productiveexpenditure. Presently, the FRLs of the States do notprovide for any expenditure rules. In the post-FRL regime,certain numerical targets in respect of certain categoriesof expenditure may be stipulated so as to make theexpenditure allocation process more efficient. At present,a few States have debt-GSDP rules and interest payment-revenue receipts (IP-RR) targets in their FRLs. With a viewto attaining debt sustainability, each State may prescribea target for debt-GSDP and IP-RR.
The recent downturn in the economy and the associatedimpact on State finances reflects the need for introducingthe counter-cyclical clause in the post-FRL fiscalarchitecture. Given the lack of standardisation acrossStates in terms of budgetary practices and transparencyrules, the post-FRL framework may place emphasis oninstitutional reforms towards adoption of commonpractices.
To sum up, the post-FRL framework may be designedkeeping in view the experience gained so far fromimplementation of FRLs. The post-FRL framework maybuild in specific rules for debt and expenditure besidesthe current focus on deficits. The States may placeemphasis on transparency in budgetary operations. Theneed for counter-cyclical fiscal policy framework may alsobe explored.
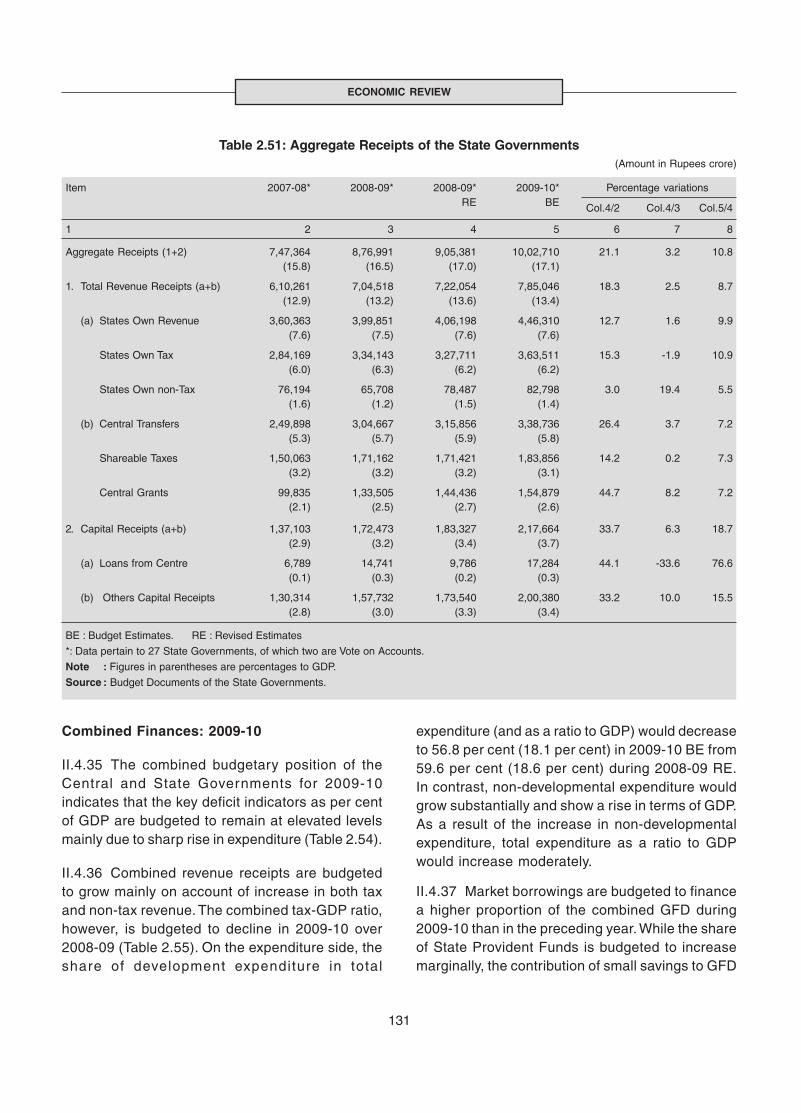
131
ECONOMIC REVIEW
Combined Finances: 2009-10
II.4.35 The combined budgetary position of theCentral and State Governments for 2009-10indicates that the key deficit indicators as per centof GDP are budgeted to remain at elevated levelsmainly due to sharp rise in expenditure (Table 2.54).
II.4.36 Combined revenue receipts are budgetedto grow mainly on account of increase in both taxand non-tax revenue. The combined tax-GDP ratio,however, is budgeted to decline in 2009-10 over2008-09 (Table 2.55). On the expenditure side, theshare of development expenditure in total
Table 2.51: Aggregate Receipts of the State Governments(Amount in Rupees crore)
Item 2007-08* 2008-09* 2008-09* 2009-10* Percentage variationsRE BE Col.4/2 Col.4/3 Col.5/4
1 2 3 4 5 6 7 8
Aggregate Receipts (1+2) 7,47,364 8,76,991 9,05,381 10,02,710 21.1 3.2 10.8(15.8) (16.5) (17.0) (17.1)
1. Total Revenue Receipts (a+b) 6,10,261 7,04,518 7,22,054 7,85,046 18.3 2.5 8.7(12.9) (13.2) (13.6) (13.4)
(a) States Own Revenue 3,60,363 3,99,851 4,06,198 4,46,310 12.7 1.6 9.9(7.6) (7.5) (7.6) (7.6)
States Own Tax 2,84,169 3,34,143 3,27,711 3,63,511 15.3 -1.9 10.9(6.0) (6.3) (6.2) (6.2)
States Own non-Tax 76,194 65,708 78,487 82,798 3.0 19.4 5.5(1.6) (1.2) (1.5) (1.4)
(b) Central Transfers 2,49,898 3,04,667 3,15,856 3,38,736 26.4 3.7 7.2(5.3) (5.7) (5.9) (5.8)
Shareable Taxes 1,50,063 1,71,162 1,71,421 1,83,856 14.2 0.2 7.3(3.2) (3.2) (3.2) (3.1)
Central Grants 99,835 1,33,505 1,44,436 1,54,879 44.7 8.2 7.2(2.1) (2.5) (2.7) (2.6)
2. Capital Receipts (a+b) 1,37,103 1,72,473 1,83,327 2,17,664 33.7 6.3 18.7(2.9) (3.2) (3.4) (3.7)
(a) Loans from Centre 6,789 14,741 9,786 17,284 44.1 -33.6 76.6(0.1) (0.3) (0.2) (0.3)
(b) Others Capital Receipts 1,30,314 1,57,732 1,73,540 2,00,380 33.2 10.0 15.5(2.8) (3.0) (3.3) (3.4)
BE : Budget Estimates. RE : Revised Estimates
*: Data pertain to 27 State Governments, of which two are Vote on Accounts.
Note : Figures in parentheses are percentages to GDP.
Source : Budget Documents of the State Governments.
expenditure (and as a ratio to GDP) would decreaseto 56.8 per cent (18.1 per cent) in 2009-10 BE from59.6 per cent (18.6 per cent) during 2008-09 RE.In contrast, non-developmental expenditure wouldgrow substantially and show a rise in terms of GDP.As a result of the increase in non-developmentalexpenditure, total expenditure as a ratio to GDPwould increase moderately.
II.4.37 Market borrowings are budgeted to financea higher proportion of the combined GFD during2009-10 than in the preceding year. While the shareof State Provident Funds is budgeted to increasemarginally, the contribution of small savings to GFD
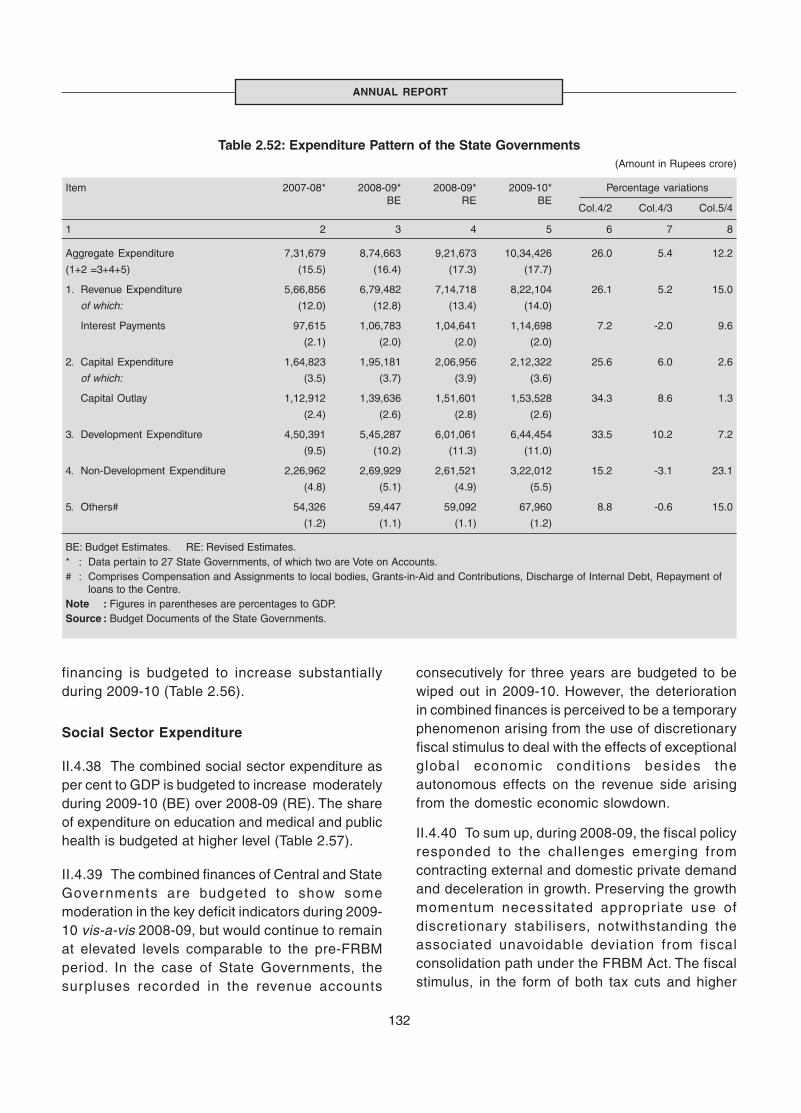
132
ANNUAL REPORT
Table 2.52: Expenditure Pattern of the State Governments(Amount in Rupees crore)
Item 2007-08* 2008-09* 2008-09* 2009-10* Percentage variationsBE RE BE
Col.4/2 Col.4/3 Col.5/4
1 2 3 4 5 6 7 8
Aggregate Expenditure 7,31,679 8,74,663 9,21,673 10,34,426 26.0 5.4 12.2
(1+2 =3+4+5) (15.5) (16.4) (17.3) (17.7)
1. Revenue Expenditure 5,66,856 6,79,482 7,14,718 8,22,104 26.1 5.2 15.0
of which: (12.0) (12.8) (13.4) (14.0)
Interest Payments 97,615 1,06,783 1,04,641 1,14,698 7.2 -2.0 9.6
(2.1) (2.0) (2.0) (2.0)
2. Capital Expenditure 1,64,823 1,95,181 2,06,956 2,12,322 25.6 6.0 2.6
of which: (3.5) (3.7) (3.9) (3.6)
Capital Outlay 1,12,912 1,39,636 1,51,601 1,53,528 34.3 8.6 1.3
(2.4) (2.6) (2.8) (2.6)
3. Development Expenditure 4,50,391 5,45,287 6,01,061 6,44,454 33.5 10.2 7.2
(9.5) (10.2) (11.3) (11.0)
4. Non-Development Expenditure 2,26,962 2,69,929 2,61,521 3,22,012 15.2 -3.1 23.1
(4.8) (5.1) (4.9) (5.5)
5. Others# 54,326 59,447 59,092 67,960 8.8 -0.6 15.0
(1.2) (1.1) (1.1) (1.2)
BE: Budget Estimates. RE: Revised Estimates.* : Data pertain to 27 State Governments, of which two are Vote on Accounts.# : Comprises Compensation and Assignments to local bodies, Grants-in-Aid and Contributions, Discharge of Internal Debt, Repayment of
loans to the Centre.Note : Figures in parentheses are percentages to GDP.Source : Budget Documents of the State Governments.
financing is budgeted to increase substantiallyduring 2009-10 (Table 2.56).
Social Sector Expenditure
II.4.38 The combined social sector expenditure asper cent to GDP is budgeted to increase moderatelyduring 2009-10 (BE) over 2008-09 (RE). The shareof expenditure on education and medical and publichealth is budgeted at higher level (Table 2.57).
II.4.39 The combined finances of Central and StateGovernments are budgeted to show somemoderation in the key deficit indicators during 2009-10 vis-a-vis 2008-09, but would continue to remainat elevated levels comparable to the pre-FRBMperiod. In the case of State Governments, thesurpluses recorded in the revenue accounts
consecutively for three years are budgeted to bewiped out in 2009-10. However, the deteriorationin combined finances is perceived to be a temporaryphenomenon arising from the use of discretionaryfiscal stimulus to deal with the effects of exceptionalglobal economic condit ions besides theautonomous effects on the revenue side arisingfrom the domestic economic slowdown.
II.4.40 To sum up, during 2008-09, the fiscal policyresponded to the challenges emerging fromcontracting external and domestic private demandand deceleration in growth. Preserving the growthmomentum necessitated appropriate use ofdiscretionary stabilisers, notwithstanding theassociated unavoidable deviation from fiscalconsolidation path under the FRBM Act. The fiscalstimulus, in the form of both tax cuts and higher
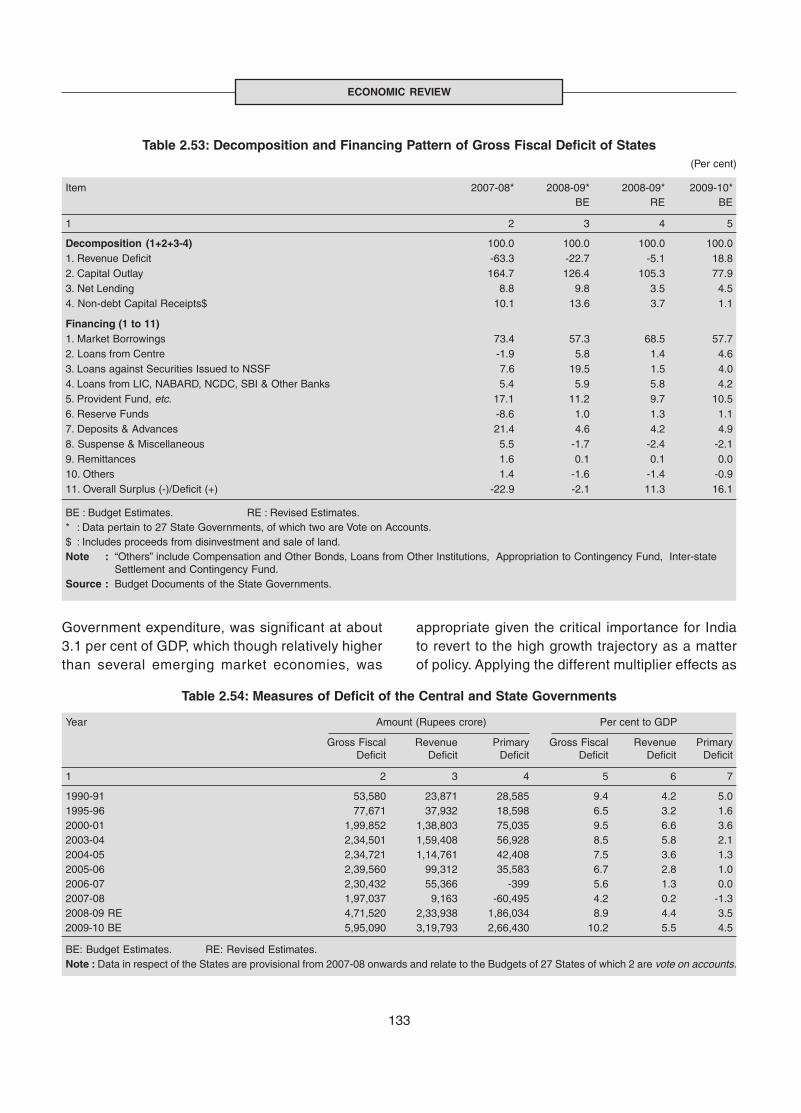
133
ECONOMIC REVIEW
Table 2.53: Decomposition and Financing Pattern of Gross Fiscal Deficit of States(Per cent)
Item 2007-08* 2008-09* 2008-09* 2009-10*BE RE BE
1 2 3 4 5
Decomposition (1+2+3-4) 100.0 100.0 100.0 100.01. Revenue Deficit -63.3 -22.7 -5.1 18.82. Capital Outlay 164.7 126.4 105.3 77.93. Net Lending 8.8 9.8 3.5 4.54. Non-debt Capital Receipts$ 10.1 13.6 3.7 1.1
Financing (1 to 11)1. Market Borrowings 73.4 57.3 68.5 57.72. Loans from Centre -1.9 5.8 1.4 4.63. Loans against Securities Issued to NSSF 7.6 19.5 1.5 4.04. Loans from LIC, NABARD, NCDC, SBI & Other Banks 5.4 5.9 5.8 4.25. Provident Fund, etc. 17.1 11.2 9.7 10.56. Reserve Funds -8.6 1.0 1.3 1.17. Deposits & Advances 21.4 4.6 4.2 4.98. Suspense & Miscellaneous 5.5 -1.7 -2.4 -2.19. Remittances 1.6 0.1 0.1 0.010. Others 1.4 -1.6 -1.4 -0.911. Overall Surplus (-)/Deficit (+) -22.9 -2.1 11.3 16.1
BE : Budget Estimates. RE : Revised Estimates.* : Data pertain to 27 State Governments, of which two are Vote on Accounts.$ : Includes proceeds from disinvestment and sale of land.Note : “Others” include Compensation and Other Bonds, Loans from Other Institutions, Appropriation to Contingency Fund, Inter-state
Settlement and Contingency Fund.Source : Budget Documents of the State Governments.
Table 2.54: Measures of Deficit of the Central and State Governments
Year Amount (Rupees crore) Per cent to GDP
Gross Fiscal Revenue Primary Gross Fiscal Revenue PrimaryDeficit Deficit Deficit Deficit Deficit Deficit
1 2 3 4 5 6 7
1990-91 53,580 23,871 28,585 9.4 4.2 5.01995-96 77,671 37,932 18,598 6.5 3.2 1.62000-01 1,99,852 1,38,803 75,035 9.5 6.6 3.62003-04 2,34,501 1,59,408 56,928 8.5 5.8 2.12004-05 2,34,721 1,14,761 42,408 7.5 3.6 1.32005-06 2,39,560 99,312 35,583 6.7 2.8 1.02006-07 2,30,432 55,366 -399 5.6 1.3 0.02007-08 1,97,037 9,163 -60,495 4.2 0.2 -1.32008-09 RE 4,71,520 2,33,938 1,86,034 8.9 4.4 3.52009-10 BE 5,95,090 3,19,793 2,66,430 10.2 5.5 4.5
BE: Budget Estimates. RE: Revised Estimates.Note : Data in respect of the States are provisional from 2007-08 onwards and relate to the Budgets of 27 States of which 2 are vote on accounts.
Government expenditure, was significant at about3.1 per cent of GDP, which though relatively higherthan several emerging market economies, was
appropriate given the critical importance for Indiato revert to the high growth trajectory as a matterof policy. Applying the different multiplier effects as
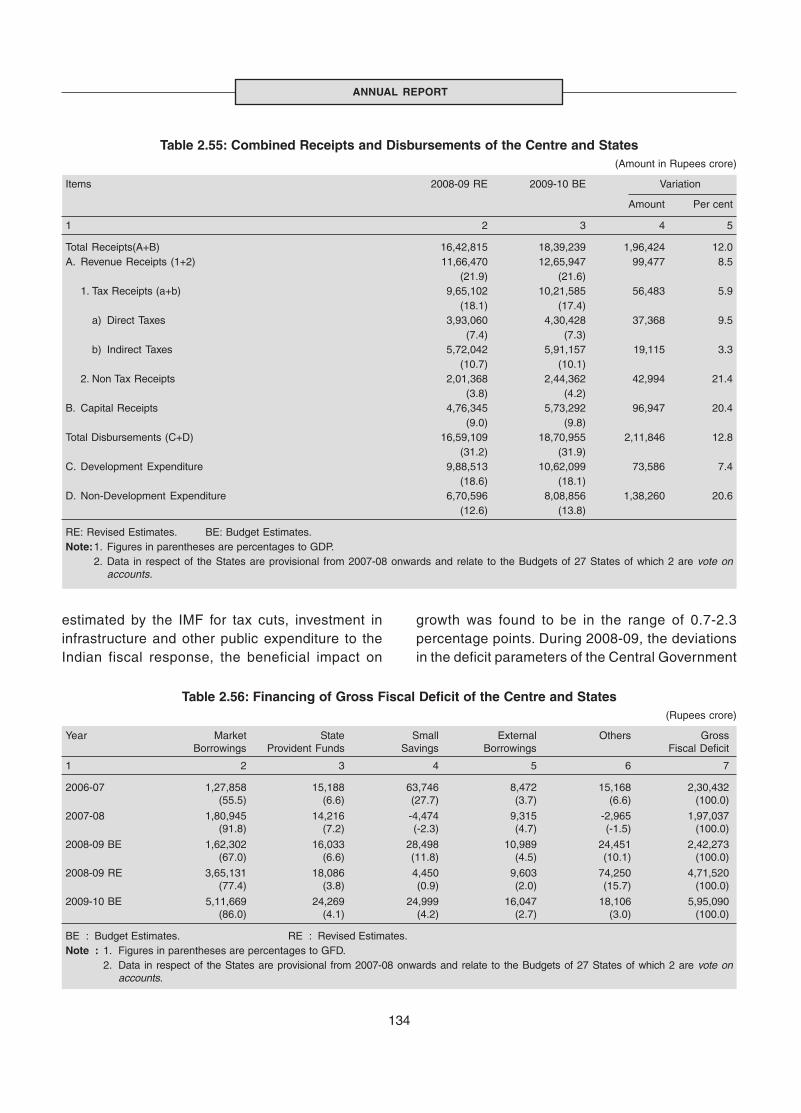
134
ANNUAL REPORT
Table 2.55: Combined Receipts and Disbursements of the Centre and States(Amount in Rupees crore)
Items 2008-09 RE 2009-10 BE Variation
Amount Per cent
1 2 3 4 5
Total Receipts(A+B) 16,42,815 18,39,239 1,96,424 12.0A. Revenue Receipts (1+2) 11,66,470 12,65,947 99,477 8.5
(21.9) (21.6)1. Tax Receipts (a+b) 9,65,102 10,21,585 56,483 5.9
(18.1) (17.4)a) Direct Taxes 3,93,060 4,30,428 37,368 9.5
(7.4) (7.3)b) Indirect Taxes 5,72,042 5,91,157 19,115 3.3
(10.7) (10.1)2. Non Tax Receipts 2,01,368 2,44,362 42,994 21.4
(3.8) (4.2)B. Capital Receipts 4,76,345 5,73,292 96,947 20.4
(9.0) (9.8)Total Disbursements (C+D) 16,59,109 18,70,955 2,11,846 12.8
(31.2) (31.9)C. Development Expenditure 9,88,513 10,62,099 73,586 7.4
(18.6) (18.1)D. Non-Development Expenditure 6,70,596 8,08,856 1,38,260 20.6
(12.6) (13.8)
RE: Revised Estimates. BE: Budget Estimates.Note:1. Figures in parentheses are percentages to GDP.
2. Data in respect of the States are provisional from 2007-08 onwards and relate to the Budgets of 27 States of which 2 are vote onaccounts.
Table 2.56: Financing of Gross Fiscal Deficit of the Centre and States(Rupees crore)
Year Market State Small External Others GrossBorrowings Provident Funds Savings Borrowings Fiscal Deficit
1 2 3 4 5 6 7
2006-07 1,27,858 15,188 63,746 8,472 15,168 2,30,432(55.5) (6.6) (27.7) (3.7) (6.6) (100.0)
2007-08 1,80,945 14,216 -4,474 9,315 -2,965 1,97,037(91.8) (7.2) (-2.3) (4.7) (-1.5) (100.0)
2008-09 BE 1,62,302 16,033 28,498 10,989 24,451 2,42,273(67.0) (6.6) (11.8) (4.5) (10.1) (100.0)
2008-09 RE 3,65,131 18,086 4,450 9,603 74,250 4,71,520(77.4) (3.8) (0.9) (2.0) (15.7) (100.0)
2009-10 BE 5,11,669 24,269 24,999 16,047 18,106 5,95,090(86.0) (4.1) (4.2) (2.7) (3.0) (100.0)
BE : Budget Estimates. RE : Revised Estimates.Note : 1. Figures in parentheses are percentages to GFD.
2. Data in respect of the States are provisional from 2007-08 onwards and relate to the Budgets of 27 States of which 2 are vote onaccounts.
estimated by the IMF for tax cuts, investment ininfrastructure and other public expenditure to theIndian fiscal response, the beneficial impact on
growth was found to be in the range of 0.7-2.3percentage points. During 2008-09, the deviationsin the deficit parameters of the Central Government

135
ECONOMIC REVIEW
Table 2.57: Combined Expenditure of the Centreand States on Social Sector
(Amount in Rupees crore)
2007-08 2008-09 2008-09 2009-10BE RE BE
1 2 3 4 5
Expenditure on 3,71,435 4,42,777 5,25,052 6,07,651Social Sector *
Of which:Social Services 2,88,500 3,52,188 3,98,828 4,45,751
Of which:i) Education 1,27,547 1,58,823 1,67,981 1,98,842ii) Medical &
Public Health 60,869 73,164 76,488 89,305
Per cent of GDP
Expenditure on 7.9 8.3 9.9 10.4Social Sector
Of which:Social Services 6.1 6.6 7.5 7.6
Of which:i) Education 2.7 3.0 3.2 3.4ii) Medical &
Public Health 1.3 1.4 1.4 1.5
Per cent of Total Expenditure
Expenditure on 28.7 30.2 31.6 32.5Social Sector
Of which:Social Services 22.3 24.0 24.0 23.8
Of which:i) Education 9.8 10.8 10.1 10.6ii) Medical &
Public Health 4.7 5.0 4.6 4.8
* : Expenditure on social sector includes expenditure on socialservices, rural development and food subsidies.
Note : Data in respect of the States are provisional from 2007-08onwards and relate to the Budgets of 27 States of which 2are vote on accounts.
from the FRBM targets and the set back in the fiscalconsolidation path of the State Governments wereconditioned by the needs of the exceptionalcircumstances. With economic recovery, the automaticstabilisers operating to restore revenue buoyancycould create the necessary fiscal space for thereversion of discretionary fiscal policy stance to theprevious path of correction and consolidation, therebyalleviating current concerns associated with thestimulus driven widening of the deficit parameters.
V. FINANCIAL MARKETS
II.5.1 The financial markets of the advancedcountries were disrupted and at times even turneddysfunctional during 2008-09 as the sub-primecrisis affected the financial markets first, beforetransmitting to financial institutions and the realeconomy. With the adverse feedback loop becomingstronger over t ime, fai l ing insti tut ions andweakening growth prospects increased the level ofstress in the financial markets. The significantdeter ioration in global f inancial condit ions,particularly since mid-September 2008, led tosevere disruptions in the shor t-term fundingmarkets, widening of risk spreads, rapid fall in equityprices and inactivity in the markets for private asset-backed securities and related derivatives. Pricepatterns over time began to mirror the strains ofthe economic recession and remained highlyvolatile given the environment of uncertainty andchanging risk perceptions. The crisis that originatedin the financial sector in the US, led to collapse ornear collapse of some large financial institutionsand banks. Every major entity with large financialinvestment portfolio had to suffer substantial lossesdue to mark-to-market accounting in the face ofcollapsing asset prices. Banks, investment banks,non-banks such as insurance companies, pensionfunds, private equity funds, shadow banks such asstructured investment vehicles (SIVs), mutual fundsand money market mutual funds came under stressfollowing evaporation of market liquidity. Withsignificant erosion of banks’ balance sheets,mistrust among banks intensified, as a result ofwhich inter-bank markets choked and moneymarkets dried up. This engendered a credit squeezethat amplif ied under deleveraging and gottransmitted to the real economy.
II.5.2 The main impact of the unfolding globalfinancial crisis on the Indian financial markets,particularly following the collapse of LehmanBrothers in September 2008, was in the form ofreduction in net capital inflows and significantcorrection in the domestic stock markets on theback of sell-off in the equity market by the foreign
136
ANNUAL REPORT
institutional investors (FIIs). The withdrawal of fundsfrom the Indian equity markets, as in the case ofother emerging market economies (EMEs) andreduced access of the Indian entities to funds fromthe international markets put significant pressureon dollar liquidity in the domestic foreign exchangemarket. These developments created adverseexpectations of the BoP difficulties and led todepreciation pressure and higher volatility in theforeign exchange market. The constrained accessto foreign funding and the lacklustre domesticcapital market put pressures on some segments ofthe financial system, such as NBFCs and mutualfunds. Liquidity pressures on mutual funds, whichin turn were provider of funds to other sectors, likeNBFCs, fur ther st i f led the f low of funds.Consequently, the pressure for funding liquiditycame to rest on banks.
INTERNATIONAL FINANCIAL MARKETS
II.5.3 Many systemically important commercialbanks, investment banks, insurance companies andother financial institutions in the US and Europesuffered large losses that undermined their capitalbases. The credit spreads for corporate papers wentup sharply. The US Federal Reserve and othercentral banks/governments had to rescue a numberof failing financial institutions through large scalebailout packages, but financial markets continuedto suffer from a crisis of confidence. The unfoldingdevelopments entailed broader ramifications forboth growth and stability in an integrated world,where cross-exposures, particularly among banks/financial institutions, and trade links are inextricablystrong and complex.
II.5.4 The EMEs, which showed considerableresilience in weathering the crisis up to September2008, came under strain in the last quarter of 2008through the spread of contagion. As a sign of flightto safety, capital flows from developed countries tothe EMEs declined sharply in 2008. Reflecting lowerflows through current and capital accounts,currencies of the EMEs depreciated against the USdollar. EME equity markets suffered large losses in
the wake of reversal of portfolio flows. Bank lendingto the EMEs declined and credit spreads increasedsharply due to the prevailing credit crunch inadvanced economies. Notwithstanding, thefinancial market environment in the EMEs remainedquite different. By and large, their f inancialinstitutions did not exhibit fragility; inter-bankconfidence was relatively normal and inter-bankmoney markets also continued to function. Thecrisis affected the EMEs mainly through three keyfinancial channels. The first was the exit of foreignportfolio equity investments, resulting in decline instock markets which together with rapid decline inexport demand, exerted significant pressures onthe exchange rate. The second channel was thedrying up of overseas lines of credit for banks andcorporates, which shifted demand to the domesticcredit market. Third, there was severe constrainton trade emanating from drying up of trade finance.Monetary policy actions by the EMEs, therefore,had to respond more to emerging real economyproblems rather than financial sector problems.
II.5.5 The extent of disruptions and volatility inthe global financial markets could be seen from thebehaviour of key indicators in Chart II.29. While thestock market corrections were sharp (Chart 29-Aand 29-B), the volatility rose to unprecedentedlevels; yield spreads on EME corporate bondsescalated significantly, reflecting the rising riskpremium (Chart 29-C); and credit default swappremia, signifying the cost of insurance againstdefault, rose sharply (Chart 29-D). Reflecting thepressure on short-term funding markets, the spreadon CPs widened (Chart 29-E) and yields on lowerrated corporate bonds increased significantly(Chart 29-F). These trends in the financial marketsof the advanced countries had the potential to affectthe Indian financial markets, in view of the growingglobalisation and rising integration of the financialmarkets. The EMEs in general exper iencedcontagion from the adverse global financial marketsin the form of significant corrections in their stockprices (Table 2.58), besides notable depreciationof their currencies.
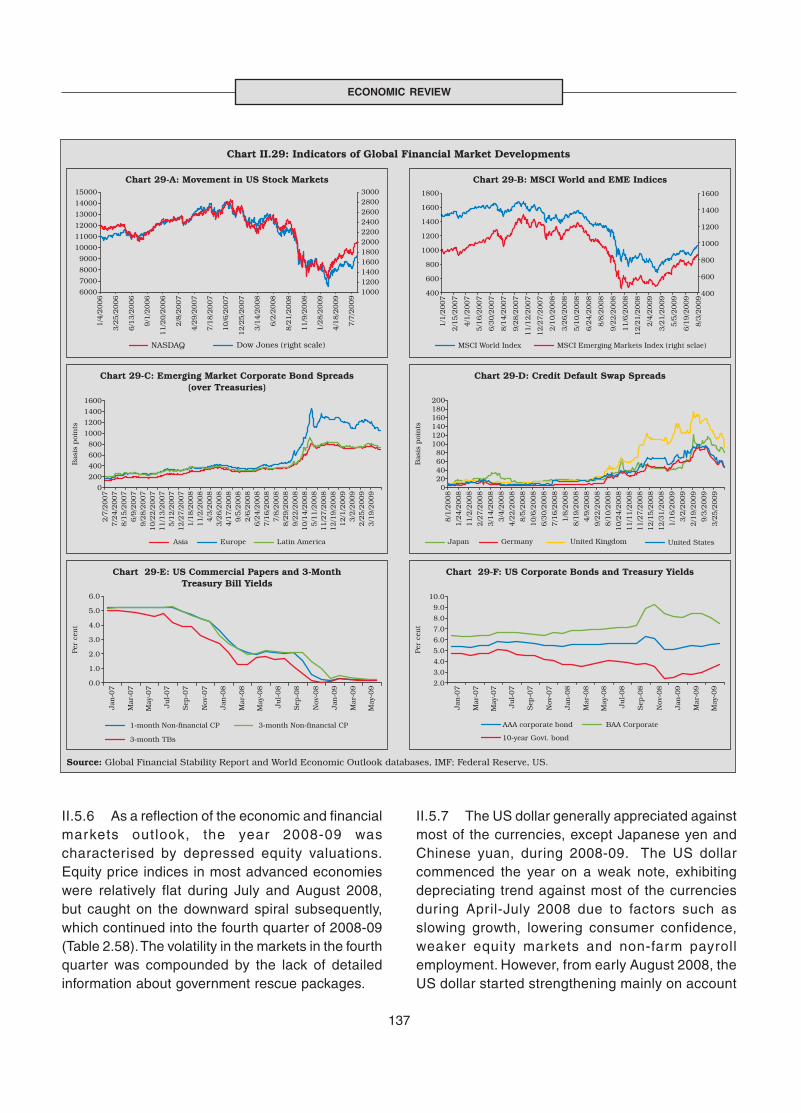
137
ECONOMIC REVIEW
II.5.6 As a reflection of the economic and financialmarkets outlook, the year 2008-09 wascharacterised by depressed equity valuations.Equity price indices in most advanced economieswere relatively flat during July and August 2008,but caught on the downward spiral subsequently,which continued into the fourth quarter of 2008-09(Table 2.58). The volatility in the markets in the fourthquarter was compounded by the lack of detailedinformation about government rescue packages.
II.5.7 The US dollar generally appreciated againstmost of the currencies, except Japanese yen andChinese yuan, during 2008-09. The US dollarcommenced the year on a weak note, exhibitingdepreciating trend against most of the currenciesduring April-July 2008 due to factors such asslowing growth, lowering consumer confidence,weaker equity markets and non-farm payrollemployment. However, from early August 2008, theUS dollar started strengthening mainly on account
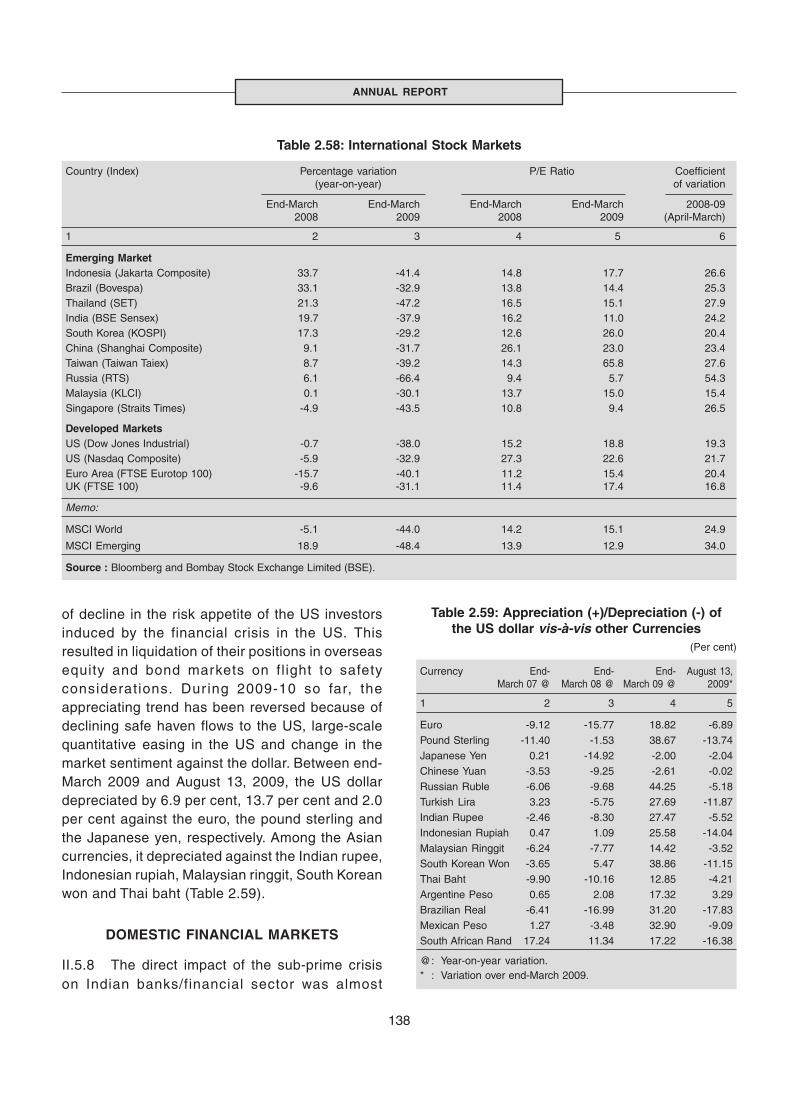
138
ANNUAL REPORT
of decline in the risk appetite of the US investorsinduced by the financial crisis in the US. Thisresulted in liquidation of their positions in overseasequity and bond markets on fl ight to safetyconsiderations. During 2009-10 so far, theappreciating trend has been reversed because ofdeclining safe haven flows to the US, large-scalequantitative easing in the US and change in themarket sentiment against the dollar. Between end-March 2009 and August 13, 2009, the US dollardepreciated by 6.9 per cent, 13.7 per cent and 2.0per cent against the euro, the pound sterling andthe Japanese yen, respectively. Among the Asiancurrencies, it depreciated against the Indian rupee,Indonesian rupiah, Malaysian ringgit, South Koreanwon and Thai baht (Table 2.59).
DOMESTIC FINANCIAL MARKETS
II.5.8 The direct impact of the sub-prime crisison Indian banks/financial sector was almost
Table 2.58: International Stock Markets
Country (Index) Percentage variation P/E Ratio Coefficient(year-on-year) of variation
End-March End-March End-March End-March 2008-092008 2009 2008 2009 (April-March)
1 2 3 4 5 6
Emerging MarketIndonesia (Jakarta Composite) 33.7 -41.4 14.8 17.7 26.6Brazil (Bovespa) 33.1 -32.9 13.8 14.4 25.3Thailand (SET) 21.3 -47.2 16.5 15.1 27.9India (BSE Sensex) 19.7 -37.9 16.2 11.0 24.2South Korea (KOSPI) 17.3 -29.2 12.6 26.0 20.4China (Shanghai Composite) 9.1 -31.7 26.1 23.0 23.4Taiwan (Taiwan Taiex) 8.7 -39.2 14.3 65.8 27.6Russia (RTS) 6.1 -66.4 9.4 5.7 54.3Malaysia (KLCI) 0.1 -30.1 13.7 15.0 15.4Singapore (Straits Times) -4.9 -43.5 10.8 9.4 26.5
Developed MarketsUS (Dow Jones Industrial) -0.7 -38.0 15.2 18.8 19.3US (Nasdaq Composite) -5.9 -32.9 27.3 22.6 21.7Euro Area (FTSE Eurotop 100) -15.7 -40.1 11.2 15.4 20.4UK (FTSE 100) -9.6 -31.1 11.4 17.4 16.8
Memo:
MSCI World -5.1 -44.0 14.2 15.1 24.9
MSCI Emerging 18.9 -48.4 13.9 12.9 34.0
Source : Bloomberg and Bombay Stock Exchange Limited (BSE).
Table 2.59: Appreciation (+)/Depreciation (-) ofthe US dollar vis-à-vis other Currencies
(Per cent)
Currency End- End- End- August 13,March 07 @ March 08 @ March 09 @ 2009*
1 2 3 4 5
Euro -9.12 -15.77 18.82 -6.89
Pound Sterling -11.40 -1.53 38.67 -13.74
Japanese Yen 0.21 -14.92 -2.00 -2.04
Chinese Yuan -3.53 -9.25 -2.61 -0.02
Russian Ruble -6.06 -9.68 44.25 -5.18
Turkish Lira 3.23 -5.75 27.69 -11.87
Indian Rupee -2.46 -8.30 27.47 -5.52
Indonesian Rupiah 0.47 1.09 25.58 -14.04
Malaysian Ringgit -6.24 -7.77 14.42 -3.52
South Korean Won -3.65 5.47 38.86 -11.15
Thai Baht -9.90 -10.16 12.85 -4.21
Argentine Peso 0.65 2.08 17.32 3.29
Brazilian Real -6.41 -16.99 31.20 -17.83
Mexican Peso 1.27 -3.48 32.90 -9.09
South African Rand 17.24 11.34 17.22 -16.38
@: Year-on-year variation.* : Variation over end-March 2009.
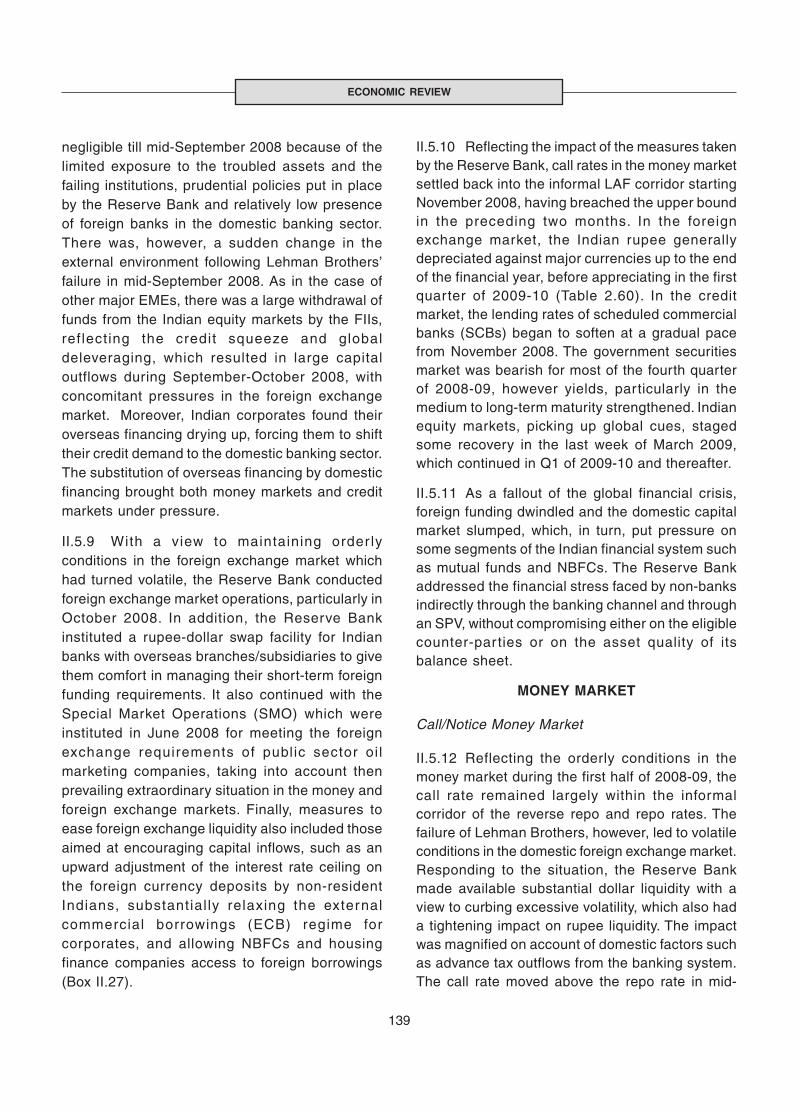
139
ECONOMIC REVIEW
negligible till mid-September 2008 because of thelimited exposure to the troubled assets and thefailing institutions, prudential policies put in placeby the Reserve Bank and relatively low presenceof foreign banks in the domestic banking sector.There was, however, a sudden change in theexternal environment following Lehman Brothers’failure in mid-September 2008. As in the case ofother major EMEs, there was a large withdrawal offunds from the Indian equity markets by the FIIs,reflecting the credit squeeze and globaldeleveraging, which resulted in large capitaloutflows during September-October 2008, withconcomitant pressures in the foreign exchangemarket. Moreover, Indian corporates found theiroverseas financing drying up, forcing them to shifttheir credit demand to the domestic banking sector.The substitution of overseas financing by domesticfinancing brought both money markets and creditmarkets under pressure.
II.5.9 With a view to maintaining order lyconditions in the foreign exchange market whichhad turned volatile, the Reserve Bank conductedforeign exchange market operations, particularly inOctober 2008. In addition, the Reserve Bankinstituted a rupee-dollar swap facility for Indianbanks with overseas branches/subsidiaries to givethem comfort in managing their short-term foreignfunding requirements. It also continued with theSpecial Market Operations (SMO) which wereinstituted in June 2008 for meeting the foreignexchange requirements of public sector oi lmarketing companies, taking into account thenprevailing extraordinary situation in the money andforeign exchange markets. Finally, measures toease foreign exchange liquidity also included thoseaimed at encouraging capital inflows, such as anupward adjustment of the interest rate ceiling onthe foreign currency deposits by non-residentIndians, substantial ly relaxing the externalcommercial borrowings (ECB) regime forcorporates, and allowing NBFCs and housingfinance companies access to foreign borrowings(Box II.27).
II.5.10 Reflecting the impact of the measures takenby the Reserve Bank, call rates in the money marketsettled back into the informal LAF corridor startingNovember 2008, having breached the upper boundin the preceding two months. In the foreignexchange market, the Indian rupee generallydepreciated against major currencies up to the endof the financial year, before appreciating in the firstquarter of 2009-10 (Table 2.60). In the creditmarket, the lending rates of scheduled commercialbanks (SCBs) began to soften at a gradual pacefrom November 2008. The government securitiesmarket was bearish for most of the fourth quarterof 2008-09, however yields, particularly in themedium to long-term maturity strengthened. Indianequity markets, picking up global cues, stagedsome recovery in the last week of March 2009,which continued in Q1 of 2009-10 and thereafter.
II.5.11 As a fallout of the global financial crisis,foreign funding dwindled and the domestic capitalmarket slumped, which, in turn, put pressure onsome segments of the Indian financial system suchas mutual funds and NBFCs. The Reserve Bankaddressed the financial stress faced by non-banksindirectly through the banking channel and throughan SPV, without compromising either on the eligiblecounter-par ties or on the asset quality of itsbalance sheet.
MONEY MARKET
Call/Notice Money Market
II.5.12 Reflecting the orderly conditions in themoney market during the first half of 2008-09, thecall rate remained largely within the informalcorridor of the reverse repo and repo rates. Thefailure of Lehman Brothers, however, led to volatileconditions in the domestic foreign exchange market.Responding to the situation, the Reserve Bankmade available substantial dollar liquidity with aview to curbing excessive volatility, which also hada tightening impact on rupee liquidity. The impactwas magnified on account of domestic factors suchas advance tax outflows from the banking system.The call rate moved above the repo rate in mid-
140
ANNUAL REPORT
Monetary Measures
• Cut in the repo rate under the LAF by a cumulative 425basis points from 9.0 per cent to 4.75 per cent.
• Cut in the reverse repo rate by a cumulative 275 basispoints from 6.0 per cent to 3.25 per cent.
Rupee Liquidity/Credit Delivery
• Cut in the CRR by a cumulative 400 basis points of NDTLfrom 9.0 per cent to 5.0 per cent.
• Introduction of a special refinance facility up to March31, 2010 under which all SCBs (excluding RRBs) areprovided refinance from the Reserve Bank equivalent to1.0 per cent of each bank’s NDTL as on October 24,2008.
• Term repo facility under the LAF to enable banks to easeliquidity stress faced by mutual funds, NBFCs andhousing finance companies (HFCs) with associated SLRexemption of 1.5 per cent of NDTL. This facility isavailable up to March 31, 2010.
• Reduction in statutory liquidity ratio (SLR) from 25 per centto 24 per cent of NDTL with effect from the fortnightbeginning November 8, 2008.
• Introduction of a mechanism to buyback dated securitiesissued under the MSS.
• Extension of the period of entitlement by 90 days of thefirst slab of pre-shipment and post-shipment rupee exportcredit with effect from November 15, 2008 and November28, 2008, respectively.
• Increase in the eligible limit of the ECR facility forscheduled banks (excluding RRBs) from 15 per cent to50 per cent of the outstanding export credit eligible forrefinance.
• Amounts allocated, in advance, from SCBs forcontribution to the SIDBI and the NHB against banks’estimated shortfall in priority sector lending in March2009.
• Reduction in the provisioning requirements for all typesof standard assets to a uniform level of 0.40 per centexcept in case of direct advances to agricultural and SMEsector which shall continue to attract provisioning of 0.25per cent.
• All unrated claims on corporates and claims secured bycommercial real estate attract a uniform risk weight of100 per cent as against the risk weight of 150 per centprescribed earlier. Claims on rated as well as unrated non-deposit taking systemically important NBFCs are uniformlyrisk weighted at 100 per cent.
• In order to provide liquidity support to housing, exportand MSE sectors, the Reserve Bank provided a refinancefacility to NHB, EXIM Bank and SIDBI up to March 2010.
Box II.27Policy Response of the Reserve Bank since mid-September 2008
• The scope of OMO widened by including purchases ofgovernment securities through an auction-basedmechanism.
Foreign Exchange Liquidity
• Sold foreign exchange (US dollars) through agent banksto augment supply in the domestic foreign exchangemarket or intervene directly to meet any demand-supplygaps.
• Special market operations to meet the foreign exchangerequirements of public sector oil marketing companiesagainst oil bonds.
• The ceiling rate on export credit in foreign currencyincreased to LIBOR plus 350 basis points.
• Authorised Dealer (AD) category - I banks allowed toborrow funds from their head office, overseas branchesand correspondents and overdrafts in nostro accountsup to a limit of 50 per cent of their unimpaired Tier 1capital or US$ 10 million, whichever was higher.
• HFCs registered with the NHB were allowed to raiseshort-term foreign currency borrowings under theapproval route, subject to compliance with prudentialnorms laid down by the NHB.
• A foreign exchange swap facility with tenure up to threemonths to Indian public and private sector banks havingoverseas operations in order to provide them flexibilityin managing their short-term funding requirements attheir overseas offices.
• Cumulative increase in the interest rate ceilings onFCNR(B) and NR(E)RA term deposits by 175 basispoints each since September 16, 2008.
• Proposals from Indian companies to prematurely buybacktheir FCCBs considered under the approval or automaticroute. Extension of FCCBs also permitted.
• The all-in-cost ceiling for ECBs dispensed with up toDecember 31, 2009 and enhanced for trade credit lessthan 3 years (6-month LIBOR plus 200 basis points).
• ECBs up to US$ 500 million per borrower per financialyear were permitted for rupee/foreign currencyexpenditure for permissible end-uses under theautomatic route.
• The definition of infrastructure sector for availing ECB wasexpanded and the requirement of minimum averagematurity period of 7 years for ECB of more than US$ 100million for rupee capital expenditure was dispensed with.
• Systemically important non-deposit taking NBFCs werepermitted to raise short-term foreign currency borrowingsunder the approval route, subject to compliance with theprudential requirements of capital adequacy andexposure norms.

141
ECONOMIC REVIEW
September 2008 (Char t II.30). The weightedaverage daily call rate increased to 9.46 per centin the second quarter of 2008-09 from 6.83 per centin the first quarter (Table 2.60). The concomitanttightening of liquidity conditions coupled with weakmarket sentiment put pressures on some segmentsof the financial system, such as NBFCs and mutualfunds. A substantial proportion of collections ofmutual funds reflected bulk funds from thecorporate sector under the money market schemes,partly reflecting tax and other regulatory arbitrage.
As sources of funding dried up due to risk aversion,there was large redemption pressure on mutualfunds. Drying up of funds with mutual funds, whichin turn were providers of funds to other sectors suchas the NBFCs, further attenuated the flow of funds.Consequently, the entire pressure for funds cameto rest on banks: from the corporate sector unableto get external funds or new financing from theequity market, NBFCs and mutual funds; and fromthe growing perception of an emerging creditcrunch.
Table 2.60: Domestic Markets at a Glance
Year/Month
Average Average Average Average Average RBI’s net Average Average Average Average Average Average AverageCall Turnover 10-year Daily Exchange Foreign 3-month MSS Daily Daily Daily BSE S & P
Rates* (Rs. Yield@ Inter- Rate Currency Forward Out- LAF BSE NSE Sensex CNX(Per crore)+ (Per bank (Rs. per Sales (-)/ Premia standing# Out- Turnover Turnover ** Nifty
cent) cent) Turnover US$) Purchases (Per (Rs. standing (Rs. (Rs. **(US$ (+) cent) crore) (Rs. crore) crore)
million) (US$ crore)million)
1 2 3 4 5 6 7 8 9 10 11 12 13 14 15
2006-07 21,725 7.22 4,863 7.78 18,717 45.28 26,824## 2.14 37,698 21,973 3,866 7,812 12,277 3,572
2007-08 21,393 6.07 8,104 7.91 34,044 40.24 78,203## 2.16 1,28,684 4,677 6,275 14,148 16,569 4,897
2008-09 22,436 7.06 7,344 7.54 34,812 45.92 -34,922## 3.47 1,48,889 2,885 4,498 11,325 12,366 3,731
Jan-08 27,531 6.69 19,182 7.61 38,676 39.37 13,625 2.07 1,59,866 15,692 8,071 19,441 19,326 5,756
Feb-08 22,716 7.06 12,693 7.57 42,068 39.73 3,884 0.24 1,75,166 -1,294 5,808 13,342 17,728 5,202
Mar-08 22,364 7.37 5,881 7.69 39,087 40.36 2,809 1.25 1,70,285 -8,271 6,166 14,056 15,838 4,770
Apr-08 19,516 6.11 6,657 8.10 37,580 40.02 4,325 2.68 1,70,726 26,359 5,773 13,561 16,291 4,902
May-08 19,481 6.62 6,780 8.04 32,287 42.13 148 2.45 1,75,565 11,841 6,084 13,896 16,946 5,029
Jun-08 21,707 7.75 6,835 8.43 38,330 42.82 -5,229 3.69 1,74,433 -8,622 5,410 12,592 14,997 4,464
Jul-08 24,736 8.76 5,474 9.18 37,173 42.84 -6,320 6.04 1,72,169 -27,961 5,388 12,862 13,716 4,125
Aug-08 23,408 9.10 7,498 9.06 38,388 42.94 1,210 4.71 1,71,944 -22,560 4,996 11,713 14,722 4,417
Sep-08 23,379 10.52 10,418 8.45 44,700 45.56 -3,784 2.35 1,75,666 -42,591 5,147 12,489 13,943 4,207
Oct-08 28,995 9.90 4,321 7.85 36,999 48.66 -18,666 1.13 1,69,123 -45,612 3,911 10,810 10,550 3,210
Nov-08 21,812 7.57 5,866 7.41 31,322 49.00 -3,101 4.20 1,47,648 -8,017 3,539 9,618 9,454 2,835
Dec-08 21,641 5.92 11,451 5.55 34,874 48.63 -318 4.59 1,24,848 22,294 3,851 10,141 9,514 2,896
Jan-09 18,496 4.18 9,568 5.84 27,895 48.83 -29 3.10 1,13,535 45,474 3,526 9,559 9,350 2,854
Feb-09 22,241 4.16 5,916 5.98 25,068 49.26 230 2.68 1,02,934 50,649 2,859 7,887 9,188 2,819
Mar-09 23,818 4.17 5,322 6.59 33,126 51.23 -3,388 3.99 88,077 33,360 3,489 10,140 8,966 2,802
Apr-09 21,820 3.28 7,998 6.55 27,796 50..06 -2,487 3.34 75,146 1,01,561 5,232 15,688 10,911 3,360
May-09 19,037 3.17 7,292 6.41 32,227 48.53 -1,437 3.42 45,955 1,25,728 6,427 19,128 13,046 3,958
Jun-09 17,921 3.21 7,288 6.83 32,431 47.77 1,044 3.30 27,140 1,23,400 7,236 21,928 14,782 4,436
July-09 14,394 3.21 - - - 48.48 - 2.60 22,159 1,30,891 6,043 18,528 14,635 4,343
* : Average of daily weighted call money borrowing rates. + : Average of daily outright turnover in Central Government dated securities.@ : Average of daily closing rates. # : Average of weekly outstanding MSS.** : Average of daily closing indices. ## : Cumulative for the financial year.- : Not available.LAF : Liquidity Adjustment Facility. MSS : Market Stabilisation Scheme.BSE : Bombay Stock Exchange Limited. NSE : National Stock Exchange of India Limited.Note: In column 11, (-) indicates injection of liquidity, while (+) indicates absorption of liquidity.
Govt. Securities Foreign Exchange LiquidityManagement
Equity
AverageDaily
Turnover(Rs.crore)
Call Money
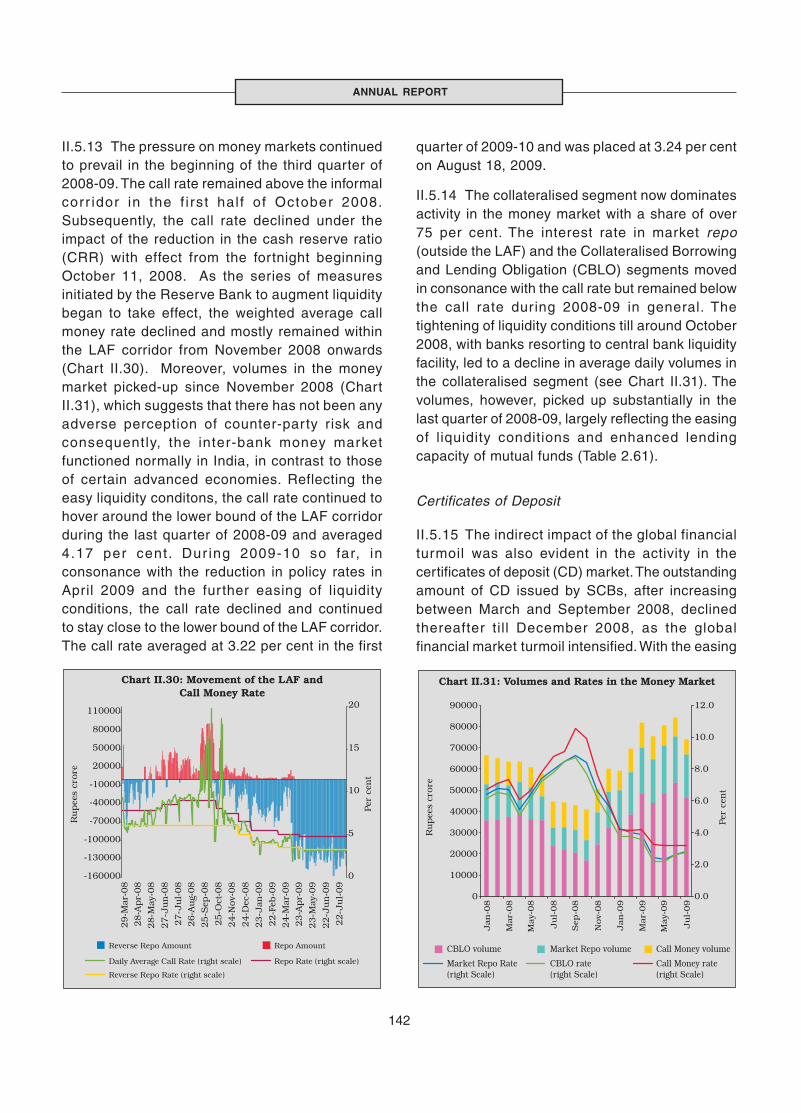
142
ANNUAL REPORT
II.5.13 The pressure on money markets continuedto prevail in the beginning of the third quarter of2008-09. The call rate remained above the informalcorr idor in the f i rst hal f of October 2008.Subsequently, the call rate declined under theimpact of the reduction in the cash reserve ratio(CRR) with effect from the fortnight beginningOctober 11, 2008. As the series of measuresinitiated by the Reserve Bank to augment liquiditybegan to take effect, the weighted average callmoney rate declined and mostly remained withinthe LAF corridor from November 2008 onwards(Chart II.30). Moreover, volumes in the moneymarket picked-up since November 2008 (ChartII.31), which suggests that there has not been anyadverse perception of counter-party risk andconsequently, the inter-bank money marketfunctioned normally in India, in contrast to thoseof certain advanced economies. Reflecting theeasy liquidity conditons, the call rate continued tohover around the lower bound of the LAF corridorduring the last quarter of 2008-09 and averaged4.17 per cent. Dur ing 2009-10 so far, inconsonance with the reduction in policy rates inApril 2009 and the further easing of liquidityconditions, the call rate declined and continuedto stay close to the lower bound of the LAF corridor.The call rate averaged at 3.22 per cent in the first
quarter of 2009-10 and was placed at 3.24 per centon August 18, 2009.
II.5.14 The collateralised segment now dominatesactivity in the money market with a share of over75 per cent. The interest rate in market repo(outside the LAF) and the Collateralised Borrowingand Lending Obligation (CBLO) segments movedin consonance with the call rate but remained belowthe call rate during 2008-09 in general. Thetightening of liquidity conditions till around October2008, with banks resorting to central bank liquidityfacility, led to a decline in average daily volumes inthe collateralised segment (see Chart II.31). Thevolumes, however, picked up substantially in thelast quarter of 2008-09, largely reflecting the easingof liquidity conditions and enhanced lendingcapacity of mutual funds (Table 2.61).
Certificates of Deposit
II.5.15 The indirect impact of the global financialturmoil was also evident in the activity in thecertificates of deposit (CD) market. The outstandingamount of CD issued by SCBs, after increasingbetween March and September 2008, declinedthereafter till December 2008, as the globalfinancial market turmoil intensified. With the easing
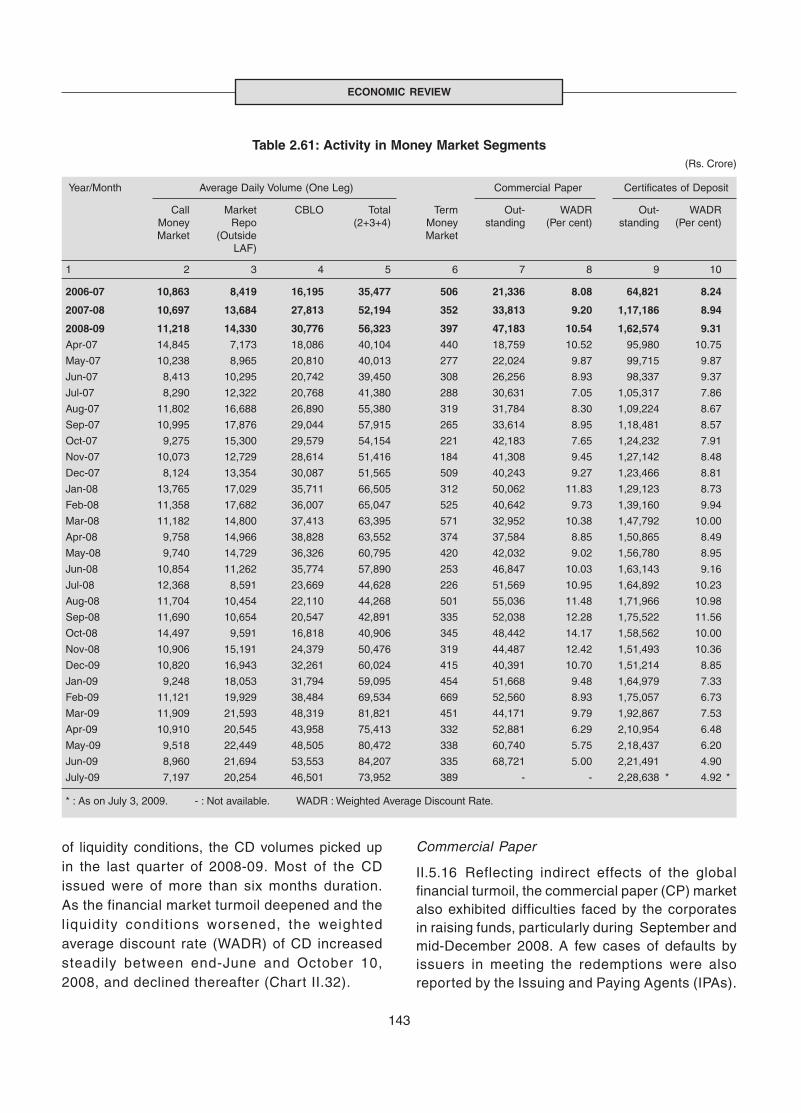
143
ECONOMIC REVIEW
of liquidity conditions, the CD volumes picked upin the last quarter of 2008-09. Most of the CDissued were of more than six months duration.As the financial market turmoil deepened and theliquidity conditions worsened, the weightedaverage discount rate (WADR) of CD increasedsteadily between end-June and October 10,2008, and declined thereafter (Chart II.32).
Commercial Paper
II.5.16 Reflecting indirect effects of the globalfinancial turmoil, the commercial paper (CP) marketalso exhibited difficulties faced by the corporatesin raising funds, particularly during September andmid-December 2008. A few cases of defaults byissuers in meeting the redemptions were alsoreported by the Issuing and Paying Agents (IPAs).
Table 2.61: Activity in Money Market Segments(Rs. Crore)
Year/Month Average Daily Volume (One Leg) Commercial Paper Certificates of Deposit
Call Market CBLO Total Term Out- WADR Out- WADRMoney Repo (2+3+4) Money standing (Per cent) standing (Per cent)Market (Outside Market
LAF)
1 2 3 4 5 6 7 8 9 10
2006-07 10,863 8,419 16,195 35,477 506 21,336 8.08 64,821 8.24
2007-08 10,697 13,684 27,813 52,194 352 33,813 9.20 1,17,186 8.94
2008-09 11,218 14,330 30,776 56,323 397 47,183 10.54 1,62,574 9.31
Apr-07 14,845 7,173 18,086 40,104 440 18,759 10.52 95,980 10.75
May-07 10,238 8,965 20,810 40,013 277 22,024 9.87 99,715 9.87
Jun-07 8,413 10,295 20,742 39,450 308 26,256 8.93 98,337 9.37
Jul-07 8,290 12,322 20,768 41,380 288 30,631 7.05 1,05,317 7.86
Aug-07 11,802 16,688 26,890 55,380 319 31,784 8.30 1,09,224 8.67
Sep-07 10,995 17,876 29,044 57,915 265 33,614 8.95 1,18,481 8.57
Oct-07 9,275 15,300 29,579 54,154 221 42,183 7.65 1,24,232 7.91
Nov-07 10,073 12,729 28,614 51,416 184 41,308 9.45 1,27,142 8.48
Dec-07 8,124 13,354 30,087 51,565 509 40,243 9.27 1,23,466 8.81
Jan-08 13,765 17,029 35,711 66,505 312 50,062 11.83 1,29,123 8.73
Feb-08 11,358 17,682 36,007 65,047 525 40,642 9.73 1,39,160 9.94
Mar-08 11,182 14,800 37,413 63,395 571 32,952 10.38 1,47,792 10.00
Apr-08 9,758 14,966 38,828 63,552 374 37,584 8.85 1,50,865 8.49
May-08 9,740 14,729 36,326 60,795 420 42,032 9.02 1,56,780 8.95
Jun-08 10,854 11,262 35,774 57,890 253 46,847 10.03 1,63,143 9.16
Jul-08 12,368 8,591 23,669 44,628 226 51,569 10.95 1,64,892 10.23
Aug-08 11,704 10,454 22,110 44,268 501 55,036 11.48 1,71,966 10.98
Sep-08 11,690 10,654 20,547 42,891 335 52,038 12.28 1,75,522 11.56
Oct-08 14,497 9,591 16,818 40,906 345 48,442 14.17 1,58,562 10.00
Nov-08 10,906 15,191 24,379 50,476 319 44,487 12.42 1,51,493 10.36
Dec-09 10,820 16,943 32,261 60,024 415 40,391 10.70 1,51,214 8.85
Jan-09 9,248 18,053 31,794 59,095 454 51,668 9.48 1,64,979 7.33
Feb-09 11,121 19,929 38,484 69,534 669 52,560 8.93 1,75,057 6.73
Mar-09 11,909 21,593 48,319 81,821 451 44,171 9.79 1,92,867 7.53
Apr-09 10,910 20,545 43,958 75,413 332 52,881 6.29 2,10,954 6.48
May-09 9,518 22,449 48,505 80,472 338 60,740 5.75 2,18,437 6.20
Jun-09 8,960 21,694 53,553 84,207 335 68,721 5.00 2,21,491 4.90
July-09 7,197 20,254 46,501 73,952 389 - - 2,28,638 * 4.92 *
* : As on July 3, 2009. - : Not available. WADR : Weighted Average Discount Rate.

144
ANNUAL REPORT
Subsequently, as liquidity conditions eased, theoutstanding amount of CPs picked up (refer Table2.60). Leasing and finance companies continuedto be the major issuers of CPs, followed by‘manufacturing and other companies’ and financialinstitutions (Table 2.62). The WADR on CPs, whichwas witnessing a steadily declining trend till mid-May 2008, increased sharply thereafter till end-October 2008. With the easing of l iquidityconditions, the WADR significantly moderated in thesubsequent period (Chart II.33). The most preferredtenor for issuance of CPs was more than 180 days.
FOREIGN EXCHANGE MARKET
II.5.17 The cascading effect of the global financialcrisis on the domestic foreign exchange market wasfelt through the dollar liquidity shocks emanatingfrom the lower level of net capital inflows. Consistentwith its policy objective of maintaining orderlyconditions in the foreign exchange market, theReserve Bank sold foreign exchange to meet themismatch in the market. Despite the deepening ofthe financial crisis and weakness in economicactivity in the US, the flight to safety considerationshelped the US dollar to strengthen against mostcurrencies during 2008-09, including the Indianrupee, particularly since the middle of August 2008.The Indian rupee exhibited greater two-waymovements during 2008-09, moving betweenRs.39.89 and Rs.52.09 per US dollar (Charts II.34).The rupee generally depreciated during the first halfof 2008-09, reflecting FIIs outflows, high inflationand higher crude oil prices, indicating higherdemand for dollars. The rupee, which stood at 39.99per US dollar as at end-March 2008, was generallyrange bound up to April 2008 but subsequentlydepreciated and moved in a narrow range of Rs.42-43 per US dollar from the third week of May tothe middle of August 2008. With the intensifyingexternal shocks, it depreciated sharply thereafter
Table 2.62: Commercial Paper - Major Issuers(Rs. crore)
Category of Issuer End- End- End- End- End-Jun-08 Sep-08 Dec-08 Mar-09 Jun-09
1 2 3 4 5 6
Leasing and Finance 34,957 39,053 27,965 27,183 34,437
(74.6) (75.0) (73.5) (61.5) (50.1)
Manufacturing 8,150 9,925 6,833 12,738 23,454
(17.4) (19.1) (18.0) (28.9) (34.1)
Financial Institutions 3,740 3,060 3,257 4,250 10,830
(8.0) (5.9) (8.5) (9.6) (15.8)
Total 46,847 52,038 38,055 44,171 68,721
Note : Figures in brackets are percentages to total.
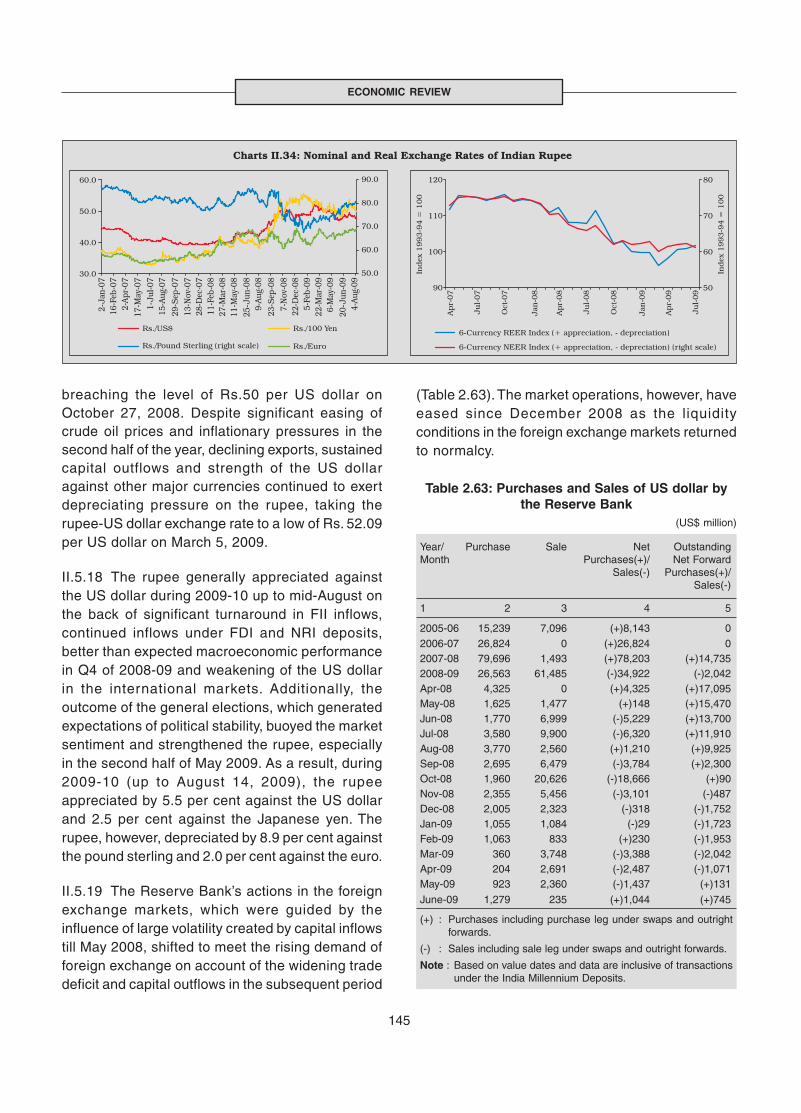
145
ECONOMIC REVIEW
breaching the level of Rs.50 per US dollar onOctober 27, 2008. Despite significant easing ofcrude oil prices and inflationary pressures in thesecond half of the year, declining exports, sustainedcapital outflows and strength of the US dollaragainst other major currencies continued to exertdepreciating pressure on the rupee, taking therupee-US dollar exchange rate to a low of Rs. 52.09per US dollar on March 5, 2009.
II.5.18 The rupee generally appreciated againstthe US dollar during 2009-10 up to mid-August onthe back of significant turnaround in FII inflows,continued inflows under FDI and NRI deposits,better than expected macroeconomic performancein Q4 of 2008-09 and weakening of the US dollarin the international markets. Additionally, theoutcome of the general elections, which generatedexpectations of political stability, buoyed the marketsentiment and strengthened the rupee, especiallyin the second half of May 2009. As a result, during2009-10 (up to August 14, 2009), the rupeeappreciated by 5.5 per cent against the US dollarand 2.5 per cent against the Japanese yen. Therupee, however, depreciated by 8.9 per cent againstthe pound sterling and 2.0 per cent against the euro.
II.5.19 The Reserve Bank’s actions in the foreignexchange markets, which were guided by theinfluence of large volatility created by capital inflowstill May 2008, shifted to meet the rising demand offoreign exchange on account of the widening tradedeficit and capital outflows in the subsequent period
(Table 2.63). The market operations, however, haveeased since December 2008 as the liquidityconditions in the foreign exchange markets returnedto normalcy.
Table 2.63: Purchases and Sales of US dollar bythe Reserve Bank
(US$ million)
Year/ Purchase Sale Net OutstandingMonth Purchases(+)/ Net Forward
Sales(-) Purchases(+)/Sales(-)
1 2 3 4 5
2005-06 15,239 7,096 (+)8,143 02006-07 26,824 0 (+)26,824 02007-08 79,696 1,493 (+)78,203 (+)14,7352008-09 26,563 61,485 (-)34,922 (-)2,042Apr-08 4,325 0 (+)4,325 (+)17,095May-08 1,625 1,477 (+)148 (+)15,470Jun-08 1,770 6,999 (-)5,229 (+)13,700Jul-08 3,580 9,900 (-)6,320 (+)11,910Aug-08 3,770 2,560 (+)1,210 (+)9,925Sep-08 2,695 6,479 (-)3,784 (+)2,300Oct-08 1,960 20,626 (-)18,666 (+)90Nov-08 2,355 5,456 (-)3,101 (-)487Dec-08 2,005 2,323 (-)318 (-)1,752Jan-09 1,055 1,084 (-)29 (-)1,723Feb-09 1,063 833 (+)230 (-)1,953Mar-09 360 3,748 (-)3,388 (-)2,042Apr-09 204 2,691 (-)2,487 (-)1,071May-09 923 2,360 (-)1,437 (+)131
June-09 1,279 235 (+)1,044 (+)745
(+) : Purchases including purchase leg under swaps and outrightforwards.
(-) : Sales including sale leg under swaps and outright forwards.
Note : Based on value dates and data are inclusive of transactionsunder the India Millennium Deposits.
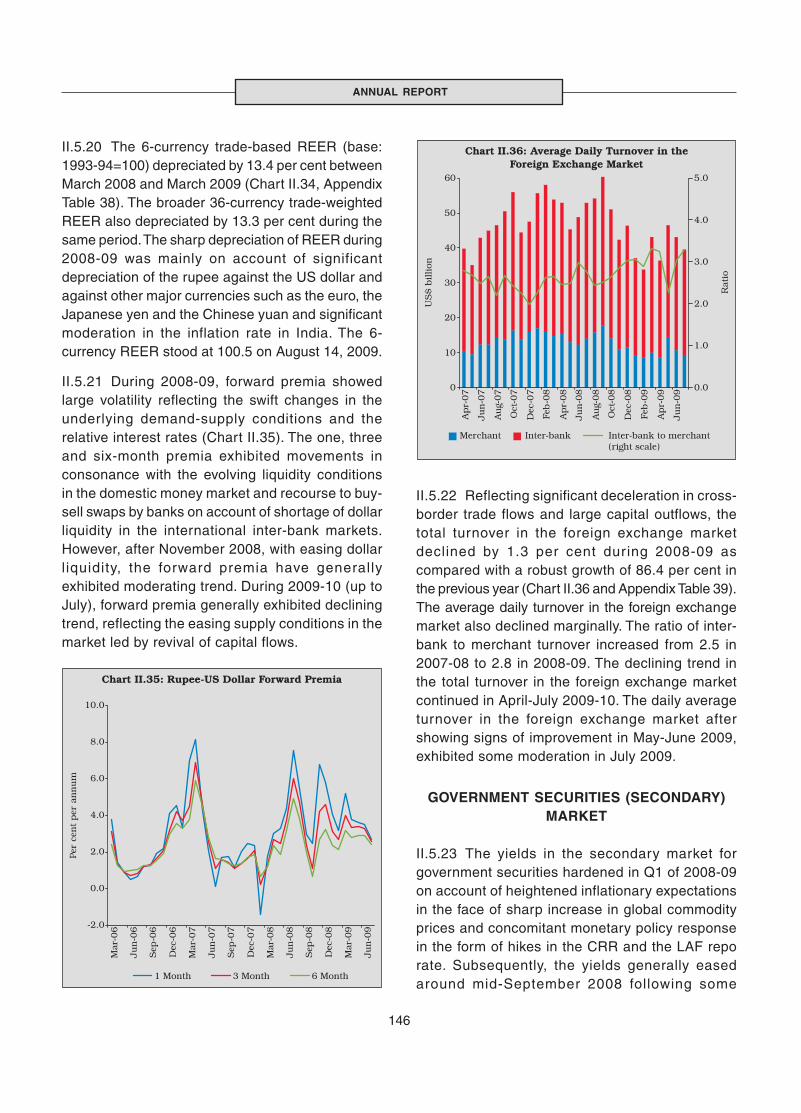
146
ANNUAL REPORT
II.5.20 The 6-currency trade-based REER (base:1993-94=100) depreciated by 13.4 per cent betweenMarch 2008 and March 2009 (Chart II.34, AppendixTable 38). The broader 36-currency trade-weightedREER also depreciated by 13.3 per cent during thesame period. The sharp depreciation of REER during2008-09 was mainly on account of significantdepreciation of the rupee against the US dollar andagainst other major currencies such as the euro, theJapanese yen and the Chinese yuan and significantmoderation in the inflation rate in India. The 6-currency REER stood at 100.5 on August 14, 2009.
II.5.21 During 2008-09, forward premia showedlarge volatility reflecting the swift changes in theunderlying demand-supply conditions and therelative interest rates (Chart II.35). The one, threeand six-month premia exhibited movements inconsonance with the evolving liquidity conditionsin the domestic money market and recourse to buy-sell swaps by banks on account of shortage of dollarliquidity in the international inter-bank markets.However, after November 2008, with easing dollarl iquidity, the forward premia have generallyexhibited moderating trend. During 2009-10 (up toJuly), forward premia generally exhibited decliningtrend, reflecting the easing supply conditions in themarket led by revival of capital flows.
II.5.22 Reflecting significant deceleration in cross-border trade flows and large capital outflows, thetotal turnover in the foreign exchange marketdeclined by 1.3 per cent during 2008-09 ascompared with a robust growth of 86.4 per cent inthe previous year (Chart II.36 and Appendix Table 39).The average daily turnover in the foreign exchangemarket also declined marginally. The ratio of inter-bank to merchant turnover increased from 2.5 in2007-08 to 2.8 in 2008-09. The declining trend inthe total turnover in the foreign exchange marketcontinued in April-July 2009-10. The daily averageturnover in the foreign exchange market aftershowing signs of improvement in May-June 2009,exhibited some moderation in July 2009.
GOVERNMENT SECURITIES (SECONDARY)MARKET
II.5.23 The yields in the secondary market forgovernment securities hardened in Q1 of 2008-09on account of heightened inflationary expectationsin the face of sharp increase in global commodityprices and concomitant monetary policy responsein the form of hikes in the CRR and the LAF reporate. Subsequently, the yields generally easedaround mid-September 2008 following some
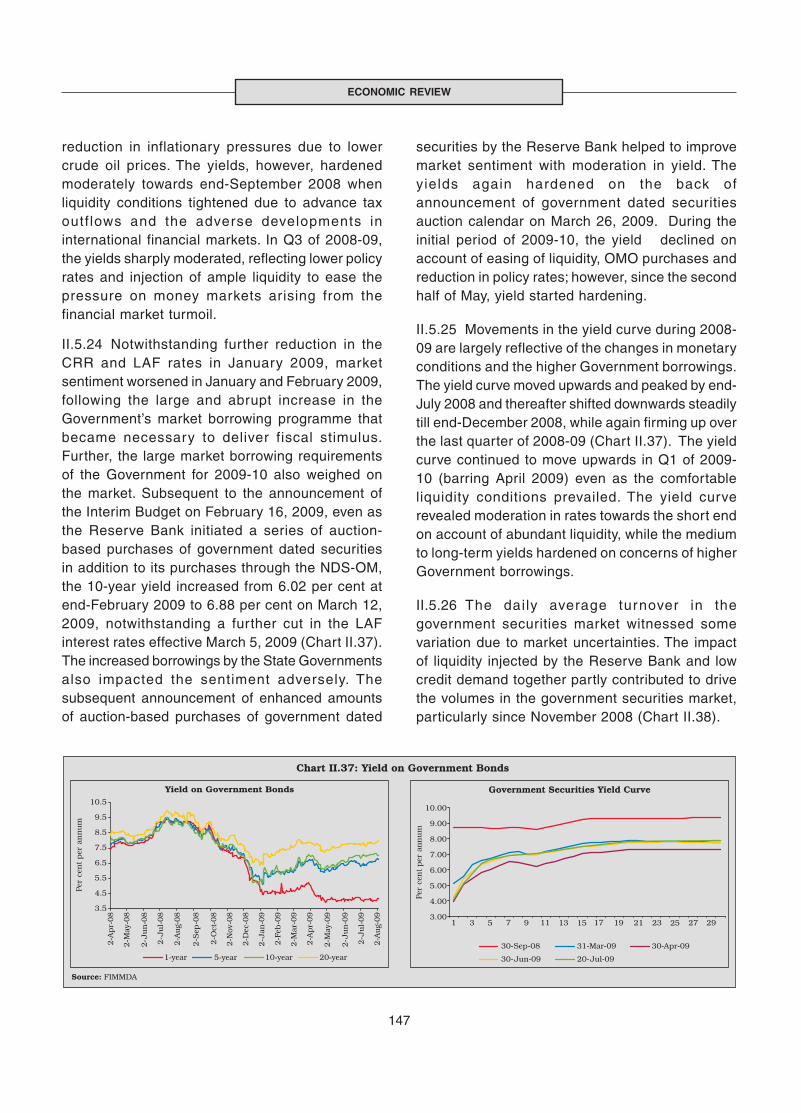
147
ECONOMIC REVIEW
reduction in inflationary pressures due to lowercrude oil prices. The yields, however, hardenedmoderately towards end-September 2008 whenliquidity conditions tightened due to advance taxoutf lows and the adverse developments ininternational financial markets. In Q3 of 2008-09,the yields sharply moderated, reflecting lower policyrates and injection of ample liquidity to ease thepressure on money markets arising from thefinancial market turmoil.
II.5.24 Notwithstanding further reduction in theCRR and LAF rates in January 2009, marketsentiment worsened in January and February 2009,following the large and abrupt increase in theGovernment’s market borrowing programme thatbecame necessary to deliver fiscal stimulus.Further, the large market borrowing requirementsof the Government for 2009-10 also weighed onthe market. Subsequent to the announcement ofthe Interim Budget on February 16, 2009, even asthe Reserve Bank initiated a series of auction-based purchases of government dated securitiesin addition to its purchases through the NDS-OM,the 10-year yield increased from 6.02 per cent atend-February 2009 to 6.88 per cent on March 12,2009, notwithstanding a further cut in the LAFinterest rates effective March 5, 2009 (Chart II.37).The increased borrowings by the State Governmentsalso impacted the sentiment adversely. Thesubsequent announcement of enhanced amountsof auction-based purchases of government dated
securities by the Reserve Bank helped to improvemarket sentiment with moderation in yield. Theyields again hardened on the back ofannouncement of government dated securitiesauction calendar on March 26, 2009. During theinitial period of 2009-10, the yield declined onaccount of easing of liquidity, OMO purchases andreduction in policy rates; however, since the secondhalf of May, yield started hardening.
II.5.25 Movements in the yield curve during 2008-09 are largely reflective of the changes in monetaryconditions and the higher Government borrowings.The yield curve moved upwards and peaked by end-July 2008 and thereafter shifted downwards steadilytill end-December 2008, while again firming up overthe last quarter of 2008-09 (Chart II.37). The yieldcurve continued to move upwards in Q1 of 2009-10 (barring April 2009) even as the comfortableliquidity conditions prevailed. The yield curverevealed moderation in rates towards the short endon account of abundant liquidity, while the mediumto long-term yields hardened on concerns of higherGovernment borrowings.
II.5.26 The daily average turnover in thegovernment securities market witnessed somevariation due to market uncertainties. The impactof liquidity injected by the Reserve Bank and lowcredit demand together partly contributed to drivethe volumes in the government securities market,particularly since November 2008 (Chart II.38).
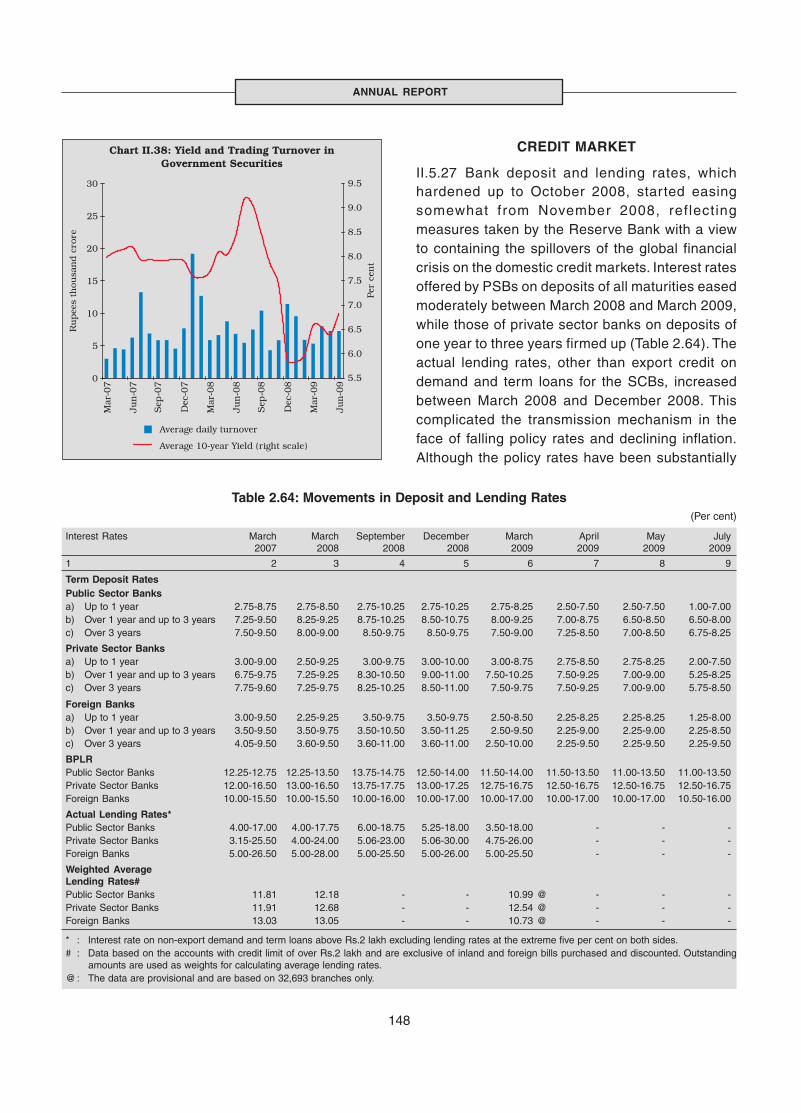
148
ANNUAL REPORT
CREDIT MARKET
II.5.27 Bank deposit and lending rates, whichhardened up to October 2008, started easingsomewhat from November 2008, reflectingmeasures taken by the Reserve Bank with a viewto containing the spillovers of the global financialcrisis on the domestic credit markets. Interest ratesoffered by PSBs on deposits of all maturities easedmoderately between March 2008 and March 2009,while those of private sector banks on deposits ofone year to three years firmed up (Table 2.64). Theactual lending rates, other than export credit ondemand and term loans for the SCBs, increasedbetween March 2008 and December 2008. Thiscomplicated the transmission mechanism in theface of falling policy rates and declining inflation.Although the policy rates have been substantially
Table 2.64: Movements in Deposit and Lending Rates(Per cent)
Interest Rates March March September December March April May July2007 2008 2008 2008 2009 2009 2009 2009
1 2 3 4 5 6 7 8 9
Term Deposit RatesPublic Sector Banksa) Up to 1 year 2.75-8.75 2.75-8.50 2.75-10.25 2.75-10.25 2.75-8.25 2.50-7.50 2.50-7.50 1.00-7.00b) Over 1 year and up to 3 years 7.25-9.50 8.25-9.25 8.75-10.25 8.50-10.75 8.00-9.25 7.00-8.75 6.50-8.50 6.50-8.00c) Over 3 years 7.50-9.50 8.00-9.00 8.50-9.75 8.50-9.75 7.50-9.00 7.25-8.50 7.00-8.50 6.75-8.25
Private Sector Banksa) Up to 1 year 3.00-9.00 2.50-9.25 3.00-9.75 3.00-10.00 3.00-8.75 2.75-8.50 2.75-8.25 2.00-7.50b) Over 1 year and up to 3 years 6.75-9.75 7.25-9.25 8.30-10.50 9.00-11.00 7.50-10.25 7.50-9.25 7.00-9.00 5.25-8.25c) Over 3 years 7.75-9.60 7.25-9.75 8.25-10.25 8.50-11.00 7.50-9.75 7.50-9.25 7.00-9.00 5.75-8.50
Foreign Banksa) Up to 1 year 3.00-9.50 2.25-9.25 3.50-9.75 3.50-9.75 2.50-8.50 2.25-8.25 2.25-8.25 1.25-8.00b) Over 1 year and up to 3 years 3.50-9.50 3.50-9.75 3.50-10.50 3.50-11.25 2.50-9.50 2.25-9.00 2.25-9.00 2.25-8.50c) Over 3 years 4.05-9.50 3.60-9.50 3.60-11.00 3.60-11.00 2.50-10.00 2.25-9.50 2.25-9.50 2.25-9.50
BPLRPublic Sector Banks 12.25-12.75 12.25-13.50 13.75-14.75 12.50-14.00 11.50-14.00 11.50-13.50 11.00-13.50 11.00-13.50Private Sector Banks 12.00-16.50 13.00-16.50 13.75-17.75 13.00-17.25 12.75-16.75 12.50-16.75 12.50-16.75 12.50-16.75Foreign Banks 10.00-15.50 10.00-15.50 10.00-16.00 10.00-17.00 10.00-17.00 10.00-17.00 10.00-17.00 10.50-16.00
Actual Lending Rates*Public Sector Banks 4.00-17.00 4.00-17.75 6.00-18.75 5.25-18.00 3.50-18.00 - - -Private Sector Banks 3.15-25.50 4.00-24.00 5.06-23.00 5.06-30.00 4.75-26.00 - - -Foreign Banks 5.00-26.50 5.00-28.00 5.00-25.50 5.00-26.00 5.00-25.50 - - -
Weighted AverageLending Rates#Public Sector Banks 11.81 12.18 - - 10.99 @ - - -Private Sector Banks 11.91 12.68 - - 12.54 @ - - -Foreign Banks 13.03 13.05 - - 10.73 @ - - -
* : Interest rate on non-export demand and term loans above Rs.2 lakh excluding lending rates at the extreme five per cent on both sides.# : Data based on the accounts with credit limit of over Rs.2 lakh and are exclusive of inland and foreign bills purchased and discounted. Outstanding
amounts are used as weights for calculating average lending rates.@: The data are provisional and are based on 32,693 branches only.
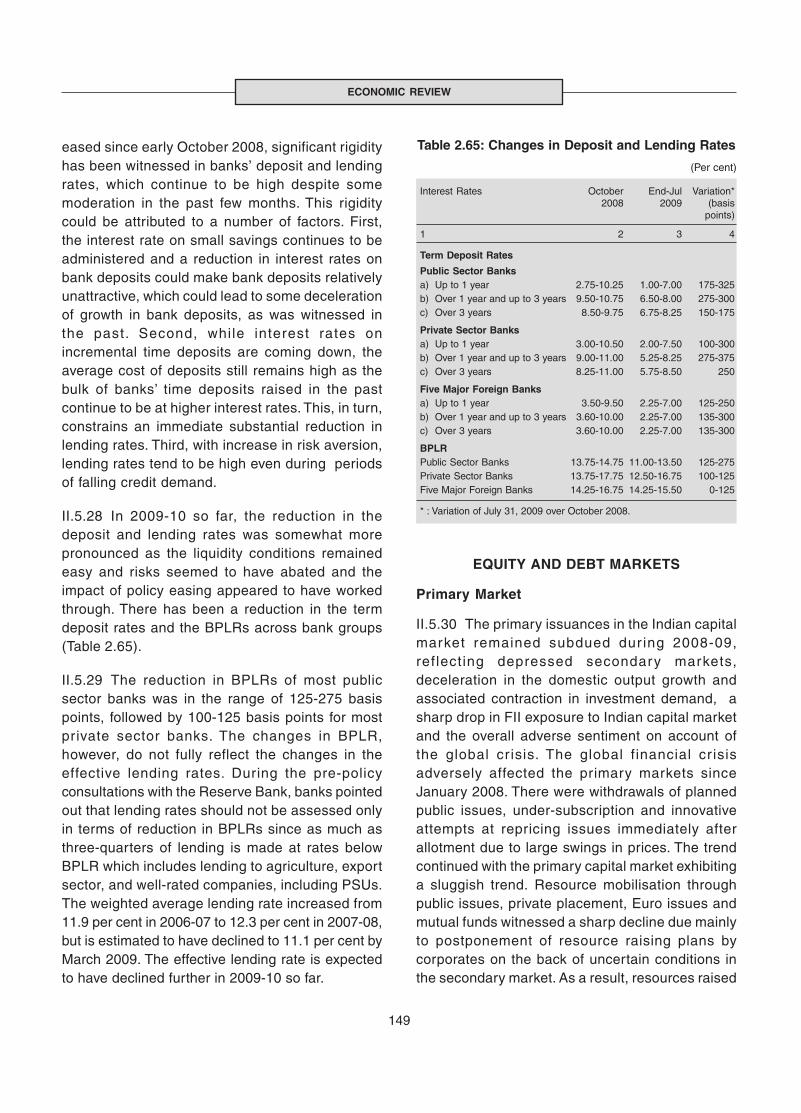
149
ECONOMIC REVIEW
eased since early October 2008, significant rigidityhas been witnessed in banks’ deposit and lendingrates, which continue to be high despite somemoderation in the past few months. This rigiditycould be attributed to a number of factors. First,the interest rate on small savings continues to beadministered and a reduction in interest rates onbank deposits could make bank deposits relativelyunattractive, which could lead to some decelerationof growth in bank deposits, as was witnessed inthe past. Second, while interest rates onincremental time deposits are coming down, theaverage cost of deposits still remains high as thebulk of banks’ time deposits raised in the pastcontinue to be at higher interest rates. This, in turn,constrains an immediate substantial reduction inlending rates. Third, with increase in risk aversion,lending rates tend to be high even during periodsof falling credit demand.
II.5.28 In 2009-10 so far, the reduction in thedeposit and lending rates was somewhat morepronounced as the liquidity conditions remainedeasy and risks seemed to have abated and theimpact of policy easing appeared to have workedthrough. There has been a reduction in the termdeposit rates and the BPLRs across bank groups(Table 2.65).
II.5.29 The reduction in BPLRs of most publicsector banks was in the range of 125-275 basispoints, followed by 100-125 basis points for mostprivate sector banks. The changes in BPLR,however, do not fully reflect the changes in theeffective lending rates. During the pre-policyconsultations with the Reserve Bank, banks pointedout that lending rates should not be assessed onlyin terms of reduction in BPLRs since as much asthree-quarters of lending is made at rates belowBPLR which includes lending to agriculture, exportsector, and well-rated companies, including PSUs.The weighted average lending rate increased from11.9 per cent in 2006-07 to 12.3 per cent in 2007-08,but is estimated to have declined to 11.1 per cent byMarch 2009. The effective lending rate is expectedto have declined further in 2009-10 so far.
EQUITY AND DEBT MARKETS
Primary Market
II.5.30 The primary issuances in the Indian capitalmarket remained subdued dur ing 2008-09,reflecting depressed secondary markets,deceleration in the domestic output growth andassociated contraction in investment demand, asharp drop in FII exposure to Indian capital marketand the overall adverse sentiment on account ofthe global cr isis. The global f inancial cr isisadversely affected the primary markets sinceJanuary 2008. There were withdrawals of plannedpublic issues, under-subscription and innovativeattempts at repricing issues immediately afterallotment due to large swings in prices. The trendcontinued with the primary capital market exhibitinga sluggish trend. Resource mobilisation throughpublic issues, private placement, Euro issues andmutual funds witnessed a sharp decline due mainlyto postponement of resource raising plans bycorporates on the back of uncertain conditions inthe secondary market. As a result, resources raised
Table 2.65: Changes in Deposit and Lending Rates
(Per cent)
Interest Rates October End-Jul Variation*2008 2009 (basis
points)
1 2 3 4
Term Deposit Rates
Public Sector Banksa) Up to 1 year 2.75-10.25 1.00-7.00 175-325b) Over 1 year and up to 3 years 9.50-10.75 6.50-8.00 275-300c) Over 3 years 8.50-9.75 6.75-8.25 150-175
Private Sector Banksa) Up to 1 year 3.00-10.50 2.00-7.50 100-300b) Over 1 year and up to 3 years 9.00-11.00 5.25-8.25 275-375c) Over 3 years 8.25-11.00 5.75-8.50 250
Five Major Foreign Banksa) Up to 1 year 3.50-9.50 2.25-7.00 125-250b) Over 1 year and up to 3 years 3.60-10.00 2.25-7.00 135-300c) Over 3 years 3.60-10.00 2.25-7.00 135-300
BPLRPublic Sector Banks 13.75-14.75 11.00-13.50 125-275Private Sector Banks 13.75-17.75 12.50-16.75 100-125Five Major Foreign Banks 14.25-16.75 14.25-15.50 0-125
* : Variation of July 31, 2009 over October 2008.
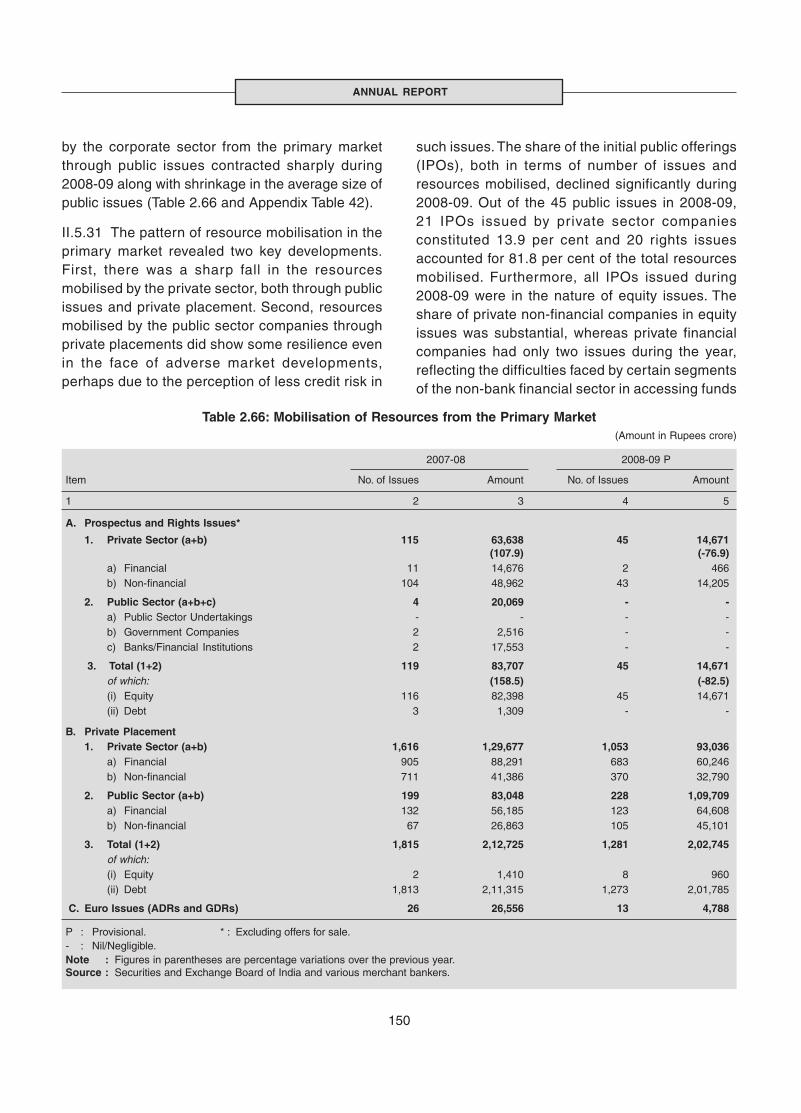
150
ANNUAL REPORT
by the corporate sector from the primary marketthrough public issues contracted sharply during2008-09 along with shrinkage in the average size ofpublic issues (Table 2.66 and Appendix Table 42).
II.5.31 The pattern of resource mobilisation in theprimary market revealed two key developments.First, there was a sharp fall in the resourcesmobilised by the private sector, both through publicissues and private placement. Second, resourcesmobilised by the public sector companies throughprivate placements did show some resilience evenin the face of adverse market developments,perhaps due to the perception of less credit risk in
such issues. The share of the initial public offerings(IPOs), both in terms of number of issues andresources mobilised, declined significantly during2008-09. Out of the 45 public issues in 2008-09,21 IPOs issued by private sector companiesconstituted 13.9 per cent and 20 rights issuesaccounted for 81.8 per cent of the total resourcesmobilised. Furthermore, all IPOs issued during2008-09 were in the nature of equity issues. Theshare of private non-financial companies in equityissues was substantial, whereas private financialcompanies had only two issues during the year,reflecting the difficulties faced by certain segmentsof the non-bank financial sector in accessing funds
Table 2.66: Mobilisation of Resources from the Primary Market(Amount in Rupees crore)
2007-08 2008-09 P
Item No. of Issues Amount No. of Issues Amount
1 2 3 4 5
A. Prospectus and Rights Issues*
1. Private Sector (a+b) 115 63,638 45 14,671(107.9) (-76.9)
a) Financial 11 14,676 2 466b) Non-financial 104 48,962 43 14,205
2. Public Sector (a+b+c) 4 20,069 - -a) Public Sector Undertakings - - - -b) Government Companies 2 2,516 - -c) Banks/Financial Institutions 2 17,553 - -
3. Total (1+2) 119 83,707 45 14,671of which: (158.5) (-82.5)(i) Equity 116 82,398 45 14,671(ii) Debt 3 1,309 - -
B. Private Placement1. Private Sector (a+b) 1,616 1,29,677 1,053 93,036
a) Financial 905 88,291 683 60,246b) Non-financial 711 41,386 370 32,790
2. Public Sector (a+b) 199 83,048 228 1,09,709a) Financial 132 56,185 123 64,608b) Non-financial 67 26,863 105 45,101
3. Total (1+2) 1,815 2,12,725 1,281 2,02,745of which:(i) Equity 2 1,410 8 960(ii) Debt 1,813 2,11,315 1,273 2,01,785
C. Euro Issues (ADRs and GDRs) 26 26,556 13 4,788
P : Provisional. * : Excluding offers for sale.- : Nil/Negligible.Note : Figures in parentheses are percentage variations over the previous year.Source : Securities and Exchange Board of India and various merchant bankers.

151
ECONOMIC REVIEW
because of spillover effects of the global financialcrisis. During 2008-09, the difficulties involved inraising resources from the primary segment of thecapital market were evident even in terms ofinstances of extension of cut-off dates andwithdrawal of some public issues due to lowsubscription.
II.5.32 The domestic private placement market,which has emerged as a major alternative sourceof funding for the Indian corporate sector in therecent years, also witnessed a slowdown during2008-09 due to adverse capital market conditions.Mobilisation of resources through private placementwas lower during 2008-09 than in 2007-08. Publicsector entities accounted for a larger share in totalprivate placement in 2008-09 (Chart II.39). Theresource mobilisation through financialintermediaries registered a decline during 2008-09;however, non-financial intermediaries registered anincrease.
II.5.33 Resources raised by Indian corporatesthrough Euro issues – American DepositoryReceipts (ADRs) and Global Depository Receipts(GDRs) – declined significantly owing to difficultliquidity conditions in the international financialmarkets.
Secondary Market
II.5.34 The global stock market crash waswidespread as the stock prices in almost allcountries around the world witnessed substantialcorrection, notwithstanding the differences acrosscountries in terms of fundamentals and the extentof impact of the financial cr isis on the realeconomies. Many EMEs became part of the globalasset price bubble, as the turmoil in the advancedcountries became widespread. The domesticequity market remained generally weak during2008-09 and witnessed one of the highest degreesof volatility in stock prices in recent years. The BSESensex fell to a low of 8160 on March 9, 2009,witnessing a decline of 60.9 per cent from the peakof January 8, 2008. The corresponding decline inmarket capitalisation was 63 per cent. During 2008-09, the BSE Sensex and S&P CNX Nifty decreasedby 37.9 per cent and 36.2 per cent, respectively.The slide in the stock prices during 2008-09reflected the response to a series of negative news(Box II.28).
II.5.35 The market capitalisation of BSE contractedsharply by 39.9 per cent by end-March 2009,reflecting fall in stock prices and significantly lowerlisting of new securities (Table 2.67 and AppendixTable 44). The price-earning (P/E) ratio of BSESensex also declined significantly. Volatility in thestock markets increased sharply during 2008-09with a significant drop in the turnover – both in cashand derivatives segments (Appendix Table 45).
II.5.36 The losses suffered in the domestic stockmarket during 2008-09 were spread across stocksin all sectors. Consumer durables, metal, capitalgoods and banking sector indices suffered higherlosses than the average BSE Sensex during 2008-09,while information technology, auto, oil and gas,public sector units, healthcare and fast movingconsumer goods sectoral indices posted relativelylower losses. The higher losses encountered by theformer group of sectors of BSE Sensex perhapsrevealed the greater sensitivity of these sectors toeconomic slowdown and the impact of the globalfinancial crisis. The BSE mid-cap and BSE small-

152
ANNUAL REPORT
The capital markets across the world reacted sharply tothe gradually unfolding severity of the sub-prime crisis withsteep downward corrections. This created a major negativewealth effect that precipitated the contraction in aggregatedemand. While the initial impetus for price corrections camethrough deleveraging and weakening earning prospectson account of deteriorating growth, adverse expectationsgaining prominence over t ime and the persistentuncertainty left the markets depressed. The Indian stockprices responded significantly to the global developments,partly reflecting the growing integration of the Indian stockmarket with the global markets, as reflected in a highercorrelation of the BSE Sensex with MSCI (Emerging) at0.63 during 2008-09 as compared to 0.13 and 0.37 withDow Jones and FTSE, respectively. Although the sub-primecrisis erupted in the latter part of 2007, the effects on theIndian equity markets were felt only in early January 2008.After touching an all-time high of 20873 on January 8,2008, the BSE Sensex started declining rapidly. During2008-09, Indian equity markets largely remained weak andvolatile, in line with the trends in international equitymarkets.
In terms of the sequence of major events and their impacton the stock prices in India (Chart A), the turbulence inglobal financial markets began to deepen in July 2008when the US Government sponsored mor tgageguarantors, Fannie Mae and Freddie Mac, which hadguaranteed over US$ 12 trillion in US home mortgageloans, reported a drastic drop in the fair value of theirassets. The BSE Sensex dipped to 12576 on July 16, 2008,lower by 19.6 per cent from end-March 2008, and 39.8per cent from January 8, 2008 peak level. The next roundof sell-off pressure in equities was felt after September15, 2008, when a major US investment bank, LehmanBrothers filed for bankruptcy protection, another majorinvestment bank, Merill Lynch was rescued by mergingwith Bank of America and the largest US insurer, AIG hadto be saved with the largest ever support from the Fed.The BSE Sensex closed lower at 13531 on September15, 2008, a decline of 3.4 per cent over the previous trading
Box II.28Turmoil in Global Financial Markets – Impact on Indian Capital Market
day and it was 35.2 per cent lower than the peak reachedon January 08, 2008 (Chart A). The market capitalisationdeclined by 13.5 per cent on September 15, 2008 overMarch 2008 and the P/E ratio also fell sharply to 16.77from 20.11 during the same period.
As the real effects of the financial crisis became visiblein the form of a global recession, the depressedconditions in the market continued and got aggravatedwith further bad news flowing in the form of corporategovernance at the Satyam. The BSE Sensex fell to a newlow on March 9, 2009, a decline of 60.9 per cent over thepeak (as on January 8, 2008). The volatility of the BSESensex (coefficient of variation) increased, the marketcapitalisation fell and P/E ratio declined significantly.
The capital outflows that ensued in the wake of the crisis,particularly in the form of FII disinvestment, affected theIndian equity markets directly. During 2008-09, Indian stockmarkets witnessed an outflow of around US$ 15 billion.FII outflows raised concerns about the pressures on India’sBoP, which were manifested in the form of depreciatingrupee and loss of reserves. The confidence factor alsoweakened on account of deteriorating earnings prospectsof the listed companies, thereby further undermining themarket sentiment.
cap recorded higher losses during 2008-09, whichcould be partly because of the greater impact ofcredit squeeze on these categories of companiesand also the greater impact of export slowdown onsmall and medium sized companies (Table 2.68).
II.5.37 As a part of the global deleveraging processand general increase in risk aversion towards
EMEs, the foreign institutional investors (FIIs)withdrew large amount of their investments fromthe Indian market. According to the data releasedby the SEBI, FIIs made swift reversals from largenet purchases in the Indian equity market during2007-08 to large net sales during 2008-09.Investments by mutual funds in equities alsodeclined during 2008-09, whereas their investments
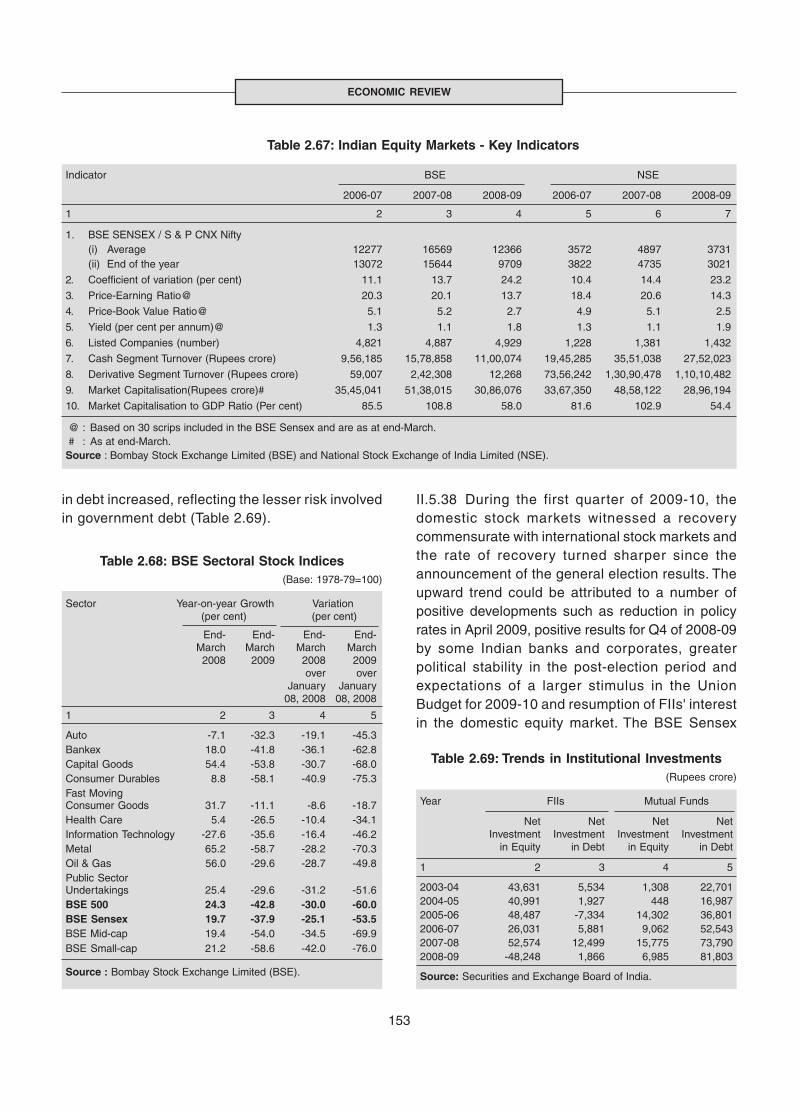
153
ECONOMIC REVIEW
in debt increased, reflecting the lesser risk involvedin government debt (Table 2.69).
Table 2.67: Indian Equity Markets - Key Indicators
Indicator BSE NSE
2006-07 2007-08 2008-09 2006-07 2007-08 2008-09
1 2 3 4 5 6 7
1. BSE SENSEX / S & P CNX Nifty(i) Average 12277 16569 12366 3572 4897 3731(ii) End of the year 13072 15644 9709 3822 4735 3021
2. Coefficient of variation (per cent) 11.1 13.7 24.2 10.4 14.4 23.2
3. Price-Earning Ratio@ 20.3 20.1 13.7 18.4 20.6 14.3
4. Price-Book Value Ratio@ 5.1 5.2 2.7 4.9 5.1 2.5
5. Yield (per cent per annum)@ 1.3 1.1 1.8 1.3 1.1 1.9
6. Listed Companies (number) 4,821 4,887 4,929 1,228 1,381 1,432
7. Cash Segment Turnover (Rupees crore) 9,56,185 15,78,858 11,00,074 19,45,285 35,51,038 27,52,023
8. Derivative Segment Turnover (Rupees crore) 59,007 2,42,308 12,268 73,56,242 1,30,90,478 1,10,10,482
9. Market Capitalisation(Rupees crore)# 35,45,041 51,38,015 30,86,076 33,67,350 48,58,122 28,96,194
10. Market Capitalisation to GDP Ratio (Per cent) 85.5 108.8 58.0 81.6 102.9 54.4
@ : Based on 30 scrips included in the BSE Sensex and are as at end-March. # : As at end-March.Source : Bombay Stock Exchange Limited (BSE) and National Stock Exchange of India Limited (NSE).
Table 2.69: Trends in Institutional Investments(Rupees crore)
Year FIIs Mutual Funds
Net Net Net NetInvestment Investment Investment Investment
in Equity in Debt in Equity in Debt
1 2 3 4 5
2003-04 43,631 5,534 1,308 22,7012004-05 40,991 1,927 448 16,9872005-06 48,487 -7,334 14,302 36,8012006-07 26,031 5,881 9,062 52,5432007-08 52,574 12,499 15,775 73,7902008-09 -48,248 1,866 6,985 81,803
Source: Securities and Exchange Board of India.
Table 2.68: BSE Sectoral Stock Indices(Base: 1978-79=100)
Sector Year-on-year Growth Variation(per cent) (per cent)
End- End- End- End-March March March March2008 2009 2008 2009
over overJanuary January
08, 2008 08, 2008
1 2 3 4 5
Auto -7.1 -32.3 -19.1 -45.3Bankex 18.0 -41.8 -36.1 -62.8Capital Goods 54.4 -53.8 -30.7 -68.0Consumer Durables 8.8 -58.1 -40.9 -75.3Fast MovingConsumer Goods 31.7 -11.1 -8.6 -18.7Health Care 5.4 -26.5 -10.4 -34.1Information Technology -27.6 -35.6 -16.4 -46.2Metal 65.2 -58.7 -28.2 -70.3Oil & Gas 56.0 -29.6 -28.7 -49.8Public SectorUndertakings 25.4 -29.6 -31.2 -51.6BSE 500 24.3 -42.8 -30.0 -60.0BSE Sensex 19.7 -37.9 -25.1 -53.5BSE Mid-cap 19.4 -54.0 -34.5 -69.9BSE Small-cap 21.2 -58.6 -42.0 -76.0
Source : Bombay Stock Exchange Limited (BSE).
II.5.38 During the first quarter of 2009-10, thedomestic stock markets witnessed a recoverycommensurate with international stock markets andthe rate of recovery turned sharper since theannouncement of the general election results. Theupward trend could be attributed to a number ofpositive developments such as reduction in policyrates in April 2009, positive results for Q4 of 2008-09by some Indian banks and corporates, greaterpolitical stability in the post-election period andexpectations of a larger stimulus in the UnionBudget for 2009-10 and resumption of FIIs' interestin the domestic equity market. The BSE Sensex
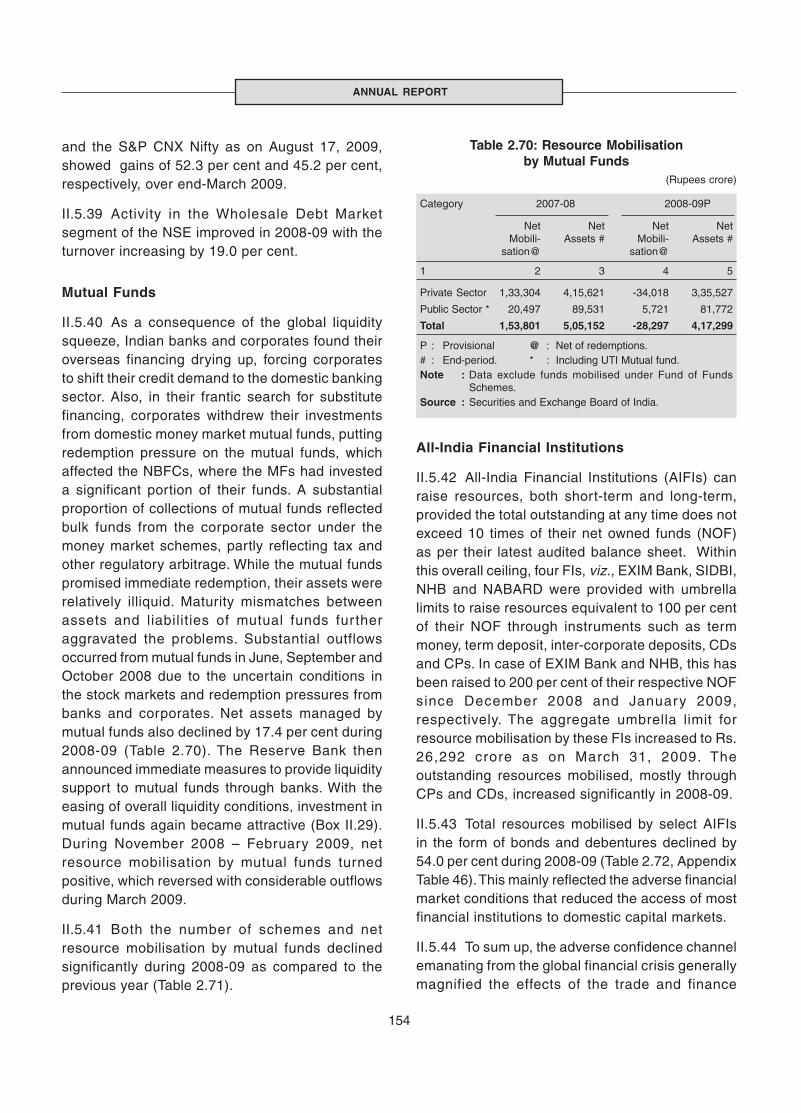
154
ANNUAL REPORT
and the S&P CNX Nifty as on August 17, 2009,showed gains of 52.3 per cent and 45.2 per cent,respectively, over end-March 2009.
II.5.39 Activity in the Wholesale Debt Marketsegment of the NSE improved in 2008-09 with theturnover increasing by 19.0 per cent.
Mutual Funds
II.5.40 As a consequence of the global liquiditysqueeze, Indian banks and corporates found theiroverseas financing drying up, forcing corporatesto shift their credit demand to the domestic bankingsector. Also, in their frantic search for substitutefinancing, corporates withdrew their investmentsfrom domestic money market mutual funds, puttingredemption pressure on the mutual funds, whichaffected the NBFCs, where the MFs had investeda significant portion of their funds. A substantialproportion of collections of mutual funds reflectedbulk funds from the corporate sector under themoney market schemes, partly reflecting tax andother regulatory arbitrage. While the mutual fundspromised immediate redemption, their assets wererelatively illiquid. Maturity mismatches betweenassets and liabilities of mutual funds fur theraggravated the problems. Substantial outflowsoccurred from mutual funds in June, September andOctober 2008 due to the uncertain conditions inthe stock markets and redemption pressures frombanks and corporates. Net assets managed bymutual funds also declined by 17.4 per cent during2008-09 (Table 2.70). The Reserve Bank thenannounced immediate measures to provide liquiditysupport to mutual funds through banks. With theeasing of overall liquidity conditions, investment inmutual funds again became attractive (Box II.29).During November 2008 – February 2009, netresource mobilisation by mutual funds turnedpositive, which reversed with considerable outflowsduring March 2009.
II.5.41 Both the number of schemes and netresource mobilisation by mutual funds declinedsignificantly during 2008-09 as compared to theprevious year (Table 2.71).
All-India Financial Institutions
II.5.42 All-India Financial Institutions (AIFIs) canraise resources, both short-term and long-term,provided the total outstanding at any time does notexceed 10 times of their net owned funds (NOF)as per their latest audited balance sheet. Withinthis overall ceiling, four FIs, viz., EXIM Bank, SIDBI,NHB and NABARD were provided with umbrellalimits to raise resources equivalent to 100 per centof their NOF through instruments such as termmoney, term deposit, inter-corporate deposits, CDsand CPs. In case of EXIM Bank and NHB, this hasbeen raised to 200 per cent of their respective NOFsince December 2008 and January 2009,respectively. The aggregate umbrella limit forresource mobilisation by these FIs increased to Rs.26,292 crore as on March 31, 2009. Theoutstanding resources mobilised, mostly throughCPs and CDs, increased significantly in 2008-09.
II.5.43 Total resources mobilised by select AIFIsin the form of bonds and debentures declined by54.0 per cent during 2008-09 (Table 2.72, AppendixTable 46). This mainly reflected the adverse financialmarket conditions that reduced the access of mostfinancial institutions to domestic capital markets.
II.5.44 To sum up, the adverse confidence channelemanating from the global financial crisis generallymagnified the effects of the trade and finance
Table 2.70: Resource Mobilisationby Mutual Funds
(Rupees crore)
Category 2007-08 2008-09P
Net Net Net NetMobili- Assets # Mobili- Assets #
sation@ sation@
1 2 3 4 5
Private Sector 1,33,304 4,15,621 -34,018 3,35,527
Public Sector * 20,497 89,531 5,721 81,772
Total 1,53,801 5,05,152 -28,297 4,17,299
P : Provisional @ : Net of redemptions.# : End-period. * : Including UTI Mutual fund.Note : Data exclude funds mobilised under Fund of Funds
Schemes.Source : Securities and Exchange Board of India.

155
ECONOMIC REVIEW
In a phase of significant downward correction in stockprices, the falling value of financial savings of small andretail investors and more importantly their confidence inthe capital market emerged as significant concerns for themutual funds industry in India. The mutual funds industryin India has come a long way since 1963, when the UnitTrust of India was set up at the initiative of the Governmentof India and the Reserve Bank. The industry was openedup to public sector entities such as government-ownedbanks, life insurance companies and GIC between 1987and 1993, and to private sector players in 1993. For overa decade, with a view to broadening the range of investorparticipation, promoting equity culture and spreading thebenefits of a deep and liquid capital market, policymakersin India encouraged mutual funds as a safe vehicle ofinvestment for retail or small investors. Fiscal incentivesin the form of tax breaks were provided to help the industryto scale up their size and importance in the market.
The growing popularity of mutual funds is clearly evidentfrom the growth of assets over the years. The buoyancy instock markets during 2004-07 enabled mutual funds toattract fresh inflow of funds. During the first eight monthsof 2008-09, however, with downtrend in stock markets andin view of the tight liquidity conditions precipitated by avariety of reasons including advance tax outflows,suppliers’ credit withdrawal partly on account of freezingof external credit markets and drying up money marketliquidity, the mutual fund industry faced unprecedentedlevel of stress. The decline in the net resource mobilisationwas especially pronounced in the months of June,September, October, 2008 and March 2009 (Chart A).
Box II.29Mutual Funds Industry in India - Current Issues
reduced. These measures along with the fiscal–monetarystimuli measures to improve the overall liquidity positionseem to have helped the mutual funds industry to repositionitself to face the challenges arising in the light of the ongoingglobal financial turmoil. Some systemic issues have comeup which, however, are crucial for the future of the industry.
Despite a significant growth in the number of schemes andassets under management of mutual funds in India in recentyears, their level of penetration remains limited in comparisonwith other countries. This is reflected in the small size ofassets managed by them (amounting to less than 5 per centof GDP as against 70 per cent in the US, 61 per cent inFrance and 37 per cent in Brazil) and small share ofhousehold savings in units of mutual funds. As per a recentresearch report on ‘Indian Mutual Fund Industry’ publishedby RNCOS, however, the asset size of the industry isprojected to touch US$ 300 billion by 2015. Despite immensegrowth potential, limited involvement of the rural sector dueto lack of awareness and limited banking services in therural regions, could prove to be a constraining factor.
Although the share of equity-oriented schemes hasincreased significantly in recent years, these still accountfor less than 25 per cent of the assets of the industry. Mostof the funds mobilised by mutual funds are through liquid/money market schemes, which remain attractive for parkingof funds by corporates and other large institutional investorswith a short-term perspective. A high dependence oncorporates for funds implies a lesser role for retail investors.Moreover, it makes the funds more volatile as corporateand other institutional investors can withdraw funds at shortnotice. Attempts to r ing-fence them in the form ofsegregation of schemes into institutional and retail havenot worked so far, and SEBI is currently contemplating amore detailed disclosure norm for corporate investments.
The proliferation of schemes (1,000 to 5,000 variants)leads to confusion among investors. Over four lakhsystematic investment plan (SIP) accounts have beenclosed over the last few months. Some consolidation inthe industry could be effected by linking the number ofschemes permitted to the net owned funds. Though theinvestment by asset management companies in debtpapers of realty firms was being viewed with some amountof scepticism in the current backdrop of the sub-primecrisis, SEBI is reported to have issued detailed regulationsgoverning real estate mutual funds, under which mutualfunds would be allowed to invest directly or indirectly inreal estate assets or other permissible assets.
References:
1. Sethu, G. (2006), ‘‘Governance of Mutual Funds andthe Institution of Trustee’’, Economic and PoliticalWeekly, April 15.
2. Tarapore, S.S. (2009), ‘‘Mutual Funds: Need forReforms’’, editorial in Business Line, April 10.
The Reserve Bank announced some quick measures inOctober 2008 to make available liquidity support to mutualfunds through banks. With a view to helping redemptionswithout affecting the cash position of the mutual funds, SEBIannounced that for all close-ended schemes (except EquityLinked Savings Schemes) to be launched on or afterDecember 12, 2008, the units must be mandatorily listed.As per the SEBI circular dated January 19, 2009, the tenureof the securities held in the portfolio of liquid schemes was
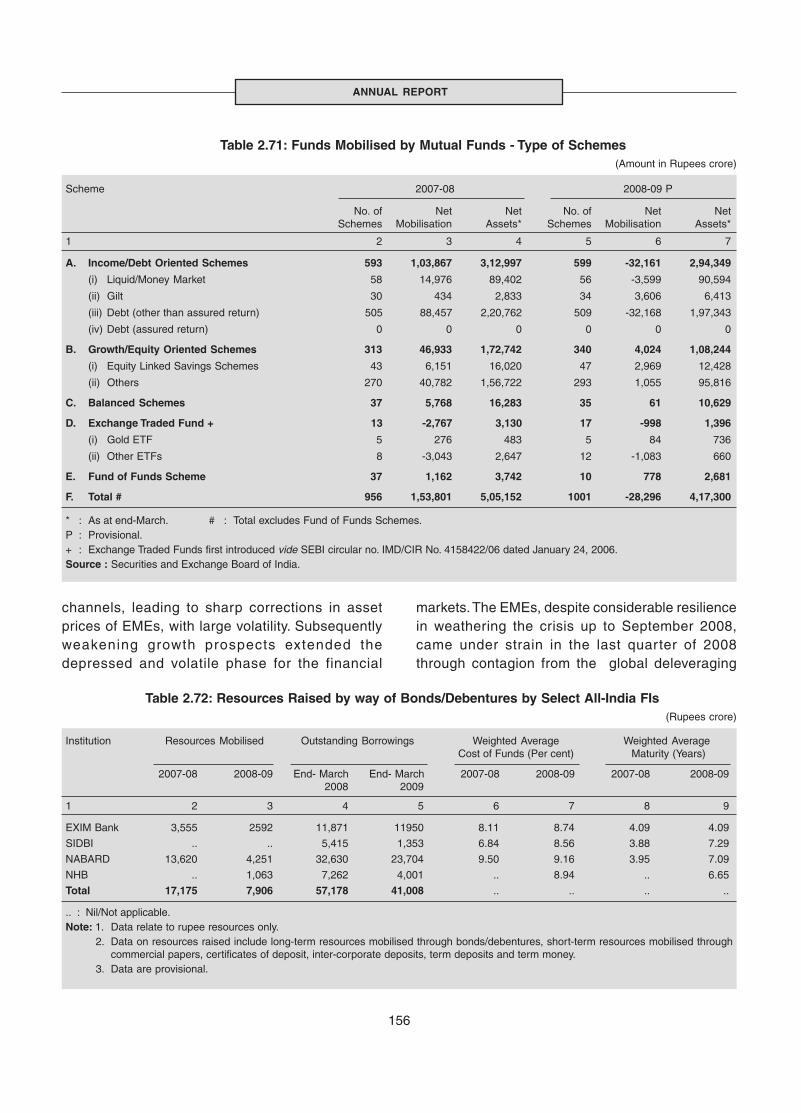
156
ANNUAL REPORT
channels, leading to sharp corrections in assetprices of EMEs, with large volatility. Subsequentlyweakening growth prospects extended thedepressed and volatile phase for the financial
Table 2.71: Funds Mobilised by Mutual Funds - Type of Schemes (Amount in Rupees crore)
Scheme 2007-08 2008-09 P
No. of Net Net No. of Net NetSchemes Mobilisation Assets* Schemes Mobilisation Assets*
1 2 3 4 5 6 7
A. Income/Debt Oriented Schemes 593 1,03,867 3,12,997 599 -32,161 2,94,349
(i) Liquid/Money Market 58 14,976 89,402 56 -3,599 90,594
(ii) Gilt 30 434 2,833 34 3,606 6,413
(iii) Debt (other than assured return) 505 88,457 2,20,762 509 -32,168 1,97,343
(iv) Debt (assured return) 0 0 0 0 0 0
B. Growth/Equity Oriented Schemes 313 46,933 1,72,742 340 4,024 1,08,244
(i) Equity Linked Savings Schemes 43 6,151 16,020 47 2,969 12,428
(ii) Others 270 40,782 1,56,722 293 1,055 95,816
C. Balanced Schemes 37 5,768 16,283 35 61 10,629
D. Exchange Traded Fund + 13 -2,767 3,130 17 -998 1,396
(i) Gold ETF 5 276 483 5 84 736
(ii) Other ETFs 8 -3,043 2,647 12 -1,083 660
E. Fund of Funds Scheme 37 1,162 3,742 10 778 2,681
F. Total # 956 1,53,801 5,05,152 1001 -28,296 4,17,300
* : As at end-March. # : Total excludes Fund of Funds Schemes.P : Provisional.+ : Exchange Traded Funds first introduced vide SEBI circular no. IMD/CIR No. 4158422/06 dated January 24, 2006.Source : Securities and Exchange Board of India.
markets. The EMEs, despite considerable resiliencein weathering the crisis up to September 2008,came under strain in the last quarter of 2008through contagion from the global deleveraging
Table 2.72: Resources Raised by way of Bonds/Debentures by Select All-India FIs(Rupees crore)
Institution Resources Mobilised Outstanding Borrowings Weighted Average Weighted AverageCost of Funds (Per cent) Maturity (Years)
2007-08 2008-09 End- March End- March 2007-08 2008-09 2007-08 2008-092008 2009
1 2 3 4 5 6 7 8 9
EXIM Bank 3,555 2592 11,871 11950 8.11 8.74 4.09 4.09
SIDBI .. .. 5,415 1,353 6.84 8.56 3.88 7.29
NABARD 13,620 4,251 32,630 23,704 9.50 9.16 3.95 7.09
NHB .. 1,063 7,262 4,001 .. 8.94 .. 6.65
Total 17,175 7,906 57,178 41,008 .. .. .. ..
.. : Nil/Not applicable.Note: 1. Data relate to rupee resources only.
2. Data on resources raised include long-term resources mobilised through bonds/debentures, short-term resources mobilised throughcommercial papers, certificates of deposit, inter-corporate deposits, term deposits and term money.
3. Data are provisional.

157
ECONOMIC REVIEW
by large financial entities to meet the capital needsin the parent countries and a rise in overall risktowards EMEs. EME equity markets suffered largelosses in the wake of reversal of portfolio flows,bank lending declined and credit spreads increasedsharply. The financial institutions in EMEs, however,did not exhibit the type of fragility and the magnitudeof stress that was seen in the advanced economies.By the second quarter of 2009, the internationalmarkets gained a modicum of stability followinggreater public policy action, however, somesegments of financial market still appear vulnerable.
II.5.45 Like other EMEs, although India remainedimmune to the direct impact of mortgage crisis onthe Indian financial markets till September 2008,reduction in net capital inflows following failure ofLehman Brothers and the significant correction inthe domestic stock markets on the back of sell-offby FIIs created stress on various segments of theIndian financial market, particularly the foreignexchange and the money markets. The ReserveBank took a number of conventional andunconventional measures to augment the domesticand foreign exchange liquidity. An impor tantdistinction between the actions taken by theReserve Bank and other central banks is that theoperations were conducted through the bankingchannel and even the measures aimed ataddressing the liquidity and redemption needs ofmutual funds, NBFCs and housing f inancecompanies were directed through the banks.Monetary transmission weaknesses emerged as anissue as the adjustment in market interest rates inresponse to changes in policy rates got reflectedwith some lag and at a slow pace. In India, themonetary transmission has a differential impactacross different segments of the financial market.While the transmission turned out to be faster inthe money and bond markets, it was relativelymuted in the credit market on account of severalstructural rigidities. Overall, although the shocksemanating from the global financial crisis createdliquidity strains on the domestic money and foreignexchange markets, besides triggering major assetprice correction in the stock market, the stress
impact remained generally temporary and wasadequately and swiftly addressed through the policyactions taken by the Reserve Bank. The Indianmarkets had functioned normally even during thepeak of the financial crisis, and the excessivevolatility was contained by November 2008 throughappropriate policy response from the ReserveBank. The credit market witnessed some tighteningof interest rates due to general risk aversion. Withreceding risks and volatility, markets improvedfurther in the first quarter of 2009-10 as spreadsnarrowed significantly and market activity pickedup. In Q1 of 2009-10, the bond yield, particularly inthe medium to long-term maturity, exhibitedincrease due to concerns arising from largegovernment borrowings. The equity markets, on theback of some positive global cues and domesticdevelopments, have witnessed significant gains,which may help in reviving the primary equitymarkets when the investment demand star tslooking up.
VI. EXTERNAL SECTOR
INTERNATIONAL DEVELOPMENTS
II.6.1 The global economic and financial marketcondit ions deter iorated to unprecedentedproportions during 2008-09, creating one of theseverest external shocks not only for advancedeconomies but also for all emerging marketeconomies (EMEs), including India. Irrespective ofthe degree of globalisation of a country andsoundness of respective domestic policyenvironments, the deepening of crisis in theadvanced countries snowballed into a synchronisedglobal contraction with specific channels oftransmission of contagion gathering speed andintensity over time. The ‘negative feedback loop’contaminated each and every sector and thedownward spiral turned almost resistant to largedoses of policy stimulus engineered and deliveredby countries around the world, revealing therebythe complex nature and the enormous dimensionsof the crisis.

158
ANNUAL REPORT
II.6.2 The subprime crisis that emanated from theUS housing mortgage market in the second half of2007 snowballed into a global financial crisis withthe global financial landscape changing significantlyduring the course of 2008 wherein several largeinternational financial institutions either failed orwere restructured to avoid failure. With the unfoldingof financial crisis, the strains on the balance sheetsof financial institutions increased over time, whichfurther threatened the viability of some of theleading global f inancial entit ies. The mult i-dimensional ramifications of the crisis weremanifested in intense deleveraging, extreme levelsof risk aversion, mounting losses of banks andfinancial institutions, the collapse of commodityprices from their peaks and sharp corrections inasset prices. All these together led to a sharpslowdown in growth and trade flows, and risingunemployment, besides triggering large scalereversals in capital f lows (Char t II.40). Thedeleveraging by large financial institutions wasdisorderly under the pressure of market drivencontraction in their balance sheets on the asset sideand inadequacy of capital in the face of risinglosses. This deleveraging process created severedisruptions in the short-term funding markets, asreflected in the tightening access and widening ofrisk spreads. A wide range of non-bank financialinstitutions also came under strain during the crisiswith rapidly falling asset prices. While the pensionfunds exhibited rapid decline in their asset values,life insurance companies experienced losses onequity and corporate bond holdings. The massiveerosion of financial wealth arising from asset priceshocks had severe adverse impact on both thecorporate and the household balance sheets, whichwas amplified by the deteriorating employmentconditions. These, in turn, led to deterioration inconsumer confidence and contraction inconsumption demand, while at the same timereducing the values of collaterals of the corporatesand their ability to raise resources. The financialcrisis, thus, had cascading effects on the globaleconomy through financial, trade and confidencechannels. The deceleration in growth outlook wasso rapid that the IMF had to repeatedly revise its
global growth projections downwards for 2009, i.e.from a somewhat healthy 3.8 per cent in April 2008to (-) 1.4 per cent in July 2009, which is the deepestrecession seen since the post-World War II (IMF,2009). While major advanced economies slippedinto recession, the EMEs - which were perceivedto be decoupling till the early part of 2008- alsoexperienced significant growth deceleration.
II.6.3 Apar t from the intensity, the globalslowdown also remained more widespread andsynchronised due to the much higher degree ofglobal integration through international trade andfinance. Even EMEs with sound macroeconomicand financial pre-conditions have been stronglyaffected by the financial contagion, which in late2008 spilled over to the real sector, with export andGDP growth rates plunging and trade financecontracting across the world. Thus, the notion ofdecoupling of EMEs, which was held until early2008, faded as the crisis intensified and spreadacross countries with greater speed (Box II.31). Inthe EMEs, the adverse impact of the crisis wastransmitted through both financial and tradechannels, particularly to the East Asian countriesthat rely heavily on manufacturing exports and theemerging European and Commonwealth ofIndependent States (CIS) economies, whichexcessively depended on capital inflows to propelgrowth. Latin America, the Middle East and Africasuffered from falling commodity prices and weakexport demand. Although emerging and developingeconomies as a group are projected to grow by 1.5per cent in 2009, real GDP is expected to contractacross many countries under the drag of fallingexport demand, lower commodity prices and tighterfinancing constraints.
II.6.4 One of the important manifestations of theglobal financial crisis was in the form of massiveerosion in the capital base of the large financialinstitutions across countries. IMF’s Global FinancialStability Report (April 2009) projected that the write-downs suffered by all holders of the US-originatedassets since the outbreak of the crisis until 2010could increase from an initial estimate of US $ 945
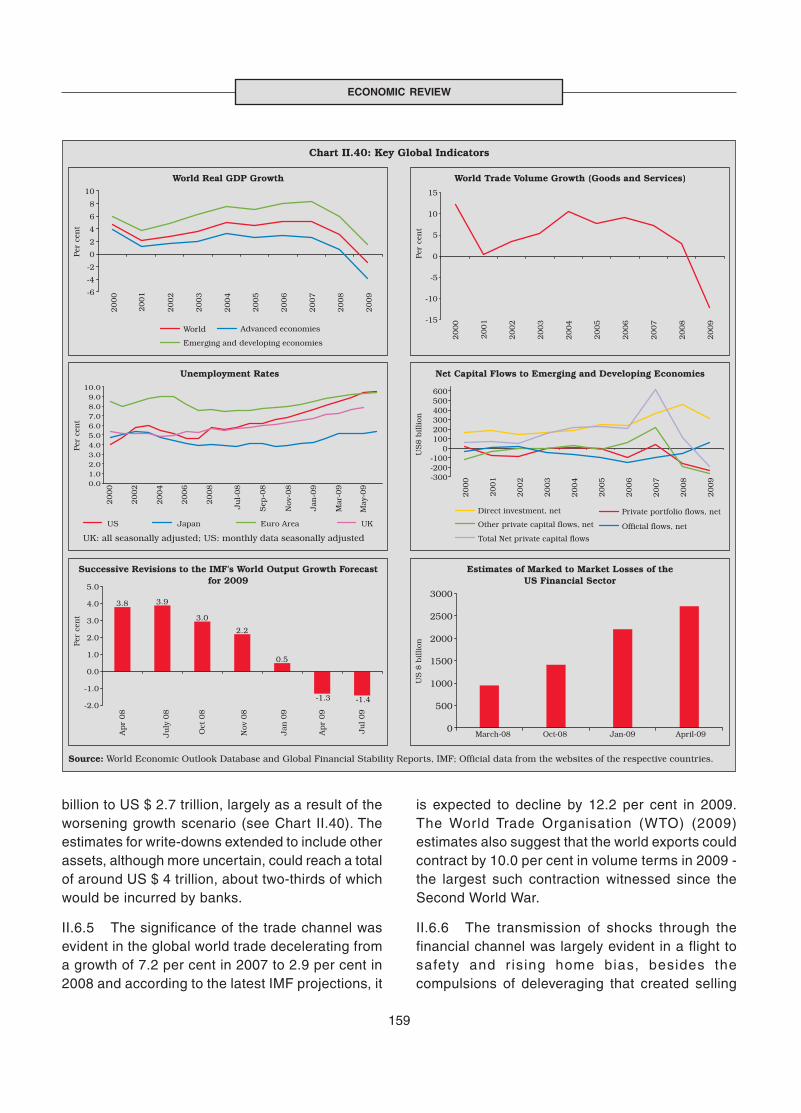
159
ECONOMIC REVIEW
billion to US $ 2.7 trillion, largely as a result of theworsening growth scenario (see Chart II.40). Theestimates for write-downs extended to include otherassets, although more uncertain, could reach a totalof around US $ 4 trillion, about two-thirds of whichwould be incurred by banks.
II.6.5 The significance of the trade channel wasevident in the global world trade decelerating froma growth of 7.2 per cent in 2007 to 2.9 per cent in2008 and according to the latest IMF projections, it
is expected to decline by 12.2 per cent in 2009.The World Trade Organisation (WTO) (2009)estimates also suggest that the world exports couldcontract by 10.0 per cent in volume terms in 2009 -the largest such contraction witnessed since theSecond World War.
II.6.6 The transmission of shocks through thefinancial channel was largely evident in a flight tosafety and r ising home bias, besides thecompulsions of deleveraging that created selling
160
ANNUAL REPORT
When the financial crisis started in the advanced countries,the immediate concern of a vast majority of EMEs was topreserve financial stability at home. As it turned out, thefinancial system of EMEs, particularly India, remainedlargely insulated from the direct adverse impact due tolimited exposure to the failing financial institutions and tothe troubled assets. This started the perception of possible‘decoupling’ and the argument was extended that even ifthe advanced countries experienced significant decelerationin growth, the growth prospects of countries, which are lessdependent on external demand, may remain decoupled.
The decoupling hypothesis was driven by the perceptionthat if advanced economies went into a synchroniseddownturn, emerging economies could remain unscathedbecause of their substantial foreign exchange reserves,improved policy framework, robust corporate balance sheetsand relatively healthy banking sector. An intense recessionin the advanced countries, undermined the perception ofdecoupling at some stage, which later became evident whenmost of the countries participating in the globalisation startedto experience and recognise the impact of the global crisisduring the course of 2008-09.
The global economic landscape has shifted dramaticallysince the mid-1980s. EMEs have increasingly becomemajor players and they now account for about a quarterof world output and a major share of global growth. In arecent study, Kose, Otrok and Prasad (2008) found thatduring the period of globalisation (1985-2005), there hasbeen some convergence of business cycle fluctuationsamong the group of industrial economies and among thegroup of EMEs. Surpr is ingly, there has been aconcomitant decline in the relative importance of theglobal factors. In other words, there is evidence ofbusiness cycle convergence within each of these twogroups of countries but divergence (or decoupling)between them. The rising financial linkages could resultin a higher degree of business cycle co-movement viathe wealth effects of external shocks. However, they couldreduce cross-country output correlations by stimulatingspecialisation of production through the reallocation ofcapital in a manner consistent with countries’ comparativeadvantages. Trade linkages generate both demand-sideand supply-side spillovers across countries, which couldresult in more highly correlated output fluctuations. Onthe other hand, if stronger trade linkages facilitateincreased specialisation of production across countries,and if sector-specific shocks are dominant, then the
Box II.30Globalisation and the Pattern of World Growth: Issues of Decoupling
degree of co-movement of output could fall (Baxter andKouparitsas, 2005).
The phenomenon of decoupling in the early part of thecurrent global crisis was explained in different ways. It wasobserved that the correlation of business cycles is specificto the shocks driving the cycles. In 2001 and 2002, thesharp decline in growth in the foreign countries soon afterthe US economy slowed reflected the global nature of thebursting of the technology bubble and its worldwidetransmission through equity markets and manufacturing.In the current slowdown, however, the implosion of thehousing sector played the most prominent role in draggingdown the US GDP growth. As construction utilises localinputs and results in an output that is not tradedinternationally, its spillovers abroad were expected to belimited. But financial innovations had made housingtradable and the role of the derivatives was large in relationto the underlying housing loans with major financialinstitutions exposed to this market.
According to the IMF, the Financial Stress Indices forAdvanced Economies turned positive in the second quarterof 2007 and then rose rapidly. In contrast, the FinancialStress Indices for EMEs stayed significantly negative untilthe first quarter of 2008. It turned positive only in thesecond quarter of 2008 and then magnified in the thirdand particularly in the fourth quarter. In this episode, therewas a limited early response in emerging economies, butthen there was a sharp catch-up. Thus, there was someinitial ‘decoupling’, and subsequent ‘recoupling’ as thecrisis deepened over time. In a rapidly globalising world,the decoupling hypothesis was never totally persuasive. Reinforcing the notion that in a globalised world no countrycan be an island, growth prospects of EMEs have beenundermined by the cascading financial crisis with, ofcourse, considerable variations across countries.
References:
1. IMF (2009), World Economic Outlook, April.
2. Kose, M. Ayhan and Otrok, Christopher and Prasad,Eswar (2008), “Global Business Cycles: Convergenceor Decoupling?” IMF Working Paper, WP/08/143, June.
3. Baxter, Marianne and Kouparitsas, Michael (2005),“Determinants of Business Cycle Co-movement: ARobust Analysis”, Journal of Monetary Economics, Vol.52, pp. 113-57.
pressures around the world. Private capital flowsare expected to decline in 2009 in line with theprojected contraction in world growth. On a netbasis, capital flows have been attracted by countries
with the most liquid and safe government securitiesmarkets. According to the IMF, private capital flowsto emerging and developing countries in 2008declined significantly to US$ 109 billion from US$
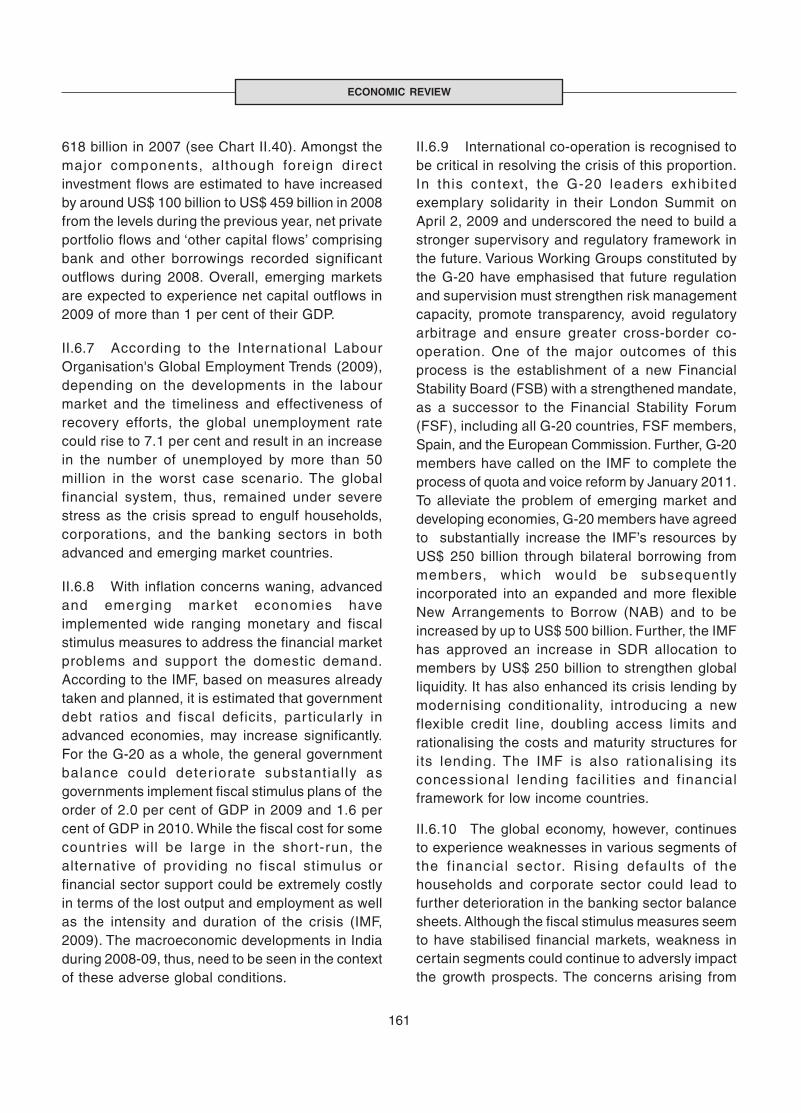
161
ECONOMIC REVIEW
618 billion in 2007 (see Chart II.40). Amongst themajor components, although foreign directinvestment flows are estimated to have increasedby around US$ 100 billion to US$ 459 billion in 2008from the levels during the previous year, net privateportfolio flows and ‘other capital flows’ comprisingbank and other borrowings recorded significantoutflows during 2008. Overall, emerging marketsare expected to experience net capital outflows in2009 of more than 1 per cent of their GDP.
II.6.7 According to the International LabourOrganisation's Global Employment Trends (2009),depending on the developments in the labourmarket and the timeliness and effectiveness ofrecovery efforts, the global unemployment ratecould rise to 7.1 per cent and result in an increasein the number of unemployed by more than 50million in the worst case scenario. The globalfinancial system, thus, remained under severestress as the crisis spread to engulf households,corporations, and the banking sectors in bothadvanced and emerging market countries.
II.6.8 With inflation concerns waning, advancedand emerging market economies haveimplemented wide ranging monetary and fiscalstimulus measures to address the financial marketproblems and support the domestic demand.According to the IMF, based on measures alreadytaken and planned, it is estimated that governmentdebt ratios and fiscal deficits, par ticularly inadvanced economies, may increase significantly.For the G-20 as a whole, the general governmentbalance could deter iorate substantial ly asgovernments implement fiscal stimulus plans of theorder of 2.0 per cent of GDP in 2009 and 1.6 percent of GDP in 2010. While the fiscal cost for somecountr ies will be large in the shor t-run, thealternative of providing no fiscal stimulus orfinancial sector support could be extremely costlyin terms of the lost output and employment as wellas the intensity and duration of the crisis (IMF,2009). The macroeconomic developments in Indiaduring 2008-09, thus, need to be seen in the contextof these adverse global conditions.
II.6.9 International co-operation is recognised tobe critical in resolving the crisis of this proportion.In this context, the G-20 leaders exhibitedexemplary solidarity in their London Summit onApril 2, 2009 and underscored the need to build astronger supervisory and regulatory framework inthe future. Various Working Groups constituted bythe G-20 have emphasised that future regulationand supervision must strengthen risk managementcapacity, promote transparency, avoid regulatoryarbitrage and ensure greater cross-border co-operation. One of the major outcomes of thisprocess is the establishment of a new FinancialStability Board (FSB) with a strengthened mandate,as a successor to the Financial Stability Forum(FSF), including all G-20 countries, FSF members,Spain, and the European Commission. Further, G-20members have called on the IMF to complete theprocess of quota and voice reform by January 2011.To alleviate the problem of emerging market anddeveloping economies, G-20 members have agreedto substantially increase the IMF’s resources byUS$ 250 billion through bilateral borrowing frommembers, which would be subsequentlyincorporated into an expanded and more flexibleNew Arrangements to Borrow (NAB) and to beincreased by up to US$ 500 billion. Further, the IMFhas approved an increase in SDR allocation tomembers by US$ 250 billion to strengthen globalliquidity. It has also enhanced its crisis lending bymodernising conditionality, introducing a newflexible credit line, doubling access limits andrationalising the costs and maturity structures forits lending. The IMF is also rationalising itsconcessional lending facil it ies and financialframework for low income countries.
II.6.10 The global economy, however, continuesto experience weaknesses in various segments ofthe f inancial sector. Rising defaults of thehouseholds and corporate sector could lead tofurther deterioration in the banking sector balancesheets. Although the fiscal stimulus measures seemto have stabilised financial markets, weakness incertain segments could continue to adversly impactthe growth prospects. The concerns arising from

162
ANNUAL REPORT
large fiscal stimulus plans and consequent wideningof fiscal deficit and debt have raised renewedchallenges for economies. In addition, the pace andtiming of fiscal and monetary unwinding haveemerged as important challenges.
INDIA’S BALANCE OF PAYMENTSDEVELOPMENTS
II.6.11 In the face of one of the severest externalshocks, India’s balance of payments (BoP)exhibited resilience, characterised by a currentaccount deficit (CAD) well within the sustainablelimits, and limited use of foreign exchange reservesdespite the pressure of large capital outflows. Thedirect impact of the global financial crisis wastransmitted to India through various external sectortransactions, some of which exhibited notable trendreversals during the year. The transmission ofexternal demand shocks was much more swift andsevere on export growth, which, on BoP basis,declined from a peak of 43 per cent in Q1 of 2008-09to (-)9 per cent in Q3 and further to (-)24 per centin Q4 – a fall for the first time since 2001-02. Importdemand growth, which remained robust till the Q2of 2008-09, collapsed to a single digit level in Q3,followed by a substantial decline in Q4 (-27 percent), moving in tandem with the slowdown in thedomestic industrial demand and the sharp declinein international crude oil and other pr imarycommodity prices. Thus, trade deficit generallyexpanded in the first three quarters of 2008-09 dueto the combined effect of high crude oil prices drivenincreases in imports and the collapse in externaldemand. However, in Q4 of 2008-09, with the paceof decline in imports outpacing that in exports, tradedeficit narrowed down significantly. For the fiscalyear 2008-09, trade deficit witnessed a markedexpansion to 10.3 per cent of GDP. Two componentsof the current receipts, which remained relativelyresilient in the face of the global slowdown weresoftware services and workers’ remittances. Theremittance inflows from overseas Indians, thoughwitnessed a slowdown in the second half of 2008-09,still remained relatively stable as compared to theearlier shocks during the Gulf crisis and the Asian
crisis. Despite higher invisibles surplus, whichturned the current account into a surplus in Q4 of2008-09, the large expansion in trade deficit led toa higher current account deficit of 2.6 per cent ofGDP in 2008-09 (1.5 per cent of GDP a year ago).
II.6.12 The impact of the crisis through the financialchannel was reflected in the sharp turnaround inthe capital flows cycle from a sustained phase ofsurges in capital inflows in to large outflows,particularly in Q3 of 2008-09, which continuedduring Q4 as well. The early signs of the impact offinancial crisis on capital inflows were evident inthe portfolio outflows that started in February 2008.Following the failure of Lehman Brothers, there wasa sudden change in the external environment, whichled to a sell-off in domestic equity markets by portfolioinvestors, reflecting deleveraging, as evidenced inthe case of other major EMEs. Thus, there were largecapital outflows by por tfolio investors duringSeptember-October 2008, with concomitantpressures in the foreign exchange market. Thedeteriorating external financing conditions alsorendered Indian firm’s access to external commercialborrowings and trade credits somewhat difficult. Theresilience shown by foreign direct investment (FDI)inflows, however, reflects the continued confidencein the Indian economy as a long-term investmentdestination (Appendix Table 51).
II.6.13 Although during the recessions of the early1990s and the Asian crisis India had witnessedcapital outflows, the current crisis is marked bylarge volatile movements in capital flows under thepressure of intense deleveraging. Thus, while thepolicy focus unti l Q1 of 2008-09,was themanagement of the surges in capital inflows, withgradually evolving global developments and slowingdown of capital inflows since Q2 of 2008-09, thebalance of policy emphasis shifted to the financingof the widening current account deficits. Theadverse impact of the global trade and financialshocks on the BoP of India could be contained dueto the adequate cushion in the form of foreignexchange reserves. The foreign exchange reservesof India (excluding valuation effects) fell by US$20.1 billion during 2008-09, even though the foreign
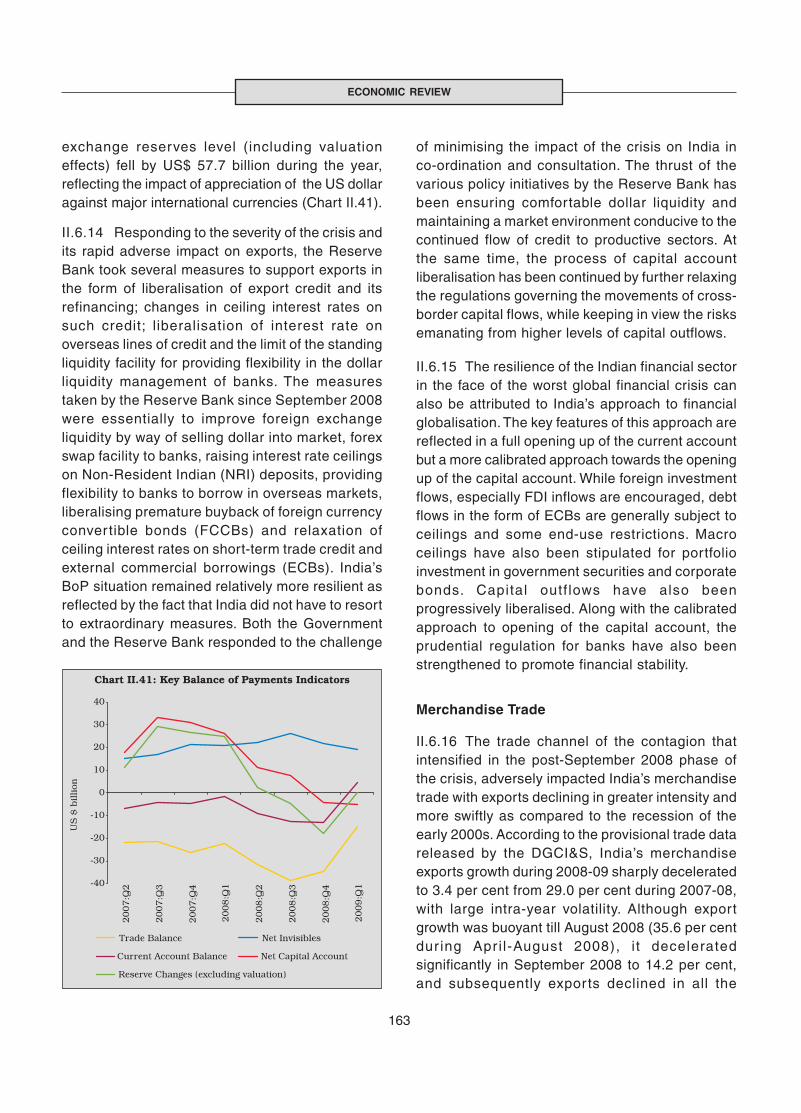
163
ECONOMIC REVIEW
exchange reserves level (including valuationeffects) fell by US$ 57.7 billion during the year,reflecting the impact of appreciation of the US dollaragainst major international currencies (Chart II.41).
II.6.14 Responding to the severity of the crisis andits rapid adverse impact on exports, the ReserveBank took several measures to support exports inthe form of liberalisation of export credit and itsrefinancing; changes in ceiling interest rates onsuch credit; liberalisation of interest rate onoverseas lines of credit and the limit of the standingliquidity facility for providing flexibility in the dollarliquidity management of banks. The measurestaken by the Reserve Bank since September 2008were essentially to improve foreign exchangeliquidity by way of selling dollar into market, forexswap facility to banks, raising interest rate ceilingson Non-Resident Indian (NRI) deposits, providingflexibility to banks to borrow in overseas markets,liberalising premature buyback of foreign currencyconvertible bonds (FCCBs) and relaxation ofceiling interest rates on short-term trade credit andexternal commercial borrowings (ECBs). India’sBoP situation remained relatively more resilient asreflected by the fact that India did not have to resortto extraordinary measures. Both the Governmentand the Reserve Bank responded to the challenge
of minimising the impact of the crisis on India inco-ordination and consultation. The thrust of thevarious policy initiatives by the Reserve Bank hasbeen ensuring comfortable dollar liquidity andmaintaining a market environment conducive to thecontinued flow of credit to productive sectors. Atthe same time, the process of capital accountliberalisation has been continued by further relaxingthe regulations governing the movements of cross-border capital flows, while keeping in view the risksemanating from higher levels of capital outflows.
II.6.15 The resilience of the Indian financial sectorin the face of the worst global financial crisis canalso be attributed to India’s approach to financialglobalisation. The key features of this approach arereflected in a full opening up of the current accountbut a more calibrated approach towards the openingup of the capital account. While foreign investmentflows, especially FDI inflows are encouraged, debtflows in the form of ECBs are generally subject toceilings and some end-use restrictions. Macroceilings have also been stipulated for portfolioinvestment in government securities and corporatebonds. Capital outf lows have also beenprogressively liberalised. Along with the calibratedapproach to opening of the capital account, theprudential regulation for banks have also beenstrengthened to promote financial stability.
Merchandise Trade
II.6.16 The trade channel of the contagion thatintensified in the post-September 2008 phase ofthe crisis, adversely impacted India’s merchandisetrade with exports declining in greater intensity andmore swiftly as compared to the recession of theearly 2000s. According to the provisional trade datareleased by the DGCI&S, India’s merchandiseexports growth during 2008-09 sharply deceleratedto 3.4 per cent from 29.0 per cent during 2007-08,with large intra-year volatility. Although exportgrowth was buoyant till August 2008 (35.6 per centdur ing Apr i l-August 2008), i t deceleratedsignificantly in September 2008 to 14.2 per cent,and subsequently exports declined in all the

164
ANNUAL REPORT
remaining months of 2008-09, in tandem with thedeepening of recession in the developed countries(Char t I I .42 and Box II.31). Impor t growthdecelerated to 14.3 per cent in 2008-09 from 35.5per cent a year ago; however, the slowdown inimports was delayed due to resilient domesticdemand. Synchronised with the moderation indomestic economic activity and movement in crudeoil and other commodity prices, merchandiseimports, which showed a high growth during thefirst half of 2008-09 (43.9 per cent during April-September 2008) decelerated sharply duringOctober and November and declined thereafterduring the period December 2008 to March 2009.Oil imports, after increasing by 60.0 per cent duringApril-October 2008, declined by 29.0 per centduring November 2008-March 2009, due to sharpdecline in oil prices. Non-oil imports, althoughremained resilient during the first three quarters of2008-09 (22.7 per cent growth), declined by 15.3per cent during Q4 of 2008-09, mainly due toslowdown in the growth in imports of capital goodsand gold and silver. Trade deficit during 2008-09showed a substantial expansion to US$ 119.1billion from US$ 88.5 billion in 2007-08 (AppendixTable 48).
II.6.17 In a phase of weakening export prospectsfor all countries around the world, the relativeperformance of countries on the export front,however, varied significantly. The decline in India’sexports since Q3 of 2008-09, when the globalrecession intensified, was lower than the fall inexport growth of some of the advanced economiesas well as some of the EMEs (Chart II.43).
II.6.18 The commodity-wise exports data availablefor 2008-09 (Apr i l-February) indicated thatmanufactured goods continued to maintain thelargest share followed by petroleum products andprimary products (Appendix Table 49). Within themanufactured exports, leather and manufactures,textiles and textile products and chemicals andrelated products witnessed moderation in growthand gems and jewellery showed decline as thesesectors were more severely affected by the demandrecession in the developed countries (Chart II.44).Gems and jewellery exports during 2008-09 (April-February) registered a decline, reflecting mainly therecessionary conditions in the largest exportdestination viz., the US. Exports of textiles andtextile products, an important employment intensivesector, also exhibited significant moderation ingrowth dur ing 2008-09 (Apr i l-February).Engineering goods exports, which constitute morethan one-fourth of India's total exports, however,showed a high growth at 23.5 per cent during 2008-09 (April-February) on the top of 24.4 per centduring 2007-08 (April-February), contributed largelyby transpor t equipments, iron and steel andelectronic goods.
II.6.19 India’s export growth to the EU, OPEC,Eastern Europe and Latin American developingcountries decelerated, while exports to NorthAmerica, Asia and Oceania and Asian and Africandeveloping countries showed decline. During2008-09 (April-February), the US continued to bethe single largest market for India, despite a fall inits share to 11.7 per cent from 12.8 per cent a yearago, followed by the UAE, China and Singapore(Table 2.73).

165
ECONOMIC REVIEW
India’s integration into the world economy over the lastdecade has been remarkably rapid. India’s merchandisetrade has been on a high growth path since 2002-03, a trendwhich continued up to the first five months of 2008-09 (April-August). The sustained export growth witnessed in recentyears was facilitated, inter alia, by conducive policyenvironment, changes in the commodity basket, marketdiversification, exchange rate stability and terms-of-tradebenefits stemming from general increase in the prices ofcertain export items. In spite of the special policy focusaccorded to the traditional sectors like textiles, leather andhandicrafts, their performance during the high export phasewas relatively sluggish due to structural reasons. At the sametime, manufactured products like engineering goods,petroleum products and chemicals have emerged as themajor drivers of export growth.
The slowdown in exports during 2008-09 was mainly due todemand recession in OECD as well as developing countries,both of which have major shares of about 38 per cent each inIndia’s exports. During 2008-09 (April-February), exportsgrowth to OECD countries decelerated mainly due toslowdown in exports to European Union, North America andAsia and Oceania. Exports to developing countries showed adecline primarily due to moderation in export growth/declinein exports to SAARC and other Asian developing countriesas also to African and Latin American developing countries.OPEC, which has about 19 per cent share in India’s exports,however, maintained the high growth momentum.
Except ‘engineering goods’, which has withstood the impactof global economic crisis and continued to exhibit high
Box II.31Impact of the Global Crisis on India’s Exports
growth, all other sectors have been adversely affected.Exports of agriculture and allied products, gems andjewellery and ores and minerals have declined, while theother sectors showed sharp deceleration in export growth.Growth in exports of primary products during April 2008-February 2009 declined by 3.6 per cent against a growth of38.6 per cent during the corresponding period of the previousyear. This was due to the decline in exports of agriculturaland allied products and ores and minerals (Chart A).
Growth in exports of textiles and textile products during April2008-February 2009 sharply slowed down with all the majorcomponents, especially the readymade garments, whichaccounted for about 52 per cent share in textiles andtextile products exports, witnessing a slowdown in growth(Chart B). Gems and jewellery exports recorded a decline,reflecting mainly the recessionary conditions in the largestdestination viz., the US (Chart C). Petroleum products exports,which constituted the second largest component of India’sexports, witnessed a sharp deceleration in growth bothbecause of the sharp reduction in international POL pricesand recessionary conditions in major export destinations ofIndia (Chart D). Leather and manufactures exports alsodecelerated. Slowdown in exports of labour-intensive sectors,viz., gems and jewellery, textiles and textile products andleather and manufactures is a concern because of its adverseimplications for employment. Thus, the concentration of exportslowdown in employment intensive and relatively lowtechnology sectors could potentially enhance the adverseeffects of a global slowdown because of the loss ofemployment associated with such decline in exports.

166
ANNUAL REPORT
II.6.20 A commodity-wise analysis of imports in2008-09 reveals that import growth of petroleum,oil and lubricants (POL) significantly moderated to26.8 per cent from 35.8 per cent in 2007-08, mainlydue to sharp decline in international crude oil pricesduring the second half of the financial year 2008-09(Chart II.45). During 2008-09, the monthly average
price of the Indian basket of crude oil declined fromUS$ 132.5 per barrel in July 2008 to a low of US$40.6 per barrel in December 2008, though itincreased to US$ 46.0 per barrel in March 2009.For the full fiscal year, the average price of Indianbasket of crude oil stood at US$ 82.7 per barrel. Intandem with the movement in crude prices, POL
Table 2.73: Direction of India’s Exports
Group / Country US $ billion Variation (per cent)
2007-08 2007-08R 2008-09P 2007-08 2007-08 2008-09
April-February April-February
1 2 3 4 5 6 7
1. OECD Countries 62.6 57.2 60.1 20.4 20.2 5.1of which
a) EU 32.9 30.6 34.1 27.6 27.5 11.4b) North America 22.0 19.8 19.7 10.0 10.4 -0.9
US 20.7 18.7 18.4 9.8 10.2 -1.62. OPEC 26.7 23.9 29.6 28.8 26.7 24.1
of which UAE 15.6 14.0 16.6 29.9 29.3 18.0
3. Developing Countries 69.6 60.5 60.2 37.1 33.6 -0.5of which Asia 51.5 45.0 44.5 36.9 33.0 -1.0People’s Republic of China 10.8 9.5 7.7 30.6 27.1 -18.1Singapore 7.4 6.4 7.3 21.4 17.3 13.0
4. Total Exports 163.1 145.9 157.2 29.0 28.5 7.8
R: Revised. P: Provisional.Source : DGCI&S.
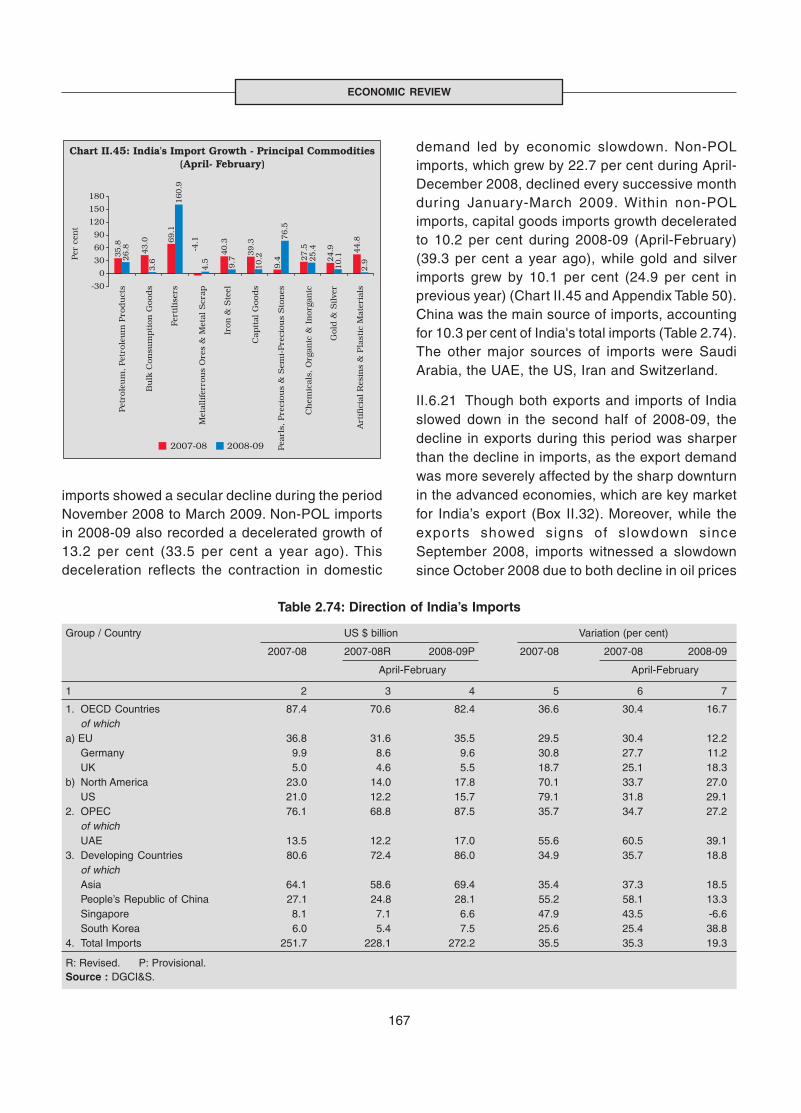
167
ECONOMIC REVIEW
imports showed a secular decline during the periodNovember 2008 to March 2009. Non-POL importsin 2008-09 also recorded a decelerated growth of13.2 per cent (33.5 per cent a year ago). Thisdeceleration reflects the contraction in domestic
demand led by economic slowdown. Non-POLimports, which grew by 22.7 per cent during April-December 2008, declined every successive monthduring January-March 2009. Within non-POLimports, capital goods imports growth deceleratedto 10.2 per cent during 2008-09 (April-February)(39.3 per cent a year ago), while gold and silverimports grew by 10.1 per cent (24.9 per cent inprevious year) (Chart II.45 and Appendix Table 50).China was the main source of imports, accountingfor 10.3 per cent of India's total imports (Table 2.74).The other major sources of imports were SaudiArabia, the UAE, the US, Iran and Switzerland.
II.6.21 Though both exports and imports of Indiaslowed down in the second half of 2008-09, thedecline in exports during this period was sharperthan the decline in imports, as the export demandwas more severely affected by the sharp downturnin the advanced economies, which are key marketfor India’s export (Box II.32). Moreover, while theexpor ts showed signs of slowdown sinceSeptember 2008, imports witnessed a slowdownsince October 2008 due to both decline in oil prices
Table 2.74: Direction of India’s Imports
Group / Country US $ billion Variation (per cent)
2007-08 2007-08R 2008-09P 2007-08 2007-08 2008-09
April-February April-February
1 2 3 4 5 6 7
1. OECD Countries 87.4 70.6 82.4 36.6 30.4 16.7of which
a) EU 36.8 31.6 35.5 29.5 30.4 12.2Germany 9.9 8.6 9.6 30.8 27.7 11.2UK 5.0 4.6 5.5 18.7 25.1 18.3
b) North America 23.0 14.0 17.8 70.1 33.7 27.0US 21.0 12.2 15.7 79.1 31.8 29.1
2. OPEC 76.1 68.8 87.5 35.7 34.7 27.2of which UAE 13.5 12.2 17.0 55.6 60.5 39.1
3. Developing Countries 80.6 72.4 86.0 34.9 35.7 18.8of which Asia 64.1 58.6 69.4 35.4 37.3 18.5People’s Republic of China 27.1 24.8 28.1 55.2 58.1 13.3Singapore 8.1 7.1 6.6 47.9 43.5 -6.6South Korea 6.0 5.4 7.5 25.6 25.4 38.8
4. Total Imports 251.7 228.1 272.2 35.5 35.3 19.3
R: Revised. P: Provisional.Source : DGCI&S.
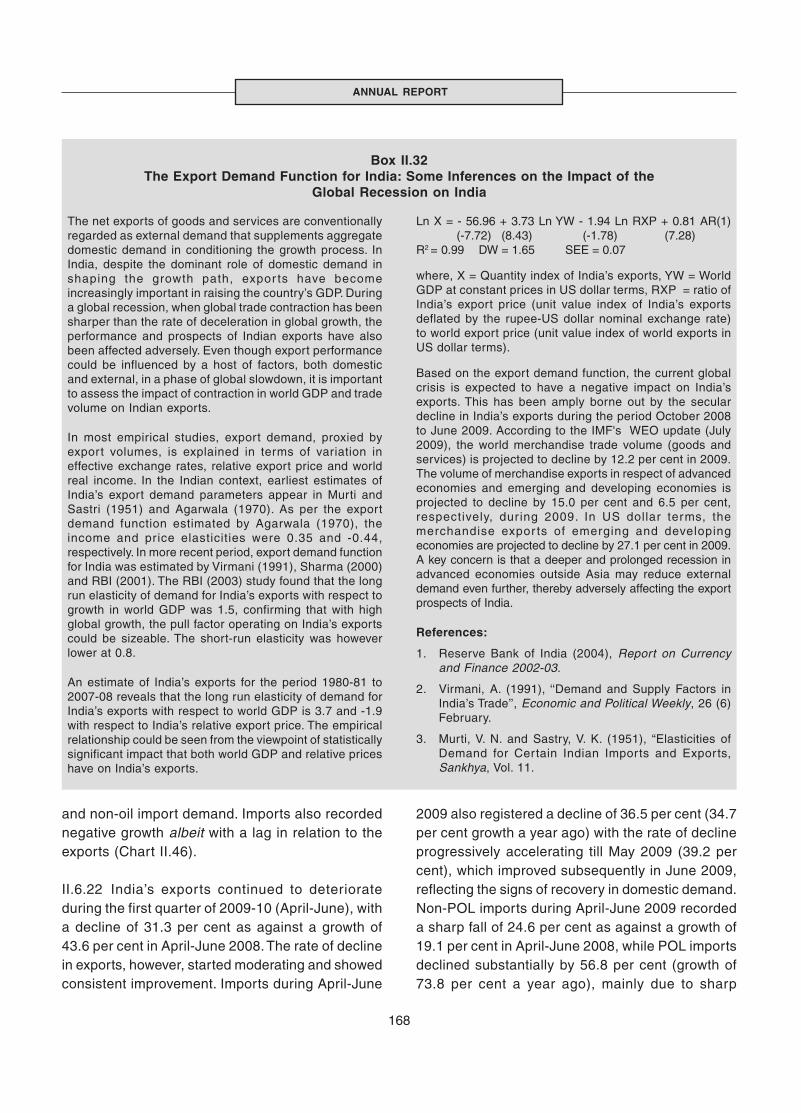
168
ANNUAL REPORT
The net exports of goods and services are conventionallyregarded as external demand that supplements aggregatedomestic demand in conditioning the growth process. InIndia, despite the dominant role of domestic demand inshaping the growth path, expor ts have becomeincreasingly important in raising the country’s GDP. Duringa global recession, when global trade contraction has beensharper than the rate of deceleration in global growth, theperformance and prospects of Indian exports have alsobeen affected adversely. Even though export performancecould be influenced by a host of factors, both domesticand external, in a phase of global slowdown, it is importantto assess the impact of contraction in world GDP and tradevolume on Indian exports.
In most empirical studies, export demand, proxied byexport volumes, is explained in terms of variation ineffective exchange rates, relative export price and worldreal income. In the Indian context, earliest estimates ofIndia’s export demand parameters appear in Murti andSastri (1951) and Agarwala (1970). As per the exportdemand function estimated by Agarwala (1970), theincome and price elasticities were 0.35 and -0.44,respectively. In more recent period, export demand functionfor India was estimated by Virmani (1991), Sharma (2000)and RBI (2001). The RBI (2003) study found that the longrun elasticity of demand for India’s exports with respect togrowth in world GDP was 1.5, confirming that with highglobal growth, the pull factor operating on India’s exportscould be sizeable. The short-run elasticity was howeverlower at 0.8.
An estimate of India’s exports for the period 1980-81 to2007-08 reveals that the long run elasticity of demand forIndia’s exports with respect to world GDP is 3.7 and -1.9with respect to India’s relative export price. The empiricalrelationship could be seen from the viewpoint of statisticallysignificant impact that both world GDP and relative priceshave on India’s exports.
Box II.32The Export Demand Function for India: Some Inferences on the Impact of the
Global Recession on India
Ln X = - 56.96 + 3.73 Ln YW - 1.94 Ln RXP + 0.81 AR(1) (-7.72) (8.43) (-1.78) (7.28)R2 = 0.99 DW = 1.65 SEE = 0.07
where, X = Quantity index of India’s exports, YW = WorldGDP at constant prices in US dollar terms, RXP = ratio ofIndia’s export price (unit value index of India’s exportsdeflated by the rupee-US dollar nominal exchange rate)to world export price (unit value index of world exports inUS dollar terms).
Based on the export demand function, the current globalcrisis is expected to have a negative impact on India’sexports. This has been amply borne out by the seculardecline in India’s exports during the period October 2008to June 2009. According to the IMF's WEO update (July2009), the world merchandise trade volume (goods andservices) is projected to decline by 12.2 per cent in 2009.The volume of merchandise exports in respect of advancedeconomies and emerging and developing economies isprojected to decline by 15.0 per cent and 6.5 per cent,respectively, dur ing 2009. In US dollar terms, themerchandise expor ts of emerging and developingeconomies are projected to decline by 27.1 per cent in 2009.A key concern is that a deeper and prolonged recession inadvanced economies outside Asia may reduce externaldemand even further, thereby adversely affecting the exportprospects of India.
References:
1. Reserve Bank of India (2004), Report on Currencyand Finance 2002-03.
2. Virmani, A. (1991), ‘‘Demand and Supply Factors inIndia’s Trade’’, Economic and Political Weekly, 26 (6)February.
3. Murti, V. N. and Sastry, V. K. (1951), “Elasticities ofDemand for Certain Indian Imports and Exports,Sankhya, Vol. 11.
and non-oil import demand. Imports also recordednegative growth albeit with a lag in relation to theexports (Chart II.46).
II.6.22 India’s exports continued to deteriorateduring the first quarter of 2009-10 (April-June), witha decline of 31.3 per cent as against a growth of43.6 per cent in April-June 2008. The rate of declinein exports, however, started moderating and showedconsistent improvement. Imports during April-June
2009 also registered a decline of 36.5 per cent (34.7per cent growth a year ago) with the rate of declineprogressively accelerating till May 2009 (39.2 percent), which improved subsequently in June 2009,reflecting the signs of recovery in domestic demand.Non-POL imports during April-June 2009 recordeda sharp fall of 24.6 per cent as against a growth of19.1 per cent in April-June 2008, while POL importsdeclined substantially by 56.8 per cent (growth of73.8 per cent a year ago), mainly due to sharp
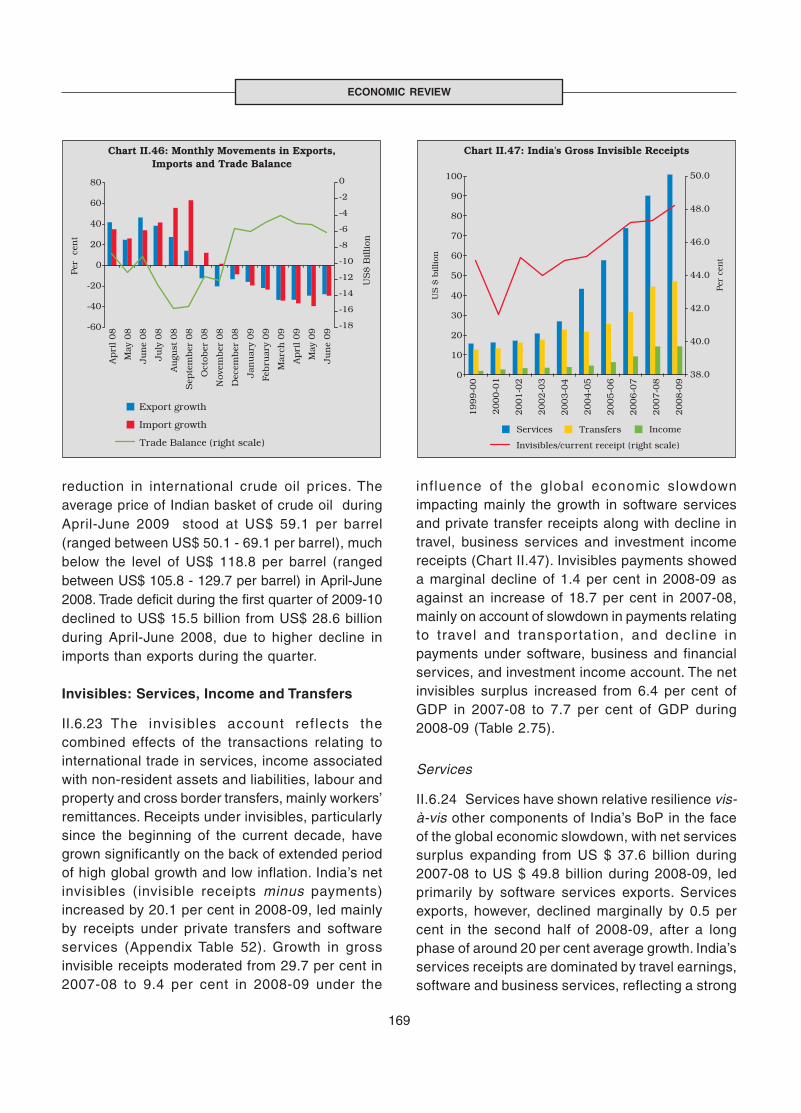
169
ECONOMIC REVIEW
reduction in international crude oil prices. Theaverage price of Indian basket of crude oil duringApril-June 2009 stood at US$ 59.1 per barrel(ranged between US$ 50.1 - 69.1 per barrel), muchbelow the level of US$ 118.8 per barrel (rangedbetween US$ 105.8 - 129.7 per barrel) in April-June2008. Trade deficit during the first quarter of 2009-10declined to US$ 15.5 billion from US$ 28.6 billionduring April-June 2008, due to higher decline inimports than exports during the quarter.
Invisibles: Services, Income and Transfers
II.6.23 The invisibles account reflects thecombined effects of the transactions relating tointernational trade in services, income associatedwith non-resident assets and liabilities, labour andproperty and cross border transfers, mainly workers’remittances. Receipts under invisibles, particularlysince the beginning of the current decade, havegrown significantly on the back of extended periodof high global growth and low inflation. India’s netinvisibles (invisible receipts minus payments)increased by 20.1 per cent in 2008-09, led mainlyby receipts under private transfers and softwareservices (Appendix Table 52). Growth in grossinvisible receipts moderated from 29.7 per cent in2007-08 to 9.4 per cent in 2008-09 under the
influence of the global economic slowdownimpacting mainly the growth in software servicesand private transfer receipts along with decline intravel, business services and investment incomereceipts (Chart II.47). Invisibles payments showeda marginal decline of 1.4 per cent in 2008-09 asagainst an increase of 18.7 per cent in 2007-08,mainly on account of slowdown in payments relatingto travel and transpor tation, and decline inpayments under software, business and financialservices, and investment income account. The netinvisibles surplus increased from 6.4 per cent ofGDP in 2007-08 to 7.7 per cent of GDP during2008-09 (Table 2.75).
Services
II.6.24 Services have shown relative resilience vis-à-vis other components of India’s BoP in the faceof the global economic slowdown, with net servicessurplus expanding from US $ 37.6 billion during2007-08 to US $ 49.8 billion during 2008-09, ledprimarily by software services exports. Servicesexports, however, declined marginally by 0.5 percent in the second half of 2008-09, after a longphase of around 20 per cent average growth. India’sservices receipts are dominated by travel earnings,software and business services, reflecting a strong
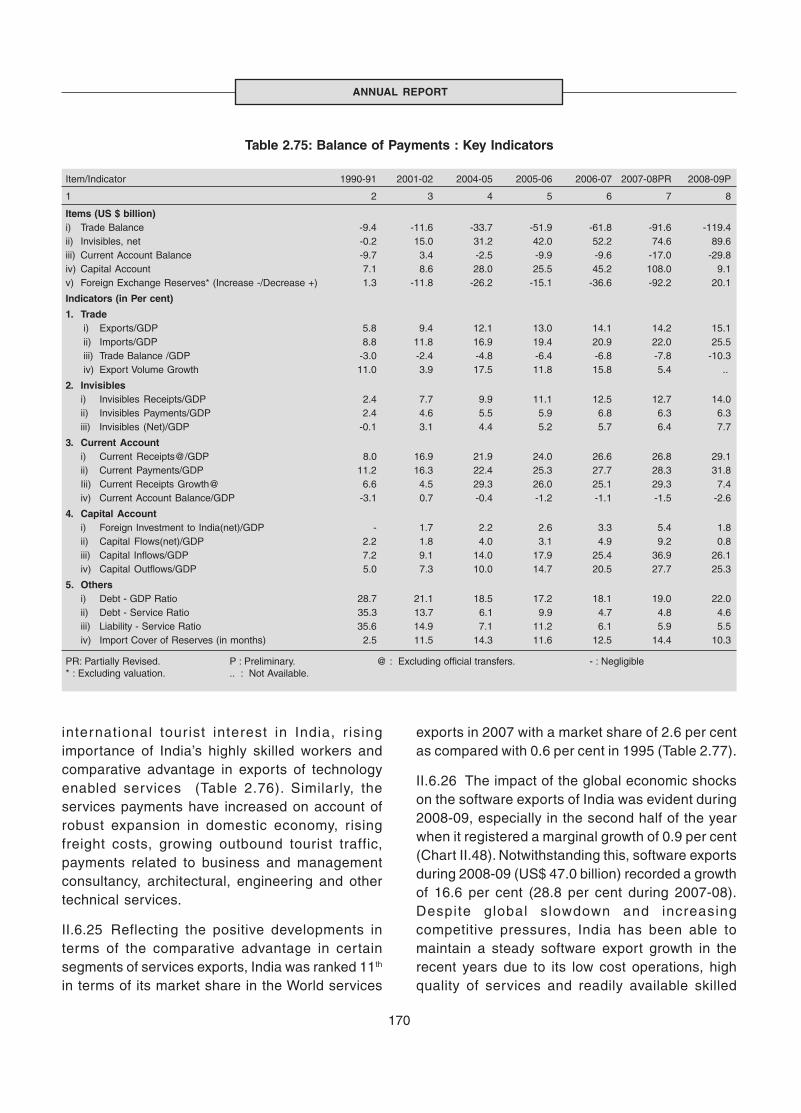
170
ANNUAL REPORT
Table 2.75: Balance of Payments : Key Indicators
Item/Indicator 1990-91 2001-02 2004-05 2005-06 2006-07 2007-08PR 2008-09P
1 2 3 4 5 6 7 8
Items (US $ billion)i) Trade Balance -9.4 -11.6 -33.7 -51.9 -61.8 -91.6 -119.4ii) Invisibles, net -0.2 15.0 31.2 42.0 52.2 74.6 89.6iii) Current Account Balance -9.7 3.4 -2.5 -9.9 -9.6 -17.0 -29.8iv) Capital Account 7.1 8.6 28.0 25.5 45.2 108.0 9.1v) Foreign Exchange Reserves* (Increase -/Decrease +) 1.3 -11.8 -26.2 -15.1 -36.6 -92.2 20.1
Indicators (in Per cent)
1. Trade i) Exports/GDP 5.8 9.4 12.1 13.0 14.1 14.2 15.1 ii) Imports/GDP 8.8 11.8 16.9 19.4 20.9 22.0 25.5 iii) Trade Balance /GDP -3.0 -2.4 -4.8 -6.4 -6.8 -7.8 -10.3 iv) Export Volume Growth 11.0 3.9 17.5 11.8 15.8 5.4 ..
2. Invisibles i) Invisibles Receipts/GDP 2.4 7.7 9.9 11.1 12.5 12.7 14.0ii) Invisibles Payments/GDP 2.4 4.6 5.5 5.9 6.8 6.3 6.3iii) Invisibles (Net)/GDP -0.1 3.1 4.4 5.2 5.7 6.4 7.7
3. Current Account i) Current Receipts@/GDP 8.0 16.9 21.9 24.0 26.6 26.8 29.1ii) Current Payments/GDP 11.2 16.3 22.4 25.3 27.7 28.3 31.8Iii) Current Receipts Growth@ 6.6 4.5 29.3 26.0 25.1 29.3 7.4iv) Current Account Balance/GDP -3.1 0.7 -0.4 -1.2 -1.1 -1.5 -2.6
4. Capital Account i) Foreign Investment to India(net)/GDP - 1.7 2.2 2.6 3.3 5.4 1.8ii) Capital Flows(net)/GDP 2.2 1.8 4.0 3.1 4.9 9.2 0.8iii) Capital Inflows/GDP 7.2 9.1 14.0 17.9 25.4 36.9 26.1iv) Capital Outflows/GDP 5.0 7.3 10.0 14.7 20.5 27.7 25.3
5. Others i) Debt - GDP Ratio 28.7 21.1 18.5 17.2 18.1 19.0 22.0ii) Debt - Service Ratio 35.3 13.7 6.1 9.9 4.7 4.8 4.6iii) Liability - Service Ratio 35.6 14.9 7.1 11.2 6.1 5.9 5.5iv) Import Cover of Reserves (in months) 2.5 11.5 14.3 11.6 12.5 14.4 10.3
PR: Partially Revised. P : Preliminary. @ : Excluding official transfers. - : Negligible* : Excluding valuation. .. : Not Available.
international tourist interest in India, r isingimportance of India’s highly skilled workers andcomparative advantage in exports of technologyenabled services (Table 2.76). Similarly, theservices payments have increased on account ofrobust expansion in domestic economy, risingfreight costs, growing outbound tourist traffic,payments related to business and managementconsultancy, architectural, engineering and othertechnical services.
II.6.25 Reflecting the positive developments interms of the comparative advantage in certainsegments of services exports, India was ranked 11th
in terms of its market share in the World services
exports in 2007 with a market share of 2.6 per centas compared with 0.6 per cent in 1995 (Table 2.77).
II.6.26 The impact of the global economic shockson the software exports of India was evident during2008-09, especially in the second half of the yearwhen it registered a marginal growth of 0.9 per cent(Chart II.48). Notwithstanding this, software exportsduring 2008-09 (US$ 47.0 billion) recorded a growthof 16.6 per cent (28.8 per cent during 2007-08).Despite global slowdown and increasingcompetitive pressures, India has been able tomaintain a steady software export growth in therecent years due to its low cost operations, highquality of services and readily available skilled
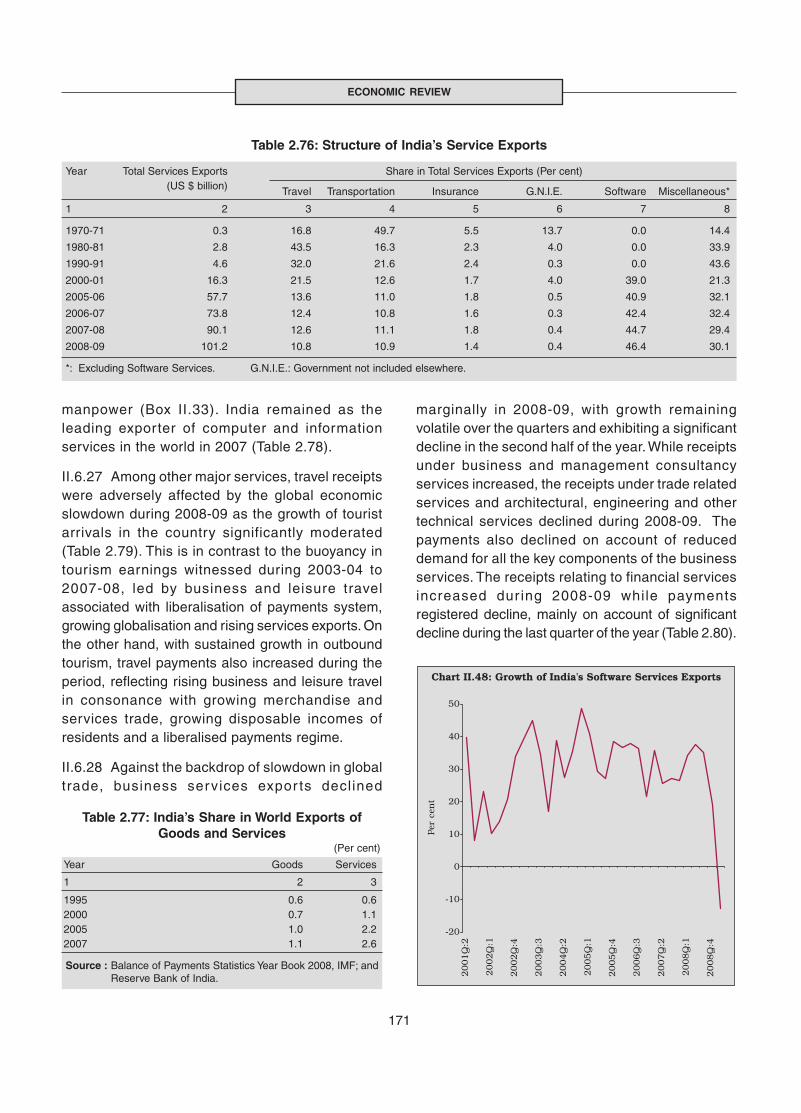
171
ECONOMIC REVIEW
manpower (Box II.33). India remained as theleading exporter of computer and informationservices in the world in 2007 (Table 2.78).
II.6.27 Among other major services, travel receiptswere adversely affected by the global economicslowdown during 2008-09 as the growth of touristarrivals in the country significantly moderated(Table 2.79). This is in contrast to the buoyancy intourism earnings witnessed during 2003-04 to2007-08, led by business and leisure travelassociated with liberalisation of payments system,growing globalisation and rising services exports. Onthe other hand, with sustained growth in outboundtourism, travel payments also increased during theperiod, reflecting rising business and leisure travelin consonance with growing merchandise andservices trade, growing disposable incomes ofresidents and a liberalised payments regime.
II.6.28 Against the backdrop of slowdown in globaltrade, business services expor ts declined
marginally in 2008-09, with growth remainingvolatile over the quarters and exhibiting a significantdecline in the second half of the year. While receiptsunder business and management consultancyservices increased, the receipts under trade relatedservices and architectural, engineering and othertechnical services declined during 2008-09. Thepayments also declined on account of reduceddemand for all the key components of the businessservices. The receipts relating to financial servicesincreased dur ing 2008-09 while paymentsregistered decline, mainly on account of significantdecline during the last quarter of the year (Table 2.80).
Table 2.76: Structure of India’s Service Exports
Year Total Services Exports Share in Total Services Exports (Per cent)(US $ billion) Travel Transportation Insurance G.N.I.E. Software Miscellaneous*
1 2 3 4 5 6 7 8
1970-71 0.3 16.8 49.7 5.5 13.7 0.0 14.4
1980-81 2.8 43.5 16.3 2.3 4.0 0.0 33.9
1990-91 4.6 32.0 21.6 2.4 0.3 0.0 43.6
2000-01 16.3 21.5 12.6 1.7 4.0 39.0 21.3
2005-06 57.7 13.6 11.0 1.8 0.5 40.9 32.1
2006-07 73.8 12.4 10.8 1.6 0.3 42.4 32.4
2007-08 90.1 12.6 11.1 1.8 0.4 44.7 29.4
2008-09 101.2 10.8 10.9 1.4 0.4 46.4 30.1
*: Excluding Software Services. G.N.I.E.: Government not included elsewhere.
Table 2.77: India’s Share in World Exports ofGoods and Services
(Per cent)
Year Goods Services
1 2 3
1995 0.6 0.62000 0.7 1.12005 1.0 2.22007 1.1 2.6
Source : Balance of Payments Statistics Year Book 2008, IMF; andReserve Bank of India.
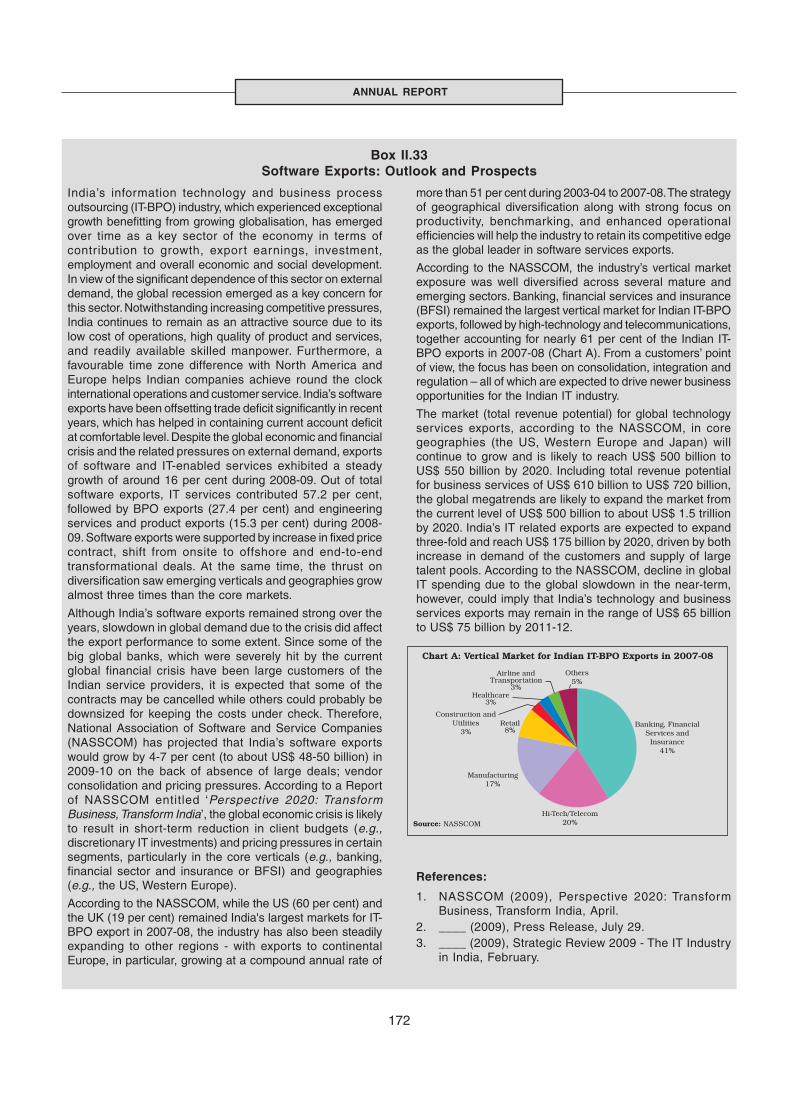
172
ANNUAL REPORT
India’s information technology and business processoutsourcing (IT-BPO) industry, which experienced exceptionalgrowth benefitting from growing globalisation, has emergedover time as a key sector of the economy in terms ofcontribution to growth, expor t earnings, investment,employment and overall economic and social development.In view of the significant dependence of this sector on externaldemand, the global recession emerged as a key concern forthis sector. Notwithstanding increasing competitive pressures,India continues to remain as an attractive source due to itslow cost of operations, high quality of product and services,and readily available skilled manpower. Furthermore, afavourable time zone difference with North America andEurope helps Indian companies achieve round the clockinternational operations and customer service. India’s softwareexports have been offsetting trade deficit significantly in recentyears, which has helped in containing current account deficitat comfortable level. Despite the global economic and financialcrisis and the related pressures on external demand, exportsof software and IT-enabled services exhibited a steadygrowth of around 16 per cent during 2008-09. Out of totalsoftware exports, IT services contributed 57.2 per cent,followed by BPO exports (27.4 per cent) and engineeringservices and product exports (15.3 per cent) during 2008-09. Software exports were supported by increase in fixed pricecontract, shift from onsite to offshore and end-to-endtransformational deals. At the same time, the thrust ondiversification saw emerging verticals and geographies growalmost three times than the core markets.
Although India’s software exports remained strong over theyears, slowdown in global demand due to the crisis did affectthe export performance to some extent. Since some of thebig global banks, which were severely hit by the currentglobal financial crisis have been large customers of theIndian service providers, it is expected that some of thecontracts may be cancelled while others could probably bedownsized for keeping the costs under check. Therefore,National Association of Software and Service Companies(NASSCOM) has projected that India’s software exportswould grow by 4-7 per cent (to about US$ 48-50 billion) in2009-10 on the back of absence of large deals; vendorconsolidation and pricing pressures. According to a Reportof NASSCOM entitled ‘Perspective 2020: TransformBusiness, Transform India’, the global economic crisis is likelyto result in short-term reduction in client budgets (e.g.,discretionary IT investments) and pricing pressures in certainsegments, particularly in the core verticals (e.g., banking,financial sector and insurance or BFSI) and geographies(e.g., the US, Western Europe).
According to the NASSCOM, while the US (60 per cent) andthe UK (19 per cent) remained India's largest markets for IT-BPO export in 2007-08, the industry has also been steadilyexpanding to other regions - with exports to continentalEurope, in particular, growing at a compound annual rate of
Box II.33Software Exports: Outlook and Prospects
more than 51 per cent during 2003-04 to 2007-08. The strategyof geographical diversification along with strong focus onproductivity, benchmarking, and enhanced operationalefficiencies will help the industry to retain its competitive edgeas the global leader in software services exports.
According to the NASSCOM, the industry’s vertical marketexposure was well diversified across several mature andemerging sectors. Banking, financial services and insurance(BFSI) remained the largest vertical market for Indian IT-BPOexports, followed by high-technology and telecommunications,together accounting for nearly 61 per cent of the Indian IT-BPO exports in 2007-08 (Chart A). From a customers’ pointof view, the focus has been on consolidation, integration andregulation – all of which are expected to drive newer businessopportunities for the Indian IT industry.
The market (total revenue potential) for global technologyservices exports, according to the NASSCOM, in coregeographies (the US, Western Europe and Japan) willcontinue to grow and is likely to reach US$ 500 billion toUS$ 550 billion by 2020. Including total revenue potentialfor business services of US$ 610 billion to US$ 720 billion,the global megatrends are likely to expand the market fromthe current level of US$ 500 billion to about US$ 1.5 trillionby 2020. India’s IT related exports are expected to expandthree-fold and reach US$ 175 billion by 2020, driven by bothincrease in demand of the customers and supply of largetalent pools. According to the NASSCOM, decline in globalIT spending due to the global slowdown in the near-term,however, could imply that India’s technology and businessservices exports may remain in the range of US$ 65 billionto US$ 75 billion by 2011-12.
References:
1. NASSCOM (2009), Perspective 2020: TransformBusiness, Transform India, April.
2. ____ (2009), Press Release, July 29.3. ____ (2009), Strategic Review 2009 - The IT Industry
in India, February.

173
ECONOMIC REVIEW
Table 2.78: Computer & InformationServices Exports
(US$ billion)
Rank Country 2000 2005 2007
1 2 3 4 5
1 India 6.3 22.0 37.0
2 Ireland 7.5 19.6 26.1
3 U.K. 4.3 11.2 14.1
4 U.S.A. 5.6 7.3 12.7
5 Germany 3.8 8.4 12.2
6 Sweden 1.2 2.7 6.5
7 Israel 4.2 4.5 5.8
8 Spain 2.0 3.6 5.3
9 Canada 2.4 3.6 4.4
10 China 0.4 1.8 4.3
Source: Balance of Payments Statistics Year Book 2008 andReserve Bank of India.
Table 2.79 : Foreign Tourists Arrival in India andOutbound Tourist Traffic
Year Arrivals Growth Departure Growth(Calendar) (millions) Rate (%) (millions) Rate (%)
1 2 3 4 5
2000 2.65 6.7 4.42 7.32001 2.54 -4.2 4.56 3.42002 2.38 -6.0 4.94 8.22003 2.73 14.3 5.35 8.32004 3.46 26.8 6.21 16.12005 3.92 13.3 7.18 15.62006 4.45 13.5 8.34 16.12007 5.08 14.3 9.78 17.32008 5.37 5.6 .. ..
.. : Not available.Source: Ministry of Tourism, Government of India.
Table 2.80: Non-Software Miscellaneous Receipts & Payments(US$ billion)
Receipts Payments
2006-07 2007-08 2008-09 2006-07 2007-08 2008-09
1 2 3 4 5 6 7
1. Communication 2.3 2.4 2.2 0.8 0.9 1.0
2. Construction 0.7 0.8 0.9 0.7 0.8 0.9
3. Financial 3.1 3.2 3.9 3.0 3.1 3.0
4. News Agency 0.3 0.5 0.8 0.2 0.3 0.4
5. Royalties, Copyrights & Licence Fees 0.1 0.2 0.1 1.0 1.1 1.8
6. Business Services 14.5 16.8 16.3 15.9 16.7 15.3
7. Personal, Cultural, Recreational 0.2 0.6 0.7 0.1 0.2 0.3
8. Others 2.6 2.1 5.6 4.5 4.2 1.9
Total (1 to 8) 23.9 26.4 30.5 26.2 27.3 24.5
Private Transfers
II.6.29 Private transfers include inward remittancesfrom Indian workers abroad for family maintenance,local withdrawal from NRI Rupee deposits, Goldand silver brought through passenger baggage, andpersonal gifts/donations to charitable/religiousinstitutions. Private transfer receipts, comprisingmainly remittances from Indians working overseas,increased in 2008-09 over the previous year(Table 2.81). The quar ter ly movement inremittances, however, reveals moderation in thesecond half of 2008-09, with deepening globalfinancial crisis affecting the employment prospects
and sharp decline in oil prices affecting the demandfor expatriate labour in the oil exporting Gulf countriesfrom where a major share of remittances to Indiaoriginates (Chart II.49).
II.6.30 A major part of outflows from NRI depositsis in the form of local withdrawals, which are notactually repatriated out of the country but utiliseddomestically, making them equivalent of unilateraltransfers without any quid pro quo. Such localwithdrawals/redemptions cease to exist as externalliability in the capital account. India maintained itsposition as the leading remittance receiving countryin the world during 2008 with relative stability insuch inflows (Table 2.82). In the context of therecent global financial crisis and its impact on
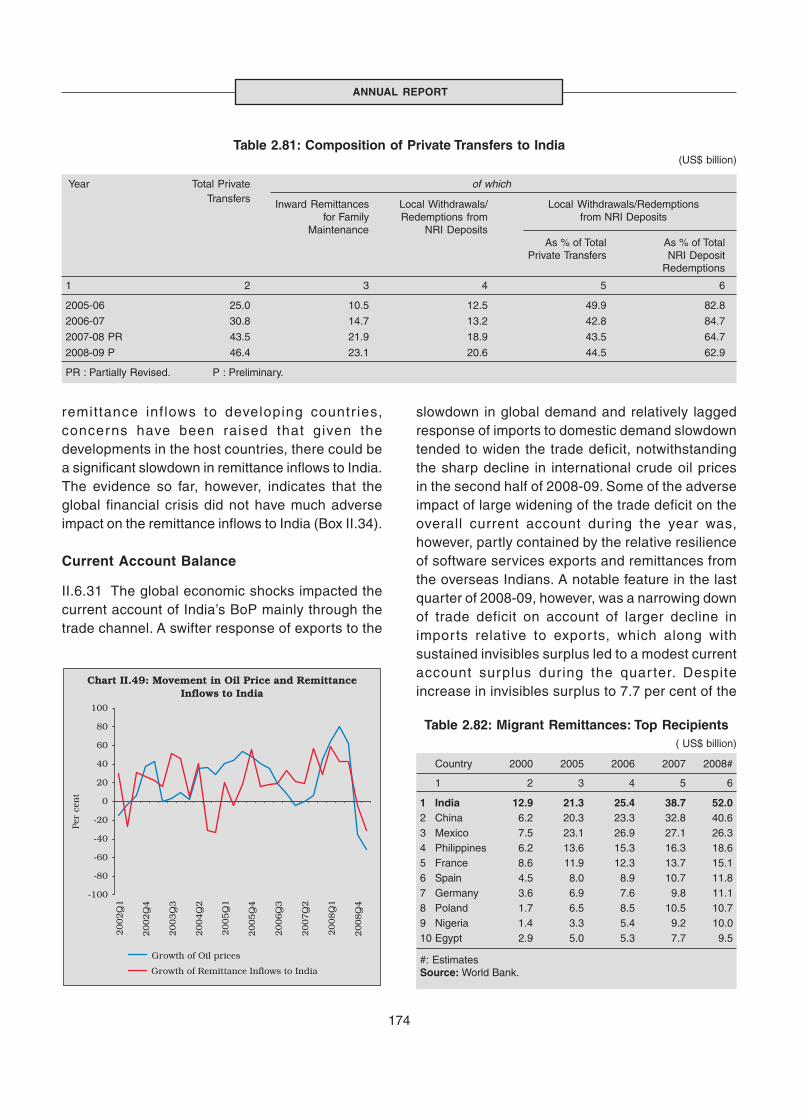
174
ANNUAL REPORT
remittance inflows to developing countr ies,concerns have been raised that given thedevelopments in the host countries, there could bea significant slowdown in remittance inflows to India.The evidence so far, however, indicates that theglobal financial crisis did not have much adverseimpact on the remittance inflows to India (Box II.34).
Current Account Balance
II.6.31 The global economic shocks impacted thecurrent account of India’s BoP mainly through thetrade channel. A swifter response of exports to the
slowdown in global demand and relatively laggedresponse of imports to domestic demand slowdowntended to widen the trade deficit, notwithstandingthe sharp decline in international crude oil pricesin the second half of 2008-09. Some of the adverseimpact of large widening of the trade deficit on theoverall current account during the year was,however, partly contained by the relative resilienceof software services exports and remittances fromthe overseas Indians. A notable feature in the lastquarter of 2008-09, however, was a narrowing downof trade deficit on account of larger decline inimports relative to exports, which along withsustained invisibles surplus led to a modest currentaccount surplus during the quar ter. Despiteincrease in invisibles surplus to 7.7 per cent of the
Table 2.81: Composition of Private Transfers to India(US$ billion)
Year Total Private of whichTransfers Inward Remittances Local Withdrawals/ Local Withdrawals/Redemptions
for Family Redemptions from from NRI DepositsMaintenance NRI Deposits
As % of Total As % of TotalPrivate Transfers NRI Deposit
Redemptions
1 2 3 4 5 6
2005-06 25.0 10.5 12.5 49.9 82.8
2006-07 30.8 14.7 13.2 42.8 84.7
2007-08 PR 43.5 21.9 18.9 43.5 64.7
2008-09 P 46.4 23.1 20.6 44.5 62.9
PR : Partially Revised. P : Preliminary.
Table 2.82: Migrant Remittances: Top Recipients( US$ billion)
Country 2000 2005 2006 2007 2008#
1 2 3 4 5 6
1 India 12.9 21.3 25.4 38.7 52.02 China 6.2 20.3 23.3 32.8 40.63 Mexico 7.5 23.1 26.9 27.1 26.34 Philippines 6.2 13.6 15.3 16.3 18.65 France 8.6 11.9 12.3 13.7 15.16 Spain 4.5 8.0 8.9 10.7 11.87 Germany 3.6 6.9 7.6 9.8 11.18 Poland 1.7 6.5 8.5 10.5 10.79 Nigeria 1.4 3.3 5.4 9.2 10.010 Egypt 2.9 5.0 5.3 7.7 9.5
#: EstimatesSource: World Bank.

175
ECONOMIC REVIEW
Workers’ remittances to India have imparted significantresilience and strength to India’s balance of payments inthe past, particularly in conditions of notable capitaloutflows or adverse external shocks. There is a perceptionthat global recession and the weakening employmentprospects in the host countries could affect India’s inwardremittance flows. According to the World Bank estimates(July 2009), remittance flows to developing countries, whichincreased to US$ 328 billion in 2008 from US$ 285 billionin 2007, are projected to decline by 7.3 per cent in 2009.India, China and Mexico retain their position as the toprecipients of migrant remittances among developingcountries. According to the World Bank’s revised outlook,the slowdown in remittance flows that became evident inthe last quarter of 2008 has continued into the first half of2009. As the US job market weakness continues, officiallyrecorded remittance flows to the Latin America and theCaribbean region have dropped significantly in the first halfof 2009. In contrast, remittance flows to South Asia andEast Asia have continued to post strong growth in 2009.This is in part due to the fact that the Gulf CooperationCouncil (GCC) countries, a major destination for Asianmigrants, have not significantly reduced hiring migrants.GCC countries are following a long-term strategy ofinfrastructure development funded by accumulatedreserves and are unlikely to slow down such investmentsand lay off migrant workers in large numbers. A secondreason for the growth of remittances to South Asia andEast Asia appears to be a switch in the motivation forremittances from consumption to investment: falling assetprices, rising interest rate differentials and a depreciationof the local currency have attracted investments frommigrants. This is the dominant reason for the sharpincrease in remittances to India in 2008. Remittance flowsto all the developing regions are expected to decline in2009. Europe and Central Asia is expected to experiencethe largest decline (15 per cent) among all developingregions in 2009. However, remittance flows to South Asiaare expected to decline more modestly by 4 per cent.These flows are expected to return to positive growthterritory in 2010 and 2011.
The surge in workers’ remittances to India, responding tooil boom in the Middle East during the 1980s and theinformation technology revolution in the 1990s, has putIndia among the top remittance receiving countries in theWorld. Remittances have helped in offsetting India’smerchandise trade deficit to a large extent. The relativestability in such transfers, compared to other capitalaccount items, such as NRI deposits, foreign directinvestment and portfolio investment, has also enabled the
Box II.34Impact of the Global Slowdown on Remittances
containment of the current account deficits at modest levelsin the face of pressures on other accounts. In the aftermathof the global meltdown, however, it is feared that recessioninduced rising job losses in the US and Europe couldimpact migrant workers more severely. Even if there is nolay-off, workers may often have to accept lower wages asemployers worldwide are seeking to cut costs in an attemptto cope with the financial crisis. Fears have also beenexpressed about reverse migration of Indian labourersworking in Gulf countries, which could result in a declinein inflows of remittances and NRI deposits to India. Theconstruction industry in the Gulf region, especially in theUAE, is facing a difficult time due to global meltdown andhas left millions of construction workers with uncertainfuture. Furthermore, declining oil prices, by reducingincomes of workers in the Gulf countries, could also leadto reduced remittances flows to India.
Available information indicates that inward remittances toIndia have not been impacted significantly by the globaleconomic crisis. According to the World Bank estimates,India received significantly higher remittances to the tune ofUS$ 52 billion in 2008 as compared with US$ 38.7 billion in2007. This could be attributed to a number of factors, suchas, depreciation of the rupee, hike in interest rate ceilingson NRI deposits since September 2008 and uncertaintiesin oil-prices, which might have induced the workers to remittheir money to India as a hedging mechanism due to itsrelatively better growth prospects. According to an earlierstudy by the Reserve Bank of India, region-wise, NorthAmerica accounts for nearly 44 per cent of the totalremittances to India, followed by the Middle East (24 percent) and Europe (13 per cent). In view of the recessionaryconditions in the advanced economies and sharp moderationin growth in the Middle East, some slowdown in remittancescould be experienced in the near term.
References:
1. Ratha, D., S. Mohapatra and Z. Xu (2008), “Outlookfor Remittances 2008-10”, Development ProspectsGroup, Migration and Remittances Team, The WorldBank, November.
2. Reserve Bank of India (2006), ''Remittances fromOverseas Indians: A Study of Methods of Transmission,Cost and Time '', in the article on 'Invisibles in India'sBalance of Payments', RBI Bulletin, November.
3. World Bank (2009), Migration and Development Brief,No.10, July.
GDP, the current account deficit (CAD) increasedto 2.6 per cent of GDP in 2008-09, mainly onaccount of the widening trade deficit. India’s current
account balance averaged a deficit of 1.0 to 1.5per cent of GDP during 2005-06 to 2007-08supported by the steadily rising invisibles surplus.
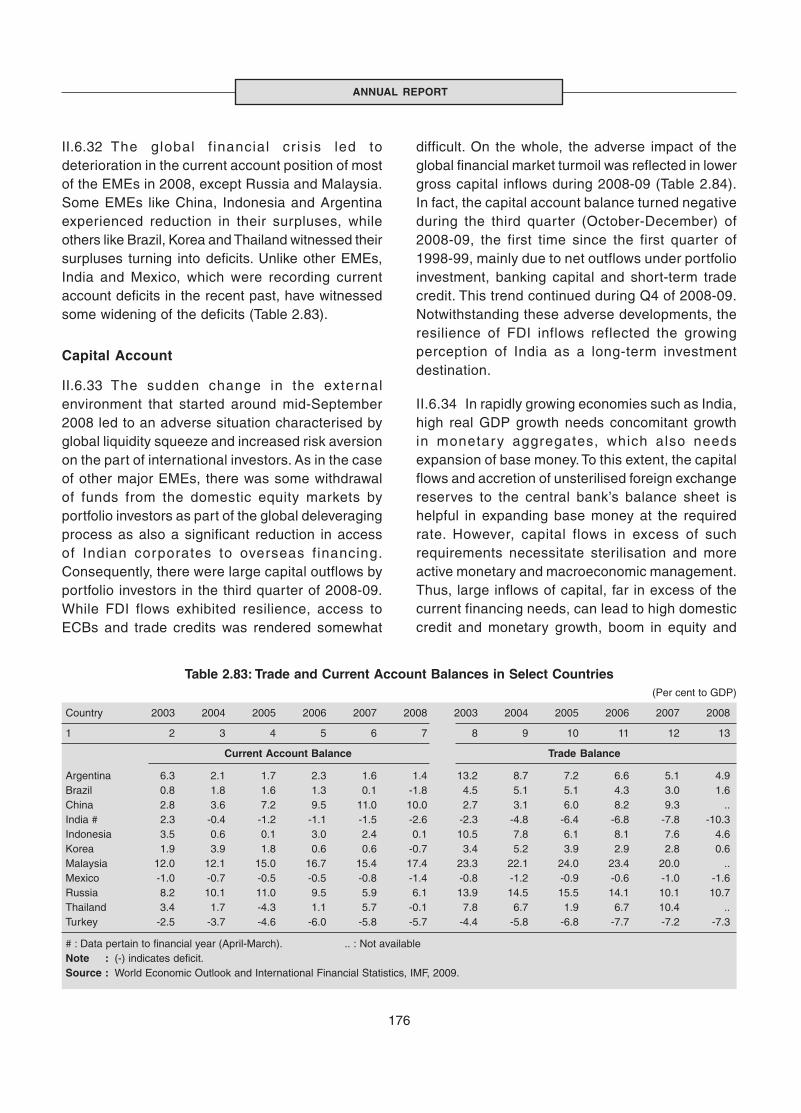
176
ANNUAL REPORT
II.6.32 The global f inancial cr isis led todeterioration in the current account position of mostof the EMEs in 2008, except Russia and Malaysia.Some EMEs like China, Indonesia and Argentinaexperienced reduction in their surpluses, whileothers like Brazil, Korea and Thailand witnessed theirsurpluses turning into deficits. Unlike other EMEs,India and Mexico, which were recording currentaccount deficits in the recent past, have witnessedsome widening of the deficits (Table 2.83).
Capital Account
II.6.33 The sudden change in the externalenvironment that started around mid-September2008 led to an adverse situation characterised byglobal liquidity squeeze and increased risk aversionon the part of international investors. As in the caseof other major EMEs, there was some withdrawalof funds from the domestic equity markets byportfolio investors as part of the global deleveragingprocess as also a significant reduction in accessof Indian corporates to overseas financing.Consequently, there were large capital outflows byportfolio investors in the third quarter of 2008-09.While FDI flows exhibited resilience, access toECBs and trade credits was rendered somewhat
Table 2.83: Trade and Current Account Balances in Select Countries(Per cent to GDP)
Country 2003 2004 2005 2006 2007 2008 2003 2004 2005 2006 2007 2008
1 2 3 4 5 6 7 8 9 10 11 12 13
Current Account Balance Trade Balance
Argentina 6.3 2.1 1.7 2.3 1.6 1.4 13.2 8.7 7.2 6.6 5.1 4.9Brazil 0.8 1.8 1.6 1.3 0.1 -1.8 4.5 5.1 5.1 4.3 3.0 1.6China 2.8 3.6 7.2 9.5 11.0 10.0 2.7 3.1 6.0 8.2 9.3 ..India # 2.3 -0.4 -1.2 -1.1 -1.5 -2.6 -2.3 -4.8 -6.4 -6.8 -7.8 -10.3Indonesia 3.5 0.6 0.1 3.0 2.4 0.1 10.5 7.8 6.1 8.1 7.6 4.6Korea 1.9 3.9 1.8 0.6 0.6 -0.7 3.4 5.2 3.9 2.9 2.8 0.6Malaysia 12.0 12.1 15.0 16.7 15.4 17.4 23.3 22.1 24.0 23.4 20.0 ..Mexico -1.0 -0.7 -0.5 -0.5 -0.8 -1.4 -0.8 -1.2 -0.9 -0.6 -1.0 -1.6Russia 8.2 10.1 11.0 9.5 5.9 6.1 13.9 14.5 15.5 14.1 10.1 10.7Thailand 3.4 1.7 -4.3 1.1 5.7 -0.1 7.8 6.7 1.9 6.7 10.4 ..Turkey -2.5 -3.7 -4.6 -6.0 -5.8 -5.7 -4.4 -5.8 -6.8 -7.7 -7.2 -7.3
# : Data pertain to financial year (April-March). .. : Not availableNote : (-) indicates deficit.Source : World Economic Outlook and International Financial Statistics, IMF, 2009.
difficult. On the whole, the adverse impact of theglobal financial market turmoil was reflected in lowergross capital inflows during 2008-09 (Table 2.84).In fact, the capital account balance turned negativeduring the third quarter (October-December) of2008-09, the first time since the first quarter of1998-99, mainly due to net outflows under portfolioinvestment, banking capital and short-term tradecredit. This trend continued during Q4 of 2008-09.Notwithstanding these adverse developments, theresilience of FDI inflows reflected the growingperception of India as a long-term investmentdestination.
II.6.34 In rapidly growing economies such as India,high real GDP growth needs concomitant growthin monetary aggregates, which also needsexpansion of base money. To this extent, the capitalflows and accretion of unsterilised foreign exchangereserves to the central bank’s balance sheet ishelpful in expanding base money at the requiredrate. However, capital flows in excess of suchrequirements necessitate sterilisation and moreactive monetary and macroeconomic management.Thus, large inflows of capital, far in excess of thecurrent financing needs, can lead to high domesticcredit and monetary growth, boom in equity and
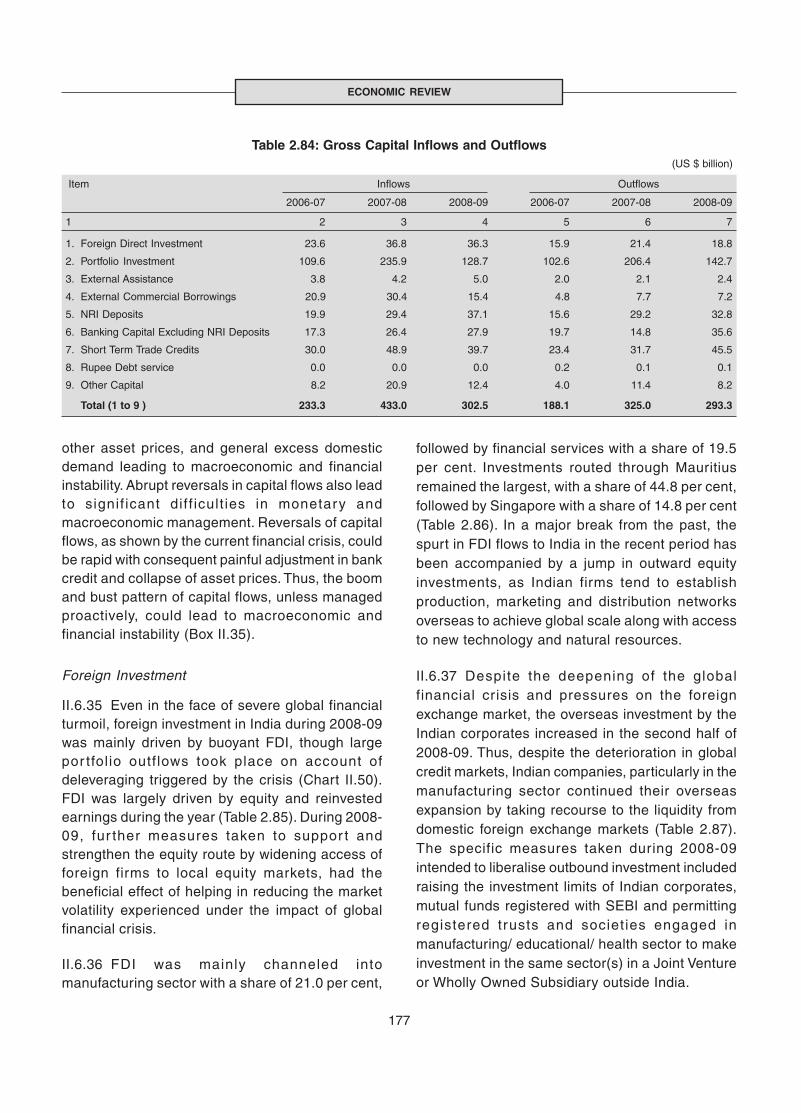
177
ECONOMIC REVIEW
other asset prices, and general excess domesticdemand leading to macroeconomic and financialinstability. Abrupt reversals in capital flows also leadto signif icant diff icult ies in monetary andmacroeconomic management. Reversals of capitalflows, as shown by the current financial crisis, couldbe rapid with consequent painful adjustment in bankcredit and collapse of asset prices. Thus, the boomand bust pattern of capital flows, unless managedproactively, could lead to macroeconomic andfinancial instability (Box II.35).
Foreign Investment
II.6.35 Even in the face of severe global financialturmoil, foreign investment in India during 2008-09was mainly driven by buoyant FDI, though largepor tfol io outflows took place on account ofdeleveraging triggered by the crisis (Chart II.50).FDI was largely driven by equity and reinvestedearnings during the year (Table 2.85). During 2008-09, fur ther measures taken to suppor t andstrengthen the equity route by widening access offoreign firms to local equity markets, had thebeneficial effect of helping in reducing the marketvolatility experienced under the impact of globalfinancial crisis.
II.6.36 FDI was mainly channeled intomanufacturing sector with a share of 21.0 per cent,
followed by financial services with a share of 19.5per cent. Investments routed through Mauritiusremained the largest, with a share of 44.8 per cent,followed by Singapore with a share of 14.8 per cent(Table 2.86). In a major break from the past, thespurt in FDI flows to India in the recent period hasbeen accompanied by a jump in outward equityinvestments, as Indian firms tend to establishproduction, marketing and distribution networksoverseas to achieve global scale along with accessto new technology and natural resources.
II.6.37 Despite the deepening of the globalfinancial crisis and pressures on the foreignexchange market, the overseas investment by theIndian corporates increased in the second half of2008-09. Thus, despite the deterioration in globalcredit markets, Indian companies, particularly in themanufacturing sector continued their overseasexpansion by taking recourse to the liquidity fromdomestic foreign exchange markets (Table 2.87).The specific measures taken during 2008-09intended to liberalise outbound investment includedraising the investment limits of Indian corporates,mutual funds registered with SEBI and permittingregistered trusts and societies engaged inmanufacturing/ educational/ health sector to makeinvestment in the same sector(s) in a Joint Ventureor Wholly Owned Subsidiary outside India.
Table 2.84: Gross Capital Inflows and Outflows(US $ billion)
Item Inflows Outflows
2006-07 2007-08 2008-09 2006-07 2007-08 2008-09
1 2 3 4 5 6 7
1. Foreign Direct Investment 23.6 36.8 36.3 15.9 21.4 18.8
2. Portfolio Investment 109.6 235.9 128.7 102.6 206.4 142.7
3. External Assistance 3.8 4.2 5.0 2.0 2.1 2.4
4. External Commercial Borrowings 20.9 30.4 15.4 4.8 7.7 7.2
5. NRI Deposits 19.9 29.4 37.1 15.6 29.2 32.8
6. Banking Capital Excluding NRI Deposits 17.3 26.4 27.9 19.7 14.8 35.6
7. Short Term Trade Credits 30.0 48.9 39.7 23.4 31.7 45.5
8. Rupee Debt service 0.0 0.0 0.0 0.2 0.1 0.1
9. Other Capital 8.2 20.9 12.4 4.0 11.4 8.2
Total (1 to 9 ) 233.3 433.0 302.5 188.1 325.0 293.3
178
ANNUAL REPORT
Private capital flows to EMEs have grown rapidly sincethe 1980s, but with sporadic volatility over time. Largecapital flows to the EMEs could be attributed to a varietyof push and pull factors. The pull factors that have led tohigher capital flows include strong growth in the EMEsover the past decade, reduction in inf lat ion,macroeconomic stability, opening up of capital accountsand buoyant growth prospects. The stance of monetarypolicy in the advanced economies has been recognisedas an important push factor in the sense that periods ofloose monetary policy and search for yield in the advancedeconomies encourages large capital inflows to the EMEsand vice versa in periods of tighter monetary policy. Thus,cycles in monetary policy in the advanced economies haveaffected the cycles and volatility in capital flows to theEMEs. Innovations in information technology have alsocontributed to the two-way movement in capital flows.Overall, in response to these factors, capital flows to theEMEs since the early 1980s have grown over time, butwith large volatility (Committee on Global FinancialSystem, 2009).
Reversals of capital flows from the EMEs, as experiencedagain following the current financial crisis, as in periods ofprevious crisis in EMEs, are generally quick, entailingpainful adjustment costs in the economy. Such reversalsand associated loss of foreign exchange reserves alsooften give rise to contraction in the central bank’s balancesheet, creating challenges for monetary management inthe form of offsetting adjustments in domestic assets.
As the historical evidence suggests, extended periodsof monetary accommodation in the advanced economiesoften coincided with large capital flows to EMEs. Inresponse to the ongoing global financial crisis, monetarypolicies across the advanced economies have again beenaggressively eased and policy interest rates have reachedlevels even lower than those which were witnessed in2002. Base money in the US has increased substantiallyin the recent months; similar is the case in many advancedeconomies. Given such a large monetary expansion andthe past experiences, large capital inflows to the EMEscould resume in the foreseeable future, if the unwindingof the current monetary expansion is not made in atimely fashion (Mohan, 2009).
Box II.35Global Financial Crisis and Capital Flows
India received large capital inflows in recent years prior tothe onset of the global financial crisis. The Reserve Bank hadto sterilise the liquidity impact of large foreign exchangepurchases through a series of increases in the cash reserveratio and issuances under the Market Stabilisation Scheme.In the aftermath of the collapse of Lehman brothers, however,and the chain of events that unfolded, portfolio investors soldheavily in domestic equity markets as part of their deleveragingprocess and repatriated the sales proceeds, as in other majorEMEs. On the whole, net capital inflows during 2008-09 weresubstantially lower than in 2007-08 and there was a depletionof reserves as the capital flows were insufficient to financecurrent account deficits. This had put pressures in the foreignexchange market as well as domestic money marketsprompting the Reserve Bank to undertake various measuresto augment forex as well as rupee liquidity. The debt creatingflows also reduced reflecting limited availability of credits aswell as higher costs of borrowings from the international creditmarkets. The Reserve Bank and the Government of India tooka number of measures to augment capital flows, whichyielded positive results in terms of a turnaround in NRI flowsas well as net inflows under FIIs, especially from thebeginning of the current financial year 2009-10. A positivefeature, however, has been the resilience shown by foreigndirect investment flows in the face of the deepening of theglobal financial crisis, which reflect the attractiveness of Indiaas a preferred investment destination. Overall, the adverseimpact of the global financial crisis on capital flows wasmanaged through drawdown of reserves and policies toattract inflows without severely disrupting the financialmarkets. The prudent management of the capital accountand the self insurance in the form of adequate foreignexchange reserves has helped India in moderating the impactof any crisis driven capital outflows from India.
References:
1. Mohan, Rakesh (2009), “Global Financial Crisis:Causes, Consequences and India’s Prospects”,Speech at London Business School on April 23.
2. Bank for International Settlements (2009), Report ofthe CGFS Working Group on Capital Flows andEmerging Market Economies (Chairman: RakeshMohan), January.
II.6.38 Although India was one of the largestrecipients of portfolio inflows among the EMEs in2007, such flows comprising foreign institutionalinvestors’ (FIIs) investments and Amer icanDepository Receipts (ADRs)/Global DepositoryReceipts (GDRs) witnessed large outflows in
2008-09 with the unfolding of global financial crisis(see Table 2.85). On the back of volatility andweaknesses in the major global stock marketsand the process of withdrawal of funds from theEMEs, portfolio equity outflows from the Indianmarkets had started as early as February 2008
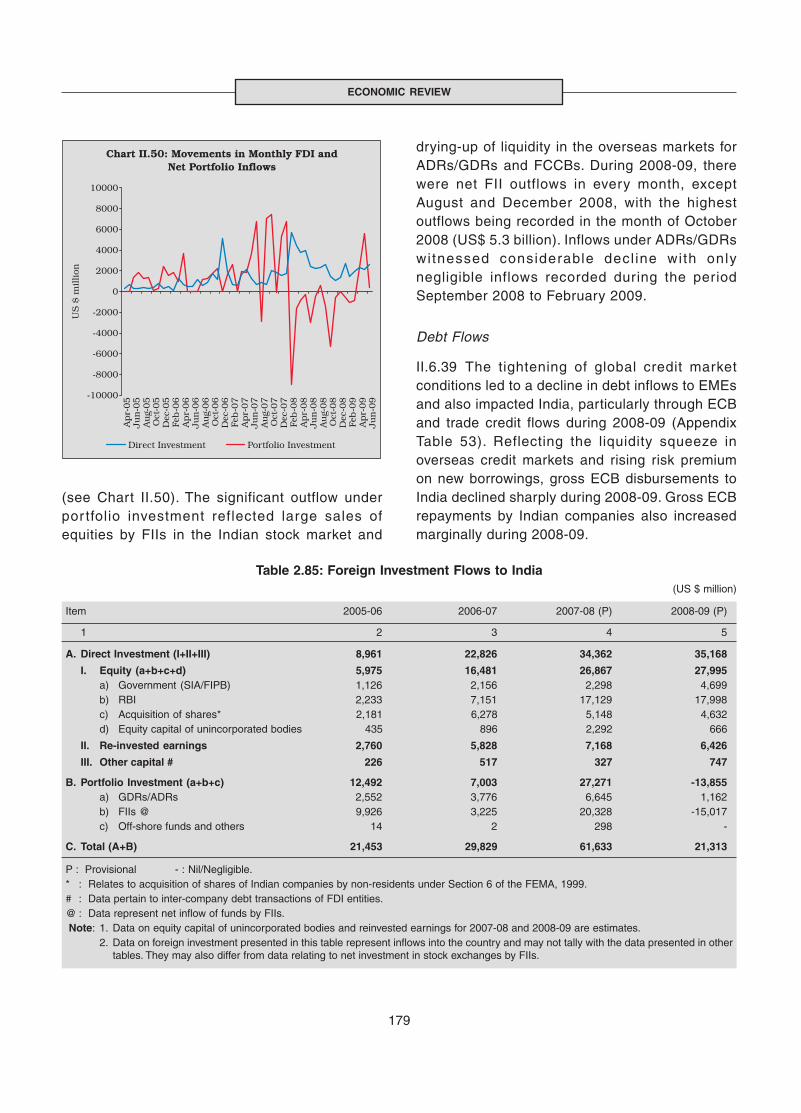
179
ECONOMIC REVIEW
(see Chart II.50). The significant outflow underpor tfolio investment reflected large sales ofequities by FIIs in the Indian stock market and
drying-up of liquidity in the overseas markets forADRs/GDRs and FCCBs. During 2008-09, therewere net FII outflows in every month, exceptAugust and December 2008, with the highestoutflows being recorded in the month of October2008 (US$ 5.3 billion). Inflows under ADRs/GDRswitnessed considerable decl ine with onlynegligible inflows recorded during the periodSeptember 2008 to February 2009.
Debt Flows
II.6.39 The tightening of global credit marketconditions led to a decline in debt inflows to EMEsand also impacted India, particularly through ECBand trade credit flows during 2008-09 (AppendixTable 53). Reflecting the liquidity squeeze inoverseas credit markets and rising risk premiumon new borrowings, gross ECB disbursements toIndia declined sharply during 2008-09. Gross ECBrepayments by Indian companies also increasedmarginally during 2008-09.
Table 2.85: Foreign Investment Flows to India(US $ million)
Item 2005-06 2006-07 2007-08 (P) 2008-09 (P)
1 2 3 4 5
A. Direct Investment (I+II+III) 8,961 22,826 34,362 35,168
I. Equity (a+b+c+d) 5,975 16,481 26,867 27,995a) Government (SIA/FIPB) 1,126 2,156 2,298 4,699b) RBI 2,233 7,151 17,129 17,998c) Acquisition of shares* 2,181 6,278 5,148 4,632d) Equity capital of unincorporated bodies 435 896 2,292 666
II. Re-invested earnings 2,760 5,828 7,168 6,426
III. Other capital # 226 517 327 747
B. Portfolio Investment (a+b+c) 12,492 7,003 27,271 -13,855a) GDRs/ADRs 2,552 3,776 6,645 1,162b) FIIs @ 9,926 3,225 20,328 -15,017c) Off-shore funds and others 14 2 298 -
C. Total (A+B) 21,453 29,829 61,633 21,313
P : Provisional - : Nil/Negligible.* : Relates to acquisition of shares of Indian companies by non-residents under Section 6 of the FEMA, 1999.# : Data pertain to inter-company debt transactions of FDI entities.@ : Data represent net inflow of funds by FIIs. Note: 1. Data on equity capital of unincorporated bodies and reinvested earnings for 2007-08 and 2008-09 are estimates.
2. Data on foreign investment presented in this table represent inflows into the country and may not tally with the data presented in othertables. They may also differ from data relating to net investment in stock exchanges by FIIs.
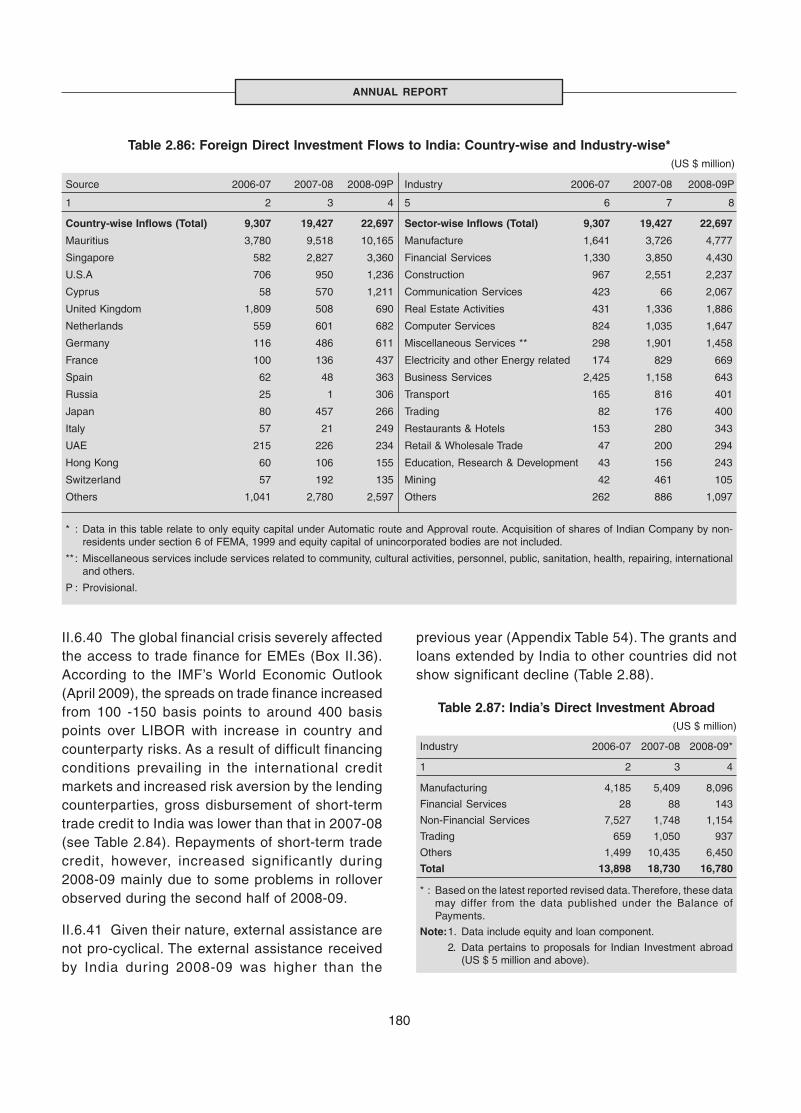
180
ANNUAL REPORT
II.6.40 The global financial crisis severely affectedthe access to trade finance for EMEs (Box II.36).According to the IMF’s World Economic Outlook(April 2009), the spreads on trade finance increasedfrom 100 -150 basis points to around 400 basispoints over LIBOR with increase in country andcounterparty risks. As a result of difficult financingconditions prevailing in the international creditmarkets and increased risk aversion by the lendingcounterparties, gross disbursement of short-termtrade credit to India was lower than that in 2007-08(see Table 2.84). Repayments of short-term tradecredit, however, increased significantly during2008-09 mainly due to some problems in rolloverobserved during the second half of 2008-09.
II.6.41 Given their nature, external assistance arenot pro-cyclical. The external assistance receivedby India during 2008-09 was higher than the
previous year (Appendix Table 54). The grants andloans extended by India to other countries did notshow significant decline (Table 2.88).
Country-wise Inflows (Total) 9,307 19,427 22,697
Mauritius 3,780 9,518 10,165
Singapore 582 2,827 3,360
U.S.A 706 950 1,236
Cyprus 58 570 1,211
United Kingdom 1,809 508 690
Netherlands 559 601 682
Germany 116 486 611
France 100 136 437
Spain 62 48 363
Russia 25 1 306
Japan 80 457 266
Italy 57 21 249
UAE 215 226 234
Hong Kong 60 106 155
Switzerland 57 192 135
Others 1,041 2,780 2,597
Sector-wise Inflows (Total) 9,307 19,427 22,697
Manufacture 1,641 3,726 4,777
Financial Services 1,330 3,850 4,430
Construction 967 2,551 2,237
Communication Services 423 66 2,067
Real Estate Activities 431 1,336 1,886
Computer Services 824 1,035 1,647
Miscellaneous Services ** 298 1,901 1,458
Electricity and other Energy related 174 829 669
Business Services 2,425 1,158 643
Transport 165 816 401
Trading 82 176 400
Restaurants & Hotels 153 280 343
Retail & Wholesale Trade 47 200 294
Education, Research & Development 43 156 243
Mining 42 461 105
Others 262 886 1,097
Table 2.86: Foreign Direct Investment Flows to India: Country-wise and Industry-wise*(US $ million)
Source 2006-07 2007-08 2008-09P
1 2 3 4
Industry 2006-07 2007-08 2008-09P
5 6 7 8
* : Data in this table relate to only equity capital under Automatic route and Approval route. Acquisition of shares of Indian Company by non-residents under section 6 of FEMA, 1999 and equity capital of unincorporated bodies are not included.
** : Miscellaneous services include services related to community, cultural activities, personnel, public, sanitation, health, repairing, internationaland others.
P : Provisional.
Table 2.87: India’s Direct Investment Abroad(US $ million)
Industry 2006-07 2007-08 2008-09*
1 2 3 4
Manufacturing 4,185 5,409 8,096
Financial Services 28 88 143
Non-Financial Services 7,527 1,748 1,154
Trading 659 1,050 937
Others 1,499 10,435 6,450
Total 13,898 18,730 16,780
* : Based on the latest reported revised data. Therefore, these datamay differ from the data published under the Balance ofPayments.
Note:1. Data include equity and loan component.
2. Data pertains to proposals for Indian Investment abroad(US $ 5 million and above).
181
ECONOMIC REVIEW
The global credit squeeze in the second half of 2008-09affected the exporters and importers in terms of the accessto and the cost of trade credit. This necessitated institutionof specific policy measures to address the concernsrelating to trade credit. Trade finance often takes manyforms depending on the extent of trust betweencounterparties and the degree of financing needed fromthe banks. When the transaction is purely between theimporter and the exporter, it could be done on a cash-in-advance basis (payment is received before goods areshipped), or on an open account basis (shipment occursbefore payment is received). Otherwise, banks play therole as a facilitator for the movements of merchandisearound the globe and offer products to mitigate the risk ofnonpayment (such as letters of credit), the credit risks(such as through export credit insurance) besides tradelending (also called export working capital) against thesecurity of the actual goods. The developments in theinternational finance in recent years, however, have blurredthe distinction between trade credits and financial credits,which has led to a drop in the confidence of internationalbanks about the payment priority accorded to trade creditsover others at times of crisis. Trade finance has alsobecome more vulnerable to capital flight, induced by thedwindling confidence of international investors during thetime of financial stress. With trade credit lines usually beingshort-term and capable of being redeemed quickly at par,they are considered operationally the easiest asset classfor a bank to cut at times of heightened risk aversion, oftenin the form of not rolling over maturing credits, as a part ofbanks’ policy of overall reductions in country exposuresduring a crisis.
The deteriorating global financial market conditions haveled to a dramatic reduction in the total volume of financingflows provided by banks for all activities, including tradefinance. The combination of the higher cost of funds,liquidity premiums, and higher risk have resulted in asharp increase in the price of short-term trade finance,according to the IMF. As the increase in cost alongwithdeclining availability of finance has the potential toseverely undermine the current effor ts to stimulatedomestic economies, co-ordinated initiatives globally tosuppor t trade finance have been under taken. Forinstance, the G-20 has agreed to ensure availability of atleast US$ 250 billion over the next two years to supporttrade finance. The proposals include the use of a varietyof financing tools to address the general shortages inliquidity, reduction in the risk premiums by extendingguarantees as well as to induce the return of privatefinancial flows.
Box II.36Trade Credit
Although the spurt in costs of trade finance is global, thedecline in availability of trade credit has been felt more bythe emerging market economies (EMEs), especially theAsian EMEs, where much of inter-regional trade is in low-profit margin items that are part of manufacturing supplychain for exports to advanced economies. The IMF-Bankers’ Association for Finance and Trade (BAFT)’ssurvey of advanced, emerging market and developingcountry banks on the bank-intermediated forms ofinternational trade finance indicated that the price of tradefinance increased sharply due to increased cost of fundsto the banks, which has outweighed the dampening priceeffect of less restr ictive monetary policies in manyadvanced economies. Higher capital requirementsimposed by regulators and by banks on their own lendingalso increased the spreads between the banks’ costs offunds and the price of trade finance to their customers.Additionally, fear of default/counterparty risk is causingbanks to tighten lending guidelines. The Survey expectsthe current pricing trends to continue in 2009 and suggeststhat emerging markets and commodities trade are likelyto be the hardest hit.
The trade finance problem is also sector-specific, apartfrom being country/region specific. India has been relativelyless affected by the liquidity squeeze in international creditmarkets. Despite tightness in the overseas markets sinceSeptember 2008, the disbursement of short-term credit toIndia has hovered around its monthly trend of over US$ 3billion in the subsequent months. Although the higherrepayments during the second half of 2008-09 suggestedsome problems in rolling over maturing trade credits, thecontinuing trend in disbursement indicates no significantproblem in servicing short-term debt. This is also indicativeof the confidence enjoyed by the Indian importers in theinternational financial markets. The various policy initiativestaken in this regard, such as hike in the all-in-cost ceilingfor raising trade credit, enhancement of limit on overseasborrowings by banks, extending the line of credit as wellas swap facility to the EXIM Bank, etc., have also helpedin easing the pressure on trade financing.
References:
1. Dorsey, Thomas (2009), “Trade Finance Stumbles”,Finance and Development, International MonetaryFund, March.
2. Wang, Jian-Ye and Helaway Tadesse (2005), ''AnOverview'', in J. Y. Wang and M. Ronci (eds.) Accessto Trade Finance in Times of Crisis, InternationalMonetary Fund.

182
ANNUAL REPORT
Table 2.90: Ceiling Interest Rates on NRI Deposits
Period NR(E)RA FCNR(B)Deposits Deposits
1 2 3
(+ )/ (-) LIBOR/SWAP Rate
April 24, 2007 LIBOR/SWAP rate -75 basis points
September 16, 2008 + 50 basis points - 25 basis points
October 15, 2008 + 100 basis points + 25 basis points
November 15, 2008 + 175 basis points + 100 basis points
Table 2.89: Balances under NRI Deposit Schemes(US$ million)
Scheme Outstanding Net Inflows(end-March) (April-March)
2008 2009 2007-08 2008-09
1 2 3 4 5
FCNR(B) 14,168 13,211 -960 -957
NR(E)RA 26,716 23,570 109 2,508
NRO 2,788 4,773 1030 2,738
Total 43,672 41,554 179 4,289
Table 2.88: India’s Grants and Loans to Foreign Governments(US $ million)
Item 2007-08 2008-09
Grants Loan Total Grants Loan Total
1 2 3 4 5 6 7
A. Plan (External Affairs) 63 12 75 73 25 98
B. Non-Plan (i+ii+iii) 359 17 376 313 1 314
i. External Affairs 349 0 349 304 0 304
Bangladesh 15 0 15 1 0 1
Bhutan 132 0 132 121 0 121
Nepal 25 0 25 22 0 22
Aid to African countries 12 0 12 21 0 21
Maldives 5 0 5 1 0 1
Myanmar 5 0 5 7 0 7
Sri Lanka 7 0 7 7 0 7
Central Asia 5 0 5 4 0 4
ITEC Programme 15 0 15 14 0 14
Latin African Countries 0 0 0 0 0 0
Afghanistan 83 0 83 74 0 74
Other Developing Countries 45 0 45 33 0 33
ii. Finance 10 17 27 8 1 9
iii. Shipping 1 0 1 1 0 1
C. Grand Total (A+B) 422 29 451 386 26 412
Source : Union Budgets, Government of India.
II.6.42 There was a turnaround in the flows underthe NRI deposit schemes as reflected in significantrise in inflow during 2008-09, responding to thehikes in the ceiling interest rates on NRI depositschemes by the Reserve Bank (Table 2.89). Withthe deepening of financial crisis in September 2008,the ceiling interest rates on NRI deposits wererevised upwards thrice in order to encourageinflows (Table 2.90).
EXTERNAL DEBT
II.6.43 The outstanding external debt stock of Indiamodestly increased at end-March 2009, mainly onaccount of increase in long-term debt (Table 2.91and Appendix Table 55). The increase in long-termdebt was mainly due to increase in trade credit andbilateral debt. The outstanding debt under NRIdeposits declined over the level at end-March 2008mainly due to valuation effects as there were positive

183
ECONOMIC REVIEW
inflows under NRI deposits during 2008-09. In termsof original maturity, the shares of long-term debtand short-term debt in the total debt were 78.5 percent and 21.5 per cent, respectively, at end-March2009. In terms of currency composition, US dollardenominated debt accounted for 57.1 per cent oftotal external debt at end-March 2009, followed byJapanese Yen (14.2 per cent), Indian Rupee (13.2per cent), SDR (9.2 per cent) and Euro (4.1 per cent).
Short-term Debt
II.6.44 Despite apprehensions in the second halfof 2008-09 on the availability of short-term tradecredits due to tightness in the global creditmarkets, financing of short-term trade credit didnot pose much problem in India. Based on residualmaturity, the total short-term debt obligationsaccounted for 40.6 per cent of the total externaldebt outstanding at end-March 2009. The totalshort-term debt in terms of residual maturity (US$93.3 billion) at end-March 2009 consists of shortterm debt based on original maturity of US$ 49.4bil l ion and long-term external debt due for
Table 2.92: External Debt Service Payments
Item 2006-07 2007-08 2008-09
1 2 3 4
Components (US$ million)
1. External Assistance @ 2,942 3,241 3,381
2. External Commercial Borrowings* 6,331 9,771 10,401
3. NRI Deposits (Interest Payments) 1,969 1813 1,547
4. Rupee Debt Service 162 121 101
5. Total Debt Servicing 11,404 14,946 15,430
6. Total Current Receipts# 242,811 314,014 337,095
Indicators ( Per cent)
7. External Debt to GDP Ratio 18.1 19.0 22.0
8. Short Term Debt to Total Debt Ratio 16.4 20.9 21.5
9. Short Term Debt to ForeignExchange Reserves Ratio 14.1 15.2 19.6
10. Foreign Exchange Reserves toExternal Debt Ratio 116.2 137.9 109.6
11. Debt Service Ratio 4.7 4.8 4.6
12. Interest Payments to CurrentReceipts Ratio 2.3 2.1 1.9
13. Debt to Current Receipts Ratio 70.6 71.5 68.2
14. Liability Service Ratio 6.1 5.9 5.5
@ : Inclusive of non-Government loans.* : Inclusive of interest components of trade credits.# : Excluding official transfers.Note: 1. Debt service payments in this table follow accrual method of
accounting consistent with balance of payments compilation andmay, therefore, vary from those recorded on cash basis.
2. The liability service represents debt service payments andpayments of profits and dividends as a ratio to current receipts.
Table 2.91: India’s External Debt
Item US $ million Percentage variation
Mar-08 Mar-09P Mar-08 Mar-09over over
Mar-07 Mar-08
1 2 3 4 5
1. Multilateral 39,490 39,566 11.8 0.2
2. Bilateral 19,701 20,587 22.6 4.5
3. IMF 0 0 0 0
4. Trade Credit 10,358 14,604 44.6 41.0
5. Commercial Borrowings 62,337 62,676 50.4 0.5
6. NRI Deposits 43,672 41,554 5.9 -4.8
7. Rupee Debt 2,016 1,527 3.3 -24.3
8. Short-Term Debt 46,999 49,373 67.1 5.1
Total Debt (1 to 8) 224,573 229,887 31.1 2.4
Memo Items:
A. Long-term Debt 177,574 180,514 24.0 1.7(1 to 7)
B. Short-term Debt 46,999 49,373 67.1 5.1
P : Provisional.Source: Ministry of Finance, Government of India and Reserve
Bank of India.
repayment within one year of US$ 43.9 billion. Outof the US$ 43.9 billion, the NRI deposits constitutethe major portion (US$ 32.1 billion), which aremore likely to be rolled over going by the past trend.
II.6.45 The short-term debt as ratio to total debtand to foreign exchange reserves increased at end-March 2009 (Table 2.92). The debt service ratioremained stable and reasonably low. The majorindicators of external sector vulnerability reflectIndia’s continued resilience in the face of one ofthe severest global crises.
II.6.46 The data released by the World Bank onexternal debt for the top ten debtor developingcountries for the calendar year 2007 revealed thatIndia continued to be at the fifth position amongthe countries having the largest external debt stocks
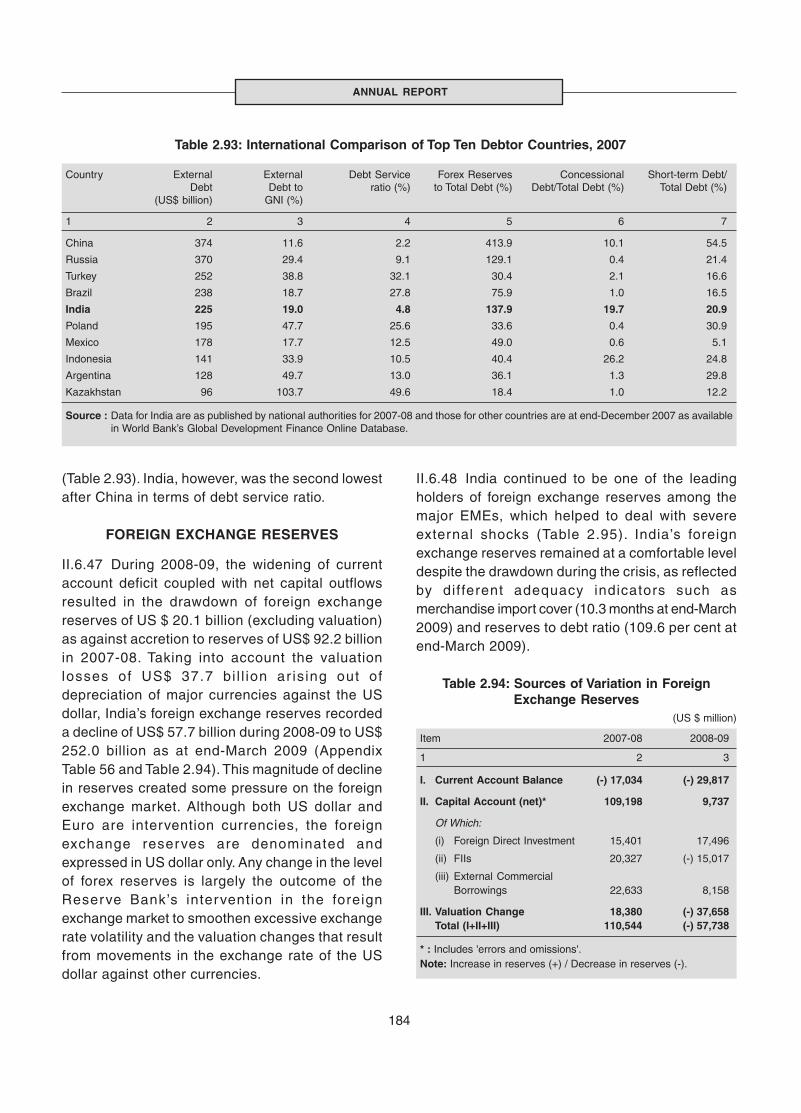
184
ANNUAL REPORT
(Table 2.93). India, however, was the second lowestafter China in terms of debt service ratio.
FOREIGN EXCHANGE RESERVES
II.6.47 During 2008-09, the widening of currentaccount deficit coupled with net capital outflowsresulted in the drawdown of foreign exchangereserves of US $ 20.1 billion (excluding valuation)as against accretion to reserves of US$ 92.2 billionin 2007-08. Taking into account the valuationlosses of US$ 37.7 bi l l ion ar is ing out ofdepreciation of major currencies against the USdollar, India’s foreign exchange reserves recordeda decline of US$ 57.7 billion during 2008-09 to US$252.0 billion as at end-March 2009 (AppendixTable 56 and Table 2.94). This magnitude of declinein reserves created some pressure on the foreignexchange market. Although both US dollar andEuro are intervention currencies, the foreignexchange reserves are denominated andexpressed in US dollar only. Any change in the levelof forex reserves is largely the outcome of theReserve Bank’s intervention in the foreignexchange market to smoothen excessive exchangerate volatility and the valuation changes that resultfrom movements in the exchange rate of the USdollar against other currencies.
Table 2.93: International Comparison of Top Ten Debtor Countries, 2007
Country External External Debt Service Forex Reserves Concessional Short-term Debt/Debt Debt to ratio (%) to Total Debt (%) Debt/Total Debt (%) Total Debt (%)
(US$ billion) GNI (%)
1 2 3 4 5 6 7
China 374 11.6 2.2 413.9 10.1 54.5
Russia 370 29.4 9.1 129.1 0.4 21.4
Turkey 252 38.8 32.1 30.4 2.1 16.6
Brazil 238 18.7 27.8 75.9 1.0 16.5
India 225 19.0 4.8 137.9 19.7 20.9
Poland 195 47.7 25.6 33.6 0.4 30.9
Mexico 178 17.7 12.5 49.0 0.6 5.1
Indonesia 141 33.9 10.5 40.4 26.2 24.8
Argentina 128 49.7 13.0 36.1 1.3 29.8
Kazakhstan 96 103.7 49.6 18.4 1.0 12.2
Source : Data for India are as published by national authorities for 2007-08 and those for other countries are at end-December 2007 as availablein World Bank’s Global Development Finance Online Database.
Table 2.94: Sources of Variation in ForeignExchange Reserves
(US $ million)
Item 2007-08 2008-09
1 2 3
I. Current Account Balance (-) 17,034 (-) 29,817
II. Capital Account (net)* 109,198 9,737
Of Which:
(i) Foreign Direct Investment 15,401 17,496
(ii) FIIs 20,327 (-) 15,017
(iii) External CommercialBorrowings 22,633 8,158
III. Valuation Change 18,380 (-) 37,658Total (I+II+III) 110,544 (-) 57,738
* : Includes 'errors and omissions'.Note: Increase in reserves (+) / Decrease in reserves (-).
II.6.48 India continued to be one of the leadingholders of foreign exchange reserves among themajor EMEs, which helped to deal with severeexternal shocks (Table 2.95). India’s foreignexchange reserves remained at a comfortable leveldespite the drawdown during the crisis, as reflectedby different adequacy indicators such asmerchandise import cover (10.3 months at end-March2009) and reserves to debt ratio (109.6 per cent atend-March 2009).

185
ECONOMIC REVIEW
II.6.49 The Reserve Bank’s holding of reserves inthe form of gold was at 357.8 tonnes as on March31, 2009, which in value terms amounted to about3.8 percent of the total reserves. Of this, 65 tonnesare held abroad since 1991 with the Bank ofEngland and the Bank for International Settlements(BIS). Holdings of gold have remained unchangedand gold reserves are managed passively. Foreigncurrency assets (FCAs) of the RBI are held asassets in the Issue Department (foreign securities)as well as in the Banking Department (balancesheld abroad and investments). Gold is also held inthe Issue Department (under Gold coin and bullion)and in the Banking Department as well. AlthoughSDRs and Reserve Tranche Position (RTP) formpart of India’s official reserves, these are held bythe Government of India and are not reflected inthe Reserve Bank’s balance sheet.
Management of Foreign Exchange Reserves
II.6.50 Movements in the foreign currency reservesoccur mainly out of purchase and sale transactionsin foreign exchange by the Reserve Bank in themarket. In addit ion, there is income from
deployment of FCAs held in the portfolio of theReserve Bank. External aid receipts of theGovernment of India also flow into the reserves. Inline with international practices in this regard, theReserve Bank follows the practice of expressingthe foreign exchange reserves in US dollar termsand, hence, the periodic currency revaluations alsoimpact the level of reserves.
II.6.51 The guiding objectives of foreign exchangereserves management in India are safety, liquidityand returns in line with the broad internationalpractices in this regard. The demands on country’sforeign exchange reserves may vary widely overtime, depending on a variety of factors includingthe exchange rate regime adopted by the countryand the extent of openness of the economy.
II.6.52 The RBI Act, 1934 provides the legalframework for deployment of the FCAs as well asgold. The investment universe for the FCAscomprises deposits with other central banks, theBank for International Settlements (BIS), foreigncommercial banks, securities representing debt ofsovereigns and supranational institutions withresidual maturity not exceeding 10 years and anyother instruments or institutions as approved by theCentral Board of the Reserve Bank in accordancewith the provisions of the Act (Table 2.96). Inpursuance of the Act, the investment strategy aimsat diversification with regard to currency, marketsand instruments. As such, the FCAs are investedin multi-currency and multi-market portfolios. Inresponse to the developments in the global financialmarkets in 2008-09, the strategy of the ReserveBank was suitably adjusted in regard to exposureto the foreign commercial banks. Decisionsinvolving the pattern of investments are driven bythe broad parameters of portfolio managementviz., safety, liquidity and returns. The FCAs areinvested in assets of the highest quality with asignificant proportion convertible into cash at shortnotice. The foreign exchange assets have beenplaced in various portfolio tranches to providebetter balancing of the various objectives of liquidityand return.
Table 2.95: Foreign Exchange Reserves ofthe Major EMEs
(End-March 2009)(US$ billion)
Country Forex Reserves*
1 2
1. China 1,953.7
2. Russia 368.1
3. Taiwan 300.1
4. India 242.4
5. South Korea 206.3
6. Brazil 189.4
7. Hong Kong 186.2
8. Singapore 166.3
9. Thailand 113.7
10. Mexico 85.5
* : Excluding gold except China.
Note : Foreign exchange reserves of India exclude US$ 250million invested in foreign currency denominated bondsissued by IIFC (UK) since March 20, 2009.
Source : The International Financial Statistics (IFS), IMF; andCentral Bank websites.
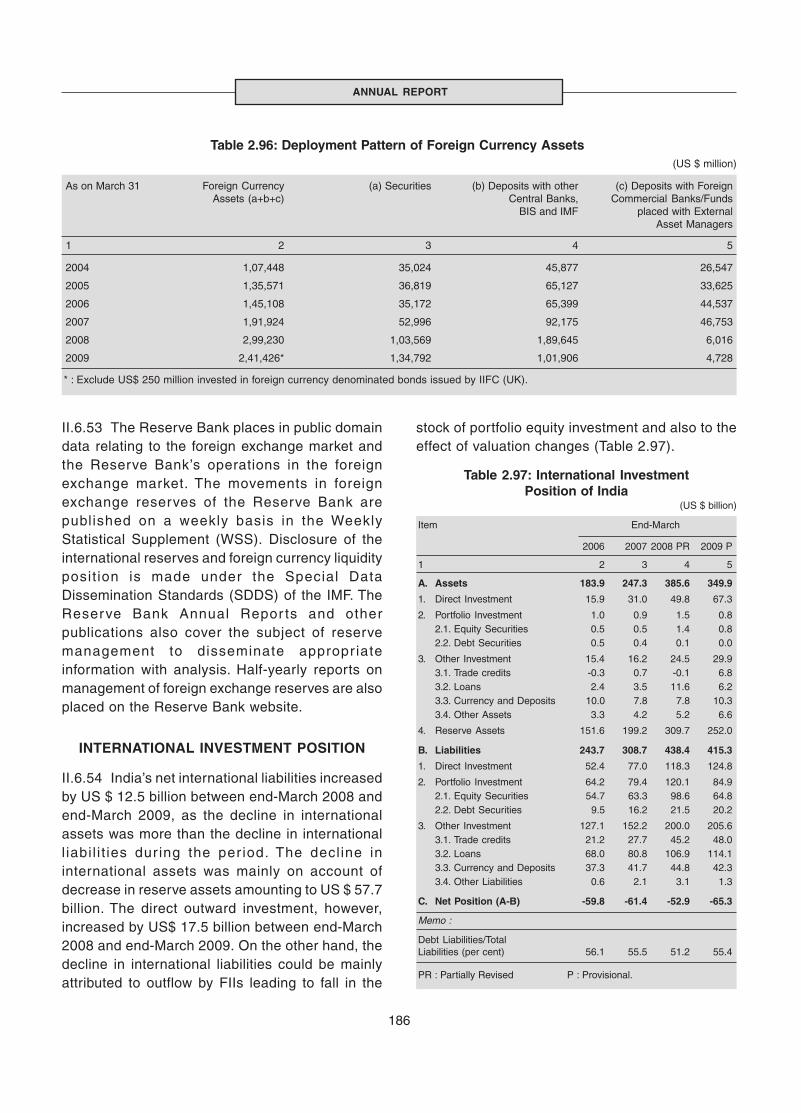
186
ANNUAL REPORT
II.6.53 The Reserve Bank places in public domaindata relating to the foreign exchange market andthe Reserve Bank’s operations in the foreignexchange market. The movements in foreignexchange reserves of the Reserve Bank arepublished on a weekly basis in the WeeklyStatistical Supplement (WSS). Disclosure of theinternational reserves and foreign currency liquidityposit ion is made under the Special DataDissemination Standards (SDDS) of the IMF. TheReserve Bank Annual Repor ts and otherpublications also cover the subject of reservemanagement to disseminate appropr iateinformation with analysis. Half-yearly reports onmanagement of foreign exchange reserves are alsoplaced on the Reserve Bank website.
INTERNATIONAL INVESTMENT POSITION
II.6.54 India’s net international liabilities increasedby US $ 12.5 billion between end-March 2008 andend-March 2009, as the decline in internationalassets was more than the decline in internationall iabi l i t ies dur ing the per iod. The decline ininternational assets was mainly on account ofdecrease in reserve assets amounting to US $ 57.7billion. The direct outward investment, however,increased by US$ 17.5 billion between end-March2008 and end-March 2009. On the other hand, thedecline in international liabilities could be mainlyattributed to outflow by FIIs leading to fall in the
Table 2.97: International InvestmentPosition of India
(US $ billion)
Item End-March
2006 2007 2008 PR 2009 P
1 2 3 4 5
A. Assets 183.9 247.3 385.6 349.9
1. Direct Investment 15.9 31.0 49.8 67.3
2. Portfolio Investment 1.0 0.9 1.5 0.82.1. Equity Securities 0.5 0.5 1.4 0.82.2. Debt Securities 0.5 0.4 0.1 0.0
3. Other Investment 15.4 16.2 24.5 29.93.1. Trade credits -0.3 0.7 -0.1 6.83.2. Loans 2.4 3.5 11.6 6.23.3. Currency and Deposits 10.0 7.8 7.8 10.33.4. Other Assets 3.3 4.2 5.2 6.6
4. Reserve Assets 151.6 199.2 309.7 252.0
B. Liabilities 243.7 308.7 438.4 415.3
1. Direct Investment 52.4 77.0 118.3 124.8
2. Portfolio Investment 64.2 79.4 120.1 84.92.1. Equity Securities 54.7 63.3 98.6 64.82.2. Debt Securities 9.5 16.2 21.5 20.2
3. Other Investment 127.1 152.2 200.0 205.63.1. Trade credits 21.2 27.7 45.2 48.03.2. Loans 68.0 80.8 106.9 114.13.3. Currency and Deposits 37.3 41.7 44.8 42.33.4. Other Liabilities 0.6 2.1 3.1 1.3
C. Net Position (A-B) -59.8 -61.4 -52.9 -65.3
Memo :
Debt Liabilities/TotalLiabilities (per cent) 56.1 55.5 51.2 55.4
PR : Partially Revised P : Provisional.
Table 2.96: Deployment Pattern of Foreign Currency Assets (US $ million)
As on March 31 Foreign Currency (a) Securities (b) Deposits with other (c) Deposits with ForeignAssets (a+b+c) Central Banks, Commercial Banks/Funds
BIS and IMF placed with ExternalAsset Managers
1 2 3 4 5
2004 1,07,448 35,024 45,877 26,547
2005 1,35,571 36,819 65,127 33,625
2006 1,45,108 35,172 65,399 44,537
2007 1,91,924 52,996 92,175 46,753
2008 2,99,230 1,03,569 1,89,645 6,016
2009 2,41,426* 1,34,792 1,01,906 4,728
* : Exclude US$ 250 million invested in foreign currency denominated bonds issued by IIFC (UK).
stock of portfolio equity investment and also to theeffect of valuation changes (Table 2.97).
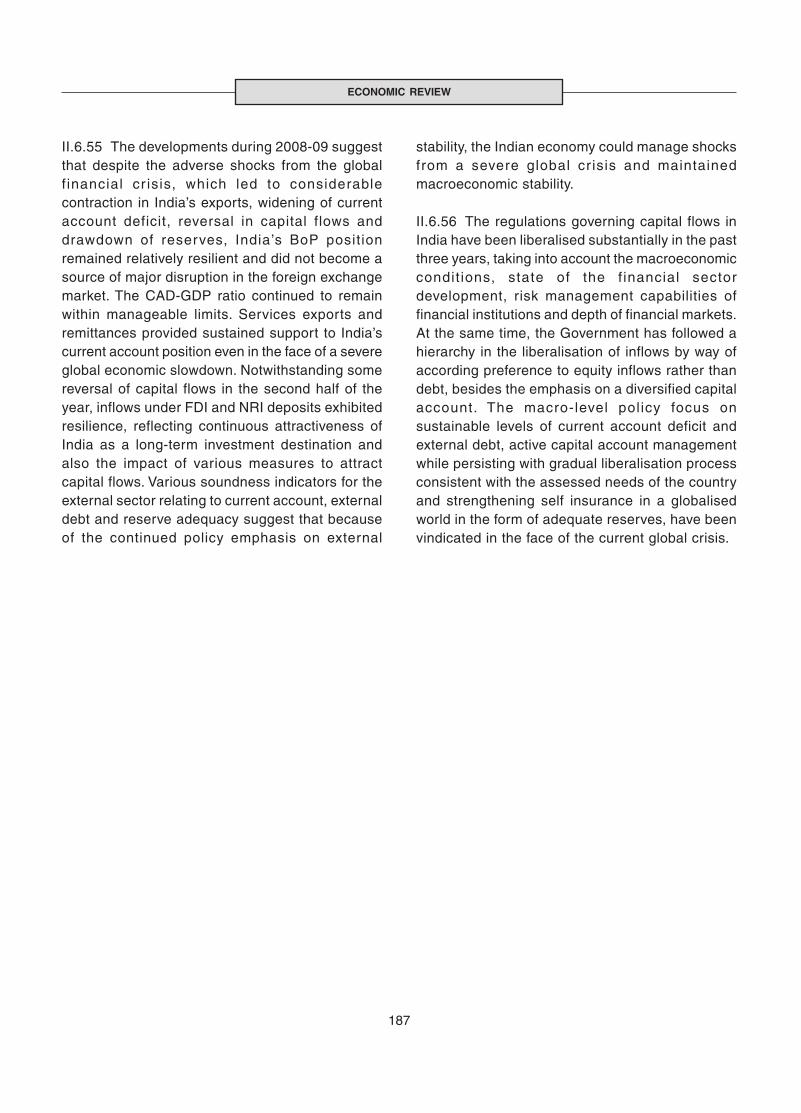
187
ECONOMIC REVIEW
II.6.55 The developments during 2008-09 suggestthat despite the adverse shocks from the globalf inancial cr isis, which led to considerablecontraction in India’s exports, widening of currentaccount deficit, reversal in capital flows anddrawdown of reserves, India’s BoP positionremained relatively resilient and did not become asource of major disruption in the foreign exchangemarket. The CAD-GDP ratio continued to remainwithin manageable limits. Services exports andremittances provided sustained support to India’scurrent account position even in the face of a severeglobal economic slowdown. Notwithstanding somereversal of capital flows in the second half of theyear, inflows under FDI and NRI deposits exhibitedresilience, reflecting continuous attractiveness ofIndia as a long-term investment destination andalso the impact of various measures to attractcapital flows. Various soundness indicators for theexternal sector relating to current account, externaldebt and reserve adequacy suggest that becauseof the continued policy emphasis on external
stability, the Indian economy could manage shocksfrom a severe global cr isis and maintainedmacroeconomic stability.
II.6.56 The regulations governing capital flows inIndia have been liberalised substantially in the pastthree years, taking into account the macroeconomiccondit ions, state of the f inancial sectordevelopment, risk management capabilities offinancial institutions and depth of financial markets.At the same time, the Government has followed ahierarchy in the liberalisation of inflows by way ofaccording preference to equity inflows rather thandebt, besides the emphasis on a diversified capitalaccount. The macro-level policy focus onsustainable levels of current account deficit andexternal debt, active capital account managementwhile persisting with gradual liberalisation processconsistent with the assessed needs of the countryand strengthening self insurance in a globalisedworld in the form of adequate reserves, have beenvindicated in the face of the current global crisis.
188
MONETARY AND CREDIT POLICYOPERATIONSIII
THE ANNUAL REPORT ON THE WORKING OF THE RESERVE BANK OF INDIA
PART TWO : THE WORKING AND OPERATIONS OFTHE RESERVE BANK OF INDIA
III.1 The stance of monetary policy shifted inphases in response to multiple challenges thatemerged during the course of the year in the formof significant changes in both outcome and outlookrelating to inflation, growth and stability of financialmarkets. Both the Government and the ReserveBank responded to the challenges decisively,swiftly and in close coordination and consultation.The policy stance shifted from monetary tighteningin response to the elevated inflationary pressuresin the first half of 2008-09 to monetary easing inthe second half as significant moderation ininflationary pressures created the scope forenhancing the magnitude and speed of responseto the weakening growth impulses as well as tooccasional disorderly pressures in financialmarkets. The changing stance of policy must beseen in the context of the previous period ofgradual withdrawal of monetary accommodationfrom September 2004 till August 2008 duringwhich the repo/reverse repo rates had beenincreased by 300/150 basis points, the cashreserve ratio (CRR) for scheduled banks had been
raised by 450 basis points, and risk weights andgeneral provisioning requirements for standardadvances were raised in the case of specificsectors. In response to the knock-on effects of theglobal economic crisis on the Indian economy,since October 11, 2008 the Reserve Bank hasreduced the CRR by a cumulative 400 basis pointsto 5.0 per cent of NDTL, the repo rate by 425 basispoints to 4.75 per cent and the reverse repo rateby 275 basis points to 3.25 per cent.
III.2 The magnitude and the pace of theresponse have to be seen particularly in thecontext of the fact that despite signif icantmoderation, India’s growth remained one of thehighest in the world, at 6.7 per cent for the fullyear, and the minimum quarterly growth during theyear was 5.8 per cent. Thus, the policy stanceclearly reflected the forward looking undertone,particularly the expectations of more prolongedadverse external conditions in the face of no visiblerisks to inflation. Moreover, the gradual withdrawalof monetary accommodation that had started from
Monetary management during 2008-09 had to contend with the challenges of high inflation in thefirst half and the high speed and magnitude of the external shock and its spill-over effects through thereal, financial and confidence channels in the second half. Policy initiatives by the Reserve Bank wereaimed at providing ample rupee liquidity, ensuring comfortable foreign exchange liquidity andmaintaining a market environment conducive for the continued flow of credit at viable rates toproductive sectors of the economy. The large government borrowings resulting from the fiscal stimulus,and net capital outflows in the second half of the year warranted simultaneous offsetting operations bythe Reserve Bank in different markets, particularly the money market, the government securities marketand the foreign exchange market. The flexible use of multiple instruments enabled the Reserve Bankto steer the liquidity and interest rate conditions amidst uncertain global macroeconomic environment.
September 2004 was a signal of the ReserveBank’s assessment of possible overheating, eventhough subsequent monetary tightening was inresponse to building of inflationary pressures up tomid 2008-09. The need for monetary policy cycleremaining ahead of the business cycle, whichemerged as a lesson from the current global crisis,was already evident in the Reserve Bank’s actualconduct of policy even before the crisis. Similarly,the current post-crisis suggestion for use of pro-cyclical provisioning norms and counter-cyclicalregulat ions as a bulwark against f inancialinstability had already been implemented in Indiaprior to the crisis.
Organisational Framework for Monetary Policy
Technical Advisory Committee
III.3 The Reserve Bank had constituted aTechnical Advisory Committee (TAC) on MonetaryPolicy in July 2005 with four external experts in theareas of monetary economics, central banking,financial markets and public finance with a view tostrengthening the consultative process in theconduct of monetary policy. The TAC reviewsmacroeconomic and monetary developments andadvises the Reserve Bank on the stance ofmonetary policy and monetary measures. TheCommittee was reconstituted in April 2007 and themembership of the Committee was expanded byincluding two additional members of the CentralBoard of the Reserve Bank and one more externalexpert. The tenure of the reconstituted Committeewas extended up to June 30, 2009. The ReserveBank has now reconstituted the TAC on MonetaryPolicy with effect from July 1, 2009 with a view toobtaining continued benefit of advice from externalexperts. The tenure of the Committee is for twoyears, i.e., up to June 30, 2011. The Committee isheaded by Governor, with the Deputy Governor incharge of monetary policy as the vice-chairman.The other Deputy Governors of the Bank are alsomembers of the Committee. The TAC normallymeets once in a quarter. However, the meeting ofthe TAC could be held at any other time also, ifnecessary. The role of the TAC is advisory in nature.
The responsibility, accountability and time path ofthe decision making remain entirely with theReserve Bank. In addition to the quarterly pre-policymeeting where the TAC members contributed toenriching the inputs and processes of policy setting,there were two special meetings held on June 23,2008 and December 17, 2008 in the context of theevolving global economic crisis and to advise theReserve Bank on the stance of monetary policy.
Pre-policy Consultation Meetings
III.4 It has been the endeavour of the ReserveBank to make the policy making process moreconsultative. As part of this outreach and theReserve Bank’s growing emphasis onstrengthening the consultative process of monetarypolicy formulation, the Reserve Bank hasconstituted a process of consulting different entities/experts before each policy Statement/Review.Accordingly, with effect from October 2005, theReserve Bank has introduced pre-policyconsultation meetings with the Indian Banks’Association (IBA), market participants (FixedIncome Money Market and Derivatives Associationof India, Foreign Exchange Dealers’ Association ofIndia, and Primary Dealers Association of India),leaders of trade and industry and other institutions(urban co-operative banks, non-banking financialcompanies, rural co-operatives and regional ruralbanks). This consultative process has contributedto enriching the policy formulation process andenhanced the effectiveness of monetary policymeasures.
III.5 The specific aspects of monetary policyoperations of the Reserve Bank during 2008-09 and2009-10 so far and the context against which policydecisions were formulated and implemented havebeen outlined in this chapter.
MONETARY POLICY OPERATIONS: 2008-09
III.6 The conduct of monetary policy during2008-09 witnessed two distinctly different phases.The first phase up to mid-September 2008 was
189
MONETARY AND CREDIT POLICY OPERATIONS
190
ANNUAL REPORT
characterised by monetary tightening, reflecting theneed to contain high inflation and adverse inflationexpectations. The policy stance during the secondphase starting from mid-September 2008 was guidedby the ramifications of the global financial crisis foreconomic growth and financial markets in India.
Annual Policy Statement for 2008-09
III.7 The Annual Policy Statement (APS) for2008-09 (April 29, 2008) had noted that there weresignificant shifts in both global and domesticdevelopments in relation to initial assessmentspresented for 2007-08. In the backdrop of thedeteriorating outlook for the global economy, theAPS highlighted that the dangers of globalrecession had increased at the t ime ofannouncement of the Third Quarter Review ofJanuary 2008. It also added that since January2008, the upside pressures from international foodand energy prices appeared to have imparted adegree of persistent upward pressure to inflationglobally. On the domestic front, the outlookremained positive up to January 2008, with someindications of moderation in industrial production,services sector activity, business confidence andnon-food credit thereafter.
III.8 The initial forecast predicted a near-normalrainfall in the 2008 South-West monsoon season,suggesting sustenance of the trend growth inagriculture. The Statement noted that the expecteddecline in world GDP growth in 2008 in relation tothe preceding year could temper the prospects ofgrowth in the industrial and services sectors atthe margin, although the underlying momentumof expansion in these sectors was likely to bemaintained. In view of this overall macroeconomicscenario, the APS placed real GDP growth during2008-09 in the range of 8.0 to 8.5 per cent forpolicy purposes, assuming that (a) global financialand commodity markets and real economy wouldbe broadly aligned with the central scenario asassessed at that stage; and (b) domestically,normal monsoon conditions may prevail. In view
of the lagged and cumulative effects of monetarypolicy on aggregate demand and assuming thatsupply management would be conducive, capitalflows had to be managed actively and in theabsence of new adversities emanating in thedomestic or global economy, the Policy Statementindicated that the monetary policy endeavourwould be to bring down inflation from the prevailinghigh level of above 7.0 per cent to around 5.5 percent in 2008-09, with a preference for bringing itclose to 5.0 per cent as soon as possible,recognising the evolving complexities in globally-transmitted inflation. The Statement also addedthat going forward, the Reserve Bank wouldcontinue to condition policy and perceptions forinflation in the range of 4.0-4.5 per cent so thatan inflation rate of around 3.0 per cent became amedium-term objective consistent with India’sbroader integration into the global economy andwith the goal of maintaining self-acceleratinggrowth over the medium-term.
III.9 The Statement also noted that moneysupply remained above indicative projectionspersistently through 2005-07 on the back ofsizeable accretions to the Reserve Bank’s foreignexchange assets and a cyclical acceleration incredit and deposit growth. In view of the resultingmonetary overhang, the Statement mentioned thatthere was a need to moderate monetary expansionin the range of 16.5-17.0 per cent in 2008-09 inconsonance with the outlook on growth and inflationso as to ensure macroeconomic and financialstability. Consistent with the projections of moneysupply, the growth in aggregate deposits for 2008-09 was placed at around 17.0 per cent or aroundRs.5,50,000 crore. Based on the overal lassessment of the sources of funding and theoverall credit requirements of various productivesectors of the economy, the growth of non-foodcredit, including investments in bonds/debentures/shares of public sector undertakings and privatecorporate sector and commercial paper (CP), wasplaced at around 20.0 per cent for 2008-09consistent with the monetary projections.
191
MONETARY AND CREDIT POLICY OPERATIONS
III.10 Given the unprecedented complexitiesinvolved and the heightened uncer tainties, anumber of factors inf luenced the stance ofmonetary policy for 2008-09. First, there was theimmediate challenge of escalated and volatile foodand energy prices, which possibly contained somestructural components apar t from cyclicalcomponents. Second, while demand pressurespersisted, there was some improvement in thedomestic supply response. Third, previousinitiatives in regard to supply-management by theGovernment of India and monetary measures bythe Reserve Bank were in the process of impactingthe economy. Fourth, policy responses emphasisedmanaging expectations in an environment of theevolving global and domestic uncertainties. Fifth,monetary policy had demonstrated a resolve to actdecisively on a continuing basis to curb any signsof adverse developments with regard to inflationexpectations.
III.11 In view of the macroeconomic conditions andthen prevailing inflationary condition, the ReserveBank continued with its pre-emptive and calibratedapproach to contain inflation expectations, and raisedCRR by 25 basis points to 8.25 per cent with effectfrom the fortnight beginning May 24, 2008. Thisfollowed the hike in the CRR by 25 basis points eacheffective from the fortnights beginning April 26 andMay 10, 2008 respectively. The Reserve Bankannounced on June 11, 2008 an increase in the reporate under the Liquidity Adjustment Facility (LAF) by25 basis points to 8.00 per cent from 7.75 per centwith immediate effect.
III.12 Inflat ion, based on var iat ions in thewholesale price index (WPI) on a year-on-yearbasis, increased to 11.05 per cent as on June 7,2008 from 7.75 per cent at end-March 2008 and4.28 per cent a year ago. At that juncture, theoverriding priority for monetary policy was toeschew any further intensification of inflationarypressures and to f irmly anchor inf lat ionexpectations and to urgently address aggregatedemand pressures which appeared to be stronglyin evidence. Accordingly, the Reserve Bank
increased the repo rate under the LAF from 8.00per cent to 8.50 per cent effective from June 25,2008. The CRR was also raised by 50 basis pointsto 8.75 per cent in two stages, 25 basis points each,effective from the fortnights beginning July 5 andJuly 19, 2008 respectively (Table 3.1).
First Quarter Review 2008-09
III.13 The First Quarter Review of the AnnualStatement on Monetary Policy for 2008-09 (July 29,2008) noted that after the announcement of theAnnual Policy Statement in April 2008, global aswell as domestic developments on both supply anddemand sides pointed to accentuation ofinflationary pressures, especially in terms ofinflation expectations. In an environment of surgingglobal inflation, and with domestic inflation alsorising to a 13-year high, the Reserve Bank notedwith concern that inflation had emerged as thebiggest risk to the global outlook, having risen tovery high levels across the world, not generallyseen for a couple of decades.
III.14 The First Quar ter Review stated thatinflation was expected to moderate from the thenhigh levels in the months to come and a noticeabledecline in inflation was expected towards the lastquarter of 2008-09. Accordingly, it emphasised thatwhile the policy actions would aim to bring downthe prevailing intolerable level of inflation to atolerable level of below 5.0 per cent as soon aspossible and around 3.0 per cent over the medium-term, at that juncture a realistic policy endeavourwould be to bring down inflation from the thenprevailing level of about 11.0-12.0 per cent to a levelclose to 7.0 per cent by end-March 2009. It statedthat taking into account aggregate demandmanagement and supply prospects, the projectionof real GDP growth of the Indian economy in 2008-09, in the range of 8.0 to 8.5 per cent as set out inthe Annual Policy Statement of April 2008, mightprove to be optimistic and hence, for policypurposes, a projection of around 8.0 per centappeared to be a more realistic scenario, barringdomestic or external shocks.
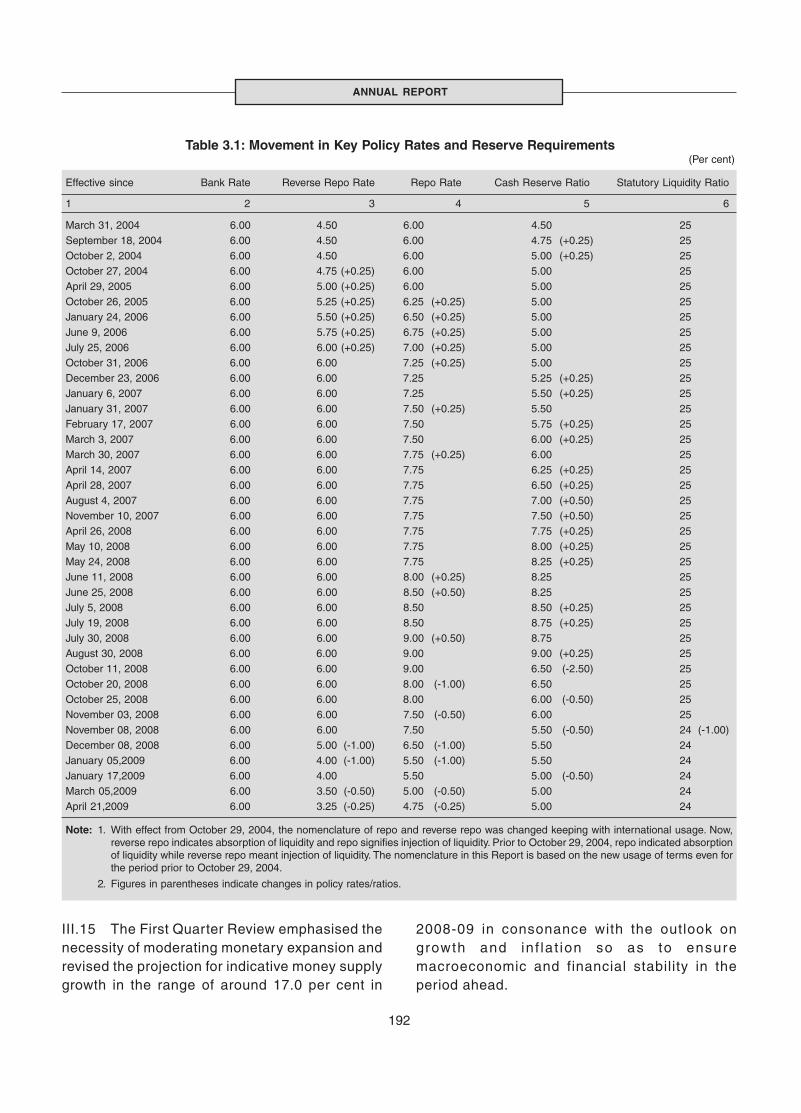
192
ANNUAL REPORT
III.15 The First Quarter Review emphasised thenecessity of moderating monetary expansion andrevised the projection for indicative money supplygrowth in the range of around 17.0 per cent in
2008-09 in consonance with the outlook ongrowth and in f la t ion so as to ensuremacroeconomic and financial stability in theperiod ahead.
Table 3.1: Movement in Key Policy Rates and Reserve Requirements(Per cent)
Effective since Bank Rate Reverse Repo Rate Repo Rate Cash Reserve Ratio Statutory Liquidity Ratio
1 2 3 4 5 6
March 31, 2004 6.00 4.50 6.00 4.50 25September 18, 2004 6.00 4.50 6.00 4.75 (+0.25) 25October 2, 2004 6.00 4.50 6.00 5.00 (+0.25) 25October 27, 2004 6.00 4.75 (+0.25) 6.00 5.00 25April 29, 2005 6.00 5.00 (+0.25) 6.00 5.00 25October 26, 2005 6.00 5.25 (+0.25) 6.25 (+0.25) 5.00 25January 24, 2006 6.00 5.50 (+0.25) 6.50 (+0.25) 5.00 25June 9, 2006 6.00 5.75 (+0.25) 6.75 (+0.25) 5.00 25July 25, 2006 6.00 6.00 (+0.25) 7.00 (+0.25) 5.00 25October 31, 2006 6.00 6.00 7.25 (+0.25) 5.00 25December 23, 2006 6.00 6.00 7.25 5.25 (+0.25) 25January 6, 2007 6.00 6.00 7.25 5.50 (+0.25) 25January 31, 2007 6.00 6.00 7.50 (+0.25) 5.50 25February 17, 2007 6.00 6.00 7.50 5.75 (+0.25) 25March 3, 2007 6.00 6.00 7.50 6.00 (+0.25) 25March 30, 2007 6.00 6.00 7.75 (+0.25) 6.00 25April 14, 2007 6.00 6.00 7.75 6.25 (+0.25) 25April 28, 2007 6.00 6.00 7.75 6.50 (+0.25) 25August 4, 2007 6.00 6.00 7.75 7.00 (+0.50) 25November 10, 2007 6.00 6.00 7.75 7.50 (+0.50) 25April 26, 2008 6.00 6.00 7.75 7.75 (+0.25) 25May 10, 2008 6.00 6.00 7.75 8.00 (+0.25) 25May 24, 2008 6.00 6.00 7.75 8.25 (+0.25) 25June 11, 2008 6.00 6.00 8.00 (+0.25) 8.25 25June 25, 2008 6.00 6.00 8.50 (+0.50) 8.25 25July 5, 2008 6.00 6.00 8.50 8.50 (+0.25) 25July 19, 2008 6.00 6.00 8.50 8.75 (+0.25) 25July 30, 2008 6.00 6.00 9.00 (+0.50) 8.75 25August 30, 2008 6.00 6.00 9.00 9.00 (+0.25) 25October 11, 2008 6.00 6.00 9.00 6.50 (-2.50) 25October 20, 2008 6.00 6.00 8.00 (-1.00) 6.50 25October 25, 2008 6.00 6.00 8.00 6.00 (-0.50) 25November 03, 2008 6.00 6.00 7.50 (-0.50) 6.00 25November 08, 2008 6.00 6.00 7.50 5.50 (-0.50) 24 (-1.00)December 08, 2008 6.00 5.00 (-1.00) 6.50 (-1.00) 5.50 24January 05,2009 6.00 4.00 (-1.00) 5.50 (-1.00) 5.50 24January 17,2009 6.00 4.00 5.50 5.00 (-0.50) 24March 05,2009 6.00 3.50 (-0.50) 5.00 (-0.50) 5.00 24April 21,2009 6.00 3.25 (-0.25) 4.75 (-0.25) 5.00 24
Note: 1. With effect from October 29, 2004, the nomenclature of repo and reverse repo was changed keeping with international usage. Now,reverse repo indicates absorption of liquidity and repo signifies injection of liquidity. Prior to October 29, 2004, repo indicated absorptionof liquidity while reverse repo meant injection of liquidity. The nomenclature in this Report is based on the new usage of terms even forthe period prior to October 29, 2004.
2. Figures in parentheses indicate changes in policy rates/ratios.
193
MONETARY AND CREDIT POLICY OPERATIONS
III.16 The First Quarter Review noted that in viewof the criticality of anchoring inflation expectations,a continuous heightened vigil over ensuingmonetary and macroeconomic developments wasto be maintained to enable swift responses withappropriate measures as necessary, consistentwith the monetary policy stance. Furthermore, inview of the then macroeconomic and overallmonetary conditions, the First Quarter Reviewannounced an increase in fixed repo rate under theLAF by 50 basis points from 8.5 per cent to 9.0 percent with effect from July 30, 2008 and an increaseof CRR by 25 basis points to 9.0 per cent with effectfrom August 30, 2008.
III.17 As the global liquidity crisis deepened inSeptember 2008, capital inflows dried up and thedemand for credit from the domestic bankingsystem increased, thereby aggravating the liquiditypressures. In the wake of the emerging stress onIndia’s financial markets as a result of the contagionfrom the global financial crisis, the immediatechallenge for the Reserve Bank was to infuseconfidence by augmenting both domestic andforeign exchange liquidity. Accordingly, the ReserveBank announced the first phase of measures onSeptember 16, 2008, including increase in theinterest rate ceilings on FCNR (B) deposits of allmaturities and on deposits under the NR(E)RA forone to three years maturity by 50 basis points andother measures to augment liquidity (for details seeChapter II.5, Box II.27).
III.18 Liquidity conditions tightened even furtherafter October 7, 2008 as contagion from the USfinancial crisis spread to Europe and Asia. Globally,money markets froze and the stock markets turnedhighly volatile. Even coordinated policy actions bymonetary authorities in America, Europe, Asia andAustralia failed to inspire the confidence of financialmarkets. In view of the persisting uncertainty in theglobal financial situation and its impact on India,and continuing demand for domestic marketliquidity, the Reserve Bank took further measuresin October 2008 including a cumulative reductionof 250 basis points in the CRR effective from thefortnight beginning October 11, further increase in
the interest rate ceilings on FCNR (B) deposits ofall maturities and on deposits under the NR(E)RAfor one to three years maturity by 50 basis pointseach and other measures to enhance availabilityof liquidity in the financial system (for details seeChapter II.5, Box II.27). On October 20, 2008 inorder to alleviate the pressures on domestic creditmarkets brought on by the indirect impact of theglobal liquidity constraint and, in particular, tomaintain financial stability, the Reserve Bankdecided to reduce the repo rate under the LAF by100 basis points to 8.0 per cent with immediate effect.
Mid-Term Review 2008-09
III.19 The Mid-Term Review of the Annual PolicyStatement 2008-09 (October 24, 2008) was set inthe context of several complex and compellingpolicy challenges as the global financial crisiswitnessed unprecedented dimensions.Governments, central banks and f inancialregulators around the world responded to the crisiswith aggressive, radical and unconventionalmeasures to restore calm and confidence to themarkets and bring them back to normalcy and stability.
III.20 The Mid-Term Review highlighted thatIndia’s financial sector continued to remain stableand healthy. All indicators of financial strength andsoundness such as capital adequacy, ratios of non-performing assets (NPA) and return on assets(RoA) for commercial banks were robust. TheReview also noted that the global developments,however, had some indirect, knock-on effects ondomestic financial markets.
III.21 The Mid-Term Review noted that themeasures taken since mid-September 2008substantially assuaged liquidity stress in domesticfinancial markets arising from the contagion ofadverse external developments. The total liquiditysuppor t through reductions in the CRR, thetemporary accommodation under the SLR and thefirst instalment of the agricultural debt waiver anddebt relief scheme was of the order of Rs.1,85,000crore. The Review further noted that the cut in therepo rate effected on October 20, 2008 was
194
ANNUAL REPORT
expected to ease the conditions in the money andcredit markets, restore their orderly functioning andsustain financial stability.
III.22 The First Quarter Review of July 2008 hadplaced the projection of real GDP growth in 2008-09 at around 8.0 per cent for policy purposes. TheMid-Term Review noted that since then there hadbeen significant global and domestic developments,which rendered the outlook uncertain, suggestingincreased downside risks associated with thisprojection. Taking these developments andprospects into account, the Mid-Term Reviewrevised the projection of overall real GDP growthfor 2008-09 to the range of 7.5-8.0 per cent.
III.23 The Mid-Term Review assessed that inflationwould remain a concern and emphasised that theReserve Bank would keep a strong vigil on inflation.Keeping in view the supply management measurestaken by the Central Government and the laggeddemand response to the monetary policy measurestaken by the Reserve Bank over the last one year,the Review maintained the earlier projection of inflationof 7.0 per cent by end-March 2009 for policy purposes.
III.24 The Mid-Term Review noted that India’sbalance of payments till then reflected strength andresilience in a highly unsettled internationalenvironment. Assessing the var ious factorsaffecting balance of payments, the Review expectedsomewhat higher current account deficit in 2008-09 than in the preceding year, but it also expectedenough capital inflows to meet the externalfinancing requirement in 2008-09.
III.25 The Review expressed the Reserve Bank’sconcerns about the depth of global financial crisisand its endeavour to remain proactive, and takemeasures to manage the unfolding developmentsby easing pressures stemming from the globalcrisis. Against the backdrop of the ensuing globaland domestic developments and in the light ofmeasures taken by the Reserve Bank overSeptember-October 2008, the Bank Rate, the reporate and the reverse repo rate and the cash reserveratio (CRR) were kept unchanged.
III.26 Early signs of a global recession becameevident by late October 2008 as global financialconditions continued to remain uncertain andunsettled. Globally, commodity prices, includingcrude oil prices, began to abate which reduceddomestic inflationary pressures. It was alsoimportant to ensure that credit requirements forproductive purposes were adequately met so as tosupport the growth momentum of the economy.Accordingly, the Reserve Bank announced a seriesof measures on November 1, 2008 includingreduction in the repo rate under the LAF by 50 basispoints to 7.5 per cent with effect from November 3,2008, reduction in the CRR by 100 basis points to5.5 per cent of NDTL and the relaxation of the SLR,on a temporary basis earlier, was made permanentand reduced to 24 per cent of NDTL effective fromNovember 8, 2008. By mid-November 2008, therewere indications that the global slowdown wasdeepening with a larger than expected impact onthe domestic economy, particularly for the mediumand small industry sector and export-oriented units.In the context of these developments, foraugmenting rupee and forex l iquidity, andstrengthening and improving credit deliverymechanisms, the Reserve Bank announcedmeasures on November 15, 2008 includingincrease in interest rate ceilings on FCNR(B) andNR(E)RA deposits by 75 basis points each to Libor/swap rates plus 100 basis points and Libor/swaprates plus 175 basis points, respectively. On afurther review of the then prevailing liquidityconditions, the Reserve Bank again announcedmeasures for liquidity management and improvingcredit flows on November 28, 2008.
III.27 The global outlook deteriorated furtherdur ing December 2008 indicat ing that therecession would be deeper and the recoverylonger than anticipated earlier. With indications ofslowing down of the domestic economic activitywhile inflationary pressures abated significantly,the Reserve Bank initiated a series of measureson December 6 and 11, 2008 which includedreduction in the repo rate under the LAF by 100basis points to 6.5 per cent, reduction in the

195
MONETARY AND CREDIT POLICY OPERATIONS
reverse repo rate by 100 basis points from 6.0 percent to 5.0 per cent, effective from December 8,2008 and measures relating to refinance facilities(for details see Chapter II.5, Box II.27). Thesemeasures were aimed at improving the credit flowto productive sectors to sustain the growthmomentum.
III.28 While domestic financial markets continuedto function in an orderly manner, India’s growthtrajectory was impacted by the global recession.The Reserve Bank’s monetary policy stancerecognised the concerns over rising credit risktogether with the slowing of economic activity whichappeared to affect credit growth. Accordingly, inorder to stimulate growth, the Reserve Bank tookthe following measures on January 2, 2009: (i) therepo rate under the LAF was reduced by 100 basispoints to 5.5 per cent with effect from January 5,2009; (ii) the reverse repo rate under the LAF wasreduced by 100 basis points to 4.0 per cent witheffect from January 5, 2009; and (iii) the CRRwas reduced from 5.5 per cent to 5.0 per cent ofNDTL effective from the for tnight beginningJanuary 17, 2009.
Third Quarter Review 2008-09
III.29 The Third Quarter Review of MonetaryPolicy 2008-09 (January 27, 2009) was set in thecontext of a deepening global crisis with persistentuncertainty in the global financial system. Therewas a rapid and marked deterioration in the globaleconomic outlook after the release of the ReserveBank’s Mid-term Review in October 2008. Thecontinued bad news from large internationalfinancial institutions on a regular basis renewedconcerns about the time when the global financialsector would attain a semblance of stability. Therewas an emerging consensus that there might beno recovery till late 2009; indeed, some outlooksuggested that the recovery might be delayedbeyond 2009.
III.30 The Third Quarter Review, prepared in thebackdrop of rising effects of contagion from theglobal crisis, observed that the Indian economy
experienced a cyclical moderation in growthaccompanied by high inflation in the first half of2008-09 and there was a distinct evidence of furtherslowdown as a consequence of the globaldownturn. The knock-on effects of the global crisis,and falling commodity prices affected the Indianeconomy in several ways. Access to internationalcredit continued to be constrained; capital marketvaluations remained low; industrial productiongrowth slackened; export growth turned negative,and overall business sentiment deteriorated. On thepositive side, the Review noted that the headlineinflation decelerated, though consumer priceinflation did not show any moderation. Also, thedomestic financial markets continued to functionin an orderly manner and in sharp contrast to theirinternational counterparts, the financial system inIndia remained resilient and stable. The Reviewfurther observed that although bank credit growthwas higher in 2008-09 (up to mid- January 2009)than in the previous year, the flow of overall financialresources to the commercial sector during April2008-January 2009 declined marginally ascompared with the previous year. This was onaccount of decline in other sources of funding suchas resource mobilisation from the capital market andexternal commercial borrowings (ECBs).
III.31 The Third Quarter Review noted that thedownside risks to growth had amplified since Mid-Term Review of October 2008 because ofslowdown in industrial activity and weakening ofexternal demand, as reflected in decline in exports.Services sector activities were likely to furtherdecelerate in the second half of 2008-09. Keepingin view the slowdown in industry and services andwith the assumption of normal agr iculturalproduction, the Third Quarter Review revised theprojection of overall real GDP growth for 2008-09downwards to 7.0 per cent with a downward bias.The Review emphasised that the fundamentalstrengths continued to be in place and once theglobal economy star ted to recover, India’sturnaround would be sharper and swifter, backedby India’s strong fundamentals and the untappedgrowth potential.
196
ANNUAL REPORT
III.32 Since the time of presentation of the Mid-Term Review in October 2008, pressures oncommodity prices had abated markedly around theworld, reflecting slump in global demand. In thedomestic market, WPI inflation was already below7.0 per cent, which was projected earlier for end-March 2009. Based on the then availableinformation, the Review assessed the inflation rateto moderate further in the last quarter of 2008-09.The Review recognised that the headline WPIinflation might fall well below 3.0 per cent in theshort-run partly because of the statistical reasonof high base, and the global trends caused by sharpcorrections from exceptionally high oi l andcommodity prices prevailing in early 2008.
III.33 The Review recognised that with the declinein upside risks to inflation, monetary policy wasresponding to slackening economic growth in thecontext of significant global stress. Accordingly, inthe Third Quarter Review, for policy purposes, theprojection of money supply (M3) growth for 2008-09 was raised to 19.0 per cent from 16.5-17.0 percent projected earlier.
III.34 Based on the assessment of the globalscenario and the domestic economy, particularlythe outlook for growth and inflation, the ReserveBank in the Third Quarter Review maintained itsmonetary policy stance of provision of comfortableliquidity to meet the required credit growthconsistent with the overall projection of economicgrowth. Furthermore, the Reserve Bank announcedthat monetary policy actions would be aimed atensuring a monetary and interest rate environmentconsistent with price stability, well-anchoredinflation expectations and orderly conditions infinancial markets. In light of the measures alreadytaken by the Reserve Bank over November 2008-January 2009, the Review kept the Bank Rate, therepo rate and the reverse repo rate under the LAFand the CRR unchanged. On a review of the thenprevailing liquidity conditions, the Reserve Bankannounced the extension of the special term repofacility under the LAF and special refinance facilityfor banks up to September 30, 2009.
III.35 In view of the continuing uncertain creditconditions globally and domestically, the ReserveBank, on February 5, 2009 extended the forex swapfacility and restructuring of advances by banks andraised ceiling rate on export credit in foreigncurrency.
III.36 Subsequent to the release of the ThirdQuarter Review in January 2009, there was evidenceof further slowing down of economic activity asmanifested by the decline in exports and IIP andmoderation in GDP growth (across all the sectors).The total flow of resources to the commercial sectorfrom banks and non-banks during April-February2008-09 was also lower than in the correspondingperiod of the last year. Against the backdrop of thethen prevailing macroeconomic conditions, theReserve Bank on March 4, 2009 decided to reduceboth repo and reverse repo rate under the LAF by50 basis points to 5.0 per cent and 3.5 per cent,respectively, effective from March 5, 2009.
MONETARY POLICY OPERATIONS: 2009-10
Annual Policy Statement 2009-10
III.37 The Annual Policy Statement (APS) 2009-10 (April 21, 2009) was presented in the midst ofexceptionally challenging circumstances in theglobal economy. It noted that the global economiccrisis had called into question several fundamentalassumptions and beliefs governing economicresilience and financial stability. What started offas turmoil in the financial sector of the advancedeconomies had snowballed into the deepest andmost widespread financial and economic crisis ofthe last 60 years. The Statement noted thatalthough the governments and central banksaround the world responded to the crisis throughboth conventional and unconventional fiscal andmonetary measures, the global financial situationremained uncer tain and the global economycontinued to cause anxiety for several reasons. There was no clear estimate of the quantum oftainted assets, and doubts persisted on whetherthe initiatives underway were sufficient to restorethe stability of the financial system. There was a
197
MONETARY AND CREDIT POLICY OPERATIONS
continued debate on the adequacy of the fiscalstimulus packages across countries, and theireffectiveness in arresting the downturn, reversingjob losses and reviving consumer confidence.
III.38 The Statement mentioned that both theGovernment and the Reserve Bank responded tothe challenge of minimising the impact of the crisison India in co-ordination and consultation. Thepolicy responses in India beginning September2008 were designed largely to mitigate the adverseimpact of the global financial crisis on the Indianeconomy. The conduct of monetary policy had tocontend with the high speed and magnitude of theexternal shock and its spill-over effects through thereal, financial and confidence channels. Theevolving stance of policy had been increasinglyconditioned by the need to preserve financialstability while arresting the moderation in the growthmomentum. The Policy Statement also mentionedthat taking a cue from the Reserve Bank’s monetaryeasing; most banks started to reduce their depositand lending rates.
III.39 It was viewed that the fiscal and monetarystimulus measures initiated during 2008-09 coupledwith lower commodity prices could cushion thedownturn in the growth momentum during 2009-10by stabilising domestic economic activity to someextent. While based on the available information itwas found that domestic financing conditions hadimproved, external financing conditions wereexpected to remain tight. Private investmentdemand was, therefore, expected to remainsubdued. On balance, with the assumption ofnormal monsoon, the Statement, for policy purpose,projected real GDP growth for 2009-10 at around6.0 per cent.
III.40 On account of a slump in global demand,pressures on global commodity prices abatedmarkedly around the world by the end of the fiscalyear 2008-09. The sharp decline in prices of crudeoil, metals, foodgrains, cotton and cement hadinfluenced inflation expectations in most parts ofthe world. This was also reflected in the domesticWPI inflation reaching close to zero. Keeping in view
the global trend in commodity prices and domesticdemand-supply balance, the Statement projectedWPI inflation at around 4.0 per cent by end-March2010. The Statement emphasised that monetarypolicy in India would continue to condition andcontain perceptions of inflation in the range of 4.0-4.5 per cent so that an inflation rate of around 3.0per cent becomes the medium-term objective.
III.41 Monetary and credit aggregates hadexhibited deceleration from their peak levels inOctober 2008. The liquidity overhang emanatingfrom the earlier surge in capital inflows hadsubstantially moderated in 2008-09. The ReserveBank was committed to provide ample liquidity forall productive activities on a continuous basis. Asthe upside risks to inflation declined, monetarypolicy started responding to slackening economicgrowth in the context of significant global stress.Accordingly, for policy purposes, the Statementprojected money supply (M3) growth at 17.0 per centfor 2009-10.
III.42 The Annual Policy Statement recognisedthat while continuing to support adequate liquidityin the economy, the Reserve Bank would have toensure that as economic growth gathersmomentum, the excess liquidity is rolled back inan order ly manner. Based on the overallassessment of the macroeconomic situation, thePolicy Statement emphasised the need to ensurea policy regime that would enable credit expansionat viable rates while preserving credit quality so asto support the return of the economy to a highgrowth path. It indicated that the Reserve Bankwould continuously monitor the global and domesticconditions and respond swiftly and effectivelythrough policy adjustments as warranted so as tominimise the impact of adverse developments andreinforce the impact of positive developments. Thestance further emphasised to maintain a monetaryand interest rate regime supportive of price stabilityand financial stability taking into account theemerging lessons of the global financial crisis.Against the backdrop of global and domesticdevelopments, the Reserve Bank reduced the reporate under the LAF by 25 basis points from 5.0 per

198
ANNUAL REPORT
cent to 4.75 per cent with effect from April 21, 2009.The reverse repo rate under the LAF was alsoreduced by 25 basis points from 3.5 per cent to3.25 per cent with effect from April 21, 2009.
First Quarter Review 2009-10
III.43 The First Quarter Review of MonetaryPolicy 2009-10 (July 28, 2009) noted that the globaleconomy was showing incipient signs ofstabilisation, albeit not recovery. The pace of declinein economic activity in several major advancedeconomies had slowed, frozen credit markets hadthawed and equity markets had begun to recover.Recent months also witnessed industrial activityreviving in a number of emerging marketeconomies. Notwithstanding some positive signs,the path and the time horizon for global recoveryremained uncer tain in the l ight of subduedconsumption demand, increased unemploymentlevels and in anticipation of further contraction inglobal trade and private capital flows. Whilebusiness and consumer confidence were yet toshow definitive signs of revival and the financialsector appeared to be stabilising in response toconcerted actions taken by governments andcentral banks across the world, economic recessionin the real sector persisted.
III.44 The Indian economy exper ienced asignificant slowdown in 2008-09 in comparison withthe robust growth performance in the preceding fiveyears, largely due to the knock-on effect of theglobal financial crisis. India’s exports contracted foreight straight months which, in turn, impacted theindustrial sector and the services sector. Thefinancial sector, however, remained relativelyunaffected despite the severe stress created by theglobal deleveraging process, which triggered capitaloutflows in the second half of 2008-09. Quick andaggressive policy responses both by theGovernment and the Reserve Bank mitigated theimpact of the global financial crisis. The largedomestic demand bolstered by the governmentconsumption, provision of forex and rupee liquiditycoupled with sharp cuts in policy rates, a sound
banking sector and well-functioning financialmarkets helped to cushion the economy from theworst impact of the crisis.
III.45 The First Quar ter Review noted theprogressive signs of recovery in India: (i) increasein food stocks; (ii) positive industrial productiongrowth; (iii) improved corporate performance;(iv) optimism in business confidence surveys;(v) upturn in leading indicators; (vi) easing of lendingrates; (vii) pick-up in credit off-take after May 2009;(viii) rebound in stock prices; (ix) activity in theprimary capital market; and (x) improved externalfinancing conditions. On the other hand, thenegative signs included: (i) delayed and deficientmonsoon; (ii) food price inflation; (iii) rebound inglobal commodity prices; (iv) continuing weakexternal demand; and (v) high fiscal deficit.
III.46 It was noted that due to various policyinitiatives by the Reserve Bank, the liquiditysituation remained comfor table since mid-November 2008 as evidenced by the LAF windowwhere the Reserve Bank was absorbing more thanRs.1,20,000 crore on a daily average basis. Theliquidity expansion was consistent with the ReserveBank’s stance of ensuring a policy regime thatwould enable credit expansion at viable rates whilepreserving credit quality. With ample liquidity, thecompetitive pressure on banks to reduce lendingrates increased and the transmission of policy ratechanges to bank lending rates improved since thelast Annual Policy Statement in April 2009. It furthernoted that as the short-term deposits contractedearlier at high rates mature and get repriced, itopens up room for banks to further reduce theirlending rates.
III.47 The First Quar ter Review revised theindicative policy projection for GDP growth in 2009-10 to 6.0 per cent with an upward bias whichmarked a slight improvement over the growthexpectation of around 6.0 per cent indicated in theAnnual Policy Statement. It was recognised that anuptrend in the growth momentum was unlikelybefore the middle of 2009-10. On inf lat ionprospects, WPI inflation for end-March 2010 was

199
MONETARY AND CREDIT POLICY OPERATIONS
projected higher at around 5.0 per cent from 4.0per cent given in the Annual Policy Statement ofApril 2009. It was noted that the WPI inflation turnednegative in June 2009 due to the statistical baseeffect as anticipated, and not because of anycontraction in demand. However, the sharp declinein WPI inflation had not been commensuratelymatched by a similar decline in inf lat ionexpectations. Also, inflation of WPI primary articles,particularly food articles, remained significantlypositive and consumer price indices (CPIs) alsowere elevated, indeed also hardened in recentmonths. The Review further noted that globalcommodity prices had rebounded ahead of globalrecovery and the uncertain monsoon outlook couldfurther accentuate food price inflation. On balance,the risks to the revised projections of real GDPgrowth and inflation for 2009-10 were on the upside.The comfortable levels of food grains stocks shouldhelp mitigate the r isks in the event of pricepressures from the supply side. It was emphasisedthat the Reserve Bank will also closely monitor thelevel of liquidity so as to contain inflationaryexpectations if supply side price pressures were torise. Further, in order to ensure that the increasedGovernment market borrowing programme doesnot crowd out credit flow to the private sector, theprojection of money supply (M3) growth for 2009-10 was raised to 18.0 per cent from 17.0 per centindicated in the Annual Policy Statement. Consistentwith this, aggregate deposits and adjusted non-foodcredit of commercial banks were projected to growby 19.0 per cent and 20.0 per cent, respectively.
III.48 On the basis of the overall assessment, thestance of monetary policy for the remaining periodof 2009-10 was stated to be as: (i) managingliquidity actively so that the credit demand of theGovernment is met while ensuring the flow of creditto the private sector at viable rates (ii) keeping avigil on the trends and signals of inflation, and beprepared to respond quickly and effectively throughpolicy adjustments; (iii) maintaining a monetary andinterest rate regime consistent with price stabilityand financial stability supportive of returning theeconomy to the high growth path.
III.49 Consistent with the assessment ofmacroeconomic and monetary conditions, the reporate, the reverse repo rate and the CRR were keptunchanged. The Reserve Bank reiterated that itwould maintain an accommodative monetarystance until there are definite and robust signs ofrecovery. This accommodative monetary stance is,however, not the steady state. On the way forward,the Reserve Bank would have to reverse theexpansionary measures to anchor inf lat ionexpectations and subdue inflationary pressureswhile preserving the growth momentum. The exitstrategy will be modulated in accordance with theevolving macroeconomic developments.
III.50 The stance of monetary policy changedswiftly during 2008-09 in response to the changingdomestic and international environment. In the firsthalf of 2008-09, the Reserve Bank continued withthe tight monetary stance to contain inflationaryexpectations in view of the elevated inflationarypressures emanating from the substantial increasein commodity prices. All the policy rates and theCRR were accordingly increased on a continuousbasis up to August 2008. However, the ReserveBank reversed the stance of monetary policy swiftlyafter mid-September 2008 and moved towardsmonetary easing anticipating the impact of theinternational f inancial turmoil on the Indianeconomy, in the backdrop of declining inflation.Accordingly, the Reserve Bank reduced the CRR,cut policy rates and injected liquidity in the systemto support the growth momentum of the economyand make credit available for productive purposes.During the course of last one year, thus, the stanceof monetary policy had to change significantly tomeet the various challenges in relation to theobjectives of the monetary policy (Box III.1).
Cash Reserve Ratio
III.51 Between April-August 2008, the CRR forscheduled banks was raised by 150 basis points insix stages of 25 basis points each to 9.0 per centof the banks’ net demand and time liabilities (NDTL)(Chart III.1). Subsequently, the CRR was reduced
200
ANNUAL REPORT
2008-09
Annual Policy Statement (April 2008)
• To ensure a monetary and interest rate environment thataccords high priority to price stability, well-anchoredinflation expectations and orderly conditions in financialmarkets while being conducive to continuation of thegrowth momentum.
• To respond swiftly on a continuing basis to the evolvingconstellation of adverse international developments andto the domestic situation impinging on inflationexpectations, financial stability and growth momentum,with both conventional and unconventional measures,as appropriate.
• To emphasise credit quality as well as credit delivery, inparticular, for employment-intensive sectors, whilepursuing financial inclusion.
First Quarter Review (July 2008)
• To ensure a monetary and interest rate environment thataccords high priority to price stability, well-anchoredinflation expectations and orderly conditions in financialmarkets while being conducive to continuation of thegrowth momentum.
• To respond swiftly on a continuing basis to the evolvingconstellation of adverse international developments andto the domestic situation impinging on inflationexpectations, financial stability and growth momentum,with both conventional and unconventional measures,as appropriate.
• To emphasise credit quality as well as credit delivery, inparticular, for employment-intensive sectors, whilepursuing financial inclusion.
Mid-Term Review (October 2008)
• Ensure a monetary and interest rate environment thatoptimally balances the objectives of financial stability,price stability and well-anchored inflation expectations,and growth;
• Continue with the policy of active demand managementof liquidity through appropriate use of all instrumentsincluding the CRR, open market operations (OMO), theMSS and the LAF to maintain orderly conditions infinancial markets;
• In the context of the uncertain and unsettled globalsituation and its indirect impact on the domestic economyin general and the financial markets in particular, closelyand continuously monitor the situation and respondswiftly and effectively to developments, employing bothconventional and unconventional measures;
Box III.1Changing Stance of Monetary Policy in India
• Emphasise credit quality and credit delivery, in particular,for employment-intensive sectors, while pursuingfinancial inclusion.
Third Quarter Review (January 2009)
• Provision of comfortable liquidity to meet the requiredcredit growth consistent with the overall projection ofeconomic growth.
• Respond swiftly and effectively with all possible measuresas warranted by the evolving global and domestic situationimpinging on growth and financial stability.
• Ensure a monetary and interest rate environmentconsistent with price stability, well-anchored inflationexpectations and orderly conditions in financial markets.
2009-10
Annual Policy Statement (April 2009)
• Ensure a policy regime that will enable credit expansionat viable rates while preserving credit quality so as tosupport the return of the economy to a high growth path.
• Continuously monitor the global and domestic conditionsand respond swiftly and effectively through policyadjustments as warranted so as to minimise the impactof adverse developments and reinforce the impact ofpositive developments.
• Maintain a monetary and interest rate regime supportiveof price stability and financial stability taking into accountthe emerging lessons of the global financial crisis.
First Quarter Review (July 2009)
• Manage liquidity actively so that the credit demand ofthe Government is met while ensuring the flow of creditto the private sector at viable rates.
• Keep a vigil on the trends and signals of inflation, andbe prepared to respond quickly and effectively throughpolicy adjustments.
• Maintain a monetary and interest rate regime consistentwith price stability and financial stability supportive ofreturning the economy to the high growth path.
Since September 2008, along with the usual emphasis oncontainment of inflation and inflation expectations,supporting growth momentum and financial stability, thebalance of focus in the policy stance has changed inresponse to the evolving conditions with greater policyaccent on adequate and swift response, using conventionaland unconventional measures, to maintain orderly marketconditions, and provision of adequate liquidity to supportcredit growth and aggregate demand without diluting theemphasis on credit quality.

201
MONETARY AND CREDIT POLICY OPERATIONS
by 400 basis points to 5.0 per cent in four stagesbetween October 11, 2008 and April 21, 2009.
Statutory Liquidity Ratio
III.52 The statutory liquidity ratio (SLR) wasreduced by 100 basis points to 24.0 per cent ofbanks’ NDTL effective from November 8, 2008.Commercial banks’ actual holdings of SLRsecurities as at end-March 2009 stood at 28.1 percent of their NDTL as compared with 27.8 per centat end-March 2008.
LIQUIDITY MANAGEMENT
III.53 Central banks around the world facedcomplex challenges in the conduct of their liquiditymanagement operations, as the pressure onfunding liquidity became unprecedented in theface of significant erosion in market liquidity. Sharpcorrections in asset pr ices affected marketl iquidity, which had the potential to createinsolvency problem for several leading globalfinancial institutions. Moreover, as the liquidityneeds of non-banks, ranging from investmentbanks, insurance companies, housing financecompanies, hedge funds to even money marketmutual funds increased exponentially, it came to
the notice of the central banks that liquidityinjected by the central banks to the commercialbanks may not reach the non-banks in the face ofheightened risk aversion and uncertainties aboutthe soundness of even the most reputed globalfinancial institutions. The global financial crisis notonly tested the limits of conventional liquiditymanagement operations of central banks, but alsonecessitated extensive resor t to a range ofunconvent ional measures as i t becameincreasingly evident that to avoid a systemicfinancial crisis, not only the liquidity needs of “toobig to fail” banks have to be met, but even theliquidity needs of “too interconnected to fail”financial institutions (such as Bear Stearns & AIG)must also be met.
III.54 Despite no direct exposure of the Indianbanks and financial institutions to the failinginternational institutions or troubled assets,liquidity management operations of the ReserveBank assumed greater urgency in the face of theknock-on effects of the global financial crisis,which manifested not only as reversals in capitalinflows but also adverse market expectationscausing sharp correction in asset prices, andpressures on the exchange rate. The ReserveBank had to swiftly respond to the rapidly evolvingmacroeconomic conditions. In the initial fewmonths of 2008-09, inflation expectations drivenby surge in global commodity prices dictated acontractionary stance; during the following fewmonths, the autonomous pressures on liquidityarising from capital outflows, and drying up ofsources of overseas funding necessitateddiscretionary expansion; in the last few months,the surge in Government’s market borrowings todeal with the slow-down of the economy elicitedfur ther accommodating response from theReserve Bank (Table 3.2). Thus, by synchronisingthe liquidity management operations with thoseof exchange rate management and non-disruptiveinternal debt management operat ions, theReserve Bank ensured that appropriate liquiditywas maintained in the system so that all legitimaterequirements of credit were met, particularly for
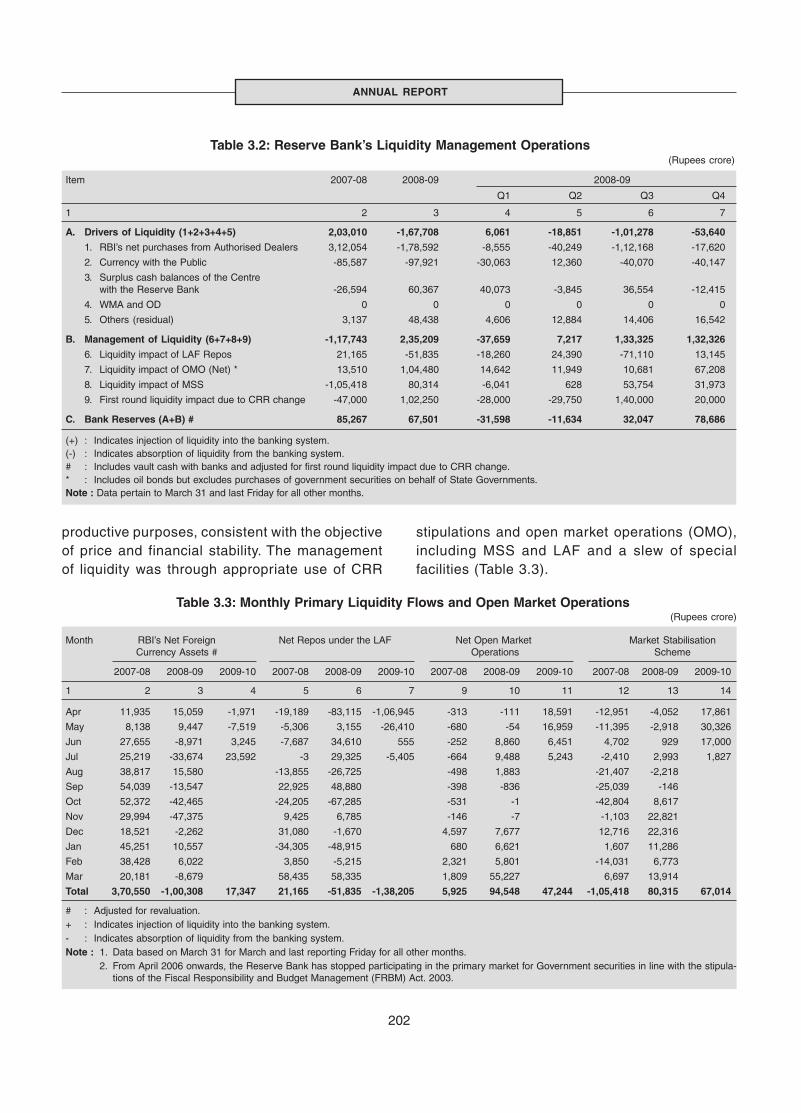
202
ANNUAL REPORT
productive purposes, consistent with the objectiveof price and financial stability. The managementof liquidity was through appropriate use of CRR
stipulations and open market operations (OMO),including MSS and LAF and a slew of specialfacilities (Table 3.3).
Table 3.3: Monthly Primary Liquidity Flows and Open Market Operations(Rupees crore)
Month RBI’s Net Foreign Net Repos under the LAF Net Open Market Market StabilisationCurrency Assets # Operations Scheme
2007-08 2008-09 2009-10 2007-08 2008-09 2009-10 2007-08 2008-09 2009-10 2007-08 2008-09 2009-10
1 2 3 4 5 6 7 9 10 11 12 13 14
Apr 11,935 15,059 -1,971 -19,189 -83,115 -1,06,945 -313 -111 18,591 -12,951 -4,052 17,861
May 8,138 9,447 -7,519 -5,306 3,155 -26,410 -680 -54 16,959 -11,395 -2,918 30,326
Jun 27,655 -8,971 3,245 -7,687 34,610 555 -252 8,860 6,451 4,702 929 17,000
Jul 25,219 -33,674 23,592 -3 29,325 -5,405 -664 9,488 5,243 -2,410 2,993 1,827
Aug 38,817 15,580 -13,855 -26,725 -498 1,883 -21,407 -2,218
Sep 54,039 -13,547 22,925 48,880 -398 -836 -25,039 -146
Oct 52,372 -42,465 -24,205 -67,285 -531 -1 -42,804 8,617
Nov 29,994 -47,375 9,425 6,785 -146 -7 -1,103 22,821
Dec 18,521 -2,262 31,080 -1,670 4,597 7,677 12,716 22,316
Jan 45,251 10,557 -34,305 -48,915 680 6,621 1,607 11,286
Feb 38,428 6,022 3,850 -5,215 2,321 5,801 -14,031 6,773
Mar 20,181 -8,679 58,435 58,335 1,809 55,227 6,697 13,914
Total 3,70,550 -1,00,308 17,347 21,165 -51,835 -1,38,205 5,925 94,548 47,244 -1,05,418 80,315 67,014
# : Adjusted for revaluation.+ : Indicates injection of liquidity into the banking system.- : Indicates absorption of liquidity from the banking system.Note : 1. Data based on March 31 for March and last reporting Friday for all other months.
2. From April 2006 onwards, the Reserve Bank has stopped participating in the primary market for Government securities in line with the stipula-tions of the Fiscal Responsibility and Budget Management (FRBM) Act. 2003.
Table 3.2: Reserve Bank’s Liquidity Management Operations(Rupees crore)
Item 2007-08 2008-09 2008-09
Q1 Q2 Q3 Q4
1 2 3 4 5 6 7
A. Drivers of Liquidity (1+2+3+4+5) 2,03,010 -1,67,708 6,061 -18,851 -1,01,278 -53,640
1. RBI’s net purchases from Authorised Dealers 3,12,054 -1,78,592 -8,555 -40,249 -1,12,168 -17,620
2. Currency with the Public -85,587 -97,921 -30,063 12,360 -40,070 -40,147
3. Surplus cash balances of the Centrewith the Reserve Bank -26,594 60,367 40,073 -3,845 36,554 -12,415
4. WMA and OD 0 0 0 0 0 0
5. Others (residual) 3,137 48,438 4,606 12,884 14,406 16,542
B. Management of Liquidity (6+7+8+9) -1,17,743 2,35,209 -37,659 7,217 1,33,325 1,32,326
6. Liquidity impact of LAF Repos 21,165 -51,835 -18,260 24,390 -71,110 13,145
7. Liquidity impact of OMO (Net) * 13,510 1,04,480 14,642 11,949 10,681 67,208
8. Liquidity impact of MSS -1,05,418 80,314 -6,041 628 53,754 31,973
9. First round liquidity impact due to CRR change -47,000 1,02,250 -28,000 -29,750 1,40,000 20,000
C. Bank Reserves (A+B) # 85,267 67,501 -31,598 -11,634 32,047 78,686
(+) : Indicates injection of liquidity into the banking system.(-) : Indicates absorption of liquidity from the banking system.# : Includes vault cash with banks and adjusted for first round liquidity impact due to CRR change.* : Includes oil bonds but excludes purchases of government securities on behalf of State Governments.Note : Data pertain to March 31 and last Friday for all other months.
203
MONETARY AND CREDIT POLICY OPERATIONS
First Half of the Fiscal Year 2008-09
III.55 The initial impact of the sub-prime crisis onthe Indian economy was rather muted. During mostpart of the first half of fiscal 2008-09, liquiditymanagement operations were essentially gearedtowards mopping up of excess domestic liquidity,mainly through CRR hikes (in April, May, July andAugust cumulatively by 150 basis points to 9.0 percent) with a view to containing inflationarypressures. Signalling the contractionary stance, theBank also raised the repo rate cumulatively by 125basis points (in June and July 2008) to 9.0 per centeffective July 30, 2008. Meanwhile, by end May,2008, capital flows had been adversely affected asa consequence of the worsening global financialconditions leading to foreign exchange marketoperations by the Reserve Bank to containexcessive volatility in the exchange rate, which inturn contributed to some absorption of domesticliquidity. Concomitantly, with the reversal in thenature of foreign exchange market operations,auction of dated securities under the MSS wassuspended. Reflecting the impact of thesedevelopments, the LAF turned from absorption modeto injection mode after the first week of June 2008.
Second Half of the Fiscal Year 2008-09
III.56 Though the direct impact of the sub-primecrisis on Indian banks/financial sector was almostnegligible because of limited exposure to thetroubled assets, prudential policies put in place bythe Reserve Bank and relatively lower presence offoreign banks in the Indian banking sector, therewas a sudden change in the external environmentfollowing the Lehman Brothers’ failure in mid-September, 2008.
III.57 With a view to maintaining order lyconditions in the foreign exchange market whichhad turned volatile, the Reserve Bank scaled upits intervention operations, particularly in October,2008. The other important measures taken by theReserve Bank to contain foreign exchange volatilityincluded a rupee-dollar swap facility for Indianbanks to give them comfort in managing their short-
term foreign funding requirements. The ReserveBank also continued with the Special MarketOperations (SMO) which were instituted in June 2008for meeting the foreign exchange requirements ofpublic sector oil marketing companies, taking intoaccount the then prevailing extraordinary situationin the money and foreign exchange markets. Finally,measures to ease foreign exchange liquidity alsoincluded those aimed at encouraging capitalinflows, such as an upward adjustment of theinterest rate ceiling on the foreign currency depositsby non-resident Indians, substantially relaxing theexternal commercial borrowings (ECB) regime forcorporates, and allowing non-banking financialcompanies and housing finance companies accessto foreign borrowing.
III.58 The cumulative effect of Reserve Bank’soperations in the foreign exchange market as wellas transient local factors such as build up ingovernment balances following quarterly advancetax payments, however, adversely impacted thedomestic liquidity conditions. Consequently, withreceding inflationary pressures and rising possibilityof global crisis affecting India’s growth prospectsthe Reserve Bank switched to an expansionaryregime in mid-October, 2008 in contrast to itscontractionary regime earlier.
III.59 As a fallout of the global financial crisis,foreign funding dwindled and the domestic capitalmarket slumped, which, in turn, put pressures onsome segments of the Indian financial system, suchas mutual funds and NBFCs. Facing largeredemption pressures, the mutual funds startedconserving their liquidity which, in turn, affectedother sections of the market, particularly NBFCs,that had been dependent on mutual funds for theirfunding needs. To address such liquidity shortages,the Reserve Bank introduced a term repo facilityfor an amount up to Rs.60,000 crore under whichbanks could avail central bank funds to addressthe liquidity stress faced by mutual funds, NBFCsand housing finance companies (HFCs) withassociated SLR exemption of up to 1.5 per cent ofNDTL. This facility has been extended up to March31, 2010. A SPV was also set up to address the
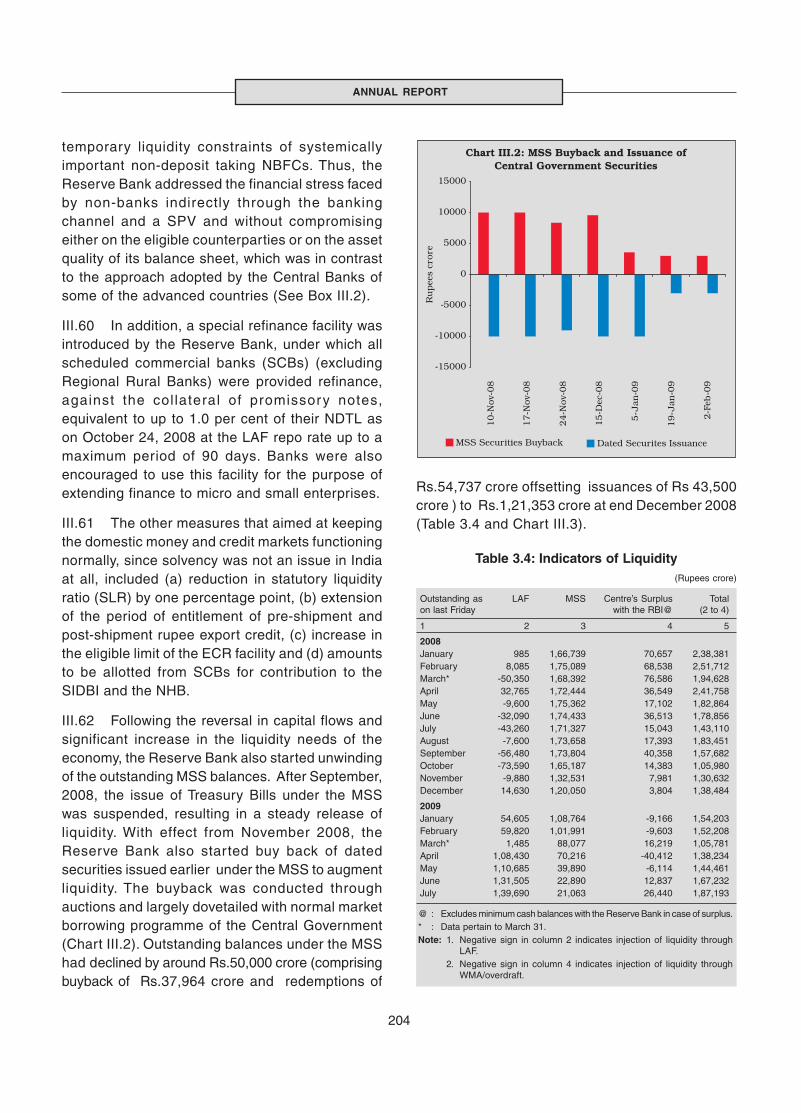
204
ANNUAL REPORT
temporary liquidity constraints of systemicallyimportant non-deposit taking NBFCs. Thus, theReserve Bank addressed the financial stress facedby non-banks indirectly through the bankingchannel and a SPV and without compromisingeither on the eligible counterparties or on the assetquality of its balance sheet, which was in contrastto the approach adopted by the Central Banks ofsome of the advanced countries (See Box III.2).
III.60 In addition, a special refinance facility wasintroduced by the Reserve Bank, under which allscheduled commercial banks (SCBs) (excludingRegional Rural Banks) were provided refinance,against the collateral of promissory notes,equivalent to up to 1.0 per cent of their NDTL ason October 24, 2008 at the LAF repo rate up to amaximum period of 90 days. Banks were alsoencouraged to use this facility for the purpose ofextending finance to micro and small enterprises.
III.61 The other measures that aimed at keepingthe domestic money and credit markets functioningnormally, since solvency was not an issue in Indiaat all, included (a) reduction in statutory liquidityratio (SLR) by one percentage point, (b) extensionof the period of entitlement of pre-shipment andpost-shipment rupee export credit, (c) increase inthe eligible limit of the ECR facility and (d) amountsto be allotted from SCBs for contribution to theSIDBI and the NHB.
III.62 Following the reversal in capital flows andsignificant increase in the liquidity needs of theeconomy, the Reserve Bank also started unwindingof the outstanding MSS balances. After September,2008, the issue of Treasury Bills under the MSSwas suspended, resulting in a steady release ofliquidity. With effect from November 2008, theReserve Bank also started buy back of datedsecurities issued earlier under the MSS to augmentliquidity. The buyback was conducted throughauctions and largely dovetailed with normal marketborrowing programme of the Central Government(Chart III.2). Outstanding balances under the MSShad declined by around Rs.50,000 crore (comprisingbuyback of Rs.37,964 crore and redemptions of
Rs.54,737 crore offsetting issuances of Rs 43,500crore ) to Rs.1,21,353 crore at end December 2008(Table 3.4 and Chart III.3).
Table 3.4: Indicators of Liquidity(Rupees crore)
Outstanding as LAF MSS Centre’s Surplus Totalon last Friday with the RBI@ (2 to 4)
1 2 3 4 5
2008January 985 1,66,739 70,657 2,38,381February 8,085 1,75,089 68,538 2,51,712March* -50,350 1,68,392 76,586 1,94,628April 32,765 1,72,444 36,549 2,41,758May -9,600 1,75,362 17,102 1,82,864June -32,090 1,74,433 36,513 1,78,856July -43,260 1,71,327 15,043 1,43,110August -7,600 1,73,658 17,393 1,83,451September -56,480 1,73,804 40,358 1,57,682October -73,590 1,65,187 14,383 1,05,980November -9,880 1,32,531 7,981 1,30,632December 14,630 1,20,050 3,804 1,38,484
2009January 54,605 1,08,764 -9,166 1,54,203February 59,820 1,01,991 -9,603 1,52,208March* 1,485 88,077 16,219 1,05,781April 1,08,430 70,216 -40,412 1,38,234May 1,10,685 39,890 -6,114 1,44,461June 1,31,505 22,890 12,837 1,67,232July 1,39,690 21,063 26,440 1,87,193
@ : Excludes minimum cash balances with the Reserve Bank in case of surplus.* : Data pertain to March 31.Note: 1. Negative sign in column 2 indicates injection of liquidity through
LAF.2. Negative sign in column 4 indicates injection of liquidity through
WMA/overdraft.
205
MONETARY AND CREDIT POLICY OPERATIONS
Some Central Banks provided liquidity support to non-bankfinancial institutions (NBFIs) as part of their ‘unconventional’policy response to deal with the intense liquidity scare that wasexperienced during the global financial crisis. Despite adequateaccess to central bank liquidity at falling costs for the bankingsystem, the non-banking financial entities had to contend witha severe liquidity crisis, as the monetary policy transmissionturned increasingly ineffective in allocating the liquidity injectedinto the banking system among non-banks. Moreover, theuncertain environment and the associated concerns aboutcounterparties, falling asset (collateral) values, and rising riskpremium also contributed to the liquidity problems for the non-banks. The central banks, in response, had to introduce a rangeof non-conventional policy measures to provide the non-banksdirect access to liquidity.
There are important strategic issues relating to use ofunconventional monetary policy measures, as highlighted bySmaghi (2009), which include: (a) why and when should centralbanks resort to unconventional measures?, (b) what are themain characteristics of unconventional measures?, (c) how areunconventional measures implemented, if and when they areneeded, and (d) how and when do central banks need to unwindthe extra monetary stimulus? On the first issue, central banksuse unconventional measures because either they exhaust theconventional option when the policy rates drop to zero, or, evenwhen the policy rates are above zero, the monetary policytransmission may get significantly impaired during an intensefinancial crisis. As regards the second issue, while theconventional measures may primarily target to anchor themarket rates around the policy rates, the unconventionalmeasures could focus on “directly targeting liquidity shortagesand credit spreads in certain market segments”. One possibleimplication of unconventional measures, though, is the impacton the soundness of the balance sheets of central banks. Onthe third question of implementation of unconventionalmeasures, there could be “direct quantitative easing”, or “directcredit easing” or “indirect/endogenous easing”.
In the case of direct quantitative easing, the central bank couldexpand the balance sheet by buying all sorts of assets from thecommercial banks (as opposed to only gilts and highly ratedpapers). Banks then get enough liquidity to expand new loans.If the banks, however, decide to hoard liquidity rather than lend,then this option may not work. The next option then could be“direct credit easing”, under which, instead of providing liquiditythrough banks, the central bank could extend liquidity supportto all non-banks directly, particularly to certain wholesalemarkets “through the purchase of commercial papers, corporatebonds and asset-backed securities”. When banks face crisisand tighten credit norms contrary to the expectations of themonetary policy stance, direct easing could become moreeffective, and a better policy alternative for the central banks.
Central Banks such as the Federal Reserve, the Bank of Englandand the Bank of Japan adopted a range of direct credit easingmeasures to address liquidity shortages and spreads in certainwholesale market segments via the purchase of commercialpaper, corporate bonds and asset-backed securities. Notable
Box III.2Central Banks’ Unconventional Policy Measures - International Experience on
Liquidity Support to Non-banking Financial Entities
examples of direct credit easing include: (i) the outrightpurchases of Commercial Paper and Asset-backed CommercialPaper as well as corporate bonds by the Bank of Japan tofacilitate corporate financing; (ii) the Bank of England’s AssetPurchase Facility; and (iii) the Fed’s Commercial Paper FundingFacility (CPFF); Term Asset-Backed Securities Loan Facility(TALF); and purchases by the Fed, in cooperation with the USTreasury Department, of mortgage securities backed bygovernment-sponsored enterprises (GSEs). Even though it isdifficult to distill the impact of all these measures, it has beenobserved that the spreads of eligible commercial paper in theUS have declined after the introduction of the CPFF; the spreadbetween mortgage rates and Treasuries have also declined.
Unlike direct easing, indirect (endogenous) easing options havebeen resorted to by the ECB. In the case of direct easing, thecentral bank acquires assets, in exchange for central bankmoney, which leads to the central bank holding the assets untilmaturity or resale, and taking thereby the associated risks onits balance sheet. In the indirect (endogenous) approach,however, “the size of the balance sheet expands by lending tobanks at longer maturities, against collateral which includesassets whose markets are temporarily impaired. The increasein the monetary base is determined endogenously by thebanking system, based on banks’ preference for liquidity andthus on the state of stress of the banking system” Smaghi (2009).This option could widen the pool of collaterals that may beaccepted by the central bank for the refinancing operations.The primary reason as to why the ECB’s approach was differentfrom that of the Fed is the importance of the banking channelin providing credit in the euro-area as against a more market-based financial system in other advanced countries.
In India, on the conventional side, the Reserve Bank reducedthe policy interest rates aggressively and rapidly, lowered thequantum of bank reserves impounded by the central bank andexpanded/ liberalised the refinance facilities for export credit.The important among the many unconventional measures takenby the Reserve Bank of India were introduction of a rupee-dollar swap facility for Indian banks to give them comfort inmanaging their short-term foreign funding requirements, anexclusive refinance window as also a special purpose vehiclefor supporting non-banking financial companies, and expandingthe lendable resources available to apex finance institutionsfor refinancing credit extended to small industries, housing andexports. Unlike other central banks, however, the Reserve Bankdeliberately avoided exposing its balance sheet to risks arisingfrom counterpar ties and collaterals in the process ofimplementing the unconventional measures.
Reference
1. Berananke, B. S. and Reinhart V. R. (2004), “ConductingMonetary Policy at Very Low Short-Term Interest Rates”,American Economic Review, 94(2), pp.85-90.
2. Smaghi, Lorenzo Bini (2009), “Conventional andUnconventional Monetary Policy”, Keynote lecture at theInternational Centre for Monetary and Banking Studies,Geneva, April 28, 2009.
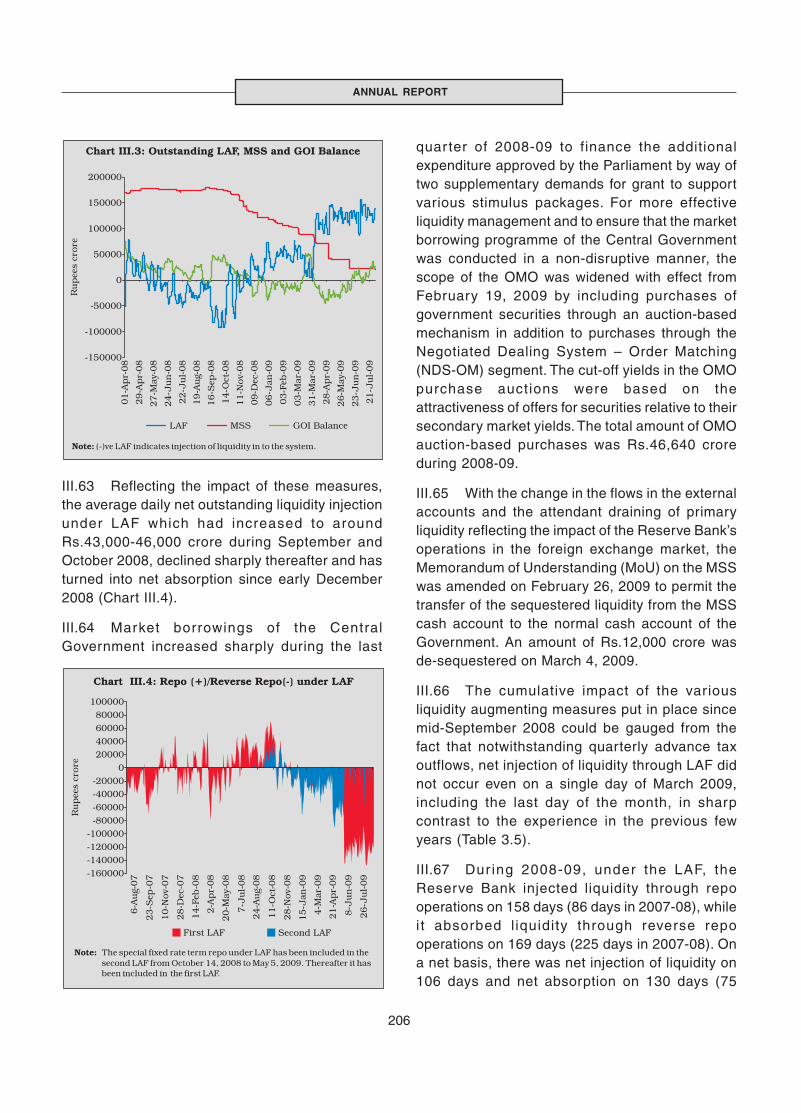
206
ANNUAL REPORT
III.63 Reflecting the impact of these measures,the average daily net outstanding liquidity injectionunder LAF which had increased to aroundRs.43,000-46,000 crore during September andOctober 2008, declined sharply thereafter and hasturned into net absorption since early December2008 (Chart III.4).
III.64 Market borrowings of the CentralGovernment increased sharply during the last
quar ter of 2008-09 to finance the additionalexpenditure approved by the Parliament by way oftwo supplementary demands for grant to supportvarious stimulus packages. For more effectiveliquidity management and to ensure that the marketborrowing programme of the Central Governmentwas conducted in a non-disruptive manner, thescope of the OMO was widened with effect fromFebruary 19, 2009 by including purchases ofgovernment securities through an auction-basedmechanism in addition to purchases through theNegotiated Dealing System – Order Matching(NDS-OM) segment. The cut-off yields in the OMOpurchase auctions were based on theattractiveness of offers for securities relative to theirsecondary market yields. The total amount of OMOauction-based purchases was Rs.46,640 croreduring 2008-09.
III.65 With the change in the flows in the externalaccounts and the attendant draining of primaryliquidity reflecting the impact of the Reserve Bank’soperations in the foreign exchange market, theMemorandum of Understanding (MoU) on the MSSwas amended on February 26, 2009 to permit thetransfer of the sequestered liquidity from the MSScash account to the normal cash account of theGovernment. An amount of Rs.12,000 crore wasde-sequestered on March 4, 2009.
III.66 The cumulative impact of the variousliquidity augmenting measures put in place sincemid-September 2008 could be gauged from thefact that notwithstanding quarterly advance taxoutflows, net injection of liquidity through LAF didnot occur even on a single day of March 2009,including the last day of the month, in sharpcontrast to the experience in the previous fewyears (Table 3.5).
III.67 Dur ing 2008-09, under the LAF, theReserve Bank injected liquidity through repooperations on 158 days (86 days in 2007-08), whilei t absorbed l iquidity through reverse repooperations on 169 days (225 days in 2007-08). Ona net basis, there was net injection of liquidity on106 days and net absorption on 130 days (75
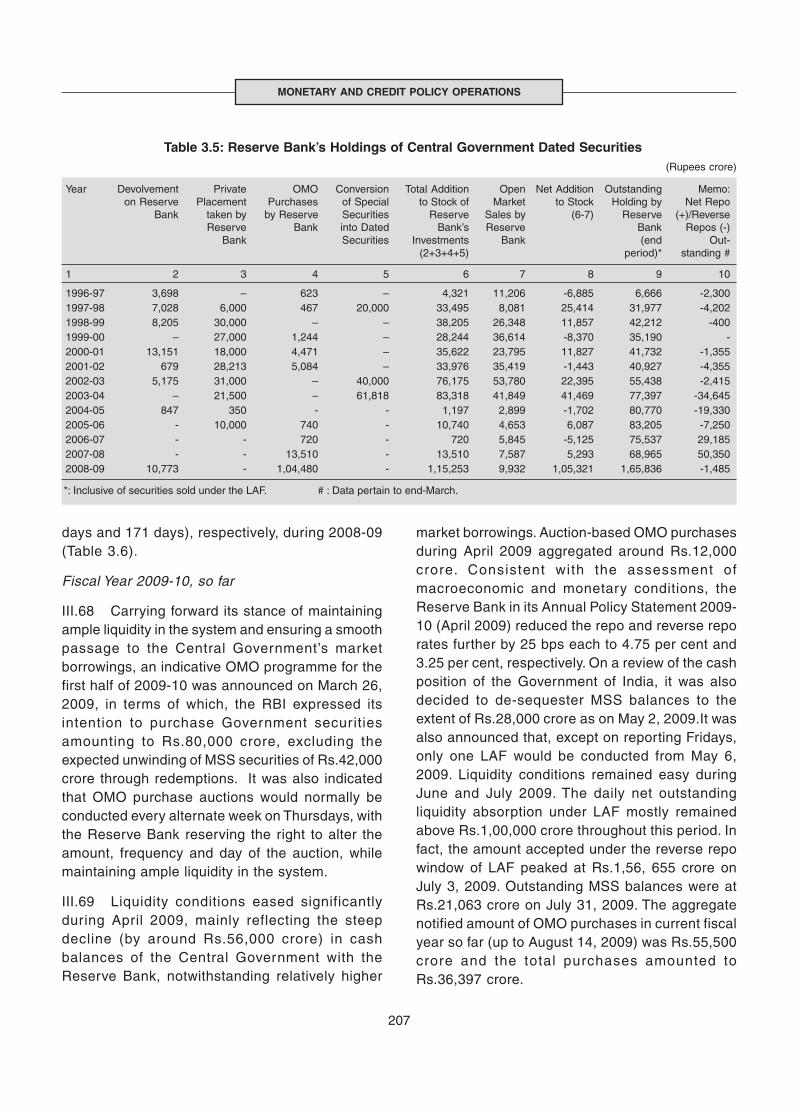
207
MONETARY AND CREDIT POLICY OPERATIONS
days and 171 days), respectively, during 2008-09(Table 3.6).
Fiscal Year 2009-10, so far
III.68 Carrying forward its stance of maintainingample liquidity in the system and ensuring a smoothpassage to the Central Government’s marketborrowings, an indicative OMO programme for thefirst half of 2009-10 was announced on March 26,2009, in terms of which, the RBI expressed itsintention to purchase Government securitiesamounting to Rs.80,000 crore, excluding theexpected unwinding of MSS securities of Rs.42,000crore through redemptions. It was also indicatedthat OMO purchase auctions would normally beconducted every alternate week on Thursdays, withthe Reserve Bank reserving the right to alter theamount, frequency and day of the auction, whilemaintaining ample liquidity in the system.
III.69 Liquidity conditions eased significantlyduring April 2009, mainly reflecting the steepdecline (by around Rs.56,000 crore) in cashbalances of the Central Government with theReserve Bank, notwithstanding relatively higher
market borrowings. Auction-based OMO purchasesduring April 2009 aggregated around Rs.12,000crore. Consistent with the assessment ofmacroeconomic and monetary conditions, theReserve Bank in its Annual Policy Statement 2009-10 (April 2009) reduced the repo and reverse reporates further by 25 bps each to 4.75 per cent and3.25 per cent, respectively. On a review of the cashposition of the Government of India, it was alsodecided to de-sequester MSS balances to theextent of Rs.28,000 crore as on May 2, 2009.It wasalso announced that, except on reporting Fridays,only one LAF would be conducted from May 6,2009. Liquidity conditions remained easy duringJune and July 2009. The daily net outstandingliquidity absorption under LAF mostly remainedabove Rs.1,00,000 crore throughout this period. Infact, the amount accepted under the reverse repowindow of LAF peaked at Rs.1,56, 655 crore onJuly 3, 2009. Outstanding MSS balances were atRs.21,063 crore on July 31, 2009. The aggregatenotified amount of OMO purchases in current fiscalyear so far (up to August 14, 2009) was Rs.55,500crore and the total purchases amounted toRs.36,397 crore.
Table 3.5: Reserve Bank’s Holdings of Central Government Dated Securities(Rupees crore)
Year Devolvement Private OMO Conversion Total Addition Open Net Addition Outstanding Memo:on Reserve Placement Purchases of Special to Stock of Market to Stock Holding by Net Repo
Bank taken by by Reserve Securities Reserve Sales by (6-7) Reserve (+)/ReverseReserve Bank into Dated Bank’s Reserve Bank Repos (-)
Bank Securities Investments Bank (end Out-(2+3+4+5) period)* standing #
1 2 3 4 5 6 7 8 9 10
1996-97 3,698 – 623 – 4,321 11,206 -6,885 6,666 -2,3001997-98 7,028 6,000 467 20,000 33,495 8,081 25,414 31,977 -4,2021998-99 8,205 30,000 – – 38,205 26,348 11,857 42,212 -4001999-00 – 27,000 1,244 – 28,244 36,614 -8,370 35,190 -2000-01 13,151 18,000 4,471 – 35,622 23,795 11,827 41,732 -1,3552001-02 679 28,213 5,084 – 33,976 35,419 -1,443 40,927 -4,3552002-03 5,175 31,000 – 40,000 76,175 53,780 22,395 55,438 -2,4152003-04 – 21,500 – 61,818 83,318 41,849 41,469 77,397 -34,6452004-05 847 350 - - 1,197 2,899 -1,702 80,770 -19,3302005-06 - 10,000 740 - 10,740 4,653 6,087 83,205 -7,2502006-07 - - 720 - 720 5,845 -5,125 75,537 29,1852007-08 - - 13,510 - 13,510 7,587 5,293 68,965 50,3502008-09 10,773 - 1,04,480 - 1,15,253 9,932 1,05,321 1,65,836 -1,485
*: Inclusive of securities sold under the LAF. # : Data pertain to end-March.

208
ANNUAL REPORT
III.70 In sum, the monetary and l iquiditymanagement operations of the Reserve Bankdur ing 2008-09 had to respond swift ly andjudiciously to the fast changing global and domesticdevelopments that necessitated timely rebalancingof the policy emphasis on containment of inflationand inflation expectations, preserving orderlyconditions in the financial markets, and supportingthe growth momentum. The anti-inflationary focusof the monetary policy stance in the first half of theyear 2008-09 was evident in the 125 basis pointincrease in repo rate and 150 basis points increasein the CRR to 9.0 per cent. In the first phase of thesecond half, restoring orderly conditions in the
markets through adequate injection of bothdomestic and foreign exchange liquidity assumedprominence. The overall emphasis in the secondhalf, however, was to support aggregate demandto contain growth slowdown, and in the face ofalmost no r isk on the inf lat ion front, theexpansionary policy stance of the Reserve Bankwas manifested in the form of cumulative reductionin CRR and the repo rate by 400 basis points and425 basis points, respectively. The intricacies of theactual conduct of policies were particularly reflectedin the liquidity management operations and themanagement of the Reserve Bank’s balance sheet.The contraction to the Reserve Bank’s balance
Table 3.6 : Reverse Repo/Repo Bids under LAF
Year/Month Reverse Repo Repo
No. of days No. of days No. of days No. of days No. of days No. of days No. of days No. of days No. of days No. of daysbids all bids of full with less of partial bids all bids of full with less of partial
received rejected acceptance than full acceptance received rejected acceptance than full acceptanceof bids acceptance of bids of bids acceptance of bids
of bids of bids
1 2 3 4 5 6 7 8 9 10 11
2005-06 244 0 244 0 0 78 0 76 @ 2 02006-07 244 0 234 0 10 64 0 63 @ 1 02007-08 225 0 165 0 60 86 0 86 0 02008-09 169 0 169 0 0 158 0 158 0 0
April 18 0 18 0 0 1 0 1 0 0May 19 0 19 0 0 7 0 7 0 0June 6 0 6 0 0 16 0 16 0 0July 5 0 5 0 0 21 0 21 0 0August 4 0 4 0 0 18 0 18 0 0September 6 0 6 0 0 20 0 20 0 0October 13 0 13 0 0 18 0 18 0 0November 19 0 19 0 0 19 0 19 0 0December 21 0 21 0 0 16 0 16 0 0January 20 0 20 0 0 8 0 8 0 0February 19 0 19 0 0 5 0 5 0 0March 19 0 19 0 0 9 0 9 0 0
2009-10 80 0 76 0 4 5 0 4 0 0April 16 0 16 0 0 1 0 1 0 0May 20 0 16 0 4 0 0 0 0 0June 22 0 22 0 0 2 0 2 0 0July 22 0 22 0 0 2 0 2 0 0
@ : Number of days of full acceptance of bids was less than the number of days bids were received on account of non-acceptance of one bid each ontechnical grounds on January 24, 2006, March 23, 2006 and April 4, 2006.
Note: 1. With effect from October 29, 2004, the nomenclature of repo and reverse repo was changed in keeping with international usage. Now, reverserepo indicates absorption of liquidity and repo signifies injection of liquidity. Prior to October 29, 2004, repo indicated absorption of liquidity whilereverse repo meant injection.
2. Between March 5 and August 5, 2007, daily reverse repo absorptions were restricted to a maximum of Rs.3000 crore comprising Rs.2000 crorein the First LAF and Rs.1000 crore in the Second LAF.
3. Bids for fixed rate term repo facility have also been included.
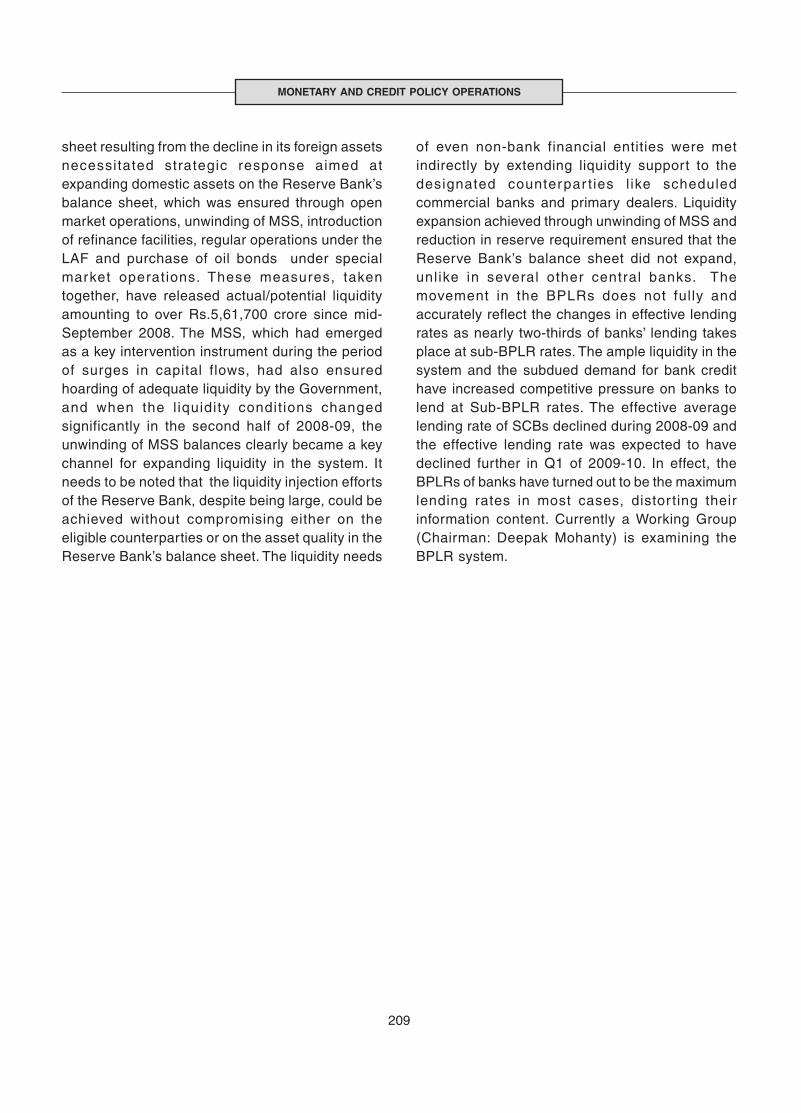
209
MONETARY AND CREDIT POLICY OPERATIONS
sheet resulting from the decline in its foreign assetsnecessitated strategic response aimed atexpanding domestic assets on the Reserve Bank’sbalance sheet, which was ensured through openmarket operations, unwinding of MSS, introductionof refinance facilities, regular operations under theLAF and purchase of oil bonds under specialmarket operations. These measures, takentogether, have released actual/potential liquidityamounting to over Rs.5,61,700 crore since mid-September 2008. The MSS, which had emergedas a key intervention instrument during the periodof surges in capital flows, had also ensuredhoarding of adequate liquidity by the Government,and when the l iquidity condit ions changedsignificantly in the second half of 2008-09, theunwinding of MSS balances clearly became a keychannel for expanding liquidity in the system. Itneeds to be noted that the liquidity injection effortsof the Reserve Bank, despite being large, could beachieved without compromising either on theeligible counterparties or on the asset quality in theReserve Bank’s balance sheet. The liquidity needs
of even non-bank financial entities were metindirectly by extending liquidity support to thedesignated counterpar t ies l ike scheduledcommercial banks and primary dealers. Liquidityexpansion achieved through unwinding of MSS andreduction in reserve requirement ensured that theReserve Bank’s balance sheet did not expand,unlike in several other central banks. Themovement in the BPLRs does not fully andaccurately reflect the changes in effective lendingrates as nearly two-thirds of banks’ lending takesplace at sub-BPLR rates. The ample liquidity in thesystem and the subdued demand for bank credithave increased competitive pressure on banks tolend at Sub-BPLR rates. The effective averagelending rate of SCBs declined during 2008-09 andthe effective lending rate was expected to havedeclined further in Q1 of 2009-10. In effect, theBPLRs of banks have turned out to be the maximumlending rates in most cases, distor ting theirinformation content. Currently a Working Group(Chairman: Deepak Mohanty) is examining theBPLR system.
CREDIT DELIVERYIV
210
IV.1 In the face of a severe global creditsqueeze, credit markets in India continued tofunction normally. While in the global credit markets,it was a problem on the supply side because of thepressure of forced deleveraging by banks andfinancial institutions, it is the economic slowdownand the associated contraction in aggregatedemand, which largely affected the credit marketsin India in the second half of 2008-09. Thus, whilein the advanced countr ies, signif icantunconventional measures were introduced tounfreeze the credit markets, in the case of India,reviving aggregate demand through policy stimulusassumed greater significance. Expansion in creditat reasonable cost without diluting the creditstandards was seen by the Reserve Bank asessential to promote consumption and investmentdemand in a slowing economy.
IV.2 The Indian financial markets came underpressure for a short time following the adverseinternational developments in September 2008,which affected the credit markets to some extent.In view of the changed environment characterisedby capital outflows and increase in risk aversion,there was a substantial shrinkage of non-banksources of funding in India, such as from domesticcapital markets, funding from NBFCs and mutualfunds and external funding in the form ofcommercial borrowings and ADRs/GDRs.Accordingly, there was a sudden rush for bank
credit from various sectors of the economy whichcreated the perception of an emerging credit crunchin India as well. This was compounded by the largedemand for credit from petroleum and fertilisercompanies, as there had been an incomplete pass-through of the high international crude prices inthe first half of 2008-09 to domestic petroleumprices. Reflecting these developments, non-foodbank credit (y-o-y) accelerated to around 30.0 percent by October 2008. In response, a number ofsteps were taken by the Reserve Bank to makeavailable adequate rupee and foreign exchangeliquidity while emphasising the need to ensureadequate flow of credit to the productive sectors ofthe economy. The subsequent period also exhibiteda turn in the credit cycle, reflecting rising riskaversion in the Indian financial system, besidesmoderation in demand for credit on account of theeconomic downturn.
IV.3 Even though bank credit had registered anannual average growth of around 29.6 per cent perannum during 2004-08, there was no dilution inlending standards to sustain the high credit growth.Bank’s loans to individuals for housing were backedby prudent loan-to-value ratios. In view of the rapidcredit growth to certain sectors, however, theReserve Bank had pre-emptively t ightenedprudential norms (in the form of provisioningrequirements and risk weights) for those sectorsin order to safeguard financial stability. Even for
Ensuring adequate flow of credit to all productive sectors of the economy without diluting the emphasison asset quality is one of the objectives of the Reserve Bank. This became all the more important inthe wake of the dampening effects of the synchronised global recession on the domestic growthmomentum in the second half of 2008-09 and the associated deceleration in credit demand. Whileannouncing a number of measures for sectors which were affected by the global crisis, the ReserveBank continued with its focus on financial inclusion and financial literacy/credit counselling.Strengthening credit delivery mechanisms to the targetted sections of the population under differentschemes has been an important aspect of the Reserve Bank’s policy focus in recent years.

standard assets, provisioning norms were raisedacross the board, except for the agriculture and theSME sectors. These tightened provisioning normsand risk weights have now been rolled back in thewake of the slowdown in order to ensure easier flowof credit to the productive sectors of the economy.This approach of the Reserve Bank facilitatedcreation of adequate buffers within the bankingsystem to deal with asset quality concernsassociated with credit cycles and the same approachis now being seen internationally as a relevantpractice in the context of the global financial crisis.
IV.4 The growth in overall credit in 2008-09,thus, was lower than that of the previous year,mainly on account of the slowdown in the growthmomentum of the economy during the second halfof the year. The Reserve Bank has maintained apolicy framework that aims at keeping creditdelivery on track so as to arrest the moderation inthe growth of the economy. Taking the signals fromthe Reserve Bank’s significant policy rate cuts, mostbig banks have reduced their benchmark primelending rates, though with a lag, both in terms oftiming and magnitude. The gradual softening oflending rates of banks has affected the pace andeffectiveness of monetary policy transmission. Theother policy measures taken during the year relatingto the credit markets include expansion andliberalisation of refinance facilities for exports andcertain unconventional measures such as anexclusive refinance window and a special purposevehicle (SPV) for supporting NBFCs. Refinancefacilities were announced for apex financial institutionsin order to augment their ability to refinance creditto small industries, housing and exports.
IV.5 It has been the endeavour of the ReserveBank to improve credit delivery mechanisms for thesmall borrowers, particularly for the agriculture andthe small enterpr ises sectors by creating aconducive environment for banks to provideadequate and timely finance at reasonable rateswithout procedural hassles. In the wake of the crisisin 2008-09, the Reserve Bank took var iousmeasures for enhancing the flow of credit to thosesectors of the economy, which were more severely
hit due to the world-wide recession, and also tothe employment-intensive sectors. The ReserveBank has also been emphasising the role of thefinancial system for ensuring greater financialinclusion, supporting employment generation inrural and unorganised sectors, promoting financialliteracy and credit counselling. Wide-ranginginitiatives have been taken in this regard. Theseinclude strengthening of the financial institutions,including rural co-operatives and regional ruralbanks (RRBs), which cater predominantly to therural areas and the common persons; liberalisationof branch licensing policies for RRBs for enhancingtheir banking outreach; encouraging multiplechannels of lending such as self-help groups(SHGs), micro finance institutions (MFIs) andadoption of business facilitator (BF)/businesscorrespondent (BC) model; improving creditdelivery through simplification of the proceduresand processes for lending to agriculture and micro,small and medium enterprises (MSME) sectors,while encouraging adoption of information andcommunication technology (ICT) solutions forachieving greater banking outreach and reducingtransaction costs.
PRIORITY SECTOR LENDING
IV.6 India’s mandated priority sector lending hashelped in imparting resilience to the agriculturalsector. Even in the wake of the global financialcrisis, this lending norm has kept the flow ofinstitutional credit to agriculture intact. The farmloan waiver package implemented by theGovernment also helped the agriculture sector.
IV.7 The domestic SCBs, both in the public andthe private sectors, which fail to achieve the prioritysector and/or agriculture lending targets, arerequired to deposit into the Rural InfrastructureDevelopment Fund (RIDF) such amounts as maybe assigned by the Reserve Bank. The Fund hasso far completed fourteen years of operation. TheUnion Budget for 2008-09 had announced thesetting up of RIDF XIV with NABARD and thecreation of certain other funds (Box IV.1).
211
CREDIT DELIVERY
212
ANNUAL REPORT
The Union Budget for 2008-09 had indicated that the RIDFXIV would have a corpus of Rs.14,000 crore during 2008-09 and a separate window under the RIDF XIV for rural roadsunder Bharat Nirman with a corpus of Rs.4,000 crore andwould be operated by NABARD. In the Budget speech, itwas also announced that in order to increase the resourcebase of NABARD, SIDBI and NHB and to take forward thefinancial inclusion process, the following funds would becreated with contributions from SCBs to the extent that theyfell short of their obligations to lend to the priority sector:
(i) A fund of Rs.5,000 crore with NABARD to enhance itsrefinance operations to short-term cooperative creditinstitutions.
(ii) Two funds of Rs.2,000 crore each with SIDBI – one forrisk capital financing and the other for enhancingrefinance capability of the MSME sector.
(iii) A fund of Rs.1,200 crore with NHB to enhance itsrefinance operations in the rural housing sector.
Each of these funds were to be governed by the generalguidelines that are applicable to the RIDF, with somemodifications.
Pursuant to the above announcements, RIDF XIV with acorpus of Rs.10,000 crore, a separate window under RIDFXIV for rural roads component of Bharat Nirman with acorpus of Rs.4,000 crore and Short-Term Co-operative RuralCredit (STCRC) (Refinance) Fund with a corpus of Rs.5,000crore were set up with NABARD; Micro Small and MediumEnterprises (Refinance) Fund with a corpus of Rs.1,600crore and MSME (Risk Capital) Fund with a corpus ofRs.1,000 crore were set up with SIDBI. The Rural HousingFund with a corpus of Rs.1,000 crore was set up with NHB.The funding for these came from contributions by SCBswhich failed to achieve their obligations to lend to the prioritysector as on the last reporting Friday of March 2008. Thebalance portion of Rs.4,000 crore of the corpus of RIDF
Box IV.1Augmentation of the Resource Base of SIDBI, NHB and NABARD
XIV and Rs.1,000 crore of the corpus of MSME (Risk Capital)Fund would be assigned to SCBs on the basis of the shortfallin achievement of priority sector lending targets/sub-targetsas on the last reporting Friday of March 2009.
With a view to dealing with the growing ramifications of theglobal crisis for the Indian economy, the Reserve Bank tooka number of policy measures. One of the primary aims ofthese measures was to augment domestic and foreignexchange liquidity and to enable banks to continue to lendfor productive purpose while maintaining credit quality soas to sustain the growth momentum. As part of the broadobjective, one measure taken by the Reserve Bank inNovember 2008 was assigning amounts, in advance, toSCBs for contribution to SIDBI and NHB to the extent ofRs.2,000 crore and Rs.1,000 crore, respectively, againstbanks’ estimated shortfall in achievement of weaker sectionlending target of 10.0 per cent as on the last reporting Fridayof March 2009.
Accordingly, the corpus of MSME (Refinance) Fund(maintained with SIDBI) and the Rural Housing Fund(maintained with NHB) were enhanced by Rs.2,000 croreand Rs.1,000 crore, respectively. It was also decided thatthe enhanced portion of the corpus of the above two Fundswould be contributed by the domestic SCBs, both in thepublic and the private sectors, which had a shortfall inachievement of the sub-target of 10 per cent for lending tothe weaker sections, on a pro-rata basis. The assignmentswere made in advance against banks’ estimated shortfall inachievement of the sub-target for lending to weaker sectionsas on the last reporting Friday of March 2009 and would beadjusted against future contributions, if any, which may beneeded to be made by banks during 2009-10 on the basisof the actual shortfall in achievement of priority sector lendingtarget/sub-targets as on the last reporting Friday of March2009. The domestic SCBs were advised on November 20,2008 their respective shares for depositing in the above Funds.
IV.8 Various banks had represented for eitherphasing out the contribution to these Funds over alonger period or exempting them from placementsof deposits in these Funds. The main contention ofbanks was that their allotment amount for the year2008-09 was very high compared to previous yearsand placing a large amount of deposit in theseFunds at a very low rate of interest could affecttheir profitability. Taking into account the largeincrease in allocations for some banks and theresultant strain on the banks’ resources/profitability,the rate of interest in respect of deposits placed by
banks in the above Funds was kept at the BankRate (6.0 per cent at present) uniformly for allbanks, irrespective of the percentage of shortfallin achievement of priority sector lending targets/sub-targets.
IV.9 The Union Finance Minister had announcedin the Interim Budget for 2009-10 (February 2009)that RIDF XV, with a corpus of Rs.14,000 crore,and a separate window under RIDF XV for ruralroads under the Bharat Nirman programme, with acorpus of Rs.4,000 crore, would be set up with
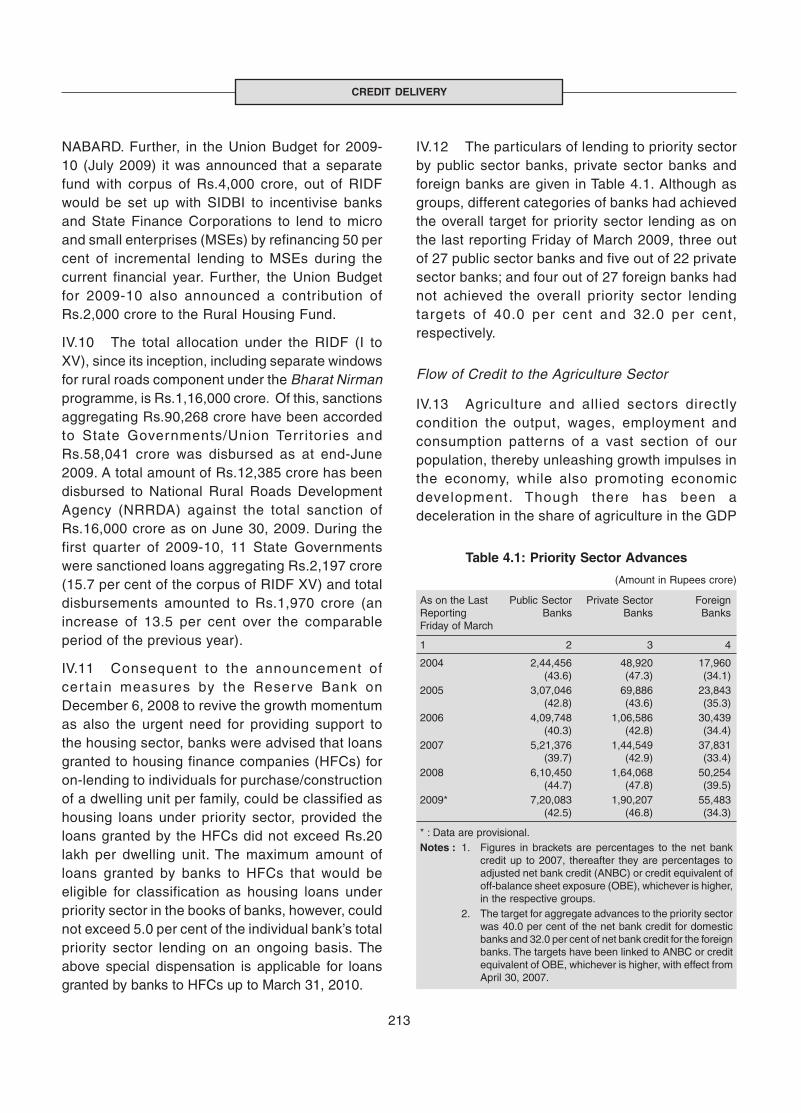
213
CREDIT DELIVERY
NABARD. Further, in the Union Budget for 2009-10 (July 2009) it was announced that a separatefund with corpus of Rs.4,000 crore, out of RIDFwould be set up with SIDBI to incentivise banksand State Finance Corporations to lend to microand small enterprises (MSEs) by refinancing 50 percent of incremental lending to MSEs during thecurrent financial year. Further, the Union Budgetfor 2009-10 also announced a contribution ofRs.2,000 crore to the Rural Housing Fund.
IV.10 The total allocation under the RIDF (I toXV), since its inception, including separate windowsfor rural roads component under the Bharat Nirmanprogramme, is Rs.1,16,000 crore. Of this, sanctionsaggregating Rs.90,268 crore have been accordedto State Governments/Union Terr itor ies andRs.58,041 crore was disbursed as at end-June2009. A total amount of Rs.12,385 crore has beendisbursed to National Rural Roads DevelopmentAgency (NRRDA) against the total sanction ofRs.16,000 crore as on June 30, 2009. During thefirst quarter of 2009-10, 11 State Governmentswere sanctioned loans aggregating Rs.2,197 crore(15.7 per cent of the corpus of RIDF XV) and totaldisbursements amounted to Rs.1,970 crore (anincrease of 13.5 per cent over the comparableperiod of the previous year).
IV.11 Consequent to the announcement ofcer tain measures by the Reserve Bank onDecember 6, 2008 to revive the growth momentumas also the urgent need for providing support tothe housing sector, banks were advised that loansgranted to housing finance companies (HFCs) foron-lending to individuals for purchase/constructionof a dwelling unit per family, could be classified ashousing loans under priority sector, provided theloans granted by the HFCs did not exceed Rs.20lakh per dwelling unit. The maximum amount ofloans granted by banks to HFCs that would beeligible for classification as housing loans underpriority sector in the books of banks, however, couldnot exceed 5.0 per cent of the individual bank’s totalpriority sector lending on an ongoing basis. Theabove special dispensation is applicable for loansgranted by banks to HFCs up to March 31, 2010.
IV.12 The particulars of lending to priority sectorby public sector banks, private sector banks andforeign banks are given in Table 4.1. Although asgroups, different categories of banks had achievedthe overall target for priority sector lending as onthe last reporting Friday of March 2009, three outof 27 public sector banks and five out of 22 privatesector banks; and four out of 27 foreign banks hadnot achieved the overall priority sector lendingtargets of 40.0 per cent and 32.0 per cent,respectively.
Flow of Credit to the Agriculture Sector
IV.13 Agriculture and allied sectors directlycondition the output, wages, employment andconsumption patterns of a vast section of ourpopulation, thereby unleashing growth impulses inthe economy, while also promoting economicdevelopment. Though there has been adeceleration in the share of agriculture in the GDP
Table 4.1: Priority Sector Advances
(Amount in Rupees crore)
As on the Last Public Sector Private Sector ForeignReporting Banks Banks BanksFriday of March
1 2 3 4
2004 2,44,456 48,920 17,960(43.6) (47.3) (34.1)
2005 3,07,046 69,886 23,843(42.8) (43.6) (35.3)
2006 4,09,748 1,06,586 30,439(40.3) (42.8) (34.4)
2007 5,21,376 1,44,549 37,831(39.7) (42.9) (33.4)
2008 6,10,450 1,64,068 50,254(44.7) (47.8) (39.5)
2009* 7,20,083 1,90,207 55,483(42.5) (46.8) (34.3)
* : Data are provisional.Notes : 1. Figures in brackets are percentages to the net bank
credit up to 2007, thereafter they are percentages toadjusted net bank credit (ANBC) or credit equivalent ofoff-balance sheet exposure (OBE), whichever is higher,in the respective groups.
2. The target for aggregate advances to the priority sectorwas 40.0 per cent of the net bank credit for domesticbanks and 32.0 per cent of net bank credit for the foreignbanks. The targets have been linked to ANBC or creditequivalent of OBE, whichever is higher, with effect fromApril 30, 2007.

214
ANNUAL REPORT
from 36.4 per cent in the 1980s to around 17.0 percent now, the number of people dependent onagriculture for their food and livelihood remainslargely unchanged. A number of steps have,therefore, been taken by the Reserve Bank andthe Government of India for facilitating increasedflow of credit to the agriculture sector.
IV.14 The public sector banks have beenformulating special agricultural credit plans(SACPs) since 1994-95 with a view to achieving adistinct and marked improvement in the flow ofcredit to agriculture. Under SACP, the banks arerequired to fix targets for achievement during thefinancial year. The targets fixed by the banks for aparticular year are generally 20 to 25 per centhigher than the disbursements made in the previousyear. The SACP mechanism was made applicableto private sector banks from the year 2005-06.Disbursements under the SACP by banks during thelast three years are depicted in Table 4.2.
IV.15 The target set for flow of credit to theagriculture sector by the Union Budget of therespective years, has been consistently exceededsince 2004-05. As regards the target of Rs.2,80,000crore set for 2008-09, the disbursement by all banks(including co-operative banks and RRBs) duringthe year was Rs.2,87,149 crore or 102.6 per centof the target (Table 4.3).
IV.16 The Kisan Credit Cards (KCCs) schemewas introduced in the year 1998-99 to enable the
Table 4.2: Disbursements under SpecialAgricultural Credit Plans
(Amount in Rupees crore)
Year Target Disburse- Achieve- Year-on-ments ment of year
Target Growth in(per cent) Disburse-
ments(per cent)
1 2 3 4 5
Public Sector Banks
2006-07 1,18,160 1,22,443 103.6 29.92007-08 1,52,133 1,33,226 87.6 8.82008-09* 1,59,470 1,44,302 90.5 8.3
Private Sector Banks
2006-07 40,656 44,093 108.5 41.32007-08 41,427 47,862 115.5 8.52008-09* 57,353 59,805 104.3 25.0
* : Provisional.
farmers to purchase agricultural inputs and drawcash for their production needs. Since the inceptionof the scheme, the number of KCCs issued bypublic sector banks stood at 37.1 million withsanctioned limits aggregating to Rs.1,93,250 croreas on March 31, 2009. During 2008-09, publicsector banks issued 5.9 mil l ion KCCs withsanctioned limits aggregating to Rs.39,009 crore.
IV.17 Though neither the public sector banks northe private sector banks, as individual groups, haveachieved the agriculture lending target of 18.0 per cent,the outstanding advances to agriculture of boththese bank groups have been gradually increasingevery year towards the stipulated target (Table 4.4).
Table 4.3: Targets and Actual Disbursement to Agriculture by Banks
(Amount in Rupees crore)
2004-05 2005-06 2006-07 2007-08 2008-09
Agency Target Disburse- Target Disburse- Target Disburse- Target Disburse- Target Disburse-ment ment ment ment ment
1 2 3 4 5 6 7 8 9 10 11
Commercial Banks 57,000 81,481 87,200 1,25,477 1,19,000 1,66,486 1,50,000 1,81,088 1,95,000 2,23,663
Co-operative Banks 39,000 31,231 38,600 39,786 41,000 42,480 52,000 48,258 55,000 36,762
RRBs 8,500 12,404 15,200 15,223 15,000 20,435 23,000 25,312 30,000 26,724
Other Agencies* - 193 - - - - - - - -
Total 1,04,500 1,25,309 1,41,000 1,80,486 1,75,000 2,29,401 2,25,000 2,54,658 2,80,000 2,87,149
* : Co-operative societies, State Financial Corporations, Agricultural Development Finance Corporation.Source : NABARD.

215
CREDIT DELIVERY
The recovery of direct agricultural advances ofpublic sector banks has shown an undulating trendin recent years (Table 4.5).
IV.18 The SCBs (including RRBs) were advisedin August 2008 to accept affidavits submitted bylandless labourers, share croppers and oral lesseesgiving occupational status (i.e., details of land tilled/crops grown) for loans up to Rs.50,000, where therewere difficulties in getting certification from localadministration/panchayati raj institutions regardingthe cultivation of crops, etc. They were also advisedto encourage the Joint Liability Group (JLG)/SHGmode of lending for such persons. Banks, however,should go through their procedures of identificationas per Know Your Customer (KYC) norms,appraisal and usual pre-sanction checks beforeextending finance.
IV.19 Following the announcement in the AnnualPolicy Statement for 2008-09, the domestic SCBs,including RRBs, were advised to select, on a pilotbasis, one rain-fed district for introduction of a newproduct for financing crop production whereby:(i) 80.0 per cent of the crop loan requirement ofindividual borrowers could be met through a short-term production loan in conformity with the presentnorms/practices; and (ii) the remaining 20.0 percent representing the ‘core component’ (expensesfor land preparation, pre-sowing operations, etc.,besides self- labour/consumption) could besanctioned as a ‘clean credit limit’ to ensure roundthe year liquidity. The banks were also advised toallow drawings from this ‘clean credit limit’ on thepattern of operations in cash credit/overdraftaccounts as long as the farmers continued toservice the interest. Asset classification norms, asapplicable to non-agricultural cash credit/overdraftaccounts, would apply to this clean credit limit.Further, any reschedulement of the loans in termsof extant guidelines on relief measures to beprovided in the event of natural calamities wouldwarrant clubbing of balances outstanding in theclean credit account with the outstanding in the loanaccount for reschedulement and a fresh ‘cleancredit limit’ would be made available to the farmer.Under normal circumstances, the extant guidelinesof borrower-wise asset classification would prevailin the case of this new product also, unlessspecifically dispensed with, as in the case of naturalcalamities. Rate of interest and periodicity ofinterest application in respect of the ‘clean creditlimit’ would be applicable as to other agriculturaladvances. Banks were asked to try the newsystem in select branches.
Guidelines for Interest Subvention Relief to Farmers
IV.20 With effect from khar if 2006-07, theGovernment has been providing an interest ratesubvention of 2.0 per cent in respect of short-termproduction credit up to Rs.3 lakh provided tofarmers by the public sector banks and RRBs. TheGovernment increased the subvention for the financialyear 2008-09 to 3.0 per cent in December 2008.
Table 4.5: Public Sector Banks – Recovery ofDirect Agricultural Advances
(Amount in Rupees crore)
End-June Demand Recovery Overdues Percentageof Recoveryto Demand
1 2 3 4 5
2004 33,544 25,002 8,542 74.52005 45,454 35,733 9,721 78.62006 46,567 37,298 9,269 80.12007 73,802 58,840 14,958 79.72008 95,100 71,739 23,361 75.4
Table 4.4: Outstanding Agricultural Advances
(Amount in Rupees crore)
As on the Last Public Sector Banks Private Sector BanksReporting Amount Per cent Amount Per centFriday of Out- of Net Bank Out- of Net BankMarch standing Credit standing Credit
1 2 3 4 5
2003 70,501 14.5 9,924 10.92004 84,435 15.1 14,730 12.72005 1,09,917 15.3 21,636 12.32006 1,55,220 15.3 36,712 13.62007 2,02,614 15.4 52,034 12.72008 2,49,397 17.5 58,567 15.42009* 2,98,211 17.2 76,062 15.9
* : Data are provisional.
Note : The target for advances to agriculture was 18.0 per cent of netbank credit for the domestic banks. The target has been linked toANBC or credit equivalent of OBE, whichever is higher, with effectfrom April 30, 2007.
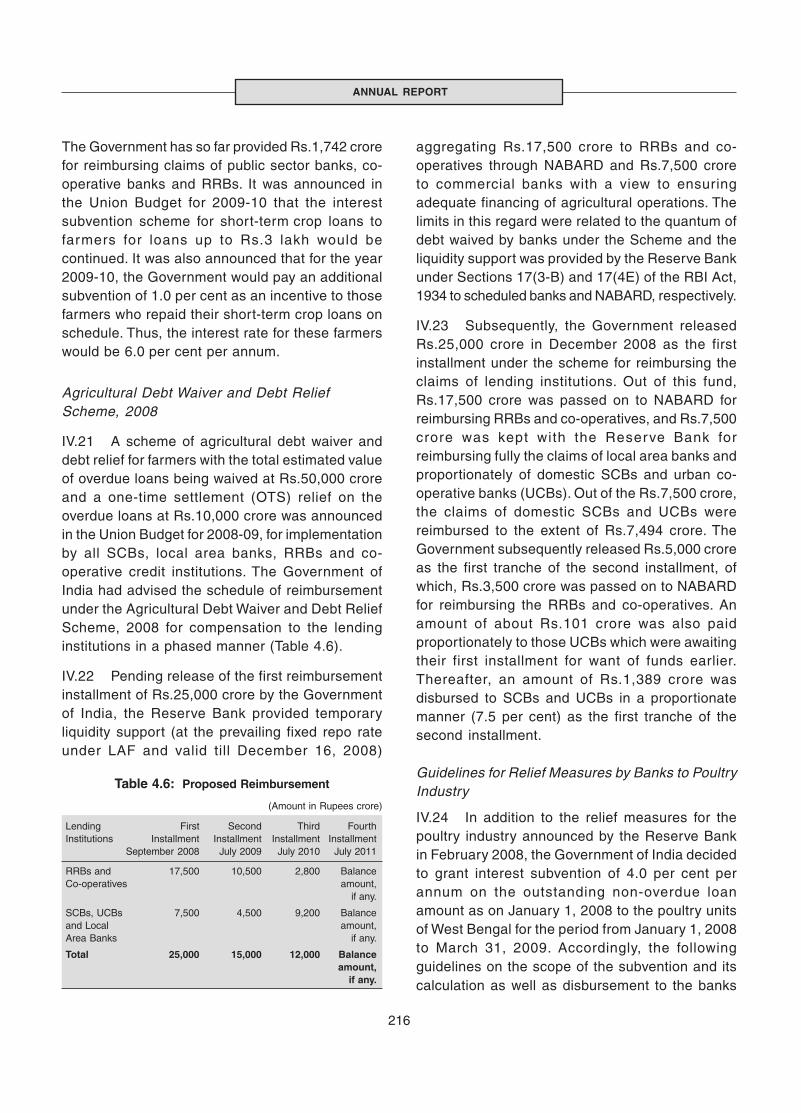
216
ANNUAL REPORT
The Government has so far provided Rs.1,742 crorefor reimbursing claims of public sector banks, co-operative banks and RRBs. It was announced inthe Union Budget for 2009-10 that the interestsubvention scheme for short-term crop loans tofarmers for loans up to Rs.3 lakh would becontinued. It was also announced that for the year2009-10, the Government would pay an additionalsubvention of 1.0 per cent as an incentive to thosefarmers who repaid their short-term crop loans onschedule. Thus, the interest rate for these farmerswould be 6.0 per cent per annum.
Agricultural Debt Waiver and Debt ReliefScheme, 2008
IV.21 A scheme of agricultural debt waiver anddebt relief for farmers with the total estimated valueof overdue loans being waived at Rs.50,000 croreand a one-time settlement (OTS) relief on theoverdue loans at Rs.10,000 crore was announcedin the Union Budget for 2008-09, for implementationby all SCBs, local area banks, RRBs and co-operative credit institutions. The Government ofIndia had advised the schedule of reimbursementunder the Agricultural Debt Waiver and Debt ReliefScheme, 2008 for compensation to the lendinginstitutions in a phased manner (Table 4.6).
IV.22 Pending release of the first reimbursementinstallment of Rs.25,000 crore by the Governmentof India, the Reserve Bank provided temporaryliquidity support (at the prevailing fixed repo rateunder LAF and valid till December 16, 2008)
aggregating Rs.17,500 crore to RRBs and co-operatives through NABARD and Rs.7,500 croreto commercial banks with a view to ensuringadequate financing of agricultural operations. Thelimits in this regard were related to the quantum ofdebt waived by banks under the Scheme and theliquidity support was provided by the Reserve Bankunder Sections 17(3-B) and 17(4E) of the RBI Act,1934 to scheduled banks and NABARD, respectively.
IV.23 Subsequently, the Government releasedRs.25,000 crore in December 2008 as the firstinstallment under the scheme for reimbursing theclaims of lending institutions. Out of this fund,Rs.17,500 crore was passed on to NABARD forreimbursing RRBs and co-operatives, and Rs.7,500crore was kept with the Reserve Bank forreimbursing fully the claims of local area banks andproportionately of domestic SCBs and urban co-operative banks (UCBs). Out of the Rs.7,500 crore,the claims of domestic SCBs and UCBs werereimbursed to the extent of Rs.7,494 crore. TheGovernment subsequently released Rs.5,000 croreas the first tranche of the second installment, ofwhich, Rs.3,500 crore was passed on to NABARDfor reimbursing the RRBs and co-operatives. Anamount of about Rs.101 crore was also paidproportionately to those UCBs which were awaitingtheir first installment for want of funds earlier.Thereafter, an amount of Rs.1,389 crore wasdisbursed to SCBs and UCBs in a proportionatemanner (7.5 per cent) as the first tranche of thesecond installment.
Guidelines for Relief Measures by Banks to PoultryIndustry
IV.24 In addition to the relief measures for thepoultry industry announced by the Reserve Bankin February 2008, the Government of India decidedto grant interest subvention of 4.0 per cent perannum on the outstanding non-overdue loanamount as on January 1, 2008 to the poultry unitsof West Bengal for the period from January 1, 2008to March 31, 2009. Accordingly, the followingguidelines on the scope of the subvention and itscalculation as well as disbursement to the banks
Table 4.6: Proposed Reimbursement
(Amount in Rupees crore)
Lending First Second Third FourthInstitutions Installment Installment Installment Installment
September 2008 July 2009 July 2010 July 2011
RRBs and 17,500 10,500 2,800 BalanceCo-operatives amount,
if any.
SCBs, UCBs 7,500 4,500 9,200 Balanceand Local amount,Area Banks if any.
Total 25,000 15,000 12,000 Balanceamount,
if any.
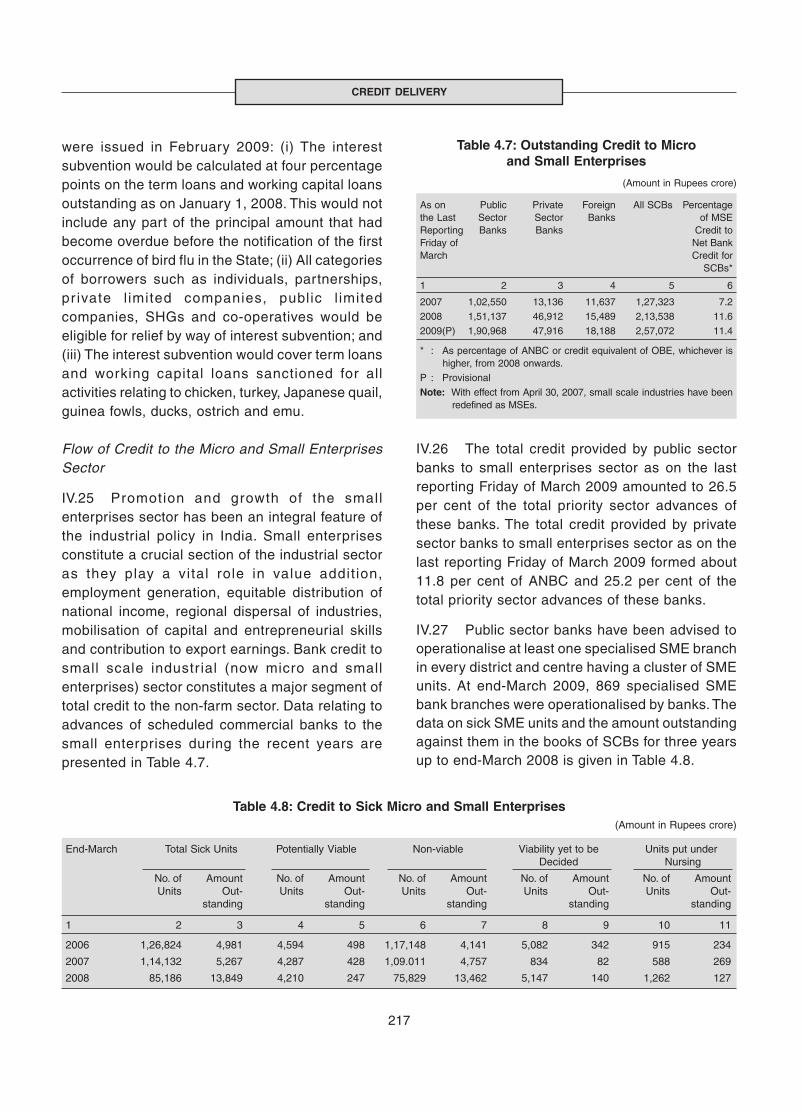
217
CREDIT DELIVERY
were issued in February 2009: (i) The interestsubvention would be calculated at four percentagepoints on the term loans and working capital loansoutstanding as on January 1, 2008. This would notinclude any part of the principal amount that hadbecome overdue before the notification of the firstoccurrence of bird flu in the State; (ii) All categoriesof borrowers such as individuals, partnerships,pr ivate l imited companies, public l imitedcompanies, SHGs and co-operatives would beeligible for relief by way of interest subvention; and(iii) The interest subvention would cover term loansand working capital loans sanctioned for allactivities relating to chicken, turkey, Japanese quail,guinea fowls, ducks, ostrich and emu.
Flow of Credit to the Micro and Small EnterprisesSector
IV.25 Promotion and growth of the smallenterprises sector has been an integral feature ofthe industrial policy in India. Small enterprisesconstitute a crucial section of the industrial sectoras they play a vital role in value addit ion,employment generation, equitable distribution ofnational income, regional dispersal of industries,mobilisation of capital and entrepreneurial skillsand contribution to export earnings. Bank credit tosmall scale industr ial (now micro and smallenterprises) sector constitutes a major segment oftotal credit to the non-farm sector. Data relating toadvances of scheduled commercial banks to thesmall enterprises during the recent years arepresented in Table 4.7.
IV.26 The total credit provided by public sectorbanks to small enterprises sector as on the lastreporting Friday of March 2009 amounted to 26.5per cent of the total priority sector advances ofthese banks. The total credit provided by privatesector banks to small enterprises sector as on thelast reporting Friday of March 2009 formed about11.8 per cent of ANBC and 25.2 per cent of thetotal priority sector advances of these banks.
IV.27 Public sector banks have been advised tooperationalise at least one specialised SME branchin every district and centre having a cluster of SMEunits. At end-March 2009, 869 specialised SMEbank branches were operationalised by banks. Thedata on sick SME units and the amount outstandingagainst them in the books of SCBs for three yearsup to end-March 2008 is given in Table 4.8.
Table 4.7: Outstanding Credit to Microand Small Enterprises
(Amount in Rupees crore)
As on Public Private Foreign All SCBs Percentagethe Last Sector Sector Banks of MSEReporting Banks Banks Credit toFriday of Net BankMarch Credit for
SCBs*
1 2 3 4 5 6
2007 1,02,550 13,136 11,637 1,27,323 7.2
2008 1,51,137 46,912 15,489 2,13,538 11.6
2009(P) 1,90,968 47,916 18,188 2,57,072 11.4
* : As percentage of ANBC or credit equivalent of OBE, whichever ishigher, from 2008 onwards.
P : Provisional
Note: With effect from April 30, 2007, small scale industries have beenredefined as MSEs.
Table 4.8: Credit to Sick Micro and Small Enterprises(Amount in Rupees crore)
End-March Total Sick Units Potentially Viable Non-viable Viability yet to be Units put underDecided Nursing
No. of Amount No. of Amount No. of Amount No. of Amount No. of AmountUnits Out- Units Out- Units Out- Units Out- Units Out-
standing standing standing standing standing
1 2 3 4 5 6 7 8 9 10 11
2006 1,26,824 4,981 4,594 498 1,17,148 4,141 5,082 342 915 234
2007 1,14,132 5,267 4,287 428 1,09.011 4,757 834 82 588 269
2008 85,186 13,849 4,210 247 75,829 13,462 5,147 140 1,262 127

218
ANNUAL REPORT
IV.28 The Government of India (Ministry ofLabour and Employment) has identified fourclusters in the minority concentrated districts of thecountry under the Prime Minister’s New 15-PointProgramme for the Welfare of Minorities. TheMinistry of MSME, Government of India hasapproved a list of clusters under the “Scheme ofFund for Regeneration of Traditional Industries”(SFURTI) and “Micro and Small Enterprises ClusterDevelopment Programme” (MSE-CDP) located in121 minority concentrated districts. Public sectorbanks have been advised to take appropriatemeasures to improve the flow of credit to theidentified clusters benefitting the micro, small andmedium entrepreneurs from the minor itycommunities residing in those districts.
IV.29 In the context of the global developmentsand the knock-on effects in the domestic creditmarkets, the Reserve Bank took several measuresto enhance credit delivery to the employment-intensive MSE sector. SCBs were advised toorganise special meetings of State Level Bankers’Committee (SLBC) to address the problems of theMSE sector, and steps were taken for timelyrestructuring and additional facilities, etc. Bankswere also advised to extend collateral-free loansup to Rs.5 lakh for all new loans to the MSE sector(both manufacturing and service enterprises).
IV.30 Since the Credit Guarantee Fund Trust forMicro and Small Enterprises (CGFTMSE) was notpicking up, it was announced in the Annual PolicyStatement for 2009-10 that the Standing AdvisoryCommittee on MSEs would be asked to review thecredit guarantee scheme so as to make it moreeffective. Accordingly, a Working Group (Chairman:Shri V.K. Sharma) was constituted, to review theworking of the scheme in order to enhance theusage and facilitate increased flow of collateral-freeloans to MSEs. The other terms of reference of theGroup include to make suggestions for simplifyingthe existing procedures and requirements forobtaining cover and invoking claims under theCGFTMSE and to examine the feasibility of a wholeturnover guarantee for the MSE portfolio.
Working Group on Rehabilitation/Nursing ofPotentially Viable Sick SME Units
IV.31 The rehabilitation/nursing of potentiallyviable sick units often gets delayed due to theinability of the promoters to bring in additionalcontribution of capital. A Working Group (Chairman:Dr. K.C. Chakrabarty) was constituted to look intothe issue and suggest remedial measures so thatpotentially viable sick units could be rehabilitatedat the earliest. Based on the recommendationsmade by the Group and public feedback, detailedguidelines were issued to banks in May 2009 andbanks were advised to undertake a review and putin place the following policies for the MSE sector,duly approved by the Board of Directors: (i) loanpolicy governing extension of credit facilities; (ii)restructuring/rehabilitation policy for revival ofpotentially viable sick units/enterprises; and (iii)non-discretionary one-time settlement scheme forrecovery of non-performing loans.
IV.32 The recommendations of the WorkingGroup on setting up of various Funds, viz.,Rehabi l i tat ion Fund, Fund for TechnologyUpgradation, Marketing Development Fund, wereforwarded to the Government in April 2009 forconsideration and necessary action. The regionaloffices of the Reserve Bank were also advised inApril 2009 to monitor the actions initiated by theState Governments/SLBC convenor banks in theSLBC meetings and keep the Reserve Bankapprised.
Lead Bank Scheme
IV.33 Subsequent to the announcement in theMid-term Review of the Annual Policy Statementfor 2007-08, a High Level Committee (Chairperson:Smt. Usha Thorat) with members drawn fromvar ious f inancial insti tut ions, banks, chiefsecretaries of select States, was constituted toreview the Lead Bank Scheme and improve itseffectiveness, with a focus on financial inclusionand recent developments in the banking sector. TheCommittee conducted ten meetings and a
219
CREDIT DELIVERY
questionnaire covering various aspects of the LeadBank Scheme was forwarded to al l StateGovernments and major banks. The Committeesubmitted its draft report in May 2009, which wasplaced on the Reserve Bank’s website forcomments from stakeholders and public (Box IV.2).
Special Task Force for the North-East Region
IV.34 A Special Task Force (Chairperson: Smt.Usha Thorat) was constituted to give a fresh
impetus for creation of banking facilities in North-Eastern India. A scheme of providing financialsupport to banks by the Reserve Bank for setting-up banking facilities (currency chests, extensionof foreign exchange and Government businessfacilities) at centres in the North-Eastern region,which are not found to be commercially viable bybanks, was formulated, requir ing the StateGovernments to make available necessarypremises and other infrastructural support. TheReserve Bank as its contribution would bear the
The High Level Committee on the Lead Bank Schemesubmitted its draft Report in May 2009, which highlights thefollowing:
Financial Inclusion
The Committee recommended that a roadmap be drawn toprovide banking services at least once a week at every GramPanchayat through a banking outlet. In the first instance,efforts could be made to cover every village with populationexceeding 2,000.
Role of State Government
The Committee suggested that State Governments shouldensure road and digital connectivity to all centres wherepenetration by the formal banking system was required.The State Governments should be able to leverage on thebenefits of undertaking Government business by banks toincentivise in Government sponsored schemes. Hence,private sector banks may actively involve themselves withthe District Consultative Committees (DCCs) and actionplans.
Banks - Strengthening State Level Banker Committee(SLBC) and DCC Machinery
The Committee suggested that a one-time comprehensiveState Level/District Level Development Plan should beformulated for all the districts that should indicate the rolesand responsibilities of banks, State Governments and otherstakeholders to ensure banking development for inclusivegrowth. The primary objective of these plans, according tothe Committee, would be to identify the ‘enablers’ and‘impeders’ for banking development and evolve a strategyfor banking development for inclusive growth. Lead banksshould organise awareness and feedback public meetingsin their districts every quarter. Wide publicity should be givento these meetings so that the people’s/media representatives,
Box IV.2Draft Report of the High Level Committee to Review the Lead Bank Scheme
local leaders as also NGOs working in the districts couldattend those meetings.
Financial Literacy and Credit Counseling
The Committee observed that there was a need to createand improve awareness of the common persons aboutbanking facilities and schemes available for their benefit.Each lead bank should open a financial literacy and creditcounseling centre in each district by following the recentguidelines issued by the Reserve Bank.
Credit Plus Activities
Credit plus initiatives include capacity/skill building ofprospective small entrepreneurs/borrowers to managebusinesses, enhancing farmers’ capability for absorbing newtechnology and practices, etc. It is proposed to establishrural development and self-employment training institutesin each district by 2012 and the lead banks should takeexpeditious steps in this regard.
Revised Service Area Monitoring and Information System(SAMIS)
The Committee recommended that the revised SAMISreporting system, known as priority sector monitoring andinformation systems, could be implemented on a pilot basisin one/two States and thereafter in other States. The IBA coulddevise software for consolidation and generation of bank-wise,block-wise, district-wise, sector-wise, activity-wise reports bythe SLBC convenor banks on an urgent basis.
Initiatives for Urban Areas
The Committee suggested that in urban areas, KYC normsfor opening bank account for small value accounts could besimplified. To start with, banks with the largest presence incities with more than one million population could take theleadership in convening a meeting of bankers and allocatingresponsibility for various wards to different banks.
220
ANNUAL REPORT
one-time capital cost and recurring expenses for alimited period of five years as per the lowest bidoffered by a bank. The Government of Meghalayaagreed to the proposal of providing premises andsecurity. Bids were received from public sectorbanks for setting-up branches at centres identifiedby the State Government and the banks, whichhave submitted the lowest bids, have been awardedcentres. Action has been initiated in respect of otherStates in the region.
Government Sponsored Schemes
IV.35 During the year 2008-09, 4,09,069 self-employed persons received bank credit amountingto Rs.333 crore under the Swarnajayanti GramSwarozgar Yojana, with Government subsidytotalling to Rs.119 crore as at end-September 2008,of which 47.2 per cent of the beneficiaries werewomen, 22.8 per cent were scheduled castes andscheduled tribes (SC/STs) and 0.7 per cent werephysically handicapped.
IV.36 Under the Swarna Jayanti Shahari RojgarYojana, disbursements amounting to Rs.75 crorewere made in 20,002 cases (out of the 46,073applications received) during 2008-09 as at end-September 2008. Of this amount, Rs.20 crore wasdisbursed to 6,040 SC/STs, Rs.17 crore wasdisbursed to 4,863 women and Rs.1 crore wasdisbursed to 184 disabled persons.
IV.37 The Self Employment Scheme forRehabilitation of Manual Scavengers (SRMS)contains provisions for capital subsidy,concessional loans and capacity building forrehabilitation of manual scavengers in alternativeoccupations. The scheme provides loans forprojects costing up to Rs.5 lakh. The loan amountcould be the remaining portion of the project cost,after deducting the admissible capital subsidy. Nomargin money/promoter’s contribution is requiredto be provided under the scheme. Both, term loan(up to a maximum cost of Rs.5 lakh) and microfinance (up to a maximum of Rs.25,000) could beadmissible under the scheme. Micro financing
would be done through SHGs and reputed nongovernment organisations (NGOs). The rate ofinterest chargeable from the beneficiaries is:(i) 5.0 per cent per annum for projects up toRs.25,000 (4.0 per cent for women beneficiaries);and (ii) 6.0 per cent per annum for projects aboveRs.25,000. The period of repayment of loan isthree years for projects up to Rs.25,000 and fiveyears for others. The moratorium period for startof repayment of loan is six months. Credit-linkedcapital subsidy is provided upfront to thebeneficiaries in a scaled manner. Under the newSRMS, disbursements aggregating to Rs.4.5 crorewere made to 1,409 beneficiaries for the half-yearended September 2008.
IV.38 The outstanding advances of public sectorbanks under the differential rate of interest (DRI)scheme, as on the last reporting Friday of March2009, amounted to Rs.753 crore under 3.11 lakhborrowal accounts, forming 0.04 per cent of theoutstanding advances of previous year as againstthe target of 1.0 per cent.
IV.39 Government of India has introduced a newcredit-linked subsidy programme called PrimeMinister’s Employment Generation Programme(PMEGP) by merging the two schemes that werein operation till March 31, 2008, namely the PrimeMinister’s Rozgar Yojana and the Rural EmploymentGeneration Programme for generation ofemployment opportunities through establishmentof micro enterprises in the rural as well as the urbanareas. PMEGP is administered by the Ministry ofMSMEs. The scheme is to be implemented by theKhadi and Village Industries Commission (KVIC),a statutory organisation under the administrativecontrol of the Ministry of MSMEs, as the singlenodal agency at the national level. At the State level,the scheme would be implemented through StateKVIC Directorates, State Khadi and Vil lageIndustries Boards (KVIBs) and District IndustriesCentres (DICs) and banks. The Governmentsubsidy under the scheme would be routed by KVICthrough the identified banks for eventual distributionto the beneficiaries/entrepreneurs in their bank
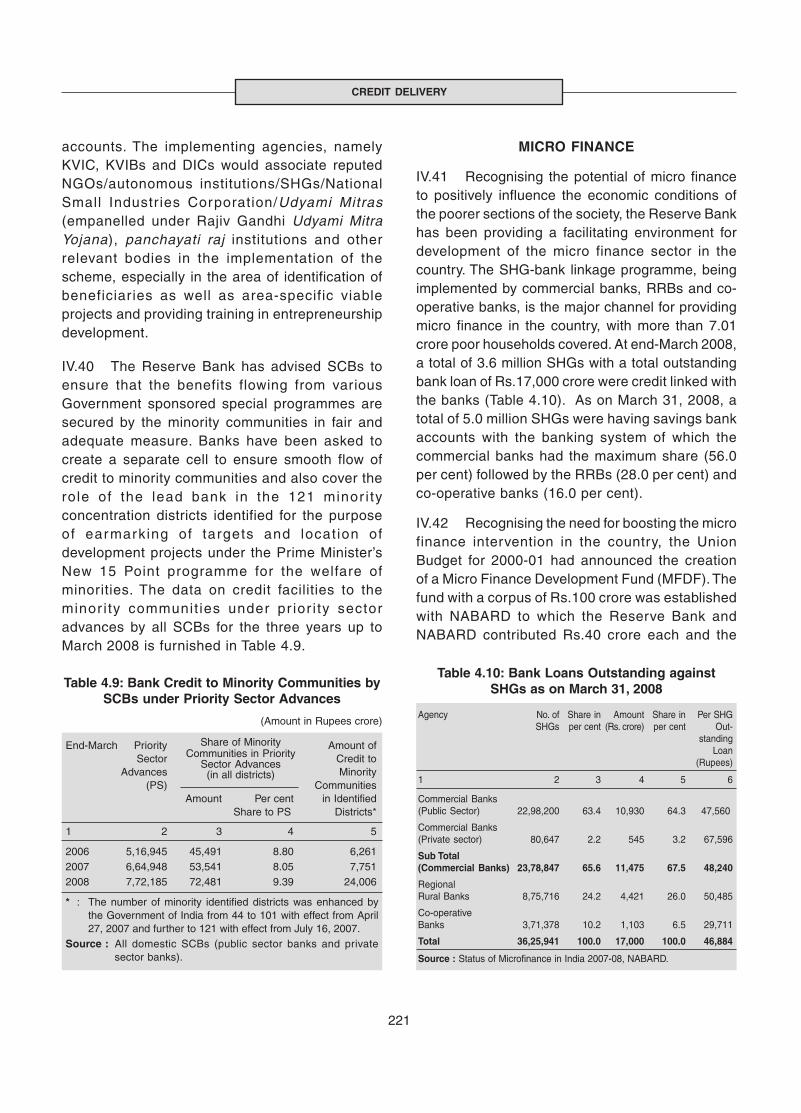
221
CREDIT DELIVERY
accounts. The implementing agencies, namelyKVIC, KVIBs and DICs would associate reputedNGOs/autonomous institutions/SHGs/NationalSmall Industr ies Corporation/Udyami Mitras(empanelled under Rajiv Gandhi Udyami MitraYojana), panchayati raj institutions and otherrelevant bodies in the implementation of thescheme, especially in the area of identification ofbeneficiar ies as well as area-specific viableprojects and providing training in entrepreneurshipdevelopment.
IV.40 The Reserve Bank has advised SCBs toensure that the benefits flowing from variousGovernment sponsored special programmes aresecured by the minority communities in fair andadequate measure. Banks have been asked tocreate a separate cell to ensure smooth flow ofcredit to minority communities and also cover therole of the lead bank in the 121 minor i tyconcentration districts identified for the purposeof earmarking of targets and locat ion ofdevelopment projects under the Prime Minister’sNew 15 Point programme for the welfare ofminorities. The data on credit facilities to theminor i ty communit ies under pr ior i ty sectoradvances by all SCBs for the three years up toMarch 2008 is furnished in Table 4.9.
MICRO FINANCE
IV.41 Recognising the potential of micro financeto positively influence the economic conditions ofthe poorer sections of the society, the Reserve Bankhas been providing a facilitating environment fordevelopment of the micro finance sector in thecountry. The SHG-bank linkage programme, beingimplemented by commercial banks, RRBs and co-operative banks, is the major channel for providingmicro finance in the country, with more than 7.01crore poor households covered. At end-March 2008,a total of 3.6 million SHGs with a total outstandingbank loan of Rs.17,000 crore were credit linked withthe banks (Table 4.10). As on March 31, 2008, atotal of 5.0 million SHGs were having savings bankaccounts with the banking system of which thecommercial banks had the maximum share (56.0per cent) followed by the RRBs (28.0 per cent) andco-operative banks (16.0 per cent).
IV.42 Recognising the need for boosting the microfinance intervention in the country, the UnionBudget for 2000-01 had announced the creationof a Micro Finance Development Fund (MFDF). Thefund with a corpus of Rs.100 crore was establishedwith NABARD to which the Reserve Bank andNABARD contributed Rs.40 crore each and the
Table 4.9: Bank Credit to Minority Communities bySCBs under Priority Sector Advances
(Amount in Rupees crore)
End-March Priority Amount ofSector Credit to
Advances Minority(PS) Communities
Amount Per cent in IdentifiedShare to PS Districts*
1 2 3 4 5
2006 5,16,945 45,491 8.80 6,2612007 6,64,948 53,541 8.05 7,7512008 7,72,185 72,481 9.39 24,006
* : The number of minority identified districts was enhanced bythe Government of India from 44 to 101 with effect from April27, 2007 and further to 121 with effect from July 16, 2007.
Source : All domestic SCBs (public sector banks and privatesector banks).
Share of MinorityCommunities in Priority
Sector Advances(in all districts)
Table 4.10: Bank Loans Outstanding againstSHGs as on March 31, 2008
Agency No. of Share in Amount Share in Per SHGSHGs per cent (Rs. crore) per cent Out-
standingLoan
(Rupees)
1 2 3 4 5 6
Commercial Banks(Public Sector) 22,98,200 63.4 10,930 64.3 47,560
Commercial Banks(Private sector) 80,647 2.2 545 3.2 67,596
Sub Total(Commercial Banks) 23,78,847 65.6 11,475 67.5 48,240
RegionalRural Banks 8,75,716 24.2 4,421 26.0 50,485
Co-operativeBanks 3,71,378 10.2 1,103 6.5 29,711
Total 36,25,941 100.0 17,000 100.0 46,884
Source : Status of Microfinance in India 2007-08, NABARD.
222
ANNUAL REPORT
balance Rs.20 crore was allocated to 11 publicsector banks with CRAR of 11.5 per cent and aboveas on March 31, 2000. Subsequently, in line withthe announcement in the Union Budget of 2005-06,the MFDF was redesignated as Micro FinanceDevelopment and Equity Fund (MFDEF) with anenhanced corpus of Rs.200 crore. The objective ofthe redesignated Fund was to facilitate and supportthe growth of the micro finance sector throughdiverse modalities for enlarging the flow of financialservices to the poor, particularly for women andvulnerable sections of the society, consistent withsustainability. The Fund is being managed by aBoard comprising representatives of the ReserveBank, NABARD, commercial banks andprofessionals possessing domain knowledge. TheGovernment also decided that the additionalamount of Rs.100 crore would be contributed bythe Reserve Bank, NABARD and other banks onthe same pattern as the earlier MFDF. NABARDcontributed Rs.40 crore to the MFDEF. The ReserveBank has made its contribution of Rs.20 crore tothe Fund and has advised NABARD that thebalance would be released as the fund gets furtherutilised. Those public sector banks which had notcontributed to the Fund earlier were advised tocontribute a total of Rs.20 crore to the MFDEFbased on their net working funds.
FINANCIAL INCLUSION
IV.43 Banks and financial institutions play a vitalrole as financial intermediaries by acceptingdeposits from the public and providing creditfacilities to the needy sectors of the economy fortheir development. As participants in the paymentsand settlement system, they also help in themanagement of assets and income streams. TheReserve Bank, therefore, has all along emphasisedaccess to banking services for all sections of thesociety and all regions, which is reflected in thebranch authorisation policy and the guidelines onpriority sector lending. Despite the substantialincrease in the number of bank branches, asignificant portion of the households still remainoutside the coverage of the formal banking sector.
The Reserve Bank has taken a number ofmeasures since 2005 to promote financial inclusion(Box IV.3).
IV.44 RRBs and UCBs play an important role inthe process of financial inclusion as also inextending credit to MSEs. Therefore, with a viewto ensuring that a larger section of the populationis covered by the commitment of banks to provideeasy, speedy and transparent access to bankingservices, the Banking Codes and Standards Boardof India (BCSBI) decided to enrol scheduled UCBsand RRBs as its members. Presently, 79 SCBs/UCBs/RRBs are members of the BCSBI, whilemembership of seven RRBs is under process.
IV.45 In pursuance of the commitments made inthe Code of Bank’s Commitment to Micro and SmallEnterprises a simple, standardised and easy tounderstand loan application form for MSEs wascirculated by the IBA for expeditious adoption bybanks. During 2008-09, 268 branches of memberbanks located in different cities were visited toreview the extent of their adherence to the twoCodes. The sample was such that it included 70per cent of the branches which had a poor trackrecord of adherence to the Code. The findings ofthe branch visits revealed some perceptibleimprovement in overall adherence to the provisionsof the Code over that observed during the previoussurvey conducted in 2007. Fur thermore, toascertain the factual position regarding opening of‘no frills’ accounts at branches, the BCSBI randomlyselected 44 branches of 26 public, private andforeign banks located in Mumbai and carried outincognito visits. The findings revealed that thegeneral awareness about the ‘no frills’ accountsand relaxed KYC requirements in respect of thesame was insufficient among the staff of the banksvisited and the staff were not proactive in openingsuch accounts.
IV.46 As part of the initiative to identify at leastone suitable district in each State/Union Territoryfor achieving 100 per cent financial inclusion, whichstar ted in April 2006, 431 districts had beenidentified as on March 31, 2009. The target has
223
CREDIT DELIVERY
Financial inclusion broadly refers to delivery of financialservices, at an affordable cost, to the vast sections ofdisadvantaged/low-income groups who often tend to beexcluded from the formal financial system. Notwithstandingthe widespread expansion of the banking sector during thelast four decades, a sizeable proportion of households,especially in the rural areas, remains outside the coverageof the formal banking system. The Reserve Bank has takena number of initiatives for bringing the financially excludedpopulation within the ambit of the formal financial system.The major initiatives include:
(i) In November 2005, banks were advised to makeavailable a basic banking ‘no frills’ account with low ornil minimum balances as well as charges so as toexpand the outreach of banking services to vast sectionsof the population. As on March 31, 2009, public sectorbanks had opened 2,98,59,178 ‘no frills’ accounts, whileprivate sector banks and foreign banks had opened31,24,101 accounts and 41,482 accounts, respectively.
(ii) In order to ensure that persons belonging to low incomegroup, both in urban and rural areas, do not encounterdifficulties in opening bank accounts, the KYC normsfor opening accounts were simplified for those accountswith balances not exceeding Rs.50,000 and creditsthereto not exceeding Rs.1,00,000 in a year. Thesimplified procedure allowed introduction by a customeron whom the full KYC drill had been already applied.
(iii) Banks have been asked to consider introduction of ageneral-purpose credit card (GCC) facility up toRs.25,000 at their rural and semi-urban branches. Thecredit facility is in the nature of a revolving credit entitlingthe holder to withdraw up to the limit sanctioned. TheReserve Bank further advised banks in May 2008 to
Box IV.3Financial Inclusion: Policy Prescriptions
classify 100 per cent of the credit outstanding underGCCs as indirect finance to the agriculture sector underthe priority sector with immediate effect.
(iv) At the state level, the SLBC is required to identify oneor more districts for 100 per cent financial inclusion.Responsibility is given to the banks in the area forensuring that all those who desire to have a bankaccount are provided with one by allocating the villagesamong the different banks.
(v) In certain less developed states, such as those in theNorth Eastern region, Bihar, Chhattisgarh, Jharkand,Himachal Pradesh, Lakshadweep and Uttarakhand,Working Groups appointed by the Reserve Bank havemade specific recommendations for financial inclusion,strengthening financial institutions and improvingcurrency and payments systems. The recommendationsof these Working Groups are under implementation.
(vi) In January 2006, the Reserve Bank permitted banks toutilise the services of NGOs, MFIs (other than NBFCs)and other civil society organisations as intermediariesin providing financial and banking services through theuse of business facilitator (BF) and businesscorrespondent (BC) models. The BC model allows banksto do ‘cash in - cash out’ transactions at a location muchcloser to the rural population.
(vii) The Reserve Bank has been encouraging the use ofICT solutions by banks for enhancing their outreach withthe help of their BCs. Banks have been urged to scaleup IT initiatives for financial inclusion speedily whileensuring that solutions are highly secure, amenable toaudit and follow widely-accepted open standards toensure eventual inter-operability among the differentsystems.
reportedly been achieved in 204 districts in 18States and six Union Territories. All districts ofHaryana, Himachal Pradesh, Karnataka, Kerala,Uttarakhand, Goa, Chandigarh, Puducherry,Daman and Diu, Dadra and Nagar Haveli andLakshadweep have reported achieving 100 percent financial inclusion.
IV.47 The Reserve Bank undertook an evaluationstudy through external agencies on the progressmade in achieving 100 per cent financial inclusionin 26 districts that had reported achievement of thetarget with a view to draw lessons for further actionin this regard. The studies were carried out in the
States of Andhra Pradesh, Gujarat, HimachalPradesh, Karnataka, Orissa, Punjab, Rajasthanand West Bengal. The findings revealed thatalthough the SLBCs had declared several districtsas fully financially included, the actual financialinclusion was not to the full extent in all the districts.Further, most of the accounts that had been openedas a part of the financial inclusion drive remainedinoperative due to various reasons. The awarenesswith regard to ‘no frills’ accounts continued to bedismal and virtually non-existent in many districts.In order to sustain the momentum for financialinclusion, banks were advised in January 2009,among others, to ensure that steps were taken to

224
ANNUAL REPORT
provide banking services nearer to the location ofthe ‘no frills’ account holders through a variety ofchannels, to consider providing GCCs/smalloverdrafts along with ‘no fr i l ls’ accounts toencourage the account holders to actively operatethe accounts, to conduct awareness drives so thatthe ‘no frills’ account holders were made aware ofthe facilities offered, to review the extent ofcoverage in districts declared as 100 per centfinancially included and to efficiently leverage thetechnology-enabled financial inclusion initiativesbeing implemented in various States.
IV.48 In April 2008, banks were permitted toengage retired bank employees, ex-servicemenand retired government employees as BCs, inaddition to the entities already permitted, subjectto appropriate due diligence. The distance betweenthe place of business of a BC and the base branchwas not to, ordinarily, exceed 15 kms in rural, semi-urban and urban areas and 5 kms in metropolitancentres. In case a need was felt to relax thedistance criterion, however, the matter could bereferred to the District Consultative Committee(DCC) of the district concerned for approval. Wheresuch relaxations covered adjoining districts, thematter could be cleared by the SLBC, which wouldalso be the concerned forum for metropolitan areas.The distance criterion for rural, semi-urban andurban areas was relaxed to 30 kms with effect fromApril 24, 2009.
IV.49 SCBs, including RRBs and local areabanks, were advised in August 2008 that they couldengage companies registered under Section 25 ofthe Companies Act, 1956 as BCs, provided thatthese companies were stand-alone entities or notmore than 10 per cent of their equity was held byNBFCs, banks, telecom companies and othercorporate entities or their holding companies.Further, while engaging Section 25 companies asBCs, banks would have to strictly adhere to thedistance criterion, between the place of businessof the BC and the branch.
IV.50 In case, the duly appointed BCs of banksdesired to appoint sub-agents at the grassroot level
to render the services of a BC, banks were advisedto ensure that: (i) the sub-agents of BCs fulfilledall relevant criteria stipulated for BCs in terms ofextant guidelines; (ii) the BC appointed by themcarried out proper due diligence in respect of thesub-agent in order to address reputational andother risks involved; and (iii) the distance criterion,as applicable, from the base branch shouldinvariably be fulfilled in the case of all sub-agents.Banks were also advised that where individualsunder the permitted categories were appointed asBCs, they could not in turn appoint sub-agents.Consequent to the announcement in the AnnualPolicy Statement for 2009-10, a Working Group wasconstituted to examine the experience to date ofthe BC model and suggest measures, to enlargethe category of persons that could act as BCs,keeping in view the regulatory and supervisoryframework and consumer protection issues. TheWorking Group has since submitted its Report.
IV.51 The Reserve Bank had constituted a HighLevel Committee to go into the issues connectedwith the modalities of electronic benefit transfer(EBT) and suggest a common strategy for adoptionby the State Governments. Subsequently, theReserve Bank formulated a scheme to quicken thepace of adoption of the smart card/biometric basedEBT mechanism by the banks and roll out the EBTsystem in the States that are ready to adopt thescheme. As per the scheme, the Reserve Bankwould partially reimburse the banks the cost ofopening accounts with biometric access at the rateof Rs.50 per account through which payment ofsocial security benefits, National Rural EmploymentGuarantee Act payments and payments underother Government benefit programmes would berouted.
IV.52 The Working Groups set up to suggestmeasures for improving the outreach of banks andtheir services and promoting financial inclusion incertain less developed States/Union Territories,have made specific recommendations for achievingthe above objectives and strengthening of financialinstitutions, improving currency and paymentssystems and revitalisation of the RRBs and UCBs
225
CREDIT DELIVERY
The Reserve Bank in the recent period constituted WorkingGroups in certain States with a view to improving theoutreach of banks and their services, promoting financialinclusion and supporting the development plans of the StateGovernments. The reports submitted by these Groups havebeen found very useful from several points of view. First,they have examined the adequacy of banking services inthe context of the respective State’s development plan andtried to plug the gaps. Second, they have thrown up a hostof constructive suggestions towards enhancing the outreachof banks and promoting financial inclusion, keeping in viewthe regional requirements, resources and opportunities.Third, the studies undertaken have also made usefulsuggestions for revitalisation of RRBs and UCBs in therespective regions. Lastly and most importantly, the studiesundertaken jointly by the Reserve Bank, the concerned StateGovernments, NABARD, banks and financial institutionshave imparted a renewed impetus for concerted action tobring about improvements in the economies of the respectiveStates. In this regard, Working Groups were constituted forBihar, Uttaranchal, Chhattisgarh, Lakshadweep, HimachalPradesh and Jharkhand between July 2006 and October 2007.
These Working Groups made wide-ranging recommendations,which included not only measures for enhancing greateroutreach/penetration of the banking system throughconsistent use of IT and available business processingtechnologies but also developmental measures to be takenby respective State Governments to improve infrastructureand attract investment.
The compliance marked to State Governments/banks/otheragencies are monitored through the respective regionaloffices of the Reserve Bank. For this purpose it wasdecided to constitute a special sub-committee of the SLBC,which was entrusted with the implementation of therecommendations made by the Working Group within aprescribed timeframe. The sub-committee would be chairedby the SLBC convenor bank and have representatives fromrespective State Governments, Reserve Bank, other banksand NABARD. The State Governments were requested tonominate a senior official from the Finance and PlanningDepar tment on this sub-committee to oversee theimplementation of the recommendations of the Working
Box IV.4Implementation of Recommendations of the Working Groups on Improvement of
Banking Services in Different States/Union Territories
Groups. Further, State Governments were also requestedto form Empowered Committees under the chairmanship ofthe Chief Secretary to expedite action on the unfulfilledrecommendations. Thus, there exists a proper mechanismto strategise and implement the recommendations of theWorking Groups. A lot of qualitative and sustainable actionhas been initiated by the regional offices that are monitoredby the central office of the Reserve Bank. Action has beeninitiated by all the regional offices on majorrecommendations/suggestions to improve the financialnetwork as also the banking facilities and services inunbanked areas. The regional offices have reportedcompliance related to following recommendations:
1. Opening of new branches.
2. All branches to be made RTGS and NEFT enabled toreap the benefits of electronic payment and settlementsystem.
3. Agencies to take initiatives to promote more SHGs bymaking use of the services of NGOs
4. Setting up of rural development and self-employmenttraining institutes for promoting self employmentopportunities.
5. Banks to aggressively use the BF model for increasingbanking outreach.
6. Use of post offices for augmenting credit flow in ruralareas.
7. Village panchayats can also act as BFs/BCs for banks.
8. Banks and other agencies to carry out awarenesscampaign for opening of ‘no frills’ accounts.
9. Inclusion of under developed districts for 100 per centfinancial inclusion.
10. Opening of credit counselling centres in the districts ofthe States by major banks.
Most of the recommendations, particularly those marked toState Governments, are long-term in nature such asdevelopment of infrastructure, horticulture, fisheries, tourism,in the States. Thus, the implementation of suchrecommendations is an ongoing process.
in the respective regions. The status in respect ofcompliance with the recommendations of theseGroups is outlined in Box IV.4.
IV.53 Despite the host of measures taken by theReserve Bank since 2005, moneylenders remain
a dominant source of credit, especially in the ruralareas and hinterland. With a view to addressingthe needs of the people who rely on informalsources of credit, the Reserve Bank had constituteda Group to review the legislation on money lending(Box IV.5).
226
ANNUAL REPORT
A Technical Group (Chairman: Shri S.C. Gupta) was set upto review both the efficacy of the existing legislativeframework governing money lending and its enforcementmachinery in different States and to make recommendationsto the State Governments for improving the legal andenforcement framework in the interest of the rural households.The Group had submitted its Report in July 2007.
The Group prepared a model legislation for considerationand adoption by the State Governments that do notpresently have a comprehensive legislation in place forgoverning money lending. The model legislation providesfor a hassle-free procedure for compulsory registration andperiodic renewal by money lenders, a simplified disputeresolution mechanism to ensure better enforcement,periodic fixing of the maximum interest rate in line withmarket rates and adoption of the rule of damdupat,restricting the maximum amount of interest chargeable bythe money lender. The Group also explored establishmentof a link between the formal and informal credit providerswhereby a money lender, who is an ‘accredited loanprovider’, could serve as an additional credit delivery
Box IV.5Technical Group for Review of Legislation on Money Lending
channel for the formal sector, provided there weresafeguard measures.
The Report was translated into different vernacular languagesfor all regions with copies handed over to the Chief Secretariesof the State Governments by the Regional Directors of theReserve Bank. As per the responses received, although someof the State Governments have evinced interest in the modellegislation, relevant action in regard to adoption of itsrecommendations into their respective extant legislations hasnot yet been taken. The Government of Uttar Pradesh hasincorporated some suggestions of the model legislation inthe UP Regulation of Money Lending (Amendment) Act, 2008.Reportedly, a few State Governments such as Bihar, Delhi,Kerala, Orissa and West Bengal are processing the matter. InMaharashtra, the State Government is reported to be enactinga new legislation in which the provision of damdupat has beenincorporated. The Maharashtra Money Lending (Regulation)Act, 2008 has been submitted to the Central Government forclearance as some provisions of the proposed Act fall withinthe ambit of certain Central Government Acts. The regionaloffices of Reserve Bank are following up the matter.
FINANCIAL LITERACY AND CREDITCOUNSELLING
IV.54 The Reserve Bank has been taking anumber of initiatives to promote financial literacy,as lack of awareness is a major factor for financialexclusion. ‘Project Financial Literacy’ has beenundertaken to educate the common person onfinancial matters. The common person for thispurpose is defined as one who is not financiallyliterate. To ease access to information, the ‘For theCommon Person’ link on the Reserve Bank’swebsite has been made mult i- l ingual, withinformation accessible in Hindi, English and elevenregional languages.
IV.55 The financial education site launched by theReserve Bank in November 2007 and aimed atteaching basics of banking, finance and centralbanking to children in different age groups, wouldeventually have information useful to other targetgroups.
IV.56 The other initiatives of the Reserve Bankto promote financial awareness include conducting
essay/quiz/inter-school debate competitions forschool children on topics related to banking andfinancial inclusion; distributing material such ascomic books, pamphlets and posters on financialliteracy free-of-cost; participating in fairs/exhibitionsto disseminate information on the Reserve Bank’srole as a central bank; educating the general publicabout the Reserve Bank’s clean note policy,security features of currency notes, detection offorged notes, foreign exchange facil i t ies toresidents, guidance to the public on investment inNBFCs and on the Banking Ombudsman Scheme,among others. The Reserve Bank holds meetingswith banks, MFIs, rural insurance agencies, officialsof Depar tment of Posts and other field-levelfunctionaries to familiarise them with the ReserveBank’s instructions on financial inclusion andprovide operational guidance. Workshops/seminarsare conducted for the controlling heads of majorbanks to encourage them about working towardsgreater financial inclusion, such as, opening of ‘nofrills’ accounts, IT-enabled financial inclusion,formation of SHGs. The Reserve Bank urges thebranch managers of banks operating in districts,
227
CREDIT DELIVERY
block development officers, lead district managers,lead district officers and members of local mediato have a door-to-door campaign to bring all thehouseholds in their areas into the banking fold.There is interaction with the representatives of localpr int and electronic media to disseminateinformation on financial literacy initiatives of theReserve Bank and matters pertaining to currencymanagement taken up by the regional offices.Select villages are visited to discuss issues relatingto, inter alia, financial planning, accessing bankingservices, availing loans under the DRI scheme andother Government sponsored schemes, availing theservices of rural self-employment training institutes,simplification of lending procedures for crop loans,advantages of KCCs. An awareness campaign hasbeen launched for the army personnel to apprisethem of the var ious banking products andinteractive sessions are held with officers andjawans to address their banking related queries.Roadshows are organised at prominent publicplaces such as railway stations, bus stands andbeaches, to promote financial inclusion.
IV.57 The Reserve Bank has under taken aproject of setting up a permanent exhibition centreon financial education in Mumbai. A pilot projecton developing and including chapters on financialeducation as part of the curriculum in schools hasbeen under taken in col laboration with theKarnataka Government.
IV.58 The Annual Policy Statement for 2007-08had advised SLBC convenor banks to set up afinancial literacy cum counselling centre in any onedistrict on a pilot basis and extend it to all otherdistricts in due course, based on the experiencegained. Several banks have since taken initiativesin opening credit counselling centres in the country.So far, banks have reported setting up 148 creditcounselling centres in various States of the country.The feedback received in this regard indicated thatmost of these centres were in effect set up asextensions of the bank branches and engaged inpromotion of bank-specific products. Accordingly,a Model Scheme on Financial Literacy and CreditCounselling Centres (FLCCs) was formulated and
communicated to all SCBs and RRBs with theadvice to set up the centres as distinct entitiesmaintaining an ‘arm’s length’ from the bank so thatthe FLCC’s services were available to even otherbanks’ customers in the district (Box IV.6).
EXPORT CREDIT
IV.59 The export sector not only confronted withthe challenge of decelerating global demand butalso tighter access conditions in the market for tradecredit. In response, a number of measures weretaken to address the concerns relating to tradecredit and give a boost to the export sector.
IV.60 The challenges relating to trade credit haveto be seen in the context of the fact that theinventories were building up due to the slowdownin export demand. Further, the realisation of exportproceeds was not taking place on the due date.Therefore, a need was felt to extend the period ofentitlement of pre-shipment and post-shipmentexport credit. Accordingly, the period for prescribedinterest rate ceiling of 250 basis points below BPLRfor pre-shipment and post-shipment rupee exportcredit was extended by 90 days each to 270 days(with effect from November 15, 2008) and 180 days(with effect from November 28, 2008), respectively.The prescribed rate was also made applicable tooverdue bills up to 180 days with effect fromDecember 8, 2008. Further, the validity of theinterest rate ceiling of 250 basis points below BPLRfor pre-shipment rupee export credit up to 270 daysand post-shipment rupee export credit up to 180days was extended up to October 31, 2009(Appendix Table 57).
IV.61 Banks are permitted to deploy amountsraised through FCNR (B) deposits and foreigncurrency lines of credit for extending foreigncurrency loans to exporters. Though banks arepermitted to access overseas lines of credit for on-lending to exporters, the ability of banks to borrowis constrained by the interest rate ceiling specifiedby the Reserve Bank on such borrowings. As theavailability of US dollar funds in the inter-bankmoney market dried up with considerable widening
228
ANNUAL REPORT
Consequent to the announcement in the Mid-term Review ofthe Annual Policy for 2007-08, a concept paper on FinancialLiteracy and Credit Counselling Centres (FLCCs) was placedon the Reserve Bank’s website. Based on the feedbackreceived from the public as also from banks that had startedoperating the counselling centres, a model scheme for settingup FLCCs was formulated in February 2009.
Model Scheme for FLCCs
The broad objective of the FLCCs would be to provide freefinancial literacy/education and credit counselling. Thespecific objectives of the FLCCs would be: (i) to providefinancial counselling services through face-to-faceinteraction and other available media as per the convenienceof the interested persons, including education on responsibleborrowing, proactive and early savings and debt counsellingto individuals who are indebted to formal/informal financialsectors; (ii) to educate the people in the rural and the urbanareas with regard to various financial products and servicesavailable from the formal financial sector; (iii) to make thepeople aware of the advantages of being connected withthe formal financial sector; (iv) to formulate debt restructuringplans for borrowers in distress and recommend the same toformal financial institutions, including co-operatives, forconsideration; (v) to take up any activity that promotesfinancial literacy, awareness regarding banking services,financial planning and amelioration of debt-related distressof an individual.
To start with, banks could set up trusts/societies for runningthe FLCCs, singly or jointly with other banks. Respectedlocal citizens could be inducted on the Board of such a trust/society while serving bankers could be excluded. Initially,the FLCCs may be fully funded by the bank/s.
The counselling centres should maintain ‘arm’s length’relationship with the parent bank and, preferably, not belocated in the bank’s premises. The centres should notpromote the products of their parent banks. Theindependence of the counselling centres has to be ensuredso that non-partisan and objective guidance is provided tothe customers.
In order to have maximum coverage, FLCCs should be setup in blocks, districts, towns and cities. SLBCs couldcoordinate with banks, both in the public and the privatesectors, and arrive at a plan for setting up FLCCs at differentlevels in a phased manner.
Debt counselling/credit counselling can be both preventiveand curative. In case of preventive counselling, the centrescould provide awareness regarding the cost of credit,availability of backward and forward linkages where warranted,etc. The clients could be encouraged to avail of credit on thebasis of their repaying capacity. Preventive counselling couldbe through the media, workshops and seminars.
Box IV.6Financial Literacy and Credit Counselling Centres – Model Scheme
FLCCs may consider introducing a generic financialeducation module in vernacular language, broadly includingthe need for savings, budgeting, advantages of banking withformal financial institutions, concept of risk and rewards andtime value of money, various products offered by banks,insurance companies, etc. The module may also coveraspects relating to deposits and various other financialproducts, the method of calculation of interest on savingsaccounts, fixed deposits, etc., and method of compounding.
In the case of curative counselling, the clients couldapproach the counselling centres to work out individual debtmanagement plans for resolving their unmanageable debtportfolio. Preventive counselling may be made mandatoryfor individual borrowers based on their income level or sizeof loan. Such mandatory credit counselling could be madea part of fair lending practice of banks.
Banks may encourage their own customers in distress orcustomers of any bank to approach the FLCCs set up bythem. Information about such FLCCs could be providedthrough the various fora available under the Lead BankScheme. Banks may evolve trigger points to refer cases,where there are early warning signals, to the counsellingcentres before taking measures for recovery. Timelyintervention would help to arrest any further financialdeterioration of the borrower. The counsellors should bemandated to refer cases to banks and work out debtmanagement plans for distressed borrowers with a view tofacilitating restructuring/rescheduling of their debts. Thechoice of finally accepting or rejecting a debt restructuringproposal suggested by the FLCCs may be left to the bank/s concerned. However, in case of non-acceptance orrejection of restructuring proposals forwarded by FLCCs,the banks may give the reasons in writing to the concernedFLCC in the interest of transparency.
As FLCCs are expected to play a crucial role in assistingand guiding the distressed individual/borrower, it isnecessary that only well-qualified and trained counsellorsare selected to man the centre on a full time basis.Individuals such as retired bank officers and ex-servicemen,may be allowed to be appointed, among others, as creditcounsellors. Credit counsellors should have soundknowledge of banking, law, f inance, requisitecommunication and team building skills, among others.Training is also required to be provided to the counsellorson an ongoing basis to constantly upgrade their skills.
The functioning of the FLCCs in each State may bemonitored by a committee headed by the Regional Directorof the Reserve Bank and the feedback be provided to thebanks on a regular basis. The committee may compriseSLBC convenor bank, other banks, NABARD, IBA,consumer organisations and NGOs working in the area.
229
CREDIT DELIVERY
of spreads in the international market, in theaftermath of global financial crisis, Indian bankswere finding it difficult to access foreign exchangelines of credit within the interest rate ceiling andextend export credit within the prescribed ceilingrate. In order to facilitate banks financing of exportcredit in foreign currency to expor ters, inconsultation with the Government of India, theceiling rate on export credit in foreign currency wasraised to LIBOR plus 350 basis points from LIBORplus 100 basis points on February 5, 2009 and theceiling interest rate on the lines of credit withoverseas banks for the banks providing exportcredit was raised from 6- month LIBOR plus 75basis points to 6-month LIBOR plus 150 basis points.
IV.62 The rupee export credit interest rate schemeis formulated by the Government of India for whichoperational details are issued by the Reserve Bank.The scheme of rupee expor t credit interestsubvention of 2.0/4.0 per cent for certain specifiedsectors effective from April 1, 2007 was brought to aclose on September 30, 2008. This scheme wasformulated to alleviate the exporters’ concerns in thecontext of appreciation of the rupee. In the wake ofthe global financial crisis, a fresh scheme of rupeeexport credit interest subvention of 2.0 per cent was,however, introduced for seven employment-orientedexport sectors for the period from December 1, 2008to September 30, 2009 on pre- and post-shipmentrupee export credit. This scheme has since beenextended up to March 31, 2010.
IV.63 The Reserve Bank provides export creditrefinance (ECR) facility to scheduled banks underSection 17(3A) of the Reserve Bank of India Act,1934. All scheduled banks (excluding RRBs), whichare authorised dealers in foreign exchange andhave extended rupee export credit (for both pre-shipment and post-shipment), are eligible forrefinance. The quantum of the refinance facility andthe rate of interest applicable are prescribed by theReserve Bank from time to time based on themonetary policy stance. In 2001, the quantum ofECR limit was fixed at 15.0 per cent of theoutstanding rupee expor t credit el igible forrefinance as at the end of the second preceding
fortnight. With a view to strengthening the creditdelivery mechanism and improving credit deliveryfor sustaining the growth momentum, this limit wasenhanced to 50.0 per cent with effect fromNovember 15, 2008. The rate of interest chargedon ECR facility is fixed at the repo rate under theLAF of the Reserve Bank. The reliance on ECRfacility by banks was generally low, barring a fewoccasions. However, the recourse to ECR facilityin terms of daily average utilisation by banks duringJuly-September 2008 was higher in the range of26.0-56.0 per cent of the limit, coincident with thetightening of overal l l iquidity condit ions.Nevertheless, aggregate utilisation of the ECRfacility remained much below the ECR limits in therecent period and it was as low as 5.4 per cent inJune 2009 (Appendix Table 22).
EXTENSION OF COLLATERAL FACILITY –SAVINGS BONDS
IV.64 In terms of relevant Government of IndiaNotifications, 7.0% Savings Bonds 2002, 6.5%Savings Bonds 2003 (Non-taxable) and 8.0%Savings (Taxable) Bonds 2003, were not eligible ascollateral for loans from banks, financial institutionsand NBFCs, etc. On a review, it was decided by theGovernment of India to allow for pledge orhypothecation or lien of the bonds issued under theabove schemes as collateral for obtaining loans fromscheduled banks. Accordingly, the holders of the saidbonds would be entitled to create pledge orhypothecation or lien in favour of scheduled banksin accordance with Section 28 of the GovernmentSecurities Act, 2006 and Regulations 21 and 22 ofthe Government Securities Regulations, 2007.However, the collateral facility is available only forthe loans extended to the holders of the bonds and,as such, the facility is not available in respect of theloans extended to third parties.
NON-BANKING FINANCIAL COMPANIES
IV.65 The Government had announced thesetting up of an SPV for addressing the temporaryliquidity constraints of NBFCs-ND-SI. The SPV
230
ANNUAL REPORT
issues Government guaranteed securities to theReserve Bank and uses the funds to acquire onlyinvestment grade CPs and non-conver tibledebentures of the NBFCs to tide over temporaryliquidity mismatch. The total liquidity support fromthe Reserve Bank to NBFCs would be limited toRs.20,000 crore with an option to raise it by afurther Rs.5,000 crore. This facility is available forany paper issued by NBFCs up to September 30,2009. The SPV would cease to make freshpurchases after December 31, 2009 and wouldrecover all dues by March 31, 2010. NBFCs utilisedthe special liquidity facility from the Reserve Bankthrough the SPV (viz., IDBI SASF) in the range of0.8-3.0 per cent up to July 6, 2009 and the totaloutstanding amount of Rs.290 crore was repaid onJuly 7, 2009.
SCHEDULED COMMERCIAL BANKS
IV.66 The Reserve Bank has allowed banks toavail liquidity support under the LAF for the purposeof meeting the funding requirements of mutualfunds (MFs), NBFCs and housing f inancecompanies (HFCs) through relaxation in themaintenance of SLR up to 1.5 per cent of theirNDTL. This facility, with a limit of Rs.60,000 crore,is available up to March 31, 2010. Banks haveutilised only a small portion of their limit so far.During November 2008-July 2009, utilisation wasin the range of 0.2-8.4 per cent.
IV.67 In order to provide flexibility to Indian banksin managing their short-term funding requirementsat their overseas offices, the Reserve Bank witheffect from November 7, 2008 provided foreignexchange liquidity to Indian public and privatesector banks having foreign branches orsubsidiaries, through foreign exchange swaps oftenures up to three months. Banks are allowed toborrow under the LAF for the corresponding tenure
at the prevailing repo rate for funding the swaps,and the Reserve Bank is also prepared to considerany specific relaxation of SLR requirements, if needbe, for this purpose. This facility is available up toMarch 31, 2010. Under the foreign exchange swapfacility, banks have availed funds in the range ofRs.470-1,030 crore till August 14, 2009.
IV.68 In the context of the intense credit freeze thataffected the global economy, the significance of theReserve Bank’s continuous emphasis on ensuringadequate flow of credit to all productive sectors ofthe economy and the specific measures forpromoting credit delivery alongside financialinclusion of the masses became evident. Despitesome moderation in credit growth, credit continuedto flow to all the productive sectors of the economy.In this regard, the Reserve Bank policies have beensupplemented by the Government of India initiatives,such as the Agriculture Debt Waiver and Debt ReliefScheme, 2008. Recent years have seen a steadyimprovement in credit flow to the agriculture and theMSE sectors. Though ‘no frills’ accounts have beenopened at a rapid pace since their introduction inNovember 2005 as part of the policy on financialinclusion, the Reserve Bank has issued freshinstructions to ensure that these accounts remainoperative and serve the purpose of financialinclusion. The new model scheme on FLCCs shouldincrease awareness about the array of products thatare available to an individual to connect with the formalbanking system. The model legislation on moneylending suggested by the concerned Technical Groupis expected to be incorporated into various States’laws on money lending and help address the needsof people who remain outside the formal creditchannel. Even though the Reserve Bank wouldcontinue to take initiatives to further strengthen thecredit delivery mechanisms, the emphasis on creditquality would, however, not be diluted.
V.1 Deep and efficient financial markets areessential for realising the growth potential of aneconomy; however, disorderly financial marketscould be a source of risk to both financial institutionsand the economy. The serious ramifications ofdisorderly, volatile and disruptive conditions in theglobal financial markets became clearly evidentduring 2008-09. The strong inter-linkages amongmarkets, financial institutions and the real economyalso highlighted the significance of focusedattention given to the development and regulationof markets in India. The severe stress condition inthe financial markets of the advanced countriesrevealed that failure of a few systemically importantfinancial institutions could create concerns aboutthe counterparties that could even freeze thecollateralised segment of the money market. Scarefor hoarding liquidity could further dry up liquidityin such conditions in the collateralised segment ofthe market, because of re-pricing of risk, higher riskpremium and use of stiffer margin requirements. Itwas also recognised during the crisis that provisionof adequate central bank l iquidity may notnecessarily address the problem of market liquidity,as banks may not transmit the liquidity received
from central banks among the needy non-banks,that lack acceptable sufficient collaterals to accessfunding liquidity.
V.2 The contagion from the global markets didaffect the Indian markets, particularly in the post-Lehman period up to November 2008, but swift andcommensurate policy response from the ReserveBank (as outlined in chapter I.V), ensured that themarkets functioned normally and also remainedorderly and resilient. The Annual Policy Statementof April 2008 highlighted the market developmentaland regulatory policies for the year 2008-09 with afocus on developing a sound, efficient and vibrantfinancial system that ensures the provision ofefficient financial services to the widest sections ofthe real economy. The Mid-Term Review of theAnnual Policy Statement for 2008-09 focused oncarrying forward development of various segmentsof financial markets and strengthening the financialmarket infrastructure. The broad policy objectivesin the money market continued to be ensuringstability and minimising risk, while trying to developnew instruments and products. The Reserve Bankinitiated various steps to further broaden anddeepen the government securities market in
DEVELOPMENT AND REGULATIONOF FINANCIAL MARKETSV
231
In the backdrop of the global financial turmoil, securing and maintaining domestic financial stabilitywas accorded priority from a policy perspective, with readiness for swift responses to any risk to financialstability from adverse international developments. The institutional framework for financial marketswas further strengthened in terms of new instruments, better market infrastructure and enhancedprudential norms. The key measures aimed at the money market were designed to enable the marketfunction smoothly in an environment of global liquidity squeeze and to contain the excessive stresson some of the segments. The Reserve Bank also took initiatives relating to improving the efficiencyof the auction process, operational readiness for introduction of STRIPS, clearing and settlement ofOTC rupee interest rate derivatives and revision of repo accounting norms. Measures were alsoundertaken to simplify the procedures in the conduct of foreign exchange transactions with a view tofacilitating prompt and efficient customer service and the process of liberalisation of the capitalaccount continued by further relaxing the regulations governing the movements of cross-bordercapital flows.
232
ANNUAL REPORT
consultation with market participants. The ReserveBank took initiatives to rationalise and simplify theprocedures in the conduct of foreign exchangetransactions with a view to facilitating prompt andefficient customer service. A number of measureswere taken towards further liberalisation of foreignexchange transactions. This chapter sets outvarious regulatory and development measuresinitiated by the Reserve Bank during 2008-09towards further widening and deepening of varioussegments of the f inancial market under i tsjurisdiction, viz., the money market, the governmentsecurities market and the foreign exchange market.
MONEY MARKET
V.3 For effective transmission of monetarypolicy and integration among various segments ofthe financial market, a developed money market isan essential precondition. In the context of thesignificant changes in the policy rates and liquidityoperations of the Reserve Bank, the behaviour ofthe money market during 2008-09 assumed criticalsignificance. Even prior to the crisis, with a view toimproving the functioning of various segments ofthe money market and enhancing the smooth flowof funds across instruments and participants, a hostof measures were undertaken by the Reserve Bank.These measures contributed towards improvingtransparency, facilitating price discovery processand providing avenues for better liquidity and riskmanagement. During 2008-09, the key measuresaimed at the money market were designed toenable the market function smoothly in anenvironment of global liquidity squeeze and tocontain the excessive stress on some of themarket segments.
V.4 The Reserve Bank introduced a special14-day term repo facility for banks in October 2008through relaxation in the maintenance of SLR upto 1.5 per cent of their NDTL to enable them tomeet the liquidity requirements of MFs, NBFCsand housing f inance companies. A specialrefinance facility was introduced on November 1,2008 to provide funding to schedule commercial
banks up to 1.0 per cent of their NDTL as onOctober 24, 2008 at the repo rate. With a view toproviding flexibility in the liquidity management ofbanks, the limit of the standing liquidity facility tobanks in terms of export credit refinance wasraised from 15.0 per cent of the el ig ibleoutstanding rupee expor t credi t as on thepreceding fortnight to 50.0 per cent in November2008. The liquidity stress faced by mutual funds,par ticular ly the money market mutual funds(MMMFs) during September-October 2008, wascaused primarily on account of mobilisation ofsignificant resources from large corporates andbanks with redemption facilities on par with currentaccounts of banks. In view of the systemicimplications of the activities of such funds, it wasproposed to identify and address the macro-prudential concerns arising from the currentframework in consultation with SEBI.
V.5 The Technical Advisory Committee (TAC)for Money, Foreign Exchange and GovernmentSecurities Markets had released the Report of theWorking Group on Interest Rate Futures (Chairman:V. K. Sharma) in August 2008. The Working Grouphad recommended, inter alia, the introduction of aphysically settled futures contract based on a 10-year notional coupon bearing Government bond.The Reserve Bank has already permitted banks totake trading positions in interest rate futures (IRFs).The RBI-SEBI Standing Technical Committee hascompleted the preparatory work and an exchangetraded IRFs contract on the 10-year notionalcoupon bearing government bond is expected tobe launched shortly.
V.6 With a view to assessing the factorsimpeding the development of the term moneymarket and exploring the possibility of rejuvenatingthe market, a Working Group on the Term MoneyMarket was constituted by the Reserve Bank inJuly 2007. The draft Repor t of the Group,submitted in May 2009, was discussed in themeeting of the Technical Advisory Committee onMoney, Government Secur it ies and ForeignExchange Markets.

233
DEVELOPMENT AND REGULATION OF FINANCIAL MARKETS
GOVERNMENT SECURITIES MARKET
V.7 The government securities market acquiredrenewed attention not only in the context of thefiscal stimulus plan of the Government but also onaccount of the marked preference for safety underconditions of stress in the financial system. In termsof market development, the Reserve Bank initiatedvarious steps to further broaden and deepen thegovernment securities market in consultation withmarket participants, which included: (i) improvingthe efficiency of auction process, (ii) new issuancestructure for floating rate bonds (FRBs), (iii)operational readiness for introduction of STRIPS,(iv) new settlement mechanism for non-currentaccount holders, (v) clearing and settlement of OTCrupee interest rate derivatives and (vi) revision ofrepo accounting norms.
V.8 With a view to improving the efficiency ofthe auction process for government securities andbringing it on par with the international beststandards, an Internal Working Group on AuctionProcess of Government of India Secur it ies(Chairman: H.R.Khan) was constituted. Therecommendations such as reduction of the time gapbetween bid submission and declaration of auctionresults, withdrawal of the facility of bidding inphysical form and submission of competitive bidsonly through the NDS, and submission of a singleconsolidated bid on behalf of all its constituents bythe bank/PD in respect of non-competitive bids,have already been implemented.
Floating Rate Bonds (FRBs)
V.9 The auction of FRBs would be conductedas a price-based one as against the earlier spread-based and the base yield for the FRBs would belinked to the primary market cut-off yield of the182-day treasury bills. The new format wouldsimplify the methodology for pricing of FRBs inthe secondary market. The auction of FRBs wouldbe through the new auction platform beingmanaged by the CCIL, which has the capability tofacilitate issuance of various types of instruments,including FRBs.
Separate Trading of Registered Interest andPrincipal of Securities (STRIPS)
V.10 As announced in the Annual Policy for2008-09, operational readiness for the introductionof STRIPS has been achieved. The guidelines thatwill govern the stripping and reconstitution of thegovernment securities are being finalised inconsultation with the market associations and thedraft guidelines were placed on the website of theReserve Bank on May 14, 2009 seeking comments(Box V.1). STRIPS will be launched during 2009-10 once the guidelines are finalised.
Netted Settlement Mechanism for Non-currentAccount Holders
V.11 A new settlement mechanism in governmentsecurities through settlement banks was formulatedin order to facilitate direct access to NDS and NDS-OM for participants who do not maintain currentaccounts but maintain SGL accounts with the ReserveBank. This new system would facilitate phasing out ofcurrent accounts of non-banks and non-PD entitieswith the Reserve Bank. Under this mechanism, whilesettlement of the securities leg will continue to takeplace in the SGL account maintained with the ReserveBank, the funds leg will settle through ‘DesignatedSettlement Banks’ (DSBs) appointed by the CCIL.From June 30, 2008 onwards, secondary markettransactions in government securities undertaken bymutual funds are being settled only through the DSBs.Arrangements for settlement of primary auction biddingunder the new mechanism are being worked out.
Clearing and Settlement of OTC Rupee InterestRate Derivatives
V.12 In order to strengthen the over-the-counter(OTC) derivatives market and mitigate the risksinvolved, a clearing and settlement arrangement ona non-guaranteed basis has been put in placethrough the CCIL for the OTC interest rate derivativestrades since November 27, 2008. By March 2009,13 members participated in the non-guaranteedsettlement of OTC rupee interest-rate derivatives.
234
ANNUAL REPORT
Stripping is the process of separating a standard coupon-bearing bond into its constituent interest and principalcomponents. These can then be separately held or tradedzero coupon instruments. For example, stripping a ten-yearsecurity would yield 20 coupon securities (representing thecoupons), maturing on the respective coupon dates andone principal security representing the principal amount,maturing on the redemption date of the 10-year security.All the 20 coupon securities and the principal security wouldthereafter become zero coupon bonds. Reconstitution isthe reverse of stripping, where the coupon STRIPS andprincipal STRIPS are reassembled into the originalgovernment security. An important feature of STRIPS isthat the coupon STRIPS of the same date from differentstocks are fungible - they are just not identical butexchangeable, i.e., such coupon STRIPS do not refer tothe bonds from which they are derived, and are identifiedby their maturity dates.
STRIPS help in improving liquidity and widening theinvestor base of the government securities market. STRIPSin government securities ensure availability of sovereignzero coupon bonds, which lead to the development of amarket determined zero coupon yield curve. STRIPS alsoprovide institutional investors with an additional instrumentfor their asset-liability management. Further, as STRIPShave zero reinvestment risk (discounted instruments withno periodic interest payment thereby obviating the needfor reinvestment of intermediate cash flows arising out ofthe investment); they can be attractive to retail/non-institutional investors.
The stripping of designated treasury securities wasintroduced in the US in 1985. All treasury notes and bondsare currently strippable in the US where there is a large andactive market for principal STRIPS. The UK introducedstripping of conventional fixed coupon in 1997 and whileanyone can trade or hold STRIPS, only a market maker,Debt Management Office or Bank of England can stripstrippable gilt or reconstitute it. France introduced treasurystrips in 1991 and has the largest and most active STRIPSmarket in Europe.
In the Indian context, the Government Securities Act, 2006permits stripping and reconstitution of government securities.The operational guidelines are being finalised in consultationwith the market participants, the salient features of which
Box V.1Separate Trading of Registered Interest and Principal of Securities (STRIPS) – Operational Guidelines
are as under:
(i) Any entity, including individuals, holding governmentsecurities that are eligible for stripping/reconstitution(as notified by RBI from time to time) can strip/reconstitute these securities. Stripping/reconstitution,however, is permitted only in the eligible governmentsecurities held in Subsidiary General Leger (SGL)/Constituent Subsidiary General Ledger (CSGL)accounts maintained at Public Debt Office, RBI,Mumbai. Hence, any participant desirous of stripping/reconstituting government securities must open andmaintain a demat account (SGL account or a Giltaccount with a constituent) and hold governmentsecurities in electronic form.
(ii) The process of stripping/reconstitution of governmentsecurities shall be carried out at RBI, Public Debt Office,Mumbai in the PDO-NDS as a straight-through processwithout any manual intervention.
(iii) Holders of government securities shall place theirrequests for stripping/reconstitution with an authorisedentity. Initially, all PDs would be eligible to authorisestripping/reconstitution requests.
(iv) Stripping/reconstitution may be done at the option ofthe holder at any time from the date of issuance of agovernment security till its maturity.
(v) All dated government securities having couponpayment dates on January 2 and July 2, irrespective ofthe year of maturity shall be eligible for stripping/reconstitution.
(vi) The minimum amount of securities that needs to besubmitted for stripping/reconstitution will be Rs. 1 crore(face value) and multiples thereof.
(vii) STRIPS will be reckoned as eligible governmentsecurities for SLR purposes and retain all thecharacteristics of government security. They will beeligible securities for market repo as well as repo underLAF of RBI but with appropriate haircut.
(viii) STRIPS, being zero coupon securities, trade at adiscount and are redeemed at face value. To begin with,STRIPS will be tradable only in the OTC market andsuch trades in STRIPS need to be reported on NDSfor clearing and settlement through CCIL.
Revision of Repo Accounting Norms
V.13 The accounting norms on repotransactions, prescribed by the Reserve Bank in2003, treated repo as a set of two independentoutright transactions. Amendment to the Reserve
Bank of India Act in June 2006, necessitated areview of the extant accounting guidelines to reflectthe economic essence of repo as a collateralisedborrowing/lending instrument and not as an outrightsale/purchase transaction. Accordingly, a draft of
235
DEVELOPMENT AND REGULATION OF FINANCIAL MARKETS
the revised guidelines was placed on the ReserveBank’s website on November 14, 2008 seekingcomments and the final guidelines would be issuedfor implementation from April 1, 2010.
Auction Module for Government Securities (NDS-Auction) at CCIL
V.14 Auctions of Government of India datedsecurities were earlier conducted on the PDO-NDSplatform developed and maintained by the ReserveBank. However, in order to free system resourcesfor the PDO-NDS and to improve operationalefficiency, a new auction platform, i.e., NDS Auctionhas been developed and maintained by the CCILon behalf of the Reserve Bank. The new platformhas the capability to handle auction of various typesof instruments of Centre and State Governmentsincluding inflation indexed bonds, floating ratebonds and zero coupon bonds. Further, the platformcan also handle non-competitive bidding in theauction of State Development loans in addition tothe Government of India securities. The datedsecurities module of the NDS Auction has beenmade operational since May 11, 2009.
Primary Dealers (PDs)
V.15 As on July 31, 2009, out of 18 PDs, 11were banks under taking PD operat ionsdepartmentally and the remaining 7 were stand-alone PD entities. Following the filing of Chapter11 bankruptcy petit ion by Lehman BrothersHolding Inc. in the US, Lehman Brothers FixedIncome Securities Pvt. Ltd., a primary dealer, wasadvised on September 16, 2008 not to undertaketransactions in the primary market of governmentsecurities. During the year, the PD operations ofABN AMRO Securities India Private Limited, astandalone PD, were taken over by its parent bank,viz. ABN AMRO Bank and the bank has beenundertaking PD business departmentally sinceDecember 16, 2008. Morgan Stanley India PrimaryDealer Pr ivate Limited was author ised toundertake Primary Dealership business with effectfrom July 20, 2009.
Corporate Bond Market – Settlement of OTC Trades
V.16 For facilitating settlement of OTC corporatebond transactions in real time gross settlement(RTGS) system on a DvP-I basis (i.e., on a trade-by-trade basis), it has been decided, in consultationwith SEBI, to allow the clearing houses of theexchanges to have a transitory pooling accountfacility with the Reserve Bank. Under the proposedsettlement mechanism, the buyer of securities willtransfer the funds through his bank to this transitoryaccount through RTGS. The clearing house willthereafter transfer the securities from the seller’saccount to the buyer’s account and effect therelease of funds from the transitory account to theseller’s account.
FOREIGN EXCHANGE MARKET
V.17 The foreign exchange market in 2008-09testified the relevance of Reserve Bank’s policyapproach to exchange rate, foreign exchangereserves and capital account in the face of adverseexternal shocks arising from the global economiccrisis. In the midst of the shocks emanating fromthe global f inancial markets, not only thetransactions in already liberalised areas continuedwithout any concerns, the process of liberalisationin the pursuit of fuller capital account convertibilityalso continued by further relaxation of regulationsgoverning the movement of cross-borders capitalflows, especially in the areas of inward and outwardforeign direct investments, while recognising thedownside risks emanating from higher level ofcapital outflows from the country.
Liquidity Enhancing Initiatives
V.18 The key policy initiatives taken by theReserve Bank in response to the developmentsafter September 2008 were essentially to improvethe availability of foreign exchange liquidity by wayof Reserve Bank selling US dollar into the market,opening a new foreign exchange swap facility forthe banks and raising interest rate ceilings onFCNR(B) and NR(E)RA deposits to attract largerinflows. Cumulative increase of 175 basis points in
236
ANNUAL REPORT
the interest rate ceilings each on FCNR(B) andNR(E)RA term deposits were effected between mid-September and November 2008.
V.19 The cap for loans by Authorised DealerCategory-I and authorised banks against thesecurity of funds held in NR(E)RA and FCNR(B)deposits was enhanced from Rs.20 lakh to Rs. 1crore on April 29, 2009. Banks were permitted toborrow funds from their overseas branches andcorrespondent banks to the extent of 50 per centof their unimpaired Tier-I capital or US$ 10 million,whichever is higher. The systemically importantnon-deposit taking NBFCs (NBFC-ND-SI) andhousing finance companies (HFCs) were permittedto raise short-term foreign currency borrowings. Theceiling rate on export credit in foreign currency wasraised by 250 basis points to LIBOR+350 basispoints on February 5, 2009. Correspondingly, theceiling interest rate on the lines of credit fromoverseas banks was also increased by 75 basispoints to 6-months LIBOR/EURO LIBOR/EURIBOR+150 basis points.
V.20 The policy on the premature buyback ofFCCBs was l iberalised in December 2008,recognising the benefits accruing to the Indiancompanies as well as to the economy on accountof depressed global markets. Under this scheme,buyback of FCCBs by Indian companies wasallowed both under the approval and the automaticroutes, provided buyback was financed out offoreign currency resources held in India or abroadand/or out of fresh ECBs raised in conformity withthe extant ECB norms and out of internal accruals.As per the liberalisation, the total amount ofpermissible buyback, out of internal accruals, wasenhanced from US$ 50 million of the redemptionvalue per company to US$ 100 million, by linkingthe higher amount of buyback to larger discountsat which FCCBs could be bought back. Accordingly,under the approval route, companies werepermitted to buyback FCCBs out of internalaccruals with a minimum discount of 25 per cent ofbook value for redemption amount of up to US$ 50million; 35 per cent of book value for redemptionamount more than US$ 50 million and up to US$
75 million; and 50 per cent of book value forredemption amount more than US $ 75 million andup to US $ 100 million.
V.21 Considering the continuing tightness ofcredit spreads in the international markets, the all-in-cost ceilings for different maturities wereincreased in respect of ECBs (150 to 250 basispoints) as well as trade credit (75 to 150 basispoints). Furthermore, the all-in-cost ceiling for ECBsunder the approval route was dispensed withinitially up to June 30, 2009, and later extendeduntil December 31, 2009.
V.22 Measures were also initiated to safeguardthe interest of India’s export sector which wasaffected by recession in the global economy. Theperiod of realisation and repatriation to India of theamount representing the full export value of goodsor software exported, was enhanced from sixmonths to twelve months from the date of export,subject to review after one year. Similarly, as ameasure of relief to importers, the limit for directreceipt of import bills/documents from overseassuppliers was enhanced from US$ 100,000 to US$300,000 in the case of import of rough diamonds,rough precious and semi-precious stones by non-status holder exporters, enabling them to reducetransaction costs.
Continuity in Capital Account Liberalisation
V.23 Despite unfavourable internationalinvestment climate, the process of capital accountliberalisation in India maintained its logicalmomentum, consistent with the overall approachto the capital account management. The regulationsgoverning capital flows have been liberalisedsubstantially in the past three years taking intoaccount the macroeconomic conditions, state offinancial sector development, risk managementcapabilities of financial institutions and depth off inancial markets. At the same time, theGovernment has followed a hierarchy in theliberalisation of inflows by way of preference toequity inflows rather than debt from the point ofview of the potential vulnerability of reversal of
237
DEVELOPMENT AND REGULATION OF FINANCIAL MARKETS
capital flows, while having a diversified capitalaccount to minimise the impact of a major shockarising from any single source.
Foreign Direct Investment (FDI)
V.24 During 2008-09, further measures weretaken to support and strengthen the equity routeby widening access of foreign firms to local equitymarkets, which had some sobering effect inreducing the market volatility experienced under theimpact of the global f inancial cr isis. Creditinformation companies complying with the CreditInformation Companies (Regulations) Act, 2005 areallowed to invest as FDI up to a composite limit of49 per cent, with the prior approval of FIPB andregulatory clearance from the Reserve Bank. FDIin commodity exchanges has been permitted withina composite ceiling of 49 per cent, with FDI limit of26 per cent and FII limit of 23 per cent, subject tocertain terms and conditions. In order to accordflexibility to FIIs to allocate their investments acrossequity and debt instruments, the restriction of 70:30ratio of investment in equity and debt, respectively,has been dispensed with. The Government vide itsPress Notes 2, 3 and 4 released in 2009 has furtherliberalised the FDI policy.
Overseas Direct Investment
V.25 Specific measures during 2008-09 intendedto liberalise outbound investment included raisingthe investment limits for Indian corporate andmutual funds registered with SEBI, higher ceilingfor mutual funds, permitted registered trusts andsocieties engaged in manufacturing/educational/hospital sector to make investment in the samesector(s) in a joint venture or wholly ownedsubsidiary outside India. The aggregate ceiling onoverseas investments by mutual funds wasenhanced from US$ 4 billion to US$ 5 billion inSeptember 2007 and further to US$ 7 billion in April2008. In addition, limited numbers of qualified Indianmutual funds were allowed to invest cumulativelyup to US$ 1 billion in overseas exchange-tradedfunds as permitted by SEBI. Indian companies have
been allowed to invest in excess of 400 per cent oftheir net worth, as on the date of the last auditedbalance sheet, in the energy and natural resourcessectors, such as oil, gas, coal and mineral ores withthe prior approval of the Reserve Bank.
V.26 In order to facilitate eligible companiesresident outside India to mobilise funds from theIndian Capital Market, the issue of IndianDepository Receipt (IDR) through a DomesticDepository has been operationalised with effectfrom July 22, 2009.
External Commercial Borrowings
V.27 The ECB policy is reviewed periodicallyconsider ing the evolving macroeconomicconditions, inflation expectations, liquidity, build upof external liabilities and currency risk and the fiscaldeficit. During 2008-09, the ECB route has beenexpanded for the services sector, viz., hotels,hospitals and software, as companies engaged inthese sectors have now been allowed to avail ECBup to US$ 100 million per financial year under theautomatic route for foreign currency and/or rupeecapital expenditure for permissible end-uses. ECBsup to US$ 500 million per borrower per financialyear is permitted for rupee expenditure and/orforeign currency expenditure for permissible enduses under the automatic route. Definition ofinfrastructure sectors has been modified byincluding mining, exploration and refining. NBFCs,which are exclusively involved in f inancinginfrastructure sector, are now allowed to avail ofECB from multilateral/regional financial institutionsand government owned development financialinstitutions for on-lending to borrowers in theinfrastructure sector under the approval route.Corporate engaged in the development ofintegrated township have been permitted to availECB under the Approval Route. SEZ developershave been permitted to avail ECB under theapproval route for providing infrastructural facilitiesas defined in the ECB policy within the SEZ. Thecumulative l imits for investments by FIIs ingovernment securities and corporate debts have

238
ANNUAL REPORT
been increased to US$ 5 billion and US$ 15 billion,respectively.
Currency Futures
V.28 Since the launch of the first currency futuresexchange in September 2008, currency futurescontracts are being traded in three recognisedexchanges. The functioning of the exchangescontinues to be reviewed by the RBI-SEBI StandingTechnical Committee. On the recommendation ofthe Committee, the position limits on the clients andtrading members have been doubled from US$ 5million and US$ 25 million, respectively, to US$ 10million and US$ 50 million. The upper limits of 6per cent and 15 per cent of the total open intereston clients and trading members, however, remainunchanged. The position limit for banks continuesat 15 per cent of total open interest or US $ 100million, whichever is higher.
Asian Clearing Union (ACU)
V.29 Participants in the Asian Clearing Union(ACU) have the option to settle their transactionseither in ACU Dollar or in ACU Euro. Accordingly,the Asian Monetary Unit (AMU) has to bedenominated as ACU Dollar and ACU Euro. Banksoperating in India have been permitted to payinterest, at their discretion, on ACU Euro Vostroaccounts in addition to ACU Dollar Vostro accountsmaintained by them. The decision to pay interest,interest rate and all other conditions would be atthe discretion of the bank.
Inter-Regulatory Coordination
V.30 Following financial l iberalisation, theboundaries between the specialised entities aregetting blurred and entities are involved in activitiesthat span across the domains of multiple regulators.Efficient inter-regulatory coordination removes theregulatory gaps, enhances the information flowsbetween regulators and ensures that no systemicallyimportant entity escapes regulation. The G-20Working Group on Enhancing Sound Regulation andStrengthening Transparency recommended that
there should be an effective mechanism forappropriate domestic financial sector authoritieswithin each country to jointly assess the systemicrisks across the financial system and to co-ordinatethe domestic policy response to limit the build-up ofsystemic risk. The structure of this coordinatingmechanism should be transparent, with clearassignments of roles, responsibilit ies andaccountability for each authority. In this regard, inIndia, the inter-regulatory coordination is ensuredunder the aegis of the High-Level CoordinationCommittee on Financial Markets (HLCCFM) with theGovernor of the Reserve Bank as Chairman, andthe chiefs of the SEBI, the IRDA and the PensionFund Regulatory and Development Authority(PFRDA), and the Finance Secretary, Ministry ofFinance, Government of India as members. It issupported by separate technical committees for theReserve Bank regulated entities, SEBI regulatedentities and IRDA regulated entities. Thesecommittees review financial market/institution-relateddevelopments and attempt to identify any unusualdevelopments that may require co-ordinated action.Besides, there are other committees to achieve inter-regulatory co-operation in the area of exchange-traded currency futures and interest rate futures,financial conglomerate monitoring, crisismanagement and corporate bond and securitisation(Box V.2). During 2008-09, five meetings of theHLCCFM were held as compared with two meetingsin 2007-08. In the meeting held on October 1, 2008,the HLCCFM discussed exclusively the implicationsof the global financial turmoil for the Indian financialmarkets, reviewed the soundness of the systemicframework, and the preparedness of all regulatorsto act in a coordinated and timely manner to dealwith the emerging situation in order to ensurecontinued smooth functioning of the financial system.The Committee decided to meet on a frequent basisto discuss the way forward in dealing with the effectsof the global financial crises and subsequently heldthree more meetings.
V.31 In the domestic financial markets, the keymeasures aimed at the money market weredesigned to enable the market to function smoothly
239
DEVELOPMENT AND REGULATION OF FINANCIAL MARKETS
in an environment of global liquidity squeeze andto contain the excessive stress on some of themarket segments, while at the same time trying todevelop new instruments and products. TheReserve Bank took initiatives to improve theefficiency of the auction process, operationalreadiness for introduction of STRIPS, clearing andsettlement of OTC rupee interest rate derivatives,new issuance structure for floating rate bonds andrevision of repo accounting norms. Measures werealso undertaken to simplify the procedures in theconduct of foreign exchange transactions with aview to facilitating prompt and efficient customerservice. The process of liberalisation towards fullercapital account convertibility was continued by
further relaxing the regulations governing themovement of cross-border capital flows.
V.32 The resilience of the Indian financial sectorin the face of the worst global financial crisis couldbe attributed to India’s sound and well-calibratedapproach to financial globalisation. With a view tomitigating liquidity risks, at the system as well asinstitution level, the Reserve Bank over the pastfew years has taken a number of initiatives, whichinclude: (i) participation in the overnight unsecuredmoney market has been restricted to banks andPDs and ceilings have been stipulated on theirborrowing and lending operations in this market;(ii) prudential limits have been imposed on banks
One of the key lessons from the global financial crisis isthe need for an appropriate and more effective coordinationamong all regulators to ensure joint responsibility forsystemic crises, notwithstanding the mandated jurisdictionof any single regulatory authority. In India, the frameworkfor co-ordination is well entrenched, as under, with theHLCCFM as the apex body for co-ordination.
Technical Committee on RBI regulated entities: TheTechnical Committee on RBI regulated entities withmembers from SEBI, IRDA and RBI meets generally sixtimes a year and at short notice if any unusual developmentis noted by any of the supervisory agencies. RBI is theconvener of the Committee.
Technical Committee on SEBI regulated entities: TheTechnical Committee on SEBI regulated entities withmembers from SEBI, IRDA and RBI provides an inter-agency forum to review capital market relateddevelopments with a view to identifying any unusualdevelopments, and to coordinate action with otherregulators based on early warning system developed bythe committee. SEBI is the convener of the Committee.The committee meets generally six times a year and atshort notice if any unusual development is noted by any ofthe supervisory agencies.
Technical Committee on IRDA regulated entities: TheTechnical Committee on IRDA regulated entities withmembers from SEBI, IRDA and RBI meets generally sixtimes a year and at short notice if any unusual developmentis noted by any of the supervisory agencies. IRDA is theconvener of the Committee.
Box V.2Inter-Regulatory Coordination
There is a Standing Technical Committee comprising ofmembers from RBI and SEBI that meets periodically asand when warranted, but at least once every six monthsto take stock of market developments and to sort out inter-regulatory issues.
Additionally, there are a few inter-regulatory committees(with RBI and SEBI members) that examine specific issueslike introduction of currency futures and interest ratefutures, and development of corporate bond markets(Corporate Bonds and Securitisation Advisory Committee-CoBoSAC).
Inter-regulatory cooperation is also ensured in the areasof supervision of Systemically Impor tant FinancialIntermediaries (SIFI) in the form of Financial Conglomerate(FC) monitoring framework established by the RBI, SEBIand IRDA.
To deal with unforeseen events, which could impact thefunctioning of the financial system, a Crisis ManagementGroup is in place comprising senior officials from theGovernment of India, RBI, Government of Maharashtra,SEBI, IRDA, PFRDA, Bombay Stock Exchange, CCIL,Indian Banks’ Association, Institute for Development andResearch in Banking Technology, Multi CommodityExchange of India Limited, National Securities ClearingCorporation Limited, National Commodity and DerivativesExchange Limited, Fixed Income Money Market andDerivatives Association and Foreign Exchange Dealers’Association of India. The directory of the contingencycontact list is periodically updated and circulated.
240
ANNUAL REPORT
on their inter-bank liabilities as a percentage to theirnet worth; (iii) asset-liability management guidelineshave been framed that take cognizance of both onand off balance sheet items; and (iv) a detailedpolicy on the provision of liquidity support to SpecialPurpose Vehicles (SPVs) has been outlined in theguidelines on securitisation of standard assets.Apart from normal prudential requirements onbanks, as part of dynamic provisioning and counter-cyclical capital requirement through revisions inr isk-weights for specif ic assets, addit ionalprudential measures in respect of exposures tospecific sectors such as real estate, housing loansto individuals and consumer credit, have been
successively imposed. In the context of the globaleconomic crisis, the scope for further strengtheningof capital requirements, the credit conversionfactors, risk weights and provisioning requirementsfor specific off-balance sheet items, includingderivatives, is being reviewed. In India, complexstructures like synthetic securitisation have notbeen permitted so far. However, going forward,introduction of such products, i f and whenconsidered appropriate, would be guided by riskmanagement capabilities of the system, consistentwith the policy goals of sound regulation, improvingcredit delivery, developing financial markets andpromoting financial inclusion.
VI.1 Indian banks and financial institutionsexhibited resilience in the midst of a severe globalfinancial cr isis. Notwithstanding the growingfinancial integration and globalisation, the bankingsystem in India had no direct exposure to the sub-prime assets that tr iggered the crisis in theadvanced economies. The indirect exposure ofbanks in this regard was also insignificant. Muchbefore the cr isis star ted in the advancedeconomies, the Reserve Bank had taken a numberof measures which contributed to strengthening theresilience in the Indian banking system. Theseincluded prudential regulations for limiting theexposure of the banking system to sensitive sectorsand appropriately rebalancing the risk weights ofdifferent assets. Necessary provisioning normswere prescribed and there has been a sustainedemphasis on CAMELS parameters for supervisionof Indian banks and financial institutions. TheCommittee on Financial Sector Assessmentunder took single-factor stress tests for end-September 2008, which revealed that the Indianbanking system could withstand significant shocksarising from large potential changes in credit quality,interest rate and liquidity conditions. It wasassessed that even under the worst case scenario,the capital to risk-weighted assets ratio (CRAR) of
Indian banks would remain above the regulatoryminimum. Notwithstanding the resilience of Indianbanks and financial institutions to the internationalfinancial crisis, when the global economic crisisstarted to dampen the domestic growth prospects,the Reserve Bank had to take a number of policymeasures aimed at preserving and promotingfinancial stability, while supporting faster economicrecovery.
VI.2 The regulatory and supervisory initiativestaken by the Reserve Bank during 2008-09 withregard to banks and other financial institutions arepresented in this Chapter. A distinguishing featureof the various policy initiatives to strengthen thebanking system and thereby promote financialstability is that some of these initiatives were a partof the ongoing policy efforts and not a response tothe sequence of events that led to the globalfinancial crisis. In addition to prudential regulations,steps were taken to improve customer service,enhance supervision and strengthen the anti-money laundering measures in the banking sector.
VI.3 For UCBs, further regulatory measureswere taken in order to reap the gains accruing fromthe path laid down by the vision document for thesector through the MoUs and the Task Force for
FINANCIAL REGULATIONAND SUPERVISIONVI
241
The banking system in India remained largely unaffected by the financial crisis, while several banks andfinancial institutions in the advanced countries failed or had to be bailed out with large sovereign support.The financial soundness indicators for the banking system in India during 2008-09 showed stability andstrength; every bank in the system remained above the minimum regulatory capital requirement. Stresstest findings suggested the resilience of the financial system, in the face of the severe external contagionfrom the global financial crisis. As at end-March 2009, all Indian scheduled commercial banks hadmigrated to the simpler approaches available under the Basel II framework. Post-crisis changes that maybe necessary to strengthen the regulatory and supervisory architecture would be based on the evolvinginternational consensus as well as careful examination of their relevance to the India-specific context.The time schedule for implementation of advanced approaches under Basel II has been notified and aninter-disciplinary Financial Stability Unit has been set up to monitor and address systemic vulnerabilities.

242
ANNUAL REPORT
UCBs arrangement. During 2008-09, the ReserveBank continued its regulatory focus on systemicallyimportant non-deposit taking NBFCs. A spate ofmeasures was taken to address the liquidityconcerns arising for the sector in the wake of theinternational financial crisis.
Measures Taken Before the Global Crisis
VI.4 Regulation of non-banking entities is beingprogressively strengthened and the process hadstarted before the onset of the global financial crisis.NBFCs owned by foreign banks and regulated bythe Reserve Bank, were brought under the Groupconcept, to contain the regulatory arbitrage. Anelaborate prudential framework was put in placefor NBFCs-ND-SI. Consolidated supervision ofbanking groups was introduced in 2003 and hasbeen constantly strengthened thereafter.
VI.5 To limit the growth of bank-led financialconglomerates (FCs), banks’ equity investment inindividual financial subsidiaries has been limitedto 10 per cent of paid-up capital and reserves ofthe bank and aggregate investment has beenlimited to 20 per cent of paid-up capital andreserves. Banks’ non-banking activities are alsolimited by law and any significant strategic equityinvestments by banks require the Reserve Bank’sprior approval.
VI.6 Prudential regulations have beenconsistently strengthened. Major steps takeninclude limits on capital market exposures of banks,prescription of 50 per cent margin for advancesagainst shares, limits on lending and borrowing incall money market, limit on inter-bank liabilities andrestrictions on investment in unlisted and unratednon-SLR securities. The provisioning requirementsfor sub-standard and doubtful assets have beenprogressively aligned with best internationalpractices, diminution in fair value of restructuredaccounts is required to be provided for and netappreciation in trading and available for sale bookis not permitted to be recognised. The dividendpayout ratio in case of banks is not allowed toexceed 40 per cent and dividend can be paid only
out of current year’s profit. Securitisation profitscannot be booked upfront to contain perverseincentives.
VI.7 In order to ensure higher quali ty ofregulatory capital, existing capital adequacyguidelines require that Tier I capital of banks shouldbe at least 6 per cent of risk-weighted assets byMarch 31, 2010. Tier III capital for market risk hasnot been introduced, as it is short-term.
VI.8 Further, when there was very rapid creditgrowth from 2004-05 onwards, risk weights andprovisioning for banks’ exposure to rapidly growingor sensitive sectors (such as commercial realestate, consumer loans and capital market), evenwhen classif ied as standard assets, wereprogressively increased since 2005-06 as acounter-cycl ical measure. Banks were alsoencouraged to maintain floating provisions whichcould be drawn down in extraordinary circumstances.
VI.9 To ensure adequate liquidity buffers withindividual banks, banks were required to invest25 per cent of their NDTL in government securitiesto maintain SLR (reduced to 24 per cent of NDTLin November 2008). The framework for monitoringand reporting of liquidity position of individualbanks was improved by way of introduction of moregranular liquidity buckets within the 1-14 segment(i.e., next day, 2-7 days, 8-14 days). Table 6.1shows that Indian banking system continues toremain healthy.
Table 6.1: Health of Scheduled CommercialBanks in India
Item End- March
1998 2008 2009
1 2 3 4
CRAR (per cent) 11.51 13.01 13.19
Gross NPA (Rs. crore) 48,306 55,842 67,497
Gross NPA (per cent) 14.78 2.39 2.42
Net NPA (Rs. crore ) 23,013 24,891 30,924
Net NPA (per cent) 7.63 1.08 1.12
Return on Equity (per cent) 14.63 12.52 13.25
Interest Spread (per cent) 3.05 2.37 2.44
243
FINANCIAL REGULATION AND SUPERVISION
Measures Taken During the Global Crisis
VI.10 The measures taken by the Reserve Bankduring 2008-09 broadly include counter-cyclicalmoderation of capital and provisioning norms whichhad been enhanced earlier and provision ofadequate rupee/foreign exchange liquidity to enablethe banks to continue to lend for viable economicactivities. The prudential measures are discussedin detail in subsequent paragraphs of this Chapter.The measures relating to liquidity and creditdelivery are discussed in relevant Chapters.
REGULATORY FRAMEWORK FOR THE INDIANFINANCIAL SYSTEM
VI.11 In the overall architecture for the regulationand supervision of the financial system in India,the Reserve Bank’s regulatory and supervisorypurview extends to a large segment of financialinstitutions, including commercial banks, co-operative banks, non-banking financial institutionsand various financial markets. At end-March 2009,there were 801 commercial banks (excludingRRBs); 4 local area banks; 86 RRBs; 1,721 UCBs;4 development finance institutions; 12,739 NBFCs(of which 336 NBFCs were permitted to accept/holdpublic deposits) and 182 primary dealers (PDs) [ofwhich 11 were banks undertaking PD business asa departmental activity, known as bank-PDs, and7 were non-bank entities, also referred to as stand-alone PDs]. The Board for Financial Supervision(BFS) has been mandated to ensure integratedoversight over the financial institutions that areunder the purview of the Reserve Bank.
Board for Financial Supervision (BFS)
VI.12 The BFS, constituted in November 1994,remains the principal guiding force behind theReserve Bank’s supervisory and regulatoryinitiatives. It reviews the inspection findings inrespect of commercial banks/UCBs and periodic
1 Including Bank International Indonesia, which ceased operations in India and is being wound up.2 This excludes Lehman Brothers Fixed Income Securities Ltd., which was prohibited from undertaking primary market operations with effect
from September 16, 2008.
reports on critical areas of functioning of banks suchas reconciliation of accounts, fraud monitoring,overseas operations and banks under monthlymonitoring. In addition, the BFS also reviews themicro and macro prudential indicators, bankingoutlook and interest rate sensitivity analysis. It alsoissues a number of directions with a view tostrengthening the overall functioning of individualbanks and the banking system. The BFS held eightmeetings during the period July 2008 to June 2009.In these meetings, it considered, inter alia, theperformance and the financial position of banks andfinancial institutions during 2008-09. It reviewed 70inspection reports (27 of public sector banks, 16 ofprivate sector banks, 20 of foreign banks, 4 of localarea banks and 3 of financial institutions). Some ofthe important issues deliberated upon by the BFSduring 2008-09 are highlighted in this section.
VI.13 In the wake of the global financial crisis,the BFS was apprised of the exposure of Indianbanks to tainted assets and also the safeguardsavailable within the Indian banking system onaccount of the regulatory measures initiated tostrengthen the risk management and liquiditymanagement systems of banks. The BFS wasinformed that an in-depth examination of investmentportfolio of banks was being done as part of theAnnual Financial Inspection (AFI). The BFS alsoenhanced its focus on monitoring the mark-to-market (MTM) losses in credit derivatives and otherinvestment portfolios of overseas operations ofbanks in India on a monthly basis (Box VI.1).
VI.14 In response to concerns in some quartersregarding risks associated with foreign exchangederivatives, detailed information was called for instructured formats by the Reserve Bank fromcertain select banks which were operating at thetop-end of the system-level exposures. Based on adialogue process with these banks regarding, interalia, the ‘suitability and appropriateness’ principles
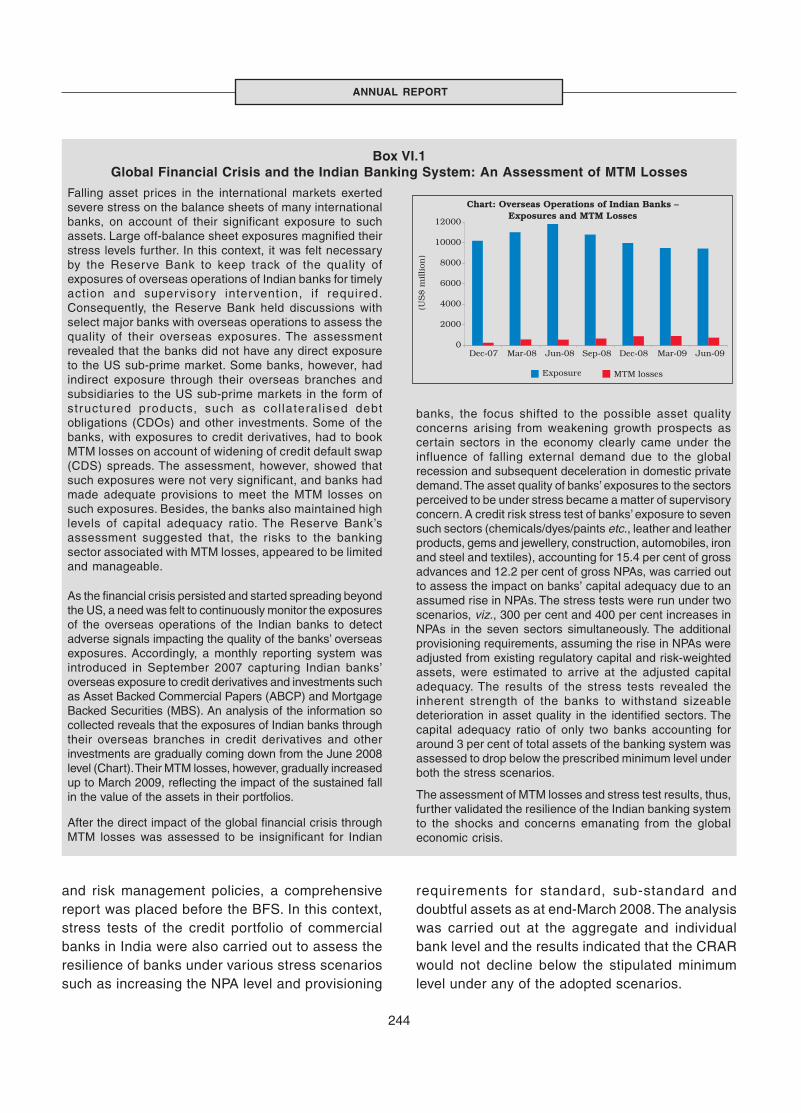
244
ANNUAL REPORT
Falling asset prices in the international markets exertedsevere stress on the balance sheets of many internationalbanks, on account of their significant exposure to suchassets. Large off-balance sheet exposures magnified theirstress levels further. In this context, it was felt necessaryby the Reserve Bank to keep track of the quality ofexposures of overseas operations of Indian banks for timelyaction and supervisory intervention, if required.Consequently, the Reserve Bank held discussions withselect major banks with overseas operations to assess thequality of their overseas exposures. The assessmentrevealed that the banks did not have any direct exposureto the US sub-prime market. Some banks, however, hadindirect exposure through their overseas branches andsubsidiaries to the US sub-prime markets in the form ofstructured products, such as col lateral ised debtobligations (CDOs) and other investments. Some of thebanks, with exposures to credit derivatives, had to bookMTM losses on account of widening of credit default swap(CDS) spreads. The assessment, however, showed thatsuch exposures were not very significant, and banks hadmade adequate provisions to meet the MTM losses onsuch exposures. Besides, the banks also maintained highlevels of capital adequacy ratio. The Reserve Bank’sassessment suggested that, the risks to the bankingsector associated with MTM losses, appeared to be limitedand manageable.
As the financial crisis persisted and started spreading beyondthe US, a need was felt to continuously monitor the exposuresof the overseas operations of the Indian banks to detectadverse signals impacting the quality of the banks’ overseasexposures. Accordingly, a monthly reporting system wasintroduced in September 2007 capturing Indian banks’overseas exposure to credit derivatives and investments suchas Asset Backed Commercial Papers (ABCP) and MortgageBacked Securities (MBS). An analysis of the information socollected reveals that the exposures of Indian banks throughtheir overseas branches in credit derivatives and otherinvestments are gradually coming down from the June 2008level (Chart). Their MTM losses, however, gradually increasedup to March 2009, reflecting the impact of the sustained fallin the value of the assets in their portfolios.
After the direct impact of the global financial crisis throughMTM losses was assessed to be insignificant for Indian
Box VI.1Global Financial Crisis and the Indian Banking System: An Assessment of MTM Losses
banks, the focus shifted to the possible asset qualityconcerns arising from weakening growth prospects ascertain sectors in the economy clearly came under theinfluence of falling external demand due to the globalrecession and subsequent deceleration in domestic privatedemand. The asset quality of banks’ exposures to the sectorsperceived to be under stress became a matter of supervisoryconcern. A credit risk stress test of banks’ exposure to sevensuch sectors (chemicals/dyes/paints etc., leather and leatherproducts, gems and jewellery, construction, automobiles, ironand steel and textiles), accounting for 15.4 per cent of grossadvances and 12.2 per cent of gross NPAs, was carried outto assess the impact on banks’ capital adequacy due to anassumed rise in NPAs. The stress tests were run under twoscenarios, viz., 300 per cent and 400 per cent increases inNPAs in the seven sectors simultaneously. The additionalprovisioning requirements, assuming the rise in NPAs wereadjusted from existing regulatory capital and risk-weightedassets, were estimated to arrive at the adjusted capitaladequacy. The results of the stress tests revealed theinherent strength of the banks to withstand sizeabledeterioration in asset quality in the identified sectors. Thecapital adequacy ratio of only two banks accounting foraround 3 per cent of total assets of the banking system wasassessed to drop below the prescribed minimum level underboth the stress scenarios.
The assessment of MTM losses and stress test results, thus,further validated the resilience of the Indian banking systemto the shocks and concerns emanating from the globaleconomic crisis.
and risk management policies, a comprehensivereport was placed before the BFS. In this context,stress tests of the credit portfolio of commercialbanks in India were also carried out to assess theresilience of banks under various stress scenariossuch as increasing the NPA level and provisioning
requirements for standard, sub-standard anddoubtful assets as at end-March 2008. The analysiswas carried out at the aggregate and individualbank level and the results indicated that the CRARwould not decline below the stipulated minimumlevel under any of the adopted scenarios.
245
FINANCIAL REGULATION AND SUPERVISION
VI.15 During the period under reference, the BFSissued several directions for enhancing the qualityof regulation and supervision of financial institutionsand some of the important directions were asfollows: (i) need for evaluation by the Reserve Bank,for robustness and efficacy, of the statistical scoringand loss forecasting models deployed by banks formanaging retail credit portfolios; (ii) fine-tuning andmaking more dynamic the process for selection ofbranches for the AFIs, by including additionalparameters for branch-selection; (iii) prohibitingsubsidiaries of banks from undertaking activitieswhich the bank itself was not permitted to undertakeas per the provisions of the Banking Regulation Act,1949; (iv) submission of confirmation report andcompliance certificate with regard to adherence tothe Reserve Bank's guidelines on outsourcingarrangements entered into by banks; (v) sensitisingthe banks that the principles for sale/purchase ofNPAs, issued in October 2007, were laid down asa broad criteria only to be adopted while enteringinto compromise settlements and not meant to berigid or restrictive (hence, banks could enter intothese settlements based on the circumstances/factsof each case and their commercial judgement andshould be able to justify the decision taken); and(vi) recording of intent of holding the investments,for a temporary period or otherwise, at the time ofinvestment in a subsidiary, associate and jointventure, for the purpose of consolidation.
VI.16 The BFS also accorded its approval tocertain important proposals aimed at enhancingthe regulatory provisions/intent and supervisoryfocus. Some of them were as fol lows:(i) prescribing the extent of admissible liabilitytowards Tier I and Tier II instruments in the schemeof merger/amalgamation of banks as and whensuch cases arose; ( i i) a one-t ime measuredesigned to help banks to clear their large numberof smal l value outstanding nostro entr iesoriginated up to March 31, 2002 while concurrentlydirecting the banks to concentrate on follow-upeffort on the high value entries that were stilloutstanding and to leverage technology to avoidbuilding up of unreconciled balances.
COMMITTEE ON FINANCIAL SECTORASSESSMENT
VI.17 The work on a comprehensive self-assessment of India’s financial sector, particularlyfocussing on stability assessment, stress testingand compliance with all financial standards andcodes star ted in September 2006 by theCommittee on Financial Sector Assessment(CFSA), chaired by Dr. Rakesh Mohan. Shri AshokChawla, Shri Ashok Jha and Dr. D. Subbarao asSecretary, Economic Affairs, Government of India,were the Co-Chairmen of the CFSA at differentpoints of time. In March 2009, the Government andthe Reserve Bank jointly released the Report ofthe CFSA (Box VI.2). The CFSA followed aforward-looking and holistic approach to self-assessment, based on three mutually reinforcingpillars – financial stability assessment and stresstest ing; legal, infrastructural and marketdevelopment issues; and an assessment of thestatus of implementation of international financialstandards and codes.
VI.18 Overall, the CFSA found that the Indianfinancial system was essentially sound andresilient, and that systemic stability was, by andlarge, robust. India was broadly compliant with mostof the standards and codes, though gaps werenoted in the timely implementation of bankruptcyproceedings. The CFSA also carried out single-factor stress tests for credit and market risks,liquidity ratio and scenario analyses. These testsshowed that there were no significant vulnerabilitiesin the banking system. Though NPAs could riseduring the current economic slowdown, given thestrength of the banks’ balance sheets, the rise wasnot likely to pose any systemic risk.
VI.19 Since risk assessment is a continuousprocess and stress tests need to be conductedtaking into account the macroeconomic linkagesas also the second round effects and contagionrisks, consequent to the announcement in theAnnual Policy Statement for 2009-10, an inter-disciplinary Financial Stability Unit was set up tomonitor and address systemic vulnerabilities.
246
ANNUAL REPORT
The CFSA presented its assessment of India’s financialsector along with a set of recommendations meant for themedium-term of about five years. The key assessmentsand recommendations under major heads are summarisedbelow.
Sustainability of Macroeconomic Growth
India’s growth in the recent period was primarily contributedby high domestic demand, productivity, credit growth andhigh levels of savings and investment. In the wake of thecrisis, India could face deceleration in its macroeconomicgrowth in the short-term; however, growth of 8.0 per centwas sustainable in the medium-term. India would need tofocus on revival of growth in agriculture, address quickrestoration of the fiscal reform path, continue financialsector consolidation/development and address theinfrastructure deficit . While ful ler capital accountconvertibility was desirable, it should be concomitant withmacroeconomic and market developments.
Financial Institutions
Commercial Banks
The stress testing of the financial institutions revealed thatbanks were generally in a position to absorb significantshocks due to credit, liquidity and market risks, thoughthere were some concerns relating to liquidity risk due toincreasing illiquidity in banks’ balance sheets. There was,therefore, a need to strengthen liquidity management.
The CFSA highlighted risk management as a priority areaand noted that the counter-cyclical prudential normsimposed by the Reserve Bank had paid dividends in recenttimes. It highlighted the growing requirement of appropriateaccounting and disclosure norms, particularly with regardto derivatives transactions.
Co-operative Sector
While the financial position of UCBs had improved, stresstests conducted for this sector revealed that these entitieswould remain vulnerable to credit risk. The financialindicators of the rural co-operatives threw up some causefor concern. Noting the dual control over co-operatives andrural banks, the CFSA stressed the need for bettergovernance in these institutions.
NBFCs
The CFSA noted that NBFCs were important players infinancial markets with broadly satisfactory financials.Development of the corporate bond market could ease thefunding constraints of this sector. Further strengtheningof prudential regulations of NBFCs was also suggested.
Housing Finance Companies (HFCs)The CFSA recommended that a National Housing PriceIndex and a Housing Starts Index were priorities for thegrowing and important segment of HFCs.
Box VI.2Major Recommendations of the Committee on Financial Sector Assessment (CFSA)
Insurance Sector
For further development of the insurance sector, the CFSAsuggested, inter alia, that the supervisory powers of IRDAbe improved and an effective policy for group-widesupervision be put in place.
Financial Markets
The CFSA recommended, inter alia, further improvementsin infrastructure, risk management and transparency/disclosure in equity, foreign exchange and governmentsecurities markets. On the issue of development of marketsfor credit derivatives and asset securitisation products, theCommittee noted that it should be pursued in a gradualmanner, by sequencing reforms and putting in placeappropriate safeguards before introduction of such products.
Financial Infrastructure
Regulatory Structure
The CFSA felt that the existence of multiple regulators wasconsistent with the current stage of financial developmentin India, but stressed the need for further improvement inregulatory coordination. The Reserve Bank could, in theinterest of financial stability, be armed with sufficientsupervisory powers and monitoring functions in respectof financial conglomerates.
Liquidity Infrastructure
Systems and procedures should be developed forsmoothing out volatility in liquidity and call money ratesarising out of quarterly tax payments. The introduction ofauction of Central Government surplus balances with theReserve Bank in a non-collateralised manner could beconsidered, though with appropriate caution.
Payments and Settlement InfrastructureThe current low utilisation of the electronic paymentsinfrastructure could be increased with the use oftechnology to make the facilities more accessible tocustomers, thereby optimising the use of this infrastructureand achieving greater financial inclusion.
Others
The Committee also discussed insolvency regime,corporate governance and safety nets, among others.
Development Issues in the Socio-economic Context
A stability assessment of the financial sector should alsoaddress broader development aspects in the socio-economiccontext, which affect social stability and have an indirectbearing on financial stability. Financial inclusion is one ofthe major determinants of economic growth. Highereconomic growth and infrastructure, in turn, play a crucialrole in promoting financial inclusion. In order to achieve theobjective of growth with equity, it was imperative thatinfrastructure was developed in tandem with financialinclusion, to facilitate and enhance credit absorptive capacity.
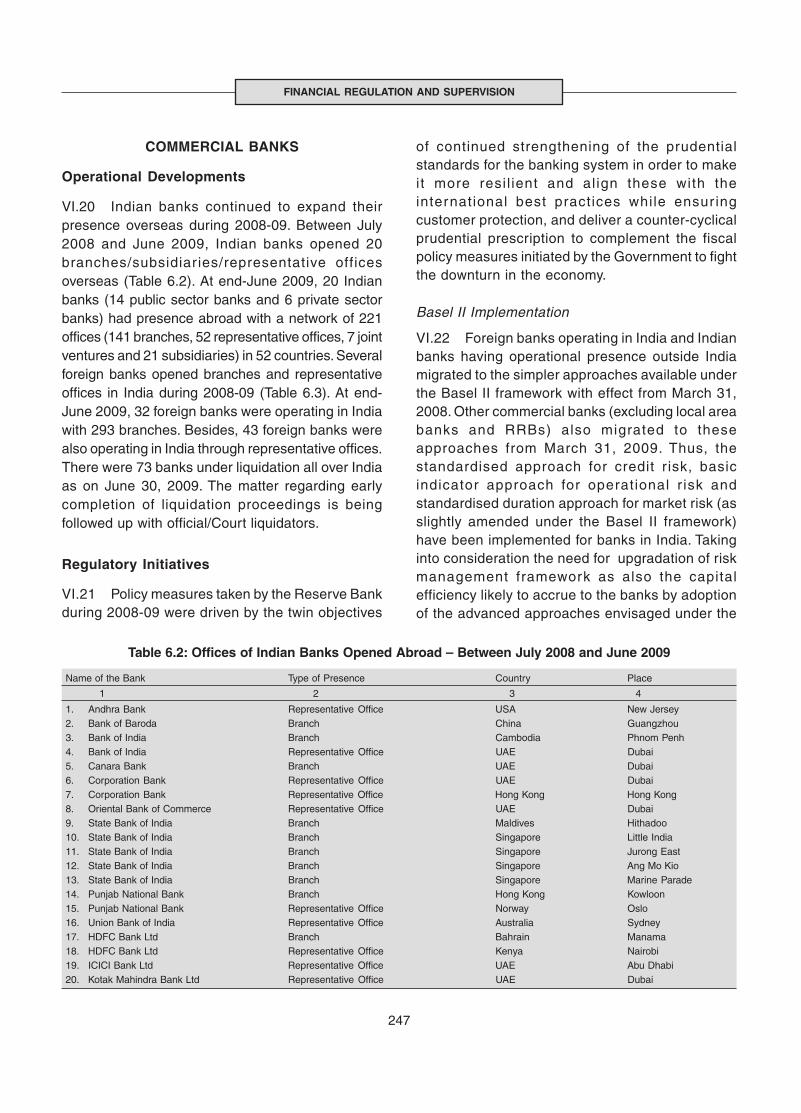
247
FINANCIAL REGULATION AND SUPERVISION
Table 6.2: Offices of Indian Banks Opened Abroad – Between July 2008 and June 2009
Name of the Bank Type of Presence Country Place
1 2 3 4
1. Andhra Bank Representative Office USA New Jersey2. Bank of Baroda Branch China Guangzhou3. Bank of India Branch Cambodia Phnom Penh4. Bank of India Representative Office UAE Dubai5. Canara Bank Branch UAE Dubai6. Corporation Bank Representative Office UAE Dubai7. Corporation Bank Representative Office Hong Kong Hong Kong8. Oriental Bank of Commerce Representative Office UAE Dubai9. State Bank of India Branch Maldives Hithadoo10. State Bank of India Branch Singapore Little India11. State Bank of India Branch Singapore Jurong East12. State Bank of India Branch Singapore Ang Mo Kio13. State Bank of India Branch Singapore Marine Parade14. Punjab National Bank Branch Hong Kong Kowloon15. Punjab National Bank Representative Office Norway Oslo16. Union Bank of India Representative Office Australia Sydney17. HDFC Bank Ltd Branch Bahrain Manama18. HDFC Bank Ltd Representative Office Kenya Nairobi19. ICICI Bank Ltd Representative Office UAE Abu Dhabi20. Kotak Mahindra Bank Ltd Representative Office UAE Dubai
COMMERCIAL BANKS
Operational Developments
VI.20 Indian banks continued to expand theirpresence overseas during 2008-09. Between July2008 and June 2009, Indian banks opened 20branches/subsidiaries/representative officesoverseas (Table 6.2). At end-June 2009, 20 Indianbanks (14 public sector banks and 6 private sectorbanks) had presence abroad with a network of 221offices (141 branches, 52 representative offices, 7 jointventures and 21 subsidiaries) in 52 countries. Severalforeign banks opened branches and representativeoffices in India during 2008-09 (Table 6.3). At end-June 2009, 32 foreign banks were operating in Indiawith 293 branches. Besides, 43 foreign banks werealso operating in India through representative offices.There were 73 banks under liquidation all over Indiaas on June 30, 2009. The matter regarding earlycompletion of liquidation proceedings is beingfollowed up with official/Court liquidators.
Regulatory Initiatives
VI.21 Policy measures taken by the Reserve Bankduring 2008-09 were driven by the twin objectives
of continued strengthening of the prudentialstandards for the banking system in order to makeit more resi l ient and al ign these with theinternational best practices while ensur ingcustomer protection, and deliver a counter-cyclicalprudential prescription to complement the fiscalpolicy measures initiated by the Government to fightthe downturn in the economy.
Basel II Implementation
VI.22 Foreign banks operating in India and Indianbanks having operational presence outside Indiamigrated to the simpler approaches available underthe Basel II framework with effect from March 31,2008. Other commercial banks (excluding local areabanks and RRBs) also migrated to theseapproaches from March 31, 2009. Thus, thestandardised approach for credit r isk, basicindicator approach for operational r isk andstandardised duration approach for market risk (asslightly amended under the Basel II framework)have been implemented for banks in India. Takinginto consideration the need for upgradation of riskmanagement framework as also the capitalefficiency likely to accrue to the banks by adoptionof the advanced approaches envisaged under the
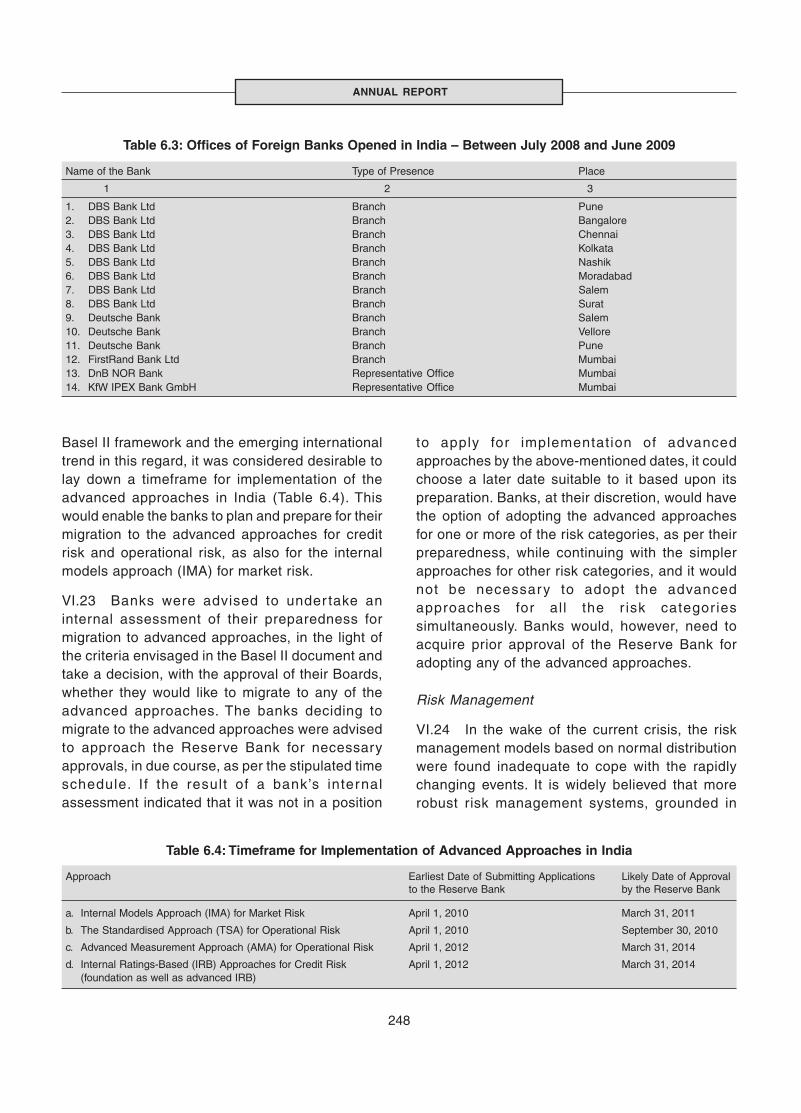
248
ANNUAL REPORT
Basel II framework and the emerging internationaltrend in this regard, it was considered desirable tolay down a timeframe for implementation of theadvanced approaches in India (Table 6.4). Thiswould enable the banks to plan and prepare for theirmigration to the advanced approaches for creditrisk and operational risk, as also for the internalmodels approach (IMA) for market risk.
VI.23 Banks were advised to under take aninternal assessment of their preparedness formigration to advanced approaches, in the light ofthe criteria envisaged in the Basel II document andtake a decision, with the approval of their Boards,whether they would like to migrate to any of theadvanced approaches. The banks deciding tomigrate to the advanced approaches were advisedto approach the Reserve Bank for necessaryapprovals, in due course, as per the stipulated timeschedule. I f the result of a bank’s internalassessment indicated that it was not in a position
to apply for implementation of advancedapproaches by the above-mentioned dates, it couldchoose a later date suitable to it based upon itspreparation. Banks, at their discretion, would havethe option of adopting the advanced approachesfor one or more of the risk categories, as per theirpreparedness, while continuing with the simplerapproaches for other risk categories, and it wouldnot be necessary to adopt the advancedapproaches for al l the r isk categor iessimultaneously. Banks would, however, need toacquire prior approval of the Reserve Bank foradopting any of the advanced approaches.
Risk Management
VI.24 In the wake of the current crisis, the riskmanagement models based on normal distributionwere found inadequate to cope with the rapidlychanging events. It is widely believed that morerobust risk management systems, grounded in
Table 6.4: Timeframe for Implementation of Advanced Approaches in India
Approach Earliest Date of Submitting Applications Likely Date of Approvalto the Reserve Bank by the Reserve Bank
a. Internal Models Approach (IMA) for Market Risk April 1, 2010 March 31, 2011
b. The Standardised Approach (TSA) for Operational Risk April 1, 2010 September 30, 2010
c. Advanced Measurement Approach (AMA) for Operational Risk April 1, 2012 March 31, 2014
d. Internal Ratings-Based (IRB) Approaches for Credit Risk April 1, 2012 March 31, 2014(foundation as well as advanced IRB)
Table 6.3: Offices of Foreign Banks Opened in India – Between July 2008 and June 2009
Name of the Bank Type of Presence Place
1 2 3
1. DBS Bank Ltd Branch Pune2. DBS Bank Ltd Branch Bangalore3. DBS Bank Ltd Branch Chennai4. DBS Bank Ltd Branch Kolkata5. DBS Bank Ltd Branch Nashik6. DBS Bank Ltd Branch Moradabad7. DBS Bank Ltd Branch Salem8. DBS Bank Ltd Branch Surat9. Deutsche Bank Branch Salem10. Deutsche Bank Branch Vellore11. Deutsche Bank Branch Pune12. FirstRand Bank Ltd Branch Mumbai13. DnB NOR Bank Representative Office Mumbai14. KfW IPEX Bank GmbH Representative Office Mumbai
249
FINANCIAL REGULATION AND SUPERVISION
Stress testing is a multi-dimensional risk management toolwith numerous and varied potential applications. It involvesthe use of a range of techniques, both quantitative andqualitative, to evaluate a bank’s financial position underexceptional but plausible scenarios of varying severity.Stress test findings could assist in forward looking decisionmaking.
Globally, banks are increasingly relying on statistical modelssuch as Value at Risk (VaR) for their risk managementframeworks. These models are, however, based mainly onlimited historical data and simplistic assumptions andtherefore, cannot capture sudden, dramatic, high magnitudeand long duration events. To overcome the limitations of riskmanagement models, stress testing is being used as asupplementary tool to quantify “tail risks”, i.e., the risk oflosses under abnormal market conditions and re-assessmodeling assumptions, particularly those in relation tovolatility and correlation. It is especially important after longperiods of favourable economic and financial conditions,when fading memory of negative conditions could lead tocomplacency and neglect as well as under-pricing of risk. Itis also a key risk management tool during periods ofexpansion, when innovations may lead to new products thatcould grow rapidly and for which limited or no loss data maybe available.
Stress testing is useful in a bank’s risk managementframework and decision making process on account ofthe following:
• It provides a means for estimating a bank’s riskexposures under stressed conditions and enables it todevelop or choose appropriate strategies for mitigatingsuch risks.
• It helps a bank in identifying hidden risks and riskconcentrations across multiple business lines or units.
• It enables a bank to better shape its risk profile througha forward-looking assessment of the risks it may beexposed to and facilitates monitoring of changes in theprofile over time.
• It allows the Board of Directors and senior managementto determine whether a bank’s risk exposure or profilecorresponds to its risk appetite and risk tolerance.
Box VI.3Risk Management: Role of Stress Testing
• It enables the bank management to integrate businessstrategy, risk management and liquidity and capitalplanning decisions in an improved way.
Considering the importance of stress testing in any riskmanagement framework, the Basel Committee on BankingSupervision issued in May 2009 the paper titled “Principlesfor Sound Stress Testing Practices and Supervision”. Thepaper presents sound principles for the governance, designand implementation of stress testing programmes in banks.It says that stress testing should form an integral part of theoverall risk governance and risk management culture of abank. Stress testing should be actionable, with the resultsfrom stress testing analyses impacting decision making atthe appropriate management level, including strategicbusiness decisions of the Board and senior management.Board and senior management involvement in the stresstesting programme is essential for its effective operation. Abank should operate a stress testing programme thatpromotes risk identification and control, provides acomplementary risk perspective to other risk managementtools, improves capital and liquidity management andenhances internal and external communication.
Though stress testing and scenario analysis play animportant role in any risk management framework, they havecertain limitations such as subjective selection of scenarios,skill of the modeler, uncertain probabilities of the eventsconcerned and use of a small number of parameters. Stresstesting, therefore, by itself cannot address all r iskmanagement weaknesses, but as part of a comprehensiveapproach, it has a useful role in aiding timely policyintervention to strengthen the resilience of individual banksand the financial system.
References
1. Basel Committee on Banking Supervision (2009).“Principles for Sound Stress Testing Practices andSupervision”, Bank for International Settlements, May 20.
2. Haldane A.G. (2009). “Why Banks Failed the StressTest”, Bank of England (speech), February 13.
3. Duguay P. (2009). “Financial Stability through Sound RiskManagement”, Bank of Canada (remarks), January 8.
appropriately designed stress tests, could havehelped prevent the build-up of leverage that becameunsustainable. Thus, there is an imperative needto strengthen the risk management systems/modelsby incorporating imaginative stress testing practicesto avoid recurrence of such events and preservenational and global financial stability (Box VI.3).
NPA Management
VI.25 The three legal options available to banksfor resolution of NPAs, viz., the Securitisation andReconstruction of Financial Assets andEnforcement of Secur ity Interest Act, 2002(SARFAESI Act, 2002), Debt Recovery Tribunals

250
ANNUAL REPORT
(DRTs) and Lok Adalats, have led to a steadyincrease in the adjudication and recovery ofdisputed amounts (Table 6.5).
Restructuring of Advances
VI.26 The guidelines on restructuring of advanceswere revised in August 2008 in accordance withthe recommendations of the Working Group toreview and align the existing guidelines onrestructur ing of advances [other than undercorporate debt restructuring (CDR) mechanism] onthe lines of provisions under the revised CDRmechanism. The main features of the guidelines,which are uniformly applicable across all sectors,are: (i) Retention of asset classification status onrestructuring is an exception rather than a rule. Itis, however, available to all borrowers who meetspecified conditions, except to the borrowers ofthree categories, viz., consumer and personaladvances, advances classified as capital marketexposure and advances classified as commercialreal estate exposures (subject to modificationscarried out subsequently); (ii) The CDR mechanismwould be available to the borrowers engaged inactivities other than industrial advances as well,albeit subject to the same terms and conditions asapplicable to industrial advances. There is nochange in the insti tut ional framework forrestructuring under the CDR mechanism; (iii) Thelinkage of asset classif ication benefit withmoratorium has been dispensed with considering
certain natural checks built in the guidelines againstextension of longer moratorium; (iv) Banks shouldmake provision for diminution in the fair value ofthe loan (both principal and interest cash flows)rather than for economic loss arising from reductionin rate of interest alone, as done hitherto; a simplermechanism to compute the diminution in fair valueat a flat rate of 5 per cent would be available toborrowers with outstanding amounts below Rs.1crore; (v) The unrealised income represented bythe Funded Interest Term Loan (FITL)/debt or equityinstrument should not be taken to the profit andloss account but credited into an account styled as‘Sundry Liabilities Account (Interest Capitalisation)’[SLA(IC)]. Only on repayment in case of FITL orsale/redemption proceeds of the debt/equityinstruments, the amount received would berecognised in the profit and loss account, whilesimultaneously reducing the balance in the‘SLA(IC)’; (vi) The terms – ‘satisfactory performanceduring the specified period of one year afterrestructuring’, ‘repeated restructuring’ and ‘securedadvances’ were clarified; (vii) In the case ofinfrastructure projects, in order to become entitledfor the asset classification benefit, the period withinwhich the viability had to be established wasincreased from 7 years to 10 years, and the periodwithin which the loan had to be repaid wasincreased from 10 years to 15 years. In the case ofhousing loans, individual banks, with the approvalof their Boards, were permitted to decide on therepayment period required for restructured loans;
Table 6.5: Resolution of NPAs(Cumulative as at end-March 2009)
(Amount in Rupees crore)
Resolution Mechanism Number Amount Number Amount Number Amount
1 2 3 4 5 6 7
SARFAESI Notices Issued Recovery Compromise Proposals
3,41,756 68,127 2,10,641 19,396 79,277 11,249
DRTs Cases Filed Adjudicated Cases Recovery
81,173 1,30,508 49,033 65,585 N.A. 24,889
Lok Adalats Cases Filed Cases Decided Recovery
17,12,958 11,763 4,55,423 2,220 3,75,858 982
N.A.: Not Available.

251
FINANCIAL REGULATION AND SUPERVISION
(viii) One of the conditions for availing special assetclassification benefit in terms of guidelines onrestructuring of advances is that the account shouldbe fully secured. This condition would not beapplicable in the case of infrastructure projects,provided the cash flows generated from theseprojects were adequate for repayment of theadvance, the financing bank(s) had in place anappropriate mechanism to escrow the cash flowsand also had a clear and legal first claim on thesecash flows.
Credit Information Companies
VI.27 The Reserve Bank had invited applicationsfrom companies interested in continuing/commencing business of credit information in April2007. A High Level Advisory Committee (HLAC)under the Chairmanship of Dr. R.H. Patil was setup for screening the applications andrecommending the names of the companies towhich certificates of registration (CoRs) could begranted. The Government announced the FDI policyfor credit information companies (CICs) in March2008. The Reserve Bank announced in November2008 that FDI up to 49 per cent in CICs would beconsidered in cases: (a) where the investor was acompany with an established track record ofrunning a credit information bureau in a wellregulated environment; (b) no shareholder in theinvestor company held more than 10 per cent votingrights in that company; and (c) preferably, thecompany was a listed company on a recognisedstock exchange. Keeping in view the provisions ofthe CICs (Regulation) Act, 2005 as well as thedirectives issued by the Reserve Bank, the HLAChad recommended the names of four applicantswhich the Reserve Bank could consider for grantingCoRs. Accordingly, the Reserve Bank, in April 2009,issued ‘in-principle approval’ to four companies toset up CICs.
Approval for Offering Complex Financial Products
VI.28 Indian banks were advised in December2008 that if their foreign branches/subsidiaries were
transacting in any financial products, which werenot available in the Indian market, but on which nospecific prohibition was placed by the ReserveBank, prior approval would not be required only ifthese were plain-vanilla financial products. Theforeign branches/subsidiaries dealing with suchproducts, however, must have adequate knowledge,understanding and risk management capability forhandling such products. Such products were to beappropriately captured and reported in the extantoff-site returns. Banks would have to obtain priorapproval in case their foreign branches/subsidiariesproposed to handle such products.
Unhedged Foreign Exchange Exposure of Clients
VI.29 Banks had been advised in December 2003to have a policy, which explicitly recognised andtook into account risks arising on account ofunhedged foreign exchange exposures of theirclients. It was also advised that foreign currencyloans above a specified limit could be extended onlyon the basis of a well laid out policy of banks’ Boardswith regard to the hedging of such loans. It wasfurther advised in December 2008 that the Board’spolicy should cover unhedged foreign exchangeexposure of all clients, including SMEs, whichshould take into account exposure from all sources,including ECBs. Banks were advised to monitor andreview on a monthly basis the unhedged portion ofthe foreign currency exposures of clients with largeforeign currency exposures and the unhedgedexposure of SMEs. In all other cases, banks wereadvised to put in place a system to monitor andreview such positions on a quarterly basis.
Counter-cyclical Prudential Norms
VI.30 Banks’ loans and advances portfolio oftenmove pro-cyclically, growing faster during anexpansionary phase and vice versa. During timesof expansion and accelerated credit growth, thereis a tendency to underestimate the level of inherentrisk and the converse holds during times ofrecession. This tendency is not effectivelyaddressed by capital adequacy and specific
252
ANNUAL REPORT
provisioning requirements since they capture riskex-post, not ex-ante. It is, therefore, necessary tobuild up capital and provisioning buffers during acyclical boom, which could be used to cushionbanks’ balance sheets in the event of a downturnin the economy or deterioration in credit quality onaccount of other reasons. In order to ensure thatasset quality was maintained in the light of highcredit growth, r isk weights and provisioningrequirements on standard advances for banks’exposures to the sectors showing above averagegrowth had been progressively raised during thelast 3-4 years, as a counter-cyclical measure.However, with the global financial crisis starting toaffect Indian economy from September 2008onwards, the Reserve Bank reduced the enhancedrisk weights and provisioning requirements to thenormal level.
VI.31 Risk weight for all unrated claims, long-termas well as short-term, regardless of the amount ofclaim, on the corporates was reduced from 150 percent to 100 per cent in November 2008. Risk weighton the claims secured by commercial real estateand exposure to NBFCs-ND-SI was reduced to 100per cent from 125 per cent.
VI.32 Prior to the unfolding of the global crisis, toensure that asset quality was maintained in the lightof high credit growth, the general provisioningrequirement for standard advances in specificsectors, i.e., personal loans, capital marketexposures and commercial real estate loans hadbeen increased from 0.4 per cent to 2.0 per cent,and to 1.0 per cent for residential housing loansbeyond Rs.20 lakh in January 2007. To mitigate theimpact of the current economic slowdown, as acounter-cycl ical measure, the provisioningrequirement for standard assets was reduced witheffect from November 15, 2008, to a uniform levelof 0.4 per cent, except in the case of directadvances to the agricultural and the SME sectors,which continue to attract provisioning of 0.25 percent. The revised norms were made effectiveprospectively and thus, the provisions already heldwere not to be reversed. Similar instructions wereissued to UCBs.
VI.33 In December 2008, in view of the growingconcern of possible increase in stress in the Indianbanking system, certain modifications were madeto the guidelines on restructuring of advances(issued in August 2008) as a one-time measure andfor a limited period of time, i.e., up to June 30, 2009.The special regulatory treatment for assetclassif ication ( i .e., retention of the assetclassification status of the account as obtaining atthe time of restructur ing), was extended tocommercial real estate exposures restructured forthe first time and in the case of exposures (otherthan commercial real estate, capital markets andpersonal/consumer loans), which were viable butwere facing temporary cash flow problems andneeded a second restructuring. Accounts whichwere standard as on September 1, 2008 but slippedinto the NPA category subsequently, were treatedas standard on restructuring provided banks tookthem up for restructuring on or before March 31,2009 and the restructuring package was put inplace within the prescribed quick implementationtime schedule. The condition of full security coverfor availing the special regulatory treatment waswaived in case of cash credit accounts which hadbeen rendered unsecured due to fall in inventoryprices, subject to banks making provisions asprescribed. It was emphasised that the relaxationseffected to the guidelines on restructuring ofadvances by the Reserve Bank were aimed atproviding an opportunity to banks and borrowers topreserve the economic value of units and should notbe considered as means to evergreen the advances.
Floating Provisions
VI.34 Floating provisions made by the bankscould not be reversed by credit to the profit andloss account but could only be utilised for makingspecif ic provisions under extraordinarycircumstances with the prior approval of theReserve Bank. Unti l such uti l isation, theseprovisions could be netted off from gross NPAs toarrive at net NPAs, or alternatively, they could betreated as part of the Tier II capital within the overallceiling of 1.25 per cent of total risk weighted

253
FINANCIAL REGULATION AND SUPERVISION
assets. The former option was, however, removedwith effect from April 1, 2009. Further, it wasdecided to allow banks to utilise, at their discretion,the floating provisions held for ‘advances’ portfolio,to the extent of meeting such interest/chargeswaived under the Agricultural Debt Waiver andDebt Relief Scheme, 2008.
Unsecured Loans
VI.35 In order to enhance transparency andensure correct reflection of the unsecuredadvances in banks’ balance sheets, it was advisedthat for determining the amount of unsecuredadvances that could be presented in schedule 9 ofthe published balance sheet, the rights, licenses,authorisations charged to the banks as collateralin respect of projects (including infrastructureprojects) financed by them, should not be reckonedas tangible security. Hence, such advances wouldbe reckoned as unsecured.
Off-balance Sheet Exposures
VI.36 For the purpose of computing creditexposure and also for computing capital adequacy,banks were advised in August 2008 to compute theircredit exposures/credit equivalent, arising onaccount of the interest rate and foreign exchangederivative transactions and gold, using the ‘currentexposure method’. The credit exposures computedwould attract provisioning requirement as applicableto the loan assets in the ‘standard’ category of theconcerned counterparties. In October 2008, bankswere advised that the overdue receivablesrepresenting positive MTM value of a derivativecontract would be treated as NPAs, if these remainedunpaid for 90 days or more, and all other fundedfacilities of the client would be treated as NPAfollowing the principle of borrower-wise classification.The principle of borrower-wise asset classificationwould apply to all overdues arising from forwardcontracts, plain vanilla swaps and options and othercomplex derivatives with the exception of complexderivative contracts entered into during the periodbetween April 2007 and June 2008.
Anti Money Laundering Measures
VI.37 The Prevention of Money Laundering(Amendment) Act, 2009 [PMLA] received theassent of the President on March 6, 2009. Theamendment sought, inter alia, to include paymentsystem operators and ‘authorised persons’ asdefined in Foreign Exchange Management Act,1999 within the prevention of money launderingframework. The reporting guidelines for banks wereupdated during the year by the Reserve Bank, thesalient features of which include:
(i) Al l cash transactions, where forged orcounterfeit Indian currency notes were used asgenuine, should be reported by the PrincipalOfficer to the Financial Intelligence Unit – India(FIU-IND) immediately in the prescribed format– counterfeit currency report (CCR).
(ii) The background including all documents/officerecords/memorandums per taining to al lcomplex, unusually large transactions and allunusual patterns of transactions, which had noapparent economic or visible lawful purposeshould, as far as possible, be examined andthe findings at the branch as well as thePrincipal Officer level should be properlyrecorded. These records should be preservedfor ten years as required under the PMLA, 2002.
(iii) It is likely that in some cases transactions areabandoned/aborted by customers on beingasked to give some details or to providedocuments. It was clarified that banks shouldreport all such attempted transactions insuspicious transactions reports (STRs), evenif not completed by customers, irrespective ofthe amount of the transaction.
(iv) While making STRs, banks should be guidedby the definition of ‘suspicious transaction’ ascontained in rule 2(g) of rules notified underPMLA, 2002. STRs should be made if there wasreasonable ground to believe that the transactioninvolved proceeds of crime, irrespective of theamount of the transaction and/or the thresholdlimit envisaged for predicate offences in part Bof schedule of PMLA, 2002.

254
ANNUAL REPORT
(v) In the context of creating KYC/anti-moneylaundering awareness among the staff and forgenerating alerts for suspicious transactions,banks were advised to consider the indicativelist of suspicious activities contained in theIBA’s Guidance Note for Banks, 2005.
Customer Service
VI.38 During the year, many important initiativeswere taken for improving customer service in banks.In order to make available all current instructionson the subject at one place, several importantinstructions relating to customer service werecompiled in the form of a Master Circular, whichwas issued on November 3, 2008.
VI.39 Based on the experience gained in runningthe Banking Ombudsman Scheme, 2006, arevision to the Scheme was effected in February2009. The salient features of the amendmentsinclude widening of the scope of the Scheme toconsider deficiencies ar ising out of internetbanking services, enabling customers to lodgecomplaints against banks for their non-adherenceto the provisions of the Fair Practices Code forLenders or the Code of Bank’s Commitment toCustomers and non-observance of the ReserveBank’s guidelines on engagement of recoveryagents. The Reserve Bank also asked all banksto place a copy of the Banking OmbudsmanScheme, 2006, on their websites, for widerdissemination.
VI.40 Banks were reported to be levying highservice charges for collection of outstation chequesand for use of certain electronic remittance/transferof funds services. To reduce the complaints in thisregard, instructions were issued in October 2008for uniform service charges for electronic paymentproducts and also charges for collection ofoutstation cheques.
VI.41 The Committee on Customer Services(Chairman: Shri H. Prabhakar Rao) submitted itsreport in April 2008 and covered matters relatingto currency management, Government business,
inclusive of payment of pension and taxes andforeign exchange services (Box VI.4).
VI.42 Banks were advised in August 2008 toconduct an annual review of accounts in which therewere no operations for more than one year andprocedures for tracing the customers, ascertainingthe reasons for inactivity in the account andlabelling the account as inoperative/dormant wherethere were no transactions for over a period of twoyears, and payment of interest on savings bankaccount were prescr ibed. Since one of theobjectives of the segregation of the inoperativeaccounts was to reduce the risk of frauds, thetransaction should be monitored by banks at a higherlevel both from the point of view of preventing fraudand making an STR.
VI.43 As display of customer-friendly informationby banks in their branches is one of the modes ofimparting financial education, commercial bankswere advised to put the important aspects ormandatory instructions relating to ‘customerservice information’, ‘interest rates’, ‘servicecharges’, ‘grievance redressal’ and ‘others’ on acomprehensive notice board and make thedetai led information avai lable in booklets/brochures.
VI.44 During the year, instructions were issuedto banks to ensure that their branches invariablyaccepted cash over the counter from all customerswho desired to do so; to ensure that all informationrelating to charges/fees for processing wereinvariably disclosed in the loan application formsand to inform the ‘all-in-cost’ to the customers toenable them to compare the rates charged withother alternative sources of finance; to indicate thename of the nominee in the passbook/statementof account with the consent of the customer; andto provide ramps in ATMs /bank branches and alsoto make at least one-third of new ATMs installedas talking ATMs with Braille keypads.
VI.45 At present, interest on savings bankaccounts is calculated on the minimum balancesheld in the accounts during the period from the tenth
255
FINANCIAL REGULATION AND SUPERVISION
day to the last day of each calendar month. In viewof the present satisfactory level of computerisationand extensive networking in commercial banks, andin line with the announcement in the Annual Policy
Statement for 2009-10, it is proposed that thepayment of interest on savings bank accounts bySCBs would be on a daily product basis with effectfrom April 1, 2010.
The Reserve Bank had set up the Committee on CustomerServices (Chairman: Shri H. Prabhakar Rao) to look intocustomer services provided by the Reserve Bank directlyor through banks/institutions with a view to maximisinggeneral public satisfaction. The major recommendationsmade by the Committee include:
Payment of Government Pension through PublicSector Banks:
• Branch manager should interact with a cross-section ofpensioners serviced at the branch on a quarterly basis.
• Banks should follow-up actively and ensure that,wherever possible, pensioners who had retired earlierconvert their pension accounts to joint accounts.Nominations should invariably be taken.
• Banks should organise regular training sessions for bankpersonnel dealing with pension matters in consultationwith the concerned Government Department.
• Banks should establish a Centralised Pension PaymentCell (CPPC) to take over back-office work relating todisbursement of Government pension.
Collection of Taxes by Agency Banks (Online TaxAccounting System - OLTAS):
• All banks were advised to ensure that all concernedstaff were appropriately trained to the requirements ofthe OLTAS and were also sensitised to the needs ofthe individual assessees.
• All bank branches authorised to accept payment ofincome tax should clearly and prominently display thefact by way of a notice/board.
• Banks were advised to put up notices in their branchesasking assessees to quote correct PAN number,assessment year and other details in the challan.Further, an easy to read/comprehend list of “Do’s andDon’ts” is required to be put up as a notice for theguidance of customers.
• Banks should strictly follow the process of verificationof the PAN number of existing assessees to eliminateany incorrect entry by the assessees.
• Banks should provide blank printed challans for theconvenience of the assessees who could not obtainpre-verified, pre-printed challans over the internet.
Box VI.4 Committee on Customer Services
• Tax collecting bank branches should invariably givepaper token in acknowledgement of the receipt of thecheque.
• All banks should set up e-payment facilities in a time-bound manner.
Issue and Operations of ‘Savings Bonds’:
• Instructions were issued to banks to ensure that everybranch conducting Government business of volumeabove a specified amount (say Rs.25 lakh) was coveredby concurrent audit. The scope of the concurrent auditshould be prescribed to include various aspects ofservicing of savings bonds with specific reference tothe customer service related aspects.
• Each bank was asked to automate the processingrelated to the servicing of savings bonds to ensure thetimely servicing of the bonds.
• Banks were advised to actively make efforts to obtainthe bank accounts details of the investors in order tomigrate to electronic servicing of interest and maturityproceeds of the savings bonds through the electronicclearing service and the national electronic fundstransfer.
• Banks were advised to obtain the opinion and views ofthe investors on the quality of the services renderedby the authorised agencies by means of a survey orquestionnaires.
Additionally, the Reserve Bank took the following initiatives:
• Frequently Asked Questions (FAQs) relating to pensiondisbursement by the public sector banks under theCentral Government pension schemes were hosted onthe Reserve Bank’s website in June 2008.
• A checklist relating to pension payments/Governmentbusiness for use of internal inspection of bank brancheswas forwarded to banks advising them to issueinstructions to their internal auditors/inspectors tobestow due attention to adherence to the items of worklisted therein and comment on the quality of customerservice in their report.
• Efforts were made to extend the electronic paymentnetwork to more locations in the country so that everyinvestor could opt for receiving interest and repaymentproceeds of Saving Bonds directly into his/her account.
256
ANNUAL REPORT
VI.46 Detailed instructions were issued to banksin July 2008 on their credit card operations coveringaspects such as issue of unsolicited cards,insurance cover to credit card holders, safeguardsagainst misuse of lost/stolen cards, educatingcustomers on the implications of paying only the‘minimum amount due’ on credit cards, excessiveinterest/other charges, escalation of unresolvedcomplaints, reporting to Credit Information Bureauof India Ltd./CICs, registration of telemarketers,wrongful billing and redressal of grievances.
VI.47 With a view to enhancing awareness aboutthe Codes evolved by the Banking Codes andStandards Board of India, the BCSBI launched aquarterly newsletter titled “Customer Matters”,which was distributed to each branch of eachmember bank. The BCSBI invited suggestions frommembers of the public, Banking Ombudsmen,various bodies representing interests of banks'customers, and has now completed the processof review of the Code of Bank’s Commitment toCustomers, in collaboration with the IBA. Publicgrievance is an effective tool through which theBCSBI carries out its ongoing monitoring of banks’compliance with the Code provisions. The BCSBI,by design and mandate, is not a redressal agencyto arbitrate on a dispute between an individual andhis/her bank but grievances ventilated by individualssometimes throw up issues on systemicdeficiencies. They enable the BCSBI to monitorCode compliances at system or bank-specific level.
Supervisory Initiatives
VI.48 An Internal Working Group constituted tolay down the road map for adoption of a suitableframework for cross-border supervision andsupervisory co-operation with overseas regulatorssubmitted its Repor t in January 2009. Therecommendations of the Group are being examinedfor initiating further action. An Inter-departmentalGroup is also examining additional areas/issueswhich need to be brought under the supervisoryfocus, including modalities for on-site supervisionof overseas branches and subsidiaries of Indian
banks. The Group is expected to submit its Reportshortly. Keeping in view the systemic importanceof financial conglomerates (FCs), efforts are beinginitiated to strengthen the FC monitoring systemfurther by introducing certain prudential measuressuch as group-wide capital adequacy requirements,safe conduct of Intra-Group Transactions andExposures (ITEs) and management of r iskconcentrations, governance systems in FCsincluding ‘fit and proper’ principles and r iskmanagement systems, supervisory co-operationand information-sharing amongst the sectoralregulators.
VI.49 Banks were advised to be extremelycautious while continuing relationships withrespondent banks located in countries with poorKYC standards and countr ies identif ied as‘uncooperative’ in the f ight against moneylaundering and terrorist financing. The anti-moneylaundering (AML)/combating financing of terrorism(CFT) guidelines issued by the Reserve Bank arein consonance with the Financial Action Task Force(FATF) recommendations. Increased disclosurerequirements have been emphasised on the partof tax payers and f inancial insti tut ions fortransactions involving uncooperative jurisdictions.The Reserve Bank would continue to incorporatethe latest international best practices in itsregulations.
Off-Site Returns
VI.50 Off-site supervision, introduced in 1995,has steadily become an integral component of theReserve Bank’s financial stability architecture,providing early warning on weaknesses at the banklevel as well as the system level. In order to maintainits effectiveness, changes have been continuallyincorporated into the off-site surveillance systemin alignment with the evolving internationalpractices as also the country-specific needs.
VI.51 As part of the policy decision to receive allregulatory returns through a secured online returnsfi l ing system (ORFS), the exist ing per iodicprudential off-site returns submitted by banks are
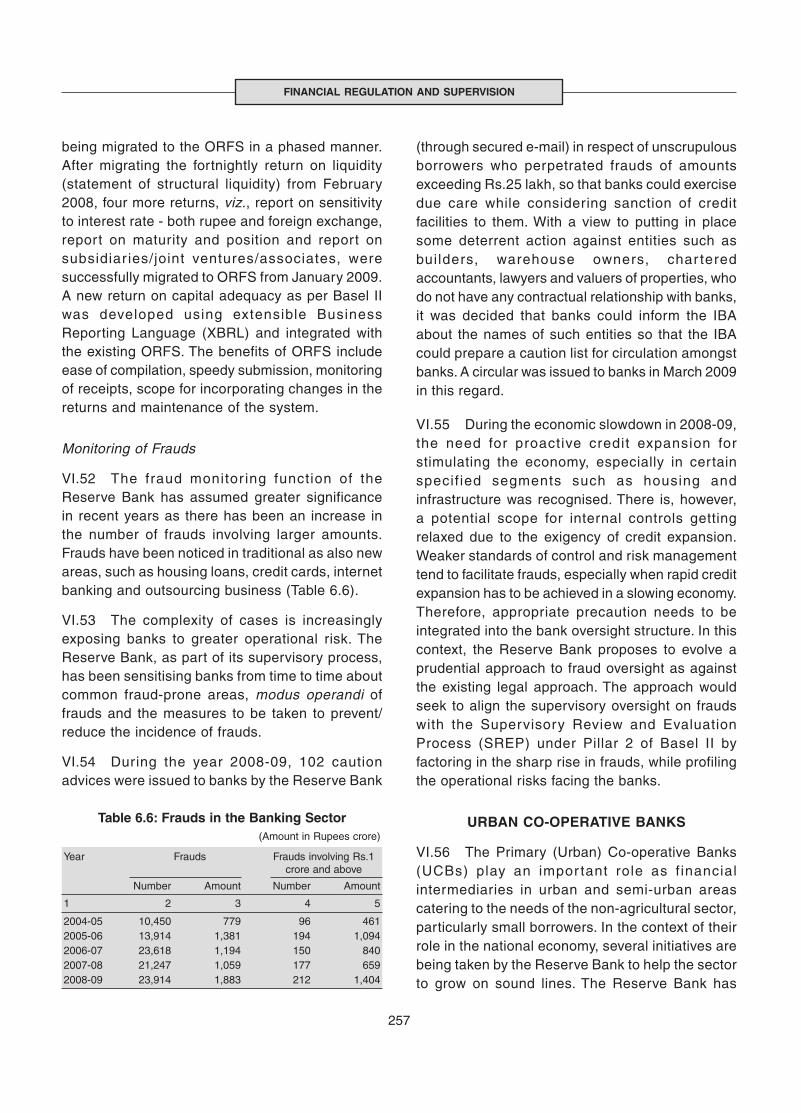
257
FINANCIAL REGULATION AND SUPERVISION
being migrated to the ORFS in a phased manner.After migrating the fortnightly return on liquidity(statement of structural liquidity) from February2008, four more returns, viz., report on sensitivityto interest rate - both rupee and foreign exchange,report on maturity and position and report onsubsidiar ies/joint ventures/associates, weresuccessfully migrated to ORFS from January 2009.A new return on capital adequacy as per Basel IIwas developed using extensible BusinessReporting Language (XBRL) and integrated withthe existing ORFS. The benefits of ORFS includeease of compilation, speedy submission, monitoringof receipts, scope for incorporating changes in thereturns and maintenance of the system.
Monitoring of Frauds
VI.52 The fraud monitor ing function of theReserve Bank has assumed greater significancein recent years as there has been an increase inthe number of frauds involving larger amounts.Frauds have been noticed in traditional as also newareas, such as housing loans, credit cards, internetbanking and outsourcing business (Table 6.6).
VI.53 The complexity of cases is increasinglyexposing banks to greater operational risk. TheReserve Bank, as part of its supervisory process,has been sensitising banks from time to time aboutcommon fraud-prone areas, modus operandi offrauds and the measures to be taken to prevent/reduce the incidence of frauds.
VI.54 During the year 2008-09, 102 cautionadvices were issued to banks by the Reserve Bank
(through secured e-mail) in respect of unscrupulousborrowers who perpetrated frauds of amountsexceeding Rs.25 lakh, so that banks could exercisedue care while considering sanction of creditfacilities to them. With a view to putting in placesome deterrent action against entities such asbuilders, warehouse owners, char teredaccountants, lawyers and valuers of properties, whodo not have any contractual relationship with banks,it was decided that banks could inform the IBAabout the names of such entities so that the IBAcould prepare a caution list for circulation amongstbanks. A circular was issued to banks in March 2009in this regard.
VI.55 During the economic slowdown in 2008-09,the need for proactive credit expansion forstimulating the economy, especially in certainspecif ied segments such as housing andinfrastructure was recognised. There is, however,a potential scope for internal controls gettingrelaxed due to the exigency of credit expansion.Weaker standards of control and risk managementtend to facilitate frauds, especially when rapid creditexpansion has to be achieved in a slowing economy.Therefore, appropriate precaution needs to beintegrated into the bank oversight structure. In thiscontext, the Reserve Bank proposes to evolve aprudential approach to fraud oversight as againstthe existing legal approach. The approach wouldseek to align the supervisory oversight on fraudswith the Supervisory Review and EvaluationProcess (SREP) under Pillar 2 of Basel II byfactoring in the sharp rise in frauds, while profilingthe operational risks facing the banks.
URBAN CO-OPERATIVE BANKS
VI.56 The Primary (Urban) Co-operative Banks(UCBs) play an impor tant role as f inancialintermediaries in urban and semi-urban areascatering to the needs of the non-agricultural sector,particularly small borrowers. In the context of theirrole in the national economy, several initiatives arebeing taken by the Reserve Bank to help the sectorto grow on sound lines. The Reserve Bank has
Table 6.6: Frauds in the Banking Sector(Amount in Rupees crore)
Year Frauds Frauds involving Rs.1crore and above
Number Amount Number Amount
1 2 3 4 5
2004-05 10,450 779 96 4612005-06 13,914 1,381 194 1,0942006-07 23,618 1,194 150 8402007-08 21,247 1,059 177 6592008-09 23,914 1,883 212 1,404
258
ANNUAL REPORT
entered into MoUs with 26 State Governments andwith the Central Government (for multi-State UCBs)and Task Forces on Urban Co-operative Banks(TAFCUBs) were constituted in these States andat the Centre for identification of non-viable UCBsand deciding their future set up. The MoUarrangement now covers over 99 per cent of thebanks that account for over 99 per cent of depositsin the sector.
VI.57 With a view to providing an additionalavenue for non-disruptive exit of weak/unviableentities in the co-operative banking sector, theReserve Bank issued guidelines on merger/amalgamation of UCBs with Deposit Insurance andCredit Guarantee Corporation (DICGC) support inJanuary 2009. UCBs with negative net worth werepermitted to restructure their liabilities and converta part of deposits of the large depositors havingdeposits of Rs.1 lakh and above and those ofco-operative institutions into equity capital andInnovative Perpetual Debt Instruments (IPDIs) soas to restore viability to the restructured banks. Inorder to protect the interests of the depositors, theReserve Bank also permitted transfer of assets andliabilities of a mid-sized UCB to a public sectorcommercial bank. To overcome the difficulties inraising of capital funds and achieving the prescribedCRAR of 9 per cent, the Reserve Bank issuedguidelines for raising of capital by way of preferenceshares and long-term deposits. With the comfort ofcoordinated supervision, UCBs in States which hadsigned the MoUs, were permitted to open currencychests, sell units of mutual funds and insuranceproducts, provide foreign exchange services, opennew ATMs and convert extension counters intobranches. Further, banks were granted authorisationto open new branches.
VI.58 There has been a change in the profile ofthe sector due to measures taken in recent times.The number of banks in Grade I or II have increasedsignificantly from 1,147 (61 per cent of the total of1,872 banks) as on March 31, 2005 to 1,326 (77per cent of total of 1,721 banks) as on March 31,2009. The number of Grade III and Grade IV UCBstaken together, (implying weakness/sickness in
UCBs) have similarly declined from 725 (39 per centof the total) as on March 31, 2005 to 395 banks(23 per cent of total) as on March 31, 2009.
Branch Expansion
VI.59 Sound and well-functioning Tier II UCBs inStates that had signed MoUs were providedavenues for organic growth as they could submitapplications to the Reserve Bank for extension oftheir areas of operation to the entire State. Thebranch licensing norms for such Tier I and Tier IIUCBs were further liberalised in 2008-09 and it wasdecided that approvals for branch expansion,including off-site ATMs would be considered subjectto satisfaction of certain criteria. The eligibilitynorms for opening up of on-site ATMs wereliberalised following the announcement to the effectin the Annual Policy Statement for 2008-09.
Financial Restructuring
VI.60 UCBs were advised that, subject to certainconditions, their proposals for financial restructuringwould be considered as an additional option forresolution of problem banks.
Prudential Guidelines
VI.61 The proportion of SLR holdings in the formof Government and other approved securities aspercentage of NDTL was revised and non-scheduled UCBs were asked to maintain SLR of7.5 per cent by September 30, 2009, 15 per centby March 31, 2010 and 25 per cent by March 31,2011. Non-SLR investments of UCBs continue tobe limited to 10 per cent of a bank’s total depositsas on March 31 of the previous year.
VI.62 In view of the economic downturn in 2008-09, which created stress on liquidity and repaymentcapability of the otherwise viable units, revisedguidelines were issued to UCBs on restructuringof advances, applicable to all accounts restructuredafter March 6, 2009 (i.e., the date of issue of thecircular). Under the revised guidelines, specialregulatory treatment is available to the borrowers
259
FINANCIAL REGULATION AND SUPERVISION
engaged in important business activities, subject tocompliance with certain conditions. The specialregulatory treatment has two components – incentivefor quick implementation of the restructuring packageand asset classification benefits.
VI.63 In respect of legacy cases pertaining toUCBs having negative net worth as on March 31,2007, it was decided that Reserve Bank wouldconsider a scheme of amalgamation that providesfor payment to depositors, financial contribution bythe transferee bank and sacr if ice by largedepositors. The detailed guidelines for merger ofUCBs in such legacy cases were laid down togetherwith guidelines for valuation of assets and liabilitiesof the transferor bank and the additional incentivesthat could be provided to the transferee bank.
Regulatory Initiatives
VI.64 More granular asset-liability managementguidelines (splitting the first time bucket in thestatement of structural liquidity into three buckets)became effective for scheduled UCBs from January1, 2009. Consequent to the announcement in theAnnual Policy Statement for 2008-09, Tier II UCBswere permitted to extend individual housing loansup to a maximum of Rs.50 lakh (Rs.25 lakh earlier)per beneficiary of a dwelling unit subject to extantprudential exposure limits.
Customer Service
VI.65 All UCBs were advised to conform to the timeframe prescribed by the National Consumer DisputeRedressal Commission in the matter of clearance ofcheques. For delays beyond the stipulated period,banks should pay interest at the fixed deposit rateor at the specified rate as per the respective bank’spolicy, to the payee of the cheques.
VI.66 Notifications oriented towards customerservice issued to UCBs by the Reserve Bank during2008-09 include instructions regarding display ofinformation by banks on comprehensive noticeboards, display of information relating to interestrates and service charges and need to make bank
branches and ATMs accessible to persons withdisabilities. Since visually challenged persons werelegally competent to enter into business contracts,UCBs were advised to ensure that all bankingfacilities such as cheque book facility (includingthird-party cheques), ATM facility, net bankingfacility, locker facility, retail loans, and credit cardswere invariably offered to the visually challengedwithout any discrimination. UCBs were advised toensure that a suitable mechanism existed forreceiving and addressing complaints from theircustomers with specific emphasis on resolving suchcomplaints fairly and expeditiously regardless of thesource of the complaints.
Business Facilitation
VI.67 UCBs, which are recognised as authoriseddealer category I and II, could par ticipate indesignated currency futures exchanges recognisedby the SEBI as clients, only for the purpose ofhedging their under lying foreign exchangeexposures.
Mergers and Amalgamations
VI.68 The process of consolidation of the sectorthrough the merger of weak entities with strongerones has been set in motion by providingtransparent and objective guidelines for grantingno-objection to merger proposals (Box VI.5). TheReserve Bank, while considering proposals formerger/amalgamation, confines its approval to thefinancial aspects of the merger, taking intoconsideration the interests of the depositors andfinancial stability. Invariably, it is a voluntary decisionof the banks that approach the Reserve Bank forobtaining no objection for their merger proposal.As of end-June 2009, 71 UCBs had been merged,with 50 being Grade IV banks of which 44 hadnegative net worth.
RURAL CO-OPERATIVES
VI.69 The Government of India had constituted aTask Force on Revival of Shor t-Term Rural
260
ANNUAL REPORT
Co-operative Credit Institutions to propose anaction plan for reviving the rural co-operativebanking institutions and suggest an appropriateregulatory framework for these institutions. In orderto give a further fillip to the co-operative bankingsector, the Task Force also undertook a study onrevival of long-term co-operative credit structure inthe country (Box VI.6).
VI.70 The Reserve Bank regulates state co-operative banks (St.CBs) and district central co-operative banks (DCCBs) under the BankingRegulation Act, 1949, (AACS) while NABARDsupervises them. Only 14 out of the 31 St.CBs and75 out of the 371 DCCBs have been grantedlicences by the Reserve Bank so far. 16 St.CBshave also been granted scheduled status underSection 42 of the Reserve Bank of India Act, 1934.
VI.71 The CFSA had observed that there was aneed to draw up a roadmap for ensuring that only
licensed banks operated in the co-operative spaceby the year 2012. This would expedite the processof consolidation and weeding out of non-viableentities from the co-operative space. Accordingly,it was announced in the Annual Policy Statementfor 2009-10 that a roadmap would be worked outfor achieving this objective in a non-disruptive mannerin consultation with NABARD. The discussions withNABARD have been initiated in the matter.
REGIONAL RURAL BANKS
VI.72 The process of consolidation throughamalgamation of RRBs is now almost complete,resulting in a decline in the total number of RRBsto 86 as on March 2009 (which includes a new RRBset up in the Union Territory of Puducherry) andfurther to 84 as on July 31, 2009. The process ofrecapitalisation of RRBs with negative net worth iscomplete, with 27 RRBs fully recapitalised with anamount of Rs.1,796 crore at end-July 2009.
With a view to facilitating consolidation and emergence ofstrong entities as well as for providing an avenue for non-disruptive exit of weak/unviable entities in the co-operativebanking sector, the Reserve Bank issued guidelines onmerger/amalgamation of UCBs in February 2005.
An elaborate process is fol lowed for merger andamalgamation. The merger proposal has to be submittedby the acquirer bank to the Registrar of Co-operativeSocieties (RCS)/Central Registrar of Co-operativeSocieties (CRCS) and a copy of the proposal is alsosimultaneously forwarded to the Reserve Bank along withcer tain specif ied information. The Reserve Bankexamines the proposals and places the same before anExpert Group for screening of applications of merger andamalgamation. On evaluation, if the proposal is found tobe suitable, the Reserve Bank issues no objectioncer tificate (NOC) to the RCS/CRCS and the banksconcerned. The RCS/CRCS then issue the order ofamalgamation of the target UCB in compliance with theprovisions of the Co-operative Societies Act under whichthe bank is registered.
In legacy cases pertaining to UCBs having negative networth as on March 31, 2007, it has been decided that theBank may also consider scheme of merger that providespayment to depositors under Section 16 (2) of the DICGC
Box VI.5Merger and Amalgamation of UCBs
Act, 1961, financial contribution by the transferee bankand sacrifice by large depositors. Additional incentiveswere provided to the transferor bank on merger. Theadditional incentives include permission for closure of lossmaking branches of the transferor bank, shifting/relocationof branches of the transferor bank within the area ofoperations, retention of facilities such as Authorised Dealerlicence where higher level of CRAR at 12 per cent wasprescribed on an ongoing basis provided the bankmaintained the benchmark CRAR of 9 per cent, minimumentry point norm of Rs.50 crore not being insisted for abank to become multi-State on account of taking overanother UCB registered outside the State.
Pursuant to the issue of the guidelines, the Reserve Bankreceived 119 proposals for merger in respect of 104 banks.The Reserve Bank has issued NOCs in 82 cases. Of these,71 mergers became effective upon the issue of statutoryorders by the concerned RCS/CRCS. 21 proposals formerger were rejected by the Reserve Bank, threeproposals were withdrawn by the banks and the remaining13 are under consideration. Out of the 71 banks for whichorders of merger were received from the RCS/CRCS, 44had negative net worth. The profit making banks were alsopermitted to merge with the aim of strengthening the sectorand in some cases, because they were not considered tobe viable on a stand-alone basis in the long run.
261
FINANCIAL REGULATION AND SUPERVISION
Recognising the continued significance of the co-operative credit structure in the economy, despite thesignificant spread of banks and non-banks to all regionsof the country and taking into account the deep-rootedintegration of the co-operative structure in the Indiansocio-economic systems, the Government of India hadconstituted a Task Force on Revival of Short-Term RuralCo-operative Credit Institutions (Chairman: Prof. A.Vaidyanathan). The Task Force submitted its report to theCentral Government in February 2005. Based on therecommendations of the Task Force and in consultationwith the State Governments, the Government of India hadapproved a package for revival of the Short Term RuralCo-operative Credit Structure, which consists of PrimaryAgricultural Credit Societies (PACS) at the village/baselevel, Central Co-operat ive Banks (CCBs) at theintermediate level and the State Co-operative Banks(StCBs) at the apex level. The revival package aims atreviving the short-term rural co-operative credit structureto make it a well-managed and vibrant medium to servethe credit needs of rural India, especially the small andmarginal farmers. The package seeks to: (i) providefinancial assistance to bring the system to an acceptablelevel of health; (ii) introduce legal and institutional reformsnecessary for its democratic, self- reliant and efficientfunctioning; and (iii) take measures to improve the qualityof management.
The total financial assistance under the revival package isestimated at Rs.13,596 crore. The liability for funding thefinancial package would be shared by the CentralGovernment, the State Government and the co-operativecredit structure based on the origin of losses and existingcommitments. The financial assistance would be releasedonly on the implementation of the recommendation for legaland institutional reforms. The States willing to participatewere required to enter into a MoU with the CentralGovernment and NABARD. So far, twenty-five States haveexecuted MoUs with the Government of India and theNABARD, as envisaged under the package. This covers
Box VI.6Revival of Co-operative Credit Structure
more than 96 per cent of the short-term co-operative creditstructure units in the country.
Ten States, namely, Andhra Pradesh, Bihar, Gujarat,Haryana, Madhya Pradesh, Maharashtra, Meghalaya,Or issa, Tamil Nadu and Uttar Pradesh had madenecessary amendments in their Cooperative Societies Actsas at end-June 2009. The State Governments ofChhattisgarh and West Bengal have taken a Cabinetdecision approving the amendments in respect of thereform measures as they have submitted their new StateCooperative Societies Acts to Hon’ble President for assent.Draft amendments to Co-operative Societies Acts ofArunachal Pradesh, Assam, Karnataka, Punjab,Rajasthan, Tripura, Uttarakhand, Sikkim, Jharkhand,Jammu and Kashmir, Mizoram, Manipur and Meghalayaare under consideration.
As required in the revival package, the Reserve Bank hasprescribed ‘fit and proper’ criteria for the Directors and CEOsof the StCBs and CCBs for circulation amongst the concernedbanks through NABARD. An aggregate amount of Rs.6,170.3crore had been released by NABARD as the Government ofIndia’s share for recapitalisation of PACS in ten States namely,Andhra Pradesh, Chhattisgarh, Gujarat, Haryana, MadhyaPradesh, Maharashtra, Orissa, Tamil Nadu, Uttar Pradeshand West Bengal, as on June 30, 2009, while the StateGovernments had released their share of Rs.614.8 crore. TheNational Implementing and Monitoring Committee, set up bythe Government of India, is guiding and monitoring theimplementation of the revival package on an all-India basis.
Furthermore, the study of the long-term cooperative creditstructure was entrusted by the Government to the same TaskForce. The Report was submitted in August 2006. It wasannounced in the Union Budget for 2008-09 that the CentralGovernment and the State Governments had reached anagreement on the content of the package for revival of thelong-term cooperative credit structure. The cost of the packagewas estimated at Rs.3,074 crore, of which the CentralGovernment’s share would be Rs.2,642 crore.
VI.73 With effect from the fortnight beginningFebruary 28, 2009, penalty is imposed on thoseRRBs which default in maintenance of SLR. Theexemption granted to RRBs from the purview ofSection 31 of the Banking Regulation Act, 1949 inregard to publishing their balance sheet was alsowithdrawn, effective from the financial year endingMarch 31, 2009.
VI.74 Measures taken to further liberalise thebranch licensing policy for RRBs during 2008-09include relaxation of conditions for opening
branches in hither to uncovered districts andopening of service branches/central processingcentres/back offices. During 2008-09, the ReserveBank granted 780 licences to RRBs for openingbranches, of which 690 were opened.
VI.75 The CFSA had suggested a phasedintroduction of CRAR in RRBs, along with therecapitalisation, after consolidation of theseentities. It was, therefore, announced in the AnnualPolicy Statement for 2009-10 to introduce CRARfor RRBs in a phased manner, taking into account
262
ANNUAL REPORT
the status of recapitalisation and amalgamation.A time-table for this purpose would be announcedin consultation with NABARD. Accordingly, NABARDhas been advised to constitute a Working Group tosuggest bank-wise actionable measures for RRBswhich had CRAR less than 1 per cent as on March31, 2008 so that they could achieve the target of 7per cent by March 2010.
VI.76 In order to prepare the RRBs to adoptappropriate technology and migrate to core bankingsolutions (CBS) for better customer services, aWorking Group (Chairman: Shri G. Srinivasan) wasconstituted to prepare a roadmap for migration toCBS by the RRBs. The Working Group reviewedthe present status of computerisation in RRBs andviewed that RRBs could not remain isolated fromthe technological developments sweeping thebanking sector and that the “one strategy fits all”approach was not workable. The Group alsoexamined the use of solar power as an alternativesource of energy for powering branches located inremote places and suggested that although heavyinitial cost was involved in installation of solar powerunits, the long-term benefits would justify poweringbranches through solar power. The Report, amongother things, set September 2011 as the target forall RRBs to move towards CBS, with all branchesof RRBs opened after September 2009 to be CBScompliant from day one. The Report was forwardedto all sponsor banks to take necessary action.
VI.77 A Working Group (Chairman: Shri G.Padmanadbhan) was constituted to explore variousaffordable ICT-based solutions suitable for RRBsand to identify the cost elements and recommendthe manner and criteria for funding such ICTsolutions. The Group examined the existingconstraints, both financial and infrastructural, inadoption of financial inclusion initiatives by theRRBs. It also explored the various availabletechnology options and suggested modalities forthe Reserve Bank’s support to finance ICT solutionsfor the RRBs. It was announced in the Annual PolicyStatement for 2009-10 that a scheme would beworked out, in consultation with NABARD, to decidethe manner of providing assistance to RRBs
adopting ICT solutions for financial inclusion indistricts identified as having high level of exclusion.
ALL INDIA FINANCIAL INSTITUTIONS (AIFIs)
VI.78 As at end-March 2009, there were fourinstitutions, viz., EXIM Bank, NABARD, NHB andSIDBI, regulated by the Reserve Bank as all-IndiaFinancial Institutions (AIFIs). In the wake of theemerging global developments and their impact onfinancial institutions, the Reserve Bank receivedrequests from select AIFIs for liquidity support foron-lending to HFCs/NBFCs/MFIs and exporters,and accordingly, took a number of measures.
VI.79 In December 2008, the Reserve Banksanctioned refinance facilities of Rs.7,000 crore,Rs.5,000 crore and Rs.4,000 crore for SIDBI, EXIMBank and NHB, respectively, under the relevantprovisions of the Reserve Bank of India Act, 1934.The availment of refinance by the above AIFIs underthis facility is restricted to a period of 90 days and theamount could be flexibly drawn and repaid during theperiod. The facility could be rolled over and would beavailable up to March 31, 2010. Advances under thisfacility are charged at the repo rate under the LAF ofthe Reserve Bank. The funds provided under therefinance facility should be utilised as per the policyapproved by the Board of the respective financialinstitution, and in adherence with the extant exposurenorms for these entities. To facilitate monitoring, thefinancial institutions are required to submit a weeklyreport on the utilisation of the refinance facility. Theamount outstanding under the special refinance facilityremained small up to February 2009 for eachinstitution but picked up subsequently (Table 6.7).
VI.80 The ceiling on aggregate resources mobilisedby SIDBI, NHB and EXIM Bank was raised subject toconditions, with effect from December 8, 2008, for aperiod of one year. The guidelines regardingrestructuring of advances issued to banks have beenmutatis mutandis applied to the select AIFIs.Provisions relating to certain activities generally notundertaken by FIs, such as extending workingcapital, overdrafts and personal loans would,however, not be applicable to them.
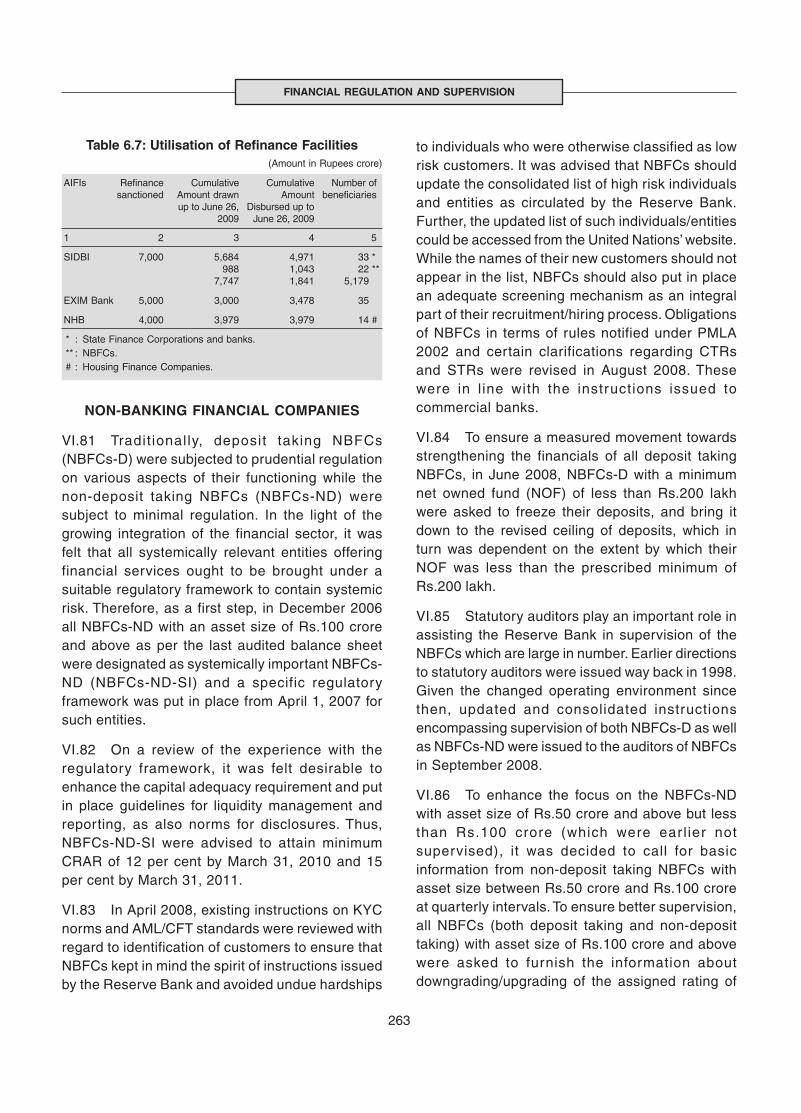
263
FINANCIAL REGULATION AND SUPERVISION
NON-BANKING FINANCIAL COMPANIES
VI.81 Tradit ionally, deposit taking NBFCs(NBFCs-D) were subjected to prudential regulationon various aspects of their functioning while thenon-deposit taking NBFCs (NBFCs-ND) weresubject to minimal regulation. In the light of thegrowing integration of the financial sector, it wasfelt that all systemically relevant entities offeringfinancial services ought to be brought under asuitable regulatory framework to contain systemicrisk. Therefore, as a first step, in December 2006all NBFCs-ND with an asset size of Rs.100 croreand above as per the last audited balance sheetwere designated as systemically important NBFCs-ND (NBFCs-ND-SI) and a specific regulatoryframework was put in place from April 1, 2007 forsuch entities.
VI.82 On a review of the experience with theregulatory framework, it was felt desirable toenhance the capital adequacy requirement and putin place guidelines for liquidity management andreporting, as also norms for disclosures. Thus,NBFCs-ND-SI were advised to attain minimumCRAR of 12 per cent by March 31, 2010 and 15per cent by March 31, 2011.
VI.83 In April 2008, existing instructions on KYCnorms and AML/CFT standards were reviewed withregard to identification of customers to ensure thatNBFCs kept in mind the spirit of instructions issuedby the Reserve Bank and avoided undue hardships
to individuals who were otherwise classified as lowrisk customers. It was advised that NBFCs shouldupdate the consolidated list of high risk individualsand entities as circulated by the Reserve Bank.Further, the updated list of such individuals/entitiescould be accessed from the United Nations’ website.While the names of their new customers should notappear in the list, NBFCs should also put in placean adequate screening mechanism as an integralpart of their recruitment/hiring process. Obligationsof NBFCs in terms of rules notified under PMLA2002 and certain clarifications regarding CTRsand STRs were revised in August 2008. Thesewere in l ine with the instructions issued tocommercial banks.
VI.84 To ensure a measured movement towardsstrengthening the financials of all deposit takingNBFCs, in June 2008, NBFCs-D with a minimumnet owned fund (NOF) of less than Rs.200 lakhwere asked to freeze their deposits, and bring itdown to the revised ceiling of deposits, which inturn was dependent on the extent by which theirNOF was less than the prescribed minimum ofRs.200 lakh.
VI.85 Statutory auditors play an important role inassisting the Reserve Bank in supervision of theNBFCs which are large in number. Earlier directionsto statutory auditors were issued way back in 1998.Given the changed operating environment sincethen, updated and consolidated instructionsencompassing supervision of both NBFCs-D as wellas NBFCs-ND were issued to the auditors of NBFCsin September 2008.
VI.86 To enhance the focus on the NBFCs-NDwith asset size of Rs.50 crore and above but lessthan Rs.100 crore (which were ear l ier notsupervised), it was decided to call for basicinformation from non-deposit taking NBFCs withasset size between Rs.50 crore and Rs.100 croreat quarterly intervals. To ensure better supervision,all NBFCs (both deposit taking and non-deposittaking) with asset size of Rs.100 crore and abovewere asked to furnish the information aboutdowngrading/upgrading of the assigned rating of
Table 6.7: Utilisation of Refinance Facilities(Amount in Rupees crore)
AIFIs Refinance Cumulative Cumulative Number ofsanctioned Amount drawn Amount beneficiaries
up to June 26, Disbursed up to2009 June 26, 2009
1 2 3 4 5
SIDBI 7,000 5,684 4,971 33 *988 1,043 22 **
7,747 1,841 5,179
EXIM Bank 5,000 3,000 3,478 35
NHB 4,000 3,979 3,979 14 #
* : State Finance Corporations and banks.** : NBFCs.# : Housing Finance Companies.
264
ANNUAL REPORT
any financial product issued by them, within fifteendays of such a change in the rating.
VI.87 On account of intensification of the globalfinancial crisis in September 2008, some immediateimpact was felt in the domestic capital markets,resulting in redemption pressure on mutual funds,which created liquidity constraints for NBFCs. Inresponse, the Reserve Bank introduced specialfixed rate Repo under LAF to banks exclusively forthe purpose of meeting the funding requirementsof mutual funds and NBFCs. The precautionarymeasures taken by the Reserve Bank sinceOctober 2008 to enhance the availability of liquidityto NBFCs are:
(i) Taking into consideration, the need forenhanced funds for increasing business andmeeting regulatory requirements, it wasdecided that NBFCs-ND-SI could augment theircapital funds by issue of Perpetual DebtInstruments (PDI) in accordance with thestipulated guidelines. Such PDI would beeligible for inclusion as Tier I capital to theextent of 15 per cent of total Tier I capital as onMarch 31 of the previous accounting year andthe excess amount would qualify as Tier IIcapital within the eligible limits. The minimuminvestment in each such issue/tranche by asingle investor would not be less than Rs.5 lakh.The amount of funds raised by NBFCs-ND-SIwould not be treated as ‘public deposit’ within themeaning of Reserve Bank directives in this regard.
(ii) NBFCs-ND-SI which were facing problems ofliquidity and ALM mismatch in the existenteconomic scenario were permitted, as atemporary measure, to raise short-term foreigncurrency borrowings under the approval route,subject to certain conditions.
(iii) To ease the flow of bank credit to the NBFCs,certain changes initiated were: (a) standardasset provisioning required to be made bybanks on advances to NBFCs was reducedfrom 2.0 per cent to 0.4 per cent; (b) the riskweight on banks’ exposure to NBFCs-ND-SIreduced to 100 per cent from 125 per cent
earlier, irrespective of credit rating whileexposure to AFCs which attracted risk weight of150 per cent was also reduced to 100 per cent;and (c) banks were permitted, on a temporarybasis, to avail liquidity support under the LAFwindow through relaxation in the maintenanceof SLR to the extent of up to 1.5 per cent of theirNDTL, exclusively for meeting the fundingrequirements of NBFCs and mutual funds.
(iv) A scheme for providing liquidity support toeligible NBFCs-ND-SI through an SPV formeeting the temporary liquidity mismatches intheir operations was introduced. IDBI StressedAsset Stabilisation Fund (SASF) Trust wasnotified as the SPV for under taking thisoperation. The SPV would purchase short-termpapers from eligible NBFCs-ND-SI to meet thetemporary liquidity mismatches. The instrumentswould be CPs and CDs, with a residual maturityof not more than three months and rated asinvestment grade. The facility would not beavailable for any paper issued after September30, 2009 and the SPV would cease to makefresh purchases after December 31, 2009 andwould recover all dues by March 31, 2010. Therate of interest charged by the IDBI SASF Trustwould be 12.0 per cent.
VI.88 These steps indirectly also helped indealing with the market pressure which had beenbuilding up on the liquid and fixed maturity planportfolios of mutual funds. In this context, a reviewof the impact of these measures/relaxations onrelease of credit by banks to mutual funds/NBFCswas carried out in mid-November 2008. The reviewrevealed that during the period from October 14 toNovember 20, 2008, many banks availed liquiditysupport under the 14-day special fixed rate repo ofthe Reserve Bank funding to mutual funds againstthe collateral of CDs. Some banks also availedliquidity support under 14-day special fixed raterepo of the Reserve Bank against their funding toNBFCs against the collateral of receivables of theirregular NBFC cl ients. Overall , the policyannouncement had a salutary effect on the mutualfunds that faced liquidity problems (Box VI.7).
265
FINANCIAL REGULATION AND SUPERVISION
In view of the funding inter-linkages between NBFCs, mutualfunds and commercial banks, when the contagion from theglobal financial crisis created selling pressures in the stockmarkets in India, the liquidity needs of the system as a wholehad to be addressed by the Reserve Bank. The ripple effectof the US and European markets led to heavy redemptionpressure on mutual funds, starting in September 2008, asseveral investors, especially institutional investors, startedredeeming their investments in liquid funds/money marketfunds. Mutual funds are major subscribers to CPs anddebentures issued by the NBFCs, besides CDs issued bybanks. With the mutual funds facing redemption pressuresand difficulties in rolling over the maturing investments, oneof the prime sources of funds available to NBFCs dried upand, hence, there was no market for rollover of maturing short-term instruments floated by NBFCs for having regular accessto market funding. Apart from this, there were reports thatthe liquidity crunch also made banks reluctant to lend toNBFCs. This heightened the perception that NBFCs werefacing severe liquidity constraints. To ascertain the groundreality, a study involving discussions with a large number ofNBFCs-ND-SI was initiated.
The discussions centered on the immediate issue of liquidityconstraints faced by the NBFCs and their experience withthe measures taken by the Reserve Bank to ease the situation.The focus areas for discussions were: (i) the profile,composition and maturity pattern of assets and liabilities; (ii)liquidity issues/constraints faced by the companies; (iii)measures taken for mitigation of such constraints; (iv)feedback on the easing measures taken by the Reserve Bank;(v) business strategy/plans of the NBFCs in the immediatefuture, including substitution of short-term funds, possibilityof downsizing the balance sheet and growth plans; and (vi)real estate/capital market exposures.
It emerged from the discussions that based on their liquiditysensitivity to the changing market conditions, NBFCs couldbe categorised into four groups. The first group ofcompanies had financed assets with long-term liabilitiesand small amounts of CPs and had no asset-liabilitymismatches, as they mainly had short-term assets and also
Box VI.7Liquidity Crisis – Implications for NBFCs
back-up lines of credit. They constituted the largest groupand covered nearly three fourths of the total assets ofcompanies under discussion. Another minority group hadasset-liability mismatches but these companies had foreignparents from whom funds could be received. This grouprepresented only 2.0 per cent of the total assets of theNBFCs. The third group of companies had financed assetswith a mix of short-term CPs and bank funds and had amismatch within tolerance limits. They had around 6.0 percent of the total assets of the NBFCs. The last group ofcompanies had long-term assets and short-term liabilitiesand was facing liquidity problems. These companiesaccounted for 17.0 per cent of the total assets of the NBFCs.
There was a general view among the companies that fundshad become costlier and that raising funds outside bankborrowings had become extremely difficult in view of the thenmarket conditions. Further, banks were also reluctant to extendadditional credit or increase credit to NBFCs. Some of theNBFCs had put on hold incremental disbursements as theywere utilising inflows to repay their short-term obligations anduncertainty of funds flow did not encourage them to expandtheir balance sheets.
Loan companies were expecting a slight increase indelinquency rates, as they had ventured into riskier segments,viz., unsecured loans and retail finance. The investmentcompanies anticipated difficulty in subscriptions to their CPs/debentures for which mostly mutual funds and banks weretheir mainstay. A number of companies, particularly investmentcompanies, that had significant exposure in the capital marketalso had not indicated any liquidity problems except in thefirst few weeks of October 2008 largely on account of the factthat the companies lent only up to 50.0 per cent of the marketvalue and in some cases only up to 33.3 per cent, coupledwith regular margin calls.
Thus, even though at some point it was widely perceived thatthe NBFCs were facing significant problems, in reality, only asmall segment of the NBFCs had real liquidity constraints andthe Reserve Bank’s timely and adequate liquidity interventionscould address the problems over a short timeframe.
VI.89 In January 2009, the Boards of NBFCs wereasked to adopt a well documented interest ratemodel taking into account the relevant factors todetermine the interest rate to be charged on loansand advances. With reference to the queries raisedregarding repossession of vehicles, the ReserveBank clarified in April 2009 that NBFCs must havea built in re-possession clause in the contract/loanagreement with the borrower, which must be legally
enforceable. In order to ensure transparency, theterms and conditions of the contract/loan agreementshould also contain provisions regarding certainprocedures and a copy of such terms and conditionsmust be made available to the borrowers.
Securitisation Companies/Reconstruction Companies
VI.90 The Reserve Bank revised the formats ofquar ter ly statements to be submitted by

266
ANNUAL REPORT
Secur it isation Companies/ReconstructionCompanies (SCs/RCs) in September 2008. Therevised statements would capture, inter alia, dataon position of owned fund of the SCs/RCs (includingFDI component); position of acquisition/realisationof financial assets from banks/FIs by the SCs/RCsin terms of the SARFAESI Act, 2002; andinformation as regards security receipts (SRs)issued, redeemed and outstanding at the end ofparticular quarter.
VI.91 It was clarified that a SC/RC was neither a‘bank’ nor a ‘f inancial institution’ under theprovisions of the SARFAESI Act. Therefore, theacquisition of financial assets by a SC/RC fromanother SC/RC would not be in conformity with theprovisions of the said Act. There was, however, nobar on SCs/RCs deploying their funds forundertaking restructuring of acquired loan accountswith the sole purpose of realising their dues.
DEPOSIT INSURANCE AND CREDITGUARANTEE CORPORATION OF INDIA
VI.92 The deposit insurance scheme at presentcovers commercial banks including local area banksand RRBs in all States and Union Territories. Thenumber of registered insured banks as on March31, 2009 stood at 2,307 comprising of 80commercial banks, 86 RRBs, 4 local area banksand 2,137 co-operative banks. The extent ofprotection accorded to depositors in terms ofpercentage of the number of fully protectedaccounts to the total number of accounts and theamount of insured deposits to assessable depositsas on March 31, 2009 stood at 89.3 per cent and56.2 per cent, respectively (Chart VI.1). The currentlevel of insurance cover, at Rs.1 lakh, is 2.2 timesper capita GDP as on March 31, 2009, as againstthe global average of around three times per capitaGDP3 . During 2008-09, the Corporation settledaggregate claims worth Rs.228 crore in respect ofone commercial bank and 75 co-operative banks.
Evolving Regulatory and Supervisory Regimein the Context of the Crisis
VI.93 The lessons from the financial crisis haveprovided the necessary motivation and rationale forrevamping the financial stability architecture ofcountries, with a view to strengthening the systemsand preventing systemic crisis. Policy makers allover the globe have been assessing whether – andto what extent – certain features of the financialsystem encouraged market excesses and the build-up of large financial imbalances. They have alsobeen considering what changes need be made tothe financial system and to the regulatory andsupervisory frameworks so as to prevent similarfinancial crises in future (Box VI.8). Internationally,many countries are contemplating significantchanges to the existing regulatory regimes, in termsof jurisdiction powers, operational systems andprocedures. The financial regulation review in June2009 by the US introduces a ‘systemic-r iskregulation’ which includes a “Financial ServicesOversight Council”, which would coordinate policyand identify emerging risks, among other roles. Anew Banking Act has been introduced in the UK,
3 Based on data from 68 Countries - "Report of the Committee on Financial Sector Assessment (2009), constituted by Government of India,March, Vol. III, page 309".
267
FINANCIAL REGULATION AND SUPERVISION
Several regulatory and supervisory issues have surfacedfrom the financial crisis in the advanced countries. Followingintense deliberations on these issues, national regulatorsare broadly highlighting the following for reforming theirfinancial stability architecture:
i. Strengthening the minimum capital adequacyrequirements, with a focus on both the quality andquantity of the capital, supplemented with an overallleverage ratio.
ii. Reducing the pro-cyclicality attached to the regulatoryframework (Basel II) through introduction of dynamicprovisioning or counter-cyclical capital requirements.
iii. Macro-prudential analysis to study the interactionsbetween the economy and the financial system and toprovide early warning signals about the risks to thefinancial system and to the economy.
iv. Monitoring and supervision of large and complex banks,especially those which have cross-border presence andinstitution of ‘college of supervisors’ for effective cross-border supervision and supervisory co-operation.
v. Strengthening the individual bank’s risk managementframework, especially for off-balance sheet items andneed for stress testing, regulation and supervision ofliquidity at micro (individual banks) and macro (systemic)level.
vi. Strengthening the corporate governance, includingadoption of ‘fit and proper’ norms by the Board and thesenior management of a bank.
vii. Extending regulation and supervision to all markets andinstitutions which are systemically important, even if theyare non-deposit taking institutions/not directly dealingwith the public.
viii. Creation of central counterparties in OTC derivativestrading.
ix. Considering alternative approaches for recognising andmeasuring loan losses that incorporate a broader rangeof available credit information; examining changes torelevant standards to dampen adverse dynamicsassociated with fair value accounting, includingimprovements to valuations when data or modeling maybe weak.
x. Reducing the complexity of accounting standards forfinancial instruments and improving presentationstandards to allow the users of financial statements tobetter assess the uncertainty surrounding the valuationof financial instruments.
Box VI.8:Evolving Regulatory Changes in Response to the Crisis: The Indian Position
The Indian regulatory structure for the entire financial systemwould respond appropriately to the emerging internationalinitiatives, modulating the changes to country-specific needs.The well thought out and calibrated approach adopted by Indiawhile globalising the financial system in a phased mannercommensurate with the system’s preparedness in terms ofrisk management and technology was instrumental in avoidingthe direct harmful effects of the contagion on the domesticfinancial system weathering the crisis to a large extent. Severalmeasures have been initiated in recent years, as detailedearlier in the Chapter, for strengthening the regulatory andsupervisory functions of the Reserve Bank. Management ofprivate pools of capital is not a major concern in India asventure capital funds and mutual funds are registered andregulated by the SEBI, while hedge funds do not operate inIndia at present. The High Level Co-ordination Committee onFinancial Markets (HLCCFM) provides a coordinationmechanism among financial sector regulators, viz., ReserveBank, SEBI, IRDA and PFRDA. It is supported by othertechnical committees/sub-committees, which examine issuesrelating to entities under various regulators that have cross-sector implications.
Since end-March 2009, all the SCBs in India have migratedto the Basel II framework and would be subjected to thesupervisory review and evaluation process (SREP) underPillar 2 of Basel II for assessing the capital requirement asalso the capital adequacy of each bank vis-à-vis its risk profileand the standard of its internal controls system and riskmanagement practices. The maintenance of financial stabilityhas been explicitly recognised as a key objective by theReserve Bank in various policy documents. The Reserve Bankhas also set up a Financial Stability Unit as announced in theAnnual Policy Statement for 2009-10, for carrying out periodicstress testing and for preparing financial stability reports.
References:
1. European Union (2009), Report of The High Level Groupon Financial Supervision in the EU, (Chairman: Jacquesde Larosiere), February 25.
2. G20 (2009), Report of the Group on Enhancing SoundRegulation and Strengthening Transparency, (Chairman:Dr. Rakesh Mohan), March.
3. Government of India and Reserve Bank of India (2009),Report of the Committee on Financial Sector Assessment,(Chairman: Dr. Rakesh Mohan), March.
4. Reserve Bank of India (2008), Report on Currency andFinance, 2006-08, September.
which assigns the Bank of England a statutory rolerelating to the financial stability objective and alsointroduces a new special resolution regime for
dealing with failing banks. A new Systemic RiskBoard in the EU identifies EU-wide systemic riskand makes appropriate policy recommendations to
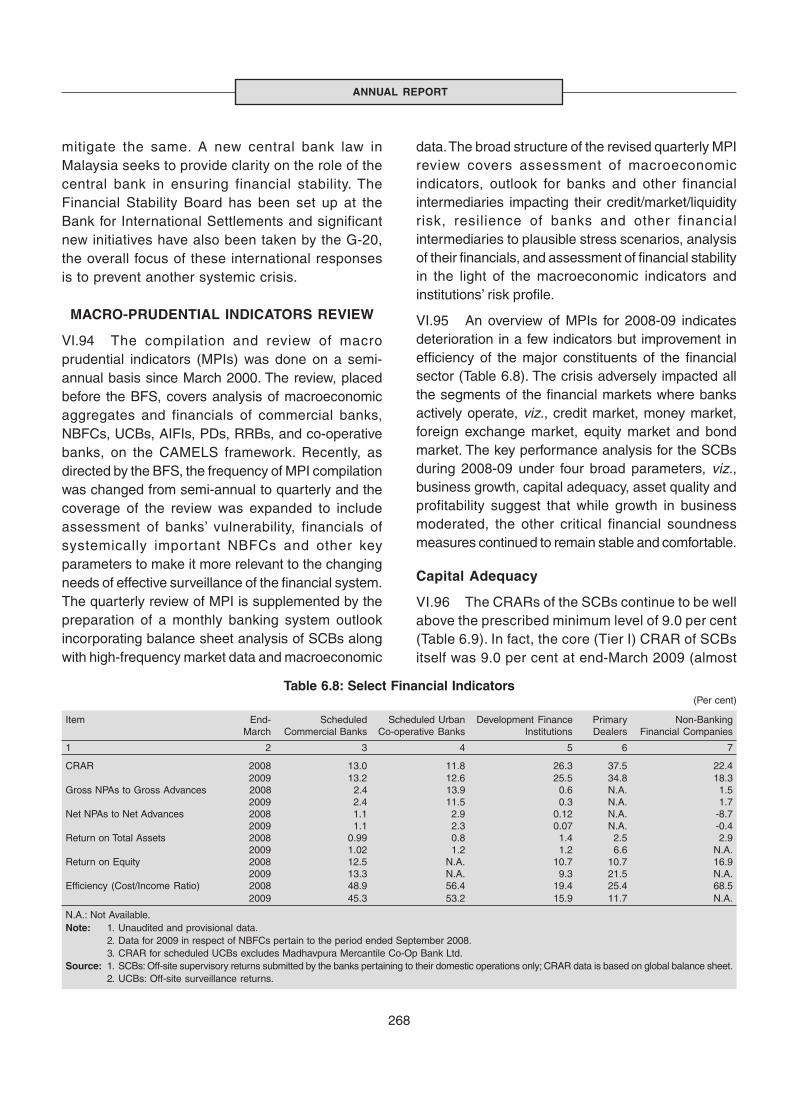
268
ANNUAL REPORT
mitigate the same. A new central bank law inMalaysia seeks to provide clarity on the role of thecentral bank in ensuring financial stability. TheFinancial Stability Board has been set up at theBank for International Settlements and significantnew initiatives have also been taken by the G-20,the overall focus of these international responsesis to prevent another systemic crisis.
MACRO-PRUDENTIAL INDICATORS REVIEW
VI.94 The compilation and review of macroprudential indicators (MPIs) was done on a semi-annual basis since March 2000. The review, placedbefore the BFS, covers analysis of macroeconomicaggregates and financials of commercial banks,NBFCs, UCBs, AIFIs, PDs, RRBs, and co-operativebanks, on the CAMELS framework. Recently, asdirected by the BFS, the frequency of MPI compilationwas changed from semi-annual to quarterly and thecoverage of the review was expanded to includeassessment of banks’ vulnerability, financials ofsystemically important NBFCs and other keyparameters to make it more relevant to the changingneeds of effective surveillance of the financial system.The quarterly review of MPI is supplemented by thepreparation of a monthly banking system outlookincorporating balance sheet analysis of SCBs alongwith high-frequency market data and macroeconomic
data. The broad structure of the revised quarterly MPIreview covers assessment of macroeconomicindicators, outlook for banks and other financialintermediaries impacting their credit/market/liquidityrisk, resilience of banks and other financialintermediaries to plausible stress scenarios, analysisof their financials, and assessment of financial stabilityin the light of the macroeconomic indicators andinstitutions’ risk profile.
VI.95 An overview of MPIs for 2008-09 indicatesdeterioration in a few indicators but improvement inefficiency of the major constituents of the financialsector (Table 6.8). The crisis adversely impacted allthe segments of the financial markets where banksactively operate, viz., credit market, money market,foreign exchange market, equity market and bondmarket. The key performance analysis for the SCBsduring 2008-09 under four broad parameters, viz.,business growth, capital adequacy, asset quality andprofitability suggest that while growth in businessmoderated, the other critical financial soundnessmeasures continued to remain stable and comfortable.
Capital Adequacy
VI.96 The CRARs of the SCBs continue to be wellabove the prescribed minimum level of 9.0 per cent(Table 6.9). In fact, the core (Tier I) CRAR of SCBsitself was 9.0 per cent at end-March 2009 (almost
Table 6.8: Select Financial Indicators(Per cent)
Item End- Scheduled Scheduled Urban Development Finance Primary Non-BankingMarch Commercial Banks Co-operative Banks Institutions Dealers Financial Companies
1 2 3 4 5 6 7
CRAR 2008 13.0 11.8 26.3 37.5 22.42009 13.2 12.6 25.5 34.8 18.3
Gross NPAs to Gross Advances 2008 2.4 13.9 0.6 N.A. 1.52009 2.4 11.5 0.3 N.A. 1.7
Net NPAs to Net Advances 2008 1.1 2.9 0.12 N.A. -8.72009 1.1 2.3 0.07 N.A. -0.4
Return on Total Assets 2008 0.99 0.8 1.4 2.5 2.92009 1.02 1.2 1.2 6.6 N.A.
Return on Equity 2008 12.5 N.A. 10.7 10.7 16.92009 13.3 N.A. 9.3 21.5 N.A.
Efficiency (Cost/Income Ratio) 2008 48.9 56.4 19.4 25.4 68.52009 45.3 53.2 15.9 11.7 N.A.
N.A.: Not Available.Note: 1. Unaudited and provisional data.
2. Data for 2009 in respect of NBFCs pertain to the period ended September 2008.3. CRAR for scheduled UCBs excludes Madhavpura Mercantile Co-Op Bank Ltd.
Source: 1. SCBs: Off-site supervisory returns submitted by the banks pertaining to their domestic operations only; CRAR data is based on global balance sheet.2. UCBs: Off-site surveillance returns.
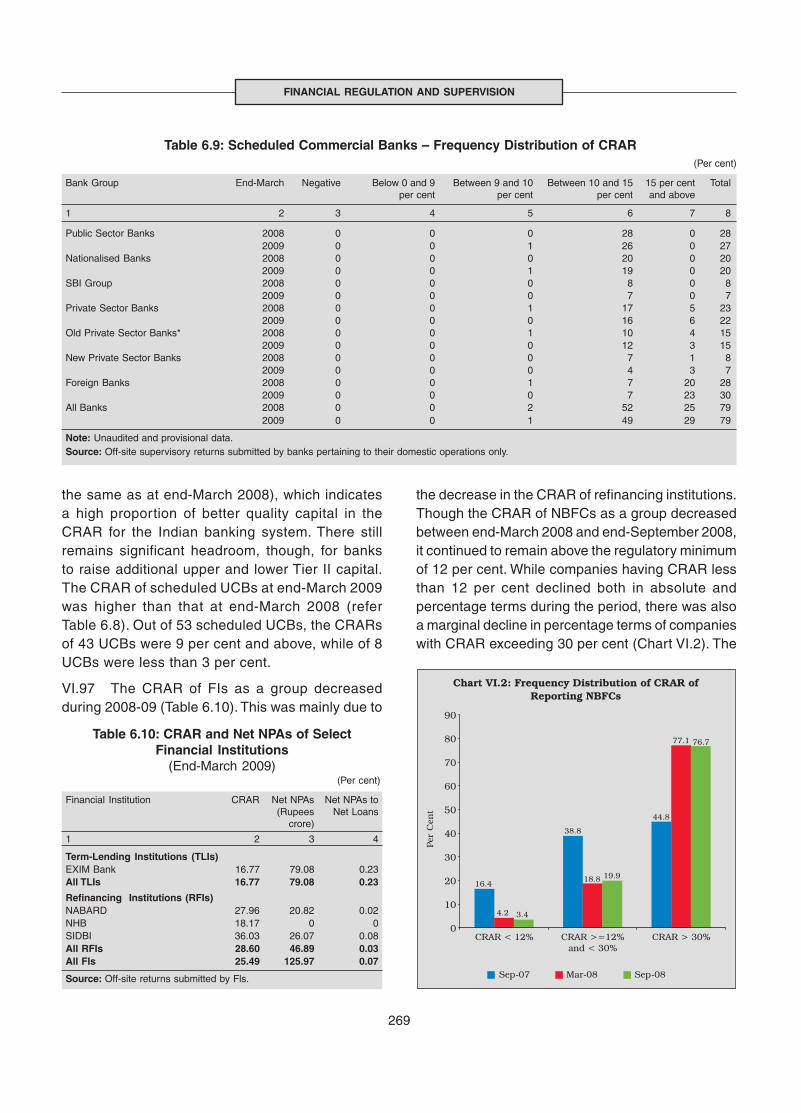
269
FINANCIAL REGULATION AND SUPERVISION
Table 6.9: Scheduled Commercial Banks – Frequency Distribution of CRAR (Per cent)
Bank Group End-March Negative Below 0 and 9 Between 9 and 10 Between 10 and 15 15 per cent Totalper cent per cent per cent and above
1 2 3 4 5 6 7 8
Public Sector Banks 2008 0 0 0 28 0 28 2009 0 0 1 26 0 27Nationalised Banks 2008 0 0 0 20 0 20 2009 0 0 1 19 0 20SBI Group 2008 0 0 0 8 0 8 2009 0 0 0 7 0 7Private Sector Banks 2008 0 0 1 17 5 23 2009 0 0 0 16 6 22Old Private Sector Banks* 2008 0 0 1 10 4 15 2009 0 0 0 12 3 15New Private Sector Banks 2008 0 0 0 7 1 8 2009 0 0 0 4 3 7Foreign Banks 2008 0 0 1 7 20 28 2009 0 0 0 7 23 30All Banks 2008 0 0 2 52 25 79 2009 0 0 1 49 29 79
Note: Unaudited and provisional data.Source: Off-site supervisory returns submitted by banks pertaining to their domestic operations only.
Table 6.10: CRAR and Net NPAs of SelectFinancial Institutions
(End-March 2009)(Per cent)
Financial Institution CRAR Net NPAs Net NPAs to(Rupees Net Loans
crore)
1 2 3 4
Term-Lending Institutions (TLIs) EXIM Bank 16.77 79.08 0.23All TLIs 16.77 79.08 0.23
Refinancing Institutions (RFIs) NABARD 27.96 20.82 0.02NHB 18.17 0 0SIDBI 36.03 26.07 0.08All RFIs 28.60 46.89 0.03All FIs 25.49 125.97 0.07
Source: Off-site returns submitted by Fls.
the same as at end-March 2008), which indicatesa high proportion of better quality capital in theCRAR for the Indian banking system. There stillremains significant headroom, though, for banksto raise additional upper and lower Tier II capital.The CRAR of scheduled UCBs at end-March 2009was higher than that at end-March 2008 (referTable 6.8). Out of 53 scheduled UCBs, the CRARsof 43 UCBs were 9 per cent and above, while of 8UCBs were less than 3 per cent.
VI.97 The CRAR of FIs as a group decreasedduring 2008-09 (Table 6.10). This was mainly due to
the decrease in the CRAR of refinancing institutions.Though the CRAR of NBFCs as a group decreasedbetween end-March 2008 and end-September 2008,it continued to remain above the regulatory minimumof 12 per cent. While companies having CRAR lessthan 12 per cent declined both in absolute andpercentage terms during the period, there was alsoa marginal decline in percentage terms of companieswith CRAR exceeding 30 per cent (Chart VI.2). The
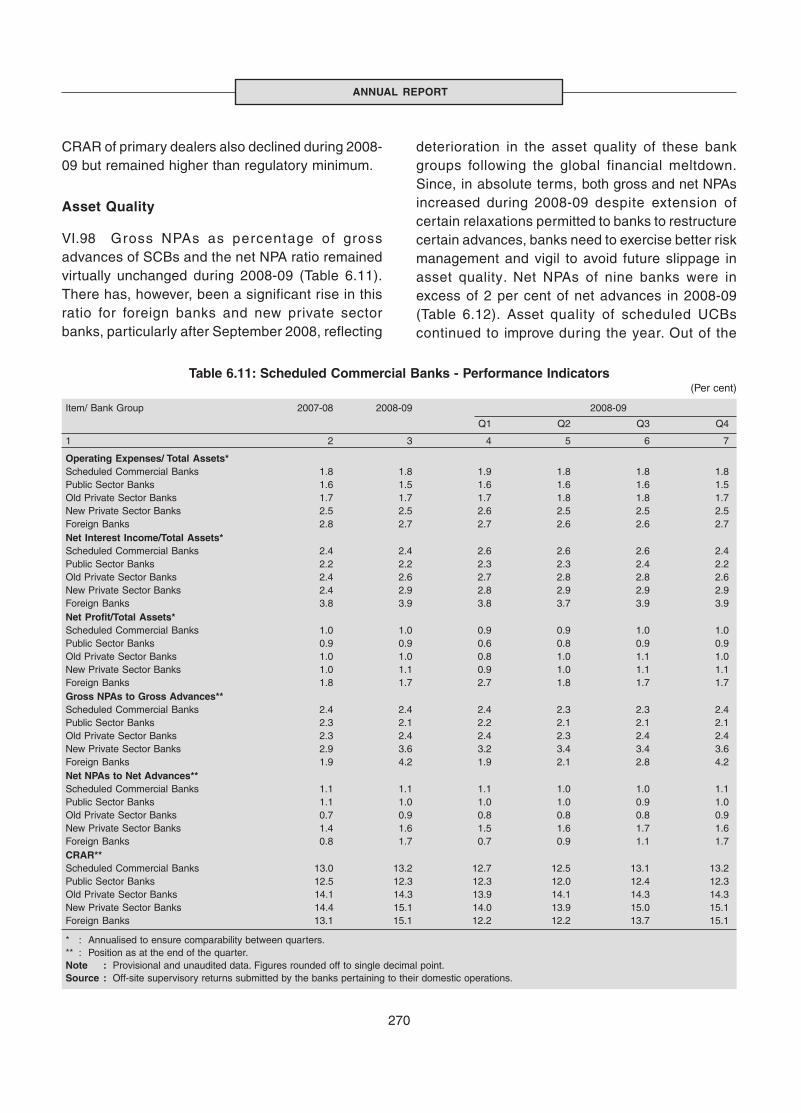
270
ANNUAL REPORT
Table 6.11: Scheduled Commercial Banks - Performance Indicators(Per cent)
Item/ Bank Group 2007-08 2008-09 2008-09
Q1 Q2 Q3 Q4
1 2 3 4 5 6 7
Operating Expenses/ Total Assets*Scheduled Commercial Banks 1.8 1.8 1.9 1.8 1.8 1.8Public Sector Banks 1.6 1.5 1.6 1.6 1.6 1.5Old Private Sector Banks 1.7 1.7 1.7 1.8 1.8 1.7New Private Sector Banks 2.5 2.5 2.6 2.5 2.5 2.5Foreign Banks 2.8 2.7 2.7 2.6 2.6 2.7Net Interest Income/Total Assets*Scheduled Commercial Banks 2.4 2.4 2.6 2.6 2.6 2.4Public Sector Banks 2.2 2.2 2.3 2.3 2.4 2.2Old Private Sector Banks 2.4 2.6 2.7 2.8 2.8 2.6New Private Sector Banks 2.4 2.9 2.8 2.9 2.9 2.9Foreign Banks 3.8 3.9 3.8 3.7 3.9 3.9Net Profit/Total Assets*Scheduled Commercial Banks 1.0 1.0 0.9 0.9 1.0 1.0Public Sector Banks 0.9 0.9 0.6 0.8 0.9 0.9Old Private Sector Banks 1.0 1.0 0.8 1.0 1.1 1.0New Private Sector Banks 1.0 1.1 0.9 1.0 1.1 1.1Foreign Banks 1.8 1.7 2.7 1.8 1.7 1.7Gross NPAs to Gross Advances**Scheduled Commercial Banks 2.4 2.4 2.4 2.3 2.3 2.4Public Sector Banks 2.3 2.1 2.2 2.1 2.1 2.1Old Private Sector Banks 2.3 2.4 2.4 2.3 2.4 2.4New Private Sector Banks 2.9 3.6 3.2 3.4 3.4 3.6Foreign Banks 1.9 4.2 1.9 2.1 2.8 4.2Net NPAs to Net Advances**Scheduled Commercial Banks 1.1 1.1 1.1 1.0 1.0 1.1Public Sector Banks 1.1 1.0 1.0 1.0 0.9 1.0Old Private Sector Banks 0.7 0.9 0.8 0.8 0.8 0.9New Private Sector Banks 1.4 1.6 1.5 1.6 1.7 1.6Foreign Banks 0.8 1.7 0.7 0.9 1.1 1.7CRAR**Scheduled Commercial Banks 13.0 13.2 12.7 12.5 13.1 13.2Public Sector Banks 12.5 12.3 12.3 12.0 12.4 12.3Old Private Sector Banks 14.1 14.3 13.9 14.1 14.3 14.3New Private Sector Banks 14.4 15.1 14.0 13.9 15.0 15.1Foreign Banks 13.1 15.1 12.2 12.2 13.7 15.1
* : Annualised to ensure comparability between quarters.** : Position as at the end of the quarter.Note : Provisional and unaudited data. Figures rounded off to single decimal point.Source : Off-site supervisory returns submitted by the banks pertaining to their domestic operations.
CRAR of primary dealers also declined during 2008-09 but remained higher than regulatory minimum.
Asset Quality
VI.98 Gross NPAs as percentage of grossadvances of SCBs and the net NPA ratio remainedvirtually unchanged during 2008-09 (Table 6.11).There has, however, been a significant rise in thisratio for foreign banks and new private sectorbanks, particularly after September 2008, reflecting
deterioration in the asset quality of these bankgroups following the global financial meltdown.Since, in absolute terms, both gross and net NPAsincreased during 2008-09 despite extension ofcertain relaxations permitted to banks to restructurecertain advances, banks need to exercise better riskmanagement and vigil to avoid future slippage inasset quality. Net NPAs of nine banks were inexcess of 2 per cent of net advances in 2008-09(Table 6.12). Asset quality of scheduled UCBscontinued to improve during the year. Out of the

271
FINANCIAL REGULATION AND SUPERVISION
Table 6.12: Net NPA to Net Advances of Scheduled Commercial Banks(Frequency Distribution)
Year Public Sector Banks Private Sector Banks Foreign Banks
SBI Group Nationalised Old Private New PrivateBanks Sector Banks Sector Banks
1 2 3 4 5 6
2004-05Up to 2 per cent 7 10 4 6 22Above 2 per cent and up to 5 per cent 1 8 12 3 2Above 5 per cent and up to 10 per cent 0 2 4 1 2Above 10 per cent 0 0 0 0 4
2005-06Up to 2 per cent 7 15 11 6 26Above 2 per cent and up to 5 per cent 1 5 7 2 0Above 5 per cent and up to 10 per cent 0 0 2 0 0Above 10 per cent 0 0 0 0 3
2006-07Up to 2 per cent 8 18 14 7 27Above 2 per cent and up to 5 per cent 0 2 2 1 1Above 5 per cent and up to 10 per cent 0 0 1 0 0Above 10 per cent 0 0 0 0 1
2007-08Up to 2 per cent 7 19 15 7 25Above 2 per cent and up to 5 per cent 1 1 0 1 2Above 5 per cent and up to 10 per cent 0 0 0 0 0Above 10 per cent 0 0 0 0 1
2008-09 PUp to 2 per cent 7 20 14 4 24Above 2 percent and up to 5 per cent 0 0 1 3 5Above 5 percent and up to 10 per cent 0 0 0 0 1Above 10 per cent 0 0 0 0 0
P: Data unaudited and provisional.
Source: Off-site supervisory returns submitted by the banks pertaining to their domestic operations only.
53 scheduled UCBs, net NPA ratios of 44 were 5per cent or less (Table 6.13).
Earnings and Profitability Indicators
VI.99 While the cost of deposits and cost of fundsfor all bank groups increased in 2008-09, the returnon advances and return on funds also registeredan increase (Table 6.14).
VI.100 In terms of measures of profitability, theperformance of SCBs was not affected by theeconomic slowdown as the RoA of SCBs was higherduring 2008-09, than last fiscal year (Table 6.15). Thenon-interest income of SCBs increased by nearly25 per cent. The increase in income more than
Table 6.13: Net NPAs to Net Advances of SUCBs(Frequency Distribution)
2004-05R 2005-06R 2006-07R 2007-08R 2008-09
1 2 3 4 5 6
Up to 2 per cent 20 24 24 25 24
Above 2 and up to5 per cent 5 7 13 11 20
Above 5 and up to10 per cent 12 13 7 8 3
Above 10 per cent 18 11 10 9 6
Total 55 55 54 53 53
Net NPAs to NetAdvances (per cent) 8.4 5.5 4.3 2.9 2.3
R: Revised.Note: Provisional data.Source: Off-site surveillance returns.
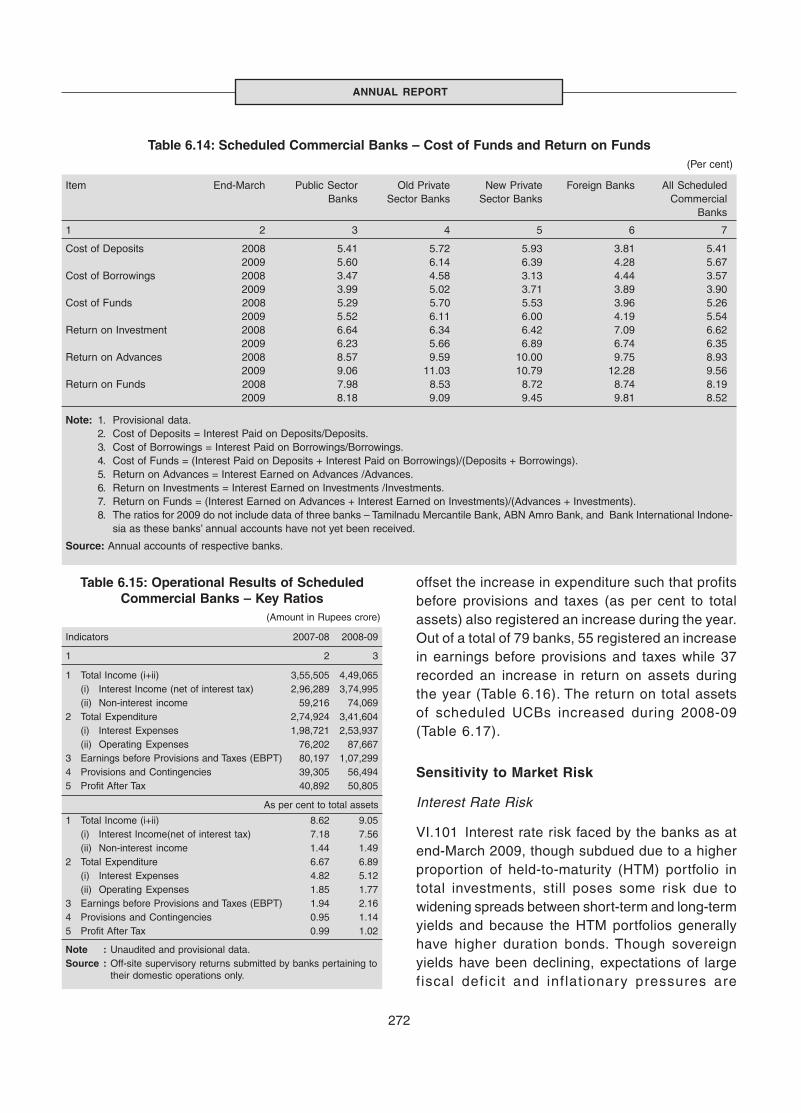
272
ANNUAL REPORT
Table 6.14: Scheduled Commercial Banks – Cost of Funds and Return on Funds(Per cent)
Item End-March Public Sector Old Private New Private Foreign Banks All ScheduledBanks Sector Banks Sector Banks Commercial
Banks
1 2 3 4 5 6 7
Cost of Deposits 2008 5.41 5.72 5.93 3.81 5.412009 5.60 6.14 6.39 4.28 5.67
Cost of Borrowings 2008 3.47 4.58 3.13 4.44 3.572009 3.99 5.02 3.71 3.89 3.90
Cost of Funds 2008 5.29 5.70 5.53 3.96 5.262009 5.52 6.11 6.00 4.19 5.54
Return on Investment 2008 6.64 6.34 6.42 7.09 6.622009 6.23 5.66 6.89 6.74 6.35
Return on Advances 2008 8.57 9.59 10.00 9.75 8.932009 9.06 11.03 10.79 12.28 9.56
Return on Funds 2008 7.98 8.53 8.72 8.74 8.192009 8.18 9.09 9.45 9.81 8.52
Note: 1. Provisional data.2. Cost of Deposits = Interest Paid on Deposits/Deposits.3. Cost of Borrowings = Interest Paid on Borrowings/Borrowings.4. Cost of Funds = (Interest Paid on Deposits + Interest Paid on Borrowings)/(Deposits + Borrowings).5. Return on Advances = Interest Earned on Advances /Advances.6. Return on Investments = Interest Earned on Investments /Investments.7. Return on Funds = (Interest Earned on Advances + Interest Earned on Investments)/(Advances + Investments).8. The ratios for 2009 do not include data of three banks – Tamilnadu Mercantile Bank, ABN Amro Bank, and Bank International Indone-
sia as these banks’ annual accounts have not yet been received.
Source: Annual accounts of respective banks.
offset the increase in expenditure such that profitsbefore provisions and taxes (as per cent to totalassets) also registered an increase during the year.Out of a total of 79 banks, 55 registered an increasein earnings before provisions and taxes while 37recorded an increase in return on assets duringthe year (Table 6.16). The return on total assetsof scheduled UCBs increased during 2008-09(Table 6.17).
Sensitivity to Market Risk
Interest Rate Risk
VI.101 Interest rate risk faced by the banks as atend-March 2009, though subdued due to a higherproportion of held-to-maturity (HTM) portfolio intotal investments, still poses some risk due towidening spreads between short-term and long-termyields and because the HTM portfolios generallyhave higher duration bonds. Though sovereignyields have been declining, expectations of largefiscal deficit and inflationary pressures are
Table 6.15: Operational Results of ScheduledCommercial Banks – Key Ratios
(Amount in Rupees crore)
Indicators 2007-08 2008-09
1 2 3
1 Total Income (i+ii) 3,55,505 4,49,065 (i) Interest Income (net of interest tax) 2,96,289 3,74,995 (ii) Non-interest income 59,216 74,0692 Total Expenditure 2,74,924 3,41,604 (i) Interest Expenses 1,98,721 2,53,937 (ii) Operating Expenses 76,202 87,6673 Earnings before Provisions and Taxes (EBPT) 80,197 1,07,2994 Provisions and Contingencies 39,305 56,4945 Profit After Tax 40,892 50,805
As per cent to total assets
1 Total Income (i+ii) 8.62 9.05 (i) Interest Income(net of interest tax) 7.18 7.56 (ii) Non-interest income 1.44 1.492 Total Expenditure 6.67 6.89 (i) Interest Expenses 4.82 5.12 (ii) Operating Expenses 1.85 1.773 Earnings before Provisions and Taxes (EBPT) 1.94 2.164 Provisions and Contingencies 0.95 1.145 Profit After Tax 0.99 1.02
Note : Unaudited and provisional data.Source : Off-site supervisory returns submitted by banks pertaining to
their domestic operations only.
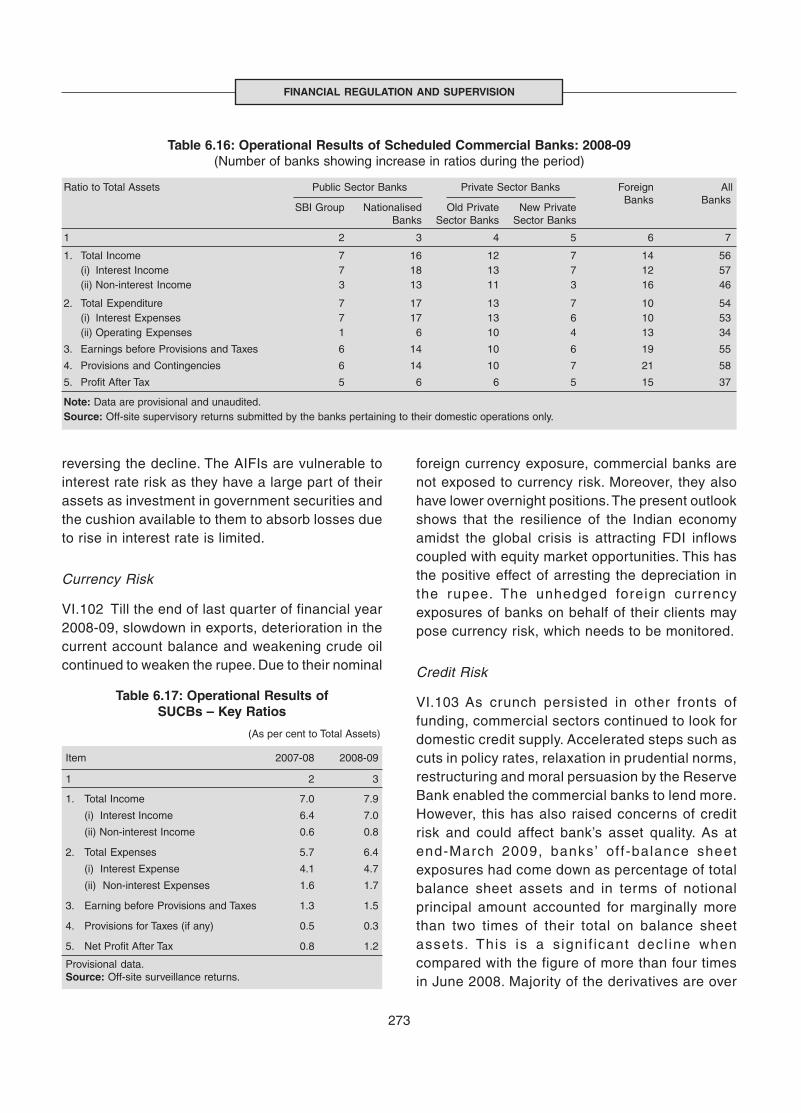
273
FINANCIAL REGULATION AND SUPERVISION
Table 6.17: Operational Results ofSUCBs – Key Ratios
(As per cent to Total Assets)
Item 2007-08 2008-09
1 2 3
1. Total Income 7.0 7.9
(i) Interest Income 6.4 7.0
(ii) Non-interest Income 0.6 0.8
2. Total Expenses 5.7 6.4
(i) Interest Expense 4.1 4.7
(ii) Non-interest Expenses 1.6 1.7
3. Earning before Provisions and Taxes 1.3 1.5
4. Provisions for Taxes (if any) 0.5 0.3
5. Net Profit After Tax 0.8 1.2
Provisional data.Source: Off-site surveillance returns.
reversing the decline. The AIFIs are vulnerable tointerest rate risk as they have a large part of theirassets as investment in government securities andthe cushion available to them to absorb losses dueto rise in interest rate is limited.
Currency Risk
VI.102 Till the end of last quarter of financial year2008-09, slowdown in exports, deterioration in thecurrent account balance and weakening crude oilcontinued to weaken the rupee. Due to their nominal
foreign currency exposure, commercial banks arenot exposed to currency risk. Moreover, they alsohave lower overnight positions. The present outlookshows that the resilience of the Indian economyamidst the global crisis is attracting FDI inflowscoupled with equity market opportunities. This hasthe positive effect of arresting the depreciation inthe rupee. The unhedged foreign currencyexposures of banks on behalf of their clients maypose currency risk, which needs to be monitored.
Credit Risk
VI.103 As crunch persisted in other fronts offunding, commercial sectors continued to look fordomestic credit supply. Accelerated steps such ascuts in policy rates, relaxation in prudential norms,restructuring and moral persuasion by the ReserveBank enabled the commercial banks to lend more.However, this has also raised concerns of creditrisk and could affect bank’s asset quality. As atend-March 2009, banks’ off-balance sheetexposures had come down as percentage of totalbalance sheet assets and in terms of notionalprincipal amount accounted for marginally morethan two times of their total on balance sheetassets. This is a signi f icant decl ine whencompared with the figure of more than four timesin June 2008. Majority of the derivatives are over
Table 6.16: Operational Results of Scheduled Commercial Banks: 2008-09(Number of banks showing increase in ratios during the period)
Ratio to Total Assets Public Sector Banks Private Sector Banks Foreign All
SBI Group Nationalised Old Private New PrivateBanks Banks
Banks Sector Banks Sector Banks
1 2 3 4 5 6 7
1. Total Income 7 16 12 7 14 56(i) Interest Income 7 18 13 7 12 57(ii) Non-interest Income 3 13 11 3 16 46
2. Total Expenditure 7 17 13 7 10 54(i) Interest Expenses 7 17 13 6 10 53(ii) Operating Expenses 1 6 10 4 13 34
3. Earnings before Provisions and Taxes 6 14 10 6 19 55
4. Provisions and Contingencies 6 14 10 7 21 58
5. Profit After Tax 5 6 6 5 15 37
Note: Data are provisional and unaudited.Source: Off-site supervisory returns submitted by the banks pertaining to their domestic operations only.
274
ANNUAL REPORT
the counter deals and largely concentrated amonga few foreign banks.
Liquidity Risk
VI.104 When compared with the first three quartersof 2008-09, the last quarter saw some easing onthe liquidity front enabled by the Reserve Bank’sseries of monetary easing and liquidity enhancingmeasures. Despite the additional pressure ondemand for bank credit, commercial bankspreferred to tread cautiously and maintain liquidityon hand. The banking system has come back tosurplus mode since last quarter. Large demand forlong-term credit by the real and infrastructuresectors hardens liquidity management of banks.Continued recessionary conditions also createsmore funding and timing risk. Funding risk arisesdue to unexpected withdrawal of deposits,especially wholesale deposits. Liquidity timing riskcould arise when expected cash inflows falter. Thiscalls for di l igent l iquidity management bycommercial banks despite being in surplus modeat present.
VI.105 The effectiveness of the Reserve Bank’sregulatory and supervisory structure in dealing witha major contagion from a severe global crisis wastested in 2008-09. All financial soundness indicatorsfor the Indian banking system, however, exhibitedsigns of stability and strength at the end of March2009. Not only did every bank remain above theminimum regulatory capital requirement but eventhe quality of capital was high, which is evident fromthe fact that Tier I capital alone was at 9.0 per centfor the banking system. Gross NPAs as percentageof gross advances has not deteriorated, whileprofitability indicators (i.e., RoE and RoA) furtherimproved during 2008-09. Stress test results alsorevealed that Indian banks could withstandprobable extreme shocks. The comprehensive self-assessment was conducted by the CFSA at a timewhen a relook at the Indian regulatory architecturewas necessary in the context of the global financialcrisis. The findings of the Committee corroboratedthe resilience of the Indian banking system towithstand extreme shocks.
VI.106 The main factors responsible for thisendurance in the financial system were the robustregulatory regime in place and an effectivesupervisory mechanism. While assessing thesafety, soundness and solvency of banks, the riskprofile and systemic risk potential of banks, both atthe individual and sector level are also assessed.Any symptom of build-up of large imbalancesacross institutions/different economic segments/sectors as also perception of risks which couldescalate into a contagion are dealt withappropriately by enhancing the rigorousness ofavailable prudential and other regulatory andsupervisory measures. Several measures such asenhanced provisions, r isk weights, targetedappraisals, special supervisory review along withregulatory restrictions and penalties are resortedto, as and when considered necessary. A systemof Prompt Corrective Action (PCA), based on threeparameters viz., CRAR, net NPAs and RoA is in place.
VI.107 When the crisis reached a flashpoint inSeptember 2008, besides meeting the liquidityneeds of the banking system through provision ofboth domestic and foreign currency liquidity, theReserve Bank also prudently changed the counter-cyclical risk weights, provisioning requirements andasset classification norms for restructured assets,all of which created enabling conditions forpreventing sharp moderation in credit growth duringthe economic slowdown. NBFCs, mutual funds andfinance companies experienced some liquiditystress, which was carefully examined by theReserve Bank. Contrary to the initial perception, itturned out that liquidity problems were confined toonly a small section of NBFCs. The problem wasswiftly addressed by the Reserve Bank throughappropriate liquidity enhancing measures. With aview to preserving and further strengthening theregulatory and supervisory architecture, theReserve Bank would constantly review the lessonsfrom the global financial crisis, as also the emergingviews in the context of Basel II framework relatingto procyclicality, risk coverage, quality of bankcapital, credit ratings, stress tests, management ofliquidity and other emerging issues relating to
275
FINANCIAL REGULATION AND SUPERVISION
cross-border supervision and supervisorycooperation, monitoring of large and complex banksand enhancing the scope of regulation andsupervision for systemic stability. As on March 31,2009 all Indian banks, including the foreign banks,had migrated to the Basel II simpler approaches,
and as such they will be subject to the SREP underPillar 2 of Basel II for assessing the capitalrequirement as also the capital adequacy of eachbank vis-a-vis its risk profile and the standard of itsinternal control system and risk managementpractices.
VII.1 Management of large government borrowingprogramme in a manner supporting the expansionarycounter-cyclical fiscal policy stance of theGovernment without creating any disruptivepressures on the government securities market wasa key challenge for the Reserve Bank in 2008-09. Todeal with the growth dampening moderation inprivate consumption and investment demand, somedeviation from the fiscal consolidation path andintroduction of adequate fiscal stimulus becameessential, which concomitantly escalated the size ofthe borrowing programme significantly. In 2008-09,larger recourse to market borrowing and flight tosafety were the common trends across countriesaround the world; while the cost of borrowingsdeclined in general, reflecting the low policy interestrates and quantitative easing stance of the centralbanks, significant increase in risk aversion andresultant preference for government securities ledto a larger demand for these securities.
VII.2 Recognising the challenge, the ReserveBank had to continuously review and adapt its debtmanagement strategy, in consultation with theCentral Government, in response to the evolvingeconomic conditions, while striving to ensure thatthe sharp and abrupt increase in the Government’smarket borrowing programme was conducted in anon-disruptive manner, without any conflict with itsmonetary management function. Higher governmentborrowings could potentially raise the interest ratesin the system by pushing up yields on governmentsecurities, which entail the risk of conflicting with thelow interest rate stance that may be pursued by themonetary authority in the face of an economicslowdown. During the second half of 2008-09, theReserve Bank’s policy stance aimed at increasingbank credit to the commercial sector at lower cost,reflecting the trends in policy rates to support therevival of economic growth; this objective had to beattained while managing a large Government
276
PUBLIC DEBT MANAGEMENTVII
The expansionary counter-cyclical fiscal policy stance adopted by the Government, in the face ofemerging ramifications of the global economic crisis for growth and aggregate demand, resulted ina sharp increase in both the borrowings of the Central and State Governments during 2008-09 overtheir respective budget estimates. The key challenge for the Reserve Bank in its debt managementoperations for 2008-09, therefore, was to manage this vastly expanded government market borrowingprogramme without creating any disruptive pressures on the government securities market. TheReserve Bank employed a combination of measures involving monetary easing and use of innovativedebt management tools such as synchronising the Market Stabilisation Scheme (MSS) buybackauctions and open market purchases with the Government’s normal market borrowings andde-sequestering of MSS balances. By appropriately timing the release of liquidity to the financialsystem to coincide with the auctions of government securities, the Reserve Bank ensured a relativelysmooth conduct of the Governments’ market borrowing programme, resulting in the decline in thecost of borrowings during 2008-09 for the first time in the last five years. Reflecting the continuedneed for fiscal stimulus in 2009-10, the combined net market borrowing programme of the Centreand the State Governments (dated securities and 364-day Treasury Bills) is estimated to beRs.5,37,957 crore as against Rs.3,46,083 crore in 2008-09. This calls for continuance of the activedebt management strategy by the Reserve Bank so as to mitigate pressures on interest rates andavert possible crowding-out of private sector demand for credit.
borrowing programme. The Reserve Bank, therefore,employed a combination of measures involving easingof monetary conditions and use of innovative toolsfor debt management such as synchronising theMarket Stabilisation Scheme (MSS) buyback auctionsand open market purchases with Government’snormal market borrowings and de-sequestering ofMSS balances. The release of liquidity to the financialsystem by the Reserve Bank was timed appropriatelyto coincide with the auctions of government securities,ensuring the smooth conduct of the large marketborrowing programme of the Government.
VII.3 The debt management operations of theReserve Bank during 2008-09 are presented in thischapter in the context of specific policy issues. Thefiscal year 2008-09 saw a sharp increase in the marketborrowings of Central and State Governments onaccount of the fiscal stimulus measures undertakenby the Governments in the wake of the globaleconomic slowdown and other additional expendituressuch as the Agricultural Debt Waiver and Debt ReliefScheme, various rural development schemes and therevision in Central Government pay scales followingthe recommendations of the Sixth Pay Commission.Despite the sharp increase in the quantum of marketborrowings, the debt management strategy continuedto be guided by the prime objectives of minimisationof cost over time and determination of maturity profilesconsistent with rollover risk. In the first half of the year,the debt management operations were undertakenin an environment of pre-emptive monetary tighteningmeasures that aimed at containing the inflationaryimpulses in the economy. During the second half,however, while the monetary conditions easedsignificantly, in response to the softening of inflationarypressures coupled with economic slowdown, thefrequency and amount of issuances by the Centraland State Governments increased significantly.
VII.4 The gross market borrowing programme ofthe Central Government (dated securities and 364-day Treasury Bills) was about 181 per cent of thebudget estimate for 2008-09 and the net borrowing,about 210 per cent of the budget estimates. Duringthe first half of the year, the auctions for datedsecurities were broadly in accordance with the
relevant issuance calendar. For the second half,though, three additional calendars were issued insupersession of the scheduled issuance calendar,which became necessary to meet the additionalexpenditure approved under supplementary demandsfor grants. The weighted average cost of marketborrowings moved upwards up to August 2008 butdecelerated subsequently, up to January 2009, largelyreflecting the pattern in monetary policy rates. Due tohigher than expected borrowing programme by boththe Central and the State Governments, however, theweighted average cost of borrowings moderatelyincreased thereafter. For the year as a whole, theweighted average yield was lower than in 2007-08.
VII.5 As in the previous two financial years, theentire market borrowing programme of the StateGovernments during 2008-09 was conducted throughthe auction route. The gross amount raised during2008-09 was 74 per cent higher than that in theprevious year as States were sanctioned additionalallocations by the Centre to meet the shortfall in theNational Small Savings Fund (NSSF) collections andto facilitate additional capital expenditure by the Statesas part of the fiscal stimulus measures. The weightedaverage yield on the State Development Loans (SDLs)decreased by 38 basis points during the year, althoughthe weighted average spread over comparable CentralGovernment securities was higher by 74 basis points,reflecting the increased size and bunching ofissuances during the last quarter of the year,particularly during March 2009 when about 26.5 percent of the total borrowings of the States were raised.
VII.6 The combined net market borrowings of theCentral and the State Governments in 2008-09 were209 per cent of their net borrowings during 2007-08.In addition, special securities (oil and fertiliser bonds)amounting to Rs.95,942 crore were issued by theCentral Government outside the market borrowingprogramme for 2008-09.
CENTRAL GOVERNMENT
Market Borrowings
Dated Securities
VII.7 In line with global trends of increasedGovernment spending as a response to counter
277
PUBLIC DEBT MANAGEMENT
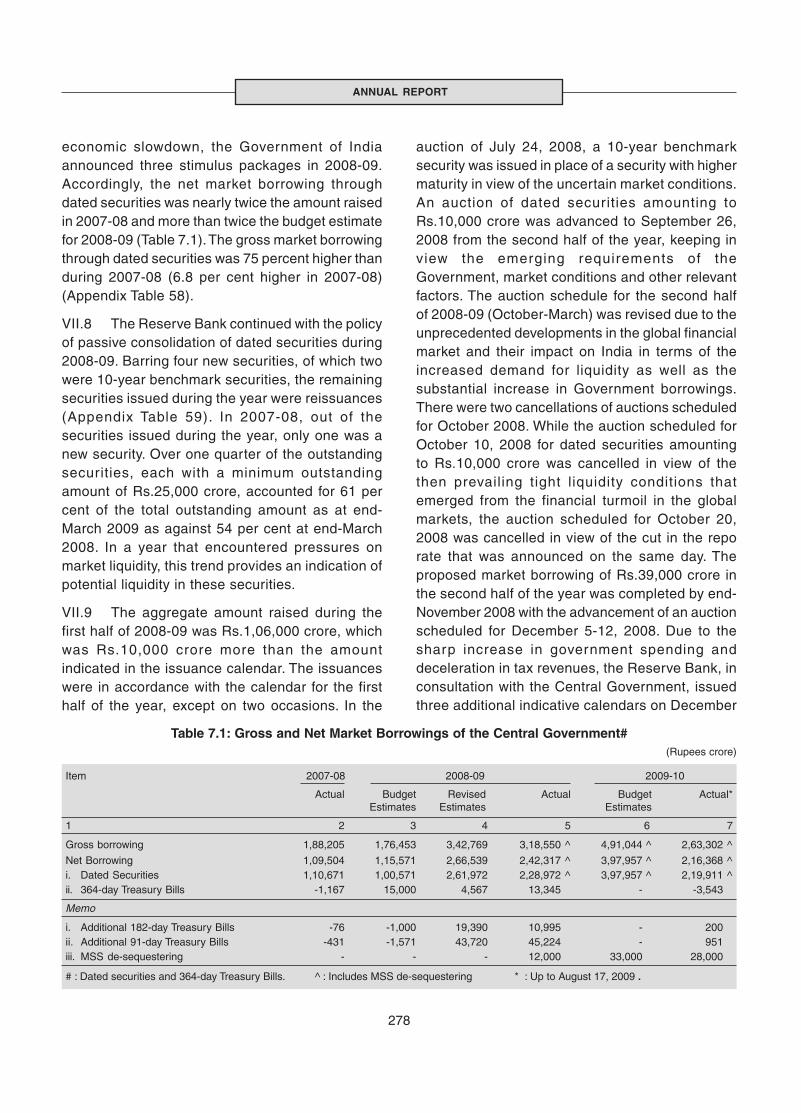
278
ANNUAL REPORT
economic slowdown, the Government of Indiaannounced three stimulus packages in 2008-09.Accordingly, the net market borrowing throughdated securities was nearly twice the amount raisedin 2007-08 and more than twice the budget estimatefor 2008-09 (Table 7.1). The gross market borrowingthrough dated securities was 75 percent higher thanduring 2007-08 (6.8 per cent higher in 2007-08)(Appendix Table 58).
VII.8 The Reserve Bank continued with the policyof passive consolidation of dated securities during2008-09. Barring four new securities, of which twowere 10-year benchmark securities, the remainingsecurities issued during the year were reissuances(Appendix Table 59). In 2007-08, out of thesecurities issued during the year, only one was anew security. Over one quarter of the outstandingsecurities, each with a minimum outstandingamount of Rs.25,000 crore, accounted for 61 percent of the total outstanding amount as at end-March 2009 as against 54 per cent at end-March2008. In a year that encountered pressures onmarket liquidity, this trend provides an indication ofpotential liquidity in these securities.
VII.9 The aggregate amount raised during thefirst half of 2008-09 was Rs.1,06,000 crore, whichwas Rs.10,000 crore more than the amountindicated in the issuance calendar. The issuanceswere in accordance with the calendar for the firsthalf of the year, except on two occasions. In the
auction of July 24, 2008, a 10-year benchmarksecurity was issued in place of a security with highermaturity in view of the uncertain market conditions.An auction of dated securities amounting toRs.10,000 crore was advanced to September 26,2008 from the second half of the year, keeping inview the emerging requirements of theGovernment, market conditions and other relevantfactors. The auction schedule for the second halfof 2008-09 (October-March) was revised due to theunprecedented developments in the global financialmarket and their impact on India in terms of theincreased demand for liquidity as well as thesubstantial increase in Government borrowings.There were two cancellations of auctions scheduledfor October 2008. While the auction scheduled forOctober 10, 2008 for dated securities amountingto Rs.10,000 crore was cancelled in view of thethen prevailing tight liquidity conditions thatemerged from the financial turmoil in the globalmarkets, the auction scheduled for October 20,2008 was cancelled in view of the cut in the reporate that was announced on the same day. Theproposed market borrowing of Rs.39,000 crore inthe second half of the year was completed by end-November 2008 with the advancement of an auctionscheduled for December 5-12, 2008. Due to thesharp increase in government spending anddeceleration in tax revenues, the Reserve Bank, inconsultation with the Central Government, issuedthree additional indicative calendars on December
Table 7.1: Gross and Net Market Borrowings of the Central Government# (Rupees crore)
Item 2007-08 2008-09 2009-10
Actual Budget Revised Actual Budget Actual*Estimates Estimates Estimates
1 2 3 4 5 6 7
Gross borrowing 1,88,205 1,76,453 3,42,769 3,18,550 ^ 4,91,044 ^ 2,63,302 ^
Net Borrowing 1,09,504 1,15,571 2,66,539 2,42,317 ^ 3,97,957 ^ 2,16,368 ^i. Dated Securities 1,10,671 1,00,571 2,61,972 2,28,972 ^ 3,97,957 ^ 2,19,911 ^ii. 364-day Treasury Bills -1,167 15,000 4,567 13,345 - -3,543
Memo
i. Additional 182-day Treasury Bills -76 -1,000 19,390 10,995 - 200ii. Additional 91-day Treasury Bills -431 -1,571 43,720 45,224 - 951iii. MSS de-sequestering - - - 12,000 33,000 28,000
# : Dated securities and 364-day Treasury Bills. ^ : Includes MSS de-sequestering * : Up to August 17, 2009 .

279
PUBLIC DEBT MANAGEMENT
5, 2008, January 6, 2009 and February 10, 2009and accordingly, Rs.1,16,000 crore was raisedbetween December 2008 and March 2009.
VII.10 The challenge posed to the debtmanagement function needs to be viewed in the
context of global developments whereby manycountr ies, including advanced economies,announced fiscal stimulus packages to compensatefor the fall in consumption and investment demand(Box VII.1). In India, specific strategic measures
The global financial crisis created large and unanticipatedpressures on the fiscal position of many countries. While somecountries had to support the financial sector directly or throughoperations giving rise to higher contingent liabilities, mostcountries had to expand fiscal expenditure to containrecessionary impulses.
While fiscal balances have been affected by the crisis in theshort-run, the impact on government debt ratios will be feltover the medium term. The deterioration of the fiscal outlookraises issues of fiscal solvency and has the potential to triggeradverse market reactions. In turn, higher interest rates (andexchange rate depreciations in countries with significantborrowing in foreign currency, like most emerging economies)could further add to government debts which in some cases,result in ‘snowballing’ debt dynamics.
Market confidence in gilts issued by various Governmentshas been a source of stability and has, so far, helped to avoida complete meltdown of financial markets, notwithstandingthe hardening of credit default swap (CDS) premia for manyGovernment issues, implying higher cost of insurance againstdefault. Thus far, government debt market reaction to theweaker fiscal outlook has been relatively muted. Nevertheless,some of the Government bond auctions since January 2009have witnessed pressures. UK, Germany and Netherlandscould not mobilise the notified amount on some occasion/swhereas France, Italy, Austria and Portugal were forced topay higher interest rates. On May 25, 2009, the UK DMOfailed for the first time since 1995 to sell conventionalgovernment bonds in an auction, attracting bids of 1.63 billionpounds against the notified amount of 1.75 billion pounds of2049 gilts. The Ministry of Finance, China also failed to sell,for the first time since 2003, one-year government bonds ofyuan 28 bn in an auction held on July 7, 2009. On May 7,2009, US Treasury yields soared by 20 basis points to 4.30per cent after the 30-year bond auction saw poor demand.The rating outlook of sovereign borrowings for countries, suchas Portugal, Spain, Greece and the UK was downgraded bycredit rating agencies. An abrupt market reaction to weakeningfundamentals remains a concern. Towards boosting nominaldemand by increasing broad money, lowering gilt yields andimproving corporate credit markets, the Bank of England hasundertaken open market purchase of government bonds whilethe US Federal Reserve and the Bank of Japan have alsocarried out such open market purchases towards ‘quantitative’easing. In the context of the on-going global financial crisis,
Box VII.1Debt Management and the Global Financial Crisis
Iceland has recently shifted debt management from the DMOto the central bank. For smooth conduct of large borrowingprogramme of the Governments, with minimal impact on thefinancial markets, closer co-ordination between the Treasuryand the central bank, as is being practised in large countrieslike the US, Canada and India has assumed greater importance.
Deterioration in the fiscal position and increased governmentborrowings have raised the level of roll-over risk even foradvanced economies. Many sovereign defaults haveoriginated in the past, from situations of excessive short-termdebt. It is, therefore, imperative for the debt managementauthorities to set an acceptable level of roll-over risk. If thereis a high default risk premium built into longer term rates,shorter term debt may be cheaper but could increase risk byincreasing the volatility of debt-servicing costs. Building upliquidity in longer benchmark maturities could help in reducingrefinancing risk and also decrease risk premia over time, evenif there are higher debt-servicing costs when this strategy isinitially adopted.
In some countries, Government support to weak financialinstitutions has been extended as implicit or explicit guaranteesor similar forms of contingent liability. A sharp increase incontingent liabilities introduces greater uncertainty to the fiscalposition as it could complicate accurate estimation of theprobability of devolvement. Debt managers need to not onlyreckon such contingent liabilities but also estimate probabilityof devolvement and consequent addition to public debt.
As the frequency and volume of public debt increasessignificantly, debt managers need to ensure transparency sothat investors are not taken by surprise. Clarity incommunication and adherence to the indicative borrowingprogramme would add credibility and thereby cushion volatilityin market yields, which ultimately may help in contributing tolower cost of borrowing.
References
1. BIS Quarterly Review (2009)– Government debtmanagement at low interest rates, June.
2. The IMF (2009) - The State of Public Finances: Outlookand Medium-Term Policies After the 2008 Crisis, March 6.
3. Standard and Poors (2009), United Kingdom OutlookRevised To Negative On Deteriorating Public Finances;‘AAA/A-1+’ Ratings Affirmed, May 21.
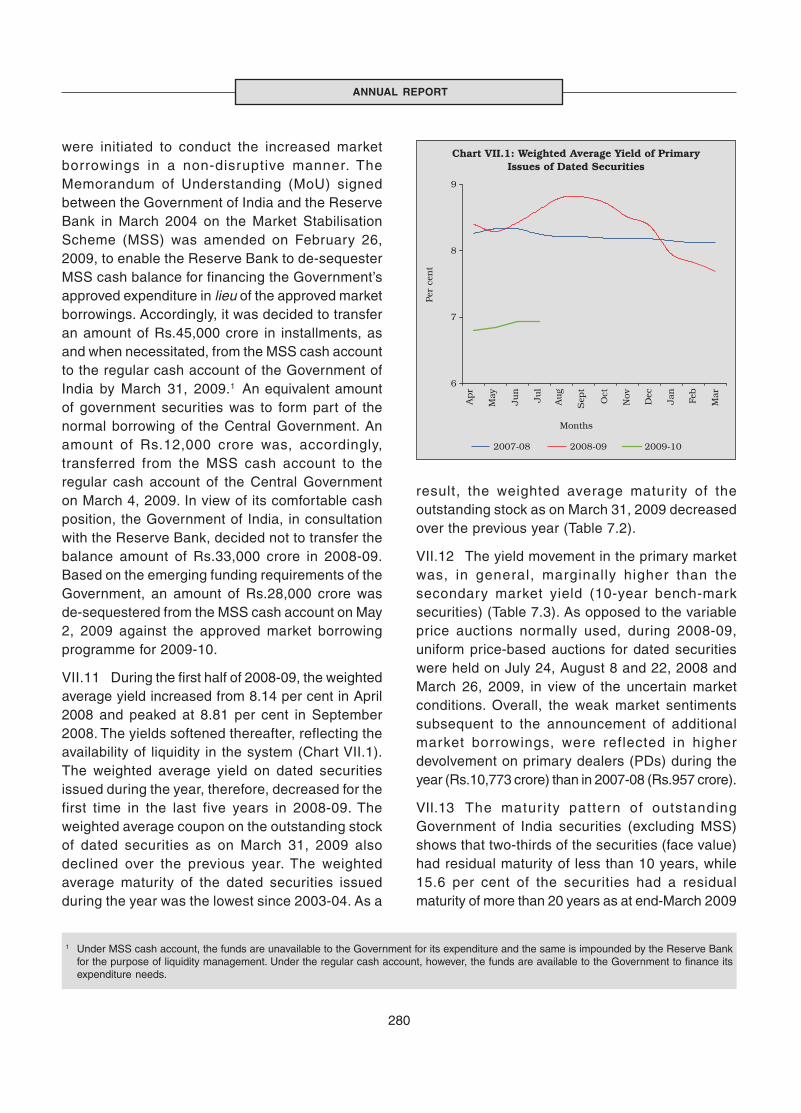
280
ANNUAL REPORT
were initiated to conduct the increased marketborrowings in a non-disruptive manner. TheMemorandum of Understanding (MoU) signedbetween the Government of India and the ReserveBank in March 2004 on the Market StabilisationScheme (MSS) was amended on February 26,2009, to enable the Reserve Bank to de-sequesterMSS cash balance for financing the Government’sapproved expenditure in lieu of the approved marketborrowings. Accordingly, it was decided to transferan amount of Rs.45,000 crore in installments, asand when necessitated, from the MSS cash accountto the regular cash account of the Government ofIndia by March 31, 2009.1 An equivalent amountof government securities was to form part of thenormal borrowing of the Central Government. Anamount of Rs.12,000 crore was, accordingly,transferred from the MSS cash account to theregular cash account of the Central Governmenton March 4, 2009. In view of its comfortable cashposition, the Government of India, in consultationwith the Reserve Bank, decided not to transfer thebalance amount of Rs.33,000 crore in 2008-09.Based on the emerging funding requirements of theGovernment, an amount of Rs.28,000 crore wasde-sequestered from the MSS cash account on May2, 2009 against the approved market borrowingprogramme for 2009-10.
VII.11 During the first half of 2008-09, the weightedaverage yield increased from 8.14 per cent in April2008 and peaked at 8.81 per cent in September2008. The yields softened thereafter, reflecting theavailability of liquidity in the system (Chart VII.1).The weighted average yield on dated securitiesissued during the year, therefore, decreased for thefirst time in the last five years in 2008-09. Theweighted average coupon on the outstanding stockof dated securities as on March 31, 2009 alsodeclined over the previous year. The weightedaverage maturity of the dated securities issuedduring the year was the lowest since 2003-04. As a
1 Under MSS cash account, the funds are unavailable to the Government for its expenditure and the same is impounded by the Reserve Bankfor the purpose of liquidity management. Under the regular cash account, however, the funds are available to the Government to finance itsexpenditure needs.
result, the weighted average maturity of theoutstanding stock as on March 31, 2009 decreasedover the previous year (Table 7.2).
VII.12 The yield movement in the primary marketwas, in general, marginally higher than thesecondary market yield (10-year bench-marksecurities) (Table 7.3). As opposed to the variableprice auctions normally used, during 2008-09,uniform price-based auctions for dated securitieswere held on July 24, August 8 and 22, 2008 andMarch 26, 2009, in view of the uncertain marketconditions. Overall, the weak market sentimentssubsequent to the announcement of additionalmarket borrowings, were reflected in higherdevolvement on primary dealers (PDs) during theyear (Rs.10,773 crore) than in 2007-08 (Rs.957 crore).
VII.13 The matur ity pattern of outstandingGovernment of India securities (excluding MSS)shows that two-thirds of the securities (face value)had residual maturity of less than 10 years, while15.6 per cent of the securities had a residualmaturity of more than 20 years as at end-March 2009
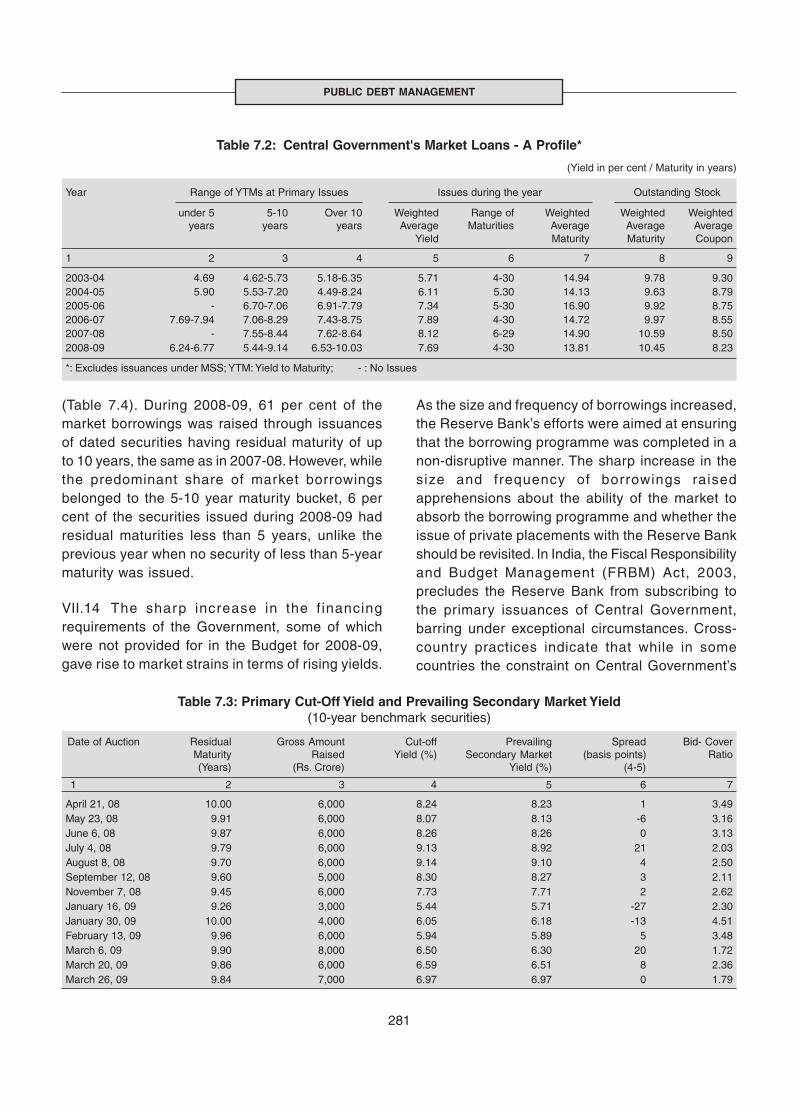
281
PUBLIC DEBT MANAGEMENT
(Table 7.4). During 2008-09, 61 per cent of themarket borrowings was raised through issuancesof dated securities having residual maturity of upto 10 years, the same as in 2007-08. However, whilethe predominant share of market borrowingsbelonged to the 5-10 year maturity bucket, 6 percent of the securities issued during 2008-09 hadresidual maturities less than 5 years, unlike theprevious year when no security of less than 5-yearmaturity was issued.
VII.14 The sharp increase in the f inancingrequirements of the Government, some of whichwere not provided for in the Budget for 2008-09,gave rise to market strains in terms of rising yields.
As the size and frequency of borrowings increased,the Reserve Bank’s efforts were aimed at ensuringthat the borrowing programme was completed in anon-disruptive manner. The sharp increase in thesize and frequency of borrowings raisedapprehensions about the ability of the market toabsorb the borrowing programme and whether theissue of private placements with the Reserve Bankshould be revisited. In India, the Fiscal Responsibilityand Budget Management (FRBM) Act, 2003,precludes the Reserve Bank from subscribing tothe primary issuances of Central Government,barring under exceptional circumstances. Cross-country practices indicate that while in somecountries the constraint on Central Government’s
Table 7.3: Primary Cut-Off Yield and Prevailing Secondary Market Yield(10-year benchmark securities)
Date of Auction Residual Gross Amount Cut-off Prevailing Spread Bid- CoverMaturity Raised Yield (%) Secondary Market (basis points) Ratio(Years) (Rs. Crore) Yield (%) (4-5)
1 2 3 4 5 6 7
April 21, 08 10.00 6,000 8.24 8.23 1 3.49May 23, 08 9.91 6,000 8.07 8.13 -6 3.16June 6, 08 9.87 6,000 8.26 8.26 0 3.13July 4, 08 9.79 6,000 9.13 8.92 21 2.03August 8, 08 9.70 6,000 9.14 9.10 4 2.50September 12, 08 9.60 5,000 8.30 8.27 3 2.11November 7, 08 9.45 6,000 7.73 7.71 2 2.62January 16, 09 9.26 3,000 5.44 5.71 -27 2.30January 30, 09 10.00 4,000 6.05 6.18 -13 4.51February 13, 09 9.96 6,000 5.94 5.89 5 3.48March 6, 09 9.90 8,000 6.50 6.30 20 1.72March 20, 09 9.86 6,000 6.59 6.51 8 2.36March 26, 09 9.84 7,000 6.97 6.97 0 1.79
Table 7.2: Central Government's Market Loans - A Profile*
(Yield in per cent / Maturity in years)
Year Range of YTMs at Primary Issues Issues during the year Outstanding Stock
under 5 5-10 Over 10 Weighted Range of Weighted Weighted Weightedyears years years Average Maturities Average Average Average
Yield Maturity Maturity Coupon
1 2 3 4 5 6 7 8 9
2003-04 4.69 4.62-5.73 5.18-6.35 5.71 4-30 14.94 9.78 9.302004-05 5.90 5.53-7.20 4.49-8.24 6.11 5.30 14.13 9.63 8.792005-06 - 6.70-7.06 6.91-7.79 7.34 5-30 16.90 9.92 8.752006-07 7.69-7.94 7.06-8.29 7.43-8.75 7.89 4-30 14.72 9.97 8.552007-08 - 7.55-8.44 7.62-8.64 8.12 6-29 14.90 10.59 8.502008-09 6.24-6.77 5.44-9.14 6.53-10.03 7.69 4-30 13.81 10.45 8.23
*: Excludes issuances under MSS; YTM: Yield to Maturity; - : No Issues

282
ANNUAL REPORT
access to central bank credit is binding, in someothers it is weak (Box VII. 2).
Market Borrowings during 2009-10
VII.15 The gross and net market borrowings of theCentral Government through dated securities for2009-10 are budgeted higher, at Rs.4,51,093 croreand Rs.3,97,957 crore, respectively, than the actualamount raised in 2008-09. On March 26, 2009, theissuance calendar for dated securities for the firsthalf of 2009-10 (April-September) was released inconsultation with the Central Government.Accordingly, an amount of Rs.2,41,000 crore wasscheduled to be raised as compared withRs.1,06,000 crore raised during the correspondingperiod of the previous year. Following the revisionin the market borrowing requirement as per theUnion Budget, 2009-10, a new issuance calendarfor dated securities was released on July 16, 2009for mobilization of Rs. 1,10,000 crore during July18, 2009 through September 30, 2009 (as againstRs. 79,000 crore as per the earlier calendar issuedon March 26, 2009).
VII.16 During 2009-10 so far (up to August 17,2009), the Central Government raised Rs.2,25,000crore on gross basis (excluding MSS de-sequestering of Rs.28,000 crore) and the netmarket borrowings amounted to Rs 1,91,911 crore,through dated secur it ies under the marketborrowing programme. Market borrowing throughdated securities was higher than that indicated inthe calendar on account of increased requirement
of the Government. The monthly amount raisedincreased from Rs.48,000 crore in April 2009 toRs.60,000 crore in June 2009 before declining toRs.39,000 crore in July 2009. The weighted averageyield of dated securities issued during 2009-10 (upto August 17, 2009) declined to 6.96 per cent from8.72 per cent in the corresponding quarter of theprevious year. The weighted average maturity ofsecurities issued was lower at 10.92 years ascompared with 15.21 years in the correspondingperiod of the previous year.
Treasury Bills
VII.17 The notified amounts of 91-day,182-dayand 364-day Treasury Bills under the normal marketborrowing programme as per the annual issuancecalendar released on March 24, 2008, were keptunchanged at Rs.500 crore (weekly auction),Rs.500 crore (fortnightly auction) and Rs.1,000crore (fortnightly auction), respectively, for 2008-09. Additional Treasury Bills over and above thenotified amounts were, however, raised during2008-09, which were nearly seven times thoseraised during 2007-08 (Appendix Table 60). Theadditional Treasury Bills issuances were spreadthroughout the year unlike in 2007-08 when theywere concentrated in the month of June to enablethe Government to acquire the Reserve Bank’sstake in State Bank of India in 2007. During 2008-09, while initially the additional resources raisedthrough Treasury Bills were meant to partly meetthe expenditure on agricultural debt waiver scheme,
Table 7.4: Maturity Profile of Central Government Dated Securities*(per cent)
Year Issued during the year Outstanding Stock #
Under 5 Years 5-10 Years Over 10 Years Under 5 Years 5-10 Years Over 10 Years
1 2 3 4 5 6 7
2004-05 11 11 78 25 31 44
2005-06 0 26 74 25 32 43
2006-07 7 47 46 26 35 39
2007-08 0 61 39 26 38 36
2008-09 6 55 39 26 40 34
* : Excludes issuances under MSS. # : As at end-March.
283
PUBLIC DEBT MANAGEMENT
subsequently, in view of the large increase in thegross fiscal deficit (GFD) which could not beentirely funded by issuances of dated securities,Treasury Bills also served as an instrument offinancing GFD. Reflecting the disinvestment byStates in the non-competitive segment of theauction treasury bil ls, the net issuances ofTreasury Bil ls dur ing 2008-09 amounted toRs.69,564 crore, contributing to financing 21.3 per
cent of GFD (as per the revised estimates) asagainst a negative contribution of 1.8 per cent toGFD financing in 2007-08 (Appendix Table 61).
VII.18 The primary market yields of Treasury Billsacross all maturities hardened up to August 2008and softened, thereafter, reflecting the interest ratecycle coupled with improvement in l iquidityconditions from October 2008 (Table 7.5 and
The extent of accommodation of fiscal deficit by the centralbank is often seen as an indicator of the nature of co-ordination between monetary and fiscal authorities. Themonetisation of fiscal deficit through devolvement inauctions or pr ivate placement entails the r isk ofsubordinating monetary policy to the fiscal policy, which,in turn, could engender inflationary expectations. Sinceinflation expectations play a key role in determining actualinflation, central banks aim at entrenching their credibilityso that inflation expectations could be stabilised at lowerlevels. Prohibition of central bank credit to the Governmentis one of the instruments for achieving this credibility. Thesanctity of prohibition on central bank credit to theGovernment usually stems from frameworks based on clearmandate/fiscal rule as enshrined in fiscal responsibilitylegislation or central bank Act. Countries with bindingconstraints on Government’s access to central bank creditinclude the US, the UK, the Euro zone, Mexico, Peru andArgentina. Countries with weak constraints or flexiblelegislation include Canada, Chile, Japan, Korea, Malaysiaand South Africa permitting central bank purchases ofGovernment securities from the primary market as detailedbelow.
Canada: The Bank of Canada Act, 1934 permits the centralbank to make loans to the Government of Canada or theGovernment of a province, within stipulated limits.
Chile: The Basic Constitutional Act of the Central Bank ofChile prohibits the Central Bank from directly purchasingsecurities from the Government. However, in the event offoreign war or threat of foreign war, to be qualified by theCouncil on National Security by means of a secret resolution,the Bank may obtain, confer or finance credits to the stateand to public or private entities.
Japan: The Public Finance Law, 1947 explicitly prohibits theBank of Japan from directly participating in the primaryissuance of public bonds and from underwriting the issue.However, the prohibition is relaxed for some special reasonsand the DIET (the Japanese Parliament) may allow privateplacement within the approved limits.
Box VII.2Private Placement of Sovereign Debt with the Central Banks – Cross-country Practices
Korea: Korean Central Bank is permitted by the Bank ofKorea Act, 1950 to subscribe to the Government Bond issuesand also to the bonds guaranteed by the Government.
Malaysia: Bank Negara Malaysia is permitted by the CentralBank of Malaysia Act, 1958 to invest in Central Governmentsecurities and also to underwrite the same.
South Africa: South African Central Bank is prohibited fromholding government securities directly purchased from theTreasury, beyond certain limits stipulated by the SouthAfrican Reserve Bank Act of 1989.
In the Indian context, the Reserve Bank of India Act, 1934authorises the Bank to grant advances repayable not laterthan three months from the date of advance, therebyenabling the Government to br idge the temporarymismatches in its receipts and expenditures. Theseprovisions are, however, enabling and are not mandatory. Inpractice, this became a permanent source of financing theGovernment budget deficit through automatic creation of adhoc Treasury Bills (with a tenor of 91 days) wheneverGovernment’s balances with the Reserve Bank fell belowthe minimum stipulations. Monetisation of deficit was notrestricted to the amount issued through the ad hoc TreasuryBills but also by way of subscription to primary issuances ofGovernment securities. In September 1994, the ReserveBank and the Central Government signed a landmarkagreement to phase out automatic monetisation through adhoc Treasury Bills. Effective April 1997, with the phasing outof ad hoc Treasury Bills, the scheme of Ways and MeansAdvances (WMA) was introduced which provides temporaryaccommodation to the Government (up to 90 days) and issubject to limits. The Fiscal Responsibility and BudgetManagement (FRBM) Act 2003 which was subsequentlyenacted has since prohibited direct borrowings by the Centrefrom the Reserve Bank with effect from April 2006 exceptby way of WMA or under exceptional circumstances. Till date,the proviso in the FRBM Act 2003 permitting borrowingsfrom the central bank under exceptional circumstances hasnot been invoked.
Source: Websites of respective central banks.
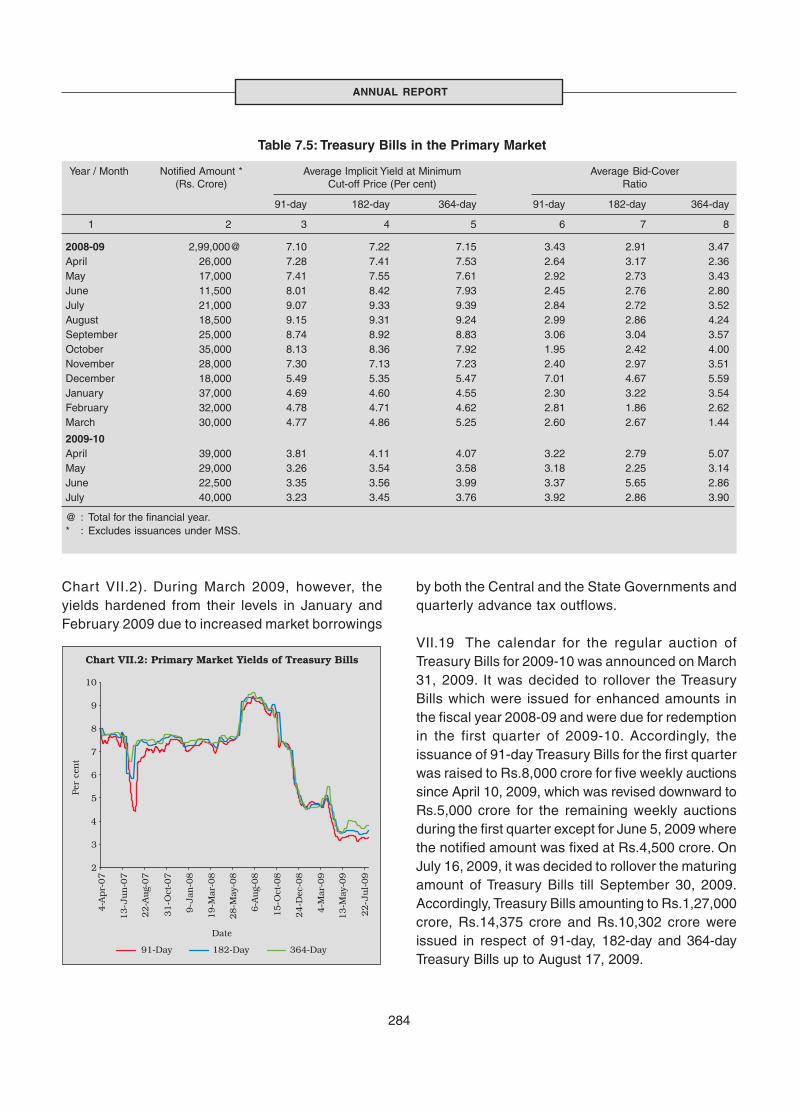
284
ANNUAL REPORT
by both the Central and the State Governments andquarterly advance tax outflows.
VII.19 The calendar for the regular auction ofTreasury Bills for 2009-10 was announced on March31, 2009. It was decided to rollover the TreasuryBills which were issued for enhanced amounts inthe fiscal year 2008-09 and were due for redemptionin the first quarter of 2009-10. Accordingly, theissuance of 91-day Treasury Bills for the first quarterwas raised to Rs.8,000 crore for five weekly auctionssince April 10, 2009, which was revised downward toRs.5,000 crore for the remaining weekly auctionsduring the first quarter except for June 5, 2009 wherethe notified amount was fixed at Rs.4,500 crore. OnJuly 16, 2009, it was decided to rollover the maturingamount of Treasury Bills till September 30, 2009.Accordingly, Treasury Bills amounting to Rs.1,27,000crore, Rs.14,375 crore and Rs.10,302 crore wereissued in respect of 91-day, 182-day and 364-dayTreasury Bills up to August 17, 2009.
Table 7.5: Treasury Bills in the Primary Market
Year / Month Notified Amount * Average Implicit Yield at Minimum Average Bid-Cover(Rs. Crore) Cut-off Price (Per cent) Ratio
91-day 182-day 364-day 91-day 182-day 364-day
1 2 3 4 5 6 7 8
2008-09 2,99,000@ 7.10 7.22 7.15 3.43 2.91 3.47April 26,000 7.28 7.41 7.53 2.64 3.17 2.36May 17,000 7.41 7.55 7.61 2.92 2.73 3.43June 11,500 8.01 8.42 7.93 2.45 2.76 2.80July 21,000 9.07 9.33 9.39 2.84 2.72 3.52August 18,500 9.15 9.31 9.24 2.99 2.86 4.24September 25,000 8.74 8.92 8.83 3.06 3.04 3.57October 35,000 8.13 8.36 7.92 1.95 2.42 4.00November 28,000 7.30 7.13 7.23 2.40 2.97 3.51December 18,000 5.49 5.35 5.47 7.01 4.67 5.59January 37,000 4.69 4.60 4.55 2.30 3.22 3.54February 32,000 4.78 4.71 4.62 2.81 1.86 2.62March 30,000 4.77 4.86 5.25 2.60 2.67 1.44
2009-10April 39,000 3.81 4.11 4.07 3.22 2.79 5.07May 29,000 3.26 3.54 3.58 3.18 2.25 3.14June 22,500 3.35 3.56 3.99 3.37 5.65 2.86July 40,000 3.23 3.45 3.76 3.92 2.86 3.90
@ : Total for the financial year.* : Excludes issuances under MSS.
Chart VII.2). During March 2009, however, theyields hardened from their levels in January andFebruary 2009 due to increased market borrowings
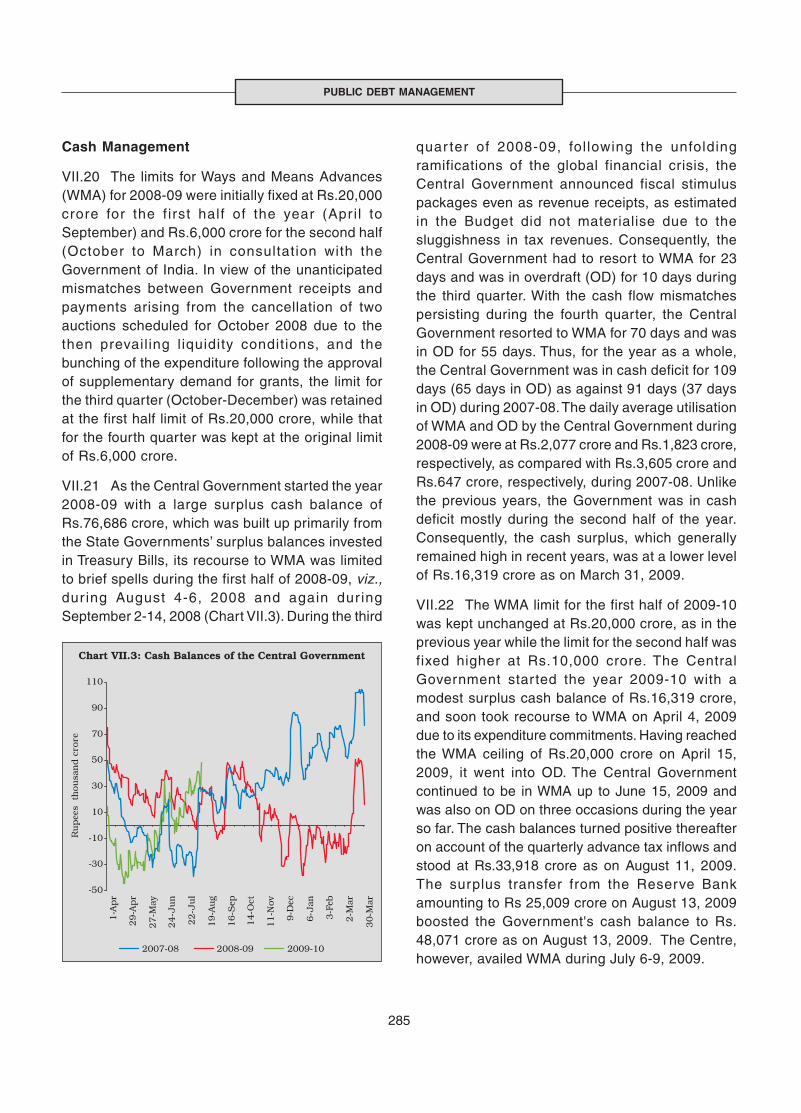
285
PUBLIC DEBT MANAGEMENT
Cash Management
VII.20 The limits for Ways and Means Advances(WMA) for 2008-09 were initially fixed at Rs.20,000crore for the f irst half of the year (Apr i l toSeptember) and Rs.6,000 crore for the second half(October to March) in consultation with theGovernment of India. In view of the unanticipatedmismatches between Government receipts andpayments arising from the cancellation of twoauctions scheduled for October 2008 due to thethen prevail ing l iquidity conditions, and thebunching of the expenditure following the approvalof supplementary demand for grants, the limit forthe third quarter (October-December) was retainedat the first half limit of Rs.20,000 crore, while thatfor the fourth quarter was kept at the original limitof Rs.6,000 crore.
VII.21 As the Central Government started the year2008-09 with a large surplus cash balance ofRs.76,686 crore, which was built up primarily fromthe State Governments’ surplus balances investedin Treasury Bills, its recourse to WMA was limitedto brief spells during the first half of 2008-09, viz.,dur ing August 4-6, 2008 and again dur ingSeptember 2-14, 2008 (Chart VII.3). During the third
quar ter of 2008-09, fol lowing the unfoldingramifications of the global financial crisis, theCentral Government announced fiscal stimuluspackages even as revenue receipts, as estimatedin the Budget did not materialise due to thesluggishness in tax revenues. Consequently, theCentral Government had to resort to WMA for 23days and was in overdraft (OD) for 10 days duringthe third quarter. With the cash flow mismatchespersisting during the fourth quarter, the CentralGovernment resorted to WMA for 70 days and wasin OD for 55 days. Thus, for the year as a whole,the Central Government was in cash deficit for 109days (65 days in OD) as against 91 days (37 daysin OD) during 2007-08. The daily average utilisationof WMA and OD by the Central Government during2008-09 were at Rs.2,077 crore and Rs.1,823 crore,respectively, as compared with Rs.3,605 crore andRs.647 crore, respectively, during 2007-08. Unlikethe previous years, the Government was in cashdeficit mostly during the second half of the year.Consequently, the cash surplus, which generallyremained high in recent years, was at a lower levelof Rs.16,319 crore as on March 31, 2009.
VII.22 The WMA limit for the first half of 2009-10was kept unchanged at Rs.20,000 crore, as in theprevious year while the limit for the second half wasfixed higher at Rs.10,000 crore. The CentralGovernment started the year 2009-10 with amodest surplus cash balance of Rs.16,319 crore,and soon took recourse to WMA on April 4, 2009due to its expenditure commitments. Having reachedthe WMA ceiling of Rs.20,000 crore on April 15,2009, it went into OD. The Central Governmentcontinued to be in WMA up to June 15, 2009 andwas also on OD on three occasions during the yearso far. The cash balances turned positive thereafteron account of the quarterly advance tax inflows andstood at Rs.33,918 crore as on August 11, 2009.The surplus transfer from the Reserve Bankamounting to Rs 25,009 crore on August 13, 2009boosted the Government's cash balance to Rs.48,071 crore as on August 13, 2009. The Centre,however, availed WMA during July 6-9, 2009.
286
ANNUAL REPORT
Special Securities issued by the CentralGovernment
VII.23 In addition to dated securities, the CentralGovernment issued special securities aggregatingto Rs.95,942 crore to oil marketing companies andfertiliser companies during 2008-09, as comparedwith Rs.38,050 crore during 2007-08. With a viewto compensating oil marketing companies towardsestimated under-recoveries on account of sale ofpetroleum products at administered prices, theCentral Government issued four special securitiesto three oil marketing companies for an aggregateamount of Rs.75,942 crore: Rs.22,000 crore (15-yearmaturity) on November 10, 2008, Rs.22,000 crore(16-year matur ity) on December 23, 2008,Rs.21,942 crore (17-year maturity) on February 4,2009 and Rs.10,000 crore (17-year maturity) onMarch 23, 2009. During 2008-09, the CentralGovernment issued three special securities of 14-yearmaturity, each, aggregating to Rs.20,000 crore tofertiliser companies as compensation towardsfertiliser subsidy during 2008-09: Rs.10,000 croreon December 10, 2008, Rs.4,000 crore onDecember 24, 2008 and Rs.6,000 crore on January29, 2009.
STATE GOVERNMENTS
Market Borrowings
VII.24 The net al location under the marketborrowing programme of State Governmentsinclusive of additional allocations for shortfall inNational Small Savings Fund (NSSF) collectionsand towards the second stimulus package for2008-09 was about two-thirds higher than that in2007-08. Taking into account the repayments, thegross allocation amounted to Rs.1,29,081 croreduring 2008-09, of which 91.5 per cent was actuallyraised by the State Governments during the year(Table 7.6, Appendix Table 62). The entire amountwas raised through the auction route during 2008-09as in the previous year. Two States (viz.,Chhattisgarh and Orissa) did not participate in themarket borrowing programme during 2008-09 asagainst four States (viz., Chhattisgarh, Haryana,
Table 7.6 : Annual Market Borrowings ofState Governments #
(Rupees crore)
Item 2007-08 2008-09
1 2 3
1. Net Allocation 28,781 51,7192. Additional Allocation 4,454 14,3263. Additional Allocation on account
of NSSF shortfall 35,780 19,7684. Additional Allocation towards second
stimulus package - 28,8965. Total Net Allocation (1+2+3+4) 69,015 1,14,7096. Repayments 11,555* 14,3717. Gross Allocation (5+6) 80,570 1,29,0818. Total Amount Raised 67,779 1,18,1389. Net Amount Raised (8-6) 56,224 1,03,76610. Outstanding State Development
Loans (end-period) 2,98,845 4,02,611
# : Includes the Union Territory of Puducherry.
* : Excludes Rs.156 crore of buy-back of securities by theGovernment of Orissa.
Orissa and Tripura) during 2007-08. Besides, 13States did not raise their full allocations as against11 States during 2007-08.
VII.25 During 2008-09, 27 State Governments/UT(i.e., except Chhattisgarh and Orissa) accessed themarket in 23 tranches as compared with 25 States/UT through 18 tranches during 2007-08. Almost allthe States accessed the market during the secondhalf of the year raising 86.6 per cent of the totalborrowings during the year, the bulk of which was inthe fourth quarter. In March 2009 alone, more than aquarter of the total borrowings was raised, whichexerted pressure on the market. As a result, the netsupply of State Development Loan (SDL) securitiesin the market increased from Rs.8,472 crore duringthe first half of 2008-09 to Rs.95,294 crore during thesecond half. The bunching of SDLs of the States/UTduring the last quarter was mainly due to theGovernment of India’s sanctions under Article 293(3)towards NSSF shortfalls and the second stimuluspackage sanctioned during the quarter. All the issuesduring 2008-09 were of 10-year maturity.
VII.26 Reflecting the softer interest rateenvironment since the second half of the year, theweighted average yield of State Government
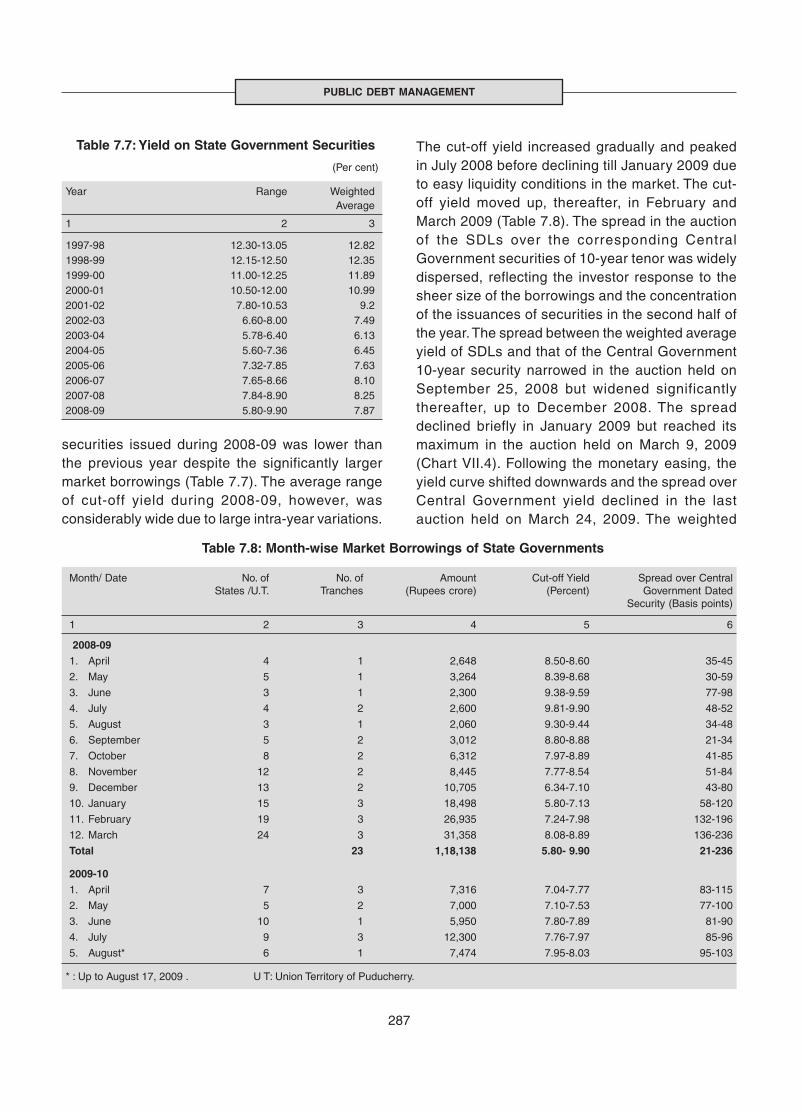
287
PUBLIC DEBT MANAGEMENT
securities issued during 2008-09 was lower thanthe previous year despite the significantly largermarket borrowings (Table 7.7). The average rangeof cut-off yield during 2008-09, however, wasconsiderably wide due to large intra-year variations.
The cut-off yield increased gradually and peakedin July 2008 before declining till January 2009 dueto easy liquidity conditions in the market. The cut-off yield moved up, thereafter, in February andMarch 2009 (Table 7.8). The spread in the auctionof the SDLs over the corresponding CentralGovernment securities of 10-year tenor was widelydispersed, reflecting the investor response to thesheer size of the borrowings and the concentrationof the issuances of securities in the second half ofthe year. The spread between the weighted averageyield of SDLs and that of the Central Government10-year security narrowed in the auction held onSeptember 25, 2008 but widened significantlythereafter, up to December 2008. The spreaddeclined briefly in January 2009 but reached itsmaximum in the auction held on March 9, 2009(Chart VII.4). Following the monetary easing, theyield curve shifted downwards and the spread overCentral Government yield declined in the lastauction held on March 24, 2009. The weighted
Table 7.7: Yield on State Government Securities
(Per cent)
Year Range WeightedAverage
1 2 3
1997-98 12.30-13.05 12.821998-99 12.15-12.50 12.351999-00 11.00-12.25 11.892000-01 10.50-12.00 10.992001-02 7.80-10.53 9.22002-03 6.60-8.00 7.492003-04 5.78-6.40 6.132004-05 5.60-7.36 6.452005-06 7.32-7.85 7.632006-07 7.65-8.66 8.102007-08 7.84-8.90 8.252008-09 5.80-9.90 7.87
Table 7.8: Month-wise Market Borrowings of State Governments
Month/ Date No. of No. of Amount Cut-off Yield Spread over CentralStates /U.T. Tranches (Rupees crore) (Percent) Government Dated
Security (Basis points)
1 2 3 4 5 6
2008-09
1. April 4 1 2,648 8.50-8.60 35-45
2. May 5 1 3,264 8.39-8.68 30-59
3. June 3 1 2,300 9.38-9.59 77-98
4. July 4 2 2,600 9.81-9.90 48-52
5. August 3 1 2,060 9.30-9.44 34-48
6. September 5 2 3,012 8.80-8.88 21-34
7. October 8 2 6,312 7.97-8.89 41-85
8. November 12 2 8,445 7.77-8.54 51-84
9. December 13 2 10,705 6.34-7.10 43-80
10. January 15 3 18,498 5.80-7.13 58-120
11. February 19 3 26,935 7.24-7.98 132-196
12. March 24 3 31,358 8.08-8.89 136-236
Total 23 1,18,138 5.80- 9.90 21-236
2009-10
1. April 7 3 7,316 7.04-7.77 83-115
2. May 5 2 7,000 7.10-7.53 77-100
3. June 10 1 5,950 7.80-7.89 81-90
4. July 9 3 12,300 7.76-7.97 85-96
5. August* 6 1 7,474 7.95-8.03 95-103
* : Up to August 17, 2009 . U T: Union Territory of Puducherry.
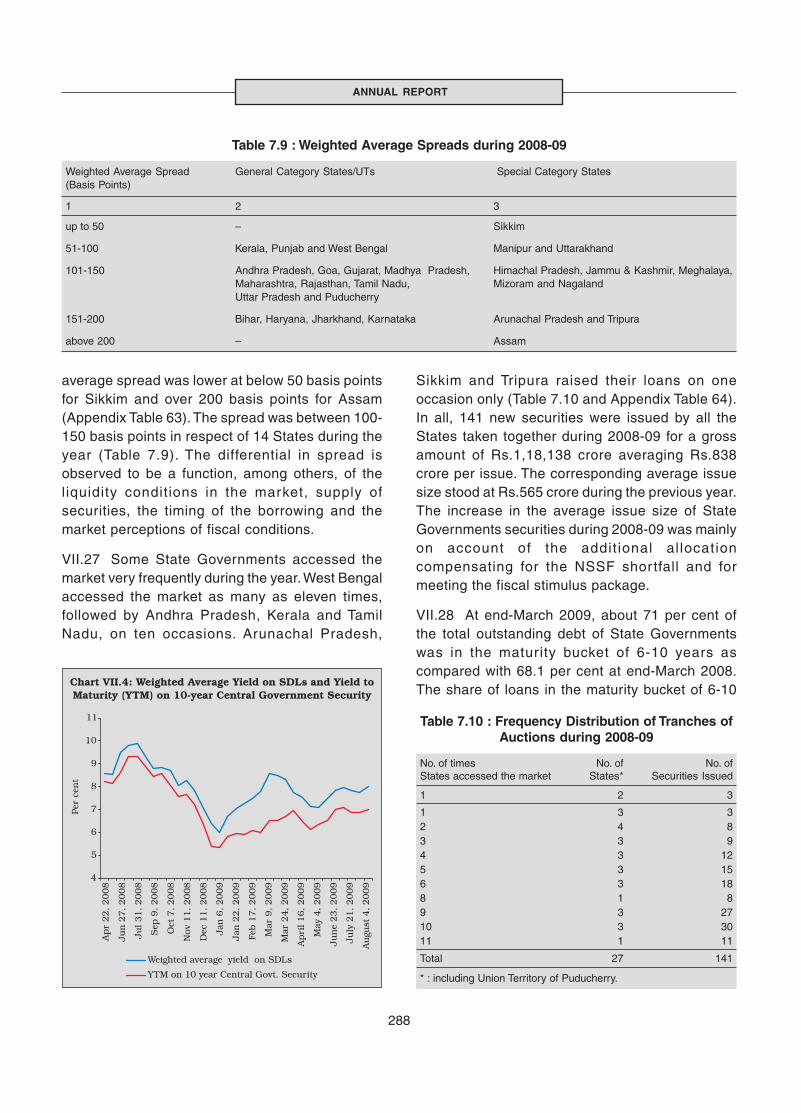
288
ANNUAL REPORT
average spread was lower at below 50 basis pointsfor Sikkim and over 200 basis points for Assam(Appendix Table 63). The spread was between 100-150 basis points in respect of 14 States during theyear (Table 7.9). The differential in spread isobserved to be a function, among others, of theliquidity conditions in the market, supply ofsecurities, the timing of the borrowing and themarket perceptions of fiscal conditions.
VII.27 Some State Governments accessed themarket very frequently during the year. West Bengalaccessed the market as many as eleven times,followed by Andhra Pradesh, Kerala and TamilNadu, on ten occasions. Arunachal Pradesh,
Sikkim and Tripura raised their loans on oneoccasion only (Table 7.10 and Appendix Table 64).In all, 141 new securities were issued by all theStates taken together during 2008-09 for a grossamount of Rs.1,18,138 crore averaging Rs.838crore per issue. The corresponding average issuesize stood at Rs.565 crore during the previous year.The increase in the average issue size of StateGovernments securities during 2008-09 was mainlyon account of the addit ional al locationcompensating for the NSSF shortfall and formeeting the fiscal stimulus package.
VII.28 At end-March 2009, about 71 per cent ofthe total outstanding debt of State Governmentswas in the maturity bucket of 6-10 years ascompared with 68.1 per cent at end-March 2008.The share of loans in the maturity bucket of 6-10
Table 7.10 : Frequency Distribution of Tranches ofAuctions during 2008-09
No. of times No. of No. ofStates accessed the market States* Securities Issued
1 2 3
1 3 32 4 83 3 94 3 125 3 156 3 188 1 89 3 2710 3 3011 1 11
Total 27 141
* : including Union Territory of Puducherry.
Table 7.9 : Weighted Average Spreads during 2008-09
Weighted Average Spread General Category States/UTs Special Category States(Basis Points)
1 2 3
up to 50 – Sikkim
51-100 Kerala, Punjab and West Bengal Manipur and Uttarakhand
101-150 Andhra Pradesh, Goa, Gujarat, Madhya Pradesh, Himachal Pradesh, Jammu & Kashmir, Meghalaya,Maharashtra, Rajasthan, Tamil Nadu, Mizoram and NagalandUttar Pradesh and Puducherry
151-200 Bihar, Haryana, Jharkhand, Karnataka Arunachal Pradesh and Tripura
above 200 – Assam
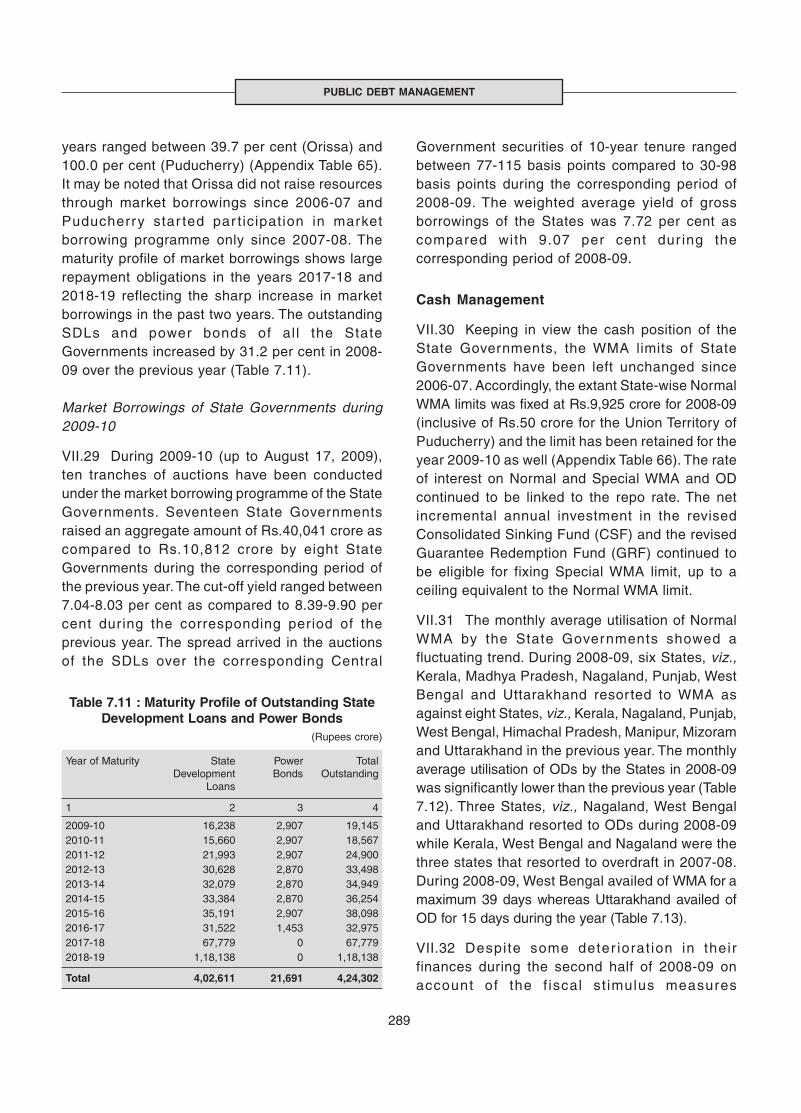
289
PUBLIC DEBT MANAGEMENT
years ranged between 39.7 per cent (Orissa) and100.0 per cent (Puducherry) (Appendix Table 65).It may be noted that Orissa did not raise resourcesthrough market borrowings since 2006-07 andPuducherry star ted par t icipation in marketborrowing programme only since 2007-08. Thematurity profile of market borrowings shows largerepayment obligations in the years 2017-18 and2018-19 reflecting the sharp increase in marketborrowings in the past two years. The outstandingSDLs and power bonds of al l the StateGovernments increased by 31.2 per cent in 2008-09 over the previous year (Table 7.11).
Market Borrowings of State Governments during2009-10
VII.29 During 2009-10 (up to August 17, 2009),ten tranches of auctions have been conductedunder the market borrowing programme of the StateGovernments. Seventeen State Governmentsraised an aggregate amount of Rs.40,041 crore ascompared to Rs.10,812 crore by eight StateGovernments during the corresponding period ofthe previous year. The cut-off yield ranged between7.04-8.03 per cent as compared to 8.39-9.90 percent during the corresponding period of theprevious year. The spread arrived in the auctionsof the SDLs over the corresponding Central
Government securities of 10-year tenure rangedbetween 77-115 basis points compared to 30-98basis points during the corresponding period of2008-09. The weighted average yield of grossborrowings of the States was 7.72 per cent ascompared with 9.07 per cent dur ing thecorresponding period of 2008-09.
Cash Management
VII.30 Keeping in view the cash position of theState Governments, the WMA limits of StateGovernments have been left unchanged since2006-07. Accordingly, the extant State-wise NormalWMA limits was fixed at Rs.9,925 crore for 2008-09(inclusive of Rs.50 crore for the Union Territory ofPuducherry) and the limit has been retained for theyear 2009-10 as well (Appendix Table 66). The rateof interest on Normal and Special WMA and ODcontinued to be linked to the repo rate. The netincremental annual investment in the revisedConsolidated Sinking Fund (CSF) and the revisedGuarantee Redemption Fund (GRF) continued tobe eligible for fixing Special WMA limit, up to aceiling equivalent to the Normal WMA limit.
VII.31 The monthly average utilisation of NormalWMA by the State Governments showed afluctuating trend. During 2008-09, six States, viz.,Kerala, Madhya Pradesh, Nagaland, Punjab, WestBengal and Uttarakhand resorted to WMA asagainst eight States, viz., Kerala, Nagaland, Punjab,West Bengal, Himachal Pradesh, Manipur, Mizoramand Uttarakhand in the previous year. The monthlyaverage utilisation of ODs by the States in 2008-09was significantly lower than the previous year (Table7.12). Three States, viz., Nagaland, West Bengaland Uttarakhand resorted to ODs during 2008-09while Kerala, West Bengal and Nagaland were thethree states that resorted to overdraft in 2007-08.During 2008-09, West Bengal availed of WMA for amaximum 39 days whereas Uttarakhand availed ofOD for 15 days during the year (Table 7.13).
VII.32 Despite some deter iorat ion in theirfinances during the second half of 2008-09 onaccount of the f iscal st imulus measures
Table 7.11 : Maturity Profile of Outstanding StateDevelopment Loans and Power Bonds
(Rupees crore)
Year of Maturity State Power TotalDevelopment Bonds Outstanding
Loans
1 2 3 4
2009-10 16,238 2,907 19,1452010-11 15,660 2,907 18,5672011-12 21,993 2,907 24,9002012-13 30,628 2,870 33,4982013-14 32,079 2,870 34,9492014-15 33,384 2,870 36,2542015-16 35,191 2,907 38,0982016-17 31,522 1,453 32,9752017-18 67,779 0 67,7792018-19 1,18,138 0 1,18,138
Total 4,02,611 21,691 4,24,302
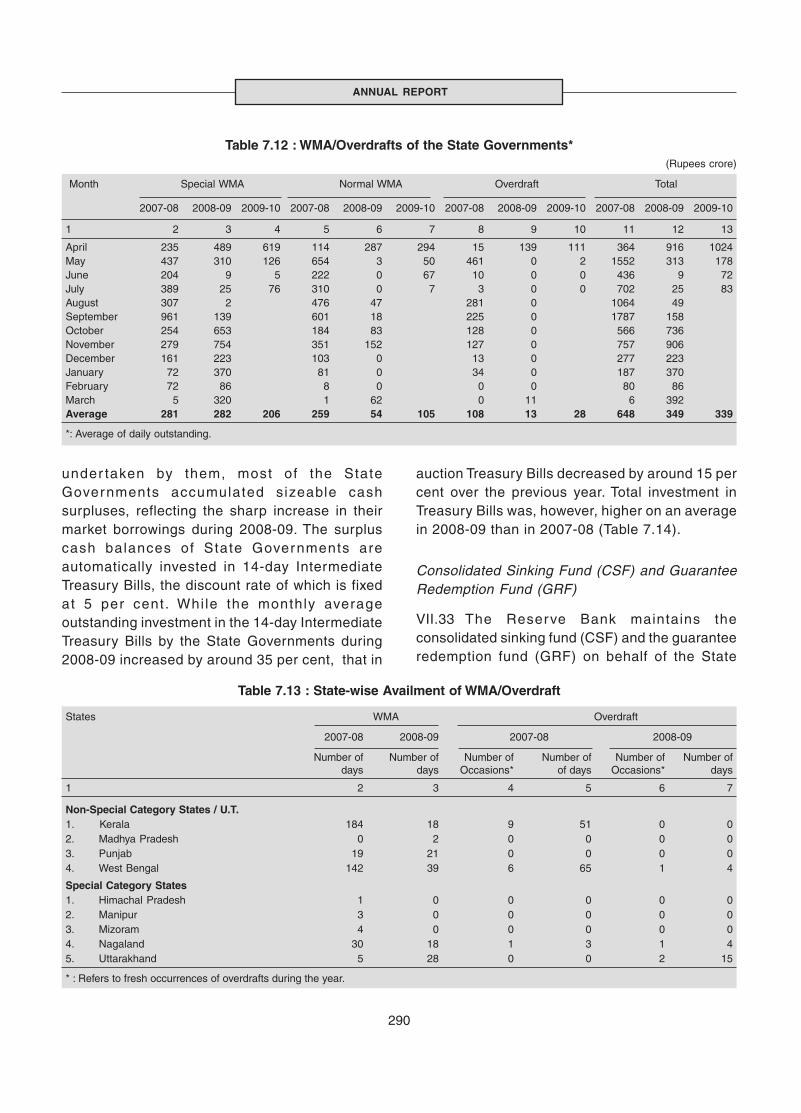
290
ANNUAL REPORT
under taken by them, most of the StateGovernments accumulated sizeable cashsurpluses, reflecting the sharp increase in theirmarket borrowings during 2008-09. The surpluscash balances of State Governments areautomatically invested in 14-day IntermediateTreasury Bills, the discount rate of which is fixedat 5 per cent. Whi le the monthly averageoutstanding investment in the 14-day IntermediateTreasury Bills by the State Governments during2008-09 increased by around 35 per cent, that in
auction Treasury Bills decreased by around 15 percent over the previous year. Total investment inTreasury Bills was, however, higher on an averagein 2008-09 than in 2007-08 (Table 7.14).
Consolidated Sinking Fund (CSF) and GuaranteeRedemption Fund (GRF)
VII.33 The Reserve Bank maintains theconsolidated sinking fund (CSF) and the guaranteeredemption fund (GRF) on behalf of the State
Table 7.12 : WMA/Overdrafts of the State Governments*(Rupees crore)
Month Special WMA Normal WMA Overdraft Total
2007-08 2008-09 2009-10 2007-08 2008-09 2009-10 2007-08 2008-09 2009-10 2007-08 2008-09 2009-10
1 2 3 4 5 6 7 8 9 10 11 12 13
April 235 489 619 114 287 294 15 139 111 364 916 1024May 437 310 126 654 3 50 461 0 2 1552 313 178June 204 9 5 222 0 67 10 0 0 436 9 72July 389 25 76 310 0 7 3 0 0 702 25 83August 307 2 476 47 281 0 1064 49September 961 139 601 18 225 0 1787 158October 254 653 184 83 128 0 566 736November 279 754 351 152 127 0 757 906December 161 223 103 0 13 0 277 223January 72 370 81 0 34 0 187 370February 72 86 8 0 0 0 80 86March 5 320 1 62 0 11 6 392Average 281 282 206 259 54 105 108 13 28 648 349 339
*: Average of daily outstanding.
Table 7.13 : State-wise Availment of WMA/Overdraft
States WMA Overdraft
2007-08 2008-09 2007-08 2008-09
Number of Number of Number of Number of Number of Number ofdays days Occasions* of days Occasions* days
1 2 3 4 5 6 7
Non-Special Category States / U.T.1. Kerala 184 18 9 51 0 02. Madhya Pradesh 0 2 0 0 0 03. Punjab 19 21 0 0 0 04. West Bengal 142 39 6 65 1 4
Special Category States1. Himachal Pradesh 1 0 0 0 0 02. Manipur 3 0 0 0 0 03. Mizoram 4 0 0 0 0 04. Nagaland 30 18 1 3 1 45. Uttarakhand 5 28 0 0 2 15
* : Refers to fresh occurrences of overdrafts during the year.

291
PUBLIC DEBT MANAGEMENT
Governments from contributions made by them.While the CSF provides a cushion for amortisationof market borrowing/liabilities, the GRF provides acushion for the servicing of contingent liabilityarising from invocation of guarantees issued by theState Governments in respect of bonds issued andother borrowings by state level undertakings orother bodies. The aggregate outstandinginvestments in CSF by the 18 State Governmentsincreased to Rs. 24,032 crore at end-March 2009from Rs.18,946 crore in respect of 17 States at end-March 2008. As on March 31, 2009, nine Statesnotified their GRF scheme and the aggregateoutstanding investments in GRF by these Statesincreased to Rs.3,082 crore as on March 31, 2009from Rs.2,805 crore in respect of 8 States as onMarch 31, 2008.
Conference of State Finance Secretaries
VII.34 The 21st Conference of State FinanceSecretaries was held on May 15, 2008. Apart fromoperational issues per taining to Governmenttransactions, the discussions primarily focused onissues relating to the fiscal transparency at the Statelevel, financing of local (urban) bodies, managementof investment portfolio of the States, estimation ofthe States’ market borrowings and budget
Table 7.14 : Investments of the State Governments / UT*(Rupees crore)
Month Investment in 14-day Treasury Bills Investment in Auction Treasury Bills Total
2007-08 2008-09 2009-10 2007-08 2008-09 2009-10 2007-08 2008-09 2009-10
1 2 3 4 5 6 7 8 9 10
April 31,160 48,192 74,607 34,496 31,780 8,875 65,656 79,972 83,482May 31,359 48,280 66,585 32,612 32,244 8,664 63,971 80,525 75,249June 44,430 42,865 69,482 32,500 40,285 6,125 76,930 83,150 75,607July 35,938 46,742 75,403 39,557 38,802 2,125 75,495 85,543 77,528August 36,458 44,110 42,477 43,069 78,935 87,179September 34,282 40,112 39,201 40,927 73,483 81,038October 32,052 39,328 35,195 32,705 67,247 72,033November 30,556 41,878 33,872 26,988 64,428 68,866December 38,042 51,551 31,565 24,055 69,607 75,606January 45,029 63,420 29,661 20,084 74,690 83,504February 50,633 75,193 32,403 14,150 83,036 89,342March 65,910 1,01,557 29,181 6,893 95,091 1,08,450Average 39,654 53,602 71,519 34,393 29,332 6,447 74,047 82,934 77,966
*: Average of Friday outstanding.
management of the States. Following discussionsin the Conference, three Working Groups, viz.,Working Groups on ‘Fiscal Management beyondFRBM’, ‘Local (urban) Finances’ and ‘FiscalTransparency at State Level’ have been set up toexamine the related issues. The major issuesfocused in the 22nd Conference of the State FinanceSecretaries held on May 29, 2009, related to surpluscash balances of the State Governments; projectionson market borrowings of the States; advanceplanning for borrowing by the States; imparting ofliquidity to the State Development Loans byreissuance and consolidation; electronic benefittransfer to the beneficiaries of the social securityassistance of the Governments and impact ofcounter-cyclical fiscal measures taken by the States.
VII.35 The Reserve Bank has responded to thechallenge of managing the large market borrowingprogramme with an appropriate assessment of theliquidity conditions and market disruptions havebeen avoided by synchronising liquidity enhancingoperations, such as unwinding balances under theMSS and conducting open market purchases ofgovernment securities, with the timing of borrowingprogrammes, while also seeking feedback frommarket participants on a regular basis. Hence,despite the sharp increase in the size of
292
ANNUAL REPORT
borrowings, the market borrowing programme of theCentral and State Governments during 2008-09could be completed in a non-disruptive manner.Apart from the Reserve Bank’s active and dynamicdebt management strategy which was well co-ordinated with monetary management in terms ofensuring ample liquidity in the system and cut inmonetary policy rates, other factors whichfacilitated the relatively smooth conduct of themarket borrowing programme included decline ininflation, weak private sector demand for credit andgreater appetite for government securities bycommercial banks due to higher risk aversion.
VII.36 The size of combined net market borrowingrequirements of the Central and State Governmentsfor 2009-10 (dated securities and 364-day TreasuryBills), at Rs.5,37,957 crore, is estimated to be higherthan the 2008-09 actual borrowings by 55.4 per cent,
which was on top of an increase of 108.8 per centover 2007-08. Accordingly, the smooth conduct ofdebt management would assume even greaterimpor tance dur ing the current f iscal year.Hardening of yields witnessed in recent monthscould militate against the low interest rate regimerequired to stimulate and revive the economy. TheReserve Bank would continue with its activeliquidity management policy to ensure that the largegovernment borrowing does not crowd out presentand potential credit demand from the private sector.As the private sector demand picks up with therevival of the economy, and the need for fiscalstimulus also declines correspondingly, theGovernment could phase out its large borrowings,thereby allowing the private sector demand topropel and sustain the growth momentum, withoutbeing constrained by concerns on the availabilityof liquidity in the system.
CURRENCY MANAGEMENTVIII
293
VIII.1 Issue and management of currencycontinues to be one of the traditional functions ofthe Reserve Bank since its inception. But thechallenges to managing currency have increasedover time. Given the expansion of the economy andthe growing needs for banknotes, the task ofcurrency management has become increasinglycomplex. Distribution of fresh notes as well aswithdrawal and destruction of soi led notesconstitute the core of the currency managementoperations of the Reserve Bank.
VIII.2 The Reserve Bank, dur ing 2008-09,continued to take various measures to meet theincreased public demand for banknotes and coinswhile simultaneously improving the quality ofbanknotes. The demand for banknotes was thusmet in full during 2008-09 along with a markedimprovement in the quali ty of banknotes,particularly in Rs.10 denomination banknotes. Thenumber of soiled banknotes disposed of by theReserve Bank dur ing 2008-09 increasedsignificantly, following continued and concertedefforts to increase its disposal capacity. All thecurrency chests maintained with the banks havealready been equipped with Note Sorting Machines(NSMs). Going forward, the Reserve Bank hastaken steps to procure and install desktop NSMsin select 210 non-currency chest branches during
2008-09. NSMs have been instal led at 192branches as a part of this initiative.
VIII.3 During 2008-09, the indent for banknotesplaced with the printing presses was met in full interms of volume and substantially in terms of value.The Reserve Bank also adequately met theincreased demand for coins, which began fromOctober 2006 and strengthened further during2008-09. The total number of currency chestsdeclined during 2008-09, reflecting the impact ofthe ongoing policy of rat ionalisation andconsolidation of currency chests by public sectorbanks. This chapter documents the measures andinitiatives taken by the Reserve Bank during thecourse of the year on specific aspects of currencymanagement.
BANKNOTES IN CIRCULATION
VIII.4 The value as well as the volume ofbanknotes continued to increase during 2008-09(Table 8.1). The growth in the volume of banknotes,however, was lower than that in value terms,reflecting the gradual compositional shift towardshigher denomination banknotes, par ticularlyRs.1,000 and Rs.500. The volume of Rs.10denomination banknotes, however, increased by31.0 per cent due to sustained efforts to infuse a
During 2008-09, there was a marked improvement in the quality of banknotes. The value ofbanknotes increased by 17.1 per cent and by 10.7 per cent in volume terms. The Reserve Bank hastaken further steps to strengthen mechanised processing of banknotes, as a part of the Clean NotePolicy. The Reserve Bank is examining various options to increase the life of banknotes, especiallyin the lower denominations. For the third year in succession, the indent for banknotes for 2008-09was met in full by the printing presses. The Bank continued its efforts to bring down the cost ofbanknotes while maintaining their quality. The policy of rationalisation and consolidation ofcurrency chests resulted in further decline in the number of chests maintained by the publicsector banks. The Reserve Bank has taken several steps to check the menace of counterfeitbanknotes.

294
ANNUAL REPORT
Table 8.1: Banknotes in Circulation
Denomination Volume (Million pieces) Value (Rupees crore)
End-March End-March End-March End-March End-March End-March2007 2008 2009 2007 2008 2009
1 2 3 4 5 6 7
Rs.2 and Rs.5 6,008 7,405 7,867 2,334 2,747 2,936(15.1) (16.7) (16.1) (0.5) (0.5) (0.4)
Rs.10 7,155 9,333 12,222 7,155 9,333 12,222(18.0) (21.1) (25.0) (1.4) (1.6) (1.8)
Rs.20 2,089 2,054 2,200 4,178 4,108 4,399(5.2) (4.6) (4.5) (0.8) (0.7) (0.6)
Rs.50 5,590 5,302 4,888 27,951 26,508 24,440(14.0) (12.0) (10.0) (5.6) (4.6) (3.6)
Rs.100 13,544 13,457 13,702 1,35,444 1,34,575 1,37,028(34.0) (30.4) (28.0) (27.3) (23.1) (20.1)
Rs.500 4,508 5,262 6,166 2,25,400 2,63,108 3,08,304(11.3) (11.9) (12.6) (45.4) (45.2) (45.3)
Rs.1,000 937 1,412 1,918 93,676 1,41,219 1,91,784(2.4) (3.2) (3.9) (18.9) (24.3) (28.2)
Total 39,831 44,225 48,963 4,96,138 5,81,598 6,81,113
Note: Figures in parentheses in columns 2 to 7 indicate percentage to total banknotes in circulation.
greater number of fresh banknotes into circulationfor improving the quality of such banknotes.
VIII.5 The long-run secular decline in the share ofcurrency in broad money (M3) continued in 2008-09.The ratio has declined steadily from as high as 39.7per cent as at end-March 1971 to 16.0 per cent asat end-March 2001 and gradually thereafter to 14.0per cent as at end March 2009, reflecting financialdeepening, increased use of credit and debit cardsand liquid financial markets. The ratio of currencywith the public to GDP, however, increased to 12.5
per cent in 2008-09 from 12.0 per cent a year ago(Chart VIII.1).
VIII.6 In volume terms, Rs.100 denominationbanknotes had the largest share, while in terms ofvalue, Rs. 500 denomination banknotes had thelargest share as at end-March 2009 (Chart VIII.2).
COINS IN CIRCULATION
VIII.7 The increased demand for coins that startedfrom October 2006, continued during 2008-09.
294
CURRENCY MANAGEMENT
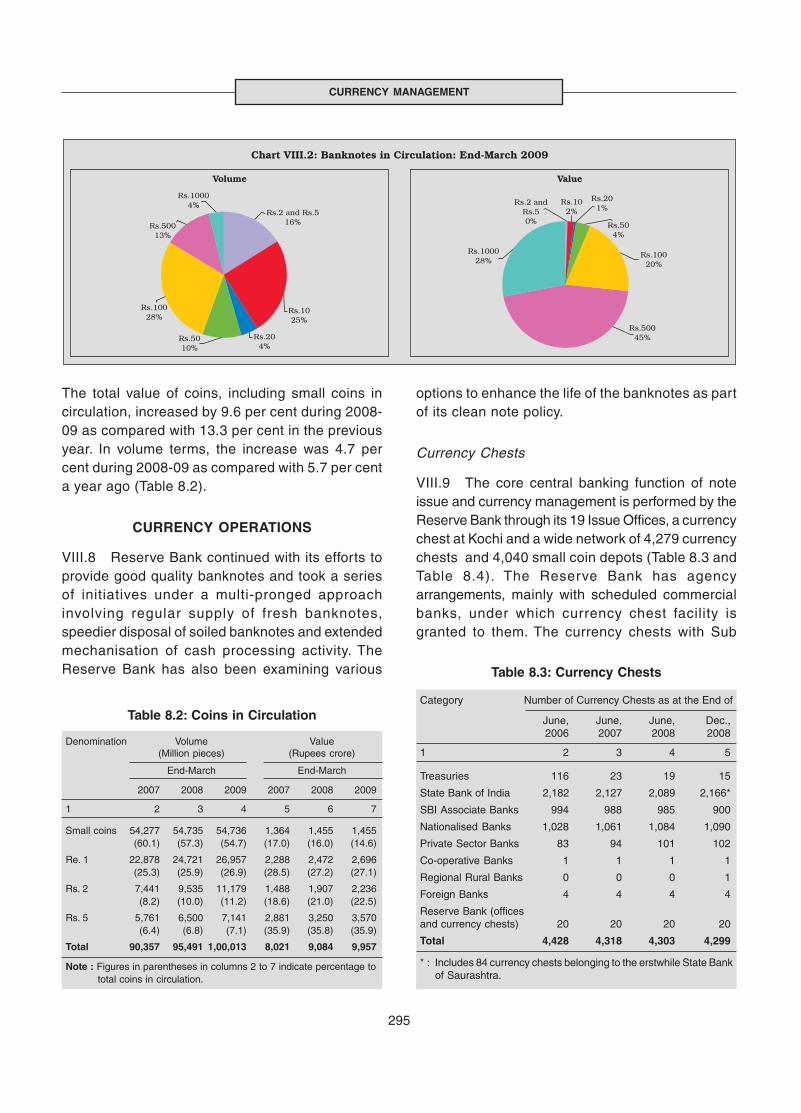
295
CURRENCY MANAGEMENT
The total value of coins, including small coins incirculation, increased by 9.6 per cent during 2008-09 as compared with 13.3 per cent in the previousyear. In volume terms, the increase was 4.7 percent during 2008-09 as compared with 5.7 per centa year ago (Table 8.2).
CURRENCY OPERATIONS
VIII.8 Reserve Bank continued with its efforts toprovide good quality banknotes and took a seriesof initiatives under a multi-pronged approachinvolving regular supply of fresh banknotes,speedier disposal of soiled banknotes and extendedmechanisation of cash processing activity. TheReserve Bank has also been examining various Table 8.3: Currency Chests
Category Number of Currency Chests as at the End of
June, June, June, Dec.,2006 2007 2008 2008
1 2 3 4 5
Treasuries 116 23 19 15
State Bank of India 2,182 2,127 2,089 2,166*
SBI Associate Banks 994 988 985 900
Nationalised Banks 1,028 1,061 1,084 1,090
Private Sector Banks 83 94 101 102
Co-operative Banks 1 1 1 1
Regional Rural Banks 0 0 0 1
Foreign Banks 4 4 4 4
Reserve Bank (officesand currency chests) 20 20 20 20
Total 4,428 4,318 4,303 4,299
* : Includes 84 currency chests belonging to the erstwhile State Bankof Saurashtra.
options to enhance the life of the banknotes as partof its clean note policy.
Currency Chests
VIII.9 The core central banking function of noteissue and currency management is performed by theReserve Bank through its 19 Issue Offices, a currencychest at Kochi and a wide network of 4,279 currencychests and 4,040 small coin depots (Table 8.3 andTable 8.4). The Reserve Bank has agencyarrangements, mainly with scheduled commercialbanks, under which currency chest facility isgranted to them. The currency chests with Sub
Table 8.2: Coins in Circulation
Denomination Volume Value(Million pieces) (Rupees crore)
End-March End-March
2007 2008 2009 2007 2008 2009
1 2 3 4 5 6 7
Small coins 54,277 54,735 54,736 1,364 1,455 1,455(60.1) (57.3) (54.7) (17.0) (16.0) (14.6)
Re. 1 22,878 24,721 26,957 2,288 2,472 2,696(25.3) (25.9) (26.9) (28.5) (27.2) (27.1)
Rs. 2 7,441 9,535 11,179 1,488 1,907 2,236(8.2) (10.0) (11.2) (18.6) (21.0) (22.5)
Rs. 5 5,761 6,500 7,141 2,881 3,250 3,570(6.4) (6.8) (7.1) (35.9) (35.8) (35.9)
Total 90,357 95,491 1,00,013 8,021 9,084 9,957
Note : Figures in parentheses in columns 2 to 7 indicate percentage tototal coins in circulation.
296
ANNUAL REPORT
Treasury Offices (STOs) are being gradually phasedout and their number reduced further to 15 during2008-09. The State Bank Group continued to havethe largest share (71.3 per cent) of currency chests,followed by nationalised banks (25.3 per cent).
Indent and Supply of Fresh Banknotes
VIII.10 For the third year in succession, the indentfor banknotes for 2008-09 was met in full by theprinting presses. The indent was matched by thesupply both in volume and value terms (Tables 8.5and 8.6), which affirms the effective monitoring of
supplies and efficient allocation and managementof the capacities at the banknote presses.
VIII.11 The Bharatiya Reserve Bank Note MudranPvt. Ltd. (BRBNMPL), a wholly owned subsidiaryof the Reserve Bank was set up in 1996 to takeover the work of the New Note Press project.BRBNMPL prints bank notes at its two note pressesviz., Mysore (Karnataka) and Salboni (WestBengal). The total supply of banknotes byBRBNMPL during 2008-09 (July-June) was 8,501million pieces as compared with 8,488 millionpieces during 2007-08. During 2008-09, 5,160mil l ion pieces of notes were supplied byGovernment owned Security Printing and MintingCorporation of India Limited (SPMCIL) ascompared with 5,442 million pieces in 2007-08.
Printing Costs of Banknotes
VIII.12 It has been the Reserve Bank’s effort toconsistently br ing down the cost of pr intingbanknotes and to encourage the note printingpresses to bring about greater efficiencies in theiroperations, while maintaining the quality of theprinted banknotes. As a part of these ongoingefforts, the Reserve Bank continued to sourcebanknotes from the lowest cost producers, viz., theSecurity Printing and Minting Corporation of IndiaLtd. (SPMCIL) and the Bharatiya Reserve BankNote Mudran (Pvt.) Ltd. (BRBNMPL) (Table 8.7).
Table 8.4: Small Coin Depots
Category Number of Small Coin Depots as at the End of
June, June, June, Dec.,2006 2007 2008 2008
1 2 3 4 5
Treasuries 1 - - -
State Bank of India 2,088 2,043 2,019 2,098*
SBI Associate Banks 1,013 965 965 882
Nationalised Banks 895 917 943 953
Private Sector Banks 80 92 100 101
Co-operative Banks 1 1 1 1
Regional Rural Banks 0 0 0 1
Foreign Banks 4 4 4 4
Reserve Bank (officesand currency chests) 20 20 20 20
Total 4,102 4,042 4,052 4,060
* : Includes 83 small coin depots belonging to the erstwhile StateBank of Saurashtra.
Table 8.5: Volume of Banknotes Indented and Supplied(Million pieces)
Denomination 2006-07 2007-08 2008-09 2009-10
Indent Supply % of Indent Supply % of Indent Supply % of Indentsupply to supply to supply to
indent indent indent
1 2 3 4 5 6 7 8 9 10 11
Rs. 5 - 50 - - - - 250 250 100 1,000
Rs. 10 3,500 3,480 99 4,200 4,193 100 5,000 5,030 101 5,000
Rs. 20 500 438 88 600 636 106 500 500 100 800
Rs. 50 1,400 1,458 104 1,200 1,213 101 1,000 1,008 101 1,000
Rs. 100 4,000 4,034 101 4,200 4,199 100 4,200 4,215 100 4,000
Rs. 500 1,500 1,473 98 1,800 1,805 100 3,500 3,459 99 4,000
Rs. 1,000 600 589 98 700 699 100 800 763 95 1,000
Total 11,500 11,522 100 12,700 12,745 100 15,250 15,225 100 16,800
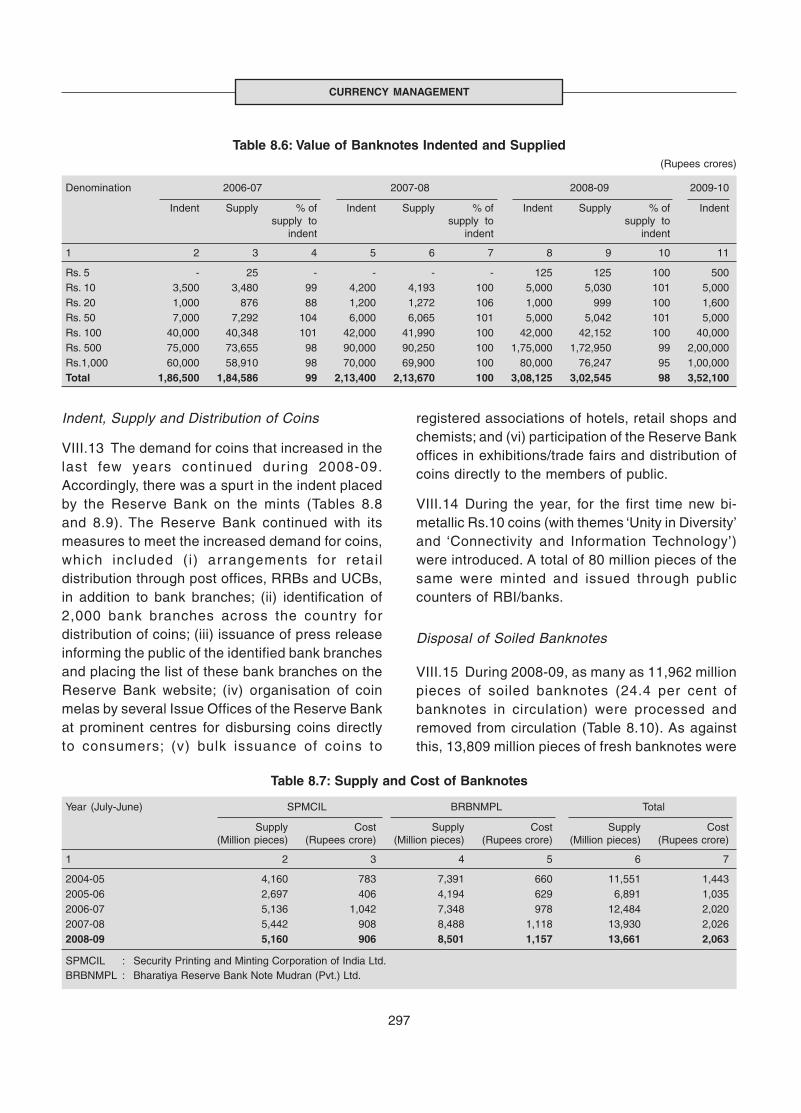
297
CURRENCY MANAGEMENT
Table 8.6: Value of Banknotes Indented and Supplied(Rupees crores)
Denomination 2006-07 2007-08 2008-09 2009-10
Indent Supply % of Indent Supply % of Indent Supply % of Indentsupply to supply to supply to
indent indent indent
1 2 3 4 5 6 7 8 9 10 11
Rs. 5 - 25 - - - - 125 125 100 500Rs. 10 3,500 3,480 99 4,200 4,193 100 5,000 5,030 101 5,000Rs. 20 1,000 876 88 1,200 1,272 106 1,000 999 100 1,600Rs. 50 7,000 7,292 104 6,000 6,065 101 5,000 5,042 101 5,000Rs. 100 40,000 40,348 101 42,000 41,990 100 42,000 42,152 100 40,000Rs. 500 75,000 73,655 98 90,000 90,250 100 1,75,000 1,72,950 99 2,00,000Rs.1,000 60,000 58,910 98 70,000 69,900 100 80,000 76,247 95 1,00,000Total 1,86,500 1,84,586 99 2,13,400 2,13,670 100 3,08,125 3,02,545 98 3,52,100
Table 8.7: Supply and Cost of Banknotes
Year (July-June) SPMCIL BRBNMPL Total
Supply Cost Supply Cost Supply Cost(Million pieces) (Rupees crore) (Million pieces) (Rupees crore) (Million pieces) (Rupees crore)
1 2 3 4 5 6 7
2004-05 4,160 783 7,391 660 11,551 1,4432005-06 2,697 406 4,194 629 6,891 1,0352006-07 5,136 1,042 7,348 978 12,484 2,0202007-08 5,442 908 8,488 1,118 13,930 2,0262008-09 5,160 906 8,501 1,157 13,661 2,063
SPMCIL : Security Printing and Minting Corporation of India Ltd.BRBNMPL : Bharatiya Reserve Bank Note Mudran (Pvt.) Ltd.
Indent, Supply and Distribution of Coins
VIII.13 The demand for coins that increased in thelast few years continued dur ing 2008-09.Accordingly, there was a spurt in the indent placedby the Reserve Bank on the mints (Tables 8.8and 8.9). The Reserve Bank continued with itsmeasures to meet the increased demand for coins,which included (i) arrangements for retai ldistribution through post offices, RRBs and UCBs,in addition to bank branches; (ii) identification of2,000 bank branches across the country fordistribution of coins; (iii) issuance of press releaseinforming the public of the identified bank branchesand placing the list of these bank branches on theReserve Bank website; (iv) organisation of coinmelas by several Issue Offices of the Reserve Bankat prominent centres for disbursing coins directlyto consumers; (v) bulk issuance of coins to
registered associations of hotels, retail shops andchemists; and (vi) participation of the Reserve Bankoffices in exhibitions/trade fairs and distribution ofcoins directly to the members of public.
VIII.14 During the year, for the first time new bi-metallic Rs.10 coins (with themes ‘Unity in Diversity’and ‘Connectivity and Information Technology’)were introduced. A total of 80 million pieces of thesame were minted and issued through publiccounters of RBI/banks.
Disposal of Soiled Banknotes
VIII.15 During 2008-09, as many as 11,962 millionpieces of soiled banknotes (24.4 per cent ofbanknotes in circulation) were processed andremoved from circulation (Table 8.10). As againstthis, 13,809 million pieces of fresh banknotes were
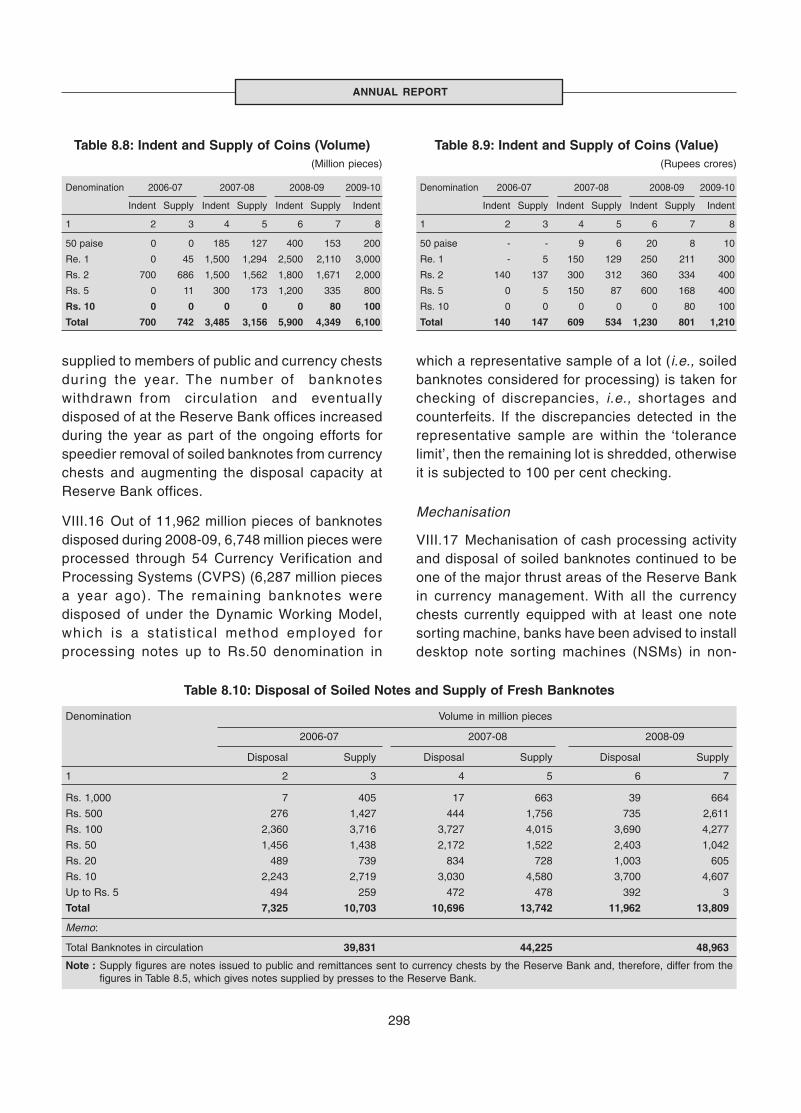
298
ANNUAL REPORT
which a representative sample of a lot (i.e., soiledbanknotes considered for processing) is taken forchecking of discrepancies, i.e., shortages andcounterfeits. If the discrepancies detected in therepresentative sample are within the ‘tolerancelimit’, then the remaining lot is shredded, otherwiseit is subjected to 100 per cent checking.
Mechanisation
VIII.17 Mechanisation of cash processing activityand disposal of soiled banknotes continued to beone of the major thrust areas of the Reserve Bankin currency management. With all the currencychests currently equipped with at least one notesorting machine, banks have been advised to installdesktop note sorting machines (NSMs) in non-
Table 8.8: Indent and Supply of Coins (Volume)(Million pieces)
Denomination 2006-07 2007-08 2008-09 2009-10
Indent Supply Indent Supply Indent Supply Indent
1 2 3 4 5 6 7 8
50 paise 0 0 185 127 400 153 200
Re. 1 0 45 1,500 1,294 2,500 2,110 3,000
Rs. 2 700 686 1,500 1,562 1,800 1,671 2,000
Rs. 5 0 11 300 173 1,200 335 800
Rs. 10 0 0 0 0 0 80 100
Total 700 742 3,485 3,156 5,900 4,349 6,100
supplied to members of public and currency chestsduring the year. The number of banknoteswithdrawn from circulation and eventuallydisposed of at the Reserve Bank offices increasedduring the year as part of the ongoing efforts forspeedier removal of soiled banknotes from currencychests and augmenting the disposal capacity atReserve Bank offices.
VIII.16 Out of 11,962 million pieces of banknotesdisposed during 2008-09, 6,748 million pieces wereprocessed through 54 Currency Verification andProcessing Systems (CVPS) (6,287 million piecesa year ago). The remaining banknotes weredisposed of under the Dynamic Working Model,which is a statist ical method employed forprocessing notes up to Rs.50 denomination in
Table 8.9: Indent and Supply of Coins (Value)(Rupees crores)
Denomination 2006-07 2007-08 2008-09 2009-10
Indent Supply Indent Supply Indent Supply Indent
1 2 3 4 5 6 7 8
50 paise - - 9 6 20 8 10
Re. 1 - 5 150 129 250 211 300
Rs. 2 140 137 300 312 360 334 400
Rs. 5 0 5 150 87 600 168 400
Rs. 10 0 0 0 0 0 80 100
Total 140 147 609 534 1,230 801 1,210
Table 8.10: Disposal of Soiled Notes and Supply of Fresh Banknotes
Denomination Volume in million pieces
2006-07 2007-08 2008-09
Disposal Supply Disposal Supply Disposal Supply
1 2 3 4 5 6 7
Rs. 1,000 7 405 17 663 39 664
Rs. 500 276 1,427 444 1,756 735 2,611
Rs. 100 2,360 3,716 3,727 4,015 3,690 4,277
Rs. 50 1,456 1,438 2,172 1,522 2,403 1,042
Rs. 20 489 739 834 728 1,003 605
Rs. 10 2,243 2,719 3,030 4,580 3,700 4,607
Up to Rs. 5 494 259 472 478 392 3
Total 7,325 10,703 10,696 13,742 11,962 13,809
Memo:
Total Banknotes in circulation 39,831 44,225 48,963
Note : Supply figures are notes issued to public and remittances sent to currency chests by the Reserve Bank and, therefore, differ from thefigures in Table 8.5, which gives notes supplied by presses to the Reserve Bank.
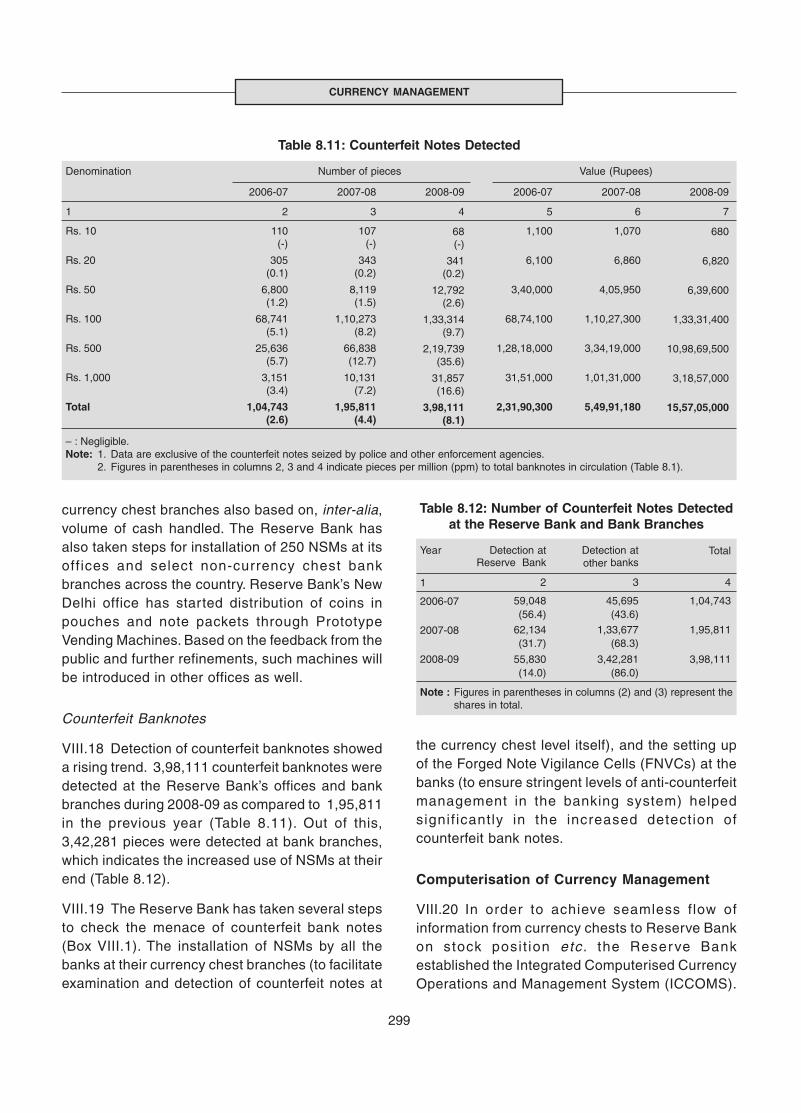
299
CURRENCY MANAGEMENT
currency chest branches also based on, inter-alia,volume of cash handled. The Reserve Bank hasalso taken steps for installation of 250 NSMs at itsoffices and select non-currency chest bankbranches across the country. Reserve Bank’s NewDelhi office has started distribution of coins inpouches and note packets through PrototypeVending Machines. Based on the feedback from thepublic and further refinements, such machines willbe introduced in other offices as well.
Counterfeit Banknotes
VIII.18 Detection of counterfeit banknotes showeda rising trend. 3,98,111 counterfeit banknotes weredetected at the Reserve Bank’s offices and bankbranches during 2008-09 as compared to 1,95,811in the previous year (Table 8.11). Out of this,3,42,281 pieces were detected at bank branches,which indicates the increased use of NSMs at theirend (Table 8.12).
VIII.19 The Reserve Bank has taken several stepsto check the menace of counterfeit bank notes(Box VIII.1). The installation of NSMs by all thebanks at their currency chest branches (to facilitateexamination and detection of counterfeit notes at
Table 8.12: Number of Counterfeit Notes Detectedat the Reserve Bank and Bank Branches
Year Detection at Detection at TotalReserve Bank other banks
1 2 3 4
2006-07 59,048 45,695 1,04,743(56.4) (43.6)
2007-08 62,134 1,33,677 1,95,811(31.7) (68.3)
2008-09 55,830 3,42,281 3,98,111(14.0) (86.0)
Note : Figures in parentheses in columns (2) and (3) represent theshares in total.
the currency chest level itself), and the setting upof the Forged Note Vigilance Cells (FNVCs) at thebanks (to ensure stringent levels of anti-counterfeitmanagement in the banking system) helpedsignif icantly in the increased detection ofcounterfeit bank notes.
Computerisation of Currency Management
VIII.20 In order to achieve seamless flow ofinformation from currency chests to Reserve Bankon stock posi t ion etc. the Reserve Bankestablished the Integrated Computerised CurrencyOperations and Management System (ICCOMS).
Table 8.11: Counterfeit Notes Detected
Denomination Number of pieces Value (Rupees)
2006-07 2007-08 2008-09 2006-07 2007-08 2008-09
1 2 3 4 5 6 7
Rs. 10 110 107 68 1,100 1,070 680(-) (-) (-)
Rs. 20 305 343 341 6,100 6,860 6,820(0.1) (0.2) (0.2)
Rs. 50 6,800 8,119 12,792 3,40,000 4,05,950 6,39,600(1.2) (1.5) (2.6)
Rs. 100 68,741 1,10,273 1,33,314 68,74,100 1,10,27,300 1,33,31,400(5.1) (8.2) (9.7)
Rs. 500 25,636 66,838 2,19,739 1,28,18,000 3,34,19,000 10,98,69,500(5.7) (12.7) (35.6)
Rs. 1,000 3,151 10,131 31,857 31,51,000 1,01,31,000 3,18,57,000(3.4) (7.2) (16.6)
Total 1,04,743 1,95,811 3,98,111 2,31,90,300 5,49,91,180 15,57,05,000(2.6) (4.4) (8.1)
– : Negligible.Note: 1. Data are exclusive of the counterfeit notes seized by police and other enforcement agencies.
2. Figures in parentheses in columns 2, 3 and 4 indicate pieces per million (ppm) to total banknotes in circulation (Table 8.1).
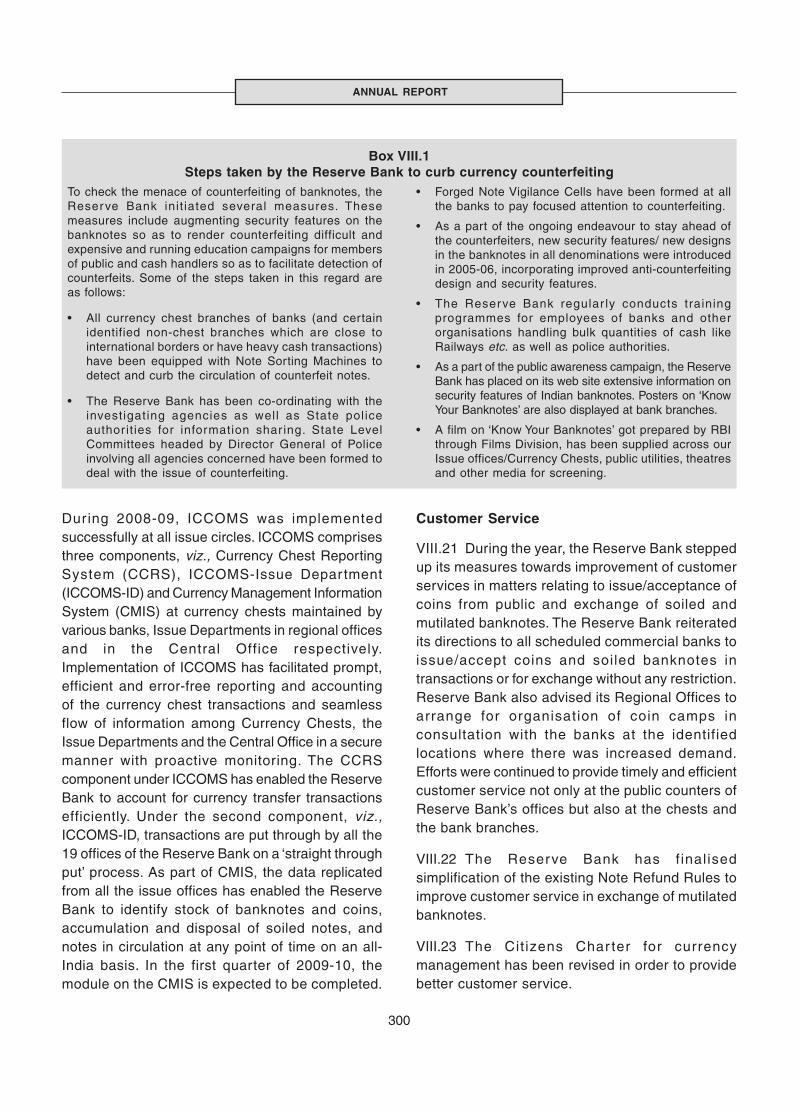
300
ANNUAL REPORT
To check the menace of counterfeiting of banknotes, theReserve Bank init iated several measures. Thesemeasures include augmenting security features on thebanknotes so as to render counterfeiting difficult andexpensive and running education campaigns for membersof public and cash handlers so as to facilitate detection ofcounterfeits. Some of the steps taken in this regard areas follows:
• All currency chest branches of banks (and certainidentified non-chest branches which are close tointernational borders or have heavy cash transactions)have been equipped with Note Sorting Machines todetect and curb the circulation of counterfeit notes.
• The Reserve Bank has been co-ordinating with theinvestigating agencies as well as State policeauthor it ies for information shar ing. State LevelCommittees headed by Director General of Policeinvolving all agencies concerned have been formed todeal with the issue of counterfeiting.
Box VIII.1Steps taken by the Reserve Bank to curb currency counterfeiting
• Forged Note Vigilance Cells have been formed at allthe banks to pay focused attention to counterfeiting.
• As a part of the ongoing endeavour to stay ahead ofthe counterfeiters, new security features/ new designsin the banknotes in all denominations were introducedin 2005-06, incorporating improved anti-counterfeitingdesign and security features.
• The Reserve Bank regular ly conducts trainingprogrammes for employees of banks and otherorganisations handling bulk quantities of cash likeRailways etc. as well as police authorities.
• As a part of the public awareness campaign, the ReserveBank has placed on its web site extensive information onsecurity features of Indian banknotes. Posters on ‘KnowYour Banknotes’ are also displayed at bank branches.
• A film on ‘Know Your Banknotes’ got prepared by RBIthrough Films Division, has been supplied across ourIssue offices/Currency Chests, public utilities, theatresand other media for screening.
During 2008-09, ICCOMS was implementedsuccessfully at all issue circles. ICCOMS comprisesthree components, viz., Currency Chest ReportingSystem (CCRS), ICCOMS-Issue Depar tment(ICCOMS-ID) and Currency Management InformationSystem (CMIS) at currency chests maintained byvarious banks, Issue Departments in regional officesand in the Central Office respectively.Implementation of ICCOMS has facilitated prompt,efficient and error-free reporting and accountingof the currency chest transactions and seamlessflow of information among Currency Chests, theIssue Departments and the Central Office in a securemanner with proactive monitoring. The CCRScomponent under ICCOMS has enabled the ReserveBank to account for currency transfer transactionsefficiently. Under the second component, viz.,ICCOMS-ID, transactions are put through by all the19 offices of the Reserve Bank on a ‘straight throughput’ process. As part of CMIS, the data replicatedfrom all the issue offices has enabled the ReserveBank to identify stock of banknotes and coins,accumulation and disposal of soiled notes, andnotes in circulation at any point of time on an all-India basis. In the first quarter of 2009-10, themodule on the CMIS is expected to be completed.
Customer Service
VIII.21 During the year, the Reserve Bank steppedup its measures towards improvement of customerservices in matters relating to issue/acceptance ofcoins from public and exchange of soiled andmutilated banknotes. The Reserve Bank reiteratedits directions to all scheduled commercial banks toissue/accept coins and soiled banknotes intransactions or for exchange without any restriction.Reserve Bank also advised its Regional Offices toarrange for organisation of coin camps inconsultation with the banks at the identifiedlocations where there was increased demand.Efforts were continued to provide timely and efficientcustomer service not only at the public counters ofReserve Bank’s offices but also at the chests andthe bank branches.
VIII.22 The Reserve Bank has f inal isedsimplification of the existing Note Refund Rules toimprove customer service in exchange of mutilatedbanknotes.
VIII.23 The Cit izens Char ter for currencymanagement has been revised in order to providebetter customer service.
301
CURRENCY MANAGEMENT
VIII.24 Providing adequate supply of good qualitybanknotes and coins in the country would continueto be the focus of currency management operationsin the Reserve Bank. With the computerisation ofcurrency chests along with enhancedmechanisation of note processing activities, theReserve Bank would continue to effectively respondto the emerging challenges. It would also continuewith its efforts to further strengthen security features
in the banknotes to mitigate the risk posed bycounterfeiting. The initiatives in other areas ofcurrency management would also be pursuedvigorously, particularly examining various options forincreasing the circulation life of banknotes of lowerdenominations, ensuring printing of banknotesmeeting very strict quality rules/standards, reviewingthe banknotes and coins handling practices includingrecycling of banknotes and coins etc.
IX.1 The ability of economic agents to transfermoney and exchange financial claims embeddedin financial instruments smoothly and securelythrough payment and settlement systems is criticalnot only for sustaining the public confidence in thefinancial system but also for creating an efficientand deep financial system. The Reserve Bank, asthe supervisor and regulator of the payments andsettlement systems, strives to ensure developmentof efficient and smooth systems matching the needsand growing sophistication of the financial sector.The rapid advancements in the field of informationtechnology (IT) have contributed to emergence ofnew products as well as methods of payment andsettlement. Emergence of new modes of paymentsand increasing complexity of transactions, however,also pose challenges in terms of formulatingappropriate regulatory and supervisory frameworks.Apart from facilitating advancements in the paymentand settlement systems, the information andcommunication technology has been harnessedinto the functioning of the Reserve Bank in allimportant areas.
IX.2 This chapter outl ines the majordevelopments in the payment and settlement
systems in India during 2008-09 as well as theprogress made in terms of use of informationtechnology both in service delivery as well as inoperations relating to core functional areas of theReserve Bank. Various developments in terms ofdesigning and implementing regulatory frameworksto effectively monitor the emerging modes ofpayments and settlements as well as the increasingdiversification of payments and settlement systemsin terms of greater penetration of informationtechnology are discussed in detail. Apart from this,the developments in information technology front,both in terms of use of IT within the Reserve Bankand initiatives for enhancing IT intensity of thefinancial sector are also highlighted.
PAYMENT AND SETTLEMENT SYSTEMS
IX.3 The Reserve Bank, as the Central Bank ofthe country has played a catalytic role, over theyears, in creating an institutional framework fordevelopment of a safe, secure, sound and efficientpayment system in the country. A major milestonewas achieved when the Payment and SettlementSystems Act, 2007 was enacted empowering theReserve Bank to regulate and supervise the
PAYMENT AND SETTLEMENT SYSTEMSAND INFORMATION TECHNOLOGYIX
302
The payment and settlement systems in India functioned normally in the midst of the global financialcrisis, ensuring the continued confidence of the public in these systems. The Payment and SettlementSystems Act, Board for Regulation and Supervision of Payments and Settlement Systems Regulations,2008 and the Payment and Settlement Systems Regulations, 2008 have come into effect in August2008 and accordingly, the Board for Regulation and Supervision of Payment and Settlement Systemswas reconstituted. While the growth and penetration of conventional non-cash modes of paymentscontinued to remain strong in 2008-09, new modes of payments like mobile payment transactions andpre-paid credit instruments have also started. Harnessing information technology (IT) for internalfunctioning of the Reserve Bank as well as for delivery of services have continued to ensure greaterefficiency. The rapid advances in the application of IT and emerging forms of payments and theirsettlement systems necessitate the Reserve Bank to improve the regulatory frameworks while integratingthese developments to the overall goals of the financial system.

payment and settlement systems, lay down policiesto this effect and provide a legal basis formult i lateral nett ing and sett lement f inal i ty.Accordingly, the Reserve Bank framed and notifiedthe ‘Board for Regulation and Supervision ofPayment and Settlement Systems Regulations,2008’ and ‘Payment and Settlement SystemsRegulations, 2008’ for operationalisation of thePayment and Settlement Systems Act.
Regulation and Supervision of Payment Systems
IX.4 The Payment and Settlement Systems Act,2007 (the PSS Act, 51 of 2007) and the tworegulations (i) Board for Regulation and Supervisionof Payment and Settlement Systems Regulations2008 and (ii) Payment and Settlement SystemsRegulations, 2008 have come into effect fromAugust 12, 2008. The PSS Act stipulates that noperson other than the Reserve Bank shallcommence or operate a payment system, exceptunder and in accordance with an authorisationissued by the Reserve Bank as per the provisionsof the PSS Act. All persons operating a ‘paymentsystem’ or desirous of setting up a payment systemas defined in the PSS Act, need to apply forauthor isation to the Reserve Bank, unlessspecifically exempted in terms of the PSS Act, inthe form and manner as stipulated in the Paymentand Settlement Systems Regulations, 2008. TheStock Exchanges and the Clearing Corporationsof the Stock Exchanges have been exempted fromthe provisions of the PSS Act.
IX.5 Since the PSS Act became effective, theReserve Bank has received applications forauthorisation from operators/proposed operators ofprepaid and other cards, payment gateways, moneytransfers, mobile payments, Automated TellerMachine (ATM) network, etc. Authorisation has sofar been accorded to 21 entities for operatingspecified payment systems. The banks providingmobile payment services in accordance with the“Mobile Banking Transactions in India - OperativeGuidelines for Banks” issued on October 8, 2008under Section 18 of the PSS Act, are required to
obtain approval from the Reserve Bank. Approvalhas so far been accorded to 29 banks to providemobile payment services.
Board for Regulation and Supervision ofPayment and Settlement Systems (BPSS)
IX.6 In order to strengthen the institutionalframework for the payment and settlement systemsin the country, the Board for Regulation andSupervision of Payment and Settlement Systems(BPSS) as a Committee of its Central Board wasconstituted by the Reserve Bank in March 2005following the notification of the Reserve Bank ofIndia, Regulations, 2005. The BPSS wasreconstituted in August 2008 fol lowing thenotification of the PSS Act and the Board forRegulation and Supervision of Payment andSettlement Systems Regulations, 2008. The Boardmet on five occasions during the period from July2008 to June 2009. The operationalisation of thePSS Act, issuance of guidelines for smoothoperations of payment systems and transparencyin charges levied to customers for the servicesoffered by banks were some of the key focus areasof the BPSS at its meetings. The impor tantdirections of the Board, inter-alia, include: (i) grantof author isation to various payment systemproviders in terms of the provisions of the PSS Act,(ii) guidelines on mobile payments, (iii) guidelineson issuance and operation of prepaid paymentinstruments in India, (iv) rationalisation of thecharges for electronic payment products andoutstation cheque collection, (v) migration of large-value payments to more secure electronic modesand (vi) incentivising the usage of satell i tecommunication for penetration of banking servicesto remote places.
IX.7 In accordance with the directions of theBPSS, operative guidelines on mobile banking forbanks were issued on October 8, 2008 andGuidelines for prepaid payment instruments in Indiawere issued on April 27, 2009. The use of otherbank ATMs for cash withdrawal has become freeof charge with effect from April 1, 2009. The
303
PAYMENT AND SETTLEMENT SYSTEMS ANDINFORMATION TECHNOLOGY
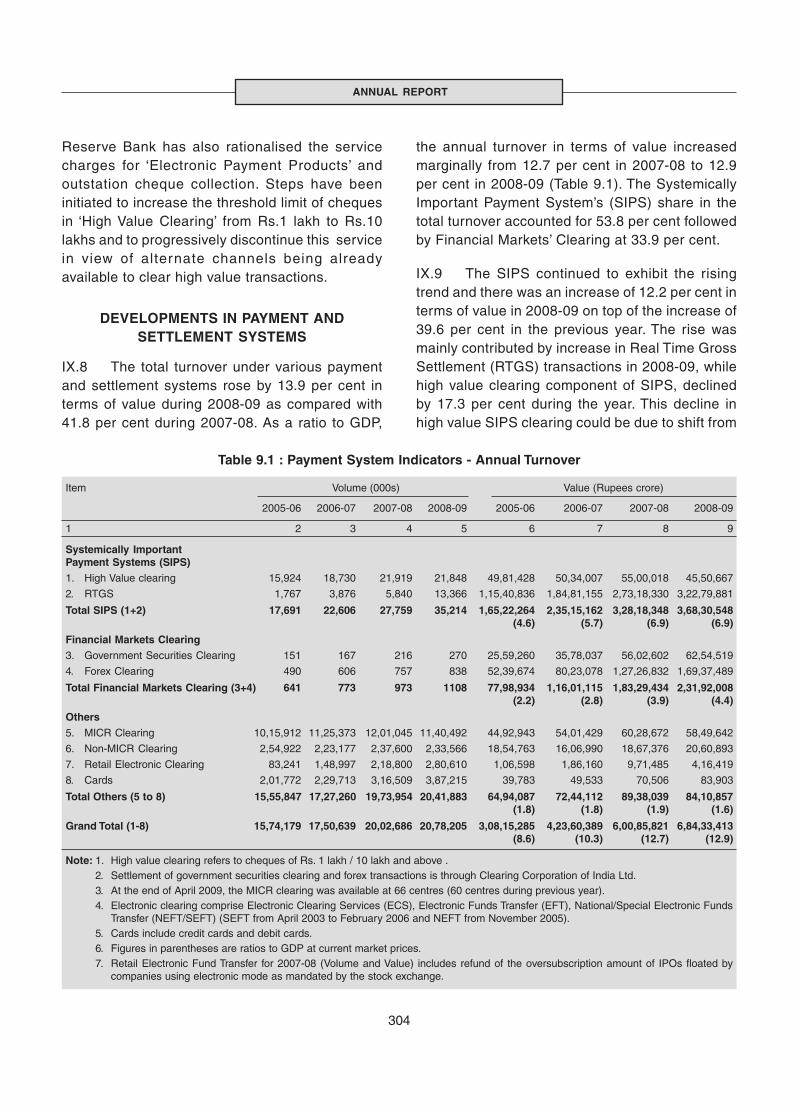
304
ANNUAL REPORT
Reserve Bank has also rationalised the servicecharges for ‘Electronic Payment Products’ andoutstation cheque collection. Steps have beeninitiated to increase the threshold limit of chequesin ‘High Value Clearing’ from Rs.1 lakh to Rs.10lakhs and to progressively discontinue this servicein view of alternate channels being alreadyavailable to clear high value transactions.
DEVELOPMENTS IN PAYMENT ANDSETTLEMENT SYSTEMS
IX.8 The total turnover under various paymentand settlement systems rose by 13.9 per cent interms of value during 2008-09 as compared with41.8 per cent during 2007-08. As a ratio to GDP,
the annual turnover in terms of value increasedmarginally from 12.7 per cent in 2007-08 to 12.9per cent in 2008-09 (Table 9.1). The SystemicallyImportant Payment System’s (SIPS) share in thetotal turnover accounted for 53.8 per cent followedby Financial Markets’ Clearing at 33.9 per cent.
IX.9 The SIPS continued to exhibit the risingtrend and there was an increase of 12.2 per cent interms of value in 2008-09 on top of the increase of39.6 per cent in the previous year. The rise wasmainly contributed by increase in Real Time GrossSettlement (RTGS) transactions in 2008-09, whilehigh value clearing component of SIPS, declinedby 17.3 per cent during the year. This decline inhigh value SIPS clearing could be due to shift from
Table 9.1 : Payment System Indicators - Annual Turnover
Item Volume (000s) Value (Rupees crore)
2005-06 2006-07 2007-08 2008-09 2005-06 2006-07 2007-08 2008-09
1 2 3 4 5 6 7 8 9
Systemically ImportantPayment Systems (SIPS)1. High Value clearing 15,924 18,730 21,919 21,848 49,81,428 50,34,007 55,00,018 45,50,667
2. RTGS 1,767 3,876 5,840 13,366 1,15,40,836 1,84,81,155 2,73,18,330 3,22,79,881
Total SIPS (1+2) 17,691 22,606 27,759 35,214 1,65,22,264 2,35,15,162 3,28,18,348 3,68,30,548(4.6) (5.7) (6.9) (6.9)
Financial Markets Clearing3. Government Securities Clearing 151 167 216 270 25,59,260 35,78,037 56,02,602 62,54,519
4. Forex Clearing 490 606 757 838 52,39,674 80,23,078 1,27,26,832 1,69,37,489
Total Financial Markets Clearing (3+4) 641 773 973 1108 77,98,934 1,16,01,115 1,83,29,434 2,31,92,008(2.2) (2.8) (3.9) (4.4)
Others5. MICR Clearing 10,15,912 11,25,373 12,01,045 11,40,492 44,92,943 54,01,429 60,28,672 58,49,642
6. Non-MICR Clearing 2,54,922 2,23,177 2,37,600 2,33,566 18,54,763 16,06,990 18,67,376 20,60,893
7. Retail Electronic Clearing 83,241 1,48,997 2,18,800 2,80,610 1,06,598 1,86,160 9,71,485 4,16,419
8. Cards 2,01,772 2,29,713 3,16,509 3,87,215 39,783 49,533 70,506 83,903
Total Others (5 to 8) 15,55,847 17,27,260 19,73,954 20,41,883 64,94,087 72,44,112 89,38,039 84,10,857(1.8) (1.8) (1.9) (1.6)
Grand Total (1-8) 15,74,179 17,50,639 20,02,686 20,78,205 3,08,15,285 4,23,60,389 6,00,85,821 6,84,33,413(8.6) (10.3) (12.7) (12.9)
Note: 1. High value clearing refers to cheques of Rs. 1 lakh / 10 lakh and above .2. Settlement of government securities clearing and forex transactions is through Clearing Corporation of India Ltd.3. At the end of April 2009, the MICR clearing was available at 66 centres (60 centres during previous year).4. Electronic clearing comprise Electronic Clearing Services (ECS), Electronic Funds Transfer (EFT), National/Special Electronic Funds
Transfer (NEFT/SEFT) (SEFT from April 2003 to February 2006 and NEFT from November 2005).5. Cards include credit cards and debit cards.6. Figures in parentheses are ratios to GDP at current market prices.7. Retail Electronic Fund Transfer for 2007-08 (Volume and Value) includes refund of the oversubscription amount of IPOs floated by
companies using electronic mode as mandated by the stock exchange.
305
PAYMENT AND SETTLEMENT SYSTEMS ANDINFORMATION TECHNOLOGY
paper based transactions to electronic modes ofpayments like RTGS, besides the impact of thegeneral slowdown in the economy on the value andvolume of such transactions.
Retail Payment Systems
IX.10 The retail payment system includes chequeclearing (automated clearing done using magneticink character recognition (MICR) and non-MICR),retail electronic fund transfer and card payments.The year 2008-09 registered a decline of 5.9 percent in the overall turnover of various retail paymentproducts as compared to an increase of 23.4 percent during 2007-08, mainly on account of negativegrowth in retail electronic clearing and MICRclearing. The issue and refund of IPOs during 2007-08,among others, was one of the reasons for thesignificant increase in 2007-08. The depressedprimary and secondary market in 2008-09 partlycontributed to the drop in turnover from the highbase in 2007-08.
Paper-based Clearing and Settlement
IX.11 Cheque is still being predominantly used asan important instrument of cashless paper basedmode of payment and, therefore, sustaining andpromoting efficiency in this system for clearing andsettlement of cheques assumes importance. During2008-09, six new MICR cheque processing centres(Belgaum, Bhavnagar, Jamnagar, Kota, Tirunelveliand Anand) were opened. At present there are 71MICR-CPCs functioning in the country. At centreswhere setting up of MICR-CPC was not found to beviable, the settlement operations have beencomputerised (1064 clearing houses) so that thesettlement is done electronically even though theinstruments still continue to be sorted manually. Sofar, operations of more than 99.3 per cent of the totalnumber of 1138 Clearing Houses in the country havebeen computerised. The year 2008-09 registered adecline of 5.0 per cent in the volume and 3.0 percent in the value of MICR transactions. This declinecould be attributed to shift to electronic modes ofpayment and general slowdown in the economy.
IX.12 High Value Clearing: High Value Clearingis available at 24 major locations in the country. Inview of the various risks associated with the use ofpaper-based instruments for clear ing andsettlement of large-value transactions, it has beendecided to increase the threshold limit for chequeseligible to be presented in High Value Clearing fromthe present Rs.1 lakh to Rs.10 lakh. This is also astep towards encouraging migration of large valuepayments from paper based instruments likecheque to electronic mode like RTGS/NEFT.
IX.13 Speed Clearing: A new clearing arrangementnamed ‘Speed Clearing’ was introduced in June2008 for collection of outstation cheques through localclearing, if such cheques are drawn on core bankingenabled branches of the paying banks. UnderSpeed Clearing, cheques drawn on outstation CBSbranches of a drawee bank can be processed inthe local clearing. Speed Clearing reduces the timetaken for realisation of outstation cheques and cannow be paid on T+1 or T+2 basis. Speed Clearinghas been introduced at 53 centres. The introductionof Speed Clearing has reduced the volume ofcheques processed in Inter-City Clearing (conductedat Reserve Bank locations) to a great extent; as aresult Inter-City (Outward) Clearing has also beendiscontinued at 11 Reserve Bank locations and isnow available at only 4 centres.
IX.14 Cheque Truncation: To enhance theefficiency of the paper based clearing system, theCheque Truncation System (CTS) was implementedin February 2008 as a pilot project with the 10 banksin the National Capital Region (NCR). Since July2008, all the member banks of the New DelhiBankers’ Clearing House are participating in theCTS. To encourage complete migration of chequesin the National Capital Region of Delhi to CTS, theprocessing charges in respect of chequespresented in CTS were waived till June 2009. Withthe complete migration of cheque to CTS, theseparate paper based clearing held has beendiscontinued from July 2009. A fee of Rs.0.50 perinstrument each for both the presenting and the payingbank in CTS has been introduced from July 1, 2009.
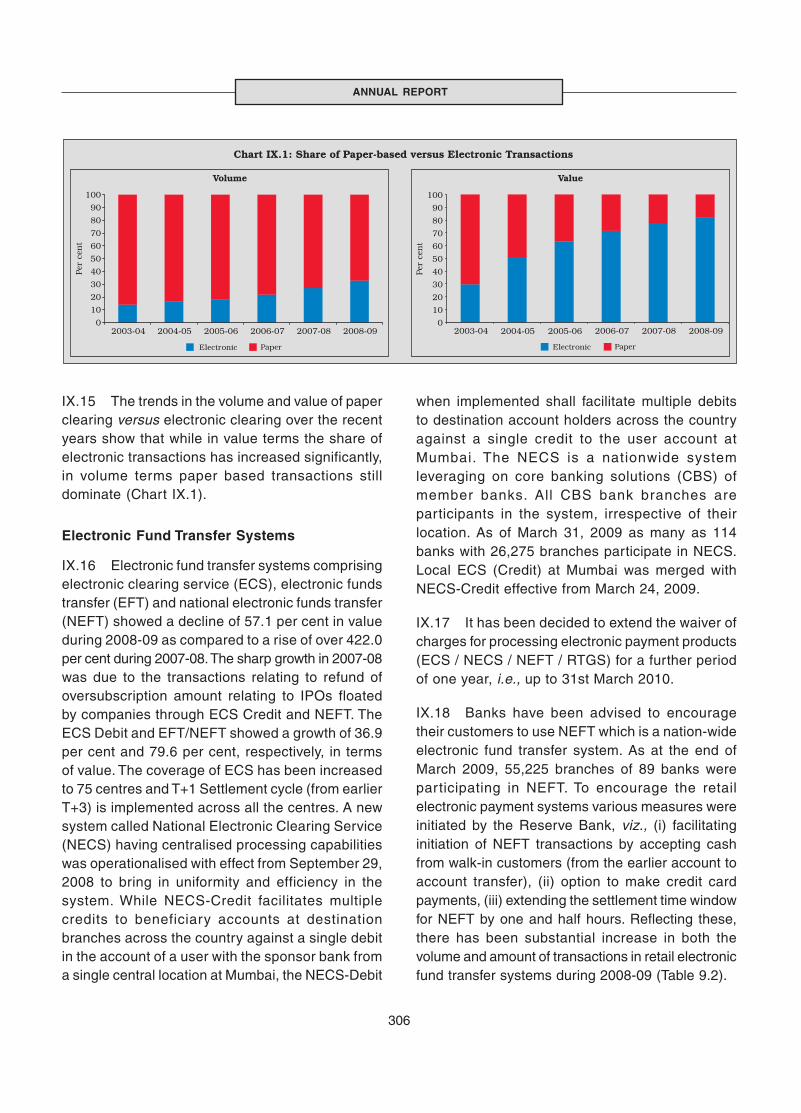
306
ANNUAL REPORT
IX.15 The trends in the volume and value of paperclearing versus electronic clearing over the recentyears show that while in value terms the share ofelectronic transactions has increased significantly,in volume terms paper based transactions stilldominate (Chart IX.1).
Electronic Fund Transfer Systems
IX.16 Electronic fund transfer systems comprisingelectronic clearing service (ECS), electronic fundstransfer (EFT) and national electronic funds transfer(NEFT) showed a decline of 57.1 per cent in valueduring 2008-09 as compared to a rise of over 422.0per cent during 2007-08. The sharp growth in 2007-08was due to the transactions relating to refund ofoversubscription amount relating to IPOs floatedby companies through ECS Credit and NEFT. TheECS Debit and EFT/NEFT showed a growth of 36.9per cent and 79.6 per cent, respectively, in termsof value. The coverage of ECS has been increasedto 75 centres and T+1 Settlement cycle (from earlierT+3) is implemented across all the centres. A newsystem called National Electronic Clearing Service(NECS) having centralised processing capabilitieswas operationalised with effect from September 29,2008 to bring in uniformity and efficiency in thesystem. While NECS-Credit facilitates multiplecredits to beneficiary accounts at destinationbranches across the country against a single debitin the account of a user with the sponsor bank froma single central location at Mumbai, the NECS-Debit
when implemented shall facilitate multiple debitsto destination account holders across the countryagainst a single credit to the user account atMumbai. The NECS is a nationwide systemleveraging on core banking solutions (CBS) ofmember banks. All CBS bank branches areparticipants in the system, irrespective of theirlocation. As of March 31, 2009 as many as 114banks with 26,275 branches participate in NECS.Local ECS (Credit) at Mumbai was merged withNECS-Credit effective from March 24, 2009.
IX.17 It has been decided to extend the waiver ofcharges for processing electronic payment products(ECS / NECS / NEFT / RTGS) for a further periodof one year, i.e., up to 31st March 2010.
IX.18 Banks have been advised to encouragetheir customers to use NEFT which is a nation-wideelectronic fund transfer system. As at the end ofMarch 2009, 55,225 branches of 89 banks wereparticipating in NEFT. To encourage the retailelectronic payment systems various measures wereinitiated by the Reserve Bank, viz., (i) facilitatinginitiation of NEFT transactions by accepting cashfrom walk-in customers (from the earlier account toaccount transfer), (ii) option to make credit cardpayments, (iii) extending the settlement time windowfor NEFT by one and half hours. Reflecting these,there has been substantial increase in both thevolume and amount of transactions in retail electronicfund transfer systems during 2008-09 (Table 9.2).

307
PAYMENT AND SETTLEMENT SYSTEMS ANDINFORMATION TECHNOLOGY
Cards
IX.19 The use of card based payments rose by22.3 per cent in volume and by 19.0 per cent invalue during 2008-09. One notable trend in thecontext of economic slowdown was that while thegrowth in value of credit card transactionsdecelerated in 2008-09, the growth in the value ofdebit card transactions continued to remain strongas in the previous year (Table 9.3).
Automated Teller Machines (ATMs)
IX.20 ATMs have become an important channelfor delivering banking transactions and services inIndia, particularly for cash withdrawal and accountbalance enquiry. The spread of ATMs has increasedfrom 34,789 in March 2008 to 43,651 in March2009. To extend the facility of use of ATMs of onebank to the customers of other banks, banks haveentered into bilateral or multilateral arrangementswith other banks to have bilateral or inter-bank ATM
networks. The charges levied on the customers foruse of ATMs varied from bank to bank and alsovaried according to the ATM network that was usedfor the transaction. In order to bring greatertransparency and reasonableness in ATM chargesbeing levied by banks on their customers, theReserve Bank issued directives making use of ownbank’s ATM or any other bank’s ATM free of chargefor cash withdrawal, from April 1, 2009. The volumeof ATM transactions has increased from 17,797 lakhaggregating to Rs.4,38,151 crore during 2007-08to 23,530 lakh aggregating to Rs.6,16,456 croreduring 2008-09.
IX.21 ATMs have the potential to provide facilitiesother than balance enquiry and cash dispensing.Some banks have tapped these capabilities andare providing value added services to theircustomers such as funds transfer, bill paymentservices, mobile phone recharge, etc. Anassessment carried out in the Reserve Bankrevealed that density of ATM availability (as the ratio
Table 9.2 : Retail Electronic Funds Transfer Systems
Item Volume (000s) Value (Rupees crore)
2005-06 2006-07 2007-08 2008-09 2005-06 2006-07 2007-08 2008-09
1 2 3 4 5 6 7 8 9
ECS / NECS Credit 44,216 69,019 78,365 88,394 32,324 83,273 7,82,222 97,487(10.4) (56.1) (13.5) (12.80) (60.2) (157.6) (839.3) (-87.5)
ECS Debit 35,958 75,202 1,27,120 1,60,055 12,986 25,441 48,937 66,976(135.0) (109.1) (69.0) (25.9) (344.6) (95.9) (92.4) (36.9)
EFT/NEFT 3,067 4,776 13,315 32,161 61,288 77,446 1,40,326 2,51,956(20.3) (55.7) (178.8) (141.5) (12.2) (26.4) (81.2) (79.6)
Note: 1. Figures in parentheses represent percentage change over previous year.
2. The ECS Credit figures of 2007-08 include transactions for refunds of oversubscribed IPOs by various companies as mandated by theStock Exchange.
Table 9.3 Card-Based Payment Transactions
Item Volume (000s) Value (Rupees crore)
2005-06 2006-07 2007-08 2008-09 2005-06 2006-07 2007-08 2008-09
1 2 3 4 5 6 7 8 9
Credit Cards 156,086 169,536 228,203 259,561 33,886 41,361 57,985 65,356(20.6) (8.6) (34.6) (13.7) (31.9) (22.1) (40.2) (12.7)
Debit Cards 45,686 60,177 88,306 127,654 5,897 8,172 12,521 18,547 (10.0) (31.7) (46.7) (44.6) (10.0) (38.6) (53.2) (48.1)
Note: Figures in parentheses represent percentage change over previous year.

308
ANNUAL REPORT
of availability of ATM to population) in India wasvery low compared to developed countries andsome emerging market economies. The populationper ATM in India was more than 29,500 (March2008) as against the range of 1000 – 9500 in someof the EMEs. To encourage the spread of ATMs forbuilding the national payment infrastructure,relaxation has been announced in the Annual PolicyStatement 2009-10 to allow scheduled commercialbanks (SCBs) to set up offsite ATMs without priorapproval of the Reserve Bank.
Real Time Gross Settlement (RTGS) System
IX.22 The RTGS system in operation since March2004 is primarily for large value transactions withthe minimum threshold limit at Rs.1 lakh. Theservice window for customer transactions isavailable from 09.00 hours to 16.30 hours onweekdays (up to 12.30 hours on Saturdays). Forinter-bank transactions, the RTGS system staysopen up to 18.00 hours on week days (14.30 hourson Saturdays).
IX.23 The number of RTGS enabled bankbranches stood at 55,006 as on March 31, 2009with the addition of 11,494 branches to the RTGSnetwork during the year 2008-09. The increasednetwork coverage is reflected in the increase in thevolume and value settled in RTGS (Chart IX.2).RTGS peak volume and value in a day were
1,28,295 transactions and Rs.2,73,450 crore,respectively, on March 30, 2009.
IX.24 RTGS being a systemically importantpayment system, which is reflected in value settledin RTGS and also with other Multilateral NetSettlements relating to important retail and largevalue payments being settled in RTGS, it wasimperative to assess the operations of the systemagainst the international standards. Theassessment was done against the Core Principlesfor Systemically Important Payment Systems,published by the Committee on Payment andSettlement Systems of the Bank for InternationalSettlements (BIS). The Reserve Bank’s ownassessment published as part of the Report of theCommittee on Financial Sector Assessment(CFSA) assessed that the RTGS system in Indiafully complied with 6 core principles and broadlycomplied with the Core Principle numbers 3, 7 and8 relating to management of credit and liquidity risk,operational reliability and efficiency. Core Principle5 is not applicable to RTGS.
IX.25 Reserve Bank also commissioned anexternal assessment of the RTGS system by a teamof experts from the Swiss National Bank. Theseexperts viewed that the RTGS system in India iscompliant with all the Core Principles, except theone on efficiency. The recommendations made bythe team for compliance with this Core Principle is
309
PAYMENT AND SETTLEMENT SYSTEMS ANDINFORMATION TECHNOLOGY
to have a strategy and project business developmentover the next 5 to 10 years, to monitor the relationshipwith third-party vendors and ensure effectivesafeguards in order to retain full control over allaspects of the RTGS system, to have a cost-benefit-analysis, appropriate pricing of paymentservices, etc.
Indo-Nepal Remittance Facility Scheme
IX.26 The Indo-Nepal Remittance Facility Schemewas launched in May 2008, which enables one-wayfunds transfer from India to Nepal. A remitter cantransfer funds up to Indian rupees 50,000 from anyof the NEFT-enabled bank branches in the countryto Nepal. The beneficiary would receive funds inNepalese Rupees. The charges for effecting fundstransfer under the Scheme were rationalised andrevised effective from February 9, 2009, with themaximum charge being Rs.75. Although the use ofthis scheme has been minimal, efforts are beingmade to popularise this scheme through meetingsheld with associations of Nepalese migrant workersin various cities in India.
New Payment Channels / Products
IX.27 The developments in computer andcommunication technology have also resulted in thespread of new retail payment products and newmodes of delivering/settling such payments. Theseproducts and channels of effecting payments areinnovative, using the latest available technologyinterfaces and such transactions do not rely ontraditional payment systems to transfer valuebetween person to person.
Mobile Banking Transactions
IX.28 Rapid expansion in the use of mobilephones as a mode of communication has creatednew opportunities for banks to use this mode forbanking transactions. Many countries have adoptedthis delivery channel as a means of financialinclusion as this facilitates small value payments
at a very low cost (Box IX.1). Predominantly, twodistinct models are in vogue in countries wheremobile banking has taken off – the bank-led modeland the telecom company-led model. The telecomcompany led model is preferred in countries whichhave relatively less coverage of formal bankingfacilities (e.g. Kenya). After taking into accountvarious issues involved, India has adopted thebank-led model.
IX.29 Operative guidelines for Mobile BankingTransactions in India were notified on October 8,2008. The major features of the guidelines are:(i) Only banks who have received one time approvalfrom Reserve Bank are permitted to provide thisfacility to customers; (ii) Banks can extend thisfacility only to their customers and their holders ofdebit/credit cards issued as per the extant ReserveBank guidelines; (iii) banks can extend only IndianRupee based domestic services as per theguidelines; (iv) banks can extend this facility throughtheir business correspondents also in order topromote financial inclusion; (v) Minimum “Technologyand Security Standards” have been prescribed inthe guidelines; (vi) limit of Rs.5000 per transactionsfor funds transfer and m-commerce transaction limitof Rs.10,000 has been prescribed to ensure thesafety of transactions through this channel; and(vii) the guidelines mandate interoperability amongservice providers to ensure prevent ion ofmonopoly by one or a few mobile operators.
Pre-paid Payment Instruments
IX.30 Prepaid payment instruments are paymentinstruments where value for use is stored inadvance, such as, smart cards, magnetic stripcards, internet accounts, internet wallets, mobileaccounts, mobile wallets, paper vouchers, etc.Prepaid payment instruments enhanceconvenience as a mode of payment in lieu of cash.Also, this facilitates e-payment for goods/servicespurchased/availed through internet/ mobile. Themaximum loss on account of fraudulent use of thecard is limited to balance available on the card.

310
ANNUAL REPORT
IX.31 The development of any new paymentproduct and mode of payment requires theconfidence of the public in the efficiency and safetyof the technology and the systems offered. Further,to bring about efficiency and competitive pricing, alevel playing field has to be ensured. Taking intoconsideration these issues, the Reserve Bankissued Policy Guidelines for ‘ Issuance andOperation of Pre-paid Payment Instruments in Indiaon April 27, 2009’ (Box IX.2).
Information Exchange
IX.32 An international seminar on Payment andSettlement Systems was held in March 2009 at
Chennai, which was organised jointly by theReserve Bank and the Committee on Payment andSettlement Systems set up under the aegis of Bankfor International Settlements. Deliberating on thetheme ‘Retail Payment – Issues and Risks’, theseminar highlighted that with the role of non-banksgaining importance in payment systems, the centralbanks worldwide have to remain more vigilant aboutthe challenges to regulate and monitor theoperations of diverse entities in payments arena;rationalise charges for retail payments; mitigaterisks in retail payment systems; and implementinitiatives needed to address customer-protectionrelated issues.
The efforts for promoting financial inclusion are oftenconstrained by the spread/dispersion of banks’ networks,cost of banking services, and lower priority attached tosmall value transactions associated with customers whoare underprivileged. The wide penetration and acceptanceof mobile phones in the country, irrespective of the socialand economic status of the people, provides an opportunityto extend banking facilities to the hitherto excludedsections of the population.
The developing countr ies have adopted differentapproaches for promoting mobile phone based bankingfacility in their countries, depending on the banking andfinancial infrastructure available. Two models have mainlybeen chosen – ‘Bank Led Model’ and ‘Mobile ServiceProvider Led Model’. The bank-led model provides forpromotion of mobile phone banking through businesscorrespondents of banks, whereas in mobile serviceproviders led model, the agent network of cellular operatorsare identified as the correspondents.
The experiences of Philippines, Kenya and South Africain implementing mobile banking facilities are outlinedbelow:
Philippines: The country has been the pioneer inimplementation of mobile phone led banking facilities. Bothbank-led and mobile service provider led models have beenimplemented in the country. SMART Cash is a bank ledmodel where the customer service outlets are provided bythe mobile service providers and the customer accountsare maintained by the partnering banks. Customers are alsogiven a debit card linked to their account for cash withdrawal.Cash based transactions at the agents of mobile serviceprovider require identification of the customer.
Box IX.1Mobile Banking : Select Country Experiences
‘G-Cash’ is a mobile service provider led model. In thismodel the funds collected are maintained at a bank by themobile service provider as per the requirement prescribedby the central bank. The agents of the mobile serviceprovider facilitate customer acquisition and extension ofservices to the customers.
Both the models facilitate a number of transactionalbanking services. Receipt of cross border remittance isalso permitted. The Philippines central bank has placedrestriction on the amount that can be maintained in SMARTCash and G-Cash accounts.
Kenya: In Kenya, mobile service providers (Safaricom andVodafone) have implemented the mobile banking facilitycalled M-Pesa. The accounts of the customers aremaintained with the mobile service provider. M-Pesaprovides a number of transactional services to itscustomers. The agents of mobile service provider act asthe agent for customer acquisition and servicing. M-Pesafacilitates receipt of cross border remittances also.
South Africa: South Africa has mainly chosen bank ledmobile banking facilities. One of the products, ‘MTNBanking’ is the result of the tie-up between a bank and amobile service provider. The agents of mobile serviceprovider act as the agent for collection, customersacquisition and servicing. ‘Wizzit’ is another mobilebanking facility promoted by a commercial bank. Wizzithas been set-up as a branchless bank. The customeracquisition and servicing are done through dedicatedgroup of people known as Wizzkids. Wizzit providesnumber of transactional banking services to its customers.The customers are also provided debit cards facilitatingcash withdrawal.

311
PAYMENT AND SETTLEMENT SYSTEMS ANDINFORMATION TECHNOLOGY
Consequent to the passing of the Payment and SettlementSystems Act, 2007, all persons currently operatingpayment systems involved in the issuance of Pre-paidPayment Instruments and those proposing to operate suchsystems would have to approach the Reserve Bank forauthor isation. To ensure order ly development andoperation of pre-paid payment instruments in the country,a set of guidelines were issued by the Reserve Bank inApril 2009.
The salient aspects covered in the guidelines are:
Categorising the instruments: The pre-paid paymentinstruments that can be issued in the country are classifiedunder three categories, viz. (i) closed system paymentinstruments, (ii) semi-closed system payment instrumentsand (iii) open system payment instruments.
(i) Closed System Payment Instruments: These arepayment instruments issued by a person for facilitatingthe purchase of goods and services from him/it. Theseinstruments do not permit cash withdrawal orredemption. As these instruments do not facilitatepayments and settlement for third party services,issue and operation of such instruments are notclassified as payment systems.
(ii) Semi-Closed System Payment Instruments: Theseare payment instruments which are redeemable at agroup of clear ly identified merchant locations/establishments which contract specifically with theissuer to accept the payment instruments. Theseinstruments do not permit cash withdrawal orredemption by the holder.
(iii) Open System Payment Instruments: These arepayment instruments which can be used for purchaseof goods and services at any card accepting merchantlocations (point of sale terminals) and also permitcash withdrawal at ATMs.
• Eligibility: Banks and non-banks would be permittedto issue pre-paid payment instruments in the country.While banks would be permitted to issue all categoriesof these instruments, non-banks would be permittedto issue only semi-closed system paymentinstruments.
• Capital: Only banks and Non-Banking FinancialCompanies (NBFCs) complying with CRAR normswould be permitted to issue prepaid instruments. Allother entities shall have to have a minimum paid-upcapital of Rs. 100 lakh and positive net owned funds.
• Maximum Limit: The maximum value of any pre-paidpayment instrument has been fixed at Rs 50,000/-.
Box IX.2Pre-paid Payment Instruments in India
The money collected against issue of pre-paid paymentinstruments at a point of time could be substantial. Further,the turnover of funds may also be rapid. The confidenceof public and merchant establishments on pre-paidinstruments schemes depends on the timely settlementof claims arising from use of such instruments. To ensuretimely settlement, conditions have been stipulated ondeployment of money collected by the issuer.
The money collected by banks against issue of pre-paidpayment instruments shall be part of the ‘net demand andtime liabilities’ for the purpose of maintenance of reserverequirements.
Other non-banks issuing payment instruments are requiredto maintain their outstanding balance in an ‘escrowaccount’ with any scheduled commercial bank. The amountin the escrow account would be only for making payment tothe participating merchant establishments and no interestis payable by the bank on such balances, and no loan ispermissible against such deposits. The entities can enterinto an agreement with the bank where escrow account ismaintained to transfer “core portion” (i.e., the average ofthe lowest daily outstanding balance (LB) on a fortnightly(FN) basis, for one year (26 fortnights) from the precedingmonth) of the amount, in the escrow account to a separateaccount on which interest is payable, subject to the banksatisfying itself that the amount deposited represents the“core portion”. The amount shall be linked to the escrowaccount, i.e., the amounts held in the interest bearingaccount shall be available to the bank, to meet paymentrequirements. This facility is, however, only available toentities who have been in business for more than a year.
• Banks have been permitted to issue and reload suchpayment instruments at their branches, ATMs andthrough their business correspondents appointed as perthe guidelines issued by the Reserve Bank in this regard.
• Others have been permitted to issue and reload suchpayment instruments through their authorised outletsor through their agents.
• The prepaid card issued must have a minimum validityperiod of six months from the date of activation/issuance to the holder.
• Pre-paid payment instrument issuers must disclose allimportant terms and conditions in clear and simplelanguage (preferably in English, Hindi and the locallanguage) comprehensible to the holders while issuingthe instruments. These, among others, include (i)charges and fees associated with the use of theinstrument, (ii) expiry period, etc. A customer redressalmechanism has to be also put in place by the issuer.
312
ANNUAL REPORT
IX.33 The Fifth Annual Conference of the Headsof National Clearing Cells was organised in February2009 at Jaipur with active participation from headsof Banking Departments and National Clearing Cellsfrom Reserve Bank, senior executives from IBA,settlement banks and vendors. The focus of theConference was to synergise and organise theoversight and monitoring mechanism to deliveroptimal benefits efficiently by the Clearing Housesin their payment system activities. The deliberationsat the seminar on the recent initiatives and theparticipants’ expectations as well as suggestionsfor shaping the future of payment systems providedinputs for reforms in the payment systems.
National Payments Corporation of India (NPCI)
IX.34 The process for setting-up an umbrellaorganisation for retail payment systems wasinitiated by Indian Banks’ Association (IBA).Accordingly, National Payments Corporation ofIndia (NPCI) has since been incorporated as acompany under section 25 of the Companies Act.NPCI has an authorised capital of Rs.300 crore.
Oversight of the Payment and Settlement Systems
IX.35 In order to ensure that the efforts taken forimproving the clearing and settlement operationsand the various instructions issued for the sameare adhered to by all, the Reserve Bank has framedthe minimum standards of operational efficiency(MSOE) for MICR CPCs, MSOE for MMBCS(automated) Clearing Houses, Benchmark Indicatorsfor ECS and NEFT benchmark indicators ofefficiency. The minimum standards prescribedrequire submission of quarterly/half yearly selfassessment reports to the Regional Office of theReserve Bank under whose jurisdiction they operate.
DEVELOPMENTS IN USE OF INFORMATIONTECHNOLOGY
Information Technology in the Reserve Bank
IX.36 In its efforts to ensure that IT paves the wayfor efficiency and excellence, the Reserve Bank has
been taking steps to ensure that users of IT getthe IT services at their desktop and ensurebusiness continuity at all times without the endusers having to worry about the activities ‘behindthe scene’. Towards this end, the major focus ofthe IT related endeavours was on migration ofvarious application systems to the data centres,aimed at providing all IT based services from thedata centres, for both the users within the ReserveBank as well as external users.
IX.37 Operations resulting in the uninterruptedavailability of critical payment and settlementsystems such as the RTGS system, the Public DebtOffice – Negotiated Dealing System/SecuritiesSettlement System(PDO-NDS/SSS), the CentralisedFunds Management System (CFMS) and theStructured Financial Messaging System (SFMS))were also primary focus areas of the data centres –aimed at the financial sector in particular and thegeneral public at large. In respect of the RTGSsystem, the system has been fine-tuned to be ableto process increasing transactions, which haveincreased substantially to about 80,000 transactionsa day during 2008-09 from about 40,000 transactionson an average day during 2007-08.
IX.38 The Reserve Bank followed a three-prongedapproach with regard to the technology initiativeswithin the organisation. The first pertained to thecentralisation of all application systems whileproviding for decentralised access to IT users withinthe Reserve Bank. The second related to themigration of all IT based application systems to the‘state-of-the-art’ data centres of the Reserve Bank.The third - at the heart of all IT initiatives - was theimplementation of appropriate security safeguardsin all the IT based systems.
IX.39 As par t of the approach towardscentralisation of IT based application systems, allthe application systems pertaining to the BankingDepartment have been restructured to function ina centralised environment, with users spreadacross the various locations having access to thesesystems in a decentralised manner. The firstinitiative in this area was the ‘Centralised Public
313
PAYMENT AND SETTLEMENT SYSTEMS ANDINFORMATION TECHNOLOGY
Debt Office’ (CPDO) system which has been invogue for some time now. The ‘IntegratedAccounting System’ for the Deposit AccountsDepartment has established itself well in theMumbai Regional Office where it was used as theprimary accounting system for the first time duringthe year 2008-09. The implementation of the‘Centralised Public Accounts Department System’(CPADS) across all offices of the Reserve Bankduring the year resulted in the culmination of effortsaimed at centralising the Banking Department'sfunctions. Continuing the trend of centralisation, the‘Integrated Computerised Currency Operations andManagement System’ (ICCOMS) was extended tocover all the currency chests in the country and allthe Issue Departments of the Reserve Bank,thereby making the IT based currency managementsystem also function in a centralised manner.
IX.40 The housekeeping and other internalfunctions of the Reserve Bank were also broughtunder the ambit of computerisation during 2008-09. The complete operationalisation of the‘Integrated Establishment System’ (IES) across allthe offices took care of the establishment relatedfunctions for the staff of the Reserve Bank. Theadvanced level of completion of the ‘HumanResources Management System’ (HRMS), theimplementation of the computerisation modules ofthe ‘Central Debt Division’ of the Department ofGovernment and Bank Accounts and the issue ofMulti-Application-Smart Card based identity cards
for the staff members of the Reserve Bank on anenterprise wide basis, have been some of the otherIT based projects providing support to the internalrequirements of the Reserve Bank.
IX.41 During 2008-09, substantial progress couldbe made in the migration of existing applicationsystems to the newly set up IT infrastructure at thedata centres. The use of IT based applications forworkflow and knowledge management hasemerged as a key development in the use of ITwithin the Reserve Bank (Box IX.3).
IX.42 A self evaluation of the IT based operationalthresholds of the Reserve Bank reveals a high levelof conformity to the objectives in this regard(Table 9.4).
IX.43 An important constituent of IT basedoperations pertains to business continuity, with theobjective being that IT based systems should beavailable even in the event of any breakdown, andmore so, if a disaster strikes. All the critical systemsat the data centres have been planned and designedin such a manner that there is adequate provision forredundancy and back-up. Furthermore, DisasterRecovery (DR) exercises covering all systems as alsothe participants are conducted on a regular basis.
Technology upgradation
IX.44 On account of the quick rate oftechnological obsolescence, continuous
Knowledge management and workflow refers to a systemwhich ensures that all users have instant access to all theinformation needed for their roles within an organisation.Some of the other aspects covered under workflow andknowledge management include training managementfeatures and user-specific responsibilities notification andrepor ting. As a central feature of the knowledgemanagement workflow, there is a ‘dashboard’ which iscustomisable to ensure that all users are aware of the tasks,actions and documents that they are responsible for or needto be aware of. The dashboard also provides user-specifictraffic light performance and compliance scorecards andkeeps users up-to-date with news, events and alerts.
Box IX.3Work Flow and Knowledge Management
Resource features allow users to share information andenable executives and senior managers to set,communicate and monitor compliance with policies,procedures and guidelines. This ‘resources library’ alsoprovides easy access to best practices, corporate guidanceand the features necessary to document the expandingknowledge base of experience and expertise of theorganisation.
Communication and people search tools make it quick andeasy to locate and connect with other users within theorganisation, so that organisational knowledge is optimallyused.
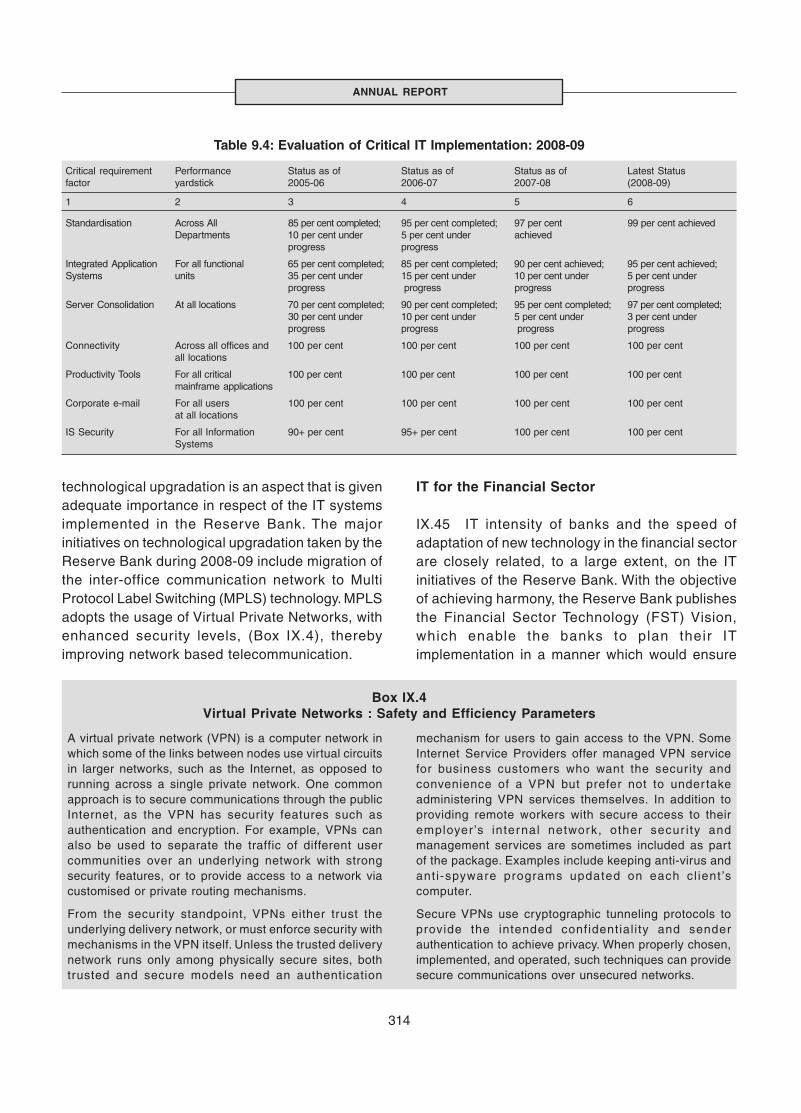
314
ANNUAL REPORT
technological upgradation is an aspect that is givenadequate importance in respect of the IT systemsimplemented in the Reserve Bank. The majorinitiatives on technological upgradation taken by theReserve Bank during 2008-09 include migration ofthe inter-office communication network to MultiProtocol Label Switching (MPLS) technology. MPLSadopts the usage of Virtual Private Networks, withenhanced security levels, (Box IX.4), therebyimproving network based telecommunication.
IT for the Financial Sector
IX.45 IT intensity of banks and the speed ofadaptation of new technology in the financial sectorare closely related, to a large extent, on the ITinitiatives of the Reserve Bank. With the objectiveof achieving harmony, the Reserve Bank publishesthe Financial Sector Technology (FST) Vision,which enable the banks to plan their ITimplementation in a manner which would ensure
Table 9.4: Evaluation of Critical IT Implementation: 2008-09
Critical requirement Performance Status as of Status as of Status as of Latest Statusfactor yardstick 2005-06 2006-07 2007-08 (2008-09)
1 2 3 4 5 6
Standardisation Across All 85 per cent completed; 95 per cent completed; 97 per cent 99 per cent achievedDepartments 10 per cent under 5 per cent under achieved
progress progress
Integrated Application For all functional 65 per cent completed; 85 per cent completed; 90 per cent achieved; 95 per cent achieved;Systems units 35 per cent under 15 per cent under 10 per cent under 5 per cent under
progress progress progress progress
Server Consolidation At all locations 70 per cent completed; 90 per cent completed; 95 per cent completed; 97 per cent completed;30 per cent under 10 per cent under 5 per cent under 3 per cent underprogress progress progress progress
Connectivity Across all offices and 100 per cent 100 per cent 100 per cent 100 per centall locations
Productivity Tools For all critical 100 per cent 100 per cent 100 per cent 100 per centmainframe applications
Corporate e-mail For all users 100 per cent 100 per cent 100 per cent 100 per centat all locations
IS Security For all Information 90+ per cent 95+ per cent 100 per cent 100 per centSystems
A virtual private network (VPN) is a computer network inwhich some of the links between nodes use virtual circuitsin larger networks, such as the Internet, as opposed torunning across a single private network. One commonapproach is to secure communications through the publicInternet, as the VPN has security features such asauthentication and encryption. For example, VPNs canalso be used to separate the traffic of different usercommunities over an underlying network with strongsecurity features, or to provide access to a network viacustomised or private routing mechanisms.
From the security standpoint, VPNs either trust theunderlying delivery network, or must enforce security withmechanisms in the VPN itself. Unless the trusted deliverynetwork runs only among physically secure sites, bothtrusted and secure models need an authentication
Box IX.4Virtual Private Networks : Safety and Efficiency Parameters
mechanism for users to gain access to the VPN. SomeInternet Service Providers offer managed VPN servicefor business customers who want the security andconvenience of a VPN but prefer not to under takeadministering VPN services themselves. In addition toproviding remote workers with secure access to theiremployer’s internal network, other secur i ty andmanagement services are sometimes included as partof the package. Examples include keeping anti-virus andant i-spyware programs updated on each cl ient ’scomputer.
Secure VPNs use cryptographic tunneling protocols toprovide the intended confidential i ty and senderauthentication to achieve privacy. When properly chosen,implemented, and operated, such techniques can providesecure communications over unsecured networks.
315
PAYMENT AND SETTLEMENT SYSTEMS ANDINFORMATION TECHNOLOGY
congruity with the approaches followed by theReserve Bank. The latest version of the FST Visiondocument was published in 2007-08, which outlinedvarious goal posts for adoption by both the ReserveBank and the commercial banks.
IX.46 A review of the achievements vis-à-vis thegoals reveal the following: (i) network basedoperations and centralised processing of data hasbeen achieved by the migration to core bankingsystems by banks, (ii) sharing of resources forreaping economies of scale and mutual benefit hascommenced for the ATMs by making them part ofthe National Financial Switch (NFS) established bythe Institute for Development and Research inBanking Technology (IDRBT), (iii) initial trial runshave commenced for introduction of ExtensibleMarkup Language (XML) for easy inter-operability,(iv) completion of the implementation of corebanking systems (CBS) in banks has been almostachieved with many banks reporting 100 per centCBS coverage, (v) integrating the CBS withcommon interbank applications such as the RTGS,NEFT, PDO-NDS/Security Settlement Systems(SSS), etc. has been completed by most of thebanks, (vi) migration to electronic modes ofpayments on a time bound basis has been achievedin a phased manner by means of a minimum limitfor RTGS transactions, compulsory processing oflarge values only through electronic means and thediscontinuance of the high value clearing, (vii)effective and failsafe business continuity plans(BCP) have been put in place and periodical BCPexercises initiated by the Reserve Bank, (viii)Information Systems Audit is now an integral partof the controls and checks measures implementedby banks and (ix) management of outsourcing,especially with reference to vendor management,has improved.
IX.47 Efforts have been directed at benchmarkingthe various payment products and systems toassure availability and continuity of business, evenin the unlikely event of disruptions to normal
operations, besides assessment againstSystemically Important Payment Systems. The newfrontiers of technology are being adopted to makefurther advances in areas like mobile banking,electronic fund transfer, development of pre-paidpayment instruments, speed clearing, chequetruncation, besides gradual shifting of paper basedpayments to electronic payment modes. TheReserve Bank’s approach is also to ensure thatregulations do not st i f le innovations andcompetition, and the new products and systemsmust embrace high levels of safety and security soas to instill confidence among the users. Theinfrastructure of core-banking solutions that isavailable across the banking industry has to beleveraged to launch payment applications andproducts that benefit the cross-section of customersacross banks in a cost-effective manner.
IX.48 To sum up, non-disruptive functioning of thepayment and settlement system during the periodof global financial crisis is a notable aspect of theIndian financial system. Since markets andinstitutions in India functioned normally even duringthe peak of the crisis, it did not give rise to concernsregarding payment and settlement of transactions.More importantly, the advancements made inpayment and settlements on account of sustainedforward looking measures taken by the ReserveBank have contributed to strengthening a majorpillar of the financial system, which providesresilience against shocks to the financial system.The regulatory interventions of the Reserve Bankin new emerging modes of payments and theirsettlement have ensured appropriate institutionalmechanisms for their functioning in consonancewith the overall objectives of an efficient and stablefinancial system. The IT initiatives, both for theinternal functioning of the Reserve Bank and foradoption in the financial system have facilitatedimproved service delivery as well as greatereff iciency of the f inancial system, besidessubstantially contributing to the Reserve Bank’sefforts for promoting financial inclusion.
X.1 The range of complex issues and policychallenges that emerged from the global financialcrisis clearly highlight the importance of the qualityof human resources available in the central banksto ensure financial stability in a market economy.The global crisis brought the role of central banksto the centre stage of crisis management, testingthe resolve and competence of the available humanresources to face the challenges. The ReserveBank, as the central bank of one of the fastestgrowing emerging economies in the world with anexpanding and l iberalised financial system,recognises the critical significance of ensuringquality human resources to be able to dischargeall the responsibilities effectively and efficiently. Inits continued concerted efforts to strengthen thehuman resources, as a public institution, it facesstiff competition from the market in search of righttalent. Moreover, in view of the increasingimportance of coordination and cooperation amongcentral banks in a globalised world on the one hand,and the need for continuous interactions with themarket entities on the other, to enhance theunderstanding of issues and to maintain the flow
of information through relevant feedback, existinghuman resources need to be exposed on a regularbasis to other central banks and markets.Empowering the existing staff with adequatetraining in leading universities and researchorganisations is another important task of humanresources management in central banks. TheReserve Bank has a multi-pronged approach tostrengthen its human resources, using alternativeavailable avenues in relation to the Bank’s identifiedneeds. This Chapter documents the specificaspects of Reserve Bank’s various human resourcedevelopment initiatives.
HUMAN RESOURCE INITIATIVES
Training and Skills Enhancement
X.2 The two training establishments of theReserve Bank, viz., the Reserve Bank Staff College(RBSC), Chennai and the College of AgriculturalBanking (CAB), Pune cater to the training needs ofthe officers of the Reserve Bank and the bankingindustry. The four Zonal Training Centres (ZTCs)
HUMAN RESOURCES DEVELOPMENTAND ORGANISATIONAL MATTERSX
316
As a knowledge driven public institution, the Reserve Bank assigns significant importance to themanagement of human resources. The Reserve Bank constantly strives to enhance the professionalskills of the staff through appropriate training as well as providing scope for learning in every importantarea relevant to central banking for the staff at all levels. The two-way interactions through variouscollaborative efforts with different external institutions and agencies, both within the country andoutside, provide opportunities for acquiring relevant feedback and gaining important insights fromthe experience and practices of others. The interactions of the Reserve Bank with the public throughits various education as well as customer service delivery mechanisms aim at greater informationdissemination about the Reserve Bank’s role and functions in the economy. Various modes ofcommunication have also been effectively utilised to improve the flow of information, with betterclarity. The improvements in internal functioning of the various departments have been ensuredthrough appropriate checks and balances and internal auditing policy. The contribution of the ReserveBank to economic research activities in India has been significant, which range from research by itsown staff members to supporting academic research initiatives outside.
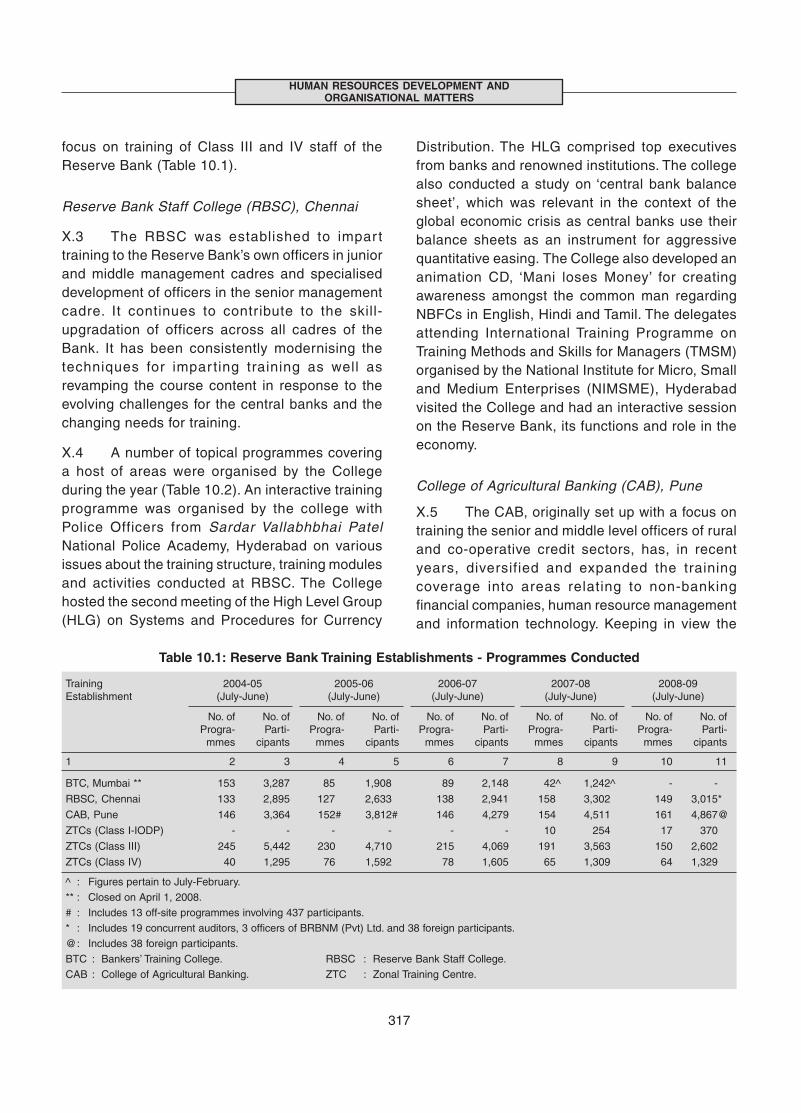
focus on training of Class III and IV staff of theReserve Bank (Table 10.1).
Reserve Bank Staff College (RBSC), Chennai
X.3 The RBSC was established to impar ttraining to the Reserve Bank’s own officers in juniorand middle management cadres and specialiseddevelopment of officers in the senior managementcadre. It continues to contribute to the skill-upgradation of officers across all cadres of theBank. It has been consistently modernising thetechniques for impar ting training as well asrevamping the course content in response to theevolving challenges for the central banks and thechanging needs for training.
X.4 A number of topical programmes coveringa host of areas were organised by the Collegeduring the year (Table 10.2). An interactive trainingprogramme was organised by the college withPolice Officers from Sardar Vallabhbhai PatelNational Police Academy, Hyderabad on variousissues about the training structure, training modulesand activities conducted at RBSC. The Collegehosted the second meeting of the High Level Group(HLG) on Systems and Procedures for Currency
Distribution. The HLG comprised top executivesfrom banks and renowned institutions. The collegealso conducted a study on ‘central bank balancesheet’, which was relevant in the context of theglobal economic crisis as central banks use theirbalance sheets as an instrument for aggressivequantitative easing. The College also developed ananimation CD, ‘Mani loses Money’ for creatingawareness amongst the common man regardingNBFCs in English, Hindi and Tamil. The delegatesattending International Training Programme onTraining Methods and Skills for Managers (TMSM)organised by the National Institute for Micro, Smalland Medium Enterprises (NIMSME), Hyderabadvisited the College and had an interactive sessionon the Reserve Bank, its functions and role in theeconomy.
College of Agricultural Banking (CAB), Pune
X.5 The CAB, originally set up with a focus ontraining the senior and middle level officers of ruraland co-operative credit sectors, has, in recentyears, diversified and expanded the trainingcoverage into areas relating to non-bankingfinancial companies, human resource managementand information technology. Keeping in view the
Table 10.1: Reserve Bank Training Establishments - Programmes Conducted
Training 2004-05 2005-06 2006-07 2007-08 2008-09Establishment (July-June) (July-June) (July-June) (July-June) (July-June)
No. of No. of No. of No. of No. of No. of No. of No. of No. of No. ofProgra- Parti- Progra- Parti- Progra- Parti- Progra- Parti- Progra- Parti-
mmes cipants mmes cipants mmes cipants mmes cipants mmes cipants
1 2 3 4 5 6 7 8 9 10 11
BTC, Mumbai ** 153 3,287 85 1,908 89 2,148 42^ 1,242^ - -
RBSC, Chennai 133 2,895 127 2,633 138 2,941 158 3,302 149 3,015*
CAB, Pune 146 3,364 152# 3,812# 146 4,279 154 4,511 161 4,867@
ZTCs (Class I-IODP) - - - - - - 10 254 17 370
ZTCs (Class III) 245 5,442 230 4,710 215 4,069 191 3,563 150 2,602
ZTCs (Class IV) 40 1,295 76 1,592 78 1,605 65 1,309 64 1,329
^ : Figures pertain to July-February.
** : Closed on April 1, 2008.
# : Includes 13 off-site programmes involving 437 participants.
* : Includes 19 concurrent auditors, 3 officers of BRBNM (Pvt) Ltd. and 38 foreign participants.
@: Includes 38 foreign participants.
BTC : Bankers’ Training College. RBSC : Reserve Bank Staff College.
CAB : College of Agricultural Banking. ZTC : Zonal Training Centre.
317
HUMAN RESOURCES DEVELOPMENT ANDORGANISATIONAL MATTERS
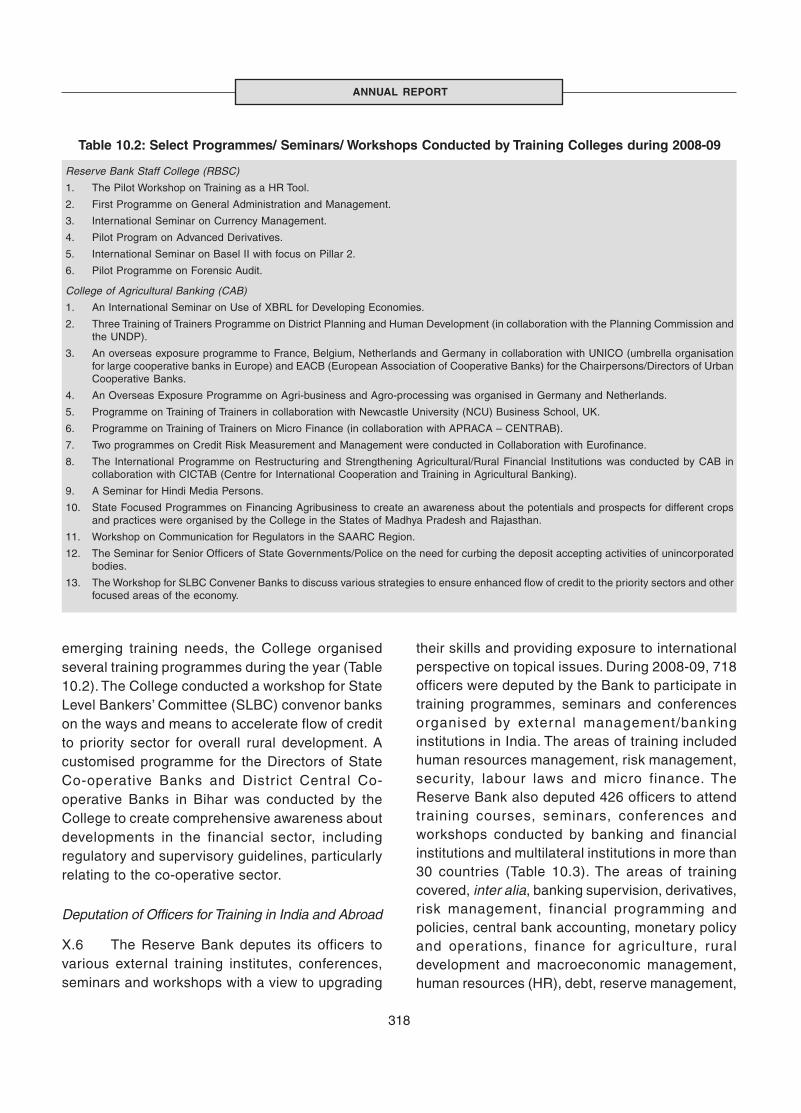
318
ANNUAL REPORT
emerging training needs, the College organisedseveral training programmes during the year (Table10.2). The College conducted a workshop for StateLevel Bankers’ Committee (SLBC) convenor bankson the ways and means to accelerate flow of creditto priority sector for overall rural development. Acustomised programme for the Directors of StateCo-operative Banks and Distr ict Central Co-operative Banks in Bihar was conducted by theCollege to create comprehensive awareness aboutdevelopments in the financial sector, includingregulatory and supervisory guidelines, particularlyrelating to the co-operative sector.
Deputation of Officers for Training in India and Abroad
X.6 The Reserve Bank deputes its officers tovarious external training institutes, conferences,seminars and workshops with a view to upgrading
their skills and providing exposure to internationalperspective on topical issues. During 2008-09, 718officers were deputed by the Bank to participate intraining programmes, seminars and conferencesorganised by external management/bankinginstitutions in India. The areas of training includedhuman resources management, risk management,security, labour laws and micro finance. TheReserve Bank also deputed 426 officers to attendtraining courses, seminars, conferences andworkshops conducted by banking and financialinstitutions and multilateral institutions in more than30 countries (Table 10.3). The areas of trainingcovered, inter alia, banking supervision, derivatives,risk management, financial programming andpolicies, central bank accounting, monetary policyand operations, finance for agriculture, ruraldevelopment and macroeconomic management,human resources (HR), debt, reserve management,
Table 10.2: Select Programmes/ Seminars/ Workshops Conducted by Training Colleges during 2008-09
Reserve Bank Staff College (RBSC)
1. The Pilot Workshop on Training as a HR Tool.
2. First Programme on General Administration and Management.
3. International Seminar on Currency Management.
4. Pilot Program on Advanced Derivatives.
5. International Seminar on Basel II with focus on Pillar 2.
6. Pilot Programme on Forensic Audit.
College of Agricultural Banking (CAB)
1. An International Seminar on Use of XBRL for Developing Economies.
2. Three Training of Trainers Programme on District Planning and Human Development (in collaboration with the Planning Commission andthe UNDP).
3. An overseas exposure programme to France, Belgium, Netherlands and Germany in collaboration with UNICO (umbrella organisationfor large cooperative banks in Europe) and EACB (European Association of Cooperative Banks) for the Chairpersons/Directors of UrbanCooperative Banks.
4. An Overseas Exposure Programme on Agri-business and Agro-processing was organised in Germany and Netherlands.
5. Programme on Training of Trainers in collaboration with Newcastle University (NCU) Business School, UK.
6. Programme on Training of Trainers on Micro Finance (in collaboration with APRACA – CENTRAB).
7. Two programmes on Credit Risk Measurement and Management were conducted in Collaboration with Eurofinance.
8. The International Programme on Restructuring and Strengthening Agricultural/Rural Financial Institutions was conducted by CAB incollaboration with CICTAB (Centre for International Cooperation and Training in Agricultural Banking).
9. A Seminar for Hindi Media Persons.
10. State Focused Programmes on Financing Agribusiness to create an awareness about the potentials and prospects for different cropsand practices were organised by the College in the States of Madhya Pradesh and Rajasthan.
11. Workshop on Communication for Regulators in the SAARC Region.
12. The Seminar for Senior Officers of State Governments/Police on the need for curbing the deposit accepting activities of unincorporatedbodies.
13. The Workshop for SLBC Convener Banks to discuss various strategies to ensure enhanced flow of credit to the priority sectors and otherfocused areas of the economy.
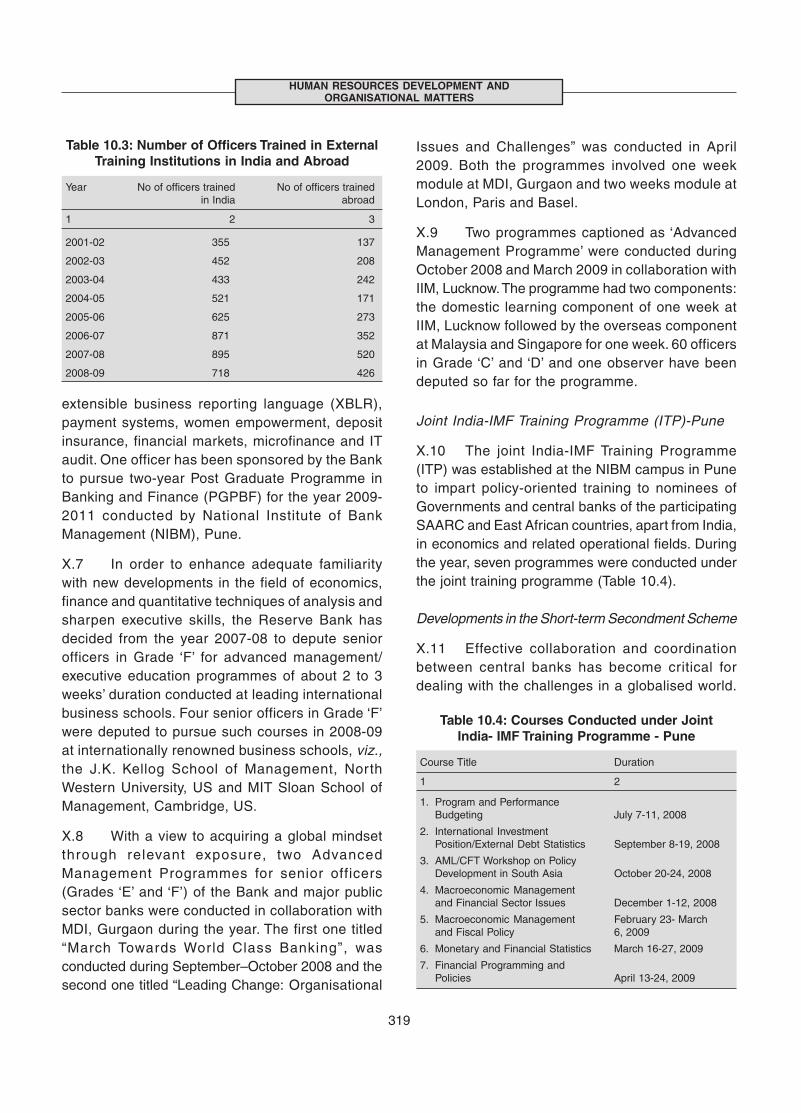
319
HUMAN RESOURCES DEVELOPMENT ANDORGANISATIONAL MATTERS
extensible business reporting language (XBLR),payment systems, women empowerment, depositinsurance, financial markets, microfinance and ITaudit. One officer has been sponsored by the Bankto pursue two-year Post Graduate Programme inBanking and Finance (PGPBF) for the year 2009-2011 conducted by National Institute of BankManagement (NIBM), Pune.
X.7 In order to enhance adequate familiaritywith new developments in the field of economics,finance and quantitative techniques of analysis andsharpen executive skills, the Reserve Bank hasdecided from the year 2007-08 to depute seniorofficers in Grade ‘F’ for advanced management/executive education programmes of about 2 to 3weeks’ duration conducted at leading internationalbusiness schools. Four senior officers in Grade ‘F’were deputed to pursue such courses in 2008-09at internationally renowned business schools, viz.,the J.K. Kellog School of Management, NorthWestern University, US and MIT Sloan School ofManagement, Cambridge, US.
X.8 With a view to acquiring a global mindsetthrough relevant exposure, two AdvancedManagement Programmes for senior officers(Grades ‘E’ and ‘F’) of the Bank and major publicsector banks were conducted in collaboration withMDI, Gurgaon during the year. The first one titled“March Towards World Class Banking”, wasconducted during September–October 2008 and thesecond one titled “Leading Change: Organisational
Issues and Challenges” was conducted in April2009. Both the programmes involved one weekmodule at MDI, Gurgaon and two weeks module atLondon, Paris and Basel.
X.9 Two programmes captioned as ‘AdvancedManagement Programme’ were conducted duringOctober 2008 and March 2009 in collaboration withIIM, Lucknow. The programme had two components:the domestic learning component of one week atIIM, Lucknow followed by the overseas componentat Malaysia and Singapore for one week. 60 officersin Grade ‘C’ and ‘D’ and one observer have beendeputed so far for the programme.
Joint India-IMF Training Programme (ITP)-Pune
X.10 The joint India-IMF Training Programme(ITP) was established at the NIBM campus in Puneto impart policy-oriented training to nominees ofGovernments and central banks of the participatingSAARC and East African countries, apart from India,in economics and related operational fields. Duringthe year, seven programmes were conducted underthe joint training programme (Table 10.4).
Developments in the Short-term Secondment Scheme
X.11 Effective collaboration and coordinationbetween central banks has become critical fordealing with the challenges in a globalised world.
Table 10.3: Number of Officers Trained in ExternalTraining Institutions in India and Abroad
Year No of officers trained No of officers trainedin India abroad
1 2 3
2001-02 355 137
2002-03 452 208
2003-04 433 242
2004-05 521 171
2005-06 625 273
2006-07 871 352
2007-08 895 520
2008-09 718 426
Table 10.4: Courses Conducted under JointIndia- IMF Training Programme - Pune
Course Title Duration
1 2
1. Program and PerformanceBudgeting July 7-11, 2008
2. International InvestmentPosition/External Debt Statistics September 8-19, 2008
3. AML/CFT Workshop on PolicyDevelopment in South Asia October 20-24, 2008
4. Macroeconomic Managementand Financial Sector Issues December 1-12, 2008
5. Macroeconomic Management February 23- Marchand Fiscal Policy 6, 2009
6. Monetary and Financial Statistics March 16-27, 2009
7. Financial Programming andPolicies April 13-24, 2009
320
ANNUAL REPORT
Working in other central banks for a short periodcould provide direct exposure to the Bank’s officersto the approach adopted in other central banks inperforming more or less similar broad functions. Inpursuance of the Short-term Secondment Schemethat the Reserve Bank has worked out with selectcentral banks, i.e., the Bank of England, ReserveBank of Australia and Banque de France, twoofficers from the Reserve Bank were seconded toBank of England in their Monetary and FinancialStatistics Division and International EconomicAnalysis Division, respectively. One more officialfrom the Reserve Bank was also seconded to theFinancial Markets Group in the Reserve Bank ofAustralia during the period. Under the arrangementother central banks have with the Reserve Bank,while one official from Banque de France took uphis secondment in the Department of BankingSupervision and Department of Banking Operationsand Development, another official from the ReserveBank of Australia undertook her secondment workin the Department of Economic Analysis and Policy.
International Seminar
X.12 As par t of inter-insti tut ional synergyinitiatives, the Reserve Bank and Banque de Francehad decided in the year 2007 to organise jointseminars on topics of contemporary and mutualrelevance. Taking these initiatives forward, acollaborative seminar was organised on a broadtheme- “Issues in Capital Account Convertibility andLessons from the Current Financial Crisis” on April02 and 03, 2009 at the CAB, Pune. While theresource persons for the seminar covered acombination of Senior Executives of the ReserveBank, Banque de France and the IMF, theparticipants comprised select officers from theReserve Bank, French Consulate in India andvarious French credit institutions located in India.The Reserve Bank and the Bank of England co-hosted a G-20 Workshop on the “The Causes ofthe Crisis: Key Lessons” in Mumbai on May 24-26,2009. The focus of the Workshop was on the roleplayed by macroeconomic factors in the crisis andits propagation around the world. The workshop
deliberated on the role and possible reforms of theinternational monetary system and the internationalfinancial institutions. Senior executives from thegovernments and central banks of the G-20member countries participated in the Workshop.
X.13 Five officers were selected during 2008-09under the Golden Jubilee Scholarship Scheme forhigher studies abroad. In all, 95 officers have beenselected under this scheme since its inception in1986. Under this scheme, officers of the Bank getthe opportunity to pursue academic excellence inthe leading international universities. Two officersavailed study leave under different schemes forpursuing higher studies during the year.
Zonal Training Centres (ZTCs)
X.14 ZTCs of the Reserve Bank organisedtraining programmes on functional areas of theBank, information technology and behaviouralareas for Class III and IV employees of the ReserveBank. Apart from conducting regular programmesat their premises, ZTCs also conduct off-siteprogrammes on personnel effectiveness, functionsand working of the Reserve Bank for Class III staffand developmental programme for Class IV staff.
X.15 In addition to the regular training initiatives,ZTC Belapur (Mumbai) and ZTC, Kolkata hadintroduced Integrated Officers DevelopmentProgrammes (IODP) during 2007-08. Observing thesuccess of these programmes at ZTCs, a total of17 such programmes were conducted during 2008-09 at ZTC, Belapur and ZTC Kolkata. For 2009-10,20 Integrated Officers Development Programmes(IODP), now renamed as Basic ManagementProgramme (BMP), at ZTC, Belapur and 15 BMPsat ZTC, Kolkata have been scheduled.
Deputation of Class III and IV Staff to ExternalInstitutions in India
X.16 Under the scheme for deputation of ClassIII and IV staff for training in external institutions inIndia, 92 Class III employees and 79 Class IVemployees were deputed for external training

321
HUMAN RESOURCES DEVELOPMENT ANDORGANISATIONAL MATTERS
institutions during July 2008-June 2009. In addition,817 Class III employees and 397 Class IVemployees have been deputed for in-houseprogrammes within the Bank.
OTHER INITIATIVES
360-Degree Appraisal for Officers in Grade ‘F’ inthe Bank
X.17 The Bank has constituted a panel of HRconsultants to assist the Bank in framing,implementing and deliver ing integrated HRsolutions in the areas of HR policies, processesand systems, etc., as and when the need arises.Subsequent to a Quality and Cost Based Selection(QCBS), M/s Ernst and Young have been awardedthe contract by the Bank for conduct of a 360-degree feedback exercise for Grade ‘F’ Officers ofthe Bank. The exercise, which is being co-ordinatedby Central Office, Human Resources DevelopmentDepartment, is purely developmental in nature.
RBI Young Scholars Scheme 2008-09
X.18 The Reserve Bank launched the ReserveBank Young Scholars Scheme for students in theage group of 18 and 23 years, studying inundergraduate classes in various institutionsacross the country in 2007. Under the scheme for2009, a country-wide selection test was conductedin all scheduled languages for the purpose and 150Young Scholars were selected for being located atvarious Reserve Bank offices spread across India.This marks a significant effort on the part of theBank, especially in view of its uniqueness of beingperhaps the f irst such exercise, which wasconducted in all major Indian languages. Theunderlying purpose of taking this innovativeinitiative has, in a sense, been quite well servedas this has been a major awareness andsensitisation exercise on the role of the ReserveBank and the banking system across the country.
Committee of Executive Directors on Regional Offices
X.19 A Committee of Executive Directors was setup by the Bank in April 2007 for identifying major
focus areas for its Regional Offices and makingbetter use of human resources deployed therein.Human Resources Development Depar tmentprovided the Secretariat for the Committee. Themandate and terms of reference of the Committeerequired it to identify redefined roles for theRegional Offices of the Reserve Bank and situatingthem in the overal l context of the evolvingchallenges for the central bank and policy concerns.The Repor t of this Committee of ExecutiveDirectors, which was submitted to the Bank in July2008, focused on 4 major areas, namely:(i) Organisational Issues; (ii) Customer Service;(iii) Communication Strategies and (iv) FinancialEducation and Inclusion Initiatives. The broad thrustof the recommendations made in this Report hassince been considered and given in-principleapproval by the Bank and currently the Bank’sDepar tment of Administration and Personnelmanagement is co-ordinating the follow-up exerciseto implement the said recommendations across theBank’s offices/departments.
Senior Management Conference 2008
X.20 The Senior Management Conference 2008of the Bank was held in Mumbai from November20 to 23, 2008. The broad theme of theConference was “Financial Sector Developmentin India: Agenda for the Reserve Bank in the Next5 years”. Besides individual sessions by the TopExecutives of the Bank and diverse functionalpresentat ions, 4 eminent guest speakersaddressed the Conference on emerging issues ofcontemporary relevance. These varied lecturesfocused on issues like the need to move beyondgrowth alone to an expansive view of India’s future,building of a new financial architecture, the needfor putting in place proper Information SystemControls in modern organisations and the usageand possibilities of the Right to Information (RTI)Act. The Guest Speakers at the SeniorManagement Conference 2008 were: (i) Sir MarkTully, former Chief of BBC India Bureau; (ii) Smt.Ela Bhatt, Chairperson of the Self-EmployedWomen’s Association (SEWA), Ahmedabad;
322
ANNUAL REPORT
(iii) Shri K. Natarajan, Chief Executive Officer,Mindtree Ltd., Bangalore; and (iv) Shri ArvindKejr iwal, leading RTI Act iv ist and RamonMagsaysay Award Winner.
Human Resources Audit
X.21 The Reserve Bank has several HRsystems and policies designed to enhance andharness the potential of its human capital. TheBank has decided to undertake an HR audit inorder to further improve the HR processes andevolve the HR function accordingly. This audit,while analysing the existing HR processes, willhelp identify areas for further improvement. TheHR audit will be employed in some critical HRareas like Performance Appraisal, RecruitmentPolicies and Practices, Transfers and Rotations,Promotions, Training and Development andCompensation Policy.
SAARCFINANCE Study on HR
X.22 In pursuance of the deliberations at the17th SAARCFINANCE Governors’ meeting held inWashington DC on April 12, 2008, a paper wasprepared with a broad theme of “Loss of centralbank’s human capital to commercial organisationsand the appropriate ways and means to retain thebest talent keeping in view the predefined rolesand funct ions of the central bank”. Whi leattempting a brief scan of human resources incentral banks in general and analysing the broadtrends in the evolving manpower turnover scenariotherein, the paper delved into the Indian contextand the challenges faced in this regard by theReserve Bank, and the strategies that the Bankhas adopted or needs to consider as appropriateresponse. With a view to having more definitiveinsights from the internal and externalstakeholders, along with a comparative analysisof talent processes in the Reserve Bank vis-à-visthose in select Indian banks and a couple ofleading central banks in Asia for making the presentexercise more comprehensive, the Bank has alsotaken relevant research inputs from M/s Hewitt
Associates, India, which is in the Bank’s approvedpanel of HR Consultants.
Knowledge Sharing Series
X.23 The Bank has initiated a regular interfacemechanism in the form of a knowledge-sharinglecture series, wherein leaders from the financialand corporate world are invited to share theirknowledge and experiences with the Bank’s officialson a wide range of critical issues. Several interactivelectures have been organised by the Bank underthe ambit of this series, which include interfaceswith renowned nutr i t ionist and dietician,cardiologist, gynecologist, and lectures on the artof storytelling, positive thinking and counseling,music therapy for stress relieving etc.
Incentive Scheme for Distance Learning/Part-timeCourses
X.24 During 2008-09 (July-June), 468 employeesavailed the benefits under the incentive scheme forpursuing select categories of part time and distanceeducation courses. The major areas of the studyare management, information technology, financialanalysis, commerce and economics.
Awards for Without Reserve
X.25 The Bank’s in-house journal “WithoutReserve” received an award for overall excellenceand a citation of encomium in the XIth All IndiaJournal Competition instituted by the MayaramSurjan Foundation, Raipur. “Without Reserve” alsobagged the National Award for House Magazine(First Prize) 2007 for the fourth consecutive yearfor being the best National in-house magazine in acontest organised by the Press Club,Thiruvananthapuram. The Association of BusinessCommunicators of India (ABCI), at the 48th annualawards competition, awarded “Magazine of theYear” award along with 8 other prizes in variouscategories covering internal magazines, bilingualpublication, magazine design, features (English),
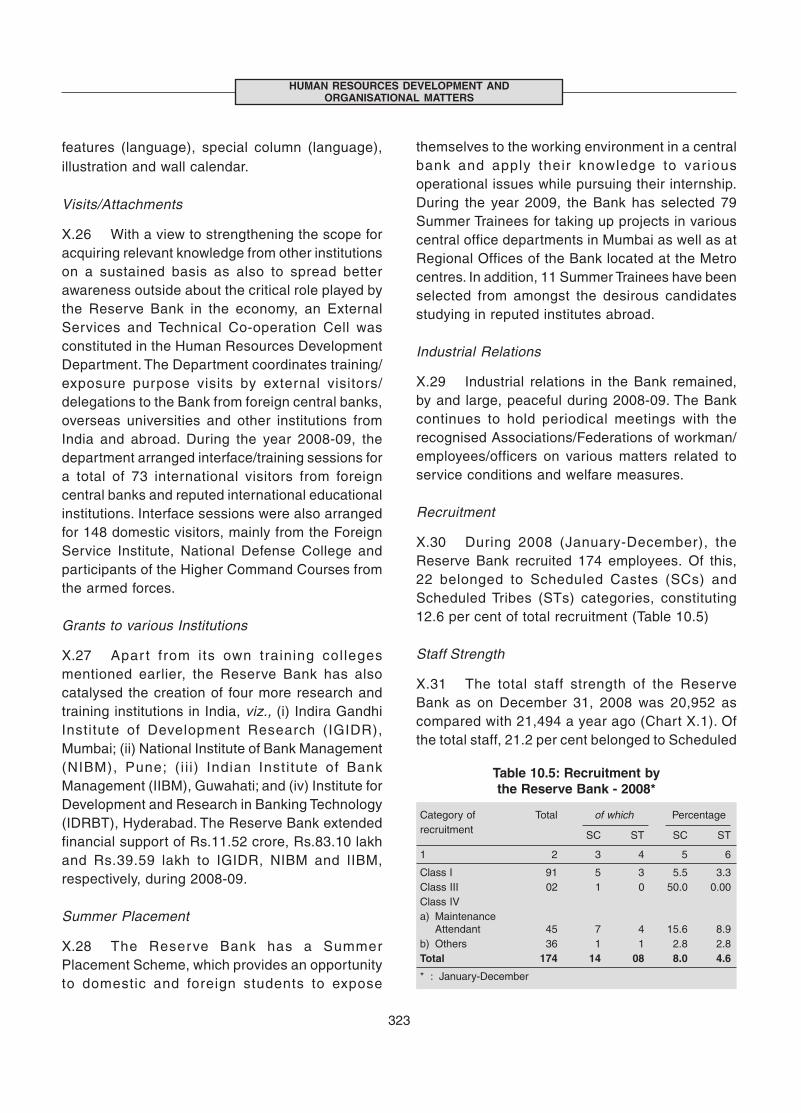
323
HUMAN RESOURCES DEVELOPMENT ANDORGANISATIONAL MATTERS
features (language), special column (language),illustration and wall calendar.
Visits/Attachments
X.26 With a view to strengthening the scope foracquiring relevant knowledge from other institutionson a sustained basis as also to spread betterawareness outside about the critical role played bythe Reserve Bank in the economy, an ExternalServices and Technical Co-operation Cell wasconstituted in the Human Resources DevelopmentDepartment. The Department coordinates training/exposure purpose visits by external visitors/delegations to the Bank from foreign central banks,overseas universities and other institutions fromIndia and abroad. During the year 2008-09, thedepartment arranged interface/training sessions fora total of 73 international visitors from foreigncentral banks and reputed international educationalinstitutions. Interface sessions were also arrangedfor 148 domestic visitors, mainly from the ForeignService Institute, National Defense College andparticipants of the Higher Command Courses fromthe armed forces.
Grants to various Institutions
X.27 Apar t from its own training collegesmentioned earlier, the Reserve Bank has alsocatalysed the creation of four more research andtraining institutions in India, viz., (i) Indira GandhiInstitute of Development Research (IGIDR),Mumbai; (ii) National Institute of Bank Management(NIBM), Pune; ( i i i ) Indian Insti tute of BankManagement (IIBM), Guwahati; and (iv) Institute forDevelopment and Research in Banking Technology(IDRBT), Hyderabad. The Reserve Bank extendedfinancial support of Rs.11.52 crore, Rs.83.10 lakhand Rs.39.59 lakh to IGIDR, NIBM and IIBM,respectively, during 2008-09.
Summer Placement
X.28 The Reserve Bank has a SummerPlacement Scheme, which provides an opportunityto domestic and foreign students to expose
themselves to the working environment in a centralbank and apply their knowledge to variousoperational issues while pursuing their internship.During the year 2009, the Bank has selected 79Summer Trainees for taking up projects in variouscentral office departments in Mumbai as well as atRegional Offices of the Bank located at the Metrocentres. In addition, 11 Summer Trainees have beenselected from amongst the desirous candidatesstudying in reputed institutes abroad.
Industrial Relations
X.29 Industrial relations in the Bank remained,by and large, peaceful during 2008-09. The Bankcontinues to hold periodical meetings with therecognised Associations/Federations of workman/employees/officers on various matters related toservice conditions and welfare measures.
Recruitment
X.30 During 2008 (January-December), theReserve Bank recruited 174 employees. Of this,22 belonged to Scheduled Castes (SCs) andScheduled Tribes (STs) categories, constituting12.6 per cent of total recruitment (Table 10.5)
Staff Strength
X.31 The total staff strength of the ReserveBank as on December 31, 2008 was 20,952 ascompared with 21,494 a year ago (Chart X.1). Ofthe total staff, 21.2 per cent belonged to Scheduled
Table 10.5: Recruitment bythe Reserve Bank - 2008*
Category of Total of which Percentagerecruitment SC ST SC ST
1 2 3 4 5 6
Class I 91 5 3 5.5 3.3Class III 02 1 0 50.0 0.00Class IVa) Maintenance
Attendant 45 7 4 15.6 8.9b) Others 36 1 1 2.8 2.8Total 174 14 08 8.0 4.6
* : January-December
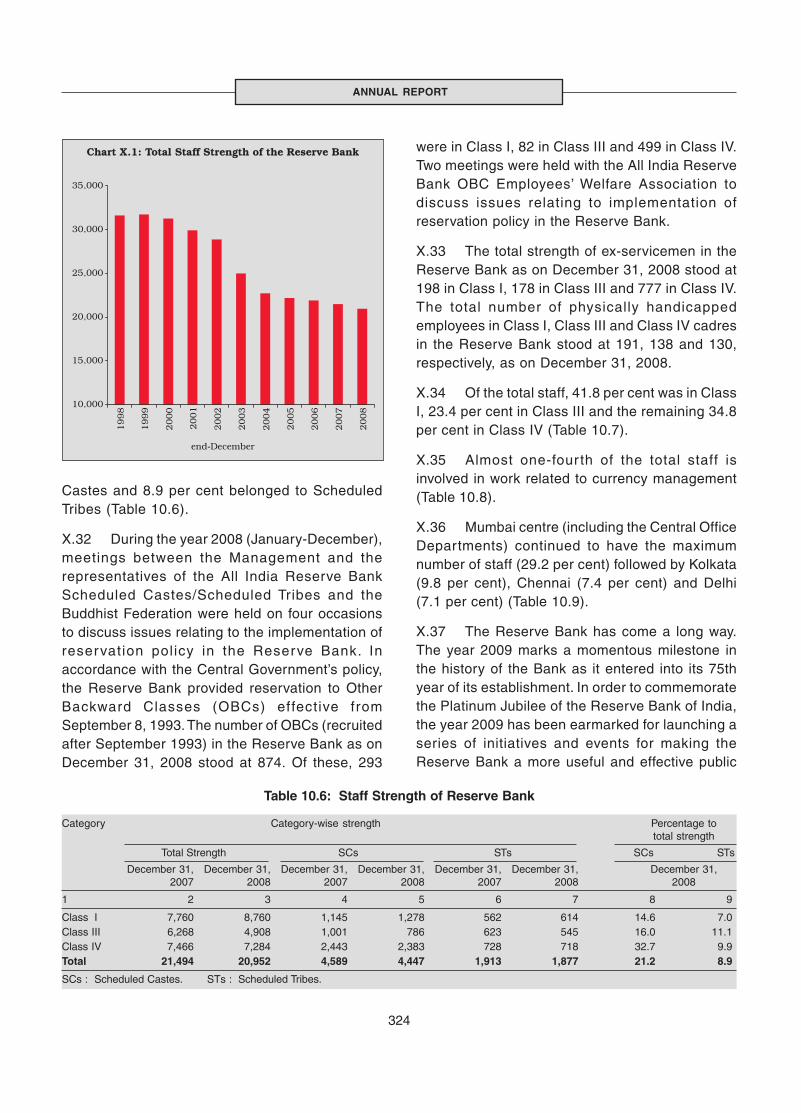
324
ANNUAL REPORT
were in Class I, 82 in Class III and 499 in Class IV.Two meetings were held with the All India ReserveBank OBC Employees’ Welfare Association todiscuss issues relating to implementation ofreservation policy in the Reserve Bank.
X.33 The total strength of ex-servicemen in theReserve Bank as on December 31, 2008 stood at198 in Class I, 178 in Class III and 777 in Class IV.The total number of physically handicappedemployees in Class I, Class III and Class IV cadresin the Reserve Bank stood at 191, 138 and 130,respectively, as on December 31, 2008.
X.34 Of the total staff, 41.8 per cent was in ClassI, 23.4 per cent in Class III and the remaining 34.8per cent in Class IV (Table 10.7).
X.35 Almost one-four th of the total staff isinvolved in work related to currency management(Table 10.8).
X.36 Mumbai centre (including the Central OfficeDepartments) continued to have the maximumnumber of staff (29.2 per cent) followed by Kolkata(9.8 per cent), Chennai (7.4 per cent) and Delhi(7.1 per cent) (Table 10.9).
X.37 The Reserve Bank has come a long way.The year 2009 marks a momentous milestone inthe history of the Bank as it entered into its 75thyear of its establishment. In order to commemoratethe Platinum Jubilee of the Reserve Bank of India,the year 2009 has been earmarked for launching aseries of initiatives and events for making theReserve Bank a more useful and effective public
Table 10.6: Staff Strength of Reserve Bank Category Category-wise strength Percentage to
total strength
Total Strength SCs STs SCs STs
December 31, December 31, December 31, December 31, December 31, December 31, December 31,2007 2008 2007 2008 2007 2008 2008
1 2 3 4 5 6 7 8 9
Class I 7,760 8,760 1,145 1,278 562 614 14.6 7.0Class III 6,268 4,908 1,001 786 623 545 16.0 11.1Class IV 7,466 7,284 2,443 2,383 728 718 32.7 9.9Total 21,494 20,952 4,589 4,447 1,913 1,877 21.2 8.9
SCs : Scheduled Castes. STs : Scheduled Tribes.
Castes and 8.9 per cent belonged to ScheduledTribes (Table 10.6).
X.32 During the year 2008 (January-December),meetings between the Management and therepresentatives of the All India Reserve BankScheduled Castes/Scheduled Tribes and theBuddhist Federation were held on four occasionsto discuss issues relating to the implementation ofreservation policy in the Reserve Bank. Inaccordance with the Central Government’s policy,the Reserve Bank provided reservation to OtherBackward Classes (OBCs) effective fromSeptember 8, 1993. The number of OBCs (recruitedafter September 1993) in the Reserve Bank as onDecember 31, 2008 stood at 874. Of these, 293
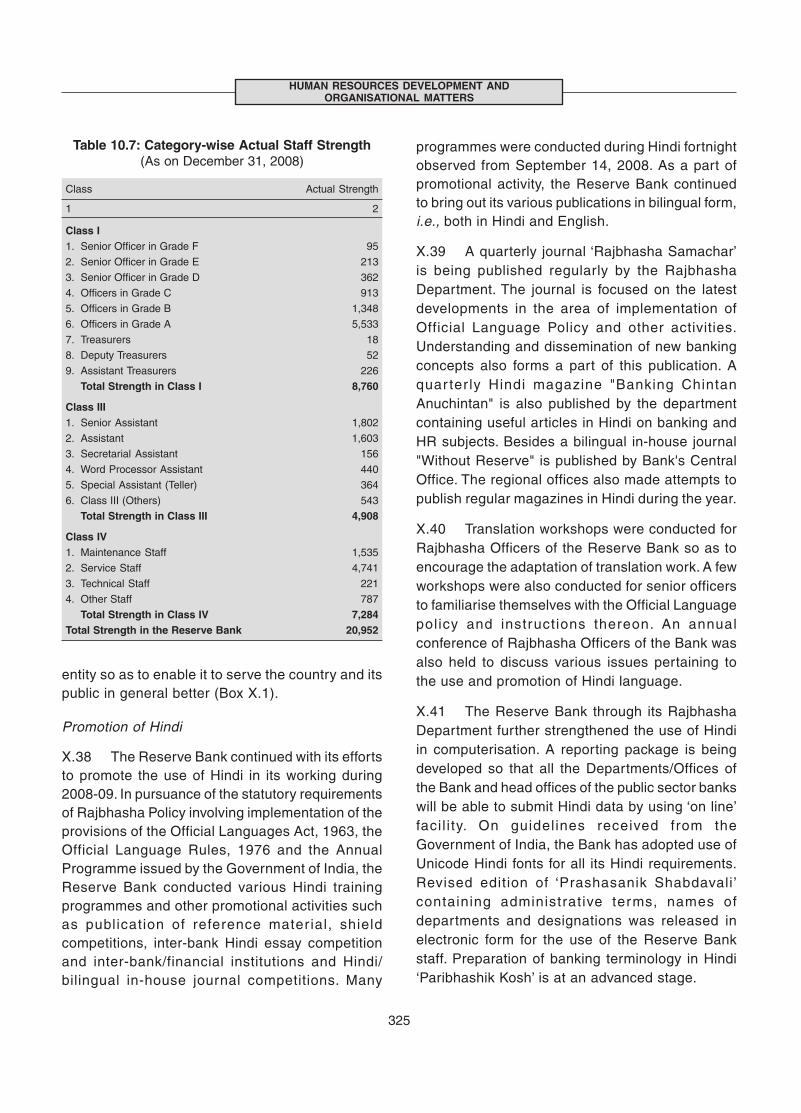
325
HUMAN RESOURCES DEVELOPMENT ANDORGANISATIONAL MATTERS
entity so as to enable it to serve the country and itspublic in general better (Box X.1).
Promotion of Hindi
X.38 The Reserve Bank continued with its effortsto promote the use of Hindi in its working during2008-09. In pursuance of the statutory requirementsof Rajbhasha Policy involving implementation of theprovisions of the Official Languages Act, 1963, theOfficial Language Rules, 1976 and the AnnualProgramme issued by the Government of India, theReserve Bank conducted various Hindi trainingprogrammes and other promotional activities suchas publication of reference mater ial, shieldcompetitions, inter-bank Hindi essay competitionand inter-bank/financial institutions and Hindi/bilingual in-house journal competitions. Many
programmes were conducted during Hindi fortnightobserved from September 14, 2008. As a part ofpromotional activity, the Reserve Bank continuedto bring out its various publications in bilingual form,i.e., both in Hindi and English.
X.39 A quarterly journal ‘Rajbhasha Samachar’is being published regularly by the RajbhashaDepartment. The journal is focused on the latestdevelopments in the area of implementation ofOfficial Language Policy and other activities.Understanding and dissemination of new bankingconcepts also forms a part of this publication. Aquar ter ly Hindi magazine "Banking ChintanAnuchintan" is also published by the departmentcontaining useful articles in Hindi on banking andHR subjects. Besides a bilingual in-house journal"Without Reserve" is published by Bank's CentralOffice. The regional offices also made attempts topublish regular magazines in Hindi during the year.
X.40 Translation workshops were conducted forRajbhasha Officers of the Reserve Bank so as toencourage the adaptation of translation work. A fewworkshops were also conducted for senior officersto familiarise themselves with the Official Languagepolicy and instructions thereon. An annualconference of Rajbhasha Officers of the Bank wasalso held to discuss various issues pertaining tothe use and promotion of Hindi language.
X.41 The Reserve Bank through its RajbhashaDepartment further strengthened the use of Hindiin computerisation. A reporting package is beingdeveloped so that all the Departments/Offices ofthe Bank and head offices of the public sector bankswill be able to submit Hindi data by using ‘on line’faci l i ty. On guidelines received from theGovernment of India, the Bank has adopted use ofUnicode Hindi fonts for all its Hindi requirements.Revised edition of ‘Prashasanik Shabdavali’containing administrative terms, names ofdepartments and designations was released inelectronic form for the use of the Reserve Bankstaff. Preparation of banking terminology in Hindi‘Paribhashik Kosh’ is at an advanced stage.
Table 10.7: Category-wise Actual Staff Strength(As on December 31, 2008)
Class Actual Strength
1 2
Class I
1. Senior Officer in Grade F 95
2. Senior Officer in Grade E 213
3. Senior Officer in Grade D 362
4. Officers in Grade C 913
5. Officers in Grade B 1,348
6. Officers in Grade A 5,533
7. Treasurers 18
8. Deputy Treasurers 52
9. Assistant Treasurers 226
Total Strength in Class I 8,760
Class III
1. Senior Assistant 1,802
2. Assistant 1,603
3. Secretarial Assistant 156
4. Word Processor Assistant 440
5. Special Assistant (Teller) 364
6. Class III (Others) 543
Total Strength in Class III 4,908
Class IV
1. Maintenance Staff 1,535
2. Service Staff 4,741
3. Technical Staff 221
4. Other Staff 787
Total Strength in Class IV 7,284Total Strength in the Reserve Bank 20,952
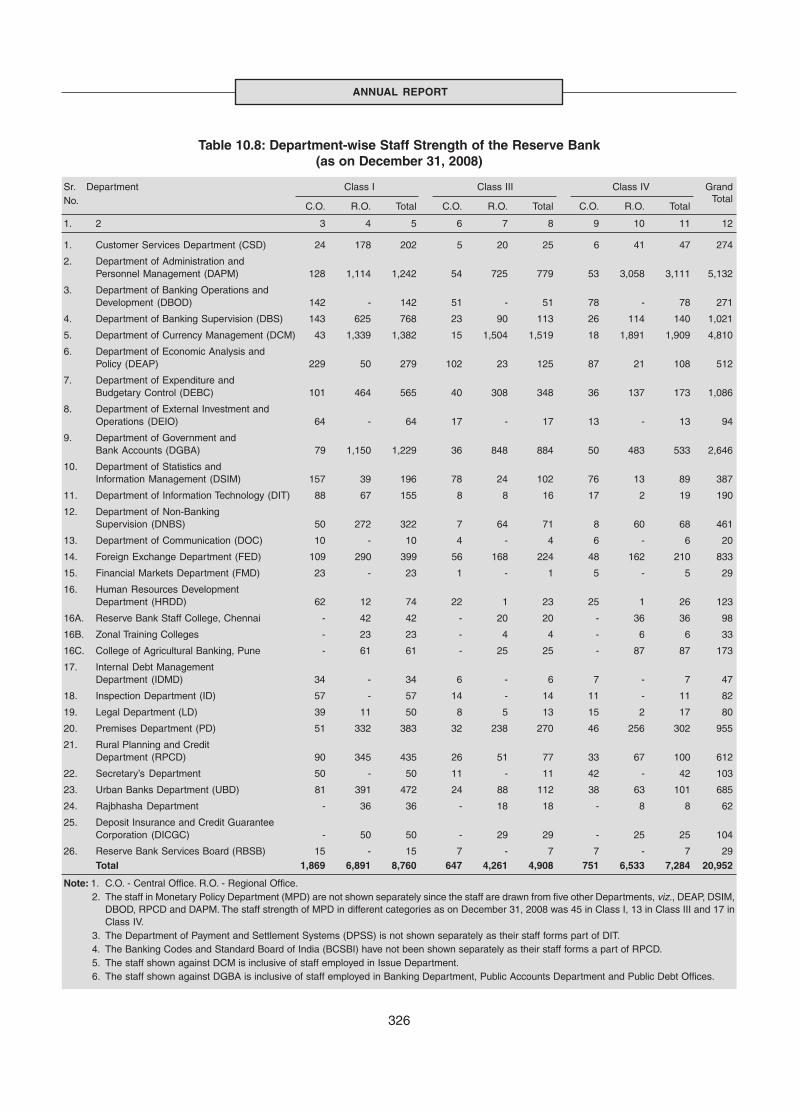
326
ANNUAL REPORT
Table 10.8: Department-wise Staff Strength of the Reserve Bank(as on December 31, 2008)
Sr. Department Class I Class III Class IV GrandNo. C.O. R.O. Total C.O. R.O. Total C.O. R.O. Total
Total
1. 2 3 4 5 6 7 8 9 10 11 12
1. Customer Services Department (CSD) 24 178 202 5 20 25 6 41 47 274
2. Department of Administration andPersonnel Management (DAPM) 128 1,114 1,242 54 725 779 53 3,058 3,111 5,132
3. Department of Banking Operations andDevelopment (DBOD) 142 - 142 51 - 51 78 - 78 271
4. Department of Banking Supervision (DBS) 143 625 768 23 90 113 26 114 140 1,021
5. Department of Currency Management (DCM) 43 1,339 1,382 15 1,504 1,519 18 1,891 1,909 4,810
6. Department of Economic Analysis andPolicy (DEAP) 229 50 279 102 23 125 87 21 108 512
7. Department of Expenditure andBudgetary Control (DEBC) 101 464 565 40 308 348 36 137 173 1,086
8. Department of External Investment andOperations (DEIO) 64 - 64 17 - 17 13 - 13 94
9. Department of Government andBank Accounts (DGBA) 79 1,150 1,229 36 848 884 50 483 533 2,646
10. Department of Statistics andInformation Management (DSIM) 157 39 196 78 24 102 76 13 89 387
11. Department of Information Technology (DIT) 88 67 155 8 8 16 17 2 19 190
12. Department of Non-BankingSupervision (DNBS) 50 272 322 7 64 71 8 60 68 461
13. Department of Communication (DOC) 10 - 10 4 - 4 6 - 6 20
14. Foreign Exchange Department (FED) 109 290 399 56 168 224 48 162 210 833
15. Financial Markets Department (FMD) 23 - 23 1 - 1 5 - 5 29
16. Human Resources DevelopmentDepartment (HRDD) 62 12 74 22 1 23 25 1 26 123
16A. Reserve Bank Staff College, Chennai - 42 42 - 20 20 - 36 36 98
16B. Zonal Training Colleges - 23 23 - 4 4 - 6 6 33
16C. College of Agricultural Banking, Pune - 61 61 - 25 25 - 87 87 173
17. Internal Debt ManagementDepartment (IDMD) 34 - 34 6 - 6 7 - 7 47
18. Inspection Department (ID) 57 - 57 14 - 14 11 - 11 82
19. Legal Department (LD) 39 11 50 8 5 13 15 2 17 80
20. Premises Department (PD) 51 332 383 32 238 270 46 256 302 955
21. Rural Planning and CreditDepartment (RPCD) 90 345 435 26 51 77 33 67 100 612
22. Secretary’s Department 50 - 50 11 - 11 42 - 42 103
23. Urban Banks Department (UBD) 81 391 472 24 88 112 38 63 101 685
24. Rajbhasha Department - 36 36 - 18 18 - 8 8 62
25. Deposit Insurance and Credit GuaranteeCorporation (DICGC) - 50 50 - 29 29 - 25 25 104
26. Reserve Bank Services Board (RBSB) 15 - 15 7 - 7 7 - 7 29Total 1,869 6,891 8,760 647 4,261 4,908 751 6,533 7,284 20,952
Note: 1. C.O. - Central Office. R.O. - Regional Office.2. The staff in Monetary Policy Department (MPD) are not shown separately since the staff are drawn from five other Departments, viz., DEAP, DSIM,
DBOD, RPCD and DAPM. The staff strength of MPD in different categories as on December 31, 2008 was 45 in Class I, 13 in Class III and 17 inClass IV.
3. The Department of Payment and Settlement Systems (DPSS) is not shown separately as their staff forms part of DIT.4. The Banking Codes and Standard Board of India (BCSBI) have not been shown separately as their staff forms a part of RPCD.5. The staff shown against DCM is inclusive of staff employed in Issue Department.6. The staff shown against DGBA is inclusive of staff employed in Banking Department, Public Accounts Department and Public Debt Offices.
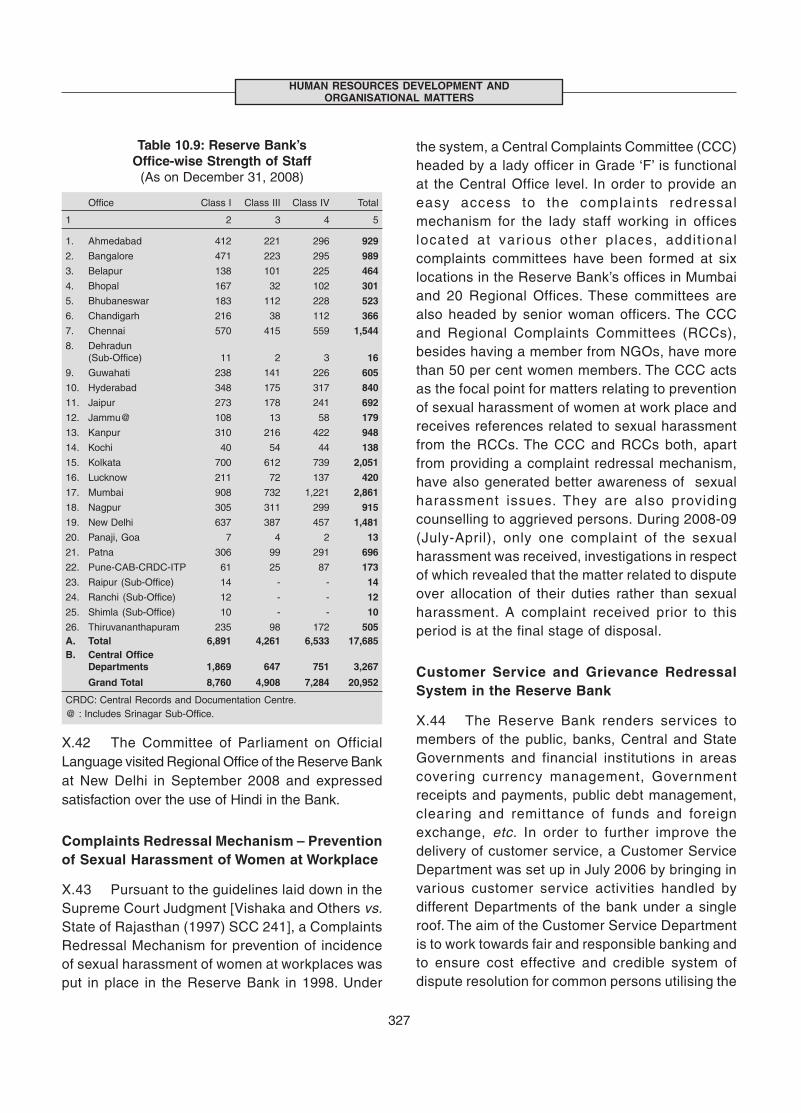
327
HUMAN RESOURCES DEVELOPMENT ANDORGANISATIONAL MATTERS
X.42 The Committee of Parliament on OfficialLanguage visited Regional Office of the Reserve Bankat New Delhi in September 2008 and expressedsatisfaction over the use of Hindi in the Bank.
Complaints Redressal Mechanism – Preventionof Sexual Harassment of Women at Workplace
X.43 Pursuant to the guidelines laid down in theSupreme Court Judgment [Vishaka and Others vs.State of Rajasthan (1997) SCC 241], a ComplaintsRedressal Mechanism for prevention of incidenceof sexual harassment of women at workplaces wasput in place in the Reserve Bank in 1998. Under
the system, a Central Complaints Committee (CCC)headed by a lady officer in Grade ‘F’ is functionalat the Central Office level. In order to provide aneasy access to the complaints redressalmechanism for the lady staff working in officeslocated at various other places, addit ionalcomplaints committees have been formed at sixlocations in the Reserve Bank’s offices in Mumbaiand 20 Regional Offices. These committees arealso headed by senior woman officers. The CCCand Regional Complaints Committees (RCCs),besides having a member from NGOs, have morethan 50 per cent women members. The CCC actsas the focal point for matters relating to preventionof sexual harassment of women at work place andreceives references related to sexual harassmentfrom the RCCs. The CCC and RCCs both, apartfrom providing a complaint redressal mechanism,have also generated better awareness of sexualharassment issues. They are also providingcounselling to aggrieved persons. During 2008-09(July-April), only one complaint of the sexualharassment was received, investigations in respectof which revealed that the matter related to disputeover allocation of their duties rather than sexualharassment. A complaint received prior to thisperiod is at the final stage of disposal.
Customer Service and Grievance RedressalSystem in the Reserve Bank
X.44 The Reserve Bank renders services tomembers of the public, banks, Central and StateGovernments and financial institutions in areascovering currency management, Governmentreceipts and payments, public debt management,clearing and remittance of funds and foreignexchange, etc. In order to further improve thedelivery of customer service, a Customer ServiceDepartment was set up in July 2006 by bringing invarious customer service activities handled bydifferent Departments of the bank under a singleroof. The aim of the Customer Service Departmentis to work towards fair and responsible banking andto ensure cost effective and credible system ofdispute resolution for common persons utilising the
Table 10.9: Reserve Bank’sOffice-wise Strength of Staff
(As on December 31, 2008)
Office Class I Class III Class IV Total
1 2 3 4 5
1. Ahmedabad 412 221 296 929
2. Bangalore 471 223 295 989
3. Belapur 138 101 225 464
4. Bhopal 167 32 102 301
5. Bhubaneswar 183 112 228 523
6. Chandigarh 216 38 112 366
7. Chennai 570 415 559 1,544
8. Dehradun(Sub-Office) 11 2 3 16
9. Guwahati 238 141 226 605
10. Hyderabad 348 175 317 840
11. Jaipur 273 178 241 692
12. Jammu@ 108 13 58 179
13. Kanpur 310 216 422 948
14. Kochi 40 54 44 138
15. Kolkata 700 612 739 2,051
16. Lucknow 211 72 137 420
17. Mumbai 908 732 1,221 2,861
18. Nagpur 305 311 299 915
19. New Delhi 637 387 457 1,481
20. Panaji, Goa 7 4 2 13
21. Patna 306 99 291 696
22. Pune-CAB-CRDC-ITP 61 25 87 173
23. Raipur (Sub-Office) 14 - - 14
24. Ranchi (Sub-Office) 12 - - 12
25. Shimla (Sub-Office) 10 - - 10
26. Thiruvananthapuram 235 98 172 505A. Total 6,891 4,261 6,533 17,685B. Central Office
Departments 1,869 647 751 3,267
Grand Total 8,760 4,908 7,284 20,952
CRDC: Central Records and Documentation Centre. @ : Includes Srinagar Sub-Office.
328
ANNUAL REPORT
banking services. Towards this vision, theDepartment focused on several important activitiesduring the year, viz., to ensure redressal ofgrievances of users of banking services in aninexpensive, expeditious, fair and reasonablemanner so as to provide impetus to improvedcustomer services in the banking sector on acontinuous basis; to provide valuable feedback/suggestions to the Reserve Bank towards framingappropriate and timely guidelines to banks toimprove the level of customer service and tostrengthen their internal grievance redressalsystems; to enhance the awareness of the BankingOmbudsman Scheme; and to facilitate quick andfair (non-discriminatory) redressal of grievancesthrough use of IT systems, comprehensive andeasily accessible database and enhancedcapabilities of staff through training.
X.45 The Complaints Redressal Cell (CRC) ofthe Customer Service Department coordinates withdifferent Departments of the Bank, which have
direct dealings with the public for prompt disposalof complaints against the services rendered by theReserve Bank to the satisfaction of members of thepublic. Complaints by the members of public/Bank’sconstituents pointing out deficiencies in the servicesrendered by the various Departments of the Bankat different centres, including Central OfficeDepartments, fall within the ambit of the CRC. CRCcovers all service-oriented Departments of theBank and in particular, the Banking Department[Public Accounts Department (PAD), DepositsAccounts Department (DAD), and Public DebtOffice (PDO)], Foreign Exchange Department andIssue Department.
X.46 CRCs have been established at all Offices/Central Office Departments. Advertisements, givingwide publicity about the functioning of the CRC atvarious Centres and also at the Central Office aresimultaneously published on a half-yearly basis, onfirst Sunday of January and July every year. The
The Reserve Bank, which commenced its operations onApr i l 1, 1935, has entered into i ts 75th year ofestablishment. Not only does this Platinum Jubilee yearmark a momentous milestone in the history of the Bankin terms of past numerous achievements in serving thenation, it also provides an occasion for introspection, anoccasion to reflect on the evolution of the institution andto reinvent as to how the institution could fulfill itsobjectives even better so that the Reserve Bank continuesto make a positive difference in the life of every Indian.
Keeping this in view, a series of initiatives and events hasbeen planned to coincide with the Platinum Jubilee yearof the Reserve Bank. Besides var ious events ofcelebration, a number of initiatives and activities have beenproposed for making the Reserve Bank a more useful,relevant, professional and effective public institution thatcan serve the country better. The broad components ofthese celebrations will be three-fold: (i) learning eventssuch as seminars, memorial lectures, etc.; (ii) functionsand events like the Down the Memory Lane events,bringing out special issue of “Without Reserve”, the annualSenior Management Conference, release ofcommemorative stamp and coin, cultural and sportsevents, etc. and (iii) Outreach programmes.
Box X. 1Commemoration of Reserve Bank’s Platinum Jubilee Year
The Bank plans to make use of this to more effectivelyreach out to the users of its services by seeking toassociate them proactively in the dissemination anddeliberation process. For this, seminars and paneldiscussions on key issues and themes are beingorganised at select Regional Offices of the ReserveBank inviting various constituents of the Bank. It isexpected that such an initiative will form an importantpart of the Reserve Bank’s efforts, especially throughits Regional Offices, to seize and create potential fornewer and wider engagement in the local developmentprocesses so as to be able to look after the soundnessof the financial system. This will also seek to ensurethat the broad economic concerns of all sections of thepopulation of these areas, with the vulnerable andmarginalised groups at the core of the agenda, areadequately addressed.
Keeping in mind that these Platinum Jubilee Yearcelebrations of the central bank need to reflect the Bank’spast and also manifest its current and future approach,the Governor, in his broadcast to the members of theBank’s staff on Apr i l 1, 2009, has elucidated thesignificance of the occasion and set forth the Bank’s broadagenda for the near/medium term.
329
HUMAN RESOURCES DEVELOPMENT ANDORGANISATIONAL MATTERS
adver tisements are published in the leadingEnglish and regional dailies. Citizens’ Charterspecifying the timeframe for each of the customerrelated activities of the Banking Department isprominently displayed in the Banking Hall for thebenefit of the customers/members of the publicvisiting the Reserve Bank for availing of variouskinds of services. Due publicity to the Citizens’Charter is also given through the Reserve Bank’swebsite and hard copies of the same are madeavailable to the customers/members of public overthe counter. CRC obtains Monthly Status Reportson the receipt and disposal of complaints from alloffices/Departments. CRC also receives QuarterlyReports based on the feedback received in writingfrom the Bank’s customers on Citizens’ Charter.The Regional Offices are required to assess thelevel of customer service every quarter. CRCanalyses these reports to assess the level ofcustomer service. The issues relating to thecustomer service and redressal of complaints arediscussed at the Branch Level ManagementCommittee meetings that are held at periodicintervals. Offices also arrange periodic meetingswith the customers, viz., commercial banks, urbanco-operative banks, Government agencies/departments and members of public and submitreports thereon to the CRC. Customer servicecomplaints/grievances, both against the ReserveBank and commercial banks were brought withinthe purview of Local Boards.
X.47 The Complaint Tracking System (CTS) isbeing periodically updated to deal with the risingnumber of complaints and also to get quickresponse from the banks. The upgraded version ofthe CTS envisages paperless office at BankingOmbudsmen (BO) offices. The upgradation wouldprovide aler t facility to Nodal Officers of therespective banks under each BO’s jurisdiction assoon as the complaint against the concerned bankis received by the BO office for the purpose ofmonitoring at the bank level. It also provides forcomprehensive reports of the complaints receivedby BO offices under different categories, reasonsand bank-wise classification.
X.48 Customer Service Department plans topublish four booklets during 2009-10 on the rightsand obligations of customers related to credit cards,service charges, housing loans and collection ofcheques. The booklets on housing loans andcollection of cheques have already been finalisedand are in the process of being pr inted.Furthermore, Microsoft excel based programmehas been developed by the Customer ServiceDepartment, which would be put up on the Bank’swebsite so as to enable the customers to calculateEMIs and loan amounts and compare the sameacross banks for different maturities and interestrates. Also a massive publicity campaign on theBanking Ombudsman Scheme is being launchedcovering both print and electronic media (JagoGrahak Jago campaign) in collaboration with theGovernment of India.
X.49 Customers, particularly in rural and semi-urban areas, find it difficult to switch their accountsfrom one bank to another because of lack ofgeographic coverage. Hence, there is a need forregulatory oversight as also creating customerawareness. Banking Ombudsmen (BO) haveunder taken face to face interaction with thestakeholders at fora like farmer’s associations,consumer societies, chambers of commerce, tradeassociations, etc. BOs have been advised to holdquarterly meetings with the lead banks at districtlevels to explain the policies of the Reserve Bank.BOs were also advised to take particular interestin dissemination of knowledge on the recentchanges in the BO Scheme and the rationale forthe same. BOs have been encouraged to spreadawareness about the Scheme in the interior partsof the country to empower the customers and alsoto sensitise bankers to deal with the customersfairly.
Management of the Bank’s Premises
X.50 Premises Department is responsible forframing policies for creation, maintenance,renovation and consolidation of the Bank’s physicalinfrastructure (office/residential buildings) by
330
ANNUAL REPORT
adopting modern technologies and materials, etc.The Department, in coordination with Estate Officeat Regional Offices, is focusing on providingmodern infrastructural facilities in office buildingsas well as residential quarters in a planned mannerso as to inculcate a sense of pride and belongingnessamongst officers/staff.
X.51 Keeping in view the importance attachedto scarce resources, the Premises Department hasinitiated energy/water saving measures, as a partof its responsibility to address ecological andenvironmental concerns. The Department hastaken up the national objective of reduction inenergy consumption and implementation ofenvironment friendly measures. The initiativestaken by the Bank in upgrading energy efficiencyin all its office buildings and detailed monitoringof energy use have been recognised by Bureauof Energy Efficiency (BEE), Ministry of Power,Government of India. BEE has developed normsfor the ‘Building Energy Star Rating Programme’and all the buildings of the Bank have been ratedas the most energy efficient buildings in thecountry. BEE, on the occasion of launching of thestar rating program for the buildings at New Delhion February 25, 2009 recognised the ReserveBank’s commitment to enhancing energy efficiencyand awarded the first star rating labels to theBank’s building at Bhubaneswar and New Delhi.The four buildings located at Bhubaneswar,Chennai, Kochi, Kolkata are recognised as 5-starbuilding under the rating system. Nine buildingsat Bhopal, Chandigarh, Hyderabad, Jaipur,Kanpur, Mumbai, Nagpur, New Delhi andThiruvananthapuram have been given 4-star ratingby BEE. Keeping in view the phasing out datesdeclared by Ministry of Environment and Forestsfor the Ozone Depleting Substances (ODS), thePremises Depar tment reviewed the air-conditioning plant working on these refrigerantsin the Bank’s buildings and an action plan hasbeen prepared for replacement of these plants by2010. Replacement of air-conditioning plants wastaken up at Belapur, Mumbai Regional Office,Kolkata and Thiruvananthapuram during the year
2008-09 and is at various stages of implementation/processing.
X.52 Water conservation and water audit havebeen initiated and all the Regional Offices havebeen advised to conduct Water Audit. The actionpoints have been identif ied for immediateimplementation and advised to all the RegionalOffices accordingly. The Bank is exploring thefeasibility of implementing ‘Green Building Projects’to rationalise the use of natural resources. Stepshave also been initiated to enhance the greeneryand to maintain the ecological balance in oursurroundings by undertaking tree planting in Bank’sproperties.
X.53 The Department has initiated the processof construction of Officers’ residential flats at NewDelhi, Mumbai, Chennai, Jammu and Hyderabadunder Design – Build mode of Construction in whicha single entity, i.e., DB Developers assumescomplete responsibility of executing the project. Theproject is likely to be completed in the next 2 yearsand wil l address the Off icers’ residentialrequirement at these centres. The Department hastaken up major structural rehabilitation work in theCentral Office Building, which is likely to becompleted by the close of 2009.
X.54 In the light of the experience gained overthe years, a need was felt to revisit and revise thepolicy and practices relating to dead stockmanagement and also to computer ise themaintenance of dead stock accounts in order toreduce the administrative and operational costs.Accordingly, a revised Fixed Asset Policy was putin place with the approval of the Committee of theCentral Board. The policy was designed to be inline with the best global accounting practices andin conformity with AS 10 of the Institute of CharteredAccountants of India (ICAI). The Departmentdeveloped a computerised Inventory ManagementSystem for implementation with effect from 1st July2009. The system is web-based, accessed fromNagpur Data Centre and will address the functionsof Estate Department at Regional Offices.
331
HUMAN RESOURCES DEVELOPMENT ANDORGANISATIONAL MATTERS
Inspection of Offices/Departments in theReserve Bank
X.55 The Management Audit and SystemsInspection (MASI), Information Systems Audit,Concurrent Audit (CA) and Control Self-Assessment Audit (CSAA) of the Off ices/departments of the Reserve Bank are undertakenat prescribed intervals. The MASI evaluates theadequacy and reliability of existing systems andprocedures to ensure that laws, regulations, internalpolicy guidelines and instructions are meticulouslyfollowed. Aspects relating to organisational goals,delegation of power and customer service in thedepartment/Office and management efficacy arealso looked into under Management Audit. Duringthe year 2008-09, Systems Inspections, includingInformation Systems Audits of eleven RegionalOffices (ROs), fifteen Central Office Departments(CODs), one Training Establishment (TE) and oneAssociate Institute were completed. In addition,Risk Based Inspection/Audit of New Delhi Officewas also taken up and completed.
X.56 The monitoring of the efficacy of theConcurrent Audit and Control Self Assessment Auditprevailing at various ROs/CODs continued to beundertaken through an off-site Audit MonitoringArrangement and on-site snap audits of offices (ROs/CODs/ TEs). During the year 2008-09, snap audits of21 Regional Offices, 24 Central Office Departmentsand two Training Establishments were conducted.
X.57 Technology audits of critical and importantIT applications/ systems were undertaken byinvolving external experts in the field of InformationSystems Audit. During the year, technology auditsof National Electronic Clearing Systems (NECS),Centralised PAD Systems (CPAD), ClearingCorporation of India Limited (CCIL) Transactions andIntegrated Accounting Systems (IAS) wereconducted. Technology Audits of e-Treasuryapplication and Liquidity Adjustment Facility (LAF)module covering functionality and security review areunderway. The project for obtaining ISO 9001-2000Certification in select work areas/Departments wastaken up in the Bank, in phases (Box X.2).
Information Systems (IS) Audit Policy
X.58 In order to address the changing businessenvironment and needs ushered in by increasedusage of technology in the Reserve Bank as alsoto map Bank’s IS Audit Policy to international bestpractices and standards, a comprehensive reviewof the existing Policy was undertaken in consultationwith the Institute of Internal Auditors (IIA). Therevised IS Audit Policy has been approved in March2009. An IS Audit strategic plan document preparedto facilitate achievement of Policy objectives hasalso been approved (Box X.3).
Risk Based Internal Audit (RBIA)
X.59 Implementation of the project forintroduction of Risk Based Internal Audit (RBIA) inthe Reserve Bank has been taken forward duringthe year by taking up live run of RBIA at New DelhiRO. Based on the experience gained during thisAudit and some more such live runs to follow,methodology for conducting such audits is beingevolved in order to facilitate transition from the existingSystems of Inspection to RBIA in a year’s time.
Communication
X.60 The Reserve Bank recognises the criticalsignificance of a sound communication policy. Thegoals of its communication policy are intimatelyinterlinked to its objectives. Transparency, clarity,managing expectations and promoting two-way flowof information along with dissemination ofinformation, statistics and research at variousfrequencies continued to remain the principal goalsof the Reserve Bank’s communication policy.
X.61 In keeping with its communication policy,the Reserve Bank continued to disseminateinformation through various channels, such as,press releases, notif ications, speeches,publications, frequently asked questions (FAQs),advertisements in print and electronic media andthe website. Press and video conferences with thepar ticipation of national and regional mediafollowing the announcement of annual, quarterly
332
ANNUAL REPORT
As a part of the Reserve Bank’s continuing initiatives toadopt and adhere to the international best practices andstandards, the project of obtaining Quality ManagementSystem (QMS) certification (ISO 9001) and InformationSecurity Management System (ISMS) certification (ISO27001) in select work areas was undertaken in phases.ISO 9001-2000 is a generic management standardproviding an internationally accepted framework forestablishing quality management systems with customerfocus and continual improvement as the key elements.Quality Management System (QMS) enables theorganisation to identify, measure, control and improvevarious business processes for better achievement of itsbusiness objectives. The ISO 9001 Standards are flexibleenough to be implemented in any kind and size oforganization and have ‘Plan, Do, Check, Act’ cycle asoperating principle. Information Security ManagementSystem (ISMS) is a systematic approach to managingsensitive information. It encompasses people, processesand Information Management systems. The Standardprovides a framework for selection of adequate securitycontrols proportionate to the criticality of the informationprocessed/ stored and business process r isks in aparticular work area/ domain by alignment of businessprocesses and information secur ity needs. It isimplemented through the process of information systemasset inventorisation, risk identification and documentationof management and information security policies as wellas control procedures for effective risk mitigation.
Status of ISO 9001 Certification in the Bank
During the first phase, ISO 9001 certification was obtainedfor DCM, DGBA, and Issue and Banking Departments atKolkata and Hyderabad ROs. It completed first cycle of 3years in April 2009 and recertification at these locationswas successfully accomplished through external certifyingagency. During second phase of certification, Issue andBanking Departments at New Delhi, Jaipur, Bangalore andChennai ROs were certified. These locations successfully
Box X.2ISO Certifications in the Bank
faced second surveillance (sustenance) audit during theyear. The certified Departments have benefited fromimplementation of standards by way of continualimprovement through measurable quality objectives,par ticular ly in the areas of house-keeping, recordmanagement and customer service; re-emphasisedcalibration system of measuring/processing devices,especially Currency Verification and Processing Systems(CVPS), among others. Currently, third phase ofcertification covering DEAP, DAPM, HRDD and Issue andBanking Departments at Ahmedabad, Bhopal, Nagpur andThiruvananthapuram ROs is underway. Fourth phase ofcertification at Issue and Banking Departments in 8 of theremaining ROs has been initiated. As a part of extendingISO certification to other work areas, FED is also plannedfor implementing these Standards.
Status of ISO 27001 Certification in the Bank
ISO 27001 Standards are implemented in select workareas of the Reserve Bank, in phases, with assistancefrom external experts/consultants. During the first phase,such certification was obtained for Departments such asDEIO and IDMD. First cycle of 3 years was completed atthese locations in April 2009 and recertification wassuccessfully accomplished through external certifyingagency. During the second phase of certification, two moreDepartments, viz. DBS and DBOD were covered. DBSsuccessfully faced 1st surveillance (sustenance) auditduring the year. Implementation of ISO 27001 has beentaken-up Depar tment-wise, in view of the diversefunctionality, multiple information processing systems andvarying levels of cr i t ical i ty of information acrossDepartments. The certified Departments have benefittedfrom implementation of Standards by way of increasedsecurity awareness at all levels, documented incidentrepor ting system, dynamic IS r isk assessment andtreatment. Currently, third phase of ISO 27001 certificationcovering Central Accounts Section (CAS), Nagpur andFinancial Market Department (FMD) is underway.
and half year ly monetary policy statementscontinued to play a significant role in reaching outto the public at large. Occasional interviews of theTop Management with national and internationalmedia helped in covering the Reserve Bank’sassessment of the economy and the financialsystem conveying to the wider audience.
X.62 During the year ended June 30, 2009, theReserve Bank issued 2,119 press releases, 79 mastercirculars and 517 notifications. It organised meetings,
workshops and seminars to interact with specialaudiences. Queries relating to banking, foreignexchange, economy, customer service were receivedthrough e-mail in the helpdesk email boxes set up inthe various Departments and Regional Offices.These queries were over and above the queriesreceived under the Right to Information Act, 2005.
X.63 With accent on transparency andaccountability, the Reserve Bank has been makingincreasing use of its website (URL:http://www.rbi.org.in)
333
HUMAN RESOURCES DEVELOPMENT ANDORGANISATIONAL MATTERS
Information Systems Audit (ISA) function was formalisedin the Reserve Bank, with the necessary responsibilitiesentrusted to the Inspection Department in 2001, in thewake of increasing computerisation and growing usage ofIT in work processes. An IS Audit Policy, with provision forperiodical review was also formulated. Considering theemerging business environment character ised byincreased technology usage as also enhanced complexityof technologies being deployed, r isks and resultantassurance needs have grown over the years. The IS Auditpolicy was, therefore, revised in order to refocus theapproach to IS Audit in the Bank, in tandem withinternational best practices.
The objective of the revised IS Audit Policy is to assessand provide independent, objective assessment of thestate of affairs and make audit recommendations regardingIT and IS in terms of Functionality, Secur ity andPerformance. The policy, prepared in consultation withInstitute of Internal Auditors (IIA) also refers to guidelinesprovided by the Information Systems Audit and ControlAssociation (ISACA) and other best practices followedinternationally. The key changes in the revised IS AuditPolicy apart from relevance and business need perspectiveinclude: (i) issues related to functionality and performanceaspect of the IT systems delivering the business objectivesalong with risk assessment, (ii) consulting role in IS Auditfunction at various stages of IT projects and applications
Box X.3IS Audit Policy
and (iii) provision for effective deployment and appropriateand adequate resources, internal as well as external, withnecessary flexibility.
During 2008-2009, a strategic plan for aligning IS Auditfunction to the organisational requirements in the wake ofincreasing use of technology in business processes wasapproved. It included taking up periodical third party ISAudits. The components of strategic plan include: (i) riskorientation of audit function, (ii) changing the audit reportstructure, ( i i i ) ski l l up-gradation and knowledgedissemination/sharing, (iv) availing external assistancewherever required, (v) audit resource augmentation and(vi) introducing a system or regular third party audits inIT/IS aspects thereby achieving the attributes such asvalued assurance, scalable model and sustainable effortin IS Audit function.
Various steps were taken to operationalise the strategic plansuch as: (i) the major IT systems were classified based onthe importance (criticality, important or normal) based onthe availability factor along with complexity of rating, (ii) auditactivities pertaining to periodical review with respect to themajor IT systems were categorised into three levels and(iii) the broad scope of periodic audit was formalised forthese audit activities. The audit guidelines are beingprepared for generic/application specific scopes against keycomponents defined in live run of Risk Based Internal Audit.
for communicating with the external audiences. Thesite is used not only to disseminate informationemanating from the Reserve Bank but also to seekfeedback on reports and recommendations as wellas on draft regulatory guidelines. During 2008-09,eight draft guidelines, one draft report and twoapproach papers were placed on the website forfeedback. The number of users who registeredthemselves for receiving information available on theReserve Bank’s website through email increased two-fold during the year. As many as 19,096 usersregistered themselves during the year taking the totalnumber of registered users to 34,104.
X.64 Under the outreach programme and to givean insight into its role and functions, the ReserveBank had, in 2006, embarked on a programme ofinviting school/college children and other interestgroups of members of the public to its offices. Theoutreach programme is conducted at the Reserve
Bank’s Central Office and some of the RegionalOffices. As many as 1,600 school children, teachersand other interest groups took advantage of thisopportunity in Mumbai alone in the last one year.As a module of learning about the role andfunctions of the Reserve Bank, they visited theCentral Office, Monetary Museum and NationalClearing Cell in Mumbai and had an interactivesession with officers of the economic researchdepartment of the Reserve Bank.
X.65 Under the outreach programme, the staffof the Reserve Bank also visited schools, colleges,professional and other academic/vocationalinstitutions in both, Mumbai and various otherregional centres for an interactive session. Theinteraction was mainly on subjects, such as, roleand functions of the Reserve Bank, Indianeconomy, evolution of money, salient securityfeatures of currency notes, the Reserve Bank’s
334
ANNUAL REPORT
financial literacy project, understanding of paymentsystem and general banking.
X.66 The Reserve Bank arranged an interactiveworkshop for communicators of central banks ofSAARC countries and other regulators of financialsector in India in February 2009. Hosted by theCollege of Agricultural Banking, Pune, the objectiveof the three-day workshop was to facil i tateexchange of ideas and networking. Topics, such,as communication policy, internal communication,role and tools of communication and challenges ofcommunication were discussed at the workshop.The workshop was organised under theSAARCFINANCE forum.
X.67 Regional Directors of select off icesinteracted with the representatives of local print andelectronic media to disseminate information onfinancial literacy initiatives taken up by the ReserveBank, coin and note distribution measures of theregional offices and other matters pertaining tocurrency management. Participation in radio andtelevision programmes by senior officers alsohelped in spreading awareness and sensitising thepublic about the role of the central bank and theimportance of financial literacy.
Customer Service
X.68 During the year under review, RegionalOffices undertook various measures including theevaluation of customer satisfaction for furtherimproving customer service in the areas of banking,currency management, foreign exchangemanagement and clearing mechanism. The effortsincluded training programmes/workshops/meetings to educate officials of various banking andnon-banking organisations, such as, State andCentral Government undertakings, authorisedforeign exchange dealers, rural and urban moneylenders, representatives of major NGOs, professorsand farmers’ organisations.
X.69 Officers in some regional centres madeincognito visits to bank branches to assess customerservice in areas, such as, exchange of defective notes,
display of service charges and interest rate on variousdeposits, cheque drop box facility, conduct of foreignexchange business, the Banking OmbudsmanScheme, etc. Several Regional Offices organisedmelas for exchange of soiled/mutilated notes and coindistribution as well as camps on weekly market daysfor supply of new notes and coins.
X.70 Workshops/seminars/meetings were heldwith banks, micro finance institutions, ruralinsurance agencies, officials of Department of Postsand other field level functionaries to familiarise themwith the Reserve Bank’s instructions on financialinclusion and also to discuss issues, such as,opening of no-frills accounts, IT-enabled financialinclusion, formation of self-help groups, etc.
X.71 Advertising campaigns were undertaken tohighlight investor fr iendly features of theGovernment Securities Act, 2006 and to cautionthe public against fictitious offers of remitting cheapfunds from abroad.
Financial Education and Literacy
X.72 In an effort to enhance and promote financialeducation and literacy, a few more comic books werereleased under Raju and Money Kumar series. Theseincluded ‘Raju and the Sky Ladder’, ‘Raju and theMagical Goat’ and ‘Money Kumar and Caring forCurrency’. A few Regional Offices of the Bankcollaborated with the state level bankers’ committeesand district level government officials in disseminationof financial education material in the local language.
X.73 Regional Offices also participated in fairs/exhibit ions of local and national reach todisseminate information on the Reserve Bank’s roleas a central bank, besides currency management,clean note policy, security features of new seriesof notes issued in 2005, star series notes, detectionof forged notes, foreign exchange facilities toresidents, investment in non-banking financialcompanies and Banking Ombudsman Scheme, etc.Dissemination of useful information emanating fromthe Reserve Bank in local language, besidesEnglish and Hindi, was the objective of participatingin exhibitions and melas.
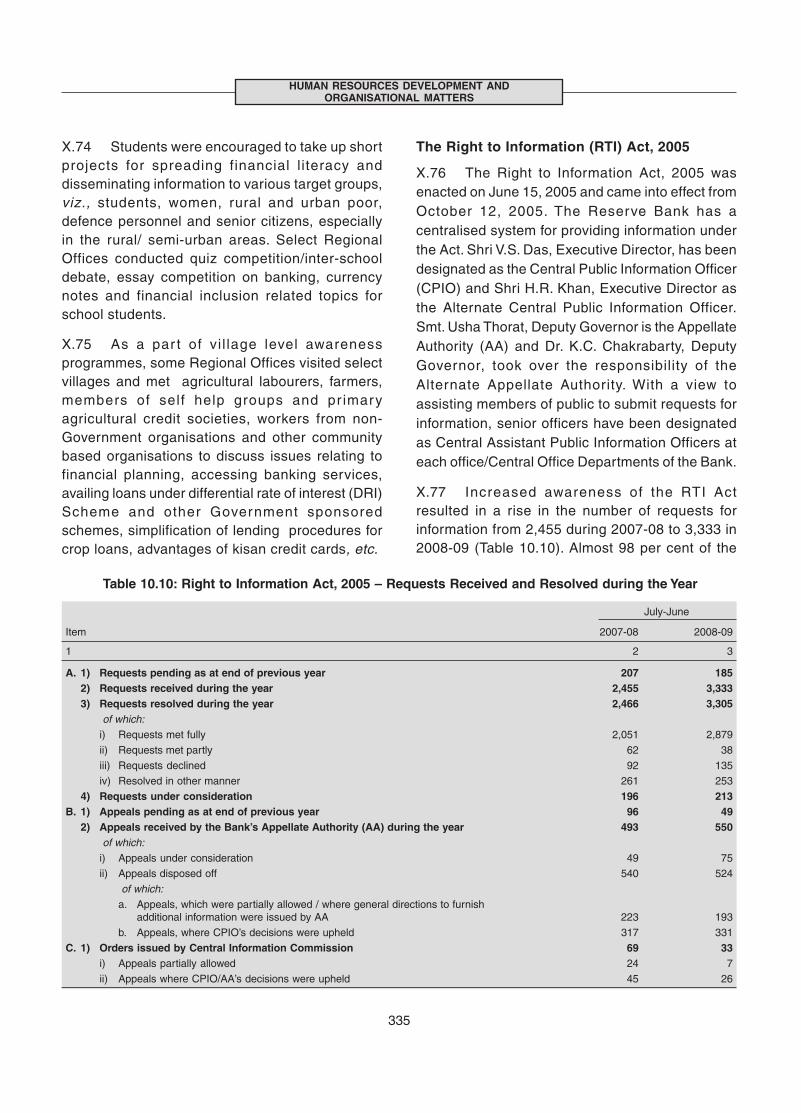
335
HUMAN RESOURCES DEVELOPMENT ANDORGANISATIONAL MATTERS
X.74 Students were encouraged to take up shortprojects for spreading financial l iteracy anddisseminating information to various target groups,viz., students, women, rural and urban poor,defence personnel and senior citizens, especiallyin the rural/ semi-urban areas. Select RegionalOffices conducted quiz competition/inter-schooldebate, essay competition on banking, currencynotes and financial inclusion related topics forschool students.
X.75 As a par t of vi l lage level awarenessprogrammes, some Regional Offices visited selectvillages and met agricultural labourers, farmers,members of self help groups and pr imaryagricultural credit societies, workers from non-Government organisations and other communitybased organisations to discuss issues relating tofinancial planning, accessing banking services,availing loans under differential rate of interest (DRI)Scheme and other Government sponsoredschemes, simplification of lending procedures forcrop loans, advantages of kisan credit cards, etc.
The Right to Information (RTI) Act, 2005
X.76 The Right to Information Act, 2005 wasenacted on June 15, 2005 and came into effect fromOctober 12, 2005. The Reserve Bank has acentralised system for providing information underthe Act. Shri V.S. Das, Executive Director, has beendesignated as the Central Public Information Officer(CPIO) and Shri H.R. Khan, Executive Director asthe Alternate Central Public Information Officer.Smt. Usha Thorat, Deputy Governor is the AppellateAuthority (AA) and Dr. K.C. Chakrabarty, DeputyGovernor, took over the responsibility of theAlternate Appellate Authority. With a view toassisting members of public to submit requests forinformation, senior officers have been designatedas Central Assistant Public Information Officers ateach office/Central Office Departments of the Bank.
X.77 Increased awareness of the RTI Actresulted in a rise in the number of requests forinformation from 2,455 during 2007-08 to 3,333 in2008-09 (Table 10.10). Almost 98 per cent of the
Table 10.10: Right to Information Act, 2005 – Requests Received and Resolved during the Year
July-June
Item 2007-08 2008-09
1 2 3
A. 1) Requests pending as at end of previous year 207 185 2) Requests received during the year 2,455 3,333 3) Requests resolved during the year 2,466 3,305 of which: i) Requests met fully 2,051 2,879
ii) Requests met partly 62 38
iii) Requests declined 92 135
iv) Resolved in other manner 261 253
4) Requests under consideration 196 213B. 1) Appeals pending as at end of previous year 96 49 2) Appeals received by the Bank’s Appellate Authority (AA) during the year 493 550 of which: i) Appeals under consideration 49 75
ii) Appeals disposed off 540 524
of which:
a. Appeals, which were partially allowed / where general directions to furnishadditional information were issued by AA 223 193
b. Appeals, where CPIO’s decisions were upheld 317 331
C. 1) Orders issued by Central Information Commission 69 33 i) Appeals partially allowed 24 7
ii) Appeals where CPIO/AA’s decisions were upheld 45 26
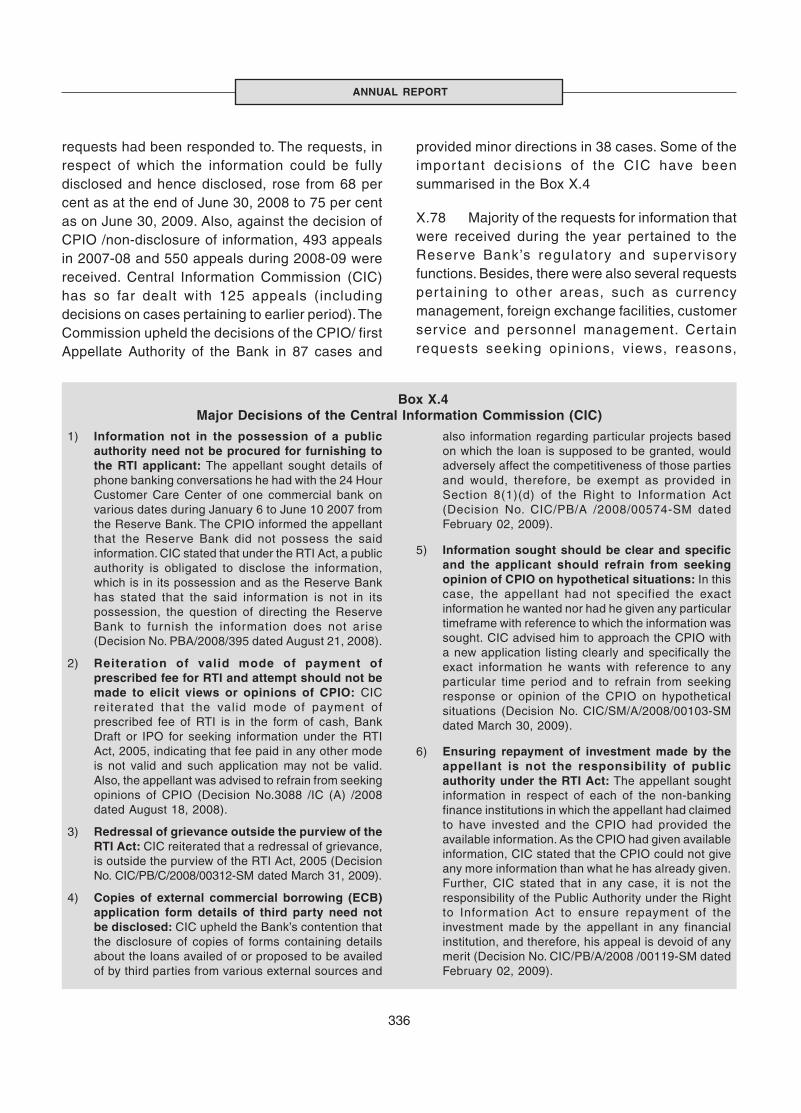
336
ANNUAL REPORT
requests had been responded to. The requests, inrespect of which the information could be fullydisclosed and hence disclosed, rose from 68 percent as at the end of June 30, 2008 to 75 per centas on June 30, 2009. Also, against the decision ofCPIO /non-disclosure of information, 493 appealsin 2007-08 and 550 appeals during 2008-09 werereceived. Central Information Commission (CIC)has so far dealt with 125 appeals (includingdecisions on cases pertaining to earlier period). TheCommission upheld the decisions of the CPIO/ firstAppellate Authority of the Bank in 87 cases and
provided minor directions in 38 cases. Some of theimpor tant decisions of the CIC have beensummarised in the Box X.4
X.78 Majority of the requests for information thatwere received during the year pertained to theReserve Bank’s regulatory and supervisoryfunctions. Besides, there were also several requestsper taining to other areas, such as currencymanagement, foreign exchange facilities, customerservice and personnel management. Cer tainrequests seeking opinions, views, reasons,
1) Information not in the possession of a publicauthority need not be procured for furnishing tothe RTI applicant: The appellant sought details ofphone banking conversations he had with the 24 HourCustomer Care Center of one commercial bank onvarious dates during January 6 to June 10 2007 fromthe Reserve Bank. The CPIO informed the appellantthat the Reserve Bank did not possess the saidinformation. CIC stated that under the RTI Act, a publicauthority is obligated to disclose the information,which is in its possession and as the Reserve Bankhas stated that the said information is not in itspossession, the question of directing the ReserveBank to furnish the information does not arise(Decision No. PBA/2008/395 dated August 21, 2008).
2) Reiteration of valid mode of payment ofprescribed fee for RTI and attempt should not bemade to elicit views or opinions of CPIO: CICreiterated that the valid mode of payment ofprescribed fee of RTI is in the form of cash, BankDraft or IPO for seeking information under the RTIAct, 2005, indicating that fee paid in any other modeis not valid and such application may not be valid.Also, the appellant was advised to refrain from seekingopinions of CPIO (Decision No.3088 /IC (A) /2008dated August 18, 2008).
3) Redressal of grievance outside the purview of theRTI Act: CIC reiterated that a redressal of grievance,is outside the purview of the RTI Act, 2005 (DecisionNo. CIC/PB/C/2008/00312-SM dated March 31, 2009).
4) Copies of external commercial borrowing (ECB)application form details of third party need notbe disclosed: CIC upheld the Bank’s contention thatthe disclosure of copies of forms containing detailsabout the loans availed of or proposed to be availedof by third parties from various external sources and
Box X.4Major Decisions of the Central Information Commission (CIC)
also information regarding particular projects basedon which the loan is supposed to be granted, wouldadversely affect the competitiveness of those partiesand would, therefore, be exempt as provided inSection 8(1)(d) of the Right to Information Act(Decision No. CIC/PB/A /2008/00574-SM datedFebruary 02, 2009).
5) Information sought should be clear and specificand the applicant should refrain from seekingopinion of CPIO on hypothetical situations: In thiscase, the appellant had not specified the exactinformation he wanted nor had he given any particulartimeframe with reference to which the information wassought. CIC advised him to approach the CPIO witha new application listing clearly and specifically theexact information he wants with reference to anyparticular time period and to refrain from seekingresponse or opinion of the CPIO on hypotheticalsituations (Decision No. CIC/SM/A/2008/00103-SMdated March 30, 2009).
6) Ensuring repayment of investment made by theappellant is not the responsibility of publicauthority under the RTI Act: The appellant soughtinformation in respect of each of the non-bankingfinance institutions in which the appellant had claimedto have invested and the CPIO had provided theavailable information. As the CPIO had given availableinformation, CIC stated that the CPIO could not giveany more information than what he has already given.Further, CIC stated that in any case, it is not theresponsibility of the Public Authority under the Rightto Information Act to ensure repayment of theinvestment made by the appellant in any financialinstitution, and therefore, his appeal is devoid of anymerit (Decision No. CIC/PB/A/2008 /00119-SM datedFebruary 02, 2009).
337
HUMAN RESOURCES DEVELOPMENT ANDORGANISATIONAL MATTERS
interpretations or grievance redressal were outsidethe scope of the Act and dealt with accordingly.Information, which is exempted from disclosureunder the provisions of the RTI Act was notfurnished. A ‘Disclosure Log’ summar isingdisclosures of general interest has also been placedon the Reserve Bank’s website.
RESEARCH ACTIVITIES
X.79 The Reserve Bank, as in the case of othercentral banks, has been at the forefront ofpromoting research activities both, within andoutside the Bank. Timely availability of relevantinformation and quality analysis of the informationin the country specific context are critical forformulating appropriate policies. All Departments,in particular the economic research and statisticsDepartments, have constantly strived to meet thegrowing research and information needs of theReserve Bank. Staff members of the Bank are alsoencouraged to conduct independent research andpublish their personal views in the occasionalpapers, staff studies and external research journals(Annex IV). A number of research articles werepublished by the staff of the Reserve Bank during2008-09. In order to explain the rationale and theanalytics of its policy initiatives to the public, theReserve Bank disseminated wide ranginginformation through publications and speeches.
X.80 The Reserve Bank over time has beenwidely recognised for its qualitative reports andresearch publications. These reports not onlycontribute to strengthening the communicationpolicy of the Bank on all important functional areasof the Bank but also serve as an important channelfor explaining the Bank’s views on emergingeconomic issues. The challenges that emergedduring the current global financial crisis clearlymanifest the need for better understanding of issuesand relevant analytical and empirical research forundertaking crisis prevention as well as crisismanagement policy measures. Against thisbackdrop, the research Departments of the Bank,viz., Department of Economic Analysis and Policy
(DEAP) and Depar tment of Statist ics andInformation Management (DSIM) continued toprovide analytical research inputs on variousaspects of the Indian economy for the conduct andformulation of policies by the Reserve Bank.
Department of Economic Analysis and Policy
X.81 The Department of Economic Analysis andPolicy is engaged in conducting policy orientedresearch relating to various facets of the Indianeconomy as well as emerging issues ofcontemporary relevance. The Department plays animportant role in terms of furnishing high qualityresearch inputs on var ious policy mattersconcerning the Reserve Bank. As in the past, twostatutory reports of the Reserve Bank, i.e., AnnualReport and the Report on Trend and Progress ofBanking in India during 2007-08 were prepared inthe Department. A study titled ‘State Finances – AStudy of Budgets of 2008-09’ was published inDecember 2008, which carried a special theme on‘Revenue Receipts of the State Governments’. TheDepartment also brought out the Summary of theUnion Budget 2009-10 (Vote-on-Account) andRailway Budget 2009-10 (Vote-on-Account) in theReserve Bank Bulletin.
X.82 The Report on Currency and Finance 2006-08,covering the theme “The Banking Sector in India:Emerging Issues and Challenges” was also released.Further, a special edition of Reports on Currencyand Finance covering the period 2003-04 to 2006-08 was also released. This special edition of Reportson Currency and Finance brings together theanalytical work of last four Reports with the objectiveof providing greater access to research conductedin the Reserve Bank in the areas of monetary policy,central banking, financial markets and the bankingsector. The Report on Currency and Finance, 2008-09 covering a theme of most contemporaryrelevance, viz., “Global Financial Crisis and theIndian Economy’’ is currently under preparation.
X.83 The Department assisted the ThirteenthFinance Commission, Government of India bypresenting a study in National Institute of Public
338
ANNUAL REPORT
Finance and Policy (NIPFP) on ‘FiscalConsolidation by Central and State Governments’.In pursuance of the decision taken at the twentyfirst Conference of State Finance Secretaries, twoworking Groups, viz., (i) Fiscal Transparency atState Level and (ii) Working Group on Local (Urban)Finance have been set up. The Department hasbeen providing secretarial assistance to theWorking Groups. Based on a request from theThirteenth Finance Commission, three ConceptPapers on terms of reference of the Commission,viz., (i) Introducing Expenditure Quality in Inter-Governmental Transfers: A Triple-E Framework, (ii)Strengthening Decentralisation - Augmenting theConsolidated Fund of the States by the ThirteenthFinance Commission: A Normative Approach and(i i i) An Outl ine of Post 2009 FRBM FiscalArchitecture of the Union Government in theMedium-term were forwarded to the Commission.These Concept Papers are being published asDevelopment Research Group (DRG) Studies. Inaddition, the Department provided technical inputsfor the paper “Post FRBM Fiscal Architecture-Suggestions” forwarded to the Thirteenth FinanceCommission. Inputs were also provided for thepresentations at the twenty second Conference ofState Finance Secretaries held on May 29, 2009.
X.84 The Department functioned as a nodal unitfor preparing the Reserve Bank’s comments on the‘Committee on Financial Sector Reforms’(Chairman: Prof. Raghuram Rajan). It also providedinputs/material for the Committee on FinancialSector Assessment (Chairman: Dr. Rakesh Mohan).The Department prepared a paper titled ‘FinancialInclusion in SAARC Countries – Approaches,Issues and Challenges’ for circulation amongSAARCFINANCE members. The Department alsohosted the seminar on ‘Strengthening FinancialStability Arrangements’ which was jointly organisedby the Reserve Bank and the World Bank at Mumbaidur ing June 15-18, 2009. There were 10participants from the SAARC member countries, 8from the World Bank and 12 from the Reserve Bank.
X.85 The Department acted as the Secretariatto the ‘High Level Committee on Estimation of
Savings and Investment’ set up by the Governmentof India under the Chairmanship of Dr. C.Rangarajan and coordinated and released the finalReport on behalf of the Ministry of Statistics andProgramme Implementation on March 2, 2009. TheDepartment participated in the inter-departmentalMonetary Policy Strategy meetings and providedprojections for 2008-09 and 2009-10 for growth,inflation, demand side aggregates and savings.Secretariat to the Working Group on the Real Sectoris also with the Department. The Report of theWorking Group on the Real Sector has beensubmitted to Top Management, appraisingdevelopments in the real sector of the economy atthe time of monetary policy formulation. The Reportof the Inter-departmental Working Group on ‘Co-operative Credit Insti tut ions in India-DataAvailabi l i ty’ was also submitted to the Topmanagement. During May 2009, the compilationwork of Flow of Funds (FOF) has been initiated,which is expected to be finalised by the end ofSeptember 2009.
X.86 The Depar tment released the‘Macroeconomic and Monetary Developments’ ona quarterly basis during 2008-09 which is issuedalong with the Monetary Policy Statements/Reviews. Presentations on macroeconomic andmonetary developments were made by theDepar tment before the Technical AdvisoryCommittee on Monetary Policy at each of itsquarterly meetings during the year. The Departmentalso regularly published a monthly review on “India’sForeign Trade” in the Reserve Bank Bulletin. TheDepartment published on a quarterly basis, adetailed article on “Indian Investment Abroad inJoint Ventures and Wholly Owned Subsidiaries”.
X.87 The Department is the primary source ofdata on balance of payments of the country, whichare released at the end of each quarter with a lagof one quarter. The Reserve Bank releases a PressRelease at the end of every quarter detailing thetrends in Balance of Payments (BoP) statistics.Further, an article on the developments in India’sBoP during every quarter is also published in themonthly issue of the Reserve Bank Bulletin. The

339
HUMAN RESOURCES DEVELOPMENT ANDORGANISATIONAL MATTERS
quarterly data on external debt are compiled by theDepartment for two quarters, while the Governmentof India compiles the same for the remaining twoquarters. The Department also compiles the indexof Nominal and Real Effective Exchange Rate (36-country) for India. These data are disseminatedthrough various publications of the Department. TheDepar tment also disseminates the var iouseconomic indicators under the Special DataDissemination Standards (SDDS) of the IMF. Apartfrom primary compilation of data, the Departmentalso focuses on research relating to balance ofpayments, capital flows, exchange rate and foreignexchange reserves. The articles on areas such as‘India’s External Debt as at end-March 2008’,‘India’s External Debt: Trend, Policy Changes andCross Country Comparisons’; ‘Invisibles in India’sBalance of Payments’ and ‘An Analysis of Trade inServices, Remittances and Income and India’sBalance of Payments Developments’ during fourquarters of 2008-09 were published in the ReserveBank Bulletin. A ‘Working Group on Balance ofPayments Manual for India’ has been constitutedunder the chairmanship of Shri Deepak Mohanty,Executive Director, Reserve Bank, to draftcomprehensive manual/guidelines on the definition,methodology, coverage and compilation of BoP inIndia consistent with the international bestpractices.
X.88 The Department is also entrusted with theresponsibi l i ty of compil ing the majormacroeconomic aggregates such as data onmonetary aggregates, consolidated state finances,flow-of-funds accounts and household financialsavings. Detailed time-series statistical informationcovering various sectors of the Indian economy –real, monetary, fiscal, external and financialmarkets – continued to be released through thepublication titled “Handbook of Statistics on IndianEconomy, 2007-08” for use by researchers. Thepublication provides annual data (in many casesfrom 1950-51 onwards), quarterly/monthly data(from 1990-91 onwards) as well as daily data inthe case of many financial variables for the last fewyears. The Depar tment also disseminated
information on key parameters of the Indianeconomy in the Reserve Bank’s Monthly Bulletinand its Weekly Statistical Supplement. During 2008-09, the Department prepared the Weekly Financialand Commercial Report for the Committee of theCentral Board/Central Board Meeting and theAnnual Memorandum on Current Economic Situationfor Central Board Meetings. Analytical studies inareas concerning the Indian economy werepublished in the Reserve Bank’s Occasional Papers.
X.89 The Department monitors developments inthe international monetary and financial systemwith a view to examining their implications for India.In pursuit of the above objective, it undertakespolicy oriented research pertaining to issues likeglobal financial and currency crises, analyses ofvar ious repor ts prepared by the IMF ondevelopments in the global economy such as theWorld Economic Outlook (WEO) and GlobalFinancial Stability Report (GFSR) and preparesreports on the developments in the global economy.The Department serves as the nodal point for mostof the work pertaining to multilateral institutionssuch as the IMF and the BIS and tracksdevelopments in these institutions. It preparesbriefs/comments on documents released by the IMFfor discussions by its Executive Board, co-ordinateswork relating to the visit of the IMF team to India inconnection with discussions under Article IV andserves as the back office for ED (IMF), India’s office.It also provides briefs/background material forInternational Monetary and Financial Committee(IMFC) meetings, besides prepar ing br iefs/comments/background material for bi-monthlymeetings of Governors at BIS as also for the G-20meetings, which are attended by the topmanagement of the Bank, in collaboration with otheroperational Departments. Further, it acts as theSecretariat of the SAARCFINANCE activities. Italso serves as a nodal unit for visits by dignitariesfrom multilateral financial institutions, central banksof other countries, international banks, credit ratingagencies, academics, and other internationaldelegations; arranges lecture ser ies in theReserve Bank.
340
ANNUAL REPORT
X.90 The Department provided valuable inputsto the inter-Departmental groups, viz., Group onMacro Prudential Indicators (MPI) (convened byDBS) and Corporate Performance MonitoringGroup (CPMG) (convened by DSIM), the TechnicalAdvisory Committee (TAC) on Money, ForeignExchange and Government Securities Markets,RBI-SEBI Technical Committee on RBI RegulatedEntit ies, the RBI-SEBI Standing TechnicalCommittee and Standing Parliamentary Committeeon Finance.
X.91 The Regional Offices of the Departmentcontinued to contribute to the research efforts ofthe Reserve Bank. Regular monthly/quarterlyreviews pertaining to the specific States/regionswere prepared. The Regional Economic Profileswere also prepared for the use of Central and LocalBoards of the Bank. The Regional ExpectationSurvey was also submitted as an input for MonetaryPolicy formulation. A regional study on impact ofglobal crisis on reverse migration of workers wasprepared. To strengthen the research effort, DEAPRegional Offices’ Conference was organised duringMarch 30-31, 2009. The Conference, which wasattended by eminent economists, covered threethemes, viz., (i) Beige Book, (ii) Impact of GlobalCrisis on India and (iii) Financial Inclusion. Inaddition, var ious studies on areas coveringeconomic, banking and fiscal sectors were alsoundertaken by the regional offices. They also madeseveral presentations in outside venues to a wideraudience of academicians, policy makers,corporates, research scholars and students on thelatest policy developments/measures of theReserve Bank.
X.92 The Development Research Group (DRG)was constituted in the Reserve Bank in November1991 with the objective to undertake quick andeffective policy-oriented research, backed by stronganalytical and empirical work. DRG continued toserve as a platform for collaborative researchbetween outside experts/academics and pool ofresearch talent available within the Reserve Bank.DRG has published 28 studies since its inception,and 8 more studies are expected to be published
during the next few months. The studies cover awide range of subjects relating to real sector,monetary policy, fiscal policy, banking, agriculture,external sector and social sector.
X.93 The Depar tment also manages theEndowment Scheme of the Bank. Under thescheme, financial support is provided to variousinstitutions for the purpose of research and trainingin areas of interest to the Reserve Bank. Thefinancial support is provided through corpus funds.At present, there are 22 corpus funds, with a totalcorpus of Rs.26 crore. Besides the EndowmentScheme, the Reserve Bank also grants financialsupport to universities/institutions for fundingresearch projects, publication of specialisedjournals and holding of conferences/seminars/workshops. During the year 2008-09, two newprojects were initiated: (i) the RBI-Madras Schoolof Economics (MSE) Macroeconomic ModelingProject, and (ii) the Indian Institute of Foreign Trade(IIFT) Project on Exchange Rate Movement andIndia’s Exports of Textile and Engineering Goods.
X.94 To increase the spread of research activitiesin the country, an expert committee (Chairman:Dr. Bimal Jalan) was constituted to review themission, objectives, scope and modalities of theReserve Bank’s research funding policy and tosuggest changes to provide greater clarity andeffectiveness of the programme. The Exper tCommittee submitted its Report to the Governoron February 19, 2009. The Committee has madewide ranging recommendations covering variousaspects of the research support activities of theBank (Box X.5). The recommendations of theCommittee have been accepted by the Bank andare under implementation.
Library
X.95 The Central Library of the Reserve Bank,attached to the Department of Economic Analysisand Policy (DEAP) plays an important role in thecollection, storage and dissemination ofinformation. The Library has a comprehensivecollection of books, journals, working papers,
341
HUMAN RESOURCES DEVELOPMENT ANDORGANISATIONAL MATTERS
reports, CD-ROMs and other documents. TheLibrary maintains electronic databases of all thesedocuments (OPAC-Online Public AccessCatalogue), which can be accessed through Librarywebsite (homepage) from the Central Officebuilding and from all other offices of the ReserveBank. Cen t ra l Lib ra ry a l so subsc r ibes tovar ious online databases such as Bankscope,CentralBankNews.com, Datastream, RGE Monitor,World Bank resources. In addition, e-journals, viz.,JSTOR Business, Mathematics, Statistics andLegal collections, ECONLIT, Proquest BusinessPeriodical Databases, Springer Business andEconomics package and Elsevier Science DirectE-journals and E-handbooks are subscribed toby the Central Library. The Central Library isimplementing new Library Website and a search
software, viz., ERMSS, which would scan all thesubscribed electronic resources and display theresults based on keyword based search. TheLibrary database has a collection of about 99,246documents compr ising books, Governmentpublications, working papers, discussion papersand complimentary publications. It also maintainsan online database of 31,261 journal articles andreceives 340 technical journals. The Library alsoprovides information services and technical supportto training colleges and libraries in other offices ofthe Reserve Bank.
Department of Statistics and Information Management
X.96 The Depar tment meets the Bank’sstatistical needs, which range from collection,
The Reserve Bank of India Act, 1934 [Section 17 (15B)]permits the Reserve Bank of India (the Reserve Bank orthe Bank) to provide facilities for training in banking andfor the promotion of research, where in the opinion of theBank, such provision may facilitate the exercise of itspowers and functions or the discharge of its duties. Inpursuance of this Act, the Bank has been providingfinancial support for research and training to universities/institutions under the Reserve Bank Endowment Scheme.Besides, the Bank grants financial support to universities/institutions for publication of specialised journals andholding of conferences/ seminars.
The Reserve Bank Endowment Scheme is reviewedperiodically by the Department of Economic Analysis andPolicy of the Bank. The last such review was undertaken inFebruary 2008 and submitted to the Central Board ofDirectors of the Bank. In the meeting of the Central Boardheld on February 7, 2008, it was proposed that the followingaspects of the endowment scheme need to be examined –policy on selection of universities/ institutions for institutinga corpus fund; funding arrangements; institutionalmechanisms, including accountability and transparency;and eligibility criteria for expanded funding. In the meetingof the Central Board held on March 6, 2008, the proposalto set up an Expert Committee to review the mission,objectives, scope and modalities of the Bank’s researchfunding policy and to suggest changes to provide greaterclarity and effectiveness of the programme was approved.
Consequently, the Expert Committee was constituted onJune 17, 2008 by the Bank under the Chairmanship of Dr.
Box X. 5Expert Committee on Research Funding Policy
Bimal Jalan. DRG, DEAP provided the Secretariat to theCommittee. The Committee deliberated on the terms ofreferences, including the overall mission, objectives andscope of the Bank’s research funding programme andsubmitted its Report to the Governor on February 19,2009. The main recommendations of the Committee areas follows:
• The mission and objectives of the Bank’s support forresearch activities should be clearly defined.
• There should be a coordinated approach to researchwithin the Bank.
• The interested scholars/researchers could be advisedto send their research proposals to the Bank forscrutiny.
• Enhancement of the corpus funds on account of changesin interest rates, inflation and recommendations of theSixth Pay Commission. Increase in corpus fund shouldbe done only after a thorough review and on a case-by-case basis, based on the requests received fromthe universities/institutions.
• The magnitude of grant for projects should be basedon the need of the project, considering the theme/subject area of each project proposed by theresearcher/institution.
• To incentivise research in RBI Chairs, the magnitudeof corpus fund could have two components – a nominalcomponent and a special component.
342
ANNUAL REPORT
compilat ion, analysis and dissemination ofinformation relating to various sectors of theeconomy to study important dynamics of theeconomy and the financial system through theapplication of econometr ic and statist icalprocedures. The Department has been entrustedwith managing electronic data disseminationplatform through Database on the Indian Economy,i.e., Data Warehouse of the Reserve Bank.Providing technical support to other Departmentsin statist ical analysis and large-scale datamanagement in specific areas also form the coreactivities of the Department.
X.97 During 2008-09, the Department conductedthe following surveys: (a) quarterly industrialoutlook surveys for four quarters during the year,providing insight into the performance andprospects of the private corporate sector engagedin manufacturing activities; (b) quarterly InflationExpectations Survey of Households, covering 4000households in 12 cities; (c) quarterly Survey ofInventories, Order Books and Capacity Utilisationfor the pr ivate corporate sector providinginformation relevant to business cycle analysis; d)biennial Survey of Small Borrowal Accounts (eachwith credit limit of Rs.2 lakh or below) with March31, 2008 as the reference period.
X.98 An inter-departmental Working Group hasbeen set up to assess the information requirementthrough surveys for monetary policy formulationand to carry out a review of the surveys beingconducted by the Depar tment. The Group isheaded by Shri Deepak Mohanty, ExecutiveDirector and members are drawn from MPD, DEAPand DSIM.
X.99 With a view to reviewing the methodologyand data quality of various rounds of the InflationExpectation Survey and to suggest ways to improveit, a Technical Advisory Committee on Surveyswas set up in 2007 under the Chairmanship ofDr. Rakesh Mohan, the then Deputy Governor. Themembers were drawn from MPD, DEAP, DSIM aswell as external experts from IGIDR, ISI andagencies conducting economic surveys like ABN
Amro and Dun and Bradstreet. The group is nowfinalising its report.
X.100 The information on the performance of thecorporate sector is an important input to policyformulation. Though the domestic economy hasbeen passing through a robust growth phase inrecent years, it has felt the impact of unprecedentedfinancial crisis world over on account of gettingincreasingly integrated with the global markets.Monitoring corporate performance has becomemore significant in the present scenario. TheDepartment made concerted efforts to expand thescope of studies and analytical work on thecorporate sector to extract useful information forpolicy formulation. Besides, as per the agreementbetween Central Statistical Organisation (CSO) andthe Bank and also on recommendations of variouscommittees, the Department estimates the savingand capital formation of the private corporatebusiness sector and forwards it to CSO for inclusionin National Account Statistics every year.
X.101 Economic forecasting is a pre-requisite fora forward-looking macroeconomic policy. Forecastsof key macroeconomic indicators, such as outputgrowth, inflation and interest rates are importantnot only for the Central Bank, but also for theGovernment, private businesses and individualhouseholds. The availability of reliable and accuratemacroeconomic forecasts is essential forpolicymakers conducting monetary and fiscal policy.Against this background and keeping in view theinternational exper ience, the Depar tmentintroduced ‘Survey of Professional Forecasters’ in2007 on a quarterly basis. Eight rounds of thesurvey have been conducted successfully. Theresults of the survey are placed on the ReserveBank’s website and are also published in thequar ter ly Macroeconomic and MonetaryDevelopments.
X.102 The house prices are traditionally lookedinto for an assessment of operative asset pricechannel of monetary policy. However, constructionof house starts database also provides additionaland supplementary information about the impact
343
HUMAN RESOURCES DEVELOPMENT ANDORGANISATIONAL MATTERS
of monetary policy impulses on housinginvestments. Keeping in view the importance ofsuch an indicator for central bank, the ReserveBank constituted a Technical Advisory Group (TAG)on Development of Housing Start Up Index (HSUI)(Chairman: Prof. Amitabh Kundu). The TAG, sincesubmitted its final report, has recommended thatthe Housing Start-up Index based on newly builtresidential units in urban India may be compiledon a quarterly basis and the Reserve Bank mayset up a Standing Committee to launch thisinitiative, monitor its progress, commission andoverview the surveys for constructing start-upcoefficients and consider increasing the scope andcoverage of HSUI over time.
X.103 With a view to monitoring the current trendsin real estate prices and rent, it was felt imperativeto establish an appropriate statistical data collectionsystem within the Reserve Bank. An Expert Groupon Asset Price Monitoring System has been set upin the Bank with the objective of developing aninformation system on asset prices. The group hasmembership from the Reserve Bank (DSIM), StateBank of India, NHB, ICICI, IGIDR, ISI, CSO andHDFC Realty. The Department is providing thesecretarial support to the Group.
X.104 The system of the Uniform Code Numbers(UCNs) was put in place in 1972, as a need wasfelt for a unique identification of each of thebranches/offices of the banks in India. Under thesystem, a bank office/branch is allotted a uniquecode number, known as Uniform Code Number(UCN). These codes, for the branches transactingin foreign exchange, are also known as AuthorisedDealers (AD) Codes. The UCNs, along with otherparticulars of bank branches, such as locationaldetails (state, district, centre), population category,type of business conducted, AD Category, etc. ismaintained in the DSIM in the form of the MasterOffice File (MOF) system. The details are updatedin the MOF system based on the informationsubmitted by the banks. These UCNs allotted tobank branches faci l i tate to get the spatialdistributions of the bank branches functioning on agiven date or opened or closed/merged/converted
during a given period and also the distributions ofthe deposit and credit data received through theBSR returns. Dur ing the year, Depar tmentcontinued to update the MOF by the way of state/district level amalgamation/ merger of RRBs andUCBs, continuous allotment of the new bankbranches/ offices, affecting closures and any otherchanges. Based on the MOF, 115 Parliamentqueries/Government queries/ under Right toInformation Act queries were replied, in addition tothe 120 data supply cases relating to updated bankbranch details to var ious state governmentdepartments in connection with their publications,disbursement of pension, online reporting of taxpayment data to Online Tax Accounting System(OLTAS), the Office of the Customs and CentralExcise (New Delhi), other organizations, otherDepartments of Reserve Bank, and researchers.
X.105 The BIS system of quarterly compilation ofInternational Banking Statist ics (IBS) wasimplemented by the Reserve Bank in December1999. The data on IBS of India comprising 18statements on locational banking statistics (LBS)and 5 statements on consolidated banking statistics(CBS) are being supplied to the BIS beginningMarch 2001. During the year, LBS and CBSstatements in the prescribed format, based on IBSdata for the three quarters from end-June 2008 toend December 2008 were supplied to the BIS.
X.106 With a view to reviewing the presentposition regarding receipt and compilation of databy the Reserve Bank and NABARD on bank creditto agriculture and other priority sectors, so as toensure consistency and accuracy, a WorkingGroup on Rationalisation of Returns furnished byscheduled commercial banks to the ReserveBank and NABARD was constituted in the DSIM.The group submitted its report in the month ofAugust 2008.
X.107 Data on various characteristics of credit anddeposits are collected from offices of scheduledcommercial banks through the Basic StatisticalReturns (BSR) 1 and 2, under the BSR system.BSR 1 provides data on purpose (occupation)-wise
344
ANNUAL REPORT
distribution of credit along with spatial distributionof place of sanction and place of utilisation of credit.It also provides data on credit amount outstandingon various parameters like type of account,organisation, interest rate, bank groups andpopulation groups. BSR 2 provides data on depositsamount outstanding according to type of deposits,spatial distr ibution of total deposits andclassif ication of term deposits on var iousparameters such as original maturity period,interest rate range, size of deposits and residualmaturity period. As stated in the last year’s AnnualReport, Basic Statistical Return 1 was revised andimplemented with effect from March 2008. Datapertaining to March 2008 have been collected inthe revised format and finalisation of results withMarch 31, 2008 as reference date is at advancedstage. The survey for March 2009 data with March31, 2009 as reference date has been launched. Inorder to ensure improvement in quality/coverageof the BSR system and IBS data, the Departmentcontinued to conduct workshops/trainingprogrammes for officials of participating banks atthe colleges and various centres of the ReserveBank and other banks.
X.108 The Depar tment compiles anddisseminates International Investment Position (IIP)of India as per Special Data DisseminationStandard (SDDS) of IMF on annual basis. Theannual data on International Investment Position(IIP) of India as at end- March 2008 were compiledand released on RBI website within two quarterslag. Further, IIP data is also being compiled anddisseminated on quarterly basis since June 2006.The latest IIP was disseminated for the quarter asat end December 2008.
X.109 As per the recommendation of the TechnicalGroup on Statistics for International Trade inBanking Services, comprising members from theMinistry of Finance, Ministry of Commerce and theconcerned Departments of the Bank, a survey waslaunched in January 2008 for collecting informationon trade in banking services, from foreign banksoperating in India and the Indian banks havingbranches abroad. The article based on the 2006-
07 survey was published in RBI Bulletin, January2009. The survey for 2007-08 has been launchedand the data have been processed. Further, therepor t submitted by the Technical Group onComputer Services Exports (comprising membersfrom National Association of Software and ServicesCompanies (NASSCOM), Software TechnologyParks of India (STPI) and the Reserve Bank) in May2008, was accepted by the Reserve Bank. As perthe recommendations, a comprehensive survey forthe period 2007-08 was launched in September 2008to collect information on computer/software servicesexports from the companies dealing in computersoftware/ information technology (IT) and IT enabledservices. The survey results have been finalised.
X.110 During the year, the Depar tment wasactively involved in migration of Database on IndianEconomy (DBIE): Reserve Bank’s Data Warehouseto the Bank's Data Centre and successfullycompleted migration of Database and Web layer ofthe DBIE site. Accordingly, URL of the site has beenchanged to http://dbie.rbi.org.in.
X.111 The ORFS, a web based platform for onlinesubmission of returns, has been successfullymigrated in the state-of-art data centre of the Bank.The system is currently being used by DBOD, DBS,FED, DPSS, MPD and DSIM for receiving variousreturns submitted by commercial banks. As a result,the data submission and compilation time has comedown significantly. The system has facilitated onlinesubmission of 17 important returns; including thestatutory Section 42(2) form ‘A’ return, under thephase I of this project. In phase II, 41 more returnsfrom DPSS, FED and DBS have been taken upunder the coverage of ORFS. All returns underOSMOS system of DBS are also proposed to becovered under this phase. As on date, 13 returnsof phase II are made live and others are at variousstages of implementation.
X.112 The Depar tment is coordinating theadoption of Extensible Business Repor tingLanguage (XBRL) standard in Indian bankingindustry for financial reporting. This effort is beingmonitored by a High Level Steering Committee
345
HUMAN RESOURCES DEVELOPMENT ANDORGANISATIONAL MATTERS
chaired by Smt Usha Thorat, Deputy Governor. Theentire project of XBRL is targeting to cover all thereturns submitted by commercial banks to theReserve Bank by 2011. In the first stage, Basel IIRepor ting System has been developed andimplemented in the Bank’s data centre. On thiscontent, an international seminar on “Use of XBRLby Developing Economies – Central Bank’sPerspective” was also organized. Various subjectmatter experts from different organization, viz.,XBRL International Inc., Bank of Spain, Bank ofJapan, and Australian Prudential RegulatoryAuthority (APRA), IT firms providing core bankingsolution in India, SEBI and a few selectedcommercial banks were invited for sharing theirexperiences. The High Level Steering Committeealso took initiative in reducing the number of returnsto be submitted by commercial banks to 225 from291. Also, the first phase of the XBRL project coversfive returns and is nearing completion. The XBRLCore Group is working in close coordination withthe Institute of Chartered Accountants of India(ICAI) for designing the banking taxonomy forfinancial statements of the banks.
X.113 The Annual Conference of the Departmentof Statistics and Information Management was heldduring November 27-28, 2008. The theme of thisyear’s conference was ‘changing role of DSIM’.Shr i Deepak Mohanty, Executive Directorinaugurated the conference and all the officers ofthe DSIM across central office departments andregional offices participated. During two days,prospective role of every individual unit of DSIMwere discussed.
X.114 As a part of the Platinum Jubilee celebrationof the Reserve Bank, the Department organisedthe Statistics Day International Conference 2009on July 2, 2009. The deliberations of the conferencehighlighted issues relating to revision,measurement, and collection of data, leadingindicators for business cycles, financial soundnessindicators, sample surveys, cross checking andvalidation of data, and data quality and policy. TheStatistics Day marks the birth anniversary of Prof.P. C. Mahalanobis, the legendary statistician who
contributed enormously on the development ofstatistics and statistical infrastructure in the country.
X.115 Continuing with the strong commitment forthe knowledge and skill development of the officers,the Department arranged in-house lecture serieson relevant topics in statist ics, economics,econometr ics and f inance. As par t of thisprogramme, the Depar tment organised thefollowing lecture series during the year- StochasticFrontier Analysis, Nonparametr ic smoothing(Regression), Resampling (Bootstrapping),Regression Diagnostics and International FinancialReporting Standards.
THE CENTRAL BOARD AND ITS COMMITTEES
X.116 Six meetings of the Central Board were heldduring the year. Of these, three meetings were heldat traditional centres (Kolkata, Chennai andMumbai) and three were held at non-traditionalcentres (Panaji, Ahmedabad and Bengaluru). Theusual post-Budget meeting of the Central Boardheld in New Delhi in March every year was heldthis year on July 11, 2009 after the presentation ofthe Union Budget on July 6, 2009. Forty-six weeklymeetings of the Committee of the Central Boardwere held during the year at Mumbai. ThreeCommittees, i.e., Committee of the Central Board,Board for Financial Supervision and Board forRegulation of Payment and Settlement System andthree sub-Committees, i.e., Inspection and Auditsub-Committee, Staff sub-Committee and Buildingsub-Committee have been constituted to assist theCentral Board in its decisions on various affairs ofthe Reserve Bank. The Committee of the CentralBoard, as usual, attended to the current businessof the Bank, including approval of the ReserveBank’s weekly accounts pertaining to the Issue andthe Banking Departments. The discussions at themeetings of the Central Board broadly coveredmatters pertaining to general superintendence anddirection of the Reserve Bank’s affairs, in which theDirectors, with their vast experience in diversefields, actively contributed to important decisionspertaining to currency management, information
346
ANNUAL REPORT
technology, human resource development, bankingregulation and supervision, monetary and creditpolicy, the Reserve Bank’s accounting policy, internaldebt management policy, global economic turmoiland functioning of Local Boards, among others. Thedeliberations of the Board also focused on the criticalassessment of the percolation of benefits of growthto the poorer sections of the society and onagriculture and rural areas in general.
X.117 Four meetings of the Inspection and AuditSub-Committee (IASC) were held during the year.The IASC examined, inter alia, the critical areasemanating from the Management and SystemsInspection of Central Office Departments andRegional Offices of the Reserve Bank.
X.118 The Building Sub-Committee (BSC) wasreconstituted for a period of two years with effectfrom June 11, 2009. Shri Sanjay Labroo, Director ofthe Central Board, was nominated on the reconstitutedBSC in place of Dr. D. Jayavarthanavelu. Threemeetings of BSC were held during the year. BSCadvised the Bank on various matters includingconstruction of staff quarters under Design andBuild mode, installation/replacement of air-conditioning plants and renovation of the executivefloors of Central Office Building.
X.119 On the occasion of the meetings of theCentral Board held at Panaji, Ahmedabad andBengaluru, the Reserve Bank officials led byGovernor held meetings with the senior officials ofthe State Government, commercial banks andfinancial institutions in Goa, Gujarat and Karnataka,to discuss the State-specific issues relating tobanking. Pursuant to the deliberations at themeetings at Ahmedabad and Bangalore, majordecisions were taken to energise financial inclusionin the respective States. A Task Force, consistingof the representatives of the State Government, theSLBC convenor and other bankers, was constitutedto look into the distress arising on account of theproblems faced by the diamond industry in Gujaratand to make practicable recommendations formitigating the difficulties. It was decided to launcha pi lot programme for f inancial l i teracy inKarnataka. This programme, to be launched by the
Reserve Bank in collaboration with the StateGovernments, will involve introduction of financialand related material in the curriculum of schoolsand colleges. Steps would also be taken to makefinancial literacy part of non-formal education.
Directors / Members of the Central Board / Local Boards
X.120 Dr. Y. V. Reddy demitted the office ofGovernor of the Bank on September 5, 2008 oncompletion of five year term.
X.121 Dr. D. Subbarao assumed the office ofGovernor of the Bank on September 5, 2008 for aperiod of three years.
X.122 Shri V. Leeladhar relinquished the office ofDeputy Governor of the Bank on completion of histerm on December 8, 2008.
X.123 Dr Rakesh Mohan relinquished the officeof Deputy Governor of the Bank, as at the close ofbusiness on June 10, 2009.
X.124 Dr. K. C. Chakrabarty assumed the Officeof Deputy Governor of the Bank on June 15, 2009for a period of three years.
Awards
X.125 Dr. Ashok S. Ganguly, Director of the CentralBoard was awarded Padma Vibhushan in the field ofTrade and Industry on the Republic Day 2009.
Obituary
X.126 Shri S.S. Marathe, former Director of theCentral Board and Chairman of the Local Board(Western Area) during January 16, 1986 to March28, 1994, passed away on September 28, 2008.
Appointment of Executives
X.127 Shri Deepak Mohanty was appointed asExecutive Director with effect from October 13, 2008.
Retirement of Executives
X.128 Dr. R.B. Barman, Executive Director retiredfrom the Bank’s service at the close of the businesson July 31, 2008.
347
HUMAN RESOURCES DEVELOPMENT ANDORGANISATIONAL MATTERS
Foreign Dignitaries
X.129 A number of foreign delegations visited theReserve Bank during the year and interacted withTop Management (Annex IV).
X.130 The sustained emphasis of the ReserveBank in strengthening its human resources to meetthe changing needs of the Reserve Bank was,thus, carried forward during 2008-09 with severalnew initiatives. The Reserve Bank explored and
utilised alternative channels for enhancing therequired skill levels of its officers, besides offeringadequate incentives to the staff to seek knowledgeand practical experience in any area that may berelevant to the functioning of the Bank. Theinitiatives taken by the respective Departmentsalso contributed to strengthen the organisation inits capacity to meet new challenges and also inmaking advances with forward looking vision inthe relevant areas.
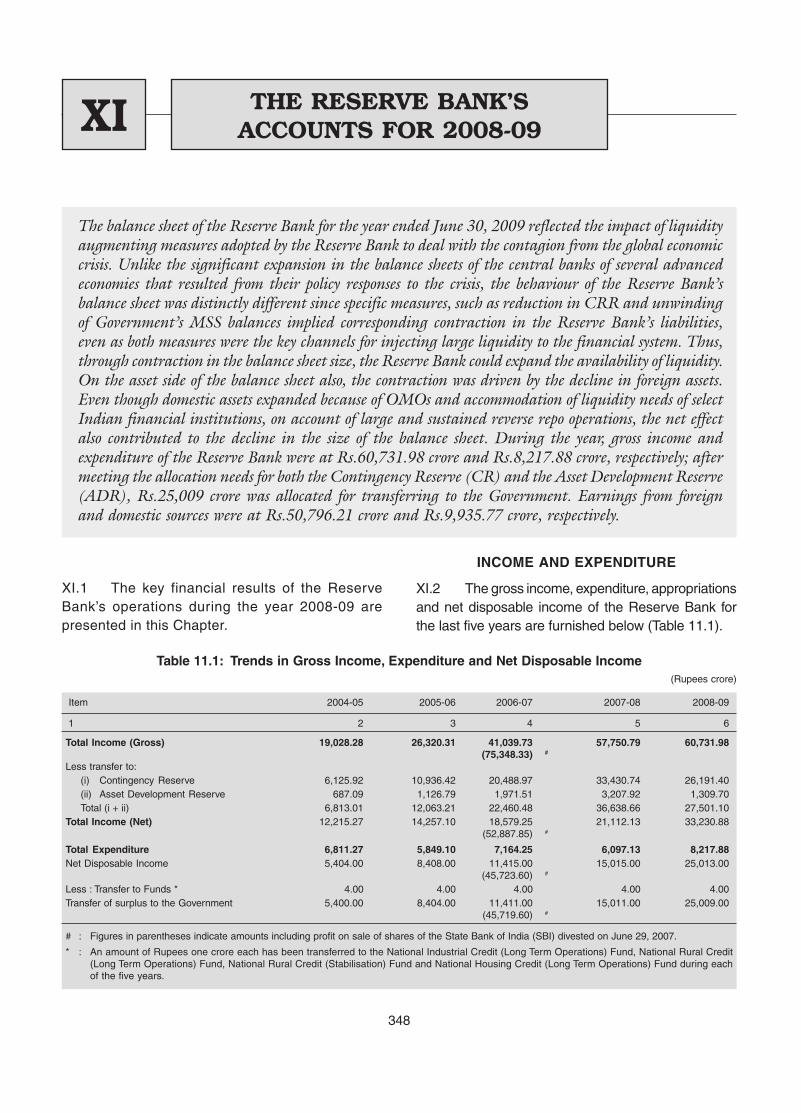
XI.1 The key financial results of the ReserveBank’s operations during the year 2008-09 arepresented in this Chapter.
INCOME AND EXPENDITURE
XI.2 The gross income, expenditure, appropriationsand net disposable income of the Reserve Bank forthe last five years are furnished below (Table 11.1).
THE RESERVE BANK’SACCOUNTS FOR 2008-09XI
348
Table 11.1: Trends in Gross Income, Expenditure and Net Disposable Income (Rupees crore)
Item 2004-05 2005-06 2006-07 2007-08 2008-09
1 2 3 4 5 6
Total Income (Gross) 19,028.28 26,320.31 41,039.73 57,750.79 60,731.98(75,348.33) #
Less transfer to:(i) Contingency Reserve 6,125.92 10,936.42 20,488.97 33,430.74 26,191.40(ii) Asset Development Reserve 687.09 1,126.79 1,971.51 3,207.92 1,309.70Total (i + ii) 6,813.01 12,063.21 22,460.48 36,638.66 27,501.10
Total Income (Net) 12,215.27 14,257.10 18,579.25 21,112.13 33,230.88 (52,887.85) #
Total Expenditure 6,811.27 5,849.10 7,164.25 6,097.13 8,217.88Net Disposable Income 5,404.00 8,408.00 11,415.00 15,015.00 25,013.00
(45,723.60) #
Less : Transfer to Funds * 4.00 4.00 4.00 4.00 4.00Transfer of surplus to the Government 5,400.00 8,404.00 11,411.00 15,011.00 25,009.00
(45,719.60) #
# : Figures in parentheses indicate amounts including profit on sale of shares of the State Bank of India (SBI) divested on June 29, 2007.
* : An amount of Rupees one crore each has been transferred to the National Industrial Credit (Long Term Operations) Fund, National Rural Credit(Long Term Operations) Fund, National Rural Credit (Stabilisation) Fund and National Housing Credit (Long Term Operations) Fund during eachof the five years.
The balance sheet of the Reserve Bank for the year ended June 30, 2009 reflected the impact of liquidityaugmenting measures adopted by the Reserve Bank to deal with the contagion from the global economiccrisis. Unlike the significant expansion in the balance sheets of the central banks of several advancedeconomies that resulted from their policy responses to the crisis, the behaviour of the Reserve Bank’sbalance sheet was distinctly different since specific measures, such as reduction in CRR and unwindingof Government’s MSS balances implied corresponding contraction in the Reserve Bank’s liabilities,even as both measures were the key channels for injecting large liquidity to the financial system. Thus,through contraction in the balance sheet size, the Reserve Bank could expand the availability of liquidity.On the asset side of the balance sheet also, the contraction was driven by the decline in foreign assets.Even though domestic assets expanded because of OMOs and accommodation of liquidity needs of selectIndian financial institutions, on account of large and sustained reverse repo operations, the net effectalso contributed to the decline in the size of the balance sheet. During the year, gross income andexpenditure of the Reserve Bank were at Rs.60,731.98 crore and Rs.8,217.88 crore, respectively; aftermeeting the allocation needs for both the Contingency Reserve (CR) and the Asset Development Reserve(ADR), Rs.25,009 crore was allocated for transferring to the Government. Earnings from foreignand domestic sources were at Rs.50,796.21 crore and Rs.9,935.77 crore, respectively.
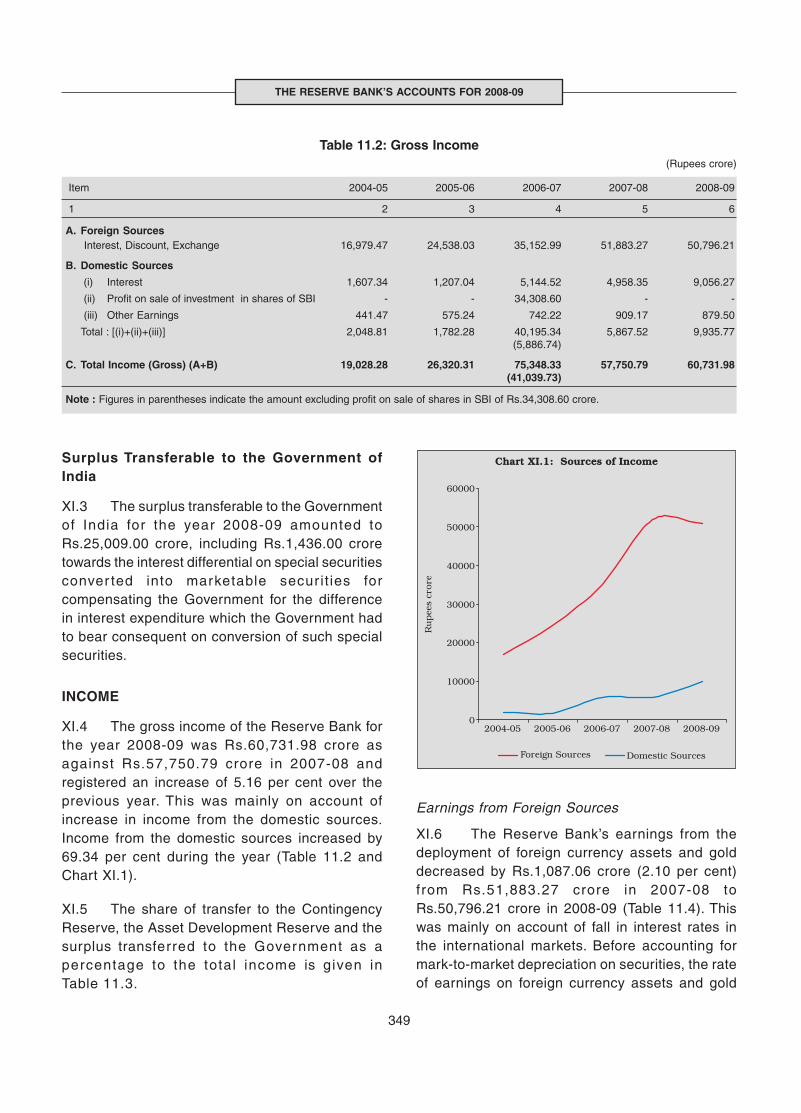
Surplus Transferable to the Government ofIndia
XI.3 The surplus transferable to the Governmentof India for the year 2008-09 amounted toRs.25,009.00 crore, including Rs.1,436.00 croretowards the interest differential on special securitiesconver ted into marketable secur it ies forcompensating the Government for the differencein interest expenditure which the Government hadto bear consequent on conversion of such specialsecurities.
INCOME
XI.4 The gross income of the Reserve Bank forthe year 2008-09 was Rs.60,731.98 crore asagainst Rs.57,750.79 crore in 2007-08 andregistered an increase of 5.16 per cent over theprevious year. This was mainly on account ofincrease in income from the domestic sources.Income from the domestic sources increased by69.34 per cent during the year (Table 11.2 andChart XI.1).
XI.5 The share of transfer to the ContingencyReserve, the Asset Development Reserve and thesurplus transferred to the Government as apercentage to the total income is given inTable 11.3.
Earnings from Foreign Sources
XI.6 The Reserve Bank’s earnings from thedeployment of foreign currency assets and golddecreased by Rs.1,087.06 crore (2.10 per cent)from Rs.51,883.27 crore in 2007-08 toRs.50,796.21 crore in 2008-09 (Table 11.4). Thiswas mainly on account of fall in interest rates inthe international markets. Before accounting formark-to-market depreciation on securities, the rateof earnings on foreign currency assets and gold
Table 11.2: Gross Income (Rupees crore)
Item 2004-05 2005-06 2006-07 2007-08 2008-09
1 2 3 4 5 6
A. Foreign Sources Interest, Discount, Exchange 16,979.47 24,538.03 35,152.99 51,883.27 50,796.21
B. Domestic Sources
(i) Interest 1,607.34 1,207.04 5,144.52 4,958.35 9,056.27
(ii) Profit on sale of investment in shares of SBI - - 34,308.60 - -
(iii) Other Earnings 441.47 575.24 742.22 909.17 879.50
Total : [(i)+(ii)+(iii)] 2,048.81 1,782.28 40,195.34 5,867.52 9,935.77(5,886.74)
C. Total Income (Gross) (A+B) 19,028.28 26,320.31 75,348.33 57,750.79 60,731.98(41,039.73)
Note : Figures in parentheses indicate the amount excluding profit on sale of shares in SBI of Rs.34,308.60 crore.
349
THE RESERVE BANK’S ACCOUNTS FOR 2008-09
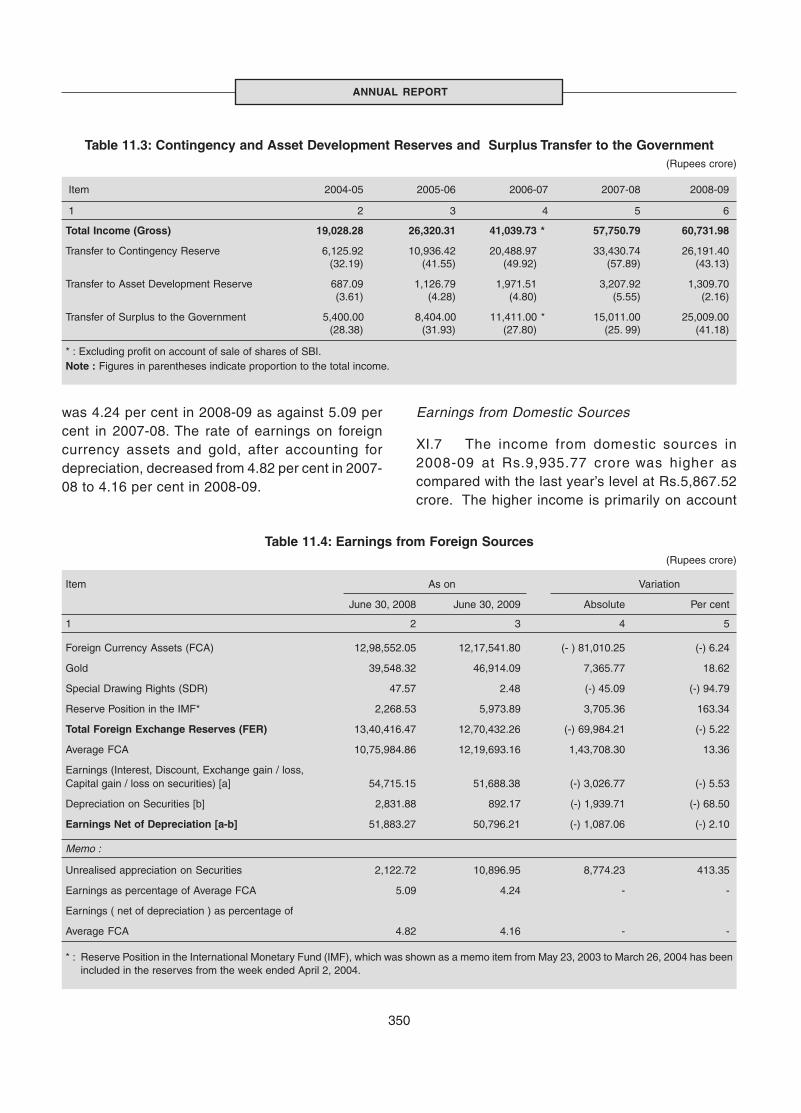
350
ANNUAL REPORT
Table 11.3: Contingency and Asset Development Reserves and Surplus Transfer to the Government (Rupees crore)
Item 2004-05 2005-06 2006-07 2007-08 2008-09
1 2 3 4 5 6
Total Income (Gross) 19,028.28 26,320.31 41,039.73 * 57,750.79 60,731.98
Transfer to Contingency Reserve 6,125.92 10,936.42 20,488.97 33,430.74 26,191.40(32.19) (41.55) (49.92) (57.89) (43.13)
Transfer to Asset Development Reserve 687.09 1,126.79 1,971.51 3,207.92 1,309.70(3.61) (4.28) (4.80) (5.55) (2.16)
Transfer of Surplus to the Government 5,400.00 8,404.00 11,411.00 * 15,011.00 25,009.00(28.38) (31.93) (27.80) (25. 99) (41.18)
* : Excluding profit on account of sale of shares of SBI.Note : Figures in parentheses indicate proportion to the total income.
was 4.24 per cent in 2008-09 as against 5.09 percent in 2007-08. The rate of earnings on foreigncurrency assets and gold, after accounting fordepreciation, decreased from 4.82 per cent in 2007-08 to 4.16 per cent in 2008-09.
Earnings from Domestic Sources
XI.7 The income from domestic sources in2008-09 at Rs.9,935.77 crore was higher ascompared with the last year’s level at Rs.5,867.52crore. The higher income is primarily on account
Table 11.4: Earnings from Foreign Sources (Rupees crore)
Item As on Variation
June 30, 2008 June 30, 2009 Absolute Per cent
1 2 3 4 5
Foreign Currency Assets (FCA) 12,98,552.05 12,17,541.80 (- ) 81,010.25 (-) 6.24
Gold 39,548.32 46,914.09 7,365.77 18.62
Special Drawing Rights (SDR) 47.57 2.48 (-) 45.09 (-) 94.79
Reserve Position in the IMF* 2,268.53 5,973.89 3,705.36 163.34
Total Foreign Exchange Reserves (FER) 13,40,416.47 12,70,432.26 (-) 69,984.21 (-) 5.22
Average FCA 10,75,984.86 12,19,693.16 1,43,708.30 13.36
Earnings (Interest, Discount, Exchange gain / loss,Capital gain / loss on securities) [a] 54,715.15 51,688.38 (-) 3,026.77 (-) 5.53
Depreciation on Securities [b] 2,831.88 892.17 (-) 1,939.71 (-) 68.50
Earnings Net of Depreciation [a-b] 51,883.27 50,796.21 (-) 1,087.06 (-) 2.10
Memo :
Unrealised appreciation on Securities 2,122.72 10,896.95 8,774.23 413.35
Earnings as percentage of Average FCA 5.09 4.24 - -
Earnings ( net of depreciation ) as percentage of
Average FCA 4.82 4.16 - -
* : Reserve Position in the International Monetary Fund (IMF), which was shown as a memo item from May 23, 2003 to March 26, 2004 has beenincluded in the reserves from the week ended April 2, 2004.
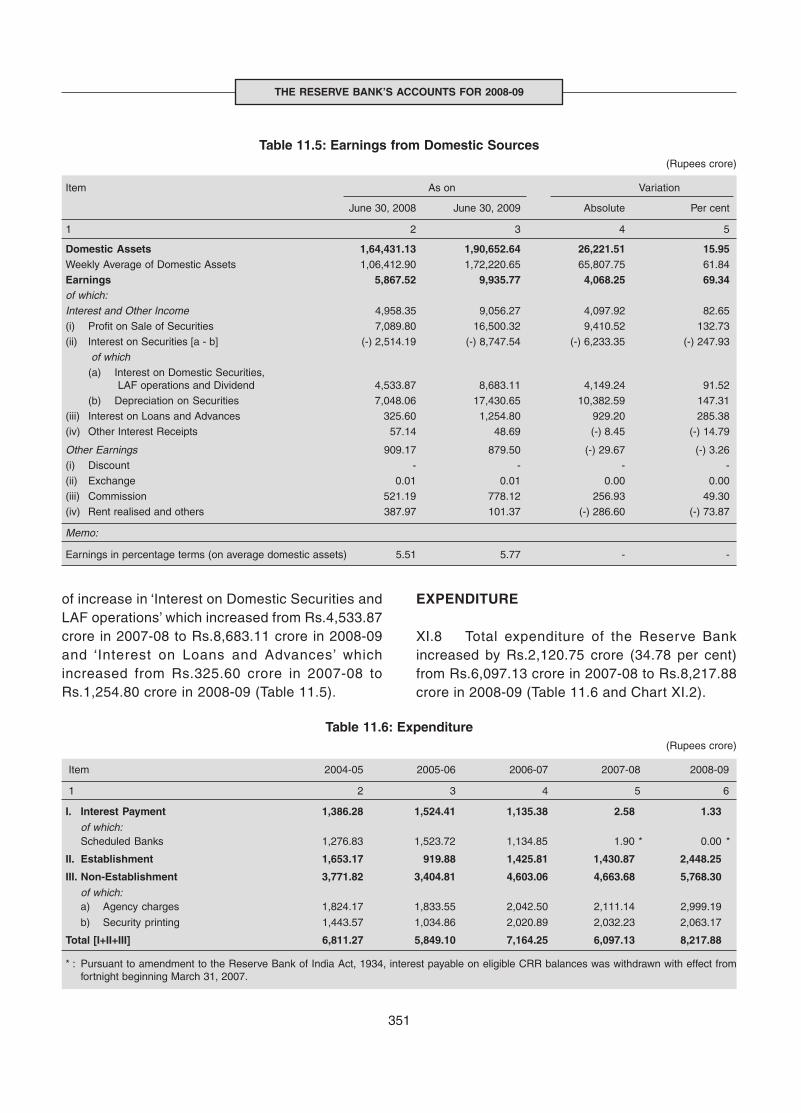
351
THE RESERVE BANK’S ACCOUNTS FOR 2008-09
of increase in ‘Interest on Domestic Securities andLAF operations’ which increased from Rs.4,533.87crore in 2007-08 to Rs.8,683.11 crore in 2008-09and ‘Interest on Loans and Advances’ whichincreased from Rs.325.60 crore in 2007-08 toRs.1,254.80 crore in 2008-09 (Table 11.5).
EXPENDITURE
XI.8 Total expenditure of the Reserve Bankincreased by Rs.2,120.75 crore (34.78 per cent)from Rs.6,097.13 crore in 2007-08 to Rs.8,217.88crore in 2008-09 (Table 11.6 and Chart XI.2).
Table 11.6: Expenditure (Rupees crore)
Item 2004-05 2005-06 2006-07 2007-08 2008-09
1 2 3 4 5 6
I. Interest Payment 1,386.28 1,524.41 1,135.38 2.58 1.33
of which:Scheduled Banks 1,276.83 1,523.72 1,134.85 1.90 * 0.00 *
II. Establishment 1,653.17 919.88 1,425.81 1,430.87 2,448.25
III. Non-Establishment 3,771.82 3,404.81 4,603.06 4,663.68 5,768.30
of which:a) Agency charges 1,824.17 1,833.55 2,042.50 2,111.14 2,999.19
b) Security printing 1,443.57 1,034.86 2,020.89 2,032.23 2,063.17
Total [I+II+III] 6,811.27 5,849.10 7,164.25 6,097.13 8,217.88
* : Pursuant to amendment to the Reserve Bank of India Act, 1934, interest payable on eligible CRR balances was withdrawn with effect fromfortnight beginning March 31, 2007.
Table 11.5: Earnings from Domestic Sources (Rupees crore)
Item As on Variation
June 30, 2008 June 30, 2009 Absolute Per cent
1 2 3 4 5
Domestic Assets 1,64,431.13 1,90,652.64 26,221.51 15.95Weekly Average of Domestic Assets 1,06,412.90 1,72,220.65 65,807.75 61.84
Earnings 5,867.52 9,935.77 4,068.25 69.34of which:Interest and Other Income 4,958.35 9,056.27 4,097.92 82.65
(i) Profit on Sale of Securities 7,089.80 16,500.32 9,410.52 132.73
(ii) Interest on Securities [a - b] (-) 2,514.19 (-) 8,747.54 (-) 6,233.35 (-) 247.93
of which(a) Interest on Domestic Securities,
LAF operations and Dividend 4,533.87 8,683.11 4,149.24 91.52
(b) Depreciation on Securities 7,048.06 17,430.65 10,382.59 147.31
(iii) Interest on Loans and Advances 325.60 1,254.80 929.20 285.38
(iv) Other Interest Receipts 57.14 48.69 (-) 8.45 (-) 14.79
Other Earnings 909.17 879.50 (-) 29.67 (-) 3.26
(i) Discount - - - -
(ii) Exchange 0.01 0.01 0.00 0.00
(iii) Commission 521.19 778.12 256.93 49.30
(iv) Rent realised and others 387.97 101.37 (-) 286.60 (-) 73.87
Memo:
Earnings in percentage terms (on average domestic assets) 5.51 5.77 - -
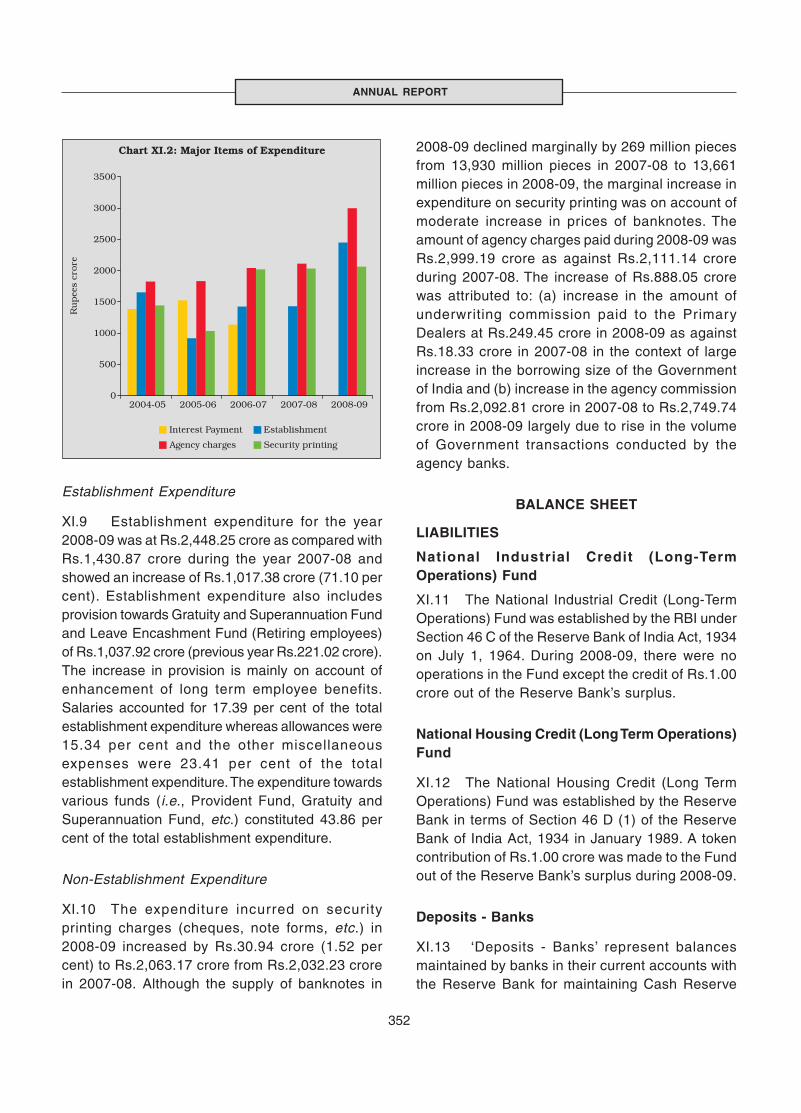
352
ANNUAL REPORT
Establishment Expenditure
XI.9 Establishment expenditure for the year2008-09 was at Rs.2,448.25 crore as compared withRs.1,430.87 crore during the year 2007-08 andshowed an increase of Rs.1,017.38 crore (71.10 percent). Establishment expenditure also includesprovision towards Gratuity and Superannuation Fundand Leave Encashment Fund (Retiring employees)of Rs.1,037.92 crore (previous year Rs.221.02 crore).The increase in provision is mainly on account ofenhancement of long term employee benefits.Salaries accounted for 17.39 per cent of the totalestablishment expenditure whereas allowances were15.34 per cent and the other miscellaneousexpenses were 23.41 per cent of the totalestablishment expenditure. The expenditure towardsvarious funds (i.e., Provident Fund, Gratuity andSuperannuation Fund, etc.) constituted 43.86 percent of the total establishment expenditure.
Non-Establishment Expenditure
XI.10 The expenditure incurred on securityprinting charges (cheques, note forms, etc.) in2008-09 increased by Rs.30.94 crore (1.52 percent) to Rs.2,063.17 crore from Rs.2,032.23 crorein 2007-08. Although the supply of banknotes in
2008-09 declined marginally by 269 million piecesfrom 13,930 million pieces in 2007-08 to 13,661million pieces in 2008-09, the marginal increase inexpenditure on security printing was on account ofmoderate increase in prices of banknotes. Theamount of agency charges paid during 2008-09 wasRs.2,999.19 crore as against Rs.2,111.14 croreduring 2007-08. The increase of Rs.888.05 crorewas attributed to: (a) increase in the amount ofunderwriting commission paid to the PrimaryDealers at Rs.249.45 crore in 2008-09 as againstRs.18.33 crore in 2007-08 in the context of largeincrease in the borrowing size of the Governmentof India and (b) increase in the agency commissionfrom Rs.2,092.81 crore in 2007-08 to Rs.2,749.74crore in 2008-09 largely due to rise in the volumeof Government transactions conducted by theagency banks.
BALANCE SHEET
LIABILITIES
National Industrial Credit (Long-TermOperations) Fund
XI.11 The National Industrial Credit (Long-TermOperations) Fund was established by the RBI underSection 46 C of the Reserve Bank of India Act, 1934on July 1, 1964. During 2008-09, there were nooperations in the Fund except the credit of Rs.1.00crore out of the Reserve Bank’s surplus.
National Housing Credit (Long Term Operations)Fund
XI.12 The National Housing Credit (Long TermOperations) Fund was established by the ReserveBank in terms of Section 46 D (1) of the ReserveBank of India Act, 1934 in January 1989. A tokencontribution of Rs.1.00 crore was made to the Fundout of the Reserve Bank’s surplus during 2008-09.
Deposits - Banks
XI.13 ‘Deposits - Banks’ represent balancesmaintained by banks in their current accounts withthe Reserve Bank for maintaining Cash Reserve
353
THE RESERVE BANK’S ACCOUNTS FOR 2008-09
Ratio and as working funds for meeting paymentrequirements.
Deposits - Others
XI.14 ‘Deposits - Others’ include deposits fromfinancial institutions, employees’ provident funddeposits and sundry deposits.
Other Liabilities
XI.15 ‘Other Liabilities’ include the internalreserves and provisions of the Reserve Bank,Currency and Gold Revaluation Account (CGRA)and surplus pending transfer to the Government.The balance in ‘Other Liabilities’ increased byRs.72,739.45 crore (22.52 per cent) fromRs.3,22,968.10 crore as on June 30, 2008 toRs.3,95,707.55 crore as on June 30, 2009, mainlyon account of increase in the level of Currency andGold Revaluation Account (CGRA).
XI.16 The Contingency Reserve and the AssetDevelopment Reserve reflected in ‘Other Liabilities’are in addition to the ‘Reserve Fund’ of Rs.6,500.00crore held by the Reserve Bank as a distinctbalance sheet head.
Currency and Gold Revaluation Account (CGRA) andExchange Equalisation Account (EEA)
XI.17 Gains / losses on valuation of foreigncurrency assets and gold due to movements in theexchange rates and / or prices of gold are not takento the Profit and Loss Account but instead bookedunder a balance sheet head named as the Currencyand Gold Revaluation Account (CGRA). The balancerepresents accumulated net gain on valuation offoreign currency assets and gold. During 2008-09,there was an accretion of Rs.35,630.20 crore inCGRA, thus increasing its balance fromRs.1,63,211.83 crore as on June 30, 2008 toRs.1,98,842.03 crore as on June 30, 2009. Theincrease in CGRA was on account of net effect ofdepreciation of other currencies against the USdollar, depreciation of Indian rupee against the USdollar and increase in the price of gold. The balance
in the Exchange Equalisation Account (EEA)represents provision made for exchange lossesarising out of forward commitments. The balance inEEA as on June 30, 2009 stood at Rs.26.98 crore(Table 11.7)
Contingency Reserve and Asset DevelopmentReserve
XI.18 The Reserve Bank maintains aContingency Reserve (CR) to enable it to absorbunexpected and unforeseen contingencies. With atransfer of Rs.26,191.40 crore to CR during 2008-09 from the Reserve Bank’s income, the balancein CR increased to Rs.1,53,392.21 crore as on June30, 2009 from Rs.1,27,200.81 crore as on June 30,2008. The balance in CR is sufficient to meet thecontingent liabilities.
XI.19 To meet the internal capital expenditure andmake investments in its subsidiaries and associateinstitutions, the Reserve Bank had created aseparate Asset Development Reserve (ADR) in1997-98 with the aim of reaching one per cent ofthe Reserve Bank’s total assets within the overallindicative target of 12 per cent set for CR and ADR.In the year 2008-09, an amount of Rs.1,309.70crore was transferred from income to ADR, raisingits level from Rs.12,772.25 crore as on June 30,2008 to Rs.14,081.95 crore as on June 30, 2009.CR and ADR together constituted 11.89 per cent ofthe total assets of the Bank as on June 30, 2009(Table 11.8). ADR now accounts for one per cent ofthe assets of the Bank.
Table 11.7: Balances in Currency andGold Revaluation Account and Exchange
Equalisation Account (Rupees crore)
As on June 30 Currency and Gold ExchangeRevaluation Account Equalisation Account
1 2 3
2005 26,906.21 0.502006 86,789.18 3.282007 21,723.52 9.682008 1,63,211.83 -2009 1,98,842.03 26.98
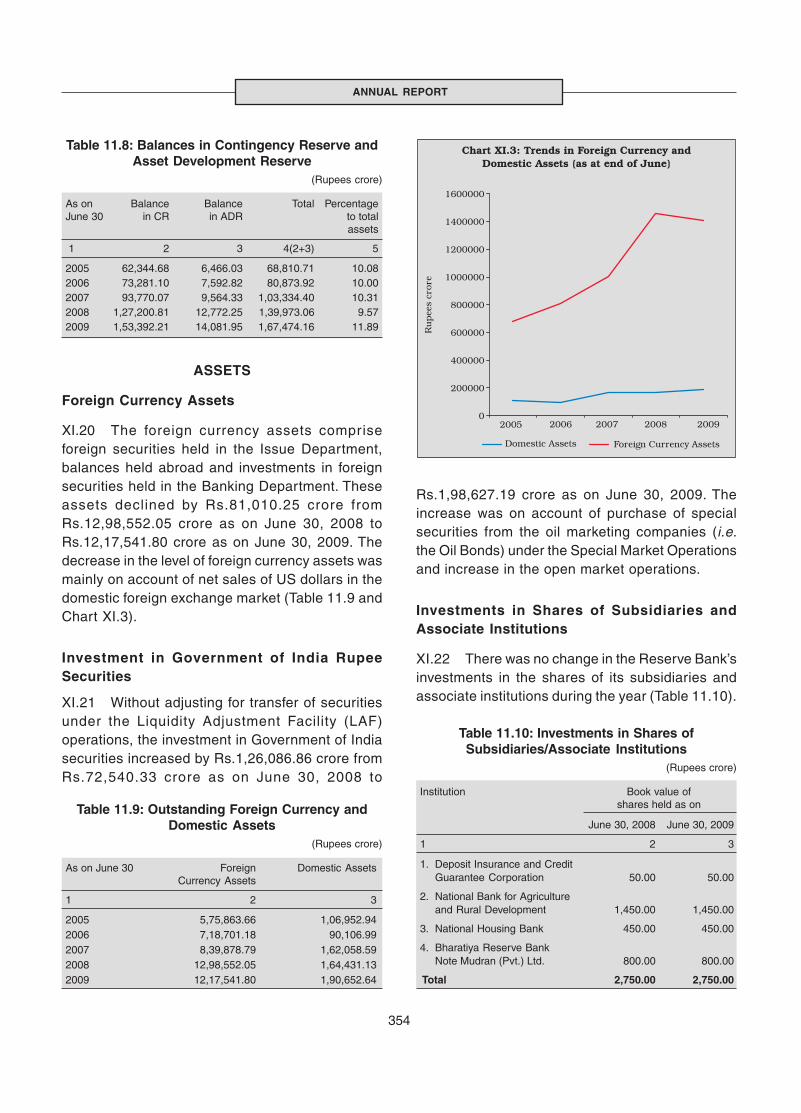
354
ANNUAL REPORT
ASSETS
Foreign Currency Assets
XI.20 The foreign currency assets compriseforeign securities held in the Issue Department,balances held abroad and investments in foreignsecurities held in the Banking Department. Theseassets declined by Rs.81,010.25 crore fromRs.12,98,552.05 crore as on June 30, 2008 toRs.12,17,541.80 crore as on June 30, 2009. Thedecrease in the level of foreign currency assets wasmainly on account of net sales of US dollars in thedomestic foreign exchange market (Table 11.9 andChart XI.3).
Investment in Government of India RupeeSecurities
XI.21 Without adjusting for transfer of securitiesunder the Liquidity Adjustment Facility (LAF)operations, the investment in Government of Indiasecurities increased by Rs.1,26,086.86 crore fromRs.72,540.33 crore as on June 30, 2008 to
Table 11.8: Balances in Contingency Reserve andAsset Development Reserve
(Rupees crore)
As on Balance Balance Total PercentageJune 30 in CR in ADR to total
assets
1 2 3 4(2+3) 5
2005 62,344.68 6,466.03 68,810.71 10.082006 73,281.10 7,592.82 80,873.92 10.002007 93,770.07 9,564.33 1,03,334.40 10.312008 1,27,200.81 12,772.25 1,39,973.06 9.572009 1,53,392.21 14,081.95 1,67,474.16 11.89
Table 11.9: Outstanding Foreign Currency andDomestic Assets
(Rupees crore)
As on June 30 Foreign Domestic AssetsCurrency Assets
1 2 3
2005 5,75,863.66 1,06,952.942006 7,18,701.18 90,106.992007 8,39,878.79 1,62,058.592008 12,98,552.05 1,64,431.132009 12,17,541.80 1,90,652.64
Table 11.10: Investments in Shares ofSubsidiaries/Associate Institutions
(Rupees crore)
Institution Book value ofshares held as on
June 30, 2008 June 30, 2009
1 2 3
1. Deposit Insurance and CreditGuarantee Corporation 50.00 50.00
2. National Bank for Agricultureand Rural Development 1,450.00 1,450.00
3. National Housing Bank 450.00 450.00
4. Bharatiya Reserve BankNote Mudran (Pvt.) Ltd. 800.00 800.00
Total 2,750.00 2,750.00
Rs.1,98,627.19 crore as on June 30, 2009. Theincrease was on account of purchase of specialsecurities from the oil marketing companies (i.e.the Oil Bonds) under the Special Market Operationsand increase in the open market operations.
Investments in Shares of Subsidiaries andAssociate Institutions
XI.22 There was no change in the Reserve Bank’sinvestments in the shares of its subsidiaries andassociate institutions during the year (Table 11.10).
355
THE RESERVE BANK’S ACCOUNTS FOR 2008-09
Other Assets
XI.23 ‘Other Assets’ comprise income accruedbut not received, fixed assets, gold holdings in theBanking Department, amounts spent on projectspending completion and staff advances. The levelof ‘Other Assets’ increased by Rs.332.80 crore fromRs.30,805.95 crore as on June 30, 2008 toRs.31,138.75 crore as on June 30, 2009.
Auditors
XI.24 The accounts of the Reserve Bank for theyear 2008-09 were audited by M/s. Kalyaniwalla &Mistry, Mumbai and M/s. Mukund M. Chitale & Co.Mumbai as the Statutory Central Auditors. Thebranch offices were audited by the Statutory BranchAuditors, namely, M/s. Basant Ram & Sons, NewDelhi, M/s. Ved Prakash Agrawal & Co., Nagpur,M/s. G. Natesan & Co., Chennai and M/s. S. K. Basu& Co., Kolkata. The auditors were appointed by theCentral Government.
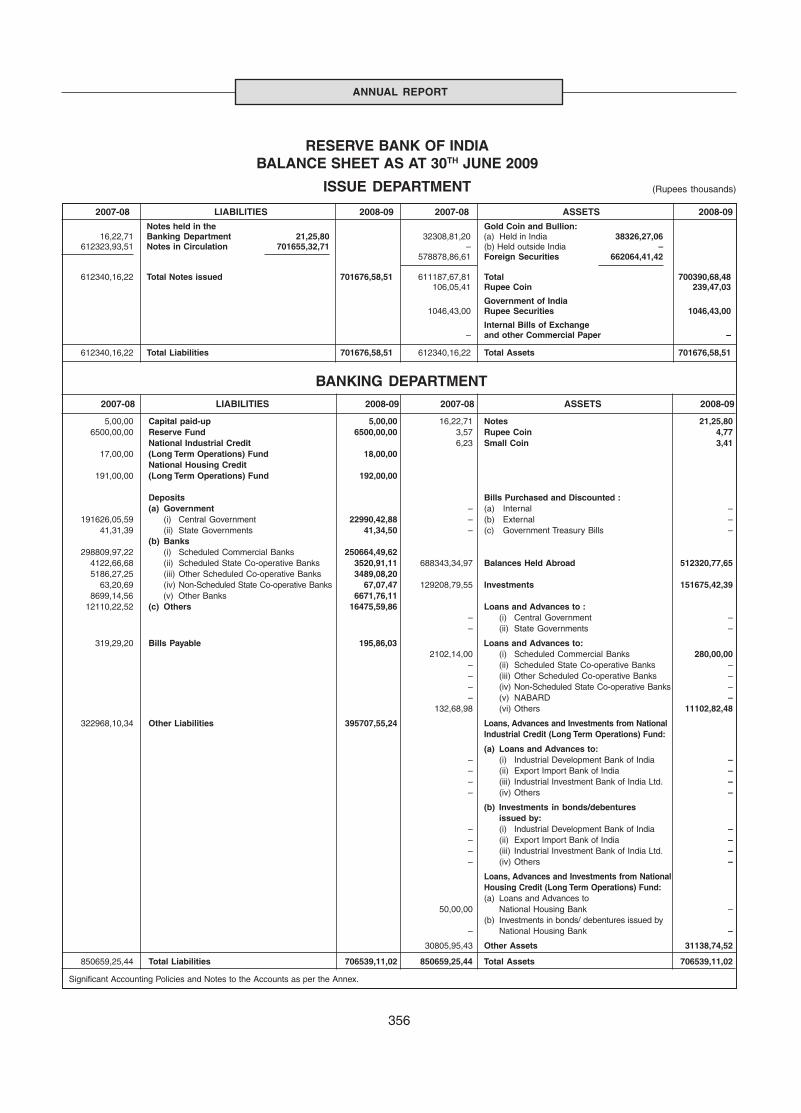
356
ANNUAL REPORT
2007-08 LIABILITIES 2008-09 2007-08 ASSETS 2008-09
Notes held in the Gold Coin and Bullion:16,22,71 Banking Department 21,25,80 32308,81,20 (a) Held in India 38326,27,06
612323,93,51 Notes in Circulation 701655,32,71 – (b) Held outside India –578878,86,61 Foreign Securities 662064,41,42
612340,16,22 Total Notes issued 701676,58,51 611187,67,81 Total 700390,68,48106,05,41 Rupee Coin 239,47,03
Government of India1046,43,00 Rupee Securities 1046,43,00
Internal Bills of Exchange– and other Commercial Paper –
612340,16,22 Total Liabilities 701676,58,51 612340,16,22 Total Assets 701676,58,51
RESERVE BANK OF INDIABALANCE SHEET AS AT 30TH JUNE 2009
ISSUE DEPARTMENT (Rupees thousands)
2007-08 LIABILITIES 2008-09 2007-08 ASSETS 2008-09
Significant Accounting Policies and Notes to the Accounts as per the Annex.
BANKING DEPARTMENT
5,00,00 Capital paid-up 5,00,00 16,22,71 Notes 21,25,806500,00,00 Reserve Fund 6500,00,00 3,57 Rupee Coin 4,77
National Industrial Credit 6,23 Small Coin 3,4117,00,00 (Long Term Operations) Fund 18,00,00
National Housing Credit191,00,00 (Long Term Operations) Fund 192,00,00
Deposits Bills Purchased and Discounted :(a) Government – (a) Internal –
191626,05,59 (i) Central Government 22990,42,88 – (b) External –41,31,39 (ii) State Governments 41,34,50 – (c) Government Treasury Bills –
(b) Banks298809,97,22 (i) Scheduled Commercial Banks 250664,49,62
4122,66,68 (ii) Scheduled State Co-operative Banks 3520,91,11 688343,34,97 Balances Held Abroad 512320,77,655186,27,25 (iii) Other Scheduled Co-operative Banks 3489,08,20
63,20,69 (iv) Non-Scheduled State Co-operative Banks 67,07,47 129208,79,55 Investments 151675,42,398699,14,56 (v) Other Banks 6671,76,11
12110,22,52 (c) Others 16475,59,86 Loans and Advances to :– (i) Central Government –– (ii) State Governments –
319,29,20 Bills Payable 195,86,03 Loans and Advances to:2102,14,00 (i) Scheduled Commercial Banks 280,00,00
– (ii) Scheduled State Co-operative Banks –– (iii) Other Scheduled Co-operative Banks –– (iv) Non-Scheduled State Co-operative Banks –– (v) NABARD –
132,68,98 (vi) Others 11102,82,48
322968,10,34 Other Liabilities 395707,55,24 Loans, Advances and Investments from NationalIndustrial Credit (Long Term Operations) Fund:
(a) Loans and Advances to:– (i) Industrial Development Bank of India –– (ii) Export Import Bank of India –– (iii) Industrial Investment Bank of India Ltd. –– (iv) Others –
(b) Investments in bonds/debenturesissued by:
– (i) Industrial Development Bank of India –– (ii) Export Import Bank of India –– (iii) Industrial Investment Bank of India Ltd. –– (iv) Others –
Loans, Advances and Investments from NationalHousing Credit (Long Term Operations) Fund:(a) Loans and Advances to
50,00,00 National Housing Bank –(b) Investments in bonds/ debentures issued by
– National Housing Bank –
30805,95,43 Other Assets 31138,74,52
850659,25,44 Total Liabilities 706539,11,02 850659,25,44 Total Assets 706539,11,02
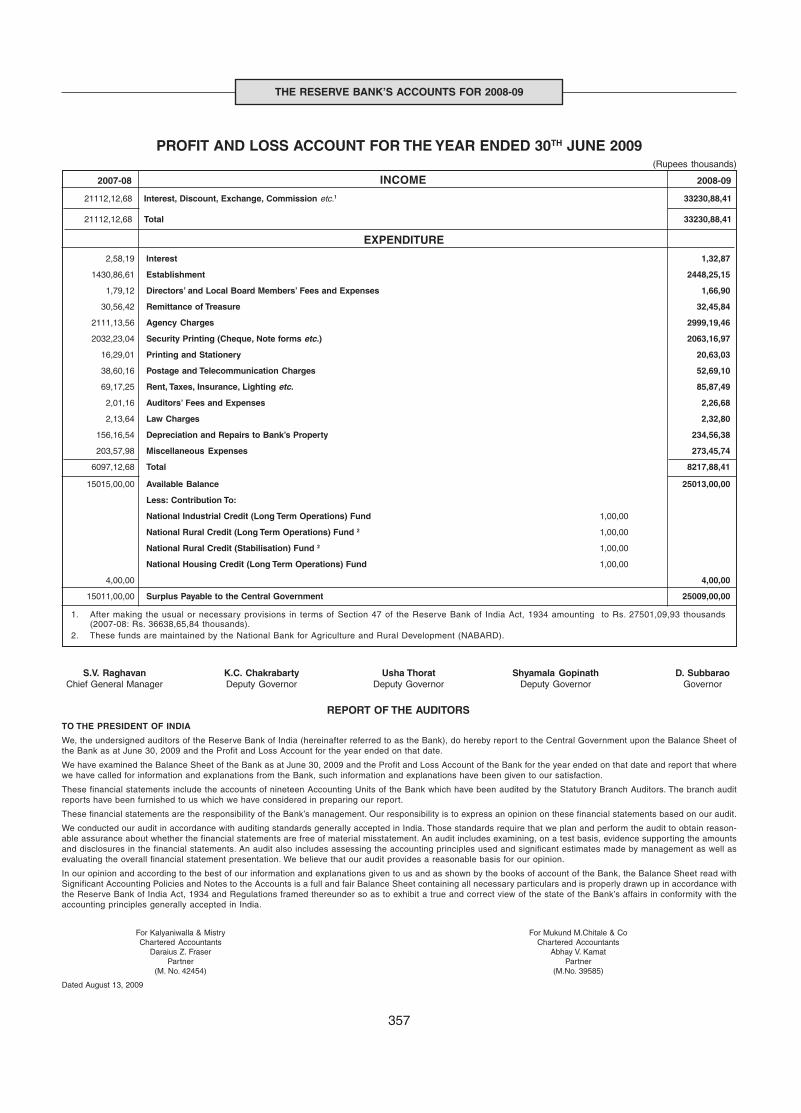
357
THE RESERVE BANK’S ACCOUNTS FOR 2008-09
TO THE PRESIDENT OF INDIA
We, the undersigned auditors of the Reserve Bank of India (hereinafter referred to as the Bank), do hereby report to the Central Government upon the Balance Sheet ofthe Bank as at June 30, 2009 and the Profit and Loss Account for the year ended on that date.
We have examined the Balance Sheet of the Bank as at June 30, 2009 and the Profit and Loss Account of the Bank for the year ended on that date and report that wherewe have called for information and explanations from the Bank, such information and explanations have been given to our satisfaction.
These financial statements include the accounts of nineteen Accounting Units of the Bank which have been audited by the Statutory Branch Auditors. The branch auditreports have been furnished to us which we have considered in preparing our report.
These financial statements are the responsibility of the Bank’s management. Our responsibility is to express an opinion on these financial statements based on our audit.
We conducted our audit in accordance with auditing standards generally accepted in India. Those standards require that we plan and perform the audit to obtain reason-able assurance about whether the financial statements are free of material misstatement. An audit includes examining, on a test basis, evidence supporting the amountsand disclosures in the financial statements. An audit also includes assessing the accounting principles used and significant estimates made by management as well asevaluating the overall financial statement presentation. We believe that our audit provides a reasonable basis for our opinion.
In our opinion and according to the best of our information and explanations given to us and as shown by the books of account of the Bank, the Balance Sheet read withSignificant Accounting Policies and Notes to the Accounts is a full and fair Balance Sheet containing all necessary particulars and is properly drawn up in accordance withthe Reserve Bank of India Act, 1934 and Regulations framed thereunder so as to exhibit a true and correct view of the state of the Bank’s affairs in conformity with theaccounting principles generally accepted in India.
REPORT OF THE AUDITORS
S.V. Raghavan K.C. Chakrabarty Usha Thorat Shyamala Gopinath D. SubbaraoChief General Manager Deputy Governor Deputy Governor Deputy Governor Governor
For Kalyaniwalla & Mistry For Mukund M.Chitale & CoChartered Accountants Chartered Accountants
Daraius Z. Fraser Abhay V. KamatPartner Partner
(M. No. 42454) (M.No. 39585)
Dated August 13, 2009
PROFIT AND LOSS ACCOUNT FOR THE YEAR ENDED 30TH JUNE 2009
2,58,19 Interest 1,32,87
1430,86,61 Establishment 2448,25,15
1,79,12 Directors’ and Local Board Members’ Fees and Expenses 1,66,90
30,56,42 Remittance of Treasure 32,45,84
2111,13,56 Agency Charges 2999,19,46
2032,23,04 Security Printing (Cheque, Note forms etc.) 2063,16,97
16,29,01 Printing and Stationery 20,63,03
38,60,16 Postage and Telecommunication Charges 52,69,10
69,17,25 Rent, Taxes, Insurance, Lighting etc. 85,87,49
2,01,16 Auditors’ Fees and Expenses 2,26,68
2,13,64 Law Charges 2,32,80
156,16,54 Depreciation and Repairs to Bank’s Property 234,56,38
203,57,98 Miscellaneous Expenses 273,45,74
6097,12,68 Total 8217,88,41
15015,00,00 Available Balance 25013,00,00
Less: Contribution To:
National Industrial Credit (Long Term Operations) Fund 1,00,00
National Rural Credit (Long Term Operations) Fund 2 1,00,00
National Rural Credit (Stabilisation) Fund 2 1,00,00
National Housing Credit (Long Term Operations) Fund 1,00,00
4,00,00 4,00,00
15011,00,00 Surplus Payable to the Central Government 25009,00,00
2007-08 INCOME 2008-09
21112,12,68 Interest, Discount, Exchange, Commission etc.1 33230,88,41
21112,12,68 Total 33230,88,41
1. After making the usual or necessary provisions in terms of Section 47 of the Reserve Bank of India Act, 1934 amounting to Rs. 27501,09,93 thousands(2007-08: Rs. 36638,65,84 thousands).
2. These funds are maintained by the National Bank for Agriculture and Rural Development (NABARD).
EXPENDITURE
(Rupees thousands)
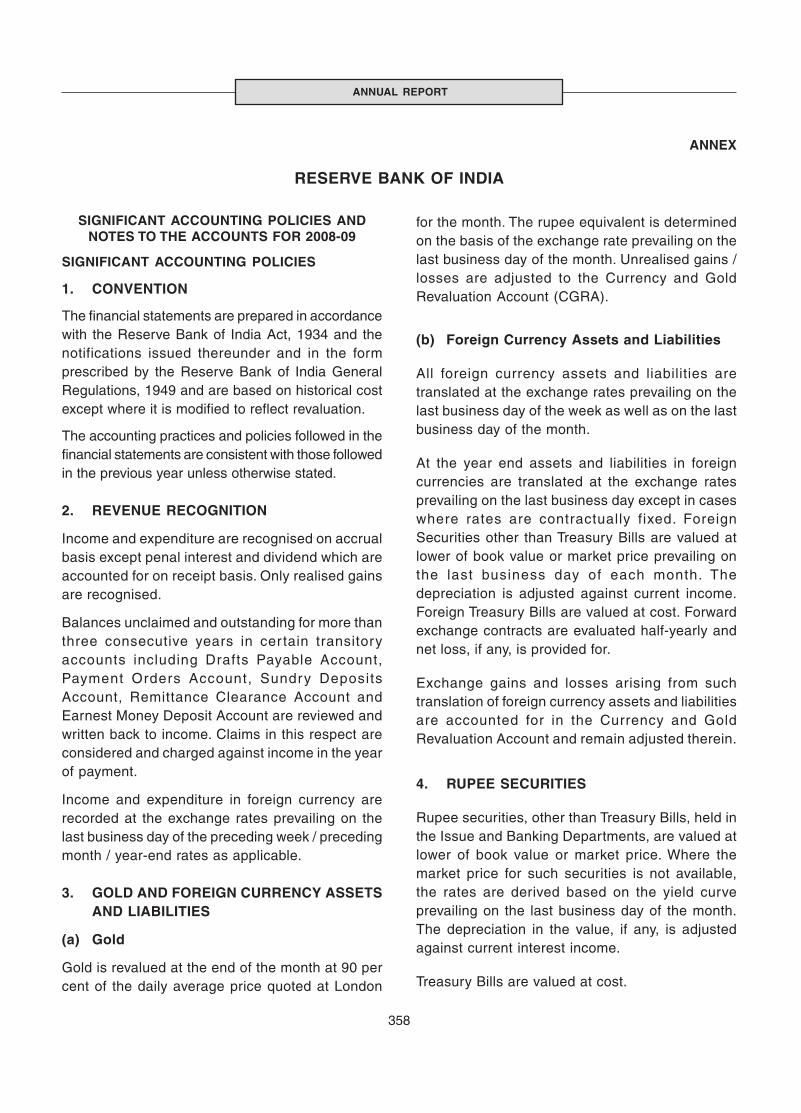
358
ANNUAL REPORT
ANNEX
RESERVE BANK OF INDIA
SIGNIFICANT ACCOUNTING POLICIES ANDNOTES TO THE ACCOUNTS FOR 2008-09
SIGNIFICANT ACCOUNTING POLICIES
1. CONVENTION
The financial statements are prepared in accordancewith the Reserve Bank of India Act, 1934 and thenotifications issued thereunder and in the formprescribed by the Reserve Bank of India GeneralRegulations, 1949 and are based on historical costexcept where it is modified to reflect revaluation.
The accounting practices and policies followed in thefinancial statements are consistent with those followedin the previous year unless otherwise stated.
2. REVENUE RECOGNITION
Income and expenditure are recognised on accrualbasis except penal interest and dividend which areaccounted for on receipt basis. Only realised gainsare recognised.
Balances unclaimed and outstanding for more thanthree consecutive years in cer tain transitoryaccounts including Drafts Payable Account,Payment Orders Account, Sundry DepositsAccount, Remittance Clearance Account andEarnest Money Deposit Account are reviewed andwritten back to income. Claims in this respect areconsidered and charged against income in the yearof payment.
Income and expenditure in foreign currency arerecorded at the exchange rates prevailing on thelast business day of the preceding week / precedingmonth / year-end rates as applicable.
3. GOLD AND FOREIGN CURRENCY ASSETSAND LIABILITIES
(a) Gold
Gold is revalued at the end of the month at 90 percent of the daily average price quoted at London
for the month. The rupee equivalent is determinedon the basis of the exchange rate prevailing on thelast business day of the month. Unrealised gains /losses are adjusted to the Currency and GoldRevaluation Account (CGRA).
(b) Foreign Currency Assets and Liabilities
All foreign currency assets and liabilities aretranslated at the exchange rates prevailing on thelast business day of the week as well as on the lastbusiness day of the month.
At the year end assets and liabilities in foreigncurrencies are translated at the exchange ratesprevailing on the last business day except in caseswhere rates are contractually fixed. ForeignSecurities other than Treasury Bills are valued atlower of book value or market price prevailing onthe last business day of each month. Thedepreciation is adjusted against current income.Foreign Treasury Bills are valued at cost. Forwardexchange contracts are evaluated half-yearly andnet loss, if any, is provided for.
Exchange gains and losses arising from suchtranslation of foreign currency assets and liabilitiesare accounted for in the Currency and GoldRevaluation Account and remain adjusted therein.
4. RUPEE SECURITIES
Rupee securities, other than Treasury Bills, held inthe Issue and Banking Departments, are valued atlower of book value or market price. Where themarket price for such securities is not available,the rates are derived based on the yield curveprevailing on the last business day of the month.The depreciation in the value, if any, is adjustedagainst current interest income.
Treasury Bills are valued at cost.
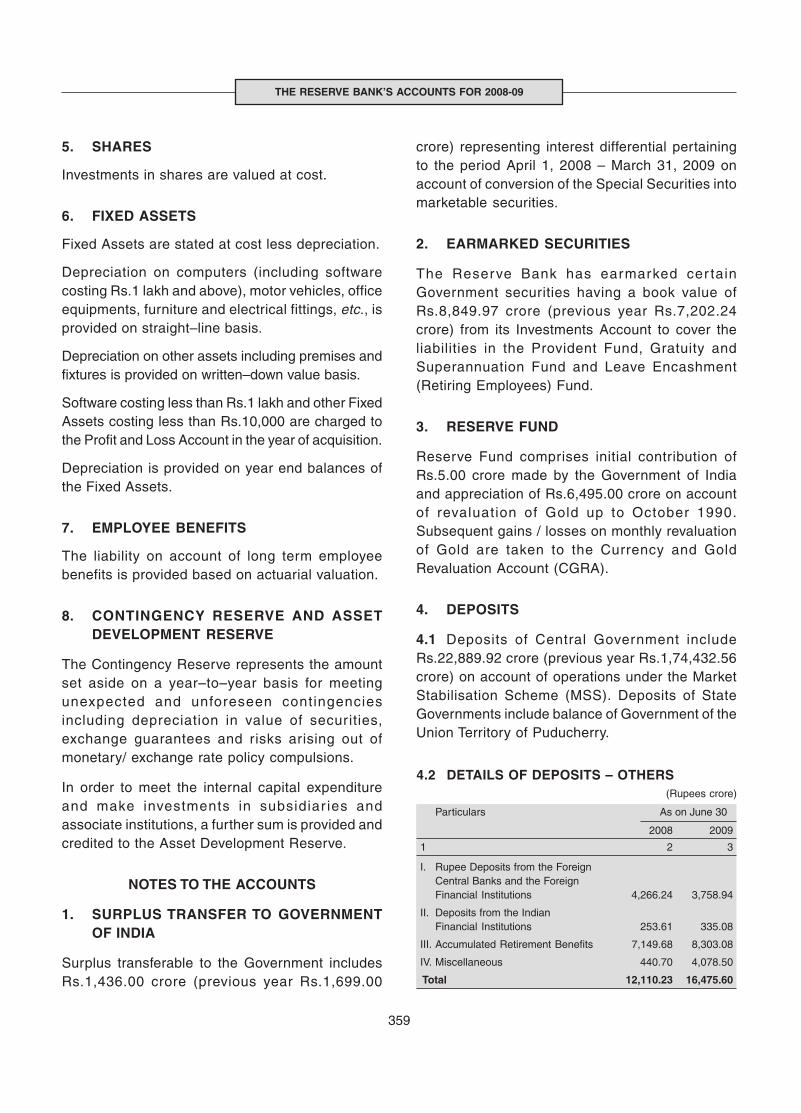
359
THE RESERVE BANK’S ACCOUNTS FOR 2008-09
5. SHARES
Investments in shares are valued at cost.
6. FIXED ASSETS
Fixed Assets are stated at cost less depreciation.
Depreciation on computers (including softwarecosting Rs.1 lakh and above), motor vehicles, officeequipments, furniture and electrical fittings, etc., isprovided on straight–line basis.
Depreciation on other assets including premises andfixtures is provided on written–down value basis.
Software costing less than Rs.1 lakh and other FixedAssets costing less than Rs.10,000 are charged tothe Profit and Loss Account in the year of acquisition.
Depreciation is provided on year end balances ofthe Fixed Assets.
7. EMPLOYEE BENEFITS
The liability on account of long term employeebenefits is provided based on actuarial valuation.
8. CONTINGENCY RESERVE AND ASSETDEVELOPMENT RESERVE
The Contingency Reserve represents the amountset aside on a year–to–year basis for meetingunexpected and unforeseen contingenciesincluding depreciation in value of securities,exchange guarantees and risks arising out ofmonetary/ exchange rate policy compulsions.
In order to meet the internal capital expenditureand make investments in subsidiar ies andassociate institutions, a further sum is provided andcredited to the Asset Development Reserve.
NOTES TO THE ACCOUNTS
1. SURPLUS TRANSFER TO GOVERNMENTOF INDIA
Surplus transferable to the Government includesRs.1,436.00 crore (previous year Rs.1,699.00
crore) representing interest differential pertainingto the period April 1, 2008 – March 31, 2009 onaccount of conversion of the Special Securities intomarketable securities.
2. EARMARKED SECURITIES
The Reserve Bank has earmarked cer tainGovernment securities having a book value ofRs.8,849.97 crore (previous year Rs.7,202.24crore) from its Investments Account to cover theliabilities in the Provident Fund, Gratuity andSuperannuation Fund and Leave Encashment(Retiring Employees) Fund.
3. RESERVE FUND
Reserve Fund comprises initial contribution ofRs.5.00 crore made by the Government of Indiaand appreciation of Rs.6,495.00 crore on accountof revaluation of Gold up to October 1990.Subsequent gains / losses on monthly revaluationof Gold are taken to the Currency and GoldRevaluation Account (CGRA).
4. DEPOSITS
4.1 Deposits of Central Government includeRs.22,889.92 crore (previous year Rs.1,74,432.56crore) on account of operations under the MarketStabilisation Scheme (MSS). Deposits of StateGovernments include balance of Government of theUnion Territory of Puducherry.
4.2 DETAILS OF DEPOSITS – OTHERS(Rupees crore)
Particulars As on June 30
2008 2009
1 2 3
I. Rupee Deposits from the ForeignCentral Banks and the ForeignFinancial Institutions 4,266.24 3,758.94
II. Deposits from the IndianFinancial Institutions 253.61 335.08
III. Accumulated Retirement Benefits 7,149.68 8,303.08
IV. Miscellaneous 440.70 4,078.50
Total 12,110.23 16,475.60
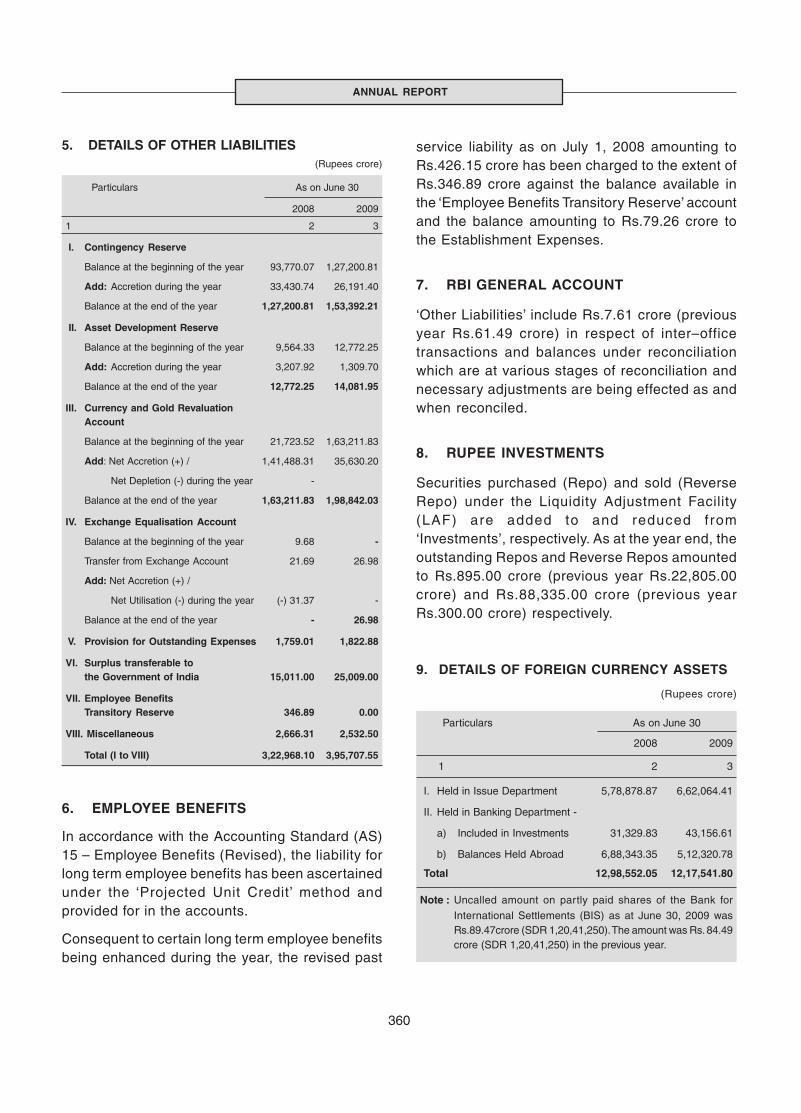
360
ANNUAL REPORT
6. EMPLOYEE BENEFITS
In accordance with the Accounting Standard (AS)15 – Employee Benefits (Revised), the liability forlong term employee benefits has been ascertainedunder the ‘Projected Unit Credit’ method andprovided for in the accounts.
Consequent to certain long term employee benefitsbeing enhanced during the year, the revised past
service liability as on July 1, 2008 amounting toRs.426.15 crore has been charged to the extent ofRs.346.89 crore against the balance available inthe ‘Employee Benefits Transitory Reserve’ accountand the balance amounting to Rs.79.26 crore tothe Establishment Expenses.
7. RBI GENERAL ACCOUNT
‘Other Liabilities’ include Rs.7.61 crore (previousyear Rs.61.49 crore) in respect of inter–officetransactions and balances under reconciliationwhich are at various stages of reconciliation andnecessary adjustments are being effected as andwhen reconciled.
8. RUPEE INVESTMENTS
Securities purchased (Repo) and sold (ReverseRepo) under the Liquidity Adjustment Facility(LAF) are added to and reduced from‘Investments’, respectively. As at the year end, theoutstanding Repos and Reverse Repos amountedto Rs.895.00 crore (previous year Rs.22,805.00crore) and Rs.88,335.00 crore (previous yearRs.300.00 crore) respectively.
5. DETAILS OF OTHER LIABILITIES (Rupees crore)
Particulars As on June 30
2008 2009
1 2 3
I. Contingency Reserve
Balance at the beginning of the year 93,770.07 1,27,200.81
Add: Accretion during the year 33,430.74 26,191.40
Balance at the end of the year 1,27,200.81 1,53,392.21
II. Asset Development Reserve
Balance at the beginning of the year 9,564.33 12,772.25
Add: Accretion during the year 3,207.92 1,309.70
Balance at the end of the year 12,772.25 14,081.95
III. Currency and Gold RevaluationAccount
Balance at the beginning of the year 21,723.52 1,63,211.83
Add: Net Accretion (+) / 1,41,488.31 35,630.20
Net Depletion (-) during the year -
Balance at the end of the year 1,63,211.83 1,98,842.03
IV. Exchange Equalisation Account
Balance at the beginning of the year 9.68 -
Transfer from Exchange Account 21.69 26.98
Add: Net Accretion (+) /
Net Utilisation (-) during the year (-) 31.37 -
Balance at the end of the year - 26.98
V. Provision for Outstanding Expenses 1,759.01 1,822.88
VI. Surplus transferable tothe Government of India 15,011.00 25,009.00
VII. Employee BenefitsTransitory Reserve 346.89 0.00
VIII. Miscellaneous 2,666.31 2,532.50
Total (I to VIII) 3,22,968.10 3,95,707.55
9. DETAILS OF FOREIGN CURRENCY ASSETS
(Rupees crore)
Particulars As on June 30
2008 2009
1 2 3
I. Held in Issue Department 5,78,878.87 6,62,064.41
II. Held in Banking Department -
a) Included in Investments 31,329.83 43,156.61
b) Balances Held Abroad 6,88,343.35 5,12,320.78
Total 12,98,552.05 12,17,541.80
Note : Uncalled amount on partly paid shares of the Bank for
International Settlements (BIS) as at June 30, 2009 wasRs.89.47crore (SDR 1,20,41,250). The amount was Rs. 84.49crore (SDR 1,20,41,250) in the previous year.

361
THE RESERVE BANK’S ACCOUNTS FOR 2008-09
12. Previous year’s figures have been regrouped/reclassified, wherever necessary, to conform to thecurrent year’s presentation.
11. INTEREST, DISCOUNT, EXCHANGE,COMMISSION, etc.
Interest income is net of depreciation on revaluation ofsecurities amounting to Rs.17,430.65 crore.
Interest, Discount, Exchange, Commission, etc. includethe following:
(Rupees crore)
Particulars Year ended
June 30, June 30,2008 2009
1 2 3
I. Profit on sale of Foreignand Rupee Securities 7,823.52 18,957.36
II. Net profit on sale of Bank’s Property 25.10 7.36III. Dividend from Subsidiaries &
Associate Institutions@ 440.07 -
@:Dividend in respect of Bank’s holding in the equity of SBI for theyear ended June 2007 was accounted on cash basis. The entireequity holding in SBI was transferred to the Government of Indiaon June 29, 2007.
10. DETAILS OF OTHER ASSETS(Rupees crore)
Particulars As on June 30
2008 2009
1 2 3
I. Fixed Assets
(net of accumulated depreciation) 479.75 609.40
II. Gold 7,239.51 8,587.82
III. Income accrued but not received 22,203.28 16,734.04
IV. Miscellaneous 883.41 5,207.49
Total 30,805.95 31,138.75
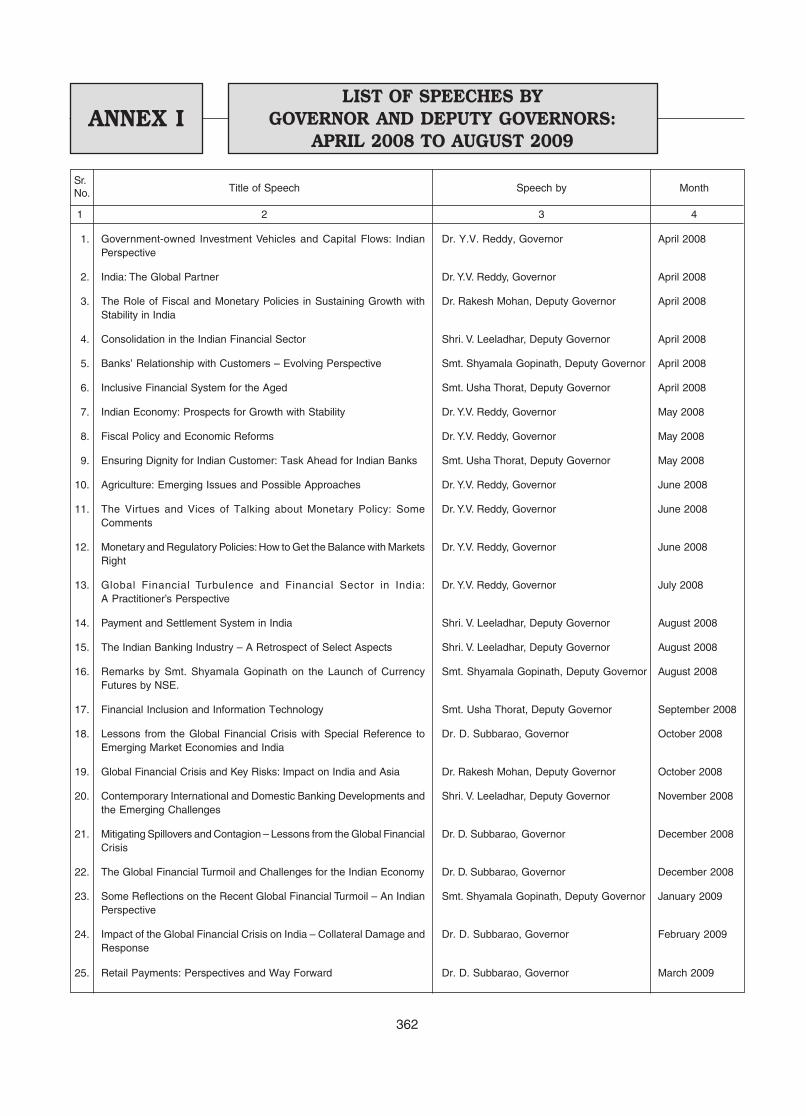
362
Sr.Title of Speech Speech by MonthNo.
1 2 3 4
1.
2.
3.
4.
5.
6.
7.
8.
9.
10.
11.
12.
13.
14.
15.
16.
17.
18.
19.
20.
21.
22.
23.
24.
25.
Government-owned Investment Vehicles and Capital Flows: IndianPerspective
India: The Global Partner
The Role of Fiscal and Monetary Policies in Sustaining Growth withStability in India
Consolidation in the Indian Financial Sector
Banks’ Relationship with Customers – Evolving Perspective
Inclusive Financial System for the Aged
Indian Economy: Prospects for Growth with Stability
Fiscal Policy and Economic Reforms
Ensuring Dignity for Indian Customer: Task Ahead for Indian Banks
Agriculture: Emerging Issues and Possible Approaches
The Virtues and Vices of Talking about Monetary Policy: SomeComments
Monetary and Regulatory Policies: How to Get the Balance with MarketsRight
Global Financial Turbulence and Financial Sector in India:A Practitioner’s Perspective
Payment and Settlement System in India
The Indian Banking Industry – A Retrospect of Select Aspects
Remarks by Smt. Shyamala Gopinath on the Launch of CurrencyFutures by NSE.
Financial Inclusion and Information Technology
Lessons from the Global Financial Crisis with Special Reference toEmerging Market Economies and India
Global Financial Crisis and Key Risks: Impact on India and Asia
Contemporary International and Domestic Banking Developments andthe Emerging Challenges
Mitigating Spillovers and Contagion – Lessons from the Global FinancialCrisis
The Global Financial Turmoil and Challenges for the Indian Economy
Some Reflections on the Recent Global Financial Turmoil – An IndianPerspective
Impact of the Global Financial Crisis on India – Collateral Damage andResponse
Retail Payments: Perspectives and Way Forward
Dr. Y.V. Reddy, Governor
Dr. Y.V. Reddy, Governor
Dr. Rakesh Mohan, Deputy Governor
Shri. V. Leeladhar, Deputy Governor
Smt. Shyamala Gopinath, Deputy Governor
Smt. Usha Thorat, Deputy Governor
Dr. Y.V. Reddy, Governor
Dr. Y.V. Reddy, Governor
Smt. Usha Thorat, Deputy Governor
Dr. Y.V. Reddy, Governor
Dr. Y.V. Reddy, Governor
Dr. Y.V. Reddy, Governor
Dr. Y.V. Reddy, Governor
Shri. V. Leeladhar, Deputy Governor
Shri. V. Leeladhar, Deputy Governor
Smt. Shyamala Gopinath, Deputy Governor
Smt. Usha Thorat, Deputy Governor
Dr. D. Subbarao, Governor
Dr. Rakesh Mohan, Deputy Governor
Shri. V. Leeladhar, Deputy Governor
Dr. D. Subbarao, Governor
Dr. D. Subbarao, Governor
Smt. Shyamala Gopinath, Deputy Governor
Dr. D. Subbarao, Governor
Dr. D. Subbarao, Governor
April 2008
April 2008
April 2008
April 2008
April 2008
April 2008
May 2008
May 2008
May 2008
June 2008
June 2008
June 2008
July 2008
August 2008
August 2008
August 2008
September 2008
October 2008
October 2008
November 2008
December 2008
December 2008
January 2009
February 2009
March 2009
ANNEX ILIST OF SPEECHES BY
GOVERNOR AND DEPUTY GOVERNORS:APRIL 2008 TO AUGUST 2009
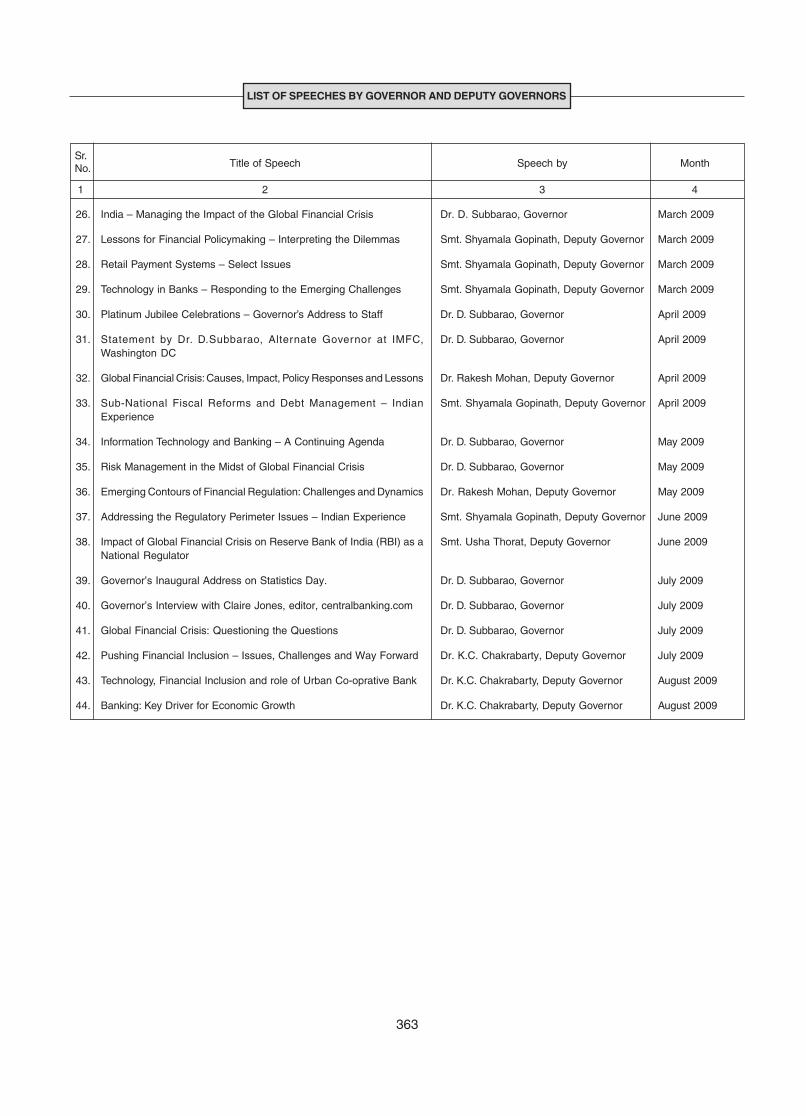
India – Managing the Impact of the Global Financial Crisis
Lessons for Financial Policymaking – Interpreting the Dilemmas
Retail Payment Systems – Select Issues
Technology in Banks – Responding to the Emerging Challenges
Platinum Jubilee Celebrations – Governor’s Address to Staff
Statement by Dr. D.Subbarao, Alternate Governor at IMFC,Washington DC
Global Financial Crisis: Causes, Impact, Policy Responses and Lessons
Sub-National Fiscal Reforms and Debt Management – IndianExperience
Information Technology and Banking – A Continuing Agenda
Risk Management in the Midst of Global Financial Crisis
Emerging Contours of Financial Regulation: Challenges and Dynamics
Addressing the Regulatory Perimeter Issues – Indian Experience
Impact of Global Financial Crisis on Reserve Bank of India (RBI) as aNational Regulator
Governor’s Inaugural Address on Statistics Day.
Governor’s Interview with Claire Jones, editor, centralbanking.com
Global Financial Crisis: Questioning the Questions
Pushing Financial Inclusion – Issues, Challenges and Way Forward
Technology, Financial Inclusion and role of Urban Co-oprative Bank
Banking: Key Driver for Economic Growth
Dr. D. Subbarao, Governor
Smt. Shyamala Gopinath, Deputy Governor
Smt. Shyamala Gopinath, Deputy Governor
Smt. Shyamala Gopinath, Deputy Governor
Dr. D. Subbarao, Governor
Dr. D. Subbarao, Governor
Dr. Rakesh Mohan, Deputy Governor
Smt. Shyamala Gopinath, Deputy Governor
Dr. D. Subbarao, Governor
Dr. D. Subbarao, Governor
Dr. Rakesh Mohan, Deputy Governor
Smt. Shyamala Gopinath, Deputy Governor
Smt. Usha Thorat, Deputy Governor
Dr. D. Subbarao, Governor
Dr. D. Subbarao, Governor
Dr. D. Subbarao, Governor
Dr. K.C. Chakrabarty, Deputy Governor
Dr. K.C. Chakrabarty, Deputy Governor
Dr. K.C. Chakrabarty, Deputy Governor
March 2009
March 2009
March 2009
March 2009
April 2009
April 2009
April 2009
April 2009
May 2009
May 2009
May 2009
June 2009
June 2009
July 2009
July 2009
July 2009
July 2009
August 2009
August 2009
26.
27.
28.
29.
30.
31.
32.
33.
34.
35.
36.
37.
38.
39.
40.
41.
42.
43.
44.
363
Sr.Title of Speech Speech by MonthNo.
1 2 3 4
LIST OF SPEECHES BY GOVERNOR AND DEPUTY GOVERNORS

Sr.Title Chairperson / Convenor DateNo.
1 2 3 4
1. Report on Interest Rate Futures Shri V.K. Sharma August 2008
2. Report of the Working Group on Technology Upgradation of Regional Rural Banks Shri G. Srinivasan August 2008
3. Report of the Working Group on IT support for Urban Cooperative Banks Shri R. Gandhi August 2008
4. Report of the Committee on the Global Financial System (CGFS) Dr. Rakesh Mohan January 2009on Capital Flows and Emerging Market Economies
5. Report of the Technical Advisory Group on Development of Prof. Amitabh Kundu January 2009Housing Start-Up Index in India
6. Task Force For Diamond Sector Shri A.K.Bera February 2009
7. Report of the High Level Committee on Estimation of Savings and Investment Dr. C. Rangarajan March 2009
8. Report of the Committee on Financial Sector Assessment Dr. Rakesh Mohan March 2009
Executive Summary - Volume I Dr. Rakesh Mohan March 2009
Overview - Volume II Dr. Rakesh Mohan March 2009
Advisory Panel on Financial Stability Assessment and Stress Testing - Volume III Shri M.B.N.Rao March 2009
Advisory Panel on Financial Regulation and Supervision – Volume IV Shri M.S.Verma March 2009
Advisory Panel on Institutions and Market Structure - Volume V Shri C. M. Vasudev March 2009
Advisory Panel on Transparency Standards - Volume VI Shri Nitin Desai March 2009
9. Report of G20 Working Group on Enhancing Sound Regulation Dr. Rakesh Mohan andand Strengthening Transparency Mr. Tiff Macklem March 2009
10. Report of the RBI-SEBI Standing Technical Committee on Interest Rate Futures RBI and SEBI June 2009
ANNEX II LIST OF REPORTS OF GROUPS/COMMITTEESSUBMITTED: JULY 2008 TO JUNE 2009
364

ANNEX IIILIST OF PUBLICATIONS BY
THE STAFF OF THE RESERVE BANK:JULY 2008 TO JUNE 2009
Sr. No. Title of the Paper/Article Author/s Publication/ Journal Publication Month
1 2 3 4 5
365
Trade Pattern of SAARC Countries: RecentTrends
Sovereign Wealth Funds for India:Delineating Issues and Options fromInternational Experience#
Oman’s Monetary Policy TransmissionProcess under the Fixed Peg: SomeEmpirical Puzzles
Some perspectives on the Possible Impactof the Recent Turmoil in the GlobalFinancial Markets on the Indian Economy
India’s Financial Openness and Integrationwith Southeast Asian Countries:An Analytical Perspective
Integration of India’s Stock Market withGlobal and Major Regional Markets
Does Sub-prime Mortgage Crisis in the USImpact India? An Exploration
Global Financial Crisis and its Fallout:A Stocktaking
Gender Inequality in Banking Services
External Sector Openness and PurchasingPower Parity in India : A Long-SpanAnalysis
Empirical Fiscal Research in India:A Survey
Can an Inter-Temporal Model ExplainIndia’s Current Account Balance
Determinants of WADR for CommercialPaper: An empirical Analysis for India
Capital Adequacy in Indian Agriculture:A Riposte
Rajeev JainJ. B. Singh
Narayan Chandra PradhanRamesh Golait
Sitikantha Pattanaik
Jayanthi K AnandD. P. RathGunjeet KaurP. K. NayakL. LakshmananRamesh GolaitKumarjit MandalS. M. LokareRaj RajeshPankaj KumarNaveen KumarRakesh Kumar
Chandan SinhaNarayan Chandra Pradhan
Janak RajSarat Dhal
T. Gopinath
Amaresh Samantaraya
Pallavi Chavan
Sunil KumarS. M. Lokare
R.K.PattnaikDeepa S. RajJai Chander
J.K. KhundrakpamRajiv Ranjan
Narayan Chandra PradhanSaurabh Ghosh
Ramesh GolaitS. M. Lokare
Special Volume of SAARC FINANCEGovernors’ Symposium “South Asia’sRecent Growth and FutureProspects”, Central Bank of Sri Lanka.
Central Bank of Sri Lanka (CBSL)Inaugural International ResearchConference ‘Central Banking andFinancial Markets’, pp. 1-14
Macroeconomics and Finance inEmerging Market Economies(MFEME), Vol.1, No.2.
RBI Staff Study SS DEAP 2/2008
BIS Paper No. 42, pp. 181-201
BIS Papers 42
Indian Economic Journal, Vo.56 (3)
CAB Calling Vol. 32 (4) PP. 10 – 15.
Economic and Political Weekly
45th Annual Conference of the IndianEconometric Society (TIES) GauhatiUniversity, January 8 to 10, 2009.
RBI Staff Studies
RBI Occasional Papers Vol.29, No.1,Summer-2008
-do-
-do-
August 2008
August 2008
September 2008
October 2008
October, 2008
October 2008
October-December 2008
October-December 2008,
November 2008
January 2009
January 2009
February 2009
February 2009
February 2009
1.
2.
3.
4.
5.
6.
7.
8.
9.
10.
11.
12.
13.
14.
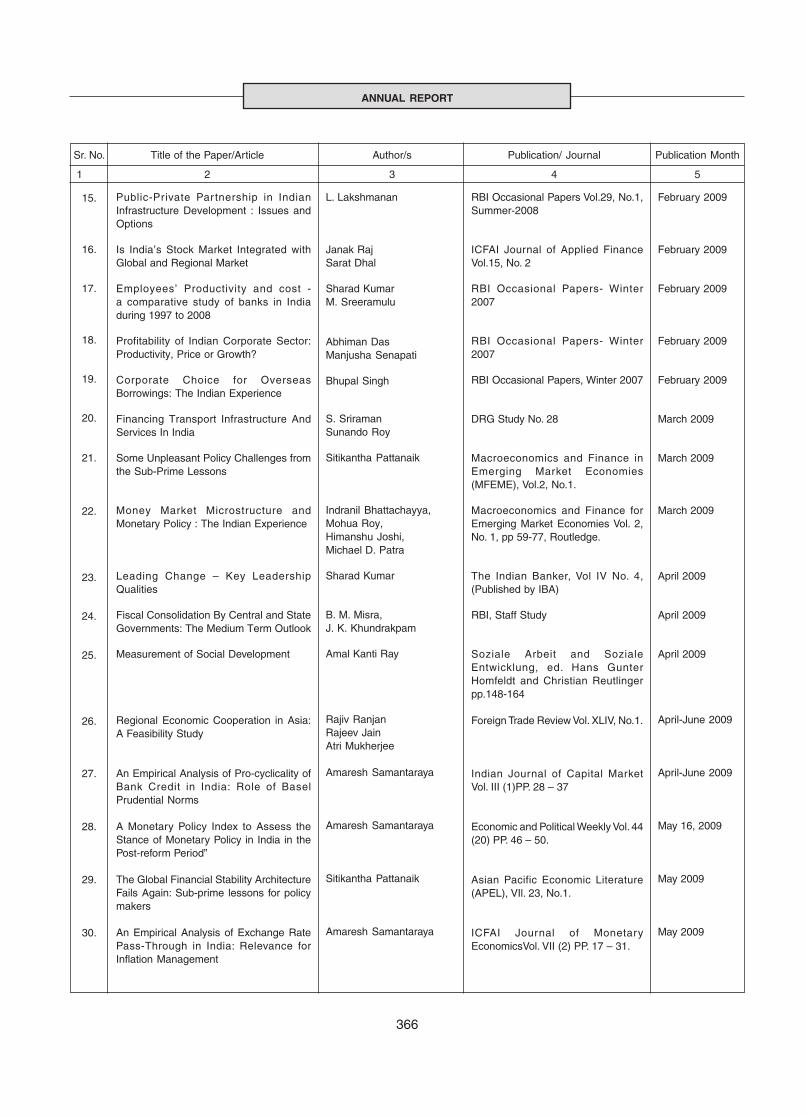
366
ANNUAL REPORT
Sr. No. Title of the Paper/Article Author/s Publication/ Journal Publication Month
1 2 3 4 5
Public-Private Par tnership in IndianInfrastructure Development : Issues andOptions
Is India’s Stock Market Integrated withGlobal and Regional Market
Employees’ Productivity and cost -a comparative study of banks in Indiaduring 1997 to 2008
Profitability of Indian Corporate Sector:Productivity, Price or Growth?
Corporate Choice for OverseasBorrowings: The Indian Experience
Financing Transport Infrastructure AndServices In India
Some Unpleasant Policy Challenges fromthe Sub-Prime Lessons
Money Market Microstructure andMonetary Policy : The Indian Experience
Leading Change – Key LeadershipQualities
Fiscal Consolidation By Central and StateGovernments: The Medium Term Outlook
Measurement of Social Development
Regional Economic Cooperation in Asia:A Feasibility Study
An Empirical Analysis of Pro-cyclicality ofBank Credit in India: Role of BaselPrudential Norms
A Monetary Policy Index to Assess theStance of Monetary Policy in India in thePost-reform Period”
The Global Financial Stability ArchitectureFails Again: Sub-prime lessons for policymakers
An Empirical Analysis of Exchange RatePass-Through in India: Relevance forInflation Management
L. Lakshmanan
Janak RajSarat Dhal
Sharad KumarM. Sreeramulu
Abhiman DasManjusha Senapati
Bhupal Singh
S. SriramanSunando Roy
Sitikantha Pattanaik
Indranil Bhattachayya,Mohua Roy,Himanshu Joshi,Michael D. Patra
Sharad Kumar
B. M. Misra,J. K. Khundrakpam
Amal Kanti Ray
Rajiv RanjanRajeev JainAtri Mukherjee
Amaresh Samantaraya
Amaresh Samantaraya
Sitikantha Pattanaik
Amaresh Samantaraya
RBI Occasional Papers Vol.29, No.1,Summer-2008
ICFAI Journal of Applied FinanceVol.15, No. 2
RBI Occasional Papers- Winter2007
RBI Occasional Papers- Winter2007
RBI Occasional Papers, Winter 2007
DRG Study No. 28
Macroeconomics and Finance inEmerging Market Economies(MFEME), Vol.2, No.1.
Macroeconomics and Finance forEmerging Market Economies Vol. 2,No. 1, pp 59-77, Routledge.
The Indian Banker, Vol IV No. 4,(Published by IBA)
RBI, Staff Study
Soziale Arbeit and SozialeEntwicklung, ed. Hans GunterHomfeldt and Christian Reutlingerpp.148-164
Foreign Trade Review Vol. XLIV, No.1.
Indian Journal of Capital MarketVol. III (1)PP. 28 – 37
Economic and Political Weekly Vol. 44(20) PP. 46 – 50.
Asian Pacific Economic Literature(APEL), VIl. 23, No.1.
ICFAI Journal of MonetaryEconomicsVol. VII (2) PP. 17 – 31.
February 2009
February 2009
February 2009
February 2009
February 2009
March 2009
March 2009
March 2009
April 2009
April 2009
April 2009
April-June 2009
April-June 2009
May 16, 2009
May 2009
May 2009
15.
16.
17.
18.
19.
20.
21.
22.
23.
24.
25.
26.
27.
28.
29.
30.
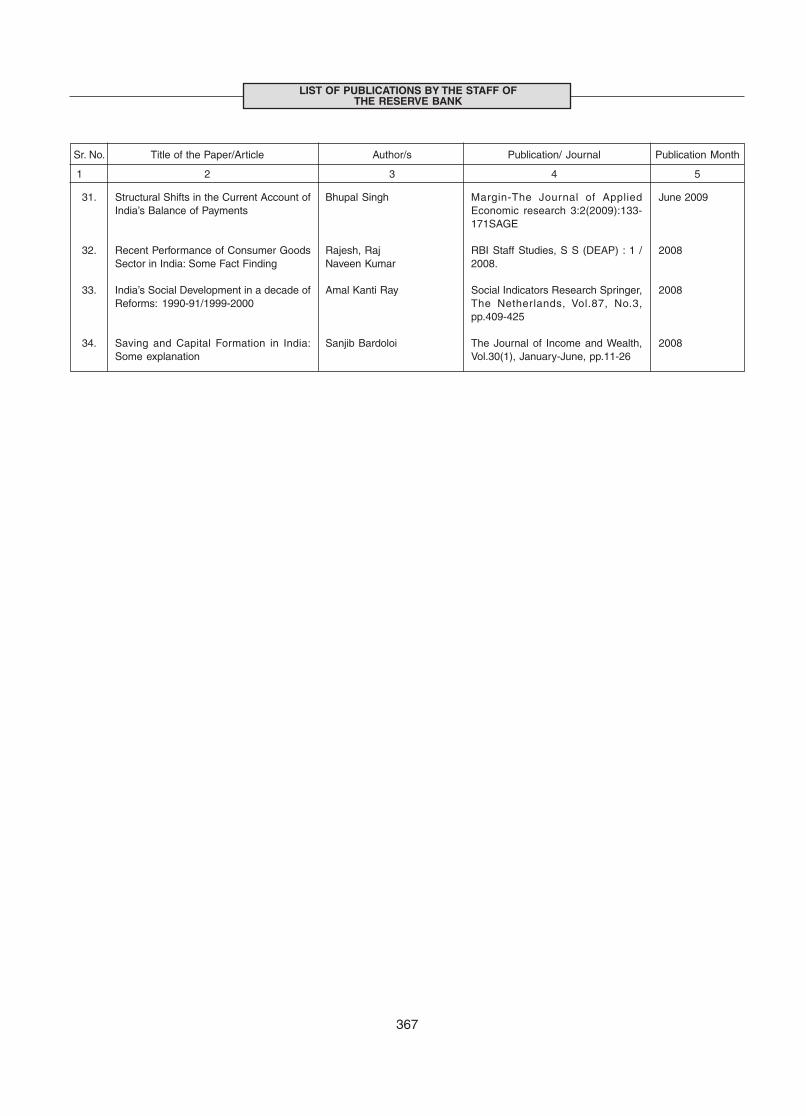
367
LIST OF PUBLICATIONS BY THE STAFF OFTHE RESERVE BANK
Sr. No. Title of the Paper/Article Author/s Publication/ Journal Publication Month
1 2 3 4 5
31.
32.
33.
34.
Structural Shifts in the Current Account ofIndia’s Balance of Payments
Recent Performance of Consumer GoodsSector in India: Some Fact Finding
India’s Social Development in a decade ofReforms: 1990-91/1999-2000
Saving and Capital Formation in India:Some explanation
Bhupal Singh
Rajesh, RajNaveen Kumar
Amal Kanti Ray
Sanjib Bardoloi
Margin-The Journal of AppliedEconomic research 3:2(2009):133-171SAGE
RBI Staff Studies, S S (DEAP) : 1 /2008.
Social Indicators Research Springer,The Netherlands, Vol.87, No.3,pp.409-425
The Journal of Income and Wealth,Vol.30(1), January-June, pp.11-26
June 2009
2008
2008
2008

ANNEX IV VISITS OF FOREIGN DELEGATIONS TOTHE RESERVE BANK
368
Sr. No. Date of Meeting Delegation led by Officials met
1 2 3 4
1.
2.
3.
4.
5.
6.
7.
8.
9.
10.
11.
12.
13.
14.
15.
16.
17.
July 04, 2008
August 08, 2008
August 25, 2008
September 12,2008
October 06, 2008
November 10 &11, 2008
November 19,2008
November 26,2008
January 16, 2009
February 24, 2009
March 16, 2009
March 18, 2009
March 25, 2009
April 01, 2009
May 20, 2009
June 19, 2009
June 26. 2009
Ms. Magdalena Balcells, Adviser to Minister of Financeof Chile
Mr. Nicolas Ferrari, Regional Financial Councellor,Trade & Economic Commission of the French Embassy,New Delhi
Mr. Lee Boon Ngiap, Executive Director, MonetaryAuthority of Singapore
Dr. Pattama Teanravisitsagool, Thailand
Group members of Royal College of Defence Studies,UK
Delegation from Central Bank of Russian Federation
Lord Nicholas Stern, IG Patel Professor, IndiaObservatory, London School of Economics (LSE) UK
Mr. Jerome Bonnafont, French Ambassador to India
Swedish Parliament’s Standing Committee on ForeignRelations led by Ms Carina Hagg, Social DemocraticParty
Hon. Tim Groser, Minister of Trade, New Zealand
Mr. Robert Dohner, Deputy Assistant Secretary for AsiaInternational Affairs of U S Treasury Department
Mr. Kevin Lynch, Clerk of Privy Council, Secretary tothe Cabinet, Government of Canada
Dr. Ramakrishna Sithanen, Vice Prime Minister ofMauritius
Mr. Benjamin Delozier, Senior Economist & Director,French Treasury.
Mr.Hector Sants, CEO, Financial Services Authority,London (FSA), Mrs.Melanie Beaman, Senior Official,FSA and Mr.Andrew McNab, Head, ComplianceMonitoring, FSA.
Mr.Durmus Yilmaz, Governor, Central Bank of theRepublic of Turkey
New Zealand Treasury Delegation led by Mr.Colin Hall,Acting Assistant Secretary of the New Zealand Treasury
Shri Anand Sinha, Executive Director and other SeniorOfficers
Shri V.K. Sharma, Executive Director and other seniorofficers.
Shri V. Leeladhar, Deputy Governor, Shri Anand Sinha,Executive Director and other Senior Officers.
Shri V.K. Sharma, Executive Director and other seniorofficers.
Shri V.K. Sharma, Executive Director and other seniorofficers.
Shri H.R.Khan, Executive Director and other SeniorOfficers
Dr. D. Subbarao, Governor- one to one meetingDr. Rakesh Mohan, Deputy Governor - one to onemeetingAddress the Research Officers of Department ofEconomic Analysis and Policy
Dr. D. Subbarao, Governor
Smt. Usha Thorat, Deputy Governor, S/Shri AnandSinha, Deepak Mohanty, Executive Directors and otherSenior Officers.
Dr. D. Subbarao, Governor, Smt.Shyamala Gopinath,Deputy Governor, Shri Deepak Mohanty, ExecutiveDirector and other Senior Officials.
Shri Anand Sinha, Executive Director and other SeniorOfficers
Dr. D. Subbarao, Governor.
Dr. D. Subbarao, Governor, Dr. Rakesh Mohan,Dy.Governor, Shri V.K.Sharma, Shri Anand Sinha, ShriDeepak Mohanty, Executive Directors.
Shri Deepak Mohanty, Executive Director and otherSenior Officials.
Dr. D. Subbarao, Governor, Mrs. Usha Thorat, DeputyGovernor, Mr. Anand Sinha & Mr.G. Gopalakrishna,Executive Directors, Mr. H. N. Prasad, Chief ExecutiveOfficer, Deposit Insurance and Credit GuaranteeCorporation and other Senior Officers.
Dr. D. Subbarao, Governor – One-to-one meeting.Smt.Shyamal Gopinath, Smt. Usha Thorat & Dr.K.C.Chakrabar ty, Deputy Governors, S/ShriV.K.Sharma, C. Krishnan, Anand Sinha, V.S. Das,G.Gopalakrishna and Deepak Mohanty, ExecutiveDirectors.
Shri Deepak Mohanty, Executive Director and otherSenior Officers.
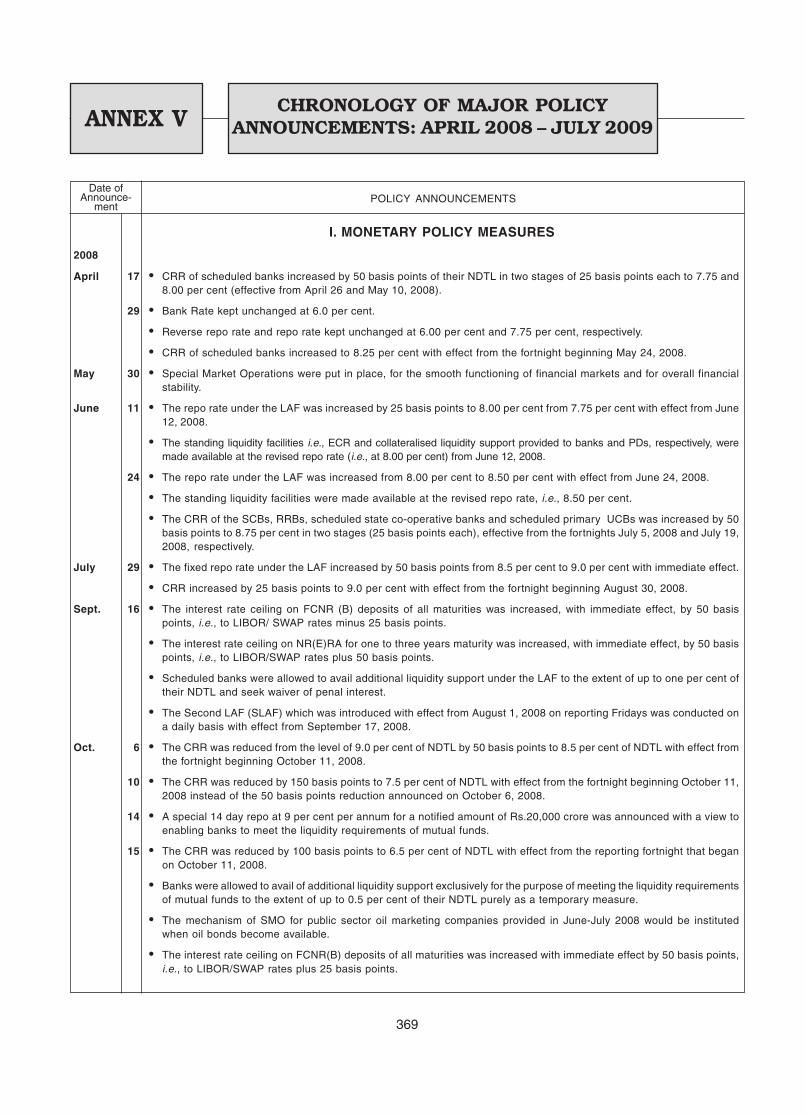
369
ANNEX VCHRONOLOGY OF MAJOR POLICY
ANNOUNCEMENTS: APRIL 2008 – JULY 2009
POLICY ANNOUNCEMENTSDate of
Announce-ment
I. MONETARY POLICY MEASURES
2008
April 17 • CRR of scheduled banks increased by 50 basis points of their NDTL in two stages of 25 basis points each to 7.75 and8.00 per cent (effective from April 26 and May 10, 2008).
29 • Bank Rate kept unchanged at 6.0 per cent.
• Reverse repo rate and repo rate kept unchanged at 6.00 per cent and 7.75 per cent, respectively.
• CRR of scheduled banks increased to 8.25 per cent with effect from the fortnight beginning May 24, 2008.
May 30 • Special Market Operations were put in place, for the smooth functioning of financial markets and for overall financialstability.
June 11 • The repo rate under the LAF was increased by 25 basis points to 8.00 per cent from 7.75 per cent with effect from June12, 2008.
• The standing liquidity facilities i.e., ECR and collateralised liquidity support provided to banks and PDs, respectively, weremade available at the revised repo rate (i.e., at 8.00 per cent) from June 12, 2008.
24 • The repo rate under the LAF was increased from 8.00 per cent to 8.50 per cent with effect from June 24, 2008.
• The standing liquidity facilities were made available at the revised repo rate, i.e., 8.50 per cent.
• The CRR of the SCBs, RRBs, scheduled state co-operative banks and scheduled primary UCBs was increased by 50basis points to 8.75 per cent in two stages (25 basis points each), effective from the fortnights July 5, 2008 and July 19,2008, respectively.
July 29 • The fixed repo rate under the LAF increased by 50 basis points from 8.5 per cent to 9.0 per cent with immediate effect.
• CRR increased by 25 basis points to 9.0 per cent with effect from the fortnight beginning August 30, 2008.
Sept. 16 • The interest rate ceiling on FCNR (B) deposits of all maturities was increased, with immediate effect, by 50 basispoints, i.e., to LIBOR/ SWAP rates minus 25 basis points.
• The interest rate ceiling on NR(E)RA for one to three years maturity was increased, with immediate effect, by 50 basispoints, i.e., to LIBOR/SWAP rates plus 50 basis points.
• Scheduled banks were allowed to avail additional liquidity support under the LAF to the extent of up to one per cent oftheir NDTL and seek waiver of penal interest.
• The Second LAF (SLAF) which was introduced with effect from August 1, 2008 on reporting Fridays was conducted ona daily basis with effect from September 17, 2008.
Oct. 6 • The CRR was reduced from the level of 9.0 per cent of NDTL by 50 basis points to 8.5 per cent of NDTL with effect fromthe fortnight beginning October 11, 2008.
10 • The CRR was reduced by 150 basis points to 7.5 per cent of NDTL with effect from the fortnight beginning October 11,2008 instead of the 50 basis points reduction announced on October 6, 2008.
14 • A special 14 day repo at 9 per cent per annum for a notified amount of Rs.20,000 crore was announced with a view toenabling banks to meet the liquidity requirements of mutual funds.
15 • The CRR was reduced by 100 basis points to 6.5 per cent of NDTL with effect from the reporting fortnight that beganon October 11, 2008.
• Banks were allowed to avail of additional liquidity support exclusively for the purpose of meeting the liquidity requirementsof mutual funds to the extent of up to 0.5 per cent of their NDTL purely as a temporary measure.
• The mechanism of SMO for public sector oil marketing companies provided in June-July 2008 would be institutedwhen oil bonds become available.
• The interest rate ceiling on FCNR(B) deposits of all maturities was increased with immediate effect by 50 basis points,i.e., to LIBOR/SWAP rates plus 25 basis points.
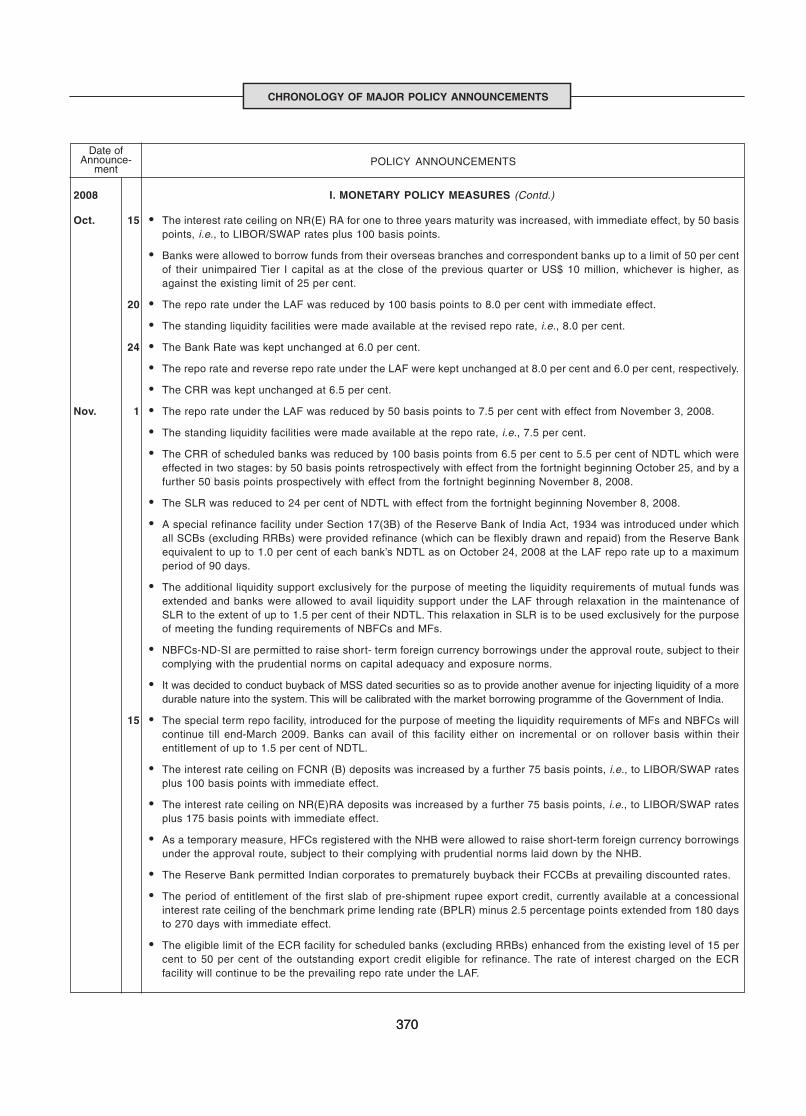
ANNUAL REPORT
370
POLICY ANNOUNCEMENTSDate of
Announce-ment
2008 I. MONETARY POLICY MEASURES (Contd.)
Oct. 15 • The interest rate ceiling on NR(E) RA for one to three years maturity was increased, with immediate effect, by 50 basispoints, i.e., to LIBOR/SWAP rates plus 100 basis points.
• Banks were allowed to borrow funds from their overseas branches and correspondent banks up to a limit of 50 per centof their unimpaired Tier I capital as at the close of the previous quarter or US$ 10 million, whichever is higher, asagainst the existing limit of 25 per cent.
20 • The repo rate under the LAF was reduced by 100 basis points to 8.0 per cent with immediate effect.
• The standing liquidity facilities were made available at the revised repo rate, i.e., 8.0 per cent.
24 • The Bank Rate was kept unchanged at 6.0 per cent.
• The repo rate and reverse repo rate under the LAF were kept unchanged at 8.0 per cent and 6.0 per cent, respectively.
• The CRR was kept unchanged at 6.5 per cent.
Nov. 1 • The repo rate under the LAF was reduced by 50 basis points to 7.5 per cent with effect from November 3, 2008.
• The standing liquidity facilities were made available at the repo rate, i.e., 7.5 per cent.
• The CRR of scheduled banks was reduced by 100 basis points from 6.5 per cent to 5.5 per cent of NDTL which wereeffected in two stages: by 50 basis points retrospectively with effect from the fortnight beginning October 25, and by afurther 50 basis points prospectively with effect from the fortnight beginning November 8, 2008.
• The SLR was reduced to 24 per cent of NDTL with effect from the fortnight beginning November 8, 2008.
• A special refinance facility under Section 17(3B) of the Reserve Bank of India Act, 1934 was introduced under whichall SCBs (excluding RRBs) were provided refinance (which can be flexibly drawn and repaid) from the Reserve Bankequivalent to up to 1.0 per cent of each bank’s NDTL as on October 24, 2008 at the LAF repo rate up to a maximumperiod of 90 days.
• The additional liquidity support exclusively for the purpose of meeting the liquidity requirements of mutual funds wasextended and banks were allowed to avail liquidity support under the LAF through relaxation in the maintenance ofSLR to the extent of up to 1.5 per cent of their NDTL. This relaxation in SLR is to be used exclusively for the purposeof meeting the funding requirements of NBFCs and MFs.
• NBFCs-ND-SI are permitted to raise short- term foreign currency borrowings under the approval route, subject to theircomplying with the prudential norms on capital adequacy and exposure norms.
• It was decided to conduct buyback of MSS dated securities so as to provide another avenue for injecting liquidity of a moredurable nature into the system. This will be calibrated with the market borrowing programme of the Government of India.
15 • The special term repo facility, introduced for the purpose of meeting the liquidity requirements of MFs and NBFCs willcontinue till end-March 2009. Banks can avail of this facility either on incremental or on rollover basis within theirentitlement of up to 1.5 per cent of NDTL.
• The interest rate ceiling on FCNR (B) deposits was increased by a further 75 basis points, i.e., to LIBOR/SWAP ratesplus 100 basis points with immediate effect.
• The interest rate ceiling on NR(E)RA deposits was increased by a further 75 basis points, i.e., to LIBOR/SWAP ratesplus 175 basis points with immediate effect.
• As a temporary measure, HFCs registered with the NHB were allowed to raise short-term foreign currency borrowingsunder the approval route, subject to their complying with prudential norms laid down by the NHB.
• The Reserve Bank permitted Indian corporates to prematurely buyback their FCCBs at prevailing discounted rates.
• The period of entitlement of the first slab of pre-shipment rupee export credit, currently available at a concessionalinterest rate ceiling of the benchmark prime lending rate (BPLR) minus 2.5 percentage points extended from 180 daysto 270 days with immediate effect.
• The eligible limit of the ECR facility for scheduled banks (excluding RRBs) enhanced from the existing level of 15 percent to 50 per cent of the outstanding export credit eligible for refinance. The rate of interest charged on the ECRfacility will continue to be the prevailing repo rate under the LAF.
370
CHRONOLOGY OF MAJOR POLICY ANNOUNCEMENTS

371
CHRONOLOGY OF MAJOR POLICY ANNOUNCEMENTS
2008 I. MONETARY POLICY MEASURES (Contd.)
POLICY ANNOUNCEMENTSDate of
Announce-ment
Nov. 28 • Special refinance facility up to 1.0 per cent of each bank’s NDTL as on October 24, 2008 at the LAF repo rate wasextended up to June 30, 2009.
• Liquidity support under the LAF through relaxation in the maintenance of SLR to the extent of up to 1.5 per cent of theirNDTL for the purpose of meeting the funding requirements of NBFCs, MFs and HFCs, which was available up to March31, 2009, was extended to June 30, 2009.
• Forex swaps facility of tenors up to three months, which was available on request, will be made available up to June 30, 2009.
• In view of the difficulties being faced by exporters on account of the weakening of external demand, the period ofentitlement of the first slab of post-shipment rupee export credit, which was available at a concessional interest rateceiling of the BPLR minus 2.5 percentage points, was extended from 90 days to 180 days with effect from December 1, 2008.
Dec. 6 • The repo rate under the LAF was reduced by 100 basis points from 7.5 per cent to 6.5 per cent and the reverse reporate by 100 basis points from 6.0 per cent to 5.0 per cent, effective December 8, 2008.
• Refinance facility of an amount of Rs.7,000 crore was provided to SIDBI under the provisions of Section 17(4H) of theReserve Bank of India Act, 1934. This refinance facility will be available up to March 31, 2010.
• The prescribed interest rate as applicable to post shipment rupee export credit (not exceeding BPLR minus 2.5percentage points) was extended to overdue bills up to 180 days.
11 • Refinance facility of an amount of Rs 4,000 crore was provided to the National Housing Bank (NHB) under the provisionsof Section 17(4DD) of the Reserve Bank of India Act, 1934. This refinance facility will be available up to March 31, 2010.
• Refinance facility of Rs.5,000 crore was provided to the EXIM Bank under the provisions of Section 17(4J) of theReserve Bank of India Act, 1934. This refinance facility will be available up to March 31, 2010.
2009
Jan. 2 • Reduced the repo rate under the LAF by 100 basis points from 6.5 per cent to 5.5 per cent and the reverse repo rate by100 basis points from 5.0 per cent to 4.0 per cent, effective January 03, 2009.
• The CRR of scheduled banks was reduced by 50 basis points from 5.5 per cent to 5.0 per cent of NDTL with effect fromthe fortnight beginning January 17, 2009 releasing around Rs.20,000 crore into the system.
27 • The special refinance facility for SCBs under Section 17(3B) of the Reserve Bank of India Act, 1934 was extended upto September 30, 2009.
• The special term repo facility under LAF for the purpose of meeting the liquidity requirements of MFs, NBFCs andHFCs was extended up to September 30, 2009.
Feb. 5 • The foreign exchange swap facility was extended till March 31, 2010.
• The ceiling rate on export credit in foreign currency was raised from LIBOR + 100 basis points to LIBOR + 350 basispoints on February 5, 2009 subject to the condition that the banks would not levy any other charges.
• Correspondingly, the ceiling interest rate on the lines of credit with overseas banks was also increased from 6-monthLIBOR/EURO LIBOR/EURIBOR + 75 basis points to 6-month LIBOR/ EURO LIBOR/ EURIBOR + 150 basis points.
March 4 • The repo rate under the LAF was reduced by 50 basis points from 5.5 per cent to 5.0 per cent with effect from March 5, 2009.
• The reverse repo rate under the LAF was reduced by 50 basis points from 4.0 per cent to 3.5 per cent with effect fromMarch 5, 2009.
26 • The Reserve Bank announced OMO purchase of government securities of the order of Rs.80,000 crore in the first halfof 2009-10, of which Rs.40,000 crore is envisaged for the first quarter of 2009-10.
31 • The facility of providing liquidity support to meet the temporary liquidity mismatches for eligible NBFCs-ND-SI, whichwas initially available for any paper issued up to March 31, 2009 was extended for any paper issued up to June 30,2009. Accordingly, the SPV would cease to make fresh purchases after September 30, 2009 and would recover alldues by December 31, 2009.
April 21 • Repo rate under the LAF was reduced by 25 basis points from 5.0 per cent to 4.75 per cent with effect from April 21, 2009.
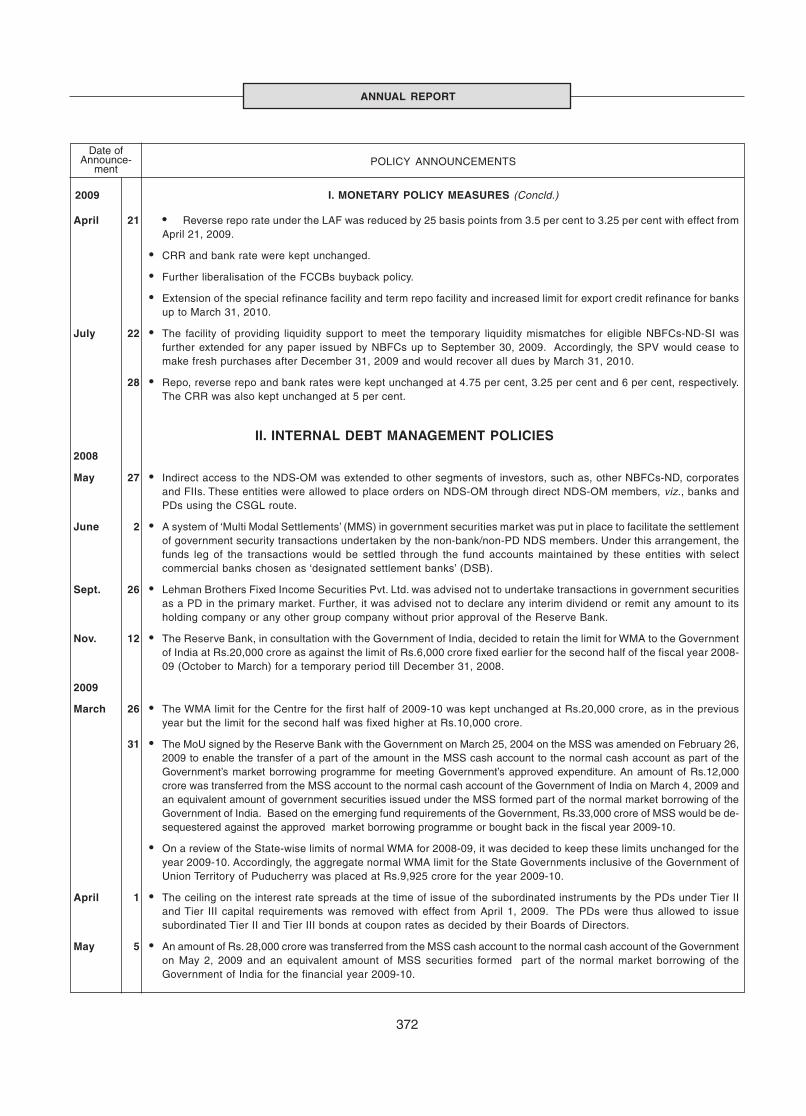
ANNUAL REPORT
372
POLICY ANNOUNCEMENTSDate of
Announce-ment
April 21 • Reverse repo rate under the LAF was reduced by 25 basis points from 3.5 per cent to 3.25 per cent with effect fromApril 21, 2009.
• CRR and bank rate were kept unchanged.
• Further liberalisation of the FCCBs buyback policy.
• Extension of the special refinance facility and term repo facility and increased limit for export credit refinance for banksup to March 31, 2010.
July 22 • The facility of providing liquidity support to meet the temporary liquidity mismatches for eligible NBFCs-ND-SI wasfurther extended for any paper issued by NBFCs up to September 30, 2009. Accordingly, the SPV would cease tomake fresh purchases after December 31, 2009 and would recover all dues by March 31, 2010.
28 • Repo, reverse repo and bank rates were kept unchanged at 4.75 per cent, 3.25 per cent and 6 per cent, respectively.The CRR was also kept unchanged at 5 per cent.
II. INTERNAL DEBT MANAGEMENT POLICIES2008
May 27 • Indirect access to the NDS-OM was extended to other segments of investors, such as, other NBFCs-ND, corporatesand FIIs. These entities were allowed to place orders on NDS-OM through direct NDS-OM members, viz., banks andPDs using the CSGL route.
June 2 • A system of ‘Multi Modal Settlements’ (MMS) in government securities market was put in place to facilitate the settlementof government security transactions undertaken by the non-bank/non-PD NDS members. Under this arrangement, thefunds leg of the transactions would be settled through the fund accounts maintained by these entities with selectcommercial banks chosen as ‘designated settlement banks’ (DSB).
Sept. 26 • Lehman Brothers Fixed Income Securities Pvt. Ltd. was advised not to undertake transactions in government securitiesas a PD in the primary market. Further, it was advised not to declare any interim dividend or remit any amount to itsholding company or any other group company without prior approval of the Reserve Bank.
Nov. 12 • The Reserve Bank, in consultation with the Government of India, decided to retain the limit for WMA to the Governmentof India at Rs.20,000 crore as against the limit of Rs.6,000 crore fixed earlier for the second half of the fiscal year 2008-09 (October to March) for a temporary period till December 31, 2008.
2009
March 26 • The WMA limit for the Centre for the first half of 2009-10 was kept unchanged at Rs.20,000 crore, as in the previousyear but the limit for the second half was fixed higher at Rs.10,000 crore.
31 • The MoU signed by the Reserve Bank with the Government on March 25, 2004 on the MSS was amended on February 26,2009 to enable the transfer of a part of the amount in the MSS cash account to the normal cash account as part of theGovernment’s market borrowing programme for meeting Government’s approved expenditure. An amount of Rs.12,000crore was transferred from the MSS account to the normal cash account of the Government of India on March 4, 2009 andan equivalent amount of government securities issued under the MSS formed part of the normal market borrowing of theGovernment of India. Based on the emerging fund requirements of the Government, Rs.33,000 crore of MSS would be de-sequestered against the approved market borrowing programme or bought back in the fiscal year 2009-10.
• On a review of the State-wise limits of normal WMA for 2008-09, it was decided to keep these limits unchanged for theyear 2009-10. Accordingly, the aggregate normal WMA limit for the State Governments inclusive of the Government ofUnion Territory of Puducherry was placed at Rs.9,925 crore for the year 2009-10.
April 1 • The ceiling on the interest rate spreads at the time of issue of the subordinated instruments by the PDs under Tier IIand Tier III capital requirements was removed with effect from April 1, 2009. The PDs were thus allowed to issuesubordinated Tier II and Tier III bonds at coupon rates as decided by their Boards of Directors.
May 5 • An amount of Rs. 28,000 crore was transferred from the MSS cash account to the normal cash account of the Governmenton May 2, 2009 and an equivalent amount of MSS securities formed part of the normal market borrowing of theGovernment of India for the financial year 2009-10.
2009 I. MONETARY POLICY MEASURES (Concld.)
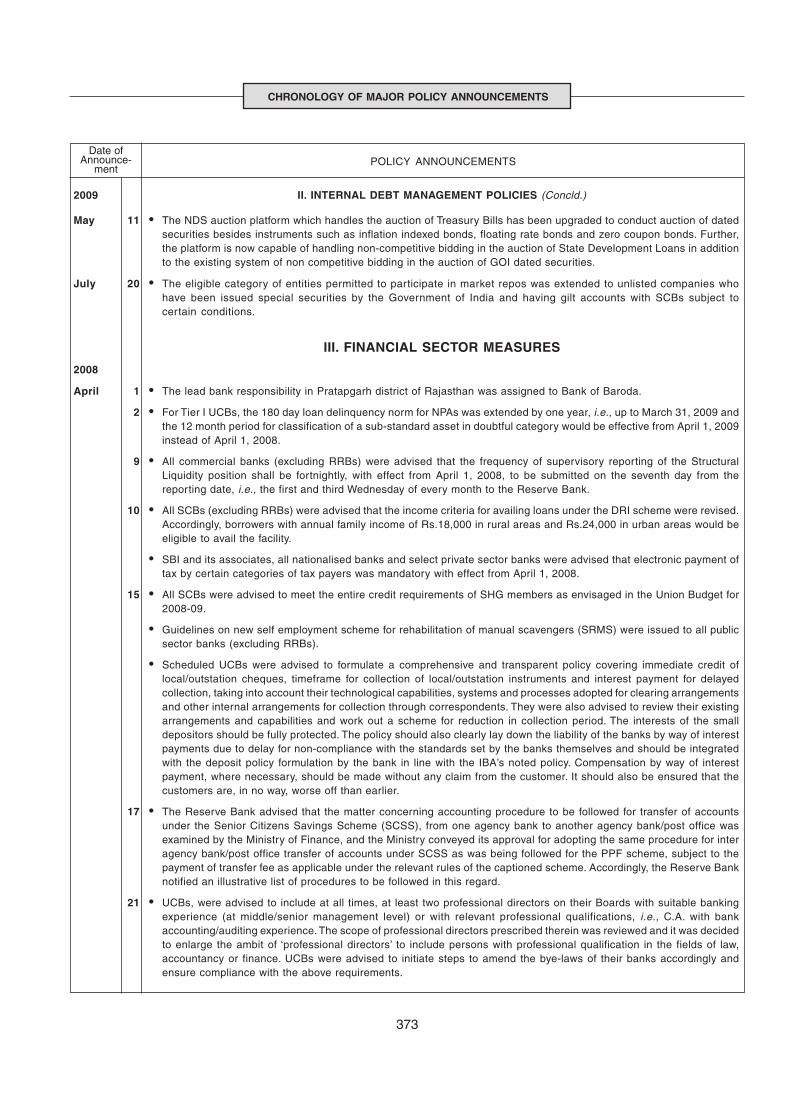
373
CHRONOLOGY OF MAJOR POLICY ANNOUNCEMENTS
POLICY ANNOUNCEMENTSDate of
Announce-ment
2009 II. INTERNAL DEBT MANAGEMENT POLICIES (Concld.)
May 11 • The NDS auction platform which handles the auction of Treasury Bills has been upgraded to conduct auction of datedsecurities besides instruments such as inflation indexed bonds, floating rate bonds and zero coupon bonds. Further,the platform is now capable of handling non-competitive bidding in the auction of State Development Loans in additionto the existing system of non competitive bidding in the auction of GOI dated securities.
July 20 • The eligible category of entities permitted to participate in market repos was extended to unlisted companies whohave been issued special securities by the Government of India and having gilt accounts with SCBs subject tocertain conditions.
III. FINANCIAL SECTOR MEASURES
2008
April 1 • The lead bank responsibility in Pratapgarh district of Rajasthan was assigned to Bank of Baroda.
2 • For Tier I UCBs, the 180 day loan delinquency norm for NPAs was extended by one year, i.e., up to March 31, 2009 andthe 12 month period for classification of a sub-standard asset in doubtful category would be effective from April 1, 2009instead of April 1, 2008.
9 • All commercial banks (excluding RRBs) were advised that the frequency of supervisory reporting of the StructuralLiquidity position shall be fortnightly, with effect from April 1, 2008, to be submitted on the seventh day from thereporting date, i.e., the first and third Wednesday of every month to the Reserve Bank.
10 • All SCBs (excluding RRBs) were advised that the income criteria for availing loans under the DRI scheme were revised.Accordingly, borrowers with annual family income of Rs.18,000 in rural areas and Rs.24,000 in urban areas would beeligible to avail the facility.
• SBI and its associates, all nationalised banks and select private sector banks were advised that electronic payment oftax by certain categories of tax payers was mandatory with effect from April 1, 2008.
15 • All SCBs were advised to meet the entire credit requirements of SHG members as envisaged in the Union Budget for2008-09.
• Guidelines on new self employment scheme for rehabilitation of manual scavengers (SRMS) were issued to all publicsector banks (excluding RRBs).
• Scheduled UCBs were advised to formulate a comprehensive and transparent policy covering immediate credit oflocal/outstation cheques, timeframe for collection of local/outstation instruments and interest payment for delayedcollection, taking into account their technological capabilities, systems and processes adopted for clearing arrangementsand other internal arrangements for collection through correspondents. They were also advised to review their existingarrangements and capabilities and work out a scheme for reduction in collection period. The interests of the smalldepositors should be fully protected. The policy should also clearly lay down the liability of the banks by way of interestpayments due to delay for non-compliance with the standards set by the banks themselves and should be integratedwith the deposit policy formulation by the bank in line with the IBA’s noted policy. Compensation by way of interestpayment, where necessary, should be made without any claim from the customer. It should also be ensured that thecustomers are, in no way, worse off than earlier.
17 • The Reserve Bank advised that the matter concerning accounting procedure to be followed for transfer of accountsunder the Senior Citizens Savings Scheme (SCSS), from one agency bank to another agency bank/post office wasexamined by the Ministry of Finance, and the Ministry conveyed its approval for adopting the same procedure for interagency bank/post office transfer of accounts under SCSS as was being followed for the PPF scheme, subject to thepayment of transfer fee as applicable under the relevant rules of the captioned scheme. Accordingly, the Reserve Banknotified an illustrative list of procedures to be followed in this regard.
21 • UCBs, were advised to include at all times, at least two professional directors on their Boards with suitable bankingexperience (at middle/senior management level) or with relevant professional qualifications, i.e., C.A. with bankaccounting/auditing experience. The scope of professional directors prescribed therein was reviewed and it was decidedto enlarge the ambit of ‘professional directors’ to include persons with professional qualification in the fields of law,accountancy or finance. UCBs were advised to initiate steps to amend the bye-laws of their banks accordingly andensure compliance with the above requirements.
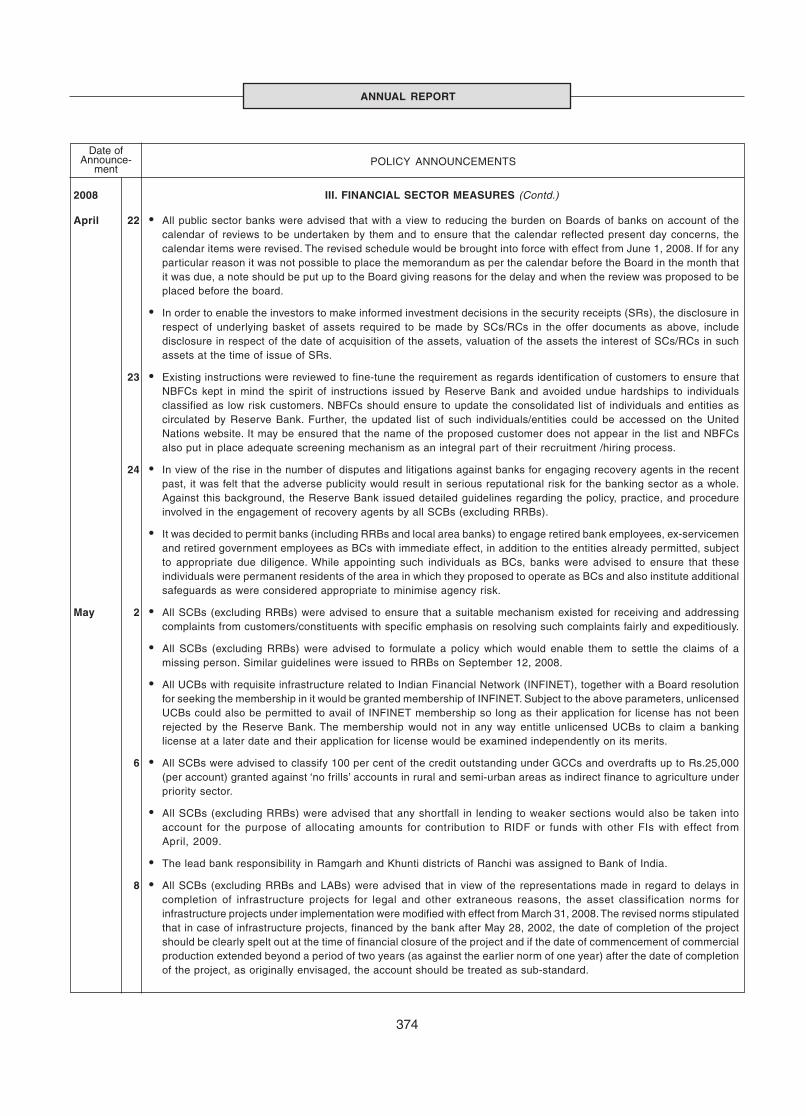
ANNUAL REPORT
374
POLICY ANNOUNCEMENTSDate of
Announce-ment
2008 III. FINANCIAL SECTOR MEASURES (Contd.)
April 22 • All public sector banks were advised that with a view to reducing the burden on Boards of banks on account of thecalendar of reviews to be undertaken by them and to ensure that the calendar reflected present day concerns, thecalendar items were revised. The revised schedule would be brought into force with effect from June 1, 2008. If for anyparticular reason it was not possible to place the memorandum as per the calendar before the Board in the month thatit was due, a note should be put up to the Board giving reasons for the delay and when the review was proposed to beplaced before the board.
• In order to enable the investors to make informed investment decisions in the security receipts (SRs), the disclosure inrespect of underlying basket of assets required to be made by SCs/RCs in the offer documents as above, includedisclosure in respect of the date of acquisition of the assets, valuation of the assets the interest of SCs/RCs in suchassets at the time of issue of SRs.
23 • Existing instructions were reviewed to fine-tune the requirement as regards identification of customers to ensure thatNBFCs kept in mind the spirit of instructions issued by Reserve Bank and avoided undue hardships to individualsclassified as low risk customers. NBFCs should ensure to update the consolidated list of individuals and entities ascirculated by Reserve Bank. Further, the updated list of such individuals/entities could be accessed on the UnitedNations website. It may be ensured that the name of the proposed customer does not appear in the list and NBFCsalso put in place adequate screening mechanism as an integral part of their recruitment /hiring process.
24 • In view of the rise in the number of disputes and litigations against banks for engaging recovery agents in the recentpast, it was felt that the adverse publicity would result in serious reputational risk for the banking sector as a whole.Against this background, the Reserve Bank issued detailed guidelines regarding the policy, practice, and procedureinvolved in the engagement of recovery agents by all SCBs (excluding RRBs).
• It was decided to permit banks (including RRBs and local area banks) to engage retired bank employees, ex-servicemenand retired government employees as BCs with immediate effect, in addition to the entities already permitted, subjectto appropriate due diligence. While appointing such individuals as BCs, banks were advised to ensure that theseindividuals were permanent residents of the area in which they proposed to operate as BCs and also institute additionalsafeguards as were considered appropriate to minimise agency risk.
May 2 • All SCBs (excluding RRBs) were advised to ensure that a suitable mechanism existed for receiving and addressingcomplaints from customers/constituents with specific emphasis on resolving such complaints fairly and expeditiously.
• All SCBs (excluding RRBs) were advised to formulate a policy which would enable them to settle the claims of amissing person. Similar guidelines were issued to RRBs on September 12, 2008.
• All UCBs with requisite infrastructure related to Indian Financial Network (INFINET), together with a Board resolutionfor seeking the membership in it would be granted membership of INFINET. Subject to the above parameters, unlicensedUCBs could also be permitted to avail of INFINET membership so long as their application for license has not beenrejected by the Reserve Bank. The membership would not in any way entitle unlicensed UCBs to claim a bankinglicense at a later date and their application for license would be examined independently on its merits.
6 • All SCBs were advised to classify 100 per cent of the credit outstanding under GCCs and overdrafts up to Rs.25,000(per account) granted against ‘no frills’ accounts in rural and semi-urban areas as indirect finance to agriculture underpriority sector.
• All SCBs (excluding RRBs) were advised that any shortfall in lending to weaker sections would also be taken intoaccount for the purpose of allocating amounts for contribution to RIDF or funds with other FIs with effect fromApril, 2009.
• The lead bank responsibility in Ramgarh and Khunti districts of Ranchi was assigned to Bank of India.
8 • All SCBs (excluding RRBs and LABs) were advised that in view of the representations made in regard to delays incompletion of infrastructure projects for legal and other extraneous reasons, the asset classification norms forinfrastructure projects under implementation were modified with effect from March 31, 2008. The revised norms stipulatedthat in case of infrastructure projects, financed by the bank after May 28, 2002, the date of completion of the projectshould be clearly spelt out at the time of financial closure of the project and if the date of commencement of commercialproduction extended beyond a period of two years (as against the earlier norm of one year) after the date of completionof the project, as originally envisaged, the account should be treated as sub-standard.
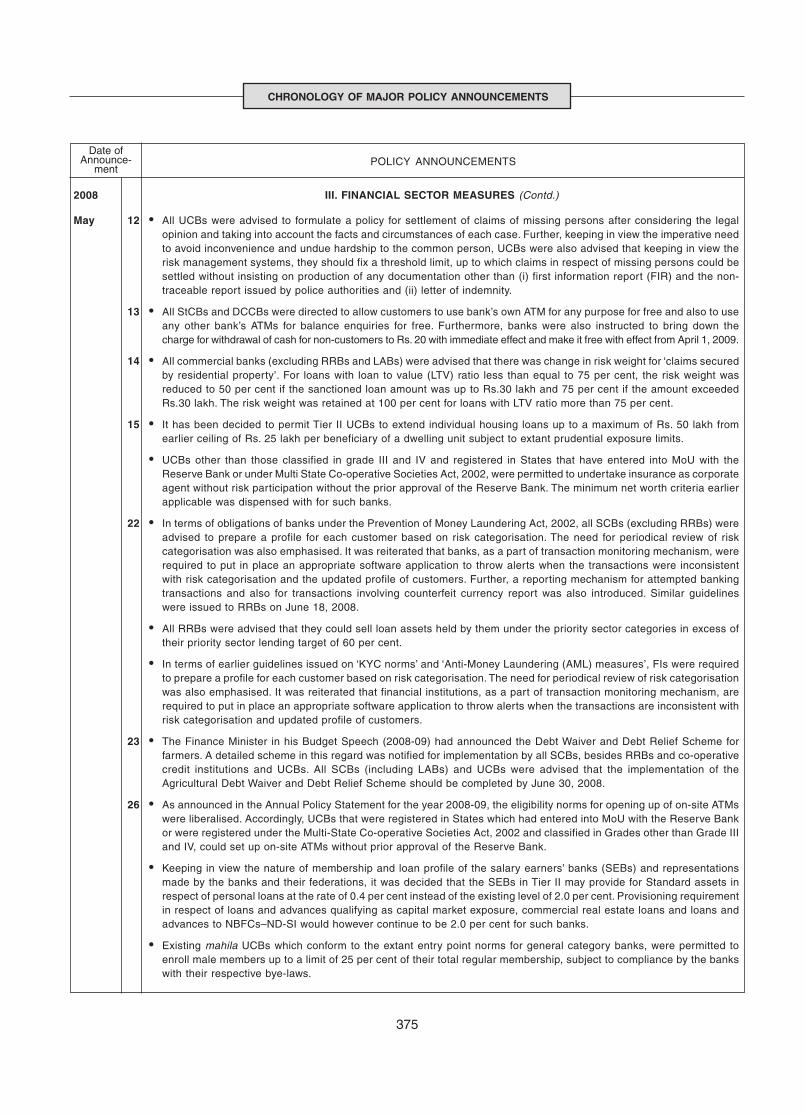
375
CHRONOLOGY OF MAJOR POLICY ANNOUNCEMENTS
POLICY ANNOUNCEMENTSDate of
Announce-ment
2008 III. FINANCIAL SECTOR MEASURES (Contd.)
May 12 • All UCBs were advised to formulate a policy for settlement of claims of missing persons after considering the legalopinion and taking into account the facts and circumstances of each case. Further, keeping in view the imperative needto avoid inconvenience and undue hardship to the common person, UCBs were also advised that keeping in view therisk management systems, they should fix a threshold limit, up to which claims in respect of missing persons could besettled without insisting on production of any documentation other than (i) first information report (FIR) and the non-traceable report issued by police authorities and (ii) letter of indemnity.
13 • All StCBs and DCCBs were directed to allow customers to use bank’s own ATM for any purpose for free and also to useany other bank’s ATMs for balance enquiries for free. Furthermore, banks were also instructed to bring down thecharge for withdrawal of cash for non-customers to Rs. 20 with immediate effect and make it free with effect from April 1, 2009.
14 • All commercial banks (excluding RRBs and LABs) were advised that there was change in risk weight for ‘claims securedby residential property’. For loans with loan to value (LTV) ratio less than equal to 75 per cent, the risk weight wasreduced to 50 per cent if the sanctioned loan amount was up to Rs.30 lakh and 75 per cent if the amount exceededRs.30 lakh. The risk weight was retained at 100 per cent for loans with LTV ratio more than 75 per cent.
15 • It has been decided to permit Tier II UCBs to extend individual housing loans up to a maximum of Rs. 50 lakh fromearlier ceiling of Rs. 25 lakh per beneficiary of a dwelling unit subject to extant prudential exposure limits.
• UCBs other than those classified in grade III and IV and registered in States that have entered into MoU with theReserve Bank or under Multi State Co-operative Societies Act, 2002, were permitted to undertake insurance as corporateagent without risk participation without the prior approval of the Reserve Bank. The minimum net worth criteria earlierapplicable was dispensed with for such banks.
22 • In terms of obligations of banks under the Prevention of Money Laundering Act, 2002, all SCBs (excluding RRBs) wereadvised to prepare a profile for each customer based on risk categorisation. The need for periodical review of riskcategorisation was also emphasised. It was reiterated that banks, as a part of transaction monitoring mechanism, wererequired to put in place an appropriate software application to throw alerts when the transactions were inconsistentwith risk categorisation and the updated profile of customers. Further, a reporting mechanism for attempted bankingtransactions and also for transactions involving counterfeit currency report was also introduced. Similar guidelineswere issued to RRBs on June 18, 2008.
• All RRBs were advised that they could sell loan assets held by them under the priority sector categories in excess oftheir priority sector lending target of 60 per cent.
• In terms of earlier guidelines issued on ‘KYC norms’ and ‘Anti-Money Laundering (AML) measures’, FIs were requiredto prepare a profile for each customer based on risk categorisation. The need for periodical review of risk categorisationwas also emphasised. It was reiterated that financial institutions, as a part of transaction monitoring mechanism, arerequired to put in place an appropriate software application to throw alerts when the transactions are inconsistent withrisk categorisation and updated profile of customers.
23 • The Finance Minister in his Budget Speech (2008-09) had announced the Debt Waiver and Debt Relief Scheme forfarmers. A detailed scheme in this regard was notified for implementation by all SCBs, besides RRBs and co-operativecredit institutions and UCBs. All SCBs (including LABs) and UCBs were advised that the implementation of theAgricultural Debt Waiver and Debt Relief Scheme should be completed by June 30, 2008.
26 • As announced in the Annual Policy Statement for the year 2008-09, the eligibility norms for opening up of on-site ATMswere liberalised. Accordingly, UCBs that were registered in States which had entered into MoU with the Reserve Bankor were registered under the Multi-State Co-operative Societies Act, 2002 and classified in Grades other than Grade IIIand IV, could set up on-site ATMs without prior approval of the Reserve Bank.
• Keeping in view the nature of membership and loan profile of the salary earners’ banks (SEBs) and representationsmade by the banks and their federations, it was decided that the SEBs in Tier II may provide for Standard assets inrespect of personal loans at the rate of 0.4 per cent instead of the existing level of 2.0 per cent. Provisioning requirementin respect of loans and advances qualifying as capital market exposure, commercial real estate loans and loans andadvances to NBFCs–ND-SI would however continue to be 2.0 per cent for such banks.
• Existing mahila UCBs which conform to the extant entry point norms for general category banks, were permitted toenroll male members up to a limit of 25 per cent of their total regular membership, subject to compliance by the bankswith their respective bye-laws.
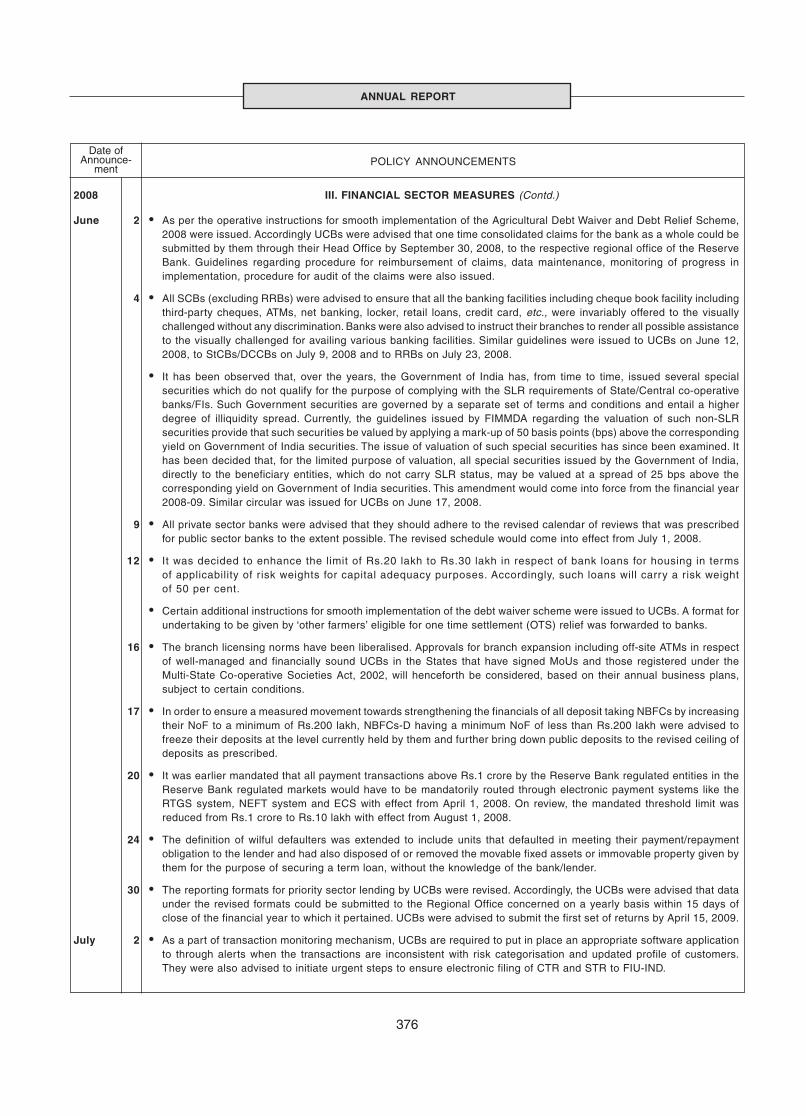
ANNUAL REPORT
376
POLICY ANNOUNCEMENTSDate of
Announce-ment
2008 III. FINANCIAL SECTOR MEASURES (Contd.)
June 2 • As per the operative instructions for smooth implementation of the Agricultural Debt Waiver and Debt Relief Scheme,2008 were issued. Accordingly UCBs were advised that one time consolidated claims for the bank as a whole could besubmitted by them through their Head Office by September 30, 2008, to the respective regional office of the ReserveBank. Guidelines regarding procedure for reimbursement of claims, data maintenance, monitoring of progress inimplementation, procedure for audit of the claims were also issued.
4 • All SCBs (excluding RRBs) were advised to ensure that all the banking facilities including cheque book facility includingthird-party cheques, ATMs, net banking, locker, retail loans, credit card, etc., were invariably offered to the visuallychallenged without any discrimination. Banks were also advised to instruct their branches to render all possible assistanceto the visually challenged for availing various banking facilities. Similar guidelines were issued to UCBs on June 12,2008, to StCBs/DCCBs on July 9, 2008 and to RRBs on July 23, 2008.
• It has been observed that, over the years, the Government of India has, from time to time, issued several specialsecurities which do not qualify for the purpose of complying with the SLR requirements of State/Central co-operativebanks/FIs. Such Government securities are governed by a separate set of terms and conditions and entail a higherdegree of illiquidity spread. Currently, the guidelines issued by FIMMDA regarding the valuation of such non-SLRsecurities provide that such securities be valued by applying a mark-up of 50 basis points (bps) above the correspondingyield on Government of India securities. The issue of valuation of such special securities has since been examined. Ithas been decided that, for the limited purpose of valuation, all special securities issued by the Government of India,directly to the beneficiary entities, which do not carry SLR status, may be valued at a spread of 25 bps above thecorresponding yield on Government of India securities. This amendment would come into force from the financial year2008-09. Similar circular was issued for UCBs on June 17, 2008.
9 • All private sector banks were advised that they should adhere to the revised calendar of reviews that was prescribedfor public sector banks to the extent possible. The revised schedule would come into effect from July 1, 2008.
12 • It was decided to enhance the limit of Rs.20 lakh to Rs.30 lakh in respect of bank loans for housing in termsof applicability of risk weights for capital adequacy purposes. Accordingly, such loans will carry a risk weightof 50 per cent.
• Certain additional instructions for smooth implementation of the debt waiver scheme were issued to UCBs. A format forundertaking to be given by ‘other farmers’ eligible for one time settlement (OTS) relief was forwarded to banks.
16 • The branch licensing norms have been liberalised. Approvals for branch expansion including off-site ATMs in respectof well-managed and financially sound UCBs in the States that have signed MoUs and those registered under theMulti-State Co-operative Societies Act, 2002, will henceforth be considered, based on their annual business plans,subject to certain conditions.
17 • In order to ensure a measured movement towards strengthening the financials of all deposit taking NBFCs by increasingtheir NoF to a minimum of Rs.200 lakh, NBFCs-D having a minimum NoF of less than Rs.200 lakh were advised tofreeze their deposits at the level currently held by them and further bring down public deposits to the revised ceiling ofdeposits as prescribed.
20 • It was earlier mandated that all payment transactions above Rs.1 crore by the Reserve Bank regulated entities in theReserve Bank regulated markets would have to be mandatorily routed through electronic payment systems like theRTGS system, NEFT system and ECS with effect from April 1, 2008. On review, the mandated threshold limit wasreduced from Rs.1 crore to Rs.10 lakh with effect from August 1, 2008.
24 • The definition of wilful defaulters was extended to include units that defaulted in meeting their payment/repaymentobligation to the lender and had also disposed of or removed the movable fixed assets or immovable property given bythem for the purpose of securing a term loan, without the knowledge of the bank/lender.
30 • The reporting formats for priority sector lending by UCBs were revised. Accordingly, the UCBs were advised that dataunder the revised formats could be submitted to the Regional Office concerned on a yearly basis within 15 days ofclose of the financial year to which it pertained. UCBs were advised to submit the first set of returns by April 15, 2009.
July 2 • As a part of transaction monitoring mechanism, UCBs are required to put in place an appropriate software applicationto through alerts when the transactions are inconsistent with risk categorisation and updated profile of customers.They were also advised to initiate urgent steps to ensure electronic filing of CTR and STR to FIU-IND.
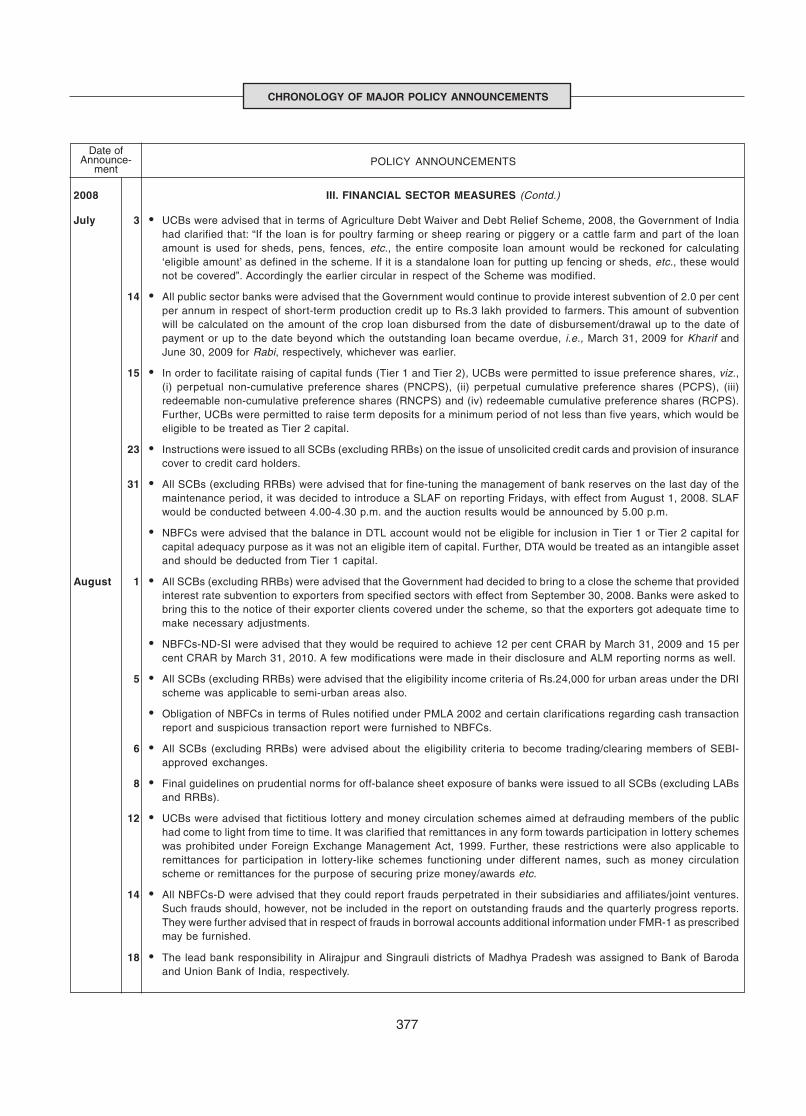
377
CHRONOLOGY OF MAJOR POLICY ANNOUNCEMENTS
POLICY ANNOUNCEMENTSDate of
Announce-ment
2008 III. FINANCIAL SECTOR MEASURES (Contd.)
July 3 • UCBs were advised that in terms of Agriculture Debt Waiver and Debt Relief Scheme, 2008, the Government of Indiahad clarified that: “If the loan is for poultry farming or sheep rearing or piggery or a cattle farm and part of the loanamount is used for sheds, pens, fences, etc., the entire composite loan amount would be reckoned for calculating‘eligible amount’ as defined in the scheme. If it is a standalone loan for putting up fencing or sheds, etc., these wouldnot be covered”. Accordingly the earlier circular in respect of the Scheme was modified.
14 • All public sector banks were advised that the Government would continue to provide interest subvention of 2.0 per centper annum in respect of short-term production credit up to Rs.3 lakh provided to farmers. This amount of subventionwill be calculated on the amount of the crop loan disbursed from the date of disbursement/drawal up to the date ofpayment or up to the date beyond which the outstanding loan became overdue, i.e., March 31, 2009 for Kharif andJune 30, 2009 for Rabi, respectively, whichever was earlier.
15 • In order to facilitate raising of capital funds (Tier 1 and Tier 2), UCBs were permitted to issue preference shares, viz.,(i) perpetual non-cumulative preference shares (PNCPS), (ii) perpetual cumulative preference shares (PCPS), (iii)redeemable non-cumulative preference shares (RNCPS) and (iv) redeemable cumulative preference shares (RCPS).Further, UCBs were permitted to raise term deposits for a minimum period of not less than five years, which would beeligible to be treated as Tier 2 capital.
23 • Instructions were issued to all SCBs (excluding RRBs) on the issue of unsolicited credit cards and provision of insurancecover to credit card holders.
31 • All SCBs (excluding RRBs) were advised that for fine-tuning the management of bank reserves on the last day of themaintenance period, it was decided to introduce a SLAF on reporting Fridays, with effect from August 1, 2008. SLAFwould be conducted between 4.00-4.30 p.m. and the auction results would be announced by 5.00 p.m.
• NBFCs were advised that the balance in DTL account would not be eligible for inclusion in Tier 1 or Tier 2 capital forcapital adequacy purpose as it was not an eligible item of capital. Further, DTA would be treated as an intangible assetand should be deducted from Tier 1 capital.
August 1 • All SCBs (excluding RRBs) were advised that the Government had decided to bring to a close the scheme that providedinterest rate subvention to exporters from specified sectors with effect from September 30, 2008. Banks were asked tobring this to the notice of their exporter clients covered under the scheme, so that the exporters got adequate time tomake necessary adjustments.
• NBFCs-ND-SI were advised that they would be required to achieve 12 per cent CRAR by March 31, 2009 and 15 percent CRAR by March 31, 2010. A few modifications were made in their disclosure and ALM reporting norms as well.
5 • All SCBs (excluding RRBs) were advised that the eligibility income criteria of Rs.24,000 for urban areas under the DRIscheme was applicable to semi-urban areas also.
• Obligation of NBFCs in terms of Rules notified under PMLA 2002 and certain clarifications regarding cash transactionreport and suspicious transaction report were furnished to NBFCs.
6 • All SCBs (excluding RRBs) were advised about the eligibility criteria to become trading/clearing members of SEBI-approved exchanges.
8 • Final guidelines on prudential norms for off-balance sheet exposure of banks were issued to all SCBs (excluding LABsand RRBs).
12 • UCBs were advised that fictitious lottery and money circulation schemes aimed at defrauding members of the publichad come to light from time to time. It was clarified that remittances in any form towards participation in lottery schemeswas prohibited under Foreign Exchange Management Act, 1999. Further, these restrictions were also applicable toremittances for participation in lottery-like schemes functioning under different names, such as money circulationscheme or remittances for the purpose of securing prize money/awards etc.
14 • All NBFCs-D were advised that they could report frauds perpetrated in their subsidiaries and affiliates/joint ventures.Such frauds should, however, not be included in the report on outstanding frauds and the quarterly progress reports.They were further advised that in respect of frauds in borrowal accounts additional information under FMR-1 as prescribedmay be furnished.
18 • The lead bank responsibility in Alirajpur and Singrauli districts of Madhya Pradesh was assigned to Bank of Barodaand Union Bank of India, respectively.

ANNUAL REPORT
378
POLICY ANNOUNCEMENTSDate of
Announce-ment
August 22 • All SCBs (excluding RRBs) were issued detailed instructions for dealing with inoperative accounts. Banks were askedto consider launching a special drive for finding the whereabouts of the customers/legal heirs in respect of existingaccounts which had been transferred to the separate ledger of ‘inoperative accounts’.
• All SCBs (excluding RRBs) were issued detailed instructions regarding display of information through comprehensivenotice boards.
26 • All SCBs were advised that they could accept an affidavit submitted by landless labourers, share croppers and orallessees giving occupational status (i.e., details of land tilled/crops grown) for loans up to Rs.50,000. Banks could alsoencourage the JLG/SHG mode of lending for such persons. However, banks should go through their procedures ofidentification as per KYC norms, appraisal and usual pre-sanction checks before extending finance.
27 • All SCBs (including RRBs and local area banks) were advised that companies registered under Section 25 of theCompanies Act, 1956, could be employed as BCs provided that the companies were stand-alone entities in whichNBFCs, banks, telecom companies and other corporate entities did not have equity holdings in excess of 10 per cent.Further, while engaging Section 25 companies as BCs, banks would have to strictly adhere to the distance criterion of15 kms/5 kms, as applicable, between the place of business of the BC and the branch.
28 • All SCBs (excluding RRBs) were advised that banking by definition meant acceptance of deposits of money from thepublic for the purpose of lending and investment. As such, banks could not design any product which was not in tunewith the basic tenets of banking. Further, incorporating such clauses in terms and conditions which restricted depositof cash over the counters also amounted to an unfair practice. Banks were therefore advised to ensure that theirbranches invariably accepted cash over the counters from all their customers who desired to deposit cash at thecounters.
• All SCBs were advised that each bank could select one rain-fed district for introduction, on a pilot basis, of a newproduct for financing crop production whereby: (a) 80 per cent of the crop loan requirement of individual borrowerscould be released through a short-term production loan in conformity with the extant norms/practices; and (b) theremaining 20 per cent representing the ‘core component’ (expenses for land preparation, pre-sowing operations, etc.,besides self-labour/consumption) could be sanctioned as a ‘clean credit limit’ to ensure year-round liquidity.
• UCBs were advised to ensure that a suitable mechanism exists for receiving and addressing complaints from theircustomers with specific emphasis on resolving such complaints fairly and expeditiously. Several specific measures inthis respect were suggested.
Sept. 1 • UCBs were advised to consider launching special drive for finding the whereabouts of the customers/legal heirs inrespect of existing accounts which had been transferred to the separate ledger of ‘inoperative accounts’.
• In view of the increase in the amount of the unclaimed deposits with banks year after year and the inherent riskassociated with such deposits, UCBs were advised to play a more pro-active role in finding the whereabouts of theaccount holders whose accounts have remained in-operative. Interests on savings accounts should be credited onregular basis whether the account is operative or not. If a matured fixed deposit is unpaid, the amount will attractsavings bank rate of interest.
4 • All SCBs (including LABs) were advised that procedures for reimbursement of claims and audit of claims under theAgricultural Debt Waiver and Debt Relief Scheme, 2008 had been modified. Similar guidelines are issued to UCBs onSeptember 5, 2008.
8 • All SCBs were advised that the name of the “Industrial Development Bank of India Limited” had been changed to “IDBIBank Limited” in the Second Schedule to the RBI Act, 1934 with effect from May 7, 2008.
9 • With a view to improving the quality of customer service in UCBs, scheduled UCBs were suggested to consider becomingmembers of BCSBI.
12 • All SCBs (excluding RRBs) were advised to adopt the format devised by the Reserve Bank for display of informationrelating to interest rates and service charges which would enable the customer to obtain the desired information at aquick glance. Banks should also ensure that only the latest updated information in the above format was placed ontheir websites and the same was easily accessible from the home pages of their websites. UCBs were issued similarguidelines on September 18, 2008.
2008 III. FINANCIAL SECTOR MEASURES (Contd.)
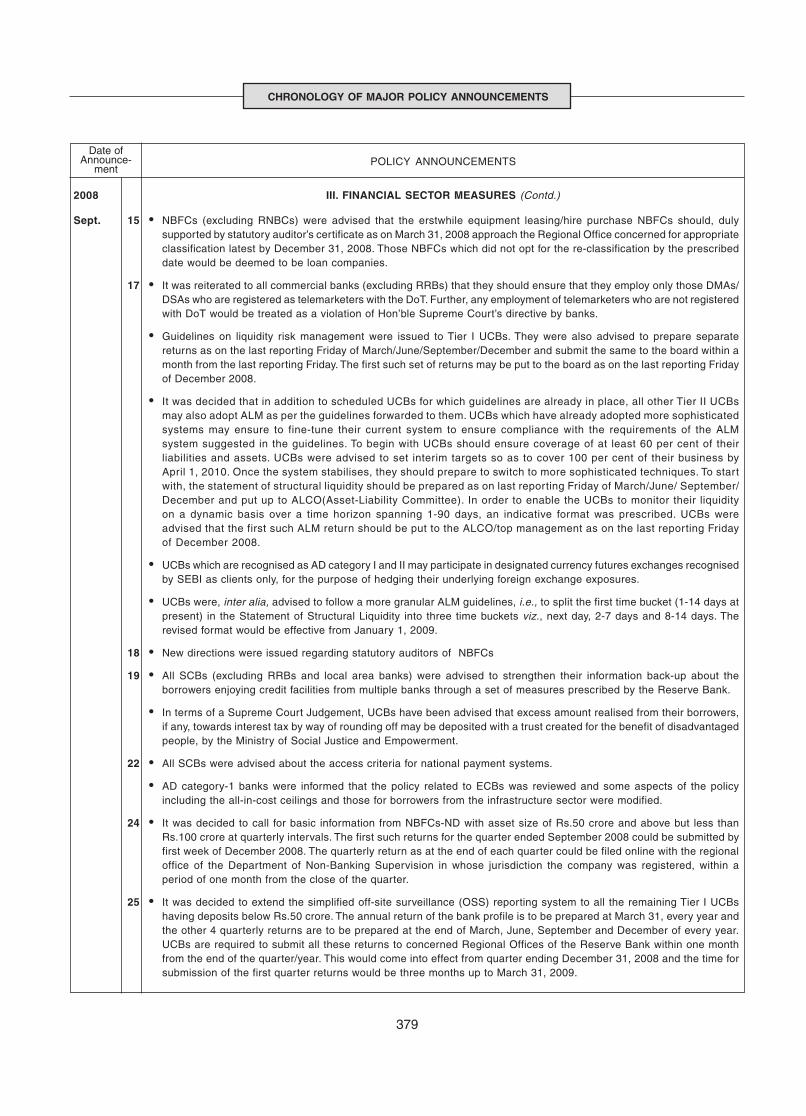
379
CHRONOLOGY OF MAJOR POLICY ANNOUNCEMENTS
POLICY ANNOUNCEMENTSDate of
Announce-ment
2008 III. FINANCIAL SECTOR MEASURES (Contd.)
Sept. 15 • NBFCs (excluding RNBCs) were advised that the erstwhile equipment leasing/hire purchase NBFCs should, dulysupported by statutory auditor’s certificate as on March 31, 2008 approach the Regional Office concerned for appropriateclassification latest by December 31, 2008. Those NBFCs which did not opt for the re-classification by the prescribeddate would be deemed to be loan companies.
17 • It was reiterated to all commercial banks (excluding RRBs) that they should ensure that they employ only those DMAs/DSAs who are registered as telemarketers with the DoT. Further, any employment of telemarketers who are not registeredwith DoT would be treated as a violation of Hon’ble Supreme Court’s directive by banks.
• Guidelines on liquidity risk management were issued to Tier I UCBs. They were also advised to prepare separatereturns as on the last reporting Friday of March/June/September/December and submit the same to the board within amonth from the last reporting Friday. The first such set of returns may be put to the board as on the last reporting Fridayof December 2008.
• It was decided that in addition to scheduled UCBs for which guidelines are already in place, all other Tier II UCBsmay also adopt ALM as per the guidelines forwarded to them. UCBs which have already adopted more sophisticatedsystems may ensure to fine-tune their current system to ensure compliance with the requirements of the ALMsystem suggested in the guidelines. To begin with UCBs should ensure coverage of at least 60 per cent of theirliabilities and assets. UCBs were advised to set interim targets so as to cover 100 per cent of their business byApril 1, 2010. Once the system stabilises, they should prepare to switch to more sophisticated techniques. To startwith, the statement of structural liquidity should be prepared as on last reporting Friday of March/June/ September/December and put up to ALCO(Asset-Liability Committee). In order to enable the UCBs to monitor their liquidityon a dynamic basis over a time horizon spanning 1-90 days, an indicative format was prescribed. UCBs wereadvised that the first such ALM return should be put to the ALCO/top management as on the last reporting Fridayof December 2008.
• UCBs which are recognised as AD category I and II may participate in designated currency futures exchanges recognisedby SEBI as clients only, for the purpose of hedging their underlying foreign exchange exposures.
• UCBs were, inter alia, advised to follow a more granular ALM guidelines, i.e., to split the first time bucket (1-14 days atpresent) in the Statement of Structural Liquidity into three time buckets viz., next day, 2-7 days and 8-14 days. Therevised format would be effective from January 1, 2009.
18 • New directions were issued regarding statutory auditors of NBFCs
19 • All SCBs (excluding RRBs and local area banks) were advised to strengthen their information back-up about theborrowers enjoying credit facilities from multiple banks through a set of measures prescribed by the Reserve Bank.
• In terms of a Supreme Court Judgement, UCBs have been advised that excess amount realised from their borrowers,if any, towards interest tax by way of rounding off may be deposited with a trust created for the benefit of disadvantagedpeople, by the Ministry of Social Justice and Empowerment.
22 • All SCBs were advised about the access criteria for national payment systems.
• AD category-1 banks were informed that the policy related to ECBs was reviewed and some aspects of the policyincluding the all-in-cost ceilings and those for borrowers from the infrastructure sector were modified.
24 • It was decided to call for basic information from NBFCs-ND with asset size of Rs.50 crore and above but less thanRs.100 crore at quarterly intervals. The first such returns for the quarter ended September 2008 could be submitted byfirst week of December 2008. The quarterly return as at the end of each quarter could be filed online with the regionaloffice of the Department of Non-Banking Supervision in whose jurisdiction the company was registered, within aperiod of one month from the close of the quarter.
25 • It was decided to extend the simplified off-site surveillance (OSS) reporting system to all the remaining Tier I UCBshaving deposits below Rs.50 crore. The annual return of the bank profile is to be prepared at March 31, every year andthe other 4 quarterly returns are to be prepared at the end of March, June, September and December of every year.UCBs are required to submit all these returns to concerned Regional Offices of the Reserve Bank within one monthfrom the end of the quarter/year. This would come into effect from quarter ending December 31, 2008 and the time forsubmission of the first quarter returns would be three months up to March 31, 2009.
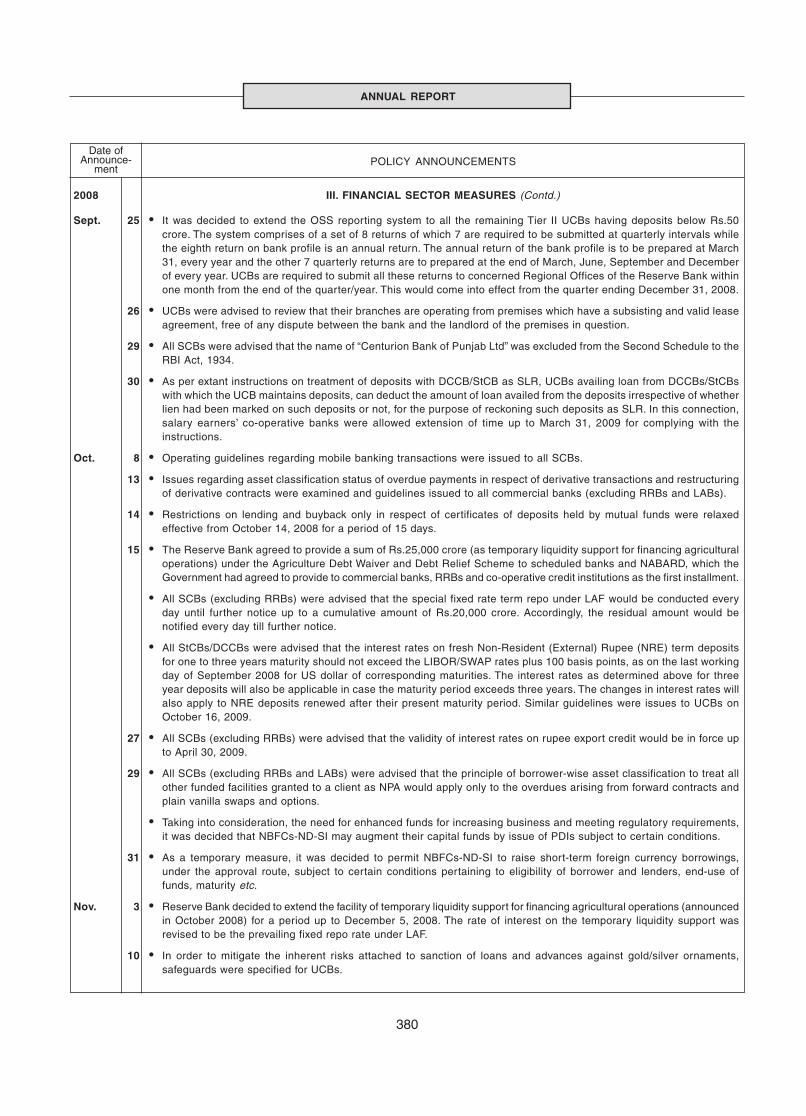
ANNUAL REPORT
380
POLICY ANNOUNCEMENTSDate of
Announce-ment
2008 III. FINANCIAL SECTOR MEASURES (Contd.)
Sept. 25 • It was decided to extend the OSS reporting system to all the remaining Tier II UCBs having deposits below Rs.50crore. The system comprises of a set of 8 returns of which 7 are required to be submitted at quarterly intervals whilethe eighth return on bank profile is an annual return. The annual return of the bank profile is to be prepared at March31, every year and the other 7 quarterly returns are to prepared at the end of March, June, September and Decemberof every year. UCBs are required to submit all these returns to concerned Regional Offices of the Reserve Bank withinone month from the end of the quarter/year. This would come into effect from the quarter ending December 31, 2008.
26 • UCBs were advised to review that their branches are operating from premises which have a subsisting and valid leaseagreement, free of any dispute between the bank and the landlord of the premises in question.
29 • All SCBs were advised that the name of “Centurion Bank of Punjab Ltd” was excluded from the Second Schedule to theRBI Act, 1934.
30 • As per extant instructions on treatment of deposits with DCCB/StCB as SLR, UCBs availing loan from DCCBs/StCBswith which the UCB maintains deposits, can deduct the amount of loan availed from the deposits irrespective of whetherlien had been marked on such deposits or not, for the purpose of reckoning such deposits as SLR. In this connection,salary earners’ co-operative banks were allowed extension of time up to March 31, 2009 for complying with theinstructions.
Oct. 8 • Operating guidelines regarding mobile banking transactions were issued to all SCBs.
13 • Issues regarding asset classification status of overdue payments in respect of derivative transactions and restructuringof derivative contracts were examined and guidelines issued to all commercial banks (excluding RRBs and LABs).
14 • Restrictions on lending and buyback only in respect of certificates of deposits held by mutual funds were relaxedeffective from October 14, 2008 for a period of 15 days.
15 • The Reserve Bank agreed to provide a sum of Rs.25,000 crore (as temporary liquidity support for financing agriculturaloperations) under the Agriculture Debt Waiver and Debt Relief Scheme to scheduled banks and NABARD, which theGovernment had agreed to provide to commercial banks, RRBs and co-operative credit institutions as the first installment.
• All SCBs (excluding RRBs) were advised that the special fixed rate term repo under LAF would be conducted everyday until further notice up to a cumulative amount of Rs.20,000 crore. Accordingly, the residual amount would benotified every day till further notice.
• All StCBs/DCCBs were advised that the interest rates on fresh Non-Resident (External) Rupee (NRE) term depositsfor one to three years maturity should not exceed the LIBOR/SWAP rates plus 100 basis points, as on the last workingday of September 2008 for US dollar of corresponding maturities. The interest rates as determined above for threeyear deposits will also be applicable in case the maturity period exceeds three years. The changes in interest rates willalso apply to NRE deposits renewed after their present maturity period. Similar guidelines were issues to UCBs onOctober 16, 2009.
27 • All SCBs (excluding RRBs) were advised that the validity of interest rates on rupee export credit would be in force upto April 30, 2009.
29 • All SCBs (excluding RRBs and LABs) were advised that the principle of borrower-wise asset classification to treat allother funded facilities granted to a client as NPA would apply only to the overdues arising from forward contracts andplain vanilla swaps and options.
• Taking into consideration, the need for enhanced funds for increasing business and meeting regulatory requirements,it was decided that NBFCs-ND-SI may augment their capital funds by issue of PDIs subject to certain conditions.
31 • As a temporary measure, it was decided to permit NBFCs-ND-SI to raise short-term foreign currency borrowings,under the approval route, subject to certain conditions pertaining to eligibility of borrower and lenders, end-use offunds, maturity etc.
Nov. 3 • Reserve Bank decided to extend the facility of temporary liquidity support for financing agricultural operations (announcedin October 2008) for a period up to December 5, 2008. The rate of interest on the temporary liquidity support wasrevised to be the prevailing fixed repo rate under LAF.
10 • In order to mitigate the inherent risks attached to sanction of loans and advances against gold/silver ornaments,safeguards were specified for UCBs.
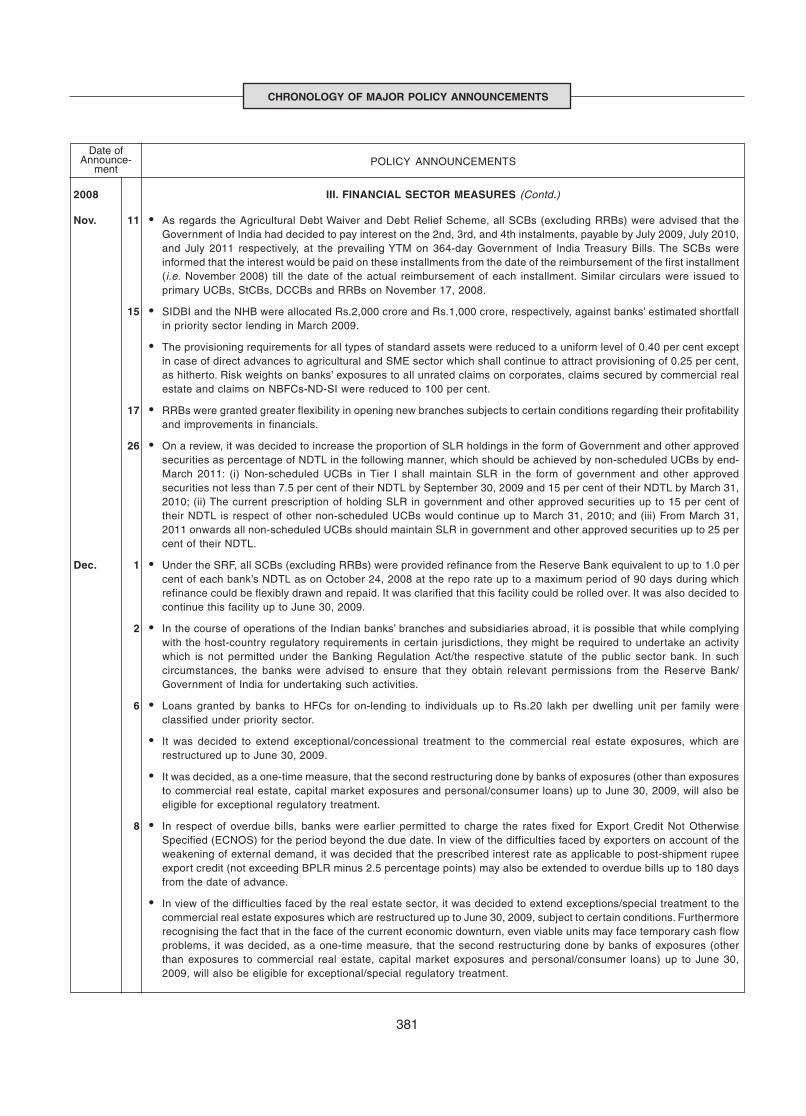
381
CHRONOLOGY OF MAJOR POLICY ANNOUNCEMENTS
POLICY ANNOUNCEMENTSDate of
Announce-ment
Nov. 11 • As regards the Agricultural Debt Waiver and Debt Relief Scheme, all SCBs (excluding RRBs) were advised that theGovernment of India had decided to pay interest on the 2nd, 3rd, and 4th instalments, payable by July 2009, July 2010,and July 2011 respectively, at the prevailing YTM on 364-day Government of India Treasury Bills. The SCBs wereinformed that the interest would be paid on these installments from the date of the reimbursement of the first installment(i.e. November 2008) till the date of the actual reimbursement of each installment. Similar circulars were issued toprimary UCBs, StCBs, DCCBs and RRBs on November 17, 2008.
15 • SIDBI and the NHB were allocated Rs.2,000 crore and Rs.1,000 crore, respectively, against banks’ estimated shortfallin priority sector lending in March 2009.
• The provisioning requirements for all types of standard assets were reduced to a uniform level of 0.40 per cent exceptin case of direct advances to agricultural and SME sector which shall continue to attract provisioning of 0.25 per cent,as hitherto. Risk weights on banks’ exposures to all unrated claims on corporates, claims secured by commercial realestate and claims on NBFCs-ND-SI were reduced to 100 per cent.
17 • RRBs were granted greater flexibility in opening new branches subjects to certain conditions regarding their profitabilityand improvements in financials.
26 • On a review, it was decided to increase the proportion of SLR holdings in the form of Government and other approvedsecurities as percentage of NDTL in the following manner, which should be achieved by non-scheduled UCBs by end-March 2011: (i) Non-scheduled UCBs in Tier I shall maintain SLR in the form of government and other approvedsecurities not less than 7.5 per cent of their NDTL by September 30, 2009 and 15 per cent of their NDTL by March 31,2010; (ii) The current prescription of holding SLR in government and other approved securities up to 15 per cent oftheir NDTL is respect of other non-scheduled UCBs would continue up to March 31, 2010; and (iii) From March 31,2011 onwards all non-scheduled UCBs should maintain SLR in government and other approved securities up to 25 percent of their NDTL.
Dec. 1 • Under the SRF, all SCBs (excluding RRBs) were provided refinance from the Reserve Bank equivalent to up to 1.0 percent of each bank’s NDTL as on October 24, 2008 at the repo rate up to a maximum period of 90 days during whichrefinance could be flexibly drawn and repaid. It was clarified that this facility could be rolled over. It was also decided tocontinue this facility up to June 30, 2009.
2 • In the course of operations of the Indian banks’ branches and subsidiaries abroad, it is possible that while complyingwith the host-country regulatory requirements in certain jurisdictions, they might be required to undertake an activitywhich is not permitted under the Banking Regulation Act/the respective statute of the public sector bank. In suchcircumstances, the banks were advised to ensure that they obtain relevant permissions from the Reserve Bank/Government of India for undertaking such activities.
6 • Loans granted by banks to HFCs for on-lending to individuals up to Rs.20 lakh per dwelling unit per family wereclassified under priority sector.
• It was decided to extend exceptional/concessional treatment to the commercial real estate exposures, which arerestructured up to June 30, 2009.
• It was decided, as a one-time measure, that the second restructuring done by banks of exposures (other than exposuresto commercial real estate, capital market exposures and personal/consumer loans) up to June 30, 2009, will also beeligible for exceptional regulatory treatment.
8 • In respect of overdue bills, banks were earlier permitted to charge the rates fixed for Export Credit Not OtherwiseSpecified (ECNOS) for the period beyond the due date. In view of the difficulties faced by exporters on account of theweakening of external demand, it was decided that the prescribed interest rate as applicable to post-shipment rupeeexport credit (not exceeding BPLR minus 2.5 percentage points) may also be extended to overdue bills up to 180 daysfrom the date of advance.
• In view of the difficulties faced by the real estate sector, it was decided to extend exceptions/special treatment to thecommercial real estate exposures which are restructured up to June 30, 2009, subject to certain conditions. Furthermorerecognising the fact that in the face of the current economic downturn, even viable units may face temporary cash flowproblems, it was decided, as a one-time measure, that the second restructuring done by banks of exposures (otherthan exposures to commercial real estate, capital market exposures and personal/consumer loans) up to June 30,2009, will also be eligible for exceptional/special regulatory treatment.
2008 III. FINANCIAL SECTOR MEASURES (Contd.)
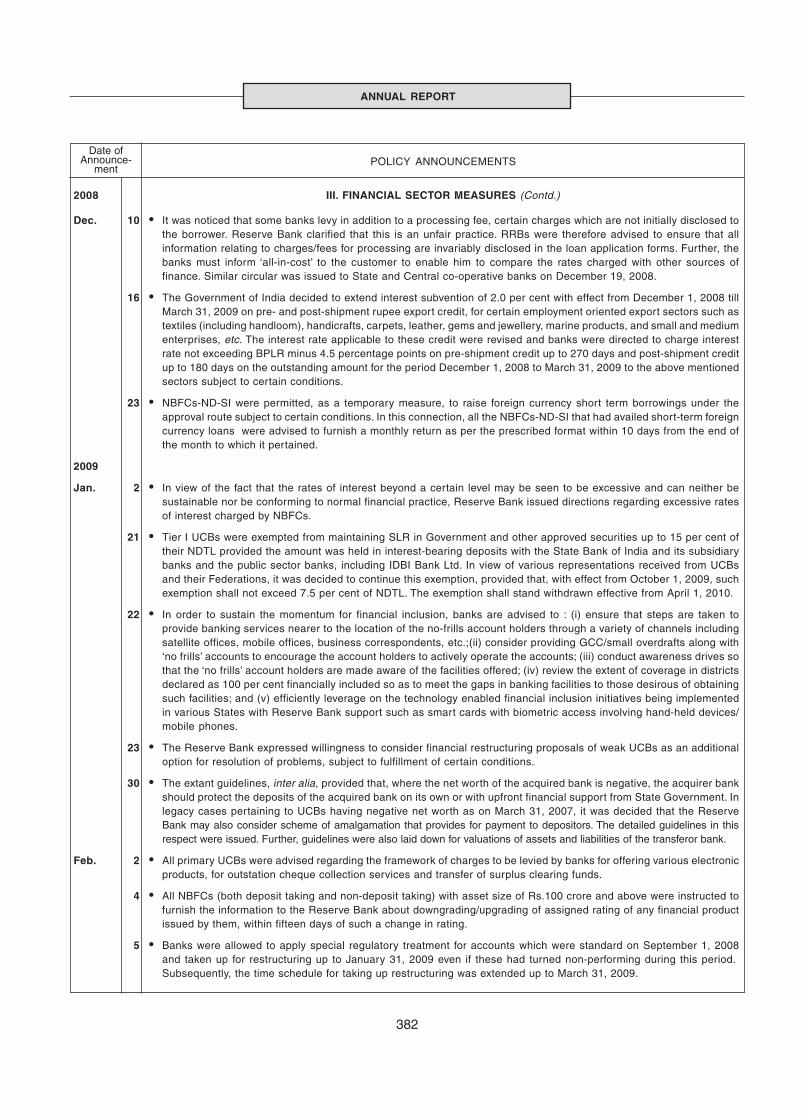
ANNUAL REPORT
382
POLICY ANNOUNCEMENTSDate of
Announce-ment
Dec. 10 • It was noticed that some banks levy in addition to a processing fee, certain charges which are not initially disclosed tothe borrower. Reserve Bank clarified that this is an unfair practice. RRBs were therefore advised to ensure that allinformation relating to charges/fees for processing are invariably disclosed in the loan application forms. Further, thebanks must inform ‘all-in-cost’ to the customer to enable him to compare the rates charged with other sources offinance. Similar circular was issued to State and Central co-operative banks on December 19, 2008.
16 • The Government of India decided to extend interest subvention of 2.0 per cent with effect from December 1, 2008 tillMarch 31, 2009 on pre- and post-shipment rupee export credit, for certain employment oriented export sectors such astextiles (including handloom), handicrafts, carpets, leather, gems and jewellery, marine products, and small and mediumenterprises, etc. The interest rate applicable to these credit were revised and banks were directed to charge interestrate not exceeding BPLR minus 4.5 percentage points on pre-shipment credit up to 270 days and post-shipment creditup to 180 days on the outstanding amount for the period December 1, 2008 to March 31, 2009 to the above mentionedsectors subject to certain conditions.
23 • NBFCs-ND-SI were permitted, as a temporary measure, to raise foreign currency short term borrowings under theapproval route subject to certain conditions. In this connection, all the NBFCs-ND-SI that had availed short-term foreigncurrency loans were advised to furnish a monthly return as per the prescribed format within 10 days from the end ofthe month to which it pertained.
2009
Jan. 2 • In view of the fact that the rates of interest beyond a certain level may be seen to be excessive and can neither besustainable nor be conforming to normal financial practice, Reserve Bank issued directions regarding excessive ratesof interest charged by NBFCs.
21 • Tier I UCBs were exempted from maintaining SLR in Government and other approved securities up to 15 per cent oftheir NDTL provided the amount was held in interest-bearing deposits with the State Bank of India and its subsidiarybanks and the public sector banks, including IDBI Bank Ltd. In view of various representations received from UCBsand their Federations, it was decided to continue this exemption, provided that, with effect from October 1, 2009, suchexemption shall not exceed 7.5 per cent of NDTL. The exemption shall stand withdrawn effective from April 1, 2010.
22 • In order to sustain the momentum for financial inclusion, banks are advised to : (i) ensure that steps are taken toprovide banking services nearer to the location of the no-frills account holders through a variety of channels includingsatellite offices, mobile offices, business correspondents, etc.;(ii) consider providing GCC/small overdrafts along with‘no frills’ accounts to encourage the account holders to actively operate the accounts; (iii) conduct awareness drives sothat the ‘no frills’ account holders are made aware of the facilities offered; (iv) review the extent of coverage in districtsdeclared as 100 per cent financially included so as to meet the gaps in banking facilities to those desirous of obtainingsuch facilities; and (v) efficiently leverage on the technology enabled financial inclusion initiatives being implementedin various States with Reserve Bank support such as smart cards with biometric access involving hand-held devices/mobile phones.
23 • The Reserve Bank expressed willingness to consider financial restructuring proposals of weak UCBs as an additionaloption for resolution of problems, subject to fulfillment of certain conditions.
30 • The extant guidelines, inter alia, provided that, where the net worth of the acquired bank is negative, the acquirer bankshould protect the deposits of the acquired bank on its own or with upfront financial support from State Government. Inlegacy cases pertaining to UCBs having negative net worth as on March 31, 2007, it was decided that the ReserveBank may also consider scheme of amalgamation that provides for payment to depositors. The detailed guidelines in thisrespect were issued. Further, guidelines were also laid down for valuations of assets and liabilities of the transferor bank.
Feb. 2 • All primary UCBs were advised regarding the framework of charges to be levied by banks for offering various electronicproducts, for outstation cheque collection services and transfer of surplus clearing funds.
4 • All NBFCs (both deposit taking and non-deposit taking) with asset size of Rs.100 crore and above were instructed tofurnish the information to the Reserve Bank about downgrading/upgrading of assigned rating of any financial productissued by them, within fifteen days of such a change in rating.
5 • Banks were allowed to apply special regulatory treatment for accounts which were standard on September 1, 2008and taken up for restructuring up to January 31, 2009 even if these had turned non-performing during this period. Subsequently, the time schedule for taking up restructuring was extended up to March 31, 2009.
2008 III. FINANCIAL SECTOR MEASURES (Contd.)
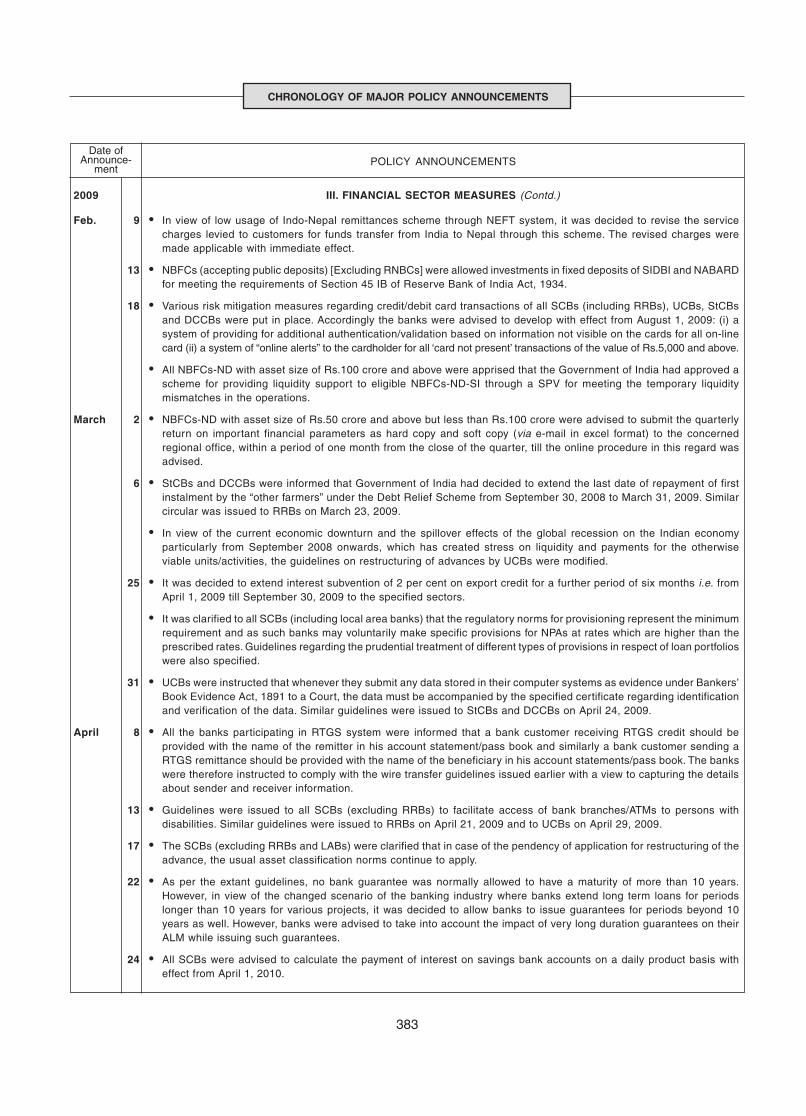
383
CHRONOLOGY OF MAJOR POLICY ANNOUNCEMENTS
POLICY ANNOUNCEMENTSDate of
Announce-ment
2009 III. FINANCIAL SECTOR MEASURES (Contd.)
Feb. 9 • In view of low usage of Indo-Nepal remittances scheme through NEFT system, it was decided to revise the servicecharges levied to customers for funds transfer from India to Nepal through this scheme. The revised charges weremade applicable with immediate effect.
13 • NBFCs (accepting public deposits) [Excluding RNBCs] were allowed investments in fixed deposits of SIDBI and NABARDfor meeting the requirements of Section 45 IB of Reserve Bank of India Act, 1934.
18 • Various risk mitigation measures regarding credit/debit card transactions of all SCBs (including RRBs), UCBs, StCBsand DCCBs were put in place. Accordingly the banks were advised to develop with effect from August 1, 2009: (i) asystem of providing for additional authentication/validation based on information not visible on the cards for all on-linecard (ii) a system of “online alerts” to the cardholder for all ‘card not present’ transactions of the value of Rs.5,000 and above.
• All NBFCs-ND with asset size of Rs.100 crore and above were apprised that the Government of India had approved ascheme for providing liquidity support to eligible NBFCs-ND-SI through a SPV for meeting the temporary liquiditymismatches in the operations.
March 2 • NBFCs-ND with asset size of Rs.50 crore and above but less than Rs.100 crore were advised to submit the quarterlyreturn on important financial parameters as hard copy and soft copy (via e-mail in excel format) to the concernedregional office, within a period of one month from the close of the quarter, till the online procedure in this regard wasadvised.
6 • StCBs and DCCBs were informed that Government of India had decided to extend the last date of repayment of firstinstalment by the “other farmers” under the Debt Relief Scheme from September 30, 2008 to March 31, 2009. Similarcircular was issued to RRBs on March 23, 2009.
• In view of the current economic downturn and the spillover effects of the global recession on the Indian economyparticularly from September 2008 onwards, which has created stress on liquidity and payments for the otherwiseviable units/activities, the guidelines on restructuring of advances by UCBs were modified.
25 • It was decided to extend interest subvention of 2 per cent on export credit for a further period of six months i.e. fromApril 1, 2009 till September 30, 2009 to the specified sectors.
• It was clarified to all SCBs (including local area banks) that the regulatory norms for provisioning represent the minimumrequirement and as such banks may voluntarily make specific provisions for NPAs at rates which are higher than theprescribed rates. Guidelines regarding the prudential treatment of different types of provisions in respect of loan portfolioswere also specified.
31 • UCBs were instructed that whenever they submit any data stored in their computer systems as evidence under Bankers’Book Evidence Act, 1891 to a Court, the data must be accompanied by the specified certificate regarding identificationand verification of the data. Similar guidelines were issued to StCBs and DCCBs on April 24, 2009.
April 8 • All the banks participating in RTGS system were informed that a bank customer receiving RTGS credit should beprovided with the name of the remitter in his account statement/pass book and similarly a bank customer sending aRTGS remittance should be provided with the name of the beneficiary in his account statements/pass book. The bankswere therefore instructed to comply with the wire transfer guidelines issued earlier with a view to capturing the detailsabout sender and receiver information.
13 • Guidelines were issued to all SCBs (excluding RRBs) to facilitate access of bank branches/ATMs to persons withdisabilities. Similar guidelines were issued to RRBs on April 21, 2009 and to UCBs on April 29, 2009.
17 • The SCBs (excluding RRBs and LABs) were clarified that in case of the pendency of application for restructuring of theadvance, the usual asset classification norms continue to apply.
22 • As per the extant guidelines, no bank guarantee was normally allowed to have a maturity of more than 10 years.However, in view of the changed scenario of the banking industry where banks extend long term loans for periodslonger than 10 years for various projects, it was decided to allow banks to issue guarantees for periods beyond 10years as well. However, banks were advised to take into account the impact of very long duration guarantees on theirALM while issuing such guarantees.
24 • All SCBs were advised to calculate the payment of interest on savings bank accounts on a daily product basis witheffect from April 1, 2010.
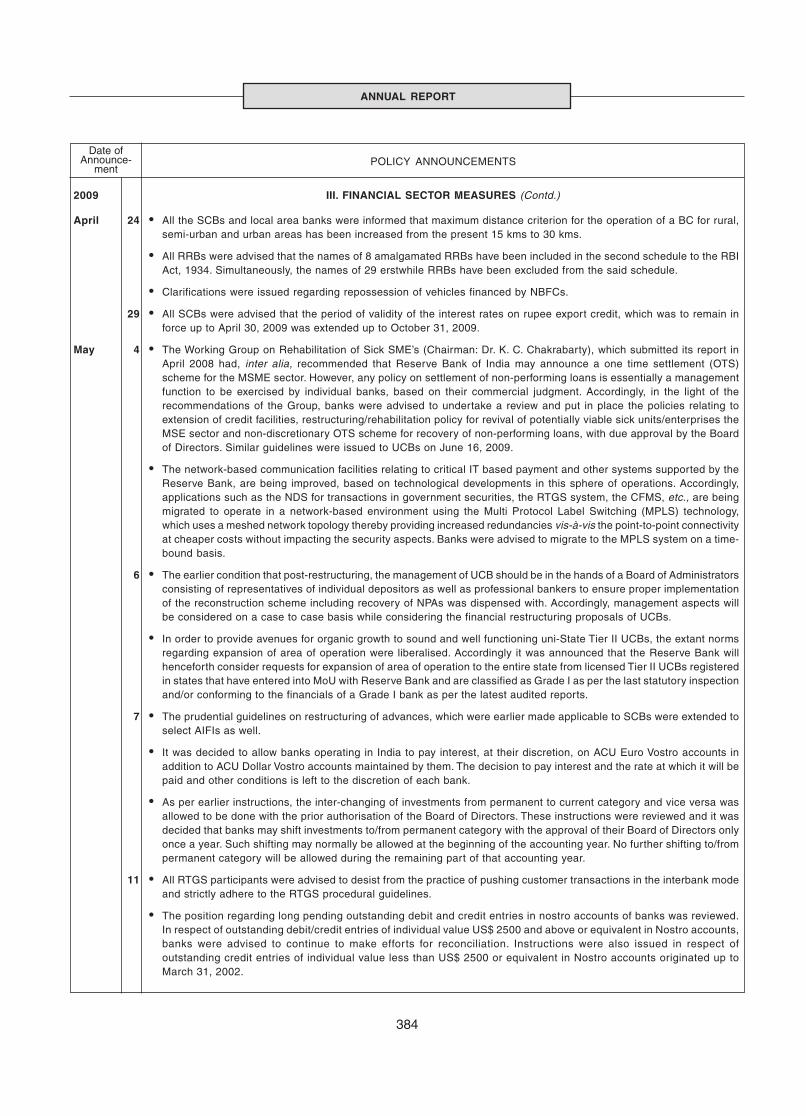
ANNUAL REPORT
384
POLICY ANNOUNCEMENTSDate of
Announce-ment
2009 III. FINANCIAL SECTOR MEASURES (Contd.)
April 24 • All the SCBs and local area banks were informed that maximum distance criterion for the operation of a BC for rural,semi-urban and urban areas has been increased from the present 15 kms to 30 kms.
• All RRBs were advised that the names of 8 amalgamated RRBs have been included in the second schedule to the RBIAct, 1934. Simultaneously, the names of 29 erstwhile RRBs have been excluded from the said schedule.
• Clarifications were issued regarding repossession of vehicles financed by NBFCs.
29 • All SCBs were advised that the period of validity of the interest rates on rupee export credit, which was to remain inforce up to April 30, 2009 was extended up to October 31, 2009.
May 4 • The Working Group on Rehabilitation of Sick SME’s (Chairman: Dr. K. C. Chakrabarty), which submitted its report inApril 2008 had, inter alia, recommended that Reserve Bank of India may announce a one time settlement (OTS)scheme for the MSME sector. However, any policy on settlement of non-performing loans is essentially a managementfunction to be exercised by individual banks, based on their commercial judgment. Accordingly, in the light of therecommendations of the Group, banks were advised to undertake a review and put in place the policies relating toextension of credit facilities, restructuring/rehabilitation policy for revival of potentially viable sick units/enterprises theMSE sector and non-discretionary OTS scheme for recovery of non-performing loans, with due approval by the Boardof Directors. Similar guidelines were issued to UCBs on June 16, 2009.
• The network-based communication facilities relating to critical IT based payment and other systems supported by theReserve Bank, are being improved, based on technological developments in this sphere of operations. Accordingly,applications such as the NDS for transactions in government securities, the RTGS system, the CFMS, etc., are beingmigrated to operate in a network-based environment using the Multi Protocol Label Switching (MPLS) technology,which uses a meshed network topology thereby providing increased redundancies vis-à-vis the point-to-point connectivityat cheaper costs without impacting the security aspects. Banks were advised to migrate to the MPLS system on a time-bound basis.
6 • The earlier condition that post-restructuring, the management of UCB should be in the hands of a Board of Administratorsconsisting of representatives of individual depositors as well as professional bankers to ensure proper implementationof the reconstruction scheme including recovery of NPAs was dispensed with. Accordingly, management aspects willbe considered on a case to case basis while considering the financial restructuring proposals of UCBs.
• In order to provide avenues for organic growth to sound and well functioning uni-State Tier II UCBs, the extant normsregarding expansion of area of operation were liberalised. Accordingly it was announced that the Reserve Bank willhenceforth consider requests for expansion of area of operation to the entire state from licensed Tier II UCBs registeredin states that have entered into MoU with Reserve Bank and are classified as Grade I as per the last statutory inspectionand/or conforming to the financials of a Grade I bank as per the latest audited reports.
7 • The prudential guidelines on restructuring of advances, which were earlier made applicable to SCBs were extended toselect AIFIs as well.
• It was decided to allow banks operating in India to pay interest, at their discretion, on ACU Euro Vostro accounts inaddition to ACU Dollar Vostro accounts maintained by them. The decision to pay interest and the rate at which it will bepaid and other conditions is left to the discretion of each bank.
• As per earlier instructions, the inter-changing of investments from permanent to current category and vice versa wasallowed to be done with the prior authorisation of the Board of Directors. These instructions were reviewed and it wasdecided that banks may shift investments to/from permanent category with the approval of their Board of Directors onlyonce a year. Such shifting may normally be allowed at the beginning of the accounting year. No further shifting to/frompermanent category will be allowed during the remaining part of that accounting year.
11 • All RTGS participants were advised to desist from the practice of pushing customer transactions in the interbank modeand strictly adhere to the RTGS procedural guidelines.
• The position regarding long pending outstanding debit and credit entries in nostro accounts of banks was reviewed.In respect of outstanding debit/credit entries of individual value US$ 2500 and above or equivalent in Nostro accounts,banks were advised to continue to make efforts for reconciliation. Instructions were also issued in respect ofoutstanding credit entries of individual value less than US$ 2500 or equivalent in Nostro accounts originated up toMarch 31, 2002.
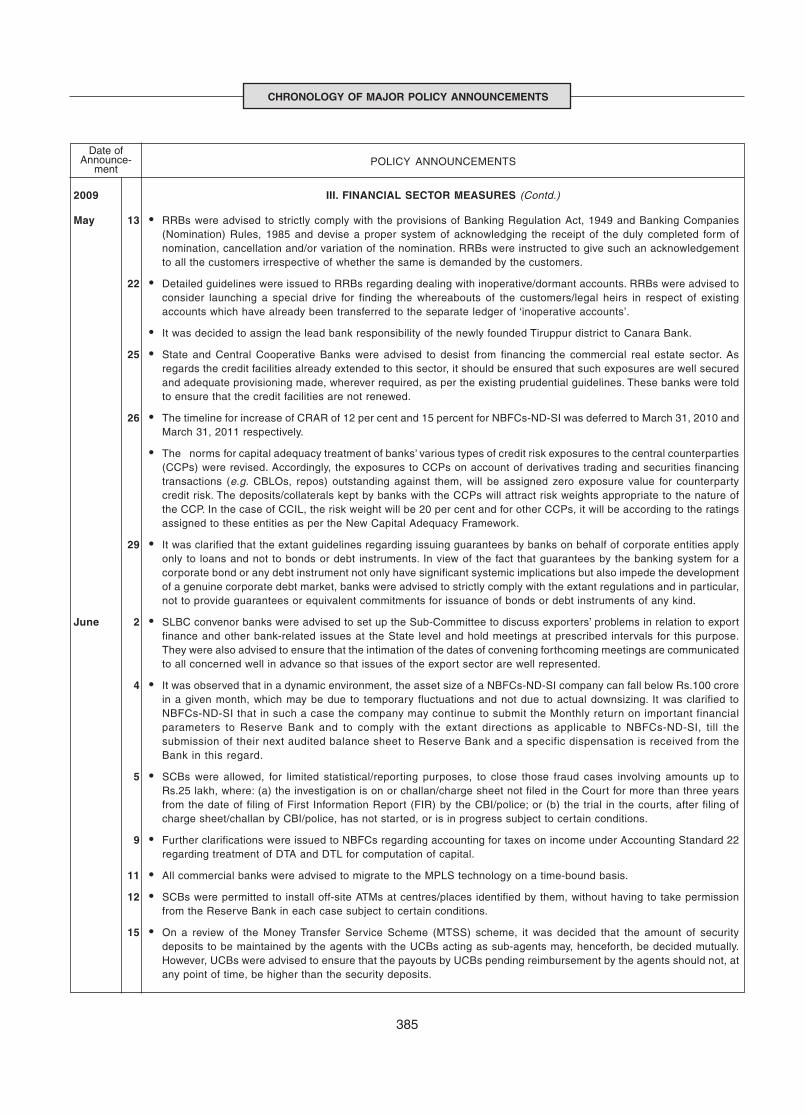
385
CHRONOLOGY OF MAJOR POLICY ANNOUNCEMENTS
May 13 • RRBs were advised to strictly comply with the provisions of Banking Regulation Act, 1949 and Banking Companies(Nomination) Rules, 1985 and devise a proper system of acknowledging the receipt of the duly completed form ofnomination, cancellation and/or variation of the nomination. RRBs were instructed to give such an acknowledgementto all the customers irrespective of whether the same is demanded by the customers.
22 • Detailed guidelines were issued to RRBs regarding dealing with inoperative/dormant accounts. RRBs were advised toconsider launching a special drive for finding the whereabouts of the customers/legal heirs in respect of existingaccounts which have already been transferred to the separate ledger of ‘inoperative accounts’.
• It was decided to assign the lead bank responsibility of the newly founded Tiruppur district to Canara Bank.
25 • State and Central Cooperative Banks were advised to desist from financing the commercial real estate sector. Asregards the credit facilities already extended to this sector, it should be ensured that such exposures are well securedand adequate provisioning made, wherever required, as per the existing prudential guidelines. These banks were toldto ensure that the credit facilities are not renewed.
26 • The timeline for increase of CRAR of 12 per cent and 15 percent for NBFCs-ND-SI was deferred to March 31, 2010 andMarch 31, 2011 respectively.
• The norms for capital adequacy treatment of banks’ various types of credit risk exposures to the central counterparties(CCPs) were revised. Accordingly, the exposures to CCPs on account of derivatives trading and securities financingtransactions (e.g. CBLOs, repos) outstanding against them, will be assigned zero exposure value for counterpartycredit risk. The deposits/collaterals kept by banks with the CCPs will attract risk weights appropriate to the nature ofthe CCP. In the case of CCIL, the risk weight will be 20 per cent and for other CCPs, it will be according to the ratingsassigned to these entities as per the New Capital Adequacy Framework.
29 • It was clarified that the extant guidelines regarding issuing guarantees by banks on behalf of corporate entities applyonly to loans and not to bonds or debt instruments. In view of the fact that guarantees by the banking system for acorporate bond or any debt instrument not only have significant systemic implications but also impede the developmentof a genuine corporate debt market, banks were advised to strictly comply with the extant regulations and in particular,not to provide guarantees or equivalent commitments for issuance of bonds or debt instruments of any kind.
June 2 • SLBC convenor banks were advised to set up the Sub-Committee to discuss exporters’ problems in relation to exportfinance and other bank-related issues at the State level and hold meetings at prescribed intervals for this purpose.They were also advised to ensure that the intimation of the dates of convening forthcoming meetings are communicatedto all concerned well in advance so that issues of the export sector are well represented.
4 • It was observed that in a dynamic environment, the asset size of a NBFCs-ND-SI company can fall below Rs.100 crorein a given month, which may be due to temporary fluctuations and not due to actual downsizing. It was clarified toNBFCs-ND-SI that in such a case the company may continue to submit the Monthly return on important financialparameters to Reserve Bank and to comply with the extant directions as applicable to NBFCs-ND-SI, till thesubmission of their next audited balance sheet to Reserve Bank and a specific dispensation is received from theBank in this regard.
5 • SCBs were allowed, for limited statistical/reporting purposes, to close those fraud cases involving amounts up toRs.25 lakh, where: (a) the investigation is on or challan/charge sheet not filed in the Court for more than three yearsfrom the date of filing of First Information Report (FIR) by the CBI/police; or (b) the trial in the courts, after filing ofcharge sheet/challan by CBI/police, has not started, or is in progress subject to certain conditions.
9 • Further clarifications were issued to NBFCs regarding accounting for taxes on income under Accounting Standard 22regarding treatment of DTA and DTL for computation of capital.
11 • All commercial banks were advised to migrate to the MPLS technology on a time-bound basis.
12 • SCBs were permitted to install off-site ATMs at centres/places identified by them, without having to take permissionfrom the Reserve Bank in each case subject to certain conditions.
15 • On a review of the Money Transfer Service Scheme (MTSS) scheme, it was decided that the amount of securitydeposits to be maintained by the agents with the UCBs acting as sub-agents may, henceforth, be decided mutually.However, UCBs were advised to ensure that the payouts by UCBs pending reimbursement by the agents should not, atany point of time, be higher than the security deposits.
POLICY ANNOUNCEMENTSDate of
Announce-ment
2009 III. FINANCIAL SECTOR MEASURES (Contd.)
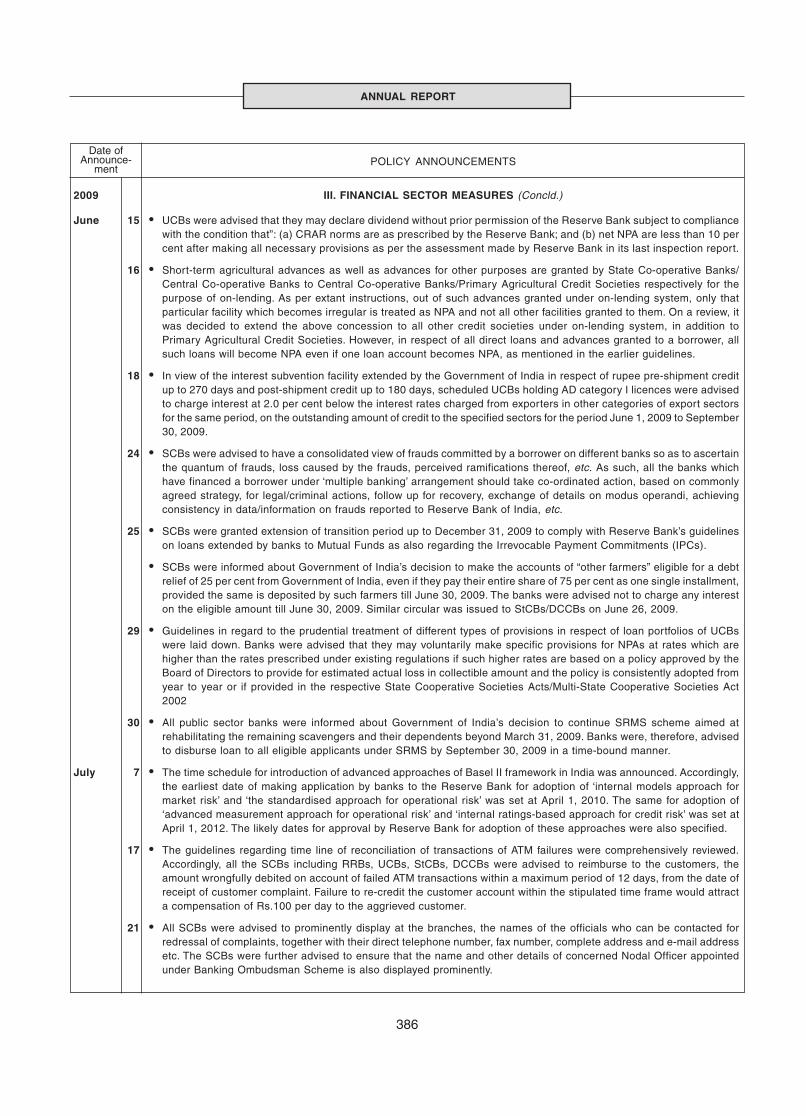
ANNUAL REPORT
386
June 15 • UCBs were advised that they may declare dividend without prior permission of the Reserve Bank subject to compliancewith the condition that”: (a) CRAR norms are as prescribed by the Reserve Bank; and (b) net NPA are less than 10 percent after making all necessary provisions as per the assessment made by Reserve Bank in its last inspection report.
16 • Short-term agricultural advances as well as advances for other purposes are granted by State Co-operative Banks/Central Co-operative Banks to Central Co-operative Banks/Primary Agricultural Credit Societies respectively for thepurpose of on-lending. As per extant instructions, out of such advances granted under on-lending system, only thatparticular facility which becomes irregular is treated as NPA and not all other facilities granted to them. On a review, itwas decided to extend the above concession to all other credit societies under on-lending system, in addition toPrimary Agricultural Credit Societies. However, in respect of all direct loans and advances granted to a borrower, allsuch loans will become NPA even if one loan account becomes NPA, as mentioned in the earlier guidelines.
18 • In view of the interest subvention facility extended by the Government of India in respect of rupee pre-shipment creditup to 270 days and post-shipment credit up to 180 days, scheduled UCBs holding AD category I licences were advisedto charge interest at 2.0 per cent below the interest rates charged from exporters in other categories of export sectorsfor the same period, on the outstanding amount of credit to the specified sectors for the period June 1, 2009 to September30, 2009.
24 • SCBs were advised to have a consolidated view of frauds committed by a borrower on different banks so as to ascertainthe quantum of frauds, loss caused by the frauds, perceived ramifications thereof, etc. As such, all the banks whichhave financed a borrower under ‘multiple banking’ arrangement should take co-ordinated action, based on commonlyagreed strategy, for legal/criminal actions, follow up for recovery, exchange of details on modus operandi, achievingconsistency in data/information on frauds reported to Reserve Bank of India, etc.
25 • SCBs were granted extension of transition period up to December 31, 2009 to comply with Reserve Bank’s guidelineson loans extended by banks to Mutual Funds as also regarding the Irrevocable Payment Commitments (IPCs).
• SCBs were informed about Government of India’s decision to make the accounts of “other farmers” eligible for a debtrelief of 25 per cent from Government of India, even if they pay their entire share of 75 per cent as one single installment,provided the same is deposited by such farmers till June 30, 2009. The banks were advised not to charge any intereston the eligible amount till June 30, 2009. Similar circular was issued to StCBs/DCCBs on June 26, 2009.
29 • Guidelines in regard to the prudential treatment of different types of provisions in respect of loan portfolios of UCBswere laid down. Banks were advised that they may voluntarily make specific provisions for NPAs at rates which arehigher than the rates prescribed under existing regulations if such higher rates are based on a policy approved by theBoard of Directors to provide for estimated actual loss in collectible amount and the policy is consistently adopted fromyear to year or if provided in the respective State Cooperative Societies Acts/Multi-State Cooperative Societies Act2002
30 • All public sector banks were informed about Government of India’s decision to continue SRMS scheme aimed atrehabilitating the remaining scavengers and their dependents beyond March 31, 2009. Banks were, therefore, advisedto disburse loan to all eligible applicants under SRMS by September 30, 2009 in a time-bound manner.
July 7 • The time schedule for introduction of advanced approaches of Basel II framework in India was announced. Accordingly,the earliest date of making application by banks to the Reserve Bank for adoption of ‘internal models approach formarket risk’ and ‘the standardised approach for operational risk’ was set at April 1, 2010. The same for adoption of‘advanced measurement approach for operational risk’ and ‘internal ratings-based approach for credit risk’ was set atApril 1, 2012. The likely dates for approval by Reserve Bank for adoption of these approaches were also specified.
17 • The guidelines regarding time line of reconciliation of transactions of ATM failures were comprehensively reviewed.Accordingly, all the SCBs including RRBs, UCBs, StCBs, DCCBs were advised to reimburse to the customers, theamount wrongfully debited on account of failed ATM transactions within a maximum period of 12 days, from the date ofreceipt of customer complaint. Failure to re-credit the customer account within the stipulated time frame would attracta compensation of Rs.100 per day to the aggrieved customer.
21 • All SCBs were advised to prominently display at the branches, the names of the officials who can be contacted forredressal of complaints, together with their direct telephone number, fax number, complete address and e-mail addressetc. The SCBs were further advised to ensure that the name and other details of concerned Nodal Officer appointedunder Banking Ombudsman Scheme is also displayed prominently.
POLICY ANNOUNCEMENTSDate of
Announce-ment
2009 III. FINANCIAL SECTOR MEASURES (Concld.)

387
CHRONOLOGY OF MAJOR POLICY ANNOUNCEMENTS
IV. CAPITAL MARKET POLICIES
2008 Securities and Exchange Board of India (SEBI)
April 3 • Investors residing in Sikkim were exempted from the mandatory requirement of PAN for their investments in mutual funds.
7 • Filing fees for offer documents was revised downwards by SEBI.
8 • SEBI increased the aggregate ceiling for overseas investment by mutual funds to US$ 7 billion.
9 • SEBI amended provisions with respect to independent directors in Clause 49 of the listing agreement.
16 • Mutual funds were allowed to sell government securities contracted for purchase in DVP III mode for governmentsecurities market.
• SEBI amended (Mutual Funds) Regulations, 1996 to permit mutual funds to launch Real Estate Mutual Funds.
17 • Guidelines were issued by SEBI for Comprehensive Risk Management framework for cash market.
30 • SEBI revised the format of Monthly Cumulative Report of Mutual Funds.
May 5 • Cross margining across cash and derivatives segments were allowed.
6 • SEBI simplified the process of half-yearly reporting of information by merchant bankers. Accordingly, reports have tobe submitted only in electronic form. SEBI also simplified reporting of information with respect to bankers to issue anddebenture trustees.
29 • SEBI (FIIs) Regulation, 1995 was amended. Under this, asset management company, investment manager, or institutionalportfolio manager owned by NRIs, shall be eligible to be registered as FII subject to the condition that they shall notinvest their proprietary funds. Furthermore, the type of securities in which FIIs were permitted to invest has beenwidened to include schemes floated by a Collective Investment Scheme.
June 6 • The cumulative debt-investment limit for FII Investments in Government Securities and corporate debt was increasedto US$ 5 billion and US$ 3 billion from US$ 3.2 billion and US$1.5 billion, respectively.
19 • SEBI (Intermediaries) Regulations, 2008 was released, whereby a comprehensive regulation, applicable to allintermediaries, simplified registration practices.
• SEBI released SEBI (Public Offer and Listing of Securitised Debt Instruments) Regulations, 2008.
• SEBI notified regulation for issuance and listing of debt securities to provide for simplified regulatory framework forissuance and listing of non-convertible debt securities issued by any company, public sector or statutory corporations.
30 • SEBI clarified that PAN may not be insisted in case of Central Government, State Government and court officials fortransacting in securities markets.
July 7 • SEBI instructed all registered intermediaries to create a designated email-id for regulatory communications. It wasclarified that the email-id shall be an exclusive email-id only for the above purpose and should not be a person centricemail-id.
23 • SEBI instructed all the exchanges to conduct comprehensive audit relating to examination of trading systems, clearingand settlement systems (clearing corporation/clearing house), risk management, databases, disaster recovery sites,business continuity planning, security capacity management and information security of their systems by a reputedindependent auditor on an annual basis.
30 • In its continuing endeavour to make the existing public issue process more efficient, SEBI introduced a supplementaryprocess of applying in public issues, viz., the “Applications Supported by Blocked Amount (ASBA)” process. The ASBAprocess shall be available in all public issues made through the book building route. It shall co-exist with the current process.
August 4 • SEBI amended Employee Stock Option Scheme (ESOS) and Employee Stock Purchase Scheme (ESPS) Guidelines,1999, bringing the accounting treatment prescribed by SEBI in line with the accounting treatment provided by ICAI inthis regard.
6 • As per recommendations of the Committee Report on Exchange Traded Currency Futures, SEBI instructed therecognised stock exchanges and their clearing corporations / clearing houses, clearing members and trading membersregarding the compulsory requirements to introduce exchange traded currency derivatives.
POLICY ANNOUNCEMENTSDate of
Announce-ment
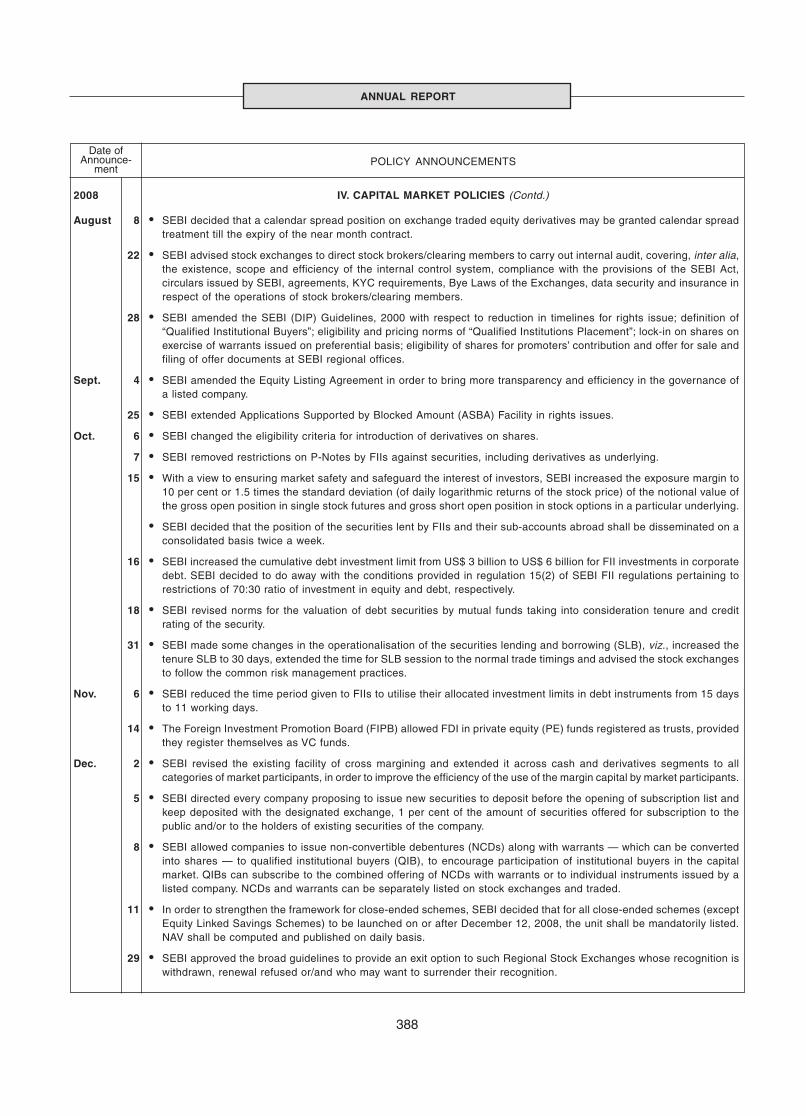
ANNUAL REPORT
388
August 8 • SEBI decided that a calendar spread position on exchange traded equity derivatives may be granted calendar spreadtreatment till the expiry of the near month contract.
22 • SEBI advised stock exchanges to direct stock brokers/clearing members to carry out internal audit, covering, inter alia,the existence, scope and efficiency of the internal control system, compliance with the provisions of the SEBI Act,circulars issued by SEBI, agreements, KYC requirements, Bye Laws of the Exchanges, data security and insurance inrespect of the operations of stock brokers/clearing members.
28 • SEBI amended the SEBI (DIP) Guidelines, 2000 with respect to reduction in timelines for rights issue; definition of“Qualified Institutional Buyers”; eligibility and pricing norms of “Qualified Institutions Placement”; lock-in on shares onexercise of warrants issued on preferential basis; eligibility of shares for promoters’ contribution and offer for sale andfiling of offer documents at SEBI regional offices.
Sept. 4 • SEBI amended the Equity Listing Agreement in order to bring more transparency and efficiency in the governance ofa listed company.
25 • SEBI extended Applications Supported by Blocked Amount (ASBA) Facility in rights issues.
Oct. 6 • SEBI changed the eligibility criteria for introduction of derivatives on shares.
7 • SEBI removed restrictions on P-Notes by FIIs against securities, including derivatives as underlying.
15 • With a view to ensuring market safety and safeguard the interest of investors, SEBI increased the exposure margin to10 per cent or 1.5 times the standard deviation (of daily logarithmic returns of the stock price) of the notional value ofthe gross open position in single stock futures and gross short open position in stock options in a particular underlying.
• SEBI decided that the position of the securities lent by FIIs and their sub-accounts abroad shall be disseminated on aconsolidated basis twice a week.
16 • SEBI increased the cumulative debt investment limit from US$ 3 billion to US$ 6 billion for FII investments in corporatedebt. SEBI decided to do away with the conditions provided in regulation 15(2) of SEBI FII regulations pertaining torestrictions of 70:30 ratio of investment in equity and debt, respectively.
18 • SEBI revised norms for the valuation of debt securities by mutual funds taking into consideration tenure and creditrating of the security.
31 • SEBI made some changes in the operationalisation of the securities lending and borrowing (SLB), viz., increased thetenure SLB to 30 days, extended the time for SLB session to the normal trade timings and advised the stock exchangesto follow the common risk management practices.
Nov. 6 • SEBI reduced the time period given to FIIs to utilise their allocated investment limits in debt instruments from 15 daysto 11 working days.
14 • The Foreign Investment Promotion Board (FIPB) allowed FDI in private equity (PE) funds registered as trusts, providedthey register themselves as VC funds.
Dec. 2 • SEBI revised the existing facility of cross margining and extended it across cash and derivatives segments to allcategories of market participants, in order to improve the efficiency of the use of the margin capital by market participants.
5 • SEBI directed every company proposing to issue new securities to deposit before the opening of subscription list andkeep deposited with the designated exchange, 1 per cent of the amount of securities offered for subscription to thepublic and/or to the holders of existing securities of the company.
8 • SEBI allowed companies to issue non-convertible debentures (NCDs) along with warrants — which can be convertedinto shares — to qualified institutional buyers (QIB), to encourage participation of institutional buyers in the capitalmarket. QIBs can subscribe to the combined offering of NCDs with warrants or to individual instruments issued by alisted company. NCDs and warrants can be separately listed on stock exchanges and traded.
11 • In order to strengthen the framework for close-ended schemes, SEBI decided that for all close-ended schemes (exceptEquity Linked Savings Schemes) to be launched on or after December 12, 2008, the unit shall be mandatorily listed.NAV shall be computed and published on daily basis.
29 • SEBI approved the broad guidelines to provide an exit option to such Regional Stock Exchanges whose recognition iswithdrawn, renewal refused or/and who may want to surrender their recognition.
POLICY ANNOUNCEMENTSDate of
Announce-ment
2008 IV. CAPITAL MARKET POLICIES (Contd.)
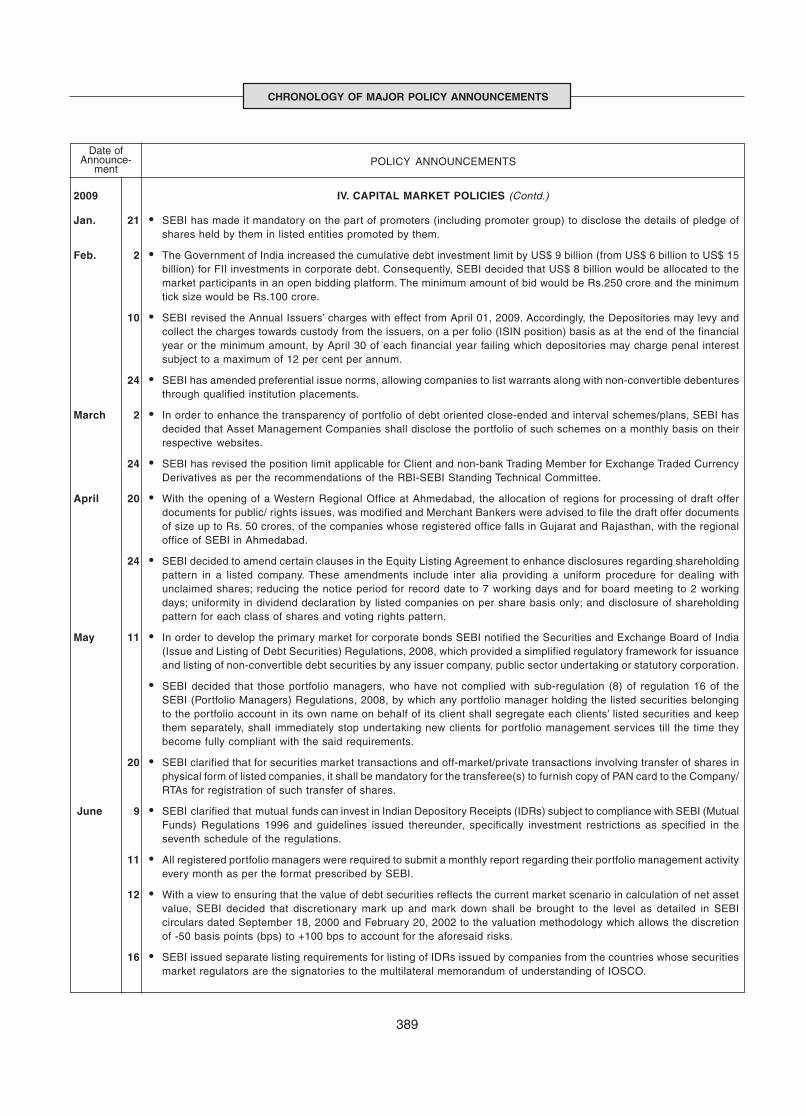
389
CHRONOLOGY OF MAJOR POLICY ANNOUNCEMENTS
Jan. 21 • SEBI has made it mandatory on the part of promoters (including promoter group) to disclose the details of pledge ofshares held by them in listed entities promoted by them.
Feb. 2 • The Government of India increased the cumulative debt investment limit by US$ 9 billion (from US$ 6 billion to US$ 15billion) for FII investments in corporate debt. Consequently, SEBI decided that US$ 8 billion would be allocated to themarket participants in an open bidding platform. The minimum amount of bid would be Rs.250 crore and the minimumtick size would be Rs.100 crore.
10 • SEBI revised the Annual Issuers’ charges with effect from April 01, 2009. Accordingly, the Depositories may levy andcollect the charges towards custody from the issuers, on a per folio (ISIN position) basis as at the end of the financialyear or the minimum amount, by April 30 of each financial year failing which depositories may charge penal interestsubject to a maximum of 12 per cent per annum.
24 • SEBI has amended preferential issue norms, allowing companies to list warrants along with non-convertible debenturesthrough qualified institution placements.
March 2 • In order to enhance the transparency of portfolio of debt oriented close-ended and interval schemes/plans, SEBI hasdecided that Asset Management Companies shall disclose the portfolio of such schemes on a monthly basis on theirrespective websites.
24 • SEBI has revised the position limit applicable for Client and non-bank Trading Member for Exchange Traded CurrencyDerivatives as per the recommendations of the RBI-SEBI Standing Technical Committee.
April 20 • With the opening of a Western Regional Office at Ahmedabad, the allocation of regions for processing of draft offerdocuments for public/ rights issues, was modified and Merchant Bankers were advised to file the draft offer documentsof size up to Rs. 50 crores, of the companies whose registered office falls in Gujarat and Rajasthan, with the regionaloffice of SEBI in Ahmedabad.
24 • SEBI decided to amend certain clauses in the Equity Listing Agreement to enhance disclosures regarding shareholdingpattern in a listed company. These amendments include inter alia providing a uniform procedure for dealing withunclaimed shares; reducing the notice period for record date to 7 working days and for board meeting to 2 workingdays; uniformity in dividend declaration by listed companies on per share basis only; and disclosure of shareholdingpattern for each class of shares and voting rights pattern.
May 11 • In order to develop the primary market for corporate bonds SEBI notified the Securities and Exchange Board of India(Issue and Listing of Debt Securities) Regulations, 2008, which provided a simplified regulatory framework for issuanceand listing of non-convertible debt securities by any issuer company, public sector undertaking or statutory corporation.
• SEBI decided that those portfolio managers, who have not complied with sub-regulation (8) of regulation 16 of theSEBI (Portfolio Managers) Regulations, 2008, by which any portfolio manager holding the listed securities belongingto the portfolio account in its own name on behalf of its client shall segregate each clients’ listed securities and keepthem separately, shall immediately stop undertaking new clients for portfolio management services till the time theybecome fully compliant with the said requirements.
20 • SEBI clarified that for securities market transactions and off-market/private transactions involving transfer of shares inphysical form of listed companies, it shall be mandatory for the transferee(s) to furnish copy of PAN card to the Company/RTAs for registration of such transfer of shares.
June 9 • SEBI clarified that mutual funds can invest in Indian Depository Receipts (IDRs) subject to compliance with SEBI (MutualFunds) Regulations 1996 and guidelines issued thereunder, specifically investment restrictions as specified in theseventh schedule of the regulations.
11 • All registered portfolio managers were required to submit a monthly report regarding their portfolio management activityevery month as per the format prescribed by SEBI.
12 • With a view to ensuring that the value of debt securities reflects the current market scenario in calculation of net assetvalue, SEBI decided that discretionary mark up and mark down shall be brought to the level as detailed in SEBIcirculars dated September 18, 2000 and February 20, 2002 to the valuation methodology which allows the discretionof -50 basis points (bps) to +100 bps to account for the aforesaid risks.
16 • SEBI issued separate listing requirements for listing of IDRs issued by companies from the countries whose securitiesmarket regulators are the signatories to the multilateral memorandum of understanding of IOSCO.
POLICY ANNOUNCEMENTSDate of
Announce-ment
2009 IV. CAPITAL MARKET POLICIES (Contd.)
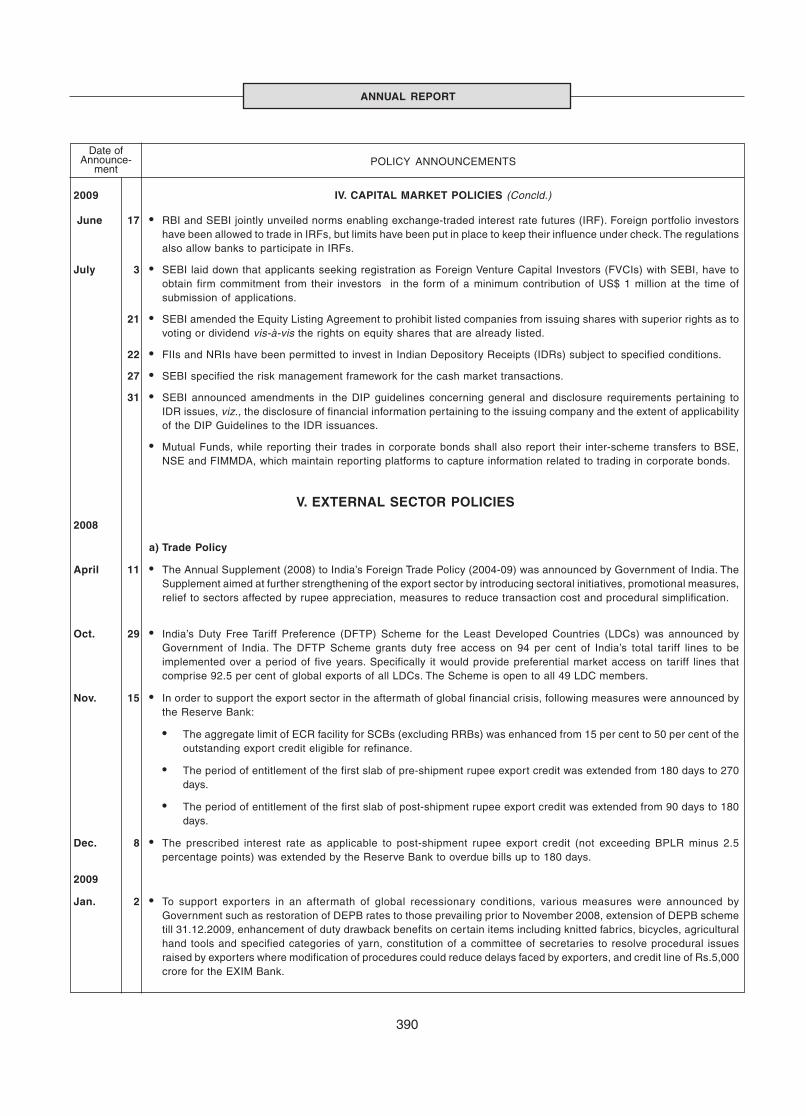
ANNUAL REPORT
390
June 17 • RBI and SEBI jointly unveiled norms enabling exchange-traded interest rate futures (IRF). Foreign portfolio investorshave been allowed to trade in IRFs, but limits have been put in place to keep their influence under check. The regulationsalso allow banks to participate in IRFs.
July 3 • SEBI laid down that applicants seeking registration as Foreign Venture Capital Investors (FVCIs) with SEBI, have toobtain firm commitment from their investors in the form of a minimum contribution of US$ 1 million at the time ofsubmission of applications.
21 • SEBI amended the Equity Listing Agreement to prohibit listed companies from issuing shares with superior rights as tovoting or dividend vis-à-vis the rights on equity shares that are already listed.
22 • FIIs and NRIs have been permitted to invest in Indian Depository Receipts (IDRs) subject to specified conditions.
27 • SEBI specified the risk management framework for the cash market transactions.
31 • SEBI announced amendments in the DIP guidelines concerning general and disclosure requirements pertaining toIDR issues, viz., the disclosure of financial information pertaining to the issuing company and the extent of applicabilityof the DIP Guidelines to the IDR issuances.
• Mutual Funds, while reporting their trades in corporate bonds shall also report their inter-scheme transfers to BSE,NSE and FIMMDA, which maintain reporting platforms to capture information related to trading in corporate bonds.
V. EXTERNAL SECTOR POLICIES
2008
a) Trade Policy
April 11 • The Annual Supplement (2008) to India’s Foreign Trade Policy (2004-09) was announced by Government of India. TheSupplement aimed at further strengthening of the export sector by introducing sectoral initiatives, promotional measures,relief to sectors affected by rupee appreciation, measures to reduce transaction cost and procedural simplification.
Oct. 29 • India’s Duty Free Tariff Preference (DFTP) Scheme for the Least Developed Countries (LDCs) was announced byGovernment of India. The DFTP Scheme grants duty free access on 94 per cent of India’s total tariff lines to beimplemented over a period of five years. Specifically it would provide preferential market access on tariff lines thatcomprise 92.5 per cent of global exports of all LDCs. The Scheme is open to all 49 LDC members.
Nov. 15 • In order to support the export sector in the aftermath of global financial crisis, following measures were announced bythe Reserve Bank:
• The aggregate limit of ECR facility for SCBs (excluding RRBs) was enhanced from 15 per cent to 50 per cent of theoutstanding export credit eligible for refinance.
• The period of entitlement of the first slab of pre-shipment rupee export credit was extended from 180 days to 270days.
• The period of entitlement of the first slab of post-shipment rupee export credit was extended from 90 days to 180days.
Dec. 8 • The prescribed interest rate as applicable to post-shipment rupee export credit (not exceeding BPLR minus 2.5percentage points) was extended by the Reserve Bank to overdue bills up to 180 days.
2009
Jan. 2 • To support exporters in an aftermath of global recessionary conditions, various measures were announced byGovernment such as restoration of DEPB rates to those prevailing prior to November 2008, extension of DEPB schemetill 31.12.2009, enhancement of duty drawback benefits on certain items including knitted fabrics, bicycles, agriculturalhand tools and specified categories of yarn, constitution of a committee of secretaries to resolve procedural issuesraised by exporters where modification of procedures could reduce delays faced by exporters, and credit line of Rs.5,000crore for the EXIM Bank.
POLICY ANNOUNCEMENTSDate of
Announce-ment
2009 IV. CAPITAL MARKET POLICIES (Concld.)
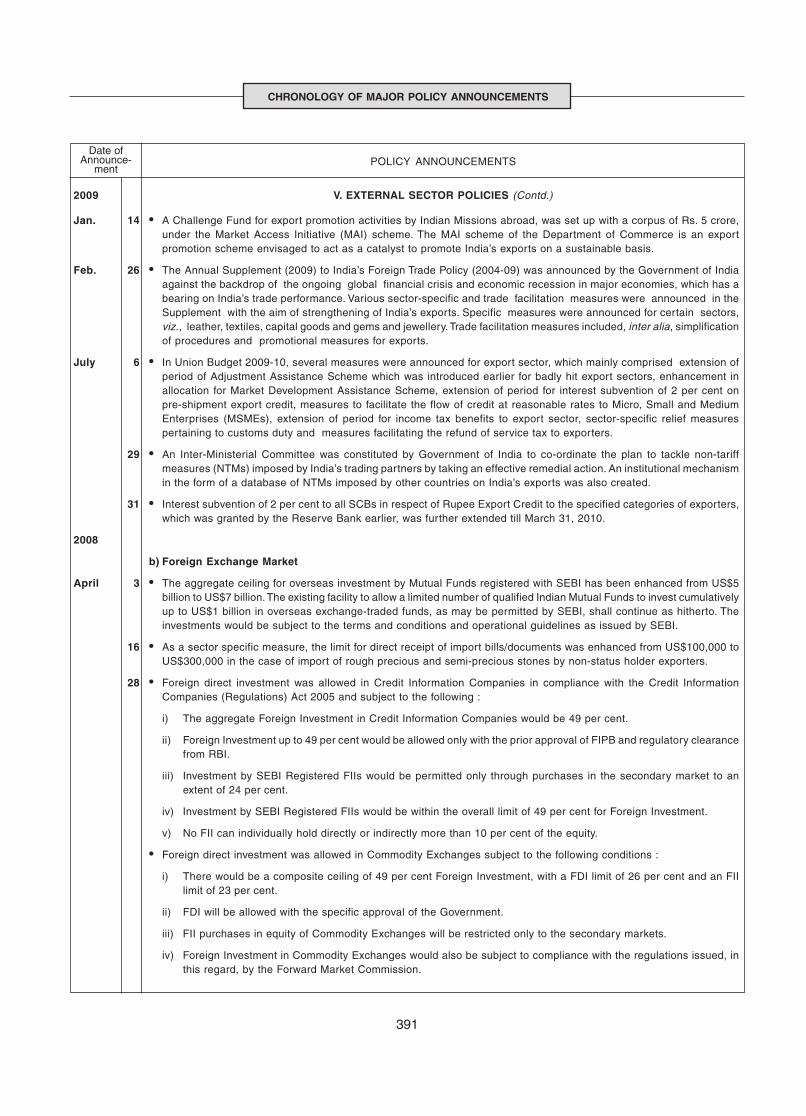
391
CHRONOLOGY OF MAJOR POLICY ANNOUNCEMENTS
Jan. 14 • A Challenge Fund for export promotion activities by Indian Missions abroad, was set up with a corpus of Rs. 5 crore,under the Market Access Initiative (MAI) scheme. The MAI scheme of the Department of Commerce is an exportpromotion scheme envisaged to act as a catalyst to promote India’s exports on a sustainable basis.
Feb. 26 • The Annual Supplement (2009) to India’s Foreign Trade Policy (2004-09) was announced by the Government of Indiaagainst the backdrop of the ongoing global financial crisis and economic recession in major economies, which has abearing on India’s trade performance. Various sector-specific and trade facilitation measures were announced in theSupplement with the aim of strengthening of India’s exports. Specific measures were announced for certain sectors,viz., leather, textiles, capital goods and gems and jewellery. Trade facilitation measures included, inter alia, simplificationof procedures and promotional measures for exports.
July 6 • In Union Budget 2009-10, several measures were announced for export sector, which mainly comprised extension ofperiod of Adjustment Assistance Scheme which was introduced earlier for badly hit export sectors, enhancement inallocation for Market Development Assistance Scheme, extension of period for interest subvention of 2 per cent onpre-shipment export credit, measures to facilitate the flow of credit at reasonable rates to Micro, Small and MediumEnterprises (MSMEs), extension of period for income tax benefits to export sector, sector-specific relief measurespertaining to customs duty and measures facilitating the refund of service tax to exporters.
29 • An Inter-Ministerial Committee was constituted by Government of India to co-ordinate the plan to tackle non-tariffmeasures (NTMs) imposed by India’s trading partners by taking an effective remedial action. An institutional mechanismin the form of a database of NTMs imposed by other countries on India’s exports was also created.
31 • Interest subvention of 2 per cent to all SCBs in respect of Rupee Export Credit to the specified categories of exporters,which was granted by the Reserve Bank earlier, was further extended till March 31, 2010.
2008
b) Foreign Exchange Market
April 3 • The aggregate ceiling for overseas investment by Mutual Funds registered with SEBI has been enhanced from US$5billion to US$7 billion. The existing facility to allow a limited number of qualified Indian Mutual Funds to invest cumulativelyup to US$1 billion in overseas exchange-traded funds, as may be permitted by SEBI, shall continue as hitherto. Theinvestments would be subject to the terms and conditions and operational guidelines as issued by SEBI.
16 • As a sector specific measure, the limit for direct receipt of import bills/documents was enhanced from US$100,000 toUS$300,000 in the case of import of rough precious and semi-precious stones by non-status holder exporters.
28 • Foreign direct investment was allowed in Credit Information Companies in compliance with the Credit InformationCompanies (Regulations) Act 2005 and subject to the following :
i) The aggregate Foreign Investment in Credit Information Companies would be 49 per cent.
ii) Foreign Investment up to 49 per cent would be allowed only with the prior approval of FIPB and regulatory clearancefrom RBI.
iii) Investment by SEBI Registered FIIs would be permitted only through purchases in the secondary market to anextent of 24 per cent.
iv) Investment by SEBI Registered FIIs would be within the overall limit of 49 per cent for Foreign Investment.
v) No FII can individually hold directly or indirectly more than 10 per cent of the equity.
• Foreign direct investment was allowed in Commodity Exchanges subject to the following conditions :
i) There would be a composite ceiling of 49 per cent Foreign Investment, with a FDI limit of 26 per cent and an FIIlimit of 23 per cent.
ii) FDI will be allowed with the specific approval of the Government.
iii) FII purchases in equity of Commodity Exchanges will be restricted only to the secondary markets.
iv) Foreign Investment in Commodity Exchanges would also be subject to compliance with the regulations issued, inthis regard, by the Forward Market Commission.
POLICY ANNOUNCEMENTSDate of
Announce-ment
2009 V. EXTERNAL SECTOR POLICIES (Contd.)
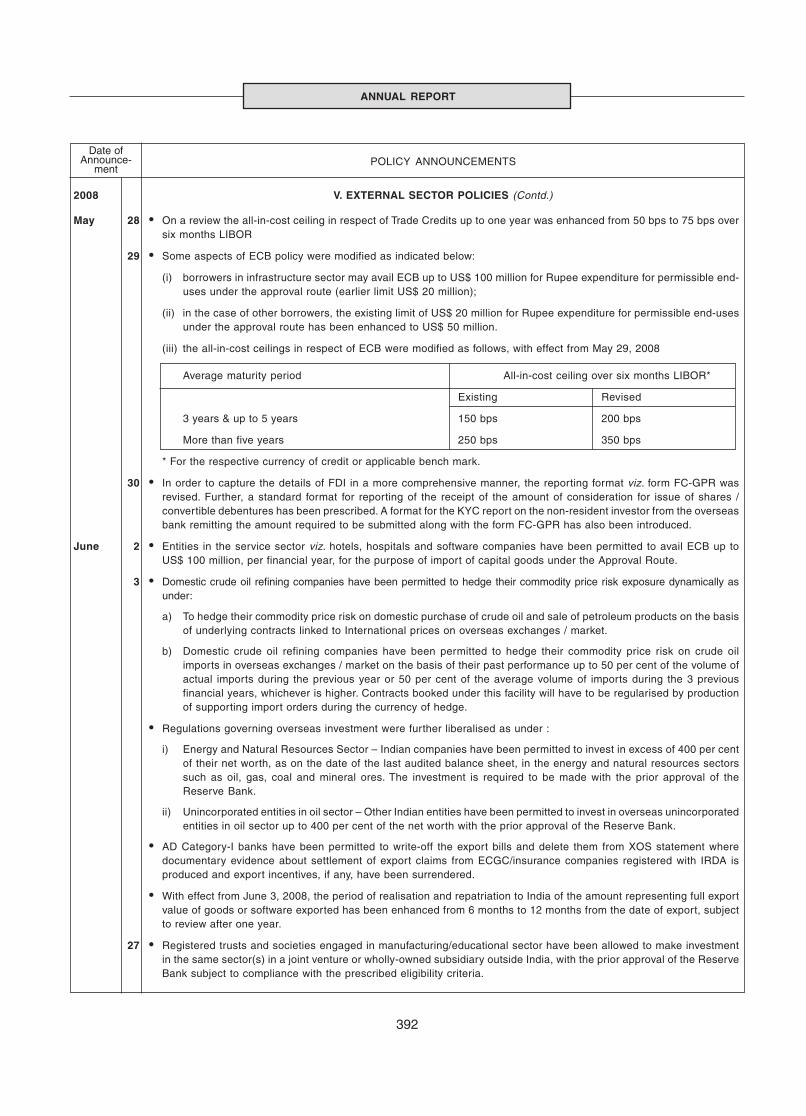
ANNUAL REPORT
392
May 28 • On a review the all-in-cost ceiling in respect of Trade Credits up to one year was enhanced from 50 bps to 75 bps oversix months LIBOR
29 • Some aspects of ECB policy were modified as indicated below:
(i) borrowers in infrastructure sector may avail ECB up to US$ 100 million for Rupee expenditure for permissible end-uses under the approval route (earlier limit US$ 20 million);
(ii) in the case of other borrowers, the existing limit of US$ 20 million for Rupee expenditure for permissible end-usesunder the approval route has been enhanced to US$ 50 million.
(iii) the all-in-cost ceilings in respect of ECB were modified as follows, with effect from May 29, 2008
Average maturity period All-in-cost ceiling over six months LIBOR*
Existing Revised
3 years & up to 5 years 150 bps 200 bps
More than five years 250 bps 350 bps
* For the respective currency of credit or applicable bench mark.
30 • In order to capture the details of FDI in a more comprehensive manner, the reporting format viz. form FC-GPR wasrevised. Further, a standard format for reporting of the receipt of the amount of consideration for issue of shares /convertible debentures has been prescribed. A format for the KYC report on the non-resident investor from the overseasbank remitting the amount required to be submitted along with the form FC-GPR has also been introduced.
June 2 • Entities in the service sector viz. hotels, hospitals and software companies have been permitted to avail ECB up toUS$ 100 million, per financial year, for the purpose of import of capital goods under the Approval Route.
3 • Domestic crude oil refining companies have been permitted to hedge their commodity price risk exposure dynamically asunder:
a) To hedge their commodity price risk on domestic purchase of crude oil and sale of petroleum products on the basisof underlying contracts linked to International prices on overseas exchanges / market.
b) Domestic crude oil refining companies have been permitted to hedge their commodity price risk on crude oilimports in overseas exchanges / market on the basis of their past performance up to 50 per cent of the volume ofactual imports during the previous year or 50 per cent of the average volume of imports during the 3 previousfinancial years, whichever is higher. Contracts booked under this facility will have to be regularised by productionof supporting import orders during the currency of hedge.
• Regulations governing overseas investment were further liberalised as under :
i) Energy and Natural Resources Sector – Indian companies have been permitted to invest in excess of 400 per centof their net worth, as on the date of the last audited balance sheet, in the energy and natural resources sectorssuch as oil, gas, coal and mineral ores. The investment is required to be made with the prior approval of theReserve Bank.
ii) Unincorporated entities in oil sector – Other Indian entities have been permitted to invest in overseas unincorporatedentities in oil sector up to 400 per cent of the net worth with the prior approval of the Reserve Bank.
• AD Category-I banks have been permitted to write-off the export bills and delete them from XOS statement wheredocumentary evidence about settlement of export claims from ECGC/insurance companies registered with IRDA isproduced and export incentives, if any, have been surrendered.
• With effect from June 3, 2008, the period of realisation and repatriation to India of the amount representing full exportvalue of goods or software exported has been enhanced from 6 months to 12 months from the date of export, subjectto review after one year.
27 • Registered trusts and societies engaged in manufacturing/educational sector have been allowed to make investmentin the same sector(s) in a joint venture or wholly-owned subsidiary outside India, with the prior approval of the ReserveBank subject to compliance with the prescribed eligibility criteria.
POLICY ANNOUNCEMENTSDate of
Announce-ment
2008 V. EXTERNAL SECTOR POLICIES (Contd.)
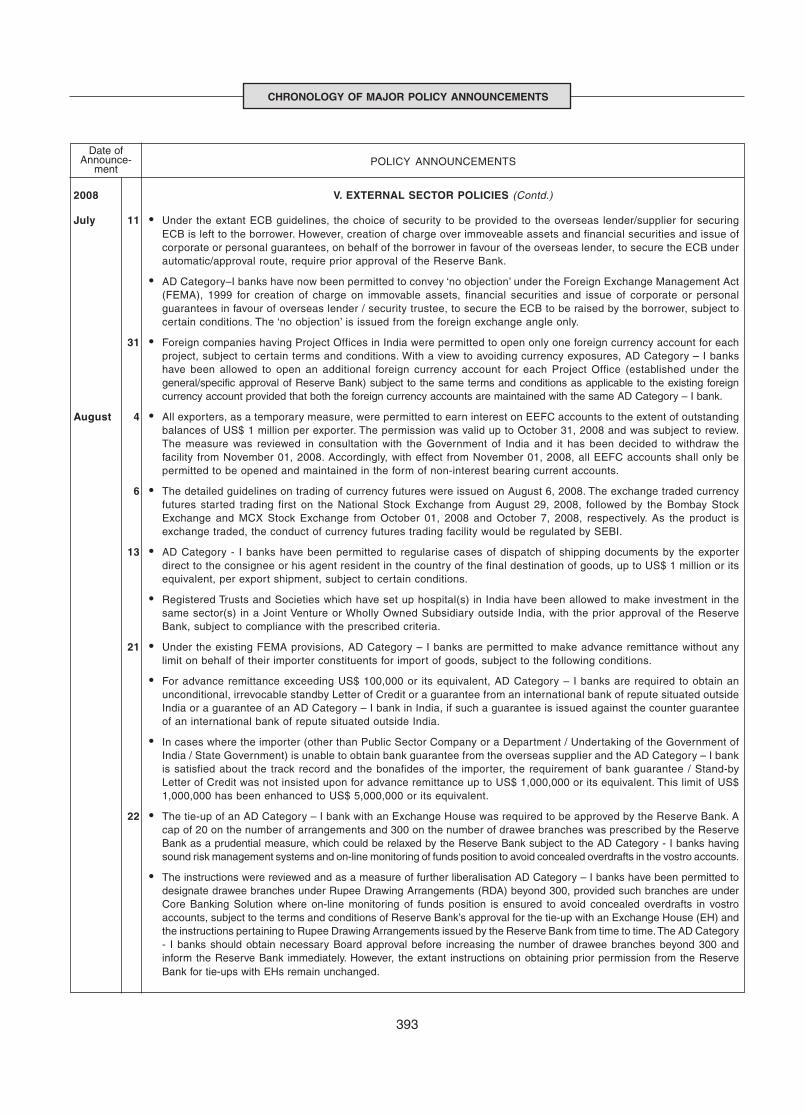
393
CHRONOLOGY OF MAJOR POLICY ANNOUNCEMENTS
July 11 • Under the extant ECB guidelines, the choice of security to be provided to the overseas lender/supplier for securingECB is left to the borrower. However, creation of charge over immoveable assets and financial securities and issue ofcorporate or personal guarantees, on behalf of the borrower in favour of the overseas lender, to secure the ECB underautomatic/approval route, require prior approval of the Reserve Bank.
• AD Category–I banks have now been permitted to convey ‘no objection’ under the Foreign Exchange Management Act(FEMA), 1999 for creation of charge on immovable assets, financial securities and issue of corporate or personalguarantees in favour of overseas lender / security trustee, to secure the ECB to be raised by the borrower, subject tocertain conditions. The ‘no objection’ is issued from the foreign exchange angle only.
31 • Foreign companies having Project Offices in India were permitted to open only one foreign currency account for eachproject, subject to certain terms and conditions. With a view to avoiding currency exposures, AD Category – I bankshave been allowed to open an additional foreign currency account for each Project Office (established under thegeneral/specific approval of Reserve Bank) subject to the same terms and conditions as applicable to the existing foreigncurrency account provided that both the foreign currency accounts are maintained with the same AD Category – I bank.
August 4 • All exporters, as a temporary measure, were permitted to earn interest on EEFC accounts to the extent of outstandingbalances of US$ 1 million per exporter. The permission was valid up to October 31, 2008 and was subject to review.The measure was reviewed in consultation with the Government of India and it has been decided to withdraw thefacility from November 01, 2008. Accordingly, with effect from November 01, 2008, all EEFC accounts shall only bepermitted to be opened and maintained in the form of non-interest bearing current accounts.
6 • The detailed guidelines on trading of currency futures were issued on August 6, 2008. The exchange traded currencyfutures started trading first on the National Stock Exchange from August 29, 2008, followed by the Bombay StockExchange and MCX Stock Exchange from October 01, 2008 and October 7, 2008, respectively. As the product isexchange traded, the conduct of currency futures trading facility would be regulated by SEBI.
13 • AD Category - I banks have been permitted to regularise cases of dispatch of shipping documents by the exporterdirect to the consignee or his agent resident in the country of the final destination of goods, up to US$ 1 million or itsequivalent, per export shipment, subject to certain conditions.
• Registered Trusts and Societies which have set up hospital(s) in India have been allowed to make investment in thesame sector(s) in a Joint Venture or Wholly Owned Subsidiary outside India, with the prior approval of the ReserveBank, subject to compliance with the prescribed criteria.
21 • Under the existing FEMA provisions, AD Category – I banks are permitted to make advance remittance without anylimit on behalf of their importer constituents for import of goods, subject to the following conditions.
• For advance remittance exceeding US$ 100,000 or its equivalent, AD Category – I banks are required to obtain anunconditional, irrevocable standby Letter of Credit or a guarantee from an international bank of repute situated outsideIndia or a guarantee of an AD Category – I bank in India, if such a guarantee is issued against the counter guaranteeof an international bank of repute situated outside India.
• In cases where the importer (other than Public Sector Company or a Department / Undertaking of the Government ofIndia / State Government) is unable to obtain bank guarantee from the overseas supplier and the AD Category – I bankis satisfied about the track record and the bonafides of the importer, the requirement of bank guarantee / Stand-byLetter of Credit was not insisted upon for advance remittance up to US$ 1,000,000 or its equivalent. This limit of US$1,000,000 has been enhanced to US$ 5,000,000 or its equivalent.
22 • The tie-up of an AD Category – I bank with an Exchange House was required to be approved by the Reserve Bank. Acap of 20 on the number of arrangements and 300 on the number of drawee branches was prescribed by the ReserveBank as a prudential measure, which could be relaxed by the Reserve Bank subject to the AD Category - I banks havingsound risk management systems and on-line monitoring of funds position to avoid concealed overdrafts in the vostro accounts.
• The instructions were reviewed and as a measure of further liberalisation AD Category – I banks have been permitted todesignate drawee branches under Rupee Drawing Arrangements (RDA) beyond 300, provided such branches are underCore Banking Solution where on-line monitoring of funds position is ensured to avoid concealed overdrafts in vostroaccounts, subject to the terms and conditions of Reserve Bank’s approval for the tie-up with an Exchange House (EH) andthe instructions pertaining to Rupee Drawing Arrangements issued by the Reserve Bank from time to time. The AD Category- I banks should obtain necessary Board approval before increasing the number of drawee branches beyond 300 andinform the Reserve Bank immediately. However, the extant instructions on obtaining prior permission from the ReserveBank for tie-ups with EHs remain unchanged.
POLICY ANNOUNCEMENTSDate of
Announce-ment
2008 V. EXTERNAL SECTOR POLICIES (Contd.)
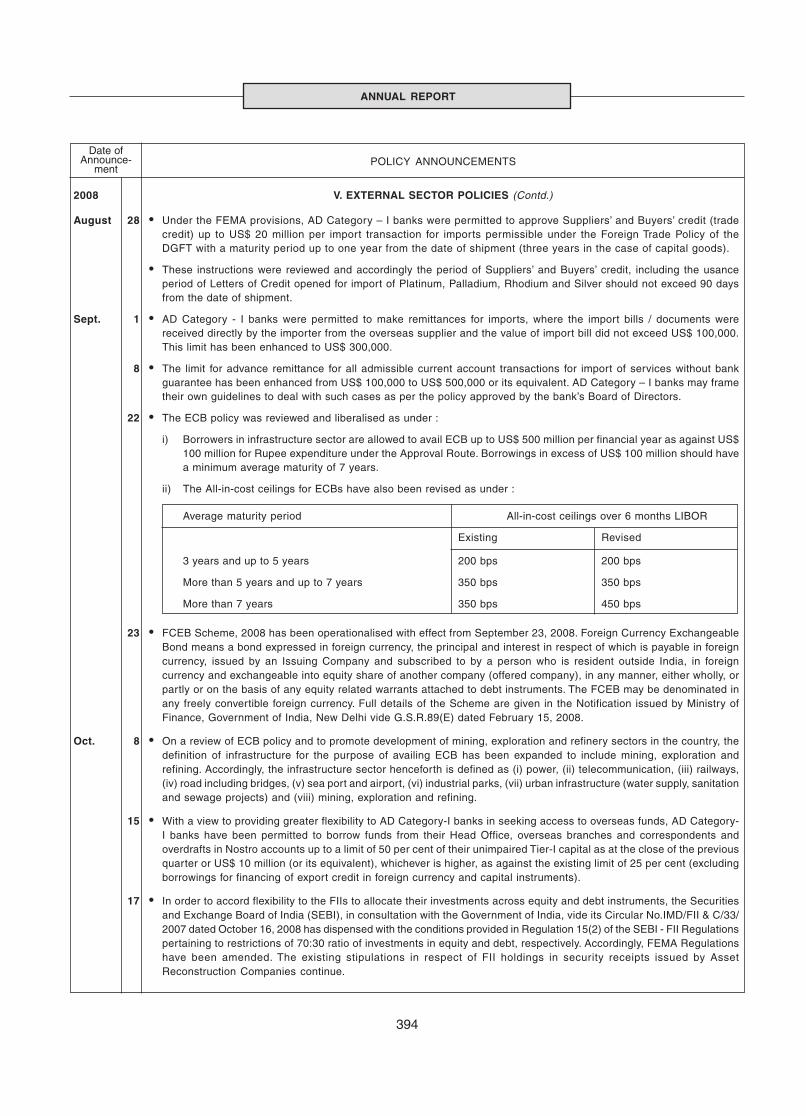
ANNUAL REPORT
394
August 28 • Under the FEMA provisions, AD Category – I banks were permitted to approve Suppliers’ and Buyers’ credit (tradecredit) up to US$ 20 million per import transaction for imports permissible under the Foreign Trade Policy of theDGFT with a maturity period up to one year from the date of shipment (three years in the case of capital goods).
• These instructions were reviewed and accordingly the period of Suppliers’ and Buyers’ credit, including the usanceperiod of Letters of Credit opened for import of Platinum, Palladium, Rhodium and Silver should not exceed 90 daysfrom the date of shipment.
Sept. 1 • AD Category - I banks were permitted to make remittances for imports, where the import bills / documents werereceived directly by the importer from the overseas supplier and the value of import bill did not exceed US$ 100,000.This limit has been enhanced to US$ 300,000.
8 • The limit for advance remittance for all admissible current account transactions for import of services without bankguarantee has been enhanced from US$ 100,000 to US$ 500,000 or its equivalent. AD Category – I banks may frametheir own guidelines to deal with such cases as per the policy approved by the bank’s Board of Directors.
22 • The ECB policy was reviewed and liberalised as under :
i) Borrowers in infrastructure sector are allowed to avail ECB up to US$ 500 million per financial year as against US$100 million for Rupee expenditure under the Approval Route. Borrowings in excess of US$ 100 million should havea minimum average maturity of 7 years.
ii) The All-in-cost ceilings for ECBs have also been revised as under :
Average maturity period All-in-cost ceilings over 6 months LIBOR
Existing Revised
3 years and up to 5 years 200 bps 200 bps
More than 5 years and up to 7 years 350 bps 350 bps
More than 7 years 350 bps 450 bps
23 • FCEB Scheme, 2008 has been operationalised with effect from September 23, 2008. Foreign Currency ExchangeableBond means a bond expressed in foreign currency, the principal and interest in respect of which is payable in foreigncurrency, issued by an Issuing Company and subscribed to by a person who is resident outside India, in foreigncurrency and exchangeable into equity share of another company (offered company), in any manner, either wholly, orpartly or on the basis of any equity related warrants attached to debt instruments. The FCEB may be denominated inany freely convertible foreign currency. Full details of the Scheme are given in the Notification issued by Ministry ofFinance, Government of India, New Delhi vide G.S.R.89(E) dated February 15, 2008.
Oct. 8 • On a review of ECB policy and to promote development of mining, exploration and refinery sectors in the country, thedefinition of infrastructure for the purpose of availing ECB has been expanded to include mining, exploration andrefining. Accordingly, the infrastructure sector henceforth is defined as (i) power, (ii) telecommunication, (iii) railways,(iv) road including bridges, (v) sea port and airport, (vi) industrial parks, (vii) urban infrastructure (water supply, sanitationand sewage projects) and (viii) mining, exploration and refining.
15 • With a view to providing greater flexibility to AD Category-I banks in seeking access to overseas funds, AD Category-I banks have been permitted to borrow funds from their Head Office, overseas branches and correspondents andoverdrafts in Nostro accounts up to a limit of 50 per cent of their unimpaired Tier-I capital as at the close of the previousquarter or US$ 10 million (or its equivalent), whichever is higher, as against the existing limit of 25 per cent (excludingborrowings for financing of export credit in foreign currency and capital instruments).
17 • In order to accord flexibility to the FIIs to allocate their investments across equity and debt instruments, the Securitiesand Exchange Board of India (SEBI), in consultation with the Government of India, vide its Circular No.IMD/FII & C/33/2007 dated October 16, 2008 has dispensed with the conditions provided in Regulation 15(2) of the SEBI - FII Regulationspertaining to restrictions of 70:30 ratio of investments in equity and debt, respectively. Accordingly, FEMA Regulationshave been amended. The existing stipulations in respect of FII holdings in security receipts issued by AssetReconstruction Companies continue.
POLICY ANNOUNCEMENTSDate of
Announce-ment
2008 V. EXTERNAL SECTOR POLICIES (Contd.)
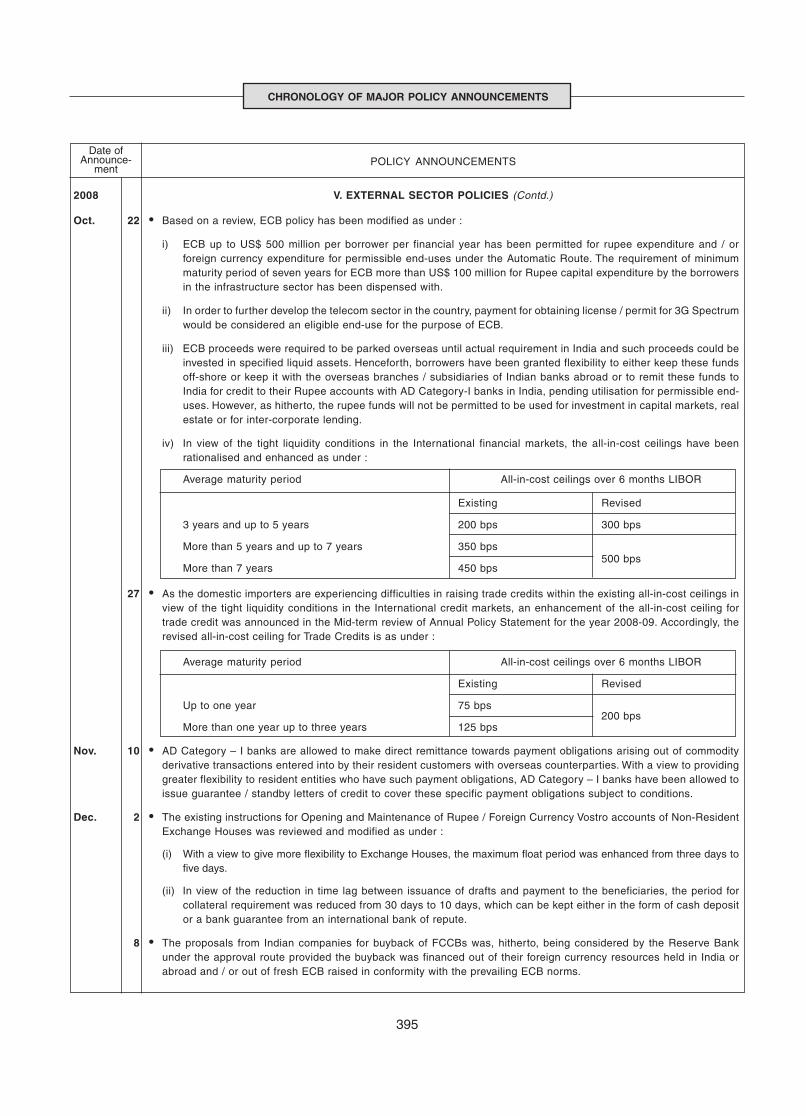
395
CHRONOLOGY OF MAJOR POLICY ANNOUNCEMENTS
Oct. 22 • Based on a review, ECB policy has been modified as under :
i) ECB up to US$ 500 million per borrower per financial year has been permitted for rupee expenditure and / orforeign currency expenditure for permissible end-uses under the Automatic Route. The requirement of minimummaturity period of seven years for ECB more than US$ 100 million for Rupee capital expenditure by the borrowersin the infrastructure sector has been dispensed with.
ii) In order to further develop the telecom sector in the country, payment for obtaining license / permit for 3G Spectrumwould be considered an eligible end-use for the purpose of ECB.
iii) ECB proceeds were required to be parked overseas until actual requirement in India and such proceeds could beinvested in specified liquid assets. Henceforth, borrowers have been granted flexibility to either keep these fundsoff-shore or keep it with the overseas branches / subsidiaries of Indian banks abroad or to remit these funds toIndia for credit to their Rupee accounts with AD Category-I banks in India, pending utilisation for permissible end-uses. However, as hitherto, the rupee funds will not be permitted to be used for investment in capital markets, realestate or for inter-corporate lending.
iv) In view of the tight liquidity conditions in the International financial markets, the all-in-cost ceilings have beenrationalised and enhanced as under :
Average maturity period All-in-cost ceilings over 6 months LIBOR
Existing Revised
3 years and up to 5 years 200 bps 300 bps
More than 5 years and up to 7 years 350 bps
More than 7 years 450 bps500 bps
27 • As the domestic importers are experiencing difficulties in raising trade credits within the existing all-in-cost ceilings inview of the tight liquidity conditions in the International credit markets, an enhancement of the all-in-cost ceiling fortrade credit was announced in the Mid-term review of Annual Policy Statement for the year 2008-09. Accordingly, therevised all-in-cost ceiling for Trade Credits is as under :
Average maturity period All-in-cost ceilings over 6 months LIBOR
Existing Revised
Up to one year 75 bps
More than one year up to three years 125 bps200 bps
Nov. 10 • AD Category – I banks are allowed to make direct remittance towards payment obligations arising out of commodityderivative transactions entered into by their resident customers with overseas counterparties. With a view to providinggreater flexibility to resident entities who have such payment obligations, AD Category – I banks have been allowed toissue guarantee / standby letters of credit to cover these specific payment obligations subject to conditions.
Dec. 2 • The existing instructions for Opening and Maintenance of Rupee / Foreign Currency Vostro accounts of Non-ResidentExchange Houses was reviewed and modified as under :
(i) With a view to give more flexibility to Exchange Houses, the maximum float period was enhanced from three days tofive days.
(ii) In view of the reduction in time lag between issuance of drafts and payment to the beneficiaries, the period forcollateral requirement was reduced from 30 days to 10 days, which can be kept either in the form of cash depositor a bank guarantee from an international bank of repute.
8 • The proposals from Indian companies for buyback of FCCBs was, hitherto, being considered by the Reserve Bankunder the approval route provided the buyback was financed out of their foreign currency resources held in India orabroad and / or out of fresh ECB raised in conformity with the prevailing ECB norms.
POLICY ANNOUNCEMENTSDate of
Announce-ment
2008 V. EXTERNAL SECTOR POLICIES (Contd.)
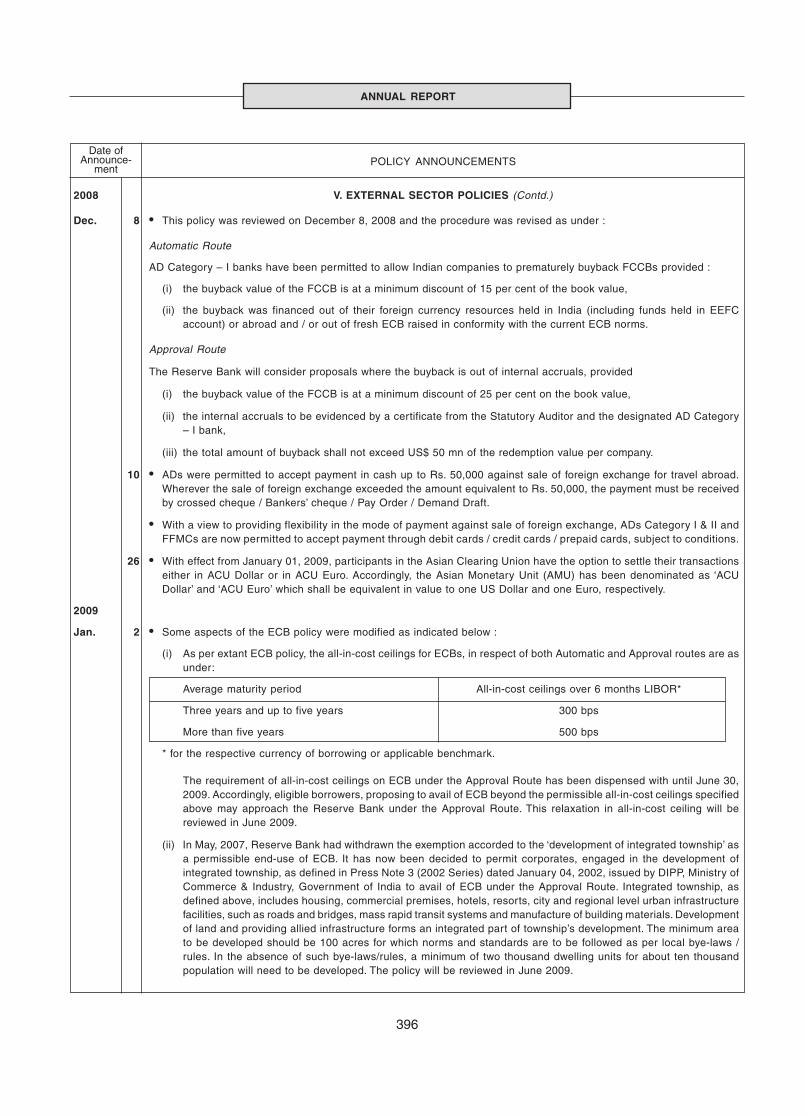
ANNUAL REPORT
396
Dec. 8 • This policy was reviewed on December 8, 2008 and the procedure was revised as under :
Automatic Route
AD Category – I banks have been permitted to allow Indian companies to prematurely buyback FCCBs provided :
(i) the buyback value of the FCCB is at a minimum discount of 15 per cent of the book value,
(ii) the buyback was financed out of their foreign currency resources held in India (including funds held in EEFCaccount) or abroad and / or out of fresh ECB raised in conformity with the current ECB norms.
Approval Route
The Reserve Bank will consider proposals where the buyback is out of internal accruals, provided
(i) the buyback value of the FCCB is at a minimum discount of 25 per cent on the book value,
(ii) the internal accruals to be evidenced by a certificate from the Statutory Auditor and the designated AD Category– I bank,
(iii) the total amount of buyback shall not exceed US$ 50 mn of the redemption value per company.
10 • ADs were permitted to accept payment in cash up to Rs. 50,000 against sale of foreign exchange for travel abroad.Wherever the sale of foreign exchange exceeded the amount equivalent to Rs. 50,000, the payment must be receivedby crossed cheque / Bankers’ cheque / Pay Order / Demand Draft.
• With a view to providing flexibility in the mode of payment against sale of foreign exchange, ADs Category I & II andFFMCs are now permitted to accept payment through debit cards / credit cards / prepaid cards, subject to conditions.
26 • With effect from January 01, 2009, participants in the Asian Clearing Union have the option to settle their transactionseither in ACU Dollar or in ACU Euro. Accordingly, the Asian Monetary Unit (AMU) has been denominated as ‘ACUDollar’ and ‘ACU Euro’ which shall be equivalent in value to one US Dollar and one Euro, respectively.
2009
Jan. 2 • Some aspects of the ECB policy were modified as indicated below :
(i) As per extant ECB policy, the all-in-cost ceilings for ECBs, in respect of both Automatic and Approval routes are asunder:
Average maturity period All-in-cost ceilings over 6 months LIBOR*
Three years and up to five years 300 bps
More than five years 500 bps
* for the respective currency of borrowing or applicable benchmark.
The requirement of all-in-cost ceilings on ECB under the Approval Route has been dispensed with until June 30,2009. Accordingly, eligible borrowers, proposing to avail of ECB beyond the permissible all-in-cost ceilings specifiedabove may approach the Reserve Bank under the Approval Route. This relaxation in all-in-cost ceiling will bereviewed in June 2009.
(ii) In May, 2007, Reserve Bank had withdrawn the exemption accorded to the ‘development of integrated township’ asa permissible end-use of ECB. It has now been decided to permit corporates, engaged in the development ofintegrated township, as defined in Press Note 3 (2002 Series) dated January 04, 2002, issued by DIPP, Ministry ofCommerce & Industry, Government of India to avail of ECB under the Approval Route. Integrated township, asdefined above, includes housing, commercial premises, hotels, resorts, city and regional level urban infrastructurefacilities, such as roads and bridges, mass rapid transit systems and manufacture of building materials. Developmentof land and providing allied infrastructure forms an integrated part of township’s development. The minimum areato be developed should be 100 acres for which norms and standards are to be followed as per local bye-laws /rules. In the absence of such bye-laws/rules, a minimum of two thousand dwelling units for about ten thousandpopulation will need to be developed. The policy will be reviewed in June 2009.
POLICY ANNOUNCEMENTSDate of
Announce-ment
2008 V. EXTERNAL SECTOR POLICIES (Contd.)
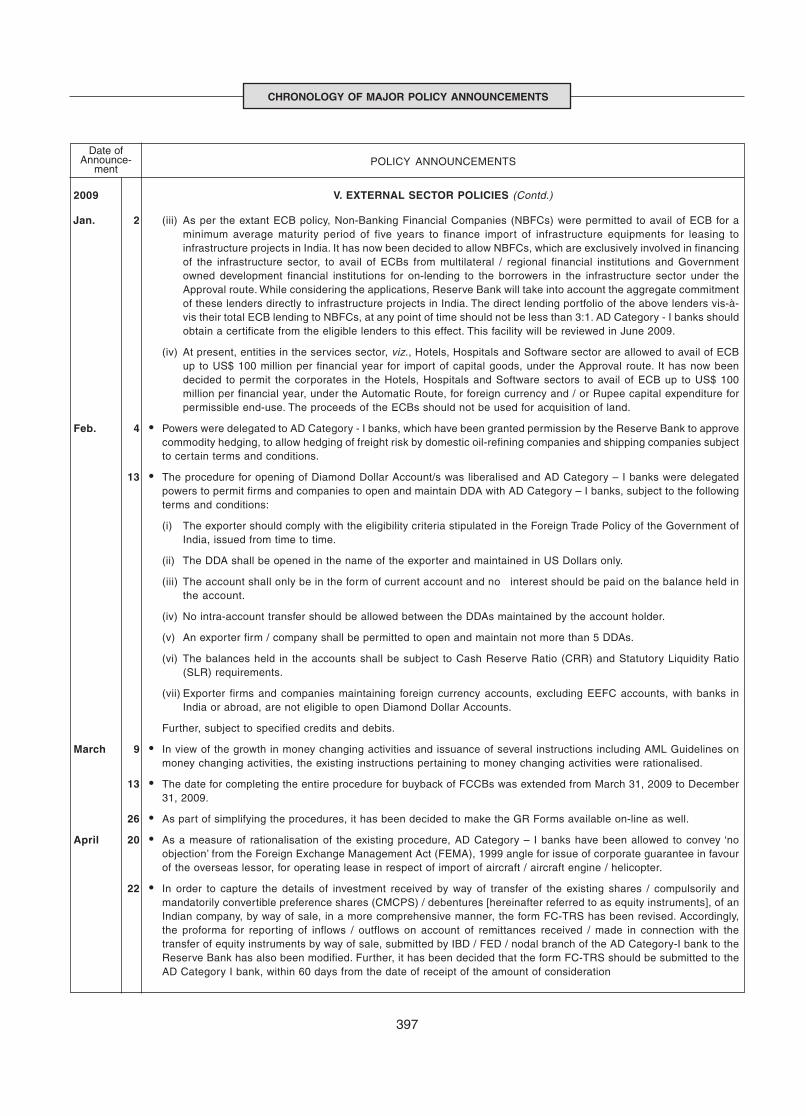
397
CHRONOLOGY OF MAJOR POLICY ANNOUNCEMENTS
POLICY ANNOUNCEMENTSDate of
Announce-ment
2009 V. EXTERNAL SECTOR POLICIES (Contd.)
Jan. 2 (iii) As per the extant ECB policy, Non-Banking Financial Companies (NBFCs) were permitted to avail of ECB for aminimum average maturity period of five years to finance import of infrastructure equipments for leasing toinfrastructure projects in India. It has now been decided to allow NBFCs, which are exclusively involved in financingof the infrastructure sector, to avail of ECBs from multilateral / regional financial institutions and Governmentowned development financial institutions for on-lending to the borrowers in the infrastructure sector under theApproval route. While considering the applications, Reserve Bank will take into account the aggregate commitmentof these lenders directly to infrastructure projects in India. The direct lending portfolio of the above lenders vis-à-vis their total ECB lending to NBFCs, at any point of time should not be less than 3:1. AD Category - I banks shouldobtain a certificate from the eligible lenders to this effect. This facility will be reviewed in June 2009.
(iv) At present, entities in the services sector, viz., Hotels, Hospitals and Software sector are allowed to avail of ECBup to US$ 100 million per financial year for import of capital goods, under the Approval route. It has now beendecided to permit the corporates in the Hotels, Hospitals and Software sectors to avail of ECB up to US$ 100million per financial year, under the Automatic Route, for foreign currency and / or Rupee capital expenditure forpermissible end-use. The proceeds of the ECBs should not be used for acquisition of land.
Feb. 4 • Powers were delegated to AD Category - I banks, which have been granted permission by the Reserve Bank to approvecommodity hedging, to allow hedging of freight risk by domestic oil-refining companies and shipping companies subjectto certain terms and conditions.
13 • The procedure for opening of Diamond Dollar Account/s was liberalised and AD Category – I banks were delegatedpowers to permit firms and companies to open and maintain DDA with AD Category – I banks, subject to the followingterms and conditions:
(i) The exporter should comply with the eligibility criteria stipulated in the Foreign Trade Policy of the Government ofIndia, issued from time to time.
(ii) The DDA shall be opened in the name of the exporter and maintained in US Dollars only.
(iii) The account shall only be in the form of current account and no interest should be paid on the balance held inthe account.
(iv) No intra-account transfer should be allowed between the DDAs maintained by the account holder.
(v) An exporter firm / company shall be permitted to open and maintain not more than 5 DDAs.
(vi) The balances held in the accounts shall be subject to Cash Reserve Ratio (CRR) and Statutory Liquidity Ratio(SLR) requirements.
(vii) Exporter firms and companies maintaining foreign currency accounts, excluding EEFC accounts, with banks inIndia or abroad, are not eligible to open Diamond Dollar Accounts.
Further, subject to specified credits and debits.
March 9 • In view of the growth in money changing activities and issuance of several instructions including AML Guidelines onmoney changing activities, the existing instructions pertaining to money changing activities were rationalised.
13 • The date for completing the entire procedure for buyback of FCCBs was extended from March 31, 2009 to December31, 2009.
26 • As part of simplifying the procedures, it has been decided to make the GR Forms available on-line as well.
April 20 • As a measure of rationalisation of the existing procedure, AD Category – I banks have been allowed to convey ‘noobjection’ from the Foreign Exchange Management Act (FEMA), 1999 angle for issue of corporate guarantee in favourof the overseas lessor, for operating lease in respect of import of aircraft / aircraft engine / helicopter.
22 • In order to capture the details of investment received by way of transfer of the existing shares / compulsorily andmandatorily convertible preference shares (CMCPS) / debentures [hereinafter referred to as equity instruments], of anIndian company, by way of sale, in a more comprehensive manner, the form FC-TRS has been revised. Accordingly,the proforma for reporting of inflows / outflows on account of remittances received / made in connection with thetransfer of equity instruments by way of sale, submitted by IBD / FED / nodal branch of the AD Category-I bank to theReserve Bank has also been modified. Further, it has been decided that the form FC-TRS should be submitted to theAD Category I bank, within 60 days from the date of receipt of the amount of consideration

ANNUAL REPORT
398
April 28 • As announced in Para 107 of the Annual Policy Statement 2009-10 and considering the continuing pressure on creditspreads in the international markets, the relaxation in all-in-cost ceilings has been extended up to December 31, 2009under the approval route.
• As announced in Para 110 of the Annual Policy Statement 2009-10 and keeping in view the benefits accruing to theIndian companies, the current policy has been reviewed and the total amount of permissible buyback of FCCBs, out ofinternal accruals, has been increased form US$ 50 million of the redemption value per company to US$ 100 million,under the approval route subject to conditions
• As announced in Para 111 of the Annual Policy Statement 2009-10 , the existing cap of Rs. 20 lakh has been enhancedto Rs. 100 lakh on loans against security of funds held in NR (E) RA and FCNR (B) deposits either to the depositors orthird parties.
June 30 • In June 2008, the period of realisation and repatriation to India of the amount representing the full export value ofgoods and software exported was enhanced from six months to twelve months subject to review after one year. Onreview the said relaxation has been extended up to June 30, 2010 subject to review.
• On a review, the permission to corporates, engaged in the development of Integrated township permitted to avail ofECB, under the Approval route has been extended up to December 31, 2009.
• The condition of direct lending portfolio of the lenders (multilateral / regional financial institutions and Governmentowned development financial institutions ) vis-a vis their total ECB lending to NBFCs for financing of infrastructuresector, at any point of time, should not be less than 3:1 has been withdrawn with effect from July 1, 2009. The proposalswill, however, continue to be examined by the Reserve Bank under the Approval route, as hitherto.
• SEZ developers have been permitted to avail of ECB under the Approval route for providing infrastructure facilities, asdefined in the ECB policy, within the SEZ. However, ECB shall not be permissible for development of integrated townshipand commercial real estate within the SEZ.
July 22 • In order to facilitate the eligible companies resident outside India to issue Indian Depository Receipts (IDRs) througha Domestic Depository and to permit persons resident in India and outside India to purchase, possess, transfer andredeem IDRs, the IDR Rules, notified by the Government of India, as amended from time to time, have beenoperationalised with effect from July 22, 2009
• Accordingly, eligible companies resident outside India may issue Indian Depository Receipts (IDRs) through a DomesticDepository subject to compliance with the Companies (Issue of Depository Receipts) Rules, 2004 and subsequentamendments made thereto and the SEBI (DIP) Guidelines, 2000, as amended from time to time. In case of raising offunds through issuance of IDRs by financial / banking companies having presence in India, either through a branch orsubsidiary, the approval of the sectoral regulator(s) should be obtained before the issuance of IDRs.
POLICY ANNOUNCEMENTSDate of
Announce-ment
2009 V. EXTERNAL SECTOR POLICIES (Concld.)

399
APPENDIX TABLES
APPENDIX TABLE 1 : SELECT MACROECONOMIC AND FINANCIAL INDICATORS
Average Average1990-91 2000-01
Item to to 2004-05 2005-06 2006-07 2007-08 2008-091999-2000 2008-09(10 years) (9 years)
1 2 3 4 5 6 7 8
1. Real GDP ( % change ) 5.7 7.2 7.5 9.5 9.7 9.0 QE 6.7 RE
a) Agriculture ( % change ) 3.2 2.8 0.0 5.8 4.0 4.9 1.6
b) Industry ( % change ) 5.7 6.5 8.5 8.1 10.7 7.4 2.6
c) Services (% change) 7.1 9.0 9.9 11.2 11.3 10.8 9.4
2. Per Capita Income (% change) 3.6 5.4 5.6 7.9 8.2 7.6 4.9
3. Foodgrains Production (Million tonnes ) 188.6 209.6 198.4 208.6 217.3 230.8 233.9
4. Gross Domestic Saving Rate (% of GDP) 23.0 30.3 ^ 31.7 34.2 35.7 37.7 ..
5. Gross Domestic Investment Rate (% of GDP ) 24.4 30.4 ^ 32.1 35.5 36.9 39.1 ..
6. Central Government Finances ( % of GDP )
a) Total Revenue Receipts 9.2 9.9 9.7 9.7 10.5 11.5 10.6 RE
b) Total Expenditure 16.0 15.7 15.8 14.1 14.1 14.3 ** 16.9 RE
c) Revenue Deficit 3.0 3.2 2.5 2.6 1.9 1.1 4.5 RE
d) Fiscal Deficit 5.9 4.7 4.0 4.1 3.4 2.7 6.1 RE
e) Net RBI Credit to Centre 0.7 -0.5 -1.9 0.8 -0.1 -2.5 3.3 RE
f) Interest Payments 4.2 4.2 4.0 3.7 3.6 3.6 3.6 RE
g) Domestic Debt 48.0 58.5 61.4 60.4 59.0 57.7 56.6 RE
7. Monetary Aggregates ( % change )
a) Broad Money ( M3) 17.2 17.0 11.8 @ 16.9 # 21.7 21.4 18.6
b) Narrow Money ( M1) 15.6 14.9 12.3 20.7 # 17.1 19.4 8.4
c) Reserve Money 13.9 15.3 12.1 16.9 23.9 31.0 6.4
d) Bank Credit to Commercial Sector (% of GDP) 28.8 43.0 39.5 @ 47.1 51.6 54.6 55.5
8. Scheduled Commercial Banks (% change)
a) Aggregate Deposits 17.2 17.9 12.8 @ 18.1 # 23.8 22.4 19.9
b) Bank Credit 15.9 21.1 27.0 @ 30.8 # 28.1 22.3 17.5
c) Non-Food Credit 15.4 21.6 27.5 @ 31.8 # 28.5 23.0 17.8
d) Investments in Government Securities 20.9 17.3 7.9 @ -2.7 # 10.7 23.5 20.6
9. Wholesale Price Index (% change)
a) Point-to-Point 8.7 4.6 5.1 4.1 5.9 7.7 0.8
b) Average 8.1 5.4 6.4 4.4 5.4 4.7 8.3
10. Consumer Price Index - Industrial Workers( % change )
a) Point-to-Point 9.4 5.2 4.2 4.9 6.7 7.9 8.0
b) Average 9.5 5.1 3.8 4.4 6.7 6.2 9.1
11. BSE Sensitive Index ( % change ) 37.0 14.1 16.1 73.7 15.9 19.7 -37.9
12. Trade and Balance of Payments
a) Exports in US $ ( % change ) 8.6 19.1 28.5 23.4 22.6 28.9 5.4
b) Imports in US $ ( % change ) 9.7 21.3 48.6 32.1 21.4 35.2 14.3
c) Current Account ( % of GDP ) -1.3 -0.4 -0.4 -1.2 -1.1 -1.5 -2.6
d) Capital Account ( % of GDP ) 2.2 3.4 4.0 3.1 4.9 9.2 0.8
13. Foreign Exchange Reserves* (US $ Billion) .. .. 141.5 151.6 199.1 309.7 252.0
14. External Debt* (US $ Billion) 92.7 146.0 133.0 138.1 171.3 224.6 229.9
a) Debt-GDP Ratio 29.0 19.6 18.5 17.2 18.1 19.0 22.0
b) Debt-Service Ratio 24.9 10.3 5.9 ## 10.1 ^^ 4.7 4.8 4.6
15. Exchange Rate (Rupee / US $)
a) High – – 43.36 43.3 43.14 39.26 52.09
b) Low – – 46.46 46.33 46.97 43.15 39.89
QE : Quick Estimates. RE : Revised Estimates. .. : Not available – : Not applicable.* : As at the end of the period. @ : Adjusted for the mergers and conversions in the banking system.# : Variation over April 1, 2005. ^ : Average for the period 2000-01 to 2007-08. **: Excludes acquisition cost of Reserve Bank’s stake in SBI at Rs.35,531 crore.## : Works out to 5.7 per cent with the exclusion of pre-payment of external debt of US $ 381 million.^^ : Works out to 6.3 per cent with the exclusion of India Millennium Deposits (IMDs) repayments of US $ 7.1 billion and prepayment of US $ 23.5 million.
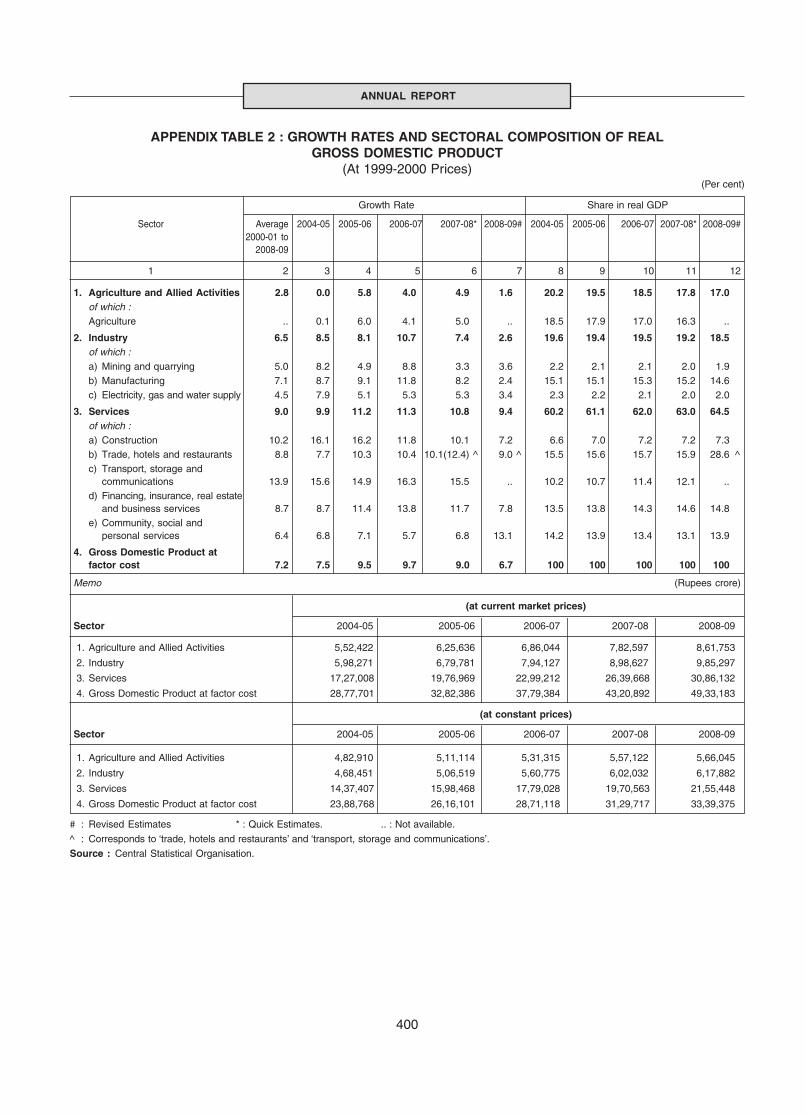
400
ANNUAL REPORT
APPENDIX TABLE 2 : GROWTH RATES AND SECTORAL COMPOSITION OF REALGROSS DOMESTIC PRODUCT
(At 1999-2000 Prices)(Per cent)
Growth Rate Share in real GDP
Sector Average 2004-05 2005-06 2006-07 2007-08* 2008-09# 2004-05 2005-06 2006-07 2007-08* 2008-09#2000-01 to
2008-09
1 2 3 4 5 6 7 8 9 10 11 12
1. Agriculture and Allied Activities 2.8 0.0 5.8 4.0 4.9 1.6 20.2 19.5 18.5 17.8 17.0of which :Agriculture .. 0.1 6.0 4.1 5.0 .. 18.5 17.9 17.0 16.3 ..
2. Industry 6.5 8.5 8.1 10.7 7.4 2.6 19.6 19.4 19.5 19.2 18.5of which :a) Mining and quarrying 5.0 8.2 4.9 8.8 3.3 3.6 2.2 2.1 2.1 2.0 1.9b) Manufacturing 7.1 8.7 9.1 11.8 8.2 2.4 15.1 15.1 15.3 15.2 14.6c) Electricity, gas and water supply 4.5 7.9 5.1 5.3 5.3 3.4 2.3 2.2 2.1 2.0 2.0
3. Services 9.0 9.9 11.2 11.3 10.8 9.4 60.2 61.1 62.0 63.0 64.5of which :a) Construction 10.2 16.1 16.2 11.8 10.1 7.2 6.6 7.0 7.2 7.2 7.3b) Trade, hotels and restaurants 8.8 7.7 10.3 10.4 10.1(12.4) ^ 9.0 ^ 15.5 15.6 15.7 15.9 28.6 ^c) Transport, storage and
communications 13.9 15.6 14.9 16.3 15.5 .. 10.2 10.7 11.4 12.1 ..d) Financing, insurance, real estate
and business services 8.7 8.7 11.4 13.8 11.7 7.8 13.5 13.8 14.3 14.6 14.8e) Community, social and
personal services 6.4 6.8 7.1 5.7 6.8 13.1 14.2 13.9 13.4 13.1 13.9
4. Gross Domestic Product atfactor cost 7.2 7.5 9.5 9.7 9.0 6.7 100 100 100 100 100
Memo (Rupees crore)
(at current market prices)
Sector 2004-05 2005-06 2006-07 2007-08 2008-09
1. Agriculture and Allied Activities 5,52,422 6,25,636 6,86,044 7,82,597 8,61,753
2. Industry 5,98,271 6,79,781 7,94,127 8,98,627 9,85,297
3. Services 17,27,008 19,76,969 22,99,212 26,39,668 30,86,132
4. Gross Domestic Product at factor cost 28,77,701 32,82,386 37,79,384 43,20,892 49,33,183
(at constant prices)
Sector 2004-05 2005-06 2006-07 2007-08 2008-09
1. Agriculture and Allied Activities 4,82,910 5,11,114 5,31,315 5,57,122 5,66,045
2. Industry 4,68,451 5,06,519 5,60,775 6,02,032 6,17,882
3. Services 14,37,407 15,98,468 17,79,028 19,70,563 21,55,448
4. Gross Domestic Product at factor cost 23,88,768 26,16,101 28,71,118 31,29,717 33,39,375
# : Revised Estimates * : Quick Estimates. .. : Not available.
^ : Corresponds to ‘trade, hotels and restaurants’ and ‘transport, storage and communications’.
Source : Central Statistical Organisation.
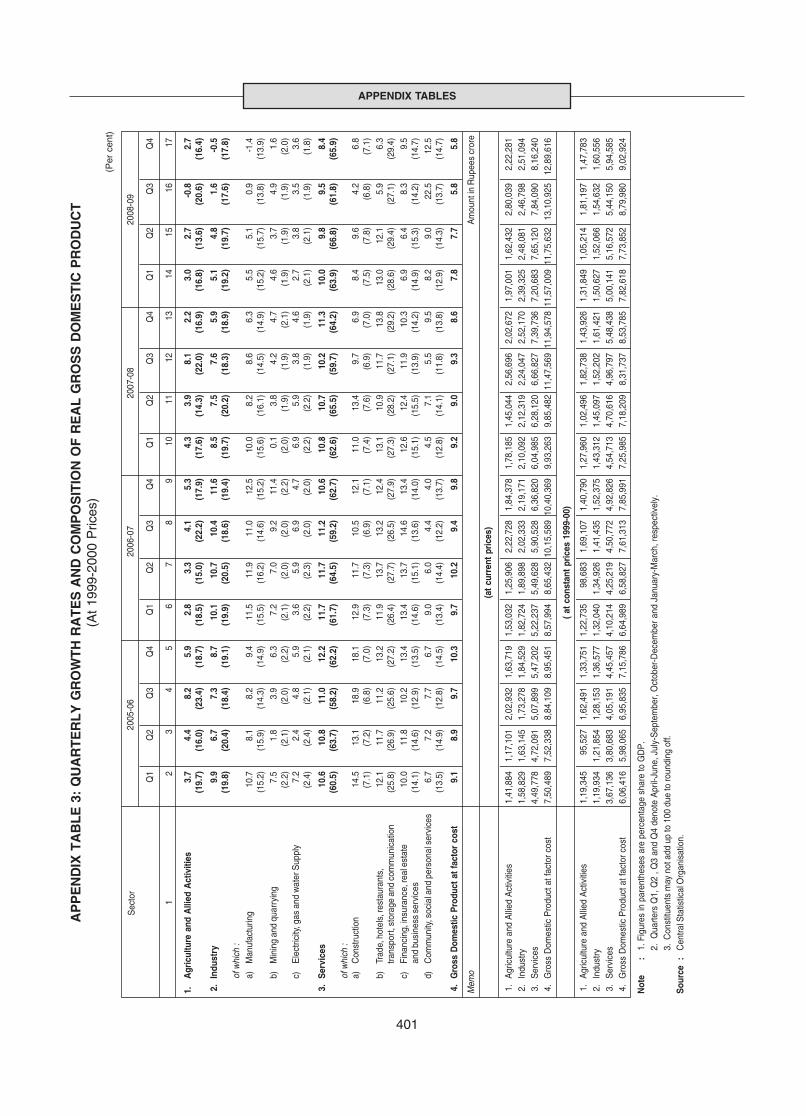
401
APPENDIX TABLES
AP
PE
ND
IX T
AB
LE
3:
QU
AR
TE
RL
Y G
RO
WT
H R
AT
ES
AN
D C
OM
PO
SIT
ION
OF
RE
AL
GR
OS
S D
OM
ES
TIC
PR
OD
UC
T(A
t 19
99-2
000
Pric
es)
(Per
cen
t)
Sec
tor
2005
-06
2006
-07
2007
-08
2008
-09
Q1
Q2
Q3
Q4
Q1
Q2
Q3
Q4
Q1
Q2
Q3
Q4
Q1
Q2
Q3
Q4
12
34
56
78
910
1112
1314
1516
17
1.A
gric
ultu
re a
nd A
llied
Act
iviti
es3.
74.
48.
25.
92.
83.
34.
15.
34.
33.
98.
12.
23.
02.
7-0
.82.
7(1
9.7)
(16.
0)(2
3.4)
(18.
7)(1
8.5)
(15.
0)(2
2.2)
(17.
9)(1
7.6)
(14.
3)(2
2.0)
(16.
9)(1
6.8)
(13.
6)(2
0.6)
(16.
4)
2.
Indu
stry
9.9
6.7
7.3
8.7
10.1
10.7
10.4
11.6
8.5
7.5
7.6
5.9
5.1
4.8
1.6
-0.5
(19.
8)(2
0.4)
(18.
4)(1
9.1)
(19.
9)(2
0.5)
(18.
6)(1
9.4)
(19.
7)(2
0.2)
(18.
3)(1
8.9)
(19.
2)(1
9.7)
(17.
6)(1
7.8)
of w
hich
:a)
Man
ufac
turin
g10
.78.
18.
29.
411
.511
.911
.012
.510
.08.
28.
66.
35.
55.
10.
9-1
.4(1
5.2)
(15.
9)(1
4.3)
(14.
9)(1
5.5)
(16.
2)(1
4.6)
(15.
2)(1
5.6)
(16.
1)(1
4.5)
(14.
9)(1
5.2)
(15.
7)(1
3.8)
(13.
9)b)
Min
ing
and
quar
ryin
g7.
51.
83.
96.
37.
27.
09.
211
.40.
13.
84.
24.
74.
63.
74.
91.
6(2
.2)
(2.1
)(2
.0)
(2.2
)(2
.1)
(2.0
)(2
.0)
(2.2
)(2
.0)
(1.9
)(1
.9)
(2.1
)(1
.9)
(1.9
)(1
.9)
(2.0
)c)
Ele
ctric
ity, g
as a
nd w
ater
Sup
ply
7.2
2.4
4.8
5.9
3.6
5.9
6.9
4.7
6.9
5.9
3.8
4.6
2.7
3.8
3.5
3.6
(2.4
)(2
.4)
(2.1
)(2
.1)
(2.2
)(2
.3)
(2.0
)(2
.0)
(2.2
)(2
.2)
(1.9
)(1
.9)
(2.1
)(2
.1)
(1.9
)(1
.8)
3.
Ser
vice
s10
.610
.811
.012
.211
.711
.711
.210
.610
.810
.710
.211
.310
.09.
89.
58.
4(6
0.5)
(63.
7)(5
8.2)
(62.
2)(6
1.7)
(64.
5)(5
9.2)
(62.
7)(6
2.6)
(65.
5)(5
9.7)
(64.
2)(6
3.9)
(66.
8)(6
1.8)
(65.
9)of
whi
ch :
a)C
onst
ruct
ion
14.5
13.1
18.9
18.1
12.9
11.7
10.5
12.1
11.0
13.4
9.7
6.9
8.4
9.6
4.2
6.8
(7.1
)(7
.2)
(6.8
)(7
.0)
(7.3
)(7
.3)
(6.9
)(7
.1)
(7.4
)(7
.6)
(6.9
)(7
.0)
(7.5
)(7
.8)
(6.8
)(7
.1)
b)Tr
ade,
hot
els,
rest
aura
nts,
12.1
11.7
11.2
13.2
11.9
13.7
13.2
12.4
13.1
10.9
11.7
13.8
13.0
12.1
5.9
6.3
trans
port
, sto
rage
and
com
mun
icat
ion
(25.
8)(2
6.9)
(25.
6)(2
7.2)
(26.
4)(2
7.7)
(26.
5)(2
7.9)
(27.
3)(2
8.2)
(27.
1)(2
9.2)
(28.
6)(2
9.4)
(27.
1)(2
9.4)
c)Fi
nanc
ing,
insu
ranc
e, re
al e
stat
e10
.011
.810
.213
.413
.413
.714
.613
.412
.612
.411
.910
.36.
96.
48.
39.
5an
d bu
sine
ss s
ervi
ces
(14.
1)(1
4.6)
(12.
9)(1
3.5)
(14.
6)(1
5.1)
(13.
6)(1
4.0)
(15.
1)(1
5.5)
(13.
9)(1
4.2)
(14.
9)(1
5.3)
(14.
2)(1
4.7)
d)C
omm
unity
, soc
ial a
nd p
erso
nal s
ervi
ces
6.7
7.2
7.7
6.7
9.0
6.0
4.4
4.0
4.5
7.1
5.5
9.5
8.2
9.0
22.5
12.5
(13.
5)(1
4.9)
(12.
8)(1
4.5)
(13.
4)(1
4.4)
(12.
2)(1
3.7)
(12.
8)(1
4.1)
(11.
8)(1
3.8)
(12.
9)(1
4.3)
(13.
7)(1
4.7)
4.
Gro
ss D
omes
tic P
rodu
ct a
t fac
tor
cost
9.1
8.9
9.7
10.3
9.7
10.2
9.4
9.8
9.2
9.0
9.3
8.6
7.8
7.7
5.8
5.8
Mem
oA
mou
nt in
Rup
ees
cror
e
(at
curr
ent
pric
es)
1.
Agr
icul
ture
and
Alli
ed A
ctiv
ities
1,41
,884
1,17
,101
2,02
,932
1,63
,719
1,53
,032
1,25
,906
2,22
,728
1,84
,378
1,78
,185
1,45
,044
2,56
,696
2,02
,672
1,97
,001
1,62
,432
2,80
,039
2,22
,281
2.
Indu
stry
1,58
,829
1,63
,145
1,73
,278
1,84
,529
1,82
,724
1,89
,898
2,02
,333
2,19
,171
2,10
,092
2,12
,319
2,24
,047
2,52
,170
2,39
,325
2,48
,081
2,46
,798
2,51
,094
3.
Ser
vice
s4,
49,7
784,
72,0
915,
07,8
995,
47,2
025,
22,2
375,
49,6
285,
90,5
286,
36,8
206,
04,9
856,
28,1
206,
66,8
277,
39,7
367,
20,6
837,
65,1
207,
84,0
908,
16,2
40 4
.G
ross
Dom
estic
Pro
duct
at f
acto
r cos
t7,
50,4
897,
52,3
388,
84,1
098,
95,4
518,
57,9
948,
65,4
3210
,15,
589
10,4
0,36
99,
93,2
639,
85,4
8211
,47,
569
11,9
4,57
811
,57,
009
11,7
5,63
213
,10,
925
12,8
9,61
6
( at c
onst
ant p
rices
199
9-00
)
1.
Agr
icul
ture
and
Alli
ed A
ctiv
ities
1,19
,345
95,5
271,
62,4
911,
33,7
511,
22,7
3598
,683
1,69
,107
1,40
,790
1,27
,960
1,02
,496
1,82
,738
1,43
,926
1,31
,849
1,05
,214
1,81
,197
1,47
,783
2.
Indu
stry
1,19
,934
1,21
,854
1,28
,153
1,36
,577
1,32
,040
1,34
,926
1,41
,435
1,52
,375
1,43
,312
1,45
,097
1,52
,202
1,61
,421
1,50
,627
1,52
,066
1,54
,632
1,60
,556
3.
Ser
vice
s3,
67,1
363,
80,6
834,
05,1
914,
45,4
574,
10,2
144,
25,2
194,
50,7
724,
92,8
264,
54,7
134,
70,6
164,
96,7
975,
48,4
385,
00,1
415,
16,5
725,
44,1
505,
94,5
85 4
.G
ross
Dom
estic
Pro
duct
at f
acto
r cos
t6,
06,4
165,
98,0
656,
95,8
357,
15,7
866,
64,9
896,
58,8
277,
61,3
137,
85,9
917,
25,9
857,
18,2
098,
31,7
378,
53,7
857,
82,6
187,
73,8
528,
79,9
809,
02,9
24
Not
e:
1. F
igur
es in
par
enth
eses
are
per
cent
age
shar
e to
GD
P.
2. Q
uarte
rs Q
1, Q
2 , Q
3 an
d Q
4 de
note
Apr
il-Ju
ne, J
uly-
Sep
tem
ber,
Oct
ober
-Dec
embe
r and
Jan
uary
-Mar
ch, r
espe
ctiv
ely.
3. C
onst
ituen
ts m
ay n
ot a
dd u
p to
100
due
to ro
undi
ng o
ff.S
ourc
e:
Cen
tral S
tatis
tical
Org
anis
atio
n.
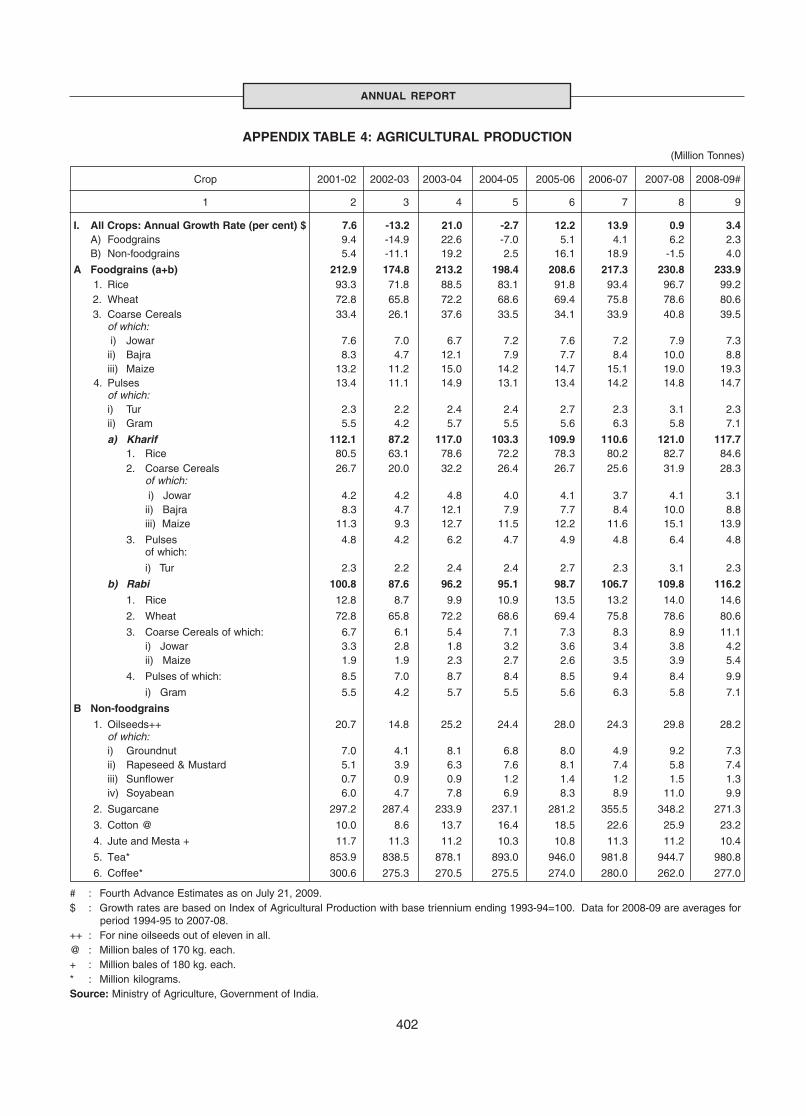
402
ANNUAL REPORT
APPENDIX TABLE 4: AGRICULTURAL PRODUCTION(Million Tonnes)
Crop 2001-02 2002-03 2003-04 2004-05 2005-06 2006-07 2007-08 2008-09#
1 2 3 4 5 6 7 8 9
I. All Crops: Annual Growth Rate (per cent) $ 7.6 -13.2 21.0 -2.7 12.2 13.9 0.9 3.4A) Foodgrains 9.4 -14.9 22.6 -7.0 5.1 4.1 6.2 2.3B) Non-foodgrains 5.4 -11.1 19.2 2.5 16.1 18.9 -1.5 4.0
A Foodgrains (a+b) 212.9 174.8 213.2 198.4 208.6 217.3 230.8 233.9 1. Rice 93.3 71.8 88.5 83.1 91.8 93.4 96.7 99.2 2. Wheat 72.8 65.8 72.2 68.6 69.4 75.8 78.6 80.6 3. Coarse Cereals 33.4 26.1 37.6 33.5 34.1 33.9 40.8 39.5
of which: i) Jowar 7.6 7.0 6.7 7.2 7.6 7.2 7.9 7.3ii) Bajra 8.3 4.7 12.1 7.9 7.7 8.4 10.0 8.8iii) Maize 13.2 11.2 15.0 14.2 14.7 15.1 19.0 19.3
4. Pulses 13.4 11.1 14.9 13.1 13.4 14.2 14.8 14.7of which:i) Tur 2.3 2.2 2.4 2.4 2.7 2.3 3.1 2.3ii) Gram 5.5 4.2 5.7 5.5 5.6 6.3 5.8 7.1
a) Kharif 112.1 87.2 117.0 103.3 109.9 110.6 121.0 117.71. Rice 80.5 63.1 78.6 72.2 78.3 80.2 82.7 84.62. Coarse Cereals 26.7 20.0 32.2 26.4 26.7 25.6 31.9 28.3
of which: i) Jowar 4.2 4.2 4.8 4.0 4.1 3.7 4.1 3.1ii) Bajra 8.3 4.7 12.1 7.9 7.7 8.4 10.0 8.8iii) Maize 11.3 9.3 12.7 11.5 12.2 11.6 15.1 13.9
3. Pulses 4.8 4.2 6.2 4.7 4.9 4.8 6.4 4.8of which:
i) Tur 2.3 2.2 2.4 2.4 2.7 2.3 3.1 2.3
b) Rabi 100.8 87.6 96.2 95.1 98.7 106.7 109.8 116.2
1. Rice 12.8 8.7 9.9 10.9 13.5 13.2 14.0 14.6
2. Wheat 72.8 65.8 72.2 68.6 69.4 75.8 78.6 80.6
3. Coarse Cereals of which: 6.7 6.1 5.4 7.1 7.3 8.3 8.9 11.1i) Jowar 3.3 2.8 1.8 3.2 3.6 3.4 3.8 4.2ii) Maize 1.9 1.9 2.3 2.7 2.6 3.5 3.9 5.4
4. Pulses of which: 8.5 7.0 8.7 8.4 8.5 9.4 8.4 9.9
i) Gram 5.5 4.2 5.7 5.5 5.6 6.3 5.8 7.1
B Non-foodgrains
1. Oilseeds++ 20.7 14.8 25.2 24.4 28.0 24.3 29.8 28.2of which:i) Groundnut 7.0 4.1 8.1 6.8 8.0 4.9 9.2 7.3ii) Rapeseed & Mustard 5.1 3.9 6.3 7.6 8.1 7.4 5.8 7.4iii) Sunflower 0.7 0.9 0.9 1.2 1.4 1.2 1.5 1.3iv) Soyabean 6.0 4.7 7.8 6.9 8.3 8.9 11.0 9.9
2. Sugarcane 297.2 287.4 233.9 237.1 281.2 355.5 348.2 271.3
3. Cotton @ 10.0 8.6 13.7 16.4 18.5 22.6 25.9 23.2
4. Jute and Mesta + 11.7 11.3 11.2 10.3 10.8 11.3 11.2 10.4
5. Tea* 853.9 838.5 878.1 893.0 946.0 981.8 944.7 980.8
6. Coffee* 300.6 275.3 270.5 275.5 274.0 280.0 262.0 277.0
# : Fourth Advance Estimates as on July 21, 2009.$ : Growth rates are based on Index of Agricultural Production with base triennium ending 1993-94=100. Data for 2008-09 are averages for
period 1994-95 to 2007-08.++ : For nine oilseeds out of eleven in all.@ : Million bales of 170 kg. each.+ : Million bales of 180 kg. each.* : Million kilograms.Source: Ministry of Agriculture, Government of India.
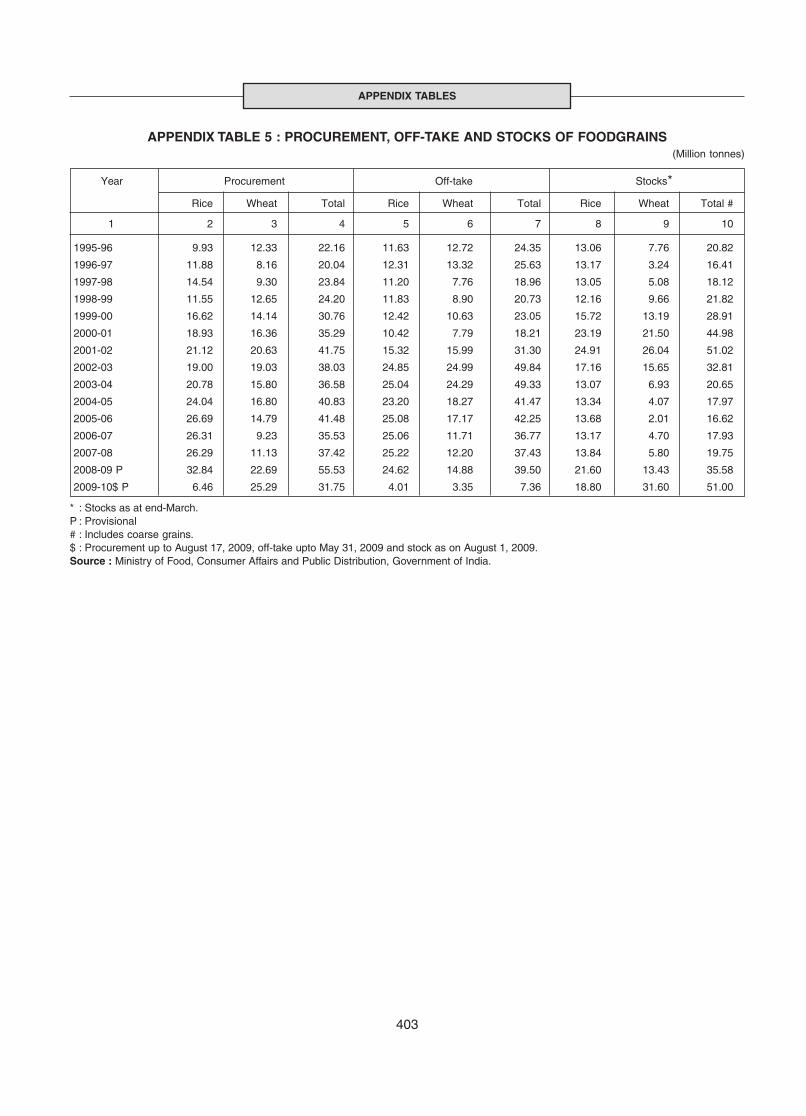
403
APPENDIX TABLES
APPENDIX TABLE 5 : PROCUREMENT, OFF-TAKE AND STOCKS OF FOODGRAINS(Million tonnes)
Year Procurement Off-take Stocks*
Rice Wheat Total Rice Wheat Total Rice Wheat Total #
1 2 3 4 5 6 7 8 9 10
1995-96 9.93 12.33 22.16 11.63 12.72 24.35 13.06 7.76 20.82
1996-97 11.88 8.16 20.04 12.31 13.32 25.63 13.17 3.24 16.41
1997-98 14.54 9.30 23.84 11.20 7.76 18.96 13.05 5.08 18.12
1998-99 11.55 12.65 24.20 11.83 8.90 20.73 12.16 9.66 21.82
1999-00 16.62 14.14 30.76 12.42 10.63 23.05 15.72 13.19 28.91
2000-01 18.93 16.36 35.29 10.42 7.79 18.21 23.19 21.50 44.98
2001-02 21.12 20.63 41.75 15.32 15.99 31.30 24.91 26.04 51.02
2002-03 19.00 19.03 38.03 24.85 24.99 49.84 17.16 15.65 32.81
2003-04 20.78 15.80 36.58 25.04 24.29 49.33 13.07 6.93 20.65
2004-05 24.04 16.80 40.83 23.20 18.27 41.47 13.34 4.07 17.97
2005-06 26.69 14.79 41.48 25.08 17.17 42.25 13.68 2.01 16.62
2006-07 26.31 9.23 35.53 25.06 11.71 36.77 13.17 4.70 17.93
2007-08 26.29 11.13 37.42 25.22 12.20 37.43 13.84 5.80 19.75
2008-09 P 32.84 22.69 55.53 24.62 14.88 39.50 21.60 13.43 35.58
2009-10$ P 6.46 25.29 31.75 4.01 3.35 7.36 18.80 31.60 51.00
* : Stocks as at end-March.P : Provisional# : Includes coarse grains.$ : Procurement up to August 17, 2009, off-take upto May 31, 2009 and stock as on August 1, 2009.Source : Ministry of Food, Consumer Affairs and Public Distribution, Government of India.
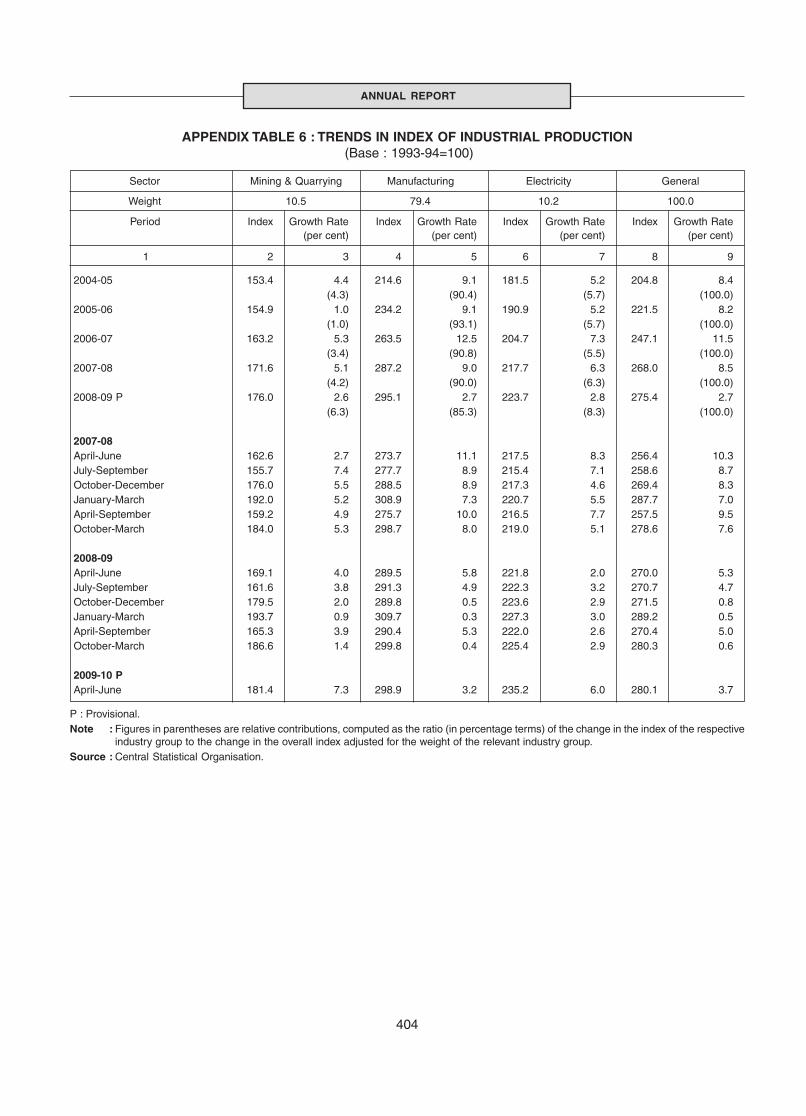
404
ANNUAL REPORT
APPENDIX TABLE 6 : TRENDS IN INDEX OF INDUSTRIAL PRODUCTION(Base : 1993-94=100)
Sector Mining & Quarrying Manufacturing Electricity General
Weight 10.5 79.4 10.2 100.0
Period Index Growth Rate Index Growth Rate Index Growth Rate Index Growth Rate(per cent) (per cent) (per cent) (per cent)
1 2 3 4 5 6 7 8 9
2004-05 153.4 4.4 214.6 9.1 181.5 5.2 204.8 8.4(4.3) (90.4) (5.7) (100.0)
2005-06 154.9 1.0 234.2 9.1 190.9 5.2 221.5 8.2(1.0) (93.1) (5.7) (100.0)
2006-07 163.2 5.3 263.5 12.5 204.7 7.3 247.1 11.5(3.4) (90.8) (5.5) (100.0)
2007-08 171.6 5.1 287.2 9.0 217.7 6.3 268.0 8.5(4.2) (90.0) (6.3) (100.0)
2008-09 P 176.0 2.6 295.1 2.7 223.7 2.8 275.4 2.7(6.3) (85.3) (8.3) (100.0)
2007-08April-June 162.6 2.7 273.7 11.1 217.5 8.3 256.4 10.3July-September 155.7 7.4 277.7 8.9 215.4 7.1 258.6 8.7October-December 176.0 5.5 288.5 8.9 217.3 4.6 269.4 8.3January-March 192.0 5.2 308.9 7.3 220.7 5.5 287.7 7.0April-September 159.2 4.9 275.7 10.0 216.5 7.7 257.5 9.5October-March 184.0 5.3 298.7 8.0 219.0 5.1 278.6 7.6
2008-09April-June 169.1 4.0 289.5 5.8 221.8 2.0 270.0 5.3July-September 161.6 3.8 291.3 4.9 222.3 3.2 270.7 4.7October-December 179.5 2.0 289.8 0.5 223.6 2.9 271.5 0.8January-March 193.7 0.9 309.7 0.3 227.3 3.0 289.2 0.5April-September 165.3 3.9 290.4 5.3 222.0 2.6 270.4 5.0October-March 186.6 1.4 299.8 0.4 225.4 2.9 280.3 0.6
2009-10 PApril-June 181.4 7.3 298.9 3.2 235.2 6.0 280.1 3.7
P : Provisional.Note : Figures in parentheses are relative contributions, computed as the ratio (in percentage terms) of the change in the index of the respective
industry group to the change in the overall index adjusted for the weight of the relevant industry group.Source : Central Statistical Organisation.

405
APPENDIX TABLES
APPENDIX TABLE 7 : GROWTH IN INDEX OF SEVENTEEN MAJOR INDUSTRY GROUPS OFMANUFACTURING SECTOR
(Base : 1993-94=100)
Index Percentage Relative ContributionIndustry Group Weight Variation (Per cent)
2007-08 2008-09 2007-08 2008-09 2007-08 2008-09
1 2 3 4 5 6 7 8
I. Acceleration 4.92
1. Beverages,tobacco and related products 2.38 498.0 578.5 12.0 16.2 6.8 32.3
2. Textile products (including wearing apparel) 2.54 295.5 312.5 3.7 4.2 1.4 5.2
II. Deceleration 44.61
3. Machinery and Equipment other than 9.60 394.4 429.1 10.5 8.7 19.0 54.9Transport Equipment
4. Chemicals and chemical products except 14.00 313.4 326.3 10.6 4.1 22.4 30.4Products of Petroleum & coal
5. Basic metal and alloy industries 7.50 312.7 325.1 12.1 4.0 13.4 15.5
6. Transport equipment and parts 4.00 378.4 387.9 2.9 2.1 2.3 5.4
7. Paper and Paper products and printing, 2.70 255.3 260.0 2.7 1.7 0.9 2.0Publishing and Allied Activities
8. Non-metallic mineral products 4.40 323.2 327.0 5.7 1.1 4.1 2.7
9. Other manufacturing industries 2.60 357.4 358.9 19.8 0.4 8.0 0.7
III. Negative 29.83
10. Wool,silk and man-made fibre textiles 2.30 281.2 281.2 4.8 -0.2 1.5 -0.2
11. Rubber, plastic, petroleum and coal products 5.70 246.4 242.6 8.9 -1.5 6.1 -3.6
12. Cotton textiles 5.50 164.0 160.9 4.3 -2.1 2.0 -3.2
13. Metal products and parts 2.80 172.9 165.9 -5.6 -4.1 -1.5 -3.3(except machinery and Equipment)
14. Leather and Leather & fur products 1.10 167.8 156.3 11.7 -6.9 1.1 -2.2
15. Food products 9.10 198.2 178.9 7.0 -9.7 6.3 -29.3
16. Jute and other vegetable fibre textiles 0.60 120.7 108.6 33.0 -10.1 0.9 -1.2(except cotton)
17. Wood and wood products, furniture & fixtures 2.70 127.9 115.6 40.5 -10.3 5.3 -6.0
Manufacturing (Total) 79.36 287.2 295.1 6.7 0.7 100.0 100.0
Note : 1. The industry groups of manufacturing sector have been categorised according to their performance during 2008-09.2. The relative contribution is computed as the ratio ( in percentage terms ) of the change in the index of the respective industry group
to the change in the overall index adjusted for the weight of the relevant industry group.Source : Central Statistical Organisation.
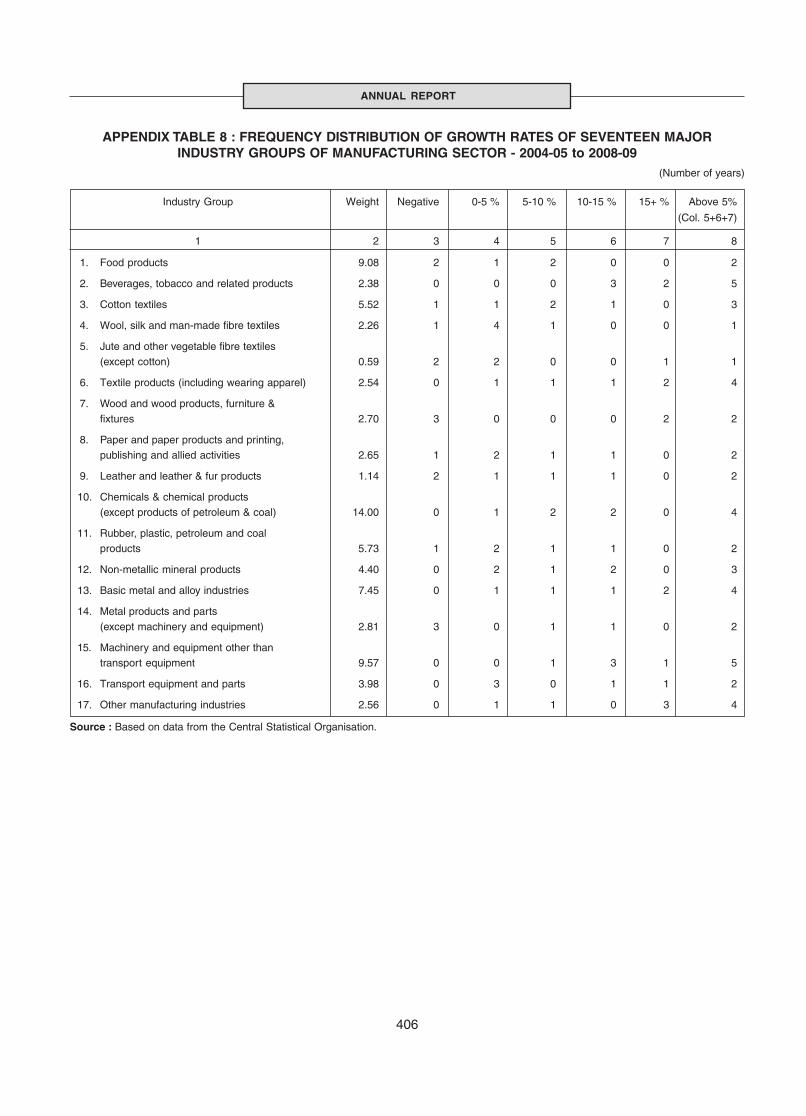
406
ANNUAL REPORT
APPENDIX TABLE 8 : FREQUENCY DISTRIBUTION OF GROWTH RATES OF SEVENTEEN MAJORINDUSTRY GROUPS OF MANUFACTURING SECTOR - 2004-05 to 2008-09
(Number of years)
Industry Group Weight Negative 0-5 % 5-10 % 10-15 % 15+ % Above 5%
(Col. 5+6+7)
1 2 3 4 5 6 7 8
1. Food products 9.08 2 1 2 0 0 2
2. Beverages, tobacco and related products 2.38 0 0 0 3 2 5
3. Cotton textiles 5.52 1 1 2 1 0 3
4. Wool, silk and man-made fibre textiles 2.26 1 4 1 0 0 1
5. Jute and other vegetable fibre textiles(except cotton) 0.59 2 2 0 0 1 1
6. Textile products (including wearing apparel) 2.54 0 1 1 1 2 4
7. Wood and wood products, furniture &fixtures 2.70 3 0 0 0 2 2
8. Paper and paper products and printing,publishing and allied activities 2.65 1 2 1 1 0 2
9. Leather and leather & fur products 1.14 2 1 1 1 0 2
10. Chemicals & chemical products(except products of petroleum & coal) 14.00 0 1 2 2 0 4
11. Rubber, plastic, petroleum and coalproducts 5.73 1 2 1 1 0 2
12. Non-metallic mineral products 4.40 0 2 1 2 0 3
13. Basic metal and alloy industries 7.45 0 1 1 1 2 4
14. Metal products and parts(except machinery and equipment) 2.81 3 0 1 1 0 2
15. Machinery and equipment other thantransport equipment 9.57 0 0 1 3 1 5
16. Transport equipment and parts 3.98 0 3 0 1 1 2
17. Other manufacturing industries 2.56 0 1 1 0 3 4
Source : Based on data from the Central Statistical Organisation.
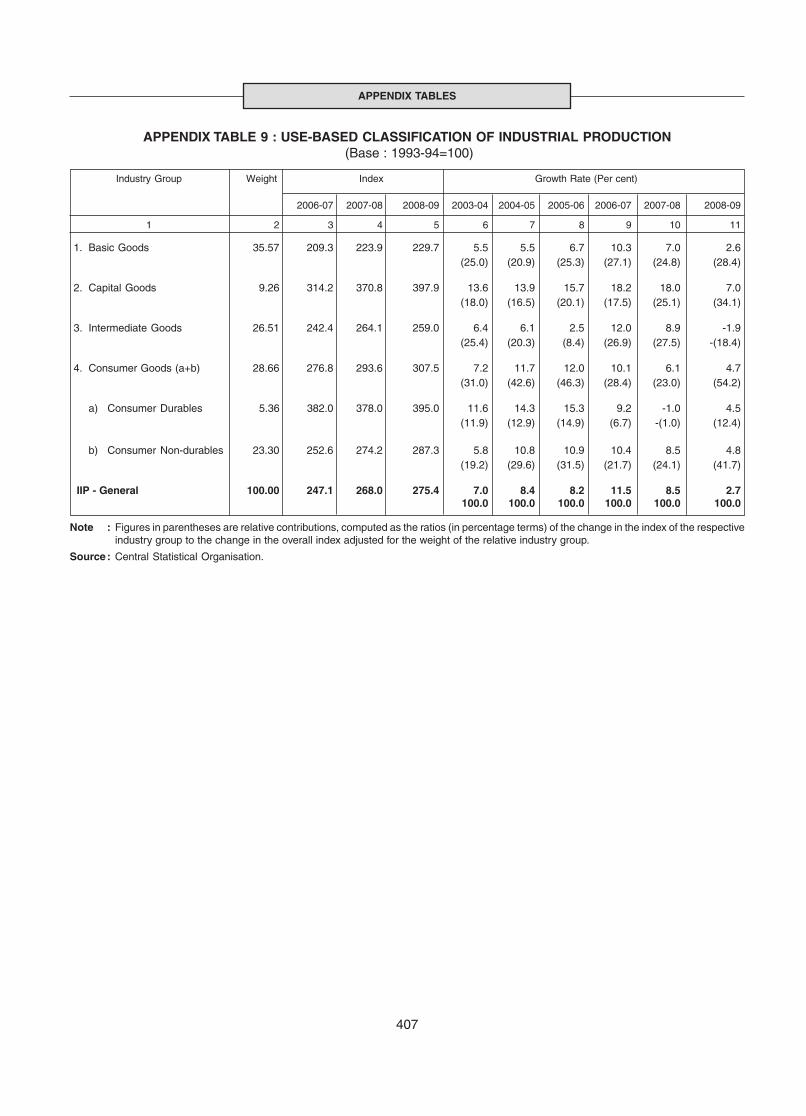
407
APPENDIX TABLES
APPENDIX TABLE 9 : USE-BASED CLASSIFICATION OF INDUSTRIAL PRODUCTION (Base : 1993-94=100)
Industry Group Weight Index Growth Rate (Per cent)
2006-07 2007-08 2008-09 2003-04 2004-05 2005-06 2006-07 2007-08 2008-09
1 2 3 4 5 6 7 8 9 10 11
1. Basic Goods 35.57 209.3 223.9 229.7 5.5 5.5 6.7 10.3 7.0 2.6(25.0) (20.9) (25.3) (27.1) (24.8) (28.4)
2. Capital Goods 9.26 314.2 370.8 397.9 13.6 13.9 15.7 18.2 18.0 7.0(18.0) (16.5) (20.1) (17.5) (25.1) (34.1)
3. Intermediate Goods 26.51 242.4 264.1 259.0 6.4 6.1 2.5 12.0 8.9 -1.9(25.4) (20.3) (8.4) (26.9) (27.5) -(18.4)
4. Consumer Goods (a+b) 28.66 276.8 293.6 307.5 7.2 11.7 12.0 10.1 6.1 4.7(31.0) (42.6) (46.3) (28.4) (23.0) (54.2)
a) Consumer Durables 5.36 382.0 378.0 395.0 11.6 14.3 15.3 9.2 -1.0 4.5(11.9) (12.9) (14.9) (6.7) -(1.0) (12.4)
b) Consumer Non-durables 23.30 252.6 274.2 287.3 5.8 10.8 10.9 10.4 8.5 4.8(19.2) (29.6) (31.5) (21.7) (24.1) (41.7)
IIP - General 100.00 247.1 268.0 275.4 7.0 8.4 8.2 11.5 8.5 2.7100.0 100.0 100.0 100.0 100.0 100.0
Note : Figures in parentheses are relative contributions, computed as the ratios (in percentage terms) of the change in the index of the respectiveindustry group to the change in the overall index adjusted for the weight of the relative industry group.
Source : Central Statistical Organisation.

408
ANNUAL REPORT
APPENDIX TABLE 10 : GROWTH OF SIX INFRASTRUCTURE INDUSTRIES (Base: 1993-94=100)
Industry Weight Index Growth Rate (Per cent)
2007-08 2008-09 2004-05 2005-06 2006-07 2007-08 2008-09
1 2 3 4 5 6 7 8 9
1. Electricity 10.17 217.7 223.7 5.2 5.2 7.3 6.3 2.8(32.1) (30.5) (28.0) (37.2) (36.3)
2. Coal 3.22 183.6 197.9 6.2 6.6 5.9 6.3 7.8(10.2) (10.4) (6.2) (9.8) (27.2)
3. Steel 5.13 350.7 353.4 8.4 10.8 13.1 6.2 0.8(37.1) (46.9) (38.9) (29.5) (8.2)
4. Cement 1.99 304.1 326.9 6.6 12.4 9.1 8.1 7.5(10.0) (18.1) (9.3) (12.7) (27.1)
5. Petroleum Crude 4.17 126.2 124.0 1.8 -5.2 5.5 0.4 -1.8(3.3) -(8.8) (5.5) (0.5) -(5.7)
6. Petroleum Refinery Products 2.00 292.4 301.2 4.3 2.1 12.9 6.5 3.0(7.0) (3.3) (12.4) (10.0) (10.4)
Composite Index ofInfrastructure Industries # 26.68 236.9 243.5 5.8 6.1 9.3 5.9 2.8
(100.0) (100.0) (100.0) (100.0) (100.0)
# : Estimate based on weighted industry-wise index.
Note : Figures in brackets are relative contributions. The relative contribution is computed as the ratio (in percentage terms) of the change inthe index of the respective industry group to the change in the overall index adjusted for the weight of the relative industry group.
Source : Office of the Economic Adviser, Ministry of Industry, Government of India.
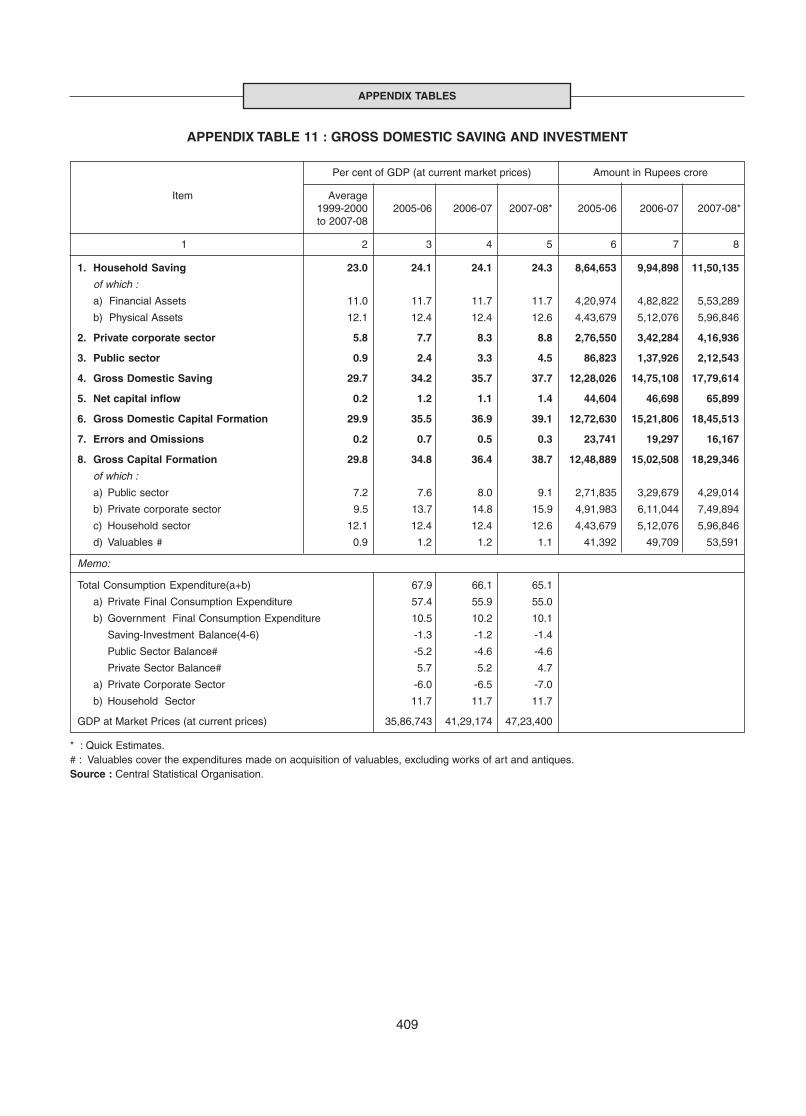
409
APPENDIX TABLES
APPENDIX TABLE 11 : GROSS DOMESTIC SAVING AND INVESTMENT
Per cent of GDP (at current market prices) Amount in Rupees crore
Item Average1999-2000 2005-06 2006-07 2007-08* 2005-06 2006-07 2007-08*to 2007-08
1 2 3 4 5 6 7 8
1. Household Saving 23.0 24.1 24.1 24.3 8,64,653 9,94,898 11,50,135
of which :
a) Financial Assets 11.0 11.7 11.7 11.7 4,20,974 4,82,822 5,53,289
b) Physical Assets 12.1 12.4 12.4 12.6 4,43,679 5,12,076 5,96,846
2. Private corporate sector 5.8 7.7 8.3 8.8 2,76,550 3,42,284 4,16,936
3. Public sector 0.9 2.4 3.3 4.5 86,823 1,37,926 2,12,543
4. Gross Domestic Saving 29.7 34.2 35.7 37.7 12,28,026 14,75,108 17,79,614
5. Net capital inflow 0.2 1.2 1.1 1.4 44,604 46,698 65,899
6. Gross Domestic Capital Formation 29.9 35.5 36.9 39.1 12,72,630 15,21,806 18,45,513
7. Errors and Omissions 0.2 0.7 0.5 0.3 23,741 19,297 16,167
8. Gross Capital Formation 29.8 34.8 36.4 38.7 12,48,889 15,02,508 18,29,346
of which :
a) Public sector 7.2 7.6 8.0 9.1 2,71,835 3,29,679 4,29,014
b) Private corporate sector 9.5 13.7 14.8 15.9 4,91,983 6,11,044 7,49,894
c) Household sector 12.1 12.4 12.4 12.6 4,43,679 5,12,076 5,96,846
d) Valuables # 0.9 1.2 1.2 1.1 41,392 49,709 53,591
Memo:
Total Consumption Expenditure(a+b) 67.9 66.1 65.1
a) Private Final Consumption Expenditure 57.4 55.9 55.0
b) Government Final Consumption Expenditure 10.5 10.2 10.1
Saving-Investment Balance(4-6) -1.3 -1.2 -1.4
Public Sector Balance# -5.2 -4.6 -4.6
Private Sector Balance# 5.7 5.2 4.7
a) Private Corporate Sector -6.0 -6.5 -7.0
b) Household Sector 11.7 11.7 11.7
GDP at Market Prices (at current prices) 35,86,743 41,29,174 47,23,400
* : Quick Estimates.# : Valuables cover the expenditures made on acquisition of valuables, excluding works of art and antiques.Source : Central Statistical Organisation.
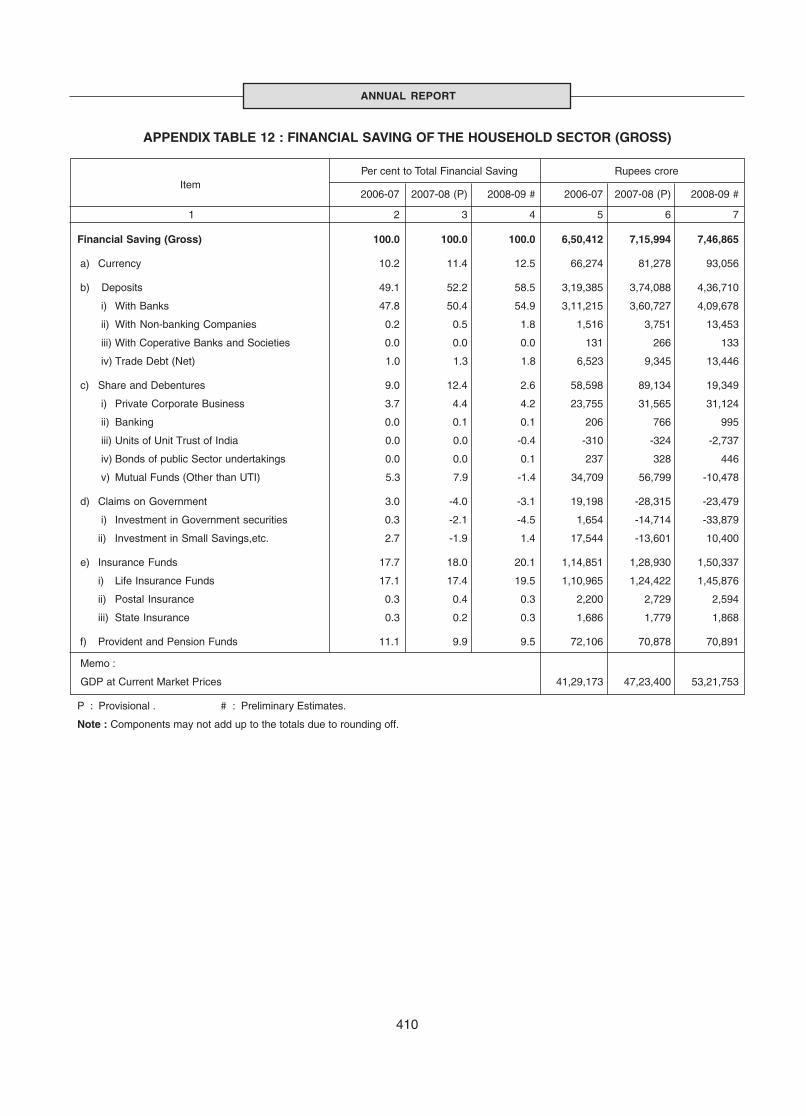
410
ANNUAL REPORT
APPENDIX TABLE 12 : FINANCIAL SAVING OF THE HOUSEHOLD SECTOR (GROSS)
Per cent to Total Financial Saving Rupees croreItem
2006-07 2007-08 (P) 2008-09 # 2006-07 2007-08 (P) 2008-09 #
1 2 3 4 5 6 7
Financial Saving (Gross) 100.0 100.0 100.0 6,50,412 7,15,994 7,46,865
a) Currency 10.2 11.4 12.5 66,274 81,278 93,056
b) Deposits 49.1 52.2 58.5 3,19,385 3,74,088 4,36,710
i) With Banks 47.8 50.4 54.9 3,11,215 3,60,727 4,09,678
ii) With Non-banking Companies 0.2 0.5 1.8 1,516 3,751 13,453
iii) With Coperative Banks and Societies 0.0 0.0 0.0 131 266 133
iv) Trade Debt (Net) 1.0 1.3 1.8 6,523 9,345 13,446
c) Share and Debentures 9.0 12.4 2.6 58,598 89,134 19,349
i) Private Corporate Business 3.7 4.4 4.2 23,755 31,565 31,124
ii) Banking 0.0 0.1 0.1 206 766 995
iii) Units of Unit Trust of India 0.0 0.0 -0.4 -310 -324 -2,737
iv) Bonds of public Sector undertakings 0.0 0.0 0.1 237 328 446
v) Mutual Funds (Other than UTI) 5.3 7.9 -1.4 34,709 56,799 -10,478
d) Claims on Government 3.0 -4.0 -3.1 19,198 -28,315 -23,479
i) Investment in Government securities 0.3 -2.1 -4.5 1,654 -14,714 -33,879
ii) Investment in Small Savings,etc. 2.7 -1.9 1.4 17,544 -13,601 10,400
e) Insurance Funds 17.7 18.0 20.1 1,14,851 1,28,930 1,50,337
i) Life Insurance Funds 17.1 17.4 19.5 1,10,965 1,24,422 1,45,876
ii) Postal Insurance 0.3 0.4 0.3 2,200 2,729 2,594
iii) State Insurance 0.3 0.2 0.3 1,686 1,779 1,868
f) Provident and Pension Funds 11.1 9.9 9.5 72,106 70,878 70,891
Memo :
GDP at Current Market Prices 41,29,173 47,23,400 53,21,753
P : Provisional . # : Preliminary Estimates.
Note : Components may not add up to the totals due to rounding off.
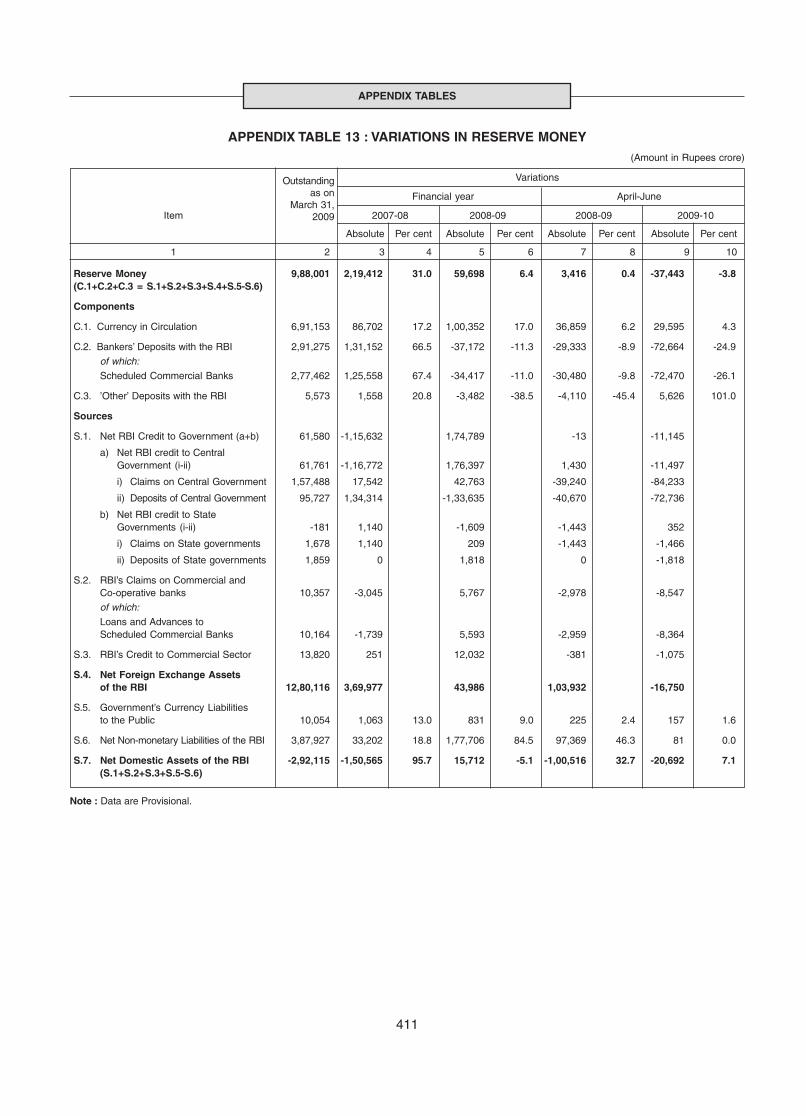
411
APPENDIX TABLES
APPENDIX TABLE 13 : VARIATIONS IN RESERVE MONEY(Amount in Rupees crore)
Variations
Financial year April-June
Item 2007-08 2008-09 2008-09 2009-10
Absolute Per cent Absolute Per cent Absolute Per cent Absolute Per cent
1 2 3 4 5 6 7 8 9 10
Reserve Money 9,88,001 2,19,412 31.0 59,698 6.4 3,416 0.4 -37,443 -3.8(C.1+C.2+C.3 = S.1+S.2+S.3+S.4+S.5-S.6)
Components
C.1. Currency in Circulation 6,91,153 86,702 17.2 1,00,352 17.0 36,859 6.2 29,595 4.3
C.2. Bankers’ Deposits with the RBI 2,91,275 1,31,152 66.5 -37,172 -11.3 -29,333 -8.9 -72,664 -24.9
of which:Scheduled Commercial Banks 2,77,462 1,25,558 67.4 -34,417 -11.0 -30,480 -9.8 -72,470 -26.1
C.3. ’Other’ Deposits with the RBI 5,573 1,558 20.8 -3,482 -38.5 -4,110 -45.4 5,626 101.0
Sources
S.1. Net RBI Credit to Government (a+b) 61,580 -1,15,632 1,74,789 -13 -11,145
a) Net RBI credit to CentralGovernment (i-ii) 61,761 -1,16,772 1,76,397 1,430 -11,497
i) Claims on Central Government 1,57,488 17,542 42,763 -39,240 -84,233
ii) Deposits of Central Government 95,727 1,34,314 -1,33,635 -40,670 -72,736
b) Net RBI credit to StateGovernments (i-ii) -181 1,140 -1,609 -1,443 352
i) Claims on State governments 1,678 1,140 209 -1,443 -1,466
ii) Deposits of State governments 1,859 0 1,818 0 -1,818
S.2. RBI’s Claims on Commercial andCo-operative banks 10,357 -3,045 5,767 -2,978 -8,547
of which:Loans and Advances toScheduled Commercial Banks 10,164 -1,739 5,593 -2,959 -8,364
S.3. RBI’s Credit to Commercial Sector 13,820 251 12,032 -381 -1,075
S.4. Net Foreign Exchange Assetsof the RBI 12,80,116 3,69,977 43,986 1,03,932 -16,750
S.5. Government’s Currency Liabilitiesto the Public 10,054 1,063 13.0 831 9.0 225 2.4 157 1.6
S.6. Net Non-monetary Liabilities of the RBI 3,87,927 33,202 18.8 1,77,706 84.5 97,369 46.3 81 0.0
S.7. Net Domestic Assets of the RBI -2,92,115 -1,50,565 95.7 15,712 -5.1 -1,00,516 32.7 -20,692 7.1(S.1+S.2+S.3+S.5-S.6)
Note : Data are Provisional.
Outstandingas on
March 31,2009
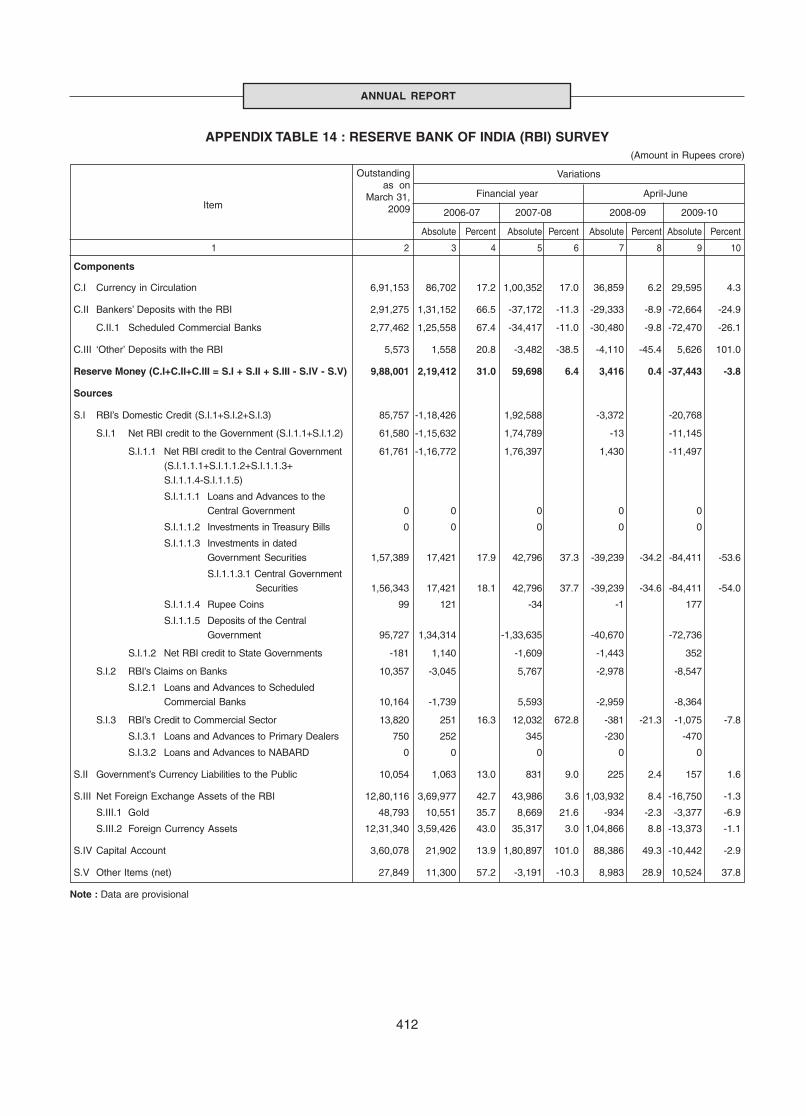
412
ANNUAL REPORT
APPENDIX TABLE 14 : RESERVE BANK OF INDIA (RBI) SURVEY(Amount in Rupees crore)
Variations
Financial year April-JuneItem
2006-07 2007-08 2008-09 2009-10
Absolute Percent Absolute Percent Absolute Percent Absolute Percent
1 2 3 4 5 6 7 8 9 10
Components
C.I Currency in Circulation 6,91,153 86,702 17.2 1,00,352 17.0 36,859 6.2 29,595 4.3
C.II Bankers’ Deposits with the RBI 2,91,275 1,31,152 66.5 -37,172 -11.3 -29,333 -8.9 -72,664 -24.9
C.II.1 Scheduled Commercial Banks 2,77,462 1,25,558 67.4 -34,417 -11.0 -30,480 -9.8 -72,470 -26.1
C.III ‘Other’ Deposits with the RBI 5,573 1,558 20.8 -3,482 -38.5 -4,110 -45.4 5,626 101.0
Reserve Money (C.I+C.II+C.III = S.I + S.II + S.III - S.IV - S.V) 9,88,001 2,19,412 31.0 59,698 6.4 3,416 0.4 -37,443 -3.8
Sources
S.I RBI’s Domestic Credit (S.I.1+S.I.2+S.I.3) 85,757 -1,18,426 1,92,588 -3,372 -20,768
S.I.1 Net RBI credit to the Government (S.I.1.1+S.I.1.2) 61,580 -1,15,632 1,74,789 -13 -11,145
S.I.1.1 Net RBI credit to the Central Government 61,761 -1,16,772 1,76,397 1,430 -11,497(S.I.1.1.1+S.I.1.1.2+S.I.1.1.3+S.I.1.1.4-S.I.1.1.5)
S.I.1.1.1 Loans and Advances to theCentral Government 0 0 0 0 0
S.I.1.1.2 Investments in Treasury Bills 0 0 0 0 0
S.I.1.1.3 Investments in datedGovernment Securities 1,57,389 17,421 17.9 42,796 37.3 -39,239 -34.2 -84,411 -53.6
S.I.1.1.3.1 Central Government Securities 1,56,343 17,421 18.1 42,796 37.7 -39,239 -34.6 -84,411 -54.0
S.I.1.1.4 Rupee Coins 99 121 -34 -1 177
S.I.1.1.5 Deposits of the CentralGovernment 95,727 1,34,314 -1,33,635 -40,670 -72,736
S.I.1.2 Net RBI credit to State Governments -181 1,140 -1,609 -1,443 352
S.I.2 RBI’s Claims on Banks 10,357 -3,045 5,767 -2,978 -8,547
S.I.2.1 Loans and Advances to ScheduledCommercial Banks 10,164 -1,739 5,593 -2,959 -8,364
S.I.3 RBI’s Credit to Commercial Sector 13,820 251 16.3 12,032 672.8 -381 -21.3 -1,075 -7.8
S.I.3.1 Loans and Advances to Primary Dealers 750 252 345 -230 -470
S.I.3.2 Loans and Advances to NABARD 0 0 0 0 0
S.II Government’s Currency Liabilities to the Public 10,054 1,063 13.0 831 9.0 225 2.4 157 1.6
S.III Net Foreign Exchange Assets of the RBI 12,80,116 3,69,977 42.7 43,986 3.6 1,03,932 8.4 -16,750 -1.3
S.III.1 Gold 48,793 10,551 35.7 8,669 21.6 -934 -2.3 -3,377 -6.9
S.III.2 Foreign Currency Assets 12,31,340 3,59,426 43.0 35,317 3.0 1,04,866 8.8 -13,373 -1.1
S.IV Capital Account 3,60,078 21,902 13.9 1,80,897 101.0 88,386 49.3 -10,442 -2.9
S.V Other Items (net) 27,849 11,300 57.2 -3,191 -10.3 8,983 28.9 10,524 37.8
Note : Data are provisional
Outstandingas on
March 31,2009
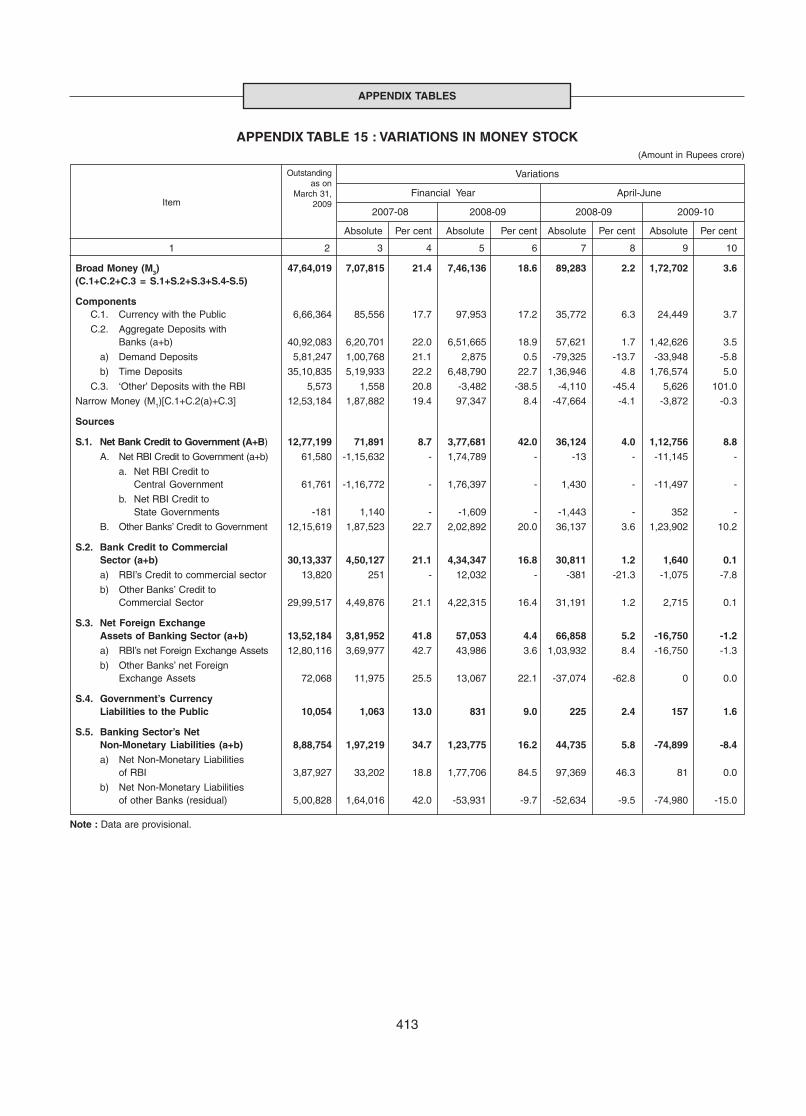
413
APPENDIX TABLES
Item
APPENDIX TABLE 15 : VARIATIONS IN MONEY STOCK(Amount in Rupees crore)
Variations
Financial Year April-June
2007-08 2008-09 2008-09 2009-10
Absolute Per cent Absolute Per cent Absolute Per cent Absolute Per cent
1 2 3 4 5 6 7 8 9 10
Broad Money (M3) 47,64,019 7,07,815 21.4 7,46,136 18.6 89,283 2.2 1,72,702 3.6(C.1+C.2+C.3 = S.1+S.2+S.3+S.4-S.5)
ComponentsC.1. Currency with the Public 6,66,364 85,556 17.7 97,953 17.2 35,772 6.3 24,449 3.7
C.2. Aggregate Deposits withBanks (a+b) 40,92,083 6,20,701 22.0 6,51,665 18.9 57,621 1.7 1,42,626 3.5
a) Demand Deposits 5,81,247 1,00,768 21.1 2,875 0.5 -79,325 -13.7 -33,948 -5.8
b) Time Deposits 35,10,835 5,19,933 22.2 6,48,790 22.7 1,36,946 4.8 1,76,574 5.0
C.3. ‘Other’ Deposits with the RBI 5,573 1,558 20.8 -3,482 -38.5 -4,110 -45.4 5,626 101.0
Narrow Money (M1)[C.1+C.2(a)+C.3] 12,53,184 1,87,882 19.4 97,347 8.4 -47,664 -4.1 -3,872 -0.3
Sources
S.1. Net Bank Credit to Government (A+B) 12,77,199 71,891 8.7 3,77,681 42.0 36,124 4.0 1,12,756 8.8A. Net RBI Credit to Government (a+b) 61,580 -1,15,632 - 1,74,789 - -13 - -11,145 -
a. Net RBI Credit toCentral Government 61,761 -1,16,772 - 1,76,397 - 1,430 - -11,497 -
b. Net RBI Credit toState Governments -181 1,140 - -1,609 - -1,443 - 352 -
B. Other Banks’ Credit to Government 12,15,619 1,87,523 22.7 2,02,892 20.0 36,137 3.6 1,23,902 10.2
S.2. Bank Credit to CommercialSector (a+b) 30,13,337 4,50,127 21.1 4,34,347 16.8 30,811 1.2 1,640 0.1a) RBI’s Credit to commercial sector 13,820 251 - 12,032 - -381 -21.3 -1,075 -7.8
b) Other Banks’ Credit toCommercial Sector 29,99,517 4,49,876 21.1 4,22,315 16.4 31,191 1.2 2,715 0.1
S.3. Net Foreign ExchangeAssets of Banking Sector (a+b) 13,52,184 3,81,952 41.8 57,053 4.4 66,858 5.2 -16,750 -1.2a) RBI’s net Foreign Exchange Assets 12,80,116 3,69,977 42.7 43,986 3.6 1,03,932 8.4 -16,750 -1.3
b) Other Banks’ net ForeignExchange Assets 72,068 11,975 25.5 13,067 22.1 -37,074 -62.8 0 0.0
S.4. Government’s CurrencyLiabilities to the Public 10,054 1,063 13.0 831 9.0 225 2.4 157 1.6
S.5. Banking Sector’s NetNon-Monetary Liabilities (a+b) 8,88,754 1,97,219 34.7 1,23,775 16.2 44,735 5.8 -74,899 -8.4a) Net Non-Monetary Liabilities
of RBI 3,87,927 33,202 18.8 1,77,706 84.5 97,369 46.3 81 0.0
b) Net Non-Monetary Liabilitiesof other Banks (residual) 5,00,828 1,64,016 42.0 -53,931 -9.7 -52,634 -9.5 -74,980 -15.0
Note : Data are provisional.
Outstandingas on
March 31,2009
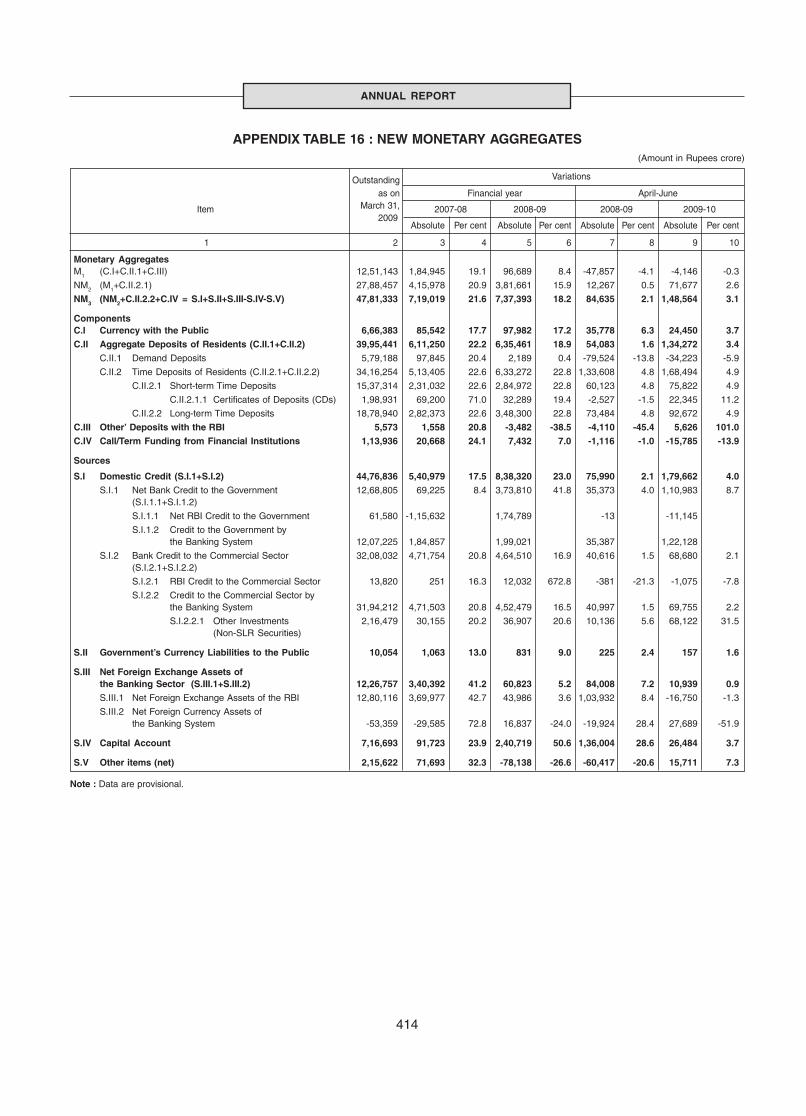
414
ANNUAL REPORT
APPENDIX TABLE 16 : NEW MONETARY AGGREGATES(Amount in Rupees crore)
Outstanding Variations
as on Financial year April-June
Item March 31, 2007-08 2008-09 2008-09 2009-102009
Absolute Per cent Absolute Per cent Absolute Per cent Absolute Per cent
1 2 3 4 5 6 7 8 9 10
Monetary AggregatesM1 (C.I+C.II.1+C.III) 12,51,143 1,84,945 19.1 96,689 8.4 -47,857 -4.1 -4,146 -0.3
NM2 (M1+C.II.2.1) 27,88,457 4,15,978 20.9 3,81,661 15.9 12,267 0.5 71,677 2.6
NM3 (NM2+C.II.2.2+C.IV = S.I+S.II+S.III-S.IV-S.V) 47,81,333 7,19,019 21.6 7,37,393 18.2 84,635 2.1 1,48,564 3.1
ComponentsC.I Currency with the Public 6,66,383 85,542 17.7 97,982 17.2 35,778 6.3 24,450 3.7C.II Aggregate Deposits of Residents (C.II.1+C.II.2) 39,95,441 6,11,250 22.2 6,35,461 18.9 54,083 1.6 1,34,272 3.4
C.II.1 Demand Deposits 5,79,188 97,845 20.4 2,189 0.4 -79,524 -13.8 -34,223 -5.9
C.II.2 Time Deposits of Residents (C.II.2.1+C.II.2.2) 34,16,254 5,13,405 22.6 6,33,272 22.8 1,33,608 4.8 1,68,494 4.9
C.II.2.1 Short-term Time Deposits 15,37,314 2,31,032 22.6 2,84,972 22.8 60,123 4.8 75,822 4.9
C.II.2.1.1 Certificates of Deposits (CDs) 1,98,931 69,200 71.0 32,289 19.4 -2,527 -1.5 22,345 11.2
C.II.2.2 Long-term Time Deposits 18,78,940 2,82,373 22.6 3,48,300 22.8 73,484 4.8 92,672 4.9
C.III Other’ Deposits with the RBI 5,573 1,558 20.8 -3,482 -38.5 -4,110 -45.4 5,626 101.0C.IV Call/Term Funding from Financial Institutions 1,13,936 20,668 24.1 7,432 7.0 -1,116 -1.0 -15,785 -13.9
Sources
S.I Domestic Credit (S.I.1+S.I.2) 44,76,836 5,40,979 17.5 8,38,320 23.0 75,990 2.1 1,79,662 4.0S.I.1 Net Bank Credit to the Government 12,68,805 69,225 8.4 3,73,810 41.8 35,373 4.0 1,10,983 8.7
(S.I.1.1+S.I.1.2)
S.I.1.1 Net RBI Credit to the Government 61,580 -1,15,632 1,74,789 -13 -11,145
S.I.1.2 Credit to the Government bythe Banking System 12,07,225 1,84,857 1,99,021 35,387 1,22,128
S.I.2 Bank Credit to the Commercial Sector 32,08,032 4,71,754 20.8 4,64,510 16.9 40,616 1.5 68,680 2.1(S.I.2.1+S.I.2.2)
S.I.2.1 RBI Credit to the Commercial Sector 13,820 251 16.3 12,032 672.8 -381 -21.3 -1,075 -7.8
S.I.2.2 Credit to the Commercial Sector bythe Banking System 31,94,212 4,71,503 20.8 4,52,479 16.5 40,997 1.5 69,755 2.2
S.I.2.2.1 Other Investments 2,16,479 30,155 20.2 36,907 20.6 10,136 5.6 68,122 31.5(Non-SLR Securities)
S.II Government’s Currency Liabilities to the Public 10,054 1,063 13.0 831 9.0 225 2.4 157 1.6
S.III Net Foreign Exchange Assets ofthe Banking Sector (S.III.1+S.III.2) 12,26,757 3,40,392 41.2 60,823 5.2 84,008 7.2 10,939 0.9S.III.1 Net Foreign Exchange Assets of the RBI 12,80,116 3,69,977 42.7 43,986 3.6 1,03,932 8.4 -16,750 -1.3
S.III.2 Net Foreign Currency Assets ofthe Banking System -53,359 -29,585 72.8 16,837 -24.0 -19,924 28.4 27,689 -51.9
S.IV Capital Account 7,16,693 91,723 23.9 2,40,719 50.6 1,36,004 28.6 26,484 3.7
S.V Other items (net) 2,15,622 71,693 32.3 -78,138 -26.6 -60,417 -20.6 15,711 7.3
Note : Data are provisional.
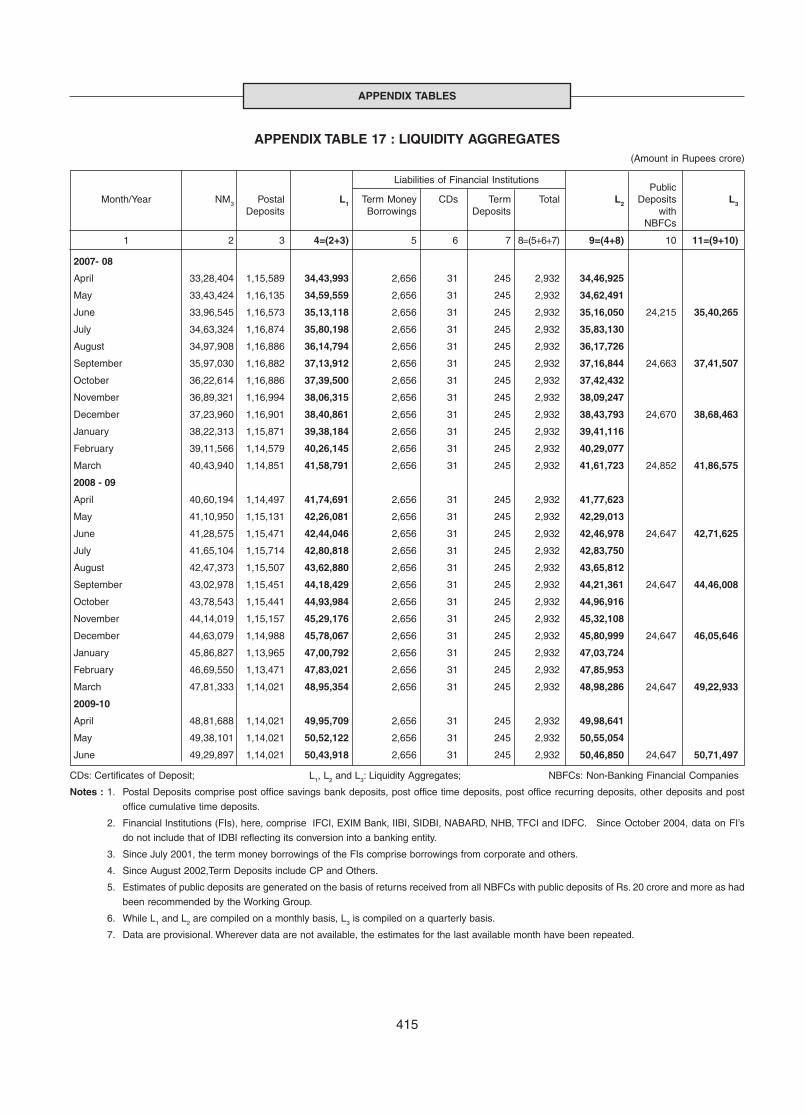
415
APPENDIX TABLES
APPENDIX TABLE 17 : LIQUIDITY AGGREGATES(Amount in Rupees crore)
Liabilities of Financial InstitutionsPublic
Month/Year NM3 Postal L1 Term Money CDs Term Total L2 Deposits L3Deposits Borrowings Deposits with
NBFCs
1 2 3 4=(2+3) 5 6 7 8=(5+6+7) 9=(4+8) 10 11=(9+10)
2007- 08
April 33,28,404 1,15,589 34,43,993 2,656 31 245 2,932 34,46,925
May 33,43,424 1,16,135 34,59,559 2,656 31 245 2,932 34,62,491
June 33,96,545 1,16,573 35,13,118 2,656 31 245 2,932 35,16,050 24,215 35,40,265
July 34,63,324 1,16,874 35,80,198 2,656 31 245 2,932 35,83,130
August 34,97,908 1,16,886 36,14,794 2,656 31 245 2,932 36,17,726
September 35,97,030 1,16,882 37,13,912 2,656 31 245 2,932 37,16,844 24,663 37,41,507
October 36,22,614 1,16,886 37,39,500 2,656 31 245 2,932 37,42,432
November 36,89,321 1,16,994 38,06,315 2,656 31 245 2,932 38,09,247
December 37,23,960 1,16,901 38,40,861 2,656 31 245 2,932 38,43,793 24,670 38,68,463
January 38,22,313 1,15,871 39,38,184 2,656 31 245 2,932 39,41,116
February 39,11,566 1,14,579 40,26,145 2,656 31 245 2,932 40,29,077
March 40,43,940 1,14,851 41,58,791 2,656 31 245 2,932 41,61,723 24,852 41,86,575
2008 - 09
April 40,60,194 1,14,497 41,74,691 2,656 31 245 2,932 41,77,623
May 41,10,950 1,15,131 42,26,081 2,656 31 245 2,932 42,29,013
June 41,28,575 1,15,471 42,44,046 2,656 31 245 2,932 42,46,978 24,647 42,71,625
July 41,65,104 1,15,714 42,80,818 2,656 31 245 2,932 42,83,750
August 42,47,373 1,15,507 43,62,880 2,656 31 245 2,932 43,65,812
September 43,02,978 1,15,451 44,18,429 2,656 31 245 2,932 44,21,361 24,647 44,46,008
October 43,78,543 1,15,441 44,93,984 2,656 31 245 2,932 44,96,916
November 44,14,019 1,15,157 45,29,176 2,656 31 245 2,932 45,32,108
December 44,63,079 1,14,988 45,78,067 2,656 31 245 2,932 45,80,999 24,647 46,05,646
January 45,86,827 1,13,965 47,00,792 2,656 31 245 2,932 47,03,724
February 46,69,550 1,13,471 47,83,021 2,656 31 245 2,932 47,85,953
March 47,81,333 1,14,021 48,95,354 2,656 31 245 2,932 48,98,286 24,647 49,22,933
2009-10
April 48,81,688 1,14,021 49,95,709 2,656 31 245 2,932 49,98,641
May 49,38,101 1,14,021 50,52,122 2,656 31 245 2,932 50,55,054
June 49,29,897 1,14,021 50,43,918 2,656 31 245 2,932 50,46,850 24,647 50,71,497
CDs: Certificates of Deposit; L1, L2 and L3: Liquidity Aggregates; NBFCs: Non-Banking Financial Companies
Notes : 1. Postal Deposits comprise post office savings bank deposits, post office time deposits, post office recurring deposits, other deposits and post
office cumulative time deposits.
2. Financial Institutions (FIs), here, comprise IFCI, EXIM Bank, IIBI, SIDBI, NABARD, NHB, TFCI and IDFC. Since October 2004, data on FI’s
do not include that of IDBI reflecting its conversion into a banking entity.
3. Since July 2001, the term money borrowings of the FIs comprise borrowings from corporate and others.
4. Since August 2002,Term Deposits include CP and Others.
5. Estimates of public deposits are generated on the basis of returns received from all NBFCs with public deposits of Rs. 20 crore and more as had
been recommended by the Working Group.
6. While L1 and L2 are compiled on a monthly basis, L3 is compiled on a quarterly basis.
7. Data are provisional. Wherever data are not available, the estimates for the last available month have been repeated.
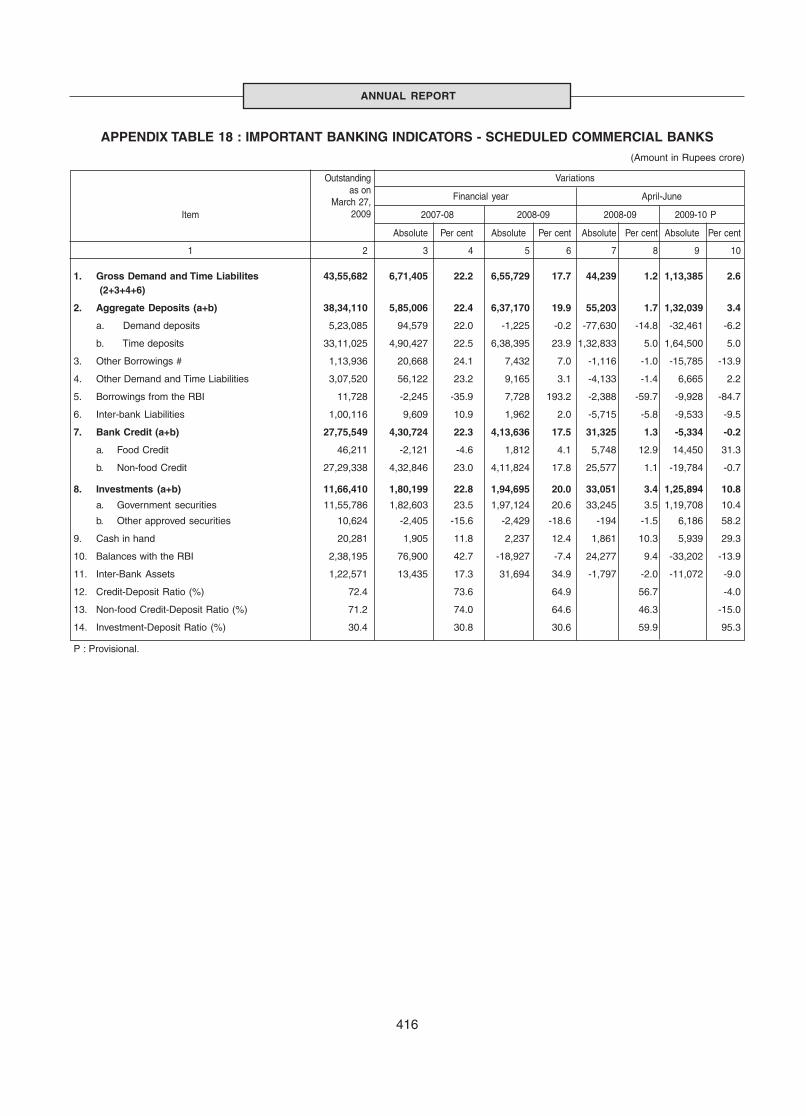
416
ANNUAL REPORT
APPENDIX TABLE 18 : IMPORTANT BANKING INDICATORS - SCHEDULED COMMERCIAL BANKS(Amount in Rupees crore)
Variations
Financial year April-June
Item 2007-08 2008-09 2008-09 2009-10 P
Absolute Per cent Absolute Per cent Absolute Per cent Absolute Per cent
1 2 3 4 5 6 7 8 9 10
1. Gross Demand and Time Liabilites 43,55,682 6,71,405 22.2 6,55,729 17.7 44,239 1.2 1,13,385 2.6 (2+3+4+6)
2. Aggregate Deposits (a+b) 38,34,110 5,85,006 22.4 6,37,170 19.9 55,203 1.7 1,32,039 3.4
a. Demand deposits 5,23,085 94,579 22.0 -1,225 -0.2 -77,630 -14.8 -32,461 -6.2
b. Time deposits 33,11,025 4,90,427 22.5 6,38,395 23.9 1,32,833 5.0 1,64,500 5.0
3. Other Borrowings # 1,13,936 20,668 24.1 7,432 7.0 -1,116 -1.0 -15,785 -13.9
4. Other Demand and Time Liabilities 3,07,520 56,122 23.2 9,165 3.1 -4,133 -1.4 6,665 2.2
5. Borrowings from the RBI 11,728 -2,245 -35.9 7,728 193.2 -2,388 -59.7 -9,928 -84.7
6. Inter-bank Liabilities 1,00,116 9,609 10.9 1,962 2.0 -5,715 -5.8 -9,533 -9.5
7. Bank Credit (a+b) 27,75,549 4,30,724 22.3 4,13,636 17.5 31,325 1.3 -5,334 -0.2
a. Food Credit 46,211 -2,121 -4.6 1,812 4.1 5,748 12.9 14,450 31.3
b. Non-food Credit 27,29,338 4,32,846 23.0 4,11,824 17.8 25,577 1.1 -19,784 -0.7
8. Investments (a+b) 11,66,410 1,80,199 22.8 1,94,695 20.0 33,051 3.4 1,25,894 10.8
a. Government securities 11,55,786 1,82,603 23.5 1,97,124 20.6 33,245 3.5 1,19,708 10.4
b. Other approved securities 10,624 -2,405 -15.6 -2,429 -18.6 -194 -1.5 6,186 58.2
9. Cash in hand 20,281 1,905 11.8 2,237 12.4 1,861 10.3 5,939 29.3
10. Balances with the RBI 2,38,195 76,900 42.7 -18,927 -7.4 24,277 9.4 -33,202 -13.9
11. Inter-Bank Assets 1,22,571 13,435 17.3 31,694 34.9 -1,797 -2.0 -11,072 -9.0
12. Credit-Deposit Ratio (%) 72.4 73.6 64.9 56.7 -4.0
13. Non-food Credit-Deposit Ratio (%) 71.2 74.0 64.6 46.3 -15.0
14. Investment-Deposit Ratio (%) 30.4 30.8 30.6 59.9 95.3
P : Provisional.
Outstanding as on
March 27,2009
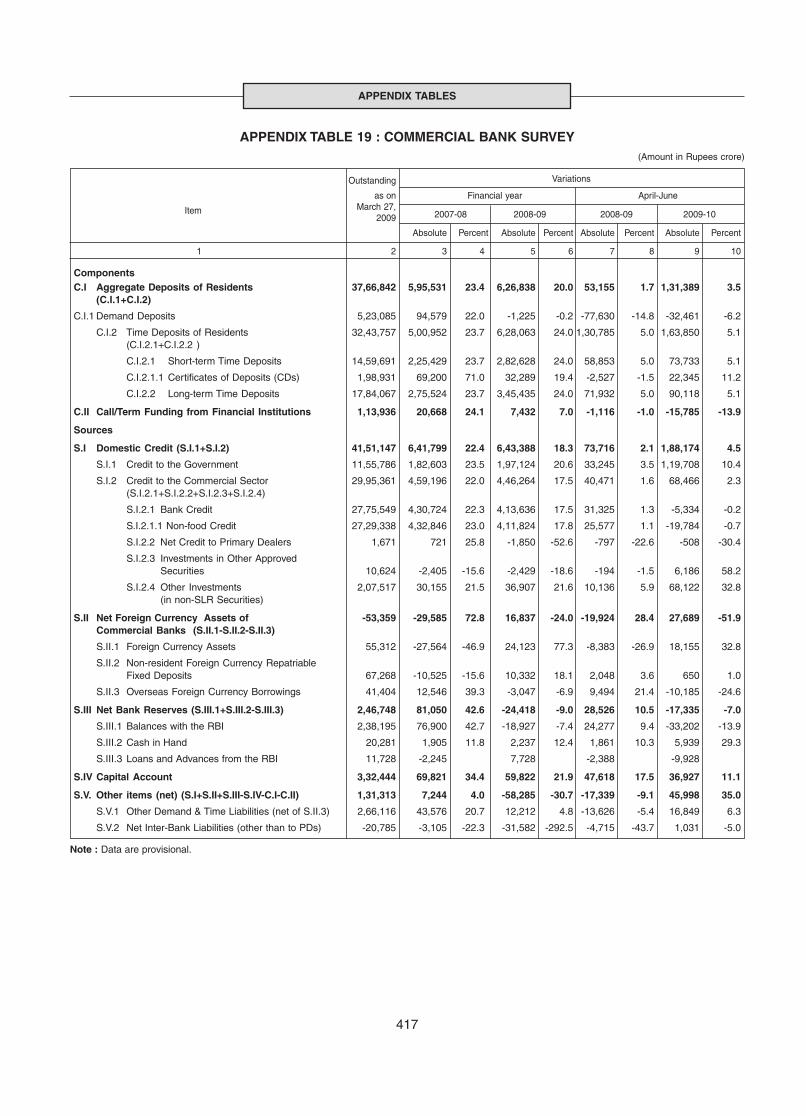
417
APPENDIX TABLES
Outstanding Variations
as on Financial year April-June
Item March 27,2007-08 2008-09 2008-09 2009-102009
Absolute Percent Absolute Percent Absolute Percent Absolute Percent
1 2 3 4 5 6 7 8 9 10
ComponentsC.I Aggregate Deposits of Residents 37,66,842 5,95,531 23.4 6,26,838 20.0 53,155 1.7 1,31,389 3.5
(C.I.1+C.I.2)
C.I.1 Demand Deposits 5,23,085 94,579 22.0 -1,225 -0.2 -77,630 -14.8 -32,461 -6.2
C.I.2 Time Deposits of Residents 32,43,757 5,00,952 23.7 6,28,063 24.0 1,30,785 5.0 1,63,850 5.1(C.I.2.1+C.I.2.2 )
C.I.2.1 Short-term Time Deposits 14,59,691 2,25,429 23.7 2,82,628 24.0 58,853 5.0 73,733 5.1
C.I.2.1.1 Certificates of Deposits (CDs) 1,98,931 69,200 71.0 32,289 19.4 -2,527 -1.5 22,345 11.2
C.I.2.2 Long-term Time Deposits 17,84,067 2,75,524 23.7 3,45,435 24.0 71,932 5.0 90,118 5.1
C.II Call/Term Funding from Financial Institutions 1,13,936 20,668 24.1 7,432 7.0 -1,116 -1.0 -15,785 -13.9
Sources
S.I Domestic Credit (S.I.1+S.I.2) 41,51,147 6,41,799 22.4 6,43,388 18.3 73,716 2.1 1,88,174 4.5
S.I.1 Credit to the Government 11,55,786 1,82,603 23.5 1,97,124 20.6 33,245 3.5 1,19,708 10.4
S.I.2 Credit to the Commercial Sector 29,95,361 4,59,196 22.0 4,46,264 17.5 40,471 1.6 68,466 2.3(S.I.2.1+S.I.2.2+S.I.2.3+S.I.2.4)
S.I.2.1 Bank Credit 27,75,549 4,30,724 22.3 4,13,636 17.5 31,325 1.3 -5,334 -0.2
S.I.2.1.1 Non-food Credit 27,29,338 4,32,846 23.0 4,11,824 17.8 25,577 1.1 -19,784 -0.7
S.I.2.2 Net Credit to Primary Dealers 1,671 721 25.8 -1,850 -52.6 -797 -22.6 -508 -30.4
S.I.2.3 Investments in Other ApprovedSecurities 10,624 -2,405 -15.6 -2,429 -18.6 -194 -1.5 6,186 58.2
S.I.2.4 Other Investments 2,07,517 30,155 21.5 36,907 21.6 10,136 5.9 68,122 32.8(in non-SLR Securities)
S.II Net Foreign Currency Assets of -53,359 -29,585 72.8 16,837 -24.0 -19,924 28.4 27,689 -51.9Commercial Banks (S.II.1-S.II.2-S.II.3)
S.II.1 Foreign Currency Assets 55,312 -27,564 -46.9 24,123 77.3 -8,383 -26.9 18,155 32.8
S.II.2 Non-resident Foreign Currency RepatriableFixed Deposits 67,268 -10,525 -15.6 10,332 18.1 2,048 3.6 650 1.0
S.II.3 Overseas Foreign Currency Borrowings 41,404 12,546 39.3 -3,047 -6.9 9,494 21.4 -10,185 -24.6
S.III Net Bank Reserves (S.III.1+S.III.2-S.III.3) 2,46,748 81,050 42.6 -24,418 -9.0 28,526 10.5 -17,335 -7.0
S.III.1 Balances with the RBI 2,38,195 76,900 42.7 -18,927 -7.4 24,277 9.4 -33,202 -13.9
S.III.2 Cash in Hand 20,281 1,905 11.8 2,237 12.4 1,861 10.3 5,939 29.3
S.III.3 Loans and Advances from the RBI 11,728 -2,245 7,728 -2,388 -9,928
S.IV Capital Account 3,32,444 69,821 34.4 59,822 21.9 47,618 17.5 36,927 11.1
S.V. Other items (net) (S.I+S.II+S.III-S.IV-C.I-C.II) 1,31,313 7,244 4.0 -58,285 -30.7 -17,339 -9.1 45,998 35.0
S.V.1 Other Demand & Time Liabilities (net of S.II.3) 2,66,116 43,576 20.7 12,212 4.8 -13,626 -5.4 16,849 6.3
S.V.2 Net Inter-Bank Liabilities (other than to PDs) -20,785 -3,105 -22.3 -31,582 -292.5 -4,715 -43.7 1,031 -5.0
Note : Data are provisional.
APPENDIX TABLE 19 : COMMERCIAL BANK SURVEY(Amount in Rupees crore)
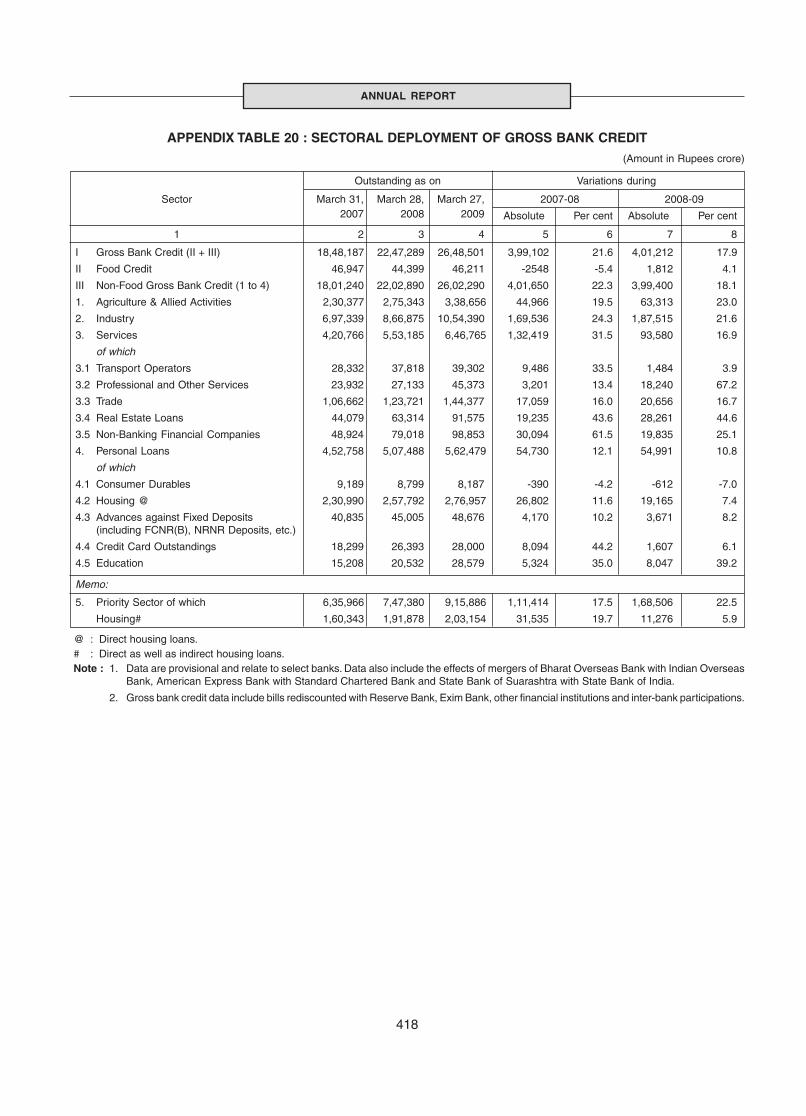
418
ANNUAL REPORT
APPENDIX TABLE 20 : SECTORAL DEPLOYMENT OF GROSS BANK CREDIT
(Amount in Rupees crore)
Outstanding as on Variations during
Sector March 31, March 28, March 27, 2007-08 2008-092007 2008 2009 Absolute Per cent Absolute Per cent
1 2 3 4 5 6 7 8
I Gross Bank Credit (II + III) 18,48,187 22,47,289 26,48,501 3,99,102 21.6 4,01,212 17.9
II Food Credit 46,947 44,399 46,211 -2548 -5.4 1,812 4.1
III Non-Food Gross Bank Credit (1 to 4) 18,01,240 22,02,890 26,02,290 4,01,650 22.3 3,99,400 18.1
1. Agriculture & Allied Activities 2,30,377 2,75,343 3,38,656 44,966 19.5 63,313 23.0
2. Industry 6,97,339 8,66,875 10,54,390 1,69,536 24.3 1,87,515 21.6
3. Services 4,20,766 5,53,185 6,46,765 1,32,419 31.5 93,580 16.9
of which
3.1 Transport Operators 28,332 37,818 39,302 9,486 33.5 1,484 3.9
3.2 Professional and Other Services 23,932 27,133 45,373 3,201 13.4 18,240 67.2
3.3 Trade 1,06,662 1,23,721 1,44,377 17,059 16.0 20,656 16.7
3.4 Real Estate Loans 44,079 63,314 91,575 19,235 43.6 28,261 44.6
3.5 Non-Banking Financial Companies 48,924 79,018 98,853 30,094 61.5 19,835 25.1
4. Personal Loans 4,52,758 5,07,488 5,62,479 54,730 12.1 54,991 10.8
of which
4.1 Consumer Durables 9,189 8,799 8,187 -390 -4.2 -612 -7.0
4.2 Housing @ 2,30,990 2,57,792 2,76,957 26,802 11.6 19,165 7.4
4.3 Advances against Fixed Deposits 40,835 45,005 48,676 4,170 10.2 3,671 8.2(including FCNR(B), NRNR Deposits, etc.)
4.4 Credit Card Outstandings 18,299 26,393 28,000 8,094 44.2 1,607 6.1
4.5 Education 15,208 20,532 28,579 5,324 35.0 8,047 39.2
Memo:
5. Priority Sector of which 6,35,966 7,47,380 9,15,886 1,11,414 17.5 1,68,506 22.5
Housing# 1,60,343 1,91,878 2,03,154 31,535 19.7 11,276 5.9
@ : Direct housing loans.# : Direct as well as indirect housing loans.Note : 1. Data are provisional and relate to select banks. Data also include the effects of mergers of Bharat Overseas Bank with Indian Overseas
Bank, American Express Bank with Standard Chartered Bank and State Bank of Suarashtra with State Bank of India.
2. Gross bank credit data include bills rediscounted with Reserve Bank, Exim Bank, other financial institutions and inter-bank participations.
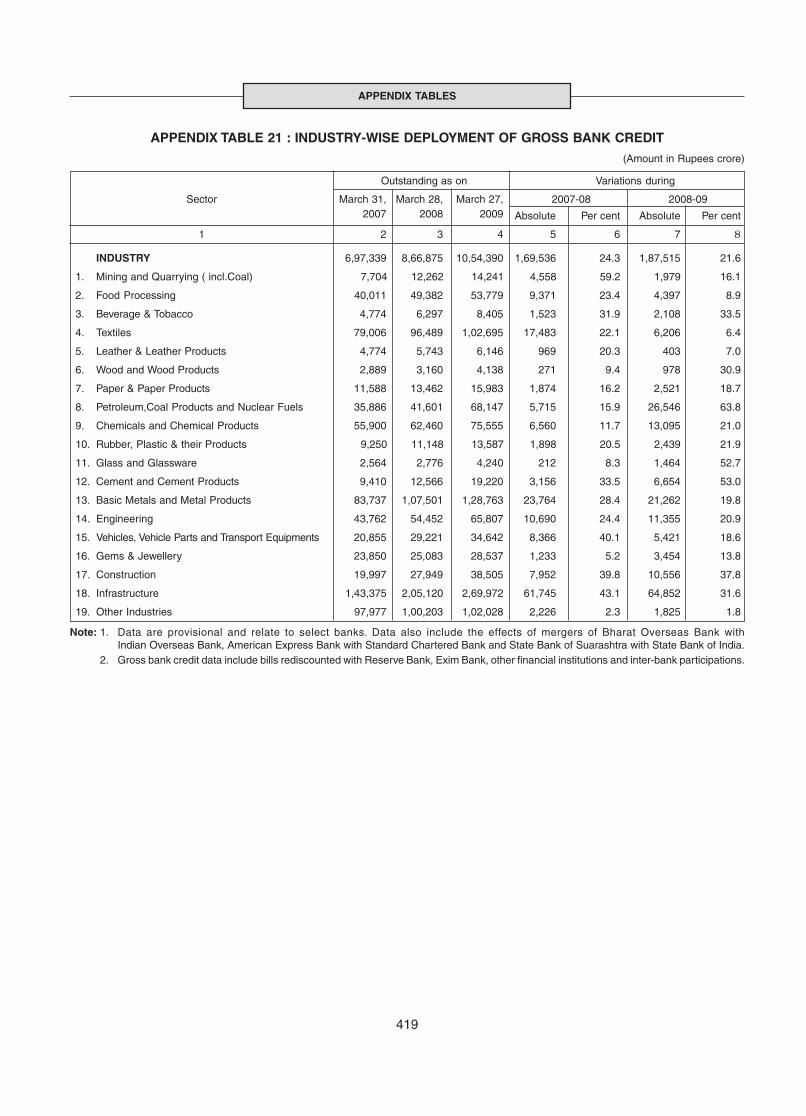
419
APPENDIX TABLES
APPENDIX TABLE 21 : INDUSTRY-WISE DEPLOYMENT OF GROSS BANK CREDIT
(Amount in Rupees crore)
Outstanding as on Variations during
Sector March 31, March 28, March 27, 2007-08 2008-092007 2008 2009 Absolute Per cent Absolute Per cent
1 2 3 4 5 6 7 8
INDUSTRY 6,97,339 8,66,875 10,54,390 1,69,536 24.3 1,87,515 21.6
1. Mining and Quarrying ( incl.Coal) 7,704 12,262 14,241 4,558 59.2 1,979 16.1
2. Food Processing 40,011 49,382 53,779 9,371 23.4 4,397 8.9
3. Beverage & Tobacco 4,774 6,297 8,405 1,523 31.9 2,108 33.5
4. Textiles 79,006 96,489 1,02,695 17,483 22.1 6,206 6.4
5. Leather & Leather Products 4,774 5,743 6,146 969 20.3 403 7.0
6. Wood and Wood Products 2,889 3,160 4,138 271 9.4 978 30.9
7. Paper & Paper Products 11,588 13,462 15,983 1,874 16.2 2,521 18.7
8. Petroleum,Coal Products and Nuclear Fuels 35,886 41,601 68,147 5,715 15.9 26,546 63.8
9. Chemicals and Chemical Products 55,900 62,460 75,555 6,560 11.7 13,095 21.0
10. Rubber, Plastic & their Products 9,250 11,148 13,587 1,898 20.5 2,439 21.9
11. Glass and Glassware 2,564 2,776 4,240 212 8.3 1,464 52.7
12. Cement and Cement Products 9,410 12,566 19,220 3,156 33.5 6,654 53.0
13. Basic Metals and Metal Products 83,737 1,07,501 1,28,763 23,764 28.4 21,262 19.8
14. Engineering 43,762 54,452 65,807 10,690 24.4 11,355 20.9
15. Vehicles, Vehicle Parts and Transport Equipments 20,855 29,221 34,642 8,366 40.1 5,421 18.6
16. Gems & Jewellery 23,850 25,083 28,537 1,233 5.2 3,454 13.8
17. Construction 19,997 27,949 38,505 7,952 39.8 10,556 37.8
18. Infrastructure 1,43,375 2,05,120 2,69,972 61,745 43.1 64,852 31.6
19. Other Industries 97,977 1,00,203 1,02,028 2,226 2.3 1,825 1.8
Note: 1. Data are provisional and relate to select banks. Data also include the effects of mergers of Bharat Overseas Bank withIndian Overseas Bank, American Express Bank with Standard Chartered Bank and State Bank of Suarashtra with State Bank of India.
2. Gross bank credit data include bills rediscounted with Reserve Bank, Exim Bank, other financial institutions and inter-bank participations.

420
ANNUAL REPORT
APPENDIX TABLE 22 : RESERVE BANK’S ACCOMMODATION TOSCHEDULED COMMERCIAL BANKS
(Amount in Rupees crore)
Item2007-08 2008-09 2009-10
March June September December March June
1 2 3 4 5 6 7
1. Export Credit Refinance
A) Limit 9,103 9,052 9,434 35,992 34,952 33,196
B) Outstanding 2,825 1,132 4,481 5,331 3,107 1,800
Memo Items :
1. Aggregate Export Credit 1,29,983 1,29,956 1,36,172 1,37,451 1,28,940 1,19,717
2. Export Credit Eligible for Refinance 60,690 60,347 62,895 71,984 69,903 66,354
3. Aggregate Export Credit as Percentage of Net Bank Credit 5.5 5.4 5.3 5.2 4.6 4.3
Notes : 1. Data pertain to the last Reporting Friday of the month.
2. Effective November 15, 2008, ECR facility is being provided to banks to the extent of 50 per cent of the outstanding export crediteligible for refinance as at the end of second preceding forthnight.
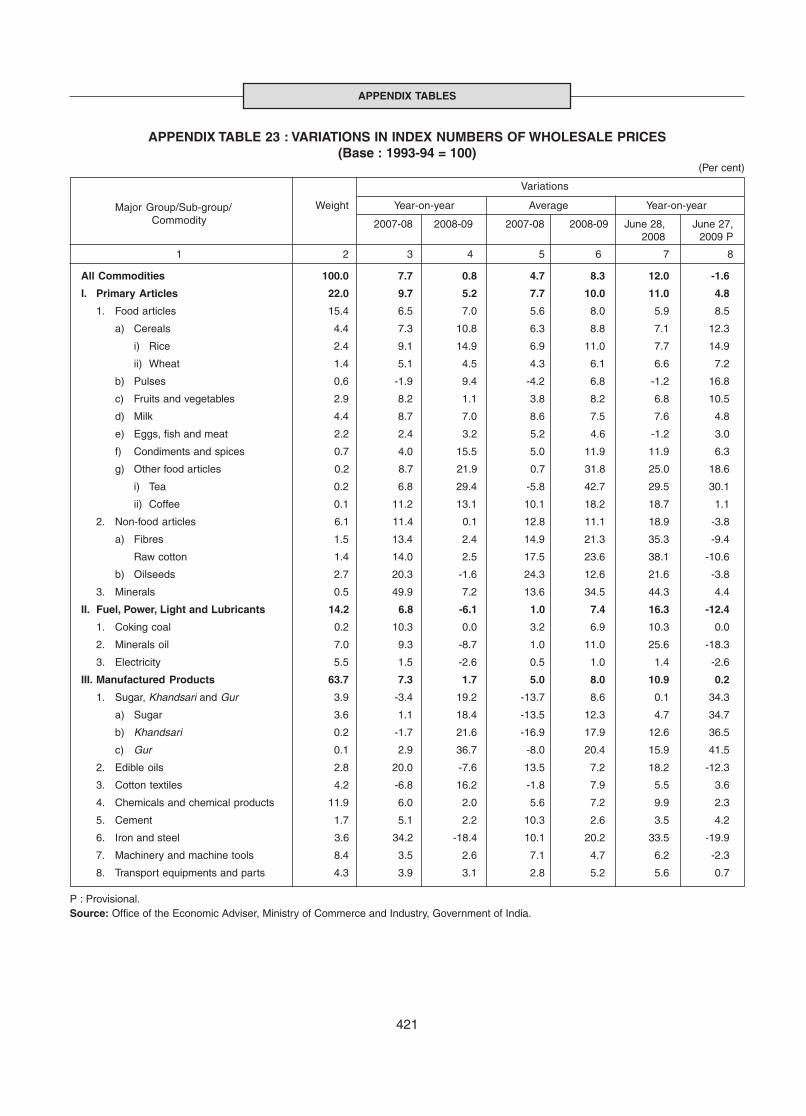
421
APPENDIX TABLES
Variations
Major Group/Sub-group/ Weight Year-on-year Average Year-on-yearCommodity 2007-08 2008-09 2007-08 2008-09 June 28, June 27,
2008 2009 P
1 2 3 4 5 6 7 8
All Commodities 100.0 7.7 0.8 4.7 8.3 12.0 -1.6
I. Primary Articles 22.0 9.7 5.2 7.7 10.0 11.0 4.8
1. Food articles 15.4 6.5 7.0 5.6 8.0 5.9 8.5
a) Cereals 4.4 7.3 10.8 6.3 8.8 7.1 12.3
i) Rice 2.4 9.1 14.9 6.9 11.0 7.7 14.9
ii) Wheat 1.4 5.1 4.5 4.3 6.1 6.6 7.2
b) Pulses 0.6 -1.9 9.4 -4.2 6.8 -1.2 16.8
c) Fruits and vegetables 2.9 8.2 1.1 3.8 8.2 6.8 10.5
d) Milk 4.4 8.7 7.0 8.6 7.5 7.6 4.8
e) Eggs, fish and meat 2.2 2.4 3.2 5.2 4.6 -1.2 3.0
f) Condiments and spices 0.7 4.0 15.5 5.0 11.9 11.9 6.3
g) Other food articles 0.2 8.7 21.9 0.7 31.8 25.0 18.6
i) Tea 0.2 6.8 29.4 -5.8 42.7 29.5 30.1
ii) Coffee 0.1 11.2 13.1 10.1 18.2 18.7 1.1
2. Non-food articles 6.1 11.4 0.1 12.8 11.1 18.9 -3.8
a) Fibres 1.5 13.4 2.4 14.9 21.3 35.3 -9.4
Raw cotton 1.4 14.0 2.5 17.5 23.6 38.1 -10.6
b) Oilseeds 2.7 20.3 -1.6 24.3 12.6 21.6 -3.8
3. Minerals 0.5 49.9 7.2 13.6 34.5 44.3 4.4
II. Fuel, Power, Light and Lubricants 14.2 6.8 -6.1 1.0 7.4 16.3 -12.4
1. Coking coal 0.2 10.3 0.0 3.2 6.9 10.3 0.0
2. Minerals oil 7.0 9.3 -8.7 1.0 11.0 25.6 -18.3
3. Electricity 5.5 1.5 -2.6 0.5 1.0 1.4 -2.6
III. Manufactured Products 63.7 7.3 1.7 5.0 8.0 10.9 0.2
1. Sugar, Khandsari and Gur 3.9 -3.4 19.2 -13.7 8.6 0.1 34.3
a) Sugar 3.6 1.1 18.4 -13.5 12.3 4.7 34.7
b) Khandsari 0.2 -1.7 21.6 -16.9 17.9 12.6 36.5
c) Gur 0.1 2.9 36.7 -8.0 20.4 15.9 41.5
2. Edible oils 2.8 20.0 -7.6 13.5 7.2 18.2 -12.3
3. Cotton textiles 4.2 -6.8 16.2 -1.8 7.9 5.5 3.6
4. Chemicals and chemical products 11.9 6.0 2.0 5.6 7.2 9.9 2.3
5. Cement 1.7 5.1 2.2 10.3 2.6 3.5 4.2
6. Iron and steel 3.6 34.2 -18.4 10.1 20.2 33.5 -19.9
7. Machinery and machine tools 8.4 3.5 2.6 7.1 4.7 6.2 -2.3
8. Transport equipments and parts 4.3 3.9 3.1 2.8 5.2 5.6 0.7
P : Provisional.Source: Office of the Economic Adviser, Ministry of Commerce and Industry, Government of India.
APPENDIX TABLE 23 : VARIATIONS IN INDEX NUMBERS OF WHOLESALE PRICES(Base : 1993-94 = 100)
(Per cent)
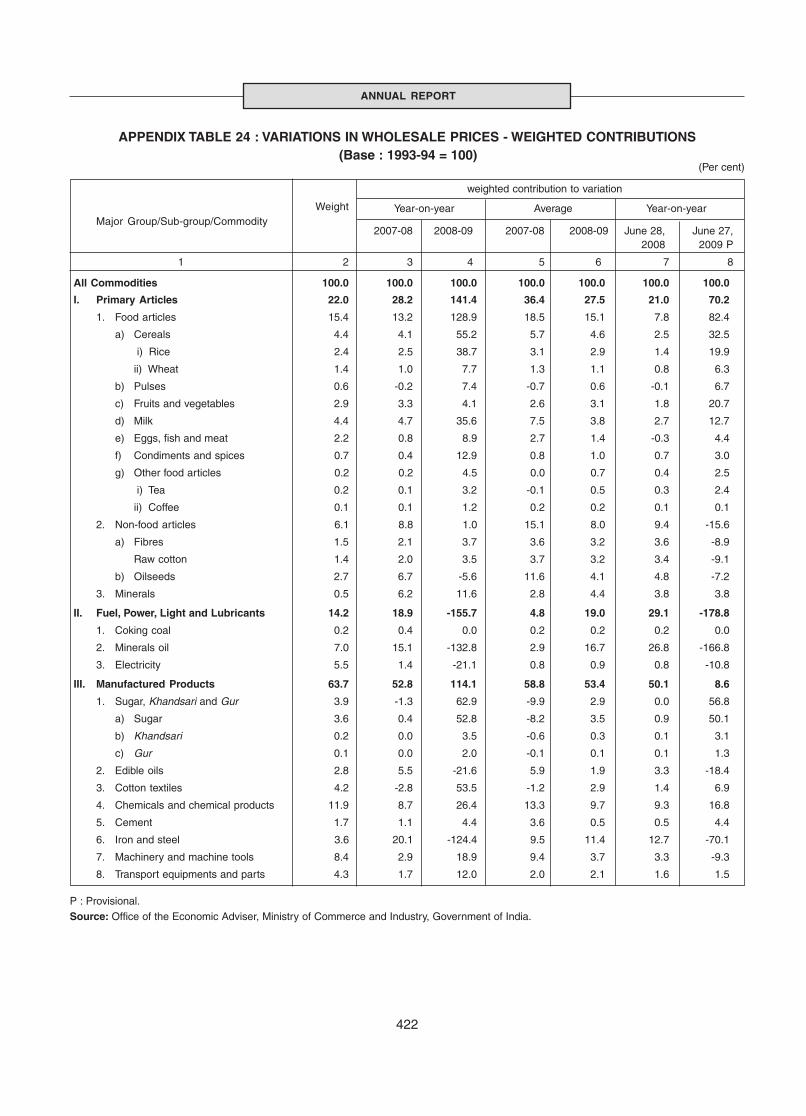
422
ANNUAL REPORT
weighted contribution to variation
Weight Year-on-year Average Year-on-yearMajor Group/Sub-group/Commodity
2007-08 2008-09 2007-08 2008-09 June 28, June 27,2008 2009 P
1 2 3 4 5 6 7 8
All Commodities 100.0 100.0 100.0 100.0 100.0 100.0 100.0
I. Primary Articles 22.0 28.2 141.4 36.4 27.5 21.0 70.2
1. Food articles 15.4 13.2 128.9 18.5 15.1 7.8 82.4
a) Cereals 4.4 4.1 55.2 5.7 4.6 2.5 32.5
i) Rice 2.4 2.5 38.7 3.1 2.9 1.4 19.9
ii) Wheat 1.4 1.0 7.7 1.3 1.1 0.8 6.3
b) Pulses 0.6 -0.2 7.4 -0.7 0.6 -0.1 6.7
c) Fruits and vegetables 2.9 3.3 4.1 2.6 3.1 1.8 20.7
d) Milk 4.4 4.7 35.6 7.5 3.8 2.7 12.7
e) Eggs, fish and meat 2.2 0.8 8.9 2.7 1.4 -0.3 4.4
f) Condiments and spices 0.7 0.4 12.9 0.8 1.0 0.7 3.0
g) Other food articles 0.2 0.2 4.5 0.0 0.7 0.4 2.5
i) Tea 0.2 0.1 3.2 -0.1 0.5 0.3 2.4
ii) Coffee 0.1 0.1 1.2 0.2 0.2 0.1 0.1
2. Non-food articles 6.1 8.8 1.0 15.1 8.0 9.4 -15.6
a) Fibres 1.5 2.1 3.7 3.6 3.2 3.6 -8.9
Raw cotton 1.4 2.0 3.5 3.7 3.2 3.4 -9.1
b) Oilseeds 2.7 6.7 -5.6 11.6 4.1 4.8 -7.2
3. Minerals 0.5 6.2 11.6 2.8 4.4 3.8 3.8
II. Fuel, Power, Light and Lubricants 14.2 18.9 -155.7 4.8 19.0 29.1 -178.8
1. Coking coal 0.2 0.4 0.0 0.2 0.2 0.2 0.0
2. Minerals oil 7.0 15.1 -132.8 2.9 16.7 26.8 -166.8
3. Electricity 5.5 1.4 -21.1 0.8 0.9 0.8 -10.8
III. Manufactured Products 63.7 52.8 114.1 58.8 53.4 50.1 8.6
1. Sugar, Khandsari and Gur 3.9 -1.3 62.9 -9.9 2.9 0.0 56.8
a) Sugar 3.6 0.4 52.8 -8.2 3.5 0.9 50.1
b) Khandsari 0.2 0.0 3.5 -0.6 0.3 0.1 3.1
c) Gur 0.1 0.0 2.0 -0.1 0.1 0.1 1.3
2. Edible oils 2.8 5.5 -21.6 5.9 1.9 3.3 -18.4
3. Cotton textiles 4.2 -2.8 53.5 -1.2 2.9 1.4 6.9
4. Chemicals and chemical products 11.9 8.7 26.4 13.3 9.7 9.3 16.8
5. Cement 1.7 1.1 4.4 3.6 0.5 0.5 4.4
6. Iron and steel 3.6 20.1 -124.4 9.5 11.4 12.7 -70.1
7. Machinery and machine tools 8.4 2.9 18.9 9.4 3.7 3.3 -9.3
8. Transport equipments and parts 4.3 1.7 12.0 2.0 2.1 1.6 1.5
P : Provisional.
Source: Office of the Economic Adviser, Ministry of Commerce and Industry, Government of India.
APPENDIX TABLE 24 : VARIATIONS IN WHOLESALE PRICES - WEIGHTED CONTRIBUTIONS(Base : 1993-94 = 100)
(Per cent)
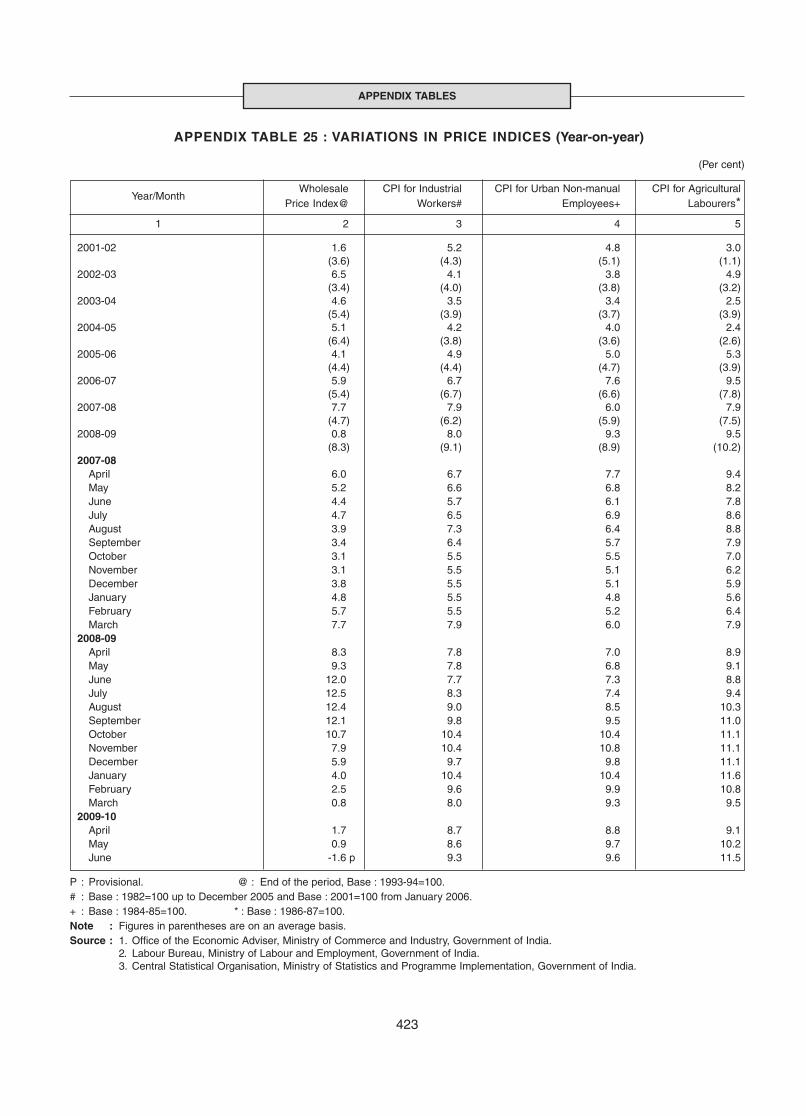
423
APPENDIX TABLES
APPENDIX TABLE 25 : VARIATIONS IN PRICE INDICES (Year-on-year)
(Per cent)
Year/MonthWholesale CPI for Industrial CPI for Urban Non-manual CPI for Agricultural
Price Index@ Workers# Employees+ Labourers*
1 2 3 4 5
2001-02 1.6 5.2 4.8 3.0(3.6) (4.3) (5.1) (1.1)
2002-03 6.5 4.1 3.8 4.9(3.4) (4.0) (3.8) (3.2)
2003-04 4.6 3.5 3.4 2.5(5.4) (3.9) (3.7) (3.9)
2004-05 5.1 4.2 4.0 2.4(6.4) (3.8) (3.6) (2.6)
2005-06 4.1 4.9 5.0 5.3(4.4) (4.4) (4.7) (3.9)
2006-07 5.9 6.7 7.6 9.5(5.4) (6.7) (6.6) (7.8)
2007-08 7.7 7.9 6.0 7.9(4.7) (6.2) (5.9) (7.5)
2008-09 0.8 8.0 9.3 9.5(8.3) (9.1) (8.9) (10.2)
2007-08April 6.0 6.7 7.7 9.4May 5.2 6.6 6.8 8.2June 4.4 5.7 6.1 7.8July 4.7 6.5 6.9 8.6August 3.9 7.3 6.4 8.8September 3.4 6.4 5.7 7.9October 3.1 5.5 5.5 7.0November 3.1 5.5 5.1 6.2December 3.8 5.5 5.1 5.9January 4.8 5.5 4.8 5.6February 5.7 5.5 5.2 6.4March 7.7 7.9 6.0 7.9
2008-09April 8.3 7.8 7.0 8.9May 9.3 7.8 6.8 9.1June 12.0 7.7 7.3 8.8July 12.5 8.3 7.4 9.4August 12.4 9.0 8.5 10.3September 12.1 9.8 9.5 11.0October 10.7 10.4 10.4 11.1November 7.9 10.4 10.8 11.1December 5.9 9.7 9.8 11.1January 4.0 10.4 10.4 11.6February 2.5 9.6 9.9 10.8March 0.8 8.0 9.3 9.5
2009-10April 1.7 8.7 8.8 9.1May 0.9 8.6 9.7 10.2June -1.6 p 9.3 9.6 11.5
P : Provisional. @ : End of the period, Base : 1993-94=100.# : Base : 1982=100 up to December 2005 and Base : 2001=100 from January 2006.+ : Base : 1984-85=100. * : Base : 1986-87=100.Note : Figures in parentheses are on an average basis.Source : 1. Office of the Economic Adviser, Ministry of Commerce and Industry, Government of India.
2. Labour Bureau, Ministry of Labour and Employment, Government of India.3. Central Statistical Organisation, Ministry of Statistics and Programme Implementation, Government of India.
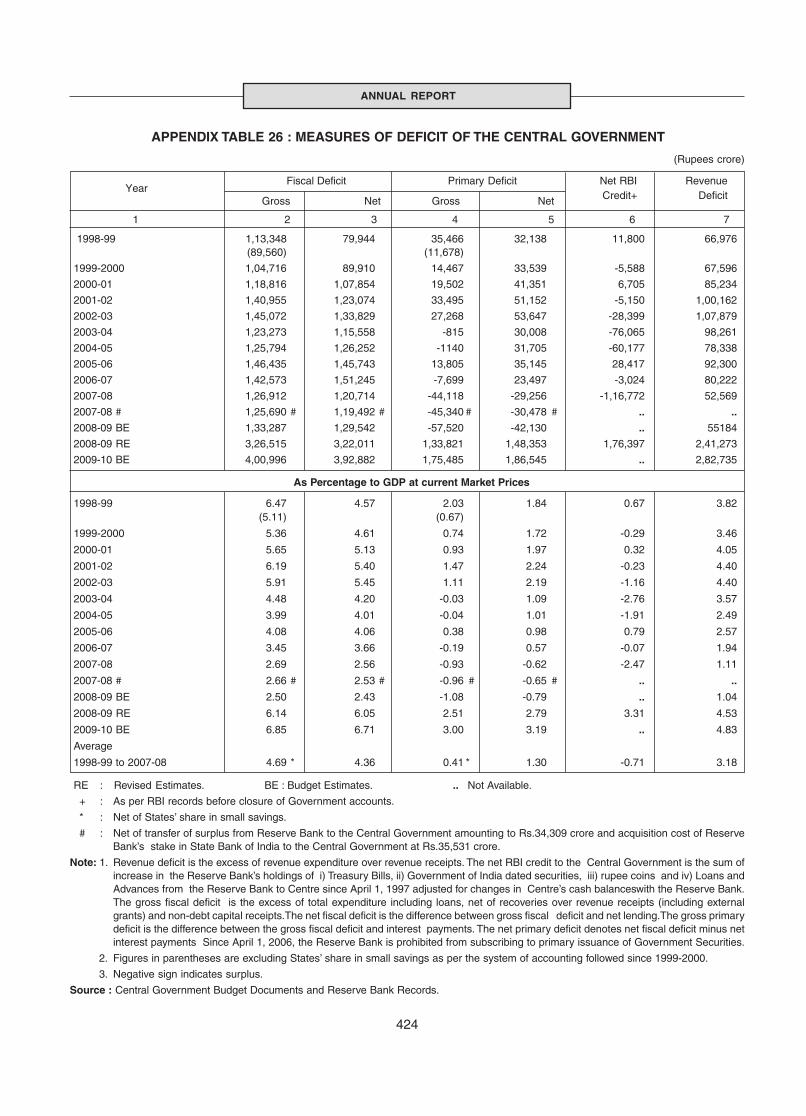
424
ANNUAL REPORT
APPENDIX TABLE 26 : MEASURES OF DEFICIT OF THE CENTRAL GOVERNMENT
(Rupees crore)
Year
Fiscal Deficit Primary Deficit Net RBI Revenue
Gross Net Gross Net Credit+ Deficit
1 2 3 4 5 6 7
1998-99 1,13,348 79,944 35,466 32,138 11,800 66,976(89,560) (11,678)
1999-2000 1,04,716 89,910 14,467 33,539 -5,588 67,596
2000-01 1,18,816 1,07,854 19,502 41,351 6,705 85,234
2001-02 1,40,955 1,23,074 33,495 51,152 -5,150 1,00,162
2002-03 1,45,072 1,33,829 27,268 53,647 -28,399 1,07,879
2003-04 1,23,273 1,15,558 -815 30,008 -76,065 98,261
2004-05 1,25,794 1,26,252 -1140 31,705 -60,177 78,338
2005-06 1,46,435 1,45,743 13,805 35,145 28,417 92,300
2006-07 1,42,573 1,51,245 -7,699 23,497 -3,024 80,222
2007-08 1,26,912 1,20,714 -44,118 -29,256 -1,16,772 52,569
2007-08 # 1,25,690 # 1,19,492 # -45,340 # -30,478 # .. ..
2008-09 BE 1,33,287 1,29,542 -57,520 -42,130 .. 55184
2008-09 RE 3,26,515 3,22,011 1,33,821 1,48,353 1,76,397 2,41,273
2009-10 BE 4,00,996 3,92,882 1,75,485 1,86,545 .. 2,82,735
As Percentage to GDP at current Market Prices
1998-99 6.47 4.57 2.03 1.84 0.67 3.82(5.11) (0.67)
1999-2000 5.36 4.61 0.74 1.72 -0.29 3.46
2000-01 5.65 5.13 0.93 1.97 0.32 4.05
2001-02 6.19 5.40 1.47 2.24 -0.23 4.40
2002-03 5.91 5.45 1.11 2.19 -1.16 4.40
2003-04 4.48 4.20 -0.03 1.09 -2.76 3.57
2004-05 3.99 4.01 -0.04 1.01 -1.91 2.49
2005-06 4.08 4.06 0.38 0.98 0.79 2.57
2006-07 3.45 3.66 -0.19 0.57 -0.07 1.94
2007-08 2.69 2.56 -0.93 -0.62 -2.47 1.11
2007-08 # 2.66 # 2.53 # -0.96 # -0.65 # .. ..
2008-09 BE 2.50 2.43 -1.08 -0.79 .. 1.04
2008-09 RE 6.14 6.05 2.51 2.79 3.31 4.53
2009-10 BE 6.85 6.71 3.00 3.19 .. 4.83
Average
1998-99 to 2007-08 4.69 * 4.36 0.41 * 1.30 -0.71 3.18
RE : Revised Estimates. BE : Budget Estimates. .. Not Available.
+ : As per RBI records before closure of Government accounts.
* : Net of States’ share in small savings.
# : Net of transfer of surplus from Reserve Bank to the Central Government amounting to Rs.34,309 crore and acquisition cost of ReserveBank’s stake in State Bank of India to the Central Government at Rs.35,531 crore.
Note: 1. Revenue deficit is the excess of revenue expenditure over revenue receipts. The net RBI credit to the Central Government is the sum ofincrease in the Reserve Bank’s holdings of i) Treasury Bills, ii) Government of India dated securities, iii) rupee coins and iv) Loans andAdvances from the Reserve Bank to Centre since April 1, 1997 adjusted for changes in Centre’s cash balanceswith the Reserve Bank.The gross fiscal deficit is the excess of total expenditure including loans, net of recoveries over revenue receipts (including externalgrants) and non-debt capital receipts.The net fiscal deficit is the difference between gross fiscal deficit and net lending.The gross primarydeficit is the difference between the gross fiscal deficit and interest payments. The net primary deficit denotes net fiscal deficit minus netinterest payments Since April 1, 2006, the Reserve Bank is prohibited from subscribing to primary issuance of Government Securities.
2. Figures in parentheses are excluding States’ share in small savings as per the system of accounting followed since 1999-2000.
3. Negative sign indicates surplus.
Source : Central Government Budget Documents and Reserve Bank Records.
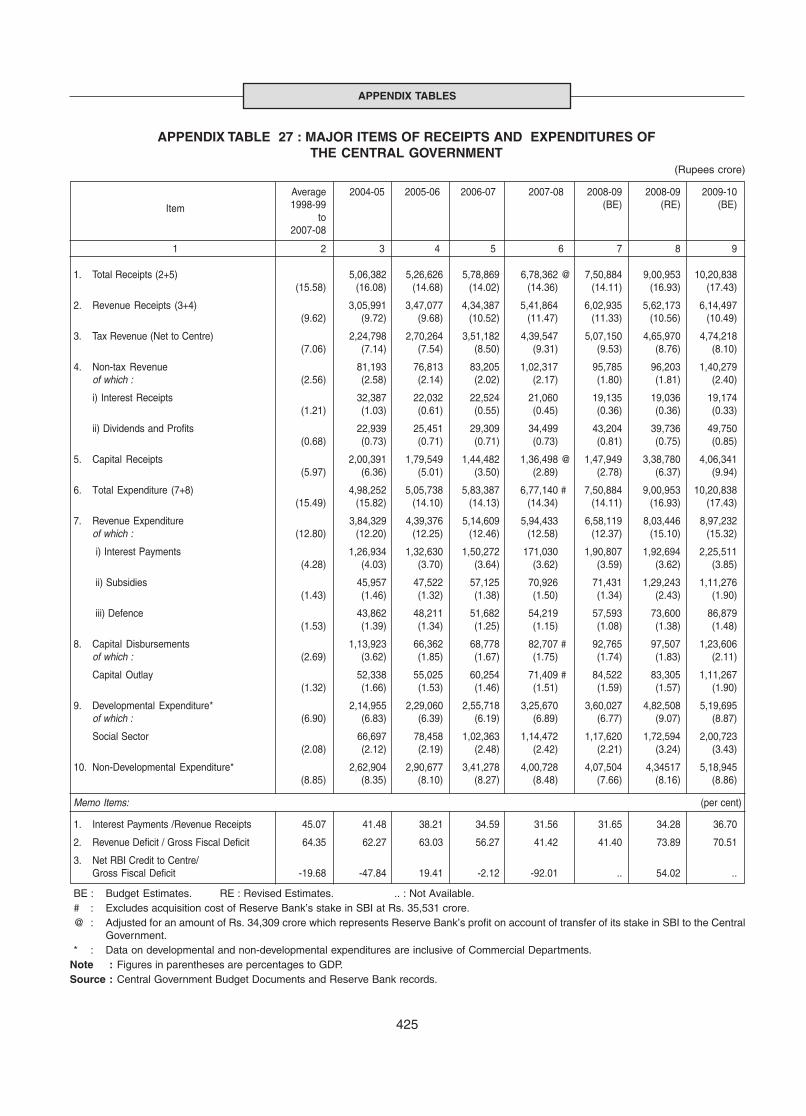
425
APPENDIX TABLES
APPENDIX TABLE 27 : MAJOR ITEMS OF RECEIPTS AND EXPENDITURES OFTHE CENTRAL GOVERNMENT
(Rupees crore)
Average 2004-05 2005-06 2006-07 2007-08 2008-09 2008-09 2009-10
Item 1998-99 (BE) (RE) (BE)to
2007-08
1 2 3 4 5 6 7 8 9
1. Total Receipts (2+5) 5,06,382 5,26,626 5,78,869 6,78,362 @ 7,50,884 9,00,953 10,20,838(15.58) (16.08) (14.68) (14.02) (14.36) (14.11) (16.93) (17.43)
2. Revenue Receipts (3+4) 3,05,991 3,47,077 4,34,387 5,41,864 6,02,935 5,62,173 6,14,497(9.62) (9.72) (9.68) (10.52) (11.47) (11.33) (10.56) (10.49)
3. Tax Revenue (Net to Centre) 2,24,798 2,70,264 3,51,182 4,39,547 5,07,150 4,65,970 4,74,218(7.06) (7.14) (7.54) (8.50) (9.31) (9.53) (8.76) (8.10)
4. Non-tax Revenue 81,193 76,813 83,205 1,02,317 95,785 96,203 1,40,279of which : (2.56) (2.58) (2.14) (2.02) (2.17) (1.80) (1.81) (2.40)
i) Interest Receipts 32,387 22,032 22,524 21,060 19,135 19,036 19,174(1.21) (1.03) (0.61) (0.55) (0.45) (0.36) (0.36) (0.33)
ii) Dividends and Profits 22,939 25,451 29,309 34,499 43,204 39,736 49,750(0.68) (0.73) (0.71) (0.71) (0.73) (0.81) (0.75) (0.85)
5. Capital Receipts 2,00,391 1,79,549 1,44,482 1,36,498 @ 1,47,949 3,38,780 4,06,341(5.97) (6.36) (5.01) (3.50) (2.89) (2.78) (6.37) (9.94)
6. Total Expenditure (7+8) 4,98,252 5,05,738 5,83,387 6,77,140 # 7,50,884 9,00,953 10,20,838(15.49) (15.82) (14.10) (14.13) (14.34) (14.11) (16.93) (17.43)
7. Revenue Expenditure 3,84,329 4,39,376 5,14,609 5,94,433 6,58,119 8,03,446 8,97,232of which : (12.80) (12.20) (12.25) (12.46) (12.58) (12.37) (15.10) (15.32)
i) Interest Payments 1,26,934 1,32,630 1,50,272 171,030 1,90,807 1,92,694 2,25,511(4.28) (4.03) (3.70) (3.64) (3.62) (3.59) (3.62) (3.85)
ii) Subsidies 45,957 47,522 57,125 70,926 71,431 1,29,243 1,11,276(1.43) (1.46) (1.32) (1.38) (1.50) (1.34) (2.43) (1.90)
iii) Defence 43,862 48,211 51,682 54,219 57,593 73,600 86,879(1.53) (1.39) (1.34) (1.25) (1.15) (1.08) (1.38) (1.48)
8. Capital Disbursements 1,13,923 66,362 68,778 82,707 # 92,765 97,507 1,23,606of which : (2.69) (3.62) (1.85) (1.67) (1.75) (1.74) (1.83) (2.11)
Capital Outlay 52,338 55,025 60,254 71,409 # 84,522 83,305 1,11,267(1.32) (1.66) (1.53) (1.46) (1.51) (1.59) (1.57) (1.90)
9. Developmental Expenditure* 2,14,955 2,29,060 2,55,718 3,25,670 3,60,027 4,82,508 5,19,695of which : (6.90) (6.83) (6.39) (6.19) (6.89) (6.77) (9.07) (8.87)
Social Sector 66,697 78,458 1,02,363 1,14,472 1,17,620 1,72,594 2,00,723(2.08) (2.12) (2.19) (2.48) (2.42) (2.21) (3.24) (3.43)
10. Non-Developmental Expenditure* 2,62,904 2,90,677 3,41,278 4,00,728 4,07,504 4,34517 5,18,945(8.85) (8.35) (8.10) (8.27) (8.48) (7.66) (8.16) (8.86)
Memo Items: (per cent)
1. Interest Payments /Revenue Receipts 45.07 41.48 38.21 34.59 31.56 31.65 34.28 36.70
2. Revenue Deficit / Gross Fiscal Deficit 64.35 62.27 63.03 56.27 41.42 41.40 73.89 70.51
3. Net RBI Credit to Centre/Gross Fiscal Deficit -19.68 -47.84 19.41 -2.12 -92.01 .. 54.02 ..
BE : Budget Estimates. RE : Revised Estimates. .. : Not Available.# : Excludes acquisition cost of Reserve Bank’s stake in SBI at Rs. 35,531 crore.@ : Adjusted for an amount of Rs. 34,309 crore which represents Reserve Bank’s profit on account of transfer of its stake in SBI to the Central
Government.* : Data on developmental and non-developmental expenditures are inclusive of Commercial Departments.
Note : Figures in parentheses are percentages to GDP.Source : Central Government Budget Documents and Reserve Bank records.

426
ANNUAL REPORT
APPENDIX TABLE 28 : FINANCING OF GROSS FISCAL DEFICIT OF THE CENTRAL GOVERNMENT
(Rupees crore)
Internal Finance External Total Finance/ Year Finance Gross Fiscal
Market Other Drawdown of Total Deficit (5+6)Borrowings # Borrowings @ cash balances * (2+3+4)
1 2 3 4 5 6 7
1990-91 8,001 22,103 11,347 41,451 3,181 44,632(17.9) (49.5) (25.4) (92.9) (7.1) (100.0)
1995-96 34,001 16,117 9,807 59,925 318 60,243(56.4) (26.8) (16.3) (99.5) (0.5) (100.0)
2002-03 1,04,126 50,997 1,883 1,57,006 -11,934 1,45,072(71.8) (35.2) (1.3) (108.2) -(8.2) (100.0)
2003-04 88,870 51,833 -3,942 1,36,761 -13,488 1,23,273(72.1) (42.0) -(3.2) (110.9) -(10.9) (100.0)
2004-05 50,939 68,232 -8,130 1,11,041 14,753 1,25,794(40.5) (54.2) -(6.5) (88.3) (11.7) (100.0)
2005-06 1,06,241 53,610 -20,888 1,38,963 7,472 1,46,435(72.6) (36.6) -(14.3) (94.9) (5.1) (100.0)
2006-07 1,14,801 14,782 4,518 1,34,101 8,472 1,42,573(80.5) (10.4) (3.2) (94.1) (5.9) (100.0)
2007-08 1,30,600 -39,597 26,594 1,17,597 9,315 1,26,912(102.9) -(31.2) (21.0) (92.7) (7.3) (100.0)
2008-09(BE) 99,000 16,073 7,225 1,22,298 10,989 1,33,287(74.3) (12.1) (5.4) (91.8) (8.2) (100.0)
2008-09(RE) 2,66,539 20,389 29,984 3,16,912 9,603 3,26,515(81.6) (6.2) (9.2) (97.1) (2.9) (100.0)
2009-10(BE) 3,97,957 -13,008 (0.0) 3,84,949 16,047 4,00,996(99.2) -(3.2) (0.0) (96.0) (4.0) (100.0)
RE : Revised Estimates. BE : Budget Estimates.
# : Comprised dated securities and 364-day Treasury Bills.
@ : Other borrowings comprise small savings, state provident funds, special deposits, reserve funds, Treasury Bills (excluding 364- day TreasuryBill). From 1999-2000 onwards, small savings and public provident funds are represented through NSSF’s investment in Central governmentspecial securities.Also includes NSSF’s investment of redemption proceeds in Central Government special securities since 2003-04.
* : Prior to 1997, represents variations in 91-day Treasury Bills issued net of changes in cash balances with the Reserve Bank.
Note : 1. Figures in parentheses represent percentages to total finance (gross fiscal deficit).
2. Since 1999-2000, gross fiscal deficit excludes the States’ share in small savings.
3. Market Borrowings are exclusive of amount raised under Market Stabilisation Scheme (MSS) effective from 2004-05.
Source : Central Government Budget Documents and Reserve Bank records.
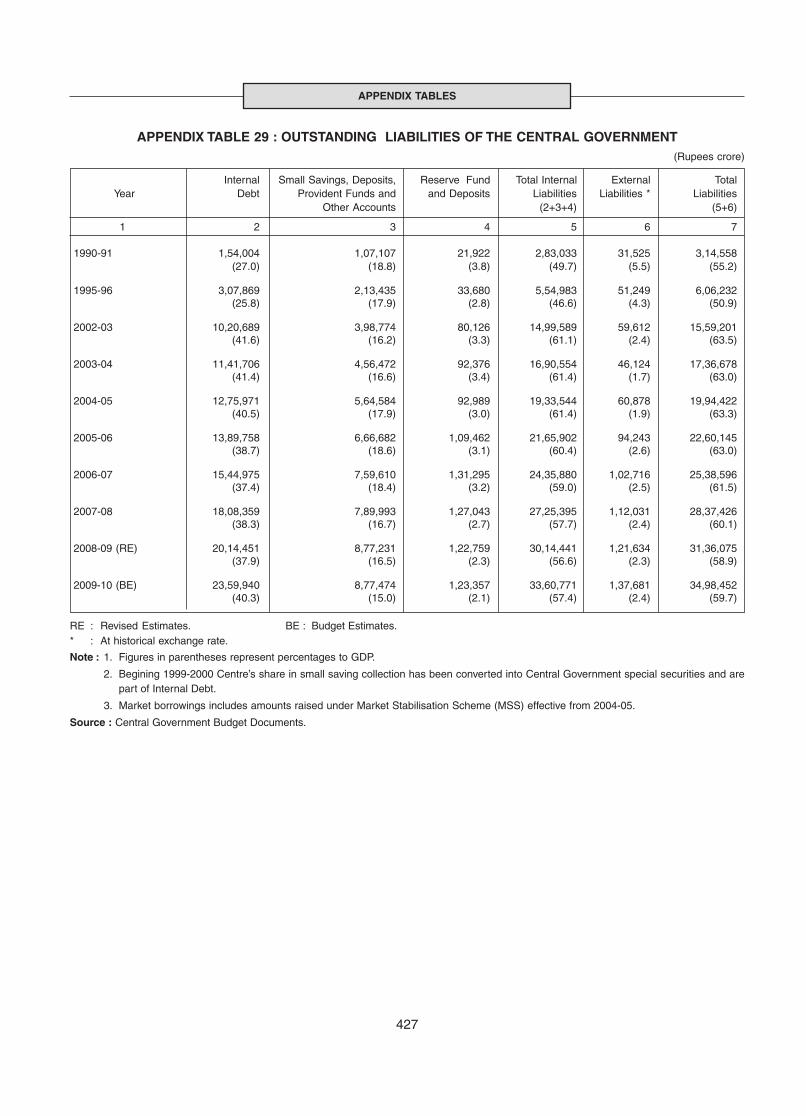
427
APPENDIX TABLES
APPENDIX TABLE 29 : OUTSTANDING LIABILITIES OF THE CENTRAL GOVERNMENT(Rupees crore)
Internal Small Savings, Deposits, Reserve Fund Total Internal External TotalYear Debt Provident Funds and and Deposits Liabilities Liabilities * Liabilities
Other Accounts (2+3+4) (5+6)
1 2 3 4 5 6 7
1990-91 1,54,004 1,07,107 21,922 2,83,033 31,525 3,14,558(27.0) (18.8) (3.8) (49.7) (5.5) (55.2)
1995-96 3,07,869 2,13,435 33,680 5,54,983 51,249 6,06,232(25.8) (17.9) (2.8) (46.6) (4.3) (50.9)
2002-03 10,20,689 3,98,774 80,126 14,99,589 59,612 15,59,201(41.6) (16.2) (3.3) (61.1) (2.4) (63.5)
2003-04 11,41,706 4,56,472 92,376 16,90,554 46,124 17,36,678(41.4) (16.6) (3.4) (61.4) (1.7) (63.0)
2004-05 12,75,971 5,64,584 92,989 19,33,544 60,878 19,94,422(40.5) (17.9) (3.0) (61.4) (1.9) (63.3)
2005-06 13,89,758 6,66,682 1,09,462 21,65,902 94,243 22,60,145(38.7) (18.6) (3.1) (60.4) (2.6) (63.0)
2006-07 15,44,975 7,59,610 1,31,295 24,35,880 1,02,716 25,38,596(37.4) (18.4) (3.2) (59.0) (2.5) (61.5)
2007-08 18,08,359 7,89,993 1,27,043 27,25,395 1,12,031 28,37,426(38.3) (16.7) (2.7) (57.7) (2.4) (60.1)
2008-09 (RE) 20,14,451 8,77,231 1,22,759 30,14,441 1,21,634 31,36,075(37.9) (16.5) (2.3) (56.6) (2.3) (58.9)
2009-10 (BE) 23,59,940 8,77,474 1,23,357 33,60,771 1,37,681 34,98,452(40.3) (15.0) (2.1) (57.4) (2.4) (59.7)
RE : Revised Estimates. BE : Budget Estimates.* : At historical exchange rate.
Note : 1. Figures in parentheses represent percentages to GDP.
2. Begining 1999-2000 Centre’s share in small saving collection has been converted into Central Government special securities and arepart of Internal Debt.
3. Market borrowings includes amounts raised under Market Stabilisation Scheme (MSS) effective from 2004-05.
Source : Central Government Budget Documents.

428
ANNUAL REPORT
APPENDIX TABLE 30 : BUDGETARY OPERATIONS OF THE STATE GOVERNMENTS
A : Measures of Deficit of State Governments (Rupees crore)
Year Fiscal Deficit Primary Deficit Net RBI Conventional Revenue
Gross Net Gross Net Credit# Deficit Deficit
1 2 3 4 5 6 7 8
1990-91 18,786 14,531 10,131 8,280 420 -72 5,3091995-96 30,869 26,845 9,030 10,791 16 -2,680 8,6202000-01 87,922 85,576 36,936 45,550 -1092 -2,379 55,3162007-08* P 68,572 62,552 -29,044 -22,421 1140 -15,685 -43,4052008-09* (RE) P 1,43,924 1,38,950 39,283 50,860 602 16,293 -7,3362009-10* (BE) P 1,97,186 1,88,370 82,488 86,660 .. 31,716 37,058
As Percentage to GDP at Current Market Prices
1990-91 3.30 2.55 1.78 1.45 0.07 -0.01 0.931995-96 2.59 2.25 0.76 0.91 0.00 -0.22 0.722000-01 4.18 4.07 1.76 2.17 -0.05 -0.11 2.632007-08* P 1.45 1.32 -0.61 -0.47 0.02 -0.33 -0.922008-09* (RE) P 2.70 2.61 0.74 0.96 0.01 0.31 -0.142009-10* (BE) P 3.37 3.22 1.41 1.48 .. 0.54 0.63
B : Select Budgetary Variables of State Governments (Per cent)
Item 1990-00 2007-08 P 2008-09 P 2009-10 P(Average) (RE) (BE)
1 2 3 4 5
1. GFD / Total Expenditure (excluding recoveries) 22.4 9.6 16.0 19.52. Revenue Deficit / Revenue Expenditure 9.5 -7.7 -1.0 4.53. Conventional Deficit / Aggregate Disbursements -0.04 2.1 -1.8 -3.14. Revenue Deficit / GFD 36.2 -63.3 -5.1 18.85. Non-Developmental Revenue Expenditure / Revenue Receipts 39.8 36.3 35.4 40.26. Interest Payments/Revenue Receipts 16.6 16.0 14.5 14.67. Developmental Expenditure / GDP 10.0 9.5 11.3 11.0
of which :Social Sector Expenditure / GDP 5.7 5.5 6.7 7.0
8. Non-Developmental Expenditure / GDP 4.6 4.8 4.9 5.59. States’ Own Tax Revenue/GDP 5.2 6.0 6.2 6.210. States’ Own Non Tax Revenue / GDP 1.7 1.6 1.5 1.4
RE : Revised Estimates. BE : Budget Estimates. .. : Not available.GFD : Gross Fiscal Deficit. P : Provisional data.* : Data from 2007-08 onwards pertain to 27 State Governments of which two are Vote on Accounts.# : Data pertain to State Governments having accounts with the Reserve Bank of India.Notes : 1. Negative sign (-) indicates surplus in deficit indicators.
2. The net RBI credit to State Governments refers to variations in loans and advances given to them by the Reserve Bank net of theirincreamental deposits with the Reserve Bank.
Source : Budget Documents of the State Governments and the Reserve Bank Records.
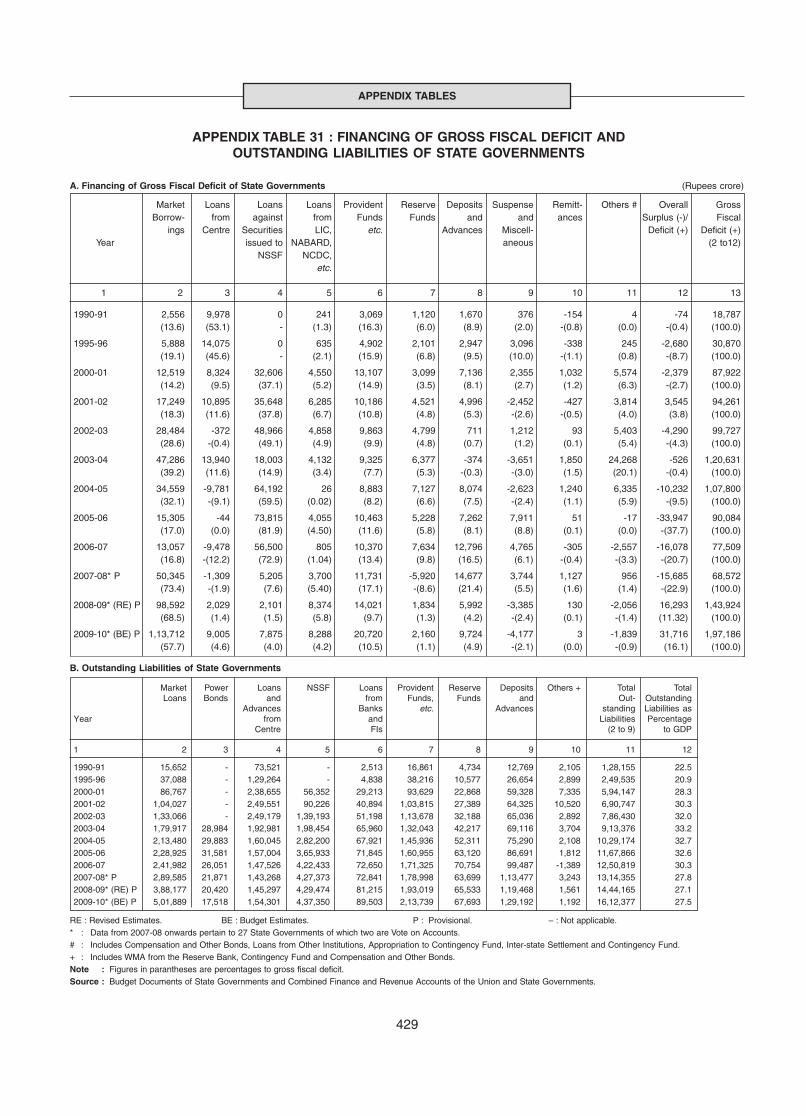
429
APPENDIX TABLES
APPENDIX TABLE 31 : FINANCING OF GROSS FISCAL DEFICIT ANDOUTSTANDING LIABILITIES OF STATE GOVERNMENTS
A. Financing of Gross Fiscal Deficit of State Governments (Rupees crore)
Market Loans Loans Loans Provident Reserve Deposits Suspense Remitt- Others # Overall GrossBorrow- from against from Funds Funds and and ances Surplus (-)/ Fiscal
ings Centre Securities LIC, etc. Advances Miscell- Deficit (+) Deficit (+)Year issued to NABARD, aneous (2 to12)
NSSF NCDC,etc.
1 2 3 4 5 6 7 8 9 10 11 12 13
1990-91 2,556 9,978 0 241 3,069 1,120 1,670 376 -154 4 -74 18,787(13.6) (53.1) - (1.3) (16.3) (6.0) (8.9) (2.0) -(0.8) (0.0) -(0.4) (100.0)
1995-96 5,888 14,075 0 635 4,902 2,101 2,947 3,096 -338 245 -2,680 30,870(19.1) (45.6) - (2.1) (15.9) (6.8) (9.5) (10.0) -(1.1) (0.8) -(8.7) (100.0)
2000-01 12,519 8,324 32,606 4,550 13,107 3,099 7,136 2,355 1,032 5,574 -2,379 87,922(14.2) (9.5) (37.1) (5.2) (14.9) (3.5) (8.1) (2.7) (1.2) (6.3) -(2.7) (100.0)
2001-02 17,249 10,895 35,648 6,285 10,186 4,521 4,996 -2,452 -427 3,814 3,545 94,261(18.3) (11.6) (37.8) (6.7) (10.8) (4.8) (5.3) -(2.6) -(0.5) (4.0) (3.8) (100.0)
2002-03 28,484 -372 48,966 4,858 9,863 4,799 711 1,212 93 5,403 -4,290 99,727(28.6) -(0.4) (49.1) (4.9) (9.9) (4.8) (0.7) (1.2) (0.1) (5.4) -(4.3) (100.0)
2003-04 47,286 13,940 18,003 4,132 9,325 6,377 -374 -3,651 1,850 24,268 -526 1,20,631(39.2) (11.6) (14.9) (3.4) (7.7) (5.3) -(0.3) -(3.0) (1.5) (20.1) -(0.4) (100.0)
2004-05 34,559 -9,781 64,192 26 8,883 7,127 8,074 -2,623 1,240 6,335 -10,232 1,07,800(32.1) -(9.1) (59.5) (0.02) (8.2) (6.6) (7.5) -(2.4) (1.1) (5.9) -(9.5) (100.0)
2005-06 15,305 -44 73,815 4,055 10,463 5,228 7,262 7,911 51 -17 -33,947 90,084(17.0) (0.0) (81.9) (4.50) (11.6) (5.8) (8.1) (8.8) (0.1) (0.0) -(37.7) (100.0)
2006-07 13,057 -9,478 56,500 805 10,370 7,634 12,796 4,765 -305 -2,557 -16,078 77,509(16.8) -(12.2) (72.9) (1.04) (13.4) (9.8) (16.5) (6.1) -(0.4) -(3.3) -(20.7) (100.0)
2007-08* P 50,345 -1,309 5,205 3,700 11,731 -5,920 14,677 3,744 1,127 956 -15,685 68,572(73.4) -(1.9) (7.6) (5.40) (17.1) -(8.6) (21.4) (5.5) (1.6) (1.4) -(22.9) (100.0)
2008-09* (RE) P 98,592 2,029 2,101 8,374 14,021 1,834 5,992 -3,385 130 -2,056 16,293 1,43,924(68.5) (1.4) (1.5) (5.8) (9.7) (1.3) (4.2) -(2.4) (0.1) -(1.4) (11.32) (100.0)
2009-10* (BE) P 1,13,712 9,005 7,875 8,288 20,720 2,160 9,724 -4,177 3 -1,839 31,716 1,97,186(57.7) (4.6) (4.0) (4.2) (10.5) (1.1) (4.9) -(2.1) (0.0) -(0.9) (16.1) (100.0)
B. Outstanding Liabilities of State Governments
Market Power Loans NSSF Loans Provident Reserve Deposits Others + Total TotalLoans Bonds and from Funds, Funds and Out- Outstanding
Advances Banks etc. Advances standing Liabilities asYear from and Liabilities Percentage
Centre FIs (2 to 9) to GDP
1 2 3 4 5 6 7 8 9 10 11 12
1990-91 15,652 - 73,521 - 2,513 16,861 4,734 12,769 2,105 1,28,155 22.51995-96 37,088 - 1,29,264 - 4,838 38,216 10,577 26,654 2,899 2,49,535 20.92000-01 86,767 - 2,38,655 56,352 29,213 93,629 22,868 59,328 7,335 5,94,147 28.32001-02 1,04,027 - 2,49,551 90,226 40,894 1,03,815 27,389 64,325 10,520 6,90,747 30.32002-03 1,33,066 - 2,49,179 1,39,193 51,198 1,13,678 32,188 65,036 2,892 7,86,430 32.02003-04 1,79,917 28,984 1,92,981 1,98,454 65,960 1,32,043 42,217 69,116 3,704 9,13,376 33.22004-05 2,13,480 29,883 1,60,045 2,82,200 67,921 1,45,936 52,311 75,290 2,108 10,29,174 32.72005-06 2,28,925 31,581 1,57,004 3,65,933 71,845 1,60,955 63,120 86,691 1,812 11,67,866 32.62006-07 2,41,982 26,051 1,47,526 4,22,433 72,650 1,71,325 70,754 99,487 -1,389 12,50,819 30.32007-08* P 2,89,585 21,871 1,43,268 4,27,373 72,841 1,78,998 63,699 1,13,477 3,243 13,14,355 27.82008-09* (RE) P 3,88,177 20,420 1,45,297 4,29,474 81,215 1,93,019 65,533 1,19,468 1,561 14,44,165 27.12009-10* (BE) P 5,01,889 17,518 1,54,301 4,37,350 89,503 2,13,739 67,693 1,29,192 1,192 16,12,377 27.5
RE : Revised Estimates. BE : Budget Estimates. P : Provisional. – : Not applicable.* : Data from 2007-08 onwards pertain to 27 State Governments of which two are Vote on Accounts.# : Includes Compensation and Other Bonds, Loans from Other Institutions, Appropriation to Contingency Fund, Inter-state Settlement and Contingency Fund.+ : Includes WMA from the Reserve Bank, Contingency Fund and Compensation and Other Bonds.Note : Figures in parantheses are percentages to gross fiscal deficit.Source : Budget Documents of State Governments and Combined Finance and Revenue Accounts of the Union and State Governments.
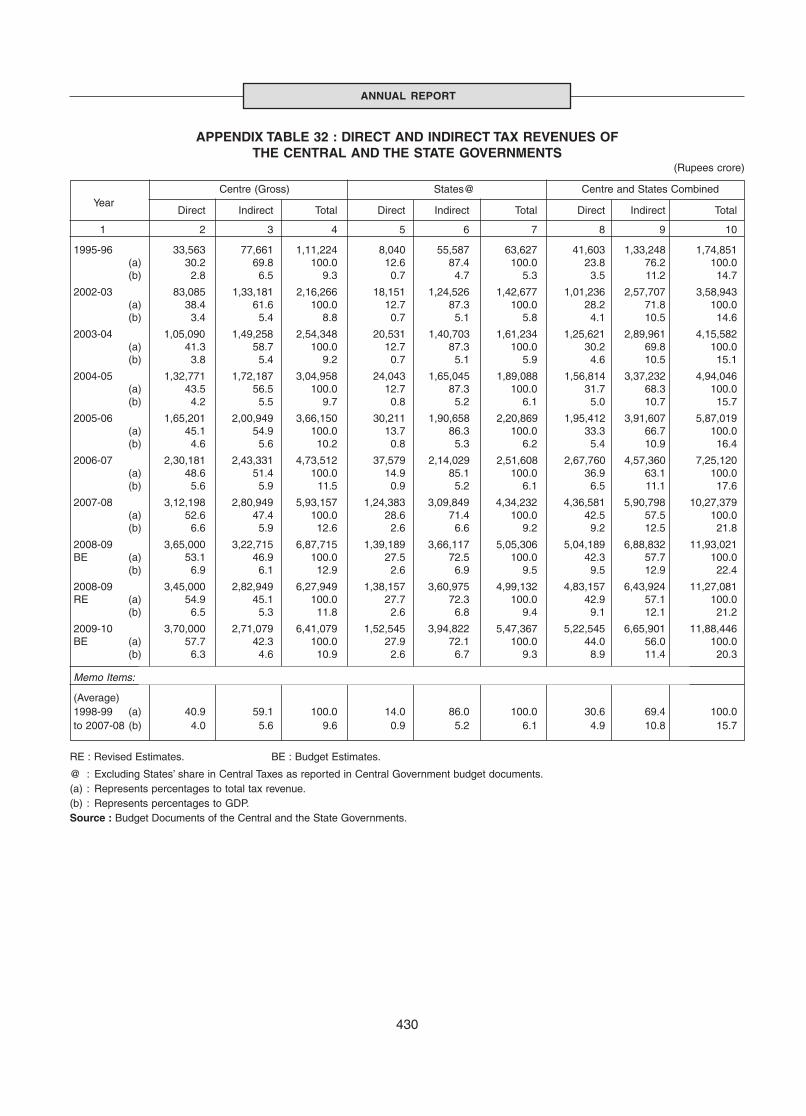
430
ANNUAL REPORT
APPENDIX TABLE 32 : DIRECT AND INDIRECT TAX REVENUES OFTHE CENTRAL AND THE STATE GOVERNMENTS
(Rupees crore)
Centre (Gross) States@ Centre and States Combined
Year
Direct Indirect Total Direct Indirect Total Direct Indirect Total
1 2 3 4 5 6 7 8 9 10
1995-96 33,563 77,661 1,11,224 8,040 55,587 63,627 41,603 1,33,248 1,74,851(a) 30.2 69.8 100.0 12.6 87.4 100.0 23.8 76.2 100.0(b) 2.8 6.5 9.3 0.7 4.7 5.3 3.5 11.2 14.7
2002-03 83,085 1,33,181 2,16,266 18,151 1,24,526 1,42,677 1,01,236 2,57,707 3,58,943(a) 38.4 61.6 100.0 12.7 87.3 100.0 28.2 71.8 100.0(b) 3.4 5.4 8.8 0.7 5.1 5.8 4.1 10.5 14.6
2003-04 1,05,090 1,49,258 2,54,348 20,531 1,40,703 1,61,234 1,25,621 2,89,961 4,15,582(a) 41.3 58.7 100.0 12.7 87.3 100.0 30.2 69.8 100.0(b) 3.8 5.4 9.2 0.7 5.1 5.9 4.6 10.5 15.1
2004-05 1,32,771 1,72,187 3,04,958 24,043 1,65,045 1,89,088 1,56,814 3,37,232 4,94,046(a) 43.5 56.5 100.0 12.7 87.3 100.0 31.7 68.3 100.0(b) 4.2 5.5 9.7 0.8 5.2 6.1 5.0 10.7 15.7
2005-06 1,65,201 2,00,949 3,66,150 30,211 1,90,658 2,20,869 1,95,412 3,91,607 5,87,019(a) 45.1 54.9 100.0 13.7 86.3 100.0 33.3 66.7 100.0(b) 4.6 5.6 10.2 0.8 5.3 6.2 5.4 10.9 16.4
2006-07 2,30,181 2,43,331 4,73,512 37,579 2,14,029 2,51,608 2,67,760 4,57,360 7,25,120(a) 48.6 51.4 100.0 14.9 85.1 100.0 36.9 63.1 100.0(b) 5.6 5.9 11.5 0.9 5.2 6.1 6.5 11.1 17.6
2007-08 3,12,198 2,80,949 5,93,157 1,24,383 3,09,849 4,34,232 4,36,581 5,90,798 10,27,379(a) 52.6 47.4 100.0 28.6 71.4 100.0 42.5 57.5 100.0(b) 6.6 5.9 12.6 2.6 6.6 9.2 9.2 12.5 21.8
2008-09 3,65,000 3,22,715 6,87,715 1,39,189 3,66,117 5,05,306 5,04,189 6,88,832 11,93,021BE (a) 53.1 46.9 100.0 27.5 72.5 100.0 42.3 57.7 100.0
(b) 6.9 6.1 12.9 2.6 6.9 9.5 9.5 12.9 22.4
2008-09 3,45,000 2,82,949 6,27,949 1,38,157 3,60,975 4,99,132 4,83,157 6,43,924 11,27,081RE (a) 54.9 45.1 100.0 27.7 72.3 100.0 42.9 57.1 100.0
(b) 6.5 5.3 11.8 2.6 6.8 9.4 9.1 12.1 21.2
2009-10 3,70,000 2,71,079 6,41,079 1,52,545 3,94,822 5,47,367 5,22,545 6,65,901 11,88,446BE (a) 57.7 42.3 100.0 27.9 72.1 100.0 44.0 56.0 100.0
(b) 6.3 4.6 10.9 2.6 6.7 9.3 8.9 11.4 20.3
Memo Items:
(Average)1998-99 (a) 40.9 59.1 100.0 14.0 86.0 100.0 30.6 69.4 100.0to 2007-08 (b) 4.0 5.6 9.6 0.9 5.2 6.1 4.9 10.8 15.7
RE : Revised Estimates. BE : Budget Estimates.
@ : Excluding States’ share in Central Taxes as reported in Central Government budget documents.(a) : Represents percentages to total tax revenue.(b) : Represents percentages to GDP.Source : Budget Documents of the Central and the State Governments.
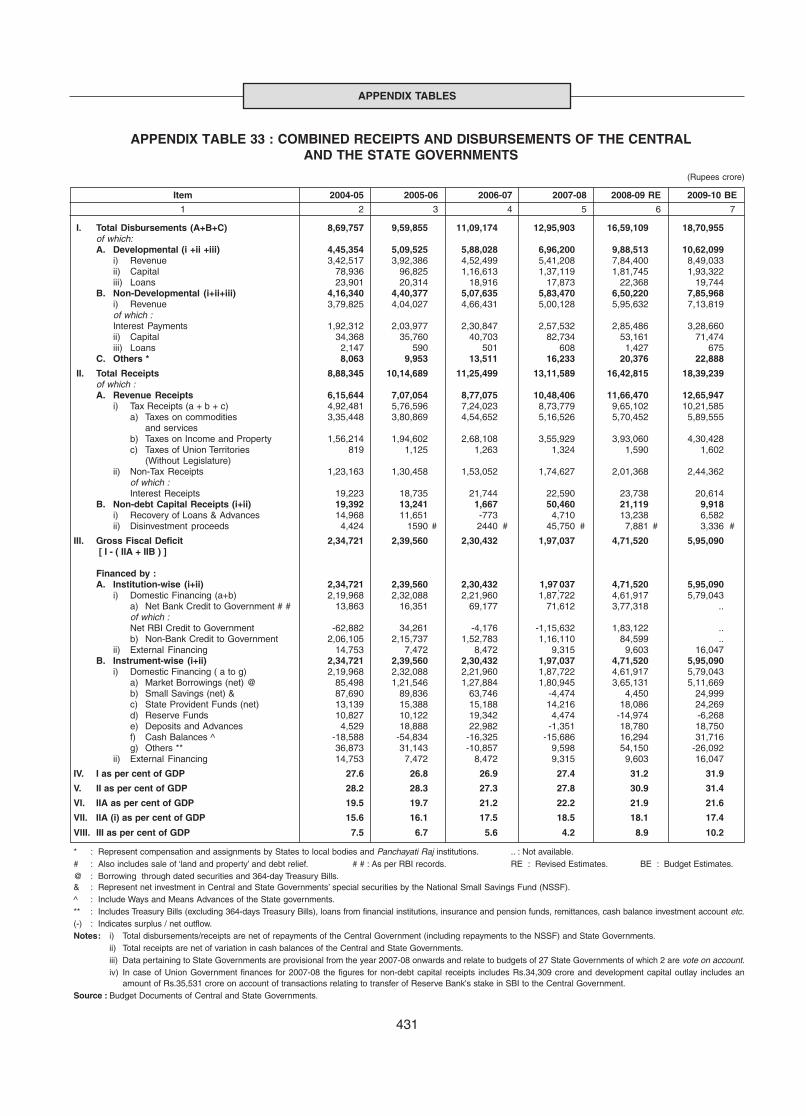
431
APPENDIX TABLES
APPENDIX TABLE 33 : COMBINED RECEIPTS AND DISBURSEMENTS OF THE CENTRALAND THE STATE GOVERNMENTS
(Rupees crore)
Item 2004-05 2005-06 2006-07 2007-08 2008-09 RE 2009-10 BE
1 2 3 4 5 6 7
I. Total Disbursements (A+B+C) 8,69,757 9,59,855 11,09,174 12,95,903 16,59,109 18,70,955of which:A. Developmental (i +ii +iii) 4,45,354 5,09,525 5,88,028 6,96,200 9,88,513 10,62,099
i) Revenue 3,42,517 3,92,386 4,52,499 5,41,208 7,84,400 8,49,033ii) Capital 78,936 96,825 1,16,613 1,37,119 1,81,745 1,93,322iii) Loans 23,901 20,314 18,916 17,873 22,368 19,744
B. Non-Developmental (i+ii+iii) 4,16,340 4,40,377 5,07,635 5,83,470 6,50,220 7,85,968i) Revenue 3,79,825 4,04,027 4,66,431 5,00,128 5,95,632 7,13,819of which :Interest Payments 1,92,312 2,03,977 2,30,847 2,57,532 2,85,486 3,28,660ii) Capital 34,368 35,760 40,703 82,734 53,161 71,474iii) Loans 2,147 590 501 608 1,427 675
C. Others * 8,063 9,953 13,511 16,233 20,376 22,888
II. Total Receipts 8,88,345 10,14,689 11,25,499 13,11,589 16,42,815 18,39,239of which :A. Revenue Receipts 6,15,644 7,07,054 8,77,075 10,48,406 11,66,470 12,65,947
i) Tax Receipts (a + b + c) 4,92,481 5,76,596 7,24,023 8,73,779 9,65,102 10,21,585a) Taxes on commodities 3,35,448 3,80,869 4,54,652 5,16,526 5,70,452 5,89,555
and servicesb) Taxes on Income and Property 1,56,214 1,94,602 2,68,108 3,55,929 3,93,060 4,30,428c) Taxes of Union Territories 819 1,125 1,263 1,324 1,590 1,602
(Without Legislature)ii) Non-Tax Receipts 1,23,163 1,30,458 1,53,052 1,74,627 2,01,368 2,44,362
of which :Interest Receipts 19,223 18,735 21,744 22,590 23,738 20,614
B. Non-debt Capital Receipts (i+ii) 19,392 13,241 1,667 50,460 21,119 9,918i) Recovery of Loans & Advances 14,968 11,651 -773 4,710 13,238 6,582ii) Disinvestment proceeds 4,424 1590 # 2440 # 45,750 # 7,881 # 3,336 #
III. Gross Fiscal Deficit 2,34,721 2,39,560 2,30,432 1,97,037 4,71,520 5,95,090 [ I - ( IIA + IIB ) ]
Financed by :A. Institution-wise (i+ii) 2,34,721 2,39,560 2,30,432 1,97,037 4,71,520 5,95,090
i) Domestic Financing (a+b) 2,19,968 2,32,088 2,21,960 1,87,722 4,61,917 5,79,043a) Net Bank Credit to Government # # 13,863 16,351 69,177 71,612 3,77,318 ..of which :Net RBI Credit to Government -62,882 34,261 -4,176 -1,15,632 1,83,122 ..b) Non-Bank Credit to Government 2,06,105 2,15,737 1,52,783 1,16,110 84,599 ..
ii) External Financing 14,753 7,472 8,472 9,315 9,603 16,047B. Instrument-wise (i+ii) 2,34,721 2,39,560 2,30,432 1,97,037 4,71,520 5,95,090
i) Domestic Financing ( a to g) 2,19,968 2,32,088 2,21,960 1,87,722 4,61,917 5,79,043a) Market Borrowings (net) @ 85,498 1,21,546 1,27,884 1,80,945 3,65,131 5,11,669b) Small Savings (net) & 87,690 89,836 63,746 -4,474 4,450 24,999c) State Provident Funds (net) 13,139 15,388 15,188 14,216 18,086 24,269d) Reserve Funds 10,827 10,122 19,342 4,474 -14,974 -6,268e) Deposits and Advances 4,529 18,888 22,982 -1,351 18,780 18,750f) Cash Balances ^ -18,588 -54,834 -16,325 -15,686 16,294 31,716g) Others ** 36,873 31,143 -10,857 9,598 54,150 -26,092
ii) External Financing 14,753 7,472 8,472 9,315 9,603 16,047
IV. I as per cent of GDP 27.6 26.8 26.9 27.4 31.2 31.9
V. II as per cent of GDP 28.2 28.3 27.3 27.8 30.9 31.4
VI. IIA as per cent of GDP 19.5 19.7 21.2 22.2 21.9 21.6
VII. IIA (i) as per cent of GDP 15.6 16.1 17.5 18.5 18.1 17.4
VIII. III as per cent of GDP 7.5 6.7 5.6 4.2 8.9 10.2
* : Represent compensation and assignments by States to local bodies and Panchayati Raj institutions. .. : Not available.# : Also includes sale of ‘land and property’ and debt relief. # # : As per RBI records. RE : Revised Estimates. BE : Budget Estimates.@ : Borrowing through dated securities and 364-day Treasury Bills.& : Represent net investment in Central and State Governments’ special securities by the National Small Savings Fund (NSSF).^ : Include Ways and Means Advances of the State governments.** : Includes Treasury Bills (excluding 364-days Treasury Bills), loans from financial institutions, insurance and pension funds, remittances, cash balance investment account etc.(-) : Indicates surplus / net outflow.Notes: i) Total disbursements/receipts are net of repayments of the Central Government (including repayments to the NSSF) and State Governments.
ii) Total receipts are net of variation in cash balances of the Central and State Governments.iii) Data pertaining to State Governments are provisional from the year 2007-08 onwards and relate to budgets of 27 State Governments of which 2 are vote on account.iv) In case of Union Government finances for 2007-08 the figures for non-debt capital receipts includes Rs.34,309 crore and development capital outlay includes an
amount of Rs.35,531 crore on account of transactions relating to transfer of Reserve Bank's stake in SBI to the Central Government.Source : Budget Documents of Central and State Governments.
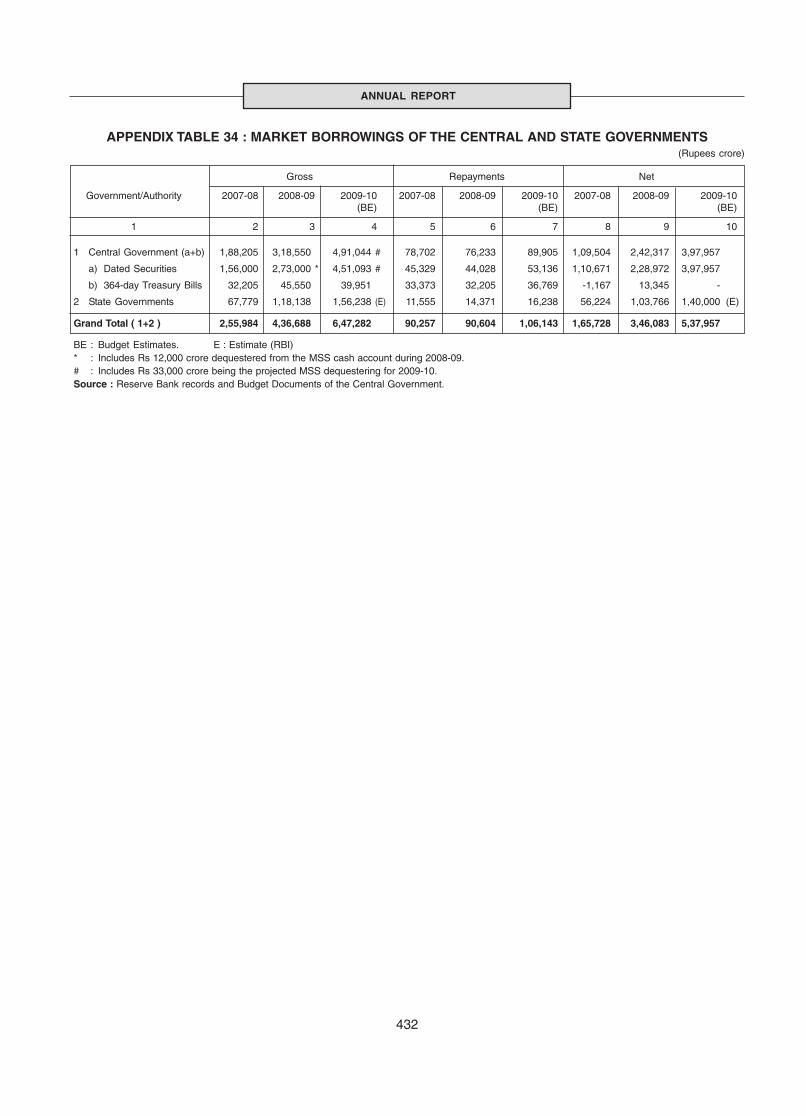
432
ANNUAL REPORT
APPENDIX TABLE 34 : MARKET BORROWINGS OF THE CENTRAL AND STATE GOVERNMENTS(Rupees crore)
Gross Repayments Net
Government/Authority 2007-08 2008-09 2009-10 2007-08 2008-09 2009-10 2007-08 2008-09 2009-10(BE) (BE) (BE)
1 2 3 4 5 6 7 8 9 10
1 Central Government (a+b) 1,88,205 3,18,550 4,91,044 # 78,702 76,233 89,905 1,09,504 2,42,317 3,97,957
a) Dated Securities 1,56,000 2,73,000 * 4,51,093 # 45,329 44,028 53,136 1,10,671 2,28,972 3,97,957
b) 364-day Treasury Bills 32,205 45,550 39,951 33,373 32,205 36,769 -1,167 13,345 -
2 State Governments 67,779 1,18,138 1,56,238 (E) 11,555 14,371 16,238 56,224 1,03,766 1,40,000 (E)
Grand Total ( 1+2 ) 2,55,984 4,36,688 6,47,282 90,257 90,604 1,06,143 1,65,728 3,46,083 5,37,957
BE : Budget Estimates. E : Estimate (RBI)* : Includes Rs 12,000 crore dequestered from the MSS cash account during 2008-09.# : Includes Rs 33,000 crore being the projected MSS dequestering for 2009-10.Source : Reserve Bank records and Budget Documents of the Central Government.

433
APPENDIX TABLES
APPENDIX TABLE 35 : REPO/REVERSE REPO AUCTIONS UNDER LIQUIDITY ADJUSTMENT FACILITY(Amount in Rupees crore)
Repo (Injection) Reverse Repo (Absorption)
Number
Bids received
Amount
Bids Accepted
Number Amount
Cut-OffRate %
Bids Received Cut-OffRate %
Net Injec-tions (+)/absorp-tion(-) ofliquidity
LAFDate
Repo/Reverse
Repoperiod
(Day(s))Number Amount Number Amount
Bids Accepted
OutstandingAmount@
1 2 3 4 5 6 7 8 9 10 11 12 13 14
1-Aug-08 3 1 8,000 1 8,000 9.00 3 1,695 3 1,695 6.00 6,305$ 3 2 5,000 2 5,000 9.00 14 3,105 14 3,105 6.00 1,895 –8,200
4-Aug-08 1 19 23,810 19 23,810 9.00 – – – – – 23,810 –23,8105-Aug-08 1 23 22,790 23 22,790 9.00 – – – – – 22,790 –22,7906-Aug-08 1 17 14,855 17 14,855 9.00 – – – – – 14,855 –14,8557-Aug-08 1 24 18,640 24 18,640 9.00 – – – – – 18,640 –18,6408-Aug-08 3 29 32,720 29 32,720 9.00 – – – – – 32,720 –32,720
11-Aug-08 1 25 23,705 25 23,705 9.00 – – – – – 23,705 –23,70512-Aug-08 1 30 29,075 30 29,075 9.00 – – – – – 29,075 –29,07513-Aug-08 1 33 35,025 33 35,025 9.00 – – – – – 35,025 –35,02514-Aug-08 4 24 26,130 24 26,130 9.00 – – – – – 26,130
$ 4 7 5,505 7 5,505 9.00 5 1,300 5 1,300 6.00 4,205 –30,33518-Aug-08 2 25 34,725 25 34,725 9.00 – – – – – 34,725 –34,72520-Aug-08 1 28 38,910 28 38,910 9.00 – – – – – 38,910 –38,91021-Aug-08 1 25 29,470 25 29,470 9.00 – – – – – 29,470 –29,47022-Aug-08 3 27 32,675 27 32,675 9.00 – – – – – 32,675 –32,67525-Aug-08 1 23 20,165 23 20,165 9.00 – – – – – 20,165 –20,16526-Aug-08 1 10 5,500 10 5,500 9.00 – – – – – 5,500 –5,50027-Aug-08 1 6 4,050 6 4,050 9.00 – – – – – 4,050 –4,05028-Aug-08 1 – – – – – 1 1,000 1 1,000 6.00 -1,000 1,00029-Aug-08 3 – – – – – 2 60 2 60 6.00 -60
$ 3 3 8,700 3 8,700 9.00 7 1,040 7 1,040 6.00 7,660 –7,6001-Sep-08 1 20 22,055 20 22,055 9.00 - - - - - 22,055 -22,0552-Sep-08 2 13 10,975 13 10,975 9.00 1 1,000 1 1,000 6.00 9,975 -9,9754-Sep-08 1 11 7,845 11 7,845 9.00 - - - - - 7,845 -7,8455-Sep-08 3 15 18,550 15 18,550 9.00 - - - - - 18,550 -18,5508-Sep-08 1 1 1,025 1 1,025 9.00 - - - - - 1,025 -1,0259-Sep-08 1 2 3,025 2 3,025 9.00 1 10 1 10 6.00 3,015 -3,015
10-Sep-08 1 12 12,985 12 12,985 9.00 - - - - - 12,985 -12,98511-Sep-08 1 11 15,195 11 15,195 9.00 - - - - - 15,195 -15,19512-Sep-08 3 1 200 1 200 9.00 - - - - - 200
# 3 5 14,200 5 14,200 9.00 9 2,185 9 2,185 6.00 12,015 -12,21515-Sep-08 1 41 51,815 41 51,815 9.00 - - - - - 51,815 -51,81516-Sep-08 1 51 57,565 51 57,565 9.00 - - - - - 57,565 -57,56517-Sep-08 1 24 29,815 24 29,815 9.00 - - - - - 29,815
$ 1 36 29,665 36 29,665 9.00 - - - - - 29,665 -59,48018-Sep-08 1 39 48,950 39 48,950 9.00 - - - - - 48,950
$ 1 37 26,365 37 26,365 9.00 - - - - - 26,365 -75,31519-Sep-08 3 47 59,135 47 59,135 9.00 - - - - - 59,135
$ 3 30 24,375 30 24,375 9.00 1 1,200 1 1,200 6.00 23,175 -82,31022-Sep-08 1 49 63,595 49 63,595 9.00 - - - - - 63,595
$ 1 18 15,265 18 15,265 9.00 - - - - - 15,265 -78,86023-Sep-08 1 44 52,145 44 52,145 9.00 - - - - - 52,145
$ 1 33 18,155 33 18,155 9.00 - - - - - 18,155 -70,30024-Sep-08 1 37 54,430 37 54,430 9.00 - - - - - 54,430
$ 1 22 9,890 22 9,890 9.00 1 5 1 5 6.00 9,885 -64,31525-Sep-08 1 25 38,545 25 38,545 9.00 - - - - - 38,545
$ 1 21 10,660 21 10,660 9.00 - - - - - 10,660 -49,20526-Sep-08 3 28 43,505 28 43,505 9.00 - - - - - 43,505
$ 3 27 13,095 27 13,095 9.00 2 120 2 120 6.00 12,975 -56,48029-Sep-08 2 36 53,940 36 53,940 9.00 - - - - - 53,940
$ 2 47 36,135 47 36,135 9.00 - - - - - 36,135 -90,0751-Oct-08 2 51 70,295 51 70,295 9.00 - - - - - 70,295
$ 2 27 21,425 27 21,425 9.00 - - - - - 21,425 -91,7203-Oct-08 3 49 65,095 49 65,095 9.00 - - - - - 65,095
$ 3 33 25,630 33 25,630 9.00 - - - - - 25,630 -90,7256-Oct-08 1 38 49,460 38 49,460 9.00 - - - - - 49,460
$ 1 28 18,140 28 18,140 9.00 2 2,100 2 2,100 6.00 16,040 -65,5007-Oct-08 1 40 42,165 40 42,165 9.00 - - - - - 42,165
$ 1 22 21,120 22 21,120 9.00 1 3,650 1 3,650 6.00 17,470 -59,6358-Oct-08 2 40 42,690 40 42,690 9.00 - - - - - 42,690
$ 2 44 38,445 44 38,445 9.00 2 1,100 2 1,100 6.00 37,345 -80,03510-Oct-08 3 42 50,270 42 50,270 9.00 - - - - - 50,270
$ 3 43 41,730 43 41,730 9.00 1 500 1 500 6.00 41,230 -91,50013-Oct-08 1 33 35,600 33 35,600 9.00 - - - - - 35,600
$ 1 29 23,975 29 23,975 9.00 3 4,135 3 4,135 6.00 19,840 -55,440
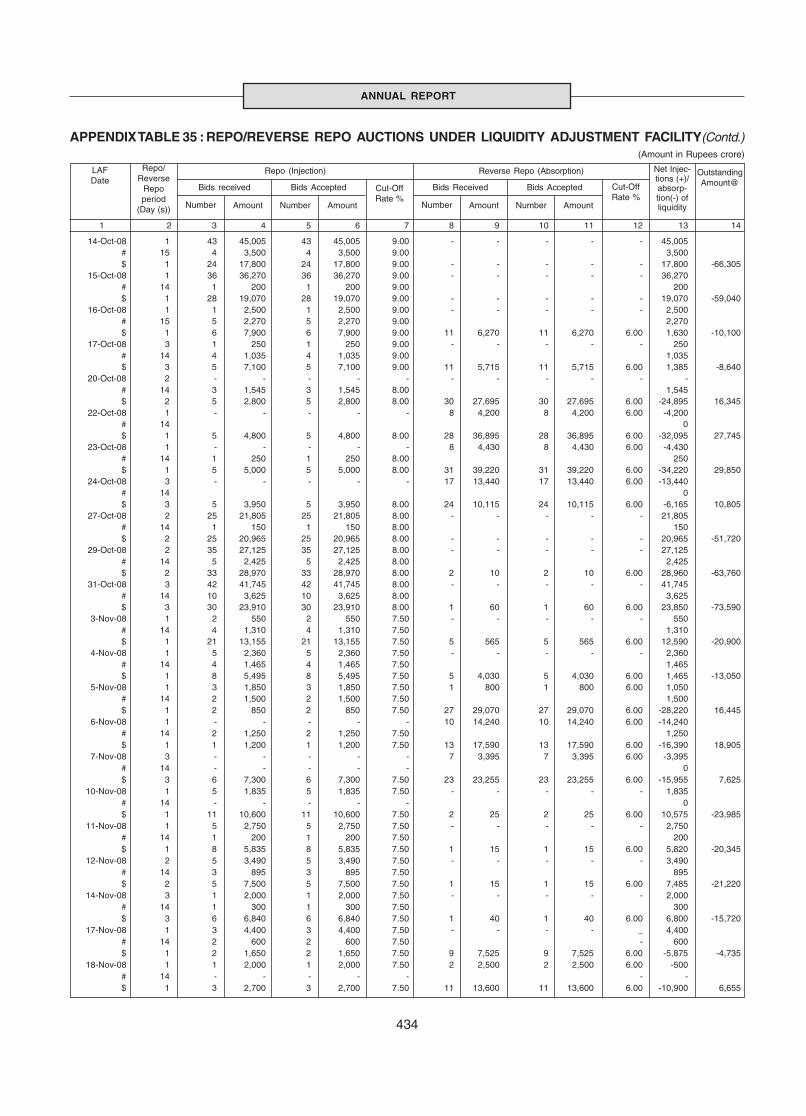
434
ANNUAL REPORT
Repo (Injection) Reverse Repo (Absorption)
Number
Bids received
Amount
Bids Accepted
Number Amount
Cut-OffRate %
Bids Received Cut-OffRate %
LAFDate
Repo/Reverse
Repoperiod
(Day (s)) Number Amount Number Amount
Bids Accepted
Net Injec-tions (+)/absorp-tion(-) ofliquidity
OutstandingAmount@
APPENDIX TABLE 35 : REPO/REVERSE REPO AUCTIONS UNDER LIQUIDITY ADJUSTMENT FACILITY(Contd.)(Amount in Rupees crore)
14-Oct-08 1 43 45,005 43 45,005 9.00 - - - - - 45,005# 15 4 3,500 4 3,500 9.00 3,500$ 1 24 17,800 24 17,800 9.00 - - - - - 17,800 -66,305
15-Oct-08 1 36 36,270 36 36,270 9.00 - - - - - 36,270# 14 1 200 1 200 9.00 200$ 1 28 19,070 28 19,070 9.00 - - - - - 19,070 -59,040
16-Oct-08 1 1 2,500 1 2,500 9.00 - - - - - 2,500# 15 5 2,270 5 2,270 9.00 2,270$ 1 6 7,900 6 7,900 9.00 11 6,270 11 6,270 6.00 1,630 -10,100
17-Oct-08 3 1 250 1 250 9.00 - - - - - 250# 14 4 1,035 4 1,035 9.00 1,035$ 3 5 7,100 5 7,100 9.00 11 5,715 11 5,715 6.00 1,385 -8,640
20-Oct-08 2 - - - - - - - - - - -# 14 3 1,545 3 1,545 8.00 1,545$ 2 5 2,800 5 2,800 8.00 30 27,695 30 27,695 6.00 -24,895 16,345
22-Oct-08 1 - - - - - 8 4,200 8 4,200 6.00 -4,200# 14 0$ 1 5 4,800 5 4,800 8.00 28 36,895 28 36,895 6.00 -32,095 27,745
23-Oct-08 1 - - - - - 8 4,430 8 4,430 6.00 -4,430# 14 1 250 1 250 8.00 250$ 1 5 5,000 5 5,000 8.00 31 39,220 31 39,220 6.00 -34,220 29,850
24-Oct-08 3 - - - - - 17 13,440 17 13,440 6.00 -13,440# 14 0$ 3 5 3,950 5 3,950 8.00 24 10,115 24 10,115 6.00 -6,165 10,805
27-Oct-08 2 25 21,805 25 21,805 8.00 - - - - - 21,805# 14 1 150 1 150 8.00 150$ 2 25 20,965 25 20,965 8.00 - - - - - 20,965 -51,720
29-Oct-08 2 35 27,125 35 27,125 8.00 - - - - - 27,125# 14 5 2,425 5 2,425 8.00 2,425$ 2 33 28,970 33 28,970 8.00 2 10 2 10 6.00 28,960 -63,760
31-Oct-08 3 42 41,745 42 41,745 8.00 - - - - - 41,745# 14 10 3,625 10 3,625 8.00 3,625$ 3 30 23,910 30 23,910 8.00 1 60 1 60 6.00 23,850 -73,590
3-Nov-08 1 2 550 2 550 7.50 - - - - - 550# 14 4 1,310 4 1,310 7.50 1,310$ 1 21 13,155 21 13,155 7.50 5 565 5 565 6.00 12,590 -20,900
4-Nov-08 1 5 2,360 5 2,360 7.50 - - - - - 2,360# 14 4 1,465 4 1,465 7.50 1,465$ 1 8 5,495 8 5,495 7.50 5 4,030 5 4,030 6.00 1,465 -13,050
5-Nov-08 1 3 1,850 3 1,850 7.50 1 800 1 800 6.00 1,050# 14 2 1,500 2 1,500 7.50 1,500$ 1 2 850 2 850 7.50 27 29,070 27 29,070 6.00 -28,220 16,445
6-Nov-08 1 - - - - - 10 14,240 10 14,240 6.00 -14,240# 14 2 1,250 2 1,250 7.50 1,250$ 1 1 1,200 1 1,200 7.50 13 17,590 13 17,590 6.00 -16,390 18,905
7-Nov-08 3 - - - - - 7 3,395 7 3,395 6.00 -3,395# 14 - - - - - 0$ 3 6 7,300 6 7,300 7.50 23 23,255 23 23,255 6.00 -15,955 7,625
10-Nov-08 1 5 1,835 5 1,835 7.50 - - - - - 1,835# 14 - - - - - 0$ 1 11 10,600 11 10,600 7.50 2 25 2 25 6.00 10,575 -23,985
11-Nov-08 1 5 2,750 5 2,750 7.50 - - - - - 2,750# 14 1 200 1 200 7.50 200$ 1 8 5,835 8 5,835 7.50 1 15 1 15 6.00 5,820 -20,345
12-Nov-08 2 5 3,490 5 3,490 7.50 - - - - - 3,490# 14 3 895 3 895 7.50 895$ 2 5 7,500 5 7,500 7.50 1 15 1 15 6.00 7,485 -21,220
14-Nov-08 3 1 2,000 1 2,000 7.50 - - - - - 2,000# 14 1 300 1 300 7.50 300$ 3 6 6,840 6 6,840 7.50 1 40 1 40 6.00 6,800 -15,720
17-Nov-08 1 3 4,400 3 4,400 7.50 - - - - _ 4,400# 14 2 600 2 600 7.50 - 600$ 1 2 1,650 2 1,650 7.50 9 7,525 9 7,525 6.00 -5,875 -4,735
18-Nov-08 1 1 2,000 1 2,000 7.50 2 2,500 2 2,500 6.00 -500# 14 - - - - - - -$ 1 3 2,700 3 2,700 7.50 11 13,600 11 13,600 6.00 -10,900 6,655
1 2 3 4 5 6 7 8 9 10 11 12 13 14

435
APPENDIX TABLES
Repo (Injection) Reverse Repo (Absorption)
Number
Bids received
Amount
Bids Accepted
Number Amount
Cut-OffRate %
Bids Received Cut-OffRate %
LAFDate
Repo/Reverse
Repoperiod
(Day (s)) Number Amount Number Amount
Bids Accepted
1 2 3 4 5 6 7 8 9 10 11 12 13 14
Net Injec-tions (+)/absorp-tion(-) ofliquidity
OutstandingAmount@
APPENDIX TABLE 35 : REPO/REVERSE REPO AUCTIONS UNDER LIQUIDITY ADJUSTMENT FACILITY(Contd.)(Amount in Rupees crore)
19-Nov-08 1 1 2,000 1 2,000 7.50 5 7,125 5 7,125 6.00 -5,125# 14 2 1,950 2 1,950 7.50 - 1,950$ 1 2 1,950 2 1,950 7.50 11 17,310 11 17,310 6.00 -15,360 15,290
20-Nov-08 1 1 1,000 1 1,000 7.50 6 8,435 6 8,435 6.00 -7,435# 14 1 1,000 1 1,000 7.50 - 1,000$ 1 3 1,600 3 1,600 7.50 11 19,110 11 19,110 6.00 -17,510 20,000
21-Nov-08 3 2 2,800 2 2,800 7.50 4 4,640 4 4,640 6.00 -1,840# 14 - - - - - - -$ 3 5 4,000 5 4,000 7.50 27 11,375 27 11,375 6.00 -7,375
## 90 1 250 1 250 7.50 - 250 4,02024-Nov-08 1 1 2,400 1 2,400 7.50 1 80 1 80 6.00 2,320
# 14 - - - - - 0$ 1 4 2,825 4 2,825 7.50 8 6,635 8 6,635 6.00 -3,810
## 88 1 790 1 790 7.50 790 -4,49525-Nov-08 1 1 1,600 1 1,600 7.50 3 805 3 805 6.00 795
# 15 - - - - - 0$ 1 4 2,175 4 2,175 7.50 8 3,690 8 3,690 6.00 -1,515 -5,065
26-Nov-08 2 1 1,600 1 1,600 7.50 8 5,505 8 5,505 6.00 -3,905# 14 1 600 1 600 7.50 600$ 2 2 1,500 2 1,500 7.50 9 6,475 9 6,475 6.00 -4,975 3,390
27-Nov-08 1 3 735 3 735 7.50 - - - - - 735# 14 1 150 1 150 7.50 150$ 1 2 2,000 2 2,000 7.50 4 2,350 4 2,350 6.00 -350 2,855
28-Nov-08 3 4 10,000 4 10,000 7.50 - - - - - 10,000# 14 - - - - - 0$ 3 3 2,250 3 2,250 7.50 17 7,710 17 7,710 6.00 -5,460 -9,880
1-Dec-08 1 1 500 1 500 7.50 12 21,885 12 21,885 6.00 -21,385# 14 1 400 1 400 7.50 400$ 1 - - - - - 24 14,680 24 14,680 6.00 -14,680 30,925
2-Dec-08 1 - - - - - 13 28,625 13 28,625 6.00 -28,625# 14 - - - - -$ 1 - - - - - 32 24,355 32 24,355 6.00 -24,355 47,840
3-Dec-08 1 - - - - - 17 28,020 17 28,020 6.00 -28,020# 14 2 1,950 2 1,950 7.50 1,950$ 1 - - - - - 28 28,590 28 28,590 6.00 -28,590 51,470
4-Dec-08 1 - - - - - 19 27,655 19 27,655 6.00 -27,655# 14 1 1,000 1 1,000 7.50 1,000$ 1 - - - - - 23 24,405 23 24,405 6.00 -24,405 46,920
5-Dec-08 3 - - - - - 9 13,120 9 13,120 6.00 -13,120# 14 2 835 2 835 7.50 835$ 3 - - - - - 42 31,975 42 31,975 6.00 -31,975 39,120
8-Dec-08 2 - - - - - 8 1,070 8 1,070 5.00 -1,070# 14 - - - - -$ 2 - - - - - 18 26,330 18 26,330 5.00 -26,330 21,425
10-Dec-08 1 - - - - - 13 11,970 13 11,970 5.00 -11,970# 14 1 600 1 600 6.50 600$ 1 - - - - - 17 15,400 17 15,400 5.00 -15,400 21,395
11-Dec-08 1 - - - - - 13 17,835 13 17,835 5.00 -17,835# 15 - - - - -$ 1 - - - - - 11 13,830 11 13,830 5.00 -13,830 25,840
12-Dec-08 3 - - - - - 3 6,590 3 6,590 5.00 -6,590# 14 - - - - -$ 3 - - - - - 8 17,445 8 17,445 5.00 -17,445 18,210
15-Dec-08 1 - - - - - 6 16,600 6 16,600 5.00 -16,600# 14 1 400 1 400 6.50 400$ 1 3 2,300 3 2,300 6.50 10 19,070 10 19,070 5.00 -16,770 27,545
16-Dec-08 1 - - - - - 5 3,245 5 3,245 5.00 -3,245# 14 1 35 1 35 6.50 35$ 1 4 7,375 4 7,375 6.50 15 28,350 15 28,350 5.00 -20,975 18,360
17-Dec-08 1 2 3,000 2 3,000 6.50 7 6,230 7 6,230 5.00 -3,230# 14 3 1,760 3 1,760 6.50 1,760$ 1 4 4,125 4 4,125 6.50 9 12,905 9 12,905 5.00 -8,780 6,340
18-Dec-08 1 2 3,000 2 3,000 6.50 1 70 1 70 5.00 2,930# 14 1 250 1 250 6.50 250$ 1 3 2,470 3 2,470 6.50 15 19,430 15 19,430 5.00 -16,960 9,110

436
ANNUAL REPORT
Repo (Injection) Reverse Repo (Absorption)
Number
Bids received
Amount
Bids Accepted
Number Amount
Cut-OffRate %
Bids Received Cut-OffRate %
LAFDate
Repo/Reverse
Repoperiod
(Day (s)) Number Amount Number Amount
Bids Accepted
1 2 3 4 5 6 7 8 9 10 11 12 13 14
Net Injec-tions (+)/absorp-tion(-) ofliquidity
OutstandingAmount@
APPENDIX TABLE 35 : REPO/REVERSE REPO AUCTIONS UNDER LIQUIDITY ADJUSTMENT FACILITY(Contd.)(Amount in Rupees crore)
19-Dec-08 3 7 6,500 7 6,500 6.50 5 820 5 820 5.00 5,680# 14 1 785 1 785 6.50 785$ 3 12 7,890 12 7,890 6.50 22 24,130 22 24,130 5.00 -16,240 5,690
22-Dec-08 1 2 2,050 2 2,050 6.50 3 5,000 3 5,000 5.00 -2,950# 14 1 550 1 550 6.50 550$ 1 3 1,820 3 1,820 6.50 1 130 1 130 5.00 1,690 -4,160
23-Dec-08 1 2 2,000 2 2,000 6.50 1 125 1 125 5.00 1,875# 14 1 75 1 75 6.50 75$ 1 1 100 1 100 6.50 6 7,460 6 7,460 5.00 -7,360 -10
24-Dec-08 2 - - - - - 2 325 2 325 5.00 -325# 14 2 1,180 2 1,180 6.50 1,180$ 2 - - - - - 10 15,050 10 15,050 5.00 -15,050 9,300
26-Dec-08 3 - - - - - 3 505 3 505 5.00 -505# 14 - - - - - $ 3 2 3,400 2 3,400 6.50 14 23,600 14 23,600 5.00 -20,200 14,630
29-Dec-08 1 - - - - - 6 2,265 6 2,265 5.00 -2,265# 14 - - - - -$ 1 1 100 1 100 6.50 33 45,085 33 45,085 5.00 -44,985 41,575
30-Dec-08 1 - - - - - 6 2,115 6 2,115 5.00 -2,115# 14 - - - - -$ 1 - - - - - 23 37,050 23 37,050 5.00 -37,050 33,525
31-Dec-08 1 - - - - - 5 1,695 5 1,695 5.00 -1,695# 14 2 760 2 760 6.50 760$ 1 2 3,000 2 3,000 6.50 30 45,970 30 45,970 5.00 -42,970 40,025
1-Jan-09 1 - - - - - 5 1,500 5 1,500 5.00 -1,500# 14 - - - - -$ 1 - - - - - 33 67,215 33 67,215 5.00 -67,215 64,325
2-Jan-09 3 2 1,010 2 1,010 6.50 12 6,705 12 6,705 5.00 -5,695# 14 - - - - -$ 3 - - - - - 48 71,230 48 71,230 5.00 -71,230 73,320
5-Jan-09 1 - - - - - 10 14,530 10 14,530 4.00 -14,530# 14 - - - - -$ 1 - - - - - 20 42,960 20 42,960 4.00 -42,960 54,435
6-Jan-09 1 - - - - - 9 5,375 9 5,375 4.00 -5,375# 14 - - - - -$ 1 - - - - - 20 53,985 20 53,985 4.00 -53,985 56,380
7-Jan-09 2 - - - - - 6 2,680 6 2,680 4.00 -2,680# 14 - - - - -$ 2 - - - - - 18 40,650 18 40,650 4.00 -40,650 41,530
9-Jan-09 3 - - - - - 11 11,880 11 11,880 4.00 -11,880# 14 1 90 1 90 5.50 90$ 3 - - - - - 16 15,560 16 15,560 4.00 -15,560 25,550
12-Jan-09 1 - - - - - 9 6,635 9 6,635 4.00 -6,635# 15 - - - - -$ 1 - - - - - 22 22,225 22 22,225 4.00 -22,225 26,970
13-Jan-09 1 - - - - - 8 6,725 8 6,725 4.00 -6,725# 14 - - - - -$ 1 - - - - - 18 22,245 18 22,245 4.00 -22,245 27,080
14-Jan-09 1 - - - - - 7 6,880 7 6,880 4.00 -6,880# 14 1 550 1 550 5.50 550$ 1 - - - - - 13 16,115 13 16,115 4.00 -16,115 21,315
15-Jan-09 1 - - - - - 5 5,625 5 5,625 4.00 -5,625# 14 1 280 1 280 5.50 280$ 1 2 1,950 2 1,950 5.50 16 17,200 16 17,200 4.00 -15,250 18,915
16-Jan-09 3 1 1,300 1 1,300 5.50 5 6,105 5 6,105 4.00 -4,805# 14 - - - - -$ 3 5 3,735 5 3,735 5.50 31 32,685 31 32,685 4.00 -28,950 31,795
19-Jan-09 1 - - - - - 10 12,910 10 12,910 4.00 -12,910# 14 - - - - -$ 1 - - - - - 22 30,290 22 30,290 4.00 -30,290 41,240
20-Jan-09 1 - - - - - 12 19,140 12 19,140 4.00 -19,140# 14 - - - - -$ 1 - - - - - 22 30,085 22 30,085 4.00 -30,085 47,265
21-Jan-09 1 - - - - - 11 19,835 11 19,835 4.00 -19,835# 14 - - - - -$ 1 - - - - - 26 34,620 26 34,620 4.00 -34,620 52,495
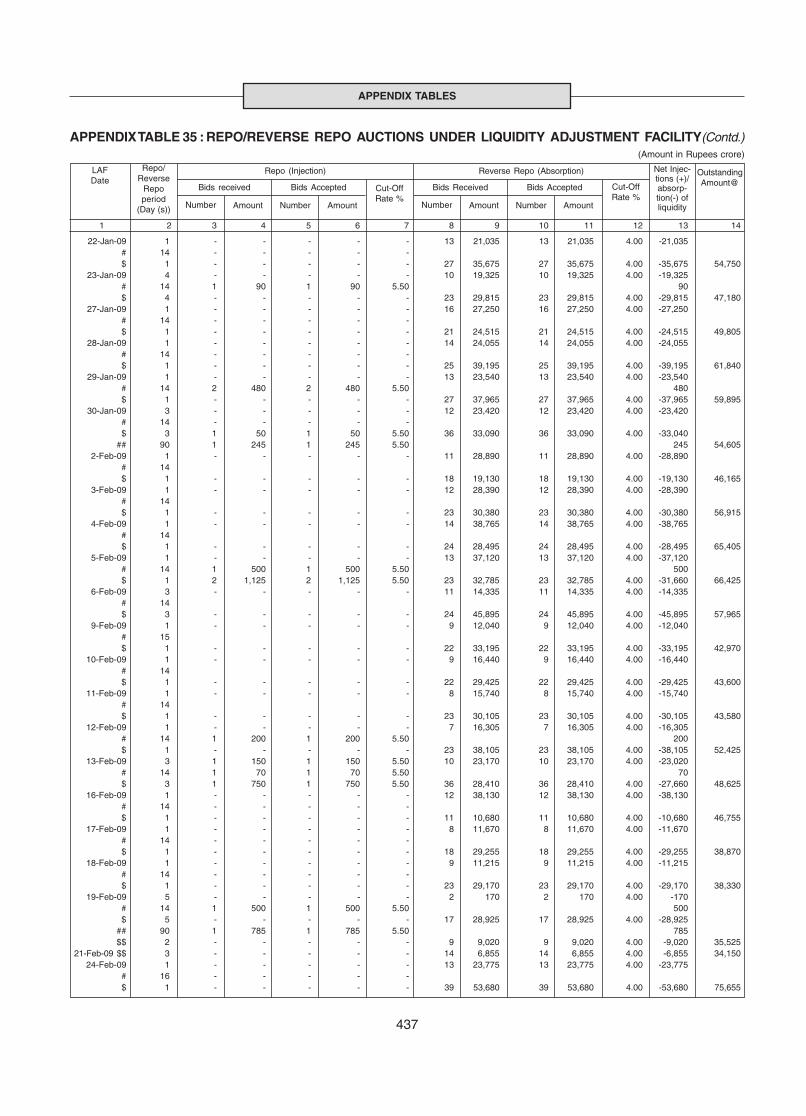
437
APPENDIX TABLES
Repo (Injection) Reverse Repo (Absorption)
Number
Bids received
Amount
Bids Accepted
Number Amount
Cut-OffRate %
Bids Received Cut-OffRate %
LAFDate
Repo/Reverse
Repoperiod
(Day (s)) Number Amount Number Amount
Bids Accepted
1 2 3 4 5 6 7 8 9 10 11 12 13 14
Net Injec-tions (+)/absorp-tion(-) ofliquidity
OutstandingAmount@
APPENDIX TABLE 35 : REPO/REVERSE REPO AUCTIONS UNDER LIQUIDITY ADJUSTMENT FACILITY(Contd.)(Amount in Rupees crore)
22-Jan-09 1 - - - - - 13 21,035 13 21,035 4.00 -21,035# 14 - - - - -$ 1 - - - - - 27 35,675 27 35,675 4.00 -35,675 54,750
23-Jan-09 4 - - - - - 10 19,325 10 19,325 4.00 -19,325# 14 1 90 1 90 5.50 90$ 4 - - - - - 23 29,815 23 29,815 4.00 -29,815 47,180
27-Jan-09 1 - - - - - 16 27,250 16 27,250 4.00 -27,250# 14 - - - - -$ 1 - - - - - 21 24,515 21 24,515 4.00 -24,515 49,805
28-Jan-09 1 - - - - - 14 24,055 14 24,055 4.00 -24,055# 14 - - - - -$ 1 - - - - - 25 39,195 25 39,195 4.00 -39,195 61,840
29-Jan-09 1 - - - - - 13 23,540 13 23,540 4.00 -23,540# 14 2 480 2 480 5.50 480$ 1 - - - - - 27 37,965 27 37,965 4.00 -37,965 59,895
30-Jan-09 3 - - - - - 12 23,420 12 23,420 4.00 -23,420# 14 - - - - -$ 3 1 50 1 50 5.50 36 33,090 36 33,090 4.00 -33,040
## 90 1 245 1 245 5.50 245 54,6052-Feb-09 1 - - - - - 11 28,890 11 28,890 4.00 -28,890
# 14$ 1 - - - - - 18 19,130 18 19,130 4.00 -19,130 46,165
3-Feb-09 1 - - - - - 12 28,390 12 28,390 4.00 -28,390# 14$ 1 - - - - - 23 30,380 23 30,380 4.00 -30,380 56,915
4-Feb-09 1 - - - - - 14 38,765 14 38,765 4.00 -38,765# 14$ 1 - - - - - 24 28,495 24 28,495 4.00 -28,495 65,405
5-Feb-09 1 - - - - - 13 37,120 13 37,120 4.00 -37,120# 14 1 500 1 500 5.50 500$ 1 2 1,125 2 1,125 5.50 23 32,785 23 32,785 4.00 -31,660 66,425
6-Feb-09 3 - - - - - 11 14,335 11 14,335 4.00 -14,335# 14$ 3 - - - - - 24 45,895 24 45,895 4.00 -45,895 57,965
9-Feb-09 1 - - - - - 9 12,040 9 12,040 4.00 -12,040# 15$ 1 - - - - - 22 33,195 22 33,195 4.00 -33,195 42,970
10-Feb-09 1 - - - - - 9 16,440 9 16,440 4.00 -16,440# 14$ 1 - - - - - 22 29,425 22 29,425 4.00 -29,425 43,600
11-Feb-09 1 - - - - - 8 15,740 8 15,740 4.00 -15,740# 14$ 1 - - - - - 23 30,105 23 30,105 4.00 -30,105 43,580
12-Feb-09 1 - - - - - 7 16,305 7 16,305 4.00 -16,305# 14 1 200 1 200 5.50 200$ 1 - - - - - 23 38,105 23 38,105 4.00 -38,105 52,425
13-Feb-09 3 1 150 1 150 5.50 10 23,170 10 23,170 4.00 -23,020# 14 1 70 1 70 5.50 70$ 3 1 750 1 750 5.50 36 28,410 36 28,410 4.00 -27,660 48,625
16-Feb-09 1 - - - - - 12 38,130 12 38,130 4.00 -38,130# 14 - - - - -$ 1 - - - - - 11 10,680 11 10,680 4.00 -10,680 46,755
17-Feb-09 1 - - - - - 8 11,670 8 11,670 4.00 -11,670# 14 - - - - -$ 1 - - - - - 18 29,255 18 29,255 4.00 -29,255 38,870
18-Feb-09 1 - - - - - 9 11,215 9 11,215 4.00 -11,215# 14 - - - - -$ 1 - - - - - 23 29,170 23 29,170 4.00 -29,170 38,330
19-Feb-09 5 - - - - - 2 170 2 170 4.00 -170# 14 1 500 1 500 5.50 500$ 5 - - - - - 17 28,925 17 28,925 4.00 -28,925
## 90 1 785 1 785 5.50 785$$ 2 - - - - - 9 9,020 9 9,020 4.00 -9,020 35,525
21-Feb-09 $$ 3 - - - - - 14 6,855 14 6,855 4.00 -6,855 34,15024-Feb-09 1 - - - - - 13 23,775 13 23,775 4.00 -23,775
# 16 - - - - -$ 1 - - - - - 39 53,680 39 53,680 4.00 -53,680 75,655
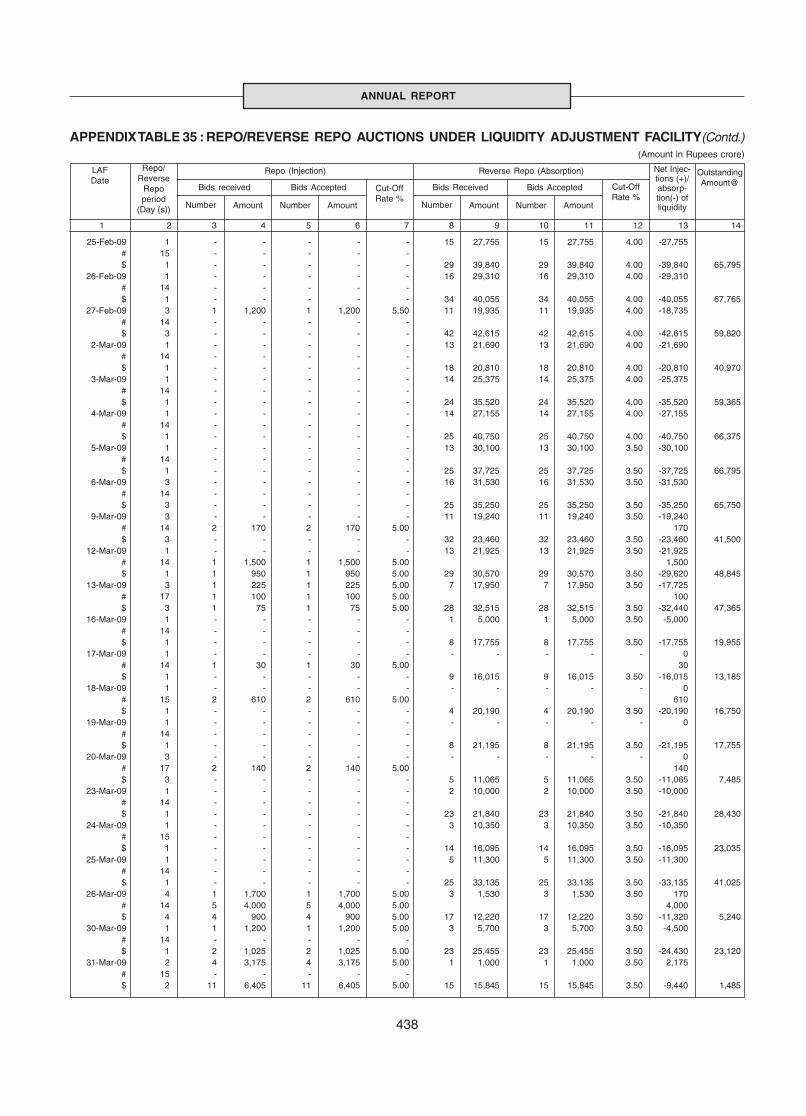
438
ANNUAL REPORT
Repo (Injection) Reverse Repo (Absorption)
Number
Bids received
Amount
Bids Accepted
Number Amount
Cut-OffRate %
Bids Received Cut-OffRate %
LAFDate
Repo/Reverse
Repoperiod
(Day (s)) Number Amount Number Amount
Bids Accepted
1 2 3 4 5 6 7 8 9 10 11 12 13 14
Net Injec-tions (+)/absorp-tion(-) ofliquidity
OutstandingAmount@
APPENDIX TABLE 35 : REPO/REVERSE REPO AUCTIONS UNDER LIQUIDITY ADJUSTMENT FACILITY(Contd.)(Amount in Rupees crore)
25-Feb-09 1 - - - - - 15 27,755 15 27,755 4.00 -27,755# 15 - - - - -$ 1 - - - - - 29 39,840 29 39,840 4.00 -39,840 65,795
26-Feb-09 1 - - - - - 16 29,310 16 29,310 4.00 -29,310# 14 - - - - -$ 1 - - - - - 34 40,055 34 40,055 4.00 -40,055 67,765
27-Feb-09 3 1 1,200 1 1,200 5.50 11 19,935 11 19,935 4.00 -18,735# 14 - - - - -$ 3 - - - - - 42 42,615 42 42,615 4.00 -42,615 59,820
2-Mar-09 1 - - - - - 13 21,690 13 21,690 4.00 -21,690# 14 - - - - -$ 1 - - - - - 18 20,810 18 20,810 4.00 -20,810 40,970
3-Mar-09 1 - - - - - 14 25,375 14 25,375 4.00 -25,375# 14 - - - - -$ 1 - - - - - 24 35,520 24 35,520 4.00 -35,520 59,365
4-Mar-09 1 - - - - - 14 27,155 14 27,155 4.00 -27,155# 14 - - - - -$ 1 - - - - - 25 40,750 25 40,750 4.00 -40,750 66,375
5-Mar-09 1 - - - - - 13 30,100 13 30,100 3.50 -30,100# 14 - - - - -$ 1 - - - - - 25 37,725 25 37,725 3.50 -37,725 66,795
6-Mar-09 3 - - - - - 16 31,530 16 31,530 3.50 -31,530# 14 - - - - -$ 3 - - - - - 25 35,250 25 35,250 3.50 -35,250 65,750
9-Mar-09 3 - - - - - 11 19,240 11 19,240 3.50 -19,240# 14 2 170 2 170 5.00 170$ 3 - - - - - 32 23,460 32 23,460 3.50 -23,460 41,500
12-Mar-09 1 - - - - - 13 21,925 13 21,925 3.50 -21,925# 14 1 1,500 1 1,500 5.00 1,500$ 1 1 950 1 950 5.00 29 30,570 29 30,570 3.50 -29,620 48,845
13-Mar-09 3 1 225 1 225 5.00 7 17,950 7 17,950 3.50 -17,725# 17 1 100 1 100 5.00 100$ 3 1 75 1 75 5.00 28 32,515 28 32,515 3.50 -32,440 47,365
16-Mar-09 1 - - - - - 1 5,000 1 5,000 3.50 -5,000# 14 - - - - -$ 1 - - - - - 8 17,755 8 17,755 3.50 -17,755 19,955
17-Mar-09 1 - - - - - - - - - - 0# 14 1 30 1 30 5.00 30$ 1 - - - - - 9 16,015 9 16,015 3.50 -16,015 13,185
18-Mar-09 1 - - - - - - - - - - 0# 15 2 610 2 610 5.00 610$ 1 - - - - - 4 20,190 4 20,190 3.50 -20,190 16,750
19-Mar-09 1 - - - - - - - - - - 0# 14 - - - - -$ 1 - - - - - 8 21,195 8 21,195 3.50 -21,195 17,755
20-Mar-09 3 - - - - - - - - - - 0# 17 2 140 2 140 5.00 140$ 3 - - - - - 5 11,065 5 11,065 3.50 -11,065 7,485
23-Mar-09 1 - - - - - 2 10,000 2 10,000 3.50 -10,000# 14 - - - - -$ 1 - - - - - 23 21,840 23 21,840 3.50 -21,840 28,430
24-Mar-09 1 - - - - - 3 10,350 3 10,350 3.50 -10,350# 15 - - - - -$ 1 - - - - - 14 16,095 14 16,095 3.50 -16,095 23,035
25-Mar-09 1 - - - - - 5 11,300 5 11,300 3.50 -11,300# 14 - - - - -$ 1 - - - - - 25 33,135 25 33,135 3.50 -33,135 41,025
26-Mar-09 4 1 1,700 1 1,700 5.00 3 1,530 3 1,530 3.50 170# 14 5 4,000 5 4,000 5.00 4,000$ 4 4 900 4 900 5.00 17 12,220 17 12,220 3.50 -11,320 5,240
30-Mar-09 1 1 1,200 1 1,200 5.00 3 5,700 3 5,700 3.50 -4,500# 14 - - - - -$ 1 2 1,025 2 1,025 5.00 23 25,455 23 25,455 3.50 -24,430 23,120
31-Mar-09 2 4 3,175 4 3,175 5.00 1 1,000 1 1,000 3.50 2,175# 15 - - - - -$ 2 11 6,405 11 6,405 5.00 15 15,845 15 15,845 3.50 -9,440 1,485
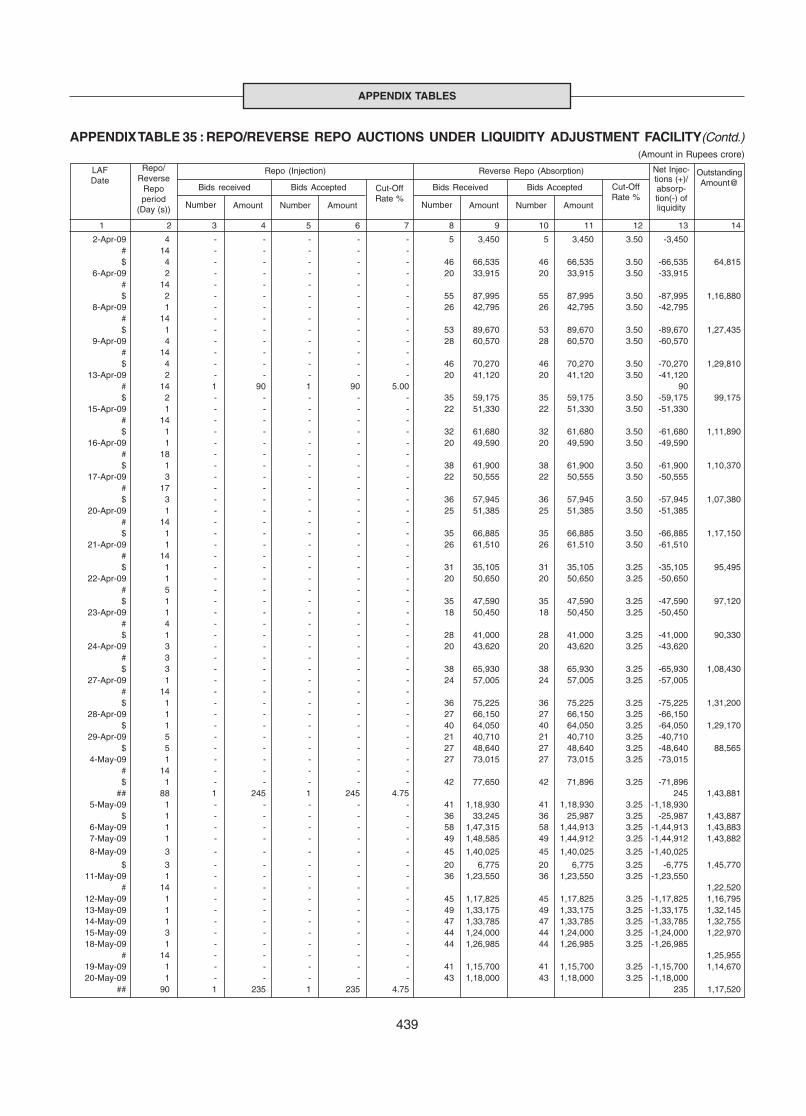
439
APPENDIX TABLES
Repo (Injection) Reverse Repo (Absorption)
Number
Bids received
Amount
Bids Accepted
Number Amount
Cut-OffRate %
Bids Received Cut-OffRate %
LAFDate
Repo/Reverse
Repoperiod
(Day (s)) Number Amount Number Amount
Bids Accepted
1 2 3 4 5 6 7 8 9 10 11 12 13 14
Net Injec-tions (+)/absorp-tion(-) ofliquidity
OutstandingAmount@
APPENDIX TABLE 35 : REPO/REVERSE REPO AUCTIONS UNDER LIQUIDITY ADJUSTMENT FACILITY(Contd.)(Amount in Rupees crore)
2-Apr-09 4 - - - - - 5 3,450 5 3,450 3.50 -3,450# 14 - - - - -$ 4 - - - - - 46 66,535 46 66,535 3.50 -66,535 64,815
6-Apr-09 2 - - - - - 20 33,915 20 33,915 3.50 -33,915# 14 - - - - -$ 2 - - - - - 55 87,995 55 87,995 3.50 -87,995 1,16,880
8-Apr-09 1 - - - - - 26 42,795 26 42,795 3.50 -42,795# 14 - - - - -$ 1 - - - - - 53 89,670 53 89,670 3.50 -89,670 1,27,435
9-Apr-09 4 - - - - - 28 60,570 28 60,570 3.50 -60,570# 14 - - - - -$ 4 - - - - - 46 70,270 46 70,270 3.50 -70,270 1,29,810
13-Apr-09 2 - - - - - 20 41,120 20 41,120 3.50 -41,120# 14 1 90 1 90 5.00 90$ 2 - - - - - 35 59,175 35 59,175 3.50 -59,175 99,175
15-Apr-09 1 - - - - - 22 51,330 22 51,330 3.50 -51,330# 14 - - - - -$ 1 - - - - - 32 61,680 32 61,680 3.50 -61,680 1,11,890
16-Apr-09 1 - - - - - 20 49,590 20 49,590 3.50 -49,590# 18 - - - - -$ 1 - - - - - 38 61,900 38 61,900 3.50 -61,900 1,10,370
17-Apr-09 3 - - - - - 22 50,555 22 50,555 3.50 -50,555# 17 - - - - -$ 3 - - - - - 36 57,945 36 57,945 3.50 -57,945 1,07,380
20-Apr-09 1 - - - - - 25 51,385 25 51,385 3.50 -51,385# 14 - - - - -$ 1 - - - - - 35 66,885 35 66,885 3.50 -66,885 1,17,150
21-Apr-09 1 - - - - - 26 61,510 26 61,510 3.50 -61,510# 14 - - - - -$ 1 - - - - - 31 35,105 31 35,105 3.25 -35,105 95,495
22-Apr-09 1 - - - - - 20 50,650 20 50,650 3.25 -50,650# 5 - - - - -$ 1 - - - - - 35 47,590 35 47,590 3.25 -47,590 97,120
23-Apr-09 1 - - - - - 18 50,450 18 50,450 3.25 -50,450# 4 - - - - -$ 1 - - - - - 28 41,000 28 41,000 3.25 -41,000 90,330
24-Apr-09 3 - - - - - 20 43,620 20 43,620 3.25 -43,620# 3 - - - - -$ 3 - - - - - 38 65,930 38 65,930 3.25 -65,930 1,08,430
27-Apr-09 1 - - - - - 24 57,005 24 57,005 3.25 -57,005# 14 - - - - -$ 1 - - - - - 36 75,225 36 75,225 3.25 -75,225 1,31,200
28-Apr-09 1 - - - - - 27 66,150 27 66,150 3.25 -66,150$ 1 - - - - - 40 64,050 40 64,050 3.25 -64,050 1,29,170
29-Apr-09 5 - - - - - 21 40,710 21 40,710 3.25 -40,710$ 5 - - - - - 27 48,640 27 48,640 3.25 -48,640 88,565
4-May-09 1 - - - - - 27 73,015 27 73,015 3.25 -73,015# 14 - - - - -$ 1 - - - - - 42 77,650 42 71,896 3.25 -71,896
## 88 1 245 1 245 4.75 245 1,43,8815-May-09 1 - - - - - 41 1,18,930 41 1,18,930 3.25 -1,18,930
$ 1 - - - - - 36 33,245 36 25,987 3.25 -25,987 1,43,8876-May-09 1 - - - - - 58 1,47,315 58 1,44,913 3.25 -1,44,913 1,43,8837-May-09 1 - - - - - 49 1,48,585 49 1,44,912 3.25 -1,44,912 1,43,882
8-May-09 3 - - - - - 45 1,40,025 45 1,40,025 3.25 -1,40,025
$ 3 - - - - - 20 6,775 20 6,775 3.25 -6,775 1,45,77011-May-09 1 - - - - - 36 1,23,550 36 1,23,550 3.25 -1,23,550
# 14 - - - - - 1,22,52012-May-09 1 - - - - - 45 1,17,825 45 1,17,825 3.25 -1,17,825 1,16,79513-May-09 1 - - - - - 49 1,33,175 49 1,33,175 3.25 -1,33,175 1,32,14514-May-09 1 - - - - - 47 1,33,785 47 1,33,785 3.25 -1,33,785 1,32,75515-May-09 3 - - - - - 44 1,24,000 44 1,24,000 3.25 -1,24,000 1,22,97018-May-09 1 - - - - - 44 1,26,985 44 1,26,985 3.25 -1,26,985
# 14 - - - - - 1,25,95519-May-09 1 - - - - - 41 1,15,700 41 1,15,700 3.25 -1,15,700 1,14,67020-May-09 1 - - - - - 43 1,18,000 43 1,18,000 3.25 -1,18,000
## 90 1 235 1 235 4.75 235 1,17,520
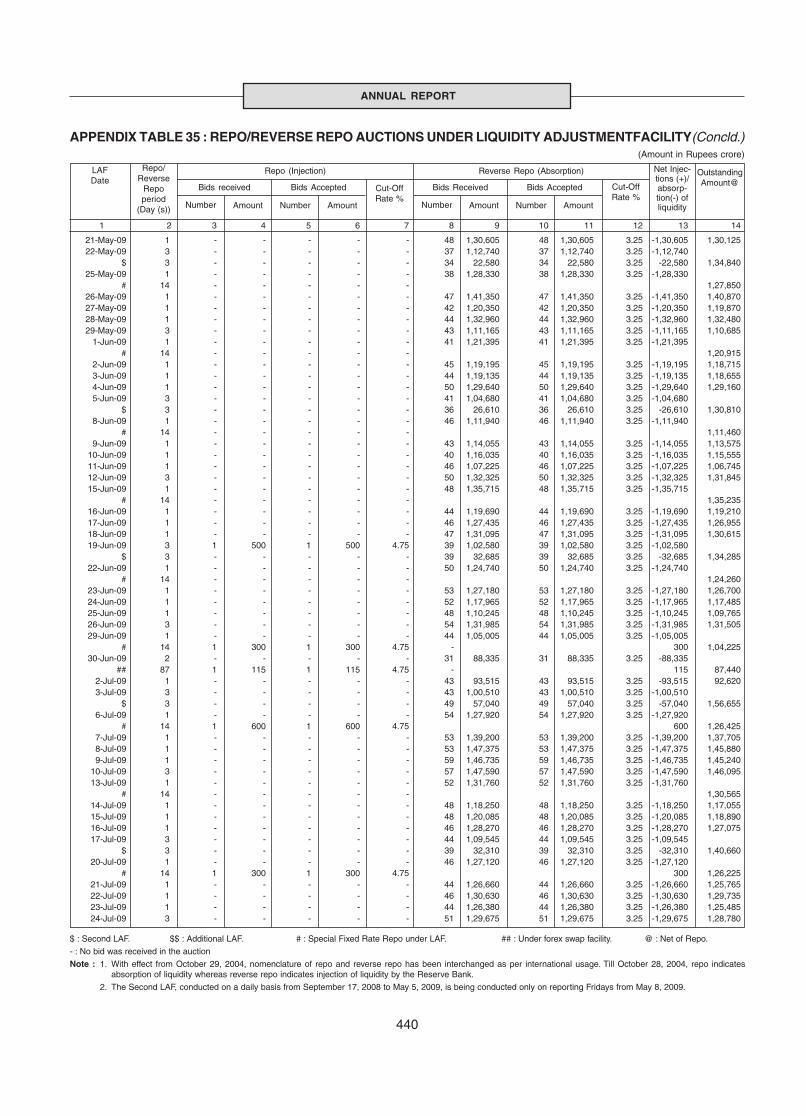
440
ANNUAL REPORT
Repo (Injection) Reverse Repo (Absorption)
Number
Bids received
Amount
Bids Accepted
Number Amount
Cut-OffRate %
Bids Received Cut-OffRate %
LAFDate
Repo/Reverse
Repoperiod
(Day (s)) Number Amount Number Amount
Bids Accepted
1 2 3 4 5 6 7 8 9 10 11 12 13 14
Net Injec-tions (+)/absorp-tion(-) ofliquidity
OutstandingAmount@
APPENDIX TABLE 35 : REPO/REVERSE REPO AUCTIONS UNDER LIQUIDITY ADJUSTMENTFACILITY(Concld.)(Amount in Rupees crore)
21-May-09 1 - - - - - 48 1,30,605 48 1,30,605 3.25 -1,30,605 1,30,12522-May-09 3 - - - - - 37 1,12,740 37 1,12,740 3.25 -1,12,740
$ 3 - - - - - 34 22,580 34 22,580 3.25 -22,580 1,34,84025-May-09 1 - - - - - 38 1,28,330 38 1,28,330 3.25 -1,28,330
# 14 - - - - - 1,27,85026-May-09 1 - - - - - 47 1,41,350 47 1,41,350 3.25 -1,41,350 1,40,87027-May-09 1 - - - - - 42 1,20,350 42 1,20,350 3.25 -1,20,350 1,19,87028-May-09 1 - - - - - 44 1,32,960 44 1,32,960 3.25 -1,32,960 1,32,48029-May-09 3 - - - - - 43 1,11,165 43 1,11,165 3.25 -1,11,165 1,10,685
1-Jun-09 1 - - - - - 41 1,21,395 41 1,21,395 3.25 -1,21,395# 14 - - - - - 1,20,915
2-Jun-09 1 - - - - - 45 1,19,195 45 1,19,195 3.25 -1,19,195 1,18,7153-Jun-09 1 - - - - - 44 1,19,135 44 1,19,135 3.25 -1,19,135 1,18,6554-Jun-09 1 - - - - - 50 1,29,640 50 1,29,640 3.25 -1,29,640 1,29,1605-Jun-09 3 - - - - - 41 1,04,680 41 1,04,680 3.25 -1,04,680
$ 3 - - - - - 36 26,610 36 26,610 3.25 -26,610 1,30,8108-Jun-09 1 - - - - - 46 1,11,940 46 1,11,940 3.25 -1,11,940
# 14 - - - - - 1,11,4609-Jun-09 1 - - - - - 43 1,14,055 43 1,14,055 3.25 -1,14,055 1,13,575
10-Jun-09 1 - - - - - 40 1,16,035 40 1,16,035 3.25 -1,16,035 1,15,55511-Jun-09 1 - - - - - 46 1,07,225 46 1,07,225 3.25 -1,07,225 1,06,74512-Jun-09 3 - - - - - 50 1,32,325 50 1,32,325 3.25 -1,32,325 1,31,84515-Jun-09 1 - - - - - 48 1,35,715 48 1,35,715 3.25 -1,35,715
# 14 - - - - - 1,35,23516-Jun-09 1 - - - - - 44 1,19,690 44 1,19,690 3.25 -1,19,690 1,19,21017-Jun-09 1 - - - - - 46 1,27,435 46 1,27,435 3.25 -1,27,435 1,26,95518-Jun-09 1 - - - - - 47 1,31,095 47 1,31,095 3.25 -1,31,095 1,30,61519-Jun-09 3 1 500 1 500 4.75 39 1,02,580 39 1,02,580 3.25 -1,02,580
$ 3 - - - - - 39 32,685 39 32,685 3.25 -32,685 1,34,28522-Jun-09 1 - - - - - 50 1,24,740 50 1,24,740 3.25 -1,24,740
# 14 - - - - - 1,24,26023-Jun-09 1 - - - - - 53 1,27,180 53 1,27,180 3.25 -1,27,180 1,26,70024-Jun-09 1 - - - - - 52 1,17,965 52 1,17,965 3.25 -1,17,965 1,17,48525-Jun-09 1 - - - - - 48 1,10,245 48 1,10,245 3.25 -1,10,245 1,09,76526-Jun-09 3 - - - - - 54 1,31,985 54 1,31,985 3.25 -1,31,985 1,31,50529-Jun-09 1 - - - - - 44 1,05,005 44 1,05,005 3.25 -1,05,005
# 14 1 300 1 300 4.75 - 300 1,04,22530-Jun-09 2 - - - - - 31 88,335 31 88,335 3.25 -88,335
## 87 1 115 1 115 4.75 - 115 87,4402-Jul-09 1 - - - - - 43 93,515 43 93,515 3.25 -93,515 92,6203-Jul-09 3 - - - - - 43 1,00,510 43 1,00,510 3.25 -1,00,510
$ 3 - - - - - 49 57,040 49 57,040 3.25 -57,040 1,56,6556-Jul-09 1 - - - - - 54 1,27,920 54 1,27,920 3.25 -1,27,920
# 14 1 600 1 600 4.75 600 1,26,4257-Jul-09 1 - - - - - 53 1,39,200 53 1,39,200 3.25 -1,39,200 1,37,7058-Jul-09 1 - - - - - 53 1,47,375 53 1,47,375 3.25 -1,47,375 1,45,8809-Jul-09 1 - - - - - 59 1,46,735 59 1,46,735 3.25 -1,46,735 1,45,240
10-Jul-09 3 - - - - - 57 1,47,590 57 1,47,590 3.25 -1,47,590 1,46,09513-Jul-09 1 - - - - - 52 1,31,760 52 1,31,760 3.25 -1,31,760
# 14 - - - - - 1,30,56514-Jul-09 1 - - - - - 48 1,18,250 48 1,18,250 3.25 -1,18,250 1,17,05515-Jul-09 1 - - - - - 48 1,20,085 48 1,20,085 3.25 -1,20,085 1,18,89016-Jul-09 1 - - - - - 46 1,28,270 46 1,28,270 3.25 -1,28,270 1,27,07517-Jul-09 3 - - - - - 44 1,09,545 44 1,09,545 3.25 -1,09,545
$ 3 - - - - - 39 32,310 39 32,310 3.25 -32,310 1,40,66020-Jul-09 1 - - - - - 46 1,27,120 46 1,27,120 3.25 -1,27,120
# 14 1 300 1 300 4.75 300 1,26,22521-Jul-09 1 - - - - - 44 1,26,660 44 1,26,660 3.25 -1,26,660 1,25,76522-Jul-09 1 - - - - - 46 1,30,630 46 1,30,630 3.25 -1,30,630 1,29,73523-Jul-09 1 - - - - - 44 1,26,380 44 1,26,380 3.25 -1,26,380 1,25,48524-Jul-09 3 - - - - - 51 1,29,675 51 1,29,675 3.25 -1,29,675 1,28,780
$ : Second LAF. $$ : Additional LAF. # : Special Fixed Rate Repo under LAF. ## : Under forex swap facility. @ : Net of Repo.
- : No bid was received in the auction
Note : 1. With effect from October 29, 2004, nomenclature of repo and reverse repo has been interchanged as per international usage. Till October 28, 2004, repo indicatesabsorption of liquidity whereas reverse repo indicates injection of liquidity by the Reserve Bank.
2. The Second LAF, conducted on a daily basis from September 17, 2008 to May 5, 2009, is being conducted only on reporting Fridays from May 8, 2009.
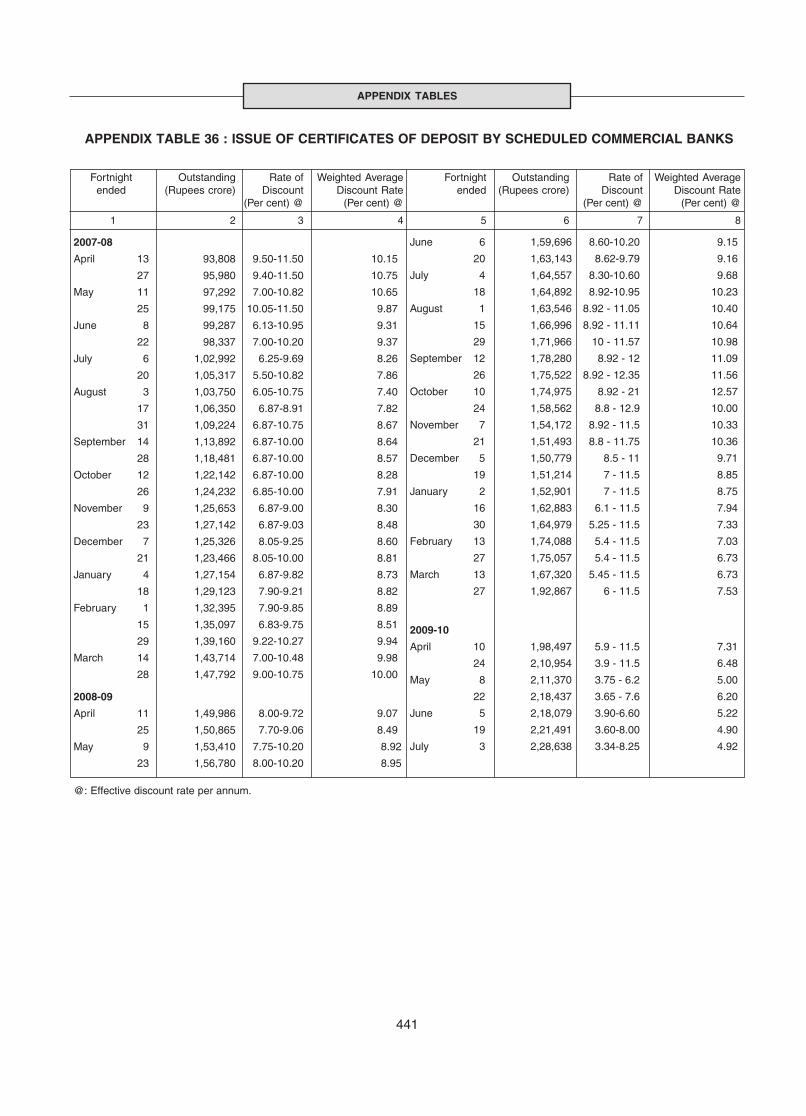
441
APPENDIX TABLES
Fortnight Outstanding Rate of Weighted Average Fortnight Outstanding Rate of Weighted Averageended (Rupees crore) Discount Discount Rate ended (Rupees crore) Discount Discount Rate
(Per cent) @ (Per cent) @ (Per cent) @ (Per cent) @ (Per cent) @
1 2 3 4 5 6 7 8
APPENDIX TABLE 36 : ISSUE OF CERTIFICATES OF DEPOSIT BY SCHEDULED COMMERCIAL BANKS
2007-08
April 13 93,808 9.50-11.50 10.15
27 95,980 9.40-11.50 10.75
May 11 97,292 7.00-10.82 10.65
25 99,175 10.05-11.50 9.87
June 8 99,287 6.13-10.95 9.31
22 98,337 7.00-10.20 9.37
July 6 1,02,992 6.25-9.69 8.26
20 1,05,317 5.50-10.82 7.86
August 3 1,03,750 6.05-10.75 7.40
17 1,06,350 6.87-8.91 7.82
31 1,09,224 6.87-10.75 8.67
September 14 1,13,892 6.87-10.00 8.64
28 1,18,481 6.87-10.00 8.57
October 12 1,22,142 6.87-10.00 8.28
26 1,24,232 6.85-10.00 7.91
November 9 1,25,653 6.87-9.00 8.30
23 1,27,142 6.87-9.03 8.48
December 7 1,25,326 8.05-9.25 8.60
21 1,23,466 8.05-10.00 8.81
January 4 1,27,154 6.87-9.82 8.73
18 1,29,123 7.90-9.21 8.82
February 1 1,32,395 7.90-9.85 8.89
15 1,35,097 6.83-9.75 8.51
29 1,39,160 9.22-10.27 9.94
March 14 1,43,714 7.00-10.48 9.98
28 1,47,792 9.00-10.75 10.00
2008-09
April 11 1,49,986 8.00-9.72 9.07
25 1,50,865 7.70-9.06 8.49
May 9 1,53,410 7.75-10.20 8.92
23 1,56,780 8.00-10.20 8.95
June 6 1,59,696 8.60-10.20 9.15
20 1,63,143 8.62-9.79 9.16
July 4 1,64,557 8.30-10.60 9.68
18 1,64,892 8.92-10.95 10.23
August 1 1,63,546 8.92 - 11.05 10.40
15 1,66,996 8.92 - 11.11 10.64
29 1,71,966 10 - 11.57 10.98
September 12 1,78,280 8.92 - 12 11.09
26 1,75,522 8.92 - 12.35 11.56
October 10 1,74,975 8.92 - 21 12.57
24 1,58,562 8.8 - 12.9 10.00
November 7 1,54,172 8.92 - 11.5 10.33
21 1,51,493 8.8 - 11.75 10.36
December 5 1,50,779 8.5 - 11 9.71
19 1,51,214 7 - 11.5 8.85
January 2 1,52,901 7 - 11.5 8.75
16 1,62,883 6.1 - 11.5 7.94
30 1,64,979 5.25 - 11.5 7.33
February 13 1,74,088 5.4 - 11.5 7.03
27 1,75,057 5.4 - 11.5 6.73
March 13 1,67,320 5.45 - 11.5 6.73
27 1,92,867 6 - 11.5 7.53
2009-10
April 10 1,98,497 5.9 - 11.5 7.31
24 2,10,954 3.9 - 11.5 6.48
May 8 2,11,370 3.75 - 6.2 5.00
22 2,18,437 3.65 - 7.6 6.20
June 5 2,18,079 3.90-6.60 5.22
19 2,21,491 3.60-8.00 4.90
July 3 2,28,638 3.34-8.25 4.92
@: Effective discount rate per annum.

442
ANNUAL REPORT
Fortnight Outstanding Amount Typical Weighted Fortnight Outstanding Amount Typical Weightedended (Rupees Issued Effective Average ended (Rupees Issued Effective Average
crore) (Rupees Rates of Discount crore) (Rupees Rates of Discount crore) Discount Rate crore) Discount Rate
(Per cent) (Per cent) (Per cent) (Per cent)
1 2 3 4 5 6 7 8 9 10
APPENDIX TABLE 37 : COMMERCIAL PAPER*
* : Face value.
2007-08
April 15 19,013 1,952 10.00-14.00 10.46
30 18,759 1,815 9.65-11.75 10.52
May 15 19,288 2,309 9.25-11.45 10.50
31 22,024 4,016 8.71-12.00 9.87
June 15 25,500 5,238 7.00-10.80 9.13
30 26,256 2,287 7.35-12.00 8.93
July 15 28,129 4,200 4.00-11.50 7.55
31 30,631 6,346 2.25-11.50 7.05
August 15 31,784 3,823 6.25-13.50 7.59
31 31,527 4,494 6.80-10.25 8.30
September 15 33,227 4,793 6.35-10.90 8.84
30 33,614 3,515 7.70-12.00 8.95
October 15 38,495 6,977 7.00-13.00 7.99
31 42,183 6,252 6.70-12.00 7.65
November 15 41,678 1,517 7.50-12.00 8.62
30 41,308 3,403 8.05-11.50 9.45
December 15 40,914 3,180 8.22-11.50 9.17
31 40,243 6,477 7.60-12.00 9.27
January 15 42,392 5,588 7.35-12.50 9.16
31 50,062 10,330 7.55-16.00 11.83
February 15 43,970 3,036 6.95-11.00 9.31
29 40,642 3,509 7.40-11.00 9.73
March 15 37,283 1,928 9.50-11.00 10.44
31 32,592 2,691 9.50-14.25 10.38
2008-09
April 15 35,794 6,283 7.74-10.25 8.58
30 37,584 3,172 7.35-10.10 8.85
May 15 41,006 4,726 7.15-10.75 8.57
31 42,032 3,863 7.70-10.50 9.02
June 15 45,983 6,680 8.25-11.60 9.26
30 46,847 5,245 9.00-12.25 10.03
July 15 48,342 5,917 9.5 - 12.25 10.75
31 51,569 5,957 9.6 - 12 10.95
August 15 52,831 5,418 9.54 - 12.5 10.83
31 55,036 6,418 10.2 - 14.75 11.48
September 15 54,182 6,909 10.25 - 14.25 11.51
30 52,038 5,578 11.4 - 13.95 12.28
October 15 49,359 3,039 11.9 - 17.75 13.17
31 48,442 1,940 11.55 - 16.9 14.17
November 15 45,382 2,065 11.5 - 15.5 13.16
30 44,487 3,430 9 - 15.5 12.42
December 15 40,270 3,248 10.4 - 16 12.35
31 40,391 6,070 8.25 - 14 10.70
January 15 48,803 10,682 7.75 - 14 8.76
31 51,668 4,855 6.75 - 13 9.48
February 15 53,615 4,164 5.25 - 12.5 8.1
29 52,560 1,885 5.8 - 11.75 8.93
March 15 49,953 1,363 7.5 - 12.5 9.78
31 44,171 2,113 6.4 - 12.5 9.79
2009-10
April 15 46,551 2,918 6 - 12.5 7.96
30 52,881 7,675 3.3 - 10.25 6.29
May 15 57,845 7,660 2.83 - 9.9 5.61
31 60,740 4,655 3.32-9.00 5.75
June 15 67,239 8,755 3.50-9.15 5.11
30 68,721 8,560 3.20-12.00 5.00
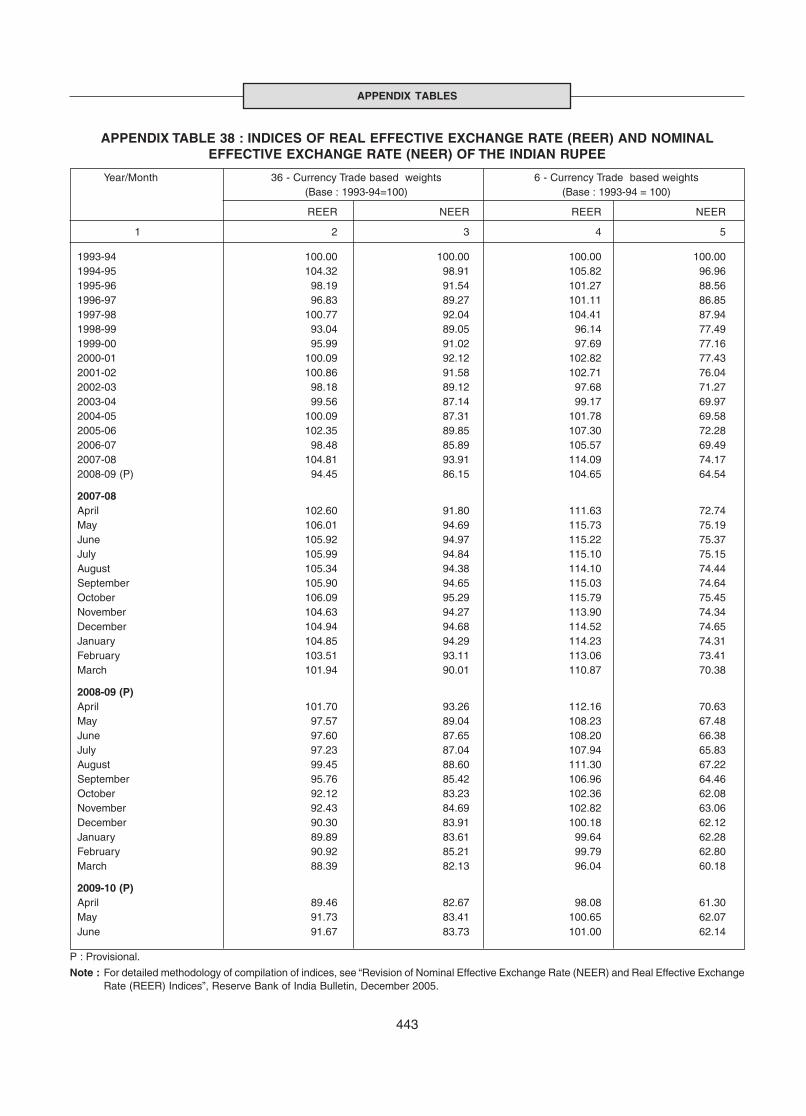
443
APPENDIX TABLES
APPENDIX TABLE 38 : INDICES OF REAL EFFECTIVE EXCHANGE RATE (REER) AND NOMINALEFFECTIVE EXCHANGE RATE (NEER) OF THE INDIAN RUPEE
Year/Month 36 - Currency Trade based weights 6 - Currency Trade based weights(Base : 1993-94=100) (Base : 1993-94 = 100)
REER NEER REER NEER
1 2 3 4 5
1993-94 100.00 100.00 100.00 100.001994-95 104.32 98.91 105.82 96.961995-96 98.19 91.54 101.27 88.561996-97 96.83 89.27 101.11 86.851997-98 100.77 92.04 104.41 87.941998-99 93.04 89.05 96.14 77.491999-00 95.99 91.02 97.69 77.162000-01 100.09 92.12 102.82 77.432001-02 100.86 91.58 102.71 76.042002-03 98.18 89.12 97.68 71.272003-04 99.56 87.14 99.17 69.972004-05 100.09 87.31 101.78 69.582005-06 102.35 89.85 107.30 72.282006-07 98.48 85.89 105.57 69.492007-08 104.81 93.91 114.09 74.172008-09 (P) 94.45 86.15 104.65 64.54
2007-08April 102.60 91.80 111.63 72.74May 106.01 94.69 115.73 75.19June 105.92 94.97 115.22 75.37July 105.99 94.84 115.10 75.15August 105.34 94.38 114.10 74.44September 105.90 94.65 115.03 74.64October 106.09 95.29 115.79 75.45November 104.63 94.27 113.90 74.34December 104.94 94.68 114.52 74.65January 104.85 94.29 114.23 74.31February 103.51 93.11 113.06 73.41March 101.94 90.01 110.87 70.38
2008-09 (P)April 101.70 93.26 112.16 70.63May 97.57 89.04 108.23 67.48June 97.60 87.65 108.20 66.38July 97.23 87.04 107.94 65.83August 99.45 88.60 111.30 67.22September 95.76 85.42 106.96 64.46October 92.12 83.23 102.36 62.08November 92.43 84.69 102.82 63.06December 90.30 83.91 100.18 62.12January 89.89 83.61 99.64 62.28February 90.92 85.21 99.79 62.80March 88.39 82.13 96.04 60.18
2009-10 (P)April 89.46 82.67 98.08 61.30May 91.73 83.41 100.65 62.07June 91.67 83.73 101.00 62.14
P : Provisional.
Note : For detailed methodology of compilation of indices, see “Revision of Nominal Effective Exchange Rate (NEER) and Real Effective ExchangeRate (REER) Indices”, Reserve Bank of India Bulletin, December 2005.

444
ANNUAL REPORT
AP
PE
ND
IX T
AB
LE
39:
IN
TE
R-B
AN
K A
ND
ME
RC
HA
NT
TR
AN
SA
CT
ION
S I
N T
HE
FO
RE
IGN
EX
CH
AN
GE
MA
RK
ET
(US
$ m
illio
n)
Inte
r-ba
nkM
erch
ant
Mon
thS
pot
For
war
d/S
wap
Spo
tF
orw
ard
Pur
chas
esS
ales
Net
Pur
chas
esS
ales
Net
Turn
over
Pur
chas
esS
ales
Net
Pur
chas
esS
ales
Net
Turn
over
12
34
56
78
910
1112
1314
15
2006
Jan
89,8
9689
,066
830
78,5
2093
,489
-14,
969
3,50
,971
26,4
9226
,748
-256
36,2
7638
,605
-2,3
291,
28,1
21F
eb78
,270
78,2
656
70,9
8388
,434
-17,
451
3,15
,952
25,3
0723
,847
1,46
026
,345
27,4
99-1
,154
1,02
,999
Mar
92,2
5799
,494
-7,2
3796
,311
1,16
,734
-20,
423
4,04
,797
37,5
4031
,770
5,77
135
,401
36,5
21-1
,120
1,41
,231
Apr
90,1
9592
,037
-1,8
4279
,144
92,8
58-1
3,71
43,
54,2
3433
,118
29,6
263,
493
31,7
6935
,503
-3,7
341,
30,0
16M
ay1,
17,4
611,
15,7
151,
745
92,6
3997
,847
-5,2
084,
23,6
6134
,504
37,7
20-3
,216
48,5
3446
,523
2,01
11,
67,2
82Ju
ne96
,853
95,4
181,
435
70,1
6074
,384
-4,2
243,
36,8
1528
,946
29,7
62-8
1732
,977
34,3
51-1
,374
1,26
,036
July
86,6
4384
,848
1,79
562
,377
66,9
62-4
,585
3,00
,829
25,4
1125
,781
-370
32,2
8333
,999
-1,7
161,
17,4
74A
ug1,
03,2
261,
00,7
232,
503
72,9
0073
,703
-803
3,50
,553
30,5
7931
,856
-1,2
7734
,939
37,7
02-2
,763
1,35
,075
Sep
t1,
03,1
841,
01,8
081,
376
87,8
6887
,389
479
3,80
,248
33,6
7832
,705
974
38,7
4040
,002
-1,2
621,
45,1
25O
ct96
,569
95,5
521,
017
82,3
9580
,881
1,51
43,
55,3
9837
,130
35,8
421,
288
40,2
5342
,451
-2,1
981,
55,6
75N
ov1,
22,1
171,
26,6
08-4
,491
1,00
,542
1,01
,182
-640
4,50
,450
37,5
8632
,898
4,68
845
,891
45,2
8760
41,
61,6
62D
ec1,
03,0
691,
02,6
3943
094
,497
98,4
44-3
,947
3,98
,649
36,3
8536
,677
-292
41,2
4942
,846
-1,5
961,
57,1
57
2007
Jan
1,21
,321
1,23
,163
-1,8
411,
00,6
7899
,427
1,25
14,
44,5
8938
,260
38,7
45-4
8544
,962
44,2
0575
71,
66,1
73F
eb1,
11,3
101,
13,7
71-2
,462
86,3
7694
,507
-8,1
304,
05,9
6434
,717
32,2
032,
514
34,1
1332
,024
2,08
91,
33,0
57M
ar1,
40,5
641,
39,7
4581
91,
43,5
241,
47,9
93-4
,469
5,71
,827
48,7
7545
,195
3,58
053
,617
55,2
88-1
,671
2,02
,875
Apr
1,59
,985
1,60
,120
-135
1,44
,488
1,50
,946
-6,4
586,
15,5
3956
,231
54,8
781,
352
54,6
7653
,542
1,13
42,
19,3
27M
ay1,
52,1
101,
55,9
83-3
,873
1,40
,900
1,39
,090
1,81
05,
88,0
8359
,772
55,1
274,
644
53,3
5350
,653
2,70
02,
18,9
05Ju
n1,
67,1
341,
68,8
89-1
,755
1,53
,138
1,52
,135
1,00
36,
41,2
9667
,512
59,6
647,
848
64,7
2066
,962
-2,2
422,
58,8
59Ju
l1,
84,6
921,
95,3
09-1
0,61
71,
68,5
111,
68,3
8512
67,
16,8
9771
,909
59,3
5712
,552
67,5
8072
,368
-4,7
882,
71,2
15A
ug1,
91,0
491,
90,4
8956
01,
56,0
481,
66,2
72-1
0,22
47,
03,8
5863
,149
62,1
7397
695
,318
98,0
13-2
,696
3,18
,654
Sep
1,87
,563
2,01
,416
-13,
852
1,73
,019
1,73
,355
-337
7,35
,353
63,7
7751
,818
11,9
5979
,620
79,4
0221
82,
74,6
16O
ct2,
16,5
132,
25,2
59-8
,746
2,13
,474
2,17
,749
-4,2
758,
72,9
9591
,104
74,1
6416
,940
96,5
9996
,880
-281
3,58
,748
Nov
1,72
,802
1,77
,637
-4,8
351,
59,6
471,
64,9
35-5
,288
6,75
,022
70,9
7871
,976
-998
80,4
9878
,496
2,00
23,
01,9
48D
ec1,
48,0
811,
46,4
411,
640
1,50
,751
1,54
,502
-3,7
515,
99,7
7481
,103
72,0
789,
026
71,5
1277
,958
-6,4
453,
02,6
51
2008
Jan
2,31
,213
2,36
,881
-5,6
682,
06,7
782,
14,6
65-7
,887
8,89
,538
89,4
2983
,238
6,19
11,
08,8
301,
08,6
1921
13,
90,1
15F
eb2,
03,4
801,
98,6
024,
878
2,39
,008
2,42
,327
-3,3
198,
83,4
1870
,346
71,5
43-1
,197
97,2
1696
,182
1,03
33,
35,2
87M
ar1,
96,5
511,
89,4
777,
074
1,96
,650
1,99
,061
-2,4
117,
81,7
3964
,052
60,1
723,
880
83,1
4687
,392
-4,2
472,
94,7
63A
pr1,
84,9
941,
81,8
393,
155
1,79
,991
1,67
,202
12,7
897,
14,0
2663
,989
64,7
86-7
9783
,587
79,0
204,
567
2,91
,382
May
1,85
,695
1,80
,894
4,80
11,
70,0
951,
73,6
36-3
,541
7,10
,319
56,6
9856
,001
697
85,0
3388
,411
-3,3
792,
86,1
43Ju
n1,
95,5
231,
82,4
9513
,028
2,14
,479
2,12
,441
2,03
88,
04,9
3955
,657
57,6
76-2
,018
76,8
0479
,001
-2,1
972,
69,1
37Ju
l2,
17,7
522,
06,2
8611
,465
2,15
,086
2,15
,849
-763
8,54
,973
63,0
4962
,382
667
89,6
4692
,976
-3,3
303,
08,0
53A
ug1,
93,1
581,
88,6
744,
484
1,89
,557
1,96
,369
-6,8
127,
67,7
5758
,737
57,0
991,
639
99,5
151,
00,0
93-5
783,
15,4
44S
ep2,
52,8
872,
40,8
0612
,081
2,39
,875
2,49
,831
-9,9
569,
83,3
9963
,500
68,6
23-5
,123
1,26
,489
1,32
,999
-6,5
103,
91,6
11O
ct2,
32,2
762,
08,6
6623
,610
2,01
,290
2,08
,754
-7,4
638,
50,9
8646
,879
56,1
62-9
,283
1,05
,481
1,14
,263
-8,7
823,
22,7
86N
ov1,
46,5
561,
39,3
447,
211
1,68
,368
1,72
,169
-3,8
026,
26,4
3637
,621
39,8
66-2
,245
71,1
2070
,630
490
2,19
,237
Dec
1,54
,681
1,50
,147
4,53
42,
12,7
842,
14,7
45-1
,961
7,32
,358
43,2
6343
,485
-221
77,5
7676
,808
769
2,41
,132
2009
Jan
1,35
,388
1,33
,217
2,17
11,
54,1
201,
63,0
74-8
,954
5,85
,798
36,7
2434
,732
1,99
260
,866
59,6
121,
254
1,91
,934
Feb
1,18
,155
1,15
,544
2,61
11,
31,0
781,
36,5
91-5
,513
5,01
,369
31,5
8532
,962
-1,3
7753
,903
55,6
02-1
,699
1,74
,053
Mar
1,58
,858
1,50
,373
8,48
42,
06,6
742,
12,8
67-6
,193
7,28
,771
43,1
1742
,311
806
66,5
0767
,823
-1,3
162,
19,7
58A
pr1,
25,3
851,
22,1
263,
258
1,67
,902
1,68
,294
-392
5,83
,706
36,8
6235
,881
981
50,9
5056
,515
-5,5
651,
80,2
08M
ay1,
64,6
311,
60,7
703,
862
1,73
,704
1,77
,655
-3,9
516,
76,7
6044
,795
41,5
183,
278
1,44
,364
68,5
0075
,865
2,99
,177
Jun
1,83
,652
1,82
,005
1,64
81,
70,4
571,
77,3
67-6
,910
7,13
,482
46,9
2945
,869
1,06
070
,903
71,1
44-2
412,
34,8
45
P :
Pro
visi
onal
.N
ote
:1.
Mer
chan
t tu
rnov
er in
clud
es c
ross
-cur
renc
y (i.
e.,
fore
ign
curr
ency
to
fore
ign
curr
ency
, bo
th s
pot
and
forw
ard)
tra
nsac
tions
and
can
cella
tion
of fo
rwar
d co
ntra
cts.
2.In
ter-
bank
tur
nove
r in
clud
es c
ross
-cur
renc
y (i.
e.,
fore
ign
curr
ency
to
fore
ign
curr
ency
, bo
th s
pot
and
forw
ard)
tra
nsac
tions
.
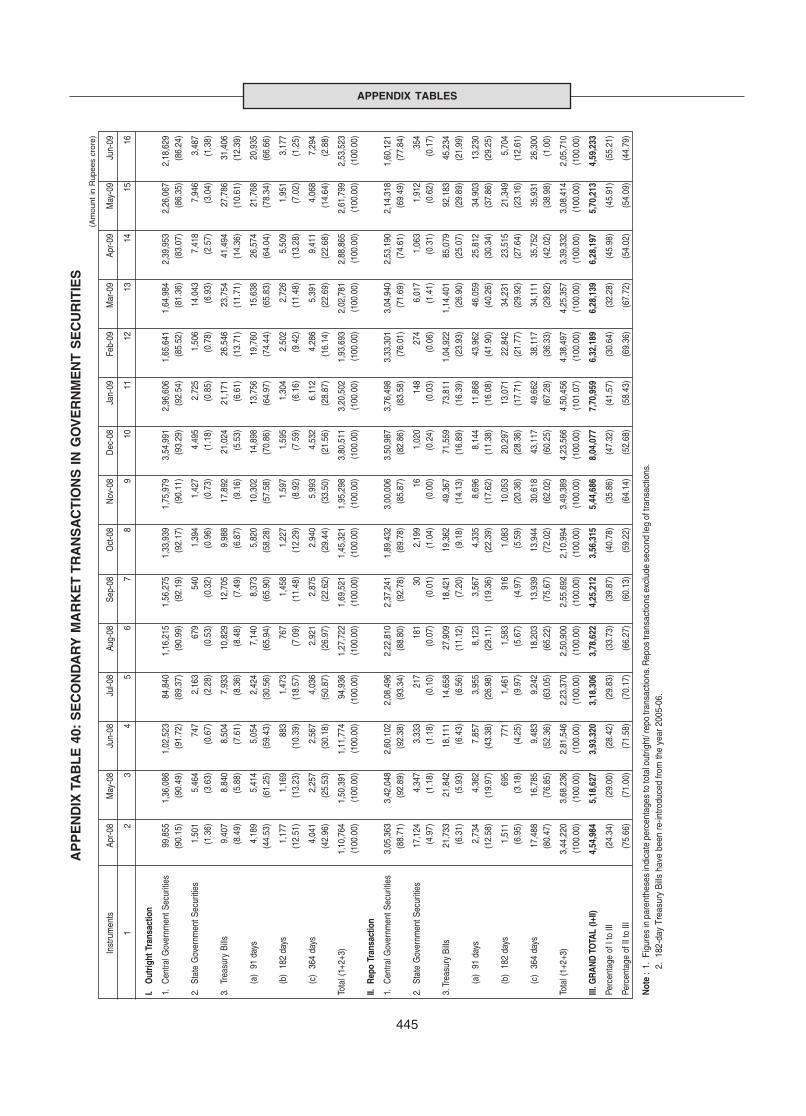
445
APPENDIX TABLES
AP
PE
ND
IX T
AB
LE
40:
SE
CO
ND
AR
Y M
AR
KE
T T
RA
NS
AC
TIO
NS
IN
GO
VE
RN
ME
NT
SE
CU
RIT
IES
(Am
ount
in R
upee
s cr
ore)
Inst
rum
ents
Apr-0
8M
ay-0
8Ju
n-08
Jul-0
8Au
g-08
Sep-
08O
ct-0
8N
ov-0
8D
ec-0
8Ja
n-09
Feb-
09M
ar-0
9Ap
r-09
May
-09
Jun-
09
12
34
56
78
910
1112
1314
1516
I.O
utrig
ht T
rans
actio
n
1.C
entra
l Gov
ernm
ent S
ecur
ities
99,8
551,
36,0
861,
02,5
2384
,840
1,16
,215
1,56
,275
1,33
,939
1,75
,979
3,54
,991
2,96
,606
1,65
,641
1,64
,984
2,39
,953
2,26
,067
2,18
,629
(90.
15)
(90.
49)
(91.
72)
(89.
37)
(90.
99)
(92.
19)
(92.
17)
(90.
11)
(93.
29)
(92.
54)
(85.
52)
(81.
36)
(83.
07)
(86.
35)
(86.
24)
2.St
ate
Gov
ernm
ent S
ecur
ities
1,50
15,
464
747
2,16
367
954
01,
394
1,42
74,
495
2,72
51,
506
14,0
437,
418
7,94
63,
487
(1.3
6)(3
.63)
(0.6
7)(2
.28)
(0.5
3)(0
.32)
(0.9
6)(0
.73)
(1.1
8)(0
.85)
(0.7
8)(6
.93)
(2.5
7)(3
.04)
(1.3
8)
3.Tr
easu
ry B
ills9,
407
8,84
08,
504
7,93
310
,829
12,7
059,
988
17,8
9221
,024
21,1
7126
,546
23,7
5441
,494
27,7
8631
,406
(8.4
9)(5
.88)
(7.6
1)(8
.36)
(8.4
8)(7
.49)
(6.8
7)(9
.16)
(5.5
3)(6
.61)
(13.
71)
(11.
71)
(14.
36)
(10.
61)
(12.
39)
(a)
91 d
ays
4,18
95,
414
5,05
42,
424
7,14
08,
373
5,82
010
,302
14,8
9813
,756
19,7
6015
,638
26,5
7421
,768
20,9
35(4
4.53
)(6
1.25
)(5
9.43
)(3
0.56
)(6
5.94
)(6
5.90
)(5
8.28
)(5
7.58
)(7
0.86
)(6
4.97
)(7
4.44
)(6
5.83
)(6
4.04
)(7
8.34
)(6
6.66
)
(b)
182
days
1,17
71,
169
883
1,47
376
71,
458
1,22
71,
597
1,59
51,
304
2,50
22,
726
5,50
91,
951
3,17
7(1
2.51
)(1
3.23
)(1
0.39
)(1
8.57
)(7
.09)
(11.
48)
(12.
29)
(8.9
2)(7
.59)
(6.1
6)(9
.42)
(11.
48)
(13.
28)
(7.0
2)(1
.25)
(c)
364
days
4,04
12,
257
2,56
74,
036
2,92
12,
875
2,94
05,
993
4,53
26,
112
4,28
65,
391
9,41
14,
068
7,29
4(4
2.96
)(2
5.53
)(3
0.18
)(5
0.87
)(2
6.97
)(2
2.62
)(2
9.44
)(3
3.50
)(2
1.56
)(2
8.87
)(1
6.14
)(2
2.69
)(2
2.68
)(1
4.64
)(2
.88)
Tota
l (1+
2+3)
1,10
,764
1,50
,391
1,11
,774
94,9
361,
27,7
221,
69,5
211,
45,3
211,
95,2
983,
80,5
113,
20,5
021,
93,6
932,
02,7
812,
88,8
652,
61,7
992,
53,5
23(1
00.0
0)(1
00.0
0)(1
00.0
0)(1
00.0
0)(1
00.0
0)(1
00.0
0)(1
00.0
0)(1
00.0
0) (1
00.0
0)(1
00.0
0)(1
00.0
0)(1
00.0
0)(1
00.0
0)(1
00.0
0)(1
00.0
0)
II.R
epo
Tran
sact
ion
1.C
entra
l Gov
ernm
ent S
ecur
ities
3,05
,363
3,42
,048
2,60
,102
2,08
,496
2,22
,810
2,37
,241
1,89
,432
3,00
,006
3,50
,987
3,76
,498
3,33
,301
3,04
,940
2,53
,190
2,14
,318
1,60
,121
(88.
71)
(92.
89)
(92.
38)
(93.
34)
(88.
80)
(92.
78)
(89.
78)
(85.
87)
(82.
86)
(83.
58)
(76.
01)
(71.
69)
(74.
61)
(69.
49)
(77.
84)
2.St
ate
Gov
ernm
ent S
ecur
ities
17,1
244,
347
3,33
321
718
130
2,19
916
1,02
014
827
46,
017
1,06
31,
912
354
(4.9
7)(1
.18)
(1.1
8)(0
.10)
(0.0
7)(0
.01)
(1.0
4)(0
.00)
(0.2
4)(0
.03)
(0.0
6)(1
.41)
(0.3
1)(0
.62)
(0.1
7)
3. T
reas
ury
Bills
21,7
3321
,842
18,1
1114
,658
27,9
0918
,421
19,3
6249
,367
71,5
5973
,811
1,04
,922
1,14
,401
85,0
7992
,183
45,2
34(6
.31)
(5.9
3)(6
.43)
(6.5
6)(1
1.12
)(7
.20)
(9.1
8)(1
4.13
)(1
6.89
)(1
6.39
)(2
3.93
)(2
6.90
)(2
5.07
)(2
9.89
)(2
1.99
)
(a)
91 d
ays
2,73
44,
362
7,85
73,
955
8,12
33,
567
4,33
58,
696
8,14
411
,868
43,9
6246
,059
25,8
1234
,903
13,2
30(1
2.58
)(1
9.97
)(4
3.38
)(2
6.98
)(2
9.11
)(1
9.36
)(2
2.39
)(1
7.62
)(1
1.38
)(1
6.08
)(4
1.90
)(4
0.26
)(3
0.34
)(3
7.86
)(2
9.25
)
(b)
182
days
1,51
169
577
11,
461
1,58
391
61,
083
10,0
5320
,297
13,0
7122
,842
34,2
3123
,515
21,3
495,
704
(6.9
5)(3
.18)
(4.2
5)(9
.97)
(5.6
7)(4
.97)
(5.5
9)(2
0.36
)(2
8.36
)(1
7.71
)(2
1.77
)(2
9.92
)(2
7.64
)(2
3.16
)(1
2.61
)
(c)
364
days
17,4
8816
,785
9,48
39,
242
18,2
0313
,939
13,9
4430
,618
43,1
1749
,662
38,1
1734
,111
35,7
5235
,931
26,3
00(8
0.47
)(7
6.85
)(5
2.36
)(6
3.05
)(6
5.22
)(7
5.67
)(7
2.02
)(6
2.02
)(6
0.25
)(6
7.28
)(3
6.33
)(2
9.82
)(4
2.02
)(3
8.98
)(1
.00)
Tota
l (1+
2+3)
3,44
,220
3,68
,236
2,81
,546
2,23
,370
2,50
,900
2,55
,692
2,10
,994
3,49
,389
4,23
,566
4,50
,456
4,38
,497
4,25
,357
3,39
,332
3,08
,414
2,05
,710
(100
.00)
(100
.00)
(100
.00)
(100
.00)
(100
.00)
(100
.00)
(100
.00)
(100
.00)
(100
.00)
(101
.07)
(100
.00)
(100
.00)
(100
.00)
(100
.00)
(100
.00)
III. G
RA
ND
TO
TAL
(I+II)
4,54
,984
5,18
,627
3,93
,320
3,18
,306
3,78
,622
4,25
,212
3,56
,315
5,44
,686
8,04
,077
7,70
,959
6,32
,189
6,28
,139
6,28
,197
5,70
,213
4,59
,233
Perc
enta
ge o
f I to
III
(24.
34)
(29.
00)
(28.
42)
(29.
83)
(33.
73)
(39.
87)
(40.
78)
(35.
86)
(47.
32)
(41.
57)
(30.
64)
(32.
28)
(45.
98)
(45.
91)
(55.
21)
Perc
enta
ge o
f II t
o III
(75.
66)
(71.
00)
(71.
58)
(70.
17)
(66.
27)
(60.
13)
(59.
22)
(64.
14)
(52.
68)
(58.
43)
(69.
36)
(67.
72)
(54.
02)
(54.
09)
(44.
79)
Not
e :
1.Fi
gure
s in
par
enth
eses
indi
cate
per
cent
ages
to to
tal o
utrig
ht/ r
epo
trans
actio
ns. R
epos
tran
sact
ions
exc
lude
sec
ond
leg
of tr
ansa
ctio
ns.
2.18
2-da
y Tr
easu
ry B
ills
have
bee
n re
-intro
duce
d fro
m th
e ye
ar 2
005-
06.
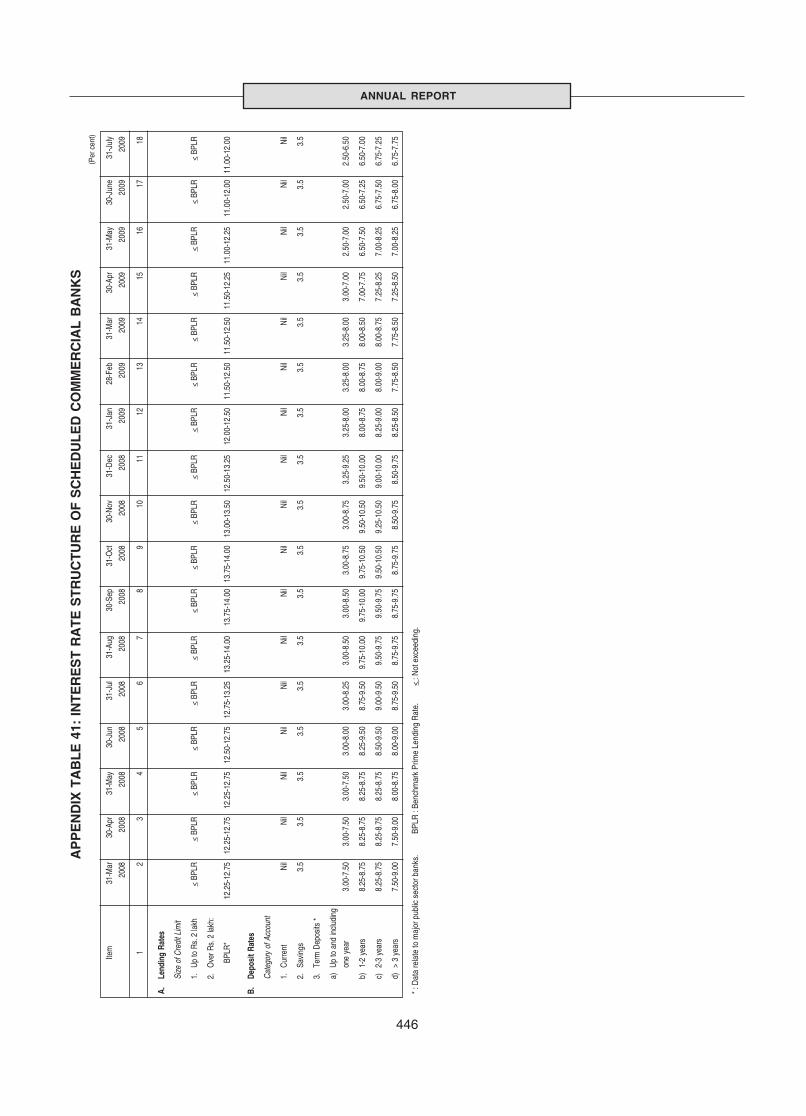
446
ANNUAL REPORT
AP
PE
ND
IX T
AB
LE
41:
IN
TE
RE
ST
RA
TE
ST
RU
CT
UR
E O
F S
CH
ED
UL
ED
CO
MM
ER
CIA
L B
AN
KS
(Per
cen
t)
Item
31-M
ar30
-Apr
31-M
ay30
-Jun
31-J
ul31
-Aug
30-S
ep31
-Oct
30-N
ov31
-Dec
31-J
an28
-Feb
31-M
ar30
-Apr
31-M
ay30
-Jun
e31
-Jul
y
2008
2008
2008
2008
2008
2008
2008
2008
2008
2008
2009
2009
2009
2009
2009
2009
2009
12
34
56
78
910
1112
1314
1516
1718
A.Le
ndin
g Ra
tes
Size
of C
redi
t Lim
it
1.Up
to R
s. 2
lakh
< BP
LR<
BPLR
< BP
LR<
BPLR
< BP
LR<
BPLR
< BP
LR<
BPLR
< BP
LR<
BPLR
< BP
LR<
BPLR
< BP
LR<
BPLR
< BP
LR<
BPLR
< BP
LR
2.O
ver R
s. 2
lakh
:
BPLR
*12
.25-
12.7
512
.25-
12.7
512
.25-
12.7
512
.50-
12.7
512
.75-
13.2
513
.25-
14.0
013
.75-
14.0
013
.75-
14.0
013
.00-
13.5
012
.50-
13.2
512
.00-
12.5
011
.50-
12.5
011
.50-
12.5
011
.50-
12.2
511
.00-
12.2
511
.00-
12.0
011
.00-
12.0
0
B.De
posi
t Rat
es
Cate
gory
of A
ccou
nt
1.Cu
rrent
Nil
Nil
Nil
Nil
Nil
Nil
Nil
Nil
Nil
Nil
Nil
Nil
Nil
Nil
Nil
Nil
Nil
2.Sa
ving
s3.
53.
53.
53.
53.
53.
53.
53.
53.
53.
53.
53.
53.
53.
53.
53.
53.
5
3.Te
rm D
epos
its *
a)Up
to a
nd in
cludi
ng
one
year
3.00
-7.5
03.
00-7
.50
3.00
-7.5
03.
00-8
.00
3.00
-8.2
53.
00-8
.50
3.00
-8.5
03.
00-8
.75
3.00
-8.7
53.
25-9
.25
3.25
-8.0
03.
25-8
.00
3.25
-8.0
03.
00-7
.00
2.50
-7.0
02.
50-7
.00
2.50
-6.5
0
b)1-
2 ye
ars
8.25
-8.7
58.
25-8
.75
8.25
-8.7
58.
25-9
.50
8.75
-9.5
09.
75-1
0.00
9.75
-10.
009.
75-1
0.50
9.50
-10.
509.
50-1
0.00
8.00
-8.7
58.
00-8
.75
8.00
-8.5
07.
00-7
.75
6.50
-7.5
06.
50-7
.25
6.50
-7.0
0
c)2-
3 ye
ars
8.25
-8.7
58.
25-8
.75
8.25
-8.7
58.
50-9
.50
9.00
-9.5
09.
50-9
.75
9.50
-9.7
59.
50-1
0.50
9.25
-10.
509.
00-1
0.00
8.25
-9.0
08.
00-9
.00
8.00
-8.7
57.
25-8
.25
7.00
-8.2
56.
75-7
.50
6.75
-7.2
5
d)>
3 ye
ars
7.50
-9.0
07.
50-9
.00
8.00
-8.7
58.
00-9
.00
8.75
-9.5
08.
75-9
.75
8.75
-9.7
58.
75-9
.75
8.50
-9.7
58.
50-9
.75
8.25
-8.5
07.
75-8
.50
7.75
-8.5
07.
25-8
.50
7.00
-8.2
56.
75-8
.00
6.75
-7.7
5
* : D
ata
rela
te to
maj
or p
ublic
sec
tor b
anks
.
BPLR
: Be
nchm
ark
Prim
e Le
ndin
g R
ate.
<
: Not
exc
eedi
ng.
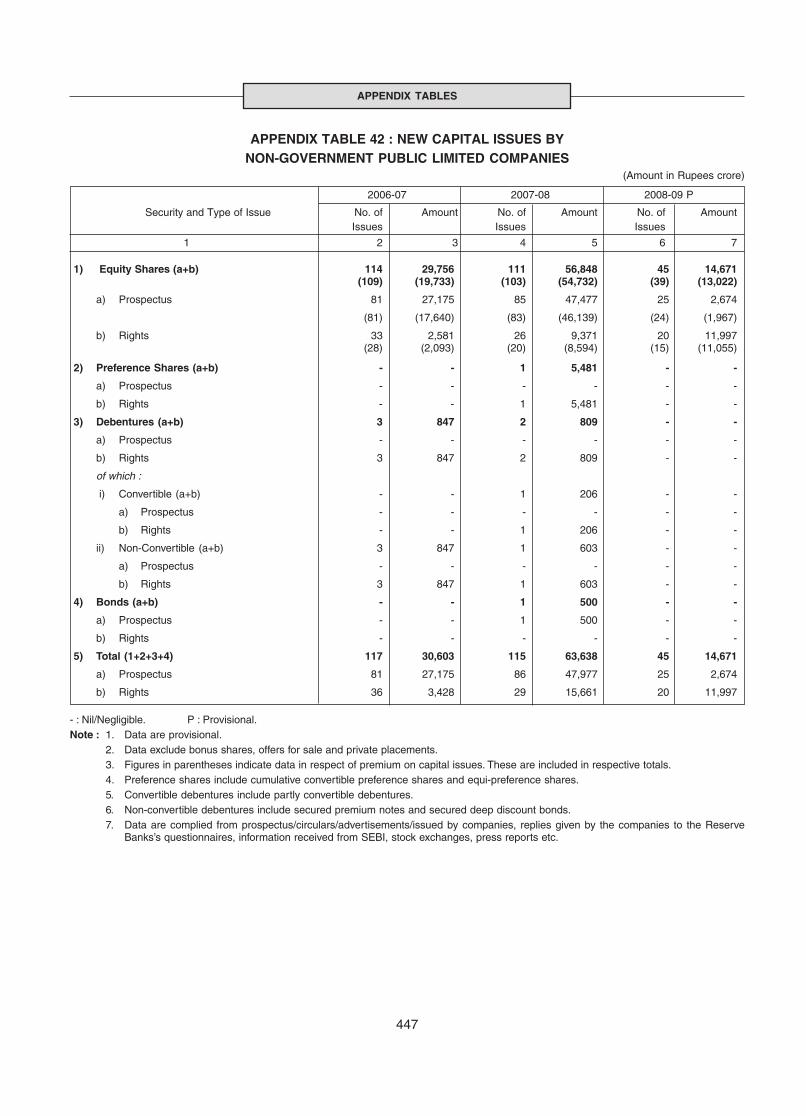
447
APPENDIX TABLES
APPENDIX TABLE 42 : NEW CAPITAL ISSUES BYNON-GOVERNMENT PUBLIC LIMITED COMPANIES
(Amount in Rupees crore)
2006-07 2007-08 2008-09 P
Security and Type of Issue No. of Amount No. of Amount No. of AmountIssues Issues Issues
1 2 3 4 5 6 7
1) Equity Shares (a+b) 114 29,756 111 56,848 45 14,671(109) (19,733) (103) (54,732) (39) (13,022)
a) Prospectus 81 27,175 85 47,477 25 2,674
(81) (17,640) (83) (46,139) (24) (1,967)
b) Rights 33 2,581 26 9,371 20 11,997(28) (2,093) (20) (8,594) (15) (11,055)
2) Preference Shares (a+b) - - 1 5,481 - -
a) Prospectus - - - - - -
b) Rights - - 1 5,481 - -
3) Debentures (a+b) 3 847 2 809 - -
a) Prospectus - - - - - -
b) Rights 3 847 2 809 - -
of which :
i) Convertible (a+b) - - 1 206 - -
a) Prospectus - - - - - -
b) Rights - - 1 206 - -
ii) Non-Convertible (a+b) 3 847 1 603 - -
a) Prospectus - - - - - -
b) Rights 3 847 1 603 - -
4) Bonds (a+b) - - 1 500 - -
a) Prospectus - - 1 500 - -
b) Rights - - - - - -
5) Total (1+2+3+4) 117 30,603 115 63,638 45 14,671
a) Prospectus 81 27,175 86 47,977 25 2,674
b) Rights 36 3,428 29 15,661 20 11,997
- : Nil/Negligible. P : Provisional.Note : 1. Data are provisional.
2. Data exclude bonus shares, offers for sale and private placements.3. Figures in parentheses indicate data in respect of premium on capital issues. These are included in respective totals.4. Preference shares include cumulative convertible preference shares and equi-preference shares.5. Convertible debentures include partly convertible debentures.6. Non-convertible debentures include secured premium notes and secured deep discount bonds.7. Data are complied from prospectus/circulars/advertisements/issued by companies, replies given by the companies to the Reserve
Banks’s questionnaires, information received from SEBI, stock exchanges, press reports etc.

448
ANNUAL REPORT
APPENDIX TABLE 43 : DOMESTIC STOCK INDICES
BSE Index (Base: 1978-79=100) S&P CNX Nifty (Base: Nov 3, 1995 = 1000)
Year/Month Average High Low End of the Average High Low End of theYear/Month Year/Month
1 2 3 4 5 6 7 8 9
2004-05 5,741 6,915 4,505 6,493 1,805 2,169 1,389 2,036(27.8) (16.1) (26.5) (14.9)
2005-06 8,280 11,307 6,135 11,280 2,513 3,419 1,903 3,403(44.2) (73.7) (39.2) (67.1)
2006-07 12,278 14,652 8,929 13,072 3,572 4,224 2,632 3,822(48.3) (15.9) (42.1) (12.3)
2007-08 16,569 20,873 12,455 15,644 4,897 6,288 3,634 4,735(35.0) (19.7) (37.1) (23.9)
2008-09 12,366 17,600 8,160 9,709 3,731 12,455 2,524 3,021(-25.4) (-37.9) (-23.8) (-36.2)
2006-07April 11,742 12,043 11,237 12,043 3,494 3,574 3,346 3,558May 11,599 12,612 10,399 10,399 3,437 3,754 3,071 3,071June 9,935 10,609 8,929 10,609 2,915 3,128 2,633 3,128July 10,557 10,930 10,007 10,744 3,092 3,197 2,933 3,143August 11,305 11,724 10,752 11,699 3,306 3,430 3,148 3,414September 12,036 12,454 11,551 12,455 3,492 3,588 3,366 3,588October 12,637 13,024 12,204 12,962 3,648 3,769 3,515 3,744November 13,416 13,774 13,033 13,696 3,869 3,969 3,767 3,955December 13,628 13,972 12,995 13,787 3,910 4,016 3,717 3,966January 13,984 14,283 13,362 14,091 4,037 4,148 3,850 4,083February 14,143 14,652 12,938 12,938 4,084 4,224 3,745 3,745March 12,858 13,308 12,415 13,072 3,731 3,876 3,577 3,822
2007-08April 13,478 14,229 12,455 13,872 3,947 4,178 3,634 4,088May 14,156 14,544 13,765 14,544 4,184 4,296 4,067 4,296June 14,334 14,651 14,003 14,651 4,222 4,318 4,113 4,318July 15,253 15,795 14,664 15,551 4,474 4,621 4,314 4,529August 14,779 15,319 13,989 15,319 4,301 4,464 4,075 4,464September 16,046 17,291 15,422 17,291 4,660 5,021 4,475 5,021October 18,500 19,978 17,329 19,838 5,457 5,906 5,069 5,901November 19,260 19,976 18,526 19,363 5,749 5,938 5,519 5,763December 19,827 20,376 19,080 20,287 5,964 6,159 5,742 6,139January 19,326 20,873 16,730 17,649 5,756 6,288 4,899 5,137February 17,728 18,663 16,608 17,579 5,202 5,484 4,838 5,224March 15,838 16,678 14,809 15,644 4,769 4,953 4,503 4,735
2008-09April 16,291 17,378 15,343 17,287 4,902 5,196 4,647 5,166May 16,946 17,600 16,276 16,416 5,029 5,228 4,835 4,870June 14,997 16,063 13,462 13,462 4,464 4,740 4,041 4,041July 13,717 14,942 12,576 14,356 4,125 4,477 3,817 4,333August 14,722 15,504 14,048 14,565 4,417 4,620 4,214 4,360September 13,943 15,050 12,596 12,860 4,207 4,504 3,850 3,921October 10,550 13,056 8,510 9,788 3,210 3,951 2,524 2,886November 9,454 10,631 8,451 9,093 2,835 3,148 2,553 2,755December 9,514 10,100 8,739 9,647 2,896 3,078 2,656 2,959January 9,350 10,336 8,674 9,424 2,854 3,121 2,679 2,875February 9,188 9,647 8,822 8,892 2,819 2,948 2,734 2,764March 8,995 10,048 8,160 9,709 2,802 3,109 2,573 3,021
Note : Figures in parentheses are percentage variations over the previous year.Source : Bombay Stock Exchange Limited (BSE) and the National Stock Exchange of India Limited (NSE).
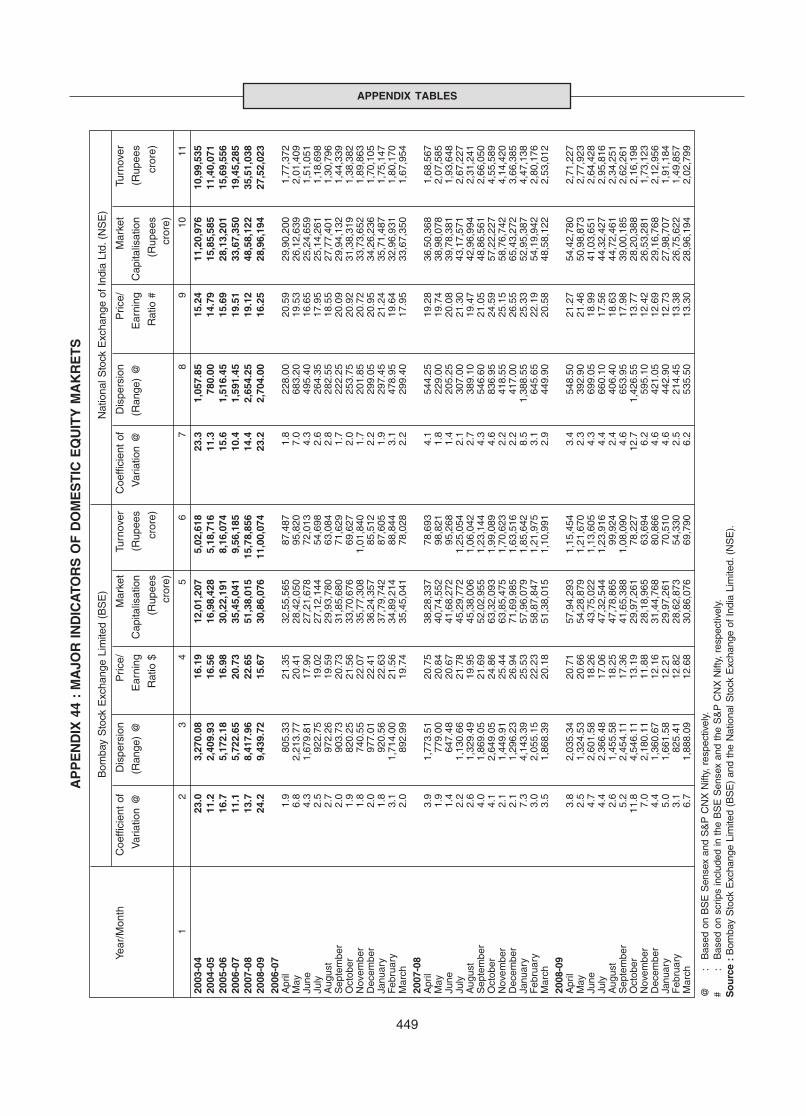
449
APPENDIX TABLES
AP
PE
ND
IX 4
4 :
MA
JOR
IND
ICA
TOR
S O
F D
OM
ES
TIC
EQ
UIT
Y M
AK
RE
TS
Bom
bay
Sto
ck E
xcha
nge
Lim
ited
(BS
E)
Nat
iona
l Sto
ck E
xcha
nge
of I
ndia
Ltd
. (N
SE
)
Year
/Mon
thC
oeffi
cien
t of
Dis
pers
ion
Pric
e/M
arke
tTu
rnov
erC
oeffi
cien
t of
Dis
pers
ion
Pric
e/M
arke
tTu
rnov
er
Var
iatio
n @
(Ran
ge)
@E
arni
ngC
apita
lisat
ion
(Rup
ees
Var
iatio
n @
(Ran
ge)
@E
arni
ngC
apita
lisat
ion
(Rup
ees
Rat
io $
(Rup
ees
cror
e)R
atio
#(R
upee
scr
ore)
cror
e)cr
ore)
12
34
56
78
910
11
2003
-04
23.0
3,27
0.08
16.1
912
,01,
207
5,02
,618
23.3
1,05
7.85
15.2
411
,20,
976
10,9
9,53
520
04-0
511
.22,
409.
9316
.56
16,9
8,42
85,
18,7
1611
.378
0.00
14.7
915
,85,
585
11,4
0,07
120
05-0
616
.75,
172.
1816
.98
30,2
2,19
18,
16,0
7415
.61,
516.
4515
.69
28,1
3,20
115
,69,
556
2006
-07
11.1
5,72
2.65
20.7
335
,45,
041
9,56
,185
10.4
1,59
1.45
19.5
133
,67,
350
19,4
5,28
520
07-0
813
.78,
417.
9622
.65
51,3
8,01
515
,78,
856
14.4
2,65
4.25
19.1
248
,58,
122
35,5
1,03
820
08-0
924
.29,
439.
7215
.67
30,8
6,07
611
,00,
074
23.2
2,70
4.00
16.2
528
,96,
194
27,5
2,02
320
06-0
7A
pril
1.9
805.
3321
.35
32,5
5,56
587
,487
1.8
228.
0020
.59
29,9
0,20
01,
77,3
72M
ay6.
82,
213.
7720
.41
28,4
2,05
095
,820
7.0
683.
2019
.53
26,1
2,63
92,
01,4
09Ju
ne4.
31,
679.
8117
.90
27,2
1,67
872
,013
4.3
495.
4016
.65
25,2
4,65
91,
51,0
51Ju
ly2.
592
2.75
19.0
227
,12,
144
54,6
982.
626
4.35
17.9
525
,14,
261
1,18
,698
Aug
ust
2.7
972.
2619
.59
29,9
3,78
063
,084
2.8
282.
5518
.55
27,7
7,40
11,
30,7
96S
epte
mbe
r2.
090
3.73
20.7
331
,85,
680
71,6
291.
722
2.25
20.0
929
,94,
132
1,44
,339
Oct
ober
1.9
820.
2521
.56
33,7
0,67
669
,627
2.0
253.
7520
.92
31,3
8,31
91,
38,3
82N
ovem
ber
1.8
740.
5522
.07
35,7
7,30
81,
01,8
401.
720
1.85
20.7
233
,73,
652
1,89
,863
Dec
embe
r2.
097
7.01
22.4
136
,24,
357
85,5
122.
229
9.05
20.9
534
,26,
236
1,70
,105
Janu
ary
1.8
920.
5622
.63
37,7
9,74
287
,605
1.9
297.
4521
.24
35,7
1,48
71,
75,1
47F
ebru
ary
3.1
1,71
4.00
21.5
634
,89,
214
88,8
443.
147
8.95
19.6
432
,96,
931
1,80
,170
Mar
ch2.
089
2.99
19.7
435
,45,
041
78,0
282.
229
9.40
17.9
533
,67,
350
1,67
,954
2007
-08
Apr
il3.
91,
773.
5120
.75
38,2
8,33
778
,693
4.1
544.
2519
.28
36,5
0,36
81,
68,5
67M
ay1.
977
9.00
20.8
440
,74,
552
98,8
211.
822
9.00
19.7
438
,98,
078
2,07
,585
June
1.4
647.
4820
.67
41,6
8,27
295
,268
1.4
205.
2520
.08
39,7
8,38
11,
93,6
48Ju
ly2.
21,
130.
6621
.78
45,2
9,77
21,
25,0
542.
130
7.00
21.3
043
,17,
571
2,67
,227
Aug
ust
2.6
1,32
9.49
19.9
545
,38,
006
1,06
,042
2.7
389.
1019
.47
42,9
6,99
42,
31,2
41S
epte
mbe
r4.
01,
869.
0521
.69
52,0
2,95
51,
23,1
444.
354
6.60
21.0
548
,86,
561
2,66
,050
Oct
ober
4.1
2,64
9.05
24.8
663
,32,
093
1,99
,089
4.6
836.
9524
.59
57,2
2,22
74,
55,5
89N
ovem
ber
2.1
1,44
9.91
25.4
463
,85,
475
1,70
,623
2.2
418.
5525
.15
58,7
6,74
24,
14,4
20D
ecem
ber
2.1
1,29
6.23
26.9
471
,69,
985
1,63
,516
2.2
417.
0026
.55
65,4
3,27
23,
66,3
85Ja
nuar
y7.
34,
143.
3925
.53
57,9
6,07
91,
85,6
428.
51,
388.
5525
.33
52,9
5,38
74,
47,1
38F
ebru
ary
3.0
2,05
5.15
22.2
358
,87,
847
1,21
,975
3.1
645.
6522
.19
54,1
9,94
22,
80,1
76M
arch
3.5
1,86
8.39
20.1
851
,38,
015
1,10
,991
2.9
449.
9020
.58
48,5
8,12
22,
53,0
12
2008
-09
Apr
il3.
82,
035.
3420
.71
57,9
4,29
31,
15,4
543.
454
8.50
21.2
754
,42,
780
2,71
,227
May
2.5
1,32
4.53
20.6
654
,28,
879
1,21
,670
2.3
392.
9021
.46
50,9
8,87
32,
77,9
23Ju
ne4.
72,
601.
5818
.26
43,7
5,02
21,
13,6
054.
369
9.05
18.9
941
,03,
651
2,64
,428
July
4.4
2,36
6.48
17.0
647
,32,
544
1,23
,916
4.4
660.
1017
.56
44,3
2,42
72,
95,8
16A
ugus
t2.
61,
455.
5818
.25
47,7
8,86
599
,924
2.4
406.
4018
.63
44,7
2,46
12,
34,2
51S
epte
mbe
r5.
22,
454.
1117
.36
41,6
5,38
81,
08,0
904.
665
3.95
17.9
839
,00,
185
2,62
,261
Oct
ober
11.8
4,54
6.11
13.1
929
,97,
261
78,2
2712
.71,
426.
5513
.77
28,2
0,38
82,
16,1
98N
ovem
ber
7.0
2,18
0.11
11.8
828
,18,
965
63,6
946.
259
5.10
12.4
226
,53,
281
1,73
,123
Dec
embe
r4.
41,
360.
6712
.16
31,4
4,76
880
,866
4.6
421.
0512
.69
29,1
6,76
82,
12,9
56Ja
nuar
y5.
01,
661.
5812
.21
29,9
7,26
170
,510
4.6
442.
9012
.73
27,9
8,70
71,
91,1
84F
ebru
ary
3.1
825.
4112
.82
28,6
2,87
354
,330
2.5
214.
4513
.38
26,7
5,62
21,
49,8
57M
arch
6.7
1,88
8.09
12.6
830
,86,
076
69,7
906.
253
5.50
13.3
028
,96,
194
2,02
,799
@:
Bas
ed o
n B
SE
Sen
sex
and
S&
P C
NX
Nift
y, r
espe
ctiv
ely.
#:
Bas
ed o
n sc
rips
incl
uded
in th
e B
SE
Sen
sex
and
the
S&
P C
NX
Nift
y, r
espe
ctiv
ely.
So
urc
e :
Bom
bay
Sto
ck E
xcha
nge
Lim
ited
(BS
E)
and
the
Nat
iona
l Sto
ck E
xcha
nge
of I
ndia
Lim
ited.
(N
SE
).
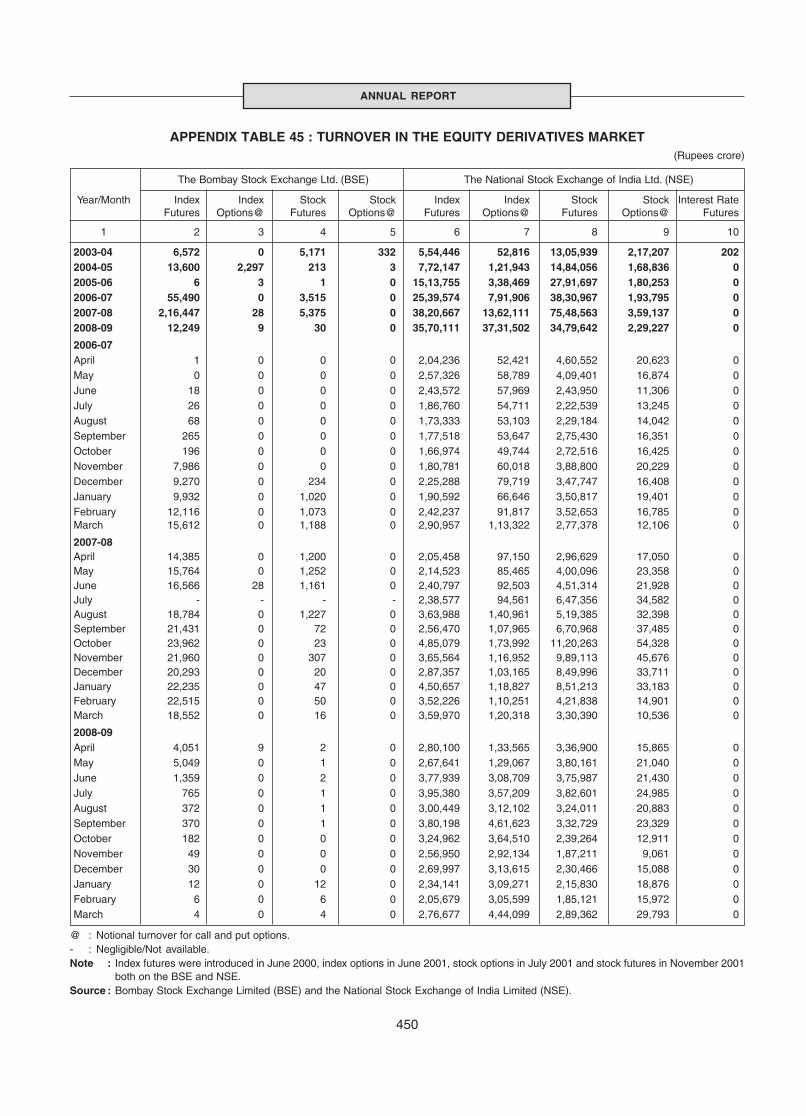
450
ANNUAL REPORT
APPENDIX TABLE 45 : TURNOVER IN THE EQUITY DERIVATIVES MARKET(Rupees crore)
The Bombay Stock Exchange Ltd. (BSE) The National Stock Exchange of India Ltd. (NSE)
Year/Month Index Index Stock Stock Index Index Stock Stock Interest RateFutures Options@ Futures Options@ Futures Options@ Futures Options@ Futures
1 2 3 4 5 6 7 8 9 10
2003-04 6,572 0 5,171 332 5,54,446 52,816 13,05,939 2,17,207 2022004-05 13,600 2,297 213 3 7,72,147 1,21,943 14,84,056 1,68,836 02005-06 6 3 1 0 15,13,755 3,38,469 27,91,697 1,80,253 02006-07 55,490 0 3,515 0 25,39,574 7,91,906 38,30,967 1,93,795 02007-08 2,16,447 28 5,375 0 38,20,667 13,62,111 75,48,563 3,59,137 02008-09 12,249 9 30 0 35,70,111 37,31,502 34,79,642 2,29,227 0
2006-07April 1 0 0 0 2,04,236 52,421 4,60,552 20,623 0May 0 0 0 0 2,57,326 58,789 4,09,401 16,874 0June 18 0 0 0 2,43,572 57,969 2,43,950 11,306 0July 26 0 0 0 1,86,760 54,711 2,22,539 13,245 0August 68 0 0 0 1,73,333 53,103 2,29,184 14,042 0September 265 0 0 0 1,77,518 53,647 2,75,430 16,351 0October 196 0 0 0 1,66,974 49,744 2,72,516 16,425 0November 7,986 0 0 0 1,80,781 60,018 3,88,800 20,229 0December 9,270 0 234 0 2,25,288 79,719 3,47,747 16,408 0January 9,932 0 1,020 0 1,90,592 66,646 3,50,817 19,401 0February 12,116 0 1,073 0 2,42,237 91,817 3,52,653 16,785 0March 15,612 0 1,188 0 2,90,957 1,13,322 2,77,378 12,106 0
2007-08April 14,385 0 1,200 0 2,05,458 97,150 2,96,629 17,050 0May 15,764 0 1,252 0 2,14,523 85,465 4,00,096 23,358 0June 16,566 28 1,161 0 2,40,797 92,503 4,51,314 21,928 0July - - - - 2,38,577 94,561 6,47,356 34,582 0August 18,784 0 1,227 0 3,63,988 1,40,961 5,19,385 32,398 0September 21,431 0 72 0 2,56,470 1,07,965 6,70,968 37,485 0October 23,962 0 23 0 4,85,079 1,73,992 11,20,263 54,328 0November 21,960 0 307 0 3,65,564 1,16,952 9,89,113 45,676 0December 20,293 0 20 0 2,87,357 1,03,165 8,49,996 33,711 0January 22,235 0 47 0 4,50,657 1,18,827 8,51,213 33,183 0February 22,515 0 50 0 3,52,226 1,10,251 4,21,838 14,901 0March 18,552 0 16 0 3,59,970 1,20,318 3,30,390 10,536 0
2008-09April 4,051 9 2 0 2,80,100 1,33,565 3,36,900 15,865 0May 5,049 0 1 0 2,67,641 1,29,067 3,80,161 21,040 0June 1,359 0 2 0 3,77,939 3,08,709 3,75,987 21,430 0July 765 0 1 0 3,95,380 3,57,209 3,82,601 24,985 0August 372 0 1 0 3,00,449 3,12,102 3,24,011 20,883 0September 370 0 1 0 3,80,198 4,61,623 3,32,729 23,329 0October 182 0 0 0 3,24,962 3,64,510 2,39,264 12,911 0November 49 0 0 0 2,56,950 2,92,134 1,87,211 9,061 0December 30 0 0 0 2,69,997 3,13,615 2,30,466 15,088 0January 12 0 12 0 2,34,141 3,09,271 2,15,830 18,876 0February 6 0 6 0 2,05,679 3,05,599 1,85,121 15,972 0March 4 0 4 0 2,76,677 4,44,099 2,89,362 29,793 0
@ : Notional turnover for call and put options.- : Negligible/Not available.Note : Index futures were introduced in June 2000, index options in June 2001, stock options in July 2001 and stock futures in November 2001
both on the BSE and NSE.Source : Bombay Stock Exchange Limited (BSE) and the National Stock Exchange of India Limited (NSE).
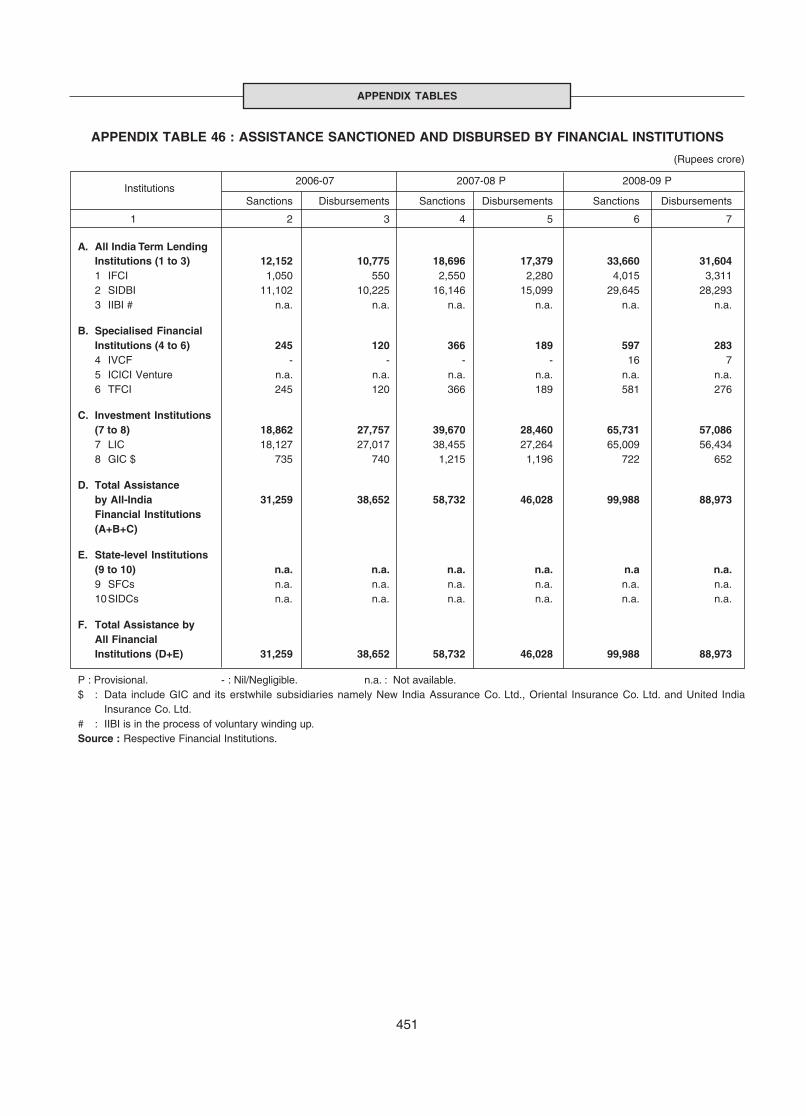
451
APPENDIX TABLES
APPENDIX TABLE 46 : ASSISTANCE SANCTIONED AND DISBURSED BY FINANCIAL INSTITUTIONS
(Rupees crore)
Institutions
2006-07 2007-08 P 2008-09 P
Sanctions Disbursements Sanctions Disbursements Sanctions Disbursements
1 2 3 4 5 6 7
A. All India Term LendingInstitutions (1 to 3) 12,152 10,775 18,696 17,379 33,660 31,6041 IFCI 1,050 550 2,550 2,280 4,015 3,3112 SIDBI 11,102 10,225 16,146 15,099 29,645 28,2933 IIBI # n.a. n.a. n.a. n.a. n.a. n.a.
B. Specialised FinancialInstitutions (4 to 6) 245 120 366 189 597 2834 IVCF - - - - 16 75 ICICI Venture n.a. n.a. n.a. n.a. n.a. n.a.6 TFCI 245 120 366 189 581 276
C. Investment Institutions(7 to 8) 18,862 27,757 39,670 28,460 65,731 57,0867 LIC 18,127 27,017 38,455 27,264 65,009 56,4348 GIC $ 735 740 1,215 1,196 722 652
D. Total Assistanceby All-India 31,259 38,652 58,732 46,028 99,988 88,973Financial Institutions(A+B+C)
E. State-level Institutions(9 to 10) n.a. n.a. n.a. n.a. n.a n.a.9 SFCs n.a. n.a. n.a. n.a. n.a. n.a.10SIDCs n.a. n.a. n.a. n.a. n.a. n.a.
F. Total Assistance byAll FinancialInstitutions (D+E) 31,259 38,652 58,732 46,028 99,988 88,973
P : Provisional. - : Nil/Negligible. n.a. : Not available.$ : Data include GIC and its erstwhile subsidiaries namely New India Assurance Co. Ltd., Oriental Insurance Co. Ltd. and United India
Insurance Co. Ltd.# : IIBI is in the process of voluntary winding up.Source : Respective Financial Institutions.
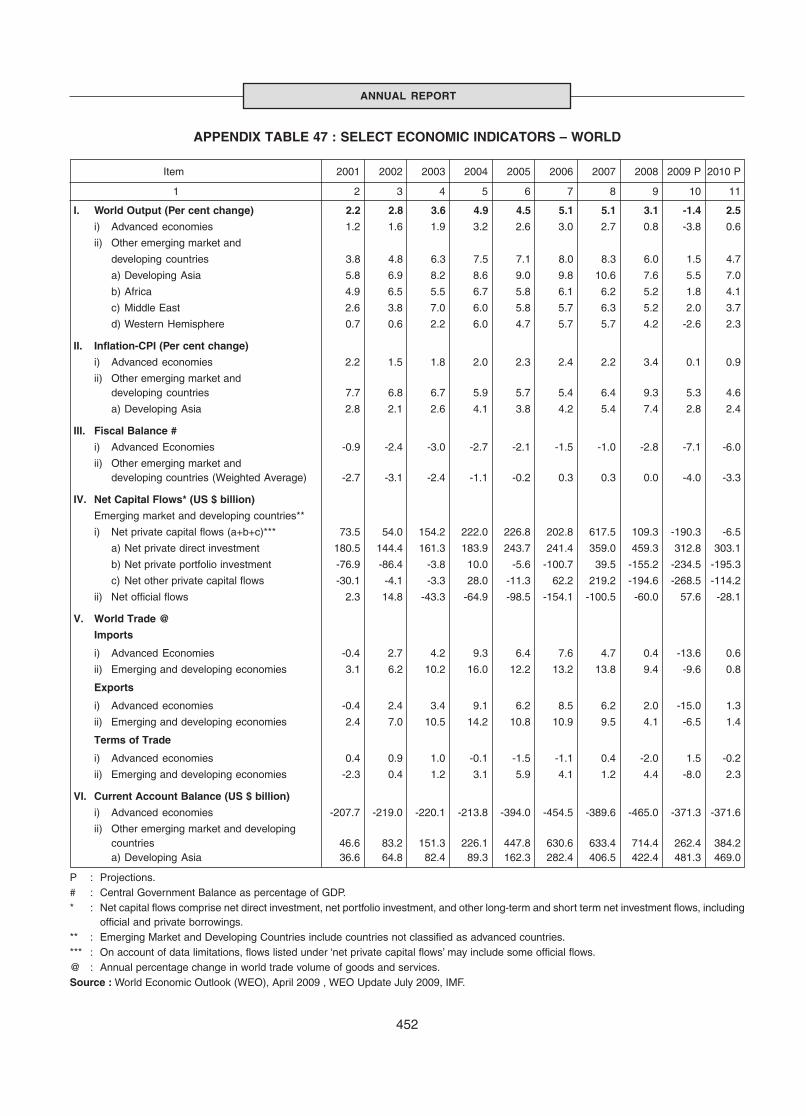
452
ANNUAL REPORT
APPENDIX TABLE 47 : SELECT ECONOMIC INDICATORS – WORLD
Item 2001 2002 2003 2004 2005 2006 2007 2008 2009 P 2010 P
1 2 3 4 5 6 7 8 9 10 11
I. World Output (Per cent change) 2.2 2.8 3.6 4.9 4.5 5.1 5.1 3.1 -1.4 2.5
i) Advanced economies 1.2 1.6 1.9 3.2 2.6 3.0 2.7 0.8 -3.8 0.6
ii) Other emerging market and
developing countries 3.8 4.8 6.3 7.5 7.1 8.0 8.3 6.0 1.5 4.7
a) Developing Asia 5.8 6.9 8.2 8.6 9.0 9.8 10.6 7.6 5.5 7.0
b) Africa 4.9 6.5 5.5 6.7 5.8 6.1 6.2 5.2 1.8 4.1
c) Middle East 2.6 3.8 7.0 6.0 5.8 5.7 6.3 5.2 2.0 3.7
d) Western Hemisphere 0.7 0.6 2.2 6.0 4.7 5.7 5.7 4.2 -2.6 2.3
II. Inflation-CPI (Per cent change)
i) Advanced economies 2.2 1.5 1.8 2.0 2.3 2.4 2.2 3.4 0.1 0.9
ii) Other emerging market anddeveloping countries 7.7 6.8 6.7 5.9 5.7 5.4 6.4 9.3 5.3 4.6
a) Developing Asia 2.8 2.1 2.6 4.1 3.8 4.2 5.4 7.4 2.8 2.4
III. Fiscal Balance #
i) Advanced Economies -0.9 -2.4 -3.0 -2.7 -2.1 -1.5 -1.0 -2.8 -7.1 -6.0
ii) Other emerging market anddeveloping countries (Weighted Average) -2.7 -3.1 -2.4 -1.1 -0.2 0.3 0.3 0.0 -4.0 -3.3
IV. Net Capital Flows* (US $ billion)
Emerging market and developing countries**
i) Net private capital flows (a+b+c)*** 73.5 54.0 154.2 222.0 226.8 202.8 617.5 109.3 -190.3 -6.5
a) Net private direct investment 180.5 144.4 161.3 183.9 243.7 241.4 359.0 459.3 312.8 303.1
b) Net private portfolio investment -76.9 -86.4 -3.8 10.0 -5.6 -100.7 39.5 -155.2 -234.5 -195.3
c) Net other private capital flows -30.1 -4.1 -3.3 28.0 -11.3 62.2 219.2 -194.6 -268.5 -114.2
ii) Net official flows 2.3 14.8 -43.3 -64.9 -98.5 -154.1 -100.5 -60.0 57.6 -28.1
V. World Trade @
Imports
i) Advanced Economies -0.4 2.7 4.2 9.3 6.4 7.6 4.7 0.4 -13.6 0.6
ii) Emerging and developing economies 3.1 6.2 10.2 16.0 12.2 13.2 13.8 9.4 -9.6 0.8
Exports
i) Advanced economies -0.4 2.4 3.4 9.1 6.2 8.5 6.2 2.0 -15.0 1.3
ii) Emerging and developing economies 2.4 7.0 10.5 14.2 10.8 10.9 9.5 4.1 -6.5 1.4
Terms of Trade
i) Advanced economies 0.4 0.9 1.0 -0.1 -1.5 -1.1 0.4 -2.0 1.5 -0.2
ii) Emerging and developing economies -2.3 0.4 1.2 3.1 5.9 4.1 1.2 4.4 -8.0 2.3
VI. Current Account Balance (US $ billion)
i) Advanced economies -207.7 -219.0 -220.1 -213.8 -394.0 -454.5 -389.6 -465.0 -371.3 -371.6
ii) Other emerging market and developingcountries 46.6 83.2 151.3 226.1 447.8 630.6 633.4 714.4 262.4 384.2a) Developing Asia 36.6 64.8 82.4 89.3 162.3 282.4 406.5 422.4 481.3 469.0
P : Projections.# : Central Government Balance as percentage of GDP.* : Net capital flows comprise net direct investment, net portfolio investment, and other long-term and short term net investment flows, including
official and private borrowings.** : Emerging Market and Developing Countries include countries not classified as advanced countries.*** : On account of data limitations, flows listed under ‘net private capital flows’ may include some official flows.@ : Annual percentage change in world trade volume of goods and services.Source : World Economic Outlook (WEO), April 2009 , WEO Update July 2009, IMF.

453
APPENDIX TABLES
APPENDIX TABLE 48 : INDIA’S FOREIGN TRADE
Rupees crore US $ million SDR million
2006-07 2007-08 R 2008-09 P 2006-07 2007-08 R 2008-09 P 2006-07 2007-08 R 2008-09 P
1 2 3 4 5 6 7 8 9 10
I. Exports 5,71,779 6,55,864 7,66,935 1,26,414 1,63,132 1,68,704 84,996 1,04,603 1,07,645(25.3) (14.7) (16.9) (22.6) (29.0) (3.4) 20.1 23.1 2.9
a. POL @ 84,520 1,14,192 .. 18,635 26,904 25,407* 12,534 17,271 ..(64.0) (35.1) (60.1) (44.4) (4.5) (56.9) (37.8)
b. Non-oil 4,87,259 5,41,672 .. 1,07,780 1,36,228 1,31,781* 72,462 87,332 ..(20.3) (11.2) (17.9) (26.4) (8.4) (15.4) (20.5)
II. Imports 8,40,506 10,12,312 13,05,503 1,85,735 2,51,654 2,87,759 1,24,928 1,61,567 1,83,103(27.3) (20.4) (29.0) (24.5) (35.5) (14.3) (22.0) (29.3) (13.3)
a. Oil and POL 2,58,572 3,20,655 4,17,472 56,945 79,715 93,176 38,317 51,063 58,418(32.8) (24.0) (30.2) (29.5) (40.0) (16.9) (27.0) (33.3) (14.4)
b. Non-oil 5,81,935 6,91,657 8,88,031 1,28,790 1,71,939 1,94,583 86,611 1,10,504 1,24,685(24.9) (18.9) (28.4) (22.4) (33.5) (13.2) (19.9) (27.6) (12.8)
III. Trade Balance (I-II) -2,68,727 -3,56,448 -5,38,568 -59,321 -88,522 -1,19,055 -39,932 -56,964 -75,458
a. Oil Balance -1,74,052 -2,06,463 .. -38,311 -52,811 .. -25,783 -33,792 ..
(I.a-II.a)
b. Non-oil Balance -94,675 -1,49,985 .. -21,010 -35,711 .. -14,149 -23,172 ..
(I.b-II.b)
R: Revised. P: Provisional. @ : Petroleum Oil and Lubricants. * : Figures pertain to the period April-February... : Not available.Note : Figures in brackets relate to percentage variations over the previous year.Source : DGCI & S.
Item
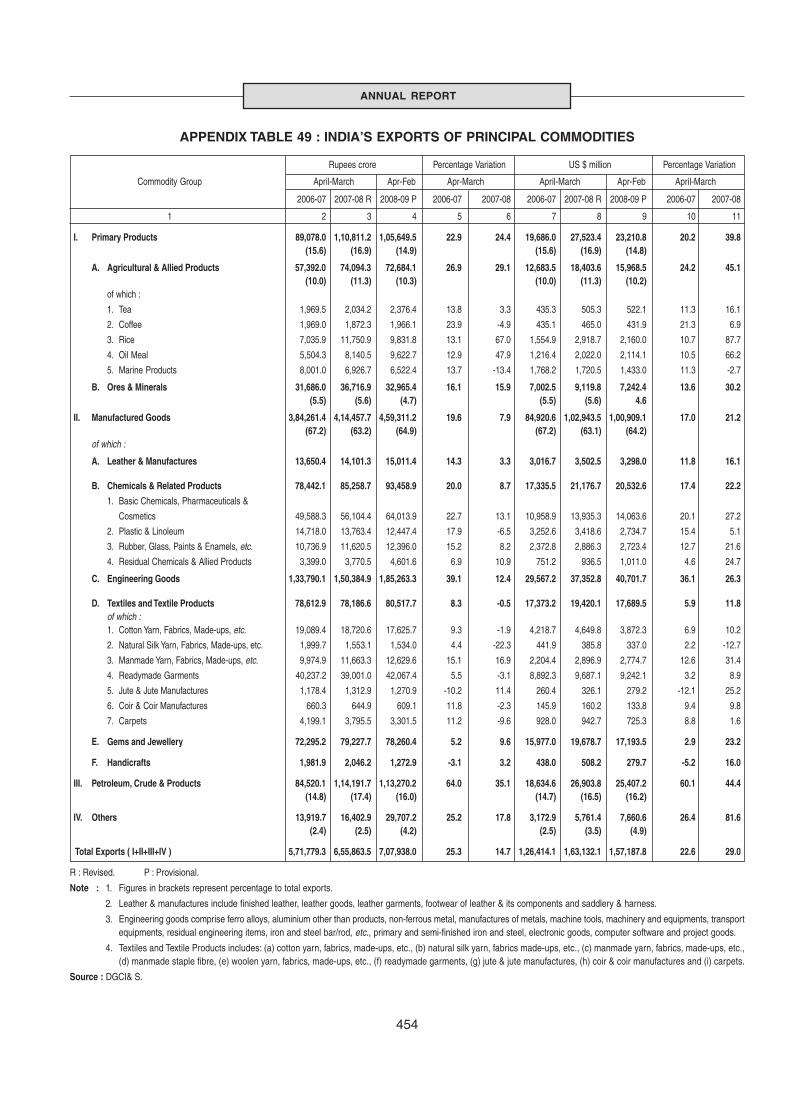
454
ANNUAL REPORT
APPENDIX TABLE 49 : INDIA’S EXPORTS OF PRINCIPAL COMMODITIES
Rupees crore Percentage Variation US $ million Percentage Variation
Commodity Group April-March Apr-Feb Apr-March April-March Apr-Feb April-March
2006-07 2007-08 R 2008-09 P 2006-07 2007-08 2006-07 2007-08 R 2008-09 P 2006-07 2007-08
1 2 3 4 5 6 7 8 9 10 11
I. Primary Products 89,078.0 1,10,811.2 1,05,649.5 22.9 24.4 19,686.0 27,523.4 23,210.8 20.2 39.8(15.6) (16.9) (14.9) (15.6) (16.9) (14.8)
A. Agricultural & Allied Products 57,392.0 74,094.3 72,684.1 26.9 29.1 12,683.5 18,403.6 15,968.5 24.2 45.1(10.0) (11.3) (10.3) (10.0) (11.3) (10.2)
of which :
1. Tea 1,969.5 2,034.2 2,376.4 13.8 3.3 435.3 505.3 522.1 11.3 16.1
2. Coffee 1,969.0 1,872.3 1,966.1 23.9 -4.9 435.1 465.0 431.9 21.3 6.9
3. Rice 7,035.9 11,750.9 9,831.8 13.1 67.0 1,554.9 2,918.7 2,160.0 10.7 87.7
4. Oil Meal 5,504.3 8,140.5 9,622.7 12.9 47.9 1,216.4 2,022.0 2,114.1 10.5 66.2
5. Marine Products 8,001.0 6,926.7 6,522.4 13.7 -13.4 1,768.2 1,720.5 1,433.0 11.3 -2.7
B. Ores & Minerals 31,686.0 36,716.9 32,965.4 16.1 15.9 7,002.5 9,119.8 7,242.4 13.6 30.2(5.5) (5.6) (4.7) (5.5) (5.6) 4.6
II. Manufactured Goods 3,84,261.4 4,14,457.7 4,59,311.2 19.6 7.9 84,920.6 1,02,943.5 1,00,909.1 17.0 21.2(67.2) (63.2) (64.9) (67.2) (63.1) (64.2)
of which :
A. Leather & Manufactures 13,650.4 14,101.3 15,011.4 14.3 3.3 3,016.7 3,502.5 3,298.0 11.8 16.1
B. Chemicals & Related Products 78,442.1 85,258.7 93,458.9 20.0 8.7 17,335.5 21,176.7 20,532.6 17.4 22.2
1. Basic Chemicals, Pharmaceuticals &
Cosmetics 49,588.3 56,104.4 64,013.9 22.7 13.1 10,958.9 13,935.3 14,063.6 20.1 27.2
2. Plastic & Linoleum 14,718.0 13,763.4 12,447.4 17.9 -6.5 3,252.6 3,418.6 2,734.7 15.4 5.1
3. Rubber, Glass, Paints & Enamels, etc. 10,736.9 11,620.5 12,396.0 15.2 8.2 2,372.8 2,886.3 2,723.4 12.7 21.6
4. Residual Chemicals & Allied Products 3,399.0 3,770.5 4,601.6 6.9 10.9 751.2 936.5 1,011.0 4.6 24.7
C. Engineering Goods 1,33,790.1 1,50,384.9 1,85,263.3 39.1 12.4 29,567.2 37,352.8 40,701.7 36.1 26.3
D. Textiles and Textile Products 78,612.9 78,186.6 80,517.7 8.3 -0.5 17,373.2 19,420.1 17,689.5 5.9 11.8of which :1. Cotton Yarn, Fabrics, Made-ups, etc. 19,089.4 18,720.6 17,625.7 9.3 -1.9 4,218.7 4,649.8 3,872.3 6.9 10.2
2. Natural Silk Yarn, Fabrics, Made-ups, etc. 1,999.7 1,553.1 1,534.0 4.4 -22.3 441.9 385.8 337.0 2.2 -12.7
3. Manmade Yarn, Fabrics, Made-ups, etc. 9,974.9 11,663.3 12,629.6 15.1 16.9 2,204.4 2,896.9 2,774.7 12.6 31.4
4. Readymade Garments 40,237.2 39,001.0 42,067.4 5.5 -3.1 8,892.3 9,687.1 9,242.1 3.2 8.9
5. Jute & Jute Manufactures 1,178.4 1,312.9 1,270.9 -10.2 11.4 260.4 326.1 279.2 -12.1 25.2
6. Coir & Coir Manufactures 660.3 644.9 609.1 11.8 -2.3 145.9 160.2 133.8 9.4 9.8
7. Carpets 4,199.1 3,795.5 3,301.5 11.2 -9.6 928.0 942.7 725.3 8.8 1.6
E. Gems and Jewellery 72,295.2 79,227.7 78,260.4 5.2 9.6 15,977.0 19,678.7 17,193.5 2.9 23.2
F. Handicrafts 1,981.9 2,046.2 1,272.9 -3.1 3.2 438.0 508.2 279.7 -5.2 16.0
III. Petroleum, Crude & Products 84,520.1 1,14,191.7 1,13,270.2 64.0 35.1 18,634.6 26,903.8 25,407.2 60.1 44.4(14.8) (17.4) (16.0) (14.7) (16.5) (16.2)
IV. Others 13,919.7 16,402.9 29,707.2 25.2 17.8 3,172.9 5,761.4 7,660.6 26.4 81.6(2.4) (2.5) (4.2) (2.5) (3.5) (4.9)
Total Exports ( I+II+III+IV ) 5,71,779.3 6,55,863.5 7,07,938.0 25.3 14.7 1,26,414.1 1,63,132.1 1,57,187.8 22.6 29.0
R : Revised. P : Provisional.
Note : 1. Figures in brackets represent percentage to total exports.
2. Leather & manufactures include finished leather, leather goods, leather garments, footwear of leather & its components and saddlery & harness.
3. Engineering goods comprise ferro alloys, aluminium other than products, non-ferrous metal, manufactures of metals, machine tools, machinery and equipments, transportequipments, residual engineering items, iron and steel bar/rod, etc., primary and semi-finished iron and steel, electronic goods, computer software and project goods.
4. Textiles and Textile Products includes: (a) cotton yarn, fabrics, made-ups, etc., (b) natural silk yarn, fabrics made-ups, etc., (c) manmade yarn, fabrics, made-ups, etc.,(d) manmade staple fibre, (e) woolen yarn, fabrics, made-ups, etc., (f) readymade garments, (g) jute & jute manufactures, (h) coir & coir manufactures and (i) carpets.
Source : DGCI& S.
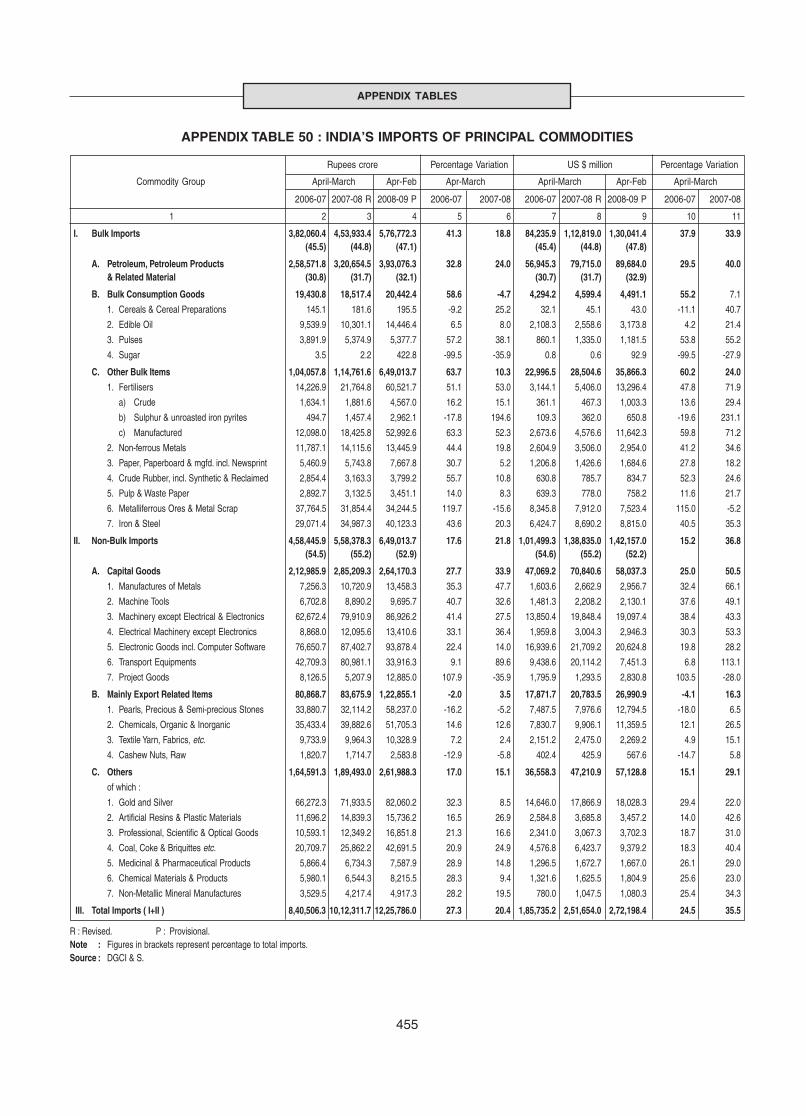
455
APPENDIX TABLES
APPENDIX TABLE 50 : INDIA’S IMPORTS OF PRINCIPAL COMMODITIES
Rupees crore Percentage Variation US $ million Percentage Variation
Commodity Group April-March Apr-Feb Apr-March April-March Apr-Feb April-March
2006-07 2007-08 R 2008-09 P 2006-07 2007-08 2006-07 2007-08 R 2008-09 P 2006-07 2007-08
1 2 3 4 5 6 7 8 9 10 11
I. Bulk Imports 3,82,060.4 4,53,933.4 5,76,772.3 41.3 18.8 84,235.9 1,12,819.0 1,30,041.4 37.9 33.9(45.5) (44.8) (47.1) (45.4) (44.8) (47.8)
A. Petroleum, Petroleum Products 2,58,571.8 3,20,654.5 3,93,076.3 32.8 24.0 56,945.3 79,715.0 89,684.0 29.5 40.0& Related Material (30.8) (31.7) (32.1) (30.7) (31.7) (32.9)
B. Bulk Consumption Goods 19,430.8 18,517.4 20,442.4 58.6 -4.7 4,294.2 4,599.4 4,491.1 55.2 7.1
1. Cereals & Cereal Preparations 145.1 181.6 195.5 -9.2 25.2 32.1 45.1 43.0 -11.1 40.7
2. Edible Oil 9,539.9 10,301.1 14,446.4 6.5 8.0 2,108.3 2,558.6 3,173.8 4.2 21.4
3. Pulses 3,891.9 5,374.9 5,377.7 57.2 38.1 860.1 1,335.0 1,181.5 53.8 55.2
4. Sugar 3.5 2.2 422.8 -99.5 -35.9 0.8 0.6 92.9 -99.5 -27.9
C. Other Bulk Items 1,04,057.8 1,14,761.6 6,49,013.7 63.7 10.3 22,996.5 28,504.6 35,866.3 60.2 24.0
1. Fertilisers 14,226.9 21,764.8 60,521.7 51.1 53.0 3,144.1 5,406.0 13,296.4 47.8 71.9
a) Crude 1,634.1 1,881.6 4,567.0 16.2 15.1 361.1 467.3 1,003.3 13.6 29.4
b) Sulphur & unroasted iron pyrites 494.7 1,457.4 2,962.1 -17.8 194.6 109.3 362.0 650.8 -19.6 231.1
c) Manufactured 12,098.0 18,425.8 52,992.6 63.3 52.3 2,673.6 4,576.6 11,642.3 59.8 71.2
2. Non-ferrous Metals 11,787.1 14,115.6 13,445.9 44.4 19.8 2,604.9 3,506.0 2,954.0 41.2 34.6
3. Paper, Paperboard & mgfd. incl. Newsprint 5,460.9 5,743.8 7,667.8 30.7 5.2 1,206.8 1,426.6 1,684.6 27.8 18.2
4. Crude Rubber, incl. Synthetic & Reclaimed 2,854.4 3,163.3 3,799.2 55.7 10.8 630.8 785.7 834.7 52.3 24.6
5. Pulp & Waste Paper 2,892.7 3,132.5 3,451.1 14.0 8.3 639.3 778.0 758.2 11.6 21.7
6. Metalliferrous Ores & Metal Scrap 37,764.5 31,854.4 34,244.5 119.7 -15.6 8,345.8 7,912.0 7,523.4 115.0 -5.2
7. Iron & Steel 29,071.4 34,987.3 40,123.3 43.6 20.3 6,424.7 8,690.2 8,815.0 40.5 35.3
II. Non-Bulk Imports 4,58,445.9 5,58,378.3 6,49,013.7 17.6 21.8 1,01,499.3 1,38,835.0 1,42,157.0 15.2 36.8(54.5) (55.2) (52.9) (54.6) (55.2) (52.2)
A. Capital Goods 2,12,985.9 2,85,209.3 2,64,170.3 27.7 33.9 47,069.2 70,840.6 58,037.3 25.0 50.5
1. Manufactures of Metals 7,256.3 10,720.9 13,458.3 35.3 47.7 1,603.6 2,662.9 2,956.7 32.4 66.1
2. Machine Tools 6,702.8 8,890.2 9,695.7 40.7 32.6 1,481.3 2,208.2 2,130.1 37.6 49.1
3. Machinery except Electrical & Electronics 62,672.4 79,910.9 86,926.2 41.4 27.5 13,850.4 19,848.4 19,097.4 38.4 43.3
4. Electrical Machinery except Electronics 8,868.0 12,095.6 13,410.6 33.1 36.4 1,959.8 3,004.3 2,946.3 30.3 53.3
5. Electronic Goods incl. Computer Software 76,650.7 87,402.7 93,878.4 22.4 14.0 16,939.6 21,709.2 20,624.8 19.8 28.2
6. Transport Equipments 42,709.3 80,981.1 33,916.3 9.1 89.6 9,438.6 20,114.2 7,451.3 6.8 113.1
7. Project Goods 8,126.5 5,207.9 12,885.0 107.9 -35.9 1,795.9 1,293.5 2,830.8 103.5 -28.0
B. Mainly Export Related Items 80,868.7 83,675.9 1,22,855.1 -2.0 3.5 17,871.7 20,783.5 26,990.9 -4.1 16.3
1. Pearls, Precious & Semi-precious Stones 33,880.7 32,114.2 58,237.0 -16.2 -5.2 7,487.5 7,976.6 12,794.5 -18.0 6.5
2. Chemicals, Organic & Inorganic 35,433.4 39,882.6 51,705.3 14.6 12.6 7,830.7 9,906.1 11,359.5 12.1 26.5
3. Textile Yarn, Fabrics, etc. 9,733.9 9,964.3 10,328.9 7.2 2.4 2,151.2 2,475.0 2,269.2 4.9 15.1
4. Cashew Nuts, Raw 1,820.7 1,714.7 2,583.8 -12.9 -5.8 402.4 425.9 567.6 -14.7 5.8
C. Others 1,64,591.3 1,89,493.0 2,61,988.3 17.0 15.1 36,558.3 47,210.9 57,128.8 15.1 29.1
of which :
1. Gold and Silver 66,272.3 71,933.5 82,060.2 32.3 8.5 14,646.0 17,866.9 18,028.3 29.4 22.0
2. Artificial Resins & Plastic Materials 11,696.2 14,839.3 15,736.2 16.5 26.9 2,584.8 3,685.8 3,457.2 14.0 42.6
3. Professional, Scientific & Optical Goods 10,593.1 12,349.2 16,851.8 21.3 16.6 2,341.0 3,067.3 3,702.3 18.7 31.0
4. Coal, Coke & Briquittes etc. 20,709.7 25,862.2 42,691.5 20.9 24.9 4,576.8 6,423.7 9,379.2 18.3 40.4
5. Medicinal & Pharmaceutical Products 5,866.4 6,734.3 7,587.9 28.9 14.8 1,296.5 1,672.7 1,667.0 26.1 29.0
6. Chemical Materials & Products 5,980.1 6,544.3 8,215.5 28.3 9.4 1,321.6 1,625.5 1,804.9 25.6 23.0
7. Non-Metallic Mineral Manufactures 3,529.5 4,217.4 4,917.3 28.2 19.5 780.0 1,047.5 1,080.3 25.4 34.3
III. Total Imports ( I+II ) 8,40,506.3 10,12,311.7 12,25,786.0 27.3 20.4 1,85,735.2 2,51,654.0 2,72,198.4 24.5 35.5
R : Revised. P : Provisional.Note : Figures in brackets represent percentage to total imports.Source : DGCI & S.

ANNUAL REPORT
456
APPENDIX TABLE 51 : INDIA’S OVERALL BALANCE OF PAYMENTS
ItemRupees crore US $ million
2006-07 2007-08 PR 2008-09 P 2006-07 2007-08 PR 2008-09 P
1 2 3 4 5 6 7
A. CURRENT ACCOUNT
1. Exports, f.o.b. 5,82,871 6,67,757 7,98,956 1,28,888 1,66,163 1,75,1842. Imports, c.i.f. 8,62,833 10,36,289 13,41,069 1,90,670 2,57,789 2,94,5873. Trade Balance -2,79,962 -3,68,532 -5,42,113 -61,782 -91,626 -1,19,4034. Invisibles, Net 2,35,579 2,99,618 4,09,842 52,217 74,592 89,586
a) ‘Non-Factor’ Services 1,33,064 1,51,059 2,28,778 29,469 37,565 49,818of which:Software Services 1,41,356 1,62,020 2,15,588 31,300 40,300 47,000
b) Income -33,234 -19,888 -21,116 -7,331 -4,917 -4,511c) Private Transfers 1,34,608 1,67,495 2,01,050 29,825 41,705 44,047d) Official Transfers 1,141 952 1,130 254 239 232
5. Current Account Balance -44,383 -68,914 -1,32,271 -9,565 -17,034 -29,817
B. CAPITAL ACCOUNT1. Foreign Investment, Net (a+b) 66,791 1,80,788 11,760 14,753 44,957 3,462
a) Direct Investmentof which: 34,910 61,793 76,822 7,693 15,401 17,496i) In India 1,02,652 1,37,434 1,58,579 22,739 34,236 34,982
Equity 73,969 1,07,320 1,25,362 16,394 26,758 27,809Re-invested Earnings 26,371 28,859 29,705 5,828 7,168 6,426Other Capital 2,312 1,255 3,512 517 310 747
ii) Abroad -67,742 -75,641 -81,757 -15,046 -18,835 -17,486Equity -56,711 -57,936 -63,478 -12,604 -14,421 -13,558Re-invested Earnings -4,868 -4,363 -4,985 -1,076 -1,084 -1,084Other Capital -6,163 -13,342 -13,294 -1,366 -3,330 -2,844
b) Portfolio Investment 31,881 1,18,995 -65,062 7,060 29,556 -14,034In India 31,630 1,18,348 -64,206 7,004 29,394 -13,855Abroad 251 647 -856 56 162 -179
2. External Assistance, Net 7,973 8,465 12,435 1,775 2,114 2,638Disbursements 16,978 17,022 23,535 3,767 4,241 5,042Amortisation -9,005 -8,557 -11,100 -1,992 -2,127 -2,404
3. Commercial Borrowings, Net 72,365 91,180 38,009 16,103 22,633 8,158Disbursements 93,932 1,22,270 71,626 20,883 30,376 15,382Amortisation -21,567 -31,090 -33,617 -4,780 -7,743 -7,224
4. Short Term Credit, Net 30,096 68,878 -31,160 6,612 17,183 -5,7955. Banking Capital
of which: 8,477 47,148 -19,868 1,913 11,757 -3,397NRI Deposits, Net 19,574 706 20,431 4,321 179 4,290
6. Rupee Debt Service -725 -488 -476 -162 -121 -1017. Other Capital, Net @ 18,696 37,802 21,681 4,209 9,470 4,1818. Total Capital Account 2,03,673 4,33,773 32,381 45,203 1,07,993 9,146
C. Errors & Omissions 4,344 4,830 2,775 968 1,205 591
D. Overall Balance [A(5)+B(8)+C] 1,63,634 3,69,689 -97,115 36,606 92,164 -20,080
E. Monetary Movements (F+G) -1,63,634 -3,69,689 97,115 -36,606 -92,164 20,080
F. IMF, Net 0 0 0 0 0 0
G. Reserves and Monetary Gold -1,63,634 -3,69,689 97,115 -36,606 -92,164 20,080(Increase -, Decrease +)
P : Provisional. PR : Partially Revised.@ : Includes delayed export receipts, advance payments against imports, net funds held abroad and advances received pending issue of
shares under FDI.Note : 1. Gold and silver brought by returning Indians have been included under imports, with a contra entry in private transfer receipts.
2. Data on exports and imports differ from those given by DGCI&S on account of differences in coverage, valuation and timing.
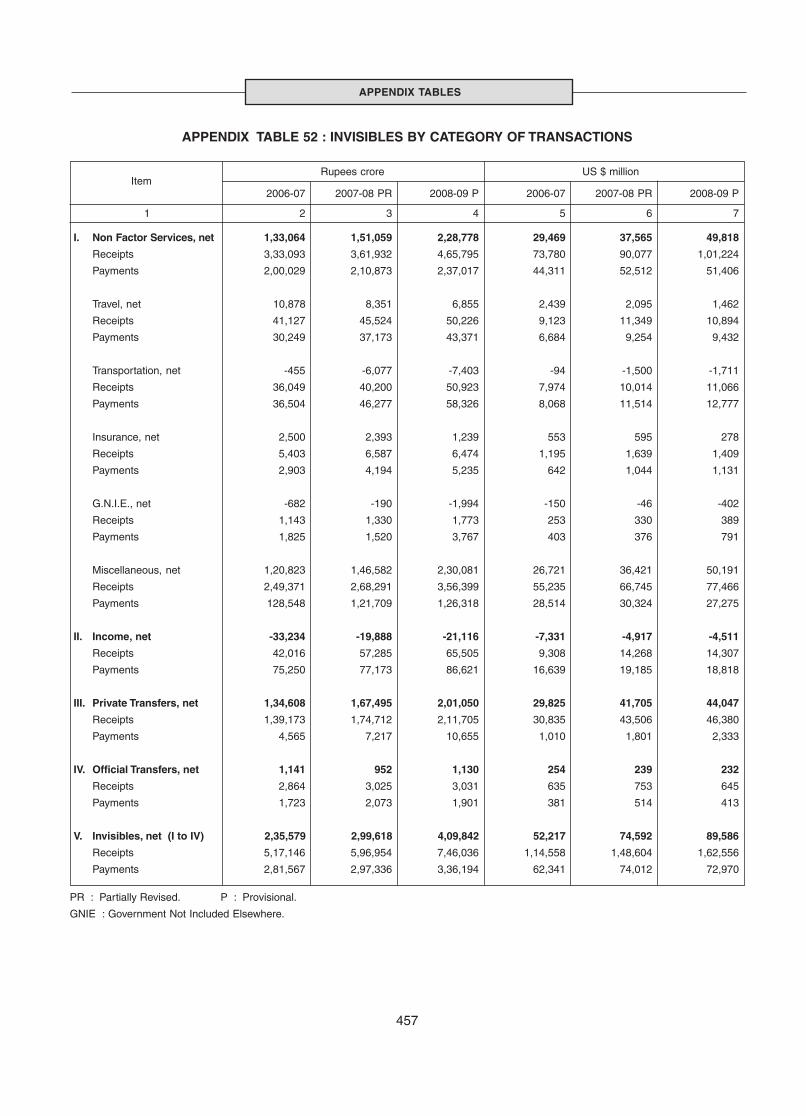
457
APPENDIX TABLES
APPENDIX TABLE 52 : INVISIBLES BY CATEGORY OF TRANSACTIONS
ItemRupees crore US $ million
2006-07 2007-08 PR 2008-09 P 2006-07 2007-08 PR 2008-09 P
1 2 3 4 5 6 7
I. Non Factor Services, net 1,33,064 1,51,059 2,28,778 29,469 37,565 49,818
Receipts 3,33,093 3,61,932 4,65,795 73,780 90,077 1,01,224
Payments 2,00,029 2,10,873 2,37,017 44,311 52,512 51,406
Travel, net 10,878 8,351 6,855 2,439 2,095 1,462
Receipts 41,127 45,524 50,226 9,123 11,349 10,894
Payments 30,249 37,173 43,371 6,684 9,254 9,432
Transportation, net -455 -6,077 -7,403 -94 -1,500 -1,711
Receipts 36,049 40,200 50,923 7,974 10,014 11,066
Payments 36,504 46,277 58,326 8,068 11,514 12,777
Insurance, net 2,500 2,393 1,239 553 595 278
Receipts 5,403 6,587 6,474 1,195 1,639 1,409
Payments 2,903 4,194 5,235 642 1,044 1,131
G.N.I.E., net -682 -190 -1,994 -150 -46 -402
Receipts 1,143 1,330 1,773 253 330 389
Payments 1,825 1,520 3,767 403 376 791
Miscellaneous, net 1,20,823 1,46,582 2,30,081 26,721 36,421 50,191
Receipts 2,49,371 2,68,291 3,56,399 55,235 66,745 77,466
Payments 128,548 1,21,709 1,26,318 28,514 30,324 27,275
II. Income, net -33,234 -19,888 -21,116 -7,331 -4,917 -4,511
Receipts 42,016 57,285 65,505 9,308 14,268 14,307
Payments 75,250 77,173 86,621 16,639 19,185 18,818
III. Private Transfers, net 1,34,608 1,67,495 2,01,050 29,825 41,705 44,047
Receipts 1,39,173 1,74,712 2,11,705 30,835 43,506 46,380
Payments 4,565 7,217 10,655 1,010 1,801 2,333
IV. Official Transfers, net 1,141 952 1,130 254 239 232
Receipts 2,864 3,025 3,031 635 753 645
Payments 1,723 2,073 1,901 381 514 413
V. Invisibles, net (I to IV) 2,35,579 2,99,618 4,09,842 52,217 74,592 89,586
Receipts 5,17,146 5,96,954 7,46,036 1,14,558 1,48,604 1,62,556
Payments 2,81,567 2,97,336 3,36,194 62,341 74,012 72,970
PR : Partially Revised. P : Provisional.
GNIE : Government Not Included Elsewhere.
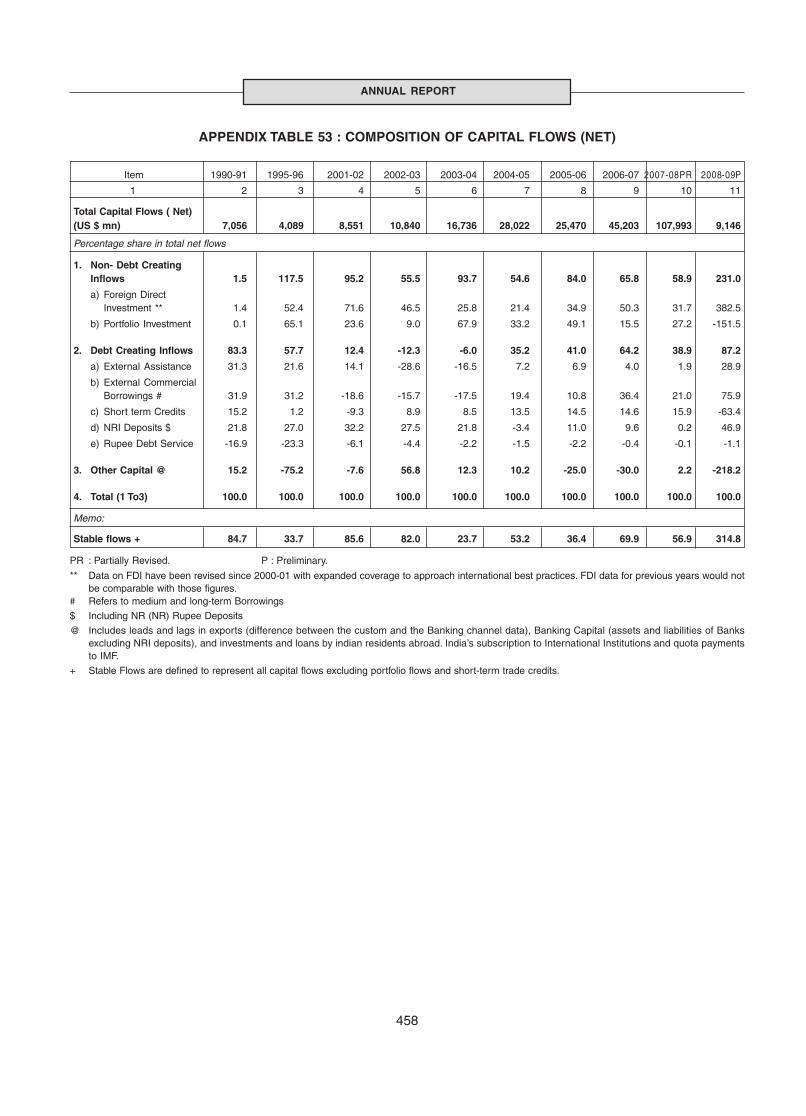
ANNUAL REPORT
458
APPENDIX TABLE 53 : COMPOSITION OF CAPITAL FLOWS (NET)
Item 1990-91 1995-96 2001-02 2002-03 2003-04 2004-05 2005-06 2006-07 2007-08PR 2008-09P
1 2 3 4 5 6 7 8 9 10 11
Total Capital Flows ( Net)(US $ mn) 7,056 4,089 8,551 10,840 16,736 28,022 25,470 45,203 107,993 9,146
Percentage share in total net flows
1. Non- Debt CreatingInflows 1.5 117.5 95.2 55.5 93.7 54.6 84.0 65.8 58.9 231.0
a) Foreign DirectInvestment ** 1.4 52.4 71.6 46.5 25.8 21.4 34.9 50.3 31.7 382.5
b) Portfolio Investment 0.1 65.1 23.6 9.0 67.9 33.2 49.1 15.5 27.2 -151.5
2. Debt Creating Inflows 83.3 57.7 12.4 -12.3 -6.0 35.2 41.0 64.2 38.9 87.2
a) External Assistance 31.3 21.6 14.1 -28.6 -16.5 7.2 6.9 4.0 1.9 28.9
b) External CommercialBorrowings # 31.9 31.2 -18.6 -15.7 -17.5 19.4 10.8 36.4 21.0 75.9
c) Short term Credits 15.2 1.2 -9.3 8.9 8.5 13.5 14.5 14.6 15.9 -63.4
d) NRI Deposits $ 21.8 27.0 32.2 27.5 21.8 -3.4 11.0 9.6 0.2 46.9
e) Rupee Debt Service -16.9 -23.3 -6.1 -4.4 -2.2 -1.5 -2.2 -0.4 -0.1 -1.1
3. Other Capital @ 15.2 -75.2 -7.6 56.8 12.3 10.2 -25.0 -30.0 2.2 -218.2
4. Total (1 To3) 100.0 100.0 100.0 100.0 100.0 100.0 100.0 100.0 100.0 100.0
Memo:
Stable flows + 84.7 33.7 85.6 82.0 23.7 53.2 36.4 69.9 56.9 314.8
PR : Partially Revised. P : Preliminary.
** Data on FDI have been revised since 2000-01 with expanded coverage to approach international best practices. FDI data for previous years would notbe comparable with those figures.
# Refers to medium and long-term Borrowings
$ Including NR (NR) Rupee Deposits
@ Includes leads and lags in exports (difference between the custom and the Banking channel data), Banking Capital (assets and liabilities of Banksexcluding NRI deposits), and investments and loans by indian residents abroad. India’s subscription to International Institutions and quota paymentsto IMF.
+ Stable Flows are defined to represent all capital flows excluding portfolio flows and short-term trade credits.
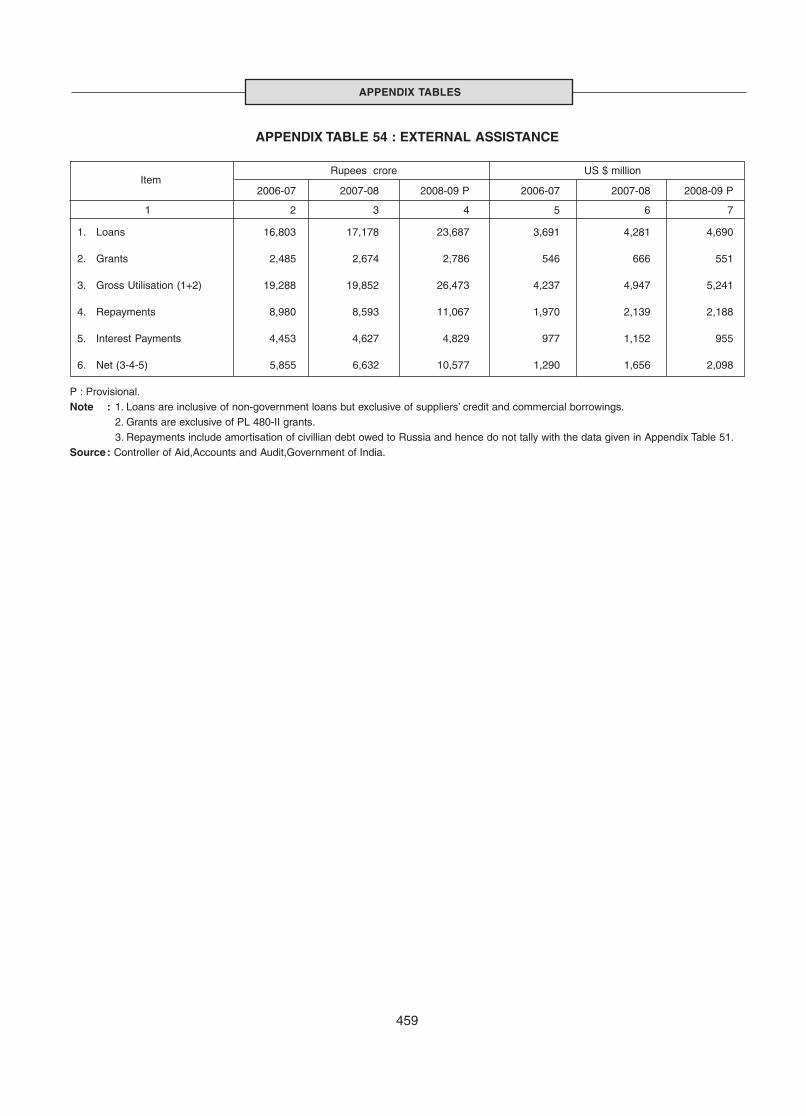
459
APPENDIX TABLES
APPENDIX TABLE 54 : EXTERNAL ASSISTANCE
Rupees crore US $ million
2006-07 2007-08 2008-09 P 2006-07 2007-08 2008-09 P
1 2 3 4 5 6 7
1. Loans 16,803 17,178 23,687 3,691 4,281 4,690
2. Grants 2,485 2,674 2,786 546 666 551
3. Gross Utilisation (1+2) 19,288 19,852 26,473 4,237 4,947 5,241
4. Repayments 8,980 8,593 11,067 1,970 2,139 2,188
5. Interest Payments 4,453 4,627 4,829 977 1,152 955
6. Net (3-4-5) 5,855 6,632 10,577 1,290 1,656 2,098
P : Provisional.Note : 1. Loans are inclusive of non-government loans but exclusive of suppliers’ credit and commercial borrowings.
2. Grants are exclusive of PL 480-II grants.3. Repayments include amortisation of civillian debt owed to Russia and hence do not tally with the data given in Appendix Table 51.
Source : Controller of Aid,Accounts and Audit,Government of India.
Item
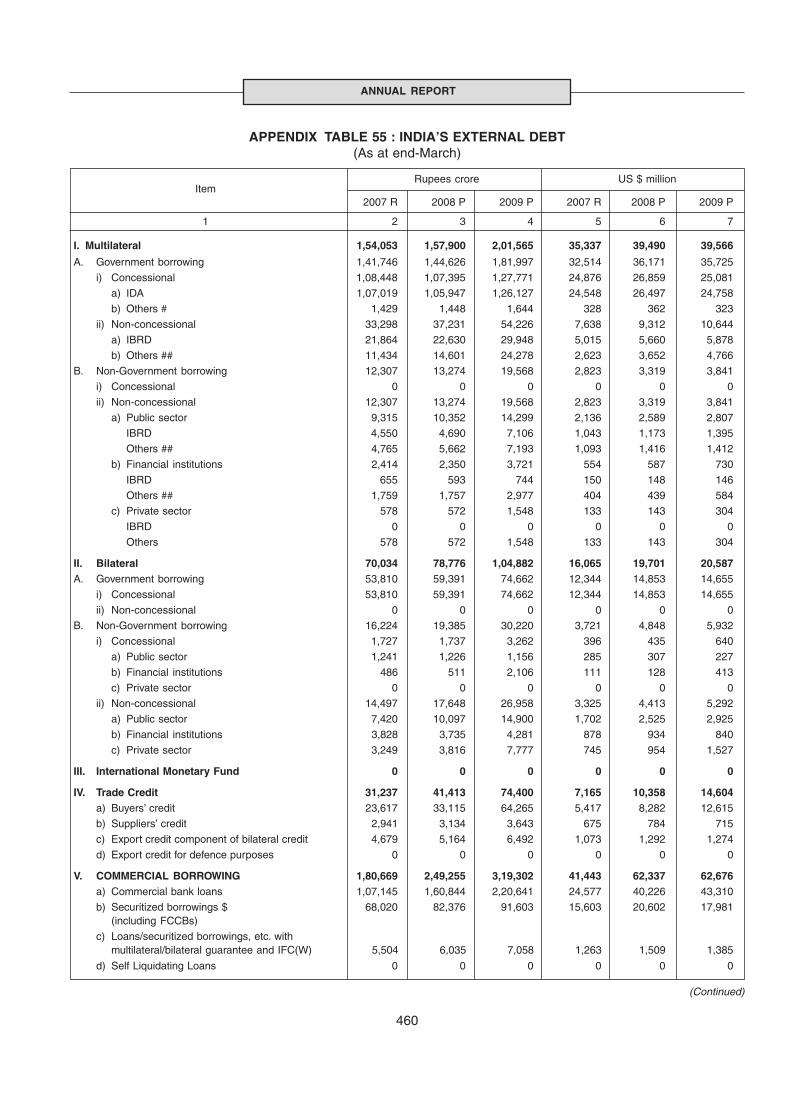
ANNUAL REPORT
460
APPENDIX TABLE 55 : INDIA’S EXTERNAL DEBT(As at end-March)
ItemRupees crore US $ million
2007 R 2008 P 2009 P 2007 R 2008 P 2009 P
1 2 3 4 5 6 7
(Continued)
I. Multilateral 1,54,053 1,57,900 2,01,565 35,337 39,490 39,566
A. Government borrowing 1,41,746 1,44,626 1,81,997 32,514 36,171 35,725
i) Concessional 1,08,448 1,07,395 1,27,771 24,876 26,859 25,081
a) IDA 1,07,019 1,05,947 1,26,127 24,548 26,497 24,758
b) Others # 1,429 1,448 1,644 328 362 323
ii) Non-concessional 33,298 37,231 54,226 7,638 9,312 10,644
a) IBRD 21,864 22,630 29,948 5,015 5,660 5,878
b) Others ## 11,434 14,601 24,278 2,623 3,652 4,766
B. Non-Government borrowing 12,307 13,274 19,568 2,823 3,319 3,841
i) Concessional 0 0 0 0 0 0
ii) Non-concessional 12,307 13,274 19,568 2,823 3,319 3,841
a) Public sector 9,315 10,352 14,299 2,136 2,589 2,807
IBRD 4,550 4,690 7,106 1,043 1,173 1,395
Others ## 4,765 5,662 7,193 1,093 1,416 1,412
b) Financial institutions 2,414 2,350 3,721 554 587 730
IBRD 655 593 744 150 148 146
Others ## 1,759 1,757 2,977 404 439 584
c) Private sector 578 572 1,548 133 143 304
IBRD 0 0 0 0 0 0
Others 578 572 1,548 133 143 304
II. Bilateral 70,034 78,776 1,04,882 16,065 19,701 20,587A. Government borrowing 53,810 59,391 74,662 12,344 14,853 14,655
i) Concessional 53,810 59,391 74,662 12,344 14,853 14,655
ii) Non-concessional 0 0 0 0 0 0
B. Non-Government borrowing 16,224 19,385 30,220 3,721 4,848 5,932
i) Concessional 1,727 1,737 3,262 396 435 640
a) Public sector 1,241 1,226 1,156 285 307 227
b) Financial institutions 486 511 2,106 111 128 413
c) Private sector 0 0 0 0 0 0
ii) Non-concessional 14,497 17,648 26,958 3,325 4,413 5,292
a) Public sector 7,420 10,097 14,900 1,702 2,525 2,925
b) Financial institutions 3,828 3,735 4,281 878 934 840
c) Private sector 3,249 3,816 7,777 745 954 1,527
III. International Monetary Fund 0 0 0 0 0 0
IV. Trade Credit 31,237 41,413 74,400 7,165 10,358 14,604a) Buyers’ credit 23,617 33,115 64,265 5,417 8,282 12,615
b) Suppliers’ credit 2,941 3,134 3,643 675 784 715
c) Export credit component of bilateral credit 4,679 5,164 6,492 1,073 1,292 1,274
d) Export credit for defence purposes 0 0 0 0 0 0
V. COMMERCIAL BORROWING 1,80,669 2,49,255 3,19,302 41,443 62,337 62,676a) Commercial bank loans 1,07,145 1,60,844 2,20,641 24,577 40,226 43,310
b) Securitized borrowings $ 68,020 82,376 91,603 15,603 20,602 17,981(including FCCBs)
c) Loans/securitized borrowings, etc. withmultilateral/bilateral guarantee and IFC(W) 5,504 6,035 7,058 1,263 1,509 1,385
d) Self Liquidating Loans 0 0 0 0 0 0
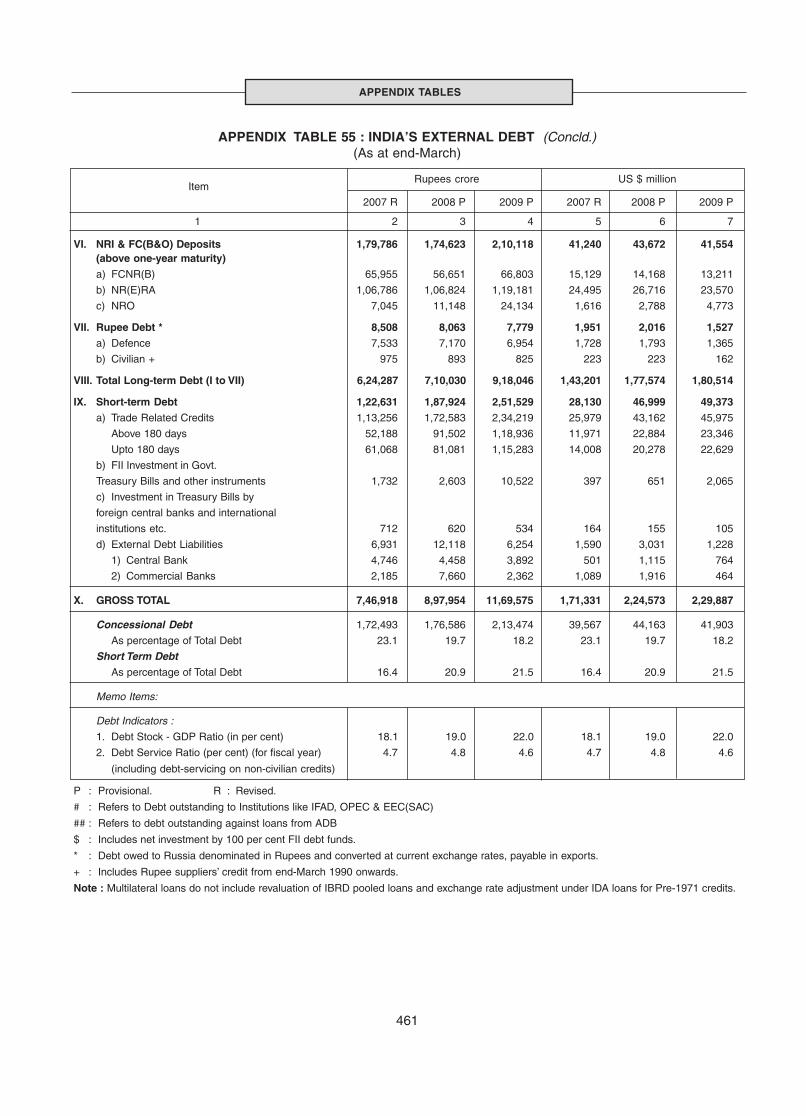
461
APPENDIX TABLES
APPENDIX TABLE 55 : INDIA’S EXTERNAL DEBT (Concld.)(As at end-March)
Item
Rupees crore US $ million
2007 R 2008 P 2009 P 2007 R 2008 P 2009 P
1 2 3 4 5 6 7
VI. NRI & FC(B&O) Deposits 1,79,786 1,74,623 2,10,118 41,240 43,672 41,554(above one-year maturity)
a) FCNR(B) 65,955 56,651 66,803 15,129 14,168 13,211
b) NR(E)RA 1,06,786 1,06,824 1,19,181 24,495 26,716 23,570
c) NRO 7,045 11,148 24,134 1,616 2,788 4,773
VII. Rupee Debt * 8,508 8,063 7,779 1,951 2,016 1,527a) Defence 7,533 7,170 6,954 1,728 1,793 1,365
b) Civilian + 975 893 825 223 223 162
VIII. Total Long-term Debt (I to VII) 6,24,287 7,10,030 9,18,046 1,43,201 1,77,574 1,80,514
IX. Short-term Debt 1,22,631 1,87,924 2,51,529 28,130 46,999 49,373a) Trade Related Credits 1,13,256 1,72,583 2,34,219 25,979 43,162 45,975
Above 180 days 52,188 91,502 1,18,936 11,971 22,884 23,346
Upto 180 days 61,068 81,081 1,15,283 14,008 20,278 22,629
b) FII Investment in Govt.
Treasury Bills and other instruments 1,732 2,603 10,522 397 651 2,065
c) Investment in Treasury Bills by
foreign central banks and international
institutions etc. 712 620 534 164 155 105
d) External Debt Liabilities 6,931 12,118 6,254 1,590 3,031 1,228
1) Central Bank 4,746 4,458 3,892 501 1,115 764
2) Commercial Banks 2,185 7,660 2,362 1,089 1,916 464
X. GROSS TOTAL 7,46,918 8,97,954 11,69,575 1,71,331 2,24,573 2,29,887
Concessional Debt 1,72,493 1,76,586 2,13,474 39,567 44,163 41,903
As percentage of Total Debt 23.1 19.7 18.2 23.1 19.7 18.2
Short Term DebtAs percentage of Total Debt 16.4 20.9 21.5 16.4 20.9 21.5
Memo Items:
Debt Indicators :
1. Debt Stock - GDP Ratio (in per cent) 18.1 19.0 22.0 18.1 19.0 22.0
2. Debt Service Ratio (per cent) (for fiscal year) 4.7 4.8 4.6 4.7 4.8 4.6
(including debt-servicing on non-civilian credits)
P : Provisional. R : Revised.
# : Refers to Debt outstanding to Institutions like IFAD, OPEC & EEC(SAC)
## : Refers to debt outstanding against loans from ADB
$ : Includes net investment by 100 per cent FII debt funds.
* : Debt owed to Russia denominated in Rupees and converted at current exchange rates, payable in exports.
+ : Includes Rupee suppliers’ credit from end-March 1990 onwards.
Note : Multilateral loans do not include revaluation of IBRD pooled loans and exchange rate adjustment under IDA loans for Pre-1971 credits.

ANNUAL REPORT
462
APPENDIX TABLE 56 : INDIA’S FOREIGN EXCHANGE RESERVES
Foreign Exchange Reserves Foreign Exchange Reserves Total Movement(Rupees crore) (US $ million) Foreign in Foreign
End of Month Exchange ExchangeSDRs Gold # Foreign Reserve Total SDRs Gold # Foreign Reserve Total Reserves Reserves
Currency Tranche (2+3+ Currency Tranche (7+8+ (in SDR (in SDRAssets Position 4+5) Assets Position 9+10) million) million)*
in IMF in IMF
1 2 3 4 5 6 7 8 9 10 11 12 13
Mar-94 339 12,794 47,287 938 61,358 108 4,078 15,068 299 19,553 13,841 6,595
Mar-95 23 13,752 66,005 1,050 80,830 7 4,370 20,809 331 25,517 16,352 2,511
Mar-96 280 15,658 58,446 1,063 75,447 82 4,561 17,044 310 21,997 15,054 -1,298
Mar-97 7 14,557 80,368 1,046 95,978 2 4,054 22,367 291 26,714 19,272 4,218
Mar-98 4 13,394 1,02,507 1,117 1,17,022 1 3,391 25,975 283 29,650 22,200 2,929
Mar-99 34 12,559 1,25,412 2,816 1,40,821 8 2,960 29,522 663 33,153 24,413 2,213
Mar-00 16 12,973 1,52,924 2,870 1,68,783 4 2,974 35,058 658 38,694 28,728 4,315
Mar-01 11 12,711 1,84,482 2,873 2,00,077 2 2,725 39,554 616 42,897 34,034 5,306
Mar-02 50 14,868 2,49,118 2,977 2,67,013 10 3,047 51,049 610 54,716 43,876 9,842
Mar-03 19 16,785 3,41,476 3,190 3,61,470 4 3,534 71,890 672 76,100 55,394 11,518
Mar-04 10 18,216 4,66,215 5,688 4,90,129 2 4,198 1,07,448 1,311 1,12,959 76,298 20,904
Mar-05 20 19,686 5,93,121 6,289 6,19,116 5 4,500 1,35,571 1,438 1,41,514 93,666 17,368
Mar-06 12 25,674 6,47,327 3,374 6,76,387 3 5,755 1,45,108 756 1,51,622 1,05,231 11,565
Jun-06 2 28,479 7,18,701 3,518 7,50,700 – 6,180 1,55,968 764 1,62,912 1,10,123 4,892
Sep-06 6 28,506 7,27,733 3,502 7,59,747 1 6,202 1,58,340 762 1,65,305 1,11,967 6,736
Dec-06 4 28,824 7,52,738 2,416 7,83,982 1 6,517 1,70,187 546 1,77,251 1,17,822 12,591
Mar-07 8 29,573 8,36,597 2,044 8,68,222 2 6,784 1,91,924 469 1,99,179 1,31,890 26,659
Jun-07 6 27,655 8,39,913 1,875 8,69,449 1 6,787 2,06,114 460 2,13,362 1,40,780 8,890
Sep-07 8 29,275 953,581 1,740 9,84,604 2 7,367 2,39,955 438 2,47,762 1,59,164 27,274
Dec-07 13 32,819 10,50,485 1,703 10,85,020 3 8,328 2,66,553 432 2,75,316 1,74,223 42,333
Mar-08 74 40,124 11,96,023 1,744 12,37,965 18 10,039 2,99,230 436 3,09,723 1,88,339 56,449
Jun-08 48 39,548 12,98,552 2,269 13,40,417 11 9,208 3,02,340 528 3,12,087 1,91,040 2,701
Sep-08 17 40,205 13,01,645 2,194 13,44,061 4 8,565 2,77,300 467 2,86,336 1,83,876 -4,463
Dec-08 13 41,110 11,94,790 4,248 12,40,161 3 8,485 2,46,603 877 2,55,968 1,66,184 -22,155
Mar-09 6 48,793 12,30,066 5,000 12,83,865 1 9,577 2,41,426 981 2,51,985 1,68,544 -19,795
Jun-09 2 46,914 12,16,345 5,974 12,69,235 1 9,800 2,54,093 1,248 2,65,142 1,70,814 2,270
– : Negligible.
# : Gold has been valued close to international market price.
* : Variations over the previous March.
Note : 1. Gold holdings include acquisition of gold worth US $ 191million from the Government during 1991-92, US $ 29.4 million during 1992-93, US $139.3 million during 1993-94, US $ 315.0 million during 1994-95 and US $ 17.9 million during 1995-96. On the other hand, 1.27 tonnes of goldamounting to Rs 43.55 crore (US $11.97 million), 38.9 tonnes of gold amounting to Rs 1,485.22 crore (US $ 376.0 million) and 0.06 tonnes of goldamounting to Rs. 2.13 crore (US $ 0.5 million) were repurchased by the Central Government on November 13, 1997, April 1, 1998 and October 5,1998 respectively for meeting its redemption obligation under the Gold Bond Scheme.
2. Conversion of foreign currency assets into US dollar was done at exchange rates supplied by the IMF up to March 1999. Effective April 1, 1999, theconversion is at New York closing exchange rate.
3. Foreign currency assets excludes US $ 250.00 million (as also its equivalent in Indian Rupee) invested in foreign currency denominated bondsissued by IIFC (UK) since March 20, 2009.
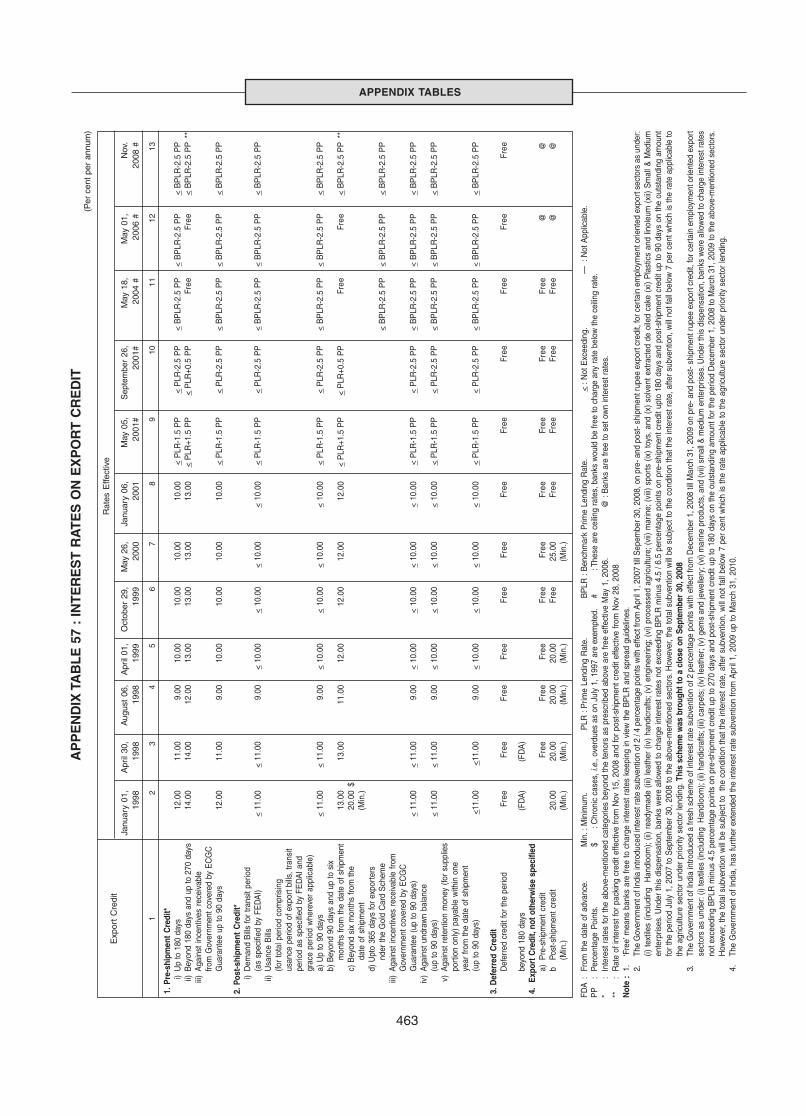
463
APPENDIX TABLES(P
er c
ent p
er a
nnum
)
Exp
ort
Cre
dit
Rat
es E
ffect
ive
Janu
ary
01,
Apr
il 30
,A
ugus
t 06
,A
pril
01,
Oct
ober
29,
May
26,
Janu
ary
06,
May
05,
Sep
tem
ber
26,
May
18,
May
01,
Nov
.19
9819
9819
98 1
999
199
9 2
000
2001
2001
#20
01#
200
4 #
2006
#20
08 #
12
34
56
78
910
1112
13
1. P
re-s
hipm
ent
Cre
dit*
i)U
p to
180
day
s12
.00
11.0
09.
0010
.00
10.0
010
.00
10.0
0<
PLR
-1.5
PP
< P
LR-2
.5 P
P<
BP
LR-2
.5 P
P<
BP
LR-2
.5 P
P<
BP
LR-2
.5 P
Pii)
Bey
ond
180
days
and
up
to 2
70 d
ays
14.0
014
.00
12.0
013
.00
13.0
013
.00
13.0
0<
PLR
+1.5
PP
< P
LR+0
.5 P
PFr
eeFr
ee<
BP
LR-2
.5 P
P**
iii)
Aga
inst
ince
ntiv
es r
ecei
vabl
efro
m G
over
nmen
t cov
ered
by
EC
GC
Gua
rant
ee u
p to
90
days
12.0
011
.00
9.00
10.0
010
.00
10.0
010
.00
< P
LR-1
.5 P
P<
PLR
-2.5
PP
< B
PLR
-2.5
PP
< B
PLR
-2.5
PP
< B
PLR
-2.5
PP
2. P
ost-s
hipm
ent
Cre
dit*
i)D
eman
d B
ills
for
trans
it pe
riod
(as
spec
ified
by
FED
AI)
< 11
.00
< 11
.00
9.00
< 10
.00
< 10
.00
< 10
.00
< 10
.00
< P
LR-1
.5 P
P<
PLR
-2.5
PP
< B
PLR
-2.5
PP
< B
PLR
-2.5
PP
< B
PLR
-2.5
PP
ii)U
sanc
e B
ills
(for
tota
l per
iod
com
pris
ing
usan
ce p
erio
d of
exp
ort b
ills,
tran
sit
perio
d as
spe
cifie
d by
FE
DA
I and
grac
e pe
riod
whe
reve
r ap
plic
able
)a)
Up
to 9
0 da
ys<
11.0
0<
11.0
09.
00<
10.0
0<
10.0
0<
10.0
0<
10.0
0<
PLR
-1.5
PP
< P
LR-2
.5 P
P<
BP
LR-2
.5 P
P<
BP
LR-2
.5 P
P<
BP
LR-2
.5 P
Pb)
Bey
ond
90 d
ays
and
up to
six
mon
ths
from
the
date
of s
hipm
ent
13.0
013
.00
11.0
012
.00
12.0
012
.00
12.0
0 <
PLR
+1.5
PP
< P
LR+0
.5 P
PFr
eeFr
ee<
BP
LR-2
.5 P
P**
c) B
eyon
d si
x m
onth
s fro
m th
e20
.00
$da
te o
f shi
pmen
t(M
in.)
d) U
pto
365
days
for e
xpor
ters
nder
the
Gol
d C
ard
Sch
eme
< B
PLR
-2.5
PP
< B
PLR
-2.5
PP
< B
PLR
-2.5
PP
iii)
Aga
inst
ince
ntiv
es r
ecei
vabl
e fro
mG
over
nmen
t cov
ered
by
EC
GC
Gua
rant
ee (u
p to
90
days
)<
11.0
0<
11.0
09.
00<
10.0
0<
10.0
0<
10.0
0<
10.0
0<
PLR
-1.5
PP
< P
LR-2
.5 P
P<
BP
LR-2
.5 P
P<
BP
LR-2
.5 P
P<
BP
LR-2
.5 P
Piv
)A
gain
st u
ndra
wn
bala
nce
(up
to 9
0 da
ys)
< 11
.00
< 11
.00
9.00
< 10
.00
< 10
.00
< 10
.00
< 10
.00
< P
LR-1
.5 P
P<
PLR
-2.5
PP
< B
PLR
-2.5
PP
< B
PLR
-2.5
PP
< B
PLR
-2.5
PP
v)A
gain
st r
eten
tion
mon
ey (
for
supp
lies
port
ion
only
) pa
yabl
e w
ithin
one
year
from
the
date
of s
hipm
ent
(up
to 9
0 da
ys)
<11.
00<1
1.00
9.00
< 10
.00
< 10
.00
< 10
.00
< 10
.00
< P
LR-1
.5 P
P<
PLR
-2.5
PP
< B
PLR
-2.5
PP
< B
PLR
-2.5
PP
< B
PLR
-2.5
PP
3. D
efer
red
Cre
dit
Def
erre
d cr
edit
for t
he p
erio
dFr
eeFr
eeFr
eeFr
eeFr
eeFr
eeFr
eeFr
eeFr
eeFr
eeFr
eeFr
ee
beyo
nd 1
80 d
ays
(FD
A)
(FD
A)
4.
Expo
rt C
redi
t, no
t oth
erw
ise
spec
ified
a)P
re-s
hipm
ent
cred
itFr
eeFr
eeFr
eeFr
eeFr
eeFr
eeFr
eeFr
eeFr
ee@
@b
Post
-shi
pmen
t cr
edit
20.0
020
.00
20.0
020
.00
Free
25.0
0Fr
eeFr
eeFr
eeFr
ee@
@(M
in.)
(Min
.)(M
in.)
(Min
.)(M
in.)
(Min
.)
FDA
:Fr
om th
e da
te o
f adv
ance
.M
in. :
Min
imum
.P
LR :
Prim
e Le
ndin
g R
ate.
BP
LR :
Ben
chm
ark
Prim
e Le
ndin
g R
ate.
< : N
ot E
xcee
ding
.—
: N
ot A
pplic
able
.P
P:
Perc
enta
ge P
oint
s.$
:
Chr
onic
cas
es, i
.e.,
over
dues
as
on J
uly
1, 1
997
are
exem
pted
.#
: T
hese
are
cei
ling
rate
s, b
anks
wou
ld b
e fre
e to
cha
rge
any
rate
bel
ow th
e ce
iling
rate
.*
:In
tere
st r
ates
for
the
abov
e-m
entio
ned
cate
gorie
s be
yond
the
teno
rs a
s pr
escr
ibed
abo
ve a
re fr
ee e
ffect
ive
May
1, 2
006.
@ :
Ban
ks a
re fr
ee to
set
ow
n in
tere
st ra
tes.
**:
Rat
e of
inte
rest
for
pack
ing
cred
it ef
fect
ive
from
Nov
15,
200
8 an
d fo
r po
st-s
hipm
ent c
redi
t effe
ctiv
e fro
m N
ov 2
8, 2
008
Not
e :
1.‘F
ree’
mea
ns b
anks
are
free
to c
harg
e in
tere
st ra
tes
keep
ing
in v
iew
the
BP
LR a
nd s
prea
d gu
idel
ines
.2.
The
Gov
ernm
ent o
f Ind
ia in
trodu
ced
inte
rest
rate
sub
vent
ion
of 2
/ 4
perc
enta
ge p
oint
s w
ith e
ffect
from
Apr
il 1,
200
7 til
l Sep
embe
r 30,
200
8, o
n pr
e- a
nd p
ost-
ship
men
t rup
ee e
xpor
t cre
dit,
for c
erta
in e
mpl
oym
ent o
rient
ed e
xpor
t sec
tors
as
unde
r:(i)
text
iles
(incl
udin
g H
andl
oom
); (ii
) re
adym
ade
(iii)
leat
her
(iv)
hand
icra
fts; (
v) e
ngin
eerin
g; (
vi)
proc
esse
d ag
ricul
ture
; (vi
i) m
arin
e; (
viii)
spo
rts
(ix)
toys
, and
(x)
sol
vent
ext
ract
ed d
e oi
led
cake
(xi
) P
last
ics
and
linol
eum
(xi
i) S
mal
l & M
ediu
men
terp
rises
. Und
er th
is d
ispe
nsat
ion,
ban
ks w
ere
allo
wed
to c
harg
e in
tere
st ra
tes
not e
xcee
ding
BP
LR m
inus
4.5
/ 6.
5 pe
rcen
tage
poi
nts
on p
re-s
hipm
ent c
redi
t upt
o 18
0 da
ys a
nd p
ost-s
hipm
ent c
redi
t up
to 9
0 da
ys o
n th
e ou
tsta
ndin
g am
ount
for t
he p
erio
d Ju
ly 1
, 200
7 to
Sep
tem
ber 3
0, 2
008
to th
e ab
ove-
men
tione
d se
ctor
s. H
owev
er, t
he to
tal s
ubve
ntio
n w
ill b
e su
bjec
t to
the
cond
ition
that
the
inte
rest
rate
, afte
r sub
vent
ion,
will
not
fall
belo
w 7
per
cen
t whi
ch is
the
rate
app
licab
le to
the
agric
ultu
re s
ecto
r un
der
prio
rity
sect
or le
ndin
g. T
his
sche
me
was
bro
ught
to a
clo
se o
n Se
ptem
ber
30, 2
008
3.Th
e G
over
nmen
t of I
ndia
intro
duce
d a
fresh
sch
eme
of in
tere
st ra
te s
ubve
ntio
n of
2 p
erce
ntag
e po
ints
with
effe
ct fr
om D
ecem
ber 1
, 200
8 til
l Mar
ch 3
1, 2
009
on p
re- a
nd p
ost-
ship
men
t rup
ee e
xpor
t cre
dit,
for c
erta
in e
mpl
oym
ent o
rient
ed e
xpor
tse
ctor
s as
und
er: (
i) te
xtile
s (in
clud
ing
Han
dloo
m);
(ii) h
andi
craf
ts; (
iii) c
arpe
ts; (
iv) l
eath
er; (
v) g
ems
and
jew
elle
ry; (
vi) m
arin
e pr
oduc
ts, a
nd (v
ii) s
mal
l & m
ediu
m e
nter
pris
es. U
nder
this
dis
pens
atio
n, b
anks
wer
e al
low
ed to
cha
rge
inte
rest
rate
sno
t exc
eedi
ng B
PLR
min
us 4
.5 p
erce
ntag
e po
ints
on
pre-
ship
men
t cre
dit u
p to
270
day
s an
d po
st-s
hipm
ent c
redi
t up
to 1
80 d
ays
on th
e ou
tsta
ndin
g am
ount
for t
he p
erio
d D
ecem
ber 1
, 200
8 to
Mar
ch 3
1, 2
009
to th
e ab
ove-
men
tione
d se
ctor
s.H
owev
er, t
he to
tal s
ubve
ntio
n w
ill b
e su
bjec
t to
the
cond
ition
that
the
inte
rest
rate
, afte
r sub
vent
ion,
will
not
fall
belo
w 7
per
cen
t whi
ch is
the
rate
app
licab
le to
the
agric
ultu
re s
ecto
r und
er p
riorit
y se
ctor
lend
ing.
4.Th
e G
over
nmen
t of I
ndia
, has
furt
her
exte
nded
the
inte
rest
rat
e su
bven
tion
from
Apr
il 1,
200
9 up
to M
arch
31,
201
0.
AP
PE
ND
IX T
AB
LE
57
: IN
TE
RE
ST
RA
TE
S O
N E
XP
OR
T C
RE
DIT
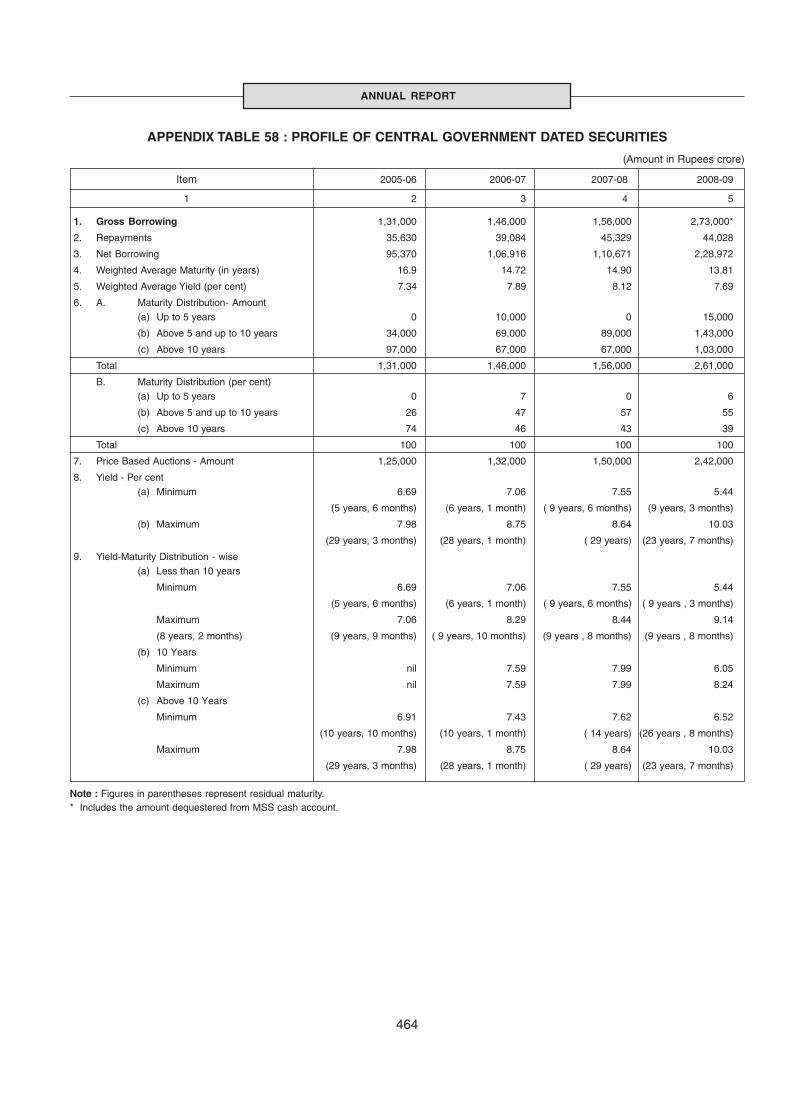
464
ANNUAL REPORT
APPENDIX TABLE 58 : PROFILE OF CENTRAL GOVERNMENT DATED SECURITIES
(Amount in Rupees crore)
Item 2005-06 2006-07 2007-08 2008-09
1 2 3 4 5
1. Gross Borrowing 1,31,000 1,46,000 1,56,000 2,73,000*
2. Repayments 35,630 39,084 45,329 44,028
3. Net Borrowing 95,370 1,06,916 1,10,671 2,28,972
4. Weighted Average Maturity (in years) 16.9 14.72 14.90 13.81
5. Weighted Average Yield (per cent) 7.34 7.89 8.12 7.69
6. A. Maturity Distribution- Amount(a) Up to 5 years 0 10,000 0 15,000
(b) Above 5 and up to 10 years 34,000 69,000 89,000 1,43,000
(c) Above 10 years 97,000 67,000 67,000 1,03,000
Total 1,31,000 1,46,000 1,56,000 2,61,000
B. Maturity Distribution (per cent)(a) Up to 5 years 0 7 0 6
(b) Above 5 and up to 10 years 26 47 57 55
(c) Above 10 years 74 46 43 39
Total 100 100 100 100
7. Price Based Auctions - Amount 1,25,000 1,32,000 1,50,000 2,42,000
8. Yield - Per cent(a) Minimum 6.69 7.06 7.55 5.44
(5 years, 6 months) (6 years, 1 month) ( 9 years, 6 months) (9 years, 3 months)
(b) Maximum 7.98 8.75 8.64 10.03
(29 years, 3 months) (28 years, 1 month) ( 29 years) (23 years, 7 months)
9. Yield-Maturity Distribution - wise(a) Less than 10 years
Minimum 6.69 7.06 7.55 5.44
(5 years, 6 months) (6 years, 1 month) ( 9 years, 6 months) ( 9 years , 3 months)
Maximum 7.06 8.29 8.44 9.14
(8 years, 2 months) (9 years, 9 months) ( 9 years, 10 months) (9 years , 8 months) (9 years , 8 months)
(b) 10 Years
Minimum nil 7.59 7.99 6.05
Maximum nil 7.59 7.99 8.24
(c) Above 10 Years
Minimum 6.91 7.43 7.62 6.52
(10 years, 10 months) (10 years, 1 month) ( 14 years) (26 years , 8 months)
Maximum 7.98 8.75 8.64 10.03
(29 years, 3 months) (28 years, 1 month) ( 29 years) (23 years, 7 months)
Note : Figures in parentheses represent residual maturity.* Includes the amount dequestered from MSS cash account.
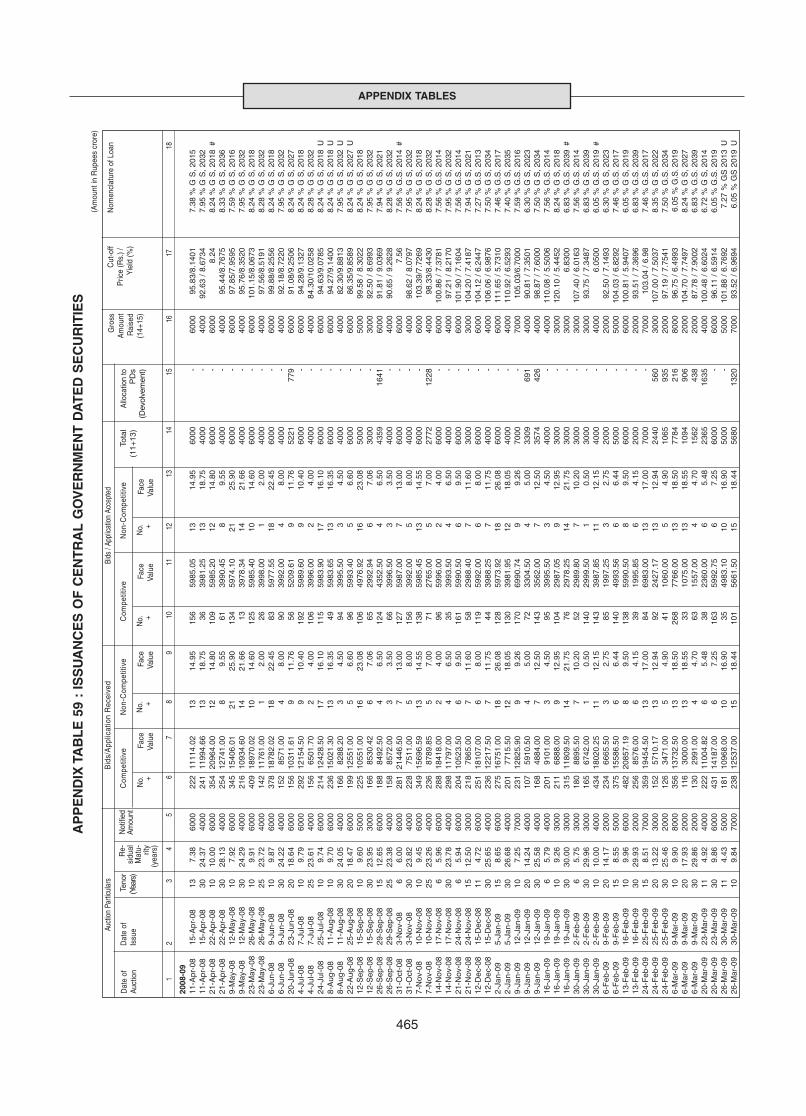
465
APPENDIX TABLES
12
34
56
78
910
1112
1314
1516
1718
2008
-09
11-A
pr-0
815
-Apr
-08
137.
3860
0022
211
114.
0213
14.9
515
659
85.0
513
14.9
560
00-
6000
95.8
3/8.
1401
7.38
% G
S, 2
015
11-A
pr-0
815
-Apr
-08
3024
.37
4000
241
1199
4.66
1318
.75
3639
81.2
513
18.7
540
00-
4000
92.6
3 /
8.67
347.
95 %
G S
, 203
221
-Apr
-08
22-A
pr-0
810
10.0
060
0035
420
964.
0012
14.8
010
959
85.2
012
14.8
060
00-
6000
8.24
8.24
% G
S, 2
018
#21
-Apr
-08
22-A
pr-0
830
28.1
340
0025
412
741.
008
9.55
6139
90.4
58
9.55
4000
-40
0095
.44/
8.76
758.
33 %
G S
, 203
69-
May
-08
12-M
ay-0
810
7.92
6000
345
1540
6.01
2125
.90
134
5974
.10
2125
.90
6000
-60
0097
.85/
7.95
957.
59 %
G S
, 201
69-
May
-08
12-M
ay-0
830
24.2
940
0021
610
934.
6014
21.6
613
3978
.34
1421
.66
4000
-40
0095
.76/
8.35
207.
95 %
G S
, 203
223
-May
-08
26-M
ay-0
810
9.91
6000
409
1897
0.02
1014
.60
125
5985
.40
1014
.60
6000
-60
0010
1.15
/8.0
673
8.24
% G
S, 2
018
23-M
ay-0
826
-May
-08
2523
.72
4000
142
1176
1.00
12.
0026
3998
.00
12.
0040
00-
4000
97.5
6/8.
5191
8.28
% G
S, 2
032
6-Ju
n-08
9-Ju
n-08
109.
8760
0037
818
782.
0218
22.4
583
5977
.55
1822
.45
6000
-60
0099
.88/
8.25
568.
24 %
G S
, 201
86-
Jun-
089-
Jun-
0830
24.2
240
0015
285
71.0
04
8.00
9039
92.0
04
8.00
4000
-40
0092
.18/
8.72
207.
95 %
G S
, 203
220
-Jun
-08
23-J
un-0
820
18.6
460
0015
610
311.
619
11.7
656
5209
.61
911
.76
5221
779
6000
91.0
8/9.
2506
8.24
% G
S, 2
027
4-Ju
l-08
7-Ju
l-08
109.
7960
0029
212
154.
509
10.4
019
259
89.6
09
10.4
060
00-
6000
94.2
8/9.
1327
8.24
% G
S, 2
018
4-Ju
l-08
7-Ju
l-08
2523
.61
4000
156
6501
.70
24.
0010
639
96.0
02
4.00
4000
-40
0084
.30/
10.0
258
8.28
% G
S, 2
032
24-J
ul-0
825
-Jul
-08
109.
7460
0021
412
428.
5017
16.1
011
559
83.9
017
16.1
060
00-
6000
94.6
3/9.
0785
8.24
% G
S, 2
018
U8-
Aug
-08
11-A
ug-0
810
9.70
6000
236
1502
1.30
1316
.35
4959
83.6
513
16.3
560
00-
6000
94.2
7/9.
1400
8.24
% G
S, 2
018
U8-
Aug
-08
11-A
ug-0
830
24.0
540
0016
682
88.2
03
4.50
9439
95.5
03
4.50
4000
-40
0082
.30/
9.88
137.
95 %
G S
, 203
2U
22-A
ug-0
825
-Aug
-08
2018
.47
6000
199
1255
1.00
56.
6096
5993
.40
56.
6060
00-
6000
86.3
5/9.
8589
8.24
% G
S, 2
027
U12
-Sep
-08
15-S
ep-0
810
9.60
5000
225
1055
1.00
1623
.08
106
4976
.92
1623
.08
5000
-50
0099
.58
/ 8.
3022
8.24
% G
S, 2
018
12-S
ep-0
815
-Sep
-08
3023
.95
3000
166
8530
.42
67.
0665
2992
.94
67.
0630
00-
3000
92.5
0 /
8.69
937.
95 %
G S
, 203
226
-Sep
-08
29-S
ep-0
815
12.6
560
0018
884
92.5
04
6.50
124
4352
.50
46.
5043
5916
4160
0091
.81
/ 9.
0369
7.94
% G
S, 2
021
26-S
ep-0
829
-Sep
-08
2523
.38
4000
158
8572
.00
33.
5066
3996
.50
33.
5040
00-
4000
90.6
5 /
9.26
288.
28 %
G S
, 203
231
-Oct
-08
3-N
ov-0
86
6.00
6000
281
2144
6.50
713
.00
127
5987
.00
713
.00
6000
-60
007.
567.
56 %
G.S
. 201
4#
31-O
ct-0
83-
Nov
-08
3023
.82
4000
228
7511
.00
58.
0015
639
92.0
05
8.00
4000
-40
0098
.62
/ 8.
0797
7.95
% G
S, 2
032
7-N
ov-0
810
-Nov
-08
109.
4560
0034
915
696.
5913
14.5
513
859
85.4
513
14.5
560
00-
6000
103.
39/7
.726
98.
24 %
G S
, 201
87-
Nov
-08
10-N
ov-0
825
23.2
640
0023
687
89.8
55
7.00
7127
65.0
05
7.00
2772
1228
4000
98.3
3/8.
4430
8.28
% G
S, 2
032
14-N
ov-0
817
-Nov
-08
65.
9660
0028
818
418.
002
4.00
9659
96.0
02
4.00
6000
-60
0010
0.86
/ 7
.378
17.
56 %
G.S
. 201
414
-Nov
-08
17-N
ov-0
830
23.7
840
0029
811
797.
004
6.50
3539
93.5
04
6.50
4000
-40
0097
.21
/ 8.
2170
7.95
% G
S, 2
032
21-N
ov-0
824
-Nov
-08
65.
9460
0020
410
523.
506
9.50
161
5990
.50
69.
5060
00-
6000
101.
90 /
7.1
604
7.56
% G
.S. 2
014
21-N
ov-0
824
-Nov
-08
1512
.50
3000
218
7865
.00
711
.60
5829
88.4
07
11.6
030
00-
3000
104.
20 /
7.4
187
7.9
4 %
G S
, 202
112
-Dec
-08
15-D
ec-0
811
4.72
6000
251
1810
7.00
68.
0011
959
92.0
06
8.00
6000
-60
0010
4.12
/ 6
.244
77.
27 %
G.S
. 201
312
-Dec
-08
15-D
ec-0
830
25.6
540
0023
612
217.
507
11.7
544
3988
.25
711
.75
4000
-40
0010
6.06
/ 6
.987
6 7
.50
% G
S, 2
034
2-Ja
n-09
5-Ja
n-09
158.
6560
0027
516
751.
0018
26.0
812
859
73.9
218
26.0
860
00-
6000
111.
65 /
5.7
310
7.46
% G
.S. 2
017
2-Ja
n-09
5-Ja
n-09
3026
.68
4000
201
7715
.50
1218
.05
130
3981
.95
1218
.05
4000
-40
0011
0.92
/ 6
.529
37.
40 %
G S
, 203
59-
Jan-
0912
-Jan
-09
107.
2570
0023
112
825.
909
9.26
170
6990
.74
99.
2670
00-
7000
105.
03/6
.700
07.
59 %
G.S
. 201
69-
Jan-
0912
-Jan
-09
2014
.24
4000
107
5910
.50
45.
0072
3304
.50
45.
0033
0969
140
0090
.81
/ 7.
3501
6.30
% G
S, 2
023
9-Ja
n-09
12-J
an-0
930
25.5
840
0016
848
84.0
07
12.5
014
335
62.0
07
12.5
035
7442
640
0098
.87
/ 7.
6000
7.50
% G
S, 2
034
16-J
an-0
919
-Jan
-09
65.
7940
0020
191
01.0
03
4.50
9539
95.5
03
4.50
4000
-40
0011
0.08
/ 5
.500
67.
56 %
G.S
. 201
416
-Jan
-09
19-J
an-0
910
9.26
3000
211
6888
.00
912
.95
104
2987
.05
912
.95
3000
-30
0012
0.10
/ 5
.445
28.
24 %
G S
, 201
816
-Jan
-09
19-J
an-0
930
30.0
030
0031
511
809.
5014
21.7
576
2978
.25
1421
.75
3000
-30
006.
8300
6.83
% G
.S. 2
039
#30
-Jan
-09
2-F
eb-0
96
5.75
3000
180
8895
.50
710
.20
5229
89.8
07
10.2
030
00-
3000
107.
40 /
6.0
163
7.56
% G
.S. 2
014
30-J
an-0
92-
Feb
-09
3029
.96
3000
165
6742
.00
10.
5014
029
99.5
01
0.50
3000
-30
0093
.75
/ 7.
3487
6.83
% G
S, 2
039
30-J
an-0
92-
Feb
-09
1010
.00
4000
434
1802
0.25
1112
.15
143
3987
.85
1112
.15
4000
-40
006.
0500
6.05
% G
.S. 2
019
#6-
Feb
-09
9-F
eb-0
920
14.1
720
0023
466
65.5
03
2.75
8519
97.2
53
2.75
2000
-20
0092
.50
/ 7.
1493
6.30
% G
S, 2
023
6-F
eb-0
99-
Feb
-09
158.
5550
0037
515
586.
506
6.44
140
4993
.56
66.
4450
00-
5000
104.
03 /
6.8
292
7.46
% G
.S. 2
017
13-F
eb-0
916
-Feb
-09
109.
9660
0048
220
857.
198
9.50
138
5990
.50
89.
5060
00-
6000
100.
81 /
5.9
407
6.05
% G
S, 2
019
13-F
eb-0
916
-Feb
-09
3029
.93
2000
256
8576
.00
64.
1539
1995
.85
64.
1520
00-
2000
93.5
1 /
7.36
966.
83 %
G.S
. 203
924
-Feb
-09
25-F
eb-0
915
8.51
7000
359
1945
4.50
1317
.00
8469
83.0
013
17.0
070
00-
7000
103.
04 /
6.9
87.
46 %
G.S
. 201
724
-Feb
-09
25-F
eb-0
920
13.2
230
0015
257
10.1
713
12.9
492
2427
.17
1312
.94
2440
560
3000
107.
00 /
7.5
037
8.35
% G
S, 2
022
24-F
eb-0
925
-Feb
-09
3025
.46
2000
126
3471
.00
54.
9041
1060
.00
54.
9010
6593
520
0097
.19
/ 7.
7541
7.50
% G
.S. 2
034
6-M
ar-0
99-
Mar
-09
109.
9080
0035
613
732.
5013
18.5
026
877
66.0
013
18.5
077
8421
680
0096
.75
/ 6.
4993
6.05
% G
.S. 2
019
6-M
ar-0
99-
Mar
-09
2017
.93
2000
116
3000
.00
1318
.55
3310
75.0
013
18.5
510
9490
620
0010
4.70
/ 7
.749
78.
24 %
G S
, 202
76-
Mar
-09
9-M
ar-0
930
29.8
620
0013
029
91.0
04
4.70
6315
57.0
04
4.70
1562
438
2000
87.7
8 /
7.90
026.
83 %
G.S
. 203
920
-Mar
-09
23-M
ar-0
911
4.92
4000
222
1100
4.82
65.
4838
2360
.00
65.
4823
6516
3540
0010
0.48
/ 6
.602
46.
72 %
G S
, 201
420
-Mar
-09
23-M
ar-0
930
9.86
6000
431
1418
7.00
67.
2516
359
92.7
56
7.25
6000
-60
0096
.11
/ 6.
5914
6.05
% G
.S. 2
019
26-M
ar-0
930
-Mar
-09
114.
4350
0018
110
968.
0010
16.9
035
4983
.10
1016
.90
5000
-50
0010
1.88
/ 6
.769
27.
27 %
GS
201
3U
26-M
ar-0
930
-Mar
-09
109.
8470
0023
812
537.
0015
18.4
410
156
61.5
015
18.4
456
8013
2070
0093
.52
/ 6.
9694
6.05
% G
S 2
019
U
AP
PE
ND
IX T
AB
LE
59
: IS
SU
AN
CE
S O
F C
EN
TR
AL
GO
VE
RN
ME
NT
DA
TE
D S
EC
UR
ITIE
S(A
mou
nt in
Rup
ees
cror
e)
Nom
encl
atur
e of
Loa
n
Allo
catio
n to
PD
s(D
evol
vem
ent)
Gro
ssA
mou
ntR
aise
d(1
4+15
)
Auct
ion
Parti
cula
rsC
ut-o
ffP
rice
(Rs.
)/Y
ield
(%)
Not
ified
Am
ount
Bid
s/A
pplic
atio
n R
ecei
ved
Bids
/ Ap
plica
tion
Acce
pted
Com
petit
ive
Non
-Com
petit
ive
Com
petit
ive
Non
-Com
petit
ive
Tota
l(1
1+13
)N
o. +Fa
ceVa
lue
No. +
Face
Valu
eN
o. +Fa
ceVa
lue
Face
Valu
eN
o. +
Re-
sidu
alM
atu- rity
(yea
rs)
Dat
e of
Issu
eD
ate
ofAu
ctio
nTe
nor
(Yea
rs)
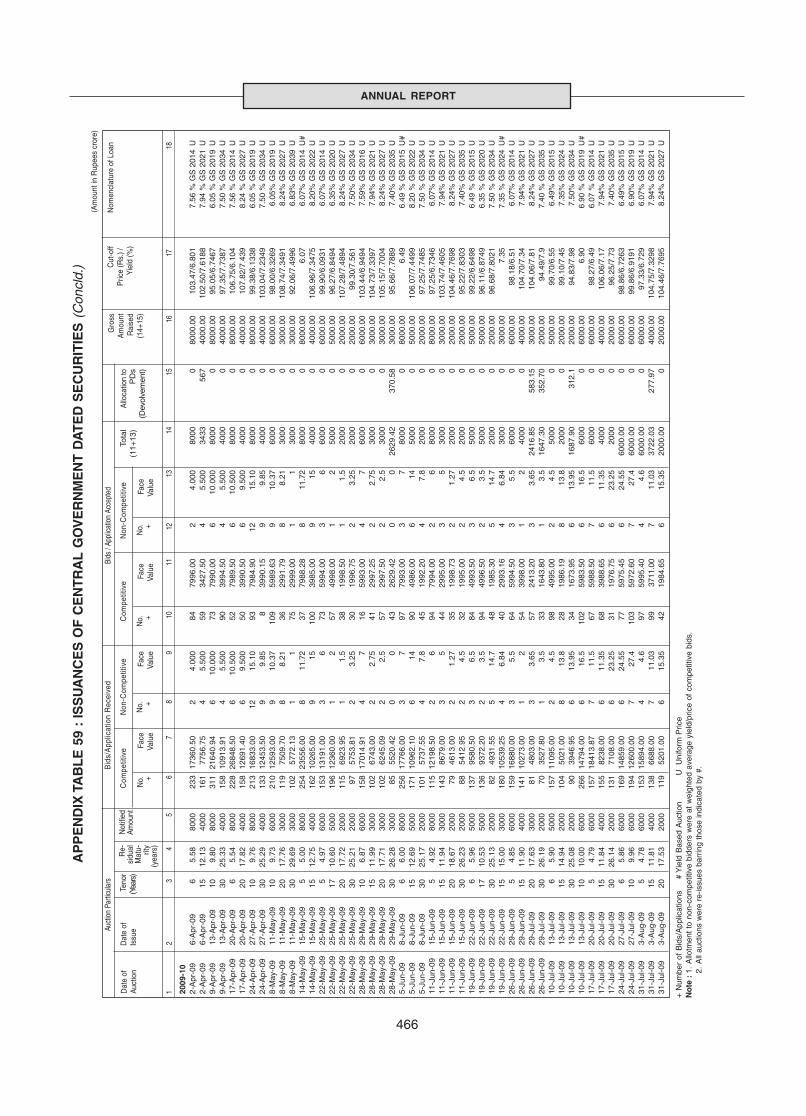
466
ANNUAL REPORT
12
34
56
78
910
1112
1314
1516
1718
2009
-10
2-A
pr-0
96-
Apr
-09
65.
5880
0023
317
360.
502
4.00
084
7996
.00
24.
000
8000
080
00.0
010
3.47
/6.8
017.
56 %
GS
201
4U
2-A
pr-0
96-
Apr
-09
1512
.13
4000
161
7756
.75
45.
500
5934
27.5
04
5.50
034
3356
740
00.0
010
2.50
/7.6
188
7.94
% G
S 2
021
U9-
Apr
-09
13-A
pr-0
910
9.80
8000
311
2164
0.94
610
.000
7379
90.0
06
10.0
0080
000
8000
.00
95.0
5/6.
7467
6.05
% G
S 2
019
U9-
Apr
-09
13-A
pr-0
930
25.3
340
0015
810
913.
914
5.50
090
3994
.50
45.
500
4000
040
00.0
097
.35/
7.73
877.
50 %
GS
203
4U
17-A
pr-0
920
-Apr
-09
65.
5480
0022
826
848.
506
10.5
0052
7989
.50
610
.500
8000
080
00.0
010
6.75
/6.1
047.
56 %
GS
201
4U
17-A
pr-0
920
-Apr
-09
2017
.82
4000
158
1269
1.40
69.
500
5039
90.5
06
9.50
040
000
4000
.00
107.
82/7
.439
8.24
% G
S 2
027
U24
-Apr
-09
27-A
pr-0
910
9.76
8000
213
1683
3.00
1215
.10
9379
84.9
012
15.1
080
000
8000
.00
99.3
8/6.
1338
6.05
% G
S 2
019
U24
-Apr
-09
27-A
pr-0
930
25.2
940
0013
312
453.
509
9.85
839
90.1
59
9.85
4000
040
00.0
010
3.04
/7.2
349
7.50
% G
S 2
034
U8-
May
-09
11-M
ay-0
910
9.73
6000
210
1259
3.00
910
.37
109
5989
.63
910
.37
6000
060
00.0
098
.00/
6.32
696.
05%
GS
201
9U
8-M
ay-0
911
-May
-09
2017
.76
3000
119
7509
.70
88.
2136
2991
.79
88.
2130
000
3000
.00
108.
74/7
.349
18.
24%
GS
202
7U
8-M
ay-0
911
-May
-09
3029
.69
3000
102
5772
.13
11
7529
99.0
01
130
000
3000
.00
92.0
6/7.
4996
6.83
% G
S 2
039
U14
-May
-09
15-M
ay-0
95
5.00
8000
254
2355
6.00
811
.72
3779
88.2
88
11.7
280
000
8000
.00
6.07
6.07
% G
S 2
014
U#
14-M
ay-0
915
-May
-09
1512
.75
4000
162
1026
5.00
915
100
3985
.00
915
4000
040
00.0
010
6.96
/7.3
475
8.20
% G
S 2
022
U22
-May
-09
25-M
ay-0
95
4.97
6000
153
1319
1.00
36
7359
94.0
03
660
000
6000
.00
99.9
0/6.
0931
6.07
% G
S 2
014
U22
-May
-09
25-M
ay-0
917
10.6
050
0019
612
360.
001
257
4998
.00
12
5000
050
00.0
096
.27/
6.84
946.
35%
GS
202
0U
22-M
ay-0
925
-May
-09
2017
.72
2000
115
6923
.95
11.
538
1998
.50
11.
520
000
2000
.00
107.
28/7
.489
48.
24%
GS
202
7U
22-M
ay-0
925
-May
-09
3025
.21
2000
9757
53.8
12
3.25
3019
96.7
52
3.25
2000
020
00.0
099
.30/
7.56
17.
50%
GS
203
4U
28-M
ay-0
929
-May
-09
106.
8760
0015
817
014.
914
716
5993
.00
47
6000
060
00.0
010
3.44
/6.9
494
7.59
% G
S 2
016
U28
-May
-09
29-M
ay-0
915
11.9
930
0010
267
43.0
02
2.75
4129
97.2
52
2.75
3000
030
00.0
010
4.73
/7.3
397
7.94
% G
S 2
021
U28
-May
-09
29-M
ay-0
920
17.7
130
0010
262
45.0
92
2.5
5729
97.5
02
2.5
3000
030
00.0
010
5.15
/7.7
004
8.24
% G
S 2
027
U28
-May
-09
29-M
ay-0
930
26.2
830
0085
5520
.42
00
4326
29.4
20
026
29.4
237
0.58
3000
.00
95.6
6/7.
7889
7.40
% G
S 2
035
U5-
Jun-
098-
Jun-
096
6.00
8000
256
1776
6.00
37
9779
93.0
03
780
000
8000
.00
6.49
6.49
% G
S 2
015
U#
5-Ju
n-09
8-Ju
n-09
1512
.69
5000
171
1096
2.10
614
9049
86.0
06
1450
000
5000
.00
106.
07/7
.449
98.
20 %
GS
202
2U
5-Ju
n-09
8-Ju
n-09
3025
.17
2000
101
5737
.55
47.
845
1992
.20
47.
820
000
2000
.00
97.2
5/7.
7485
7.50
% G
S 2
034
U11
-Jun
-09
15-J
un-0
95
4.92
8000
115
1219
8.50
26
9479
94.0
02
680
000
8000
.00
97.2
5/6.
7346
6.07
% G
S 2
014
U11
-Jun
-09
15-J
un-0
915
11.9
430
0014
386
79.0
03
544
2995
.00
35
3000
030
00.0
010
3.74
/7.4
605
7.94
% G
S 2
021
U11
-Jun
-09
15-J
un-0
920
18.6
720
0079
4613
.00
21.
2735
1998
.73
21.
2720
000
2000
.00
104.
46/7
.769
88.
24%
GS
202
7U
11-J
un-0
915
-Jun
-09
3026
.23
2000
8854
12.9
52
4.5
3219
95.0
02
4.5
2000
020
00.0
095
.22/
7.83
037.
40%
GS
203
5U
19-J
un-0
922
-Jun
-09
65.
9650
0013
795
80.5
03
6.5
8449
93.5
03
6.5
5000
050
00.0
099
.22/
6.64
986.
49 %
GS
201
5U
19-J
un-0
922
-Jun
-09
1710
.53
5000
136
9372
.20
23.
594
4996
.50
23.
550
000
5000
.00
96.1
1/6.
8749
6.35
% G
S 2
020
U19
-Jun
-09
22-J
un-0
930
25.1
320
0082
4931
.55
514
.748
1985
.30
514
.720
000
2000
.00
96.6
8/7.
8021
7.50
% G
S 2
034
U19
-Jun
-09
22-J
un-0
915
15.0
030
0018
010
539.
254
6.84
4029
93.1
64
6.84
3000
030
00.0
07.
357.
35 %
GS
202
4U
#26
-Jun
-09
29-J
un-0
95
4.85
6000
159
1688
0.00
35.
564
5994
.50
35.
560
000
6000
.00
98.1
8/6.
516.
07%
GS
201
4U
26-J
un-0
929
-Jun
-09
1511
.90
4000
141
1027
3.00
12
5439
98.0
01
240
000
4000
.00
104.
70/7
.34
7.94
% G
S 2
021
U26
-Jun
-09
29-J
ul-0
920
17.6
330
0081
4803
.00
33.
6557
2413
.20
33.
6524
16.8
558
3.15
3000
.00
104.
06/7
.81
8.24
% G
S 2
027
U26
-Jun
-09
29-J
ul-0
930
26.1
920
0070
3527
.80
13.
533
1643
.80
13.
516
47.3
035
2.70
2000
.00
94.4
9/7.
97.
40 %
GS
203
5U
10-J
ul-0
913
-Jul
-09
65.
9050
0015
711
095.
002
4.5
9849
95.0
02
4.5
5000
050
00.0
099
.70/
6.55
6.49
% G
S 2
015
U10
-Jul
-09
13-J
ul-0
915
14.9
420
0010
450
21.0
08
13.8
2819
86.1
98
13.8
2000
020
00.0
099
.10/
7.45
7.35
% G
S 2
024
U10
-Jul
-09
13-J
ul-0
930
25.0
820
0090
3946
.95
613
.95
3416
73.9
56
13.9
516
87.9
031
2.1
2000
.00
94.8
3/7.
987.
50%
GS
203
4U
10-J
ul-0
913
-Jul
-09
1010
.00
6000
266
1479
4.00
616
.510
259
83.5
06
16.5
6000
060
00.0
06.
906.
90 %
GS
201
9U
#17
-Jul
-09
20-J
ul-0
95
4.79
6000
157
1841
3.87
711
.567
5988
.50
711
.560
000
6000
.00
98.2
7/6.
496.
07 %
GS
201
4U
17-J
ul-0
920
-Jul
-09
1511
.84
4000
155
8238
.00
611
.35
6839
88.6
56
11.3
540
000
4000
.00
106.
06/7
.17
7.94
% G
S 2
021
U17
-Jul
-09
20-J
ul-0
930
26.1
420
0013
171
08.0
06
23.2
531
1976
.75
623
.25
2000
020
00.0
096
.25/
7.73
7.40
% G
S 2
035
U24
-Jul
-09
27-J
ul-0
96
5.86
6000
169
1485
9.00
624
.55
7759
75.4
56
24.5
560
00.0
00
6000
.00
98.8
6/6.
7263
6.49
% G
S 2
015
U24
-Jul
-09
27-J
ul-0
910
9.96
6000
194
1260
0.00
727
.410
359
72.6
07
27.4
6000
.00
060
00.0
099
.86/
6.91
916.
90%
GS
201
9U
31-J
ul-0
93-
Aug
-09
54.
7860
0015
315
894.
004
4.6
9759
95.4
04
4.6
6000
.00
060
00.0
097
.33/
6.72
96.
07%
GS
201
4U
31-J
ul-0
93-
Aug
-09
1511
.81
4000
138
6688
.00
711
.03
9937
11.0
07
11.0
337
22.0
327
7.97
4000
.00
104.
75/7
.329
87.
94%
GS
202
1U
31-J
ul-0
93-
Aug
-09
2017
.53
2000
119
5201
.00
615
.35
4219
84.6
56
15.3
520
00.0
00
2000
.00
104.
46/7
.769
58.
24%
GS
202
7U
+ N
umbe
r of
Bid
s/A
pplic
atio
ns#
Yie
ld B
ased
Auc
tion
U
Uni
form
Pric
eN
ote
:1.
Allo
tmen
t to
non
-com
petit
ive
bidd
ers
wer
e at
wei
ghte
d av
erag
e yi
eld/
pric
e of
com
petit
ive
bids
.2.
All
auct
ions
wer
e re
-issu
es b
arrin
g th
ose
indi
cate
d by
#.
AP
PE
ND
IX T
AB
LE
59
: IS
SU
AN
CE
S O
F C
EN
TR
AL
GO
VE
RN
ME
NT
DA
TE
D S
EC
UR
ITIE
S (
Con
cld.
)(A
mou
nt in
Rup
ees
cror
e)
Nom
encl
atur
e of
Loa
n
Allo
catio
n to
PD
s(D
evol
vem
ent)
Gro
ssA
mou
ntR
aise
d(1
4+15
)
Auct
ion
Parti
cula
rsC
ut-o
ffP
rice
(Rs.
)/Y
ield
(%)
Dat
e of
Issu
eD
ate
ofAu
ctio
nN
otifi
ed A
mou
nt
Bid
s/A
pplic
atio
n R
ecei
ved
Bids
/ Ap
plica
tion
Acce
pted
Com
petit
ive
Non
-Com
petit
ive
Com
petit
ive
Non
-Com
petit
ive
Tota
l(1
1+13
)N
o. +Fa
ceVa
lue
No. +
Face
Valu
eN
o. +Fa
ceVa
lue
Face
Valu
eN
o. +
Re-
sidu
alM
atu- rity
(yea
rs)
Teno
r(Y
ears
)
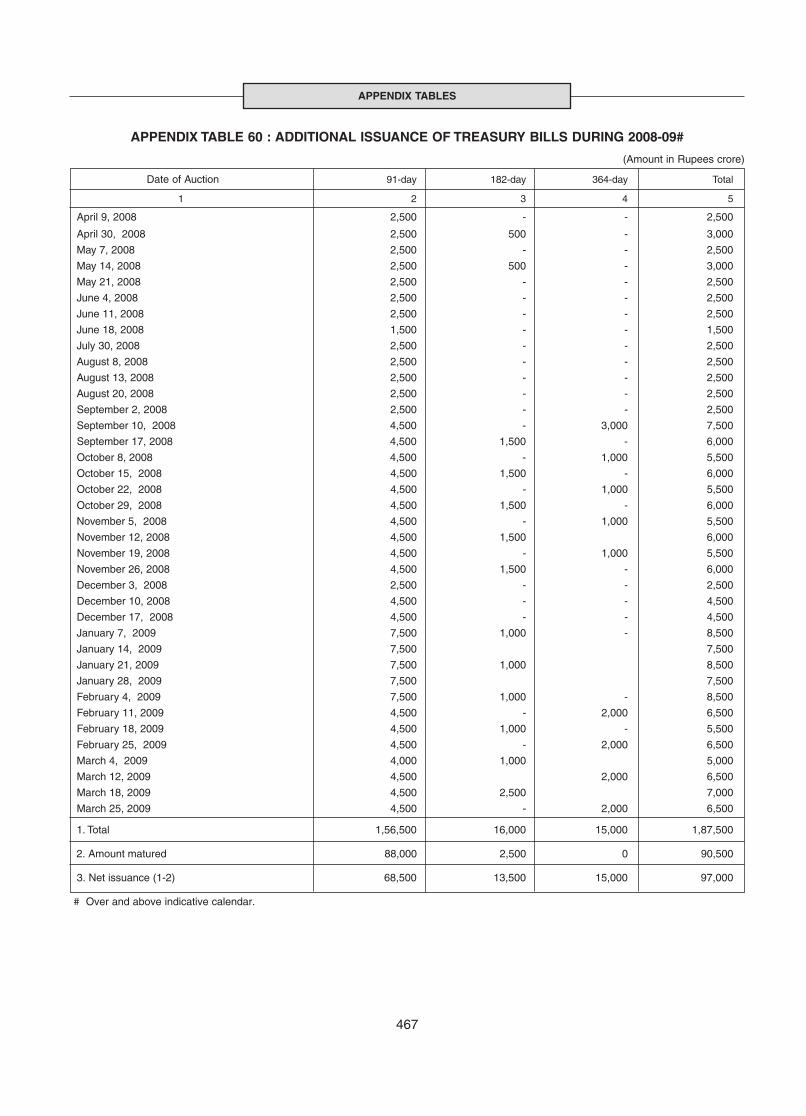
467
APPENDIX TABLES
APPENDIX TABLE 60 : ADDITIONAL ISSUANCE OF TREASURY BILLS DURING 2008-09#
(Amount in Rupees crore)
Date of Auction 91-day 182-day 364-day Total
1 2 3 4 5
April 9, 2008 2,500 - - 2,500
April 30, 2008 2,500 500 - 3,000
May 7, 2008 2,500 - - 2,500
May 14, 2008 2,500 500 - 3,000
May 21, 2008 2,500 - - 2,500
June 4, 2008 2,500 - - 2,500
June 11, 2008 2,500 - - 2,500
June 18, 2008 1,500 - - 1,500
July 30, 2008 2,500 - - 2,500
August 8, 2008 2,500 - - 2,500
August 13, 2008 2,500 - - 2,500
August 20, 2008 2,500 - - 2,500
September 2, 2008 2,500 - - 2,500
September 10, 2008 4,500 - 3,000 7,500
September 17, 2008 4,500 1,500 - 6,000
October 8, 2008 4,500 - 1,000 5,500
October 15, 2008 4,500 1,500 - 6,000
October 22, 2008 4,500 - 1,000 5,500
October 29, 2008 4,500 1,500 - 6,000
November 5, 2008 4,500 - 1,000 5,500
November 12, 2008 4,500 1,500 6,000
November 19, 2008 4,500 - 1,000 5,500
November 26, 2008 4,500 1,500 - 6,000
December 3, 2008 2,500 - - 2,500
December 10, 2008 4,500 - - 4,500
December 17, 2008 4,500 - - 4,500
January 7, 2009 7,500 1,000 - 8,500
January 14, 2009 7,500 7,500
January 21, 2009 7,500 1,000 8,500
January 28, 2009 7,500 7,500
February 4, 2009 7,500 1,000 - 8,500
February 11, 2009 4,500 - 2,000 6,500
February 18, 2009 4,500 1,000 - 5,500
February 25, 2009 4,500 - 2,000 6,500
March 4, 2009 4,000 1,000 5,000
March 12, 2009 4,500 2,000 6,500
March 18, 2009 4,500 2,500 7,000
March 25, 2009 4,500 - 2,000 6,500
1. Total 1,56,500 16,000 15,000 1,87,500
2. Amount matured 88,000 2,500 0 90,500
3. Net issuance (1-2) 68,500 13,500 15,000 97,000
# Over and above indicative calendar.
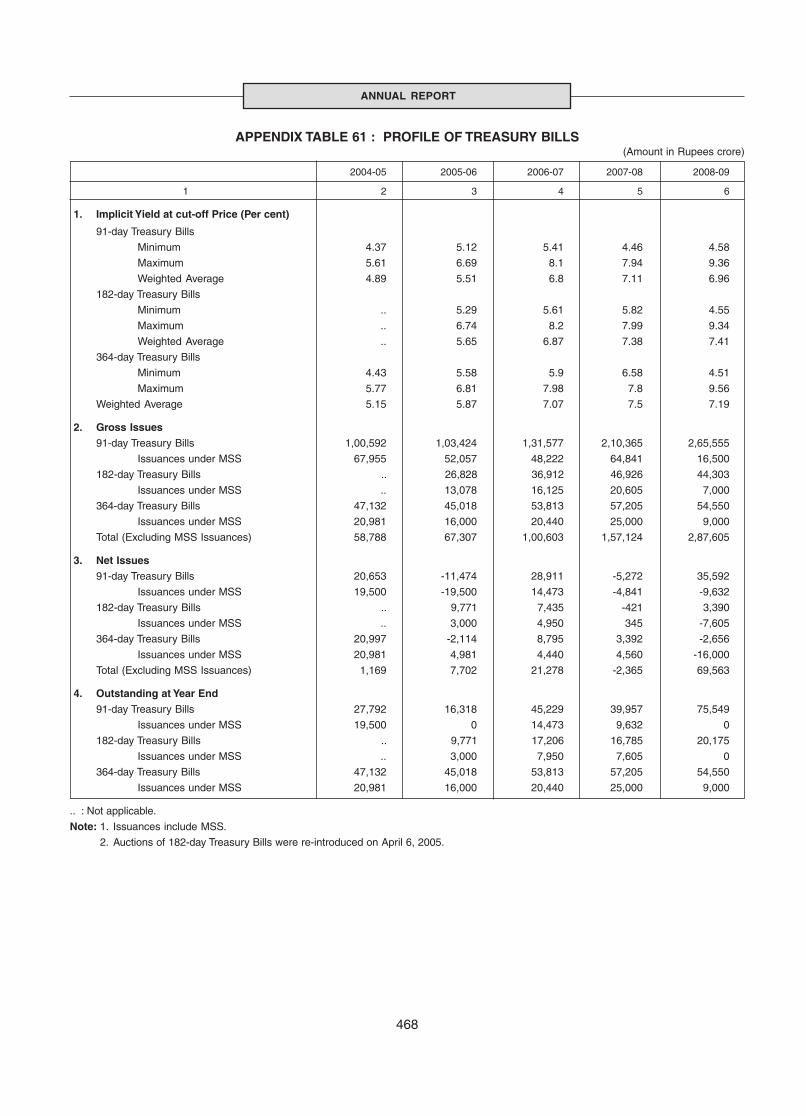
468
ANNUAL REPORT
APPENDIX TABLE 61 : PROFILE OF TREASURY BILLS(Amount in Rupees crore)
2004-05 2005-06 2006-07 2007-08 2008-09
1 2 3 4 5 6
1. Implicit Yield at cut-off Price (Per cent)
91-day Treasury Bills
Minimum 4.37 5.12 5.41 4.46 4.58
Maximum 5.61 6.69 8.1 7.94 9.36
Weighted Average 4.89 5.51 6.8 7.11 6.96
182-day Treasury Bills
Minimum .. 5.29 5.61 5.82 4.55
Maximum .. 6.74 8.2 7.99 9.34
Weighted Average .. 5.65 6.87 7.38 7.41
364-day Treasury Bills
Minimum 4.43 5.58 5.9 6.58 4.51
Maximum 5.77 6.81 7.98 7.8 9.56
Weighted Average 5.15 5.87 7.07 7.5 7.19
2. Gross Issues91-day Treasury Bills 1,00,592 1,03,424 1,31,577 2,10,365 2,65,555
Issuances under MSS 67,955 52,057 48,222 64,841 16,500
182-day Treasury Bills .. 26,828 36,912 46,926 44,303
Issuances under MSS .. 13,078 16,125 20,605 7,000
364-day Treasury Bills 47,132 45,018 53,813 57,205 54,550
Issuances under MSS 20,981 16,000 20,440 25,000 9,000
Total (Excluding MSS Issuances) 58,788 67,307 1,00,603 1,57,124 2,87,605
3. Net Issues91-day Treasury Bills 20,653 -11,474 28,911 -5,272 35,592
Issuances under MSS 19,500 -19,500 14,473 -4,841 -9,632
182-day Treasury Bills .. 9,771 7,435 -421 3,390
Issuances under MSS .. 3,000 4,950 345 -7,605
364-day Treasury Bills 20,997 -2,114 8,795 3,392 -2,656
Issuances under MSS 20,981 4,981 4,440 4,560 -16,000
Total (Excluding MSS Issuances) 1,169 7,702 21,278 -2,365 69,563
4. Outstanding at Year End91-day Treasury Bills 27,792 16,318 45,229 39,957 75,549
Issuances under MSS 19,500 0 14,473 9,632 0
182-day Treasury Bills .. 9,771 17,206 16,785 20,175
Issuances under MSS .. 3,000 7,950 7,605 0
364-day Treasury Bills 47,132 45,018 53,813 57,205 54,550
Issuances under MSS 20,981 16,000 20,440 25,000 9,000
.. : Not applicable.
Note: 1. Issuances include MSS.
2. Auctions of 182-day Treasury Bills were re-introduced on April 6, 2005.
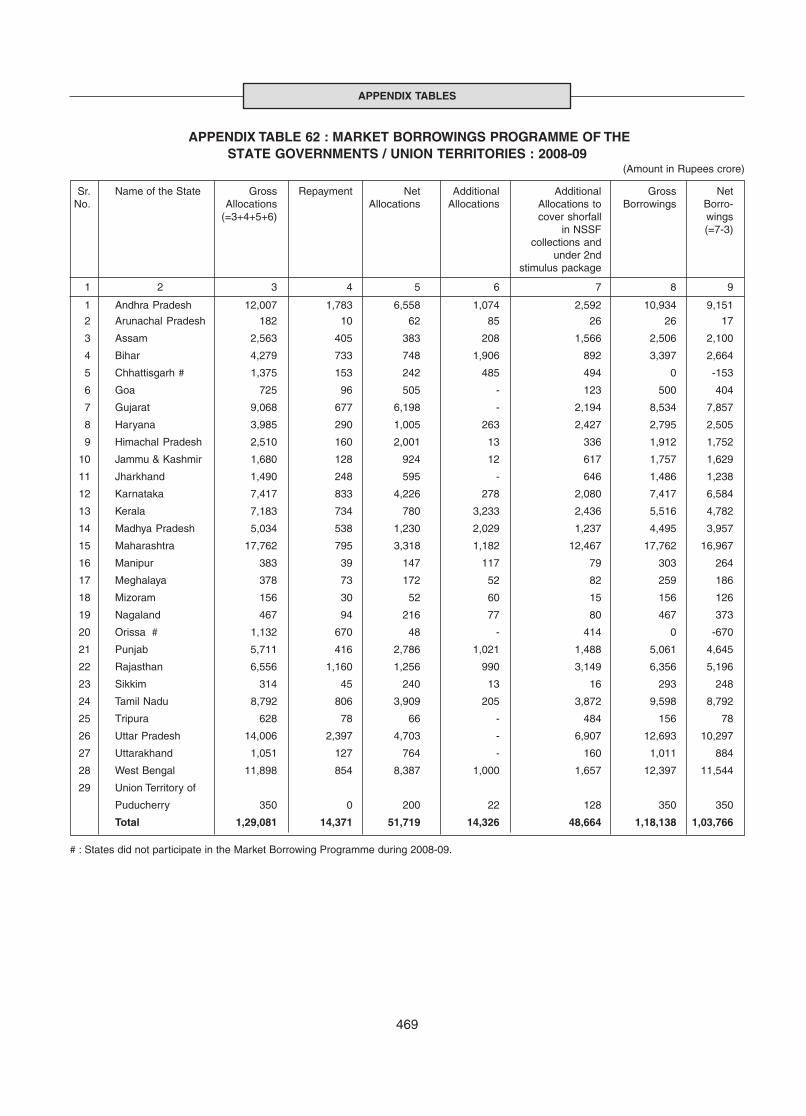
469
APPENDIX TABLES
APPENDIX TABLE 62 : MARKET BORROWINGS PROGRAMME OF THESTATE GOVERNMENTS / UNION TERRITORIES : 2008-09
(Amount in Rupees crore)
Sr. Name of the State Gross Repayment Net Additional Additional Gross NetNo. Allocations Allocations Allocations Allocations to Borrowings Borro-
(=3+4+5+6) cover shorfall wingsin NSSF (=7-3)
collections andunder 2nd
stimulus package
1 2 3 4 5 6 7 8 9
1 Andhra Pradesh 12,007 1,783 6,558 1,074 2,592 10,934 9,151
2 Arunachal Pradesh 182 10 62 85 26 26 17
3 Assam 2,563 405 383 208 1,566 2,506 2,100
4 Bihar 4,279 733 748 1,906 892 3,397 2,664
5 Chhattisgarh # 1,375 153 242 485 494 0 -153
6 Goa 725 96 505 - 123 500 404
7 Gujarat 9,068 677 6,198 - 2,194 8,534 7,857
8 Haryana 3,985 290 1,005 263 2,427 2,795 2,505
9 Himachal Pradesh 2,510 160 2,001 13 336 1,912 1,752
10 Jammu & Kashmir 1,680 128 924 12 617 1,757 1,629
11 Jharkhand 1,490 248 595 - 646 1,486 1,238
12 Karnataka 7,417 833 4,226 278 2,080 7,417 6,584
13 Kerala 7,183 734 780 3,233 2,436 5,516 4,782
14 Madhya Pradesh 5,034 538 1,230 2,029 1,237 4,495 3,957
15 Maharashtra 17,762 795 3,318 1,182 12,467 17,762 16,967
16 Manipur 383 39 147 117 79 303 264
17 Meghalaya 378 73 172 52 82 259 186
18 Mizoram 156 30 52 60 15 156 126
19 Nagaland 467 94 216 77 80 467 373
20 Orissa # 1,132 670 48 - 414 0 -670
21 Punjab 5,711 416 2,786 1,021 1,488 5,061 4,645
22 Rajasthan 6,556 1,160 1,256 990 3,149 6,356 5,196
23 Sikkim 314 45 240 13 16 293 248
24 Tamil Nadu 8,792 806 3,909 205 3,872 9,598 8,792
25 Tripura 628 78 66 - 484 156 78
26 Uttar Pradesh 14,006 2,397 4,703 - 6,907 12,693 10,297
27 Uttarakhand 1,051 127 764 - 160 1,011 884
28 West Bengal 11,898 854 8,387 1,000 1,657 12,397 11,544
29 Union Territory of
Puducherry 350 0 200 22 128 350 350
Total 1,29,081 14,371 51,719 14,326 48,664 1,18,138 1,03,766
# : States did not participate in the Market Borrowing Programme during 2008-09.
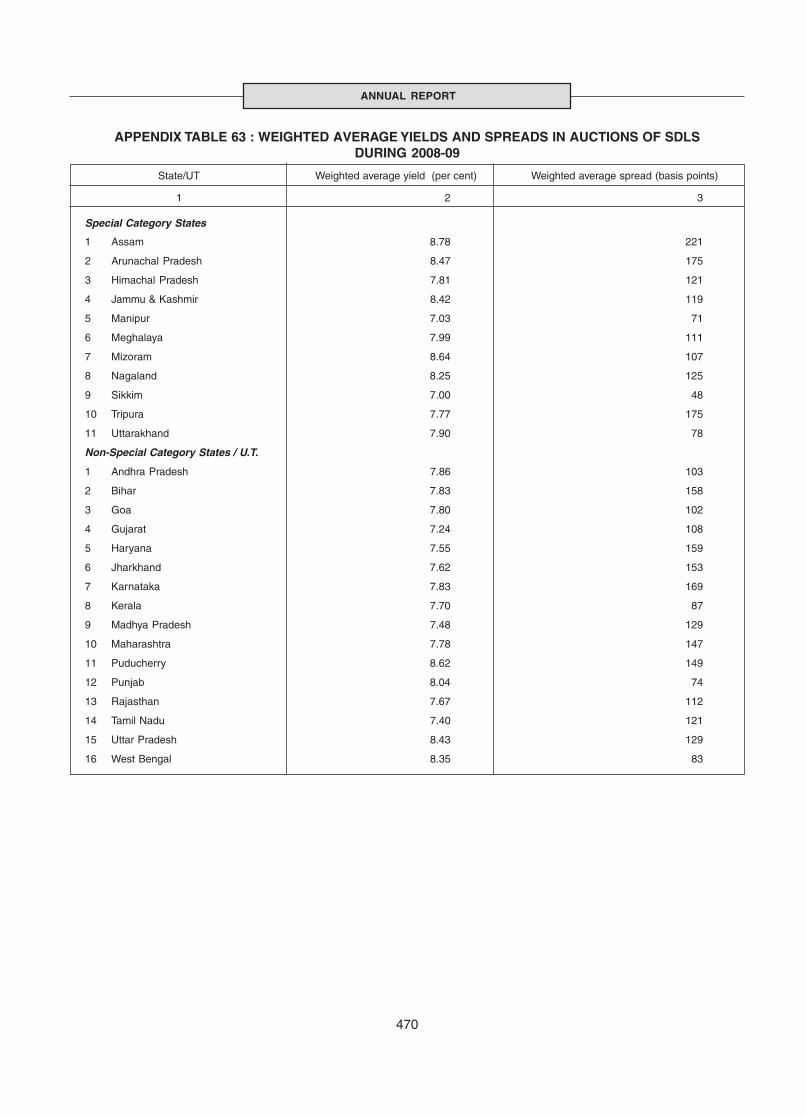
470
ANNUAL REPORT
APPENDIX TABLE 63 : WEIGHTED AVERAGE YIELDS AND SPREADS IN AUCTIONS OF SDLSDURING 2008-09
State/UT Weighted average yield (per cent) Weighted average spread (basis points)
1 2 3
Special Category States
1 Assam 8.78 221
2 Arunachal Pradesh 8.47 175
3 Himachal Pradesh 7.81 121
4 Jammu & Kashmir 8.42 119
5 Manipur 7.03 71
6 Meghalaya 7.99 111
7 Mizoram 8.64 107
8 Nagaland 8.25 125
9 Sikkim 7.00 48
10 Tripura 7.77 175
11 Uttarakhand 7.90 78
Non-Special Category States / U.T.
1 Andhra Pradesh 7.86 103
2 Bihar 7.83 158
3 Goa 7.80 102
4 Gujarat 7.24 108
5 Haryana 7.55 159
6 Jharkhand 7.62 153
7 Karnataka 7.83 169
8 Kerala 7.70 87
9 Madhya Pradesh 7.48 129
10 Maharashtra 7.78 147
11 Puducherry 8.62 149
12 Punjab 8.04 74
13 Rajasthan 7.67 112
14 Tamil Nadu 7.40 121
15 Uttar Pradesh 8.43 129
16 West Bengal 8.35 83
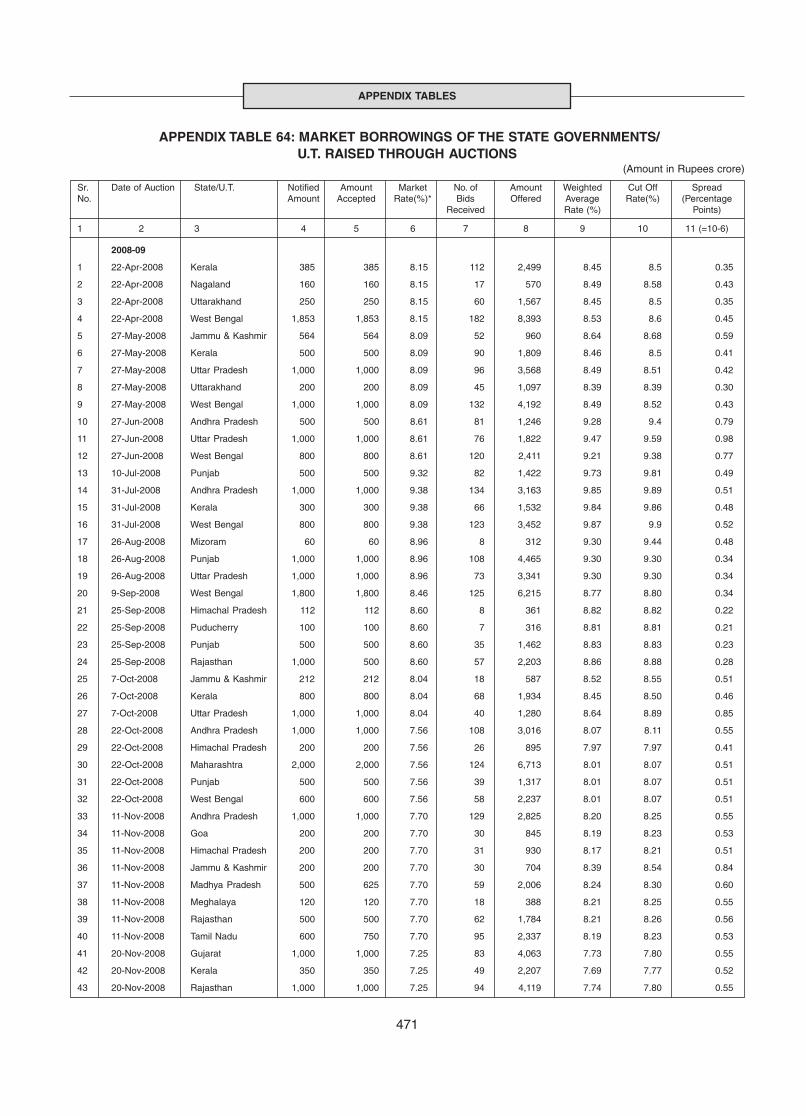
471
APPENDIX TABLES
APPENDIX TABLE 64: MARKET BORROWINGS OF THE STATE GOVERNMENTS/U.T. RAISED THROUGH AUCTIONS
(Amount in Rupees crore)
2008-09
1 22-Apr-2008 Kerala 385 385 8.15 112 2,499 8.45 8.5 0.35
2 22-Apr-2008 Nagaland 160 160 8.15 17 570 8.49 8.58 0.43
3 22-Apr-2008 Uttarakhand 250 250 8.15 60 1,567 8.45 8.5 0.35
4 22-Apr-2008 West Bengal 1,853 1,853 8.15 182 8,393 8.53 8.6 0.45
5 27-May-2008 Jammu & Kashmir 564 564 8.09 52 960 8.64 8.68 0.59
6 27-May-2008 Kerala 500 500 8.09 90 1,809 8.46 8.5 0.41
7 27-May-2008 Uttar Pradesh 1,000 1,000 8.09 96 3,568 8.49 8.51 0.42
8 27-May-2008 Uttarakhand 200 200 8.09 45 1,097 8.39 8.39 0.30
9 27-May-2008 West Bengal 1,000 1,000 8.09 132 4,192 8.49 8.52 0.43
10 27-Jun-2008 Andhra Pradesh 500 500 8.61 81 1,246 9.28 9.4 0.79
11 27-Jun-2008 Uttar Pradesh 1,000 1,000 8.61 76 1,822 9.47 9.59 0.98
12 27-Jun-2008 West Bengal 800 800 8.61 120 2,411 9.21 9.38 0.77
13 10-Jul-2008 Punjab 500 500 9.32 82 1,422 9.73 9.81 0.49
14 31-Jul-2008 Andhra Pradesh 1,000 1,000 9.38 134 3,163 9.85 9.89 0.51
15 31-Jul-2008 Kerala 300 300 9.38 66 1,532 9.84 9.86 0.48
16 31-Jul-2008 West Bengal 800 800 9.38 123 3,452 9.87 9.9 0.52
17 26-Aug-2008 Mizoram 60 60 8.96 8 312 9.30 9.44 0.48
18 26-Aug-2008 Punjab 1,000 1,000 8.96 108 4,465 9.30 9.30 0.34
19 26-Aug-2008 Uttar Pradesh 1,000 1,000 8.96 73 3,341 9.30 9.30 0.34
20 9-Sep-2008 West Bengal 1,800 1,800 8.46 125 6,215 8.77 8.80 0.34
21 25-Sep-2008 Himachal Pradesh 112 112 8.60 8 361 8.82 8.82 0.22
22 25-Sep-2008 Puducherry 100 100 8.60 7 316 8.81 8.81 0.21
23 25-Sep-2008 Punjab 500 500 8.60 35 1,462 8.83 8.83 0.23
24 25-Sep-2008 Rajasthan 1,000 500 8.60 57 2,203 8.86 8.88 0.28
25 7-Oct-2008 Jammu & Kashmir 212 212 8.04 18 587 8.52 8.55 0.51
26 7-Oct-2008 Kerala 800 800 8.04 68 1,934 8.45 8.50 0.46
27 7-Oct-2008 Uttar Pradesh 1,000 1,000 8.04 40 1,280 8.64 8.89 0.85
28 22-Oct-2008 Andhra Pradesh 1,000 1,000 7.56 108 3,016 8.07 8.11 0.55
29 22-Oct-2008 Himachal Pradesh 200 200 7.56 26 895 7.97 7.97 0.41
30 22-Oct-2008 Maharashtra 2,000 2,000 7.56 124 6,713 8.01 8.07 0.51
31 22-Oct-2008 Punjab 500 500 7.56 39 1,317 8.01 8.07 0.51
32 22-Oct-2008 West Bengal 600 600 7.56 58 2,237 8.01 8.07 0.51
33 11-Nov-2008 Andhra Pradesh 1,000 1,000 7.70 129 2,825 8.20 8.25 0.55
34 11-Nov-2008 Goa 200 200 7.70 30 845 8.19 8.23 0.53
35 11-Nov-2008 Himachal Pradesh 200 200 7.70 31 930 8.17 8.21 0.51
36 11-Nov-2008 Jammu & Kashmir 200 200 7.70 30 704 8.39 8.54 0.84
37 11-Nov-2008 Madhya Pradesh 500 625 7.70 59 2,006 8.24 8.30 0.60
38 11-Nov-2008 Meghalaya 120 120 7.70 18 388 8.21 8.25 0.55
39 11-Nov-2008 Rajasthan 500 500 7.70 62 1,784 8.21 8.26 0.56
40 11-Nov-2008 Tamil Nadu 600 750 7.70 95 2,337 8.19 8.23 0.53
41 20-Nov-2008 Gujarat 1,000 1,000 7.25 83 4,063 7.73 7.80 0.55
42 20-Nov-2008 Kerala 350 350 7.25 49 2,207 7.69 7.77 0.52
43 20-Nov-2008 Rajasthan 1,000 1,000 7.25 94 4,119 7.74 7.80 0.55
Sr. Date of Auction State/U.T. Notified Amount Market No. of Amount Weighted Cut Off SpreadNo. Amount Accepted Rate(%)* Bids Offered Average Rate(%) (Percentage
Received Rate (%) Points)
1 2 3 4 5 6 7 8 9 10 11 (=10-6)
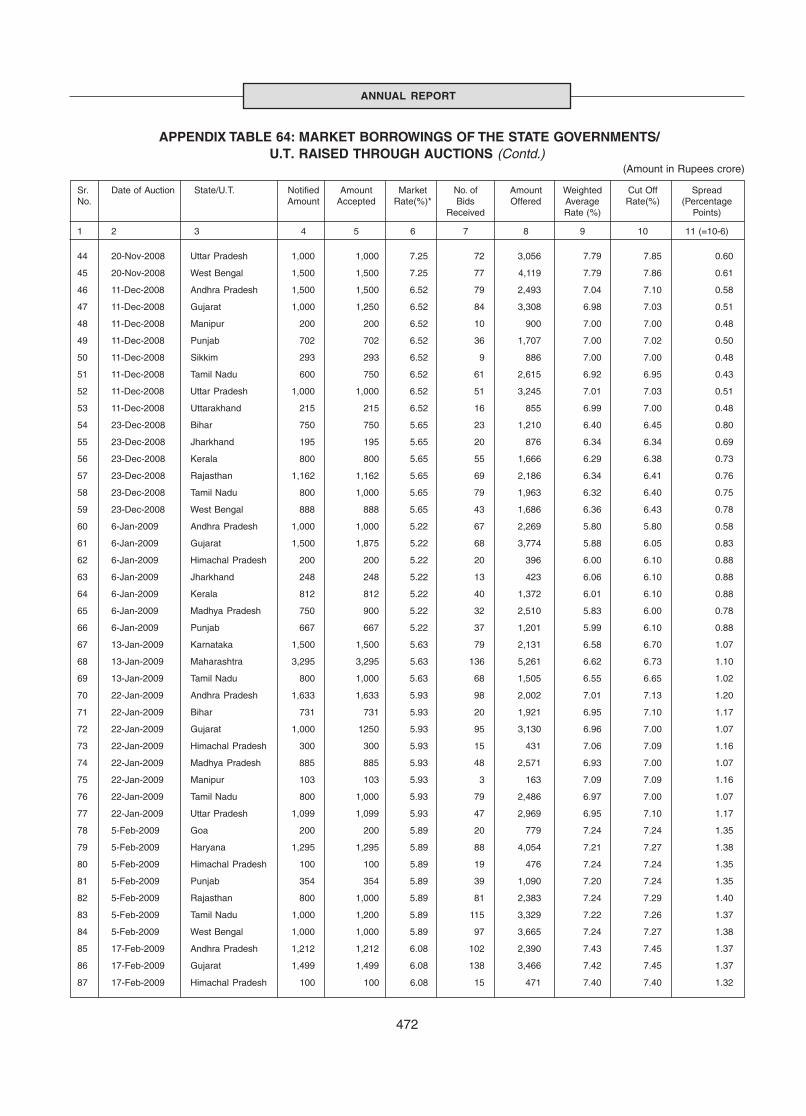
472
ANNUAL REPORT
APPENDIX TABLE 64: MARKET BORROWINGS OF THE STATE GOVERNMENTS/U.T. RAISED THROUGH AUCTIONS (Contd.)
(Amount in Rupees crore)
44 20-Nov-2008 Uttar Pradesh 1,000 1,000 7.25 72 3,056 7.79 7.85 0.60
45 20-Nov-2008 West Bengal 1,500 1,500 7.25 77 4,119 7.79 7.86 0.61
46 11-Dec-2008 Andhra Pradesh 1,500 1,500 6.52 79 2,493 7.04 7.10 0.58
47 11-Dec-2008 Gujarat 1,000 1,250 6.52 84 3,308 6.98 7.03 0.51
48 11-Dec-2008 Manipur 200 200 6.52 10 900 7.00 7.00 0.48
49 11-Dec-2008 Punjab 702 702 6.52 36 1,707 7.00 7.02 0.50
50 11-Dec-2008 Sikkim 293 293 6.52 9 886 7.00 7.00 0.48
51 11-Dec-2008 Tamil Nadu 600 750 6.52 61 2,615 6.92 6.95 0.43
52 11-Dec-2008 Uttar Pradesh 1,000 1,000 6.52 51 3,245 7.01 7.03 0.51
53 11-Dec-2008 Uttarakhand 215 215 6.52 16 855 6.99 7.00 0.48
54 23-Dec-2008 Bihar 750 750 5.65 23 1,210 6.40 6.45 0.80
55 23-Dec-2008 Jharkhand 195 195 5.65 20 876 6.34 6.34 0.69
56 23-Dec-2008 Kerala 800 800 5.65 55 1,666 6.29 6.38 0.73
57 23-Dec-2008 Rajasthan 1,162 1,162 5.65 69 2,186 6.34 6.41 0.76
58 23-Dec-2008 Tamil Nadu 800 1,000 5.65 79 1,963 6.32 6.40 0.75
59 23-Dec-2008 West Bengal 888 888 5.65 43 1,686 6.36 6.43 0.78
60 6-Jan-2009 Andhra Pradesh 1,000 1,000 5.22 67 2,269 5.80 5.80 0.58
61 6-Jan-2009 Gujarat 1,500 1,875 5.22 68 3,774 5.88 6.05 0.83
62 6-Jan-2009 Himachal Pradesh 200 200 5.22 20 396 6.00 6.10 0.88
63 6-Jan-2009 Jharkhand 248 248 5.22 13 423 6.06 6.10 0.88
64 6-Jan-2009 Kerala 812 812 5.22 40 1,372 6.01 6.10 0.88
65 6-Jan-2009 Madhya Pradesh 750 900 5.22 32 2,510 5.83 6.00 0.78
66 6-Jan-2009 Punjab 667 667 5.22 37 1,201 5.99 6.10 0.88
67 13-Jan-2009 Karnataka 1,500 1,500 5.63 79 2,131 6.58 6.70 1.07
68 13-Jan-2009 Maharashtra 3,295 3,295 5.63 136 5,261 6.62 6.73 1.10
69 13-Jan-2009 Tamil Nadu 800 1,000 5.63 68 1,505 6.55 6.65 1.02
70 22-Jan-2009 Andhra Pradesh 1,633 1,633 5.93 98 2,002 7.01 7.13 1.20
71 22-Jan-2009 Bihar 731 731 5.93 20 1,921 6.95 7.10 1.17
72 22-Jan-2009 Gujarat 1,000 1250 5.93 95 3,130 6.96 7.00 1.07
73 22-Jan-2009 Himachal Pradesh 300 300 5.93 15 431 7.06 7.09 1.16
74 22-Jan-2009 Madhya Pradesh 885 885 5.93 48 2,571 6.93 7.00 1.07
75 22-Jan-2009 Manipur 103 103 5.93 3 163 7.09 7.09 1.16
76 22-Jan-2009 Tamil Nadu 800 1,000 5.93 79 2,486 6.97 7.00 1.07
77 22-Jan-2009 Uttar Pradesh 1,099 1,099 5.93 47 2,969 6.95 7.10 1.17
78 5-Feb-2009 Goa 200 200 5.89 20 779 7.24 7.24 1.35
79 5-Feb-2009 Haryana 1,295 1,295 5.89 88 4,054 7.21 7.27 1.38
80 5-Feb-2009 Himachal Pradesh 100 100 5.89 19 476 7.24 7.24 1.35
81 5-Feb-2009 Punjab 354 354 5.89 39 1,090 7.20 7.24 1.35
82 5-Feb-2009 Rajasthan 800 1,000 5.89 81 2,383 7.24 7.29 1.40
83 5-Feb-2009 Tamil Nadu 1,000 1,200 5.89 115 3,329 7.22 7.26 1.37
84 5-Feb-2009 West Bengal 1,000 1,000 5.89 97 3,665 7.24 7.27 1.38
85 17-Feb-2009 Andhra Pradesh 1,212 1,212 6.08 102 2,390 7.43 7.45 1.37
86 17-Feb-2009 Gujarat 1,499 1,499 6.08 138 3,466 7.42 7.45 1.37
87 17-Feb-2009 Himachal Pradesh 100 100 6.08 15 471 7.40 7.40 1.32
Sr. Date of Auction State/U.T. Notified Amount Market No. of Amount Weighted Cut Off SpreadNo. Amount Accepted Rate(%)* Bids Offered Average Rate(%) (Percentage
Received Rate (%) Points)
1 2 3 4 5 6 7 8 9 10 11 (=10-6)
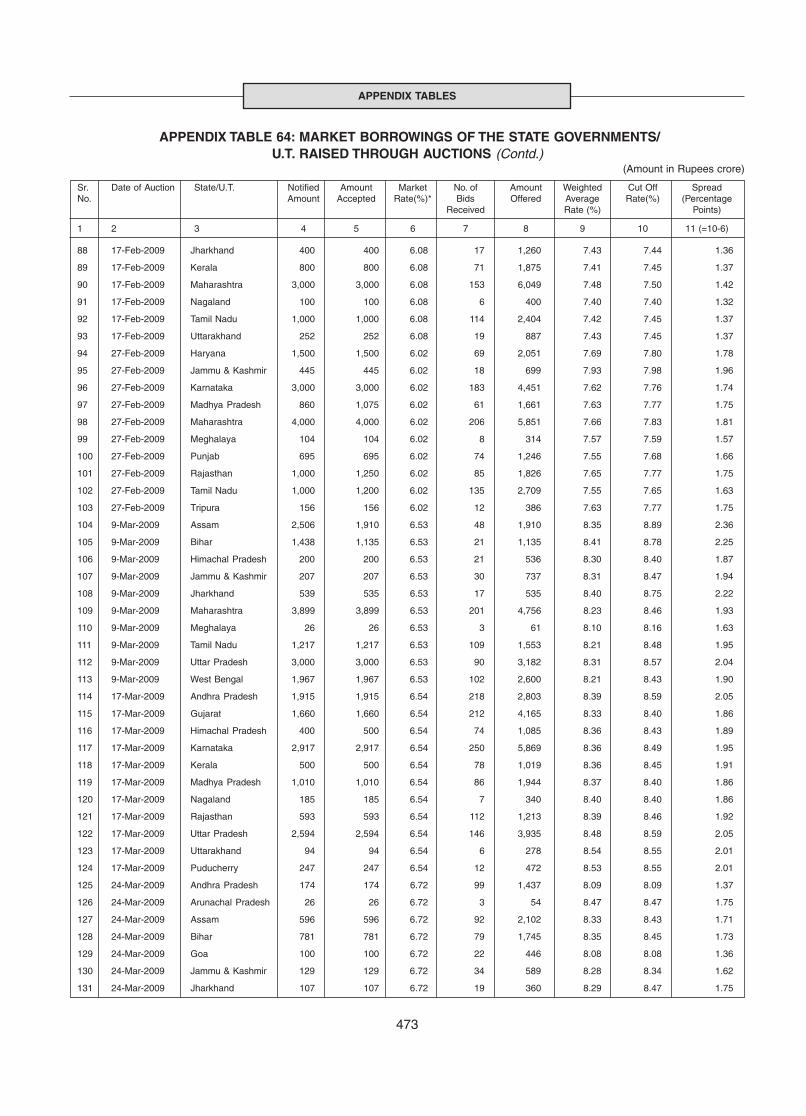
473
APPENDIX TABLES
APPENDIX TABLE 64: MARKET BORROWINGS OF THE STATE GOVERNMENTS/U.T. RAISED THROUGH AUCTIONS (Contd.)
(Amount in Rupees crore)
88 17-Feb-2009 Jharkhand 400 400 6.08 17 1,260 7.43 7.44 1.36
89 17-Feb-2009 Kerala 800 800 6.08 71 1,875 7.41 7.45 1.37
90 17-Feb-2009 Maharashtra 3,000 3,000 6.08 153 6,049 7.48 7.50 1.42
91 17-Feb-2009 Nagaland 100 100 6.08 6 400 7.40 7.40 1.32
92 17-Feb-2009 Tamil Nadu 1,000 1,000 6.08 114 2,404 7.42 7.45 1.37
93 17-Feb-2009 Uttarakhand 252 252 6.08 19 887 7.43 7.45 1.37
94 27-Feb-2009 Haryana 1,500 1,500 6.02 69 2,051 7.69 7.80 1.78
95 27-Feb-2009 Jammu & Kashmir 445 445 6.02 18 699 7.93 7.98 1.96
96 27-Feb-2009 Karnataka 3,000 3,000 6.02 183 4,451 7.62 7.76 1.74
97 27-Feb-2009 Madhya Pradesh 860 1,075 6.02 61 1,661 7.63 7.77 1.75
98 27-Feb-2009 Maharashtra 4,000 4,000 6.02 206 5,851 7.66 7.83 1.81
99 27-Feb-2009 Meghalaya 104 104 6.02 8 314 7.57 7.59 1.57
100 27-Feb-2009 Punjab 695 695 6.02 74 1,246 7.55 7.68 1.66
101 27-Feb-2009 Rajasthan 1,000 1,250 6.02 85 1,826 7.65 7.77 1.75
102 27-Feb-2009 Tamil Nadu 1,000 1,200 6.02 135 2,709 7.55 7.65 1.63
103 27-Feb-2009 Tripura 156 156 6.02 12 386 7.63 7.77 1.75
104 9-Mar-2009 Assam 2,506 1,910 6.53 48 1,910 8.35 8.89 2.36
105 9-Mar-2009 Bihar 1,438 1,135 6.53 21 1,135 8.41 8.78 2.25
106 9-Mar-2009 Himachal Pradesh 200 200 6.53 21 536 8.30 8.40 1.87
107 9-Mar-2009 Jammu & Kashmir 207 207 6.53 30 737 8.31 8.47 1.94
108 9-Mar-2009 Jharkhand 539 535 6.53 17 535 8.40 8.75 2.22
109 9-Mar-2009 Maharashtra 3,899 3,899 6.53 201 4,756 8.23 8.46 1.93
110 9-Mar-2009 Meghalaya 26 26 6.53 3 61 8.10 8.16 1.63
111 9-Mar-2009 Tamil Nadu 1,217 1,217 6.53 109 1,553 8.21 8.48 1.95
112 9-Mar-2009 Uttar Pradesh 3,000 3,000 6.53 90 3,182 8.31 8.57 2.04
113 9-Mar-2009 West Bengal 1,967 1,967 6.53 102 2,600 8.21 8.43 1.90
114 17-Mar-2009 Andhra Pradesh 1,915 1,915 6.54 218 2,803 8.39 8.59 2.05
115 17-Mar-2009 Gujarat 1,660 1,660 6.54 212 4,165 8.33 8.40 1.86
116 17-Mar-2009 Himachal Pradesh 400 500 6.54 74 1,085 8.36 8.43 1.89
117 17-Mar-2009 Karnataka 2,917 2,917 6.54 250 5,869 8.36 8.49 1.95
118 17-Mar-2009 Kerala 500 500 6.54 78 1,019 8.36 8.45 1.91
119 17-Mar-2009 Madhya Pradesh 1,010 1,010 6.54 86 1,944 8.37 8.40 1.86
120 17-Mar-2009 Nagaland 185 185 6.54 7 340 8.40 8.40 1.86
121 17-Mar-2009 Rajasthan 593 593 6.54 112 1,213 8.39 8.46 1.92
122 17-Mar-2009 Uttar Pradesh 2,594 2,594 6.54 146 3,935 8.48 8.59 2.05
123 17-Mar-2009 Uttarakhand 94 94 6.54 6 278 8.54 8.55 2.01
124 17-Mar-2009 Puducherry 247 247 6.54 12 472 8.53 8.55 2.01
125 24-Mar-2009 Andhra Pradesh 174 174 6.72 99 1,437 8.09 8.09 1.37
126 24-Mar-2009 Arunachal Pradesh 26 26 6.72 3 54 8.47 8.47 1.75
127 24-Mar-2009 Assam 596 596 6.72 92 2,102 8.33 8.43 1.71
128 24-Mar-2009 Bihar 781 781 6.72 79 1,745 8.35 8.45 1.73
129 24-Mar-2009 Goa 100 100 6.72 22 446 8.08 8.08 1.36
130 24-Mar-2009 Jammu & Kashmir 129 129 6.72 34 589 8.28 8.34 1.62
131 24-Mar-2009 Jharkhand 107 107 6.72 19 360 8.29 8.47 1.75
Sr. Date of Auction State/U.T. Notified Amount Market No. of Amount Weighted Cut Off SpreadNo. Amount Accepted Rate(%)* Bids Offered Average Rate(%) (Percentage
Received Rate (%) Points)
1 2 3 4 5 6 7 8 9 10 11 (=10-6)
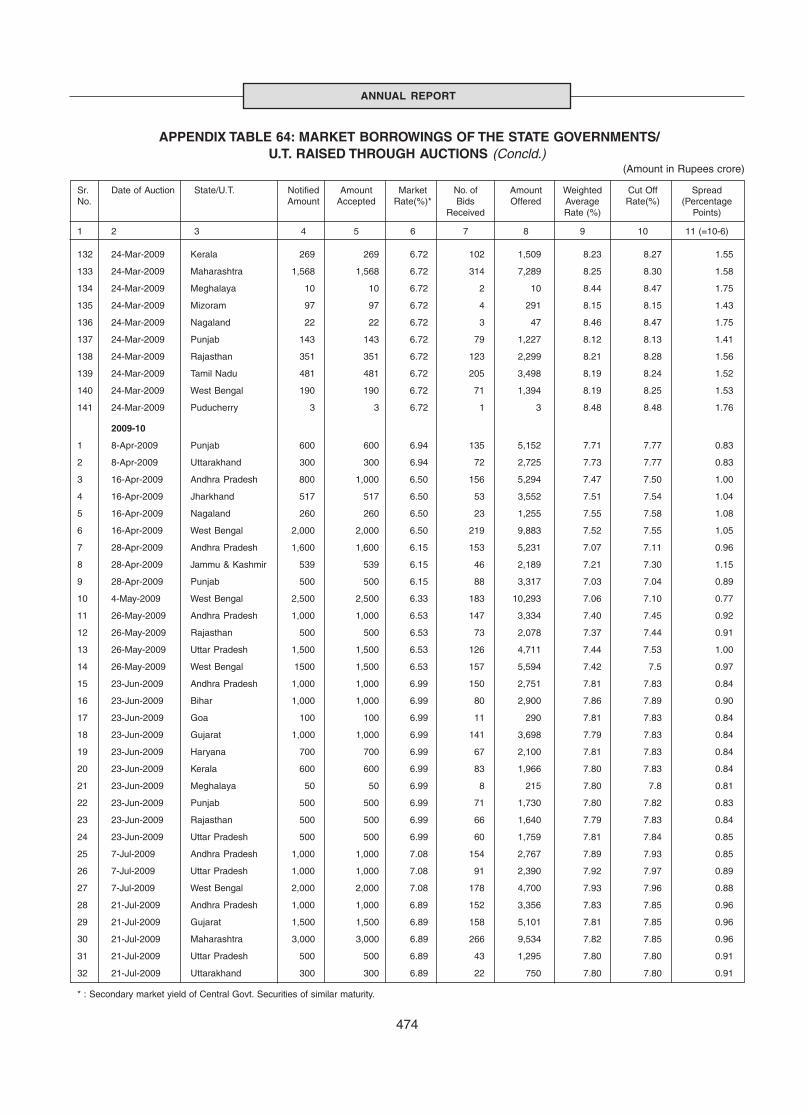
474
ANNUAL REPORT
APPENDIX TABLE 64: MARKET BORROWINGS OF THE STATE GOVERNMENTS/U.T. RAISED THROUGH AUCTIONS (Concld.)
(Amount in Rupees crore)
132 24-Mar-2009 Kerala 269 269 6.72 102 1,509 8.23 8.27 1.55
133 24-Mar-2009 Maharashtra 1,568 1,568 6.72 314 7,289 8.25 8.30 1.58
134 24-Mar-2009 Meghalaya 10 10 6.72 2 10 8.44 8.47 1.75
135 24-Mar-2009 Mizoram 97 97 6.72 4 291 8.15 8.15 1.43
136 24-Mar-2009 Nagaland 22 22 6.72 3 47 8.46 8.47 1.75
137 24-Mar-2009 Punjab 143 143 6.72 79 1,227 8.12 8.13 1.41
138 24-Mar-2009 Rajasthan 351 351 6.72 123 2,299 8.21 8.28 1.56
139 24-Mar-2009 Tamil Nadu 481 481 6.72 205 3,498 8.19 8.24 1.52
140 24-Mar-2009 West Bengal 190 190 6.72 71 1,394 8.19 8.25 1.53
141 24-Mar-2009 Puducherry 3 3 6.72 1 3 8.48 8.48 1.76
2009-10
1 8-Apr-2009 Punjab 600 600 6.94 135 5,152 7.71 7.77 0.83
2 8-Apr-2009 Uttarakhand 300 300 6.94 72 2,725 7.73 7.77 0.83
3 16-Apr-2009 Andhra Pradesh 800 1,000 6.50 156 5,294 7.47 7.50 1.00
4 16-Apr-2009 Jharkhand 517 517 6.50 53 3,552 7.51 7.54 1.04
5 16-Apr-2009 Nagaland 260 260 6.50 23 1,255 7.55 7.58 1.08
6 16-Apr-2009 West Bengal 2,000 2,000 6.50 219 9,883 7.52 7.55 1.05
7 28-Apr-2009 Andhra Pradesh 1,600 1,600 6.15 153 5,231 7.07 7.11 0.96
8 28-Apr-2009 Jammu & Kashmir 539 539 6.15 46 2,189 7.21 7.30 1.15
9 28-Apr-2009 Punjab 500 500 6.15 88 3,317 7.03 7.04 0.89
10 4-May-2009 West Bengal 2,500 2,500 6.33 183 10,293 7.06 7.10 0.77
11 26-May-2009 Andhra Pradesh 1,000 1,000 6.53 147 3,334 7.40 7.45 0.92
12 26-May-2009 Rajasthan 500 500 6.53 73 2,078 7.37 7.44 0.91
13 26-May-2009 Uttar Pradesh 1,500 1,500 6.53 126 4,711 7.44 7.53 1.00
14 26-May-2009 West Bengal 1500 1,500 6.53 157 5,594 7.42 7.5 0.97
15 23-Jun-2009 Andhra Pradesh 1,000 1,000 6.99 150 2,751 7.81 7.83 0.84
16 23-Jun-2009 Bihar 1,000 1,000 6.99 80 2,900 7.86 7.89 0.90
17 23-Jun-2009 Goa 100 100 6.99 11 290 7.81 7.83 0.84
18 23-Jun-2009 Gujarat 1,000 1,000 6.99 141 3,698 7.79 7.83 0.84
19 23-Jun-2009 Haryana 700 700 6.99 67 2,100 7.81 7.83 0.84
20 23-Jun-2009 Kerala 600 600 6.99 83 1,966 7.80 7.83 0.84
21 23-Jun-2009 Meghalaya 50 50 6.99 8 215 7.80 7.8 0.81
22 23-Jun-2009 Punjab 500 500 6.99 71 1,730 7.80 7.82 0.83
23 23-Jun-2009 Rajasthan 500 500 6.99 66 1,640 7.79 7.83 0.84
24 23-Jun-2009 Uttar Pradesh 500 500 6.99 60 1,759 7.81 7.84 0.85
25 7-Jul-2009 Andhra Pradesh 1,000 1,000 7.08 154 2,767 7.89 7.93 0.85
26 7-Jul-2009 Uttar Pradesh 1,000 1,000 7.08 91 2,390 7.92 7.97 0.89
27 7-Jul-2009 West Bengal 2,000 2,000 7.08 178 4,700 7.93 7.96 0.88
28 21-Jul-2009 Andhra Pradesh 1,000 1,000 6.89 152 3,356 7.83 7.85 0.96
29 21-Jul-2009 Gujarat 1,500 1,500 6.89 158 5,101 7.81 7.85 0.96
30 21-Jul-2009 Maharashtra 3,000 3,000 6.89 266 9,534 7.82 7.85 0.96
31 21-Jul-2009 Uttar Pradesh 500 500 6.89 43 1,295 7.80 7.80 0.91
32 21-Jul-2009 Uttarakhand 300 300 6.89 22 750 7.80 7.80 0.91
* : Secondary market yield of Central Govt. Securities of similar maturity.
Sr. Date of Auction State/U.T. Notified Amount Market No. of Amount Weighted Cut Off SpreadNo. Amount Accepted Rate(%)* Bids Offered Average Rate(%) (Percentage
Received Rate (%) Points)
1 2 3 4 5 6 7 8 9 10 11 (=10-6)

475
APPENDIX TABLES
APPENDIX TABLE 65 : MATURITY PROFILE OF OUTSTANDING SECURITIES OFSTATE GOVERNMENTS / U. T.
Percentage to Total Amount OutstandingTotal Amount Outstanding (Rs. Crore)Sr. State/UT
0-5 years 6-10 yearsNo
1 2 3 4 5
1 Andhra Pradesh 32 68 38,336
2 Arunachal Pradesh 20.2 79.8 615
3 Assam 30.4 69.6 9,255
4 Bihar 41.5 58.5 13,817
5 Chhattisgarh 52.2 47.8 1,837
6 Goa 28.4 71.6 1,881
7 Gujarat 29.4 70.6 26,879
8 Haryana 35.2 64.8 7,246
9 Himachal Pradesh 28.9 71.1 7,658
10 Jammu & Kashmir 23.3 76.7 7,275
11 Jharkhand 24.7 75.3 5,525
12 Karnataka 35 65 18,572
13 Kerala 24.9 75.1 21,263
14 Madhya Pradesh 31.1 68.9 17,061
15 Maharashtra 19.6 80.4 44,678
16 Manipur 19.3 80.7 1,342
17 Meghalaya 27.1 72.9 1,454
18 Mizoram 27.2 72.8 964
19 Nagaland 30.1 69.9 2,371
20 Orissa 60.3 39.7 7,354
21 Punjab 24.4 75.6 17,874
22 Rajasthan 33.2 66.8 24,499
23 Sikkim 13.7 86.3 990
24 Tamil Nadu 27.1 72.9 29,294
25 Tripura 38.7 61.3 1,192
26 Uttar Pradesh 31.8 68.2 43,941
27 Uttarakhand 34.5 65.5 5,630
28 West Bengal 22.2 77.8 43,123
29 Puducherry 0 100 687
Total 29 71 4,02,611

476
ANNUAL REPORT
APPENDIX TABLE 66: NORMAL WMA LIMITS OF STATES/UT
2005-06 2006-07 2007-08 2008-09 2009-10State / Union Territory (effective (effective (effective (effective (effective
April 1, 2005) April 1, 2006) April 1, 2007) April 1, 2008) April 1, 2009)
1 2 3 4 5 6
Non-Special Category States/U.T.
Andhra Pradesh 770 880 880 880 880
Bihar 380 425 425 425 425
Chhattisgarh 175 190 190 190 190
Goa 65 65 65 65 65
Gujarat 575 630 630 630 630
Jharkhand 225 280 280 280 280
Haryana 280 295 295 295 295
Karnataka 570 625 625 625 625
Kerala 345 350 350 350 350
Madhya Pradesh 420 460 460 460 460
Maharashtra 1,050 1,160 1,160 1,160 1,160
Orissa 270 300 300 300 300
Punjab 360 360 360 360 360
Rajasthan 440 505 505 505 505
Tamil Nadu 670 730 730 730 730
Uttar Pradesh 920 1,020 1,020 1,020 1,020
West Bengal 495 545 545 545 545
Puducherry NA NA 50# 50 50
Sub Total 8,010 8,820 8,870 8,870 8,870
Special Category States
Arunachal Pradesh 50 65 65 65 65
Assam 295 300 300 300 300
Himachal Pradesh 145 190 190 190 190
Manipur 55 60 60 60 60
Meghalaya 55 60 60 60 60
Mizoram 50 55 55 55 55
Nagaland 65 80 80 80 80
Tripura 80 100 100 100 100
Uttarakhand 130 145 145 145 145
Sub Total 925 1,055 1,055 1,055 1,055
Total 8,935 9,875 9,925 9,925 9,925
# : Effective December 17, 2007. N. A. : Not Applicable.