Embed Size (px)
Citation preview
CENTRALIZED GRAIN STORAGE IN GHANA: A
FEASIBILITY ANALYSIS
By
ANNIE NSAFOAH
Bachelor of Science in Agricultural Biotechnology
University of Kentucky
Lexington, Kentucky
2008
Submitted to the Faculty of the
Graduate College of the
Oklahoma State University
in partial fulfillment of
the requirements for
the Degree of
MASTER OF SCIENCE
December, 2012
ii
CENTRALIZED GRAIN STORAGE IN GHANA: A
FEASIBILITY ANALYSIS
Thesis Approved:
Dr. Mike Dicks
Thesis Adviser
Dr. Philip Kenkel
Dr. Rodney Holcomb
Dr. Carol Jones
iii
Name: ANNIE NSAFOAH
Date of Degree: DECEMBER, 2012
Title of Study: CENTRALIZED GRAIN STORAGE IN GHANA: A FEASIBILITY
ANALYSIS
Major Field: AGRICULTURAL ECONOMICS
ABSTRACT:
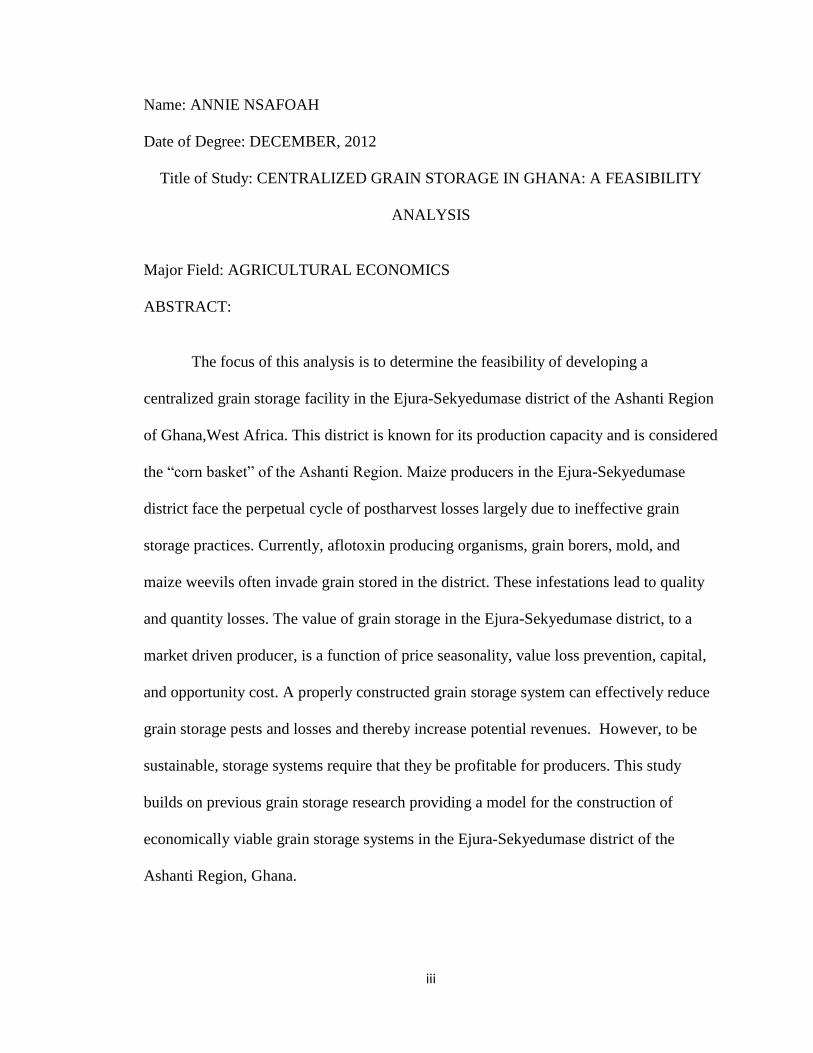
The focus of this analysis is to determine the feasibility of developing a
centralized grain storage facility in the Ejura-Sekyedumase district of the Ashanti Region
of Ghana,West Africa. This district is known for its production capacity and is considered
the “corn basket” of the Ashanti Region. Maize producers in the Ejura-Sekyedumase
district face the perpetual cycle of postharvest losses largely due to ineffective grain
storage practices. Currently, aflotoxin producing organisms, grain borers, mold, and
maize weevils often invade grain stored in the district. These infestations lead to quality
and quantity losses. The value of grain storage in the Ejura-Sekyedumase district, to a
market driven producer, is a function of price seasonality, value loss prevention, capital,
and opportunity cost. A properly constructed grain storage system can effectively reduce
grain storage pests and losses and thereby increase potential revenues. However, to be
sustainable, storage systems require that they be profitable for producers. This study
builds on previous grain storage research providing a model for the construction of
economically viable grain storage systems in the Ejura-Sekyedumase district of the
Ashanti Region, Ghana.
iv
TABLE OF CONTENTS
Chapter Page
I. INTRODUCTION .................................................................................................. 1-2
Objective of Study ..................................................................................................2
Benefit of Study ......................................................................................................3
II. REVIEW OF LITERATURE....................................................................................4
Grain Stage History ............................................................................................. 5-6
Grain Storage in Medieval England .................................................................... 6-7
Examples of grain storage in countries with
Weather and economy similar to Ghana ............................................................ 7-11
Profitability of Maize Storage Techniques in Kwara State, Nigeria .............. 11-12
Grain Storage in Ghana .................................................................................... 13-15
The Role of Agriculture Cooperatives in Grain Storage Systems ................... 15-17
Role of Grain Drying ............................................................................................18
Solar Heat for Grain Drying ........................................................................... 18-19
Types of Grain Storage .................................................................................... 19-20
III. METHODS ............................................................................................................21
Conceptual Framework .........................................................................................21
Feasibility Study .............................................................................................. 21-23
Project Overview ............................................................................................. 23-24
Grain Storage Venture ..........................................................................................25
Description of the Facility ....................................................................................25
In-Bin Dryer and Storage System: Flat Storage .............................................. 25-27
Warehouse Storage System.............................................................................. 28-31
Model Assumptions ..............................................................................................32
Input Value Page .............................................................................................. 32-33
Shrinkage ...............................................................................................................33
Drying Cost ...................................................................................................... 33-34
Depreciation Expense ...........................................................................................34
Personnel Expense ........................................................................................... 34-35
Market Projection...................................................................................................35
v
Loan Amortization .................................................................................................36
Expense Projection.................................................................................................37
Summary of Revenue, Expenses, and Cash Flow..................................................38
Return on Investment ...................................................................................... 39-40
Sensitivity Analysis ........................................................................................ 40-41
General Assumptions .............................................................................................41
Grain Handling Cost and Revenue Assumptions ..................................................42
Grain Drying .........................................................................................................43
vi
Chapter Page
IV. RESULTS ..............................................................................................................45
Storage Cost Comparison .....................................................................................45
Feasibility of the In-Bin Storage System ........................................................ 46-50
Feasibility of the Warehouse Storage System ................................................. 50-55
V. CONCLUSION ......................................................................................................56
Specific Conclusions ..............................................................................................57
Limitations and Recommendations for Future Research ................................ 58-59
REFERENCES ...................................................................................................... 60-61
VITA ................................................................................................................................
vii
LIST OF TABLES
Table Page
Table 1: Sales Projections .........................................................................................35
Table 2: Total Investment .........................................................................................36
Table 3: Expense Projections ...................................................................................37
Table 4: Statement of Operation and Cash Flow Statement .....................................38
Table 5: Estimate of Cash Flow ................................................................................39
Table 6: Baseline Assumptions for Feasibility Study and Business Plan .................42
Table 7: Annual Total Depreciation .........................................................................43
Table 8: Personnel Costs .........................................................................................44
Table 9: Storage Cost Comparison ..........................................................................45
Table 10: Result for Baseline Corn Price .................................................................46
Table 11: Result for Baseline Rice Price ................................................................47
Table 12: Result for Baseline Corn and Rice Storage ..............................................48
Table 13: Sensitivity Result on Fan Time ................................................................50
Table 14: Sensitivity Result on Grain Volume .........................................................50
Table 15 Result for Baseline Corn Price: .................................................................51
Table 16: Result for Baseline Rice Price .................................................................52
Table 17: Result for Baseline Corn and Rice Storage ..............................................53
Table 18: Sensitivity Result on Fan Time: ...............................................................54
Table 19: Sensitivity Result on Volume Analysis ...................................................55
viii
LIST OF FIGURES
Figure Page
Figure 1: Aeration Duct ...........................................................................................26
Figure 2: Aeration Building .....................................................................................27
Figure 3: Image of Stillwater Milling Warehouse ....................................................28
Figure 4: Image of Grain Warehouse in Ejura-Sekyedumase ..................................29
Figure 5: Image of Receipt Warehouse in Ejura-Sekyedumase ..............................30
Figure 6: Image of Grain Scale in Ejura-Sekyedumase ............................................31
Figure 7: Sensitivity of Corn, Rice and Storage Prices ............................................49
Figure 8: Summary of Sensitivity Analysis for Baseline Scenario:
Warehouse System ...................................................................................................53
1
CHAPTER I
INTRODUCTION
Based on current growth rates, the world population is projected to double from
more than 6 billion to more than 12 billion in less than 50 years (Mataruka, 2009).
Population and consumption growth means that the demand for food will increase for at
least another 40 years. As a result, a global strategy is needed to insure food security.
Food production has increased in the past half-century, yet more than one in seven people
today still lacks access to sufficient protein and energy in their diet, and. even more
suffer from chronic hunger and malnourishment (Godfray, Beddington et al., 2010).
Food producers are expected to meet the challenge of producing enough to feed the
growing population.
One way to feed more people is to reduce postharvest waste. Corn (maize) is a
staple food in most African countries, and serves as a strategic grain. Producers in
developing countries often struggle to preserve and secure food after harvest. This is
largely due to inefficient drying and storage facilities. Many producers in developing
countries are small-scale famers who lack access to advanced agricultural machinery that
will reduce labor and increase production. Small-scale Ghanaian maize producers tend to
act collectively or form cooperatives to help tackle some of the social and economic
problems they face. Cooperatives range from informal information networking to legal
entities. Nso Nyame Ye Women’s Cooperative (NNYWC) in the Ejura-Sekyedumase
district of the Ashanti Region of Ghana faces the problem of postharvest losses. Maize
harvested in the Ejura- Sekyedumase district of the Ashanti Region in Ghana is
2
traditionally dried in open areas. Farmers spread grain on the side of the road or in an
open field leading to pest infestation, mold, aflatoxin, and reduced quality and quantity.
Inefficient grain storage practices increase the level of postharvest loss and
contribute to the perpetuating cycle of food insecurity in the Ejura-Sekyedumase district.
Objectives of Study
The objective of this study is to determine the economic feasibility of constructing
and operating a grain storage facility in the Ejura-Sekyedumase district of the Ashanti
Region of Ghana. If a centralized grain storage facility can prove to be economically
viable then investing in the grain storage facility will be considered feasible. The
objective will be fulfilled by: (1) determining the kind of grain storage facility that might
be economically viable in the Ejura- Sekyedumase district; (2) determining the cost of the
centralized grain storage; (3) determine the profitability of grain storage; (4) determining
the minimum scale, volume of production requirement for a profitable enterprise; and (5)
estimating the supply of corn in the Ashanti Region and determining the required storage
capacity for the Nso Nyame Ye Women’s cooperative. In completing these objectives, a
model will be developed to estimate potential earnings over a ten year period. The model
will be constructed using numbers derived from the Nso Nyame Ye Women’s
cooperative action plan and include assumptions that will be based on project estimates
consistent with previous research conducted with regard to grain storage enterprises.
3
Benefits of Study
This study will be useful to potential agribusiness investors, the ministry of
agriculture, and other governmental agencies interested in agriculture development
projects. For individuals interested in opening a grain storage facility and grain
processing plants this business model will assist in answering questions about potential
profitability, net present value, benefit cost ratio, rate of return and break even period.
These factors are essential in determining if opening and operating a grain storage facility
is profitable. Intuitively, anyone interested in a business venture would prefer to
maximize profit and understand cash flow. This study will be beneficial to famers both
directly and in-directly in assisting them in understanding the importance of
implementing proper post harvest practices and the impact of this practice on their
bottom line.
4
CHAPTER II
REVIEW OF LITERATURE
Grain quality is important for producer’s profitability. Therefore, the proper post-
harvest storage system must maintain and/or improve grain quality. Grain companies
understand this and invest in technologies that maintain the quality of their grain from
harvest to purchase. However, in most developing countries, like Ghana, grain production
is in the hands of small-scale producers who lack access to modern farm technologies and
facilities. This means producers are forced to store their grain in their homes or on their
farms. The grain is often stored in unsuitable conditions under fluctuating temperatures
and humid conditions. Poorly stored grain will ultimately result in reduced grain quality
as well as reduced weight.
Maize producers in Sub-Saharan Africa have been challenged for centuries by
post-harvest losses from insect infestation, molds, and rodents. Small scale farmers are
the most vulnerable because the lack of knowledge and capital needed to invest in proper
storage technology. According to Jones el al. (2011), “escalating post-harvest maize grain
losses in Sub-Saharan Africa have reached the highest level in recent history with the
accidental introduction of the storage pest Prostephanus truncatus, or Larger Grain Borer
(LGB), into Eastern and Western African in the late 1970s and early 1980s” (Jones,
Alexander et al., 2011).
5
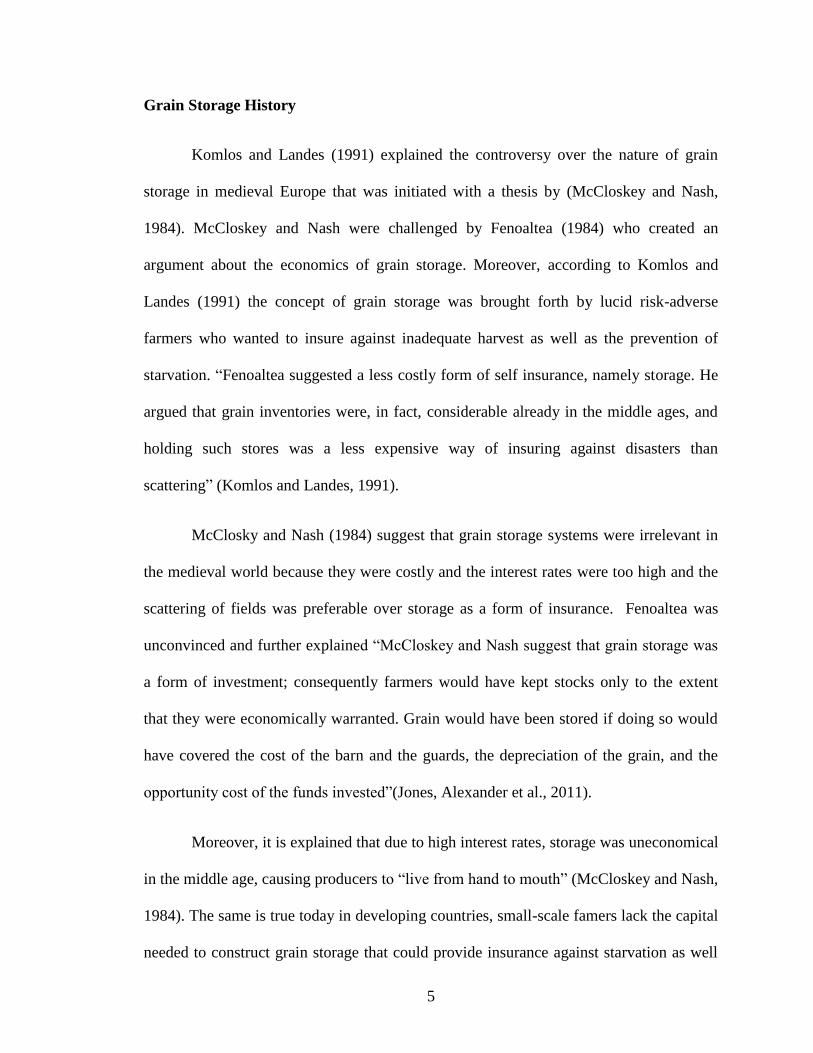
Grain Storage History
Komlos and Landes (1991) explained the controversy over the nature of grain
storage in medieval Europe that was initiated with a thesis by (McCloskey and Nash,
1984). McCloskey and Nash were challenged by Fenoaltea (1984) who created an
argument about the economics of grain storage. Moreover, according to Komlos and
Landes (1991) the concept of grain storage was brought forth by lucid risk-adverse
farmers who wanted to insure against inadequate harvest as well as the prevention of
starvation. “Fenoaltea suggested a less costly form of self insurance, namely storage. He
argued that grain inventories were, in fact, considerable already in the middle ages, and
holding such stores was a less expensive way of insuring against disasters than
scattering” (Komlos and Landes, 1991).
McClosky and Nash (1984) suggest that grain storage systems were irrelevant in
the medieval world because they were costly and the interest rates were too high and the
scattering of fields was preferable over storage as a form of insurance. Fenoaltea was
unconvinced and further explained “McCloskey and Nash suggest that grain storage was
a form of investment; consequently farmers would have kept stocks only to the extent
that they were economically warranted. Grain would have been stored if doing so would
have covered the cost of the barn and the guards, the depreciation of the grain, and the
opportunity cost of the funds invested”(Jones, Alexander et al., 2011).
Moreover, it is explained that due to high interest rates, storage was uneconomical
in the middle age, causing producers to “live from hand to mouth” (McCloskey and Nash,
1984). The same is true today in developing countries, small-scale famers lack the capital
needed to construct grain storage that could provide insurance against starvation as well
6
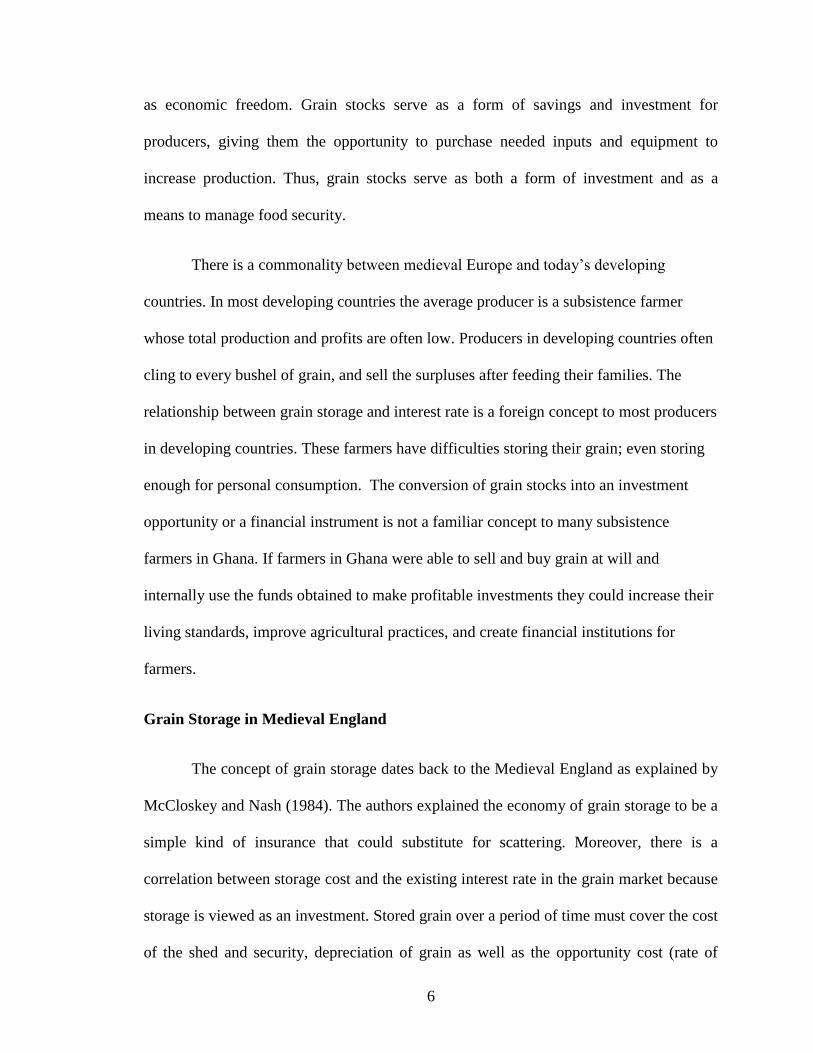
as economic freedom. Grain stocks serve as a form of savings and investment for
producers, giving them the opportunity to purchase needed inputs and equipment to
increase production. Thus, grain stocks serve as both a form of investment and as a
means to manage food security.
There is a commonality between medieval Europe and today’s developing
countries. In most developing countries the average producer is a subsistence farmer
whose total production and profits are often low. Producers in developing countries often
cling to every bushel of grain, and sell the surpluses after feeding their families. The
relationship between grain storage and interest rate is a foreign concept to most producers
in developing countries. These farmers have difficulties storing their grain; even storing
enough for personal consumption. The conversion of grain stocks into an investment
opportunity or a financial instrument is not a familiar concept to many subsistence
farmers in Ghana. If farmers in Ghana were able to sell and buy grain at will and
internally use the funds obtained to make profitable investments they could increase their
living standards, improve agricultural practices, and create financial institutions for
farmers.
Grain Storage in Medieval England
The concept of grain storage dates back to the Medieval England as explained by
McCloskey and Nash (1984). The authors explained the economy of grain storage to be a
simple kind of insurance that could substitute for scattering. Moreover, there is a
correlation between storage cost and the existing interest rate in the grain market because
storage is viewed as an investment. Stored grain over a period of time must cover the cost
of the shed and security, depreciation of grain as well as the opportunity cost (rate of

7
interest) of funds invested. The authors further explained that, in the medieval ages,
storage was neglected. (McCloskey and Nash, 1984). because “medieval Europe did not
know how to store grain or accumulate reserves”(Komlos and Landes, 1991). Stefano
Fenoaltea attempted to illustrate the estimate of carryover grain in dimensions of
monastic barns. He estimated that “the monastic barns alone could hold enough grain to
feed England’s human population for over a year and half” (McCloskey, 2001).
McCloskey and Nash (1984) disagreed because they felt that Fenoaltea did not
consider storage of seed. The correct estimation was suggested to be “barn capacity =
consumption + seed + carryover” (McCloskey and Nash, 1984). McCloskey and Nash
further explained why storage of grains for food was not common in that it was
expensive. “The cost of storing a bushel of wheat is the cost of the barn per bushel plus
the loss in value of that grain rotting in storage plus the expected percentage loss of
capital value due to falls in the price per bushel plus the opportunity cost of the interest
forgone on the sum expended on the bushel”(McCloskey and Nash, 1984).
Examples of grain storage in countries with weather and economy similar to Ghana
Adda et.al. (2002) conducted large-scale experiments in maize storage in Togo.
Togo borders Ghana and has similar environmental conditions. The authors explained
that post-harvest losses experienced in Togo (West Africa) are largely caused by pests
such as the weevil Sitopphilus zeamais and Anagoumois. They further explained that
famers in Ghana, as in Togo, have been introduced to alternative chemical interventions
as the means to help solve pest problems. However, due to economic constraints, the
strategies have not been adopted in several West African countries. Misuse of the
chemical intervention strategy poses a health hazards for famers and their families and
8
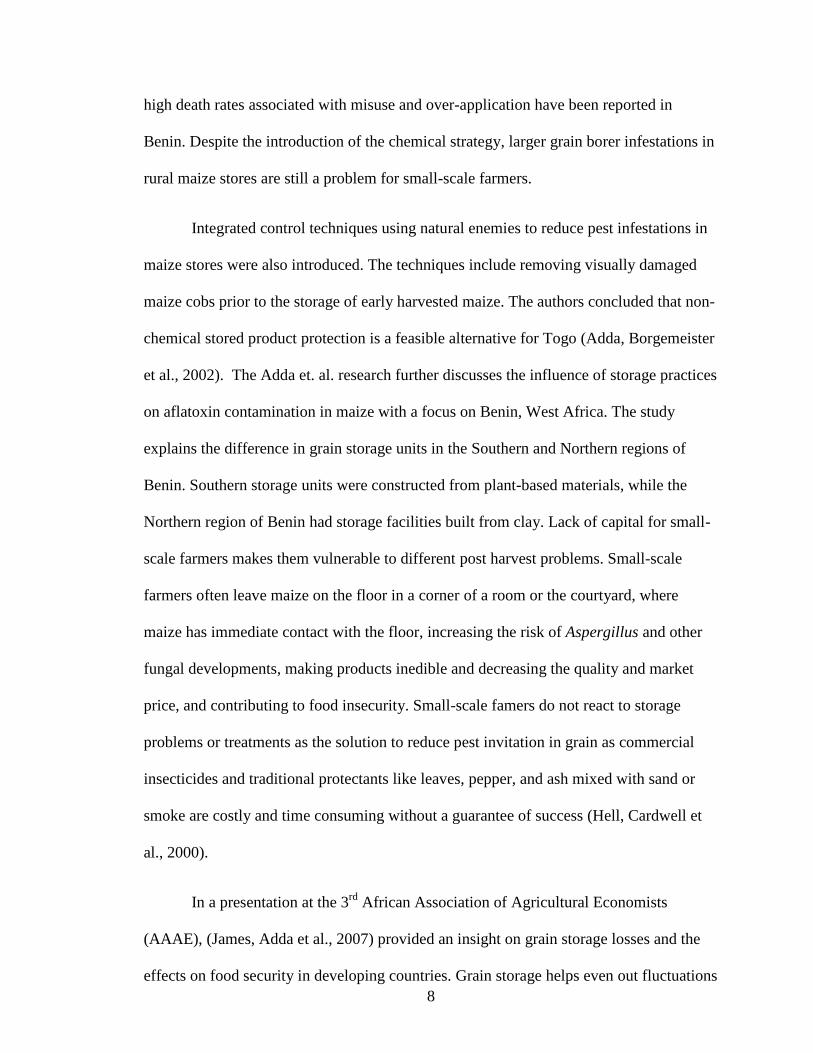
high death rates associated with misuse and over-application have been reported in
Benin. Despite the introduction of the chemical strategy, larger grain borer infestations in
rural maize stores are still a problem for small-scale farmers.
Integrated control techniques using natural enemies to reduce pest infestations in
maize stores were also introduced. The techniques include removing visually damaged
maize cobs prior to the storage of early harvested maize. The authors concluded that non-
chemical stored product protection is a feasible alternative for Togo (Adda, Borgemeister
et al., 2002). The Adda et. al. research further discusses the influence of storage practices
on aflatoxin contamination in maize with a focus on Benin, West Africa. The study
explains the difference in grain storage units in the Southern and Northern regions of
Benin. Southern storage units were constructed from plant-based materials, while the
Northern region of Benin had storage facilities built from clay. Lack of capital for small-
scale farmers makes them vulnerable to different post harvest problems. Small-scale
farmers often leave maize on the floor in a corner of a room or the courtyard, where
maize has immediate contact with the floor, increasing the risk of Aspergillus and other
fungal developments, making products inedible and decreasing the quality and market
price, and contributing to food insecurity. Small-scale famers do not react to storage
problems or treatments as the solution to reduce pest invitation in grain as commercial
insecticides and traditional protectants like leaves, pepper, and ash mixed with sand or
smoke are costly and time consuming without a guarantee of success (Hell, Cardwell et
al., 2000).
In a presentation at the 3rd
African Association of Agricultural Economists
(AAAE), (James, Adda et al., 2007) provided an insight on grain storage losses and the
effects on food security in developing countries. Grain storage helps even out fluctuations
9
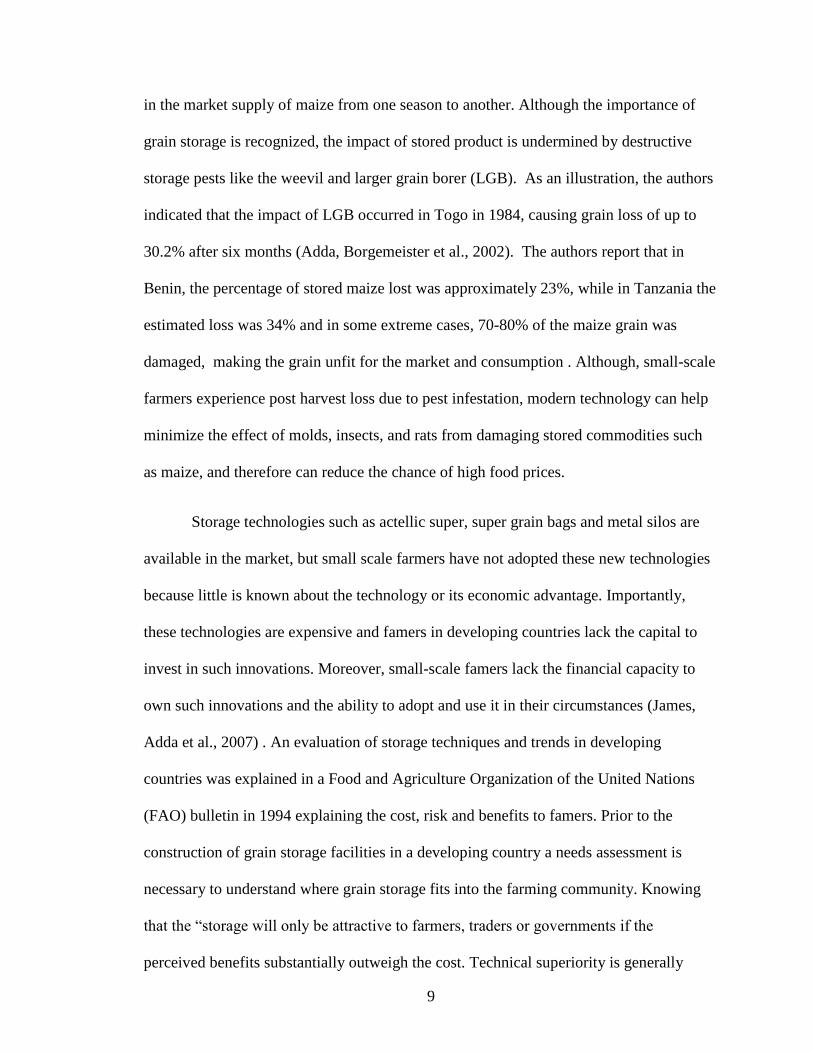
in the market supply of maize from one season to another. Although the importance of
grain storage is recognized, the impact of stored product is undermined by destructive
storage pests like the weevil and larger grain borer (LGB). As an illustration, the authors
indicated that the impact of LGB occurred in Togo in 1984, causing grain loss of up to
30.2% after six months (Adda, Borgemeister et al., 2002). The authors report that in
Benin, the percentage of stored maize lost was approximately 23%, while in Tanzania the
estimated loss was 34% and in some extreme cases, 70-80% of the maize grain was
damaged, making the grain unfit for the market and consumption . Although, small-scale
farmers experience post harvest loss due to pest infestation, modern technology can help
minimize the effect of molds, insects, and rats from damaging stored commodities such
as maize, and therefore can reduce the chance of high food prices.
Storage technologies such as actellic super, super grain bags and metal silos are
available in the market, but small scale farmers have not adopted these new technologies
because little is known about the technology or its economic advantage. Importantly,
these technologies are expensive and famers in developing countries lack the capital to
invest in such innovations. Moreover, small-scale famers lack the financial capacity to
own such innovations and the ability to adopt and use it in their circumstances (James,
Adda et al., 2007) . An evaluation of storage techniques and trends in developing
countries was explained in a Food and Agriculture Organization of the United Nations
(FAO) bulletin in 1994 explaining the cost, risk and benefits to famers. Prior to the
construction of grain storage facilities in a developing country a needs assessment is
necessary to understand where grain storage fits into the farming community. Knowing
that the “storage will only be attractive to farmers, traders or governments if the
perceived benefits substantially outweigh the cost. Technical superiority is generally
10
insufficient (although it can be attractive for its prestige value), and farmers and traders
are likely to tolerate high storage losses before undertaking complex or expensive
changes to their storage system” (Proctor, 1994).
To help reduce post harvest loss and invest in innovations that will minimize
waste, formation of agricultural cooperatives might be beneficial to small-scale farmers
in Ghana. Cooperatives in developing countries such as Ghana are not as profitable as
those in the United States. Cocoa is the largest exported and most profitable commodity
in Ghana. Should Ghana have successful profitable agricultural cocoa cooperatives,
producers will be able to gain confidence in the formation of other community based
cooperatives. (Cazzuffi and Moradi, 2010) evaluated why cooperatives fail by studying
Ghanaian cocoa producers. Cooperatives represent an effective institution for solving
problems faced by small farmers. Small-scale farmers often form cooperatives to
undertake a new market, to achieve better prices in the existing market, to provide access
to capital, and knowledge sharing. Another important reason for cooperative formation is
that economies of scale that can be obtained. (Coulter and Onumah, 2002) presented a
study of Ghana and Zambia that examined the role of third party warehousing services as
a means to enhance African agriculture. Furthermore, the authors explained that high
profits could be earned from intra-seasonal storage of grains in both Ghana and Zambia.
Establishment of public warehousing services is difficult in grain producing areas due to
the risk of low capacity utilization. In general “warehousing services are normally most
developed in port areas, involving both bonded and non-bounded cargo entering
international trade. Warehousing skills developed in this environment are largely
transferable to up-country storage situations, and while the latter have tended to be a
preserve for enterprises, port or urban warehousing concerns may get involved in the
11
future” (Coulter, Sondhi et al., 2000). Moreover, Coulter et. al. (2002) point out that
“most of Ghana’s trade is carried out by a myriad of small informal traders, each of them
moving an insignificant portion of the crop. No Ghanaian grain trader markets as much as
10,000 tones of domestic grain a year”.
Profitability of Maize Storage Techniques in Kwara State, Nigeria
Maize is a key staple food in Ghana, consumed in various forms by virtually
every household in Ghana. In Ghana and most of Africa, the maize grain is stored for
both seed and food. Nigeria, another West African country in close proximity to Ghana,
has climatic and growing conditions that are similar to those of Ghana. And, Nigeria’s
storage systems are the mostly local aboriginal structures as they are in Ghana. (Adetunji,
2009) explains the grain storage structures in Nigeria:
“They are constructed from a wide variety of locally available materials such as
paddy straw, split bamboo, reeds, mud, timber, bricks, etc. Most of these
structures were not found to be suitable for storage of quality grains over a long
period. People who became involved in grain storage were the peasant farmers
who produced the grains mostly in small quantities all over the country and
usually disposed of them soon after harvest or stored some for household
consumption”.
The same storage characteristics can be found among Ghanaian farmers. Lack of
proper storage systems often lead farmers to dispose of their grains at harvest. Adetunji
(2007) also explains the behavior of other grain producers that are involved in large-scale
enterprises such as breweries, flourmills and consumer food industries. These industries
always have grain silos nearby for short-term stocks (Adetunji, 2007). Government and
12
other agriculture institutions also store grain for their purpose of selling to processing
facilities. Moreover, three types of grain storage systems exist including: (i) local storage
techniques at the domestic level (e.g., cribs, open field, platforms, roofs and fireplaces);
(ii) semi-modern storage techniques at the domestic level (e.g., ventilated cribs, improved
rhombus, and brick bins; and (iii) modern centralized storage at the commercial level
(e.g., silos, warehouses). Farmers often make suitable storage decisions based on
affordability (Adetunji, 2007). The Adetunji study illustrates that 38% of farmers use
local storage systems, 31% did not store their maize, 21% used semi-modern techniques
and 11% used modern storage techniques. Most Nigerian farmers store grain for
household use – suggesting local storage is commonly used among grain producers and
traders in Kwara State, Nigeria. However, modern storage systems (e.g., silos, and
warehouses) were the best techniques based on the gross margin and rate of return
(Adentunji, 2007).
13
Grain Storage in Ghana
Like many West African countries, small-scale farmers in Ghana face the problem
of post harvest loss. Inefficient grain storage systems make harvested maize more
susceptible to mold and insect infestation. Armah and Asante (2006) concluded that
though Ghana is about 99% self-sufficient in domestic maize production, maize prices
are high in the post-harvest season due to poor storage, distribution difficulties, and
market demand. This contributes to increased poverty levels since many people in the
rural areas do not have the purchasing power to buy maize in the post harvest season.
Moreover, traditional maize storage systems in Ghana contribute to food insecurity
(Armah and Asante, 2006). Inefficient technology and storage practices play a part in the
maize price variability.
Reportedly, 78% of maize traders in Ghana indicated the need for a warehouse in
the marketplace for maize storage purposes (Armah and Asante, 2006). Maize prices are
generally low during the major harvest season (August- October) as farmers sell their
output immediately after harvest. Maize prices are at the highest during the minor season
(January to February). The length of storage of maize during the minor season influences
maize availability in the country. Moreover, stored maize from the minor season is
insufficient to eliminate the availability-gap or stabilize maize prices in the post-harvest
season.
There is a direct correlation between inadequate maize storage in the post-harvest
season and food insecurity in Ghana. Armah and Asante (2006) stated, “there is no
standard method for appraising the efficiencies of the traditional maize-storage systems”.
Developing countries such as Ghana lack the institutions, resources, and policy needed to
14
regulate and appraise agriculture commodities, as they often do not support farmers.
Different organizations and strategies, such as the Ghana Food Distribution Corporation’s
(GFDC) Cocoa Marketing Board (CMB) and Action Aid, establish warehouse and silo
projects to promote maize storage and stabilize maize prices. Many of these projects are
now idle and rusting.
Armah and Asante (2006) relied on socioeconomic and behavior characteristics of
farmers to understand the factors influencing grain storage decisions in the Ghanaian
maize industry, to overcome maize shortages in the country and to reduce high grain
prices by providing storage policies. This task was difficult since many famers kept
minimal or no farming and marketing records. The authors used an integration of direct
and indirect analysis to cross check ineffectiveness of current maize storage facilities.
Evaluation of traditional maize storage cribs was considered by assuming a perfectly
competitive market that utilized the temporal pricing model of (Tomek, 2000) to appraise
storage opportunities. The empirical results suggested 38% of producers store maize until
the post-harvest season, while 58% indicate selling their maize immediately after harvest.
Further analysis suggested that maize stored until the post-harvest season is from the
minor season (February) and sold between May and July (Armah and Asante, 2006).
Moreover, the authors explained that 72% of the farmers and traders interviewed were
aware of market prices, yet sell their maize immediately after harvest to meet cash needs,
while 42% indicate storing until the post-harvest season to sell for high future prices and
less than 50% of farmers owned a storage barn or crib. The authors concluded that
“maize prices are at their highest in the post-harvest season suggesting that maize storage
is inadequate and that there is poor maize security to storage relationship”. Producers
often sell their maize immediately after harvest to meet cash needs because of the general
15
capital shortage for producers. Overall, results of the study indicate that there is an
opportunity for long-term grain storage systems.
The Role of Agriculture Cooperatives in Grain Storage Systems
An average machinery cost saving of 35% per acre for a small grain farm in
Saskatchewan that jointly owned farm equipment with at least two other farmers instead
of individual ownership (Long and Kenkel, 2007). Chambo (2009) from the Moshi
University College of Co-operative and Business Studies in Moshi, Tanzania further
explains agriculture cooperatives in Africa. Historically, agricultural marketing
cooperatives have been the most popular mode linking developing countries with the rest
of the world through exporting. Traditionally, small scale farmers form marketing based
cooperatives that combine agricultural input supply and output marketing- that is critical
in meeting the needs of small scale farmers’ production requirements. Furthermore,
Chambo (2009) explains:
“In Tanzania, Kenya, Uganda, Ghana, and Nigeria, cooperatives were established
to make coffee, cotton, cashew nuts and cocoa. The development of food
marketing cooperatives was associated with post colonial governments, when they
realized the organizational importance of the cooperative enterprise for the
development of the whole country. It is historically obvious that the structure of
traditional agricultural cooperatives is directly affected by the shocks of declining
world market prices because; Africa has not changed its pattern of production and
consumption” (Chambo, 2009).
16
Moreover, there is a division between financial institutions and agricultural cooperatives.
Lack of capital and interest from financial institutions makes the agriculture cooperative
movement in Africa unstable and disjointed and results in difficulties for Africans trying
to solve many of their market problems. An investment from financial institutions could
affect small-scale farmers’ productivity and increase market access. Access to capital for
small-scale farmers could improve rural development in terms of employment creation,
rural market development and access to social services. Agricultural cooperatives may be
an important component in rural development because of their ability to create
employment for the rural community (Chambo, 2009).
The food crisis of the 1970s led to the formation of the Group for Assistance on
Systems Relating to Grain After-Harvest (GASGA). Later known as the Global
Postharvest Forum (PhAction), the group’s main objective was to reduce postharvest
loss. The largest initiative was the Prevention of Food Losses program of the 1980s and
1990s. PhAction fell apart in the early 2000s. Economically, one can argue that the
increase in food prices in 2007 was also positive – though it presents a threat to food
security, it created an opportunity for farmers to benefit from high food prices and
increased demand. The recent food crisis depicts the need for action against postharvest
loss.
Although, the advancement in farm equipment may help reduce labor costs and
increase productivity, many farmers do not have the purchasing power needed to own this
equipment. In a stable environment, farmers are able to form a cooperative to help
minimize the cost of owning farm machinery. Farmers often have an understanding of
equal access to the equipment and an agreement regarding repair costs.
17
(Carlberg, Ward et al., 2006) explained the success factors for new generation
cooperatives. The success of new generation cooperatives lies in the planning,
development, financing and cost of the organization. They noted that farms in the United
States have a long tradition of cooperative behaviors. In 2002, there were 2.8 million
members in 3,140 farmer cooperatives, created jobs for 166,000 people, and earned net
incomes of over $3.1 billion with a net worth of $20 billon.
The most important reason for the formation of cooperatives is the economies of
scale that famers are not able to realize individually. Carlberget al (2006), maintain that
cooperatives, if organized correctly, can be highly profitable, boost employment and
promote economic development. Agriculture cooperatives play a significant role in food
security and rural development. (Long and Kenkel, 2007) explained the structural
considerations for machinery cooperatives. Individual farm agricultural machinery
ownership and operation are too costly, allowing producers in the United States to form
machinery cooperatives enabling them to become more efficient by spreading the cost of
the machinery across more producers and saving on labor expenses associated with
maintenance. The authors also reported that machinery costs represent approximately 20-
30% of the total production costs for corn and soybeans, making it necessary for small
farmers to spread the equipment cost over increased acreage. Kenkel and Long (2006)
explain that as in developing countries, small farm producers in the US lack capital
investment for emerging farm technology that could increase production efficiency. By
forming a cooperative small farm producers can alleviate the high cost of farm
machinery.

18
Role of Grain Drying
Drying grain to a moisture content which will allow long term storage is an
essential component of a storage system. For corn tolerable moisture content ranges from
13% to 15.5% storage moisture. The current method for drying grain in the Ejura –
Sekyereduamase district is to spread corn out in an open area on the field or on concrete
close to the road. The most common drying system explained by (Jayas and White, 2003)
is the controlled drying system consisting of fans at the base of a granary, blowing air
under stored grain. (Rausser, Perloff et al., 1985) point out that an economic efficiency
for drying and storage technologies in the Ejura- Sekyedumase district of the Ashanti
Region of Ghana is needed to evaluate the cost, benefit, and efficiency for the
construction of a grain storage facility. A needs assessment was completed in the district
in 2010. However, an evaluation of the grain storage economic efficiency is still needed.
Solar Heat for Grain Drying
Modern solar grain dryers offer a potential alternative for small-scale famers in
the Ejura- Sekyedumase district of the Ashanti Region of Ghana. (Tayeb, 1986)
explained, “for safe, long-term storage of agricultural produce, maximum moisture
content has been determined (known as the sage storage moisture content), below which
produce can be store for a definite duration without the possibility of spoilage at ambient
temperatures”. The use of solar energy is considered an option to replace sun drying for
crops; however, alternate drying methods will be needed during the rainy season in
Ghana when there is reduced sunshine. Tayeb (1986) further described the design of the
rotary dryer, explaining that wet grain enters at one end of the cylinder, and dry material
discharges at the other end. The economics of solar drying indicate the cost of a solar
19
dryer is offset by the saving of at least 50% in fan and power costs. Since drying can be
done rapidly, this may result in reduced fuel costs if solar heat is used instead of fuel
heat. In conclusion, Taybe (2006) noted that for the required levels of heat needed to dry
grain, the solar rotary dryer is an inexpensive and efficient method.
Solar energy could be beneficial in Ghana (Sub-Saharan Africa) because it is
fairly hot during the day and the energy can be harnessed and used for the storage
facility. “The machine shed roof and sidewall collector can produce about 2,000,000
Btu/day in the fall in Lincoln, NE. A high temperature dryer might use 50,000,000
Btu/day to dry 10 pints of moisture from 3,000 bu/day. The collector could replace about
4% of the purchased energy, or about 24 gal/day of LP” (Spillman, Bern et al., 1980).
The solar drying system was not modeled in the feasibility analysis but it could represent
an attractive alternative.
Types of Grain Storage
Often traditional farms/villages in most African countries have developed their
own techniques of post harvest storage. In Ghana the temporary storage method includes,
aerial storage, storage on the ground, and open timber platforms, while the long-term
storage methods include storage baskets (cribs), calabashes (pots), jars, solid wall bins,
underground storage, and warehouse systems. The safest and most financially profitable
method appears to be the warehouse storage system. Unfortunately, many farmers are
unable to afford the construction of their own warehouse system. Cooperatives also find
it difficult to establish adequate capital to secure a warehouse storage system. The
warehouse storage system is becoming a profitable venture. During my visit to the Ejura-
Sekyedumase district in 2011, the Pan Africa Food Bank had initiated a warehouse
20
storage system. Space in the facility is rented out to producers in the area. Farmers in the
Ejura-Sekyedumase district are unable to afford the storage rates charged by the facility.
According to the Ghana shippers’ authority, traditionally there are four main types
of warehouses in Ghana: State Warehouses, Government Warehouses, Private Bonded
Warehouses, and Public Warehouses. The grain warehouse storage systems in Ghana are
usually constructed from cement blocks similar to the walls of a house. (Coulter and
Onumah, 2002) explain the warehouse receipts system in Africa as “documents issued by
warehouse operators as evidence that specified commodities of stated quantity and
quality have been deposited at particular locations by named depositors” (Coulter, Sondhi
et al., 2000). Depositors are often producers, traders, processors or farm workers.
The warehouse operators hold the grain stock as security for a loan or trade.
However, there are various limitations to this warehouse storage system. (Coulter and
Onumah, 2002) explained, “users tend to be large operators, who own or can rent entire
warehouses or silos, and can afford fees costing thousands of dollars (US) per month.
Warehouse storage services are not available to farmer groups or traders who wish to
deposit relatively small volumes of a commodity (e.g 50-100ton)” (Coulter, Sondhi et al.,
2000). The average producer is often forced to sell immediately after harvesting due to
high storage costs. The authors further proposed an alternative storage system approach
for Africa, acknowledging that the North America warehouse model may not be
appropriate. Some of the differences discussed include assurance of public regulatory
functions and difficulty of overcoming embezzlement, ensuring financial sustainability
and ensuring that smallholder farmers benefit from the system.
21
CHAPTER III
METHODS
Conceptual Framework
Grain storage offers the potential to provide a consistent supply of grain in the
face of weather and pest related production problems and also enables the capturing of
best prices in the face of within year price volatility. The price inconsistency between
harvest periods allows producers to capture profit from stored grain. Moreover, it is not
financially possible for small-scale famers to take advantage of seasonal increases in
grain prices (Jones et. al 2011). Producers often sell part or all of their harvested grain
directly after harvest because they lack storage capacity, have debts, or face cash
restrictions. Timing of grain sales vary. Ghanaian studies indicate an average storage
period for smallholders of three to four months (Motte et al., 1995). To assist African
grain producers in analyzing the relative merits of grain storage systems as a potential
alternative for economic improvement, a feasibility study has been conducted of two
grain storage systems for a corn producing region in Ghana.
Feasibility Study
A feasibility study is the progression of thinking through a concept, idea or a
business opportunity from start up to complete implementation and allows for a complete
understanding of the potential viability before implementation. The intention of a
feasibility study is to assist in determining if a business opportunity is achievable,
sensible, realistic, and viable. Feasibility studies are conducted in diverse disciplines such
as education, construction, business ventures and other program initiatives. Feasibility

22
studies help venture capitalist, entrepreneurs and investors determine if their proposed
business idea can be profitable.
According to Vincent Amanor-Boadu (2003) a visiting professor and director of
the value-added business development program at Kansas State University, “a feasibility
study or assessment is conducted at three levels. The first level involves operational
feasibility and the question that is asked at this level is “will it work?” The second level
involves technical feasibility and its associated question is “can it be built?” The third and
final level is economic feasibility and it brings the operational and technical levels
together into a common unit by asking “will it make economic sense if it works and it is
built?”
The purpose of a feasibility study varies, but one important role for all feasibility
studies is the identification of the factors that will be important to the success of the
opportunity under study. For example, the construction of centralized grain storage
facility may be feasible in a farming community but infeasible in an area with little or no
production. For this reason, it is essential to understand the environment of the proposed
project. Boadu (2003) further explains that there can be three possible results for a
feasibility study: (1) feasible; (2) feasible with changes; and (3) infeasible, all of which
are identified within market, location, and project context. A good study can cut down on
project development time, and save investors money.
A feasibility study is a significant tool used to aid in making a decision as to
whether or not the proposed venture is viable. For this study, we focus on a grain storage
business venture and analyze the construction process and compare two different storage
systems and the rate of return for each. Six steps in the process are as follows;
23
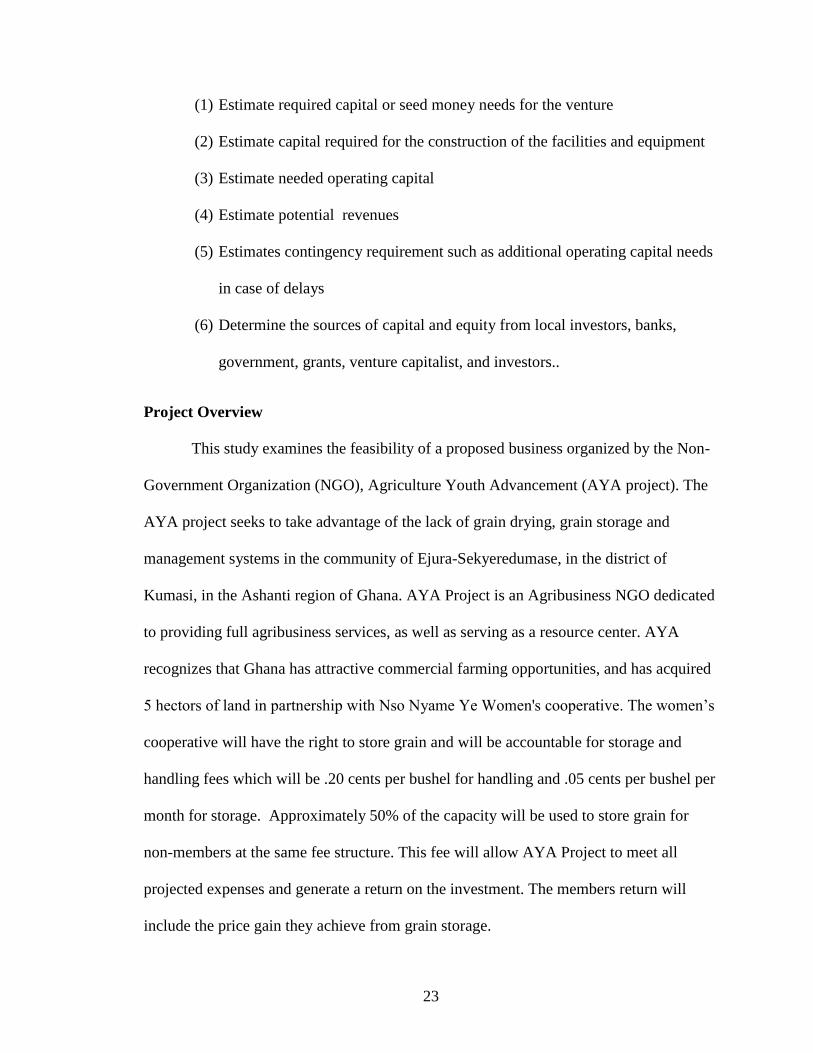
(1) Estimate required capital or seed money needs for the venture
(2) Estimate capital required for the construction of the facilities and equipment
(3) Estimate needed operating capital
(4) Estimate potential revenues
(5) Estimates contingency requirement such as additional operating capital needs
in case of delays
(6) Determine the sources of capital and equity from local investors, banks,
government, grants, venture capitalist, and investors..
Project Overview
This study examines the feasibility of a proposed business organized by the Non-
Government Organization (NGO), Agriculture Youth Advancement (AYA project). The
AYA project seeks to take advantage of the lack of grain drying, grain storage and
management systems in the community of Ejura-Sekyeredumase, in the district of
Kumasi, in the Ashanti region of Ghana. AYA Project is an Agribusiness NGO dedicated
to providing full agribusiness services, as well as serving as a resource center. AYA
recognizes that Ghana has attractive commercial farming opportunities, and has acquired
5 hectors of land in partnership with Nso Nyame Ye Women's cooperative. The women’s
cooperative will have the right to store grain and will be accountable for storage and
handling fees which will be .20 cents per bushel for handling and .05 cents per bushel per
month for storage. Approximately 50% of the capacity will be used to store grain for
non-members at the same fee structure. This fee will allow AYA Project to meet all
projected expenses and generate a return on the investment. The members return will
include the price gain they achieve from grain storage.
24
This study investigates the profitability of a grain storage venture proposed by the
AYA Project. The venture is in partnership with Nso Nyame Ye Women’s cooperative..
This study begins by examining the cost and returns of two grain storage facilities in the
Ejura – Sekyereduamase district. The costs and returns are then used to project the net
income, cash flow, and return on investment of the grain storage systems. The goal of
developing the grain storage facility is to assist local producers in achieving higher grain
prices and expand their market opportunities. Finally, a sensitivity analysis is conducted
to evaluate the potential variation in returns of the grain storage systems as prices and
costs vary over time.
25
Grain Storage Venture
A joint venture between AYA project and the Nso Nyame Ye Women’s
Cooperative will allow the cooperative’s producers to access grain storage at a lower
price and provide an opportunity to centralize grain storage management and gain market
access as well as provide a stable infrastructure for further business opportunities. The
proposed grain storage venture will operate under a limited liability company (LLC). The
Cooperative’s fifty farmer members will purchase shares in the LLC and receive storage
rights based on the capital they provide. AYA Project LLC will raise the capital needed
for construction of the grain storage facility and will also hire two full time employees to
manage the grain inventory. In addition to having the rights to store grain, each
member/owner will be accountable for storage and handling fees connected to their level
of production capacity. It should be clear that each member/owner is also responsible for
these fees whether they use the facility or not. It is expected that approximately 50% of
the storage facility will handle and store grain from non-members at a structured fee.
Fees and cash flow projections reflect expenditures at the end of year five.
Description of the Facilities
Two grain storage facilities are evaluated, a flat in-bin dryer storage system (dries
and stores grain in bulk) and warehouse storage systems (grain is dried, bag, and stored).
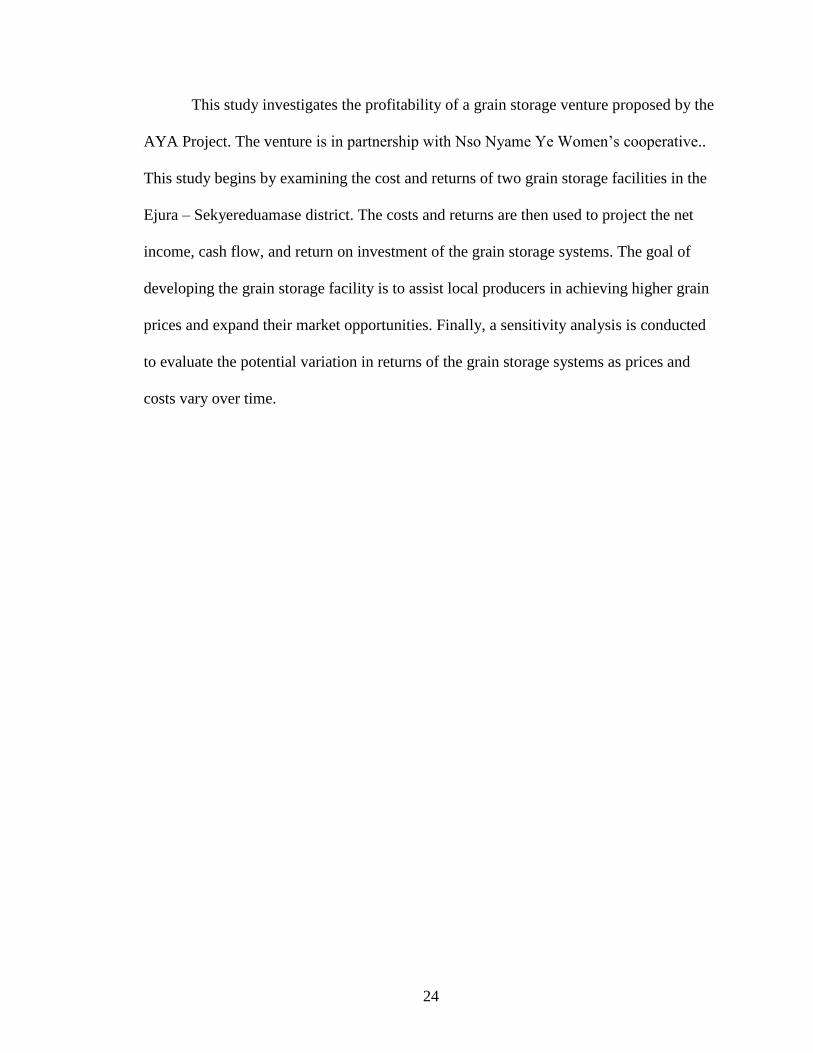
In-bin dryer and storage system: Flat Storage
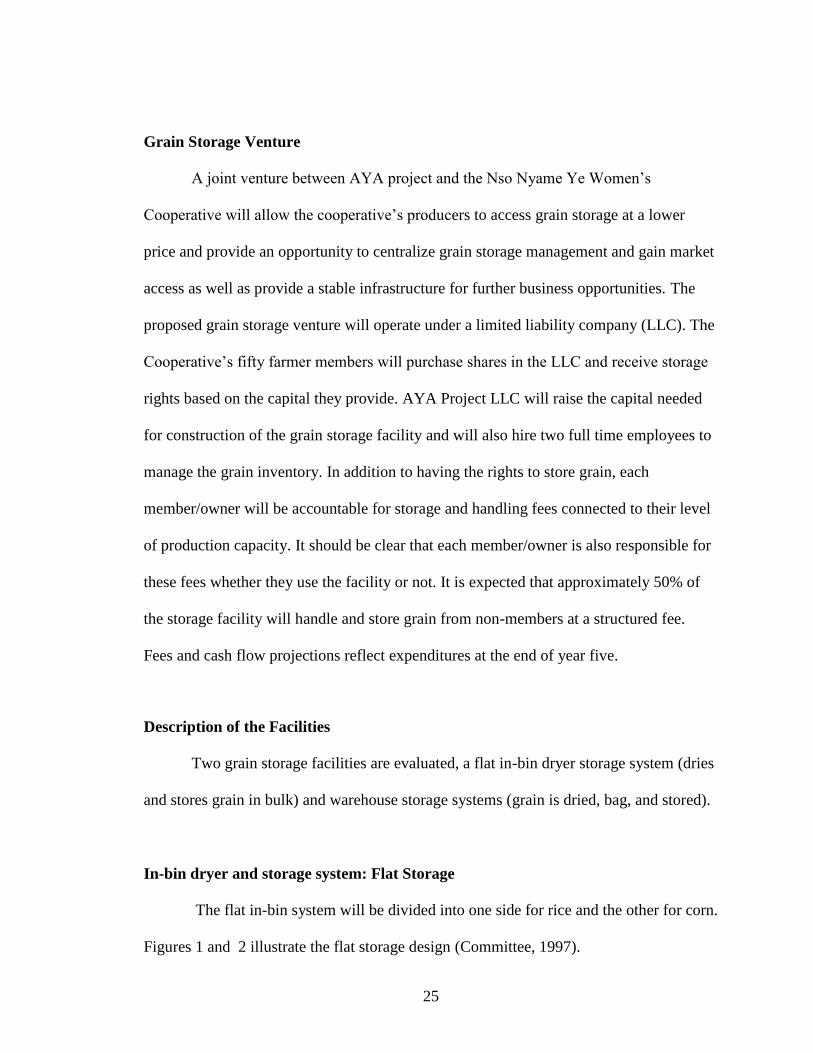
The flat in-bin system will be divided into one side for rice and the other for corn.
Figures 1 and 2 illustrate the flat storage design (Committee, 1997).
26
The concrete flat, in-bin facility will have the capacity to dry and store 800,000kg
of grain. The in-bin storage facility will have a low temperature bin dryer and solar heat
will be used as a source of energy to reduce energy costs. The in-bin solar dryer can
manage low temperature and maintain low moisture to lower spoilage. The solar dryer
provides a feasible alternative when gas/diesel is not available. Figure 1 shows an
example of an in-bin grain dryer and storage system. In this example the grain will be
dried in bulk and stored in a controlled environment, this will also help to maintain its
grain quality.
Figure 1: (Committee, 1997)
27
Figure 2: (Committee, 1997)
28
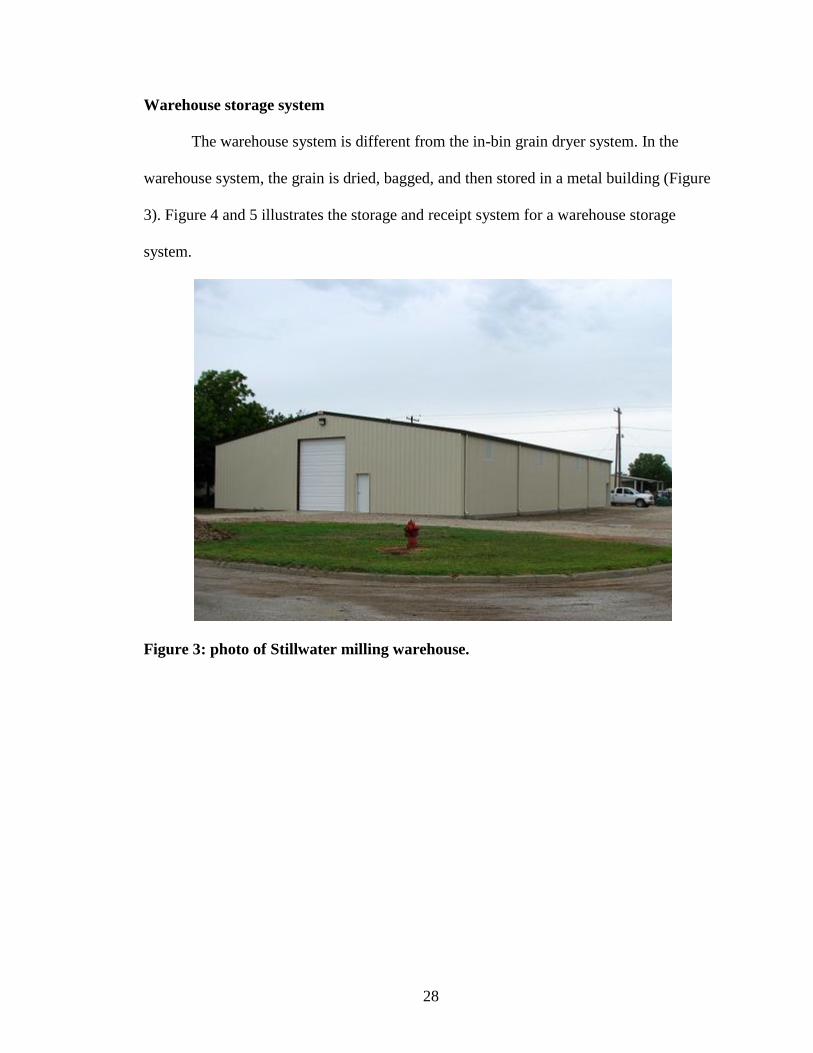
Warehouse storage system
The warehouse system is different from the in-bin grain dryer system. In the
warehouse system, the grain is dried, bagged, and then stored in a metal building (Figure
3). Figure 4 and 5 illustrates the storage and receipt system for a warehouse storage
system.
Figure 3: photo of Stillwater milling warehouse.

29
Figure 4: photo of grain warehouse in Ejura- Sekyedumase in Ghana.
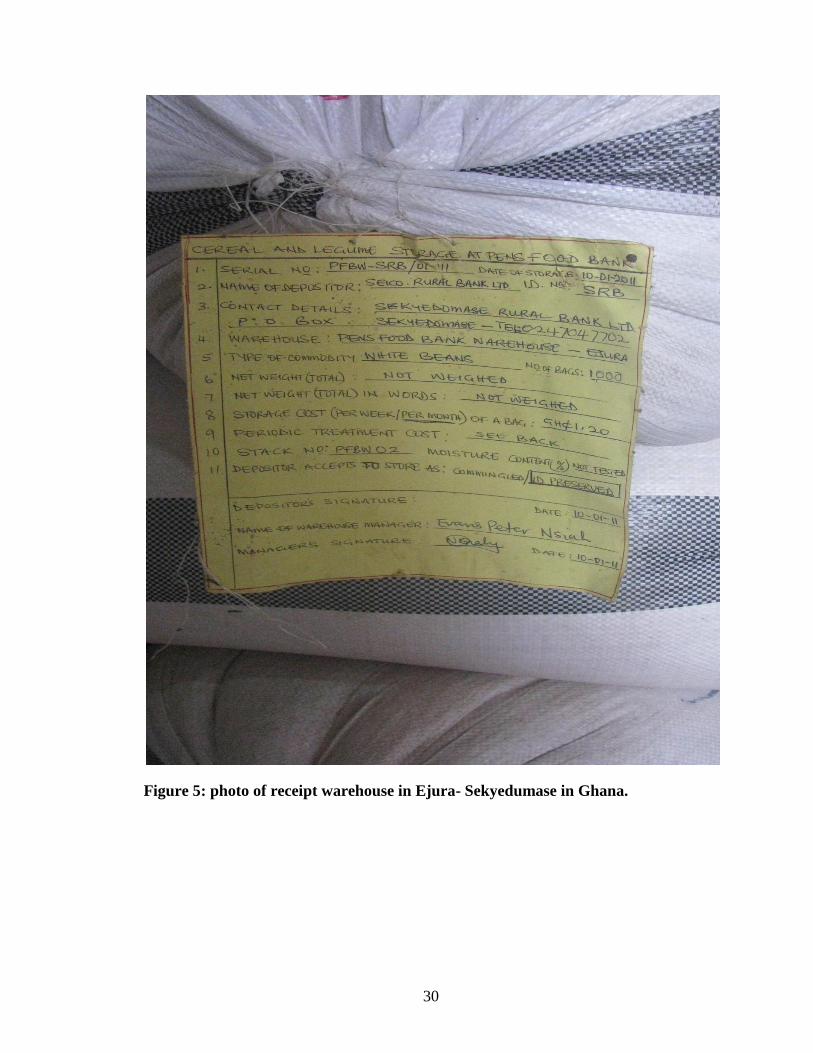
30
Figure 5: photo of receipt warehouse in Ejura- Sekyedumase in Ghana.
31
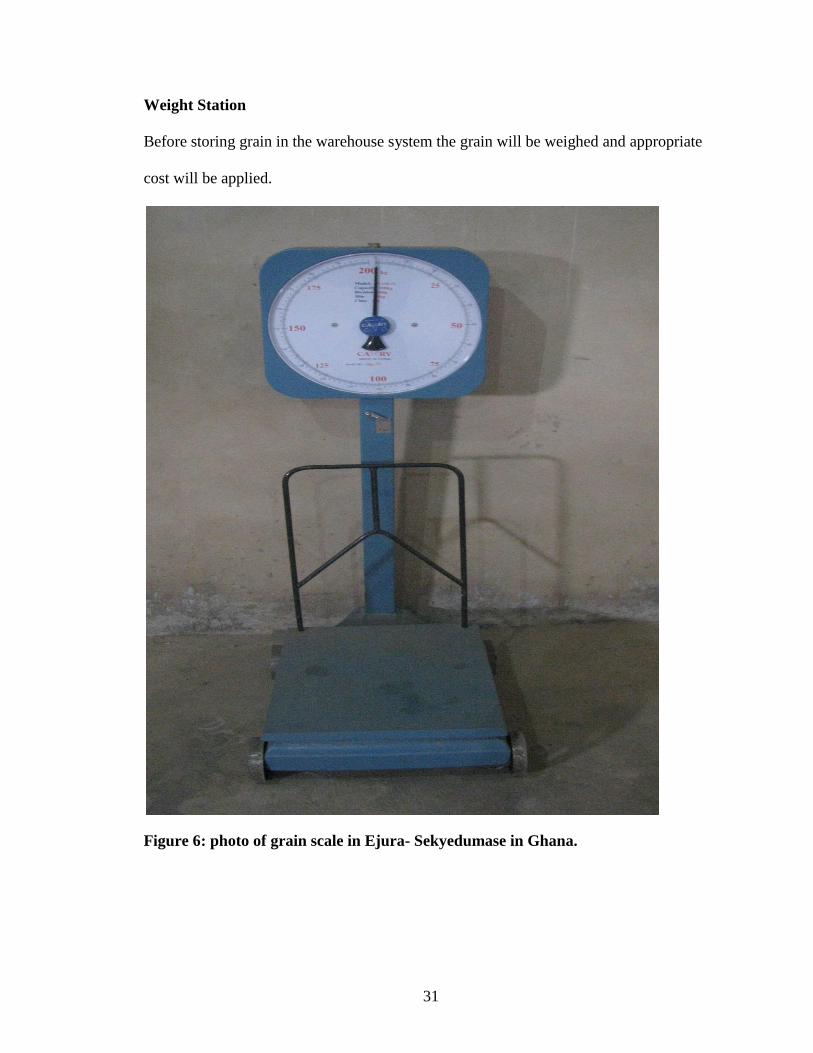
Weight Station
Before storing grain in the warehouse system the grain will be weighed and appropriate
cost will be applied.
Figure 6: photo of grain scale in Ejura- Sekyedumase in Ghana.
32
Model Assumptions
A feasibility template was constructed using Microsoft Excel to project the cost
and returns of construction and operation of alternative grain storage systems. Some of
the information for the assumptions was obtained through personal email
communications with Mr. Evans Peters of Pens Food Bank LLC in the Ejura-
Sekyedumase district. The structure of the feasibility template was based on a feasibility
assessment template developed for the Agriculture Marketing Resource Center by Dr.
Philip Kenkel and Dr. Rodney Holcomb at Oklahoma State University. The completed
template contains twelve worksheets of inputs and outputs including worksheets on
capital, capacity, storage cost, grain buying and selling prices, personnel and equipment
expenses,
The user of the template supplies the required information to generate the
financial calculations. The calculations include input values, grain drying, shrinkage,
drying cost, market and expense projections, loan amortization, personnel expenses,
statement of operations, owners equity, equipment and depreciation, return on
investment, owners return, and a balance sheet, all of which were calculated for a ten year
period. Detailed explanations of each of the worksheets are provided below.
Input Value
The Input Value sheet can be downloaded and reviewed for additional directions
on how to use the template. The template is intended to support the feasibility assessment
of various projects. The “input value sheet” contains a basic set of parameters such as the
storage capacity, the anticipated amount of stored grain, grain prices, storage price, and
33
marketing prices. In addition, the amount of shrinkage, grain drying, and grain drying
costs, personnel expenses, equipment expenses and depreciation are determined.
Shrinkage
Shrinkage is calculated as:
Shrinkage = 100% - % Dry matter Wet grain / % Dry Matter Dry Grain X 100 + .5%
After calculating shrinkage and inputting initial grain volume the total grain volume can
be determined (after the water is removed from the grain). The shrinkage calculations
were used to determine the actual amount of grain marketed which was less than the
amount purchased from the producers. In addition to the moisture shrinkage described
above, an additional 1% shrinkage from handling was assumed.
Drying Cost
This sheet allows the user to input values specific to their use. Aeration cost was modeled
for both an electric system and a direct drive diesel system with the costs based on the
required horse power and either KW/hour or diesel fuel consumption per hour. The
supplemental heat for drying was assumed to come from a fuel oil burner and the fuel oil
consumption was based on the BTUs required per gallon, number of gallons required and
the cost per kilogram for the fuel. Options are available for various sources of energy to
allow for scenarios with different energy sources or situations. The baseline assumptions
for drying include;
Beginning moisture of 28%
Ending moisture of 13%
34
Diesel motor for the fans (under the assumption that the local electrical
distribution system could not support the required starting load for the fan
motors)
Depreciation Expense
This sheet includes detailed cost estimates for the construction of an in-bin grain
storage system and a warehouse storage system. This sheet enables the user to choose
between an in-bin storage system and warehouse storage system. The vehicles and
equipment associated with each system are also included. The grain storage system was
valued at $89,500 and was depreciated over ten years using the modified accelerated cost
recovery system method (MACRS). The depreciable assets used for calculation includes
the cost of construction, bricks, woods, cement, design and consultancy costs, wiring,
augers, fans, conveyers, light trucks and vehicles. Buildings are deprecated on a 39 year
straight line, special purpose buildings are deprecated on a 10 year straight line,
equipment, heavy rolling stock are depreciated on a 7 year life, and light trucks and
vehicles are deprecated on a 5 year life all using the MACRS. In addition, the template
assumed that additional investments will be made for upgrades and replacements in the
3rd
, 6th
and 9th
year the assumption is based on a percentage of the original equipment
investment.
Personnel Expenses
This sheet includes adjustable personnel expenses for various positions, the
number of personnel, salary, benefits and overtime percentage. Personnel costs were
35
based on full time employees that consist of a general manager, secretary, and staff that
will be employed year round. Taxes and benefits were estimated at 15% of salary
expense. A 2% annual inflation rate was applied to personnel costs including benefits.
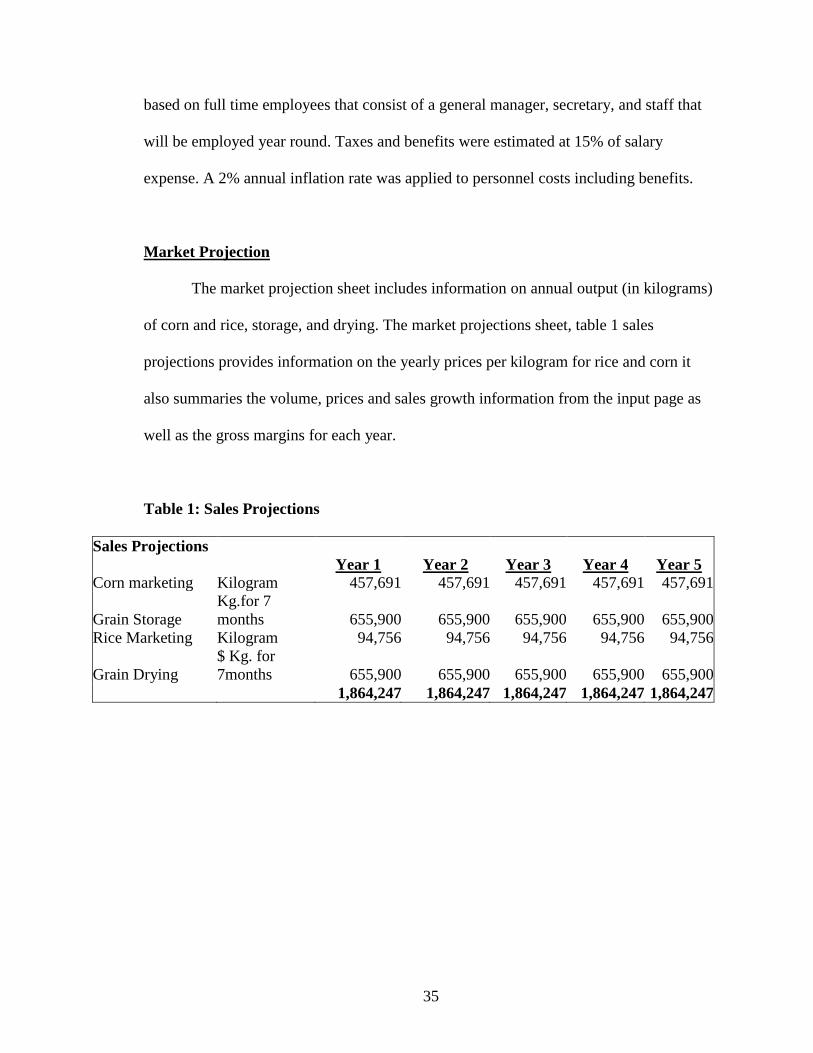
Market Projection
The market projection sheet includes information on annual output (in kilograms)
of corn and rice, storage, and drying. The market projections sheet, table 1 sales
projections provides information on the yearly prices per kilogram for rice and corn it
also summaries the volume, prices and sales growth information from the input page as
well as the gross margins for each year.
Table 1: Sales Projections
Sales Projections
Year 1 Year 2 Year 3 Year 4 Year 5
Corn marketing Kilogram 457,691 457,691 457,691 457,691 457,691
Grain Storage
Kg.for 7
months 655,900 655,900 655,900 655,900 655,900
Rice Marketing Kilogram 94,756 94,756 94,756 94,756 94,756
Grain Drying
$ Kg. for
7months 655,900 655,900 655,900 655,900 655,900
1,864,247 1,864,247 1,864,247 1,864,247 1,864,247
36
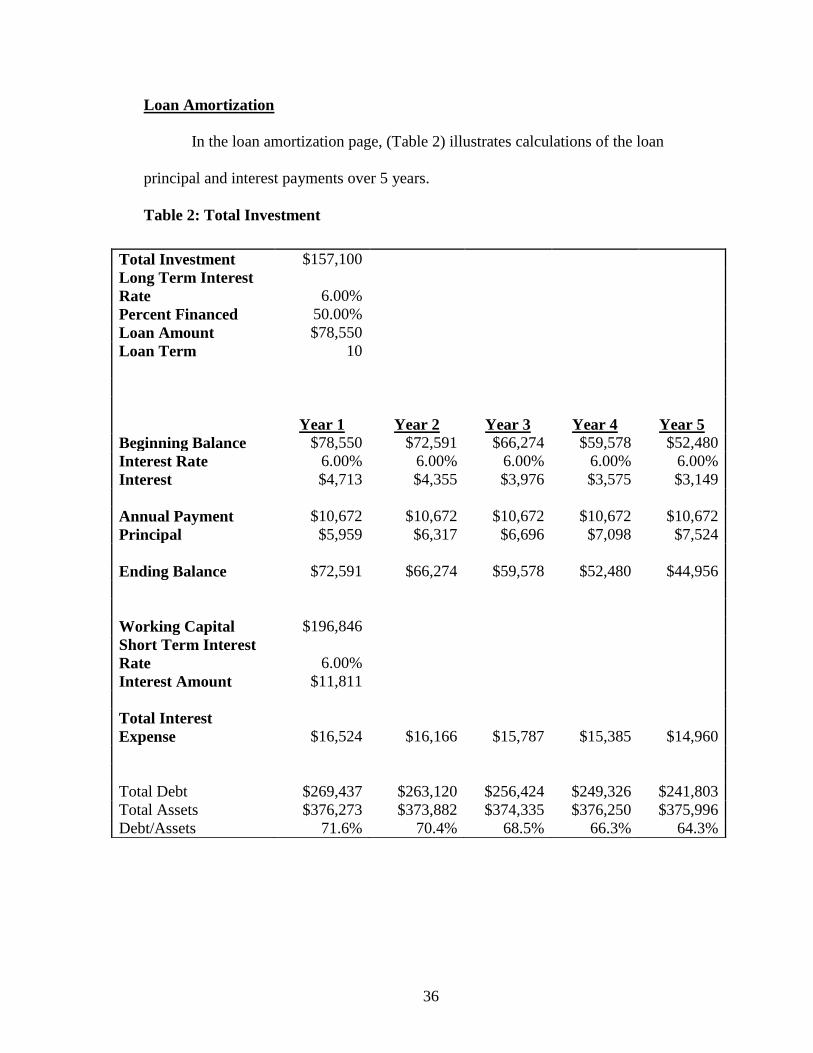
Loan Amortization
In the loan amortization page, (Table 2) illustrates calculations of the loan
principal and interest payments over 5 years.
Table 2: Total Investment
Total Investment $157,100
Long Term Interest
Rate 6.00%
Percent Financed 50.00%
Loan Amount $78,550
Loan Term 10
Year 1 Year 2 Year 3 Year 4 Year 5
Beginning Balance $78,550 $72,591 $66,274 $59,578 $52,480
Interest Rate 6.00% 6.00% 6.00% 6.00% 6.00%
Interest $4,713 $4,355 $3,976 $3,575 $3,149
Annual Payment $10,672 $10,672 $10,672 $10,672 $10,672
Principal $5,959 $6,317 $6,696 $7,098 $7,524
Ending Balance $72,591 $66,274 $59,578 $52,480 $44,956
Working Capital $196,846
Short Term Interest
Rate 6.00%
Interest Amount $11,811
Total Interest
Expense $16,524 $16,166 $15,787 $15,385 $14,960
Total Debt $269,437 $263,120 $256,424 $249,326 $241,803
Total Assets $376,273 $373,882 $374,335 $376,250 $375,996
Debt/Assets 71.6% 70.4% 68.5% 66.3% 64.3%
37
Expense Projection
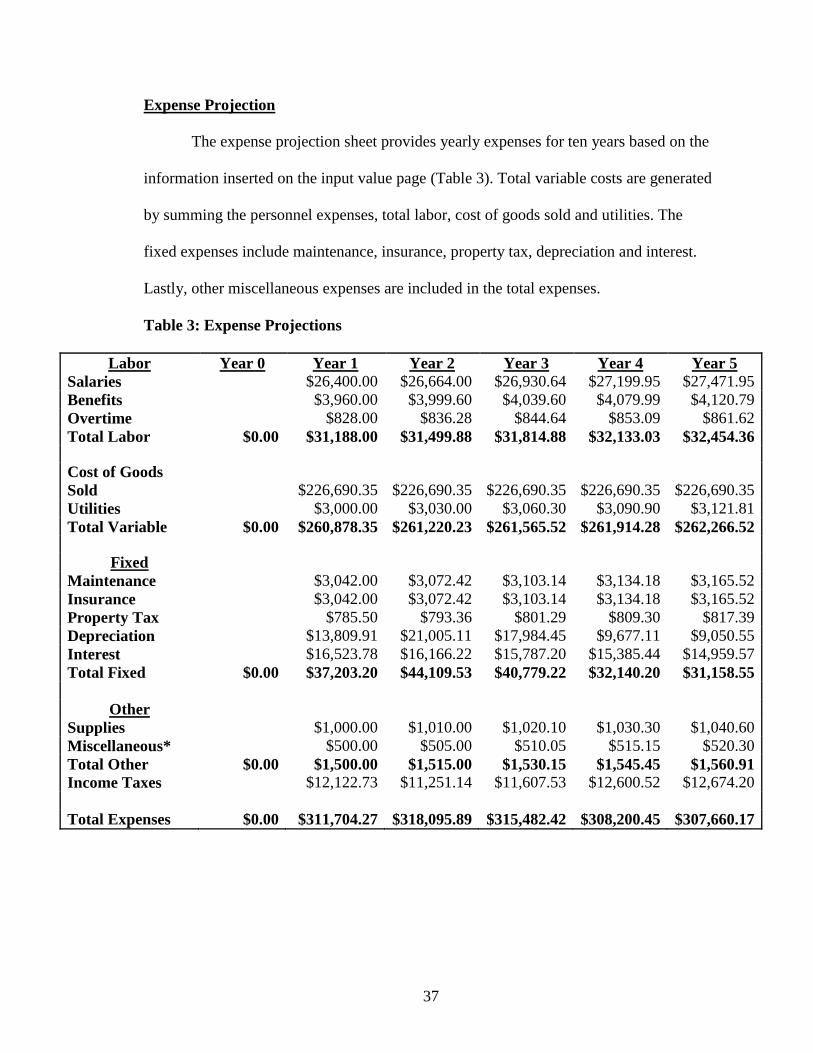
The expense projection sheet provides yearly expenses for ten years based on the
information inserted on the input value page (Table 3). Total variable costs are generated
by summing the personnel expenses, total labor, cost of goods sold and utilities. The
fixed expenses include maintenance, insurance, property tax, depreciation and interest.
Lastly, other miscellaneous expenses are included in the total expenses.
Table 3: Expense Projections
Labor Year 0 Year 1 Year 2 Year 3 Year 4 Year 5
Salaries
$26,400.00 $26,664.00 $26,930.64 $27,199.95 $27,471.95
Benefits
$3,960.00 $3,999.60 $4,039.60 $4,079.99 $4,120.79
Overtime
$828.00 $836.28 $844.64 $853.09 $861.62
Total Labor $0.00 $31,188.00 $31,499.88 $31,814.88 $32,133.03 $32,454.36
Cost of Goods
Sold
$226,690.35 $226,690.35 $226,690.35 $226,690.35 $226,690.35
Utilities
$3,000.00 $3,030.00 $3,060.30 $3,090.90 $3,121.81
Total Variable $0.00 $260,878.35 $261,220.23 $261,565.52 $261,914.28 $262,266.52
Fixed
Maintenance
$3,042.00 $3,072.42 $3,103.14 $3,134.18 $3,165.52
Insurance
$3,042.00 $3,072.42 $3,103.14 $3,134.18 $3,165.52
Property Tax
$785.50 $793.36 $801.29 $809.30 $817.39
Depreciation
$13,809.91 $21,005.11 $17,984.45 $9,677.11 $9,050.55
Interest
$16,523.78 $16,166.22 $15,787.20 $15,385.44 $14,959.57
Total Fixed $0.00 $37,203.20 $44,109.53 $40,779.22 $32,140.20 $31,158.55
Other
Supplies
$1,000.00 $1,010.00 $1,020.10 $1,030.30 $1,040.60
Miscellaneous*
$500.00 $505.00 $510.05 $515.15 $520.30
Total Other $0.00 $1,500.00 $1,515.00 $1,530.15 $1,545.45 $1,560.91
Income Taxes
$12,122.73 $11,251.14 $11,607.53 $12,600.52 $12,674.20
Total Expenses $0.00 $311,704.27 $318,095.89 $315,482.42 $308,200.45 $307,660.17
38
Summary of Revenues, Expenses and Cash Flows
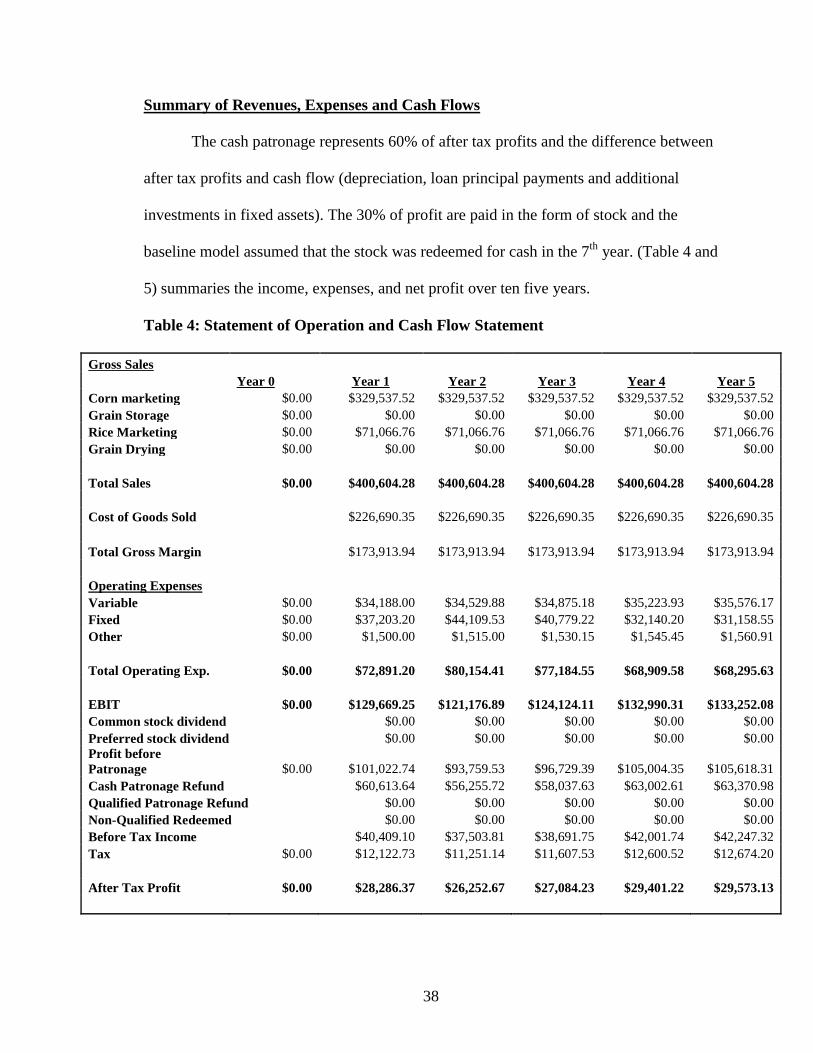
The cash patronage represents 60% of after tax profits and the difference between
after tax profits and cash flow (depreciation, loan principal payments and additional
investments in fixed assets). The 30% of profit are paid in the form of stock and the
baseline model assumed that the stock was redeemed for cash in the 7th
year. (Table 4 and
5) summaries the income, expenses, and net profit over ten five years.
Table 4: Statement of Operation and Cash Flow Statement
Gross Sales
Year 0 Year 1 Year 2 Year 3 Year 4 Year 5
Corn marketing $0.00 $329,537.52 $329,537.52 $329,537.52 $329,537.52 $329,537.52
Grain Storage $0.00 $0.00 $0.00 $0.00 $0.00 $0.00
Rice Marketing $0.00 $71,066.76 $71,066.76 $71,066.76 $71,066.76 $71,066.76
Grain Drying $0.00 $0.00 $0.00 $0.00 $0.00 $0.00
Total Sales $0.00 $400,604.28 $400,604.28 $400,604.28 $400,604.28 $400,604.28
Cost of Goods Sold
$226,690.35 $226,690.35 $226,690.35 $226,690.35 $226,690.35
Total Gross Margin
$173,913.94 $173,913.94 $173,913.94 $173,913.94 $173,913.94
Operating Expenses
Variable $0.00 $34,188.00 $34,529.88 $34,875.18 $35,223.93 $35,576.17
Fixed $0.00 $37,203.20 $44,109.53 $40,779.22 $32,140.20 $31,158.55
Other $0.00 $1,500.00 $1,515.00 $1,530.15 $1,545.45 $1,560.91
Total Operating Exp. $0.00 $72,891.20 $80,154.41 $77,184.55 $68,909.58 $68,295.63
EBIT $0.00 $129,669.25 $121,176.89 $124,124.11 $132,990.31 $133,252.08
Common stock dividend $0.00 $0.00 $0.00 $0.00 $0.00
Preferred stock dividend $0.00 $0.00 $0.00 $0.00 $0.00
Profit before
Patronage $0.00 $101,022.74 $93,759.53 $96,729.39 $105,004.35 $105,618.31
Cash Patronage Refund $60,613.64 $56,255.72 $58,037.63 $63,002.61 $63,370.98
Qualified Patronage Refund $0.00 $0.00 $0.00 $0.00 $0.00
Non-Qualified Redeemed $0.00 $0.00 $0.00 $0.00 $0.00
Before Tax Income
$40,409.10 $37,503.81 $38,691.75 $42,001.74 $42,247.32
Tax $0.00 $12,122.73 $11,251.14 $11,607.53 $12,600.52 $12,674.20
After Tax Profit $0.00 $28,286.37 $26,252.67 $27,084.23 $29,401.22 $29,573.13
39
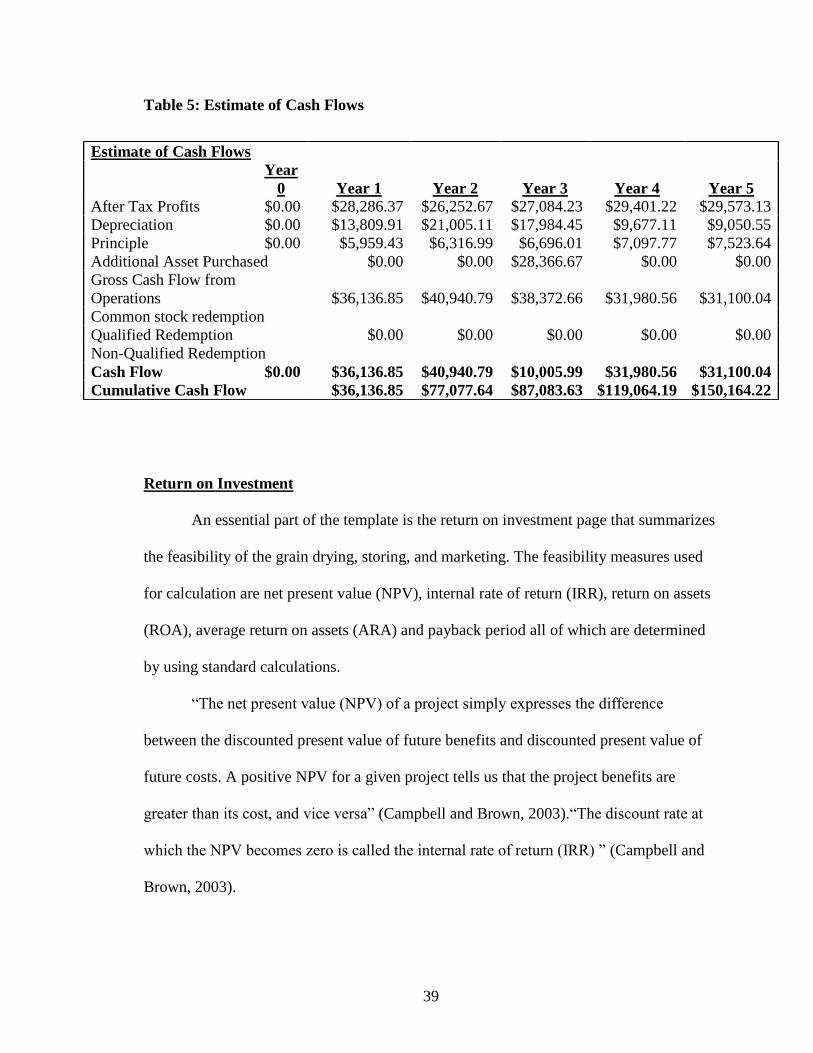
Table 5: Estimate of Cash Flows
Return on Investment
An essential part of the template is the return on investment page that summarizes
the feasibility of the grain drying, storing, and marketing. The feasibility measures used
for calculation are net present value (NPV), internal rate of return (IRR), return on assets
(ROA), average return on assets (ARA) and payback period all of which are determined
by using standard calculations.
“The net present value (NPV) of a project simply expresses the difference
between the discounted present value of future benefits and discounted present value of
future costs. A positive NPV for a given project tells us that the project benefits are
greater than its cost, and vice versa” (Campbell and Brown, 2003).“The discount rate at
which the NPV becomes zero is called the internal rate of return (IRR) ” (Campbell and
Brown, 2003).
Estimate of Cash Flows
Year
0 Year 1 Year 2 Year 3 Year 4 Year 5
After Tax Profits $0.00 $28,286.37 $26,252.67 $27,084.23 $29,401.22 $29,573.13
Depreciation $0.00 $13,809.91 $21,005.11 $17,984.45 $9,677.11 $9,050.55
Principle $0.00 $5,959.43 $6,316.99 $6,696.01 $7,097.77 $7,523.64
Additional Asset Purchased $0.00 $0.00 $28,366.67 $0.00 $0.00
Gross Cash Flow from
Operations $36,136.85 $40,940.79 $38,372.66 $31,980.56 $31,100.04
Common stock redemption
Qualified Redemption
$0.00 $0.00 $0.00 $0.00 $0.00
Non-Qualified Redemption
Cash Flow $0.00 $36,136.85 $40,940.79 $10,005.99 $31,980.56 $31,100.04
Cumulative Cash Flow $36,136.85 $77,077.64 $87,083.63 $119,064.19 $150,164.22
40
“Return on assets (ROA) should be determined at both book value and fair market value.,
ROA at fair market value represents the percentage return on the average total resale
value that is estimated for all assets involved in the business during a particular year”
(Ferguson, 1990). ROA at book value represents the percentage return on the actual cost
of all assets involved in the business during a particular year (Ferguson, 1990) ROA is
an accounting based concept and is calculated as after tax income divided by the book (or
fair market) value of assets. Because ROA is impacted by accounting conventions and it
does not consider the time value of money it is generally less preferred relative to internal
rate of return IRR. Lastly, the payback period represents the number of years required for
the project’s cash flow to equal the original investment. The major disadvantage with the
payback method is that it does consider cash flows past; the payback period does not
reflect the timing of the cash flows. It is often used as a simple, initial measure of
feasibility. Because the cash flows were determined in our model on an annual basis the
payback period was only calculated in whole year increments.
Sensitivity Analysis
According to Breierova and Choudhari (1996) “Sensitivity analysis is used to
determine how “sensitive” a model is to changes in the value of the parameters of the
model and to changes in the structure of the model. For the purpose of this feasibility
study a sensitivity analysis was conducted to project the outcome of change in
commodity prices, storage price, and drying prices. The sensitivity analysis includes
projections for the price for corn, cost of corn storage, cost of corn drying, rice prices,
cost of rice storage, and cost of rice drying. The feasibility template was used to estimate
the returns on investment for each sensitivity scenario. The internal rate of return (IRR),
41
net present value (NPV), return on assets (ROA), and payback period were calculated to
measure return on investments. The sensitivity of return on investment for corn price,
cost of corn storage, cost of corn drying, rice price, cost of rice storage, and cost of rice
drying were performed for all the six scenarios. It’s important to note that irrespective of
the scenario the baseline value of internal rate of return (IRR), net present value (NPV),
return on assets (ROA) and payback period remain constant. Details of the sensitivity
analysis for the in-bin storage system and the warehouse storage system and are
discussed in a subsequent section.
General Assumptions
The basic assumption for the preliminary feasibility estimates are provided in
Table 5. The model illustrates a group grain storage operation storing 800,000 Kilogram.
543,000 kilogram of corn and 112,500 bushels of rice harvest was assumed to be
produced during the two harvest seasons in Ghana, the major season (August- October)
and the minor season (January- February), with the grain drying process being completed
within a 3 week period.
The assumption table depicts 50% financing with a total project cost of $157,100.
A loan term of 10 years and interest rate of 6% were used in projecting interest and
principal payment requirements. It was also assumed that the grain storage LLC has no
line of credit needed for the start-up or any expenses and thus 100% of the expenses will
be financed. Moreover, payments for member’s grain will be postponed until the LLC
generates income from grain sales, a line of credit will be needed to purchase grain from
non-members. This short term credit line is further explained in the 36 months cash flow
projection. The maximum working capital required is $123,029.
42
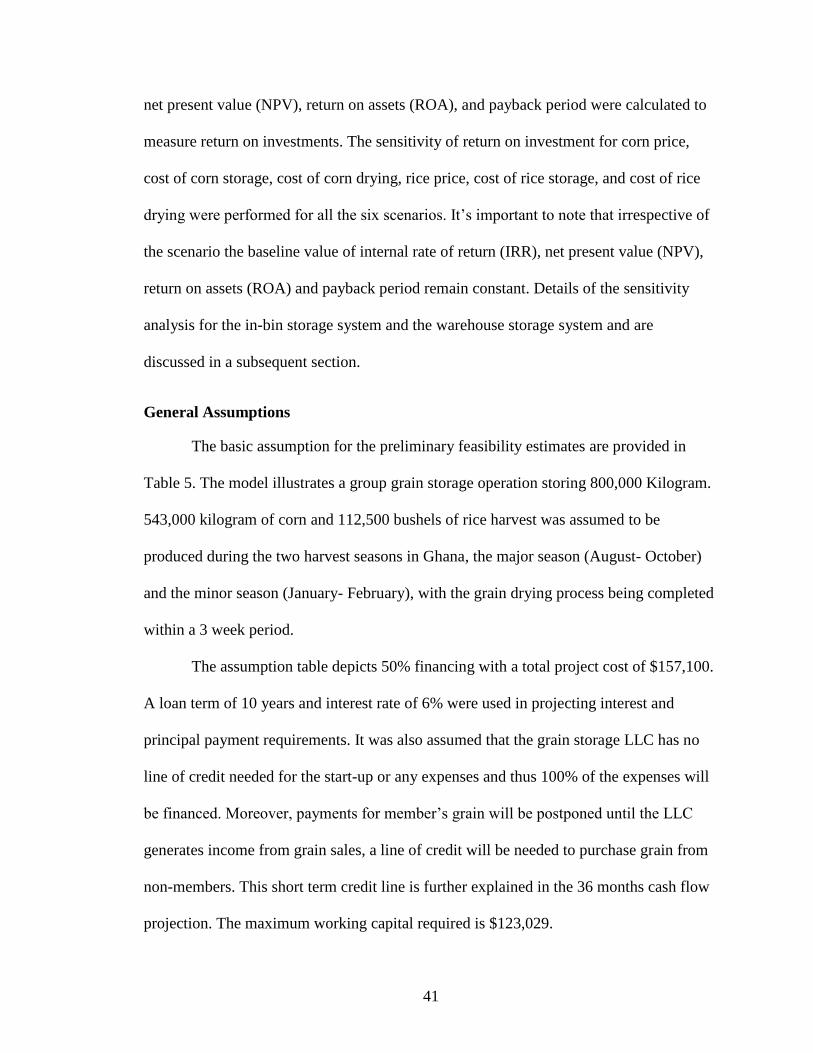
Grain Handling Cost and Revenue Assumptions
The projections were based on an annual storage of 655,900 kilogram; 543,400 of
corn and 112,500 of rice. An average weight loss due to handling (shrinkage) of 15% and
handling shrinkage at 1% moisture loss, turning and aeration costs were estimated at
$.003 per kilo at a corn price of $0.37 per kg, rice price at $ 0.40 per kilo and cost of
handling and storage is assumed to be $0.13 per kilo. Table 6; below summaries the
baseline assumptions for the feasibility study.
Table 6: Baseline Assumptions for Feasibility Study and Business Plan
Capacity- kilogram 800,000
Facility cost $157,100
Maintenance % of facility cost 2%
Property tax % of facility cost 0.50%
Insurance % of facility cost 2.00%
Percent financed 50%
Interest rate 10%
Loan term-Years 10.0
Initial working capital $100,000
Maximum working capital $123,029
Average working capital $50,000
Start-up and contingency cost $5,000
Short term interest rate 6%
Telephone & internet- per year $100
Electricity- office &Lighting per year $100
Benefits as % of salary 15%
Expense inflation rate 1%
Wage inflation rate 1%
% Member Business 50%
% Profits Retained 40%
43
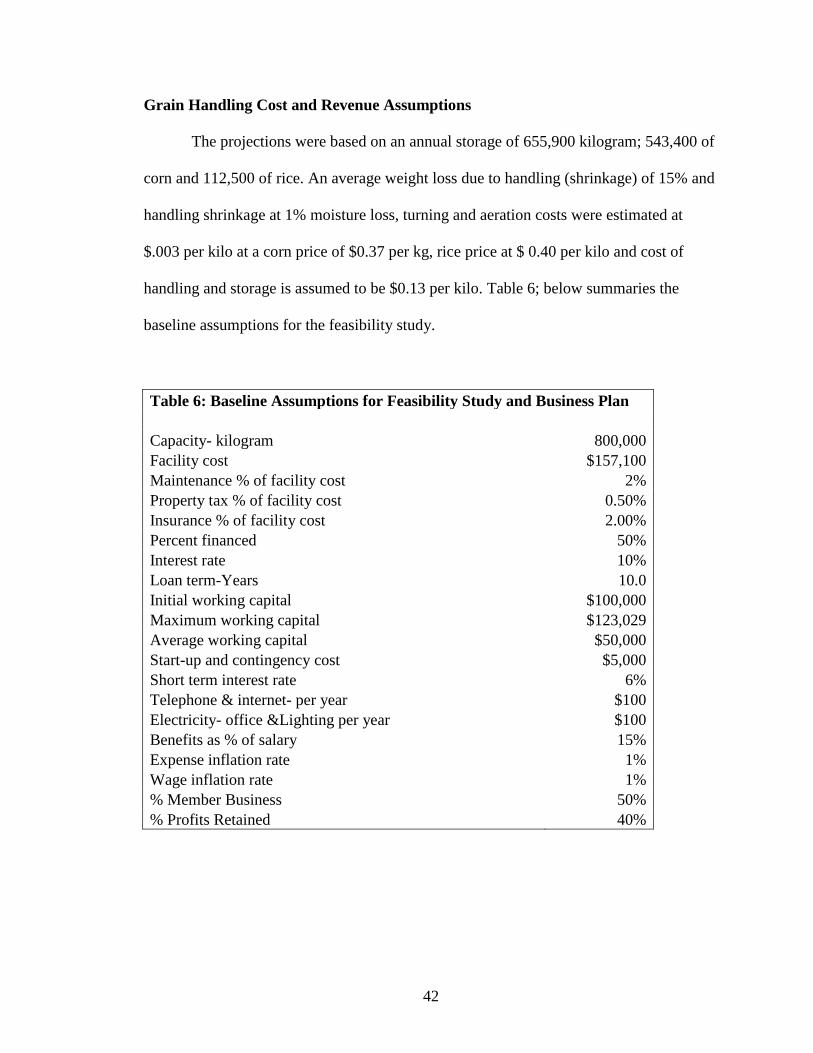
Grain Drying
. Under the grain storage LLC the members will not be charged for drying, the
expense will be absorbed by the cooperative out of their margin between the harvest and
final sale price. For the purpose of this study we can assume that dryer charges are
$.05/point of moisture with dryer operating cost at $0.13/kilo per point of moisture. It is
projected that dryer operating cost is an additional source of income for the AYA Project,
while seasonal labor cost will reflected in the personnel expenses. Interest expenses and
loan principal payments are summarized in (Table 7); the loan was amortized over 10
year period, the 5 year depreciation is illustrated below.
Table 7: Annual Total Depreciation
Annual Total Depreciation
Year 1 2 3 4 5
Buildings $2,295 $2,295 $2,295 $2,295 $2,295
Special Purpose Buildings $0 $0 $0 $0 $0
Equipment and Heavy Rolling Stock $2,515 $4,310 $3,078 $2,198 $1,572
Light Truck and Vehicles $9,000 $14,400 $8,640 $5,184 $5,184
Additional Depreciation 0 0 3971.333333 0 0
Total Depreciation $13,810 $21,005 $17,984 $9,677 $9,051
Buildings 39 year Straight Line
Special Purpose Buildings
10 year with percentage from
table
Equipment and Heavy Rolling
Stock
7 year with percentage from
table
Light Trucks and Vehicles
5 year with percentage from
table
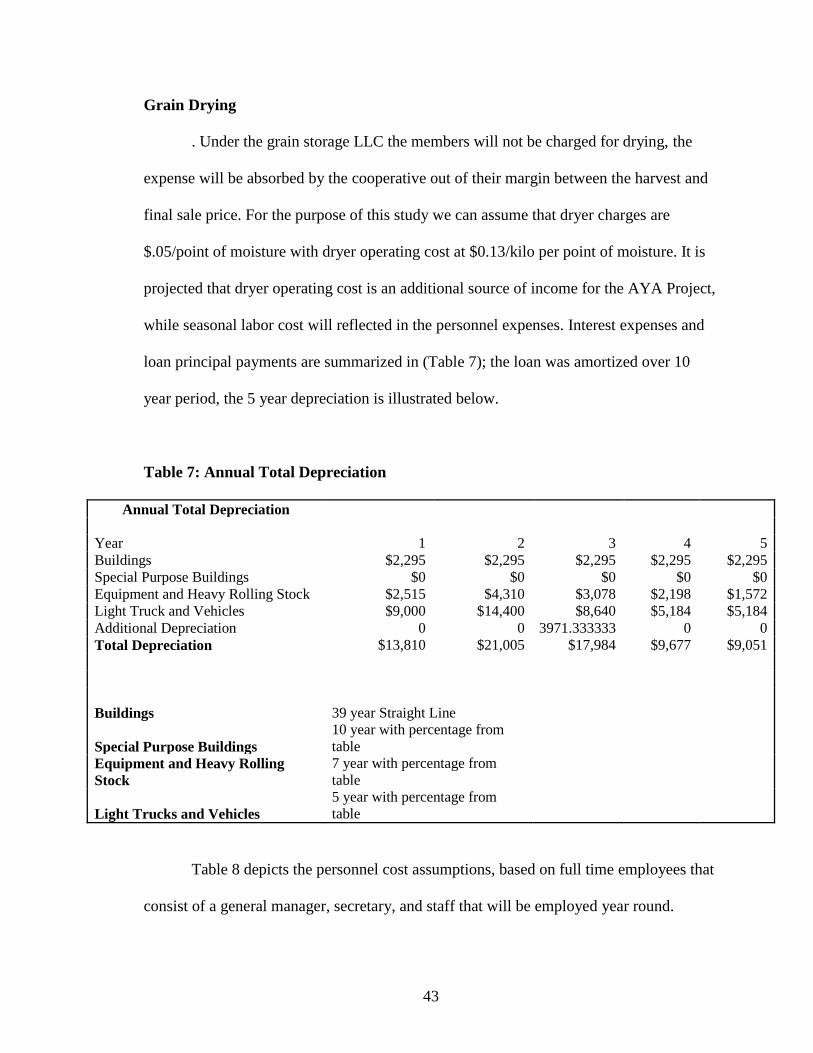
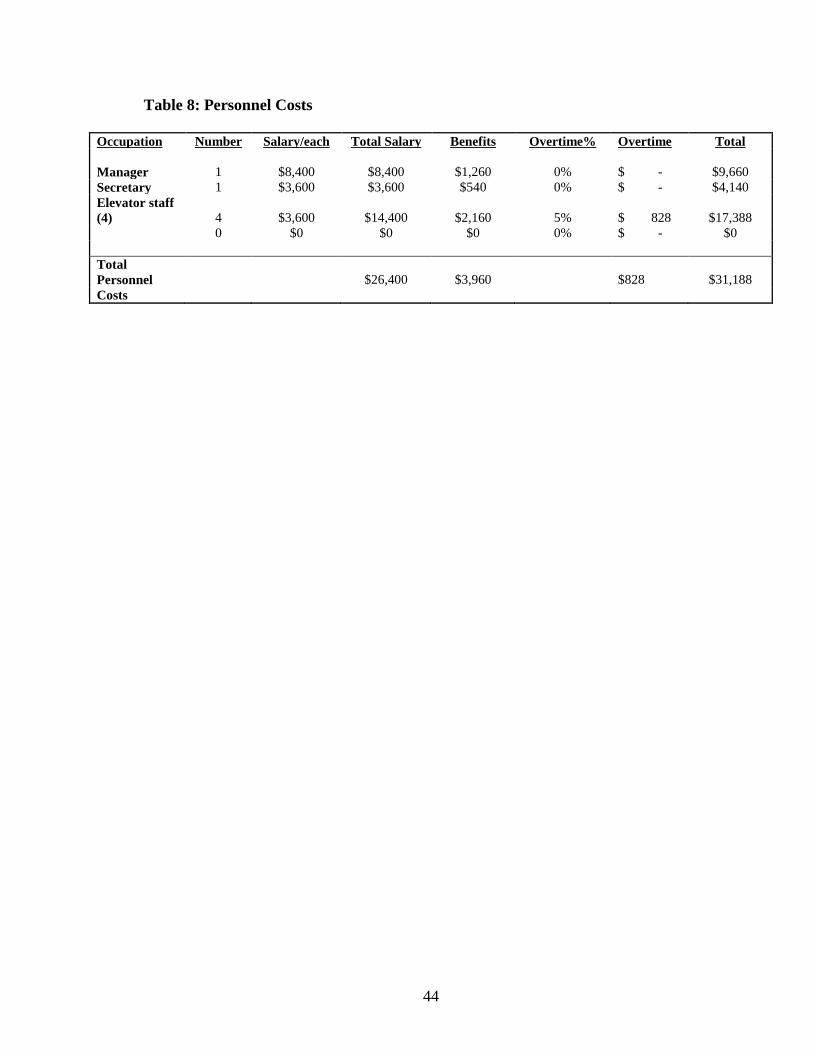
Table 8 depicts the personnel cost assumptions, based on full time employees that
consist of a general manager, secretary, and staff that will be employed year round.
44
Table 8: Personnel Costs
Occupation Number Salary/each Total Salary Benefits Overtime% Overtime Total
Manager 1 $8,400 $8,400 $1,260 0% $ - $9,660
Secretary 1 $3,600 $3,600 $540 0% $ - $4,140
Elevator staff
(4) 4 $3,600 $14,400 $2,160 5% $ 828 $17,388
0 $0 $0 $0 0% $ - $0
Total
Personnel
$26,400 $3,960
$828 $31,188
Costs

45
CHAPTER IV
RESULTS
Storage Cost Comparison
The ware house system (current technology) appears more expensive than the in-
bin system and is labor intensive. On the other hand the in-bin system (improved
technology) is considerable cheaper to construct with value added end product and less
labor is required (Table 9).
Table 9: Storage Cost Comparison
Buildings Description
In-Bin System Warehouse System
Storage facility cost
$ 64,000 $ 80,100
Design and consultancy
cost
$ 10,000 $ 10,000
Construction cost
$ 8,000 $ 8,000
Labor
$ 0
$ 7,500
Dryer bin
$ 7,500 $ 0
Total Buildings
$ 89,500 $ 105,600
IRR
63.08%
56.76%
46
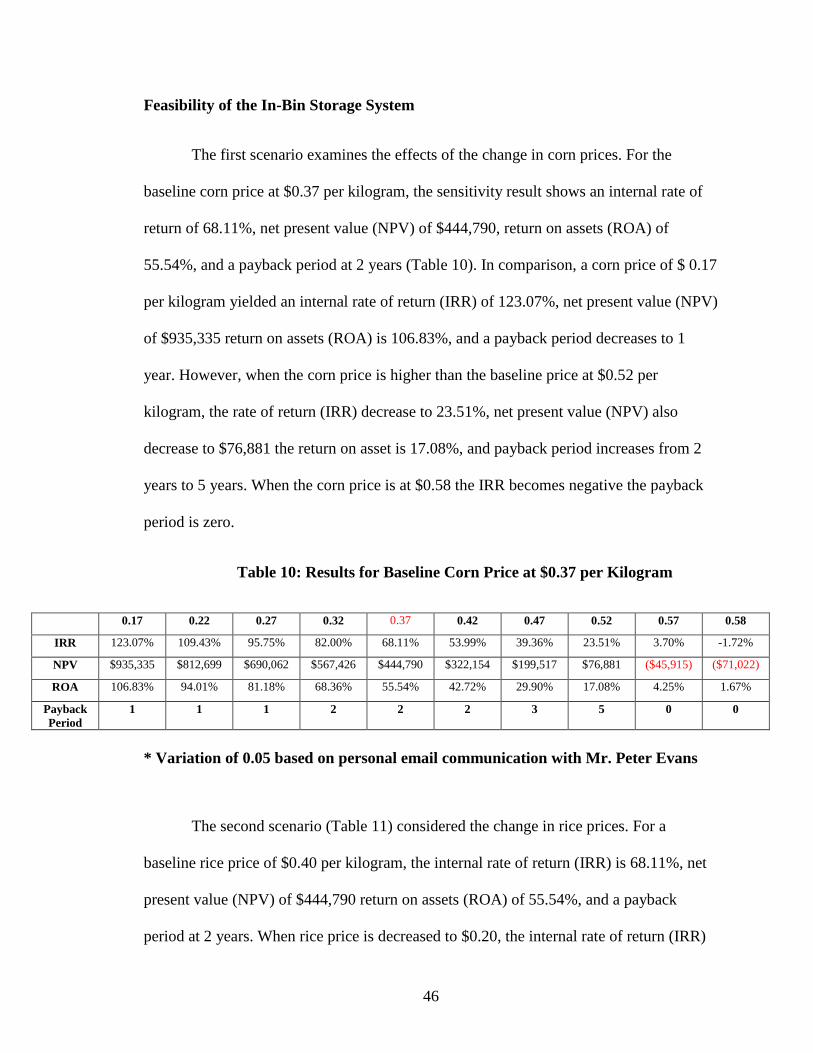
Feasibility of the In-Bin Storage System
The first scenario examines the effects of the change in corn prices. For the
baseline corn price at $0.37 per kilogram, the sensitivity result shows an internal rate of
return of 68.11%, net present value (NPV) of $444,790, return on assets (ROA) of
55.54%, and a payback period at 2 years (Table 10). In comparison, a corn price of $ 0.17
per kilogram yielded an internal rate of return (IRR) of 123.07%, net present value (NPV)
of $935,335 return on assets (ROA) is 106.83%, and a payback period decreases to 1
year. However, when the corn price is higher than the baseline price at $0.52 per
kilogram, the rate of return (IRR) decrease to 23.51%, net present value (NPV) also
decrease to $76,881 the return on asset is 17.08%, and payback period increases from 2
years to 5 years. When the corn price is at $0.58 the IRR becomes negative the payback
period is zero.
Table 10: Results for Baseline Corn Price at $0.37 per Kilogram
0.17 0.22 0.27 0.32 0.37 0.42 0.47 0.52 0.57 0.58
IRR 123.07% 109.43% 95.75% 82.00% 68.11% 53.99% 39.36% 23.51% 3.70% -1.72%
NPV $935,335 $812,699 $690,062 $567,426 $444,790 $322,154 $199,517 $76,881 ($45,915) ($71,022)
ROA 106.83% 94.01% 81.18% 68.36% 55.54% 42.72% 29.90% 17.08% 4.25% 1.67%
Payback
Period
1 1 1 2 2 2 3 5 0 0
* Variation of 0.05 based on personal email communication with Mr. Peter Evans
The second scenario (Table 11) considered the change in rice prices. For a
baseline rice price of $0.40 per kilogram, the internal rate of return (IRR) is 68.11%, net
present value (NPV) of $444,790 return on assets (ROA) of 55.54%, and a payback
period at 2 years. When rice price is decreased to $0.20, the internal rate of return (IRR)
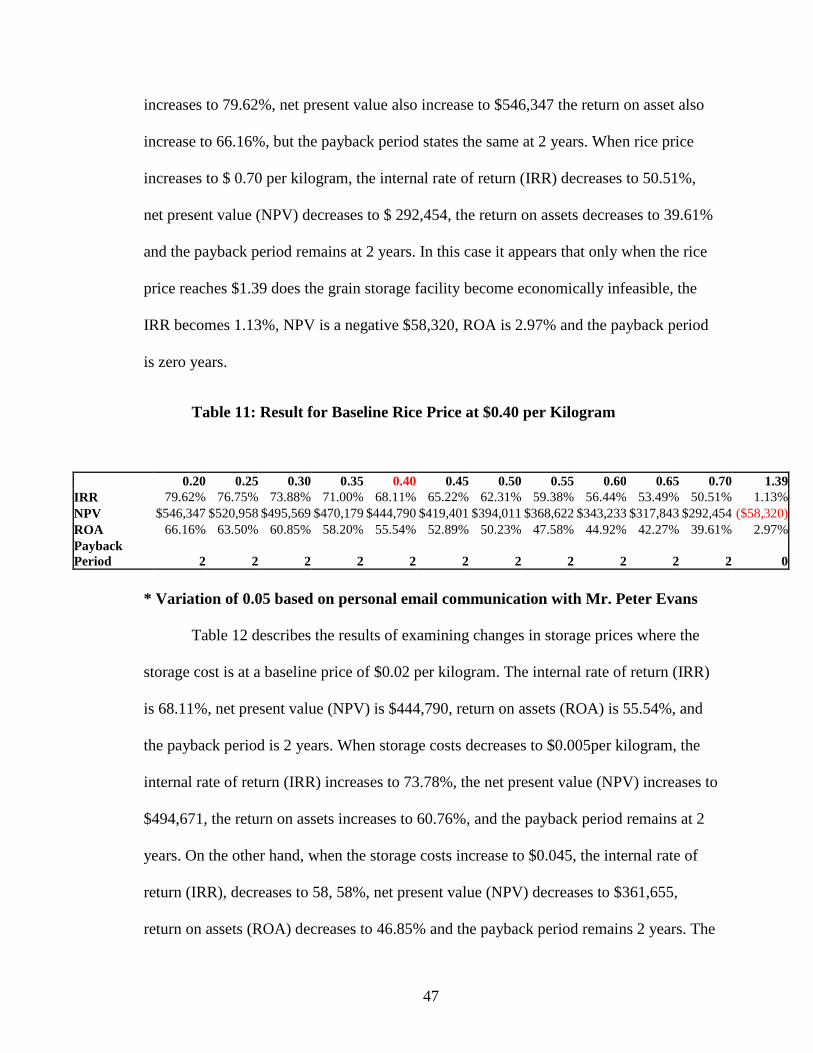
47
increases to 79.62%, net present value also increase to $546,347 the return on asset also
increase to 66.16%, but the payback period states the same at 2 years. When rice price
increases to $ 0.70 per kilogram, the internal rate of return (IRR) decreases to 50.51%,
net present value (NPV) decreases to $ 292,454, the return on assets decreases to 39.61%
and the payback period remains at 2 years. In this case it appears that only when the rice
price reaches $1.39 does the grain storage facility become economically infeasible, the
IRR becomes 1.13%, NPV is a negative $58,320, ROA is 2.97% and the payback period
is zero years.
Table 11: Result for Baseline Rice Price at $0.40 per Kilogram
0.20 0.25 0.30 0.35 0.40 0.45 0.50 0.55 0.60 0.65 0.70 1.39
IRR 79.62% 76.75% 73.88% 71.00% 68.11% 65.22% 62.31% 59.38% 56.44% 53.49% 50.51% 1.13%
NPV $546,347 $520,958 $495,569 $470,179 $444,790 $419,401 $394,011 $368,622 $343,233 $317,843 $292,454 ($58,320)
ROA 66.16% 63.50% 60.85% 58.20% 55.54% 52.89% 50.23% 47.58% 44.92% 42.27% 39.61% 2.97%
Payback
Period 2 2 2 2 2 2 2 2 2 2 2 0
* Variation of 0.05 based on personal email communication with Mr. Peter Evans
Table 12 describes the results of examining changes in storage prices where the
storage cost is at a baseline price of $0.02 per kilogram. The internal rate of return (IRR)
is 68.11%, net present value (NPV) is $444,790, return on assets (ROA) is 55.54%, and
the payback period is 2 years. When storage costs decreases to $0.005per kilogram, the
internal rate of return (IRR) increases to 73.78%, the net present value (NPV) increases to
$494,671, the return on assets increases to 60.76%, and the payback period remains at 2
years. On the other hand, when the storage costs increase to $0.045, the internal rate of
return (IRR), decreases to 58, 58%, net present value (NPV) decreases to $361,655,
return on assets (ROA) decreases to 46.85% and the payback period remains 2 years. The
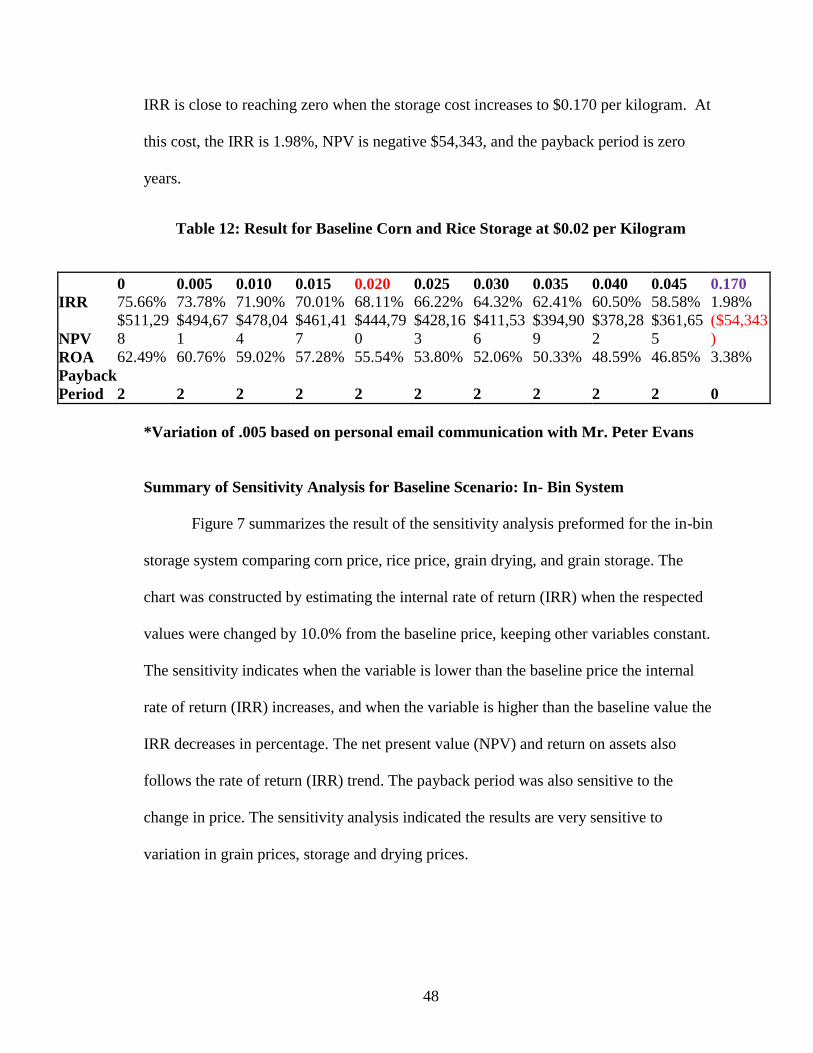
48
IRR is close to reaching zero when the storage cost increases to $0.170 per kilogram. At
this cost, the IRR is 1.98%, NPV is negative $54,343, and the payback period is zero
years.
Table 12: Result for Baseline Corn and Rice Storage at $0.02 per Kilogram
0 0.005 0.010 0.015 0.020 0.025 0.030 0.035 0.040 0.045 0.170
IRR 75.66% 73.78% 71.90% 70.01% 68.11% 66.22% 64.32% 62.41% 60.50% 58.58% 1.98%
NPV
$511,29
8
$494,67
1
$478,04
4
$461,41
7
$444,79
0
$428,16
3
$411,53
6
$394,90
9
$378,28
2
$361,65
5
($54,343
)
ROA 62.49% 60.76% 59.02% 57.28% 55.54% 53.80% 52.06% 50.33% 48.59% 46.85% 3.38%
Payback
Period 2 2 2 2 2 2 2 2 2 2 0
*Variation of .005 based on personal email communication with Mr. Peter Evans
Summary of Sensitivity Analysis for Baseline Scenario: In- Bin System
Figure 7 summarizes the result of the sensitivity analysis preformed for the in-bin
storage system comparing corn price, rice price, grain drying, and grain storage. The
chart was constructed by estimating the internal rate of return (IRR) when the respected
values were changed by 10.0% from the baseline price, keeping other variables constant.
The sensitivity indicates when the variable is lower than the baseline price the internal
rate of return (IRR) increases, and when the variable is higher than the baseline value the
IRR decreases in percentage. The net present value (NPV) and return on assets also
follows the rate of return (IRR) trend. The payback period was also sensitive to the
change in price. The sensitivity analysis indicated the results are very sensitive to
variation in grain prices, storage and drying prices.
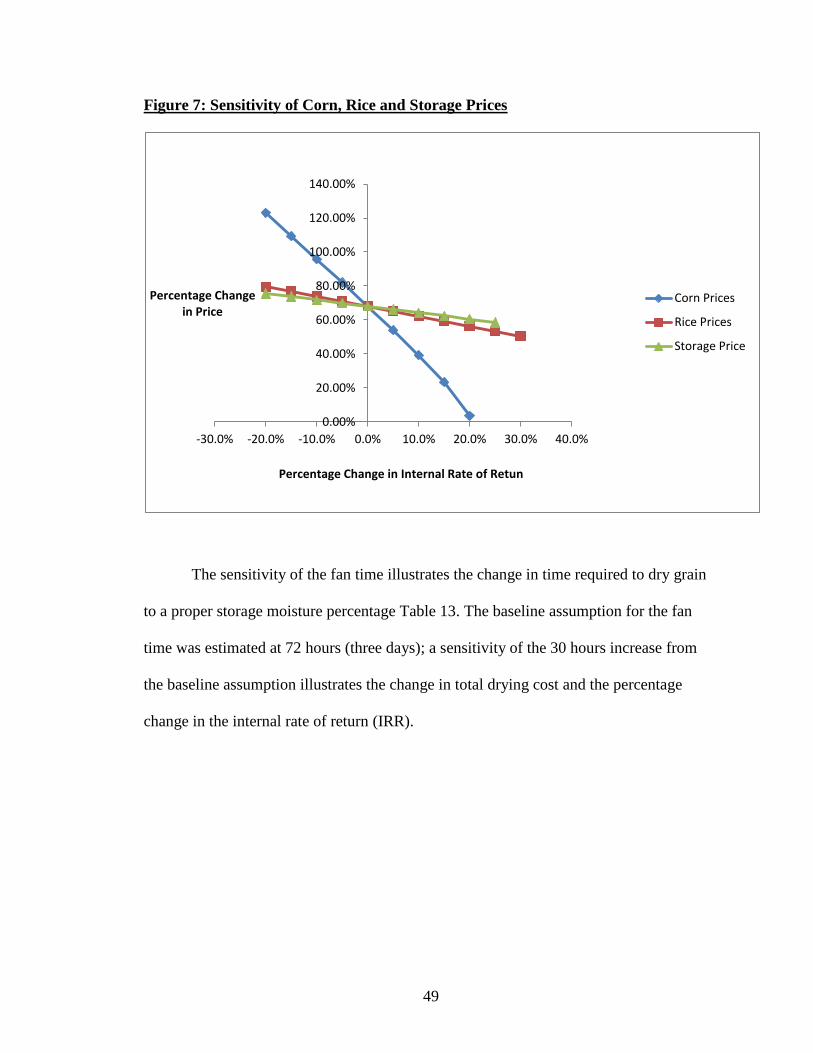
49
Figure 7: Sensitivity of Corn, Rice and Storage Prices
The sensitivity of the fan time illustrates the change in time required to dry grain
to a proper storage moisture percentage Table 13. The baseline assumption for the fan
time was estimated at 72 hours (three days); a sensitivity of the 30 hours increase from
the baseline assumption illustrates the change in total drying cost and the percentage
change in the internal rate of return (IRR).
0.00%
20.00%
40.00%
60.00%
80.00%
100.00%
120.00%
140.00%
-30.0% -20.0% -10.0% 0.0% 10.0% 20.0% 30.0% 40.0%
Percentage Change in Price
Percentage Change in Internal Rate of Retun
Corn Prices
Rice Prices
Storage Price
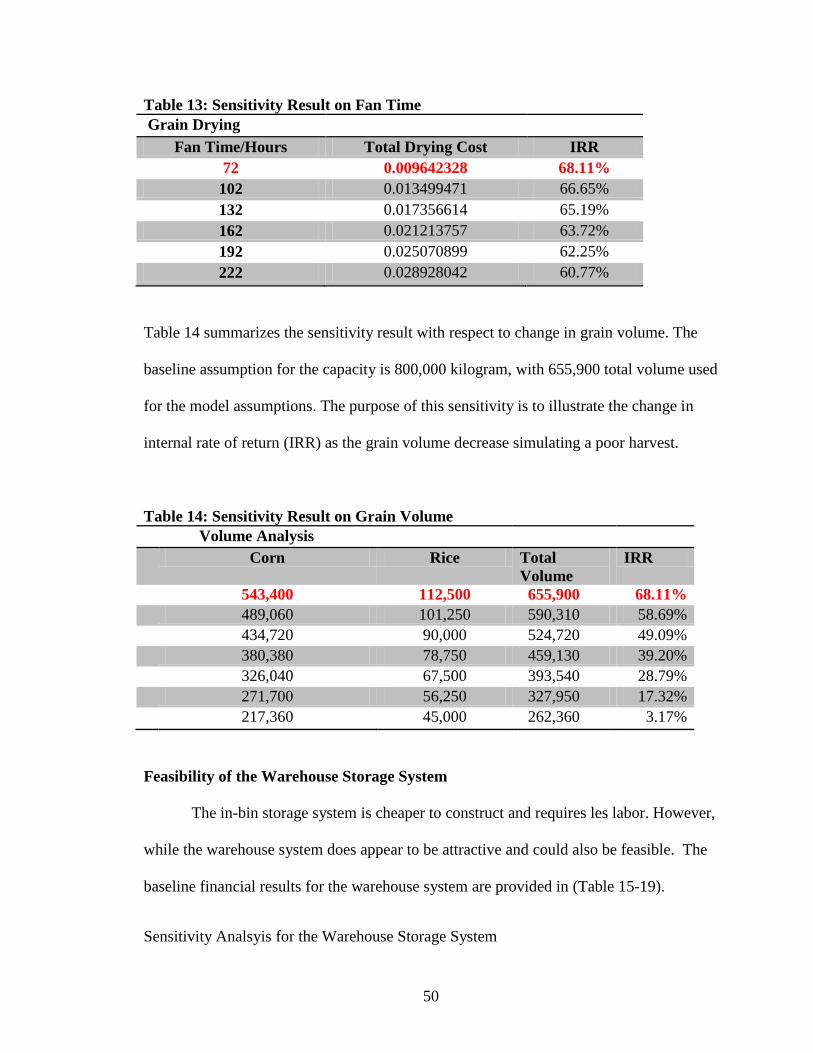
50
Table 13: Sensitivity Result on Fan Time
Grain Drying
Fan Time/Hours Total Drying Cost IRR
72 0.009642328 68.11%
102 0.013499471 66.65%
132 0.017356614 65.19%
162 0.021213757 63.72%
192 0.025070899 62.25%
222 0.028928042 60.77%
Table 14 summarizes the sensitivity result with respect to change in grain volume. The
baseline assumption for the capacity is 800,000 kilogram, with 655,900 total volume used
for the model assumptions. The purpose of this sensitivity is to illustrate the change in
internal rate of return (IRR) as the grain volume decrease simulating a poor harvest.
Table 14: Sensitivity Result on Grain Volume
Volume Analysis
Corn Rice Total
Volume
IRR
543,400 112,500 655,900 68.11%
489,060 101,250 590,310 58.69%
434,720 90,000 524,720 49.09%
380,380 78,750 459,130 39.20%
326,040 67,500 393,540 28.79%
271,700 56,250 327,950 17.32%
217,360 45,000 262,360 3.17%
Feasibility of the Warehouse Storage System
The in-bin storage system is cheaper to construct and requires les labor. However,
while the warehouse system does appear to be attractive and could also be feasible. The
baseline financial results for the warehouse system are provided in (Table 15-19).
Sensitivity Analsyis for the Warehouse Storage System
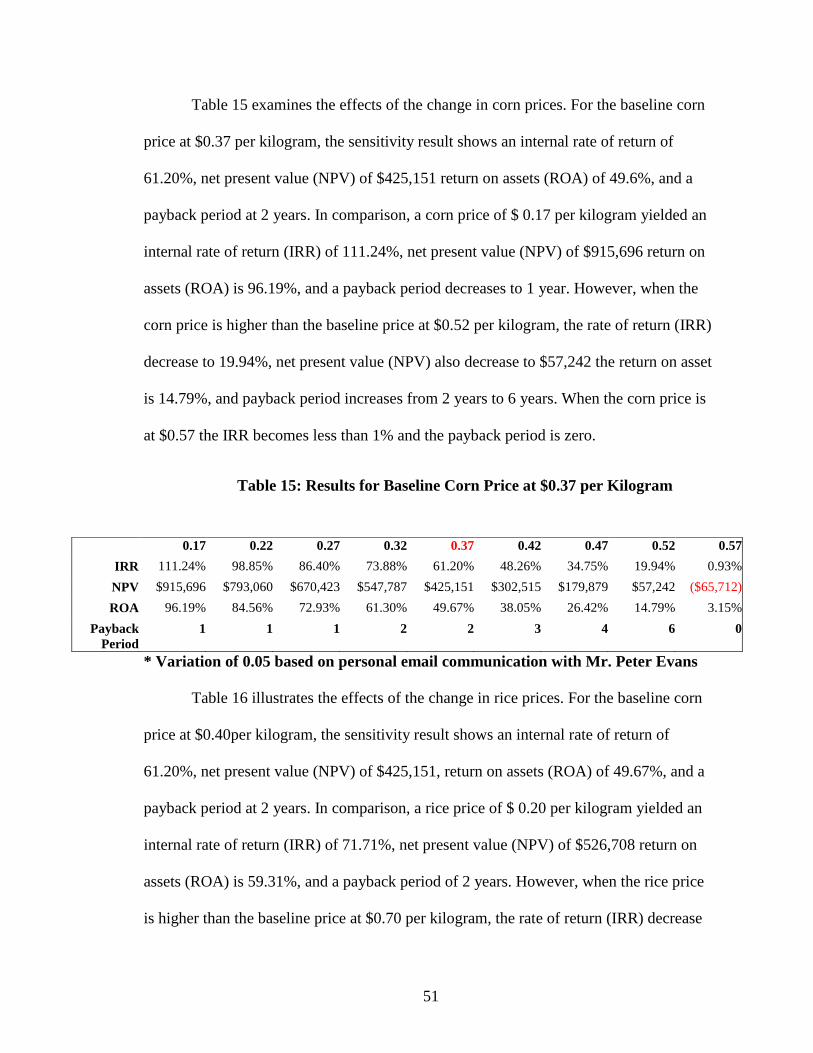
51
Table 15 examines the effects of the change in corn prices. For the baseline corn
price at $0.37 per kilogram, the sensitivity result shows an internal rate of return of
61.20%, net present value (NPV) of $425,151 return on assets (ROA) of 49.6%, and a
payback period at 2 years. In comparison, a corn price of $ 0.17 per kilogram yielded an
internal rate of return (IRR) of 111.24%, net present value (NPV) of $915,696 return on
assets (ROA) is 96.19%, and a payback period decreases to 1 year. However, when the
corn price is higher than the baseline price at $0.52 per kilogram, the rate of return (IRR)
decrease to 19.94%, net present value (NPV) also decrease to $57,242 the return on asset
is 14.79%, and payback period increases from 2 years to 6 years. When the corn price is
at $0.57 the IRR becomes less than 1% and the payback period is zero.
Table 15: Results for Baseline Corn Price at $0.37 per Kilogram
* Variation of 0.05 based on personal email communication with Mr. Peter Evans
Table 16 illustrates the effects of the change in rice prices. For the baseline corn
price at $0.40per kilogram, the sensitivity result shows an internal rate of return of
61.20%, net present value (NPV) of $425,151, return on assets (ROA) of 49.67%, and a
payback period at 2 years. In comparison, a rice price of $ 0.20 per kilogram yielded an
internal rate of return (IRR) of 71.71%, net present value (NPV) of $526,708 return on
assets (ROA) is 59.31%, and a payback period of 2 years. However, when the rice price
is higher than the baseline price at $0.70 per kilogram, the rate of return (IRR) decrease
0.17 0.22 0.27 0.32 0.37 0.42 0.47 0.52 0.57
IRR 111.24% 98.85% 86.40% 73.88% 61.20% 48.26% 34.75% 19.94% 0.93%
NPV $915,696 $793,060 $670,423 $547,787 $425,151 $302,515 $179,879 $57,242 ($65,712)
ROA 96.19% 84.56% 72.93% 61.30% 49.67% 38.05% 26.42% 14.79% 3.15%
Payback
Period
1 1 1 2 2 3 4 6 0
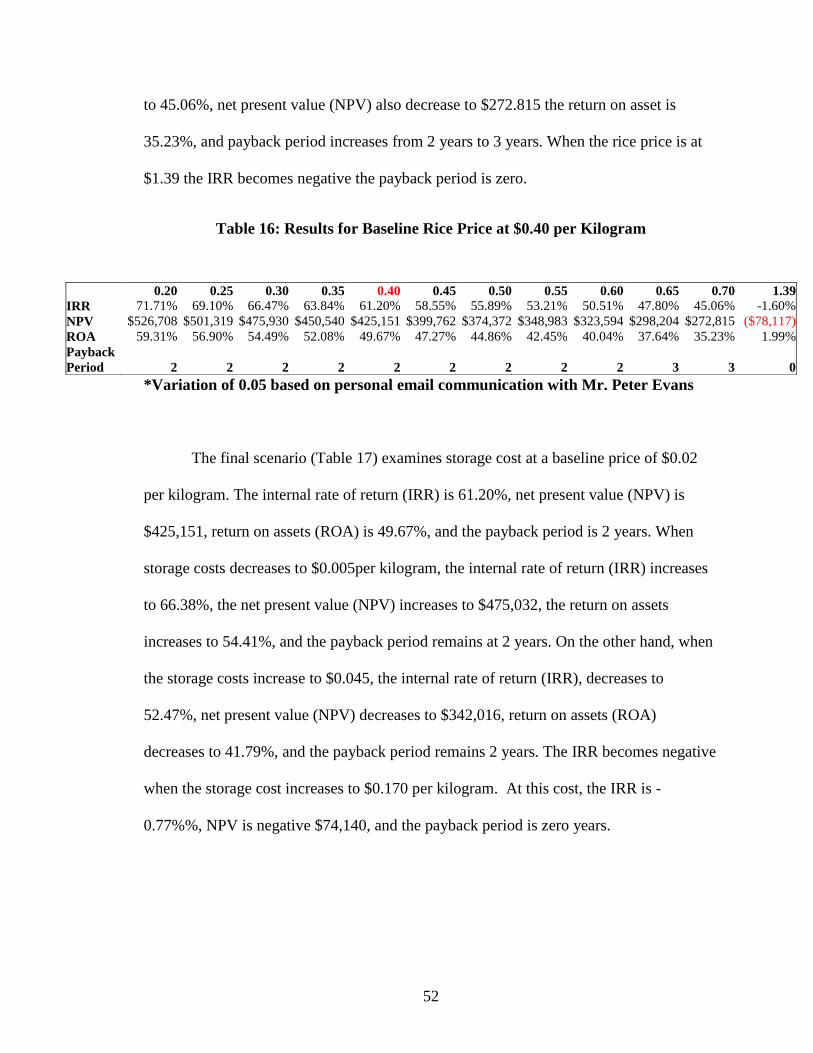
52
to 45.06%, net present value (NPV) also decrease to $272.815 the return on asset is
35.23%, and payback period increases from 2 years to 3 years. When the rice price is at
$1.39 the IRR becomes negative the payback period is zero.
Table 16: Results for Baseline Rice Price at $0.40 per Kilogram
*Variation of 0.05 based on personal email communication with Mr. Peter Evans
The final scenario (Table 17) examines storage cost at a baseline price of $0.02
per kilogram. The internal rate of return (IRR) is 61.20%, net present value (NPV) is
$425,151, return on assets (ROA) is 49.67%, and the payback period is 2 years. When
storage costs decreases to $0.005per kilogram, the internal rate of return (IRR) increases
to 66.38%, the net present value (NPV) increases to $475,032, the return on assets
increases to 54.41%, and the payback period remains at 2 years. On the other hand, when
the storage costs increase to $0.045, the internal rate of return (IRR), decreases to
52.47%, net present value (NPV) decreases to $342,016, return on assets (ROA)
decreases to 41.79%, and the payback period remains 2 years. The IRR becomes negative
when the storage cost increases to $0.170 per kilogram. At this cost, the IRR is -
0.77%%, NPV is negative $74,140, and the payback period is zero years.
0.20 0.25 0.30 0.35 0.40 0.45 0.50 0.55 0.60 0.65 0.70 1.39
IRR 71.71% 69.10% 66.47% 63.84% 61.20% 58.55% 55.89% 53.21% 50.51% 47.80% 45.06% -1.60%
NPV $526,708 $501,319 $475,930 $450,540 $425,151 $399,762 $374,372 $348,983 $323,594 $298,204 $272,815 ($78,117)
ROA 59.31% 56.90% 54.49% 52.08% 49.67% 47.27% 44.86% 42.45% 40.04% 37.64% 35.23% 1.99%
Payback
Period 2 2 2 2 2 2 2 2 2 3 3 0

53
Table 17: Results for Baseline Corn and Rice Storage at $0.02 per Kilogram
0 0.005 0.010 0.015 0.020 0.025 0.030 0.035 0.040 0.045 0.170
IRR 68.10% 66.38% 64.66% 62.93% 61.20% 59.47% 57.73% 55.98% 54.23% 52.47% -0.77%
NPV $491,659 $475,032 $458,405 $441,778 $425,151 $408,524 $391,897 $375,270 $358,643 $342,016 ($74,140)
ROA 55.98% 54.41% 52.83% 51.25% 49.67% 48.10% 46.52% 44.94% 43.37% 41.79% 2.36%
Payback
Period 2 2 2 2 2 2 2 2 2 2 0
*Variation of .005 based on personal email communication with Mr. Peter Evans
Figure 8: Summary of Sensitivity Analysis for Baseline Scenario: Warehouse System
Figure 8 illustrates the result of the sensitivity analysis preformed for the
warehouse storage system comparing corn price, rice price, grain drying, and grain
storage. The chart was constructed by estimating the internal rate of return (IRR) when
the respected values were changed by 10.0% from the baseline price, keeping other
-20.00%
0.00%
20.00%
40.00%
60.00%
80.00%
100.00%
120.00%
-30.0% -20.0% -10.0% 0.0% 10.0% 20.0% 30.0% 40.0%
Percentage Change in Prices
Percentage Change in Internal Rate of Return
Corn Price
Rice Price
Storage Price
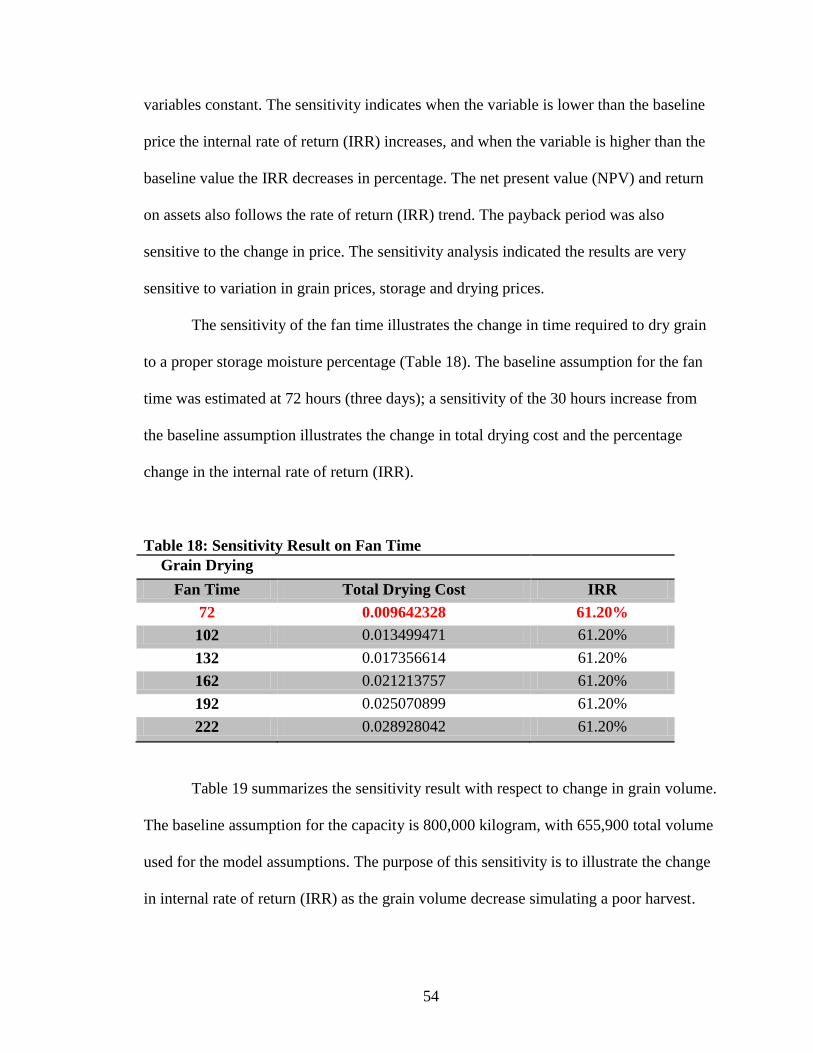
54
variables constant. The sensitivity indicates when the variable is lower than the baseline
price the internal rate of return (IRR) increases, and when the variable is higher than the
baseline value the IRR decreases in percentage. The net present value (NPV) and return
on assets also follows the rate of return (IRR) trend. The payback period was also
sensitive to the change in price. The sensitivity analysis indicated the results are very
sensitive to variation in grain prices, storage and drying prices.
The sensitivity of the fan time illustrates the change in time required to dry grain
to a proper storage moisture percentage (Table 18). The baseline assumption for the fan
time was estimated at 72 hours (three days); a sensitivity of the 30 hours increase from
the baseline assumption illustrates the change in total drying cost and the percentage
change in the internal rate of return (IRR).
Table 18: Sensitivity Result on Fan Time
Grain Drying
Fan Time Total Drying Cost IRR
72 0.009642328 61.20%
102 0.013499471 61.20%
132 0.017356614 61.20%
162 0.021213757 61.20%
192 0.025070899 61.20%
222 0.028928042 61.20%
Table 19 summarizes the sensitivity result with respect to change in grain volume.
The baseline assumption for the capacity is 800,000 kilogram, with 655,900 total volume
used for the model assumptions. The purpose of this sensitivity is to illustrate the change
in internal rate of return (IRR) as the grain volume decrease simulating a poor harvest.
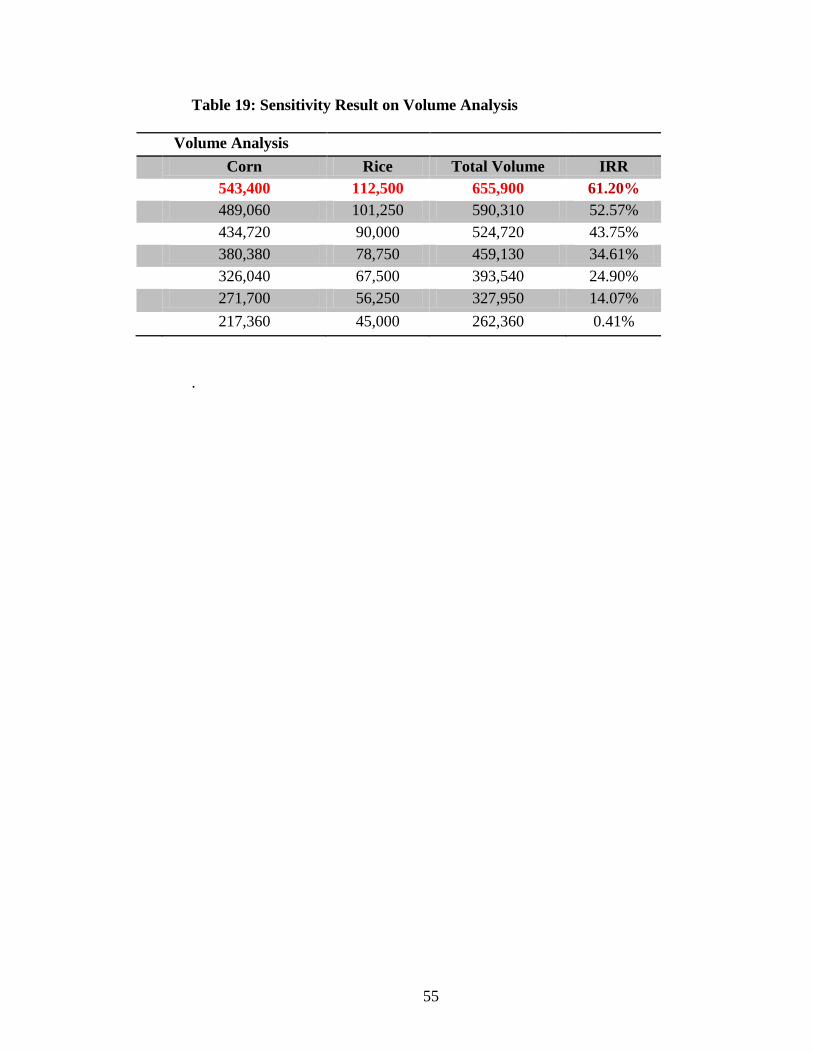
55
Table 19: Sensitivity Result on Volume Analysis
Volume Analysis
Corn Rice Total Volume IRR
543,400 112,500 655,900 61.20%
489,060 101,250 590,310 52.57%
434,720 90,000 524,720 43.75%
380,380 78,750 459,130 34.61%
326,040 67,500 393,540 24.90%
271,700 56,250 327,950 14.07%
217,360 45,000 262,360 0.41%
.
56
CHAPTER V
CONCLUSION
The focused area for the purpose of this study is the Ejura-Sekyedumase district
of the Ashanti, Region in Ghana. The feasibility analysis was performed on two grain
storage facilities and for four different scenarios, two of which analyzed the difference in
corn and rice prices, and the others compared the variation in drying and storage prices.
An Excel based feasibility template was generated to perform the feasibility analysis. The
template allowed for comparing grain prices, drying cost, and storing costs.
This study explored the feasibility of a proposed business venture by Agriculture
Youth Advancement (AYA Project) LLC which involves the construction of a
centralized grain dryer and storage system in Ghana. The capacity of the grain storage
facility is 800,000 kilogram storing 543,400 of corn and 112,500 of rice on an annual
basis. The financial projections determined that $.13 drying fee per kilogram and $0.02
storage fee per kilogram (includes fumigation fee) will allow the AYA Project to cover
all anticipated costs and generate an annual profit. The projections included detailed
monthly cash flows for the first 24 months of operation and $1,500 for contingency
expenses. At the baseline assumptions AYA Project LLC achieves an internal rate of
return of 23.15% under the assumption that AYA distributes 60% of its profits to its
members and the members achieve a net cost of storage of $0.02 per kilo and net cost of
grain drying at $0.13 per kilo.
57
Specific Conclusions
The feasibility template was used to determine the economic feasibility of
constructing and operating a grain storage facility in a specific area of Ghana. The
template provides a helpful process for understanding the impact of changing values of
important factors in the economic feasibility of developing grain storage facilities. The
in-bin storage system was determined to be slightly more profitable than the warehouse
system. However, based on our assumption, a centralized grain storage facility in this
area of Ghana appears to be economically viable, generating high returns to members.
While the in-bin storage system is more profitable than the warehouse system at baseline
levels and assumptions, the in-bin system is also more sensitive to volume of grain
received.
58
Limitations and Recommendations for Future Research
The feasibility template created for the purpose of this study has the potential to help the
farming community in Ghana become more profitable and opportunity for grain drying and
storing ventures. The projects also assume that grain storage shrinkage and moisture loss are at
moderate level described in the baseline assumptions. This will require the user to implement
accurate procedures and for stored grain. The projects include a brief analysis of the change in
corn, rice, drying cost, and storage cost. This provides a scale for potential price gains as grain
prices fluctuates.
Several assumptions were made for the input prices for corn, rice, drying, and storage
costs. Other data and information gathered were from Mr. Peters Evans of Pen Food Bank in
Ghana. The results of this study highly depended on factors such as corn price, rice price, drying
and storage prices. As the research went further it became difficult to gather exact values needed
to conduct the necessary calculations for drying cost, and storage cost. At times, the approach
taken to identify the actual cost of drying grain, or storing grain will be to understand the United
States method or price and then convert the values to fit Ghanaian standards. Therefore, an exact
value was hard to find as such information were not available. Based on the sensitivity results,
drying and storage venture can be economically feasible and it’s recommended for producers in
Ghana to consider. Future research can evaluate the cost and benefit of introducing the in-bin
system and assess the risk.
This drying system modeled in this feasibility analysis consisted of a diesel fuel powered
aeration fan and a fuel oil fired burner for supplemental heat. The feasibility and possible cost
59
advantages of a solar powered system are a topic further research. In addition to capital and
operating costs, the time required to dry grain with a solar system will be a key consideration.
This research has examined only a single scale of grain storage. The costs and returns of storage
for other scales of storage is also a worthy topic for investigation.
This study has demonstrated high returns to a centralized storage system. This result is
due in part to the large discrepancy between the harvest price paid to producers and the
subsequent value of the grain later in the season. This situation is what economist commonly
refer to as a market failure. As this market failure is corrected through the formation of storage
infrastructure, the returns for storage will likely decrease. It is not possible to forecast future
changes in the spread between harvest and later season grain prices that may occur as storage
infrastructure is created and that lack of information is recognized as a limitation of this study.
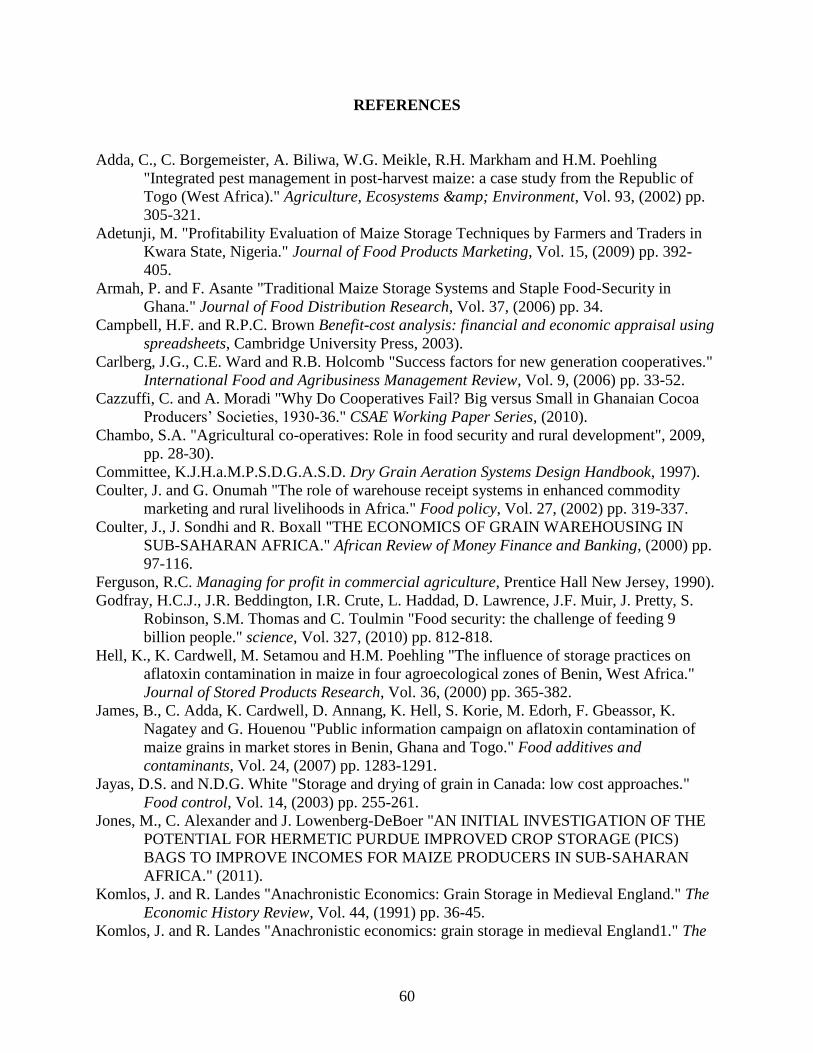
60
REFERENCES
Adda, C., C. Borgemeister, A. Biliwa, W.G. Meikle, R.H. Markham and H.M. Poehling
"Integrated pest management in post-harvest maize: a case study from the Republic of
Togo (West Africa)." Agriculture, Ecosystems & Environment, Vol. 93, (2002) pp.
305-321.
Adetunji, M. "Profitability Evaluation of Maize Storage Techniques by Farmers and Traders in
Kwara State, Nigeria." Journal of Food Products Marketing, Vol. 15, (2009) pp. 392-
405.
Armah, P. and F. Asante "Traditional Maize Storage Systems and Staple Food-Security in
Ghana." Journal of Food Distribution Research, Vol. 37, (2006) pp. 34.
Campbell, H.F. and R.P.C. Brown Benefit-cost analysis: financial and economic appraisal using
spreadsheets, Cambridge University Press, 2003).
Carlberg, J.G., C.E. Ward and R.B. Holcomb "Success factors for new generation cooperatives."
International Food and Agribusiness Management Review, Vol. 9, (2006) pp. 33-52.
Cazzuffi, C. and A. Moradi "Why Do Cooperatives Fail? Big versus Small in Ghanaian Cocoa
Producers’ Societies, 1930-36." CSAE Working Paper Series, (2010).
Chambo, S.A. "Agricultural co-operatives: Role in food security and rural development", 2009,
pp. 28-30).
Committee, K.J.H.a.M.P.S.D.G.A.S.D. Dry Grain Aeration Systems Design Handbook, 1997).
Coulter, J. and G. Onumah "The role of warehouse receipt systems in enhanced commodity
marketing and rural livelihoods in Africa." Food policy, Vol. 27, (2002) pp. 319-337.
Coulter, J., J. Sondhi and R. Boxall "THE ECONOMICS OF GRAIN WAREHOUSING IN
SUB-SAHARAN AFRICA." African Review of Money Finance and Banking, (2000) pp.
97-116.
Ferguson, R.C. Managing for profit in commercial agriculture, Prentice Hall New Jersey, 1990).
Godfray, H.C.J., J.R. Beddington, I.R. Crute, L. Haddad, D. Lawrence, J.F. Muir, J. Pretty, S.
Robinson, S.M. Thomas and C. Toulmin "Food security: the challenge of feeding 9
billion people." science, Vol. 327, (2010) pp. 812-818.
Hell, K., K. Cardwell, M. Setamou and H.M. Poehling "The influence of storage practices on
aflatoxin contamination in maize in four agroecological zones of Benin, West Africa."
Journal of Stored Products Research, Vol. 36, (2000) pp. 365-382.
James, B., C. Adda, K. Cardwell, D. Annang, K. Hell, S. Korie, M. Edorh, F. Gbeassor, K.
Nagatey and G. Houenou "Public information campaign on aflatoxin contamination of
maize grains in market stores in Benin, Ghana and Togo." Food additives and
contaminants, Vol. 24, (2007) pp. 1283-1291.
Jayas, D.S. and N.D.G. White "Storage and drying of grain in Canada: low cost approaches."
Food control, Vol. 14, (2003) pp. 255-261.
Jones, M., C. Alexander and J. Lowenberg-DeBoer "AN INITIAL INVESTIGATION OF THE
POTENTIAL FOR HERMETIC PURDUE IMPROVED CROP STORAGE (PICS)
BAGS TO IMPROVE INCOMES FOR MAIZE PRODUCERS IN SUB-SAHARAN
AFRICA." (2011).
Komlos, J. and R. Landes "Anachronistic Economics: Grain Storage in Medieval England." The
Economic History Review, Vol. 44, (1991) pp. 36-45.
Komlos, J. and R. Landes "Anachronistic economics: grain storage in medieval England1." The
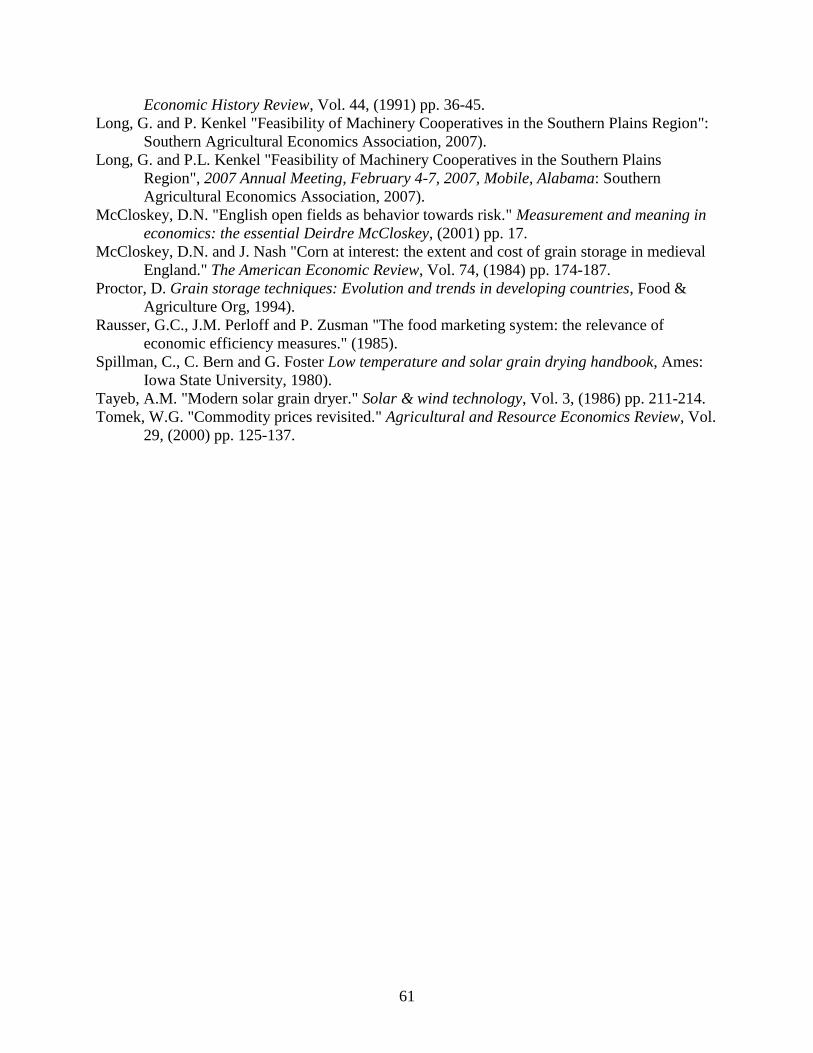
61
Economic History Review, Vol. 44, (1991) pp. 36-45.
Long, G. and P. Kenkel "Feasibility of Machinery Cooperatives in the Southern Plains Region":
Southern Agricultural Economics Association, 2007).
Long, G. and P.L. Kenkel "Feasibility of Machinery Cooperatives in the Southern Plains
Region", 2007 Annual Meeting, February 4-7, 2007, Mobile, Alabama: Southern
Agricultural Economics Association, 2007).
McCloskey, D.N. "English open fields as behavior towards risk." Measurement and meaning in
economics: the essential Deirdre McCloskey, (2001) pp. 17.
McCloskey, D.N. and J. Nash "Corn at interest: the extent and cost of grain storage in medieval
England." The American Economic Review, Vol. 74, (1984) pp. 174-187.
Proctor, D. Grain storage techniques: Evolution and trends in developing countries, Food &
Agriculture Org, 1994).
Rausser, G.C., J.M. Perloff and P. Zusman "The food marketing system: the relevance of
economic efficiency measures." (1985).
Spillman, C., C. Bern and G. Foster Low temperature and solar grain drying handbook, Ames:
Iowa State University, 1980).
Tayeb, A.M. "Modern solar grain dryer." Solar & wind technology, Vol. 3, (1986) pp. 211-214.
Tomek, W.G. "Commodity prices revisited." Agricultural and Resource Economics Review, Vol.
29, (2000) pp. 125-137.
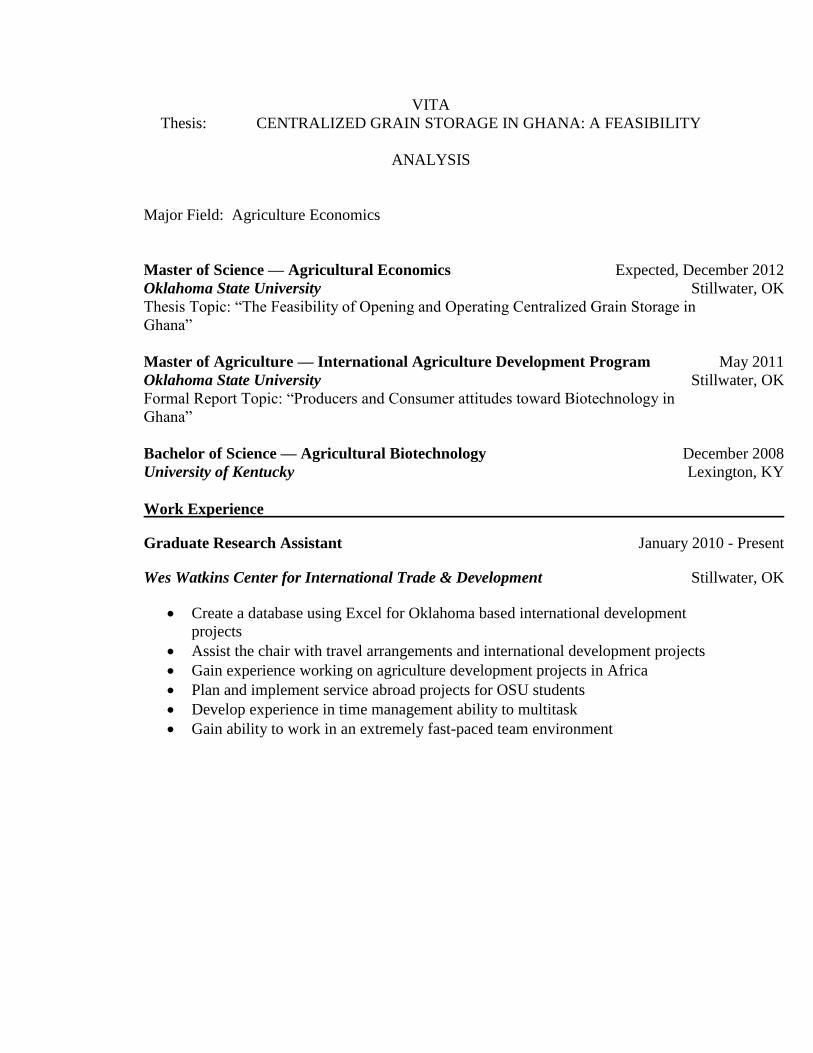
VITA
Thesis: CENTRALIZED GRAIN STORAGE IN GHANA: A FEASIBILITY
ANALYSIS
Major Field: Agriculture Economics
Master of Science — Agricultural Economics Expected, December 2012
Oklahoma State University Stillwater, OK
Thesis Topic: “The Feasibility of Opening and Operating Centralized Grain Storage in
Ghana”
Master of Agriculture — International Agriculture Development Program May 2011
Oklahoma State University Stillwater, OK
Formal Report Topic: “Producers and Consumer attitudes toward Biotechnology in
Ghana”
Bachelor of Science — Agricultural Biotechnology December 2008
University of Kentucky Lexington, KY
Work Experience
Graduate Research Assistant January 2010 - Present
Wes Watkins Center for International Trade & Development Stillwater, OK
Create a database using Excel for Oklahoma based international development
projects
Assist the chair with travel arrangements and international development projects
Gain experience working on agriculture development projects in Africa
Plan and implement service abroad projects for OSU students
Develop experience in time management ability to multitask
Gain ability to work in an extremely fast-paced team environment


