Embed Size (px)
Citation preview
The Journal of Neuroscience, February 1993, 73(2): 820-833
Cell Cycle Parameters and Patterns of Nuclear Movement in the Neocortical Proliferative Zone of the Fetal Mouse
T. Takahashi,’ R. S. Nowakowski,2 and V. S. Caviness, Jr.’
‘Department of Neurology, Massachusetts General Hospital, Harvard Medical School, Boston, Massachusetts, 02114 and *Department of Neuroscience and Cell Biology, UMDNJ-Robert Wood Johnson Medical School, Piscataway, New Jersey 08854
Cytogenesis is the critical determinant of the total number of neurons that contribute to the formation of the cerebral cortex and the rate at which the cells are produced. Two distinct cell populations constitute the proliferative popu- lation, a pseudostratified ventricular epithelium (PVE) lying within the ventricular zone (VZ) at the margin of the ventricle, and a secondary proliferative population that is intermixed with the PVE within the VZ but also is distributed through the overlying subventricular and intermediate zones of the cerebral wall. The present analysis, based upon cumulative S-phase labeling of the proliferative cells with 5-bromo-2’- deoxyuridine, is principally concerned with the PVE of the gestational-day-14 (E14) murine cerebral wall. It has im- mediate but also more far reaching general objectives. The most immediate objective, essential to the design and in- terpretation of later experiments, is to provide estimates of critical parameters of cytogenesis for the PVE. The growth fraction is virtually 100%. The lengths of the overall cell cycle, S-, G2+M-, and Gl-phases are 15.1 hr, 3.8 hr, 2 hr, and 9.3 hr, respectively. The PVE is homogeneous with re- spect to cell cycle length. For methodological considera- tions, these estimates are more accurate than estimates of the same parameters obtained in earlier analyses based upon S-phase labeling with tritiated thymidine. It is partic- ularly with respect to a shorter length of S-phase determined here that the present values are different from those ob- tained with thymidine.
At a more innovative level, the temporal and spatial res- olution of nuclear movement made possible by the methods developed here will allow, in a way not previously attempted, a fine-grained tracking of nuclear movement as cells exe- cute the successive stages of the cell cycle or exit the cycle subsequent to mitosis. Such observations are pertinent to our understanding of the regulatory mechanisms of neocor- tical histogenesis and the cell biological mechanisms that govern the proliferative cycle of the ventricular epithelium
Received May 13, 1992; revised July 29, 1992; accepted Aug. 25, 1992. This work was sunnorted bv NIH Grants NS12005 and NS28061 and NSF
Grant BNS892 102O.T.T. is supported by a fellowship ofThe Medical Foundation, Inc., Charles A. Ring Trust, Boston, MA. We gratefully acknowledge valuable discussions with Pradeep Bhide and Douglas Frost and their critical comments on earlier versions ofthe manuscript, technical assistance by Margaretha Jacobson, and helpful comments on the manuscript by Nancy Hayes.
Correspondence should be addressed to Takao Takahashi, Developmental Neu- robiology, Department of Neurology, Massachusetts General Hospital, 25 Fruit Street, Boston, MA 02114. Copyright 0 1993 Society for Neuroscience 0270-6474/93/130820-14$05.00/O
itself. It is known that the velocity of nuclear movement in the PVE is maximum in G2 (fourfold increase from S-phase) and minimum in M and early Gi. It has been determined here that after the initiation of Gl there is a substantial differential in the time that postmitotic cells spend before they start their ascent toward the outer margin of the PVE; that is, some nuclei leave the ventricular surface shortly after mitosis (within 1.5 hr) while the more sluggish group of cells stays in the vicinity of the ventricular surface for up to 8 hr. Once postmitotic nuclei begin their ascent from the ventricular surface, they accelerate progressively through the outer half of the PVE. The analysis also shows that the cells are en- tering and leaving S-phase at equal rates, evidence in con- firmation of the hypothesis that proliferation in the devel- oping mouse cerebral wall at El4 is asynchronous.
Key words: neurogenesis, neocortical histogenesis, cell cycle, proliferation, bromodeoxyuridine, ventricular zone, subventricular zone, mouse]
Neocortical histogenesis is initiated with cytogenesis, which oc- curs in a proliferative zone at the margin of the lateral ventricle in the depths of the cerebral wall. It is generally believed that most neocortical neurons are formed within a pseudostratified epithelium immediately adjacent to the ventricular cavity. The nuclei of cells proliferating in this epithelium undergo an inter- kinetic migration such that DNA synthesis occurs in the outer half of the epithelium and mitosis at its ventricular margin (His, 1904; Sauer, 1935, 1937; Sauer and Walker, 1959; Angevine and Sidman, 1961; Berry et al., 1964; Rakic, 1972, 1978, 1988; Caviness and Sidman, 1973; Shoukimas and Hinds, 1978; No- wakowski and Rakic, 198 1; Caviness, 1982; Bayer and Altman, 199 la). A smaller proliferative population, which is not part of the pseudostratified proliferative epithelium, has been recog- nized at the interface of the epithelium and the intermediate zone (Boulder Committee, 1970) of the overlying cerebral wall. This secondary proliferative population is thought to give rise principally to glial cells (Smart, 196 1; Smart and Leblond, 196 1; Altman, 1966; Mares and Bruckner, 1978; Schmechel and Rak- ic, 1979a,b, Bayer and Altman, 199 la), although in the olfactory bulb, at least, it is also the source of neurons (Hinds, 1968).
Investigators in the “autoradiography epoch” of studies of cortical histogenesis adopted the convention whereby the pro- liferative zones of the developing cortex were defined architec- tonically. The zone immediately adjacent to the ventricle be- came referred to as the ventricular zone (VZ) while the overlying zone became referred to as the subventricular zone (SVZ, see
The Journal of Neuroscience, February 1993, 73(2) 821
Fig. 2; Boulder Committee, 1970). Whereas these architectonic subdivisions are unambiguous and useful landmarks for analysis of cellular events in the proliferative zone, it became evident in the course of the present analysis that they did not demarcate satisfactorily the two proliferative populations. On the contrary, these populations proved to be substantially intermixed, par- ticularly at the interface of the VZ and SVZ, and could not be critically distinguished by the cytoarchitectonic criteria usually used to distinguish the VZ and SVZ subdivisions of the cerebral wall. In order to avoid ambiguity in reference to the specific populations, we have retained for the population that is pre- dominant in the VZ the earlier-used term pseudostratified ven- tricular epithelium (PVE) and have referred to the other pop- ulation that is predominant in the SVZ as the secondary proliferative population (SPP; Fig. 1; Takahashi et al., 1992b).
The PVE is the principal focus of this analysis, which is part of a series of investigations ultimately to be concerned with both the regulatory mechanisms of neocortical histogenesis and the cell biological mechanisms that govern the proliferative cycle of the ventricular epithelium itself. The structure of the PVE provides critical analytic advantages to these objectives. Spe- cifically, the cycling cells of the PVE oscillate through a range of configurations and sizes that are systematically related to the proliferative state of the cell as it traverses the cell cycle (see Fig. 7; His, 1904; Sauer, 1935, 1937; Sauer and Walker, 1959; Sidman et al., 1959; Fujita, 1960; Stensaas and Stensaas, 1968; Hinds and Ruffett, 197 1). Interphase cells are affixed to each other by zonulae adherentes that are concentrated in a plane at the very margin of the ventricle (Sauer, 1935; Stensaas and Stensaas, 1968; Hinds and Ruffett, 1971). At the outset of the mitotic cycle, just after the completion of mitosis (M-phase), the cell is located at the ventricular surface. At that moment the size of the cell is at its smallest, and the cell is slightly elliptical in shape. In the course of the first gap phase (G 1 -phase) the cell elongates, retaining its attachment to the ventricular surface and presumably also the attachments to its neighbors via the zonulae adherentes.
The nucleus of the cell undergoes an interkinetic movement within the “cell envelope” as it traverses the separate phases of the mitotic cycle. The DNA synthetic phase (S-phase) is initiated with the nucleus at the outer margin of the epithelium (Taka- hashi et al., 1992a). From that point, the nucleus descends to- ward the ventricle in the course of DNA synthesis and the second gap phase (G2-phase).
Two of the cytokinetic parameters, the growth fraction (GF; proportion of proliferating cells) and the overall length of the cell cycle (T,), are critical determinants of the proliferative out- put of the ventricular epithelium in the course of neocortical histogenesis. The analysis builds upon a preparatory set of meth- odological studies (Takahashi et al., 1992a) that established a strategy of quantitative analysis that makes it possible to track changes in PVE cell nuclear position as the cell traverses the cycle or after the postmitotic cell initiates its migration toward the cortical plate. The present analysis, based upon cumulative S-phase labeling with 5-bromo-2’-deoxyuridine (BUdR) (Miller and Nowakowski, 1988, 1991; Nowakowski et al., 1989), will establish GF and determine T, as well as the lengths of the four cell cycle phases Gl, S, G2, and M (Tel, T,, TG2, and TM, re- spectively) in the cerebral PVE of the mouse on gestational day 14 (E14).
The analysis, at a most immediate level, will provide esti- mates of cytokinetic parameters revised from those that have
I
LV yVentricular Zone - Interkdiate Zone 8 I 1 j Subventricular !
Zone j
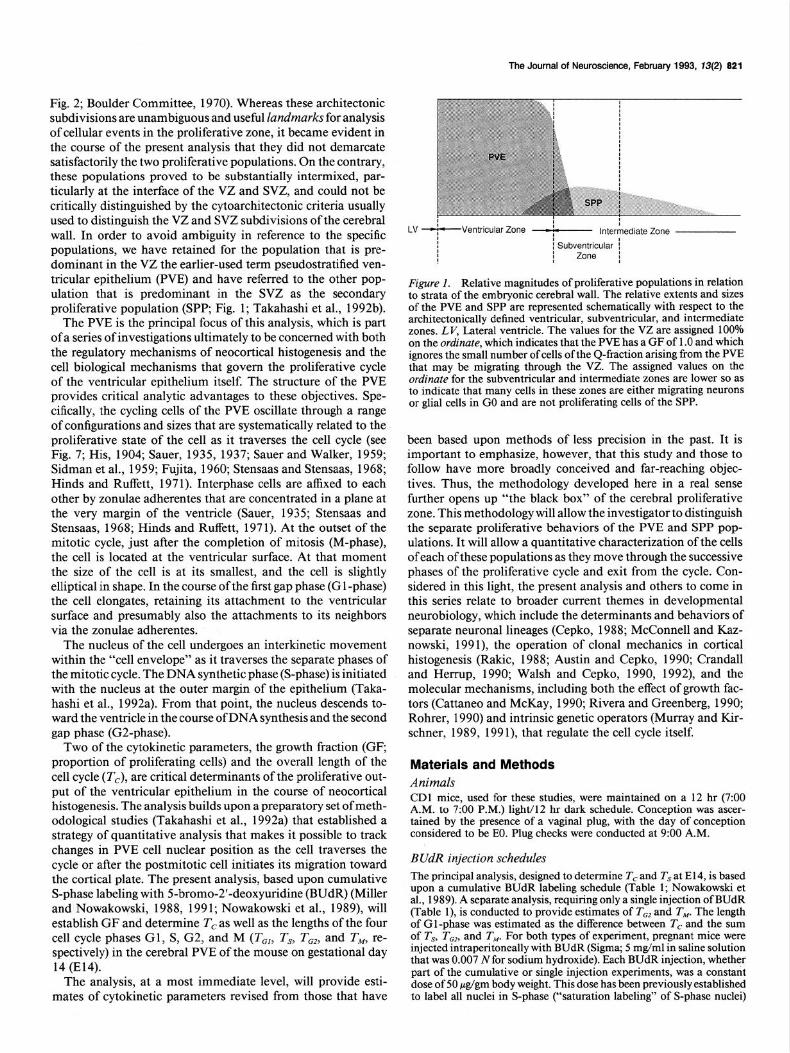
Figure I. Relative magnitudes of proliferative populations in relation to strata of the embryonic cerebral wall. The relative extents and sizes of the PVE and SPP are represented schematically with respect to the architectonically defined ventricular, subventricular, and intermediate zones. LV, Lateral ventricle. The values for the VZ are assigned 100°Ya on the ordinate, which indicates that the PVE has a GF of 1 .O and which ignores the small number of cells of the Q-fraction arising from the PVE that may be migrating through the VZ. The assigned values on the ordinate for the subventricular and intermediate zones are lower so as to indicate that many cells in these zones are either migrating neurons or glial cells in GO and are not proliferating cells of the SPP.
been based upon methods of less precision in the past. It is important to emphasize, however, that this study and those to follow have more broadly conceived and far-reaching objec- tives. Thus, the methodology developed here in a real sense further opens up “the black box” of the cerebral proliferative zone. This methodology will allow the investigator to distinguish the separate proliferative behaviors of the PVE and SPP pop- ulations. It will allow a quantitative characterization of the cells of each of these populations as they move through the successive phases of the proliferative cycle and exit from the cycle. Con- sidered in this light, the present analysis and others to come in this series relate to broader current themes in developmental neurobiology, which include the determinants and behaviors of separate neuronal lineages (Cepko, 1988; McConnell and Kaz- nowski, 199 l), the operation of clonal mechanics in cortical histogenesis (Rakic, 1988; Austin and Cepko, 1990; Crandall and Herrup, 1990; Walsh and Cepko, 1990, 1992), and the molecular mechanisms, including both the effect of growth fac- tors (Cattaneo and McKay, 1990; Rivera and Greenberg, 1990; Rohrer, 1990) and intrinsic genetic operators (Murray and Kir- schner, 1989, 199 l), that regulate the cell cycle itself.
Materials and Methods Animals CD1 mice, used for these studies, were maintained on a 12 hr (7:00 A.M. to 7:00 P.M.) light/l2 hr dark schedule. Conception was ascer- tained by the presence of a vaginal plug, with the day of conception considered to be EO. Plug checks were conducted at 9:00 A.M.
BVdR injection schedules The principal analysis, designed to determine Tc and Ts at El 4, is based uvon a cumulative BUdR labelina schedule (Table 1: Nowakowski et ai., 1989). A separate analysis, req&ing only a single injection of BUdR (Table l), is conducted to provide estimates of Tcz and T,. The length of Gl-phase was estimated as the difference between Tc and the sum of T,, T,,, and T,. For both types of experiment, pregnant mice were injected intraperitoneally with BUdR (Sigma; 5 mg/ml in saline solution that was 0.007 Nfor sodium hvdroxidd. Each BUdR injection. whether part of the cumulative or single injection experiments; was a’constant dose of 50 rcg/gm body weight. This dose has been previously established to label all nuclei in S-phase (“saturation labeling” of S-phase nuclei)
822 Takahashi et al. - Cerebral Cell Cycle
Table 1. BUdR injection schedules on El4
Survival time after initial Time (elapsed time)
injection 9:oo 12:oo 15:oo 18:OO 21:oo (W (0:OO) (3:OO) (6:00) (9:OO) (12:OO)
Cumulative labeling 0.5 ID 2.0 I ID 3.5 I ID 5.0 I I ID 6.5 I I ID 8.0 I I I ID 9.5 I I I ID
11.0 I I I I ID 12.5 I I I I ID 14.0 I I I I I ID
Single injection 1.0 ID 1.5 ID
I, Injection; D, death.
for an interval extending from at least 15 min through at least 2.0 hr following injection (Takahashi et al., 1992a).
Cumulative labeling schedules. Estimates of T, and Ts based upon cumulative labeling schedules require that the serial injections be spaced so that the length of nonlabeling intervals between injections is less than the length of S-phase. Under these conditions of exposure to BUdR, all nuclei passing through S-phase will be labeled (Sidman, 1970; Waechter and Jaensch, 1972; Nowakowski et al., 1989). Previous estimates of T, in the PVE of rodents have varied from 4 to 8 hr (Atlas and Bond, 1965; Kauffman, 1966, 1968; Shimada and Langman, 1970; Waechter and Jaensch, 1972). The dose of BUdR employed here, 50 &pm body weight, was found in a prior analysis to provide saturation S-phase labeling for at least 2.0 hr following the injection (Takahashi et al., 1992a).
Given the foregoing considerations, the present experiments were set up with a maximum interinjection interval of 3.0 hr (i.e., a nonlabeling interval of 1 hr) so as to assure that all cells passing through S-phase would be labeled. The initial injections of the cumulative labeling se- quences were given at 9:00 A.M. on El4 (Table 1). The initial survival time was 0.5 hr. (Note that although involving only a single injection, the 0.5 hr injection time point is presented as the initial step in the cumulative labeling series.) Subsequent survival times were spaced at 1.5 hr intervals through 14.0 hr. For each survival time, the last BUdR injection had been given 0.5 hr before death. This required that the survival times “on the hour,” that is, at 2.0, 5.0, 8.0, 11 .O, and 14.0 hr, be preceded by two injections separated only by 1.5 hr.
Single injection experiments. Single injections of BUdR were followed by survival times of 1 .O and 1.5 hr (Table 1) so as to define the lengths of G2- and M-phases.
Histology Embryos were removed by hysterotomy from dams deeply anesthetized with a mixture of ketamine (50 mg/kg body weight) and xylazine (10 mg/kg body weight). The embryos were decapitated, and the whole heads were fixed overnight by immersion in 70% ethanol, dehydrated in graded ethanol solutions, and cleared in xylene. The brains were embedded in paraffin and sectioned at 4 pm in the coronal plane. The sections were stained immunohistochemically for BUdR (Gratzner, 1982) using the Vector ABC Elite kit and diaminobenzidine with cobalt-nickel color intensification, and counterstained with basic fuchsin as previously described (Takahashi et al. 1992a).
Enumeration of BUdR-labeled nuclei The analysis was conducted in a sector of the dorsomedial cerebral wall, overlying the medial region of the lateral ventricle and corresponding to the location of the future primary somatosensory representation. This sector has as its base a segment of the VZ that is 100 pm in its medial-
lateral dimension. Prior analyses have established that the radial glial fiber fascicles spanning this sector are aligned in a true radial fashion (Gadisseux et al., 1989; Takahashi et al., 1990). This sector was defined as 4 pm in its anterior-posterior dimension, which corresponds to the thickness of the histological sections. The area of ventricular surface thus defined is constant at 400 Nrn* (100 l 4 pm2) for the period of the analysis. The sector was subdivided into bins, parallel to the ventricular surface, 10 pm in height, and the bins were numbered I, II, III, and so on from the ventricular surface outward (Fig. 2A; Takahashi et al., 1992a). BUdR-labeled and unlabeled nuclei were scored with respect to their bin location. Nuclei on the boundary between two bins were assigned to the bin closer to the ventricle. Arbitrarily, it was decided to include only those nuclei touching the medial margin but not those touching the lateral margin in the respective bin. Endothelial cells were not counted.
The “LI projle” For each time point in the cumulative labeling schedules, an average labeling index (LI; labeled cells as a proportion of total cells) was cal- culated for each bin across the entire series of six brains obtained from the fetuses in two litters. The plot of LIs for each bin for each time point is referred to as the “LI profile” for that time point (Fig. 2; Takahashi et al., 1992a). The average LIs for each bin were derived as follows. For each brain, the LI was determined for each of the bins in four nonadjacent sections included within a series of 10 consecutive sections. (In practice, this was every other section in a series of seven consecutive sections except where sections were marred in some way that made them unsuitable.) First, the numbers of BUdR-positive and BUdR-negative nuclei in each bin in each of the four sections in a single brain were separately summed. The fraction of BUdR-positive nuclei with respect to the total number of nuclei for each bin provided the average LI for the four sections taken from the single brain. Overall, a total of approximately 54,000 nuclei were counted.
Enumeration of mitoses Mitotic figures in the sectors of the dorsomedial cerebral wall were counted with respect to their bin locations in slides stained with cresyl violet and adjacent to each used for BUdR immunocytochemistry. Counts were made only in 0.5, 2.0, and 3.5 hr specimens so as to minimize heterogeneities that might arise with the rapid architectonic and pro- liferative changes occurring throughout the full 14 hr experimental in- terval. Counts of mitotic figures were made in sectors of both right and left hemispheres from five nonadjacent sections from each brain (i.e., in 10 sectors/brain). Mitotic figures lying on a boundary between bins were assigned according to the same convention as was used for BUdR- positive or -negative nuclei. Mitotic figures of endothelial cells were not counted.
The Journal of Neuroscience, Februaty 1993, 13(2) 823
A 0.5 hr
B 14.0 hr
Results The cerebral wall at El4 Stratljication. The dorsomedial cerebral wall of the earliest spec- imen examined (9:30 A.M.) is formed of a proliferative zone at the margin of the ventricle and the overlying primordial plexi- form zone (PPZ, Figs. 2A, 3; Marin-Padilla, 197 1, 1978; Cav- iness, 1982; Takahashi et al., 1992a). During the next 5 hr, the molecular layer, cortical plate, and subjacent intermediate zone emerge from the PPZ, above the proliferative zone. Overall, the dorsomedial sector of the cerebral wall nearly doubles in thick- ness [an increase from 100 pm (10 bins) to 200 Km (20 bins)] and increases in architectonic complexity during the 14 hr pe- riod of observation. The rapid expansion of the intermediate zone contributes the major increment in thickness of the cerebral wall (Figs. 2B, 3).
Proliferative populations. The proliferative zone of the cere- bral wall, including both the PVE and the SPP, lies adjacent to
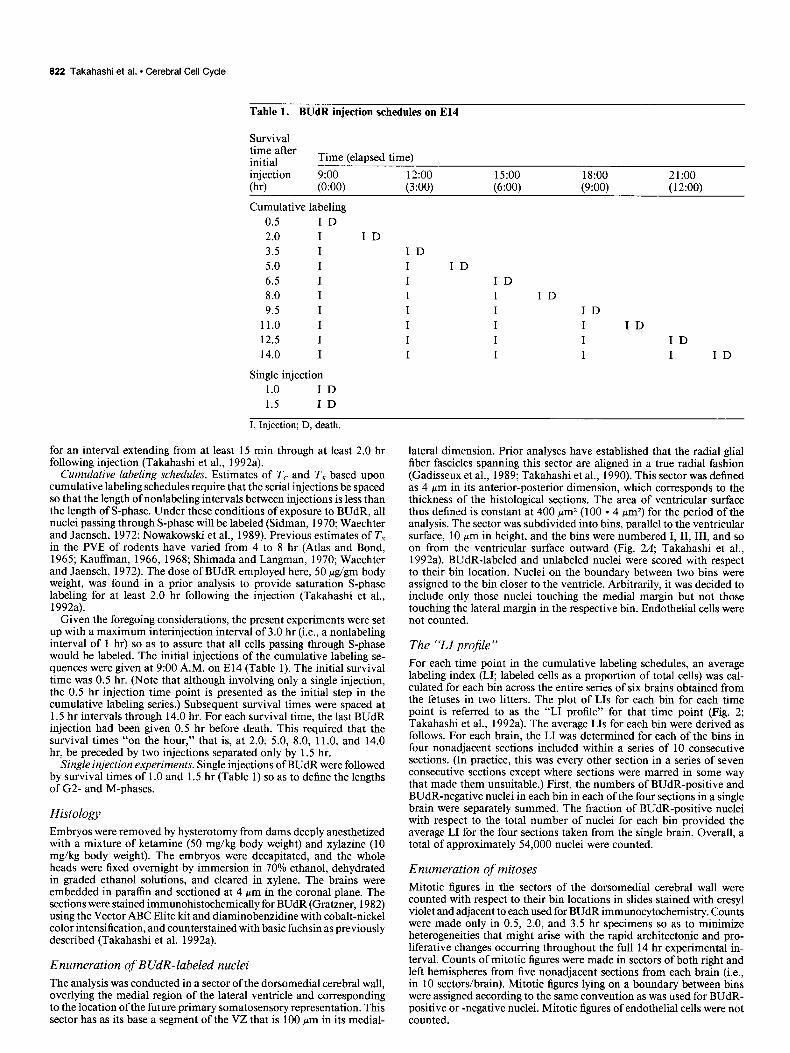
Figure 2. The dorsomedial region of the murine cerebral wall at E14. Rep- resentative photomicrographs with LI profiles (error bars = SEM) are illus- trated for 0.5 hr and 14.0 hr time points, respectively, in A and B. The analysis was conducted in a sector 100 pm wide (vertical lines in micrograph in A) and 4 pm in depth (corresponding to tissue section thickness). The sector was sub- divided into bins 10 pm in height, num- bered I, II, and so on from the ventric- ular surface outward (horizontal lines in micrograph in A). A, At 0.5 hr, the distribution of labeled nuclei (arrow in micrograph) demonstrates the zone where S-phase is occurring. V, lateral ventricle. A star marks the skull. B, At 14.0 hr, the LIs in bins I-VI are 1.0, indicating that the GF is 1.0. This is after the cumulative labeling has been continued for an interval at least as long as Tc - T9 The lower LIs in bins su- perficial to bin VI reflect the distribu- tion of BUdR-labeled cells of part of the SPP as well as that of migrating cells that have arisen earlier in the prolifer- ative zone and have been labeled with BUdR. ZZ, Intermediate zone. Coronal 4 pm sections, stained immunohisto- chemically for BUdR. (In order to heighten photographic contrast, the il- lustrated section was not counters- tained, the sections used for the analysis itself were counterstained.) Scale bar in B, 20 pm.
the ventricular cavity. The overall cell density of the prolifer- ative zone is essentially constant throughout the 14 hr period of analysis (Fig. 4). The number of nuclei per bin is greatest immediately adjacent to the ventricular surface (bin I) and de- clines gradually by approximately 10% with ascent to the outer bins of the VZ. Pyknotic nuclei were not observed among the cells of the PVE and SPP in the course of the analyses undertaken on E14.
Size and extent of the SPP. The PVE and SPP are distin- guished both by their cytokinetic behaviors and loci of mitosis; cells of the SPP do not have systematic interkinetic nuclear movement and undergo mitosis at a distance from the ventric- ular surface. For this reason, the best indicator of the position of the SPP may be taken to be the distribution of abventricular mitoses, that is, mitoses located at a distance from the ventric- ular surface. This approach to definition of the SPP is supported by the observation that the distribution of mitotic figures in the

824 Takahashi et al. - Cerebral Cell Cycle
w 200
CP
l”e
100 / PPZ
le = ; = ; /---- Proliferative Zone
o! 1 9:oo I!?00 21 :oo
Time on El4
Figure 3. The changing pattern of cerebral stratification on E14. At each time point, the averaged value for the upper border of each of the layers of the developing cerebral wall is plotted on the ordinate as the distance from the vent&ular surface. Initially, the cerebral wall is con- stituted onlv of vroliferative zone. including VZ and SVZ, and the overlying PPZ. Within 5 hr (14:00), the intermediate zone, co&Cal plate (CP), and molecular layer (ML) have differentiated within the PPZ. The thickness of the proliferative zone changes relatively little throughout the interval of analysis. The overlying strata, by contrast, undergo sub- stantial expansion, occurring particularly rapidly beyond 8 hr (17:OO) on E14.
proliferative zone is bimodal. Approximately 90% of nuclei in M-phase in the early El4 cerebral wall are concentrated in bin I and are taken to belong to cells of the PVE (Fig. 5A). The remaining 10% of mitoses, the abventricular mitoses, are dis- tributed continuously through bins III-XII with approximately 75% being concentrated in bins VII-IX (Fig. 5@. No mitoses were observed in bin II, and mitoses in bin III were rare. The abventricular mitoses, those in the outer distribution, are taken to belong to the SPP. If one assumes that the SPP, like the PVE, is an asynchronously dividing population, and that TM/T, for proliferating cells of the SPP is approximately the same as that for cells of the PVE, and if one considers that early on El4 the number of mitoses in the SPP is 10% of that in the PVE, then the size of the SPP must be approximately 10% of the size of the PVE population at E14.
On its inner, or ventricular, aspect, the zone of “abventricular mitoses” marking the location of the SPP considerably overlaps the PVE across the VZ-SVZ transition (Figs. 1, 5). This zone of transition is defined by cytoarchitectonic criteria as the ap- parent outer limit of the compact, radially aligned PVE (Boulder Committee, 1970). Similarly, the outer limit of distribution of cells of the SPP extends beyond that of the SVZ. Again in terms of cytoarchitectonic criteria, the SVZ is defined as a zone of non-radially-aligned cells that is less compact than the VZ (Boul- der Committee, 1970). Later on El4 the SVZ is demarcated at about bin IX by tangential fiber bundles of the intermediate zone. It is not known if the proliferative cells dispersed in the intermediate zone of the cerebral wall superficial to bin IX have destinies different from those of cells concentrated in the zone adjacent to the PVE.
Thus, the outer bins of the VZ proper, in particular bin VII, mark a transition from a nearly pure PVE (in bins I-VI) to an
Bin -- 1
Figure 4. A three-dimensional plot of nuclear density. The nuclear density (z-axis: total number of nuclei/bin) in bins I-X (x-axis) of the El4 cerebral wall is plotted as a function of time (y-axis) in the course of the 14 hr experimental interval. Bins representing the intermediate zone and cortical strata late in the experimental interval are not included because they have no satisfactory homolog at the outset of the experi- mental interval (see Figs. 2, 3). The nuclear density declines from bin I outward without net change with time. This three-dimensional plot was generated from data collected for the time points listed in Table 1; the “surface” shown was obtained using a bivariate spline interpolation to generate intermediate points (SPS/GRAPH software).
intermixed PVE + SPP. We have considered the consequences of PVE and SPP intermixing through this zone of transition in our computations of the lengths of the cell cycle phases and the GF of the PVE (Fig. 6B, Table 2; see also subsequent section). In order to deal with the intermixing, we have made an estimate of the absolute number of SPP nuclei and the proportions of these nuclei relative to those of the PVE, as distributed in bins III-XII (see also Fig. 5 caption). These estimates are plotted in Figure 5, C and D, and were used to derive the proportionate contribution of the SPP and PVE GFs to the overall S-phase population as represented by the 0.5 hr LI profile (Fig. 5E). These estimates are made from the number of abventricular mitoses/bin and the total number of nuclei/bin and from the assumptions that TM/T, (for Fig. 5C.D) and TM/T, (for Fig. 5E) are the same for PVE and SPP. [Subsequent work, still in prog- ress, has established that T, is the same for the PVE and SPP at E 14 (T. Takahashi, unpublished observations). We have not, however, established that T, is the same for the two populations at this developmental stage.]
Parameters of the PVE cytokinetic cycle Growth fraction and the lengths of the cell cycle and S-phase. For each experimental animal, the initial BUdR injection was given at 9:00 A.M. Each animal was killed at a precisely specified time after the initial injection at 9:00 A.M. Further, the width of the VZ is essentially stable throughout the 14 hr experimental interval. For these reasons, neither variations in the precise time of copulation and initiation of pregnancy among the experi- mental animals nor the rapid growth of cerebral strata overlying the VZ will be expected to affect the apparent values of the GF and lengths of cell cycle phases computed in these experiments.
A plot of the LI in bins I-VII, that is, the predominant bins ofthe PVE, for each ofthe survival times shows that LI increased

Number of Mltoses
The Journal of Neuroscience, February 1993, 13(2) 525
6 Number of Abventricular Mitoses
0.15 -I
Bin
Bin
C Estimated SPP Size
D E % Estimated SPP Size (%) Estimated Distribution of S-phase Nuclei
Bin Bin
Bin
Figure 5. Extent and size of the SPP in the early El4 cerebral wall. A and B, The distribution of mitotic figures with respect to the series of bins in the sector of the El4 murine dorsomedial cerebral wall. Counts were made in 0.5, 2.0, and 3.5 hr specimens. The ordinate shows the average number of mitoses/bin. The abventricular mitoses only, that is, the mitoses belonging to the SPP, are presented with an expanded scale on the ordinate in B. Mitotic figures are distributed bimodally. They are most concentrated in bin I, but they are also observed in bins III-XII. The mitotic figures in bin I, that is, those taken to represent the PVE, are approximately 10 times as abundant as those of the SPP. No mitoses are observed in bin II. Of the abventricular mitoses lying in bins III-XII and taken to represent the SPP, approximately 75% are found in bins VII-IX. Error bars = SEM. C, The number of SPP nuclei/bin is estimated by assuming (1) that cells of the SPP, like those of the PVE, cycle asynchronously such that the number of cells in M- or S-phases/the total number of cells in the SPP is proportional to TJT, or TJT,, respectively, and (2) that TJ TM is the same for the PVE and SPP, that is, values in B * (Tc/TJ. D, Nuclei of the SPP are shown as percentage of nuclei in each bin (values in C/nuclear density from Fig. 4). E, S-phase population of the overall proliferative zone (represented by the 0.5 hr LI profile) is partitioned into the estimated PVE and SPP contributions. The SPP contribution is estimated by again assuming that T,/T, is the same for the PVE and SPP, that is, values in C * (TJTJnuclear density.
linearly from 0.28 at the 0.5 hr time point to 0.94 at 11.0 hr zone of analysis has been progressively extended to include bins (Fig. 6A). In this plot, GF, T,, and T, can be calculated from I-VI, then bins I-VII, bins I-VIII, and finally bins I-IX are the y-intercept (= TJT, * GF) and from the time at which the presented in Figure 6B. In Table 2, GF, T,, and T, as computed asymptote is reached (i.e., the time required to label the com- by a best fit to all of the data points (Nowakowski et al., 1989) plete GF), which is T, - T, (i.e., at T, - T,, LI = GF). In for this series of plots are presented. The calculations assume order to get the actual slope of this plot, we have used a least- that cells leaving the cell cycle to begin their migrations will exit squares fit that considers all of the data points (Nowakowski et the VZ “immediately” and therefore will not shorten the ap- al., 1989). Plots showing the increases in average LI where the parent T, - T,, that is, the time required for LI to reach its

626 Takahashi et al. * Cerebral Cell Cycle
A Table 2. Cytogenetic parameters and size of proliferative population
Bins GF
I-VI 0.99
T, (W
13.5
T, 0-4
3.0
0.8-
0.6 -
I-VII 0.98 15.1 3.8 I-VIII 0.95 15.1 3.5 I-IX 0.90 15.1 3.4
Data are. variation in GF, T,, and T, in relation to the number of bins.
Therefore, the length of T, - T, and the calculated value for A T, will be shorter than the correct values (Nowakowski et al.,
0.4- 1989). The actual magnitude of the error attributable to this consideration is not presently known. However, the linear ascent
0.2-T
of LI for these plots to its maximum value suggests that the attributable error is small.
(Ts/Tc)+GF As progressively more abventricular bins are added, the ap- parent value of T, increases from 13.5 hr when only bins I-VI
0.0 1 1 1 1 1 1 ’ ’ ’ ’ 0.5 2.0 3.5 5.0 6.5 6.0 9.5 11.0 12.5 14.0
Hours Atter lnltlal Injection
are considered to reach a maximum and stable value of 15.1 hr (Table 2). The apparent value for T,, similarly, increases from 3.0 hr when only bins I-VI are included to reach a maximum value of 3.8 hr when the calculation considers bins I-VII. The apparent values for T, are slightly (but not significantly) less
B than 3.8 hr when they are calculated for bins I-VIII or bins I- IX. The apparent GF, by contrast, is maximum at an extrap- olated value virtually at 100% for bins I-VI, and then declines
1.0 slightly as bins VII, VIII, and IX are included in the analysis.
0.8
0.6
0.2
- I-VI - I-VII - I-VIII - I-IX
We conclude that the population included within bins I-VII best represents the proliferative population of the PVE and therefore that the values of T, and T, for the PVE are 15.1 hr and 3.8 hr, respectively. The major reason for this conclusion is the observation that the Gl nuclei of the PVE enter the S-phase only after ascending to the level of bin VII (Takahashi et al., 1992a). Although there is substantial mixing of PVE and SPP cells in bin VII (see previous section), to exclude this bin would truncate the apparent length ofboth T,and T, by ignoring both the terminal part of G 1 -phase and the initial part of S-phase. This accounts for the shorter values obtained for T, and T, when only bins I-VI are considered (Table 2).
The GF in the proliferative zone, corresponding to the max- imum LI attained with cumulative labeling after T, - T,, is virtuallv 1 .O when onlv bins I-VI are considered. With recruit-
0.0: . . . . 1 - . . - 1 . . . ’
0 5 10 15 ment of overlying bins, the apparent value for GF declines reaching 0.9 when bins I-IX are the basis of the estimate. Thus,
Hours after Initial lnjectlon it seems that the GF for the PVE at El4 is indistinguishable from 1 .O (i.e., all cells of the PVE are proliferating). The GF of the SPP is an uncertain value less than 1.0. Figure 6. Changes in labeling indices with cumulative labeling. A, Plots
of the full set of the overall LIs in bins Z-VU for each of the time points in the complete series of animals. The SE is 6% of the mean LI at 0.5 and 2.0 hr and 2% at later time points. A best-fit slope is linear with an extrapolated y-axis intercept (= TJT, * GF) at an LI of 0.25. The LI reaches 0.98 (= GF) at an interpolated value of 11.3 hr corresponding to T, - Ts. B, The ascent with time of the mean LIs for bins Z-VI is compared to plots where the nuclei in bins VZZ, VIII, and IX have been successively included in the proliferative population. There is a pro- gressive, albeit slight, decline in the maximum LI (= GF) with recruit- ment of each additional bin. Thus, although the progressive recruitment of the populations in bins VZZ-IX has relatively little effect on the com- puted values for Tc and T,, it results in a decline in the apparent GF (see Table 2).
maximum value. To the extent that this assumption is not cor- rect and depending upon the proportion of postmitotic cells that exit the VZ on E 14, the rate of ascent of LI toward its maximum value will accelerate with time, that is, will become nonlinear.
The lengths of G2-, M-, and Gl -phases. The combined length of the G2- and M-phases (TGz+,J can be determined from the minimum time required for all of the mitotic figures to become labeled (Atlas and Bond, 1965; Kauffman, 1966,1968; Shimada and Langman, 1970). From the single injection experiments (Table l), it was found that 100% of the mitoses were labeled at 2.0 hr but not at 1.5 hr (83%). This means that T,,,,,, is approximately 2.0 hr.
T, was computed by two different methods so as to give minimum and maximum estimates. A minimum estimate for T, was made based upon the mitotic index, which is the number of mitotic figures as a fraction of the total PVE population. (This method arrives at a minimum estimate because it depends upon counts of mitotic figures observed at the light microscopic level of resolution, which may be expected to be an underestimate

The Journal of Neuroscience, February 1993, 13(2) 827
S-phase zone
Figure 7. The sequence of “checkpoints” in the VZ. A series of checkpoints are cleared by each nucleus in the course of its descent to undergo mitosis in bin Z or by its daughter nuclei in the course of their subsequent ascent. The nucleus exits S-phase to enter G2-phase at a point, t,, arrives in bin Z at t,, and initiates and completes mitosis at t2 and t3, respectively. Daughter cells will exit bin Z at variable time points, t4 and t’,.
of the actual number of mitotic figures.) If it is assumed that the proliferating cells are asynchronously distributed through the cell cycle, then the number of cells in mitosis (NJ as a fraction of the total number of cells in the PVE (NTOT) will equal TM divided by T,. In other words,
At E 14, N,,, is 3.4 1 mitotic figures/sector (abventricular mitotic figures not included; Fig. 5A) while NToT for bins I-VII is 140/ sector. Thus,
TM (minimum) = 15.1 hr x 3.41/140 = 0.368 hr (=22 min).
Note that the same calculation for bins I-VI (to minimize the contribution of the SPP) would use an average density of 122 cells and would yield an estimate for TM of 25 min.
A maximum estimate of TM was made based upon estimates of the rates at which cells were observed to pass through a sequence of “transition points” in bin I (Fig. 7). The nucleus is considered to pass from S-phase to G2-phase at to, to descend into bin I at t, where it enters M-phase at tZ, to complete M-phase at t,, and to ascend from bin I at t,. These transition points divide the stay in bin I into t, - tz (=G2-phase), tz - t3 (=M- phase), and t, - t, (=post M-phase) intervals. We are concerned here with the M-phase, or the tz - t,, interval.
The first BUdR-labeled mitoses are evident in bin I at I .O hr (=tJ. At this time point, only 7% of the mitotic figures in bin I are BUdR positive, and only a part of the chromosomal mass of these earliest-labeled mitotic figures is labeled with BUdR. These partially labeled mitotic figures are believed to represent the leading edge of the BUdR-labeled cohort of cells (Takahashi et al., 1992a). Given that only a very small number of mitotic figures are BUdR labeled and with the above-mentioned stain- ing pattern at 1 .O hr, it seems reasonable to infer that the tran- sition point t2 is passed just before 1.0 hr, that is, that T,, = 1 .O hr. At 1.5 hr, 83%, and at 2.0 hr, 100% of the mitotic figures are BUdR labeled. This means that the transition point, t, has been passed sometime between 1.5 and 2.0 hr, and therefore a maximum value for TM is 1.0 hr.
The length of Gl can be estimated by subtraction. Since TC = Ts + Tm+.u + TGI, T,, may be estimated to be
TG, = T, (15.1 hr) - [T, (3.8 hr) + T,,,, (2.0 hr)] = 9.3 ir.
LI profiles in the course of cumulative labeling with BUdR
LI profiles for each of the time points in cumulative labeling schedules were produced by computing the LIs separately for each of the bins of the cerebral wall’(Fig. 2). These are plotted in Figure 8A. The distribution of nuclei in S-phase is most closely approximated by the initial or 0.5 hr LI profile (Fig. 2A). Ac- tually, the 0.5 hr LI profile demonstrates not only the distri- bution of nuclei in S-phase but also that of nuclei that entered G2-phase in the 0.5 hr interval between the BUdR injection and animal death (Takahashi et al., 1992a). The LI profile for the 0.5 hr time point is approximately a symmetrical distri- bution with a peak value of 0.63 that lies in bin VI (Fig. 2.4). The LI values fall sharply in bins to the ventricular and abven- tricular sides of bin VI, referred to here as the ventricular and abventricular slopes of the 0.5 hr LI profile.
At successively later survival times, the LI profiles change most dramatically on their ventricular slope (Fig. 8A; see defi- nition of ventricular and abventricular slopes of the LI profiles in preceding paragraph). Within 2.0 hr of the initial injection (= Tcz+,,,), the LI in bin I at the ventricular surface ascends from its initial value of 0 to 0.5, and there are substantial though lesser elevations in the LIs in bins II and III (Fig. 8B). This initial interval produces no change in the LI profiles in bins IV- VII, defined as the “S-phase zone” (Takahashi et al., 1992a). In particular, the LI in bin VI, by contrast to those in bins closer to the ventricular surface, remains stable at about 0.6 through 8.0 hr after the initial exposure to BUdR. In bins I-V the LIs increase progressively after 2.0 hr, presumably as a function of BUdR-positive nuclei of postmitotic cells moving outward from the ventricular surface. By the 12.5 hr time point, the LIs in bins I-VI all advance to 1 .O. (The pattern of LI ascent in these bins and its significance will be considered in more detail in subsequent sections.)
The abventricular slope of the LI profile (i.e., bins VII-X) is more stable, with only slight increases in LIs through 8.0 hr (Fig. 8A). After 8.0 hr, LIs in bins of the abventricular slope increase more rapidly but do not reach 1 .O. The slope of the LI profile at later time points falls sharply to an inflection in bin X and then falls more gradually with progression outward through the cerebral wall.

828 Takahashi et al. * Cerebral Cell Cycle
BIN
0 5 IO
Hours After Initial Injection
Figure 8. Changes in LIs with cumulative labeling. A, The LI profiles are plotted for each of the full set of time points in the cumulative labeling experiments. The “S-phase zone” is defined as the region oc- cupied by bins in which there is no difference between the 0.5 hr and the 2.0 hr LI profiles, corresponding to bins IV-VII (Takahashi et al., 1992a). The earliest changes in LI profiles are observed in bins close to the ventricle (bins Z-III) as the BUdR-labeled nuclei progress initially through G2 to undergo M and to become postmitotic. Subsequently, there is a rapid increase in the LIs, first on the ventricular side of the S-phase zone (bins IV-V) but then in the outer bins (VZ) as BUdR- positive daughter cells progress through Gl either to reenter S or, if permanently postmitotic, to begin their migrations across the inter- mediate zone. An LI of 1 .O is achieved in bin Z by 8.0 hr and in bin VZ by 12.5 hr. B, The increase in LI with progression ofcumulative labeling, plotted separately for each of bins Z-VZ, taken as representative of the “pure” PVE population. A broken vertical line partitions the plots into two epochs: (1) the initial interval of 2.0 hr (left ofbroken line) during which the first BUdR-positive cells will have undergone mitosis to give rise to BUdR-positive daughter cells (i.e., 2.0 hr = T,,,,), and (2) the
Cytokinetic cycle and nuclear movement
The pseudostratified ventricular epithelium. The pattern of LI ascent in the PVE is best understood if the proliferative period is considered as two epochs (separated by the broken vertical line in Fig. 8B).
(1) The initial 2.0 hr of the cumulative labeling interval marks the passage of the first cells, that is, the “leading edge,” of the BUdR-labeled cohort through G2 and M (2 hr = T,,,,,,). The rise of LI in bins II and III signals the descent of BUdR-labeled nuclei as they move through G2, and the steep increase in the LI in bin I indicates the rapid accumulation of BUdR-labeled nuclei in G2 and those undergoing mitosis in that bin (Fig. SB). There is not yet a change in the LIs in bins IV-VI within the “S-phase zone,” evidence that cell nuclei are entering and leav- ing S-phase at equal rates.
(2) After completing G2 and M, the daughter cells of the BUdR-labeled cohort enter Gl, from which they will either reenter S or leave the cell cycle to initiate migration away from the VZ. During the second epoch, the ascent of LI in bin I continues steeply upward but at a decelerating rate (Fig. SB). The last of the unlabeled nuclei are not cleared from bin I until the LI in that bin reaches 1.0, which is at least 8.0 hr after the initial injection or 6.0 hr after the leading edge will have com- pleted mitosis.
The sharp increase in LI in bin II as early as 3.5 hr indicates that some of the postmitotic nuclei quickly reverse their direc- tion and begin their ascent from the ventricular surface im- mediately after completing mitosis. Upward inflections in the curves of LI ascent are then seen in succession with progressively decreasing latency in bins III-VI. The rapid ascent of LIs in bins IV-VI occurs in quick succession with the respective curves separated by only relatively short intervals. The decreasing in- tervals between the periods of rapid LI ascent from bin I outward through bin VI suggest that the rate of ascent of postmitotic nuclei, though somewhat sluggish through the inner half of the VZ (bins I-III), progressively accelerates as they gain the outer half of the VZ (bins IV-VI).
The overlying cerebral wall. The density of BUdR-labeled nuclei (number of BUdR-labeled nuclei/bin) rather than the LI is represented here because this measure highlights, in bins over- lying the VZ, the progressive entry of BUdR-labeled postmitotic cells (and nuclei in other phases of the cell cycle) as cumulative labeling continues. The progression in this parameter beyond the initial, or 0.5 hr, densities throughout the cerebral wall is constructed graphically in Figure 9A. Because the density of BUdR-labeled nuclei increases continuously from the earliest survival time in bins VII-VIII, these bins must include prolif- erative populations (* in Fig. 9A). The more rapid ascent in the density of BUdR-labeled nuclei after 8.0 hr in these bins pre- sumably reflects the influence of both SPP cells and transmi- grating BUdR-labeled postmitotic cells arising in the PVE. Nu- clei of cells of the PVE that are in Gl and are reentering S must also contribute to the upward inflection in bin VII and, to a lesser extent, in adjacent bins. The accumulation of BUdR- labeled nuclei in the intermediate zone (** in Fig. 9A) suggests
t
remainder of the interval during which BUdR-positive daughter cells initiate interphase, either to reenter S or to initiate migrations toward the cortical plate.

The Journal of Neuroscience, February 1993, 73(2) 829
A
20
10 1
TC
0
Bin
B
-TS
Figure 9. Three-dimensional plots of net changes with cumulative labeling with BUdR. In A, the density of labeled nuclei and in B the LIs (z-axis) are plot- ted as functions of bins (x-axis) and time (y-axis) in the course of 14 hr of cumulative labeling with BUdR. A This plot was made from data generated by subtracting the number of labeled nu- clei in each bin at the 0.5 hr time point from the number of labeled nuclei in the respective bins at each subsequent survival time. The graph highlights a massive earlv accumulation of BUdR- labeled nuclei within bins close to the ventricle as nuclei progress from S-phase through mitosis (curved arrow). There is also early accumulation of BUdR- labeled nuclei in the bins corresponding to the SVZ (*) signaling the proliferative activity of the SPP. A net accumulation occurs somewhat later (but prior to Tc - T,) in the overlying intermediate zone (**). B, The graph was generated from data collected for Figure 8. The stability of the LI in bins of the S-phase zone (*) through the initial 8.0 hr of cumulative labeling is supportive of the assumption that this is an asynchronously prolif- erating population. The “surfaces” shown in A and B were obtained using a bivariate spline interpolation to gen- erate intermediate points (SAS/GRAFW
software). ___
Bin
that the earliest postmitotic cells to migrate as far as bin XV have done so in less time than T, - T, (11.3 hr, the average time required for BUdR-labeled postmitotic cells to reenter S-phase). BUdR-labeled cells that have moved radially outward after mitosis and contribute to this peak in the intermediate zone may have arisen from both the PVE and the SPP. In other experiments with a double labeling strategy [tritiated thymidine (3H-TdR) followed in 2 hr by BUdR; Takahashi et al., 19911, it has been demonstrated that a portion of these, at least, do arise from the PVE. The relationship of this accumulation of cells to those of the “sojourn zones” of Bayer and Altman (199 la,b) is for the present uncertain. Those observed by these authors are considered to be in a “staging area” in a state of arrested migration within 24 hr of their terminal divisions.
Net changes in LI Figure 9B is a graphic construction of the full set of LI profiles through time as the cumulative labeling proceeds. The figure represents in a single plot the relative rates of increase of the LIs in the separate bins, considered in more detail in the fore- going section. Among the salient features of the construction is the relative stability of the LI in the S-phase zone (bins IV-VII) and in particular in bin VI through the initial 8.0 hr of cumu- lative labeling (* in Fig. 9B). The stability ofthe LI in the S-phase zone through the first 8.0 hr of cumulative labeling affirms, among other fundamental assumptions of the present meth- odology, that the proliferative activity of the PVE is asynchro- nous.

830 Takahashi et al. l Cerebral Cell Cycle
Discussion This analysis presents the first determination of the full sequence of cell cycle parameters of the neocortical PVE based upon S-phase labeling with BUdR. These parameters are estimates of the average kinetic behavior within a complex proliferative zone that is heterogeneous with respect to mode of interkinetic nuclear movement and cell lineage. The analysis provides a more complete view than previously available of the pattern of intermixing of the PVE and SPP across the VZ-SVZ boundary. It tracks, further, the step-by-step progression of cells of the PVE as they move through the successive phases of the cell cycle and exit from the cycle. In particular, this aspect of the analysis discloses previously unsuspected halts and accelerations in nu- clear movement and even suggests that there may be wide vari- ations in the swiftness with which postmitotic cells initiate their movement away from the zone of mitosis.
Cell cycle parameters The cell cycle parameters obtained in this analysis are viewed as reflecting principally the proliferative behavior of the PVE population. Because of heterogeneities in the proliferative pop- ulation, these parameters are to be regarded as only close ap- proximations of the true values. These heterogeneities derive both from the intermixing of PVE and SPP in the outer bins of the VZ and from the uncertainty relating to the size of the postmitotic population that migrates from the VZ and the rate at which this population exits from the VZ.
The cumulative BUdR labeling method used in this analysis to compute cell cycle parameters is similar to that used by Waechter and Jaensch (1972) an analysis in the rat that was based upon cumulative S-phase labeling with 3H-TdR. At E 16 in rat (corresponding approximately to El 4 in mice), T, was estimated to fall between 12.8 and 16.5 hr. This range is in accord with the value of 15.1 hr found here for the E 14 mouse. The estimated value for TG2+,+, in the El6 rat, 2.5 hr, was also little different from the present estimate. The value for T, in the El6 rat, by contrast, was 6.6 hr in comparison to the value of 3.8 hr determined here for the El4 mouse.
Whereas species differences may account for part of the dis- parity in these two estimates of Ts, there are also computational factors that account for a portion of this difference. In the study of Waechter and Jaensch (1972), an LI of 0.5 1, obtained 1 .O hr after a single injection of 3H-TdR, was taken to estimate TJT,; in contrast, we used the y-intercept to estimate TJT,. Waechter and Jaensch (1972) assumed that the single injection labeled only those cells in S-phase at the moment of injection, that is, that the ‘H-TdR behaved as a pulse with negligible effective labeling time in the tissue. This assumption is certainly in error; the effective labeling time of 3H-TdR in the El4 mouse CNS is approximately 1.0-l .5 hr (T. Takahashi and V. S. Waviness, unpublished observations). Thus, it is likely that the number of labeled nuclei would have continued to increase over the full 1.0 hr survival time before determination of their “zero inter- cept LI.” This means that an LI of 0.5 1, assumed to be TJT, instead would have been (Ts + 1.0)/T,. This consideration re- duces the Waechter and Jaensch (1972) estimate of T, from 6.6 to 5.6 hr.
In other earlier studies of cell cycle parameters in the rodent cerebral PVE but based upon the method of percentage of la- beled mitotic figures following a single injection of 3H-TdR rather than upon the cumulative labeling method (Atlas and
Bond, 1965; Kauffman, 1966, 1968; Shimada and Langman, 1970), estimates of T, have ranged from 4 to 6 hr. In all of these analyses, T, was computed without considering the effective labeling time of the 3H-TdR. If these studies were corrected by this factor, their estimates of T, in the rodent PVE would have been shorter by l-l.5 hr and thus essentially the same as the T, obtained in the present experiments. The estimates of T,, however, would not have been affected by underestimates of the effective labeling time of ‘H-TdR.
Homogeneity of T, for the proliferative populations
The PVE at El4 includes not only the precursors of the full range of neurons that will populate the neocortex (Caviness, 1982) but also the progenitors of a portion, at least, of prolif- erative radial glial and perhaps other glial cells (Misson et al., 1988a,b). This heterogeneity of lineage destiny notwithstanding, there is linear ascent of the LI for the entire PVE (Fig. 6A). That is, by the criterion of cell cycle length, and within the limits of sensitivity of the method used here, the mitotically cycling pop- ulation of the PVE appears to be homogeneous on E 14. In the rhesus brain, a portion at least of the radial glial cells exit the mitotic cycle during the period that neuron migration is pro- ceeding (Schmechel and Rakic, 1979a,b). The nuclei of these cells accumulate in the SVZ. Presumably this stable form of the cell is the classic bipolar radial glial cell, which serves as a guide to neuronal migration (Schmechel and.Rakic, 1979a,b). Cycling radial glial cells in the E 14 mouse PVE may similarly exit the cycle and enter G,. Because the GF of the PVE is 1 .O, the somata containing nuclei of such cells would have to shift outward into the SVZ or intermediate zone as described for the monkey. This might occur through nuclear translocation as has been dem- onstrated to occur at the end of migration when large numbers of radial glial cells with somata deep in the cerebral wall ascend to the upper intermediate zone (Takahashi et al., 1990; Misson et al., 199 1). Thus, the populations representing neuronal and glial lineages in the PVE either have the same or similar cell cycle parameters, or the population producing the glial cell lin- eages is a relatively small proportion of the total population of the PVE.
The slight terminal delay in ascent of the LI in the outer bins of the VZ (Fig. 8B) might, in theory, reflect the behavior of some combination of three additional subpopulations of cells: ( 1) G l- phase nuclei of cells that belong to the PVE but that have a T, more prolonged than the majority of PVE cells; (2) Gl-phase nuclei of SPP cells that might be intermixed with those of PVE cells in the outer bins of the VZ-such a population might delay the terminal ascent of LI in the outer bins if their T, were longer than that of the principal PVE population; and (3) postmitotic cells arising from the PVE-a fraction of postmitotic cells exit from the VZ rather than reentering S. The average and range of transit times of these cells exiting the VZ are not known.
It should be noted that the progressive inclusion of popula- tions in bins VIII-IX has no significant effect on the T, com- puted for bins I-VII. This does not necessarily mean that the overall PVE + SPP is a homogeneous population with respect to T, on E14. This is because the SPP is small relative to PVE (approximately 10%; Fig. 5), and the apparent uniformity of T, throughout the proliferative zone may disguise substantial dif- ferences that may exist at E14. By comparison, experiments at a later developmental age (E21) in the rat (Miller and Nowa- kowski, 1991) obtained a T, for the “SVZ population” (pre- dominantly SPP) that is shorter than that for the “VZ popula-
The Journal of Neuroscience, February 1993. 13(2) 831
tion” (predominantly PVE). In this same study, the PVE and SPP were found to differ also with respect to GF. For the “VZ,” predominantly PVE, population this value is virtually 100% as observed here for the mouse at E14. For the “SVZ,” predom- inantly SPP, population the value was less than lOO%, which also appears to be the case here for the SPP of the El4 mouse.
Expansion of the proliferative population It is known that the postmitotic daughter cells will become partitioned into two separate populations with respect to their subsequent proliferative behavior (Nowakowski, 199 1; Taka- hashi et al., 1991; R. S. Nowakowski, unpublished observa- tions). One population, to be referred to as the “P” or “prolif- erative” fraction, will be committed to G 1 -phase and will reenter S-phase. The other population, to be referred to as the “Q” or “quiescent” fraction, will exit the cell cycle and migrate away from the VZ. A major portion of the Q-fraction on E14, at least, is thought to be neurons that will never reenter the cell cycle. Some, however, may be of glial lineage and enter the GO state with the possibility to reenter S-phase at some later time.
Our preliminary determinations of the fraction of cells that have re-entered S-phase on El4 indicate that more than 60% of the daughter cells will reenter S (i.e., P is higher than 0.6; Takahashi et al., 1991). Thus, for each passage through the complete cell cycle there must be a net increase in the mitotic pool on E14. In this study, we have shown that the nuclear density within the VZ remained constant throughout the 14.0 hr interval of observation (Fig. 4). Thus, there is a net increase in the size of the proliferating population without a net change in nuclear density within the VZ in the dorsomedial cerebral wall of the mouse at El 4. Assuming that cell death is negligible in the VZ (Oppenheim, 1991; Gressens et al., 1992) and that the density of cell processes in the plane of zonulae adherentes at the ventricular surface (Sauer, 1937; Stensaas and Stensaas, 1968; Hinds and Ruffett, 197 1) remains constant, any comple- ment of the P-fraction in excess of 0.5 must contribute to tan- gential growth of the PVE.
Cytokinetic cycle and nuclear movement The nuclei of proliferative cells of the PVE undergo an up-and- down (“to-and-fro”) interkinetic movement as the cells pass through the successive phases of the cell cycle. As noted earlier, DNA replication is initiated when a nucleus is positioned at the outer margin of the VZ (Takahashi et al., 1992a). The nucleus descends as the cell proceeds through S and G2 (Fig. 7). M-phase is initiated and completed at the ventricular surface, included within bin I. The ascent of the nucleus occurs during Gl after mitosis is completed. The relative rates of nuclear movement in its advance toward and retreat from the zone of mitosis at the ventricular margin has been implicit in the findings of all prior studies that have computed the cytokinetic parameters of this population (Kauffman, 1966,1968; Shimada and Langman, 1970; Waechter and Jaensch, 1972). The present analysis com- plements those going before in its illustration of variations in the latency of initiation of nuclear ascent after mitosis and vari- ations in the rate of ascent once movement away from the ventricular surface is initiated.
The descent. The present observations suggest that the rate of descent of the nucleus toward the ventricular surface during S is different from that during G2 (Fig. 7). To consider the descent, beginning with the nucleus in S-phase, it takes 3.8 hr
to descend through bins VII-IV during S, which corresponds to about half of the distance traveled by the descending nuclei (Takahashi et al., 1992a). In contrast, the second half of the descent through bins III, II, and I, that is, as the nucleus proceeds through G2, is completed in about 1 hr. This corresponds to a fourfold increase (3.8 hr/l.O hr) in the apparent rate of nuclear movement.
The ascent. The apparent rate of ascent of the postmitotic nuclei is more prolonged (Fig. 7). The complexity of postmitotic nuclear behavior becomes evident as soon as cell division is completed at the ventricular surface. In particular, there appears to be a substantial differential in the time that the postmitotic nuclei spend in bin I, that is, a substantial differential in the length of the t, - t4 interval (Fig. 7). The rationale for inferring that this difference represents biological, as opposed to technical or methodological artifactual, differences is based on the fol- lowing observations.
(1) The LI in bin I is only 0.5 at 2.0 hr when 100% of mitotic figures are labeled (Fig. 8). That is, at least 50% of cells in bin I are in the t, - t4 interval, that is, are postmitotic.
(2) For some cells t, - t4 appears to be brief in that some proportion of the postmitotic nuclei labeled with the initial (9: 00 A.M.) BUdR injection moves quickly away from the ven- tricular surface. This is reflected in the sharp rise in the LI in bin II, occurring as early as the 3.5 hr time point (Fig. S), cor- responding to a time in bin I following mitosis of 1.5 hr (t, - t4 -c 1.5 hr).
(3) Some nuclei remain in bin I much longer. This is inferred from the observation that the LI in bin I does not reach 1.0 until 8.0 hr (Fig. 8). Thus, for a more “sluggish” population of postmitotic nuclei, the t, - t, interval may be as long as 6.0 hr (i.e., 8.0 hr - 2.0 hr). For the entire postmitotic population, the modal t, - t, interval would be 3.75 hr [i.e., (1.5 hr + 6.0 hr)/2].
The reasons for this marked difference in the initiation of ascent of different postmitotic nuclei are not clear. One possi- bility is that it reflects differences in the behavior of cells that will reenter the S-phase (P-fraction) as opposed to cells that will exit the cycle (Q-fraction). It is unknown when and where, fol- lowing mitosis, a daughter cell becomes committed to the Q- or P-fraction. An additional possibility supported by observa- tions from work in progress (Takahashi, unpublished obser- vations) is that the cells of the Q-fraction differ from each other in the rate at which they leave the VZ to continue their migra- tions across the cerebral wall. A small contingent exits from the VZ within several hours while others delay for a much longer time after mitosis. Once nuclei begin their ascent from bin I, whether representing cells of the Q- or P-fractions, they appear to do so at rates that are different over the course of the ascent. Thus, nuclei ascending through bins II-III appear to do so rel- atively slowly but to continue beyond bin III at an accelerating rate.
Cytokinetic behavior of the secondary proliferative population It is not known if systematic cell shape changes occur in the SPP with mitotic cycling. At present little is known about these cells, their fates, or their cytokinetic behavior. Experiments con- cerned with the proliferative behavior of cells of the SPP, and based upon S-phase labeling with BUdR or other markers of DNA synthesis, will be complicated by the migration through the SPP of relatively massive populations of labeled cells arising within the PVE.

832 Takahashi et al. * Cerebral Cell Cycle
Prospectus
The present analysis provides a characterization of the prolif- erative population of the murine dorsomedial cerebral wall for E14, which is only a limited interval of the cytogenetic period of neocortical histogenesis. The proliferative characteristics of this population may be expected to evolve dynamically through the full cytogenetic epoch (ElO-EI7), which extends through the terminal half ofgestation. Cytokinetic parameters (Waechter and Jaensch, 1972; Gulay et al., 1989; Caviness et al., 199 1) and also the P- and Q-fractions (Takahashi et al., 199 1) may be expected to vary as the epoch advances. The complete set of parameters for the full histogenetic epoch will support a his- togenetic model that will characterize both the overall cell out- put and growth characteristics of the neocortical proliferative zone. At the same time, characterization of nuclear movement of proliferative cells will serve to highlight the operation of control processes that regulate the proliferative process itself.
The proliferative population is treated here as having a static epithelial base where the tangential relationships of adjacent cells are fixed by junctions at the ventricular zone of insertion. By implication, cell cycle sequences and postmitotic cell move- ments should proceed in only the radial dimension of the ce- rebral wall. The analysis of Walsh and Cepko (1992) strongly challenges this principle. This study provides evidence that there is also substantial tangential movement and this may be direc- tionally systematic as proliferation proceeds within a cell lin- eage. This tangentially shifting behavior is not detectable itl the present analysis, which is sensitive to oscillatory nuclear move- ment in the course of the cell cycle and postmitotic migratory movements in the radial dimension of the cerebral wall but does not see population variation resulting from tangential cell shifts into and out of the analytic sector. The significance of the tan- gential mixing is for the present obscure. To the extent that it may result in regional localizations of cells with specific attri- butes or intercellular relationships in the course of migration at developmental stages after E14, these phenomena may be de- tected by the fine-grain tracking of cellular behavior possible with the present methodology.
References Altman J (1966) Proliferation and migration of undifferentiated pre-
cursor cells in the rat during postnatal gliogenesis. Exp Nemo1 16: 263-278.
Angevine JB, Sidman RL (1961) Autoradiographic study of cell mi- gration during histogenesis ofthe cerebral cortex in the mouse. Nature 192~766-768.
Atlas M, Bond VP (1965) The cell generation cycle of the eleven-day mouse embryo. J Cell Biol 26: 19-24.
Austin CP. Cenko CL (1990) Cellular migration nattems in the de- veloping mouse cerebral cortex. Development 1 lb:7 13-732.
Bayer SA, Altman J (199 la) Neocortical development. New York: Raven.
Bayer SA, Altman J (199 1 b) Cell-specific sorting in the subventricular zones of the embryonic rat neocortex. Sot Neurosci Abstr 17:205.
Berrv M. Roeers AW. Eavres JT (1964) Pattern ofcell migration durine cortical hiitogenesis. Nature 2b3:59’1-593.
Boulder Committee (1970) Embryonic vertebrate nervous system: re- vised terminology. Anat Ret 1661257-262.
Cattaneo E, McKay R (1990) Proliferation and differentiation of neu- ronal stem cells regulated by nerve growth factor. Nature 347:762- 165.
Caviness VS Jr (1982) Neocortical histogenesis in normal and reeler mice: a developmental study based upon [3H]thymidine autoradiog- raphy. Dev Brain Res 4:293-302.
Caviness VS Jr, Sidman RL (1973) Time of origin of corresponding
cell classes in the cerebral cortex of normal and reeler mutant mice: an autoradiographic analysis. J Comp Neurol 148: 14 l-l 52.
Caviness VS Jr, Takahashi T, Jacobson M, Nowakowski RS (1991) Cytokinetic parameters of the ventricular zone in developing mouse neocortex. Sot Neurosci Abstr 17:29.
Cepko CL (1988) Retrovirus vectors and their applications in neu- robiology.‘Neuron 1:343-353.
Crandall JE. Hemm K (1990) Patterns of cell lineage in the cerebral cortex reveal evidence for developmental bound&es. Exp Neurol 109:131-139.
Fujita S (1960) Mitotic pattern and histogenesis of the central nervous system. Nature 185:702-703.
Gadisseux J-F, Evrard P, Misson J-P, Caviness VS Jr (1989) Dynamic structure of the radial glial fiber system of the developing murine cerebral wall. An immunocvtochemical analysis. Dev Brain Res 50: 56-67.
Gratzner HG (1982) Monoclonal antibody to 5-bromo- and 5-iododeoxyuridine; a new reagent for detection of DNA replication. Science 2 18474-475.
Gressens P, Gofflot F, Van Maele-Fabry G, Misson J-P, Gadisseux J-F, Evrard P, Picard JJ (1992) Early neurogenesis and teratogenesis in whole mouse embryo cultures: histochemical, immunocytological and ultrastructural study of the premigratory neuronal-glial unit in normal mouse embryo and in mouse embryos influenced by cocaine and retinoic acid. J Neuropathol Exp Neurol 5 1:206-2 19.
Gulay RR, Miller MW, Nowakowski RS (1989) Progressive changes in cell cycle and DNA-synthetic phase lengths during the development of the dentate gyrus of C57B1/6J mouse. Sot Neurosci Abstr 15:599.
Hinds JW (1968) Autoradiographic study of histogenesis in the mouse olfactory bulb. II. Cell proliferation and migration. J Comp Neurol 134:305-322.
Hinds JW, Ruffett TL (197 1) Cell proliferation in the neural tube: an electron microscopic and Golgi analysis in the mouse cerebral vesicle. Z Zellforsch Mikrosk Anat 115:226-264.
His W (1904) Die Entwicklung des Menschlichen Gehims wahrend der ersten Monate. Leipzig: Hirzel.
Kauffman SL ( 1966) An autoradiographic study of the generation cycle in the ten-day mouse embryo neural tube. Exp Cell Res 42:67-73.
Kauffman SL (1968) Lengthening of the generation cycle during em- bryonic differentiation of the mouse neural tube. Exp Cell Res 49: 42w24.
Mares V, Bruckner G (1978) Postnatal formation of neural cells in the rat occipital cerebrum: an autoradiographic study of the time and space pattern of cell division. J Comp Neurol 177:5 19-528.
Marin-Padilla M (197 1) Early prenatal ontogenesis of the cerebral cortex (neocortex) of the cat (Felis domestica). A Golgi study. I. The primordial neocortical organization. Z Anat Entwicklungsgesch 134: 117-145.
Marin-Padilla M (1978) Dual origin of the mammalian neocortex and evolution of the cortical plate. Anat Embryo1 (Berl) 152: 109-l 26.
McConnell SK, Kaznowski CE (199 1) Cell cycle dependence of lam- inar determination in developing neocortex. Science 254:282-284.
Miller MW, Nowakowski RS (1988) Use of bromodeoxyuridine-im- munohistochemistry to examine the proliferation, migration and time of origin of cells in the central nervous system. Brain Res 457:44-52.
Miller MW, Nowakowski RS (1991) Effect of prenatal exposure to ethanol on the cell cycle kinetics and growth fraction in proliferative zones of the fetal rat cerebral cortex. Alcohol Clin Exp Res 15:229- 232.
Misson J-P, Edwards MA, Yamamoto M, Caviness VS Jr (1988a) Mitotic cycling of radial glial cells of the fetal murine cerebral wall: a combined autoradiographic and immunohistochemical study. Dev Brain Res 38: 183-l 90.
Misson J-P, Edwards MA, Yamamoto M, Caviness VS Jr (1988b) Identification of radial glial cells within the developing murine central nervous system: studies based upon a new immunohistochemical marker. Dev Brain Res 44:95-108.
Misson J-P, Takahashi T, Caviness VS Jr (199 1) Ontogeny of radial and other astroglial cells in murine cerebral cortex. Glia 4: 138-148.
Murray A, Kirschner MW (1989) Dominoes and clocks: the union of two views of the cell cycle. Science 246:6 14-62 1.
Murray A, Kirschner MW (199 1) What controls the cell cycle. Sci Am 264156-63.
Nowakowski RS (1991) The contribution of competition during Gl
The Journal of Neuroscience, February 1993, 13(2) 833
and reentry into the proliferative population to variation in clone size. Sot Neurosci Abstr 17:30.
Nowakowski RS, Rakic P (198 1) The site of origin and route and rate of migration of neurons to the hippocampal region of the rhesus monkey. J Comp Neurol 196: 129-l 54.
Nowakowski RS, Lewin SB, Miller MW (1989) Bromodeoxyuridine immunohistochemical determination of the lengths of the cell cycle and the DNA-synthetic phase for an anatomically defined population. J Neurocytol 183 1 l-3 18.
Oppenheim RW (199 1) Cell death during development of the nervous system. In: Annual review of neuroscience, Vol 14 (Cowan WM, Shooter EM, Stevens CF, Thompson RF, eds), pp 453-501. Palo Alto: Annual Reviews.
Rakic P (1972) Mode of cell migration to the superficial layers of fetal monkey neocortex. J Comp Neurol 145:61-84.
Rakic P (1978) Neuronal migration and contact guidance in the pri- mate telencephalon. Postgrad Med J 54:25-40.
Rakic P (1988) Specification of cerebral cortical areas. Science 24 1: 170-176.
Rivera VM, Greenberg ME (1990) Growth factor-induced gene ex- pression: the ups and downs of c-fos regulation. New Biol2:75 l-758.
Rohrer H (1990) The role of growth factors in the control of neuro- genesis. Eur J Neurosci 2: 1005-l 0 15.
Sauer FC (1935) Mitosis in the neural tube. J Comp Neurol 62:377- 405.
Sauer FC (1937) Some factors in the morphogenesis of vertebrate embryonic epithelia. J Morph01 6 1:563-579.
Sauer ME, Walker BE (1959) Radioautographic study of interkinetic nuclear migration in the neural tube. Proc Sot Exp Biol Med 101: 557-560.
Schmechel DE, Rakic P (1979a) Arrested proliferation of radial glial cells during midgestation in rhesus monkey. Nature 277:303-305.
Schmechel DE, Rakic P (1979b) A Golgi study of radial glial cells in developing monkey telencephalon: morphogenesis and transforma- tion into astrocytes. Anat Embryo1 (Berl) 156: 115-l 52.
Shimada M, Langman J (1970) Cell proliferation, migration and dif- ferentiation in the cerebral cortex of the golden hamster. J Comp Neurol 1391227-244.
Shoukimas GM, Hinds JW (1978) The development of the cerebral
cortex in the embryonic mouse: an electron microscopic serial section analysis. J Comp Neurol 179:795-830.
Sidman RL (1970) Autoradiographic methods and principles for study of the nervous system with thymidine-H3. In: Contemporary research methods in neuroanatomy (Nauta WJH, Ebbesson SOE, eds), pp 252- 274. New York: Springer.
Sidman RL, Miale IL, Feder N (1959) Cell proliferation and migration in the primitive ependymal zone: an autoradiographic study of his- togenesis in the nervous system. Exp Neurol 1:322-333.
Smart I (1961) The subependymal layer of the mouse brain and its cell production as shown by autoradiography after thymidine-H3 in- jection. J Comp Neurol 116:325-347.
Smart I, Leblond CP (196 1) Evidence for division and transformation of neuroglia cells in the mouse brain, as derived from radioautography after injection of thymidine-H3. J Comp Neurol 116:349-367.
Stensaas LJ, Stensaas SS (1968) An electron microscope study of cells in the matrix and intermediate laminae of the cerebral hemisphere of the 45 mm rabbit embryo. Z Zellforsch Mikrosk Anat 9 1:341-365.
Takahashi T, Misson J-P, Caviness VS Jr (1990) Glial process elon- gation and branching in the developing murine neocortex: a quali- tative and quantitative immunohistochemical analysis. J Comp Neu- rol 302: 15-28.
Takahashi T, Nowakowski RS, Jacobson M, Caviness VS Jr (1991) Cell output of the ventricular zone of the E 14 mouse neocortex. Sot Neurosci Abstr 17:29.
Takahashi T, Nowakowski RS, Caviness VS Jr (1992a) BUdR as an S-phase marker for quantitative studies of cytokinetic behavior in the murine cerebral ventricular zone. J Neurocytol 2 1: 185-l 97.
Takahashi T, Nowakowski RS, Caviness VS Jr (1992b) Cytogenesis in the secondary proliferative population of the murine cerebral wall. Sot Neurosci Abstr 18:30.
Waechter RV, Jaensch B (1972) Generation times of the matrix cells during embryonic brain development: an autoradiographic study in rats. Brain Res 46:235-250.
Walsh C, Cepko CL (1990) Cell lineage and cell migration in the developing cerebral cortex. Experientia 46:940-947.
Walsh C, Cepko CL (1992) Widespread dispersion of neuronal clones across functional regions of the cerebral cortex. Science 255:434-440.


![[Biochemical aspects of fetal hypoxia]](https://img.dokumen.tips/doc/110x75/635d79de88f33c6f8200b2b0/biochemical-aspects-of-fetal-hypoxia.jpg)