Embed Size (px)
Citation preview
[ ]SPECIAL EDITION CAN ER
aaas.org/science-journals

Submit Your Research for Publication in the Science Family of JournalsThe Science family of journals are among the most highly-regarded journals in the world for quality and selectivity. Our peer-reviewed journals are committed to publishing cutting-edge research, incisive scientific commentary, and insights on what’s important to the scientific world at the highest standards.
Submit your research today!Learn more at www.sciencemag.org/journals
Introducing theNEBNext Direct™
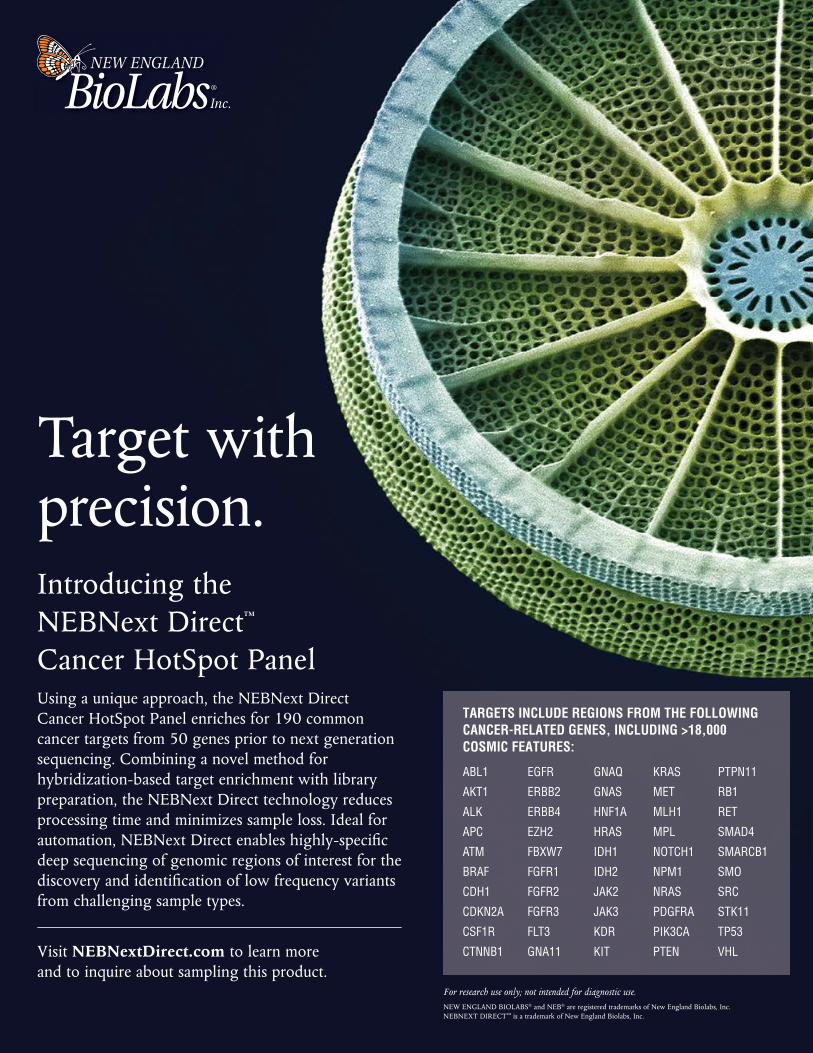
Cancer HotSpot PanelUsing a unique approach, the NEBNext DirectCancer HotSpot Panel enriches for 190 commoncancer targets from 50 genes prior to next generationsequencing. Combining a novel method forhybridization-based target enrichment with librarypreparation, the NEBNext Direct technology reducesprocessing time and minimizes sample loss. Ideal forautomation, NEBNext Direct enables highly-specificdeep sequencing of genomic regions of interest for thediscovery and identification of low frequency variantsfrom challenging sample types.
Visit NEBNextDirect.com to learn moreand to inquire about sampling this product.
Target withprecision.
TARGETS INCLUDE REGIONS FROM THE FOLLOWINGCANCER-RELATED GENES, INCLUDING >18,000COSMIC FEATURES:
ABL1 EGFR GNAQ KRAS PTPN11
AKT1 ERBB2 GNAS MET RB1
ALK ERBB4 HNF1A MLH1 RET
APC EZH2 HRAS MPL SMAD4
ATM FBXW7 IDH1 NOTCH1 SMARCB1
BRAF FGFR1 IDH2 NPM1 SMO
CDH1 FGFR2 JAK2 NRAS SRC
CDKN2A FGFR3 JAK3 PDGFRA STK11
CSF1R FLT3 KDR PIK3CA TP53
CTNNB1 GNA11 KIT PTEN VHL
For research use only; not intended for diagnostic use.NEW ENGLAND BIOLABS® and NEB® are registered trademarks of New England Biolabs, Inc.NEBNEXT DIRECT™ is a trademark of New England Biolabs, Inc.

Learn more and submit your research today: aaas.org/science-journals
Science Translational Medicine is an interdisciplinary journal that publishes translational research with impact for human health that fills the knowledge gaps between preclinical stud-ies and clinical applications.
Chief Scientific AdvisorsElazer R. Edelman, M.D., Ph.D. Massachusetts Institute of Technology
Garret FitzGerald, M.D. University of Pennsylvania
Editor Orla M. Smith, Ph.D.
Editorial Team Catherine A. Charneski, Ph.D. Caitlin A. Czajka, Ph.D. Mattia Maroso, Ph.D. Yevgeniya Nusinovich, M.D., Ph.D. Lindsey Pujanandez, Ph.D.
Science Advances is the digital, open access expansion of Science magazine. The journal publishes significant, innovative original research that advances the frontiers of science across a broad range of disciplines, from bioscience and medicine to neuroscience, physics, ecology, and material sciences.
Managing Editor Philippa Benson, Ph.D.
Editorial Team Lynden Archer, Ph.D.Aaron Clauset, Ph.D. Sarah M. Fortune, M.D.Kip V. Hodges, Ph.D.Jeremy Jackson, Ph.D.Zakya H. Kafafi, Ph.D.
Kevin S. LaBar, Ph.D.Shahid Naeem, Ph.D.Ali Shilatifard, Ph.D.Philip Yeagle, Ph.D.Warren Warren, Ph.D.
Science Signaling publishes peer-reviewed, original research investigating cell signaling that underlies physiology and disease, on the molecular, cellular, intercellular and organis-mal levels.
Chief Scientific EditorMichael B. Yaffe, M.D., Ph.D. Massachusetts Institute of Technology
Editor John F. Foley, Ph.D.
Editorial TeamLeslie K. Ferrarelli, Ph.D. Annalisa M. VanHook, Ph.D. Erin R. Williams, Ph.D. Wei Wong, Ph.D.
SPECIAL EDITION: Cancer Select research published in Science, Science Advances, Science Immunology, Science Signaling, and Science Translational Medicine
Cancer remains one of the leading causes of death worldwide, but the rap-id pace of innovation and discovery in this field is increasingly transforming cancer into a survivable and sometimes even curable condition. In this booklet are samples of empirical research from five featured journals from the Science family, showcasing various discoveries in cancer biology and treatment.
Image: Steve Gschmeissner/Science Photo Library
Science is a leading outlet for scientific news, commentary, and cutting-edge research. The journal publishes original peer-reviewed research across the sciences, with articles that consistently rank among the most cited in the world.
Deputy EditorsLisa D. Chong, Ph.D. Andrew M. Sugden, Ph.D. Valda J. Vinson, Ph.D. Jake S. Yeston, Ph.D.
Cancer EditorsPriscilla Kelly, Ph.D. Paula Kiberstis, Ph.D.
Science Immunology publishes original, peer-reviewed, sci-ence-based research articles that report critical advances in all areas of immunological research, including important new tools and techniques.
Chief Scientific Advisors Abul K. Abbas, M.D. University of California, San Francisco
Federica Sallusto, Ph.D. Università della Svizzera Italiana
Editor Ifor Williams, M.D., Ph.D.
Editorial Team Anand Balasubramani, Ph.D.
Editor-in-Chief Jeremy Berg, Ph.D. Science family of journals AAAS, Washington, DC

Learn more and submit your research today: aaas.org/science-journals
I N T H I S B O O K L E T
Science
4 R E P O R T
Detection and localization of surgically resectable cancers with a multi-analyte blood test Joshua D. Cohen et al. (Nickolas Papadopoulos)
12 R E S E A R C H | R E P O R T
Analysis of Fusobacterium persistence and antibiotic response in colorectal cancer
Susan Bullman et al. (Mathew Meyerson)
Science Advances
18 R E V I E W
Fundamentals of cancer metabolism Ralph J. DeBerardinis and Navdeep S. Chandel
36 R E S E A R C H A R T I C L E
The DNA cytosine deaminase APOBEC3B promotes tamoxifen resistance in ER-positive breast cancer
Emily K. Law et al. (Reuben S. Harris)
Science Immunology
45 R E S E A R C H A R T I C L E
A melanin-mediated cancer immunotherapy patch
Yanqui Ye et al. (Zhen Gu)
57 R E S E A R C H A R T I C L E
Platelets subvert T cell immunity against cancer via GARP-TGFβ axis Saleh Rachidi et al. (Zihai Li)
Science Signaling
69 R E S E A R C H A R T I C L E
Blockade of TNFR2 signaling enhances the immunotherapeutic effect of CpG ODN in a mouse model of colon cancer Yingjie Nie et al. (Joost J. Oppenheim, Xin Chen)
78 R E S E A R C H A R T I C L E
Androgen receptor inhibitor–induced “BRCAness” and PARP inhibition are synthetically lethal for castration-resistant prostate cancer Likun Li Park et al. (Timothy C. Thompson)
Science Translational Medicine
89 R E S E A R C H A R T I C L E Identifying DNA methylation biomarkers for non-endoscopic detection of Barrett’s esophagus Helen R. Moinova et al. (Sanford D. Markowitz)
00 R E S E A R C H A R T I C L E
A precision therapy against cancers driven by KIT/PDGFRA mutations Erica K. Evans et al. (Christoph Lengauer)
© 2018 by The American Association for the Advancement of Science. All Rights Reserved.
Publisher: Bill Moran
AD/ Business Development: Justin Sawyers
Marketing Manager: Shawana Arnold
Layout/Design: Kim Huynh
¾
1
STAND TOGETHERBe a Force for Science
GET THE FACTS
Understand the
science behind the
issues that matter.
FOLLOW AAAS ADVOCACY
Champion public
discussion and
evidence-based policy.
TAKE ACTION
Learn ways you can
become an advocate
and stand up for
science.
F O R C E F O R S C I E N C E . O R G
Memb_ForceForScience_FP_8.5x11[Cancer].indd 1 3/7/18 2:50 PM
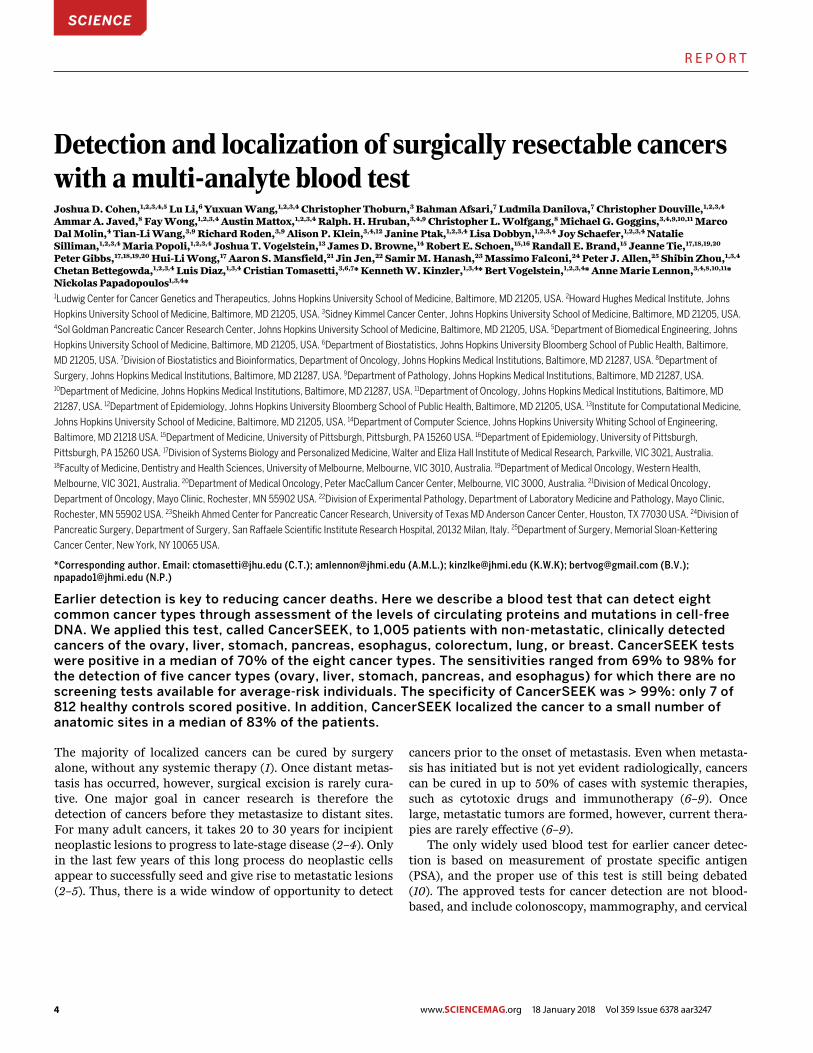
4 www.SCIENCEMAG.org 18 January 2018 Vol 359 Issue 6378 aar3247
Cite as: J. D. Cohen et al., Science10.1126/science.aar3247 (2018).
REPORTS
First release: 18 January 2018 www.sciencemag.org (Page numbers not final at time of first release) 1
The majority of localized cancers can be cured by surgery alone, without any systemic therapy (1). Once distant metas-tasis has occurred, however, surgical excision is rarely cura-tive. One major goal in cancer research is therefore the detection of cancers before they metastasize to distant sites. For many adult cancers, it takes 20 to 30 years for incipient neoplastic lesions to progress to late-stage disease (2–4). Only in the last few years of this long process do neoplastic cells appear to successfully seed and give rise to metastatic lesions (2–5). Thus, there is a wide window of opportunity to detect
cancers prior to the onset of metastasis. Even when metasta-sis has initiated but is not yet evident radiologically, cancers can be cured in up to 50% of cases with systemic therapies, such as cytotoxic drugs and immunotherapy (6–9). Once large, metastatic tumors are formed, however, current thera-pies are rarely effective (6–9).
The only widely used blood test for earlier cancer detec-tion is based on measurement of prostate specific antigen (PSA), and the proper use of this test is still being debated (10). The approved tests for cancer detection are not blood-based, and include colonoscopy, mammography, and cervical
Detection and localization of surgically resectable cancers with a multi-analyte blood test Joshua D. Cohen,1,2,3,4,5 Lu Li,6 Yuxuan Wang,1,2,3,4 Christopher Thoburn,3 Bahman Afsari,7 Ludmila Danilova,7 Christopher Douville,1,2,3,4 Ammar A. Javed,8 Fay Wong,1,2,3,4 Austin Mattox,1,2,3,4 Ralph. H. Hruban,3,4,9 Christopher L. Wolfgang,8 Michael G. Goggins,3,4,9,10,11 Marco Dal Molin,4 Tian-Li Wang,3,9 Richard Roden,3,9 Alison P. Klein,3,4,12 Janine Ptak,1,2,3,4 Lisa Dobbyn,1,2,3,4 Joy Schaefer,1,2,3,4 Natalie Silliman,1,2,3,4 Maria Popoli,1,2,3,4 Joshua T. Vogelstein,13 James D. Browne,14 Robert E. Schoen,15,16 Randall E. Brand,15 Jeanne Tie,17,18,19,20 Peter Gibbs,17,18,19,20 Hui-Li Wong,17 Aaron S. Mansfield,21 Jin Jen,22 Samir M. Hanash,23 Massimo Falconi,24 Peter J. Allen,25 Shibin Zhou,1,3,4 Chetan Bettegowda,1,2,3,4 Luis Diaz,1,3,4 Cristian Tomasetti,3,6,7* Kenneth W. Kinzler,1,3,4* Bert Vogelstein,1,2,3,4* Anne Marie Lennon,3,4,8,10,11* Nickolas Papadopoulos1,3,4* 1Ludwig Center for Cancer Genetics and Therapeutics, Johns Hopkins University School of Medicine, Baltimore, MD 21205, USA. 2Howard Hughes Medical Institute, Johns
Hopkins University School of Medicine, Baltimore, MD 21205, USA. 3Sidney Kimmel Cancer Center, Johns Hopkins University School of Medicine, Baltimore, MD 21205, USA. 4Sol Goldman Pancreatic Cancer Research Center, Johns Hopkins University School of Medicine, Baltimore, MD 21205, USA. 5Department of Biomedical Engineering, Johns
Hopkins University School of Medicine, Baltimore, MD 21205, USA. 6Department of Biostatistics, Johns Hopkins University Bloomberg School of Public Health, Baltimore,
MD 21205, USA. 7Division of Biostatistics and Bioinformatics, Department of Oncology, Johns Hopkins Medical Institutions, Baltimore, MD 21287, USA. 8Department of
Surgery, Johns Hopkins Medical Institutions, Baltimore, MD 21287, USA. 9Department of Pathology, Johns Hopkins Medical Institutions, Baltimore, MD 21287, USA. 10Department of Medicine, Johns Hopkins Medical Institutions, Baltimore, MD 21287, USA. 11Department of Oncology, Johns Hopkins Medical Institutions, Baltimore, MD
21287, USA. 12Department of Epidemiology, Johns Hopkins University Bloomberg School of Public Health, Baltimore, MD 21205, USA. 13Institute for Computational Medicine,
Johns Hopkins University School of Medicine, Baltimore, MD 21205, USA. 14Department of Computer Science, Johns Hopkins University Whiting School of Engineering,
Baltimore, MD 21218 USA. 15Department of Medicine, University of Pittsburgh, Pittsburgh, PA 15260 USA. 16Department of Epidemiology, University of Pittsburgh,
Pittsburgh, PA 15260 USA. 17Division of Systems Biology and Personalized Medicine, Walter and Eliza Hall Institute of Medical Research, Parkville, VIC 3021, Australia. 18Faculty of Medicine, Dentistry and Health Sciences, University of Melbourne, Melbourne, VIC 3010, Australia. 19Department of Medical Oncology, Western Health,
Melbourne, VIC 3021, Australia. 20Department of Medical Oncology, Peter MacCallum Cancer Center, Melbourne, VIC 3000, Australia. 21Division of Medical Oncology,
Department of Oncology, Mayo Clinic, Rochester, MN 55902 USA. 22Division of Experimental Pathology, Department of Laboratory Medicine and Pathology, Mayo Clinic,
Rochester, MN 55902 USA. 23Sheikh Ahmed Center for Pancreatic Cancer Research, University of Texas MD Anderson Cancer Center, Houston, TX 77030 USA. 24Division of
Pancreatic Surgery, Department of Surgery, San Raffaele Scientific Institute Research Hospital, 20132 Milan, Italy. 25Department of Surgery, Memorial Sloan-Kettering
Cancer Center, New York, NY 10065 USA.
*Corresponding author. Email: [email protected] (C.T.); [email protected] (A.M.L.); [email protected] (K.W.K); [email protected] (B.V.); [email protected] (N.P.)
Earlier detection is key to reducing cancer deaths. Here we describe a blood test that can detect eight common cancer types through assessment of the levels of circulating proteins and mutations in cell-free DNA. We applied this test, called CancerSEEK, to 1,005 patients with non-metastatic, clinically detected cancers of the ovary, liver, stomach, pancreas, esophagus, colorectum, lung, or breast. CancerSEEK tests were positive in a median of 70% of the eight cancer types. The sensitivities ranged from 69% to 98% for the detection of five cancer types (ovary, liver, stomach, pancreas, and esophagus) for which there are no screening tests available for average-risk individuals. The specificity of CancerSEEK was > 99%: only 7 of 812 healthy controls scored positive. In addition, CancerSEEK localized the cancer to a small number of anatomic sites in a median of 83% of the patients.
SCIENCE
R E P O R T
5
R E P O R T
www.SCIENCEMAG.org 18 January 2018 Vol 359 Issue 6378 aar3247
First release: 18 January 2018 www.sciencemag.org (Page numbers not final at time of first release) 2
cytology. New blood tests for cancer must have very high specificity; otherwise, too many healthy individuals will re-ceive positive test results, leading to unnecessary follow-up procedures and anxiety. Blood tests that detect somatic mu-tations (“liquid biopsies”) offer the promise of exquisite spec-ificity because they are based on driver gene mutations that are expected to be found only in abnormal clonal prolifera-tions of cells, such as cancers (11–18). To date, the vast major-ity of cancer patients evaluated with mutation-based liquid biopsies have advanced-stage disease. In addition, no studies have examined a large number of healthy control individuals, which is essential for evaluation of the specificity of such tests (19). Diagnostic sensitivity is also an issue for liquid biopsies. Available evidence indicates that patients with early-stage cancers can harbor < 1 mutant template molecule per ml of plasma (11, 20), which is often beyond the limit of detection of previously reported technologies that assess multiple mu-tations simultaneously (19, 21). Yet another issue with liquid biopsies is the identification of the underlying tissue of origin. Because the same gene mutations drive multiple tu-mor types, liquid biopsies based on genomic analysis alone generally cannot identify the anatomical location of the pri-mary tumor.
We describe here a new blood test, called CancerSEEK, which addresses the issues described above. The test utilizes combined assays for genetic alterations and protein bi-omarkers and has the capacity not only to identify the pres-ence of relatively early cancers but also to localize the organ of origin of these cancers.
Initial studies demonstrated that the maximum sensitiv-ity of plasma DNA-based tests (“liquid biopsies”) was limited for localized cancers (11). A subsequent study suggested that the combination of four protein biomarkers with one genetic marker (KRAS) could enhance sensitivity for the detection of pancreatic cancers (20). We sought to generalize this ap-proach by evaluating a panel of protein and gene markers that might be used to detect many solid tumors at a stage prior to the emergence of distant metastases. We began by designing a polymerase chain reaction (PCR)-based assay that could simultaneously assess multiple regions of driver genes that are commonly mutated in a variety of cancer types. In designing this test, we were confronted by four competing challenges. First, the test must query a sufficient number of bases to allow detection of a large number of cancers. Second, each base queried in the test must be sequenced thousands of times to detect low prevalence mutations (11, 19, 21, 22). Third, there must be a limit on the number of bases queried in the test because the more bases queried, the more likely that artifactual mutations would be identified, reducing the signal-to-noise ratio. And fourth, for implementation in a screening setting, the test must be cost effective and amena-
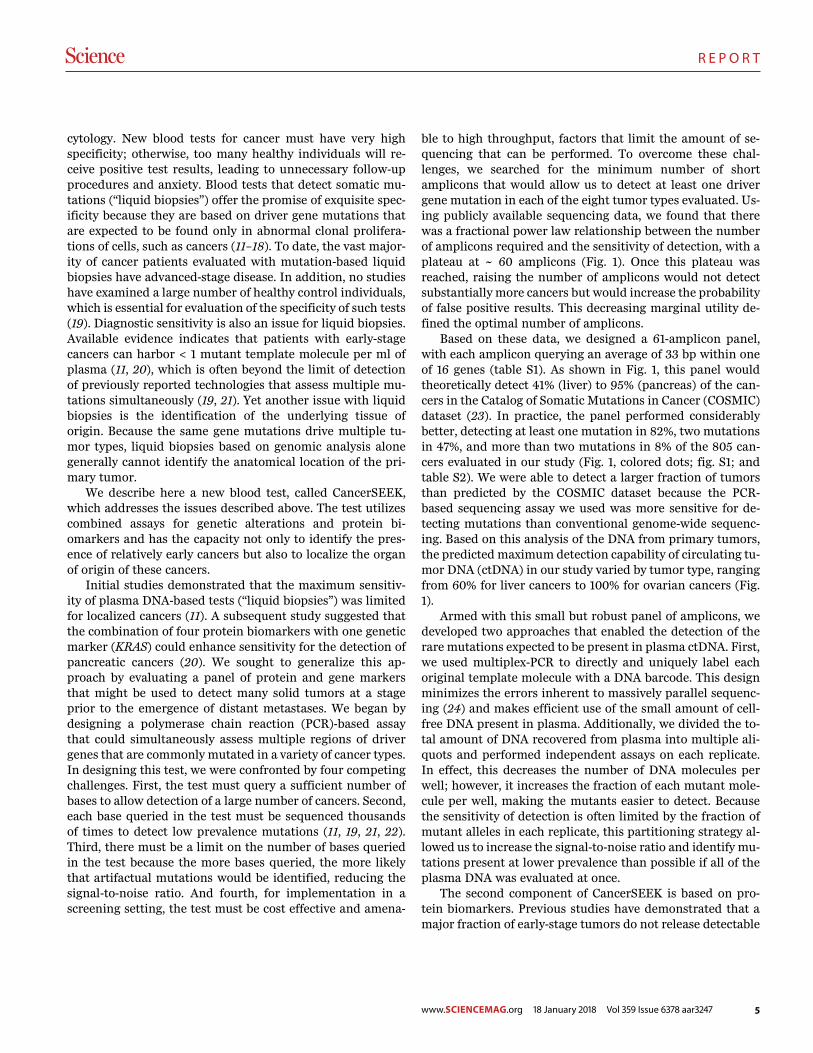
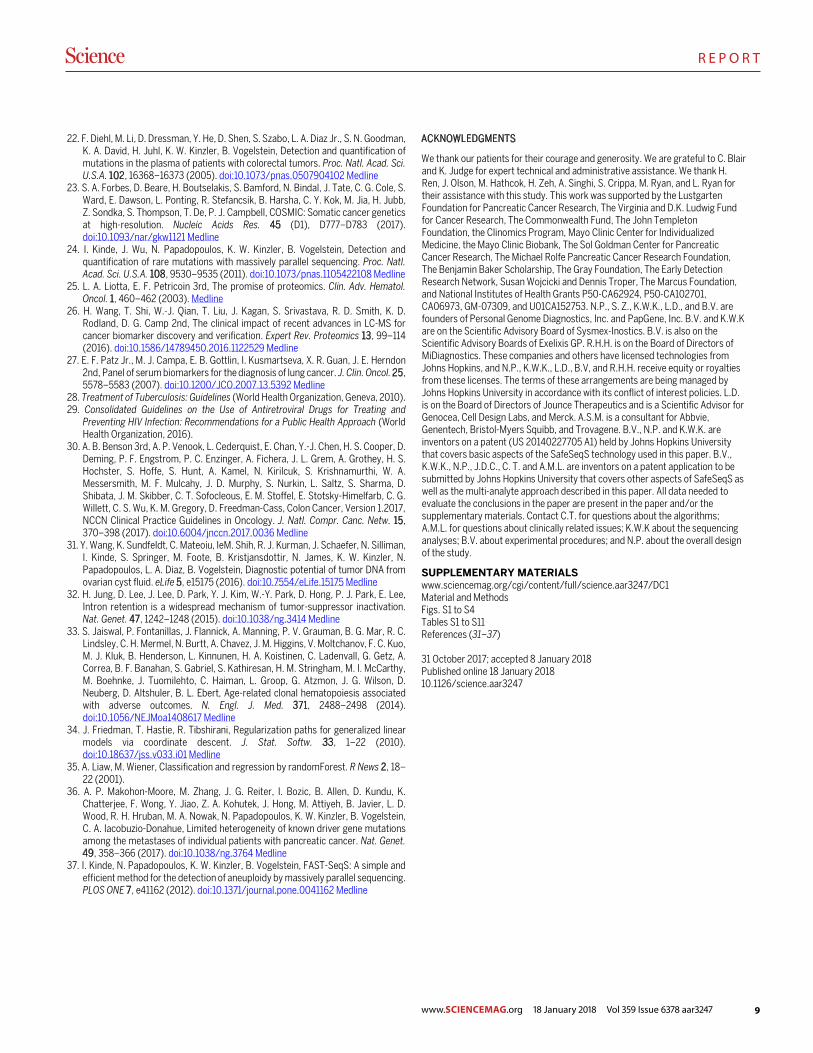
ble to high throughput, factors that limit the amount of se-quencing that can be performed. To overcome these chal-lenges, we searched for the minimum number of short amplicons that would allow us to detect at least one driver gene mutation in each of the eight tumor types evaluated. Us-ing publicly available sequencing data, we found that there was a fractional power law relationship between the number of amplicons required and the sensitivity of detection, with a plateau at ~ 60 amplicons (Fig. 1). Once this plateau was reached, raising the number of amplicons would not detect substantially more cancers but would increase the probability of false positive results. This decreasing marginal utility de-fined the optimal number of amplicons.
Based on these data, we designed a 61-amplicon panel, with each amplicon querying an average of 33 bp within one of 16 genes (table S1). As shown in Fig. 1, this panel would theoretically detect 41% (liver) to 95% (pancreas) of the can-cers in the Catalog of Somatic Mutations in Cancer (COSMIC) dataset (23). In practice, the panel performed considerably better, detecting at least one mutation in 82%, two mutations in 47%, and more than two mutations in 8% of the 805 can-cers evaluated in our study (Fig. 1, colored dots; fig. S1; and table S2). We were able to detect a larger fraction of tumors than predicted by the COSMIC dataset because the PCR-based sequencing assay we used was more sensitive for de-tecting mutations than conventional genome-wide sequenc-ing. Based on this analysis of the DNA from primary tumors, the predicted maximum detection capability of circulating tu-mor DNA (ctDNA) in our study varied by tumor type, ranging from 60% for liver cancers to 100% for ovarian cancers (Fig. 1).
Armed with this small but robust panel of amplicons, we developed two approaches that enabled the detection of the rare mutations expected to be present in plasma ctDNA. First, we used multiplex-PCR to directly and uniquely label each original template molecule with a DNA barcode. This design minimizes the errors inherent to massively parallel sequenc-ing (24) and makes efficient use of the small amount of cell-free DNA present in plasma. Additionally, we divided the to-tal amount of DNA recovered from plasma into multiple ali-quots and performed independent assays on each replicate. In effect, this decreases the number of DNA molecules per well; however, it increases the fraction of each mutant mole-cule per well, making the mutants easier to detect. Because the sensitivity of detection is often limited by the fraction of mutant alleles in each replicate, this partitioning strategy al-lowed us to increase the signal-to-noise ratio and identify mu-tations present at lower prevalence than possible if all of the plasma DNA was evaluated at once.
The second component of CancerSEEK is based on pro-tein biomarkers. Previous studies have demonstrated that a major fraction of early-stage tumors do not release detectable
6
R E P O R T
First release: 18 January 2018 www.sciencemag.org (Page numbers not final at time of first release) 3
amounts of ctDNA, even when extremely sensitive techniques are used to identify them (11, 20). Many proteins potentially useful for early detection and diagnosis of cancer have been described in the literature (25–27). We searched this litera-ture to find proteins that had previously been shown to detect at least one of the eight cancer types described above with sensitivities > 10% and specificities > 99%. We identified 41 potential protein biomarkers (table S3) and evaluated them in preliminary studies on plasma samples from normal indi-viduals as well as from cancer patients. We found that 39 of these proteins could be reproducibly evaluated through a sin-gle immunoassay platform and we then used this platform to assay all plasma samples (table S3). Eight of the 39 proteins proved to be particularly useful for discriminating cancer pa-tients from healthy controls (table S3).
We then used CancerSEEK to study 1,005 patients who had been diagnosed with Stage I to III cancers of the ovary, liver, stomach, pancreas, esophagus, colorectum, lung, or breast. No patient received neo-adjuvant chemotherapy prior to blood sample collection and none had evident distant me-tastasis at the time of study entry. The median age at diagno-sis was 64 (range 22 to 93). The eight cancer types were chosen because they are common in western populations and because no blood-based tests for their earlier detection are in common clinical use. The histopathological and clinical char-acteristics of the patients are summarized in table S4. The most common stage at presentation was American Joint Commission on Cancer (AJCC) stage II, accounting for 49% of patients, with the remaining patients harboring stage I (20%) or stage III (31%) disease. The number of samples per stage for each of the eight tumor types is summarized in table S11. The healthy control cohort consisted of 812 individuals of median age 55 (range 17 to 88) with no known history of cancer, high-grade dysplasia, autoimmune disease, or chronic kidney disease.
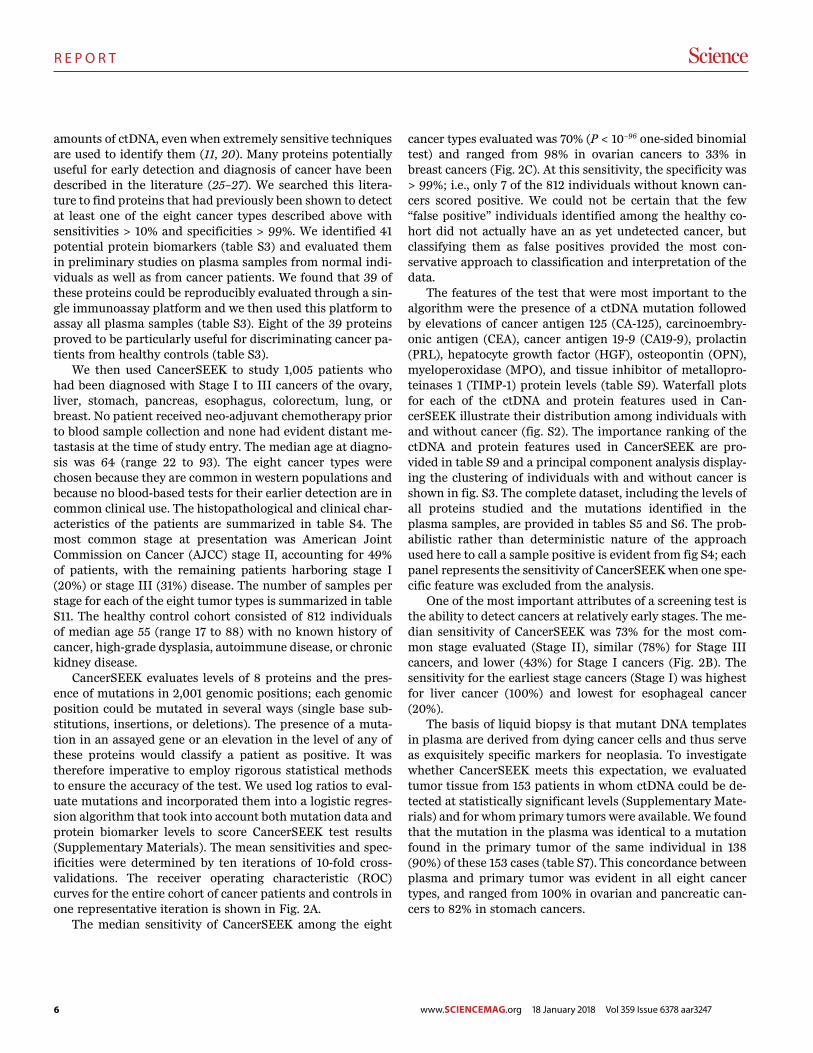
CancerSEEK evaluates levels of 8 proteins and the pres-ence of mutations in 2,001 genomic positions; each genomic position could be mutated in several ways (single base sub-stitutions, insertions, or deletions). The presence of a muta-tion in an assayed gene or an elevation in the level of any of these proteins would classify a patient as positive. It was therefore imperative to employ rigorous statistical methods to ensure the accuracy of the test. We used log ratios to eval-uate mutations and incorporated them into a logistic regres-sion algorithm that took into account both mutation data and protein biomarker levels to score CancerSEEK test results (Supplementary Materials). The mean sensitivities and spec-ificities were determined by ten iterations of 10-fold cross-validations. The receiver operating characteristic (ROC) curves for the entire cohort of cancer patients and controls in one representative iteration is shown in Fig. 2A.
The median sensitivity of CancerSEEK among the eight
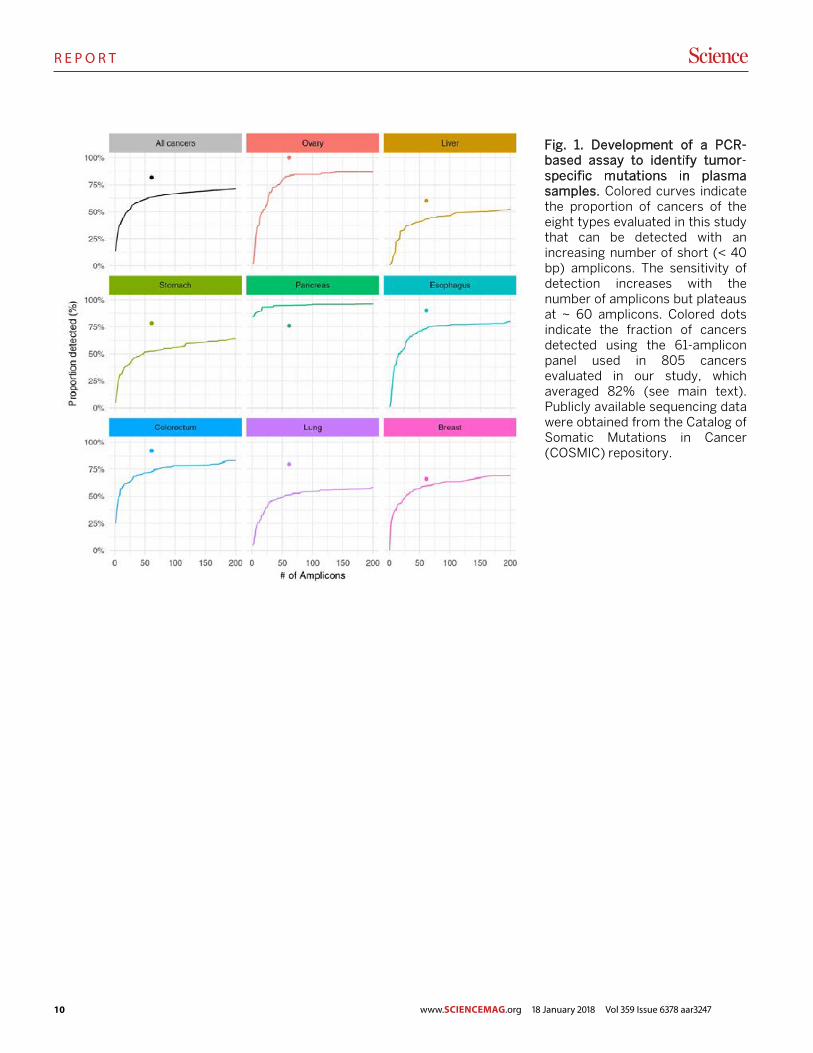
cancer types evaluated was 70% (P < 10−96 one-sided binomial test) and ranged from 98% in ovarian cancers to 33% in breast cancers (Fig. 2C). At this sensitivity, the specificity was > 99%; i.e., only 7 of the 812 individuals without known can-cers scored positive. We could not be certain that the few “false positive” individuals identified among the healthy co-hort did not actually have an as yet undetected cancer, but classifying them as false positives provided the most con-servative approach to classification and interpretation of the data.
The features of the test that were most important to the algorithm were the presence of a ctDNA mutation followed by elevations of cancer antigen 125 (CA-125), carcinoembry-onic antigen (CEA), cancer antigen 19-9 (CA19-9), prolactin (PRL), hepatocyte growth factor (HGF), osteopontin (OPN), myeloperoxidase (MPO), and tissue inhibitor of metallopro-teinases 1 (TIMP-1) protein levels (table S9). Waterfall plots for each of the ctDNA and protein features used in Can-cerSEEK illustrate their distribution among individuals with and without cancer (fig. S2). The importance ranking of the ctDNA and protein features used in CancerSEEK are pro-vided in table S9 and a principal component analysis display-ing the clustering of individuals with and without cancer is shown in fig. S3. The complete dataset, including the levels of all proteins studied and the mutations identified in the plasma samples, are provided in tables S5 and S6. The prob-abilistic rather than deterministic nature of the approach used here to call a sample positive is evident from fig S4; each panel represents the sensitivity of CancerSEEK when one spe-cific feature was excluded from the analysis.
One of the most important attributes of a screening test is the ability to detect cancers at relatively early stages. The me-dian sensitivity of CancerSEEK was 73% for the most com-mon stage evaluated (Stage II), similar (78%) for Stage III cancers, and lower (43%) for Stage I cancers (Fig. 2B). The sensitivity for the earliest stage cancers (Stage I) was highest for liver cancer (100%) and lowest for esophageal cancer (20%).
The basis of liquid biopsy is that mutant DNA templates in plasma are derived from dying cancer cells and thus serve as exquisitely specific markers for neoplasia. To investigate whether CancerSEEK meets this expectation, we evaluated tumor tissue from 153 patients in whom ctDNA could be de-tected at statistically significant levels (Supplementary Mate-rials) and for whom primary tumors were available. We found that the mutation in the plasma was identical to a mutation found in the primary tumor of the same individual in 138 (90%) of these 153 cases (table S7). This concordance between plasma and primary tumor was evident in all eight cancer types, and ranged from 100% in ovarian and pancreatic can-cers to 82% in stomach cancers.
www.SCIENCEMAG.org 18 January 2018 Vol 359 Issue 6378 aar3247
7
R E P O R T
First release: 18 January 2018 www.sciencemag.org (Page numbers not final at time of first release) 4
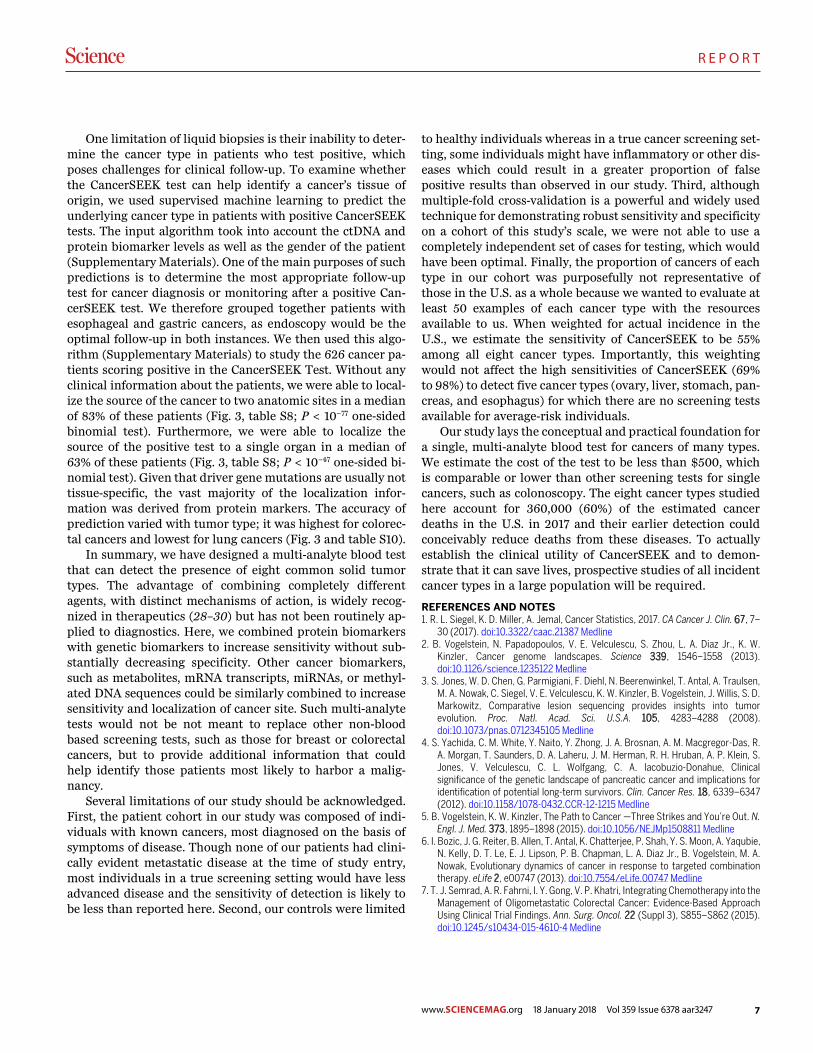
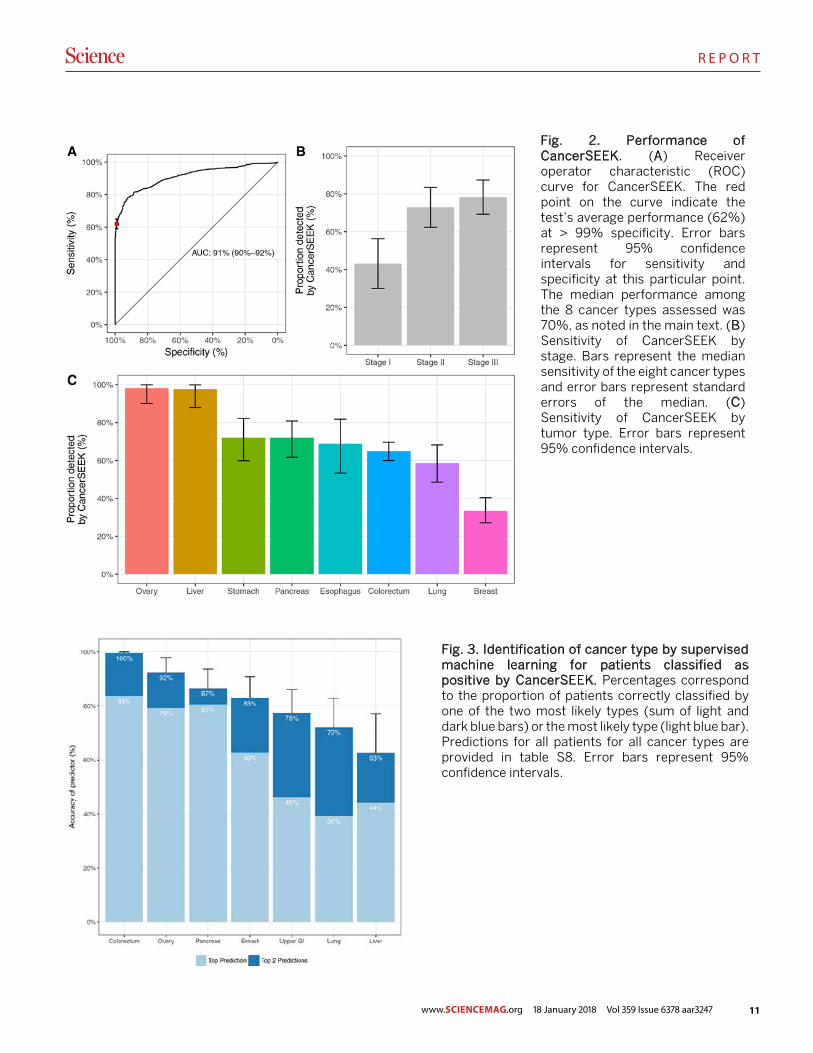
One limitation of liquid biopsies is their inability to deter-mine the cancer type in patients who test positive, which poses challenges for clinical follow-up. To examine whether the CancerSEEK test can help identify a cancer’s tissue of origin, we used supervised machine learning to predict the underlying cancer type in patients with positive CancerSEEK tests. The input algorithm took into account the ctDNA and protein biomarker levels as well as the gender of the patient (Supplementary Materials). One of the main purposes of such predictions is to determine the most appropriate follow-up test for cancer diagnosis or monitoring after a positive Can-cerSEEK test. We therefore grouped together patients with esophageal and gastric cancers, as endoscopy would be the optimal follow-up in both instances. We then used this algo-rithm (Supplementary Materials) to study the 626 cancer pa-tients scoring positive in the CancerSEEK Test. Without any clinical information about the patients, we were able to local-ize the source of the cancer to two anatomic sites in a median of 83% of these patients (Fig. 3, table S8; P < 10−77 one-sided binomial test). Furthermore, we were able to localize the source of the positive test to a single organ in a median of 63% of these patients (Fig. 3, table S8; P < 10−47 one-sided bi-nomial test). Given that driver gene mutations are usually not tissue-specific, the vast majority of the localization infor-mation was derived from protein markers. The accuracy of prediction varied with tumor type; it was highest for colorec-tal cancers and lowest for lung cancers (Fig. 3 and table S10).
In summary, we have designed a multi-analyte blood test that can detect the presence of eight common solid tumor types. The advantage of combining completely different agents, with distinct mechanisms of action, is widely recog-nized in therapeutics (28–30) but has not been routinely ap-plied to diagnostics. Here, we combined protein biomarkers with genetic biomarkers to increase sensitivity without sub-stantially decreasing specificity. Other cancer biomarkers, such as metabolites, mRNA transcripts, miRNAs, or methyl-ated DNA sequences could be similarly combined to increase sensitivity and localization of cancer site. Such multi-analyte tests would not be not meant to replace other non-blood based screening tests, such as those for breast or colorectal cancers, but to provide additional information that could help identify those patients most likely to harbor a malig-nancy.
Several limitations of our study should be acknowledged. First, the patient cohort in our study was composed of indi-viduals with known cancers, most diagnosed on the basis of symptoms of disease. Though none of our patients had clini-cally evident metastatic disease at the time of study entry, most individuals in a true screening setting would have less advanced disease and the sensitivity of detection is likely to be less than reported here. Second, our controls were limited
to healthy individuals whereas in a true cancer screening set-ting, some individuals might have inflammatory or other dis-eases which could result in a greater proportion of false positive results than observed in our study. Third, although multiple-fold cross-validation is a powerful and widely used technique for demonstrating robust sensitivity and specificity on a cohort of this study’s scale, we were not able to use a completely independent set of cases for testing, which would have been optimal. Finally, the proportion of cancers of each type in our cohort was purposefully not representative of those in the U.S. as a whole because we wanted to evaluate at least 50 examples of each cancer type with the resources available to us. When weighted for actual incidence in the U.S., we estimate the sensitivity of CancerSEEK to be 55% among all eight cancer types. Importantly, this weighting would not affect the high sensitivities of CancerSEEK (69% to 98%) to detect five cancer types (ovary, liver, stomach, pan-creas, and esophagus) for which there are no screening tests available for average-risk individuals.
Our study lays the conceptual and practical foundation for a single, multi-analyte blood test for cancers of many types. We estimate the cost of the test to be less than $500, which is comparable or lower than other screening tests for single cancers, such as colonoscopy. The eight cancer types studied here account for 360,000 (60%) of the estimated cancer deaths in the U.S. in 2017 and their earlier detection could conceivably reduce deaths from these diseases. To actually establish the clinical utility of CancerSEEK and to demon-strate that it can save lives, prospective studies of all incident cancer types in a large population will be required.
REFERENCES AND NOTES 1. R. L. Siegel, K. D. Miller, A. Jemal, Cancer Statistics, 2017. CA Cancer J. Clin. 67, 7–
30 (2017). doi:10.3322/caac.21387 Medline 2. B. Vogelstein, N. Papadopoulos, V. E. Velculescu, S. Zhou, L. A. Diaz Jr., K. W.
Kinzler, Cancer genome landscapes. Science 339, 1546–1558 (2013). doi:10.1126/science.1235122 Medline
3. S. Jones, W. D. Chen, G. Parmigiani, F. Diehl, N. Beerenwinkel, T. Antal, A. Traulsen, M. A. Nowak, C. Siegel, V. E. Velculescu, K. W. Kinzler, B. Vogelstein, J. Willis, S. D. Markowitz, Comparative lesion sequencing provides insights into tumor evolution. Proc. Natl. Acad. Sci. U.S.A. 105, 4283–4288 (2008). doi:10.1073/pnas.0712345105 Medline
4. S. Yachida, C. M. White, Y. Naito, Y. Zhong, J. A. Brosnan, A. M. Macgregor-Das, R. A. Morgan, T. Saunders, D. A. Laheru, J. M. Herman, R. H. Hruban, A. P. Klein, S. Jones, V. Velculescu, C. L. Wolfgang, C. A. Iacobuzio-Donahue, Clinical significance of the genetic landscape of pancreatic cancer and implications for identification of potential long-term survivors. Clin. Cancer Res. 18, 6339–6347 (2012). doi:10.1158/1078-0432.CCR-12-1215 Medline
5. B. Vogelstein, K. W. Kinzler, The Path to Cancer —Three Strikes and You’re Out. N. Engl. J. Med. 373, 1895–1898 (2015). doi:10.1056/NEJMp1508811 Medline
6. I. Bozic, J. G. Reiter, B. Allen, T. Antal, K. Chatterjee, P. Shah, Y. S. Moon, A. Yaqubie, N. Kelly, D. T. Le, E. J. Lipson, P. B. Chapman, L. A. Diaz Jr., B. Vogelstein, M. A. Nowak, Evolutionary dynamics of cancer in response to targeted combination therapy. eLife 2, e00747 (2013). doi:10.7554/eLife.00747 Medline
7. T. J. Semrad, A. R. Fahrni, I. Y. Gong, V. P. Khatri, Integrating Chemotherapy into the Management of Oligometastatic Colorectal Cancer: Evidence-Based Approach Using Clinical Trial Findings. Ann. Surg. Oncol. 22 (Suppl 3), S855–S862 (2015). doi:10.1245/s10434-015-4610-4 Medline
www.SCIENCEMAG.org 18 January 2018 Vol 359 Issue 6378 aar3247
8
R E P O R T
First release: 18 January 2018 www.sciencemag.org (Page numbers not final at time of first release) 5
8. C. G. Moertel, T. R. Fleming, J. S. Macdonald, D. G. Haller, J. A. Laurie, C. M. Tangen, J. S. Ungerleider, W. A. Emerson, D. C. Tormey, J. H. Glick, M. H. Veeder, J. A. Mailliard, Fluorouracil plus levamisole as effective adjuvant therapy after resection of stage III colon carcinoma: A final report. Ann. Intern. Med. 122, 321–326 (1995). doi:10.7326/0003-4819-122-5-199503010-00001 Medline
9. A. C. Huang, M. A. Postow, R. J. Orlowski, R. Mick, B. Bengsch, S. Manne, W. Xu, S. Harmon, J. R. Giles, B. Wenz, M. Adamow, D. Kuk, K. S. Panageas, C. Carrera, P. Wong, F. Quagliarello, B. Wubbenhorst, K. D’Andrea, K. E. Pauken, R. S. Herati, R. P. Staupe, J. M. Schenkel, S. McGettigan, S. Kothari, S. M. George, R. H. Vonderheide, R. K. Amaravadi, G. C. Karakousis, L. M. Schuchter, X. Xu, K. L. Nathanson, J. D. Wolchok, T. C. Gangadhar, E. J. Wherry, T-cell invigoration to tumour burden ratio associated with anti-PD-1 response. Nature 545, 60–65 (2017). doi:10.1038/nature22079 Medline
10. P. F. Pinsky, P. C. Prorok, B. S. Kramer, Prostate Cancer Screening - A Perspective on the Current State of the Evidence. N. Engl. J. Med. 376, 1285–1289 (2017). doi:10.1056/NEJMsb1616281 Medline
11. C. Bettegowda, M. Sausen, R. J. Leary, I. Kinde, Y. Wang, N. Agrawal, B. R. Bartlett, H. Wang, B. Luber, R. M. Alani, E. S. Antonarakis, N. S. Azad, A. Bardelli, H. Brem, J. L. Cameron, C. C. Lee, L. A. Fecher, G. L. Gallia, P. Gibbs, D. Le, R. L. Giuntoli, M. Goggins, M. D. Hogarty, M. Holdhoff, S.-M. Hong, Y. Jiao, H. H. Juhl, J. J. Kim, G. Siravegna, D. A. Laheru, C. Lauricella, M. Lim, E. J. Lipson, S. K. N. Marie, G. J. Netto, K. S. Oliner, A. Olivi, L. Olsson, G. J. Riggins, A. Sartore-Bianchi, K. Schmidt, M. Shih, S. M. Oba-Shinjo, S. Siena, D. Theodorescu, J. Tie, T. T. Harkins, S. Veronese, T.-L. Wang, J. D. Weingart, C. L. Wolfgang, L. D. Wood, D. Xing, R. H. Hruban, J. Wu, P. J. Allen, C. M. Schmidt, M. A. Choti, V. E. Velculescu, K. W. Kinzler, B. Vogelstein, N. Papadopoulos, L. A. Diaz Jr., Detection of circulating tumor DNA in early- and late-stage human malignancies. Sci. Transl. Med. 6, 224ra24 (2014). doi:10.1126/scitranslmed.3007094 Medline
12. D. A. Haber, V. E. Velculescu, Blood-based analyses of cancer: Circulating tumor cells and circulating tumor DNA. Cancer Discov. 4, 650–661 (2014). doi:10.1158/2159-8290.CD-13-1014 Medline
13. S. J. Dawson, D. W. Y. Tsui, M. Murtaza, H. Biggs, O. M. Rueda, S.-F. Chin, M. J. Dunning, D. Gale, T. Forshew, B. Mahler-Araujo, S. Rajan, S. Humphray, J. Becq, D. Halsall, M. Wallis, D. Bentley, C. Caldas, N. Rosenfeld, Analysis of circulating tumor DNA to monitor metastatic breast cancer. N. Engl. J. Med. 368, 1199–1209 (2013). doi:10.1056/NEJMoa1213261 Medline
14. Y. Wang, S. Springer, C. L. Mulvey, N. Silliman, J. Schaefer, M. Sausen, N. James, E. M. Rettig, T. Guo, C. R. Pickering, J. A. Bishop, C. H. Chung, J. A. Califano, D. W. Eisele, C. Fakhry, C. G. Gourin, P. K. Ha, H. Kang, A. Kiess, W. M. Koch, J. N. Myers, H. Quon, J. D. Richmon, D. Sidransky, R. P. Tufano, W. H. Westra, C. Bettegowda, L. A. Diaz Jr., N. Papadopoulos, K. W. Kinzler, B. Vogelstein, N. Agrawal, Detection of somatic mutations and HPV in the saliva and plasma of patients with head and neck squamous cell carcinomas. Sci. Transl. Med. 7, 293ra104 (2015). doi:10.1126/scitranslmed.aaa8507 Medline
15. T. Forshew, M. Murtaza, C. Parkinson, D. Gale, D. W. Y. Tsui, F. Kaper, S.-J. Dawson, A. M. Piskorz, M. Jimenez-Linan, D. Bentley, J. Hadfield, A. P. May, C. Caldas, J. D. Brenton, N. Rosenfeld, Noninvasive identification and monitoring of cancer mutations by targeted deep sequencing of plasma DNA. Sci. Transl. Med. 4, 136ra68 (2012). doi:10.1126/scitranslmed.3003726 Medline
16. C. Abbosh, N. J. Birkbak, G. A. Wilson, M. Jamal-Hanjani, T. Constantin, R. Salari, J. Le Quesne, D. A. Moore, S. Veeriah, R. Rosenthal, T. Marafioti, E. Kirkizlar, T. B. K. Watkins, N. McGranahan, S. Ward, L. Martinson, J. Riley, F. Fraioli, M. Al Bakir, E. Grönroos, F. Zambrana, R. Endozo, W. L. Bi, F. M. Fennessy, N. Sponer, D. Johnson, J. Laycock, S. Shafi, J. Czyzewska-Khan, A. Rowan, T. Chambers, N. Matthews, S. Turajlic, C. Hiley, S. M. Lee, M. D. Forster, T. Ahmad, M. Falzon, E. Borg, D. Lawrence, M. Hayward, S. Kolvekar, N. Panagiotopoulos, S. M. Janes, R. Thakrar, A. Ahmed, F. Blackhall, Y. Summers, D. Hafez, A. Naik, A. Ganguly, S. Kareht, R. Shah, L. Joseph, A. Marie Quinn, P. A. Crosbie, B. Naidu, G. Middleton, G. Langman, S. Trotter, M. Nicolson, H. Remmen, K. Kerr, M. Chetty, L. Gomersall, D. A. Fennell, A. Nakas, S. Rathinam, G. Anand, S. Khan, P. Russell, V. Ezhil, B. Ismail, M. Irvin-Sellers, V. Prakash, J. F. Lester, M. Kornaszewska, R. Attanoos, H. Adams, H. Davies, D. Oukrif, A. U. Akarca, J. A. Hartley, H. L. Lowe, S. Lock, N. Iles, H. Bell, Y. Ngai, G. Elgar, Z. Szallasi, R. F. Schwarz, J. Herrero, A. Stewart, S. A. Quezada, K. S. Peggs, P. Van Loo, C. Dive, C. J. Lin, M. Rabinowitz, H. J. W. L. Aerts, A. Hackshaw, J. A. Shaw, B. G. Zimmermann, C. Swanton, M. Jamal-Hanjani, C.
Abbosh, S. Veeriah, S. Shafi, J. Czyzewska-Khan, D. Johnson, J. Laycock, L. Bosshard-Carter, G. Goh, R. Rosenthal, P. Gorman, N. Murugaesu, R. E. Hynds, G. A. Wilson, N. J. Birkbak, T. B. K. Watkins, N. McGranahan, S. Horswell, M. A. Bakir, E. Grönroos, R. Mitter, M. Escudero, A. Stewart, P. Van Loo, A. Rowan, H. Xu, S. Turajlic, C. Hiley, J. Goldman, R. K. Stone, T. Denner, N. Matthews, G. Elgar, S. Ward, J. Biggs, M. Costa, S. Begum, B. Phillimore, T. Chambers, E. Nye, S. Graca, K. Joshi, A. Furness, A. Ben Aissa, Y. N. S. Wong, A. Georgiou, S. A. Quezada, K. S. Peggs, J. A. Hartley, H. L. Lowe, J. Herrero, D. Lawrence, M. Hayward, N. Panagiotopoulos, S. Kolvekar, M. Falzon, E. Borg, T. Marafioti, C. Simeon, G. Hector, A. Smith, M. Aranda, M. Novelli, D. Oukrif, A. U. Akarca, S. M. Janes, R. Thakrar, M. D. Forster, T. Ahmad, S. M. Lee, D. Papadatos-Pastos, D. Carnell, R. Mendes, J. George, N. Navani, A. Ahmed, M. Taylor, J. Choudhary, Y. Summers, R. Califano, P. Taylor, R. Shah, P. Krysiak, K. Rammohan, E. Fontaine, R. Booton, M. Evison, P. A. Crosbie, S. Moss, F. Idries, L. Joseph, P. Bishop, A. Chaturvedi, A. M. Quinn, H. Doran, A. Leek, P. Harrison, K. Moore, R. Waddington, J. Novasio, F. Blackhall, J. Rogan, E. Smith, C. Dive, J. Tugwood, G. Brady, D. G. Rothwell, F. Chemi, J. Pierce, S. Gulati, B. Naidu, G. Langman, S. Trotter, M. Bellamy, H. Bancroft, A. Kerr, S. Kadiri, J. Webb, G. Middleton, M. Djearaman, D. A. Fennell, J. A. Shaw, J. L. Quesne, D. A. Moore, A. Thomas, H. Walter, J. Riley, L. Martinson, A. Nakas, S. Rathinam, W. Monteiro, H. Marshall, L. Nelson, J. Bennett, L. Primrose, G. Anand, S. Khan, A. Amadi, M. Nicolson, K. Kerr, S. Palmer, H. Remmen, J. Miller, K. Buchan, M. Chetty, L. Gomersall, J. F. Lester, A. Edwards, F. Morgan, H. Adams, H. Davies, M. Kornaszewska, R. Attanoos, S. Lock, A. Verjee, M. MacKenzie, M. Wilcox, H. Bell, N. Iles, A. Hackshaw, Y. Ngai, S. Smith, N. Gower, C. Ottensmeier, S. Chee, B. Johnson, A. Alzetani, E. Shaw, E. Lim, P. De Sousa, M. T. Barbosa, A. Bowman, S. Jordan, A. Rice, H. Raubenheimer, C. Proli, M. E. Cufari, J. C. Ronquillo, A. Kwayie, H. Bhayani, M. Hamilton, Y. Bakar, N. Mensah, L. Ambrose, A. Devaraj, S. Buderi, J. Finch, L. Azcarate, H. Chavan, S. Green, H. Mashinga, A. G. Nicholson, K. Lau, M. Sheaff, P. Schmid, J. Conibear, V. Ezhil, B. Ismail, M. Irvin-Sellers, V. Prakash, P. Russell, T. Light, T. Horey, S. Danson, J. Bury, J. Edwards, J. Hill, S. Matthews, Y. Kitsanta, K. Suvarna, P. Fisher, A. D. Keerio, M. Shackcloth, J. Gosney, P. Postmus, S. Feeney, J. Asante-Siaw, T. Constantin, R. Salari, N. Sponer, A. Naik, B. G. Zimmermann, M. Rabinowitz, H. J. W. L. Aerts, S. Dentro, C. Dessimoz, C. Swanton; TRACERx consortium; PEACE consortium, Phylogenetic ctDNA analysis depicts early-stage lung cancer evolution. Nature 545, 446–451 (2017). doi:10.1038/nature22364 Medline
17. E. Beddowes, S. J. Sammut, M. Gao, C. Caldas, Predicting treatment resistance and relapse through circulating DNA. Breast 34 (Suppl 1), S31–S35 (2017). doi:10.1016/j.breast.2017.06.024 Medline
18. J. Phallen, M. Sausen, V. Adleff, A. Leal, C. Hruban, J. White, V. Anagnostou, J. Fiksel, S. Cristiano, E. Papp, S. Speir, T. Reinert, M. W. Orntoft, B. D. Woodward, D. Murphy, S. Parpart-Li, D. Riley, M. Nesselbush, N. Sengamalay, A. Georgiadis, Q. K. Li, M. R. Madsen, F. V. Mortensen, J. Huiskens, C. Punt, N. van Grieken, R. Fijneman, G. Meijer, H. Husain, R. B. Scharpf, L. A. Diaz Jr., S. Jones, S. Angiuoli, T. Ørntoft, H. J. Nielsen, C. L. Andersen, V. E. Velculescu, Direct detection of early-stage cancers using circulating tumor DNA. Sci. Transl. Med. 9, eaan2415 (2017). doi:10.1126/scitranslmed.aan2415 Medline
19. I. A. Cree, L. Uttley, H. Buckley Woods, H. Kikuchi, A. Reiman, S. Harnan, B. L. Whiteman, S. T. Philips, M. Messenger, A. Cox, D. Teare, O. Sheils, J. Shaw; UK Early Cancer Detection Consortium, The evidence base for circulating tumour DNA blood-based biomarkers for the early detection of cancer: A systematic mapping review. BMC Cancer 17, 697 (2017). doi:10.1186/s12885-017-3693-7 Medline
20. J. D. Cohen, A. A. Javed, C. Thoburn, F. Wong, J. Tie, P. Gibbs, C. M. Schmidt, M. T. Yip-Schneider, P. J. Allen, M. Schattner, R. E. Brand, A. D. Singhi, G. M. Petersen, S.-M. Hong, S. C. Kim, M. Falconi, C. Doglioni, M. J. Weiss, N. Ahuja, J. He, M. A. Makary, A. Maitra, S. M. Hanash, M. Dal Molin, Y. Wang, L. Li, J. Ptak, L. Dobbyn, J. Schaefer, N. Silliman, M. Popoli, M. G. Goggins, R. H. Hruban, C. L. Wolfgang, A. P. Klein, C. Tomasetti, N. Papadopoulos, K. W. Kinzler, B. Vogelstein, A. M. Lennon, Combined circulating tumor DNA and protein biomarker-based liquid biopsy for the earlier detection of pancreatic cancers. Proc. Natl. Acad. Sci. U.S.A. 114, 10202–10207 (2017). doi:10.1073/pnas.1704961114 Medline
21. A. Bardelli, K. Pantel, Liquid Biopsies, What We Do Not Know (Yet). Cancer Cell 31, 172–179 (2017). doi:10.1016/j.ccell.2017.01.002 Medline
www.SCIENCEMAG.org 18 January 2018 Vol 359 Issue 6378 aar3247
9
R E P O R T
www.SCIENCEMAG.org 18 January 2018 Vol 359 Issue 6378 aar3247
First release: 18 January 2018 www.sciencemag.org (Page numbers not final at time of first release) 6
22. F. Diehl, M. Li, D. Dressman, Y. He, D. Shen, S. Szabo, L. A. Diaz Jr., S. N. Goodman, K. A. David, H. Juhl, K. W. Kinzler, B. Vogelstein, Detection and quantification of mutations in the plasma of patients with colorectal tumors. Proc. Natl. Acad. Sci. U.S.A. 102, 16368–16373 (2005). doi:10.1073/pnas.0507904102 Medline
23. S. A. Forbes, D. Beare, H. Boutselakis, S. Bamford, N. Bindal, J. Tate, C. G. Cole, S. Ward, E. Dawson, L. Ponting, R. Stefancsik, B. Harsha, C. Y. Kok, M. Jia, H. Jubb, Z. Sondka, S. Thompson, T. De, P. J. Campbell, COSMIC: Somatic cancer genetics at high-resolution. Nucleic Acids Res. 45 (D1), D777–D783 (2017). doi:10.1093/nar/gkw1121 Medline
24. I. Kinde, J. Wu, N. Papadopoulos, K. W. Kinzler, B. Vogelstein, Detection and quantification of rare mutations with massively parallel sequencing. Proc. Natl. Acad. Sci. U.S.A. 108, 9530–9535 (2011). doi:10.1073/pnas.1105422108 Medline
25. L. A. Liotta, E. F. Petricoin 3rd, The promise of proteomics. Clin. Adv. Hematol. Oncol. 1, 460–462 (2003). Medline
26. H. Wang, T. Shi, W.-J. Qian, T. Liu, J. Kagan, S. Srivastava, R. D. Smith, K. D. Rodland, D. G. Camp 2nd, The clinical impact of recent advances in LC-MS for cancer biomarker discovery and verification. Expert Rev. Proteomics 13, 99–114 (2016). doi:10.1586/14789450.2016.1122529 Medline
27. E. F. Patz Jr., M. J. Campa, E. B. Gottlin, I. Kusmartseva, X. R. Guan, J. E. Herndon 2nd, Panel of serum biomarkers for the diagnosis of lung cancer. J. Clin. Oncol. 25, 5578–5583 (2007). doi:10.1200/JCO.2007.13.5392 Medline
28. Treatment of Tuberculosis: Guidelines (World Health Organization, Geneva, 2010). 29. Consolidated Guidelines on the Use of Antiretroviral Drugs for Treating and
Preventing HIV Infection: Recommendations for a Public Health Approach (World Health Organization, 2016).
30. A. B. Benson 3rd, A. P. Venook, L. Cederquist, E. Chan, Y.-J. Chen, H. S. Cooper, D. Deming, P. F. Engstrom, P. C. Enzinger, A. Fichera, J. L. Grem, A. Grothey, H. S. Hochster, S. Hoffe, S. Hunt, A. Kamel, N. Kirilcuk, S. Krishnamurthi, W. A. Messersmith, M. F. Mulcahy, J. D. Murphy, S. Nurkin, L. Saltz, S. Sharma, D. Shibata, J. M. Skibber, C. T. Sofocleous, E. M. Stoffel, E. Stotsky-Himelfarb, C. G. Willett, C. S. Wu, K. M. Gregory, D. Freedman-Cass, Colon Cancer, Version 1.2017, NCCN Clinical Practice Guidelines in Oncology. J. Natl. Compr. Canc. Netw. 15, 370–398 (2017). doi:10.6004/jnccn.2017.0036 Medline
31. Y. Wang, K. Sundfeldt, C. Mateoiu, IeM. Shih, R. J. Kurman, J. Schaefer, N. Silliman, I. Kinde, S. Springer, M. Foote, B. Kristjansdottir, N. James, K. W. Kinzler, N. Papadopoulos, L. A. Diaz, B. Vogelstein, Diagnostic potential of tumor DNA from ovarian cyst fluid. eLife 5, e15175 (2016). doi:10.7554/eLife.15175 Medline
32. H. Jung, D. Lee, J. Lee, D. Park, Y. J. Kim, W.-Y. Park, D. Hong, P. J. Park, E. Lee, Intron retention is a widespread mechanism of tumor-suppressor inactivation. Nat. Genet. 47, 1242–1248 (2015). doi:10.1038/ng.3414 Medline
33. S. Jaiswal, P. Fontanillas, J. Flannick, A. Manning, P. V. Grauman, B. G. Mar, R. C. Lindsley, C. H. Mermel, N. Burtt, A. Chavez, J. M. Higgins, V. Moltchanov, F. C. Kuo, M. J. Kluk, B. Henderson, L. Kinnunen, H. A. Koistinen, C. Ladenvall, G. Getz, A. Correa, B. F. Banahan, S. Gabriel, S. Kathiresan, H. M. Stringham, M. I. McCarthy, M. Boehnke, J. Tuomilehto, C. Haiman, L. Groop, G. Atzmon, J. G. Wilson, D. Neuberg, D. Altshuler, B. L. Ebert, Age-related clonal hematopoiesis associated with adverse outcomes. N. Engl. J. Med. 371, 2488–2498 (2014). doi:10.1056/NEJMoa1408617 Medline
34. J. Friedman, T. Hastie, R. Tibshirani, Regularization paths for generalized linear models via coordinate descent. J. Stat. Softw. 33, 1–22 (2010). doi:10.18637/jss.v033.i01 Medline
35. A. Liaw, M. Wiener, Classification and regression by randomForest. R News 2, 18–22 (2001).
36. A. P. Makohon-Moore, M. Zhang, J. G. Reiter, I. Bozic, B. Allen, D. Kundu, K. Chatterjee, F. Wong, Y. Jiao, Z. A. Kohutek, J. Hong, M. Attiyeh, B. Javier, L. D. Wood, R. H. Hruban, M. A. Nowak, N. Papadopoulos, K. W. Kinzler, B. Vogelstein, C. A. Iacobuzio-Donahue, Limited heterogeneity of known driver gene mutations among the metastases of individual patients with pancreatic cancer. Nat. Genet. 49, 358–366 (2017). doi:10.1038/ng.3764 Medline
37. I. Kinde, N. Papadopoulos, K. W. Kinzler, B. Vogelstein, FAST-SeqS: A simple and efficient method for the detection of aneuploidy by massively parallel sequencing. PLOS ONE 7, e41162 (2012). doi:10.1371/journal.pone.0041162 Medline
ACKNOWLEDGMENTS
We thank our patients for their courage and generosity. We are grateful to C. Blair and K. Judge for expert technical and administrative assistance. We thank H. Ren, J. Olson, M. Hathcok, H. Zeh, A. Singhi, S. Crippa, M. Ryan, and L. Ryan for their assistance with this study. This work was supported by the Lustgarten Foundation for Pancreatic Cancer Research, The Virginia and D.K. Ludwig Fund for Cancer Research, The Commonwealth Fund, The John Templeton Foundation, the Clinomics Program, Mayo Clinic Center for Individualized Medicine, the Mayo Clinic Biobank, The Sol Goldman Center for Pancreatic Cancer Research, The Michael Rolfe Pancreatic Cancer Research Foundation, The Benjamin Baker Scholarship, The Gray Foundation, The Early Detection Research Network, Susan Wojcicki and Dennis Troper, The Marcus Foundation, and National Institutes of Health Grants P50-CA62924, P50-CA102701, CA06973, GM-07309, and U01CA152753. N.P., S. Z., K.W.K., L.D., and B.V. are founders of Personal Genome Diagnostics, Inc. and PapGene, Inc. B.V. and K.W.K are on the Scientific Advisory Board of Sysmex-Inostics. B.V. is also on the Scientific Advisory Boards of Exelixis GP. R.H.H. is on the Board of Directors of MiDiagnostics. These companies and others have licensed technologies from Johns Hopkins, and N.P., K.W.K., L.D., B.V, and R.H.H. receive equity or royalties from these licenses. The terms of these arrangements are being managed by Johns Hopkins University in accordance with its conflict of interest policies. L.D. is on the Board of Directors of Jounce Therapeutics and is a Scientific Advisor for Genocea, Cell Design Labs, and Merck. A.S.M. is a consultant for Abbvie, Genentech, Bristol-Myers Squibb, and Trovagene. B.V., N.P. and K.W.K. are inventors on a patent (US 20140227705 A1) held by Johns Hopkins University that covers basic aspects of the SafeSeqS technology used in this paper. B.V., K.W.K., N.P., J.D.C., C. T. and A.M.L. are inventors on a patent application to be submitted by Johns Hopkins University that covers other aspects of SafeSeqS as well as the multi-analyte approach described in this paper. All data needed to evaluate the conclusions in the paper are present in the paper and/or the supplementary materials. Contact C.T. for questions about the algorithms; A.M.L. for questions about clinically related issues; K.W.K about the sequencing analyses; B.V. about experimental procedures; and N.P. about the overall design of the study.
SUPPLEMENTARY MATERIALS www.sciencemag.org/cgi/content/full/science.aar3247/DC1 Material and Methods Figs. S1 to S4 Tables S1 to S11 References (31–37) 31 October 2017; accepted 8 January 2018 Published online 18 January 2018 10.1126/science.aar3247
10
R E P O R T
First release: 18 January 2018 www.sciencemag.org (Page numbers not final at time of first release) 7
Fig. 1. Development of a PCR-based assay to identify tumor-specific mutations in plasma samples. Colored curves indicate the proportion of cancers of the eight types evaluated in this study that can be detected with an increasing number of short (< 40 bp) amplicons. The sensitivity of detection increases with the number of amplicons but plateaus at ~ 60 amplicons. Colored dots indicate the fraction of cancers detected using the 61-amplicon panel used in 805 cancers evaluated in our study, which averaged 82% (see main text). Publicly available sequencing data were obtained from the Catalog of Somatic Mutations in Cancer (COSMIC) repository.
www.SCIENCEMAG.org 18 January 2018 Vol 359 Issue 6378 aar3247
11
R E P O R T
First release: 18 January 2018 www.sciencemag.org (Page numbers not final at time of first release) 8
Fig. 2. Performance of CancerSEEK. (A) Receiver operator characteristic (ROC) curve for CancerSEEK. The red point on the curve indicate the test’s average performance (62%) at > 99% specificity. Error bars represent 95% confidence intervals for sensitivity and specificity at this particular point. The median performance among the 8 cancer types assessed was 70%, as noted in the main text. (B) Sensitivity of CancerSEEK by stage. Bars represent the median sensitivity of the eight cancer types and error bars represent standard errors of the median. (C) Sensitivity of CancerSEEK by tumor type. Error bars represent 95% confidence intervals.
First release: 18 January 2018 www.sciencemag.org (Page numbers not final at time of first release) 9
Fig. 3. Identification of cancer type by supervised machine learning for patients classified as positive by CancerSEEK. Percentages correspond to the proportion of patients correctly classified by one of the two most likely types (sum of light and dark blue bars) or the most likely type (light blue bar). Predictions for all patients for all cancer types are provided in table S8. Error bars represent 95% confidence intervals.
www.SCIENCEMAG.org 18 January 2018 Vol 359 Issue 6378 aar3247
12 www.SCIENCEMAG.org 15 December 2017 Vol 358 Issue 6369 aal5240
R E S E A R C H | R E P O R T
CANCER
Analysis of Fusobacterium persistenceand antibiotic response incolorectal cancerSusan Bullman,1,2 Chandra S. Pedamallu,1,2 Ewa Sicinska,1 Thomas E. Clancy,3
Xiaoyang Zhang,1,2 Diana Cai,1,2 Donna Neuberg,1 Katherine Huang,2 Fatima Guevara,1
Timothy Nelson,1 Otari Chipashvili,1 Timothy Hagan,1 Mark Walker,2
Aruna Ramachandran,1,2 Begoña Diosdado,1,2 Garazi Serna,4 Nuria Mulet,4
Stefania Landolfi,4 Santiago Ramon y Cajal,4 Roberta Fasani,4 Andrew J. Aguirre,1,2,3
Kimmie Ng,1 Elena Élez,4 Shuji Ogino,1,3,5 Josep Tabernero,4 Charles S. Fuchs,6
William C. Hahn,1,2,3 Paolo Nuciforo,4 Matthew Meyerson1,2,3*
Colorectal cancers comprise a complex mixture of malignant cells, nontransformed cells,and microorganisms. Fusobacterium nucleatum is among the most prevalent bacterialspecies in colorectal cancer tissues. Here we show that colonization of human colorectalcancers with Fusobacterium and its associated microbiome—including Bacteroides,Selenomonas, and Prevotella species—is maintained in distal metastases, demonstratingmicrobiome stability between paired primary and metastatic tumors. In situ hybridizationanalysis revealed that Fusobacterium is predominantly associated with cancer cells inthe metastatic lesions. Mouse xenografts of human primary colorectal adenocarcinomaswere found to retain viable Fusobacterium and its associated microbiome through successivepassages. Treatment of mice bearing a colon cancer xenograft with the antibioticmetronidazole reduced Fusobacterium load, cancer cell proliferation, and overall tumorgrowth.These observations argue for further investigation of antimicrobial interventions asa potential treatment for patients with Fusobacterium-associated colorectal cancer.
The cancer-associated microbiota are knownto influence cancer development and pro-gression, most notably for colorectal can-cer (1–5). Unbiased genomic analyses haverevealed an enrichment of Fusobacterium
nucleatum in human colon cancers and adeno-mas relative to noncancerous colon tissues (6, 7).These observations have been confirmed in studiesof multiple colon cancer patient cohorts fromaround the world (8–12). Increased tumor levelsof F. nucleatum have been correlated with lowerT cell infiltration (13); with advanced disease stageand poorer patient survival (10, 11, 14); and withclinical and molecular characteristics such asright-sided anatomic location, BRAF mutation,and hypermutation with microsatellite instability(9, 12, 15).Studies in diverse experimental models have
suggested a pro-tumorigenic role for Fusobacterium.Feedingmice with Fusobacterium (16–18), infectionof colorectal cancer cell lines with Fusobacterium(19–21), and generation of xenografts derived fromFusobacterium-infected colorectal cancer cell
lines (17) were all observed to potentiate tumorcell growth. Suggested mechanisms have rangedfrom enhanced tumor cell adhesion and invasion(17, 19, 22) to modulation of the host immuneresponse (16, 23) to activation of the Toll-likereceptor 4 pathway (17, 20, 21). However, not allanimal or cellular studies of Fusobacterium havedemonstrated a cancer-promoting effect (24). Arecent editorial has highlighted the importanceof studying Fusobacterium infection in colon can-cer as a component of the diverse microbiota with-in the native tumor microenvironment (25).To investigate the role of Fusobacterium and
its associated microbiota in native human colo-rectal cancers, we analyzed five independent co-horts of patient-derived colorectal cancers forFusobacterium and microbiome RNA and/orDNA. Where technically possible, we performedFusobacterium culture and tested the effect ofantibiotic treatment upon the growth of propa-gated patient-derived colon cancer xenografts.These cohorts (table S1) include: (i) 11 fresh-frozen primary colorectal cancers and pairedliver metastases (frozen paired cohort); (ii) 77fresh-frozen primary colorectal cancers with de-tailed recurrence information (frozen primarycohort); (iii) published data from 430 resectedfresh-frozen colon carcinomas from The CancerGenome Atlas (26) (TCGA cohort), together withdata from 201 resected fresh-frozen hepatocellularcarcinomas from TCGA (27); (iv) 101 formalin-fixed paraffin-embedded colorectal carcinomasand paired liver metastases (FFPE paired cohort);and (v) 13 fresh primary colorectal cancers used
for patient-derived xenograft studies (xenograftcohort).Using the frozen paired cohort, we tested
whether we could culture viable Fusobacteriumspecies from primary colorectal carcinomas andcorresponding liver metastases. Quantitative poly-merase chain reaction (qPCR) analysis showedthat 9 of 11 (82%) snap-frozen primary tumors(table S2) were positive for Fusobacterium in theprimary tumor [patients one through nine (P1through P9)]; we could isolate Fusobacterium spe-cies from 73% of these tumors (n = 8 of 11 tumors;P1 through P8) (Fig. 1A). In addition, we culturedFusobacterium species from two liver metastases(P1 and P2) from Fusobacterium-positive primarytumors. Five metastatic specimens had inadequateamounts of tissue for culture but were positivefor Fusobacterium by qPCR (P3 through P7), fora total of seven primary-metastatic tumor pairs(64%) testing positive for Fusobacterium by qPCR(Fig. 1A). This finding extends previous resultsshowing the presence of Fusobacterium nucleicacids in hepatic and lymph node metastases ofcolon cancer (7, 22, 28) to now demonstrate thatviable Fusobacterium species are present in dis-tant metastases.To address whether the same Fusobacterium
is present in primary cancers and metastases,we performed whole-genome sequencing of pureFusobacterium isolates from primary and meta-static tumors from two patients (P1 and P2). Forboth patients, the primary-metastatic tumor pairsharbored highly similar strains of Fusobacterium,with >99.9% average nucleotide identity, despitethe tissue being collected months (P2) or evenyears (P1) apart (Fig. 1B and fig. S1). We culturedFusobacterium necrophorum subsp. funduliformefrom the primary colorectal tumor and liver meta-stasis of P1 and F. nucleatum subsp. animalis fromthe primary tumor and metastasis of P2. We alsocultured other anaerobes, including Bacteroidesspecies, from the primary-metastasis pairs (table S3).Our finding of nearly identical, viable Fusobacteriumstrains in matched primary and metastatic colo-rectal cancers confirms the persistence of viableFusobacterium species through the metastatic pro-cess and suggests that Fusobacterium speciesmay migrate with the colorectal cancer cells tothe metastatic site.To quantitate the relative abundance of Fuso-
bacterium and to evaluate the overall microbiomein the paired primary and metastatic tumors,we performed RNA sequencing of 10 primarycancers and their matched liver metastases fromthe frozen paired cohort (P1 to P6 and P8 to P11).PathSeq analysis (29) of the RNA sequencingdata showed that the same Fusobacterium spe-cies were present, at a similar relative abundance,in the paired primary-metastatic tumors (Fig. 1C,samples P1 to P6) and that the overall dominantmicrobiome was also qualitatively similar. In ad-dition to F. nucleatum and F. necrophorum,primary cancer microbes that persisted in theliver metastases included Bacteroides fragilis,Bacteroides thetaiotaomicron, and several typicallyoral anaerobes such as Prevotella intermedia andSelenomonas sputigena (Fig. 1C). In contrast, there
RESEARCH
Bullman et al., Science 358, 1443–1448 (2017) 15 December 2017 1 of 6
1Dana-Farber Cancer Institute, Harvard Medical School,Boston, MA 02115, USA. 2Broad Institute of MIT andHarvard, Cambridge, MA 02142, USA. 3Brigham andWomen’s Hospital, Harvard Medical School, Boston, MA02115, USA. 4Vall d’Hebron University Hospital, Valld’Hebron Institute of Oncology, Barcelona, CIBERONC,Universitat Autònoma de Barcelona, Spain. 5HarvardT.H. Chan School of Public Health, Boston, MA 02115,USA. 6Yale Cancer Center, Yale School of Medicine, NewHaven, CT 06520, USA.*Corresponding author. Email: [email protected]
13www.SCIENCEMAG.org 15 December 2017 Vol 358 Issue 6369 aal5240
R E S E A R C H | R E P O R T
was little similarity between bacterial sequencesin the primary colorectal cancer and liver meta-stasis in the lone sample where Fusobacteriumwas present in the primary cancer but not de-tected in the metastasis (Fig. 1C, sample P8) orin the three samples with low or undetectable
levels of Fusobacterium in the primary cancer(Fig. 1C, samples P9 to P11). Jaccard index analy-sis revealed a high correlation between the domi-nant bacterial genera in the primary tumor andmetastasis for Fusobacterium-positive pairs, buta low correlation between bacterial genera in the
primary tumor and metastasis for Fusobacterium-negative pairs (Fig. 1D and fig. S2).Targeted bacterial 16S ribosomal RNA (rRNA)
gene sequencing on DNA from the 11 frozenpaired samples confirmed that (i) Fusobacteriumspecies are present in paired primary-metastatic
Bullman et al., Science 358, 1443–1448 (2017) 15 December 2017 2 of 6
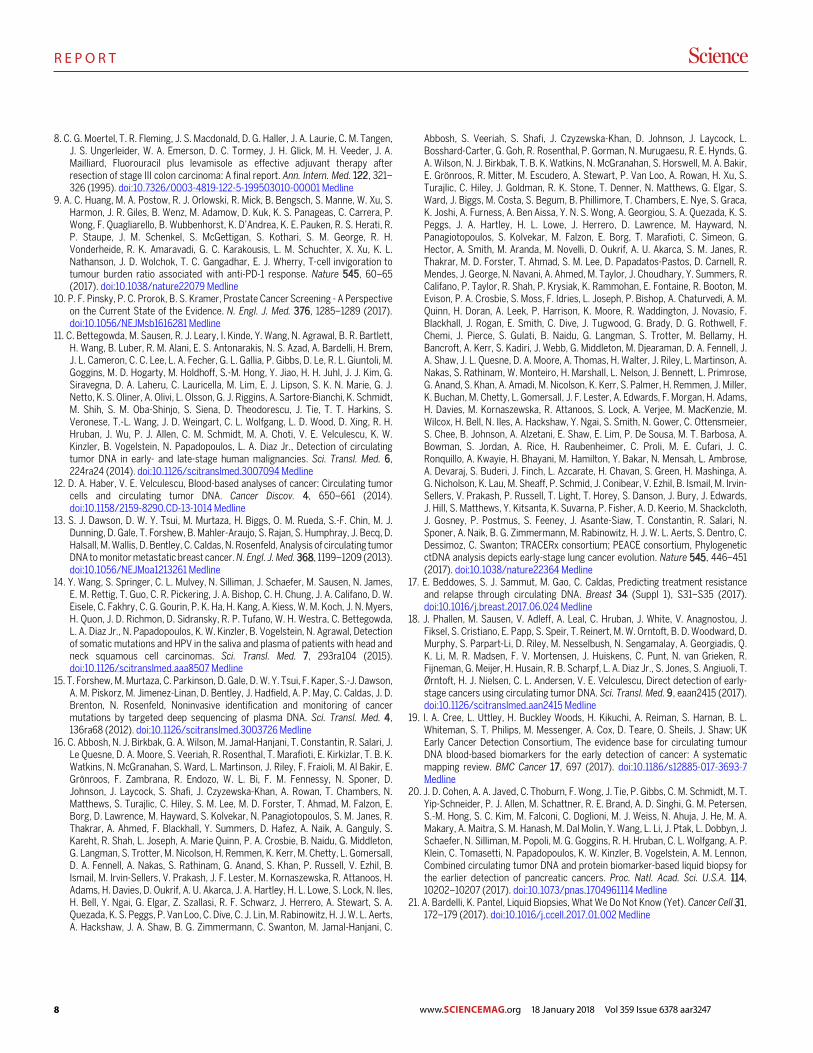
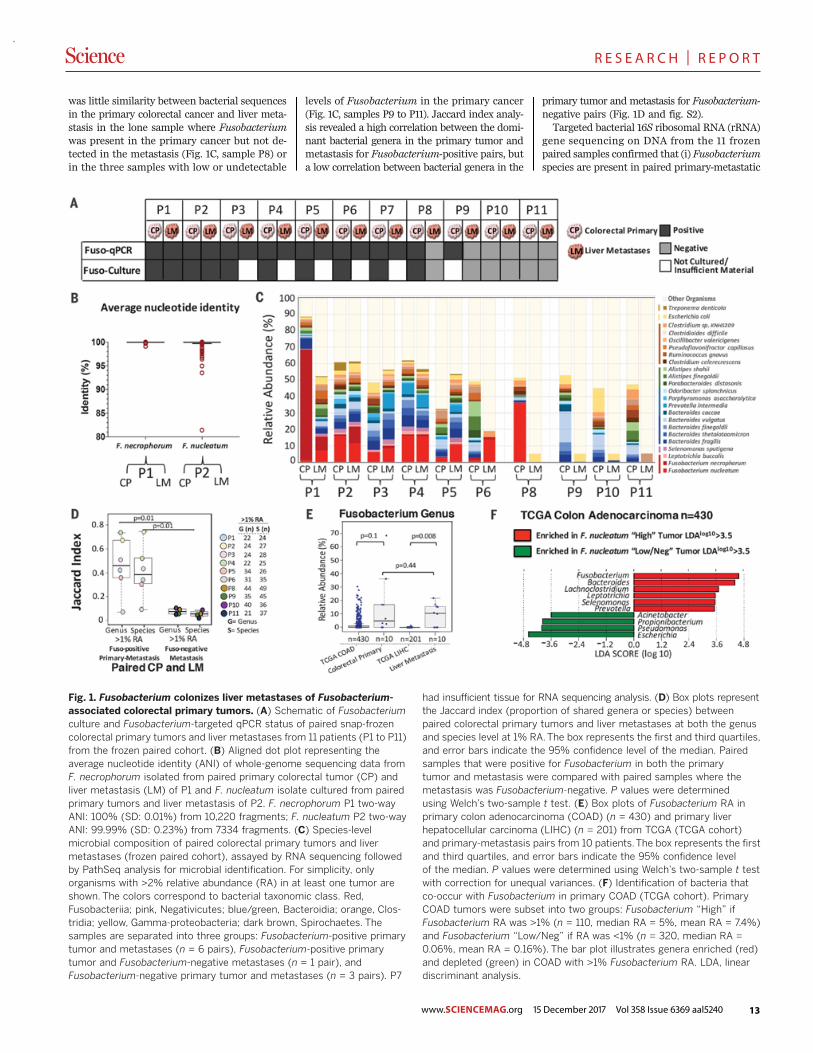
Fig. 1. Fusobacterium colonizes liver metastases of Fusobacterium-associated colorectal primary tumors. (A) Schematic of Fusobacteriumculture and Fusobacterium-targeted qPCR status of paired snap-frozencolorectal primary tumors and liver metastases from 11 patients (P1 to P11)from the frozen paired cohort. (B) Aligned dot plot representing theaverage nucleotide identity (ANI) of whole-genome sequencing data fromF. necrophorum isolated from paired primary colorectal tumor (CP) andliver metastasis (LM) of P1 and F. nucleatum isolate cultured from pairedprimary tumors and liver metastasis of P2. F. necrophorum P1 two-wayANI: 100% (SD: 0.01%) from 10,220 fragments; F. nucleatum P2 two-wayANI: 99.99% (SD: 0.23%) from 7334 fragments. (C) Species-levelmicrobial composition of paired colorectal primary tumors and livermetastases (frozen paired cohort), assayed by RNA sequencing followedby PathSeq analysis for microbial identification. For simplicity, onlyorganisms with >2% relative abundance (RA) in at least one tumor areshown. The colors correspond to bacterial taxonomic class. Red,Fusobacteriia; pink, Negativicutes; blue/green, Bacteroidia; orange, Clos-tridia; yellow, Gamma-proteobacteria; dark brown, Spirochaetes. Thesamples are separated into three groups: Fusobacterium-positive primarytumor and metastases (n = 6 pairs), Fusobacterium-positive primarytumor and Fusobacterium-negative metastases (n = 1 pair), andFusobacterium-negative primary tumor and metastases (n = 3 pairs). P7
had insufficient tissue for RNA sequencing analysis. (D) Box plots representthe Jaccard index (proportion of shared genera or species) betweenpaired colorectal primary tumors and liver metastases at both the genusand species level at 1% RA.The box represents the first and third quartiles,and error bars indicate the 95% confidence level of the median. Pairedsamples that were positive for Fusobacterium in both the primarytumor and metastasis were compared with paired samples where themetastasis was Fusobacterium-negative. P values were determinedusing Welch’s two-sample t test. (E) Box plots of Fusobacterium RA inprimary colon adenocarcinoma (COAD) (n = 430) and primary liverhepatocellular carcinoma (LIHC) (n = 201) from TCGA (TCGA cohort)and primary-metastasis pairs from 10 patients.The box represents the firstand third quartiles, and error bars indicate the 95% confidence levelof the median. P values were determined using Welch’s two-sample t testwith correction for unequal variances. (F) Identification of bacteria thatco-occur with Fusobacterium in primary COAD (TCGA cohort). PrimaryCOAD tumors were subset into two groups: Fusobacterium “High” ifFusobacterium RA was >1% (n = 110, median RA = 5%, mean RA = 7.4%)and Fusobacterium “Low/Neg” if RA was <1% (n = 320, median RA =0.06%, mean RA = 0.16%). The bar plot illustrates genera enriched (red)and depleted (green) in COAD with >1% Fusobacterium RA. LDA, lineardiscriminant analysis.
RESEARCH | REPORT
14
R E S E A R C H | R E P O R T
www.SCIENCEMAG.org 15 December 2017 Vol 358 Issue 6369 aal5240
tumors, (ii) the relative abundance of Fusobacte-rium is correlated between primary tumors andmetastases, and (iii) the dominant microbialgenera in the liver metastases correspond to thosein the primary tumors, demonstrating micro-biome stability between paired Fusobacterium-positive primary-metastatic tumors (P = 0.01)(fig. S3).To investigate the relationship between
Fusobacterium and cancer recurrence, we per-formedmicrobial culture and bacterial 16S rRNAgene sequencing in a blinded fashion on the fro-zen primary cohort of 77 snap-frozen colorectalcancers lacking paired metastases (n = 21 withrecurrence,n= 56without recurrence) (table S4).We discovered that 44 of 77 tumors (57%) hadcultivable Fusobacterium species and 45 of 77had >1% Fusobacterium relative abundance.We found no correlation between Fusobacteriumload or culture with either recurrence or stabledisease in this cohort (fig. S4).To assess Fusobacterium persistence and its
correlation with clinical parameters, we ana-lyzed the 101 primary-metastasis pairs from theFFPE paired cohort (table S5). We found that43% (n = 44 of 101) of primary colorectal cancerstested positive for Fusobacterium by qPCR and45% (n = 20 of 44) of liver metastases arisingfrom these primary tumors were Fusobacterium-positive (fig. S5A).To determine the spatial distribution of
Fusobacterium in these tumors, Fusobacterium
RNA in situ hybridization (ISH) analysis was per-formed on five qPCR-positive primary-metastasispairs from this cohort (table S6, Fig. 2, and fig.S6). Both biofilm and invasive F. nucleatum wereobserved in primary colorectal cancer (Fig. 2,A to D). Invasive F. nucleatum distribution washighly heterogeneous and focal, found in isolatedor small groups of cells with morphology consist-ent with that of malignant cells and located closeto the lumen and ulcerated regions. F. nucleatumwas also observed in glandular structures presentin the tumor center and invasive margins, but toa lesser extent. In adjacent normal mucosa (whenpresent), F. nucleatum was exclusively located inthe biofilm. In liver metastasis, F. nucleatum waspredominantly localized in isolated cells whosehistomorphology is consistent with colon cancercells (Fig. 2, E to H), although occasional stro-mal F. nucleatum could be observed as well. NoF. nucleatumwas detected in the adjacent residualliver parenchyma.Notably, none of the 57Fusobacterium-negative
primary colorectal tumors were associated with aFusobacterium-positive liver metastasis (n = 0 of57; P = 0) (fig. S5A). Consistent with previous re-ports (15), the presence of Fusobacterium in pairedprimary tumors and corresponding metastaseswas enriched in metastatic cancers of the cecumand ascending colon (n = 10 of 20 Fusobacterium-positive primary-metastasis pairs, P = 0.002),(fig. S5B), whereas cancers thatwere Fusobacterium-negative in both primary and metastatic lesions
weremore likely to be rectal cancers (n = 29 of 57of the Fusobacterium-negative primary-metastasispairs, P = 0.016) (fig. S5B).To assess the relationship between patient
survival and Fusobacterium presence in the pri-mary cecum and ascending colon, we carried outPathSeq (29) analysis on RNA sequencing datafrom the 430 primary colon adenocarcinomas inthe TCGA cohort. Patients with cancer of the ce-cumand ascending colon exhibitedworse overallsurvival than patients with non-cecum ascend-ing colon cancer (P = 0.01) (fig. S5C). Amongpatientswith cecumand ascending colon tumors,we observed poorer overall survival in correla-tion with tumor Fusobacterium load (fig. S5D)(P = 0.004).To determine whether Fusobacterium is associ-
ated with primary liver hepatocellular carcinoma,we performed PathSeq analysis (29) of RNA se-quencing data from 201 primary liver tumors fromthe TCGA cohort. This analysis demonstrated thatFusobacterium is rare in primary liver carcinomasand that the relative abundance of Fusobacteriumis significantly enriched in liver metastases arisingfrom colorectal cancers compared with primaryliver cancers (P = 0.008) (Fig. 1E).PathSeq analysis of data from the TCGA co-
hort also confirmed that the microbes present inliver metastases of Fusobacterium-positive colo-rectal carcinomas are similar to those associatedwith Fusobacterium in primary colorectal carci-noma. Selenomonas, Bacteroides, and Prevotella
Bullman et al., Science 358, 1443–1448 (2017) 15 December 2017 3 of 6
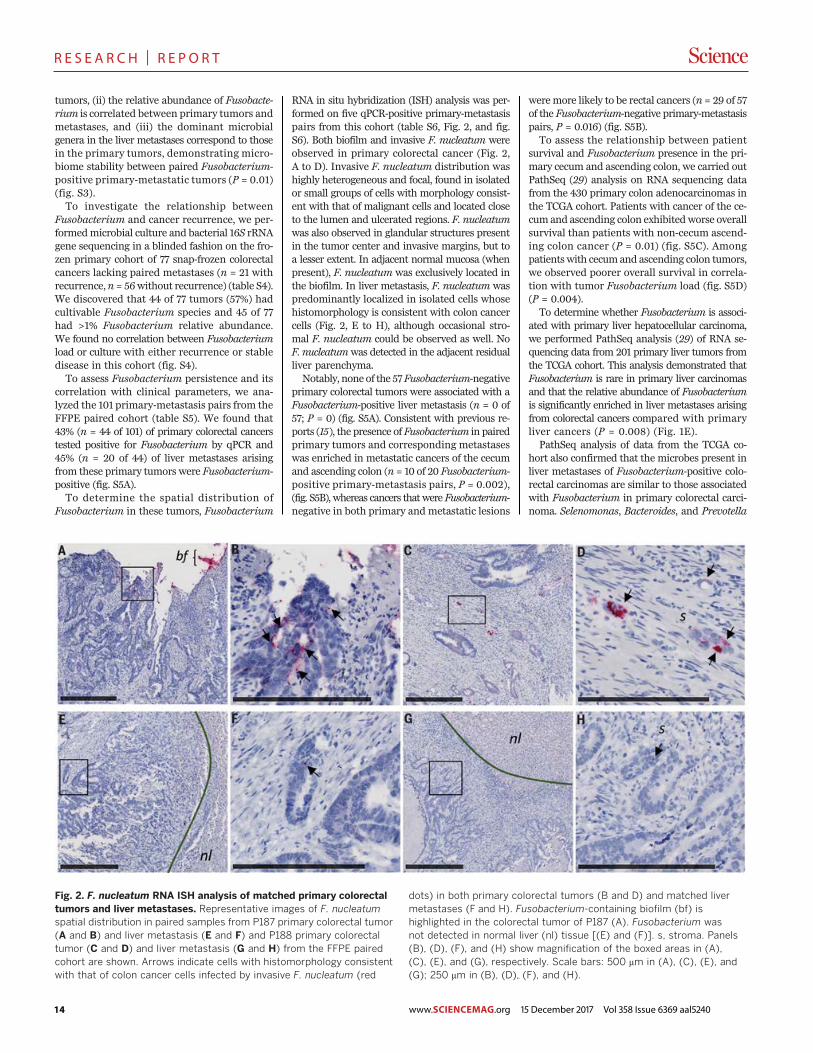
Fig. 2. F. nucleatum RNA ISH analysis of matched primary colorectaltumors and liver metastases. Representative images of F. nucleatumspatial distribution in paired samples from P187 primary colorectal tumor(A and B) and liver metastasis (E and F) and P188 primary colorectaltumor (C and D) and liver metastasis (G and H) from the FFPE pairedcohort are shown. Arrows indicate cells with histomorphology consistentwith that of colon cancer cells infected by invasive F. nucleatum (red
dots) in both primary colorectal tumors (B and D) and matched livermetastases (F and H). Fusobacterium-containing biofilm (bf) ishighlighted in the colorectal tumor of P187 (A). Fusobacterium wasnot detected in normal liver (nl) tissue [(E) and (F)]. s, stroma. Panels(B), (D), (F), and (H) show magnification of the boxed areas in (A),(C), (E), and (G), respectively. Scale bars: 500 mm in (A), (C), (E), and(G); 250 mm in (B), (D), (F), and (H).
RESEARCH | REPORT
15www.SCIENCEMAG.org 15 December 2017 Vol 358 Issue 6369 aal5240
R E S E A R C H | R E P O R T
genera were shared between primary and meta-static colorectal cancers and also correlated withFusobacterium abundance in primary colon ade-nocarcinoma (Fig. 1F, fig. S7, and table S7).Given that metastatic colorectal carcinomas
harbored cultivable Fusobacterium species, wewondered whether viable Fusobacterium couldpersist in xenografts from human colorectal can-cers,whichwouldprovide a valuablemodel systemfor evaluating the effects ofmicrobiotamodulationon cancer growth. In a double-blinded approach,13 fresh human primary colorectal tumors fromthe xenograft cohort were evaluated, by cultureor qPCR, for the presence of Fusobacterium. Inparallel, these tumors were implanted subcutane-ously, by an independent investigator, into Nu/Numice to establishpatient-derived xenografts (PDXs)(table S8). All five Fusobacterium–culture positivetumors resulted in successful xenografts (fig. S8),one of four qPCR-positive but culture-negativetumors gave rise to a successful xenograft, andnone of the four Fusobacterium-negative tumorsgenerated successful xenografts (P = 0.003). Tu-mor grade did not appear to significantly influ-ence successful xenograft formation (P = 0.1)(fig. S9A), although we noted a modest associa-tion between Fusobacterium cultivability and high-grade tumors in this cohort (n = 4 of 5 tumors, P =0.03) (fig. S9B).Next, we sought to determine whether
Fusobacterium species would remain viable andstably associatedwith a xenograft. A PDXderivedfrom an F. nucleatum culture–positive colon can-cer (COCA36) was passaged to xenograft genera-tion F8 over 29 weeks and tested for F. nucleatum.We cultured F. nucleatum from this PDX for up tofour generations and 124days in vivo. All xenograftgenerations, from F1 through F8, were positivefor Fusobacterium by qPCR (Fig. 3A). Additional-ly, we cultured other anaerobic bacteria, includingB. fragilis and B. thetaiotaomicron, from both theprimary tumor and PDXs. We further culturedFusobacterium species from PDXs generatedfrom two additional patient tumors (table S9).qPCR andmicrobiome analysis of fecal pellets andoral swabs from the PDX-bearing animals werenegative for Fusobacterium species (fig. S10), ar-guing against the possibility of Fusobacterium spe-cies arising fromtheendogenousmurinemicrobiota.To evaluate the overall microbiome stability
and to identify bacteria that are persistently asso-ciated with the primary colorectal tumor and de-rived xenografts, we carried out unbiased totalRNA sequencing followed by PathSeq analysis,which revealed that F. nucleatum and otherGram-negative anaerobes, including B. fragilisand S. sputigena, persist in these PDX modelsfor multiple generations (Fig. 3B). The bacteriathat persist within the PDX include the generathat we report to persist in distant-sitemetastasesto the liver (Fig. 1C) and that are enriched inFusobacterium-associated colorectal cancer fromanalysis of TCGA data (Fig. 1F). Bacterial 16S rRNAgene sequencing further confirmed the persistenceof Fusobacterium and co-occurring anaerobes inthese primary colorectal tumors and derived xeno-grafts (fig. S11).
Transmission electronmicroscopy showed thatF. nucleatum isolates from both the primary co-lon carcinoma and PDXwere invasivewhen incu-bated with human colon cancer cell lines HT-29and HCT-116. Upon infection with F. nucleatum,we saw evidence of bacterial cells within vesicle-like structures in the cancer cell (fig. S12, A to C).We also observed evidence of bacterial adhesionand invasion in the respective patient xenografttissue (fig. S12D).Finally, we asked whether treatment of
Fusobacterium-positive colon cancer xenograftswitheither (i) an antibiotic to which Fusobacterium isresistantor (ii) anantibiotic towhichFusobacteriumis sensitivewould affect tumor growth.We choseerythromycin as a resistant antibiotic because theF. nucleatum clinical isolates were resistant tohigh concentrations of erythromycin (minimuminhibitory concentration >25 mg/ml) (fig. S13A).After oral gavage of the Fusobacterium-harboringPDX COCA36, with erythromycin, we observed aslight decrease in tumor volume compared withmice treated with the vehicle control. However,erythromycin did not significantly affect the tra-
jectory of tumor growth (P = 0.073) (fig. S13B),Fusobacterium tumor load (P = 0.98) (fig. S13C),or tumor cell proliferation (P = 0.3) (fig. S13D).For a Fusobacterium-killing antibiotic, we chose
metronidazole because fusobacteria are knownto be highly sensitive to this drug (30). We thenconfirmed sensitivity of the F. nucleatum isolatefrom PDXCOCA36 (minimum inhibitory concen-tration<0.01 mg/ml) (fig. S14). BecausePDXs couldnot be generated from Fusobacterium-negativeprimary tumors, we treated Fusobacterium-freexenografts derived from HT-29 colon adeno-carcinoma cells with metronidazole to assesswhether metronidazole inhibits the growth ofFusobacterium-negative colorectal carcinomas.This experiment revealed no significant changein tumor growth (P = 0.88) (Fig. 4A).Finally, oral administration of metronidazole
to mice bearing Fusobacterium-positive PDXs re-sulted in a statistically significant decrease in thetrajectory of tumor growth, compared with PDXsinmice treatedwith vehicle (P = 0.0005) (Fig. 4A).Treatmentwithmetronidazolewas associatedwitha significant decrease in Fusobacterium load in the
Bullman et al., Science 358, 1443–1448 (2017) 15 December 2017 4 of 6
Fig. 3. Fusobacterium and co-occurring anaerobes persist in colon adenocarcinoma PDXs.(A) Assessment of Fusobacterium persistence in PDX COCA36 over a period of 204 days.Fusobacterium persistence was determined via microbial culture and Fusobacterium-targetedqPCR. F0 denotes the first implantation of the tumor into mice; F1 to F8 represent sequential xenograftpassages after F0. (B) Species-level microbial composition of three patient primary colon adeno-carcinomas (COCA36, COCA39, and COCA6) and subsequent PDXs. Total RNA sequencing was carriedout, followed by PathSeq analysis for microbial identification. For simplicity, selected species with>1% relative abundance in the primary tumor and either corresponding PDX are shown. The colorscorrespond to bacterial taxonomic class. Red, Fusobacteriia; pink, Negativicutes; blue/green, Bacte-roidia; orange, Clostridia.
RESEARCH | REPORT
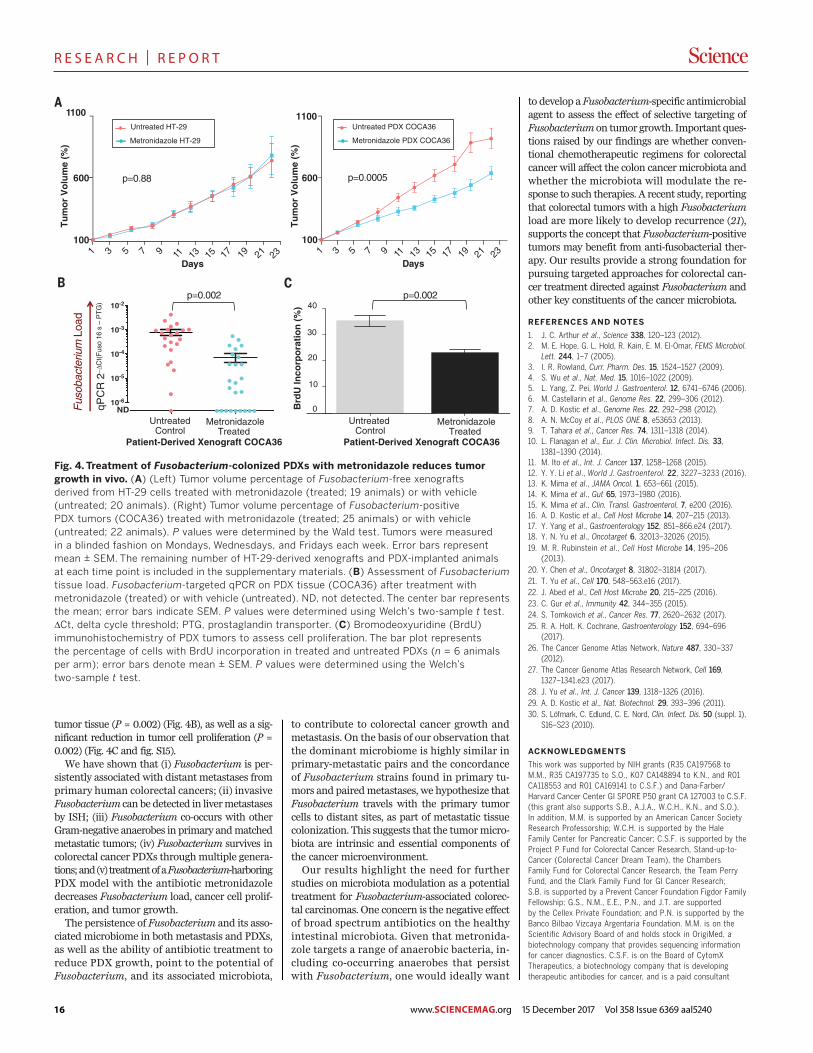
16 www.SCIENCEMAG.org 15 December 2017 Vol 358 Issue 6369 aal5240
R E S E A R C H | R E P O R T
tumor tissue (P = 0.002) (Fig. 4B), as well as a sig-nificant reduction in tumor cell proliferation (P =0.002) (Fig. 4C and fig. S15).We have shown that (i) Fusobacterium is per-
sistently associated with distant metastases fromprimary human colorectal cancers; (ii) invasiveFusobacterium can be detected in livermetastasesby ISH; (iii) Fusobacterium co-occurs with otherGram-negative anaerobes in primary andmatchedmetastatic tumors; (iv) Fusobacterium survives incolorectal cancer PDXs throughmultiple genera-tions;and(v) treatmentofaFusobacterium-harboringPDX model with the antibiotic metronidazoledecreases Fusobacterium load, cancer cell prolif-eration, and tumor growth.The persistence of Fusobacterium and its asso-
ciated microbiome in both metastasis and PDXs,as well as the ability of antibiotic treatment toreduce PDX growth, point to the potential ofFusobacterium, and its associated microbiota,
to contribute to colorectal cancer growth andmetastasis. On the basis of our observation thatthe dominant microbiome is highly similar inprimary-metastatic pairs and the concordanceof Fusobacterium strains found in primary tu-mors and pairedmetastases, we hypothesize thatFusobacterium travels with the primary tumorcells to distant sites, as part of metastatic tissuecolonization. This suggests that the tumormicro-biota are intrinsic and essential components ofthe cancer microenvironment.Our results highlight the need for further
studies on microbiota modulation as a potentialtreatment for Fusobacterium-associated colorec-tal carcinomas. One concern is the negative effectof broad spectrum antibiotics on the healthyintestinal microbiota. Given that metronida-zole targets a range of anaerobic bacteria, in-cluding co-occurring anaerobes that persistwith Fusobacterium, one would ideally want
to develop a Fusobacterium-specific antimicrobialagent to assess the effect of selective targeting ofFusobacterium on tumor growth. Important ques-tions raised by our findings are whether conven-tional chemotherapeutic regimens for colorectalcancer will affect the colon cancer microbiota andwhether the microbiota will modulate the re-sponse to such therapies. A recent study, reportingthat colorectal tumors with a high Fusobacteriumload are more likely to develop recurrence (21),supports the concept that Fusobacterium-positivetumors may benefit from anti-fusobacterial ther-apy. Our results provide a strong foundation forpursuing targeted approaches for colorectal can-cer treatment directed against Fusobacterium andother key constituents of the cancer microbiota.
REFERENCES AND NOTES
1. J. C. Arthur et al., Science 338, 120–123 (2012).2. M. E. Hope, G. L. Hold, R. Kain, E. M. El-Omar, FEMS Microbiol.
Lett. 244, 1–7 (2005).3. I. R. Rowland, Curr. Pharm. Des. 15, 1524–1527 (2009).4. S. Wu et al., Nat. Med. 15, 1016–1022 (2009).5. L. Yang, Z. Pei, World J. Gastroenterol. 12, 6741–6746 (2006).6. M. Castellarin et al., Genome Res. 22, 299–306 (2012).7. A. D. Kostic et al., Genome Res. 22, 292–298 (2012).8. A. N. McCoy et al., PLOS ONE 8, e53653 (2013).9. T. Tahara et al., Cancer Res. 74, 1311–1318 (2014).10. L. Flanagan et al., Eur. J. Clin. Microbiol. Infect. Dis. 33,
1381–1390 (2014).11. M. Ito et al., Int. J. Cancer 137, 1258–1268 (2015).12. Y. Y. Li et al., World J. Gastroenterol. 22, 3227–3233 (2016).13. K. Mima et al., JAMA Oncol. 1, 653–661 (2015).14. K. Mima et al., Gut 65, 1973–1980 (2016).15. K. Mima et al., Clin. Transl. Gastroenterol. 7, e200 (2016).16. A. D. Kostic et al., Cell Host Microbe 14, 207–215 (2013).17. Y. Yang et al., Gastroenterology 152, 851–866.e24 (2017).18. Y. N. Yu et al., Oncotarget 6, 32013–32026 (2015).19. M. R. Rubinstein et al., Cell Host Microbe 14, 195–206
(2013).20. Y. Chen et al., Oncotarget 8, 31802–31814 (2017).21. T. Yu et al., Cell 170, 548–563.e16 (2017).22. J. Abed et al., Cell Host Microbe 20, 215–225 (2016).23. C. Gur et al., Immunity 42, 344–355 (2015).24. S. Tomkovich et al., Cancer Res. 77, 2620–2632 (2017).25. R. A. Holt, K. Cochrane, Gastroenterology 152, 694–696
(2017).26. The Cancer Genome Atlas Network, Nature 487, 330–337
(2012).27. The Cancer Genome Atlas Research Network, Cell 169,
1327–1341.e23 (2017).28. J. Yu et al., Int. J. Cancer 139, 1318–1326 (2016).29. A. D. Kostic et al., Nat. Biotechnol. 29, 393–396 (2011).30. S. Löfmark, C. Edlund, C. E. Nord, Clin. Infect. Dis. 50 (suppl. 1),
S16–S23 (2010).
ACKNOWLEDGMENTS
This work was supported by NIH grants (R35 CA197568 toM.M., R35 CA197735 to S.O., K07 CA148894 to K.N., and R01CA118553 and R01 CA169141 to C.S.F.) and Dana-Farber/Harvard Cancer Center GI SPORE P50 grant CA 127003 to C.S.F.(this grant also supports S.B., A.J.A., W.C.H., K.N., and S.O.).In addition, M.M. is supported by an American Cancer SocietyResearch Professorship; W.C.H. is supported by the HaleFamily Center for Pancreatic Cancer; C.S.F. is supported by theProject P Fund for Colorectal Cancer Research, Stand-up-to-Cancer (Colorectal Cancer Dream Team), the ChambersFamily Fund for Colorectal Cancer Research, the Team PerryFund, and the Clark Family Fund for GI Cancer Research;S.B. is supported by a Prevent Cancer Foundation Figdor FamilyFellowship; G.S., N.M., E.E., P.N., and J.T. are supportedby the Cellex Private Foundation; and P.N. is supported by theBanco Bilbao Vizcaya Argentaria Foundation. M.M. is on theScientific Advisory Board of and holds stock in OrigiMed, abiotechnology company that provides sequencing informationfor cancer diagnostics. C.S.F. is on the Board of CytomXTherapeutics, a biotechnology company that is developingtherapeutic antibodies for cancer, and is a paid consultant
Bullman et al., Science 358, 1443–1448 (2017) 15 December 2017 5 of 6
1 3 5 7 9 11 13 15 17 19 21 23100
600
Days
1100Untreated PDX COCA36
Metronidazole PDX COCA36
p=0.0005
1 3 5 7 9 17 19 21100
600
11 13 15 23Days
Untreated HT-29
Metronidazole HT-29
p=0.88
1100
Tu
mo
r V
olu
me
(%)
Tu
mo
r V
olu
me
(%)
d10-6
10-5
10-4
10-3
10-2
NDFus
obac
teriu
m L
oad
qPC
R 2
−ΔC
t(F
uso
16 s
– P
TG
)
p=0.002
0
10
20
30
40
UntreatedControl
MetronidazoleTreated
Brd
U In
corp
ora
tio
n (
%)
p=0.002
Patient-Derived Xenograft COCA36
UntreatedControl
MetronidazoleTreated
Patient-Derived Xenograft COCA36
Fig. 4. Treatment of Fusobacterium-colonized PDXs with metronidazole reduces tumorgrowth in vivo. (A) (Left) Tumor volume percentage of Fusobacterium-free xenograftsderived from HT-29 cells treated with metronidazole (treated; 19 animals) or with vehicle(untreated; 20 animals). (Right) Tumor volume percentage of Fusobacterium-positivePDX tumors (COCA36) treated with metronidazole (treated; 25 animals) or with vehicle(untreated; 22 animals). P values were determined by the Wald test. Tumors were measuredin a blinded fashion on Mondays, Wednesdays, and Fridays each week. Error bars representmean ± SEM. The remaining number of HT-29-derived xenografts and PDX-implanted animalsat each time point is included in the supplementary materials. (B) Assessment of Fusobacteriumtissue load. Fusobacterium-targeted qPCR on PDX tissue (COCA36) after treatment withmetronidazole (treated) or with vehicle (untreated). ND, not detected. The center bar representsthe mean; error bars indicate SEM. P values were determined using Welch’s two-sample t test.DCt, delta cycle threshold; PTG, prostaglandin transporter. (C) Bromodeoxyuridine (BrdU)immunohistochemistry of PDX tumors to assess cell proliferation. The bar plot representsthe percentage of cells with BrdU incorporation in treated and untreated PDXs (n = 6 animalsper arm); error bars denote mean ± SEM. P values were determined using the Welch’stwo-sample t test.
RESEARCH | REPORT

17www.SCIENCEMAG.org 15 December 2017 Vol 358 Issue 6369 aal5240
R E S E A R C H | R E P O R T
for Eli Lilly, Genentech, Merck, Sanofi, Five Prime Therapeutics,Merrimack Pharmaceuticals, Bayer, Agios Pharmaceuticals,Taiho Oncology, and KEW Group. M.M. and S.B. are inventorson U.S. Provisional Patent Application no. 62/534,672,submitted by the Broad Institute and Dana-Farber CancerInstitute, that covers targeting of Fusobacterium fortreatment of colorectal cancer. All raw sequencing datafrom this study can be accessed at the National Center forBiotechnology Information (NCBI) under the bioprojectPRJNA362951. Bacterial whole-genome sequences have beendeposited at DNA Data Bank of Japan/European Nucleotide
Archive/GenBank, with the following NCBI accession, GenBankassembly accession, and BioSample numbers, respectively:F. necrophorum subsp. funduliforme P1_CP patient P1 primarycolorectal tumor (NPNF00000000, GCA_002761995.1, andSAMN07448029), F. necrophorum subsp. funduliforme P1_LMpatient P1 liver metastasis (NPNE00000000, GCA_002762025.1, andSAMN07448030), F. nucleatum subsp. animalis P2_CP patient P2primary colorectal tumor (NPND00000000, GCA_002762005.1,and SAMN07448031), and F. nucleatum subsp. animalisP2_LM patient P2 liver metastasis (NPNC00000000,GCA_002762015.1, and SAMN07448032).
SUPPLEMENTARY MATERIALS
www.sciencemag.org/content/358/6369/1443/suppl/DC1Materials and MethodsFigs. S1 to S15Tables S1 to S9References (31–43)
2 December 2016; resubmitted 17 August 2017Accepted 13 November 2017Published online 23 November 201710.1126/science.aal5240
Bullman et al., Science 358, 1443–1448 (2017) 15 December 2017 6 of 6
RESEARCH | REPORT
THIS IS NOT SCIENCE FICTIONThis is captivating, impactful Science
Contact us today to discuss pricing options for adding any of these journals to your collection of Science resources.
Institutional Licensing ScienceMag.org/request | [email protected] 1-866-265-4152 (USA) |+1-202-326-6730 (outside USA)
18
R E V I E W
ONCOLOGY 2016 © The Authors, some rights reserved;
exclusive licensee American Association for
the Advancement of Science. Distributed
under a Creative Commons Attribution
NonCommercial License 4.0 (CC BY-NC).
10.1126/sciadv.1600200
Fundamentals of cancer metabolismRalph J. DeBerardinis1* and Navdeep S. Chandel2*
Tumors reprogram pathways of nutrient acquisition and metabolism to meet the bioenergetic, biosynthetic,and redox demands of malignant cells. These reprogrammed activities are now recognized as hallmarks ofcancer, and recent work has uncovered remarkable flexibility in the specific pathways activated by tumor cellsto support these key functions. In this perspective, we provide a conceptual framework to understand how andwhy metabolic reprogramming occurs in tumor cells, and the mechanisms linking altered metabolism to tumor-igenesis andmetastasis. Understanding these concepts will progressively support the development of new strat-egies to treat human cancer.
INTRODUCTION AND OVERARCHING PRINCIPLES
Cancer metabolism is one of the oldest areas of research in cancerbiology, predating the discovery of oncogenes and tumor suppressorsby some 50 years. The field is based on the principle that metabolicactivities are altered in cancer cells relative to normal cells, and thatthese alterations support the acquisition and maintenance of malig-nant properties. Because some altered metabolic features are observedquite generally across many types of cancer cells, reprogrammed me-tabolism is considered a hallmark of cancer (1, 2). Precisely how me-tabolism becomes reprogrammed in cancer cells, whose functions ormalignant properties are enabled by these activities, and how to ex-ploit metabolic changes for therapeutic benefit are among the keyquestions driving research in the field.
This review covers several fundamental principles in cancer metab-olism, with the goal of introducing non-experts to the concepts mo-tivating ongoing research. With the explosion of research in cancermetabolism over the past decade, no single review can possibly coverit all. The sections below highlight some of the essential, recent paperssupporting these core principles. An overarching theme in cancer me-tabolism is that reprogrammed activities improve cellular fitness toprovide a selective advantage during tumorigenesis. Most of the clas-sical examples of reprogrammed activities either support cell survivalunder stressful conditions or allow cells to grow and proliferate at path-ologically elevated levels. Three of these—altered bioenergetics,enhanced biosynthesis, and redox balance—are discussed at length be-low. It logically flows that if these activities provide benefit to the ma-lignant cell, then some of them might be suitable therapeutic targets.This rendering of cancer metabolism is supported by many examplesin which inhibition of an enhanced metabolic activity results in im-paired growth of experimental tumors (3, 4). In some cases, the par-ticular metabolic liabilities of cancer cells have been translated intoeffective therapies in human cancer. Asparaginase, an enzyme thatconverts the amino acid asparagine to aspartic acid and ammonia, isan essential component of treatment for acute lymphoblastic leukemia(ALL) (5). Because of their high rates of protein synthesis and poorability to synthesize asparagine de novo, ALL cells require a constantsupply of asparagine from the plasma. This supply is essentially elimi-
nated by systemic administration of asparaginase. Ultimately, effectivemetabolic therapy will require defining the stage of tumor progressionin which each pathway provides its benefit to the cancer cell. Someactivities first become essential very early in tumorigenesis as the nas-cent tumor begins to experience nutrient limitations (6). In other cases,altered pathways may be dispensable in primary tumors but essentialfor metastasis (7, 8). Because new therapeutic targets are nominatedfrom simple experimental models like cultured cells, it will be essentialto define their context-specific roles in biologically accurate models oftumor initiation and progression.
METABOLIC REPROGRAMMING AND ONCOMETABOLITESIN CANCER
Altered metabolic activity supports anabolic growth during nutrient-replete conditions, catabolism to support cell survival during nutrientlimitation, and fortification of redox homeostatic systems to counter-act the metabolic effects of oncogene activation, tumor suppressorloss, and other stresses (9). Discovery and characterization of repro-grammed activities may provide opportunities to image tumor tissuenoninvasively, predict tumor behavior, and prevent tumor progressionby blocking essential pathways. It is important to differentiate “meta-bolic reprogramming” from “oncometabolites,” two terms widely usedin the recent cancer metabolism literature (10). We propose that theterm metabolic reprogramming be used to describe conventionalmetabolic pathways whose activities are enhanced or suppressed intumor cells relative to benign tissues as a consequence of tumorigenicmutations and/or other factors. Oncometabolite is a relatively newterm that refers to metabolites whose abundance increases markedlyin tumors. We suggest that this term be reserved for metabolites forwhich (i) there is a clear mechanism connecting a specific mutation inthe tumor to accumulation of the metabolite, and (ii) there iscompelling evidence for involvement of the metabolite in the develop-ment of malignancy.
The classical example of a reprogrammed metabolic pathway incancer is the Warburg effect or aerobic glycolysis (11). Glycolysis isa physiological response to hypoxia in normal tissues, but Otto Warburgin the 1920s observed that tumor slices and ascites cancer cellsconstitutively take up glucose and produce lactate regardless of oxygenavailability, an observation that has been seen in many types of cancercells and tumors (12). The increase in glycolytic flux allows glycolytic
1Children’s Medical Center Research Institute, University of Texas Southwestern Med-ical Center, Dallas, TX 75390, USA. 2Department of Medicine, Northwestern UniversityFeinberg School of Medicine, Chicago, IL 60611, USA.*Corresponding author. Email: [email protected] (R.J.D.); [email protected] (N.S.C.)
REV I EW
DeBerardinis and Chandel Sci. Adv. 2016; 2 : e1600200 27 May 2016 1 of 18
on February 22, 2018http://advances.sciencem
ag.org/D
ownloaded from
SCIENCE ADVANCES
www.SCIENCEADVANCES.org 27 May 2016 Vol 2 e16001200
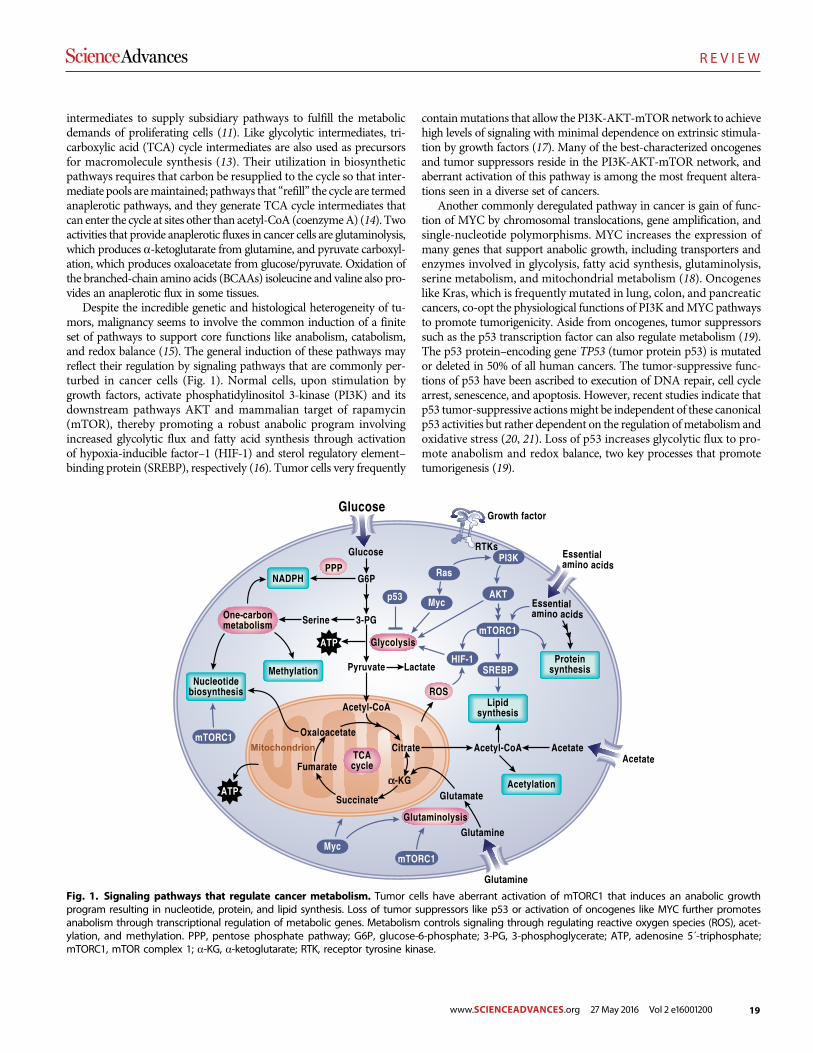
19
R E V I E W
intermediates to supply subsidiary pathways to fulfill the metabolicdemands of proliferating cells (11). Like glycolytic intermediates, tri-carboxylic acid (TCA) cycle intermediates are also used as precursorsfor macromolecule synthesis (13). Their utilization in biosyntheticpathways requires that carbon be resupplied to the cycle so that inter-mediate pools aremaintained; pathways that “refill” the cycle are termedanaplerotic pathways, and they generate TCA cycle intermediates thatcan enter the cycle at sites other than acetyl-CoA (coenzymeA) (14). Twoactivities that provide anaplerotic fluxes in cancer cells are glutaminolysis,which produces a-ketoglutarate from glutamine, and pyruvate carboxyl-ation, which produces oxaloacetate from glucose/pyruvate. Oxidation ofthe branched-chain amino acids (BCAAs) isoleucine and valine also pro-vides an anaplerotic flux in some tissues.
Despite the incredible genetic and histological heterogeneity of tu-mors, malignancy seems to involve the common induction of a finiteset of pathways to support core functions like anabolism, catabolism,and redox balance (15). The general induction of these pathways mayreflect their regulation by signaling pathways that are commonly per-turbed in cancer cells (Fig. 1). Normal cells, upon stimulation bygrowth factors, activate phosphatidylinositol 3-kinase (PI3K) and itsdownstream pathways AKT and mammalian target of rapamycin(mTOR), thereby promoting a robust anabolic program involvingincreased glycolytic flux and fatty acid synthesis through activationof hypoxia-inducible factor–1 (HIF-1) and sterol regulatory element–binding protein (SREBP), respectively (16). Tumor cells very frequently
containmutations that allow the PI3K-AKT-mTORnetwork to achievehigh levels of signaling with minimal dependence on extrinsic stimula-tion by growth factors (17). Many of the best-characterized oncogenesand tumor suppressors reside in the PI3K-AKT-mTOR network, andaberrant activation of this pathway is among the most frequent altera-tions seen in a diverse set of cancers.
Another commonly deregulated pathway in cancer is gain of func-tion of MYC by chromosomal translocations, gene amplification, andsingle-nucleotide polymorphisms. MYC increases the expression ofmany genes that support anabolic growth, including transporters andenzymes involved in glycolysis, fatty acid synthesis, glutaminolysis,serine metabolism, and mitochondrial metabolism (18). Oncogeneslike Kras, which is frequently mutated in lung, colon, and pancreaticcancers, co-opt the physiological functions of PI3K andMYC pathwaysto promote tumorigenicity. Aside from oncogenes, tumor suppressorssuch as the p53 transcription factor can also regulate metabolism (19).The p53 protein–encoding gene TP53 (tumor protein p53) is mutatedor deleted in 50% of all human cancers. The tumor-suppressive func-tions of p53 have been ascribed to execution of DNA repair, cell cyclearrest, senescence, and apoptosis. However, recent studies indicate thatp53 tumor-suppressive actionsmight be independent of these canonicalp53 activities but rather dependent on the regulation ofmetabolism andoxidative stress (20, 21). Loss of p53 increases glycolytic flux to pro-mote anabolism and redox balance, two key processes that promotetumorigenesis (19).
Fig. 1. Signaling pathways that regulate cancer metabolism. Tumor cells have aberrant activation of mTORC1 that induces an anabolic growthprogram resulting in nucleotide, protein, and lipid synthesis. Loss of tumor suppressors like p53 or activation of oncogenes like MYC further promotesanabolism through transcriptional regulation of metabolic genes. Metabolism controls signaling through regulating reactive oxygen species (ROS), acet-ylation, and methylation. PPP, pentose phosphate pathway; G6P, glucose-6-phosphate; 3-PG, 3-phosphoglycerate; ATP, adenosine 5´-triphosphate;mTORC1, mTOR complex 1; a-KG, a-ketoglutarate; RTK, receptor tyrosine kinase.
R E V I EW
DeBerardinis and Chandel Sci. Adv. 2016; 2 : e1600200 27 May 2016 2 of 18
on February 22, 2018http://advances.sciencem
ag.org/D
ownloaded from
www.SCIENCEADVANCES.org 27 May 2016 Vol 2 e16001200
20
R E V I E W
A salient feature of many tumors is that they reside in a low-oxygenenvironment (hypoxia) ranging from 0 to 2%O2 because the tumor cellproliferation rate often exceeds the rate of new blood vessel formation(angiogenesis) (22). Themetabolic adaptation to hypoxia is coordinatedby HIF-1, which induces metabolic genes involved in increasing glyco-lytic flux (23). Some tumors display constitutive activation of HIF-1 un-der normoxic conditions through a variety of mechanisms, including(i) hyperactivation of mTORC1, (ii) loss of von Hippel–Lindau, (iii)accumulation of ROS, and (iv) accumulation of the TCA cycle metabo-lites succinate or fumarate due to cancer-specific mutations in succinatedehydrogenase (SDH) or fumarate hydratase (FH), respectively (24).
The robust coordinated induction of metabolic pathways thatsupport tumorigenesis by combination of deregulation of PI3K-AKT-mTOR signaling pathways, loss of tumor suppressors, and activation ofoncogenes alleviates the necessity of havingmutations or amplificationsin metabolic enzymes per se. Thus, examples of metabolic enzyme de-regulation through genetic mutation are rare. One example is the ele-vated expression of phosphoglycerate dehydrogenase (PHGDH) dueto amplification in a fraction of breast cancer andmelanoma (25, 26).PHGDH catalyzes the conversion of the glycolytic intermediate 3-phosphoglycerate to 3-phosphohydroxypyruvate in the first step ofthe serine biosynthesis pathway. Serine metabolism supplies methylgroups to the one-carbon and folate pools contributing to nucleotidesynthesis, methylation reactions, and NADPH (reduced nicotinamideadenine dinucleotide phosphate) production (27). Inhibiting serinebiosynthesis by silencing PHGDH in cells with high levels of this en-zyme results in growth suppression, and the enzyme displays oncogenicproperties in gain of function assays (25, 26).
The other examples of mutational deregulation of metabolic en-zymes are those that generate oncometabolites. The current list of trueoncometabolites is short (28). The term is most commonly and appro-priately applied to D-2-hydroxyglutarate (D2HG), a reduced formof theTCA cycle intermediate a-ketoglutarate. D2HG is scarce in normal tis-sues but rises to millimolar concentrations in tumors with mutations inisocitrate dehydrogenase 1 or 2 (IDH1 or IDH2). These mutations oc-cur commonly in gliomas, acute myelogenous leukemias (AMLs), andother types of cancer (29–31). D2HG and its relationship to mutantIDH1 and IDH2 have been reviewed extensively elsewhere (32). Themost relevant point here is that D2HG production requires a neomor-phic enzyme activity imparted to IDH1/IDH2 by specific active-sitemutations (33, 34). High levels of D2HG interfere with the functionof dioxygenases requiring a-ketoglutarate as a cosubstrate. These in-cludeprolylhydroxylases, cytosinehydroxylases, andhistonedemethylases,whose inhibition influences gene expression in part via an altered epi-genetic state characterized by a failure to express differentiation pro-grams (35–41). Thus, although D2HG arises from an alteration of themetabolic network, its role in cancer seems to depend on nonmetaboliceffects. Currently, D2HG is being used as a biomarker for disease mo-nitoring, and inhibitors specific to mutants IDH1/IDH2 are in clinicaltrials for AML and solid tumors.
The metabolite 2HG also exists as the enantiomer L-2HG (L2HG),which is not produced bymutant forms of IDH1/IDH2.Thismetabolitearises from the noncanonical activity of various dehydrogenases, in-cluding malate dehydrogenase and lactate dehydrogenase, whose pro-miscuous behavior reduces a-ketoglutarate to L2HG (42–44). L2HGmay be oxidized back to a-ketoglutarate by a FAD-linked enzyme,L2HG dehydrogenase (L2HGDH). L2HGDH deficiency, also calledL2HG aciduria, is a rare neurometabolic disease of childhood caused
by the inheritance of biallelicmutations in the gene encoding L2HGDH(45). Affected children have seizures, mental retardation, white matterabnormalities of the brain, and systemically elevated levels of L2HG.Remarkably, a number of these children have developed malignantbrain tumors (46), providing an early clue to the significance of D2HGin IDH1/IDH2-mutant gliomas and raising the question of whetherL2HG is also an oncometabolite. L2HG and D2HG exhibit differenteffects on dioxygenase function (38), suggesting that the sensitivity of aparticular tissue to the presence of either metabolite may depend onwhich dioxygenases are expressed. Recent work has demonstratedmod-est accumulation of L2HG in cells experiencing hypoxia or electrontransport chain (ETC) dysfunction (42, 47) and in human renal cellcarcinomas, which frequently display epigenetic silencing of L2HGDH(48). It is unknown whether reducing L2HG levels in these settings willpromote cellular differentiation or suppress tumor progression.
The principle that oncometabolites exert their effects outside of theconventional metabolic network also applies to the other twomoleculesthat can reasonably be called oncometabolites: fumarate and succinate(28). Both are TCA cycle intermediates found throughout the body, butsome tumors accumulatemassive levels of fumarate and/or succinate asa consequence of loss-of-functionmutations in FHor the SDHcomplex,respectively (49–51). Although these mutations markedly reprogrammetabolism by impairing TCA cycle flux, the extent to which fumarateand succinate participate in cancer development likely involves theirnonmetabolic functions (28). Like D2HG, evidence indicates that suc-cinate and fumarate interfere with dioxygenase activity, supporting thenotion that a general property of oncometabolites is the ability to regulateepigenetics (52, 53). PHGDH overexpression and mutations in IDH1/IDH2, SDH, and FH all alter metabolite levels that control epigenetics(54). Several othermetabolites, including acetyl-CoA, a-ketoglutarate,and S-adenosylmethionine also participate in epigenetic reprogramming,and timewill tell whether genetically specific alterations of thesemetab-olites in tumors promote tumorigenesis (54). Somemetabolites, notablyfumarate, covalently bind to sulfhydryl groups in glutathione, proteins,and peptides, altering their function and perhaps accounting for anoth-er mechanism by which oncometabolites promote or perpetuate malig-nant phenotypes (55–58).
BIOENERGETICS
Otto Warburg’s hypothesis that cancer cells take up glucose and gen-erate a substantial amount of lactate in the presence of ambient oxygendue to impaired mitochondrial function led to the widely held miscon-ception that cancer cells rely on glycolysis as their major source of ATP(59, 60). Today, it is clear that cancer cells exhibit aerobic glycolysis dueto activation of oncogenes, loss of tumor suppressors, and up-regulationof the PI3K pathway, and that one advantage of high glycolytic rates isthe availability of precursors for anabolic pathways (2, 61). Warburg’sobservation that tumors display a high rate of glucose consumption hasbeen validated in many human cancers with fluorodeoxyglucose posi-tron emission tomography, which uses a radioactive glucose analog toimage glucose uptake in tumors and adjacent normal tissue. Neverthe-less, many studies have demonstrated that the great majority of tumorcells have the capacity to produce energy through glucose oxidation(that is, the process by which glucose-derived carbons enter the TCA cy-cle and are oxidized toCO2, producingATP throughoxidative phospho-rylation). Furthermore, limiting glycolytic ATP production by inhibiting
REV I EW
DeBerardinis and Chandel Sci. Adv. 2016; 2 : e1600200 27 May 2016 3 of 18
on February 22, 2018http://advances.sciencem
ag.org/D
ownloaded from
www.SCIENCEADVANCES.org 27 May 2016 Vol 2 e16001200
21
R E V I E W
the activity of pyruvate kinase fails to prevent tumorigenesis, suggest-ing that themajor role of glycolysis is not to supplyATP (62).Moreover,mitochondrial metabolism is necessary for cancer cell proliferation andtumorigenesis (63–65). Thus, despite their high glycolytic rates,most can-cer cells generate the majority of ATP through mitochondrial function,with the likely exception of tumors bearingmutations in enzymes involvedin mitochondrial respiration (for example, SDH and FH) (66). Neverthe-less, cells harboring mutations in FH or SDH still rely on mitochondrialmetabolism by metabolically rewiring themselves to provide the neces-sary TCA cycle intermediates andROS for cell proliferation (55, 67–70).
In addition to pyruvate derived from glycolysis, fatty acids and aminoacids can supply substrates to the TCA cycle to sustain mitochondrialATP production in cancer cells (Fig. 2). The breakdown of fatty acids(b-oxidation) in themitochondria generates acetyl-CoAand the reducingequivalents NADH and FADH2, which are used by the ETC to producemitochondrial ATP. The amino acid glutamine can generate glutamateand subsequently a-ketoglutarate to fuel the TCA cycle through a seriesof biochemical reactions termed glutaminolysis (71). Furthermore, theBCAAs isoleucine, valine, and leucine, which are elevated in plasma ofpatients with pancreatic cancers, can be converted into acetyl-CoA andother organicmolecules that also enter theTCAcycle (72). Themetabolicflexibility afforded by multiple inputs into the TCA cycle allows cancercells to adequately respond to the fuels available in the changing micro-environment during the evolution of the tumor (9). A combination of thelocal tumormicroenvironment and oncogenic lesions is likely to dictatethe fuel used by mitochondria to sustain tumor growth.
Solid tumors contain significant heterogeneity of perfusion, suchthatmany tumor cells reside innutrient- andoxygen-poor environments.Cancer cells have therefore adapted multiple mechanisms to sustainmitochondrial function for survival. For example, the mitochondrialETC can function optimally at oxygen levels as low as 0.5% (73). More-over, hypoxic tumor cells (<2%O2) can continue to cycle and use gluta-mine as a fuel for oxidative ATP production (74–76). Kras-drivenpancreatic cancer cells in nutrient-depleted conditions use proteinsscavenged from the extracellular space to produce glutamine andother amino acids to fuel the TCA cycle for cell survival and growth(Fig. 2) (77). Furthermore, if pyruvate oxidation to acetyl-CoA is com-promised by hypoxia or ETC impairment, glutamine can provide acetyl-CoA as a biosynthetic precursor to sustain tumor growth (69, 78, 79).
When tumor cells become nutrient-deprived, they adapt to themicroenvironment by decreasing their demand for ATP. The result-ant increase in ATP availability maintains an adequate ATP/ADP(adenosine 5´-diphosphate) ratio to drive unfavorable biological re-actions. The anabolic kinase mTOR, discussed in greater detail below,drives the energetically demanding growth of tumor cells. This kinaseis inhibited when amino acids and oxygen levels are diminished (80).Furthermore, decreased mTOR activity increases autophagic flux. Inoncogenic Kras- or Braf-driven non–small-cell lung cancer (NSCLC)cells, autophagy provides an intracellular glutamine supply to sustainmitochondrial function (81, 82). To survive the hypoxic tumormicro-environment, cancer cells also diminish their demand for ATP by de-creasing highly demanding ATP-dependent processes, such as runningthe Na/K-dependent adenosine triphosphatase. If diminishing ATPdemand is not sufficient tomaintain ATP/ADP ratio, the rise in ADPactivates adenylate kinase, a phosphotransferase enzyme that buffersthe fall in ATP levels by converting two ADPmolecules into adenosine5´-monophosphate (AMP) and ATP (83). The rise in AMP during nu-trient deprivation triggers the activation ofAMPkinase (AMPK), which
activates catabolic pathways like fatty acid oxidation to stimulate ATPproduction (84). In conditions of metabolic stress, certain Ras-drivencancer cells scavenge lipids to support ATP production (85). Ovariancancer cells use fatty acids from neighboring adipocytes to fuel mito-chondrial ATP production (86). Thus, there are multiple mechanismsby which cancer cells maintain their ATP/ADP ratio to sustain viabilityin nutrient- and oxygen-poor environments.
BIOSYNTHESIS OF MACROMOLECULES
Biosynthetic or anabolic pathways are an essential aspect of cancer me-tabolism because they enable cells to produce the macromolecules re-quired for replicative cell division and tumor growth. As a general theme,these pathways involve the acquisition of simple nutrients (sugars, es-sential amino acids, etc.) from the extracellular space, followed by theirconversion into biosynthetic intermediates through core metabolicpathways like glycolysis, the PPP, the TCA cycle, and nonessential aminoacid synthesis, and finally the assembly of larger andmore complexmol-ecules through ATP-dependent processes (Fig. 3). The three macro-molecular classes most commonly studied in cancer metabolism areproteins, lipids, and nucleic acids, which comprise approximately 60,15, and 5% of the dry mass of mammalian cells, respectively. Evidenceindicates that biosynthesis of all three classes is under the control of thesame signaling pathways that govern cell growth and are activated incancer via tumorigenic mutations, particularly PI3K-mTOR signaling.
Protein biosynthesis is highly regulated and requires access to a fullcomplement of essential and nonessential amino acids. Cancer cellsand other cells under the influence of growth factor signaling express sur-face transporters that allow them to acquire amino acids from the extra-cellular space (87). This not only provides cells with the raw materialsneeded for protein synthesis but also allows them to maintain activityof the mTOR signaling system, specifically mTORC1. mTORC1 is stim-ulated by the presence of amino acids and activates protein synthesis via itseffects on translation and ribosome biogenesis (80). Most nonessentialamino acids are produced through transamination reactions, which trans-fer the amino group fromglutamate to a ketoacid. Proliferating cancer cellstake up glutamine and convert it to glutamate through a variety of de-amidation and transamidation reactions, most notably the mitochondrialamidohydrolase glutaminase (71).Together, these enzymesgenerate a largeintracellular glutamate pool available for nonessential amino acid syn-thesis. Both glutamine uptake and glutaminase activity are stimulated bymTORC1, providing glutamate for transamination reactions and/ormain-tenance of the TCA cycle, which also contributes to amino acid synthesis.Furthermore, when the intracellular glutamine supply exceeds the cell’sdemands, glutamine can be exported in exchange for essential amino acidsto stimulatemTORC1 andprotein synthesis (88). Thus, growth conditionsin which glutamine and essential amino acids are abundant enablemTORC1-mediated activation of protein synthesis.
When nutrients are scarce, cells have access to a number of catabolicpathways to degrade macromolecules and resupply key pools of intra-cellular metabolic intermediates. Protein degradation pathways havebeen characterized extensively as mechanisms to supply amino acidsin cancer cells. Intracellular proteins and other macromolecules can berecycled through autophagy, a highly regulated process through whichproteins and organelles are delivered to the lysosome and degraded(89). Autophagy is an essential survival pathway during nutrient or growthfactor deprivation, and genetic studies demonstrate that it contributes to
REV I EW
DeBerardinis and Chandel Sci. Adv. 2016; 2 : e1600200 27 May 2016 4 of 18
on February 22, 2018http://advances.sciencem
ag.org/D
ownloaded from
www.SCIENCEADVANCES.org 27 May 2016 Vol 2 e16001200
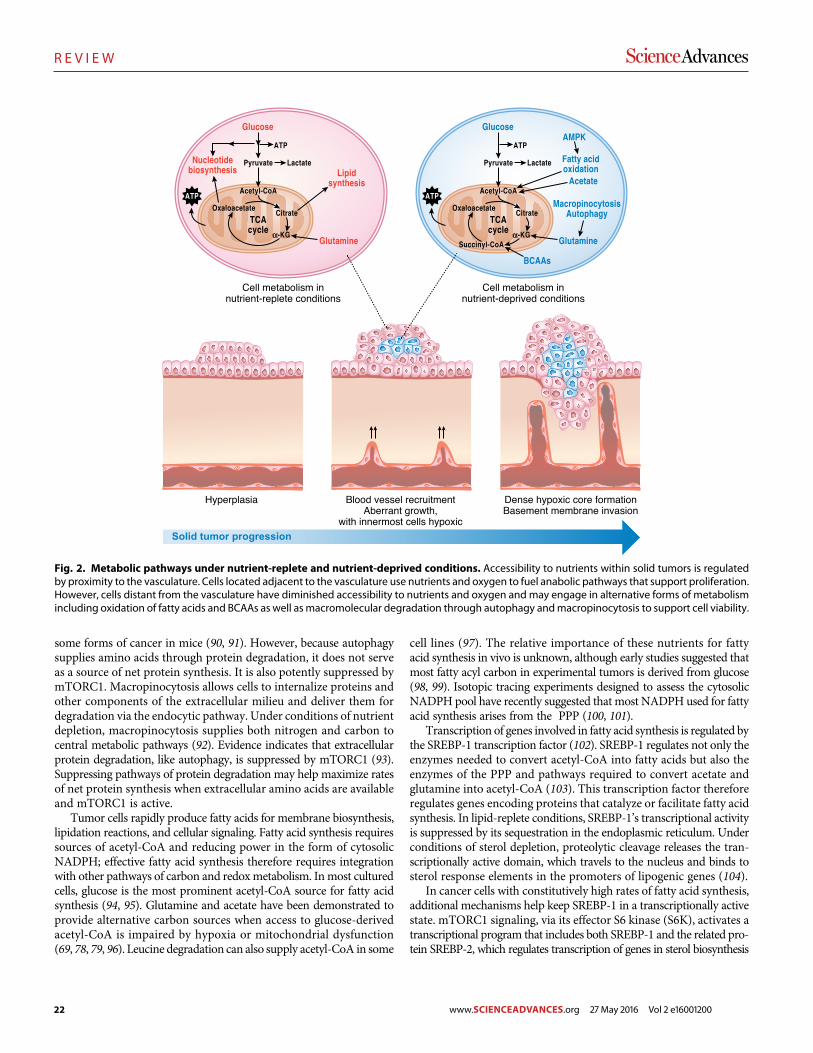
22
R E V I E W
some forms of cancer in mice (90, 91). However, because autophagysupplies amino acids through protein degradation, it does not serveas a source of net protein synthesis. It is also potently suppressed bymTORC1. Macropinocytosis allows cells to internalize proteins andother components of the extracellular milieu and deliver them fordegradation via the endocytic pathway. Under conditions of nutrientdepletion, macropinocytosis supplies both nitrogen and carbon tocentral metabolic pathways (92). Evidence indicates that extracellularprotein degradation, like autophagy, is suppressed by mTORC1 (93).Suppressing pathways of protein degradation may help maximize ratesof net protein synthesis when extracellular amino acids are availableand mTORC1 is active.
Tumor cells rapidly produce fatty acids for membrane biosynthesis,lipidation reactions, and cellular signaling. Fatty acid synthesis requiressources of acetyl-CoA and reducing power in the form of cytosolicNADPH; effective fatty acid synthesis therefore requires integrationwith other pathways of carbon and redoxmetabolism. Inmost culturedcells, glucose is the most prominent acetyl-CoA source for fatty acidsynthesis (94, 95). Glutamine and acetate have been demonstrated toprovide alternative carbon sources when access to glucose-derivedacetyl-CoA is impaired by hypoxia or mitochondrial dysfunction(69, 78, 79, 96). Leucine degradation can also supply acetyl-CoA in some
cell lines (97). The relative importance of these nutrients for fattyacid synthesis in vivo is unknown, although early studies suggested thatmost fatty acyl carbon in experimental tumors is derived from glucose(98, 99). Isotopic tracing experiments designed to assess the cytosolicNADPH pool have recently suggested that most NADPH used for fattyacid synthesis arises from the PPP (100, 101).
Transcription of genes involved in fatty acid synthesis is regulated bythe SREBP-1 transcription factor (102). SREBP-1 regulates not only theenzymes needed to convert acetyl-CoA into fatty acids but also theenzymes of the PPP and pathways required to convert acetate andglutamine into acetyl-CoA (103). This transcription factor thereforeregulates genes encoding proteins that catalyze or facilitate fatty acidsynthesis. In lipid-replete conditions, SREBP-1’s transcriptional activityis suppressed by its sequestration in the endoplasmic reticulum. Underconditions of sterol depletion, proteolytic cleavage releases the tran-scriptionally active domain, which travels to the nucleus and binds tosterol response elements in the promoters of lipogenic genes (104).
In cancer cells with constitutively high rates of fatty acid synthesis,additional mechanisms help keep SREBP-1 in a transcriptionally activestate. mTORC1 signaling, via its effector S6 kinase (S6K), activates atranscriptional program that includes both SREBP-1 and the related pro-tein SREBP-2, which regulates transcription of genes in sterol biosynthesis
Fig. 2. Metabolic pathways under nutrient-replete and nutrient-deprived conditions. Accessibility to nutrients within solid tumors is regulatedby proximity to the vasculature. Cells located adjacent to the vasculature use nutrients and oxygen to fuel anabolic pathways that support proliferation.However, cells distant from the vasculature have diminished accessibility to nutrients and oxygen and may engage in alternative forms of metabolismincluding oxidation of fatty acids and BCAAs as well asmacromolecular degradation through autophagy andmacropinocytosis to support cell viability.
R E V I EW
DeBerardinis and Chandel Sci. Adv. 2016; 2 : e1600200 27 May 2016 5 of 18
on February 22, 2018http://advances.sciencem
ag.org/D
ownloaded from
www.SCIENCEADVANCES.org 27 May 2016 Vol 2 e16001200
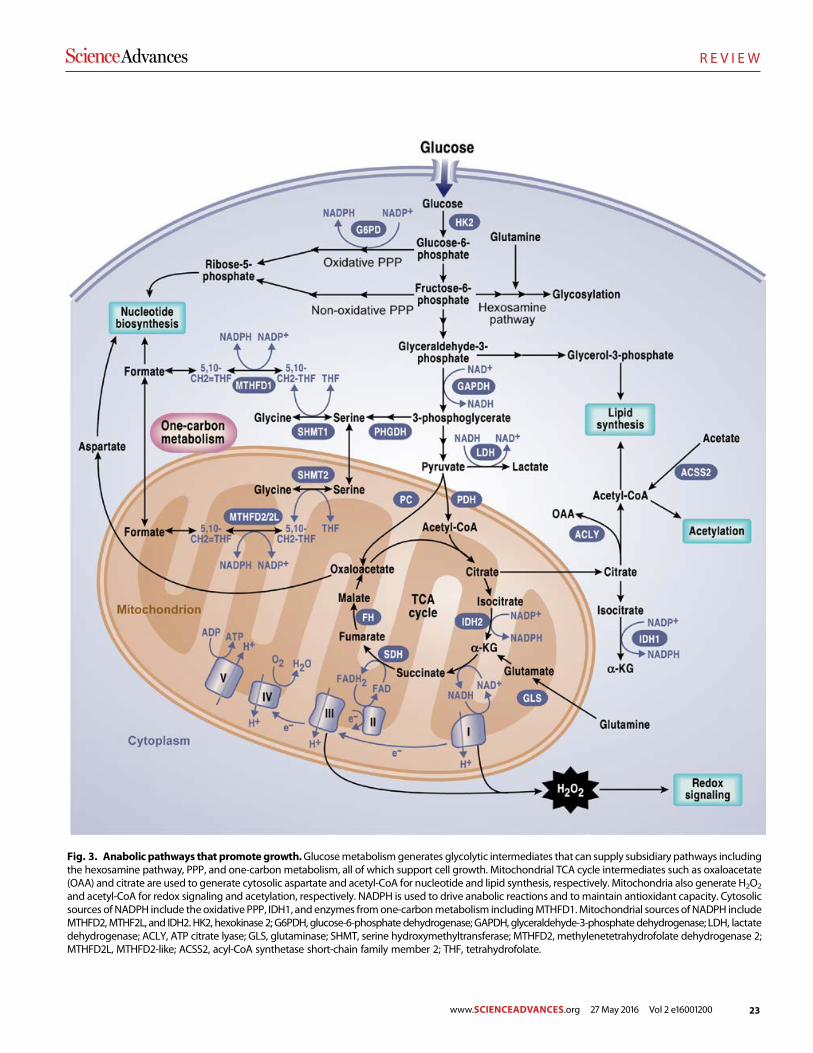
23
R E V I E W
Fig. 3. Anabolic pathways that promote growth.Glucosemetabolismgenerates glycolytic intermediates that can supply subsidiary pathways includingthe hexosamine pathway, PPP, and one-carbon metabolism, all of which support cell growth. Mitochondrial TCA cycle intermediates such as oxaloacetate(OAA) and citrate are used to generate cytosolic aspartate and acetyl-CoA for nucleotide and lipid synthesis, respectively. Mitochondria also generate H2O2
and acetyl-CoA for redox signaling and acetylation, respectively. NADPH is used to drive anabolic reactions and to maintain antioxidant capacity. Cytosolicsources of NADPH include theoxidative PPP, IDH1, and enzymes fromone-carbonmetabolism includingMTHFD1.Mitochondrial sourcesof NADPH includeMTHFD2,MTHF2L, and IDH2. HK2, hexokinase 2; G6PDH, glucose-6-phosphate dehydrogenase; GAPDH, glyceraldehyde-3-phosphate dehydrogenase; LDH, lactatedehydrogenase; ACLY, ATP citrate lyase; GLS, glutaminase; SHMT, serine hydroxymethyltransferase; MTHFD2, methylenetetrahydrofolate dehydrogenase 2;MTHFD2L, MTHFD2-like; ACSS2, acyl-CoA synthetase short-chain family member 2; THF, tetrahydrofolate.
R E V I EW
DeBerardinis and Chandel Sci. Adv. 2016; 2 : e1600200 27 May 2016 6 of 18
on February 22, 2018http://advances.sciencem
ag.org/D
ownloaded from
www.SCIENCEADVANCES.org 27 May 2016 Vol 2 e16001200
24
R E V I E W
(103). Both SREBP-1 and SREBP-2 are required for mTORC1-mediatedcell proliferation. Themechanism of SREBP activation bymTORC1 isincompletely understood but involves nuclear entry of the phosphatidicacid phosphatase Lipin-1, which enhances nuclear SREBP abundanceand activity on the promoters of lipogenic genes (105).
Both fatty acids and lipids can also be acquired from the extracellularspace to supply membrane biosynthesis. PI3K signaling activates fattyacid uptake and suppresses fatty acid oxidation, thereby maximizinglipogenesis in proliferating cells under the control of growth factors(106). Lipid uptake may acquire further importance during conditionsof metabolic stress, when the ability to meet oncogene-driven demandsfor biosynthesis is compromised. The ability to scavenge lysophospho-lipids (lipid intermediates containing a glycerophosphate backbonewith one acyl chain) is required for maximal cancer cell growth duringhypoxia, which suppresses de novo fatty acid synthesis from glucose(85). Furthermore, in cancer cells with constitutive mTORC1 signaling,hypoxia induces a state of dependence on access to extracellular desatu-rated fatty acids tomaintain endoplasmic reticulum integrity in supportof protein biosynthesis (107). Notably, SREBP-1was first identified as thetranscription factor responsible for expression of the low-density lipo-protein receptor (LDLR) (108), implying that enhanced de novo lipo-genesis occurs concomitantly with enhanced import of lipids from theextracellular space. These parallel pathways appear to be essentialin glioma, where oncogenic activation of epidermal growth factor re-ceptor (EGFR) signaling stimulates SREBP-1 and expression of LDLR(109). These cancer cells are highly sensitive to inhibitors of fatty acidand cholesterol biosynthesis. Inhibition of the EGFR-PI3K signalingaxis but not of mTORC1 suppresses nuclear translocation of SREBP-1in glioma cells with oncogenic EGFR, suggesting an alternate, mTORC1-independent mode of SREBP-1 activation in glioma cells (109). Thistranscriptional program includes LDLRexpression and induces relianceon cholesterol uptake to maintain the intracellular pool (110). Impairingintracellular cholesterol availability by activating liver X receptor inducedcell death both in culture and in vivo, suggesting a pharmacological ap-proach to silence lipogenic programs in glioma (110).
Purine and pyrimidine nucleotides are required for synthesis ofRNA and DNA. De novo biosynthesis of nucleotides is complex, re-quiring input from several pathways in a coordinated fashion. Thephosphoribosylamine backbone of these molecules is produced fromribose-5-phosphate, an intermediate of the PPP, and an amide donationreaction using glutamine as a substrate (111). The purine and pyrimidinebases are constructed from various nonessential amino acids andmethylgroups donated from the one-carbon/folate pool. TheTCA cycle contrib-utes oxaloacetate, which is transaminated to aspartate, an intermediaterequired to synthesize both purine and pyrimidine bases. Conversionof ribonucleotides to deoxynucleotides by ribonucleotide reductase re-quires a source of NADPH.Well-characterized mechanisms of feedbackinhibition exist to prevent excessive accumulation of nucleotides, andmutations interrupting these mechanisms can produce pathological ac-cumulationof nucleotide intermediates (for example, precipitationof uricacid crystals in gout).
Clearly, nucleotide biosynthesis is a targetable vulnerability in cancercells because nucleoside analogs and antifolates have been amainstay ofchemotherapeutic regimens for decades (112). However, relatively littleis known about how oncogenic signaling interfaces with nucleotide bio-synthesis. It is likely that the effects of numerous signaling pathways onglucose and amino acid metabolism influence the availability of pre-cursors for purines and pyrimidines. In the case of mTORC1, evidence
points to a distinct mechanism by which activation of the signalingpathway enables nucleotide biosynthesis. The mTORC1 effector ribo-somal S6K1 phosphorylates the trifunctional enzymeCAD (carbamoyl-phosphate synthetase 2, aspartate transcarbamoylase, dihydroorotase),which catalyzes the first three steps of pyrimidine synthesis (113). Phos-phorylation on CAD S1859 is required for mTORC1-dependent stim-ulation of pyrimidine biosynthesis (113). Additional work is needed todetermine how other aspects of de novo nucleotide synthesis, purineandpyrimidine salvage pathways, and accessory activities like folateme-tabolism are regulated in cancer cells in support of cell proliferation.
REDOX BALANCE
ROS are intracellular chemical species that contain oxygen and includethe superoxide anion (O2
−), hydrogen peroxide (H2O2), and the hy-droxyl radical (OH·) (114). The mitochondria and cytosolic NADPHoxidases (NOXs) produce O2
− from the one-electron reduction of ox-ygen (115). O2
− is converted into H2O2 by the enzymatic activity ofsuperoxide dismutase 1 or 2, which are localized to the cytosol ormito-chondrial matrix, respectively. H2O2 is subsequently detoxified to waterby the enzymatic activity of mitochondrial and cytosolic peroxiredoxins(PRXs), which, as a consequence, undergo H2O2-mediated oxidation oftheir active-site cysteines (116). Thioredoxin (TXN), thioredoxin reduc-tase (TrxR), and the reducing equivalent NADPH reduce oxidized PRXsto complete the catalytic cycle (117). Glutathione peroxidases (GPXs)can also convert H2O2 to water in themitochondrial matrix and cytosolthrough H2O2-mediated oxidation of reduced glutathione (GSH)(118). Glutathione reductase (GR) and NADPH reduce oxidized gluta-thione (GSSG) back to GSH. Additionally, catalase, an abundant antiox-idant in peroxisomes, can detoxify H2O2 to water without any cofactors.However, in the presence of ferrous or cuprous ions, H2O2 can becomeOH· and quickly cause the oxidation of lipids, proteins, and DNA, re-sulting in cellular damage.NADPH is required tomaintainmultiple anti-oxidant defense systems. The cytosol has multiple sources of NADPHgeneration, including the oxidative PPP, malic enzyme 1, IDH1, andone-carbon metabolism. NADPH generation in the mitochondria, inpart, is controlled by one-carbon metabolism and IDH2.
Historically, ROS have been thought of as lethal metabolic by-products of cellular respiration and protein folding. However, studiesover the past two decades have unveiled a previously underappreciatedrole of ROS in cellular signaling. Low levels of ROS, particularly H2O2,can reversibly oxidize the cysteine residues of proteins to positively reg-ulate cell proliferation and cellular adaptation to metabolic stress (119).As H2O2 levels increase, however, cell death signaling pathways are ini-tiated, andH2O2 is converted to OH·, which can directly damage DNA,proteins, and lipids. Cancer cells have an increased rate of spatially lo-calizedmitochondria- andNOX-dependentROSproduction comparedto normal cells. This allows for the proximal activation of signalingpathways [PI3K and mitogen-activated protein kinase/extracellularsignal–regulated kinase (MAPK/ERK)] and transcription factors [HIFand nuclear factor kB (NF-kB)] necessary for tumorigenesis. The can-cer cell–specific increased rate of spatially localized ROS production isdue to a combination of oncogenic lesions and the tumor micro-environment. For example, the activation of oncogenes, PI3K signalingpathway induction, and hypoxia (low-oxygen levels) stimulate theincreased rate of ROS production from the mitochondria and NOXsin cancer cells (120–122). Thus, mitochondria-targeted antioxidants
REV I EW
DeBerardinis and Chandel Sci. Adv. 2016; 2 : e1600200 27 May 2016 7 of 18
on February 22, 2018http://advances.sciencem
ag.org/D
ownloaded from
www.SCIENCEADVANCES.org 27 May 2016 Vol 2 e16001200
25
R E V I E W
and NOX inhibitors can prevent cancer cell proliferation, hypoxic acti-vation of HIF, tumorigenesis, and metastasis (64, 123–125).
The increased localized ROS in cancer cells, which activates sig-naling pathways and transcription factors to promote tumorigenesis,needs to be buffered from reaching levels of ROS that incur cellulardamage by the increased expression of antioxidant proteins (126). Thus,cancer cells have higher levels of ROS scavenging enzymes than normalcells, preventing ROS-mediated activation of death-inducing pathwayslike c-Jun N-terminal kinase (JNK) and p38 MAPK and oxidation oflipids, proteins, and DNA, resulting in irreversible damage and celldeath. One mechanism by which cancer cells increase their antioxidantcapacity is by activating the transcription factor nuclear factor (erythroid-derived 2)–related factor-2 (NRF2) (127). Specifically, NRF2 is activatedfollowing disruption of the interaction of NRF2 with its binding partnerKelch-like ECH-associated protein 1 (KEAP1). Critical cysteine residueswithin KEAP1 can undergo oxidation, succination, and glutathionylation,thereby inhibiting theKEAP1-NRF2 interaction, leading to the proteasomaldegradation of NRF2. Additionally, NRF2 activation can occur indepen-dently of KEAP1 (128). Once activated, NRF2 induces the transcriptionof many antioxidant proteins including GPXs and TXNs as well as en-zymes involved inGSHsynthesis and cysteine import through the cystine/glutamate antiporter. Furthermore, tomaintain the antioxidant capacityof GPXs and TXNs, NADPH is required. NRF2 plays an important rolein activating enzymes that increase cytosolic NADPH levels. NRF2 alsoregulates the serine biosynthesis pathway, generating NADPH in themitochondria, which is critical for redox balance under hypoxic condi-tions (129, 130). Therefore, inactivating NRF2 or disabling antioxidantproteins in cancer cells would allow for the accumulation of excessiveamounts of ROS to levels that initiate toxicity and reduce tumorigenesis(128, 131, 132).
During tumorigenesis andmetastasis, redox homeostasis is required(Fig. 4). An emergingmodel of redox balance is that as a tumor initiates,themetabolic activity of cancer cells is increased, resulting in an increasein ROS production and subsequent activation of signaling pathwaysthat support cancer cell proliferation, survival, andmetabolic adaptation(126). Accordingly, to prevent toxic levels of ROS, tumor cells increasetheir antioxidant capacity to allow for cancer progression (133). The harshtumor microenvironment increases ROS levels due to hypoxia, and thelow glucose levels limit flux through the cytosolic oxidative PPP, thusdecreasing cytosolicNADPH levels. Cells in these nutrient-deprived con-ditions activate AMPK to increase NADPH levels by stimulating PPP-dependent NADPH and diminishing anabolic pathways, such as lipidsynthesis, that require high levels ofNADPH(134,135). ROS-dependentsignaling and increased mitochondrial respiration are also necessary fortumor metastasis (124, 136). However, when tumor cells detach from amatrix, they encounter high levels of ROS that incur cellular damageand require activation of adaptive ROS-mitigating pathways to surviveand grow (137, 138). The ability to up-regulate antioxidant proteins andincrease flux through NADPH-producing metabolic pathways enablesdistant metastasis to occur (8). These findings suggest that perhaps dis-abling antioxidant capacity in cancer cells to raise ROS levels might bebeneficial in preventing metastasis.
TARGETING METABOLISM FOR CANCER THERAPY
There are a few things to consider when determining what makes agoodmetabolic target for cancer therapy. First, inhibition of somemeta-
bolic enzymes is likely to be systemically toxic because of their physio-logical functions in normal tissues (139). The feasibility of targetingthese pathways therapeutically depends on whether systemic blockadeof the pathway can be tolerated. Normal proliferating cells, such as im-mune cells and stem cells, also reprogram theirmetabolism in amannersimilar to cancer cells (140, 141). Metabolic inhibitors should likely notinterfere with the adaptive immune system. Nevertheless, there are ex-cellent examples of pathways whose reprogramming does provide anadequate therapeutic window in cancer. Enhanced nucleotide and DNAsynthesis in tumor cells is targeted by antifolates (methotrexate, peme-trexed, and others) (112). Although these drugs do produce toxicity innormal proliferative tissues like the intestinal epithelium and bone mar-row, they are essential components of highly successful chemotherapeuticregimens. Thus, it is critical to elucidate in normal cells any toxic effectsof metabolic enzyme inhibition. To circumvent this challenge, one ap-proach is to target ametabolic enzyme in a deregulated pathway specificto cancer cells. To date, many of the genetic and pharmacologic inter-ventions on metabolic enzymes have been conducted using humancancer cells subcutaneously injected into athymicmice. Therefore, it willbe important for future experiments to not only use patient-derived xeno-graft (PDX) models but also make use of genetically engineered mousecancer models and syngeneic mouse models that have intact immunesystems, especially given the promising results from immunotherapy.An emerging theme is that cancer cells display metabolic plasticity andcan alter their metabolic profile during the course of tumorigenesis andmetastasis. Thus, it is conceivable that cancer cells could develop resist-ance to inhibition of a particularmetabolic pathway by expressing alter-nate protein isoforms or up-regulating compensatory pathways. Therefore,a rational cancer therapeutic strategy should involve targeting multiplemetabolic pathways simultaneously or targeting a particular metabolicpathway in combination with therapies against oncogenic or signalingpathways. Here, we highlight a few promising metabolic targets in gly-colytic, one-carbon, mitochondrial, and redox metabolism.
Glycolysis was an early attractive target for cancer therapy giventhe clinical observation thatmany tumors exhibit a significant increasein glucose uptake compared with adjacent normal tissue (112). LDH-A,a metabolic enzyme that converts pyruvate (the final product of glycol-ysis) to lactate, was identified as the first metabolic target of the oncogeneMYC (142). Genetic or pharmacologic inhibition of LDH-A has beenshown to diminish MYC-driven tumors in xenograft models (143, 144).Furthermore, recent studies indicate that inhibition of LDH-A leadsto the regression of established tumors in genetically engineered mousemodels of NSCLC without systemic toxicity (145). Genetic ablation ofLDH-A also delays the progression of myeloid leukemia (146). Thus,the increased expression of LDH-A, specifically inMYC-mutant cancercells, may prove to be an attractive target. Another potential therapeutictarget is the glycolytic proteinHK2.Many tumor cells overexpressHK2,andpreclinicalmousemodels of genetically engineeredNSCLCandbreastcancer demonstrate that HK2 inhibition delays tumor progression (3).Furthermore, systemic HK2 deletion in mice does not cause adversephysiological consequences. However, the effect of LDH-A andHK2on the adaptive immune system is currently unknown. Lactate has beenshown to inhibit cytotoxic T cells; thus, LDH-A inhibition may coop-erate with immune checkpoint inhibitors to unleash host inflammatoryT cells that will specifically attack tumor cells (147). Lactate can also re-programmacrophages to promote tumorigenesis (148). Thus, it may beefficacious to target LDH-A or HK2 in highly glycolytic tumors thatoverexpress these proteins.
REV I EW
DeBerardinis and Chandel Sci. Adv. 2016; 2 : e1600200 27 May 2016 8 of 18
on February 22, 2018http://advances.sciencem
ag.org/D
ownloaded from
www.SCIENCEADVANCES.org 27 May 2016 Vol 2 e16001200
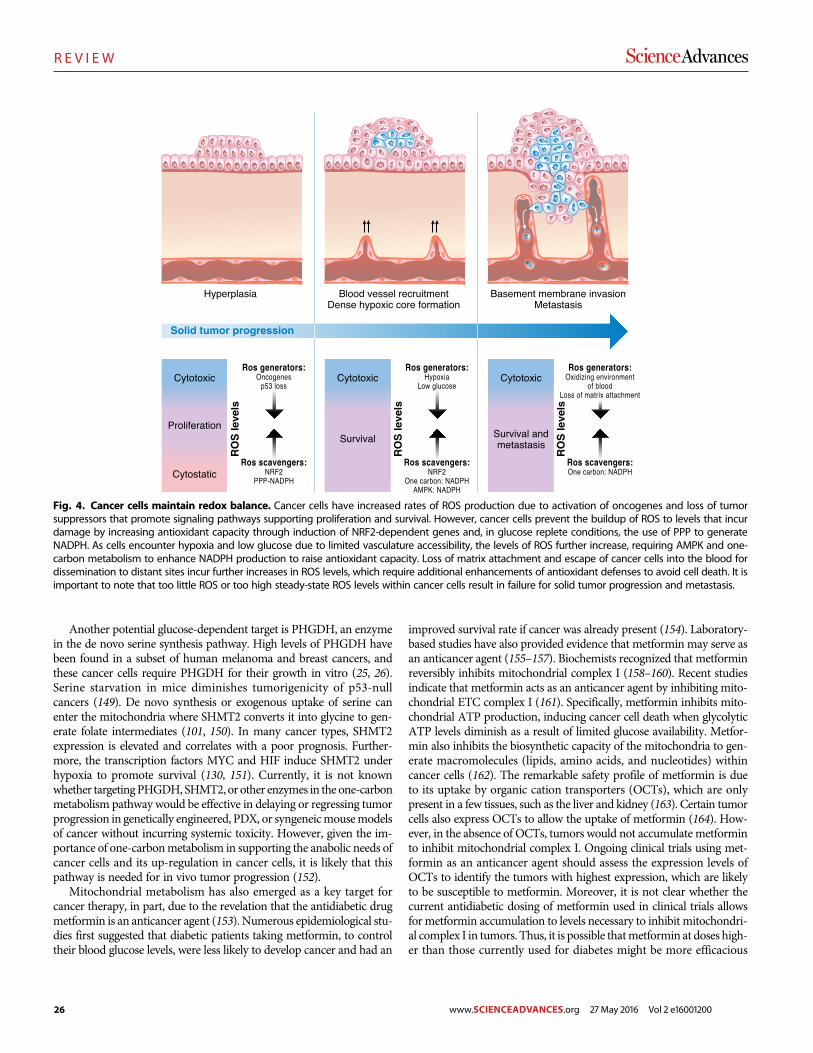
26
R E V I E W
Another potential glucose-dependent target is PHGDH, an enzymein the de novo serine synthesis pathway. High levels of PHGDH havebeen found in a subset of human melanoma and breast cancers, andthese cancer cells require PHGDH for their growth in vitro (25, 26).Serine starvation in mice diminishes tumorigenicity of p53-nullcancers (149). De novo synthesis or exogenous uptake of serine canenter the mitochondria where SHMT2 converts it into glycine to gen-erate folate intermediates (101, 150). In many cancer types, SHMT2expression is elevated and correlates with a poor prognosis. Further-more, the transcription factors MYC and HIF induce SHMT2 underhypoxia to promote survival (130, 151). Currently, it is not knownwhether targetingPHGDH, SHMT2, or other enzymes in the one-carbonmetabolism pathway would be effective in delaying or regressing tumorprogression in genetically engineered, PDX, or syngeneicmousemodelsof cancer without incurring systemic toxicity. However, given the im-portance of one-carbonmetabolism in supporting the anabolic needs ofcancer cells and its up-regulation in cancer cells, it is likely that thispathway is needed for in vivo tumor progression (152).
Mitochondrial metabolism has also emerged as a key target forcancer therapy, in part, due to the revelation that the antidiabetic drugmetformin is an anticancer agent (153). Numerous epidemiological stu-dies first suggested that diabetic patients taking metformin, to controltheir blood glucose levels, were less likely to develop cancer and had an
improved survival rate if cancer was already present (154). Laboratory-based studies have also provided evidence that metformin may serve asan anticancer agent (155–157). Biochemists recognized that metforminreversibly inhibits mitochondrial complex I (158–160). Recent studiesindicate that metformin acts as an anticancer agent by inhibiting mito-chondrial ETC complex I (161). Specifically, metformin inhibits mito-chondrial ATP production, inducing cancer cell death when glycolyticATP levels diminish as a result of limited glucose availability. Metfor-min also inhibits the biosynthetic capacity of the mitochondria to gen-erate macromolecules (lipids, amino acids, and nucleotides) withincancer cells (162). The remarkable safety profile of metformin is dueto its uptake by organic cation transporters (OCTs), which are onlypresent in a few tissues, such as the liver and kidney (163). Certain tumorcells also express OCTs to allow the uptake of metformin (164). How-ever, in the absence of OCTs, tumors would not accumulate metforminto inhibit mitochondrial complex I. Ongoing clinical trials using met-formin as an anticancer agent should assess the expression levels ofOCTs to identify the tumors with highest expression, which are likelyto be susceptible to metformin. Moreover, it is not clear whether thecurrent antidiabetic dosing of metformin used in clinical trials allowsfor metformin accumulation to levels necessary to inhibit mitochondri-al complex I in tumors. Thus, it is possible thatmetformin at doses high-er than those currently used for diabetes might be more efficacious
Fig. 4. Cancer cells maintain redox balance. Cancer cells have increased rates of ROS production due to activation of oncogenes and loss of tumorsuppressors that promote signaling pathways supporting proliferation and survival. However, cancer cells prevent the buildup of ROS to levels that incurdamage by increasing antioxidant capacity through induction of NRF2-dependent genes and, in glucose replete conditions, the use of PPP to generateNADPH. As cells encounter hypoxia and low glucose due to limited vasculature accessibility, the levels of ROS further increase, requiring AMPK and one-carbon metabolism to enhance NADPH production to raise antioxidant capacity. Loss of matrix attachment and escape of cancer cells into the blood fordissemination to distant sites incur further increases in ROS levels, which require additional enhancements of antioxidant defenses to avoid cell death. It isimportant to note that too little ROS or too high steady-state ROS levels within cancer cells result in failure for solid tumor progression and metastasis.
R E V I EW
DeBerardinis and Chandel Sci. Adv. 2016; 2 : e1600200 27 May 2016 9 of 18
on February 22, 2018http://advances.sciencem
ag.org/D
ownloaded from
www.SCIENCEADVANCES.org 27 May 2016 Vol 2 e16001200
27
R E V I E W
without causing toxicity. Like metformin, the biguanide phenforminexhibits anticancer properties by inhibiting mitochondrial complex I(165). In contrast to metformin, phenformin is readily transported intotumor cells and has been withdrawn from human use in most parts ofthe world due to its clinical increase in the incidence of lactic acidosis.However, it is worth considering phenformin as a possible cancer ther-apy because lactic acidosis can bemonitored. Biguanide sensitivity canbe improved inmice starved for serine or in tumors that have lost p53or LKB1 (155, 166, 167). Thus, biguanides, and possibly other mito-chondrial complex I inhibitors, may be effective anticancer agents.
Another potential therapeutic strategy to inhibit mitochondrial me-tabolism in certain tumors would be to use autophagy or glutaminaseinhibitors. Autophagy provides amino acids, such as glutamine, that fu-el the TCA cycle in NSCLC and pancreatic cancers, and short-termautophagy inhibition has been shown to decrease tumor progressionwithout incurring systemic toxicity in mouse models of NSCLC (168, 169).Some tumors are addicted to using glutamine to support TCA cyclemetabolism even in the absence of autophagy; thus, glutaminase inhib-itors can reduce tumor burden in thesemodels (4, 75, 170). An alterna-tive approach is to target acetate metabolism. Although a major functionof the mitochondria is to provide acetyl-CoA to the cell, cancer cells canalso use acetate to support cell growth and survival during metabolicstress (hypoxia or nutrient deprivation) (96, 171). The cytosolic enzymeacetyl-CoA synthase 2 (ACCS2), which converts acetate to acetyl-CoA, isdispensable for normal development; thus, ACCS2 is a promising targetof acetate metabolism. ACCS2 knockout mice do not display overtpathologies, but genetic loss of ACCS2 reduces tumor burden in modelsof hepatocellular carcinoma (171). Human glioblastomas can oxidize ac-etate and may be sensitive to inhibitors of this process (172). Thus, tar-geting metabolism with inhibitors of autophagy, acetate metabolism, andother pathways that supply keymetabolic intermediatesmay be efficaciousin some contexts.
Because mitochondrial inhibitors are unlikely to be effective cancertherapies as single agents, combination therapy is likely the best ap-proach. For example, the use of metformin with the current clinicalPI3K inhibitors, which reduce glucose uptake and glycolysis (173), isone approach that would impair both sources of ATP within cells. Tar-geted therapies against oncogenes such as KRAS, BRAF, and NOTCH1kill a largemajority of cancer cells but ultimately yield resistant cells thatexhibit an increased sensitivity to inhibitors that impair mitochondrialmetabolism (174–176). Cancer-initiating cells also have increased sensi-tivity to mitochondrial inhibitors, adding further evidence that inhibitingmitochondrial metabolism may suppress tumor recurrence (177, 178).
Furthermore, to counterbalance the increased production of ROSencountered during tumorigenesis and metastasis, cancer cells increasetheir antioxidant capacity (126). Thus, an additional therapeutic ap-proach is to target redox metabolism, that is, selectively disable theantioxidant capacity of cancer cells causing ROS levels to rise and in-duce cancer cell death (133). The reducing equivalent NADPH is re-quired to maintain multiple antioxidant defense systems. The cytosolhas multiple sources of NADPH generation, including the oxidativePPP,malic enzyme 1, IDH1, and one-carbonmetabolism. By contrast,NADPH generation in the mitochondria is controlled in part by one-carbon metabolism and IDH2. Many of these NADPH-generatingsystems are critical for normal cell survival and function. Nevertheless,there are two NADPH-generating systems that may serve as potentialtherapeutic targets. It is estimated that 400 million people worldwideare deficient in G6PDH, an enzyme in the oxidative PPP that converts
NADP+ to NADPH. However, certain tumors rely on this pathway asa major source of cytosolic NADPH; therefore, it may be therapeuticto disable this pathway and induce oxidative stress and diminish tumorgrowth. Moreover, RNA profiling of metabolic enzymes identified themitochondrial one-carbon metabolism protein MTHFD2, which cangenerateNADPH, as being highly expressed in 19 different cancer typesbut not in normal adult proliferating cells (152). Loss of MTHFD2 incancer cells increasesROS levels and sensitizes the cells to oxidant-inducedcell death in vitro. An interesting approach to depleting NADPHlevels and increasing ROS is to administer high doses of vitamin C(ascorbate). Vitamin C is imported into cells through sodium-dependentvitaminC transporters,whereas theoxidized formof vitaminC, dehydro-ascorbate (DHA), is imported into cells through glucose transporterssuch as GLUT1 (179). When the cell takes up DHA, it is reduced back tovitamin C by glutathione (GSH), which consequently becomes GSSG.Subsequently, GSSG is converted back toGSH byNADPH-dependentGR. Because the blood is an oxidizing environment, vitamin C becomesoxidized to DHA before being taken up by the cell. Thus, high doses ofvitamin C diminish the tumorigenesis of colorectal tumors that harboroncogenicKRASmutations and express high levels ofGLUT1bydeplet-ing the NADPH and GSH pools and consequently increasing ROS levelsto induce cancer cell death (179, 180). Vitamin C administered at highdoses intravenously is safe in humans and, in conjunction with con-ventional paclitaxel-carboplatin therapy, demonstrated a benefit in asmall number of patients (181). Additional strategies to diminish GSHinclude the administration of buthionine sulfoximine, an irreversibleinhibitor of g-glutamylcysteine synthetase, which can be safely admin-istered to humans and is efficacious in preclinical tumor models (182).Moreover, glutathione is a tripeptide consisting of cysteine, glutamate,and glycine. Thus, decreasing glutamate levels using glutaminase inhib-itors or diminishing cysteine levels by preventing extracellular cystine(two linked cysteinemolecules) uptake can also raise ROS levels in can-cer cells to induce cell death.
An important consideration is that normal stem cells are sensitive toROS levels; thus, it is important to stratify patients on the basis of theirexpression levels of a particular antioxidant protein or antioxidantpathway. It is critical to determine which antioxidant pathways are likelyup-regulated as a result of the high rate of ROS production within cancercells.Many cancer typesuse theNRF2pathway tomaintain redoxbalance;therefore, targeting this pathway may provide a viable therapeutic op-portunity (128). Additionally, superoxide dismutase 1 (SOD1) is over-expressed in NSCLC, and its inhibition kills human NSCLC cells anddecreases the tumor burden in mouse models of NSCLC (183). BecauseNRF2 and SOD1 knockoutmice develop normally, short-term inhibitionof these pathways might be an effective way to kill cancer cells.
TECHNOLOGIES ENABLING DISCOVERYIN CANCER METABOLISM
Many recent advances in our understanding of cancer metabolismhave been propelled by advanced technologies to detect metabolitesandmetabolic activities (184). A key concept is that quantifying metab-olites (that is, metabolomics) is amore distinct form ofmetabolic analysisthan measuring the activities of metabolic pathways [that is, metabolicflux analysis (185)]. Although these two approaches can providecomplementary types of information, they are not interchangeable. Onecannot infer metabolic activity from changes in metabolite levels, and
REV I EW
DeBerardinis and Chandel Sci. Adv. 2016; 2 : e1600200 27 May 2016 10 of 18
on February 22, 2018http://advances.sciencem
ag.org/D
ownloaded from
www.SCIENCEADVANCES.org 27 May 2016 Vol 2 e16001200
28
R E V I E W
alteredmetabolic fluxesmay ormay not cause changes inmetabolite levels(186). Both of these approaches have provided important recent insightsinto cancer metabolism, and using the two techniques together providesthe most complete assessment of metabolic phenotypes.
Metabolomics experiments seek to characterize and quantify themetabolites in a biological sample, usually by nuclear magnetic reso-nance (NMR) or, more commonly, mass spectrometry. Dependingon the methods of extraction, separation, and detection, metabolomicsexperiments may focus on particular classes of metabolites or provide acomprehensive analysis of as many metabolites as possible. Targetedapproaches typically detect a few dozen to a few hundred molecules,whereas untargeted analyses may detect more than 1000. Detecting al-terations of metabolite levels in cancer can be extremely valuable. Themassive accumulation of D2HG in IDH1-mutant gliomas was initiallydiscovered through a metabolomics approach (33). Because alteredmetabolite levels can be detected noninvasively using 1H magneticresonance spectroscopy (MRS), perturbed metabolite levels discoveredthrough metabolomics can sometimes be translated into clinical diag-nostic techniques. Elevated levels of lactate, choline, glycine, and othermetabolites aredetectedbyMRS inglioma.More recently,MRS techniqueshave been developed to monitor specific metabolic states programmedby tumor-specific mutations in metabolic enzymes. Applications includeelevated 2HG in IDH1/IDH2-mutated gliomas (187) and elevated suc-cinate in SDH-deficient paragangliomas (188).
Metabolic flux studies use isotope tracers like 13C, 15N, and 2H totrack flow through metabolic pathways. Typically, a nutrient of inter-est is labeled by an isotope (for example, 13C-glucose) and supplied tocancer cells in the culture medium. Metabolites extracted from theculture are analyzed for isotope enrichment using mass spectrometryor NMR. The extent and distribution of labeling within informativemetabolites encode information about which pathways are active inthe cells. Incorporating additional data (for example, definitive ratesof nutrient consumption, waste secretion, and biomass production) al-lows quantitative fluxes to be determined across a metabolic network.
Isotope tracing studies provide information about metabolic altera-tions in cancer cells that cannot be detected by metabolite levels alone.For example, hypoxia and mutations in the ETC induce a restructur-ing of the TCA cycle in which many of the intermediates are producedin the reverse order from the conventional form of the cycle. Thekey reaction in this pathway involves the reductive carboxylation ofa-ketoglutarate to isocitrate in a NADPH-dependent carboxylationreaction catalyzed by IDH1 and/or IDH2. Although metabolomicsexperiments can detect altered levels of TCA cycle metabolites in cellsusing the reductive carboxylation pathway or in cells with deficienciesin pyruvate import into mitochondria, the marked restructuring of thecycle is apparent only through isotope tracing experiments, particular-ly experiments using 13C-glutamine as the tracer (69, 78, 79, 189–191).An example of the use of isotope tracers to identify metabolic liabilitiesinvolves the surprising discovery that a significant fraction of cellularNADPH, particularly in the mitochondria, is produced through folatemetabolism (100, 101). These studies involved a sophisticated combi-nation of 13C and 2H tracers, coupled with quantitative measurementsof metabolic flux.
Several recent studies have begun to use stable isotopes to investigatemetabolism in intact tumors. Because these isotopes do not undergoradioactive decay, they are safe for administration to animals and hu-man subjects. Systemic administration of 13C-labeled nutrients througheither boluses or continuous infusions has been shown to generate
substantial labeling of glycolytic and TCA cycle intermediates in tu-mors. In mice bearing orthotopic transplants of high-grade humangliomas, continuous infusion of 13C-glucose was demonstrated to pro-duce steady-state labeling of metabolites from the TCA cycle within thetumor, enabling the assessment of several metabolic pathways (192).Here, tumors with diverse oncogenotypes oxidized glucose-derivedpyruvate in the mitochondria and synthesized glutamine from glucosecarbon. In contrast to most cultured glioma cell lines, these tumors didnot demonstrate significant levels of 13C-glutamine oxidation in vivo,and primary cell lines derived from the tumors did not require gluta-mine for survival or proliferation. In another study, metabolism of13C-glucose and 13C-glutamine in autochthonous models of MYC- orMET-driven tumorigenesis revealed that metabolic phenotypes dependnot only on the tumor’s genetic driver but also on the tissue or origin.MYC but not MET stimulated glutamine catabolism in liver tumors,whereas MYC-driven lung tumors expressed glutamine synthetase andaccumulated glutamine (193). Thus, in vivo isotope tracing can detectmetabolic activities of intact tumors and characterize some of the factorsthat specify the metabolic phenotype.
Administration of 13C-labeled nutrients has also proven to be valu-able in human cancer (172, 194–197). Fan et al. (196) used 13C-glucoseto demonstrate that human non–small cell lung tumors metabolizeglucose through glycolysis and the TCA cycle concurrently, with me-tabolites from both pathways demonstrating higher levels of labelingin tumors relative to adjacent lung tissue. In a subsequent study, theseinvestigators demonstrated that the anaplerotic enzyme pyruvate car-boxylase (PC) was highly expressed in lung tumors and contributed to13C labeling in TCA cycle intermediates (195). Enhanced glucose oxi-dation involving both PC and pyruvate dehydrogenase (PDH) was de-monstrated in a separate cohort of non–small cell lung tumors, inwhichformal analysis of metabolic fluxes was used to complement mea-surements of 13C labeling (197). An important conclusion from thesestudies, and from a similar study in mice bearing KRAS-driven tumors(198), is that non–small cell lung tumors demonstrate higher levels ofboth glycolysis and glucose oxidation relative to adjacent, benign lung.This finding sharply contrasts with the frequently invoked “switch”from oxidative metabolism to glycolysis in malignant tissue, commonlyused to explain theWarburg effect (Fig. 5A). Rather, the data support amodel in which the amplitude of both pathways is increased simulta-neously, perhaps through increased substrate delivery and enzyme ex-pression in tumor cells (Fig. 5B). It is also significant that human tumorsexhibit substantial heterogeneity of metabolic phenotypes, both betweentumors and even within distinct regions of the same tumor (197). Theextent of glucose-dependent labeling of TCA cycle intermediates is pre-dicted by noninvasive assessment of tumor perfusion by magneticresonance imaging, providing an approach to identify areas of regionalmetabolic heterogeneity in human cancer (197).
Metabolomics and metabolic flux analysis can be integrated withfunctional genomics to identify and understand metabolic vulnerabil-ities in cancer cells. This approach has produced several good examplesof screens that identified potential therapeutic targets while stimulatingentirely new lines of investigation in cancer cell biology. For example,the serine biosynthetic enzyme PHGDH was first identified as a meta-bolic vulnerability in breast cancer cells through a large-scale in vivoshort hairpin RNA screen targeting thousands of metabolic enzymes(25). PHGDH is frequently amplified at the genomic level in breast tu-mors andmelanomas and exhibits oncogene-like features in cell culture(25, 26). Subsequent work on serine biosynthesis, much of it involving
REV I EW
DeBerardinis and Chandel Sci. Adv. 2016; 2 : e1600200 27 May 2016 11 of 18
on February 22, 2018http://advances.sciencem
ag.org/D
ownloaded from
www.SCIENCEADVANCES.org 27 May 2016 Vol 2 e16001200
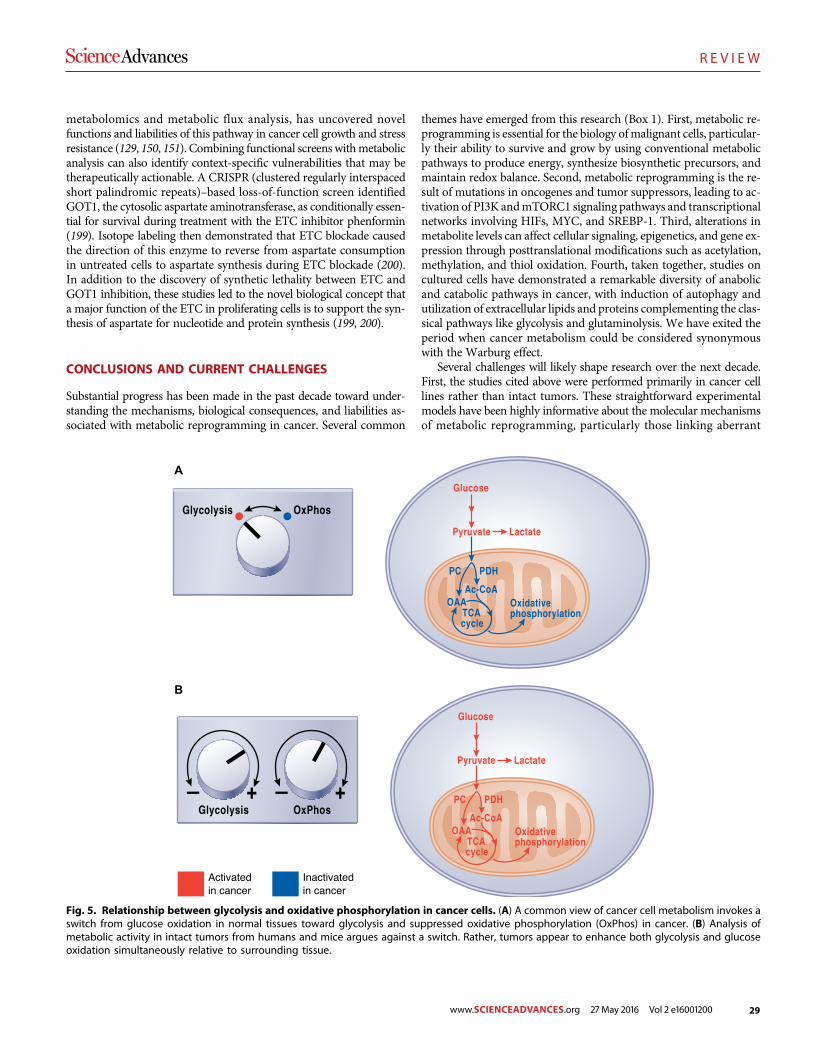
29
R E V I E W
metabolomics and metabolic flux analysis, has uncovered novelfunctions and liabilities of this pathway in cancer cell growth and stressresistance (129, 150, 151). Combining functional screens withmetabolicanalysis can also identify context-specific vulnerabilities that may betherapeutically actionable. A CRISPR (clustered regularly interspacedshort palindromic repeats)–based loss-of-function screen identifiedGOT1, the cytosolic aspartate aminotransferase, as conditionally essen-tial for survival during treatment with the ETC inhibitor phenformin(199). Isotope labeling then demonstrated that ETC blockade causedthe direction of this enzyme to reverse from aspartate consumptionin untreated cells to aspartate synthesis during ETC blockade (200).In addition to the discovery of synthetic lethality between ETC andGOT1 inhibition, these studies led to the novel biological concept thata major function of the ETC in proliferating cells is to support the syn-thesis of aspartate for nucleotide and protein synthesis (199, 200).
CONCLUSIONS AND CURRENT CHALLENGES
Substantial progress has been made in the past decade toward under-standing the mechanisms, biological consequences, and liabilities as-sociated with metabolic reprogramming in cancer. Several common
themes have emerged from this research (Box 1). First, metabolic re-programming is essential for the biology ofmalignant cells, particular-ly their ability to survive and grow by using conventional metabolicpathways to produce energy, synthesize biosynthetic precursors, andmaintain redox balance. Second, metabolic reprogramming is the re-sult of mutations in oncogenes and tumor suppressors, leading to ac-tivation of PI3K andmTORC1 signaling pathways and transcriptionalnetworks involving HIFs, MYC, and SREBP-1. Third, alterations inmetabolite levels can affect cellular signaling, epigenetics, and gene ex-pression through posttranslational modifications such as acetylation,methylation, and thiol oxidation. Fourth, taken together, studies oncultured cells have demonstrated a remarkable diversity of anabolicand catabolic pathways in cancer, with induction of autophagy andutilization of extracellular lipids and proteins complementing the clas-sical pathways like glycolysis and glutaminolysis. We have exited theperiod when cancer metabolism could be considered synonymouswith the Warburg effect.
Several challenges will likely shape research over the next decade.First, the studies cited above were performed primarily in cancer celllines rather than intact tumors. These straightforward experimentalmodels have been highly informative about the molecular mechanismsof metabolic reprogramming, particularly those linking aberrant
A
B
Fig. 5. Relationship between glycolysis and oxidative phosphorylation in cancer cells. (A) A common view of cancer cell metabolism invokes aswitch from glucose oxidation in normal tissues toward glycolysis and suppressed oxidative phosphorylation (OxPhos) in cancer. (B) Analysis ofmetabolic activity in intact tumors from humans and mice argues against a switch. Rather, tumors appear to enhance both glycolysis and glucoseoxidation simultaneously relative to surrounding tissue.
R E V I EW
DeBerardinis and Chandel Sci. Adv. 2016; 2 : e1600200 27 May 2016 12 of 18
on February 22, 2018http://advances.sciencem
ag.org/D
ownloaded from
www.SCIENCEADVANCES.org 27 May 2016 Vol 2 e16001200
30
R E V I E W
signaling to altered metabolic fluxes. But it is challenging (perhapsimpossible) to model an accurate tumor microenvironment in culture.Direct analysis of metabolic fluxes in intact tumors should begin to playa more prominent role in the field and may prove essential in deter-mining precisely how to deploy metabolic inhibitors in clinical trials.Along these lines, it is remarkable that some tumor cell metabolic vul-nerabilities observed in vivo are absent from cultured cell models (198)and that metabolic phenotypes are inconsistent even across single solidtumors in patients (197). Developing rational therapeutic strategies willbe aided by learning how to derivemetabolic information efficiently andcomprehensively from both preclinical and clinical models of intacttumor growth. A further challenge for these in vivo studies will be todevelop analytical or computational approaches to deconvolute thedistinctmetabolic phenotypes of discrete cell types (cancer cells, cancer-associated fibroblasts, lymphocytes, and endothelial cells) within solidtumors. This may allow us to understand the metabolic cooperativityamong populations of cells within a tumor and whether metabolic re-programming of stromal cells provides therapeutic opportunities. Sec-ond, by far the best recent candidate for a targetable, tumor-specificmetabolic activity is the neomorphic function of mutant IDH1/IDH2.This has stimulated intense interest in finding other metabolic altera-tions for which the therapeutic window may be wide enough for realclinical opportunities. Third, although we have learned a great deal aboutthe metabolic pathways that support cancer cell proliferation, we knowmuch less about themetabolism that supports survival of nonproliferat-ing tumor cells, which constitute the bulk of the malignant cells in mostsolid tumors. Along these lines, the metabolism of tumor-initiatingcells/cancer stem cells is just now beginning to be investigated, and itwill be ofmajor interest to devise strategies to targetmetabolism in thesecells. Finally, we still know relatively little about metabolic interactionsbetween tumor and host. This area has the potential for enormous im-
pact on public health. It is clear that obesity and diabetes, both of whichare reaching epidemic proportions in the developed world, increasecancer risk, but we lack insight into how to break these links.
REFERENCES AND NOTES1. D. Hanahan, R. A. Weinberg, Hallmarks of cancer: The next generation. Cell 144, 646–674
(2011).2. N. N. Pavlova, C. B. Thompson, The emerging hallmarks of cancer metabolism. Cell Metab.
23, 27–47 (2016).3. K. C. Patra, Q. Wang, P. T. Bhaskar, L. Miller, Z. Wang, W. Wheaton, N. Chandel, M. Laakso,
W. J. Muller, E. L. Allen, A. K. Jha, G. A. Smolen, M. F. Clasquin, R. B. Robey, N. Hay, Hexokinase2 is required for tumor initiation and maintenance and its systemic deletion is therapeutic inmouse models of cancer. Cancer Cell 24, 213–228 (2013).
4. E. H. Shroff, L. S. Eberlin, V. M. Dang, A. M. Gouw, M. Gabay, S. J. Adam, D. I. Bellovin,P. T. Tran, W. M. Philbrick, A. Garcia-Ocana, S. C. Casey, Y. Li, C. V. Dang, R. N. Zare,D. W. Felshera, MYC oncogene overexpression drives renal cell carcinoma in a mousemodel through glutamine metabolism. Proc. Natl. Acad. Sci. U.S.A. 112, 6539–6544 (2015).
5. L. A. Clavell, R. D. Gelber, H. J. Cohen, S. Hitchcock-Bryan, J. R. Cassady, N. J. Tarbell,S. R. Blattner, R. Tantravahi, P. Leavitt, S. E. Sallan, Four-agent induction and intensiveasparaginase therapy for treatment of childhood acute lymphoblastic leukemia. N. Engl.J. Med. 315, 657–663 (1986).
6. J. Yun, C. Rago, I. Cheong, R. Pagliarini, P. Angenendt, H. Rajagopalan, K. Schmidt,J. K. Willson, S. Markowitz, S. Zhou, L. A. Diaz Jr., V. E. Velculescu, C. Lengauer, K. W. Kinzler,B. Vogelstein, N. Papadopoulos, Glucose deprivation contributes to the development ofKRAS pathway mutations in tumor cells. Science 325, 1555–1559 (2009).
7. J. M. Loo, A. Scherl, A. Nguyen, F. Y. Man, E. Weinberg, Z. Zeng, L. Saltz, P. B. Paty,S. F. Tavazoie, Extracellular metabolic energetics can promote cancer progression. Cell160, 393–406 (2015).
8. E. Piskounova, M. Agathocleous, M. M. Murphy, Z. Hu, S. E. Huddlestun, Z. Zhao,A. M. Leitch, T. M. Johnson, R. J. DeBerardinis, S. J. Morrison, Oxidative stress inhibitsdistant metastasis by human melanoma cells. Nature 527, 186–191 (2015).
9. L. K. Boroughs, R. J. DeBerardinis, Metabolic pathways promoting cancer cell survival andgrowth. Nat. Cell Biol. 17, 351–359 (2015).
10. P. S. Ward, C. B. Thompson, Metabolic reprogramming: A cancer hallmark even Warburgdid not anticipate. Cancer Cell 21, 297–308 (2012).
11. S. Y. Lunt, M. G. Vander Heiden, Aerobic glycolysis: Meeting the metabolic requirementsof cell proliferation. Annu. Rev. Cell Dev. Biol. 27, 441–464 (2011).
12. W. H. Koppenol, P. L. Bounds, C. V. Dang, Otto Warburg’s contributions to current con-cepts of cancer metabolism. Nat. Rev. Cancer 11, 325–337 (2011).
13. C. S. Ahn, C. M. Metallo, Mitochondria as biosynthetic factories for cancer proliferation.Cancer Metab. 3, 1 (2015).
14. O. E. Owen, S. C. Kalhan, R. W. Hanson, The key role of anaplerosis and cataplerosis forcitric acid cycle function. J. Biol. Chem. 277, 30409–30412 (2002).
15. J. R. Cantor, D. M. Sabatini, Cancer cell metabolism: One hallmark, many faces. CancerDiscov. 2, 881–898 (2012).
16. C. C. Dibble, B. D. Manning, Signal integration by mTORC1 coordinates nutrient inputwith biosynthetic output. Nat. Cell Biol. 15, 555–564 (2013).
17. T. L. Yuan, L. C. Cantley, PI3K pathway alterations in cancer: Variations on a theme.Oncogene 27, 5497–5510 (2008).
18. Z. E. Stine, Z. E. Walton, B. J. Altman, A. L. Hsieh, C. V. Dang, MYC, metabolism, and cancer.Cancer Discov. 5, 1024–1039 (2015).
19. F. Kruiswijk, C. F. Labuschagne, K. H. Vousden, p53 in survival, death and metabolichealth: A lifeguard with a licence to kill. Nat. Rev. Mol. Cell Biol. 16, 393–405 (2015).
20. L. Jiang, N. Kon, T. Li, S. J. Wang, T. Su, H. Hibshoosh, R. Baer, W. Gu, Ferroptosis as ap53-mediated activity during tumour suppression. Nature 520, 57–62 (2015).
21. T. Li, N. Kon, L. Jiang, M. Tan, T. Ludwig, Y. Zhao, R. Baer, W. Gu, Tumor suppression in theabsence of p53-mediated cell-cycle arrest, apoptosis, and senescence. Cell 149,1269–1283 (2012).
22. R. K. Jain, L. L. Munn, D. Fukumura, Dissecting tumour pathophysiology using intravitalmicroscopy. Nat. Rev. Cancer 2, 266–276 (2002).
23. G.L. Semenza, Hypoxia-inducible factors in physiology and medicine. Cell 148, 399–408 (2012).24. W. G. Kaelin Jr., P. J. Ratcliffe, Oxygen sensing by metazoans: The central role of the HIF
hydroxylase pathway. Mol. Cell 30, 393–402 (2008).25. R. Possemato, K. M. Marks, Y. D. Shaul, M. E. Pacold, D. Kim, K. Birsoy, S. Sethumadhavan,
H.-K. Woo, H. G. Jang, A. K. Jha, W. W. Chen, F. G. Barrett, N. Stransky, Z.-Y. Tsun, G. S. Cowley,J. Barretina, N. Y. Kalaany, P. P. Hsu, K. Ottina, A. M. Chan, B. Yuan, L. A. Garraway, D. E. Root,M. Mino-Kenudson, E. F. Brachtel, E. M. Driggers, D. M. Sabatini, Functional genomics revealthat the serine synthesis pathway is essential in breast cancer. Nature 476, 346–350 (2011).
.Box 1: Key Principles and Lessons Learned
• Reprogrammed metabolic pathways are essential for cancer cellsurvival and growth.
• Frequently reprogrammed activities include those that allow tumor cellsto take up abundant nutrients and use them to produce ATP, generatebiosynthetic precursors andmacromolecules, and tolerate stresses asso-ciated with malignancy (for example, redox stress and hypoxia).
• An emerging class of reprogrammed pathways includes those allowingcancer cells to tolerate nutrient depletion by catabolizing macro-molecules from inside or outside the cell (for example, autophagy,mac-ropinocytosis, and lipid scavenging).
• Reprogramming may be regulated intrinsically by tumorigenic mu-tations in cancer cells or extrinsically by influences of the micro-environment.
•Oncometabolites (for example, D2HG) accumulate as a consequence ofgenetic changes within a tumor and contribute to the molecular pro-cess of malignant transformation.
• Many metabolites exert their biological effects outside of the classicalmetabolic network, affecting signal transduction, epigenetics, and oth-er functions.
• New approaches to assess metabolism in living tumors in humans andmice may improve our ability to understand how metabolic repro-gramming is regulated and which altered pathways hold opportu-nities to improve care of cancer patients.
R E V I EW
DeBerardinis and Chandel Sci. Adv. 2016; 2 : e1600200 27 May 2016 13 of 18
on February 22, 2018http://advances.sciencem
ag.org/D
ownloaded from
www.SCIENCEADVANCES.org 27 May 2016 Vol 2 e16001200
31
R E V I E W
26. J. W. Locasale, A. R. Grassian, T. Melman, C. A. Lyssiotis, K. R. Mattaini, A. J. Bass, G. Heffron,C. M. Metallo, T. Muranen, H. Sharfi, A. T. Sasaki, D. Anastasiou, E. Mullarky, N. I. Vokes,M. Sasaki, R. Beroukhim, G. Stephanopoulos, A. H. Ligon, M. Meyerson, A. L. Richardson,L. Chin, G. Wagner, J. M. Asara, J. S. Brugge, L. C. Cantley, M. G. Vander Heiden, Phospho-glycerate dehydrogenase diverts glycolytic flux and contributes to oncogenesis. Nat.Genet. 43, 869–874 (2011).
27. J. W. Locasale, Serine, glycine and one-carbon units: Cancer metabolism in full circle. Nat.Rev. Cancer 13, 572–583 (2013).
28. M. Yang, T. Soga, P. J. Pollard, Oncometabolites: Linking altered metabolism with cancer.J. Clin. Invest. 123, 3652–3658 (2013).
29. H. Yan, D. W. Parsons, G. Jin, R. McLendon, B. A. Rasheed, W. Yuan, I. Kos, I. Batinic-Haberle,S. Jones, G. J. Riggins, H. Friedman, A. Friedman, D. Reardon, J. Herndon, K. W. Kinzler,V. E. Velculescu, B. Vogelstein, D. D. Bigner, IDH1 and IDH2 mutations in gliomas. N. Engl.J. Med. 360, 765–773 (2009).
30. E. R. Mardis, L. Ding, D. J. Dooling, D. E. Larson, M. D. McLellan, K. Chen, D. C. Koboldt,R. S. Fulton, K. D. Delehaunty, S. D. McGrath, L. A. Fulton, D. P. Locke, V. J. Magrini,R. M. Abbott, T. L. Vickery, J. S. Reed, J. S. Robinson, T. Wylie, S. M. Smith,L. Carmichael, J. M. Eldred, C. C. Harris, J. Walker, J. B. Peck, F. Du, A. F. Dukes,G. E. Sanderson, A. M. Brummett, E. Clark, J. F. McMichael, R. J. Meyer, J. K. Schindler,C. S. Pohl, J. W. Wallis, X. Shi, L. Lin, H. Schmidt, Y. Tang, C. Haipek, M. E. Wiechert,J. V. Ivy, J. Kalicki, G. Elliott, R. E. Ries, J. E. Payton, P. Westervelt, M. H. Tomasson,M. A. Watson, J. Baty, S. Heath, W. D. Shannon, R. Nagarajan, D. C. Link, M. J. Walter,T. A. Graubert, J. F. DiPersio, R. K. Wilson, T. J. Ley, Recurring mutations found by sequen-cing an acute myeloid leukemia genome. N. Engl. J. Med. 361, 1058–1066 (2009).
31. M. R. Kang, M. S. Kim, J. E. Oh, Y. R. Kim, S. Y. Song, S. I. Seo, J. Y. Lee, N. J. Yoo, S. H. Lee,Mutational analysis of IDH1 codon 132 in glioblastomas and other common cancers. Int.J. Cancer 125, 353–355 (2009).
32. J.-A. Losman, W. G. Kaelin Jr., What a difference a hydroxyl makes: Mutant IDH, (R)-2-hydroxyglutarate, and cancer. Genes Dev. 27, 836–852 (2013).
33. L. Dang, D. W. White, S. Gross, B. D. Bennett, M. A. Bittinger, E. M. Driggers, V. R. Fantin,H. G. Jang, S. Jin, M. C. Keenan, K. M. Marks, R. M. Prins, P. S. Ward, K. E. Yen, L. M. Liau,J. D. Rabinowitz, L. C. Cantley, C. B. Thompson, M. G. Vander Heiden, S. M. Su, Cancer-associated IDH1 mutations produce 2-hydroxyglutarate. Nature 465, 966 (2010).
34. P. S. Ward, J. Patel, D. R. Wise, O. Abdel-Wahab, B. D. Bennett, H. A. Coller, J. R. Cross,V. R. Fantin, C. V. Hedvat, A. E. Perl, J. D. Rabinowitz, M. Carroll, S. M. Su, K. A. Sharp,R. L. Levine, C. B. Thompson, The common feature of leukemia-associated IDH1 and IDH2mutations is a neomorphic enzyme activity converting a-ketoglutarate to 2-hydroxyglutarate.Cancer Cell 17, 225–234 (2010).
35. M. E. Figueroa, O. Abdel-Wahab, C. Lu, P. S. Ward, J. Patel, A. Shih, Y. Li, N. Bhagwat,A. Vasanthakumar, H. F. Fernandez, M. S. Tallman, Z. Sun, K. Wolniak, J. K. Peeters,W. Liu, S. E. Choe, V. R. Fantin, E. Paietta, B. Löwenberg, J. D. Licht, L. A. Godley,R. Delwel, P. J. Valk, C. B. Thompson, R. L. Levine, A. Melnick, Leukemic IDH1 and IDH2mutations result in a hypermethylation phenotype, disrupt TET2 function, and impairhematopoietic differentiation. Cancer Cell 18, 553–567 (2010).
36. C. Lu, P. S. Ward, G. S. Kapoor, D. Rohle, S. Turcan, O. Abdel-Wahab, C. R. Edwards,R. Khanin, M. E. Figueroa, A. Melnick, K. E. Wellen, D. M. O’Rourke, S. L. Berger,T. A. Chan, R. L. Levine, I. K. Mellinghoff, C. B. Thompson, IDH mutation impairs histonedemethylation and results in a block to cell differentiation. Nature 483, 474–478 (2012).
37. J.-A. Losman, R. E. Looper, P. Koivunen, S. Lee, R. K. Schneider, C. McMahon, G. S. Cowley,D. E. Root, B. L. Ebert, W. G. Kaelin Jr., (R)-2-hydroxyglutarate is sufficient to promoteleukemogenesis and its effects are reversible. Science 339, 1621–1625 (2013).
38. P. Koivunen, S. Lee, C. G. Duncan, G. Lopez, G. Lu, S. Ramkissoon, J. A. Losman, P. Joensuu,U. Bergmann, S. Gross, J. Travins, S. Weiss, R. Looper, K. L. Ligon, R. G. W. Verhaak, H. Yan,W. G. Kaelin Jr., Transformation by the (R)-enantiomer of 2-hydroxyglutarate linked toEGLN activation. Nature 483, 484–488 (2012).
39. S. Turcan, D. Rohle, A. Goenka, L. A. Walsh, F. Fang, E. Yilmaz, C. Campos, A. W. M. Fabius,C. Lu, P. S. Ward, C. B. Thompson, A. Kaufman, O. Guryanova, R. Levine, A. Heguy, A. Viale,L. G. T. Morris, J. T. Huse, I. K. Mellinghoff, T. A. Chan, IDH1 mutation is sufficient to es-tablish the glioma hypermethylator phenotype. Nature 483, 479–483 (2012).
40. R. Chowdhury, K. K. Yeoh, Y.-M. Tian, L. Hillringhaus, E. A. Bagg, N. R. Rose, I. K. H. Leung,X. S. Li, E. C. Y. Woon, M. Yang, M. A. McDonough, O. N. King, I. J. Clifton, R. J. Klose,T. D. W. Claridge, P. J. Ratcliffe, C. J. Schofield, A. Kawamura, The oncometabolite2-hydroxyglutarate inhibits histone lysine demethylases. EMBO Rep. 12, 463–469(2011).
41. W. Xu, H. Yang, Y. Liu, Y. Yang, P. Wang, S.-H. Kim, S. Ito, C. Yang, P. Wang, M.-T. Xiao,L.-X. Liu, W.-. Jiang, J. Liu, J.-. Zhang, B. Wang, S. Frye, Y. Zhang, Y.-. Xu, Q.-. Lei, K.-L. Guan,S.-. Zhao, Y. Xiong, Oncometabolite 2-hydroxyglutarate is a competitive inhibitor ofa-ketoglutarate-dependent dioxygenases. Cancer Cell 19, 17–30 (2011).
42. A. M. Intlekofer, R. G. Dematteo, S. Venneti, L. W. S. Finley, C. Lu, A. R. Judkins,A. S. Rustenburg, P. B. Grinaway, J. D. Chodera, J. R. Cross, C. B. Thompson, Hypoxia in-duces production of L-2-hydroxyglutarate. Cell Metab. 22, 304–311 (2015).
43. R. Rzem, M.-F. Vincent, E. Van Schaftingen, M. Veiga-da-Cunha, L-2-hydroxyglutaric aciduria,a defect of metabolite repair. J. Inherit. Metab. Dis. 30, 681–689 (2007).
44. W. M. Oldham, C. B. Clish, Y. Yang, J. Loscalzo, Hypoxia-mediated increases in L-2-hydroxyglutarate coordinate the metabolic response to reductive stress. Cell Metab.22, 291–303 (2015).
45. M. Topçu, F. Jobard, S. Halliez, T. Coskun, C. Yalçinkayal, F. O. Gerceker, R. J. A. Wanders,J.-F. Prud’homme, M. Lathrop, M. Özguc, J. Fischer, L-2-Hydroxyglutaric aciduria: Identi-fication of a mutant gene C14orf160, localized on chromosome 14q22.1. Hum. Mol. Genet.13, 2803–2811 (2004).
46. M. Aghili, F. Zahedi, E. Rafiee, Hydroxyglutaric aciduria and malignant brain tumor: A casereport and literature review. J. Neurooncol 91, 233–236 (2009).
47. A. R. Mullen, Z. Hu, X. Shi, L. Jiang, L. K. Boroughs, Z. Kovacs, R. Boriack, D. Rakheja,L. B. Sullivan, W. M. Linehan, N. S. Chandel, R. J. DeBerardinis, Oxidation of alpha-ketoglutarate is required for reductive carboxylation in cancer cells with mitochon-drial defects. Cell Rep. 7, 1679–1690 (2014).
48. E.-H. Shim, C. B. Livi, D. Rakheja, J. Tan, D. Benson, V. Parekh, E.-Y. Kho, A. P. Ghosh,R. Kirkman, S. Velu, S. Dutta, B. Chenna, S. L. Rea, R. J. Mishur, Q. Li, T. L. Johnson-Pais,L. Guo, S. Bae, S. Wei, K. Block, S. Sudarshan, L-2-Hydroxyglutarate: An epigeneticmodifier and putative oncometabolite in renal cancer. Cancer Discov. 4, 1290–1298(2014).
49. I. P. M. Tomlinson, N. A. Alam, A. J. Rowan, E. Barclay, E. E. M. Jaeger, D. Kelsell, I. Leigh,P. Gorman, H. Lamlum, S. Rahman, R. R. Roylance, S. Olpin, S. Bevan, K. Barker, N. Hearle,R. S. Houlston, M. Kiuru, R. Lehtonen, A. Karhu, S. Vilkki, P. Laiho, C. Eklund, O. Vierimaa,K. Aittomäki, M. Hietala, P. Sistonen, A. Paetau, R. Salovaara, R. Herva, V. Launonen,L. A. Aaltonen; Multiple Leiomyoma Consortium, Germline mutations in FH predisposeto dominantly inherited uterine fibroids, skin leiomyomata and papillary renal cell cancer.Nat. Genet. 30, 406–410 (2002).
50. E. Gottlieb, I. P. M. Tomlinson, Mitochondrial tumour suppressors: A genetic and bio-chemical update. Nat. Rev. Cancer 5, 857–866 (2005).
51. B. E. Baysal, R. E. Ferrell, J. E. Willett-Brozick, E. C. Lawrence, D. Myssiorek, A. Bosch,A. van der Mey, P. E. M. Taschner, W. S. Rubinstein, E. N. Myers, C. W. Richard III,C. J. Cornelisse, P. Devilee, B. Devlin, Mutations in SDHD, a mitochondrial complex II gene,in hereditary paraganglioma. Science 287, 848–851 (2000).
52. T. Laukka, C. J. Mariani, T. Ihantola, J. Z. Cao, J. Hokkanen, W. G. Kaelin Jr., L. A. Godley,P. Koivunen, Fumarate and succinate regulate expression of hypoxia-inducible genes viaTET enzymes. J. Biol. Chem. 291, 4256–4265 (2016).
53. M. Xiao, H. Yang, W. Xu, S. Ma, H. Lin, H. Zhu, L. Liu, Y. Liu, C. Yang, Y. Xu, S. Zhao, D. Ye,Y. Xiong, K.-L. Guan, Inhibition of a-KG-dependent histone and DNA demethylases byfumarate and succinate that are accumulated in mutations of FH and SDH tumor sup-pressors. Genes Dev. 26, 1326–1338 (2012).
54. W. G. Kaelin Jr., S. L. McKnight, Influence of metabolism on epigenetics and disease. Cell153, 56–69 (2013).
55. L. B. Sullivan, E. Martinez-Garcia, H. Nguyen, A. R. Mullen, E. Dufour, S. Sudarshan,J. D. Licht, R. J. Deberardinis, N. S. Chandel, The proto-oncometabolite fumarate bindsglutathione to amplify ROS-dependent signaling. Mol. Cell 51, 236–248 (2013).
56. J. Adam, E. Hatipoglu, L. O’Flaherty, N. Ternette, N. Sahgal, H. Lockstone, D. Baban, E. Nye,G. W. Stamp, K. Wolhuter, M. Stevens, R. Fischer, P. Carmeliet, P. H. Maxwell, C. W. Pugh,N. Frizzell, T. Soga, B. M. Kessler, M. El-Bahrawy, P. J. Ratcliffe, P. J. Pollard, Renal cystformation in Fh1-deficient mice is independent of the Hif/Phd pathway: Roles for fuma-rate in KEAP1 succination and Nrf2 signaling. Cancer Cell 20, 524–537 (2011).
57. C. Bardella, M. El-Bahrawy, N. Frizzell, J. Adam, N. Ternette, E. Hatipoglu, K. Howarth,L. O’Flaherty, I. Roberts, G. Turner, J. Taylor, K. Giaslakiotis, V. M. Macaulay, A. L. Harris,A. Chandra, H. J. Lehtonen, V. Launonen, L. A. Aaltonen, C. W. Pugh, R. Mihai, D. Trudgian,B. Kessler, J. W. Baynes, P. J. Ratcliffe, I. P. Tomlinson, P. J. Pollard, Aberrant succination ofproteins in fumarate hydratase-deficient mice and HLRCC patients is a robust biomarkerof mutation status. J. Pathol. 225, 4–11 (2011).
58. A. Ooi, J.-C. Wong, D. Petillo, D. Roossien, V. Perrier-Trudova, D. Whitten, B. W. H. Min,M.-H. Tan, Z. Zhang, X. J. Yang, M. Zhou, B. Gardie, V. Molinié, S. Richard, P. H. Tan,B. T. Teh, K. A. Furge, An antioxidant response phenotype shared between hereditaryand sporadic type 2 papillary renal cell carcinoma. Cancer Cell 20, 511–523 (2011).
59. O. Warburg, On respiratory impairment in cancer cells. Science 124, 269–270 (1956).60. O. Warburg, On the origin of cancer cells. Science 123, 309–314 (1956).61. C. V. Dang, Links between metabolism and cancer. Genes Dev. 26, 877–890 (2012).62. W. J. Israelsen, T. L. Dayton, S. M. Davidson, B. P. Fiske, A. M. Hosios, G. Bellinger, J. Li, Y. Yu,
M. Sasaki, J. W. Horner, L. N. Burga, J. Xie, M. J. Jurczak, R. A. DePinho, C. B. Clish, T. Jacks,R. G. Kibbey, G. M. Wulf, D. Di Vizio, G. B. Mills, L. C. Cantley, M. G. Vander Heiden, PKM2isoform-specific deletion reveals a differential requirement for pyruvate kinase in tumor cells.Cell 155, 397–409 (2013).
63. S. Joshi, D. Tolkunov, H. Aviv, A. A. Hakimi, M. Yao, J. J. Hsieh, S. Ganesan, C. S. Chan,E. White, The genomic landscape of renal oncocytoma identifies a metabolic barrier totumorigenesis. Cell Rep. 13, 1895–1908 (2015).
R E V I EW
DeBerardinis and Chandel Sci. Adv. 2016; 2 : e1600200 27 May 2016 14 of 18
on February 22, 2018http://advances.sciencem
ag.org/D
ownloaded from
www.SCIENCEADVANCES.org 27 May 2016 Vol 2 e16001200
32
R E V I E W
64. F. Weinberg, R. Hamanaka, W. W. Wheaton, S. Weinberg, J. Joseph, M. Lopez,B. Kalyanaraman, G. M. Mutlu, G. R. S. Budinger, N. S. Chandel, Mitochondrial metabolismand ROS generation are essential for Kras-mediated tumorigenicity. Proc. Natl. Acad. Sci.U.S.A. 107, 8788–8793 (2010).
65. I. Martinez-Reyes, L. P. Diebold, H. Kong, M. Schieber, H. Huang, C. T. Hensley, M. M. Mehta,T. Wang, J. H. Santos, R. Woychik, E. Dufour, J. N. Spelbrink, S. E. Weinberg, Y. Zhao,R. J. DeBerardinis, N. S. Chandel, TCA cycle and mitochondrial membrane potential are nec-essary for diverse biological functions. Mol. Cell 61, 199–209 (2016).
66. X. L. Zu, M. Guppy, Cancer metabolism: Facts, fantasy, and fiction. Biochem. Biophys. Res.Commun. 313, 459–465 (2004).
67. C. Lussey-Lepoutre, K. E. R. Hollinshead, C. Ludwig, M. Menara, A. Morin, L.-J. Castro-Vega,S. J. Parker, M. Janin, C. Martinelli, C. Ottolenghi, C. Metallo, A.-P. Gimenez-Roqueplo,J. Favier, D. A. Tennant, Loss of succinate dehydrogenase activity results in dependencyon pyruvate carboxylation for cellular anabolism. Nat. Commun. 6, 8784 (2015).
68. S. Cardaci, L. Zheng, G. MacKay, N. J. F. van den Broek, E. D. MacKenzie, C. Nixon,D. Stevenson, S. Tumanov, V. Bulusu, J. J. Kamphorst, A. Vazquez, S. Fleming, F. Schiavi,G. Kalna, K. Blyth, D. Strathdee, E. Gottlieb, Pyruvate carboxylation enables growth ofSDH-deficient cells by supporting aspartate biosynthesis. Nat. Cell Biol. 17, 1317–1326(2015).
69. A. R. Mullen, W. W. Wheaton, E. S. Jin, P.-H. Chen, L. B. Sullivan, T. Cheng, Y. Yang,W. M. Linehan, N. S. Chandel, R. J. DeBerardinis, Reductive carboxylation supports growthin tumour cells with defective mitochondria. Nature 481, 385–388 (2012).
70. R. Guzy, B. Sharma, E. Bell, N. Chandel, P. Schumacker, Loss of the SdhB, but Not theSdhA, subunit of complex II triggers reactive oxygen species-dependent hypoxia-inducible factor activation and tumorigenesis. Mol. Cell. Biol. 28, 718–731 (2008).
71. C. T. Hensley, A. T. Wasti, R. J. DeBerardinis, Glutamine and cancer: Cell biology, physiol-ogy, and clinical opportunities. J. Clin. Invest. 123, 3678–3684 (2013).
72. J. R. Mayers, C. Wu, C. B. Clish, P. Kraft, M. E. Torrence, B. P. Fiske, C. Yuan, Y. Bao,M. K. Townsend, S. S. Tworoger, S. M. Davidson, T. Papagiannakopoulos, A. Yang,T. L. Dayton, S. Ogino, M. J. Stampfer, E. L. Giovannucci, Z. R. Qian, D. A. Rubinson,J. Ma, H. D. Sesso, J. M. Gaziano, B. B. Cochrane, S. Liu, J. Wactawski-Wende,J. E. Manson, M. N. Pollak, A. C. Kimmelman, A. Souza, K. Pierce, T. J. Wang, R. E. Gerszten,C. S. Fuchs, M. G. Vander Heiden, B. M. Wolpin, Elevation of circulating branched-chainamino acids is an early event in human pancreatic adenocarcinoma development. Nat. Med.20, 1193–1198 (2014).
73. N. Chandel, G. R. S. Budinger, S. H. Choe, P. T. Schumacker, Cellular respiration duringhypoxia. Role of cytochrome oxidase as the oxygen sensor in hepatocytes. J. Biol. Chem.272, 18808–18816 (1997).
74. J. Fan, J. J. Kamphorst, R. Mathew, M. K. Chung, E. White, T. Shlomi, J. D. Rabinowitz,Glutamine-driven oxidative phosphorylation is a major ATP source in transformed mam-malian cells in both normoxia and hypoxia. Mol. Syst. Biol. 9, 712 (2013).
75. A. Le, A. N. Lane, M. Hamaker, S. Bose, A. Gouw, J. Barbi, T. Tsukamoto, C. J. Rojas,B. S. Slusher, H. Zhang, L. J. Zimmerman, D. C. Liebler, R. J. C. Slebos, P. K. Lorkiewicz,R. M. Higashi, T. W. M. Fan, C. V. Dang, Glucose-independent glutamine metabolism viaTCA cycling for proliferation and survival in B cells. Cell Metab. 15, 110–121 (2012).
76. A. Le, Z. E. Stine, C. Nguyen, J. Afzal, P. Sun, M. Hamaker, N. M. Siegel, A. M. Gouw,B.-h. Kang, S.-H. Yu, R. L. Cochran, K. A. Sailor, H. Song, C. V. Dang, Tumorigenicity ofhypoxic respiring cancer cells revealed by a hypoxia–cell cycle dual reporter. Proc. Natl.Acad. Sci. U.S.A. 111, 12486–12491 (2014).
77. J. J. Kamphorst, M. Nofal, C. Commisso, S. R. Hackett, W. Lu, E. Grabocka, M. G. Vander Heiden,G. Miller, J. A. Drebin, D. Bar-Sagi, C. B. Thompson, J. D. Rabinowitz, Human pancreaticcancer tumors are nutrient poor and tumor cells actively scavenge extracellular protein.Cancer Res. 75, 544–553 (2015).
78. C. M. Metallo, P. A. Gameiro, E. L. Bell, K. R. Mattaini, J. Yang, K. Hiller, C. M. Jewell,Z. R. Johnson, D. J. Irvine, L. Guarente, J. K. Kelleher, M. G. Vander Heiden, O. Iliopoulos,G. Stephanopoulos, Reductive glutamine metabolism by IDH1 mediates lipogenesis un-der hypoxia. Nature 481, 380–384 (2012).
79. D. R. Wise, P. S. Ward, J. E. S. Shay, J. R. Cross, J. J. Gruber, U. M. Sachdeva, J. M. Platt,R. G. DeMatteo, M. C. Simon, C. B. Thompson, Hypoxia promotes isocitrate dehydrogenase-dependent carboxylation of a-ketoglutarate to citrate to support cell growth and viability.Proc. Natl. Acad. Sci. U.S.A. 108, 19611–19616 (2011).
80. M. Laplante, D. M. Sabatini, mTOR signaling in growth control and disease. Cell 149,274–293 (2012).
81. J. Y. Guo, H.-Y. Chen, R. Mathew, J. Fan, A. M. Strohecker, G. Karsli-Uzunbas, J. J. Kamphorst,G. Chen, J. M. S. Lemons, V. Karantza, H. A. Coller, R. S. DiPaola, C. Gelinas, J. D. Rabinowitz,E. White, Activated Ras requires autophagy to maintain oxidative metabolism andtumorigenesis. Genes Dev. 25, 460–470 (2011).
82. A. M. Strohecker, E. White, Autophagy promotes BrafV600E-driven lung tumorigenesis bypreserving mitochondrial metabolism. Autophagy 10, 384–385 (2014).
83. N. J. Lanning, B. D. Looyenga, A. L. Kauffman, N. M. Niemi, J. Sudderth, R. J. DeBerardinis,J. P. MacKeigan, A mitochondrial RNAi screen defines cellular bioenergetic determinants
and identifies an adenylate kinase as a key regulator of ATP levels. Cell Rep. 7, 907–917(2014).
84. D. G. Hardie, B. E. Schaffer, A. Brunet, AMPK: An energy-sensing pathway with multipleinputs and outputs. Trends Cell Biol. 26, 190–201 (2016).
85. J. J. Kamphorst, J. R. Cross, J. Fan, E. de Stanchina, R. Mathew, E. P. White, C. B. Thompson,J. D. Rabinowitz, Hypoxic and Ras-transformed cells support growth by scavenging un-saturated fatty acids from lysophospholipids. Proc. Natl. Acad. Sci. U.S.A.110, 8882–8887 (2013).
86. K. M. Nieman, H. A. Kenny, C. V. Penicka, A. Ladanyi, R. Buell-Gutbrod, M. R. Zillhardt,I. L. Romero, M. S. Carey, G. B. Mills, G. S. Hotamisligil, S. D. Yamada, M. E. Peter, K. Gwin,E. Lengyel, Adipocytes promote ovarian cancer metastasis and provide energy for rapidtumor growth. Nat. Med. 17, 1498–1503 (2011).
87. A. N. McCracken, A. L. Edinger, Nutrient transporters: The Achilles’ heel of anabolism.Trends Endocrinol. Metab. 24, 200–208 (2013).
88. P. Nicklin, P. Bergman, B. Zhang, E. Triantafellow, H. Wang, B. Nyfeler, H. Yang, M. Hild,C. Kung, C. Wilson, V. E. Myer, J. P. MacKeigan, J. A. Porter, Y. K. Wang, L. C. Cantley,P. M. Finan, L. O. Murphy, Bidirectional transport of amino acids regulates mTOR andautophagy. Cell 136, 521–534 (2009).
89. L. Galluzzi, F. Pietrocola, B. Levine, G. Kroemer, Metabolic control of autophagy. Cell 159,1263–1276 (2014).
90. E. White, The role for autophagy in cancer. J. Clin. Invest. 125, 42–46 (2015).91. L. Galluzzi, F. Pietrocola, J. M. Bravo-San Pedro, R. K. Amaravadi, E. H. Baehrecke, F. Cecconi,
P. Codogno, J. Debnath, D. A. Gewirtz, V. Karantza, A. Kimmelman, S. Kumar, B. Levine,M. C. Maiuri, S. J. Martin, J. Penninger, M. Piacentini, D. C. Rubinsztein, H.-U. Simon,A. Simonsen, A. M. Thorburn, G. Velasco, K. M. Ryan, G. Kroemer, Autophagy in malignanttransformation and cancer progression. EMBO J. 34, 856–880 (2015).
92. C. Commisso, S. M. Davidson, R. G. Soydaner-Azeloglu, S. J. Parker, J. J. Kamphorst,S. Hackett, E. Grabocka, M. Nofal, J. A. Drebin, C. B. Thompson, J. D. Rabinowitz,C. M. Metallo, M. G. Vander Heiden, D. Bar-Sagi, Macropinocytosis of protein is an aminoacid supply route in Ras-transformed cells. Nature 497, 633–637 (2013).
93. W. Palm, Y. Park, K. Wright, N. N. Pavlova, D. A. Tuveson, C. B. Thompson, The utilization ofextracellular proteins as nutrients is suppressed by mTORC1. Cell 162, 259–270 (2015).
94. H. Yoo, G. Stephanopoulos, J. K. Kelleher, Quantifying carbon sources for de novolipogenesis in wild-type and IRS-1 knockout brown adipocytes. J. Lipid Res. 45, 1324–1332(2004).
95. R. J. DeBerardinis, A. Mancuso, E. Daikhin, I. Nissim, M. Yudkoff, S. Wehrli, C. B. Thompson,Beyond aerobic glycolysis: Transformed cells can engage in glutamine metabolism thatexceeds the requirement for protein and nucleotide synthesis. Proc. Natl. Acad. Sci. U.S.A.104, 19345–19350 (2007).
96. Z. T. Schug, B. Peck, D. T. Jones, Q. Zhang, S. Grosskurth, I. S. Alam, L. M. Goodwin,E. Smethurst, S. Mason, K. Blyth, L. McGarry, D. James, E. Shanks, G. Kalna,R. E. Saunders, M. Jiang, M. Howell, F. Lassailly, M. Z. Thin, B. Spencer-Dene, G. Stamp,N. J. F. van den Broek, G. Mackay, V. Bulusu, J. J. Kamphorst, S. Tardito, D. Strachan,A. L. Harris, E. O. Aboagye, S. E. Critchlow, M. J. O. Wakelam, A. Schulze, E. Gottlieb,Acetyl-CoA synthetase 2 promotes acetate utilization and maintains cancer cellgrowth under metabolic stress. Cancer Cell 27, 57–71 (2015).
97. C. R. Green, M. Wallace, A. S. Divakaruni, S. A. Phillips, A. N. Murphy, T. P. Ciaraldi,C. M. Metallo, Branched-chain amino acid catabolism fuels adipocyte differentiationand lipogenesis. Nat. Chem. Biol. 12, 15–21 (2016).
98. R. Kannan, I. Lyon, N. Baker, Dietary control of lipogenesis in vivo in host tissues andtumors of mice bearing Ehrlich ascites carcinoma. Cancer Res. 40, 4606–4611 (1980).
99. M. Ookhtens, R. Kannan, I. Lyon, N. Baker, Liver and adipose tissue contributions to newlyformed fatty acids in an ascites tumor. Am. J. Physiol. 247, R146–R153 (1984).
100. J. Fan, J. Ye, J. J. Kamphorst, T. Shlomi, C. B. Thompson, J. D. Rabinowitz, Quantitative fluxanalysis reveals folate-dependent NADPH production. Nature 510, 298–302 (2014).
101. C. A. Lewis, S. J. Parker, B. P. Fiske, D. McCloskey, D. Y. Gui, C. R. Green, N. I. Vokes,A. M. Feist, M. G. Vander Heiden, C. M. Metallo, Tracing compartmentalized NADPHmetabolism in the cytosol and mitochondria of mammalian cells. Mol. Cell 55, 253–263(2014).
102. J. D. Horton, J. L. Goldstein, M. S. Brown, SREBPs: Activators of the complete programof cholesterol and fatty acid synthesis in the liver. J. Clin. Invest. 109, 1125–1131(2002).
103. K. Düvel, J. L. Yecies, S. Menon, P. Raman, A. I. Lipovsky, A. L. Souza, E. Triantafellow, Q. Ma,R. Gorski, S. Cleaver, M. G. Vander Heiden, J. P. MacKeigan, P. M. Finan, C. B. Clish,L. O. Murphy, B. D. Manning, Activation of a metabolic gene regulatory network downstreamof mTOR complex 1. Mol. Cell 39, 171–183 (2010).
104. J. L. Goldstein, R. A. DeBose-Boyd, M. S. Brown, Protein sensors for membrane sterols. Cell124, 35–46 (2006).
105. T. R. Peterson, S. S. Sengupta, T. E. Harris, A. E. Carmack, S. A. Kang, E. Balderas,D. A. Guertin, K. L. Madden, A. E. Carpenter, B. N. Finck, D. M. Sabatini, mTOR complex1 regulates lipin 1 localization to control the SREBP pathway. Cell 146, 408–420(2011).
R E V I EW
DeBerardinis and Chandel Sci. Adv. 2016; 2 : e1600200 27 May 2016 15 of 18
on February 22, 2018http://advances.sciencem
ag.org/D
ownloaded from
www.SCIENCEADVANCES.org 27 May 2016 Vol 2 e16001200
33
R E V I E W
106. R. J. Deberardinis, J. J. Lum, C. B. Thompson, Phosphatidylinositol 3-kinase-dependentmodulation of carnitine palmitoyltransferase 1A expression regulates lipid metabolismduring hematopoietic cell growth. J. Biol. Chem. 281, 37372–37380 (2006).
107. R. M. Young, D. Ackerman, Z. L. Quinn, A. Mancuso, M. Gruber, L. Liu, D. N. Giannoukos,E. Bobrovnikova-Marjon, J. A. Diehl, B. Keith, M. C. Simon, Dysregulated mTORC1 renderscells critically dependent on desaturated lipids for survival under tumor-like stress. GenesDev. 27, 1115–1131 (2013).
108. C. Yokoyama, X. Wang, M. R. Briggs, A. Admon, J. Wu, X. Hua, J. L. Goldstein, M. S. Brown,SREBP-1, a basic-helix-loop-helix-leucine zipper protein that controls transcription of thelow density lipoprotein receptor gene. Cell 75, 187–197 (1993).
109. D. Guo, R. M. Prins, J. Dang, D. Kuga, A. Iwanami, H. Soto, K. Y. Lin, T. T. Huang, D. Akhavan,M. B. Hock, S. Zhu, A. A. Kofman, S. J. Bensinger, W. H. Yong, H. V. Vinters, S. Horvath,A. D. Watson, J. G. Kuhn, H. I. Robins, M. P. Mehta, P. Y. Wen, L. M. DeAngelis, M. D. Prados,I. K. Mellinghoff, T. F. Cloughesy, P. S. Mischel, EGFR signaling through an Akt-SREBP-1–dependent, rapamycin-resistant pathway sensitizes glioblastomas to antilipogenic therapy.Sci. Signal. 2, ra82 (2009).
110. D. Guo, F. Reinitz, M. Youssef, C. Hong, D. Nathanson, D. Akhavan, D. Kuga, A. N. Amzajerdi,H. Soto, S. Zhu, I. Babic, K. Tanaka, J. Dang, A. Iwanami, B. Gini, J. DeJesus, D. D. Lisiero,T. T. Huang, R. M. Prins, P. Y. Wen, H. I. Robins, M. D. Prados, L. M. DeAngelis,I. K. Mellinghoff, M. P. Mehta, C. D. James, A. Chakravarti, T. F. Cloughesy, P. Tontonoz,P. S. Mischel, An LXR agonist promotes glioblastoma cell death through inhibition of anEGFR/AKT/SREBP-1/LDLR–dependent pathway. Cancer Discov. 1, 442–456 (2011).
111. A. Stincone, A. Prigione, T. Cramer, M. M. C. Wamelink, K. Campbell, E. Cheung,V. Olin-Sandoval, N.-M. Grüning, A. Krüger, M. Tauqeer Alam, M. A. Keller, M. Breitenbach,K. M. Brindle, J. D. Rabinowitz, M. Ralser, The return of metabolism: Biochemistry and phys-iology of the pentose phosphate pathway. Biol. Rev. Camb. Philos. Soc. 90, 927–963 (2014).
112. M. G. Vander Heiden, Targeting cancer metabolism: A therapeutic window opens. Nat.Rev. Drug Discov. 10, 671–684 (2011).
113. I. Ben-Sahra, J. J. Howell, J. M. Asara, B. D. Manning, Stimulation of de novo pyrimidinesynthesis by growth signaling through mTOR and S6K1. Science 339, 1323–1328 (2013).
114. M. P. Murphy, How mitochondria produce reactive oxygen species. Biochem. J. 417, 1–13(2009).
115. M. D. Brand, The sites and topology of mitochondrial superoxide production. Exp. Gerontol.45, 466–472 (2010).
116. S. G. Rhee, H. A. Woo, I. S. Kil, S. H. Bae, Peroxiredoxin functions as a peroxidase and aregulator and sensor of local peroxides. J. Biol. Chem. 287, 4403–4410 (2012).
117. A. G. Cox, C. C. Winterbourn, M. B. Hampton, Mitochondrial peroxiredoxin involvement inantioxidant defence and redox signalling. Biochem. J. 425, 313–325 (2010).
118. M. P. Murphy, Mitochondrial thiols in antioxidant protection and redox signaling: Distinctroles for glutathionylation and other thiol modifications. Antioxid. Redox Signal. 16,476–495 (2012).
119. T. Finkel, From sulfenylation to sulfhydration: What a thiolate needs to tolerate. Sci. Signal. 5,pe10 (2012).
120. E. C. Cheung, P. Lee, F. Ceteci, C. Nixon, K. Blyth, O. J. Sansom, K. H. Vousden, Opposingeffects of TIGAR- and RAC1-derived ROS on Wnt-driven proliferation in the mouse intes-tine. Genes Dev. 30, 52–63 (2016).
121. K. Irani, Y. Xia, J. L. Zweier, S. J. Sollott, C. J. Der, E. R. Fearon, M. Sundaresan, T. Finkel,P. J. Goldschmidt-Clermont, Mitogenic signaling mediated by oxidants in Ras-transformed fibroblasts. Science 275, 1649–1652 (1997).
122. N. S. Chandel, E. Maltepe, E. Goldwasser, C. E. Mathieu, M. C. Simon, P. T. Schumacker,Mitochondrial reactive oxygen species trigger hypoxia-induced transcription. Proc. Natl.Acad. Sci. U.S.A. 95, 11715–11720 (1998).
123. A. L. Orr, L. Vargas, C. N. Turk, J. E. Baaten, J. T. Matzen, V. J. Dardov, S. J. Attle, J. Li,D. C. Quackenbush, R. L. S. Goncalves, I. V. Perevoshchikova, H. M. Petrassi,S. L. Meeusen, E. K. Ainscow, M. D. Brand, Suppressors of superoxide production frommitochondrial complex III. Nat. Chem. Biol. 11, 834–836 (2015).
124. P. E. Porporato, V. L. Payen, J. Pérez-Escuredo, C. J. De Saedeleer, P. Danhier, T. Copetti,S. Dhup, M. Tardy, T. Vazeille, C. Bouzin, O. Feron, C. Michiels, B. Gallez, P. Sonveaux, Amitochondrial switch promotes tumor metastasis. Cell Rep. 8, 754–766 (2014).
125. J. M. Munson, L. Fried, S. A. Rowson, M. Y. Bonner, L. Karumbaiah, B. Diaz,S. A. Courtneidge, U. G. Knaus, D. J. Brat, J. L. Arbiser, R. V. Bellamkonda, Anti-invasiveadjuvant therapy with imipramine blue enhances chemotherapeutic efficacy againstglioma. Sci. Transl. Med. 4, 127ra36 (2012).
126. N. S. Chandel, D. A. Tuveson, The promise and perils of antioxidants for cancer patients.N. Engl. J. Med. 371, 177–178 (2014).
127. M. C. Jaramillo, D. D. Zhang, The emerging role of the Nrf2–Keap1 signaling pathway incancer. Genes Dev. 27, 2179–2191 (2013).
128. G. M. DeNicola, F. A. Karreth, T. J. Humpton, A. Gopinathan, C. Wei, K. Frese, D. Mangal,K. H. Yu, C. J. Yeo, E. S. Calhoun, F. Scrimieri, J. M. Winter, R. H. Hruban, C. Iacobuzio-Donahue,S. E. Kern, I. A. Blair, D. A. Tuveson, Oncogene-induced Nrf2 transcription promotes ROSdetoxification and tumorigenesis. Nature 475, 106–109 (2011).
129. G. M. DeNicola, P.-H. Chen, E. Mullarky, J. A. Sudderth, Z. Hu, D. Wu, H. Tang, Y. Xie,J. M. Asara, K. E. Huffman, I. I. Wistuba, J. D. Minna, R. J. DeBerardinis, L. C. Cantley,NRF2 regulates serine biosynthesis in non–small cell lung cancer. Nat. Genet. 47,1475–1481 (2015).
130. J. Ye, J. Fan, S. Venneti, Y.-W. Wan, B. R. Pawel, J. Zhang, L. W. S. Finley, C. Lu, T. Lindsten,J. R. Cross, G. Qing, Z. Liu, M. C. Simon, J. D. Rabinowitz, C. B. Thompson, Serine catabolismregulates mitochondrial redox control during hypoxia. Cancer Discov. 4, 1406–1417 (2014).
131. I. S. Harris, A. E. Treloar, S. Inoue, M. Sasaki, C. Gorrini, K. C. Lee, K. Y. Yung, D. Brenner,C. B. Knobbe-Thomsen, M. A. Cox, A. Elia, T. Berger, D. W. Cescon, A. Adeoye, A. Brüstle,S. D. Molyneux, J. M. Mason, W. Y. Li, K. Yamamoto, A. Wakeham, H. K. Berman, R. Khokha,S. J. Done, T. J. Kavanagh, C.-W. Lam, T. W. Mak, Glutathione and thioredoxin antioxidantpathways synergize to drive cancer initiation and progression. Cancer Cell 27, 211–222 (2015).
132. D. J. Garama, T. J. Harris, C. L. White, F. J. Rossello, M. Abdul-Hay, D. J. Gough, D. E. Levy, Asynthetic lethal interaction between glutathione synthesis and mitochondrial reactiveoxygen species provides a tumor-specific vulnerability dependent on STAT3. Mol. Cell.Biol. 35, 3646–3656 (2015).
133. C. Gorrini, I. S. Harris, T. W. Mak, Modulation of oxidative stress as an anticancer strategy.Nat. Rev. Drug Discov. 12, 931–947 (2013).
134. Y. Saito, R. H. Chapple, A. Lin, A. Kitano, D. Nakada, AMPK protects leukemia-initiatingcells in myeloid leukemias from metabolic stress in the bone marrow. Cell Stem Cell17, 585–596 (2015).
135. S.-M. Jeon, N. S. Chandel, N. Hay, AMPK regulates NADPH homeostasis to promote tumourcell survival during energy stress. Nature 485, 661–665 (2012).
136. V. S. LeBleu, J. T. O’Connell, K. N. Gonzalez Herrera, H. Wikman, K. Pantel, M. C. Haigis,F. M. de Carvalho, A. Damascena, L. T. Domingos Chinen, R. M. Rocha, J. M. Asara, R. Kalluri,PGC-1a mediates mitochondrial biogenesis and oxidative phosphorylation in cancer cells topromote metastasis. Nat. Cell Biol. 16, 992–1003 (2014).
137. Z. T. Schafer, A. R. Grassian, L. Song, Z. Jiang, Z. Gerhart-Hines, H. Y. Irie, S. Gao,P. Puigserver, J. S. Brugge, Antioxidant and oncogene rescue of metabolic defects causedby loss of matrix attachment. Nature 461, 109–113 (2009).
138. L. Jiang, A. A. Shestov, P. Swain, C. Yang, S. J. Parker, Q. A. Wang, L. S. Terada, N. D. Adams,M. T. McCabe, B. Pietrak, S. Schmidt, C. M. Metallo, B. P. Dranka, B. Schwartz,R. J. DeBerardinis, Reductive carboxylation supports redox homeostasis during anchorage-independent growth. Nature 532, 255–258 (2016).
139. A. Erez, R. J. DeBerardinis, Metabolic dysregulation in monogenic disorders and cancer—Finding method in madness. Nat. Rev. Cancer 15, 440–448 (2015).
140. E. L. Pearce, M. C. Poffenberger, C.-H. Chang, R. G. Jones, Fueling immunity: Insights intometabolism and lymphocyte function. Science 342, 1242454 (2013).
141. K. Ito, T. Suda, Metabolic requirements for the maintenance of self-renewing stem cells.Nat. Rev. Mol. Cell Biol. 15, 243–256 (2014).
142. H. Shim, C. Dolde, B. C. Lewis, C.-S. Wu, G. Dang, R. A. Jungmann, R. Dalla-Favera,C. V. Dang, c-Myc transactivation of LDH-A: Implications for tumor metabolism andgrowth. Proc. Natl. Acad. Sci. U.S.A. 94, 6658–6663 (1997).
143. V. R. Fantin, J. St-Pierre, P. Leder, Attenuation of LDH-A expression uncovers a link betweenglycolysis, mitochondrial physiology, and tumor maintenance. Cancer Cell 9, 425–434 (2006).
144. A. Le, C. R. Cooper, A. M. Gouw, R. Dinavahi, A. Maitra, L. M. Deck, R. E. Royer,D. L. Vander Jagt, G. L. Semenza, C. V. Dang, Inhibition of lactate dehydrogenase A in-duces oxidative stress and inhibits tumor progression. Proc. Natl. Acad. Sci. U.S.A. 107,2037–2042 (2010).
145. H. Xie, J.-. Hanai, J.-G. Ren, L. Kats, K. Burgess, P. Bhargava, S. Signoretti, J. Billiard,K. J. Duffy, A. Grant, X. Wang, P. K. Lorkiewicz, S. Schatzman, M. Bousamra II,A. N. Lane, R. M. Higashi, T. W. M. Fan, P. P. Pandolfi, V. P. Sukhatme, P. Seth, Targetinglactate dehydrogenase-a inhibits tumorigenesis and tumor progression in mouse modelsof lung cancer and impacts tumor-initiating cells. Cell Metab. 19, 795–809 (2014).
146. Y.-H. Wang, W. J. Israelsen, D. Lee, V. W. C. Yu, N. T. Jeanson, C. B. Clish, L. C. Cantley,M. G. Vander Heiden, D. T. Scadden, Cell-state-specific metabolic dependency in hema-topoiesis and leukemogenesis. Cell 158, 1309–1323 (2014).
147. R. Haas, J. Smith, V. Rocher-Ros, S. Nadkarni, T. Montero-Melendez, F. D’Acquisto,E. J. Bland, M. Bombardieri, C. Pitzalis, M. Perretti, F. M. Marelli-Berg, C. Mauro, Lactateregulates metabolic and pro-inflammatory circuits in control of T cell migration and ef-fector functions. PLOS Biol. 13, e1002202 (2015).
148. O. R. Colegio, N.-Q. Chu, A. L. Szabo, T. Chu, A. M. Rhebergen, V. Jairam, N. Cyrus,C. E. Brokowski, S. C. Eisenbarth, G. M. Phillips, G. W. Cline, A. J. Phillips, R. Medzhitov,Functional polarization of tumour-associated macrophages by tumour-derived lacticacid. Nature 513, 559–563 (2014).
149. O. D. K. Maddocks, C. R. Berkers, S. M. Mason, L. Zheng, K. Blyth, E. Gottlieb, K. H. Vousden,Serine starvation induces stress and p53-dependent metabolic remodelling in cancercells. Nature 493, 542–546 (2013).
150. C. F. Labuschagne, N. J. F. van den Broek, G. M. Mackay, K. H. Vousden, O. D. K. Maddocks,Serine, but not glycine, supports one-carbon metabolism and proliferation of cancercells. Cell Rep. 7, 1248–1258 (2014).
R E V I EW
DeBerardinis and Chandel Sci. Adv. 2016; 2 : e1600200 27 May 2016 16 of 18
on February 22, 2018http://advances.sciencem
ag.org/D
ownloaded from
www.SCIENCEADVANCES.org 27 May 2016 Vol 2 e16001200
34
R E V I E W
151. D. Kim, B. P. Fiske, K. Birsoy, E. Freinkman, K. Kami, R. L. Possemato, Y. Chudnovsky,M. E. Pacold, W. W. Chen, J. R. Cantor, L. M. Shelton, D. Y. Gui, M. Kwon,S. H. Ramkissoon, K. L. Ligon, S. W. Kang, M. Snuderl, M. G. Vander Heiden, D. M. Sabatini,SHMT2 drives glioma cell survival in ischaemia but imposes a dependence on glycineclearance. Nature 520, 363–367 (2015).
152. R. Nilsson, M. Jain, N. Madhusudhan, N. G. Sheppard, L. Strittmatter, C. Kampf, J. Huang,A. Asplund, V. K. Mootha, Metabolic enzyme expression highlights a key role for MTHFD2and the mitochondrial folate pathway in cancer. Nat. Commun. 5, 3128 (2014).
153. S. E. Weinberg, N. S. Chandel, Targeting mitochondria metabolism for cancer therapy.Nat. Chem. Biol. 11, 9–15 (2015).
154. J. M. M. Evans, L. A. Donnelly, A. M. Emslie-Smith, D. R. Alessi, A. D. Morris, Metformin andreduced risk of cancer in diabetic patients. BMJ 330, 1304–1305 (2005).
155. M. Buzzai, R. G. Jones, R. K. Amaravadi, J. J. Lum, R. J. DeBerardinis, F. Zhao, B. Viollet,C. B. Thompson, Systemic treatment with the antidiabetic drug metformin selectivelyimpairs p53-deficient tumor cell growth. Cancer Res. 67, 6745–6752 (2007).
156. R. M. Memmott, J. R. Mercado, C. R. Maier, S. Kawabata, S. D. Fox, P. A. Dennis, Metforminprevents tobacco carcinogen–induced lung tumorigenesis. Cancer Prev. Res. 3,1066–1076 (2010).
157. A. Tomimoto, H. Endo, M. Sugiyama, T. Fujisawa, K. Hosono, H. Takahashi, N. Nakajima,Y. Nagashima, K. Wada, H. Nakagama, A. Nakajima, Metformin suppresses intestinal polypgrowth in ApcMin/+ mice. Cancer Sci. 99, 2136–2141 (2008).
158. H. R. Bridges, A. J. Y. Jones, M. N. Pollak, J. Hirst, Effects of metformin and other biguanideson oxidative phosphorylation in mitochondria. Biochem. J. 462, 475–487 (2014).
159. M.-Y. El-Mir, V. Nogueira, E. Fontaine, N. Avéret, M. Rigoulet, X. Leverve, Dimethylbiguanideinhibits cell respiration via an indirect effect targeted on the respiratory chain complex I.J. Biol. Chem. 275, 223–228 (2000).
160. M. R. Owen, E. Doran, A. P. Halestrap, Evidence that metformin exerts its anti-diabeticeffects through inhibition of complex 1 of the mitochondrial respiratory chain. Biochem.J. 348 (Pt. 3), 607–614 (2000).
161. W. W. Wheaton, S. E. Weinberg, R. B. Hamanaka, S. Soberanes, L. B. Sullivan, E. Anso,A. Glasauer, E. Dufour, G. M. Mutlu, G. R. S. Budigner, N. S. Chandel, Metformin inhibitsmitochondrial complex I of cancer cells to reduce tumorigenesis. Elife 3, e02242 (2014).
162. T. Griss, E. E. Vincent, R. Egnatchik, J. Chen, E. H. Ma, B. Faubert, B. Viollet,R. J. DeBerardinis, R. G. Jones, Metformin antagonizes cancer cell proliferation by sup-pressing mitochondrial-dependent biosynthesis. PLOS Biol. 13, e1002309 (2015).
163. A. Emami Riedmaier, P. Fisel, A. T. Nies, E. Schaeffeler, M. Schwab, Metformin and cancer:From the old medicine cabinet to pharmacological pitfalls and prospects. Trends Pharmacol.Sci. 34, 126–135 (2013).
164. M. Pollak, Overcoming drug development bottlenecks with repurposing: Repurposingbiguanides to target energy metabolism for cancer treatment. Nat. Med. 20, 591–593 (2014).
165. K. Birsoy, R. Possemato, F. K. Lorbeer, E. C. Bayraktar, P. Thiru, B. Yucel, T. Wang,W. W. Chen, C. B. Clish, D. M. Sabatini, Metabolic determinants of cancer cell sensitivityto glucose limitation and biguanides. Nature 508, 108–112 (2014).
166. D. B. Shackelford, E. Abt, L. Gerken, D. S. Vasquez, A. Seki, M. Leblanc, L. Wei,M. C. Fishbein, J. Czernin, P. S. Mischel, R. J. Shaw, LKB1 inactivation dictates therapeuticresponse of non-small cell lung cancer to the metabolism drug phenformin. Cancer Cell23, 143–158 (2013).
167. S.-P. Gravel, L. Hulea, N. Toban, E. Birman, M.-J. Blouin, M. Zakikhani, Y. Zhao, I. Topisirovic,J. St-Pierre, M. Pollak, Serine deprivation enhances antineoplastic activity of biguanides.Cancer Res. 74, 7521–7533 (2014).
168. G. Karsli-Uzunbas, J. Y. Guo, S. Price, X. Teng, S. V. Laddha, S. Khor, N. Y. Kalaany, T. Jacks,C. S. Chan, J. D. Rabinowitz, E. White, Autophagy is required for glucose homeostasis andlung tumor maintenance. Cancer Discov. 4, 914–927 (2014).
169. J. Son, C. A. Lyssiotis, H. Ying, X. Wang, S. Hua, M. Ligorio, R. M. Perera, C. R. Ferrone,E. Mullarky, N. Shyh-Chang, Y. Kang, J. B. Fleming, N. Bardeesy, J. M. Asara, M. C. Haigis,R. A. DePinho, L. C. Cantley, A. C. Kimmelman, Glutamine supports pancreatic cancergrowth through a KRAS-regulated metabolic pathway. Nature 496, 101–105 (2013).
170. Y. Xiang, Z. E. Stine, J. Xia, Y. Lu, R. S. O’Connor, B. J. Altman, A. L. Hsieh, A. M. Gouw,A. G. Thomas, P. Gao, L. Sun, L. Song, B. Yan, B. S. Slusher, J. Zhuo, L. L. Ooi, C. G. L. Lee,A. Mancuso, A. S. McCallion, A. Le, M. C. Milone, S. Rayport, D. W. Felsher, C. V. Dang,Targeted inhibition of tumor-specific glutaminase diminishes cell-autonomous tumori-genesis. J. Clin. Invest. 125, 2293–2306 (2015).
171. S. A. Comerford, Z. Huang, X. Du, Y. Wang, L. Cai, A. K. Witkiewicz, H. Walters,M. N. Tantawy, A. Fu, H. C. Manning, J. D. Horton, R. E. Hammer, S. L. McKnight,B. P. Tu, Acetate dependence of tumors. Cell 159, 1591–1602 (2014).
172. T. Mashimo, K. Pichumani, V. Vemireddy, K. J. Hatanpaa, D. K. Singh, S. Sirasanagandla,S. Nannepaga, S. G. Piccirillo, Z. Kovacs, C. Foong, Z. Huang, S. Barnett, B. E. Mickey,R. J. DeBerardinis, B. P. Tu, E. A. Maher, R. M. Bachoo, Acetate is a bioenergetic substratefor human glioblastoma and brain metastases. Cell 159, 1603–1614 (2014).
173. J. A. Engelman, L. Chen, X. Tan, K. Crosby, A. R. Guimaraes, R. Upadhyay, M. Maira,K. McNamara, S. A. Perera, Y. Song, L. R. Chirieac, R. Kaur, A. Lightbown, J. Simendinger,
T. Li, R. F. Padera, C. García-Echeverría, R. Weissleder, U. Mahmood, L. C. Cantley,K.-K. Wong, Effective use of PI3K and MEK inhibitors to treat mutant Kras G12D and PIK3CAH1047R murine lung cancers. Nat. Med. 14, 1351–1356 (2008).
174. D. Herranz, A. Ambesi-Impiombato, J. Sudderth, M. Sánchez-Martín, L. Belver, V. Tosello,L. Xu, A. A. Wendorff, M. Castillo, J. E. Haydu, J. Márquez, J. M. Matés, A. L. Kung, S. Rayport,C. Cordon-Cardo, R. J. DeBerardinis, A. A. Ferrando, Metabolic reprogramming inducesresistance to anti-NOTCH1 therapies in T cell acute lymphoblastic leukemia. Nat. Med. 21,1182–1189 (2015).
175. A. Viale, P. Pettazzoni, C. A. Lyssiotis, H. Ying, N. Sánchez, M. Marchesini, A. Carugo,T. Green, S. Seth, V. Giuliani, M. Kost-Alimova, F. Muller, S. Colla, L. Nezi, G. Genovese,A. K. Deem, A. Kapoor, W. Yao, E. Brunetto, Y. Kang, M. Yuan, J. M. Asara, Y. A. Wang,T. P. Heffernan, A. C. Kimmelman, H. Wang, J. B. Fleming, L. C. Cantley, R. A. DePinho,G. F. Draetta, Oncogene ablation-resistant pancreatic cancer cells depend on mitochondrialfunction. Nature 514, 628–632 (2014).
176. P. Yuan, K. Ito, R. Perez-Lorenzo, C. Del Guzzo, J. H. Lee, C.-H. Shen, M. W. Bosenberg,M. McMahon, L. C. Cantley, B. Zheng, Phenformin enhances the therapeutic benefit ofBRAFV600E inhibition in melanoma. Proc. Natl. Acad. Sci. U.S.A. 110, 18226–18231 (2013).
177. A. Roesch, A. Vultur, I. Bogeski, H. Wang, K. M. Zimmermann, D. Speicher, C. Körbel,M. W. Laschke, P. A. Gimotty, S. E. Philipp, E. Krause, S. Pätzold, J. Villanueva, C. Krepler,M. Fukunaga-Kalabis, M. Hoth, B. C. Bastian, T. Vogt, M. Herlyn, Overcoming intrinsic multidrugresistance in melanoma by blocking the mitochondrial respiratory chain of slow-cyclingJARID1Bhigh cells. Cancer Cell 23, 811–825 (2013).
178. A. Janzer, N. J. German, K. N. Gonzalez-Herrera, J. M. Asara, M. C. Haigis, K. Struhl, Metforminand phenformin deplete tricarboxylic acid cycle and glycolytic intermediates during celltransformation and NTPs in cancer stem cells. Proc. Natl. Acad. Sci. U.S.A. 111,10574–10579 (2014).
179. J. Yun, E. Mullarky, C. Lu, K. N. Bosch, A. Kavalier, K. Rivera, J. Roper, I. I. C. Chio,E. G. Giannopoulou, C. Rago, A. Muley, J. M. Asara, J. Paik, O. Elemento, Z. Chen,D. J. Pappin, L. E. Dow, N. Papadopoulos, S. S. Gross, L. C. Cantley, Vitamin C selectivelykills KRAS and BRAF mutant colorectal cancer cells by targeting GAPDH. Science 350,1391–1396 (2015).
180. Q. Chen, M. G. Espey, A. Y. Sun, C. Pooput, K. L. Kirk, M. C. Krishna, D. B. Khosh, J. Drisko,M. Levine, Pharmacologic doses of ascorbate act as a prooxidant and decrease growth ofaggressive tumor xenografts in mice. Proc. Natl. Acad. Sci. U.S.A. 105, 11105–11109(2008).
181. Y. Ma, J. Chapman, M. Levine, K. Polireddy, J. Drisko, Q. Chen, High-dose parenteral ascorbateenhanced chemosensitivity of ovarian cancer and reduced toxicity of chemotherapy.Sci. Transl. Med. 6, 222ra18 (2014).
182. A. Tagde, H. Singh, M. H. Kang, C. P. Reynolds, The glutathione synthesis inhibitor buthioninesulfoximine synergistically enhanced melphalan activity against preclinical models ofmultiple myeloma. Blood Cancer J. 4, e229 (2014).
183. A. Glasauer, L. A. Sena, L. P. Diebold, A. P. Mazar, N. S. Chandel, Targeting SOD1 reducesexperimental non-small-cell lung cancer. J. Clin. Invest. 124, 117–128 (2014).
184. O. Oivares, J. H. M. Däbritz, A. King, E. Gottlieb, C. Halsey, Research into cancer metabo-lomics: Towards a clinical metamorphosis. Semin. Cell Dev. Biol. 43, 52–64 (2015).
185. J. M. Buescher, M. R. Antoniewicz, L. G. Boros, S. C. Burgess, H. Brunengraber, C. B. Clish,R. J. DeBerardinis, O. Feron, C. Frezza, B. Ghesquiere, E. Gottlieb, K. Hiller, R. G. Jones,J. J. Kamphorst, R. G. Kibbey, A. C. Kimmelman, J. W. Locasale, S. Y. Lunt, O. D. K. Maddocks,C. Malloy, C. M. Metallo, E. J. Meuillet, J. Munger, A roadmap for interpreting 13C metabolitelabeling patterns from cells. Curr. Opin. Biotechnol. 34, 189–201 (2015).
186. R. J. DeBerardinis, C. B. Thompson, Cellular metabolism and disease: What do metabolicoutliers teach us? Cell 148, 1132–1144 (2012).
187. O. C. Andronesi, O. Rapalino, E. Gerstner, A. Chi, T. T. Batchelor, D. P. Cahill, A. G. Sorensen,B. R. Rosen, Detection of oncogenic IDH1 mutations using magnetic resonance spectros-copy of 2-hydroxyglutarate. J. Clin. Invest. 123, 3659–3663 (2013).
188. C. Lussey-Lepoutre, A. Bellucci, A. Morin, A. Buffet, L. Amar, M. Janin, C. Ottolenghi,F. Zinzindohoué, G. Autret, N. Burnichon, E. Robidel, B. Banting, S. Fontaine,C.-A. Cuenod, P. Benit, P. Rustin, P. Halimi, L. Fournier, A.-P. Gimenez-Roqueplo, J. Favier,B. Tavitian, In vivo detection of succinate by magnetic resonance spectroscopy as a hall-mark of SDHx mutations in paraganglioma. Clin. Cancer Res. 22, 1120–1129 (2016).
189. N. M. Vacanti, A. S. Divakaruni, C. R. Green, S. J. Parker, R. R. Henry, T. P. Ciaraldi,A. N. Murphy, C. M. Metallo, Regulation of substrate utilization by the mitochondrial pyruvatecarrier. Mol. Cell 56, 425–435 (2014).
190. C. Yang, B. Ko, C. T. Hensley, L. Jiang, A. T. Wasti, J. Kim, J. Sudderth, M. A. Calvaruso,L. Lumata, M. Mitsche, J. Rutter, M. E. Merritt, R. J. DeBerardinis, Glutamine oxidationmaintains the TCA cycle and cell survival during impaired mitochondrial pyruvatetransport. Mol. Cell 56, 414–424 (2014).
191. J. C. Schell, K. A. Olson, L. Jiang, A. J. Hawkins, J. G. Van Vranken, J. Xie, R. A. Egnatchik,E. G. Earl, R. J. DeBerardinis, J. Rutter, A role for the mitochondrial pyruvate carrier as arepressor of the Warburg effect and colon cancer cell growth. Mol. Cell 56, 400–413(2014).
R E V I EW
DeBerardinis and Chandel Sci. Adv. 2016; 2 : e1600200 27 May 2016 17 of 18
on February 22, 2018http://advances.sciencem
ag.org/D
ownloaded from
www.SCIENCEADVANCES.org 27 May 2016 Vol 2 e16001200
35
R E V I E W
192. I. Marin-Valencia, C. Yang, T. Mashimo, S. Cho, H. Baek, X.-L. Yang, K. N. Rajagopalan,M. Maddie, V. Vemireddy, Z. Zhao, L. Cai, L. Good, B. P. Tu, K. J. Hatanpaa, B. E. Mickey,J. M. Matés, J. M. Pascual, E. A. Maher, C. R. Malloy, R. J. DeBerardinis, Robert M. Bachoo,Analysis of tumor metabolism reveals mitochondrial glucose oxidation in geneticallydiverse human glioblastomas in the mouse brain in vivo. Cell Metab. 15, 827–837(2012).
193. M. O. Yuneva, T. W. M. Fan, T. D. Allen, R. M. Higashi, D. V. Ferraris, T. Tsukamoto,J. M. Matés, F. J. Alonso, C. Wang, Y. Seo, X. Chen, J. M. Bishop, The metabolic profileof tumors depends on both the responsible genetic lesion and tissue type. Cell Metab.15, 157–170 (2012).
194. E. A. Maher, I. Marin-Valencia, R. M. Bachoo, T. Mashimo, J. Raisanen, K. J. Hatanpaa,A. Jindal, F. M. Jeffrey, C. Choi, C. Madden, D. Mathews, J. M. Pascual, B. E. Mickey,C. R. Malloy, R. J. DeBerardinis, Metabolism of [U-13 C]glucose in human brain tumorsin vivo. NMR Biomed. 25, 1234–1244 2012).
195. K. Sellers, M. P. Fox, M. Bousamra II, S. P. Slone, R. M. Higashi, D. M. Miller, Y. Wang, J. Yan,M. O. Yuneva, R. Deshpande, A. N. Lane, T. W.-M. Fan, Pyruvate carboxylase is critical fornon-small-cell lung cancer proliferation. J. Clin. Invest. 125, 687–698 (2015).
196. T. W. M. Fan, A. N. Lane, R. M. Higashi, M. A. Farag, H. Gao, M. Bousamra, D. M. Miller,Altered regulation of metabolic pathways in human lung cancer discerned by 13C stableisotope-resolved metabolomics (SIRM). Mol. Cancer 8, 41 (2009).
197. C. T. Hensley, B. Faubert, Q. Yuan, N. Lev-Cohain, E. Jin, J. Kim, L. Jiang, B. Ko, R. Skelton,L. Loudat, M. Wodzak, C. Klimko, E. McMillan, Y. Butt, M. Ni, D. Oliver, J. Torrealba,C. R. Malloy, K. Kernstine, R. E. Lenkinski, R. J. DeBerardinis, Metabolic heterogeneity inhuman lung tumors. Cell 164, 681–694 (2016).
198. S. M. Davidson, T. Papagiannakopoulos, B. A. Olenchock, J. E. Heyman, M. A. Keibler,A. Luengo, M. R. Bauer, A. K. Jha, J. P. O’Brien, K. A. Pierce, D. Y. Gui, L. B. Sullivan,T. M. Wasylenko, L. Subbaraj, C. R. Chin, G. Stephanopolous, B. T. Mott, T. Jacks,
C. B. Clish, M. G. Vander Heiden, Environment impacts the metabolic dependencies ofras-driven non-small cell lung cancer. Cell Metab. 23, 517–528 (2016).
199. K. Birsoy, T. Wang, W. W. Chen, E. Freikman, M. Abu-Remaileh, D. M. Sabatini, An essentialrole of the mitochondrial electron transport chain in cell proliferation is to enable aspar-tate synthesis. Cell 162, 540–551 (2015).
200. L. B. Sullivan, D. Y. Gui, A. M. Hosios, L. N. Bush, E. Freinkman, M. G. Vander Hediden,Supporting aspartate biosynthesis is an essential function of respiration in proliferatingcells. Cell 162, 552–563 (2015).
Acknowledgments: We are grateful to J. Schaffer for illustrating the figures. Funding: Thiswork was supported by NIH grants RO1 CA12306708 (to N.S.C.) and RO1 CA157996 to (R.J.D.).Author contributions: N.S.C. wrote the abstract, bioenergetics, redox, and targeting metab-olism for cancer therapy sections. R.J.D. wrote the introduction, biosynthesis, technology, Box1, and conclusion sections. N.S.C. and R.J.D. both wrote the metabolic reprogramming andoncometabolites sections. Competing interests: R.J.D. is on the Advisory Boards of AgiosPharmaceuticals and Peloton Therapeutics. N.S.C. declares no competing interests. Data andmaterials availability: All data needed to evaluate the conclusions in the paper are present inthe paper and/or the Supplementary Materials. Additional data related to this paper may berequested from the authors.
Submitted 1 February 2016Accepted 29 April 2016Published 27 May 201610.1126/sciadv.1600200
Citation: R. J. DeBerardinis, N. S. Chandel, Fundamentals of cancer metabolism. Sci. Adv. 2,e1600200 (2016).
R E V I EW
DeBerardinis and Chandel Sci. Adv. 2016; 2 : e1600200 27 May 2016 18 of 18
on February 22, 2018http://advances.sciencem
ag.org/D
ownloaded from
www.SCIENCEADVANCES.org 27 May 2016 Vol 2 e16001200
36
R E S E A R C H A R T I C L E
HEALTH AND MED IC INE 2016 © The Authors,
some rights reserved;
exclusive licensee
American Association
for the Advancement
of Science. Distributed
under a Creative
Commons Attribution
NonCommercial
License 4.0 (CC BY-NC).
The DNA cytosine deaminase APOBEC3B promotestamoxifen resistance in ER-positive breast cancerEmily K. Law,1,2,3,4* Anieta M. Sieuwerts,5* Kelly LaPara,2 Brandon Leonard,2,3,4
Gabriel J. Starrett,2,3,4 Amy M. Molan,2,3,4 Nuri A. Temiz,2,3,4 Rachel Isaksson Vogel,2,6
Marion E. Meijer-van Gelder,5 Fred C. G. J. Sweep,7 Paul N. Span,8 John A. Foekens,5
John W. M. Martens,5 Douglas Yee,2 Reuben S. Harris1,2,3,4†
Breast tumors often display extreme genetic heterogeneity characterized by hundreds of gross chromosomal aber-rations and tens of thousands of somatic mutations. Tumor evolution is thought to be ongoing and driven bymultiplemutagenic processes. Amajor outstanding question iswhether primary tumors havepreexistingmutationsfor therapy resistance or whether additional DNA damage and mutagenesis are necessary. Drug resistance is a keymeasure of tumor evolvability. If a resistancemutation preexists at the time of primary tumor presentation, then theintended therapy is likely to fail. However, if resistance does not preexist, then ongoing mutational processes stillhave the potential to undermine therapeutic efficacy. The antiviral enzyme APOBEC3B (apolipoprotein B mRNA-editing enzyme, catalytic polypeptide-like 3B) preferentially deaminates DNA C-to-U, which results in signatureC-to-T and C-to-Gmutations commonly observed in breast tumors. We use clinical data and xenograft experimentsto ask whether APOBEC3B contributes to ongoing breast tumor evolution and resistance to the selective estrogenreceptor modulator, tamoxifen. First, APOBEC3B levels in primary estrogen receptor–positive (ER+) breast tumors in-versely correlate with the clinical benefit of tamoxifen in the treatment of metastatic ER+ disease. Second, APOBEC3Bdepletion in an ER+ breast cancer cell line results in prolonged tamoxifen responses inmurine xenograft experiments.Third, APOBEC3B overexpression accelerates the development of tamoxifen resistance in murine xenograftexperiments by a mechanism that requires the enzyme’s catalytic activity. These studies combine to indicate thatAPOBEC3B promotes drug resistance in breast cancer and that inhibiting APOBEC3B-dependent tumor evolvabilitymay be an effective strategy to improve efficacies of targeted cancer therapies.
INTRODUCTIONImprovements in the detection and therapy of operable breast tumorshave contributed to a steady decline in mortality (1, 2). Essentially allbreast cancer deaths are caused by metastatic outgrowths thatcompromise vital organs, such as the brain, liver, or lungs. Adjuvantsystemic therapies effectively reduce the risk of recurrence at these dis-tant metastatic sites by treating preexisting, clinically undetectable,micrometastatic deposits. In estrogen receptor–positive (ER+) breastcancer, a propensity for late recurrencemore than 5 years after surgeryis well documented and has resulted in recommendations to extendadjuvant endocrine therapy for a total of 10 years (3, 4). Although en-docrine therapy may be extended, it is evident that late recurrencesoccur even while the patient is taking appropriate therapy (5). The laterecurrence of these apparently dormant metastatic breast cancer cellsmay be due to ongoing tumor evolution and acquisition of additionalgenetic aberrations.
Mutations are thought to be the major drivers of recurrence,metastasis, and therapeutic resistance. Recent studies on the molec-
ular origins of mutations in breast cancer have implicated severalmolecular mechanisms, including both spontaneous and enzyme-catalyzed deamination of DNA cytosine bases (6–10) [reviewed bySwanton et al. (11), Roberts and Gordenin (12), and Helleday et al.(13)]. The former process correlates with aging and is mostly due tohydrolytic conversion of 5-methyl cytosine (mC) bases within 5′NmCG motifs into thymines, which escape base excision repair andare converted into C-to-T transition mutations by DNA replication(N = A, C, G, or T). The latter process is attributable to single-strandedDNA cytosine-to-uracil (C-to-U) deamination catalyzed by one ormore members of the APOBEC3 (apolipoprotein B mRNA-editingenzyme, catalytic polypeptide-like 3) family of enzymes, characterizedby C-to-T transitions and C-to-G transversions in 5′TCW motifs(W = A or T).
Human cells have the capacity to express up to seven distinctAPOBEC3 enzymes, which function normally as overlapping innateimmune defenses against a wide variety of DNA-based viruses andtransposons [reviewed by Malim and Bieniasz (14), Stavrou and Ross(15), and Simon et al. (16)]. APOBEC3A (A3A) and APOBEC3B(A3B) are leading candidates for explaining APOBEC signature mu-tations in breast tumors because overexpression of these enzymestriggers DNA damage responses and inflicts chromosomal muta-tions in hallmark trinucleotide contexts (7, 17–21). However, endog-enous A3A is not expressed significantly, nor is its activity detectablein breast cancer cell lines (7, 22) (see Results). The molecular relevanceof A3A is therefore difficult to assess because the impact of the endog-enous protein cannot be quantified. In comparison, endogenous A3Bis predominantly nuclear and has been shown to be responsible forelevated levels of genomic uracil and mutation in multiple breastcancer cell lines (7, 22). A3B is overexpressed in approximately 50%
1Howard Hughes Medical Institute, University of Minnesota, Minneapolis, MN55455, USA. 2Masonic Cancer Center, University of Minnesota, Minneapolis, MN55455, USA. 3Institute for Molecular Virology, University of Minnesota, Minneapolis,MN 55455, USA. 4Department of Biochemistry, Molecular Biology and Biophysics,University of Minnesota, Minneapolis, MN 55455, USA. 5Department of Medical On-cology and Cancer Genomics Netherlands, Erasmus MC Cancer Institute, 3015 GERotterdam, Netherlands. 6Division of Gynecologic Oncology, Department of Obstet-rics, Gynecology and Women’s Health, University of Minnesota, Minneapolis, MN55455, USA. 7Department of Laboratory Medicine, Radboud University MedicalCenter, Nijmegen, Netherlands. 8Department of Radiation Oncology, Radboud Uni-versity Medical Center, Nijmegen, Netherlands.*These authors contributed equally to this work.†Corresponding author. Email: [email protected]
S C I ENCE ADVANCES | R E S EARCH ART I C L E
Law et al., Sci. Adv. 2016;2 : e1601737 7 October 2016 1 of 9
on February 22, 2018http://advances.sciencem
ag.org/D
ownloaded from
www.SCIENCEADVANCES.org 7 October 2016 Vol 2 e1601737
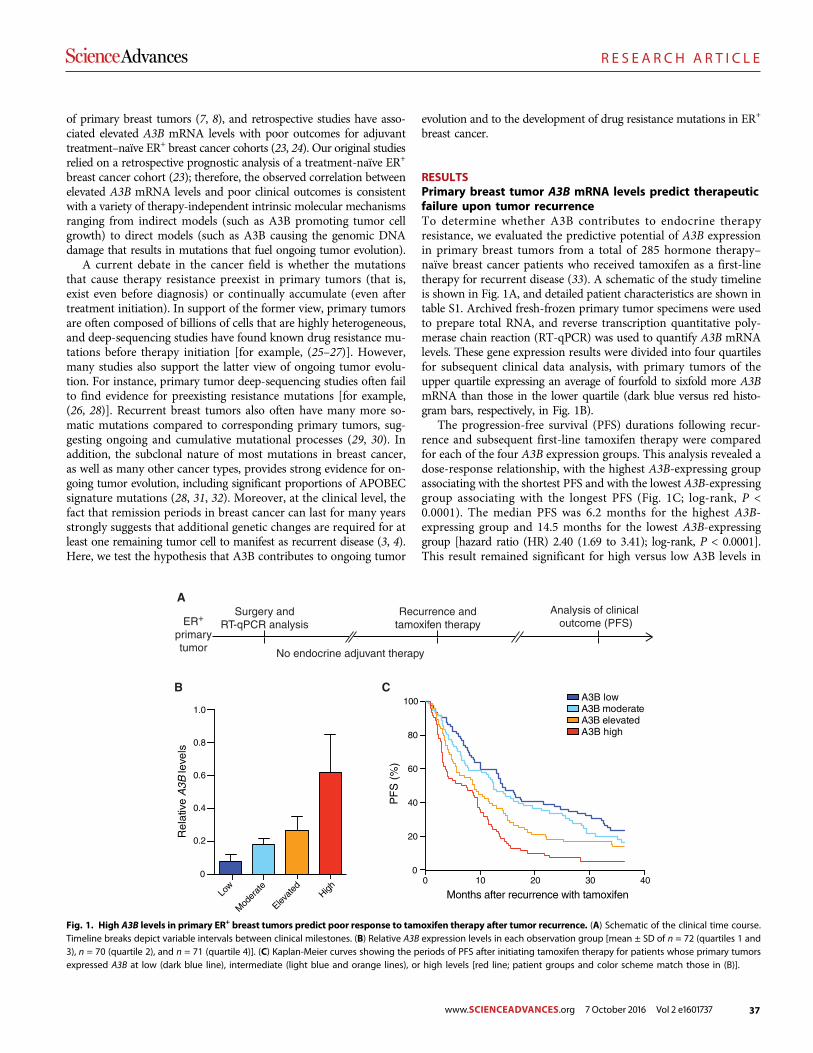
37
R E S E A R C H A R T I C L E
of primary breast tumors (7, 8), and retrospective studies have asso-ciated elevated A3B mRNA levels with poor outcomes for adjuvanttreatment–naïve ER+ breast cancer cohorts (23, 24). Our original studiesrelied on a retrospective prognostic analysis of a treatment-naïve ER+
breast cancer cohort (23); therefore, the observed correlation betweenelevated A3B mRNA levels and poor clinical outcomes is consistentwith a variety of therapy-independent intrinsic molecular mechanismsranging from indirect models (such as A3B promoting tumor cellgrowth) to direct models (such as A3B causing the genomic DNAdamage that results in mutations that fuel ongoing tumor evolution).
A current debate in the cancer field is whether the mutationsthat cause therapy resistance preexist in primary tumors (that is,exist even before diagnosis) or continually accumulate (even aftertreatment initiation). In support of the former view, primary tumorsare often composed of billions of cells that are highly heterogeneous,and deep-sequencing studies have found known drug resistance mu-tations before therapy initiation [for example, (25–27)]. However,many studies also support the latter view of ongoing tumor evolu-tion. For instance, primary tumor deep-sequencing studies often failto find evidence for preexisting resistance mutations [for example,(26, 28)]. Recurrent breast tumors also often have many more so-matic mutations compared to corresponding primary tumors, sug-gesting ongoing and cumulative mutational processes (29, 30). Inaddition, the subclonal nature of most mutations in breast cancer,as well as many other cancer types, provides strong evidence for on-going tumor evolution, including significant proportions of APOBECsignature mutations (28, 31, 32). Moreover, at the clinical level, thefact that remission periods in breast cancer can last for many yearsstrongly suggests that additional genetic changes are required for atleast one remaining tumor cell to manifest as recurrent disease (3, 4).Here, we test the hypothesis that A3B contributes to ongoing tumor
evolution and to the development of drug resistance mutations in ER+
breast cancer.
RESULTSPrimary breast tumor A3B mRNA levels predict therapeuticfailure upon tumor recurrenceTo determine whether A3B contributes to endocrine therapyresistance, we evaluated the predictive potential of A3B expressionin primary breast tumors from a total of 285 hormone therapy–naïve breast cancer patients who received tamoxifen as a first-linetherapy for recurrent disease (33). A schematic of the study timelineis shown in Fig. 1A, and detailed patient characteristics are shown intable S1. Archived fresh-frozen primary tumor specimens were usedto prepare total RNA, and reverse transcription quantitative poly-merase chain reaction (RT-qPCR) was used to quantify A3B mRNAlevels. These gene expression results were divided into four quartilesfor subsequent clinical data analysis, with primary tumors of theupper quartile expressing an average of fourfold to sixfold more A3BmRNA than those in the lower quartile (dark blue versus red histo-gram bars, respectively, in Fig. 1B).
The progression-free survival (PFS) durations following recur-rence and subsequent first-line tamoxifen therapy were comparedfor each of the four A3B expression groups. This analysis revealed adose-response relationship, with the highest A3B-expressing groupassociating with the shortest PFS and with the lowest A3B-expressinggroup associating with the longest PFS (Fig. 1C; log-rank, P <0.0001). The median PFS was 6.2 months for the highest A3B-expressing group and 14.5 months for the lowest A3B-expressinggroup [hazard ratio (HR) 2.40 (1.69 to 3.41); log-rank, P < 0.0001].This result remained significant for high versus low A3B levels in
Low
Mod
erat
e
Elevate
dHigh
A3B lowA3B moderateA3B elevatedA3B high
0 10 20 30 400
20
100
Months after recurrence with tamoxifen
PF
S (
%)
B C
ASurgery and
RT-qPCR analysis
40
60
80
0
0.2
0.4
0.6
0.8
1.0
Rel
ativ
e A
3B le
vels
ER+
primarytumor
Analysis of clinical outcome (PFS)
Recurrence andtamoxifen therapy
No endocrine adjuvant therapy
Fig. 1. High A3B levels in primary ER+ breast tumors predict poor response to tamoxifen therapy after tumor recurrence. (A) Schematic of the clinical time course.Timeline breaks depict variable intervals between clinical milestones. (B) Relative A3B expression levels in each observation group [mean ± SD of n = 72 (quartiles 1 and3), n = 70 (quartile 2), and n = 71 (quartile 4)]. (C) Kaplan-Meier curves showing the periods of PFS after initiating tamoxifen therapy for patients whose primary tumorsexpressed A3B at low (dark blue line), intermediate (light blue and orange lines), or high levels [red line; patient groups and color scheme match those in (B)].
S C I ENCE ADVANCES | R E S EARCH ART I C L E
Law et al., Sci. Adv. 2016;2 : e1601737 7 October 2016 2 of 9
on February 22, 2018http://advances.sciencem
ag.org/D
ownloaded from
www.SCIENCEADVANCES.org 7 October 2016 Vol 2 e1601737
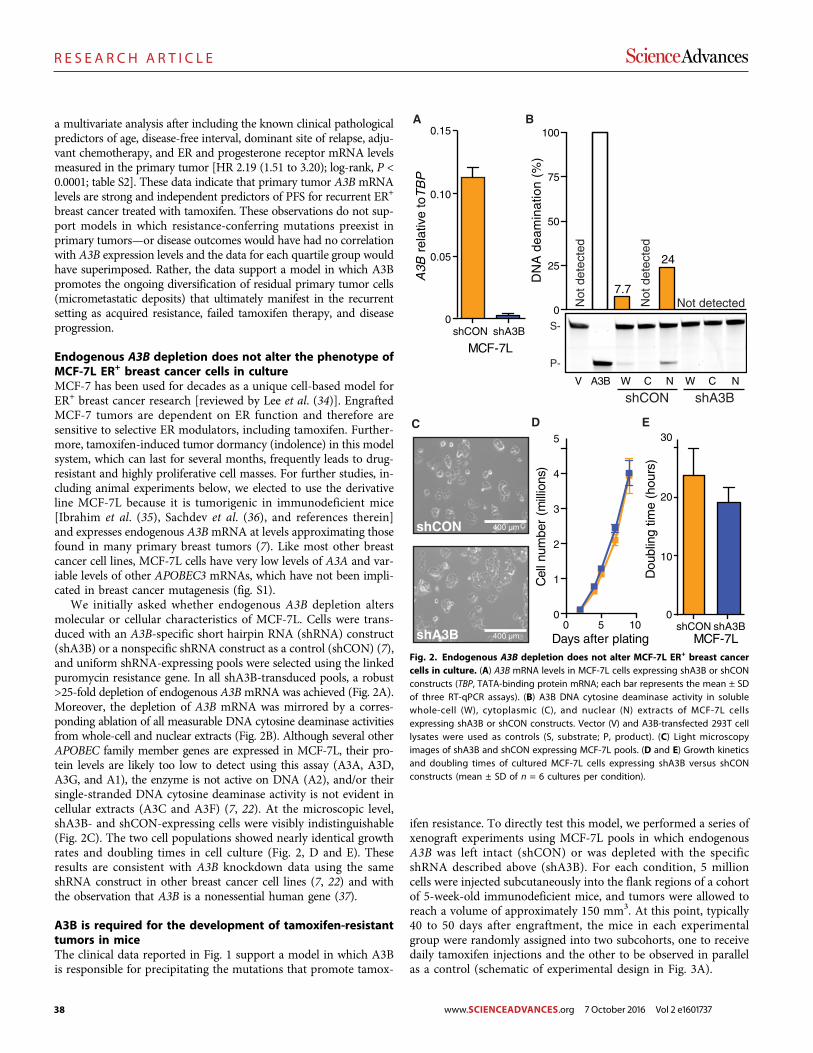
38
R E S E A R C H A R T I C L E
a multivariate analysis after including the known clinical pathologicalpredictors of age, disease-free interval, dominant site of relapse, adju-vant chemotherapy, and ER and progesterone receptor mRNA levelsmeasured in the primary tumor [HR 2.19 (1.51 to 3.20); log-rank, P <0.0001; table S2]. These data indicate that primary tumor A3B mRNAlevels are strong and independent predictors of PFS for recurrent ER+
breast cancer treated with tamoxifen. These observations do not sup-port models in which resistance-conferring mutations preexist inprimary tumors—or disease outcomes would have had no correlationwith A3B expression levels and the data for each quartile group wouldhave superimposed. Rather, the data support a model in which A3Bpromotes the ongoing diversification of residual primary tumor cells(micrometastatic deposits) that ultimately manifest in the recurrentsetting as acquired resistance, failed tamoxifen therapy, and diseaseprogression.
Endogenous A3B depletion does not alter the phenotype ofMCF-7L ER+ breast cancer cells in cultureMCF-7 has been used for decades as a unique cell-based model forER+ breast cancer research [reviewed by Lee et al. (34)]. EngraftedMCF-7 tumors are dependent on ER function and therefore aresensitive to selective ER modulators, including tamoxifen. Further-more, tamoxifen-induced tumor dormancy (indolence) in this modelsystem, which can last for several months, frequently leads to drug-resistant and highly proliferative cell masses. For further studies, in-cluding animal experiments below, we elected to use the derivativeline MCF-7L because it is tumorigenic in immunodeficient mice[Ibrahim et al. (35), Sachdev et al. (36), and references therein]and expresses endogenous A3BmRNA at levels approximating thosefound in many primary breast tumors (7). Like most other breastcancer cell lines, MCF-7L cells have very low levels of A3A and var-iable levels of other APOBEC3 mRNAs, which have not been impli-cated in breast cancer mutagenesis (fig. S1).
We initially asked whether endogenous A3B depletion altersmolecular or cellular characteristics of MCF-7L. Cells were trans-duced with an A3B-specific short hairpin RNA (shRNA) construct(shA3B) or a nonspecific shRNA construct as a control (shCON) (7),and uniform shRNA-expressing pools were selected using the linkedpuromycin resistance gene. In all shA3B-transduced pools, a robust>25-fold depletion of endogenous A3BmRNA was achieved (Fig. 2A).Moreover, the depletion of A3B mRNA was mirrored by a corres-ponding ablation of all measurable DNA cytosine deaminase activitiesfrom whole-cell and nuclear extracts (Fig. 2B). Although several otherAPOBEC family member genes are expressed in MCF-7L, their pro-tein levels are likely too low to detect using this assay (A3A, A3D,A3G, and A1), the enzyme is not active on DNA (A2), and/or theirsingle-stranded DNA cytosine deaminase activity is not evident incellular extracts (A3C and A3F) (7, 22). At the microscopic level,shA3B- and shCON-expressing cells were visibly indistinguishable(Fig. 2C). The two cell populations showed nearly identical growthrates and doubling times in cell culture (Fig. 2, D and E). Theseresults are consistent with A3B knockdown data using the sameshRNA construct in other breast cancer cell lines (7, 22) and withthe observation that A3B is a nonessential human gene (37).
A3B is required for the development of tamoxifen-resistanttumors in miceThe clinical data reported in Fig. 1 support a model in which A3Bis responsible for precipitating the mutations that promote tamox-
ifen resistance. To directly test this model, we performed a series ofxenograft experiments using MCF-7L pools in which endogenousA3B was left intact (shCON) or was depleted with the specificshRNA described above (shA3B). For each condition, 5 millioncells were injected subcutaneously into the flank regions of a cohortof 5-week-old immunodeficient mice, and tumors were allowed toreach a volume of approximately 150 mm3. At this point, typically40 to 50 days after engraftment, the mice in each experimentalgroup were randomly assigned into two subcohorts, one to receivedaily tamoxifen injections and the other to be observed in parallelas a control (schematic of experimental design in Fig. 3A).
shCON shA3B0
0.05
0.10
0.15
MCF-7L
A3B
rel
ativ
e to
TB
P
A
D
shCON shA3B0
10
20
30
MCF-7LD
oubl
ing
time
(hou
rs)
E
5 1000
1
2
3
4
5
Days after plating
Cel
l num
ber
(mill
ions
)
V A3B W C N W C N
0
50
100
DN
A d
eam
inat
ion
(%)
7.7
24
S-
P-
shCON shA3B
25
75
Not
det
ecte
d
Not detectedNot
det
ecte
d
shCON
shA3B
C
B
400 µm
400 µm
Fig. 2. Endogenous A3B depletion does not alter MCF-7L ER+ breast cancercells in culture. (A) A3B mRNA levels in MCF-7L cells expressing shA3B or shCONconstructs (TBP, TATA-binding protein mRNA; each bar represents the mean ± SDof three RT-qPCR assays). (B) A3B DNA cytosine deaminase activity in solublewhole-cell (W), cytoplasmic (C), and nuclear (N) extracts of MCF-7L cellsexpressing shA3B or shCON constructs. Vector (V) and A3B-transfected 293T celllysates were used as controls (S, substrate; P, product). (C) Light microscopyimages of shA3B and shCON expressing MCF-7L pools. (D and E) Growth kineticsand doubling times of cultured MCF-7L cells expressing shA3B versus shCONconstructs (mean ± SD of n = 6 cultures per condition).
S C I ENCE ADVANCES | R E S EARCH ART I C L E
Law et al., Sci. Adv. 2016;2 : e1601737 7 October 2016 3 of 9
on February 22, 2018http://advances.sciencem
ag.org/D
ownloaded from
www.SCIENCEADVANCES.org 7 October 2016 Vol 2 e1601737
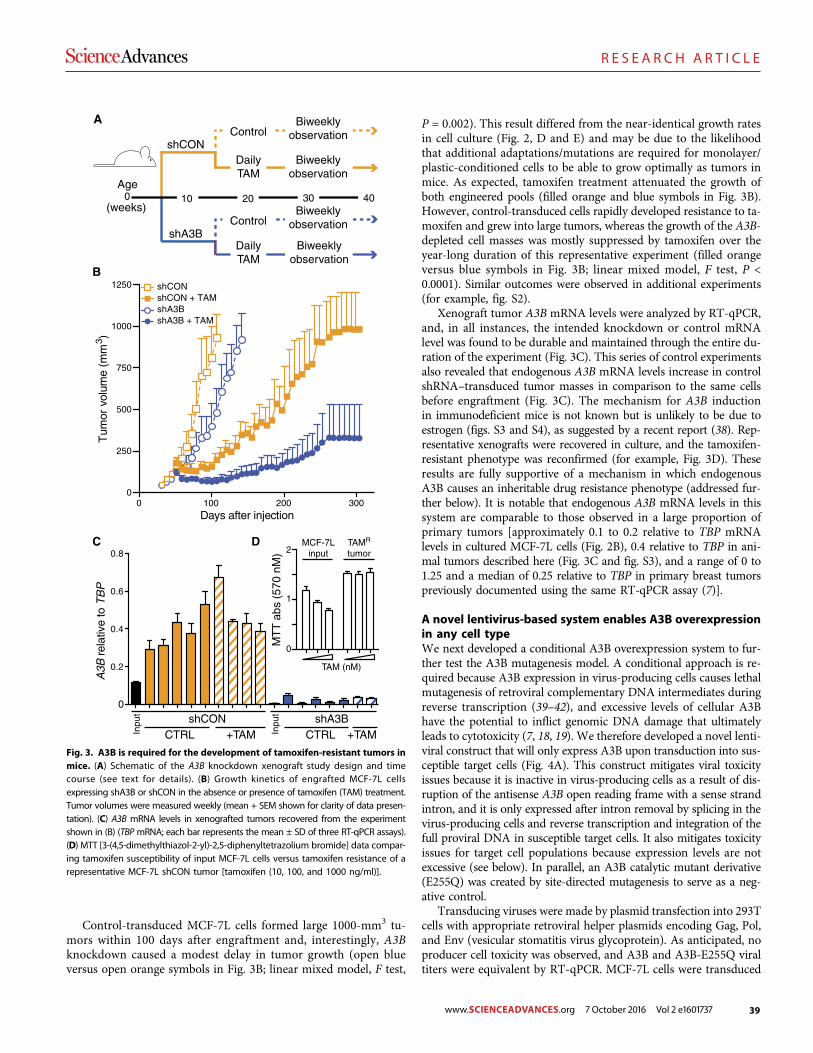
39
R E S E A R C H A R T I C L E
Control-transduced MCF-7L cells formed large 1000-mm3 tu-mors within 100 days after engraftment and, interestingly, A3Bknockdown caused a modest delay in tumor growth (open blueversus open orange symbols in Fig. 3B; linear mixed model, F test,
P = 0.002). This result differed from the near-identical growth ratesin cell culture (Fig. 2, D and E) and may be due to the likelihoodthat additional adaptations/mutations are required for monolayer/plastic-conditioned cells to be able to grow optimally as tumors inmice. As expected, tamoxifen treatment attenuated the growth ofboth engineered pools (filled orange and blue symbols in Fig. 3B).However, control-transduced cells rapidly developed resistance to ta-moxifen and grew into large tumors, whereas the growth of the A3B-depleted cell masses was mostly suppressed by tamoxifen over theyear-long duration of this representative experiment (filled orangeversus blue symbols in Fig. 3B; linear mixed model, F test, P <0.0001). Similar outcomes were observed in additional experiments(for example, fig. S2).
Xenograft tumor A3B mRNA levels were analyzed by RT-qPCR,and, in all instances, the intended knockdown or control mRNAlevel was found to be durable and maintained through the entire du-ration of the experiment (Fig. 3C). This series of control experimentsalso revealed that endogenous A3B mRNA levels increase in controlshRNA–transduced tumor masses in comparison to the same cellsbefore engraftment (Fig. 3C). The mechanism for A3B inductionin immunodeficient mice is not known but is unlikely to be due toestrogen (figs. S3 and S4), as suggested by a recent report (38). Rep-resentative xenografts were recovered in culture, and the tamoxifen-resistant phenotype was reconfirmed (for example, Fig. 3D). Theseresults are fully supportive of a mechanism in which endogenousA3B causes an inheritable drug resistance phenotype (addressed fur-ther below). It is notable that endogenous A3B mRNA levels in thissystem are comparable to those observed in a large proportion ofprimary tumors [approximately 0.1 to 0.2 relative to TBP mRNAlevels in cultured MCF-7L cells (Fig. 2B), 0.4 relative to TBP in ani-mal tumors described here (Fig. 3C and fig. S3), and a range of 0 to1.25 and a median of 0.25 relative to TBP in primary breast tumorspreviously documented using the same RT-qPCR assay (7)].
A novel lentivirus-based system enables A3B overexpressionin any cell typeWe next developed a conditional A3B overexpression system to fur-ther test the A3B mutagenesis model. A conditional approach is re-quired because A3B expression in virus-producing cells causes lethalmutagenesis of retroviral complementary DNA intermediates duringreverse transcription (39–42), and excessive levels of cellular A3Bhave the potential to inflict genomic DNA damage that ultimatelyleads to cytotoxicity (7, 18, 19). We therefore developed a novel lenti-viral construct that will only express A3B upon transduction into sus-ceptible target cells (Fig. 4A). This construct mitigates viral toxicityissues because it is inactive in virus-producing cells as a result of dis-ruption of the antisense A3B open reading frame with a sense strandintron, and it is only expressed after intron removal by splicing in thevirus-producing cells and reverse transcription and integration of thefull proviral DNA in susceptible target cells. It also mitigates toxicityissues for target cell populations because expression levels are notexcessive (see below). In parallel, an A3B catalytic mutant derivative(E255Q) was created by site-directed mutagenesis to serve as a neg-ative control.
Transducing viruses were made by plasmid transfection into 293Tcells with appropriate retroviral helper plasmids encoding Gag, Pol,and Env (vesicular stomatitis virus glycoprotein). As anticipated, noproducer cell toxicity was observed, and A3B and A3B-E255Q viraltiters were equivalent by RT-qPCR. MCF-7L cells were transduced
Age
shA3B
shCONBiweekly
observationDailyTAM
ControlBiweekly
observation
Biweeklyobservation
DailyTAM
ControlBiweekly
observation
A
(weeks)0 403010 20
B
0 100 200 3000
250
500
750
1000
1250
Days after injection
Tum
or v
olum
e (m
m3 )
shCON + TAMshCON
shA3B + TAMshA3B
C
Inpu
t
Inpu
t
0
0.2
0.4
0.6
0.8
A3B
rel
ativ
e to
TB
P
shA3BCTRL +TAM
shCONCTRL +TAM
D
0
1
2
MT
T a
bs (
570
nM)
TAM (nM)
MCF-7Linput
TAMR
tumor
Fig. 3. A3B is required for the development of tamoxifen-resistant tumors inmice. (A) Schematic of the A3B knockdown xenograft study design and timecourse (see text for details). (B) Growth kinetics of engrafted MCF-7L cellsexpressing shA3B or shCON in the absence or presence of tamoxifen (TAM) treatment.Tumor volumes were measured weekly (mean + SEM shown for clarity of data presen-tation). (C) A3B mRNA levels in xenografted tumors recovered from the experimentshown in (B) (TBPmRNA; each bar represents the mean ± SD of three RT-qPCR assays).(D) MTT [3-(4,5-dimethylthiazol-2-yl)-2,5-diphenyltetrazolium bromide] data compar-ing tamoxifen susceptibility of input MCF-7L cells versus tamoxifen resistance of arepresentative MCF-7L shCON tumor [tamoxifen (10, 100, and 1000 ng/ml)].
S C I ENCE ADVANCES | R E S EARCH ART I C L E
Law et al., Sci. Adv. 2016;2 : e1601737 7 October 2016 4 of 9
on February 22, 2018http://advances.sciencem
ag.org/D
ownloaded from
www.SCIENCEADVANCES.org 7 October 2016 Vol 2 e1601737
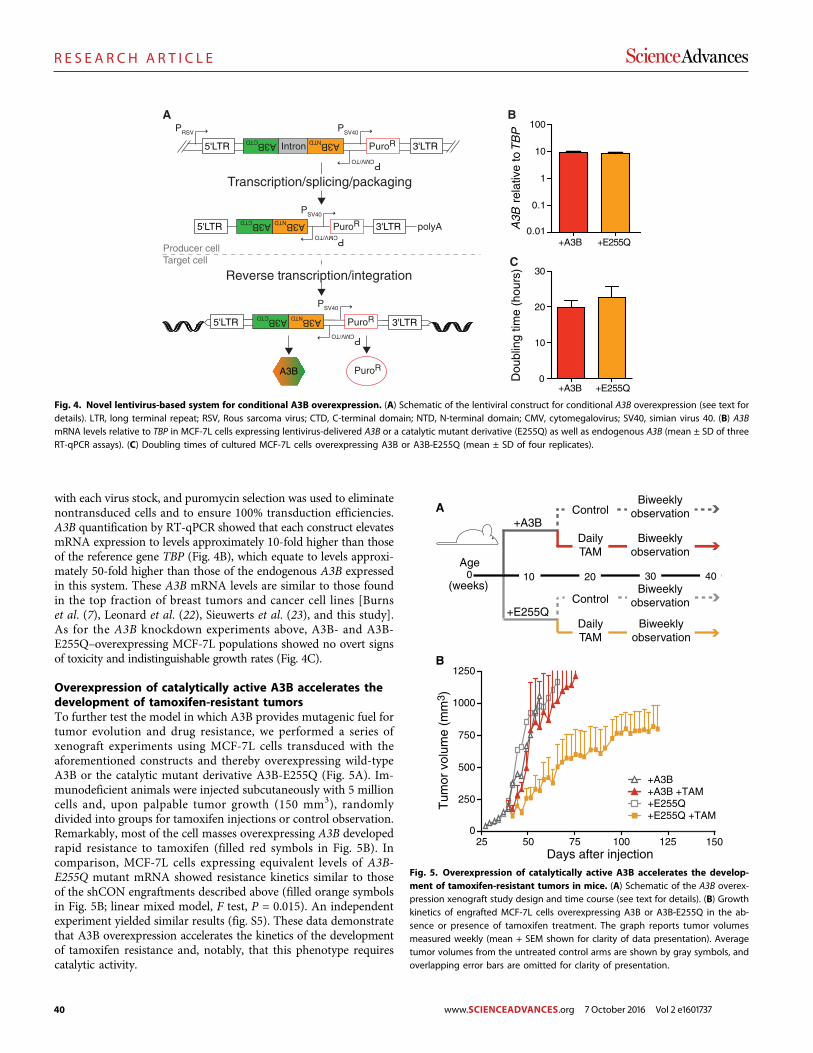
40
R E S E A R C H A R T I C L E
with each virus stock, and puromycin selection was used to eliminatenontransduced cells and to ensure 100% transduction efficiencies.A3B quantification by RT-qPCR showed that each construct elevatesmRNA expression to levels approximately 10-fold higher than thoseof the reference gene TBP (Fig. 4B), which equate to levels approxi-mately 50-fold higher than those of the endogenous A3B expressedin this system. These A3B mRNA levels are similar to those foundin the top fraction of breast tumors and cancer cell lines [Burnset al. (7), Leonard et al. (22), Sieuwerts et al. (23), and this study].As for the A3B knockdown experiments above, A3B- and A3B-E255Q–overexpressing MCF-7L populations showed no overt signsof toxicity and indistinguishable growth rates (Fig. 4C).
Overexpression of catalytically active A3B accelerates thedevelopment of tamoxifen-resistant tumorsTo further test the model in which A3B provides mutagenic fuel fortumor evolution and drug resistance, we performed a series ofxenograft experiments using MCF-7L cells transduced with theaforementioned constructs and thereby overexpressing wild-typeA3B or the catalytic mutant derivative A3B-E255Q (Fig. 5A). Im-munodeficient animals were injected subcutaneously with 5 millioncells and, upon palpable tumor growth (150 mm3), randomlydivided into groups for tamoxifen injections or control observation.Remarkably, most of the cell masses overexpressing A3B developedrapid resistance to tamoxifen (filled red symbols in Fig. 5B). Incomparison, MCF-7L cells expressing equivalent levels of A3B-E255Q mutant mRNA showed resistance kinetics similar to thoseof the shCON engraftments described above (filled orange symbolsin Fig. 5B; linear mixed model, F test, P = 0.015). An independentexperiment yielded similar results (fig. S5). These data demonstratethat A3B overexpression accelerates the kinetics of the developmentof tamoxifen resistance and, notably, that this phenotype requirescatalytic activity.
Reverse transcription/integration
Producer cellTarget cell
Transcription/splicing/packaging
PRSV
5'LTR 3'LTR
PSV40
PCMV/TO
A3BNTDA3BCTD
Intron PuroR
A3BNTDA3BCTD
polyA5'LTR 3'LTR
PSV40
PCMV/TO
A3B
A3BNTDA3BCTD
5'LTR 3'LTR
PSV40
PCMV/TO
A
PuroR
PuroR
PuroR
B
+A3B +E255Q0.01
0.1
1
10
100
A3B
rel
ativ
e to
TB
P
C
+A3B +E255Q0
10
20
30
Dou
blin
g tim
e (h
ours
)
Fig. 4. Novel lentivirus-based system for conditional A3B overexpression. (A) Schematic of the lentiviral construct for conditional A3B overexpression (see text fordetails). LTR, long terminal repeat; RSV, Rous sarcoma virus; CTD, C-terminal domain; NTD, N-terminal domain; CMV, cytomegalovirus; SV40, simian virus 40. (B) A3BmRNA levels relative to TBP in MCF-7L cells expressing lentivirus-delivered A3B or a catalytic mutant derivative (E255Q) as well as endogenous A3B (mean ± SD of threeRT-qPCR assays). (C) Doubling times of cultured MCF-7L cells overexpressing A3B or A3B-E255Q (mean ± SD of four replicates).
B
25 50 75 100 1250
500
1000
Days after injection
Tum
or v
olum
e (m
m3 )
+A3B+A3B +TAM+E255Q+E255Q +TAM
1250
750
250
Age
+E255Q
+A3BBiweekly
observationDailyTAM
ControlBiweekly
observation
Biweeklyobservation
DailyTAM
ControlBiweekly
observation
A
(weeks)0 403010 20
150
Fig. 5. Overexpression of catalytically active A3B accelerates the develop-ment of tamoxifen-resistant tumors in mice. (A) Schematic of the A3B overex-pression xenograft study design and time course (see text for details). (B) Growthkinetics of engrafted MCF-7L cells overexpressing A3B or A3B-E255Q in the ab-sence or presence of tamoxifen treatment. The graph reports tumor volumesmeasured weekly (mean + SEM shown for clarity of data presentation). Averagetumor volumes from the untreated control arms are shown by gray symbols, andoverlapping error bars are omitted for clarity of presentation.
S C I ENCE ADVANCES | R E S EARCH ART I C L E
Law et al., Sci. Adv. 2016;2 : e1601737 7 October 2016 5 of 9
on February 22, 2018http://advances.sciencem
ag.org/D
ownloaded from
www.SCIENCEADVANCES.org 7 October 2016 Vol 2 e1601737
41
R E S E A R C H A R T I C L E
ESR1 mutations are not responsible for tamoxifen resistancein the MCF-7L model for ER+ breast cancerAlthough the development of tamoxifen-resistant breast tumors isa major clinical problem, in most cases the molecular basis forresistance is unknown. A small fraction of treated patients developtumors with ESR1 exonic mutations that cause amino acid changesin the hormone-binding domain of the ER. These mutations havebeen seen mostly in tumors resistant to aromatase inhibitors andnot as frequently in tumors resistant to tamoxifen [reviewed byClarke et al. (43) and Jeselsohn et al. (44)]. To determine whetherESR1 mutations are also part of the tamoxifen resistance mecha-nism in MCF-7L cells, we performed DNA exome sequencing on9 independent tamoxifen-resistant xenografts and 10 independentcontrol tumor masses. The ESR1 gene contained no mutations un-der either condition (see table S3 for a full list of base substitutionmutations). Resistant tumor ESR1 mRNA levels were somewhatvariable but still similar to those present in the original MCF-7Lcell populations (fig. S6). Together with the data presented aboveindicating heritable resistance to tamoxifen (Fig. 3D), these resultssuggest that at least one other resistance mechanism occurs in theMCF-7 model system for ER+ breast cancer.
DISCUSSIONThe clinical and xenograft results presented here strongly support amodel in which A3B drives tamoxifen resistance in ER+ breastcancer. Clinically, resistance to endocrine therapies has been definedas primary or secondary, depending on the length of time a patientbenefits from ER-targeted therapy. Our data suggest that A3B mayhave a role in both kinds of resistance and particularly in the develop-ment of secondary, acquired resistance. Suppression of endogenouslevels of A3B enhances tamoxifen benefit (Fig. 3), whereas overex-pression of A3B eliminates almost all benefits from tamoxifen ther-apy (Fig. 5). Because the only known biochemical activity of A3B issingle-stranded DNA cytosine deamination [for example, (7, 42, 45)]and the tamoxifen resistance phenotype is heritable (Fig. 3D), themost likely mechanism is A3B-catalyzed DNA C-to-U editing coupledto the processing of these uracil lesions into somatic mutations bynormal DNA repair processes [reviewed by Swanton et al. (11), Robertsand Gordenin (12), and Helleday et al. (13)]. In further support of thismechanism, the catalytic glutamate of A3B (E255) is required foraccelerated tamoxifen resistance kinetics upon enzyme overexpression.
Because ESR1mutations were not observed in MCF-7L tamoxifen-resistant tumors, the identity of the resistance-conferring mutationsin this system will require significant future studies and possibly evenwhole-genome sequencing if the predominant causal lesions lie out-side the exomic fraction of the genome. The intrinsic signature ofA3B may help to identify candidate (frequently mutated) sites formechanistic follow-up. Then, for instance, genetic knock-in experi-ments could be used to unambiguously establish a cause-effect re-lationship. However, the resistance-conferring mutations (such asgene translocations, amplifications, or deletions) could also be complexand difficult to recapitulate precisely because DNA repair enzymescan readily process genomic uracil lesions into single- and double-stranded breaks (46, 47).
A3Bhas been implicated as a dominant source ofmutation in breast,head/neck, lung, bladder, and cervical cancers and—to a lesser but stillsignificant extent—in many other tumor types (7–10, 28, 32, 48, 49).The fundamental nature of theDNAdeaminationmechanism, together
with the data presented here, strongly suggests that A3B may be a gen-eral mechanism of therapeutic resistance to cancer therapy. At thispoint, potential mutagenic contributions from other APOBEC3 familymembers, such as A3A, cannot be excluded fully, but they do not ap-pear to manifest in the MCF-7L system, nor are these potential contri-butions large enough to prevent the significant association betweenA3B expression levels and clinical outcomes for ER+ breast cancerpatients [treatment-naïve data in the studies by Sieuwerts et al. (23)and Cescon et al. (24) and post-recurrence tamoxifen resistance datain Fig. 1]. Thus, strategies to down-regulate A3B activity or expression,as reported here using a specific shRNA knockdown construct in amodel system for ER+ breast cancer, may be beneficial as chemo-therapeutic adjuvants to “turn down” the mutation rate, decrease thelikelihood of evolving drug resistance, and prolong the clinical benefitof therapy for the many cancers that are likely to be driven by thisongoing mutational process.
MATERIALS AND METHODSClinical studiesThe clinical characteristics of the 285 patients [225 from Rotterdam(Erasmus University Medical Center) and 60 from Nijmegen (RadboudUniversity Medical Center)] whose primary tumor specimens and datawere used here have been described previously by Sieuwerts et al. (33).The protocol to study biological markers associated with disease out-come was approved by the medical ethics committee of the ErasmusUniversity Medical Center (Rotterdam, Netherlands) (MEC 02.953);for Nijmegen, coded primary tumor tissues were used in accordancewith the Codes of Conduct of the Federation of Medical Scientific So-cieties in the Netherlands (www.federa.org/codes-conduct). Thirty-two patients presented with distant metastasis at diagnosis or developeddistant metastasis (including supraclavicular lymph node metastasis)within 1 month following primary surgery (M1 patients). These 32patients and the 253 patients who developed a first recurrence duringfollow-up (25 patients with local-regional relapse and 228 patientswith distant metastasis) were treated with first-line tamoxifen. All pa-tients were ER+ and anti–hormonal therapy–naïve, but 38 patientsreceived adjuvant chemotherapy. The median time between theprimary surgery and the start of therapy was 24 months (range, 0to 120 months). The median follow-up of patients alive at the end offollow-up was 98 months (range, 9 to 240 months) after the primarysurgery and 45 months (range, 3 to 178 months) after the start offirst-line tamoxifen therapy. For 182 patients (64%), disease progres-sion occurred within 6 months of the start of the first-line therapybeing controlled by tamoxifen. At the end of the follow-up period,268 (94%) patients had developed tumor progression, and 222(78%) patients had died.
Total RNA was extracted with RNA Bee (Tel Test, Thermo FisherScientific Inc.) from 30-mm fresh-frozen primary tumor tissue sectionscontaining at least 30% invasive tumor cell nuclei, and mRNA tran-scripts were quantified by RT-qPCR as described previously by Sieuwertset al. (23). The median A3B expression level in the group of 285 breastcancers was 0.22 relative to the normalized average of three referencegenes [HPRT1, HMBS, and TBP (23)].
DNA constructsA3B knockdown and control shRNA constructs were described andvalidated previously by Burns et al. (7) and Leonard et al. (50). TheA3B and A3B-E255Q lentiviral expression constructs were based
SC I ENCE ADVANCES | R E S EARCH ART I C L E
Law et al., Sci. Adv. 2016;2 : e1601737 7 October 2016 6 of 9
on February 22, 2018http://advances.sciencem
ag.org/D
ownloaded from
www.SCIENCEADVANCES.org 7 October 2016 Vol 2 e1601737
42
R E S E A R C H A R T I C L E
on the pLenti4TO backbone (Life Technologies). Overlapping PCRwas used to place a sense-encoded intron between an antisense-encoded A3B open reading frame (primers available on request). Acytomegalovirus promoter drove A3B expression, and a simian virus40 early promoter drove puromycin resistance. Constructs were ver-ified by DNA sequencing.
Cell culture studiesMCF-7L cells were cultured at 37°C under 5% CO2 and maintainedin improved minimum essential medium (Richter’s modificationmedium) containing 5% fetal bovine serum, penicillin (100 U/ml),streptomycin (100 mg/ml), and 11.25 nM recombinant human in-sulin. These cells were originally obtained from C. Kent Osborne(Baylor College of Medicine, Houston, TX) and are subject to shorttandem repeat analysis yearly to confirm their identity with theoriginal MCF-7 cell line. Cells were transduced with the lentivirus-based shRNA or conditional expression constructs described aboveand selected with puromycin (1 mg/ml; United States Biological) for72 hours to generate uniformly transduced pools. Cell growth ex-periments were performed by plating 100,000 cells per six-well plateand incubating them at 37°C for the indicated days. Cells were tryp-sinized, diluted 1:2 in trypan blue (Invitrogen), and counted via a he-mocytometer (six biological replicates per day per condition). Cellproliferation rates were determined using the xCELLigence real-timecell analyzer dual-plate instrument according to the manufacturer’sinstructions (ACEA Biosciences).
The mRNA level of eachAPOBEC family member gene was quan-tified using previously described RT-qPCR protocols and primer/probe combinations and presented relative to the housekeeping geneTBP (7, 51, 52). ESR1 andC-MYCRNAwere quantified by RT-qPCRusing intron-spanning primers 5′-ATGACCATGACCCTCCA-CACC and 5′-TCAGACCGTGGCAGGGAAACC (UPL24) and5′-GCTGCTTAGACGCTGGATTT and 5′-TAACGTTGAGGGG-CATCG (UPL66), respectively, and manufacturer-recommendedprotocols (LightCycler 480, Roche). C-MYC is an established estrogen-responsive gene (53).
DNA deaminase activity was measured in soluble whole-cell,nuclear, and cytoplasmic fractions of MCF-7L cultures usingestablished protocols (7, 54). The single-stranded DNA substratecontained a single target cytosine (5′-ATTATTATTATTC-GAATGGATTTATTTATTTATTTATTTATTT-fluorescein); de-amination, uracil excision, and backbone cleavage resulted in asingle faster-migrating product on SDS–polyacrylamide gel electro-phoresis and image analysis (Typhoon FLA 7000 and ImageQuantsoftware, GE Healthcare Life Sciences).
Xenograft studiesThe University of Minnesota Institutional Animal Care and UseCommittee approved the animal protocols used here (1305-30638A). MCF-7L cells were harvested at 70% confluence, counted,and resuspended in serum-free medium (without phenol red) at aconcentration of 5 million cells per 50 ml of final volume. Ovariec-tomized, athymic mice (Harlan) were injected subcutaneously inthe left flank with 50 ml of cell suspension at approximately 5 weeksof age. Each experiment was initiated with 5 or 10 mice per exper-imental condition. One week before injection and at all times fol-lowing, the mice were provided with drinking water supplementedwith 1 mM b-estradiol (Sigma-Aldrich) (except for the subset ofmice used in the experiment shown in fig. S3). Tumors were measured
bidirectionally twice weekly, and tamoxifen treatment began when theaverage tumor volume reached 150 mm3. Tamoxifen citrate (500 mg;Sigma-Aldrich) emulsified in 50 ml of peanut oil was administeredsubcutaneously 5 of 7 days each week. Tumor volumes were calculatedusing the following formula: length × breadth2/2.
MCF-7L exome sequencingGenomicDNAwas prepared from tumor cellmasses (~20mg per sam-ple) via the Gentra Puregene Tissue DNA isolation protocols (Qiagen).Samples were diluted to 100 ng/ml and assessed further for quality andpurity by SYBRGreenPCRon a 197-bp fragment ofA3Husing primers5′-CATGGGACTGGACGAAGCGCA and 5′-TGGGATCCACACA-GAAGCCGCA. Samples with no amplification were excluded fromthe analysis. One microgram of total genomic DNA per sample wassubjected to whole-exome sequencing on the Complete Genomicsplatform to an average target depth of 100× (BGI). Reads werealigned by BGI using its in-house pipeline, and the alignments in bamformat were used for variant calling. Somatic variants were called foreach tumor alignment by VarScan 2 (55) using an estrogen-treatedshA3B sample as the normal control. The variants were filtered with aminimum overall coverage depth of 20 reads and a minimum coveragedepth of 4 reads for the alternate allele. Any variant occurring at anyfrequency above 0 at the same position in more than one sample wasconsidered a common mutation in the input pool and was removed.A full list of base substitution mutations is provided in table S3.
StatisticsComparisons of the PFS of hormone-naïve breast cancer patientsfollowing treatment for first recurrence with tamoxifen, by A3B ex-pression level (divided into quartiles), were conducted using log-rank tests; HRs and 95% confidence intervals are presented forpairwise comparisons. Clinical data were analyzed using SPSS Sta-tistics version 23.0 (IBM). In the xenograft studies, repeated mea-sures of tumor volume over time were compared by treatmentgroup using linear mixed models with fixed effects for treatment,days, and interaction between treatment and days and with randomintercept and slope effects for each mouse. P values <0.05 wereconsidered statistically significant. Xenograft data were analyzedusing Prism 6 and SAS 9.3.
SUPPLEMENTARY MATERIALSSupplementary material for this article is available at http://advances.sciencemag.org/cgi/content/full/2/10/e1601737/DC1fig. S1. APOBEC family member expression in MCF-7L cells.fig. S2. Replica A3B knockdown xenograft experiment.fig. S3. Estrogen does not affect A3B mRNA levels in engrafted MCF-7L cells.fig. S4. A3B is not estrogen-inducible.fig. S5. Replica A3B overexpression xenograft experiment.fig. S6. ESR1 mRNA levels in tamoxifen-resistant MCF-7L cells.table S1. Patient characteristics and median and interquartile range of APOBEC3B mRNA levels.table S2. Cox univariate and multivariate analyses for PFS after initiating first-line tamoxifen.table S3. Single-base substitution mutations in tamoxifen-resistant tumors (separate MicrosoftExcel file).
REFERENCES AND NOTES1. E. B. Elkin, C. A. Hudis, Parsing progress in breast cancer. J. Clin. Oncol. 33, 2837–2838
(2015).2. J. H. Park, W. F. Anderson, M. H. Gail, Improvements in US breast cancer survival and
proportion explained by tumor size and estrogen-receptor status. J. Clin. Oncol. 33,2870–2876 (2015).
S C I ENCE ADVANCES | R E S EARCH ART I C L E
Law et al., Sci. Adv. 2016;2 : e1601737 7 October 2016 7 of 9
on February 22, 2018http://advances.sciencem
ag.org/D
ownloaded from
www.SCIENCEADVANCES.org 7 October 2016 Vol 2 e1601737
43
R E S E A R C H A R T I C L E
3. T. Saphner, D. C. Tormey, R. Gray, Annual hazard rates of recurrence for breast cancerafter primary therapy. J. Clin. Oncol. 14, 2738–2746 (1996).
4. H. J. Burstein, S. Temin, H. Anderson, T. A. Buchholz, N. E. Davidson, K. E. Gelmon,S. H. Giordano, C. A. Hudis, D. Rowden, A. J. Solky, V. Stearns, E. P. Winer, J. J. Griggs,Adjuvant endocrine therapy for women with hormone receptor–positive breast cancer:American Society of Clinical Oncology clinical practice guideline focused update.J. Clin. Oncol. 32, 2255–2269 (2014).
5. C. Davies, H. Pan, J. Godwin, R. Gray, R. Arriagada, V. Raina, M. Abraham,V. H. Medeiros Alencar, A. Badran, X. Bonfill, J. Bradbury, M. Clarke, R. Collins, S. R. Davis,A. Delmestri, J. F. Forbes, P. Haddad, M.-F. Hou, M. Inbar, H. Khaled, J. Kielanowska,W. H. Kwan, B. S. Mathew, I. Mittra, B. Müller, A. Nicolucci, O. Peralta, F. Pernas,L. Petruzelka, T. Pienkowski, R. Radhika, B. Rajan, M. T. Rubach, S. Tort, G. Urrútia,M. Valentini, Y. Wang, R. Peto; Adjuvant Tamoxifen: Longer Against Shorter Collaborative,Long-term effects of continuing adjuvant tamoxifen to 10 years versus stopping at5 years after diagnosis of oestrogen receptor-positive breast cancer: ATLAS, arandomised trial. Lancet 381, 805–816 (2013).
6. S. Nik-Zainal, L. B. Alexandrov, D. C. Wedge, P. Van Loo, C. D. Greenman, K. Raine, D. Jones,J. Hinton, J. Marshall, L. A. Stebbings, A. Menzies, S. Martin, K. Leung, L. Chen, C. Leroy,M. Ramakrishna, R. Rance, K. W. Lau, L. J. Mudie, I. Varela, D. J. McBride, G. R. Bignell,S. L. Cooke, A. Shlien, J. Gamble, I. Whitmore, M. Maddison, P. S. Tarpey, H. R. Davies,E. Papaemmanuil, P. J. Stephens, S. McLaren, A. P. Butler, J. W. Teague, G. Jönsson,J. E. Garber, D. Silver, P. Miron, A. Fatima, S. Boyault, A. Langerød, A. Tutt, J. W. M. Martens,S. A. J. R. Aparicio, Å. Borg, A. V. Salomon, G. Thomas, A.-L. Børresen-Dale, A. L. Richardson,M. S. Neuberger, P. A. Futreal, P. J. Campbell, M. R. Stratton; Breast Cancer WorkingGroup of the International Cancer Genome Consortium, Mutational processes molding thegenomes of 21 breast cancers. Cell 149, 979–993 (2012).
7. M. B. Burns, L. Lackey, M. A. Carpenter, A. Rathore, A. M. Land, B. Leonard, E. W. Refsland,D. Kotandeniya, N. Tretyakova, J. B. Nikas, D. Yee, N. A. Temiz, D. E. Donohue,R. M. McDougle, W. L. Brown, E. K. Law, R. S. Harris, APOBEC3B is an enzymatic source ofmutation in breast cancer. Nature 494, 366–370 (2013).
8. M. B. Burns, N. A. Temiz, R. S. Harris, Evidence for APOBEC3B mutagenesis in multiplehuman cancers. Nat. Genet. 45, 977–983 (2013).
9. S. A. Roberts, M. S. Lawrence, L. J. Klimczak, S. A. Grimm, D. Fargo, P. Stojanov, A. Kiezun,G. V. Kryukov, S. L. Carter, G. Saksena, S. Harris, R. R. Shah, M. A. Resnick, G. Getz,D. A. Gordenin, An APOBEC cytidine deaminase mutagenesis pattern is widespread inhuman cancers. Nat. Genet. 45, 970–976 (2013).
10. L. B. Alexandrov, S. Nik-Zainal, D. C. Wedge, S. A. J. R. Aparicio, S. Behjati, A. V. Biankin,G. R. Bignell, N. Bolli, A. Borg, A.-L. Børresen-Dale, S. Boyault, B. Burkhardt, A. P. Butler,C. Caldas, H. R. Davies, C. Desmedt, R. Eils, J. E. Eyfjörd, J. A. Foekens, M. Greaves,F. Hosoda, B. Hutter, T. Ilicic, S. Imbeaud, M. Imielinsk, N. Jäger, D. T. W. Jones,D. Jones, S. Knappskog, M. Kool, S. R. Lakhani, C. López-Otín, S. Martin, N. C. Munshi,H. Nakamura, P. A. Northcott, M. Pajic, E. Papaemmanuil, A. Paradiso, J. V. Pearson,X. S. Puente, K. Raine, M. Ramakrishna, A. L. Richardson, J. Richter, P. Rosenstiel,M. Schlesner, T. N. Schumacher, P. N. Span, J. W. Teague, Y. Totoki, A. N. J. Tutt,R. Valdés-Mas, M. M. van Buuren, L. van‘t Veer, A. Vincent-Salomon, N. Waddell,L. R. Yates; Australian Pancreatic Cancer Genome Initiative, ICGC Breast CancerConsortium, ICGC MMML-Seq Consortium, ICGC PedBrain, J. Zucman-Rossi,P. A. Futreal, U. McDermott, P. Lichter, M. Meyerson, S. M. Grimmond, R. Siebert,E. Campo, T. Shibata, S. M. Pfister, P. J. Campbell, M. R. Stratton, Signatures ofmutational processes in human cancer. Nature 500, 415–421 (2013).
11. C. Swanton, N. McGranahan, G. J. Starrett, R. S. Harris, APOBEC enzymes: Mutagenic fuelfor cancer evolution and heterogeneity. Cancer Discov. 5, 704–712 (2015).
12. S. A. Roberts, D. A. Gordenin, Hypermutation in human cancer genomes: Footprintsand mechanisms. Nat. Rev. Cancer 14, 786–800 (2014).
13. T. Helleday, S. Eshtad, S. Nik-Zainal, Mechanisms underlying mutational signatures inhuman cancers. Nat. Rev. Genet. 15, 585–598 (2014).
14. M. H. Malim, P. D. Bieniasz, HIV restriction factors and mechanisms of evasion. Cold SpringHarb. Perspect. Med. 2, a006940 (2012).
15. S. Stavrou, S. R. Ross, APOBEC3 proteins in viral immunity. J. Immunol. 195, 4565–4570 (2015).16. V. Simon, N. Bloch, N. R. Landau, Intrinsic host restrictions to HIV-1 and mechanisms
of viral escape. Nat. Immunol. 16, 546–553 (2015).17. S. Landry, I. Narvaiza, D. C. Linfesty, M. D. Weitzman, APOBEC3A can activate the DNA
damage response and cause cell-cycle arrest. EMBO Rep. 12, 444–450 (2011).18. M. Shinohara, K. Io, K. Shindo, M. Matsui, T. Sakamoto, K. Tada, M. Kobayashi, N. Kadowaki,
A. Takaori-Kondo, APOBEC3B can impair genomic stability by inducing basesubstitutions in genomic DNA in human cells. Sci. Rep. 2, 806 (2012).
19. B. J. M. Taylor, S. Nik-Zainal, Y. L. Wu, L. A. Stebbings, K. Raine, P. J. Campbell, C. Rada,M. R. Stratton, M. S. Neuberger, DNA deaminases induce break-associated mutation showerswith implication of APOBEC3B and 3A in breast cancer kataegis. ELife 2, e00534 (2013).
20. B. Mussil, R. Suspène, M.-M. Aynaud, A. Gauvrit, J.-P. Vartanian, S. Wain-Hobson, HumanAPOBEC3A isoforms translocate to the nucleus and induce DNA double strand breaksleading to cell stress and death. PLOS One 8, e73641 (2013).
21. V. Caval, R. Suspène, M. Shapira, J.-P. Vartanian, S. Wain-Hobson, A prevalent cancersusceptibility APOBEC3A hybrid allele bearing APOBEC3B 3′UTR enhances chromosomalDNA damage. Nat. Commun. 5, 5129 (2014).
22. B. Leonard, J. L. McCann, G. J. Starrett, L. Kosyakovsky, E. M. Luengas, A. M. Molan,M. B. Burns, R. M. McDougle, P. J. Parker, W. L. Brown, R. S. Harris, The PKC/NF-kB signalingpathway induces APOBEC3B expression in multiple human cancers. Cancer Res. 75,4538–4547 (2015).
23. A. M. Sieuwerts, S. Willis, M. B. Burns, M. P. Look, M. E. Meijer-Van Gelder, A. Schlicker,M. R. Heideman, H. Jacobs, L. Wessels, B. Leyland-Jones, K. P. Gray, J. A. Foekens,R. S. Harris, J. W. M. Martens, Elevated APOBEC3B correlates with poor outcomes forestrogen-receptor-positive breast cancers. Horm. Cancer 5, 405–413 (2014).
24. D. W. Cescon, B. Haibe-Kains, T. W. Mak, APOBEC3B expression in breast cancer reflectscellular proliferation, while a deletion polymorphism is associated with immuneactivation. Proc. Natl. Acad. Sci. U.S.A. 112, 2841–2846 (2015).
25. L. R. Yates, M. Gerstung, S. Knappskog, C. Desmedt, G. Gundem, P. Van Loo, T. Aas,L. B. Alexandrov, D. Larsimont, H. Davies, Y. Li, Y. S. Ju, M. Ramakrishna, H. K. Haugland,P. K. Lilleng, S. Nik-Zainal, S. McLaren, A. Butler, S. Martin, D. Glodzik, A. Menzies,K. Raine, J. Hinton, D. Jones, L. J. Mudie, B. Jiang, D. Vincent, A. Greene-Colozzi, P.-Y. Adnet,A. Fatima, M. Maetens, M. Ignatiadis, M. R. Stratton, C. Sotiriou, A. L. Richardson,P. E. Lønning, D. C. Wedge, P. J. Campbell, Subclonal diversification of primary breastcancer revealed by multiregion sequencing. Nat. Med. 21, 751–759 (2015).
26. A. N. Hata, M. J. Niederst, H. L. Archibald, M. Gomez-Caraballo, F. M. Siddiqui, H. E. Mulvey,Y. E. Maruvka, F. Ji, H. E. Bhang, V. Krishnamurthy Radhakrishna, G. Siravegna, H. Hu,S. Raoof, E. Lockerman, A. Kalsy, D. Lee, C. L. Keating, D. A. Ruddy, L. J. Damon, A. S. Crystal,C. Costa, Z. Piotrowska, A. Bardelli, A. J. Iafrate, R. I. Sadreyev, F. Stegmeier, G. Getz,L. V. Sequist, A. C. Faber, J. A. Engelman, Tumor cells can follow distinct evolutionary pathsto become resistant to epidermal growth factor receptor inhibition. Nat. Med. 22, 262–269(2016).
27. K. Kemper, O. Krijgsman, P. Cornelissen-Steijger, A. Shahrabi, F. Weeber, J.-Y. Song,T. Kuilman, D. J. Vis, L. F. Wessels, E. E. Voest, T. N. M. Schumacher, C. U. Blank, D. J. Adams,J. B. Haanen, D. S. Peeper, Intra- and inter-tumor heterogeneity in a vemurafenib-resistantmelanoma patient and derived xenografts. EMBO Mol. Med. 7, 1104–1118 (2015).
28. S. Nik-Zainal, H. Davies, J. Staaf, M. Ramakrishna, D. Glodzik, X. Zou, I. Martincorena,L. B. Alexandrov, S. Martin, D. C. Wedge, P. Van Loo, Y. S. Ju, M. Smid, A. B. Brinkman,S. Morganella, M. R. Aure, O. C. Lingjærde, A. Langerød, M. Ringnér, S.-M. Ahn, S. Boyault,J. E. Brock, A. Broeks, A. Butler, C. Desmedt, L. Dirix, S. Dronov, A. Fatima, J. A. Foekens,M. Gerstung, G. K. J. Hooijer, S. J. Jang, D. R. Jones, H.-Y. Kim, T. A. King, S. Krishnamurthy,H.-J. Lee, J. Y. Lee, Y. Li, S. McLaren, A. Menzies, V. Mustonen, S. O’Meara, I. Pauporté,X. Pivot, C. A. Purdie, K. Raine, K. Ramakrishnan, F. G. Rodríguez-González, G. Romieu,A. M. Sieuwerts, P. T. Simpson, R. Shepherd, L. Stebbings, O. A. Stefansson, J. Teague,S. Tommasi, I. Treilleux, G. G. Van den Eynden, P. Vermeulen, A. Vincent-Salomon, L. Yates,C. Caldas, L. van’t Veer, A. Tutt, S. Knappskog, B. K. T. Tan, J. Jonkers, Å. Borg, N. T. Ueno,C. Sotiriou, A. Viari, P. A. Futreal, P. J. Campbell, P. N. Span, S. Van Laere, S. R. Lakhani,J. E. Eyfjord, A. M. Thompson, E. Birney, H. G. Stunnenberg, M. J. van de Vijver,J. W. M. Martens, A.-L. Børresen-Dale, A. L. Richardson, G. Kong, G. Thomas, M. R. Stratton,Landscape of somatic mutations in 560 breast cancer whole-genome sequences.Nature 534, 47–54 (2016).
29. D. Juric, P. Castel, M. Griffith, O. L. Griffith, H. H. Won, H. Ellis, S. H. Ebbesen, B. J. Ainscough,A. Ramu, G. Iyer, R. H. Shah, T. Huynh, M. Mino-Kenudson, D. Sgroi, S. Isakoff, A. Thabet,L. Elamine, D. B. Solit, S. W. Lowe, C. Quadt, M. Peters, A. Derti, R. Schegel, A. Huang,E. R. Mardis, M. F. Berger, J. Baselga, M. Scaltriti, Convergent loss of PTEN leads to clinicalresistance to a PI(3)Ka inhibitor. Nature 518, 240–244 (2015).
30. S. P. Shah, A. Roth, R. Goya, A. Oloumi, G. Ha, Y. Zhao, G. Turashvili, J. Ding, K. Tse,G. Haffari, A. Bashashati, L. M. Prentice, J. Khattra, A. Burleigh, D. Yap, V. Bernard,A. McPherson, K. Shumansky, A. Crisan, R. Giuliany, A. Heravi-Moussavi, J. Rosner, D. Lai,I. Birol, R. Varhol, A. Tam, N. Dhalla, T. Zeng, K. Ma, S. K. Chan, M. Griffith, A. Moradian,S.-W. G. Cheng, G. B. Morin, P. Watson, K. Gelmon, S. Chia, S.-F. Chin, C. Curtis, O. M. Rueda,P. D. Pharoah, S. Damaraju, J. Mackey, K. Hoon, T. Harkins, V. Tadigotla, M. Sigaroudinia,P. Gascard, T. Tlsty, J. F. Costello, I. M. Meyer, C. J. Eaves, W. W. Wasserman, S. Jones,D. Huntsman, M. Hirst, C. Caldas, M. A. Marra, S. Aparicio, The clonal and mutationalevolution spectrum of primary triple-negative breast cancers. Nature 486, 395–399(2012).
31. S. Nik-Zainal, P. Van Loo, D. C. Wedge, L. B. Alexandrov, C. D. Greenman, K. W. Lau,K. Raine, D. Jones, J. Marshall, M. Ramakrishna, A. Shlien, S. L. Cooke, J. Hinton, A. Menzies,L. A. Stebbings, C. Leroy, M. Jia, R. Rance, L. J. Mudie, S. J. Gamble, P. J. Stephens,S. McLaren, P. S. Tarpey, E. Papaemmanuil, H. R. Davies, I. Varela, D. J. McBride, G. R. Bignell,K. Leung, A. P. Butler, J. W. Teague, S. Martin, G. Jönsson, O. Mariani, S. Boyault,P. Miron, A. Fatima, A. Langerød, S. A. J. R. Aparicio, A. Tutt, A. M. Sieuwerts, Å. Borg,G. Thomas, A. V. Salomon, A. L. Richardson, A.-L. Børresen-Dale, P. A. Futreal, M. R. Stratton,P. J. Campbell, The life history of 21 breast cancers. Cell 149, 994–1007 (2012).
32. E. C. de Bruin, N. McGranahan, R. Mitter, M. Salm, D. C. Wedge, L. Yates, M. Jamal-Hanjani,S. Shafi, N. Murugaesu, A. J. Rowan, E. Grönroos, M. A. Muhammad, S. Horswell,
S C I ENCE ADVANCES | R E S EARCH ART I C L E
Law et al., Sci. Adv. 2016;2 : e1601737 7 October 2016 8 of 9
on February 22, 2018http://advances.sciencem
ag.org/D
ownloaded from
www.SCIENCEADVANCES.org 7 October 2016 Vol 2 e1601737
44
R E S E A R C H A R T I C L E
M. Gerlinger, I. Varela, D. Jones, J. Marshall, T. Voet, P. Van Loo, D. M. Rassl, R. C. Rintoul,S. M. Janes, S.-M. Lee, M. Forster, T. Ahmad, D. Lawrence, M. Falzon, A. Capitanio,T. T. Harkins, C. C. Lee, W. Tom, E. Teefe, S.-C. Chen, S. Begum, A. Rabinowitz, B. Phillimore,B. Spencer-Dene, G. Stamp, Z. Szallasi, N. Matthews, A. Stewart, P. Campbell, C. Swanton,Spatial and temporal diversity in genomic instability processes defines lung cancerevolution. Science 346, 251–256 (2014).
33. A. M. Sieuwerts, M. B. Lyng, M. E. Meijer-van Gelder, V. de Weerd, F. C. Sweep,J. A. Foekens, P. N. Span, J. W. Martens, H. J. Ditzel, Evaluation of the ability of adjuvanttamoxifen-benefit gene signatures to predict outcome of hormone-naive estrogenreceptor-positive breast cancer patients treated with tamoxifen in the advanced setting.Mol. Oncol. 8, 1679–1689 (2014).
34. A. V. Lee, S. Oesterreich, N. E. Davidson, MCF-7 cells—Changing the course of breastcancer research and care for 45 years. J. Natl. Cancer Inst. 107, djv073 (2015).
35. Y. H. Ibrahim, S. A. Byron, X. Cui, A. V. Lee, D. Yee, Progesterone receptor-B regulation ofinsulin-like growth factor—Stimulated cell migration in breast cancer cells via insulinreceptor substrate-2. Mol. Cancer Res. 6, 1491–1498 (2008).
36. D. Sachdev, X. Zhang, I. Matise, M. Gaillard-Kelly, D. Yee, The type I insulin-like growthfactor receptor regulates cancer metastasis independently of primary tumor growthby promoting invasion and survival. Oncogene 29, 251–262 (2010).
37. J. M. Kidd, T. L. Newman, E. Tuzun, R. Kaul, E. E. Eichler, Population stratification of acommon APOBEC gene deletion polymorphism. PLOS Genet. 3, e63 (2007).
38. M. Periyasamy, H. Patel, C.-F. Lai, V. T. M. Nguyen, E. Nevedomskaya, A. Harrod, R. Russell,J. Remenyi, A. M. Ochocka, R. S. Thomas, F. Fuller-Pace, B. Győrffy, C. Caldas,N. Navaratnam, J. S. Carroll, W. Zwart, R. C. Coombes, L. Magnani, L. Buluwela, S. Ali,APOBEC3B-mediated cytidine deamination is required for estrogen receptor action inbreast cancer. Cell Rep. 13, 108–121 (2015).
39. K. N. Bishop, R. K. Holmes, A. M. Sheehy, N. O. Davidson, S.-J. Cho, M. H. Malim, Cytidinedeamination of retroviral DNA by diverse APOBEC proteins. Curr. Biol. 14, 1392–1396 (2004).
40. Q. Yu, D. Chen, R. König, R. Mariani, D. Unutmaz, N. R. Landau, APOBEC3B and APOBEC3Care potent inhibitors of simian immunodeficiency virus replication. J. Biol. Chem. 279,53379–53386 (2004).
41. B. P. Doehle, A. Schäfer, B. R. Cullen, Human APOBEC3B is a potent inhibitor ofHIV-1 infectivity and is resistant to HIV-1 Vif. Virology 339, 281–288 (2005).
42. J. F. Hultquist, J. A. Lengyel, E. W. Refsland, R. S. LaRue, L. Lackey, W. L. Brown, R. S. Harris,Human and rhesus APOBEC3D, APOBEC3F, APOBEC3G, and APOBEC3H demonstrate aconserved capacity to restrict Vif-deficient HIV-1. J. Virol. 85, 11220–11234 (2011).
43. R. Clarke, J. J. Tyson, J. M. Dixon, Endocrine resistance in breast cancer—An overviewand update. Mol. Cell. Endocrinol. 418, 220–234 (2015).
44. R. Jeselsohn, G. Buchwalter, C. De Angelis, M. Brown, R. Schiff, ESR1 mutations—Amechanism for acquired endocrine resistance in breast cancer. Nat. Rev. Clin. Oncol. 12,573–583 (2015).
45. K. Shi, M. A. Carpenter, K. Kurahashi, R. S. Harris, H. Aihara, Crystal structure of the DNAdeaminase APOBEC3B catalytic domain. J. Biol. Chem. 290, 28120–28130 (2015).
46. H. E. Krokan, F. Drabløs, G. Slupphaug, Uracil in DNA—Occurrence, consequences andrepair. Oncogene 21, 8935–8948 (2002).
47. J. M. Di Noia, M. S. Neuberger, Molecular mechanisms of antibody somatichypermutation. Annu. Rev. Biochem. 76, 1–22 (2007).
48. S. Henderson, A. Chakravarthy, X. Su, C. Boshoff, T. R. Fenton, APOBEC-mediated cytosinedeamination links PIK3CA helical domain mutations to human papillomavirus-driventumor development. Cell Rep. 7, 1833–1841 (2014).
49. N. McGranahan, C. Swanton, Biological and therapeutic impact of intratumorheterogeneity in cancer evolution. Cancer Cell 27, 15–26 (2015).
50. B. Leonard, S. N. Hart, M. B. Burns, M. A. Carpenter, N. A. Temiz, A. Rathore, R. I. Vogel,J. B. Nikas, E. K. Law, W. L. Brown, Y. Li, Y. Zhang, M. J. Maurer, A. L. Oberg,J. M. Cunningham, V. Shridhar, D. A. Bell, C. April, D. Bentley, M. Bibikova, R. K. Cheetham,J.-B. Fan, R. Grocock, S. Humphray, Z. Kingsbury, J. Peden, J. Chien, E. M. Swisher,
L. C. Hartmann, K. R. Kalli, E. L. Goode, H. Sicotte, S. H. Kaufmann, R. S. Harris, APOBEC3Bupregulation and genomic mutation patterns in serous ovarian carcinoma. Cancer Res.73, 7222–7231 (2013).
51. E. W. Refsland, M. D. Stenglein, K. Shindo, J. S. Albin, W. L. Brown, R. S. Harris, Quantitativeprofiling of the full APOBEC3 mRNA repertoire in lymphocytes and tissues: Implicationsfor HIV-1 restriction. Nucleic Acids Res. 38, 4274–4284 (2010).
52. M. D. Stenglein, M. B. Burns, M. Li, J. Lengyel, R. S. Harris, APOBEC3 proteins mediate theclearance of foreign DNA from human cells. Nat. Struct. Mol. Biol. 17, 222–229 (2010).
53. C. S. Ross-Innes, R. Stark, A. E. Teschendorff, K. A. Holmes, H. R. Ali, M. J. Dunning,G. D. Brown, O. Gojis, I. O. Ellis, A. R. Green, S. Ali, S.-F. Chin, C. Palmieri, C. Caldas,J. S. Carroll, Differential oestrogen receptor binding is associated with clinicaloutcome in breast cancer. Nature 481, 389–393 (2012).
54. L. Lackey, E. K. Law, W. L. Brown, R. S. Harris, Subcellular localization of the APOBEC3proteins during mitosis and implications for genomic DNA deamination. Cell Cycle 12,762–772 (2013).
55. D. C. Koboldt, Q. Zhang, D. E. Larson, D. Shen, M. D. McLellan, L. Lin, C. A. Miller,E. R. Mardis, L. Ding, R. K. Wilson, VarScan 2: Somatic mutation and copy numberalteration discovery in cancer by exome sequencing. Genome Res. 22, 568–576(2012).
Acknowledgments: We thank several laboratory members for thoughtful comments.Funding: Animal studies were supported by the Department of Defense Breast CancerResearch Program (BC121347), the Jimmy V Foundation for Cancer Research, and the ProspectCreek Foundation. Additional support for cancer research in the Harris laboratory wasprovided by the Howard Hughes Medical Institute, Norwegian Centennial Chair Program, andMinnesota Ovarian Cancer Alliance. An NSF Graduate Research Fellowship provided salarysupport for G.J.S. NIH grant T32 CA009138 provided partial salary support for B.L. Clinicalstudies were supported by Cancer Genomics Netherlands (A.M.S. and J.W.M.M.), NetherlandsOrganisation for Scientific Research (NWO) (J.W.M.M.), and European Research CouncilAdvanced Grant no. 322737 (J.A.F.). Statistical analyses were supported by NIH grant P30CA77598 using the Biostatistics and Bioinformatics Core shared resource of the MasonicCancer Center, University of Minnesota (R.I.V.). R.S.H. is an investigator of the Howard HughesMedical Institute. Author contributions: R.S.H. and D.Y. designed the xenograft studies.A.M.S., J.A.F., and J.W.M.M. designed the clinical experiments. E.K.L. performed the xenograftexperiments with assistance from B.L., whereas G.J.S., N.A.T., and R.I.V. contributed tobioinformatics and statistical analyses. K.L., E.K.L., and A.M.M. performed cell culture studies.M.E.M.-v.G. supplied the clinical data. F.C.G.J.S., P.N.S., J.W.M.M., and J.A.F. provided the clinicalsamples. A.M.S. quantified gene expression in primary tumors and performed statisticalanalyses. R.S.H. drafted the manuscript. All authors contributed revisions and approved thesubmitted version. Competing interests: R.S.H. is a cofounder of ApoGen Biotechnologies Inc.D.Y. is a scientific advisory board member of ApoGen Biotechnologies Inc. All other authorsdeclare that they have no competing interests. Data and materials availability: All dataneeded to evaluate the conclusions in the paper are present in the paper and/or theSupplementary Materials. All the reagents and primary data sets reported here are availableupon written request to R.S.H.
Submitted 26 July 2016Accepted 31 August 2016Published 7 October 201610.1126/sciadv.1601737
Citation: E. K. Law, A. M. Sieuwerts, K. LaPara, B. Leonard, G. J. Starrett, A. M. Molan, N. A. Temiz,R. I. Vogel, M. E. Meijer-van Gelder, F. C. G. J. Sweep, P. N. Span, J. A. Foekens, J. W. M. Martens,D. Yee, R. S. Harris, The DNA cytosine deaminase APOBEC3B promotes tamoxifen resistance inER-positive breast cancer. Sci. Adv. 2, e1601737 (2016).
S C I ENCE ADVANCES | R E S EARCH ART I C L E
Law et al., Sci. Adv. 2016;2 : e1601737 7 October 2016 9 of 9
on February 22, 2018http://advances.sciencem
ag.org/D
ownloaded from
www.SCIENCEADVANCES.org 7 October 2016 Vol 2 e1601737
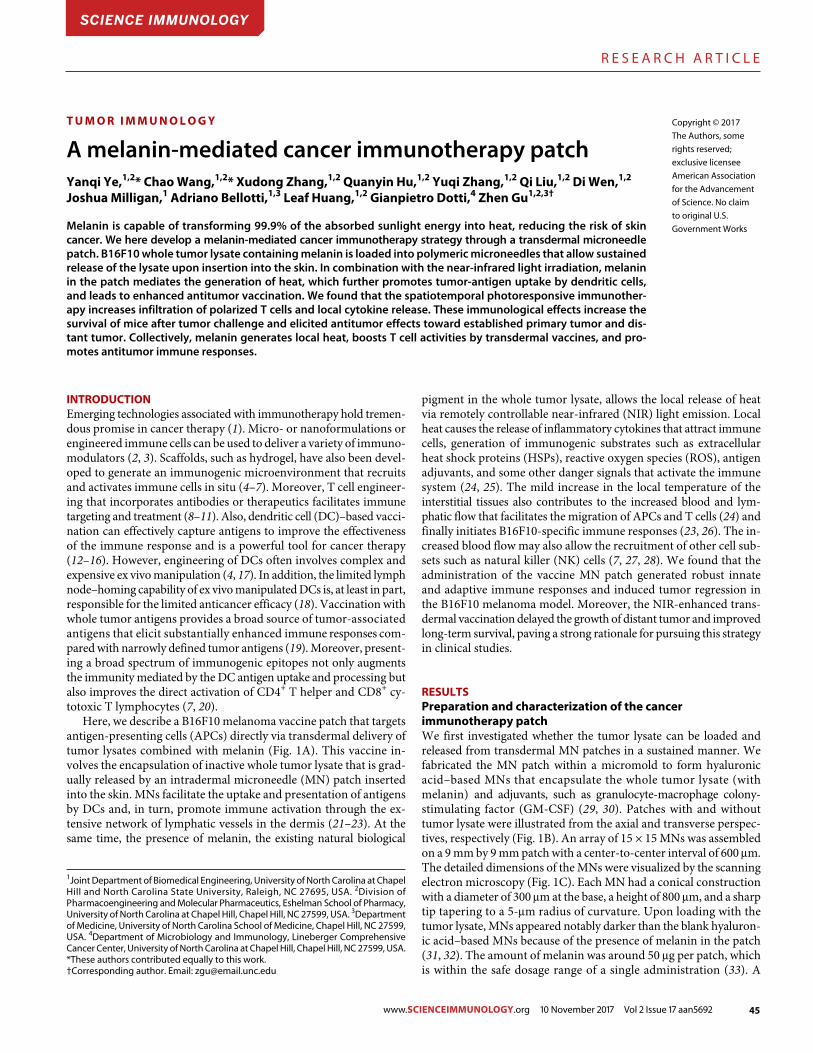
45
R E S E A R C H A R T I C L E
www.SCIENCEIMMUNOLOGY.org 10 November 2017 Vol 2 Issue 17 aan5692Ye et al., Sci. Immunol. 2, eaan5692 (2017) 10 November 2017
S C I E N C E I M M U N O L O G Y | R E S E A R C H A R T I C L E
1 of 12
T U M O R I M M U N O L O G Y
A melanin-mediated cancer immunotherapy patchYanqi Ye,1,2* Chao Wang,1,2* Xudong Zhang,1,2 Quanyin Hu,1,2 Yuqi Zhang,1,2 Qi Liu,1,2 Di Wen,1,2 Joshua Milligan,1 Adriano Bellotti,1,3 Leaf Huang,1,2 Gianpietro Dotti,4 Zhen Gu1,2,3†
Melanin is capable of transforming 99.9% of the absorbed sunlight energy into heat, reducing the risk of skin cancer. We here develop a melanin-mediated cancer immunotherapy strategy through a transdermal microneedle patch. B16F10 whole tumor lysate containing melanin is loaded into polymeric microneedles that allow sustained release of the lysate upon insertion into the skin. In combination with the near-infrared light irradiation, melanin in the patch mediates the generation of heat, which further promotes tumor-antigen uptake by dendritic cells, and leads to enhanced antitumor vaccination. We found that the spatiotemporal photoresponsive immunother-apy increases infiltration of polarized T cells and local cytokine release. These immunological effects increase the survival of mice after tumor challenge and elicited antitumor effects toward established primary tumor and dis-tant tumor. Collectively, melanin generates local heat, boosts T cell activities by transdermal vaccines, and pro-motes antitumor immune responses.
INTRODUCTIONEmerging technologies associated with immunotherapy hold tremen-dous promise in cancer therapy (1). Micro- or nanoformulations or engineered immune cells can be used to deliver a variety of immuno-modulators (2, 3). Scaffolds, such as hydrogel, have also been devel-oped to generate an immunogenic microenvironment that recruits and activates immune cells in situ (4–7). Moreover, T cell engineer-ing that incorporates antibodies or therapeutics facilitates immune targeting and treatment (8–11). Also, dendritic cell (DC)–based vacci-nation can effectively capture antigens to improve the effectiveness of the immune response and is a powerful tool for cancer therapy (12–16). However, engineering of DCs often involves complex and expensive ex vivo manipulation (4, 17). In addition, the limited lymph node–homing capability of ex vivo manipulated DCs is, at least in part, responsible for the limited anticancer efficacy (18). Vaccination with whole tumor antigens provides a broad source of tu mor-associated antigens that elicit substantially enhanced immune responses com-pared with narrowly defined tumor antigens (19). Moreover, present-ing a broad spectrum of immunogenic epitopes not only augments the immunity mediated by the DC antigen uptake and processing but also improves the direct activation of CD4+ T helper and CD8+ cy-totoxic T lymphocytes (7, 20).
Here, we describe a B16F10 melanoma vaccine patch that targets antigen-presenting cells (APCs) directly via transdermal delivery of tumor lysates combined with melanin (Fig. 1A). This vaccine in-volves the encapsulation of inactive whole tumor lysate that is grad-ually released by an intradermal microneedle (MN) patch inserted into the skin. MNs facilitate the uptake and presentation of antigens by DCs and, in turn, promote immune activation through the ex-tensive network of lymphatic vessels in the dermis (21–23). At the same time, the presence of melanin, the existing natural biological
pigment in the whole tumor lysate, allows the local release of heat via remotely controllable near-infrared (NIR) light emission. Local heat causes the release of inflammatory cytokines that attract immune cells, generation of immunogenic substrates such as extracellular heat shock proteins (HSPs), reactive oxygen species (ROS), antigen adjuvants, and some other danger signals that activate the immune system (24, 25). The mild increase in the local temperature of the interstitial tissues also contributes to the increased blood and lym-phatic flow that facilitates the migration of APCs and T cells (24) and finally initiates B16F10-specific immune responses (23, 26). The in-creased blood flow may also allow the recruitment of other cell sub-sets such as natural killer (NK) cells (7, 27, 28). We found that the administration of the vaccine MN patch generated robust innate and adaptive immune responses and induced tumor regression in the B16F10 melanoma model. Moreover, the NIR-enhanced trans-dermal vaccination delayed the growth of distant tumor and improved long-term survival, paving a strong rationale for pursuing this strategy in clinical studies.
RESULTSPreparation and characterization of the cancer immunotherapy patchWe first investigated whether the tumor lysate can be loaded and released from transdermal MN patches in a sustained manner. We fabricated the MN patch within a micromold to form hyaluronic acid–based MNs that encapsulate the whole tumor lysate (with melanin) and adjuvants, such as granulocyte-macrophage colony- stimulating factor (GM-CSF) (29, 30). Patches with and without tumor lysate were illustrated from the axial and transverse perspec-tives, respectively (Fig. 1B). An array of 15 × 15 MNs was assembled on a 9 mm by 9 mm patch with a center-to-center interval of 600 m. The detailed dimensions of the MNs were visualized by the scanning electron microscopy (Fig. 1C). Each MN had a conical construction with a diameter of 300 m at the base, a height of 800 m, and a sharp tip tapering to a 5-m radius of curvature. Upon loading with the tumor lysate, MNs appeared notably darker than the blank hyaluron-ic acid–based MNs because of the presence of melanin in the patch (31, 32). The amount of melanin was around 50 g per patch, which is within the safe dosage range of a single administration (33). A
1Joint Department of Biomedical Engineering, University of North Carolina at Chapel Hill and North Carolina State University, Raleigh, NC 27695, USA. 2Division of Pharmacoengineering and Molecular Pharmaceutics, Eshelman School of Pharmacy, University of North Carolina at Chapel Hill, Chapel Hill, NC 27599, USA. 3Department of Medicine, University of North Carolina School of Medicine, Chapel Hill, NC 27599, USA. 4Department of Microbiology and Immunology, Lineberger Comprehensive Cancer Center, University of North Carolina at Chapel Hill, Chapel Hill, NC 27599, USA.*These authors contributed equally to this work.†Corresponding author. Email: [email protected]
Copyright © 2017The Authors, somerights reserved;exclusive licenseeAmerican Associationfor the Advancementof Science. No claimto original U.S.Government Works
SCIENCE IMMUNOLOGY
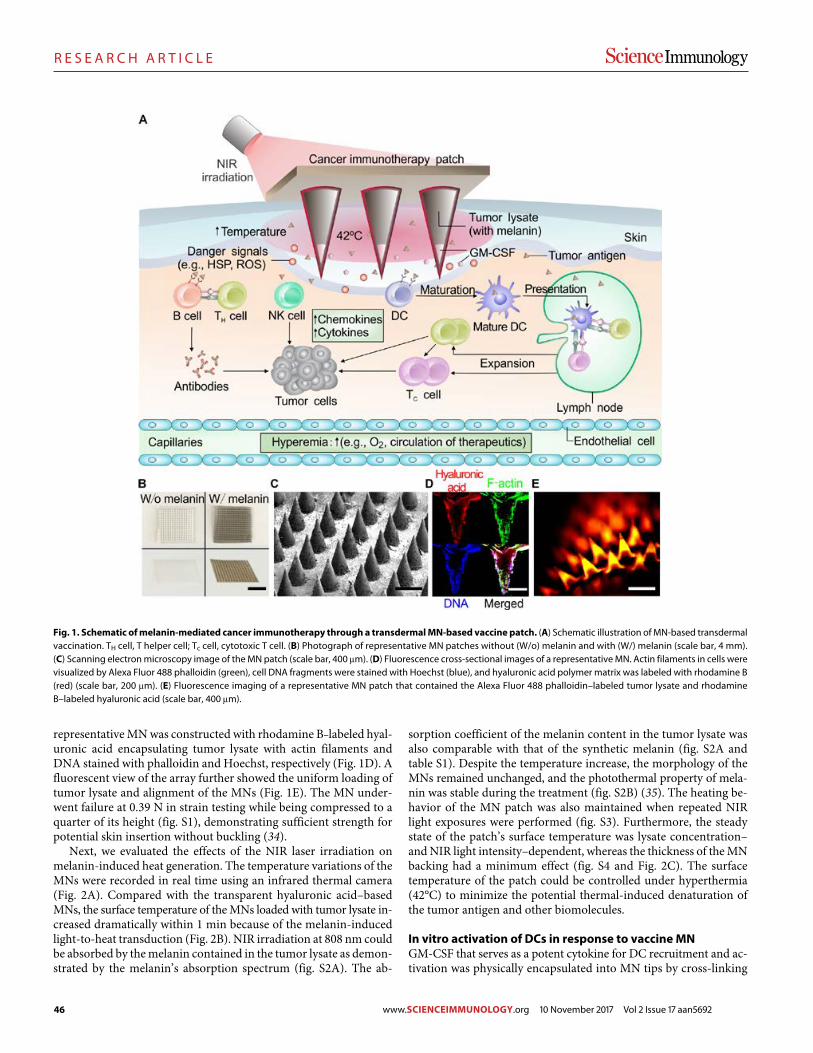
46
R E S E A R C H A R T I C L E
Ye et al., Sci. Immunol. 2, eaan5692 (2017) 10 November 2017
S C I E N C E I M M U N O L O G Y | R E S E A R C H A R T I C L E
2 of 12
representative MN was constructed with rhodamine B–labeled hyal-uronic acid encapsulating tumor lysate with actin filaments and DNA stained with phalloidin and Hoechst, respectively (Fig. 1D). A fluorescent view of the array further showed the uniform loading of tumor lysate and alignment of the MNs (Fig. 1E). The MN under-went failure at 0.39 N in strain testing while being compressed to a quarter of its height (fig. S1), demonstrating sufficient strength for potential skin insertion without buckling (34).
Next, we evaluated the effects of the NIR laser irradiation on melanin-induced heat generation. The temperature variations of the MNs were recorded in real time using an infrared thermal camera (Fig. 2A). Compared with the transparent hyaluronic acid–based MNs, the surface temperature of the MNs loaded with tumor lysate in-creased dramatically within 1 min because of the melanin-induced light-to-heat transduction (Fig. 2B). NIR irradiation at 808 nm could be absorbed by the melanin contained in the tumor lysate as demon-strated by the melanin’s absorption spectrum (fig. S2A). The ab-
sorption coefficient of the melanin content in the tumor lysate was also comparable with that of the synthetic melanin (fig. S2A and table S1). Despite the temperature increase, the morphology of the MNs remained unchanged, and the photothermal property of mela-nin was stable during the treatment (fig. S2B) (35). The heating be-havior of the MN patch was also maintained when repeated NIR light exposures were performed (fig. S3). Furthermore, the steady state of the patch’s surface temperature was lysate concentration– and NIR light intensity–dependent, whereas the thickness of the MN backing had a minimum effect (fig. S4 and Fig. 2C). The surface temperature of the patch could be controlled under hyperthermia (42°C) to minimize the potential thermal-induced denatura tion of the tumor antigen and other biomolecules.
In vitro activation of DCs in response to vaccine MNGM-CSF that serves as a potent cytokine for DC recruitment and ac-tivation was physically encapsulated into MN tips by cross-linking
Fig. 1. Schematic of melanin-mediated cancer immunotherapy through a transdermal MN-based vaccine patch. (A) Schematic illustration of MN-based transdermal vaccination. TH cell, T helper cell; Tc cell, cytotoxic T cell. (B) Photograph of representative MN patches without (W/o) melanin and with (W/) melanin (scale bar, 4 mm). (C) Scanning electron microscopy image of the MN patch (scale bar, 400 m). (D) Fluorescence cross-sectional images of a representative MN. Actin filaments in cells were visualized by Alexa Fluor 488 phalloidin (green), cell DNA fragments were stained with Hoechst (blue), and hyaluronic acid polymer matrix was labeled with rhodamine B (red) (scale bar, 200 m). (E) Fluorescence imaging of a representative MN patch that contained the Alexa Fluor 488 phalloidin–labeled tumor lysate and rhodamine B–labeled hyaluronic acid (scale bar, 400 m).
www.SCIENCEIMMUNOLOGY.org 10 November 2017 Vol 2 Issue 17 aan5692
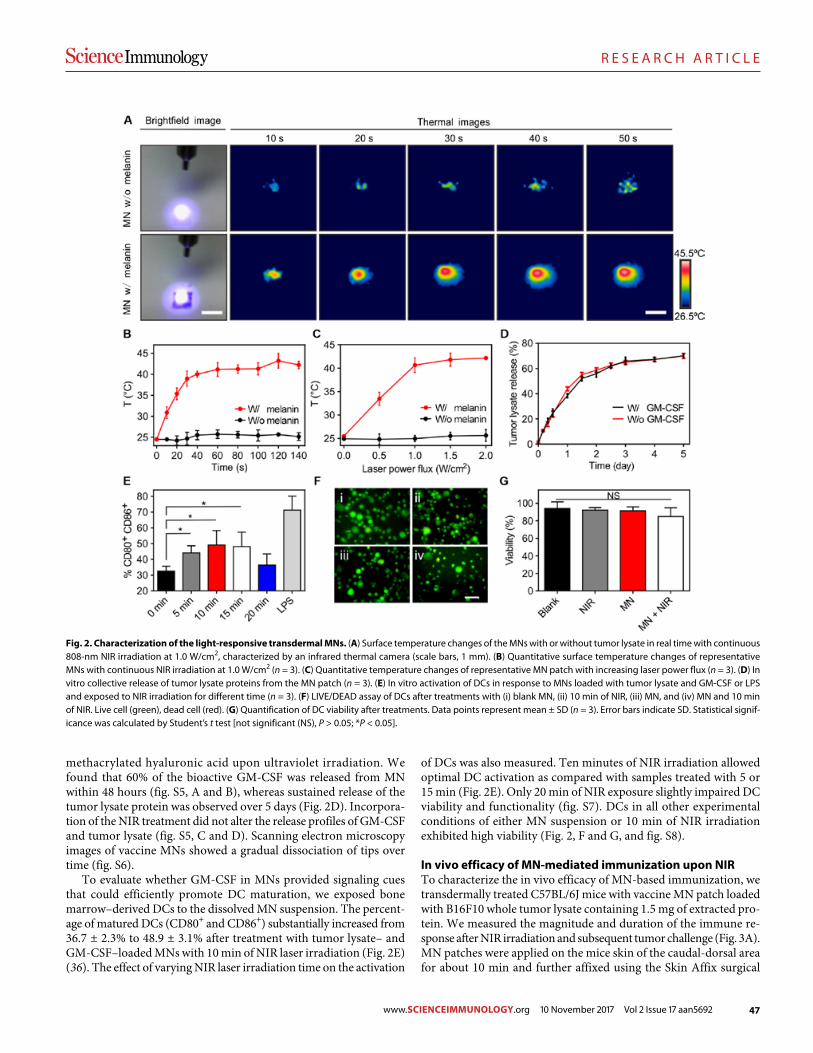
47
R E S E A R C H A R T I C L E
Ye et al., Sci. Immunol. 2, eaan5692 (2017) 10 November 2017
S C I E N C E I M M U N O L O G Y | R E S E A R C H A R T I C L E
3 of 12
methacrylated hyaluronic acid upon ultraviolet irradiation. We found that 60% of the bioactive GM-CSF was released from MN within 48 hours (fig. S5, A and B), whereas sustained release of the tumor lysate protein was observed over 5 days (Fig. 2D). Incorpora-tion of the NIR treatment did not alter the release profiles of GM-CSF and tumor lysate (fig. S5, C and D). Scanning electron microscopy images of vaccine MNs showed a gradual dissociation of tips over time (fig. S6).
To evaluate whether GM-CSF in MNs provided signaling cues that could efficiently promote DC maturation, we exposed bone marrow–derived DCs to the dissolved MN suspension. The percent-age of matured DCs (CD80+ and CD86+) substantially increased from 36.7 ± 2.3% to 48.9 ± 3.1% after treatment with tumor lysate– and GM-CSF–loaded MNs with 10 min of NIR laser irradiation (Fig. 2E) (36). The effect of varying NIR laser irradiation time on the activation
of DCs was also measured. Ten minutes of NIR irradiation allowed optimal DC activation as compared with samples treated with 5 or 15 min (Fig. 2E). Only 20 min of NIR exposure slightly impaired DC viability and functionality (fig. S7). DCs in all other experimental conditions of either MN suspension or 10 min of NIR irradiation exhibited high viability (Fig. 2, F and G, and fig. S8).
In vivo efficacy of MN-mediated immunization upon NIRTo characterize the in vivo efficacy of MN-based immunization, we transdermally treated C57BL/6J mice with vaccine MN patch loaded with B16F10 whole tumor lysate containing 1.5 mg of extracted pro-tein. We measured the magnitude and duration of the immune re-sponse after NIR irradiation and subsequent tumor challenge (Fig. 3A). MN patches were applied on the mice skin of the caudal-dorsal area for about 10 min and further affixed using the Skin Affix surgical
Fig. 2. Characterization of the light-responsive transdermal MNs. (A) Surface temperature changes of the MNs with or without tumor lysate in real time with continuous 808-nm NIR irradiation at 1.0 W/cm2, characterized by an infrared thermal camera (scale bars, 1 mm). (B) Quantitative surface temperature changes of representative MNs with continuous NIR irradiation at 1.0 W/cm2 (n = 3). (C) Quantitative temperature changes of representative MN patch with increasing laser power flux (n = 3). (D) In vitro collective release of tumor lysate proteins from the MN patch (n = 3). (E) In vitro activation of DCs in response to MNs loaded with tumor lysate and GM-CSF or LPS and exposed to NIR irradiation for different time (n = 3). (F) LIVE/DEAD assay of DCs after treatments with (i) blank MN, (ii) 10 min of NIR, (iii) MN, and (iv) MN and 10 min of NIR. Live cell (green), dead cell (red). (G) Quantification of DC viability after treatments. Data points represent mean ± SD (n = 3). Error bars indicate SD. Statistical signif-icance was calculated by Student’s t test [not significant (NS), P > 0.05; *P < 0.05].
www.SCIENCEIMMUNOLOGY.org 10 November 2017 Vol 2 Issue 17 aan5692
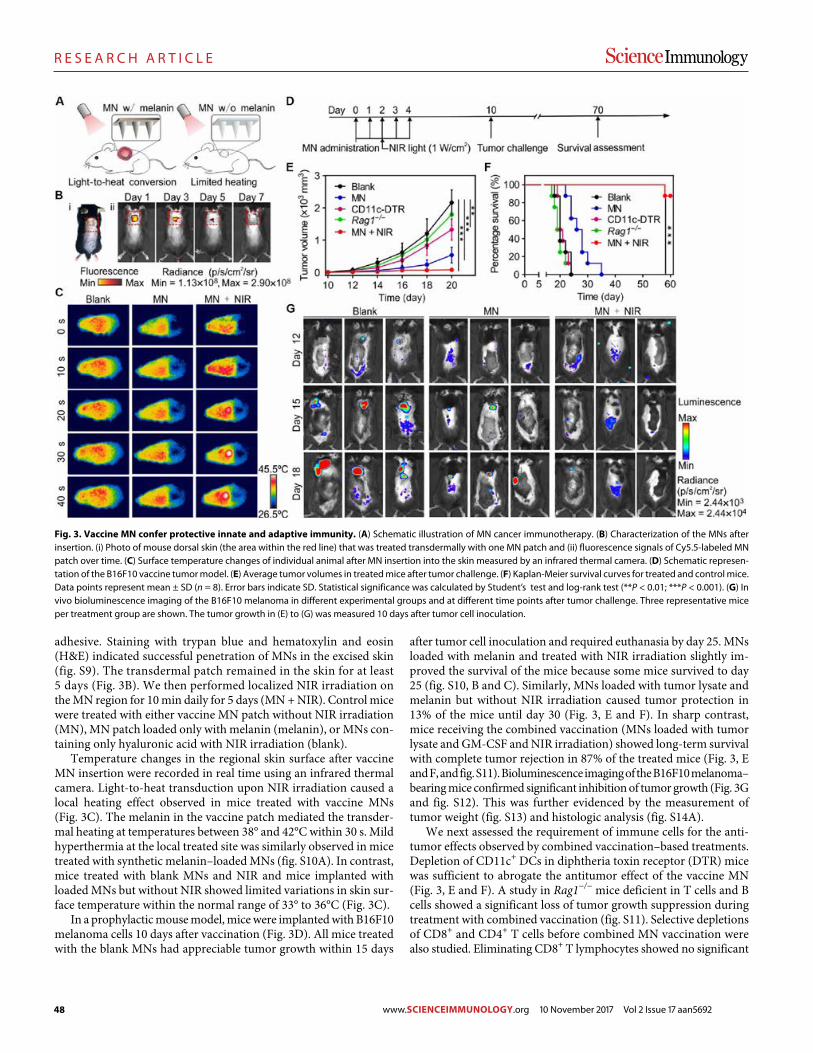
48
R E S E A R C H A R T I C L E
Ye et al., Sci. Immunol. 2, eaan5692 (2017) 10 November 2017
S C I E N C E I M M U N O L O G Y | R E S E A R C H A R T I C L E
4 of 12
adhesive. Staining with trypan blue and hematoxylin and eosin (H&E) indicated successful penetration of MNs in the excised skin (fig. S9). The transdermal patch remained in the skin for at least 5 days (Fig. 3B). We then performed localized NIR irradiation on the MN region for 10 min daily for 5 days (MN + NIR). Control mice were treated with either vaccine MN patch without NIR irradiation (MN), MN patch loaded only with melanin (melanin), or MNs con-taining only hyaluronic acid with NIR irradiation (blank).
Temperature changes in the regional skin surface after vaccine MN insertion were recorded in real time using an infrared thermal camera. Light-to-heat transduction upon NIR irradiation caused a local heating effect observed in mice treated with vaccine MNs (Fig. 3C). The melanin in the vaccine patch mediated the transder-mal heating at temperatures between 38° and 42°C within 30 s. Mild hyperthermia at the local treated site was similarly observed in mice treated with synthetic melanin–loaded MNs (fig. S10A). In contrast, mice treated with blank MNs and NIR and mice implanted with loaded MNs but without NIR showed limited variations in skin sur-face temperature within the normal range of 33° to 36°C (Fig. 3C).
In a prophylactic mouse model, mice were implanted with B16F10 melanoma cells 10 days after vaccination (Fig. 3D). All mice treated with the blank MNs had appreciable tumor growth within 15 days
after tumor cell inoculation and required euthanasia by day 25. MNs loaded with melanin and treated with NIR irradiation slightly im-proved the survival of the mice because some mice survived to day 25 (fig. S10, B and C). Similarly, MNs loaded with tumor lysate and melanin but without NIR irradiation caused tumor protection in 13% of the mice until day 30 (Fig. 3, E and F). In sharp contrast, mice receiving the combined vaccination (MNs loaded with tumor lysate and GM-CSF and NIR irradiation) showed long-term survival with complete tumor rejection in 87% of the treated mice (Fig. 3, E and F, and fig. S11). Bioluminescence imaging of the B16F10 melanoma– bearing mice confirmed significant inhibition of tumor growth (Fig. 3G and fig. S12). This was further evidenced by the measurement of tumor weight (fig. S13) and histologic analysis (fig. S14A).
We next assessed the requirement of immune cells for the anti-tumor effects observed by combined vaccination–based treatments. Depletion of CD11c+ DCs in diphtheria toxin receptor (DTR) mice was sufficient to abrogate the antitumor effect of the vaccine MN (Fig. 3, E and F). A study in Rag1−/− mice deficient in T cells and B cells showed a significant loss of tumor growth suppression during treatment with combined vaccination (fig. S11). Selective depletions of CD8+ and CD4+ T cells before combined MN vaccination were also studied. Eliminating CD8+ T lymphocytes showed no significant
Fig. 3. Vaccine MN confer protective innate and adaptive immunity. (A) Schematic illustration of MN cancer immunotherapy. (B) Characterization of the MNs after insertion. (i) Photo of mouse dorsal skin (the area within the red line) that was treated transdermally with one MN patch and (ii) fluorescence signals of Cy5.5-labeled MN patch over time. (C) Surface temperature changes of individual animal after MN insertion into the skin measured by an infrared thermal camera. (D) Schematic represen-tation of the B16F10 vaccine tumor model. (E) Average tumor volumes in treated mice after tumor challenge. (F) Kaplan-Meier survival curves for treated and control mice. Data points represent mean ± SD (n = 8). Error bars indicate SD. Statistical significance was calculated by Student’s test and log-rank test (**P < 0.01; ***P < 0.001). (G) In vivo bioluminescence imaging of the B16F10 melanoma in different experimental groups and at different time points after tumor challenge. Three representative mice per treatment group are shown. The tumor growth in (E) to (G) was measured 10 days after tumor cell inoculation.
www.SCIENCEIMMUNOLOGY.org 10 November 2017 Vol 2 Issue 17 aan5692
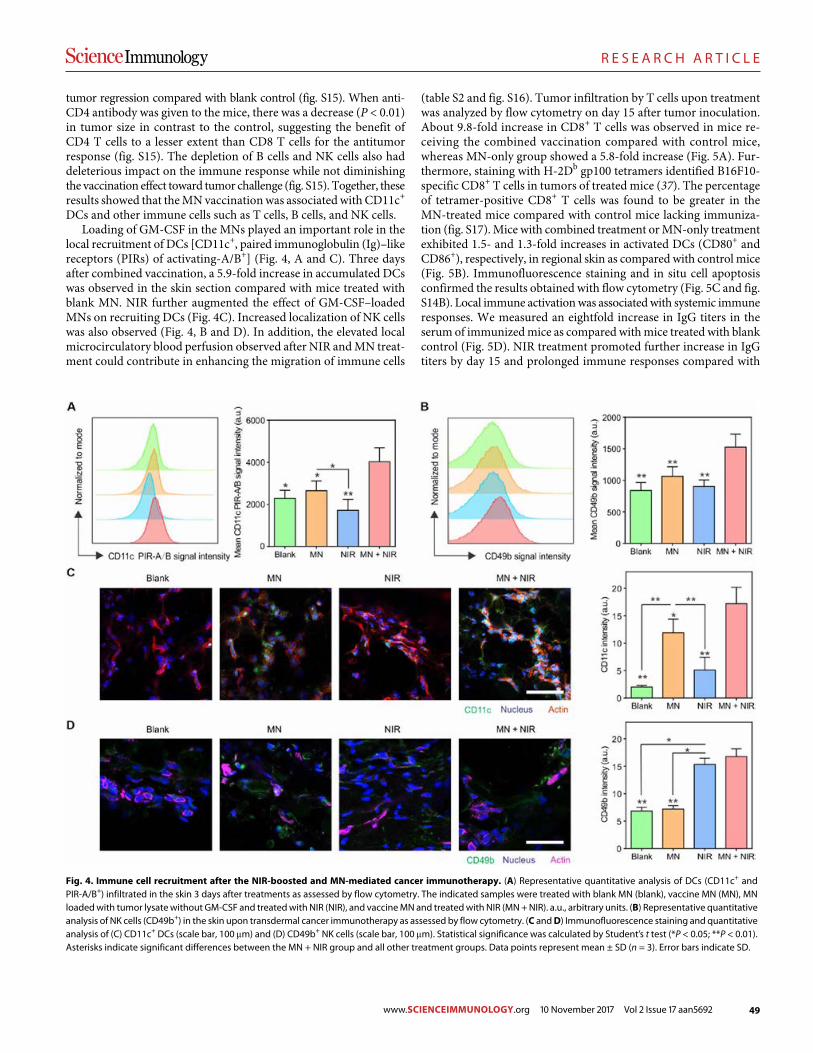
49
R E S E A R C H A R T I C L E
Ye et al., Sci. Immunol. 2, eaan5692 (2017) 10 November 2017
S C I E N C E I M M U N O L O G Y | R E S E A R C H A R T I C L E
5 of 12
tumor regression compared with blank control (fig. S15). When anti- CD4 antibody was given to the mice, there was a decrease (P < 0.01) in tumor size in contrast to the control, suggesting the benefit of CD4 T cells to a lesser extent than CD8 T cells for the antitumor response (fig. S15). The depletion of B cells and NK cells also had deleterious impact on the immune response while not diminishing the vaccination effect toward tumor challenge (fig. S15). Together, these results showed that the MN vaccination was associated with CD11c+ DCs and other immune cells such as T cells, B cells, and NK cells.
Loading of GM-CSF in the MNs played an important role in the local recruitment of DCs [CD11c+, paired immunoglobulin (Ig)–like receptors (PIRs) of activating-A/B+] (Fig. 4, A and C). Three days after combined vaccination, a 5.9-fold increase in accumulated DCs was observed in the skin section compared with mice treated with blank MN. NIR further augmented the effect of GM-CSF–loaded MNs on recruiting DCs (Fig. 4C). Increased localization of NK cells was also observed (Fig. 4, B and D). In addition, the elevated local microcirculatory blood perfusion observed after NIR and MN treat-ment could contribute in enhancing the migration of immune cells
(table S2 and fig. S16). Tumor infiltration by T cells upon treatment was analyzed by flow cytometry on day 15 after tumor inoculation. About 9.8-fold increase in CD8+ T cells was observed in mice re-ceiving the combined vaccination compared with control mice, whereas MN-only group showed a 5.8-fold increase (Fig. 5A). Fur-thermore, staining with H-2Db gp100 tetramers identified B16F10- specific CD8+ T cells in tumors of treated mice (37). The percentage of tetramer-positive CD8+ T cells was found to be greater in the MN-treated mice compared with control mice lacking immuniza-tion (fig. S17). Mice with combined treatment or MN-only treatment exhibited 1.5- and 1.3-fold increases in activated DCs (CD80+ and CD86+), respectively, in regional skin as compared with control mice (Fig. 5B). Immunofluorescence staining and in situ cell apoptosis confirmed the results obtained with flow cytometry (Fig. 5C and fig. S14B). Local immune activation was associated with systemic immune responses. We measured an eightfold increase in IgG titers in the serum of immunized mice as compared with mice treated with blank control (Fig. 5D). NIR treatment promoted further increase in IgG titers by day 15 and prolonged immune responses compared with
Fig. 4. Immune cell recruitment after the NIR-boosted and MN-mediated cancer immunotherapy. (A) Representative quantitative analysis of DCs (CD11c+ and PIR-A/B+) infiltrated in the skin 3 days after treatments as assessed by flow cytometry. The indicated samples were treated with blank MN (blank), vaccine MN (MN), MN loaded with tumor lysate without GM-CSF and treated with NIR (NIR), and vaccine MN and treated with NIR (MN + NIR). a.u., arbitrary units. (B) Representative quantitative analysis of NK cells (CD49b+) in the skin upon transdermal cancer immunotherapy as assessed by flow cytometry. (C and D) Immunofluorescence staining and quantitative analysis of (C) CD11c+ DCs (scale bar, 100 m) and (D) CD49b+ NK cells (scale bar, 100 m). Statistical significance was calculated by Student’s t test (*P < 0.05; **P < 0.01). Asterisks indicate significant differences between the MN + NIR group and all other treatment groups. Data points represent mean ± SD (n = 3). Error bars indicate SD.
www.SCIENCEIMMUNOLOGY.org 10 November 2017 Vol 2 Issue 17 aan5692
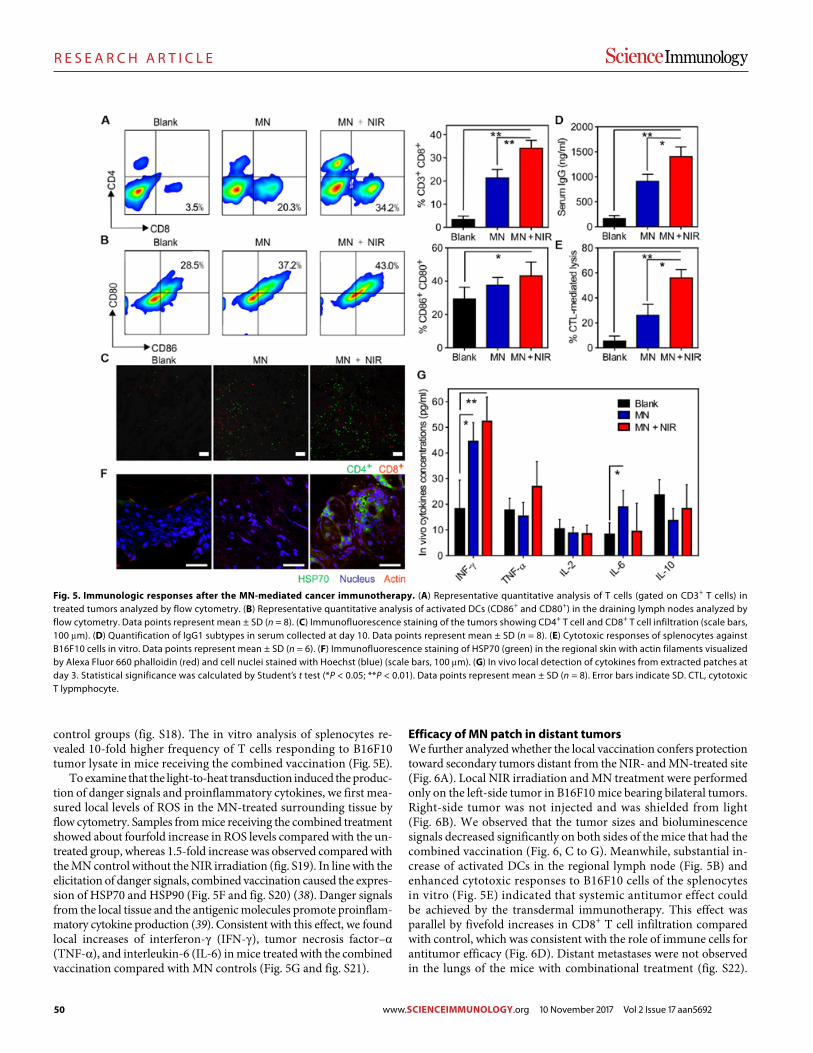
50
R E S E A R C H A R T I C L E
Ye et al., Sci. Immunol. 2, eaan5692 (2017) 10 November 2017
S C I E N C E I M M U N O L O G Y | R E S E A R C H A R T I C L E
6 of 12
control groups (fig. S18). The in vitro analysis of splenocytes re-vealed 10-fold higher frequency of T cells responding to B16F10 tumor lysate in mice receiving the combined vaccination (Fig. 5E).
To examine that the light-to-heat transduction induced the produc-tion of danger signals and proinflammatory cytokines, we first mea-sured local levels of ROS in the MN-treated surrounding tissue by flow cytometry. Samples from mice receiving the combined treat ment showed about fourfold increase in ROS levels compared with the un-treated group, whereas 1.5-fold increase was observed compared with the MN control without the NIR irradiation (fig. S19). In line with the elicitation of danger signals, combined vaccination caused the expres-sion of HSP70 and HSP90 (Fig. 5F and fig. S20) (38). Danger signals from the local tissue and the antigenic molecules promote proinflam-matory cytokine production (39). Consistent with this effect, we found local increases of interferon- (IFN-), tumor necrosis factor– (TNF-), and interleukin-6 (IL-6) in mice treated with the combined vaccination compared with MN controls (Fig. 5G and fig. S21).
Efficacy of MN patch in distant tumorsWe further analyzed whether the local vaccination confers protection toward secondary tumors distant from the NIR- and MN-treated site (Fig. 6A). Local NIR irradiation and MN treatment were performed only on the left-side tumor in B16F10 mice bearing bilateral tumors. Right-side tumor was not injected and was shielded from light (Fig. 6B). We observed that the tumor sizes and bioluminescence signals decreased significantly on both sides of the mice that had the combined vaccination (Fig. 6, C to G). Meanwhile, substantial in-crease of activated DCs in the regional lymph node (Fig. 5B) and enhanced cytotoxic responses to B16F10 cells of the splenocytes in vitro (Fig. 5E) indicated that systemic antitumor effect could be achieved by the transdermal immunotherapy. This effect was parallel by fivefold increases in CD8+ T cell infiltration compared with control, which was consistent with the role of immune cells for antitumor efficacy (Fig. 6D). Distant metastases were not observed in the lungs of the mice with combinational treatment (fig. S22).
Fig. 5. Immunologic responses after the MN-mediated cancer immunotherapy. (A) Representative quantitative analysis of T cells (gated on CD3+ T cells) in treated tumors analyzed by flow cytometry. (B) Representative quantitative analysis of activated DCs (CD86+ and CD80+) in the draining lymph nodes analyzed by flow cytometry. Data points represent mean ± SD (n = 8). (C) Immunofluorescence staining of the tumors showing CD4+ T cell and CD8+ T cell infiltration (scale bars, 100 m). (D) Quantification of IgG1 subtypes in serum collected at day 10. Data points represent mean ± SD (n = 8). (E) Cytotoxic responses of splenocytes against B16F10 cells in vitro. Data points represent mean ± SD (n = 6). (F) Immunofluorescence staining of HSP70 (green) in the regional skin with actin filaments visualized by Alexa Fluor 660 phalloidin (red) and cell nuclei stained with Hoechst (blue) (scale bars, 100 m). (G) In vivo local detection of cytokines from extracted patches at day 3. Statistical significance was calculated by Student’s t test (*P < 0.05; **P < 0.01). Data points represent mean ± SD (n = 8). Error bars indicate SD. CTL, cytotoxic T lypmphocyte.
www.SCIENCEIMMUNOLOGY.org 10 November 2017 Vol 2 Issue 17 aan5692
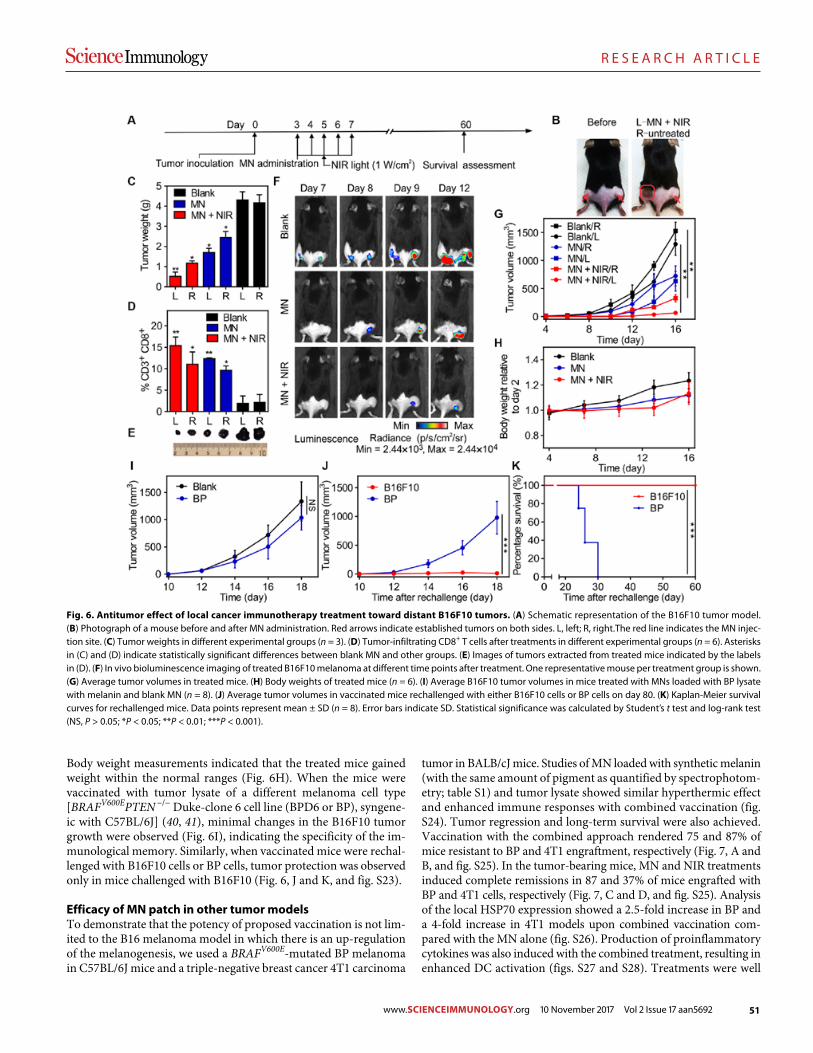
51
R E S E A R C H A R T I C L E
Ye et al., Sci. Immunol. 2, eaan5692 (2017) 10 November 2017
S C I E N C E I M M U N O L O G Y | R E S E A R C H A R T I C L E
7 of 12
Body weight measurements indicated that the treated mice gained weight within the normal ranges (Fig. 6H). When the mice were vaccinated with tumor lysate of a different melanoma cell type [BRAFV600EPTEN −/− Duke-clone 6 cell line (BPD6 or BP), syngene-ic with C57BL/6J] (40, 41), minimal changes in the B16F10 tumor growth were observed (Fig. 6I), indicating the specificity of the im-munological memory. Similarly, when vaccinated mice were rechal-lenged with B16F10 cells or BP cells, tumor protection was observed only in mice challenged with B16F10 (Fig. 6, J and K, and fig. S23).
Efficacy of MN patch in other tumor modelsTo demonstrate that the potency of proposed vaccination is not lim-ited to the B16 melanoma model in which there is an up-regulation of the melanogenesis, we used a BRAFV600E-mutated BP melanoma in C57BL/6J mice and a triple-negative breast cancer 4T1 carcinoma
tumor in BALB/cJ mice. Studies of MN loaded with synthetic melanin (with the same amount of pigment as quantified by spectrophotom-etry; table S1) and tumor lysate showed similar hyperthermic effect and enhanced immune responses with combined vaccination (fig. S24). Tumor regression and long-term survival were also achieved. Vaccination with the combined approach rendered 75 and 87% of mice resistant to BP and 4T1 engraftment, respectively (Fig. 7, A and B, and fig. S25). In the tumor-bearing mice, MN and NIR treat ments induced complete remissions in 87 and 37% of mice engrafted with BP and 4T1 cells, respectively (Fig. 7, C and D, and fig. S25). Analysis of the local HSP70 expression showed a 2.5-fold increase in BP and a 4-fold increase in 4T1 models upon combined vaccination com-pared with the MN alone (fig. S26). Production of proinflammatory cytokines was also induced with the combined treatment, resulting in enhanced DC activation (figs. S27 and S28). Treatments were well
Fig. 6. Antitumor effect of local cancer immunotherapy treatment toward distant B16F10 tumors. (A) Schematic representation of the B16F10 tumor model. (B) Photograph of a mouse before and after MN administration. Red arrows indicate established tumors on both sides. L, left; R, right.The red line indicates the MN injec-tion site. (C) Tumor weights in different experimental groups (n = 3). (D) Tumor-infiltrating CD8+ T cells after treatments in different experimental groups (n = 6). Asterisks in (C) and (D) indicate statistically significant differences between blank MN and other groups. (E) Images of tumors extracted from treated mice indicated by the labels in (D). (F) In vivo bioluminescence imaging of treated B16F10 melanoma at different time points after treatment. One representative mouse per treatment group is shown. (G) Average tumor volumes in treated mice. (H) Body weights of treated mice (n = 6). (I) Average B16F10 tumor volumes in mice treated with MNs loaded with BP lysate with melanin and blank MN (n = 8). (J) Average tumor volumes in vaccinated mice rechallenged with either B16F10 cells or BP cells on day 80. (K) Kaplan-Meier survival curves for rechallenged mice. Data points represent mean ± SD (n = 8). Error bars indicate SD. Statistical significance was calculated by Student’s t test and log-rank test (NS, P > 0.05; *P < 0.05; **P < 0.01; ***P < 0.001).
www.SCIENCEIMMUNOLOGY.org 10 November 2017 Vol 2 Issue 17 aan5692
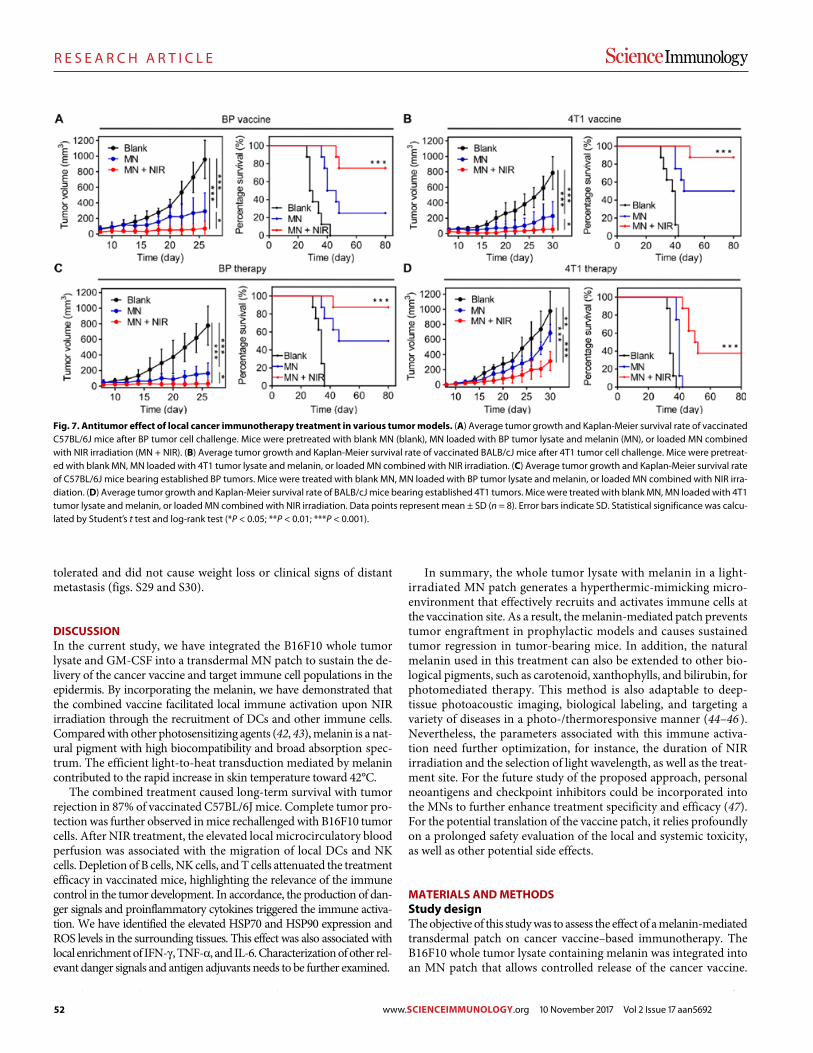
52
R E S E A R C H A R T I C L E
Ye et al., Sci. Immunol. 2, eaan5692 (2017) 10 November 2017
S C I E N C E I M M U N O L O G Y | R E S E A R C H A R T I C L E
8 of 12
tolerated and did not cause weight loss or clinical signs of distant metastasis (figs. S29 and S30).
DISCUSSIONIn the current study, we have integrated the B16F10 whole tumor lysate and GM-CSF into a transdermal MN patch to sustain the de-livery of the cancer vaccine and target immune cell populations in the epidermis. By incorporating the melanin, we have demonstrated that the combined vaccine facilitated local immune activation upon NIR irradiation through the recruitment of DCs and other immune cells. Compared with other photosensitizing agents (42, 43), melanin is a nat-ural pigment with high biocompatibility and broad absorption spec-trum. The efficient light-to-heat transduction mediated by melanin contributed to the rapid increase in skin temperature toward 42°C.
The combined treatment caused long-term survival with tumor rejection in 87% of vaccinated C57BL/6J mice. Complete tumor pro-tection was further observed in mice rechallenged with B16F10 tumor cells. After NIR treatment, the elevated local microcirculatory blood perfusion was associated with the migration of local DCs and NK cells. Depletion of B cells, NK cells, and T cells attenuated the treatment efficacy in vaccinated mice, highlighting the relevance of the immune control in the tumor development. In accordance, the production of dan-ger signals and proinflammatory cytokines triggered the immune activa-tion. We have identified the elevated HSP70 and HSP90 expression and ROS levels in the surrounding tissues. This effect was also associated with local enrichment of IFN-, TNF-, and IL-6. Characterization of other rel-evant danger signals and antigen adjuvants needs to be further examined.
In summary, the whole tumor lysate with melanin in a light- irradiated MN patch generates a hyperthermic-mimicking micro-environment that effectively recruits and activates immune cells at the vaccination site. As a result, the melanin-mediated patch prevents tumor engraftment in prophylactic models and causes sustained tumor regression in tumor-bearing mice. In addition, the natural melanin used in this treatment can also be extended to other bio-logical pigments, such as carotenoid, xanthophylls, and bilirubin, for photomediated therapy. This method is also adaptable to deep- tissue photoacoustic imaging, biological labeling, and targeting a variety of diseases in a photo-/thermoresponsive manner (44–46 ). Nevertheless, the parameters associated with this immune activa-tion need further optimization, for instance, the duration of NIR irradiation and the selection of light wavelength, as well as the treat-ment site. For the future study of the proposed approach, personal neoantigens and checkpoint inhibitors could be incorporated into the MNs to further enhance treatment specificity and efficacy (47). For the potential translation of the vaccine patch, it relies profoundly on a prolonged safety evaluation of the local and systemic toxicity, as well as other potential side effects.
MATERIALS AND METHODSStudy designThe objective of this study was to assess the effect of a melanin-mediated transdermal patch on cancer vaccine–based immunotherapy. The B16F10 whole tumor lysate containing melanin was integrated into an MN patch that allows controlled release of the cancer vaccine.
Fig. 7. Antitumor effect of local cancer immunotherapy treatment in various tumor models. (A) Average tumor growth and Kaplan-Meier survival rate of vaccinated C57BL/6J mice after BP tumor cell challenge. Mice were pretreated with blank MN (blank), MN loaded with BP tumor lysate and melanin (MN), or loaded MN combined with NIR irradiation (MN + NIR). (B) Average tumor growth and Kaplan-Meier survival rate of vaccinated BALB/cJ mice after 4T1 tumor cell challenge. Mice were pretreat-ed with blank MN, MN loaded with 4T1 tumor lysate and melanin, or loaded MN combined with NIR irradiation. (C) Average tumor growth and Kaplan-Meier survival rate of C57BL/6J mice bearing established BP tumors. Mice were treated with blank MN, MN loaded with BP tumor lysate and melanin, or loaded MN combined with NIR irra-diation. (D) Average tumor growth and Kaplan-Meier survival rate of BALB/cJ mice bearing established 4T1 tumors. Mice were treated with blank MN, MN loaded with 4T1 tumor lysate and melanin, or loaded MN combined with NIR irradiation. Data points represent mean ± SD (n = 8). Error bars indicate SD. Statistical significance was calcu-lated by Student’s t test and log-rank test (*P < 0.05; **P < 0.01; ***P < 0.001).
www.SCIENCEIMMUNOLOGY.org 10 November 2017 Vol 2 Issue 17 aan5692
53
R E S E A R C H A R T I C L E
Ye et al., Sci. Immunol. 2, eaan5692 (2017) 10 November 2017
S C I E N C E I M M U N O L O G Y | R E S E A R C H A R T I C L E
9 of 12
Upon NIR light irradiation on the patch, the local heating effect on boosting immune responses was evaluated. Mice subjects were pur-chased from the Jackson Laboratory, weighed, and randomly divided into different experimental groups. The numbers of sampling and experimental replicates were included in each figure legend.
Preparation and characterization of MNsAll MNs were prepared using silicone molds with arrays of conical holes machined by laser ablation (Blueacre Technology Ltd.). Each MN had a 300 m by 300 m round base tapering to a height of 800 m with a tip radius of around 5 m. MNs were arranged in a 15 × 15 array with a 600-m center-to-center spacing. GM-CSF solution (0.1 mg/ml, 10-l final volume) was directly deposited by pipetting onto each silicone micromold surface, followed by vacuum (600 mmHg) condition for 5 min to allow the solution to flow into the cavities. After that, 0.2 ml of 4.0 weight % (wt %) methacrylated hyaluronic acid solution mixed with N,N′-methylenebisacrylamide (2.0 wt %) and photoinitiator (Irgacure 2959; 0.05 wt %) were directly deposited by pipetting onto each silicone micromold surface, followed by vacuum (600 mmHg) condition for 5 min and centrifugation at 2000 rpm for 5 min (Hettich Universal 32R centrifuge). GM-CSF layer was cross-linked via ultraviolet irradiation (wavelength, 365 nm) for 10 s, and a piece of 4 cm by 9 cm silver adhe-sive tape was applied around the 2 cm by 2 cm micromold baseplate. Three milliliters of homogenized B16F10 tumor lysate (containing 1.5 mg of extracted tumor lysate proteins) in 4.0 wt % mixed methacrylated hyaluronic acid solution was added to the prepared micro mold reser-voir. We also used hyaluronic acid solution with different concentrations of tumor protein from 0.25 to 0.5 to 1.0 mg/ml. Protein concentration was quantified by measuring extracted protein content in the tumor lysate supernatant using T-PER (tissue protein extraction reagent) and Bradford assay before the MN fabrication. For the BP or 4T1 tumor lysate–loaded MNs, 50-g melanin was dissolved in 4.0 wt % mixed methacrylated hyaluronic acid solution with tumor lysate (containing 1.5 mg of extract tumor lysate proteins, 3.0-ml final volume) to fabri-cate the MN matrix. For the blank MNs without tumor lysate, mixed methacrylated hyaluronic acid solution was used without the tumor lysate. For the melanin-loaded MNs, 50-g melanin was dissolved in 4.0 wt % mixed methacrylated hyaluronic acid solution to fabricate the MN matrix. The stock melanin solution (100 mg/ml) was prepared by dissolving melanin in 1.0 M sodium hydroxide and heating to 99°C for 10 min. Final formulation was dried at 25°C in a vacuum desiccator overnight. After desiccation was completed, needle arrays were careful-ly separated from the silicone molds and cross-linked via ultraviolet irradiation. The needle base was tailored into a square shape. Fluores-cent MNs were fabricated with phalloidin-labeled tumor lysate and rhodamine B– or Cy5.5-labeled hyaluronic acid. The preparation and storage of MNs were under sterilized condition. Morphology of MNs was characterized on a FEI Verios 460L field-emission scanning elec-tron microscope operating at 20 kV after sputter coating with gold/palladium at the Analytical Instrumentation Facility. Cross sections of MNs were obtained by cutting 5-m slides using Thermo Fisher Scien-tific HM525 NX Cryostat and stained with Alexa Fluor 488 phalloidin and Hoechst. Fluorescence images of MNs were taken by the Olympus IX70 multiparameter fluorescence microscope.
NIR-responsive property of MNTo evaluate the property of the MN patch in response to NIR light irra-diation, we irradiated samples with 808-nm NIR laser light. The diode infrared laser module (Opto Engine LLC, MDL-N-808) was approved
by a laser safety officer of the North Carolina State University (NC State) Environmental Health and Safety Center. The MN patches were placed on a piece of white paper with the needle tips facing down. The laser wire was fixed in place using a plate stand with a support rod and a clamp. The distance between the patch and spotlight was fixed at 10 cm, and the spot size was ~1 cm2. The output energy of the diode infrared laser module was adjusted within 1.0 W and led to the intensity per unit area (E = I/d2) of 1.0 W/cm2 (at 808 nm). The NIR light was irradiated continuously or intermittently as needed. Surface temperature changes of the MN patch backing were recorded, and the highest temperature was controlled below 42°C in real time using a thermal imager (FLIR E4) and a noncontact infrared thermometer gun (Leegoal). For intermittent irradiation, the MNs were repeatedly exposed to the laser (1.0 W/cm2), and the local temperature reached about 42°C for 1 min. Subsequently, the laser was turned off for 1 min. This cycle was repeated four times to assess the responsive behavior of MN patch under repeated NIR irradiation. For the continuous irradiation, samples with different parameters were tested. The effect of melanin content on the light- responsive behavior was tested on MNs loaded with tumor lysate of different protein concentration or blank MN with hyaluronic acid. Quantitative surface temperature changes of the representative MNs were recorded under continuous NIR irradiation at 1.0 W/cm2. In a separate experiment, the laser power flux was controlled. During con-tinuous NIR exposure for 2 min, the maximal temperature of the MN surface was recorded and plotted. The effect of MN backing thickness on the light-responsive behavior was tested on MNs with continuous NIR irradiation at 1.0 W/cm2. The thickness of the MN patch was mea-sured with an average value of 181 m and an SD of 12.5 m using a digimatic indicator (Mitutoyo Corp. ID-C112E Series 543). MN patch samples with different backing thicknesses (169, 175, 179, 181, and 202 m) were used.
In vitro DC activationBone marrow was collected by flushing the femur and tibia with complete RPMI 1640 containing 10% fetal bovine growth serum. Af-ter lysis of red blood cells (lysate solution, Cwbiotech), 1 × 10⁶ bone marrow cells were seeded in six-well culture dishes with 3.0 ml of the culture medium containing GM-CSF (20 ng/ml) and 50 M -mercaptoethanol (Bio-Rad, Hercules, CA, USA). On day 3, an ad-ditional 4.0 ml of the same medium with GM-CSF was added into the plates. On day 6, half of the culture supernatant was collected and centrifuged. Cells were resuspended in RPMI 1640 and added back into the original plates. On day 7, nonadherent cells were collected and used as bone marrow–derived DCs for further research use. Another murine DC line JAWS II cells were cultured in minimum essential medium Eagle alpha modification (Sigma-Aldrich) supplemented with GM-CSF (5 ng/ml). DCs were left unstimulated or stimulated for 12 hours with blank MN (100 g/ml) or tumor lysate–loaded MN release medium or lipopolysaccharide (LPS; 100 ng/ml). After the stimulation, the cells were exposed to NIR irradiation (1.0 W/cm2) at a distance of 10 cm for 0, 5, 10, 15, and 20 min, respectively. After cell incubation for 4 hours, the supernatants were collected and measured by IL-12 p70 mouse ELISA kit (Thermo Fisher Scientific, MC0121). The cells were washed and stained with LIVE/DEAD assay (Thermo Fisher Scientific, L3224) and CD80+, and CD86+ maturation marker- specific antibodies and subsequently analyzed by the confocal microscopy and flow cytometer. Both bone marrow–derived DCs and JAWS II cell line were used for characterization of DC activation. The LIVE/DEAD assay imaging data were obtained from the JAWS II cell line.
www.SCIENCEIMMUNOLOGY.org 10 November 2017 Vol 2 Issue 17 aan5692
54
R E S E A R C H A R T I C L E
Ye et al., Sci. Immunol. 2, eaan5692 (2017) 10 November 2017
S C I E N C E I M M U N O L O G Y | R E S E A R C H A R T I C L E
10 of 12
Mice and in vivo tumor modelsFemale C57BL/6J mice, BALB/cJ mice, CD11c-DTR transgenic mice [B6.FVB-Tg(Itgax-DTR/EGFP)57Lan/J; stock no. 004509], and Rag1−/− knockout mice (B6.129S7-Rag1tm1Mom/J; stock no. 002216) were purchased from the Jackson Laboratory. Mice were weighed and randomly divided into different groups. On day 0, healthy mice were treated with MNs loaded with tumor lysates and GM-CSF, blank MNs loaded with synthetic melanin without tumor lysates, or blank MNs containing hyaluronic acid only (blank). MN patches were applied into the skin of the caudal-dorsal area for about 10 min and further fixed using Skin Affix surgical adhesive (Medline Industries Inc.). After in-jection of the MNs, NIR irradiation was performed on the localized MN region for 10 min each day for five successive days after immuni-zation (MN + NIR). The diode infrared laser module at 808 nm (Opto Engine LLC, MDL-N-808) was approved by a laser safety officer of the NC State University Environmental Health and Safety Center. Mice in the control groups were treated with either vaccine MNs without NIR irradiation (MN), blank MNs loaded with synthetic melanin without tumor lysate with NIR irradiation (melanin), or blank MNs containing hyaluronic acid only with NIR irradiation (blank). Surface temperature changes of the regional skin were recorded and controlled below 42°C in real time using a thermal imager (FLIR E4) and a noncontact infra-red thermometer gun (Leegoal). On day 10, 1 × 10⁶ B16F10 tumor cell lines in 25 l of phosphate-buffered saline (PBS) were subcutaneously transplanted into the flank of the C57BL/6J mice, CD11c-DTR trans-genic mice, and Rag1−/− knockout mice. Tumor-free mice were rechal-lenged with 1 × 10⁶ B16F10 tumor cells in 25 l of PBS 80 days after the first tumor inoculation. For the depletion antibody study, we depleted specific T cell, B cell, and NK cell populations in mouse models. Mice were intraperitoneally given 200 g of antibody purified from mouse thymus or spleen dissolved in 200 l of PBS. Antibodies against CD4 (BioLegend, LEAF 100435), CD8 (BioLegend, LEAF 100735), CD19 (BioLegend, LEAF 152402), and NK-1.1 (BioLegend, LEAF 108712) were administered twice weekly for 3 weeks, starting 1 week before the tumor inoculation. Depletions were confirmed by flow cytometry of splenic suspension. For another melanoma model, 1 × 10⁶ BP tumor cells in 25 l of PBS were subcutaneously transplanted into the flank of the C57BL/6J mice. For the carcinoma tumor model, 1 × 10⁶ 4T1 tu-mor cells in 25 l of PBS were subcutaneously transplanted into the flank of the BALB/cJ mice. For experimental metastasis model, 1 × 10⁵ tumor cells were intravenously infused into mice via the tail vein. In another set of experiments, tumor cells were subcutaneously trans-planted into the flank of the mice on day 0. The tumor-bearing mice were weighed and randomly divided into four groups when the tumor volume reached around 50 mm3 on day 3. After that, the mice were peritumorally administrated with sterile MN loaded with tumor lysate and GM-CSF (MN) or blank MN containing hyaluronic acid only (blank). After that, NIR light was irradiated on the MN patch for 10 min during the following 5 days from days 3 to 7. Tumor growth was mea-sured by a digital caliper or monitored by bioluminescence signals of luciferase-tagged cells. The tumor volume (cubic millimeter) was cal-culated as 1/2 × long diameter × (short diameter)2.
To assess potential toxicity, we monitored mice daily for weight loss. H&E staining was performed on the organs collected from the mice following the standard procedure (Histology Laboratory at NC State College of Veterinary Medicine). Lungs were excised, and macroscopi-cally visible metastases were counted. The resected primary tumors were stored at −20°C for immunofluorescence staining or fixed in 4% paraformaldehyde for subsequent analysis.
Identification of DC subsets, T cells, and cytokinesAntibodies used were purchased from Thermo Fisher Scientific and BioLegend Inc. Staining antibodies, including CD3 (Thermo Fisher Scientific, A18644), CD4 (Thermo Fisher Scientific, A18667), CD8 (Thermo Fisher Scientific, A18609), CD11c (BioLegend, 117309), CD49b (BioLegend, 108909), CD80 (BioLegend, 104707), CD86 (BioLegend, 105007), PIR-A/B (gp91, BioLegend, 144103), tetramer (MBL Interna-tional, H-2Db gp100, EGSRNQDWL-P), and fluorogenic CellROX Deep Red reagent (BioLegend, C10422) were used for fluorescence- activated cell sorting (FACS) and were analyzed following the manu-facturers’ instructions. Organs (skin, tumor, lymph node, and spleen) were harvested and minced into 2- to 4-mm pieces using scissors or scalpel blade. A single-cell suspension was prepared in the cell staining buffer (BioLegend, 420201). CellROX reagents at predetermined opti-mum concentrations were added to the cells and incubated on ice for 20 to 30 min in the dark for ROS detection. The relevant tetramer phy-coerythrin (PE) was stained at room temperature for 30 min in the dark before additional staining with appropriately conjugated fluorescent antibodies. Stained cells were analyzed on a FACSCalibur instrument (BD) and using FlowJo software. To determine the concentration of different cytokines at the vaccine MN site, patch and adjacent tissues were ex-cised and digested with T-PER (Pierce). Cytokine concentrations in the extracted patch were analyzed with a BioLegend’s LEGENDplex bead-based immunoassays, according to the manufacturer’s instructions.
Statistical analysisStatistical analysis was evaluated using GraphPad Prism (6.0). Statisti-cal analysis was performed with paired Student’s t test and analysis of variance (ANOVA). P values for Kaplan-Meier curves were calculated with log-rank test. P values of 0.05 or less were considered significant.
Study approvalAll mouse studies were performed following animal protocols ap-proved by the Institutional Animal Care and Use Committee at the NC State University and the University of North Carolina at Chapel Hill (UNC-CH).
SUPPLEMENTARY MATERIALSimmunology.sciencemag.org/cgi/content/full/2/17/eaan5692/DC1Materials and MethodsFig. S1. Mechanical property of the MN.Fig. S2. Characteristics of tumor lysate solution and synthetic melanin.Fig. S3. Heating behavior of MN patches by repetitive NIR irradiation.Fig. S4. Surface temperature of MN patches with various loadings of tumor lysates upon NIR irradiation.Fig. S5. In vitro release profiles of GM-CSF and tumor lysate proteins.Fig. S6. Scanning electron microscopy images of MN patch after insertion into the mouse skin over time.Fig. S7. DC function evaluation after in vitro activation.Fig. S8. Cytotoxicity study of the blank MNs.Fig. S9. Characterization of the skin after MN insertion.Fig. S10. Melanin-loaded MNs confer protective immunity in vivo.Fig. S11. Tumor growth in control and treated mice.Fig. S12. Quantified B16F10 bioluminescent tumor signals in control and treated mice.Fig. S13. Tumor weights in control and treated mice.Fig. S14. Histology and apoptosis analysis of the tumor sections.Fig. S15. Tumor growth of mice receiving the transdermal cancer immunotherapy.Fig. S16. Measurement of local microcirculatory blood perfusion of mice.Fig. S17. Immunologic responses after the transdermal cancer immunotherapy.Fig. S18. Quantification of IgG1 subtypes in serum after treatment with blank, MN, or MN + NIR.Fig. S19. ROS detection by flow cytometry in tumor sections.Fig. S20. HSP90 expression after the transdermal cancer immunotherapy.Fig. S21. Cytokine kinetics after the transdermal cancer immunotherapy.
www.SCIENCEIMMUNOLOGY.org 10 November 2017 Vol 2 Issue 17 aan5692
55
R E S E A R C H A R T I C L E
Ye et al., Sci. Immunol. 2, eaan5692 (2017) 10 November 2017
S C I E N C E I M M U N O L O G Y | R E S E A R C H A R T I C L E
11 of 12
Fig. S22. Histology analysis after the transdermal cancer immunotherapy.Fig. S23. Antitumor effect of the transdermal cancer immunotherapy toward different tumor models.Fig. S24. Surface temperature changes of the melanin-loaded MNs.Fig. S25. Antitumor effect of the transdermal cancer immunotherapy.Fig. S26. HSP70 expression after the transdermal cancer immunotherapy.Fig. S27. Representative quantitative analysis of the DC activation.Fig. S28. Cytokine kinetics after the transdermal cancer immunotherapy.Fig. S29. Average weights of mice after the transdermal cancer immunotherapy in control and treated mice.Fig. S30. H&E staining of organs collected after the transdermal cancer immunotherapy.Table S1. Melanin content of tumors excised from tumor-bearing mice.Table S2. Measurement of total local microcirculatory blood perfusion of mice receiving different treatments using the laser Doppler flowmetry.Excel file 1.Excel file 2.
REFERENCES AND NOTES 1. J. Couzin-Frankel, Cancer immunotherapy. Science 342, 1432–1433 (2013). 2. D. Ricklin, G. Hajishengallis, K. Yang, J. D. Lambris, Complement: A key system for
immune surveillance and homeostasis. Nat. Immunol. 11, 785–797 (2010). 3. J. B. Swann, M. J. Smyth, Immune surveillance of tumors. J. Clin. Invest. 117, 1137–1146
(2007). 4. L. Gu, D. J. Mooney, Biomaterials and emerging anticancer therapeutics: Engineering the
microenvironment. Nat. Rev. Cancer 16, 56–66 (2015). 5. L. E. Klevorn, R. M. Teague, Adapting cancer immunotherapy models for the real world.
Trends Immunol. 37, 354–363 (2016). 6. D. R. Littman, Releasing the brakes on cancer immunotherapy. Cell 162, 1186–1190
(2015). 7. C. G. Drake, E. J. Lipson, J. R. Brahmer, Breathing new life into immunotherapy: Review of
melanoma, lung and kidney cancer. Nat. Rev. Clin. Oncol. 11, 24–37 (2013). 8. M. E. Dudley, S. A. Rosenberg, Adoptive-cell-transfer therapy for the treatment of
patients with cancer. Nat. Rev. Cancer 3, 666–675 (2003). 9. S. A. Rosenberg, N. P. Restifo, J. C. Yang, R. A. Morgan, M. E. Dudley, Adoptive cell
transfer: A clinical path to effective cancer immunotherapy. Nat. Rev. Cancer 8, 299–308 (2008).
10. M. T. Stephan, J. J. Moon, S. H. Um, A. Bershteyn, D. J. Irvine, Therapeutic cell engineering with surface-conjugated synthetic nanoparticles. Nat. Med. 16, 1035–1041 (2010).
11. B. Huang, W. D. Abraham, Y. Zheng, S. C. Bustamante López, S. S. Luo, D. J. Irvine, Active targeting of chemotherapy to disseminated tumors using nanoparticle-carrying T cells. Sci. Transl. Med. 7, 291ra94 (2015).
12. D. J. Irvine, M. A. Swartz, G. L. Szeto, Engineering synthetic vaccines using cues from natural immunity. Nat. Mater. 12, 978–990 (2013).
13. M. F. Bachmann, G. T. Jennings, Vaccine delivery: A matter of size, geometry, kinetics and molecular patterns. Nat. Rev. Immunol. 10, 787–796 (2010).
14. J. Banchereau, A. K. Palucka, Dendritic cells as therapeutic vaccines against cancer. Nat. Rev. Immunol. 5, 296–306 (2005).
15. M. V. Dhodapkar, M. Sznol, B. Zhao, D. Wang, R. D. Carvajal, M. L. Keohan, E. Chuang, R. E. Sanborn, J. Lutzky, J. Powderly, H. Kluger, S. Tejwani, J. Green, V. Ramakrishna, A. Crocker, L. Vitale, M. Yellin, T. Davis, T. Keler, Induction of antigen-specific immunity with a vaccine targeting NY-ESO-1 to the dendritic cell receptor DEC-205. Sci. Transl. Med. 6, 232ra51 (2014).
16. A. D. Garg, L. Vandenberk, C. Koks, T. Verschuere, L. Boon, S. W. Van Gool, P. Agostinis, Dendritic cell vaccines based on immunogenic cell death elicit danger signals and T cell–driven rejection of high-grade glioma. Sci. Transl. Med. 8, 328ra27 (2016).
17. T. R. Fadel, F. A. Sharp, N. Vudattu, R. Ragheb, J. Garyu, D. Kim, E. P. Hong, N. Li, G. L. Haller, L. D. Pfefferle, S. Justesen, K. C. Herold, T. M. Fahmy, Corrigendum: A carbon nanotube-polymer composite for T-cell therapy. Nat. Nanotechnol. 9, 723 (2014).
18. J. V. Kim, J.-B. Latouche, I. Rivière, M. Sadelain, The ABCs of artificial antigen presentation. Nat. Biotechnol. 22, 403–410 (2004).
19. C. L.-L. Chiang, G. Coukos, L. Kandalaft, Whole tumor antigen vaccines: Where are we? Vaccines 3, 344–372 (2015).
20. W. Kratky, C. Reis e Sousa, A. Oxenius, R. Spörri, Direct activation of antigen-presenting cells is required for CD8+ T-cell priming and tumor vaccination. Proc. Natl. Acad. Sci. U.S.A. 108, 17414–17419 (2011).
21. S. B. Stephan, A. M. Taber, I. Jileaeva, E. P. Pegues, C. L. Sentman, M. T. Stephan, Biopolymer implants enhance the efficacy of adoptive T-cell therapy. Nat. Biotechnol. 33, 97–101 (2015).
22. J. Kim, W. A. Li, Y. Choi, S. A. Lewin, C. S. Verbeke, G. Dranoff, D. J. Mooney, Injectable, spontaneously assembling, inorganic scaffolds modulate immune cells in vivo and increase vaccine efficacy. Nat. Biotechnol. 33, 64–72 (2015).
23. O. A. Ali, D. Emerich, G. Dranoff, D. J. Mooney, In situ regulation of DC subsets and T cells mediates tumor regression in mice. Sci. Transl. Med. 1, 8ra19 (2009).
24. S. S. Evans, E. A. Repasky, D. T. Fisher, Fever and the thermal regulation of immunity: The immune system feels the heat. Nat. Rev. Immunol. 15, 335–349 (2015).
25. K. Sato, N. Sato, B. Xu, Y. Nakamura, T. Nagaya, P. L. Choyke, Y. Hasegawa, H. Kobayashi, Spatially selective depletion of tumor-associated regulatory T cells with near-infrared photoimmunotherapy. Sci. Transl. Med. 8, 352ra110 (2016).
26. J. Fu, D. B. Kanne, M. Leong, L. H. Glickman, S. M. McWhirter, E. Lemmens, K. Mechette, J. J. Leong, P. Lauer, W. Liu, K. E. Sivick, Q. Zeng, K. C. Soares, L. Zheng, D. A. Portnoy, J. J. Woodward, D. M. Pardoll, T. W. Dubensky Jr., Y. Kim, STING agonist formulated cancer vaccines can cure established tumors resistant to PD-1 blockade. Sci. Transl. Med. 7, 283ra52 (2015).
27. T. S. Kupper, R. C. Fuhlbrigge, Immune surveillance in the skin: Mechanisms and clinical consequences. Nat. Rev. Immunol. 4, 211–222 (2004).
28. K. Nagao, F. Ginhoux, W. W. Leitner, S.-I. Motegi, C. L. Bennett, B. E. Clausen, M. Merad, M. C. Udey, Murine epidermal Langerhans cells and langerin-expressing dermal dendritic cells are unrelated and exhibit distinct functions. Proc. Natl. Acad. Sci. U.S.A. 106, 3312–3317 (2009).
29. C. Wang, Y. Ye, G. M. Hochu, H. Sadeghifar, Z. Gu, Enhanced cancer immunotherapy by microneedle patch-assisted delivery of anti-PD1 antibody. Nano Lett. 16, 2334–2340 (2016).
30. J. Yu, Y. Zhang, Y. Ye, R. DiSanto, W. Sun, D. Ranson, F. S. Ligler, J. B. Buse, Z. Gu, Microneedle-array patches loaded with hypoxia-sensitive vesicles provide fast glucose-responsive insulin delivery. Proc. Natl. Acad. Sci. U.S.A. 112, 8260–8265 (2015).
31. A. Filson, J. Hope, Isolation of melanin granules. Nature 179, 211 (1957). 32. A. J. Lea, Solubility of melanins. Nature 170, 709 (1952). 33. R. Zhang, Q. Fan, M. Yang, K. Cheng, X. Lu, L. Zhang, W. Huang, Z. Cheng, Engineering
melanin nanoparticles as an efficient drug-delivery system for imaging-guided chemotherapy. Adv. Mater. 27, 5063–5069 (2015).
34. S. P. Sullivan, D. G. Koutsonanos, M. del Pilar Martin, J. W. Lee, V. Zarnitsyn, S.-O. Choi, N. Murthy, R. W. Compans, I. Skountzou, M. R. Prausnitz, Dissolving polymer microneedle patches for influenza vaccination. Nat. Med. 16, 915–920 (2010).
35. M. L. Moraes, P. J. Gomes, P. A. Ribeiro, P. Vieira, A. A. Freitas, R. Kohler, O. N. Oliveira Jr., M. Raposo, Polymeric scaffolds for enhanced stability of melanin incorporated in liposomes. J. Colloid Interface Sci. 350, 268–274 (2010).
36. B. M. Carreno, V. Magrini, M. Becker-Hapak, S. Kaabinejadian, J. Hundal, A. A. Petti, A. Ly, W. R. Lie, W. H. Hildebrand, E. R. Mardis, G. P. Linette, A dendritic cell vaccine increases the breadth and diversity of melanoma neoantigen-specific T cells. Science 348, 803–808 (2015).
37. J. C. Castle, S. Kreiter, J. Diekmann, M. Löwer, N. van de Roemer, J. de Graaf, A. Selmi, M. Diken, S. Boegel, C. Paret, M. Koslowski, A. N. Kuhn, C. M. Britten, C. Huber, Ö. Türeci, U. Sahin, Exploiting the mutanome for tumor vaccination. Cancer Res. 72, 1081–1091 (2012).
38. A. Murshid, J. Gong, S. K. Calderwood, The role of heat shock proteins in antigen cross presentation. Front. Immunol. 3, 63 (2012).
39. M. M. Hoffmann, C. Molina-Mendiola, A. D. Nelson, C. A. Parks, E. E. Reyes, M. J. Hansen, G. Rajagopalan, L. R. Pease, A. G. Schrum, D. Gil, Co-potentiation of antigen recognition: A mechanism to boost weak T cell responses and provide immunotherapy in vivo. Sci. Adv. 1, e1500415 (2015).
40. D. Dankort, D. P. Curley, R. A. Cartlidge, B. Nelson, A. N. Karnezis, W. E. Damsky Jr., M. J. You, R. A. DePinho, M. McMahon, M. Bosenberg, Braf V600E cooperates with Pten loss to induce metastatic melanoma. Nat. Genet. 41, 544–552 (2009).
41. A. Holtzhausen, F. Zhao, K. S. Evans, M. Tsutsui, C. Orabona, D. S. Tyler, B. A. Hanks, Melanoma-derived Wnt5a promotes local dendritic-cell expression of IDO and immunotolerance: Opportunities for pharmacologic enhancement of immunotherapy. Cancer Immunol. Res. 3, 1082–1095 (2015).
42. Q. Chen, L. Xu, C. Liang, C. Wang, R. Peng, Z. Liu, Photothermal therapy with immune-adjuvant nanoparticles together with checkpoint blockade for effective cancer immunotherapy. Nat. Commun. 7, 13193 (2016).
43. J. Conde, N. Oliva, Y. Zhang, N. Artzi, Local triple-combination therapy results in tumour regression and prevents recurrence in a colon cancer model. Nat. Mater. 15, 1128–1138 (2016).
44. W. Sun, Q. Hu, W. Ji, G. Wright, Z. Gu, Leveraging physiology for precision drug delivery. Physiol. Rev. 97, 189–225 (2017).
45. Y. Zhang, J. Yu, A. Kahkoska, Z. Gu, Photoacoustic drug delivery. Sensors 17, 1400 (2017). 46. L. Cheng, C. Wang, L. Feng, K. Yang, Z. Liu, Functional nanomaterials for phototherapies
of cancer. Chem. Rev. 114, 10869–10939 (2014). 47. C. Wang, Y. Ye, Q. Hu, A. Bellotti, Z. Gu, Tailoring biomaterials for cancer immunotherapy:
Emerging trends and future outlook. Adv. Mater. 29, 1606036 (2017).
Acknowledgments: We thank L. Huang at the UNC-CH for providing the B16F10-Luc cell line and BRAFV600EPTEN−/− Duke-clone 6 cell line (generated in the laboratory of B. A. Hanks at Duke Cancer Institute), B. Andersen at the NC State University for Fourier transform infrared analysis,
www.SCIENCEIMMUNOLOGY.org 10 November 2017 Vol 2 Issue 17 aan5692

56
R E S E A R C H A R T I C L E
Ye et al., Sci. Immunol. 2, eaan5692 (2017) 10 November 2017
S C I E N C E I M M U N O L O G Y | R E S E A R C H A R T I C L E
12 of 12
and the UNC Research Opportunity Initiative for the strain tests. Funding: This work was supported by grants from the NC Translational and Clinical Sciences, the NIH Clinical and Translational Science Awards (NIH grant 1L1TR001111) at the UNC-CH, the Sloan Research Fellowship of the Alfred P. Sloan Foundation, and the pilot grant from the UNC Lineberger Comprehensive Cancer Center. Author contributions: Y.Y., C.W., L.H., G.D., and Z.G. designed the experiments. Y.Y., C.W., and X.Z. performed the experiments. Y.Y. and C.W. performed the statistical analyses. Y.Y., C.W., Q.H., Y.Z., Q.L., D.W., J.M., A.B., L.H., G.D., and Z.G. analyzed the data and wrote the paper. Competing interests: The authors declare that they have no competing interests.
Submitted 2 May 2017Accepted 11 October 2017Published 10 November 201710.1126/sciimmunol.aan5692
Citation: Y. Ye, C. Wang, X. Zhang, Q. Hu, Y. Zhang, Q. Liu, D. Wen, J. Milligan, A. Bellotti, L. Huang, G. Dotti, Z. Gu, A melanin-mediated cancer immunotherapy patch. Sci. Immunol. 2, eaan5692 (2017).
www.SCIENCEIMMUNOLOGY.org 10 November 2017 Vol 2 Issue 17 aan5692
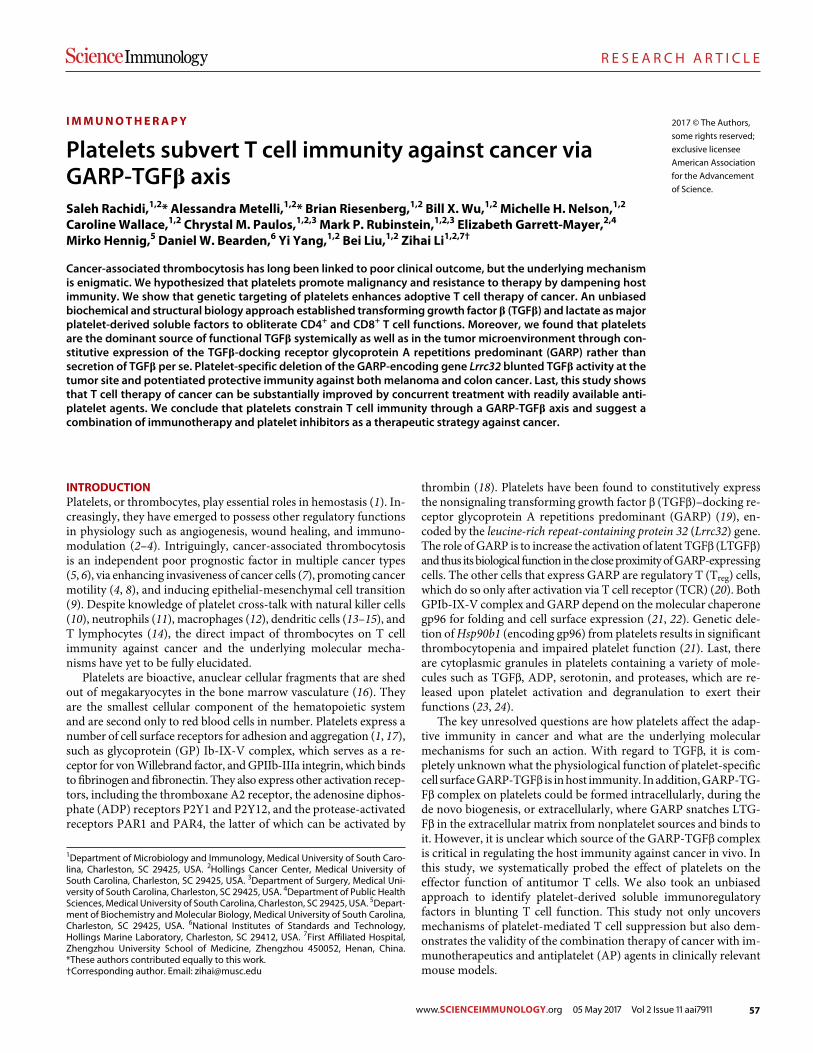
57
R E S E A R C H A R T I C L E
www.SCIENCEIMMUNOLOGY.org 05 May 2017 Vol 2 Issue 11 aai7911Rachidi et al., Sci. Immunol. 2, eaai7911 (2017) 5 May 2017
S C I E N C E I M M U N O L O G Y | R E S E A R C H A R T I C L E
1 of 12
I M M U N O T H E R A P Y
Platelets subvert T cell immunity against cancer via GARP-TGF axisSaleh Rachidi,1,2* Alessandra Metelli,1,2* Brian Riesenberg,1,2 Bill X. Wu,1,2 Michelle H. Nelson,1,2 Caroline Wallace,1,2 Chrystal M. Paulos,1,2,3 Mark P. Rubinstein,1,2,3 Elizabeth Garrett-Mayer,2,4 Mirko Hennig,5 Daniel W. Bearden,6 Yi Yang,1,2 Bei Liu,1,2 Zihai Li1,2,7†
Cancer-associated thrombocytosis has long been linked to poor clinical outcome, but the underlying mechanism is enigmatic. We hypothesized that platelets promote malignancy and resistance to therapy by dampening host immunity. We show that genetic targeting of platelets enhances adoptive T cell therapy of cancer. An unbiased biochemical and structural biology approach established transforming growth factor (TGF) and lactate as major platelet-derived soluble factors to obliterate CD4+ and CD8+ T cell functions. Moreover, we found that platelets are the dominant source of functional TGF systemically as well as in the tumor microenvironment through con-stitutive expression of the TGF-docking receptor glycoprotein A repetitions predominant (GARP) rather than secretion of TGF per se. Platelet- specific deletion of the GARP-encoding gene Lrrc32 blunted TGF activity at the tumor site and potentiated protective immunity against both melanoma and colon cancer. Last, this study shows that T cell therapy of cancer can be substantially improved by concurrent treatment with readily available anti-platelet agents. We conclude that platelets constrain T cell immunity through a GARP-TGF axis and suggest a combination of immunotherapy and platelet inhibitors as a therapeutic strategy against cancer.
INTRODUCTIONPlatelets, or thrombocytes, play essential roles in hemostasis (1). In-creasingly, they have emerged to possess other regulatory functions in physiology such as angiogenesis, wound healing, and immuno-modulation (2–4). Intriguingly, cancer-associated thrombocytosis is an independent poor prognostic factor in multiple cancer types (5, 6), via enhancing invasiveness of cancer cells (7), promoting cancer motility (4, 8), and inducing epithelial-mesenchymal cell transi tion (9). Despite knowledge of platelet cross-talk with natural killer cells (10), neutrophils (11), macrophages (12), dendritic cells (13–15), and T lymphocytes (14), the direct impact of thrombocytes on T cell immunity against cancer and the underlying molecular mecha-nisms have yet to be fully elucidated.
Platelets are bioactive, anuclear cellular fragments that are shed out of megakaryocytes in the bone marrow vasculature (16). They are the smallest cellular component of the hematopoietic system and are second only to red blood cells in number. Platelets express a number of cell surface receptors for adhesion and aggregation (1, 17), such as glycoprotein (GP) Ib-IX-V complex, which serves as a re-ceptor for von Willebrand factor, and GPIIb-IIIa integrin, which binds to fibrinogen and fibronectin. They also express other activation recep-tors, including the thromboxane A2 receptor, the adenosine diphos-phate (ADP) receptors P2Y1 and P2Y12, and the protease- activated receptors PAR1 and PAR4, the latter of which can be activated by
thrombin (18). Platelets have been found to constitutively express the nonsignaling transforming growth factor (TGF)–docking re-ceptor glycoprotein A repetitions predominant (GARP) (19), en-coded by the leucine-rich repeat-containing protein 32 (Lrrc32) gene. The role of GARP is to increase the activation of latent TGF (LTGF) and thus its biological function in the close proximity of GARP-expressing cells. The other cells that express GARP are regulatory T (Treg) cells, which do so only after activation via T cell receptor (TCR) (20). Both GPIb-IX-V complex and GARP depend on the molecular chaperone gp96 for folding and cell surface expression (21, 22). Genetic dele-tion of Hsp90b1 (encoding gp96) from platelets results in significant thrombo cytopenia and impaired platelet function (21). Last, there are cytoplasmic granules in platelets containing a variety of mole-cules such as TGF, ADP, serotonin, and proteases, which are re-leased upon platelet activation and degranulation to exert their functions (23, 24).
The key unresolved questions are how platelets affect the adap-tive immunity in cancer and what are the underlying molecular mechanisms for such an action. With regard to TGF, it is com-pletely unknown what the physiological function of platelet-specific cell surface GARP-TGF is in host immunity. In addition, GARP-TG-F complex on platelets could be formed intracellularly, during the de novo biogenesis, or extracellularly, where GARP snatches LTG-F in the extracellular matrix from nonplatelet sources and binds to it. However, it is unclear which source of the GARP-TGF complex is critical in regulating the host immunity against cancer in vivo. In this study, we systematically probed the effect of platelets on the effector function of antitumor T cells. We also took an unbiased approach to identify platelet-derived soluble immunoregulatory factors in blunting T cell function. This study not only uncovers mechanisms of platelet-mediated T cell suppression but also dem-onstrates the validity of the combination therapy of cancer with im-munotherapeutics and antiplatelet (AP) agents in clinically relevant mouse models.
1Department of Microbiology and Immunology, Medical University of South Caro-lina, Charleston, SC 29425, USA. 2Hollings Cancer Center, Medical University of South Carolina, Charleston, SC 29425, USA. 3Department of Surgery, Medical Uni-versity of South Carolina, Charleston, SC 29425, USA. 4Department of Public Health Sciences, Medical University of South Carolina, Charleston, SC 29425, USA. 5Depart-ment of Biochemistry and Molecular Bio logy, Medical University of South Carolina, Charleston, SC 29425, USA. 6National Institutes of Standards and Technology, Hollings Marine Laboratory, Charleston, SC 29412, USA. 7First Affiliated Hospital, Zhengzhou University School of Medicine, Zhengzhou 450052, Henan, China. *These authors contributed equally to this work.†Corresponding author. Email: [email protected]
2017 © The Authors, some rights reserved; exclusive licensee American Association for the Advancement of Science.
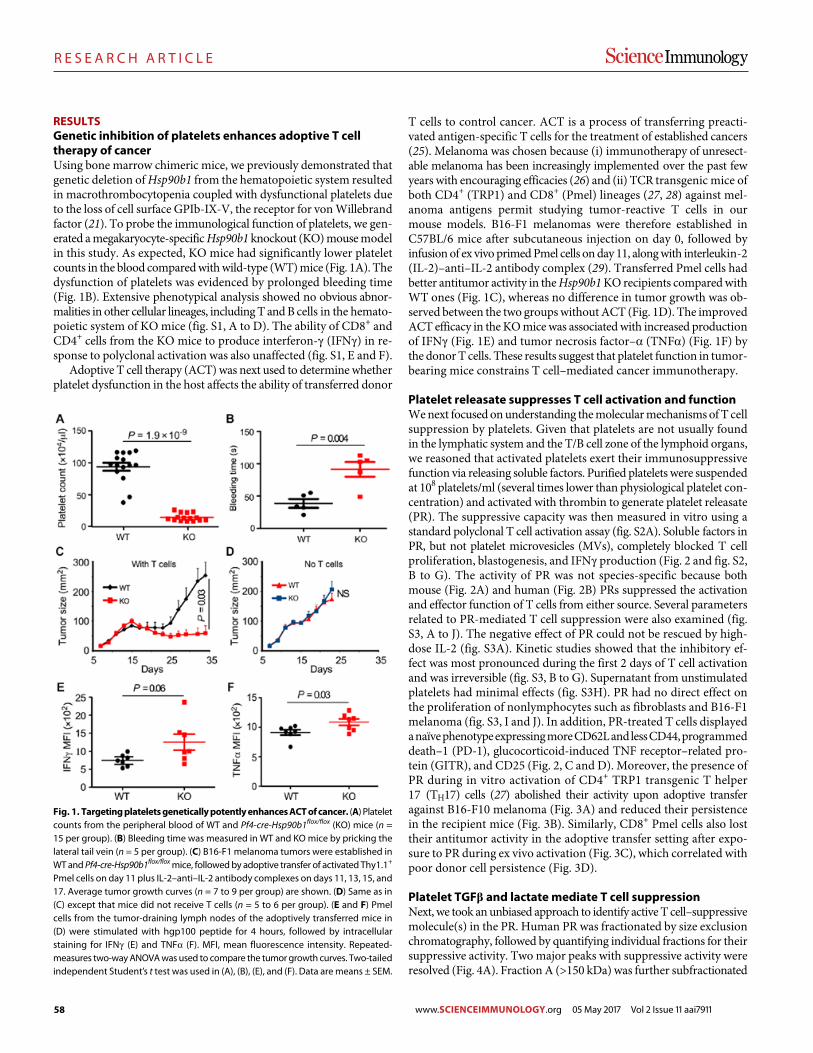
58
R E S E A R C H A R T I C L E
Rachidi et al., Sci. Immunol. 2, eaai7911 (2017) 5 May 2017
S C I E N C E I M M U N O L O G Y | R E S E A R C H A R T I C L E
2 of 12
RESULTSGenetic inhibition of platelets enhances adoptive T cell therapy of cancerUsing bone marrow chimeric mice, we previously demonstrated that genetic deletion of Hsp90b1 from the hematopoietic system resulted in macrothrombocytopenia coupled with dysfunctional platelets due to the loss of cell surface GPIb-IX-V, the receptor for von Willebrand factor (21). To probe the immunological function of platelets, we gen-erated a megakaryocyte-specific Hsp90b1 knockout (KO) mouse model in this study. As expected, KO mice had significantly lower platelet counts in the blood compared with wild-type (WT) mice (Fig. 1A). The dysfunction of platelets was evidenced by prolonged bleeding time (Fig. 1B). Extensive phenotypical analysis showed no obvious abnor-malities in other cellular lineages, including T and B cells in the hemato-poietic system of KO mice (fig. S1, A to D). The ability of CD8+ and CD4+ cells from the KO mice to produce interferon- (IFN) in re-sponse to polyclonal activation was also unaffected (fig. S1, E and F).
Adoptive T cell therapy (ACT) was next used to determine whether platelet dysfunction in the host affects the ability of transferred donor
T cells to control cancer. ACT is a process of transferring preacti-vated antigen-specific T cells for the treatment of established cancers (25). Melanoma was chosen because (i) immuno therapy of unresect-able melanoma has been increasingly implemented over the past few years with encouraging efficacies (26) and (ii) TCR trans genic mice of both CD4+ (TRP1) and CD8+ (Pmel) lineages (27, 28) against mel-anoma antigens permit studying tumor-reactive T cells in our mouse models. B16-F1 melanomas were therefore established in C57BL/6 mice after subcutaneous injection on day 0, followed by infusion of ex vivo primed Pmel cells on day 11, along with interleukin-2 (IL-2)–anti–IL-2 antibody complex (29). Transferred Pmel cells had better antitumor activity in the Hsp90b1 KO recipients compared with WT ones (Fig. 1C), whereas no difference in tumor growth was ob-served between the two groups without ACT (Fig. 1D). The improved ACT efficacy in the KO mice was associated with increased production of IFN (Fig. 1E) and tumor necrosis factor– (TNF) (Fig. 1F) by the donor T cells. These results suggest that platelet function in tumor- bearing mice constrains T cell–mediated cancer immunotherapy.
Platelet releasate suppresses T cell activation and functionWe next focused on understanding the molecular mechanisms of T cell suppression by platelets. Given that platelets are not usually found in the lymphatic system and the T/B cell zone of the lymphoid organs, we reasoned that activated platelets exert their immunosuppressive function via releasing soluble factors. Purified platelets were suspended at 108 platelets/ml (several times lower than physiological platelet con-centration) and activated with thrombin to generate platelet releasate (PR). The suppressive capacity was then measured in vitro using a standard polyclonal T cell activation assay (fig. S2A). Soluble factors in PR, but not platelet microvesicles (MVs), completely blocked T cell proliferation, blastogenesis, and IFN production (Fig. 2 and fig. S2, B to G). The activity of PR was not species-specific because both mouse (Fig. 2A) and human (Fig. 2B) PRs suppressed the activation and effector function of T cells from either source. Several parameters related to PR-mediated T cell suppression were also examined (fig. S3, A to J). The negative effect of PR could not be rescued by high-dose IL-2 (fig. S3A). Kinetic studies showed that the inhibitory ef-fect was most pronounced during the first 2 days of T cell activation and was irreversible (fig. S3, B to G). Supernatant from unstimulated platelets had minimal effects (fig. S3H). PR had no direct effect on the proliferation of nonlymphocytes such as fibroblasts and B16-F1 melanoma (fig. S3, I and J). In addition, PR-treated T cells displayed a naïve phenotype expressing more CD62L and less CD44, programmed death–1 (PD-1), glucocorticoid-induced TNF receptor–related pro-tein (GITR), and CD25 (Fig. 2, C and D). Moreover, the presence of PR during in vitro activation of CD4+ TRP1 transgenic T helper 17 (TH17) cells (27) abolished their activity upon adoptive transfer against B16-F10 melanoma (Fig. 3A) and reduced their persistence in the recipient mice (Fig. 3B). Similarly, CD8+ Pmel cells also lost their antitumor activity in the adoptive transfer setting after expo-sure to PR during ex vivo activation (Fig. 3C), which correlated with poor donor cell persistence (Fig. 3D).
Platelet TGF and lactate mediate T cell suppressionNext, we took an unbiased approach to identify active T cell–suppressive molecule(s) in the PR. Human PR was fractionated by size exclusion chromatography, followed by quantifying individual fractions for their suppressive activity. Two major peaks with suppressive activity were resolved (Fig. 4A). Fraction A (>150 kDa) was further subfractionated
Fig. 1. Targeting platelets genetically potently enhances ACT of cancer. (A) Platelet counts from the peripheral blood of WT and Pf4-cre-Hsp90b1flox/flox (KO) mice (n = 15 per group). (B) Bleeding time was measured in WT and KO mice by pricking the lateral tail vein (n = 5 per group). (C) B16-F1 melanoma tumors were established in WT and Pf4-cre-Hsp90b1flox/flox mice, followed by adoptive transfer of activated Thy1.1+ Pmel cells on day 11 plus IL-2–anti–IL-2 antibody complexes on days 11, 13, 15, and 17. Average tumor growth curves (n = 7 to 9 per group) are shown. (D) Same as in (C) except that mice did not receive T cells (n = 5 to 6 per group). (E and F) Pmel cells from the tumor-draining lymph nodes of the adoptively transferred mice in (D) were stimulated with hgp100 peptide for 4 hours, followed by intracellular staining for IFN (E) and TNF (F). MFI, mean fluorescence intensity. Repeated- measures two-way ANOVA was used to compare the tumor growth curves. Two-tailed independent Student’s t test was used in (A), (B), (E), and (F). Data are means ± SEM.
www.SCIENCEIMMUNOLOGY.org 05 May 2017 Vol 2 Issue 11 aai7911
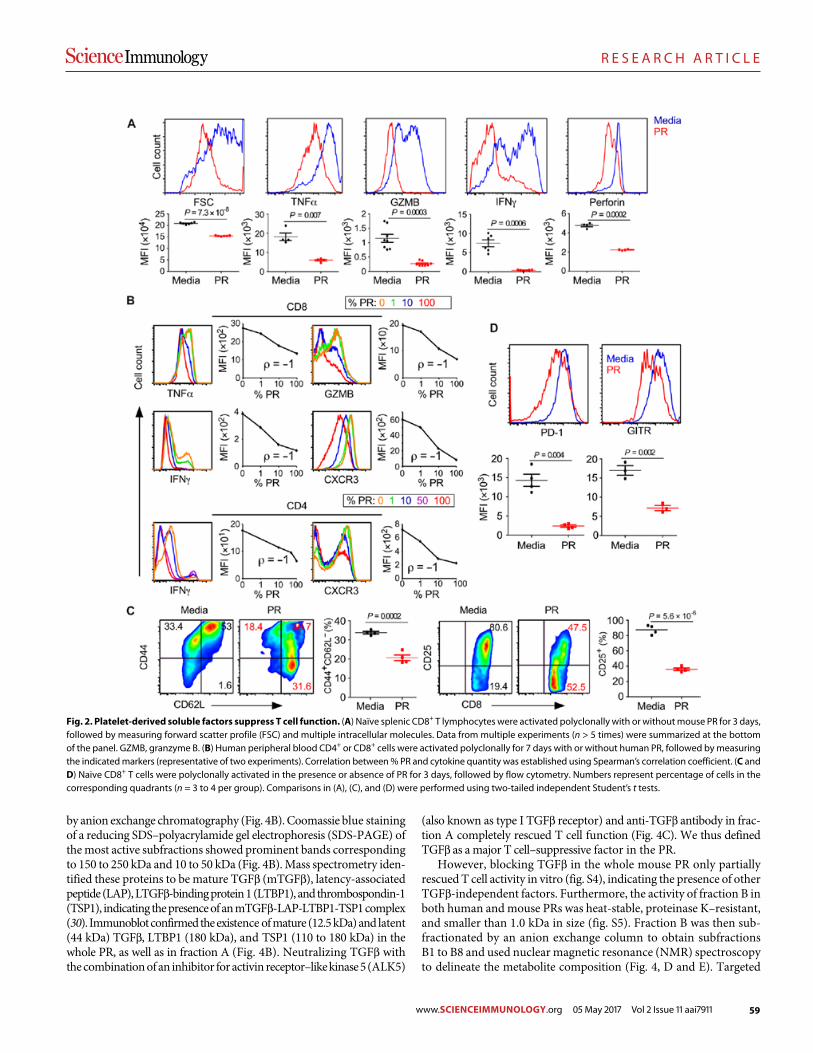
59
R E S E A R C H A R T I C L E
Rachidi et al., Sci. Immunol. 2, eaai7911 (2017) 5 May 2017
S C I E N C E I M M U N O L O G Y | R E S E A R C H A R T I C L E
3 of 12
by anion exchange chromatography (Fig. 4B). Coomassie blue staining of a reducing SDS–polyacrylamide gel electrophoresis (SDS-PAGE) of the most active subfractions showed prominent bands corresponding to 150 to 250 kDa and 10 to 50 kDa (Fig. 4B). Mass spectrometry iden-tified these proteins to be mature TGF (mTGF), latency-associated peptide (LAP), LTGF-binding protein 1 (LTBP1), and thrombospondin-1 (TSP1), indicating the presence of an mTGF-LAP-LTBP1-TSP1 complex (30). Immunoblot confirmed the existence of mature (12.5 kDa) and latent (44 kDa) TGF, LTBP1 (180 kDa), and TSP1 (110 to 180 kDa) in the whole PR, as well as in fraction A (Fig. 4B). Neutralizing TGF with the combination of an inhibitor for activin receptor–like kinase 5 (ALK5)
(also known as type I TGF receptor) and anti-TGF antibody in frac-tion A completely rescued T cell function (Fig. 4C). We thus defined TGF as a major T cell–suppressive factor in the PR.
However, blocking TGF in the whole mouse PR only partially rescued T cell activity in vitro (fig. S4), indicating the presence of other TGF-independent factors. Furthermore, the activity of fraction B in both human and mouse PRs was heat-stable, proteinase K–resistant, and smaller than 1.0 kDa in size (fig. S5). Fraction B was then sub-fractionated by an anion exchange column to obtain subfractions B1 to B8 and used nuclear magnetic resonance (NMR) spectroscopy to delineate the metabolite composition (Fig. 4, D and E). Targeted
Fig. 2. Platelet-derived soluble factors suppress T cell function. (A) Naïve splenic CD8+ T lymphocytes were activated polyclonally with or without mouse PR for 3 days, followed by measuring forward scatter profile (FSC) and multiple intracellular molecules. Data from multiple experiments (n > 5 times) were summarized at the bottom of the panel. GZMB, granzyme B. (B) Human peripheral blood CD4+ or CD8+ cells were activated polyclonally for 7 days with or without human PR, followed by measuring the indicated markers (representative of two experiments). Correlation between % PR and cytokine quantity was established using Spearman’s correlation coefficient. (C and D) Naive CD8+ T cells were polyclonally activated in the presence or absence of PR for 3 days, followed by flow cytometry. Numbers represent percentage of cells in the corresponding quadrants (n = 3 to 4 per group). Comparisons in (A), (C), and (D) were performed using two-tailed independent Student’s t tests.
www.SCIENCEIMMUNOLOGY.org 05 May 2017 Vol 2 Issue 11 aai7911
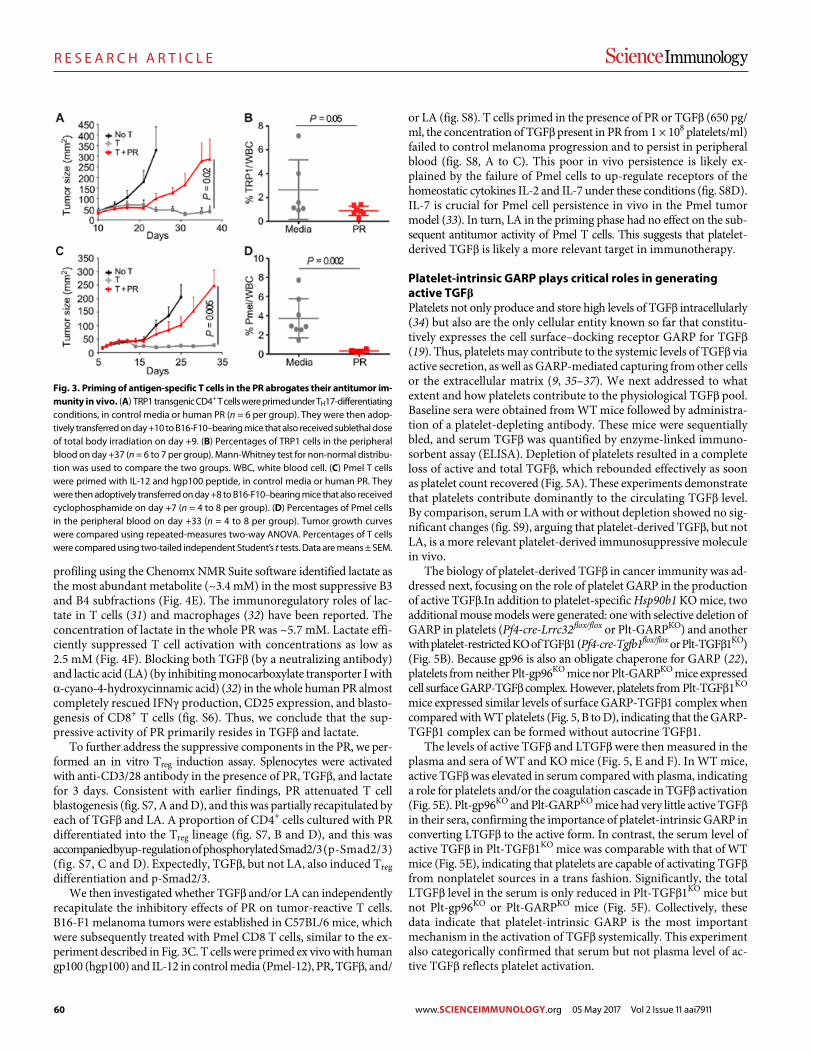
60
R E S E A R C H A R T I C L E
Rachidi et al., Sci. Immunol. 2, eaai7911 (2017) 5 May 2017
S C I E N C E I M M U N O L O G Y | R E S E A R C H A R T I C L E
4 of 12
profiling using the Chenomx NMR Suite software identified lactate as the most abundant metabolite (~3.4 mM) in the most suppressive B3 and B4 subfractions (Fig. 4E). The immunoregulatory roles of lac-tate in T cells (31) and macrophages (32) have been reported. The concentration of lactate in the whole PR was ~5.7 mM. Lactate effi-ciently suppressed T cell activation with concentrations as low as 2.5 mM (Fig. 4F). Blocking both TGF (by a neutralizing antibody) and lactic acid (LA) (by inhibiting monocarboxylate transporter I with -cyano-4-hydroxycinnamic acid) (32) in the whole human PR almost completely rescued IFN production, CD25 expression, and blasto-genesis of CD8+ T cells (fig. S6). Thus, we conclude that the sup-pressive activity of PR primarily resides in TGF and lactate.
To further address the suppressive components in the PR, we per-formed an in vitro Treg induction assay. Splenocytes were activated with anti-CD3/28 antibody in the presence of PR, TGF, and lactate for 3 days. Consistent with earlier findings, PR attenuated T cell blastogenesis (fig. S7, A and D), and this was partially recapitulated by each of TGF and LA. A proportion of CD4+ cells cultured with PR differentiated into the Treg lineage (fig. S7, B and D), and this was accompanied by up-regulation of phosphorylated Smad2/3 (p-Smad2/3) (fig. S7, C and D). Expectedly, TGF, but not LA, also induced Treg differentiation and p-Smad2/3.
We then investigated whether TGF and/or LA can independently recapitulate the inhibitory effects of PR on tumor-reactive T cells. B16-F1 melanoma tumors were established in C57BL/6 mice, which were subsequently treated with Pmel CD8 T cells, similar to the ex-periment described in Fig. 3C. T cells were primed ex vivo with human gp100 (hgp100) and IL-12 in control media (Pmel-12), PR, TGF, and/
or LA (fig. S8). T cells primed in the presence of PR or TGF (650 pg/ml, the concentration of TGF present in PR from 1 × 10⁸ platelets/ml) failed to control melanoma progression and to persist in peripheral blood (fig. S8, A to C). This poor in vivo persistence is likely ex-plained by the failure of Pmel cells to up-regulate receptors of the homeostatic cytokines IL-2 and IL-7 under these conditions (fig. S8D). IL-7 is crucial for Pmel cell persistence in vivo in the Pmel tumor model (33). In turn, LA in the priming phase had no effect on the sub-sequent antitumor activity of Pmel T cells. This suggests that platelet- derived TGF is likely a more relevant target in immunotherapy.
Platelet-intrinsic GARP plays critical roles in generating active TGFPlatelets not only produce and store high levels of TGF intracellularly (34) but also are the only cellular entity known so far that constitu-tively expresses the cell surface–docking receptor GARP for TGF (19). Thus, platelets may contribute to the systemic levels of TGF via active secretion, as well as GARP-mediated capturing from other cells or the extracellular matrix (9, 35–37). We next addressed to what extent and how platelets contribute to the physiological TGF pool. Baseline sera were obtained from WT mice followed by administra-tion of a platelet-depleting antibody. These mice were sequentially bled, and serum TGF was quantified by enzyme-linked immuno-sorbent assay (ELISA). Depletion of platelets resulted in a complete loss of active and total TGF, which rebounded effectively as soon as platelet count recovered (Fig. 5A). These experiments demonstrate that platelets contribute dominantly to the circulating TGF level. By comparison, serum LA with or without depletion showed no sig-nificant changes (fig. S9), arguing that platelet-derived TGF, but not LA, is a more relevant platelet-derived immunosuppressive molecule in vivo.
The biology of platelet-derived TGF in cancer immunity was ad-dressed next, focusing on the role of platelet GARP in the production of active TGF.In addition to platelet-specific Hsp90b1 KO mice, two additional mouse models were generated: one with selective deletion of GARP in platelets (Pf4-cre-Lrrc32flox/flox or Plt-GARPKO) and another with platelet-restricted KO of TGF1 (Pf4-cre-Tgfb1flox/flox or Plt-TGF1KO) (Fig. 5B). Because gp96 is also an obligate chaperone for GARP (22), platelets from neither Plt-gp96KO mice nor Plt-GARPKO mice expressed cell surface GARP-TGF complex. However, platelets from Plt-TGF1KO mice expressed similar levels of surface GARP-TGF1 complex when compared with WT platelets (Fig. 5, B to D), indicating that the GARP- TGF1 complex can be formed without autocrine TGF1.
The levels of active TGF and LTGF were then measured in the plasma and sera of WT and KO mice (Fig. 5, E and F). In WT mice, active TGF was elevated in serum compared with plasma, indicating a role for platelets and/or the coagulation cascade in TGF activation (Fig. 5E). Plt-gp96KO and Plt-GARPKO mice had very little active TGF in their sera, confirming the importance of platelet-intrinsic GARP in converting LTGF to the active form. In contrast, the serum level of active TGF in Plt-TGF1KO mice was comparable with that of WT mice (Fig. 5E), indicating that platelets are capable of activating TGF from nonplatelet sources in a trans fashion. Significantly, the total LTGF level in the serum is only reduced in Plt-TGF1KO mice but not Plt-gp96KO or Plt-GARPKO mice (Fig. 5F). Collectively, these data indicate that platelet-intrinsic GARP is the most important mechanism in the activation of TGF systemically. This experiment also categorically confirmed that serum but not plasma level of ac-tive TGF reflects platelet activation.
Fig. 3. Priming of antigen-specific T cells in the PR abrogates their antitumor im-munity in vivo. (A) TRP1 transgenic CD4+ T cells were primed under TH17-differentiating conditions, in control media or human PR (n = 6 per group). They were then adop-tively transferred on day +10 to B16-F10–bearing mice that also received sublethal dose of total body irradiation on day +9. (B) Percentages of TRP1 cells in the peripheral blood on day +37 (n = 6 to 7 per group). Mann-Whitney test for non-normal distribu-tion was used to compare the two groups. WBC, white blood cell. (C) Pmel T cells were primed with IL-12 and hgp100 peptide, in control media or human PR. They were then adoptively transferred on day +8 to B16-F10–bearing mice that also received cyclophosphamide on day +7 (n = 4 to 8 per group). (D) Percentages of Pmel cells in the peripheral blood on day +33 (n = 4 to 8 per group). Tumor growth curves were compared using repeated-measures two-way ANOVA. Percentages of T cells were compared using two-tailed independent Student’s t tests. Data are means ± SEM.
www.SCIENCEIMMUNOLOGY.org 05 May 2017 Vol 2 Issue 11 aai7911
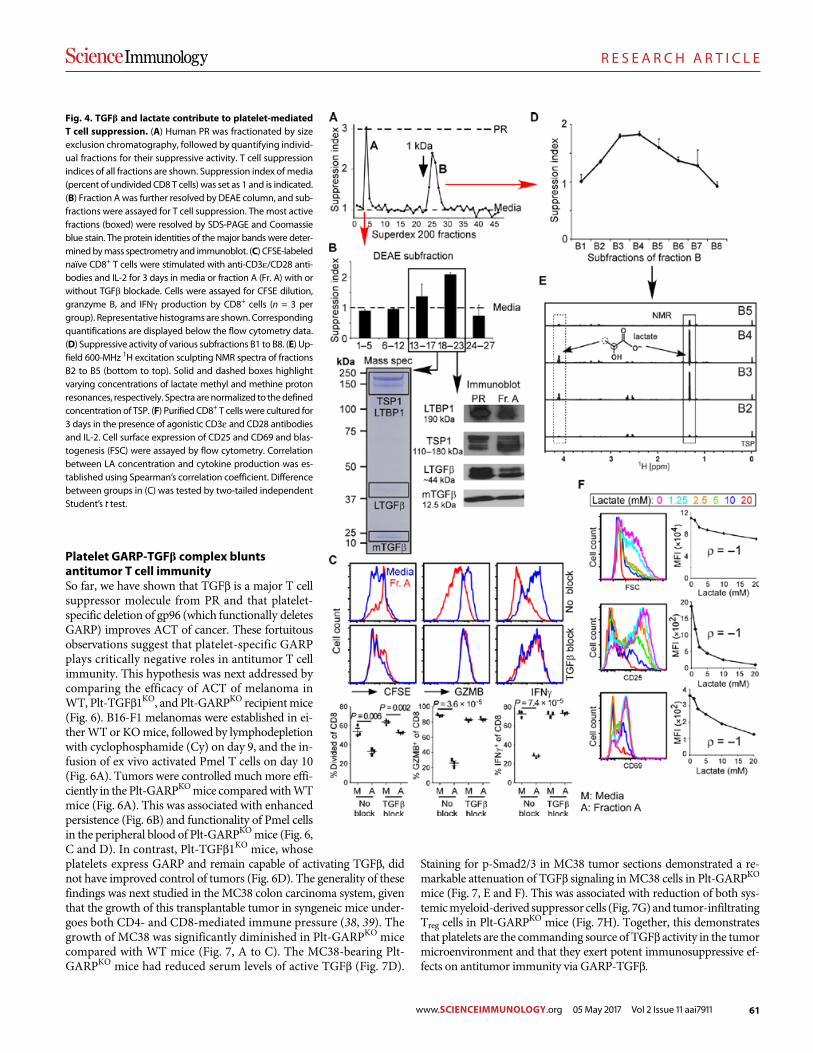
61
R E S E A R C H A R T I C L E
Rachidi et al., Sci. Immunol. 2, eaai7911 (2017) 5 May 2017
S C I E N C E I M M U N O L O G Y | R E S E A R C H A R T I C L E
5 of 12
Platelet GARP-TGF complex blunts antitumor T cell immunitySo far, we have shown that TGF is a major T cell suppressor molecule from PR and that platelet- specific deletion of gp96 (which functionally deletes GARP) improves ACT of cancer. These fortuitous observations suggest that platelet-specific GARP plays critically negative roles in antitumor T cell immunity. This hypothesis was next addressed by comparing the efficacy of ACT of melanoma in WT, Plt- TGF1KO, and Plt-GARPKO recipient mice (Fig. 6). B16-F1 melanomas were established in ei-ther WT or KO mice, followed by lymphodepletion with cyclophosphamide (Cy) on day 9, and the in-fusion of ex vivo activated Pmel T cells on day 10 (Fig. 6A). Tumors were controlled much more effi-ciently in the Plt-GARPKO mice compared with WT mice (Fig. 6A). This was associated with enhanced persistence (Fig. 6B) and functionality of Pmel cells in the peripheral blood of Plt-GARPKO mice (Fig. 6, C and D). In contrast, Plt-TGF1KO mice, whose platelets express GARP and remain capable of activating TGF, did not have improved control of tumors (Fig. 6D). The generality of these findings was next studied in the MC38 colon carcinoma system, given that the growth of this transplantable tumor in syngeneic mice under-goes both CD4- and CD8-mediated immune pressure (38, 39). The growth of MC38 was significantly diminished in Plt-GARPKO mice compared with WT mice (Fig. 7, A to C). The MC38-bearing Plt- GARPKO mice had reduced serum levels of active TGF (Fig. 7D).
Staining for p-Smad2/3 in MC38 tumor sections demonstrated a re-markable attenuation of TGF signaling in MC38 cells in Plt- GARPKO mice (Fig. 7, E and F). This was associated with reduction of both sys-temic myeloid- derived suppressor cells (Fig. 7G) and tumor- infiltrating Treg cells in Plt-GARPKO mice (Fig. 7H). Together, this demonstrates that platelets are the commanding source of TGF activity in the tumor microenvironment and that they exert potent immunosuppressive ef-fects on antitumor immunity via GARP-TGF.
Fig. 4. TGF and lactate contribute to platelet-mediated T cell suppression. (A) Human PR was fractionated by size exclusion chromatography, followed by quantifying individ-ual fractions for their suppressive activity. T cell suppression indices of all fractions are shown. Suppression index of media (percent of undivided CD8 T cells) was set as 1 and is indicated. (B) Fraction A was further resolved by DEAE column, and sub-fractions were assayed for T cell suppression. The most active fractions (boxed) were resolved by SDS-PAGE and Coomassie blue stain. The protein identities of the major bands were deter-mined by mass spectrometry and immunoblot. (C) CFSE-labeled naïve CD8+ T cells were stimulated with anti-CD3/CD28 anti-bodies and IL-2 for 3 days in media or fraction A (Fr. A) with or without TGF blockade. Cells were assayed for CFSE dilution, granzyme B, and IFN production by CD8+ cells (n = 3 per group). Representative histograms are shown. Corresponding quantifications are displayed below the flow cytometry data. (D) Suppressive activity of various subfractions B1 to B8. (E) Up-field 600-MHz 1H excitation sculpting NMR spectra of fractions B2 to B5 (bottom to top). Solid and dashed boxes highlight varying concentrations of lactate methyl and methine proton resonances, respectively. Spectra are normalized to the defined concentration of TSP. (F) Purified CD8+ T cells were cultured for 3 days in the presence of agonistic CD3 and CD28 antibodies and IL-2. Cell surface expression of CD25 and CD69 and blas-togenesis (FSC) were assayed by flow cytometry. Correlation between LA concentration and cytokine production was es-tablished using Spearman’s correlation coefficient. Difference between groups in (C) was tested by two-tailed independent Student’s t test.
www.SCIENCEIMMUNOLOGY.org 05 May 2017 Vol 2 Issue 11 aai7911
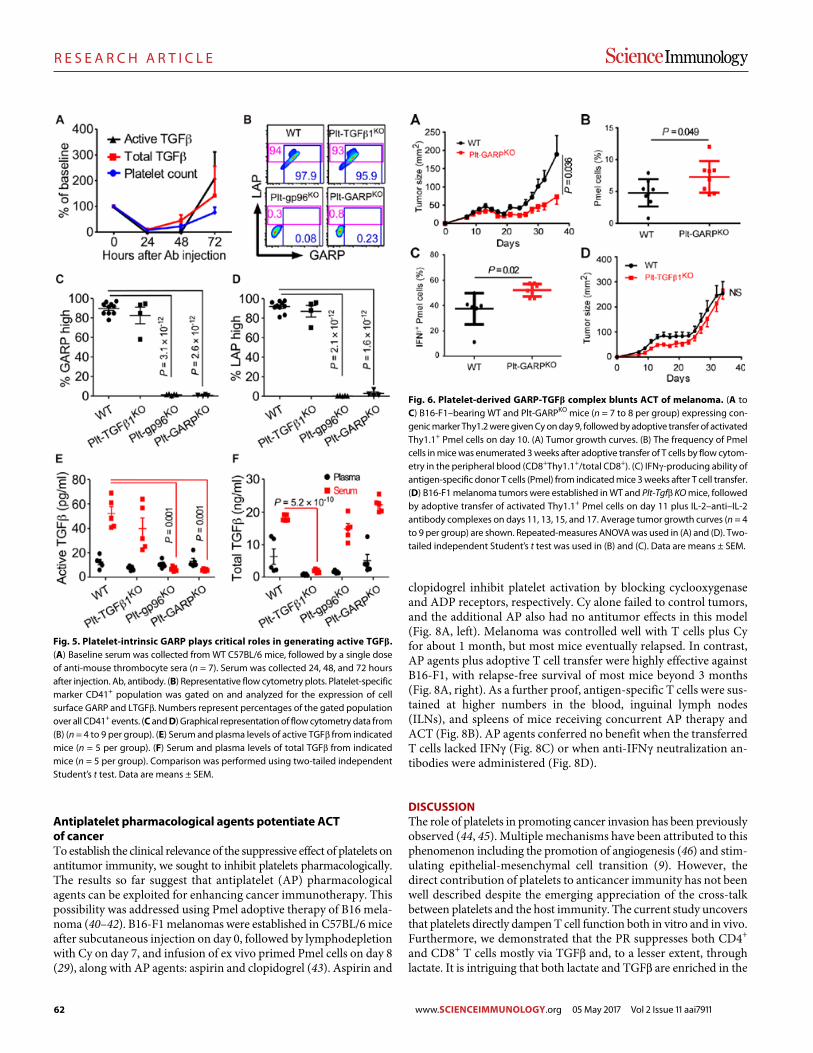
62
R E S E A R C H A R T I C L E
Rachidi et al., Sci. Immunol. 2, eaai7911 (2017) 5 May 2017
S C I E N C E I M M U N O L O G Y | R E S E A R C H A R T I C L E
6 of 12
Antiplatelet pharmacological agents potentiate ACT of cancerTo establish the clinical relevance of the suppressive effect of platelets on antitumor immunity, we sought to inhibit platelets pharmacologically. The results so far suggest that antiplatelet (AP) pharmacological agents can be exploited for enhancing cancer immunotherapy. This possibility was addressed using Pmel adoptive therapy of B16 mela-noma (40–42). B16-F1 melanomas were established in C57BL/6 mice after subcutaneous injection on day 0, followed by lymphodepletion with Cy on day 7, and infusion of ex vivo primed Pmel cells on day 8 (29), along with AP agents: aspirin and clopidogrel (43). Aspirin and
clopidogrel inhibit platelet activation by blocking cyclooxygenase and ADP receptors, respectively. Cy alone failed to control tumors, and the additional AP also had no antitumor effects in this model (Fig. 8A, left). Melanoma was controlled well with T cells plus Cy for about 1 month, but most mice eventually relapsed. In contrast, AP agents plus adoptive T cell transfer were highly effective against B16-F1, with relapse-free survival of most mice beyond 3 months (Fig. 8A, right). As a further proof, antigen-specific T cells were sus-tained at higher numbers in the blood, inguinal lymph nodes (ILNs), and spleens of mice receiving concurrent AP therapy and ACT (Fig. 8B). AP agents conferred no benefit when the transferred T cells lacked IFN (Fig. 8C) or when anti-IFN neutralization an-tibodies were administered (Fig. 8D).
DISCUSSIONThe role of platelets in promoting cancer invasion has been previously observed (44, 45). Multiple mechanisms have been attributed to this phenomenon including the promotion of angiogenesis (46) and stim-ulating epithelial-mesenchymal cell transition (9). However, the direct contribution of platelets to anticancer immunity has not been well described despite the emerging appreciation of the cross-talk between platelets and the host immunity. The current study uncovers that platelets directly dampen T cell function both in vitro and in vivo. Furthermore, we demonstrated that the PR suppresses both CD4+ and CD8+ T cells mostly via TGF and, to a lesser extent, through lactate. It is intriguing that both lactate and TGF are enriched in the
Fig. 5. Platelet-intrinsic GARP plays critical roles in generating active TGF. (A) Baseline serum was collected from WT C57BL/6 mice, followed by a single dose of anti-mouse thrombocyte sera (n = 7). Serum was collected 24, 48, and 72 hours after injection. Ab, antibody. (B) Representative flow cytometry plots. Platelet-specific marker CD41+ population was gated on and analyzed for the expression of cell surface GARP and LTGF. Numbers represent percentages of the gated population over all CD41+ events. (C and D) Graphical representation of flow cytometry data from (B) (n = 4 to 9 per group). (E) Serum and plasma levels of active TGF from indicated mice (n = 5 per group). (F) Serum and plasma levels of total TGF from indicated mice (n = 5 per group). Comparison was performed using two-tailed independent Student’s t test. Data are means ± SEM.
Fig. 6. Platelet-derived GARP-TGF complex blunts ACT of melanoma. (A to C) B16-F1–bearing WT and Plt-GARPKO mice (n = 7 to 8 per group) expressing con-genic marker Thy1.2 were given Cy on day 9, followed by adoptive transfer of activated Thy1.1+ Pmel cells on day 10. (A) Tumor growth curves. (B) The frequency of Pmel cells in mice was enumerated 3 weeks after adoptive transfer of T cells by flow cytom-etry in the peripheral blood (CD8+Thy1.1+/total CD8+). (C) IFN-producing ability of antigen-specific donor T cells (Pmel) from indicated mice 3 weeks after T cell transfer. (D) B16-F1 melanoma tumors were established in WT and Plt-Tgf KO mice, followed by adoptive transfer of activated Thy1.1+ Pmel cells on day 11 plus IL-2–anti–IL-2 antibody complexes on days 11, 13, 15, and 17. Average tumor growth curves (n = 4 to 9 per group) are shown. Repeated-measures ANOVA was used in (A) and (D). Two-tailed independent Student’s t test was used in (B) and (C). Data are means ± SEM.
www.SCIENCEIMMUNOLOGY.org 05 May 2017 Vol 2 Issue 11 aai7911
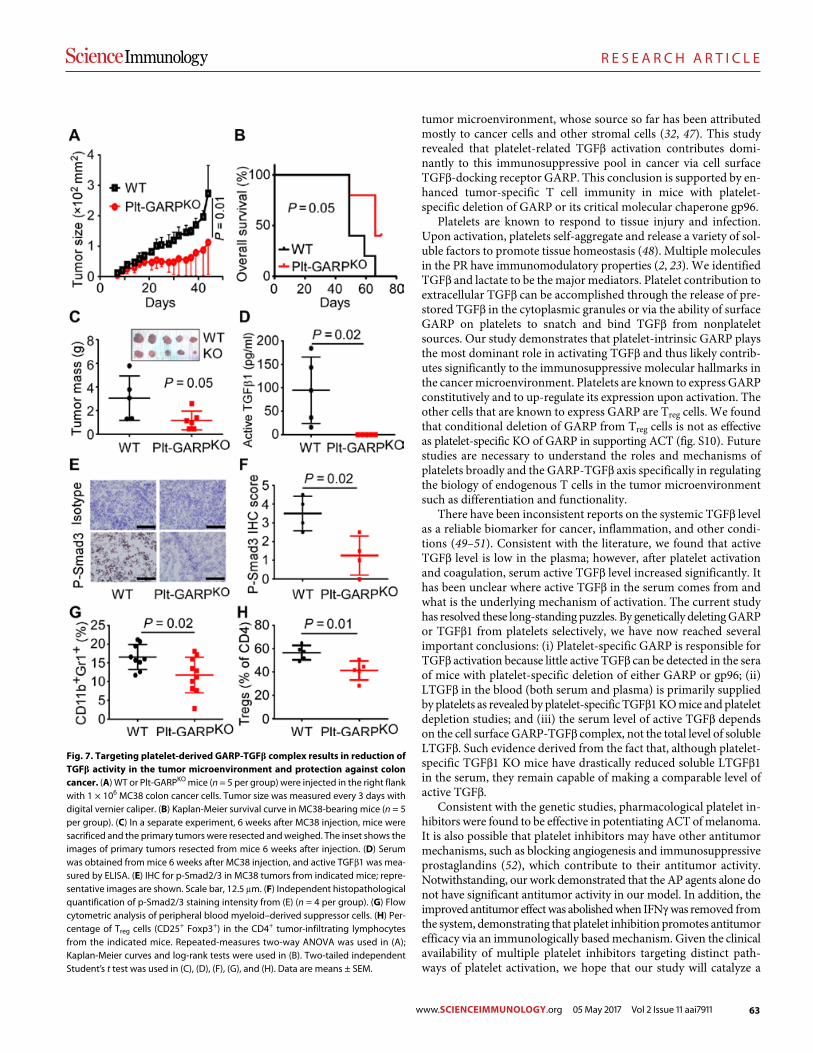
63
R E S E A R C H A R T I C L E
Rachidi et al., Sci. Immunol. 2, eaai7911 (2017) 5 May 2017
S C I E N C E I M M U N O L O G Y | R E S E A R C H A R T I C L E
7 of 12
tumor microenvironment, whose source so far has been attributed mostly to cancer cells and other stromal cells (32, 47). This study revealed that platelet-related TGF activation contributes domi-nantly to this immunosuppressive pool in cancer via cell surface TGF-docking receptor GARP. This conclusion is supported by en-hanced tumor-specific T cell immunity in mice with platelet- specific deletion of GARP or its critical molecular chaperone gp96.
Platelets are known to respond to tissue injury and infection. Upon activation, platelets self-aggregate and release a variety of sol-uble factors to promote tissue homeostasis (48). Multiple molecules in the PR have immunomodulatory properties (2, 23). We identified TGF and lactate to be the major mediators. Platelet contribution to extracellular TGF can be accomplished through the release of pre-stored TGF in the cytoplasmic granules or via the ability of surface GARP on platelets to snatch and bind TGF from nonplatelet sources. Our study demonstrates that platelet-intrinsic GARP plays the most dominant role in activating TGF and thus likely contrib-utes significantly to the immunosuppressive molecular hallmarks in the cancer microenvironment. Platelets are known to express GARP constitutively and to up-regulate its expression upon activation. The other cells that are known to express GARP are Treg cells. We found that conditional deletion of GARP from Treg cells is not as effective as platelet-specific KO of GARP in supporting ACT (fig. S10). Future studies are necessary to understand the roles and mechanisms of platelets broadly and the GARP-TGF axis specifically in regulating the biology of endogenous T cells in the tumor microenvironment such as differentiation and functionality.
There have been inconsistent reports on the systemic TGF level as a reliable biomarker for cancer, inflammation, and other condi-tions (49–51). Consistent with the literature, we found that active TGF level is low in the plasma; however, after platelet activation and coagulation, serum active TGF level increased significantly. It has been unclear where active TGF in the serum comes from and what is the underlying mechanism of activation. The current study has resolved these long-standing puzzles. By genetically deleting GARP or TGF1 from platelets selectively, we have now reached several important conclusions: (i) Platelet-specific GARP is responsible for TGF activation because little active TGF can be detected in the sera of mice with platelet-specific deletion of either GARP or gp96; (ii) LTGF in the blood (both serum and plasma) is primarily supplied by platelets as revealed by platelet-specific TGF1 KO mice and platelet depletion studies; and (iii) the serum level of active TGF depends on the cell surface GARP-TGF complex, not the total level of soluble LTGF. Such evidence derived from the fact that, although platelet- specific TGF1 KO mice have drastically reduced soluble LTGF1 in the serum, they remain capable of making a comparable level of active TGF.
Consistent with the genetic studies, pharmacological platelet in-hibitors were found to be effective in potentiating ACT of melanoma. It is also possible that platelet inhibitors may have other antitumor mechanisms, such as blocking angiogenesis and immunosuppressive prostaglandins (52), which contribute to their antitumor activity. Notwithstanding, our work demonstrated that the AP agents alone do not have significant antitumor activity in our model. In addition, the improved antitumor effect was abolished when IFN was removed from the system, demonstrating that platelet inhibition promotes antitumor efficacy via an immunologically based mechanism. Given the clinical availability of multiple platelet inhibitors targeting distinct path-ways of platelet activation, we hope that our study will catalyze a
Fig. 7. Targeting platelet-derived GARP-TGF complex results in reduction of TGF activity in the tumor microenvironment and protection against colon cancer. (A) WT or Plt-GARPKO mice (n = 5 per group) were injected in the right flank with 1 × 10⁶ MC38 colon cancer cells. Tumor size was measured every 3 days with digital vernier caliper. (B) Kaplan-Meier survival curve in MC38-bearing mice (n = 5 per group). (C) In a separate experiment, 6 weeks after MC38 injection, mice were sacrificed and the primary tumors were resected and weighed. The inset shows the images of primary tumors resected from mice 6 weeks after injection. (D) Serum was obtained from mice 6 weeks after MC38 injection, and active TGF1 was mea-sured by ELISA. (E) IHC for p-Smad2/3 in MC38 tumors from indicated mice; repre-sentative images are shown. Scale bar, 12.5 m. (F) Independent histopathological quantification of p-Smad2/3 staining intensity from (E) (n = 4 per group). (G) Flow cytometric analysis of peripheral blood myeloid–derived suppressor cells. (H) Per-centage of Treg cells (CD25+ Foxp3+) in the CD4+ tumor-infiltrating lymphocytes from the indicated mice. Repeated-measures two-way ANOVA was used in (A); Kaplan-Meier curves and log-rank tests were used in (B). Two-tailed independent Student’s t test was used in (C), (D), (F), (G), and (H). Data are means ± SEM.
www.SCIENCEIMMUNOLOGY.org 05 May 2017 Vol 2 Issue 11 aai7911
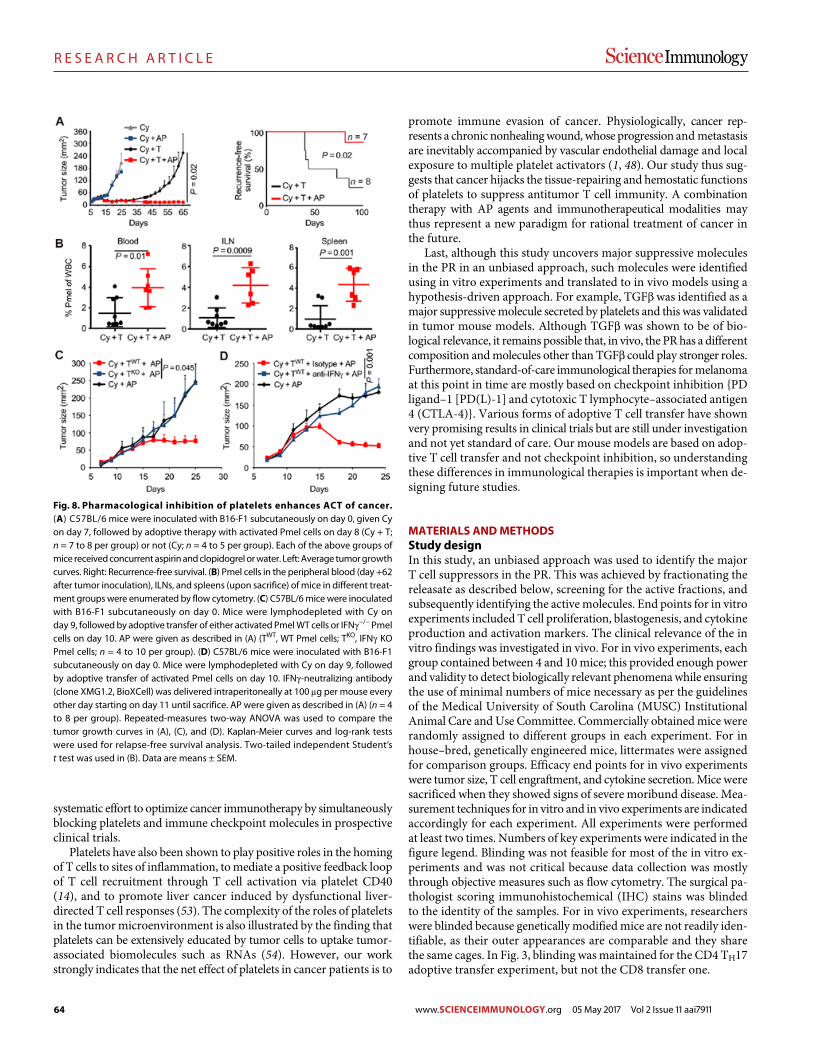
64
R E S E A R C H A R T I C L E
Rachidi et al., Sci. Immunol. 2, eaai7911 (2017) 5 May 2017
S C I E N C E I M M U N O L O G Y | R E S E A R C H A R T I C L E
8 of 12
systematic effort to optimize cancer immunotherapy by simultaneously blocking platelets and immune checkpoint molecules in prospective clinical trials.
Platelets have also been shown to play positive roles in the homing of T cells to sites of inflammation, to mediate a positive feedback loop of T cell recruitment through T cell activation via platelet CD40 (14), and to promote liver cancer induced by dysfunctional liver- directed T cell responses (53). The complexity of the roles of platelets in the tumor microenvironment is also illustrated by the finding that platelets can be extensively educated by tumor cells to uptake tumor- associated biomolecules such as RNAs (54). However, our work strongly indicates that the net effect of platelets in cancer patients is to
promote immune evasion of cancer. Physiologically, cancer rep-resents a chronic nonhealing wound, whose progression and metastasis are inevitably accompanied by vascular endothelial damage and local exposure to multiple platelet activators (1, 48). Our study thus sug-gests that cancer hijacks the tissue-repairing and hemostatic functions of platelets to suppress antitumor T cell immunity. A combination therapy with AP agents and immunotherapeutical modalities may thus represent a new paradigm for rational treatment of cancer in the future.
Last, although this study uncovers major suppressive molecules in the PR in an unbiased approach, such molecules were identified using in vitro experiments and translated to in vivo models using a hypothesis-driven approach. For example, TGF was identified as a major suppressive molecule secreted by platelets and this was validated in tumor mouse models. Although TGF was shown to be of bio-logical relevance, it remains possible that, in vivo, the PR has a different composition and molecules other than TGF could play stronger roles. Furthermore, standard-of-care immunological therapies for melanoma at this point in time are mostly based on checkpoint inhibition {PD ligand–1 [PD(L)-1] and cytotoxic T lymphocyte–associated antigen 4 (CTLA-4)}. Various forms of adoptive T cell transfer have shown very promising results in clinical trials but are still under investigation and not yet standard of care. Our mouse models are based on adop-tive T cell transfer and not checkpoint inhibition, so understanding these differences in immunological therapies is important when de-signing future studies.
MATERIALS AND METHODSStudy designIn this study, an unbiased approach was used to identify the major T cell suppressors in the PR. This was achieved by fractionating the releasate as described below, screening for the active fractions, and subsequently identifying the active molecules. End points for in vitro experiments included T cell proliferation, blastogenesis, and cytokine production and activation markers. The clinical relevance of the in vitro findings was investigated in vivo. For in vivo experiments, each group contained between 4 and 10 mice; this provided enough power and validity to detect biologically relevant phenomena while ensuring the use of minimal numbers of mice necessary as per the guidelines of the Medical University of South Carolina (MUSC) Institutional Animal Care and Use Committee. Commercially obtained mice were randomly assigned to different groups in each experiment. For in house–bred, genetically engineered mice, littermates were assigned for comparison groups. Efficacy end points for in vivo experiments were tumor size, T cell engraftment, and cytokine secretion. Mice were sacrificed when they showed signs of severe moribund disease. Mea-surement techniques for in vitro and in vivo experiments are indicated accordingly for each experiment. All experiments were performed at least two times. Numbers of key experiments were indicated in the figure legend. Blinding was not feasible for most of the in vitro ex-periments and was not critical because data collection was mostly through objective measures such as flow cytometry. The surgical pa-thologist scoring immunohistochemical (IHC) stains was blinded to the identity of the samples. For in vivo experiments, researchers were blinded because genetically modified mice are not readily iden-tifiable, as their outer appearances are comparable and they share the same cages. In Fig. 3, blinding was maintained for the CD4 TH17 adoptive transfer experiment, but not the CD8 transfer one.
Fig. 8. Pharmacological inhibition of platelets enhances ACT of cancer. (A) C57BL/6 mice were inoculated with B16-F1 subcutaneously on day 0, given Cy on day 7, followed by adoptive therapy with activated Pmel cells on day 8 (Cy + T; n = 7 to 8 per group) or not (Cy; n = 4 to 5 per group). Each of the above groups of mice received concurrent aspirin and clopidogrel or water. Left: Average tumor growth curves. Right: Recurrence-free survival. (B) Pmel cells in the peripheral blood (day +62 after tumor inoculation), ILNs, and spleens (upon sacrifice) of mice in different treat-ment groups were enumerated by flow cytometry. (C) C57BL/6 mice were inoculated with B16-F1 subcutaneously on day 0. Mice were lymphodepleted with Cy on day 9, followed by adoptive transfer of either activated Pmel WT cells or IFN−/− Pmel cells on day 10. AP were given as described in (A) (TWT, WT Pmel cells; TKO, IFN KO Pmel cells; n = 4 to 10 per group). (D) C57BL/6 mice were inoculated with B16-F1 sub cutaneously on day 0. Mice were lymphodepleted with Cy on day 9, followed by adoptive transfer of activated Pmel cells on day 10. IFN-neutralizing antibody (clone XMG1.2, BioXCell) was delivered intraperitoneally at 100 g per mouse every other day starting on day 11 until sacrifice. AP were given as described in (A) (n = 4 to 8 per group). Repeated-measures two-way ANOVA was used to compare the tumor growth curves in (A), (C), and (D). Kaplan-Meier curves and log-rank tests were used for relapse-free survival analysis. Two-tailed independent Student’s t test was used in (B). Data are means ± SEM.
www.SCIENCEIMMUNOLOGY.org 05 May 2017 Vol 2 Issue 11 aai7911
65
R E S E A R C H A R T I C L E
Rachidi et al., Sci. Immunol. 2, eaai7911 (2017) 5 May 2017
S C I E N C E I M M U N O L O G Y | R E S E A R C H A R T I C L E
9 of 12
MicePlatelet-specific Hsp90b1 KO mice were generated by crossing Pf4-cre mice (55) with Hsp90b1flox/flox mice (21, 56). Lrrc32flox/flox mice were obtained from Riken (Japan) (20). Tgfb1flox/flox, Foxp3eGFP-CreERT2, Pmel-1, and TRP1 mice were purchased from the Jackson Laboratory. Ifng−/− Pmel-1 mice were a gift from S. Mehrotra (MUSC). All animal experiments were conducted under approved protocols by the In-stitutional Animal Care and Use Committee at MUSC.
Ex vivo stimulation of tumor-draining lymph nodesILNs from tumor-bearing mice were isolated, mashed in cold phosphate-buffered saline (PBS), and filtered. One million cells per well were cultured in 96-well plates for 4 hours in the presence of phorbol 12-myristate 13-acetate (PMA) (500 ng/ml) and ionomycin (1.5 g/ml), or hgp100 peptide (Lys-Val-Pro-Arg-Asn-Gln-Asp-Trp-Leu, 25–33) (5 g/ml) for melanoma-draining lymph nodes. Brefeldin A (BD Biosciences) was added to the cells in all experiments.
Preparation of releasate from activated plateletsMice were anesthetized, and blood was withdrawn to a 5-ml tube containing another 0.5 ml of acid citrate dextrose (ACD) buffer [39 mM citric acid, 75 mM sodium citrate, 135 mM dextrose, and prostaglandin E1 (1 g/ml) (pH 7.4)]. Samples were centrifuged for 10 min at 100g, and the upper layer of platelet-rich plasma was collected. Platelets were washed twice with citrate washing buffer [128 mM NaCl, 11 mM glucose, 7.5 mM Na2HPO4, 4.8 mM sodium citrate, 4.3 mM NaH2PO4, 2.4 mM citric acid, 0.35% bovine serum albumin, and prostaglandin E1 (50 ng/ml) (pH 6.5)], then resuspended in RPMI 1640, enumerated by a blood cell counter, and diluted to a final concentration of 1 × 10⁸/ml. Purified platelets were incubated with thrombin (1 IU/ml) for 45 min at 37°C (125 rpm). Stimulated platelets were sedimented by centrifugation at 3200g for 15 min, and supernatant was collected. Microvesicles (MVs) were collected by centrifugation at 25,000g and resuspension in PBS in the same volume as the original PR volume. For human platelet secretome, platelets from healthy donors were obtained from the blood bank at MUSC, resuspended in ACD buffer at room temperature, and then activated as above.
Size-based and anion exchange fractionationPR fractionation was carried out using a Pharmacia Akta–fast per-formance liquid chromatography system, and columns were pur-chased from GE Healthcare. The first fractionation was based on size by loading PR onto a Superdex 200 column and eluting with PBS or RPMI 1640 (Gibco). The active fractions were pooled and dialyzed with phosphate buffer (20 mM; pH 7.2). The resulted material was then loaded onto a diethylaminoethyl (DEAE) column and eluted with a linear gradient of NaCl from 0 to 1 M.
NMR-based metabolite profilingHuman PR was prepared at concentrations of 2 × 10⁹/ml and frac-tionated by size exclusion chromatography, followed by anion exchange chromatography. Fractions were eluted with sodium phos-phate buffer (pH 7.0; 20 mM final concentration) containing sodium 3-trimethylsilyl-2,2,3,3-d4-propionate (TSP; 0.1 mM final concentra-tion) and 10% D2O. NMR data were collected at 298 K on a Bruker Avance III 600 MHz NMR spectrometer (Bruker BioSpin Inc.) equipped with a 5-mm cryogenically cooled QCI-inverse probe. Solvent sup-pression was achieved using the excitation sculpting scheme (57). Typically, one-dimensional (1D) 1H NMR spectra with a 7-s recycle
delay were acquired with a total of 128 transients in addition to four dummy scans. Real data points (32,768) were collected across a spectral width of 12 parts per million (ppm) (acquisition time, 2.27 s). Data were zero-filled to twice the original data set size, manually phased, and automatically baseline-corrected using TopSpin 3.1 soft-ware (Bruker BioSpin Inc., Billerica, MA), and a 1.0-Hz line-broadening apodization was applied before spectral analysis. The singlet pro-duced by the known quantity of the TSP methyl groups was used as an internal standard for chemical shift referencing (set to 0 ppm) and quantification.
Metabolite assignments were established after comparison of chem-ical shifts and spin-spin couplings with reference spectra as implemented in the Chenomx NMR Suite (Chenomx Inc., Edmonton, Alberta, Canada) profiling software (version 7.72). Specifically, quantification was achieved using the Chenomx 600 MHz metabolite library (version 8). Confirma-tory 1D 31P and 2D 1H,13C-multiplicity–edited heteronuclear single quantum correlation spectra with adiabatic 13C inversion, refocusing, and decoupling were recorded for selected PR fractions to enhance metabolite identification by comparison of 13C chemical shifts with the biological magnetic resonance data bank. Concentration of LA was then quantified by an l-lactate assay kit (Eton Bioscience).
In vitro T cell culture suppression assay of PRCD4+ and CD8+ T cells were purified using magnetic beads to a purity of ≥95%. Cells (1 × 10⁵) were cultured in 96-well plates pre-coated with anti-CD3 antibody (3 g/ml) in the presence of IL-2 (100 U/ml) and soluble anti-CD28 (2 g/ml), together with either media or PR. On day 3 of culture, T cells were stimulated with PMA (500 ng/ml)/ionomycin (1.5 g/ml) or hgp100 peptide 25–33 (5 g/ml) for 4 hours in the presence of GolgiPlug (BD Biosciences), fol-lowed by staining for relevant markers. TGF receptor signaling was blocked using the combination of an ALK5 inhibitor (SB431542, Selleckchem) at 20 M and anti-TGF antibody (clone MAB1835, R&D Systems) at 2 g/ml. LA activity was inhibited by blocking the monocarboxylate transporter using -cyano-4-hydroxycinnamic acid (C2020, Sigma-Aldrich). For carboxyfluorescein diacetate succin-imidyl ester (CFSE) dilution assays, cells were labeled with 5 M CFSE for 10 min at room temperature before culture on day 0. Flow cytometry was then performed, and the data were analyzed and dis-played with FlowJo software. Suppression index by PR was calculated as percentage of undivided cells treated with a given fraction of PR/percentage of undivided cells in the control media.
Adoptive T cell therapyTreatment of B16-F1 melanoma by adoptive transfer of ex vivo acti-vated Pmel T cells was done as described previously (29). To test the effect of AP agents on ACT, we administered clopidogrel by oral gavage 3 days after T cell transfer and then every 48 hours until day 25. Aspirin was administered through drinking water (150 mg/liter) starting 2 days before T cell transfer and was replaced every 48 hours afterward. For TRP1 TH17 T cell therapy, single-cell suspensions of splenocytes from Rag1−/− TRP1 mice (27) were seeded with irradiated C57BL/6 splenocytes pulsed with TRP1 106–130 peptide (SGHNC-GTCRPGWRGAACNQKILTVR; American Peptide). To obtain TH17-polarized cells, we added recombinant human IL-6 [100 ng/ml; National Institutes of Health (NIH)], TGF1 (30 ng/ml; BioLeg-end), IL-1 (10 ng/ml; Shenandoah), and anti–IL-4 and anti-IFN antibodies (10 g/ml; BioXCell) to the cultures. On the second day of culture, complete medium containing recombinant human IL-2
www.SCIENCEIMMUNOLOGY.org 05 May 2017 Vol 2 Issue 11 aai7911
66
R E S E A R C H A R T I C L E
Rachidi et al., Sci. Immunol. 2, eaai7911 (2017) 5 May 2017
S C I E N C E I M M U N O L O G Y | R E S E A R C H A R T I C L E
10 of 12
and IL-23 (40 ng/ml; PeproTech) was added. Where appropriate, human PR was added at 100% on days 0, 2, and 4. Cells were cultured for 5 days before experimentation. C57BL/6 mice were injected sub-cutaneously with 4 × 10⁵ B16-F10 melanoma cells and treated 10 days later with TRP1-specific CD4+ T cells. Recipient mice were lympho-depleted using 5-gray total body irradiation on the day before cell transfer. Tumor growth was measured using calipers, and the products of the perpendicular diameters were recorded. In some experiments, IFN-neutralizing antibody (clone XMG1.2, BioXCell) or isotype control antibody was administered via intraperitoneal injection at 100 g per mouse every other day starting on day 12 until sacrifice (58). The adoptive T cell transfer experiment with Ifng KO Pmel-1 cells was done identically as above except that Pmel cells were isolated from Ifng KO Pmel-1 mice (59). For some experiments, adoptive transfer was supplemented with exogenous IL-2–anti–IL-2 complexes on days 0, 2, 4, and 6 after transfer in the absence of lymphodepletion (60). Briefly, 1.5 g of human IL-2 (National Cancer Institute Bio-logical Resources Branch Preclinical Repository) was mixed with 7.5 g of anti–IL-2 monoclonal antibody (clone 5355, R&D Systems) for 15 min at room temperature. Cytokine complexes were admin-istered via intraperitoneal injections.
Platelet depletion and serum collection for TGF ELISAWT mice were given one dose of rabbit anti-mouse thrombocyte polyclonal sera (1:40, Cedarlane) at 500 l per mouse intraperitoneally in sterile-filtered PBS. Blood was collected at 0, 24, 48, and 72 hours. Serum was harvested via coagulation and centrifugation (12,000g).
Measurement of TGF via ELISAMouse serum or plasma samples were collected by pricking the lateral tail vein. Capture ELISA for TGF1 was performed according to the manufacturer’s instructions (BioLegend). Total TGF1 was measured after acidic activation using 1 M HCl for 10 min at room temperature.
Activation of human T cellsHuman samples were isolated from buffy coats (Pennsylvania Plasma). CD8+ T cells were positively enriched from human peripheral blood mononuclear cells, followed by negative isolation of CD4+ T cells using magnetic isolation kits (Invitrogen). Cells were then stimulated with anti-CD3/anti-ICOS beads (Dynal) at 10:1 T cell/bead ratio for 4 days. IL-2 (100 IU/ml; NIH) was added to the T cell cultures. Human PR was added on day 0 and every other day thereafter. Cells were assayed on day 7 for cytokine production and phenotype.
MC38 modelMC38 tumor cells were obtained from Y.-X. Fu (University of Texas Southwestern Medical Center). WT or Plt-GARPKO mice were injected in the right flank with 1 × 10⁶ MC38 colon cancer cells. Tumor size was measured with digital caliper kinetically. Tumor-infiltrating lympho-cytes were isolated from fresh primary tumors by density gradient after single-cell suspensions were made with mechanical dissocia-tion and enzymatic digestion (deoxyribonuclease and collagenase).
ImmunohistochemistryFor p-Smad2/3 stain on fresh-frozen MC38 tumors, 5-m tumor sections were fixed with 4% paraformaldehyde followed by incuba-tion with 3% H2O2. To minimize nonspecific staining, we incubated the sections with the appropriate animal serum for 20 min at room temperature, followed by incubation with primary anti–p-Smad2/3
antibody (EP823Y, Abcam) overnight at 4°C. Staining with secondary antibodies (Vectastain ABC Kit) was then performed before devel-opment using DAB substrate (SK-4100, Vector Labs). The staining intensity of p-Smad2/3 was graded as follows, with the sample iden-tity blinded: 0, negative; 1, faint; 2, moderate; 3, strong but less intense than 4; 4, intense.
Statistical analysisTwo-sided, two-sample Student’s t tests were used for all comparisons involving continuous dependent variables and categorical independent variables using Excel software. The variances were compared between groups using an F test. The Student’s t test was then implemented assuming equal or unequal variances (i.e., if the F test P value was less than 0.05, then unequal variances were assumed). For tumor curves, two-way repeated-measures analysis of variance (ANOVA) was used. For dose-response correlations between continuous de-pendent and independent variables in Figs. 2 and 4, Spearman’s rank- order correlation test was used to determine rho (). Kaplan- Meier curves were compared using log-rank tests. Error bars represent SEM. NS denotes statistically nonsignificant difference.
SUPPLEMENTARY MATERIALSimmunology.sciencemag.org/cgi/content/full/2/11/eaai7911/DC1Table S1. Source data for all the figure panels with small n (n < 20).Fig. S1. Pf4-cre-Hsp90b1flox/flox (KO) mice show no noticeable immune dysfunction at baseline.Fig. S2. PR, but not MVs, directly suppresses T cell proliferation and differentiation in vitro.Fig. S3. Immune suppression by PR is independent of TCR signaling and specific to lymphocytes.Fig. S4. T cell–suppressive function of the whole PR is significantly, but not completely, neutralized by blocking TGF pathway.Fig. S5. A small–molecular weight, heat-stable, proteinase K–resistant T cell–suppressive fraction is shared between human and mouse PRs.Fig. S6. TGF and LA in the PR are the major suppressors of CD8+ T cell activation.Fig. S7. TGF contained in the PR drives Foxp3 expression and up-regulates p-Smad2/3.Fig. S8. TGF1, but not LA, abrogates CD8-mediated tumor control.Fig. S9. Platelet depletion has no effect on serum LA concentration.Fig. S10. Inducible deletion of GARP from Foxp3+ Treg cells does not improve ACT of melanoma.Fig. S11. Sample staining and isotype controls for flow cytometry.
REFERENCES AND NOTES 1. K. Jurk, B. E. Kehrel, Platelets: Physiology and biochemistry. Semin. Thromb. Hemost. 31,
381–392 (2005). 2. A. S. Weyrich, G. A. Zimmerman, Platelets: Signaling cells in the immune continuum.
Trends Immunol. 25, 489–495 (2004). 3. R. Möhle, D. Green, M. A. S. Moore, R. L. Nachman, S. Rafii, Constitutive production and
thrombin-induced release of vascular endothelial growth factor by human megakaryocytes and platelets. Proc. Natl. Acad. Sci. U.S.A. 94, 663–668 (1997).
4. L. J. Gay, B. Felding-Habermann, Contribution of platelets to tumour metastasis. Nat. Rev. Cancer 11, 123–134 (2011).
5. E. Sierko, M. Z. Wojtukiewicz, Platelets and angiogenesis in malignancy. Semin. Thromb. Hemost. 30, 95–108 (2004).
6. R. L. Stone, A. M. Nick, I. A. McNeish, F. Balkwill, H. D. Han, J. Bottsford-Miller, R. Rupairmoole, G. N. Armaiz-Pena, C. V. Pecot, J. Coward, M. T. Deavers, H. G. Vasquez, D. Urbauer, C. N. Landen, W. Hu, H. Gershenson, K. Matsuo, M. M. K. Shahzad, E. R. King, I. Tekedereli, B. Ozpolat, E. H. Ahn, V. K. Bond, R. Wang, A. F. Drew, F. Gushiken, D. Lamkin, K. Collins, K. DeGeest, S. K. Lutgendorf, W. Chiu, G. Lopez-Berestein, V. Afshar-Kharghan, A. K. Sood, Paraneoplastic thrombocytosis in ovarian cancer. N. Engl. J. Med. 366, 610–618 (2012).
7. S. Karpatkin, E. Pearlstein, C. Ambrogio, B. S. Coller, Role of adhesive proteins in platelet tumor interaction in vitro and metastasis formation in vivo. J. Clin. Invest. 81, 1012–1019 (1988).
8. D. Schumacher, B. Strilic, K. K. Sivaraj, N. Wettschureck, S. Offermanns, Platelet-derived nucleotides promote tumor-cell transendothelial migration and metastasis via P2Y2 receptor. Cancer Cell 24, 130–137 (2013).
www.SCIENCEIMMUNOLOGY.org 05 May 2017 Vol 2 Issue 11 aai7911
67
R E S E A R C H A R T I C L E
Rachidi et al., Sci. Immunol. 2, eaai7911 (2017) 5 May 2017
S C I E N C E I M M U N O L O G Y | R E S E A R C H A R T I C L E
11 of 12
9. M. Labelle, S. Begum, R. O. Hynes, Direct signaling between platelets and cancer cells induces an epithelial-mesenchymal-like transition and promotes metastasis. Cancer Cell 20, 576–590 (2011).
10. H.-G. Kopp, T. Placke, H. R. Salih, Platelet-derived transforming growth factor- down-regulates NKG2D thereby inhibiting natural killer cell antitumor reactivity. Cancer Res. 69, 7775–7783 (2009).
11. P. Haselmayer, L. Grosse-Hovest, P. von Landenberg, H. Schild, M. P. Radsak, TREM-1 ligand expression on platelets enhances neutrophil activation. Blood 110, 1029–1035 (2007).
12. B. Xiang, G. Zhang, L. Guo, X.-A. Li, A. J. Morris, A. Daugherty, S. W. Whiteheart, S. S. Smyth, Z. Li, Platelets protect from septic shock by inhibiting macrophage-dependent inflammation via the cyclooxygenase 1 signalling pathway. Nat. Commun. 4, 2657 (2013).
13. P. Duffau, J. Seneschal, C. Nicco, C. Richez, E. Lazaro, I. Douchet, C. Bordes, J.-F. Viallard, C. Goulvestre, J.-L. Pellegrin, B. Weil, J.-F. Moreau, F. Batteux, P. Blanco, Platelet CD154 potentiates interferon- secretion by plasmacytoid dendritic cells in systemic lupus erythematosus. Sci. Transl. Med. 2, 47ra63 (2010).
14. B. D. Elzey, J. Tian, R. J. Jensen, A. K. Swanson, J. R. Lees, S. R. Lentz, C. S. Stein, B. Nieswandt, Y. Wang, B. L. Davidson, T. L. Ratliff, Platelet-mediated modulation of adaptive immunity. A communication link between innate and adaptive immune compartments. Immunity 19, 9–19 (2003).
15. A. Verschoor, M. Neuenhahn, A. A. Navarini, P. Graef, A. Plaumann, A. Seidlmeier, B. Nieswandt, S. Massberg, R. M. Zinkernagel, H. Hengartner, D. H. Busch, A platelet-mediated system for shuttling blood-borne bacteria to CD8+ dendritic cells depends on glycoprotein GPIb and complement C3. Nat. Immunol. 12, 1194–1201 (2011).
16. T. Junt, H. Schulze, Z. Chen, S. Massberg, T. Goerge, A. Krueger, D. D. Wagner, T. Graf, J. E. Italiano Jr., R. A. Shivdasani, U. H. von Andrian, Dynamic visualization of thrombopoiesis within bone marrow. Science 317, 1767–1770 (2007).
17. S. P. Jackson, Arterial thrombosis—Insidious, unpredictable and deadly. Nat. Med. 17, 1423–1436 (2011).
18. S. Offermanns, Activation of platelet function through G protein–coupled receptors. Circ. Res. 99, 1293–1304 (2006).
19. D. Q. Tran, J. Andersson, R. Wang, H. Ramsey, D. Unutmaz, E. M. Shevach, GARP (LRRC32) is essential for the surface expression of latent TGF- on platelets and activated FOXP3+ regulatory T cells. Proc. Natl. Acad. Sci. U.S.A. 106, 13445–13450 (2009).
20. J. P. Edwards, H. Fujii, A. X. Zhou, J. Creemers, D. Unutmaz, E. M. Shevach, Regulation of the expression of GARP/latent TGF-1 complexes on mouse T cells and their role in regulatory T cell and Th17 differentiation. J. Immunol. 190, 5506–5515 (2013).
21. M. Staron, S. Wu, H. Feng, A. Stojanovic, X. Du, R. Bona, B. Liu, Z. Li, Heat-shock protein gp96/grp94 is an essential chaperone for the platelet glycoprotein Ib-IX-V complex. Blood 117, 7136–7144 (2011).
22. Y. Zhang, B. X. Wu, A. Metelli, J. E. Thaxton, F. Hong, S. Rachidi, E. Ansa-Addo, S. Sun, C. Vasu, Y. Yang, B. Liu, Z. Li, GP96 is a GARP chaperone and controls regulatory T cell functions. J. Clin. Invest. 125, 859–869 (2015).
23. L. Senzel, D. V. Gnatenko, W. F. Bahou, The platelet proteome. Curr. Opin. Hematol. 16, 329–333 (2009).
24. G. L. Reed, M. L. Fitzgerald, J. Polgár, Molecular mechanisms of platelet exocytosis: Insights into the “secrete” life of thrombocytes. Blood 96, 3334–3342 (2000).
25. S. A. Rosenberg, N. P. Restifo, Adoptive cell transfer as personalized immunotherapy for human cancer. Science 348, 62–68 (2015).
26. P. Sharma, J. P. Allison, Immune checkpoint targeting in cancer therapy: Toward combination strategies with curative potential. Cell 161, 205–214 (2015).
27. P. Muranski, A. Boni, P. A. Antony, L. Cassard, K. R. Irvine, A. Kaiser, C. M. Paulos, D. C. Palmer, C. E. Touloukian, K. Ptak, L. Gattinoni, C. Wrzesinski, C. S. Hinrichs, K. W. Kerstann, L. Feigenbaum, C.-C. Chan, N. P. Restifo, Tumor-specific Th17–polarized cells eradicate large established melanoma. Blood 112, 362–373 (2008).
28. W. W. Overwijk, M. R. Theoret, S. E. Finkelstein, D. R. Surman, L. A. de Jong, F. A. Vyth-Dreese, T. A. Dellemijn, P. A. Antony, P. J. Spiess, D. C. Palmer, D. M. Heimann, C. A. Klebanoff, Z. Yu, L. N. Hwang, L. Feigenbaum, A. M. Kruisbeek, S. A. Rosenberg, N. P. Restifo, Tumor regression and autoimmunity after reversal of a functionally tolerant state of self-reactive CD8+ T cells. J. Exp. Med. 198, 569–580 (2003).
29. M. P. Rubinstein, C. A. Cloud, T. E. Garrett, C. J. Moore, K. M. Schwartz, C. B. Johnson, D. H. Craig, M. L. Salem, C. M. Paulos, D. J. Cole, Ex vivo interleukin-12-priming during CD8+ T cell activation dramatically improves adoptive T cell transfer antitumor efficacy in a lymphodepleted host. J. Am. Coll. Surg. 214, 700–707 (2012).
30. J. E. Murphy-Ullrich, M. Poczatek, Activation of latent TGF- by thrombospondin-1: Mechanisms and physiology. Cytokine Growth Factor Rev. 11, 59–69 (2000).
31. K. Fischer, P. Hoffmann, S. Voelkl, N. Meidenbauer, J. Ammer, M. Edinger, E. Gottfried, S. Schwarz, G. Rothe, S. Hoves, K. Renner, B. Timischl, A. Mackensen, L. Kunz-Schughart, R. Andreesen, S. W. Krause, M. Kreutz, Inhibitory effect of tumor cell-derived lactic acid on human T cells. Blood 109, 3812–3819 (2007).
32. O. R. Colegio, N.-Q. Chu, A. L. Szabo, T. Chu, A. M. Rhebergen, V. Jairam, N. Cyrus, C. E. Brokowski, S. C. Eisenbarth, G. M. Phillips, G. W. Cline, A. J. Phillips, R. Medzhitov,
Functional polarization of tumour-associated macrophages by tumour-derived lactic acid. Nature 513, 559–563 (2014).
33. C. B. Johnson, B. P. Riesenberg, B. R. May, S. C. Gilreath, G. Li, K. F. Staveley-O’Carroll, E. Garrett-Mayer, S. Mehrotra, D. J. Cole, M. P. Rubinstein, Effector CD8+ T-cell engraftment and antitumor immunity in lymphodepleted hosts is IL7R dependent. Cancer Immunol. Res. 3, 1364–1374 (2015).
34. R. K. Assoian, A. Komoriya, C. A. Meyers, D. M. Miller, M. B. Sporn, Transforming growth factor- in human platelets. Identification of a major storage site, purification, and characterization. J. Biol. Chem. 258, 7155–7160 (1983).
35. R. Wang, J. Zhu, X. Dong, M. Shi, C. Lu, T. A. Springer, GARP regulates the bioavailability and activation of TGF. Mol. Biol. Cell 23, 1129–1139 (2012).
36. J. Cuende, S. Liénart, O. Dedobbeleer, B. van der Woning, G. De Boeck, J. Stockis, C. Huygens, D. Colau, J. Somja, P. Delvenne, M. Hannon, F. Baron, L. Dumoutier, J.-C. Renauld, H. De Haard, M. Saunders, P. G. Coulie, S. Lucas, Monoclonal antibodies against GARP/TGF-1 complexes inhibit the immunosuppressive activity of human regulatory T cells in vivo. Sci. Transl. Med. 7, 284ra56 (2015).
37. A. Meyer, W. Wang, J. Qu, L. Croft, J. L. Degen, B. S. Coller, J. Ahamed, Platelet TGF-1 contributions to plasma TGF-1, cardiac fibrosis, and systolic dysfunction in a mouse model of pressure overload. Blood 119, 1064–1074 (2012).
38. S. F. Ngiow, A. Young, N. Jacquelot, T. Yamazaki, D. Enot, L. Zitvogel, M. J. Smyth, A threshold level of intratumor CD8+ T-cell PD1 expression dictates therapeutic response to anti-PD1. Cancer Res. 75, 3800–3811 (2015).
39. B. Homet Moreno, J. M. Zaretsky, A. Garcia-Diaz, J. Tsoi, G. Parisi, L. Robert, K. Meeth, A. Ndoye, M. Bosenberg, A. T. Weeraratna, T. G. Graeber, B. Comin-Anduix, S. Hu-Lieskovan, A. Ribas, Response to programmed cell death-1 blockade in a murine melanoma syngeneic model requires costimulation, CD4, and CD8 T cells. Cancer Immunol. Res. 4, 845–857 (2016).
40. A. Wallace, V. Kapoor, J. Sun, P. Mrass, W. Weninger, D. F. Heitjan, C. June, L. R. Kaiser, L. E. Ling, S. M. Albelda, Transforming growth factor- receptor blockade augments the effectiveness of adoptive T-cell therapy of established solid cancers. Clin. Cancer Res. 14, 3966–3974 (2008).
41. J. G. Quatromoni, Y. Wang, D. D. Vo, L. F. Morris, A. R. Jazirehi, W. McBride, T. Chatila, R. C. Koya, J. S. Economou, T cell receptor (TCR)-transgenic CD8 lymphocytes rendered insensitive to transforming growth factor beta (TGF) signaling mediate superior tumor regression in an animal model of adoptive cell therapy. J. Transl. Med. 10, 127 (2012).
42. L. Zhang, Z. Yu, P. Muranski, D. C. Palmer, N. P. Restifo, S. A. Rosenberg, R. A. Morgan, Inhibition of TGF- signaling in genetically engineered tumor antigen-reactive T cells significantly enhances tumor treatment efficacy. Gene Ther. 20, 575–580 (2013).
43. A. D. Michelson, Antiplatelet therapies for the treatment of cardiovascular disease. Nat. Rev. Drug Discov. 9, 154–169 (2010).
44. H. Zhou, E. C. Gabazza, H. Takeya, H. Deguchi, H. Urano, Y. Adachi, K. Suzuki, Prothrombin and its derivatives stimulate motility of melanoma cells. Thromb. Haemost. 80, 407–412 (1998).
45. L. Erpenbeck, M. P. Schön, Deadly allies: The fatal interplay between platelets and metastasizing cancer cells. Blood 115, 3427–3436 (2010).
46. H. M. Pinedo, H. M. W. Verheul, R. J. D’Amato, J. Folkman, Involvement of platelets in tumour angiogenesis? Lancet 352, 1775–1777 (1998).
47. J. Massagué, TGF in cancer. Cell 134, 215–230 (2008). 48. G. de Gaetano, Historical overview of the role of platelets in hemostasis and thrombosis.
Haematologica 86, 349–356 (2001). 49. D. J. Grainger, P. R. Kemp, J. C. Metcalfe, A. C. Liu, R. M. Lawn, N. R. Williams,
A. A. Grace, P. M. Schofield, A. Chauhan, The serum concentration of active transforming growth factor- is severely depressed in advanced atherosclerosis. Nat. Med. 1, 74–79 (1995).
50. T.-H. Lin, Y.-Y. Shao, S.-Y. Chan, C.-Y. Huang, C.-H. Hsu, A.-L. Cheng, High serum transforming growth factor-1 levels predict outcome in hepatocellular carcinoma patients treated with sorafenib. Clin. Cancer Res. 21, 3678–3684 (2015).
51. S. F. Shariat, M. Shalev, A. Menesses-Diaz, I. Y. Kim, M. W. Kattan, T. M. Wheeler, K. M. Slawin, Preoperative plasma levels of transforming growth factor beta1 (TGF-1) strongly predict progression in patients undergoing radical prostatectomy. J. Clin. Oncol. 19, 2856–2864 (2001).
52. S. Zelenay, A. G. van der Veen, J. P. Böttcher, K. J. Snelgrove, N. Rogers, S. E. Acton, P. Chakravarty, M. R. Girotti, R. Marais, S. A. Quezada, E. Sahai, C. Reis e Sousa, Cyclooxygenase-dependent tumor growth through evasion of immunity. Cell 162, 1257–1270 (2015).
53. G. Sitia, R. Aiolfi, P. Di Lucia, M. Mainetti, A. Fiocchi, F. Mingozzi, A. Esposito, Z. M. Ruggeri, F. V. Chisari, M. Iannacone, L. G. Guidotti, Antiplatelet therapy prevents hepatocellular carcinoma and improves survival in a mouse model of chronic hepatitis B. Proc. Natl. Acad. Sci. U.S.A. 109, E2165–E2172 (2012).
54. M. G. Best, N. Sol, I. Kooi, J. Tannous, B. A. Westerman, F. Rustenburg, P. Schellen, H. Verschueren, E. Post, J. Koster, B. Ylstra, N. Ameziane, J. Dorsman, E. F. Smit, H. M. Verheul, D. P. Noske, J. C. Reijneveld, R. J. A. Nilsson, B. A. Tannous, P. Wesseling, T. Wurdinger, RNA-seq of tumor-educated platelets enables blood-based
www.SCIENCEIMMUNOLOGY.org 05 May 2017 Vol 2 Issue 11 aai7911
68
R E S E A R C H A R T I C L E
Rachidi et al., Sci. Immunol. 2, eaai7911 (2017) 5 May 2017
S C I E N C E I M M U N O L O G Y | R E S E A R C H A R T I C L E
12 of 12
pan-cancer, multiclass, and molecular pathway cancer diagnostics. Cancer Cell 28, 666–676 (2015).
55. R. Tiedt, T. Schomber, H. Hao-Shen, R. C. Skoda, Pf4-Cre transgenic mice allow the generation of lineage-restricted gene knockouts for studying megakaryocyte and platelet function in vivo. Blood 109, 1503–1506 (2007).
56. Y. Yang, B. Liu, J. Dai, P. K. Srivastava, D. J. Zammit, L. Lefrançois, Z. Li, Heat shock protein gp96 is a master chaperone for Toll-like receptors and is important in the innate function of macrophages. Immunity 26, 215–226 (2007).
57. T. L. Hwang, A. J. Shaka, Water suppression that works. Excitation sculpting using arbitrary wave-forms and pulsed-field gradients. J. Magn. Reson. 112, 275–279 (1995).
58. H. Matsushita, A. Hosoi, S. Ueha, J. Abe, N. Fujieda, M. Tomura, R. Maekawa, K. Matsushima, O. Ohara, K. Kakimi, Cytotoxic T lymphocytes block tumor growth both by lytic activity and IFN-dependent cell-cycle arrest. Cancer Immunol. Res. 3, 26–36 (2015).
59. D. C. Palmer, C.-C. Chan, L. Gattinoni, C. Wrzesinski, C. M. Paulos, C. S. Hinrichs, D. J. Powell Jr., C. A. Klebanoff, S. E. Finkelstein, R. N. Fariss, Z. Yu, R. B. Nussenblatt, S. A. Rosenberg, N. P. Restifo, Effective tumor treatment targeting a melanoma/melanocyte-associated antigen triggers severe ocular autoimmunity. Proc. Natl. Acad. Sci. U.S.A. 105, 8061–8066 (2008).
60. E. W. Su, C. J. Moore, S. Suriano, C. B. Johnson, N. Songalia, A. Patterson, D. J. Neitzke, K. Andrijauskaite, E. Garrett-Mayer, S. Mehrotra, C. M. Paulos, A. L. Doedens, A. W. Goldrath, Z. Li, D. J. Cole, M. P. Rubinstein, IL-2R mediates temporal regulation of IL-2 signaling and enhances immunotherapy. Sci. Transl. Med. 7, 311ra170 (2015).
Acknowledgments: We received technical help from Y. Zhang, F. Hong, E. Ansa-Addo, S. Mehrotra, J. Thaxton, C. Morales, J. Bowers, S. Suriano, C. Cloud, and T. Benton. We thank Y.-T. Hsu, L. Ball, R. Drake, and J. Bielawski for their initial assistance with PR fractionation. Funding: This work was supported by multiple NIH grants CA186866, CA188419, AI070603, and AI077283 (to Z.L.); CA175061 and CA208514 (to C.M.P.); UL1 TR001450 and NIH–National Center for Advancing Translational Sciences Grant TL1 TR001451 (to C.W. and B.R.); and Hollings Cancer Center Cancer Center Support Grant P30CA138313. Author contributions: Z.L. and S.R. conceived the idea, designed the study, and wrote the manuscript. S.R., A.M., B.R., B.X.W., M.H.N., C.W., C.M.P., M.P.R., M.H., and D.W.B. performed the experiments. Z.L., B.L., and Y.Y. supervised the study. E.G.-M. assisted in data analysis, statistics, and interpretation. All authors provided critical comments on the manuscript. Competing interests: A provisional patent application has been filed to target GARP and platelets for cancer immunotherapy. The authors declare no other competing interests.
Submitted 11 August 2016Resubmitted 16 November 2016Accepted 23 March 2017Published 5 May 201710.1126/sciimmunol.aai7911
Citation: S. Rachidi, A. Metelli, B. Riesenberg, B. X. Wu, M. H. Nelson, C. Wallace, C. M. Paulos, M. P. Rubinstein, E. Garrett-Mayer, M. Hennig, D. W. Bearden, Y. Yang, B. Liu, Z. Li, Platelets subvert T cell immunity against cancer via GARP-TGF axis. Sci. Immunol. 2, eaai7911 (2017).
www.SCIENCEIMMUNOLOGY.org 05 May 2017 Vol 2 Issue 11 aai7911
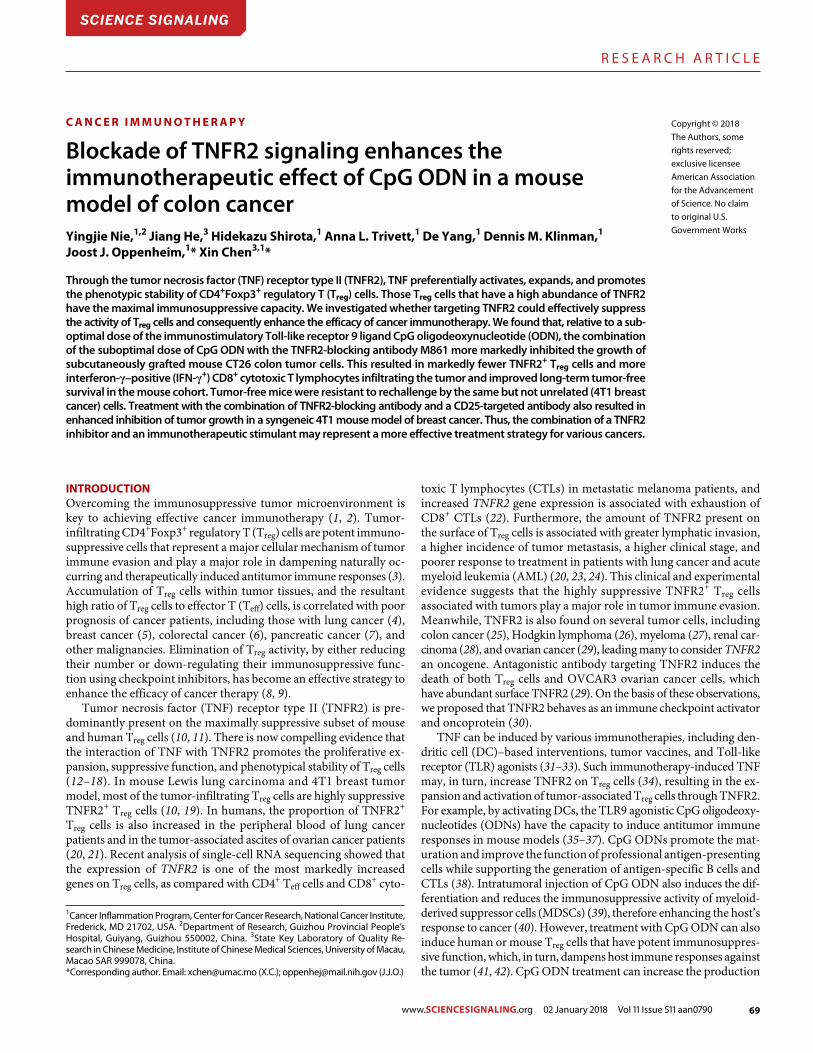
69
R E S E A R C H A R T I C L E
Nie et al., Sci. Signal. 11, eaan0790 (2018) 2 January 2018
S C I E N C E S I G N A L I N G | R E S E A R C H A R T I C L E
1 of 9
C A N C E R I M M U N O T H E R A P Y
Blockade of TNFR2 signaling enhances the immunotherapeutic effect of CpG ODN in a mouse model of colon cancerYingjie Nie,1,2 Jiang He,3 Hidekazu Shirota,1 Anna L. Trivett,1 De Yang,1 Dennis M. Klinman,1 Joost J. Oppenheim,1* Xin Chen3,1*
Through the tumor necrosis factor (TNF) receptor type II (TNFR2), TNF preferentially activates, expands, and promotes the phenotypic stability of CD4+Foxp3+ regulatory T (Treg) cells. Those Treg cells that have a high abundance of TNFR2 have the maximal immunosuppressive capacity. We investigated whether targeting TNFR2 could effectively suppress the activity of Treg cells and consequently enhance the efficacy of cancer immunotherapy. We found that, relative to a suboptimal dose of the immunostimulatory Tolllike receptor 9 ligand CpG oligodeoxynucleotide (ODN), the combination of the suboptimal dose of CpG ODN with the TNFR2blocking antibody M861 more markedly inhibited the growth of subcutaneously grafted mouse CT26 colon tumor cells. This resulted in markedly fewer TNFR2+ Treg cells and more interferon–positive (IFN+) CD8+ cytotoxic T lymphocytes infiltrating the tumor and improved longterm tumorfree survival in the mouse cohort. Tumorfree mice were resistant to rechallenge by the same but not unrelated (4T1 breast cancer) cells. Treatment with the combination of TNFR2blocking antibody and a CD25targeted antibody also resulted in enhanced inhibition of tumor growth in a syngeneic 4T1 mouse model of breast cancer. Thus, the combination of a TNFR2 inhibitor and an immunotherapeutic stimulant may represent a more effective treatment strategy for various cancers.
INTRODUCTIONOvercoming the immunosuppressive tumor microenvironment is key to achieving effective cancer immunotherapy (1, 2). Tumor- infiltrating CD4+Foxp3+ regulatory T (Treg) cells are potent immuno-suppressive cells that represent a major cellular mechanism of tumor immune evasion and play a major role in dampening naturally oc-curring and therapeutically induced antitumor immune responses (3). Accumulation of Treg cells within tumor tissues, and the resultant high ratio of Treg cells to effector T (Teff) cells, is correlated with poor prognosis of cancer patients, including those with lung cancer (4), breast cancer (5), colorectal cancer (6), pancreatic cancer (7), and other malignancies. Elimination of Treg activity, by either reducing their number or down-regulating their immunosuppressive func-tion using checkpoint inhibitors, has become an effective strategy to enhance the efficacy of cancer therapy (8, 9).
Tumor necrosis factor (TNF) receptor type II (TNFR2) is pre-dominantly present on the maximally suppressive subset of mouse and human Treg cells (10, 11). There is now compelling evidence that the interaction of TNF with TNFR2 promotes the proliferative ex-pansion, suppressive function, and phenotypical stability of Treg cells (12–18). In mouse Lewis lung carcinoma and 4T1 breast tumor model, most of the tumor-infiltrating Treg cells are highly suppressive TNFR2+ Treg cells (10, 19). In humans, the proportion of TNFR2+ Treg cells is also increased in the peripheral blood of lung cancer patients and in the tumor-associated ascites of ovarian cancer patients (20, 21). Recent analysis of single-cell RNA sequencing showed that the expression of TNFR2 is one of the most markedly increased genes on Treg cells, as compared with CD4+ Teff cells and CD8+ cyto-
toxic T lymphocytes (CTLs) in metastatic melanoma patients, and increased TNFR2 gene expression is associated with exhaustion of CD8+ CTLs (22). Furthermore, the amount of TNFR2 present on the surface of Treg cells is associated with greater lymphatic invasion, a higher incidence of tumor metastasis, a higher clinical stage, and poorer response to treatment in patients with lung cancer and acute myeloid leukemia (AML) (20, 23, 24). This clinical and experimental evidence suggests that the highly suppressive TNFR2+ Treg cells associated with tumors play a major role in tumor immune evasion. Meanwhile, TNFR2 is also found on several tumor cells, including colon cancer (25), Hodgkin lymphoma (26), myeloma (27), renal car-cinoma (28), and ovarian cancer (29), leading many to consider TNFR2 an oncogene. Antagonistic antibody targeting TNFR2 induces the death of both Treg cells and OVCAR3 ovarian cancer cells, which have abundant surface TNFR2 (29). On the basis of these observations, we proposed that TNFR2 behaves as an immune checkpoint activator and oncoprotein (30).
TNF can be induced by various immunotherapies, including den-dritic cell (DC)–based interventions, tumor vaccines, and Toll-like receptor (TLR) agonists (31–33). Such immunotherapy-induced TNF may, in turn, increase TNFR2 on Treg cells (34), resulting in the ex-pansion and activation of tumor-associated Treg cells through TNFR2. For example, by activating DCs, the TLR9 agonistic CpG oligodeoxy-nucleotides (ODNs) have the capacity to induce antitumor immune responses in mouse models (35–37). CpG ODNs promote the mat-uration and improve the function of professional antigen- presenting cells while supporting the generation of antigen-specific B cells and CTLs (38). Intratumoral injection of CpG ODN also induces the dif-ferentiation and reduces the immunosuppressive activity of myeloid- derived suppressor cells (MDSCs) (39), therefore enhancing the host’s response to cancer (40). However, treatment with CpG ODN can also induce human or mouse Treg cells that have potent immunosuppres-sive function, which, in turn, dampens host immune responses against the tumor (41, 42). CpG ODN treatment can increase the production
1Cancer Inflammation Program, Center for Cancer Research, National Cancer Institute, Frederick, MD 21702, USA. 2Department of Research, Guizhou Provincial People’s Hospital, Guiyang, Guizhou 550002, China. 3State Key Laboratory of Quality Re-search in Chinese Medicine, Institute of Chinese Medical Sciences, University of Macau, Macao SAR 999078, China.*Corresponding author. Email: [email protected] (X.C.); [email protected] (J.J.O.)
Copyright © 2018 The Authors, some rights reserved; exclusive licensee American Association for the Advancement of Science. No claim to original U.S. Government Works
www.SCIENCESIGNALING.org 02 January 2018 Vol 11 Issue 511 aan0790
SCIENCE SIGNALING
70
R E S E A R C H A R T I C L E
Nie et al., Sci. Signal. 11, eaan0790 (2018) 2 January 2018
S C I E N C E S I G N A L I N G | R E S E A R C H A R T I C L E
2 of 9
of TNF in cultured murine DCs (43) or human peripheral blood mononuclear cells (44), which is likely responsible for the activation of Treg cells. Therefore, by reducing Treg activity, blockade of TNFR2 may enhance the antitumor effect of an immunotherapeutic such as CpG ODN.
Here, we tested this hypothesis and found that the combination of a blocking antibody (M861) recognizing TNFR2 and CpG ODN more potently inhibited mouse CT26 colon tumor development and induced greater tumor regression in syngeneic mice, resulting in greater long-term tumor-free survival of the mice. In addition, in a mouse 4T1 breast cancer model, a better antitumor effect was ob-served by simultaneously blocking TNFR2 and CD25. Furthermore, tumor antigen-specific immunity developed in the mice that sur-vived CT26 tumor graftment; they completely (over the time course of the experiment) and selectively resisted a rechallenge by CT26, but not 4T1, tumor cells. This effect was associated with a decrease in the proportion of Treg cells among tumor-infiltrating leukocytes, a reduced surface abundance of TNFR2 on Treg cells, and increased tumor infiltration of interferon- (IFN-)–producing CD8+ T cells. Thus, the combination of TNFR2 antagonism and immunotherapy may be a promising cancer treatment strategy.
RESULTSM861 inhibits the stimulatory effect of TNF on Treg cellsPreviously, we showed that treatment with TNF preferentially promoted the proliferative expansion of Treg cells, accompanied by increased abundance of TNFR2 on Treg cells in vitro and in lipopolysaccharide (LPS)–treated mice (18, 34). In CD4+ T cells cultured with interleukin-2 (IL-2), treatment with the TNFR2 antibody M861 significantly in-hibited TNF-induced proliferation (Fig. 1A) and expansion (Fig. 1B) of Treg cells. M861 also significantly blocked TNF-induced increases in the cell surface abundance of TNFR2 on Treg cells (Fig. 1C). In LPS-challenged mice, although administration of M861 failed to reduce the number of Treg cells in the spleens and lymph nodes within 24 hours, the proportion of TNFR2+ Treg cells was significantly reduced by 64% and the abundance of TNFR2 on splenic Treg cells was significantly reduced by >56% (Fig. 1D). The decrease in TNFR2+ Treg cells was not due to cell death (fig. S1). Therefore, unlike two other antibodies recognizing human TNFR2 described in a recent study (29), M861 was not a Treg-depleting antibody. Furthermore, its capacity to reduce TNFR2 abundance appears to be more potent than its inhibition of the proliferative expansion of Treg cells induced by LPS treatment (Fig. 1). Overall, our data favor the idea that M861 is a blocking antibody that inhibits ligand-induced TNFR2 signaling.
Combination therapy with TNFR2-blocking antibody and CpG ODN potently inhibits the growth of CT26 tumors and generated tumor-specific immunityTo examine the effect of TNFR2 blockade on the efficacy of tumor immunotherapy, we treated female CT26 tumor-bearing Balb/c mice with M861 and CpG ODN or various controls (Fig. 2A). Treatment was started when the tumor reached 5 to 6 mm in diameter (day 0). CpG ODNs were administered by intratumoral injection, which was previously reported to achieve an optimal antitumor effect (39). To reveal the beneficial effect of combination therapy, we administered M861 with a suboptimal dose of CpG ODN, neither of which markedly inhibited tumor growth alone (Fig. 2B). The combination of M861 and CpG ODN potently inhibited the growth of primary CT26 tu-
mors (Fig. 2B). Eighty percent of mice were tumor-free and sur-vived up to the end of the experiment at 60 days, whereas mice in other groups died from tumor burden within 50 days after tumor inoculation (Fig. 2C). The individual tumor growth curves varied; although a few mice had slow tumor growth with phosphate-buffered saline (PBS), CpG, or M861 alone, the antitumor effect of the M861 and CpG ODN combination is clear (Fig. 2, D to G).
To investigate whether the tumor-free mice developed long-term CT26 tumor-specific immunity, the surviving mice were reinoculated subcutaneously with CT26 tumor cells into the right flanks, and 4T1 tumor cells were inoculated into their left flanks. As controls, both 4T1 tumor cells and CT26 tumor cells were inoculated into naïve mice at the same manner, and as expected, both tumors developed in all naïve mice (Fig. 2H). Whereas all of the CT26 (intratumoral)–surviving mice developed measurable 4T1 tumors by day 26 after inoculation, none of these mice developed CT26 colon tumors (Fig. 2I). These results indicate that the treatment with combination of M861 and CpG ODN induced the development of long-term tumor antigen-specific immunity.
M861 did not induce the death of TNFR2+ Treg cells (fig. S1), in-dicating that its effect was caused by binding and blocking TNFR2 signaling. The possibility that this antibody also binds and neutralizes soluble shed TNFR2 should be addressed in a future study. It was recently reported that antibodies recognizing human TNFR2, in ad-dition to eliminating Treg cells, could also directly act on TNFR2- expressing tumor cells (29). A considerable proportion of CT26 cancer cells are TNFR2+ cells (fig. S2A). However, treatment with M861 (up to 20 g/ml) did not inhibit the growth of CT26 cells (fig. S2B), indi-cating that the in vivo inhibitory effect of this antibody on CT26 tumor was not due to any direct effect on tumor cells.
Combination therapy with TNFR2-blocking antibody and CpG ODN reduces the proportion of tumor-infiltrating TNFR2+ Treg cells and increases IFN-+ CD8+ CTLsBecause combination therapy resulted in inhibited CT26 tumor growth and marked tumor regression in many of the mice, we were unable to examine the immune cell profile present in the tumor environment. To obtain a tumor mass for further study, we delayed the treatment until tumors reached ~10 mm in diameter, and the effect of treat-ments on tumor-infiltrating Treg cells was examined by fluorescence- activated cell sorting (FACS) analysis (Fig. 3, A to C). The proportion of intratumoral Treg cells was increased to ~20% by treatment with CpG ODN alone (Fig. 3D). Furthermore, CpG ODN treatment also significantly increased the amount of TNFR2 on Treg cells by ~20% (Fig. 3E). These results suggest that, in addition to stimulating the expansion of Treg cells as previously reported (41, 42), CpG ODN can also increase the function of Treg cells, as indicated by the increased abundance of TNFR2 (10, 45). Both the proportion of TNFR2+ Treg cells and the abundance of TNFR2 in Treg cells (measured as per cell) were markedly reduced by treatment with the TNFR2-blocking anti body (Fig. 3, E and F). Notably, the CpG ODN– induced expan-sion of Treg cells and increased abundance of TNFR2 on Treg cells were completely abrogated by M861 treatment (Fig. 3, D and E). The combination therapy markedly increased the production of IFN- by CD8+ CTLs, and the proportion of IFN-–producing CD8+ T cells was greater than threefold as com pared with CpG ODN treatment alone (Fig. 3, C and G). Thus, our data indicate that com-bination therapy reduced Treg activity and promoted the induction of potent type 1 helper T cell antitumor immune responses.
www.SCIENCESIGNALING.org 02 January 2018 Vol 11 Issue 511 aan0790
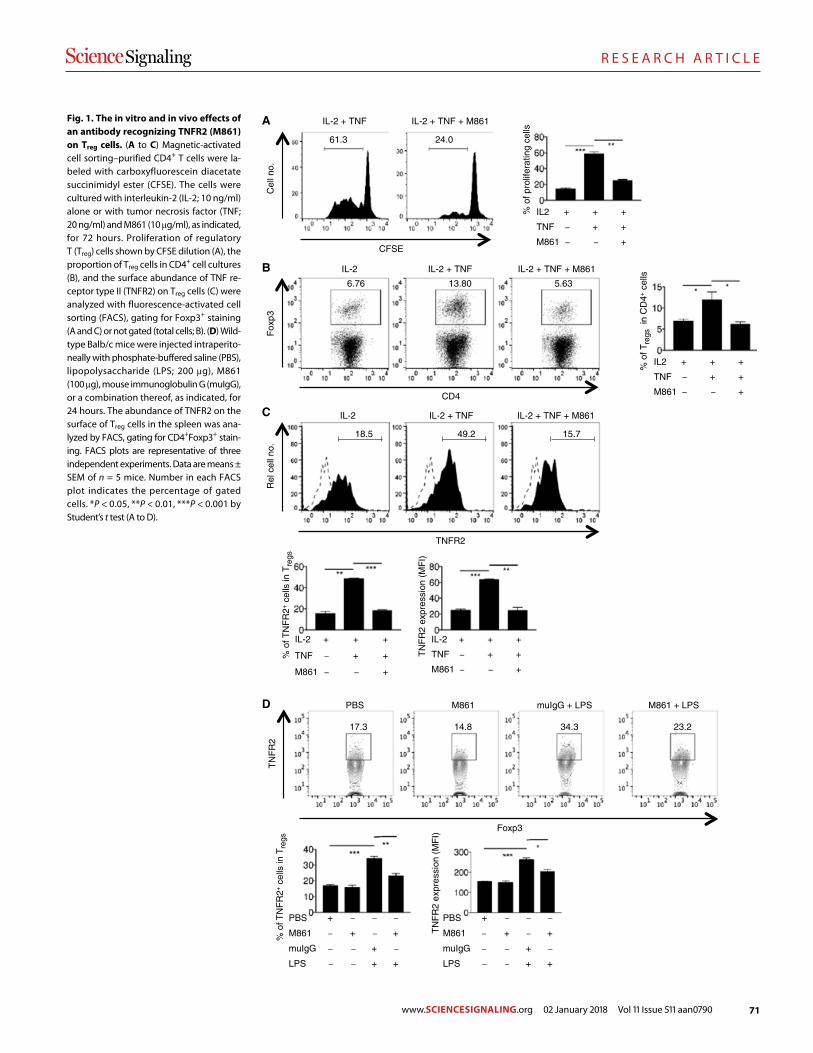
71
R E S E A R C H A R T I C L E
Nie et al., Sci. Signal. 11, eaan0790 (2018) 2 January 2018
S C I E N C E S I G N A L I N G | R E S E A R C H A R T I C L E
3 of 9
CFSE
Cel
l no.
IL-2 + TNF IL-2 + TNF + M861
IL2
TNF
M861
+
–
–
+
+
–
+
+
+
61.3 24.0
% o
f pro
lifer
atin
g ce
lls
A
CD4
Fox
p3
% o
f Tre
gs in
CD
4+ c
ells
IL2
TNF
M861
+
–
–
+
+
–
+
+
+
IL-2 + TNF IL-2 + TNF + M861IL-2
6.76 13.80 5.63
B
IL-2 + TNF IL-2 + TNF + M861IL-2
TNFR2
Rel
cel
l no.
IL-2
TNF
M861
+
–
–
+
+
–
+
+
+
IL-2
TNF
M861
+
–
–
+
+
–
+
+
+
% o
f TN
FR
2+ c
ells
in T
regs
TN
FR
2 ex
pres
sion
(M
FI)
18.5 49.2 15.7
C
Foxp3
TN
FR
2
17.3 14.8 34.3 23.2
M861 muIgG + LPSPBS M861 + LPS
PBS
M861
muIgG
LPS
+
–
–
–
–
+
–
–
–
–
+
+
–
+
–
+
PBS
M861
muIgG
LPS
+
–
–
–
–
+
–
–
–
–
+
+
–
+
–
+
% o
f TN
FR
2+ c
ells
in T
regs
TN
FR
2 ex
pres
sion
(M
FI)
D
Fig. 1. The in vitro and in vivo effects of an antibody recognizing TNFR2 (M861) on Treg cells. (A to C) Magnetic-activated cell sorting– purified CD4+ T cells were la-beled with carbo xyfluorescein diacetate succinimidyl ester (CFSE). The cells were cultured with interleukin-2 (IL-2; 10 ng/ml) alone or with tumor necrosis factor (TNF; 20 ng/ml) and M861 (10 g/ml), as indicated, for 72 hours. Proliferation of regulatory T (Treg) cells shown by CFSE dilution (A), the proportion of Treg cells in CD4+ cell cultures (B), and the surface abundance of TNF re-ceptor type II (TNFR2) on Treg cells (C) were analyzed with fluorescence-activated cell sorting (FACS), gating for Foxp3+ staining (A and C) or not gated (total cells; B). (D) Wild- type Balb/c mice were injected intraperito-neally with phosphate-buffered saline (PBS), lipopolysaccharide (LPS; 200 g), M861 (100 g), mouse immunoglobulin G (muIgG), or a com bination thereof, as indicated, for 24 hours. The abundance of TNFR2 on the surface of Treg cells in the spleen was ana-lyzed by FACS, gating for CD4+Foxp3+ stain-ing. FACS plots are representative of three independent ex periments. Data are means ± SEM of n = 5 mice. Number in each FACS plot indicates the percentage of gated cells. *P < 0.05, **P < 0.01, ***P < 0.001 by Student’s t test (A to D).
www.SCIENCESIGNALING.org 02 January 2018 Vol 11 Issue 511 aan0790
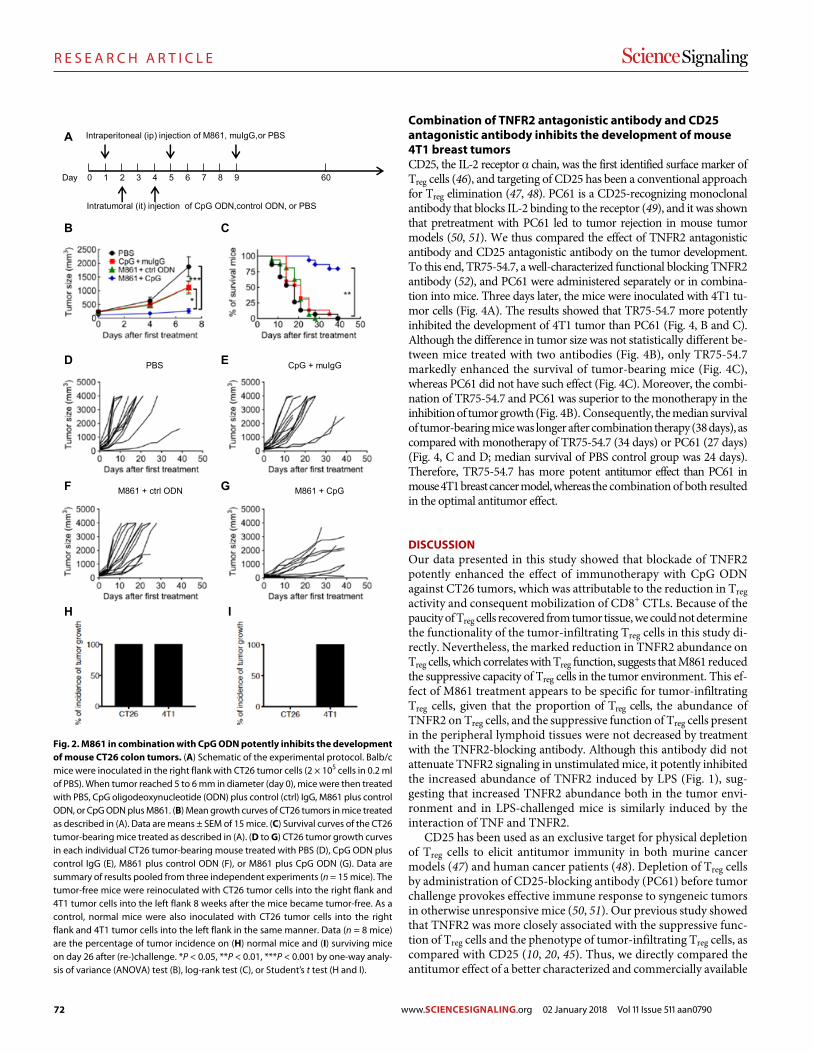
72
R E S E A R C H A R T I C L E
Nie et al., Sci. Signal. 11, eaan0790 (2018) 2 January 2018
S C I E N C E S I G N A L I N G | R E S E A R C H A R T I C L E
4 of 9
Combination of TNFR2 antagonistic antibody and CD25 antagonistic antibody inhibits the development of mouse 4T1 breast tumorsCD25, the IL-2 receptor chain, was the first identified surface marker of Treg cells (46), and targeting of CD25 has been a conventional approach for Treg elimination (47, 48). PC61 is a CD25-recognizing monoclonal antibody that blocks IL-2 binding to the receptor (49), and it was shown that pretreatment with PC61 led to tumor rejection in mouse tumor models (50, 51). We thus compared the effect of TNFR2 antagonistic antibody and CD25 antagonistic antibody on the tumor development. To this end, TR75-54.7, a well-characterized functional blocking TNFR2 antibody (52), and PC61 were administered separately or in combina-tion into mice. Three days later, the mice were inoculated with 4T1 tu-mor cells (Fig. 4A). The results showed that TR75-54.7 more potently inhibited the development of 4T1 tumor than PC61 (Fig. 4, B and C). Although the difference in tumor size was not statistically different be-tween mice treated with two antibodies (Fig. 4B), only TR75-54.7 markedly enhanced the survival of tumor- bearing mice (Fig. 4C), whereas PC61 did not have such effect (Fig. 4C). Moreover, the combi-nation of TR75-54.7 and PC61 was superior to the monotherapy in the inhibition of tumor growth (Fig. 4B). Consequently, the median survival of tumor-bearing mice was longer after combina tion therapy (38 days), as compared with monotherapy of TR75-54.7 (34 days) or PC61 (27 days) (Fig. 4, C and D; median survival of PBS control group was 24 days). Therefore, TR75-54.7 has more potent antitumor effect than PC61 in mouse 4T1 breast cancer model, whereas the combination of both resulted in the optimal antitumor effect.
DISCUSSIONOur data presented in this study showed that blockade of TNFR2 potently enhanced the effect of immunotherapy with CpG ODN against CT26 tumors, which was attributable to the reduction in Treg activity and consequent mobilization of CD8+ CTLs. Because of the paucity of Treg cells recovered from tumor tissue, we could not determine the functionality of the tumor-infiltrating Treg cells in this study di-rectly. Nevertheless, the marked reduction in TNFR2 abundance on Treg cells, which correlates with Treg function, suggests that M861 reduced the suppressive capacity of Treg cells in the tumor environment. This ef-fect of M861 treatment appears to be specific for tumor-infiltrating Treg cells, given that the proportion of Treg cells, the abundance of TNFR2 on Treg cells, and the suppressive function of Treg cells present in the peripheral lymphoid tissues were not decreased by treatment with the TNFR2-blocking antibody. Although this antibody did not attenuate TNFR2 signaling in unstimulated mice, it potently inhibited the increased abundance of TNFR2 induced by LPS (Fig. 1), sug-gesting that increased TNFR2 abundance both in the tumor envi-ronment and in LPS-challenged mice is similarly induced by the interaction of TNF and TNFR2.
CD25 has been used as an exclusive target for physical depletion of Treg cells to elicit antitumor immunity in both murine cancer models (47) and human cancer patients (48). Depletion of Treg cells by administration of CD25-blocking antibody (PC61) before tumor challenge provokes effective immune response to syngeneic tumors in otherwise unresponsive mice (50, 51). Our previous study showed that TNFR2 was more closely associated with the suppressive func-tion of Treg cells and the phenotype of tumor-infiltrating Treg cells, as compared with CD25 (10, 20, 45). Thus, we directly compared the antitumor effect of a better characterized and commercially available
Day
Intratumoral (it) injection of CpG ODN,control ODN, or PBS
Intraperitoneal (ip) injection of M861, muIgG,or PBS
601 2 3 4 5 6 7 8 9 0
A
B C
PBS CpG + muIgG
M861 + ctrl ODN M861 + CpG
D E
F G
H I
Fig. 2. M861 in combination with CpG ODN potently inhibits the development of mouse CT26 colon tumors. (A) Schematic of the experimental protocol. Balb/c mice were inoculated in the right flank with CT26 tumor cells (2 × 10⁵ cells in 0.2 ml of PBS). When tumor reached 5 to 6 mm in diameter (day 0), mice were then treated with PBS, CpG oligodeoxynucleotide (ODN) plus control (ctrl) IgG, M861 plus control ODN, or CpG ODN plus M861. (B) Mean growth curves of CT26 tumors in mice treated as described in (A). Data are means ± SEM of 15 mice. (C) Survival curves of the CT26 tumor-bearing mice treated as described in (A). (D to G) CT26 tumor growth curves in each individual CT26 tumor-bearing mouse treated with PBS (D), CpG ODN plus control IgG (E), M861 plus control ODN (F), or M861 plus CpG ODN (G). Data are summary of results pooled from three independent experiments (n = 15 mice). The tumor-free mice were reinoculated with CT26 tumor cells into the right flank and 4T1 tumor cells into the left flank 8 weeks after the mice became tumor-free. As a control, normal mice were also inoculated with CT26 tumor cells into the right flank and 4T1 tumor cells into the left flank in the same manner. Data (n = 8 mice) are the percentage of tumor incidence on (H) normal mice and (I) surviving mice on day 26 after (re-)challenge. *P < 0.05, **P < 0.01, ***P < 0.001 by one-way analy-sis of variance (ANOVA) test (B), log-rank test (C), or Student’s t test (H and I).
www.SCIENCESIGNALING.org 02 January 2018 Vol 11 Issue 511 aan0790
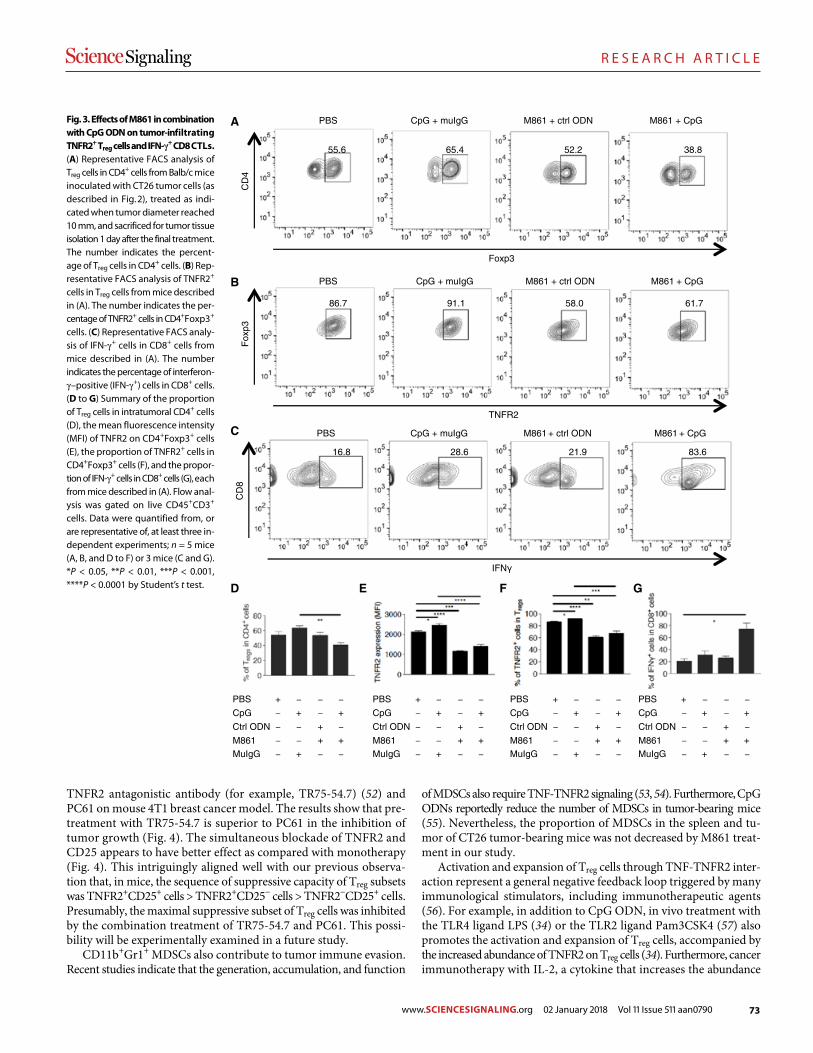
73
R E S E A R C H A R T I C L E
Nie et al., Sci. Signal. 11, eaan0790 (2018) 2 January 2018
S C I E N C E S I G N A L I N G | R E S E A R C H A R T I C L E
5 of 9
TNFR2 antagonistic antibody (for example, TR75-54.7) (52) and PC61 on mouse 4T1 breast cancer model. The results show that pre-treatment with TR75-54.7 is superior to PC61 in the inhibition of tumor growth (Fig. 4). The simultaneous blockade of TNFR2 and CD25 appears to have better effect as compared with monotherapy (Fig. 4). This intriguingly aligned well with our previous observa-tion that, in mice, the sequence of suppressive capacity of Treg subsets was TNFR2+CD25+ cells > TNFR2+CD25− cells > TNFR2−CD25+ cells. Presumably, the maximal suppressive subset of Treg cells was inhibited by the combination treatment of TR75-54.7 and PC61. This possi-bility will be experimentally examined in a future study.
CD11b+Gr1+ MDSCs also contribute to tumor immune evasion. Recent studies indicate that the generation, accumulation, and func tion
of MDSCs also require TNF-TNFR2 signaling (53, 54). Furthermore, CpG ODNs reportedly reduce the number of MDSCs in tumor- bearing mice (55). Nevertheless, the proportion of MDSCs in the spleen and tu-mor of CT26 tumor-bearing mice was not decreased by M861 treat-ment in our study.
Activation and expansion of Treg cells through TNF-TNFR2 inter-action represent a general negative feedback loop triggered by many immunological stimulators, including immunotherapeutic agents (56). For example, in addition to CpG ODN, in vivo treatment with the TLR4 ligand LPS (34) or the TLR2 ligand Pam3CSK4 (57) also promotes the activation and expansion of Treg cells, accompanied by the increased abundance of TNFR2 on Treg cells (34). Furthermore, cancer immunotherapy with IL-2, a cytokine that increases the abundance
Foxp3
CD
4
TNFR2
Fox
p3
CpG + muIgG M861 + ctrl ODNPBS M861 + CpG
CpG + muIgG M861 + ctrl ODNPBS M861 + CpG
CpG + muIgG M861 + ctrl ODNPBS M861 + CpG
IFN
CD
8
PBS
CpG
Ctrl ODN
M861
MuIgG
+
–
–
–
–
–
+
–
–
+
–
–
+
+
–
–
+
–
+
–
PBS
CpG
Ctrl ODN
M861
MuIgG
+
–
–
–
–
–
+
–
–
+
–
–
+
+
–
–
+
–
+
–
PBS
CpG
Ctrl ODN
M861
MuIgG
+
–
–
–
–
–
+
–
–
+
–
–
+
+
–
–
+
–
+
–
PBS
CpG
Ctrl ODN
M861
MuIgG
+
–
–
–
–
–
+
–
–
+
–
–
+
+
–
–
+
–
+
–
A
B
C
D E F G
55.6 65.4 52.2 38.8
86.7 91.1 58.0 61.7
16.8 28.6 21.9 83.6
Fig. 3. Effects of M861 in combination with CpG ODN on tumor-infiltrating TNFR2+ Treg cells and IFN-+ CD8 CTLs. (A) Representative FACS analysis of Treg cells in CD4+ cells from Balb/c mice inoculated with CT26 tumor cells (as described in Fig. 2), treated as indi-cated when tumor diameter reached 10 mm, and sacrificed for tumor tissue isolation 1 day after the final treatment. The number indicates the percent-age of Treg cells in CD4+ cells. (B) Rep-resentative FACS analysis of TNFR2+ cells in Treg cells from mice described in (A). The number indicates the per-centage of TNFR2+ cells in CD4+Foxp3+ cells. (C) Representative FACS analy-sis of IFN-+ cells in CD8+ cells from mice described in (A). The number indicates the percentage of interferon- –positive (IFN-+) cells in CD8+ cells. (D to G) Summary of the proportion of Treg cells in intratumoral CD4+ cells (D), the mean fluorescence intensity (MFI) of TNFR2 on CD4+Foxp3+ cells (E), the proportion of TNFR2+ cells in CD4+Foxp3+ cells (F), and the propor-tion of IFN-+ cells in CD8+ cells (G), each from mice described in (A). Flow anal-ysis was gated on live CD45+CD3+ cells. Data were quantified from, or are representative of, at least three in-dependent experiments; n = 5 mice (A, B, and D to F) or 3 mice (C and G). *P < 0.05, **P < 0.01, ***P < 0.001, ****P < 0.0001 by Student’s t test.
www.SCIENCESIGNALING.org 02 January 2018 Vol 11 Issue 511 aan0790
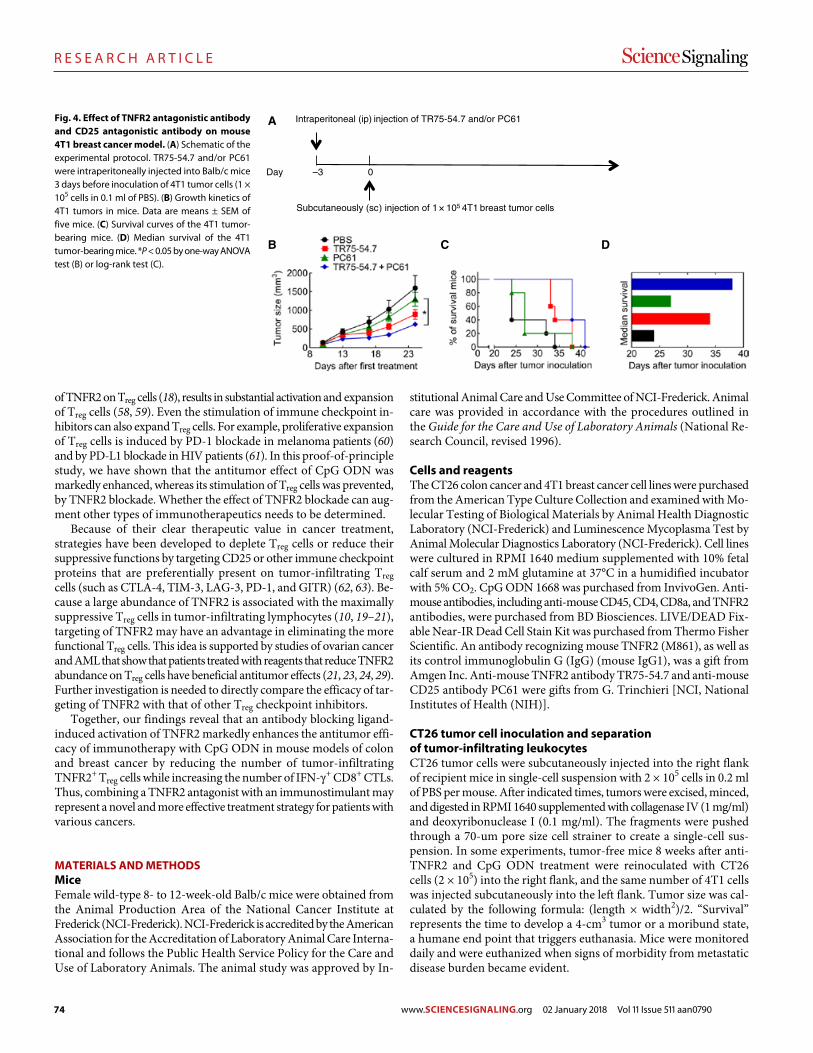
74
R E S E A R C H A R T I C L E
Nie et al., Sci. Signal. 11, eaan0790 (2018) 2 January 2018
S C I E N C E S I G N A L I N G | R E S E A R C H A R T I C L E
6 of 9
of TNFR2 on Treg cells (18), results in substantial activation and expansion of Treg cells (58, 59). Even the stimulation of immune checkpoint in-hibitors can also expand Treg cells. For example, proliferative expansion of Treg cells is induced by PD-1 blockade in melanoma patients (60) and by PD-L1 blockade in HIV patients (61). In this proof-of-principle study, we have shown that the antitumor effect of CpG ODN was markedly enhanced, whereas its stimulation of Treg cells was prevented, by TNFR2 blockade. Whether the effect of TNFR2 blockade can aug-ment other types of immunotherapeutics needs to be determined.
Because of their clear therapeutic value in cancer treatment, strategies have been developed to deplete Treg cells or reduce their suppressive functions by targeting CD25 or other immune checkpoint proteins that are preferentially present on tumor-infiltrating Treg cells (such as CTLA-4, TIM-3, LAG-3, PD-1, and GITR) (62, 63). Be-cause a large abundance of TNFR2 is associated with the maximally suppressive Treg cells in tumor-infiltrating lymphocytes (10, 19–21), targeting of TNFR2 may have an advantage in eliminating the more functional Treg cells. This idea is supported by studies of ovarian cancer and AML that show that patients treated with reagents that reduce TNFR2 abundance on Treg cells have beneficial antitumor effects (21, 23, 24, 29). Further investigation is needed to directly compare the efficacy of tar-geting of TNFR2 with that of other Treg checkpoint inhibitors.
Together, our findings reveal that an antibody blocking ligand- induced activation of TNFR2 markedly enhances the antitumor effi-cacy of immunotherapy with CpG ODN in mouse models of colon and breast cancer by reducing the number of tumor-infiltrating TNFR2+ Treg cells while increasing the number of IFN-+ CD8+ CTLs. Thus, com bining a TNFR2 antagonist with an immunostimulant may represent a novel and more effective treatment strategy for patients with various cancers.
MATERIALS AND METHODSMiceFemale wild-type 8- to 12-week-old Balb/c mice were obtained from the Animal Production Area of the National Cancer Institute at Frederick (NCI-Frederick). NCI-Frederick is accredited by the American Association for the Accreditation of Laboratory Animal Care Interna-tional and follows the Public Health Service Policy for the Care and Use of Laboratory Animals. The animal study was approved by In-
stitutional Animal Care and Use Committee of NCI-Frederick. Animal care was provided in accordance with the procedures outlined in the Guide for the Care and Use of Laboratory Animals (National Re-search Council, revised 1996).
Cells and reagentsThe CT26 colon cancer and 4T1 breast cancer cell lines were purchased from the American Type Culture Collection and examined with Mo-lecular Testing of Biological Materials by Animal Health Diagnostic Laboratory (NCI-Frederick) and Luminescence Mycoplasma Test by Animal Molecular Diagnostics Laboratory (NCI-Frederick). Cell lines were cultured in RPMI 1640 medium supplemented with 10% fetal calf serum and 2 mM glutamine at 37°C in a humidified incubator with 5% CO2. CpG ODN 1668 was purchased from InvivoGen. Anti- mouse antibodies, including anti-mouse CD45, CD4, CD8a, and TNFR2 antibodies, were purchased from BD Biosciences. LIVE/DEAD Fix-able Near-IR Dead Cell Stain Kit was purchased from Thermo Fisher Scientific. An antibody recognizing mouse TNFR2 (M861), as well as its control immunoglobulin G (IgG) (mouse IgG1), was a gift from Amgen Inc. Anti-mouse TNFR2 antibody TR75-54.7 and anti- mouse CD25 antibody PC61 were gifts from G. Trinchieri [NCI, National Institutes of Health (NIH)].
CT26 tumor cell inoculation and separation of tumor-infiltrating leukocytesCT26 tumor cells were subcutaneously injected into the right flank of recipient mice in single-cell suspension with 2 × 10⁵ cells in 0.2 ml of PBS per mouse. After indicated times, tumors were excised, minced, and digested in RPMI 1640 supplemented with collagenase IV (1 mg/ml) and deoxyribonuclease I (0.1 mg/ml). The fragments were pushed through a 70-um pore size cell strainer to create a single-cell sus-pension. In some experiments, tumor-free mice 8 weeks after anti- TNFR2 and CpG ODN treatment were reinoculated with CT26 cells (2 × 10⁵) into the right flank, and the same number of 4T1 cells was injected subcutaneously into the left flank. Tumor size was cal-culated by the following formula: (length × width2)/2. “Survival” represents the time to develop a 4-cm3 tumor or a moribund state, a humane end point that triggers euthanasia. Mice were monitored daily and were euthanized when signs of morbidity from metastatic disease burden became evident.
Day
Subcutaneously (sc) injection of 1 105 4T1 breast tumor cells
Intraperitoneal (ip) injection of TR75-54.7 and/or PC61
–3 0
A
B C D
Fig. 4. Effect of TNFR2 antagonistic antibody and CD25 antagonistic antibody on mouse 4T1 breast cancer model. (A) Schematic of the experimental protocol. TR75-54.7 and/or PC61 were intraperitoneally injected into Balb/c mice 3 days before inoculation of 4T1 tumor cells (1 × 10⁵ cells in 0.1 ml of PBS). (B) Growth kinetics of 4T1 tumors in mice. Data are means ± SEM of five mice. (C) Survival curves of the 4T1 tumor- bearing mice. (D) Median survival of the 4T1 tumor-bearing mice. *P < 0.05 by one-way ANOVA test (B) or log-rank test (C).
www.SCIENCESIGNALING.org 02 January 2018 Vol 11 Issue 511 aan0790
75
R E S E A R C H A R T I C L E
Nie et al., Sci. Signal. 11, eaan0790 (2018) 2 January 2018
S C I E N C E S I G N A L I N G | R E S E A R C H A R T I C L E
7 of 9
Treatment of mouse model of CT26 colon cancerWhen the diameter of tumor reached 5 to 6 mm, mice were treated with the following dose schedule: An antibody recognizing TNFR2 (M861) or mouse IgG1 was administered at days 1, 5, and 9 intra-peritoneally at 100 g in 0.2 ml of PBS. CpG ODN or control ODN was administered intratumorally at days 2 and 4 at 20 g in 0.1 ml of PBS. The same quantity of PBS was administered intraperitoneally or intratumorally as a control. In some experiments, the treatment was started when the diameter of tumor reached 10 mm. One day after the last treatment, mice were sacrificed and tumor and lymphoid tissues were harvested for study.
Treatment of mouse 4T1 breast cancer modelAn antibody recognizing TNFR2 (TR75-54.7) and/or an antibody recognizing CD25 (PC61) were administered at 200 g in 0.2 ml of PBS 3 days before the inoculation of 1 × 10⁵ 4T1 breast tumor cells in 0.1 ml of PBS per mouse subcutaneously injected into right mammary fat pads (thoracic No. 2 mammary glands) of recipient female Balb/c mice.
In vitro culture of CD4+ T cellsCD4+ cells were purified from lymphocytes with Mouse CD4 (L3T4) MicroBeads and LS Columns (Miltenyi Biotec). CD4+ cells were labeled with carboxyfluorescein diacetate succinimidyl ester (CFSE) and cultured at 4 × 10⁵ cells per well in a 96-well plate with medium (12) alone or IL-2 (10 ng/ml), or with or without TNF (20 ng/ml), or in the presence of M861 (10 g/ml). After 72 hours, the prolifera-tion of Treg cells (as indicated by CFSE dilution), the proportion of Treg cells, and TNFR2 abundance on Treg cells were analyzed by FACS, gating for Foxp3+ cells.
In vivo treatment with LPS and M861Normal Balb/c mice were intraperitoneally injected with 200 g of LPS (Sigma-Aldrich, catalog no. L9764) in PBS. Some mice were in-jected intraperitoneally with 200 g of M861 or control Mu IgG1 1 hour before injection of LPS. Mouse spleens and mesenteric lymph nodes were harvested at 24 hours after injection for the FACS anal-ysis of phenotype.
In vitro proliferation of CT26 and 4T1 tumor cellsCT26 and 4T1 tumor cells were seeded into 96-well plate at 5 × 10⁴ cells per well. The cells were cultured with media alone or with M861 (10 or 20 g/ml). After 72 hours, cells were treated with pulsed 1 mCi [3H]thymidine (PerkinElmer Life Sciences) per well for the last 6 hours of the culture period. The proliferation was evaluated by [3H]thymidine incorporation.
Flow cytometryAfter blocking FcR, cells were incubated with appropriately di-luted antibodies. The acquisition was performed using a Fortessa cytometer (BD Biosciences), and data analysis was conducted using FlowJo software (Tree Star Inc.). FACS analysis was gated on the live cells only by using a LIVE/DEAD Fixable Dead Cell Stain kit.
Statistical analysisTwo-tailed Student’s t test was used for the comparison of two in-dicated groups. One-way analysis of variance (ANOVA) test was used for the comparison of tumor growth between groups at the
same day shown in Figs. 2B and 4B. Log-rank test was used for the comparison of survival shown in Figs. 2C and 4C. All statistical analysis was performed with GraphPad Prism 7.0.
SUPPLEMENTARY MATERIALSwww.sciencesignaling.org/cgi/content/full/11/511/eaan0790/DC1Fig. S1. M861 does not induce the death of Treg cells in LPS-treated mice.Fig. S2. M861 does not inhibit the proliferation of TNFR2-expressing CT26 tumor cells.
REFERENCES AND NOTES 1. G. T. Motz, G. Coukos, Deciphering and reversing tumor immune suppression. Immunity
39, 61–73 (2013). 2. J. M. Pitt, A. Marabelle, A. Eggermont, J.-C. Soria, G. Kroemer, L. Zitvogel, Targeting the
tumor microenvironment: Removing obstruction to anticancer immune responses and immunotherapy. Ann. Oncol. 27, 1482–1492 (2016).
3. A. Tanaka, S. Sakaguchi, Regulatory T cells in cancer immunotherapy. Cell Res. 27, 109–118 (2017).
4. H. Tao, Y. Mimura, K. Aoe, S. Kobayashi, H. Yamamoto, E. Matsuda, K. Okabe, T. Matsumoto, K. Sugi, H. Ueoka, Prognostic potential of FOXP3 expression in non-small cell lung cancer cells combined with tumor-infiltrating regulatory T cells. Lung Cancer 75, 95–101 (2012).
5. J. Shou, Z. Zhang, Y. Lai, Z. Chen, J. Huang, Worse outcome in breast cancer with higher tumor-infiltrating FOXP3+ Tregs: A systematic review and meta-analysis. BMC Cancer 16, 687 (2016).
6. Y.-C. Lin, J. Mahalingam, J.-M. Chiang, P.-J. Su, Y.-Y. Chu, H.-Y. Lai, J.-H. Fang, C.-T. Huang, C.-T. Chiu, C.-Y. Lin, Activated but not resting regulatory T cells accumulated in tumor microenvironment and correlated with tumor progression in patients with colorectal cancer. Int. J. Cancer 132, 1341–1350 (2013).
7. L. Liu, G. Zhao, W. Wu, Y. Rong, D. Jin, D. Wang, W. Lou, X. Qin, Low intratumoral regulatory T cells and high peritumoral CD8+ T cells relate to long-term survival in patients with pancreatic ductal adenocarcinoma after pancreatectomy. Cancer Immunol. Immunother. 65, 73–82 (2016).
8. H. Nishikawa, S. Sakaguchi, Regulatory T cells in cancer immunotherapy. Curr. Opin. Immunol. 27, 1–7 (2014).
9. C. Liu, C. J. Workman, D. A. A. Vignali, Targeting regulatory T cells in tumors. FEBS J. 283, 2731–2748 (2016).
10. X. Chen, J. J. Subleski, H. Kopf, O. M. Z. Howard, D. N. Männel, J. J. Oppenheim, Cutting edge: Expression of TNFR2 defines a maximally suppressive subset of mouse CD4+CD25+FoxP3+ T regulatory cells: Applicability to tumor-infiltrating T regulatory cells. J. Immunol. 180, 6467–6471 (2008).
11. X. Chen, J. J. Subleski, R. Hamano, O. M. Z. Howard, R. H. Wiltrout, J. J. Oppenheim, Co-expression of TNFR2 and CD25 identifies more of the functional CD4+FOXP3+ regulatory T cells in human peripheral blood. Eur. J. Immunol. 40, 1099–1106 (2010).
12. Y. Grinberg-Bleyer, D. Saadoun, A. Baeyens, F. Billiard, J. D. Goldstein, S. Gregoire, G. H. Martin, R. Elhage, N. Derian, W. Carpentier, G. Marodon, D. Klatzmann, E. Piaggio, B. L. Salomon, Pathogenic T cells have a paradoxical protective effect in murine autoimmune diabetes by boosting Tregs. J. Clin. Invest. 120, 4558–4568 (2010).
13. X. Chen, X. Wu, Q. Zhou, O. M. Z. Howard, M. G. Netea, J. J. Oppenheim, TNFR2 is critical for the stabilization of the CD4+Foxp3+ regulatory T. cell phenotype in the inflammatory environment. J. Immunol. 190, 1076–1084 (2013).
14. B. Zaragoza, X. Chen, J. J. Oppenheim, A. Baeyens, S. Gregoire, D. Chader, G. Gorochov, M. Miyara, B. L. Salomon, Suppressive activity of human regulatory T cells is maintained in the presence of TNF. Nat. Med. 22, 16–17 (2016).
15. M. Chopra, M. Biehl, T. Steinfatt, A. Brandl, J. Kums, J. Amich, M. Vaeth, J. Kuen, R. Holtappels, J. Podlech, A. Mottok, S. Kraus, A.-L. Jordán-Garrote, C. A. Bäuerlein, C. Brede, E. Ribechini, A. Fick, A. Seher, J. Polz, K. J. Ottmüller, J. Baker, H. Nishikii, M. Ritz, K. Mattenheimer, S. Schwinn, T. Winter, V. Schäfer, S. Krappmann, H. Einsele, T. D. Müller, M. J. Reddehase, M. B. Lutz, D. N. Männel, F. Berberich-Siebelt, H. Wajant, A. Beilhack, Exogenous TNFR2 activation protects from acute GvHD via host T reg cell expansion. J. Exp. Med. 213, 1881–1900 (2016).
16. M. Leclerc, S. Naserian, C. Pilon, A. Thiolat, G. H. Martin, C. Pouchy, C. Dominique, Y. Belkacemi, F. Charlotte, S. Maury, B. L. Salomon, J. L. Cohen, Control of GVHD by regulatory T cells depends on TNF produced by T cells and TNFR2 expressed by regulatory T cells. Blood 128, 1651–1659 (2016).
17. A. Pierini, W. Strober, C. Moffett, J. Baker, H. Nishikii, M. Alvarez, Y. Pan, D. Schneidawind, E. Meyer, R. S. Negrin, TNF- priming enhances CD4+FoxP3+ regulatory T-cell suppressive function in murine GVHD prevention and treatment. Blood 128, 866–871 (2016).
www.SCIENCESIGNALING.org 02 January 2018 Vol 11 Issue 511 aan0790
76
R E S E A R C H A R T I C L E
Nie et al., Sci. Signal. 11, eaan0790 (2018) 2 January 2018
S C I E N C E S I G N A L I N G | R E S E A R C H A R T I C L E
8 of 9
18. X. Chen, M. Bäumel, D. N. Männel, O. M. Z. Howard, J. J. Oppenheim, Interaction of TNF with TNF receptor type 2 promotes expansion and function of mouse CD4+CD25+ T regulatory cells. J. Immunol. 179, 154–161 (2007).
19. X. Chen, Y. Yang, Q. Zhou, J. M. Weiss, O. M. Z. Howard, J. M. McPherson, L. M. Wakefield, J. J. Oppenheim, Effective chemoimmunotherapy with anti-TGF antibody and cyclophosphamide in a mouse model of breast cancer. PLOS ONE 9, e85398 (2014).
20. F. Yan, R. Du, F. Wei, H. Zhao, J. Yu, C. Wang, Z. Zhan, T. Ding, X. Ren, X. Chen, H. Li, Expression of TNFR2 by regulatory T cells in peripheral blood is correlated with clinical pathology of lung cancer patients. Cancer Immunol. Immunother. 64, 1475–1485 (2015).
21. C. Govindaraj, K. Scalzo-Inguanti, M. Madondo, J. Hallo, K. Flanagan, M. Quinn, M. Plebanski, Impaired Th1 immunity in ovarian cancer patients is mediated by TNFR2+ Tregs within the tumor microenvironment. Clin. Immunol. 149, 97–110 (2013).
22. I. Tirosh, B. Izar, S. M. Prakadan, M. H. Wadsworth II, D. Treacy, J. J. Trombetta, A. Rotem, C. Rodman, C. Lian, G. Murphy, M. Fallahi-Sichani, K. Dutton-Regester, J.-R. Lin, O. Cohen, P. Shah, D. Lu, A. S. Genshaft, T. K. Hughes, C. G. K. Ziegler, S. W. Kazer, A. Gaillard, K. E. Kolb, A.-C. Villani, C. M. Johannessen, A. Y. Andreev, E. M. Van Allen, M. Bertagnolli, P. K. Sorger, R. J. Sullivan, K. T. Flaherty, D. T. Frederick, J. Jané-Valbuena, C. H. Yoon, O. Rozenblatt-Rosen, A. K. Shalek, A. Regev, L. A. Garraway, Dissecting the multicellular ecosystem of metastatic melanoma by single-cell RNA-seq. Science 352, 189–196 (2016).
23. C. Govindaraj, P. Tan, P. Walker, A. Wei, A. Spencer, M. Plebanski, Reducing TNF receptor 2+ regulatory T cells via the combined action of azacitidine and the HDAC inhibitor, panobinostat for clinical benefit in acute myeloid leukemia patients. Clin. Cancer Res. 20, 724–735 (2014).
24. C. Govindaraj, M. Madondo, Y. Y. Kong, P. Tan, A. Wei, M. Plebanski, Lenalidomide-based maintenance therapy reduces TNF receptor 2 on CD4 T cells and enhances immune effector function in acute myeloid leukemia patients. Am. J. Hematol. 89, 795–802 (2014).
25. K. E. Hamilton, J. G. Simmons, S. Ding, L. Van Landeghem, P. K. Lund, Cytokine induction of tumor necrosis factor receptor 2 is mediated by STAT3 in colon cancer cells. Mol. Cancer Res. 9, 1718–1731 (2011).
26. S. Nakayama, T. Yokote, M. Tsuji, T. Akioka, T. Miyoshi, Y. Hirata, N. Hiraoka, K. Iwaki, A. Takayama, U. Nishiwaki, Y. Masuda, T. Hanafusa, Expression of tumour necrosis factor- and its receptors in Hodgkin lymphoma. Br. J. Haematol. 167, 574–577 (2014).
27. H. Rauert, T. Stühmer, R. Bargou, H. Wajant, D. Siegmund, TNFR1 and TNFR2 regulate the extrinsic apoptotic pathway in myeloma cells by multiple mechanisms. Cell Death Dis. 2, e194 (2011).
28. J. Wang, R. S. Al-Lamki, Tumor necrosis factor receptor 2: Its contribution to acute cellular rejection and clear cell renal carcinoma. Biomed. Res. Int. 2013, 821310 (2013).
29. H. Torrey, J. Butterworth, T. Mera, Y. Okubo, L. Wang, D. Baum, A. Defusco, S. Plager, S. Warden, D. Huang, E. Vanamee, R. Foster, D. L. Faustman, Targeting TNFR2 with antagonistic antibodies inhibits proliferation of ovarian cancer cells and tumor-associated Tregs. Sci. Signal. 10, eaaf8608 (2017).
30. X. Chen, J. J. Oppenheim, Targeting TNFR2, an immune checkpoint stimulator and oncoprotein, is a promising treatment for cancer. Sci. Signal. 10, eaal2328 (2017).
31. I. D. Jung, S. J. Shin, M.-G. Lee, T. H. Kang, H. D. Han, S. J. Lee, W. S. Kim, H. M. Kim, W. S. Park, H. W. Kim, C.-H. Yun, E. K. Lee, T.-C. Wu, Y.-M. Park, Enhancement of tumor-specific T cell-mediated immunity in dendritic cell-based vaccines by Mycobacterium tuberculosis heat shock protein X. J. Immunol. 193, 1233–1245 (2014).
32. C. Weir, A. L. Hudson, E. Moon, A. Ross, M. Alexander, L. Peters, V. Langova, S. J. Clarke, N. Pavlakis, R. Davey, V. M. Howell, Streptavidin: A novel immunostimulant for the selection and delivery of autologous and syngeneic tumor vaccines. Cancer Immunol. Res. 2, 469–479 (2014).
33. P. J. Tacken, I. S. Zeelenberg, L. J. Cruz, M. A. van Hout-Kuijer, G. van de Glind, R. G. Fokkink, A. J. A. Lambeck, C. G. Figdor, Targeted delivery of TLR ligands to human and mouse dendritic cells strongly enhances adjuvanticity. Blood 118, 6836–6844 (2011).
34. R. Hamano, J. Huang, T. Yoshimura, J. J. Oppenheim, X. Chen, TNF optimally activatives regulatory T cells by inducing TNF receptor superfamily members TNFR2, 4-1BB and OX40. Eur. J. Immunol. 41, 2010–2020 (2011).
35. S. Nierkens, M. H. den Brok, R. P. M. Sutmuller, O. M. Grauer, E. Bennink, M. E. Morgan, C. G. Figdor, T. J. M. Ruers, G. J. Adema, In vivo colocalization of antigen and CpG within dendritic cells is associated with the efficacy of cancer immunotherapy. Cancer Res. 68, 5390–5396 (2008).
36. K. Furumoto, L. Soares, E. G. Engleman, M. Merad, Induction of potent antitumor immunity by in situ targeting of intratumoral DCs. J. Clin. Invest. 113, 774–783 (2004).
37. L. Guéry, J. Dubrot, C. Lippens, D. Brighouse, P. Malinge, M. Irla, C. Pot, W. Reith, J.-M. Waldburger, S. Hugues, Ag-presenting CpG-activated pDCs prime Th17 cells that induce tumor regression. Cancer Res. 74, 6430–6440 (2014).
38. D. M. Klinman, Immunotherapeutic uses of CpG oligodeoxynucleotides. Nat. Rev. Immunol. 4, 249–259 (2004).
39. Y. Shirota, H. Shirota, D. M. Klinman, Intratumoral injection of CpG oligonucleotides induces the differentiation and reduces the immunosuppressive activity of myeloid-derived suppressor cells. J. Immunol. 188, 1592–1599 (2012).
40. J. Vollmer, A. M. Krieg, Immunotherapeutic applications of CpG oligodeoxynucleotide TLR9 agonists. Adv. Drug Deliv. Rev. 61, 195–204 (2009).
41. E. A. Moseman, X. Liang, A. J. Dawson, A. Panoskaltsis-Mortari, A. M. Krieg, Y.-J. Liu, B. R. Blazar, W. Chen, Human plasmacytoid dendritic cells activated by CpG oligodeoxynucleotides induce the generation of CD4+CD25+ regulatory T cells. J. Immunol. 173, 4433–4442 (2004).
42. B. Baban, P. R. Chandler, M. D. Sharma, J. Pihkala, P. A. Koni, D. H. Munn, A. L. Mellor, IDO activates regulatory T cells and blocks their conversion into Th17-like T cells. J. Immunol. 183, 2475–2483 (2009).
43. T. Sparwasser, E.-S. Koch, R. M. Vabulas, K. Heeg, G. B. Lipford, J. W. Ellwart, H. Wagner, Bacterial DNA and immunostimulatory CpG oligonucleotides trigger maturation and activation of murine dendritic cells. Eur. J. Immunol. 28, 2045–2054 (1998).
44. J. Ågren, C. Thiemermann, S. J. Foster, J. E. Wang, A. O. Aasen, Cytokine responses to CpG DNA in human leukocytes. Scand. J. Immunol. 64, 61–68 (2006).
45. X. Chen, R. Hamano, J. J. Subleski, A. A. Hurwitz, O. M. Z. Howard, J. J. Oppenheim, Expression of costimulatory TNFR2 induces resistance of CD4+FoxP3- conventional T cells to suppression by CD4+FoxP3+ regulatory T cells. J. Immunol. 185, 174–182 (2010).
46. S. Sakaguchi, N. Sakaguchi, M. Asano, M. Itoh, M. Toda, Immunologic self-tolerance maintained by activated T cells expressing IL-2 receptor alpha-chains (CD25). Breakdown of a single mechanism of self-tolerance causes various autoimmune diseases. J. Immunol. 155, 1151–1164 (1995).
47. Y. Y. Setiady, J. A. Coccia, P. U. Park, In vivo depletion of CD4+FOXP3+ Treg cells by the PC61 anti-CD25 monoclonal antibody is mediated by FcRIII+ phagocytes. Eur. J. Immunol. 40, 780–786 (2010).
48. A. J. Rech, R. Mick, S. Martin, A. Recio, N. A. Aqui, D. J. Powell Jr., T. A. Colligon, J. A. Trosko, L. I. Leinbach, C. H. Pletcher, C. K. Tweed, A. DeMichele, K. R. Fox, S. M. Domchek, J. L. Riley, R. H. Vonderheide, CD25 blockade depletes and selectively reprograms regulatory T cells in concert with immunotherapy in cancer patients. Sci. Transl. Med. 4, 134ra62 (2012).
49. J. W. Lowenthal, P. Corthésy, C. Tougne, R. Lees, H. R. MacDonald, M. Nabholz, High and low affinity IL 2 receptors: Analysis by IL 2 dissociation rate and reactivity with monoclonal anti-receptor antibody PC61. J. Immunol. 135, 3988–3994 (1985).
50. S. Onizuka, I. Tawara, J. Shimizu, S. Sakaguchi, T. Fujita, E. Nakayama, Tumor rejection by in vivo administration of anti-CD25 (interleukin-2 receptor ) monoclonal antibody. Cancer Res. 59, 3128–3133 (1999).
51. J. Shimizu, S. Yamazaki, S. Sakaguchi, Induction of tumor immunity by removing CD25+CD4+ T cells: A common basis between tumor immunity and autoimmunity. J. Immunol. 163, 5211–5218 (1999).
52. K. C. Sheehan, J. K. Pinckard, C. D. Arthur, L. P. Dehner, D. V. Goeddel, R. D. Schreiber, Monoclonal antibodies specific for murine p55 and p75 tumor necrosis factor receptors: Identification of a novel in vivo role for p75. J. Exp. Med. 181, 607–617 (1995).
53. X. Zhao, L. Rong, X. Zhao, X. Li, X. Liu, J. Deng, H. Wu, X. Xu, U. Erben, P. Wu, U. Syrbe, J. Sieper, Z. Qin, TNF signaling drives myeloid-derived suppressor cell accumulation. J. Clin. Invest. 122, 4094–4104 (2012).
54. X. Hu, B. Li, X. Li, X. Zhao, L. Wan, G. Lin, M. Yu, J. Wang, X. Jiang, W. Feng, Z. Qin, B. Yin, Z. Li, Transmembrane TNF- promotes suppressive activities of myeloid-derived suppressor cells via TNFR2. J. Immunol. 192, 1320–1331 (2014).
55. C. Zoglmeier, H. Bauer, D. Nörenberg, G. Wedekind, P. Bittner, N. Sandholzer, M. Rapp, D. Anz, S. Endres, C. Bourquin, CpG blocks immunosuppression by myeloid-derived suppressor cells in tumor-bearing mice. Clin. Cancer Res. 17, 1765–1775 (2011).
56. X. Chen, J. J. Oppenheim, TNF-: An activator of CD4+FoxP3+TNFR2+ regulatory T cells. Curr. Dir. Autoimmun. 11, 119–134 (2010).
57. Q. Chen, T. S. Davidson, E. N. Huter, E. M. Shevach, Engagement of TLR2 does not reverse the suppressor function of mouse regulatory T cells, but promotes their survival. J. Immunol. 183, 4458–4466 (2009).
58. G. C. Sim, N. Martin-Orozco, L. Jin, Y. Yang, S. Wu, E. Washington, D. Sanders, C. Lacey, Y. Wang, L. Vence, P. Hwu, L. Radvanyi, IL-2 therapy promotes suppressive ICOS+ Treg expansion in melanoma patients. J. Clin. Invest. 124, 99–110 (2014).
59. F. M. Lemoine, M. Cherai, C. Giverne, D. Dimitri, M. Rosenzwajg, H. Trebeden-Negre, N. Chaput, B. Barrou, N. Thioun, B. Gattegnio, F. Selles, A. Six, N. Azar, J. P. Lotz, A. Buzyn, M. Sibony, A. Delcourt, O. Boyer, S. Herson, D. Klatzmann, R. Lacave, Massive expansion of regulatory T-cells following interleukin 2 treatment during a phase I-II dendritic cell-based immunotherapy of metastatic renal cancer. Int. J. Oncol. 35, 569–581 (2009).
60. D. M. Woods, R. Rannakrishnan, A. L. Sodré, A. Berglund, J. Weber, PD-1 blockade induces phosphorylated STAT3 and results in an increase of Tregs with reduced suppressive function. J. Immunol. 198 (2017).
61. C. Peligero, J. Argilaguet, R. Güerri-Fernandez, B. Torres, C. Ligero, P. Colomer, M. Plana, H. Knobel, F. García, A. Meyerhans, PD-L1 blockade differentially impacts regulatory T cells from HIV-infected individuals depending on plasma viremia. PLOS Pathog. 11, e1005270 (2015).
www.SCIENCESIGNALING.org 02 January 2018 Vol 11 Issue 511 aan0790

77
R E S E A R C H A R T I C L E
Nie et al., Sci. Signal. 11, eaan0790 (2018) 2 January 2018
S C I E N C E S I G N A L I N G | R E S E A R C H A R T I C L E
9 of 9
62. T. L. Whiteside, The role of regulatory T cells in cancer immunology. Immunotargets Ther. 4, 159–171 (2015).
63. H. Pere, C. Tanchot, J. Bayry, M. Terme, J. Taieb, C. Badoual, O. Adotevi, N. Merillon, E. Marcheteau, V. Quillien, C. Banissi, A. Carpentier, F. Sandoval, M. Nizard, F. Quintin-Colonna, G. Kroemer, W. H. Fridman, L. Zitvogel, S. Oudard, E. Tartour, Comprehensive analysis of current approaches to inhibit regulatory T cells in cancer. Oncoimmunology 1, 326–333 (2012).
Acknowledgments: We thank O. M. Z. Howard, K. T. Czarra, T. He, and P. Li for their help in this study. We thank NCI-Frederick Cancer Inflammation Program Fluorescence Cytometry core (K. B. Noer and R. M. Matthai) for expert technical assistance with flow cytometry, and the excellent administrative support from S. D. Livingstone. Funding: This work was supported (in part) by the Intramural Research Program of the NIH, NCI, Center for Cancer Research; Department of Science and Technology, Guizhou Province, under grants G[2014]7020 and
J[2015]2003; University of Macau under grants SRG2014-00024-ICMS-QRCM, MYRG2016-00023-ICMS-QRCM, and MYRG2017-00120-ICMS; and the Science and Technology Development Fund of Macao SAR (FDCT) under grant 014/2015/A1. Author contributions: Y.N., J.H., H.S., A.L.T., D.Y., and X.C. performed experiments and analyzed data. J.J.O., D.M.K., and X.C. designed and guided the study and prepared the manuscript. Competing interests: The authors declare that they have no competing interests.
Submitted 1 March 2017Accepted 16 November 2017Published 2 January 201810.1126/scisignal.aan0790
Citation: Y. Nie, J. He, H. Shirota, A. L. Trivett, D. Yang, D. M. Klinman, J. J. Oppenheim, X. Chen, Blockade of TNFR2 signaling enhances the immunotherapeutic effect of CpG ODN in a mouse model of colon cancer. Sci. Signal. 11, eaan0790 (2018).
www.SCIENCESIGNALING.org 02 January 2018 Vol 11 Issue 511 aan0790
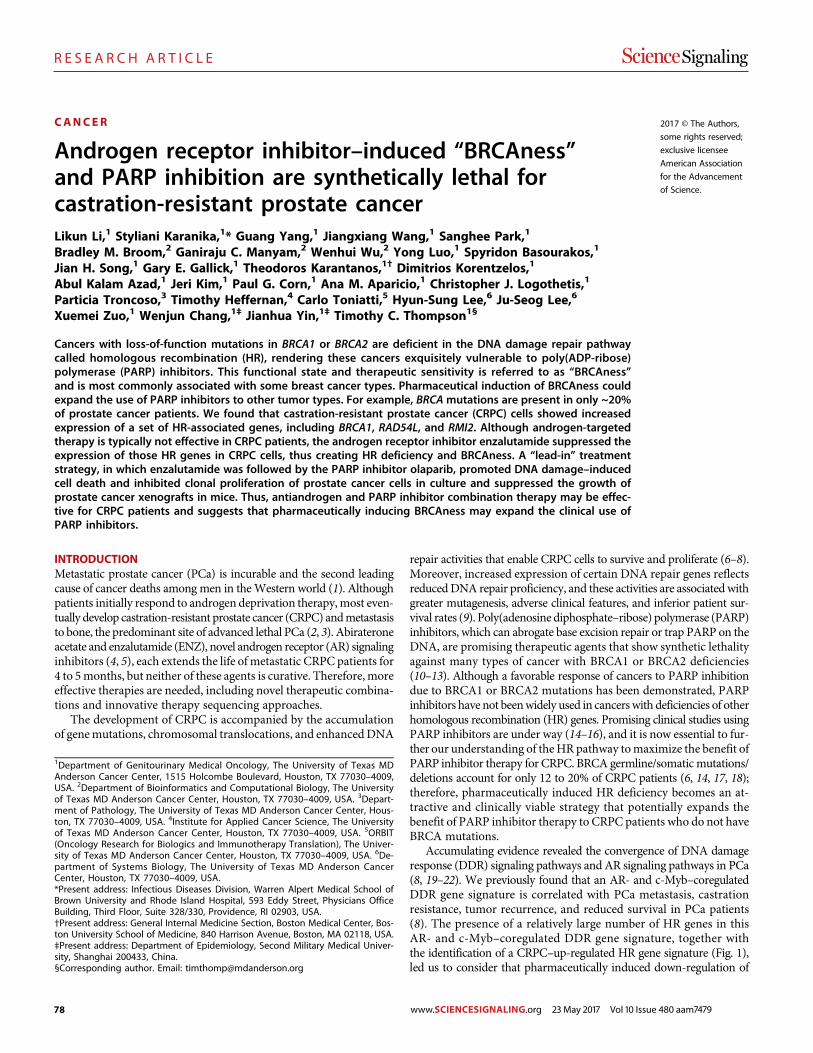
78
R E S E A R C H A R T I C L E
CANCER 2017 © The Authors,
some rights reserved;
exclusive licensee
American Association
for the Advancement
of Science.
Androgen receptor inhibitor–induced “BRCAness”and PARP inhibition are synthetically lethal forcastration-resistant prostate cancerLikun Li,1 Styliani Karanika,1* Guang Yang,1 Jiangxiang Wang,1 Sanghee Park,1
Bradley M. Broom,2 Ganiraju C. Manyam,2 Wenhui Wu,2 Yong Luo,1 Spyridon Basourakos,1
Jian H. Song,1 Gary E. Gallick,1 Theodoros Karantanos,1† Dimitrios Korentzelos,1
Abul Kalam Azad,1 Jeri Kim,1 Paul G. Corn,1 Ana M. Aparicio,1 Christopher J. Logothetis,1
Particia Troncoso,3 Timothy Heffernan,4 Carlo Toniatti,5 Hyun-Sung Lee,6 Ju-Seog Lee,6
Xuemei Zuo,1 Wenjun Chang,1‡ Jianhua Yin,1‡ Timothy C. Thompson1§
Cancers with loss-of-function mutations in BRCA1 or BRCA2 are deficient in the DNA damage repair pathwaycalled homologous recombination (HR), rendering these cancers exquisitely vulnerable to poly(ADP-ribose)polymerase (PARP) inhibitors. This functional state and therapeutic sensitivity is referred to as “BRCAness”and is most commonly associated with some breast cancer types. Pharmaceutical induction of BRCAness couldexpand the use of PARP inhibitors to other tumor types. For example, BRCAmutations are present in only ~20%of prostate cancer patients. We found that castration-resistant prostate cancer (CRPC) cells showed increasedexpression of a set of HR-associated genes, including BRCA1, RAD54L, and RMI2. Although androgen-targetedtherapy is typically not effective in CRPC patients, the androgen receptor inhibitor enzalutamide suppressed theexpression of those HR genes in CRPC cells, thus creating HR deficiency and BRCAness. A “lead-in” treatmentstrategy, in which enzalutamide was followed by the PARP inhibitor olaparib, promoted DNA damage–inducedcell death and inhibited clonal proliferation of prostate cancer cells in culture and suppressed the growth ofprostate cancer xenografts in mice. Thus, antiandrogen and PARP inhibitor combination therapy may be effec-tive for CRPC patients and suggests that pharmaceutically inducing BRCAness may expand the clinical use ofPARP inhibitors.
INTRODUCTIONMetastatic prostate cancer (PCa) is incurable and the second leadingcause of cancer deaths among men in theWestern world (1). Althoughpatients initially respond to androgen deprivation therapy, most even-tually develop castration-resistant prostate cancer (CRPC) andmetastasisto bone, the predominant site of advanced lethal PCa (2, 3). Abirateroneacetate and enzalutamide (ENZ), novel androgen receptor (AR) signalinginhibitors (4, 5), each extends the life of metastatic CRPC patients for4 to 5months, but neither of these agents is curative. Therefore, moreeffective therapies are needed, including novel therapeutic combina-tions and innovative therapy sequencing approaches.
The development of CRPC is accompanied by the accumulationof genemutations, chromosomal translocations, and enhancedDNA
repair activities that enable CRPC cells to survive and proliferate (6–8).Moreover, increased expression of certain DNA repair genes reflectsreducedDNA repair proficiency, and these activities are associated withgreater mutagenesis, adverse clinical features, and inferior patient sur-vival rates (9). Poly(adenosine diphosphate–ribose) polymerase (PARP)inhibitors, which can abrogate base excision repair or trap PARP on theDNA, are promising therapeutic agents that show synthetic lethalityagainst many types of cancer with BRCA1 or BRCA2 deficiencies(10–13). Although a favorable response of cancers to PARP inhibitiondue to BRCA1 or BRCA2 mutations has been demonstrated, PARPinhibitors have not beenwidely used in cancerswith deficiencies of otherhomologous recombination (HR) genes. Promising clinical studies usingPARP inhibitors are under way (14–16), and it is now essential to fur-ther our understanding of theHR pathway tomaximize the benefit ofPARP inhibitor therapy for CRPC. BRCA germline/somatic mutations/deletions account for only 12 to 20% of CRPC patients (6, 14, 17, 18);therefore, pharmaceutically induced HR deficiency becomes an at-tractive and clinically viable strategy that potentially expands thebenefit of PARP inhibitor therapy to CRPC patients who do not haveBRCA mutations.
Accumulating evidence revealed the convergence of DNA damageresponse (DDR) signaling pathways and AR signaling pathways in PCa(8, 19–22). We previously found that an AR- and c-Myb–coregulatedDDR gene signature is correlated with PCa metastasis, castrationresistance, tumor recurrence, and reduced survival in PCa patients(8). The presence of a relatively large number of HR genes in thisAR- and c-Myb–coregulated DDR gene signature, together withthe identification of a CRPC–up-regulated HR gene signature (Fig. 1),led us to consider that pharmaceutically induced down-regulation of
1Department of Genitourinary Medical Oncology, The University of Texas MDAnderson Cancer Center, 1515 Holcombe Boulevard, Houston, TX 77030–4009,USA. 2Department of Bioinformatics and Computational Biology, The Universityof Texas MD Anderson Cancer Center, Houston, TX 77030–4009, USA. 3Depart-ment of Pathology, The University of Texas MD Anderson Cancer Center, Hous-ton, TX 77030–4009, USA. 4Institute for Applied Cancer Science, The Universityof Texas MD Anderson Cancer Center, Houston, TX 77030–4009, USA. 5ORBIT(Oncology Research for Biologics and Immunotherapy Translation), The Univer-sity of Texas MD Anderson Cancer Center, Houston, TX 77030–4009, USA. 6De-partment of Systems Biology, The University of Texas MD Anderson CancerCenter, Houston, TX 77030–4009, USA.*Present address: Infectious Diseases Division, Warren Alpert Medical School ofBrown University and Rhode Island Hospital, 593 Eddy Street, Physicians OfficeBuilding, Third Floor, Suite 328/330, Providence, RI 02903, USA.†Present address: General Internal Medicine Section, Boston Medical Center, Bos-ton University School of Medicine, 840 Harrison Avenue, Boston, MA 02118, USA.‡Present address: Department of Epidemiology, Second Military Medical Univer-sity, Shanghai 200433, China.§Corresponding author. Email: [email protected]
S C I ENCE S I GNAL ING | R E S EARCH ART I C L E
Li et al., Sci. Signal. 10, eaam7479 (2017) 23 May 2017 1 of 11www.SCIENCESIGNALING.org 23 May 2017 Vol 10 Issue 480 aam7479
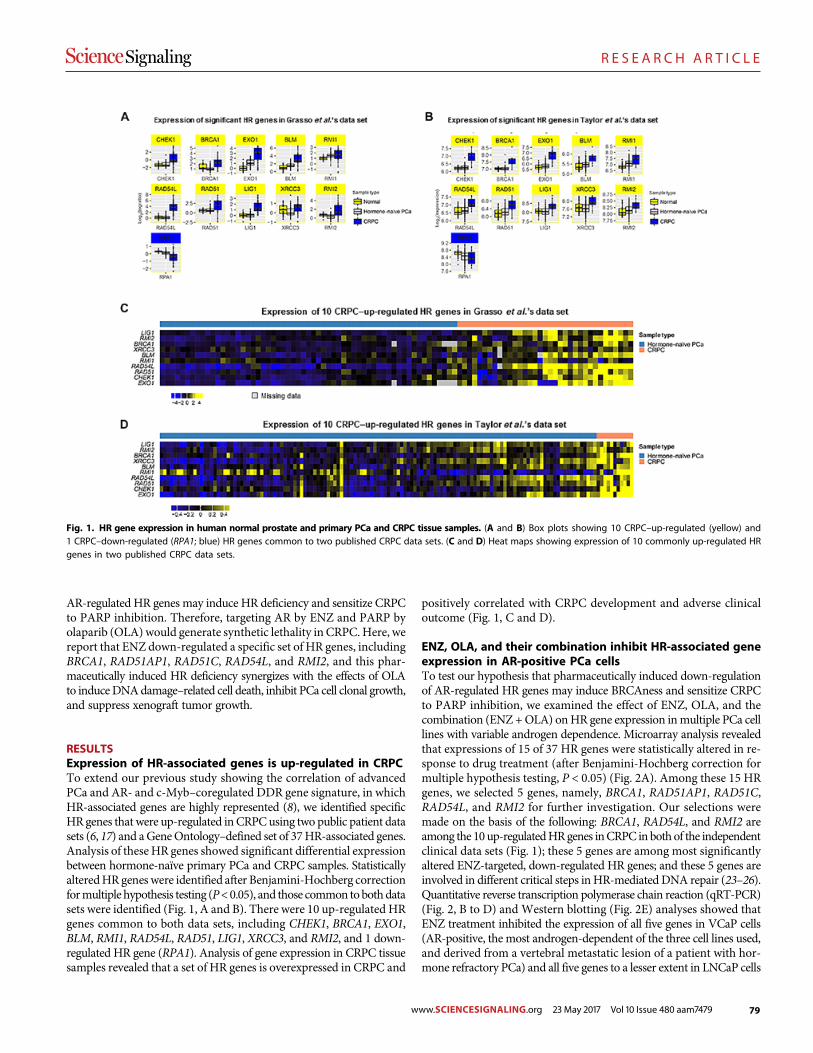
79
R E S E A R C H A R T I C L E
AR-regulated HR genes may induce HR deficiency and sensitize CRPCto PARP inhibition. Therefore, targeting AR by ENZ and PARP byolaparib (OLA) would generate synthetic lethality in CRPC. Here, wereport that ENZ down-regulated a specific set of HR genes, includingBRCA1, RAD51AP1, RAD51C, RAD54L, and RMI2, and this phar-maceutically induced HR deficiency synergizes with the effects of OLAto induceDNAdamage–related cell death, inhibit PCa cell clonal growth,and suppress xenograft tumor growth.
RESULTSExpression of HR-associated genes is up-regulated in CRPCTo extend our previous study showing the correlation of advancedPCa and AR- and c-Myb–coregulated DDR gene signature, in whichHR-associated genes are highly represented (8), we identified specificHR genes that were up-regulated in CRPCusing two public patient datasets (6, 17) and aGeneOntology–defined set of 37HR-associated genes.Analysis of theseHR genes showed significant differential expressionbetween hormone-naïve primary PCa and CRPC samples. StatisticallyalteredHR genes were identified after Benjamini-Hochberg correctionformultiple hypothesis testing (P<0.05), and those common tobothdatasets were identified (Fig. 1, A and B). There were 10 up-regulated HRgenes common to both data sets, including CHEK1, BRCA1, EXO1,BLM, RMI1, RAD54L, RAD51, LIG1, XRCC3, and RMI2, and 1 down-regulated HR gene (RPA1). Analysis of gene expression in CRPC tissuesamples revealed that a set of HR genes is overexpressed in CRPC and
positively correlated with CRPC development and adverse clinicaloutcome (Fig. 1, C and D).
ENZ, OLA, and their combination inhibit HR-associated geneexpression in AR-positive PCa cellsTo test our hypothesis that pharmaceutically induced down-regulationof AR-regulated HR genes may induce BRCAness and sensitize CRPCto PARP inhibition, we examined the effect of ENZ, OLA, and thecombination (ENZ +OLA) onHR gene expression inmultiple PCa celllines with variable androgen dependence. Microarray analysis revealedthat expressions of 15 of 37 HR genes were statistically altered in re-sponse to drug treatment (after Benjamini-Hochberg correction formultiple hypothesis testing, P < 0.05) (Fig. 2A). Among these 15 HRgenes, we selected 5 genes, namely, BRCA1, RAD51AP1, RAD51C,RAD54L, and RMI2 for further investigation. Our selections weremade on the basis of the following: BRCA1, RAD54L, and RMI2 areamong the 10up-regulatedHRgenes inCRPC in bothof the independentclinical data sets (Fig. 1); these 5 genes are among most significantlyaltered ENZ-targeted, down-regulated HR genes; and these 5 genes areinvolved in different critical steps inHR-mediated DNA repair (23–26).Quantitative reverse transcription polymerase chain reaction (qRT-PCR)(Fig. 2, B to D) and Western blotting (Fig. 2E) analyses showed thatENZ treatment inhibited the expression of all five genes in VCaP cells(AR-positive, the most androgen-dependent of the three cell lines used,and derived from a vertebral metastatic lesion of a patient with hor-mone refractory PCa) and all five genes to a lesser extent in LNCaP cells
Fig. 1. HR gene expression in human normal prostate and primary PCa and CRPC tissue samples. (A and B) Box plots showing 10 CRPC–up-regulated (yellow) and1 CRPC–down-regulated (RPA1; blue) HR genes common to two published CRPC data sets. (C and D) Heat maps showing expression of 10 commonly up-regulated HRgenes in two published CRPC data sets.
S C I ENCE S I GNAL ING | R E S EARCH ART I C L E
Li et al., Sci. Signal. 10, eaam7479 (2017) 23 May 2017 2 of 11www.SCIENCESIGNALING.org 23 May 2017 Vol 10 Issue 480 aam7479
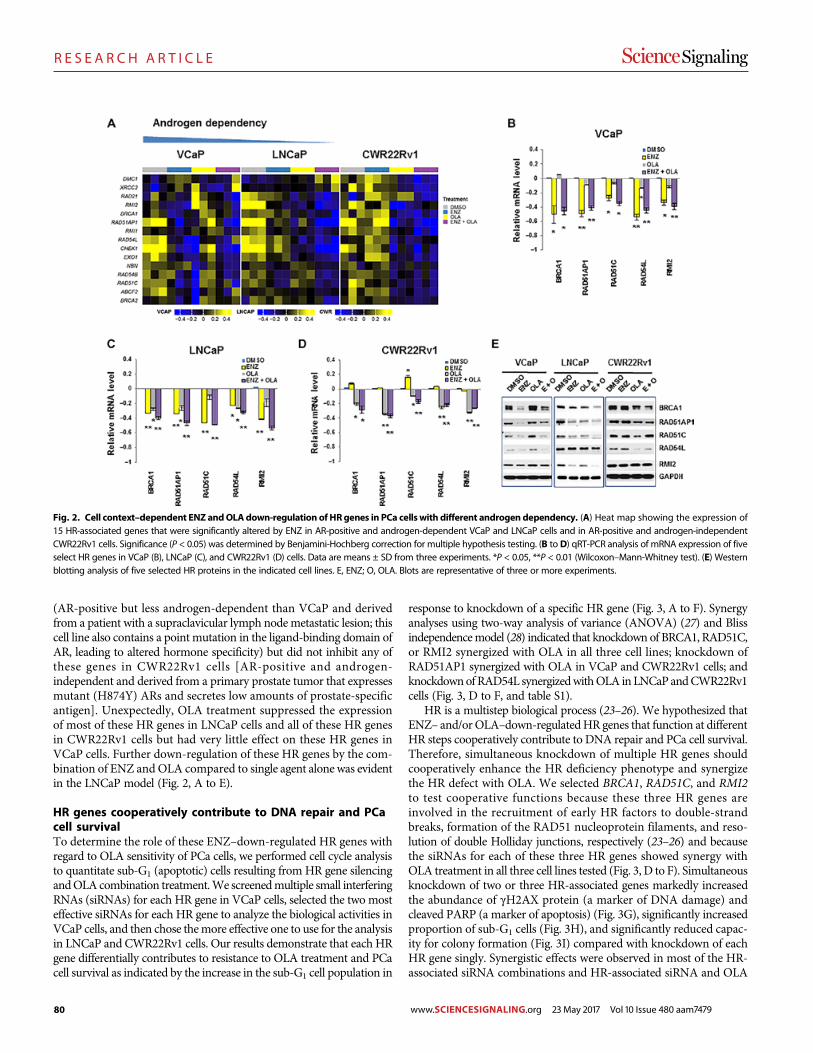
80
R E S E A R C H A R T I C L E
(AR-positive but less androgen-dependent than VCaP and derivedfrom a patient with a supraclavicular lymph nodemetastatic lesion; thiscell line also contains a point mutation in the ligand-binding domain ofAR, leading to altered hormone specificity) but did not inhibit any ofthese genes in CWR22Rv1 cells [AR-positive and androgen-independent and derived from a primary prostate tumor that expressesmutant (H874Y) ARs and secretes low amounts of prostate-specificantigen]. Unexpectedly, OLA treatment suppressed the expressionof most of these HR genes in LNCaP cells and all of these HR genesin CWR22Rv1 cells but had very little effect on these HR genes inVCaP cells. Further down-regulation of these HR genes by the com-bination of ENZ and OLA compared to single agent alone was evidentin the LNCaP model (Fig. 2, A to E).
HR genes cooperatively contribute to DNA repair and PCacell survivalTo determine the role of these ENZ–down-regulated HR genes withregard to OLA sensitivity of PCa cells, we performed cell cycle analysisto quantitate sub-G1 (apoptotic) cells resulting from HR gene silencingandOLA combination treatment.We screenedmultiple small interferingRNAs (siRNAs) for each HR gene in VCaP cells, selected the two mosteffective siRNAs for each HR gene to analyze the biological activities inVCaP cells, and then chose themore effective one to use for the analysisin LNCaP and CWR22Rv1 cells. Our results demonstrate that each HRgene differentially contributes to resistance to OLA treatment and PCacell survival as indicated by the increase in the sub-G1 cell population in
response to knockdown of a specific HR gene (Fig. 3, A to F). Synergyanalyses using two-way analysis of variance (ANOVA) (27) and Blissindependencemodel (28) indicated that knockdown of BRCA1, RAD51C,or RMI2 synergized with OLA in all three cell lines; knockdown ofRAD51AP1 synergized with OLA in VCaP and CWR22Rv1 cells; andknockdownofRAD54L synergizedwithOLA inLNCaPandCWR22Rv1cells (Fig. 3, D to F, and table S1).
HR is a multistep biological process (23–26). We hypothesized thatENZ– and/orOLA–down-regulatedHR genes that function at differentHR steps cooperatively contribute to DNA repair and PCa cell survival.Therefore, simultaneous knockdown of multiple HR genes shouldcooperatively enhance the HR deficiency phenotype and synergizethe HR defect with OLA. We selected BRCA1, RAD51C, and RMI2to test cooperative functions because these three HR genes areinvolved in the recruitment of early HR factors to double-strandbreaks, formation of the RAD51 nucleoprotein filaments, and reso-lution of double Holliday junctions, respectively (23–26) and becausethe siRNAs for each of these three HR genes showed synergy withOLA treatment in all three cell lines tested (Fig. 3, D to F). Simultaneousknockdown of two or three HR-associated genes markedly increasedthe abundance of gH2AX protein (a marker of DNA damage) andcleaved PARP (a marker of apoptosis) (Fig. 3G), significantly increasedproportion of sub-G1 cells (Fig. 3H), and significantly reduced capac-ity for colony formation (Fig. 3I) compared with knockdown of eachHR gene singly. Synergistic effects were observed in most of the HR-associated siRNA combinations and HR-associated siRNA and OLA
Fig. 2. Cell context–dependent ENZ andOLAdown-regulation of HRgenes in PCa cells with different androgen dependency. (A) Heat map showing the expression of15 HR-associated genes that were significantly altered by ENZ in AR-positive and androgen-dependent VCaP and LNCaP cells and in AR-positive and androgen-independentCWR22Rv1 cells. Significance (P < 0.05) was determined by Benjamini-Hochberg correction for multiple hypothesis testing. (B to D) qRT-PCR analysis of mRNA expression of fiveselect HR genes in VCaP (B), LNCaP (C), and CWR22Rv1 (D) cells. Data are means ± SD from three experiments. *P < 0.05, **P < 0.01 (Wilcoxon–Mann-Whitney test). (E) Westernblotting analysis of five selected HR proteins in the indicated cell lines. E, ENZ; O, OLA. Blots are representative of three or more experiments.
S C I ENCE S I GNAL ING | R E S EARCH ART I C L E
Li et al., Sci. Signal. 10, eaam7479 (2017) 23 May 2017 3 of 11www.SCIENCESIGNALING.org 23 May 2017 Vol 10 Issue 480 aam7479
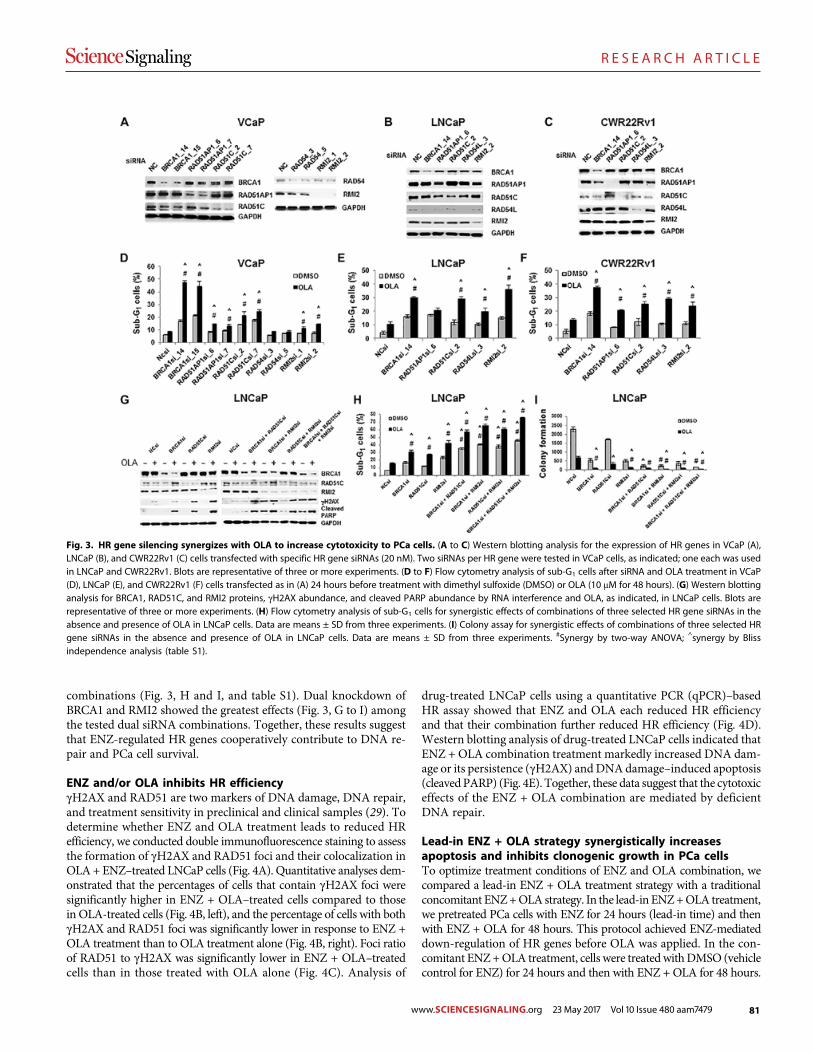
81
R E S E A R C H A R T I C L E
combinations (Fig. 3, H and I, and table S1). Dual knockdown ofBRCA1 and RMI2 showed the greatest effects (Fig. 3, G to I) amongthe tested dual siRNA combinations. Together, these results suggestthat ENZ-regulated HR genes cooperatively contribute to DNA re-pair and PCa cell survival.
ENZ and/or OLA inhibits HR efficiencygH2AX and RAD51 are two markers of DNA damage, DNA repair,and treatment sensitivity in preclinical and clinical samples (29). Todetermine whether ENZ and OLA treatment leads to reduced HRefficiency, we conducted double immunofluorescence staining to assessthe formation of gH2AX and RAD51 foci and their colocalization inOLA+ ENZ–treated LNCaP cells (Fig. 4A). Quantitative analyses dem-onstrated that the percentages of cells that contain gH2AX foci weresignificantly higher in ENZ + OLA–treated cells compared to thosein OLA-treated cells (Fig. 4B, left), and the percentage of cells with bothgH2AX and RAD51 foci was significantly lower in response to ENZ +OLA treatment than to OLA treatment alone (Fig. 4B, right). Foci ratioof RAD51 to gH2AX was significantly lower in ENZ + OLA–treatedcells than in those treated with OLA alone (Fig. 4C). Analysis of
drug-treated LNCaP cells using a quantitative PCR (qPCR)–basedHR assay showed that ENZ and OLA each reduced HR efficiencyand that their combination further reduced HR efficiency (Fig. 4D).Western blotting analysis of drug-treated LNCaP cells indicated thatENZ + OLA combination treatment markedly increased DNA dam-age or its persistence (gH2AX) andDNAdamage–induced apoptosis(cleavedPARP) (Fig. 4E). Together, these data suggest that the cytotoxiceffects of the ENZ + OLA combination are mediated by deficientDNA repair.
Lead-in ENZ + OLA strategy synergistically increasesapoptosis and inhibits clonogenic growth in PCa cellsTo optimize treatment conditions of ENZ and OLA combination, wecompared a lead-in ENZ + OLA treatment strategy with a traditionalconcomitant ENZ+OLA strategy. In the lead-in ENZ+OLA treatment,we pretreated PCa cells with ENZ for 24 hours (lead-in time) and thenwith ENZ + OLA for 48 hours. This protocol achieved ENZ-mediateddown-regulation of HR genes before OLA was applied. In the con-comitant ENZ+OLA treatment, cells were treatedwithDMSO (vehiclecontrol for ENZ) for 24 hours and then with ENZ + OLA for 48 hours.
Fig. 3. HR gene silencing synergizes with OLA to increase cytotoxicity to PCa cells. (A to C) Western blotting analysis for the expression of HR genes in VCaP (A),LNCaP (B), and CWR22Rv1 (C) cells transfected with specific HR gene siRNAs (20 nM). Two siRNAs per HR gene were tested in VCaP cells, as indicated; one each was usedin LNCaP and CWR22Rv1. Blots are representative of three or more experiments. (D to F) Flow cytometry analysis of sub-G1 cells after siRNA and OLA treatment in VCaP(D), LNCaP (E), and CWR22Rv1 (F) cells transfected as in (A) 24 hours before treatment with dimethyl sulfoxide (DMSO) or OLA (10 mM for 48 hours). (G) Western blottinganalysis for BRCA1, RAD51C, and RMI2 proteins, gH2AX abundance, and cleaved PARP abundance by RNA interference and OLA, as indicated, in LNCaP cells. Blots arerepresentative of three or more experiments. (H) Flow cytometry analysis of sub-G1 cells for synergistic effects of combinations of three selected HR gene siRNAs in theabsence and presence of OLA in LNCaP cells. Data are means ± SD from three experiments. (I) Colony assay for synergistic effects of combinations of three selected HRgene siRNAs in the absence and presence of OLA in LNCaP cells. Data are means ± SD from three experiments. #Synergy by two-way ANOVA; ^synergy by Blissindependence analysis (table S1).
S C I ENCE S I GNAL ING | R E S EARCH ART I C L E
Li et al., Sci. Signal. 10, eaam7479 (2017) 23 May 2017 4 of 11www.SCIENCESIGNALING.org 23 May 2017 Vol 10 Issue 480 aam7479
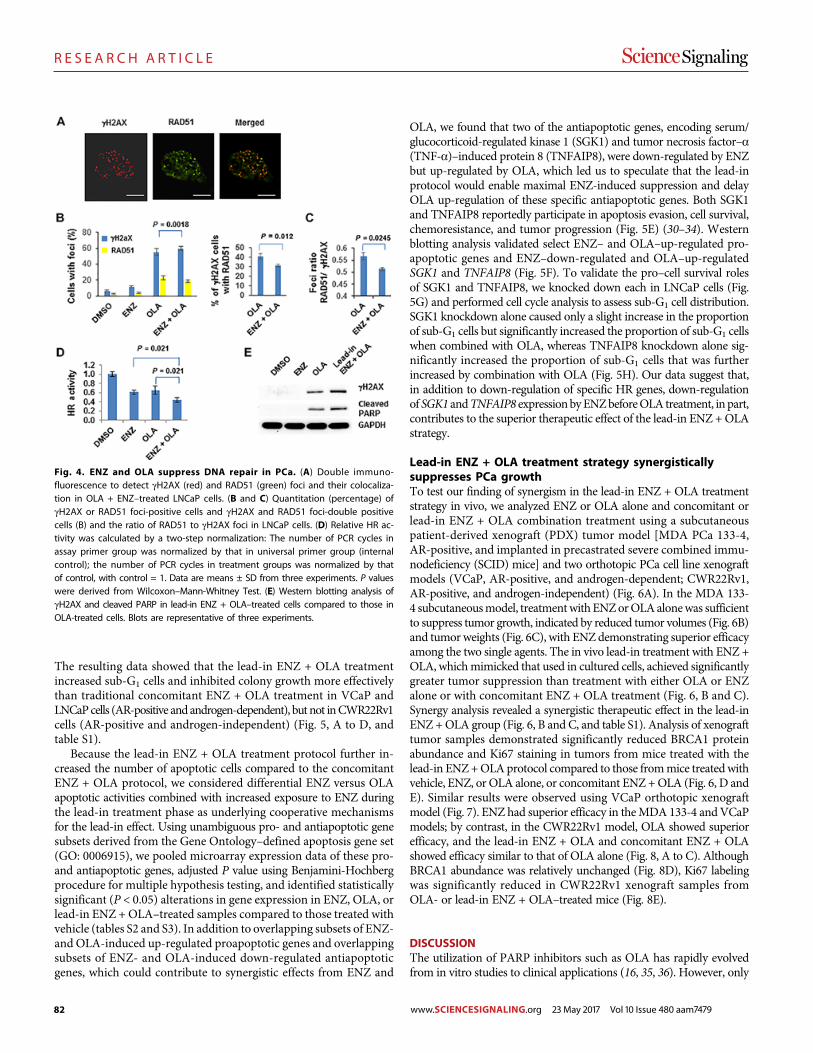
82
R E S E A R C H A R T I C L E
The resulting data showed that the lead-in ENZ + OLA treatmentincreased sub-G1 cells and inhibited colony growth more effectivelythan traditional concomitant ENZ + OLA treatment in VCaP andLNCaPcells (AR-positive and androgen-dependent), but not inCWR22Rv1cells (AR-positive and androgen-independent) (Fig. 5, A to D, andtable S1).
Because the lead-in ENZ + OLA treatment protocol further in-creased the number of apoptotic cells compared to the concomitantENZ + OLA protocol, we considered differential ENZ versus OLAapoptotic activities combined with increased exposure to ENZ duringthe lead-in treatment phase as underlying cooperative mechanismsfor the lead-in effect. Using unambiguous pro- and antiapoptotic genesubsets derived from the Gene Ontology–defined apoptosis gene set(GO: 0006915), we pooled microarray expression data of these pro-and antiapoptotic genes, adjusted P value using Benjamini-Hochbergprocedure for multiple hypothesis testing, and identified statisticallysignificant (P < 0.05) alterations in gene expression in ENZ, OLA, orlead-in ENZ + OLA–treated samples compared to those treated withvehicle (tables S2 and S3). In addition to overlapping subsets of ENZ-and OLA-induced up-regulated proapoptotic genes and overlappingsubsets of ENZ- and OLA-induced down-regulated antiapoptoticgenes, which could contribute to synergistic effects from ENZ and
OLA, we found that two of the antiapoptotic genes, encoding serum/glucocorticoid-regulated kinase 1 (SGK1) and tumor necrosis factor–a(TNF-a)–induced protein 8 (TNFAIP8), were down-regulated by ENZbut up-regulated by OLA, which led us to speculate that the lead-inprotocol would enable maximal ENZ-induced suppression and delayOLA up-regulation of these specific antiapoptotic genes. Both SGK1and TNFAIP8 reportedly participate in apoptosis evasion, cell survival,chemoresistance, and tumor progression (Fig. 5E) (30–34). Westernblotting analysis validated select ENZ– and OLA–up-regulated pro-apoptotic genes and ENZ–down-regulated and OLA–up-regulatedSGK1 and TNFAIP8 (Fig. 5F). To validate the pro–cell survival rolesof SGK1 and TNFAIP8, we knocked down each in LNCaP cells (Fig.5G) and performed cell cycle analysis to assess sub-G1 cell distribution.SGK1 knockdown alone caused only a slight increase in the proportionof sub-G1 cells but significantly increased the proportion of sub-G1 cellswhen combined with OLA, whereas TNFAIP8 knockdown alone sig-nificantly increased the proportion of sub-G1 cells that was furtherincreased by combination with OLA (Fig. 5H). Our data suggest that,in addition to down-regulation of specific HR genes, down-regulationof SGK1 andTNFAIP8 expressionbyENZbeforeOLA treatment, in part,contributes to the superior therapeutic effect of the lead-in ENZ +OLAstrategy.
Lead-in ENZ + OLA treatment strategy synergisticallysuppresses PCa growthTo test our finding of synergism in the lead-in ENZ + OLA treatmentstrategy in vivo, we analyzed ENZ or OLA alone and concomitant orlead-in ENZ + OLA combination treatment using a subcutaneouspatient-derived xenograft (PDX) tumor model [MDA PCa 133-4,AR-positive, and implanted in precastrated severe combined immu-nodeficiency (SCID) mice] and two orthotopic PCa cell line xenograftmodels (VCaP, AR-positive, and androgen-dependent; CWR22Rv1,AR-positive, and androgen-independent) (Fig. 6A). In the MDA 133-4 subcutaneousmodel, treatmentwithENZorOLAalonewas sufficientto suppress tumor growth, indicated by reduced tumor volumes (Fig. 6B)and tumor weights (Fig. 6C), with ENZ demonstrating superior efficacyamong the two single agents. The in vivo lead-in treatment with ENZ +OLA, whichmimicked that used in cultured cells, achieved significantlygreater tumor suppression than treatment with either OLA or ENZalone or with concomitant ENZ + OLA treatment (Fig. 6, B and C).Synergy analysis revealed a synergistic therapeutic effect in the lead-inENZ +OLA group (Fig. 6, B and C, and table S1). Analysis of xenografttumor samples demonstrated significantly reduced BRCA1 proteinabundance and Ki67 staining in tumors from mice treated with thelead-in ENZ+OLAprotocol compared to those frommice treatedwithvehicle, ENZ, or OLA alone, or concomitant ENZ +OLA (Fig. 6, D andE). Similar results were observed using VCaP orthotopic xenograftmodel (Fig. 7). ENZ had superior efficacy in theMDA 133-4 andVCaPmodels; by contrast, in the CWR22Rv1 model, OLA showed superiorefficacy, and the lead-in ENZ + OLA and concomitant ENZ + OLAshowed efficacy similar to that of OLA alone (Fig. 8, A to C). AlthoughBRCA1 abundance was relatively unchanged (Fig. 8D), Ki67 labelingwas significantly reduced in CWR22Rv1 xenograft samples fromOLA- or lead-in ENZ + OLA–treated mice (Fig. 8E).
DISCUSSIONThe utilization of PARP inhibitors such as OLA has rapidly evolvedfrom in vitro studies to clinical applications (16, 35, 36). However, only
Fig. 4. ENZ and OLA suppress DNA repair in PCa. (A) Double immuno-fluorescence to detect gH2AX (red) and RAD51 (green) foci and their colocaliza-tion in OLA + ENZ–treated LNCaP cells. (B and C) Quantitation (percentage) ofgH2AX or RAD51 foci-positive cells and gH2AX and RAD51 foci-double positivecells (B) and the ratio of RAD51 to gH2AX foci in LNCaP cells. (D) Relative HR ac-tivity was calculated by a two-step normalization: The number of PCR cycles inassay primer group was normalized by that in universal primer group (internalcontrol); the number of PCR cycles in treatment groups was normalized by thatof control, with control = 1. Data are means ± SD from three experiments. P valueswere derived from Wilcoxon–Mann-Whitney Test. (E) Western blotting analysis ofgH2AX and cleaved PARP in lead-in ENZ + OLA–treated cells compared to those inOLA-treated cells. Blots are representative of three experiments.
S C I ENCE S I GNAL ING | R E S EARCH ART I C L E
Li et al., Sci. Signal. 10, eaam7479 (2017) 23 May 2017 5 of 11www.SCIENCESIGNALING.org 23 May 2017 Vol 10 Issue 480 aam7479
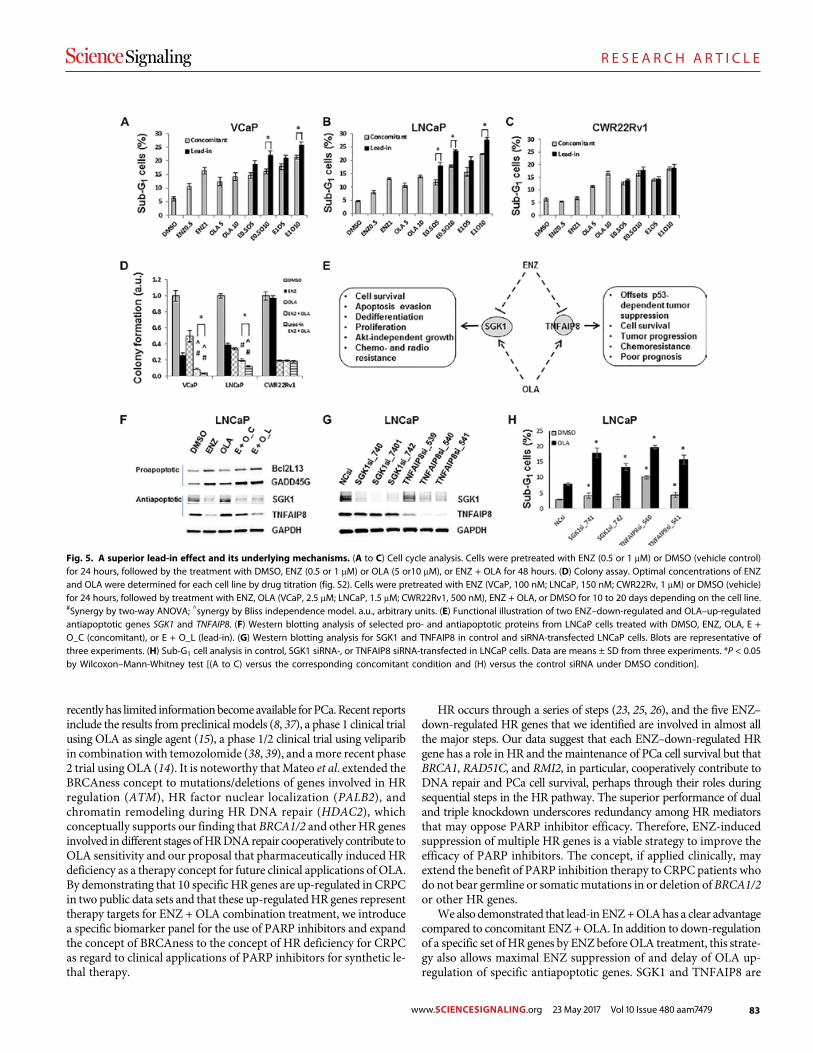
83
R E S E A R C H A R T I C L E
recently has limited informationbecomeavailable forPCa.Recent reportsinclude the results frompreclinicalmodels (8, 37), a phase 1 clinical trialusing OLA as single agent (15), a phase 1/2 clinical trial using veliparibin combination with temozolomide (38, 39), and amore recent phase2 trial using OLA (14). It is noteworthy thatMateo et al. extended theBRCAness concept to mutations/deletions of genes involved in HRregulation (ATM), HR factor nuclear localization (PALB2), andchromatin remodeling during HR DNA repair (HDAC2), whichconceptually supports our finding that BRCA1/2 and other HR genesinvolved in different stages ofHRDNArepair cooperatively contribute toOLA sensitivity and our proposal that pharmaceutically induced HRdeficiency as a therapy concept for future clinical applications of OLA.By demonstrating that 10 specific HR genes are up-regulated in CRPCin two public data sets and that these up-regulatedHR genes representtherapy targets for ENZ + OLA combination treatment, we introducea specific biomarker panel for the use of PARP inhibitors and expandthe concept of BRCAness to the concept of HR deficiency for CRPCas regard to clinical applications of PARP inhibitors for synthetic le-thal therapy.
HR occurs through a series of steps (23, 25, 26), and the five ENZ–down-regulated HR genes that we identified are involved in almost allthe major steps. Our data suggest that each ENZ–down-regulated HRgene has a role in HR and the maintenance of PCa cell survival but thatBRCA1, RAD51C, and RMI2, in particular, cooperatively contribute toDNA repair and PCa cell survival, perhaps through their roles duringsequential steps in the HR pathway. The superior performance of dualand triple knockdown underscores redundancy among HR mediatorsthat may oppose PARP inhibitor efficacy. Therefore, ENZ-inducedsuppression of multiple HR genes is a viable strategy to improve theefficacy of PARP inhibitors. The concept, if applied clinically, mayextend the benefit of PARP inhibition therapy to CRPC patients whodo not bear germline or somaticmutations in or deletion ofBRCA1/2or other HR genes.
We also demonstrated that lead-in ENZ+OLAhas a clear advantagecompared to concomitant ENZ +OLA. In addition to down-regulationof a specific set ofHR genes by ENZbefore OLA treatment, this strate-gy also allows maximal ENZ suppression of and delay of OLA up-regulation of specific antiapoptotic genes. SGK1 and TNFAIP8 are
Fig. 5. A superior lead-in effect and its underlying mechanisms. (A to C) Cell cycle analysis. Cells were pretreated with ENZ (0.5 or 1 mM) or DMSO (vehicle control)for 24 hours, followed by the treatment with DMSO, ENZ (0.5 or 1 mM) or OLA (5 or10 mM), or ENZ + OLA for 48 hours. (D) Colony assay. Optimal concentrations of ENZand OLA were determined for each cell line by drug titration (fig. S2). Cells were pretreated with ENZ (VCaP, 100 nM; LNCaP, 150 nM; CWR22Rv, 1 mM) or DMSO (vehicle)for 24 hours, followed by treatment with ENZ, OLA (VCaP, 2.5 mM; LNCaP, 1.5 mM; CWR22Rv1, 500 nM), ENZ + OLA, or DMSO for 10 to 20 days depending on the cell line.#Synergy by two-way ANOVA; ^synergy by Bliss independence model. a.u., arbitrary units. (E) Functional illustration of two ENZ–down-regulated and OLA–up-regulatedantiapoptotic genes SGK1 and TNFAIP8. (F) Western blotting analysis of selected pro- and antiapoptotic proteins from LNCaP cells treated with DMSO, ENZ, OLA, E +O_C (concomitant), or E + O_L (lead-in). (G) Western blotting analysis for SGK1 and TNFAIP8 in control and siRNA-transfected LNCaP cells. Blots are representative ofthree experiments. (H) Sub-G1 cell analysis in control, SGK1 siRNA-, or TNFAIP8 siRNA-transfected in LNCaP cells. Data are means ± SD from three experiments. *P < 0.05by Wilcoxon–Mann-Whitney test [(A to C) versus the corresponding concomitant condition and (H) versus the control siRNA under DMSO condition].
S C I ENCE S I GNAL ING | R E S EARCH ART I C L E
Li et al., Sci. Signal. 10, eaam7479 (2017) 23 May 2017 6 of 11www.SCIENCESIGNALING.org 23 May 2017 Vol 10 Issue 480 aam7479
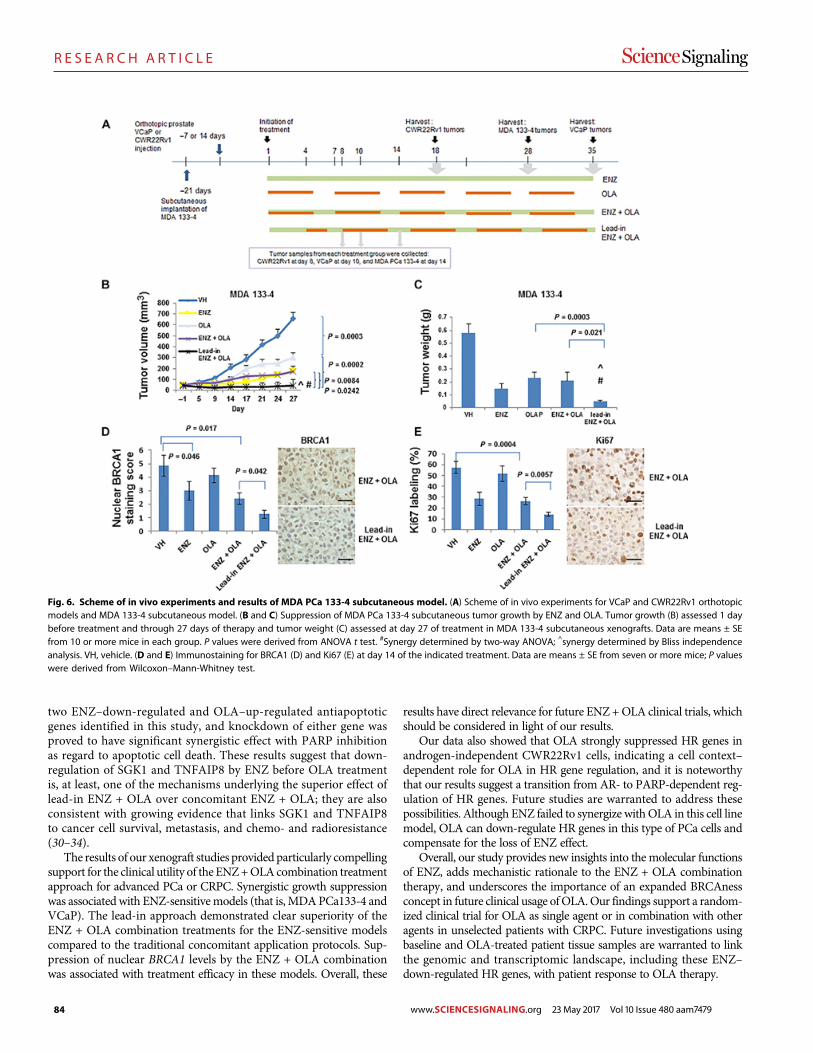
84
R E S E A R C H A R T I C L E
two ENZ–down-regulated and OLA–up-regulated antiapoptoticgenes identified in this study, and knockdown of either gene wasproved to have significant synergistic effect with PARP inhibitionas regard to apoptotic cell death. These results suggest that down-regulation of SGK1 and TNFAIP8 by ENZ before OLA treatmentis, at least, one of the mechanisms underlying the superior effect oflead-in ENZ + OLA over concomitant ENZ + OLA; they are alsoconsistent with growing evidence that links SGK1 and TNFAIP8to cancer cell survival, metastasis, and chemo- and radioresistance(30–34).
The results of our xenograft studies provided particularly compellingsupport for the clinical utility of the ENZ+OLAcombination treatmentapproach for advanced PCa or CRPC. Synergistic growth suppressionwas associated with ENZ-sensitivemodels (that is, MDAPCa133-4 andVCaP). The lead-in approach demonstrated clear superiority of theENZ + OLA combination treatments for the ENZ-sensitive modelscompared to the traditional concomitant application protocols. Sup-pression of nuclear BRCA1 levels by the ENZ + OLA combinationwas associated with treatment efficacy in these models. Overall, these
results have direct relevance for future ENZ +OLA clinical trials, whichshould be considered in light of our results.
Our data also showed that OLA strongly suppressed HR genes inandrogen-independent CWR22Rv1 cells, indicating a cell context–dependent role for OLA in HR gene regulation, and it is noteworthythat our results suggest a transition from AR- to PARP-dependent reg-ulation of HR genes. Future studies are warranted to address thesepossibilities. Although ENZ failed to synergize withOLA in this cell linemodel, OLA can down-regulate HR genes in this type of PCa cells andcompensate for the loss of ENZ effect.
Overall, our study provides new insights into the molecular functionsof ENZ, adds mechanistic rationale to the ENZ + OLA combinationtherapy, and underscores the importance of an expanded BRCAnessconcept in future clinical usage ofOLA.Our findings support a random-ized clinical trial for OLA as single agent or in combination with otheragents in unselected patients with CRPC. Future investigations usingbaseline and OLA-treated patient tissue samples are warranted to linkthe genomic and transcriptomic landscape, including these ENZ–down-regulated HR genes, with patient response to OLA therapy.
Fig. 6. Scheme of in vivo experiments and results of MDA PCa 133-4 subcutaneous model. (A) Scheme of in vivo experiments for VCaP and CWR22Rv1 orthotopicmodels and MDA 133-4 subcutaneous model. (B and C) Suppression of MDA PCa 133-4 subcutaneous tumor growth by ENZ and OLA. Tumor growth (B) assessed 1 daybefore treatment and through 27 days of therapy and tumor weight (C) assessed at day 27 of treatment in MDA 133-4 subcutaneous xenografts. Data are means ± SEfrom 10 or more mice in each group. P values were derived from ANOVA t test. #Synergy determined by two-way ANOVA; ^synergy determined by Bliss independenceanalysis. VH, vehicle. (D and E) Immunostaining for BRCA1 (D) and Ki67 (E) at day 14 of the indicated treatment. Data are means ± SE from seven or more mice; P valueswere derived from Wilcoxon–Mann-Whitney test.
S C I ENCE S I GNAL ING | R E S EARCH ART I C L E
Li et al., Sci. Signal. 10, eaam7479 (2017) 23 May 2017 7 of 11www.SCIENCESIGNALING.org 23 May 2017 Vol 10 Issue 480 aam7479
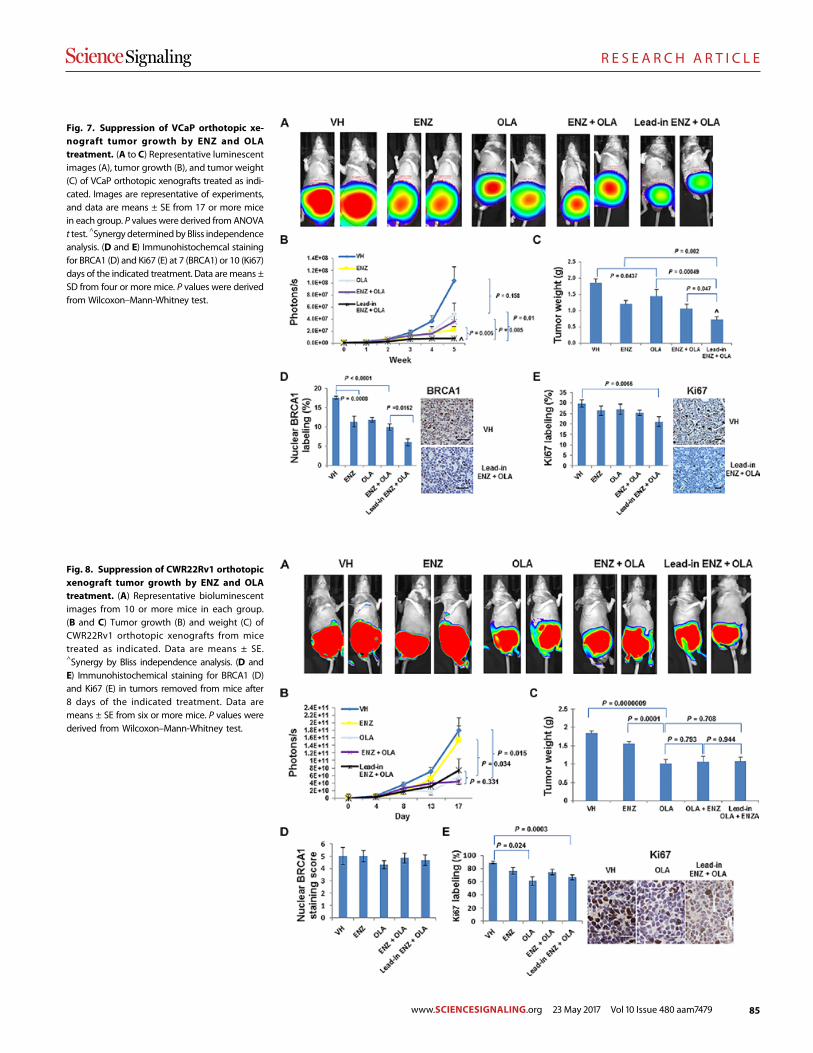
85
R E S E A R C H A R T I C L E
Fig. 7. Suppression of VCaP orthotopic xe-nograft tumor growth by ENZ and OLAtreatment. (A to C) Representative luminescentimages (A), tumor growth (B), and tumor weight(C) of VCaP orthotopic xenografts treated as indi-cated. Images are representative of experiments,and data are means ± SE from 17 or more micein each group. P values were derived from ANOVAt test. ^Synergy determinedby Bliss independenceanalysis. (D and E) Immunohistochemcal stainingfor BRCA1 (D) and Ki67 (E) at 7 (BRCA1) or 10 (Ki67)days of the indicated treatment. Data aremeans ±SD from four or more mice. P values were derivedfrom Wilcoxon–Mann-Whitney test.
Fig. 8. Suppression of CWR22Rv1 orthotopicxenograft tumor growth by ENZ and OLAtreatment. (A) Representative bioluminescentimages from 10 or more mice in each group.(B and C) Tumor growth (B) and weight (C) ofCWR22Rv1 orthotopic xenografts from micetreated as indicated. Data are means ± SE.^Synergy by Bliss independence analysis. (D andE) Immunohistochemical staining for BRCA1 (D)and Ki67 (E) in tumors removed from mice after8 days of the indicated treatment. Data aremeans ± SE from six or more mice. P values werederived from Wilcoxon–Mann-Whitney test.
S C I ENCE S I GNAL ING | R E S EARCH ART I C L E
Li et al., Sci. Signal. 10, eaam7479 (2017) 23 May 2017 8 of 11www.SCIENCESIGNALING.org 23 May 2017 Vol 10 Issue 480 aam7479
86
R E S E A R C H A R T I C L E
MATERIALS AND METHODSSources of cell lines and PDXsVCaP and LNCaP (American Type Culture Collection) and CWR22Rv1(from F. M. Sirotnak of Memorial Sloan Kettering Cancer Center) celllines were validated by short tandem repeat DNA fingerprinting withthe AmpFlSTR Identifiler PCRAmplification Kit (Applied Biosystems)in MD Anderson’s Characterized Cell Line Core Facility. Geneticbackground (genomic alterations and copy number variations) of thesecell lines, VCaP-luc, CWR22Rv1-luc, andMDA 133-4 PDXmodel wasanalyzed using MDA T200 platform and summarized in fig. S1.
Gene expression microarrayComplementary DNA (cDNA) microarray was performed using Il-lumina TotalPrep RNA Amplification Kit (Thermo Scientific) andIllumina Human HT-12 v4.0 Expression BeadChip Kit (Illumina).Microarray data were deposited in the Gene Expression Omnibus(GEO) database (accession number GSE69249).
Bioinformatics and biostatistics analysesSamples of Grasso et al. [GSE35988; (6)] were profiled on two differentAgilent Whole Genome Microarrays. The two expression matrices(GPL6480 and GPL6848) were combined for bioinformatics/biostatisticsanalyses because no obvious batch effect was detected by principalcomponent analysis. Samples of Taylor et al. [GSE21034; (17)] were pro-filed on Affymetrix Human Exon 1.0 ST arrays, and transcript-level ex-pression matrix (GPL10264) was used for the analyses. The transcriptaccession numbers were converted to gene symbols using University ofCalifornia, Santa Cruz reference gene annotation file, and median expres-sion level was used for genes with multiple transcripts. To compare theexpression of 37 HR genes between normal prostate and hormone-naïvePCa and CRPC samples, a linear model was fit to each of the genes,followedbyTukey’s all-pair comparisons of the independent variable usingR package “multcomp.” The overall P values were adjusted by Benjamini-Hochberg procedure. Genes with significant overall P value (<0.05) andalso with significant P value when comparing CRPC either to hormone-naïve PCa or to normal prostate samples were selected from both Grassoand Taylor data sets. The commonly significantly up-regulated and down-regulated genes were used for box plots (Fig. 1, A and B). The expressionprofile of the 10 commonly up-regulated genes in the samples of Grassoet al. (Fig. 1C) and Taylor et al. (Fig. 1D) was shown in semisupervisedhierarchical clustering heat maps. A similar statistical analysis was per-formed in cell line microarray data. The mean expression level was usedfor genes with multiple probes. The expression profile of genes with sig-nificant overall P value and also significant P value when comparingENZ+OLA toDMSO for any of the three cell lineswas shown in super-vised hierarchical clustering heat maps (Fig. 2A). Genes associated withapoptosiswereobtainedbytheGeneOntologyterm“apoptosis” (GO:0006915)and manually curated to characterize the pro- and antiapoptosis gene setson the basis of PubMed gene descriptions. Difference of gene expressionacross various treatments was assessed using ANOVA in these gene sets.The P values were adjusted for multiple testing by Benjamini-Hochberg(false discovery rate) method. Genes with adjusted P values less than 0.05aredefinedas significant. Further,Tukey’s testwasused toperformmultiplecomparison assessment with all the contrasts of interest in the data set.
Quantitative reverse transcription polymerasechain reactionTotal RNA from cancer cell lines was extracted with the RiboPure RNAextraction kit (Thermo Fisher Scientific). Reverse transcription reac-
tions were carried out with the High-Capacity cDNA Archive Kit (Ap-plied Biosystems) according to the manufacturer’s protocol. Real-timePCR was performed using the ABI PRISM 7000 sequence detectionsystem (Applied Biosystems) according to the manufacturer’s instruc-tions. The relative quantity of mRNA was determined by the DDCT
(comparative change in cycle threshold) method as described by themanufacturer and normalized to glyceraldehyde-3-phosphate de-hydrogenase (GAPDH) RNA in the same cDNA preparation. Primersand probes used for qRT-PCR were purchased from Integrated DNATechnologies and are listed in table S4.
Immunohistochemical analysisAntibodies to BRCA1 (Abcam, M110) and Ki67 (Santa Cruz Bio-technology, SC15401) were used for immunostaining on formalin-fixedparaffin-embedded tissue slides from themouse PCa xenografts. Briefly,rehydrated slides were microwave-heated for 20 min in citrate buffer(10 mM, pH 6.0) for antigen retrieval. They were then incubated with1% H2O2 for 10 min to inactivate endogenous horseradish peroxidase(HRP). After blocking with serum-free protein block (Dako, X0909),they were incubated with the primary antibodies (BRCA1, 1:100;Ki67, 1:100) for 90 min at room temperature, followed by incubationwith HRP-conjugated secondary antibody (Dako, K4061) for 40 min atroom temperature. The immunoreaction products were visualized with3,3′-diaminobenzidine/H2O2 solution. For quantitative analyses, 15 to20 microscopic fields (at 200×) from each specimen were randomlyselected, and immunostaining results were evaluated by investigators(G.Y. and D.K.) who were blinded to the treatment information of aspecimen, and the nuclear BRCA1 or Ki67 labeling rates were recorded.
Lead-in ENZ + OLA treatment in cultured cellsVCaP, LNCaP, and CWR22Rv1 cells were pretreated with 1 mM ENZorDMSO vehicle control for 24 hours, followed by treatment with ENZ(1 mM),OLA (10 mM for VCaP and LNCaP and 5 mM for CWR22Rv1),ENZ + OLA, or DMSO for 48 hours. The selection of OLA concentra-tions was based on the sensitivity of PCa cell lines to OLA.
Western blottingProteins were separated by electrophoresis using 4 to 20% gradientMini-PROTEAN TGX Gels (Bio-Rad) and transferred onto a nitro-cellulose blotting membrane (GE Healthcare Life Sciences). Blots withinterested proteins were blocked with tris-buffered saline buffercontaining 0.1%Tween 20 and 5%nonfatmilk for 1 hour and incubatedwith specific primary antibody overnight in a cold room rocker. Afterincubation with HRP-conjugated secondary antibody, blots were incu-bated with SuperSignalWest Dura ExtendedDuration Substrate (Ther-mo Scientific) for 2 min and imaged with ChemiDoc MP ImagingSystem (Bio-Rad). Antibodies against BRCA1 (1:2000), RAD51AP1(1:200), RAD51C (1:200), RAD54 (1:200), RMI2 (1:2000), andTNFAIP8(1:500) were purchased fromAbcam.Antibodies against gH2AX (1:250),cleaved PARP (1:500), SGK1 (1:250), andGAPDH (1:10,000) were pur-chased from Cell Signaling Technology.
HR assayHR assays were performed using LNCaP cells and an HR Assay Kit(Norgen Biotek) according to themanufacturer’s suggested protocol.Briefly, LNCaP cells were transfected with dl-1 and dl-2 vectors thatcarried a mutated lacZ gene in each plasmid using FuGENE Transfec-tion Reagent (Roche). After 6 hours of plasmid transfection, cells werepretreated with ENZ or DMSO vehicle control for 18 hours and then
SC I ENCE S I GNAL ING | R E S EARCH ART I C L E
Li et al., Sci. Signal. 10, eaam7479 (2017) 23 May 2017 9 of 11
www.SCIENCESIGNALING.org 23 May 2017 Vol 10 Issue 480 aam7479
87
R E S E A R C H A R T I C L E
treated with DMSO, ENZ, OLA, or ENZ + OLA for 24 hours. TotalDNA was isolated, and qPCR analysis was performed using universalprimers (for internal normalization) and assay-specific primers. ThePCR cycle numbers for each sample using assay-specific primers wasfirst normalized with respect to that in each sample using universalprimers and then normalized with respect to control (control = 1).
RNA interferenceCells were seeded 1 day before siRNA transfection [six-well format(for RNA or protein preparation): VCaP, 1 × 10⁶ per well; LNCaP,5 × 105 per well; CWR22Rv1, 2 × 10⁵ per well; 24-well format (for cellcycle analysis): one-fifth of cell numbers of six-well format). siRNAtransfection was performed with 20 nM siRNA using RNAiMAX (LifeTechnologies) according to the manufacturer’s protocol. The sourcesand sequences of siRNAs are listed in table S5.
Flow cytometry analysisFlow cytometry analysis was performed as described previously (8).Briefly, cells were seeded onto 24-well plates 1 day before the drugtreatment or siRNA transfection. Flow cytometry analysis was per-formed 48 hours after the drug treatment or siRNA transfection. Inthe case of siRNA and drug combination, siRNA transfection wasperformed 1 day before the drug treatment, and flow cytometry anal-ysis was performed 48 hours after the drug treatment. Cells were har-vested and prepared as a single-cell suspension, washed withphosphate-buffered saline, incubated with a staining buffercontaining 0.1% sodium citrate, 0.1% Triton X-100, and propidiumiodine (50mg/ml) for 30min at 4°C, and proceeded to cell cycle analysiswith a FACSCanto II flow cytometer (BD Biosciences). Cell cycle pro-files and quantitative data were obtained using FlowJo software (TreeStar Inc.).
Clonogenic assayPCa cells were seeded at a low density in six-well plates (VCaP, 1 × 10⁵
per well; LNCaP, 2 × 10⁴ per well; CWR22Rv1, 5 × 10³ per well) andgrown in normal growth medium for 10 to 20 days, and colonies werestained with 0.5% crystal violet and counted as described previously (8).Experiments were performed in triplicate, and data were means ±SDfrom three or more independent experiments.
Xenograft tumor assaysFor the MDA 133-4 PDX model, equal-sized tumor pieces were im-planted into subcutaneous pockets in the flanks of 6- to 8-week-oldmale CB17 SCID mice (Charles River Laboratories InternationalInc.). VCaP cells (3 × 10⁶) and CWR22Rv1 cells (2 × 10⁶) wereinjected orthotopically into the prostates. When tumors reachedan approximate volume of 30 mm3, tumor-bearing mice were ran-domly placed in experimental subgroups to receive ENZ, OLA, ENZ +OLA (concomitant or lead-in: 4-day pretreatment of ENZ beforecombined treatment with ENZ + OLA), or a vehicle control (ENZ,10mg/kg every day orally; OLA, 40mg/kg per day, 5 days each week,intraperitoneally). Subcutaneous tumor growth wasmonitored twiceper week by caliper measurement, and orthotopic tumor growth wasmonitored weekly by bioluminescent images. Mice were sacrificed,and tumor wet weights were determined. A subset of mice was eutha-nized, tumor specimens were collected, and formalin-fixed paraffin-embedded tissue slides were prepared for immunohistochemicalanalysis of BRCA1 and Ki67 from tumors taken before or after 8 to14 days of treatment.
Statistical analysisANOVA was used to assess the difference of gene expression, andBenjamini-Hochberg correction for multiple hypothesis testing wasused to adjust the P values in the determination of statistically alteredHR genes in human PCa patient samples and in drug-treated PCa cellline samples and statistically altered pro- or antiapoptotic genes indrug-treated PCa cell line samples. Wilcoxon–Mann-Whitney testwas used for data with non-normal distributions or data with smallsample sizes, including qRT-PCR, cell cycle analysis, colony assay,and immunohistochemical analyses. ANOVA t test was used foranalysis of tumor growth and tumor wet weights. Synergistic effectswere determined by two-way ANOVA tests (27) and by the Bliss inde-pendence model (28).
SUPPLEMENTARY MATERIALSwww.sciencesignaling.org/cgi/content/full/10/480/eaam7479/DC1Fig. S1. Sequence and copy number variation analysis using T200 platform.Fig. S2. Titration of ENZ and OLA for colony assays.Table S1. Determination of synergy.Table S2. Expression of proapoptotic genes.Table S3. Expression of antiapoptotic genes.Table S4. Primers and probes for qRT-PCR.Table S5. siRNA sources and sequences.
REFERENCES AND NOTES1. R. Siegel, D. Naishadham, A. Jemal, Cancer statistics. CA Cancer J. Clin. 62, 10–29 (2012).2. D. A. Loblaw, K. S. Virgo, R. Nam, M. R. Somerfield, E. Ben-Josef, D. S. Mendelson, R. Middleton,
S. A. Sharp, T. J. Smith, J. Talcott, M. Taplin, N. J. Vogelzang, J. L. Wade III, C. L. Bennett,H. I. Scher, Initial hormonal management of androgen-sensitive metastatic, recurrent, orprogressive prostate cancer: 2006 Update of an American Society of Clinical Oncologypractice guideline. J. Clin. Oncol. 25, 1596–1605 (2007).
3. J. Sturge, M. P. Caley, J. Waxman, Bone metastasis in prostate cancer: Emergingtherapeutic strategies. Nat. Rev. Clin. Oncol. 8, 357–368 (2011).
4. C. L. Derleth, E. Y. Yu, Targeted therapy in the treatment of castration-resistant prostatecancer. Oncology 27, 620–628 (2013).
5. N. J. Vogelzang, Two paths forward in metastatic castration-resistant prostate cancer.Oncology 27, 638–639 (2013).
6. C. S. Grasso, Y.-M. Wu, D. R. Robinson, X. Cao, S. M. Dhanasekaran, A. P. Khan, M. J. Quist,X. Jing, R. J. Lonigro, J. C. Brenner, I. A. Asangani, B. Ateeq, S. Y. Chun, J. Siddiqui, L. Sam,M. Anstett, R. Mehra, J. R. Prensner, N. Palanisamy, G. A. Ryslik, F. Vandin, B. J. Raphael,L. P. Kunju, D. R. Rhodes, K. J. Pienta, A. M. Chinnaiyan, S. A. Tomlins, The mutationallandscape of lethal castration-resistant prostate cancer. Nature 487, 239–243 (2012).
7. S. C. Baca, D. Prandi, M. S. Lawrence, J. M. Mosquera, A. Romanel, Y. Drier, K. Park,N. Kitabayashi, T. Y. MacDonald, M. Ghandi, E. Van Allen, G. V. Kryukov, A. Sboner,J. P. Theurillat, T. D. Soong, E. Nickerson, D. Auclair, A. Tewari, H. Beltran, R. C. Onofrio,G. Boysen, C. Guiducci, C. E. Barbieri, K. Cibulskis, A. Sivachenko, S. L. Carter, G. Saksena,D. Voet, A. H. Ramos, W. Winckler, M. Cipicchio, K. Ardlie, P. W. Kantoff, M. F. Berger,S. B. Gabriel, T. R. Golub, M. Meyerson, E. S. Lander, O. Elemento, G. Getz, F. Demichelis,M. A. Rubin, L. A. Garraway, Punctuated evolution of prostate cancer genomes. Cell 153,666–677 (2013).
8. L. Li, W. Chang, G. Yang, C. Ren, S. Park, T. Karantanos, S. Karanika, J. Wang, J. Yin,P. K. Shah, H. Takahiro, M. Dobashi, W. Zhang, E. Efstathiou, S. N. Maity, A. M. Aparicio,E. M. L. Ning Tapia, P. Troncoso, B. Broom, L. Xiao, H.-S. Lee, J.-S. Lee, P. G. Corn,N. Navone, T. C. Thompson, Targeting poly(ADP-ribose) polymerase and thec-Myb–regulated DNA damage response pathway in castration-resistant prostate cancer.Sci. Signal. 7, ra47 (2014).
9. S. P. Pitroda, I. M. Pashtan, H. L. Logan, B. Budke, T. E. Darga, R. R. Weichselbaum,P. P. Connell, DNA repair pathway gene expression score correlates with repairproficiency and tumor sensitivity to chemotherapy. Sci. Transl. Med. 6, 229ra242 (2014).
10. L. W. Ellisen, PARP inhibitors in cancer therapy: Promise, progress, and puzzles. CancerCell 19, 165–167 (2011).
11. C. J. Lord, A. Ashworth, The DNA damage response and cancer therapy. Nature 481,287–294 (2012).
12. Y. Shen, M. Aoyagi-Scharber, B. Wang, Trapping poly(ADP-ribose) polymerase.J. Pharmacol. Exp. Ther. 353, 446–457 (2015).
S C I ENCE S I GNAL ING | R E S EARCH ART I C L E
Li et al., Sci. Signal. 10, eaam7479 (2017) 23 May 2017 10 of 11
www.SCIENCESIGNALING.org 23 May 2017 Vol 10 Issue 480 aam7479
88
R E S E A R C H A R T I C L E
13. E. Castro, J. Mateo, D. Olmos, J. S. de Bono, Targeting DNA repair: The role of PARP inhibitionin the treatment of castration-resistant prostate cancer. Cancer J. 22, 353–356 (2016).
14. J. Mateo, S. Carreira, S. Sandhu, S. Miranda, H. Mossop, R. Perez-Lopez, D. N. Rodrigues,D. Robinson, A. Omlin, N. Tunariu, G. Boysen, N. Porta, P. Flohr, A. Gillman, I. Figueiredo,C. Paulding, G. Seed, S. Jain, C. Ralph, A. Protheroe, S. Hussain, R. Jones, T. Elliott,U. McGovern, D. Bianchini, J. Goodall, Z. Zafeiriou, C. T. Williamson, R. Ferraldeschi,R. Riisnaes, B. Ebbs, G. Fowler, D. Roda, W. Yuan, Y. M. Wu, X. Cao, R. Brough,H. Pemberton, R. A’Hern, A. Swain, L. P. Kunju, R. Eeles, G. Attard, C. J. Lord, A. Ashworth,M. A. Rubin, K. E. Knudsen, F. Y. Feng, A. M. Chinnaiyan, E. Hall, J. S. de Bono, DNA-repairdefects and olaparib in metastatic prostate cancer. N. Engl. J. Med. 373, 1697–1708(2015).
15. S. K. Sandhu, W. R. Schelman, G. Wilding, V. Moreno, R. D. Baird, S. Miranda, L. Hylands,R. Riisnaes, M. Forster, A. Omlin, N. Kreischer, K. Thway, H. Gevensleben, L. Sun,J. Loughney, M. Chatterjee, C. Toniatti, C. L. Carpenter, R. Iannone, S. B. Kaye, J. S. de Bono,R. M. Wenham, The poly(ADP-ribose) polymerase inhibitor niraparib (MK4827) in BRCAmutation carriers and patients with sporadic cancer: A phase 1 dose-escalation trial.Lancet Oncol. 14, 882–892 (2013).
16. C. L. Scott, E. M. Swisher, S. H. Kaufmann, Poly (adp-ribose) polymerase inhibitors: Recentadvances and future development. J. Clin. Oncol. 33, 1397–1406 (2015).
17. B. S. Taylor, N. Schultz, H. Hieronymus, A. Gopalan, Y. Xiao, B. S. Carver, V. K. Arora,P. Kaushik, E. Cerami, B. Reva, Y. Antipin, N. Mitsiades, T. Landers, I. Dolgalev, J. E. Major,M. Wilson, N. D. Socci, A. E. Lash, A. Heguy, J. A. Eastham, H. I. Scher, V. E. Reuter,P. T. Scardino, C. Sander, C. L. Sawyers, W. L. Gerald, Integrative genomic profiling ofhuman prostate cancer. Cancer Cell 18, 11–22 (2010).
18. D. Robinson, E. M. Van Allen, Y.-M. Wu, N. Schultz, R. J. Lonigro, J.-M. Mosquera,B. Montgomery, M.-E. Taplin, C. C. Pritchard, G. Attard, H. Beltran, W. Abida, R. K. Bradley,J. Vinson, X. Cao, P. Vats, L. P. Kunju, M. Hussain, F. Y. Feng, S. A. Tomlins, K. A. Cooney,D. C. Smith, C. Brennan, J. Siddiqui, R. Mehra, Y. Chen, D. E. Rathkopf, M. J. Morris,S. B. Solomon, J. C. Durack, V. E. Reuter, A. Gopalan, J. Gao, M. Loda, R. T. Lis, M. Bowden,S. P. Balk, G. Gaviola, C. Sougnez, M. Gupta, E. Y. Yu, E. A. Mostaghel, H. H. Cheng,H. Mulcahy, L. D. True, S. R. Plymate, H. Dvinge, R. Ferraldeschi, P. Flohr, S. Miranda,Z. Zafeiriou, N. Tunariu, J. Mateo, R. Perez-Lopez, F. Demichelis, B. D. Robinson,M. Schiffman, D. M. Nanus, S. T. Tagawa, A. Sigaras, K. W. Eng, O. Elemento, A. Sboner,E. I. Heath, H. I. Scher, K. J. Pienta, P. Kantoff, J. S. de Bono, M. A. Rubin, P. S. Nelson,L. A. Garraway, C. L. Sawyers, A. M. Chinnaiyan, Integrative clinical genomics of advancedprostate cancer. Cell 161, 1215–1228 (2015).
19. S. Karanika, T. Karantanos, L. Li, P. G. Corn, T. C. Thompson, DNA damage response andprostate cancer: Defects, regulation and therapeutic implications. Oncogene 34,2815–2822 (2015).
20. H. Q. Ta, D. Gioeli, The convergence of DNA damage checkpoint pathways and androgenreceptor signaling in prostate cancer. Endocr. Relat. Cancer 21, R395–R407 (2014).
21. J. F. Goodwin, M. J. Schiewer, J. L. Dean, R. S. Schrecengost, R. de Leeuw, S. Han,T. Ma, R. B. Den, A. P. Dicker, F. Y. Feng, K. E. Knudsen, A hormone–DNA repair circuitgoverns the response to genotoxic insult. Cancer Discov. 3, 1254–1271 (2013).
22. W. R. Polkinghorn, J. S. Parker, M. X. Lee, E. M. Kass, D. E. Spratt, P. J. Iaquinta, V. K. Arora,W.-F. Yen, L. Cai, D. Zheng, B. S. Carver, Y. Chen, P. A. Watson, N. P. Shah, S. Fujisawa,A. G. Goglia, A. Gopalan, H. Hieronymus, J. Wongvipat, P. T. Scardino, M. J. Zelefsky,M. Jasin, J. Chaudhuri, S. N. Powell, C. L. Sawyers, Androgen receptor signaling regulatesDNA repair in prostate cancers. Cancer Discov. 3, 1245–1253 (2013).
23. K. K. Khanna, S. P. Jackson, DNA double-strand breaks: Signaling, repair and the cancerconnection. Nat. Genet. 27, 247–254 (2001).
24. N. Suwaki, K. Klare, M. Tarsounas, RAD51 paralogs: Roles in DNA damage signalling,recombinational repair and tumorigenesis. Semin. Cell Dev. Biol. 22, 898–905(2011).
25. C. Liu, S. Srihari, K.-A. Lê Cao, G. Chenevix-Trench, P. T. Simpson, M. A. Ragan, K. K. Khanna,A fine-scale dissection of the DNA double-strand break repair machinery and itsimplications for breast cancer therapy. Nucleic Acids Res. 42, 6106–6127 (2014).
26. R. Prakash, Y. Zhang, W. Feng, M. Jasin, Homologous recombination and human health:The roles of BRCA1, BRCA2, and associated proteins. Cold Spring Harb. Perspect. Biol. 7,a016600 (2015).
27. B. K. Slinker, The statistics of synergism. J. Mol. Cell. Cardiol. 30, 723–731 (1998).28. C. I. Bliss, The toxicity of poisons appled jointly. Ann. Appl. Biol. 26, 585–615
(1939).
29. H. Willers, L. Gheorghiu, Q. Liu, J. A. Efstathiou, L. J. Wirth, M. Krause, C. von Neubeck,DNA damage response assessments in human tumor samples provide functionalbiomarkers of radiosensitivity. Semin. Radiat. Oncol. 25, 237–250 (2015).
30. C. Talarico, V. Dattilo, L. D’Antona, M. Menniti, C. Bianco, F. Ortuso, S. Alcaro, S. Schenone,N. Perrotti, R. Amato, SGK1, the new player in the game of resistance: Chemo-radiomolecular target and strategy for inhibition. Cell Physiol. Biochem. 39, 1863–1876 (2016).
31. P. Castel, M. Scaltriti, The emerging role of serum/glucocorticoid-regulated kinases incancer. Cell Cycle 16, 5–6 (2016).
32. J. M. Lowe, T.-A. Nguyen, S. A. Grimm, K. A. Gabor, S. D. Peddada, L. Li, C. W. Anderson,M. A. Resnick, D. Menendez, M. B. Fessler, The novel p53 target TNFAIP8 variant 2 isincreased in cancer and offsets p53-dependent tumor suppression. Cell Death Differ. 24,181–191 (2016).
33. T. Liu, H. Gao, M. Yang, T. Zhao, Y. Liu, G. Lou, Correlation of TNFAIP8 overexpression withthe proliferation, metastasis, and disease-free survival in endometrial cancer. Tumour Biol.35, 5805–5814 (2014).
34. T. F. Day, R. R. Mewani, J. Starr, X. Li, D. Chakravarty, H. Ressom, X. Zou, O. Eidelman,H. B. Pollard, M. Srivastava, U. N. Kasid, Transcriptome and proteome analyses of TNFAIP8knockdown cancer cells reveal new insights into molecular determinants of cellsurvival and tumor progression. Methods Mol. Biol. 1513, 83–100 (2017).
35. R. Plummer, Poly(ADP-ribose)polymerase (PARP) inhibitors: From bench to bedside. Clin.Oncol. 26, 250–256 (2014).
36. E. S. Ratner, A. C. Sartorelli, Z. P. Lin, Poly (ADP-ribose) polymerase inhibitors: On thehorizon of tailored and personalized therapies for epithelial ovarian cancer. Curr. Opin.Oncol. 24, 564–571 (2012).
37. J. C. Brenner, B. Ateeq, Y. Li, A. K. Yocum, Q. Cao, I. A. Asangani, S. Patel, X. Wang, H. Liang,J. Yu, N. Palanisamy, J. Siddiqui, W. Yan, X. Cao, R. Mehra, A. Sabolch, V. Basrur,R. J. Lonigro, J. Yang, S. A. Tomlins, C. A. Maher, K. S. Elenitoba-Johnson, M. Hussain,N. M. Navone, K. J. Pienta, S. Varambally, F. Y. Feng, A. M. Chinnaiyan, Mechanisticrationale for inhibition of poly(ADP-ribose) polymerase in ETS gene fusion-positiveprostate cancer. Cancer Cell 19, 664–678 (2011).
38. J.-m. Lee, J. A. Ledermann, E. C. Kohn, PARP Inhibitors for BRCA1/2 mutation-associatedand BRCA-like malignancies. Ann. Oncol. 25, 32–40 (2014).
39. S. Tangutoori, P. Baldwin, S. Sridhar, PARP inhibitors: A new era of targeted therapy.Maturitas 81, 5–9 (2015).
Funding: This work was supported, in part, by the National Cancer Institute grants R0150588(to T.C.T.) and 5P50 CA140388, the Prostate Cancer Specialized Program of ResearchExcellence at The University of Texas MD Anderson Cancer Center, the National CancerInstitute Support Grant CA16672, and the MD Anderson Cancer Center Support Grant. G.C.M.is supported by a grant from the Michael and Susan Dell Foundation. Author contributions:T.C.T. and L.L. conceived and designed the study and wrote the paper. L.L., J.W., X.Z., W.C.,and J.Y. performed the cell culture studies. S.K., S.P., J.W., Y.L., S.B., J.H.S., G.E.G., and T.K.performed the xenograft model experiments. G.Y. and D.K. performed the immunohistochemicalanalysis. B.M.B., G.C.M., W.W., and A.K.A. performed the gene expression analysis of CRPCpatient tissue samples and integrated genomic analysis of cell lines and xenograft models. J.K.,P.G.C., A.M.A., and C.J.L. provided clinical insight and concept development. P.T. performed thepathology evaluation of human PCa samples. J.-S.L. and H.-S.L. performed the microarrayexperiments. T.H. and C.T. provided intellectual contributions. G.E.G. revised the manuscript. Allauthors contributed to the data analysis. Competing interests: The authors declare that theyhave no competing financial interests. Data and materials availability: Microarray data aredeposited in the GEO (www.ncbi.nlm.nih.gov/geo/) (accession number GSE69249).
Submitted 11 January 2017Accepted 5 May 2017Published 23 May 201710.1126/scisignal.aam7479
Citation: L. Li, S. Karanika, G. Yang, J. Wang, S. Park, B. M. Broom, G. C. Manyam, W. Wu, Y. Luo,S. Basourakos, J. H. Song, G. E. Gallick, T. Karantanos, D. Korentzelos, A. K. Azad, J. Kim, P. G. Corn,A. M. Aparicio, C. J. Logothetis, P. Troncoso, T. Heffernan, C. Toniatti, H.-S. Lee, J.-S. Lee, X. Zuo,W. Chang, J. Yin, T. C. Thompson, Androgen receptor inhibitor–induced “BRCAness” and PARPinhibition are synthetically lethal for castration-resistant prostate cancer. Sci. Signal. 10, eaam7479(2017).
S C I ENCE S I GNAL ING | R E S EARCH ART I C L E
Li et al., Sci. Signal. 10, eaam7479 (2017) 23 May 2017 11 of 11www.SCIENCESIGNALING.org 23 May 2017 Vol 10 Issue 480 aam7479
89
R E S E A R C H A R T I C L E
SCIENCE TRANSLATIONAL MEDICINE
www.SCIENCETRANSLATIONALMEDICINE.org 17 January 2018 Vol 10 Issue 424 aao5848Moinova et al., Sci. Transl. Med. 10, eaao5848 (2018) 17 January 2018
S C I E N C E T R A N S L A T I O N A L M E D I C I N E | R E S E A R C H A R T I C L E
1 of 11
C A N C E R
Identifying DNA methylation biomarkers for non-endoscopic detection of Barrett’s esophagusHelen R. Moinova,1 Thomas LaFramboise,2,3 James D. Lutterbaugh,1 Apoorva Krishna Chandar,1 John Dumot,1 Ashley Faulx,1 Wendy Brock,1 Omar De la Cruz Cabrera,4 Kishore Guda,2 Jill S. Barnholtz-Sloan,2 Prasad G. Iyer,5 Marcia I. Canto,6 Jean S. Wang,7 Nicholas J. Shaheen,8 Prashanti N. Thota,9 Joseph E. Willis,2,10,11*† Amitabh Chak,1,2,11*† Sanford D. Markowitz1,2,3,11*†
We report a biomarker-based non-endoscopic method for detecting Barrett’s esophagus (BE) based on detecting methylated DNAs retrieved via a swallowable balloon-based esophageal sampling device. BE is the precursor of, and a major recognized risk factor for, developing esophageal adenocarcinoma. Endoscopy, the current standard for BE detection, is not cost-effective for population screening. We performed genome-wide screening to ascertain regions targeted for recurrent aberrant cytosine methylation in BE, identifying high-frequency methylation within the CCNA1 locus. We tested CCNA1 DNA methylation as a BE biomarker in cytology brushings of the distal esophagus from 173 individuals with or without BE. CCNA1 DNA methylation demonstrated an area under the curve of 0.95 for discriminating BE-related metaplasia and neoplasia cases versus normal individuals, performing identically to methylation of VIM DNA, an established BE biomarker. When combined, the resulting two biomarker panel was 95% sensitive and 91% specific. These results were replicated in an independent validation cohort of 149 individuals who were assayed using the same cutoff values for test positivity established in the training population. To progress toward non-endoscopic esophageal screening, we engineered a well-tolerated, swallowable, encapsulated balloon device able to selectively sample the distal esophagus within 5 min. In balloon samples from 86 individuals, tests of CCNA1 plus VIM DNA methylation detected BE metaplasia with 90.3% sensitivity and 91.7% specificity. Combining the balloon sampling device with molecular assays of CCNA1 plus VIM DNA methylation enables an efficient, well-tolerated, sensitive, and specific method of screening at-risk populations for BE.
INTRODUCTIONThe incidence of esophageal adenocarcinoma (EAC) has more than quadrupled in the past 30 years (1–4), and the prognosis for EAC patients remains poor, with a less than 20% survival at 5 years (4, 5). Barrett’s esophagus (BE), a premalignant intestinal-type columnar metaplasia that replaces the normal squamous mucosa of the distal esophagus, is the only known precursor for EAC, but its detection currently requires performing esophagogastroduodenoscopy (EGD). Because of the high cost of EGD and the lack of a randomized con-trolled trial demonstrating cost- effective reduction in EAC, endos-copy screening for BE has not been routinely recommended (6, 7).
Thus, in about 95% of cases of EAC, the presence of the antecedent BE remains undetected and unknown (8). Hence, there is a need for additional methods for BE detection that are less expensive than EGD and can be widely and readily implemented in an at-risk population. Molecular biomarkers for detecting BE are potentially valuable in this regard.
Acquisition of aberrant cytosine methylation within CpG-rich ge-nomic islands is a common accompaniment of many cancers and can serve as a neoplasia biomarker (9–13). We have previously reported that de novo DNA methylation of the CpG island overlapping the first exon of the vimentin gene (mVIM) is a highly sensitive BE biomarker that is present in biopsies of about 90% of BE patients, suggesting utility of mVIM as a potential biomarker for BE screening (14). In an initial pilot study, we further found that mVIM could be detected in esopha-geal brushings, suggesting that mVIM can serve as a molecular cytology biomarker to enable non-endoscopic detection of BE (14). Reduced representation bisulfite sequencing (RRBS) is a whole-genome ap-proach that allows for unbiased assessment of DNA methylation with-in CpG-dense regions of the human genome, which encompass most promoters and other regulatory regions (15, 16). RRBS thus provides the potential to identify an extended biomarker panel with increased effectiveness for detecting BE.The aims of this study were hence to identify methylated DNA biomarkers of esophageal neoplasia, to define the sensitivity and specificity of such markers in comparison to and/or in combination with mVIM for detecting BE metaplasias and related neoplasias, and to further test the efficacy of these biomarkers for detect-ing BE in samples obtained via a non-endoscopic swallowable balloon- based esophageal sampling device as compared to samples obtained via endoscopy-directed brushings.
1Department of Medicine, Case Western Reserve University and University Hospi-tals Cleveland Medical Center, Cleveland, OH 44106, USA. 2Case Comprehensive Cancer Center, Case Western Reserve University, Cleveland, OH 44106, USA. 3De-partment of Genetics and Genome Sciences, Case Western Reserve University and University Hospitals Cleveland Medical Center, Cleveland, OH 44106, USA. 4Department of Mathematical Sciences, Kent State University, Kent, OH 44242, USA. 5Barrett’s Esophagus Unit, Division of Gastroenterology and Hepatology, Mayo Clinic, Rochester, MN 55905, USA. 6Division of Gastroenterology and Hepa-tology, Department of Medicine, Johns Hopkins Medical Institutions, Baltimore, MD 21205, USA. 7Division of Gastroenterology, Department of Medicine, Washington University School of Medicine, St. Louis, MO 63110, USA. 8Center for Esophageal Diseases and Swallowing, Division of Gastroenterology and Hepatology, Univer-sity of North Carolina at Chapel Hill, Chapel Hill, NC 27599, USA. 9Digestive Disease and Surgery Institute, Cleveland Clinic, Cleveland, OH 44195, USA. 10Department of Pathology, Case Western Reserve University and University Hospitals Cleveland Medical Center, Cleveland, OH 44106, USA. 11University Hospitals Seidman Cancer Center, University Hospitals Cleveland Medical Center, Cleveland, OH 44106, USA.*Corresponding author. Email: [email protected] (S.D.M.); [email protected] (J.E.W.); [email protected] (A.C.)†These authors contributed equally to this work.
Copyright © 2018 The Authors, some rights reserved; exclusive licensee American Association for the Advancement of Science. No claim to original U.S. Government Works
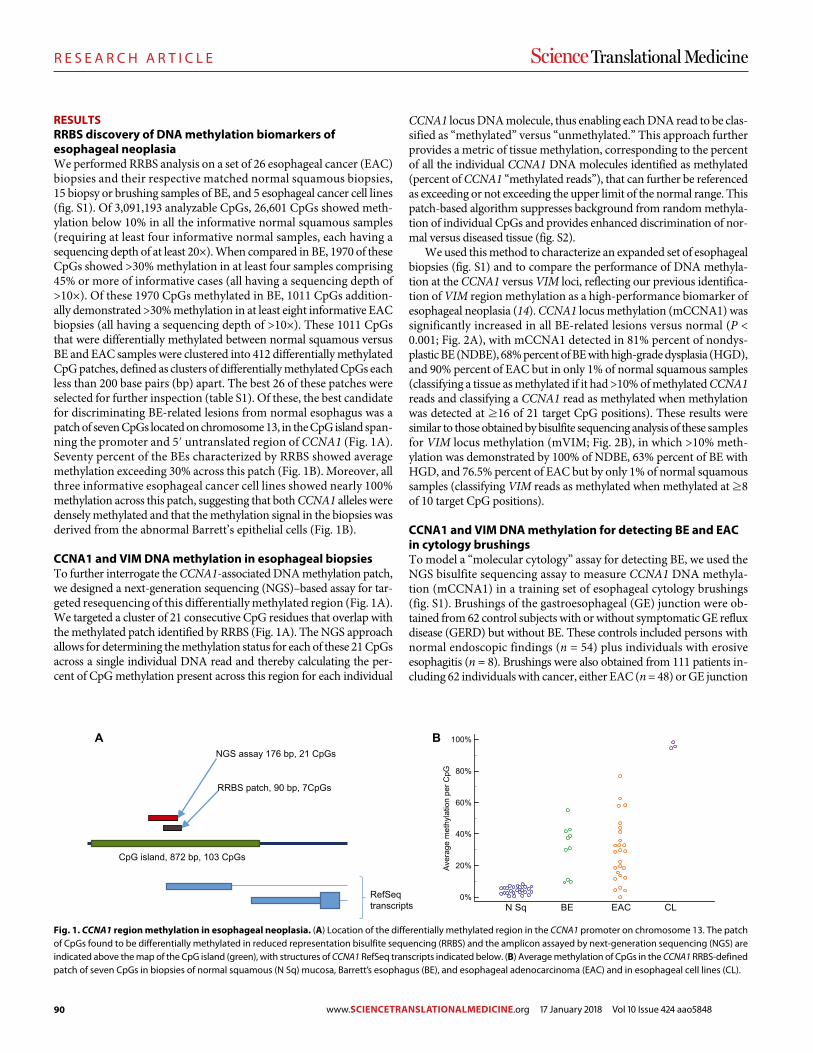
90
R E S E A R C H A R T I C L E
Moinova et al., Sci. Transl. Med. 10, eaao5848 (2018) 17 January 2018
S C I E N C E T R A N S L A T I O N A L M E D I C I N E | R E S E A R C H A R T I C L E
2 of 11
RESULTSRRBS discovery of DNA methylation biomarkers of esophageal neoplasiaWe performed RRBS analysis on a set of 26 esophageal cancer (EAC) biopsies and their respective matched normal squamous biopsies, 15 biopsy or brushing samples of BE, and 5 esophageal cancer cell lines (fig. S1). Of 3,091,193 analyzable CpGs, 26,601 CpGs showed meth-ylation below 10% in all the informative normal squamous samples (requiring at least four informative normal samples, each having a sequencing depth of at least 20×). When compared in BE, 1970 of these CpGs showed >30% methylation in at least four samples comprising 45% or more of informative cases (all having a sequencing depth of >10×). Of these 1970 CpGs methylated in BE, 1011 CpGs addition-ally demonstrated >30% methylation in at least eight informative EAC biopsies (all having a sequencing depth of >10×). These 1011 CpGs that were differentially methylated between normal squamous versus BE and EAC samples were clustered into 412 differentially methylated CpG patches, defined as clusters of differentially methylated CpGs each less than 200 base pairs (bp) apart. The best 26 of these patches were selected for further inspection (table S1). Of these, the best candidate for discriminating BE-related lesions from normal esophagus was a patch of seven CpGs located on chromosome 13, in the CpG island span-ning the promoter and 5′ untranslated region of CCNA1 (Fig. 1A). Seventy percent of the BEs characterized by RRBS showed average methylation exceeding 30% across this patch (Fig. 1B). Moreover, all three informative esophageal cancer cell lines showed nearly 100% methylation across this patch, suggesting that both CCNA1 alleles were densely methylated and that the methylation signal in the biopsies was derived from the abnormal Barrett’s epithelial cells (Fig. 1B).
CCNA1 and VIM DNA methylation in esophageal biopsiesTo further interrogate the CCNA1-associated DNA methylation patch, we designed a next-generation sequencing (NGS)–based assay for tar-geted resequencing of this differentially methylated region (Fig. 1A). We targeted a cluster of 21 consecutive CpG residues that overlap with the methylated patch identified by RRBS (Fig. 1A). The NGS approach allows for determining the methylation status for each of these 21 CpGs across a single individual DNA read and thereby calculating the per-cent of CpG methylation present across this region for each individual
CCNA1 locus DNA molecule, thus enabling each DNA read to be clas-sified as “methylated” versus “unmethylated.” This approach further provides a metric of tissue methylation, corresponding to the percent of all the individual CCNA1 DNA molecules identified as methylated (percent of CCNA1 “methylated reads”), that can further be referenced as exceeding or not exceeding the upper limit of the normal range. This patch-based algorithm suppresses background from random methyla-tion of individual CpGs and provides enhanced discrimination of nor-mal versus diseased tissue (fig. S2).
We used this method to characterize an expanded set of esophageal biopsies (fig. S1) and to compare the performance of DNA methyla-tion at the CCNA1 versus VIM loci, reflecting our previous identifica-tion of VIM region methylation as a high-performance biomarker of esophageal neoplasia (14). CCNA1 locus methylation (mCCNA1) was significantly increased in all BE-related lesions versus normal (P < 0.001; Fig. 2A), with mCCNA1 detected in 81% percent of nondys-plastic BE (NDBE), 68% percent of BE with high-grade dysplasia (HGD), and 90% percent of EAC but in only 1% of normal squamous samples (classifying a tissue as methylated if it had >10% of methylated CCNA1 reads and classifying a CCNA1 read as methylated when methylation was detected at ≥16 of 21 target CpG positions). These results were similar to those obtained by bisulfite sequencing analysis of these samples for VIM locus methylation (mVIM; Fig. 2B), in which >10% meth-ylation was demonstrated by 100% of NDBE, 63% percent of BE with HGD, and 76.5% percent of EAC but by only 1% of normal squamous samples (classifying VIM reads as methylated when methylated at ≥8 of 10 target CpG positions).
CCNA1 and VIM DNA methylation for detecting BE and EAC in cytology brushingsTo model a “molecular cytology” assay for detecting BE, we used the NGS bisulfite sequencing assay to measure CCNA1 DNA methyla-tion (mCCNA1) in a training set of esophageal cytology brushings (fig. S1). Brushings of the gastroesophageal (GE) junction were ob-tained from 62 control subjects with or without symptomatic GE reflux disease (GERD) but without BE. These controls included persons with normal endoscopic findings (n = 54) plus individuals with erosive esophagitis (n = 8). Brushings were also obtained from 111 patients in-cluding 62 individuals with cancer, either EAC (n = 48) or GE junction
A BNGS assay 176 bp, 21 CpGs
RRBS patch, 90 bp, 7CpGs
CpG island, 872 bp, 103 CpGs
RefSeqtranscripts
Aver
age
met
hyla
tion
per C
pG
0%
20%
40%
60%
80%
100%
N Sq BE EAC CL
Fig. 1. CCNA1 region methylation in esophageal neoplasia. (A) Location of the differentially methylated region in the CCNA1 promoter on chromosome 13. The patch of CpGs found to be differentially methylated in reduced representation bisulfite sequencing (RRBS) and the amplicon assayed by next-generation sequencing (NGS) are indicated above the map of the CpG island (green), with structures of CCNA1 RefSeq transcripts indicated below. (B) Average methylation of CpGs in the CCNA1 RRBS-defined patch of seven CpGs in biopsies of normal squamous (N Sq) mucosa, Barrett’s esophagus (BE), and esophageal adenocarcinoma (EAC) and in esophageal cell lines (CL).
www.SCIENCETRANSLATIONALMEDICINE.org 17 January 2018 Vol 10 Issue 424 aao5848

91
R E S E A R C H A R T I C L E
Moinova et al., Sci. Transl. Med. 10, eaao5848 (2018) 17 January 2018
S C I E N C E T R A N S L A T I O N A L M E D I C I N E | R E S E A R C H A R T I C L E
3 of 11
adenocarcinoma (n = 14), and 49 individuals with BE. Of BE cases, 12 had nondysplastic short-segment BE (SSBE; < 3 cm), 19 had non-dysplastic long-segment BE (LSBE; ≥3 cm), 8 had low-grade dysplasia (LGD), and 10 had HGD. Eighty-three percent of study participants were white. The disease group was older than controls (P < 0.0001) and included more males, reflecting the epidemiology of BE. There was no significant difference in the prevalence of smoking between cases and controls (table S2).
Figure 3A shows the receiver operating characteristic (ROC) curve for mCCNA1 in these training set samples, in which the assay demon-strated an area under the curve (AUC) of 0.95. An optimal cutpoint, in which a sample was detected as positive if it had >3.12% methylated CCNA1 templates, maximized the sum of sensitivity plus specificity. At this cutpoint, mCCNA1 demonstrated 90.7% sensitivity for detect-ing BE or cancer with 98.4% specificity. As a comparator, Fig. 3B shows the ROC curve for the same samples assayed for mVIM by bisulfite sequencing analysis. Similar to mCCNA1, the mVIM assay showed an AUC of 0.95. The optimal cutpoint for this assay, of 1.05% mVIM content, provided a sensitivity of 90.7% and a specificity of 93.2% (Fig. 3B). These mVIM results are consistent with our previous observation in a pilot set of 34 esophageal brushings that were analyzed for mVIM by quanti-tative methylation-specific (qMS)–polymerase chain reaction (PCR) (14).
To validate the performance of mCCNA1 and mVIM in molecu-lar cytology applications, we examined a second independent set of esophageal cytology brushings from 149 new individuals recruited at five different cancer centers from across the United States (fig. S1). These individuals included 30 controls with normal esophageal mor-phology and 119 cases with BE or cancer (table S2). Similarly to the training set, and reflecting the biology of BE, participants in the val-idation set were 93% white. Training and validation populations did not significantly differ by gender or smoking history, but controls were older in the validation than in training set (table S2). As shown in Fig. 3 (C and D), the validation population again showed an AUC of 0.95 for mCCNA1 and 0.96 for mVIM. Moreover, sensitivity and spec-ificity of mCCNA1 and mVIM in the validation population replicated those of the training population, using the same cutoffs for test pos-
itivity as prespecified by the training data set (Fig. 3, C and D versus A and B, and table S3).
BE progresses from nondysplastic metaplasias to LGD and then HGD that ultimately give rise to EAC (17, 18). Given the equivalent
0%
20%
40%
60%
80%
100%
Frac
tion
of m
ethy
late
d re
ads
N Sq NDBE HGD EAC0%
20%
40%
60%
80%
100%
Frac
tion
of m
ethy
late
d re
ads
N Sq NDBE HGD EAC
A B
Fig. 2. NGS bisulfite sequencing assay of DNA methylation in esophageal biopsies. (A) CCNA1 locus methylation (mCCNA1) in esophageal neoplasia and control patients. N Sq, normal squamous biopsies; NDBE, nondysplastic BE; HGD, BE with high-grade dysplasia. Fraction of methylated reads in each sample is indicated on the y axis. P < 0.001 for one-way analysis of variance (ANOVA) comparison and P < 0.001 for post hoc Student-Newman-Keuls test of N Sq versus BE, HGD, and EAC. (B) VIM locus methylation (mVIM) in esophageal neoplasia and control patients. Fraction of methylated reads in each sample is indicated on the y axis. P < 0.001 for one-way ANOVA comparison and P < 0.001 for post hoc Student-Newman-Keuls test of N Sq versus BE, HGD, and EAC.
0
20
40
60
80
100
0 20 40 60 80 100100-specificity
Sen
sitiv
ity
0
20
40
60
80
100
0 20 40 60 80 100100-specificity
Sen
sitiv
ity
0
20
40
60
80
100
0 20 40 60 80 100100-specificity
Sen
sitiv
ity
0
20
40
60
80
100
0 20 40 60 80 100100-specificity
Sen
sitiv
ity
AUC: 0.948At >1.05%Sensitivity: 90.7%Specificity: 93.2%
AUC: 0.954At >3.12%Sensitivity: 90.7%Specificity: 98.4%
AUC: 0.952At >3.12%Sensitivity: 89.6%Specificity: 92.9%
AUC: 0.956At >1.05%Sensitivity: 91.5%Specificity: 92.6%
A B
C D
Fig. 3. ROC curves of mCCNA1 and mVIM assayed in esophageal cytology brush-ings from control normal-appearing GE junctions versus BE and EAC cases. (A and B) Training samples. (A) mCCNA1, n = 61 controls and 108 cases. (B) mVIM, n = 59 controls and 107 cases. (C and D) Validation samples. (C) mCCNA1, n = 28 con-trols and 115 cases. (D) mVIM, n = 27 controls and 117 cases. Area under the curve (AUC) and the sensitivity and specificity of the assays at the indicated cutpoint are listed for each graph, with the cutpoint value of percent methylation that defines a positive test denoted by “At >.”
www.SCIENCETRANSLATIONALMEDICINE.org 17 January 2018 Vol 10 Issue 424 aao5848
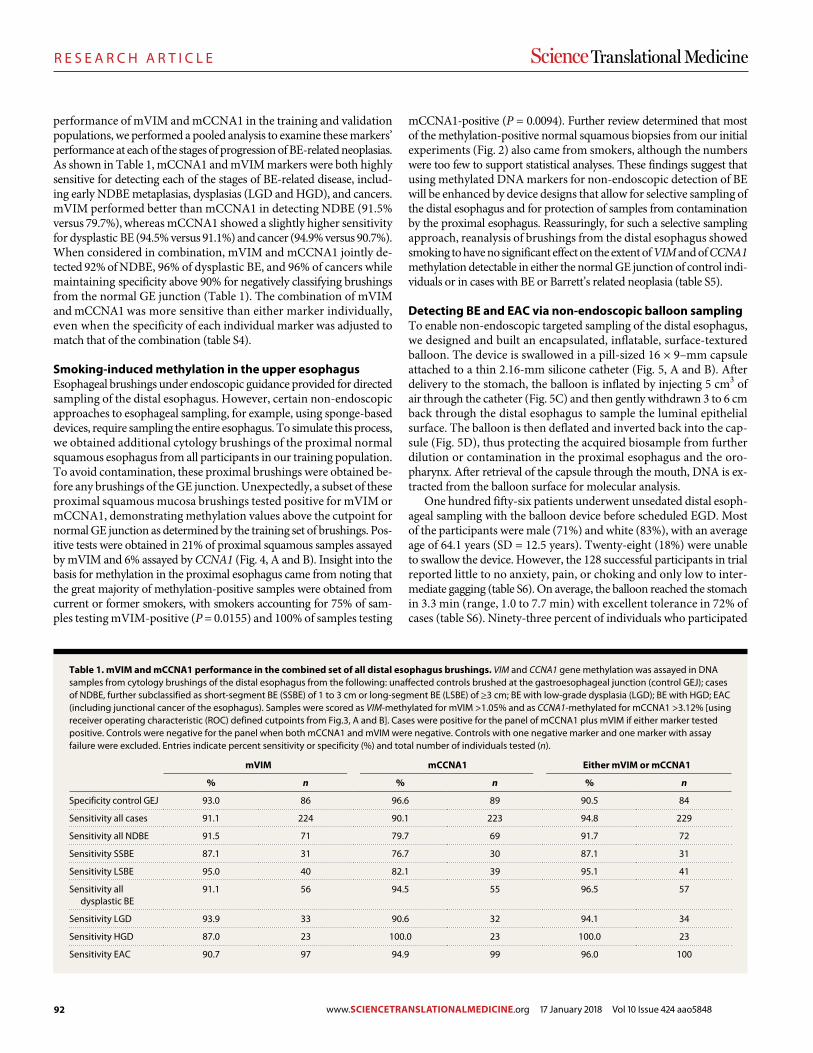
92
R E S E A R C H A R T I C L E
Moinova et al., Sci. Transl. Med. 10, eaao5848 (2018) 17 January 2018
S C I E N C E T R A N S L A T I O N A L M E D I C I N E | R E S E A R C H A R T I C L E
4 of 11
performance of mVIM and mCCNA1 in the training and validation populations, we performed a pooled analysis to examine these markers’ performance at each of the stages of progression of BE-related neoplasias. As shown in Table 1, mCCNA1 and mVIM markers were both highly sensitive for detecting each of the stages of BE-related disease, includ-ing early NDBE metaplasias, dysplasias (LGD and HGD), and cancers. mVIM performed better than mCCNA1 in detecting NDBE (91.5% versus 79.7%), whereas mCCNA1 showed a slightly higher sensitivity for dysplastic BE (94.5% versus 91.1%) and cancer (94.9% versus 90.7%). When considered in combination, mVIM and mCCNA1 jointly de-tected 92% of NDBE, 96% of dysplastic BE, and 96% of cancers while maintaining specificity above 90% for negatively classifying brushings from the normal GE junction (Table 1). The combination of mVIM and mCCNA1 was more sensitive than either marker individually, even when the specificity of each individual marker was adjusted to match that of the combination (table S4).
Smoking-induced methylation in the upper esophagusEsophageal brushings under endoscopic guidance provided for directed sampling of the distal esophagus. However, certain non-endoscopic approaches to esophageal sampling, for example, using sponge-based devices, require sampling the entire esophagus. To simulate this process, we obtained additional cytology brushings of the proximal normal squamous esophagus from all participants in our training population. To avoid contamination, these proximal brushings were obtained be-fore any brushings of the GE junction. Unexpectedly, a subset of these proximal squamous mucosa brushings tested positive for mVIM or mCCNA1, demonstrating methylation values above the cutpoint for normal GE junction as determined by the training set of brushings. Pos-itive tests were obtained in 21% of proximal squamous samples assayed by mVIM and 6% assayed by CCNA1 (Fig. 4, A and B). Insight into the basis for methylation in the proximal esophagus came from noting that the great majority of methylation-positive samples were obtained from current or former smokers, with smokers accounting for 75% of sam-ples testing mVIM-positive (P = 0.0155) and 100% of samples testing
mCCNA1-positive (P = 0.0094). Further review determined that most of the methylation-positive normal squamous biopsies from our initial experiments (Fig. 2) also came from smokers, although the numbers were too few to support statistical analyses. These findings suggest that using methylated DNA markers for non-endoscopic detection of BE will be enhanced by device designs that allow for selective sampling of the distal esophagus and for protection of samples from contamination by the proximal esophagus. Reassuringly, for such a selective sampling approach, reanalysis of brushings from the distal esophagus showed smoking to have no significant effect on the extent of VIM and of CCNA1 methylation detectable in either the normal GE junction of control indi-viduals or in cases with BE or Barrett’s related neoplasia (table S5).
Detecting BE and EAC via non-endoscopic balloon samplingTo enable non-endoscopic targeted sampling of the distal esophagus, we designed and built an encapsulated, inflatable, surface-textured balloon. The device is swallowed in a pill-sized 16 × 9–mm capsule attached to a thin 2.16-mm silicone catheter (Fig. 5, A and B). After delivery to the stomach, the balloon is inflated by injecting 5 cm3 of air through the catheter (Fig. 5C) and then gently withdrawn 3 to 6 cm back through the distal esophagus to sample the luminal epithelial surface. The balloon is then deflated and inverted back into the cap-sule (Fig. 5D), thus protecting the acquired biosample from further dilution or contamination in the proximal esophagus and the oro-pharynx. After retrieval of the capsule through the mouth, DNA is ex-tracted from the balloon surface for molecular analysis.
One hundred fifty-six patients underwent unsedated distal esoph-ageal sampling with the balloon device before scheduled EGD. Most of the participants were male (71%) and white (83%), with an average age of 64.1 years (SD = 12.5 years). Twenty-eight (18%) were unable to swallow the device. However, the 128 successful participants in trial reported little to no anxiety, pain, or choking and only low to inter-mediate gagging (table S6). On average, the balloon reached the stomach in 3.3 min (range, 1.0 to 7.7 min) with excellent tolerance in 72% of cases (table S6). Ninety-three percent of individuals who participated
Table 1. mVIM and mCCNA1 performance in the combined set of all distal esophagus brushings. VIM and CCNA1 gene methylation was assayed in DNA samples from cytology brushings of the distal esophagus from the following: unaffected controls brushed at the gastroesophageal junction (control GEJ); cases of NDBE, further subclassified as short-segment BE (SSBE) of 1 to 3 cm or long-segment BE (LSBE) of ≥3 cm; BE with low-grade dysplasia (LGD); BE with HGD; EAC (including junctional cancer of the esophagus). Samples were scored as VIM-methylated for mVIM >1.05% and as CCNA1-methylated for mCCNA1 >3.12% [using receiver operating characteristic (ROC) defined cutpoints from Fig. 3, A and B]. Cases were positive for the panel of mCCNA1 plus mVIM if either marker tested positive. Controls were negative for the panel when both mCCNA1 and mVIM were negative. Controls with one negative marker and one marker with assay failure were excluded. Entries indicate percent sensitivity or specificity (%) and total number of individuals tested (n).
mVIM mCCNA1 Either mVIM or mCCNA1
% n % n % n
Specificity control GEJ 93.0 86 96.6 89 90.5 84
Sensitivity all cases 91.1 224 90.1 223 94.8 229
Sensitivity all NDBE 91.5 71 79.7 69 91.7 72
Sensitivity SSBE 87.1 31 76.7 30 87.1 31
Sensitivity LSBE 95.0 40 82.1 39 95.1 41
Sensitivity all dysplastic BE
91.1 56 94.5 55 96.5 57
Sensitivity LGD 93.9 33 90.6 32 94.1 34
Sensitivity HGD 87.0 23 100.0 23 100.0 23
Sensitivity EAC 90.7 97 94.9 99 96.0 100
www.SCIENCETRANSLATIONALMEDICINE.org 17 January 2018 Vol 10 Issue 424 aao5848
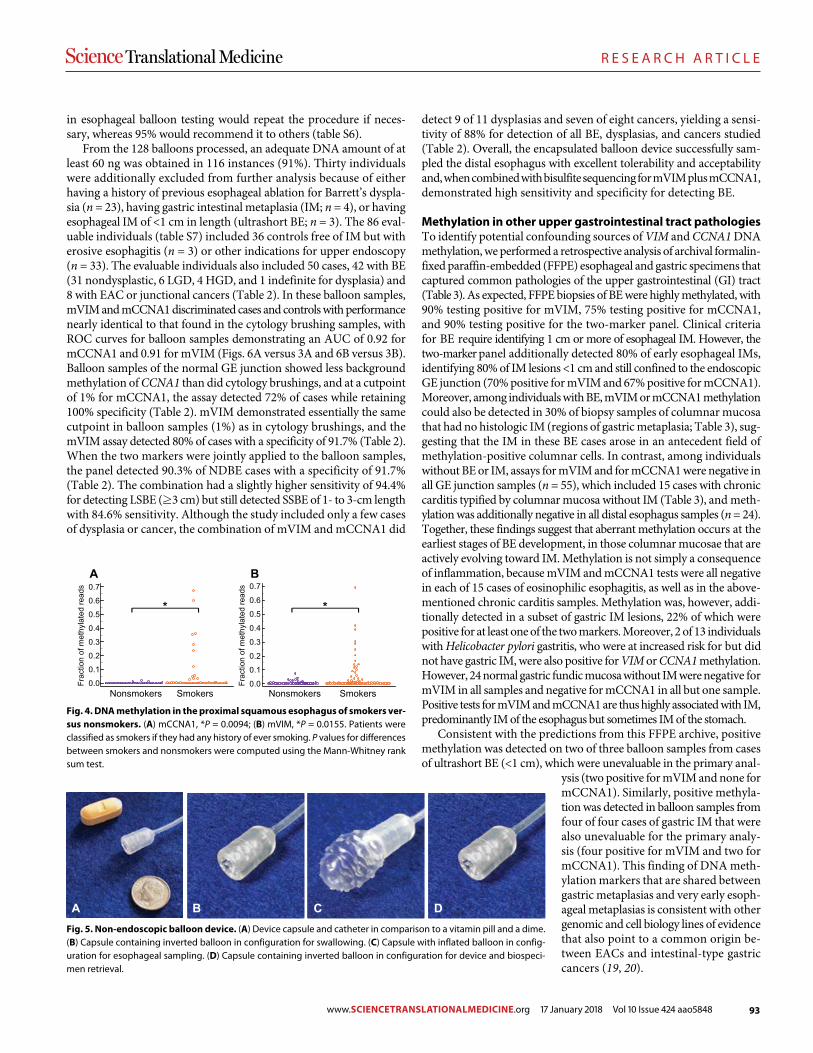
93
R E S E A R C H A R T I C L E
Moinova et al., Sci. Transl. Med. 10, eaao5848 (2018) 17 January 2018
S C I E N C E T R A N S L A T I O N A L M E D I C I N E | R E S E A R C H A R T I C L E
5 of 11
in esophageal balloon testing would repeat the procedure if neces-sary, whereas 95% would recommend it to others (table S6).
From the 128 balloons processed, an adequate DNA amount of at least 60 ng was obtained in 116 instances (91%). Thirty individuals were additionally excluded from further analysis because of either having a history of previous esophageal ablation for Barrett’s dyspla-sia (n = 23), having gastric intestinal metaplasia (IM; n = 4), or having esophageal IM of <1 cm in length (ultrashort BE; n = 3). The 86 eval-uable individuals (table S7) included 36 controls free of IM but with erosive esophagitis (n = 3) or other indications for upper endoscopy (n = 33). The evaluable individuals also included 50 cases, 42 with BE (31 nondysplastic, 6 LGD, 4 HGD, and 1 indefinite for dysplasia) and 8 with EAC or junctional cancers (Table 2). In these balloon samples, mVIM and mCCNA1 discriminated cases and controls with performance nearly identical to that found in the cytology brushing samples, with ROC curves for balloon samples demonstrating an AUC of 0.92 for mCCNA1 and 0.91 for mVIM (Figs. 6A versus 3A and 6B versus 3B). Balloon samples of the normal GE junction showed less background methylation of CCNA1 than did cytology brushings, and at a cutpoint of 1% for mCCNA1, the assay detected 72% of cases while retaining 100% specificity (Table 2). mVIM demonstrated essentially the same cutpoint in balloon samples (1%) as in cytology brushings, and the mVIM assay detected 80% of cases with a specificity of 91.7% (Table 2). When the two markers were jointly applied to the balloon samples, the panel detected 90.3% of NDBE cases with a specificity of 91.7% (Table 2). The combination had a slightly higher sensitivity of 94.4% for detecting LSBE (≥3 cm) but still detected SSBE of 1- to 3-cm length with 84.6% sensitivity. Although the study included only a few cases of dysplasia or cancer, the combination of mVIM and mCCNA1 did
detect 9 of 11 dysplasias and seven of eight cancers, yielding a sensi-tivity of 88% for detection of all BE, dysplasias, and cancers studied (Table 2). Overall, the encapsulated balloon device successfully sam-pled the distal esophagus with excellent tolerability and acceptability and, when combined with bisulfite sequencing for mVIM plus mCCNA1, demonstrated high sensitivity and specificity for detecting BE.
Methylation in other upper gastrointestinal tract pathologiesTo identify potential confounding sources of VIM and CCNA1 DNA methylation, we performed a retrospective analysis of archival formalin- fixed paraffin-embedded (FFPE) esophageal and gastric specimens that captured common pathologies of the upper gastrointestinal (GI) tract (Table 3). As expected, FFPE biopsies of BE were highly methylated, with 90% testing positive for mVIM, 75% testing positive for mCCNA1, and 90% testing positive for the two-marker panel. Clinical criteria for BE require identifying 1 cm or more of esophageal IM. However, the two-marker panel additionally detected 80% of early esophageal IMs, identifying 80% of IM lesions <1 cm and still confined to the endoscopic GE junction (70% positive for mVIM and 67% positive for mCCNA1). Moreover, among individuals with BE, mVIM or mCCNA1 methylation could also be detected in 30% of biopsy samples of columnar mucosa that had no histologic IM (regions of gastric metaplasia; Table 3), sug-gesting that the IM in these BE cases arose in an antecedent field of methylation-positive columnar cells. In contrast, among individuals without BE or IM, assays for mVIM and for mCCNA1 were negative in all GE junction samples (n = 55), which included 15 cases with chronic carditis typified by columnar mucosa without IM (Table 3), and meth-ylation was additionally negative in all distal esophagus samples (n = 24). Together, these findings suggest that aberrant methylation occurs at the earliest stages of BE development, in those columnar mucosae that are actively evolving toward IM. Methylation is not simply a consequence of inflammation, because mVIM and mCCNA1 tests were all negative in each of 15 cases of eosinophilic esophagitis, as well as in the above-mentioned chronic carditis samples. Methylation was, however, addi-tionally detected in a subset of gastric IM lesions, 22% of which were positive for at least one of the two markers. Moreover, 2 of 13 individuals with Helicobacter pylori gastritis, who were at increased risk for but did not have gastric IM, were also positive for VIM or CCNA1 methylation. However, 24 normal gastric fundic mucosa without IM were negative for mVIM in all samples and negative for mCCNA1 in all but one sample. Positive tests for mVIM and mCCNA1 are thus highly associated with IM, predominantly IM of the esophagus but sometimes IM of the stomach.
Consistent with the predictions from this FFPE archive, positive methylation was detected on two of three balloon samples from cases of ultrashort BE (<1 cm), which were unevaluable in the primary anal-
ysis (two positive for mVIM and none for mCCNA1). Similarly, positive methyla-tion was detected in balloon samples from four of four cases of gastric IM that were also unevaluable for the primary analy-sis (four positive for mVIM and two for mCCNA1). This finding of DNA meth-ylation markers that are shared between gastric metaplasias and very early esoph-ageal metaplasias is consistent with other genomic and cell biology lines of evidence that also point to a common origin be-tween EACs and intestinal-type gastric cancers (19, 20).
0.0
0.1
0.2
0.3
0.4
0.5
0.6
0.7
0.0
0.1
0.2
0.3
0.4
0.5
0.6
0.7
Frac
tion
of m
ethy
late
d re
ads
Frac
tion
of m
ethy
late
d re
ads
A B
**
Nonsmokers Smokers Nonsmokers Smokers
Fig. 4. DNA methylation in the proximal squamous esophagus of smokers ver-sus nonsmokers. (A) mCCNA1, *P = 0.0094; (B) mVIM, *P = 0.0155. Patients were classified as smokers if they had any history of ever smoking. P values for differences between smokers and nonsmokers were computed using the Mann-Whitney rank sum test.
A B C D
Fig. 5. Non-endoscopic balloon device. (A) Device capsule and catheter in comparison to a vitamin pill and a dime. (B) Capsule containing inverted balloon in configuration for swallowing. (C) Capsule with inflated balloon in config-uration for esophageal sampling. (D) Capsule containing inverted balloon in configuration for device and biospeci-men retrieval.
www.SCIENCETRANSLATIONALMEDICINE.org 17 January 2018 Vol 10 Issue 424 aao5848
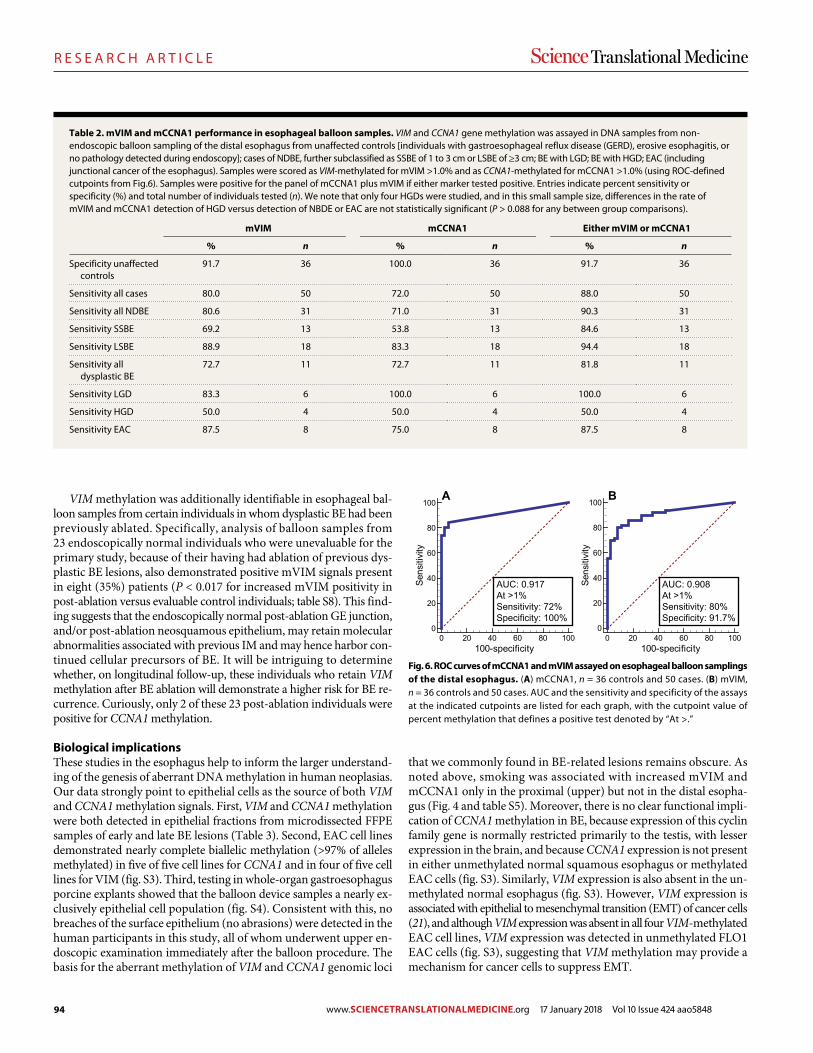
94
R E S E A R C H A R T I C L E
Moinova et al., Sci. Transl. Med. 10, eaao5848 (2018) 17 January 2018
S C I E N C E T R A N S L A T I O N A L M E D I C I N E | R E S E A R C H A R T I C L E
6 of 11
VIM methylation was additionally identifiable in esophageal bal-loon samples from certain individuals in whom dysplastic BE had been previously ablated. Specifically, analysis of balloon samples from 23 endoscopically normal individuals who were unevaluable for the primary study, because of their having had ablation of previous dys-plastic BE lesions, also demonstrated positive mVIM signals present in eight (35%) patients (P < 0.017 for increased mVIM positivity in post-ablation versus evaluable control individuals; table S8). This find-ing suggests that the endoscopically normal post-ablation GE junction, and/or post-ablation neosquamous epithelium, may retain molecular abnormalities associated with previous IM and may hence harbor con-tinued cellular precursors of BE. It will be intriguing to determine whether, on longitudinal follow-up, these individuals who retain VIM methylation after BE ablation will demonstrate a higher risk for BE re-currence. Curiously, only 2 of these 23 post-ablation individuals were positive for CCNA1 methylation.
Biological implicationsThese studies in the esophagus help to inform the larger understand-ing of the genesis of aberrant DNA methylation in human neoplasias. Our data strongly point to epithelial cells as the source of both VIM and CCNA1 methylation signals. First, VIM and CCNA1 methylation were both detected in epithelial fractions from microdissected FFPE samples of early and late BE lesions (Table 3). Second, EAC cell lines demonstrated nearly complete biallelic methylation (>97% of alleles methylated) in five of five cell lines for CCNA1 and in four of five cell lines for VIM (fig. S3). Third, testing in whole-organ gastroesophagus porcine explants showed that the balloon device samples a nearly ex-clusively epithelial cell population (fig. S4). Consistent with this, no breaches of the surface epithelium (no abrasions) were detected in the human participants in this study, all of whom underwent upper en-doscopic examination immediately after the balloon procedure. The basis for the aberrant methylation of VIM and CCNA1 genomic loci
that we commonly found in BE-related lesions remains obscure. As noted above, smoking was associated with increased mVIM and mCCNA1 only in the proximal (upper) but not in the distal esopha-gus (Fig. 4 and table S5). Moreover, there is no clear functional impli-cation of CCNA1 methylation in BE, because expression of this cyclin family gene is normally restricted primarily to the testis, with lesser expression in the brain, and because CCNA1 expression is not present in either unmethylated normal squamous esophagus or methylated EAC cells (fig. S3). Similarly, VIM expression is also absent in the un-methylated normal esophagus (fig. S3). However, VIM expression is associated with epithelial to mesenchymal transition (EMT) of cancer cells (21), and although VIM expression was absent in all four VIM-methylated EAC cell lines, VIM expression was detected in unmethylated FLO1 EAC cells (fig. S3), suggesting that VIM methylation may provide a mechanism for cancer cells to suppress EMT.
Table 2. mVIM and mCCNA1 performance in esophageal balloon samples. VIM and CCNA1 gene methylation was assayed in DNA samples from non-endoscopic balloon sampling of the distal esophagus from unaffected controls [individuals with gastroesophageal reflux disease (GERD), erosive esophagitis, or no pathology detected during endoscopy]; cases of NDBE, further subclassified as SSBE of 1 to 3 cm or LSBE of ≥3 cm; BE with LGD; BE with HGD; EAC (including junctional cancer of the esophagus). Samples were scored as VIM-methylated for mVIM >1.0% and as CCNA1-methylated for mCCNA1 >1.0% (using ROC-defined cutpoints from Fig. 6). Samples were positive for the panel of mCCNA1 plus mVIM if either marker tested positive. Entries indicate percent sensitivity or specificity (%) and total number of individuals tested (n). We note that only four HGDs were studied, and in this small sample size, differences in the rate of mVIM and mCCNA1 detection of HGD versus detection of NBDE or EAC are not statistically significant (P > 0.088 for any between group comparisons).
mVIM mCCNA1 Either mVIM or mCCNA1
% n % n % n
Specificity unaffected controls
91.7 36 100.0 36 91.7 36
Sensitivity all cases 80.0 50 72.0 50 88.0 50
Sensitivity all NDBE 80.6 31 71.0 31 90.3 31
Sensitivity SSBE 69.2 13 53.8 13 84.6 13
Sensitivity LSBE 88.9 18 83.3 18 94.4 18
Sensitivity all dysplastic BE
72.7 11 72.7 11 81.8 11
Sensitivity LGD 83.3 6 100.0 6 100.0 6
Sensitivity HGD 50.0 4 50.0 4 50.0 4
Sensitivity EAC 87.5 8 75.0 8 87.5 8
0
20
40
60
80
100
0 20 40 60 80 100100-specificity
Sens
itivi
ty
0
20
40
60
80
100
0 20 40 60 80 100100-specificity
Sens
itivi
tyAUC: 0.908At >1%Sensitivity: 80%Specificity: 91.7%
AUC: 0.917At >1%Sensitivity: 72%Specificity: 100%
A B
Fig. 6. ROC curves of mCCNA1 and mVIM assayed on esophageal balloon samplings of the distal esophagus. (A) mCCNA1, n = 36 controls and 50 cases. (B) mVIM, n = 36 controls and 50 cases. AUC and the sensitivity and specificity of the assays at the indicated cutpoints are listed for each graph, with the cutpoint value of percent methylation that defines a positive test denoted by “At >.”
www.SCIENCETRANSLATIONALMEDICINE.org 17 January 2018 Vol 10 Issue 424 aao5848
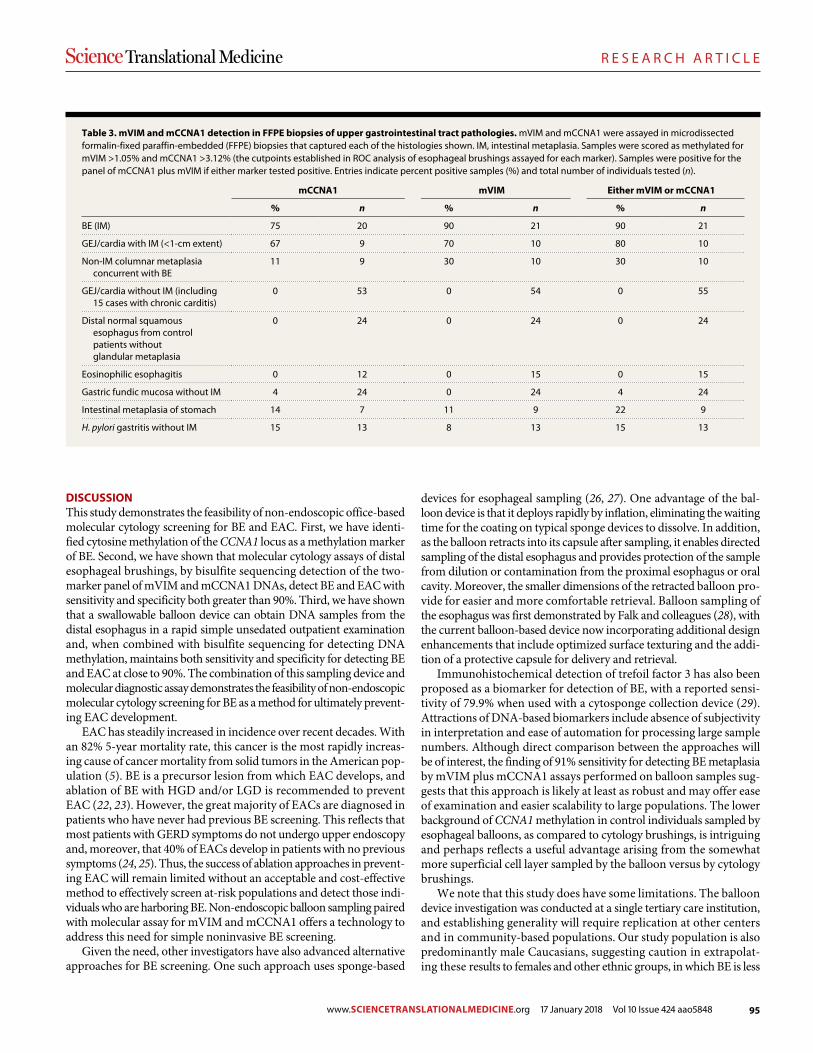
95
R E S E A R C H A R T I C L E
Moinova et al., Sci. Transl. Med. 10, eaao5848 (2018) 17 January 2018
S C I E N C E T R A N S L A T I O N A L M E D I C I N E | R E S E A R C H A R T I C L E
7 of 11
DISCUSSIONThis study demonstrates the feasibility of non-endoscopic office-based molecular cytology screening for BE and EAC. First, we have identi-fied cytosine methylation of the CCNA1 locus as a methylation marker of BE. Second, we have shown that molecular cytology assays of distal esophageal brushings, by bisulfite sequencing detection of the two- marker panel of mVIM and mCCNA1 DNAs, detect BE and EAC with sensitivity and specificity both greater than 90%. Third, we have shown that a swallowable balloon device can obtain DNA samples from the distal esophagus in a rapid simple unsedated outpatient examination and, when combined with bisulfite sequencing for detecting DNA methylation, maintains both sensitivity and specificity for detecting BE and EAC at close to 90%. The combination of this sampling device and molecular diagnostic assay demonstrates the feasibility of non-endoscopic molecular cytology screening for BE as a method for ultimately prevent-ing EAC development.
EAC has steadily increased in incidence over recent decades. With an 82% 5-year mortality rate, this cancer is the most rapidly increas-ing cause of cancer mortality from solid tumors in the American pop-ulation (5). BE is a precursor lesion from which EAC develops, and ablation of BE with HGD and/or LGD is recommended to prevent EAC (22, 23). However, the great majority of EACs are diagnosed in patients who have never had previous BE screening. This reflects that most patients with GERD symptoms do not undergo upper endoscopy and, moreover, that 40% of EACs develop in patients with no previous symptoms (24, 25). Thus, the success of ablation approaches in prevent-ing EAC will remain limited without an acceptable and cost-effective method to effectively screen at-risk populations and detect those indi-viduals who are harboring BE. Non-endoscopic balloon sampling paired with molecular assay for mVIM and mCCNA1 offers a technology to address this need for simple noninvasive BE screening.
Given the need, other investigators have also advanced alternative approaches for BE screening. One such approach uses sponge-based
devices for esophageal sampling (26, 27). One advantage of the bal-loon device is that it deploys rapidly by inflation, eliminating the waiting time for the coating on typical sponge devices to dissolve. In addition, as the balloon retracts into its capsule after sampling, it enables directed sampling of the distal esophagus and provides protection of the sample from dilution or contamination from the proximal esophagus or oral cavity. Moreover, the smaller dimensions of the retracted balloon pro-vide for easier and more comfortable retrieval. Balloon sampling of the esophagus was first demonstrated by Falk and colleagues (28), with the current balloon-based device now incorporating additional design enhancements that include optimized surface texturing and the addi-tion of a protective capsule for delivery and retrieval.
Immunohistochemical detection of trefoil factor 3 has also been proposed as a biomarker for detection of BE, with a reported sensi-tivity of 79.9% when used with a cytosponge collection device (29). Attractions of DNA-based biomarkers include absence of subjectivity in interpretation and ease of automation for processing large sample numbers. Although direct comparison between the approaches will be of interest, the finding of 91% sensitivity for detecting BE metaplasia by mVIM plus mCCNA1 assays performed on balloon samples sug-gests that this approach is likely at least as robust and may offer ease of examination and easier scalability to large populations. The lower background of CCNA1 methylation in control individuals sampled by esophageal balloons, as compared to cytology brushings, is intriguing and perhaps reflects a useful advantage arising from the somewhat more superficial cell layer sampled by the balloon versus by cytology brushings.
We note that this study does have some limitations. The balloon device investigation was conducted at a single tertiary care institution, and establishing generality will require replication at other centers and in community-based populations. Our study population is also predominantly male Caucasians, suggesting caution in extrapolat-ing these results to females and other ethnic groups, in which BE is less
Table 3. mVIM and mCCNA1 detection in FFPE biopsies of upper gastrointestinal tract pathologies. mVIM and mCCNA1 were assayed in microdissected formalin-fixed paraffin-embedded (FFPE) biopsies that captured each of the histologies shown. IM, intestinal metaplasia. Samples were scored as methylated for mVIM >1.05% and mCCNA1 >3.12% (the cutpoints established in ROC analysis of esophageal brushings assayed for each marker). Samples were positive for the panel of mCCNA1 plus mVIM if either marker tested positive. Entries indicate percent positive samples (%) and total number of individuals tested (n).
mCCNA1 mVIM Either mVIM or mCCNA1
% n % n % n
BE (IM) 75 20 90 21 90 21
GEJ/cardia with IM (<1-cm extent) 67 9 70 10 80 10
Non-IM columnar metaplasia concurrent with BE
11 9 30 10 30 10
GEJ/cardia without IM (including 15 cases with chronic carditis)
0 53 0 54 0 55
Distal normal squamous esophagus from control patients without glandular metaplasia
0 24 0 24 0 24
Eosinophilic esophagitis 0 12 0 15 0 15
Gastric fundic mucosa without IM 4 24 0 24 4 24
Intestinal metaplasia of stomach 14 7 11 9 22 9
H. pylori gastritis without IM 15 13 8 13 15 13
www.SCIENCETRANSLATIONALMEDICINE.org 17 January 2018 Vol 10 Issue 424 aao5848
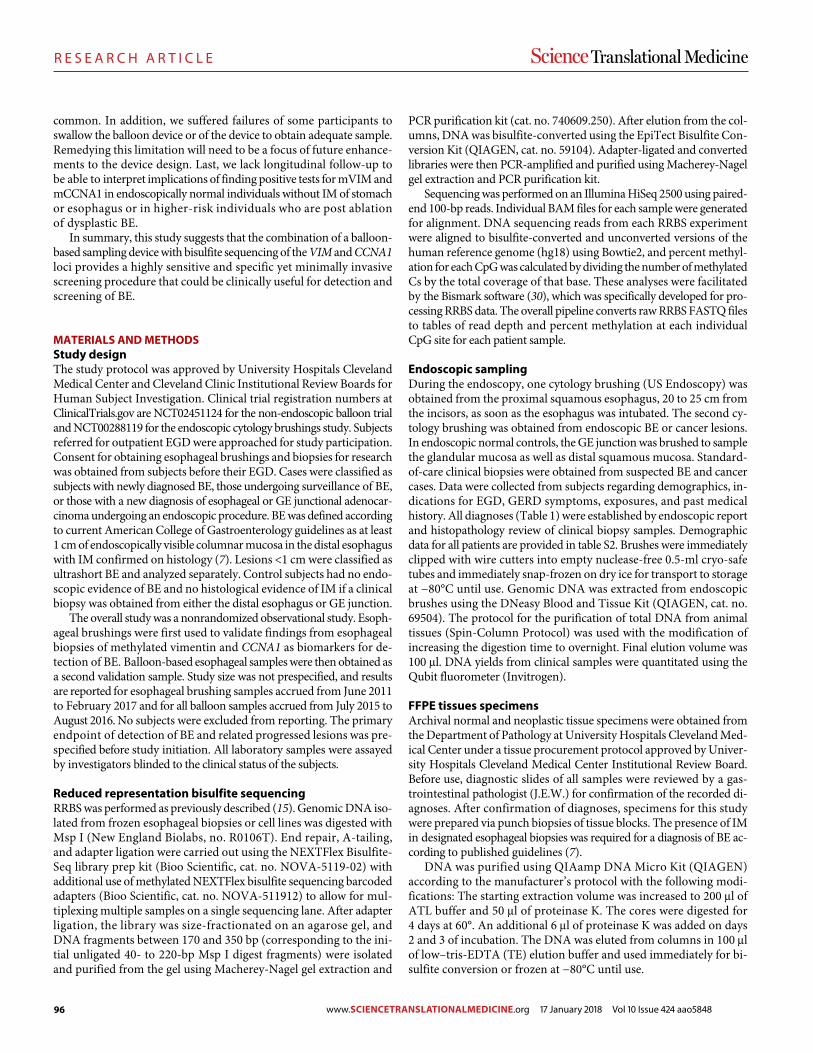
96
R E S E A R C H A R T I C L E
Moinova et al., Sci. Transl. Med. 10, eaao5848 (2018) 17 January 2018
S C I E N C E T R A N S L A T I O N A L M E D I C I N E | R E S E A R C H A R T I C L E
8 of 11
common. In addition, we suffered failures of some participants to swallow the balloon device or of the device to obtain adequate sample. Remedying this limitation will need to be a focus of future enhance-ments to the device design. Last, we lack longitudinal follow-up to be able to interpret implications of finding positive tests for mVIM and mCCNA1 in endoscopically normal individuals without IM of stomach or esophagus or in higher-risk individuals who are post ablation of dysplastic BE.
In summary, this study suggests that the combination of a balloon- based sampling device with bisulfite sequencing of the VIM and CCNA1 loci provides a highly sensitive and specific yet minimally invasive screening procedure that could be clinically useful for detection and screening of BE.
MATERIALS AND METHODSStudy designThe study protocol was approved by University Hospitals Cleveland Medical Center and Cleveland Clinic Institutional Review Boards for Human Subject Investigation. Clinical trial registration numbers at ClinicalTrials.gov are NCT02451124 for the non-endoscopic balloon trial and NCT00288119 for the endoscopic cytology brushings study. Subjects referred for outpatient EGD were approached for study participation. Consent for obtaining esophageal brushings and biopsies for research was obtained from subjects before their EGD. Cases were classified as subjects with newly diagnosed BE, those undergoing surveillance of BE, or those with a new diagnosis of esophageal or GE junctional adenocar-cinoma undergoing an endoscopic procedure. BE was defined according to current American College of Gastroenterology guidelines as at least 1 cm of endoscopically visible columnar mucosa in the distal esophagus with IM confirmed on histology (7). Lesions <1 cm were classified as ultrashort BE and analyzed separately. Control subjects had no endo-scopic evidence of BE and no histological evidence of IM if a clinical biopsy was obtained from either the distal esophagus or GE junction.
The overall study was a nonrandomized observational study. Esoph-ageal brushings were first used to validate findings from esophageal biopsies of methylated vimentin and CCNA1 as biomarkers for de-tection of BE. Balloon-based esophageal samples were then obtained as a second validation sample. Study size was not prespecified, and results are reported for esophageal brushing samples accrued from June 2011 to February 2017 and for all balloon samples accrued from July 2015 to August 2016. No subjects were excluded from reporting. The primary endpoint of detection of BE and related progressed lesions was pre-specified before study initiation. All laboratory samples were assayed by investigators blinded to the clinical status of the subjects.
Reduced representation bisulfite sequencingRRBS was performed as previously described (15). Genomic DNA iso-lated from frozen esophageal biopsies or cell lines was digested with Msp I (New England Biolabs, no. R0106T). End repair, A-tailing, and adapter ligation were carried out using the NEXTFlex Bisulfite- Seq library prep kit (Bioo Scientific, cat. no. NOVA-5119-02) with additional use of methylated NEXTFlex bisulfite sequencing barcoded adapters (Bioo Scientific, cat. no. NOVA-511912) to allow for mul-tiplexing multiple samples on a single sequencing lane. After adapter ligation, the library was size-fractionated on an agarose gel, and DNA fragments between 170 and 350 bp (corresponding to the ini-tial unligated 40- to 220-bp Msp I digest fragments) were isolated and purified from the gel using Macherey-Nagel gel extraction and
PCR purification kit (cat. no. 740609.250). After elution from the col-umns, DNA was bisulfite-converted using the EpiTect Bisulfite Con-version Kit (QIAGEN, cat. no. 59104). Adapter-ligated and converted libraries were then PCR-amplified and purified using Macherey-Nagel gel extraction and PCR purification kit.
Sequencing was performed on an Illumina HiSeq 2500 using paired- end 100-bp reads. Individual BAM files for each sample were generated for alignment. DNA sequencing reads from each RRBS experiment were aligned to bisulfite-converted and unconverted versions of the human reference genome (hg18) using Bowtie2, and percent methyl-ation for each CpG was calculated by dividing the number of methylated Cs by the total coverage of that base. These analyses were facilitated by the Bismark software (30), which was specifically developed for pro-cessing RRBS data. The overall pipeline converts raw RRBS FASTQ files to tables of read depth and percent methylation at each individual CpG site for each patient sample.
Endoscopic samplingDuring the endoscopy, one cytology brushing (US Endoscopy) was obtained from the proximal squamous esophagus, 20 to 25 cm from the incisors, as soon as the esophagus was intubated. The second cy-tology brushing was obtained from endoscopic BE or cancer lesions. In endoscopic normal controls, the GE junction was brushed to sample the glandular mucosa as well as distal squamous mucosa. Standard-of-care clinical biopsies were obtained from suspected BE and cancer cases. Data were collected from subjects regarding demographics, in-dications for EGD, GERD symptoms, exposures, and past medical history. All diagnoses (Table 1) were established by endoscopic report and histopathology review of clinical biopsy samples. Demographic data for all patients are provided in table S2. Brushes were immediately clipped with wire cutters into empty nuclease-free 0.5-ml cryo-safe tubes and immediately snap-frozen on dry ice for transport to storage at −80°C until use. Genomic DNA was extracted from endoscopic brushes using the DNeasy Blood and Tissue Kit (QIAGEN, cat. no. 69504). The protocol for the purification of total DNA from animal tissues (Spin-Column Protocol) was used with the modification of increasing the digestion time to overnight. Final elution volume was 100 l. DNA yields from clinical samples were quantitated using the Qubit fluorometer (Invitrogen).
FFPE tissues specimensArchival normal and neoplastic tissue specimens were obtained from the Department of Pathology at University Hospitals Cleveland Med-ical Center under a tissue procurement protocol approved by Univer-sity Hospitals Cleveland Medical Center Institutional Review Board. Before use, diagnostic slides of all samples were reviewed by a gas-trointestinal pathologist (J.E.W.) for confirmation of the recorded di-agnoses. After confirmation of diagnoses, specimens for this study were prepared via punch biopsies of tissue blocks. The presence of IM in designated esophageal biopsies was required for a diagnosis of BE ac-cording to published guidelines (7).
DNA was purified using QIAamp DNA Micro Kit (QIAGEN) according to the manufacturer’s protocol with the following modi-fications: The starting extraction volume was increased to 200 l of ATL buffer and 50 l of proteinase K. The cores were digested for 4 days at 60°. An additional 6 l of proteinase K was added on days 2 and 3 of incubation. The DNA was eluted from columns in 100 l of low–tris-EDTA (TE) elution buffer and used immediately for bi-sulfite conversion or frozen at −80°C until use.
www.SCIENCETRANSLATIONALMEDICINE.org 17 January 2018 Vol 10 Issue 424 aao5848
97
R E S E A R C H A R T I C L E
Moinova et al., Sci. Transl. Med. 10, eaao5848 (2018) 17 January 2018
S C I E N C E T R A N S L A T I O N A L M E D I C I N E | R E S E A R C H A R T I C L E
9 of 11
Non-endoscopic esophageal brushing via a balloon deviceWe designed an encapsulated, inflatable, surface-featured balloon for targeted sampling of the distal esophagus. The device was delivered in a 16 × 9–mm capsule that also protected the acquired biospecimen from potential contamination with proximal esophagus material during withdrawal. Subjects referred for outpatient EGD were approached for study participation. Patients underwent unsedated distal esophageal sampling with the balloon device before scheduled EGD. After a patient swallowed the capsule with the balloon and the capsule was allowed to reach the stomach, the balloon was inflated with 5 to 5.5 cm3 of air using the attached tubing and syringe. On average, the balloon reached the stomach in 3.3 min (range, 1 to 7 min). The inflated balloon was pulled slowly for 3 to 6 cm from the point where the constriction of the esophageal sphincter was felt by the endoscopist and then deflated using an attached syringe, thus retracting the balloon inside the cap-sule and protecting the sample. After the capsule was removed, the bal-loon was reinflated, cut off from the capsule, and immediately frozen. DNA was extracted from balloons using the same protocol as for en-doscopic brushings but with the modification of increasing the volumes of kit buffers ATL and AL to 1 ml, to completely cover the balloons. After the procedure, each patient filled out a standardized tolerance and acceptance questionnaire (table S9) (31).
Bisulfite conversion of the genomic DNATo create a template for PCR and then DNA methylation analysis, DNA samples were subjected to treatment with sodium bisulfite, which converts unmethylated cytosine bases into uracil, while leaving methyl-ated cytosines intact, using an EpiTect kit (QIAGEN) according to the manufacturer’s protocol. The person performing the methylation anal-ysis was blinded to the clinical history of the samples until after all pro-cedures and calculations were completed.
Bisulfite sequencing–based methylation detectionBisulfite-converted DNA samples from cytology brushings were ana-lyzed by NGS. Bisulfite-specific, methylation-indifferent PCR primers were constructed as a mixture of primers against converted products of fully methylated or fully unmethylated templates and were used to amplify a differentially methylated region of the vimentin exon 1 CpG island [previously described, (32)] or CCNA1 (table S10). Platinum Taq reaction mix (Invitrogen) was supplemented with 1 mM MgCl2, 0.2 mM deoxyribonucleotide triphosphates (New England Biolabs), 0.5 M betaine (Sigma), and a mix of the four primers, each at 0.1 M final concentration. PCR was performed using a touchdown protocol, where after the activation of Taq polymerase at 95°C for 5 min, the initial cycling conditions were 95°C for 45 s, 67°C for 45 s, and 72°C for 45 s. The annealing temperature was decreased by 3°C every three cycles to a final of 55°C. An additional 33 cycles of PCR were performed at the annealing temperature of 55°C. Successful amplification was confirmed by agarose gel electrophoresis. PCR products were purified using NucleoSpin Gel and PCR Clean-up kit (Macherey-Nagel) and quantitated by Qubit. The NEXTflex Rapid DNA-Seq Kit (Bioo Scientific) was used to prepare indexed libraries for NGS sequencing (Illumina- compatible), and NGS was performed using a MiSeq platform at the McGill University and Génome Québec Innovation Centre, Montréal, Canada. FFPE DNA samples were bisulfite-converted and sequenced by EpiQuest (Zymo Research), using the same protocol as above.
Analysis of non-endoscopic balloon DNA samples was done the same way as for brushing samples above, except that the PCR ampli-fication primers (table S10) were indexed by adding 96 different 7-bp
index tags to the 5′ end of both forward and reverse primers (table S11). The amplification with indexed primers was carried out under the same conditions as for nonindexed primers, and the PCR products were subsequently mixed together, before preparing a library for NGS using a nonindexed library adapter.
DNA sequencing reads from each sample were aligned to bisulfite- converted and unconverted versions of the human reference genome (hg18) using Bowtie2. VIM aligned reads were classified as methylated if they indicated that 8 or more CpG dinucleotides were methylated (out of total of 10 CpGs present between the primers in the VIM PCR fragment). CCNA1 aligned reads were classified as methylated if they indicated that 16 or more CpG dinucleotides were methylated (out of a total of 21 CpGs present between the primers in the CCNA1 PCR fragment). These analyses were facilitated by use of Bismark software (30), which was specifically developed for processing bisulfite sequenc-ing data.
Statistical methodsBetween-group comparisons of continuous variables were performed using unpaired Student’s t test (for two groups) or one-way analysis of variance (ANOVA) for groups of three or more, followed by the post hoc Student- Newman-Keuls test for all pairwise comparisons. The Mann-Whitney rank sum test was used to determine the P value for comparison of smokers and nonsmokers. Fisher’s exact test was used for comparison of demographic composition of cases/controls in brushing and balloon studies. ROC curves and all associated statis-tics were generated using MedCalc software. The optimal cutpoints were calculated as maximizing the sum of sensitivity plus specificity.
SUPPLEMENTARY MATERIALSwww.sciencetranslationalmedicine.org/cgi/content/full/10/424/eaao5848/DC1Fig. S1. Flowchart of study analyses.Fig. S2. Comparison of methylation of individual CpGs versus CpG patches in discriminating esophageal lesions.Fig. S3. Comparing VIM and CCNA1 expression versus methylation.Fig. S4. Morphology of touch preps from balloon brushings of three intact porcine esophagus samples from esophagogastric organ explants.Table S1. Location of 26 differentially methylated patches identified by RRBS comparison of normal esophageal squamous mucosa versus Barrett’s lesions.Table S2. Demographic characteristics of training and validation esophageal brushing populations.Table S3. mVIM and mCCNA1 performance in training and validation esophageal brushing samples.Table S4. Comparison of sensitivities of mVIM plus mCCNA1 versus mVIM or mCCNA1, all at equal specificities.Table S5. Influence of smoking on VIM and CCNA1 methylation in proximal versus distal esophagus.Table S6. Participant evaluation of the non-endoscopic balloon sampling of the esophagus.Table S7. Demographic characteristics of subjects in non-endoscopic balloon study.Table S8. Methylation in post-ablation subjects.Table S9. Post-examination questionnaire.Table S10. Bisulfite-specific methylation-independent PCR primer sequences.Table S11. Index tags for bisulfite-specific methylation-independent PCR primer sequences.References (33–66)
REFERENCES AND NOTES 1. W. J. Blot, S. S. Devesa, R. W. Kneller, J. F. Fraumeni Jr., Rising incidence of
adenocarcinoma of the esophagus and gastric cardia. JAMA 265, 1287–1289 (1991). 2. S. S. Devesa, W. J. Blot, J. F. Fraumeni Jr., Changing patterns in the incidence of
esophageal and gastric carcinoma in the United States. Cancer 83, 2049–2053 (1998). 3. M. Pera, A. J. Cameron, V. F. Trastek, H. A. Carpenter, A. R. Zinsmeister, Increasing
incidence of adenocarcinoma of the esophagus and esophagogastric junction. Gastroenterology 104, 510–513 (1993).
www.SCIENCETRANSLATIONALMEDICINE.org 17 January 2018 Vol 10 Issue 424 aao5848
98
R E S E A R C H A R T I C L E
Moinova et al., Sci. Transl. Med. 10, eaao5848 (2018) 17 January 2018
S C I E N C E T R A N S L A T I O N A L M E D I C I N E | R E S E A R C H A R T I C L E
10 of 11
4. H. Pohl, H. G. Welch, The role of overdiagnosis and reclassification in the marked increase of esophageal adenocarcinoma incidence. J. Natl. Cancer Inst. 97, 142–146 (2005).
5. R. L. Siegel, K. D. Miller, A. Jemal, Cancer statistics, 2016. CA Cancer J. Clin. 66, 7–30 (2016). 6. American Gastroenterological Association, American Gastroenterological Association
medical position statement on the management of Barrett’s esophagus. Gastroenterology 140, 1084–1091 (2011).
7. N. J. Shaheen, G. W. Falk, P. G. Iyer, L. B. Gerson, ACG clinical guideline: Diagnosis and management of Barrett’s esophagus. Am. J. Gastroenterol. 111, 30–50 (2016).
8. G. S. Dulai, S. Guha, K. L. Kahn, J. Gornbein, W. M. Weinstein, Preoperative prevalence of Barrett’s esophagus in esophageal adenocarcinoma: A systematic review. Gastroenterology 122, 26–33 (2002).
9. W.-D. Chen, Z. J. Han, J. Skoletsky, J. Olson, J. Sah, L. Myeroff, P. Platzer, S. Lu, D. Dawson, J. Willis, T. P. Pretlow, J. Lutterbaugh, L. Kasturi, J. K. V. Willson, J. S. Rao, A. Shuber, S. D. Markowitz, Detection in fecal DNA of colon cancer–specific methylation of the nonexpressed vimentin gene. J. Natl. Cancer Inst. 97, 1124–1132 (2005).
10. W. M. Grady, J. Willis, P. J. Guilford, A. K. Dunbier, T. T. Toro, H. Lynch, G. Wiesner, K. Ferguson, C. Eng, J.-G. Park, S.-J. Kim, S. Markowitz, Methylation of the CDH1 promoter as the second genetic hit in hereditary diffuse gastric cancer. Nat. Genet. 26, 16–17 (2000).
11. D. M. Marzese, D. S. B. Hoon, Emerging technologies for studying DNA methylation for the molecular diagnosis of cancer. Expert Rev. Mol. Diagn. 15, 647–664 (2015).
12. H. R. Moinova, W.-D. Chen, L. Shen, D. Smiraglia, J. Olechnowicz, L. Ravi, L. Kasturi, L. Myeroff, C. Plass, R. Parsons, J. Minna, J. K. V. Willson, S. B. Green, J.-P. Issa, S. D. Markowitz, HLTF gene silencing in human colon cancer. Proc. Natl. Acad. Sci. U.S.A. 99, 4562–4567 (2002).
13. C. Noehammer, W. Pulverer, M. R. Hassler, M. Hofner, M. Wielscher, K. Vierlinger, T. Liloglou, D. McCarthy, T. J. Jensen, A. Nygren, H. Gohlke, G. Trooskens, M. Braspenning, W. Van Criekinge, G. Egger, A. Weinhaeusel, Strategies for validation and testing of DNA methylation biomarkers. Epigenomics 6, 603–622 (2014).
14. H. Moinova, R. S. Leidner, L. Ravi, J. Lutterbaugh, J. S. Barnholtz-Sloan, Y. Chen, A. Chak, S. D. Markowitz, J. E. Willis, Aberrant vimentin methylation is characteristic of upper gastrointestinal pathologies. Cancer Epidemiol. Biomarkers Prev. 21, 594–600 (2012).
15. H. Gu, Z. D. Smith, C. Bock, P. Boyle, A. Gnirke, A. Meissner, Preparation of reduced representation bisulfite sequencing libraries for genome-scale DNA methylation profiling. Nat. Protoc. 6, 468–481 (2011).
16. C. Bock, E. M. Tomazou, A. B. Brinkman, F. Müller, F. Simmer, H. Gu, N. Jäger, A. Gnirke, H. G. Stunnenberg, A. Meissner, Quantitative comparison of genome-wide DNA methylation mapping technologies. Nat. Biotechnol. 28, 1106–1114 (2010).
17. E. Richmond, A. Umar, Mechanisms of esophageal adenocarcinoma formation and approaches to chemopreventive intervention. Semin. Oncol. 43, 78–85 (2016).
18. A. Singh, A. Chak, Advances in the management of Barrett’s esophagus and early esophageal adenocarcinoma. Gastroenterol. Rep. (Oxf) 3, 303–315 (2015).
19. Y. Hayakawa, N. Sethi, A. R. Sepulveda, A. J. Bass, T. C. Wang, Oesophageal adenocarcinoma and gastric cancer: Should we mind the gap? Nat. Rev. Cancer 16, 305–318 (2016).
20. Cancer Genome Atlas Research Network, Integrated genomic characterization of oesophageal carcinoma. Nature 541, 169–175 (2017).
21. S. Lamouille, J. Xu, R. Derynck, Molecular mechanisms of epithelial–mesenchymal transition. Nat. Rev. Mol. Cell Biol. 15, 178–196 (2014).
22. C. L. Greene, E. M. Tomazou, A. B. Brinkman, F. Müller, F. Simmer, H. Gu, N. Jäger, A. Gnirke, H. G. Stunnenberg, A. Meissner, Emerging concepts for the endoscopic management of superficial esophageal adenocarcinoma. J. Gastrointest. Surg. 20, 851–860 (2016).
23. A. J. Small, J. L. Araujo, C. L. Leggett, A. H. Mendelson, A. Agarwalla, J. A. Abrams, C. J. Lightdale, T. C. Wang, P. G. Iyer, K. K. Wang, A. K. Rustgi, G. G. Ginsberg, K. A. Forde, P. A. Gimotty, J. D. Lewis, G. W. Falk, M. Bewtra, Radiofrequency ablation is associated with decreased neoplastic progression in patients with Barrett’s esophagus and confirmed low-grade dysplasia. Gastroenterology 149, 567–576.e3 (2015).
24. A. Chak, A. Faulx, C. Eng, W. Grady, M. Kinnard, H. Ochs-Balcom, G. Falk, Gastroesophageal reflux symptoms in patients with adenocarcinoma of the esophagus or cardia. Cancer 107, 2160–2166 (2006).
25. J. Lagergren, R. Bergström, A. Lindgren, O. Nyrén, Symptomatic gastroesophageal reflux as a risk factor for esophageal adenocarcinoma. N. Engl. J. Med. 340, 825–831 (1999).
26. S. Kadri, P. Lao-Sirieix, R. C. Fitzgerald, Developing a nonendoscopic screening test for Barrett’s esophagus. Biomark. Med. 5, 397–404 (2011).
27. S. R. Kadri, P. Lao-Sirieix, M. O’Donovan, I. Debiram, M. Das, J. M. Blazeby, J. Emery, A. Boussioutas, H. Morris, F. M. Walter, P. Pharoah, R. H. Hardwick, R. C. Fitzgerald, Acceptability and accuracy of a non-endoscopic screening test for Barrett’s oesophagus in primary care: Cohort study. BMJ 341, c4372 (2010).
28. G. W. Falk, R. Chittajallu, J. R. Goldblum, C. V. Biscotti, K. R. Geisinger, R. E. Petras, S. Birgisson, T. W. Rice, J. E. Richter, Surveillance of patients with Barrett’s esophagus for dysplasia and cancer with balloon cytology. Gastroenterology 112, 1787–1797 (1997).
29. C. S. Ross-Innes, C. S. Ross-Innes, I. Debiram-Beecham, M. O’Donovan, E. Walker, S. Varghese, P. Lao-Sirieix, L. Lovat, M. Griffin, K. Ragunath, R. Haidry, S. S. Sami, P. Kaye, M. Novelli, B. Disep, R. Ostler, B. Aigret, B. V. North, P. Bhandari, A. Haycock, D. Morris, S. Attwood, A. Dhar, C. Rees, M. D. D. Rutter, P. D. Sasieni, R. C. Fitzgerald, Evaluation of a minimally invasive cell sampling device coupled with assessment of trefoil factor 3 expression for diagnosing Barrett’s esophagus: A multi-center case–control study. PLOS MED. 12, e1001780 (2015).
30. F. Krueger, S. R. Andrews, Bismark: A flexible aligner and methylation caller for Bisulfite-Seq applications. Bioinformatics 27, 1571–1572 (2011).
31. A. F. Peery, T. Hoppo, K. S. Garman, E. S. Dellon, N. Daugherty, S. Bream, A. F. Sanz, J. Davison, M. Spacek, D. Connors, A. L. Faulx, A. Chak, J. D. Luketich, N. J. Shaheen, B. A. Jobe; Barret’s Esophagus Risk Consotium, Feasibility, safety, acceptability, and yield of office-based, screening transnasal esophagoscopy (with video). Gastrointest. Endosc. 75, 945–953.e2 (2012).
32. M. Li, W.-d. Chen, N. Papadopoulos, S. N. Goodman, N. C. Bjerregaard, S. Laurberg, B. Levin, H. Juhl, N. Arber, H. Moinova, K. Durkee, K. Schmidt, Y. He, F. Diehl, V. E. Velculescu, S. Zhou, L. A. Diaz Jr., K. W. Kinzler, S. D. Markowitz, B. Vogelstein, Sensitive digital quantification of DNA methylation in clinical samples. Nat. Biotechnol. 27, 858–863 (2009).
33. A. Ooki, Z. Maleki, J.-J. Tsay, C. Goparaju, M. Brait, N. Turaga, H. S. Nam, W. N. Rom, H. I. Pass, D. Sidransky, R. Guerrero-Preston, M. O. Hoque, A panel of novel detection and prognostic methylated DNA markers in primary non-small cell lung cancer and serum DNA. Clin. Cancer Res. 23, 7141–7152 (2017).
34. S. Shen, G. Wang, Q. Shi, R. Zhang, Y. Zhao, Y. Wei, F. Chen, D. C. Christiani, Seven-CpG-based prognostic signature coupled with gene expression predicts survival of oral squamous cell carcinoma. Clin. Epigenetics 9, 88 (2017).
35. H. Tanaka, M. Kanda, M. Koike, N. Iwata, D. Shimizu, K. Ezaka, S. Sueoka, Y. Tanaka, H. Takami, R. Hashimoto, C. Tanaka, S. Yamada, T. Fujii, G. Nakayama, H. Sugimoto, M. Fujiwara, Y. Kodera, Adherens junctions associated protein 1 serves as a predictor of recurrence of squamous cell carcinoma of the esophagus. Int. J. Oncol. 47, 1811–1818 (2015).
36. D. Cogdell, W. Chung, Y. Liu, J. M. McDonald, K. Aldape, J. P. Issa, G. N. Fuller, W. Zhang, Tumor-associated methylation of the putative tumor suppressor AJAP1 gene and association between decreased AJAP1 expression and shorter survival in patients with glioma. Chin. J. Cancer 30, 247–253 (2011).
37. E.-J. Lee, P. Rath, J. Liu, D. Ryu, L. Pei, S. K. Noonepalle, A. Y. Shull, Q. Feng, N. S. Litofsky, D. C. Miller, D. C. Anthony, M. D. Kirk, J. Laterra, L. Deng, H.-B. Xin, X. Wang, J.-H. Choi, H. Shi, Identification of global DNA methylation signatures in glioblastoma-derived cancer stem cells. J. Genet. Genomics 42, 355–371 (2015).
38. K. Matsusaka, A. Kaneda, G. Nagae, T. Ushiku, Y. Kikuchi, R. Hino, H. Uozaki, Y. Seto, K. Takada, H. Aburatani, M. Fukayama, Classification of Epstein–Barr virus–positive gastric cancers by definition of DNA methylation epigenotypes. Cancer Res. 71, 7187–7197 (2011).
39. H.-C. Lai, Y.-C. Wang, M.-H. Yu, R.-L. Huang, C.-C. Yuan, K.-J. Chen, C.-C. Wu, K.-J. Chiang, T.-K. Chao, DNA methylation as a biomarker for the detection of hidden carcinoma in endometrial atypical hyperplasia. Gynecol. Oncol. 135, 552–559 (2014).
40. Y.-C. Chen, R.-L. Huang, Y.-K. Huang, Y.-P. Liao, P.-H. Su, H.-C. Wang, C.-C. Chang, Y.-W. Lin, M.-H. Yu, T.-Y. Chu, H.-C. Lai, Methylomics analysis identifies epigenetically silenced genes and implies an activation of -catenin signaling in cervical cancer. Int. J. Cancer 135, 117–127 (2014).
41. M. O. Kitchen, R. T. Bryan, R. D. Emes, J. R. Glossop, C. Luscombe, K. K. Cheng, M. P. Zeegers, N. D. James, A. J. Devall, C. A. Mein, L. Gommersall, A. A. Fryer, W. E. Farrell, Quantitative genome-wide methylation analysis of high-grade non-muscle invasive bladder cancer. Epigenetics 11, 237–246 (2016).
42. M. Murakami, T. Yoshimoto, K. Nakabayashi, K. Tsuchiya, I. Minami, R. Bouchi, H. Izumiyama, Y. Fujii, K. Abe, C. Tayama, K. Hashimoto, T. Suganami, K. Hata, K.-i. Kihara, Y. Ogawa, Integration of transcriptome and methylome analysis of aldosterone-producing adenomas. Eur. J. Endocrinol. 173, 185–195 (2015).
43. E. Kostareli, D. Holzinger, O. Bogatyrova, T. Hielscher, G. Wichmann, M. Keck, B. Lahrmann, N. Grabe, C. Flechtenmacher, C. R. Schmidt, T. Seiwert, G. Dyckhoff, A. Dietz, D. Höfler, M. Pawlita, A. Benner, F. X. Bosch, P. Plinkert, C. Plass, D. Weichenhan, J. Hess, HPV-related methylation signature predicts survival in oropharyngeal squamous cell carcinomas. J. Clin. Invest. 123, 2488–2501 (2013).
44. C. P. E. Lange, M. Campan, T. Hinoue, R. F. Schmitz, A. E. van der Meulen-de Jong, H. Slingerland, P. J. M. J. Kok, C. M. van Dijk, D. J. Weisenberger, H. Shen, R. A. E. M. Tollenaar, P. W. Laird, Genome-scale discovery of DNA-methylation biomarkers for blood-based detection of colorectal cancer. PLOS ONE 7, e50266 (2012).
45. V. Kloten, M. Rose, S. Kaspar, S. von Stillfried, R. Knüchel, E. Dahl, Epigenetic inactivation of the novel candidate tumor suppressor gene ITIH5 in colon cancer predicts unfavorable overall survival in the CpG island methylator phenotype. Epigenetics 9, 1290–1301 (2014).
46. M. Rose, N. T. Gaisa, P. Antony, D. Fiedler, A. Heidenreich, W. Otto, S. Denzinger, S. Bertz, A. Hartmann, A. Karl, R. Knüchel, E. Dahl, Epigenetic inactivation of ITIH5 promotes
www.SCIENCETRANSLATIONALMEDICINE.org 17 January 2018 Vol 10 Issue 424 aao5848
99
R E S E A R C H A R T I C L E
Moinova et al., Sci. Transl. Med. 10, eaao5848 (2018) 17 January 2018
S C I E N C E T R A N S L A T I O N A L M E D I C I N E | R E S E A R C H A R T I C L E
11 of 11
bladder cancer progression and predicts early relapse of pT1 high-grade urothelial tumours. Carcinogenesis 35, 727–736 (2014).
47. V. Kloten, B. Becker, K. Winner, M. G. Schrauder, P. A. Fasching, T. Anzeneder, J. Veeck, A. Hartmann, R. Knüchel, E. Dahl, Promoter hypermethylation of the tumor-suppressor genes ITIH5, DKK3, and RASSF1A as novel biomarkers for blood-based breast cancer screening. Breast Cancer Res. 15, R4 (2013).
48. J. Dittmann, A. Ziegfeld, L. Jansen, M. Gajda, V. Kloten, E. Dahl, I. B. Runnebaum, M. Dürst, C. Backsch, Gene expression analysis combined with functional genomics approach identifies ITIH5 as tumor suppressor gene in cervical carcinogenesis. Mol. Carcinog. 56, 1578–1589 (2017).
49. S. Zhang, X.-L. Feng, L. Shi, C.-J. Gong, Z.-J. He, H.-J. Wu, T.-Y. Ling, Genome-wide analysis of DNA methylation in tongue squamous cell carcinoma. Oncol. Rep. 29, 1819–1826 (2013).
50. G. Ma, H. Liu, Q. Hua, M. Wang, M. Du, Y. Lin, Y. Ge, W. Gong, Q. Zhao, F. Qiang, G. Tao, Z. Zhang, H. Chu, KCNMA1 cooperating with PTK2 is a novel tumor suppressor in gastric cancer and is associated with disease outcome. Mol. Cancer 16, 46 (2017).
51. D. K. Vanaja, M. Ehrich, D. Boom, J. C. Cheville, R. J. Karnes, D. J. Tindall, C. R. Cantor, C. Y. Young, Hypermethylation of genes for diagnosis and risk stratification of prostate cancer. Cancer Invest. 27, 549–560 (2009).
52. J. M. Yi, M. Dhir, A. A. Guzzetta, C. A. Iacobuzio-Donahue, K. Heo, K. M. Yang, H. Suzuki, M. Toyota, H.-M. Kim, N. Ahuja, DNA methylation biomarker candidates for early detection of colon cancer. Tumour Biol. 33, 363–372 (2012).
53. J.-H. Bae, J. Park, K. M. Yang, T.-O. Kim, J. M. Yi; IBD Study Group of Korean Association for Study of Intestinal Diseases (KASID), Detection of DNA hypermethylation in sera of patients with Crohn’s disease. Mol. Med. Rep. 9, 725–729 (2014).
54. D. Li, Z. Xu, J. Liu, X. Pu, Y. Luo, X. Zheng, [Restriction landmark genomic scanning for screening aberrant CpG methylations in prostate cancer]. Nan Fang Yi Ke Da Xue Xue Bao 36, 103–108 (2016).
55. L. M. R. B. Arantes, A. C. de Carvalho, M. E. Melendez, C. C. Centrone, J. F. Góis-Filho, T. N. Toporcov, D. N. Caly, E. H. Tajara, E. M. Goloni-Bertollo, A. L. Carvalho; GENCAPO, Validation of methylation markers for diagnosis of oral cavity cancer. Eur. J. Cancer 51, 632–641 (2015).
56. K. Chalertpet, W. Pakdeechaidan, V. Patel, A. Mutirangura, P. Yanatatsaneejit, Human papillomavirus type 16 E7 oncoprotein mediates CCNA1 promoter methylation. Cancer Sci. 106, 1333–1340 (2015).
57. J. Klajic, F. Busato, H. Edvardsen, N. Touleimat, T. Fleischer, I. Bukholm, A.-L. Børresen-Dale, P. E. Lønning, J. Tost, V. N. Kristensen, DNA methylation status of key cell-cycle regulators such as CDKNA2/p16 and CCNA1 correlates with treatment response to doxorubicin and 5-fluorouracil in locally advanced breast tumors. Clin. Cancer Res. 20, 6357–6366 (2014).
58. L. Maldonado, M. Brait, C. Michailidi, E. Munari, T. Driscoll, L. Schultz, T. Bivalacqua, M. Schoenberg, D. Sidransky, G. J. Netto, M. O. Hoque, An epigenetic marker panel for recurrence risk prediction of low grade papillary urothelial cell carcinoma (LGPUCC) and its potential use for surveillance after transurethral resection using urine. Oncotarget 5, 5218–5233 (2014).
59. Y. Li, J. Xu, H. Ju, Y. Xiao, H. Chen, J. Lv, T. Shao, J. Bai, Y. Zhang, L. Wang, X. Wang, H. Ren, X. Li, A network-based, integrative approach to identify genes with aberrant co-methylation in colorectal cancer. Mol. Biosyst. 10, 180–190 (2014).
60. H. Bae, B. Kim, H. Lee, S. Lee, H.-S. Kang, S. Jung Kim, Epigenetically regulated Fibronectin leucine rich transmembrane protein 2 (FLRT2) shows tumor suppressor activity in breast cancer cells. Sci. Rep. 7, 272 (2017).
61. M. Kusakabe, T. Kutomi, K. Watanabe, N. Emoto, N. Aki, H. Kage, E. Hamano, H. Kitagawa, T. Nagase, A. Sano, Y. Yoshida, T. Fukami, T. Murakawa, J. Nakajima, S. Takamoto, S. Ota, M. Fukayama, Y. Yatomi, N. Ohishi, D. Takai, Identification of G0S2 as a gene frequently methylated in squamous lung cancer by combination of in silico and experimental approaches. Int. J. Cancer 126, 1895–1902 (2010).
62. Y. Wu, J. Davison, X. Qu, C. Morrissey, B. Storer, L. Brown, R. Vessella, P. Nelson, M. Fang, Methylation profiling identified novel differentially methylated markers including OPCML and FLRT2 in prostate cancer. Epigenetics 11, 247–258 (2016).
63. S. Windhorst, K. Song, A. F. Gazdar, Inositol-1,4,5-trisphosphate 3-kinase-A (ITPKA) is frequently over-expressed and functions as an oncogene in several tumor types. Biochem. Pharmacol. 137, 1–9 (2017).
64. Y.-W. Wang, X. Ma, Y.-A. Zhang, M.-J. Wang, Y. Yatabe, S. Lam, L. Girard, J.-Y. Chen, A. F. Gazdar, ITPKA gene body methylation regulates gene expression and serves as an early diagnostic marker in lung and other cancers. J. Thorac. Oncol. 11, 1469–1481 (2016).
65. H. Takamaru, E. Yamamoto, H. Suzuki, M. Nojima, R. Maruyama, H. O. Yamano, K. Yoshikawa, T. Kimura, T. Harada, M. Ashida, R. Suzuki, H.-o. Yamamoto, M. Kai, T. Tokino, T. Sugai, K. Imai, M. Toyota, Y. Shinomura, Aberrant methylation of RASGRF1 is associated with an epigenetic field defect and increased risk of gastric cancer. Cancer Prev. Res. (Phila.) 5, 1203–1212 (2012).
66. N. Uehiro, F. Sato, F. Pu, S. Tanaka, M. Kawashima, K. Kawaguchi, M. Sugimoto, S. Saji, M. Toi, Circulating cell-free DNA-based epigenetic assay can detect early breast cancer. Breast Cancer Res. 18, 129 (2016).
Acknowledgments: We acknowledge the contribution of staff of the McGill University and Génome Québec Innovation Centre, Montréal, Canada for NGS sequencing and thank Nottingham Spirk, North Coast Medical Development, and M. Haag and S. Weidenbecher for support and assistance in development of the balloon device. Funding: This study was supported by NIH grants P50CA150964, U54CA163060, UO1CA152756, UL1TR000439, and UH2CA205105; American Cancer Society grant 123436-RSG-12-159-01-DMC; and awards from the Case-Coulter Foundation Partnership for Translational Research and the Ohio Third Frontier Technology Validation and Start-Up Fund. Author contributions: S.D.M. and A.C. designed the study; A.C., J.D., P.N.T., A.F., and J.S.B.-S. wrote and submitted the clinical protocol and treated the patients; P.G.I., M.I.C., J.S.W., and N.J.S. recruited the patients and obtained research tissue samples; A.K.C. and W.B. archived and managed the clinical samples; J.E.W. performed the pathology review of FFPE samples; J.D.L. prepared and archived DNA for all samples used in the study; H.R.M. and K.G. performed the experiments; O.D.l.C.C. and T.L. performed the NGS analyses; H.R.M. and S.D.M. analyzed the data; and H.R.M., S.D.M., and A.C. wrote the manuscript. All authors reviewed and approved the final manuscript. Competing interests: A.C., J.E.W., and S.D.M. have awarded patents on the use of methylated vimentin for detection of BE and other GI cancers and have also pending patent on a balloon-based device for non-endoscopic sampling of the esophagus. A.C., J.E.W., S.D.M., T.L., O.D.l.C.C., and H.R.M. have pending patents on methylated CCNA1. Patent rights have been assigned to Case Western Reserve University and are managed under institutional conflict of interest policies. Awarded patents include U.S. Patent 9580754 (Methods and compositions for detecting gastrointestinal and other cancers), U.S. Patent 8415100 (Methods and compositions for detecting gastrointestinal and other cancers), and U.S. Patent 8221977 (Methods and compositions for detecting colon cancers). Pending patents include PCT/US2014/070060 (Device for collecting a biological sample), PCT/US2010/030084 (Digital quantification of DNA methylation), PCT/US2015/068131 (Methods and compositions for detecting esophageal neoplasias and metaplasias), and PCT/US2017/040708 (Methods and compositions for detecting esophageal neoplasias and/or metaplasias in the esophagus). S.D.M. has consulting relationships with Rodeo Therapeutics, Janssen Pharmaceuticals, and GlaxoSmithKline. A.C. has consulting relationships with US Endoscopy and C2 Therapeutics. N.J.S. consults for Shire, Ambu, and Boston Scientific and has research funding from Medtronic, C2 Therapeutics, CSA Medical, EndoStim, CDx Diagnostics, and Interpace Diagnostics. P.G.I. consults for Medtronic and has research funding from Exact Sciences, IntroMedic, and C2 Therapeutics. M.I.C. consults for PENTAX Medical Corporation and Cook Medical and has research funding from C2 Therapeutics Inc. J.D. consults for US Endoscopy and CSA Medical and has research funding from C2 Therapeutics. No other financial conflicts of interest pertain to the authors of this paper.
Submitted 7 August 2017Accepted 8 November 2017Published 17 January 201810.1126/scitranslmed.aao5848
Citation: H. R. Moinova, T. LaFramboise, J. D. Lutterbaugh, A. K. Chandar, J. Dumot, A. Faulx, W. Brock, O. De la Cruz Cabrera, K. Guda, J. S. Barnholtz-Sloan, P. G. Iyer, M. I. Canto, J. S. Wang, N. J. Shaheen, P. N. Thota, J. E. Willis, A. Chak, S. D. Markowitz, Identifying DNA methylation biomarkers for non-endoscopic detection of Barrett’s esophagus. Sci. Transl. Med. 10, eaao5848 (2018).
www.SCIENCETRANSLATIONALMEDICINE.org 17 January 2018 Vol 10 Issue 424 aao5848
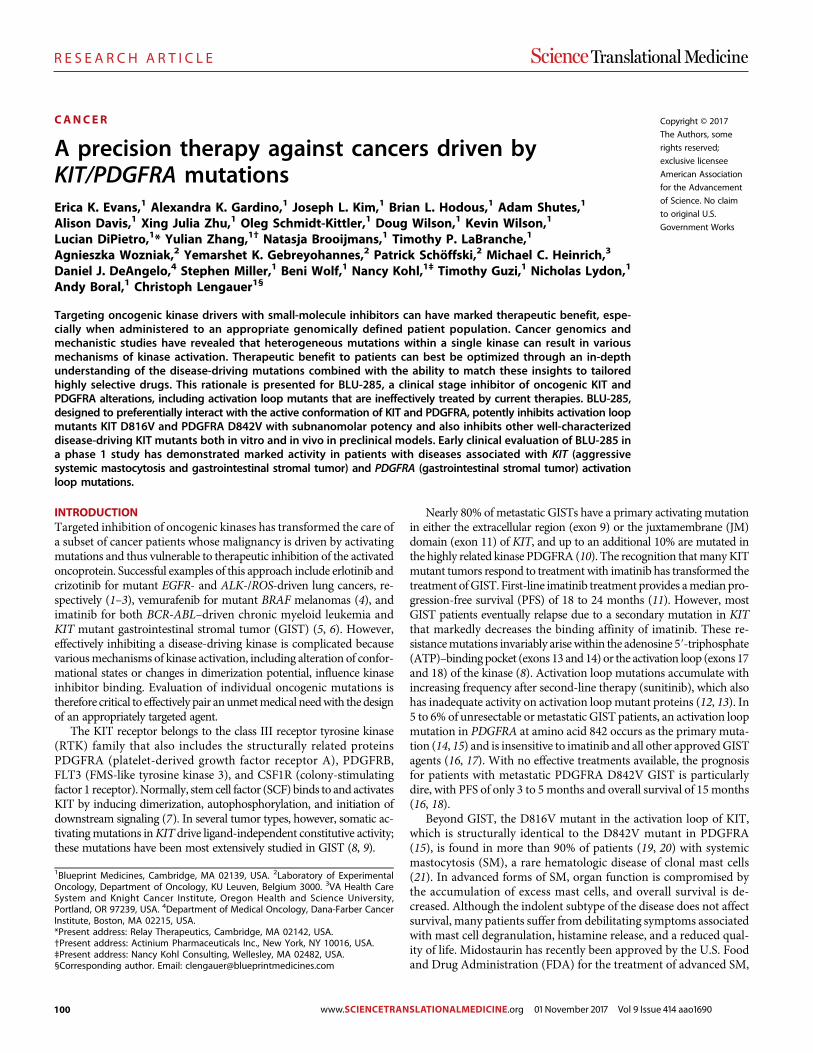
100
R E S E A R C H A R T I C L E
CANCER Copyright © 2017
The Authors, some
rights reserved;
exclusive licensee
American Association
for the Advancement
of Science. No claim
to original U.S.
Government Works
A precision therapy against cancers driven byKIT/PDGFRA mutationsErica K. Evans,1 Alexandra K. Gardino,1 Joseph L. Kim,1 Brian L. Hodous,1 Adam Shutes,1
Alison Davis,1 Xing Julia Zhu,1 Oleg Schmidt-Kittler,1 Doug Wilson,1 Kevin Wilson,1
Lucian DiPietro,1* Yulian Zhang,1† Natasja Brooijmans,1 Timothy P. LaBranche,1
Agnieszka Wozniak,2 Yemarshet K. Gebreyohannes,2 Patrick Schöffski,2 Michael C. Heinrich,3
Daniel J. DeAngelo,4 Stephen Miller,1 Beni Wolf,1 Nancy Kohl,1‡ Timothy Guzi,1 Nicholas Lydon,1
Andy Boral,1 Christoph Lengauer1§
Targeting oncogenic kinase drivers with small-molecule inhibitors can have marked therapeutic benefit, espe-cially when administered to an appropriate genomically defined patient population. Cancer genomics andmechanistic studies have revealed that heterogeneous mutations within a single kinase can result in variousmechanisms of kinase activation. Therapeutic benefit to patients can best be optimized through an in-depthunderstanding of the disease-driving mutations combined with the ability to match these insights to tailoredhighly selective drugs. This rationale is presented for BLU-285, a clinical stage inhibitor of oncogenic KIT andPDGFRA alterations, including activation loop mutants that are ineffectively treated by current therapies. BLU-285,designed to preferentially interact with the active conformation of KIT and PDGFRA, potently inhibits activation loopmutants KIT D816V and PDGFRA D842V with subnanomolar potency and also inhibits other well-characterizeddisease-driving KIT mutants both in vitro and in vivo in preclinical models. Early clinical evaluation of BLU-285 ina phase 1 study has demonstrated marked activity in patients with diseases associated with KIT (aggressivesystemic mastocytosis and gastrointestinal stromal tumor) and PDGFRA (gastrointestinal stromal tumor) activationloop mutations.
INTRODUCTIONTargeted inhibition of oncogenic kinases has transformed the care ofa subset of cancer patients whose malignancy is driven by activatingmutations and thus vulnerable to therapeutic inhibition of the activatedoncoprotein. Successful examples of this approach include erlotinib andcrizotinib for mutant EGFR- and ALK-/ROS-driven lung cancers, re-spectively (1–3), vemurafenib for mutant BRAF melanomas (4), andimatinib for both BCR-ABL–driven chronic myeloid leukemia andKIT mutant gastrointestinal stromal tumor (GIST) (5, 6). However,effectively inhibiting a disease-driving kinase is complicated becausevariousmechanisms of kinase activation, including alteration of confor-mational states or changes in dimerization potential, influence kinaseinhibitor binding. Evaluation of individual oncogenic mutations istherefore critical to effectively pair anunmetmedical needwith thedesignof an appropriately targeted agent.
The KIT receptor belongs to the class III receptor tyrosine kinase(RTK) family that also includes the structurally related proteinsPDGFRA (platelet-derived growth factor receptor A), PDGFRB,FLT3 (FMS-like tyrosine kinase 3), and CSF1R (colony-stimulatingfactor 1 receptor).Normally, stemcell factor (SCF) binds to and activatesKIT by inducing dimerization, autophosphorylation, and initiation ofdownstream signaling (7). In several tumor types, however, somatic ac-tivatingmutations inKIT drive ligand-independent constitutive activity;these mutations have been most extensively studied in GIST (8, 9).
Nearly 80% of metastatic GISTs have a primary activating mutationin either the extracellular region (exon 9) or the juxtamembrane (JM)domain (exon 11) of KIT, and up to an additional 10% are mutated inthe highly related kinase PDGFRA (10). The recognition thatmanyKITmutant tumors respond to treatment with imatinib has transformed thetreatment ofGIST. First-line imatinib treatment provides amedian pro-gression-free survival (PFS) of 18 to 24 months (11). However, mostGIST patients eventually relapse due to a secondary mutation in KITthat markedly decreases the binding affinity of imatinib. These re-sistancemutations invariably arisewithin the adenosine 5′-triphosphate(ATP)–bindingpocket (exons 13 and 14) or the activation loop (exons 17and 18) of the kinase (8). Activation loop mutations accumulate withincreasing frequency after second-line therapy (sunitinib), which alsohas inadequate activity on activation loopmutant proteins (12, 13). In5 to 6% of unresectable ormetastatic GIST patients, an activation loopmutation in PDGFRA at amino acid 842 occurs as the primary muta-tion (14, 15) and is insensitive to imatinib and all other approvedGISTagents (16, 17). With no effective treatments available, the prognosisfor patients with metastatic PDGFRA D842V GIST is particularlydire, with PFS of only 3 to 5 months and overall survival of 15months(16, 18).
Beyond GIST, the D816V mutant in the activation loop of KIT,which is structurally identical to the D842V mutant in PDGFRA(15), is found in more than 90% of patients (19, 20) with systemicmastocytosis (SM), a rare hematologic disease of clonal mast cells(21). In advanced forms of SM, organ function is compromised bythe accumulation of excess mast cells, and overall survival is de-creased. Although the indolent subtype of the disease does not affectsurvival, many patients suffer from debilitating symptoms associatedwith mast cell degranulation, histamine release, and a reduced qual-ity of life. Midostaurin has recently been approved by the U.S. Foodand Drug Administration (FDA) for the treatment of advanced SM,
1Blueprint Medicines, Cambridge, MA 02139, USA. 2Laboratory of ExperimentalOncology, Department of Oncology, KU Leuven, Belgium 3000. 3VA Health CareSystem and Knight Cancer Institute, Oregon Health and Science University,Portland, OR 97239, USA. 4Department of Medical Oncology, Dana-Farber CancerInstitute, Boston, MA 02215, USA.*Present address: Relay Therapeutics, Cambridge, MA 02142, USA.†Present address: Actinium Pharmaceuticals Inc., New York, NY 10016, USA.‡Present address: Nancy Kohl Consulting, Wellesley, MA 02482, USA.§Corresponding author. Email: [email protected]
SC I ENCE TRANS LAT IONAL MED I C I N E | R E S EARCH ART I C L E
Evans et al., Sci. Transl. Med. 9, eaao1690 (2017) 1 November 2017 1 of 11www.SCIENCETRANSLATIONALMEDICINE.org 01 November 2017 Vol 9 Issue 414 aao1690
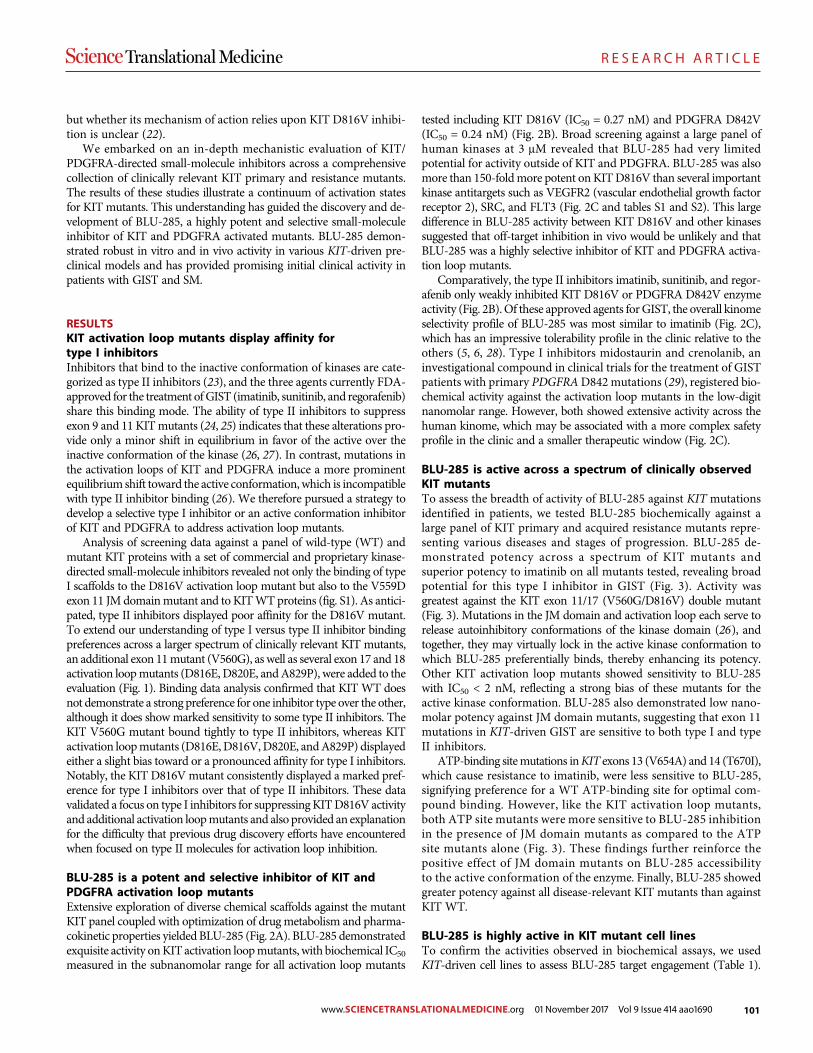
101
R E S E A R C H A R T I C L E
but whether its mechanism of action relies upon KIT D816V inhibi-tion is unclear (22).
We embarked on an in-depth mechanistic evaluation of KIT/PDGFRA-directed small-molecule inhibitors across a comprehensivecollection of clinically relevant KIT primary and resistance mutants.The results of these studies illustrate a continuum of activation statesfor KIT mutants. This understanding has guided the discovery and de-velopment of BLU-285, a highly potent and selective small-moleculeinhibitor of KIT and PDGFRA activated mutants. BLU-285 demon-strated robust in vitro and in vivo activity in various KIT-driven pre-clinical models and has provided promising initial clinical activity inpatients with GIST and SM.
RESULTSKIT activation loop mutants display affinity fortype I inhibitorsInhibitors that bind to the inactive conformation of kinases are cate-gorized as type II inhibitors (23), and the three agents currently FDA-approved for the treatment ofGIST (imatinib, sunitinib, and regorafenib)share this binding mode. The ability of type II inhibitors to suppressexon 9 and 11 KITmutants (24, 25) indicates that these alterations pro-vide only a minor shift in equilibrium in favor of the active over theinactive conformation of the kinase (26, 27). In contrast, mutations inthe activation loops of KIT and PDGFRA induce a more prominentequilibrium shift toward the active conformation, which is incompatiblewith type II inhibitor binding (26). We therefore pursued a strategy todevelop a selective type I inhibitor or an active conformation inhibitorof KIT and PDGFRA to address activation loop mutants.
Analysis of screening data against a panel of wild-type (WT) andmutant KIT proteins with a set of commercial and proprietary kinase-directed small-molecule inhibitors revealed not only the binding of typeI scaffolds to the D816V activation loop mutant but also to the V559Dexon 11 JM domainmutant and to KITWTproteins (fig. S1). As antici-pated, type II inhibitors displayed poor affinity for the D816V mutant.To extend our understanding of type I versus type II inhibitor bindingpreferences across a larger spectrum of clinically relevant KIT mutants,an additional exon 11mutant (V560G), as well as several exon 17 and 18activation loopmutants (D816E, D820E, andA829P), were added to theevaluation (Fig. 1). Binding data analysis confirmed that KIT WT doesnot demonstrate a strong preference for one inhibitor type over the other,although it does show marked sensitivity to some type II inhibitors. TheKIT V560G mutant bound tightly to type II inhibitors, whereas KITactivation loopmutants (D816E,D816V,D820E, andA829P) displayedeither a slight bias toward or a pronounced affinity for type I inhibitors.Notably, the KIT D816Vmutant consistently displayed a marked pref-erence for type I inhibitors over that of type II inhibitors. These datavalidated a focus on type I inhibitors for suppressingKITD816V activityand additional activation loopmutants and also provided an explanationfor the difficulty that previous drug discovery efforts have encounteredwhen focused on type II molecules for activation loop inhibition.
BLU-285 is a potent and selective inhibitor of KIT andPDGFRA activation loop mutantsExtensive exploration of diverse chemical scaffolds against the mutantKIT panel coupled with optimization of drugmetabolism and pharma-cokinetic properties yielded BLU-285 (Fig. 2A). BLU-285 demonstratedexquisite activity onKIT activation loopmutants, with biochemical IC50
measured in the subnanomolar range for all activation loop mutants
tested including KIT D816V (IC50 = 0.27 nM) and PDGFRA D842V(IC50 = 0.24 nM) (Fig. 2B). Broad screening against a large panel ofhuman kinases at 3 mM revealed that BLU-285 had very limitedpotential for activity outside of KIT and PDGFRA. BLU-285 was alsomore than 150-foldmore potent on KITD816V than several importantkinase antitargets such as VEGFR2 (vascular endothelial growth factorreceptor 2), SRC, and FLT3 (Fig. 2C and tables S1 and S2). This largedifference in BLU-285 activity between KIT D816V and other kinasessuggested that off-target inhibition in vivo would be unlikely and thatBLU-285 was a highly selective inhibitor of KIT and PDGFRA activa-tion loop mutants.
Comparatively, the type II inhibitors imatinib, sunitinib, and regor-afenib only weakly inhibited KIT D816V or PDGFRA D842V enzymeactivity (Fig. 2B).Of these approved agents forGIST, the overall kinomeselectivity profile of BLU-285 was most similar to imatinib (Fig. 2C),which has an impressive tolerability profile in the clinic relative to theothers (5, 6, 28). Type I inhibitors midostaurin and crenolanib, aninvestigational compound in clinical trials for the treatment of GISTpatients with primary PDGFRAD842mutations (29), registered bio-chemical activity against the activation loop mutants in the low-digitnanomolar range. However, both showed extensive activity across thehuman kinome, which may be associated with a more complex safetyprofile in the clinic and a smaller therapeutic window (Fig. 2C).
BLU-285 is active across a spectrum of clinically observedKIT mutantsTo assess the breadth of activity of BLU-285 against KIT mutationsidentified in patients, we tested BLU-285 biochemically against alarge panel of KIT primary and acquired resistance mutants repre-senting various diseases and stages of progression. BLU-285 de-monstrated potency across a spectrum of KIT mutants andsuperior potency to imatinib on all mutants tested, revealing broadpotential for this type I inhibitor in GIST (Fig. 3). Activity wasgreatest against the KIT exon 11/17 (V560G/D816V) double mutant(Fig. 3). Mutations in the JM domain and activation loop each serve torelease autoinhibitory conformations of the kinase domain (26), andtogether, they may virtually lock in the active kinase conformation towhich BLU-285 preferentially binds, thereby enhancing its potency.Other KIT activation loop mutants showed sensitivity to BLU-285with IC50 < 2 nM, reflecting a strong bias of these mutants for theactive kinase conformation. BLU-285 also demonstrated low nano-molar potency against JM domain mutants, suggesting that exon 11mutations in KIT-driven GIST are sensitive to both type I and typeII inhibitors.
ATP-binding sitemutations inKIT exons 13 (V654A) and 14 (T670I),which cause resistance to imatinib, were less sensitive to BLU-285,signifying preference for a WT ATP-binding site for optimal com-pound binding. However, like the KIT activation loop mutants,both ATP site mutants were more sensitive to BLU-285 inhibitionin the presence of JM domain mutants as compared to the ATPsite mutants alone (Fig. 3). These findings further reinforce thepositive effect of JM domain mutants on BLU-285 accessibilityto the active conformation of the enzyme. Finally, BLU-285 showedgreater potency against all disease-relevant KIT mutants than againstKIT WT.
BLU-285 is highly active in KIT mutant cell linesTo confirm the activities observed in biochemical assays, we usedKIT-driven cell lines to assess BLU-285 target engagement (Table 1).
SC I ENCE TRANS LAT IONAL MED I C I N E | R E S EARCH ART I C L E
Evans et al., Sci. Transl. Med. 9, eaao1690 (2017) 1 November 2017 2 of 11www.SCIENCETRANSLATIONALMEDICINE.org 01 November 2017 Vol 9 Issue 414 aao1690
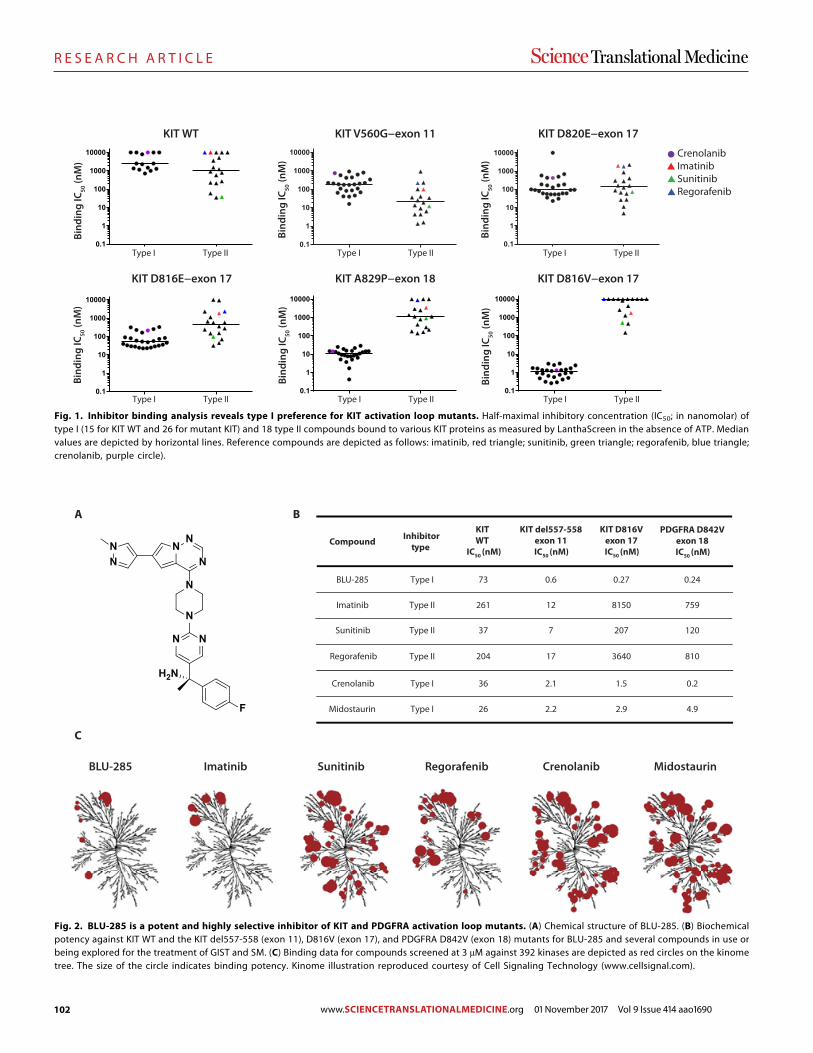
102
R E S E A R C H A R T I C L E
0.1
1
10
100
1000
10000
0.1
1
10
100
1000
10000
0.1
1
10
100
1000
10000
0.1
1
10
100
1000
10000
CrenolanibImatinibSunitinibRegorafenib
Type I Type II
Type I Type II
Type I Type II
Type I Type II
Type I Type II
Type I Type II
Bind
ing
IC50
(nM
)
Bind
ing
IC50
(nM
)
Bind
ing
IC50
(nM
)
Bind
ing
IC50
(nM
)
Bind
ing
IC50
(nM
)
Bind
ing
IC50
(nM
)
KIT WT KIT V560G−exon 11 KIT D820E−exon 17
KIT D816E−exon 17 KIT A829P−exon 18 KIT D816V−exon 17
0.1
1
10
100
1000
10000
0.1
1
10
100
1000
10000
Fig. 1. Inhibitor binding analysis reveals type I preference for KIT activation loop mutants. Half-maximal inhibitory concentration (IC50; in nanomolar) oftype I (15 for KIT WT and 26 for mutant KIT) and 18 type II compounds bound to various KIT proteins as measured by LanthaScreen in the absence of ATP. Medianvalues are depicted by horizontal lines. Reference compounds are depicted as follows: imatinib, red triangle; sunitinib, green triangle; regorafenib, blue triangle;crenolanib, purple circle).
BLU-285 Imatinib Sunitinib Regorafenib Crenolanib Midostaurin
A
BLU-285
Imatinib
Sunitinib
Regorafenib
Crenolanib
Midostaurin
Type I
Type II
Type II
Type II
Type I
Type I
0.6
12
7
17
2.1
2.2
0.27
8150
207
3640
1.5
2.9
0.24
759
120
810
0.2
4.9
Compound Inhibitortype
KIT del557-558exon 11IC50 (nM)
KIT D816Vexon 17IC50 (nM)
PDGFRA D842Vexon 18IC50 (nM)
B
C
73
261
37
204
36
26
KIT WT
IC50 (nM)NN
N
N
N
NN
N N
F
H2N
Fig. 2. BLU-285 is a potent and highly selective inhibitor of KIT and PDGFRA activation loop mutants. (A) Chemical structure of BLU-285. (B) Biochemicalpotency against KIT WT and the KIT del557-558 (exon 11), D816V (exon 17), and PDGFRA D842V (exon 18) mutants for BLU-285 and several compounds in use orbeing explored for the treatment of GIST and SM. (C) Binding data for compounds screened at 3 mM against 392 kinases are depicted as red circles on the kinometree. The size of the circle indicates binding potency. Kinome illustration reproduced courtesy of Cell Signaling Technology (www.cellsignal.com).
S C I ENCE TRANS LAT IONAL MED I C I N E | R E S EARCH ART I C L E
Evans et al., Sci. Transl. Med. 9, eaao1690 (2017) 1 November 2017 3 of 11www.SCIENCETRANSLATIONALMEDICINE.org 01 November 2017 Vol 9 Issue 414 aao1690
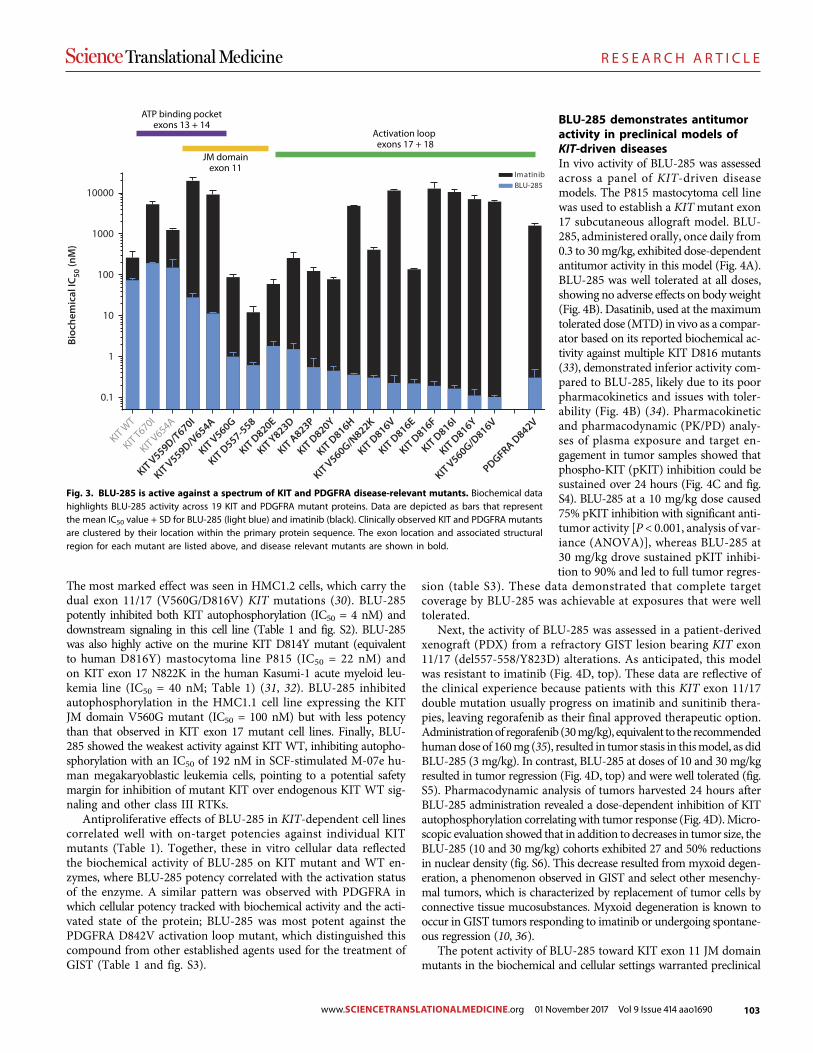
103
R E S E A R C H A R T I C L E
The most marked effect was seen in HMC1.2 cells, which carry thedual exon 11/17 (V560G/D816V) KIT mutations (30). BLU-285potently inhibited both KIT autophosphorylation (IC50 = 4 nM) anddownstream signaling in this cell line (Table 1 and fig. S2). BLU-285was also highly active on the murine KIT D814Y mutant (equivalentto human D816Y) mastocytoma line P815 (IC50 = 22 nM) andon KIT exon 17 N822K in the human Kasumi-1 acute myeloid leu-kemia line (IC50 = 40 nM; Table 1) (31, 32). BLU-285 inhibitedautophosphorylation in the HMC1.1 cell line expressing the KITJM domain V560G mutant (IC50 = 100 nM) but with less potencythan that observed in KIT exon 17 mutant cell lines. Finally, BLU-285 showed the weakest activity against KIT WT, inhibiting autopho-sphorylation with an IC50 of 192 nM in SCF-stimulated M-07e hu-man megakaryoblastic leukemia cells, pointing to a potential safetymargin for inhibition of mutant KIT over endogenous KIT WT sig-naling and other class III RTKs.
Antiproliferative effects of BLU-285 in KIT-dependent cell linescorrelated well with on-target potencies against individual KITmutants (Table 1). Together, these in vitro cellular data reflectedthe biochemical activity of BLU-285 on KIT mutant and WT en-zymes, where BLU-285 potency correlated with the activation statusof the enzyme. A similar pattern was observed with PDGFRA inwhich cellular potency tracked with biochemical activity and the acti-vated state of the protein; BLU-285 was most potent against thePDGFRA D842V activation loop mutant, which distinguished thiscompound from other established agents used for the treatment ofGIST (Table 1 and fig. S3).
BLU-285 demonstrates antitumoractivity in preclinical models ofKIT-driven diseasesIn vivo activity of BLU-285 was assessedacross a panel of KIT-driven diseasemodels. The P815 mastocytoma cell linewas used to establish a KITmutant exon17 subcutaneous allograft model. BLU-285, administered orally, once daily from0.3 to 30mg/kg, exhibited dose-dependentantitumor activity in this model (Fig. 4A).BLU-285 was well tolerated at all doses,showing no adverse effects on body weight(Fig. 4B). Dasatinib, used at the maximumtolerated dose (MTD) in vivo as a compar-ator based on its reported biochemical ac-tivity against multiple KIT D816 mutants(33), demonstrated inferior activity com-pared to BLU-285, likely due to its poorpharmacokinetics and issues with toler-ability (Fig. 4B) (34). Pharmacokineticand pharmacodynamic (PK/PD) analy-ses of plasma exposure and target en-gagement in tumor samples showed thatphospho-KIT (pKIT) inhibition could besustained over 24 hours (Fig. 4C and fig.S4). BLU-285 at a 10 mg/kg dose caused75% pKIT inhibition with significant anti-tumor activity [P < 0.001, analysis of var-iance (ANOVA)], whereas BLU-285 at30 mg/kg drove sustained pKIT inhibi-tion to 90% and led to full tumor regres-
sion (table S3). These data demonstrated that complete targetcoverage by BLU-285 was achievable at exposures that were welltolerated.
Next, the activity of BLU-285 was assessed in a patient-derivedxenograft (PDX) from a refractory GIST lesion bearing KIT exon11/17 (del557-558/Y823D) alterations. As anticipated, this modelwas resistant to imatinib (Fig. 4D, top). These data are reflective ofthe clinical experience because patients with this KIT exon 11/17double mutation usually progress on imatinib and sunitinib thera-pies, leaving regorafenib as their final approved therapeutic option.Administrationof regorafenib (30mg/kg), equivalent to the recommendedhumandose of 160mg (35), resulted in tumor stasis in thismodel, as didBLU-285 (3 mg/kg). In contrast, BLU-285 at doses of 10 and 30 mg/kgresulted in tumor regression (Fig. 4D, top) and were well tolerated (fig.S5). Pharmacodynamic analysis of tumors harvested 24 hours afterBLU-285 administration revealed a dose-dependent inhibition of KITautophosphorylation correlating with tumor response (Fig. 4D).Micro-scopic evaluation showed that in addition to decreases in tumor size, theBLU-285 (10 and 30 mg/kg) cohorts exhibited 27 and 50% reductionsin nuclear density (fig. S6). This decrease resulted from myxoid degen-eration, a phenomenon observed in GIST and select other mesenchy-mal tumors, which is characterized by replacement of tumor cells byconnective tissue mucosubstances. Myxoid degeneration is known tooccur in GIST tumors responding to imatinib or undergoing spontane-ous regression (10, 36).
The potent activity of BLU-285 toward KIT exon 11 JM domainmutants in the biochemical and cellular settings warranted preclinical
PDGFRA D842V
0.1
1
10
100
1000
10000BLU-285Imatinib
ATP binding pocketexons 13 + 14
JM domainexon 11
Activation loopexons 17 + 18
Bioc
hem
ical
IC50
(nM
)
KIT WT
KIT T670I
KIT V654A
KIT V559D/T670I
KIT V559D/V654A
KIT V560G
KIT D557-558
KIT D820E
KIT Y823D
KIT A823P
KIT D820Y
KIT D816H
KIT V560G/N822K
KIT D816V
KIT D816E
KIT D816F
KIT D816I
KIT D816Y
KIT V560G/D816V
Fig. 3. BLU-285 is active against a spectrum of KIT and PDGFRA disease-relevant mutants. Biochemical datahighlights BLU-285 activity across 19 KIT and PDGFRA mutant proteins. Data are depicted as bars that representthe mean IC50 value + SD for BLU-285 (light blue) and imatinib (black). Clinically observed KIT and PDGFRA mutantsare clustered by their location within the primary protein sequence. The exon location and associated structuralregion for each mutant are listed above, and disease relevant mutants are shown in bold.
S C I ENCE TRANS LAT IONAL MED I C I N E | R E S EARCH ART I C L E
Evans et al., Sci. Transl. Med. 9, eaao1690 (2017) 1 November 2017 4 of 11www.SCIENCETRANSLATIONALMEDICINE.org 01 November 2017 Vol 9 Issue 414 aao1690
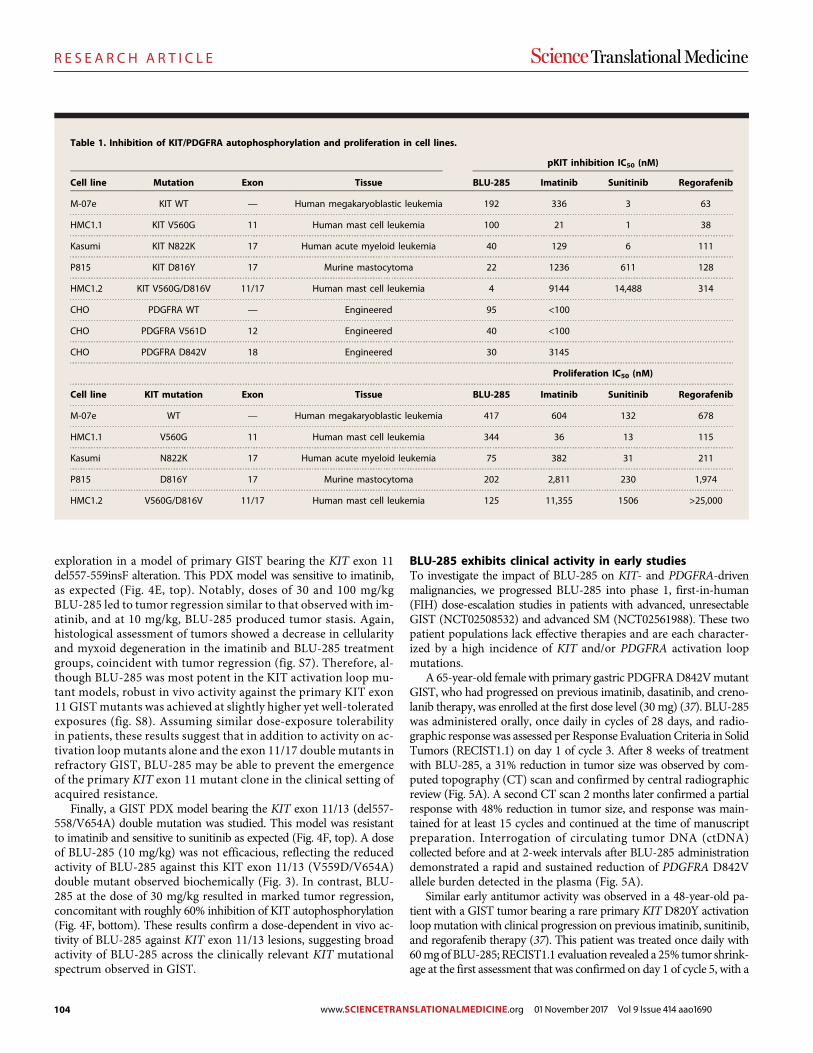
104
R E S E A R C H A R T I C L E
exploration in a model of primary GIST bearing the KIT exon 11del557-559insF alteration. This PDX model was sensitive to imatinib,as expected (Fig. 4E, top). Notably, doses of 30 and 100 mg/kgBLU-285 led to tumor regression similar to that observed with im-atinib, and at 10 mg/kg, BLU-285 produced tumor stasis. Again,histological assessment of tumors showed a decrease in cellularityand myxoid degeneration in the imatinib and BLU-285 treatmentgroups, coincident with tumor regression (fig. S7). Therefore, al-though BLU-285 was most potent in the KIT activation loop mu-tant models, robust in vivo activity against the primary KIT exon11 GIST mutants was achieved at slightly higher yet well-toleratedexposures (fig. S8). Assuming similar dose-exposure tolerabilityin patients, these results suggest that in addition to activity on ac-tivation loop mutants alone and the exon 11/17 double mutants inrefractory GIST, BLU-285 may be able to prevent the emergenceof the primary KIT exon 11 mutant clone in the clinical setting ofacquired resistance.
Finally, a GIST PDX model bearing the KIT exon 11/13 (del557-558/V654A) double mutation was studied. This model was resistantto imatinib and sensitive to sunitinib as expected (Fig. 4F, top). A doseof BLU-285 (10 mg/kg) was not efficacious, reflecting the reducedactivity of BLU-285 against this KIT exon 11/13 (V559D/V654A)double mutant observed biochemically (Fig. 3). In contrast, BLU-285 at the dose of 30 mg/kg resulted in marked tumor regression,concomitant with roughly 60% inhibition of KIT autophosphorylation(Fig. 4F, bottom). These results confirm a dose-dependent in vivo ac-tivity of BLU-285 against KIT exon 11/13 lesions, suggesting broadactivity of BLU-285 across the clinically relevant KIT mutationalspectrum observed in GIST.
BLU-285 exhibits clinical activity in early studiesTo investigate the impact of BLU-285 on KIT- and PDGFRA-drivenmalignancies, we progressed BLU-285 into phase 1, first-in-human(FIH) dose-escalation studies in patients with advanced, unresectableGIST (NCT02508532) and advanced SM (NCT02561988). These twopatient populations lack effective therapies and are each character-ized by a high incidence of KIT and/or PDGFRA activation loopmutations.
A 65-year-old female with primary gastric PDGFRAD842VmutantGIST, who had progressed on previous imatinib, dasatinib, and creno-lanib therapy, was enrolled at the first dose level (30 mg) (37). BLU-285was administered orally, once daily in cycles of 28 days, and radio-graphic response was assessed per Response Evaluation Criteria in SolidTumors (RECIST1.1) on day 1 of cycle 3. After 8 weeks of treatmentwith BLU-285, a 31% reduction in tumor size was observed by com-puted topography (CT) scan and confirmed by central radiographicreview (Fig. 5A). A second CT scan 2 months later confirmed a partialresponse with 48% reduction in tumor size, and response was main-tained for at least 15 cycles and continued at the time of manuscriptpreparation. Interrogation of circulating tumor DNA (ctDNA)collected before and at 2-week intervals after BLU-285 administrationdemonstrated a rapid and sustained reduction of PDGFRA D842Vallele burden detected in the plasma (Fig. 5A).
Similar early antitumor activity was observed in a 48-year-old pa-tient with a GIST tumor bearing a rare primary KIT D820Y activationloopmutation with clinical progression on previous imatinib, sunitinib,and regorafenib therapy (37). This patient was treated once daily with60mgof BLU-285; RECIST1.1 evaluation revealed a 25% tumor shrink-age at the first assessment that was confirmed on day 1 of cycle 5, with a
Table 1. Inhibition of KIT/PDGFRA autophosphorylation and proliferation in cell lines.
pKIT inhibition IC50 (nM)
Cell line Mutation Exon Tissue BLU-285 Imatinib Sunitinib Regorafenib
M-07e KIT WT — Human megakaryoblastic leukemia 192 336 3 63
HMC1.1 KIT V560G 11 Human mast cell leukemia 100 21 1 38
Kasumi KIT N822K 17 Human acute myeloid leukemia 40 129 6 111
P815 KIT D816Y 17 Murine mastocytoma 22 1236 611 128
HMC1.2 KIT V560G/D816V 11/17 Human mast cell leukemia 4 9144 14,488 314
CHO PDGFRA WT — Engineered 95 <100
CHO PDGFRA V561D 12 Engineered 40 <100
CHO PDGFRA D842V 18 Engineered 30 3145
Proliferation IC50 (nM)
Cell line KIT mutation Exon Tissue BLU-285 Imatinib Sunitinib Regorafenib
M-07e WT — Human megakaryoblastic leukemia 417 604 132 678
HMC1.1 V560G 11 Human mast cell leukemia 344 36 13 115
Kasumi N822K 17 Human acute myeloid leukemia 75 382 31 211
P815 D816Y 17 Murine mastocytoma 202 2,811 230 1,974
HMC1.2 V560G/D816V 11/17 Human mast cell leukemia 125 11,355 1506 >25,000
S C I ENCE TRANS LAT IONAL MED I C I N E | R E S EARCH ART I C L E
Evans et al., Sci. Transl. Med. 9, eaao1690 (2017) 1 November 2017 5 of 11www.SCIENCETRANSLATIONALMEDICINE.org 01 November 2017 Vol 9 Issue 414 aao1690
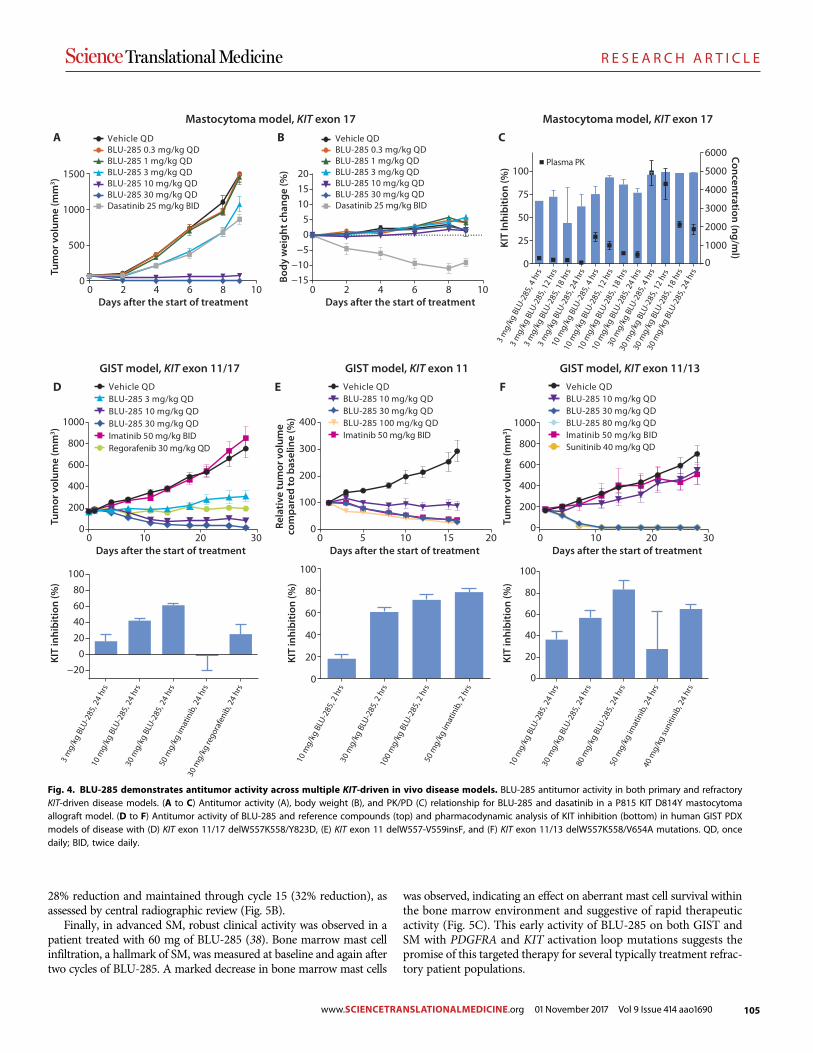
105
R E S E A R C H A R T I C L E
28% reduction and maintained through cycle 15 (32% reduction), asassessed by central radiographic review (Fig. 5B).
Finally, in advanced SM, robust clinical activity was observed in apatient treated with 60 mg of BLU-285 (38). Bone marrow mast cellinfiltration, a hallmark of SM, was measured at baseline and again aftertwo cycles of BLU-285. A marked decrease in bone marrow mast cells
was observed, indicating an effect on aberrant mast cell survival withinthe bone marrow environment and suggestive of rapid therapeuticactivity (Fig. 5C). This early activity of BLU-285 on both GIST andSM with PDGFRA and KIT activation loop mutations suggests thepromise of this targeted therapy for several typically treatment refrac-tory patient populations.
0 2 4 6 8 10−15−10
−505
101520
Days after the start of treatment
0 10 20 300
200
400
600
800
1000
Days after the start of treatment
Vehicle QDBLU-285 3 mg/kg QDBLU-285 10 mg/kg QDBLU-285 30 mg/kg QDImatinib 50 mg/kg BIDRegorafenib 30 mg/kg QD
−200
20
4060
80
100
Vehicle QDBLU-285 10 mg/kg QDBLU-285 30 mg/kg QDBLU-285 80 mg/kg QDImatinib 50 mg/kg BIDSunitinib 40 mg/kg QD
0
20
40
60
80
100
0
500
1000
1500
0 2 4 6 8 10Days after the start of treatment
A
0
25
50
75
100
0
1000
2000
3000
4000
5000
6000Plasma PK
3 m
g/kg
BLU
-285
, 4 h
rs
3 m
g/kg
BLU
-285
, 12
hrs
3 m
g/kg
BLU
-285
, 18
hrs
3 m
g/kg
BLU
-285
, 24
hrs
10 m
g/kg
BLU
-285
, 4 h
rs
10 m
g/kg
BLU
-285
, 12
hrs
10 m
g/kg
BLU
-285
, 18
hrs
10 m
g/kg
BLU
-285
, 24
hrs
30 m
g/kg
BLU
-285
, 4 h
rs
30 m
g/kg
BLU
-285
, 12
hrs
30 m
g/kg
BLU
-285
, 18
hrs
30 m
g/kg
BLU
-285
, 24
hrs
Concentration (ng/ml)
KIT
Inhi
bitio
n (%
)
Tum
or v
olum
e (m
m3 )
Vehicle QD
Imatinib 50 mg/kg BID
BLU-285 10 mg/kg QDBLU-285 30 mg/kg QDBLU-285 100 mg/kg QD
0 10 20 300
200
400
600
800
1000
Tum
or v
olum
e (m
m3 )
Tum
or v
olum
e (m
m3 )
Body
wei
ght c
hang
e (%
)
KIT
inhi
bitio
n (%
)
0
20
40
60
80
100
KIT
inhi
bitio
n (%
)
KIT
inhi
bitio
n (%
)3
mg/
kg B
LU-2
85, 2
4 hr
s10
mg/
kg B
LU-2
85, 2
4 hr
s30
mg/
kg B
LU-2
85, 2
4 hr
s50
mg/
kg im
atin
ib, 2
4 hr
s
30 m
g/kg
rego
rafe
nib,
24
hrs
10 m
g/kg
BLU
-285
, 2 h
rs30
mg/
kg B
LU-2
85, 2
hrs
100
mg/
kg B
LU-2
85, 2
hrs
50 m
g/kg
imat
inib
, 2 h
rs
10 m
g/kg
BLU
-285
, 24
hrs
30 m
g/kg
BLU
-285
, 24
hrs
80 m
g/kg
BLU
-285
, 24
hrs
50 m
g/kg
imat
inib
, 24
hrs
40 m
g/kg
suni
tinib
, 24
hrs
0 5 10 15 200
100
200
300
400
Days after the start of treatment
Rela
tive
tum
or v
olum
e co
mpa
red
to b
asel
ine
(%)
B C
D E F
Mastocytoma model, KIT exon 17 Mastocytoma model, KIT exon 17
GIST model, KIT exon 11/13GIST model, KIT exon 11GIST model, KIT exon 11/17
Vehicle QD
Dasatinib 25 mg/kg BID
BLU-285 0.3 mg/kg QDBLU-285 1 mg/kg QDBLU-285 3 mg/kg QDBLU-285 10 mg/kg QDBLU-285 30 mg/kg QD
Vehicle QDBLU-285 0.3 mg/kg QDBLU-285 1 mg/kg QDBLU-285 3 mg/kg QDBLU-285 10 mg/kg QDBLU-285 30 mg/kg QDDasatinib 25 mg/kg BID
Days after the start of treatment
Fig. 4. BLU-285 demonstrates antitumor activity across multiple KIT-driven in vivo disease models. BLU-285 antitumor activity in both primary and refractoryKIT-driven disease models. (A to C) Antitumor activity (A), body weight (B), and PK/PD (C) relationship for BLU-285 and dasatinib in a P815 KIT D814Y mastocytomaallograft model. (D to F) Antitumor activity of BLU-285 and reference compounds (top) and pharmacodynamic analysis of KIT inhibition (bottom) in human GIST PDXmodels of disease with (D) KIT exon 11/17 delW557K558/Y823D, (E) KIT exon 11 delW557-V559insF, and (F) KIT exon 11/13 delW557K558/V654A mutations. QD, oncedaily; BID, twice daily.
S C I ENCE TRANS LAT IONAL MED I C I N E | R E S EARCH ART I C L E
Evans et al., Sci. Transl. Med. 9, eaao1690 (2017) 1 November 2017 6 of 11www.SCIENCETRANSLATIONALMEDICINE.org 01 November 2017 Vol 9 Issue 414 aao1690
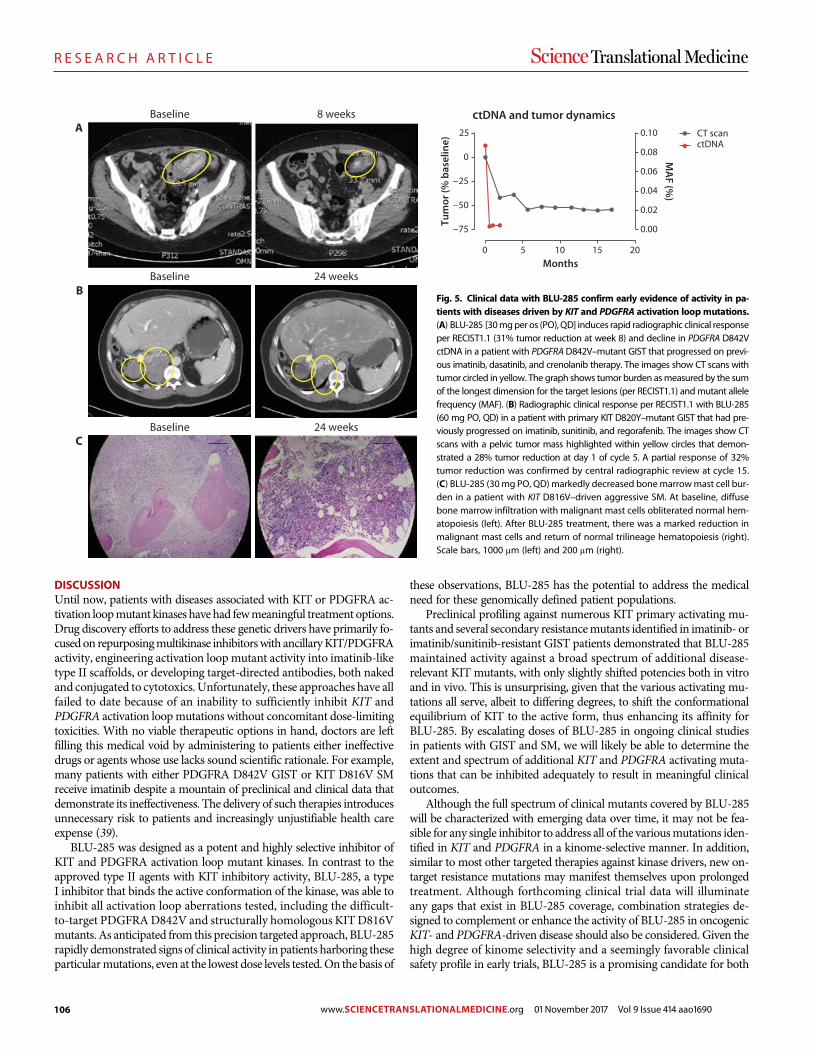
106
R E S E A R C H A R T I C L E
DISCUSSIONUntil now, patients with diseases associated with KIT or PDGFRA ac-tivation loopmutant kinases have had fewmeaningful treatment options.Drug discovery efforts to address these genetic drivers have primarily fo-cusedon repurposingmultikinase inhibitorswith ancillaryKIT/PDGFRAactivity, engineering activation loopmutant activity into imatinib-liketype II scaffolds, or developing target-directed antibodies, both nakedand conjugated to cytotoxics. Unfortunately, these approaches have allfailed to date because of an inability to sufficiently inhibit KIT andPDGFRA activation loopmutations without concomitant dose-limitingtoxicities. With no viable therapeutic options in hand, doctors are leftfilling this medical void by administering to patients either ineffectivedrugs or agents whose use lacks sound scientific rationale. For example,many patients with either PDGFRA D842V GIST or KIT D816V SMreceive imatinib despite a mountain of preclinical and clinical data thatdemonstrate its ineffectiveness. The delivery of such therapies introducesunnecessary risk to patients and increasingly unjustifiable health careexpense (39).
BLU-285 was designed as a potent and highly selective inhibitor ofKIT and PDGFRA activation loop mutant kinases. In contrast to theapproved type II agents with KIT inhibitory activity, BLU-285, a typeI inhibitor that binds the active conformation of the kinase, was able toinhibit all activation loop aberrations tested, including the difficult-to-target PDGFRAD842V and structurally homologous KITD816Vmutants. As anticipated from this precision targeted approach, BLU-285rapidly demonstrated signs of clinical activity in patients harboring theseparticularmutations, even at the lowest dose levels tested.On the basis of
these observations, BLU-285 has the potential to address the medicalneed for these genomically defined patient populations.
Preclinical profiling against numerous KIT primary activating mu-tants and several secondary resistancemutants identified in imatinib- orimatinib/sunitinib-resistant GIST patients demonstrated that BLU-285maintained activity against a broad spectrum of additional disease-relevant KIT mutants, with only slightly shifted potencies both in vitroand in vivo. This is unsurprising, given that the various activating mu-tations all serve, albeit to differing degrees, to shift the conformationalequilibrium of KIT to the active form, thus enhancing its affinity forBLU-285. By escalating doses of BLU-285 in ongoing clinical studiesin patients with GIST and SM, we will likely be able to determine theextent and spectrum of additional KIT and PDGFRA activating muta-tions that can be inhibited adequately to result in meaningful clinicaloutcomes.
Although the full spectrum of clinical mutants covered by BLU-285will be characterized with emerging data over time, it may not be fea-sible for any single inhibitor to address all of the variousmutations iden-tified in KIT and PDGFRA in a kinome-selective manner. In addition,similar to most other targeted therapies against kinase drivers, new on-target resistance mutations may manifest themselves upon prolongedtreatment. Although forthcoming clinical trial data will illuminateany gaps that exist in BLU-285 coverage, combination strategies de-signed to complement or enhance the activity of BLU-285 in oncogenicKIT- and PDGFRA-driven disease should also be considered. Given thehigh degree of kinome selectivity and a seemingly favorable clinicalsafety profile in early trials, BLU-285 is a promising candidate for both
A
B
C
Baseline
Baseline
Baseline
8 weeks
24 weeks
24 weeks
0 5 10 15 20
−75
−50
−25
0
25
0.00
0.02
0.04
0.06
0.08
0.10
Months
ctDNACT scan
ctDNA and tumor dynamics
Tum
or (%
bas
elin
e)
MA
F (%)
Fig. 5. Clinical data with BLU-285 confirm early evidence of activity in pa-tients with diseases driven by KIT and PDGFRA activation loopmutations.(A) BLU-285 [30mgper os (PO), QD] induces rapid radiographic clinical responseper RECIST1.1 (31% tumor reduction at week 8) and decline in PDGFRA D842VctDNA in a patient with PDGFRAD842V–mutant GIST that progressed on previ-ous imatinib, dasatinib, and crenolanib therapy. The images show CT scans withtumor circled in yellow. The graph shows tumor burden asmeasured by the sumof the longest dimension for the target lesions (per RECIST1.1) andmutant allelefrequency (MAF). (B) Radiographic clinical response per RECIST1.1 with BLU-285(60 mg PO, QD) in a patient with primary KIT D820Y–mutant GIST that had pre-viously progressed on imatinib, sunitinib, and regorafenib. The images show CTscans with a pelvic tumor mass highlighted within yellow circles that demon-strated a 28% tumor reduction at day 1 of cycle 5. A partial response of 32%tumor reduction was confirmed by central radiographic review at cycle 15.(C) BLU-285 (30mg PO, QD)markedly decreased bonemarrowmast cell bur-den in a patient with KIT D816V–driven aggressive SM. At baseline, diffusebone marrow infiltration with malignant mast cells obliterated normal hem-atopoiesis (left). After BLU-285 treatment, there was a marked reduction inmalignant mast cells and return of normal trilineage hematopoiesis (right).Scale bars, 1000 mm (left) and 200 mm (right).
S C I ENCE TRANS LAT IONAL MED I C I N E | R E S EARCH ART I C L E
Evans et al., Sci. Transl. Med. 9, eaao1690 (2017) 1 November 2017 7 of 11
www.SCIENCETRANSLATIONALMEDICINE.org 01 November 2017 Vol 9 Issue 414 aao1690
107
R E S E A R C H A R T I C L E
targeted single agent and combination regimens in KIT/PDGFRA-driven malignancies.
MATERIALS AND METHODSStudy designThe aim of this study was to design and characterize BLU-285, a potent,selective small-molecule inhibitor of KIT/PDGFRA activating mutantsincluding activation loop mutants. BLU-285 activity was assessed inenzymatic assays with recombinant KIT/PDGFRA WT or mutantprotein, cell lines driven by mutant KIT activation, and in vivo pre-clinical KIT-driven models. All animal studies were performed underInstitutional Animal Care and Use Committee (IACUC) guidelinesestablished at each respective institution where study was conducted.The sample size for animal experiments (n = 6 to 11) was based onthe results of preliminary experiments, with exact numbers describedin Materials and Methods. Mice were randomly assigned to the treat-ment and control groups; investigators were not blinded during evalu-ation of the preclinical in vivo experiments. The BLU-285 FIH phase1 clinical trial was an open-label, nonrandomized study built to assesssafety, MTD, pharmacokinetics, pharmacodynamics, and preliminaryantitumor activity of BLU-285.
LanthaScreen binding assaysSeriallydilutedcompounds,KITprotein, andanti–glutathioneS-transferase–Europium antibody were incubated with tracer as follows: KIT WT,V560G, and D820E proteins with tracer 222 and KIT D816E, A829P,and D816V with Tracer 178. Plates were incubated at 25°C for 60 minand read on a PerkinElmer EnVision with two excitation flashes and twoemission reads:lex = 350nm,lem=665nm;lex = 350nm,lem=615nm.
IC50 generationRaw data were normalized to 0 and 100% inhibition controls usingdimethyl sulfoxide (DMSO) and staurosporine, respectively. IC50
values were calculated using a three- or four-parameter logisticnonlinear regression model.
BLU-285 synthesisThe synthesis of BLU-285 is described in issued patent WO2015/057873; example 7, compound 44.
KINOMEscan binding assaysCompounds were screened at 3 mM concentration against a panel of392WT kinase constructs using the KINOMEscan assay platform atDiscoveRx, as previously described (40).
Hotspot kinase profiling assaysIn vitro kinase profiling ofKIT andPDGFRAconstructs was performedat Reaction Biology Corporation. Kinase/substrate pairs, serially dilutedcompounds, and any additional cofactors required were prepared ina reaction buffer at their respectiveMichaelis constant (Km) for ATP.33P-ATP (10 mCi/ml) was added to initiate the reaction, followed bythe detection of kinase activity by a filter-binding method.
Cell cultureHMC1.1 andHMC1.2 cell lines were licensed from J. Butterfield (MayoClinic) (41). Cells were grown in Iscove’s modified Dulbecco’s mediumcontaining 20or 10% fetal calf serumsupplementedwith iron (HyClone).Kasumi-1, P815, andChinese hamster ovary (CHO)–K1 cells (American
TypeCulture Collection) were grown in vendor-recommendedmedium.M-07e cells (DSMZ)were grown inDulbecco’smodified Eagle’smediumcontaining granulocyte-macrophage colony-stimulating factor (5 ng/ml)formaintenance or in SCF (5 ng/ml) for cell-based assays. PDGFRAWTand mutant kinase constructs were transiently transfected into CHOcells, as previously described (29). All cells underwent short tandemrepeat authentication; cells were discarded after 20 passages.
Immunoblot analysisAfter treatment of cells with compounds, cells were lysed in Phospho-Safe lysis buffer with protease/phosphatase inhibitors. Total proteinconcentration was determined using a bicinchoninic acid (BCA) assay(Pierce). Primary antibodies include total KIT (#3308, Cell SignalingTechnology), pTyr719-KIT (#3391, Cell Signaling Technology), totalPDGFRA (sc-338), pTyr754-PDGFRA (sc-12911), total AKT (#2920,Cell Signaling Technology), pSer473-AKT (#4060, Cell Signaling Tech-nology), total ERK (#9107, Cell Signaling Technology), pTyr/Thr 202/204-ERK (#4370, Cell Signaling Technology), and b-actin (ab3280,Abcam). Secondary antibodies were from Rockland Antibodies andAssays [IRDye 800–conjugated rabbit immunoglobulin G (IgG) andIRDye 700–conjugated mouse IgG]. Immunoblots were imaged usingan Odyssey LI-COR Fluorescent imaging system. PDGFRA autopho-sphorylationwas assessedby immunoprecipitation, followedby immuno-blotting for phospho-PDGFRA and total PDGFRA, as previouslydescribed (14). To quantitate the percent of pKIT/PDGFR inhibitionin cells, the pKIT/total KIT ratio was calculated for each concentrationof compound and normalized to the average of DMSO-treated cells.
Autophosphorylation assaysAlphaLISACells were seeded in a 384-well plate and incubated overnight at 37°C.Compounds were serially diluted in 100% DMSO, added to cells at afinal DMSO concentration of 0.25%, and incubated at 37°C for 90 min.Cellswere lysedwithAlphaLISALysisBuffer supplementedwithprotease/phosphatase inhibitors with shaking for 30 min at 4°C. Total biotinylatedhuman KIT (#3308, Cell Signaling Technology), murine KIT (ab112167,Abcam), and phosphoY719-KIT (#3391, Cell Signaling Technology) anti-bodies and AlphaLISA donor and acceptor beads were added to lysates.Plates were read on an EnVision using an AlphaScreen protocol.
Enzyme-linked immunosorbent assayAPathScan phospho c-kit (panTyr) sandwich enzyme-linked immuno-sorbent assay (#7294, Cell Signaling Technology) was used to assess thepercent inhibition of autophosphorylation ofKITWT.M-07e cells wereseeded into a 96-well plate in serum/cytokine-freemedium, followed bythe addition of compounds for 60 min at 37°C. The cells were stimu-lated with human SCF (50 ng/ml) and scanned on an EnVision platereader.
Cellular proliferationCells were plated in serum-containing medium and incubatedovernight at 37°C. Compounds were serially diluted and added to cellsat a final DMSO concentration of 0.25% and incubated at 37°C for72 hours. Cell Titer-Glo reagent was added and read on the EnVisionusing a 384-well luminescence protocol.
Animal studiesAll animal studies were performed under IACUC guidelines establishedat each respective institution where the study was conducted. BLU-285
SC I ENCE TRANS LAT IONAL MED I C I N E | R E S EARCH ART I C L E
Evans et al., Sci. Transl. Med. 9, eaao1690 (2017) 1 November 2017 8 of 11
www.SCIENCETRANSLATIONALMEDICINE.org 01 November 2017 Vol 9 Issue 414 aao1690
108
R E S E A R C H A R T I C L E
was formulated in 0.5% carboxymethyl cellulose + 1% Tween 80.Dasatinib (Selleckchem) was formulated in 50% propylene glycol.Imatinib (Carbosynth) was formulated in sterile water. Regorafenib(Carbosynth) was formulated in a PEG400/125 mM methanesulfonicacid (MSA) mixture at 80:20 ratio. MSA (125 mM) was prepared inwater. Sunitinib (Carbosynth) was formulated in 50 mM citrate buffer(pH 3.5). The P815 xenograft study was performed atWuXi AppTecin Shanghai, China. BALB/c nude mice were inoculated with 1 × 10⁶
P815 cells subcutaneously at the right flank.When the average tumorsize reached about 75 mm3, treatment with test article began. Tenanimals were treated per group. Tumors were measured to assess an-titumor activity. For PK/PD analysis, plasma and tumors werecollected from three mice per group. The GIST exon 11/17 (model2007031011) and exon 11/13 (model GS11331) xenograft studies wereperformed at Crown Biosciences. Nonobese diabetic–severe combinedimmunodeficient mice were inoculated with 100,000 to 125,000 viablecells subcutaneously into the rear flank. Animals were randomizedwhen average tumor volume reached 150 to 200 mm3, followed by oraldosing of compounds. Eleven animals were treated per group. Plasmaand tumor samples were collected from three animals per group. TheGIST exon11 (modelUZLX-GIST3) xenograft (42) studywas performedin the Laboratory of Experimental Oncology at KU Leuven, Belgium.Tumors were bilaterally implanted onto the rear flanks of adult nudenu/nu NMRI mice and randomized upon reaching an average tumorvolume of ~500 mm3. Six animals were treated per group for a total of12 individual tumormeasurements. One animal per groupwas sacrificedfor PK/PD analysis, and the other five were used to evaluate antitumoractivity.
Xenograft tumor pharmacodynamic analysisFrozen tumor slices were homogenized in 400 ml of PhosphoSafe lysisbuffer with protease/phosphatase inhibitors. Protein concentration wasdetermined using a BCAassay. Fiftymicrograms of lysatewas subject toSDS–polyacrylamide gel electrophoresis, followed by immunoblotting.
BLU-285 phase 1 studyOpen label, nonrandomized, global, FIH phase 1, dose-escalation stu-dies with BLU-285 in advanced, unresectable GIST (NCT02508532)and advanced SM (NCT02561988) were initiated to define the safety,MTD, pharmacokinetics, pharmacodynamics, and preliminary anti-tumor activity of BLU-285 in each indication. Initial sample size foreach study was about 60 patients (25 patients in dose escalation and35 in dose expansion) as appropriate for FIH studies designed to iden-tify an MTD and assess preliminary antitumor activity. All statisticalanalyses of safety, pharmacokinetic, pharmacodynamic, and efficacydata were descriptive in nature because the primary objective of the stu-dies was to define the safety and MTD of BLU-285. The studies werereviewed and approved by the institutional review board at each clinicalsite. Written informed consent was obtained from all patients beforestudy entry. Key eligibility criteria for the GIST study included adultpatients (≥18 years of age) with unresectable GIST who had received≥2 kinase inhibitors, including imatinib, or patients with tumorsbearing aPDGFRAD842mutation regardless of previous therapy; East-ernCooperativeOncologyGroup (ECOG) performance status of 0 to 2;and adequate bone marrow, hepatic, renal, and cardiac function. BLU-285was administered orally, once daily, on a 4-week cycle using a 3+ 3dose-escalation design. Adverse events per Common TerminologyCriteria for Adverse Events (CTCAE), pharmacokinetics, ctDNA levels(Sysmex Inostics), and centrally reviewed radiographic response per
RECIST1.1 were assessed. Presented data are preliminary and representa cutoff of 28 April 2017. Key eligibility criteria for the advanced SMstudy included adult patients (≥18 years of age) with aggressive SM,SMwith associated hematologic neoplasm and one ormore C-findings,or mast cell leukemia per World Health Organization diagnosticcriteria; ECOGperformance status of 0 to 3; and adequate bonemarrow,hepatic, renal, and cardiac function. BLU-285 was administered orally,once daily, on a 4-week cycle using a 3+3dose escalation design.Adverseevents per CTCAE, pharmacokinetics, ctDNA levels, and markers ofmast cell burden, including serum tryptase and bone marrow mast cellcontent, were assessed. Presented data are preliminary with data cutoff of1 December 2016.
Statistical analysisResults for in vivo preclinical models were expressed as mean ±SEM. Multiple group comparisons were made using Wilcoxon’smatched pair test, Mann-Whitney U test, or one-way ANOVA,followed by Tukey’s multiple comparisons test. P < 0.05 wasconsidered statistically significant. Analyses of preliminary efficacydata in the phase 1 BLU-285 clinical trial are descriptive in nature.
SUPPLEMENTARY MATERIALSwww.sciencetranslationalmedicine.org/cgi/content/full/9/414/eaao1690/DC1Fig. S1. Analysis of compound binding reveals broad type I activity across various forms of KIT.Fig. S2. BLU-285 inhibits KIT signaling in a KIT exon 11/17 human cell line.Fig. S3. BLU-285 exhibits differential activity on PDGFRA WT and V561D and D842V mutants.Fig. S4. Pharmacodynamic analysis of KIT signaling in a P815 allograft model of SMdemonstrates in vivo target engagement.Fig. S5. BLU-285 is well tolerated in a KIT mutant exon 11/17 PDX model of relapsed GIST.Fig. S6. Histology of GIST PDX KIT mutant exon 11/17 tumors confirms tumor regression.Fig. S7. Histology of GIST PDX KIT mutant exon 11 tumors was correlated with tumor sizeregression.Fig. S8. BLU-285 is well tolerated in a KIT mutant exon 11 PDX model of primary GIST.Table S1. Human kinases with more than 90% binding by BLU-285, imatinib, sunitinib,regorafenib, crenolanib, and midostaurin are listed.Table S2. BLU-285 has selectivity for KIT D816V over several kinase antitargets.Table S3. Antitumor activity of BLU-285 and type II inhibitors across various KIT mutant–drivenmodels of disease highlights robust activity of BLU-285.
REFERENCES AND NOTES1. C. Zhou, Y.-L. Wu, G. Chen, J. Feng, X.-Q. Liu, C. Wang, S. Zhang, J. Wang, S. Zhou, S. Ren,
S. Lu, L. Zhang, C. Hu, C. Hu, Y. Luo, L. Chen, M. Ye, J. Huang, X. Zhi, Y. Zhang, Q. Xiu,J. Ma, L. Zhang, C. You, Erlotinib versus chemotherapy as first-line treatment for patientswith advanced EGFR mutation-positive non–small-cell lung cancer (OPTIMAL, CTONG-0802): A multicentre, open-label, randomised, phase 3 study. Lancet Oncol. 12, 735–742(2011).
2. E. L. Kwak, Y.-J. Bang, D. R. Camidge, A. T. Shaw, B. Solomon, R. G. Maki, S.-H. I. Ou,B. J. Dezube, P. A. Jänne, D. B. Costa, M. Varella-Garcia, W.-H. Kim, T. J. Lynch, P. Fidias,H. Stubbs, J. A. Engelman, L. V. Sequist, W. Tan, L. Gandhi, M. Mino-Kenudson, G. C. Wei,S. M. Shreeve, M. J. Ratain, J. Settleman, J. G. Christensen, D. A. Haber, K. Wilner, R. Salgia,G. I. Shapiro, J. W. Clark, A. J. Iafrate, Anaplastic lymphoma kinase inhibition in non–small-celllung cancer. N. Engl. J. Med. 363, 1693–1703 (2010).
3. A. T. Shaw, S.-H. I. Ou, Y.-J. Bang, D. R. Camidge, B. J. Solomon, R. Salgia, G. J. Riely,M. Varella-Garcia, G. I. Shapiro, D. B. Costa, R. C. Doebele, L. P. Le, Z. Zheng, W. Tan,P. Stephenson, S. M. Shreeve, L. M. Tye, J. G. Christensen, K. D. Wilner, J. W. Clark,A. J. Iafrate, Crizotinib in ROS1-rearranged non–small-cell lung cancer. N. Engl. J. Med. 371,1963–1971 (2014).
4. G. Bollag, P. Hirth, J. Tsai, J. Zhang, P. N. Ibrahim, H. Cho, W. Spevak, C. Zhang, Y. Zhang,G. Habets, E. A. Burton, B. Wong, G. Tsang, B. L. West, B. Powell, R. Shellooe, A. Marimuthu,H. Nguyen, K. Y. J. Zhang, D. R. Artis, J. Schlessinger, F. Su, B. Higgins, R. Iyer, K. D’Andrea,A. Koehler, M. Stumm, P. S. Lin, R. J. Lee, J. Grippo, I. Puzanov, K. B. Kim, A. Ribas,G. A. McArthur, J. A. Sosman, P. B. Chapman, K. T. Flaherty, X. Xu, K. L. Nathanson, K. Nolop,Clinical efficacy of a RAF inhibitor needs broad target blockade in BRAF-mutantmelanoma. Nature 467, 596–599 (2010).
S C I ENCE TRANS LAT IONAL MED I C I N E | R E S EARCH ART I C L E
Evans et al., Sci. Transl. Med. 9, eaao1690 (2017) 1 November 2017 9 of 11www.SCIENCETRANSLATIONALMEDICINE.org 01 November 2017 Vol 9 Issue 414 aao1690
109
R E S E A R C H A R T I C L E
5. S. G. O’Brien, F. Guilhot, R. A. Larson, I. Gathmann, M. Baccarani, F. Cervantes,J. J. Cornelissen, T. Fischer, A. Hochhaus, T. Hughes, K. Lechner, J. L. Nielsen, P. Rousselot,J. Reiffers, G. Saglio, J. Shepherd, B. Simonsson, A. Gratwohl, J. M. Goldman, H. Kantarjian,K. Taylor, G. Verhoef, A. E. Bolton, R. Capdeville, B. J. Druker; IRIS Investigators, Imatinibcompared with interferon and low-dose cytarabine for newly diagnosed chronic-phasechronic myeloid leukemia. N. Engl. J. Med. 348, 994–1004 (2003).
6. G. D. Demetri, M. von Mehren, C. D. Blanke, A. D. Van den Abbeele, B. Eisenberg,P. J. Roberts, M. C. Heinrich, D. A. Tuveson, S. Singer, M. Janicek, J. A. Fletcher,S. G. Silverman, S. L. Silberman, R. Capdeville, B. Kiese, B. Peng, S. Dimitrijevic, B. J. Druker,C. Corless, C. D. M. Fletcher, H. Joensuu, Efficacy and safety of imatinib mesylate inadvanced gastrointestinal stromal tumors. N. Engl. J. Med. 347, 472–480 (2002).
7. J. Lennartsson, L. Rönnstrand, Stem cell factor receptor/c-Kit: From basic science toclinical implications. Physiol. Rev. 92, 1619–1649 (2012).
8. C. R. Antonescu, P. Besmer, T. Guo, K. Arkun, G. Hom, B. Koryotowski, M. A. Leversha,P. D. Jeffrey, D. Desantis, S. Singer, M. F. Brennan, R. G. Maki, R. P. DeMatteo, Acquiredresistance to imatinib in gastrointestinal stromal tumor occurs through secondarygene mutation. Clin. Cancer Res. 11, 4182–4190 (2005).
9. C. M. Barnett, M. C. Heinrich, Management of tyrosine kinase inhibitor-resistantgastrointestinal stromal tumors. Am. Soc. Clin. Oncol. Educ. Book 32, 663–668 (2012).
10. C. R. Antonescu, The GIST paradigm: Lessons for other kinase-driven cancers.J. Pathol. 223, 251–261 (2011).
11. C. D. Blanke, C. Rankin, G. D. Demetri, C. W. Ryan, M. von Mehren, R. S. Benjamin,A. K. Raymond, V. H. C. Bramwell, L. H. Baker, R. G. Maki, M. Tanaka, J. R. Hecht,M. C. Heinrich, C. D. M. Fletcher, J. J. Crowley, E. C. Borden, Phase III randomized,intergroup trial assessing imatinib mesylate at two dose levels in patients withunresectable or metastatic gastrointestinal stromal tumors expressing the kit receptortyrosine kinase: S0033. J. Clin. Oncol. Off. J. Am. Soc. Clin. Oncol. 26, 626–632(2008).
12. M. C. Heinrich, R. G. Maki, C. L. Corless, C. R. Antonescu, A. Harlow, D. Griffith, A. Town,A. Mckinley, W.-B. Ou, J. A. Fletcher, C. D. M. Fletcher, X. Huang, D. P. Cohen, C. M. Baum,G. D. Demetri, Primary and secondary kinase genotypes correlate with the biologicaland clinical activity of sunitinib in imatinib-resistant gastrointestinal stromal tumor.J. Clin. Oncol. 26, 5352–5359 (2008).
13. B. Liegl, I. Kepten, C. Le, M. Zhu, G. D. Demetri, M. C. Heinrich, C. D. M. Fletcher,C. L. Corless, J. A. Fletcher, Heterogeneity of kinase inhibitor resistance mechanisms inGIST. J. Pathol. 216, 64–74 (2008).
14. M. C. Heinrich, C. L. Corless, A. Duensing, L. McGreevey, C.-J. Chen, N. Joseph, S. Singer,D. J. Griffith, A. Haley, A. Town, G. D. Demetri, C. D. M. Fletcher, J. A. Fletcher, PDGFRAactivating mutations in gastrointestinal stromal tumors. Science 299, 708–710 (2003).
15. S. Hirota, A. Ohashi, T. Nishida, K. Isozaki, K. Kinoshita, Y. Shinomura, Y. Kitamura,Gain-of-function mutations of platelet-derived growth factor receptor a gene ingastrointestinal stromal tumors. Gastroenterology 125, 660–667 (2003).
16. P. A. Cassier, E. Fumagalli, P. Rutkowski, P. Schöffski, M. Van Glabbeke, M. Debiec-Rychter,J.-F. Emile, F. Duffaud, J. Martin-Broto, B. Landi, A. Adenis, F. Bertucci, E. Bompas,O. Bouché, S. Leyvraz, I. Judson, J. Verweij, P. Casali, J.-Y. Blay, P. Hohenberger; EuropeanOrganisation for Research and Treatment of Cancer, Outcome of patients withplatelet-derived growth factor receptor alpha–mutated gastrointestinal stromal tumorsin the tyrosine kinase inhibitor era. Clin. Cancer Res. 18, 4458–4464 (2012).
17. M. C. Heinrich, C. L. Corless, G. D. Demetri, C. D. Blanke, M. von Mehren, H. Joensuu,L. S. McGreevey, C.-J. Chen, A. D. Van den Abbeele, B. J. Druker, B. Kiese, B. Eisenberg,P. J. Roberts, S. Singer, C. D. M. Fletcher, S. Silberman, S. Dimitrijevic, J. A. Fletcher, Kinasemutations and imatinib response in patients with metastatic gastrointestinal stromaltumor. J. Clin. Oncol. Off. J. Am. Soc. Clin. Oncol. 21, 4342–4349 (2003).
18. C. Yoo, M.-H. Ryu, J. Jo, I. Park, B.-Y. Ryoo, Y.-K. Kang, Efficacy of imatinib in patients withplatelet-derived growth factor receptor alpha–mutated gastrointestinal stromal tumors.Cancer Res. Treat. 48, 546–552 (2016).
19. T. Kristensen, H. Vestergaard, M. B. Møller, Improved detection of the KIT D816V mutationin patients with systemic mastocytosis using a quantitative and highly sensitive real-timeqPCR assay. J. Mol. Diagn. 13, 180–188 (2011).
20. A. C. Garcia-Montero, M. Jara-Acevedo, C. Teodosio, M. L. Sanchez, R. Nunez, A. Prados,I. Aldanondo, L. Sanchez, M. Dominguez, L. M. Botana, F. Sanchez-Jimenez, K. Sotlar,J. Almeida, L. Escribano, A. Orfao, KIT mutation in mast cells and other bone marrowhematopoietic cell lineages in systemic mast cell disorders: A prospective study of theSpanish Network on Mastocytosis (REMA) in a series of 113 patients. Blood 108,2366–2372 (2006).
21. A. Pardanani, T. L. Reeder, T. K. Kimlinger, J. Y. Baek, C.-Y. Li, J. H. Butterfield, A. Tefferi,Flt-3 and c-kit mutation studies in a spectrum of chronic myeloid disorders includingsystemic mast cell disease. Leuk. Res. 27, 739–742 (2003).
22. J. Gotlib, H. C. Kluin-Nelemans, T. I. George, C. Akin, K. Sotlar, O. Hermine, F. T. Awan,E. Hexner, M. J. Mauro, D. W. Sternberg, M. Villeneuve, A. Huntsman Labed, E. J. Stanek,K. Hartmann, H.-P. Horny, P. Valent, A. Reiter, Efficacy and safety of midostaurin inadvanced systemic mastocytosis. N. Engl. J. Med. 374, 2530–2541 (2016).
23. J. Zhang, P. L. Yang, N. S. Gray, Targeting cancer with small molecule kinase inhibitors.Nat. Rev. Cancer 9, 28–39 (2009).
24. C. D. Mol, D. R. Dougan, T. R. Schneider, R. J. Skene, M. L. Kraus, D. N. Scheibe,G. P. Snell, H. Zou, B.-C. Sang, K. P. Wilson, Structural basis for the autoinhibitionand STI-571 inhibition of c-Kit tyrosine kinase. J. Biol. Chem. 279, 31655–31663(2004).
25. C. D. Mol, K. B. Lim, V. Sridhar, H. Zou, E. Y. T. Chien, B.-C. Sang, J. Nowakowski, D. B. Kassel,C. N. Cronin, D. E. McRee, Structure of a c-Kit product complex reveals the basis for kinasetransactivation. J. Biol. Chem. 278, 31461–31464 (2003).
26. K. S. Gajiwala, J. C. Wu, J. Christensen, G. D. Deshmukh, W. Diehl, J. P. DiNitto, J. M. English,M. J. Greig, Y.-A. He, S. L. Jacques, E. A. Lunney, M. McTigue, D. Molina, T. Quenzer,P. A. Wells, X. Yu, Y. Zhang, A. Zou, M. R. Emmett, A. G. Marshall, H.-M. Zhang,G. D. Demetri, KIT kinase mutants show unique mechanisms of drug resistance toimatinib and sunitinib in gastrointestinal stromal tumor patients. Proc. Natl. Acad. Sci. U.S.A.106, 1542–1547 (2009).
27. C. L. Corless, C. M. Barnett, M. C. Heinrich, Gastrointestinal stromal tumours: Origin andmolecular oncology. Nat. Rev. Cancer 11, 865–878 (2011).
28. E. Ben Ami, G. D. Demetri, A safety evaluation of imatinib mesylate in the treatment ofgastrointestinal stromal tumor. Expert Opin. Drug Saf. 15, 571–578 (2016).
29. M. C. Heinrich, D. Griffith, A. McKinley, J. Patterson, A. Presnell, A. Ramachandran,M. Debiec-Rychter, Crenolanib inhibits the drug-resistant PDGFRA D842V mutationassociated with imatinib-resistant gastrointestinal stromal tumors. Clin. Cancer Res. 18,4375–4384 (2012).
30. M. Sundström, H. Vliagoftis, P. Karlberg, J. H. Butterfield, K. Nilsson, D. D. Metcalfe,G. Nilsson, Functional and phenotypic studies of two variants of a human mast cell linewith a distinct set of mutations in the c-kit proto-oncogene. Immunology 108, 89–97(2003).
31. S. Demehri, A. Corbin, M. Loriaux, B. J. Druker, M. W. Deininger, Establishment of a murinemodel of aggressive systemic mastocytosis/mast cell leukemia. Exp. Hematol. 34,284–288 (2006).
32. A. Beghini, I. Magnani, C. B. Ripamonti, L. Larizza, Amplification of a novel c-Kit activatingmutation Asn822-Lys in the Kasumi-1 cell line: A t(8;21)-Kit mutant model for acutemyeloid leukemia. Hematol J. 3, 157–163 (2002).
33. M. M. Schittenhelm, S. Shiraga, A. Schroeder, A. S. Corbin, D. Griffith, F. Y. Lee,C. Bokemeyer, M. W. N. Deininger, B. J. Druker, M. C. Heinrich, Dasatinib (BMS-354825), adual SRC/ABL kinase inhibitor, inhibits the kinase activity of wild-type, juxtamembrane,and activation loop mutant KIT isoforms associated with human malignancies.Cancer Res. 66, 473–481 (2006).
34. S. Verstovsek, A. Tefferi, J. Cortes, S. O’Brien, G. Garcia-Manero, A. Pardanani, C. Akin,S. Faderl, T. Manshouri, D. Thomas, H. Kantarjian, Phase II study of dasatinib inPhiladelphia chromosome–negative acute and chronic myeloid diseases, includingsystemic mastocytosis. Clin. Cancer Res. 14, 3906–3915 (2008).
35. T. Van Looy, Y. K. Gebreyohannes, A. Wozniak, J. Cornillie, J. Wellens, H. Li, U. Vanleeuw,G. Floris, M. Debiec-Rychter, R. Sciot, P. Schöffski, Characterization and assessment of thesensitivity and resistance of a newly established human gastrointestinal stromal tumourxenograft model to treatment with tyrosine kinase inhibitors. Clin. Sarcoma Res. 4, 10(2014).
36. H. Joensuu, P. J. Roberts, M. Sarlomo-Rikala, L. C. Andersson, P. Tervahartiala, D. Tuveson,S. L. Silberman, R. Capdeville, S. Dimitrijevic, B. Druker, G. D. Demetri, Effect of thetyrosine kinase inhibitor STI571 in a patient with a metastatic gastrointestinal stromaltumor. N. Engl. J. Med. 344, 1052–1056 (2001).
37. M. C. Heinrich, R. L. Jones, M. von Mehren, P. Schoffski, S. Bauer, O. Mir, P. A. Cassier,F. Eskens, H. Shi, T. Alvarez-Diez, O. Schmidt-Kittler, M. E. Healy, B. B. Wolf, S. George,Clinical activity of BLU-285 in advanced gastrointestinal stromal tumor (GIST).J. Clin. Oncol. Off. J. Am. Soc. Clin. Oncol. 35, 11011 (2017).
38. M. W. Drummond, D. J. DeAngelo, M. W. Deininger, D. Radia, A. T. Quiery, E. O. Hexner,H. Shi, T. Alvarez-Diez, E. K. Evans, M. E. Healy, B. B. Wolf, S. Verstovsek, Preliminarysafety and clinical activity in a phase 1 study of Blu-285, a potent, highly-selectiveinhibitor of KIT D816V in Advanced Systemic Mastocytosis (SM). Blood 128, 477(2016).
39. P. Schöffski, A. Wozniak, O. Schöffski, L. van Eycken, M. Debiec-Rychter, Overcoming costimplications of mutational analysis in patients with gastrointestinal stromal tumors: Apragmatic approach. Oncol. Res. Treat. 39, 811–816 (2016).
40. M. I. Davis, J. P. Hunt, S. Herrgard, P. Ciceri, L. M. Wodicka, G. Pallares, M. Hocker,D. K. Treiber, P. P. Zarrinkar, Comprehensive analysis of kinase inhibitor selectivity.Nat. Biotechnol. 29, 1046–1051 (2011).
41. J. H. Butterfield, D. Weiler, G. Dewald, G. J. Gleich, Establishment of an immature mast cellline from a patient with mast cell leukemia. Leuk. Res. 12, 345–355 (1988).
42. T. Van Looy, A. Wozniak, G. Floris, R. Sciot, H. Li, J. Wellens, U. Vanleeuw, J. A. Fletcher,P. W. Manley, M. Debiec-Rychter, P. Schöffski, Phosphoinositide 3-kinase inhibitorscombined with imatinib in patient-derived xenograft models of gastrointestinal stromaltumors: Rationale and efficacy. Clin. Cancer Res. 20, 6071–6082 (2014).
S C I ENCE TRANS LAT IONAL MED I C I N E | R E S EARCH ART I C L E
Evans et al., Sci. Transl. Med. 9, eaao1690 (2017) 1 November 2017 10 of 11www.SCIENCETRANSLATIONALMEDICINE.org 01 November 2017 Vol 9 Issue 414 aao1690

110
R E S E A R C H A R T I C L E
Acknowledgments: We thank our colleagues at Blueprint Medicines for the thoughtfuldiscussions and constructive feedback throughout the course of the BLU-285 program and forthe critical review of the manuscript. We also thank the scientists at WuXi AppTec andCrownBio for their excellent in vivo study support and execution, A. Tsimboukis for the graphicdesign contributions, and all of the patients and their families, the doctors, and the nursesfor their participation in the ongoing phase 1 clinical trials with BLU-285. Funding: This workwas funded by Blueprint Medicines. In addition, contributions from the Heinrich laboratorywere funded, in part, by a VA Merit Review grant (2I01BX000338-05) to M.C.H. Authorcontributions: E.K.E., A.K.G., J.L.K., and C.L. wrote and revised the manuscript. A.S. performedthe enzymatic binding and activity assays. A.K.G., A.D., and X.J.Z. performed the cellularassays. B.L.H., D.W., K.W., L.D., Y.Z., J.L.K., N.B., N.L., and T.G. contributed to the design andsynthesis of BLU-285. J.L.K. and N.B. provided the structural biology and computationalchemistry insights to support BLU-285 generation. E.K.E., A.K.G., N.K., A.W., Y.K.G., and P.S.designed and performed the in vivo xenograft studies. T.P.L. and Y.K.G. performedimmunohistochemistry analysis. M.C.H. contributed to the target engagement studies in CHOcells. A.B. and B.W. led the BLU-285 clinical trial design. D.J.D., P.S., and M.C.H. cared for the patientson BLU-285 trial. S.M. and O.S.-K. analyzed ctDNA from the clinical samples. Competing interests:
E.K.E., A.K.G., J.L.K., B.L.H., A.D., X.J.Z., O.S.-K., D.W., K.W., N.B., T.P.L., S.M., B.W., T.G., N.L.,A.B., and C.L. are current employees and shareholders of Blueprint Medicines. N.L. is ashareholder of Blueprint Medicines. Y.Z., B.L.H., J.L.K., K.W., and D.W. are inventors on patentWO2015/057873 held by Blueprint Medicines, which includes BLU-285. All other authors declarethat they have no competing interests.
Submitted 23 June 2017Accepted 2 October 2017Published 1 November 201710.1126/scitranslmed.aao1690
Citation: E. K. Evans, A. K. Gardino, J. L. Kim, B. L. Hodous, A. Shutes, A. Davis, X. J. Zhu,O. Schmidt-Kittler, D. Wilson, K. Wilson, L. DiPietro, Y. Zhang, N. Brooijmans, T. P. LaBranche,A. Wozniak, Y. K. Gebreyohannes, P. Schöffski, M. C. Heinrich, D. J. DeAngelo, S. Miller, B. Wolf,N. Kohl, T. Guzi, N. Lydon, A. Boral, C. Lengauer, A precision therapy against cancers driven byKIT/PDGFRA mutations. Sci. Transl. Med. 9, eaao1690 (2017).
S C I ENCE TRANS LAT IONAL MED I C I N E | R E S EARCH ART I C L E
Evans et al., Sci. Transl. Med. 9, eaao1690 (2017) 1 November 2017 11 of 11www.SCIENCETRANSLATIONALMEDICINE.org 01 November 2017 Vol 9 Issue 414 aao1690

As a multidisciplinary online-only journal, Science Robotics publishes original, peer-reviewed, science or engineering-based research articles that advance the field of robotics. The journal provides a central forum for communication of new ideas, general principles, and original developments in research and field applications of robotics for all environments.
ScienceRobotics.org
Robotics for Science, Science for RoboticsTransforming the Future of Robotics in Research !

Lightyour way.Get the full picture with trusted tumorimmune response results from ourin-house validated antibodies.
When it comes to your tumor immune responseresearch, blind spots are unacceptable. Independenttesting has demonstrated that 75% of antibodiesin today’s market are non-specific or simply do notwork at all.* But at Bethyl, we’ve manufactured andvalidated every antibody we make on site to ensuretarget specificity and sensitivity. All to guarantee ourantibodies will function as designed in your assay100% of the time. More than 10,000 independentcitations over the past 15 years have proven that,at Bethyl, we put a lot in every drop.
Antibodies shown: Rabbit anti-PD-L1 (red, A700-020) &Lamin-A/C (green, A303-430A) in FFPE lung.©2018 Bethyl Laboratories, Inc. All rights reserved.
See our data at bethyl.com/immuno-oncology