Embed Size (px)
Citation preview

containing personal stories that aim to reduce stigma and dis-crimination (see Table 1 for a description of sites tracked). In this report, we focus on the websites or portions of websites that are created, hosted, and maintained with CalMHSA funds.
Website Evaluation MethodsFor consistency of metrics and tracking, we opted to use the web analytics service provided by Google Analytics for all program partners creating online resources, rather than the various analyt-ics services that program partners may have already implemented for their own tracking purposes. Google Analytics is the most widely used website statistics service; it is a free web analytics application that generates detailed statistics and information about website performance. We captured a wide range of metrics using Google Analytics to examine the use of and interaction with each website. Measures of tra� c (site visits and page views) give a sense of the volume of visitors to the site. Measures indicat-ing how users access the website (directly, referred from another website, or through search engines) can provide insight into the factors that motivated a user to visit the site; for example, a user who accesses a site directly may have been exposed to a campaign advertising a site name, whereas a user who visits through a search engine may have been looking for information on a topic related to what is covered on the site. Indicators such as average visit duration, average number of page views per visit, how many visits comprise only one page view (i.e., the bounce rate), and what topics or pages were most viewed give a sense of how users interacted with the site and for how long. Other useful metrics include those indicators that provide insight into where website visitors are located geographically, something of particular inter-est given the focus of CalMHSA’s e� orts on Californians. We excluded tra� c from RAND during the monitoring period.1
� ere are some limitations to Google Analytics. � e applica-tion does not include some relevant downloads (for example, those accessed from a link on another site or in an email) and so may underestimate them. Also, the location of the users’ Internet connection approximates their actual geographic location, but
CalMHSA Stigma and Discrimination Reduction Online ResourcesHighlights from an Evaluation of Web Analytic Data
Jennifer L. Cerully, Courtney Ann Kase, Rebecca L. Collins, Eunice C. Wong, and Jennifer Yu
Reducing stigma and discrimination associated with mental illness is an important goal. According to Mental Health: A Report of the Surgeon General, stigma exerts negative e� ects by causing people to avoid “socializing or work-
ing with, renting to, or employing” individuals with mental health challenges, which results in decreased opportunities and resources and, ultimately, low self-esteem, isolation, and hopeless-ness (U.S. Department of Health and Human Services, 1999). Many individuals and organizations may lack the knowledge or resources on how best to address issues of stigma and dis-crimination. With funds from the Mental Health Services Act (Proposition 63), the California Mental Health Services Author-ity (CalMHSA) developed and implemented three statewide prevention and early intervention (PEI) initiatives that focus on mental illness stigma and discrimination reduction (SDR), suicide prevention, and student mental health.
Under the SDR initiative, PEI activities include a social marketing campaign, educational trainings, and online resources. Program partners developed a wide range of SDR online resources targeting individuals in positions to in� uence the lives of people with mental health challenges, known as “gatekeepers,” and the general public. Additionally, program partners devel-oped resources to help individuals � nd information and support related to mental illness. As part of the CalMHSA statewide eval-uation of the PEI initiatives, RAND evaluated the utilization of these online resources, which were distributed through websites created by program partners. � is report provides an overview of the SDR-related online resources and data that describe the use of these websites. Detailed reports of these data for each program partner are available in the appendixes of this report.
Overview of Online Resource DevelopmentAs part of the CalMHSA SDR initiative, most program part-ners developed informational and online resources related to stigma and discrimination reduction for a variety of audiences. Resources are diverse and include fact sheets, toolkits, guidelines, reviews, discussion forums, a documentary, and short videos

– 2 –
Tab
le 1
. Cal
MH
SA S
tig
ma
and
Dis
crim
inat
ion
Red
uct
ion
Pro
gra
m P
artn
er W
ebsi
tes
SDR
Pro
gra
m P
artn
er a
nd
UR
LW
ebsi
te D
escr
ipti
on
Prim
ary
Targ
et
Au
die
nce
RA
ND
Web
site
Usa
ge
Trac
kin
g P
erio
d
Dis
abili
ty R
igh
ts C
alif
orn
ia
htt
p:/
/ww
w.d
isab
ility
rig
hts
ca.o
rg/
Cal
MH
SA/C
alM
HSA
.htm
l
The
Dis
abili
ty R
igh
ts C
alif
orn
ia w
ebsi
te c
on
tain
s a
sect
ion
fea
turi
ng
mo
re t
han
30
anti
dis
crim
inat
ion
fac
tsh
eets
tra
nsl
ated
into
man
y la
ng
uag
es. T
op
ics
cove
red
incl
ud
e d
e�n
itio
ns
and
eff
ects
of
stig
ma
and
dis
crim
inat
ion
, men
tal h
ealt
h p
arit
y, a
nd
th
e p
reve
nti
on
of
dis
crim
inat
ion
as
it r
elat
es t
o e
du
cati
on
, em
plo
ymen
t, h
ou
sin
g, j
ails
an
d
pri
son
s, a
nd
hea
lth
an
d m
enta
l hea
lth
car
e.
Gen
eral
pu
blic
, g
atek
eep
ers
Mar
ch 1
5, 2
013,
to
Ju
ne
30, 2
014
Ente
rtai
nm
ent
Ind
ust
ries
Co
un
cil,
Inc.
htt
p:/
/ww
w.e
ico
nlin
e.o
rg/t
eam
up
TEA
M U
p (
Too
ls f
or
Ente
rtai
nm
ent
and
Med
ia)
is a
set
of
on
line
reso
urc
es f
or
jou
rnal
ists
an
d e
nte
rtai
nm
ent
med
ia c
reat
ors
th
at w
as la
un
ched
in J
un
e 20
13. T
he
reso
urc
es c
ove
r m
enta
l hea
lth
co
nce
rns
and
incl
ud
e th
e fo
llow
ing
: a s
tyle
gu
ide
for
rep
ort
ing
on
men
tal
hea
lth
(“S
tyle
Gu
ide:
Rep
ort
ing
on
Men
tal H
ealt
h”)
; sto
ry id
eas
and
inte
rvie
w t
ips;
so
cial
m
edia
gu
idel
ines
(“S
oci
al M
edia
Gu
idel
ines
fo
r M
enta
l Hea
lth
Pro
mo
tio
n a
nd
Su
icid
e Pr
even
tio
n”)
; dep
icti
on
su
gg
esti
on
s; a
n e
mai
l lin
k fo
r m
edia
cre
ato
rs t
o o
bta
in F
irst
Dra
ft
tech
nic
al a
ssis
tan
ce; v
ideo
s o
f En
tert
ain
men
t In
du
stri
es C
ou
nci
l eve
nts
; po
dca
sts
dis
cuss
ing
m
enta
l illn
ess
stig
ma;
lin
ks t
o m
enta
l hea
lth
–rel
ated
pu
blic
atio
ns;
En
glis
h-
and
Sp
anis
h-
lan
gu
age
reso
urc
es (
e.g
., “M
ues
tra
Esto
”); a
nd
a c
alen
dar
of
Cal
MH
SA e
ven
ts r
elev
ant
to
med
ia p
rofe
ssio
nal
s an
d jo
urn
alis
ts.
Jou
rnal
ists
, en
tert
ain
men
t
med
ia c
reat
ors
Jun
e 8,
201
3, t
o
Jun
e 30
, 201
4
Inte
gra
ted
Beh
avio
ral H
ealt
h P
roje
ct
htt
p:/
/ib
hp
.org
The
“vir
tual
lib
rary
” o
n t
he
Inte
gra
ted
Beh
avio
ral H
ealt
h P
roje
ct/C
ente
r fo
r C
are
Inn
ova
tio
ns
web
site
co
nta
ins
reso
urc
es t
o s
up
po
rt in
teg
rate
d c
are
amo
ng
pri
mar
y ca
re,
men
tal h
ealt
h, a
nd
su
bst
ance
ab
use
tre
atm
ent
sect
ors
. Th
e “P
artn
ers
in H
ealt
h: M
enta
l H
ealt
h, P
rim
ary
Car
e an
d S
ub
stan
ce U
se In
tera
gen
cy C
olla
bo
rati
on
To
ol K
it”
(2n
d E
dit
ion
, 20
13),
is in
ten
ded
to
su
pp
ort
co
llab
ora
tio
ns
acro
ss p
rim
ary
care
, beh
avio
ral h
ealt
h, a
nd
su
bst
ance
ab
use
tre
atm
ent
sect
ors
. Th
e 20
09 e
dit
ion
of
the
too
lkit
inco
rpo
rate
s co
nte
nt
spec
i�c
to t
he
imp
lem
enta
tio
n o
f in
teg
rate
d c
are
wit
hin
th
e st
ate
of
Cal
ifo
rnia
an
d a
dd
s ke
y re
sou
rces
rel
ated
to
th
e in
teg
rati
on
of
care
fo
r su
bst
ance
use
–rel
ated
pro
ble
ms.
Th
e 35
3-p
age
too
lkit
was
po
sted
fo
r d
ow
nlo
ad o
n A
pri
l 26,
201
3. T
he
too
lkit
co
nta
ins
man
y d
iffe
ren
t ty
pes
of
info
rmat
ion
, in
clu
din
g s
cien
ti�
c re
sear
ch o
n in
teg
rate
d b
ehav
iora
l h
ealt
h, q
uo
tes
fro
m m
edic
al a
nd
beh
avio
ral h
ealt
h p
rovi
der
s o
n t
he
po
siti
ve b
ene�
ts o
f in
teg
rate
d c
are,
illu
stra
tive
exa
mp
les
fro
m c
ase
stu
die
s, a
nd
pra
ctic
al in
form
atio
n o
n t
he
log
isti
cs o
f es
tab
lish
ing
inte
rag
ency
co
llab
ora
tio
ns.
Pro
fess
ion
als
wo
rkin
g in
pri
mar
y ca
re, m
enta
l hea
lth
se
rvic
es, a
nd
su
bst
ance
ab
use
tr
eatm
ent
Jun
e 8,
201
3, t
o
Jun
e 30
, 201
4
Men
tal H
ealt
h A
sso
ciat
ion
of
Sa
n F
ran
cisc
o
htt
p:/
/dig
nit
yan
dre
cove
ryce
nte
r.o
rg
The
web
site
fo
r th
e M
enta
l Hea
lth
Ass
oci
atio
n o
f Sa
n F
ran
cisc
o C
ente
r fo
r D
ign
ity,
R
eco
very
, an
d E
mp
ow
erm
ent
ho
sts
info
rmat
ion
ab
ou
t it
s R
eso
urc
e D
evel
op
men
t an
d
Pro
mis
ing
Pra
ctic
es p
rog
ram
s. T
he
site
co
nta
ins
a d
irec
tory
of
SDR
pro
gra
ms,
incl
ud
ing
st
igm
a re
du
ctio
n, e
du
cati
on
an
d t
rain
ing
, an
d c
ult
ura
lly r
esp
on
sive
pro
gra
ms.
Th
e o
rgan
izat
ion
has
dev
elo
ped
an
d m
ade
avai
lab
le m
any
too
ls a
nd
res
ou
rces
un
der
its
Res
ou
rce
Dev
elo
pm
ent
pro
gra
m a
rou
nd
th
e d
evel
op
men
t, m
ain
ten
ance
, an
d e
valu
atio
n
of
con
tact
-bas
ed s
tig
ma
red
uct
ion
pro
gra
ms.
Gen
eral
pu
blic
, g
atek
eep
ers,
o
rgan
izat
ion
s se
ekin
g t
o im
ple
men
t sp
eake
rs b
ure
aus
Jun
e 8,
201
3, t
o
Jun
e 30
, 201
4
Ru
nyo
n S
altz
man
Ein
ho
rn, I
nc.
htt
p:/
/ww
w.e
ach
min
dm
atte
rs.o
rg
The
web
site
ho
sts
the
Cal
MH
SA-f
un
ded
do
cum
enta
ry “
A N
ew S
tate
of
Min
d: E
nd
ing
th
e St
igm
a o
f M
enta
l Illn
ess”
an
d a
gal
lery
of
sho
rt v
ideo
s te
llin
g p
erso
nal
sto
ries
of
ho
pe,
re
silie
nce
, an
d r
eco
very
. Th
e si
te is
als
o a
hu
b f
or
dis
trib
uti
ng
Cal
MH
SA r
eso
urc
es a
cro
ss
the
SDR
, su
icid
e p
reve
nti
on
, an
d s
tud
ent
men
tal h
ealt
h P
EI in
itia
tive
s.
Gen
eral
pu
blic
, g
atek
eep
ers
Jun
e 8,
201
3, t
o
Jun
e 30
, 201
4
Ru
nyo
n S
altz
man
Ein
ho
rn, I
nc.
htt
p:/
/sp
eako
urm
ind
s.o
rg
The
web
site
co
nta
ins
an o
nlin
e to
ol f
or
org
aniz
atio
ns
to �
nd
loca
l men
tal h
ealt
h s
pea
kers
b
ure
aus
by
agg
reg
atin
g a
nd
pro
mo
tin
g e
xist
ing
bu
reau
s in
Cal
ifo
rnia
. It
also
ho
use
s o
nlin
e to
olk
its
to h
elp
men
tal h
ealt
h s
pea
kers
incr
ease
th
eir
skill
s.
Org
aniz
atio
ns
seek
ing
to
imp
lem
ent
spea
kers
bu
reau
s
Jun
e 8,
201
3, t
o
Jun
e 30
, 201
4
Ru
nyo
n S
altz
man
Ein
ho
rn, I
nc.
htt
p:/
/us.
reac
ho
ut.
com
/fo
rum
s
htt
p:/
/us.
reac
ho
ut.
com
/bu
scaa
po
yo
htt
p:/
/us.
reac
ho
ut.
com
/rea
cho
uth
ere
Thes
e d
iscu
ssio
n f
oru
ms
wer
e d
esig
ned
as
par
t o
f a
mo
bili
zati
on
mar
keti
ng
cam
pai
gn
to
en
cou
rag
e yo
uth
ag
es 1
4 to
24
to s
eek
and
pro
vid
e p
eer
sup
po
rt f
or
emo
tio
nal
issu
es.
Rea
chO
ut.
com
fo
rum
s p
rovi
de
a m
od
erat
ed o
nlin
e d
iscu
ssio
n e
nvi
ron
men
t fo
r te
ens
and
yo
un
g a
du
lts
to g
ive
and
get
pee
r su
pp
ort
fo
r em
oti
on
al, r
elat
ion
ship
, an
d h
ealt
h is
sues
. Th
e fo
rum
s ar
e al
so a
vaila
ble
in a
Sp
anis
h-l
ang
uag
e tr
ansl
atio
n a
nd
ad
apti
on
, Bu
scaA
po
yo.
The
Rea
chO
utH
ere
pag
e p
rovi
des
an
en
try
po
int
to t
he
foru
ms
and
incl
ud
es f
acts
hee
ts,
sto
ries
, an
d in
form
atio
n a
bo
ut
ho
w t
o g
et h
elp
fo
r o
nes
elf
or
a fr
ien
d.
The
web
an
alyt
ic d
ata
rep
ort
ed f
or
the
Rea
chO
ut.
com
fo
rum
s in
clu
de
dat
a fr
om
u
s.re
ach
ou
t.co
m/R
each
Ou
tHer
e, a
n in
form
atio
nal
acc
ess
po
int
for
the
Rea
chO
ut
foru
ms,
an
d u
s.re
ach
ou
t.co
m/B
usc
aAp
oyo
, th
e Sp
anis
h-l
ang
uag
e fo
rum
s.
Yo
uth
ag
es 1
4 to
24
Jun
e 8,
201
3, t
o
Jun
e 30
, 201
4

– 3 –
users’ networks and/or browsers can be con�gured to not share this information with analytics packages. For each website, there may be a small percentage of users for which we have no track-ing data, so these users are excluded from analyses. Despite these limitations to describing user characteristics, website analytics can be used to benchmark website use, identify patterns of use, and describe the reach of the websites, which can ultimately inform how to best maintain, support, and adapt a website.
We note that the analytic data reported here pertain only to the CalMHSA-funded online resources hosted on the sites listed in Table 1. Many program partners engaged in online activities that extend beyond the resources listed here. For example, they may have provided materials to other organizations to host on their websites, provided input into the development of other orga-nizations’ online resources, or developed additional sites that were not tracked for this evaluation. In addition, this report does not track analytic data for other partner organizations that may have helped promote the online resources developed by CalMHSA program partners. As a result, the data reported here may under-estimate the volume of online activity in which program partners are directly or indirectly engaged.
Overview of ResultsHere, we provide an overview of the web metrics across all SDR program partners for which we collected web analytic data. Detailed reports of web metrics for each program partner are provided in Appendixes A through J. We also note that we are not directly comparing metrics across the websites, because they vary widely in content and target audience, and some websites were monitored for di�erent periods. We report tracking for most websites from June 8, 2013, to June 30, 2014; web analytic data for periods prior to this window, if available, were previously reported (Burnam et al., 2014).
Visits, Page Views, and Resources DownloadedDuring the current tracking period (see Table 1 for track-ing period dates for each site), 651,243 site visits were made to CalMHSA SDR websites, leading to 1,575,957 page views and 66,871 downloads of digital resources.2 As expected—given that some websites target general audiences while others aim to reach more-speci�c audiences—numbers of visits ranged widely, from Disability Rights California’s approximately 290,000 visits over 16 months to Runyon Saltzman Einhorn’s SpeakOurMinds.org website’s 3,600 visits over 13 months (see Table 2).
User Engagement with SitesWe tracked the ways in which users arrived at or accessed the websites. Users could arrive from direct access (e.g., typing the URL into their browser, clicking on a bookmark, or following a link in an email), via a search engine such as Google or Yahoo!, or through referral via an external link on another website (e.g., clicking on a Facebook link to get to a site). Table 3 shows mea-sures of how users engaged with the websites. For Entertainment Industries Council’s TEAM Up site, Runyon Saltzman Ein-SD
R P
rog
ram
Par
tner
an
d U
RL
Web
site
Des
crip
tio
nPr
imar
y Ta
rget
A
ud
ien
ceR
AN
D W
ebsi
te U
sag
e Tr
acki
ng
Per
iod
Ru
nyo
n S
altz
man
Ein
ho
rn, I
nc.
htt
p:/
/wal
kin
ou
rsh
oes
.org
The
web
site
is a
n o
nlin
e co
mp
anio
n t
o a
sch
oo
l-b
ased
th
eate
r p
rese
nta
tio
n t
arg
etin
g
you
th a
ges
9 t
o 1
3 to
co
rrec
t m
isp
erce
pti
on
s ab
ou
t m
enta
l illn
ess.
Wal
kIn
Ou
rSh
oes
.org
co
nta
ins
a vi
deo
sto
ry g
alle
ry f
or
ado
lesc
ents
to
lear
n a
bo
ut
exp
erie
nce
s o
f m
enta
l hea
lth
an
d r
eco
very
fro
m o
ther
tra
nsi
tio
n-a
ge
you
th a
nd
ad
d t
hei
r o
wn
“sh
oe”
to
“st
om
p o
ut
stig
ma”
to
a g
alle
ry. T
her
e is
ad
dit
ion
al s
up
po
rtin
g m
ater
ial f
or
edu
cato
rs a
nd
par
ents
.
Yo
uth
ag
es 9
to
13,
ed
uca
tors
, par
ents
Au
gu
st 1
9, 2
013,
to
Ju
ne
30, 2
014
Ru
nyo
n S
altz
man
Ein
ho
rn, I
nc.
htt
p:/
/po
nte
enm
isza
pat
os.
org
Pon
teEn
Mis
Zap
ato
s.o
rg is
th
e Sp
anis
h-l
ang
uag
e tr
ansl
atio
n a
nd
ad
apta
tio
n o
f w
alki
no
urs
ho
es.o
rg.
Yo
uth
ag
es 9
to
13,
ed
uca
tors
, par
ents
Sep
tem
ber
9, 2
013,
to
Ju
ne
30, 2
014
Un
ited
Ad
voca
tes
for
Ch
ildre
n
and
Fam
ilies
htt
p:/
/ww
w.u
acf4
ho
pe.
org
The
web
site
fo
r U
nit
ed A
dvo
cate
s fo
r C
hild
ren
an
d F
amili
es c
on
tain
s a
vari
ety
of
reso
urc
es
for
fam
ilies
an
d c
hild
ren
wit
h m
enta
l hea
lth
ch
alle
ng
es. T
hes
e in
clu
de
pag
es o
n s
pec
ial
edu
cati
on
an
d f
or
vari
ou
s ta
rget
po
pu
lati
on
s, s
uch
as
mili
tary
fam
ilies
an
d t
ran
siti
on
-ag
e yo
uth
, as
wel
l as
pag
es f
ocu
sed
on
men
tal h
ealt
h d
iso
rder
s co
mm
on
am
on
g c
hild
ren
an
d
ado
lesc
ents
. A p
age
focu
sed
on
SD
R c
on
tain
s re
sou
rces
su
ch a
s tr
ain
-th
e-t
rain
er c
urr
icu
la
and
a g
uid
e to
ho
ldin
g c
om
mu
nit
y n
etw
ork
ro
un
dta
ble
s.
Gen
eral
pu
blic
, fa
mili
es a
nd
ch
ildre
n
wit
h m
enta
l hea
lth
ch
alle
ng
es
Jun
e 8,
201
3, t
o
Jun
e 30
, 201
4
NO
TE: A
ll av
aila
ble
web
an
alyt
ic d
ata
gat
her
ed p
rio
r to
Ju
ne
8, 2
013,
wer
e p
revi
ou
sly
rep
ort
ed in
Bu
rnam
et
al.,
2014
.
Tab
le 1
—C
on
tin
ued

– 4 –
Table 2. Key Traf�c and Navigation Metrics for Program Partner Websites
SDR Program Partner Months of Tracking Visits Page Views Downloads
Disability Rights California 16 292,832 580,945 45,739
Entertainment Industries Council 13 9,780 21,198 1,535
Integrated Behavioral Health Project/Center for Care Innovations 13 40,038 72,612 12,788
Mental Health Association of San Francisco 13 24,275 66,027 4,551
Runyon Saltzman Einhorn Each Mind Matters 13 57,328 116,449 538a
Runyon Saltzman Einhorn Speak Our Minds 13 3,633 11,009 953
Runyon Saltzman Einhorn ReachOut forums (includes Busca Apoyo and Reach Out Here)
13 127,074 469,235 Not availableb
Runyon Saltzman Einhorn Walk in Our Shoes 11 75,492 191,141 Not availableb
Runyon Saltzman Einhorn Ponte en Mis Zapatos 10 14,171 26,411 Not availableb
United Advocates for Children and Families 13 6,620 20,930 767
Total 651,243 1,575,957 66,871
a Vimeo data of total number of downloaded videos. b Downloads were not tracked for these sites.
Table 3. Key User Engagement Metrics for Program Partner Websites
SDR Program PartnerDirect
(%)Referrals
(%)Searches
(%)Average time
on siteaAverage number of pages visited
Disability Rights California 39 9 50 3:53 2.14
Entertainment Industries Council 30 44 24 2:55 2.17
Integrated Behavioral Health Project/Center for Care Innovations
16 10 74 2:18 1.81
Mental Health Association of San Francisco 49 36 9 3:05 2.72
Runyon Saltzman Einhorn Each Mind Matters 36 25 39 2:19 2.03
Runyon Saltzman Einhorn Speak Our Minds 24 28 48 2:32 3.03
Runyon Saltzman Einhorn ReachOut forums (includes Busca Apoyo and Reach Out Here)
18 3 49 2:07 2.56
Runyon Saltzman Einhorn Walk in Our Shoesb 18 5 12 2:04 2.53
Runyon Saltzman Einhorn Ponte en Mis Zapatosb
7 3 13 1:38 1.86
United Advocates for Children and Families 25 17 57 2:58 3.16
NOTE: Direct, referral, and search percentages were calculated as the number of site visits of that type out of the total number of site visits. For Runyon Saltzman Einhorn Reach Out forums only, site visits are the number of site visits beginning at the forum, mode-speci�c and total. Percentages may not total 100 because less frequent modes such as email, mobile banner, campaign, and streaming were excluded from the table. a Time is displayed in minutes and seconds.b For these Runyon Saltzman Einhorn websites, the Google Analytics settings were augmented to capture when users accessed the websites from online paid advertising campaigns.

– 5 –
horn’s EachMindMatters.org, and Runyon Saltzman Einhorn’s SpeakOurMinds.org, users accessed those websites in all three ways quite evenly. For example, Runyon Saltzman Einhorn’s Each-MindMatters.org had about one-third of users access the website in each way—direct, referral, and search engine. For three websites, Integrated Behavioral Health Project/Center for Care Innova-tions, United Advocates for Children and Families, and Runyon Saltzman Einhorn’s ReachOut forums, the majority of users accessed those websites via search. In contrast with the other sites, the majority of users of the Runyon Saltzman Einhorn websites WalkInOurShoes.org (59 percent) and PonteEnMisZapatos.org (77 percent) accessed the websites from online advertising cam-paigns promoting the websites, which is a type of paid referral.
We also tracked the average time that users spent on each site and the average number of pages visited while users were on the site. �e average time spent on the site varied from about one and a half minutes (Runyon Saltzman Einhorn PonteEnMis-Zapatos.org) to nearly four minutes (Disability Rights Califor-nia). �e number of pages visited varied from about 1.8 (Inte-grated Behavioral Health Project/Center for Care Innovations and Runyon Saltzman Einhorn PonteEnMisZapatos.org) to 3.2 pages (United Advocates for Children and Families).
User LocationBecause the CalMHSA e�ort is California-based and designed for reaching individuals and organizations across California, we examined the location of users accessing program partner websites (see Table 4). Google Analytics determines user location by the user’s Internet Protocol (IP) address. �is is a limitation of the metric because the geographic location indicated by the IP address may not always re�ect the actual geographic loca-tion of the user; some reports indicate IP address location data is an accurate re�ection of a user’s actual geographic location to within a 25-mile radius (Clifton, 2012). Regardless, this metric can be used to observe general trends in user location. For six websites, the vast majority of users accessed the websites from California, ranging from 66 percent to 89 percent of users. For three websites, Entertainment Industries Council’s TEAM Up site and Runyon Saltzman Einhorn’s ReachOut forums and PonteEnMisZapatos.org, 35–47 percent of users were in Cali-fornia. �ough users originated from many areas across Cali-fornia, across all websites, an average of 82 percent of the users originated from three of the largest metropolitan areas—the Los Angeles, Sacramento, and San Francisco areas.3 �is is somewhat more than would be expected, given that 60 percent of Califor-nians reside in these areas (U.S. Census, 2015).
Table 4. Key User Characteristic Metrics for Program Partner Websites
SDR Program Partner Visits from California
Visits from California (% of total visits)
Visits from the Los Angeles, Sacramento, and San Francisco metropolitan areas
(% of California visits)
Disability Rights California 261,830 89 83
Entertainment Industries Council 4,024 41 87
Integrated Behavioral Health Project/Center for Care Innovations
7,230 18 80
Mental Health Association of San Francisco 16,888 70 89
Runyon Saltzman Einhorn Each Mind Matters 37,621 66 82
Runyon Saltzman Einhorn Speak Our Minds 2,384 66 77
Runyon Saltzman Einhorn ReachOut forums (includes Busca Apoyo and Reach Out Here)
45,064 35 79
Runyon Saltzman Einhorn Walk in Our Shoes 49,623 66 80
Runyon Saltzman Einhorn Ponte en Mis Zapatos 6,684 47 82
United Advocates for Children and Families 4,776 72 85
Total 436,124 67 82
NOTE: User characteristics, such as geographical location, determined by the user’s IP address when visiting a website.

– 6 –
DiscussionRAND’s evaluation of the utilization of the CalMHSA-funded SDR online resources shows that the websites have been visited many times—more than 650,000 visits in a year’s time. Assum-ing the California-based visits were from unique individuals, this would indicate that, based on 2014 census estimates, 1.1 percent of California’s population had visited the sites. However, because visits likely were not from unique individuals and we know that some visits originated from IP addresses outside the state, this represents an upper bound (and an overestimate) on the maxi-mum potential reach of the online resources to Californians.4 We cannot determine how many individuals visited multiple CalMHSA-sponsored sites or how many represented previous visitors to these sites (in the case of sites that existed prior to receiving funding from CalMHSA).
Few studies assess the e�ects of public service announce-ments on driving tra�c to a�liated websites, so it is unclear how big a change in web tra�c should be expected for websites associ-ated with a campaign (like Runyon Saltzman Einhorn’s Each Mind Matters). One study showed that only 0.000061 percent of residents in states where an SDR campaign based on public service announcements was piloted visited an a�liated website (Corrigan, 2012); so the reach of CalMHSA sites to a very small percentage of California residents is not necessarily unexpected.
Nonetheless, the majority (60 percent) of visits to the websites originated from within California. Of those visits from within California, more than 80 percent originated from three of the largest metropolitan areas—the Los Angeles, Sacramento, and San Francisco areas. About 60 percent of Californians reside in these areas, suggesting that the reach of online resources was not as good to less populous areas of the state. �is is desirable for a program like that of the Entertainment Industries Council, which targets entertainment professionals who mostly reside in these three metropolitan areas. For the overall SDR online resource e�ort, reach to less populous areas is one advantage of using online media, and this did not appear to be achieved.
Several analytic measures provide insight into how visi-tors to CalMHSA-funded SDR online resources engaged with the sites. Visitors to the sites downloaded more than 66,000 resources. Because the data do not allow us to determine how many resources each user downloads, 66,000 is an upper-bound
estimate of the number of individuals who may have downloaded resources. �e actual number of individuals who downloaded resources is likely less, assuming that at least some individuals downloaded multiple resources. Web analytic data indicate that, on average, users spent two to three minutes on the sites when they visited. Because Google Analytics’ calculations of time on a site leave out the time spent on the last page visited, these estimates represent a conservative estimate of the time users spent on the sites.
Some program partners’ e�orts to reach Californians using online resources were particularly noteworthy in their success. For example, Disability Rights California’s e�orts to make antidiscrimination materials available yielded more than 292,000 visits, with more than half a million page views and more than 45,000 downloads of resource materials. Disability Rights California’s website targeted general audiences, so broad reach is important in judging its success. In another example, Runyon Saltzman Einhorn’s ReachOut forums, which targeted young adults between the ages of 14 and 24, resulted in more than 127,000 visits and more than 469,000 page views, suggesting that the forums were fairly heavily used. Other program partners’ sites received less tra�c, but were targeted at very speci�c, smaller groups. A good example is Entertainment Industries Council’s TEAM Up site, which had less than 10,000 visits but was target-ing media professionals. In another example, Runyon Saltzman Einhorn’s Speak Our Minds site also targeted a speci�c audi-ence—winners of grants for setting up speakers bureaus—and also had less than 10,000 visits. United Advocates for Children and Families had less than 10,000 site visits, even though that site was meant to be of fairly general interest.
�ese results suggest that future evaluation e�orts should explore the strategies by which each program partner attempted to drive tra�c to its site (e.g., through targeted advertising, advertising through partner websites). �is type of exploration is beyond the scope of the current evaluation. Conducting such an evaluation would provide insight into whether reallocation of resources to improving dissemination e�orts (e.g., better promotion of site presence, site reorganization to make available resources easier to �nd) or reallocation of funding to more- e�ective SDR e�orts might be warranted.
Key Findings
• More than 650,000 visits were made to CalMHSA-funded SDR online resources.
• 436,000 visits originated in California, with over 80 percent from three of the largest metropolitan areas—the Los Angeles, Sacramento, and San Francisco areas.
• A maximum of 1.1 percent of California’s population may have visited a CalMHSA-funded SDR online resource.
• Visitors downloaded more than 66,000 resources and spent an average of two to three minutes on the sites.

– 7 –
Notes1 We were unable to exclude program partner tra�c because there is no reliable way to determine exactly which tra�c is from a program partner and which is not after data have been collected by Google Analytics. Using the service provider or network domain is a proxy for identifying which users are a�liated with a program partner, but may not include all program partner users.2 Download tracking was not available for all program partners’ materials. Some program partners did not have CalMHSA-funded materials available for download. Some program partners made materials available during the evaluation period, but download tracking was not enabled for those items.3 In Google Analytics, these areas are de�ned as “the designated market area (DMA) from where tra�c arrived” (Google, 2015). �us, these areas can include more than one city. �e Sacramento area consists of areas in and around Sacramento, Stockton, and Modesto, and the San Francisco area con-sists of areas in and around San Francisco, Oakland, and San Jose.4 �ere is no way to accurately assess the number of unique site visitors because HTTP cookies, the small pieces of data stored in users’ browsers to “remember” interactions with websites and that are used by Google Analytics to measure how users interact with websites, are attached to individual browsers on computers, rather than people.
References
Burnam, M. Audrey, Sandra H. Berry, Jennifer L. Cerully, and Nicole K. Eberhart, Evaluation of the California Mental Health Services Authority’s Prevention and Early Intervention Initiatives: Progress and Preliminary Findings, Santa Monica, Calif.: RAND Corporation, RR-438-CMHSA, 2014. As of July 29, 2015: http://www.rand.org/pubs/research_reports/RR438.html
Clifton, Brian, Advanced Web Metrics with Google Analytics, 3rd ed., Indianapolis, Ind.: John Wiley & Sons, 2012.
Corrigan, P. W., “Where Is the Evidence Supporting Public Service Announcements to Eliminate Mental Illness Stigma?” Psychiatric Services, Vol. 63, No. 1, 2012, pp. 79–83.
Google, “Analytics Core Reporting API: Geo Network—Dimensions and Metro Explorer,” 2015. As of July 29, 2015: https://developers.google.com/analytics/devguides/reporting/core/dimsmets#view=detail&group=geo_network&jump=ga_metro
TEAM Up, Social Media Guidelines for Mental Health Promotion and Suicide Prevention, Entertainment Industries Council, 2014. As of July 30, 2015: http://www.eiconline.org/teamup/wp-content/�les/teamup-mental-health-social-media-guidelines.pdf
U.S. Census Bureau, Population Division, “Annual Estimates of the Resident Population: April 1, 2010 to July 1, 2014,” 2015. As of July 29, 2015: http://fact�nder.census.gov/faces/tableservices/jsf/pages/productview.xhtml?src=CF
U.S. Department of Health and Human Services, Mental Health: A Report of the Surgeon General, Rockville, Md., 1999.

– 8 –
Tra� c metrics. Disability Rights California’s website received 292,832 visits, 580,945 page views, and 45,739 downloads during the 16 months of monitoring. Website activity increased in March and April 2013 and then held steady June through October; a dip in activity occurred in December, but increased slightly in January and held steady again through June 2014 (see Figure A.1).
� e top � ve most frequently downloaded resources (see Table A.1) were the complete PDF and chapters 1, 2, 4, and 6 of the Special Education Rights and Responsibilities manual from the Publications and Resources page of the website, a resource that was not CalMHSA-funded.
User engagement. During the monitoring period, 50 percent of users accessed the website via search engine (see Table A.2). Another 39 percent of users accessed the website directly, and smaller proportions arrived through a referral link (9 percent) or email (2 percent). Table A.3 shows the top � ve sites (out of over 1,000 websites) from which users were referred to the Disability Rights California website.
Site users spent an average of 3 minutes and 53 seconds on the site and visited an average of 2.14 pages per visit. � e home-page bounce rate was 63.56 percent.
User characteristics. � e vast majority of users originated in the United States (see Table A.4) and 89 percent of users origi-nated from California (see Table A.5). Of the California users, nearly all were from some of the most populous metropolitan areas—the Los Angeles (37 percent), Sacramento (23 percent), San Francisco (23 percent), and San Diego (10 percent) areas (see Tables A.6 and A.7 and Figure A.2).
Table A.8 shows the cumulative site visits from the top � ve service providers that are not telecommunications companies. For example, AT&T Internet services was excluded from this list, but, as an Internet service provider, accounted for 23,020 site visits. In total, we have service provider data for 281,945 site visits occurring from over 9,000 service provider sources.
Figure A.1. Site Visits, Page Views, and Downloads, March 15, 2013–June 30, 2014
RAND RR1237-A.1
5,000
0
10,000
15,000
20,000
25,000
30,000
35,000
40,000
45,000
Visits
2013 2014
Mar
chApril
May
June
July
August
Septe
mber
October
Novem
ber
Decem
ber
Januar
y
Febru
ary
Mar
chApril
May
June
Page views
Downloads
Figure A.2. Map of Traf� c to Site from Servers Originating in California Metropolitan Areas, March 15, 2013–June 30, 2014
RAND RR1237-A.2
96,61956
Appendix A. Disability Rights California Google Analytics from March 15, 2013, to June 30, 2014

– 9 –
Table A.1. Top Five Resources Downloaded, March 15, 2013–June 30, 2014
Title/Description of Downloaded Resource
URL of Downloaded Resource Total Downloads
Percentage of Total Downloads
Special Education Rights and Responsibilities (SERR) manual /pubs/504001.pdf 1,869 4%
SERR manual Chapter 1 /pubs/504001Ch01.pdf 1,698 4%
SERR manual Chapter 2 /pubs/504001Ch02.pdf 1,594 3%
SERR manual Chapter 4 /pubs/504001Ch04.pdf 1,463 3%
SERR manual Chapter 6 /pubs/504001Ch06.pdf 1,215 3%
Table A.2. Cumulative Traf�c Sources, March 15, 2013– June 30, 2014
Source Total Percentage
Search (e.g., Google search engine) 146,445 50%
Direct (typing URL into browser, bookmarks) 114,615 39%
External link (referral) 25,025 9%
Email 5,983 2%
Total 292,832
Table A.3. Top Five Referral Sources, March 15, 2013–June 30, 2014
Source Visits Pages per Visit Average Visit Duration
facebook.com 2,526 2.29 00:07:01
webaccess.disabilityrightsca.org 1,663 1.35 00:02:00
lawhelpca.org 1,355 2.21 00:02:23
udwa.org 1,214 2.60 00:03:56
ca.db101.org 940 2.49 00:02:46
Table A.4. Cumulative Site Visits from Servers Originating in Top Five Countries, March 15, 2013–June 30, 2014
Country Visits Pages per Visit Average Visit Duration
United States 288,614 2.15 0:03:55
United Kingdom 530 1.39 0:00:29
Canada 382 1.41 0:00:49
India 350 1.23 0:00:38
Germany 257 1.08 0:00:07

– 10 –
Table A.6. Cumulative Site Visits from Servers Originating in Top Ten Metropolitan Areas, March 15, 2013–June 30, 2014
Metropolitan Area VisitsPages
per VisitAverage
Visit Duration
Los Angeles, CA 96,631 2.29 0:03:56
Sacramento-Stockton-Modesto, CA 60,857 2.10 0:04:38
San Francisco-Oakland-San Jose, CA 59,673 2.11 0:03:46
San Diego, CA 26,687 2.33 0:05:30
Fresno-Visalia, CA 6,155 2.15 0:03:37
Chico-Redding, CA 4,236 2.34 0:03:39
Santa Barbara-Santa Maria-San Luis Obispo, CA 2,613 2.32 0:04:14
New York, NY 2,243 1.42 0:00:46
Monterey-Salinas, CA 1,815 2.19 0:02:21
Washington, DC (Hagerstown, MD) 1,670 1.64 0:01:15
Table A.7. Rank Order of Traf�c to Site from Servers Originating in California Metropolitan Areas, March 15, 2013–June 30, 2014
Metropolitan Area VisitsPages
per VisitAverage
Visit Duration
Los Angeles, CA 96,631 2.29 0:03:56
Sacramento-Stockton-Modesto, CA 60,857 2.10 0:04:38
San Francisco-Oakland-San Jose, CA 59,673 2.11 0:03:46
San Diego, CA 26,687 2.33 0:05:30
Fresno-Visalia, CA 6,155 2.15 0:03:37
Chico-Redding, CA 4,236 2.34 0:03:39
Santa Barbara-Santa Maria-San Luis Obispo, CA 2,613 2.32 0:04:14
Monterey-Salinas, CA 1,815 2.19 0:02:21
Bakers�eld, CA 1,329 2.29 0:02:38
Palm Springs, CA 728 2.33 0:03:13
Table A.5. Cumulative Site Visits from Servers Originating in Top Five U.S. States, March 15, 2013–June 30, 2014
State VisitsPages
per VisitAverage
Visit Duration
California 261,830 2.21 0:04:11
New York 2,194 1.45 0:00:49
Texas 2,179 1.64 0:01:43
Florida 1,812 1.49 0:01:14
Nevada 1,421 1.69 0:01:44

– 11 –
Table A.8. Cumulative Site Visits by Top Five Service Providers, March 15, 2013– June 30, 2014
Service Provider VisitsPages
per VisitAverage
Visit Duration
Disability Rights California 43,473 2.64 0:08:08
Disability Rights 38,405 2.13 0:06:19
Health & Welfare Agency Data Center 3,734 2.37 0:03:37
California Technology Agency 858 1.66 0:01:23
County of Los Angeles 728 2.75 0:02:35

– 12 –
Tra�c metrics. �e Entertainment Industries Council TEAM Up website received 9,780 visits, 21,198 page views, and 1,535 downloads during 13 months of monitoring. Between January and June 2014, the website experienced two peaks in tra�c. Data show these peaks occurring around the end of January and at the end of April and beginning of May (see Figure B.1). �ese peaks may have been related to Entertainment Industries Council’s announcements and events related to the 2014 PRISM Awards (January 29 and April 22–24), Hollywood Looks Toward Healthier Eyes Video Campaign (April 29) (a campaign unre-lated to CalMHSA or mental health), and the TEAM Up Social Media Guidelines for Mental Health Promotion and Suicide Prevention release (May 8) (a CalMHSA-speci�c project). In addition, the following events and press releases may have caused the spikes in web tra�c:• January 29, 2014, announcement for the 18th PRISM
awards honoring the portrayal of mental health and sub-stance abuse, including drug, alcohol, tobacco use, and addiction, in television, movies, music, and comic books, presented annually by the Entertainment Industries Council.
• April 8, 2014, Generation Next TV/�lm, journalism, and social media winners announced.
• April 22–24, 2014, award ceremonies and honoree ceremo-nies held for the PRISM Awards.
• April 29, 2014, announcement for the Hollywood Looks Toward Healthier Eyes Video Campaign; this campaign was not related to mental health, but to the illegal and unsafe use of contact lenses.
• May 8, 2014, Entertainment Industries Council TEAM Up released Social Media Guidelines for Mental Health Promotion and Suicide Prevention (TEAM Up, 2014), in partnership with Dr. Drew Pinsky and Facebook.
Data on website resources downloaded support the reach of the TEAM Up tool announcement; the social media guide-lines were the most-downloaded resources from the Entertain-ment Industries Council TEAM Up website (of those tracked), accounting for 26 percent of all downloads (see Table B.1). �e
style guide also reached over 300 users, accounting for 22 percent of all Entertainment Industries Council downloads tracked. �ese aspects of the site were speci�cally funded by CalMHSA and indicate the central role of the SDR initiative in visits to the site.
User engagement. Users accessed the website in all three ways—direct, referral, and search engine—quite evenly during the tracking period. Table B.2 shows that 44 percent of users accessed the website via referral from an external link on another website and 30 percent accessed the website directly by typing the URL into their browser, clicking on a bookmark, or follow-ing a link in an email or other electronic document (e.g., PDF). One-quarter of site visitors reached the site through a search. Table B.3 shows the top �ve sites (out of over 100 websites) from which users were referred.
Site users spent an average of 2 minutes and 55 seconds on the site and visited an average of 2.17 pages per visit. �e home-page bounce rate was 48.89 percent.
User characteristics. During the tracking period, most users originated from the United States (see Table B.4); 41 per-cent originated from California (see Tables B.5–B.7 and Fig-ure B.2) and 16 percent from Washington, D.C., and Virginia (see Table B.5). �e Entertainment Industries Council has o�ces on both the West and East coasts, and the user characteristic data seems to re�ect some of the physical attributes of the Entertain-ment Industries Council in conjunction with its CalMHSA-funded website activities. Because the Entertainment Industries Council is speci�cally targeted at media professionals rather than the general public, it is not problematic that much of their reach is to persons residing outside of the state, as long as those individuals generate media (California or national) consumed by California residents.
Table B.8 shows the cumulative site visits from the top �ve service providers who are not telecommunications companies. For example, AT&T Internet services was excluded from this list, but as an ISP accounted for 360 site visits. In total, we have service provider data for 9,335 site visits from over 1,600 service provider sources.
Appendix B. Entertainment Industries Council Google Analytics from June 8, 2013, to June 30, 2014

– 13 –
Table B.1 Top Five Resources Downloaded, June 8, 2013–June 30, 2014
ResourceTotal
DownloadsPercentage
of Total
Social Media Guidelines 399 26%
Style Guide: Reporting on Mental Health 338 22%
Muestra Esto/Picture This: Mental Health in Los Angeles (English) 109 7%
Spotlight on Depiction of Health and Social Issues: Mental Illness, Wellness and Recovery (English)
1037%
Mental Health Story Ideas 99 6%
Table B.2. Cumulative Traf� c Sources, June 8, 2013–June 30,2014
Source Total Percentage
Direct (typing URL into browser, bookmarks)
2,977 30%
External link (referral) 4,333 44%
Search (e.g., Google search engine)
2,393 24%
QR code 66 <1%
Other unidenti� ed 11 <1%
Total 9,780
Table B.3. Top Five Referral Sources, June 8, 2013–June 30, 2014
Source VisitsPages
per VisitAverage
Visit Duration
Redirect link facebook.com 1,110 1.68 00:01:15
facebook.com 994 2.04 00:01:26
PRweb.com 808 1.73 00:02:38
Twitter.co 409 1.63 00:02:44
RTDNA.org 213 1.28 00:02:53
Table B.4. Cumulative Site Visits from Servers Originating in Top Five Countries, June 8, 2013–June 30, 2014
Country VisitsPages
per VisitAverage
Visit Duration
United States 7,804 2.28 00:03:20
India 242 1.39 00:00:32
United Kingdom 132 1.83 00:00:56
Netherlands 104 1.77 00:01:19
Canada 100 1.43 00:00:43
Figure B.1. Site Visits, Page Views, and Downloads, June 8, 2013–June 30, 2014
RAND RR1237-B.1
500
0
1,000
1,500
2,000
2,500
3,000
3,500
4,0002013 2014
June
July
August
Septe
mber
October
Novem
ber
Decem
ber
Januar
y
Febru
ary
Mar
chApril
May
June
Page views
Downloads
Visits
Figure B.2. Map of Traf� c to Site from Servers Originating in California Metropolitan Areas, June 8, 2013–June 30, 2014
RAND RR1237-B.2
2,2851

– 14 –
Table B.8. Cumulative Site Visits by Top Five Service Providers, June 8, 2013–June 30, 2014
VisitsPages
per VisitAverage
Visit Duration
CM Reingold 711 3.30 0:07:33
Chapman University 125 2.84 0:02:42
Loyola Marymount University
62 2.10 0:02:49
University of California Los Angeles
49 2.24 0:02:50
California State University network
42 2.07 0:02:59
Table B.7. Rank Order of Traf�c to Site from Servers Originating in California Metropolitan Areas, June 8, 2013–June 30, 2014
Metropolitan Area VisitsPages
per VisitAverage
Visit Duration
Los Angeles, CA 2,285 2.42 0:03:16
San Francisco-Oakland-San Jose, CA 781 2.15 0:02:43
Sacramento-Stockton-Modesto, CA 415 1.93 0:02:12
Santa Barbara-Santa Maria-San Luis Obispo, CA
181 2.03 0:01:46
San Diego, CA 148 1.94 0:01:29
Fresno-Visalia, CA 86 2.70 0:04:36
Chico-Redding, CA 45 2.67 0:03:29
Eureka, CA 26 1.77 0:04:33
Monterey-Salinas, CA 25 1.12 0:00:06
Bakers�eld, CA 21 2.10 0:02:15
Table B.5. Cumulative Site Visits from Servers Originating in Top Five U.S. States, June 8, 2013–June 30, 2014
State VisitsPages
per VisitAverage Visit
Duration
California 4,024 2.27 00:02:55
Virginia 785 3.25 00:05:57
Washington, DC 782 2.70 00:05:42
New York 290 2.06 00:02:14
Texas 214 1.93 00:02:46
Table B.6. Cumulative Site Visits from Servers Originating in Top Ten Metropolitan Areas, June 8, 2013–June 30, 2014
Metropolitan Area VisitsPages
per VisitAverage
Visit Duration
Los Angeles, CA 2,285 2.42 0:03:16
Washington, DC (Hagerstown, MD)
1,603 2.95 0:05:46
San Francisco-Oakland-San Jose, CA
781 2.15 0:02:43
Sacramento-Stockton-Modesto, CA
415 1.93 0:02:12
New York, NY 313 2.02 0:02:51
Santa Barbara-Santa Maria-San Luis Obispo, CA
181 2.03 0:01:46
San Diego, CA 148 1.94 0:01:29
Boston MA-Manchester, NH 108 1.60 0:01:42
Chicago, IL 88 2.17 0:02:23
Dallas-Ft. Worth, TX 86 1.83 0:02:49

– 15 –
Tra� c metrics. � e Integrated Behavioral Health Project/Center for Care Innovations website received 40,038 visits, 72,612 page views, and 12,788 downloads during 13 months of monitoring. � ere were some dips in tra� c at the end of 2013 but, overall, website tra� c increased slightly over time (see Figure C.1).
Data on website resources downloaded show that the Inter-agency Collaboration Toolkit was the most frequently down-loaded resource, and screening tools comprised the remaining top resource downloads (see Table C.1).
User engagement. � e majority of users accessed the website via a search engine, such as Google or Yahoo!, by search-ing keywords or names and following the search results to the Integrated Behavioral Health Project/Center for Care Innova-tions site (see Table C.2). Of the total visits, 74 percent occurred from a search, 16 percent came to the site directly, and 10 percent came from referral. Table C.3 shows the top � ve sites (out of over 250) from which users were referred.
Site users spent an average of two minutes and 18 seconds on the site and visited an average of 1.81 pages per visit. � e home-page bounce rate was 51.78 percent.
Figure C.1. Site Visits, Page Views, and Downloads, June 8, 2013–June 30, 2014
RAND RR1237-C.1
0
1,000
2,000
3,000
4,000
5,000
7,000
6,000
8,0002013 2014
June
July
August
Septe
mber
October
Novem
ber
Decem
ber
Januar
y
Febru
ary
Mar
chApril
May
June
Page views
Downloads
Visits
User characteristics. Most users originated from the United States (see Table C.4), and 18 percent of U.S. users originated from California (see Table C.5). Of the California users, 39 percent were from the Los Angeles area and 29 percent from the San Francisco area (see Table C.7 and Figure C.2). Although only 18 percent of Integrated Behavioral Health Project/Center for Care Innovations’s visitors used a California IP address, this represents a substantial number of Californians reached (7,230; see Table C.5), given the large number of visits to the Integrated Behavioral Health Project/Center for Care Innovations site overall.
Table C.8 shows the cumulative site visits from the top � ve service providers that are not telecommunications companies. For example, AT&T Internet services was excluded from this list, but as an ISP accounted for 1,711 site visits. In total, we have service provider data for 38,413 site visits occurring from over 5,700 service provider sources.
Appendix C. Integrated Behavioral Health Project/Center for Care Innovations Google Analytics from June 8, 2013, to June 30, 2014
Figure C.2. Map of Traf� c to Site from Servers Originating in California Metropolitan Areas, June 8, 2013–June 30, 2014
RAND RR1237-C.2
2,8115

– 16 –
Table C.5. Cumulative Site Visits from Servers Originating in Top Five U.S. States, June 8, 2013–June 30, 2014
State VisitsPages
per VisitAverage
Visit Duration
California 7,230 2.16 0:03:10
New York 2,086 1.72 0:01:53
Texas 1,903 1.77 0:02:09
Florida 1,677 1.79 0:02:11
Pennsylvania 1,530 1.76 0:02:22
Table C.1. Top Five Resources Downloaded, June 8, 2013–June 30, 2014
Resource DownloadsPercentage
of Total
IBHP Interagency Collaboration Tool Kit 2013.pdf 1,399 11%
IBH ScreeningToolsRevFinal100313.pdf 929 7%
BHAssessment.pdf 753 6%
BriefBehavioralHealthScreeningQuestionnaire.pdf 321 3%
RiskAssmnt.pdf 300 2%
Table C.2. Cumulative Traf�c Sources, June 8, 2013–June 30, 2014
Source Total Percentage
Search (e.g., Google search engine)
29,736 74%
Direct (typing URL into browser, bookmarks)
6,487 16%
External link (Referral) 3,813 10%
Email 2 <1%
Total 40,038
Table C.3. Top Five Referral Sources, June 8, 2013–June 30, 2014
Source VisitsPages
per VisitAverage
Visit Duration
integration.samhsa.gov 1,667 2.76 00:05:11
google.com 128 1.42 00:01:11
umassmed.edu 120 3.21 00:05:54
ncfahp.org 114 3.52 00:05:37
samhsa.gov 105 2.72 00:05:09
Table C.4. Cumulative Site Visits from Servers Originating in Top Five Countries, June 8, 2013–June 30, 2014
Country VisitsPages
per VisitAverage
Visit Duration
United States 37,067 1.84 0:02:22
Canada 407 1.97 0:02:07
India 366 1.29 0:00:56
United Kingdom 318 1.24 0:01:02
Philippines 250 1.21 0:00:50

– 17 –
Table C.6. Cumulative Site Visits from Servers Originating in Top Ten Metropolitan Areas, June 8, 2013–June 30, 2014
Metropolitan Area VisitsPages
per VisitAverage
Visit Duration
Los Angeles, CA 2,814 2.20 0:03:30
New York, NY 2,289 1.60 0:01:41
San Francisco-Oakland-San Jose, CA
2,076 2.09 0:02:54
Washington, DC (Hagerstown, MD)
1,305 1.83 0:02:13
Philadelphia, PA 1,211 1.72 0:02:24
Boston, MA-Manchester, NH
1,202 1.73 0:02:05
Chicago, IL 1,124 1.65 0:02:05
Sacramento-Stockton-Modesto, CA
880 2.20 0:02:59
Phoenix, AZ 863 1.76 0:02:20
Seattle-Tacoma, WA 692 1.86 0:02:12
Table C.7. Rank Order of Traf�c to Site from Servers Originating in California Metropolitan Areas, June 8, 2013–June 30, 2014
Metropolitan Area VisitsPages
per VisitAverage
Visit Duration
Los Angeles, CA 2,814 2.20 0:03:30
San Francisco-Oakland-San Jose, CA 2,076 2.09 0:02:54
Sacramento-Stockton-Modesto, CA 880 2.20 0:02:59
San Diego, CA 642 1.84 0:02:10
Fresno-Visalia, CA 242 2.33 0:03:50
Chico-Redding, CA 154 2.55 0:03:01
Bakers�eld, CA 116 3.06 0:05:34
Monterey-Salinas, CA 116 1.87 0:03:12
Santa Barbara-Santa Maria-San Luis Obispo, CA 97 2.47 0:03:58
Eureka, CA 39 2.36 0:03:29
Table C.8. Cumulative Site Visits by Top Five Service Providers, June 8, 2013–June 30, 2014
Service Provider VisitsPages
per VisitAverage
Visit Duration
Department of Veterans Affairs
354 1.77 0:01:52
Kaiser Foundation Health Plan
118 2.63 0:03:58
UnitedHealth Group Incorporated
77 1.26 0:01:16
County of Los Angeles 70 2.14 0:04:54
Santa Clara County 70 2.21 0:03:17

– 18 –
Tra�c metrics. �e Mental Health Association of San Francisco Center for Dignity, Recovery and Empowerment website received 24,275 visits, 66,027 page views, and 4,551 downloads during 13 months of monitoring. �e website experienced increasing tra�c from November to February, culminating with a peak in activity in February (see Figure D.1). �ere was a decline in March and a smaller peak of site visits and page views in April, followed by another decline. �e following events and press releases may have caused the spikes in web tra�c:• January 20, 2014, request for proposals released for Mental
Health Association of San Francisco and CAMHPRO mini-grants for community-based consumer-run and -operated programs. �e proposal applications were due February 12 and mini-grant award announcements were expected Febru-ary 19.
• February 21, 2014, the National Coalition for Mental Health Recovery hosted the Fourth Annual Consumer/Survivor Visionary Leadership Teleconference, at which the Executive Director of Mental Health Association of San Francisco spoke.
• March 7 and 8, 2014, the Mental Health Association of San Francisco Center for Dignity, Recovery and Empowerment hosted the Tools for Change 2014 conference.
• April 26, 2014, a meeting for the Cultural Idioms Research project brought together the Client Advocacy Coalition in Ventura County and the Center for Dignity, Recovery and Empowerment to discuss mental health in the Ventura community.
• May 6, 2014, the Mental Health Association of San Fran-cisco Center for Dignity, Recovery and Empowerment hosted a webinar, Developing Your Personal Story of Mental
Health Recovery, and the center’s Assistant Research Director for Resource Development was one of the webinar speakers.
�e resource download data for the website (see Table D.1) show that the top three most-downloaded resources are materials for the Tools for Change Conference, accounting for 36 percent of resources downloaded. �e mini-grant request for proposals and Tools for Change program were in the top �ve most fre-quently downloaded list, accounting for 6 percent and 5 percent of downloads, respectively.
User engagement. Users accessed the website most fre-quently through direct access and referral (see Table D.2); 49 per-cent of users accessed the website by directly typing the website URL and 36 percent of users were referred to the website from an external link. Table D.3 shows the top �ve sites (out of over 100) from which users were referred.
Site users spent an average of three minutes and �ve seconds on the site and visited an average of 2.72 pages per visit. �e homepage bounce rate was 33.31 percent.
User characteristics. Most users originated from the United States (see Table D.4); 70 percent of users originated from Cali-fornia (see Table D.5) and, of those, 61 percent were from the San Francisco area (where Mental Health Association of San Fran-cisco is located) (see Tables D.6 and D.7 and Figure D.2).
Table D.8 shows the cumulative site visits from the top �ve service providers that are not telecommunications companies. For example, AT&T Internet services was excluded from this list, but as an ISP accounted for 1,514 site visits. In total, we have service provider data for 22,969 site visits occurring from over 1,400 service provider sources.
Appendix D. Mental Health Association of San Francisco Google Analytics from June 8, 2013, to June 30, 2014

– 19 –
Table D.2. Cumulative Traf� c Sources, June 8, 2013–June 30, 2014
Source Total Percentage
Direct (typing URL into browser, bookmarks)
11,985 49%
External link (referral) 8,749 36%
Search (e.g., Google search engine) 2,213 9%
Email 1,328 5%
Total 24,275
Table D.3. Top Five Referral Sources, June 8, 2013–June 30, 2014
Source VisitsPages
per VisitAverage
Visit Duration
mentalhealthsf.org 3,099 3.37 00:04:38
prpsn.org 879 2.94 00:04:55
nytimes.com 709 3.09 00:02:49
facebook.com 432 2.31 00:02:01
Mobile facebook.com 428 1.37 00:01:48
Figure D.2. Map of Traf� c to Site from Servers Originating in California Metropolitan Areas, June 8, 2013–June 30, 2014
RAND RR1237-D.2
10,30010
Figure D.1. Site Visits and Page Views, June 8, 2013–June 30, 2014
RAND RR1237-D.1
0
2,000
4,000
6,000
8,000
10,000
14,000
12,000
16,0002013 2014
June
July
August
Septe
mber
October
Novem
ber
Decem
ber
Januar
y
Febru
ary
Mar
chApril
May
June
Downloads
Visits
Page views
Table D.1. Mental Health Association of San Francisco Top Five Resources Downloaded, June 8, 2013–June 30, 2014
Title/Description of Downloaded Resource URL of Downloaded Resource
Total Downloads
Percentage of Total Downloadsa
Agenda for 2014 Tools for Change Conference
http://dignityandrecoverycenter.org/wp-content/uploads/2014/01/Agenda-At-A-Glance-Updated-2.7.14.pdf
414 14%
Agenda for 2014 Tools for Change Conference (earlier version)
http://dignityandrecoverycenter.org/wp-content/uploads/2014/01/Agenda-At-A-Glance-1.17.14.pdf
339 12%
Workshop Day 1 Schedule for 2014 Tools for Change Conference
http://dignityandrecoverycenter.org/wp-content/uploads/2014/01/Workshop-Schedule-Day-1-2.pdf
289 10%
Mini-grant funding opportunity announcement
http://dignityandrecoverycenter.org/wp-content/uploads/2014/01/CAMHPRO-Mini-Grant-RFP-.pdf
183 6%
2014 Tools for Change Conference Program
http://dignityandrecoverycenter.org/wp-content/uploads/2014/01/Tools-for-Change-Program-2014-WEB.pdf
158 5%
a Percentage of total downloads was calculated from the number of uniquely titled resources, out of the total number of titled resources downloaded. 1,666 download events had no title linked to them because the event tracking setting to do so was not set up; those downloads are excluded from this table.

– 20 –
Table D.8. Cumulative Site Visits by Top Five Service Providers, June 8, 2013–June 30, 2014
Service Provider VisitsPages
per VisitAverage
Visit Duration
City & County of San Francisco
223 1.97 0:01:53
County of San Mateo 195 2.66 0:03:03
Santa Clara County 168 2.76 0:04:04
County of Los Angeles 116 2.74 0:05:37
Fair Haven Board of Education
97 3.98 0:03:06
Table D.4. Cumulative Site Visits from Servers Originating in Top Five Countries, June 8, 2013–June 30, 2014
Country VisitsPages
per VisitAverage
Visit Duration
United States 22,750 2.75 0:03:11
Canada 348 2.67 0:01:58
Australia 180 1.84 0:01:05
United Kingdom 165 2.31 0:01:25
France 83 1.36 0:00:08
Table D.5. Cumulative Site Visits from Servers Originating in Top Five U.S. States, June 8, 2013–June 30, 2014
State VisitsPages
per VisitAverage
Visit Duration
California 16,888 2.86 0:03:34
New York 694 2.75 0:02:06
Virginia 398 1.69 0:01:04
Texas 392 1.79 0:01:39
Massachusetts 346 2.72 0:02:21
Table D.6. Cumulative Site Visits from Servers Originating in Top Ten Metropolitan Areas, June 8, 2013–June 30, 2014
Metropolitan Area VisitsPages
per VisitAverage
Visit Duration
San Francisco-Oakland-San Jose, CA
10,300 2.95 0:03:41
Los Angeles, CA 2,489 2.83 0:03:50
Sacramento-Stockton-Modesto, CA
2,267 2.73 0:03:29
New York, NY 681 2.59 0:02:03
San Diego, CA 561 2.27 0:02:10
Washington, DC (Hagerstown, MD)
548 2.30 0:01:38
Fresno-Visalia, CA 390 2.98 0:03:10
Boston MA-Manchester, NH
319 3.02 0:02:40
Philadelphia, PA 282 2.75 0:03:16
Monterey-Salinas, CA 278 2.34 0:03:22
Table D.7. Rank Order of Traf�c to Site from Servers Originating in California Metropolitan Areas, June 8, 2013–June 30, 2014
Metropolitan Area VisitsPages
per VisitAverage
Visit Duration
San Francisco-Oakland- San Jose, CA
10,300 2.95 0:03:41
Los Angeles, CA 2,489 2.83 0:03:50
Sacramento-Stockton-Modesto, CA
2,267 2.73 0:03:29
San Diego, CA 561 2.27 0:02:10
Fresno-Visalia, CA 390 2.98 0:03:10
Monterey-Salinas, CA 278 2.34 0:03:22
Santa Barbara-Santa Maria-San Luis Obispo, CA
227 2.52 0:02:09
Chico-Redding, CA 203 2.79 0:03:11
Eureka, CA 80 2.41 0:01:55
Palm Springs, CA 22 2.41 0:03:53

– 21 –
Tra�c metrics. �e EachMindMatters.org website received 57,328 visits and 116,449 page views during 13 months of monitoring. A spike in website activity is seen in May 2014 (see Figure E.1), and the dates of most website tra�c coincided with Mental Health Matters Day on May 13, 2014.
�e Each Mind Matters California’s Mental Health Move-ment website, EachMindMatters.org, has a video gallery, called the Great Minds Gallery, which presents over 50 videos of testimonials and expert interviews to users. �rough the video-sharing site Vimeo, we have complete video viewing statistics for 51 of Each Mind Matters’ videos. We report the viewing statistics for 51 videos from June 30, 2013, to June 30, 2014.
From June 30, 2013, to June 30, 2014, the 51 videos were played 13,101 times (see Table E.1). According to the viewing statistics, viewers �nished 2,507 videos, which represents 19 percent of the number of plays; few viewers �nished watching videos through the end. Of the 51 videos and 13,101 plays, 8,288 plays were of “A New State of Mind” HD video, accounting for approximately 63 percent of all plays (see Table E.2). �e website was originally designed to house the “A New State of Mind” documentary, which is likely why it received the most plays. However, it was among the least likely to be viewed to comple-tion, with only 9 percent of those who played it watching the �lm until its conclusion (see Table E.3). It should be noted that it is an hour-long �lm, while the other videos on the site are only a few minutes in length. �e video “Alexandra’s Story” was viewed
surprisingly often, given that it was �rst posted at the beginning of June 2014, just shortly before the conclusion of our monitoring period (see Table E.3). Viewers often saw videos that were embed-ded in other websites. �e top sites in which videos were embed-ded are shown in Tables E.4 and E.5.
User engagement. Users accessed the website in all three ways. Table E.6 shows that 39 percent of users accessed the website via search engine, 36 percent of users accessed the website directly, and 25 percent of users accessed the website via referral link. Table E.7 shows the top �ve sites (out of over 500) from which users were referred to the Each Mind Matters website.
Site users spent an average of two minutes and 19 seconds on the site and visited an average of 2.03 pages per visit. �e home-page bounce rate was 40.36 percent.
User characteristics. Most users originated in the United States (see Table E.8); 66 percent of users originated from California (see Table E.9) and, of those, most were from some of the most populous metropolitan areas of California—the Los Angeles (32 percent), Sacramento (23 percent), and San Francisco (27 percent) areas (see Tables E.10 and E.11 and Figure E.2).
Table E.12 shows the cumulative site visits from the top �ve service providers that are not telecommunications companies. For example, AT&T Internet services was excluded from this list, but as an ISP accounted for 4,400 site visits. In total, we have service provider data for 57,328 site visits occurring from over 4,000 service provider sources.
Figure E.1. Site Visits and Page Views, June 8, 2013–June 30, 2014
RAND RR1237-E.1
0
2,000
4,000
6,000
8,000
10,000
14,000
16,000
12,000
18,0002013 2014
June
July
August
Septe
mber
October
Novem
ber
Decem
ber
Januar
y
Febru
ary
Mar
chApril
May
June
Visits
Page views
Appendix E. Runyon Saltzman Einhorn’s Each Mind Matters Google Analytics from June 8, 2013, to June 30, 2014
Figure E.2. Map of Traf�c to Site from Servers Originating in California Metropolitan Areas, June 8, 2013–June 30, 2014
RAND RR1237-E.2
11,9733

– 22 –
Table E.3. All Videos Sorted by Plays
Video Title URL Tag Upload DateTotal Plays
Total Finishes
Total Loads
Total Downloads
A New State of Mind: Ending the Stigma of Mental Illness (HD) /67439197 5/31/2013 8,288 758 41,005 96
A New State of Mind Exclusive Trailer /65095577 4/29/2013 1,225 572 15,542 20
A New State of Mind [with closed captioning] /70898853 7/23/2013 568 55 1,689 11
California’s Historic Effort to Reduce the Stigma of Mental Illness /68321770 6/13/2013 353 113 1,818 28
Each Mind Matters: Alexandra’s Story /97757370 6/9/2014 310 147 549 2
Each Mind Matters: Amanda Lipp’s Story /87911817 2/28/2014 263 137 912 2
PSA1 Faces of Mental Health /70864793 7/23/2013 172 97 436 4
Each Mind Matters: Monique’s Story /84815961 1/22/2014 135 55 311 9
La historia de Cristina / Cristina’s Story /81039119 12/4/2013 98 17 222 6
La historia de Veronica / Veronica’s Story /81041873 12/4/2013 83 8 215 5
Each Mind Matters: Susan’s Story /88710580 3/10/2014 81 19 118 0
DOWNLOAD: A New State of Mind: Ending the Stigma of Mental Illness
/71746241 8/5/2013 78 6 256 293
Each Mind Matters: Chua Cher Yang’s Story/Hmong /84806462 1/22/2014 78 18 178 7
Each Mind Matters: Janet King’s Story /86134409 2/7/2014 74 20 169 2
PSA3 It’s All of Us /70864792 7/23/2013 74 39 280 1
Each Mind Matters: Michelle’s Story /88710337 3/10/2014 73 23 116 3
PSA2 Life Can Get Better /70864791 7/23/2013 72 50 222 2
Each Mind Matters: Annabelle’s Story /88708750 3/10/2014 66 13 93 1
Each Mind Matters: Doug Tavira’s Story /86540827 2/12/2014 65 17 150 2
PSA3 It’s All of Us [with closed captioning] /71054957 7/25/2013 58 38 283 4
PSA2 Life Can Get Better [with closed captioning] /71054956 7/25/2013 55 42 242 1
Each Mind Matters: Jamin’s Story /88708531 3/10/2014 54 11 68 2
Each Mind Matters: Greg Louganis’ Story /87912025 2/28/2014 52 13 81 2
Each Mind Matters: Michael’s Story /84816648 1/22/2014 51 15 143 1
Each Mind Matters: Susan’s Story /84805086 1/22/2014 51 21 98 4
Each Mind Matters: Pedro & Jose’s Story /86537478 2/12/2014 50 19 157 4
Table E.1. Runyon Saltzman Einhorn Each Mind Matters Cumulative Video Viewing Statistics
Totals
Number of loads 66,590
Number of plays 13,101
Number of �nishes 2,507
Number of downloads 538
Table E.2. Top Five Cumulative Finishes and Plays of Each Mind Matters Videos
Total Finishes
Total Plays
A New State of Mind: Ending the Stigma of Mental Illness (HD) 758 8,288
A New State of Mind Exclusive Trailer 572 1,225
Each Mind Matters: Alexandra’s Story 147 353
Each Mind Matters: Amanda’s Story 137 310
California’s Historic Effort to Reduce the Stigma of Mental Illness 113 568

– 23 –
Video Title URL Tag Upload DateTotal Plays
Total Finishes
Total Loads
Total Downloads
PSA1 Faces of Mental Health [with closed captioning] /71054955 7/25/2013 46 32 212 0
Each Mind Matters: Keris’ Story /84805441 1/22/2014 44 17 77 2
Each Mind Matters: Joe’s Story /88710049 3/10/2014 42 10 73 4
EmilyV06 /99193360 6/25/2014 42 15 77 1
Each Mind Matters: Ty’s Story /88690741 3/10/2014 40 11 55 1
Each Mind Matters: Jennifer’s Story /88709807 3/10/2014 39 11 60 1
Each Mind Matters: Joshua Smith’s Story /86538900 2/12/2014 39 10 101 2
Each Mind Matters: Mercedes’ Story /88708272 3/10/2014 38 6 55 2
Each Mind Matters: David Martinez’s Story /86537242 2/12/2014 36 12 82 2
Each Mind Matters: Michael Bohon’s Story /88407322 3/6/2014 35 11 52 1
Each Mind Matters: Oscar’s Story /95009157 5/12/2014 32 10 56 0
BelindaV03 /97755610 6/9/2014 29 7 60 1
Veronica Castilla with Subtitles - Spanish-Language Vignette /81043172 12/4/2013 27 4 78 2
Each Mind Matters: Neil Shaw’s Story /86537000 2/12/2014 26 10 59 2
Cristina Zamorano with Subtitles - Spanish-Language Vignette /81041353 12/4/2013 22 4 74 5
Each Mind Matters: Sally and Jay’s Story /97747749 6/9/2014 12 6 18 0
Each Mind Matters: Charlotte’s Story /97750907 6/9/2014 10 4 16 0
Each Mind Matters: Dennis’ Story /99194065 6/25/2014 5 0 6 0
Each Mind Matters: Art’s Story /99193117 6/25/2014 2 1 6 0
Each Mind Matters: Lila’s Story /99384112 6/27/2014 2 1 7 0
Each Mind Matters: Margaret’s Story /99582198 6/30/2014 2 0 2 0
Each Mind Matters: Marie’s Story /99384078 6/27/2014 2 1 3 0
Each Mind Matters: Daniel’s Story /99369065 6/27/2014 1 1 5 0
Each Mind Matters: Sam’s Story /99581365 6/30/2014 1 0 2 0
Each Mind Matters: Adalia’s Story /99370031 6/27/2014 0 0 1 0
UNKNOWN 98 13 328 12
UNKNOWN 47 8 177 14
UNKNOWN 5 3 54 8
UNKNOWN 2 0 25 2
Table E.3—Continued

– 24 –
Table E.4. Top Ten Sites Where Videos Are Embedded, Based on Loads
Site URL Loads
Each Mind Matters eachmindmatters.org 23,732
Royal College of Psychiatrists rcpsych.ac.uk 7,837
Healthy Sonoma County healthysonoma.org 4,747
Lao Family Community Empowerment Inc. lfcempowerment.org 3,378
Unknown sites UNKNOWN 3,160
Personal Blog geishaschooldropout.typepad.com 1,395
Advocates for Mentally Ill Housing Inc. amihousing.org 1,258
KPBS San Diego News kpbs.org 811
UC Davis Each Aggie Matters eachaggiematters-dev.shcs.ucdavis.edu 564
St. Patrick Catholic Community stpatrickscottsdale.blogspot.com 437
Table E.5. Top Ten Sites Where Videos Are Embedded, Based on Plays
Site URL Plays
Each Mind Matters eachmindmatters.org 6,684
Unknown sites UNKNOWN 1,333
Royal College of Psychiatrists rcpsych.ac.uk 205
Entertainment Industries Council TV Network eicnetwork.tv 113
Facebook facebook.com 111
KPBS San Diego News kpbs.org 62
Lao Family Community Empowerment Inc. lfcempowerment.org 47
Advocates for Mentally Ill Housing Inc. amihousing.org 46
Bing bing.com 43
Tumblr www.tumblr.com 38
Table E.6. Cumulative Traf�c Sources, June 8, 2013–June 30, 2014
Source Total Percentage
Direct (typing URL into browser, bookmarks)
20,380 36%
External link (referral) 14,075 25%
Search (e.g., Google search engine) 22,596 39%
Other email 173 <1%
Other unidenti�ed 104 <1%
Total 57,328
Table E.7. Top Five Referral Sources, June 8, 2013–June 30, 2014
Source VisitsPages
per VisitAverage
Visit Duration
nami.org 2,087 1.38 00:01:32
facebook.com 2,069 1.86 00:02:04
Mobile facebook.com 1,992 1.23 00:00:44
calmhsa.org 796 3.71 00:05:34
Twitter.com 530 1.54 00:01:24
Table E.8. Cumulative Site Visits from Servers Originating in Top Five Countries, June 8, 2013–June 30, 2014
Country VisitsPages
per VisitAverage
Visit Duration
United States 53,463 2.08 00:02:24
Canada 733 1.33 00:01:09
United Kingdom 584 1.31 00:01:11
Australia 324 1.27 00:01:07
India 278 1.50 00:01:03
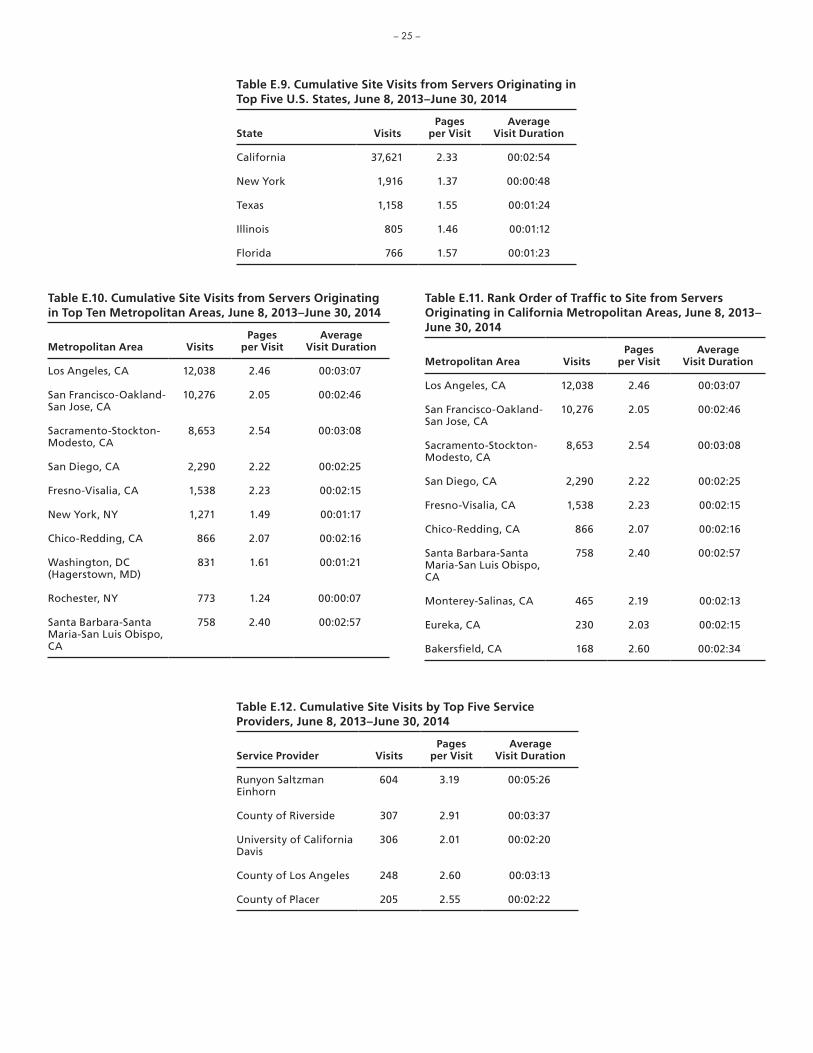
– 25 –
Table E.9. Cumulative Site Visits from Servers Originating in Top Five U.S. States, June 8, 2013–June 30, 2014
State VisitsPages
per VisitAverage
Visit Duration
California 37,621 2.33 00:02:54
New York 1,916 1.37 00:00:48
Texas 1,158 1.55 00:01:24
Illinois 805 1.46 00:01:12
Florida 766 1.57 00:01:23
Table E.10. Cumulative Site Visits from Servers Originating in Top Ten Metropolitan Areas, June 8, 2013–June 30, 2014
Metropolitan Area VisitsPages
per VisitAverage
Visit Duration
Los Angeles, CA 12,038 2.46 00:03:07
San Francisco-Oakland-San Jose, CA
10,276 2.05 00:02:46
Sacramento-Stockton-Modesto, CA
8,653 2.54 00:03:08
San Diego, CA 2,290 2.22 00:02:25
Fresno-Visalia, CA 1,538 2.23 00:02:15
New York, NY 1,271 1.49 00:01:17
Chico-Redding, CA 866 2.07 00:02:16
Washington, DC (Hagerstown, MD)
831 1.61 00:01:21
Rochester, NY 773 1.24 00:00:07
Santa Barbara-Santa Maria-San Luis Obispo, CA
758 2.40 00:02:57
Table E.11. Rank Order of Traf�c to Site from Servers Originating in California Metropolitan Areas, June 8, 2013–June 30, 2014
Metropolitan Area VisitsPages
per VisitAverage
Visit Duration
Los Angeles, CA 12,038 2.46 00:03:07
San Francisco-Oakland-San Jose, CA
10,276 2.05 00:02:46
Sacramento-Stockton-Modesto, CA
8,653 2.54 00:03:08
San Diego, CA 2,290 2.22 00:02:25
Fresno-Visalia, CA 1,538 2.23 00:02:15
Chico-Redding, CA 866 2.07 00:02:16
Santa Barbara-Santa Maria-San Luis Obispo, CA
758 2.40 00:02:57
Monterey-Salinas, CA 465 2.19 00:02:13
Eureka, CA 230 2.03 00:02:15
Bakers�eld, CA 168 2.60 00:02:34
Table E.12. Cumulative Site Visits by Top Five Service Providers, June 8, 2013–June 30, 2014
Service Provider VisitsPages
per VisitAverage
Visit Duration
Runyon Saltzman Einhorn
604 3.19 00:05:26
County of Riverside 307 2.91 00:03:37
University of California Davis
306 2.01 00:02:20
County of Los Angeles 248 2.60 00:03:13
County of Placer 205 2.55 00:02:22

– 26 –
Tra�c metrics. �e SpeakOurMinds.org website received 3,633 visits, 11,009 page views, and 953 downloads during 13 months of monitoring. A peak of page-view activity was observed in August 2013, with the most page views on August 13, 2013 (see Figure F.1). Following the peak in August, there was a decline in site activity, particularly in downloads, through December 2013, but site activity rebounded from January through June 2014. Because the site was designed largely for winners of speakers bureau mini-grants, this pattern may be due to the mini-grant funding cycle driving tra�c to the site. Applications for the mini-grant indicate that mini-grant winners received funds in July 2013, December 2013, and March 2014. Spikes in page views were observed shortly after each of these funding instances.
�e most frequently downloaded resources from SpeakOur-Minds.org were templates for presentation �yers, factsheets, and discussion starters (see Table F.1).
User engagement. Users accessed the website in all three ways. Table F.2 shows that 48 percent of users accessed the web-site via search engine, 28 percent of users accessed the website via
Figure F.1. Site Visits, Page Views, and Downloads, June 8, 2013–June 30, 2014
RAND RR1237-F.1
200
0
400
600
800
1,000
1,200
1,4002013 2014
June
July
August
Septe
mber
October
Novem
ber
Decem
ber
Januar
y
Febru
ary
Mar
chApril
May
June
Page views
Downloads
Visits
referral link, and 24 percent of users accessed the website directly. Table F.3 shows the top �ve sites (out of 44) from which users were referred.
Site users spent an average of two minutes and 32 seconds on the site and visited an average of 3.03 pages per visit. �e home-page bounce rate was 43.79 percent.
User characteristics. Most users originated from the United States (see Table F.4); 66 percent of users originated from California (see Table F.5) and, of those, most were from some of the most populous metropolitan areas in California—the Los Angeles (28 percent), Sacramento (25 percent), San Francisco (23 percent), and San Diego (8 percent) areas (see Tables F.6 and F.7 and Figure F.2).
Table F.8 shows the cumulative site visits from the top �ve service providers that are not telecommunications companies. For example, AT&T Internet services was excluded from this list, but as an ISP accounted for 283 site visits. In total, we have service provider data for 3,400 site visits occurring from over 800 service provider sources.
Appendix F. Runyon Saltzman Einhorn Speak Our Minds Google Analytics from June 8, 2013, to June 30, 2014
Figure F.2. Map of Traf�c to Site from Servers Originating in California Metropolitan Areas, June 8, 2013–June 30, 2014
RAND RR1237-F.2
6791

– 27 –
Table F.1. Runyon Saltzman Einhorn Speak Our Minds Top Five Resources Downloaded, June 8, 2013–June 30, 2014
Description of Downloaded Resource URL of Downloaded Resource Total
Percentage of Total Downloads
Template for Event Advertisement http://www.speakourminds.org/wp-content/uploads/2013/04/Presentation-Event-Flyer-Template-2.doc
279 29%
Template for Event Advertisement http://www.speakourminds.org/wp-content/uploads/2013/04/Presentation-Event-Flyer-Template-1.doc
135 14%
Myths and facts on stigma of mental illness and discrimination
http://www.speakourminds.org/wp-content/uploads/2013/04/Stigma-Myths-Facts.pdf
92 10%
Discussion starters for dialogue on stigma and mental illness
http://www.speakourminds.org/wp-content/uploads/2013/04/Stigma-Discussion-Starters.pdf
75 8%
People First Language in Mental Health http://www.speakourminds.org/wp-content/uploads/2013/04/People-First-Fact-Sheet-English.pdf
73 8%
Table F.2. Cumulative Traf�c Sources, June 8, 2013–June 30, 2014
Source Total Percentage
Search (e.g., Google search engine) 1,727 48%
External link (Referral) 1,024 28%
Direct (typing URL into browser, bookmarks)
872 24%
Email 10 <1%
Total 3,633
Table F.3. Top Five Referral Sources, June 8, 2013–June 30, 2014
Source VisitsPages
per VisitAverage
Visit Duration
eachmindmatters.org 721 4.31 00:03:19
healthiercommunityartsinitiative.com 46 4.15 00:03:01
mhac.org 37 4.51 00:03:42
eiconline.org 36 1.94 00:01:32
calmhsa.org 15 4.13 00:02:32
Table F.4. Cumulative Site Visits from Servers Originating in Top Five Countries, June 8, 2013–June 30, 2014
Country VisitsPages
per VisitAverage
Visit Duration
United States 3,291 3.19 0:02:42
Canada 76 1.51 0:01:07
Brazil 32 1.06 0:00:08
United Kingdom 26 1.31 0:02:10
Australia 25 1.40 0:00:54
Table F.5. Cumulative Site Visits from Servers Originating in Top Five U.S.States, June 8, 2013–June 30, 2014
State VisitsPages
per VisitAverage
Visit Duration
California 2,384 3.78 0:03:20
Texas 80 1.41 0:01:23
New York 76 1.78 0:01:07
Virginia 51 1.35 0:00:39
Pennsylvania 49 2.43 0:01:10

– 28 –
Table F.6. Cumulative Site Visits from Servers Originating in Top Ten Metropolitan Areas, June 8, 2013–June 30, 2014
Metropolitan Area VisitsPages
per VisitAverage
Visit Duration
Los Angeles, CA 679 3.69 0:03:13
Sacramento-Stockton-Modesto, CA
607 3.78 0:03:25
San Francisco-Oakland-San Jose, CA
560 3.85 0:03:39
San Diego, CA 193 4.07 0:03:37
Fresno-Visalia, CA 129 3.67 0:02:36
New York, NY 80 1.74 0:01:33
Monterey-Salinas, CA 66 2.39 0:01:25
Washington, DC (Hagerstown, MD)
60 1.52 0:00:53
Chico-Redding, CA 40 4.80 0:02:58
Philadelphia, PA 36 2.78 0:01:28
Table F.7. Rank Order of Traf�c to Site from Servers Originating in California Metropolitan Areas, June 8, 2013–June 30, 2014
Metropolitan Area VisitsPages
per VisitAverage
Visit Duration
Los Angeles, CA 679 3.69 0:03:13
Sacramento-Stockton-Modesto, CA
607 3.78 0:03:25
San Francisco-Oakland-San Jose, CA
560 3.85 0:03:39
San Diego, CA 193 4.07 0:03:37
Fresno-Visalia, CA 129 3.67 0:02:36
Monterey-Salinas, CA 66 2.39 0:01:25
Chico-Redding, CA 40 4.80 0:02:58
Eureka, CA 33 2.70 0:02:03
Santa Barbara-Santa Maria-San Luis Obispo, CA
23 5.70 0:03:30
Bakers�eld, CA 13 2.38 0:00:49
Table F.8. Cumulative Site Visits by Top Five Service Providers, June 8, 2013–June 30, 2014
Service Provider VisitsPages
per VisitAverage
Visit Duration
Runyon Saltzman Einhorn
38 2.53 0:03:15
County of Sacramento 18 6.83 0:05:17
Rancho Santiago College
16 6.13 0:03:16
County of Los Angeles 15 4.60 0:07:46
University of California Davis
14 1.36 0:00:15

– 29 –
Data reported for the ReachOut Forums/Busca Apoyo/ReachOutHere were generated slightly di�erently from other sites. RAND had access to Google Analytic data for the entire ReachOut site (not just the CalMHSA-funded portions of the site) and used Google’s “Advanced Segmentation” functional-ity to separate analytic data for instances where users visited us.reachout.com/forums, us.reachout.com/buscaapoyo, or us.reachout.com/reachouthere.
Tra�c metrics. Across us.reachout.com/forums, us.reachout.com/buscaapoyo, and us.reachout.com/reachouthere, the tracked ReachOut sites received 127,074 visits and 469,235 page views during 13 months of monitoring (see Figure G.1). User tra�c that began at the forums accounted for 7 percent of all visits and 13 percent of all page views continuing to the (non-CalMHSA) us.reachout.com informational site in which the forum site is housed.
User engagement. Many users accessed the us.reachout.com/forum site through a search engine. Figure G.2 shows that 49
Figure G.1. Forum Page Views, June 8, 2013–June 30, 2014
Note: The number of forum page views by month is available andrepresented in this �gure; the number of forum site visits by monthis not available, and thus not present in this �gure. RAND RR1237-G.1
0
10,000
20,000
30,000
40,000
50,000
70,000
60,000
80,0002013 2014
June
July
August
Septe
mber
October
Novem
ber
Decem
ber
Januar
y
Febru
ary
Mar
chApril
May
June
Forum page views
Figure G.2. Cumulative Traf�c Sources, June 8, 2013–June 30, 2014
RAND RR1237-G.2
49%
24%
18%
3%
Organicsearch
Banner
Direct
Referral
percent of users arrived via a search, 24 percent arrived at the site via a banner advertisement on another site, 18 percent arrived directly by typing the website’s URL, and 3 percent arrived via referral link.
On average, forum users spent an average of two minutes and seven seconds on the site and visited an average of 2.56 pages per visit. �e homepage bounce rate was 78.51 percent.
User characteristics. Approximately 35 percent of users who began a visit to one of the tracked ReachOut sites origi-nated from California and, of those, 45 percent originated from the Los Angeles area and 25 percent from the San Francisco area (see Table G.1 and Figure G.3). ReachOut is a national campaign, which may explain the low percentage of users from California. However, the total number of Californians reached by the tracked sections of the ReachOut site (the portion of the ReachOut site funded by CalMHSA) is quite high (45,064 California-based visits were recorded), given the high levels of tra�c to the site overall.
Appendix G. Runyon Saltzman Einhorn ReachOut/BuscaApoyo Forums Google Analytics from June 8, 2013, to June 30, 2014

– 30 –
Figure G.3. Map of Traf�c to Site from Servers Originating in California Metropolitan Areas, June 8, 2013–June 30, 2014
RAND RR1237-G.3
20,39927
Table G.1. Rank Order of Sessions Beginning with Forums from Servers Originating in California Metropolitan Areas, June 8, 2013–June 30, 2014
Metropolitan Area VisitsPages
per VisitAverage
Visit Duration
Los Angeles, CA 20,399 2.41 0:01:49
San Francisco-Oakland-San Jose, CA
11,168 2.81 0:02:47
Sacramento-Stockton-Modesto, CA
4,123 3.30 0:02:55
San Diego, CA 3,309 2.45 0:01:56
Fresno-Visalia, CA 1,541 3.58 0:02:42
Santa Barbara-Santa Maria-San Luis Obispo, CA
985 2.48 0:02:10
Bakers�eld, CA 906 2.66 0:01:53
Monterey-Salinas, CA 872 3.05 0:02:31
Chico-Redding, CA 738 3.41 0:02:41
Palm Springs, CA 419 2.59 0:01:54

– 31 –
Tra�c metrics. �e WalkInOurShoes.org website received 75,492 visits and 191,141 page views during 11 months of moni-toring. Tra�c to the website peaked in November 2013 with over 40,000 page views and 17,000 site visits, a time at which Runyon Saltzman Einhorn reports running media advertising for the site (see Figure H.1). In January and February, there were less than 1,000 page views and site visits. �is pattern coincides with the schedule of the Walk in Our Shoes school presentations and advertising, which launched in August 2013 and continued through October of that year. Tra�c spiked again in May 2014, also as a likely result of digital and radio advertising for the site that Runyon Saltzman Einhorn reports running at that time.
User engagement. A majority of users accessed the web-site via advertising campaign links (see Table H.1). Table H.1 also shows that 59 percent of users accessed the website via paid advertising campaigns, 18 percent accessed the site directly, and 12 percent accessed the site via search engine. Table H.2 shows the top �ve sites (out of about 160) from which users were referred.
Figure H.1. Site Visits and Page Views, August 15, 2013–June 30, 2014
RAND RR1237-H.1
0
5,000
10,000
15,000
20,000
25,000
35,000
40,000
45,000
30,000
50,0002013 2014
August
Septe
mber
October
Novem
ber
Decem
ber
Januar
y
Febru
ary
Mar
chApril
May
June
Visits
Page views
Site users spent an average of two minutes and four seconds on the site and visited an average of 2.53 pages per visit. �e homepage bounce rate was 60.03 percent.
User characteristics. Most users originated from the United States (see Table H.3); 66 percent of users originated from Cali-fornia (see Table H.4) and, of those, 51 percent were from the Los Angeles area, probably as a result of the location of the schools where the associated theater presentation took place during our monitoring period (see Tables H.5 and H.6 and Figure H.2). In addition, Runyon Saltzman Einhorn reports targeting the Los Angeles area for Walk in Our Shoes advertising in 2014.
Table H.7 shows the cumulative site visits from the top �ve service providers that are not telecommunications companies. For example, AT&T Internet services was excluded from this list, but as an ISP accounted for 7,136 site visits. In total, we have service provider data for about 71,000 site visits occurring from over 3,900 service provider sources.
Appendix H. Runyon Saltzman Einhorn Walk in Our Shoes Google Analytics from August 15, 2013, to June 30, 2014
Figure H.2. Map of Traf�c to Site from Servers Originating in California Metropolitan Areas, August 15, 2013–June 30, 2014
RAND RR1237-H.2
25,3408

– 32 –
Table H.5. Cumulative Site Visits from Servers Originating in Top Ten Metropolitan Areas, August 15, 2013–June 30, 2014
Metropolitan Area VisitsPages
per VisitAverage
Visit Duration
Los Angeles, CA 25,350 2.28 0:03:12
San Francisco-Oakland-San Jose, CA
9,460 2.11 0:01:37
San Diego, CA 5,270 2.06 0:01:22
Sacramento-Stockton-Modesto, CA
5,102 3.12 0:02:45
Miami-Ft. Lauderdale, FL
5,043 6.26 0:00:07
Rochester, NY 1,911 2.81 0:00:03
New York, NY 1,378 1.53 0:00:54
Fresno-Visalia, CA 1,100 3.26 0:03:13
Chico-Redding, CA 1,078 6.40 0:09:20
Chicago, IL 818 1.79 0:02:15
Table H.6. Rank Order of Traf�c to Site from Servers Originating in California Metropolitan Areas, August 15, 2013–June 30, 2014
Metropolitan Area VisitsPages
per VisitAverage
Visit Duration
Los Angeles, CA 25,350 2.28 0:03:12
San Francisco-Oakland-San Jose, CA
9,460 2.11 0:01:37
San Diego, CA 5,270 2.06 0:01:22
Sacramento-Stockton-Modesto, CA
5,102 3.12 0:02:45
Fresno-Visalia, CA 1,100 3.26 0:03:13
Chico-Redding, CA 1,078 6.40 0:09:20
Bakers�eld, CA 619 3.13 0:02:33
Monterey-Salinas, CA 539 2.86 0:02:36
Santa Barbara-Santa Maria-San Luis Obispo, CA
488 2.16 0:02:04
Palm Springs, CA 242 1.88 0:01:13
Table H.1. Cumulative Traf�c Sources, August 15, 2013–June 30, 2014
Source Total Percentage
Campaigns 44,394 59%
Direct (typing URL into browser, bookmarks)
13,730 18%
Search (e.g., Google search engine) 8,959 12%
External link (referral) 3,801 5%
Other 4,608 6%
Total 75,492
Table H.2. Top Five Referral Sources, August 15, 2013–June 30, 2014
Source VisitsPages
per VisitAverage
Visit Duration
kostrewards.kost1035.com 441 1.25 00:01:20
missyusa.com 323 2.27 00:01:23
ponteenmiszapatos.org 322 4.64 00:05:06
myclub.1043myfm.com 315 1.18 00:01:11
facebook.com 266 2.59 00:02:23
Table H.3. Cumulative Site Visits from Servers Originating in Top Five Countries, August 15, 2013–June 30, 2014
Country VisitsPages
per VisitAverage
Visit Duration
United States 73,276 2.55 0:02:06
Slovenia 315 2.00 0:00:36
United Kingdom 218 1.79 0:01:04
Canada 207 2.44 0:02:45
Croatia 142 1.63 0:00:24
Table H.4. Cumulative Site Visits from Servers Originating in Top Five U.S. States, August 15, 2013–June 30, 2014
State VisitsPages
per VisitAverage
Visit Duration
California 49,623 2.45 0:02:45
Florida 5,745 5.69 0:00:16
New York 3,179 2.29 0:00:25
Texas 1,533 1.77 0:01:01
Illinois 897 1.77 0:02:08

– 33 –
Table H.7. Cumulative Site Visits by Top Five Service Providers, August 15, 2013–June 30, 2014
Service Provider VisitsPages
per VisitAverage
Visit Duration
Los Angeles Uni�ed School District 356 3.03 0:03:58
California State University Network 354 5.07 0:06:07
San Diego County Of�ce of Education 276 3.67 0:02:48
San Bernardino County Superintendent of Schools
265 3.64 0:02:14
County of Los Angeles 157 2.99 0:09:24

– 34 –
Tra�c metrics. �e PonteEnMisZapatos.org website received 14,171 visits and 26,411 page views during 10 months of moni-toring. Website tra�c peaked in October 2013, a time during which Runyon Saltzman Einhorn reports running advertising, and then decreased into January 2014; from January through June, the website averaged 300 page views and 150 site visits each month (see Figure I.1). �is version of the Runyon Saltzman Einhorn website did not experience a spike in web tra�c dur-ing the month of May; Runyon Saltzman Einhorn reports that advertising only occurred for the WalkInOurShoes.org site, not PonteEnMisZapatos.org.
User engagement. Similar to user engagement observed in the English version of the website, the majority of users accessed the website via paid advertising campaign links (see Table I.1). Table I.1 also shows that 77 percent of users accessed the website via campaign link and 13 percent via search engine. Table I.2 shows the top �ve sites (out of 43) from which users were referred.
Figure I.1. Site Visits and Page Views, September 9, 2013–June 30, 2014
RAND RR1237-I.1
0
1,000
2,000
3,000
4,000
5,000
7,000
8,000
9,000
6,000
10,0002013 2014
Septe
mber
October
Novem
ber
Decem
ber
Januar
y
Febru
ary
Mar
chApril
May
June
Visits
Page views
Site users spent an average of one minute and 38 seconds on the site and visited an average of 1.86 pages per visit. �e homep-age bounce rate was 70.03 percent.
User characteristics. Most users originated from the United States, and about 20 percent originated from Mexico (see Table I.3); 47 percent of users originated from California (see Table I.4) and, of those, 51 percent were from the Los Angeles area (see Tables I.5 and I.6 and Figure I.2), an area that Runyon Saltzman Einhorn reports targeting during advertising.
Table I.7 shows the cumulative site visits from the top �ve service providers that are not telecommunications companies. For example, AT&T Internet services was excluded from this list, but as an ISP accounted for 1,234 site visits. In total, we have service provider data for about 14,000 site visits occurring from over 900 service provider sources.
Appendix I. Runyon Saltzman Einhorn Ponte En Mis Zapatos Google Analytics from September 9, 2013, to June 30, 2014
Figure I.2. Map of Traf�c to Site from Servers Originating in California Metropolitan Areas, September 9, 2013–June 30, 2014
RAND RR1237-I.2
3,4212

– 35 –
Table I.1. Cumulative Traf�c Sources, September 9, 2013–June 30, 2014
Source Total Percentage
Campaigns 10,909 77%
Search (e.g., Google search engine) 1,788 13%
Direct (typing URL into browser, bookmarks)
1,053 7%
External link (referral) 421 3%
Total 14,171
Table I.2. Top Five Referral Sources, September 9, 2013–June 30, 2014
Source VisitsPages
per VisitAverage
Visit Duration
walkinourshoes.org 219 3.00 0:02:47
facebook.com 40 1.40 0:00:21
m.facebook.com 38 1.50 0:00:19
semalt.semalt.com 35 1.00 0:00:00
eachmindmatters.org 25 3.56 0:01:36
Table I.3. Cumulative Site Visits from Servers Originating in Top Five Countries, September 9, 2013–June 30, 2014
Country VisitsPages
per VisitAverage
Visit Duration
United States 10,569 1.98 0:01:50
Mexico 2,939 1.45 0:01:02
Spain 119 2.13 0:01:02
Colombia 105 1.87 0:01:11
Argentina 38 2.32 0:02:26
Table I.4. Cumulative Site Visits from Servers Originating in Top Five U.S. States, September 9, 2013–June 30, 2014
State VisitsPages
per VisitAverage
Visit Duration
California 6,684 2.13 0:02:07
Texas 865 1.75 0:02:20
Florida 315 1.70 0:01:17
New York 280 1.54 0:00:57
New Jersey 236 1.58 0:01:23
Table I.5. Cumulative Site Visits from Servers Originating in Top Ten Metropolitan Areas, September 9, 2013–June 30, 2014
Metropolitan Area VisitsPages
per VisitAverage
Visit Duration
Los Angeles, CA 3,422 2.13 0:02:18
San Francisco-Oakland-San Jose, CA 1,513 2.04 0:01:46
Sacramento-Stockton-Modesto, CA 566 2.17 0:01:59
San Diego, CA 535 2.43 0:02:20
New York, NY 480 1.59 0:01:14
Dallas-Ft. Worth, TX 381 1.78 0:02:56
Houston, TX 248 1.75 0:01:53
Fresno-Visalia, CA 197 2.27 0:02:57
Chicago, IL 171 1.78 0:01:25
Atlanta, GA 170 1.46 0:01:14
Table I.6. Rank Order of Traf�c to Site from Servers Originating in California Metropolitan Areas, September 9, 2013–June 30, 2014
Metropolitan Area VisitsPages
per VisitAverage
Visit Duration
Los Angeles, CA 3,422 2.13 0:02:18
San Francisco-Oakland-San Jose, CA
1,513 2.04 0:01:46
Sacramento-Stockton-Modesto, CA
566 2.17 0:01:59
San Diego, CA 535 2.43 0:02:20
Fresno-Visalia, CA 197 2.27 0:02:57
Monterey-Salinas, CA 105 2.47 0:02:06
Bakers�eld, CA 101 2.33 0:02:13
Santa Barbara-Santa Maria-San Luis Obispo, CA
95 1.44 0:00:35
Palm Springs, CA 53 1.53 0:00:42
Yuma AZ-El Centro, CA 40 1.68 0:00:57

– 36 –
Table I.7 Cumulative Site Visits by Top Five Service Providers, September 9, 2013–June 30, 2014
Service Provider VisitsPages
per VisitAverage
Visit Duration
Runyon Saltzman Einhorn
48 2.42 0:02:06
County of Los Angeles 13 2.54 0:01:35
Edwards Lifes 13 1.77 0:01:11
San Diego County Of�ce of Education
13 2.38 0:01:03
County of Riverside 9 1.33 0:00:02
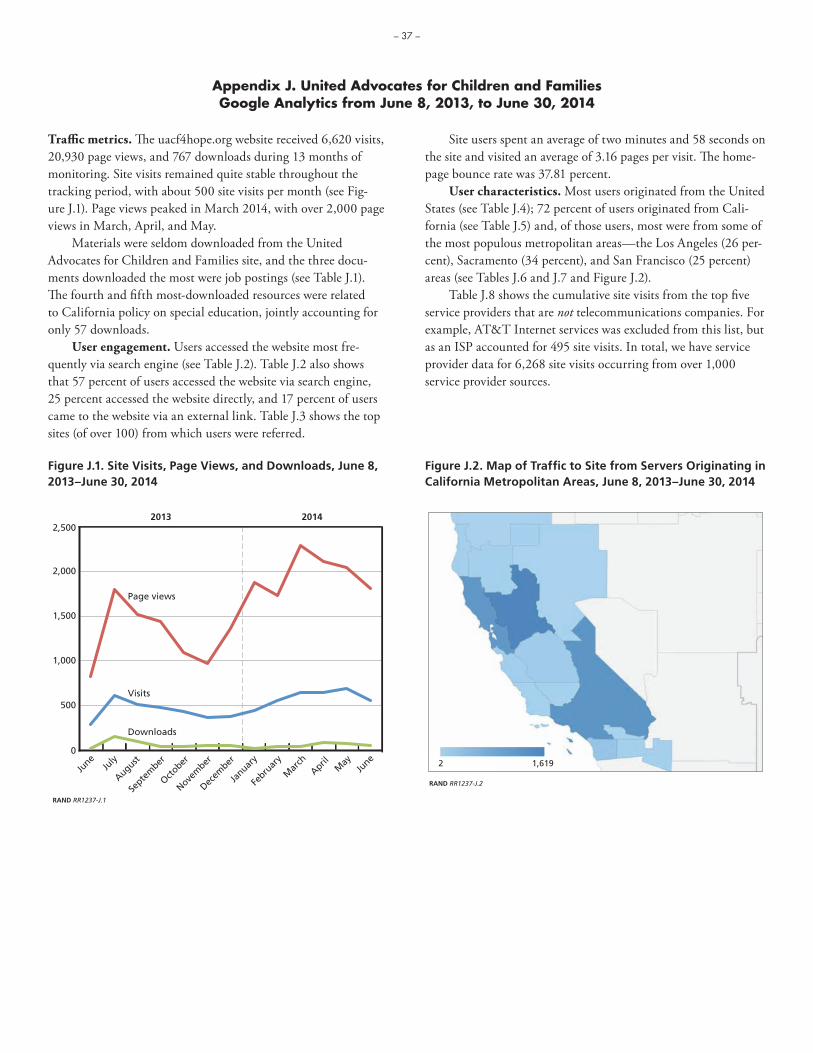
– 37 –
Tra�c metrics. �e uacf4hope.org website received 6,620 visits, 20,930 page views, and 767 downloads during 13 months of monitoring. Site visits remained quite stable throughout the tracking period, with about 500 site visits per month (see Fig-ure J.1). Page views peaked in March 2014, with over 2,000 page views in March, April, and May.
Materials were seldom downloaded from the United Advocates for Children and Families site, and the three docu-ments downloaded the most were job postings (see Table J.1). �e fourth and �fth most-downloaded resources were related to California policy on special education, jointly accounting for only 57 downloads.
User engagement. Users accessed the website most fre-quently via search engine (see Table J.2). Table J.2 also shows that 57 percent of users accessed the website via search engine, 25 percent accessed the website directly, and 17 percent of users came to the website via an external link. Table J.3 shows the top sites (of over 100) from which users were referred.
Site users spent an average of two minutes and 58 seconds on the site and visited an average of 3.16 pages per visit. �e home-page bounce rate was 37.81 percent.
User characteristics. Most users originated from the United States (see Table J.4); 72 percent of users originated from Cali-fornia (see Table J.5) and, of those users, most were from some of the most populous metropolitan areas—the Los Angeles (26 per-cent), Sacramento (34 percent), and San Francisco (25 percent) areas (see Tables J.6 and J.7 and Figure J.2).
Table J.8 shows the cumulative site visits from the top �ve service providers that are not telecommunications companies. For example, AT&T Internet services was excluded from this list, but as an ISP accounted for 495 site visits. In total, we have service provider data for 6,268 site visits occurring from over 1,000 service provider sources.
Figure J.1. Site Visits, Page Views, and Downloads, June 8, 2013–June 30, 2014
RAND RR1237-J.1
500
0
1,000
1,500
2,000
2,5002013 2014
June
July
August
Septe
mber
October
Novem
ber
Decem
ber
Januar
y
Febru
ary
Mar
chApril
May
June
Page views
Downloads
Visits
Appendix J. United Advocates for Children and Families Google Analytics from June 8, 2013, to June 30, 2014
Figure J.2. Map of Traf�c to Site from Servers Originating in California Metropolitan Areas, June 8, 2013–June 30, 2014
RAND RR1237-J.2
1,6192

– 38 –
Table J.1. Top Five Resources Downloaded, June 8, 2013–June 30, 2014
Title/Description of Downloaded Resource URL of Downloaded Resource TotalPercentage of
Total Downloads
Former United Advocates for Children and Families Job Posting
/sites/default/�les/documents/DirectorofPublicPolicyJobDescription.pdf
52 7%
Former United Advocates for Children and Families Job Posting
/sites/default/�les/documents/BilingualFamilyPartnerJobDescription.pdf
44 6%
Former United Advocates for Children and Families Job Posting
/sites/default/�les/documents/DirectorofPublicPolicy7.2013.pdf
44 6%
Fact Sheet on California’s Budget Cuts to Mental Health Services for Children in Special Education
/sites/main/�les/ab3632_fact_sheet_disability_rights.pdf
30 4%
Center for Mental Health in Schools at UCLA Policy Brief on California Assembly Bill 114
/sites/main/�les/ucla_policy_brief_ transition_of_ab_3632.pdf
27 4%
Table J.2. Cumulative Traf�c Sources, June 8, 2013–June 30, 2014
Source Total Percentage
Search (e.g., Google search engine) 3,751 57%
Direct (typing URL into browser, bookmarks)
1,676 25%
External link (referral) 1,107 17%
Email 81 1%
Other unidenti�ed 5 <1%
Total 6,620
Table J.3. Top Five Referral Sources, June 8, 2013–June 30, 2014
Source VisitsPages
per VisitAverage
Visit Duration
capitolmr.com 109 2.43 00:02:30
vcgcb.ca.gov 76 3.45 00:02:53
calmhsa.org 58 2.81 00:02:28
cde.ca.gov 46 2.65 00:03:14
uacf4hope.org 41 4.78 00:02:25
Table J.4. Cumulative Site Visits from Servers Originating in Top Five Countries, June 8, 2013–June 30, 2014
Country VisitsPages
per VisitAverage
Visit Duration
United States 6,252 3.25 0:03:06
Brazil 45 1.00 0:00:00
India 36 1.72 0:01:27
Canada 34 1.82 0:00:36
United Kingdom 27 1.44 0:00:20
Table J.5. Cumulative Site Visits from Servers Originating in Top Five U.S. States, June 8, 2013–June 30, 2014
State VisitsPages
per VisitAverage
Visit Duration
California 4,776 3.44 0:03:24
New York 164 2.12 0:01:27
Nevada 100 2.82 0:01:53
Texas 97 2.63 0:02:19
Florida 82 2.91 0:01:59

– 39 –
Table J.7. Rank Order of Traf�c to Site from Servers Originating in California Metropolitan Areas, June 8, 2013–June 30, 2014
Metropolitan Area VisitsPages
per VisitAverage
Visit Duration
Sacramento-Stockton-Modesto, CA
1,619 3.64 0:03:45
Los Angeles, CA 1,252 3.40 0:03:19
San Francisco-Oakland-San Jose, CA
1,184 3.09 0:02:46
San Diego, CA 265 3.70 0:04:00
Fresno-Visalia, CA 128 3.65 0:04:43
Monterey-Salinas, CA 87 4.18 0:03:48
Eureka, CA 54 4.28 0:04:44
Santa Barbara-Santa Maria-San Luis Obispo, CA
51 2.82 0:01:43
Chico-Redding, CA 44 4.11 0:02:53
Yuma, AZ–El Centro, CA
42 3.24 0:02:23
Table J.8. Cumulative Site Visits by Top Five Service Providers, June 8, 2013–June 30, 2014
Service Provider VisitsPages
per VisitAverage
Visit Duration
County of Los Angeles 208 3.71 0:02:57
Health and Welfare Agency Data Center
66 4.11 0:03:24
Alameda County 53 2.74 0:03:24
California Technology Agency
49 4.04 0:04:37
County of Riverside 44 3.55 0:03:27
Table J.6. Cumulative Site Visits from Servers Originating in Top Ten Metropolitan Areas, June 8, 2013–June 30, 2014
Metropolitan Area VisitsPages
per VisitAverage
Visit Duration
Sacramento-Stockton-Modesto, CA
1,619 3.64 0:03:45
Los Angeles, CA 1,252 3.40 0:03:19
San Francisco-Oakland-San Jose, CA
1,184 3.09 0:02:46
San Diego, CA 265 3.70 0:04:00
New York, NY 185 1.89 0:01:13
Fresno-Visalia, CA 128 3.65 0:04:43
Reno, NV 96 2.85 0:02:04
Washington, DC (Hagerstown, MD)
94 2.76 0:02:53
Monterey-Salinas, CA 87 4.18 0:03:48
Phoenix, AZ 55 2.76 0:02:20

The RAND Corporation is a nonprofit institution that helps improve policy and decisionmaking through research and analysis. RAND focuses on the issues that matter most, such as health, education, national security, international affairs, law and business, the environment, and more. As a nonpartisan organization, RAND operates independent of political and commercial pressures. We serve the public interest by helping lawmakers reach informed decisions on the nation’s pressing challenges. RAND’s publications do not necessarily reflect the opinions of its research clients and sponsors. R® is a registered trademark.
© Copyright 2015 RAND Corporation
www.rand.org
RR-1237-CMHSA
About the AuthorsJennifer L. Cerully, Courtney Ann Kase, Rebecca L. Collins, and Eunice C. Wong are researchers for the RAND Corporation. Jennifer Yu is a researcher for SRI International.
Acknowledgments�e RAND Health Quality Assurance process employs peer reviewers. �is document bene�ted from the rigor-ous technical reviews of Joshua Breslau and Donna Farley, which served to improve the quality of this report. In addition, members of the Statewide Evaluation Experts (SEE) Team, a diverse group of California stakeholders, provided valuable input on the project.
RAND Health�is research was conducted in RAND Health, a division of the RAND Corporation. A pro�le of RAND Health, abstracts of its publications, and ordering information can be found at http://www.rand.org/health.
CalMHSA �e California Mental Health Services Authority (CalMHSA) is an organization of county governments work-ing to improve mental health outcomes for individuals, families, and communities. Prevention and Early Inter-vention programs implemented by CalMHSA are funded by counties through the voter-approved Mental Health Services Act (Prop. 63). Prop. 63 provides the funding and framework needed to expand mental health services to previously underserved populations and all of California’s diverse communities.