Embed Size (px)
Citation preview
California Mix Design for Cement-Treated Bases
F. N. HVEEM and E. ZUBE, respectively, Materials and Research Engineer, and Supervising Materials and Research Engineer, Materials and Research Department, California Division of Highways
The California Division of Highways has constructed extensive mileage of cement-treated bases since 1938. These bases have been used primarily under asphaltic concrete pavements carrying moderate to heavy traffic. Depending upon the traffic intensity, 2 to 5 in. of asphaltic concrete is placed as a wearing course over these treated bases. The increasing occurrence of pumping and step-offs in portland cement concrete (PCC) pavements as a result of a large increase in truck traffic led to the construction of so-called cement-treated subgrades under all newly placed concrete pavements beginning about 194 5. The materials used in the ear lier jobs included fine sand, disintegrated granite, sandstones and stream bed gravels. During the last few years, more emphasis has been placed on the use of granular materials, resulting in a decrease in cement content and a tendency to minimize shrinkage cracks.
In the design of the pavement structure, a reduction in the overall thickness is obtained by virtue of the cohesion or tensile strength of the cement-treated base. The mix design is based on a compressive strength requirement of 750 psi (on a 4-x 4-in. cylinder) after a 7-day curing period. A rapid cement control test for field use to determine the actual percentage of cement in the mixture has been developed.
•SCANTY records and hazy recollections do not warrant any definite statement about the time or place when portland cement was first mixed with soil to produce a hardened water-resistant support base for highway pavements. Once the process had become established however, at least one engineer was heard to remark that he "could have discovered it years before." He had observed that truck drivers hauling cement over a dirt road would occasionally scatter a few sacks in some of the mud holes in order to get through. These crude mixtures of soil and cement were apparently effective, but he did not take the hint.
According to available information, a cement-treated section was constructed in Pennsylvania before 1930. Apparently, this project was not publicized, and in fact, appears to have been carried out almost in an atmosphere of secrecy. However, regardless of accidental or scattered prior trials, South Carolina deserves the credit for first constructing and reporting successful soil-cement bases. The pioneer work in South Carolina was reported in 1936.
Although California had tried mixing portland cement with heavy clay soils as far back as 1921, there was no immediate follow-up or attempt to develop the process further. Following the reports from South Carolina, California in 1937 constructed
Paper sponsored by Committee on Soil-Portland Cement Stabilization .
ll
12
two sections each approximately one mile long using State forces. Additional projects, each some three miles in length, were constructed under contract in 1938 and 1939.
Up to 1940, all California work of this type employed the road-mix method. However, it was often difficult to secure uniform construction both in depth of material treated and in thorough distribution of the cement. Furthermore, road mixing with farm equipment (such as disc and harrow, then generally used) required considerable time and it was common to have a delay of 6 or 8 hours between the introduction of cement and water and final compaction which, of course, had a considerable adverse effect on the compressive strength.
Long experience in mixing asphaltic materials both by road-mix and plant-mix methods had indicated the superiority of plant mixing so far as speed and uniformity are concerned. It seemed logical that the process of mixing soil and cement would likewise be improved. Therefore, beginning in 1939 three projects were initiated requiring the mixing of cement with pit run gravels or granular materials in a central mixing plant.
Because the proposed materials were generally granular and not of the type that an agriculturist would ordinarily class as "soil," it was decided that the term cementtreated base was more appropriate. Also, the term "soil stabilization" was being widely appropriated by salesmen or advertising agencies and applied to a variety of treatments which have little or nothing in common. Since that time, all work of this sort in California has been called "cement-treated base" regardless of gradation of the soil, mineral aggregate, or the method of mixing. Another change from Eastern practice is in the method of expressing the cement content. Designating cement contents in terms of volume is sound from a theoretical standpoint, but it is less convenient in practical application. There are many more individuals engaged in "construction control and inspection than there are in the laboratories; therefore, it was decided to specify the cement content in terms of percentage by weight of the aggregate. By this step, California has a uniform practice for indicating the amount of water in a soil, the amount of asphalt or road oil used in bituminous mixtures and the percentage of cement in cement-treated bases, all of which are now stated in terms of percentage by weight of the dry aggregate.
Some 30 miles of plant-mixed cement-treated base had been completed by 1941 and this mileage had increased to over 100 miles by the end of 1943 (1). During this period, laboratory work was under way to determine appropriate test procedures, methods of mixture design, specifications, etc. The establishment of test methods must, of course, require some knowledge of the essential properties, and it was taken for granted that cement-treated base mixtures should develop some appreciable compressive strength in line with the usual concepts concerning the properties of portland cement concrete. The question of what strengths were appropriate was not so self-evident and was much debated. As in all new developments, ideas are prone to be influenced by the evolutionary steps involved or by the background of the individuals. Those engineers who had long experience or indoctrination in the design and construction of concrete were inclined to favor high strengths for cement-treated bases. Therefore, these treated bases were regarded by some as a sort of inferior concrete while others thought of them as an improved aggregate base. The "concrete boys" were inclined to think that anything developing less than 3, 000 psi must be of dubious quality. On the other hand, tests on specimens of the best crushed stone base aggregates "cemented" with natural fines gave only 75 psi, and as these crushed stone bases had proven to have the qualities necessary for supporting heavy loads, there seemed to be no reason for requiring extraordinarily high compressive strengths for cement-treated bases.
It was decided to follow the practice established by the Portland Cement Association for the size of specimen (4-in. diameter and 4-in. height). However, to permit ready compaction in the field and shipping of the specimens to a central laboratory a procedure was developed involving the use of specimen molds in the form of thin metal shells or sleeves which are made to order from tinned sheet (Appendix A). By the means adopted, it is possible to compact the test specimens, seal the containers, protect and hold the specimens without loss in moisture until time for testing. The tin sleeves are the.n opened along the soldered joint and the specimens soaked before testing to determine compressive strengths.
13
A curing period of 7 days was adopted to shorten the time of testing. A compressive strength requirement of 850 psi in 7 days , and 1, 000 psi at 28 days, was agreed upon. In general, the compressive strength at age of 7 days is about 85 percent of that obtained at 28 days.
The next step was to establish a suitable compaction procedure which would simulate the compaction to be expected on the road. It will be noted that the compressive strength increases very rapidly with increased compaction. Cores were taken from finished bases and comparisons were made with laboratory compacted specimens for density and strength. The compaction procedure finally adopted was aimed at reproducing the results found in the core specimens.
It became evident that a rather wide variety of aggregate types and gradations could be successfully treated with cement, and it has been the general practice to write grading specifications which would permit the use of local materials with a minimum of waste or importation of expensive aggregates. However, the gradation of the aggregate can have some effect on the compressive strength.
It becam e ev)dent that with the granular materials being used, substantial compressive str ength values could be developed even with nominal amounts of cement r anging from 4 percent to 6 percent of the aggregate. Therefore, as previously mentioned, the mix design was initially based on a compressive strength requirement of 1, 000 psi at the age of 28 days. Work was governed by this concept for two or three years. However, a number of engineers began to complain of the transverse shrinkage cracks which appeared in the bituminous surfaces over these bases and a quick survey of all jobs constructed seemed to indicate that cracks were more evident and often opened wider over the high-strength bases than over the sections where the strengths were low. This led to a revision in strength requirements, and four types of cement-treated bases were established (~), as follows:
Class
A B c D
7-Day Comp. Strength
750 psi 400 psi R-value = 80+ a
Typical Cement Content
(%by dry wt. of agg.)
3% to 6 21/2 to 4% 2 to 3 4 to 6
aA reconstruction method where an existing asphalt treated surfacing is scarified and mixed with an equal amount of existing base or imported gravel. No strength requirement specified.
The Portland Cement Association had recommended a test procedure involving alternate cycles of wetting and drying, after which the surface of the specimen is abraded by means of a wire brush. It was judged that this operation was subject to considerable variation, depending on the individual operator, and after some investigation, it was concluded that the same evidence of deterioration could be produced by making compressive strength tests after a series of wet and dry cycles (Appendix C). However, California has encountered only a few types of material where the wet and dry test procedure seemed to be warranted.
A freeze-thaw test, patterned after the wetting and drying method, has also been developed to determine the durability of cement-treated base mixtures where intensive frost conditions are anticipated (Appendix B). This test has not had much application in "sunny" California, however, since only a limited mileage in the high mountain regions requires consideration of severe winter conditions.
When the cement-treated bases were first being considered in California, recommendations from the Portland Cement Association favored the use of only a thin
14
bituminous surface in the form of a seal coat or surface treatment. However, it was not felt that such a surface would be adequate for heavy traffic, and there were reports from other states that failures had occurred because of the slipping or peeling off of the thin surfaces. Observations on one or two early projects where the bituminous surfacing was varied from % inch to 11/2 inch in thickness indicated that slippage failures were much more likely to occur with the thin bituminous surface layers. About 1940, it was decided that cement-treated materials should be regarded only as a base and should be protected by a substantial dense-graded asphalt surface course not less than 3 in. thick. With a few exceptions, this policy has been maintained, and experience seems to justify the practice of placing an adequate thickness of asphaltic surfacing over these treated bases.
With the completion of an intensive survey and an investigation of PCC pavements through the years 1944 to 1946, it was concluded that some means must be provided to prevent the loss of support caused by the pumping out of subgrade soil from beneath the concrete slabs. Several means were considered and undoubtedly several expedients would have been effective, but a cement-treated layer 4 in. thick seemed to be the most economical, and it appeared that such a base would resist erosion if protected by a heavy penetration application of cutback asphalt (3).
The first cement-treated subgrade to support a concrete pavement was constructed in 1946 and within the next year or so it became general practice throughout the state. Since 1950, all California concrete pavements have been placed over treated bases. In a few cases where the underlying soil was a relatively clean cohesionless sand, asphalt-treated subgrades were used in lieu of portland cement and for many years it appeared that the performance was about equal. However, it is becoming increasingly apparent that the asphalt-treated subgrades are less permanent, but the cement-treated subgrades (now called CTB Class B) can be considered as being successful in more than 95 percent of the projects built. Pumping has been eliminated and faulting at the joints is rarely perceptible as a result of this design, even though dowels or load transfer devices are not used. When used to prevent pumping and erosion of the subgrade support, cement-treated bases were usually constructed after the side forms were in place, the mixing being done by traveling mixing machines.
This extended use of road mixing for the cement-treated bases under concrete pavements led the construction forces to believe that road mixing would be more economical and equally satisfactory for the heavier bases required to support an asphalt pavement. With the passage of a few more years it became increasingly evident, however, that there were more failures and more evidence of generally poor results. An investigation led to the recommendation that the road mixing process be abandoned for all heavy-duty main-line highways and that its use should be confined to lightly-traveled roads or to the relatively thin treatment employed beneath concrete pavements. It also became evident that there was more evidence of distress in the Class C bases using the very low cement contents. Furthermore, the thin bases ranging from 5 in. to 6 in. have not given a satisfactory performance in many cases, and today it is standard practice for heavy-traffic roads to construct cement-treated bases no less than 8 in. in thickness to be covered with at least 3 in. or 4 in. of dense-graded asphaltic concrete.
In effect then, it is a composite pavement in which the general behavior and characteristics are very similar to the pavements constructed 50 to 60 years ago in which an asphalt wearing surface was supported by a lean concrete base. It may be pointed out, however, that for a given aggregate and cement content, a cement-treated base is superior to and more efficient than plastic concrete. The water-cement ratio law is still valid and these relatively dry mixtures rolled and compacted with heavy equipment are stronger than if enough water were added to permit placing as conventional concrete.
CEMENT-TREATED BASE MIX DESIGN METHOD
The design of Classes A and B cement-treated base (CTB) mixtures largely involves determining, by laboratory tests, the amount of cement and water necessary to meet the minimum 7-day compressive strength requirements with a given source of aggregates. California specifications require that aggregate for cement treatment must
15
have a sand equivalent of not less than 25 and conform to the following requirements unless special gradings are provided in the special provisions for the particular project.
IL u a..
Sieve Size
1 in. % in. No. 4 No. 30 No. 200
Percent Passing
100 90-100 35-55 10-30 3-9
130 r-r-~~~l ~~~~~~~~~~~~r--~~~~~~--~~~---~
A 1 Ave rage of 42 i" / Street Spec i mens
>- : ~ 1- 1 25 rr--<>r'--~---=-----1-------t------r------;.-------i
(/) z ..... c >-a:
A
Average o f CTB Cores . I
~CTB Co r e -c 12 0 ...._ _ _ "'-_ _.__ ____ _._ ____ _._ ___ _ __.. ____ _,.__ ___ ___.
(/)
a..
J: 1-(,!)
0
900 ~
I I I I I
10 20
CTB Cores
30 40 50
800 1--t-~-+-~.i--~~---+------1----~-+~"-----1f-------f
Average of 42 Street Specimens 7 Day Comp. Str.
~ 700 t-t---+--a: I(/)
..... > ~ 600 1-t---r----H""------t-~-~--t--~....----r-----,-~--1--------1 ..... a: a.. ::!: 0 u
CTB Cores {A) taken at road locations
where moisture "squeezed out "of freshly mixed
1ma teria I is known from field control tests . I
10 20 30 40 50
MOISTURE SQUEEZED FROM STREET SPECIMENS - GRAMS
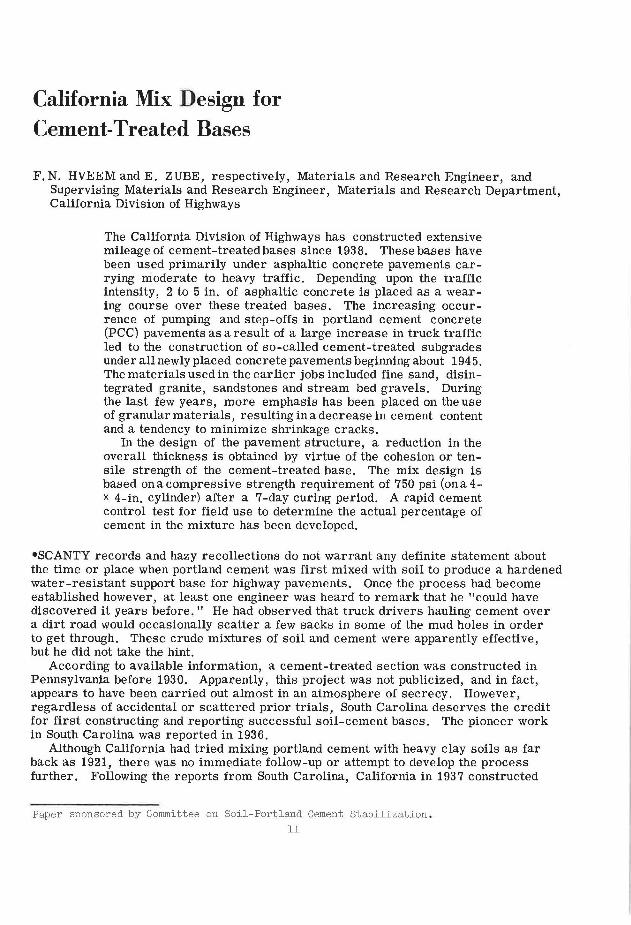
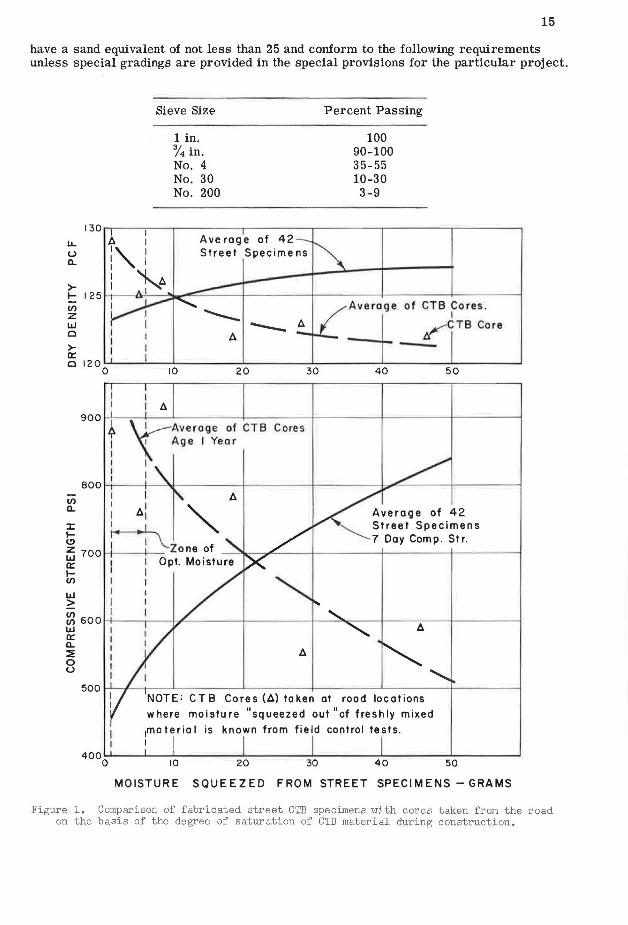
Figure 1. Comparison of fabricated street CTB specimens with cores taken from the road on the basis of the degree of saturation of CTB material during construction.
16
<!)80t--+--t-----tr--t--t--+,,,..--t->"7'tr--~
~ ~sot---+-+---1--+---1~-1-~-w----1-,
<I: ~401---l--+-~l-,,.>F--,,..l"'--h~+---+-~ ~
<!)
~601---1---t-----tr---t--t+-t-"7"--+---t-~ (/)
~ 40 1---t--+-----t--M/C--17"'-t-f-+---t-~
o~Et~_Ll_LJ 200 100 50 30 16 8 4 3/8 3/4
SIEVE SIZE
3% CEMENT USED SAMPLE 55-772
(/)
~ a (a) ~ 0001--.,_--1-----1-----t----1------t
(/) ~
w > Ui (/)
w a:
5% CEMENT USED
12001----J---7"-f-'o""--I
SAMPLE 55·566
GRADING c
~ IO~l----;C---1----+----+----~-------l{b) u
Specimen contains 100% Natural Material No Crushing
eoo~---~---~---~---~--~ 30 40 50 60 70 80
% PASSING NO. 4 SIEVE
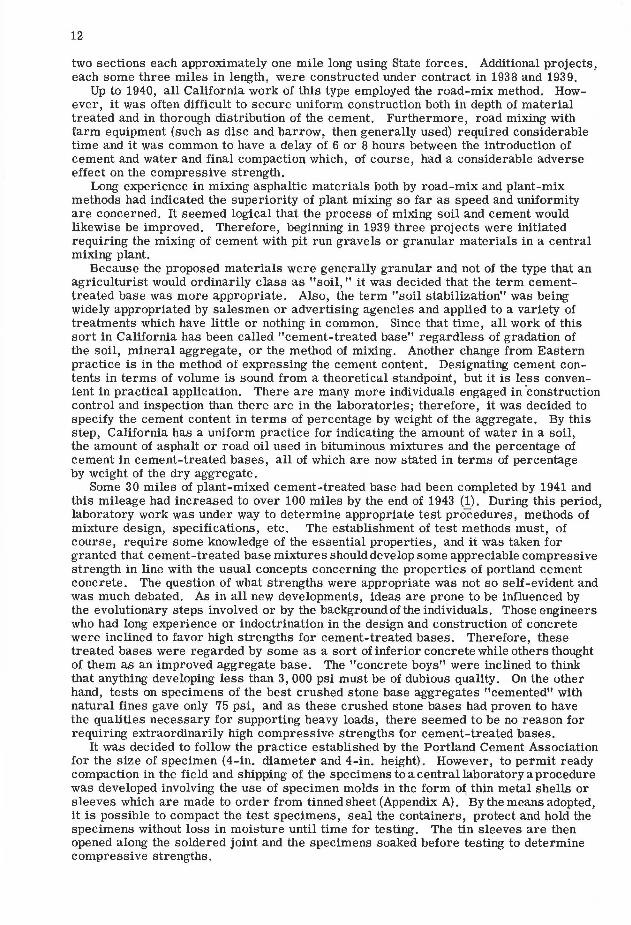
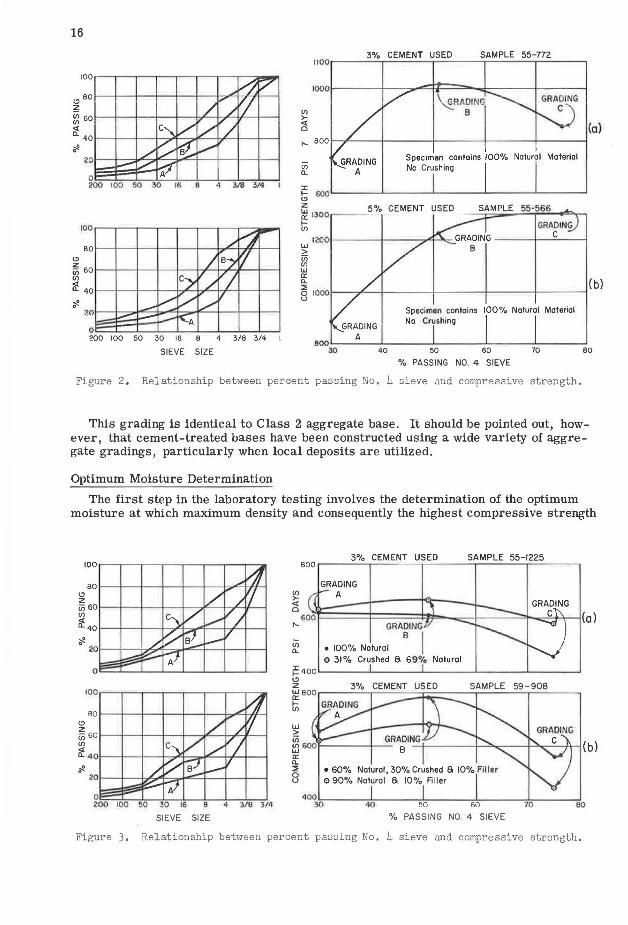
Figure 2. Relationship between percent passing No. 4 sieve and compressive strength.
This grading is identical to Class 2 aggregate base. It should be pointed out, however, that cement-treated bases have been constructed using a wide variety of aggregate gradings, particularly when local deposits are utilized.
Optimum Moisture Determination
The first step in the laboratory testing involves the determination of the optimum moisture at which maximum density and consequently the highest compressive strength
<!)
z (ii60t---+--l--t---l-r->l"---l-r'-11-----l (/)
~401---l---l--l---,,A-2"'"F---+~-l----I
~0~0~1~00=-~so'=-"~3~0___,1+s-~a--!---=-31~e,......,,...314· SIEVE SIZE
~ <I:
3% CEMENT USED
GRADING A
SAMPLE 55-1225
0
so<fo ~=====l====~n,.-=-..J--=:::::::~"""""'~H(a) ~ GRADING
(/) ~ • 100% Natural
8 I e 31% Crushed 6 69% Natural
4~~0---~4~0---~~~or----6~0,...---__,,,70':---~BO 0/ 0 PASSING NO. 4 SIEVE
Figure 3. Relationship between percent passing No, 4 sieve and compressive strength.
17
will occur. Briefly , the procedure consists of fabricating three 4-in. diameter x 4-in. high test specimens containing different percentages of moisture but the same amount of cement, typically 3 or 4 percent (the exact amount of cement is not important to this phase of the test). The mixtures of cement, aggregate and water are hand rodded (mechanical kneading compaction can be used as an alternative) into molds containing tin sleeves and then loaded in a press (or hydraulic jack in fram e), for a 2Ya-min period, to 25, 000 lb or about 2, 000 psi. During the process of static loading, notation is made of any moisture squeezed out of the specimen. The amount of such moisture loss is determined by weighing immediately before and afte r application of the static load. The amount of moisture added to the mixtures , during the fabrication process, is set high enough so that some moisture will be exuded from at least two of the three specimens. One of the specimens should be prepared at the point of saturation which
(/)
Cl.
J: I-C> z w D:: I-(/)
LU > (/) (/) w D:: Cl. :::E 0 u
300
250
200
150
3% CEMENT USED
7 I
50""-~~~ ....... ~~~~---~~~~-"-~~~~"--~~~-' 0 10 20 30 40 50
RATIO OF % PASSI NG NO. 200 TO % PASSING NO. 30 SIEVE
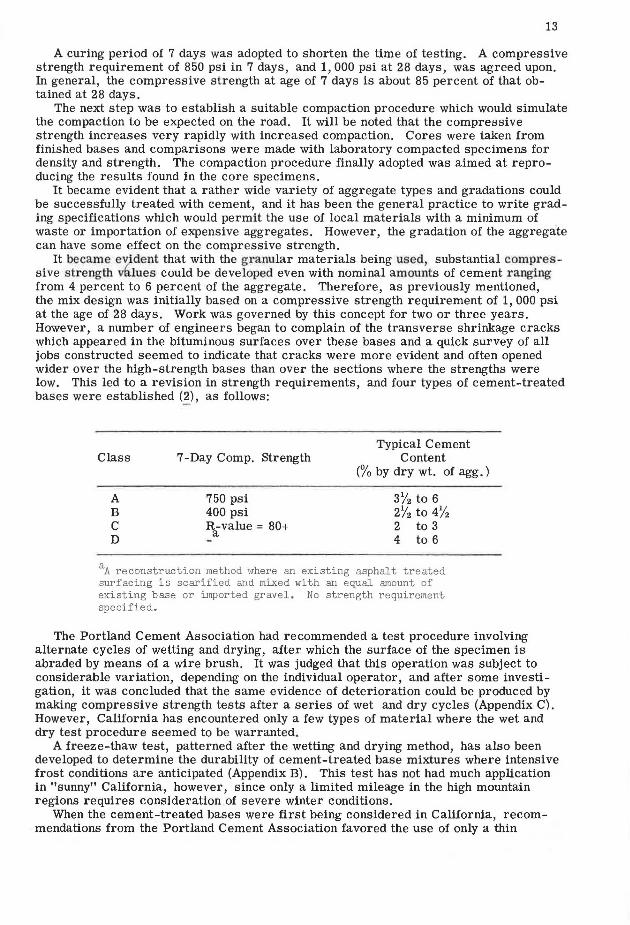
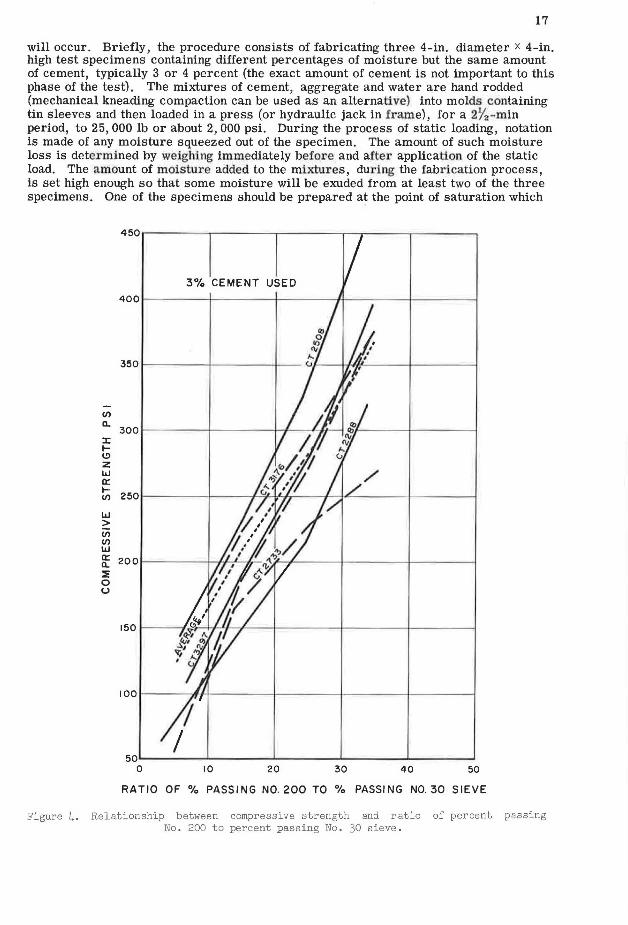
Figure 4. Relationship between compressive strength and ratio of percent passing No. 200 to percent passing No. 30 sieve.
18
is normally considered to be attained when 1 to 6 g of water are squeezed from the specimen. The other two should be slightly above and be low (this is usually ± or 2% moisture) saturation, respectively. The optimum moisture and density are calculated from the saturated specimen which exuded the 1 to 6 g of water. All three specimens are then cured and tested for 7-day compressive strength for supplemental information. While the optimum moisture determination is necessary to the second phase of the laboratory test, it is also reported for ultimate use in field construction control. In this case, the moisture content is usually expressed as a range which extends from the point of saturation to approximately 1 percent below this point. The test data (including compressive strength) from the specimens fabricated above and below the saturation serve as a guide in establishing this range.
At this point, it might be well to digress for a moment and discuRR thP. background which forms the basis for the mode of optimum moisture control of CTB's. In the
3% CEMENT USED
400
I
350
(I) a:
300 I J: I-(!)
z w a: I- 250 en 11.J ~ en en 11.J a: 200 Cl. ~ 0 (.)
150
t?i /;f
100
COMPACTED DENSITY - P.C.F.
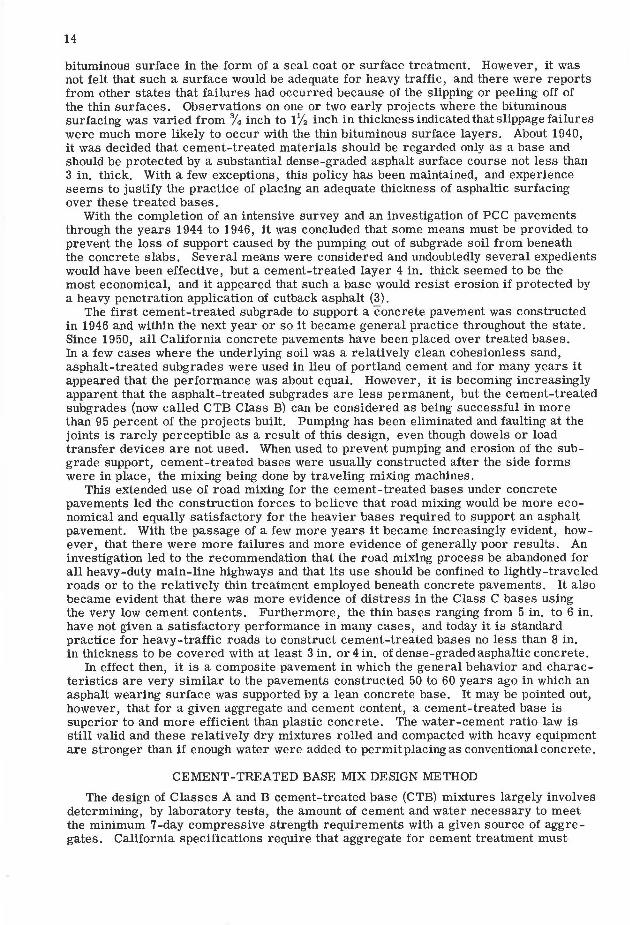
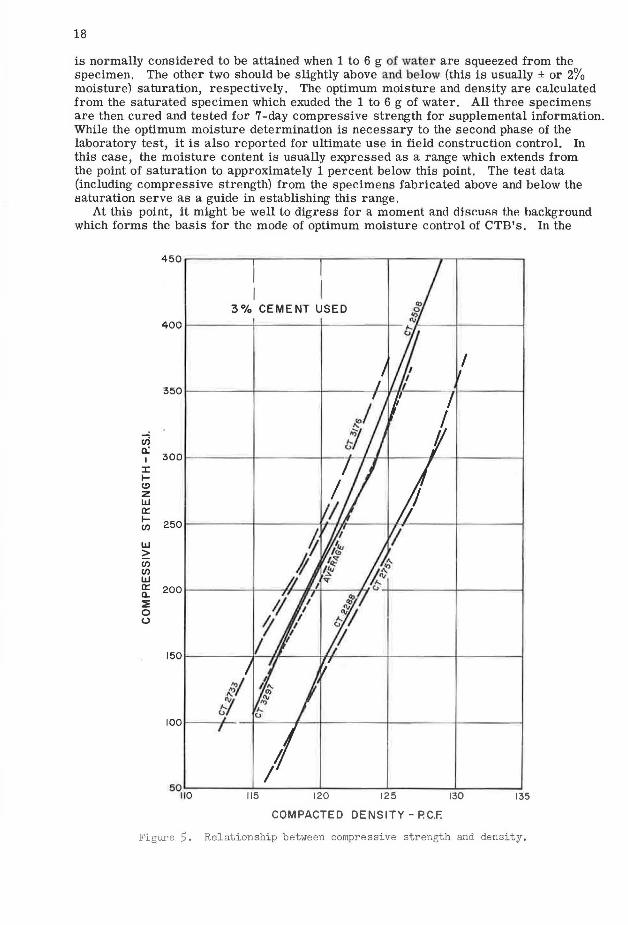
Figure 5. Relationship between compressive strength and density.
19
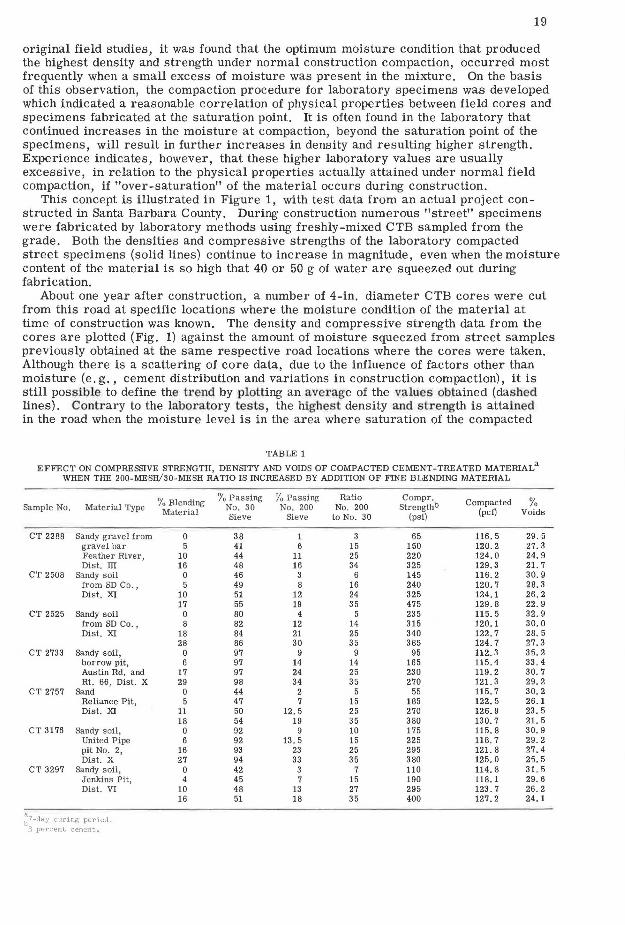
original field studies, it was found that the optimum moisture condition that produced the highest density and strength under normal construction compaction, occurred most frequently when a small excess of moisture was present in the mixture. On the basis of this observation, the compaction procedure for laboratory specimens was developed which indicated a reasonable correlation of physical properties between field cores and specimens fabricated at the saturation point. It is often found in the laboratory that continued increases in the moisture at compaction, beyond the saturation point of the specimens, will result in further increases in density and resulting higher strength. Experience indicates, however, that these higher laboratory values are usually excessive, in relation to the physical properties actually attained under normal field compaction, if "over-saturation" of the material occurs during construction.
This concept is illustrated in Figure 1, with test data from an actual project constructed in Santa Barbara County. During construction numerous "street" specimens were fabricated by laboratory methods using freshly-mixed CTB sampled from the grade. Both the densities and compressive strengths of the laboratory compacted street specimens (solid lines) continue to increase in magnitude, even when the moisture content of the material is so high that 40 or 50 g of water are squeezed out during fabrication.
About one year after construction, a number of 4-in. diameter CTB cores were cut from this road at specific locations where the moisture condition of the material at time of construction was known. The density and compressive strength data from the cores are plotted (Fig. 1) against the amount of moisture squeezed from street samples previously obtained at the same respective road locations where the cores were taken. Although there is a scattering of core data, due to the influence of factors other than moisture (e.g., cement distribution and variations in construction compaction), it is still possible to define the trend by plotting an average of the values obtained (dashed lines). Contrary to the laboratory tests, the highest density and strength is attained in the road when the moisture level is in the area where saturation of the compacted
TABLE 1
EFFECT ON COMPRESSIVE STRENGTH, DENSITY AND VOIDS OF COMPACTED CEMENT-TREATED MATERIAL a WHEN THE 200-MESH/30-MESH RATIO IS INCREASED BY ADDITION OF FINE BLENDING MATERIAL
% Blending % Passing % Passing Ratio Compr. Compacted % Sample No. Material Type Material No. 30 No. 200 No. 200 Strengthb (pcf) Voids Sieve Sieve to No. 30 (psi)
CT 2288 Sandy gravel from 0 38 1 3 65 116. 5 29.5 gravel bar 5 41 6 15 150 120.2 27. 3 Feather River, 10 44 11 25 220 124.0 24.9 Dist. III 16 48 16 34 325 129.3 21. 7
CT 2508 Sandy soil 0 46 3 6 145 116. 2 30.9 from SD Co., 5 49 8 16 240 120.7 28. 3 Dist. XI 10 51 12 24 325 124.1 26.2
17 55 19 35 475 129.8 22.9 CT 2525 Sandy soil 0 80 4 5 235 115. 5 32.9
from SD Co., 8 82 12 14 315 120.1 30.0 Dist. XI 18 84 21 25 340 122.7 28. 5
28 86 30 35 385 124.7 27. 3 CT 2733 Sandy soil, 0 97 9 9 95 112.3 35.2
borrow pit, 6 97 14 14 165 115. 4 33,4 Austin Rd. and 17 97 24 25 230 119. 2 30.7 Rt . 66, Dist . X 29 98 34 35 270 121. 3 29.2
CT 2757 Sand 0 44 2 5 55 115. 7 30.2 Reliance Pit, 5 47 7 15 185 122.5 26.1 Dist. XI 11 50 12.5 25 270 126.9 23. 5
18 54 19 35 380 130.7 21. 5 CT 3176 Sandy soil, 0 92 9 10 175 115. 8 30,9
United Pipe 6 92 13 . 5 15 225 118. 7 29.2 pit No. 2, 16 93 23 25 295 121. 8 27.4 Dist. X 27 94 33 35 380 125.0 25. 5
CT 3297 Sandy soil, 0 42 3 7 110 114. 8 31. 5 Jenkins Pit, 4 45 7 15 190 118. 1 29.6 Dist. VI 10 48 13 27 295 123. 7 26.2
16 51 18 35 400 127.2 24.1
:7-day curing period. 3 percent cement .
20
SAM PLE NO, 51-3!5.52 CLAY BALLS EXPRESSED AS % OF THE TOTAL COARSE AGGREGATE
4 '"/., CEMENT USED -001\ 00 \
:c ,_ <> r\ z • I:! ,_ "' '" "
00
u; _,
"' '" "' .. " 0 "-
...
0
"'
""' !"-.
"" ~ ~ >t "" ..
% CLAY BALLS ADDED TO SPECIMENS
~ .....
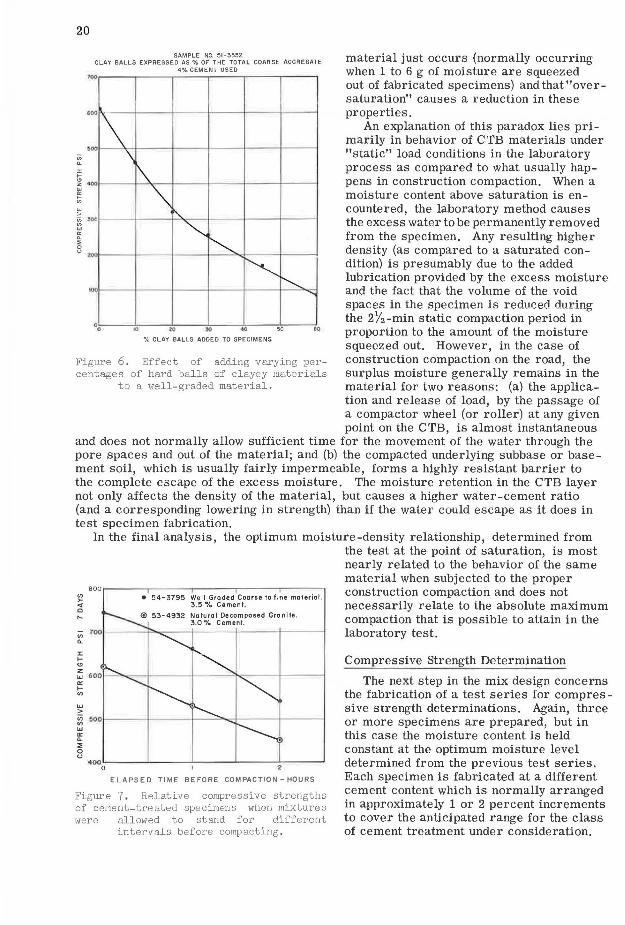
Figure 6. Effect of adding varying percentages of hard balls of clayey materials
to a well-graded material.
material just occurs (normally occurring when 1 to 6 g of moisture are squeezed out of fabricated specimens) and that "oversaturation" causes a reduction in these properties.
An explanation of this paradox lies primarily in behavior of CTB materials under "static" load conditions in the laboratory process as compared to what usually happens in construction compaction. When a moisture content above saturation is encountered, the laboratory method causes the excess water to be permanently removed from the specimen. Any resulting higher density (as compared to a saturated condition) is presumably due to the added lubrication provided by the excess moisture and the fact that the volume of the void spaces in the specimen is reduced during the 27'2-min static compaction period in proportion to the amount of the moisture squeezed out. However , in the case of construction compaction on the road, the surplus moisture generally remains in the material for two reasons: (a) the application and release of load, by the passage of a compactor wheel (or roller) at any given point on the CTB, is almost instantaneous
and does not normally allow sufficient time for the movement of the water through the pore spaces and out of the material; and (b) the compacted underlying subbase or basement soil, which is usually fairly impermeable, forms a highly resistant barrier to the complete escape of the excess moisture. The moisture retention in the CTB layer not only affects the density of the material, but causes a higher water-cement ratio (and a corresponding lowering in strength) than if the water could escape as it does in test specimen fabrication.
In the final analysis, the optimum moisture-density relationship, determined from the test at the point of saturation, is most nearly related to the behavior of the same
"' ll.
:t: ,_ "' z
• 54-3795 Well Graded Coarse to fine material. 3.5 % Cem ent,
w 600 1-.-.....~-+--
°' 1-(/)
"' > ~ ~001-~~-i-~~~1---'""""~~~-t~~~-1
"' "' ll. :I; 0 u
•oo'-~~-'--~~~'--~~--'-~~--~~~~
0 ' ELAPSED TtME BEFORE COMPACTION-HOURS
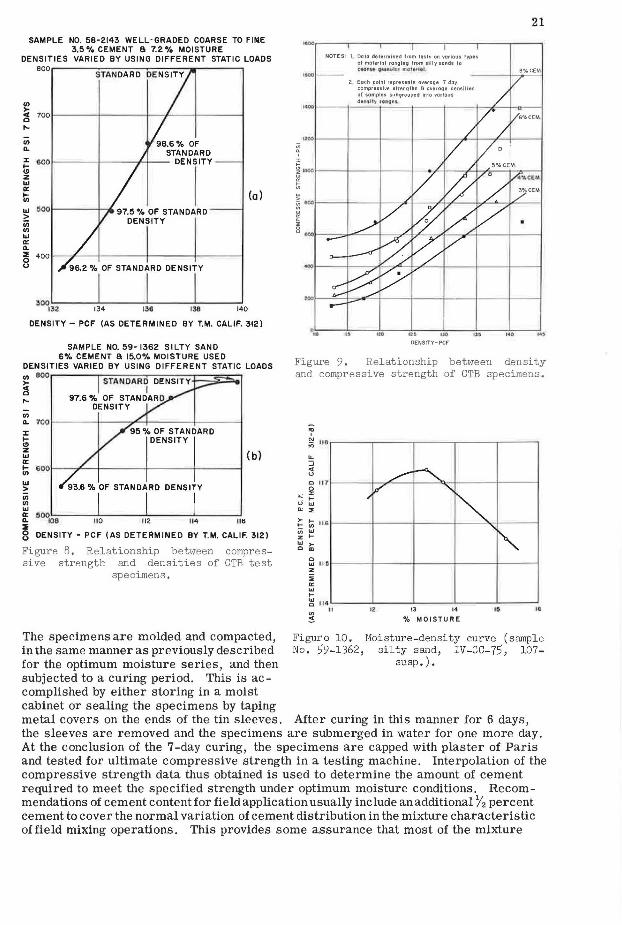
Figure 7. Relative compressive strengths of cemer1L-treaLetl specimens when mixtures were allowed to stand for different
intervals before compacting.
material when subj ected to the proper construction compaction and does not necessarily relate to the absolute maximum compaction that is possible to attain in the laboratory test.
Compressive Strength Determination
The next step in the mix design concerns the fabrication of a test series for com pres -sive strength determinations . Again, three or more specimens are prepared, but in this case the moisture content is held constant at the optimum moisture level determined from the previous test series. Each specimen is fabricated at a different cement content which is normally arranged in approximately 1 or 2 percent increments to cover the anticipated range for the class of cement treatment under consideration.
SAMPLE NO. 58-2.143 WELL-GRAOEO COARSE TO FlftE 3.5 % CEMENT 8 7.2. % MOISTURE
DENSITIES VARIED BY USING DIFFERENT STATIC LOADS ace~------~--------~ STAN DARD DENSITY
<f)
~ 1001------1-----1--+----1-----t
"" 98.6% OF
STANDARD ;: 6001-----1---+-1-- DENSITY
! I
<f) ..
II.I 6001-----+-.0. > iii <f)
II.I 0:: .. ~ 400 1--~~--1-----1----1-----t u
(a)
DENSITY - PCF (AS DETERMINED BY T.M. CALIF. 312.)
SAMPLE N0.59-1362. SILTY SAND 6% CEMENT 8 15.0% MOISTURE USED
DENSITIES VARIED BY USING DIFFERENT STATIC LOADS
"' eoor--lssiTAAiNNiD0.A~Ri°iDloD~E!'.NNSis1iTT:YY+:=::;;~::;;J ~ I
"" <f)
97.6 % OF STANDARD DENSITY
.. 7001------11--- _.,..'-ll------l-----t
:c IC> z II.I 0:: ~ 600t-- -r---1-------11-------1-----t
II.I
:!: <f) <f)
II.I
f 500I08 ~
11 0 112 114 116
(b)
0 u DENSITY - PCF (AS DETERMINED BY T.M. CALIF. 312.)
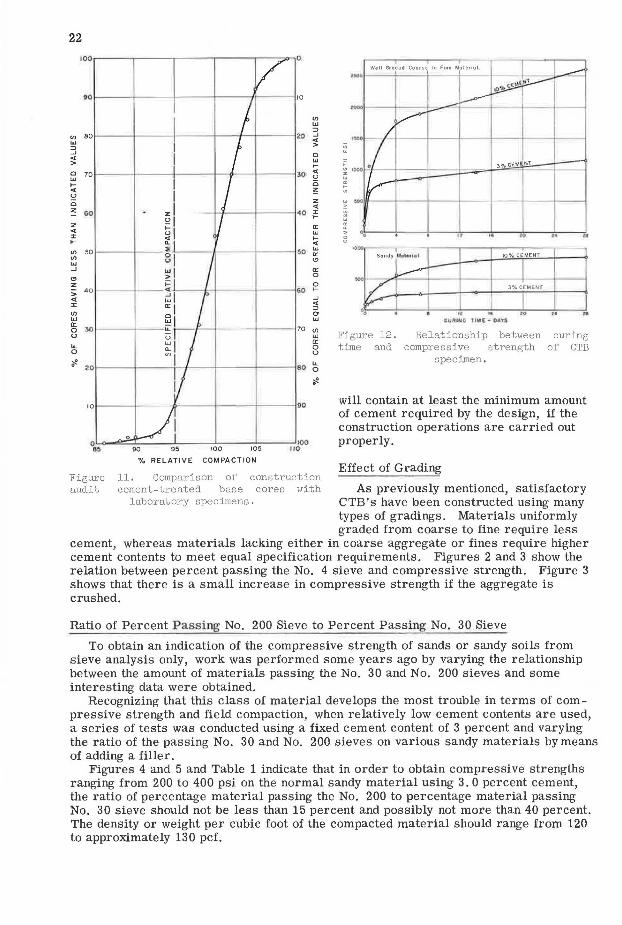
Figure 8, Relationship between compressive strength and densities of CTB test
specimens,
The specimens are molded and compacted, in the same manner as previously described for the optimum moisture series, and then subjected to a curing period. This is accomplished by either storing in a moist cabinet or sealing the specimens by taping
NOTES: 1 0010 delermin11d from lesls on various lypu of moterlol ranging rromsillysonds to ooc., •• ; .01rwla1 ~•ui..t.
""" - - 2 Each polnl represenls overage 7 day compressive strenr,ilhs a overage densllies of 1omplas sub11roup11d into various dttl\Uy f9'tll;IU
21
B%CEM
.... i---r---1---1--~-t-o--~
... '" ... 1lt1- uo
DENSITY-PCF
,,. ... ,.,
Figure 9, Relationship between density and compressive strength of CTB specimens .
... :; "' (.)
c 117 0
~ ~ (.)"' °'"' ~ ~ 116
;;; "' z .... "',_ o m
0 LI.I I I~ z
"' 0:
"' .... ~ 114
; fl"
II ·~
,,.,,.-~ ~~
'"" 13 14 .. , .
% MOISTURE
Figure 10, Moisture-density curve (sample No. 59-1362, silty sand, IV-CC-75, 107-
susp,),
metal covers on the ends of the tin sleeves. After curing in this manner for 6 days, the sleeves are removed and the specimens are submerged in water for one more day. At the conclusion of the 7-day curing, the specimens are capped with plaster of Paris and tested for ultimate compressive strength in a testing machine. Interpolation of the compressive strength data thus obtained is used to determine the amount of cement required to meet the specified strength under optimum moisture conditions. Recommendations of cement content for field application usually include an additional 12 percent cement to cover the normal variation of cement distribution in the mixture characteristic of field mixing operations. This provides some assurance that most of the mixture
22
•Ol----4----+----+----/1----110
101----1-----1>----+-- --+---!90
~~5..-e::~90.L......--9L5---l~0-0 ___ 10~5---'llJOO
% RELATIVE COMPACTION
Figure audit
11. Comparison of construction cement-treated base cores with
laboratory specimens .
Well Graded Coarse lo Fine Mulerial I .... I
T ....
~ ~
3 % CEMENT
!be >
~
~
~ '• " .. •• ,. 0 u
k>OO
Sandy M•l••l•I 10°1. CEMENT
L---i...-- l ? 3-,.., CEMENT
I I I OO II!' 10 h
tU ~IUG 11MIE: - QA'r'!
Figure 12. Relationship between curing time and compressive strength of CTB
specimen .
will contain at least the minimum amount of cement required by the design, if the construction operations are carried out properly.
Effect of Grading
As previously mentioned, satisfactory CTB's have been constructed using many types of gradings. Materials uniformly graded from coarse to fine require less
cement, whereas materials lacking either in coarse aggregate or fines require higher cement contents to meet equal specification requirements. Figures 2 and 3 show the relation between percent passing the No. 4 sieve and compressive strength. Figure 3 shows that there is a small increase in compressive strength if the aggregate is crushed.
Ratio of Percent Passing No. 200 Sieve to Percent Passing No. 30 Sieve
To obtain an indication of the compressive strength of sands or sandy soils from sieve analysis only, work was performed some years ago by varying the relationship between the amount of materials passing the No. 30 and No. 200 sieves and some interesting data were obtained.
Recognizing that this class of material develops the most trouble in terms of compressive strength and field compaction, when relatively low cement contents are used, a series of tests was conducted using a fixed cement content of 3 percent and varying the ratio of the passing No. 30 and No. 200 sieves on various sandy materials by means of adding a filler.
Figures 4 and 5 and Table 1 indicate that in order to obtain compressive strengths ranging from 200 to 400 psi on the normal sandy material using 3. 0 percent cement, the ratio of percentage material passing the No. 200 to percentage material passing No. 30 sieve should not be less than 15 percent and possibly not more than 40 percent. The density or weight per cubic foot of the compacted material should range from 120 to approximately 130 pcf.
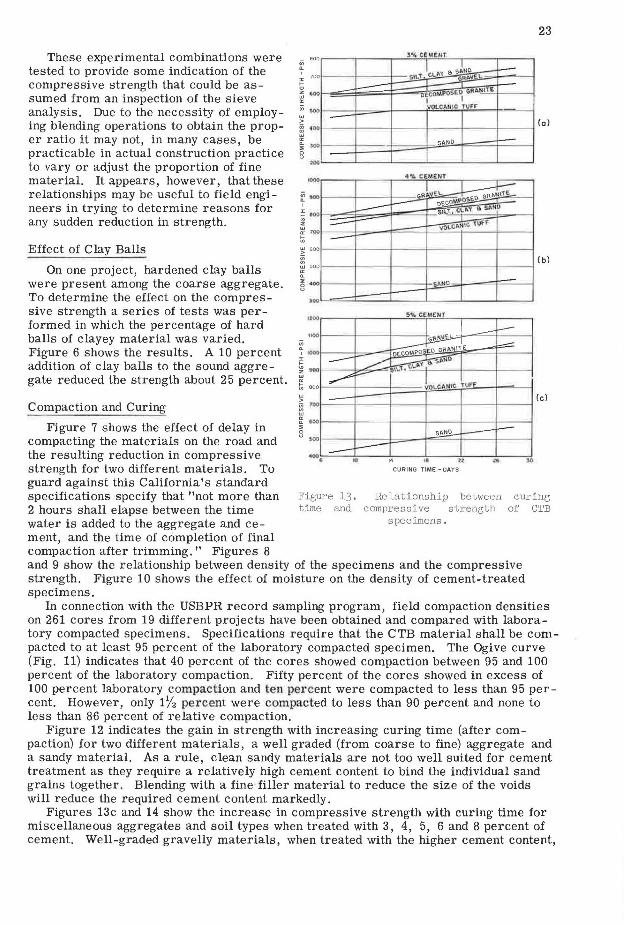
These experimental combinations were tested to provide some indication of the compressive strength that could be assumed from an inspection of the sieve analysis. Due to the necessity of employing blending operations to obtain the proper ratio it may not, in many cases, be practicable in actual construction practice to vary or adjust the proportion of fine material. It appears, however, that these relationships may be useful to field engineers in trying to determine reasons for any sudden reduction in strength.
Effect of Clay Balls
On one project, hardened clay balls were present among the coarse aggregate. To determine the effect on the compressive strength a series of tests was performed in which the percentage of hard balls of clayey material was varied. Figure 6 shows the results. A 10 percent addition of clay balls to the sound aggregate reduced the strength about 25 percent.
Compaction and Curing
Figure 7 shows the effect of delay in compacting the materials on the road and the resulting reduction in compressive strength for two different materials. To guard against this California's standard
ooo
...
-IOOO
i:'.OOO ' ~ 000
~ a:700 :;; ~ 600
12 "' 50 a: .. 0
~ •oo "
"' >
>00
-
-- --
~ 100--
"'
3.% CE'-'EHT
I'-"' s sJ .. o - -L-- .----SILT~ -
OMPOSEO GftAUITE oic:; I VOLCAHIC lUflf"
51\NO -
G~t°"£~ i---- oEcow.P<>'lE.
L----- SILT' CLAY ft SANO
-~\Jff
$MIO -
~ ·~1--~-1-~~-t-~--j~~-1-~~+-~--1
" 0
" -1-~-1-~~-l:==----i-===--i-~~+-~--t
,. CURING TIME - DAYS
23
(a)
(b)
specifications specify that "not more than Figure 13. Relationship between curing 2 hours shall elapse between the time time and compressive strength of CTB water is added to the aggregate and ce- specimens·
ment, and the time of completion of final compaction after trimming." Figures 8 and 9 show the relationship between density of the specimens and the compressive strength. Figure 10 shows the effect of moisture on the density of cement-treated specimens.
In connection with the USBPR record sampling program, field compaction densities on 261 cores from 19 different projects have been obtained and compared with laboratory compacted specimens. Specifications require that the CTB material shall be compacted to at least 95 percent of the laboratory compacted specimen. The Ogive curve (Fig. 11) indicates that 40 percent of the cores showed compaction between 95 and 100 percent of the laboratory compaction. Fifty percent of the cores showed in excess of 100 percent laboratory compaction and ten percent were compacted to less than 95 percent. However, only 17'2 percent were compacted to less than 90 percent and none to less than 86 percent of relative compaction.
Figure 12 indicates the gain in strength with increasing curing time (after compaction) for two different materials, a well graded (from coarse to fine) aggregate and a sandy material. As a rule, clean sandy materials are not too well suited for cement treatment as they require a relatively high cement content to bind the individual sand grains together. Blending with a fine filler material to reduce the size of the voids will reduce the required cement content markedly.
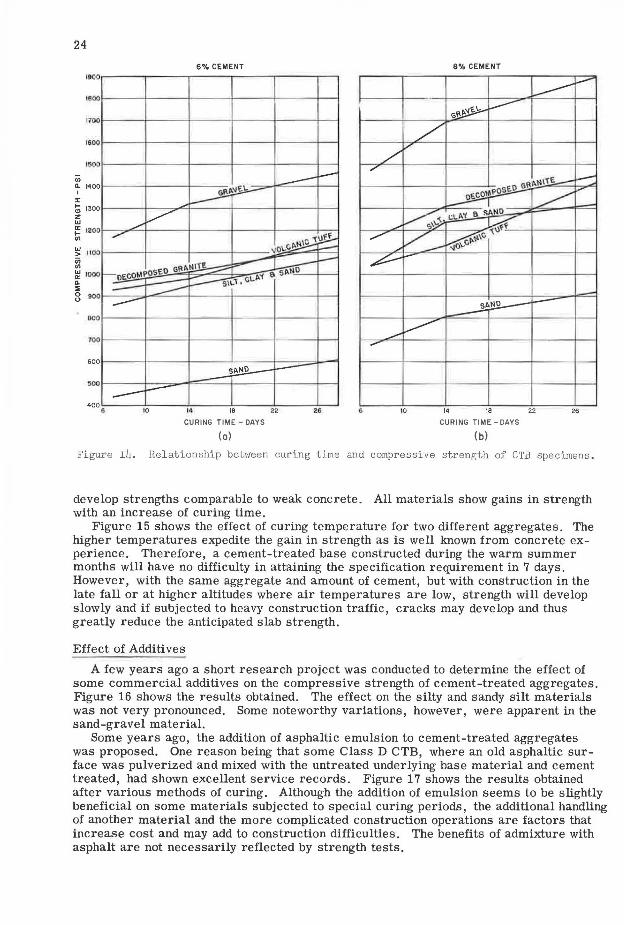
Figures 13c and 14 show the increase in compressive strength with curing time for miscellaneous aggregates and soil types when treated with 3, 4, 5, 6 and 8 percent of cement. Well-graded gravelly materials, when treated with the higher cement content,
24
1900
1800
1700
1600
111()0
"' a.. 1400 I
:i:
:; 1300 z w ~ 1200
"'
_,., ......-
6% CEMENT
--- i..--
Gllp.\IEl..
~~
~ 1c 1~ .-iol..c.J>.~~ -~ 1100
o;
"' ~ 1000 - oECOl.IPOSEO Gf\P.~11~~ i..--
:::::=::::::::::::::::--Si\.,. . C.l.. Q.
:E 8 900
800
100
60 0
500
400 6 ----IC
-~ ~
14 16 22
CURING TIME - DAYS
(a)
26
8% CEMENT
----.-I ---Gii~
/ /""
/
11p.1-111E - -~~ -
~ 1,;L i>.Y & s.o.NO ~ .. ~~ v _.,,..,.
/ ~\C ,_. _.- -JO\.C.
;?-
-~~ -
_,,... ,.,,,,,.---
10 14 18 22 26
CURING TIME -DAYS
(b)
Figure 14. Relationship between curing time and compressive strength of CTB specimens.
develop strengths comparable to weak concrete. All materials show gains in strength with an increase of curing time.
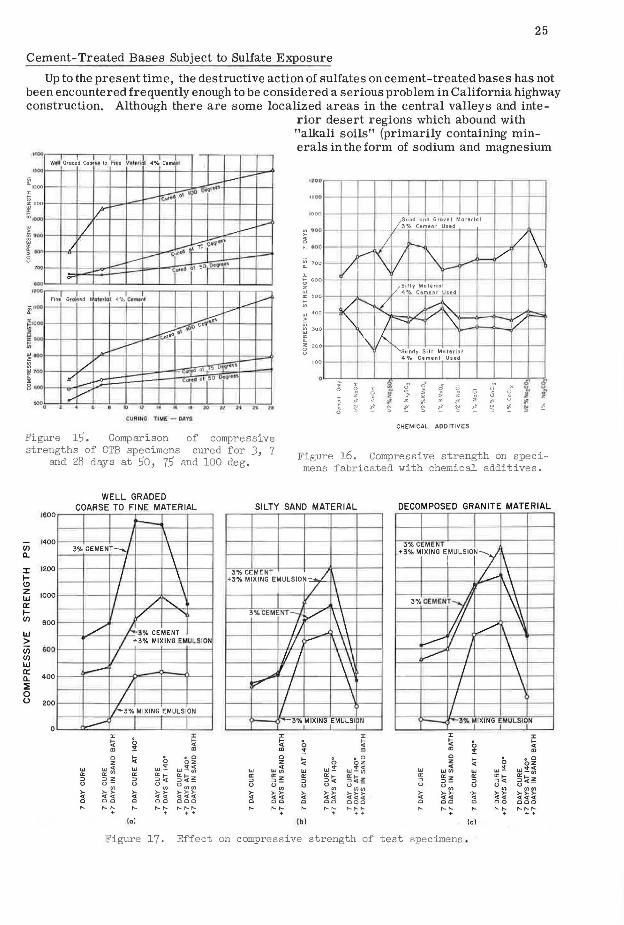
Figure 15 shows the effect of curing temperature for two different aggregates. The higher temperatures expedite the gain in strength as is well known from concrete experience. Therefore, a cement-treated base constructed during the warm summer months will have no difficulty in attaining the specification requirement in 7 days. However, with the same aggregate and amount of cement, but with construction in the late fall or at higher altitudes where air temperatures are low, strength will develop slowly and if subjected to heavy construction traffic, cracks may develop and thus greatly reduce the anticipated slab strength.
Effect of Additives
A few years ago a short research project was conducted to determine the effect of some commercial additives on the compressive strength of cement-treated aggregates. Figure 16 shows the results obtained. The effect on the silty and sandy silt materials was not very pronounced. Some noteworthy variations, however, were apparent in the sand-gravel material.
Some years ago, the addition of asphaltic emulsion to cement-treated aggregates was proposed. One reason being that some Class D CTB, where an old asphaltic surface was pulverized and mixed with the untreated underlying base material and cement treated, had shown excellent service records. Figure 17 shows the results obtained after various methods of curing. Although the addition of emulsion seems to be slightly beneficial on some materials subjected to special curing periods, the additional handling of another material and the more complicated construction operations are factors that increase cost and may add to construction difficulties. The benefits of admixture with asphalt are not necessarily reflected by strength tests.
25
Cement-Treated Bases Subject to Sulfate Exposure
Up to the present time, the destructive action of sulfates on cement-treated bases has not been encountered frequently enough to be considered a serious problem in California highway construction. Although there are some localized areas in the central valleys and inte
rior desert regions which abound with "alkali soils" (primarily containing min
HOO erals in the form of sodium and magnesium
Wt l11 Gradeld Coo a.. to Filfle Mt 1PrsJ. 4°/.,
1 Cem ;t
I---- 1100
c;;;Oo' ' ,o"' r -I/"" I ~--- --
/ ~\'lSCtrt41
L /~and and Grovel Moreriol
- - --. ... 3% Cemenr Used i-~ ·-~
-/ .,,,_ - .
uoo
1000
-- .... ~ --- ·1 cl .ot ~O DtO' d ... r
~ v I\ I "'- v I- / 1 I , _..-~ 700
' ~ -vSi llr Material
4% Cem.epl U.Jt-d FlnJ Grol!ied Ja1trlo <l%1C.~I
~ 000
~--_..L-- ~ :::
>~
~ <100
;;;
/ ........, v ........-: '"' :-"/
~,'ffory.ff __.. Cl)feO
'\ ,_ ~ 300
v ...-- 3 200
/ ~
., v ~
,/ -0-- - "~'t' al 0 " ;. ...
- v .-.... IO .. ,. ii r
0
Cl.IAIUG T!Mf: - !MYS
~
' 0
z
"
I
A
t
7 '\ ~
"-sandy Si ll Material 4% Cemenl Used
6' <l 0 u
CHEMICAL .ADDITIVES
-u
z
u
t/ --
-" O' i
Figure 1). Comparison of compressive strengths of CTB specimens cured for 3, 7
and 28 days at )o , 75 and 100 deg. Figure 16. Compressive strength on specimens fabricated with chemical additives.
V> 0..
J: 1-\!)
1600
1400
1200
~ 1000 a: 1-Vl
w > Vl Vl w a: 0.. ::!!: 0 ()
eoo
GOO
400
200
0
WELL GRADED COARSE TO FINE MATERIAL -
' \
3'/, CEMENT --.j \ I \ I \ I \ I / "-/ ....
/ /,!33 CEMENT I +3% MIXING EMULSION
I/ ..--J
I /-3% MIXING EMULSION
---" :r :r ~ 0 ~ !: "' "' 0 ~ . • 0 z 0 oz
w w., w w!: w!:l a: a:"' a: a:,_
~~~ ::> ::> z ::> =>ot 0 o- 0 0
V> o.,.,
V> >- >->- 1i >->- >->->-
" <(<( "" <(<(<( 0 00 0 00 000 ,... ,...';" ,... ,...,... ,...,...,...
+ + + (o)
Figure 17. Effect
SILTY SAND MATERIAL DECOMPOSED GRANITE MATERIAL
3% CEMENT I ,+3% MIXING EMULSION-
l \ 3% CEMENT J +-3% MIXING EMULSION I~ \
I l / \ \\ " \ 3% CEMENT-....// \\
3'4 CEMEITT-f. v \ \ II \\ /J \\
II ~ \ \ \ II I \ \\
II _,/' ~
......--- i 1- \ ,,.,.,....... \
' I \\ I \ i::""'"" I \ I \
I \ I I I
~ 3% MIXING 1EMULSIPN --. 3'41 ""No ~MULSI< N
:r :r :r :r ~ 0 ~ ~ 0 .... ., "' !: "' "' !: "' 0
~ . • 0 0
~ 0 • 0 z 0
w~~ z oz
w .,
w w!: w .,
..,!: w!~ WCI) ..,., w a: ~~ a: a:,_
~~~ a: "'z a: "'>- B~~ ::> ::> ii" ::> ::>- ::> ::><(
0 o., 0 0 o., 0 0 Cl) V>V> V> .,.,
>- >->- 1i >->- >->->- >- ~!i .,._ >->- >->->-<( "" .... ...... .. <t .. .. ......
0 00 0 00 000 0 00 0 00 ooo ,...,... ,... ,...';" ,...,...,... ,... ,...,... ,...,... ,...,..,... + + + + + ++
(bl (c)
on compressive strength of test specimens .
26
sulfate), these localities are generally isolated and are, for the most part, traversed by roads which carry only light to medium traffic . As a consequence only a few CTB proj ects have been constructed in areas where the base would be subjected to the most severe alkali attack.
However, some of these CTB projects have shown evidence of distress as a result of alkali attack. Thorough field investigations along with laboratory experiments have resulted in the determination of several important criteria which serve as guidelines for constructing more highly sulfate-resistant CTB's in the future.
First, it is most important to use a well-graded coarse granular aggregate for cement treatment. Fine -grained C TB' s are fundamentally more susceptible to alkali attack. Second, Class A cement-treated bases should be used and it is preferable to increase the cement content at least 1 percent above that required in normal mix design. Sulfate resistance increases rapidly with higher cement contents. Third, a Type II or Type V, cement if readily available, should be used. However, experience indicates that this measure is not nearly as effective in CTB as it is in portland cement concrete for minimizing sulfate attack. Finally, construction compaction should be undertaken to provide the densest mixture possible in order to minimize water permeability. Also, care must be exercised during construction to prevent drainage conditions which would promote the leaching of alkalis from surrounding soils with the consequent concentration in the structural section.
C.uring Seal of CTB
The present California standard specifications specify that the curing seal be applied as soon as possible, but not later than 8 hours after the completion of final rolling. The curing seal shall consist of MC-2 (now MC-250) and be applied at a rate between 0.15 and 0. 25 gal per sq yd of surface.
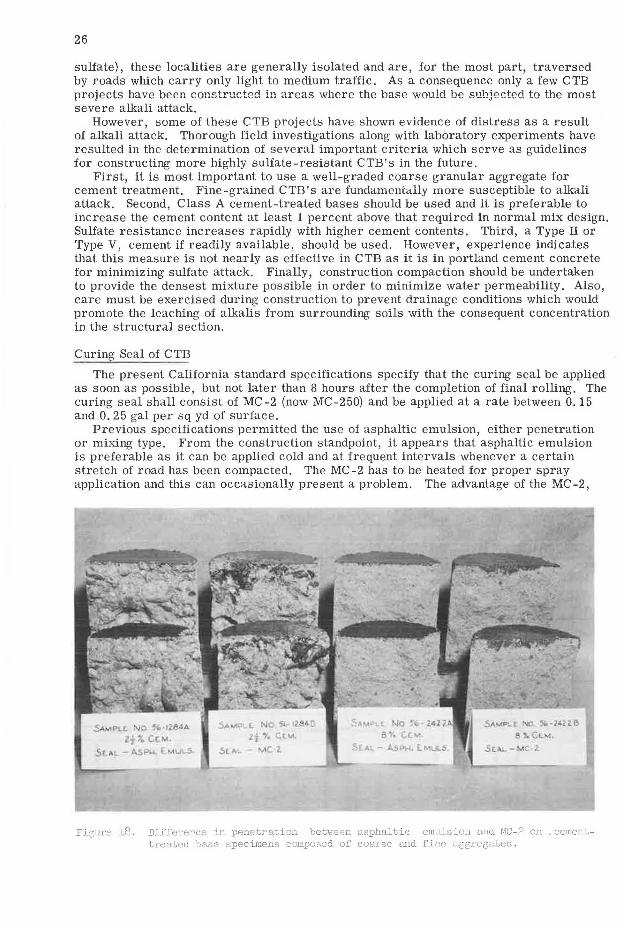
Previous specifications permitted the use of asphaltic emulsion, either penetration or mixing type. From the construction standpoint, it appears that asphaltic emulsion is preferable as it can be applied cold and at frequent intervals whenever a certain stretch of road has been compacted. The MC-2 has to be heated for proper spray application and this can occasionally present a problem. The advantage of the MC-2,
Figure 18. Difference in penetration between asphaltic emulsion and MC-2 on cementtreated base specimens composed of coarse and fi_nP. aggregates .
27
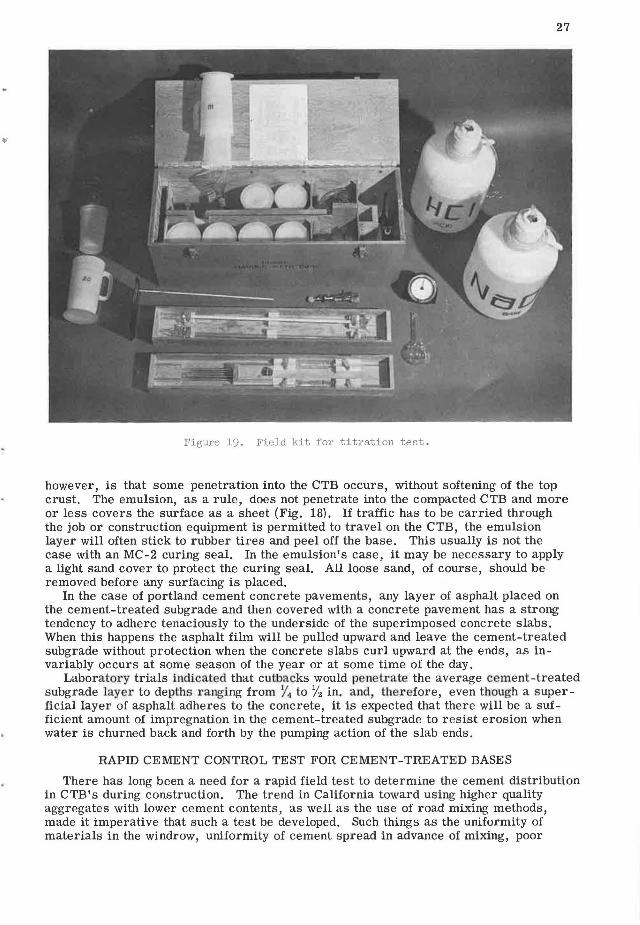
Figure l9. Field kit for titration test.
however, is that some penetration into the CTB occurs, without softening of the top crust. The emulsion, as a rule, does not penetrate into the compacted CTB and more or less covers the surface as a sheet (Fig. 18). If traffic has to be carried through the job or construction equipment is permitted to travel on the CTB, the emulsion layer will often stick to rubber tires and peel off the base. This usually is not the case with an MC-2 curing seal. In the emulsion's case, it may be necessary to apply a light sand cover to protect the curing seal. All loose sand, of course, should be removed before any surfacing is placed.
In the case of portland cement concrete pavements, any layer of asphalt placed on the cement-treated subgrade and then covered with a concrete pavement has a strong tendency to adhere tenaciously to the underside of the superimposed concrete slabs. When this happens the asphalt film will be pulled upward and leave the cement-treated subgrade without protection when the concrete slabs curl upward at the ends, as invariably occurs at some season of the year or at some time of the day.
Laboratory trials indicated that cutbacks would penetrate the average cement-treated subgrade layer to depths ranging from Y1 to Y2 in. and, therefore, even though a superficial layer of asphalt adheres to the concrete, it is expected that there will be a sufficient amount of impregnation in the cement-treated subgrade to resist erosion when water is churned back and forth by the pumping action of the slab ends.
RAPID CEMENT CONTROL TEST FOR CEMENT-TREATED BASES
There has long been a need for a rapid field test to determine the cement distribution in CTB's during construction. The trend in California toward using higher quality aggregates with lower cement contents, as well as the use of road mixing methods, made it imperative that such a test be developed. Such things as the uniformity of materials in the windrow, uniformity of cement spread in advance of mixing, poor
28
mixing due to high speeds of the mixer, size of windrow in relation to the capacity of the mixer, as well as the mechanical condition of the mixer itself can all profoundly influence the uniformity of cement distribution and thereby the uniformity of strength in the CTB. Although central mixing plants are not subject to as many variables as road mixing, serious variations in cement distribution of the final mixture can occur as a result of malfunctioning or poorly equipped plants.
The California Division of Highways laboratory has in the past investigated several test methods, such as chemical analysis, compressive strength and electrical conductivity measurements. For various reasons, these test methods did not prove satisfactory for field control ( 4). One such method, developed in England, used a chemical titration process. Although not satisfied with the test as a whole, the idea of titration was pursued and a procedure (Appendix D) was developed.
Two different titration procedures are available and the selection of the particular procedure for use on a given project depends on the nature of the aggregates encountered. The first procedure, the acid-base method, is used where the aggregates do not react with hydrochloric acid. In cases where aggregates react with this acid, the second procedure, the constant neutralization method, is used.
Briefly, the acid-base method consists of placing a 300-g sample of treated aggregates (which can contain up to 1%-in. size coarse aggregates) in a plastic container and introducing a measured quantity of 3N hydrochloric acid. This is followed by a standardized stirring procedure, during which the acid neutralizes the cement contained in the sample and causes a proportional reduction in the acidity or Ph of the total solution. The reduction in acidity is determined by withdrawing a measured portion of the liquid from the plastic container, adding a few drops of phenolphthalein indicator solution to the withdrawn portion and titrating it with sodium hydroxide (NaOH). The amount of NaOH required to neutralize the residual acid is inversely proportional to the cement content of the sample.
The acid-base test is comparatively simple and results can be obtained on groups of eight samples in about 45 minutes, excluding sampling and preparation time.
The constant neutralization method is used where the CTB aggregates contain significant amounts of such substances as limestone, calcite or dolomite and can be performed on a maximum of four 300-g test specimens at one time. The specimens are placed in a plastic container to which 250-ml of water and a small quantity of phenolphthalein solution are added. The solution will immediately turn pink due to the release of hydration products from the cement. Then, using a burette containing 3N hydrochloric acid, the operator continuously adds acid and stirs the mixture for one hour to maintain a colorless solution. The amount of hydrochloric acid used in this process is determined from volume measurements with a burette or by weight. Experience has
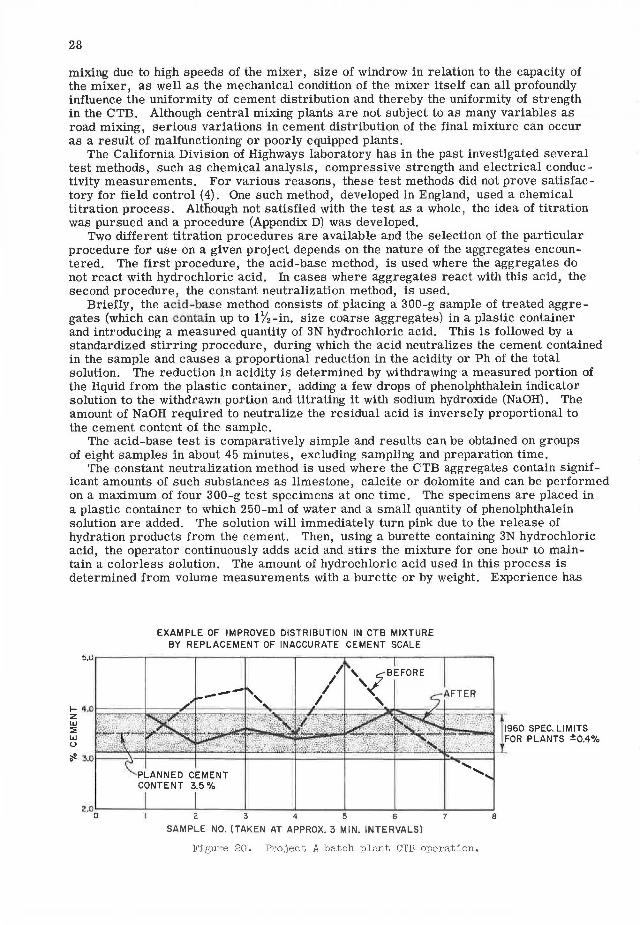
EXAMPLE OF IMPROVED DISTRIBUTION IN CTB MIXTURE BY REPLACEMENT OF INACCURATE CEMENT SCALE
s.o~--~---~---~--------------~---
2.0 ,__ __ __. ___ ........ ___ _,_ __ ~L----L---....l....---J..._--.....J
0 2 3 4 5 6 7 8
SAMPLE NO. (TAKEN AT APPROX. 3 MIN. INTERVALS)
Figure 20. Project A batch plant CTB operation.
29
shown that the amount of acid used is directly proportional to the cement content of the treated base sample.
This method is based on the principle that the rates of hydrolysis producing the hydroxyl ion (OH-) are greatly different for cement and limestone. The hydrolysis of limestone is very slow compared to that of cement. The particle size of the limestone as compared to the particle size of the cement also retards the observed rate of hydrolysis of limestone.
The application of either of these procedures in the field during construction operations is relatively simple. At the beginning of the testing operations on the project, the operator must first establish a standard curve by testing specimens fabricated to known cement contents with samples of the cement, aggregate, and water to be used on the job. This standard curve then provides the reference for calculating the cement content from test data on field-treated samples. Incidentally, the same test procedures can also be used, without alteration, for determining the percentage of lime in bases that have been treated with commercial hydrated calcium lime.
The titration test has proven to be a very effective construction control tool. California standard specifications now limit the variation from the planned cement content to a maximum of ±0. 6 percent cement (by dry weight of aggregate) for road mixing and ±0. 4 percent cement for plant-mix operations. This, in combination with the fact that up to 32 samples can be tested on the project in an 8-hr day by one operator, provides the engineer with an enforceable on-the-spot means of finding and correcting deficiencies as they happen. The arrangement of the testing equipment in a convenient and compact kit form (Fig. 19) further enhances the usefulness of the methods for field application.
There are many ways in which the titration may be utilized by the engineer to disclose sources of poor cement distribution during CTB operations. The use of various sampling techniques, together with thorough and detailed knowledge of particular construction processes, often makes it possible to isolate and correct the offending element. The following three actual C'T'B projects demonstrate the typical role played by the titration test in the control of CTB production.
Figure 20 shows an example involving a batch-type plant-mix operation. When nonuniformity was encountered during sampling of successive batches, it was found that the cement weighing scale was out of calibration. After corrective measures a vast improvement in cement distribution was noted.
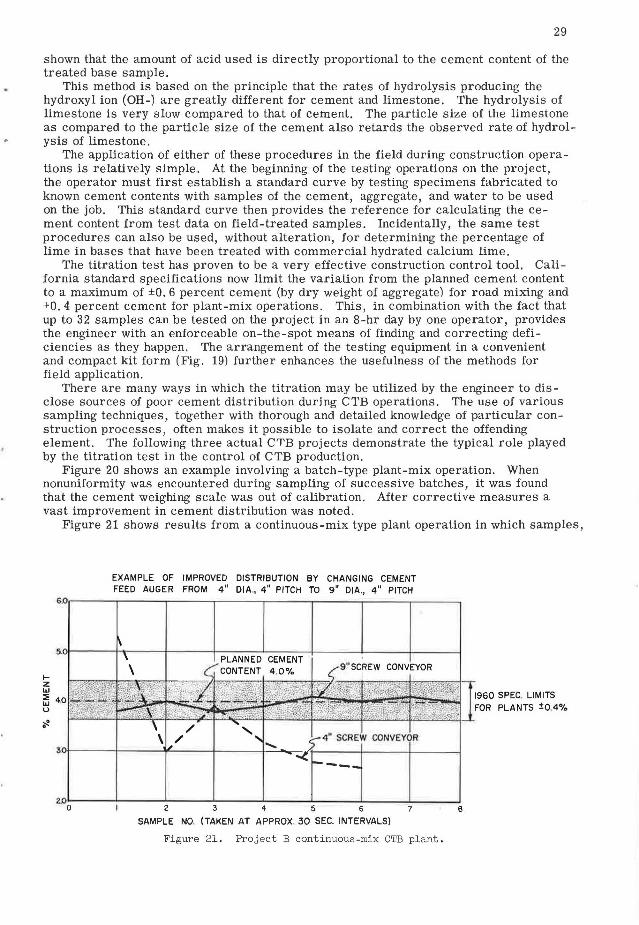
Figure 21 shows results from a continuous-mix type plant operation in which samples,
1-z w
EXAMPLE OF IMPROVED DISTRIBUTION BY CHANGING CEMENT FEED AUGER FROM 4" DIA., 4 " PITCH TO 9" DIA ., 4 " PITCH
6.0,----,----,----,----,----.,-------.---~--~
1:'j 40 u
-~---r---...,...---11-----+'~-- c;-4'' SCREW CONVEYOR 3:0, ~I --zoo ____ _._ ___ ~2---·~~~--4'--~~-'-s~--~s--~-1'----.....Js
SAMPLE NO. (TAKEN AT APPROX. 30 SEC. INTERVALS)
Figure 21. Project B continuous-mix CTB plant.
1960 SPEC. LIMITS FOR PLANTS ±0.4%
30
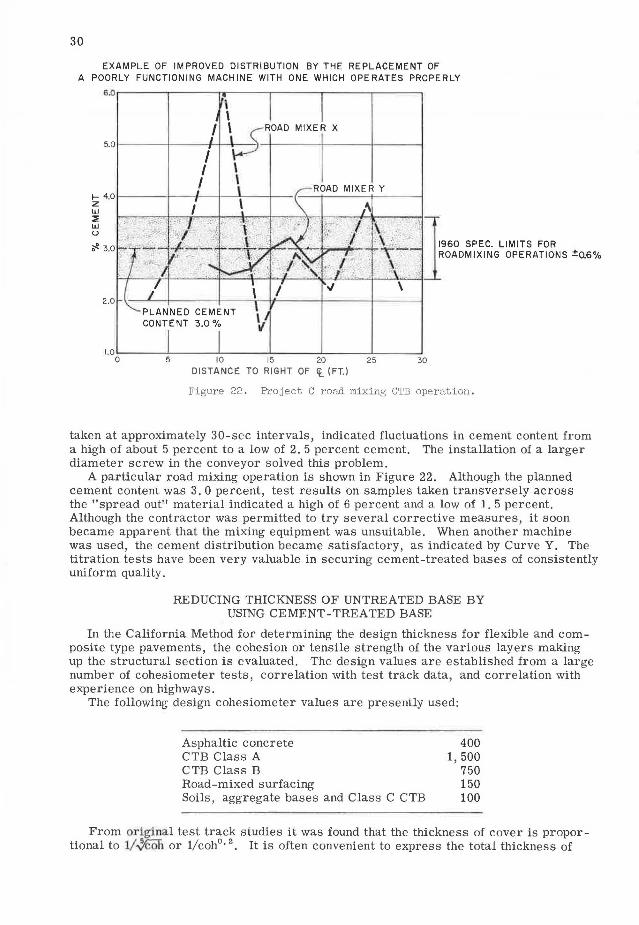
EXAMPLE OF IMPROVED DISTRIBUTION BY THE REPLACEMENT OF A POORLY FUNCTIONING MACHINE WITH ONE WHICH OPERATES PROPERLY
6.0.--- -----.--- ........ ----.r-----....----,------.
I- 4.01-----+- -l-- -l----'---l--l·---+---- -l------l 2 w :::;; w u
~ 3.0 '
2.0
I :,..~~! . ~ ..:.~~· , .. , . : ~1 I
... ;,
1.0'-----'-----'-----'----L----.._ __ __. 0 5 10 15 20 25 30
DI STANCE TO RIGHT OF ~(FT. )
Figure 22 . Project C road mixing CTB operation .
taken at approximately 30-sec intervals, indicated fluctuations in cement content from a high of about 5 percent to a low of 2. 5 percent cement. The installation of a larger diameter screw in the conveyor solved this problem.
A particular road mixing operation is shown in Figure 22. Although the planned cement content was 3. 0 percent, test results on samples taken transversely across the "spread out" material indicated a high of 6 percent and a low of 1. 5 percent. Although the contractor was permitted to try several corrective measures, it soon became apparent that the mixing equipment was unsuitable. When another machine was used, the cement distribution became satisfactory, as indicated by Curve Y. The titration tests have been very valuable in securing cement-treated bases of consistently uniform quality.
REDUCING THICKNESS OF UNTREATED BASE BY USING CEMENT-TREATED BASE
In the California Method for determining the design thickness for flexible and composite type pavements, the cohesion or tensile strength of the various layers making up the structural section is evaluated. The design values are established from a large number of cohesiometer tests, correlation with test track data, and correlation with experience on highways.
The following design cohesiometer values are presently used:
Asphaltic concrete CTB Class A CTB Class B Road-mixed surfacing Soils, aggregate bases and Class C CTB
400 1, 500
750 150 100
From 01·igina l test track studies it was found that the thickness of cover is proportional to 1/.j€0J; or 1/ coh0
• 2
• It is often convenient to express the total thickness of
"
31
cover required in terms of gravel equivalent. The gravel equivalent is the thickness of gravel (sand, crushed stone or other granular material) required to protect the underlying material from a given load, and is based on an assumed cohesion value of 100 for the granular cover material.
Through design relationships and cohesiometer values, the unit thickness of CTB (5) may be determined and expressed in terms of an equivalent thickness of gravel (or -other granular material).
Therefore, the equation for unit gravel equivalent may be derived as follows:
Let Tg = thickness of gravel, Cg = cohesiometer value of gravel, Tx = thickness of other material, and Cx = cohesiometer value of other material.
Then
Tg Tx
1 ~ -1-
lfCX
.rcx Veg
If Tx = 1 in. and Cg = 100 (cohesiometer for untreated soils or gravel), then
s!CX Tg =y TOO
Application of this equation to CTB and asphaltic concrete (for comparison), gives the following unit gravel equivalents:
1. Class A CTB
Tg = {/ 1;gg = 1. 72 in. of gravel per in. of CTB
2. Class B CTB = 1. 50 in. per in. 3. Asphaltic concrete = 1. 32 in. per in.
A reduction in base thickness, from that required for untreated aggregate bases, is made when Class A or B CTB is used.
1. Class A CTB reduces the thickness of untreated base by 42 percent. 2. Class B CTB reduces the thickness of untreated base by 33 percent.
It should be pointed out that when the reduction in thickness from an untreated base layer results in a CTB thickness of less than 6 in., it is advisable, from the construction standpoint and due to variations encountered in the construction of any base, that the CTB layer be built at least 6 in. thick, and preferably not less than 8 in. when used under asphalt concrete surfacing. It was found on the test track that cementtreated bases less than 5 in. thick over a saturated subgrade are subject to early breakup if exposed to even a comparatively small number of truck repetitions.
ACKNOWLEDGI\IBNT
The writers wish to acknowledge the assistance of Daniel Howe and Masayuki Hatano in preparing this report and collecting the data presented.
REFERENCES
1. Stanton, T. E., Hveem, F. N., and Beatty, J. L., "Progress Report on California Experience with Cement Treated Bases." HRB Proc., 23:279-296 (1943).
2. Standard Specifications, State of California (Jan. 1960). 3. Hveem, F. N., "Construction Practices on Cement-Treated Subgrades for Concrete
Pavements." HRB Bull. 265, 1-7 (1960). 4. Howe, Daniel R., "A Rapid Cement Control Test for Cement Treated Bases."
Third Annual Highway Conf., College of Pacific (March 1-3, 1960).
32
5. "Soil Stabilization with Portland Cement." HRB Bull. 292, 212 pp. (1961). 6. Test Method No. Calif. 217 (Method of Test For Sand Equivalent).
Appendix A Test Method No. Calif. 312-B
January 3, 19.56 (10 pages)
State of California Department of Public Works
Division of Highways
MATERIALS AND RESEARCH DEPARTMENT
METHOD FOR DETERMINATION OF COMPRESSIVE STRENGTH OF CEMENT TREATED BASES, CLASSES "A" AND "B,"
AND CEMENT TREATED SUBGRADE
Scope This method describes the procedure for determin
ing comp1'!' sive strength as an incl<>x of the cfl'cctiveness of c ment treatmi>nt in impal'ting desirable properties to base an<l subgradr materials.
PART I. LABORATORY METHOD
Procedure
A. Apparatus 1. Drying and preheating oven thermostatically
controlled to 230 ± 10 F . 2. Drying and preheating oven thermostatically
controlled to 140 ± 5 F. 3. \Vater tank, 6 in. deep for use in submerging
test specimens. 4. Balance with capacity of 5,000 g., accurate to
1 g. 5. Balance with capacity of 500 g., accurate to
0.1 g. 6. Sample splitter, riffle type, !-in. openings. 7. Sieves, U. S. Standard sizes, 1-in., !-in., !-in.,
~-in., No. 4, square openings. 8. Pans, 10 in. diam. x 2 in. deep. 9. Pans, 6 in. diam. x 1! in . deep.
10. Metal scoop, No. 3. 11. Funnel weigh scoop and tare weight. 12. Testing machine, 50,000-lb. capacity. l:J. Water spray metering <levire with turntable,
Figure 1. 14. Mechanical mixing mal<hinr. 15. Mixing bowl and concrete "Yli1ull'r <'alls. 16. Large mixing spoon. 17. Mechanical compactor, knl'ading type (op
tional). See Method No. Calif. 901 for details. 18. Compaction aecrssori()~, haml 111Piho<l, Fig
ure 11. 19. Compaction accessories, mechanical method,
Figure V. (The accessories for the hand compaction method can also be used for the mechanical compaction method.)
20. Mechanical device for pushing samples from mold, Figure III.
21. Measuring gauge and stantl, Figure IV.
B. Test Record Form Use work card ''Laboratory Record of Cement Treatment," Form T-342, for recording test data.
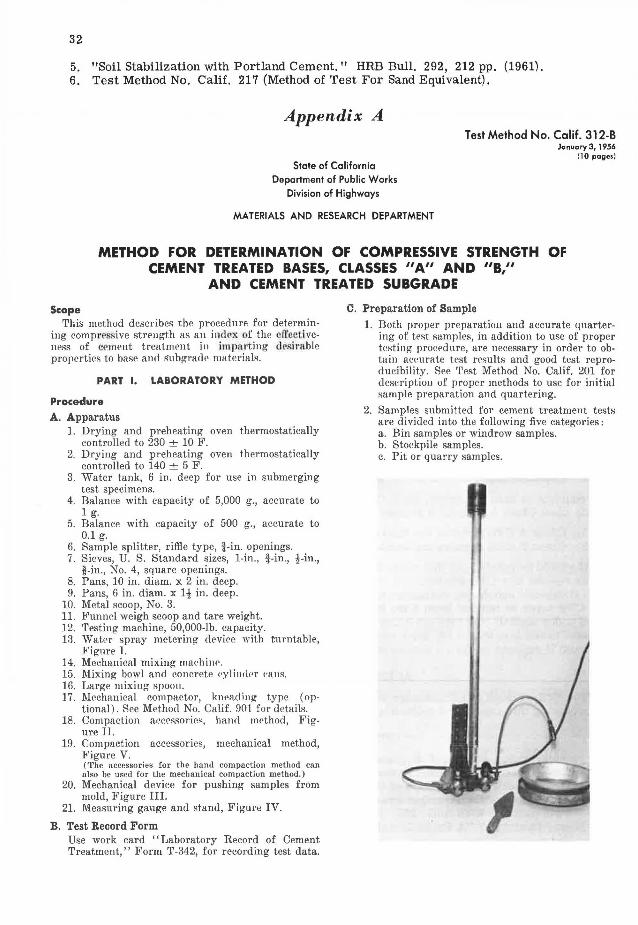
C. Preparation of Sample
1. Both proper preparation and accurate quartering of test Ramples, in addition to use of proper tr.sting procPdure, are necessary in order to obtain accurate test reRnlts and good test reproducibility. See Test Method No. Calif. 201 for descriptiou of proper methods to use for initial sample preparation and quartering.
2. Samples submitted for cement treatment tests are divided into the following five categories: a . Bin samples or windrow samples. b. Stockpile samples. c. Pit or quarry samples.
Test Method No. Calif. 312-B January 3, 1956
d. Ju-place material consisting of existing surfacing and/or base.
e. Field compacted control samples.
3. The following methods shall be used for preparation of test samples: a. Bin sa.rnples or windrow sa.rnples are not sub
jected to any further processing prior to mixing with cement. Therefore, sample preparation of these samples shall consist only of separation on the coarse aggregate sieves. Since the aggregate is to be later proportioned for mixing, it will be necessary to split each sample into the following fractions :
Passing 1-in., retained !-in. Passing !-in., retained i-in. Passing *-in., retained No. 4. Passing No. 4.
Quartering the samples for separation into smaller fractions shall be accomplished by the methods described under Test Method No. Calif. 201. Do not obtain required amounts by scooping or pouring from containers.
b. Stockpile sa.rnples shall be treated in the same manner as bin samples, provided there is to be no further processing in the field prior to addition of cement. However, if further field processing is planned, treat as described below for pit or quarry samples.
c. Pit or qua.rry sa.rnples are processed in various manners. Normally, instructions will be furnished by the sampler as to whether crushing or screening is to be employed. If crushing is to be employed, the material shall be scalped on the sieve designated as the maximum size, and the oversize crushed to pass that maximum size sieve in such a manner that when blended back with its natural component it will conform to the grading requirements for the project. Coatings shall be removed from coated coarse aggregates, and soil lumps shall be reduced to passing No: 4 sieve size. This is necessary in order that all fines be included in test specimens for determination of amount of cement required for desired compressive strength.
d. Treat the "in-pla.ce" rna.teria.ls in the same manner as a pit or quarry sample if the material does not contain bitumen, '' I'nplace '' materials containing lumps of bituminous mix shonld have the lumps reduced in size to pass a 1-in. sieve and no sieve analysis is required. Quarter out required amonnts'for test specinums from this passi ng 1-in. sieve size portion.
e. Leave field cornpacted control sarnples in the tin liner with ends sealed for a 6-day curing period from date of field compaction, then
33
remove from the liner and submerge in water for 1 day to complete the curing period.
4. Weigh representative samples of coarse and fine aggregates to 0.1 g. and heat to dryness at 230 F. to determine initial moisture in aggregate.
5. From the sieve analysis of the sample or samples, design the mix to conform to the specified grading limits by blending or adjusting if necessary. Designing to a smooth grading curve approximating the middle of a specified range is desirable but not always essential. General practice is to produce the best possible grading within the specification limits with the material on hand, but any adjustment should be such that it can be duplicated under actual field conditions. All gradings shall be washed gradings.
Whenever a larger size than 1-in. maximum is specified, the percentage of material passing the No. 4 sieve is held constant and the percentage passing the 1-in. sieve is equated to 100 percent. The intermediate sizes between the 1-in. and No. 4 are proportioned in the same ratio as the original grading.
See Method No. Calif. 905 for methods of adjusting gTadings when the ''as received'' grading is to be changed.
6. The following example illustrates a method for calculating weights of materials and moisture content for cement treated base and cement treated subgrade test specimens:
First, make an estimation of the dry weight per cubic foot for one compacted test specimen. Assume: 130 lb. per cu. ft. for trial density,
a cement content of 5 percent, 0.8 percent moisture in coarse aggregate, 1.2 percent moisture in fine aggregate and 80 g. of water added for proper consistency. From attached table of weights (Figure VI), select values opposite 130 lb. per cu. ft. and arrange as follows:
130 _________ _ _
Orama of ceme11 ~ a11d ag(Jf'egate
1,716
Grams of cement.
82
Weight of aggregate = 1,716 - 82 = 1,634 g.
Assume grading of sample as follows:
Percent pas8ing
1 in. _100 ~4in. __ 96
Percent pcuaing
Vs in. ___ __ so No. 4 _____ 60
Then from the grading analysis of the sample arrange cumulative percentages of coarse ag-
34
grcgates and percentage of fine aggregates as f ollows :
1 in. ----- - -- - --~ in ___ __ · ------% in ---------No. 4 •.• ------- -
P erce nt passing
100 96 80 60
Percent retained
0 4
20 40
Cumulative weights of aggregates, cement and moisture for one 4 in. X 4 in. compacted specimen arc as follows:
C11m11lativ<' dry wei~bts
in gram~
Ret . U in·- ··· . 04 X 1 ,634 • (i;) ReL. :YB in. ___ . 20 X 1,634 • 327
C11111ulati vc ('um11l ut ivt ~ 1:or1rr.tf'd
111 o i~ t Ul'C weights correr. ti on in ~ram~
.008 X !'Hi = I 1 66
.008 x 327 ~ 3 330
.008 x 6.54 ~ ~ 659 ReL. No. •L .... , 40 X 1,634 • 6.J4 Pa.as. No. 4 ••• L OO X I.634 • 1.634 .;+ . 012(1,634 - 654) ~ 1 7 1,6.51 Cement ____ _ l.05 X 1,634 - 1.716 17 1,733 Water • . • ..•••• 1,716 + 17 + 80 1,813
17 + 80 To tal moi8Lure in sample = --- = . 057 or 5 . 7 percen t
1,716
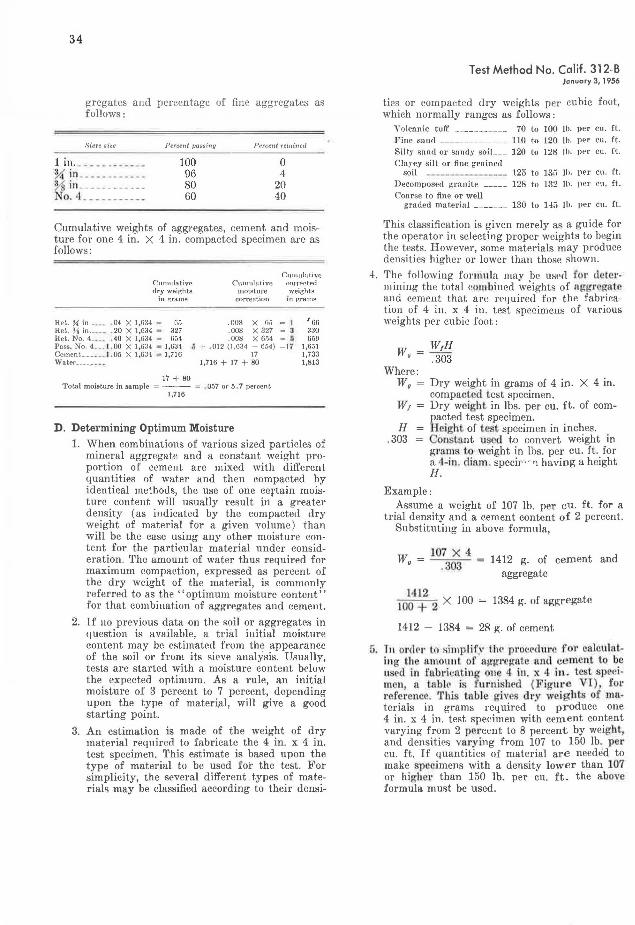
D. Determining Optimum Moisture
1. When combinations of various sized particles of mineral aggregate and a constant weight proportion of cement are mixed with different quantities of water and then compacted by identical methods, the use of one certain moisture content will usually result iii a greater density (as indicated by the compacted dry weight of material for a given volume) than will be the case using any other moisture content for the particula1· material under consideration. The amount of water thus required for maximum compaction, expressed as percent of the dry weight of the material, is commonly referred to as the ''optimum moisture content'' for that combiuation of aggregates and cement.
2. If no previous data on the soil or aggregates in question is available, a trial initial moisture content may be estimated from the appearance of the soil or from its sieve analysis. Usually, t ests are started with a moisture content below the expected optimum. As a rule, an initial moisture of 3 percent to 7 percent, depending upon the type of materi,al, will give a good starting point.
3. An estimation is made of the weight of dry material required to fabricate the 4 in. x 4 in. test specimen. This estimate is based upon the type of material to be used for the test. For simplicity, the several different types of materials may be classified according to their densi-
Test Method No. Calif. 312-B Jonuary 3, 1956
ties or compacted dry weights per cubic foot , which normally ranges as follows:
Volca nic tuft' ___________ 70 to 100 th. per cu. ft.
Fine sn nd - --- ---------- 110 to 120 Jh. per cu. ft. Sil t)· sn nd or sand)" soil. __ 120 to 128 Jh. per cu. ft. Cla.vey silt or fine grained
soil 125 to 13r. Jh. per cu. ft. Decomposed ~ranite _____ 128 to 182 Jh. per cu. ft. Course to fine or wen
gruclecl material _______ 130 to Hr. Jh. per cu. ft.
This classification is given merely as a guide for the operator in selecting proper weights to begin the tests. However, some materials may produce densities higher or lower than those shown.
4. The following formula may be ust>d i'or dctcrmining the total eornbined w~ights of ag 'l'cj?atc and cement that are required for the fabrication of 4 in. x 4 in. test specimens of various weights per cubic foot:
H .303
Dry weight in grams of 4 in . X 4 in. compacted test specimen. Dry weight in lbs. per cu. ft . of compacted test specimen. H ight of t t. specimen in inches. Con tant u d to convert weight in grllm: to weight in lbs. per cu. ft . for a 4-in. diam. specip-· " ri having a height H.
Example: Assume a weight of 107 lb. per cu. ft. for a
trial density and a cement content of 2 percent. Substituting in above formula,
w = 107 x 4 • . 303
1412 100 + 2 x lOO
1412 g. of cement and aggregate
1384 g. of aggregate
1412 - 1384 = 28 g. of cement
li. Tu orcl <' r to simplify t h<' pro ·~durn fo1· caleulnting the nmou 11 t of a1 .. q:r1·Q;:tntc. and c ment to be us('d in !'ubricntiu 011e 4 iu. x 4 in .. lest spe ·im n, a tnbh• is furnished ( Figur VI), fo r refer uce. This tnbl gives dry weights of materials in grams required to produce one 4 in. x 4 in. test specimen with cement content varying from 2 p rcent to 8 percent by weight, and densities vary ing from 107 to 150 lb. p r cu. ft . If quantities of material are needed to make specimens with a density lower than 107 or highcl' than 150 lb. per cu. ft. the above formula must be used.
Test Method No. Calif. 312-B January 3, 1956
6. For the trie.l or pilot specimen, e.dd water to the mixture in small increments up to a point where visual inspection and hand squeezing of small amounts of the mixture indicate sufficient water to provide good cohesion between the cement and aggregates. For this trial mix, attempt to produce a specimen of 4.000 ± .200 in. in height where 8 to 10 g. of water are squeezed out when the specimen is compressed with the specified static load. After the trial specimen is made, it may be necessary to make adjustments both of the amount of material needed to fabricate one specimPn 4 in. high and of the proper amount of water needed to get 8 to 10 g. squeezed out.
7. In determining the optimum moisture, fabricate three test specimens with different moisture contents. For most materials the moisture increment is about 1 percent, but for absorptive materials the moisture increment may be increased to 2 percent. The ideal situation is reached when one of the specimens is at the point of saturation, another is slightly above thP point of saturation, (8 to 10 g. of water exudt>cl under the static load), and the third spt>cimen is sli:..thtl~· b<>low the saturation point.
8. The speeinwn~ fabril·att>d to determine th<' optimum moisture are cured and tested for compressive strt>n:..tt.h.
9. Highest dt>nsit~· is usually attained in cement treated bast> and ct>ment treated subgrade test specimt>ns if a small amount of water is exuded from the specimen when subjected to a static load. From the data obtained in the fabrication of the three specimens, calculate the amount of moistnrr r quir<>d to l;)I'Oduc maximum den it~·. This amount of moi turc cicprrssed as percent of the dry weight of material is known as the optimum moisture.
10. Using the data obtained from the fabrication of the optimum moisture specimens, fabricate three additional specimens in which the cement content is varied (usually 2 percent increments for cement treated bases and 1 percent increments for ccmeut treated snb rradcs) and the moisture content is held constanl at or as near the predetermined optimum moisture as possible.
11. These three additional specimens are for compressive strength determinations and are for the purpose of determining the necessary amount of cement to provide a specified or desired strength under optimum moisture conditions.
12. Fabricate any additional tPst specimens necessary for special tests such as wetting and drying, or freezing and thawing, in the same manner.
35
rn. Mix the individual test specimens in the following- manner : a. Mix together the proper proportion of aggre
~ates and cement prior to adding water. After the dry ingredients are thoroughly mixed, add the required amount of water and continue mixing imtil all of the aggreirates are coated.
b. Any mechanical mixer which will produce a homogeneous mix may be used, or the composite materials may be mixed by spoon and mixinir bowl method.
c. After mixing-, place the aggregate-cementwater mixture in a can and cover with a tight fitting lid for a period of 30 min. before compacting the individual test specimens.
·E. Compaction of the Test Specimens The following descriptions coyer two methods of compacting cement-treat d t st pccim n . Method. ''A'' covers the hand compaction procedure, and Method '' B '' covers au alternate procedure of compacting with a mechanical compactor.
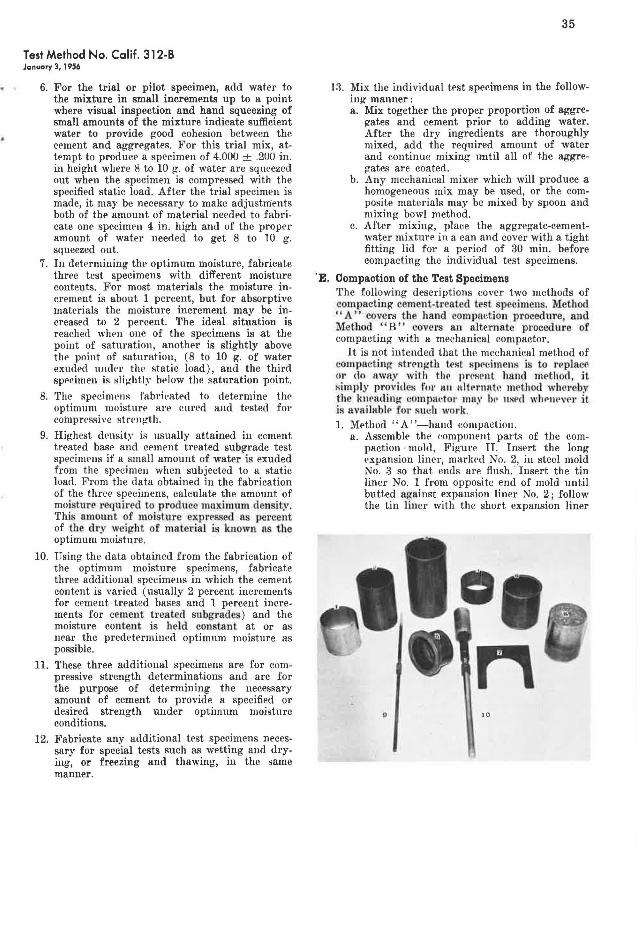
It is not intended that the mechanical method of cornpaetini:- stl'<'nirth test spl'cirnens i to replact> or do away wi1 h tlw pr('srnt hand methocl, it simply provides fol' 1111 11ltl'l'lllltr. method whereby the knrading' lmmpa\'tor ma,1· be• 11sPd wh1>11t'Yl'l' it is avnilublt> for such work. 1. Method "A "-hand compaction.
a. Assembl<> the c~ompunent parts of the compaction mold, Figure TT. Insert the long t>Xpansion liner, markt><l No. 2, in steel mold No. 3 so that ends are flush .' Insert the tin liner No. 1 from opposite end of mold until butted against expansion liner No. 2; follow the tin liner with the short expansion liner
9 10
36
No. 4, and insert bottom plunger No. 5 and extension sleeve No. 6. Insert the U-shaped spacer No. 7 between bottom of mold and bottom plunger. A set of these spacers should be available with thicknesses of -h in., ! in. and -i\J in. Use the thinner spacers when compactinl!'. granular materials, and use the thickest one when compacting plastic materials. Remove the spacer on completion of the hand compaction, and the space provided by its use results in 11 double plunger effect under the static load. Place the assembled mold on a solid foundation during compaction.
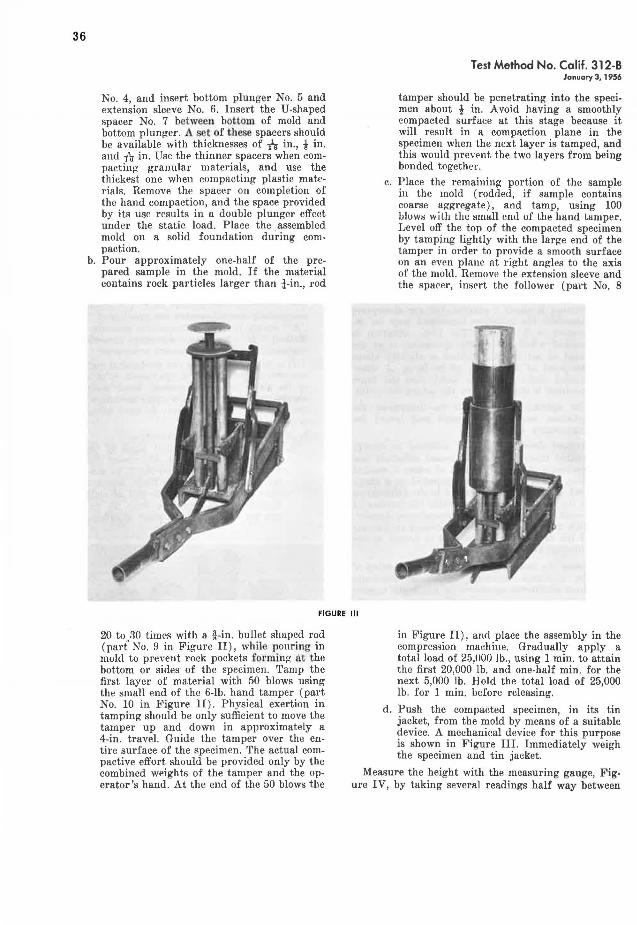
b. Pour approximately one-half of the prepared sample in the mold. If the material contains rock particles larger than i-in., rod
Test Method No. Calif. 312-B January 3, 1956
tamper should be penetrating into the specimen about ! in. Avoid having a smoothly compacted surface at this stage because it will result in a compaction plane in the specimen when the next layer is tamped, and this would prevent the two layers from being bonded together.
c. Place the remaining portion of the sample in the mold (rodded, if sample contains coarse aggregate), and tamp, using 100 liluws wiL11 Uie small end of Lhe hand Lamper. Level off the top of the compacted specimen by tamping lightly with the large end of the tamper in order to provide a smooth surface on an even plane at right angles to the axis of the mold. Remove the extension sleeve and the sparer, insrrt the follower (pa1·t No. 8
FIGURE Ill
20 to !lO timPs with a ~-in. bullet shaped rod (parf No. 9 in Figure II), while pouring in mold to prevent rock pockets forming at the bottom or sides of the specimen. Tamp the first layer of material with 50 blows using the small end of the 6-lb. hand tamper (part No. 10 in Figure II). Physical exertion in tamping should be only sufficient to move the tamper up and down in approximately a 4-in. travel. Guide the tamper over the entire surface of the specimen. The actual compactive effort should be provided only by the combined weights of the tamper and the operator's hand. At the end of the 50 blows the
in Figure II), and place the assembly in the compression machine. Gradually apply a total load of 25,000 lb., using 1 min. to attain the first 20,000 lb. and one-half min. for the next 5,000 lb. Hold the total load of 25,000 lb . for 1 min. before releasing.
d. Push the compacted specimen, in its tin jacket, from the mold by means of a suitable device. A mechanical device for this purpose is shown in Figure III. Immediately weigh the specimen and tin jacket.
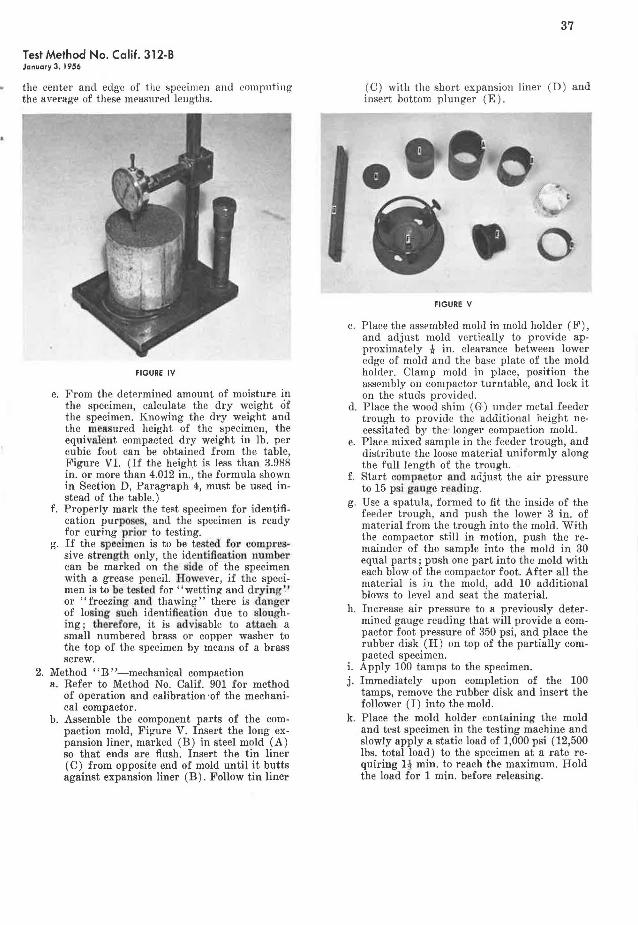
Measure the height with the measuring gauge, Figure IV, by taking several readings half way between
Test Method No. Calif. 312-B January 3, 1956
the center and edge of the specimen and eomputing the average of these measured lengths.
FIGURE IV
e. From the determined amount of moisture in the specimen, calculate the dry weight of the specimen. Knowing the dry weight and the measured height of the specimen, the equil•aleut compacted dry weight in lb. per cubic foot can be obtained from the table, Figure VI. (If the height is less than 3.988 in. or more than 4.012 in., the formula shown in Section D, Paragraph 4, must be used instead of the table.)
f. Properly mark the test specimen for identification purpo~es, and the specimen is ready for curing prior to testing.
g. If the specimen is to be tested for compressive strength only, the identification number can be marked on the sicle of the specimen with a grease pencil. How ver, if the specimen is to be tested for "wetting and dl'yiug'.' or "freezing and thawing" there is d'anger of losing suoh identification due to sloughing; tJterefor , it is advisable to attach a small numbered brass or copper washer to the top of the specimen by means of a brass screw.
2. Method "B"-mechanical compaction a. Refer to Method No. Calif. 901 for method
of operation and calibration •of the mechanical compactor.
b. Assemble the component parts of the compaction mold, Figure V. Insert the long expansion liner, marked ( B) in steel mold (A) so that ends are flush. Insert the tin liner (C) from opposite end of mold until it butts against expansion liner ( B) . Follow tin liner
37
(C) with the short expansion liner (D) and insert bottom plunger (E).
e
FIGURE V
c. Place the assembled mold in mold holder (F), and adjust mold vertically to provide approximately k in. clearance between lower edge of mold and the base plate of the mold holder. Clamp mold in place, position the assPmbly on compactor turntable, and lock it on the studs provideLl.
<l. Place the woo<l shim ( G) under metal feeder trough to provide the additional height necessitated by the longer compaction mold.
e. Place mixed sample in the feeder trough, and distribute the loose material uniformly along the full length of the trough.
f. Start compactor and adjust the air pressure to 15 psi gl)uge reading.
g. Use a spatula, formed to fit the inside of the feeder trough, and push the lower 3 in. of material from the trough into the mold. With the compactor still in motion, push the remainder of the sample into the mold in 30 equal parts; push one part into the mold with each blow of the compactor foot. After all the material is in the mold, add 10 additional blows to level and seat the material.
h. Increase air pressure to a previously determined gauge reading that will provide a compactor foot pressure of 350 psi, and place the rubber disk (H) on top of the partially compacted specimen.
i. Apply 100 tamps to the specimen. j. Immediately upon completion of the 100
tamps, remove the rubber disk and insert the follower (I) into the mold.
k. Place the mold holder containing the mold and test specimen in the testing machine and slowly apply a static load of 1,000 psi (12,500 lbs. total load) to the specimen at a rate requiring 1-! min. to reach the maximum. Hold the load for 1 min. before releasing.
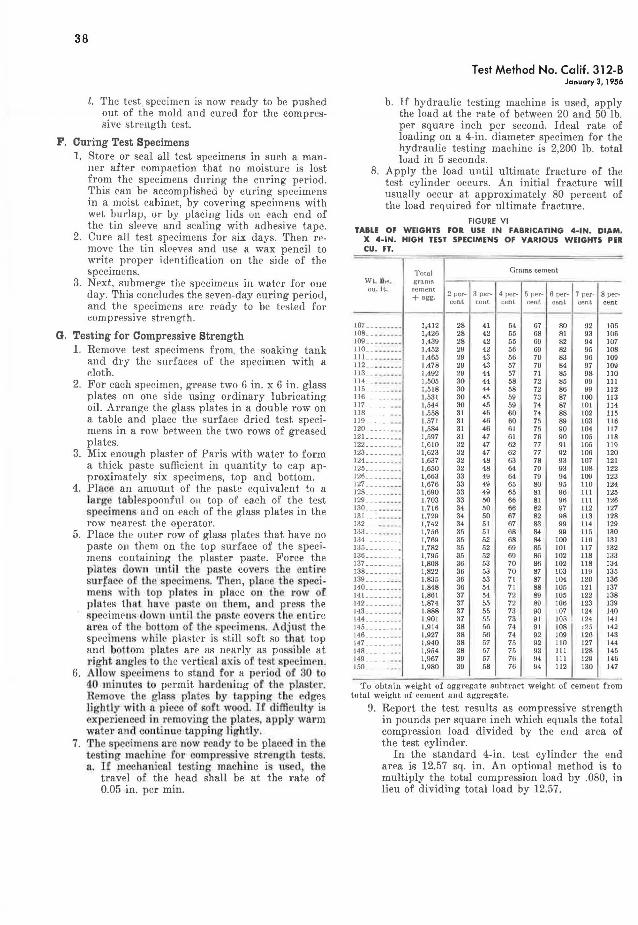
38
l. The test. specimf'n is now ready to be pushed out of the mold and cured for the compressive strength t est.
F. Curing Test Specimens 1. Store or seal all test specimens in such a man
ner after compaction that no moisture is lost from the specimens during the curing pniod. This ran be accomplished by curing specimens in a moist cabinet, by covering specimens with wet Luriaµ, ur Ly plaeiug lids on each end of the tin sleeve and sealing with adhesive tape.
2. Cure all test specimens for six days. Then remove the tin sleeves and use a wax pencil to write proper identifieation on the side of the specimens.
3. Next, submergP th e speeime1rn in water for one day. This concludes the seven-day curing period, and the speeimens are ready to be tested for compressive strength.
G. Testing for Compressive Strength 1. Remove test specimens from. the soaking tank
and dry the surfaces of the specimen with a cloth.
2. For each specimen, grease two 6 in. x 6 in. glass plates on one side using ordinary lubricating oil. Arrange the glass plates in a double row on a table and place the surface dried test specimens in a row between the two rows of greased plates.
3. Mix enough plaster of Paris with water to form a thick paste sufficient in quantity to cap approximately six specimens, top and bottom.
4. Place an amount of the paste equivalent to a large tablespoonful on top of each of the test sp cimrn. and on each of the glass plates in the row nearest the operator.
5. Place the outer row of glass plates that have no paste on them on the top surface of the specimens containing the plaster paste. Force the plat <!s clowu until the past covers the !mtir smface of the pccimens. Then, place the specimens w.ilh top p latPs in p l11ce on th row of plates that hnve paste OH them, nncl press the specimens clown unUl the pnste •ovt>r. tht> entire area of the bottom of the .·pl' ·imeus. Adjust the specimens whilt> plaster is still soft so that top and bottom pla es are as nearly as pos.<>ible at right angles to the verti ·nl axis o tcsl specinlf'n.
6. Allow speeimens to stand fo r a period of 30 to 40 minutes to permit hardenfog of th plaster. R mov th gin~ plnt1>s by Lapping t he clges lightly with a piece of soft wood. Tf diffi ult.y is experienced in removing Lhe plates, apply warm water and contbmc tapping ligl1tl.y.
7. The. pecimens arc now l'e11dy to be placed in the testing maehi11 for ompre: ·ive stre.ngt.h tests. a. If mechan.ical testing machine i used, th
travel of the head shall be at the rate of 0.05 in. per min.
Test Method No. Calif. 312-B January 3, 1956
b. If hydraulic testing machine is used, apply the load at the rate of between 20 and 50 lb. per square inch per second. Ideal rate of loading on a 4-in. diameter specimen for the hydraulic testing machine is 2,200 lb. total load in 5 seconds.
8. Apply the load until ultimate fracture of the test cylinder occurs. An initial fracture will usually occur at approximately 80 percent of the load required for ultimate fracture.
FIGURE VI TABLE OF WEIGHTS FOR USE IN FABRICATING 4-IN. DIAM.
X 4-IN. HIGH TEST SPECIMENS OF VARIOUS WEIGHTS PER CU. FT.
Total Grams cement
Wt. ll1A ~ gramA cu. It. cement
2 per- 3 per- 4 per- 5 per- 6 per- 7 per- 8 per-+ e.gg, cent cent ce nt cent cent cent cent
------------- -!07- _____ ... 1,412 28 41 54 67 80 92 !05 !08 __ __ ., ___
1,426 28 42 55 68 81 93 106 109 __ _____ _ 1,439 28 42 55 69 82 94 107 110 ___ __ ____ 1,452 29 42 56 69 82 95 108
llL ___ . • ., 1,465 29 43 56 70 83 96 109 112 __ _ · ···-- 1,478 29 43 57 70 84 97 109 113 __ ___ _ .,
1,492 29 44 57 71 85 98 110 114 .. ....... J ,505 30 44 58 72 85 99 111 115 ___ __ ____ 1,518 30 44 58 72 86 99 112 116 __ _ _ ., ___ 1,531 30 45 59 73 87 100 113 111 __ _ __ __ __
1,544 30 45 59 74 87 IOI 114 118 ___ ______ 1,558 31 45 60 74 88 102 !15 119 __ ___ ___ 1,571 31 46 60 75 89 103 116
120_ -- - ----- 1,584 31 46 61 75 90 104 117 121- ..... .. . l,597 31 47 61 76 90 105 118 122 ______ ___ l,610 32 47 62 77 91 105 110 123 ______ ___ 1,623 32 47 62 77 92 106 120 124_ ____ ____
1,637 32 48 63 78 93 107 121 125 __ ______ _ 1,650 32 48 64 79 93 108 122 126 ___ ___ ___
1,663 33 49 64 79 94 109 123 127 ______ ___ l,676 33 49 65 80 95 110 124 128 ______ ___ l,690 33 49 65 81 96 Ill 125 129 ___ ___ ___
J,703 33 50 66 81 96 Ill 126 130 ... ...... 1,716 34 50 66 82 97 112 127 131- . ....... 1,729 34 50 67 82 98 113 128 132 ___ ____ ., 1,742 34 51 67 83 99 114 129 133 ... . ..... l,756 35 51 68 84 99 115 130 134_ ___ ., ___ 1,769 35 52 68 84 100 11 6 131 135 ___ ___ __ • 1,782 35 52 69 85 IOI 117 132 136 __ __ _ ., __ 1,795 35 52 69 86 102 118 133 137_ ________
1,808 36 53 70 86 102 118 134 138 ____ ., ___ 1,822 36 53 70 87 103 119 135 139 __ __ .. ___ 1,835 36 53 71 87 104 120 136 J40 __ __ .. __ _ 1,848 36 54 71 88 105 121 137 141_ ___ _____ 1,861 37 54 72 89 105 122 138 142 __ - - -· . l,874 37 55 72 89 106 123 139 143 ____ ., __ , l,888 37 55 73 90 107 124 140 144 ... ...... l,901 37 fi5 73 91 108 124 141 145_ - - -- --·· 1,914 38 56 74 91 108 >25 142 146 ____ ., ___ 1,927 38 56 74 92 109 126 143 147_ __ _ ., ___ 1,940 38 57 75 92 110 127 144 148 ... .. .... 1,954 38 57 75 93 Ill 128 145 149 ___ ______ 1,967 39 57 76 94 Ill 129 146 150 __ ___ .... 1,980 39 58 76 94 112 130 147
To obtnin weight of aggreg-ute suhtrnct we1ght of cement from total weight of cement and aggregate.
9. Report the test results as compressive strength in pounds per square inch which equals the total compression load divided by the end area of the test cylinder.
In the standard 4-in. test cylinder the end area is 12.57 sq. in. An optional method is to multiply the total compression load by .080, in lieu of dividing total load by 12.57.
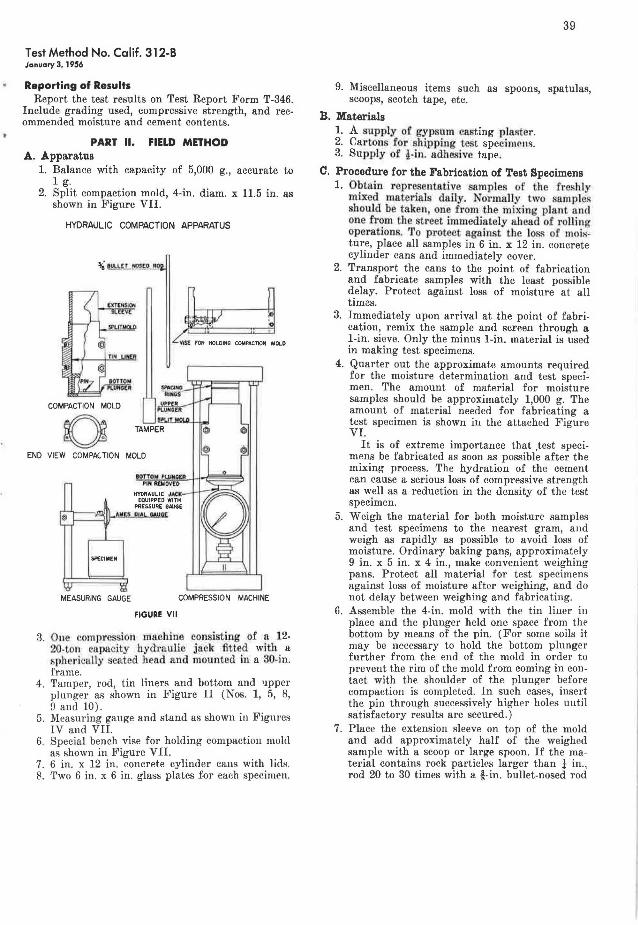
Test Method No. Calif. 312-8 January 3, 1956
Reporting of Results Report the test results on Test Report Form T-346.
Include grading used, compressive strength, and recommended moisture and cement contents.
PART II. FIELD METHOD A. Apparatus
1. Balance with capacity of 5,000 g., accurate to 1 g.
2. Split compaction mold, 4-in. diam. x 11.5 in. as shown in Figure VII.
HYDRAULIC COMPACTION APPARATUS
\' Ul.U: I ..,.£0 RO
COMPACTION MOLD
0 END VIEW COMPACTION
MEASURING GAUGE COMPRESSION MACHINE
FIGURE VII
3. ne eom·pression mnch1ne consisting of a 12-20-ton capacity hyd'raulie jack fitted with a sphcricully seated head and mounted in a 30-in. frame.
4. Tamper, rod, tin liners and bottom and upper plunger as shown in Figure II (Nos. 1, 5, 8, 9 and 10) .
5. Measuring gauge and stand as shown in Fignres IV and VII.
6. Special bench vise for holding compaction mold as shown in Figure VII.
7. 6 in. x 12 in. concrete cylinder cans with lick 8. Two 6 in. x 6 in. glass plates for each specimen.
39
9. Miscellaneous items such as spoons, spatulas, scoops, scotch tape, etc.
B. Materials 1. A supply of gypsum casting plaster. 2. Cartons for shipping test specim(' 11s. 3. Supply of ~-in. adhesive tape.
C. Procedure for the Fabrication of Test Specimens 1. Obtain representative samples of the fre.qhJy
mixed materials daily. Normally two samples bou1d be taken, one from the mixing plant and
one from the treet immediately ahead of rolling operations. To protect ago.inst the loss of nioixture, place all samples in 6 in. x 12 in. concrete cylinder cans and immediately cover.
2. Transport the cans to the point of fabrication and fabricate samples with the least possible delay. Protect against loss of moisture at all times.
3. Immediately upon arrival at the point of fabrication, remix the sample and screen through a 1-in. sieve. Only the minus 1-in. material is used in making test specimens.
4. Quarter out the approximate amounts required for the moisture determination and test specimen. The amount of material for moisture samples should be approximately 1,000 g. The amount of material needed for fabricating a test specimen is shown in the attached Figure VI.
It is of extreme importance that .test specimens be fabricated as soon as possible after the mixing process. The hydration of the cement can cause a serious loss of compressive strength as well as a reduction in the density of the test specimen.
5. Weigh the material for both moisture samples and test specimens to the nearest gram, and weigh as rapidly as possible to avoid loss of moisture. Ordinary baking pans, approximately 9 in. x 5 in. x 4 in., make convenient weighing pans. Protect all material for test specimens against loss of moisture after weighing, and do not delay between weighing and fabricating.
6. Assemble the 4-in. mold with the tin liner in place and the plunger held one space from the bottom by means of the pin. (For some soils it may be necessary to hold the bottom plunger further from the end of the mold in order to prevent the rim of the mold from coming in contact with the shoulder of the plunger before compaction is completed. In such cases, insert the pin through successively higher holes until satisfactory results are secured .)
7. Place the extension sleeve on top of the mold and add approximately half of the weighed sample with a scoop or large spoon. If the material contains rock particles larger than t in., rod 20 to 30 times with a i-in. bullet-nosed rod
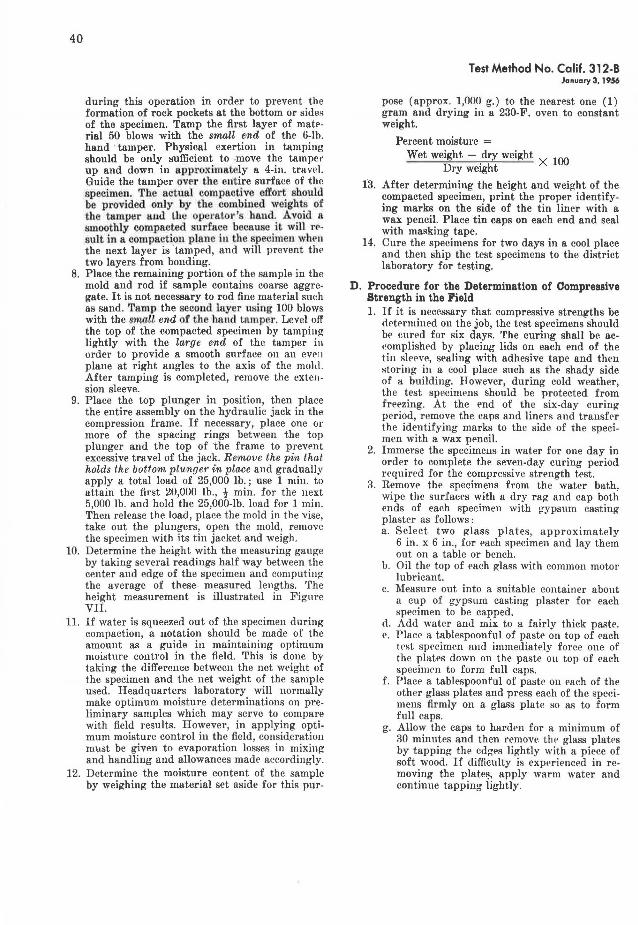
40
during this operation in order to prevent . the formation of rock pockets at the bottom or sides of the specimen. Tamp the first layer of material 50 blows with the small end of the 6-lh. hand tamper. Physical exertion in tamping should be only sufficient to .move the tamper up and down in approximately a 4-in. travel. Guide the tamper over the entire surface of the specin1en. The actual compacti~e etfor~ should be provided only by the com
1bwed weigh~ of
the tamper Buel lh11 operatol' s baud .. Av.01d a ·moothly compacted s11rfnce because 1t Will r<'sult ill a compaction plane iu the specimen when the next layer is 'tamped, and will prevent the two layers from bonding.
8. Place the remaining portion of the sample in the mold and rod if sample contains coarse aggregate. It is not necessary to rod fine material such as sand. Tamp the second layer m1ing 100 blows with the sm'1ll end of the baud tnmpe1·. Level off the top of the compacted specimen by tampi11glightly with the large end of the tamper in order to provide a smooth surface on an eve11 plane at right angles to the axis of the mohl. After tamping is completed, remove the extension sleeve.
9. Place the top plunger in position, then place the entire assembly on the hydraulic jack in the compression frame. If necessary, place one or more of the spacing rings between the top plunger and the top ?f the frame to p_revent excessive travel of the Jack. Remove the pm that holds the bottom plunger in place and gradually apply a total load of 25,000 lb.; use 1 min. to attain the first 20,000 lb., ! min. for the next 5 000 lb. and hold the 25,000-lb. load for 1 min. Then release the load, place the mold in the vise, take out the plungers, open the mold, remove the specimen with its tin jacket and weigh.
10. Determine the height with the measuring gauge by taking several readings half way between the center and edge of the specimen and computing the average of these . measured lengths. The height measurement is illustrated in Figure VII.
11. If water is squeezed out of the specimen during compaction, a notation should be made of the amount as a guide in maintaining optimum moisture control in the field. This is done by taking the difference between the net weight of the specimen and the net weight of the sample used. Headquarters laboratory will normally make optimum moisture determinations on preliminary samples which may serve to compare with field results. However, in applying optimum moisture control in the field, consideration must be given to evaporation losses in mixing and handling and allowances made accordingly.
12. Determine the moisture content of the sample by weighing the material set aside for this pur-
Test Method No. Calif. 312-8 January 3, 1956
pose (approx. 1,000 g.) to the nearest one (1) gram and drying in a 230-F. oven to constant weight.
Percent moisture = Wet weight - dry weight X
100 Dry weight
13. After determining the height and weight of the compacted specimen, print the proper identifying marks on the side of the tin liner with a wax pencil. Place tin caps on each end and seal with masking tape.
14. Cure the specimens for two days in a cool place and then ship the test specimens to the district laboratory for testing.
D. Procedure for the Determination of Compressive Strength in the Field 1. If it is necessary that compressive strengths be
dC'termined on the job, the test specimens should bi- Nired for six days. The curing shall be ac<!omplishPd by placing lids on each end of the tin slPPve., SPaling with adhesive tape and then storing in a cool place such as the shady side of a building. However, during cold weather, the test specimens should be protected from frePzing. At the end of the six-day curing period, remove the caps and liners and transfpr the identifying marks to the side of the specimen with a wax pencil.
2. Immerse the specimens in water for one day in order to complete the seven-day curing period required for the compressive strength test.
8. Remove the specimens from the water bath, wipe the surfaces with a dry rag and cap both ends of each specimen with l!YPSUm casting plaster as follows: a. Select two glass plates, approximately
6 in. x 6 in., for each specimen and lay them out on a table or bench.
b. Oil the top of each glass with common motor lubricant.
c. Measure out into a suitable container about a cup of gypsum casting plaster for each specimen to be capped.
d. Add water and mix to a fairly thick paste. e. Place a tablespoonful of paste on top of each
trst specimen and immediately force one of the plates down on the paste ou top of each specimen to form full caps.
f. Place a tablespoonful of past!' on each of the other glass plates and press each of the specimens firmly on a glass plate so as to form full caps.
g. Allow the caps to harden for a minimum of 30 minutes and then remove thP glass plates by tapping the edges lightly with a piece of soft wood. If difficulty is expPrienced in removing the plate~, apply warm water and continue tapping lightly.
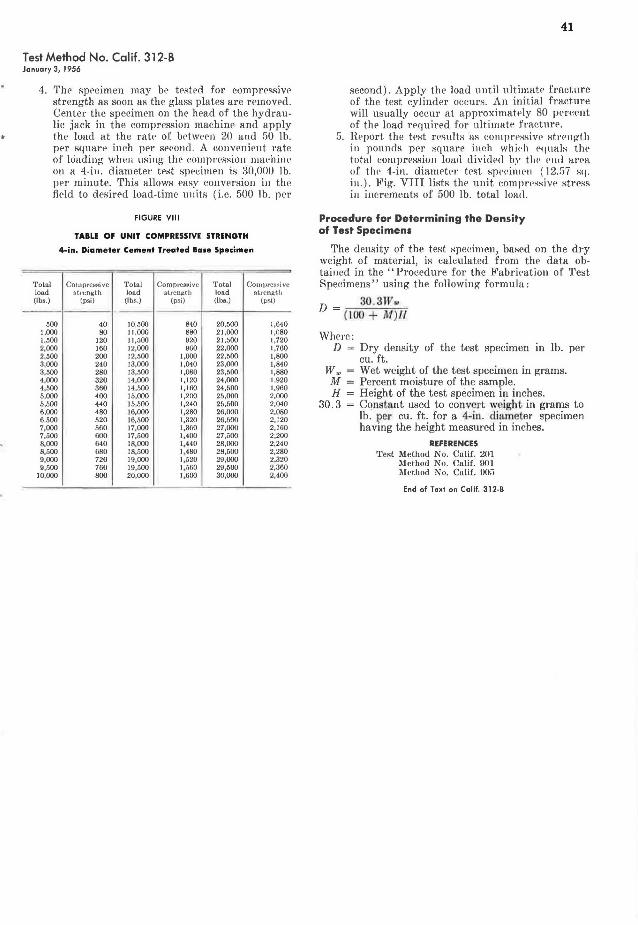
Test Method No. Calif. 312-B January 3, 1956
4. 'l'he specimen may be tested for comprPRRivr strength as soon as the glass plates are removed. Center the specimen on the head of the hydraulic jack in the compression machine and apply the load at t.he rate of betwi>Pn 20 and 50 lb. ppr squarP ineh per seC'ond. A eonveniP11t rate of loading wheu using the (•.ornpr<•ssion ma<·hilll' on a 4-in. diameter test sp1•eimen is 80,000 lb. per minute. 'fhis allows Pasy eonve.rsion in the field to desirt'd load-time 1111its (i.e. 500 lb. per
FIGURE VIII
TABLE OF UNIT COMPRESSIVE STRENGTH
4-in. Diameter Cement Treated Base Specimen
Tot.al Coinpresl'ive Total Compre!'l~ive Tot.al Compr~s~ivc lolld strength load sl.ren,1!.th load Rl. ren~th (Ibo.) (psi) (lbs.) (psi) (Ibo. ) (µ•i)
500 40 10,500 840 20,500 l,640 l,000 80 I 1,000 880 21,000 l,G80 1,500 120 JJ,GOO 920 21,500 1,720 2,000 160 12,000 900 22,000 1,700 2,500 200 12,500 1.000 22,500 1,800 3,000 240 13,000 l,040 23,000 1,840 3,500 280 13,500 1,080 23,500 1,880 4,000 320 14,000 1,120 24,000 1,920 4,500 360 14,500 1,160 24,500 1,960 6,000 400 15,000 1,200 25,000 2,000 b,LJOO 440 15,500 1,240 25,500 2,040 6,000 480 16,000 1.280 26,000 2,080 6,500 520 16,500 1,320 26,500 2,120 7,000 560 17,000 l,3fi0 27,000 2,160 7,500 600 17,500 1,400 27,500 2 ,200 8,000 640 18,000 1,440 28,000 2,240 8,500 680 18,500 1.480 28,500 2,280 9,000 720 19,000 J,520 29,000 2,320 9,500 760 19,500 l ,MSO 29,500 2,360
10,000 BOO 20,000 1,600 30,000 2,400
41
second). Apply the load until ultimate fracture of the test cylinder occurs. An initial fracture will usually occur at approximatt>ly 80 pereent of th<' load rPquired for ultimatP fraetnre.
5. Heport the tPst rrsnlts as e0111prPssivP st1·p11gt.h in pounds ppr square iueh whil·h Pqnals thi> total comprrHsio11 loa1l divided b~· th<' Plld ar<'a of thP 4-in. diamett>r trst spPl,iHH'll ( 12.57 Hq. i11.) . 1<,ig. VIII lists the unit compr1•ssivP stress in iucrement.s of 500 lb. total loa11.
Procedure for Determining the Density of Test Specimens
The density of the test specimen, bas<>d on the dry weight of material, is calculated from the data obtained in the "Procedure for the Fabri«ation of Test Specimens" using the following formula :
D = 30 .3W1• ( l.00 + M) ll
Wh<>rc: D = Dry density of the test specimen m lb. per
cu. ft. Ww
M H
30.3
Wet weight of the test specimen in grams. Percent moisture of the sample. Height of the test specimen in inches. Cqustant used to convert we-Jght in grams to lb. per cu. ft. for a 4-in. d iameter specimen having the height measured in inches.
REFERENCES Test Method No. Cnlif. 201
Method No . Calif. 901 l\Iethod No. Cnlif. OO:i
End of Text on Calif. 312-B
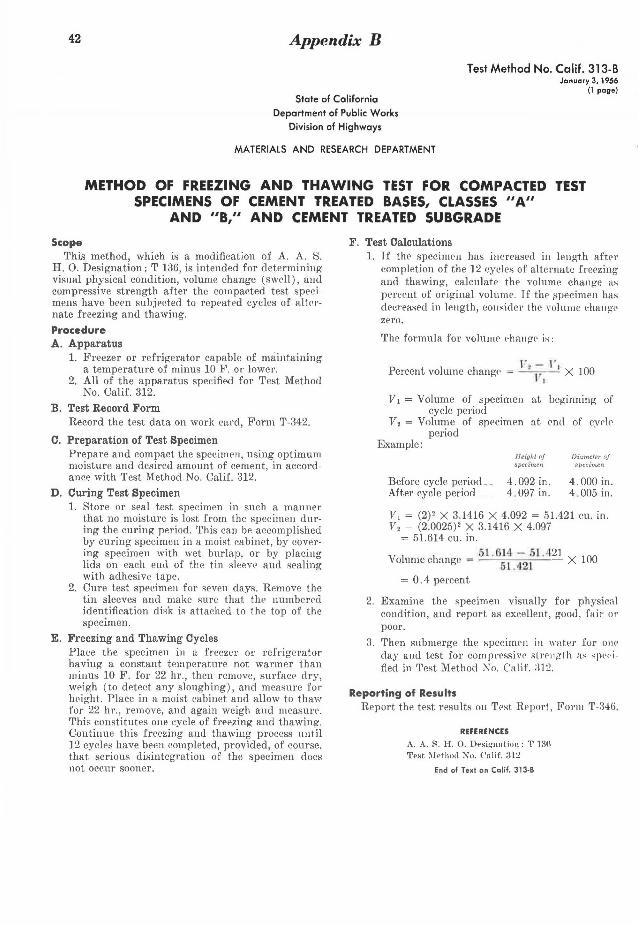
42 Appendix B
Test Method No. Calif. 313-B January 3, 1956
(l page) State of California
Department of Public Works
Division of Highways
MATERIALS AND RESEARCH DEPARTMENT
METHOD OF FREEZING AND THAWING TEST FOR COMPACTED TEST SPECIMENS OF CEMENT TREATED BASES, CLASSES "A"
AND "B," AND CEMENT TREATED SUBGRADE
Scope This method, which is a modification of A. A. S.
H. 0. Designation: T 136, is intended for determining visual physical condition, volume change (swell), and compressive strength after the compacted test specimens have been subjected to repeated cycles of alternate freezing and thawing.
Procedure A. Apparatus
1. Freezer or refrigerator capable of maintaining a temperature of minus 10 F. or lower.
2. All of the apparatus specifiocl for Test Method No. Calif. 312.
B. Test Record Form Record the t est data on work eard, Form T-342.
C. Preparation of Test Specimen Prepare and compact the speciuwn, using optimum moisture and desired amount of cement, in accordance with Test Method No. Calif. 312.
D. Curing Test Specimen 1. Store or seal test specimen in such a manner
that no moisture is lost from the specimen during the curing period. This can be accomplished by curing specimen in a moist cabinet, by covering specimen with wet burlap, or by placing lids on each end of the tin sleeve and sealing with adhesive tape.
2. Cure test specimen for seven days. Remove the tin sleeves and make sure that the numbered identification disk is attached to the top of the specimen.
E. Freezing and Thawing Cycles Place the specimen in a freezer or refrigerator having a constant temperature not warmer than minus 10 F. for 22 hr., then remove, surface dry, weigh (to detect any sloughing), and measure for height. Place in a moist cabinet and allow to thaw for 22 hr., remove, and again weigh and measure. This constitutes one cycle of freezing and thawing. Continue this freezing and thawing process until 12 cycle~ have been completed, provided, of course, that seriou~ disintegration of the specimen doe~ not oceur sooner.
F. Test Calculations 1. If the specimen has increased in leugth after
completion of the 12 cycles of alternate freezing and thawing, calculatP the volume chang-e as perrent of original volume. Tf the i;pecimen has decreased in length, consider the volume chang·e zero.
The formula for volnnw C'lrnngr is:
T'• - 1·, Percent volume chan11:f' =
1,
1 X 100
V 1 = Volume of specimen at beginning of cycle period
V, = Volume of specimen at C'nd of cyrlr period
Example:
Before cycle period __ After cycle period __ _
//eight of specimen
4.092 in. 4 .097 in.
Diameler <>f speclmen
4.000 in. 4 005 in.
V 1 = (2) 2 X 3.1416 X 4.092 = 51.421 cu. in. v, = (2.0025) 2 x 3.1416 x 4.097
= 51.614 cu. in. 51.614 - 51.421
Volume change = 51
.'12 I X 100
= 0 .4 percent
2. Examine the specimen visually for physical condition, and report as excellent, good, fair or poor.
B. Then submerge the specimrn in water for one day and test for comprPssivP streng-th as s1w1·i fied in Test Method N'o. Calif. :n2.
Reporting of Results Report the test results Oil Test Report, Form T-:34G.
REFERENCES
A. A. R. H . 0. DeRignntion: T 13!\ Test ~l etho<l Xo. Calif. :n~
End of Text on Calif. 313-B
Appendix C 43
Test Method No. Calif. 314-B January 3, 1956
(1 page) State of California
Department of Public Works Division of Highways
MATERIALS AND RESEARCH DEPARTMENT
METHOD OF WETTING AND DRYING TEST FOR COMPACTED TEST SPECIMENS OF CEMENT TREATED BASES, CLASSES "A"
AND "B," AND CEMENT TREATED SUBGRADE
Scope This test, which is a modification of A. A. S. H. 0.
Designation: T 135, is intended for determining visual physical condition, volume change (swell), and compressive strength after the compacted test specimens have been subjected to repeated cycles of alternate wetting and drying.
Procedure
A. Apparatus All of the apparatus specified for Test Method No. Calif. 312.
B. Test Record Form Record the test data on \vork card, Form No. T-342.
C. Preparation of Test Specimen Prepare and compact the specimen, using optimum moisture and desired amount of cement, in accordance with Test Method No. Calif. 312.
D. Curing Test Specimen
1. Store or seal test specimen in such a manner that no moisture is lost from the specimen during the curing period. This can be accomplished by curing specimen in a moist cabinet, by covering specimen with wet burlap, or by placing lids on each end of the tin sleeve and sealing with adhesive tape.
2. Cure test specimen for sewn days. Remove the tin sleeves an<l make sur<' that the nmnbercd identifiration disk is attached to the top of the specimen.
E. Wetting and Drying Cycles
1. Submeqre the specimen in water for 5 hr., remove, surface dry, weigh (to detect an.\· sloughing), and measure for height. Then place in a drying oven with tt>mperature at 140 F. and leave for 42 hr., at whic·h time remove and again measure and w<'igh. a. The aboYe procedure constitutes one e.vcle of
wetting and dr~·ing; and with the time use<l in transferring, wei!!hing, and measuriuµ: adds up to a total time of approximate!~· 48 hr.
b. Continue this wetting and drying process until 12 cycles have been completed, provided of course that serious disintrgration of the specimen does not occur sooner.
F. Test Calculations 1. If the specimen has increased in length after
completion of the 12 cyeles of alternate wetting and drying, calculate t!1e volume chang as percrnt of origillal volume. If th e specime1;1 has decreased in length consider the volume change zero. The formula for volume change is:
v, - v, Percent volume change = V
1 X 100
V1 = Volume of specimen at brginning of <weir. period
V, = Volume of spC'cimen at. cnrl of <~ycle pe.riorl
Example:
Before cycle period __ After cycle period __ _
Height of specimen
4 . 092 in. 4 . 097 in.
Diameter of Bpecimen
4.000 in. 4.005 in.
l11 = (2) 2 X 3.1416 X 4.092 = 51.421 Cl!. in . v, = (2.0025)' x 3.1416 x 4.097
= 51.614 en. in.
V. I ·h _ 5l.lil4 - 51.,121 X J()O o ume c ange - Sl .421 = 0 . 4 perc('nt
2. Examine the specimen visuall~· for physical condition, an<l report as <'XC(•llent, good, fair or poor.
3. Then submerge the spedmen in water over 11ight and test for compressive strength as specified in Test Method No. Calif. 312.
Reporting of Results Report the tPst results on Test Report, Form T-H46 .
REFERENCES A . .\. 8. H . 0. l>esii:nntion: T rnii. 'l'e>t ~!Ptho<I ::\o. Culif. :n:!.
End of Text on Calif. 314-B
44
Appendix D Test Method No. Calif. 338-A January 1, 1960
(12 pages)
State of California Department of Public Works
Division of Highway•
MATERIALS AND RESEARCH DEPARTMENT
DETERMINATION OF CEMENT CONTENT IN CEMENT TREATED AGGREGATE BY THE METHOD OF TITRATION
Scope
This metliod cover,,; the procedures for determining thP percentage of Portland cement in freshly mixed t·Pment treated base on .!\ project under ·onslruction. 'l'h<> det<>rminations are based npon e.hemical titration mPthods which rPlate the cemPnt concentration of field tr('l\ l<'d samples to known solution aouc('ntrntions. Two cli lfr rc>nt titration proeednn•s are gi\'(•n; first, an acidbase titration method and seeond, a constant neutralization mPthod. Normallv the first method is used when the aggreimtes ·ao not ~eact to hydrochloric acid. This method is fast and experience indicates that it l'an be used for about ~0 7o of the aggregates in California . However, when aggregates are encountered
which react to hvdrochloric acid, the second method m nst be used. ·
'l'his test method is divided into the following parts:
General I. Method of Test by Acid-Base Titration
II. Method of Test by Constant Neutralization III. Method of l<'ield Sampling
This test method was designed for Portland cement treated aggregates, but the same procedure can also be used for determining the percentage of lime in aggreirates which have been treated with commercial hv-drated calcium lime. ·
GENERAL
The ji1'.~t thing that 111.11st be done when testing for cement content on a cement treated base project is to determine whether significant amounts of such substauces as limestone, calcite, dolomite, etc., which are subj ect to attack by hydrochloric acid, exist in the aggregate. The following procedure accomplishes this and indicates whether Part I or Part II of this Test Method shonld be nsrd for cement content determinations.
The Acitl-Base test, Part I of this 'l'est Method, is pf'rformed on duplicate aggregate blank (containing no cement) specimens using the procedures for test specimen preparation, acid digestion and titration given in section E-4 (Part I). This test is then repeated on duplicate test specimens composed of standal'd or irraded Ottawa sand. Glass beads of the type
normall~· used for highwa~· centf'rlinc stripes may be substituted if Ottawa sand is not readily available.
The appropriate test procedure for use on a project is based upon the following determination :
If either of the titration tests using aggregate blanks require an amount of sodium hydroxide which is six ( 6) mililiters (mis.) or more lower than the average of the Ottawa sand blanks, the Constant Neutralization Method, Part II, shall be used. If the difference is less than 6 ml., the Acid-Base test, Part I, should be nsed (Part II may also be nsed in this case if desired) .
It is imperative that the proper test method be selected fi1'st before proceeding with a determination of actual cement content.
PART I. METHOD OF TEST BY ACID-BASE TITRATION
Scope Procedure
'l'his method describes a procedure for cement content determination based upon the neutralization of thP cemPnt with an excess of hydrochloric acid. The l'esidual excess acid. as measured by back titration with an alkali, is inversely proportional to the cement content of thP treated base sample. This test procedure eannot be used if acid active aggreirates, as indicated at the start of this Test Method under "General", are 11sPtl in the cement treate<l material.
A. Apparatus 1. 1-100 ml. titrating burette 2. 1-100 ml. pipette 3. 1-Burette stand and buret.te clamp 4. 4-200 ml. volumetric flasks ;i . 8-250 ml. Erlenmeyer flasks 6. 8-plastic beakers approximately 500 mis. min.
capacity 7. Glass (or plastic) dropping bottle
Test Method No. Calif. 338-A January 1, 1960
~. R-2 quart widt•-lllonth pol,n•th~·lene l'Olltainers !I. :i-:1 g-al. plastic "earhu_,·s" rquippNl with si
phons, nroprrne or t~·gun tubing. hose elamps rte., for !'.ontaininµ· working solutions of acid, base and water ( tlo not substitute g-lass conta iners for th e plastic rarboys).
10. 8-Stainlt>Ss sh•(•] stirri nir rods 11. % inch sieve, 12" Dia. 12. 1% inch sieve, 12" Dia. 1:1. Ohaus balance (or t>qnal), 5 Kµ-. t•apacit~·, irrad
uated to 1 g rnm 14. Torsion balance, 500 gm. c11pal'it~·, graduated to
0..1 gram 1.1. 'l'imrr
B. Reagents and Materials 1. llyrlroc:h/oric oci<I (approx. :rn)
Pour the contents of two fnll standard 6 lb. bOttlNi of ·oncentrllf P<l h\'clro1:hlori • acid C. P . (!)l'rvice & ~upply sto •k No. 69010.81 ) into one of the 5 ira l. plastic ca rboys. Add tnp wat r. r in approximntl'ly 0111' gallon increments 1111til 5 gal. of .·olution is obtninecl. Aftr.r a.ch addition of water shake the carbo~· vil{Orously for about one mi11ute to obtain a homoµ'eneous mixture.
2. Sorlium lfyflro:r:idc (approx. IN) 1:sc the followi11g procedurt> for milking 5 gallons of olulion ,
11. Hsi11g- a second plastic carbor. dissolve 800 ;..>'l·mn. of sodium hydroxide pl'llets ( erviee and S11ppl,v sto •k No. 60010.83) in about one gallon of hot tap wnt r ut a temperature of approxhnntrly llO F. ('!'his can br judged a b in1? nbout as hot as n prrson 's hand ean stand.)
b. Stopper nntl shake the carboy vigorously for about one minute.
c. Co11tinne adding tap water in one gallon 11monnts ancl shake after each addition until ;; :,?allons of solutio11 i8 attained. After the first :wllon of water is 1\llcled, succes;sively r1•dn '<' the tl'lllPl'l'Rhtrc> of each sub. equent iut·rNnl'll1 uutil lhP hist gallon i · add cl at the temperature of the cold tap.
d. Cool to room t emperatn1·<', then rxamine the solutio1i fo1· suspC'nded m11ttr1· b~· looking 1lown Un·ouA"h the n<> •k Opl'ning: of the carboy while• u ·ing- 11 flashlight around the outsicl<> oE the bottom for illumination. The solution 11111st be clear for nse. Experience indi,•atrs that when suspended matter in the form of a prt'i: ipit11tP is present it is nsu111ly the rt'stilt of either insufficient heat in the mixing wa lt•r v1· i11s11fficie11t R;!itatiou. Di i;Ol\'illl? the objeciio1111bl • precipilnte rrquin•s rt'htuiting th1• !i µ:ullonis of so.lntion. Since• this is normally impradic•al. it is bt•ltH to <liscard it ancl mix a new solution.
45
Kon:: The operator(s) mixing the acid and base solutions are requirerl, for safety, to wear chemical protective glows, goirgles, and apron:. lJo not nse compressed air to aµ-itate the solutions in the carbo~·s.
3. l'hcnolphtl111lein indicator solntion (1 % solu-tion)
Dissolve 5 grams of phl'nolphthalein powder 1 U3 .P. in 250 mls. of ethanol. Dilnte with 250 mis. of distilled wat r (~ervi(~e & , upply stock No. 69010.85 for preparf'1l l ?'< solution ) .
4. Ottawa sand (Standard or Graded) . Glass beads of the type normally used for highway centerline stripes ma~- be substituted if Ottawa sand is not readily a\'ailable.
C. Test Record Form llse work card '' Field-Laboratorv Record of Titrntion Tests ", Form 'l'-3040, · for recording project, calibrntiou , and field tt>st c\ala ( ce Fig-111'4' TI ) . ( SPrvic & • nppl~· Stock No. 12!l5a.40)
D. Titration of Field Samples 1. Determine whether the agg-reirate rea •t' with
acid, as described at the beginning of this Test 1\1.rthod under '' G!.'neral ''. If the agg-r gate does not react with acid, proceed with I.his method.
2. 8t>t•nre from one to eight field samples of cement trl'ated aggregate by means of the procedure spN:ificd in Part III. Euch fil'ld sample should weigh at least three kilograms.
3. Prepare from one. to eight 300 gram specimens as follows:
a. Determine total weight of each field sample to nearest 5 grams.
b. Remove and waste an~· airgregate retained on the 1 % inch sieve.
c. Separate sample on the o/s inch sieve and cl •te1·minc the proportion passing the o/s inch sieve 0 11 the basis of total sample weight including retained llh inch material.
d. n ecombin th retained and pas.<>ing o/s inch portion for the :mo grnm lest specimens in 1J1eir •'As received'' proportions, place each specimen in a separate two quart p lastic eontai11er, a nd line t.he contain r up along thr front of the work bench .
" · Tn field testing operations there is a lapse of time between the· mixing of the cement treated base and the final preparation of the 300 grnm test specimf'ns. This is the time required to obtain a ..ampll', transport it to the test'illg k1c11tion nnd prepare the 300 gram tt>st pecim us. ince thti cement is h~·drating 1l11ri11g this period some chan(?l'S will ocem·
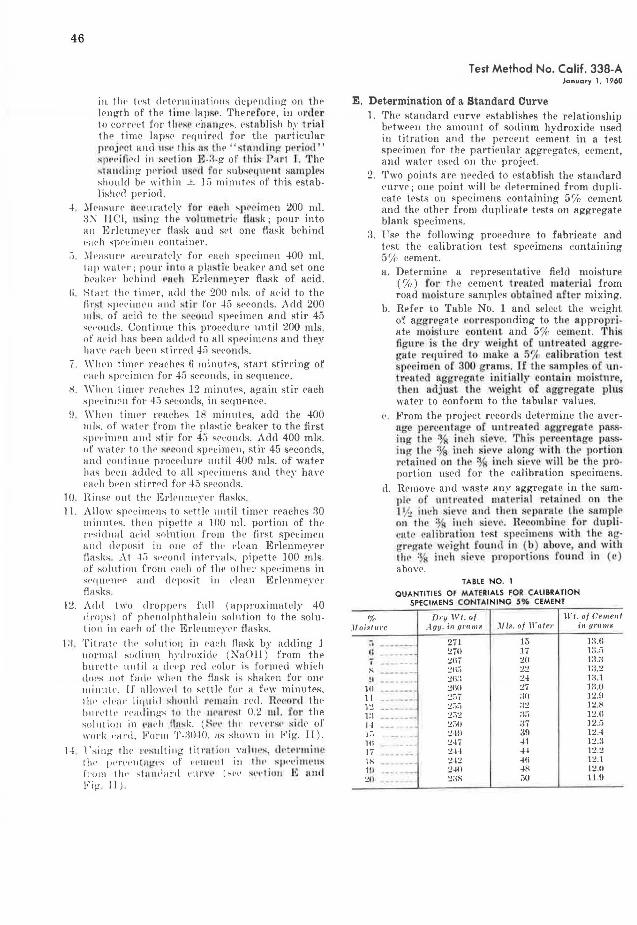
46
i11. tlw !<•st d1·kr111inatio11s dl'µrn<li11g on thP Jrngth of thP timr laps(>. Therefore, in 01•der to eorri'd for tlwsr chnnges. est11ulish by lrial the time lapse r1·quired for the partieular pro.ire! an<l nsl' this us thf' "~la 1Hl inl! p<~riod" stW<·ifi,,d in sr•dion E -:J.g of thL'> Pal't I. Thr .. ta11cling prriotl 11:c>d fcu· sul1srqnrnt sa111ples should bi· within ± Li min11trs of this estab-1 isl1r<l prriod.
-! • .\l1»1sure 111·•·1l!'atl'ic· fo1· rtl~·h spc•ci mrn 200 ml. ;{:\ JI Cl, using· the \'O h1m<'tric fltti<k; pour into a11 Erlenmenr flask anJ s<'t one flask behind 1•a"h s]Wl'illl~ll contai11er.
,,_ .\[Pas111'1' a1·1·uralt'ly for Pach spreinwn 400 ml. tap watPr; pour into a pla:tit~ beakf'r and set one b1•akPr behind ro ~ h Erlenmeyer flask of acid.
Ii. Start th1• tinH•r, add thf' 200 mis. of Hl'id to thr fi1;~1 SJH'l'i111t•11 antl . tir for 45 S<'<'Onds. ;\dd 200 mis. of acid to tlw s<'l·ond SJlf'f'imen antl stir 45 sr .. onds. Continue this procedun' until 200 mis. of al•irl has bern alldecl to all sprcinwns aud they ha"l' ra"h bef'n stined 4;'i st•<•ornls.
/. \\'l1Pn tirnrr rPachrs 6 rninutPs, start stining of l'Hl'h spl'cimen for 45 seroncls, in seqnence.
H. " ' hrn t imrl' rraehes 12 minntrs, ag-ain stir each . sJWl'intrn for 4i'i sel'oncls, in srqnencP.
~) . \Yhl'n t imrr readws 18 minutes, add the 400 111ls. of wal!•r from thP plastic bPak<>r to the first spl'l'imrn aud sl ii· for -l;i s1•co1Hls. Add 400 mis. of water to the seeond spt>einw11, stir 45 seconds, and continue prncr1lurp nntil 400 rnls. of water has bPC'll aJllrd to all sprl·it1H'llS and they havP l'ill'h lwrn stirrl'cl for 45 srco1uls.
10. Hinsl' out thr El'll'lllllP,\'er flasks . 11. Allow sprci111P11s to sptflP 1111til timrr rPaches !'10
minutes, tlwn pipl'ttr a 100 1111. portion of th<' rl'sitl11al a<'id solntion from tlw first spPcinwn and lll'posit i11 011!' of th" 1·ll•an Erlenm<:>yer flasks. "\t -I.I s1'ro111l intrrvals. pipette 100 mis. of sulntion frorn ead1 of thl' othrr spr<!imPns in si•q11l'lll'P and c!Pposit 111 l'IPall Erlrnrnr~·rt· flasks.
12. Add two droppr1·s full (approximatelc' -10 drops) of phrnolphthalri11 solution to the solution in pac·h of thr ErlPnlllP_\'l'I' flasks.
J:l, 'l'itra11• thP si1lutio1) in ra1~h flask by adding ] 11ormal sodium hc·droxidr (:\aOll) from thr bun·tt<' 1111til a tli•Pp rPd i:olor is formed whirh do1•s not Lid!' \l'hl'n tlw flask is shakrn for on<' 111i11111l'. If nllowrd to srttlt> for a fpw minutPs. 1h1• 1·lt•a1· Jiq11id slJU11 lll J'('ll lllill red. n('Co rcl th<' h11rt'll1• rl'adings 111 thr 111•ar1•st 0.2 ml. for the "'Ill t ion i I) ('l:ll' h na,,k. ( Rt'l' t llt' !'('\'t' l'~I' i; iclP of "·01·k 1·anl. forn1 'J'-:rnrn, as sho\\'11 in l•'ig . I l).
1-1. l'sing the n·.~11lti11g titration Yal111•:<, ildl'1'111in th1• lll'l'l'l'lltllg'•'S of ('('l\ll'lll in tl11·. s1w··!t11t'l1S frn111 th1• standard l'lll'\'t• (St'l' St'i' l!Ull J ~ nnd l•'ig- ll J.
Test Method No. Calif. 338-A January 1. 1960
E. Determination of a Standard Curve 1. The sta11dard t•nrye establishes the relationship
betwrr11 thl' amount of so1linm hvdroxide used in titration and the percent cerrient in a tf'st spe<·imrn for the partirnlar aggrPgates, cement, and wat r r used on thr project .
2. Two points are nreded to rstablish the standard !'lll'VP; Olli' point will be detprmined from dnplicatr t<'sts on specimens rontaining 5'/o cement and the other from du pl il'atP tests on aggregate blank spPcimens.
:1. llsr the following procedure to fabricate and trst the calibration test specimens containing 5% cement.
%
a. Determine a representative fi eld moisture ('le) to1· the cement tr<'lltC'd material from road moisture samples obtained nftcr mixing.
b. Refer to 'fable No. 1 and select the weight of aggrC'gate ''orresponding to the appropri ate moi ture content, and 5% cement. '!'his figurt> i th dry weight of unti·<'ale I aggr -"atl' requirPcl to make a fi /'t calibr11tion t . t 8pe ·imen or 300 grams. If the samples of 1111 -trNll!!cl aggregn l iuit in lly contain moist11re, then adjust the weight of aggregate plu watPr to conform to the tabular values .
l'. From the proji>ct records determine the average percenla {' o[ untreated aggregate passing the % in(•h . il'VC. 'Phi.~ pcrcpntage passinll'. till' % i11ch sirv~ ulong with tl1p portion 'l"itaint>d on thr % inch sie,·e will be I he proportion used for the calibration specimens.
d. Hrmove ancl waste an.'· aggregate in the sam-11k of 11n1 n•at J m111cri11 l retained on tl11> 1 \/~ i11(']1siw1111d tli n -1•pr1rnt• Lh SJ.lmplP on the % iu ·h icv1'. R<'combine l'or dupli ·11t 1> c11librnlio11 IC'St spe ·imcns with the ag"'l't'j?a lc weirrhL fouuil in (b) above, and with ~H' % in(' h., i;irvc proportion. found in ( t: ) aboYr.
TABLE NO. QUANTITIES OF MATERIALS FOR CALIBRATION
SPECIMENS CONTAINING 5% CEMENT
Dry Wt. of 1\'t. of Cement .lf ni.'ff llJ'C . lgy. i11 .Qrnm.11 .l/ ,,,, of ll'ater in grams
~. 271 1;; l!l.6 II ~70 17 1:·i .i>
' :!(}7 :w J:l.:{ s ---·-·- :!li~ :!:! l 'J ') ., ,_ !I :w:~ :!-! 1:u
10 :!lill 27 rn.o 11 :!:i7 :m l:!.!I 1:! :!:'1;-1 :t! l:!.~
1:1 :!:l:! :·;.i l:!.H H :!:iO ,,, 12.~
1:-1 :!4H 3fl l:!A ](j :!·ri -11 l:!.:1 11 :!H H 12.~
lX :!~:! -!ti 1:!.1 1!I :!-Ill .jfi 1:!.11 :!ll :!:lS ~.o 11.!J
Test Method No. Calif. 338-A January 1, 1960
r . Pour the weighed aggregates and cement ( cPmrnt wrighrd to 0.1 gram) into the two qnart plastic container anc1 dry mix together thoroughly with a stainless strrl stirring rod.
f. Add the mis. of watrr given in Table No. ] and again mix thoroughly.
g. In order to corrPlate with the field tPsting operations, allow the mixture to stand in the ('overed plastic container for a period of time which corresponds to the time required to obtain a field treatPd sample, transport it to thP tpst ing location and preparr the 300 gram tPst specimens (sPe SPction D-3-e). Normally the standing period should not bP less than 30 minntPs nor more than 90 minutes.
h. At thP conclusion of the standing period, start the acid digestion and titration test procedure given in the preceding Section D.
4. l!sP. thP following procedure to fabricate and tPst the aggregate blank specimens :
a. Using the representative field moisture ('lo) as determined in Section E-3-a, refer to '!'able No. 2 for the proper quantities of dry aggrpgate and watPr to be used.
%
TABLE NO. 2
QUANTlllES OF MATERIAL FOR AGGREGATE BLANK SPECIMENS
.If ofature Dry Wt. of
Agg. in grams Mls. of Water
;:; ----- - --- --------
() -----------7 ------------8 --- - ------- - -----!) - ----------
]() ---------------11 ---- -------------12 -------- --1:! --------------].! ---------- - --]~ -----------16 ------- - -------17 ------------ - ----]!' -- --------------10 - ---- - ------ ----:!() ------ ----- --
14 17 ~o :ia
:!7 30 3:l 34 37 :m 41 44 -16 48 w
h. llse these wPights of dry aggregate to fabri"ate duplfrate aggregate blank specimens in the mannPr described in Seetion E-3-d.
c. Pour th e aggreg·ates and water into the two quart plastic container, mix thoroughly, allow to stand for the standing period as specified in Section E-3-g, then tPSt in accordance with pre(•eding 8ection D.
ii. Plot the burette milliliter readings (abscissa) against the percent cement (ordinate) for both tlH' duplicate 57c cement specimens and thP duplicate aggregate blank specimens ( 0% cement) on the graph provirled on Form T-3040
47
as illustrated in Figure II. Draw a straight line between the averages of the paired tests. This is the standard curve for determinillg the cement content of field mixed cement treated specimens.
F.' Precautions l. This test should not be performed by persons
subject to color ''blindness''.
2. Keep all reagent bottles closed when not in use to prevent evaporation and the consequent change in concentration.
3. Rinse and drain all gla ware and plasticware when the day's work is done.
Notes
A standard curve should be determined at least once per day. In event of any change in source of aggregate or cement or new working solutions of acid or hydroxide, nnotJier determination sho11ld be. made.
Hazards
Extreme Cilre should be exercised in handling the concentrated solutions of hydrochlori acid (HCl) and sodium hydroxide ( aOH ). If either of these chemicals are spilled in the eye , on the kin, or on the clothing, the affected areas hould be. flu bed immediately with liberal quantities of water.
Care should also be exercised in the use of the dilute solutions of HCJ and NaOH as these dilute 8olutions can also be harmful to the eyes, cuts, skin, or clothing.
The following safety recommendations regarding the use of this test method are by the State Division of Hig:hways Safety Engineer :
1 .• ince the test is a chemical analysis requiring !he handling of acids and bases, it is recommended that it use be limited to Materials & Research trained and controlled personnel.
2. Information on the test should include a requirement that when handling either acid or bases persom1el will be reqnired to wear chemical protective glove. , goi?gles, and aprons.
:1. Test instructions should contain a requirement that gla. s carboys are not to be substituted for plastic carboys di>.~erib d in the test apparatus and that all containers 11a\'i11 either acids or bases, or solutions mitde from them, are to be ·lrarly lab led.
4. It is suggested that there be some notation that while there is limited danger associated with getting a part of the final solution in the mouth u ter it has acted on the cement, extreme care shonld be tuken not to permit any of the pnre 11<'id to get into the mouth .
48
5. Personnel conducting experiments should know that Phenolpthalein has been known to cause 1111 rgic !lymptom. in humans and has a powerful lnx11tive effect. It can be toxfo. Exposed person-
Test Method No. Calif. 338-A January 1, 1960
nel who are sensitive to it should wear protective clothing, if necessary, to avoid bodily contact. Do not ingest.
PART II. METHOD OF TEST BY CONSTANT Nl!UTRALIZATION
Scope This method is an alternate to the Acid-Base test
procedure, Part I , and is used for determining cement content when the aggregate is fo\md to react with acid. Th determinations are based upon the continuous neutralization of an aqueous solution from the cl"ment trPated agirregatc specimen for a pe •ifi d tim period. This is accomplished by adding sufficient acid t·o just nentralize the OH ion wbich is continuously beh1g liberat d dul'ing the hydration of the cement. The omonn of Raid used is directly proportional to the cement content of the treated base sample.
Procedure
A. Apparatus l. 1-100 ml. titrating burette or other device per-
mitting slow, ~a ily controlled addition of acid.
2. 1--burettc stand and burette clamp.
3. 4--2 quart wide mouth polyethylene containers.
4. 2-5 gal. pin tic "carboy:;" equipped with siphons, neop rene or tygou tnbing, hose clamps, ete., fo1· containing ncid working solution and water (do not substitute glnss containers for the plastic carboys).
5. Glass dropping bottle.
6. 4-stainless steel stirring rods.
7. % inch sieve, 12 inch Dia .
8. l % inch sieve, 12 inch Dia.
9. Ohaus balance (or equal), 5 kg. capacity, graduated to 1 gram.
10. A balance haviug a minimum capacity of 1 kg. and graduated to 0.1 gram.
B. Reagents 1. Hydrochloric acid (approx. 3N)
Pour the coi1teuts of two full standard 6 lb. bottles of concentrated hydrochloric acid C.P. (Service & Supply stock No. 69010.81) into one of the 5 gal. plastic carboys and dilute with tap wat~r in the manner indicated in Part I, Section B-1, to make 5 gal. of solution.
'.\101·i,;: The operator(s) mixing the acid solution are required, for safety, to wear chemical protective gloves, goggles, and aprons. Do 1101 use compressed air to agitate the solution in the carboy.
2. J>henol71hthalein indicator .~ol1ttion ( 1 'lo solu-tion)
Dissolve 5 grams of phenolphthalein powder U.S.P. in 250 mls. of ethanol. Dilute with 250 mls. of distilled water. (Service & Supply Rtock No. 69010.85 for prepared 1 % solution.)
O. Test Record Form Pse work card ''Field-Laboratory Record of Titration Tests'', Form T-3040 for recording project, calibration, and field test data (See Figure III). (Service & Supply stock No. 12953.40.)
D. Test Procedure for Field Samples l. Secure one to four 3 kilogram field samples of
the cement treated aggregate using the procedure specified in Part III. Prepare 300 gram test specimens as desscribed in Part I, Section D-3.
2. Place each specimen in a separate 2 quart plastic container.
3. Add 250 ml. of tap water to each specimPn and start timer.
4. Add two droppers full (approximately 40 drops) of phenolphthalein solution to each container. The water solution will normally turn red due to the presence of cement.
5. Weigh each plastic container, including its contents, to the nearest 0.5 gram.
6. At 10 minutes after the addition of watE>r, start adding the 3N hydrochloric acid with a titrating burette while stirring contin1tously.
a. The initial amount of acid to be added is based upon the planned eement content of the mix and is determined from Figure I.
Example: Suppose the planned cement con-tent for a given project is 3l/z%. Enter the abscissa of the chart in Figure I at 3%% and find the intersection with the upper diagonal line. Reading from the ordinate to the nearest milliliter, it is noted that 15 mls. of HCL is required. Use the titrating burette to measure and add the 15 mls. of acid to the specimen in the plastic container. When the proper amount of acid is used, the red color in the solution will disappear.
b. When the red color starts to reappear, after the initial introduction of acid, use the
Test Method No. Calif. 338-A January 1, I 960
h11rPllP to 11111h a sr1·oiul a1l<litio11 of al'i<l i11 the a111ou11t (mis.) indicated by the lower diagonal linP (at thr planned cPment content) of thf' chart in FigurP I.
'i. Aft1•r thr first two additions of acid. make subspqnr nt additions at ra11clom as thP reel color rPappPars using 011ly thr minimum amounts 1w<~ rss11ry to cause the color to just disappear 1111d maintain 11 lll'utral solution. This r1•qnirt's r.011.~fanf attP11tio11 by the operator.
A BPsidPs tlH' stirring accomplishPd during thP adnal introdnction of thr a1•id, additional light stirring (for ahont 3 sPconds) should be perfor111P1l r\'Pry minntP with every fifth minutP h<•ing dt'votrd to <leep stirring (for about 6 seconds).
!J. Continue this procPdu1·<' of adding acid and stirring until one hour after the initial addition of wat er to the specimen (see 3 above) . Then reweigh the plastic container and contents to the nearest 0.5 gram.
10. From the difference between the initial and final l!'l'O&s lest specimen weights (sec Fig. III ), ral<,ulllte nnd rP ·ord lhe tota l W' ight of hydro·hlori · n1, id u rd lo nr.nln1liz<' the :;olution.
11. l li.ing th rrsulting weight of hyd rochlori • acid, dC'lrr111ine the p~r ·entage o.f cement in t1:1 e <;;pceimr 11 11 from the standard curve c ~('C 'eetion E and Fig. HI).
E. Determination of a Standard Curve ] . The standard curve establishes the relationship
between the amount of hydrochloric acid used to neutralize th e OH ion in the c•emeut and the perc·ent cement in the test specimen for the particular aggregat<'s, cement, and water used on the project.
2. Nornrnlly onl.1· one point is needed to establish tht> sta11<lard eurve and this point is determinerl from ilnplicnte tests on specimen containing 5 1;1,, C'<'mcnt. llow!'ver, if a small sample of nntrl'ated aggTegate in water shows a red color on addin;t ll few drops of phenolphthalein solution, indica ting the pr<'$<> nce of water . oluble alkalis, then duplicate aggregate blank specimens ~honld al~o be testcrl.
:1. Fabricate ealilm1.t ion test specimens using the uppli .. able port ions of Part I, Sec.tion E-3 &E--l.
-l. Perf<mn the Co11~t1111t Neutralization test pro<'P<lure in aeeordatW<' with Section D of Part II with the exc<'ption that the first and second addition of a<'id sh1ill be based upon 5% cement eontent using l<,igure l (whil'h gives 21 and 8 mis. r<'sp<'etiwly).
a. l'sing the l!'raph provided 011 Form 'f.30'!0 p lot the grams of al•id nsed ngninst 1wrcent eem nt
49
for both dnpilcatl' •3 './n ceme11t specimens (1tl80 ag1?r!'g-ate bl11nk specimens if t l'.~ted; s <' 2 above) as illustrated in Figure Tfl. Draw a straight line from the origin of the chart (or the 1n •erage of the duplicate blanks) to the average of the tests on the 5% specimens. This is the standard cmn·e for d tcrmiuing the cement content of field mixed cement treated specimens.
F. Precautions 1. This test should not be performed by persons
subject to "color blindness".
2. It is very important that the operator vigi. lantly maintain a neutral solution by repeatedly adding acid as soon as the pink color r eappears. Neglect of this item will cause inaccuracies in the cement determinations.
a. After first two additions of acid, use only the amount necessary to just eliminate the red color. Excess acid may attack the aggregates, particularly in the later phases when the amount of hydration products from the cement remaining in the mixture may be low, resulting in erroneous cement determinations. It is also possible that the use of excessive acid in the final stages could cause the total quantity of acid to exceed that which would have normally been attained at the end of the one hour time period.
.i. Keep all reagent bottles closed when not in use to prevent evaporation and the consequent changes in concentration.
5. Rinse 1ind drain all glassware and plasticware when the dny 's work is done.
Note5
While the total amount of acid used for neutralization is determined by weight in this procedure, it may also be rnPasured in volumetric units using titrating b1irettes. However, since it is customary to test more than one specimt>n at a time (fonr simultaneous tests llre the maximum number for this procedure) and volume measurements would require a burette for each sample, it is more convenient to use the weight basis. A titrating burette is normally used in this procedure only as a convenient implement for introducing- the acid and not as a measuring device (except when metering the 1st & 2nd additions of acid in accordance with Section D-6 of Part II) .
The purpose of the chart in Figure I is to provide a suffici ent time lapse, before the red color reappears. in the solution, for the operator to adequately process four .·pP<.:imens in tht> early stages of th test. The indi ·llted amounts are cal ·ulut('d to allow a slight exce: 1> of acid which under normal circumstances will usuallv retard the color return for 2 or more minutes. 8tn1li~R indicate that the amounts of acid prescribed
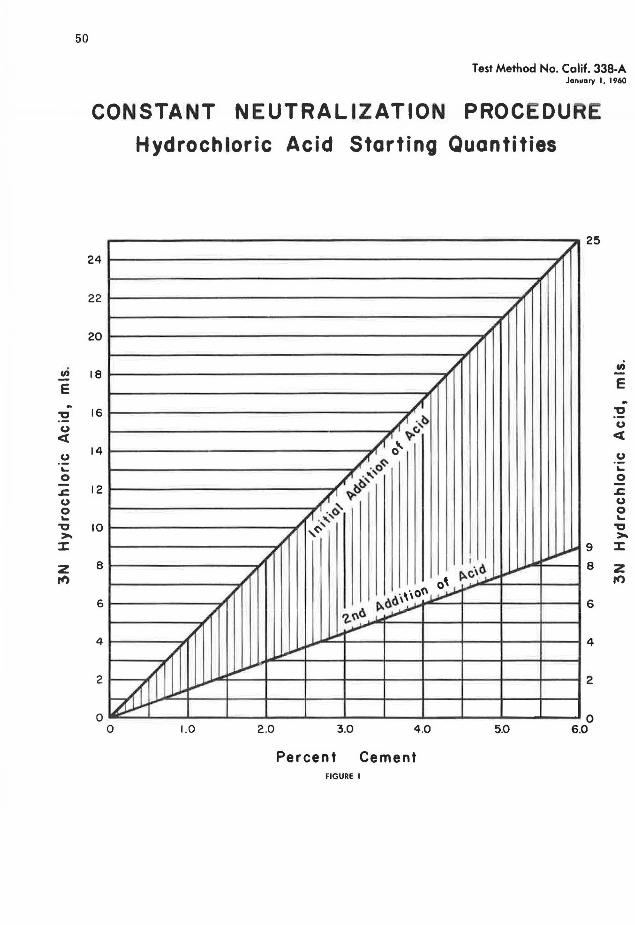
en E .. 'C (,,) <(
(,,)
.... 0
.c (,)
0 .... 'C >-z z rt>
50
Test Method No. Calif. 338-A January 1, 1960
CONSTANT NEUTRALIZATION PROCEDURE
Hydrochloric Acid Starting Quantities
24
22
20
18
16
14
12
10
8 ~I
,' ,, 6
~I
4 ,' ~I
2 ~---
~ ... ~ ~ ...
0 0 1.0 2.0
~ 1'
~' ,' ~I
,,I A
~-b c.'
A1o" ~ /. o<:-
/ ·'' b' ~I 'fl-~ ~ ~fl' _~, , ,~
I
' •6 .... ~ \ ~c' _... .. ·\\Of\~...-
~06' -z.(\6 I ~
.... ~ .........
3.0 4.0 5.0
Percent Cement FIGURE I
~' ,~
.......
,, 25
.... 9
8
6
4
2
0 6.0
.,;
E .. 'C (,,)
<(
(,,)
.... 0 .c (,,)
0 .... 'C >-z z ro
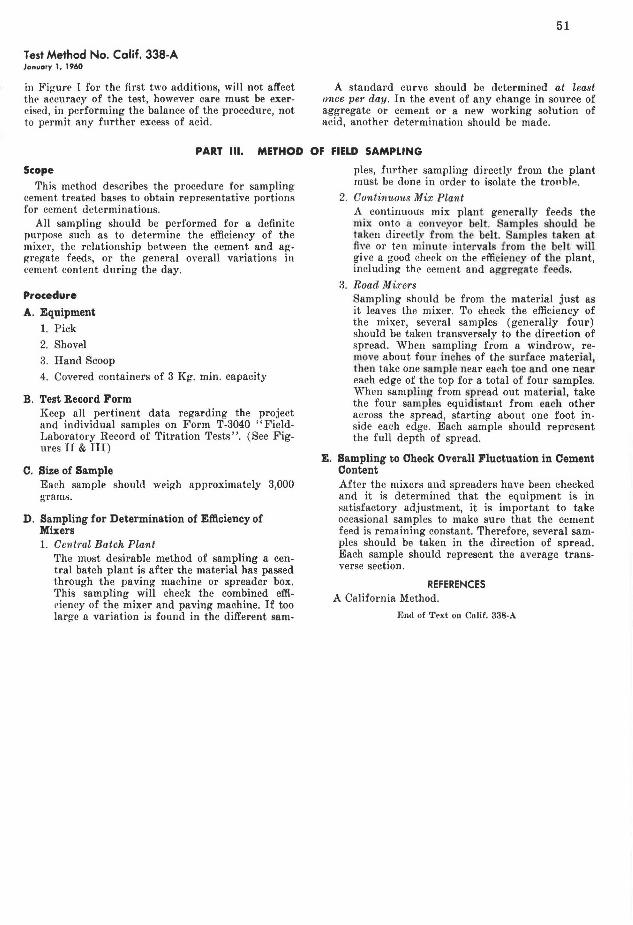
Test Method No. Calif. 338-A January 1, 1960
in Fig-urP I for the first two additions, will not affect the accuracy of the test, however care must be exercised, in performing the balance of the procedure, not to permit any further excess of acid .
51
A standard curve should be determined at least once pe1' day . In the event of any change in source of aggregate or cement or a new working solution of acid, another determination should be made.
PART Ill. METHOD OF FIELD SAMPLING
Scope
This method describes the procedure for sampling cement treated bases to obtain representative portions for cement determinations.
All sampling should be performed for a definite purpose such as to determine the efficiency of the mixPr, the relationship between the cement and agogregate feeds, or the general overall variations in cement content during the day.
Procedure
A. Equipment 1. Pick
2. Shovel
3. Hand Scoop
4. Covered containers of 3 Kg. min. capacity
B. Test Record Form Keep all pertinent data regarding the project and individual samples on Form T-3040 ''FieldLaboratory Record of Titration Tests". (See Figures II & III)
C. Size of Sample Each sample should weigh approximately 3,000 grams.
D. Sampling for Determination of Efficiency of Mixers 1. Cenfl'al Ba.tch Plant
The most desirable method of sampling a central batch plant is after the material has passed through the paving machine or spreader box. This sampling will check the combined efficiency of the mixer and paving machine. If too large a variation is found in the different sam-
pies, further sampling direct!~' from the plant must be done in order to isolate the tro1•ble.
2. Continuous Mix Plant A continuous mix plant generally feeds the mix onto a onveyor belt. amples should he taken dirt• tl_v from the belt. Samples taken at fi\'e or ten minutc> in tervals from t11e belt. will give a good check on the efficiency of the plant, including the cement and aggregate f eds.
3. Road Mixers Sampling should be from the material just as it leaves the mixer. To check the efficiency of the mixer, several samples (generally four) should be taken transversely to the direction of spread. When sampling from a windrow, remove about four inches of the surface material, t hen take one sample near each toe and one near each edge of the top for a total of four samples. When sampling from spread out material, take the four sumples equid istant from each other across the spread, starting about one foot inside each edge. Each sample should represent the full depth of spread.
E. Sampling to Check Overall Fluctuation in Cement Content After the mixers and spreaders have been checked and it is determined that the equipment is in satisfactory adjustment, it is important to take occasional samples to make sure that the cement feed is remaining constant. Therefore, several samples should be taken in the direction of spread. Each sample should represent the average transverse section.
REFERENCES A California Method.
End of T~xt on Cnlif. 338-.\
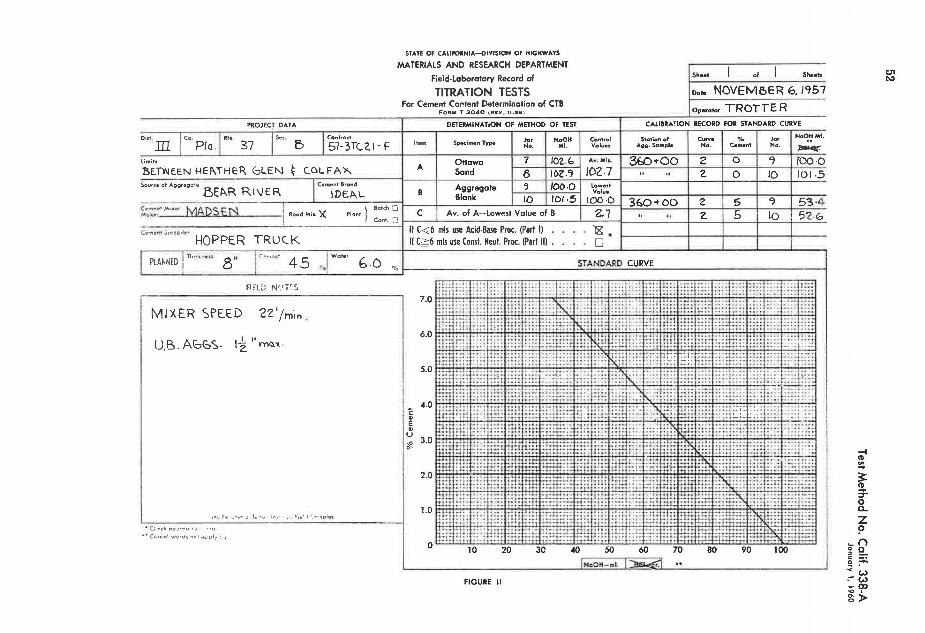
PROJECT DATA
D1"·m Se< , 5 Conlracl
57-3TC. z.1- F Co. Pia . I••• 37
Limits
BE.TWEEN HEf\THER. (:,LEN ~ C.OLFA")<...
So""eofAgg•ogoto l'.)EJ'i..R R\\J£R Cement .!rand
IDEA.L
~~A:··,. .... MADSEN
STATE Of CAllfOINIA-OIVISION Of HIGHWAYS
MATERIALS AND RESEARCH DEPARTMENT
Field-Laboratory Record of
TITRATION TESTS For Cement Content Determination of CTB
FORM T-3040 (REV 11-!!19')
DETERMINATION OF METHOD OF TEST
Item I SPKint11n Type ,., NaOH No. Ml.
Ottawa 7 IOZ.i;. A I Sand 8 IOZ-~
I Aggregate ' 100.0
B Blank 10 101.5
c I Av. of A-Lowest Value of B
Control Values
A .... Ml1-
IOZ-7 Lowest Value
100·0 I Rood M;• X -z. 7 l Batch Ci
Pl..::int
Cont.[] 1----'--------------...l...--If C<6 mis use Acid-Base Proc. (Part I) '181 If C~6 mis use Const. Neut. Proc. (Part II) . D
·------------~~ (fll"ID'll Spu:.:iodtH
HOPPER TRUC.K
Sheet I of I Sh.m
Doto NOVEMf>ER 6, /%7
Op•••••• TROTTER CALIBRATION RECORD FOR STANDARD CURVE
Slalion of l Cu~• % Jo• Naq~ Ml. Agg. Sample No. Cement No.
~
3to-tOO I 2 0 ") 100-0 2. 0 10 IDl-5
36.0+00 I 2. I 5 I ~ I 53 -4 z I 5 10 I 5'2.-6
Th•r kPoitti 8" I c ~ r->(1.1 " 4 c: I Water PLANNED I --.:J .,.. b · 0 % ST ANDARO CURVE
Afl.D N(n::s
MIXER Sf'H.D '2.'Z. 1/m.1n .
U.B. Ar::iS~- 11 '' 2 mci"-
'""" r"'. _.,.- -> i~ ',-. '' "•t1' I ' ,~'.'lf.'i'l:l
" (: <'ICli l:l;:l::V".°!J'"-' , .. 0
~ ~ (Cio,~1 words o;:-.1 .lj:;:>I~ ··.~
7.0
c: " E
" u ~ 0
10 20 30 40 50 60 70 80 90 100
NciOH-m.t.
FIGURE II
-I ID ~
~ ID --:r 0 a... z ?
~ ('\ o D ~ ::: 0 --< ~ ~w - co "'. g>
C11 N
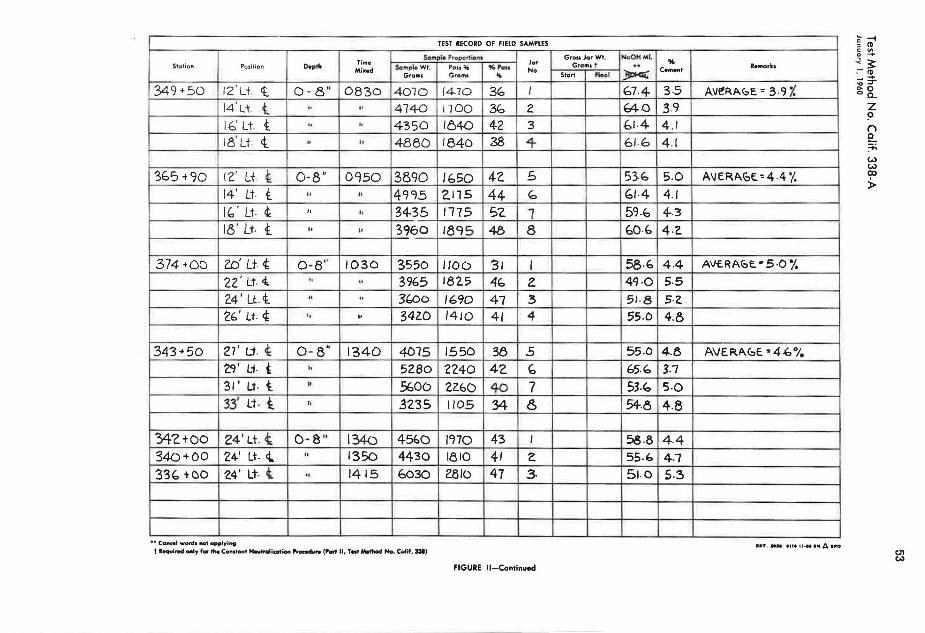
TEST RECORD OF FIELD SAMPLES
Samplt .Pl'apor1toM Station Po1i1ion Depth
Time Ja• MiHd Semple Wt. Pou %i %Pa:u Na.
Grams Grams. 10
349+50 12°Lt. ct 0 - 8 " 0830 4010 1410 3b I
14°Lt l ,, " 4140 1100 3~ 2
If,' Lt. t .. " 4350 1640 42 3
181
Lt 4. " .. 4880 1840 38 4
%5+90 12' u. t 0-8 " 0950 3890 /€.SO 42 5 14' Lt t. "
,, 4C)CJ5 2. 115 44 ~
"'' Lt. t ,,
" 3435 1175 5'2. 1 18' Lt. t .. I• 3%0 18~5 48 8
374-+00 Zr:/ Lt. { 0-8" 1030 3550 1100 31 I 22 ' Lt. 4. " " 3965 1825 4b z. 24' Lt.ct " " 3bOO 1690 47 3 2b 1
Lt- <t " .. 34ZO /410 41 4
343-+50 27' Lt. 4: 0 - 8 " 1'340 4015 1550 38 .5 Z9' Li- t .. 5280 22.40 42. b 31' Lt· t I• 5600 ZZ.60 40 7 33' Lt - l ,, 3235 1105 34 8
34'2. +oo 24' Lt. t_ 0 - 8 " 1340 4560 1"170 43 I
340+00 24' Lt. cl.. " 1350 4430 1810 41 z 3'3b +DO Z4 ' Lt- t " 1415 6030 Z810 47 3 .
.. Cone.I wan:l1 not opplyift9
t hqui,.d OAly fof the Con1tant Neutralizcrt;o.. ~ (Part II, lMt IMtt.od Ho. Cut if. 3»)
FIGURE II-Continued
Gro11JarWt. NaOHMI. Grom• f
Start final ~ b7-4
b4-0 t,1.4
61-6
53-b
f.1-4 59-b bO·b
58.f, 4q .o 51-8 55.0
55.0 65.b
53-b 54.ei
58 -8 55-b 51.0
% C•m•nt
3-5
.3.9 4.1
4 .1
5.0
4.1
4--3 4 -2.
4-4 5.5
5·2.
4.&
4 .8
3.7 5 -0
4.8
44 4 ,7
5.3
Re11tOrk1
AV~R.AC:>E"' 3.9 1,
AIJERA~E. ~ 4 -4 '/.
AVf.RAEJE. • 5 ·0 /.
AVERA.~E. "4-b 01.
••T. naa •n• 11.u •MA •~o
;;- -I , Cl)
c "' Q -+
-< ~ -- Cl) - -+ '() ;r 0. 0 Oc_
z !l () 0
~ w w CX>
>
U1 (,.)
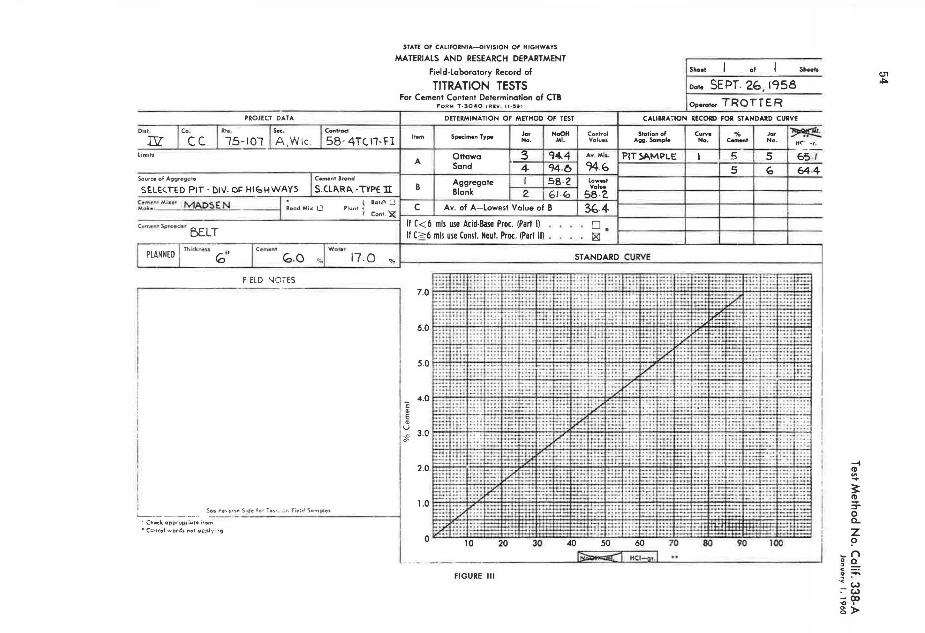
STATE OF C.4.LIFORNt.4.-0IVISION Of HIGHWAYS
MATERIALS ANO RESEARCH DEPARTMENT
Field-laboratory Record of Sh Ht of ShHtl
PROJECT D.lTA
Di1t c ...
cc ·~s-101 l'A.w1c. J 58~4TCl1-fl Til limits
Source af .4.99r~ate Cement ln:ind
SHE<.IED PIT- 01\1. 01' Hl<OHWAYS S.CLA.Rt>.. -TYPE Il C.rfl'<(f'l lMi. ice, M ADSE N MuS..•L..-- - Rood Mix lJ l Barch 0
Plant Cont. }ll
C•m•nl Si:JfCOdtt &l T
I I
i i '
I I
PLANNED I '"" ' " .. ' (O" Cem•"-' Water
<a.o %
FIELD NOTES
i L__ __ ----·-
See )""'"'~ "' So de fo• i•~·. ;r. fi":rf Somples
- Cr1•dt app":.1pirigf4 i•em • Cci.,c.el ... ·ordi not gi,:ply ;•~g
17.0 %
TITRATION TESTS Dote SEPT. '2b, 1'}58 For Cement Content Determination af CTB
FORM T . 3040 ( REV 11-!59 ) Op .. oto• TROTTER DETERMIN.lTION OF METHOD OF TEST
Item I Spec-ime" Type ,., NoOH No. Ml.
A I Ottawa 3 "144 Sand 4 94.0
B I Aggregate l 58 -2 Blank 2 Gl-<O
c I Av. of A-lowest Value af 8
C.lllll.lTION RECORD FOR ST.lND.lRD CURVE
Control Vciluff
Station of ..... Sa .......
... . Ml>- I PIT Sl>.Ml>LE 94. ~ La-t Value
58-Z 3b-4
c;::_• I c~t 5 5
'"' ~ No. H('- ~r.
5 65./
"' 64.4
If ( < 6 mis Ille Acid-Base Proc. (Part I) o. 181 If (~6 mis use Const. Neut. Proc. (Parl II) .
STANDARD CURVE
7 .0 ~:=:r~.;.:.p~i.,.:.:.;~~~,..:.:..:+.:.;.:.:tt:.:.;+::...:.:.ii.:.:.;.'f;T,.:.p.!'-!f~t'!!~~~E::~:::F.:~:..:=~
6 .o i:;..:.;+1+~:.:.:.:+--":.;.;..:.:.:+1.:..:.:.:~~~f:.:+;.i..;.;~i:.;.;~;,tt':+F;i.;.::.i:;:i:i.;.++;~~µ;::~~:..:..;;;i;;.;,;::.i:;,;;;..i: .... f ... 'j· .. !l: ' .. t:-·:.t"" l! ' iJI i..: • ·1• ·!'ti:; ' li:;, t:.;1 :J;l'f, !:1:::-IU~t::!::.i:::: t '"- n-•· :: :: ::;: : : ::i: : ::i:::tt! :.:;t.;!~4r..::1 ::.:~; :.: : +A.~:t;::-=~~-=;~~ = ::~c ::! tHk!::::
s.o LJW±iii8ti4q#tq4~;.f,~++±±¥T:T:tt:i
~ 4
·0
~Jilill.P:i~~~~~~~~~~~~~~~~H~ffff~~~~~~~-;rfit.t:tt~1f ~ c;
u
#
2 .o m::.tF..;.;.H~~~~~~~~~75:1r.;.;t!'~~EH~~::-T~~~:=t~~~
i.0E£~~:=:Bffi~ -·· · 1m::. r.tt~:t~~ I. II ~-w.··1fm~·;::if<j;: : : :: :! ::. : ''.'. ·:.:: ; ,. - ~ ~· · · -:: :::;: ·- ';;+ :-:· (~·· · .. ··- - .. , ~- ; ~!!: :::: ... :::
~:::p: •• - · · t'
0 10 20 30
FIGURE Ill
-I
[ 3:: ~
T 0 C2...
z ?
~ () 0 Cl g~ 0 --< ~ :-w - QC) -0 • g>
t.l1
""'
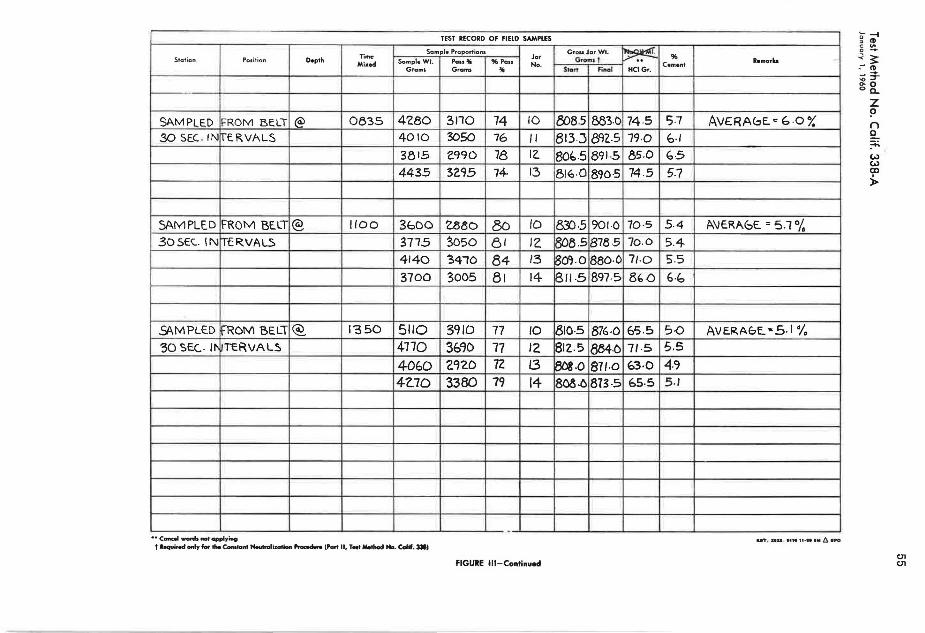
TEST RECORD Of flElD SAMPLES
Time Sample Proportions
Jo, Station Position Oepth Mi•ed Sample Wt. Pauii %Pon No.
Grams Gr a nu li
St>.MPLE.D FROM BELT @ 0535 4Z80 3110 74 10 .30 5E.C. IN rrE. RVALS 4010 3050 76 II
3815 2.990 78 12.
4435 3295 74- 13
5AMPLE.D FROM BE.LT @ 1/00 3bDO Z8BO 8o 10 305€C IN 1Tt:RVAL5 3715 Soso 61 12.
4140 3410 84 /3
3700 3005 81 14
.9\MPLED f°RCM BE.LT @. 1'350 5110 3910 17 10
30 SEC.. 11'1 lTERVALS 4770 3690 17 12
4060 2~'2.0 7Z l3 4-Z.10 3380 79 14
•• CGftC191 words llOt applyinQ t Lquw.cf only for the Con&totit Neutrali:r.at'- '""'*'-" ('-t II. T•t Method Na. Colif. Sii)
FIGURE 111-Continuocl
GrouJarWt. ~ Gram1f
Start r:lnol HCIG,.
808.5 883.D 74.5 813.J 8'1'2..5 79.0
80b.S 891.S as.o 816·0 890.S 74.5
8'!/J.S 901-0 70 ·5
808.5 818.5 10.0
800.0 880-D 11.0
811.S 897-5 8{,.Q
810-5 876-0 65.5
812.5 884-C> 7/-5
808.o 811·0 6'3·0
808.0 873 -5 f,5.5
% Cement
5.7
6·1 b5 5.7
5.4
5.4 5.5
b·b
5 ·0 5.5 4-9 5.1
le111Grb
AVERAGE."' f. -01.
A\JE.RA.(;;,E. = 5.1°fo
AVERA&E.•S.I %
•ST. DU 91M 11·•• IM /l ePO
~ -I , ID c "' Q -
-:. ~ • ID - -+ .., ::r 0. 0 0 Q..
z ? n 0
~ w w CD ),.
CJ'1 (.11