Embed Size (px)
Citation preview

This article was published in an Elsevier journal. The attached copyis furnished to the author for non-commercial research and
education use, including for instruction at the author’s institution,sharing with colleagues and providing to institution administration.
Other uses, including reproduction and distribution, or selling orlicensing copies, or posting to personal, institutional or third party
websites are prohibited.
In most cases authors are permitted to post their version of thearticle (e.g. in Word or Tex form) to their personal website orinstitutional repository. Authors requiring further information
regarding Elsevier’s archiving and manuscript policies areencouraged to visit:
http://www.elsevier.com/copyright

Author's personal copy
Robotics and Computer-Integrated Manufacturing 24 (2008) 427–434
Calculation of effective pore diameters in porous filtrationmembranes with image analysis
F.H. Shea, K.L. Tungb, L.X. Konga,�
aCentre for Advanced Manufacturing Research, University of South Australia, Mawson Lakes, AustraliabR&D Centre for Membrane Technology, Department of Chemical Engineering, Chung Yuan Christian University, Taiwan
Received 22 May 2006; received in revised form 24 August 2006; accepted 8 February 2007
Abstract
In filtration/separation applications, porous membranes separate particles by a sieving mechanism determined by pore size of
membrane and particle size. However, since pores in the membranes have irregular shape and vary in size, the definition of the pore size
has been complex and sometimes, even confusing. In this work, we introduced a novel geometric parameter called effective pore diameter
to characterize particle permeation performance in porous filtration membranes. The effective diameter of a pore is defined as the
maximum diameter of a spherical particle which can pass through the pore in the membrane. We for the first time applied advanced
image analysis techniques to automatically measure effective pore diameters and their distribution from scanning electronic microscopic
image of the membrane using Euclidean distance transform (EDT). It is found that the effective pore diameter and its distribution are
more accurate than the parameters previously used, to evaluate the membrane’s filtration and separation performance and especially,
particle permeation performance.
r 2007 Published by Elsevier Ltd.
Keywords: Effective pore diameter; Porous membrane; Filtration/separation; Particle permeation; Image analysis; Euclidean distance transform (EDT);
Virtual circle
1. Introduction
Porous membranes have been widely used in variousindustries, such as modern engineering of chemistry,energy, environmental conservation, bioengineering, med-icine, food, and military industries. Filtration and separa-tion are two major applications of porous membranes,such as desalination, wastewater treatment, water purifica-tion, and oil/water separation. Filtration is a technique thatutilizes a porous barrier (e.g., membrane) to separatesuspended or dissolved particles in solution based on thepore sizes of membrane barrier and particles sizes,eliminating the need for centrifugation, solvent phasechanges or other product damaging methods. Applicationof positive or negative pressure differential across aselectively permeable barrier drives the separation in asieve-like manner. Small particles pass through the barrier
with the solvent as filtrate while the large particles areretained. Depending on pore size spectrum, membranescan be used for macrofiltration, microfiltration, andultrafiltration applications.Characterizing the pore morphology of membranes has
been very important for both membrane users andmanufacturers, as well as for membrane scientists. Theyneed the information of membrane morphology forchoosing an appropriate membrane in a certain applica-tion, predicting membrane performance, determiningmembrane casting conditions, controlling membrane qual-ity, and understanding membrane transport mechanisms[1,2].Traditional methods used to characterize pore morphol-
ogy of membranes, such as pore size and pore sizedistribution, include microscopic method [3], mercuryporosimetry bubble pressure and gas transport method[4], gas–liquid equilibrium method (permporometry) andthermoporometry [1]. Some research groups used theconcept of active pore size [5,6] to characterize pore
ARTICLE IN PRESS
www.elsevier.com/locate/rcim
0736-5845/$ - see front matter r 2007 Published by Elsevier Ltd.
doi:10.1016/j.rcim.2007.02.023
�Corresponding author. Fax: +618 8302 5292.
E-mail address: [email protected] (L.X. Kong).

Author's personal copy
interconnectivity. More recently, some other advancedmethods have been developed to characterize the mem-brane materials of nano pore size with electrochemical andoptical single transporter recording [7], fluorescent dextrantest [8] and atomic force microscopy [9].
However, the parameters obtained by using the tradi-tional methods [1–4] or even with the more advancedtechnologies [7–9] do not give direct information aboutmembrane pore structure except the microscopic methodand there is a calibration problem commonly involved inall of these methods. Furthermore, how to define the poresize of membranes has been complex and sometimes evenconfusing since the pores in membranes have irregularshape and vary in size.
In this work, we aim to more objectively and efficientlycharacterize the porous membranes by introducing a newparameter called effective pore diameter. Other thanparameters such as pore areas, perimeters, equivalentdiameter based on the same areas, shape factors, etc., wewill develop an image analysis algorithm in Matlab [10] tocalculate the effective pore diameter for all pores and itsdistribution in polyvinylidene difluoride (PVDF) mem-brane from its scanning electronic microscopy (SEM)image. The algorithm is based on Euclidean distancetransform (EDT) and is the first time to be introduced toobjectively characterize membrane materials.
2. Materials and image acquisition
The samples used in this study are flat-sheet moldedPVDF membranes, which have various pore sizes andirregular shapes. PVDF membranes, in contrast to typicalcellulosic membranes, are hydrophobic and resistant to awide variety of organic solvents as well as most aqueousacids and bases.
The images of the membranes with a size of 480� 640pixels are taken by a CCD camera, which is mounted on aSEM and connected to a Pentiums 4 Compaq computerwith 512MB RAM in the R&D Research Center forMembrane Technology, Chung Yuan Christian University.A representative image of the PVDF membrane is shown inFig. 1.
3. Procedures of the membrane characterization
In this section, we will firstly discuss image pre-processing techniques to convert the original gray-levelimage of a membrane to a binary image. Then, a set ofconventional geometric parameters and their distributions,such as porosity, pore areas, pore perimeters, shapefactors, and equivalent diameters based on the same areas,are measured by using image analysis techniques. Further-more, a distance transform will be performed on the binaryimage to compute effective pore diameters and theirdistribution.The flow chart of the image analysis is shown in Fig. 2.
3.1. Image pre-processing
Before analyzing pore parameters of a membrane,image pre-processing is required to convert a SEMimage of membrane to a binary image, where all poreregions are shown as foreground, i.e., white pixels and non-pore region as background, i.e., membrane walls. There aremainly two kinds of artifacts in the membrane image. Forinstance, non-uniformities of pixel intensity (i.e., pixelvalue) on the membrane surface are obviously observedsince illumination is varied; furthermore, the contrast ofpixel intensities in pore regions and membrane walls issmall.We take the following steps to remove those artifacts in
the image and measure the parameters of pores.Step 1: Crop the original image of the membrane
(Fig. 3a) so that the figure label and calibration bars areremoved and only membrane surface region is left forprocessing; an image of 409� 640 pixels is resulted that isshown in Fig. 3b.
Step 2: Adjust the pixel intensity of the cropped image toenhance contrast (Fig. 3c).
Step 3: Filter the enhanced image with ‘‘averaging’’ filterto obtain a smoothened image (Fig. 3d) showing poreregions and membrane wall regions with evener pixelintensities.
Step 4: Calculate a global image threshold using Otsu’smethod [10] which chooses the threshold to convert a gray-level image (i.e., an intensity image) to a binary image (twoclasses, i.e., black and white) in which the intraclassvariance of pixel intensities of the black and white pixels isminimized and the between-class variance is maximized.
Step 5: Thresholding the image obtained in Step 3 to abinary image (Fig. 3e) based on the threshold levelcomputed in Step 4, which shows membrane wall regionsin white and pore regions in black.
Step 6: Complement the binary image that resulted fromStep 5 and remove isolated noises in the image (Fig. 3f). Inthe complement of the binary image, black and white pixelsare reversed, i.e., pore regions are shown in white andbecome foreground while membrane wall regions areshown in black and become background (Fig. 3f). From
ARTICLE IN PRESS
Fig. 1. A SEM image of a porous PVDF membrane (at the scale of 37%
of original image).
F.H. She et al. / Robotics and Computer-Integrated Manufacturing 24 (2008) 427–434428

Author's personal copy
Fig. 3f, overall porosity of the membrane surface will bemeasured.
Step 7: Perform morphological operations and labelingeach pore region on the image obtained from Step 6(Fig. 3(g)) There are three purposes in this step. The first isto remove the pore objects, which are connected to theborder of the image since those objects are split by theborders of the image frame and their shape parameters aremeaningless; the second purpose is to smoothen the poreobjects and remove isolated noise pixels; the third purposeis to assign each pore blob a unique label, which will beused in measuring geometric parameters for each poreblob.
Step 8: Perform EDT on the image obtained from Step 7(Fig. 3(h)) and compute the effective pore diameters anddistribution, More details about this step are described inthe following section.
3.2. Image analysis
From the images pre-processed in Section 3.1, a numberof parameters and their distributions can be measuredusing image analysis techniques.
3.2.1. Computing geometric features of pores
From the image in Fig. 3f, the porosity of the membranesurface is calculated as the ratio of number of white pixels(i.e., pore regions) to the total image pixels
r ¼nw
LW, (1)
where nw is the number of white pixels while L and W arethe length and width of the image in pixels, respectively.From the image in Fig. 3(g), a set of parameters will be
measured for each pore blob.Area (Ap) of a pore blob is computed by
Ap ¼ m, (2)
where m is the number of pixels contained in the pore blob.Perimeter (lp) of the pore is computed by
lp ¼Xn
i¼1
ffiffiffiffiffiffiffiffiffiffiffiffiffiffiffiffiffiffiffiffiffiffiffiffiffiffiffiffiffiffiffiffiffiffiffiffiffiffiffiffiffiffiffiffiffiffiffiffiffiffiðri � ri�1Þ
2þ ðci � ci�1Þ
2
q, (3)
where ri and ci are the row and column of a pixel i on thecontour of the pore blob, 2pipn, and n is the number ofpixels on the contour of the pore blob.Equivalent diameter (DEq
Area) based on the same area isdefined as the diameter of a circle that has the same area as
ARTICLE IN PRESS
Imaging: SEM and CCD camera
Transferring image of porous PVDF membrane to a computer
Pre-processing images: contrast enhancement, filtering, thresholding, imagecomplementing and morphological operations
Performing distance transform on the binary image of membrane
Calculating the effective pore sizes and their distribution
Preparing membrane material
Calculating other geometric features and their distributions Calculating other geometric features and their distributions, such as porosity, areas, perimeters, equivalent diameters based on the same area as pore regions, shape factors, solidities and extents of pores
Comprehensive feature set ofpores obtained
Fig. 2. Flow chart of image analysis of porous PVDF filtration membrane.
F.H. She et al. / Robotics and Computer-Integrated Manufacturing 24 (2008) 427–434 429

Author's personal copy
the pore blob:
DEqArea ¼
ffiffiffiffiffiffiffiffi4Ap
p
r. (4)
Shape factor (fs) is calculated by
f s ¼l2p
4pAp. (5)
Solidity (S) is computed as the area of pore blob (Ap)divided by the area of the convex hull of the pore blob(Aconvex),
S ¼Ap
Aconvex. (6)
The convex hull of the pore blob is the smallest convexset that contains the pore blob and is represented as a list of
ARTICLE IN PRESS
Fig. 3. Images obtained in pre-processing: (a) original gray-level image of a membrane sample, calibration bars indicate a length of 10.0 mm; (b) cropped
image; (c) contrast enhanced image; (d) filtered image; (e) thresholded image; (f) image after complementing and removing isolated noises from (e); (g)
image after morphological operations and (h) Euclidean distance transformed image of (g).
F.H. She et al. / Robotics and Computer-Integrated Manufacturing 24 (2008) 427–434430

Author's personal copy
facets, which has a set of vertices, a set of neighboringfacets and a half-space. A half-space is defined by a unitnormal and an offset [10,11].
Extent (E) is computed as the area of the pore blob (Ap)divided by the area of the bounding box (Ab), the latter isthe smallest rectangle containing the pore blob [10,11]:
E ¼Ap
Ab. (7)
3.2.2. Euclidean distance transform (EDT) and effective
pore diameter (Deff)
In this study, a new parameter, effective pore diameter foreach pore, is also extracted. It is defined as the diameter of thelargest particle which can pass through the pore in themembrane. In terms of image morphology, the effective porediameter of a pore can be considered as the diameter of alargest virtual circle that can be encompassed by this poreregion. We call it virtual circle because it does not exist in theoriginal image and is very helpful in description of effectivepore diameter [12]. In this way, the effective diameter of apore is equal to two times of the distance between the centerof the largest virtual circle and its nearest edge point in thispore region, i.e., the diameter of the largest virtual circle.
With the help of distance transform (DT ), a digitalbinary image that consists of object (i.e., pore in this case)and non-object (i.e., non-pore) pixels is converted intoanother image in which each object pixel has a valuecorresponding to the minimum distance from the objectpixel to its nearest non-object pixel by a distance function.The interior of a closed boundary is considered as objectpixels and exterior as non-object pixels [13,14].
Because of its rotation invariance property, the Eu-clidean distance function is used. The distance d(p, q)between a pixel p(x, y) in a pore region A and a pixel q(u, v)in the non-pore region Ac is defined by
dðp; qÞ ¼
ffiffiffiffiffiffiffiffiffiffiffiffiffiffiffiffiffiffiffiffiffiffiffiffiffiffiffiffiffiffiffiffiffiffiffiffiffiffiðx� uÞ2 þ ðy� vÞ2
q; pðx; yÞ 2 A and qðu; vÞ 2 Ac,
(8)
where (x, y) and (u, v) are coordinates of pixels p and q,respectively, and Ac is the complement of A.
The distance transform assigns a value DT(x, y) to thepixel p(x, y):
DTðx; yÞ ¼ minðu;vÞfdðp; qÞg; pðx; yÞ 2 A and
qðu; vÞ 2 Ac, ð9Þ
where DT(x, y) is the minimum distance from the pixelp(x, y) to non-pore pixels in Ac.
By repeating the above procedure to all pixels in the poreregion, a distance transformed matrix is formed. From thismatrix, a local maximum value can be found by searchingthroughout the pore region A:
DTðxc; ycÞ ¼ maxfDTðx; yÞg; pðx; yÞ 2 A. (10)
The coordinates (xc, yc) of this maximum represent thecenter of the virtual circle in terms of definition in previous
section. The value on the center pixel (i.e., DT(xc, yc)) inthe distance transformed image indicates the distancebetween the center and its closest non-pore pixel. Sincethe radius of the virtual circle Rv represents the distancebetween the center pixel and its closet edge point on thepore blob, Rv is calculated as following due to pixel widthconcern:
Rv ¼ DTðxc; ycÞ � 0:5. (11)
Therefore, the effective pore diameter for this pore blob
Deff ¼ 2Rv. (12)
This means that the particles with a diameter equal to orless than Deff can pass through this pore.An example of pore blob extracted from Fig. 3(g) is
displayed in Fig. 4a, where the pore region shown in graycolor for better viewing, has a pixel value of 1 while thepixels in non-pore region (i.e., the membrane walls) have avalue of 0. The distance transformed image matrix of thepore in Fig. 4a is displayed in Fig. 4b. The center of thelargest virtual circle and its radius are marked in a blackbox and an arrow in Fig. 4b, respectively.
3.2.3. Calibrations
Normally, calibration bars or scale markers are presentand clearly visible on all SEM photomicrographs. In thesample image shown in Fig. 3a, calibration bars, which arethe little lines, are located in the lower right corner of theimage. The distance between the first bar and the last one,which represents 10.0 mm, is measured as 252 pixels. Byreferencing this calibration rate, the program automaticallycalibrated the measurements, which were obtained in theprevious section, into microns.
4. Results and discussion
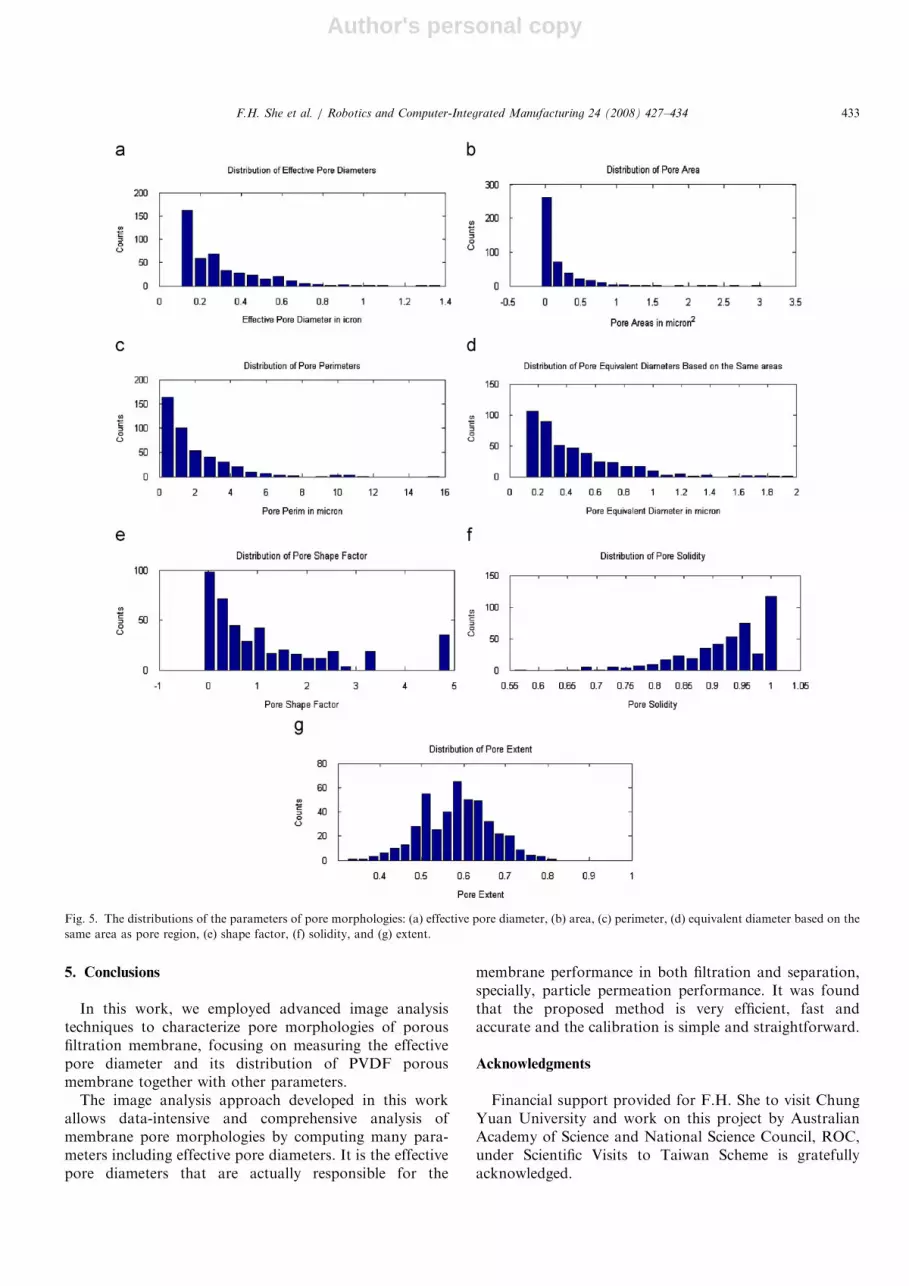
From the experiments described in Section 3.1, it can beseen that the image pre-processing can be automaticallyperformed and is robust to extract the pore regions withouthuman interaction (Fig. 3b–h). From this membraneimage, 437 pore blobs are found. In Section 3.2.1, a setof parameters, including effective diameter, area, peri-meter, equivalent diameter based on the same area as eachpore blob, pore shape factor, solidity, extent and porosity,are computed to characterize the pore morphologies of themembrane. Their statistical values are listed in Table 1 anddistributions are shown in Fig. 5.These parameters, being used together, will give more
information about the pore morphologies than when usedalone. Some parameters can hardly be extracted by usingother methods, such as effective diameter, shape factor,solidity and extent, while some others are very costly toobtain.Especially, we computed the effective diameter of pores
(Deff) and its distribution as a new parameter. By usingEDT, this algorithm performs a comprehensive search forthe largest virtual circle and its diameter throughout each
ARTICLE IN PRESSF.H. She et al. / Robotics and Computer-Integrated Manufacturing 24 (2008) 427–434 431

Author's personal copy
pore region. Consequently, the effective pore diameters andtheir distribution in the porous membrane are computed byusing Eqs. (8)–(12). The effective pore diameter obtainedhas a very clear mathematical definition and it simplyrepresents the diameter of the largest particles which canpass through the pore.For the example shown in Fig. 4a, there are 29 pixels
belonging to this pore, then the equivalent diameter basedon the same area (DEq
Area) is equal to 6.07 pixels by usingEqs. (2) and (4). Comparatively, from the correspondingdistance transformed image of Fig. 4a, the pixel with thehighest value of 3.00 is found and marked in the dark blackbox in Fig. 4b. While the pixel is the location of the centerof the largest virtual circle (shown as a dashed circle inFig. 4b) for this pore region, the radius of the circle is 2.5pixels by using Eq. (11). Therefore, the effective diameterof this pore (Deff) is equal to 5.00 pixels, which means thatthe particles with a diameter equal to or less than 5.00pixels can pass through the pore (i.e., can be encompassedby the pore region). However, the particles with theequivalent diameter D
EqArea (i.e., 6.07 pixels) cannot pass
through the pore (i.e., cannot be encompassed by the poreregion). Deff is less than D
EqArea. This trend is increased to a
great extent when the shape of pore is far away from acircle. When pores are perfect circles, Deff is equal to D
EqArea.
Our experiment results have shown the trend in Table 1,Fig. 5a and d.From the results obtained above, the effective pore
diameter will provide more objective and accurate infor-mation about the particle permeability. The membraneperformance in both filtration and separation and,specially, particle permeation performance can be betterunderstood and predicted by measuring this parameter andits distribution. Furthermore, the EDT used in this studyhas rotation invariance property as shown in Eq. (9). Withthis quality, membrane samples can be imaged at anyrotation angle, which makes sampling more convenient.The time spent on both image pre-processing and
measurement of all those parameters and their distribu-tions for the membrane is 15.58 s. This indicates the imageanalysis method is very efficient in characterizing mem-brane morphologies. The calibration can be done bycomparing the measurements in the unit of pixels withthe length (in pixels) of the calibration bars. Furthermore,unlike other traditional methods, all of these parameters inTable 1 can be easily measured with this image analysisapproach.
ARTICLE IN PRESS
Table 1
The parameters computed to characterize membrane pore morphologies
r Deff (mm) Ap (mm2) lp (mm) DEqArea (mm) fs S E
Mean 0.31 0.32 0.26 2.26 0.48 1.89 0.93 0.60
Minimum 0.14 0.02 0.48 0.16 0.88 0.57 0.34
Maximum 1.35 2.95 15.36 1.94 8.48 1.00 0.81
Standard deviation 0.19 0.39 1.99 0.31 0.91 0.07 0.08
Fig. 4. An example of distance transform: (a) an example of pore blob in
the binary image of the membrane shown in Fig. 3g; (b) the distance
transformed image of (a): the pixel with the highest value marked in the
dark black box is the center of the virtual circle, the radius of the virtual
circle (shown as a dashed circle) is shown by a black arrow, which
represents the distance between the center to its closest edge point.
F.H. She et al. / Robotics and Computer-Integrated Manufacturing 24 (2008) 427–434432
Author's personal copy
5. Conclusions
In this work, we employed advanced image analysistechniques to characterize pore morphologies of porousfiltration membrane, focusing on measuring the effectivepore diameter and its distribution of PVDF porousmembrane together with other parameters.
The image analysis approach developed in this workallows data-intensive and comprehensive analysis ofmembrane pore morphologies by computing many para-meters including effective pore diameters. It is the effectivepore diameters that are actually responsible for the
membrane performance in both filtration and separation,specially, particle permeation performance. It was foundthat the proposed method is very efficient, fast andaccurate and the calibration is simple and straightforward.
Acknowledgments
Financial support provided for F.H. She to visit ChungYuan University and work on this project by AustralianAcademy of Science and National Science Council, ROC,under Scientific Visits to Taiwan Scheme is gratefullyacknowledged.
ARTICLE IN PRESS
Fig. 5. The distributions of the parameters of pore morphologies: (a) effective pore diameter, (b) area, (c) perimeter, (d) equivalent diameter based on the
same area as pore region, (e) shape factor, (f) solidity, and (g) extent.
F.H. She et al. / Robotics and Computer-Integrated Manufacturing 24 (2008) 427–434 433

Author's personal copy
References
[1] Nakao S. Determination of pore size and pore size distribution. 3:
filtration membranes. J Membr Sci 1994;96(1–2):131–65.
[2] Gijsbertsen-Abrahamse AJ, Van der Padt A, Boom RM. Influence of
membrane morphology on pore activation in membrane emulsifica-
tion. J Membr Sci 2003;217(1–2):141–50.
[3] Zeman L, Denault L. Characterization of microfiltration membranes
by image analysis of electron micrographs. Part I. Method develop-
ment. J Membr Sci 1992;71(3):221–31.
[4] Mietton-Peuchot M, Condat C, Courtois T. Use of gas–liquid
porometry measurements for selection of microfiltration membranes.
J Membr Sci 1997;133(1):73–82.
[5] Cuperus FP, Bargeman D, Smolders CA. Permporometry: the
determination of the size distribution of active pores in UF
membranes. J Membr Sci 1992;71(1–2):57–67.
[6] Mey-Marom A, Katz MG. Measurement of active pore size
distribution of microporous membranes—a new approach. J Membr
Sci 1986;27(2):119–30.
[7] Hemmler R, Bose G, Wagner R, Peters R. Nanopore unitary
permeability measured by electrochemical and optical single trans-
porter recording. Biophys J 2005;88(6):4000–7.
[8] Mulherkar P, Van Reis R. Flex test: a fluorescent dextran test for UF
membrane characterization. J Membr Sci 2004;236(1):171–82.
[9] Hilal N, Al-Zoubi H, Darwish NA, Mohammad AW. Characteriza-
tion of nanofiltration membranes using atomic force microscopy.
Desalination 2005;177(1–3):187–99.
[10] MathWorks. MatLab: the language of technical computing. Natick:
The MathWorks Inc.; 2004.
[11] Russ JC. The image processing handbook. 3rd ed., vol. 1. Raleigh:
CRC Press LLC; 1999. p. 771.
[12] Alhichri HS, Kamel M. Virtual circles: a new set of features for fast
image registration. Pattern Recognit Lett 2003;24(9–10):1181–90.
[13] Vincent L. Exact Euclidean distance function by chain propagations.
IEEE Comp Vis Pattern Recog 1991.
[14] Shih FY, Wu Y-T. Fast Euclidean distance transformation in two
scans using a 3� 3 neighborhood. Comput Vis Image Und
2004;93(2):195–205.
ARTICLE IN PRESSF.H. She et al. / Robotics and Computer-Integrated Manufacturing 24 (2008) 427–434434


