Embed Size (px)
Citation preview

Expenses (Excluding HST)
Total VisaCarRepairs Equipment $ 80,000 Bonding $ 150,000 Leased Equipment $ - Hot Mix Asphalt * $ 200,000 Asphalt Sealer ** $ 10,000 Striping Pant *** $ 20,000 Road Signs and Supplies * $ 25,000 Small Tools $ 20,000 Travel - on Jobs $ 80,000 Permits $ 3,000 Parking $ 1,000 Professional Fees $ 40,000 Insurance $ 70,000 Purchase Equipment $ - Paver * $ 330,000 Breakdown Roller * $ 65,000 Finish Roller * $ 65,000 3 Dump Trunk * $ 60,000 2 Pickup Truck $ 50,000 2 Van $ 40,000 Cold Planer/Milling Machine * $ 323,000 Material Transfer Vehicles (MTV) * $ 200,000 Excavator **** $ 75,000 Sealcoat Trailer ** $ 50,000 Striping Machine *** $ 15,000 3 Transport Trailer * $ 50,000
Operating expensesGas 60,000 Payroll - Labor Costs:Wages 694,000 Labor Costs:Workers Compensation Insurance 70,000 Desk 2,000 Bank Fees 5,000 Meals & Entertainment 4,000 QuickBooks Pro 840 Project Management Software with Intuit 600 Postage 1,500 Travel 6,000 Attorney Fees - Setting Up Limited Liability Company 200 State of Louisiana General Contractor License 600 Stationary 2,000 Post Office Box 150 Cell Phones 400 Business Cards 150 Brochures 300 2 Computers (Fully Loaded) 3,000 4-in-1 Printer/Fax/Copier/Scanner 4,000 Website 400 Internet 1,200

Start up costs(accountants use) 1,000 Payroll Taxes 138,800 Gifts & promotion 5,000 Sales Marketing and Other Expenses 9,800 Other Expenses 42,000 Research and Development 2,000
Home officeProperty Taxes 15,000 Utilities 6,000 Deposit plus First Rent 48,000
Total $ 3,145,940 $ -
1 2 3Property Taxes Expense Profit and Loss
Utilities Expense Profit and LossDeposit plus First Rent Expense Start-up/Profit and Loss
Gas Cost of Goods Sold Profit and LossPayroll Cost of Goods Sold Profit and Loss
Labor Costs:Wages Cost of Goods Sold Profit and Loss Labor Costs:Workers Compensation Insurance Cost of Goods Sold Profit and Loss
Desk Expense Profit and LossBank Fees Expense Profit and Loss
Meals & Entertainment Expense Profit and LossQuickBooks Pro Expense Profit and Loss
Project Management Software with Intuit Expense Profit and Loss Postage Expense Profit and Loss
Depreciation - Office Expense Profit and Loss Travel Expense Profit and Loss
Attorney Fees - Setting Up Limited Liability Company Expense Start-upState of Louisiana General Contractor License Expense Start-up
Stationary Expense Start-upPost Office Box Expense Start-up/Profit and Loss
Cell Phones Expense Start-up/Profit and LossBusiness Cards Expense Start-up/Profit and Loss
Brochures Expense Start-up/Profit and Loss2 Computers (Fully Loaded) Fixed Asset Balance Sheet
4-in-1 Printer/Fax/Copier/Scanner Fixed Asset Balance SheetWebsite Office Expense Start-up/Profit and LossInternet Office Expense Start-up/Profit and Loss
Start up costs(accountants use) Other Asset Balance SheetPayroll Taxes Other Current Liability Profit and Loss
Gifts & promotion Other Expense Profit and LossSales Marketing and Other Expenses Other Expense Profit and Loss
Other Expenses Other Expense Start-upResearch and Development Other Expense Start-up/Profit and Loss
Repairs Equipment Cost of Goods Sold Profit and LossBonding Cost of Goods Sold Profit and Loss
Leased Equipment Cost of Goods Sold Profit and LossHot Mix Asphalt * Cost of Goods Sold Profit and LossAsphalt Sealer ** Cost of Goods Sold Profit and LossStriping Pant *** Cost of Goods Sold Profit and Loss
Road Signs and Supplies * Cost of Goods Sold Profit and Loss

Depreciation - Job Equipment Cost of Goods Sold Profit and Loss Small Tools Cost of Goods Sold Profit and Loss
Travel - on Jobs Cost of Goods Sold Profit and Loss Permits Cost of Goods Sold Start-up/Profit and LossParking Expense Profit and Loss
Professional Fees Expense Profit and LossInsurance Expense Profit and Loss
Purchase Equipment Fixed Asset Balance SheetPaver * Fixed Asset Balance Sheet
Breakdown Roller * Fixed Asset Balance SheetFinish Roller * Fixed Asset Balance Sheet
3 Dump Trunk * Fixed Asset Balance Sheet2 Pickup Truck Fixed Asset Balance Sheet
2 Van Fixed Asset Balance SheetCold Planer/Milling Machine * Fixed Asset Balance Sheet
Material Transfer Vehicles (MTV) * Fixed Asset Balance SheetExcavator **** Fixed Asset Balance Sheet
Sealcoat Trailer ** Fixed Asset Balance SheetStriping Machine *** Fixed Asset Balance Sheet3 Transport Trailer * Fixed Asset Balance Sheet
Inventory Asset Other Current Asset Balance Sheet

Bank Cash Personal
$ 80,000 150,000 - 200,000 10,000 20,000 25,000 20,000 80,000 3,000 1,000 40,000 70,000 - 330,000 65,000 65,000 60,000 50,000 40,000 323,000 200,000 75,000 50,000 15,000 50,000
60,000 - 694,000 70,000 2,000 5,000 4,000 840 600 1,500 6,000 200 600 2,000 150 400 150 300 3,000 4,000 400 1,200

1,000 138,800 5,000 9,800 42,000 2,000
15,000 6,000 48,000
$ 3,145,940 $ - $ -
4Home officeHome officeHome officeOperating expensesOperating expensesOperating expensesOperating expensesOperating expensesOperating expensesOperating expensesOperating expensesOperating expensesOperating expensesOperating expensesOperating expensesOperating expensesOperating expensesOperating expensesOperating expensesOperating expensesOperating expensesOperating expensesOperating expensesOperating expensesOperating expensesOperating expensesOperating expensesOperating expensesOperating expensesOperating expensesOperating expensesOperating expensesProductProductProductProductProductProductProduct

ProductProductProductProductProductProductProductProductProductProductProductProductProductProductProductProductProductProductProductProductProduct

Account Type Business checking Account Bank Out of Pocket expenses Bank Accounts Receivable Accounts Receivable Inventory Asset Other Current Asset Retainage Receivable (Customer) Other Current Asset Undeposited Funds Other Current Asset Fixed Assets Fixed Asset Fixed Assets:Accumulated Depreciation Fixed Asset Fixed Assets:Office Furn & Equip Fixed Asset Fixed Assets:Store Equipment & Fixtures Fixed Asset Fixed Assets:Vehicles Fixed Asset Start up costs(accountants use) Other Asset Start up costs(accountants use):Accumulated Amortization Other Asset Accounts Payable Accounts Payable Retainage Payable (vendor) Accounts Payable Amercan Express Credit Card Credit Card Set up 1 CCard act for each CC Credit Card Payroll Liabilities Other Current Liability Payroll Liabilities:940 Payable Other Current Liability Payroll Liabilities:941 Payable Other Current Liability Payroll Liabilities:State Employment Tax Payable Other Current Liability Sales Tax Payable Other Current Liability Bank Loans Long Term Liability Shareholder/Owner loans Long Term Liability Capital Stock Equity Dividends Paid- Shareholder 1 Equity Dividends paid shareholder 2 Equity Opening Bal Equity Equity Retained Earnings Equity Discounts given on sales Income Sales Income Bid Deposit Cost of Goods Sold Bond Expense Cost of Goods Sold Cleaning and Trash Job site Cost of Goods Sold Depreciation - Job Equipment Cost of Goods Sold Equipment Rental Cost of Goods Sold Fuel Cost of Goods Sold Labor Costs Cost of Goods Sold Labor Costs:PR Taxes Paid Cost of Goods Sold Labor Costs:PR Taxes Paid:940 Cost of Goods Sold Labor Costs:PR Taxes Paid:941 Cost of Goods Sold Labor Costs:PR Taxes Paid:State Employment Taxes Cost of Goods Sold Labor Costs:Union Dues Paid Cost of Goods Sold Labor Costs:Wages Cost of Goods Sold

Labor Costs:Workers Compensation Insurance Cost of Goods Sold Material Cost of Goods Sold Permits Cost of Goods Sold Professional Fees Direct Job Cost of Goods Sold Repairs Equipment Cost of Goods Sold Small Tools Cost of Goods Sold Subcontractors Cost of Goods Sold Sundry Supplies Cost of Goods Sold Travel - on Jobs Cost of Goods Sold Amortization Expense Expense Automobile Expense Expense Bank Service Charges Expense Cleaning - office Expense Contributions Expense Depreciation - Office Expense Discounts taken on purchases Expense Dues and Subscriptions Expense Insurance Expense Insurance:Disability Insurance Expense / Expense Insurance:Liability Insurance Expense Insurance:Life Expense / Expense Interest Expense Expense Licenses and Permits Expense Meals & Entertainment Expense Office Expenses Expense Postage Expense Professional Fees Expense Professional Fees:Accounting Expense Professional Fees:Legal Fees Expense Rent Expense Repairs overhead Expense Salaries - Office Expense Salaries - Officer Expense Tax - State Corporate Tax Expense Telephone Expense Travel Expense Utilities Expense Interest Income Other Income Other Income Other Income Ask (acct's name)(acct phoneno) Other Expense Other Expenses Other Expense

Trial Balance Worksheet[Mmmm Dd, 200X]
General Ledger
Account BalanceAccount Name Debit Credit
Petty cash $0.00 Cash in checking $0.00 Cash in savings $0.00 Accounts receivable $0.00 Reserve for bad debts $0.00 Inventory $0.00 Prepaid insurance $0.00 Prepaid other expenses $0.00 Office supplies $0.00 Utility deposits $0.00 Notes receivable $0.00 Investments $0.00 Organization expense $0.00 Vehicles $0.00 Accumulated depreciation - vehicles $0.00 Furniture and fixtures $0.00 Accumulated depreciation - furniture and fixtures $0.00 Equipment $0.00 Accumulated depreciation - equipment $0.00 Buildings $0.00 Accumulated depreciation - buildings $0.00 Land $0.00 Goodwill $0.00 Other intangible assets $0.00 Accounts payable $0.00 Sales tax payable $0.00 Federal withholding taxes payable $0.00 FICA taxes payable $0.00 State withholding taxes payable $0.00 Unemployment taxes payable $0.00 Accrued wages $0.00 Unearned revenue $0.00 Accrued income taxes $0.00 Credit card payable $0.00 Bank loan payable $0.00 Notes payable $0.00 Owner's equity $0.00 Owner's drawing account $0.00 Common stock $0.00 Additional paid-in capital $0.00 Preferred stock $0.00 Retained earnings $0.00 Sales $0.00 Revenues $0.00 Sales returns and allowances $0.00 Investment income $0.00 Gain (loss) on sale of assets $0.00 $0.00 Purchases $0.00 Freight $0.00

Purchase returns and allowances $0.00 Cost of goods sold - materials $0.00 Cost of goods sold - labor $0.00 Cost of goods sold - direct expenses $0.00 Cost of goods sold - indirect expenses $0.00 Advertising $0.00 Amortization $0.00 Bad debt expense $0.00 Bank charges $0.00 Charitable contributions $0.00 Commissions expense $0.00 Contract labor $0.00 Credit card fees expense $0.00 Delivery expense $0.00 Depreciation $0.00 Dues and subscriptions $0.00 Entertainment $0.00 Insurance $0.00 Interest expense $0.00 Maintenance $0.00 Miscellaneous $0.00 Office expense $0.00 Operating supplies $0.00 Payroll taxes $0.00 Permits and licenses $0.00 Postage $0.00 Professional fees $0.00 Property taxes $0.00 Rent $0.00 Repairs $0.00 Telephone $0.00 Travel $0.00 Utilities $0.00 Vehicle expenses $0.00 Wages $0.00 Income taxes $0.00
Totals $0.00 $0.00
Difference $0.00

Start-up
Requirements
Start-up ExpensesAttorney Fees - Setting Up Limited Liability Company $0 State of Louisiana General Contractor License $580 Permits $200 Research and Development $2,000 Deposit plus First Rent $6,000 Post Office Box $100 Internet $240 Cell Phones $200 Stationary $400 Business Cards $150 Brochures $300 Website $400 Other $600 Total Start-up Expenses $11,170
Start-up AssetsCash Required $20,000 Other Current Assets $0 Long-term Assets $0 Total Assets $20,000
Total Requirements $31,170 12
$2,597.50

$ 40,000 $ 900,000 Contract Value $ 40,000 5 Years $ - $ 180,000 Annually $ 80,000 35% Percent
$ 63,000 2
$ 31,500
$ 143,000
$ 37,000 $ 185,000

Start-up FundingStart-up Expenses to Fund $11,170 Start-up Assets to Fund $20,000 Total Funding Required $31,170
Assets Non-cash Assets from Start-up $0 Cash Requirements from Start-up $20,000 Additional Cash Raised $0 Cash Balance on Starting Date $20,000 Total Assets $20,000
Liabilities and Capital
LiabilitiesCurrent Borrowing $0 Long-term Liabilities $0 Accounts Payable (Outstanding Bills) $0 Other Current Liabilities (interest-free) $0 Total Liabilities $0
Capital
Planned InvestmentSheldon Holder $31,170 Investor $0 Additional Investment Requirement $0 Total Planned Investment $31,170
Loss at Start-up (Start-up Expenses) ($11,170)Total Capital $20,000
Total Capital and Liabilities $20,000
Total Funding $31,170

Market Analysis Year 1 Year 2 Year 3 Year 4 Year 5
Potential Customers GrowthState & Local Government 9% 18,545 20,214 22,033 24,016 26,177Commercial Businesses 8% 21,455 23,171 25,025 27,027 29,189
8% 21,455 23,171 25,025 27,027 29,189
Other 0% 0 0 0 0 0Total 8.47% 61,455 66,556 72,083 78,070 84,555
Market Analysis Year 1 Year 2 Year 3 Year 4 Year 5
Potential Customers GrowthEducational 3% 200,000 250,000 300,000 262,656 269,222Health Care / Senior Facilities 0% 75,000 75,000 75,000 50,000 50,000Commercial 0% 30,000 30,000 30,000 30,000 30,000Government 0% 30,000 30,000 30,000 30,000 30,000Program Management 0% 5,000 5,000 5,000 5,000 5,000Contractor / Design Build 0% 5,000 5,000 5,000 5,000 5,000Sub Contracting 0% 5,000 5,000 5,000 5,000 5,000Total 3.02% 350,000 400,000 450,000 387,656 394,222
Healthcare and Higher Education

CAGR9.00%8.00%
8.00%
0.00%8.47%
CAGR7.71%
-9.64%0.00%0.00%0.00%0.00%0.00%3.02%

Sales ForecastSales Year 1 Year 2 Year 3 State & Local Government $ 2,521,000 $ 7,563,000 $ 15,126,000 Commercial Businesses $ 793,000 $ 2,379,000 $ 4,758,000
$ 684,000 $ 2,052,000 $ 4,104,000 Total Sales $ 3,998,000 $ 11,994,000 $ 23,988,000
Cost of Goods Sold Year 1 Year 2 Year 3 State & Local Government $ 630,250 $ 1,890,750 $ 3,781,500 Commercial Businesses $ 198,250 $ 594,750 $ 1,189,500
$ 171,000 $ 513,000 $ 1,026,000
Subtotal Direct Cost of Sales $ 999,500 $ 2,998,500 $ 5,997,000
$ 3,780,000 $ 11,340,000 $ 22,680,000 $ 793,000 $ 2,379,000 $ 4,758,000 $ 684,000 $ 2,052,000 $ 4,104,000
$ 945,000 $ 2,835,000 $ 5,670,000 $ 198,250 $ 594,750 $ 1,189,500 $ 171,000 $ 513,000 $ 1,026,000
Sales ForecastSales Year 1 Year 2 Year 3Educational $199,992.00 $250,000.00 $238,304.00Health Care / Senior Facilities $75,000.00 $75,000.00 $99,188.00Commercial $30,000.00 $30,000.00 $39,675.00Government $30,000.00 $30,000.00 $39,675.00Program Management $4,980.00 $5,727.00 $6,586.00Contractor / design Build $4,980.00 $5,229.00 $5,490.00Consulting Income $4,800.00 $4,800.00 $4,800.00Total Sales $349,752.00 $400,756.00 $433,718.00
Direct Cost of Sales $2,004.00 $2,005.00 $2,006.00See Personnel Table $0.00 $0.00 $0.00Other $0.00 $0.00 $0.00Subtotal Direct Cost of Sales $0.00 $0.00 $0.00
Healthcare and Higher Education
Healthcare and Higher Education

12 $ 333,166.67

MilestonesMilestone Start Date End Date BudgetFile LLC 1/11/2016 2/12/2016 $200.00Request for Tax ID 1/11/2016 2/12/2016 $0.00Verify Numbers For Budget 1/11/2016 2/12/2016 $0.00Identify Office Location 1/11/2016 2/12/2016 $0.00Business plan completion 1/11/2016 2/12/2016 $0.00Apply for Bank Loan 1/11/2016 2/12/2016 $0.00Finalize Application for Insurance Coverages 1/11/2016 2/12/2016 $0.00Finalize Lease Agreement 1/11/2016 4/2/2016 $7,000.00
Move Into Offices and Prepare for Site Survey 1/11/2016 4/12/2016 $0.00
Site Survey 1/11/2016 4/12/2016 $0.00
1/11/2016 4/29/2016 $0.00
1/11/2016 5/16/2016 $0.00
Hold First All Staff Meeting 1/11/2016 5/18/2016 $0.00Profitability 1/11/2016 12/31/2016 $0.00Totals $7,200.00
MilestonesMilestone Start Date End Date BudgetBusiness Plan 10/15/2003 1/15/2004 $0.00Secure line of credit 10/15/2003 1/15/2004 $0.00Accounting Plan 10/1/2003 2/1/2004 $0.00Professional Licensing Plan 1/1/2004 2/1/2004 $0.00Press Release 10/1/2003 2/1/2004 $0.00Networking Plan 10/1/2003 2/1/2004 $0.00Engineering proposal guides 10/1/2003 3/1/2004 $0.00Client Presentations Plan 10/1/2003 3/1/2004 $0.00Write / Update Mailer 1/1/2004 3/15/2004 $0.00Review / Revise Brochure 10/1/2003 3/15/2004 $0.00Client Contact Plan 10/1/2003 3/15/2004 $0.00Advertising Campaign Plan 10/1/2003 3/15/2004 $0.00Contract Guideline / Samples 1/1/2004 3/15/2004 $0.00Initiate Direct Mailer Plan 1/1/2004 3/31/2004 $0.00Weekly Sales meetings 1/1/2004 12/31/2004 $0.00Internet up and running 10/1/2003 12/31/2004 $0.00Regular check DGS & other sites 1/1/2004 12/31/2004 $0.00Weekly check PitCon Listings 1/1/2004 12/31/2004 $0.00Totals $0.00
Develop/Finalize all forms, procedures, employment contractsHiring three full-time employees and training them
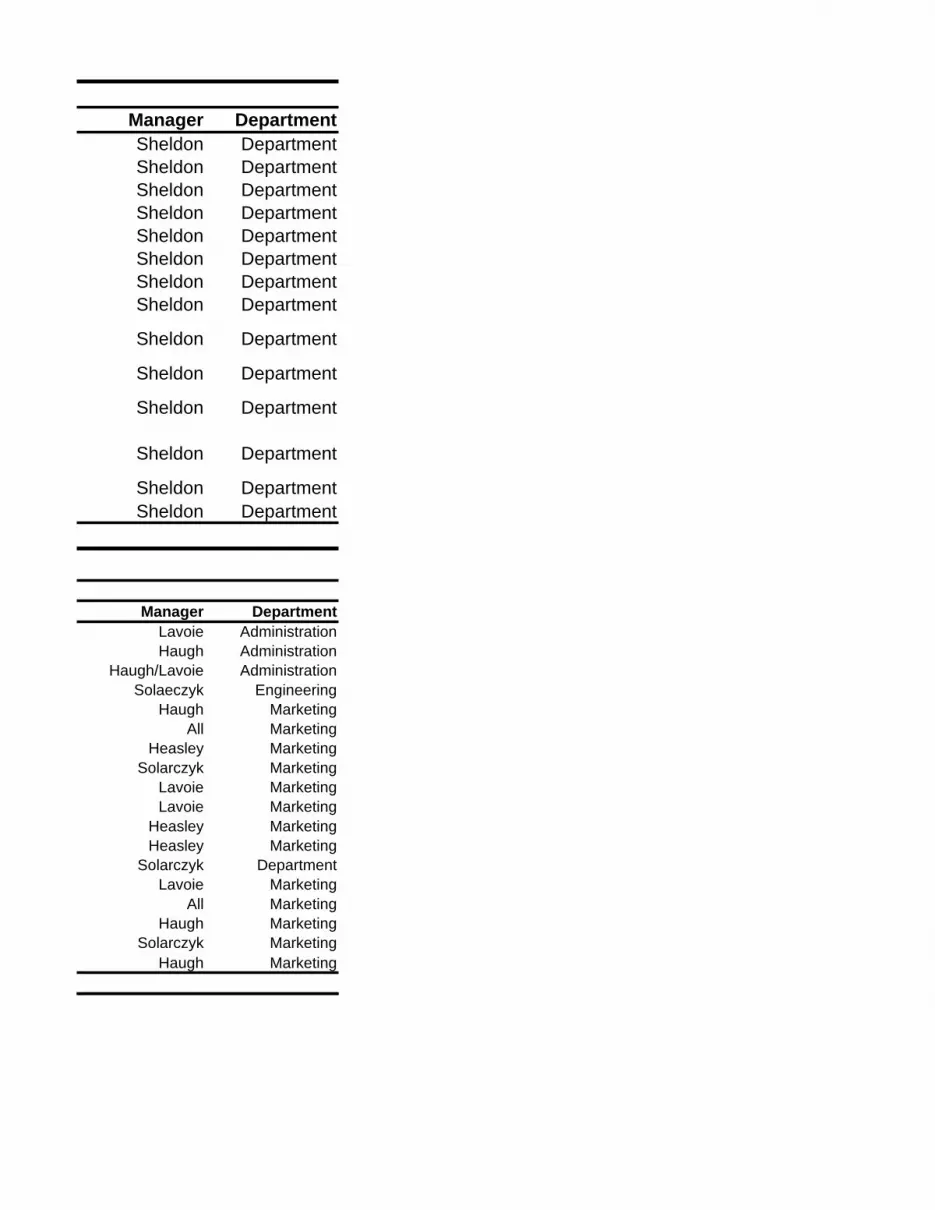
Manager DepartmentSheldon DepartmentSheldon DepartmentSheldon DepartmentSheldon DepartmentSheldon DepartmentSheldon DepartmentSheldon DepartmentSheldon Department
Sheldon Department
Sheldon Department
Sheldon Department
Sheldon Department
Sheldon DepartmentSheldon Department
Manager DepartmentLavoie AdministrationHaugh Administration
Haugh/Lavoie AdministrationSolaeczyk Engineering
Haugh MarketingAll Marketing
Heasley MarketingSolarczyk Marketing
Lavoie MarketingLavoie Marketing
Heasley MarketingHeasley Marketing
Solarczyk DepartmentLavoie Marketing
All MarketingHaugh Marketing
Solarczyk MarketingHaugh Marketing

Personnel Plan2016 2017
Mr. Sheldon Holder, CEO $0.00 $60,000 Mrs. Stephanie James, Vice President of Operations $0.00 $60,000 Mr. Mark Smith, Vice President of Business Development $0.00 $60,000 Mr. Lonnie Sandifer, Vice President of Construction $0.00 $60,000 Mr. Randall Louis, General Project Manager $0.00 $60,000 Mrs. De'Osher Holder, Finance Manager $0.00 $60,000 Job Supervisor $130,000 $195,000 Temporary employees $564,000 $846,000 Total People 24 33
Total Payroll $694,000 $1,401,000
2 318 27
23 32

$ 120 2018 12
$60,000 $ 1,440 $60,000 $60,000 $60,000 $60,000 $60,000
$325,000 $1,410,000
51
$2,095,000
9 Members 1 Foreman $ 65,000 5 Teams 1 Truck Operator $ 46,000
45 1 Superintendent $ 40,000 5 Corporate Members 1 Paver Operator $ 40,000
50 1 Roller Operator $ 40,000 4 Labor $ 116,000 9 $ 347,000
$ 282,000

$ 14 40
52 $ 29,120

General Assumptions
2016 2017 2018Plan Month 1 2 3Current Interest Rate 10.00% 10.00% 10.00%Long-term Interest Rate 10.00% 10.00% 10.00%Tax Rate 30.00% 30.00% 30.00%Other 0 0 0

Break-even Analysis
Monthly Revenue Break-even $64,451
Assumptions:Average Percent Variable Cost 72%
Estimated Monthly Fixed Cost $18,043
Create a graph that I can edit like this one ------>


Depreciation
Asset Purchase price Rate 1/2 Year Rule CCARoad Signs and Supplies * $ 25,000 100% 12,500 12,500 Small Tools $ 20,000 100% 10,000 10,000 Paver * $ 330,000 100% 165,000 165,000 Breakdown Roller * $ 65,000 100% 32,500 32,500 Finish Roller * $ 65,000 100% 32,500 32,500 3 Dump Trunk * $ 60,000 100% 30,000 30,000 2 Pickup Truck $ 50,000 100% 25,000 25,000 2 Van $ 40,000 100% 20,000 20,000 Cold Planer/Milling Machine * $ 323,000 100% 161,500 161,500 Material Transfer Vehicles (MTV) * $ 200,000 100% 100,000 100,000 Excavator **** $ 75,000 100% 37,500 37,500 Sealcoat Trailer ** $ 50,000 100% 25,000 25,000 Striping Machine *** $ 15,000 100% 7,500 7,500 3 Transport Trailer * $ 50,000 100% 25,000 25,000 Desk $ 2,000 20% 1,000 200 QuickBooks Pro $ 840 100% 420 420 Project Management Software with Intuit $ 600 100% 300 300 Cell Phones $ 400 100% 200 200 2 Computers (Fully Loaded) $ 3,000 55% 1,500 825 4-in-1 Printer/Fax/Copier/Scanner $ 4,000 55% 2,000 1,100
Total $ 687,045 Purchase Equipment

$ 25,545 Leased Equipment

Pro Forma Profit and Loss Year 1 Year 2 Year 3
Sales $3,998,000 $11,994,000 $23,988,000 Cost Of Goods Sold $999,500 $2,998,500 $5,997,000 Other Production Expenses $0 $0 $0 Total Cost of Sales $999,500 $2,998,500 $5,997,000
Gross Margin $2,998,500 $8,995,500 $17,991,000 Leased Equipment $500,000 $600,000 $700,000
Gross Margin % 75.00% 75.00% 75.00% $900,000 $900,000 $900,000
ExpensesPayroll $694,000 $1,401,000 $2,095,000 Paver * $ 330,000 PurchasePayroll Taxes $138,800 $280,200 $419,000 20.00% 20.00% 20.00% Breakdown Roller * $ 65,000 RentDepreciation $24,704 $30,632 $35,573 0.2000 0.2000 0.2000 Finish Roller * $ 65,000 RentRent $2,400 $3,600 $3,600 $138,800.00 $280,200.00 $419,000.00 Dump Trunk * $ 40,000 RentUtilities $4,000 $4,000 $4,000 Cold Planer/Milling Machine * $ 323,000 PurchaseSales Marketing and Other Expenses $22,000 $22,000 $22,000 Material Transfer Vehicles (MTV) * $ 200,000 RentInsurance $70,000 $70,000 $70,000 Excavator **** $ 75,000 RentBonding $150,000 $150,000 $150,000 Sealcoat Trailer ** $ 50,000 PurchaseLeased Equipment $494,813 $494,813 $494,813 Striping Machine *** $ 15,000 PurchaseConstruction Equipment and Supplies $164,690 $49,407 $49,407 Transport Trailer * $ 20,000 PurchaseOther $20,000 $20,000 $20,000 Hot Mix Asphalt * $ 60,000 PurchaseTotal Operating Expenses $1,785,407 $2,525,653 $3,363,393 Asphalt Sealer ** $ 3,000 Purchase
Striping Pant *** $ 15,000 PurchaseProfit Before Interest and Taxes $1,213,093 $6,469,847 $14,627,607 Road Signs and Supplies * $ 25,000 PurchaseEBITDA $1,213,093 $6,469,847 $14,627,607 Interest Expense $4,000 $4,000 $4,000 2 Computers (Fully Loaded) $ 2,500 Taxes Incurred $363,928 $1,940,954 $4,388,282 4-in-1 Printer/Fax/Copier/Scanner $ 750
QuickBooks Pro $ 840 Net Profit $845,165 $4,524,893 $10,235,325 Project Management Software with Intuit $ 600 Net Profit/Sales 21.14% 37.73% 42.67%
27.36% 25.71% 25.40%30.00% 30.00% 30.00%
Use the statement above. The statement below can be use for additional information.
Income Statement
SALES $ - ----excluding HST
EXPENSES ----excluding HST
Depreciation -
CarRepairs Equipment 600 Bonding 1,500 Leased Equipment 509,813 Hot Mix Asphalt * 200 Asphalt Sealer ** 600 Striping Pant *** 2,000 Road Signs and Supplies * 150 Small Tools 400 Travel - on Jobs 150 Permits 300 Parking 3,000 Professional Fees 4,000 Insurance 400 Purchase Equipment Purchase Equipment Leased EquipmentPaver * 1,000 129,800.00 Breakdown Roller * 138,800 25,566.67 Finish Roller * 5,000 25,566.67 3 Dump Trunk * 9,800 15,733.33 2 Pickup Truck 42,000 11,800.00 2 Van 2,000 11,800.00 Cold Planer/Milling Machine * - 127,046.67 Material Transfer Vehicles (MTV) * - 78,666.67 Excavator **** 15,000 29,500.00 Sealcoat Trailer ** 6,000 19,666.67 Striping Machine *** 48,000 15,000.00 3 Transport Trailer * - 19,666.67
267,600.00 509,813.33 Operating expensesGas - Payroll 2 Labor Costs:Wages Expense Labor Costs:Workers Compensation Insurance Expense Desk Expense Bank Fees Cost of Goods Sold Meals & Entertainment Cost of Goods Sold QuickBooks Pro Cost of Goods Sold Project Management Software with Intuit Cost of Goods Sold Postage Expense Travel Expense Attorney Fees - Setting Up Limited Liability Company Expense State of Louisiana General Contractor License Expense Stationary Expense Post Office Box Expense Cell Phones Expense Business Cards Expense Brochures Expense 2 Computers (Fully Loaded) Expense 4-in-1 Printer/Fax/Copier/Scanner Expense Website Expense Internet Expense Start up costs(accountants use) Expense Payroll Taxes Expense Gifts & promotion Fixed Asset Sales Marketing and Other Expenses Fixed Asset Other Expenses Office Expense Research and Development Office Expense
Home officeProperty Taxes Other Expense Utilities Other Expense Deposit plus First Rent Other Expense
$523,115.33
Profit Before Interest and Taxes (EBITDA) $523,115.33INCOME TAXES $156,934.60 ----per T2 returnNET PROFIT $680,049.93
Construction Equipment and Supplies

Pro Forma Balance Sheet
Assets Year 1 Year 2 Year 3
Current AssetsCash $3,732,593 $14,700,940 $36,825,547 Other Current Assets $0 $0 $0 Total Current Assets $3,732,593 $14,700,940 $36,825,547
Long-term AssetsLong-term Assets $0 $0 $0 Accumulated Depreciation $24,704 $30,632 $35,573 Total Long-term Assets ($24,704) ($30,632) ($35,573)Total Assets $3,707,890 $14,670,308 $36,789,974
Liabilities and Capital Year 1 Year 2 Year 3
Current LiabilitiesAccounts Payable $1,785,407 $2,525,653 $3,363,393 Current Borrowing $0 $0 $0 Other Current Liabilities $0 $0 $0 Subtotal Current Liabilities $1,785,407 $2,525,653 $3,363,393
Long-term Liabilities $0 $0 $0 Total Liabilities $1,785,407 $2,525,653 $3,363,393
Paid-in Capital $31,170 $31,170 $31,170Retained Earnings -$11,170 $833,995 $5,358,888Earnings $845,165 $4,524,893 $10,235,325Total Capital $865,165 $5,390,058 $15,625,383Total Liabilities and Capital $2,650,572 $7,915,711 $18,988,776
Net Worth $865,165 $5,390,058 $15,625,383
$1,057,318 $6,754,597 $17,801,198

$ 2,722
$ 10,800 $ 21,300 $ 21,300 $ 2,160 $ 6,420 $ 10,680 20% 30% 50% $ 8,640 $ 14,880 $ 10,620 $ 11,362 $ 39,278 $ 73,972
$ 8,640 $ 11,362 $ 10,500
-$243 $1,597 $1,414
$40,000 $40,000 $40,000-$400 -$28,395 -$2,319 $ (28,395)
-$27,995 $26,076 $34,878$11,605 $37,681 $72,559$11,362 $39,278 $73,972
$ 243 $ (1,597) $ (1,413)
$ 11,362 $ 39,278 $ 73,973

Pro Forma Cash Flow Year 1 Year 2 Year 3
Cash Received $ 20,000 $3,732,593 $14,700,940
Cash from OperationsCash Sales $3,998,000 $11,994,000 $23,988,000 Cash from Receivables $0 $0 $0 Subtotal Cash from Operations $3,998,000 $11,994,000 $23,988,000
Additional Cash ReceivedSales Tax, VAT, HST/GST Received $0 $0 $0 New Current Borrowing $1,500,000 $1,500,000 $1,500,000 New Other Liabilities (interest-free) $0 $0 $0 New Long-term Liabilities $0 $0 $0 Sales of Other Current Assets $0 $0 $0 Sales of Long-term Assets $0 $0 $0 New Investment Received $0 $0 $0 Subtotal Cash Received $5,498,000 $13,494,000 $25,488,000
Expenditures Year 1 Year 2 Year 3
Expenditures from OperationsCash Spending $694,000 $1,401,000 $2,095,000 Bill Payments $1,091,407 $1,124,653 $1,268,393 Subtotal Spent on Operations $1,785,407 $2,525,653 $3,363,393
Additional Cash SpentSales Tax, VAT, HST/GST Paid Out $0 $0 $0
$0 $0 $0
Other Liabilities Principal Repayment $0 $0 $0
$0 $0 $0
Purchase Other Current Assets $0 $0 $0 Purchase Long-term Assets $0 $0 $0 Dividends $0 $0 $0 Subtotal Cash Spent $1,785,407 $2,525,653 $3,363,393
Net Cash Flow $3,712,593 $10,968,347 $22,124,607 Cash Balance $3,732,593 $14,700,940 $36,825,547
Principal Repayment of Current Borrowing
Long-term Liabilities Principal Repayment

$ 84,558.00
$ 168,728.00 $ 147,052.00 $ 21,676.00
$ 24,398.00 $ 2,722.00
$ 59,680.00 $ 85,758.00 $ (26,078.00)
$ 62,880.00
$ 3,200.00
$ 33,602.00

Ratio Analysis
Year 1 Year 2 Year 3
Sales Growth n.a. 10.89% 11.04% 3.71%
Percent of Total AssetsAccounts Receivable 43.51% 27.05% 19.52% 21.90%Other Current Assets 1.66% 0.93% 0.61% 45.48%Total Current Assets 100.00% 100.00% 100.00% 69.58%Long-term Assets 0.00% 0.00% 0.00% 30.42%Total Assets 100.00% 100.00% 100.00% 100.00%
Current Liabilities 8.66% 4.25% 2.99% 35.62%Long-term Liabilities 23.74% 13.31% 8.65% 21.27%Total Liabilities 32.40% 17.56% 11.63% 56.89%Net Worth 67.60% 82.44% 88.37% 43.11%
Percent of SalesSales 100.00% 100.00% 100.00% 100.00%Gross Margin 94.43% 94.86% 95.26% 100.00%
63.87% 67.34% 66.75% 85.34%
Advertising Expenses 0.00% 0.00% 0.00% 0.70%
Profit Before Interest and Taxes 48.54% 50.63% 54.66% 0.35%
Main RatiosCurrent 11.54 23.51 33.49 1.52Quick 11.54 23.51 33.49 1.2
Total Debt to Total Assets 32.40% 17.56% 11.63% 62.84%
Pre-tax Return on Net Worth 144.76% 77.18% 56.25% 1.09%
Pre-tax Return on Assets 97.86% 63.62% 49.71% 2.93%
Additional Ratios Year 1 Year 2 Year 3Net Profit Margin 33.33% 34.86% 37.74% n.aReturn on Equity 101.33% 54.02% 39.38% n.a
Activity Ratios
Accounts Receivable Turnover 4.72 4.72 4.72 n.a
Collection Days 57 73 73 n.aAccounts Payable Turnover 9.83 12.17 12.17 n.aPayment Days 27 32 29 n.aTotal Asset Turnover 2.06 1.28 0.92 n.a
Industry Profile
Selling, General & Administrative Expenses

Debt RatiosDebt to Net Worth 0.48 0.21 0.13 n.aCurrent Liab. to Liab. 0.27 0.24 0.26 n.a
Liquidity RatiosNet Working Capital $192,408 $359,745 $560,927 n.aInterest Coverage 52.54 60.76 72.85 n.a
Additional Ratios
Assets to Sales 0.49 0.78 1.08 n.aCurrent Debt/Total Assets 9% 4% 3% n.aAcid Test 6.52 17.15 26.96 n.aSales/Net Worth 3.04 1.55 1.04 n.aDividend Payout 0 0 0 n.a

Ratio Analysis
Year 1 Year 2 Year 3
Sales Growth n.a. 182.72% 8.22% 7.50%
Percent of Total AssetsAccounts Receivable 0% 0% 0% 0%Other Current Assets 0.00% 0.00% 0.00% 29.80%Total Current Assets 23.96% 62.12% 85.64% 67.00%Long-term Assets 76.04% 37.88% 14.36% 33.00%Total Assets 100.00% 100.00% 100.00% 100.00%
Current Liabilities -2.14% 4.07% 1.91% 43.50%Long-term Liabilities 0.00% 0.00% 0.00% 14.10%Total Liabilities -2.14% 4.07% 1.91% 57.60%Net Worth 102.14% 95.93% 98.09% 42.40%
Percent of SalesSales 100.00% 100.00% 100.00% 100.00%Gross Margin 90.00% 90.00% 90.00% 29.40%
141.12% 74.62% 71.00% 15.50%
Advertising Expenses 1.21% 0.41% 0.38% 0.30%
-47.02% 21.97% 27.14% 2.40%
Main RatiosCurrent -11.2 15.28 44.81 1.55Quick -11.2 15.28 44.81 1.17
-2.14% 4.07% 1.91% 57.60%
-241.23% 98.86% 68.67% 6.50%
Pre-tax Return on Assets -246.39% 94.84% 67.36% 15.40%
Additional Ratios Year 1 Year 2 Year 3Net Profit Margin -46.91% 15.45% 19.10% n.aReturn on Equity -241.23% 69.20% 48.07% n.a
Activity Ratios
23.65 12.17 12.17 n.a
Payment Days 27 19 29 n.aTotal Asset Turnover 5.25 4.3 2.47 n.a
Debt Ratios
Industry Profile
Selling, General & Administrative Expenses
Profit Before Interest and Taxes
Total Debt to Total AssetsPre-tax Return on Net Worth
Accounts Payable Turnover

Debt to Net Worth -0.02 0.04 0.02 n.aCurrent Liab. to Liab. 0 1 1 n.a
Liquidity RatiosNet Working Capital $2,965 $22,801 $61,938 n.aInterest Coverage 0 0 0 n.a
Additional RatiosAssets to Sales 0.19 0.23 0.41 n.a
-2% 4% 2% n.a
Acid Test 0 15.28 44.81 n.aSales/Net Worth 5.14 4.48 2.52 n.aDividend Payout 0 0 0 n.a
Current Debt/Total Assets

Sales Forecast
Sales Month 1 Month 2 Month 3State & Local Government 63% $210,083 $210,083 $210,083Commercial Businesses 20% $0 $0 $99,125
17% $0 $0 $85,500Total Sales $210,083 $210,083 $394,708
Direct Cost of Sales Month 1 Month 2 Month 3State & Local Government $52,521 $52,521 $52,521Commercial Businesses $0 $0 $24,781
$0 $0 $21,375
Subtotal Direct Cost of Sales $52,521 $52,521 $98,677
Sales Forecast 12 MonthsSales Year 1 8 MonthsState & Local Government $ 2,521,000 $ 210,083.33 Commercial Businesses $ 793,000 $ 99,125.00
$ 684,000 $ 85,500.00 Total Sales $ 3,998,000
Direct Cost of Sales Year 1 State & Local Government $ 630,250 $ 52,521 Commercial Businesses $ 198,250 $ 24,781
$ 171,000 $ 21,375
Subtotal Direct Cost of Sales $ 999,500
Healthcare and Higher Education
Healthcare and Higher Education
Healthcare and Higher Education
Healthcare and Higher Education

Month 4 Month 5 Month 6 Month 7 Month 8 Month 9 Month 10$210,083 $210,083 $210,083 $210,083 $210,083 $210,083 $210,083$99,125 $99,125 $99,125 $99,125 $99,125 $99,125 $99,125
$85,500 $85,500 $85,500 $85,500 $85,500 $85,500 $85,500$394,708 $394,708 $394,708 $394,708 $394,708 $394,708 $394,708
Month 4 Month 5 Month 6 Month 7 Month 8 Month 9 Month 10$52,521 $52,521 $52,521 $52,521 $52,521 $52,521 $52,521$24,781 $24,781 $24,781 $24,781 $24,781 $24,781 $24,781
$21,375 $21,375 $21,375 $21,375 $21,375 $21,375 $21,375
$98,677 $98,677 $98,677 $98,677 $98,677 $98,677 $98,677

Month 11 Month 12 Total$210,083 $210,083 $2,521,000
$0 $0 $793,000
$0 $0 $684,000$210,083 $210,083 $3,998,000
Month 11 Month 12 Total$52,521 $52,521 $630,250
$0 $0 $198,250
$0 $0 $171,000
$52,521 $52,521 $999,500

Personnel Plan
Month 1
Mr. Sheldon Holder, CEO 0% $0 Mrs. Stephanie James, Vice President of Operations 0% $0 Mr. Mark Smith, Vice President of Business Development 0% $0 Mr. Lonnie Sandifer, Vice President of Construction 0% $0 Mr. Randall Louis, General Project Manager 0% $0 Mrs. De'Osher Holder, Finance Manager 0% $0 Job Supervisor 0% $10,833 Temporary employees 0% $0 Total People 24
Total Payroll $10,833
12Personnel Plan 8
2016Mr. Sheldon Holder, CEO $0.00 $0.00Mrs. Stephanie James, Vice President of Operations $0.00 $0.00Mr. Mark Smith, Vice President of Business Development $0.00 $0.00Mr. Lonnie Sandifer, Vice President of Construction $0.00 $0.00Mr. Randall Louis, General Project Manager $0.00 $0.00Mrs. De'Osher Holder, Finance Manager $0.00 $0.00Job Supervisor $130,000 $10,833.33Temporary employees $564,000 $70,500.00Total People 24
Total Payroll $694,000

Month 2 Month 3 Month 4 Month 5 Month 6 Month 7 Month 8 Month 9
$0 $0 $0 $0 $0 $0 $0 $0 $0 $0 $0 $0 $0 $0 $0 $0 $0 $0 $0 $0 $0 $0 $0 $0 $0 $0 $0 $0 $0 $0 $0 $0 $0 $0 $0 $0 $0 $0 $0 $0 $0 $0 $0 $0 $0 $0 $0 $0 $0 $0 $0 $0 $0 $0
$10,833 $10,833 $10,833 $10,833 $10,833 $10,833 $10,833 $10,833 $10,833 $0 $70,500 $70,500 $70,500 $70,500 $70,500 $70,500 $70,500 $70,500 24 24 24 24 24 24 24 24 24
$10,833 $81,333 $81,333 $81,333 $81,333 $81,333 $81,333 $81,333 $81,333
MonthsMonths
1111112
1624
Month 10

Total
$0 $0 $0 $0 $0 $0 $0 $0 $0 $0 $0 $0 $0 $0 $0 $0 $0 $0
$10,833 $10,833 $130,000 $0 $0 $564,000 24 24 24
$10,833 $10,833 $694,000
Month 11
Month 12

Plan Month 1 2 3 4 5 6
10.00% 10.00% 10.00% 10.00% 10.00% 10.00%
10.00% 10.00% 10.00% 10.00% 10.00% 10.00%
Tax Rate 30.00% 30.00% 30.00% 30.00% 30.00% 30.00%Other 0 0 0 0 0 0
2016Plan Month 1
10.00%
10.00%
Tax Rate 30.00%Other 0
General Assumptions
Month 1
Month 2
Month 3
Month 4
Month 5
Month 6
Current Interest RateLong-term Interest Rate
General Assumptions
Current Interest RateLong-term Interest Rate

7 8 9 10 11 12
10.00% 10.00% 10.00% 10.00% 10.00% 10.00%
10.00% 10.00% 10.00% 10.00% 10.00% 10.00%
30.00% 30.00% 30.00% 30.00% 30.00% 30.00%0 0 0 0 0 0
Month 7
Month 8
Month 9
Month 10
Month 11
Month 12

Pro Forma Profit and Loss Month 1 Month 2 Month 3
Sales $0 $0 $499,750 Direct Cost of Sales $0 $0 $124,938 Other Production Expenses $0 $0 $0 Total Cost of Sales $0 $0 $124,938
Gross Margin $0 $0 $374,813 Gross Margin % 0% 0% 75%
ExpensesPayroll $10,833 $10,833 $81,333 Payroll Taxes 20% $2,167 $2,167 $16,267Depreciation $2,059 $2,059 $2,059 Rent $200 $200 $200 Utilities $333 $333 $333
$0 $0 $2,750
Insurance $5,833 $5,833 $5,833 Bonding $12,500 $12,500 $12,500 Leased Equipment $0 $0 $61,852
$0 $0 $20,586
Other $1,667 $1,667 $1,667 Total Operating Expenses $148,784 $148,784 $148,784
Profit Before Interest and Taxes $101,091 $101,091 $101,091 EBITDA $101,091 $101,091 $101,091 Interest Expense $333 $333 $333 Taxes Incurred $30,327 $30,327 $30,327
Net Profit $70,430 $70,430 $70,430 Net Profit/Sales 14.09% 14.09% 14.09%
Pro Forma Profit and Loss 8 Months Year 1 12 Months
Sales $3,998,000 $499,750Direct Cost of Sales $999,500 $124,938Other Production Expenses $0 $0Total Cost of Sales $999,500 $124,938
Gross Margin $2,998,500 $374,813Gross Margin % 75.00% 75.00%
Sales Marketing and Other Expenses
Construction Equipment and Supplies

Expenses $130,000 $10,833.33Payroll $694,000 $57,833 $564,000 $70,500.00Payroll Taxes $138,800 $11,567Depreciation $24,704 $2,059Rent $2,400 $200Utilities $4,000 $333
$22,000 $2,750Insurance $70,000 $5,833Bonding $150,000 $12,500Leased Equipment $494,813 $61,852
$164,690 $20,586Other $20,000 $1,667Total Operating Expenses $1,785,407 $148,784
Profit Before Interest and Taxes $1,213,093 $101,091EBITDA $1,213,093 $101,091 Interest Expense $4,000 $333 Taxes Incurred $363,928 $30,327
Net Profit $845,165 $70,430Net Profit/Sales 21.14% 14.09%
Sales Marketing and Other Expenses
Construction Equipment and Supplies

Month 4 Month 5 Month 6 Month 7 Month 8 Month 9 Month 10$499,750 $499,750 $499,750 $499,750 $499,750 $499,750 $499,750 $124,938 $124,938 $124,938 $124,938 $124,938 $124,938 $124,938
$0 $0 $0 $0 $0 $0 $0 $124,938 $124,938 $124,938 $124,938 $124,938 $124,938 $124,938
$374,813 $374,813 $374,813 $374,813 $374,813 $374,813 $374,813 75% 75% 75% 75% 75% 75% 75%
$81,333 $81,333 $81,333 $81,333 $81,333 $81,333 $81,333 $16,267 $16,267 $16,267 $16,267 $16,267 $16,267 $16,267$2,059 $2,059 $2,059 $2,059 $2,059 $2,059 $2,059
$200 $200 $200 $200 $200 $200 $200 $333 $333 $333 $333 $333 $333 $333
$2,750 $2,750 $2,750 $2,750 $2,750 $2,750 $2,750
$5,833 $5,833 $5,833 $5,833 $5,833 $5,833 $5,833 $12,500 $12,500 $12,500 $12,500 $12,500 $12,500 $12,500 $61,852 $61,852 $61,852 $61,852 $61,852 $61,852 $61,852
$20,586 $20,586 $20,586 $20,586 $20,586 $20,586 $20,586
$1,667 $1,667 $1,667 $1,667 $1,667 $1,667 $1,667 $148,784 $148,784 $148,784 $148,784 $148,784 $148,784 $148,784
$101,091 $101,091 $101,091 $101,091 $101,091 $101,091 $101,091 $101,091 $101,091 $101,091 $101,091 $101,091 $101,091 $101,091
$333 $333 $333 $333 $333 $333 $333 $30,327 $30,327 $30,327 $30,327 $30,327 $30,327 $30,327
$70,430 $70,430 $70,430 $70,430 $70,430 $70,430 $70,430 14.09% 14.09% 14.09% 14.09% 14.09% 14.09% 14.09%

Month 11 Month 12 Total$0 $0 $3,998,000 $0 $0 $999,500 $0 $0 $0 $0 $0 $999,500
$0 $0 $2,998,500 0% 0% 75%
$10,833 $10,833 $694,000 $2,167 $2,167 $138,800 $2,059 $2,059 $24,704
$200 $200 $2,400 $333 $333 $4,000
$0 $0 $22,000 $5,833 $5,833 $70,000
$12,500 $12,500 $150,000 $0 $0 $494,813
$0 $0 $164,690 $1,667 $1,667 $20,000
$148,784 $148,784 $1,785,407
$101,091 $101,091 $1,213,093 $101,091 $101,091 $1,213,093
$333 $333 $4,000 $30,327 $30,327 $363,928
$70,430 $70,430 $845,165 14.09% 14.09% 14.09%

Pro Forma Cash Flow Month 1 Month 2
Cash Received $20,000 $128,784
Cash from OperationsCash Sales $0 $0 Cash from Receivables $0 $0 Subtotal Cash from Operations $0 $0
Additional Cash ReceivedSales Tax, VAT, HST/GST Received 0.00% $0 $0 New Current Borrowing $0 $0 New Other Liabilities (interest-free) $0 $0 New Long-term Liabilities $0 $0 Sales of Other Current Assets $0 $0 Sales of Long-term Assets $0 $0 New Investment Received $0 $0 Subtotal Cash Received $0 $0
Expenditures Month 1 Month 2
Expenditures from OperationsCash Spending $57,833 $57,833 Bill Payments $90,951 $90,951 Subtotal Spent on Operations $148,784 $148,784
Additional Cash SpentSales Tax, VAT, HST/GST Paid Out $0 $0
$0 $0
Other Liabilities Principal Repayment $0 $0
$0 $0
Purchase Other Current Assets $0 $0 Purchase Long-term Assets $0 $0 Dividends $0 $0 Subtotal Cash Spent $148,784 $148,784
Net Cash Flow ($148,784) ($148,784)Cash Balance ($128,784) ($277,568)
Pro Forma Cash Flow 8 Year 1 12
Cash Received $20,000
Cash from Operations
Principal Repayment of Current Borrowing
Long-term Liabilities Principal Repayment

Cash Sales $3,998,000 $499,750.00Cash from Receivables $0 $0.00Subtotal Cash from Operations $3,998,000 $499,750.00
Additional Cash ReceivedSales Tax, VAT, HST/GST Received $0 $0.00New Current Borrowing $1,500,000 $187,500.00New Other Liabilities (interest-free) $0 $0.00New Long-term Liabilities $0 $0.00Sales of Other Current Assets $0 $0.00Sales of Long-term Assets $0 $0.00New Investment Received $0 $0.00Subtotal Cash Received $5,498,000 $687,250.00
Expenditures Year 1
Expenditures from OperationsCash Spending $694,000 $57,833.33Bill Payments $1,091,407 $90,950.57Subtotal Spent on Operations $1,785,407 $148,783.90
Additional Cash SpentSales Tax, VAT, HST/GST Paid Out $0 $0.00
$0 $0.00
Other Liabilities Principal Repayment $0 $0.00
$0 $0.00Purchase Other Current Assets $0 $0.00Purchase Long-term Assets $0 $0.00Dividends $0 $0.00Subtotal Cash Spent $1,785,407 $148,783.90
Net Cash Flow $3,712,593 $309,382.76Cash Balance $3,732,593 $311,049.43
Principal Repayment of Current Borrowing
Long-term Liabilities Principal Repayment

Month 3 Month 4 Month 5 Month 6 Month 7 Month 8 Month 9$277,568 $260,898 $799,364 $1,337,830 $1,876,297 $2,414,763 $2,953,229
$499,750 $499,750 $499,750 $499,750 $499,750 $499,750 $499,750 $0 $0 $0 $0 $0 $0 $0
$499,750 $499,750 $499,750 $499,750 $499,750 $499,750 $499,750
$0 $0 $0 $0 $0 $0 $0 $187,500 $187,500 $187,500 $187,500 $187,500 $187,500 $187,500
$0 $0 $0 $0 $0 $0 $0 $0 $0 $0 $0 $0 $0 $0 $0 $0 $0 $0 $0 $0 $0 $0 $0 $0 $0 $0 $0 $0 $0 $0 $0 $0 $0 $0 $0
$687,250 $687,250 $687,250 $687,250 $687,250 $687,250 $687,250
Month 3 Month 4 Month 5 Month 6 Month 7 Month 8 Month 9
$57,833 $57,833 $57,833 $57,833 $57,833 $57,833 $57,833 $90,951 $90,951 $90,951 $90,951 $90,951 $90,951 $90,951
$148,784 $148,784 $148,784 $148,784 $148,784 $148,784 $148,784
$0 $0 $0 $0 $0 $0 $0
$0 $0 $0 $0 $0 $0 $0
$0 $0 $0 $0 $0 $0 $0
$0 $0 $0 $0 $0 $0 $0
$0 $0 $0 $0 $0 $0 $0 $0 $0 $0 $0 $0 $0 $0 $0 $0 $0 $0 $0 $0 $0
$148,784 $148,784 $148,784 $148,784 $148,784 $148,784 $148,784
$538,466 $538,466 $538,466 $538,466 $538,466 $538,466 $538,466 $260,898 $799,364 ### $1,876,297 $2,414,763 $2,953,229 $3,491,695
MonthsMonths

Month 10 Month 11 Month 12$3,491,695 $4,030,161 $3,881,377
$499,750 $0 $0 $0 $0 $0
$499,750 $0 $0
$0 $0 $0 $187,500 $0 $0
$0 $0 $0 $0 $0 $0 $0 $0 $0 $0 $0 $0 $0 $0 $0
$687,250 $0 $0
Month 10 Month 11 Month 12
$57,833 $57,833 $57,833 $90,951 $90,951 $90,951
$148,784 $148,784 $148,784
$0 $0 $0
$0 $0 $0
$0 $0 $0
$0 $0 $0
$0 $0 $0 $0 $0 $0 $0 $0 $0
$148,784 $148,784 $148,784
$538,466 ($148,784) ($148,784)$4,030,161 $3,881,377 $3,732,593

Month 1 Month 2 Month 3 Month 4
Assets
Current AssetsCash $20,000 ($128,784) ($277,568) $260,898 $799,364 Other Current Assets $0 $0 $0 $0 $0 Total Current Assets $20,000 ($128,784) ($277,568) $260,898 $799,364
Long-term AssetsLong-term Assets $0 $0 $0 $0 $0
$0 $2,059 $4,117 $6,176 $8,235
Total Long-term Assets $0 $0 $0 $0 $0 Total Assets $20,000 ($126,725) ($273,451) $267,074 $807,599
Liabilities and Capital Month 1 Month 2 Month 3 Month 4
Current LiabilitiesAccounts Payable $0 $11,777 $12,465 $12,015 $12,500 Current Borrowing $0 $0 $0 $0 $0 Other Current Liabilities $0 $0 $0 $0 $0
$0 $11,777 $12,465 $12,015 $12,500
Long-term Liabilities $0 $50,000 $50,000 $50,000 $50,000 Total Liabilities $0 $61,777 $62,465 $62,015 $62,500
Paid-in Capital $31,170 $31,170 $31,170 $31,170 $31,170 Retained Earnings ($11,170) ($11,170) ($11,170) ($11,170) ($11,170)Earnings $0 -$4,179 -$8,358 -$14,530 -$18,685Total Capital $20,000 $15,821 $11,642 $5,470 $1,315
$20,000 $77,598 $74,107 $67,485 $63,815
Net Worth $20,000 $15,821 $11,642 $5,470 $1,315
Assets Year 1
Current Assets
Pro Forma Balance Sheet
Starting Balances
Accumulated Depreciation
Subtotal Current Liabilities
Total Liabilities and Capital
Pro Forma Balance Sheet

Cash $3,732,593 Other Current Assets $0 Total Current Assets $3,732,593
Long-term AssetsLong-term Assets $0
$24,704
Total Long-term Assets ($24,704)Total Assets $3,707,890
Liabilities and Capital Year 1
Current LiabilitiesAccounts Payable $1,785,407 Current Borrowing $0 Other Current Liabilities $0
$1,785,407
Long-term Liabilities $0 Total Liabilities $1,785,407
Paid-in Capital $31,170 Retained Earnings ($11,170)Earnings $845,165 Total Capital $865,165
$2,650,572
Net Worth $865,165
Accumulated Depreciation
Subtotal Current Liabilities
Total Liabilities and Capital

Month 5 Month 6 Month 7 Month 8 Month 9 Month 10
$1,337,830 $1,876,297 $2,414,763 $2,953,229 $3,491,695 $4,030,161 $0 $0 $0 $0 $0 $0
$1,337,830 $1,876,297 $2,414,763 $2,953,229 $3,491,695 $4,030,161
$0 $0 $0 $0 $0 $0
$10,293 $12,352 $14,410 $16,469 $18,528 $20,586
$0 $0 $0 $0 $0 $0 $1,348,124 $1,888,648 $2,429,173 $2,969,698 $3,510,223 $4,050,747
Month 5 Month 6 Month 7 Month 8 Month 9 Month 10
$13,099 $13,785 $14,476 $15,202 $15,891 $16,579 $0 $0 $0 $0 $0 $0 $0 $0 $0 $0 $0 $0
$13,099 $13,785 $14,476 $15,202 $15,891 $16,579
$50,000 $50,000 $50,000 $50,000 $50,000 $50,000 $63,099 $63,785 $64,476 $65,202 $65,891 $66,579
$31,170 $31,170 $31,170 $31,170 $31,170 $31,170 ($11,170) ($11,170) ($11,170) ($11,170) ($11,170) ($11,170)-$20,898 -$20,895 -$19,446 -$17,493 -$15,483 -$19,654
($898) ($895) $554 $2,507 $4,517 $346
$62,201 $62,890 $65,030 $67,709 $70,408 $66,925
($898) ($895) $554 $2,507 $4,517 $346

Month 11 Month 12
$3,881,377 $3,732,593 $0 $0
$3,881,377 $3,732,593
$0 $0
$22,645 $24,704
$0 $0 $3,904,022 $3,757,297
Month 11 Month 12
$17,273 $18,248 $0 $0 $0 $0
$17,273 $18,248
$50,000 $50,000 $67,273 $68,248
$31,170 $31,170 ($11,170) ($11,170)-$23,825 -$27,995($3,825) ($7,995)
$63,448 $60,253
($3,825) ($7,995)

1.0 Executive SummaryChart: Highlights
1.1 Objectives1.2 Keys to Success1.3 Mission
Quality ControlLong-Term GoalsPositionRisks Associated with Growth
2.0 Company Summary2.1 Company Ownership2.2 Start-up Summary
Chart: Start-upTable: Start-upTable: Start-up Funding
3.0 ServicesOverlays ServicesDemolition & Removal ServicesAsphalt Repairs ServicesSealcoating ServicesMarking and Striping Services
3.1 Advantages and Disadvantages3.2 Factors That Affect Pricing4.0 Market Analysis Summary4.1 Market Segmentation
Table: Market AnalysisChart: Market Analysis (Pie)
4.1 Target Market Segment Strategy4.2 Service Business Analysis
4.2.1 Competition and Buying Patterns5.0 Strategy and Implementation Summary5.1 Competitive Edge5.2 Marketing Strategy5.3 Sales Strategy
5.3.1 Sales ForecastTable: Sales ForecastChart: Sales MonthlyChart: Sales by Year
5.3 MilestonesTable: MilestonesChart: Milestones
6.0 Operational plan6.1 Location

6.2 Hours of Operation6.3 Business Controls
Accounting SystemProject Management System
6.4 Insurance6.5 Bonding6.6 Equipment6.7 Supplies6.8 Equipment Transportation 6.9 Material
Hot Mix Asphalt PavementAsphalt Sealer
7.0 Management Summary7.1 Personnel Plan
Table: Personnel8.0 Funding Options9.0 Missed Opportunities
10.0 Financial Plan10.1 Important Assumptions
Table: General Assumptions10.2 Break-even Analysis
Chart: Break-even AnalysisTable: Break-even Analysis
10.3 Projected Profit and LossChart: Profit MonthlyChart: Profit YearlyChart: Gross Margin MonthlyChart: Gross Margin YearlyTable: Profit and Loss
10.4 Projected Cash FlowTable: Cash FlowChart: Cash
10.5 Projected Balance SheetTable: Balance Sheet
10.6 Business RatiosTable: RatiosTable: Sales ForecastTable: PersonnelTable: General AssumptionsTable: Profit and LossTable: Cash FlowTable: Balance Sheet

Items Amount AssetsPaver * $ 330,000 AssetBreakdown Roller * $ 65,000 AssetFinish Roller * $ 65,000 Asset3 Dump Trunk * $ 40,000 Asset2 Pickup Truck $ 30,000 Asset2 Van $ 30,000 AssetCold Planer/Milling Machine * $ 323,000 AssetMaterial Transfer Vehicles (MTV) * $ 200,000 AssetExcavator **** $ 75,000 AssetSealcoat Trailer ** $ 50,000 AssetStriping Machine *** $ 15,000 3 Transport Trailer * $ 50,000 AssetHot Mix Asphalt * $ 60,000 Asphalt Sealer ** $ 3,000 Striping Pant *** $ 15,000 Road Signs and Supplies * $ 25,000 2 Computers (Fully Loaded) $ 2,500 Asset4-in-1 Printer/Fax/Copier/Scanner $ 750 AssetQuickBooks Pro $ 840 Project Management Software with Intuit $ 600
$ 1,380,690
Payroll $ 694,000 Payroll Taxes $ 138,800 Depreciation $ 135,000 Rent $ 48,000 Utilities $ 6,000 500Sales Marketing and Other Expenses $ 9,800 Insurance $ 70,000 Bonding $ 150,000 Leased Equipment $ 494,813 Equipment $ 15,000 Supplies $ 107,690 Other $ 42,000
$ 1,911,103 $ 955,551.67
Attorney Fees - Setting Up Limited Liability Company $ 200 $ 200 State of Louisiana General Contractor License $ 600 $ 600 Research and Development $ 2,000 $ 2,000 Deposit plus First Rent $ 4,000 $ 48,000 Post Office Box $ 150 $ 150 Internet $ 100 $ 1,200 Cell Phones $ 400 $ 4,800 Stationary $ 400 $ 400 Business Cards $ 150 $ 150 Brochures $ 300 $ 300 Other $ 3,500 $ 42,000
$ 11,800 $ 99,800

3 Years6% Int Rate
Type Total after lease VarianceLease to own $ 129,800 $ 389,400 $ (59,400) $ 200,200 Lease to own $ 25,567 $ 76,700 $ (11,700) $ 39,433 Lease to own $ 25,567 $ 76,700 $ (11,700) $ 39,433 Lease to own $ 15,733 $ 47,200 $ (7,200) $ 24,267 Lease to own $ 11,800 $ 35,400 $ (5,400) $ 18,200 Lease to own $ 11,800 $ 35,400 $ (5,400) $ 18,200 Lease to own $ 127,047 $ 381,140 $ (58,140) $ 195,953 Lease to own $ 78,667 $ 236,000 $ (36,000) $ 121,333 Lease to own $ 29,500 $ 88,500 $ (13,500) $ 45,500 Lease to own $ 19,667 $ 59,000 $ (9,000) $ 30,333 Purchase $ 15,000 $ 15,000 $ - Lease to own $ 19,667 $ 59,000 $ (9,000) $ 30,333 Purchase $ 60,000 $ 60,000 $ - Purchase $ 3,000 $ 3,000 $ - Purchase $ 15,000 $ 15,000 $ - Purchase $ 25,000 $ 25,000 $ - Purchase $ 2,500 $ 2,500 $ - Purchase $ 750 $ 750 $ - Purchase $ 840 $ 840 $ - Purchase $ 600 $ 600 $ -
$ 617,503 $ 1,607,130 $ (226,440) $ 763,187
GasRepairsParking
WebsiteDesk
2 Gifts & promotionBank FeesMeals & EntertainmentProperty TaxesConsultant
12
1st yr diff from owning vs leasing

$ 3.00 Install 2' Asphalt fee per sq ft $ 158,400.00 Total Sales
10 Width (Feet)5280 Length (Feet)
52,800.00 Square Footage (ft2)
0.09290304 4,905.28 Square Meters (m2)0.1111 5,866.08 Square Yards (yd2)
2 Thickness (Inches)145 HMA density pounds pcf
8,800 Volume cu ft 1,276,000 Weight lbs
638 Asphalt Tons Required
$ 60.00 Material cost per ton from the plant $ 38,280.00
9% Sale tax $ 3,445.20 $ 41,725.20 Total Material Cost
Hourly Rates 32 Hours $ 25.00 $ 800.00 Foreman $ 22.00 $ 704.00 Superintendent $ 20.00 $ 640.00 Truck Operator $ 20.00 $ 640.00 Paver Operator $ 20.00 $ 640.00 Roller Operator $ 13.00 $ 416.00 Labor worker 1 $ 13.00 $ 416.00 Labor worker 2 $ 13.00 $ 416.00 Labor worker 3 $ 13.00 $ 416.00 Labor worker 4
$ 5,088.00 Total Labor Cost
3 Years7% Interest Rate
4 Days $ 364.66 $ 1,458.63 Paver * $ 71.83 $ 287.31 Breakdown Roller * $ 110.50 $ 442.01 Finish Roller * $ 55.25 $ 221.00 3 Dump Trunk * $ 44.20 $ 176.80 2 Pickup Truck $ 33.15 $ 132.60 2 Van $ 356.92 $ 1,427.69 Cold Planer/Milling Machine * $ 221.00 $ 884.02 Material Transfer Vehicles (MTV) * $ 110.50 $ 442.01 Excavator **** $ 66.30 $ 265.21 3 Transport Trailer * $ 154.70 $ 618.81 Wheel Loader* $ 88.40 $ 353.61 Skid Steer*
$ 6,709.70 Total Equipment Cost

$ 7,920.00 Total Supply Cost
$ 15,840.00 Other Expenses
$ 77,282.90 Subtotal Expenses
$ 81,117.10 Total Profit

1 mile equal 5280 feet
One square foot is the equivalent to 0.09290304 square metres.One square foot is the equivalent to 0.09290304 square metres.
The density of Hot Mix Asphalt (HMA)
Retail Sale Annual Retail + IntTotal Retail + Int $ 330,000.00 $ 133,100.00 $ 399,300.00 $ 65,000.00 $ 26,216.67 $ 78,650.00 $ 100,000.00 $ 40,333.33 $ 121,000.00 $ 50,000.00 $ 20,166.67 $ 60,500.00 $ 40,000.00 $ 16,133.33 $ 48,400.00 $ 30,000.00 $ 12,100.00 $ 36,300.00 $ 323,000.00 $ 130,276.67 $ 390,830.00 $ 200,000.00 $ 80,666.67 $ 242,000.00 $ 100,000.00 $ 40,333.33 $ 121,000.00 $ 60,000.00 $ 24,200.00 $ 72,600.00 $ 140,000.00 $ 56,466.67 $ 169,400.00 $ 80,000.00 $ 32,266.67 $ 96,800.00 $1,518,000.00 $ 612,260.00 $1,836,780.00

5%
10%

$50,000.00 Sealcoat Trailer ** $15,000.00 Striping Machine *** $60,000.00 Hot Mix Asphalt * $ 3,000.00 Asphalt Sealer ** $15,000.00 Striping Pant ***
Variance $ 69,300.00 40 Hours $ 13,650.00 365 Days $ 21,000.00 52 Weeks $ 10,500.00 12 Months $ 8,400.00 3 years $ 6,300.00 $ 67,830.00 $ 42,000.00 $ 21,000.00 $ 12,600.00 $ 29,400.00 $ 16,800.00 $318,780.00

Fees and CostsSaw cut 3" Asphats and 6" Linestone Sub base LFAdditional saw cut for every 1" extra depth above 3" asphalt and 6" sub base LFSaw cut concrte up to 5" thick LFAdditional cost of sawing concrete after the first 5" LFRemoval of aspahlt up to 2" thick FT2Additional cost of removing asphalt for every additional one inch afer the first 3" thi FT2Removal of sub base up to 6" FT2Additional cost for removal of the sub base for every additional one inch after the firFT2Installing 6" limestone thick sub base FT2Additional cost for each 1" additional sub base thickness after the first 6" FT2Instailing 2" asphalt FT2Additional cost for each 1" additional asphalt thickness after the first 2" FT2Installing cement stabilzed sand FT3Lime for stabilization of subgrade LBTraffic Control Systems for each site EACertified Flagmen HRUniformed Police Officer HRCost of Annual Performance, Payment and Maintenance bonds. LS

Fees and Costs $ 6.00 $ 2.00 $ 5.50 $ 1.50 $ 0.95 $ 1.20 $ 1.75 $ 1.00 $ 2.50 $ 0.50 $ 3.00 $ 0.75 $ 3.00 $ 8.00 $ 250.00 $ 50.00 $ 100.00 $50,000.00


