Embed Size (px)
Citation preview
KEI SUB COUNTY-RODO RICE PRODUCERS COOPERATIVE SOCIETY LIMITED
Business plan
INNOCENT MUNO

1
1. EXECUTIVE SUMMARY ................................................................................................................................................... 4
2. THE COOPERATIVE DESCRIPTION ............................................................................................................................... 5
1.3 Membership base ............................................................................................................................................................. 5
1.4 Governance system ......................................................................................................................................................... 5
1.5 Level(s) of operation ......................................................................................................................................................... 6
1.6 Type of services provided to members ........................................................................................................................... 6
3.0 THE BUSINESS DESCRIPTION .................................................................................................................................... 7
3.1 Business model and value proposition ............................................................................................................................ 8
3.2 Product / Service .............................................................................................................................................................. 8
3.3 Market structure and analysis ........................................................................................................................................ 10
3.3.1 Target market and customer base .............................................................................................................................. 13
3.3.2 Market size and potential ............................................................................................................................................ 13
3.3.3 Competitor analysis ..................................................................................................................................................... 13
3.3.4 Competitive advantage ............................................................................................................................................... 13
3.4 Marketing and distribution ............................................................................................................................................. 14
3.4.1 Marketing & Communication ....................................................................................................................................... 14
3.4.2 Distribution .................................................................................................................................................................. 15
3.4.3 Sales ............................................................................................................................................................................ 15
3.5 Production process & development strategy ................................................................................................................. 16
3.6 The suppliers and raw materials .................................................................................................................................... 18
2.7 Cooperative structure ..................................................................................................................................................... 18
3.7.1 Management ............................................................................................................................................................... 19
3.7.2 Legal status ................................................................................................................................................................. 20
3.7.3 Partners and sponsors ................................................................................................................................................ 20
3.8 Risks and mitigation plan .............................................................................................................................................. 21
3.9 SWOT analysis ............................................................................................................................................................... 23
3.10 Price breakdown of your product/service ................................................................................................................... 24
3.11 Investment Plan ............................................................................................................................................................ 24
4. THE FINANCIAL PLAN ................................................................................................................................................... 27
4.1 Budgeting Sheet ............................................................................................................................................................. 29
4.2 Fixed Asset Purchases ................................................................................................................................................... 30
4.3 Cash Flows ..................................................................................................................................................................... 31
4.4 Profit and Loss Statement .............................................................................................................................................. 33
4.5 Balance Sheet ................................................................................................................................................................ 35
4.6 Planning .......................................................................................................................................................................... 36
5. THE DEVELOPMENT IMPACT ....................................................................................................................................... 37
5.1 Local economic impact of the business ......................................................................................................................... 37
5.2 Local social impact of the business’s products or services .......................................................................................... 37
ANNEXES ............................................................................................................................................................................ 38
KEI SUB COUNTY-RODO RICE PRODUCERS COOPERATIVE SOCIETY LIMITED, BUSINESS PLAN
Contents
2
Table 1. summary of business performance for 2020 ............................................................................................................ 8
Table 2. Products of KROP CO-OP ....................................................................................................................................... 9
Table 3. Characteristics of the trade actors. ........................................................................................................................ 12
Table 4.Products for selected Market Segments ................................................................................................................. 14
Table 5.Promotion and Branding Strategy ........................................................................................................................... 14
Table 6. Sales Promotional Strategy .................................................................................................................................... 15
Table 7.Sales Plan and Projections for Rice ........................................................................................................................ 15
Table 8.Sales Plan and Projections for Bran ........................................................................................................................ 15
Table 9.Projected Master Production Plan 2021 -2025 ....................................................................................................... 18
Table 10. suppliers & raw materials ..................................................................................................................................... 18
Table 11. List management committee ................................................................................................................................ 19
Table 12. Proposed Personnel Compensation Plan ............................................................................................................ 20
Table 13: Partners & sponosors ........................................................................................................................................... 20
Table 14: Risk Assurnace plan ............................................................................................................................................. 21
Table 15: SWOT Analysis ..................................................................................................................................................... 23
Table 16: External environmental analysis ........................................................................................................................... 24
Table 17: Price breakdown................................................................................................................................................... 24
Table 18: Financial investment plan ..................................................................................................................................... 25
Table 19: Working capital Plan for Rice purchase (Ugx) ...................................................................................................... 26
Table 20: Investment Financing Plan .................................................................................................................................. 26
Table 21: General Financial Assumptions ............................................................................................................................ 27
Table 22: Strategy for Mobilizing Financial Resources ....................................................................................................... 27
Table 23: Break even analysis .............................................................................................................................................. 28
Table 24: Financial ratios...................................................................................................................................................... 29
Figure 1 Pass Business Performance .................................................................................................................................... 8
Figure 2. The rice value chain in Uganda ............................................................................................................................. 10
Figure 3. The Domestic rice structure .................................................................................................................................. 11
Figure 4. The Market Position Map of firms in the Seed sub-sector. .................................................................................. 16
Figure 5. Organisational structure ........................................................................................................................................ 19
3
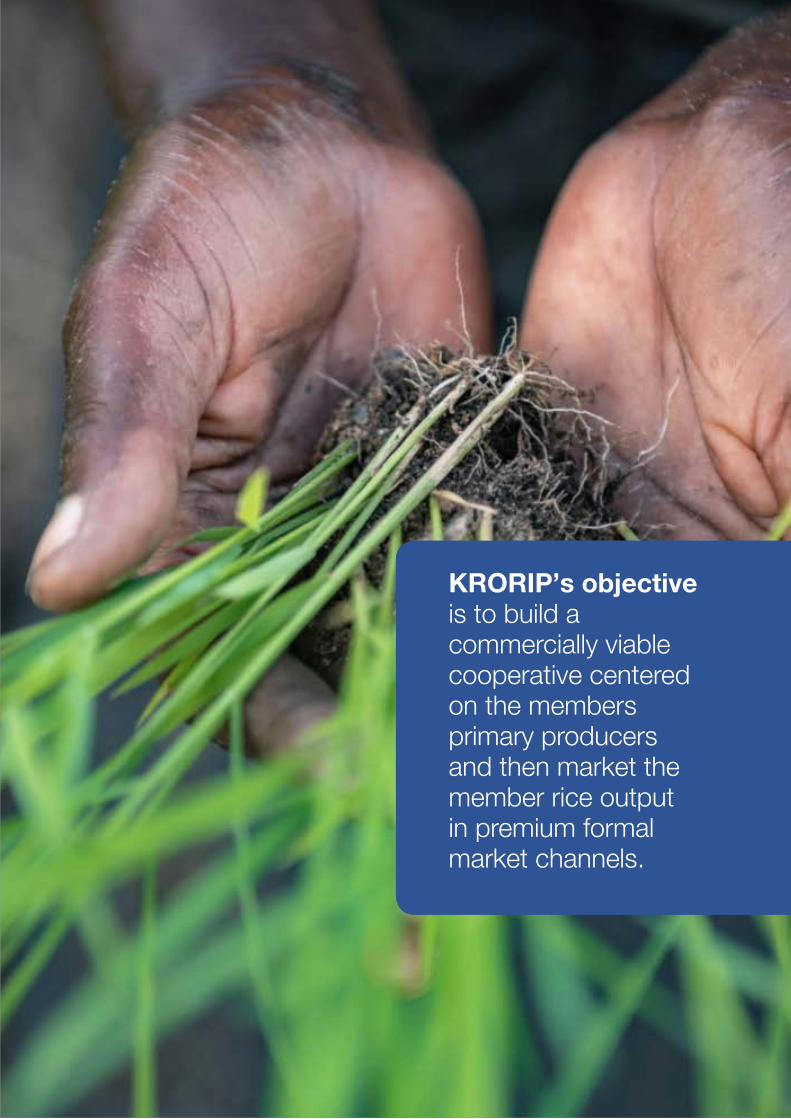
KRORIP’s objective is to build a commercially viable cooperative centered on the members primary producers and then market the member rice output in premium formal market channels.
4
Kei Sub County-Rodo Rice Producer Cooperative Society Limited (KRORIP Co-op Ltd) incorporated in September 2020 as primary multipurpose cooperative, under the overriding principles of the cooperative statutes of 1991, the Coopera-tive Regulation of 1992, and the Bye-laws under the provision of section 5 of the Co-operative Societies Act (Amended) 2016 with registration number P.12462/RC with over 159 reg-istered farmers at the grassroots level engaged in agricultural production operating in seven clusters of producer groups which were previously VSLA groups and rice farming located in Avanga parish, Kei Sub County Yumbe District. The key economic activity of the cooperative members is to produce rice for the market. The objective is to build a commercially viable cooperative centered on the members primary pro-ducers and then market the member rice output in premium formal market channels.The integrated business model enbles the cooperative in which all stages of production, processing/packaging and marketing covered in-house by the Society and its members, with a clear division of roles and responsibilities among members, farmer groups and the cooperative. This business model enables the KRORP to control all stages in the value chain and offer producers a rice purchase price above the national average. The value prepositions are to deliver high quality, high yielding, and climate-resilient seed to our farmers and provide a reliable, consistent supply of high-quality rice to our clients. The target potential domestic market estimated at over 41 million people nationwide, with over 1million consumers within Yumbe district, and over 5million within the West Nile region, and other parts of the country, WFP, Tilda the regional and international markets of South Sudan, DRC & Rwanda.
The overall objective is to create a competitive business model needed to deliver the business, social and welfare objectives of the cooperatives. The Cooperative will reach at least 450 farmers targeting 500 acres of rice. At a production rate of between 1000-1600Kg/acres, targeting production of up to 32,000MT of rice annually. The objective is to grow the Coops. Revenue to an estimated 35million Uganda shillings by 2025. The sales and marketing objectives to achieve a sales volume of 5,000MT for the first year to the end of the 5 years and achieve an estimated 40% market share of the next 60 months.
In line with the business plan 2020-2025, KRORP Co-op Ltd projected 250 million shillings, for both capital expenditure and working capital in ensuring that operation is at the
KEI SUB COUNTY-RODO RICE PRODUCERS COOPERATIVE SOCIETY LIMITED, BUSINESS PLAN
1 Executive Summary
optimum level from production to marketing for a period of 3-5years, the society investment expects to invest its funds amounting to 70 million and seeking 180 million in external support. The business financial viability is projected at 18.2%% profitability and a 44.3%% increase in gross profit margins through efficiency gains every year, achieve an estimated 18% financial self-sufficiency by the next 5 years. The venture will immediately create over 1500 new jobs at farmers’ level, 30 and 10 at the value addition and distributor levels respectively in the 5 years representing around UGX 100 million per year in salaries, commission fees, in the West Nile community, promote other farmer-owned enterprises, and increase both the quality and quantity of agricultural yields through a hub of agricultural-related services (farmer education, Agro inputs, credit, transport, micro processing and other agro services).
The cooperative has atleast 3 competent volunteers for daily operations. The society envisions its success through good governance (competent and qualified board members) and by recruiting more competent and retaining key staff members to maintain continuity of customer relationships in the business operation. The effectiveness of the board and staff will be enhanced through capacity building programs i.e. Board and Staff orientation programs, Staff and Board advanced Programs as well as the general members, BoD and Its Sub Committees, Management personnel. Staff will be recruited gradually depending on the expansion of operations. The board will be committed to developing a management team so that it can focus more on policy formulation and advisory roles. This will result in 10 competent staff employed within the plan period. The future of a business lies in the numbers of loyal customers and farmer members that they have the capacity and competence of the employees, their investment strategy, and the business structure. KRORIP Coop Ltd is to build a business that will survive off its cash flow without the need for injecting finance from external sources once the business is officially running. We know that one of the ways of gaining approval and winning customers over is to produce, process and market our wide range of good rice and rice products and well packaged processed rice from different rice production brands a little bit cheaper than what is obtainable in the market and we are well prepared to survive on the lower profit margin for a while.
Kei Sub County-Rodo Rice Producers cooperative society
5
limited (KRORP Co-op Ltd) is newly formed and registered in 2020, under the overriding principles of the cooperative statutes of 1991, the Cooperative Regulation of 1992, and the Byelaws under the provision of section 5 of the Cooperative Societies Act of 1960 when the society was registered under the Cooperative law with registration number, P.12462/RCS.
KRORP Co-op Ltd is a registered primary Multi-purpose cooperative society with over 210 farmers at the grassroots level engaged in agricultural production. KRORP Co-op Ltd is one of the producers of rice and is seeking to expand its products to enable it access to multiple markets locally, regionally and at the international level.
KRORP Co-op Ltd is in rice production, processing, and marketing organisation, located in the North-Western part of Uganda. We also deliver carefully selected rice from our partner farmers. Our focus is on providing a high-quality natural product, at a fair price, delivered on time. KRORP Co-op Ltd’s floral source speciality rice is sold in consumer-oriented packaging, gift packs and bulk containers. We will operate on the domestic market and on the external one, too.
The non-members within the community are even making the sale of their rice produce through the society because of the high bargaining power that we have exhibited. The Society intends to evolve to a higher-level farmers organization in the next three years that is why currently 7 small farmers groups pay membership to the society.
1.1 Location of the cooperative offices
The KRORP Co-op Ltd is in Yumbe district in the North-Western part of Uganda and operates in Kei Sub County with main offices in Avanga Parish. The Co-op membership is currently organized in Clusters, each cluster consists of producer groups and there are seven clusters with a total membership of 210 members. The current clusters are; 1) Ada producer group, 2) Nidro producer group, 3) Warakala, 3) Amaecora, 4) Kidia, 5) Ayikochi and 6) Avanga. KRORP Co-op Ltd established a fully-fledged rice value chain system, we have attracted huge attention from the organizations due to high-quality products and a competitive level of bulking that can hardly be seen in Yumbe District the entire West Nile.
1.2 The cooperative strategic statements.
Our Vision statement: Is to be a preferred member-based cooperative enterprise in improving income and food security of smallholder farmers for enhanced quality wellbeing in the West Nile region.
The Mission Statement: To become the most preferred members-based rice farmers cooperative enterprise in West Nile through high production and improved productivity by promoting the latest technologies, networking, partnership, and marketing members produce collectively and profitably.
Strategic goal: Contribute to sustainable incomes among the member farmers through support to increased production and productivity, processing collective access to inputs, better-paying markets for the cooperative’s products to improve member livelihoods.
Cooperative Objectives
1. To build the capacity of members and governance structures of the cooperative through membership education, sensitization to achieve better welfare by end of 2025.
2. To support market-oriented farming among members and increase member production and farm productivity by facilitating access to quality and affordable inputs, technologies, and credit for production.
3. To organize, facilitate and support collective marketing among members and build market linkages integrating warehouse receipting, bulking and storage management.
4. To process and add value to members’ produce to explore high-value markets and attract premium prices from the cooperative’s products.
5. To promote and participate in business and development partnerships beneficial to the advancements of the cooperatives market-driven business model and realization of the cooperative objectives
Business Objectives: KRORP business objective is to be competitive in the regional market for rice and build recognizable rice and Agro-commodity brand, a well-governed and vibrant member cooperative. The Cooperatives business objectives for the period 2021-2025 are listed below.
KEI SUB COUNTY-RODO RICE PRODUCERS COOPERATIVE SOCIETY LIMITED, BUSINESS PLAN
2 The Cooperative Description
6
Production Objective: To achieve a total rice acreage of 5,000 MT annually with at least a per capita of 2.5 to 15 acres and yields of 1,600kg of rice per year/acre by 2025. This will be achieved through growing the cooperative membership to 450 and have an annual production of 6,400MT by 2025.
Marketing objective: Build the capacity and position of KRROP Co-operative as a respected producer of rice and increase the visibility of our brand as the leading regional rice brand. By producing and marketing 1,766MT of rice and maintain a sales growth rate of at least 20% per year ending 2025,
Profitability Objective: To achieve annual profit earnings of Ugx 70m from the sale of rice and related by-products by 2023 and an average annual return on investment of 35% per year.
Social Objectives
To provide psycho-social support to the Co-operative’s vulnerable members and support community social development programs in health, education, and livelihood improvement.
• Create an estimated 1,840 jobs along the value chain (labour and service) based jobs resulting in average annual wage earnings of Ugx 12.7 million per year over the next 5 years.
• Strengthen the food security among cooperative members by encouraging them to retain at least 20% of the rice produced each year.
1.3 Membership base
The cooperative membership is from 7 farmer groups/clusters and each group has an average of 30 members (male & female) making a total membership-based of 159 members. The society is addressing the needs of members and expects membership to increase to over 300 in the next three years and would embark on youth and women mobilization to form 60% of the membership turn the underutilized land to full production.
1.4 Governance system
KRORP Co-op Ltd is democratically governed through cooperative rules and regulations, bye-laws, and standard operating procedures. The Board of directors and supervisory committees are elected from its members basing on and reputation and during the annual general assembly. The supreme authority is vested in the general meeting of the members at which every member has a right to attend and to vote on all questions. The governance system of our cooperative is based on cooperative principles whereby each member has one vote only, which he or she exercises in person and not by proxy irrespective of the shares held.
1.5 Level(s) of operation
KRORP Co-op Ltd operates as a primary producer society within Yumbe District, Kei Sub-county, Avanga as the head office. The cooperative expects by 2025 the cooperative expects to extend operation to all the West Nile districts with projection to go nations wide.
1.6 Type of services provided to members
The members of the cooperative society have access to affordable specialised services in ensuring cost-effectiveness and efficiencies of farmer members capacity to increase farm production and productivity, these services include
• Supply high-quality farm (certified & tested) inputs at reasonable prices to members.
• Farmers’ produce trading- bulking, processing, marketing, and selling members products-ranging from facilitating sales of members products at the first handler level, to wholesaling, retailing, and exporting.
• Provide specialized services such as tractor services, farm extension, drying, or trucking.
• Financing ranging from share savings mobilisations, credit facilities, farm insurances.
7
The Cooperative through farmer members produces and trade-in Rice (input supply, production, assembling, processing, and trading). The target markets for rice are local and regional. Besides Rice the Coop. is also working to identify additional enterprises that can be commercially promoted among members to expand the income opportunities of the members and business portfolio of the coop.
The Co-operative supplies members with farm inputs and supports them with specialized extension and equipment services for rice production. In the short and medium-term, the Co-operative sources and provide vivacious farm inputs, and crop management finance and technical expertise to boost productivity and acreage of the members.
The farmers’ harvests are bulked in designated collection satellite stores in their respective groups. The Co-operative collects the rice paddy from the group farmers’ collection centres and transports the central processing unit/ stores, where it is cleaned, milled, graded, and bagged before putting it to the market. The cooperative is seeking to invest in a grain warehouse with a capacity of 35,000 MT with state-of-the-art rice processing equipment.
The Co-operative is working to strengthen its supply chain and production capacity to position itself to take on forward contracts from large scale rice buyers and retailers as part of its growth strategy. The supply chain which is anchored on the members’ participation and development strategy is pinpointed on building a vibrant smallholder farmer membership base as the primary producers and suppliers to the Co-operative.
Driven by the preceding statements the management and leadership of the cooperative in partnership with their development partners have put together this in a 5-year business plan for guided growth.
Purpose of the Business Plan
The business plan is intended to guide the growth and investment activities of the Co-operative over the next three years ending (2025). It will be a tool for decision making, mobilizing investment capital and member mobilization.
Statement of commitment
The KROP Cooperative business plan is a decision tool, developed by the management of the Co-operative and approved by the general assembly. This document shall be a principal guide to all be business and socio-economic
KEI SUB COUNTY-RODO RICE PRODUCERS COOPERATIVE SOCIETY LIMITED, BUSINESS PLAN
3 The Business Description
operations of KROP Cooperative and each member of staff and the Co-operative will work towards its full implementation.
Business Growth and Investment Strategy.
KROP Cooperative recognizes that growth opportunities are greater and more sustainable by being consistent in the market. The Co-operative Market strategy in the next three years is to penetrate the selected market segments by ensuring sustained production and supply of our rice brand. KROP Cooperative has identified the business needs and challenges faced by these segments and three critical performance variables to realize big wins.
• Consistent and quality (low level of broken and no stones) products. Stones and broken rice are key pricing attributes for traders and the market considers important.
• Excellence in contract performance when dealing with institutional buyers and trade markets.
• Reliability and continuity in supply.
To deliver on these three performance variables KROP Cooperative will do the following.
1. Build a strong and loyal membership to produce for the target market segments; the Co-operative will put in place membership recruitment, retention and loyalty strategy.
2. Ensure quality assurance and quality management strategy and introduce an affordable pricing plan to motivate our target customers.
3. Carry out organizational development to restructure and reorganize the roles and responsibilities of staff in the Co-operative to create capacity competencies to compete in these market segments.
These actions are integral to the business growth strategy of KROP Cooperative to build a reputation as a reliable supplier for institutional, contract suppliers and retails customers. The Co-operative will also trade in complementary enterprises selected to strengthen the business model. These complimentary enterprises shall be handled on an opportunity basis and at the request of our customers.
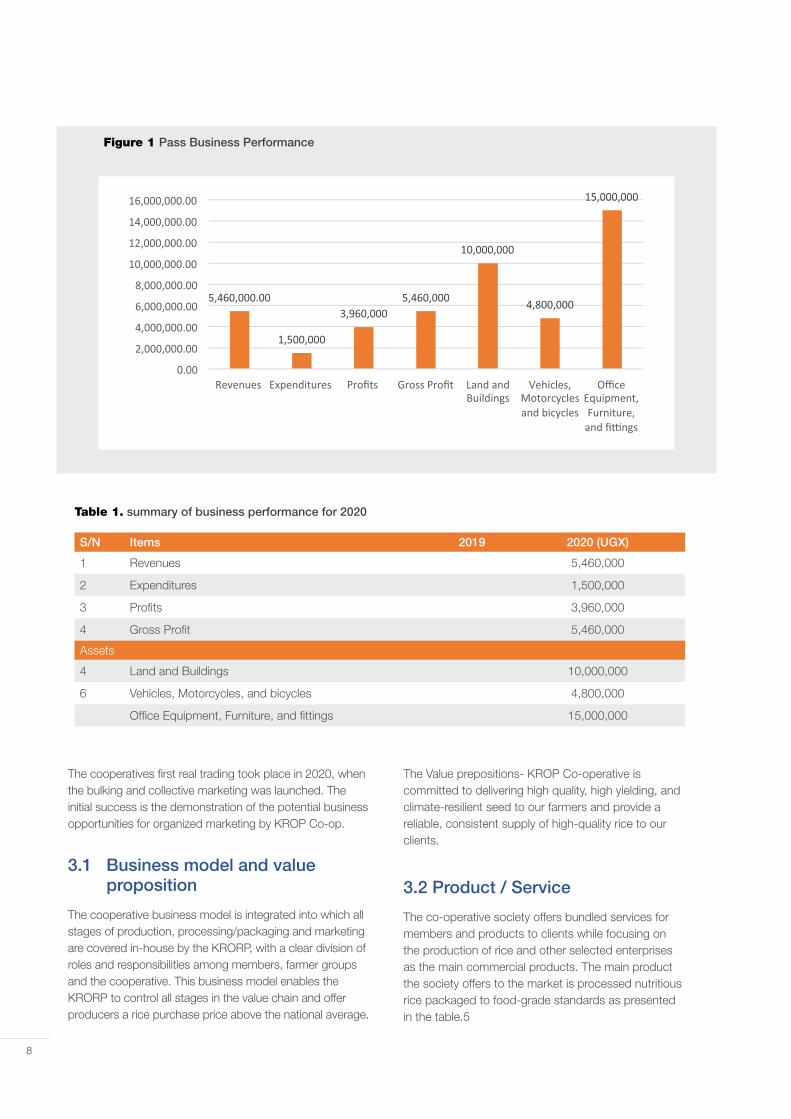
Past Performance
In the last year 2020 the Co-operative registered positive trading results as presented in fig. 2 below, however sales revenues and profits dropped in 2016 as a result of poor whether which affected production.
8
Figure 1 Pass Business Performance
Table 1. summary of business performance for 2020
S/N Items 2019 2020 (UGX)
1 Revenues 5,460,000
2 Expenditures 1,500,000
3 Profits 3,960,000
4 Gross Profit 5,460,000
Assets
4 Land and Buildings 10,000,000
6 Vehicles, Motorcycles, and bicycles 4,800,000
Office Equipment, Furniture, and fittings 15,000,000
The cooperatives first real trading took place in 2020, when the bulking and collective marketing was launched. The initial success is the demonstration of the potential business opportunities for organized marketing by KROP Co-op.
3.1 Business model and value proposition
The cooperative business model is integrated into which all stages of production, processing/packaging and marketing are covered in-house by the KRORP, with a clear division of roles and responsibilities among members, farmer groups and the cooperative. This business model enables the KRORP to control all stages in the value chain and offer producers a rice purchase price above the national average.
The Value prepositions- KROP Co-operative is committed to delivering high quality, high yielding, and climate-resilient seed to our farmers and provide a reliable, consistent supply of high-quality rice to our clients.
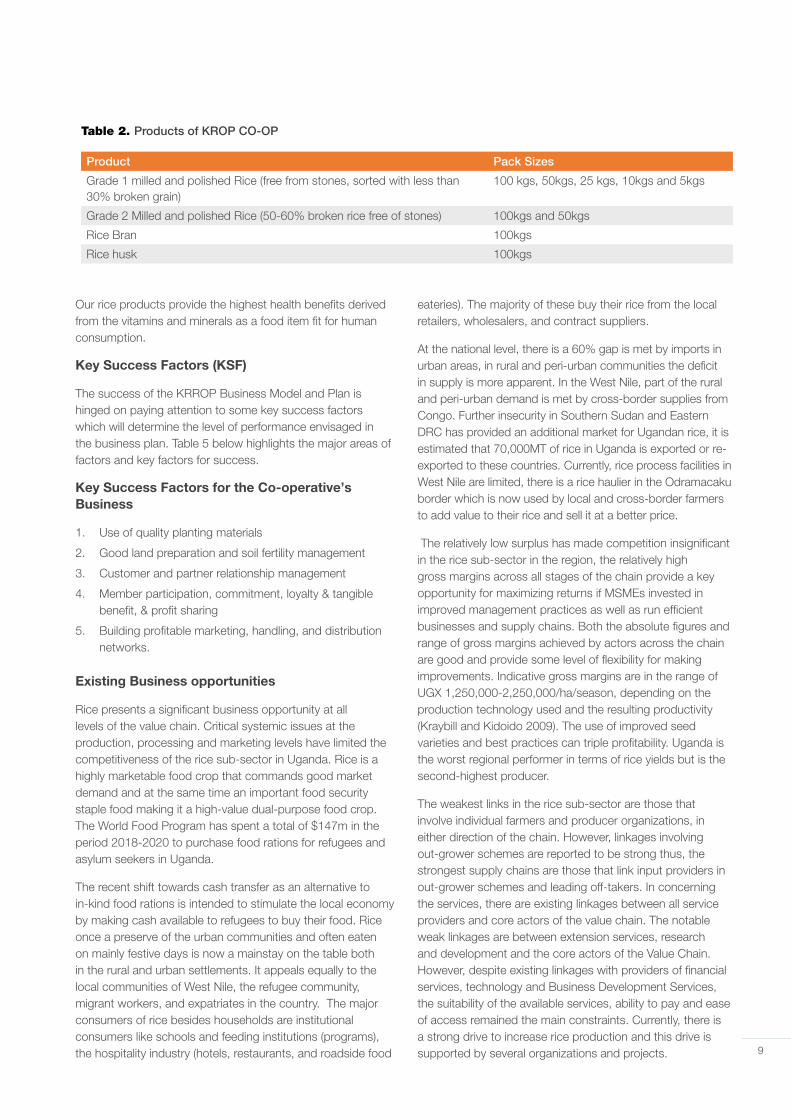
3.2 Product / Service
The co-operative society offers bundled services for members and products to clients while focusing on the production of rice and other selected enterprises as the main commercial products. The main product the society offers to the market is processed nutritious rice packaged to food-grade standards as presented in the table.5
9
Table 2. Products of KROP CO-OP
Product Pack Sizes
Grade 1 milled and polished Rice (free from stones, sorted with less than 30% broken grain)
100 kgs, 50kgs, 25 kgs, 10kgs and 5kgs
Grade 2 Milled and polished Rice (50-60% broken rice free of stones) 100kgs and 50kgs
Rice Bran 100kgs
Rice husk 100kgs
Our rice products provide the highest health benefits derived from the vitamins and minerals as a food item fit for human consumption.
Key Success Factors (KSF)
The success of the KRROP Business Model and Plan is hinged on paying attention to some key success factors which will determine the level of performance envisaged in the business plan. Table 5 below highlights the major areas of factors and key factors for success.
Key Success Factors for the Co-operative’s Business
1. Use of quality planting materials
2. Good land preparation and soil fertility management
3. Customer and partner relationship management
4. Member participation, commitment, loyalty & tangible benefit, & profit sharing
5. Building profitable marketing, handling, and distribution networks.
Existing Business opportunities
Rice presents a significant business opportunity at all levels of the value chain. Critical systemic issues at the production, processing and marketing levels have limited the competitiveness of the rice sub-sector in Uganda. Rice is a highly marketable food crop that commands good market demand and at the same time an important food security staple food making it a high-value dual-purpose food crop. The World Food Program has spent a total of $147m in the period 2018-2020 to purchase food rations for refugees and asylum seekers in Uganda.
The recent shift towards cash transfer as an alternative to in-kind food rations is intended to stimulate the local economy by making cash available to refugees to buy their food. Rice once a preserve of the urban communities and often eaten on mainly festive days is now a mainstay on the table both in the rural and urban settlements. It appeals equally to the local communities of West Nile, the refugee community, migrant workers, and expatriates in the country. The major consumers of rice besides households are institutional consumers like schools and feeding institutions (programs), the hospitality industry (hotels, restaurants, and roadside food
eateries). The majority of these buy their rice from the local retailers, wholesalers, and contract suppliers.
At the national level, there is a 60% gap is met by imports in urban areas, in rural and peri-urban communities the deficit in supply is more apparent. In the West Nile, part of the rural and peri-urban demand is met by cross-border supplies from Congo. Further insecurity in Southern Sudan and Eastern DRC has provided an additional market for Ugandan rice, it is estimated that 70,000MT of rice in Uganda is exported or re-exported to these countries. Currently, rice process facilities in West Nile are limited, there is a rice haulier in the Odramacaku border which is now used by local and cross-border farmers to add value to their rice and sell it at a better price.
The relatively low surplus has made competition insignificant in the rice sub-sector in the region, the relatively high gross margins across all stages of the chain provide a key opportunity for maximizing returns if MSMEs invested in improved management practices as well as run efficient businesses and supply chains. Both the absolute figures and range of gross margins achieved by actors across the chain are good and provide some level of flexibility for making improvements. Indicative gross margins are in the range of UGX 1,250,000-2,250,000/ha/season, depending on the production technology used and the resulting productivity (Kraybill and Kidoido 2009). The use of improved seed varieties and best practices can triple profitability. Uganda is the worst regional performer in terms of rice yields but is the second-highest producer.
The weakest links in the rice sub-sector are those that involve individual farmers and producer organizations, in either direction of the chain. However, linkages involving out-grower schemes are reported to be strong thus, the strongest supply chains are those that link input providers in out-grower schemes and leading off-takers. In concerning the services, there are existing linkages between all service providers and core actors of the value chain. The notable weak linkages are between extension services, research and development and the core actors of the Value Chain. However, despite existing linkages with providers of financial services, technology and Business Development Services, the suitability of the available services, ability to pay and ease of access remained the main constraints. Currently, there is a strong drive to increase rice production and this drive is supported by several organizations and projects.
10
In West Nile, the rice trade is dominated by informal trade arrangements between buyers (Hawkers/middlemen) and producers with more formal trade transactions occurring among the institutional traders and the importers. The rural markets dominated by producers and local retail markets (both informal) dominated by hawkers account for about 25% of rice traded in Uganda. The wholesale market channels are driven by rural aggregators who sell milled rice to urban wholesalers.
3.3 Market structure and analysis
The population growth in Uganda is unsustainable at a rate of 3.0% one of the highest in the world and calls for an increase in food production to avert challenges of food shortages. The situation in West Nile is further complicated by the population explosion resulting from the refugee influx which has increased demand for food and food prices. The region is increasingly becoming dependent on food supplies from other regions and imports from cross border sources. Rice has become a very important food security and staple for most urban communities in West Nile, it is increasingly becoming important in the rural communities as well. The region has for long depended on imported rice supplied from importers based in Kampala and other major towns as well as local production from neighbouring districts of Lira, Nwoya, Gulu and Amuru. Significant supplies also come from the Democratic Republic of Congo.
The introduction of the NRICA series and other upland varieties has resulted in increased adoption of rice production in many districts that traditionally never used to produce rice including districts in the West Nile. Rice farming is beginning to pick in Yumbe district and other parts of West Nile like Rhino Camp in Arua and Moyo district responding to the demand and growing market opportunities and food security and income needs of rural households.
The major trading hubs for Ugandan produced rice are Mbale, Butaleja, Namutumba, Iganga, Gulu, Lira, Nwoya, Soroti and Pallisa are major rice trading hubs in eastern and Northern Uganda. About 70% of the rice produced in the eastern
districts of Butaleja and Bugiri ends up in the trading hubs and warehouses in Kampala and Jinja.
The retail price of rice is variable across the country, imported rice from Vietnam, Pakistan, Indonesia, and Cambodia is priced at an average of UGX 2,500-3,000 per kg, which is lower than the locally produced rice which retails at an average of UGX 3,000-4000. Premium imported brands like the Basmati rice retail at an average UGX 6500-8500 per kg, local rice retail at an average of UGX2,500 compared to the highest-priced local brand “Super rice”. The average import price for a kg of ordinary rice brands estimated from URA import data is UGX1, 168 compared to the average unit cost of production for a kg of local rice which is UGX1, 560, making it less competitive in the marketplace.
The postharvest and handling and processing technologies used in milling further make Uganda’s rice less competitive at home and in the regional markets. Generally, in Uganda aromatic rice varieties like “Super” attract premium prices and are preferred to non-aromatic varieties. Bulging quality is preferred to the non-bulging type, non -sticky is preferred to sticky types while unbroken rice is preferred to the broken rice. These properties also influence the pricing of rice for both local and imported brands.
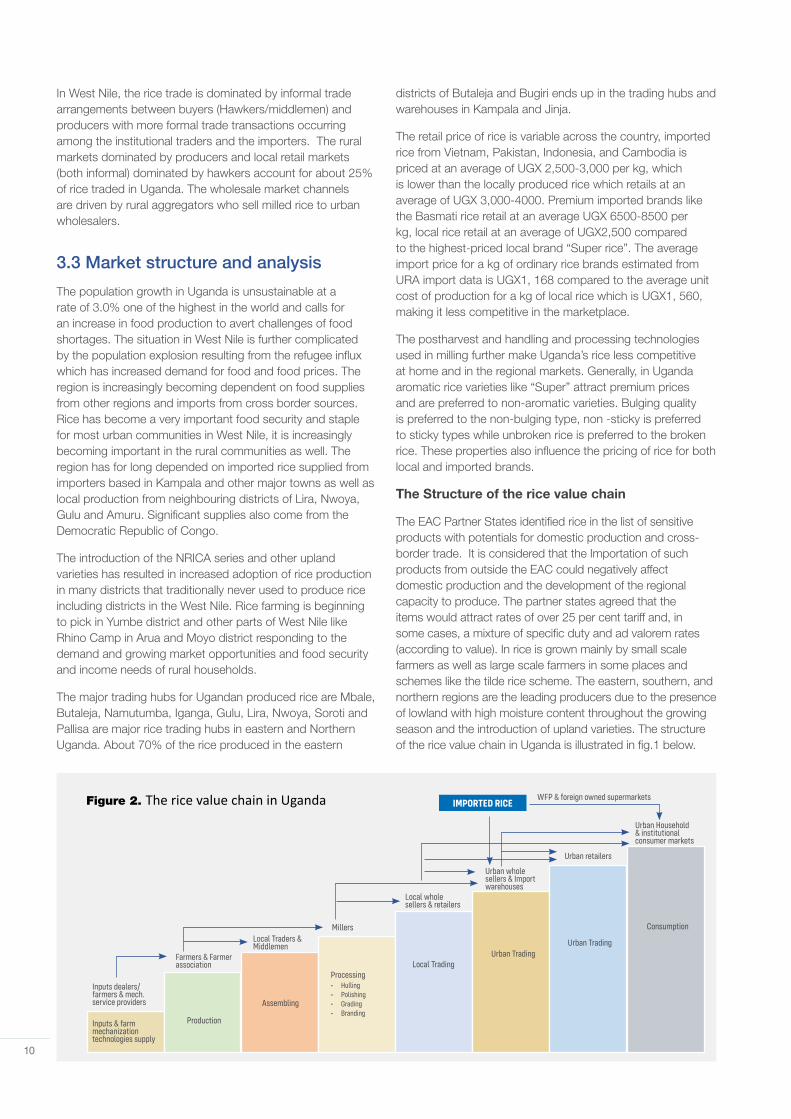
The Structure of the rice value chain
The EAC Partner States identified rice in the list of sensitive products with potentials for domestic production and cross-border trade. It is considered that the Importation of such products from outside the EAC could negatively affect domestic production and the development of the regional capacity to produce. The partner states agreed that the items would attract rates of over 25 per cent tariff and, in some cases, a mixture of specific duty and ad valorem rates (according to value). In rice is grown mainly by small scale farmers as well as large scale farmers in some places and schemes like the tilde rice scheme. The eastern, southern, and northern regions are the leading producers due to the presence of lowland with high moisture content throughout the growing season and the introduction of upland varieties. The structure of the rice value chain in Uganda is illustrated in fig.1 below.
Figure 2. The rice value chain in Uganda
Inputs & farm mechanization technologies supply
Inputs dealers/farmers & mech.service providers
Farmers & Farmer association
Local Traders & Middlemen
Millers
Local whole sellers & retailers
Urban whole sellers & Import warehouses
Urban retailers
Urban Household & institutional consumer markets
Production
Assembling
Processing• Hulling• Polishing• Grading• Branding
Local TradingUrban Trading
Urban Trading
Consumption
IMPORTED RICEWFP & foreign owned supermarkets
11
In Uganda there are three rice production systems namely: (i) rain-fed lowland, (ii) irrigated low-land and (iii) upland production systems. Producers are categorized into three as follows: (i) small-scale forming 80% of farmers employed in the production of rice cultivating less than 2 hectares of land using rudimentary technologies, (ii) medium-scale producers cultivating 2-6 hectares of land and account for 15% of the rice producers, and (iii) large scale farmers who cultivate over 6 hectares of the land and account for 5% of the people employed in rice production. However, large scale producers contribute a large proportion of rice produced in Uganda due to higher productivity per unit of land and labour employed.
In terms of productivity, the trend has been positively changing from 1,489MT in 1999 to 2,605MT in 2018, this can be increased further through the multiplication and distribution of improved foundation seed, mechanization of rice production, efficient irrigation infrastructure and provision of extension services. For the yields, the national yield per ha (kg/ha) is at 2,600MT, the yield potential is between 2,000-3,600MT thus a yield gap of 38%.
This value chain structure is similar in West Nile supplemented by cross boarder small scale traders. The country generally has experienced growth in production in the last two decades largely because of an increase in acreage, yields per acre continue to be very low at 800-1500 MT per acre of milled rice compared to neighbouring countries that achieve 3,000-4,000MT milled rice per acre. The production growth is a result of a sustained push by the government, development partners and donor-supported project activity. The growth of Uganda’s rice production has contributed to greater
food security and a reduction in rice imports. For instance, according to the Ugandan government, rice imports dropped between 2005 and 2008. The current production of rice is estimated at 237,000MT. The MAAIF and other stakeholders in the rice value chain are implementing several interventions intend to increase national rice production to 680,000MT annually to achieve national self-sufficiency in rice production.
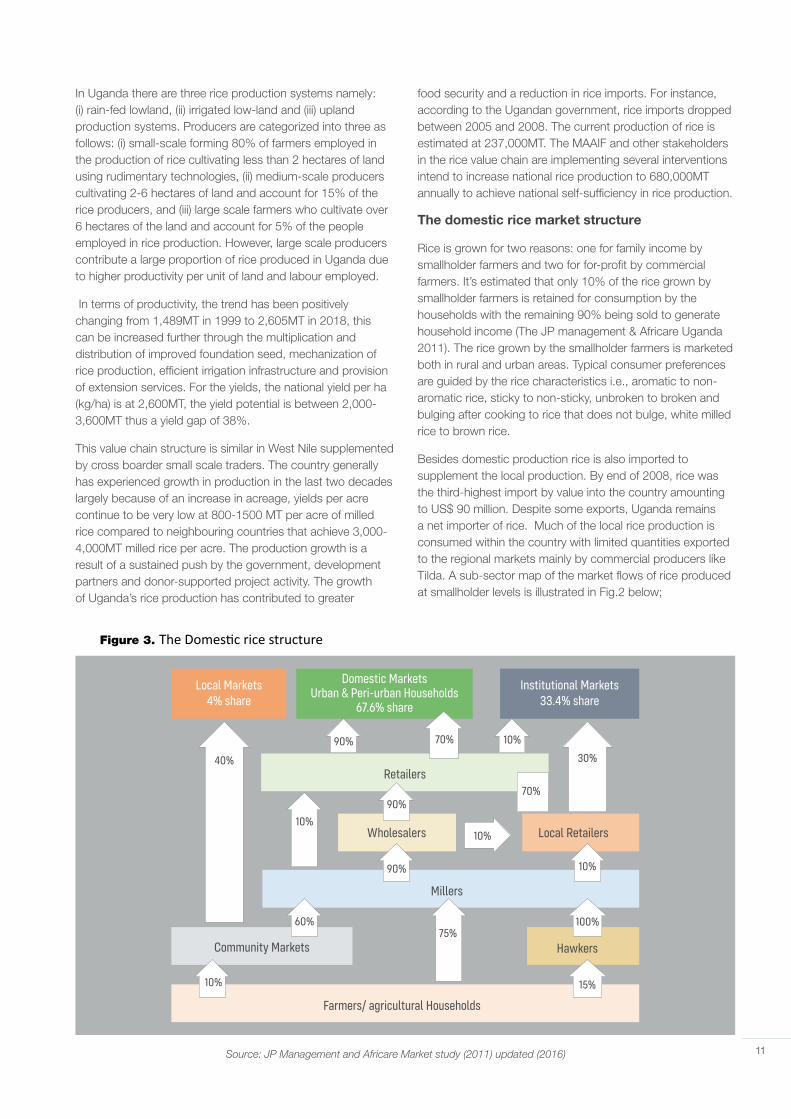
The domestic rice market structure
Rice is grown for two reasons: one for family income by smallholder farmers and two for for-profit by commercial farmers. It’s estimated that only 10% of the rice grown by smallholder farmers is retained for consumption by the households with the remaining 90% being sold to generate household income (The JP management & Africare Uganda 2011). The rice grown by the smallholder farmers is marketed both in rural and urban areas. Typical consumer preferences are guided by the rice characteristics i.e., aromatic to non-aromatic rice, sticky to non-sticky, unbroken to broken and bulging after cooking to rice that does not bulge, white milled rice to brown rice.
Besides domestic production rice is also imported to supplement the local production. By end of 2008, rice was the third-highest import by value into the country amounting to US$ 90 million. Despite some exports, Uganda remains a net importer of rice. Much of the local rice production is consumed within the country with limited quantities exported to the regional markets mainly by commercial producers like Tilda. A sub-sector map of the market flows of rice produced at smallholder levels is illustrated in Fig.2 below;
Figure 3. The Domestic rice structure
Source: JP Management and Africare Market study (2011) updated (2016)
Farmers/ agricultural Households
Millers
Retailers
Wholesalers
Community Markets Hawkers
10%
75%
70%
70%
30%
90%
90%
90%
100%
15%
60%
40%
10%
10%
10%
10%
Local Retailers
Local Markets4% share
Institutional Markets33.4% share
Domestic MarketsUrban & Peri-urban Households
67.6% share
12
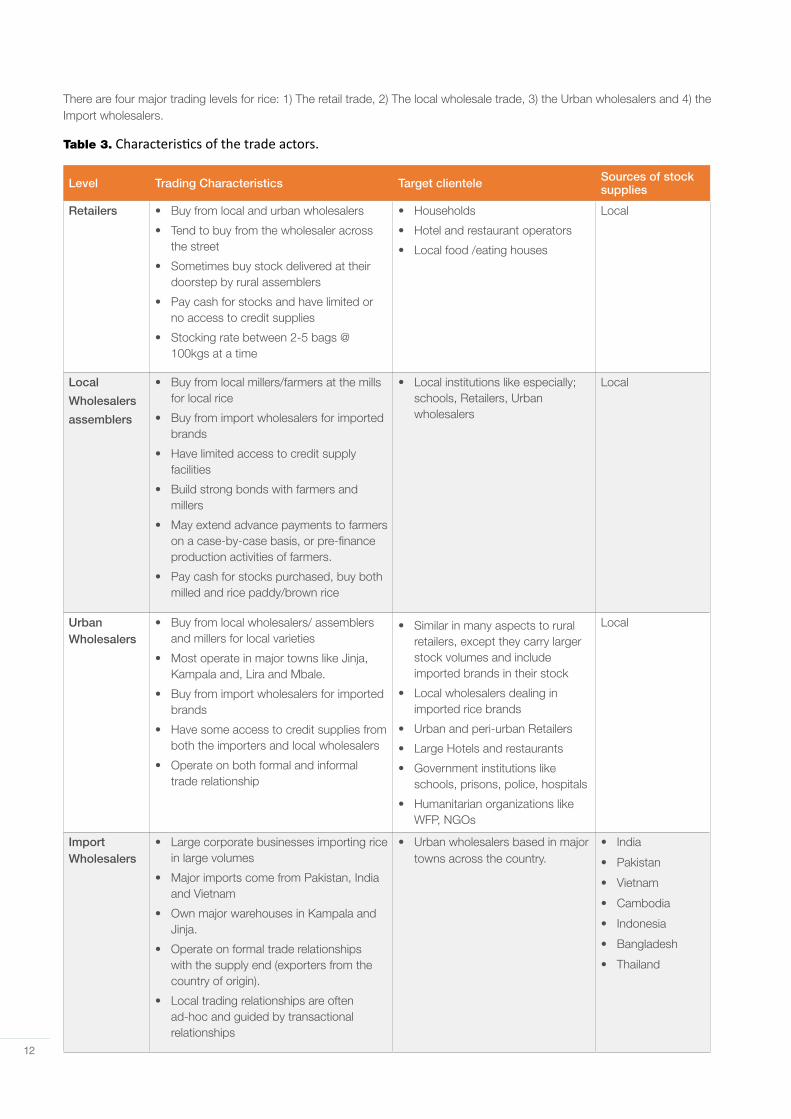
There are four major trading levels for rice: 1) The retail trade, 2) The local wholesale trade, 3) the Urban wholesalers and 4) the Import wholesalers.
Table 3. Characteristics of the trade actors.
Level Trading Characteristics Target clientele Sources of stock supplies
Retailers • Buy from local and urban wholesalers
• Tend to buy from the wholesaler across the street
• Sometimes buy stock delivered at their doorstep by rural assemblers
• Pay cash for stocks and have limited or no access to credit supplies
• Stocking rate between 2-5 bags @ 100kgs at a time
• Households
• Hotel and restaurant operators
• Local food /eating houses
Local
Local
Wholesalers
assemblers
• Buy from local millers/farmers at the mills for local rice
• Buy from import wholesalers for imported brands
• Have limited access to credit supply facilities
• Build strong bonds with farmers and millers
• May extend advance payments to farmers on a case-by-case basis, or pre-finance production activities of farmers.
• Pay cash for stocks purchased, buy both milled and rice paddy/brown rice
• Local institutions like especially; schools, Retailers, Urban wholesalers
Local
Urban Wholesalers
• Buy from local wholesalers/ assemblers and millers for local varieties
• Most operate in major towns like Jinja, Kampala and, Lira and Mbale.
• Buy from import wholesalers for imported brands
• Have some access to credit supplies from both the importers and local wholesalers
• Operate on both formal and informal trade relationship
• Similar in many aspects to rural retailers, except they carry larger stock volumes and include imported brands in their stock
• Local wholesalers dealing in imported rice brands
• Urban and peri-urban Retailers
• Large Hotels and restaurants
• Government institutions like schools, prisons, police, hospitals
• Humanitarian organizations like WFP, NGOs
Local
Import Wholesalers
• Large corporate businesses importing rice in large volumes
• Major imports come from Pakistan, India and Vietnam
• Own major warehouses in Kampala and Jinja.
• Operate on formal trade relationships with the supply end (exporters from the country of origin).
• Local trading relationships are often ad-hoc and guided by transactional relationships
• Urban wholesalers based in major towns across the country.
• India
• Pakistan
• Vietnam
• Cambodia
• Indonesia
• Bangladesh
• Thailand
13
3.3.1 Target market and customer base
The target market segments for KROP Cooperative in the next three years will be.
i. The institutional markets i.e., schools
ii. The retail markets
iii. The business (Hospitality) Markets
The Cooperative focus is to engage in market development activities to build inroads into these target markets by establishing key sales outlets or appointing agents in strategic markets to ease access to the cooperative’s products and establish itself as a key member of the rice supply chain in these markets. Yumbe district population alone is over 1 million people and the rice production are still at its infant stages. The undefined target markets to the local communities of West Nile, the refugee community, migrant workers, and expatriates in the country. The major consumers of rice besides households are institutional consumers like schools and feeding institutions (programs), the hospitality industry (hotels, restaurants, and roadside food eateries). The majority of these buy their rice from the local retailers, wholesalers, and contract suppliers.
3.3.2 Market size and potential
At a 3.0% population growth rate in Uganda with a national population standing at 41 million (UBOS 2019/2020), to meet the growing food demands this calls for an increase in food production to avert challenges of food shortages by also increasing farmer participation by almost 70%. The situation in Yumbe and other districts in the West Nile is further complicated by the population explosion resulting from the refugee influx of over 270,000 refugees in Bidibidi refugee settlement, coupled with the host population brings a total population to 1 million people which has increased demand for food and food prices. The region is increasingly becoming dependent on food supplies from other regions and imports from cross border sources. Rice in particular has become a very important food security and staple for most urban communities in West Nile, it is increasingly becoming important in the rural communities as well. The region also has a market potential to supply neighbouring countries like the Democratic Republic of Congo and South Sudan that is devastated by war and low agricultural activities.
In Uganda, the demand for rice is estimated to grow by 3.4% annually, but production is growing at a much slower rate, with nearly 60% of all the rice consumed imported into the country. This trend shows that the major rice-producing countries in Asia have limited capacity to increase production, future production growth will come from continents like Africa which have unexploited rice production potential.
Rice is the second most-produced cereal in the world after maize, the United States Department of Agriculture (USDA)
estimates that the world Rice Production in 2019 was 755.4Million MT of paddy approximately 491.1Million MT of milled rice. This represents a marginal increase of 1.0% in rice production around the globe. India and China account for 59% of world production and African production represents 6% of the world output.
Rice is now becoming increasingly popular in Africa and the continent is estimated to supplement its production through imports worthy of $15billion annually to cover the supply gap. The rice export market is highly concentrated with the top five rice exporters accounting for 80% of the global rice trade. Of the five top exporters, four (Thailand, India, Vietnam, and Pakistan) are from Asia. The middle east and Africa are the fastest-growing export markets with the imports in these regions doubling from 10million to 20 million tons in the past decade alone (http://irri.org/rice-today/trends-inglobal-rice-trade).
3.3.3 Competitor analysis
In West Nile, the production, postharvest handling, and processing technologies used in the rice sub-sector i.e. milling further make Uganda’s rice less competitive at home and in the regional markets. However, commercial corporate organizations like Tilda- import wholesaler as a large corporate business importing rice in large volumes from Pakistan, India and Vietnam etc. owns major warehouses in Kampala and Jinja, operate on formal trade relationships with the supply end (exporters from the country of origin). The middlemen, Local trading relationships are often ad-hoc and guided by transactional relationships and out-growers affiliated to commercial millers like Eastern millers in Tororo, Kingdom rice in Kampala and Upland millers in Jinja. They target urban wholesalers based in major towns across the country like Yumbe & Arua.
3.3.4 Competitive advantage
KRORP Co-op Ltd has relative competitive advantages over competitors in both the informal and formal markets. I.e., members’ loyalty oriented and provide reliable payment for produce to member-supplier-farmers as trading produce in the informal is time-consuming and unpredictable for many private dealers.
The farmer members benefit from ownership through purchase of co-operative shares hence receipt of dividends from the profits, existing partnership with key development and social stakeholders thus economies of scale and opportunity for multiple funding. KRORP Co-op Ltd.’s membership structure gives farmers an equity stake in the business and allows them to control the business, ensuring that their needs are met. We always have contract farming models with our farmers and besides, pay extra on quality members’ produce and also facilitate their production process that makes lifelong partners.
14
3.4 Marketing and distribution
Rice being food is a universal need but for the sake of making business sense the Co-operative targets institutional i.e., Schools, UNWFP, Supermarkets, retail buyers and business (hospitality) market segments. These are markets with high
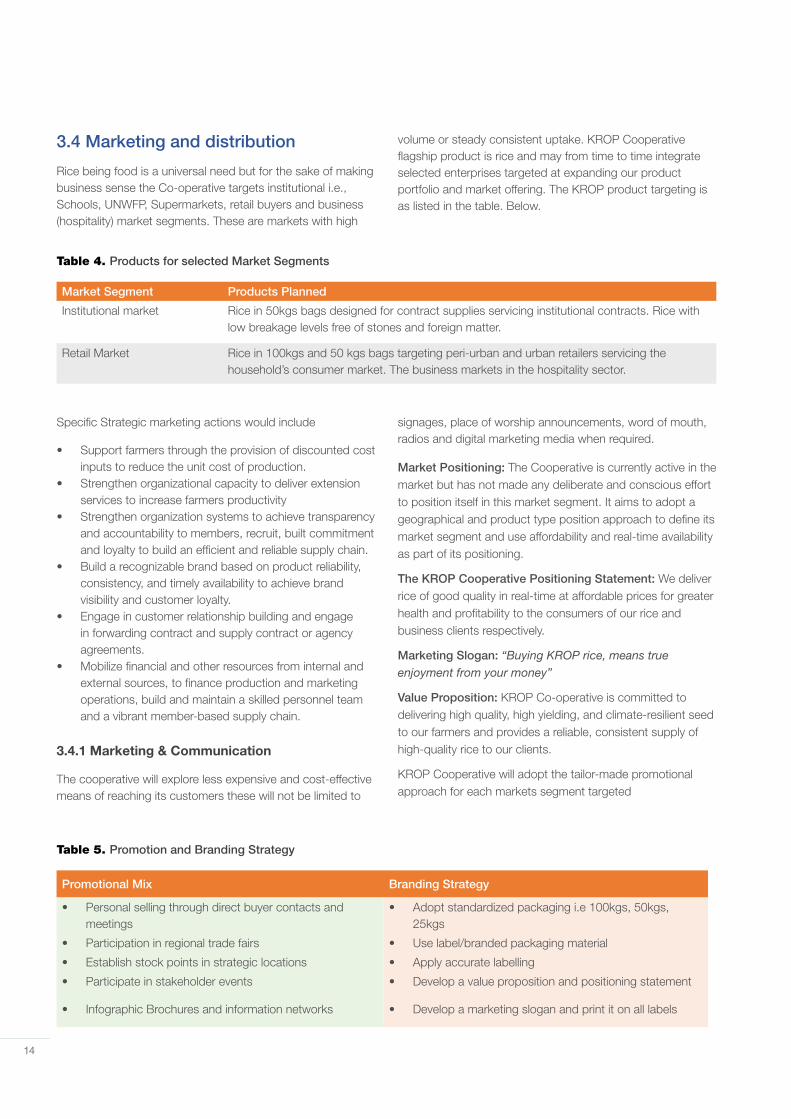
volume or steady consistent uptake. KROP Cooperative flagship product is rice and may from time to time integrate selected enterprises targeted at expanding our product portfolio and market offering. The KROP product targeting is as listed in the table. Below.
Table 4. Products for selected Market Segments
Market Segment Products Planned
Institutional market Rice in 50kgs bags designed for contract supplies servicing institutional contracts. Rice with low breakage levels free of stones and foreign matter.
Retail Market Rice in 100kgs and 50 kgs bags targeting peri-urban and urban retailers servicing the household’s consumer market. The business markets in the hospitality sector.
Specific Strategic marketing actions would include
• Support farmers through the provision of discounted cost inputs to reduce the unit cost of production.
• Strengthen organizational capacity to deliver extension services to increase farmers productivity
• Strengthen organization systems to achieve transparency and accountability to members, recruit, built commitment and loyalty to build an efficient and reliable supply chain.
• Build a recognizable brand based on product reliability, consistency, and timely availability to achieve brand visibility and customer loyalty.
• Engage in customer relationship building and engage in forwarding contract and supply contract or agency agreements.
• Mobilize financial and other resources from internal and external sources, to finance production and marketing operations, build and maintain a skilled personnel team and a vibrant member-based supply chain.
3.4.1 Marketing & Communication
The cooperative will explore less expensive and cost-effective means of reaching its customers these will not be limited to
signages, place of worship announcements, word of mouth, radios and digital marketing media when required.
Market Positioning: The Cooperative is currently active in the market but has not made any deliberate and conscious effort to position itself in this market segment. It aims to adopt a geographical and product type position approach to define its market segment and use affordability and real-time availability as part of its positioning.
The KROP Cooperative Positioning Statement: We deliver rice of good quality in real-time at affordable prices for greater health and profitability to the consumers of our rice and business clients respectively.
Marketing Slogan: “Buying KROP rice, means true enjoyment from your money”
Value Proposition: KROP Co-operative is committed to delivering high quality, high yielding, and climate-resilient seed to our farmers and provides a reliable, consistent supply of high-quality rice to our clients.
KROP Cooperative will adopt the tailor-made promotional approach for each markets segment targeted
Table 5. Promotion and Branding Strategy
Promotional Mix Branding Strategy
• Personal selling through direct buyer contacts and meetings
• Adopt standardized packaging i.e 100kgs, 50kgs, 25kgs
• Participation in regional trade fairs • Use label/branded packaging material
• Establish stock points in strategic locations • Apply accurate labelling
• Participate in stakeholder events • Develop a value proposition and positioning statement
• Infographic Brochures and information networks • Develop a marketing slogan and print it on all labels
15
The KROP Cooperative is built on the principles of personal selling to engage with potential customers. Market strategy is to penetrate the regional markets by offering consistent and quality products, excellence in contract performance and building member loyalty through improved member welfare and livelihood by creating greater livelihood opportunities.
3.4.2 Distribution
In the interim the Cooperative encourages the walk-in customers and big buyers to pick up the goods from KROP Cooperative’s central warehouse in Avanga Parish, Kei Subcounty as the distribution mechanism is being set. Thereafter the cooperative will use direct delivery of goods to buyers stores and ex-warehouse deliveries where buyers will be able to pay extra to cover the transportation cost.
3.4.3 Sales
For marketing efficiency and cost-effectiveness, KRORP Co-op Ltd will sell its products to big formal institutions in addition to the small local buyers. This kind of marketing could reduce the risks associated with dependency on one single buyer and maintaining competitive prices for product suppliers. Management will use its best efforts to attract the most competitive buyer that offers the best price and creates the most value for shareholders and members. MoUs and sale agreements will be adopted with consistent big buyers.
Sales Strategy: We plan to approach our prospects for their initial consultation, interrupting the standard practice in our industry carrying products to customers. This approach will help differentiate us and allow us to properly conduct presentations that highlight our process and showcase. This
approach also shows that we have a very professional staff and process- something that also differentiates us from much of the competition.
Table 6. Sales Promotional Strategy
Market Promotional Approach
Institutional Markets
Branded packaging, Personal contacts and client meetings, Tendering, Trade fairs, Field days
Retail and hospitality markets
Branded packaging, Personal contacts, establish stock points in major towns, Building retailer networks
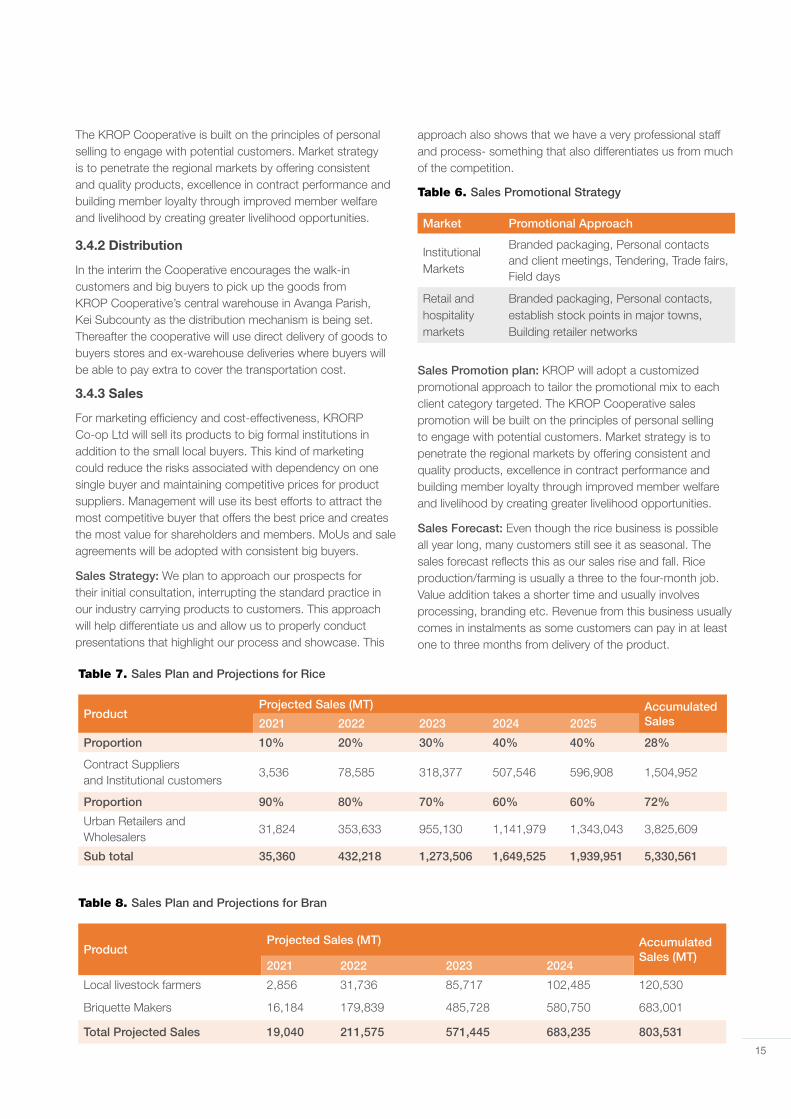
Table 7. Sales Plan and Projections for Rice
ProductProjected Sales (MT) Accumulated
Sales 2021 2022 2023 2024 2025
Proportion 10% 20% 30% 40% 40% 28%
Contract Suppliers and Institutional customers
3,536 78,585 318,377 507,546 596,908 1,504,952
Proportion 90% 80% 70% 60% 60% 72%
Urban Retailers and Wholesalers
31,824 353,633 955,130 1,141,979 1,343,043 3,825,609
Sub total 35,360 432,218 1,273,506 1,649,525 1,939,951 5,330,561
Table 8. Sales Plan and Projections for Bran
ProductProjected Sales (MT) Accumulated
Sales (MT)2021 2022 2023 2024
Local livestock farmers 2,856 31,736 85,717 102,485 120,530
Briquette Makers 16,184 179,839 485,728 580,750 683,001
Total Projected Sales 19,040 211,575 571,445 683,235 803,531
Sales Promotion plan: KROP will adopt a customized promotional approach to tailor the promotional mix to each client category targeted. The KROP Cooperative sales promotion will be built on the principles of personal selling to engage with potential customers. Market strategy is to penetrate the regional markets by offering consistent and quality products, excellence in contract performance and building member loyalty through improved member welfare and livelihood by creating greater livelihood opportunities.
Sales Forecast: Even though the rice business is possible all year long, many customers still see it as seasonal. The sales forecast reflects this as our sales rise and fall. Rice production/farming is usually a three to the four-month job. Value addition takes a shorter time and usually involves processing, branding etc. Revenue from this business usually comes in instalments as some customers can pay in at least one to three months from delivery of the product.
16
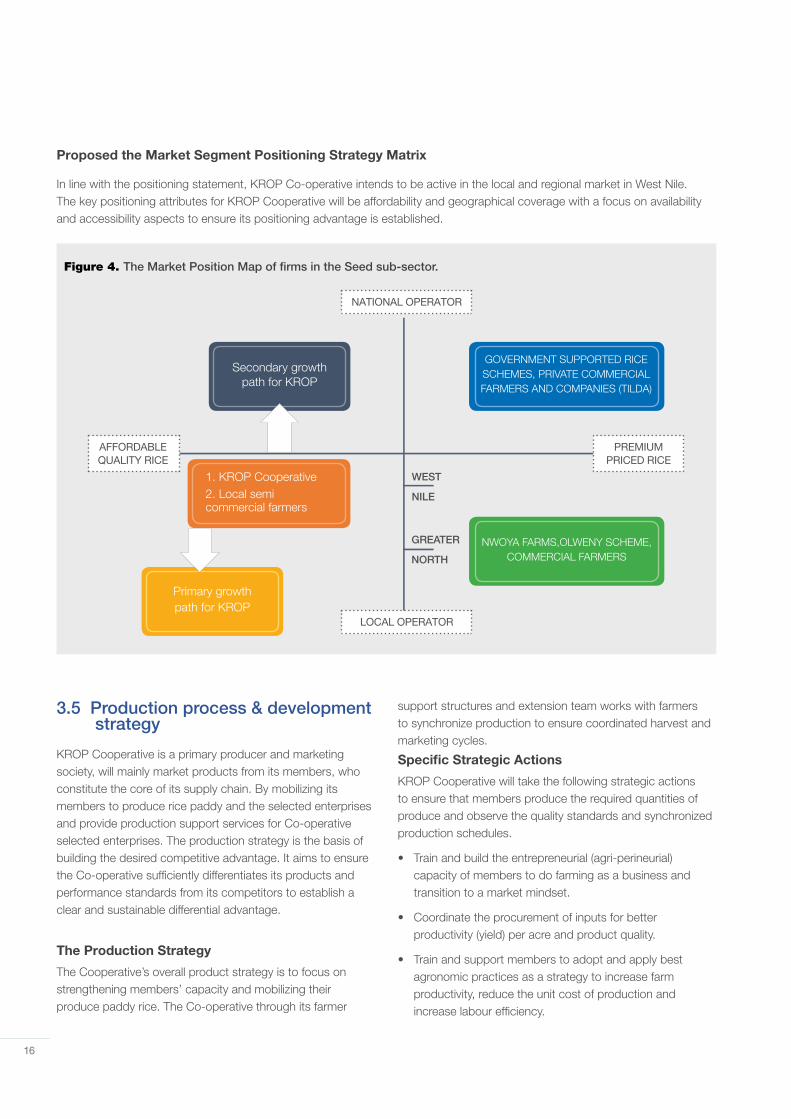
Proposed the Market Segment Positioning Strategy Matrix
In line with the positioning statement, KROP Co-operative intends to be active in the local and regional market in West Nile. The key positioning attributes for KROP Cooperative will be affordability and geographical coverage with a focus on availability and accessibility aspects to ensure its positioning advantage is established.
3.5 Production process & development strategy
KROP Cooperative is a primary producer and marketing society, will mainly market products from its members, who constitute the core of its supply chain. By mobilizing its members to produce rice paddy and the selected enterprises and provide production support services for Co-operative selected enterprises. The production strategy is the basis of building the desired competitive advantage. It aims to ensure the Co-operative sufficiently differentiates its products and performance standards from its competitors to establish a clear and sustainable differential advantage.
The Production Strategy
The Cooperative’s overall product strategy is to focus on strengthening members’ capacity and mobilizing their produce paddy rice. The Co-operative through its farmer
support structures and extension team works with farmers to synchronize production to ensure coordinated harvest and marketing cycles.
Specific Strategic Actions
KROP Cooperative will take the following strategic actions to ensure that members produce the required quantities of produce and observe the quality standards and synchronized production schedules.
• Train and build the entrepreneurial (agri-perineurial) capacity of members to do farming as a business and transition to a market mindset.
• Coordinate the procurement of inputs for better productivity (yield) per acre and product quality.
• Train and support members to adopt and apply best agronomic practices as a strategy to increase farm productivity, reduce the unit cost of production and increase labour efficiency.
Figure 4. The Market Position Map of firms in the Seed sub-sector.
Secondary growth path for KROP
1. KROP Cooperative2. Local semi commercial farmers
Primary growth path for KROP
GOVERNMENT SUPPORTED RICE SCHEMES, PRIVATE COMMERCIAL FARMERS AND COMPANIES (TILDA)
NWOYA FARMS,OLWENY SCHEME, COMMERCIAL FARMERS
NATIONAL OPERATOR
PREMIUM PRICED RICE
AFFORDABLE QUALITY RICE
LOCAL OPERATOR
WEST
NILE
GREATER
NORTH
17
• Build commitment and loyalty from members, mobilize financially (through internal savings and external grants/borrowing) and other resources to support members production activities and members welfare and benefit programs.
• Support farmers through the provision of discounted cost inputs to reduce the unit cost of production.
• Strengthen organizational capacity to deliver extension services to increase farmers productivity
Production Management plan
The production plan to operationalize this strategy will be.
• Identify and register members interested in the production of rice in each season.
• Determine expected acreage, the source for input suppliers and negotiate bulk purchase terms and procure inputs to take advantage of quantity discounts, ensure the quality of inputs and harmonize the planting timeline and harvest timeline.
• Provide extension and technical advisory services to the farmers to promote good agronomic practices (GAP) and increase productivity, improve harvest techniques and post-harvest handling.
• Mobilize resources and facilitate production activities of members through production financing, support mechanization activities and commitment building.
There are two production seasons in the year, the first season is from March to June (Season I) and the second season starts from July-October (Season II).
Production Financing Strategy
• KROP Cooperative seeks to support members in each of the 7 farmer groups to access production finance from credit institutions.
• Build internal capacity to finance member production by introducing a mandatory member saving scheme to mobilize finance for production.
• Each member is required to save 2% of their sales proceeds deducted at the source from the cooperative.
• Negotiate forward contracts and pre-financing arrangements with buyers to support farmer activities.
Supply Chain and Procurement Strategy
KROP Cooperative supply chain strategy is to collect good quality rice paddy from its farmer members who form the core of the supply chain. The Co-operative expects to recover 50-60% of the high-grade rice paddy. The Co-operative addresses competition at the supply chain level by negotiating and forming building market linkages with key distribution channel actors in the region to guarantee the market for the cooperative’s products. The objective is to neutralize the effect and financial strength of middlemen and rural traders who are the major competitors at the farmgate level.
The Cooperative uses existing agreements with institutional and bulk buyers to secure pre-financing to strengthen the financial capacity of the Co-operative to advance cash to members in support of bulking for value addition. Leveraging Cooperative’s financial capability is a strategy to strengthen our competitiveness at the supply chain level. In the short term, farmers demand cash payment for produce at the farm-gate and buyers that can afford to pay cash to become more competitive in procuring from farmers.
The following critical supply chain management actions will be performed.
• Source for short-term trade finance through a combination of grants, trade advances from buyers and credit finance from lending institutions for procurement of produce.
• Develop a quality assurance plan at the farm gate level to address quality management challenges at harvest, postharvest and storage handling of produce. The farmers in each location are facilitated to bulk their produce in selected collection points where quality inspection is done, and primary cleaning and grading are done.
• Establish satellite collection centres at the community level for aggregation/bulking of the produce before picking up and delivery to the Cooperative central stores.
• Equip the satellite collection centres with weighing scales, moisture meters and bagging materials to ensure good product handling and collection.
• Train the area or group bulking and marketing committees in quality management, product grading, record keeping, maintenance, product storage and phytosanitary management to eliminate storage and handling loss at the satellite centres.
18
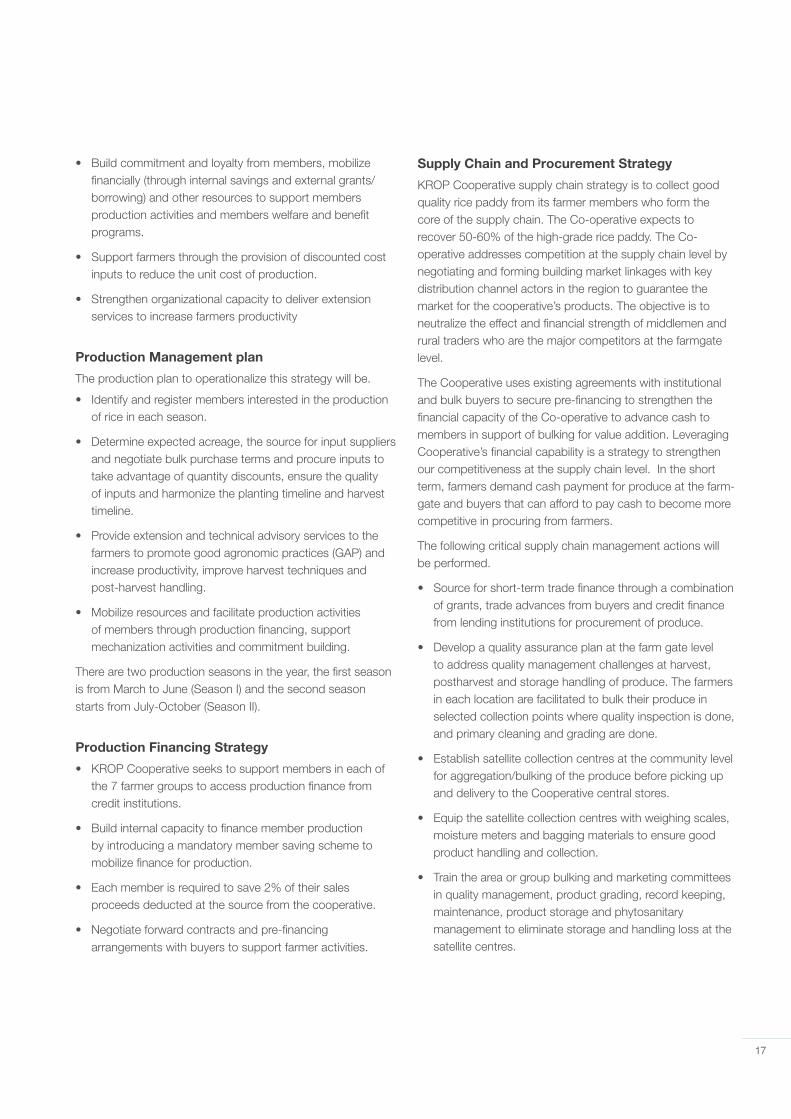
Table 9. Projected Master Production Plan 2021 -2025
Year 2021 2022 2023 2024 2025 Notes
Target acreage (Rice) 50 630 1,760 2,260 2,760
In 2020-2021 each farmer planted at least 2.5 acres and from 2022-25 each farmer is expected by the cooperative to plant at least 5 acres and above.
No. of farmers to enrol 152 252 352 452 552
Projected output (800kg/acre) 40,000 504,000 1,408,000 1,808,000 2,208,000
Household retention (20%) 8,000 100,800 281,600 361,600 441,600
Marketable Surplus (MT) 32,000 403,200 1,126,400 1,446,400 1,766,400
3.6 The suppliers and raw materials
• Credit Purchase Financing – for this type of financing to be successful, the trust and reputation of SMEs need to be established with their suppliers.
• Village assemblers buy paddy rice from smallholder
Table 10. suppliers & raw materials
No Suppliers Raw materials
1 Input suppliers East African seed, Pearl seed, FICA seeds, Rhino Seeds etc.
2 Tractor/ Agritech suppliers Yumbe DFA, Harvest Agro-works And Engineering Ltd
3 Financial services providers Centenary Bank, Post bank, Vision Fund
4 Agri-Insurance suppliers
producers and sell it to processors. Producer-trader relationships are often strong, with inputs or credit advanced by the buyers on a trust basis. Although producer organisations exist, they only perform aggregation functions to sell unprocessed paddy to millers and traders.
3.7 Cooperative structure
The management structure of KRORP Coop. Society is consistent with the Co-operative Societies Act (Amended) 2016. The AGM is the topmost decision-making body and seats at least once a year. The AGM appoints the executive who forms the board of the cooperative and is made up of 9 elected members with at least one female member.
The board is responsible for developing the strategic direction of the Co-operative Society, propose policies to
govern the society, implement the decisions of the AGM and perform an oversight function over the management of the Co-operative. The Secretariate is the seat of the management team and is led by the Manager who is an ex-officio member of the board.
The Implementation of the business plan will be the responsibility of the cooperative board. The board will be supported by the management team at the secretariat. The management team is headed by the Secretary Manager, working with a team of 3 senior secretariat staff.
19
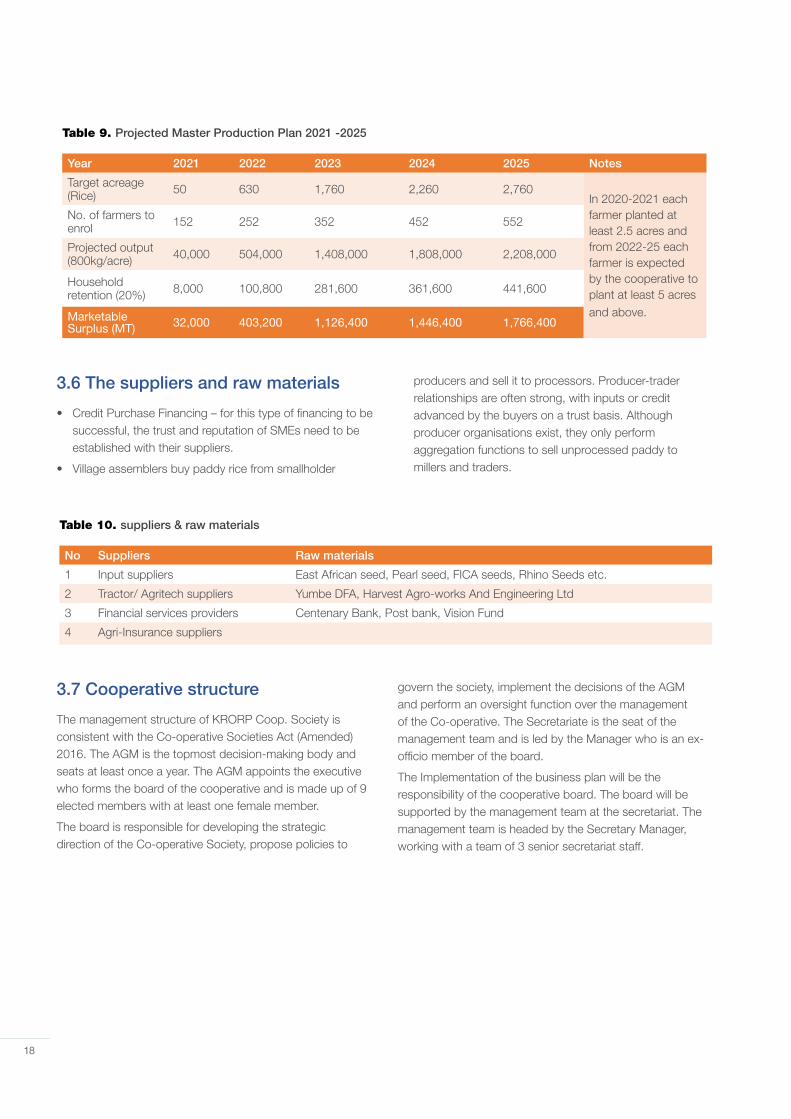
KROP Cooperative Organizational Structure
Figure 5. Organisational structure
Table 11. List management committee
S/N Name Experience Position
1 Lopia Samuel A grade certificate primary teacher Chairman
2 Driciru Peninnah Farmers and grade primary teacher Vice-Chairman
3 Guma Siraji Juma Farmer and a primary teacher Treasurer
4 Kana Richard Farmers Member
5 Atim Cissy Ogwal Farmers Member
6 Eceru Emily Farmers Member
7 Apiru Gift Farmers Member
8 Matua Richard Farmers Member
9 Akujo Margret Farmers Member
3.7.1 Management
KRORP Co-op Ltd also has a management staff that is full time and are responsible for the day to day running of the businesses. This management is recruited and paid by KRORP Co-op Ltd. The Society also gets management support from development partners to boost the staff’ professional performance and efficiency in running the enterprises as well as offering services to the farmers in form of technical assistance, co-operative development, extension and agronomy services as well as business development services.
The Management team charged with the day-to-day running of the Co-operative Society’s business is made up of the following personnel.
1. The Secretary Manager: heads the secretariat and management team and reports directly to the board. The general manager is responsible for implementing the business plans, work plans and policies approved by the board and the General Assembly and oversees the operational business of the Co-operative and is accountable for the realization of the business goals, supervise the management, field teams and is responsible for fostering good business relationships between the Co-operative customers, the members, and the partners. The general manager supports the board in resource mobilization and is the chief steward of the Co-operative’s financial and other resources.
AGM Members
Vetting Committee
Loan & savings
committee
Logistics & supplies
Production & Marketing
Finance & Adminstration
Production & marketing committee
Finance & Planning committee
Board of Directors
Secretary manager
Supervisorycommittee
20
2. The Sales and Marketing Officer; reporting to the general manager, is the public relations officer of the Co-operative. Responsible for ensuring that the Co-operative has a good working relationship with its stakeholders, contract performance and customer care standards are met, supporting the senior management, Marketing manager and production manager to negotiate MOUs and business contracts. He is also responsible for marketing activities, looking for markets and buyers of the Co-operative’s products and in collaboration with the production manager and the client relationship manager negotiate forward contract production arrangements and other business contracts.
3. The Production Officer: is responsible for supporting and coordinating the activities of the KROP members to produce for the Co-operative. The production manager is the chief quality assurance officer of the Co-operative’s and ensures that farmers receive the good seed, production support services and proper harvest and post-harvest management skills. The production manager is also responsible for coordinating and supervising the activities of the village agents and extension workers.
4. The Finance & Administration officer; responsible for
the financial and administrative operations of the Co-operative. The accountant is responsible for revenue collection, effecting payments following policy and reporting on financial and administrative matters. Supervises the stores assistant and the field procurement team to ensure proper use of the Co-operative’s finances.
5. Storekeeper (to be recruited) the storekeeper will be in charge of the stores of the cooperative and ensure all stocks which include cooperatives assets, bulked rice and processed rice is stored in good condition, maintain accurate stores records, and ensure good stores management principles such as FIFO.
6. Other key employees of the Co-operative include the machine and plant operators, drivers, and Porters.
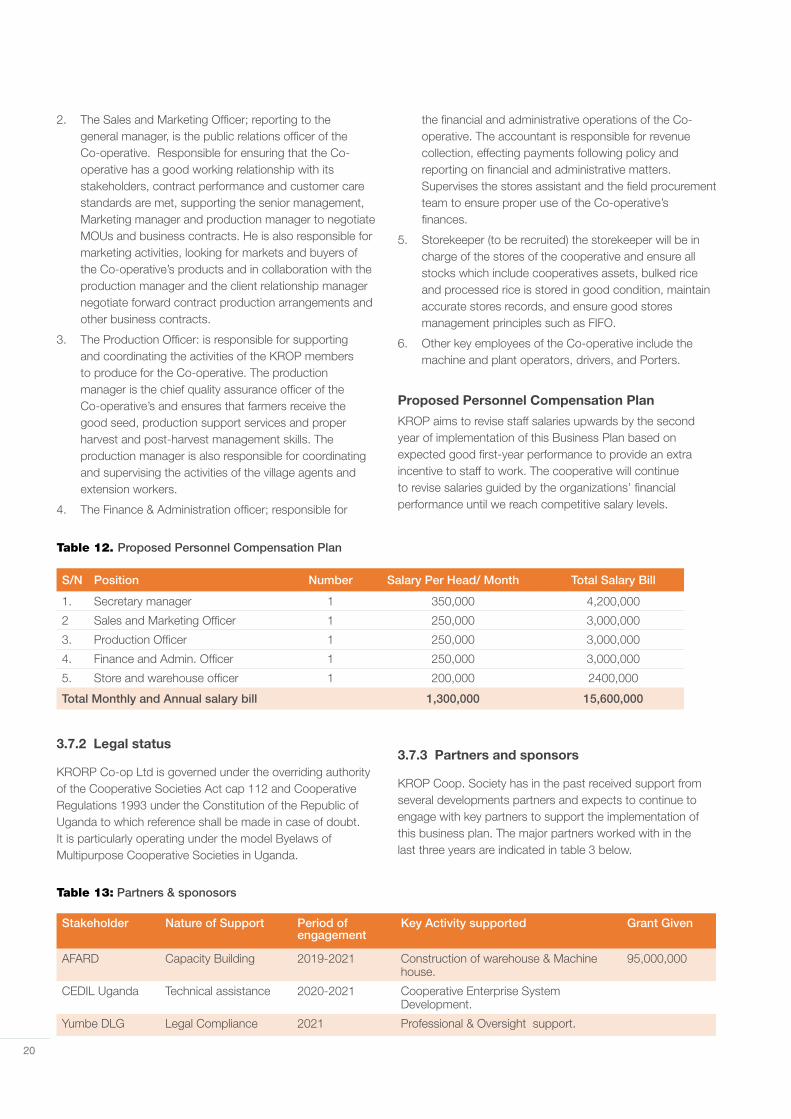
Proposed Personnel Compensation Plan
KROP aims to revise staff salaries upwards by the second year of implementation of this Business Plan based on expected good first-year performance to provide an extra incentive to staff to work. The cooperative will continue to revise salaries guided by the organizations’ financial performance until we reach competitive salary levels.
Table 12. Proposed Personnel Compensation Plan
S/N Position Number Salary Per Head/ Month Total Salary Bill
1. Secretary manager 1 350,000 4,200,000
2 Sales and Marketing Officer 1 250,000 3,000,000
3. Production Officer 1 250,000 3,000,000
4. Finance and Admin. Officer 1 250,000 3,000,000
5. Store and warehouse officer 1 200,000 2400,000
Total Monthly and Annual salary bill 1,300,000 15,600,000
3.7.2 Legal status
KRORP Co-op Ltd is governed under the overriding authority of the Cooperative Societies Act cap 112 and Cooperative Regulations 1993 under the Constitution of the Republic of Uganda to which reference shall be made in case of doubt. It is particularly operating under the model Byelaws of Multipurpose Cooperative Societies in Uganda.
3.7.3 Partners and sponsors
KROP Coop. Society has in the past received support from several developments partners and expects to continue to engage with key partners to support the implementation of this business plan. The major partners worked with in the last three years are indicated in table 3 below.
Table 13: Partners & sponosors
Stakeholder Nature of Support Period of engagement
Key Activity supported Grant Given
AFARD Capacity Building 2019-2021 Construction of warehouse & Machine house.
95,000,000
CEDIL Uganda Technical assistance 2020-2021 Cooperative Enterprise System Development.
Yumbe DLG Legal Compliance 2021 Professional & Oversight support.
21
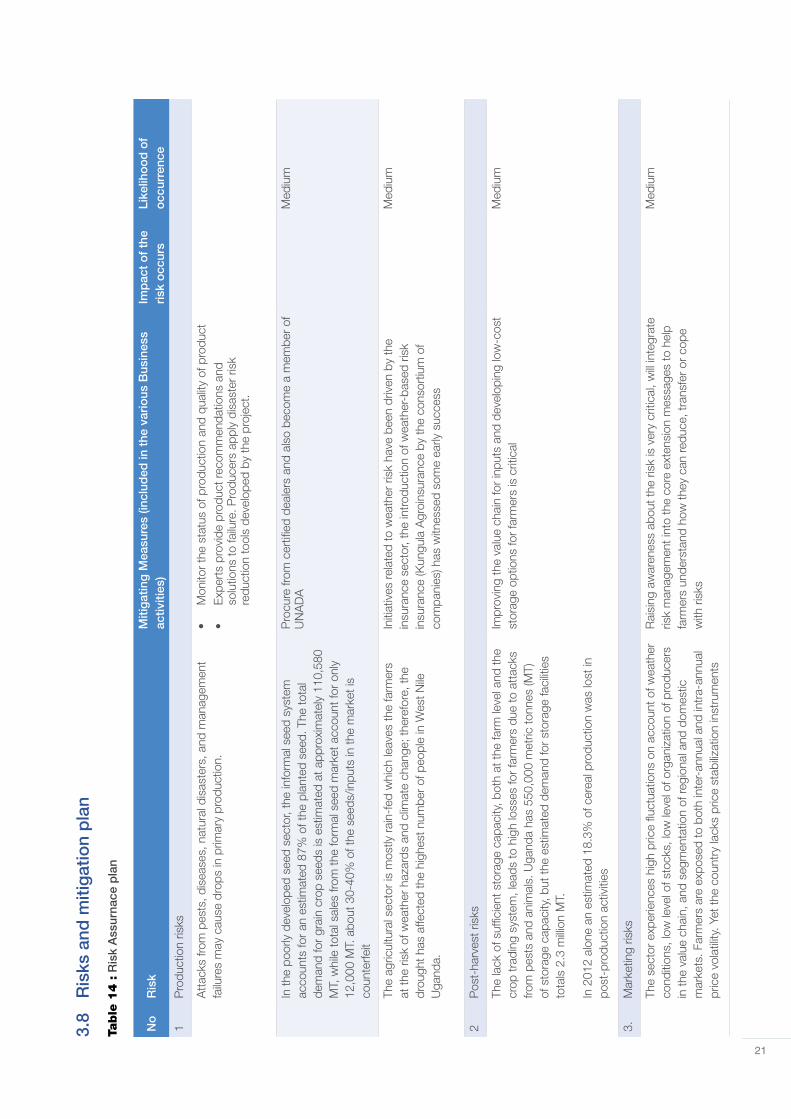
3.8
Ris
ks a
nd m
itig
atio
n p
lan
Table
14
: R
isk
Ass
urna
ce p
lan
No
R
isk
Miti
gat
ing
Mea
sure
s (in
clud
ed in
the
var
ious
Bus
ines
s ac
tiviti
es)
Imp
act
of
the
risk
occ
urs
Like
liho
od
of
occ
urre
nce
1
Pro
duct
ion
risks
Att
acks
from
pes
ts, d
isea
ses,
nat
ural
dis
aste
rs, a
nd m
anag
emen
t fa
ilure
s m
ay c
ause
dro
ps in
prim
ary
prod
uctio
n.•
Mon
itor
the
stat
us o
f pro
duct
ion
and
qual
ity o
f pro
duct
•E
xper
ts p
rovi
de p
rodu
ct re
com
men
datio
ns a
nd
solu
tions
to fa
ilure
. Pro
duce
rs a
pply
dis
aste
r ris
k re
duct
ion
tool
s de
velo
ped
by th
e pr
ojec
t.
In th
e po
orly
dev
elop
ed s
eed
sect
or, t
he in
form
al s
eed
syst
em
acco
unts
for
an e
stim
ated
87%
of t
he p
lant
ed s
eed.
The
tota
l de
man
d fo
r gr
ain
crop
see
ds is
est
imat
ed a
t app
roxi
mat
ely
110,
580
MT,
whi
le to
tal s
ales
from
the
form
al s
eed
mar
ket a
ccou
nt fo
r on
ly
12,0
00 M
T. a
bout
30-
40%
of t
he s
eeds
/inpu
ts in
the
mar
ket i
s co
unte
rfeit
Pro
cure
from
cer
tified
dea
lers
and
als
o be
com
e a
mem
ber
of
UN
AD
A
Med
ium
The
agric
ultu
ral s
ecto
r is
mos
tly r
ain-
fed
whi
ch le
aves
the
farm
ers
at th
e ris
k of
wea
ther
haz
ards
and
clim
ate
chan
ge; t
here
fore
, the
dr
ough
t has
affe
cted
the
high
est n
umbe
r of
peo
ple
in W
est N
ile
Uga
nda.
Initi
ativ
es re
late
d to
wea
ther
ris
k ha
ve b
een
driv
en b
y th
e in
sura
nce
sect
or, t
he in
trod
uctio
n of
wea
ther
-bas
ed r
isk
insu
ranc
e (K
ungu
la A
groi
nsur
ance
by
the
cons
ortiu
m o
f co
mpa
nies
) has
witn
esse
d so
me
early
suc
cess
Med
ium
2 P
ost-
harv
est r
isks
The
lack
of s
uffic
ient
sto
rage
cap
acity
, bot
h at
the
farm
leve
l and
the
crop
trad
ing
syst
em, l
eads
to h
igh
loss
es fo
r fa
rmer
s du
e to
att
acks
fro
m p
ests
and
ani
mal
s. U
gand
a ha
s 55
0,00
0 m
etric
tonn
es (M
T)
of s
tora
ge c
apac
ity, b
ut th
e es
timat
ed d
eman
d fo
r st
orag
e fa
cilit
ies
tota
ls 2
.3 m
illion
MT.
In 2
012
alon
e an
est
imat
ed 1
8.3%
of c
erea
l pro
duct
ion
was
lost
in
post
-pro
duct
ion
activ
ities
Impr
ovin
g th
e va
lue
chai
n fo
r in
puts
and
dev
elop
ing
low
-cos
t st
orag
e op
tions
for
farm
ers
is c
ritic
al
Med
ium
3.
Mar
ketin
g ris
ks
The
sect
or e
xper
ienc
es h
igh
pric
e flu
ctua
tions
on
acco
unt o
f wea
ther
co
nditi
ons,
low
leve
l of s
tock
s, lo
w le
vel o
f org
aniz
atio
n of
pro
duce
rs
in th
e va
lue
chai
n, a
nd s
egm
enta
tion
of re
gion
al a
nd d
omes
tic
mar
kets
. Far
mer
s ar
e ex
pose
d to
bot
h in
ter-
annu
al a
nd in
tra-
annu
al
pric
e vo
latil
ity. Y
et th
e co
untr
y la
cks
pric
e st
abiliz
atio
n in
stru
men
ts
Rai
sing
aw
aren
ess
abou
t the
ris
k is
ver
y cr
itica
l, w
ill in
tegr
ate
risk
man
agem
ent i
nto
the
core
ext
ensi
on m
essa
ges
to h
elp
farm
ers
unde
rsta
nd h
ow th
ey c
an re
duce
, tra
nsfe
r or
cop
e w
ith r
isks
Med
ium
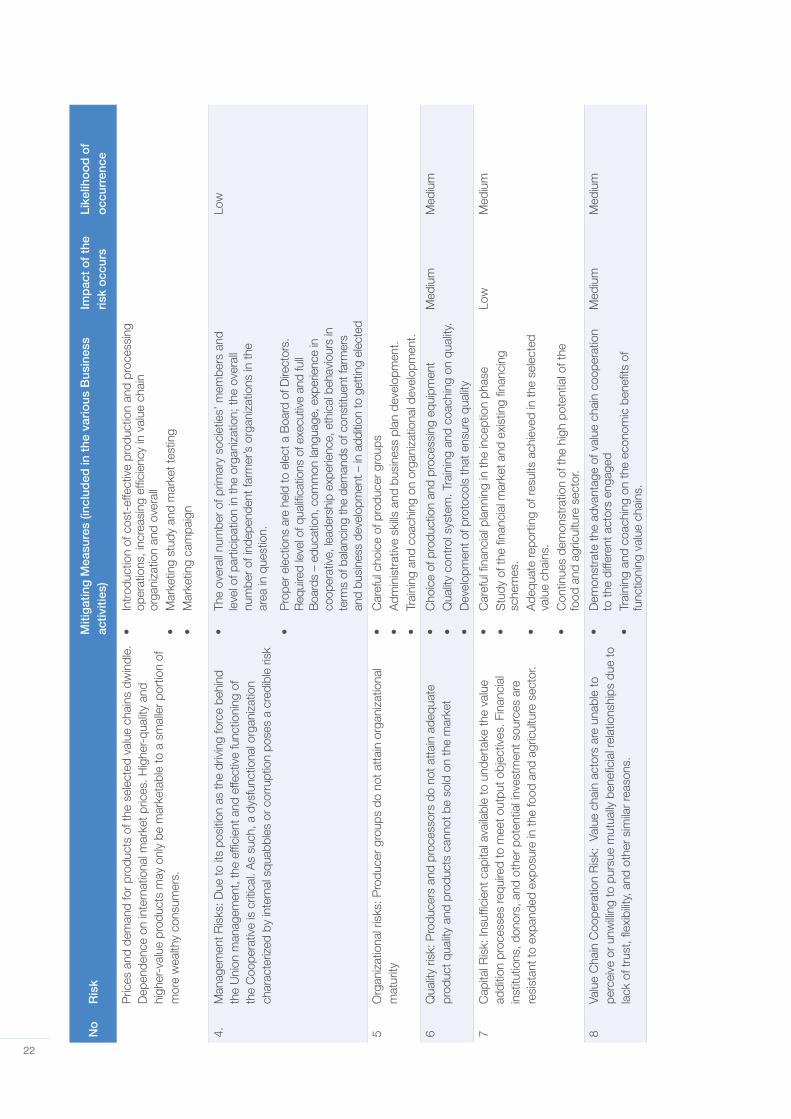
22
No
R
isk
Miti
gat
ing
Mea
sure
s (in
clud
ed in
the
var
ious
Bus
ines
s ac
tiviti
es)
Imp
act
of
the
risk
occ
urs
Like
liho
od
of
occ
urre
nce
Pric
es a
nd d
eman
d fo
r pr
oduc
ts o
f the
sel
ecte
d va
lue
chai
ns d
win
dle.
D
epen
denc
e on
inte
rnat
iona
l mar
ket p
rices
. Hig
her-
qual
ity a
nd
high
er-v
alue
pro
duct
s m
ay o
nly
be m
arke
tabl
e to
a s
mal
ler
port
ion
of
mor
e w
ealth
y co
nsum
ers.
•In
trod
uctio
n of
cos
t-ef
fect
ive
prod
uctio
n an
d pr
oces
sing
op
erat
ions
, inc
reas
ing
effic
ienc
y in
val
ue c
hain
or
gani
zatio
n an
d ov
eral
l •
Mar
ketin
g st
udy
and
mar
ket t
estin
g•
Mar
ketin
g ca
mpa
ign
4.
Man
agem
ent R
isks
: Due
to it
s po
sitio
n as
the
driv
ing
forc
e be
hind
th
e U
nion
man
agem
ent,
the
effic
ient
and
effe
ctiv
e fu
nctio
ning
of
the
Coo
pera
tive
is c
ritic
al. A
s su
ch, a
dys
func
tiona
l org
aniz
atio
n ch
arac
teriz
ed b
y in
tern
al s
quab
bles
or c
orru
ptio
n po
ses
a cr
edib
le ri
sk
•Th
e ov
eral
l num
ber
of p
rimar
y so
ciet
ies’
mem
bers
and
le
vel o
f par
ticip
atio
n in
the
orga
niza
tion;
the
over
all
num
ber
of in
depe
nden
t far
mer
’s o
rgan
izat
ions
in th
e ar
ea in
que
stio
n.
•P
rope
r ele
ctio
ns a
re h
eld
to e
lect
a B
oard
of D
irect
ors.
R
equi
red
leve
l of q
ualifi
catio
ns o
f exe
cutiv
e an
d fu
ll B
oard
s –
educ
atio
n, c
omm
on la
ngua
ge, e
xper
ienc
e in
co
oper
ativ
e, le
ader
ship
exp
erie
nce,
eth
ical
beh
avio
urs
in
term
s of
bal
anci
ng th
e de
man
ds o
f con
stitu
ent f
arm
ers
and
busi
ness
dev
elop
men
t – in
add
ition
to g
ettin
g el
ecte
d
Low
5O
rgan
izat
iona
l ris
ks: P
rodu
cer
grou
ps d
o no
t att
ain
orga
niza
tiona
l m
atur
ity•
Car
eful
cho
ice
of p
rodu
cer
grou
ps
•A
dmin
istr
ativ
e sk
ills a
nd b
usin
ess
plan
dev
elop
men
t.•
Trai
ning
and
coa
chin
g on
org
aniz
atio
nal d
evel
opm
ent.
6Q
ualit
y ris
k: P
rodu
cers
and
pro
cess
ors
do n
ot a
ttai
n ad
equa
te
prod
uct q
ualit
y an
d pr
oduc
ts c
anno
t be
sold
on
the
mar
ket
•C
hoic
e of
pro
duct
ion
and
proc
essi
ng e
quip
men
t•
Qua
lity
cont
rol s
yste
m. T
rain
ing
and
coac
hing
on
qual
ity.
•D
evel
opm
ent o
f pro
toco
ls th
at e
nsur
e qu
ality
Med
ium
Med
ium
7C
apita
l Ris
k: In
suffi
cien
t cap
ital a
vaila
ble
to u
nder
take
the
valu
e ad
ditio
n pr
oces
ses
requ
ired
to m
eet o
utpu
t obj
ectiv
es. F
inan
cial
in
stitu
tions
, don
ors,
and
oth
er p
oten
tial i
nves
tmen
t sou
rces
are
re
sist
ant t
o ex
pand
ed e
xpos
ure
in th
e fo
od a
nd a
gric
ultu
re s
ecto
r.
•C
aref
ul fi
nanc
ial p
lann
ing
in th
e in
cept
ion
phas
e•
Stu
dy o
f the
fina
ncia
l mar
ket a
nd e
xist
ing
finan
cing
sc
hem
es.
•A
dequ
ate
repo
rtin
g of
resu
lts a
chie
ved
in th
e se
lect
ed
valu
e ch
ains
.•
Con
tinue
s de
mon
stra
tion
of th
e hi
gh p
oten
tial o
f the
fo
od a
nd a
gric
ultu
re s
ecto
r.
Low
Med
ium
8Va
lue
Cha
in C
oope
ratio
n R
isk:
Val
ue c
hain
act
ors
are
unab
le to
pe
rcei
ve o
r un
willi
ng to
pur
sue
mut
ually
ben
efici
al re
latio
nshi
ps d
ue to
la
ck o
f tru
st, fl
exib
ility,
and
oth
er s
imila
r re
ason
s.
•D
emon
stra
te th
e ad
vant
age
of v
alue
cha
in c
oope
ratio
n to
the
diffe
rent
act
ors
enga
ged
•Tr
aini
ng a
nd c
oach
ing
on th
e ec
onom
ic b
enefi
ts o
f fu
nctio
ning
val
ue c
hain
s.
Med
ium
Med
ium
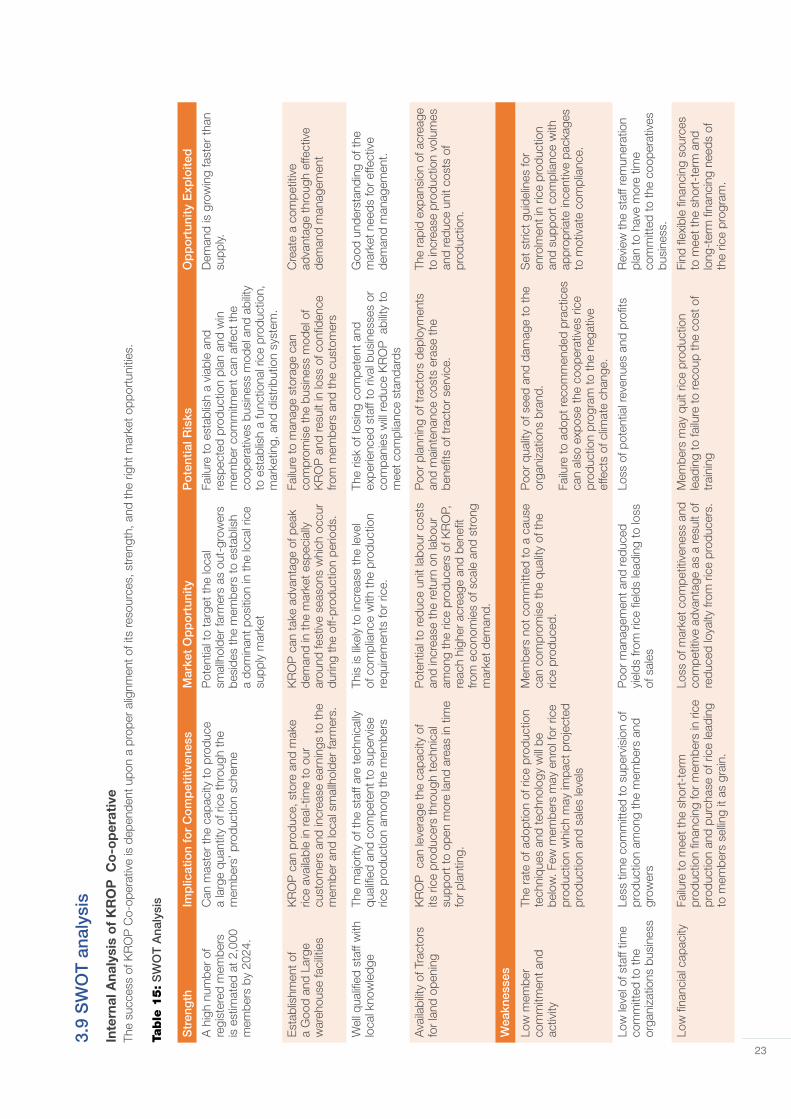
23
3.9
SW
OT
ana
lysi
s
Inte
rnal
Ana
lysi
s o
f K
RO
P C
o-o
per
ativ
eTh
e su
cces
s of
KR
OP
Co-
oper
ativ
e is
dep
ende
nt u
pon
a pr
oper
alig
nmen
t of i
ts re
sour
ces,
str
engt
h, a
nd th
e rig
ht m
arke
t opp
ortu
nitie
s.
Table
15
: S
WO
T A
naly
sis
Str
eng
thIm
plic
atio
n fo
r C
om
pet
itive
ness
Mar
ket
Op
po
rtun
ityP
ote
ntia
l Ris
ksO
pp
ort
unity
Exp
loite
d
A h
igh
num
ber
of
regi
ster
ed m
embe
rs
is e
stim
ated
at 2
,000
m
embe
rs b
y 20
24.
Can
mas
ter
the
capa
city
to p
rodu
ce
a la
rge
quan
tity
of r
ice
thro
ugh
the
mem
bers
’ pro
duct
ion
sche
me
Pot
entia
l to
targ
et th
e lo
cal
smal
lhol
der
farm
ers
as o
ut-g
row
ers
besi
des
the
mem
bers
to e
stab
lish
a do
min
ant p
ositi
on in
the
loca
l ric
e su
pply
mar
ket
Failu
re to
est
ablis
h a
viab
le a
nd
resp
ecte
d pr
oduc
tion
plan
and
win
m
embe
r co
mm
itmen
t can
affe
ct th
e co
oper
ativ
es b
usin
ess
mod
el a
nd a
bilit
y to
est
ablis
h a
func
tiona
l ric
e pr
oduc
tion,
m
arke
ting,
and
dis
trib
utio
n sy
stem
.
Dem
and
is g
row
ing
fast
er th
an
supp
ly.
Est
ablis
hmen
t of
a G
ood
and
Larg
e w
areh
ouse
faci
litie
s
KR
OP
can
pro
duce
, sto
re a
nd m
ake
rice
avai
labl
e in
real
-tim
e to
our
cu
stom
ers
and
incr
ease
ear
ning
s to
the
mem
ber
and
loca
l sm
allh
olde
r fa
rmer
s.
KR
OP
can
take
adv
anta
ge o
f pea
k de
man
d in
the
mar
ket e
spec
ially
ar
ound
fest
ive
seas
ons
whi
ch o
ccur
du
ring
the
off-
prod
uctio
n pe
riods
.
Failu
re to
man
age
stor
age
can
com
prom
ise
the
busi
ness
mod
el o
f K
RO
P a
nd re
sult
in lo
ss o
f con
fiden
ce
from
mem
bers
and
the
cust
omer
s
Cre
ate
a co
mpe
titiv
e ad
vant
age
thro
ugh
effe
ctiv
e de
man
d m
anag
emen
t
Wel
l qua
lified
sta
ff w
ith
loca
l kno
wle
dge
The
maj
ority
of t
he s
taff
are
tech
nica
lly
qual
ified
and
com
pete
nt to
sup
ervi
se
rice
prod
uctio
n am
ong
the
mem
bers
This
is li
kely
to in
crea
se th
e le
vel
of c
ompl
ianc
e w
ith th
e pr
oduc
tion
requ
irem
ents
for
rice.
The
risk
of lo
sing
com
pete
nt a
nd
expe
rienc
ed s
taff
to r
ival
bus
ines
ses
or
com
pani
es w
ill re
duce
KR
OP
abi
lity
to
mee
t com
plia
nce
stan
dard
s
Goo
d un
ders
tand
ing
of th
e m
arke
t nee
ds fo
r ef
fect
ive
dem
and
man
agem
ent.
Ava
ilabi
lity
of T
ract
ors
for
land
ope
ning
KR
OP
can
leve
rage
the
capa
city
of
its r
ice
prod
ucer
s th
roug
h te
chni
cal
supp
ort t
o op
en m
ore
land
are
as in
tim
e fo
r pl
antin
g.
Pot
entia
l to
redu
ce u
nit l
abou
r co
sts
and
incr
ease
the
retu
rn o
n la
bour
am
ong
the
rice
prod
ucer
s of
KR
OP,
re
ach
high
er a
crea
ge a
nd b
enefi
t fro
m e
cono
mie
s of
sca
le a
nd s
tron
g m
arke
t dem
and.
Poo
r pl
anni
ng o
f tra
ctor
s de
ploy
men
ts
and
mai
nten
ance
cos
ts e
rase
the
bene
fits
of tr
acto
r se
rvic
e.
The
rapi
d ex
pans
ion
of a
crea
ge
to in
crea
se p
rodu
ctio
n vo
lum
es
and
redu
ce u
nit c
osts
of
prod
uctio
n.
Wea
knes
ses
Low
mem
ber
com
mitm
ent a
nd
activ
ity
The
rate
of a
dopt
ion
of r
ice
prod
uctio
n te
chni
ques
and
tech
nolo
gy w
ill be
be
low
. Few
mem
bers
may
enr
ol fo
r ric
e pr
oduc
tion
whi
ch m
ay im
pact
pro
ject
ed
prod
uctio
n an
d sa
les
leve
ls
Mem
bers
not
com
mitt
ed to
a c
ause
ca
n co
mpr
omis
e th
e qu
ality
of t
he
rice
prod
uced
.
Poo
r qu
ality
of s
eed
and
dam
age
to th
e or
gani
zatio
ns b
rand
.
Failu
re to
ado
pt re
com
men
ded
prac
tices
ca
n al
so e
xpos
e th
e co
oper
ativ
es r
ice
prod
uctio
n pr
ogra
m to
the
nega
tive
effe
cts
of c
limat
e ch
ange
.
Set
str
ict g
uide
lines
for
enro
lmen
t in
rice
prod
uctio
n an
d su
ppor
t com
plia
nce
with
ap
prop
riate
ince
ntiv
e pa
ckag
es
to m
otiv
ate
com
plia
nce.
Low
leve
l of s
taff
time
com
mitt
ed to
the
orga
niza
tions
bus
ines
s
Less
tim
e co
mm
itted
to s
uper
visi
on o
f pr
oduc
tion
amon
g th
e m
embe
rs a
nd
grow
ers
Poo
r m
anag
emen
t and
redu
ced
yiel
ds fr
om r
ice
field
s le
adin
g to
loss
of
sal
es
Loss
of p
oten
tial r
even
ues
and
profi
ts
Rev
iew
the
staf
f rem
uner
atio
n pl
an to
hav
e m
ore
time
com
mitt
ed to
the
coop
erat
ives
bu
sine
ss.
Low
fina
ncia
l cap
acity
Failu
re to
mee
t the
sho
rt-t
erm
pr
oduc
tion
finan
cing
for
mem
bers
in r
ice
prod
uctio
n an
d pu
rcha
se o
f ric
e le
adin
g to
mem
bers
sel
ling
it as
gra
in.
Loss
of m
arke
t com
petit
iven
ess
and
com
petit
ive
adva
ntag
e as
a re
sult
of
redu
ced
loya
lty fr
om r
ice
prod
ucer
s.
Mem
bers
may
qui
t ric
e pr
oduc
tion
lead
ing
to fa
ilure
to re
coup
the
cost
of
trai
ning
Find
flex
ible
fina
ncin
g so
urce
s to
mee
t the
sho
rt-t
erm
and
lo
ng-t
erm
fina
ncin
g ne
eds
of
the
rice
prog
ram
.
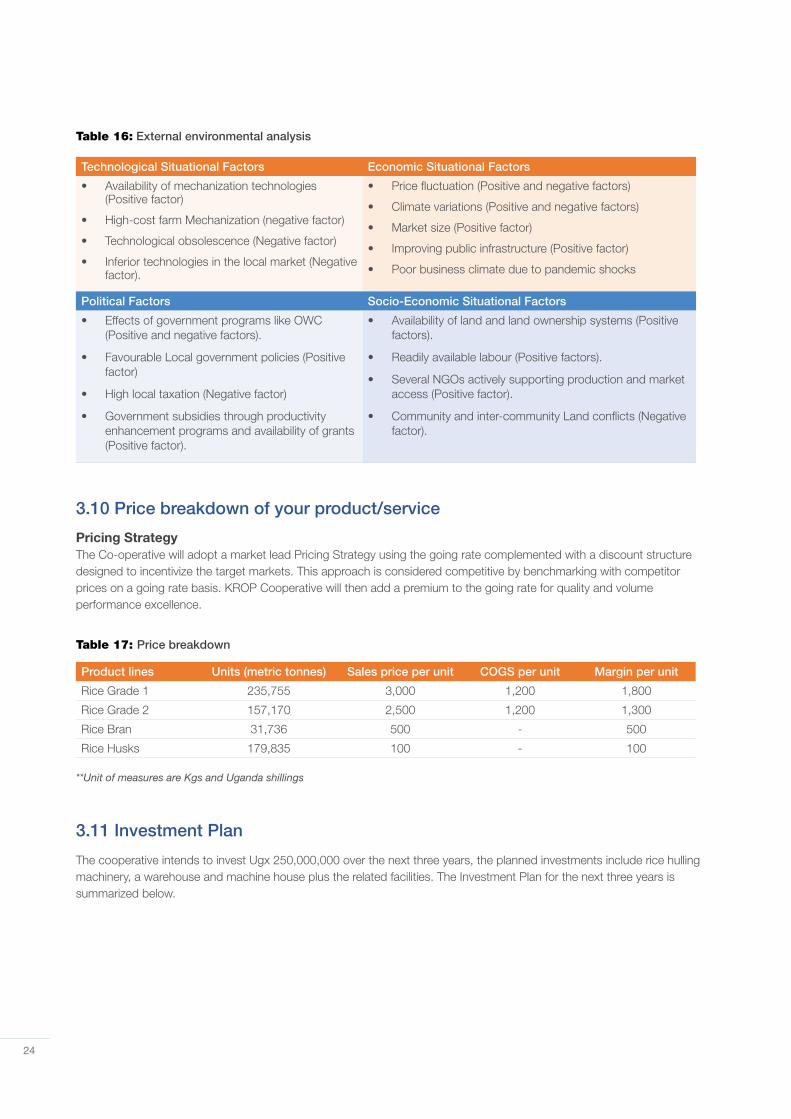
24
Table 16: External environmental analysis
Technological Situational Factors Economic Situational Factors
• Availability of mechanization technologies (Positive factor)
• High-cost farm Mechanization (negative factor)
• Technological obsolescence (Negative factor)
• Inferior technologies in the local market (Negative factor).
• Price fluctuation (Positive and negative factors)
• Climate variations (Positive and negative factors)
• Market size (Positive factor)
• Improving public infrastructure (Positive factor)
• Poor business climate due to pandemic shocks
Political Factors Socio-Economic Situational Factors
• Effects of government programs like OWC (Positive and negative factors).
• Favourable Local government policies (Positive factor)
• High local taxation (Negative factor)
• Government subsidies through productivity enhancement programs and availability of grants (Positive factor).
• Availability of land and land ownership systems (Positive factors).
• Readily available labour (Positive factors).
• Several NGOs actively supporting production and market access (Positive factor).
• Community and inter-community Land conflicts (Negative factor).
3.10 Price breakdown of your product/service
Pricing StrategyThe Co-operative will adopt a market lead Pricing Strategy using the going rate complemented with a discount structure designed to incentivize the target markets. This approach is considered competitive by benchmarking with competitor prices on a going rate basis. KROP Cooperative will then add a premium to the going rate for quality and volume performance excellence.
Table 17: Price breakdown
3.11 Investment Plan
The cooperative intends to invest Ugx 250,000,000 over the next three years, the planned investments include rice hulling machinery, a warehouse and machine house plus the related facilities. The Investment Plan for the next three years is summarized below.
Product lines Units (metric tonnes) Sales price per unit COGS per unit Margin per unit
Rice Grade 1 235,755 3,000 1,200 1,800
Rice Grade 2 157,170 2,500 1,200 1,300
Rice Bran 31,736 500 - 500
Rice Husks 179,835 100 - 100
**Unit of measures are Kgs and Uganda shillings
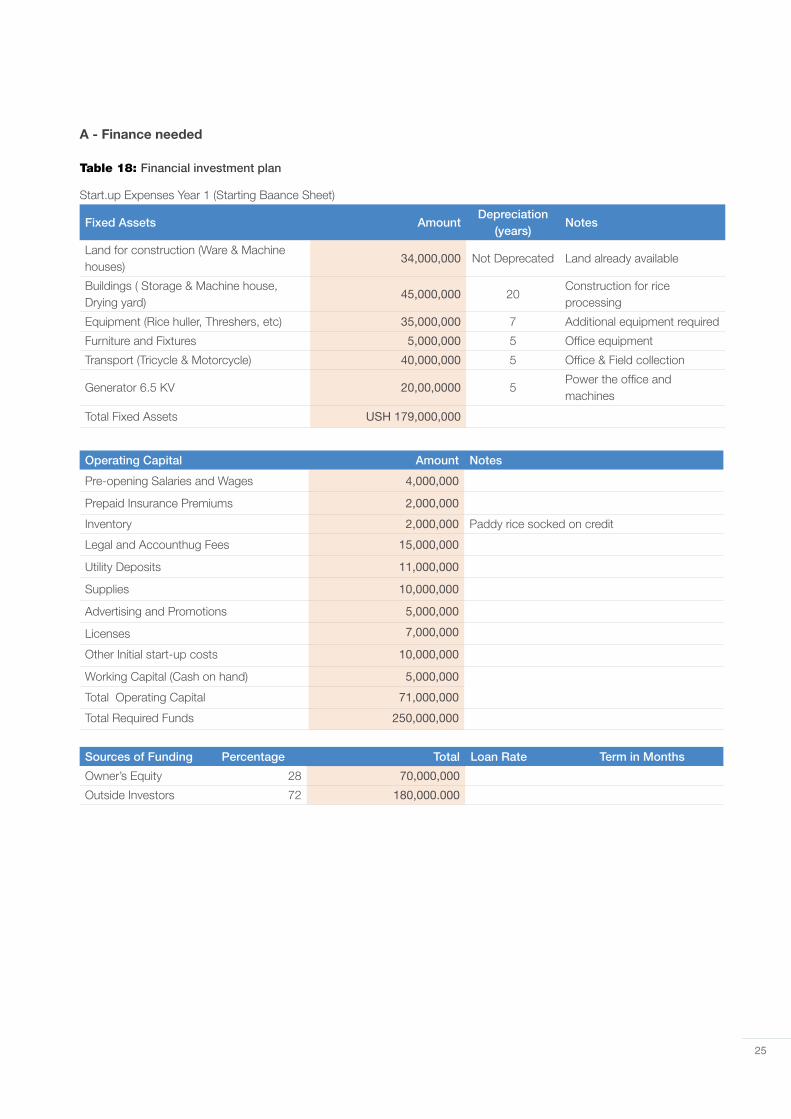
25
Start.up Expenses Year 1 (Starting Baance Sheet)
Fixed Assets AmountDepreciation
(years)Notes
Land for construction (Ware & Machine houses)
34,000,000 Not Deprecated Land already available
Buildings ( Storage & Machine house, Drying yard)
45,000,000 20Construction for rice processing
Equipment (Rice huller, Threshers, etc) 35,000,000 7 Additional equipment required
Furniture and Fixtures 5,000,000 5 Office equipment
Transport (Tricycle & Motorcycle) 40,000,000 5 Office & Field collection
Generator 6.5 KV 20,00,0000 5Power the office and machines
Total Fixed Assets USH 179,000,000
Sources of Funding Percentage Total Loan Rate Term in Months
Owner’s Equity 28 70,000,000
Outside Investors 72 180,000.000
Operating Capital Amount Notes
Pre-opening Salaries and Wages 4,000,000
Prepaid Insurance Premiums 2,000,000
Inventory 2,000,000 Paddy rice socked on credit
Legal and Accounthug Fees 15,000,000
Utility Deposits 11,000,000
Supplies 10,000,000
Advertising and Promotions 5,000,000
Licenses 7,000,000
Other Initial start-up costs 10,000,000
Working Capital (Cash on hand) 5,000,000
Total Operating Capital 71,000,000
Total Required Funds 250,000,000
A - Finance needed
Table 18: Financial investment plan
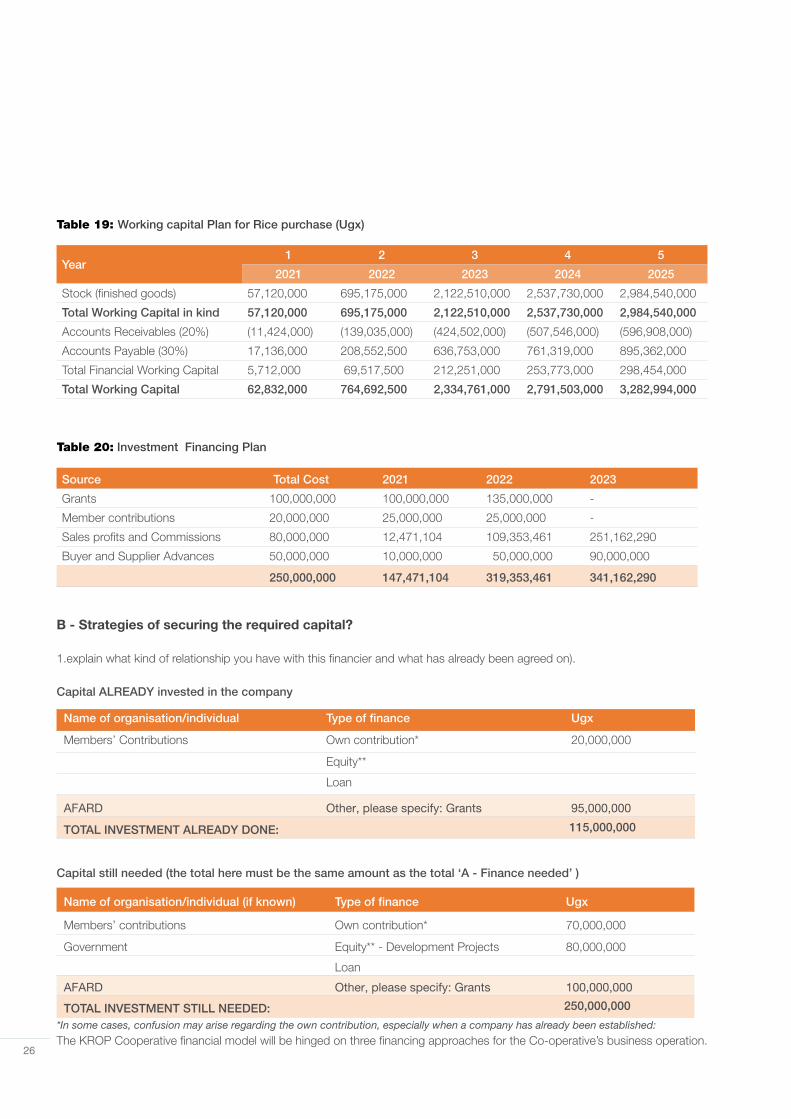
26
Table 19: Working capital Plan for Rice purchase (Ugx)
Year 1 2 3 4 5
2021 2022 2023 2024 2025
Stock (finished goods) 57,120,000 695,175,000 2,122,510,000 2,537,730,000 2,984,540,000
Total Working Capital in kind 57,120,000 695,175,000 2,122,510,000 2,537,730,000 2,984,540,000
Accounts Receivables (20%) (11,424,000) (139,035,000) (424,502,000) (507,546,000) (596,908,000)
Accounts Payable (30%) 17,136,000 208,552,500 636,753,000 761,319,000 895,362,000
Total Financial Working Capital 5,712,000 69,517,500 212,251,000 253,773,000 298,454,000
Total Working Capital 62,832,000 764,692,500 2,334,761,000 2,791,503,000 3,282,994,000
Table 20: Investment Financing Plan
Source Total Cost 2021 2022 2023
Grants 100,000,000 100,000,000 135,000,000 -
Member contributions 20,000,000 25,000,000 25,000,000 -
Sales profits and Commissions 80,000,000 12,471,104 109,353,461 251,162,290
Buyer and Supplier Advances 50,000,000 10,000,000 50,000,000 90,000,000
250,000,000 147,471,104 319,353,461 341,162,290
B - Strategies of securing the required capital?
1.explain what kind of relationship you have with this financier and what has already been agreed on).
Capital ALREADY invested in the company
Name of organisation/individual Type of finance Ugx
Members’ Contributions Own contribution* 20,000,000
Equity**
Loan
AFARD Other, please specify: Grants 95,000,000
TOTAL INVESTMENT ALREADY DONE: 115,000,000
Capital still needed (the total here must be the same amount as the total ‘A - Finance needed’ )
Name of organisation/individual (if known) Type of finance Ugx
Members’ contributions Own contribution* 70,000,000
Government Equity** - Development Projects 80,000,000
Loan
AFARD Other, please specify: Grants 100,000,000
TOTAL INVESTMENT STILL NEEDED: 250,000,000
*In some cases, confusion may arise regarding the own contribution, especially when a company has already been established:
The KROP Cooperative financial model will be hinged on three financing approaches for the Co-operative’s business operation.
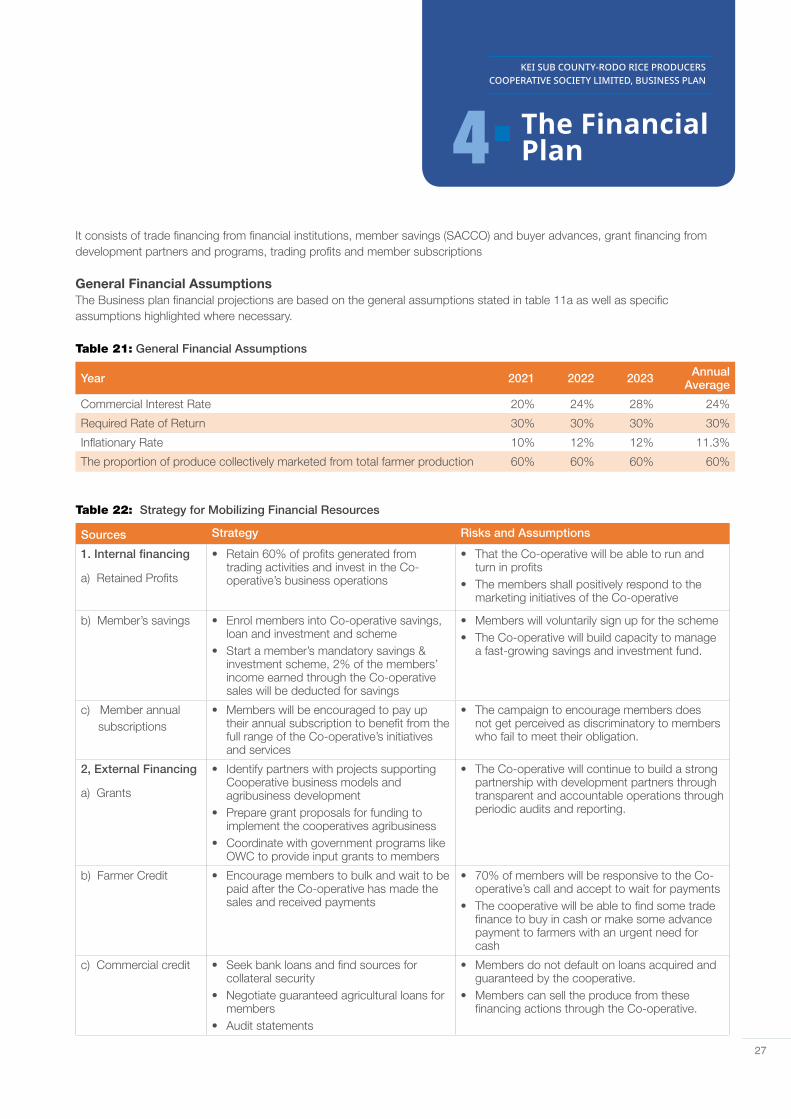
27
It consists of trade financing from financial institutions, member savings (SACCO) and buyer advances, grant financing from development partners and programs, trading profits and member subscriptions
General Financial AssumptionsThe Business plan financial projections are based on the general assumptions stated in table 11a as well as specific assumptions highlighted where necessary.
Table 21: General Financial Assumptions
Year 2021 2022 2023 Annual Average
Commercial Interest Rate 20% 24% 28% 24%
Required Rate of Return 30% 30% 30% 30%
Inflationary Rate 10% 12% 12% 11.3%
The proportion of produce collectively marketed from total farmer production 60% 60% 60% 60%
Table 22: Strategy for Mobilizing Financial Resources
Sources Strategy Risks and Assumptions
1. Internal financing
a) Retained Profits
• Retain 60% of profits generated from trading activities and invest in the Co-operative’s business operations
• That the Co-operative will be able to run and turn in profits
• The members shall positively respond to the marketing initiatives of the Co-operative
b) Member’s savings • Enrol members into Co-operative savings, loan and investment and scheme
• Start a member’s mandatory savings & investment scheme, 2% of the members’ income earned through the Co-operative sales will be deducted for savings
• Members will voluntarily sign up for the scheme• The Co-operative will build capacity to manage
a fast-growing savings and investment fund.
c) Member annual subscriptions
• Members will be encouraged to pay up their annual subscription to benefit from the full range of the Co-operative’s initiatives and services
• The campaign to encourage members does not get perceived as discriminatory to members who fail to meet their obligation.
2, External Financing
a) Grants
• Identify partners with projects supporting Cooperative business models and agribusiness development
• Prepare grant proposals for funding to implement the cooperatives agribusiness
• Coordinate with government programs like OWC to provide input grants to members
• The Co-operative will continue to build a strong partnership with development partners through transparent and accountable operations through periodic audits and reporting.
b) Farmer Credit • Encourage members to bulk and wait to be paid after the Co-operative has made the sales and received payments
• 70% of members will be responsive to the Co-operative’s call and accept to wait for payments
• The cooperative will be able to find some trade finance to buy in cash or make some advance payment to farmers with an urgent need for cash
c) Commercial credit • Seek bank loans and find sources for collateral security
• Negotiate guaranteed agricultural loans for members
• Audit statements
• Members do not default on loans acquired and guaranteed by the cooperative.
• Members can sell the produce from these financing actions through the Co-operative.
KEI SUB COUNTY-RODO RICE PRODUCERS COOPERATIVE SOCIETY LIMITED, BUSINESS PLAN
4 The Financial Plan
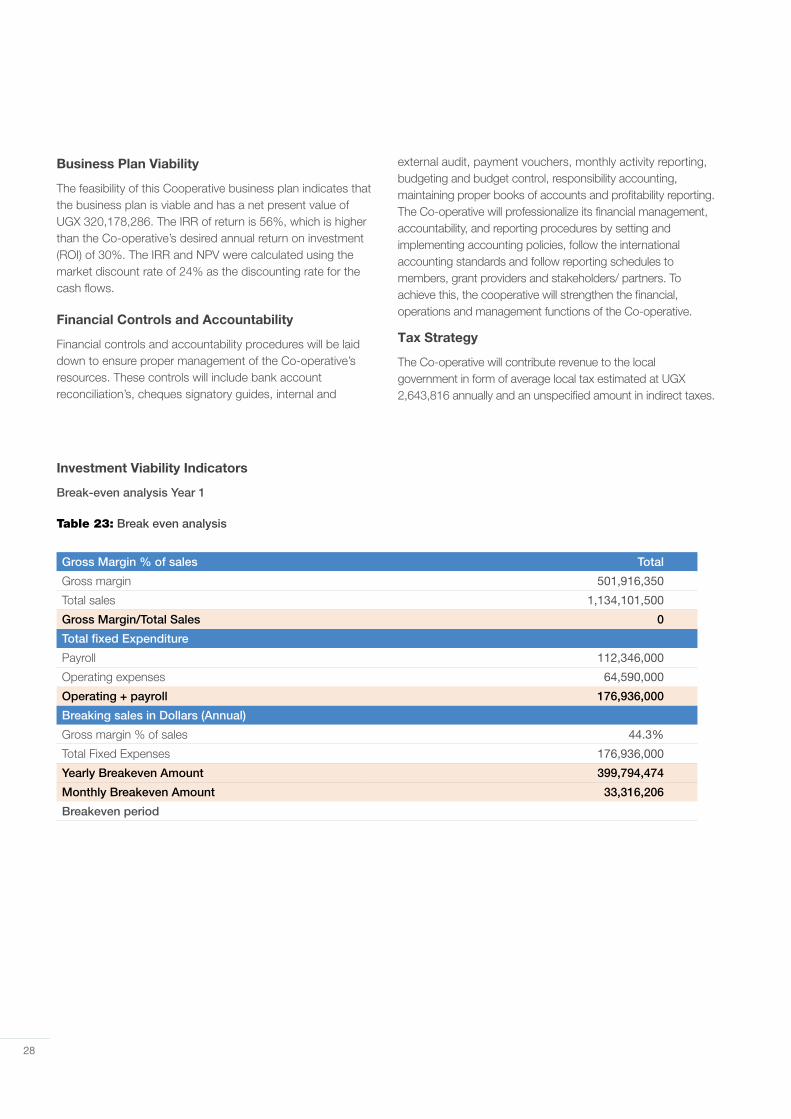
28
Business Plan Viability
The feasibility of this Cooperative business plan indicates that the business plan is viable and has a net present value of UGX 320,178,286. The IRR of return is 56%, which is higher than the Co-operative’s desired annual return on investment (ROI) of 30%. The IRR and NPV were calculated using the market discount rate of 24% as the discounting rate for the cash flows.
Financial Controls and Accountability
Financial controls and accountability procedures will be laid down to ensure proper management of the Co-operative’s resources. These controls will include bank account reconciliation’s, cheques signatory guides, internal and
external audit, payment vouchers, monthly activity reporting, budgeting and budget control, responsibility accounting, maintaining proper books of accounts and profitability reporting. The Co-operative will professionalize its financial management, accountability, and reporting procedures by setting and implementing accounting policies, follow the international accounting standards and follow reporting schedules to members, grant providers and stakeholders/ partners. To achieve this, the cooperative will strengthen the financial, operations and management functions of the Co-operative.
Tax Strategy
The Co-operative will contribute revenue to the local government in form of average local tax estimated at UGX 2,643,816 annually and an unspecified amount in indirect taxes.
Investment Viability Indicators
Break-even analysis Year 1
Table 23: Break even analysis
Gross Margin % of sales Total
Gross margin 501,916,350
Total sales 1,134,101,500
Gross Margin/Total Sales 0
Total fixed Expenditure
Payroll 112,346,000
Operating expenses 64,590,000
Operating + payroll 176,936,000
Breaking sales in Dollars (Annual)
Gross margin % of sales 44.3%
Total Fixed Expenses 176,936,000
Yearly Breakeven Amount 399,794,474
Monthly Breakeven Amount 33,316,206
Breakeven period
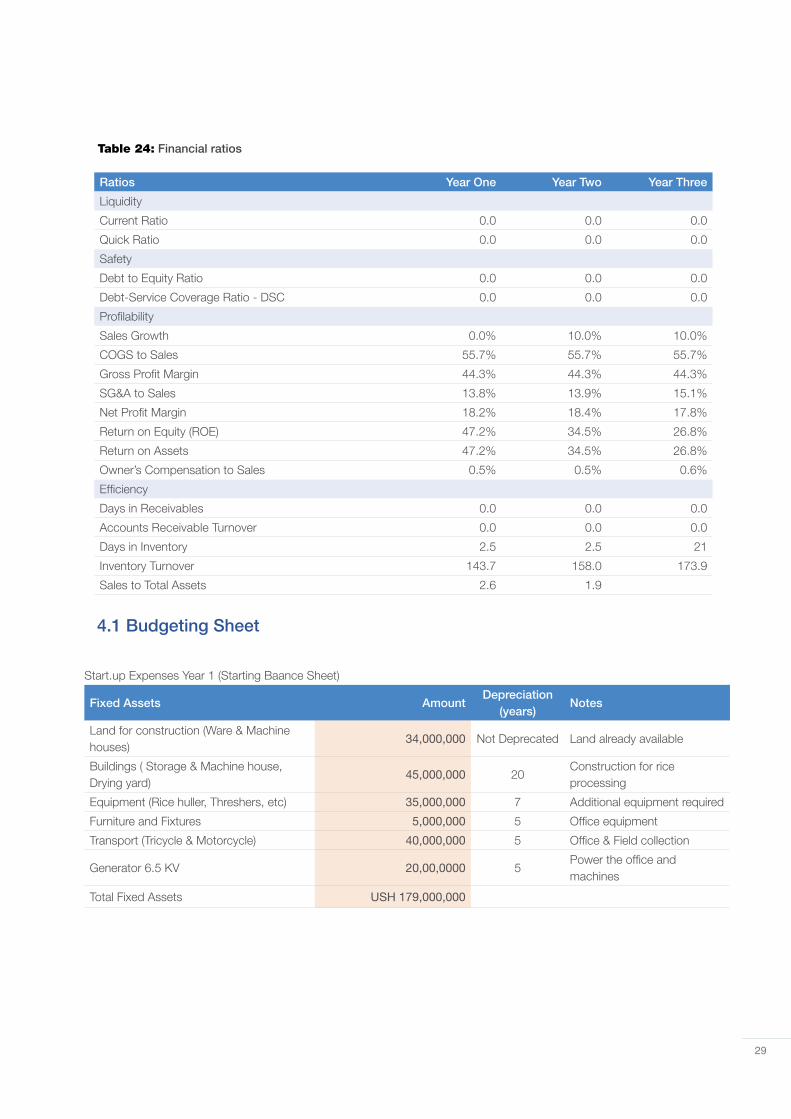
29
Table 24: Financial ratios
4.1 Budgeting Sheet
Ratios Year One Year Two Year Three
Liquidity
Current Ratio 0.0 0.0 0.0
Quick Ratio 0.0 0.0 0.0
Safety
Debt to Equity Ratio 0.0 0.0 0.0
Debt-Service Coverage Ratio - DSC 0.0 0.0 0.0
Profilability
Sales Growth 0.0% 10.0% 10.0%
COGS to Sales 55.7% 55.7% 55.7%
Gross Profit Margin 44.3% 44.3% 44.3%
SG&A to Sales 13.8% 13.9% 15.1%
Net Profit Margin 18.2% 18.4% 17.8%
Return on Equity (ROE) 47.2% 34.5% 26.8%
Return on Assets 47.2% 34.5% 26.8%
Owner’s Compensation to Sales 0.5% 0.5% 0.6%
Efficiency
Days in Receivables 0.0 0.0 0.0
Accounts Receivable Turnover 0.0 0.0 0.0
Days in Inventory 2.5 2.5 21
Inventory Turnover 143.7 158.0 173.9
Sales to Total Assets 2.6 1.9
Start.up Expenses Year 1 (Starting Baance Sheet)
Fixed Assets AmountDepreciation
(years)Notes
Land for construction (Ware & Machine houses)
34,000,000 Not Deprecated Land already available
Buildings ( Storage & Machine house, Drying yard)
45,000,000 20Construction for rice processing
Equipment (Rice huller, Threshers, etc) 35,000,000 7 Additional equipment required
Furniture and Fixtures 5,000,000 5 Office equipment
Transport (Tricycle & Motorcycle) 40,000,000 5 Office & Field collection
Generator 6.5 KV 20,00,0000 5Power the office and machines
Total Fixed Assets USH 179,000,000
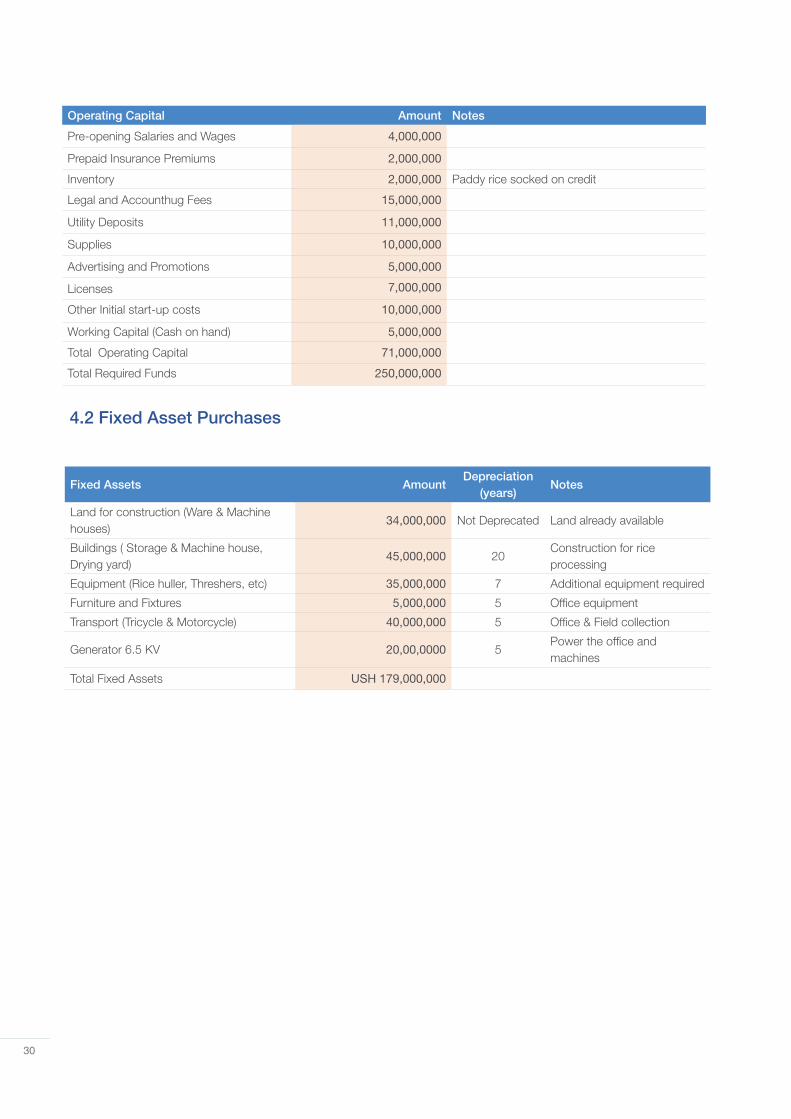
30
Operating Capital Amount Notes
Pre-opening Salaries and Wages 4,000,000
Prepaid Insurance Premiums 2,000,000
Inventory 2,000,000 Paddy rice socked on credit
Legal and Accounthug Fees 15,000,000
Utility Deposits 11,000,000
Supplies 10,000,000
Advertising and Promotions 5,000,000
Licenses 7,000,000
Other Initial start-up costs 10,000,000
Working Capital (Cash on hand) 5,000,000
Total Operating Capital 71,000,000
Total Required Funds 250,000,000
4.2 Fixed Asset Purchases
Fixed Assets AmountDepreciation
(years)Notes
Land for construction (Ware & Machine houses)
34,000,000 Not Deprecated Land already available
Buildings ( Storage & Machine house, Drying yard)
45,000,000 20Construction for rice processing
Equipment (Rice huller, Threshers, etc) 35,000,000 7 Additional equipment required
Furniture and Fixtures 5,000,000 5 Office equipment
Transport (Tricycle & Motorcycle) 40,000,000 5 Office & Field collection
Generator 6.5 KV 20,00,0000 5Power the office and machines
Total Fixed Assets USH 179,000,000
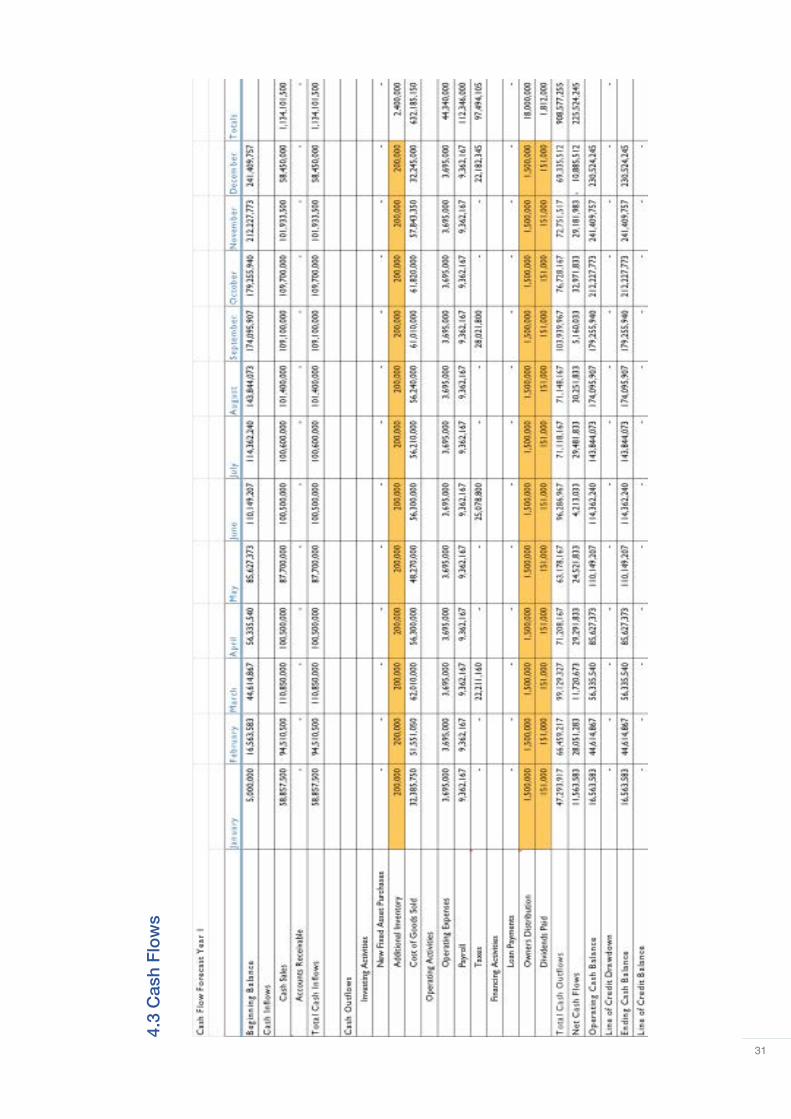
31
4.3
Cas
h F
low
s
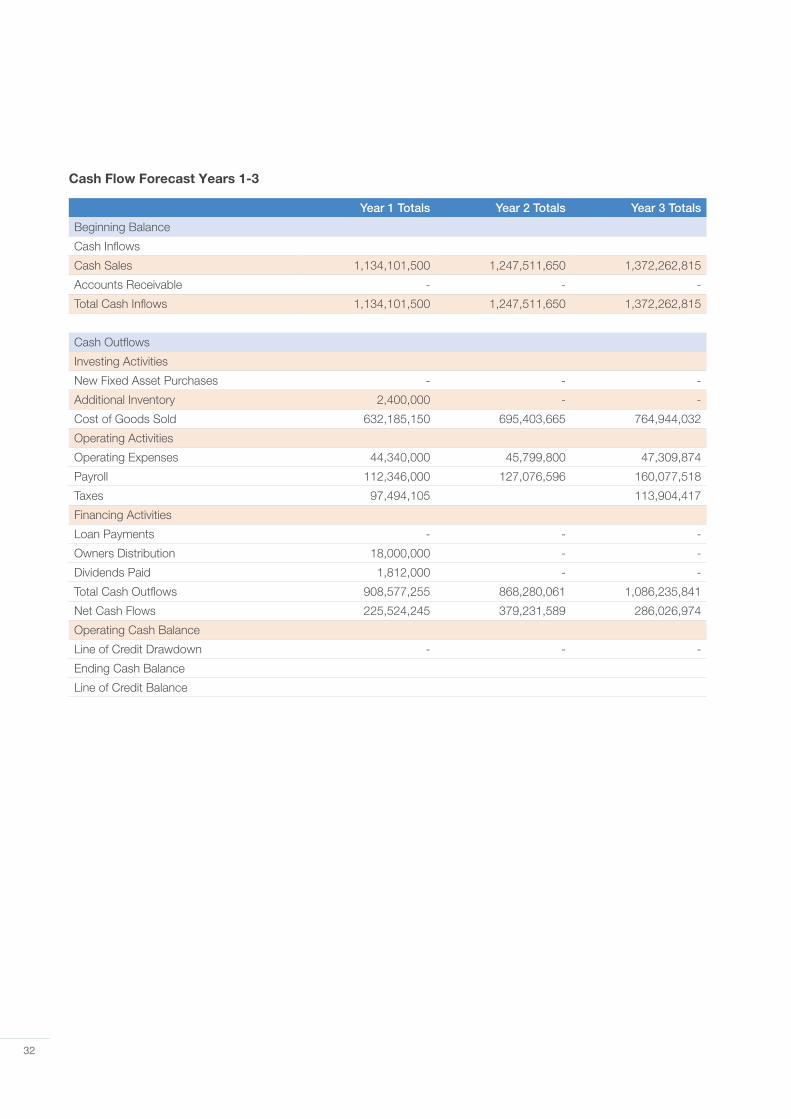
32
Cash Flow Forecast Years 1-3
Year 1 Totals Year 2 Totals Year 3 Totals
Beginning Balance
Cash Inflows
Cash Sales 1,134,101,500 1,247,511,650 1,372,262,815
Accounts Receivable - - -
Total Cash Inflows 1,134,101,500 1,247,511,650 1,372,262,815
Cash Outflows
Investing Activities
New Fixed Asset Purchases - - -
Additional Inventory 2,400,000 - -
Cost of Goods Sold 632,185,150 695,403,665 764,944,032
Operating Activities
Operating Expenses 44,340,000 45,799,800 47,309,874
Payroll 112,346,000 127,076,596 160,077,518
Taxes 97,494,105 113,904,417
Financing Activities
Loan Payments - - -
Owners Distribution 18,000,000 - -
Dividends Paid 1,812,000 - -
Total Cash Outflows 908,577,255 868,280,061 1,086,235,841
Net Cash Flows 225,524,245 379,231,589 286,026,974
Operating Cash Balance
Line of Credit Drawdown - - -
Ending Cash Balance
Line of Credit Balance
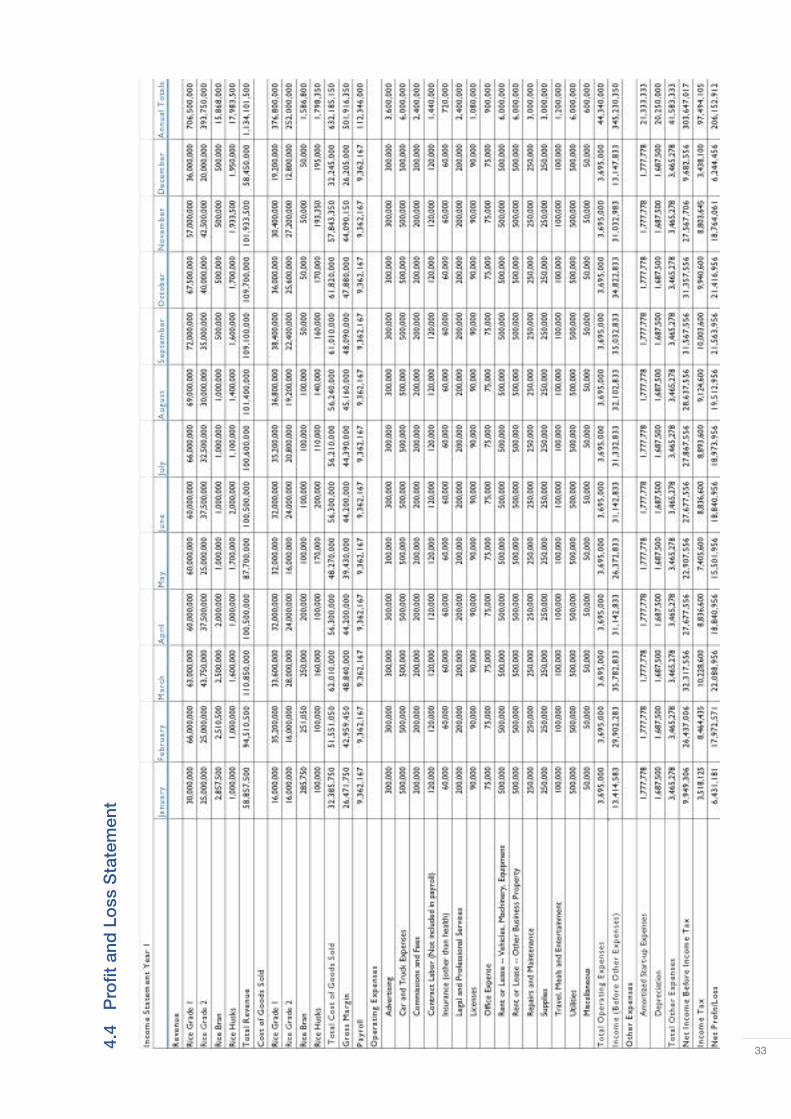
334.4
Pro
fit a
nd L
oss
Sta
tem
ent
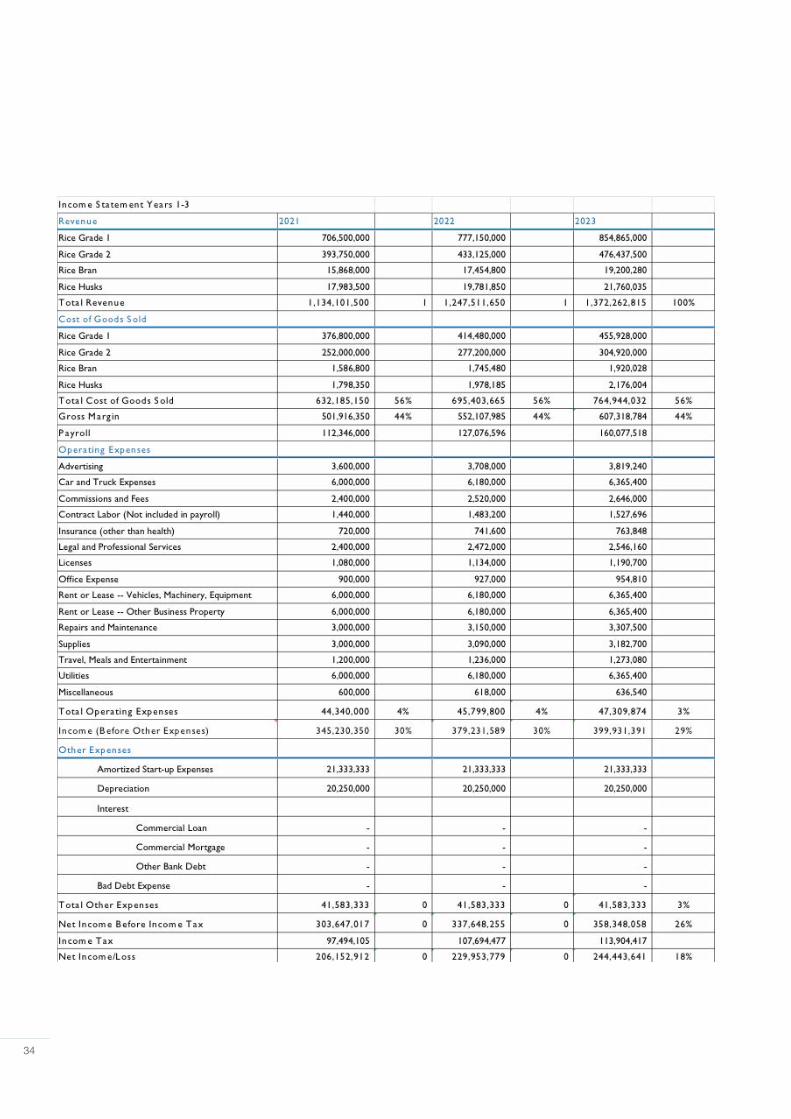
34
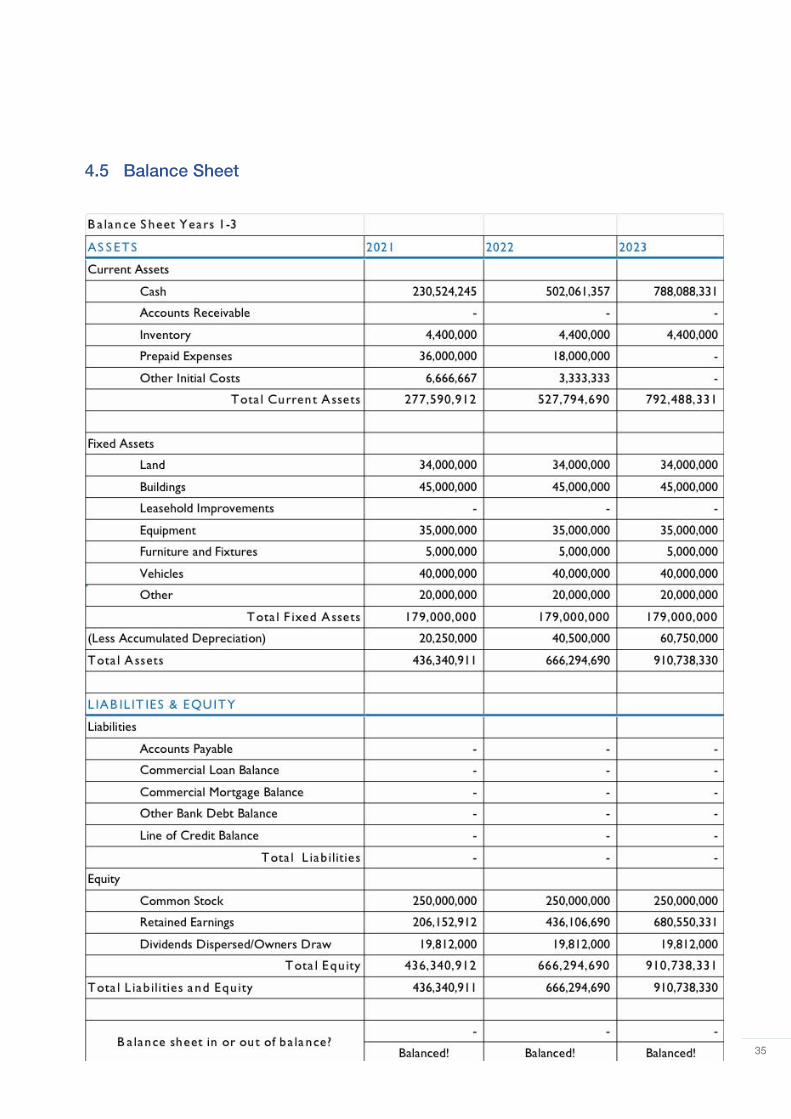
35
4.5 Balance Sheet
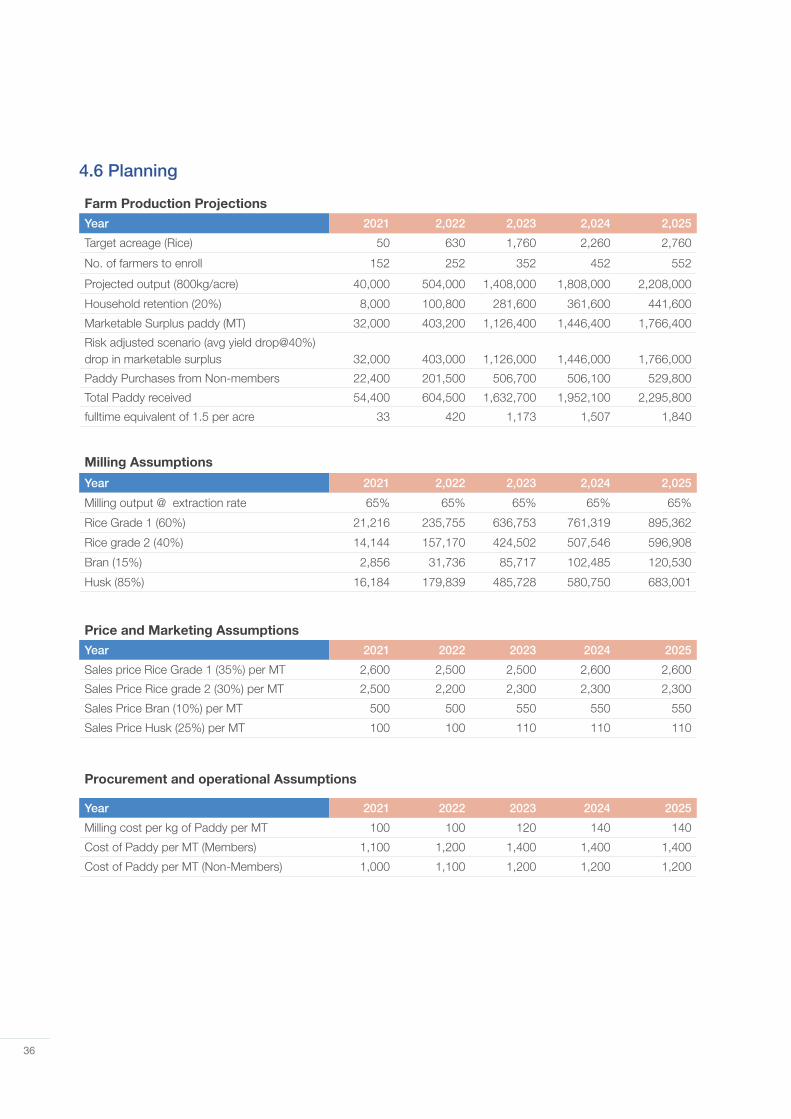
36
4.6 Planning
Farm Production ProjectionsYear 2021 2,022 2,023 2,024 2,025
Target acreage (Rice) 50 630 1,760 2,260 2,760
No. of farmers to enroll 152 252 352 452 552
Projected output (800kg/acre) 40,000 504,000 1,408,000 1,808,000 2,208,000
Household retention (20%) 8,000 100,800 281,600 361,600 441,600
Marketable Surplus paddy (MT) 32,000 403,200 1,126,400 1,446,400 1,766,400
Risk adjusted scenario (avg yield drop@40%) drop in marketable surplus 32,000 403,000 1,126,000 1,446,000 1,766,000
Paddy Purchases from Non-members 22,400 201,500 506,700 506,100 529,800
Total Paddy received 54,400 604,500 1,632,700 1,952,100 2,295,800
fulltime equivalent of 1.5 per acre 33 420 1,173 1,507 1,840
Milling Assumptions
Year 2021 2,022 2,023 2,024 2,025
Milling output @ extraction rate 65% 65% 65% 65% 65%
Rice Grade 1 (60%) 21,216 235,755 636,753 761,319 895,362
Rice grade 2 (40%) 14,144 157,170 424,502 507,546 596,908
Bran (15%) 2,856 31,736 85,717 102,485 120,530
Husk (85%) 16,184 179,839 485,728 580,750 683,001
Price and Marketing AssumptionsYear 2021 2022 2023 2024 2025
Sales price Rice Grade 1 (35%) per MT 2,600 2,500 2,500 2,600 2,600
Sales Price Rice grade 2 (30%) per MT 2,500 2,200 2,300 2,300 2,300
Sales Price Bran (10%) per MT 500 500 550 550 550
Sales Price Husk (25%) per MT 100 100 110 110 110
Procurement and operational Assumptions
Year 2021 2022 2023 2024 2025
Milling cost per kg of Paddy per MT 100 100 120 140 140
Cost of Paddy per MT (Members) 1,100 1,200 1,400 1,400 1,400
Cost of Paddy per MT (Non-Members) 1,000 1,100 1,200 1,200 1,200
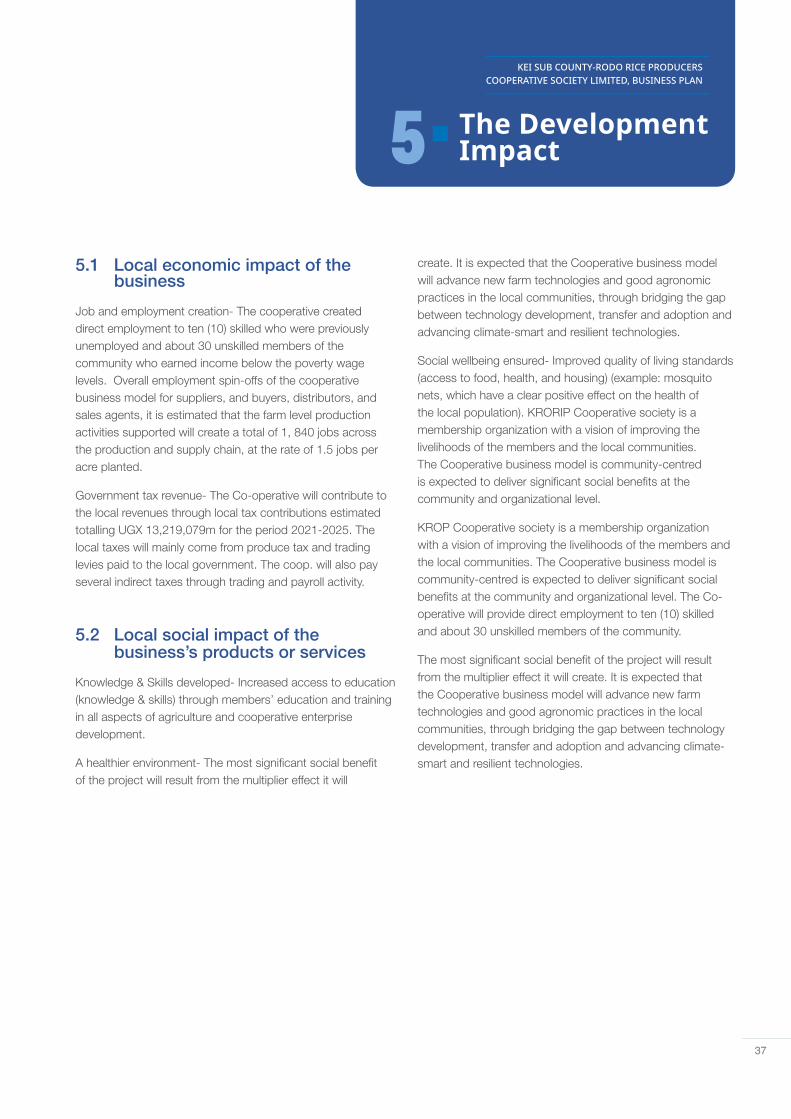
37
KEI SUB COUNTY-RODO RICE PRODUCERS COOPERATIVE SOCIETY LIMITED, BUSINESS PLAN
5 The Development Impact
5.1 Local economic impact of the business
Job and employment creation- The cooperative created direct employment to ten (10) skilled who were previously unemployed and about 30 unskilled members of the community who earned income below the poverty wage levels. Overall employment spin-offs of the cooperative business model for suppliers, and buyers, distributors, and sales agents, it is estimated that the farm level production activities supported will create a total of 1, 840 jobs across the production and supply chain, at the rate of 1.5 jobs per acre planted.
Government tax revenue- The Co-operative will contribute to the local revenues through local tax contributions estimated totalling UGX 13,219,079m for the period 2021-2025. The local taxes will mainly come from produce tax and trading levies paid to the local government. The coop. will also pay several indirect taxes through trading and payroll activity.
5.2 Local social impact of the business’s products or services
Knowledge & Skills developed- Increased access to education (knowledge & skills) through members’ education and training in all aspects of agriculture and cooperative enterprise development.
A healthier environment- The most significant social benefit of the project will result from the multiplier effect it will
create. It is expected that the Cooperative business model will advance new farm technologies and good agronomic practices in the local communities, through bridging the gap between technology development, transfer and adoption and advancing climate-smart and resilient technologies.
Social wellbeing ensured- Improved quality of living standards (access to food, health, and housing) (example: mosquito nets, which have a clear positive effect on the health of the local population). KRORIP Cooperative society is a membership organization with a vision of improving the livelihoods of the members and the local communities. The Cooperative business model is community-centred is expected to deliver significant social benefits at the community and organizational level.
KROP Cooperative society is a membership organization with a vision of improving the livelihoods of the members and the local communities. The Cooperative business model is community-centred is expected to deliver significant social benefits at the community and organizational level. The Co-operative will provide direct employment to ten (10) skilled and about 30 unskilled members of the community.
The most significant social benefit of the project will result from the multiplier effect it will create. It is expected that the Cooperative business model will advance new farm technologies and good agronomic practices in the local communities, through bridging the gap between technology development, transfer and adoption and advancing climate-smart and resilient technologies.
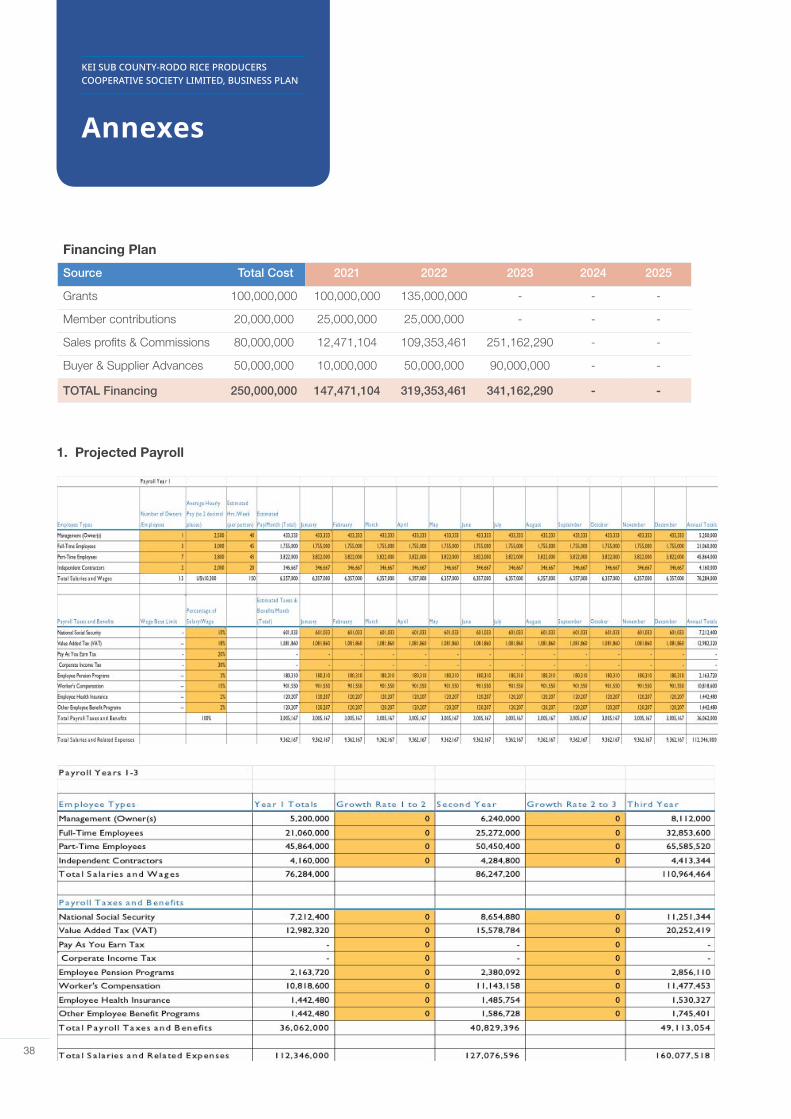
38
KEI SUB COUNTY-RODO RICE PRODUCERS COOPERATIVE SOCIETY LIMITED, BUSINESS PLAN
Annexes
Financing Plan
Source Total Cost 2021 2022 2023 2024 2025
Grants 100,000,000 100,000,000 135,000,000 - - -
Member contributions 20,000,000 25,000,000 25,000,000 - - -
Sales profits & Commissions 80,000,000 12,471,104 109,353,461 251,162,290 - -
Buyer & Supplier Advances 50,000,000 10,000,000 50,000,000 90,000,000 - -
TOTAL Financing 250,000,000 147,471,104 319,353,461 341,162,290 - -
1. Projected Payroll
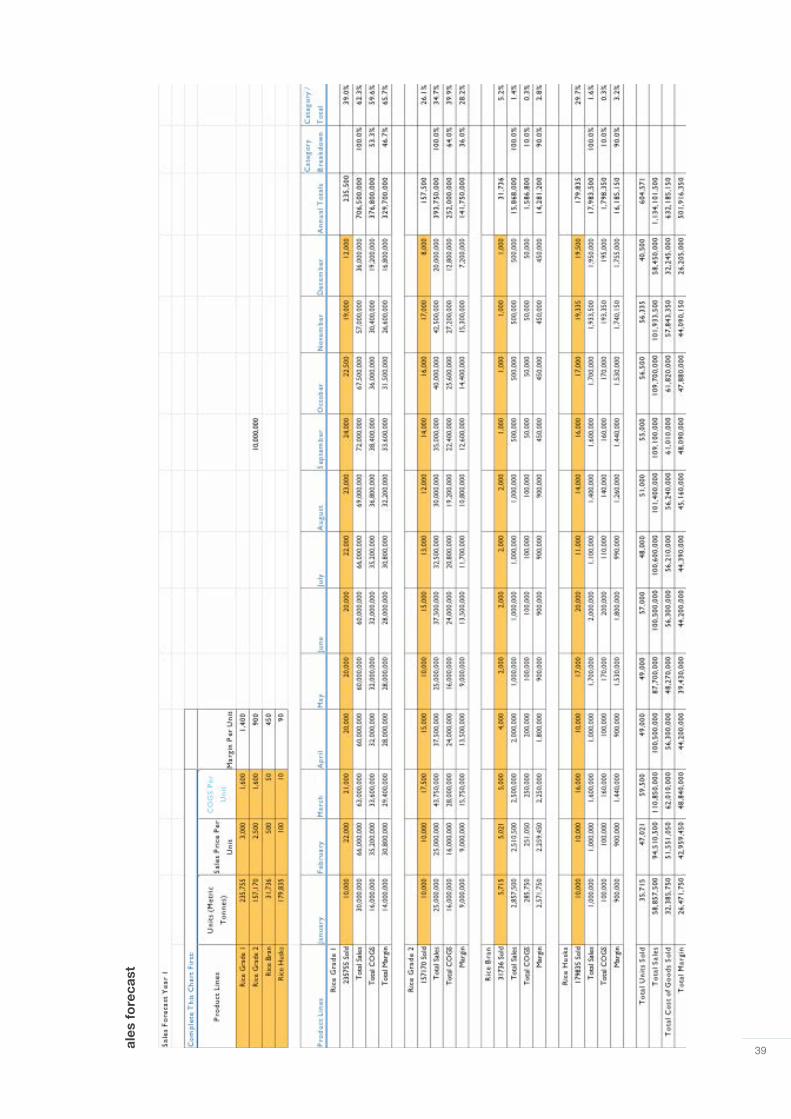
39ales
fo
reca
st
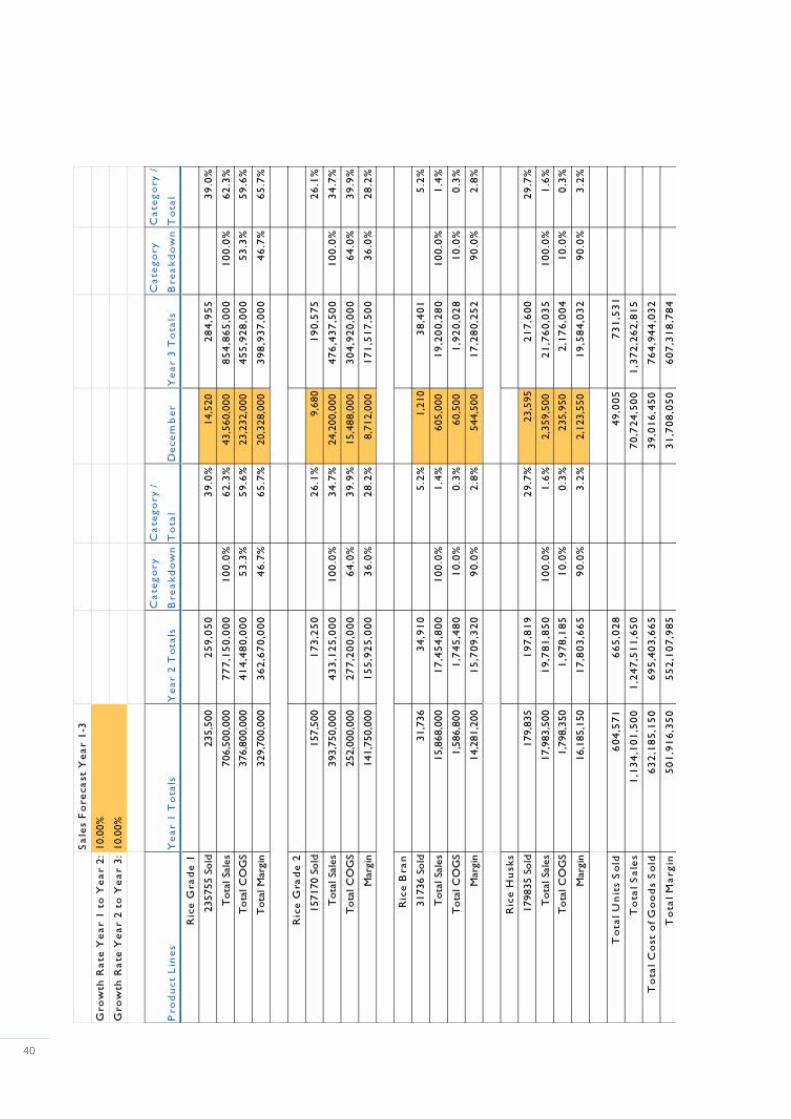
40
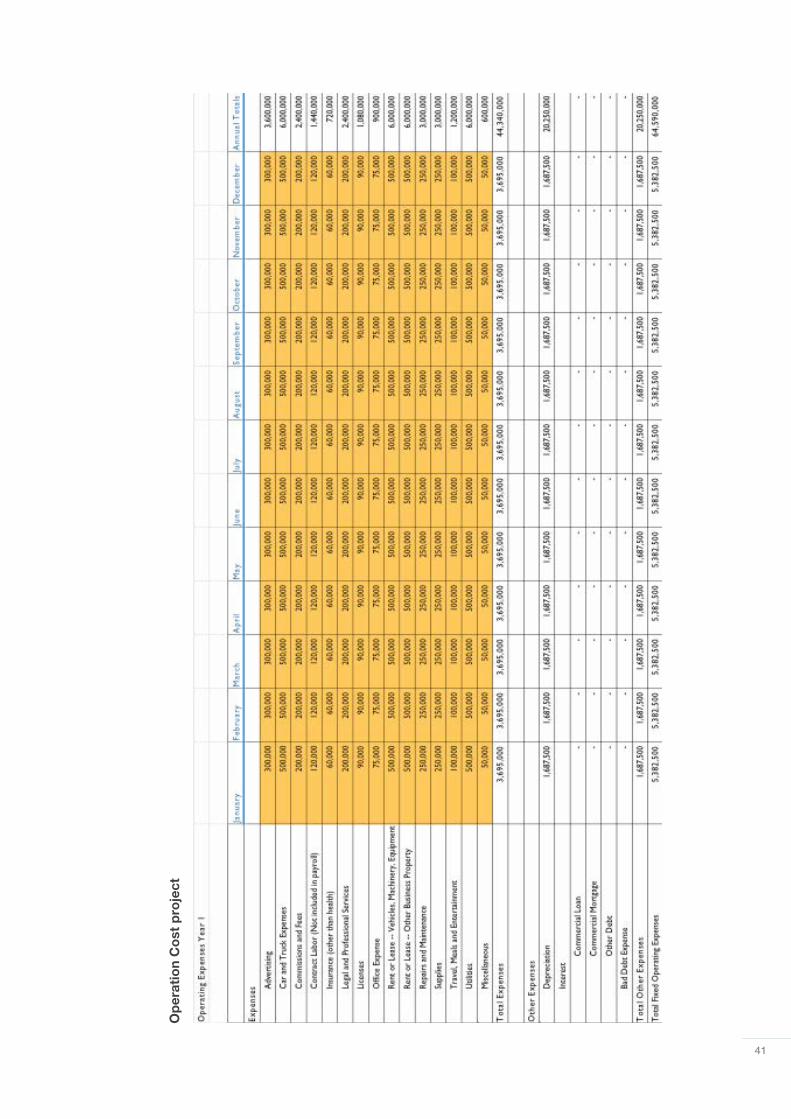
41
Op
erat
ion
Co
st p
roje
ct
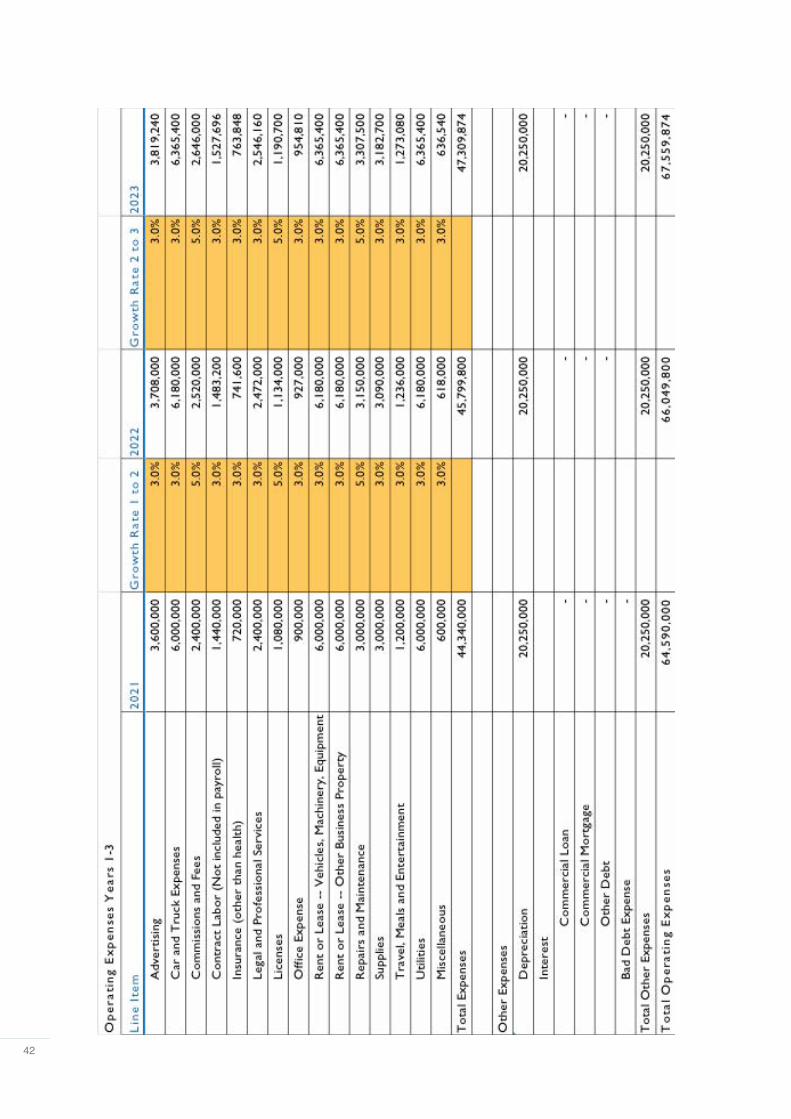
42
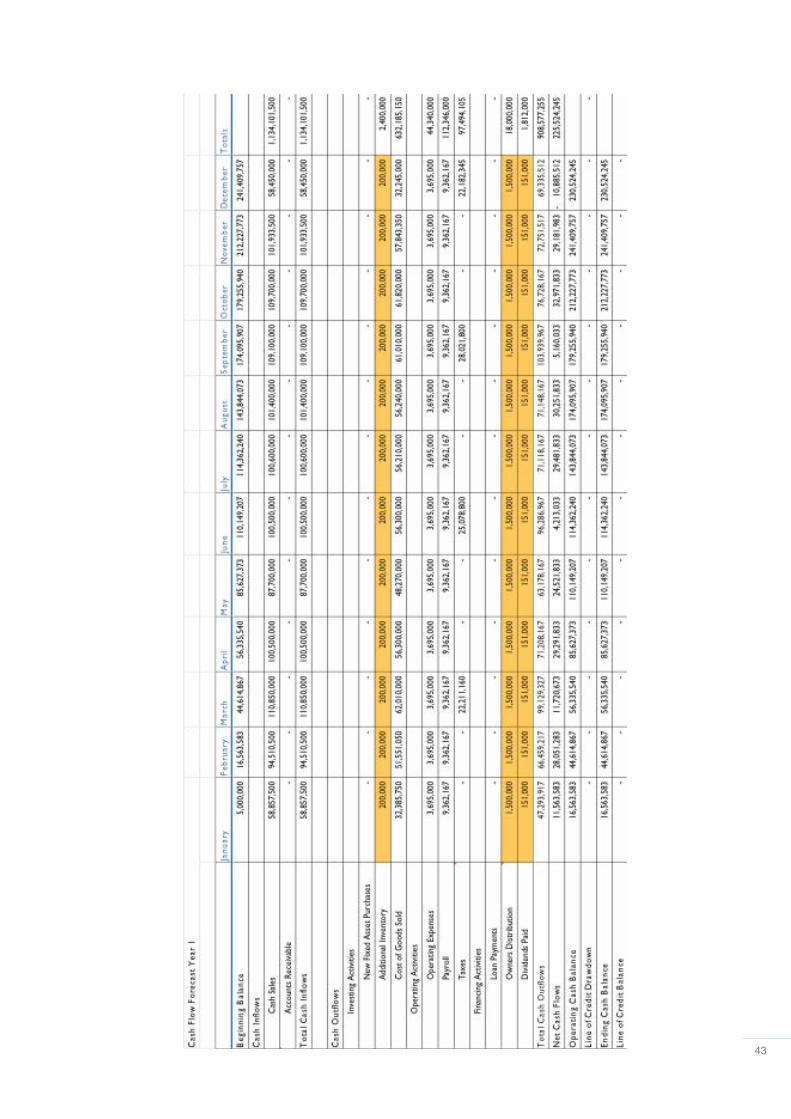
43
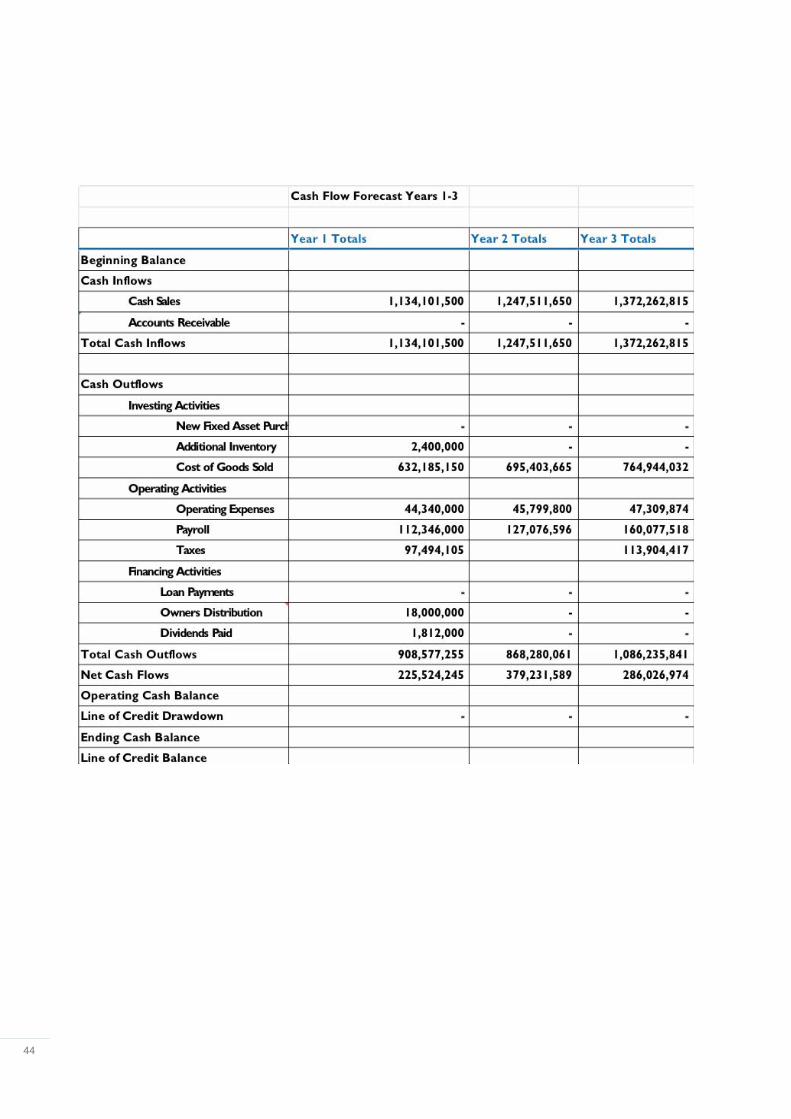
44
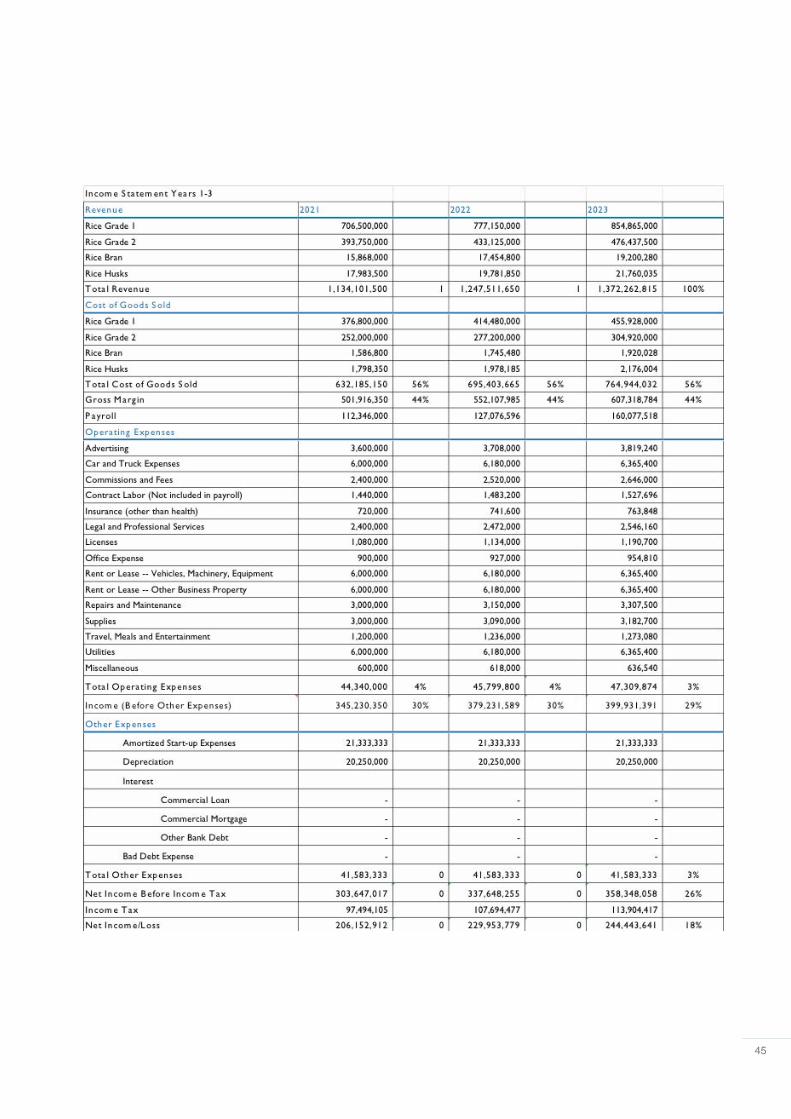
45
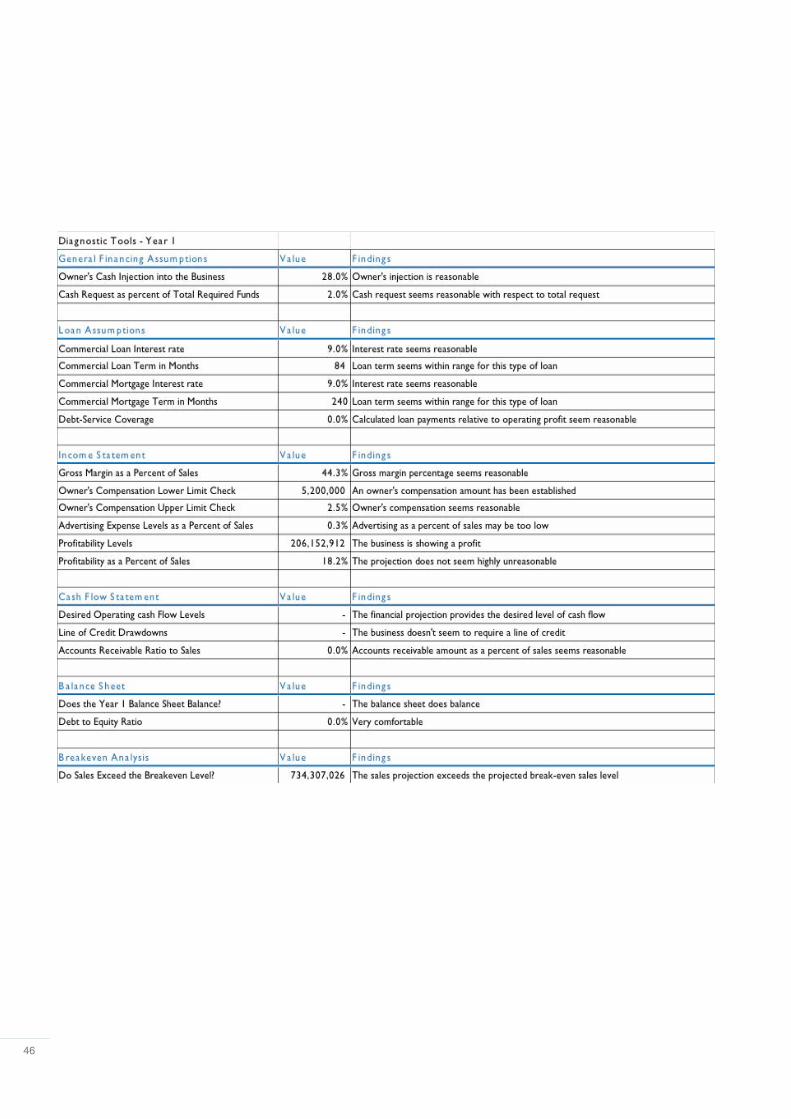
46


