Embed Size (px)
Citation preview
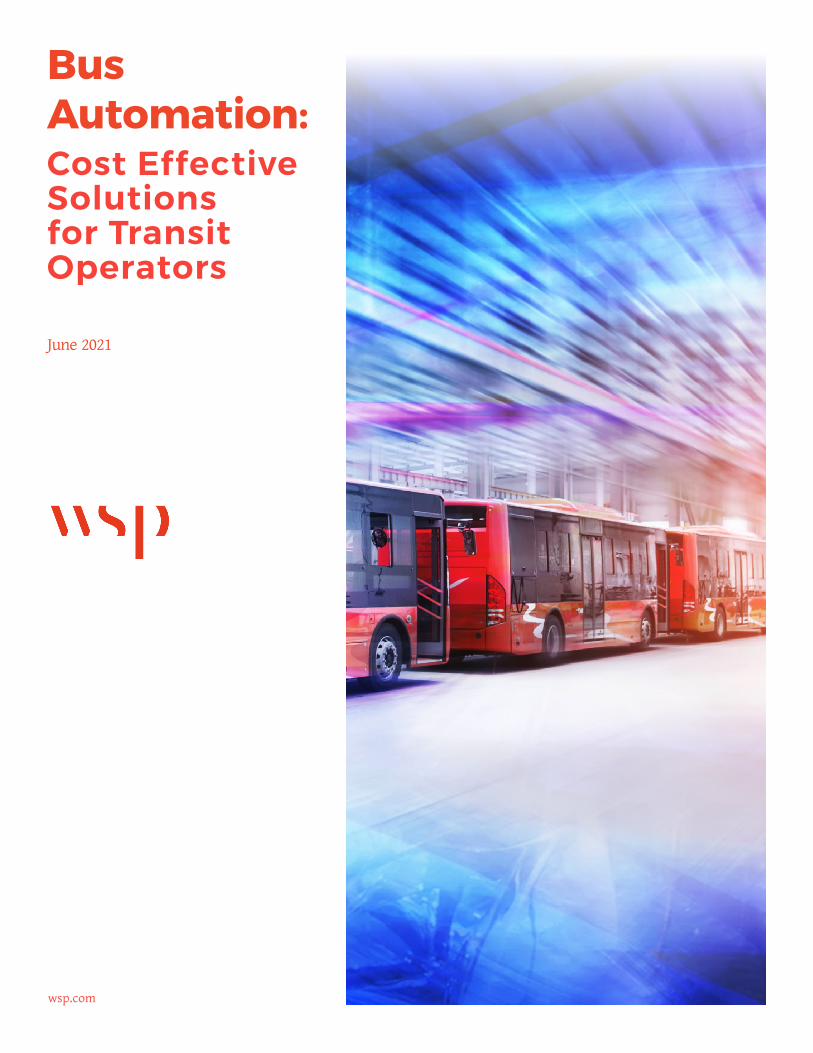
Bus Automation:Cost Effective Solutions for Transit Operators
June 2021
wsp.com

ii
CONTENTS
Executive Summary .................................................................................................................................. 1
Introduction to Bus Automation ....................................................................................................4
The Automated Bus Yard .....................................................................................................................8
Preparing for Bus Automation Integration ........................................................................... 12
The Business Case for Automating the Bus Yard .............................................................. 13
Bus Platooning .......................................................................................................................................... 15
AV Regulatory Considerations ...................................................................................................... 23
Financial Considerations with Bus Automation ............................................................... 24
Program Highlight: Cavnue Connected Corridor .............................................................29
Preparing the Transit Workforce ..................................................................................................30
Conclusion - Benefits of Bus Automation Technology ................................................. 32
Citations ........................................................................................................................................................ 34
iii
Executive Summary
In late 2017, French automated shuttle manufacturer Navya partnered with Keolis and AAA to launch the first publicly accessible automated transit pilot in Las Vegas, NV capable of transporting up to eight passengers. Only a few short years later, the Federal Transit Administration (FTA) estimated that, as of December 2020,1 dozens of bus automation testing activities were underway across the United States. This tremendous growth in the bus automation market is expected to quicken over the coming years. Bloomberg anticipates a compound annual growth rate (CAGR) of over 63% in the autonomous vehicle (AV) market by 2030. Such rapid growth of the AV market may provide transit agencies with operational, financial, safety, and service benefits.
WSP is at the forefront of this technology evolution. We have gained valuable insight into the benefits transit automation offers. This white paper presents our recommendations and analysis framed around two scenarios: Automating the bus yard and applying bus platooning within Bus Rapid Transit (BRT) systems. Both applications will showcase safety, operational, and financial benefits in the facility and corridor operating environments. Furthermore, critical topics such as workforce development and regulatory implications provide a holistic view of the future of transit automation. The intent of this white paper is to help guide and inform transit agencies, roadway authorities, and other jurisdictions when considering the implementation of cost-effective transit solutions.
THE AUTOMATED BUS YARDThe Automated Bus Yard involves the deployment of buses equipped with Automation Driving Systems (ADS) equipment programmed to safely operate within the Operational Design Domain (ODD) of the bus yard. WSP has strategically selected the bus yard as a starting point to introduce and demonstrate transit automation solutions to advance the evolving capabilities of the technology, increase safety within the yard, and explore the many ways to increase operational efficiency by test ADS-equipped buses on private property. There are five distinct operating scenarios for the automated yard that provide a competitive return-on-investment (ROI):
� Parking & Recall � Bus Wash� Bus Maintenance/Service Bays� Vaulting� Precision Docking in Service Bays
Most transit agencies will realize safety and service benefits from adopting automated bus yard technology; however, transit agencies with the following attributes may see increased benefits:
1. Buses with Drive-by-Wire (DbW) throttle control2. Existing or future plans to transition to a battery
electric fleet3. Capacity-constrained bus yard(s)4. Interest in or experience managing innovative
pilot programs5. State policy and/or Connected & Automated
Vehicle (CAV) working groups that support and provide insight throughout pilot deployments
We present four business cases for the automated yard that provide long-term cost savings and operational benefits:• Increased yard capacity• Fewer overhead pantograph
chargers• Reduction in time required for pull-
in and pull-out schedules• Decrease in safety incidents
1
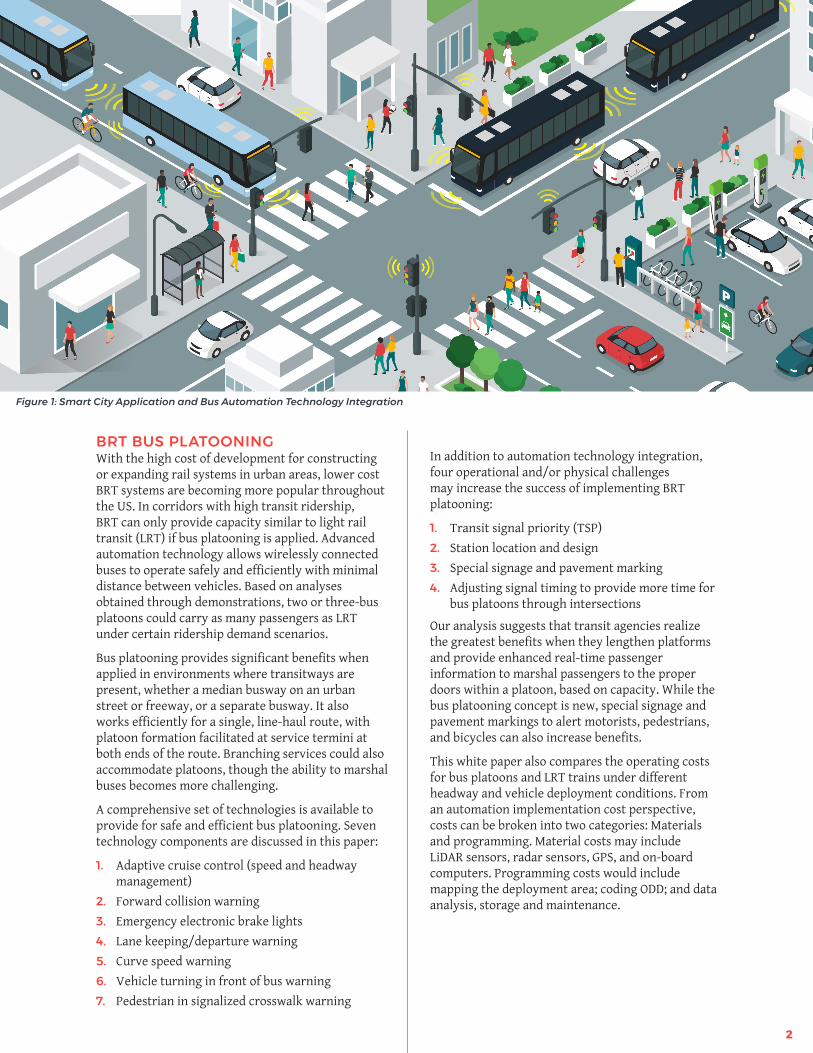
BRT BUS PLATOONINGWith the high cost of development for constructing or expanding rail systems in urban areas, lower cost BRT systems are becoming more popular throughout the US. In corridors with high transit ridership, BRT can only provide capacity similar to light rail transit (LRT) if bus platooning is applied. Advanced automation technology allows wirelessly connected buses to operate safely and efficiently with minimal distance between vehicles. Based on analyses obtained through demonstrations, two or three-bus platoons could carry as many passengers as LRT under certain ridership demand scenarios.
Bus platooning provides significant benefits when applied in environments where transitways are present, whether a median busway on an urban street or freeway, or a separate busway. It also works efficiently for a single, line-haul route, with platoon formation facilitated at service termini at both ends of the route. Branching services could also accommodate platoons, though the ability to marshal buses becomes more challenging.
A comprehensive set of technologies is available to provide for safe and efficient bus platooning. Seven technology components are discussed in this paper:
1. Adaptive cruise control (speed and headway management)
2. Forward collision warning3. Emergency electronic brake lights4. Lane keeping/departure warning 5. Curve speed warning 6. Vehicle turning in front of bus warning7. Pedestrian in signalized crosswalk warning
Figure 1: Smart City Application and Bus Automation Technology Integration
In addition to automation technology integration, four operational and/or physical challenges may increase the success of implementing BRT platooning:
1. Transit signal priority (TSP) 2. Station location and design 3. Special signage and pavement marking4. Adjusting signal timing to provide more time for
bus platoons through intersections
Our analysis suggests that transit agencies realize the greatest benefits when they lengthen platforms and provide enhanced real-time passenger information to marshal passengers to the proper doors within a platoon, based on capacity. While the bus platooning concept is new, special signage and pavement markings to alert motorists, pedestrians, and bicycles can also increase benefits.
This white paper also compares the operating costs for bus platoons and LRT trains under different headway and vehicle deployment conditions. From an automation implementation cost perspective, costs can be broken into two categories: Materials and programming. Material costs may include LiDAR sensors, radar sensors, GPS, and on-board computers. Programming costs would include mapping the deployment area; coding ODD; and data analysis, storage and maintenance.
2
POLICY & REGULATIONSThere are three types of existing regulations that apply to transit automation which fall under labor, technology, and accessibility. To date, federal legislation and regulation have focused on accessibility through American Disabilities Act (ADA) and Title VI. State and local transportation departments have been left to independently determine what changes might be needed related to motor vehicle laws, safety protecting policies, and business-friendly legislation. The most recent Strategic Transit Automation Report (STAR) published by the FTA lists multiple pilot deployments, including several applying bus automation technologies. Due to the uncertainty relating to transit automation technology and operational applications, it is important for transit agencies to partner with industry leaders like WSP to ensure deployment plans adhere to local, state, and federal policy guidelines.
PREPARING THE WORKFORCEWith the advent of transit automation technologies, there may be impacts on the transit workforce, including operations, maintenance, and information technology functions. Targeted training on the different technologies in conjunction with modifying certain roles/staff classifications will be critical. Potential workforce challenges include requisite skills development and the associated training time, cost, and access. However, the potential benefits are significant. This white paper discusses the ALERT (Awareness - Layers - E-Resources - Responsiveness - Talk) framework for transit officials to plan for technological change.
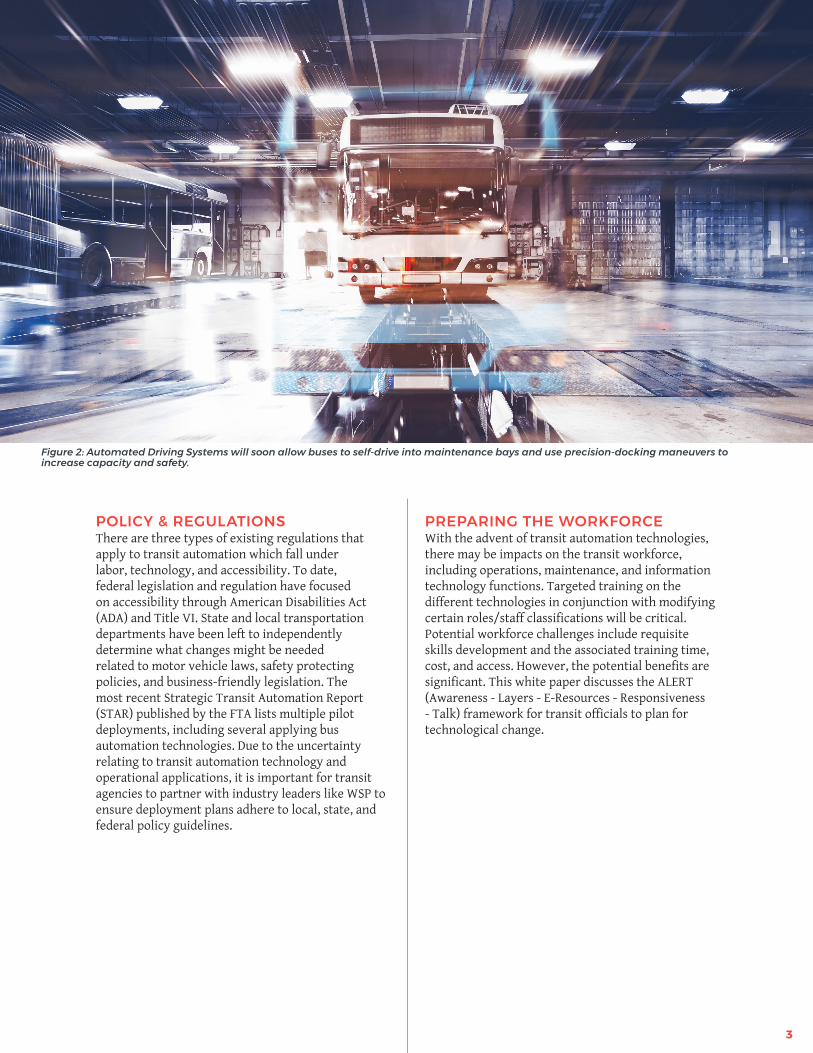
Figure 2: Automated Driving Systems will soon allow buses to self-drive into maintenance bays and use precision-docking maneuvers to increase capacity and safety.
3
OVERVIEWAutomated Vehicles have been an intriguing concept since General Motors’ Futurama exhibit at the 1938 New York World’s Fair.2 Since then, communication and computing advancements have allowed this concept to make great strides toward reality. Today, commercially available vehicles have automation features such as lane-keeping assist and automated parallel parking features as standard equipment. This trend is anticipated to continue and even accelerate.
In January 2018, the FTA published its five-year STAR Plan to advance transit bus automation with the goal to realize potential benefits in safety and operational efficiencies. This has resulted in numerous transit automation projects throughout the US.
This white paper summarizes WSP’s research showcasing practical applications of transit automation that can benefit agencies and our communities. The first application is automated bus yards, which have the potential to increase yard vehicle capacity by 25% to 30%, reduce crashes, and save millions of dollars per year in operating costs. The second application is bus platooning. Imagine a train of two or three 60-foot articulated buses following closely behind one another moving upwards of 40,000 passengers a day. This very high capacity service can deliver the necessary ridership in densely populated corridors through bus transit, saving billions in this period of constrained budgets.
The following sections describe the state and evolution of automated driver assistance systems, automated bus yards, bus platooning, and considerations for the transit workforce.
Introduction to Bus Automation
CURRENT STATEWhile it may come as a surprise to some, vehicle automation technology has been around since the late 1980s. Due to the financial, operational, and safety benefits associated with automation, the technology is becoming more prevalent in industries such as trucking, Transportation Network Companies (TNCs), such as Uber and Lyft, and more recently within the transit industry. Over the past four to five years, several transit agencies have experimented with automated shuttles that use automation technology to provide service in the first/last mile, or to supplement existing service in a campus or industrial complex environment.
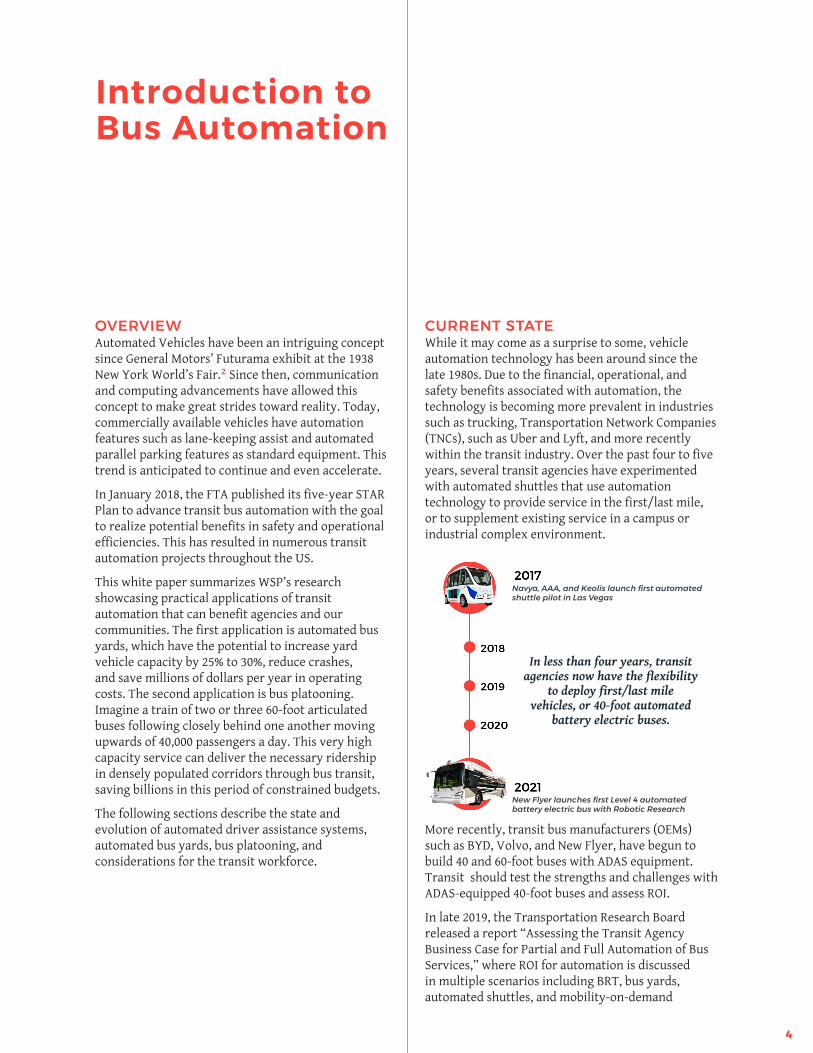
Navya, AAA, and Keolis launch first automated shuttle pilot in Las Vegas
New Flyer launches first Level 4 automated battery electric bus with Robotic Research
In less than four years, transit agencies now have the flexibility
to deploy first/last mile vehicles, or 40-foot automated
battery electric buses.
More recently, transit bus manufacturers (OEMs) such as BYD, Volvo, and New Flyer, have begun to build 40 and 60-foot buses with ADAS equipment. Transit should test the strengths and challenges with ADAS-equipped 40-foot buses and assess ROI.
In late 2019, the Transportation Research Board released a report “Assessing the Transit Agency Business Case for Partial and Full Automation of Bus Services,” where ROI for automation is discussed in multiple scenarios including BRT, bus yards, automated shuttles, and mobility-on-demand
4
services. While the research conducted by the Volpe National Transportation Systems Center covered a variety of potential benefits, there are additional operational, infrastructure, and financial incentives for equipping transit vehicles with automation technology that will increase the efficiency of any mid- to large-sized transit agency. Recognizing this opportunity, WSP has partnered with Robotic Research to develop an industry-first program focused on automating the bus yard.
Since 2002, Robotic Research has been an established leader in the autonomy industry, providing solutions for Department of Defense (AGR and ExLF projects) as well as commercial solutions (sole autonomy provider for New Flyer). In 2019, Robotic Research won a project to test platooning capabilities with commuter coaches through the Lincoln Tunnel Exclusive Bus Lane. If successful, this platooning will enable 180 additional buses to travel through Lincoln Tunnel each morning, providing service to over 10,000 passengers into New York City. CTDOT won an Integrated Mobility Innovation (IMI) grant where Robotic Research will integrate three New Flyer battery electric buses with automation equipment to test precision docking and platooning capabilities.
In light of COVID-19, use cases for and public acceptance of automated vehicles are growing rapidly. In San Francisco, self-driving vehicles are helping food banks deliver groceries, negating the risk of human-to-human contact, and in Florida, the Mayo Clinic is using driverless vehicles to transport COVID-19 tests. The transit industry serves a vital role transporting essential workers every day: Mitigating the risk of virus transmission can have large public health impacts while also offering peace of mind to passengers. Contactless payment, advanced Automated Passenger Counter (APC) systems with customizable load factor limits, and automation technologies that minimize the amount of time that yard personnel are inside buses, are all approaches transit executives should consider to protect frontline staff and customers.
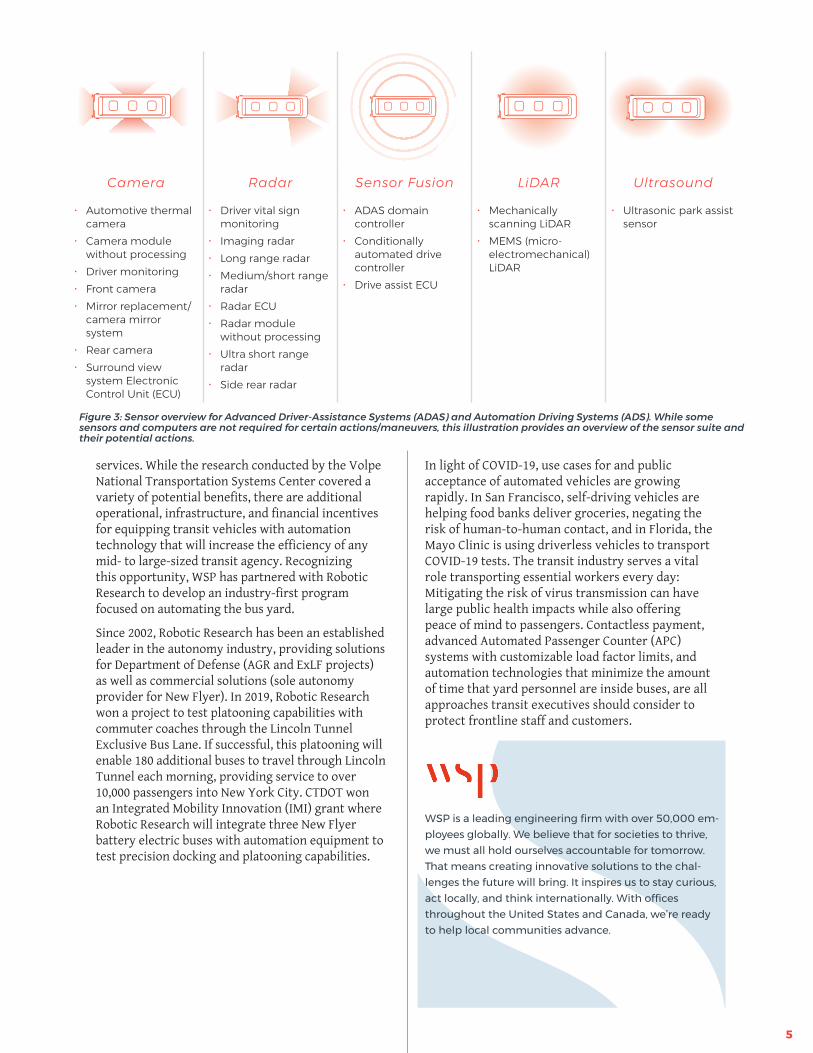
Figure 3: Sensor overview for Advanced Driver-Assistance Systems (ADAS) and Automation Driving Systems (ADS). While some sensors and computers are not required for certain actions/maneuvers, this illustration provides an overview of the sensor suite and their potential actions.
Camera Radar Sensor Fusion LiDAR Ultrasound
x Automotive thermal camera
x Camera module without processing
x Driver monitoring x Front camera x Mirror replacement/
camera mirror system
x Rear camera x Surround view
system Electronic Control Unit (ECU)
x Driver vital sign monitoring
x Imaging radar x Long range radar x Medium/short range
radar x Radar ECU x Radar module
without processing x Ultra short range
radar x Side rear radar
x ADAS domain controller
x Conditionally automated drive controller
x Drive assist ECU
x Mechanically scanning LiDAR
x MEMS (micro-electromechanical) LiDAR
x Ultrasonic park assist sensor
WSP is a leading engineering firm with over 50,000 em-ployees globally. We believe that for societies to thrive, we must all hold ourselves accountable for tomorrow. That means creating innovative solutions to the chal-lenges the future will bring. It inspires us to stay curious, act locally, and think internationally. With offices throughout the United States and Canada, we’re ready to help local communities advance.
5
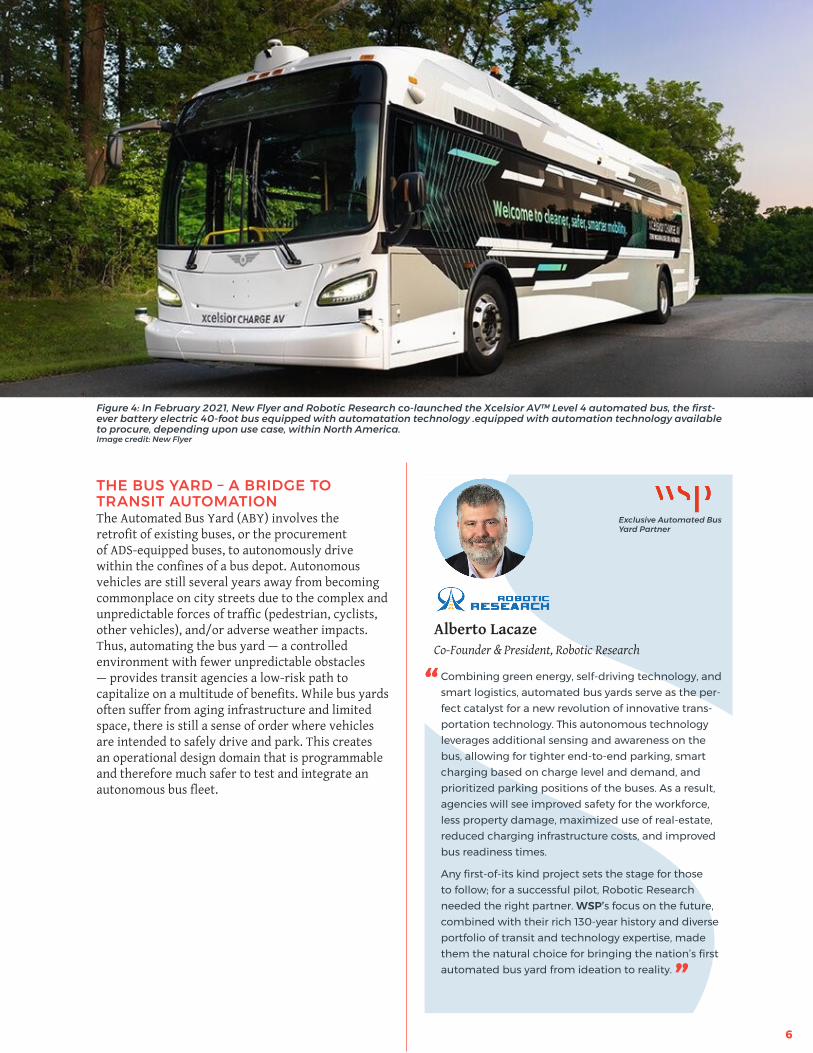
Figure 4: In February 2021, New Flyer and Robotic Research co-launched the Xcelsior AV™ Level 4 automated bus, the first-ever battery electric 40-foot bus equipped with automatation technology .equipped with automation technology available to procure, depending upon use case, within North America. Image credit: New Flyer
Alberto LacazeCo-Founder & President, Robotic Research
Exclusive Automated Bus Yard Partner
THE BUS YARD – A BRIDGE TO TRANSIT AUTOMATIONThe Automated Bus Yard (ABY) involves the retrofit of existing buses, or the procurement of ADS-equipped buses, to autonomously drive within the confines of a bus depot. Autonomous vehicles are still several years away from becoming commonplace on city streets due to the complex and unpredictable forces of traffic (pedestrian, cyclists, other vehicles), and/or adverse weather impacts. Thus, automating the bus yard — a controlled environment with fewer unpredictable obstacles — provides transit agencies a low-risk path to capitalize on a multitude of benefits. While bus yards often suffer from aging infrastructure and limited space, there is still a sense of order where vehicles are intended to safely drive and park. This creates an operational design domain that is programmable and therefore much safer to test and integrate an autonomous bus fleet.
“ Combining green energy, self-driving technology, and smart logistics, automated bus yards serve as the per-fect catalyst for a new revolution of innovative trans-portation technology. This autonomous technology leverages additional sensing and awareness on the bus, allowing for tighter end-to-end parking, smart charging based on charge level and demand, and prioritized parking positions of the buses. As a result, agencies will see improved safety for the workforce, less property damage, maximized use of real-estate, reduced charging infrastructure costs, and improved bus readiness times.
Any first-of-its kind project sets the stage for those to follow; for a successful pilot, Robotic Research needed the right partner. WSP’s focus on the future, combined with their rich 130-year history and diverse portfolio of transit and technology expertise, made them the natural choice for bringing the nation’s first automated bus yard from ideation to reality.”
6
TERMINOLOGYBus automation technology - like most transportation advancements - is evolving rapidly due to increases in computing, communications, and information technology. Connected and Automated Vehicle (CAV) initiatives are becoming commonplace among state and local departments of transportation as departments seek to evaluate and implement technology that can reduce the epidemic of roadway fatalities.
In the transit space, bus automation mirrors that of other vehicle-focused advances and can generally be described as one of two types: Technology that can assist the driver (whether through warnings or some control functions), and technology that can take the place of the driver (entirely or in specific situations).
In a 2018 document titled “Automated Vehicles 3.0: Preparing for the Future of Transportation,” the US Department of Transportation defined these two environments:
� Advanced Driver-Assistance Systems (ADAS): Systems designed to help drivers with certain driving tasks (e.g., staying in the lane, parking, avoiding collisions, reducing blind spots, and maintaining a safe headway). ADAS are generally designed to improve safety or reduce the workload on the driver.
� Automated Driving System (ADS): The hardware and software that are collectively capable of performing the entire Dynamic Driving Task on a sustained basis, regardless of whether it is limited to a specific operational design domain.
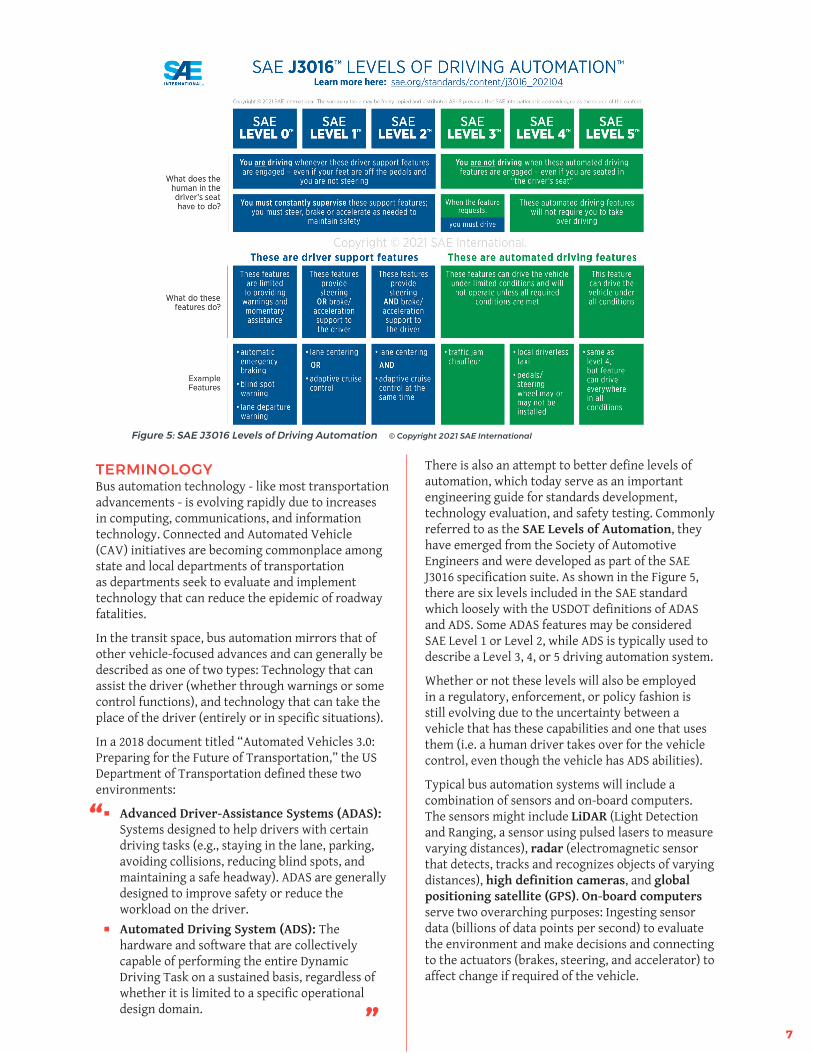
There is also an attempt to better define levels of automation, which today serve as an important engineering guide for standards development, technology evaluation, and safety testing. Commonly referred to as the SAE Levels of Automation, they have emerged from the Society of Automotive Engineers and were developed as part of the SAE J3016 specification suite. As shown in the Figure 5, there are six levels included in the SAE standard which loosely with the USDOT definitions of ADAS and ADS. Some ADAS features may be considered SAE Level 1 or Level 2, while ADS is typically used to describe a Level 3, 4, or 5 driving automation system.
Whether or not these levels will also be employed in a regulatory, enforcement, or policy fashion is still evolving due to the uncertainty between a vehicle that has these capabilities and one that uses them (i.e. a human driver takes over for the vehicle control, even though the vehicle has ADS abilities).
Typical bus automation systems will include a combination of sensors and on-board computers. The sensors might include LiDAR (Light Detection and Ranging, a sensor using pulsed lasers to measure varying distances), radar (electromagnetic sensor that detects, tracks and recognizes objects of varying distances), high definition cameras, and global positioning satellite (GPS). On-board computers serve two overarching purposes: Ingesting sensor data (billions of data points per second) to evaluate the environment and make decisions and connecting to the actuators (brakes, steering, and accelerator) to affect change if required of the vehicle.
Figure 5: SAE J3016 Levels of Driving Automation © Copyright 2021 SAE International
“
”7
While risks of introducing automated buses to the yard are significantly fewer than deploying autonomous buses on city streets, there are still inherent challenges agencies should consider. These include checking and validating sensor data against degradation and braking and/or accelerating too rapidly. Additionally, while automation technology leverages cloud computing technology, software developers must first program each operating scenario as pre-programming is required for each ODD. A LiDAR scan of the area must be completed and uploaded to the on-board computer, and code must be modified and uploaded to the cloud for fleet deployment. An operating scenario may include autonomously parking a bus at a designated location or programming the bus to autonomously charge via overhead pantographs.
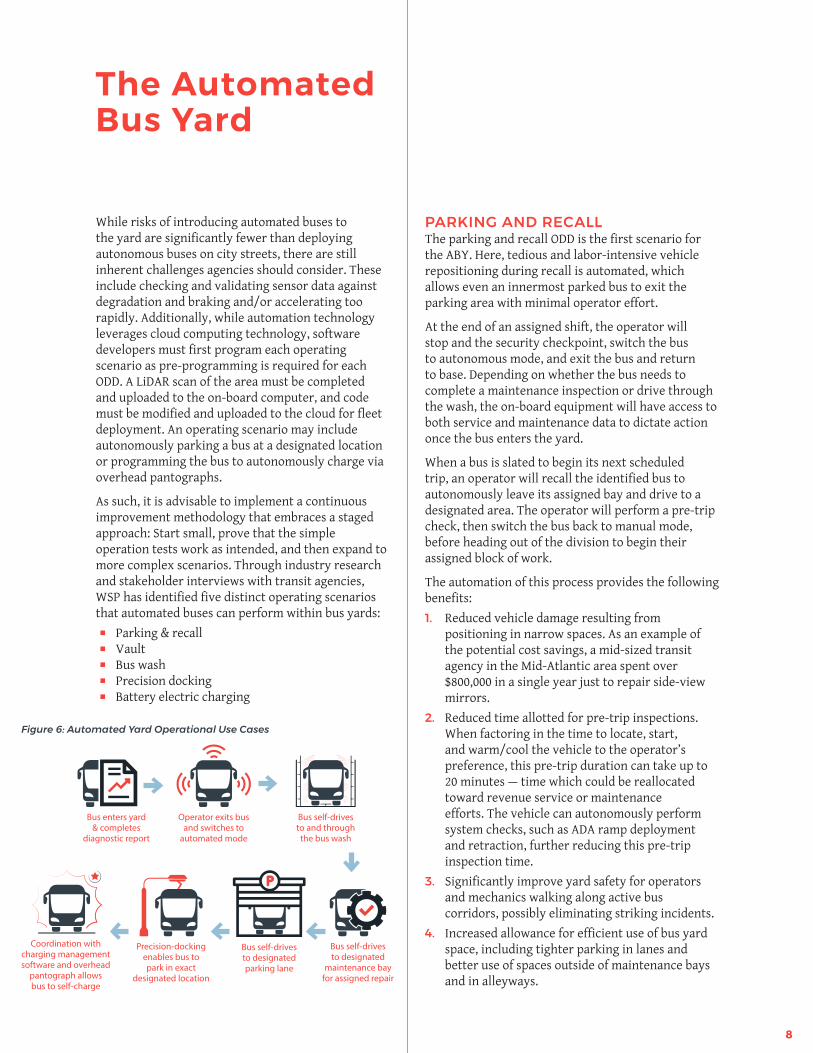
As such, it is advisable to implement a continuous improvement methodology that embraces a staged approach: Start small, prove that the simple operation tests work as intended, and then expand to more complex scenarios. Through industry research and stakeholder interviews with transit agencies, WSP has identified five distinct operating scenarios that automated buses can perform within bus yards:� Parking & recall� Vault� Bus wash� Precision docking� Battery electric charging
The Automated Bus Yard
PARKING AND RECALLThe parking and recall ODD is the first scenario for the ABY. Here, tedious and labor-intensive vehicle repositioning during recall is automated, which allows even an innermost parked bus to exit the parking area with minimal operator effort.
At the end of an assigned shift, the operator will stop and the security checkpoint, switch the bus to autonomous mode, and exit the bus and return to base. Depending on whether the bus needs to complete a maintenance inspection or drive through the wash, the on-board equipment will have access to both service and maintenance data to dictate action once the bus enters the yard.
When a bus is slated to begin its next scheduled trip, an operator will recall the identified bus to autonomously leave its assigned bay and drive to a designated area. The operator will perform a pre-trip check, then switch the bus back to manual mode, before heading out of the division to begin their assigned block of work.
The automation of this process provides the following benefits:1. Reduced vehicle damage resulting from
positioning in narrow spaces. As an example of the potential cost savings, a mid-sized transit agency in the Mid-Atlantic area spent over $800,000 in a single year just to repair side-view mirrors.
2. Reduced time allotted for pre-trip inspections. When factoring in the time to locate, start, and warm/cool the vehicle to the operator’s preference, this pre-trip duration can take up to 20 minutes — time which could be reallocated toward revenue service or maintenance efforts. The vehicle can autonomously perform system checks, such as ADA ramp deployment and retraction, further reducing this pre-trip inspection time.
3. Significantly improve yard safety for operators and mechanics walking along active bus corridors, possibly eliminating striking incidents.
4. Increased allowance for efficient use of bus yard space, including tighter parking in lanes and better use of spaces outside of maintenance bays and in alleyways.
8
Operator exits bus and switches to
automated mode
Bus self-drives to designated
maintenance bay for assigned repair
Bus self-drives to and through the bus wash
Coordination with charging management software and overhead
pantograph allows bus to self-charge
Bus self-drives to designated parking lane
Precision-docking enables bus to park in exact
designated location
Bus enters yard & completes
diagnostic report
Figure 6: Automated Yard Operational Use Cases
9
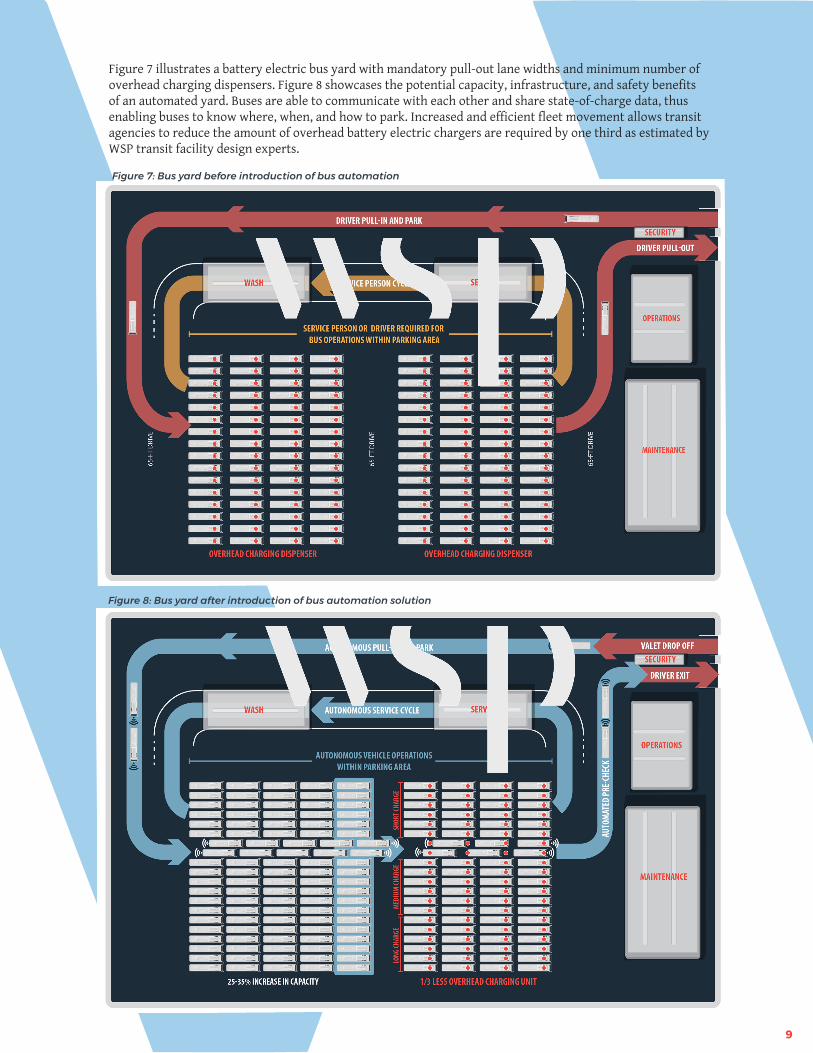
Figure 7: Bus yard before introduction of bus automation
Figure 8: Bus yard after introduction of bus automation solution
Figure 7 illustrates a battery electric bus yard with mandatory pull-out lane widths and minimum number of overhead charging dispensers. Figure 8 showcases the potential capacity, infrastructure, and safety benefits of an automated yard. Buses are able to communicate with each other and share state-of-charge data, thus enabling buses to know where, when, and how to park. Increased and efficient fleet movement allows transit agencies to reduce the amount of overhead battery electric chargers are required by one third as estimated by WSP transit facility design experts.
BUS WASHWhile yard operations vary by individual transit agencies, bus routines are typically to first park, then be vaulted by the operator and fare technician, and fueled, washed, and re-parked by a bus maintenance employee. Transit operators typically wash buses daily during this process, often after fueling. Buses are driven into automated bus washers and proceed through the bus wash bay over the course of two to three minutes. After washing, buses drive to be staged for their next run.
Many transit wash bays are automated today. Automation technology may help control the speed and position of each bus traveling through the wash bay by using a combination of a pre-programed wash circuit and a central override control system. Automating the driving associated with bus washing could save approximately five to eight minutes of manpower hours per vehicle, including the time for queuing and driving through the wash.
MAINTENANCE BAY STAGINGAutomated capabilities include the ability to perform precision docking and maneuvering, which allows buses to consistently and reliably park in designated spaces, separately by merely an inch. Allowing buses to drive autonomously into maintenance bays reduces the need to have service attendants or yard hustlers to move and stage vehicles. Furthermore, transit agencies will save time queuing buses for maintenance repairs by removing time required to walk onto the lot, locate the bus in need of repair, and drive it into the service bay.
VAULTING THE BUSWhile this operational scenario is dependent upon the transit agency, some Standard Operating Procedures (SOPs) require the operator to pull into the depot and park the bus immediately. Then, service attendants take the bus through the vault to pull the farebox, fuel the bus, and finally take the bus through the wash. Specific to vaulting the bus, an automated bus can be programmed to self-drive from the designated parking spot over to the vault which would save manpower hours and potentially streamline vaulting operations altogether. When the bus pulls up to the vault, the personnel manning the vault can open the doors, shut off autonomous mode, pull the vault, dump the money, and once they reinstall the vault, they simply switch the bus back into autonomous mode and the bus autonomously drives to its next geo-fenced location.
10
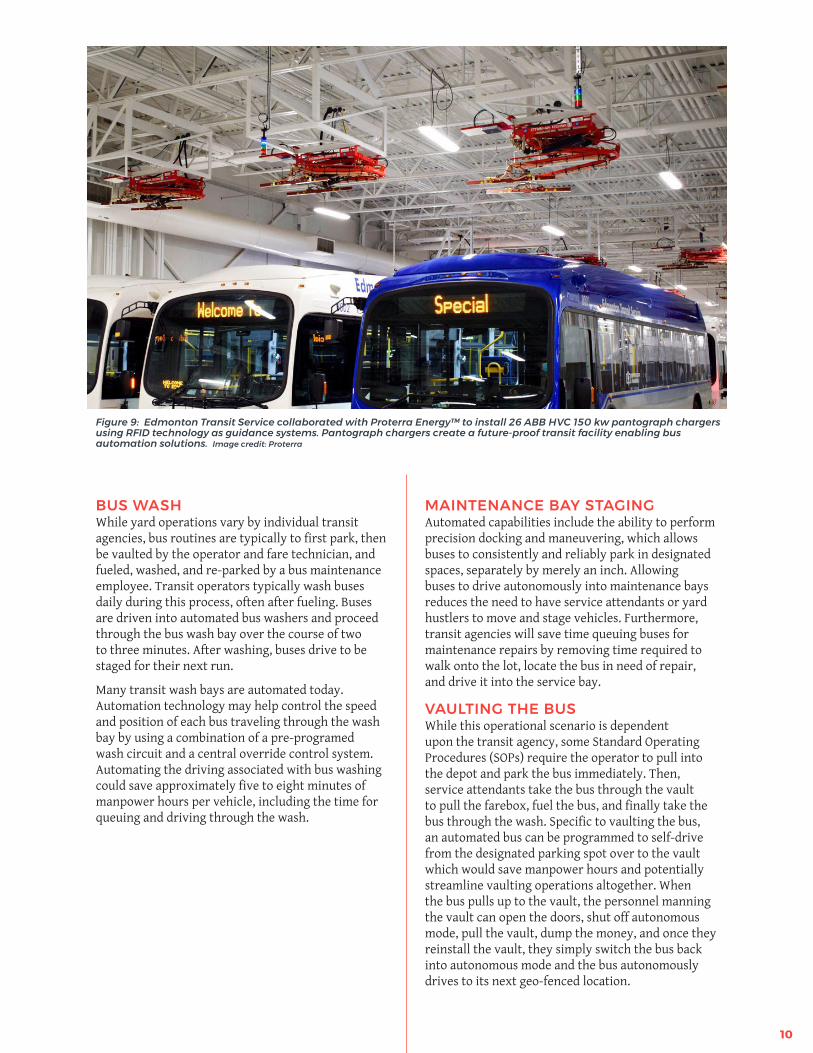
Figure 9: Edmonton Transit Service collaborated with Proterra Energy™ to install 26 ABB HVC 150 kw pantograph chargers using RFID technology as guidance systems. Pantograph chargers create a future-proof transit facility enabling bus automation solutions. Image credit: Proterra
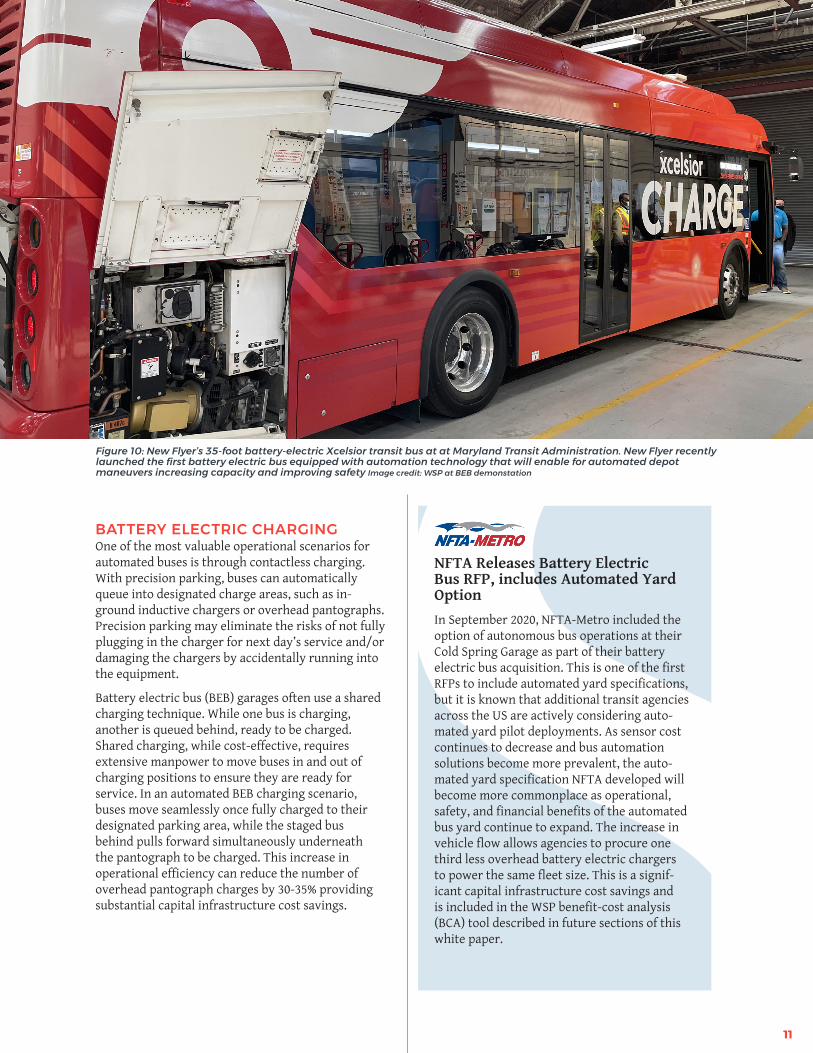
BATTERY ELECTRIC CHARGINGOne of the most valuable operational scenarios for automated buses is through contactless charging. With precision parking, buses can automatically queue into designated charge areas, such as in-ground inductive chargers or overhead pantographs. Precision parking may eliminate the risks of not fully plugging in the charger for next day’s service and/or damaging the chargers by accidentally running into the equipment.
Battery electric bus (BEB) garages often use a shared charging technique. While one bus is charging, another is queued behind, ready to be charged. Shared charging, while cost-effective, requires extensive manpower to move buses in and out of charging positions to ensure they are ready for service. In an automated BEB charging scenario, buses move seamlessly once fully charged to their designated parking area, while the staged bus behind pulls forward simultaneously underneath the pantograph to be charged. This increase in operational efficiency can reduce the number of overhead pantograph charges by 30-35% providing substantial capital infrastructure cost savings.
NFTA Releases Battery Electric Bus RFP, includes Automated Yard OptionIn September 2020, NFTA-Metro included the option of autonomous bus operations at their Cold Spring Garage as part of their battery electric bus acquisition. This is one of the first RFPs to include automated yard specifications, but it is known that additional transit agencies across the US are actively considering auto-mated yard pilot deployments. As sensor cost continues to decrease and bus automation solutions become more prevalent, the auto-mated yard specification NFTA developed will become more commonplace as operational, safety, and financial benefits of the automated bus yard continue to expand. The increase in vehicle flow allows agencies to procure one third less overhead battery electric chargers to power the same fleet size. This is a signif-icant capital infrastructure cost savings and is included in the WSP benefit-cost analysis (BCA) tool described in future sections of this white paper.
Figure 10: New Flyer’s 35-foot battery-electric Xcelsior transit bus at at Maryland Transit Administration. New Flyer recently launched the first battery electric bus equipped with automation technology that will enable for automated depot maneuvers increasing capacity and improving safety Image credit: WSP at BEB demonstation
11
There are certain desired operational and infrastructure characteristics for an automated bus yard to be successfully implemented, specifically:� Existing buses equipped with Drive-by-Wire
technology� Fleet includes battery electric buses� Wireless charging infrastructure (inductive or
overhead)� Yard with designated area for parking or recall� Existing or planned BRT lines or automated bus
yards� Demonstrated commitment to innovative
projectsIt is cost effective for buses to have Drive-by-Wire (DbW) technology, in which vehicle braking, steering, and propulsion are controlled by electrical systems. This technology is required because the automation retrofit process connects sensors and a programmable computer to these existing systems.
Though not explicitly required, there are a series of highly-desirable characteristics for transit fleets, the first of which is battery electric buses that use inductive or overhead pantograph chargers. As described in the next section, a significant opportunity of the ABY is in the charge management process, which would be a forgone benefit with hybrid or diesel vehicles. Further, inductive charging is desired as the infrastructure can begin charging autonomously, comparable to the wireless charging of a cell phone when placed on a charging pad.
Preparing for Bus Automation Integration
Beyond the electric-related characteristics, the yard should have a designated area for parking and recall. The first operational scenario envisions a bus operator exiting the vehicle and switching the bus’s automated driving capabilities on. This will take the bus to its parking spot. Without a designated area for the bus parking and hailing to occur, though customizable by transit agency, piloting automated buses into existing yard operations would be challenging.
Another desired characteristic is that the bus network includes a BRT line and ABY, which WSP envisions as being the key step after the ABY, as part of the future vision for an automated transit fleet. The benefits of automation for a BRT line include increased throughput, fast charging, and safety, as described in the following section.
Finally, and perhaps most fundamental to success, the transit agency that embarks on the ABY journey should have demonstrated commitment to innovative projects. While the transit use cases may be in their infancy, automated bus technology continues to advance and it is only a matter of time before these capabilities are more commonplace. Transit agencies that take advantage of this technology and conduct pilot demonstrations will be able to effectively plan and prepare for future integration as the technology and capabilities continue to improve. Automated bus demonstrations may allow agencies to incorporate future-ready facility designs to take advantage of narrow lanes and increased fleet capacity.
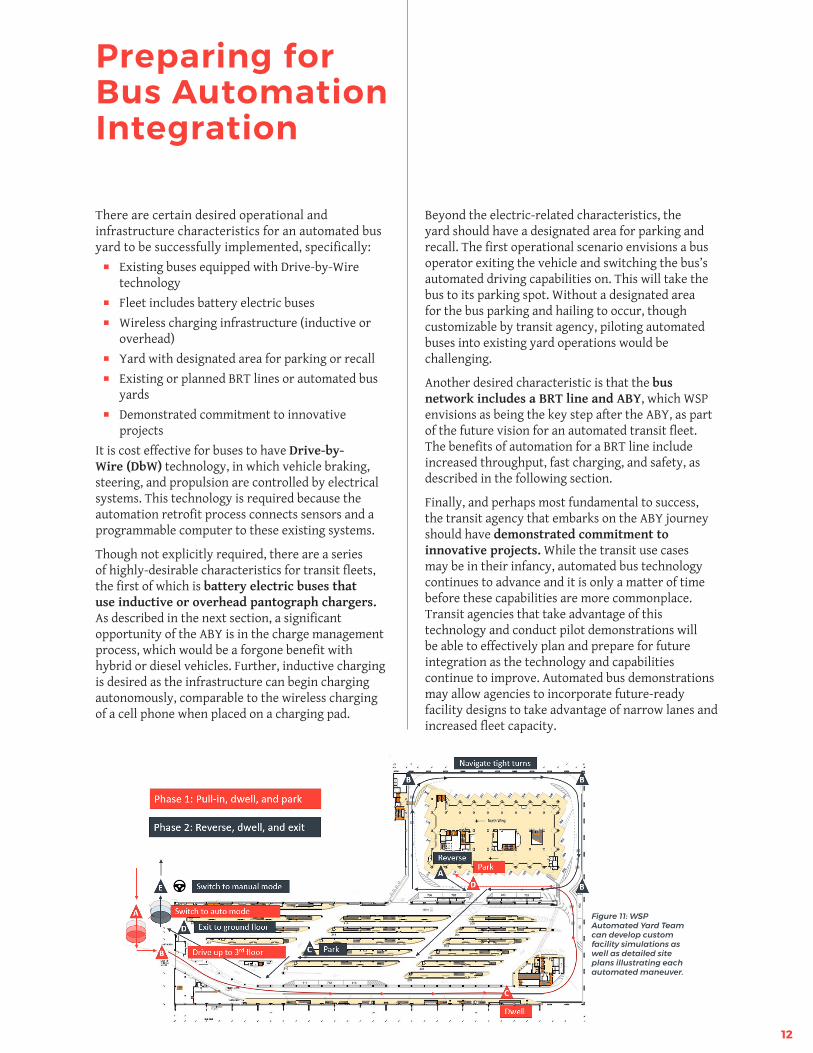
Figure 11: WSP Automated Yard Team can develop custom facility simulations as well as detailed site plans illustrating each automated maneuver.
12
The automated bus yard provides transit agencies with multiple business cases that not only have the potential to pay-off the initial capital investment, but provide long-term, sustainable operational and maintenance cost savings. There are several significant financial, operational, and safety benefits associated with the ABY that enable transit agencies a short payback period from the initial capital investment.
For a yard servicing 196 buses, it is estimated that ADAS-equipped buses would save approximately 23 manpower hours per day, almost 8,400 manpower hours per year.Federal Transit Administration, “Transit Automation Benefit-Cost Analysis Report,” Appendix, 2018
INCREASE IN YARD CAPACITYBus depots command significant real estate, which is costly to acquire and maintain. By retrofitting buses with automated bus technology, buses can park closer together, thus saving space. Additionally, since buses are programmable, maintenance and operations staff can get more creative for where buses are stored overnight and staged for morning service.
The Business Case for Automating the Bus Yard
A study prepared by FTA with support of the Volpe National Transportation Systems Center suggests ADS can provide a ~250% increase3 (from 50 buses to 134) in yard capacity; however, WSP is taking a more conservative approach with the understanding of how bus yards operate and some of the challenges with inspections, service preparation, and repair. WSP estimates closer to a 25-35% increase in capacity with our in-depth understanding of transit facility design and operations. These savings are particularly significant given that yards tend to be in dense urban areas with rising real estate value and growing fleet sizes. Furthermore, transit agencies often struggle with the increasing demand for buses in downtown areas, yet are forced to store buses in suburban locations due to capacity constraints. Even with the surrounding ridership in a post-COVID world, a reduction in operating footprint will function as a net benefit, enabling agencies to:� Repurpose newly available space� Re-allocate additional buses into urban locations
and to help optimize scheduled operations � Consider downsizing some facilities where
passenger forecasts are expected to remain low
With automated buses, the financial benefits are 2X the value of the capital and maintenance costs according to the FTA “Transit Automation Benefit-Cost Analysis Report.”
13
Figure 12: The FTA STAR Roadmap identifies both an automated yard pilot as well as an automated BRT demonstration. The STAR program proves FTA is committed to researching, testing, and investing in scalable bus automation solutions.Image credit: Volpe National Transportation Systems Center, Strategic Automation Research Plan
This increase in yard capacity is driven by a reduction of space between vehicles, as automated bus technology will enable buses to park precisely without requiring space for an operator to traverse between vehicles. They will also be able to automatically reposition, such that an inner bus can be brought into service by automatically adjusting multiple buses safely and efficiently.
CHARGE MANAGEMENT SYSTEMThe second business case centers around the charging process for growing electric bus fleets. Based on current charge speeds and operational needs, one charger can only serve two BEBs. However, BEBs equipped with automated bus technology would streamline the charging process as they could automatically queue up and rotate through chargers overnight, without the need for individual operators. Autonomous movement can be optimized such that immediately upon reaching a full state-of-charge (SOC), one bus proceeds toward a designated parking area while the queued bus takes its place to be charged.
A non-proprietary charge management system may allow for a 50% higher ratio of BEBs to electric chargers (3:1), according to a WSP analysis by Zero Emission Bus (ZEB) facilities experts. The system will also reduce the manpower required to continuously move buses throughout the yard, once charging is complete. Given that a single BEB charger can cost upwards of $250,000, this 50% improvement to the ratio can have multi-million dollar implications for the capital investment required to charge transit agency’s increasingly electric fleets.
PULL-IN/PULL-OUT TIME REDUCTIONS� Transit schedules include time to allow operators
to walk the lanes, locate their bus, perform a pre-check inspection, and drive through security to start their run. Agencies allow 15-20 minutes for operators to make pull out and 5-10 minutes for pull-in operations. Pull-in and pull-out time requirements may be substantially reduced if the bus is able to self-drive to a designated area to form a queue for operators creating a more efficient daily routine.
� Through ADS transit solutions, an average of 10 minutes for pull-outs and five minutes for pull-ins can be saved for each trip.3 This time savings can be used to add time back into revenue trips to increase on-time performance and/or reprioritize manpower needs.
� Put more time back into operator schedules (as much as 15,000 hours annually based on a 100-bus fleet averaging two pull-outs per day, used for 300 days each year.
� Repurpose labor hours elsewhere or keep the savings and reinvest.
IMPROVED SAFETY� Automated bus equipment includes
collision avoidance sensors via automated braking during object detection.
� The “Transit Automation Benefit-Cost Analysis” report estimates a mid-range of 45% reduction in rear-end crashes.
� By taking the 45% reduction and average bus incident maintenance costs, transit agencies can save approximately $3,631 annually per bus. In a 500-bus fleet, that amounts to over $1.8 million dollars per year.
14
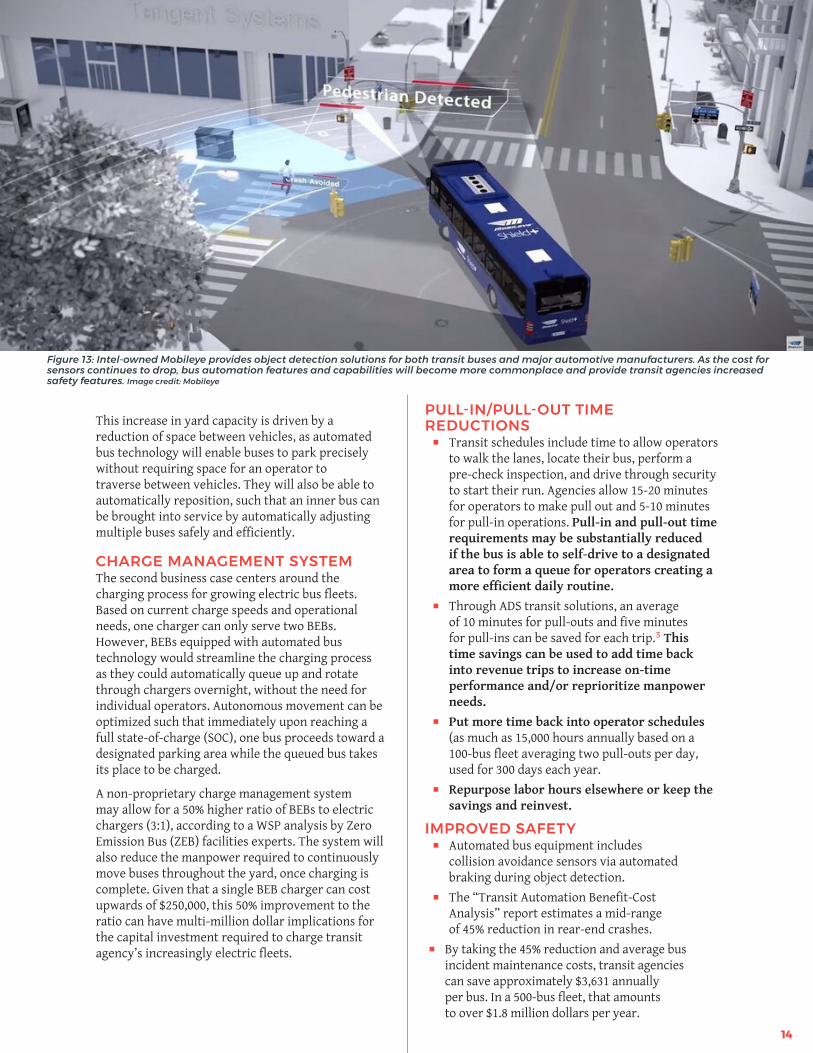
Figure 13: Intel-owned Mobileye provides object detection solutions for both transit buses and major automotive manufacturers. As the cost for sensors continues to drop, bus automation features and capabilities will become more commonplace and provide transit agencies increased safety features. Image credit: Mobileye
OPERATIONAL/PHYSICAL SCENARIOS To develop bus platooning for BRT applications on arterials and freeways, transit agencies must first determine ridership demand and then identify the optimum routing and service configuration in the corridor. Potential challenges to platooning include whether physical and environmental conditions allow for an exclusive transitway to facilitate platooning operation.
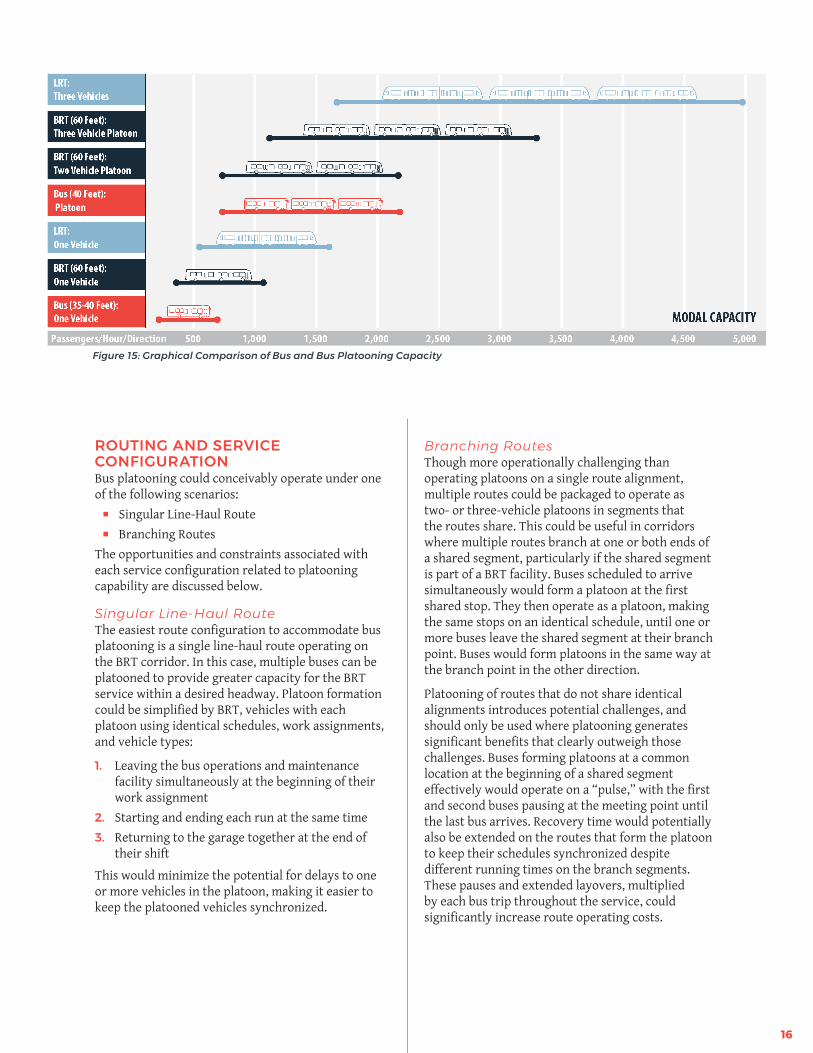
VEHICLE CAPACITYFor a single bus route, bus platooning (i.e. operating multiple buses at the same scheduled time) adds passenger capacity compared to a single vehicle. The extent to which capacity is expanded depends on size and seating/standee configuration, the number of vehicles platooning, and the headway between platoons. Figure 15 compares the passenger capacity of single 40- and 60-foot buses, low-floor BRT multi-vehicle platoons and single or multiple car trains of LRT vehicles, operating under various seating/standee configurations and for a range of headways from two to 60 minutes. Headways of six minutes or less are associated with BRT and LRT operating in exclusive right-of-way, as opposed to mixed traffic.
Bus Platooning
LRT vehicles have a typical seated capacity of about 90 passengers per vehicle, or 270 for a three-car train, compared to 60 passengers per 60-foot articulated BRT vehicle (180 for a three-bus platoon) and 40 passengers for a 40-ft BRT vehicle (120 for a three-bus platoon). This allows LRT to carry higher seating capacity at lower headways. A three-car LRT train operating at a 10-minute headway would have a one-way passenger capacity of 1,620 passengers per hour. Matching this capacity using 60-foot BRT vehicles would require operating 27 hourly bus trips, or a headway of just over two minutes. Using 40-foot vehicles would require 41 bus trips per hour, or a headway well below two minutes. Maintaining vehicle spacing at headways below three minutes, though possible, is very challenging, even on a fully-dedicated guideway. On guideways that allow crossing traffic, or in mixed traffic, vehicle bunching or passing is practically inevitable. Bus platooning allows BRT systems to more closely match LRT capacity at manageable headways. Three-bus platoons of 60-foot BRT vehicles operating at six-minute headways, or 40-foot vehicles operating at four minutes, would provide more capacity than a three-car LRT train operating at 10case s-minute headways. Additionally, platooning buses provides transit agencies flexibility to add and/or remove buses throughout the day allowing responsiveness to fluctuating passenger demand.
Using platooning, BRT can meet passenger demand in corridors requiring capacities of up to 5,000 one-way passengers per hour, at far lower capital and operating costs and with far greater operational flexibility than LRT. Using automated vehicles to operate platoons with only one bus operator (in the lead bus), or potentially no operators, would make the cost advantage of BRT even greater. A detailed cost comparison between the two modes is presented in the section entitled Financial Considerations with Bus Automation. The ability of platooning to provide higher capacity at lower headways also makes it an attractive alternative to single-bus BRT operation in corridors where headways are limited by crossing traffic and mixed-traffic operation.
15
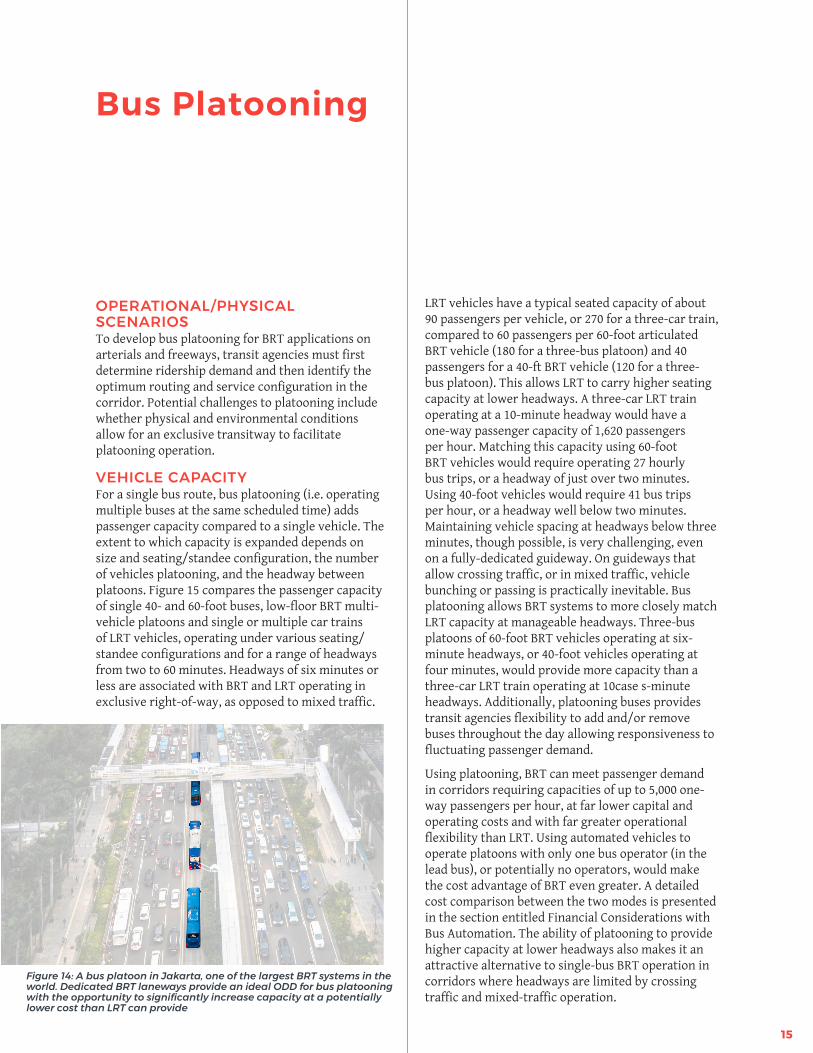
Figure 14: A bus platoon in Jakarta, one of the largest BRT systems in the world. Dedicated BRT laneways provide an ideal ODD for bus platooning with the opportunity to significantly increase capacity at a potentially lower cost than LRT can provide
ROUTING AND SERVICE CONFIGURATION Bus platooning could conceivably operate under one of the following scenarios:� Singular Line-Haul Route� Branching Routes
The opportunities and constraints associated with each service configuration related to platooning capability are discussed below.
Singular Line-Haul RouteThe easiest route configuration to accommodate bus platooning is a single line-haul route operating on the BRT corridor. In this case, multiple buses can be platooned to provide greater capacity for the BRT service within a desired headway. Platoon formation could be simplified by BRT, vehicles with each platoon using identical schedules, work assignments, and vehicle types:
1. Leaving the bus operations and maintenance facility simultaneously at the beginning of their work assignment
2. Starting and ending each run at the same time3. Returning to the garage together at the end of
their shift
This would minimize the potential for delays to one or more vehicles in the platoon, making it easier to keep the platooned vehicles synchronized.
Figure 15: Graphical Comparison of Bus and Bus Platooning Capacity
Branching RoutesThough more operationally challenging than operating platoons on a single route alignment, multiple routes could be packaged to operate as two- or three-vehicle platoons in segments that the routes share. This could be useful in corridors where multiple routes branch at one or both ends of a shared segment, particularly if the shared segment is part of a BRT facility. Buses scheduled to arrive simultaneously would form a platoon at the first shared stop. They then operate as a platoon, making the same stops on an identical schedule, until one or more buses leave the shared segment at their branch point. Buses would form platoons in the same way at the branch point in the other direction.
Platooning of routes that do not share identical alignments introduces potential challenges, and should only be used where platooning generates significant benefits that clearly outweigh those challenges. Buses forming platoons at a common location at the beginning of a shared segment effectively would operate on a “pulse,” with the first and second buses pausing at the meeting point until the last bus arrives. Recovery time would potentially also be extended on the routes that form the platoon to keep their schedules synchronized despite different running times on the branch segments. These pauses and extended layovers, multiplied by each bus trip throughout the service, could significantly increase route operating costs.
16
Another complication introduced by platooning buses of multiple routes is ensuring passengers board the bus that serves their branch route. Passengers whose trips begin and end in the shared segment could board any bus in a platoon. Those whose trips extend beyond the branch points would need to consult the head signs and board the bus that serves their destinations. This makes using the route potentially more confusing for customers, and inevitably will require allowing customers to transfer among buses within the platoon at stops along the route. This, in turn, complicates fare collection and enforcement. Electronic signs on the sides of the bus and operators reminding passengers which branch is served by the bus—common practices on branching routes that do not use platooning—can reduce customer confusion and the need for mid-route passenger transfers.
Exclusive Busway or Bus LanesPlatooning is only effective in an exclusive busway or bus lane on an urban street. Longitudinal interference by other vehicles sharing the bus lanes in mixed traffic or semi-exclusive bus lanes (such as Business Access and Transit, or BAT lanes) disrupt operations so much that it is impossible to keep vehicles synchronized. On an urban street, platooning would be effective in a median busway, or a curbside bus lane interrupted only by signalized intersections, but with no interference from driveways or right turn lanes at intersections. Platooning also could be applied in a separate busway removed from a roadway, or a median busway or bus on shoulder treatment on freeways.
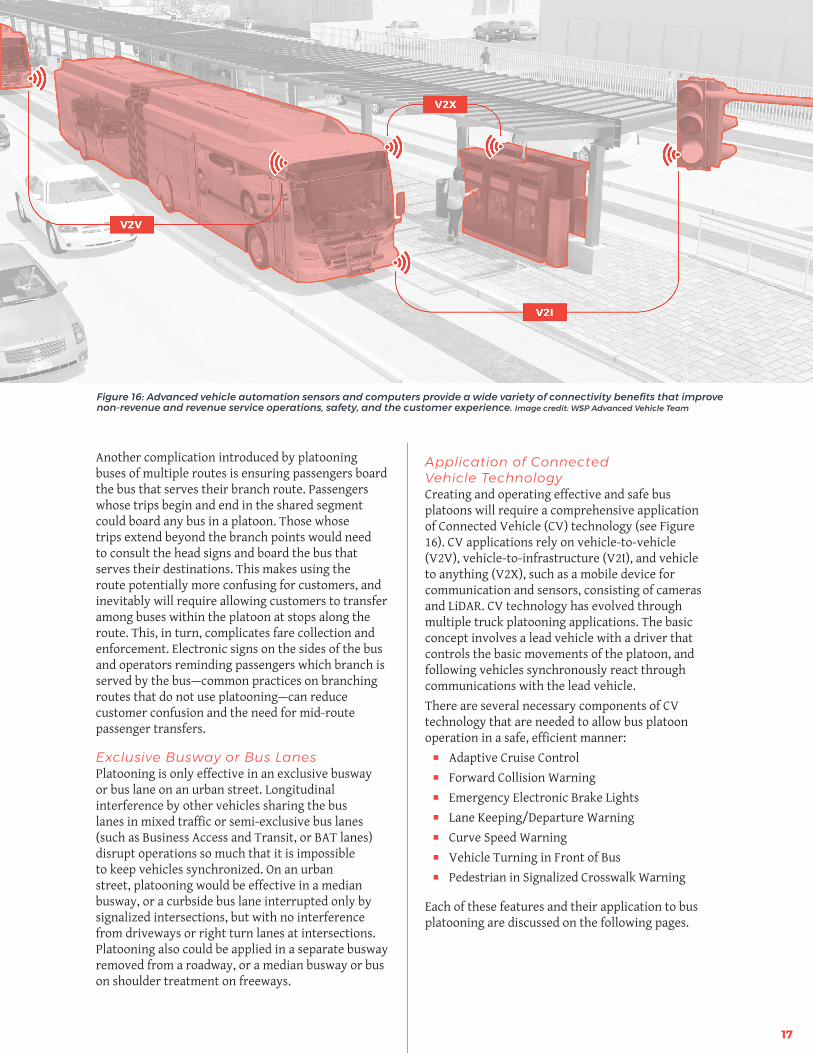
Application of Connected Vehicle TechnologyCreating and operating effective and safe bus platoons will require a comprehensive application of Connected Vehicle (CV) technology (see Figure 16). CV applications rely on vehicle-to-vehicle (V2V), vehicle-to-infrastructure (V2I), and vehicle to anything (V2X), such as a mobile device for communication and sensors, consisting of cameras and LiDAR. CV technology has evolved through multiple truck platooning applications. The basic concept involves a lead vehicle with a driver that controls the basic movements of the platoon, and following vehicles synchronously react through communications with the lead vehicle.There are several necessary components of CV technology that are needed to allow bus platoon operation in a safe, efficient manner:� Adaptive Cruise Control� Forward Collision Warning� Emergency Electronic Brake Lights� Lane Keeping/Departure Warning� Curve Speed Warning� Vehicle Turning in Front of Bus� Pedestrian in Signalized Crosswalk Warning
Each of these features and their application to bus platooning are discussed on the following pages.
Figure 16: Advanced vehicle automation sensors and computers provide a wide variety of connectivity benefits that improve non-revenue and revenue service operations, safety, and the customer experience. Image credit: WSP Advanced Vehicle Team
17
Adaptive Cruise ControlAdaptive Cruise Control will allow a bus to automatically set and adjust its cruising
speed to maintain both schedule and spacing. In bus platooning, this tool would be used to maintain the safest possible spacing between vehicles in a bus platoon. Cruising speed would be set by the lead vehicle, with V2V communications to the following vehicle(s) to adjust their speed accordingly.
Forward Collision Warning This technology will warn a bus operator if there is a risk of a collision with a vehicle,
obstruction, or person in front of the bus. It will also be helpful for the second and third buses for maintaining safe distance between buses operating in a platoon. This is another V2V application for the lead vehicle in a bus platoon, which will be connected to the following vehicle(s) via a V2V application.
Emergency Electronic Brake LightsEmergency electronic brake lights warn
the bus operator when there is a hard-braking condition in the lane ahead of the bus (which may be several vehicles in front of the bus, or in an adjacent lane). The intent is to avoid chain reaction collisions. The lead vehicle would institute the braking condition, transferring the command to the following vehicle(s).
Lane Keeping/Departure WarningThis warning mechanism alerts bus operators when their vehicle drifts from within a designated lane. This is particularly useful in narrow lane BRT applications. Sensors
on the vehicle monitor proximity of the vehicle to painted lane lines. A lane departure warning is integrated to provide an alert to the bus operator if the vehicle is straddling over the lane line. In a bus platoon, the lead vehicle would initiate the action, and communicate to the following vehicle(s) through a V2V application.
Curve Speed WarningCurve speed warnings alert a bus operator if the bus is approaching a curve too quickly for safe navigation. Curve speed warnings
can use roadside equipment to communicate actions to the vehicle as well as on-board equipment such as pre-loaded HD maps indicating curvature of the road.
Vehicle Turning in Front of BusThis technology will warn a bus operator when another vehicle is passing on the left and turning in front of the bus. This condition is applicable to an exclusive
curbside bus lane where the vehicle passing wants to access an outside right turn lane, at a signalized intersection, thus creating a potential collision situation. In this situation under a bus platoon operation, V2V communications may occur between the general traffic and the lead vehicle in the platoon, which then communicates the situation and measures to avoid collision to the following vehicle(s).
Pedestrian in Signalized Crosswalk Warning Collision prevention occurs with pre-installed
on-board object detection sensors that prevent the vehicle from moving forward. In busy intersections, transit agencies and DOTs may opt to install roadside equipment (V2I) to transmit signal phase and timing (SPaT) data and the physical geometry of the intersection. The SPaT message contains pedestrian presence and detection data objects.
18
CASE STUDIESThere is currently no application of bus platooning operating on an urban street, freeway, or separate busway in the US. Most of the research and demonstration studies have focused on truck platooning, identifying the V2V communication system to allow a lead vehicle to communicate various connected vehicle applications to following vehicles. CV technology in the US was first applied in 2011 to buses in Minneapolis to avoid crashes through communications with vehicles and nearby infrastructure. Recently, there have been three demonstration projects in the US, either in the proposal or activation phase, to evaluate the feasibility and configuration of bus platooning:
� Driver-assist system for Minnesota Valley Transit Authority bus-on-shoulder operation
� Application of ADAS features on new vehicles on the CTfastrak route in Connecticut
� The Lincoln Tunnel Bus Lane under the Hudson River connecting New Jersey and New York City
� A proposed bus platooning demonstration on California LA Metro’s Orange Line busway
These proposed projects are explored in this section.
Cedar Avenue Driver Assist SystemThe Minnesota Valley Transit Authority (MVTA) received $4.2 million from FTA to develop a lane guidance system for a bus-on-shoulder operation along Cedar Avenue. The GPS-technology system, DAS, (Driver Assist System), provides lane position feedback to the bus operator via a heads-up display, virtual mirror, vibrating seat, and actuated steering. MVTA’s primary objective was to increase operator confidence in driving on the roadway, thus increasing speed and providing for a safer operation.
When the DAS was activated, bus operators stayed in the shoulder 10% longer and drove three miles per hour faster. Lateral (side-to-side) movement was reduced by 5.5 inches and 32% of the operators felt increased levels of driving confidence with the DAS.
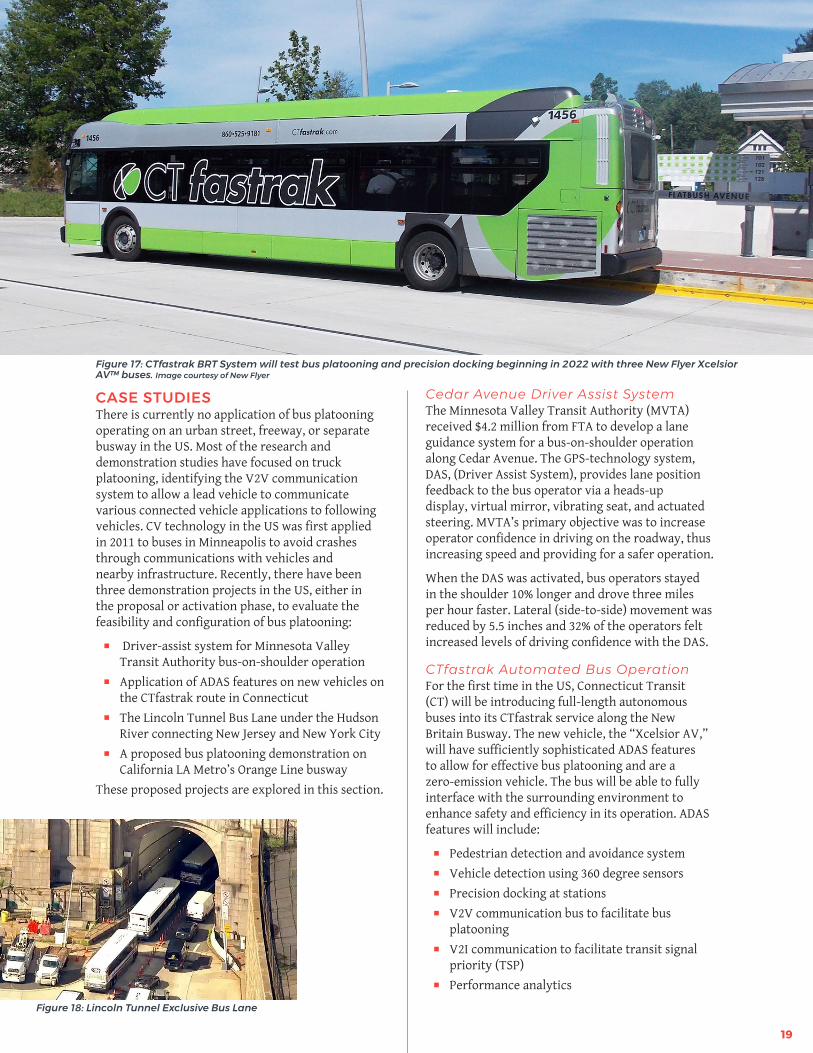
CTfastrak Automated Bus OperationFor the first time in the US, Connecticut Transit (CT) will be introducing full-length autonomous buses into its CTfastrak service along the New Britain Busway. The new vehicle, the “Xcelsior AV,” will have sufficiently sophisticated ADAS features to allow for effective bus platooning and are a zero-emission vehicle. The bus will be able to fully interface with the surrounding environment to enhance safety and efficiency in its operation. ADAS features will include:
� Pedestrian detection and avoidance system� Vehicle detection using 360 degree sensors� Precision docking at stations� V2V communication bus to facilitate bus
platooning � V2I communication to facilitate transit signal
priority (TSP)� Performance analytics
Figure 17: CTfastrak BRT System will test bus platooning and precision docking beginning in 2022 with three New Flyer Xcelsior AV™ buses. Image courtesy of New Flyer
Figure 18: Lincoln Tunnel Exclusive Bus Lane
19
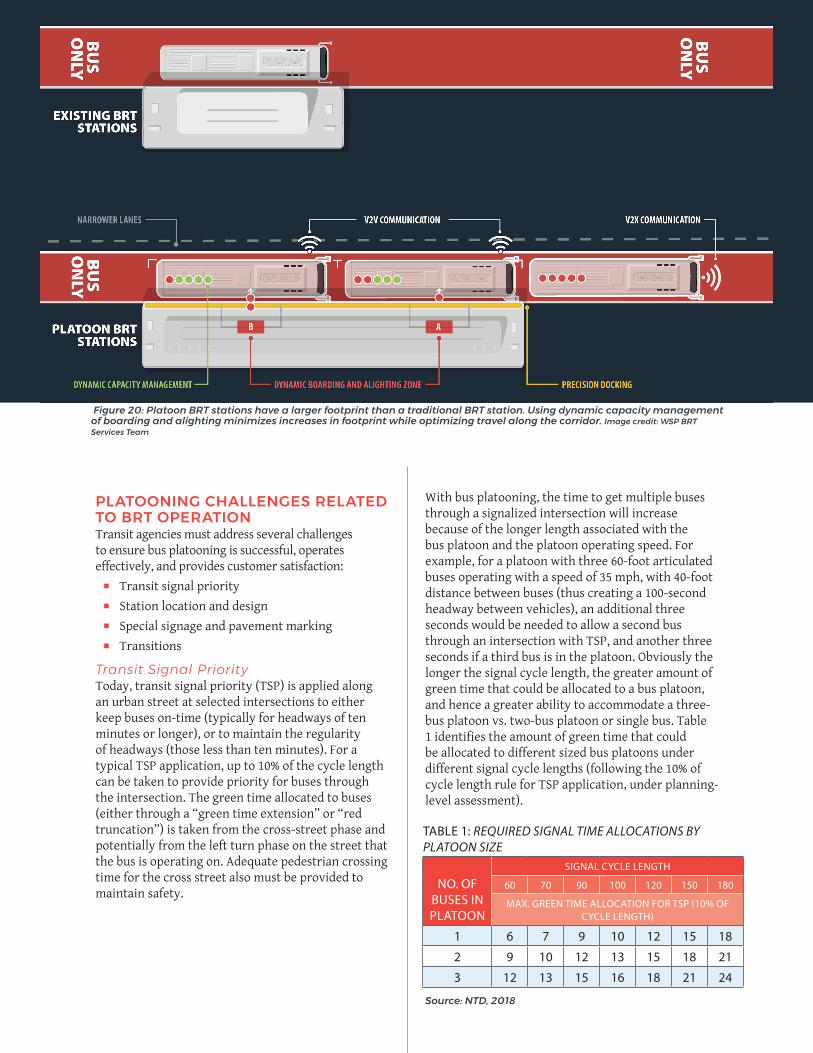
Lincoln Tunnel Bus OperationsIn 2015, the Port Authority of New York and New Jersey (PANYNJ) commissioned a study to evaluate new and innovative approaches to increasing capacity and safety along the express bus lane (XBL) and Lincoln Tunnel. The report included the potential benefits that might be achieved by instituting bus platooning in the existing eastbound bus lane through the Lincoln Tunnel. This bus lane is the most heavily-used in the US. Today, over 720 buses use the bus lane during the morning peak hour with an average headway of five seconds. This study sought to understand how much capacity of the XBL could be increased if a safe reduction in headway could be achieved through application of connected vehicle technology. For example, if the average bus headway could be reduced to four seconds (a one second reduction), the capacity of the bus lane would increase by 25% to 900 buses in the peak hour. A secondary goal was to increase the speed of buses operating in the lane, thus reducing overall travel time for different routes. Bus operating speed today is restricted by the narrow lane width and buses slowing to stay in the lane, with heavy general traffic in the adjacent lane.
The initial feasibility study assessed the impact of applying adaptive cruise control, dynamic breaking, and lane keeping to increase the capacity of the lane and increase bus speed. Also examined in this study was the ability to develop bus platoons on the New Jersey side of the tunnel, given the many different bus routes using the tunnel, and the inter-jurisdiction relationships between the PANYNJ Department of Transportation required to develop an effective connected vehicle operation.
This recommendation is in the demonstration stage, with FHWA and PANYNJ funding. In the pilot program, three operating scenarios will be tested:
1. Longitudinal control by itself (accelerator and brake petals controlled by the system, steering by the driver)
2. Longitudinal control with the addition of lane departure warning (the driver is still steering but with added guidance)
3. Longitudinal control with latitudinal control (automated acceleration, braking and steering)
The impacts on capacity, travel time, and operating cost will also be assessed
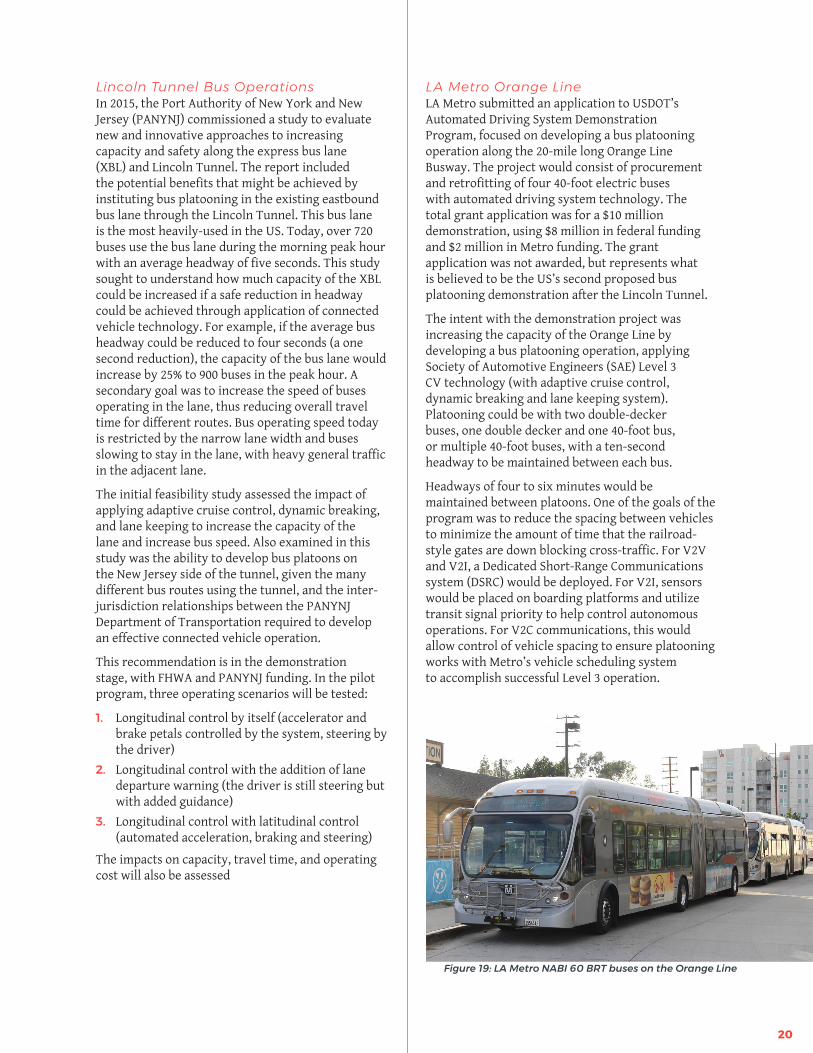
LA Metro Orange LineLA Metro submitted an application to USDOT’s Automated Driving System Demonstration Program, focused on developing a bus platooning operation along the 20-mile long Orange Line Busway. The project would consist of procurement and retrofitting of four 40-foot electric buses with automated driving system technology. The total grant application was for a $10 million demonstration, using $8 million in federal funding and $2 million in Metro funding. The grant application was not awarded, but represents what is believed to be the US’s second proposed bus platooning demonstration after the Lincoln Tunnel.
The intent with the demonstration project was increasing the capacity of the Orange Line by developing a bus platooning operation, applying Society of Automotive Engineers (SAE) Level 3 CV technology (with adaptive cruise control, dynamic breaking and lane keeping system). Platooning could be with two double-decker buses, one double decker and one 40-foot bus, or multiple 40-foot buses, with a ten-second headway to be maintained between each bus.
Headways of four to six minutes would be maintained between platoons. One of the goals of the program was to reduce the spacing between vehicles to minimize the amount of time that the railroad-style gates are down blocking cross-traffic. For V2V and V2I, a Dedicated Short-Range Communications system (DSRC) would be deployed. For V2I, sensors would be placed on boarding platforms and utilize transit signal priority to help control autonomous operations. For V2C communications, this would allow control of vehicle spacing to ensure platooning works with Metro’s vehicle scheduling system to accomplish successful Level 3 operation.
Figure 19: LA Metro NABI 60 BRT buses on the Orange Line
20
PLATOONING CHALLENGES RELATED TO BRT OPERATIONTransit agencies must address several challenges to ensure bus platooning is successful, operates effectively, and provides customer satisfaction: � Transit signal priority � Station location and design� Special signage and pavement marking� Transitions
Transit Signal PriorityToday, transit signal priority (TSP) is applied along an urban street at selected intersections to either keep buses on-time (typically for headways of ten minutes or longer), or to maintain the regularity of headways (those less than ten minutes). For a typical TSP application, up to 10% of the cycle length can be taken to provide priority for buses through the intersection. The green time allocated to buses (either through a “green time extension” or “red truncation”) is taken from the cross-street phase and potentially from the left turn phase on the street that the bus is operating on. Adequate pedestrian crossing time for the cross street also must be provided to maintain safety.
With bus platooning, the time to get multiple buses through a signalized intersection will increase because of the longer length associated with the bus platoon and the platoon operating speed. For example, for a platoon with three 60-foot articulated buses operating with a speed of 35 mph, with 40-foot distance between buses (thus creating a 100-second headway between vehicles), an additional three seconds would be needed to allow a second bus through an intersection with TSP, and another three seconds if a third bus is in the platoon. Obviously the longer the signal cycle length, the greater amount of green time that could be allocated to a bus platoon, and hence a greater ability to accommodate a three-bus platoon vs. two-bus platoon or single bus. Table 1 identifies the amount of green time that could be allocated to different sized bus platoons under different signal cycle lengths (following the 10% of cycle length rule for TSP application, under planning-level assessment).
TABLE 1: REQUIRED SIGNAL TIME ALLOCATIONS BY PLATOON SIZE
NO. OF BUSES IN PLATOON
SIGNAL CYCLE LENGTH
60 70 90 100 120 150 180
MAX. GREEN TIME ALLOCATION FOR TSP (10% OF CYCLE LENGTH)
1 6 7 9 10 12 15 18
2 9 10 12 13 15 18 21
3 12 13 15 16 18 21 24
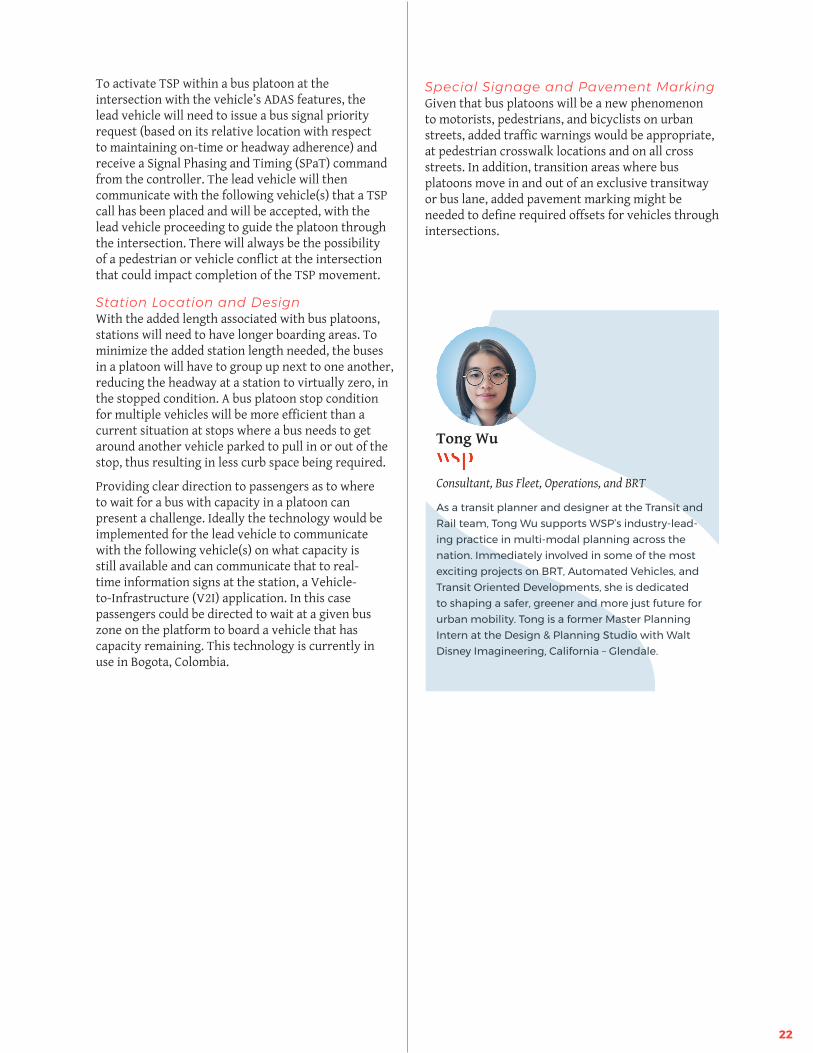
Figure 20: Platoon BRT stations have a larger footprint than a traditional BRT station. Using dynamic capacity management of boarding and alighting minimizes increases in footprint while optimizing travel along the corridor. Image credit: WSP BRT Services Team
Source: NTD, 2018
To activate TSP within a bus platoon at the intersection with the vehicle’s ADAS features, the lead vehicle will need to issue a bus signal priority request (based on its relative location with respect to maintaining on-time or headway adherence) and receive a Signal Phasing and Timing (SPaT) command from the controller. The lead vehicle will then communicate with the following vehicle(s) that a TSP call has been placed and will be accepted, with the lead vehicle proceeding to guide the platoon through the intersection. There will always be the possibility of a pedestrian or vehicle conflict at the intersection that could impact completion of the TSP movement.
Station Location and Design With the added length associated with bus platoons, stations will need to have longer boarding areas. To minimize the added station length needed, the buses in a platoon will have to group up next to one another, reducing the headway at a station to virtually zero, in the stopped condition. A bus platoon stop condition for multiple vehicles will be more efficient than a current situation at stops where a bus needs to get around another vehicle parked to pull in or out of the stop, thus resulting in less curb space being required.
Providing clear direction to passengers as to where to wait for a bus with capacity in a platoon can present a challenge. Ideally the technology would be implemented for the lead vehicle to communicate with the following vehicle(s) on what capacity is still available and can communicate that to real-time information signs at the station, a Vehicle-to-Infrastructure (V2I) application. In this case passengers could be directed to wait at a given bus zone on the platform to board a vehicle that has capacity remaining. This technology is currently in use in Bogota, Colombia.
Special Signage and Pavement MarkingGiven that bus platoons will be a new phenomenon to motorists, pedestrians, and bicyclists on urban streets, added traffic warnings would be appropriate, at pedestrian crosswalk locations and on all cross streets. In addition, transition areas where bus platoons move in and out of an exclusive transitway or bus lane, added pavement marking might be needed to define required offsets for vehicles through intersections.
Tong Wu
Consultant, Bus Fleet, Operations, and BRT
As a transit planner and designer at the Transit and Rail team, Tong Wu supports WSP’s industry-lead-ing practice in multi-modal planning across the nation. Immediately involved in some of the most exciting projects on BRT, Automated Vehicles, and Transit Oriented Developments, she is dedicated to shaping a safer, greener and more just future for urban mobility. Tong is a former Master Planning Intern at the Design & Planning Studio with Walt Disney Imagineering, California – Glendale.
22
AV Regulatory Considerations
Given the rapid evolution of vehicle automation technology and the lack of associated federal legislation or regulation, state and local transportation agencies are left to determine what – if any – changes might be needed in terms of motor vehicle laws, safety-protecting policies, or business friendly legislation. There is currently a patchwork of state and local actions – ranging from nothing at all to executive orders – to legislated regulations. Much of what does exist is recognized as a placeholder while technology continues to evolve and the promise of federal guidance continues.
For this discussion around transit automation, regulations include those focused on governing labor, technology, and accessibility. WSP is a thought leader in the planning and policy impacts of CAV technologies in our cities, having authored over ten national guidebooks through FHWA and NCHRP. WSP will continue to remain at the forefront of policy evolution in the vehicle automation space, supporting its safe, scalable growth in transit.
Labor-Related RegulationsLegislation around public transit labor rights originated in 1964, when Congress approved federal financial support for mass transit, according to a Transit Cooperative Research Program (TCRP) legal research digest. Fearing job loss when the private transit entities transitioned to public agency ownership, labor groups initially opposed; however, organized labor groups ultimately supported the Federal Transit Act (FTA), with the inclusion of a job protection and collective bargaining rights clause.
The FTA recognizes that new job functions will likely be created through automated technologies, per Transit Bus Automation Policy FAQs. With these new opportunities, the FTA requires paid retraining programs and protected employees’ collective bargaining agreements. 49 USC. § 5333(b) requires the Department of Labor to define what arrangements are considered fair for employees of agencies receiving FTA grant funding. More information around the workforce impacts through transit automation are found in the corresponding section above.
Technology Regulations As noted, there are currently few federal regulations governing vehicle automation technology. Even so, the USDOT and its safety-related administrations (NHTSA and FMCSA) are actively working with industry and infrastructure owners/operators to ensure that safe testing and deployment of technology remains at the forefront of all projects.
Based on the April 2020 FTA Transit Bus Automation: State and Local Policy Scan report, a number of states and agencies are beginning to discuss and introduce legislation that would incorporate remote operation of transit activities. Amidst mixed agencies’ opinions on automation priorities, the FTA Policy report demonstrates a consistent need for a pilot that specifically tests automated bus “driver assist” technologies, providing a model for other agencies. While the state and local policies continue to evolve, the ABY pilot uniquely exempts the transit agency from undergoing the time-intensive vehicle permitting process to test automation because the pilot will be conducted on private agency property.
Accessibility Regulations When considering automation technology for BRT service, agencies must consider ADA and Title VI requirements per FTA Transit Bus Automation Policy FAQs. These requirements outline that all publicly operated automated transit projects along a fixed-route system must comply with ADA requirements under 49 CFR § 37.71. As bus yards are not publicly accessible, transit operators are able to rigorously test automation solutions that initially may not be ADA compliant but advance the long-term reliability and safety potential of automation technology.
Eventually, transit OEMs will produce fully automated, Level 4 and 5 vehicles, which do not require an operator on-board. In this scenario, technology such as automated wheelchair securement arms will likely be required to provide access to passengers with disabilities. With no such vehicles currently available, the FTA plans to conduct more research on this topic in the coming years.
Additionally, when adopting vehicle automation solutions, transit agencies must comply with Title VI, which prohibits intentional discrimination and inequity across different communities. Agencies must consider community demographics and fare payment options as examples of Title VI compliance.
23
� GPS: While GPS systems have been commonplace in vehicles for decades, advanced GPS systems are typically required for advanced levels of automated vehicles due to real-time data and operational requirements. However, vehicles must have the ability to operate in GPS-denied environments, such as tunnels and parking garages, when HD maps and/or V2X solutions may be required to localize data. GPS systems can range from $10,000 to $30,000 per vehicle.
Financial Considerations with Bus Automation
Transit agencies should consider several factors to determine if transit automation is the right investment:
1. Capital and operating costs of ADAS2. Determining what Operating Design Domain(s)
(ODD) ADAS-equipped vehicles will be operating. Planned ODD will greatly impact ROI
3. Opportunities to subsidize costs, whether through federal grant programs and/or Public-Private Partnerships (P3s)
Capital CostsCapital costs associated with ADAS can fall into two categories: Materials and programming. Materials include all of the components required for vehicles to operate safely and efficiently at Level 3 and in some cases Level 4. Components may include:� LiDAR sensor(s): Depending on vehicle size,
the vehicle may need one or two LiDAR sensors to send data to the on-board computer. LiDAR (Light Detection and Ranging) uses a laser to measure distances via reflections. Variability in return times of data and sensor wavelengths are used to create 3D representations of objects. Due to the vast amount of data generated per second, costs for LiDAR sensors can range from $10,000 to $75,000 to $3,000 up to $35,000 based on type and capability. However, a driving force in ADAS adoption is the dramatic cost reduction of LiDAR sensors. In 2017, Waymo was able to reduce the costs by 90% from $75,000 to under $8,000.
� Radar sensor(s): Using radio frequency, radar sensors provide long-range and object detection capabilities for ADAS vehicles such as adaptive cruise control. Costs range anywhere from $2,000 to $5,000 depending upon make and model.
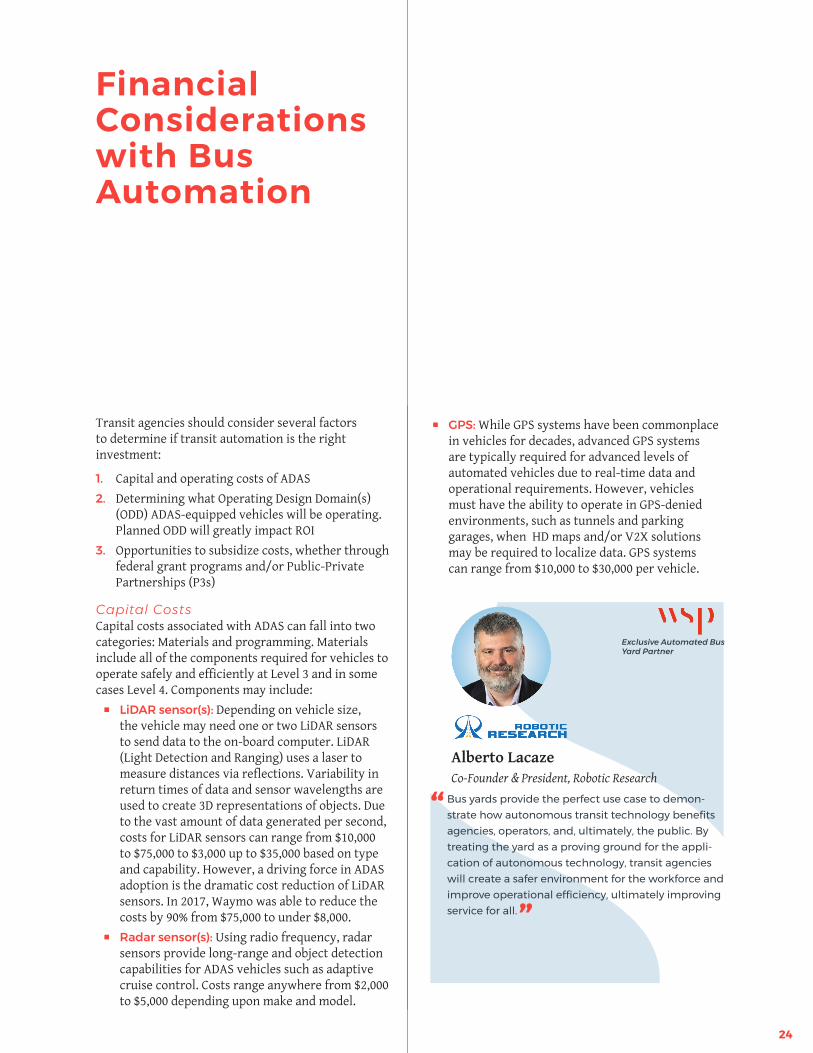
Alberto LacazeCo-Founder & President, Robotic Research
Exclusive Automated Bus Yard Partner
”
“ Bus yards provide the perfect use case to demon-strate how autonomous transit technology benefits agencies, operators, and, ultimately, the public. By treating the yard as a proving ground for the appli-cation of autonomous technology, transit agencies will create a safer environment for the workforce and improve operational efficiency, ultimately improving service for all.
24
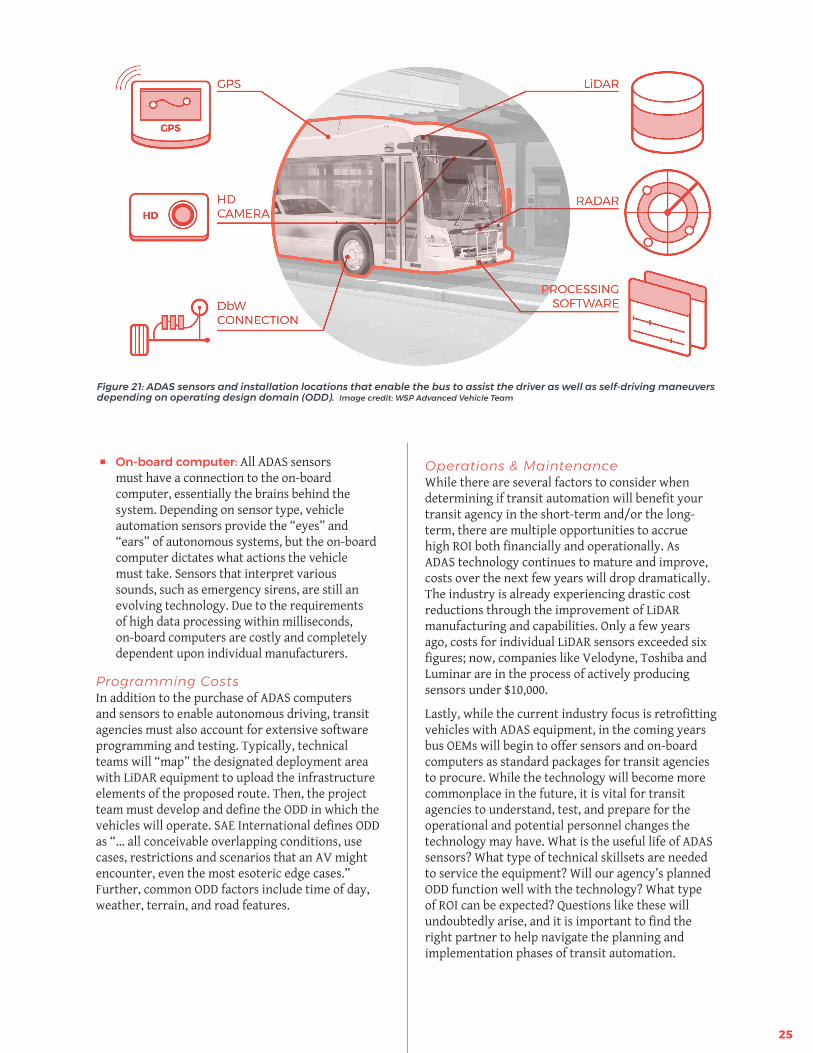
� On-board computer: All ADAS sensors must have a connection to the on-board computer, essentially the brains behind the system. Depending on sensor type, vehicle automation sensors provide the “eyes” and “ears” of autonomous systems, but the on-board computer dictates what actions the vehicle must take. Sensors that interpret various sounds, such as emergency sirens, are still an evolving technology. Due to the requirements of high data processing within milliseconds, on-board computers are costly and completely dependent upon individual manufacturers.
Programming CostsIn addition to the purchase of ADAS computers and sensors to enable autonomous driving, transit agencies must also account for extensive software programming and testing. Typically, technical teams will “map” the designated deployment area with LiDAR equipment to upload the infrastructure elements of the proposed route. Then, the project team must develop and define the ODD in which the vehicles will operate. SAE International defines ODD as “… all conceivable overlapping conditions, use cases, restrictions and scenarios that an AV might encounter, even the most esoteric edge cases.” Further, common ODD factors include time of day, weather, terrain, and road features.
Operations & MaintenanceWhile there are several factors to consider when determining if transit automation will benefit your transit agency in the short-term and/or the long-term, there are multiple opportunities to accrue high ROI both financially and operationally. As ADAS technology continues to mature and improve, costs over the next few years will drop dramatically. The industry is already experiencing drastic cost reductions through the improvement of LiDAR manufacturing and capabilities. Only a few years ago, costs for individual LiDAR sensors exceeded six figures; now, companies like Velodyne, Toshiba and Luminar are in the process of actively producing sensors under $10,000.
Lastly, while the current industry focus is retrofitting vehicles with ADAS equipment, in the coming years bus OEMs will begin to offer sensors and on-board computers as standard packages for transit agencies to procure. While the technology will become more commonplace in the future, it is vital for transit agencies to understand, test, and prepare for the operational and potential personnel changes the technology may have. What is the useful life of ADAS sensors? What type of technical skillsets are needed to service the equipment? Will our agency’s planned ODD function well with the technology? What type of ROI can be expected? Questions like these will undoubtedly arise, and it is important to find the right partner to help navigate the planning and implementation phases of transit automation.
Figure 21: ADAS sensors and installation locations that enable the bus to assist the driver as well as self-driving maneuvers depending on operating design domain (ODD). Image credit: WSP Advanced Vehicle Team
25
COST/BENEFIT IMPLICATIONSOperating CostsOperating cost impacts of platooning range from neutral to slightly higher costs. LRT requires one operator for one, two, or three car trains, resulting in lower unit costs for each incremental car added to the train. Conversely, buses offer no such potential savings if each bus is operated by a human operator; operating three buses in a platoon on a six-minute headway would cost the same as one bus every minute. The cost of platooning could potentially be higher than operating single buses. Platoon operations could require additional running time to allow lagging buses in the platoon to catch up – particularly if the operation includes signalized intersections or branching segments outside the BRT alignment. BRT station platforms and pads often are sized to serve only one, or at most two, vehicles at once. Expanding BRT stations to accommodate two or three bus platoons could require a significant capital investment in longer platforms and bus pads, and changes to other station elements.
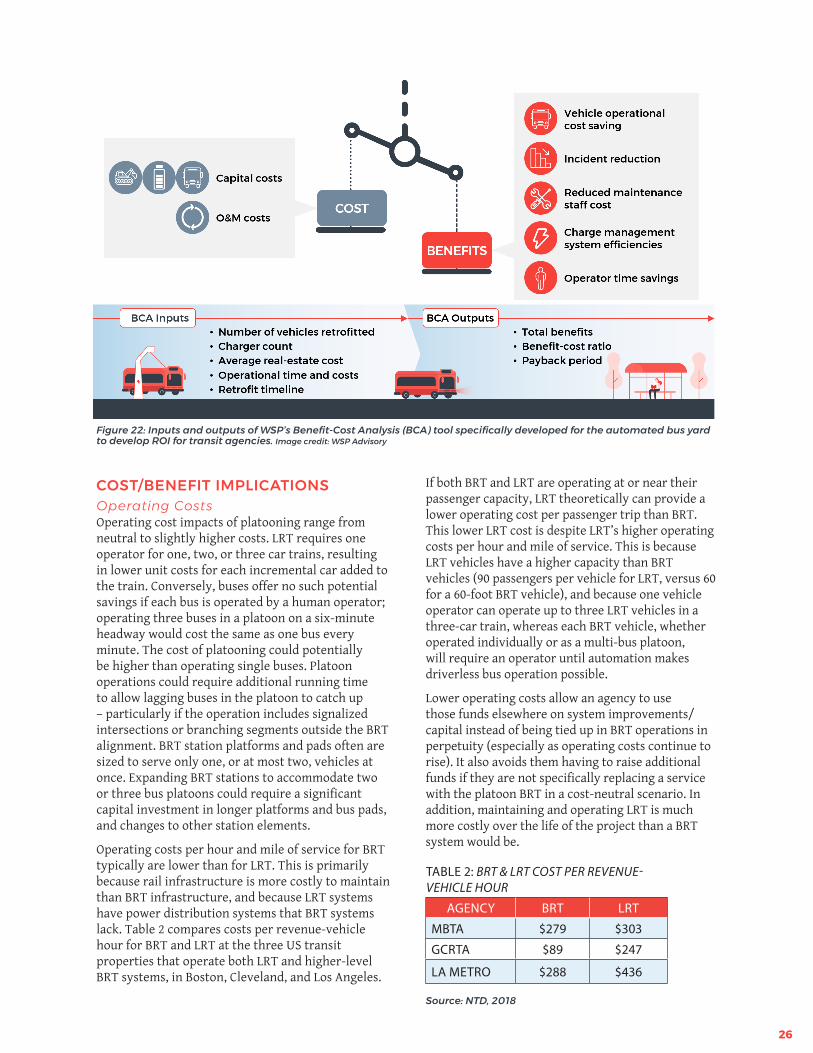
Operating costs per hour and mile of service for BRT typically are lower than for LRT. This is primarily because rail infrastructure is more costly to maintain than BRT infrastructure, and because LRT systems have power distribution systems that BRT systems lack. Table 2 compares costs per revenue-vehicle hour for BRT and LRT at the three US transit properties that operate both LRT and higher-level BRT systems, in Boston, Cleveland, and Los Angeles.
If both BRT and LRT are operating at or near their passenger capacity, LRT theoretically can provide a lower operating cost per passenger trip than BRT. This lower LRT cost is despite LRT’s higher operating costs per hour and mile of service. This is because LRT vehicles have a higher capacity than BRT vehicles (90 passengers per vehicle for LRT, versus 60 for a 60-foot BRT vehicle), and because one vehicle operator can operate up to three LRT vehicles in a three-car train, whereas each BRT vehicle, whether operated individually or as a multi-bus platoon, will require an operator until automation makes driverless bus operation possible.
Lower operating costs allow an agency to use those funds elsewhere on system improvements/capital instead of being tied up in BRT operations in perpetuity (especially as operating costs continue to rise). It also avoids them having to raise additional funds if they are not specifically replacing a service with the platoon BRT in a cost-neutral scenario. In addition, maintaining and operating LRT is much more costly over the life of the project than a BRT system would be.
TABLE 2: BRT & LRT COST PER REVENUE-VEHICLE HOUR
AGENCY BRT LRT
MBTA $279 $303
GCRTA $89 $247
LA METRO $288 $436
Figure 22: Inputs and outputs of WSP’s Benefit-Cost Analysis (BCA) tool specifically developed for the automated bus yard to develop ROI for transit agencies. Image credit: WSP Advisory
Source: NTD, 2018
26
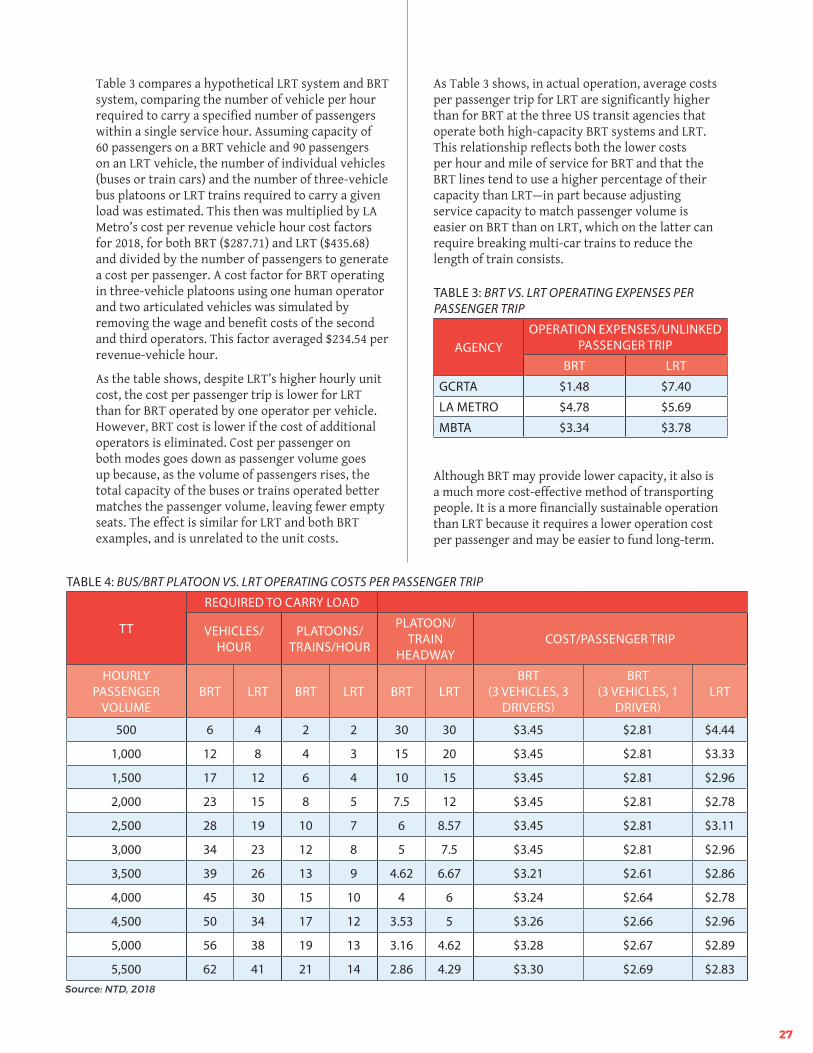
Table 3 compares a hypothetical LRT system and BRT system, comparing the number of vehicle per hour required to carry a specified number of passengers within a single service hour. Assuming capacity of 60 passengers on a BRT vehicle and 90 passengers on an LRT vehicle, the number of individual vehicles (buses or train cars) and the number of three-vehicle bus platoons or LRT trains required to carry a given load was estimated. This then was multiplied by LA Metro’s cost per revenue vehicle hour cost factors for 2018, for both BRT ($287.71) and LRT ($435.68) and divided by the number of passengers to generate a cost per passenger. A cost factor for BRT operating in three-vehicle platoons using one human operator and two articulated vehicles was simulated by removing the wage and benefit costs of the second and third operators. This factor averaged $234.54 per revenue-vehicle hour.
As the table shows, despite LRT’s higher hourly unit cost, the cost per passenger trip is lower for LRT than for BRT operated by one operator per vehicle. However, BRT cost is lower if the cost of additional operators is eliminated. Cost per passenger on both modes goes down as passenger volume goes up because, as the volume of passengers rises, the total capacity of the buses or trains operated better matches the passenger volume, leaving fewer empty seats. The effect is similar for LRT and both BRT examples, and is unrelated to the unit costs.
As Table 3 shows, in actual operation, average costs per passenger trip for LRT are significantly higher than for BRT at the three US transit agencies that operate both high-capacity BRT systems and LRT. This relationship reflects both the lower costs per hour and mile of service for BRT and that the BRT lines tend to use a higher percentage of their capacity than LRT—in part because adjusting service capacity to match passenger volume is easier on BRT than on LRT, which on the latter can require breaking multi-car trains to reduce the length of train consists.
TABLE 3: BRT VS. LRT OPERATING EXPENSES PER PASSENGER TRIP
AGENCYOPERATION EXPENSES/UNLINKED
PASSENGER TRIP
BRT LRT
GCRTA $1.48 $7.40
LA METRO $4.78 $5.69
MBTA $3.34 $3.78
Although BRT may provide lower capacity, it also is a much more cost-effective method of transporting people. It is a more financially sustainable operation than LRT because it requires a lower operation cost per passenger and may be easier to fund long-term.
TABLE 4: BUS/BRT PLATOON VS. LRT OPERATING COSTS PER PASSENGER TRIP
TT
REQUIRED TO CARRY LOAD
VEHICLES/HOUR
PLATOONS/TRAINS/HOUR
PLATOON/TRAIN
HEADWAYCOST/PASSENGER TRIP
HOURLY PASSENGER
VOLUMEBRT LRT BRT LRT BRT LRT
BRT (3 VEHICLES, 3
DRIVERS)
BRT (3 VEHICLES, 1
DRIVER)LRT
500 6 4 2 2 30 30 $3.45 $2.81 $4.44
1,000 12 8 4 3 15 20 $3.45 $2.81 $3.33
1,500 17 12 6 4 10 15 $3.45 $2.81 $2.96
2,000 23 15 8 5 7.5 12 $3.45 $2.81 $2.78
2,500 28 19 10 7 6 8.57 $3.45 $2.81 $3.11
3,000 34 23 12 8 5 7.5 $3.45 $2.81 $2.96
3,500 39 26 13 9 4.62 6.67 $3.21 $2.61 $2.86
4,000 45 30 15 10 4 6 $3.24 $2.64 $2.78
4,500 50 34 17 12 3.53 5 $3.26 $2.66 $2.96
5,000 56 38 19 13 3.16 4.62 $3.28 $2.67 $2.89
5,500 62 41 21 14 2.86 4.29 $3.30 $2.69 $2.83 Source: NTD, 2018
27
Infrastructure costs for LRT, of course, tend to be several times those of BRT. The differences are so great that no conceivable operating cost savings could compensate for it within the useful life of the LRT infrastructure and vehicles. For example, in Los Angeles, the recent Foothills extension to the Gold Line LRT cost $735 million for section 2A, an 11.3-mile extension, and $1.05 billion for section 2B, at 12.6 miles. The average construction cost per mile for the two sections were $65 and $83 million, respectively. By comparison, Metro’s 18-mile Orange Line BRT was constructed at a total cost of $324 million, around $18 million per mile. Estimates to convert the Orange Line to light rail operation range from $1.2 to $1.7 billion in additional capital investment. This additional investment, on top of the $324 million cost of the existing BRT line, would bring the combined BRT and LRT capital cost per mile to a range of $85 to $113 million per mile. The Orange Line BRT’s annual operating expenses in 2018 were $34.2 million. Even if the Orange Line LRT operated with no operating expenses at all, it would take 35 years for the operating cost savings to compensate for the LRT’s capital cost.
Given this difference in scale between BRT and LRT capital costs, no likely cost savings per passenger trip could justify the greater capital investment on LRT vehicles and infrastructure.
BenefitsBased on a Volpe Center analysis, the benefits to bus platooning span across increased fuel efficiency, reduced collision cost, and increased capacity through a BRT corridor.� Automated vehicles will experience a smoother
acceleration that improves fuel efficiency.• USDOT assumes a 7.4% fuel savings through communication between the transit bus and the traffic signal controller, as compared to “uninformed” manual driving. This improvement in fuel economy is paired with minimal impact to transit schedule adherence and travel times.• For diesel buses, the Volpe Center estimates a 6:1 benefit-cost ratio (BCR) through this application. Meanwhile, hybrid and electric buses are estimated to have a 4:1 or 5:1 BCR for automated vehicles, which is lower than that of diesel due to regenerative braking capabilities and lower fuel costs.
� Transit automation will increase safety and decrease operational expenses with Automated Emergency Braking (AEB) and Pedestrian-Collision Avoidance.
• Through the AEB system, the Volpe Center suggests a $3,600 savings per bus per year assuming a 45% reduction in all transit crashes, based on the historical annual Motor Bus average accident cost • The Chicago Transit Authority spent a total of $16 million between 2015 and 2016 on 500+ bus crashes, including settlements, judgments, and legal expenses. • Automated buses provide an opportunity to substantially reduce that figure through sensors rapidly adjusting vehicle movement based on perceived oncoming obstacles
� Substantial labor cost reduction and capacity savings are specific benefits derived from an automated BRT system, and through vehicle platooning.
• If BRT operations were fully unstaffed, technology costs would be far less than the labor savings; the Volpe Center approximates a BCR of 40. This high benefits figure requires Level 4 technology that is currently not available and costs drop to the levels of enabling technology.
� Considering a mix of applications in automation capabilities within the broader BRT context, such as smoother acceleration, AEB, and BRT operation itself, transit agencies can expect a positive ROI. The precise magnitude of that return would depend on the unique operating conditions of each agency.
Chris Wilhem
Associate Consultant, Systems Finance Economics
As a consultant with the Economic Analysis and Strategy team, Chris Wilhelm supports WSP’s wide portfolio of services related to transportation economics, economic modeling and regional eco-nomic planning for clients throughout the US. As part of projects supporting various transportation systems, including transit, aviation, commuter and high-speed rail, and pedestrian infrastructure, he is dedicated to helping optimize infrastructure in-vestment decisions for public agencies to maximize their social benefits in a cost-effective manner. Chris is a former Public Policy Analyst with the Pacific Northwest Economic Region in Seattle, WA.
28
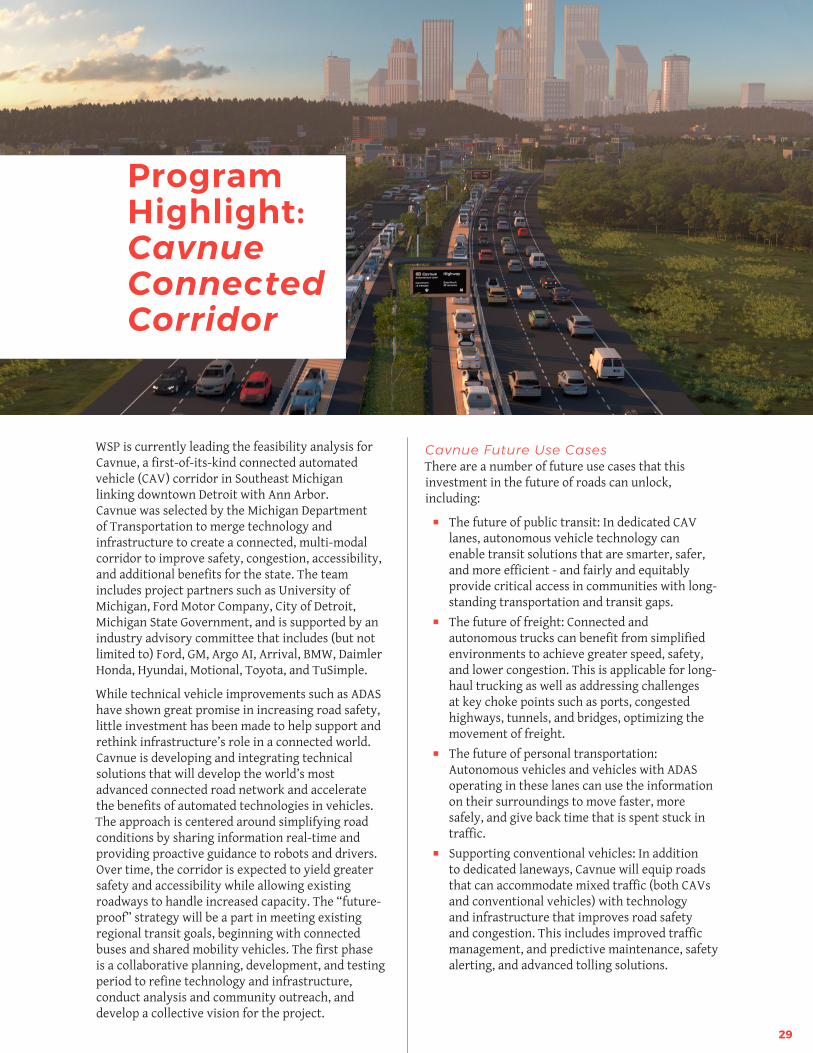
Program Highlight: Cavnue Connected Corridor
WSP is currently leading the feasibility analysis for Cavnue, a first-of-its-kind connected automated vehicle (CAV) corridor in Southeast Michigan linking downtown Detroit with Ann Arbor. Cavnue was selected by the Michigan Department of Transportation to merge technology and infrastructure to create a connected, multi-modal corridor to improve safety, congestion, accessibility, and additional benefits for the state. The team includes project partners such as University of Michigan, Ford Motor Company, City of Detroit, Michigan State Government, and is supported by an industry advisory committee that includes (but not limited to) Ford, GM, Argo AI, Arrival, BMW, Daimler Honda, Hyundai, Motional, Toyota, and TuSimple.
While technical vehicle improvements such as ADAS have shown great promise in increasing road safety, little investment has been made to help support and rethink infrastructure’s role in a connected world. Cavnue is developing and integrating technical solutions that will develop the world’s most advanced connected road network and accelerate the benefits of automated technologies in vehicles. The approach is centered around simplifying road conditions by sharing information real-time and providing proactive guidance to robots and drivers. Over time, the corridor is expected to yield greater safety and accessibility while allowing existing roadways to handle increased capacity. The “future-proof” strategy will be a part in meeting existing regional transit goals, beginning with connected buses and shared mobility vehicles. The first phase is a collaborative planning, development, and testing period to refine technology and infrastructure, conduct analysis and community outreach, and develop a collective vision for the project.
Cavnue Future Use CasesThere are a number of future use cases that this investment in the future of roads can unlock, including:
� The future of public transit: In dedicated CAV lanes, autonomous vehicle technology can enable transit solutions that are smarter, safer, and more efficient - and fairly and equitably provide critical access in communities with long-standing transportation and transit gaps.
� The future of freight: Connected and autonomous trucks can benefit from simplified environments to achieve greater speed, safety, and lower congestion. This is applicable for long-haul trucking as well as addressing challenges at key choke points such as ports, congested highways, tunnels, and bridges, optimizing the movement of freight.
� The future of personal transportation: Autonomous vehicles and vehicles with ADAS operating in these lanes can use the information on their surroundings to move faster, more safely, and give back time that is spent stuck in traffic.
� Supporting conventional vehicles: In addition to dedicated laneways, Cavnue will equip roads that can accommodate mixed traffic (both CAVs and conventional vehicles) with technology and infrastructure that improves road safety and congestion. This includes improved traffic management, and predictive maintenance, safety alerting, and advanced tolling solutions.
29
Preparing the Transit Workforce
New mobility technologies will demand different skills from many levels: From producing ADAS components and the automated vehicles themselves; to operating and maintaining vehicles; to new expectations and knowledge for supervisors and managers, and finally, appropriate handling of materials and eventual disposal of vehicles at the end of their use.
In addition to the operations needs of new vehicles, one step removed yet still essential are the needs that adoption of new technology may create. For public transit this may include new maintenance facilities and equipment needs, monitoring of passenger health and safety, information systems to track vehicles and provide provisions for cybersecurity, or a change in mindset due to a shift in operations (smaller vehicles more often) or re-imagining the passenger interface.
A final set of interests that are often outside the transit operator include building owners, urban planners, and local government officials who may need to adapt their functions to new or different mobility modes. Skills and experience with adaptive reuse, street design, and an understanding of the travel patterns ADAS may produce that change the built environment will affect operations yet may depend on decision making and funding from other entities.
As skills change, so does the workforce needed to provide necessary services. Skill changes can be managed through training and upskilling current workers, creating new positions that address emerging occupation gaps, and addressing the needs of workers who may be deskilled or lose their jobs due to technological change. A USDOT roundtable on workforce development in 2019 noted that tasks are changing within each job, and that further technical training may be needed as an ongoing process as technology advances and systems change.
In serving new skill needs there are many barriers. A 2018 survey by Gallup on a unified skills strategy for the AI age identifies a wide range of barriers to new skill acquisition, including time for training when working, cost of training, uncertainty about skills that will be in demand, and lack of convenient training options nearby.
The scale of change and its associated skill demands affects many stakeholders who may, to date, not interact as often as will be needed in the future. Stakeholders include equipment manufacturers, vehicle operations and maintenance, unions, insurers, schools and universities, and all levels of government associated with training. With fifty transit demonstration projects underway in 2020 there should be more concrete knowledge emerging about operations needs and therefore occupational skills that needs to be captured to inform decision making.
Mark Wilson, PhDProfessor, Urban and Regional PlanningProgram Director, PhD in Planning, Design & ConstructionSchool of Planning, Design and ConstructionMichigan State University
GUEST FEATURE
30
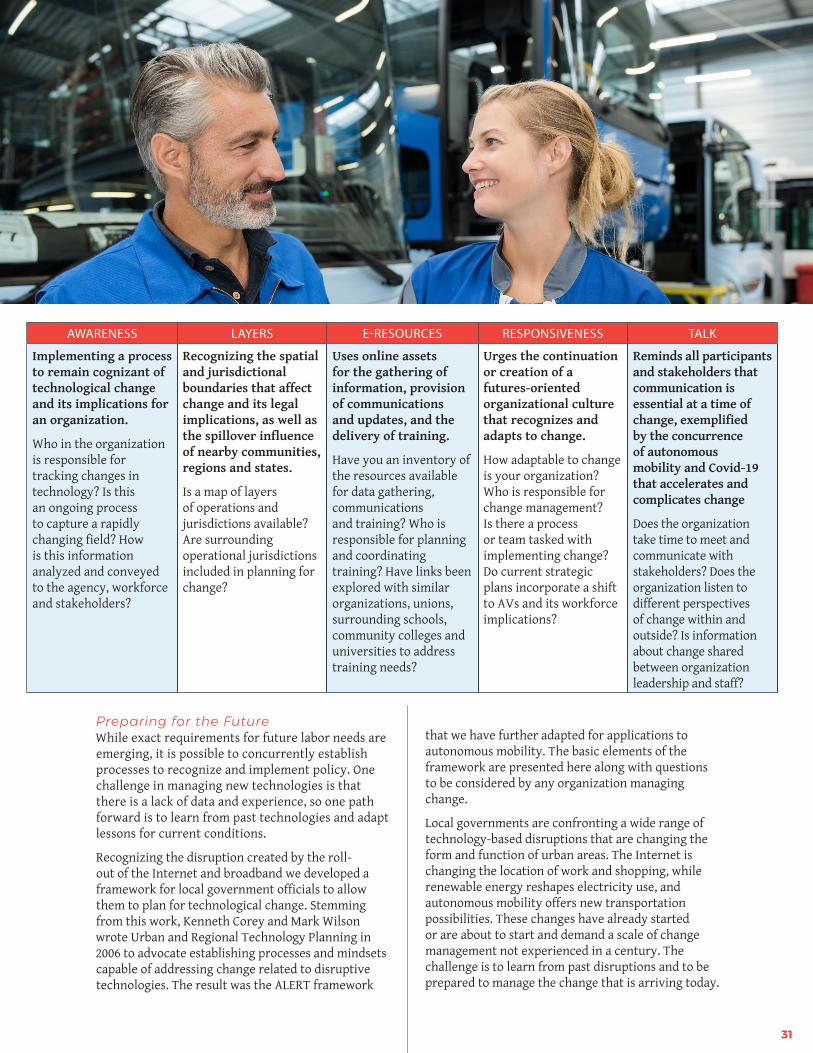
Preparing for the FutureWhile exact requirements for future labor needs are emerging, it is possible to concurrently establish processes to recognize and implement policy. One challenge in managing new technologies is that there is a lack of data and experience, so one path forward is to learn from past technologies and adapt lessons for current conditions.
Recognizing the disruption created by the roll-out of the Internet and broadband we developed a framework for local government officials to allow them to plan for technological change. Stemming from this work, Kenneth Corey and Mark Wilson wrote Urban and Regional Technology Planning in 2006 to advocate establishing processes and mindsets capable of addressing change related to disruptive technologies. The result was the ALERT framework
that we have further adapted for applications to autonomous mobility. The basic elements of the framework are presented here along with questions to be considered by any organization managing change.
Local governments are confronting a wide range of technology-based disruptions that are changing the form and function of urban areas. The Internet is changing the location of work and shopping, while renewable energy reshapes electricity use, and autonomous mobility offers new transportation possibilities. These changes have already started or are about to start and demand a scale of change management not experienced in a century. The challenge is to learn from past disruptions and to be prepared to manage the change that is arriving today.
31
AWARENESS LAYERS E-RESOURCES RESPONSIVENESS TALK
Implementing a process to remain cognizant of technological change and its implications for an organization.
Who in the organization is responsible for tracking changes in technology? Is this an ongoing process to capture a rapidly changing field? How is this information analyzed and conveyed to the agency, workforce and stakeholders?
Recognizing the spatial and jurisdictional boundaries that affect change and its legal implications, as well as the spillover influence of nearby communities, regions and states.
Is a map of layers of operations and jurisdictions available? Are surrounding operational jurisdictions included in planning for change?
Uses online assets for the gathering of information, provision of communications and updates, and the delivery of training.
Have you an inventory of the resources available for data gathering, communications and training? Who is responsible for planning and coordinating training? Have links been explored with similar organizations, unions, surrounding schools, community colleges and universities to address training needs?
Urges the continuation or creation of a futures-oriented organizational culture that recognizes and adapts to change.
How adaptable to change is your organization? Who is responsible for change management? Is there a process or team tasked with implementing change? Do current strategic plans incorporate a shift to AVs and its workforce implications?
Reminds all participants and stakeholders that communication is essential at a time of change, exemplified by the concurrence of autonomous mobility and Covid-19 that accelerates and complicates change
Does the organization take time to meet and communicate with stakeholders? Does the organization listen to different perspectives of change within and outside? Is information about change shared between organization leadership and staff?
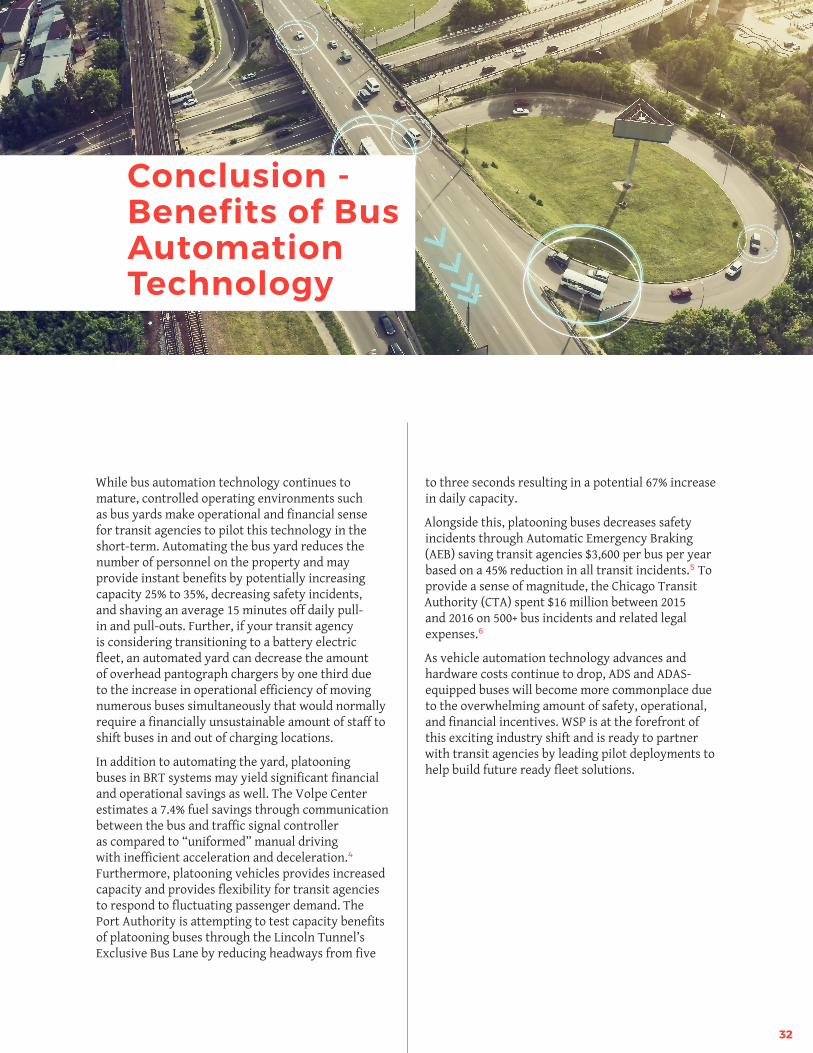
While bus automation technology continues to mature, controlled operating environments such as bus yards make operational and financial sense for transit agencies to pilot this technology in the short-term. Automating the bus yard reduces the number of personnel on the property and may provide instant benefits by potentially increasing capacity 25% to 35%, decreasing safety incidents, and shaving an average 15 minutes off daily pull-in and pull-outs. Further, if your transit agency is considering transitioning to a battery electric fleet, an automated yard can decrease the amount of overhead pantograph chargers by one third due to the increase in operational efficiency of moving numerous buses simultaneously that would normally require a financially unsustainable amount of staff to shift buses in and out of charging locations.
In addition to automating the yard, platooning buses in BRT systems may yield significant financial and operational savings as well. The Volpe Center estimates a 7.4% fuel savings through communication between the bus and traffic signal controller as compared to “uniformed” manual driving with inefficient acceleration and deceleration.4 Furthermore, platooning vehicles provides increased capacity and provides flexibility for transit agencies to respond to fluctuating passenger demand. The Port Authority is attempting to test capacity benefits of platooning buses through the Lincoln Tunnel’s Exclusive Bus Lane by reducing headways from five
to three seconds resulting in a potential 67% increase in daily capacity.
Alongside this, platooning buses decreases safety incidents through Automatic Emergency Braking (AEB) saving transit agencies $3,600 per bus per year based on a 45% reduction in all transit incidents.5 To provide a sense of magnitude, the Chicago Transit Authority (CTA) spent $16 million between 2015 and 2016 on 500+ bus incidents and related legal expenses.6
As vehicle automation technology advances and hardware costs continue to drop, ADS and ADAS-equipped buses will become more commonplace due to the overwhelming amount of safety, operational, and financial incentives. WSP is at the forefront of this exciting industry shift and is ready to partner with transit agencies by leading pilot deployments to help build future ready fleet solutions.
Conclusion - Benefits of Bus Automation Technology
32
WSP Contacts
Technical Project Manager
Tanay [email protected]
National Lead, Advanced Vehicle Programs
John [email protected]
Transit and Rail Engineer
Kate Elizabeth [email protected]
ZE Lead, Capital District Automated Vehicle Program
Severin [email protected]
Assistant VP Senior Supervising Engineer
Alan [email protected]
Bus Rapid Transit Planner
Bradley [email protected]
33
Citations
1 https://www.transit.dot.gov/sites/fta.dot.gov/files/2021-02/Transit-Bus-Automation-Quarterly-Update-Q4-2020_0.pdf2 History of the Autonomous Car, By Bonnie Gringer. Article can be found at https://www.titlemax.com/resources/history-of-the-autonomous-car/3 Federal Transit Administration, Strategic Transit Automation Research Plan, 2018, https://www.transit.dot.gov/sites/fta.dot.gov/files/docs/research-innovation/114661/strategic-transit-automation-research-report-no-0116_0.pdf4 Transportation Research Record 2673(5), p.111, Volpe Center, Assessing the Transit Agency Business Case for Partial and Full Automation of Bus Services, 2019. All estimates listed reflect significant uncertainty in technology, evolving costs, and examples that will vary across agencies. These figures are meant for illustration and must be verified by local operating parameters as well as targeted pilots around automation technology.6 https://www.pressreader.com/usa/chicago-sun-times/20170402/281552290703164. https://www.chicago-injury-lawyer.org/cta-buses-striking-sometimes-killing-pedestrians/ FTA Strategic Transit Automation Research Plan, p. 122
34

WSP is one of the world’s leading professional services consulting firms. We are dedicated to our local communities and propelled by international brainpower. We are technical experts and strategic advisors including engineers, technicians, scientists, architects, planners, surveyors and environmental specialists, as well as other design, program and construction management professionals. We design lasting solutions in the Transportation & Infrastructure, Property & Buildings, Environment, Power & Energy, Resources and Industry sectors, as well as offering strategic advisory services. With over 50,000 talented people globally, we engineer projects that will help societies grow for lifetimes to come.
1 East Pratt St. Third Floor Baltimore, MD 21202wsp.com

36