Embed Size (px)
Citation preview
Sequence variance analysis in Pepino mosaic virus quasi-species
through next-generation sequencing
Maxime R. Tijdink
Laboratory of Virology, Wageningen University, The Netherlands
Pepino mosaic virus (PepMV) is a Potex virus that commonly infects members of the Solanaceae family and has
symptoms varying from necrotic leaves to yellow mosaic. It has been transmitted to Europe and infects tomato
plants and greenhouses. An infectious clone of a necrotic PepMV isolate (PepMV-WUR48) that belongs to the
Chilean-2 strain is transferred through different host plants, creating different generations, to discover patterns
of viral quasi-species evolution. A sequence variance analysis is done from paired end reads obtained with
DeepSequencing, using the Illumina MiSeq platform. Various steps for handling these plant virus datasets are
explained as we go through quality control, filtering reads, contig assembly and identification of variations.
Single nucleotide polymorphisms (SNPs) on fixed positions were found in the first three generations and after
that, the SNPs stay unchanged. Some nucleotides from the infectious clone that are deviant from the PepMV-
WUR48 isolate will evolve back to their origin, while changes on other positions will remain.
INTRODUCTION
Pepino mosaic virus (PepMV) is a +RNA Potex virus
discovered in Peru, where it was originally found in
pepino plants (Solanum muricatum) [9]. The virus
most commonly infects members of the Solanaceae
family, but can also infect some other species [12].
The symptoms vary from necrotic leaves, to yellow
mosaic in young leaves and enations in the lower
surface of leaves [3,6]. PepMV is transmitted by plant
contact and also through seeds to the next
generation [4]. From wild Solanum species, PepMV
eventually spread to tomato and other Solanum crops
[11].
Four different strains of PepMV are distinguished,
based on their genotype [5]: the Peruvian strain (LP),
the US1 strain, the European strain (EU) and the
Chilean-2 strain (CH2). PepMV has appeared in
Europe and now infects tomato plants in greenhouses
[13]. The EU strain was first discovered in the
Netherlands in 1999 and phylogenetic analysis
showed that it is related to the LP strain. Currently
the CH2 strain is the most common strain in Europe.
Phylogenetic analyses show that the CH2 is more
related to US1 and does not originate from EU or LP
[11].
The single stranded RNA+ genome of PepMV is
around 6.4 kb long and has a 5’ cap and a 3’ poly-A
tail. The genome has 5 open reading frames (ORFs),
as it has 3’ and 5’ untranslated regions (UTRs). Also,
there is an UTR between ORF1 and ORF2 and one
between ORF4 and ORF5. ORF1 encodes a replication
enzyme that consists of an mRNA capping enzyme
domain, a RNA helicase domain and a RNA-
dependent RNA polymerase domain. ORF 2, 3 and 4
are overlapping genes, which are called the triple
gene block (TGB), they code for movement proteins
(TGB1, TGB2 and TGB3). ORF5 encodes for the coat
protein [1].
There are a range of point mutations in the CH2 strain
that have a big influence on the symptomology of the
virus. A single point mutation on the TGB3 protein
can change the symptoms from mild, to necrotic and
a single point mutation on the coat protein can cause
yellowing [7,8]. PepMV isolates from different wild
tomato species, populations in different ecological
environments in Peru, show that there is only a
variation of three single nucleotide polymorphisms
(SNPs) on fixed locations in the CP gene between
those populations [11].
To discover more of those fixed polymorphic
locations in the PepMV genome, an experiment and a
SNP analysis is done. The aim is to get a better
understanding about the evolution of PepMV under
selection and different environments.
Because of the high mutation rate of RNA, one RNA
virus population is a ‘cloud’ of different mutants, so
RNA viruses can be seen as quasi-species [2].
The RNA of the necrotic PepMV-WUR48 isolate from
the CH2 strain, is multiplied using plasmid DNA
replication and is used to infect a host plant. From
that host plant, virus particles in various dilutions
were used to infect different kinds of plants. The virus
then is transferred from the plant infected with the
highest dilution that showed severe symptoms, again
to the next range of plants in different dilutions. In
this way, a bottleneck event is created in which a
small portion of the viral quasi-species population is
transferred to the next plant. At the end, the plant
material of six plants from five generations is
sequenced, using the Illumina MiSeq platform. This
ultimately resulted in six libraries with more than 10
million 300 bp RNA sequences; this huge amount of
data has to be analysed.
New developments in next-generation sequencing
technologies have made it possible to obtain huge
quantities of data and also made it easier to detect
known and unknown sequences [10]. The standard
way in bioinformatics to process these data has four
steps: quality control, contig assembly, contig
annotation and identification of variations [10]. There
are various methods to do this, and it is still difficult
to analyse these data. That’s why effort should be
made to experiment with those methods. With this
knowledge, faster and more reliable data analysis
could be made possible.
This article shows how the data are processed and
provides an insight in analysing viral sequence data
from plants. We will go through various steps to clean
up the data sets and explain two ways to assemble
the PepMV genome.
Finally, the viral RNA sequences of the different
generations are compared for SNPs in the genome
with variant detections. This will result in the
detection of probable fixed polymorphic locations in
the PepMV genome.
MATERIALS AND METHODS
PepMV-WUR48 is an isolate of CH2 that is highly
necrotic, which was found in a Dutch greenhouse.
The single stranded RNA was previously multiplied
using polymerase chain reaction and cloned in a
plasmid vector with a T7 RNA polymerase promoter.
This clone is transcribed to single stranded capped
RNA and was subsequently used to infect a Nicotiana
benthamiana host.
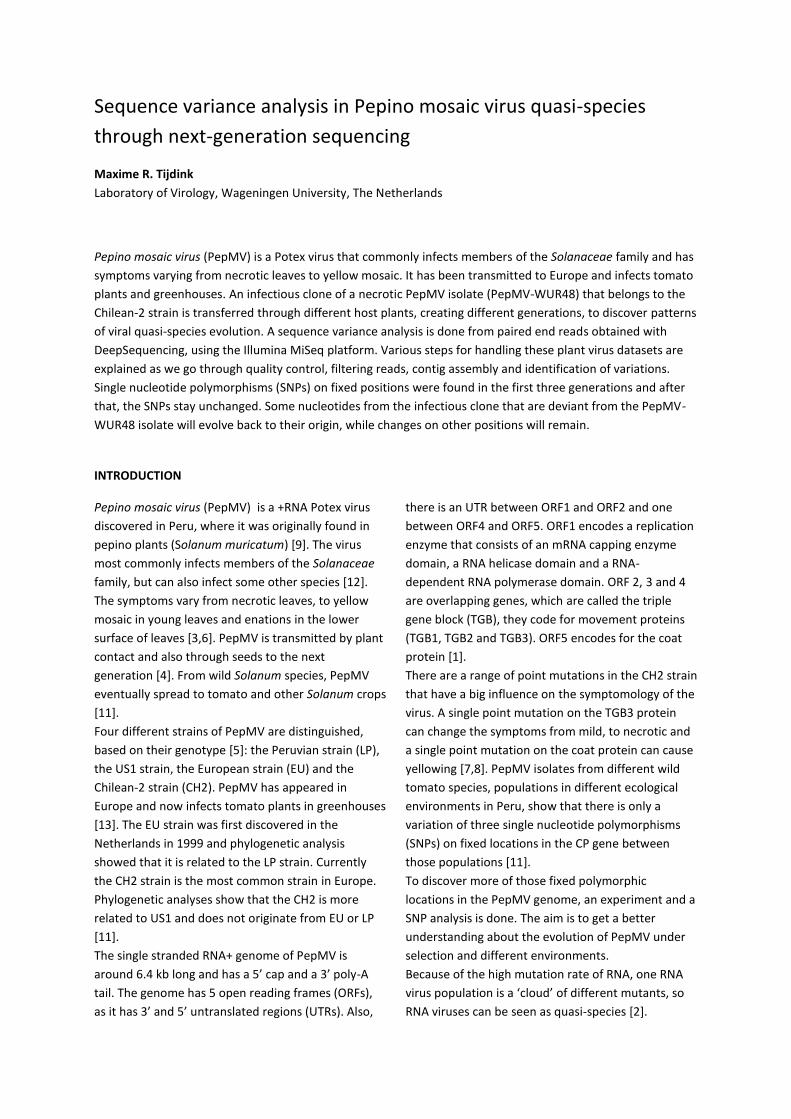
From the host plant, viral particles were extracted
and used to infect old tomato plants, young tomato
plants and N. benthamiana plants in 5 various
dilutions of respectively, 128000x, 64000x, 32000x,
16000x and 8000x. The plant infected with the
highest dilution, that showed signs of infection, is
used to infect the next range of the same kind of
plants. The next range of plants were infected with
dilutions of 1250x, 6250x, 31250x, 156250x and
181250x. In the following range, different kinds of
tomato strains were infected with the same dilutions,
only without 181250x. The last step was infecting
Money Maker tomato plants and N. benthamiana
plants (Figure 1). The analysed data are 6 libraries of
300 bp paired end reads obtained with
DeepSequencing, using the Illumina MiSeq platform
(http://www.illumina.com/systems/miseq.ilmn). The
MiSeq libraries contain all the RNA (including the
virus RNA) purified from PepMV infected plants,
except for ribosomal RNA, which was filtered out
during the library preparation.
Figure 1 Overall schema of the experiment. First N. benthamiana is infected with the necrotic strain (PepMV-WUR48), then the virus is transferred in different dilutions to the other plants. The fractions show how many plants show clear symptoms of infection. The plants marked with a circle or a stripe are eventually sequenced.
CLC Genomics Workbench 7 is used for the analysis
of the data. De Novo assemblies and Reference
assemblies are used to build contigs of the sequences
in the libraries. Contigs are identified by BLASTN
searches at NCBI and BLAST searches against a
PepMV genome in CLC Genomics Workbench.
RESULTS
The data of the paired end reads from the six selected
plants, which are 250 to 300 nt long, are stored into
six libraries. All the RNA that was present in the plant
specimen, including plant mRNA and viral RNA, are
likely to be sequenced. The idea is to get the
sequence of the viral genome, which will be a
consensus of all the viral reads.
Quality assessment
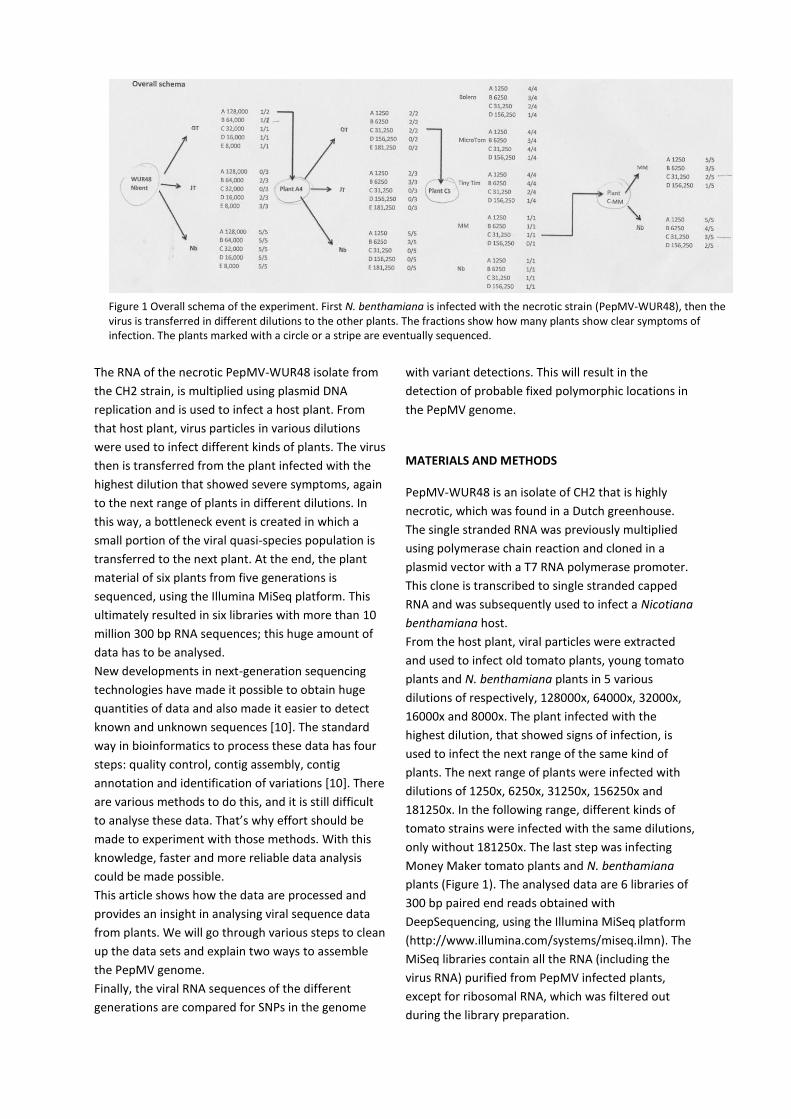
As a start, a quality assessment of the libraries is done
on the obtained data. For all the libraries, the median
PHRED score is around 38, which means the chance
of an incorrect base call is 1 in 10,000 (Figure 2).
Starting from base position 250, the median quality
and the coverage drop.
Figure 2 PHRED score of library 1.
Trim sequences
First, the sequences in the library were trimmed. Only
reads with a maximum of 3 ambiguities are used. A
quality trimming is done with a quality limit of 0.05
and the reads must be at least 250 nt long. After this
step, library 4 appeared to have the highest fraction
of 17% discarded reads, library 6 had the lowest
fraction of 9% (Table 1).
Removal of plant reads
In order to lower the chance of forming wrong
contigs, it is better to filter out as much non-viral
reads as possible. To filter out reads from plant RNA,
a reference mapping is done against the genome of
Nicotiana benthamiana. Although the complete
genome is not yet sequenced, scaffolds made of
contigs bigger than 500 bp are used as a reference.
The reference consisted of 71,057 of those contigs.
As default values, a mismatch cost of 2, an insertion
cost of 3, a deletion cost of 3 and a length fraction of
0.5 are used. The similarity fraction is changed from
de default value of 0.8 to 0.5, in order to get more
hits with the plant sequences and finally filter out
more plant reads. The reads are mapped randomly
and finally, the un-mapped reads are collected and
used for further analysis. Reference mapping with the
N. benthamiana genome also worked in tomato
plants and filtered out a high amount of plant reads
(Table 1). In library 4, the most plant reads were
removed, a fraction of 81%. The least plant reads
were removed in library 6, a fraction of 18%.
Remove Duplicates
Removing duplicates was the next logical step to
clean up libraries. Even after the sequence trimming
and reference mapping, the libraries appeared to
contain a massive amount of duplicate reads. After
removing duplicates of the first N. benthamiana
library, only 16% of the reads were left, meaning,
84% of the trimmed and cleaned data contained
duplicates. In library 4, this was only 12% (Table 1).
De Novo Assembly
In order to find PepMV sequences, a De Novo
Assembly is used to generate contigs of the library
reads. Default settings of a word size of 20 and a
bubble size of 50 were used. To spare unnecessary
computations, the assembly only searched for contigs
Library Host plant Sequences Trimmed Unmapped Reference Nicotiana
After removing duplicates
Fraction left
1 N. benthamiana 14,982,940
13,439,350 10,341,990 1,662,874 11%
2 Old tomato 10,410,420 8,451,380 4,810,530 2,545,414 24%
3 Old tomato 13,963,380 12,224,720 7,251,770 2,635,966 19%
4 Money Maker 15,831,160 13,172,610 2,499,870 2,200,438 14%
5 N. benthamiana 14,383,650 12,355,650 6,126,390 1,243,204 9%
6 Money Maker 14,325,120 13,016,880 10,717,330 2,253,854 16%
Table 1 Overview of the number reads in the libraries after the clean-up steps
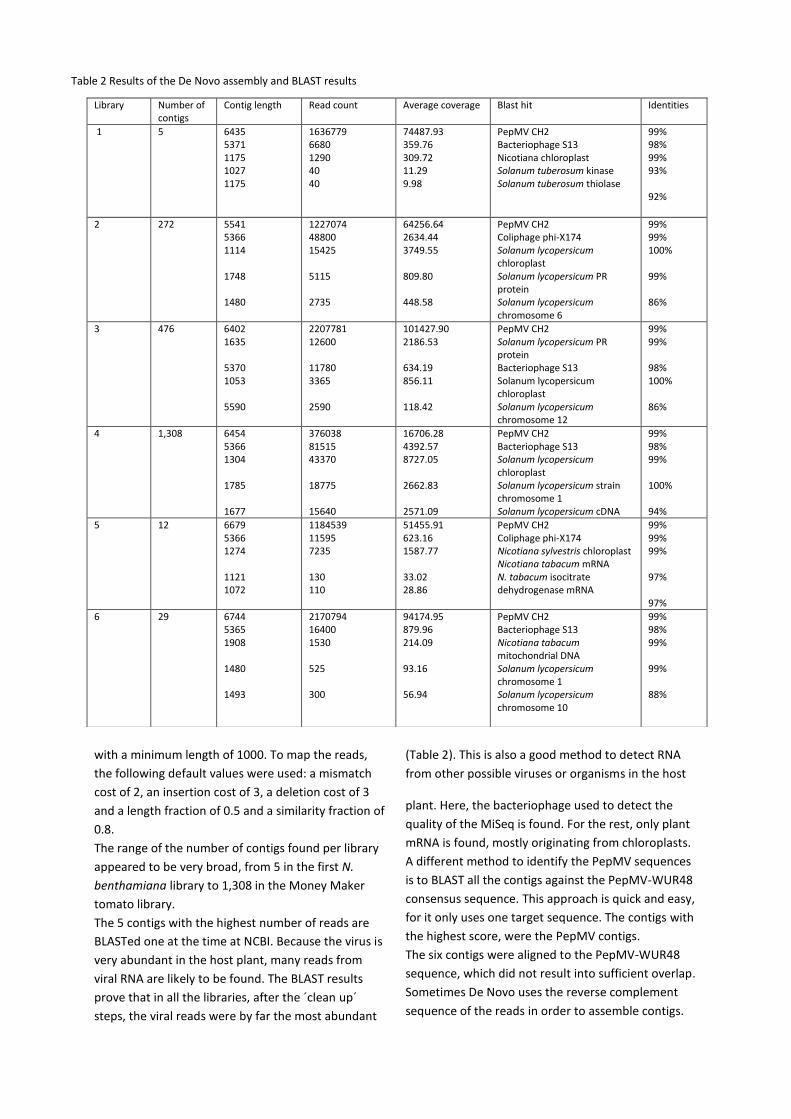
with a minimum length of 1000. To map the reads,
the following default values were used: a mismatch
cost of 2, an insertion cost of 3, a deletion cost of 3
and a length fraction of 0.5 and a similarity fraction of
0.8.
The range of the number of contigs found per library
appeared to be very broad, from 5 in the first N.
benthamiana library to 1,308 in the Money Maker
tomato library.
The 5 contigs with the highest number of reads are
BLASTed one at the time at NCBI. Because the virus is
very abundant in the host plant, many reads from
viral RNA are likely to be found. The BLAST results
prove that in all the libraries, after the ´clean up´
steps, the viral reads were by far the most abundant
(Table 2). This is also a good method to detect RNA
from other possible viruses or organisms in the host
plant. Here, the bacteriophage used to detect the
quality of the MiSeq is found. For the rest, only plant
mRNA is found, mostly originating from chloroplasts.
A different method to identify the PepMV sequences
is to BLAST all the contigs against the PepMV-WUR48
consensus sequence. This approach is quick and easy,
for it only uses one target sequence. The contigs with
the highest score, were the PepMV contigs.
The six contigs were aligned to the PepMV-WUR48
sequence, which did not result into sufficient overlap.
Sometimes De Novo uses the reverse complement
sequence of the reads in order to assemble contigs.
Library Number of contigs
Contig length Read count Average coverage Blast hit Identities
1 5 6435 5371 1175 1027 1175
1636779 6680 1290 40 40
74487.93 359.76 309.72 11.29 9.98
PepMV CH2 Bacteriophage S13 Nicotiana chloroplast Solanum tuberosum kinase Solanum tuberosum thiolase
99% 98% 99% 93% 92%
2 272 5541 5366 1114 1748 1480
1227074 48800 15425 5115 2735
64256.64 2634.44 3749.55 809.80 448.58
PepMV CH2 Coliphage phi-X174 Solanum lycopersicum chloroplast Solanum lycopersicum PR protein Solanum lycopersicum chromosome 6
99% 99% 100% 99% 86%
3 476 6402 1635 5370 1053 5590
2207781 12600 11780 3365 2590
101427.90 2186.53 634.19 856.11 118.42
PepMV CH2 Solanum lycopersicum PR protein Bacteriophage S13 Solanum lycopersicum chloroplast Solanum lycopersicum chromosome 12
99% 99% 98% 100% 86%
4 1,308 6454 5366 1304 1785 1677
376038 81515 43370 18775 15640
16706.28 4392.57 8727.05 2662.83 2571.09
PepMV CH2 Bacteriophage S13 Solanum lycopersicum chloroplast Solanum lycopersicum strain chromosome 1 Solanum lycopersicum cDNA
99% 98% 99% 100% 94%
5 12 6679 5366 1274 1121 1072
1184539 11595 7235 130 110
51455.91 623.16 1587.77 33.02 28.86
PepMV CH2 Coliphage phi-X174 Nicotiana sylvestris chloroplast Nicotiana tabacum mRNA N. tabacum isocitrate dehydrogenase mRNA
99% 99% 99% 97% 97%
6 29 6744 5365 1908 1480 1493
2170794 16400 1530 525 300
94174.95 879.96 214.09 93.16 56.94
PepMV CH2 Bacteriophage S13 Nicotiana tabacum mitochondrial DNA Solanum lycopersicum chromosome 1 Solanum lycopersicum chromosome 10
99% 98% 99% 99% 88%
Table 2 Results of the De Novo assembly and BLAST results
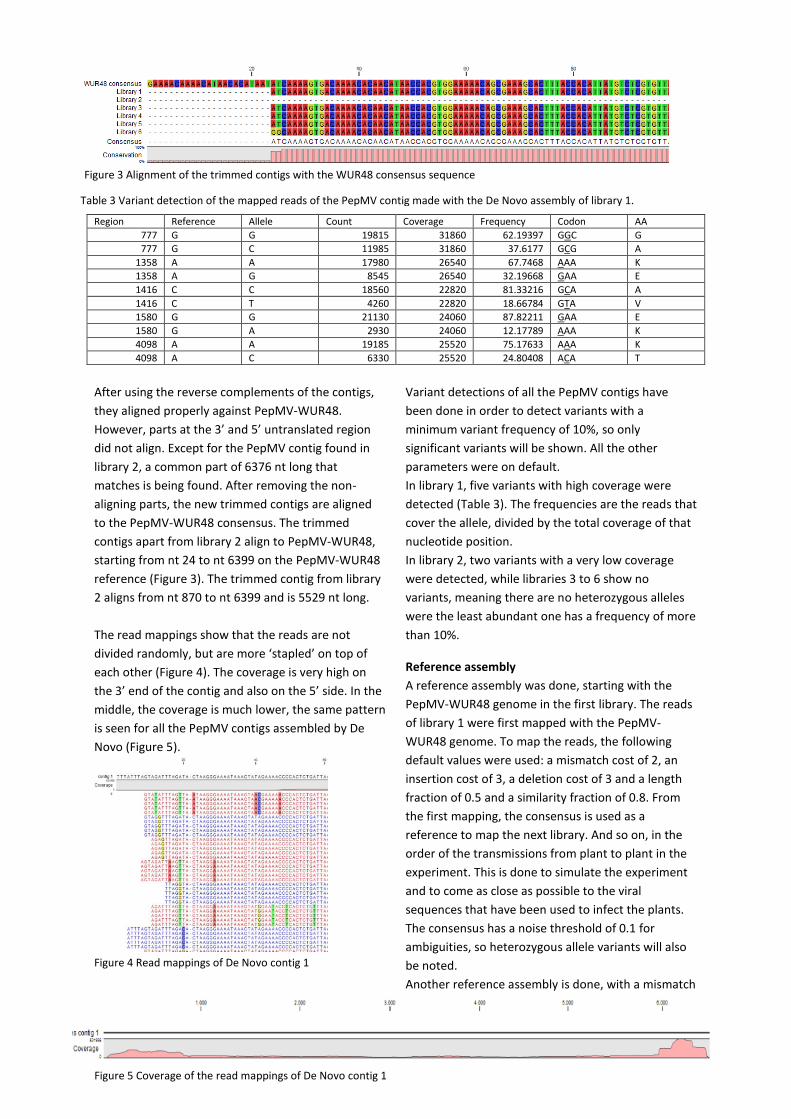
After using the reverse complements of the contigs,
they aligned properly against PepMV-WUR48.
However, parts at the 3’ and 5’ untranslated region
did not align. Except for the PepMV contig found in
library 2, a common part of 6376 nt long that
matches is being found. After removing the non-
aligning parts, the new trimmed contigs are aligned
to the PepMV-WUR48 consensus. The trimmed
contigs apart from library 2 align to PepMV-WUR48,
starting from nt 24 to nt 6399 on the PepMV-WUR48
reference (Figure 3). The trimmed contig from library
2 aligns from nt 870 to nt 6399 and is 5529 nt long.
The read mappings show that the reads are not
divided randomly, but are more ‘stapled’ on top of
each other (Figure 4). The coverage is very high on
the 3’ end of the contig and also on the 5’ side. In the
middle, the coverage is much lower, the same pattern
is seen for all the PepMV contigs assembled by De
Novo (Figure 5).
Figure 4 Read mappings of De Novo contig 1
Variant detections of all the PepMV contigs have
been done in order to detect variants with a
minimum variant frequency of 10%, so only
significant variants will be shown. All the other
parameters were on default.
In library 1, five variants with high coverage were
detected (Table 3). The frequencies are the reads that
cover the allele, divided by the total coverage of that
nucleotide position.
In library 2, two variants with a very low coverage
were detected, while libraries 3 to 6 show no
variants, meaning there are no heterozygous alleles
were the least abundant one has a frequency of more
than 10%.
Reference assembly
A reference assembly was done, starting with the
PepMV-WUR48 genome in the first library. The reads
of library 1 were first mapped with the PepMV-
WUR48 genome. To map the reads, the following
default values were used: a mismatch cost of 2, an
insertion cost of 3, a deletion cost of 3 and a length
fraction of 0.5 and a similarity fraction of 0.8. From
the first mapping, the consensus is used as a
reference to map the next library. And so on, in the
order of the transmissions from plant to plant in the
experiment. This is done to simulate the experiment
and to come as close as possible to the viral
sequences that have been used to infect the plants.
The consensus has a noise threshold of 0.1 for
ambiguities, so heterozygous allele variants will also
be noted.
Another reference assembly is done, with a mismatch
Region Reference Allele Count Coverage Frequency Codon AA
777 G G 19815 31860 62.19397 GGC G
777 G C 11985 31860 37.6177 GCG A
1358 A A 17980 26540 67.7468 AAA K
1358 A G 8545 26540 32.19668 GAA E
1416 C C 18560 22820 81.33216 GCA A
1416 C T 4260 22820 18.66784 GTA V
1580 G G 21130 24060 87.82211 GAA E
1580 G A 2930 24060 12.17789 AAA K
4098 A A 19185 25520 75.17633 AAA K
4098 A C 6330 25520 24.80408 ACA T
Figure 5 Coverage of the read mappings of De Novo contig 1
Figure 3 Alignment of the trimmed contigs with the WUR48 consensus sequence
Table 3 Variant detection of the mapped reads of the PepMV contig made with the De Novo assembly of library 1.
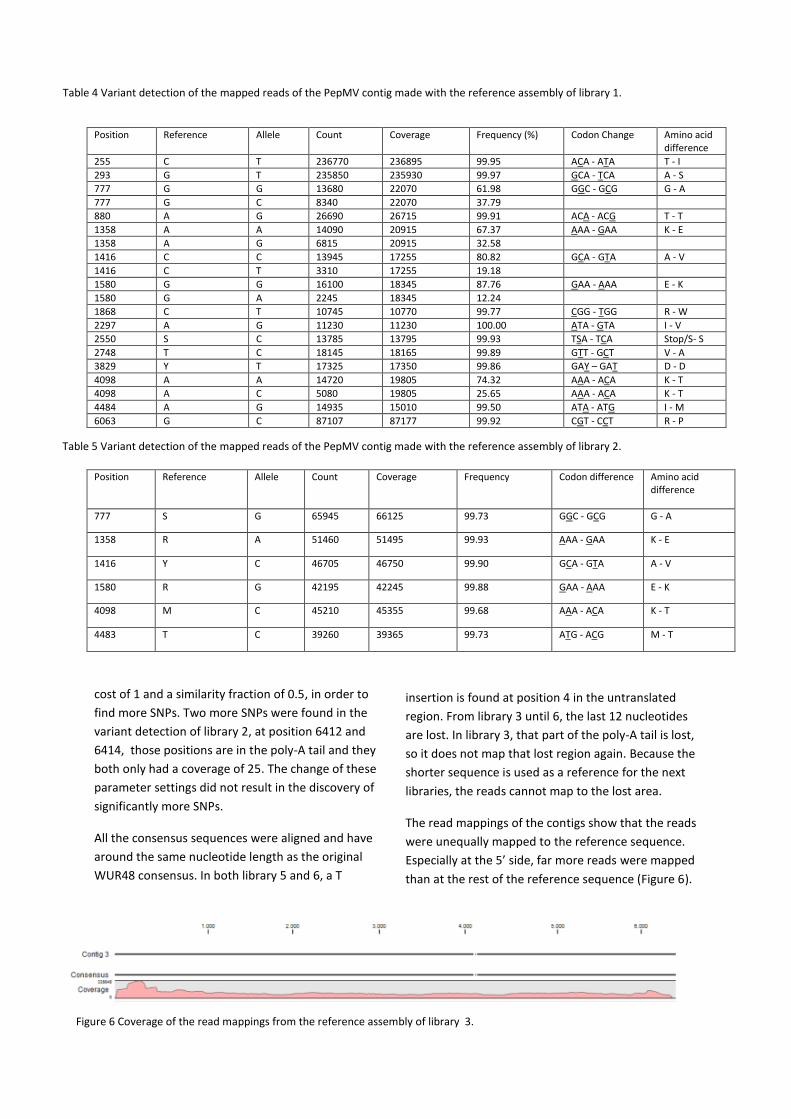
cost of 1 and a similarity fraction of 0.5, in order to
find more SNPs. Two more SNPs were found in the
variant detection of library 2, at position 6412 and
6414, those positions are in the poly-A tail and they
both only had a coverage of 25. The change of these
parameter settings did not result in the discovery of
significantly more SNPs.
All the consensus sequences were aligned and have
around the same nucleotide length as the original
WUR48 consensus. In both library 5 and 6, a T
insertion is found at position 4 in the untranslated
region. From library 3 until 6, the last 12 nucleotides
are lost. In library 3, that part of the poly-A tail is lost,
so it does not map that lost region again. Because the
shorter sequence is used as a reference for the next
libraries, the reads cannot map to the lost area.
The read mappings of the contigs show that the reads
were unequally mapped to the reference sequence.
Especially at the 5’ side, far more reads were mapped
than at the rest of the reference sequence (Figure 6).
Position Reference Allele Count Coverage Frequency Codon difference Amino acid difference
777 S G 65945 66125 99.73 GGC - GCG G - A
1358 R A 51460 51495 99.93 AAA - GAA K - E
1416 Y C 46705 46750 99.90 GCA - GTA A - V
1580 R G 42195 42245 99.88 GAA - AAA E - K
4098 M C 45210 45355 99.68 AAA - ACA K - T
4483 T C 39260 39365 99.73 ATG - ACG M - T
Position Reference Allele Count Coverage Frequency (%) Codon Change Amino acid difference
255 C T 236770 236895 99.95 ACA - ATA T - I
293 G T 235850 235930 99.97 GCA - TCA A - S
777 G G 13680 22070 61.98 GGC - GCG G - A
777 G C 8340 22070 37.79
880 A G 26690 26715 99.91 ACA - ACG T - T
1358 A A 14090 20915 67.37 AAA - GAA K - E
1358 A G 6815 20915 32.58
1416 C C 13945 17255 80.82 GCA - GTA A - V
1416 C T 3310 17255 19.18
1580 G G 16100 18345 87.76 GAA - AAA E - K
1580 G A 2245 18345 12.24
1868 C T 10745 10770 99.77 CGG - TGG R - W
2297 A G 11230 11230 100.00 ATA - GTA I - V
2550 S C 13785 13795 99.93 TSA - TCA Stop/S- S
2748 T C 18145 18165 99.89 GTT - GCT V - A
3829 Y T 17325 17350 99.86 GAY – GAT D - D
4098 A A 14720 19805 74.32 AAA - ACA K - T
4098 A C 5080 19805 25.65 AAA - ACA K - T
4484 A G 14935 15010 99.50 ATA - ATG I - M
6063 G C 87107 87177 99.92 CGT - CCT R - P
Table 4 Variant detection of the mapped reads of the PepMV contig made with the reference assembly of library 1.
Table 5 Variant detection of the mapped reads of the PepMV contig made with the reference assembly of library 2.
Figure 6 Coverage of the read mappings from the reference assembly of library 3.
Variant detections of the reference read mappings
from all the libraries have been done to detect
variants with a minimum variant frequency of 10%, so
only significant variants are shown. All the other
parameters were on default.
In a variant detection of the first library, the PepMV-
WUR48 genome is compared to the alleles in the
mapped reads of the first library, because the first
library is mapped against the PepMV-WUR48
sequence. The sequence that infected the first N.
benthamiana, originates from just one viral RNA
strand in a whole PepMV-WUR48 population, which
is a huge bottleneck. Comparing the consensus from
library 1 to the PepMV-WUR48 consensus, is a way to
detect SNP positions that vary in the original
population (Table 4). Because the consensus of the
previous library is used as reference for the current
one, also the differences (SNPs) between those
libraries are shown in the variance table. Only in
library 1, 2 and 3, SNPs were found, while the next
libraries conserved the same nucleotides as library 3.
In library 1, 10 SNPs are found, present in almost
100% of the reads, and different from the reference
genome. The only silent mutations come from
ambiguous nucleotides.
No more than five variants with a frequency of
minimum 10% difference were found in library 1, in
position 777, 1358, 1416, 1580 and 4098. In all those
heterozygous variances, the reference nucleotide is
more abundant than the other allele. These findings
are equal to the variant detection of the De Novo
assembly.
In a variant detection of the first library, the
consensus genome from library 1 is used as
reference, and is compared to the alleles in the
mapped reads of library 2. Here it appears that the
heterozygous variations at position 777, 1358, 1416
and 1580 in the first library, all have changed back to
the nucleotides of PepMV-WUR48 consensus. Those
variations have disappeared, as well as all the less
common alleles. The variation in Table 3 and 4 at
position 4098, consisted for 74% of A’s and for 26% of
C’s. Now in the second library, there can be seen that
the frequency has dramatically changed to almost
100% C’s, while the A’s have almost completely
disappeared. Another SNP is detected at position
4483, while in almost 100% of the reads; a T has
changed to C.
The consensus genome from the second library is
used as reference to map the third library, and is
compared to the alleles in the mapped reads of the
third library. Here, 4 clear SNPs were found and
changed in 100% of the cases (Table 5). Where in
library 1 to 2, position 4098 changed from 74% A to
100% C, it changes back to a majority of 100% A in
library 3. This means that the least abundant allele
found in library 1, became the only allele in the next
plant, a host switch from N. benthamiana to old
tomato. In the next host switch, to another old
tomato plant, the allele changed back to the
nucleotide on the PepMV-WUR48 consensus in 100%
of the reads. This is an amino acid change from lysine
to threonine, back to lysine.
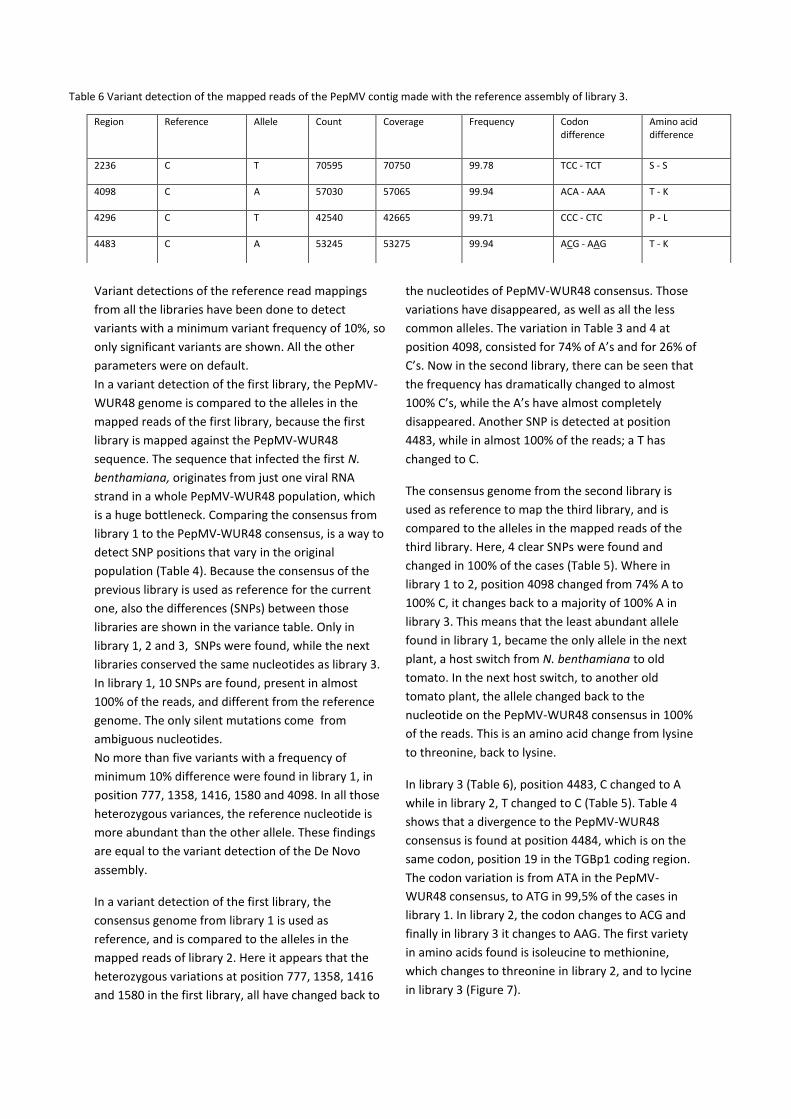
In library 3 (Table 6), position 4483, C changed to A
while in library 2, T changed to C (Table 5). Table 4
shows that a divergence to the PepMV-WUR48
consensus is found at position 4484, which is on the
same codon, position 19 in the TGBp1 coding region.
The codon variation is from ATA in the PepMV-
WUR48 consensus, to ATG in 99,5% of the cases in
library 1. In library 2, the codon changes to ACG and
finally in library 3 it changes to AAG. The first variety
in amino acids found is isoleucine to methionine,
which changes to threonine in library 2, and to lycine
in library 3 (Figure 7).
Region Reference Allele Count Coverage Frequency Codon difference
Amino acid difference
2236 C T 70595 70750 99.78 TCC - TCT S - S
4098 C A 57030 57065 99.94 ACA - AAA T - K
4296 C T 42540 42665 99.71 CCC - CTC P - L
4483 C A 53245 53275 99.94 ACG - AAG T - K
Table 6 Variant detection of the mapped reads of the PepMV contig made with the reference assembly of library 3.
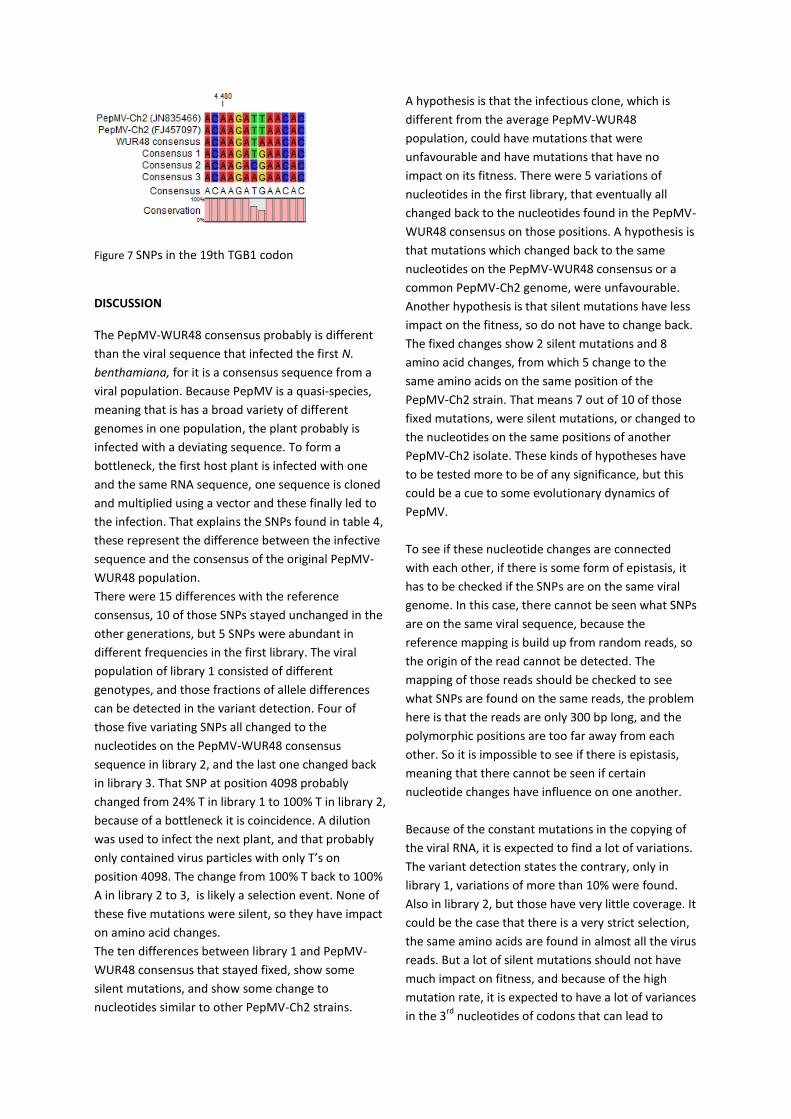
Figure 7 SNPs in the 19th TGB1 codon
DISCUSSION
The PepMV-WUR48 consensus probably is different
than the viral sequence that infected the first N.
benthamiana, for it is a consensus sequence from a
viral population. Because PepMV is a quasi-species,
meaning that is has a broad variety of different
genomes in one population, the plant probably is
infected with a deviating sequence. To form a
bottleneck, the first host plant is infected with one
and the same RNA sequence, one sequence is cloned
and multiplied using a vector and these finally led to
the infection. That explains the SNPs found in table 4,
these represent the difference between the infective
sequence and the consensus of the original PepMV-
WUR48 population.
There were 15 differences with the reference
consensus, 10 of those SNPs stayed unchanged in the
other generations, but 5 SNPs were abundant in
different frequencies in the first library. The viral
population of library 1 consisted of different
genotypes, and those fractions of allele differences
can be detected in the variant detection. Four of
those five variating SNPs all changed to the
nucleotides on the PepMV-WUR48 consensus
sequence in library 2, and the last one changed back
in library 3. That SNP at position 4098 probably
changed from 24% T in library 1 to 100% T in library 2,
because of a bottleneck it is coincidence. A dilution
was used to infect the next plant, and that probably
only contained virus particles with only T’s on
position 4098. The change from 100% T back to 100%
A in library 2 to 3, is likely a selection event. None of
these five mutations were silent, so they have impact
on amino acid changes.
The ten differences between library 1 and PepMV-
WUR48 consensus that stayed fixed, show some
silent mutations, and show some change to
nucleotides similar to other PepMV-Ch2 strains.
A hypothesis is that the infectious clone, which is
different from the average PepMV-WUR48
population, could have mutations that were
unfavourable and have mutations that have no
impact on its fitness. There were 5 variations of
nucleotides in the first library, that eventually all
changed back to the nucleotides found in the PepMV-
WUR48 consensus on those positions. A hypothesis is
that mutations which changed back to the same
nucleotides on the PepMV-WUR48 consensus or a
common PepMV-Ch2 genome, were unfavourable.
Another hypothesis is that silent mutations have less
impact on the fitness, so do not have to change back.
The fixed changes show 2 silent mutations and 8
amino acid changes, from which 5 change to the
same amino acids on the same position of the
PepMV-Ch2 strain. That means 7 out of 10 of those
fixed mutations, were silent mutations, or changed to
the nucleotides on the same positions of another
PepMV-Ch2 isolate. These kinds of hypotheses have
to be tested more to be of any significance, but this
could be a cue to some evolutionary dynamics of
PepMV.
To see if these nucleotide changes are connected
with each other, if there is some form of epistasis, it
has to be checked if the SNPs are on the same viral
genome. In this case, there cannot be seen what SNPs
are on the same viral sequence, because the
reference mapping is build up from random reads, so
the origin of the read cannot be detected. The
mapping of those reads should be checked to see
what SNPs are found on the same reads, the problem
here is that the reads are only 300 bp long, and the
polymorphic positions are too far away from each
other. So it is impossible to see if there is epistasis,
meaning that there cannot be seen if certain
nucleotide changes have influence on one another.
Because of the constant mutations in the copying of
the viral RNA, it is expected to find a lot of variations.
The variant detection states the contrary, only in
library 1, variations of more than 10% were found.
Also in library 2, but those have very little coverage. It
could be the case that there is a very strict selection,
the same amino acids are found in almost all the virus
reads. But a lot of silent mutations should not have
much impact on fitness, and because of the high
mutation rate, it is expected to have a lot of variances
in the 3rd
nucleotides of codons that can lead to
them. Still, there is only one silent mutation found in
the plant to plant infections.
Hasiów-Jaroszewska et al. (2011) shows that certain
point mutations can convert PepMV from a mild
pathotype, into a necrotic one. On the TGB3 coding
region, amino acid 67 must change from K to E to
become necrotic. On the PepMV CH2 genome that
had the highest BLAST hit from NCBI, that homologue
codon is AAA and codes for K. In the WUR48
consensus and the ones from the libraries, that is a
GAA and it codes for an E. That may explain why this
strain is already was necrotic.
Another article of Hasiów-Jaroszewska et al. (2013)
shows another interesting point mutation, in the CP
coding region at codon 155. If the codon codes for R
or K, there is yellowing and if it codes for E, there is
none. There are no variations found on that codon in
the PepMV-WUR48 genome and in the libraries. All
the codons at position 155 in the CP coding region
code for E. The only variation found in the CP coding
region is at codon position 145, between library 1 and
the PepMV-WUR48 consensus.
Three more polymorphic locations in the CP gene are
found in wild Solanum species in Peru. PepMV
isolates from different wild tomato species,
populations in different ecological environments
were isolated. The CP gene of those isolates was
amplified and the nucleotide sequence was
determined. SNPs were found on nt position 468, 495
and 712 of the CP gene and that was the only
variation found in all the isolates [11]. The only SNP
found in the CP gene in my analysis does not
correspond with these findings.
An interesting codon change is the 19th codon on the
TGB1 encoding region. There is variation between the
PepMV-WUR48 consensus and library 1, on the third
nucleotide of that codon. In the following two
generations, the second nucleotide of the same
codon changes, and this results in two amino acid
changes. All this is found in almost 100% of the reads.
Compare PepMV-WUR48 with two other PepMV-Ch2
sequences, and there is a difference in the third
nucleotide, which is silent. There is nothing known
about this codon and no experiments are done to see
the impact of change so far.
Normally, the first step of the library cleaning process
is removing the duplicate reads. The reason that it
here was the last step is, the computers did not have
enough storage capacity to store the duplicate reads
before discarding them, only after the other cleaning
steps, the computers had the capacity.
Eventually, there were a massive amount of duplicate
reads in the libraries, a possible explanation could be
a mistake in the sequencing procedure. Due to a
mistake, the MiSeq reads are not sequenced from the
large cDNA strands, but from small strands of 500-
800 nt long. That means that not the whole genome
of the virus is sequenced, but only broken RNA
strands could be sequenced. This explains how the
libraries contained a disproportional amount of
duplicate reads. After removing the duplicates and
the other ‘clean up’ steps, only 9% to 24% of the
reads were left.
The read mappings of the De Novo were not
randomly divided and some parts showed very low
coverage in the middle of the mapping, while there
was a lot of coverage on the 5’ and 3’ ends. This is
probably also due to the fractioning. Maybe the
primers could attach better on those sides, or maybe
the broken pieces of RNA are more abundant in the 3’
and 5’ regions.
Another risk to work with these data, is that the
sequences of the broken RNA parts share similarities
that makes them not function in the first place. That
means that the sequences that are used for the
reference assembly could be different from the intact
genomes that aren’t sequenced.
REFERENCES
1. Aguilar, J.M., Hernandez-Gallardo, M.D., Cenis,
J.L., Lacasa, A. and Aranda, M.A. (2002) Complete
sequence of the Pepino mosaic virus RNA genome.
Arch. Virol. 147, 2009–2015.
2. Eigen M (1993) Viral quasispecies. Sci. Am. 269,
42–49.
3. Hanssen, I.M., Paeleman, A., Vandewoestijne, E.,
Van Bergen, L., Bragard, C., Lievens, B., Vanachter,
A.C.R.C. and Thomma, B.P.H.J. (2009) Pepino
mosaic virus isolates and differential
symptomatology in tomato. Plant Pathol. 58, 450–
460.
4. Hanssen, I.M., Mumford, R., Blystad, D.R.,
Cortez, I., Hasiów-Jaroszewska, B., Hristova, D.,
Pagán, I., Pereira, A.M., Peters, J., Pospieszny, H.,
Ravnikar, M., Stijger, I., Tomassoli, L., Varveri, C.,
van der Vlugt, R., Nielsen, S.L. (2010). Seed
transmission of Pepino mosaic virus in tomato. Eur.
J. Plant Pathol. 126, 145–152.
5. Hanssen I, Thomma B (2010) Pepino mosaic
virus: a successful pathogen that rapidly evolved
from emerging to endemic in tomato crops. Mol.
Plant Pathol. 11, 179–189.
6. Hasiów-Jaroszewska, B., Pospieszny, H. and
Borodynko, N. (2009) New necrotic isolates of
Pepino mosaic virus representing the CH2
genotype. J. Phytopathol. 157, 494–496.
7. Hasiow-Jaroszewska B, Borodynko N, Jackowiak
P, Figlerowicz M, Pospieszny H (2011) A single
mutation in TGB3 converts mild pathotype of
Pepino mosaic virus into necrotic one. Virus Res
159, 57–61.
8. Hasiow-Jaroszewska B, Borodynko N (2012)
Characterization of the necrosis determinant of the
European genotype of pepino mosaic virus by site-
specific mutagenesis of an infectious cDNA clone.
Arch Virol. 157, 337–341.
9. Jones, R.A.C., Koenig, R. and Lesemann, D.E.
(1980) Pepino mosaic virus, a new potexvirus from
pepino (Solanum muricatum). Ann. Appl. Biol. 94,
61–68.
10. Massart S, Olmos A, Jijakli H, Candresse T
(2014) Current impact and future directions of high
throughput sequencing in plant virus diagnostics.
Virus Research 188, 90–96.
11. Moreno-Pérez MG, Pagán I, Aragón-Caballero
L, Cáceres F, Fraile A, García-Arenal F. (2014).
Ecological and genetic determinants of Pepino
Mosaic Virus emergence. J. Virol. 88(6), 3359-68.
12. Salomone, A. and Roggero, P. (2002) Host
range, seed transmission and detection by ELISA
and lateral flow of an Italian isolate of Pepino
mosaic virus. J. Plant Pathol. 84, 65–68.
13. van der Vlugt, R. A. A., Stijger, C. C. M. M.,
Verhoeven, J. T. J., and Lesemann, D. E. 2000. First
Report of Pepino mosaic virus on tomato. Plant
Dis. 84, 103.