Embed Size (px)
Citation preview
BRAND EXTENSION IN CUSTOMER-BASED
BRAND EQUITY MODEL: A CASE OF U.S. LODGING
INDUSTRY
By
LI DING
Bachelor of Arts in Economics
Tianjin University of Finance and Economics
Tianjin, China
2005
Master of Arts in Economics
Clemson University
Clemson, South Carolina
2011
Submitted to the Faculty of the
Graduate College of the
Oklahoma State University
in partial fulfillment of
the requirements for
the Degree of
DOCTOR OF PHILOSOPHY
May, 2018
ii
BRAND EXTENSION IN CUSTOMER-BASED
BRAND EQUITY MODEL: A CASE OF U.S. LODGING
INDUSTRY
Dissertation Approved:
Dr. Hailin Qu
Dissertation Adviser
Dr. Jing Yang
Dr. Yeasun Chung
Dr. Tom Brown
iii Acknowledgements reflect the views of the author and are not endorsed by committee
members or Oklahoma State University.
ACKNOWLEDGEMENTS
I truly thank my parents who always support me to chase my goals and dreams.
They educate me to be a noble, righteous, diligent, and confident person and encourage
me fully using my natural endowment to serve more people in this society. I owe my
appreciation to my beloved grandparents. They had/have given me endless love since my
childhood and expected I could make nonstop progress in everything I might do. I am
glad to be their pride.
I would like to express my deepest appreciation to my advisor Dr. Hailin Qu. One
of the most lucky things in my life is to be his student. He is such as wonderful advisor
who not only provides me strong support on my academic development but also inspires
me to be a good educator in the future.
I would like to express my deepest gratitude to Dr. Jing Yang, Dr. Yeasun Chung,
and Dr. Tom Brown to serve as my dissertation committee members. They provided me
valuable comments and suggestions to make my dissertation better. I am happy to work
with Dr. Jing Yang and Dr. Yeasun Chung during my doctoral studies. They are good
mentors and friends, always.
I would like to thank Dr. Ben Goh and Dr. Li Miao. They have offered me many
teaching opportunities and trusted my teaching potential. I would like to thank Dr.
Christine Johnson. She has created professional development opportunities which largely
improve my leadership skills. My appreciation extends to all faculty and staff members at
the College of Human Sciences and the School of Hospitality and Tourism Management.
Because of their supports, my heart always feels warm in this big family.
I would like to thank my dear friends Dr. DL, Linda Jansen, Dr. RDK, Dr. Guojie
Wang, Dr. Ye Wang, Lin Sun, Wei Du, Alex Dong, Dr. Fengchun Yang, Dr. Weili Song,
John Hensley, Heather Mack, Teresa Gao, Grace Chen, and James Chen.
Starting from now, I will exploit a new journal with the loves and supports from
my parents, my teachers, and my friends. I have redeemed my words when I was six and
move forward to my higher goal- using my knowledge and scholarship to benefit more
people.
Cheers to the breeze and moon, cheers to the peace world!
J. Ding
iv
Name: LI DING
Date of Degree: MAY, 2018
Title of Study: BRAND EXTENSION IN CUSTOMER-BASED BRAND EQUITY
MODEL: A CASE OF U.S. LODGING INDUSTRY
Major Field: HUMAN SCIENCES
Abstract: The main purposes of this study were (1) to establish an integrated customer-
based brand extension equity resonance model in the U.S. lodging context; and (2) to
provide practical suggestions for hotel practitioners aiming to build strong brands. This
study used descriptive and causal research methods to develop and examine the proposed
research model. The target population comprised of leisure-purposed U.S. hotel guests
who have had accommodation experiences with one of five U.S. hotel chains within the
last six months. The study employed convenience sampling and participants were
recruited from MTurk through an online self-administered survey. The sample size
included 657 cases for data analysis. Descriptive statistics, confirmatory factor analysis,
structural equation modeling, and hierarchical multiple regression were used for data
analysis. A total of 15 hypotheses were proposed based on theories and prior studies. The
findings supported all paths among the constructs, including brand extension’s attribute-
level performance, brand extension’s brand personality, perceived overall quality toward
brand extension, consumer emotional responses toward brand extension, consumer
satisfaction toward brand extension, consumer brand loyalty toward brand extension,
consumer attitudinal attachment toward parent brand, consumer sense of community
toward parent brand, and perceived image fit between parent brand and brand extension.
This study identified positive effects of brand associations on consumer judgment toward
brand extension, positive effects of consumer judgment on consumer brand loyalty
toward brand extension, positive effects of consumer brand loyalty toward brand
extension on parent brand resonance, and a positive moderating effect of perceived image
fit between consumer loyalty toward brand extension and parent brand resonance. The
study contributed to exploring the mediating effects of consumer emotional responses
toward brand extension on the relationship between brand associations and brand
extensions’ marketing performance. It also considered the feedback effect and identified
the mechanism by which consumer brand loyalty toward hotel brand extension could
affect the consumer-brand relationship of the parent brand. Finally, the study offered
lodging practitioners several suggestions for developing strong brand-consumer
relationships through the use of brand extension strategies.
v
TABLE OF CONTENTS
Chapter Page
I. INTRODUCTION ......................................................................................................1
1. Brand Equity ......................................................................................................1
2. Brand Extension .................................................................................................3
3. Brand Extension in the U.S. Lodging Industry ..................................................4
4. Problem Statement .............................................................................................7
5. Purpose of the Study ..........................................................................................9
6. Objectives of the Study ......................................................................................9
7. Significance of the Study .................................................................................10
7.1. Theoretical Contributions .........................................................................10
7.2. Practical Contributions..............................................................................11
8. Organization of the Study ................................................................................12
II. REVIEW OF LITERATURE..................................................................................13
1. Customer-based Brand Equity Related Studies ...............................................13
1.1. Definitions of Brand Equity from a Consumer’s Perspective ..................13
1.2. Influential Models of Customer-based Brand Equity ...............................18
1.2.1. Aaker’s (1991) Brand Equity Model .............................................18
1.2.2. Keller’s (1993) Customer-based Brand Equity Model ..................20
1.2.3. Keller’s (2001) Brand Resonance Model ......................................21
1.2.4. Keller & Lehmann’s (2003) Brand Value Chain Model ...............23
1.3. Other Customer-based Brand Equity Studies ...........................................24
2. Brand Extension Related Studies .....................................................................26
2.1. Types of Brand Extensions .......................................................................26
2.2. Drivers of Brand Extension Success .........................................................28
2.3. Consumer Evaluations toward Brand Extensions .....................................29
3. Conceptual Framework and Hypotheses .........................................................30
3.1. Two Constructs in Brand Associations .....................................................30
3.1.1. Associative Network Theory .........................................................31
3.1.2. Brand Performance ........................................................................32
3.1.2.1. Brand Attribute-level Performance .........................................33
3.1.2.2. Measuring Hotel Brand Attribute-level Performance .............34
3.1.3. Brand Imagery. ..............................................................................37
3.1.3.1. Brand Personality. ...................................................................38
3.1.3.2. Measuring Brand Personality. .................................................40
vi
3.2. Consumer Responses toward Brand Extension ........................................41
3.2.1. Perceived Overall Quality ..............................................................41
3.2.2. Measuring Perceived Overall Quality ............................................42
3.2.3. Relationship between Brand Extension’s Attribute-level Performance
and Perceived Overall Quality toward Brand Extension ...............44
3.2.4. Relationship between Brand Extension’s Brand Personality and
Perceived Overall Quality toward Brand Extension ......................45
3.2.5. Consumer Emotional Responses....................................................47
3.2.6. Measuring Consumer Emotional Responses .................................47
3.2.7. Relationship between Brand Extension’s Attribute-level Performance
and Consumer Emotional Responses toward Brand Extension .....49
3.2.8. Relationship between Brand Extension’s Brand Personality and
Consumer Emotional Responses toward Brand Extension ............50
3.2.9. Relationship between Perceived Overall Quality toward Brand
Extension and Consumer Emotional Responses toward Brand
Extension........................................................................................51
3.3. Consumer Satisfaction toward Brand Extension ......................................52
3.3.1. Consumer Satisfaction ...................................................................52
3.3.2. Measuring Consumer Satisfaction .................................................53
3.3.3. Relationship between Perceived Overall Quality toward Brand
Extension and Consumer Satisfaction toward Brand Extension ....54
3.3.4. Relationship between Consumer Emotional Responses toward Brand
Extension and Consumer Satisfaction toward Brand Extension ....54
3.4. Consumer Brand Loyalty toward Brand Extension ..................................55
3.4.1. Consumer Brand Loyalty ...............................................................55
3.4.2. Measuring Consumer Loyalty........................................................56
3.4.3. Relationship between Perceived Overall Quality toward Brand
Extension and Consumer Brand Loyalty toward Brand Extension
........................................................................................................56
3.4.4. Relationship between Consumer Emotional Responses toward Brand
Extension and Consumer Brand Loyalty toward Brand Extension
........................................................................................................57
3.4.5. Relationship between Consumer Satisfaction toward Brand Extension
and Consumer Brand Loyalty toward Brand Extension ................57
3.5. Parent Brand Resonance ...........................................................................58
3.5.1. Consumer Attitudinal Attachment .................................................59
3.5.2. Consumer Sense of Community ....................................................60
3.5.3. Brand Extension’s Feedback Effect on Parent Brand ....................60
3.5.4. Relationship between Consumer Attitudinal Attachment toward parent
brand and Consumer Sense of Community toward Parent Brand
vii
........................................................................................................62
3.6. Perceived Image Fit between Parent Brand and Brand Extension
........................................................................................................64
3.7. Summary of Proposed Hypotheses ...........................................................68
3.8. Proposed Framework ................................................................................70
III. METHODOLOGY ................................................................................................71
1. Research Design...............................................................................................71
2. Survey Instrument ............................................................................................71
3. Pilot Test ..........................................................................................................79
4. Sampling and Data Collection .........................................................................82
4.1. Sampling Plan ...........................................................................................82
4.2. Sample Size ...............................................................................................82
4.3. Data Collection Procedure ........................................................................83
5. Data Analysis ...................................................................................................86
5.1. Data Preparation........................................................................................86
5.2. Descriptive Analysis .................................................................................87
5.3. Confirmatory Factor Analysis...................................................................88
5.4. Structural Model Analysis ........................................................................91
5.5. Hierarchical Regression for Moderating Effects Testing .........................91
5.6. Common Method Variance and Bias ........................................................91
viii
Chapter Page
IV. FINDINGS .............................................................................................................93
1. Descriptive Analysis of the Demographic Profile ...........................................93
2. Measurement Model ........................................................................................95
2.1. Measurement Model Fit ............................................................................95
2.2. Reliability and Validity .............................................................................97
2.3. Common Method Variance .......................................................................99
3. Structural Model ............................................................................................100
3.1. Proposed Structural Model .....................................................................100
3.2. Competing Models ..................................................................................104
3.2.1. Competing Model 1 .....................................................................104
3.2.2. Competing Model 2 .....................................................................106
3.3. Mediation Analysis .................................................................................109
3.3.1. Mediating role of perceived overall quality toward brand extension on
the relationship between brand extension’s attribute-level performance
and consumer emotional responses toward brand extension .......110
3.3.2. Mediating role of perceived overall quality toward brand extension on
the relationship between Brand Extension’s Brand Personality and
consumer emotional responses toward brand extension ..............110
3.3.3. Mediating role of consumer emotional responses toward brand
extension on the relationship between perceived overall quality toward
brand extension and consumer satisfaction toward brand extension
......................................................................................................110
3.3.4. Mediating role of consumer satisfaction toward brand extension on the
relationship between perceived overall quality toward brand extension
and consumer brand loyalty toward brand extension ..................112
3.3.5. Mediating role of consumer satisfaction toward brand extension on the
relationship between consumer emotional responses toward brand
extension and consumer brand loyalty toward brand extension ..112
3.3.6. Mediating role of consumer attitudinal attachment toward parent brand
on the relationship between consumer brand loyalty toward brand
extension and consumer sense of community toward parent brand
......................................................................................................113
4. Moderating Effects of Perceived Image Fit ...................................................114
4.1. Moderating Effect of Perceived Image Fit on the Relationship between
Consumer Brand Loyalty toward Brand Extension and Consumer Attitudinal
Attachment toward Parent Brand .............................................................114
4.2. Moderating Effect of Perceived Image Fit on the Relationship between
Consumer Brand Loyalty toward Brand Extension and Consumer Sense of
Community toward Parent Brand ............................................................115
5. Summary of Hypotheses Testing Results ......................................................117
ix
V. CONCLUSION ....................................................................................................119
1. Summary of Findings .....................................................................................119
2. Discussions ....................................................................................................120
2.1. The Effects of Brand Association on Consumer Judgment toward Brand
Extension..................................................................................................120
2.2. The Effects of Consumer Judgment on Consumer Brand Loyalty toward
Brand Extension .......................................................................................121
2.3. The Effects of Consumer Brand Loyalty toward Brand Extension on Parent
Resonance ................................................................................................124
2.4. The Moderating Effect of Perceived Image Fit ......................................124
3. Contributions..................................................................................................125
3.1. Theoretical Contributions .......................................................................125
3.2. Empirical Contributions ..........................................................................126
4. Limitations and Future Studies ......................................................................129
4.1. Limitations ..............................................................................................129
4.2. Future Studies .........................................................................................131
4.2.1. Exploring the Role of Interactive Marketing Factors ...................131
4.2.2. Exploring the Role of Hotel Membership .....................................132
4.2.3. Exploring the Role of Hotel Segment ...........................................132
REFERENCES ..........................................................................................................134
APPENDICES ...........................................................................................................166
1. Survey Questionnaires ...................................................................................166
1.1. Hilton Version .........................................................................................166
1.2. Hyatt Version ..........................................................................................176
1.3. InterContinental Version .........................................................................186
1.4. Marriott Version......................................................................................196
1.5. Starwood Version....................................................................................207
2. IRB Approval Pages ......................................................................................217
x
LIST OF TABLES
Table Page
1. Top lodging companies’ brand extensions in the U.S. .........................................5
2. Definitions of customer-based brand equity. ......................................................17
3. Cited studies of customer-based brand equity. ...................................................25
4. Determinants of brand extension success. ..........................................................28
5. Measuring items and scales of hotel attribute-level performance. .....................35
6. Brand personality dimensions and contents. .......................................................39
7. Measuring items and scales of brand personality. ..............................................41
8. Measurements items and scales of perceived overall quality. ............................43
9. Measurements items and scales of consumer emotional responses. ...................48
10. Measurements items and scales of consumer satisfaction. .................................53
11. Measurements items and scales of consumer loyalty. ........................................56
12. Measurements items and scales of perceived image fit between parent brand and
brand extension. ..................................................................................................65
13. Section II measurement instruments. ..................................................................73
14. Section III measurement instruments..................................................................74
15. Section IV measurement instruments. ................................................................76
16. Section V measurement instruments. ..................................................................77
17. Section VI measurement instruments. ................................................................78
18. Items deleted based on pilot test. ........................................................................80
19. Reliability of constructs. .....................................................................................81
20. Rotated factor matrix of consumer emotional responses toward brand extension .
.............................................................................................................................81
21. GOF Indices. .......................................................................................................89
22. Demographic profile. ..........................................................................................94
23. Measurement model goodness-of-fit. .................................................................96
24. Measurement model standardized regression weights. .......................................96
25. Means, standard deviations, and correlations among latent constructs. .............97
26. CFA for measurement model. .............................................................................98
27. Discriminant validity for measurement model ...................................................99
28. Structural model goodness-of-fit ......................................................................102
29. Structural path estimates ...................................................................................102
30. Fit statistics of the original and competing models ..........................................108
31. Moderating effect of perceived image fit on the relationship between consumer
xi
brand loyalty toward brand extension and consumer attitudinal attachment toward
parent brand ......................................................................................................115
32. Moderating effect of perceived image fit on the relationship between consumer
brand loyalty toward brand extension and consumer sense of community toward
parent brand ......................................................................................................116
xii
LIST OF FIGURES
Figure Page
1. Aaker’s (1991) Customer-based Brand Equity Model .......................................19
2. Keller’s (1993) Customer-based Brand Equity Model .......................................21
3. Keller’s (2001) Brand Resonance Model ...........................................................23
4. Keller & Lehmann’s (2003) Brand Value Chain Model ....................................24
5. Hypothesized Framework H1-H5 .......................................................................52
6. Hypothesized Framework H6-H10 .....................................................................58
7. Hypothesized Framework H11-H13 ...................................................................63
8. Hypothesized Framework H14-H15 ...................................................................67
9. Hypothesized Model ..........................................................................................70
10. Hypothesized model with Path Estimates .........................................................103
11. Competing Model 1 with Path Estimates..........................................................105
12. Competing Model 2 with Path Estimates..........................................................107
13. Mediator ............................................................................................................109
14. Summary of Hypotheses Results ......................................................................108
1
CHAPTER I
INTRODUCTION
This chapter includes the sections of brand equity, brand extension, brand extension in
the U.S. lodging industry, problem statement, purposes of the study, objectives of the study,
significance of the study, and organization of the study.
1. Brand Equity
The term “brand” refers to the “name, term, design, symbol, or any other feature that
identifies one seller’s good or service as distinct from those of other sellers” (American
Marketing Association [AMA] Dictionary, 1995). However, the brand is treated far beyond a
name, a design, or a symbol due to its significant contributions to the product/service’s strategic
differentiation and the competitive advantages created to the firm (Wood, 2000). Accordingly, a
brand is usually managed as a firm’s valuable long-term asset that creates benefits and value to
both the consumers and firms (Wood, 2000). Recognizing the significant economic rewards,
building a strong brand has become a firm’s operation priority and received a great deal of
attention (Keller, 2001).
Brand equity is defined as “the marketing effects or outcomes that accrue to a product
with its brand name compared with those that would accrue if the same product did not have the
2
brand name” (Ailawadi, Lehmann, & Neslin, 2003, p. 1). Although this definition is accepted, the
brand equity measurement has received divergent viewpoints and disagreement when the researchers
conduct further discussions (Ailawadi et al., 2003). Generally speaking, the concept of brand equity
can be viewed from the financial-based perspective and customer-based perspective. The financial-
based brand equity represents firm-level outcomes, such as price, market share, incremental volume,
revenue premium, incremental cash flow, and profit from the branded product compared with those
from the unbranded product (Ailawadi et al., 2003; Simon & Sullivan, 1993). Unlike financial-based
brand equity, customer-based brand equity represents consumer-level effects, such as attitudes,
awareness, differentiated image not interpreted by product attributes, utility, loyalty, and knowledge
(Ailawadi et al., 2003). Ailawadi et al. (2003) pointed out the link between these two perspectives,
that was, the financial outcomes were the aggregated consequence of customer-based brand equity.
The commonality shared by these two perspectives emphasizes the power of brand equity on
improving a firm’s long-term profitability and increasing added value (Wood, 2000). Given the
importance, brand equity has received attention from a variety of firm’s stakeholders, such as
investors, manufacturers, retailers, and consumers (Cobb-Walgren, Ruble, & Donthu, 1995).
Apparently, brand equity is frothy to other stakeholders without benefiting consumers (Farquhar,
1989). The strong brand equity can positively shape consumer purchase preference and intention
(Cobb-Walgren et al., 1995). Therefore, understanding the mechanism of creating brand value in
consumer’s mind and transferring to consumer’s choice behaviors is crucial to managing the brand
equity strategically and holistically (Aaker, 1992; Cobb-Walgren et al., 1995; Wood, 2000).
Customer-based brand equity (hereafter denoted by CBBE) perspective has been raised based
on this concern. The definitions of CBBE falls into two categories, which involve consumer
perceptions and behaviors, respectively (Cobb-Walgren et al., 1995). One of the remarkable
definitions by Keller (1993, p. 2) defines the CBBE from consumer perception’s perspective as “the
3
differential effect of brand knowledge on consumer response to the marketing of the brand.” More
specifically, consumer’s brand knowledge comes up with brand awareness (i.e., brand recall and
brand recognition) and brand image (Keller, 1993). That is to say, given a brand recalled and
recognized by a consumer, positive customer-based brand equity possibly occurs if the consumer has
favorable, strong, and unique brand associations in the memory (Keller, 1993). Alternatively, Aaker
(1991, p.15) defined the CBBE as “a set of assets and liabilities associated linked to a brand, its name,
and symbol, that add to or subtract from the value provided by a product or service to the firm and to
that firm’s customers.” This definition incorporates perceptual perspective and behavioral perspective
(Cobb-Walgren et al., 1995), and proposes five primary CBBE elements (i.e., brand awareness, brand
associations, perceived quality, brand loyalty, and other proprietary assets) (Aaker, 1991). However,
given the inherent subjectivity, the use of CBBE has sometimes been viewed as flawed (Cobb-
Walgren et al., 1995; Simon & Sullivan, 1993). Nevertheless, CBBE is practically productive to
motivate firm managers to speculate what and how the consumers would like to think about their
brand (Szőcs, 2012).
2. Brand Extension
A brand extension is defined as “an existing brand name that is being extended to a category
of products that is different to the existing one” (Schuiling & Moss, 2004, p. 375). It is used
equivalently with the term sub-brand, which is defined as “a product brand that has its own name and
identify to differentiate it from the parent brand” (Jo, 2007, p. 184). Aaker’s (1991) and Keller’s
(1993) customer-based brand equity concepts and models significantly demonstrate the importance of
brand associations (Moisescu, 2005), and establish a theoretical foundation of brand extension
development. Brand associations consist of some elements, such as product attributes, customer
benefits, uses, users, lifestyles, product classes, competitors, and countries (Aaker, 1992). Given an
established brand, a firm normally tends to capitalize the brand on the new product/service as a way
to reduce advertising costs (Smith & Park, 1992), and exploits new market opportunities by utilizing
4
its brand associations (Aaker & Keller, 1990; Chowdhury & Kabir, 2007; Kerin, Kalyanaram, &
Howard, 1996). Following such ways, brand extension has been used to leverage brand strength
(Aaker & Keller, 1990; Aaker, 1996), and helps to enter into new product categories (Keller & Aaker,
1992). For example, Church & Dwight Co., Inc. has extended its “ARM & HAMMER” brand into
multiple product categories, including deodorization, fabric care, personal care, and pet care. This
example demonstrates how an existing brand horizontally extends to the related or new product
categories (Kim & Lavack, 1996). Alternatively, vertical extension refers to “a brand extension in the
same product category as the core brand, but at a different price point and quality level” (Kim &
Lavack, 1996, p.24). For example, InterContinental Hotels Group has vertically extended brands,
such as “Holiday Inn Hotel” and “Holiday Inn Express Hotel,” that attract the consumers who are
willing to stay in a simple and engaging hotel. The horizontal extension usually offers consumers the
variations at the same price or quality level. The vertical extension is characterized to promote a
firm’s product/service at the lower price or quality level (i.e., downward extension), or at the higher
price or quality level (i.e., upward extension) in the same product category (Keller & Aaker, 1992;
Kim, Lavack, & Smith, 2001). Technically, the second brand descriptor is commonly alongside the
parent brand name to clarify the association between the brand extension and parent brand (Kim &
Lavack, 1996). For example, the brand “Fairfield Inn & Suites by Marriott” uses a nested branding
strategy to create a further distance to its parent brand “Marriott.” An alternative example comes from
the brand “Hilton Garden Inn,” which employs a sub-branding strategy to keep its name adjacent to
the parent brand name “Hilton” (Bhat, Kelley, & O’Donnell, 1998).
3. Brand Extension in the U.S. Lodging Industry
Brand extension has been widely used to leverage brand strength in the U.S. lodging industry
since the 1970s, mainly due to the reduction of market launching costs and risks (Jiang, Dev, & Rao,
2002; Kang & Lee, 2014). Most of the U.S. well-known chained-branded lodging companies have at
least one brand extension associated with the parent brand (Kim & Lavack, 1996). Table 1 shows
5
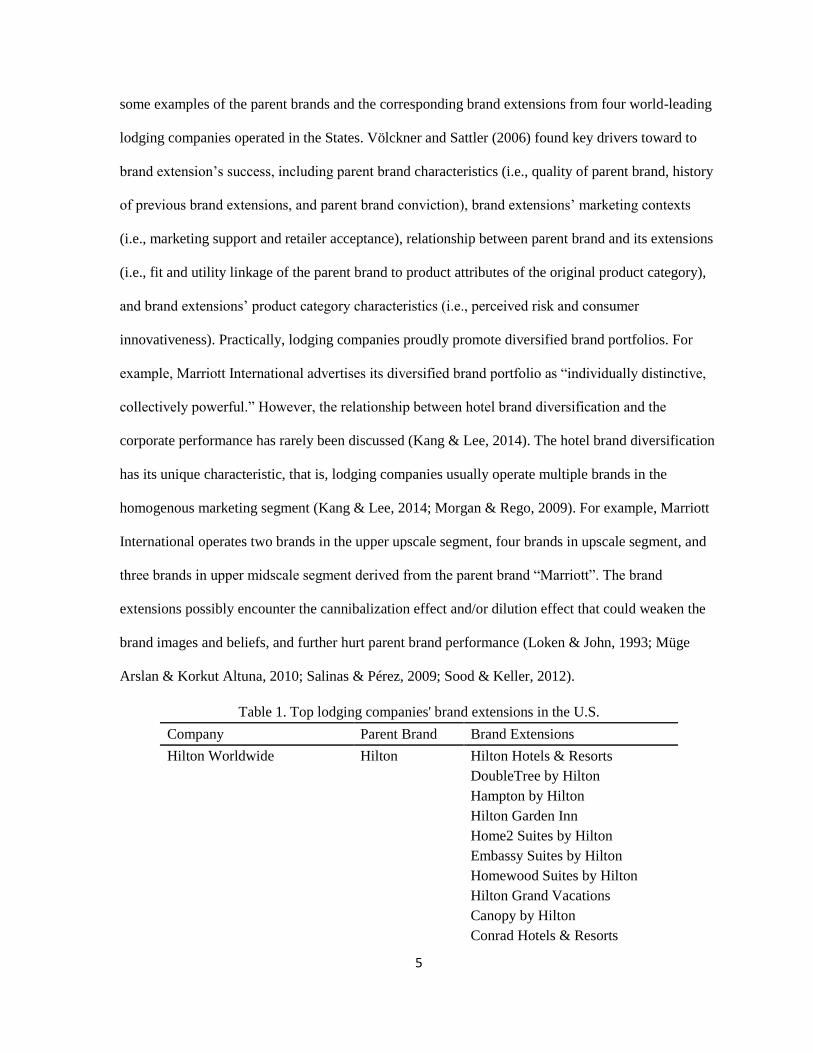
some examples of the parent brands and the corresponding brand extensions from four world-leading
lodging companies operated in the States. Völckner and Sattler (2006) found key drivers toward to
brand extension’s success, including parent brand characteristics (i.e., quality of parent brand, history
of previous brand extensions, and parent brand conviction), brand extensions’ marketing contexts
(i.e., marketing support and retailer acceptance), relationship between parent brand and its extensions
(i.e., fit and utility linkage of the parent brand to product attributes of the original product category),
and brand extensions’ product category characteristics (i.e., perceived risk and consumer
innovativeness). Practically, lodging companies proudly promote diversified brand portfolios. For
example, Marriott International advertises its diversified brand portfolio as “individually distinctive,
collectively powerful.” However, the relationship between hotel brand diversification and the
corporate performance has rarely been discussed (Kang & Lee, 2014). The hotel brand diversification
has its unique characteristic, that is, lodging companies usually operate multiple brands in the
homogenous marketing segment (Kang & Lee, 2014; Morgan & Rego, 2009). For example, Marriott
International operates two brands in the upper upscale segment, four brands in upscale segment, and
three brands in upper midscale segment derived from the parent brand “Marriott”. The brand
extensions possibly encounter the cannibalization effect and/or dilution effect that could weaken the
brand images and beliefs, and further hurt parent brand performance (Loken & John, 1993; Müge
Arslan & Korkut Altuna, 2010; Salinas & Pérez, 2009; Sood & Keller, 2012).
Table 1. Top lodging companies' brand extensions in the U.S.
Company Parent Brand Brand Extensions
Hilton Worldwide Hilton Hilton Hotels & Resorts
DoubleTree by Hilton
Hampton by Hilton
Hilton Garden Inn
Home2 Suites by Hilton
Embassy Suites by Hilton
Homewood Suites by Hilton
Hilton Grand Vacations
Canopy by Hilton
Conrad Hotels & Resorts
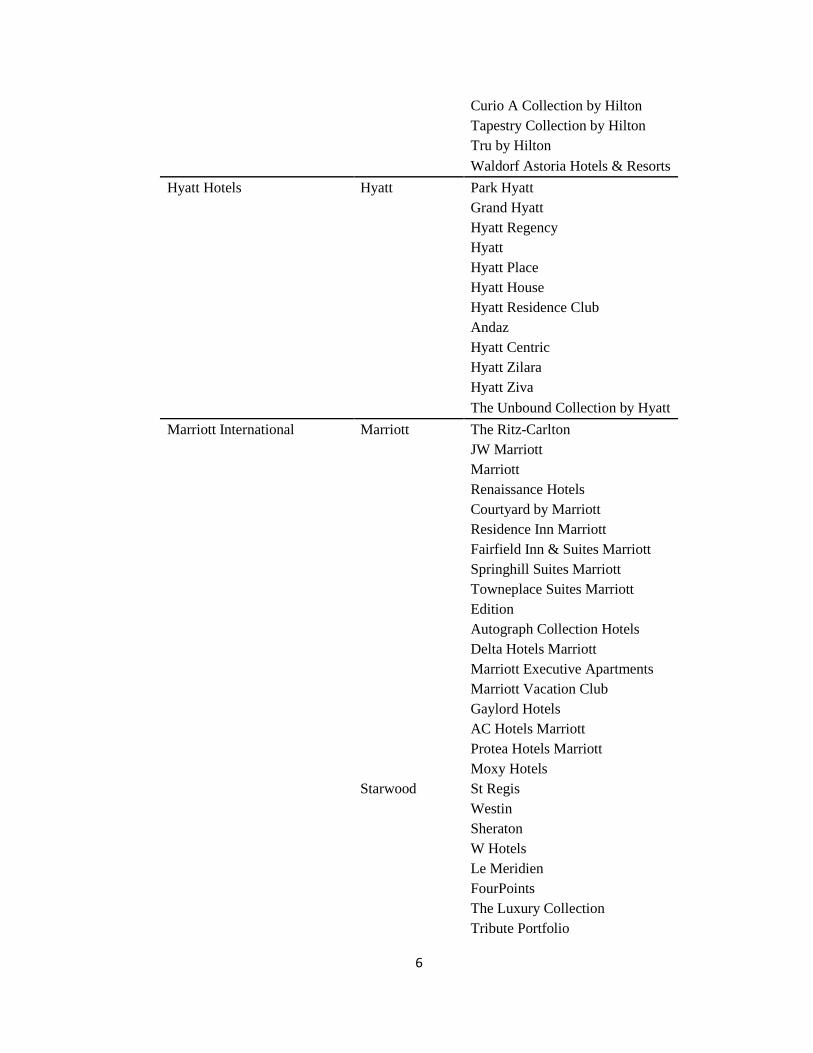
6
Curio A Collection by Hilton
Tapestry Collection by Hilton
Tru by Hilton
Waldorf Astoria Hotels & Resorts
Hyatt Hotels Hyatt Park Hyatt
Grand Hyatt
Hyatt Regency
Hyatt
Hyatt Place
Hyatt House
Hyatt Residence Club
Andaz
Hyatt Centric
Hyatt Zilara
Hyatt Ziva
The Unbound Collection by Hyatt
Marriott International Marriott The Ritz-Carlton
JW Marriott
Marriott
Renaissance Hotels
Courtyard by Marriott
Residence Inn Marriott
Fairfield Inn & Suites Marriott
Springhill Suites Marriott
Towneplace Suites Marriott
Edition
Autograph Collection Hotels
Delta Hotels Marriott
Marriott Executive Apartments
Marriott Vacation Club
Gaylord Hotels
AC Hotels Marriott
Protea Hotels Marriott
Moxy Hotels
Starwood St Regis
Westin
Sheraton
W Hotels
Le Meridien
FourPoints
The Luxury Collection
Tribute Portfolio
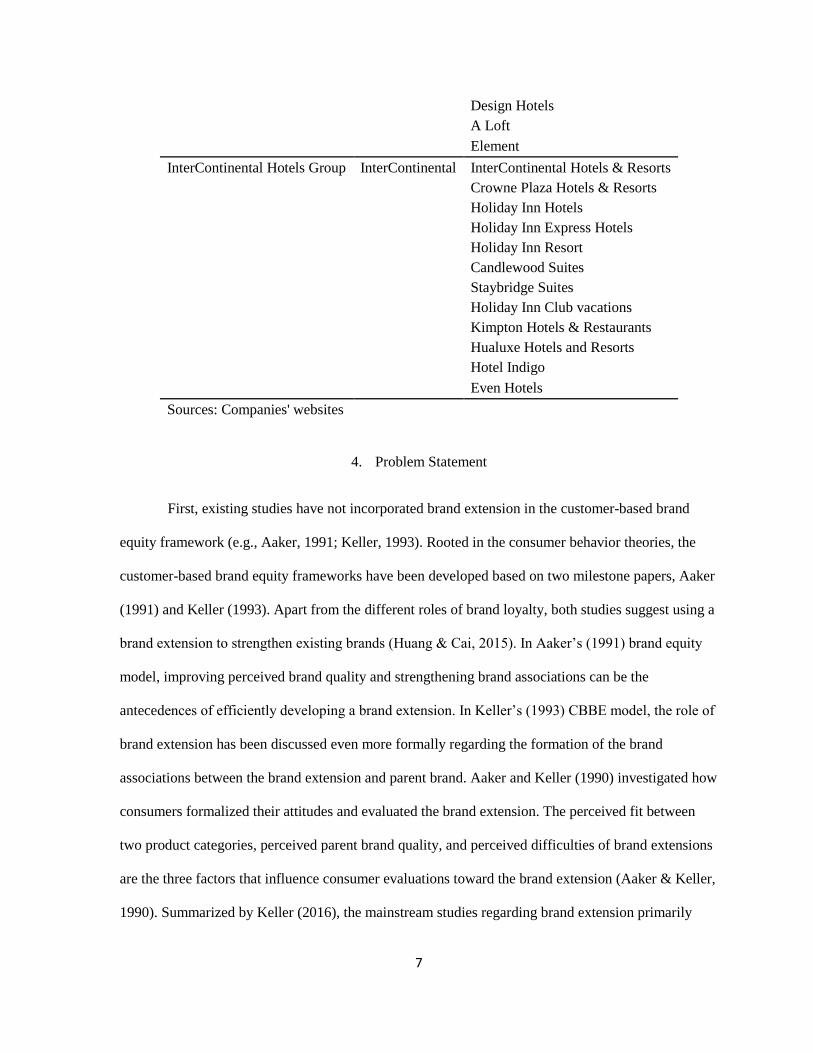
7
Design Hotels
A Loft
Element
InterContinental Hotels Group InterContinental InterContinental Hotels & Resorts
Crowne Plaza Hotels & Resorts
Holiday Inn Hotels
Holiday Inn Express Hotels
Holiday Inn Resort
Candlewood Suites
Staybridge Suites
Holiday Inn Club vacations
Kimpton Hotels & Restaurants
Hualuxe Hotels and Resorts
Hotel Indigo
Even Hotels
Sources: Companies' websites
4. Problem Statement
First, existing studies have not incorporated brand extension in the customer-based brand
equity framework (e.g., Aaker, 1991; Keller, 1993). Rooted in the consumer behavior theories, the
customer-based brand equity frameworks have been developed based on two milestone papers, Aaker
(1991) and Keller (1993). Apart from the different roles of brand loyalty, both studies suggest using a
brand extension to strengthen existing brands (Huang & Cai, 2015). In Aaker’s (1991) brand equity
model, improving perceived brand quality and strengthening brand associations can be the
antecedences of efficiently developing a brand extension. In Keller’s (1993) CBBE model, the role of
brand extension has been discussed even more formally regarding the formation of the brand
associations between the brand extension and parent brand. Aaker and Keller (1990) investigated how
consumers formalized their attitudes and evaluated the brand extension. The perceived fit between
two product categories, perceived parent brand quality, and perceived difficulties of brand extensions
are the three factors that influence consumer evaluations toward the brand extension (Aaker & Keller,
1990). Summarized by Keller (2016), the mainstream studies regarding brand extension primarily
8
focus on (1) the salience, favorability, and uniqueness of the inferred associations in the extension
class (Keller & Aaker, 1992), and (2) how compelling, relevant, consistent, and strong feedback
effect of brand extension on the parent brand (Keller & Sood, 2003). Given the brand resonance
model proposed by Keller (2001) which is a development from Keller (1993)’s CBBE framework, by
reviewing the literature, I find that there is no study exploring how hotel brand extension influences
consumer rational and emotional responses toward the brand extension and further affects parent
brand resonance intensity. The incremental value of hotel brand extension to hotel parent brand
resonance intensity is neglected in the existing literature, despite the fact that the brand extensions
have been heavily developed in the U.S. lodging industry. However, it is necessary to emphasize this
problem as the importance of brand-consumer relationship increasing in the competitive lodging
market.
Second, consumer emotional responses toward service brand extension have been not well
established based on my literature review. Keller (2001) described the term “brand feelings” as the
consumer emotional responses to the brand marketing strategies. The marketing programs related to
brand possibly evoke consumer feelings about themselves and the relationship with others (Keller,
2001). The relationship between advertising and consumer emotions has been well studied (Panda,
Panda, & Mishra, 2013; Yang, Kim, & Yoo, 2013). Percy and Elliot (2007) argued that consumers
not only considered brand benefits and features but also considered their emotional feelings toward
the brands when they retrieved the brand information from their memories. The emotional benefits
may affect the consumers’ brand beliefs (Ruth, 2001). The emotional attachments (e.g., brand love)
strengthen consumer long-term relationships with the brands (Fournier, 1998). The affect associated
with the parent brand can be transferred to the brand extension through the affect-transfer process
(Boush & Loken, 1991; Keller & Aaker, 1992). The positive and negative emotions toward a brand
may lead to different degrees of abstract construal level and further cause consumer different
psychological distances (Chowdhry et al., 2015; Labroo & Patrick, 2009; Morales & Fitzsimons,
9
2007). Accordingly, consumer emotions influence their purchase decisions toward the brand.
However, I found that there are limited numbers of studies that had addressed the role of emotions in
hotel brand extension context according to my literature review.
5. Purpose of the Study
The main purposes of this study are (1) to establish an integrated customer-based brand
extension equity resonance model in the U.S. lodging context; and (2) to provide practical
suggestions for hotel practitioners to build strong brands.
6. Objectives of the Study
The specific objectives of the study are:
1. To test the effects of hotel brand extension’s attribute-level performance on perceived overall
quality toward brand extension and consumer emotional responses toward brand extension;
2. To examine the effects of hotel brand extension’s brand personality on perceived overall
quality toward brand extension and consumer emotional responses toward brand extension;
3. To investigate the effects of perceived overall quality toward hotel brand extension on
consumer emotional responses toward brand extension, consumer satisfaction toward brand
extension, and consumer brand loyalty toward brand extension;
4. To explore the effects of consumer emotional responses toward hotel brand extension on
consumer satisfaction toward brand extension and consumer brand loyalty toward brand
extension;
5. To assess the effect of consumer satisfaction toward hotel brand extension on consumer brand
loyalty toward brand extension;
6. To identify the effects of consumer brand loyalty toward hotel brand extension on consumer
sense of community toward parent brand and consumer attitudinal attachment toward parent
brand;
10
7. To investigate the effect of consumer attitudinal attachment toward hotel parent brand on
consumer sense of community toward parent brand;
8. To examine the moderating effects of perceived image fit between hotel brand extension and
parent brand on
(1) the relationship between consumer brand loyalty toward brand extension and consumer
sense of community toward parent brand;
(2) the relationship between consumer brand loyalty toward brand extension and consumer
attitudinal attachment toward parent brand.
7. Significance of the Study
7.1. Theoretical Contributions
First, this study investigated the crucial roles of hotel brand extension’s attribute-level
performance and brand extension’s brand personality in the brand resonance model in the context of
the U.S. lodging industry. As one of the most influential papers in the CBBE literature, Keller (1993)
proposed the construct of brand knowledge, that consisted of brand awareness and brand associations
and pointed out the importance of brand knowledge on building customer-based brand equity. In the
follow-up studies, there were three brand planning models proposed by him and other scholars,
including brand positioning model, brand resonance model, and brand value chain model (Keller,
2016). These mentioned models provide the comprehensive insights of consumer minds, which react
to different marketing activities toward the brand and affect brand equity. By reviewing the literature,
I found that the role of the brand extension had been discussed insularly with the brand equity
framework. This study investigated the impacts from different types of brand extension associations
on the consumer responses, given brand extension developed from the existing marketing activity
perceived by consumers. I discussed the roles of brand extension’s self-associated attribute-level
performance and brand extension’s brand personality. The proposed model emphasized the roles of
11
brand extension’s associations on enhancing brand extension’s marketing performance and parent
brand’s resonance mediated by the consumer responses. The model comprehensively investigated the
mechanism of how brand extension strengthened corporate parent brand. Moreover, this study
extended the discussions to the dimensions of the parent brand resonance intensity (i.e., sense of
community and attitudinal attachment) as the consequences of brand extension beyond consumer
brand loyalty toward brand extension. The study enriched brand extension literature by discussing the
brand-consumer relationship and exploring the link between hotel brand extension and parent brand
resonance.
Second, this study investigated the mediating effects of consumer emotional responses
toward hotel brand extension on the relationship between brand associations and brand extension’s
marketing performance (e.g., consumer satisfaction toward brand extension and consumer brand
loyalty toward brand extension). Given the extensive studies related the effects of brand associations
on the consumer evaluations, the consumer emotions are influenced by different types of brand
associations simultaneously as well as their rational judgments. Accordingly, the consumer
satisfaction and brand loyalty are triggered by their cognitive evaluations and affective feelings.
Inspired by Keller’s (2001) brand resonance model, this study empirically investigated the mediating
effects of the consumer emotional responses toward brand extension in the lodging context. This
study extended the consumer emotional responses studies from the field of consumer satisfaction to
the brand equity framework and investigated how consumer emotional responses mediated brand
extension associations and consumer satisfaction and consumer brand loyalty toward hotel brand
extension.
7.2. Practical Contributions
This study explored brand extension value chain from customer-based brand equity’s
perspective. Aiming to build sound brands for the lodging firms, this study found how brand
12
associations influenced consumer responses throughout a specific marketing strategy (i.e., extending
the brand). It provided lodging practitioners the insights that different brand associations have
different effects on consumer emotional feelings and rational judgments. Moreover, this study
investigated how consumer brand loyalty toward hotel brand extension affected the brand-consumer
relationship at the parent brand level. The results provided three suggestions to the hotel managers
regard to the brand building. First, the hotel managers should pay attention to develop brand
extension associations. Second, marketing the significant associations linked with the consumer
emotional responses should be taken a larger weight. Third, the hotel managers should focus on the
brand-consumer relationships.
8. Organization of the Study
This study is organized into five chapters. Chapter I provides an overview of customer-based
brand equity, brand extension, problem statement, purposes, objectives, and significance of the
present study. Chapter II provides literature reviews in brand extension, theories, conceptual
frameworks, hypotheses, and the proposed theoretical model. Chapter III provides research design,
survey instrument, sampling and data collection process, and data analysis methods. Chapter VI
presents the results of the study. Chapter V provides conclusions and implications for the future
research.
13
CHAPTER II
REVIEW OF LITERATURE
This chapter reviewed the relevant literature and proposed the conceptual model and
hypotheses. The chapter consisted of three sections. The first section reviewed the concept of
brand equity and summarized the influential models of customer-based brand equity. The second
section provided an overview of the brand extension studies. The third section proposed the
conceptual research model and hypotheses in the context of the U.S. lodging industry.
1. Customer-based Brand Equity Related Studies
1.1. Definitions of Brand Equity from a Consumer’s Perspective
Because the concept of brand exists in the mind of the market, brand management closely
relates to the management of consumer perceptions (Rosenbaum-Elliott et al., 2015). A brand is
defined as the “name, term, design, symbol, or any other feature that identifies one seller’s good
or service as distinct from those of other sellers” (American Marketing Association [AMA]
Dictionary, 1995). Having a brand allows the consumers experiencing, evaluating, feeling, and
associating with the perceived value of a product (Rosenbaum-Elliott et al., 2015). To manage the
brands, the firms may implement many branding strategies. The branding strategies initially
worked for the purposes of differentiating products and conferring meanings through the designed
brand image (Moor, 2007). Later on, their importance has been amplified in growing competitive
14
market (Melewar, Lim, & Yan, 2010). Accordingly, the school of thought that focuses on the
contingent relationships between brand and corporate reputation has been labeled as the brand
management perspective (Salinas, 2009). In the meantime, two alternative perspectives,
accounting perspective, and economic perspective, have been widely discussed (Salinas, 2009).
Unlike accounting perspective, economic perspective treats a brand as an intangible asset, despite
the fact that the internally generated brands are not recognizable based on the International
Accounting Standard 38 that was effective after January 1st, 2014.
Motivated by financial and strategic purposes, the academics and practitioners have paid
increasing attention to conceptualizing, measuring, and managing the brand equity since the
1980s (Keller, 1993). Aiming to measure marketing performance, justify share prices, trade
brands, and manage taxes, defining and valuating a brand as equity has become a widely
acceptable approach (Salinas & Amber, 2009). Broadly speaking, measuring brand equity is
based on the purposes to “guide marketing strategy and tactical decisions, assess the extendibility
of a brand, evaluate the effectiveness of marketing decisions, track the brand’s health compared
with that of competitors and over time, and assign a financial value to the brand in balance sheets
and financial transactions” (Ailawadi et al., 2003, p. 2). It does not only evaluate a firm’s
marketing spending productivity but also meet the accounting need of capitalizing and/or
amortizing the acquired brand (Abratt & Bick, 2003). The existing viewpoints on the
measurements of brand equity are divergent (Ailawadi et al., 2003). The financial-based
perspective focuses on measuring how a firm’s benefits are derived from the product and
financial markets through the brand (Ailawadi et al., 2003; Keller & Lehmann, 2001). For
example, Simon and Sullivan (1993, p. 29) described brand equity as “the incremental cash flows
which accrue to branded products over and above the cash flows which would result from the sale
of unbranded products.” Based on this viewpoint, a firm’s brand equity can be extracted from
other assets’ value (Simon & Sullivan, 1993). The firm’s discounted future cash flows evaluated
15
in the financial market is the basis for this method (Simon & Sullivan, 1993). By imposing such
objective and forward-looking measure, the brand equity is no longer limited on a firm’s short-
term activities but also includes an outlook of a brand’s long-term performance (Simon &
Sullivan, 1993). Another example is from Ailawadi et al. (2003) that investigated the revenue
premium from a branded product compared with that of an unbranded product, has been
investigated as a reliable brand equity measurement. Using the revenue premium from product
market allows the firm associating financial measurements with the consumers’ mindset
(Ailawadi et al., 2003). There are other approaches that hold financial-based perspective, such as
using experts’ judgments to evaluate the hypothetical mergers (Rao, Mahajan, & Varaiya, 1991)
and employing momentum accounting to focus on the brand’s momentum changes (Ijiri, 1988).
Although the financial-based perspective regard to brand equity has the superiority of quantifying
the incremental benefit from the brand (Ailawadi et al., 2003), it suffers from the apparent
disadvantages as well. Abratt and Bick (2003) pointed out that there were obstacles of separating
the brand equity from a firm’s other intangible assets and valuating them with estimation and
subjectivity. The reliability is weakened in the absence of the ideal data information (Salinas,
2016).
Besides the financial-based perspective, the customer-based perspective of brand equity
holds a different viewpoint from the consumer-level effects. By focusing on consumers’ mindset,
customer-based brand equity represents the consumer-level effects, such as attitudes, awareness,
and the differentiated image not interpreted by product attributes, utility, loyalty, and knowledge
(Ailawadi et al., 2003; Leuthesser, 1988). It can be treated as the antecedence of the firm’s
financial outcomes (Ailawadi et al., 2003). Additionally, the relevance of financial brand equity
valuation heavily relies on managers’ strategic knowledge of exploiting brand value from a set of
marketing activities (Keller, 1993). Therefore, the managers have to know, and response to
consumers’ needs and wants based on the brand concept that prompts brand communication
16
(Park, Jaworski, & Maclnnis, 1986). As a consequence, viewing brand equity from an individual
consumer’s perspective is helpful for the managers speculating what and how the consumers
think about the brand (Szőcs, 2012), and crucial to a firm’s financial outcomes.
Rooted in the consumer behavior theories, academics have made significant contributions
to conceptualizing customer-based brand equity since the 1990s. Table 2 summarizes the
influential CBBE definitions from literature. Considering the divergent CBBE definitions, Cobb-
Walgren et al. (1995) summarized them into two primary categories that focused on consumer
perceptions and consumer behavior, respectively. The remarkable work from the perspective of
consumer perceptions is Keller (1993). The CBBE is defined as “the differential effect of brand
knowledge on consumer response to the marketing of the brand” (Keller, 1993, p. 2). Discussed
from the marketing angle, brand knowledge is proposed as the core of brand equity (Keller,
1993). Consumer brand knowledge consists of their brand awareness (i.e., brand recall and brand
recognition) and brand image (Keller, 1993). Supported by associative network memory model
(Anderson, 1983), Keller (1993) treated brand awareness as consumer memory nodes, while
brand image as the bridges among these memory nodes. The associative network memory
mechanism has been agreed as a robust and applicable approach to interpreting many kinds of
marketing and consumer behavior phenomena (Keller, 2016). Given a brand recalled and/or
recognized by a consumer, positive customer-based brand equity occurs if the consumer has the
favorable, strong, and unique brand associations in his/her memories (Keller, 1993). Keller
(2001) proposed a four-step process that worked for building a strong CBBE. On the other hand,
Aaker (1991) proposed the CBBE definition through incorporating perceptual and behavioral
perspective (Cobb-Walgren et al., 1995). It defines the CBBE as “a set of assets and liabilities
associated linked to a brand, its name, and symbol, that add to or subtract from the value provided
by a product or service to the firm and to that firm’s customers.” (Aaker, 1991, p.15). This
definition emphasizes the brand added value and demonstrates the CBBE from five key
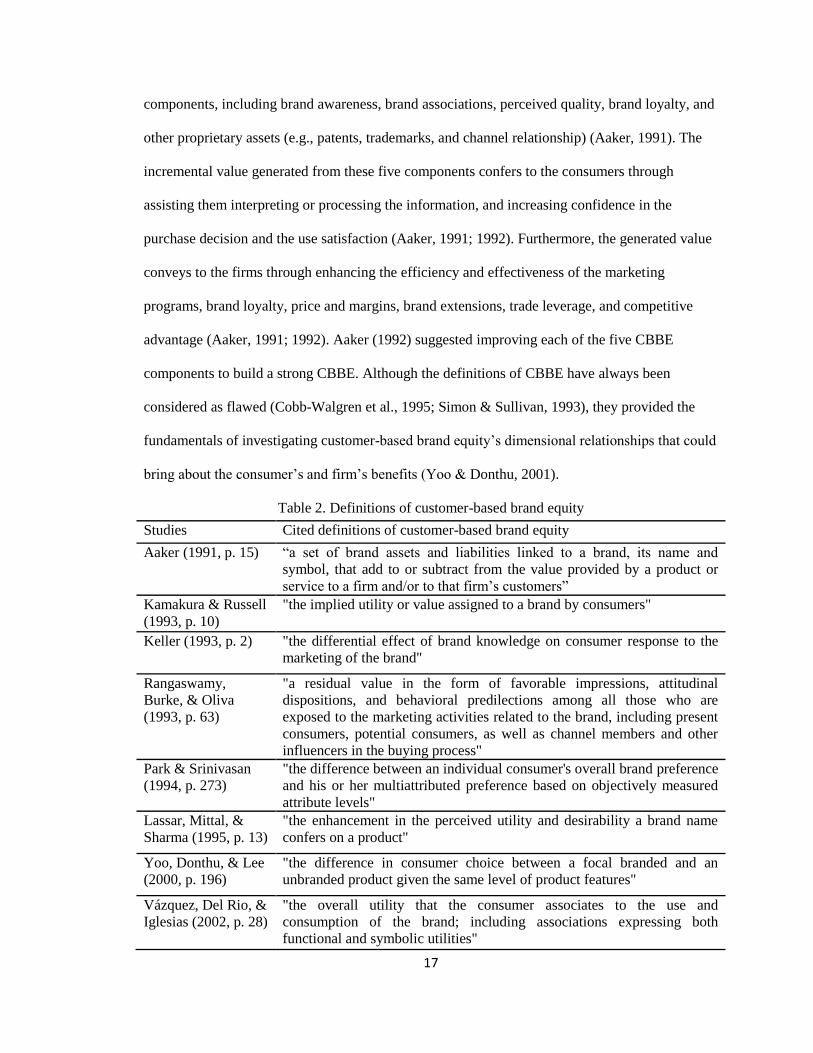
17
components, including brand awareness, brand associations, perceived quality, brand loyalty, and
other proprietary assets (e.g., patents, trademarks, and channel relationship) (Aaker, 1991). The
incremental value generated from these five components confers to the consumers through
assisting them interpreting or processing the information, and increasing confidence in the
purchase decision and the use satisfaction (Aaker, 1991; 1992). Furthermore, the generated value
conveys to the firms through enhancing the efficiency and effectiveness of the marketing
programs, brand loyalty, price and margins, brand extensions, trade leverage, and competitive
advantage (Aaker, 1991; 1992). Aaker (1992) suggested improving each of the five CBBE
components to build a strong CBBE. Although the definitions of CBBE have always been
considered as flawed (Cobb-Walgren et al., 1995; Simon & Sullivan, 1993), they provided the
fundamentals of investigating customer-based brand equity’s dimensional relationships that could
bring about the consumer’s and firm’s benefits (Yoo & Donthu, 2001).
Table 2. Definitions of customer-based brand equity
Studies Cited definitions of customer-based brand equity
Aaker (1991, p. 15) “a set of brand assets and liabilities linked to a brand, its name and
symbol, that add to or subtract from the value provided by a product or
service to a firm and/or to that firm’s customers”
Kamakura & Russell
(1993, p. 10)
"the implied utility or value assigned to a brand by consumers"
Keller (1993, p. 2) "the differential effect of brand knowledge on consumer response to the
marketing of the brand"
Rangaswamy,
Burke, & Oliva
(1993, p. 63)
"a residual value in the form of favorable impressions, attitudinal
dispositions, and behavioral predilections among all those who are
exposed to the marketing activities related to the brand, including present
consumers, potential consumers, as well as channel members and other
influencers in the buying process"
Park & Srinivasan
(1994, p. 273)
"the difference between an individual consumer's overall brand preference
and his or her multiattributed preference based on objectively measured
attribute levels"
Lassar, Mittal, &
Sharma (1995, p. 13)
"the enhancement in the perceived utility and desirability a brand name
confers on a product"
Yoo, Donthu, & Lee
(2000, p. 196)
"the difference in consumer choice between a focal branded and an
unbranded product given the same level of product features"
Vázquez, Del Rio, &
Iglesias (2002, p. 28)
"the overall utility that the consumer associates to the use and
consumption of the brand; including associations expressing both
functional and symbolic utilities"
18
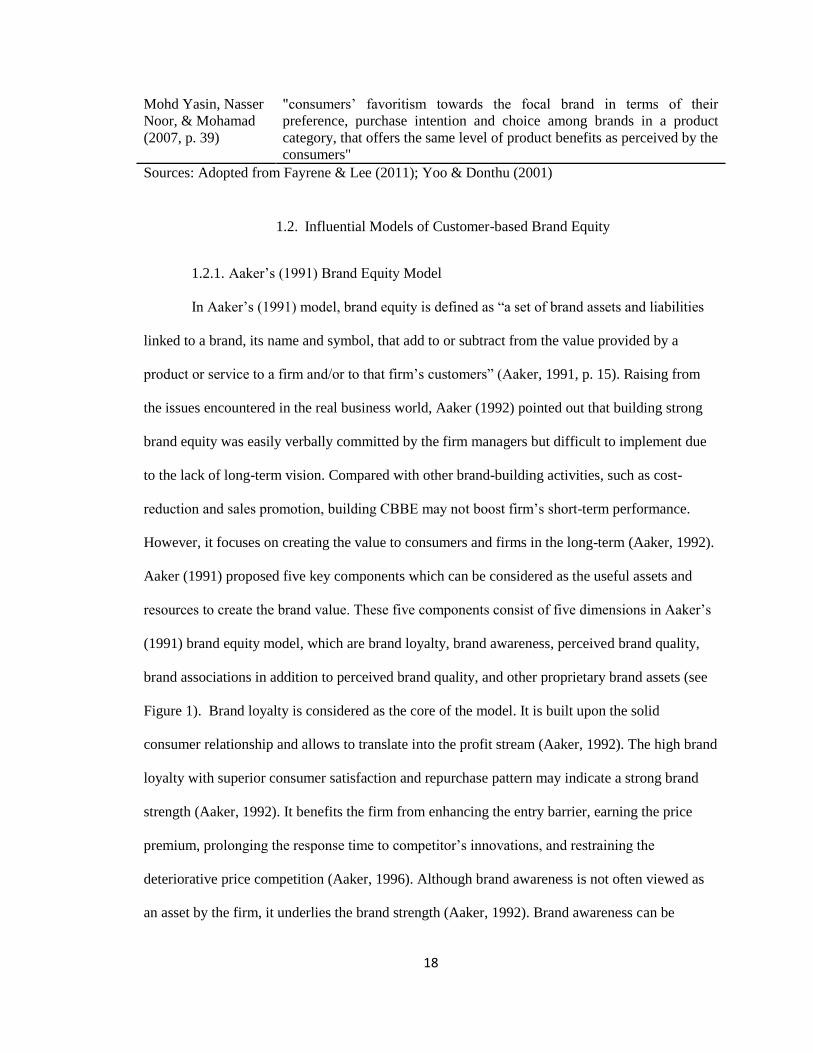
Mohd Yasin, Nasser
Noor, & Mohamad
(2007, p. 39)
"consumers’ favoritism towards the focal brand in terms of their
preference, purchase intention and choice among brands in a product
category, that offers the same level of product benefits as perceived by the
consumers"
Sources: Adopted from Fayrene & Lee (2011); Yoo & Donthu (2001)
1.2. Influential Models of Customer-based Brand Equity
1.2.1. Aaker’s (1991) Brand Equity Model
In Aaker’s (1991) model, brand equity is defined as “a set of brand assets and liabilities
linked to a brand, its name and symbol, that add to or subtract from the value provided by a
product or service to a firm and/or to that firm’s customers” (Aaker, 1991, p. 15). Raising from
the issues encountered in the real business world, Aaker (1992) pointed out that building strong
brand equity was easily verbally committed by the firm managers but difficult to implement due
to the lack of long-term vision. Compared with other brand-building activities, such as cost-
reduction and sales promotion, building CBBE may not boost firm’s short-term performance.
However, it focuses on creating the value to consumers and firms in the long-term (Aaker, 1992).
Aaker (1991) proposed five key components which can be considered as the useful assets and
resources to create the brand value. These five components consist of five dimensions in Aaker’s
(1991) brand equity model, which are brand loyalty, brand awareness, perceived brand quality,
brand associations in addition to perceived brand quality, and other proprietary brand assets (see
Figure 1). Brand loyalty is considered as the core of the model. It is built upon the solid
consumer relationship and allows to translate into the profit stream (Aaker, 1992). The high brand
loyalty with superior consumer satisfaction and repurchase pattern may indicate a strong brand
strength (Aaker, 1992). It benefits the firm from enhancing the entry barrier, earning the price
premium, prolonging the response time to competitor’s innovations, and restraining the
deteriorative price competition (Aaker, 1996). Although brand awareness is not often viewed as
an asset by the firm, it underlies the brand strength (Aaker, 1992). Brand awareness can be
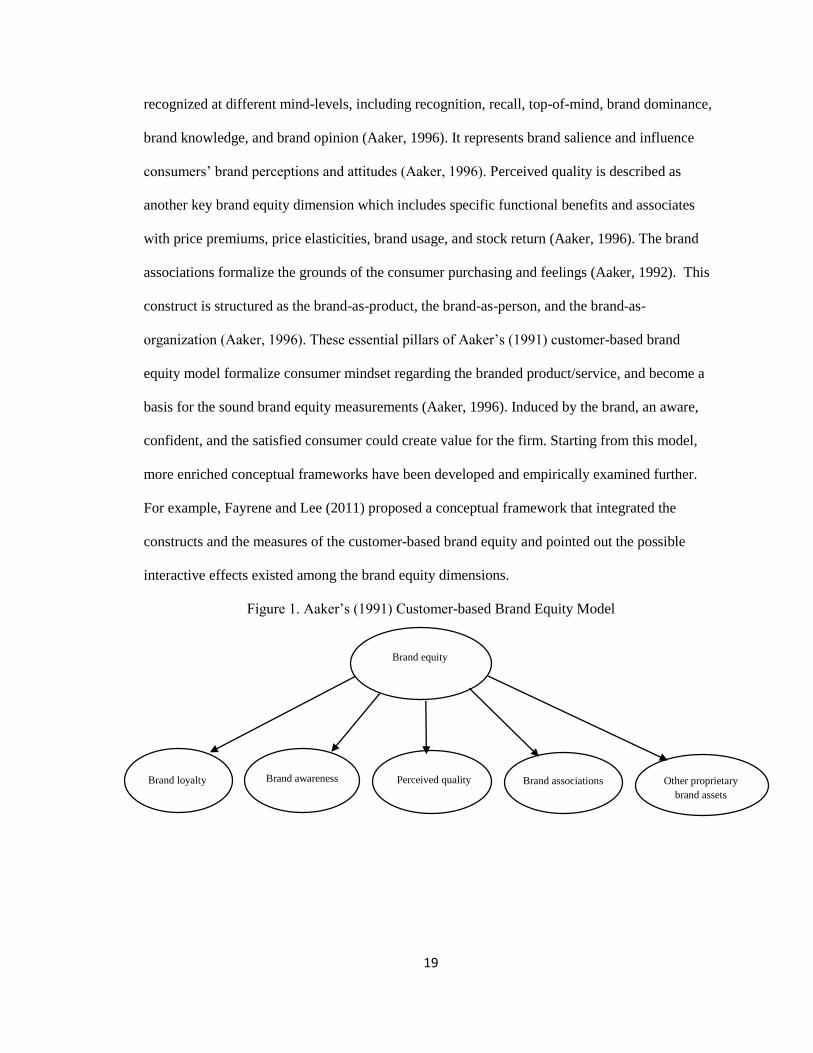
19
recognized at different mind-levels, including recognition, recall, top-of-mind, brand dominance,
brand knowledge, and brand opinion (Aaker, 1996). It represents brand salience and influence
consumers’ brand perceptions and attitudes (Aaker, 1996). Perceived quality is described as
another key brand equity dimension which includes specific functional benefits and associates
with price premiums, price elasticities, brand usage, and stock return (Aaker, 1996). The brand
associations formalize the grounds of the consumer purchasing and feelings (Aaker, 1992). This
construct is structured as the brand-as-product, the brand-as-person, and the brand-as-
organization (Aaker, 1996). These essential pillars of Aaker’s (1991) customer-based brand
equity model formalize consumer mindset regarding the branded product/service, and become a
basis for the sound brand equity measurements (Aaker, 1996). Induced by the brand, an aware,
confident, and the satisfied consumer could create value for the firm. Starting from this model,
more enriched conceptual frameworks have been developed and empirically examined further.
For example, Fayrene and Lee (2011) proposed a conceptual framework that integrated the
constructs and the measures of the customer-based brand equity and pointed out the possible
interactive effects existed among the brand equity dimensions.
Figure 1. Aaker’s (1991) Customer-based Brand Equity Model
Brand loyalty Other proprietary
brand assets
Brand associations
Brand equity
Brand awareness Perceived quality Brand loyalty
20
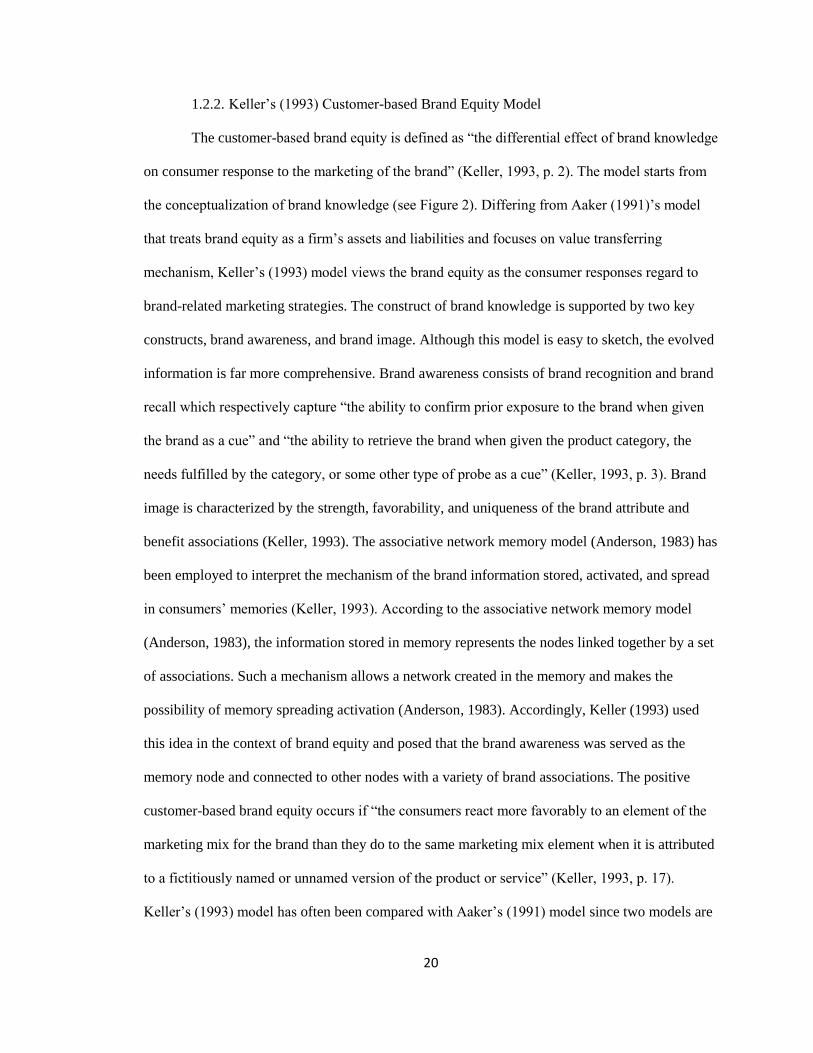
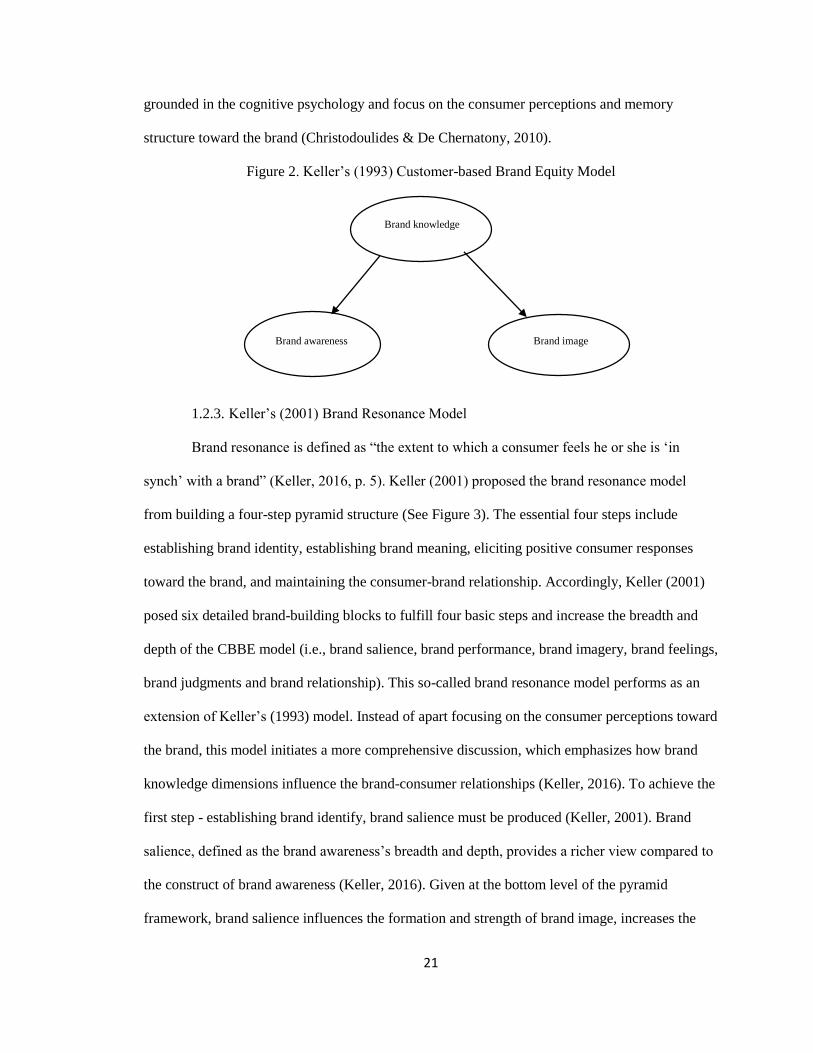
1.2.2. Keller’s (1993) Customer-based Brand Equity Model
The customer-based brand equity is defined as “the differential effect of brand knowledge
on consumer response to the marketing of the brand” (Keller, 1993, p. 2). The model starts from
the conceptualization of brand knowledge (see Figure 2). Differing from Aaker (1991)’s model
that treats brand equity as a firm’s assets and liabilities and focuses on value transferring
mechanism, Keller’s (1993) model views the brand equity as the consumer responses regard to
brand-related marketing strategies. The construct of brand knowledge is supported by two key
constructs, brand awareness, and brand image. Although this model is easy to sketch, the evolved
information is far more comprehensive. Brand awareness consists of brand recognition and brand
recall which respectively capture “the ability to confirm prior exposure to the brand when given
the brand as a cue” and “the ability to retrieve the brand when given the product category, the
needs fulfilled by the category, or some other type of probe as a cue” (Keller, 1993, p. 3). Brand
image is characterized by the strength, favorability, and uniqueness of the brand attribute and
benefit associations (Keller, 1993). The associative network memory model (Anderson, 1983) has
been employed to interpret the mechanism of the brand information stored, activated, and spread
in consumers’ memories (Keller, 1993). According to the associative network memory model
(Anderson, 1983), the information stored in memory represents the nodes linked together by a set
of associations. Such a mechanism allows a network created in the memory and makes the
possibility of memory spreading activation (Anderson, 1983). Accordingly, Keller (1993) used
this idea in the context of brand equity and posed that the brand awareness was served as the
memory node and connected to other nodes with a variety of brand associations. The positive
customer-based brand equity occurs if “the consumers react more favorably to an element of the
marketing mix for the brand than they do to the same marketing mix element when it is attributed
to a fictitiously named or unnamed version of the product or service” (Keller, 1993, p. 17).
Keller’s (1993) model has often been compared with Aaker’s (1991) model since two models are
21
grounded in the cognitive psychology and focus on the consumer perceptions and memory
structure toward the brand (Christodoulides & De Chernatony, 2010).
Figure 2. Keller’s (1993) Customer-based Brand Equity Model
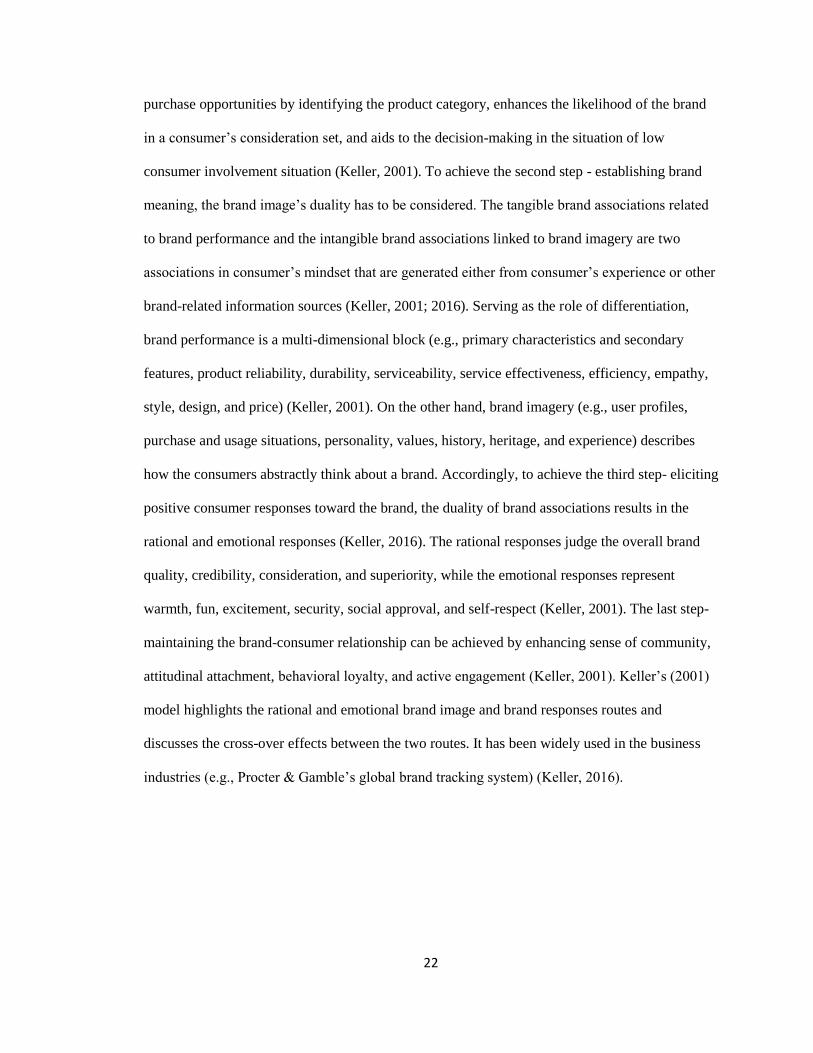
1.2.3. Keller’s (2001) Brand Resonance Model
Brand resonance is defined as “the extent to which a consumer feels he or she is ‘in
synch’ with a brand” (Keller, 2016, p. 5). Keller (2001) proposed the brand resonance model
from building a four-step pyramid structure (See Figure 3). The essential four steps include
establishing brand identity, establishing brand meaning, eliciting positive consumer responses
toward the brand, and maintaining the consumer-brand relationship. Accordingly, Keller (2001)
posed six detailed brand-building blocks to fulfill four basic steps and increase the breadth and
depth of the CBBE model (i.e., brand salience, brand performance, brand imagery, brand feelings,
brand judgments and brand relationship). This so-called brand resonance model performs as an
extension of Keller’s (1993) model. Instead of apart focusing on the consumer perceptions toward
the brand, this model initiates a more comprehensive discussion, which emphasizes how brand
knowledge dimensions influence the brand-consumer relationships (Keller, 2016). To achieve the
first step - establishing brand identify, brand salience must be produced (Keller, 2001). Brand
salience, defined as the brand awareness’s breadth and depth, provides a richer view compared to
the construct of brand awareness (Keller, 2016). Given at the bottom level of the pyramid
framework, brand salience influences the formation and strength of brand image, increases the
Brand knowledge
Brand awareness Brand image
22
purchase opportunities by identifying the product category, enhances the likelihood of the brand
in a consumer’s consideration set, and aids to the decision-making in the situation of low
consumer involvement situation (Keller, 2001). To achieve the second step - establishing brand
meaning, the brand image’s duality has to be considered. The tangible brand associations related
to brand performance and the intangible brand associations linked to brand imagery are two
associations in consumer’s mindset that are generated either from consumer’s experience or other
brand-related information sources (Keller, 2001; 2016). Serving as the role of differentiation,
brand performance is a multi-dimensional block (e.g., primary characteristics and secondary
features, product reliability, durability, serviceability, service effectiveness, efficiency, empathy,
style, design, and price) (Keller, 2001). On the other hand, brand imagery (e.g., user profiles,
purchase and usage situations, personality, values, history, heritage, and experience) describes
how the consumers abstractly think about a brand. Accordingly, to achieve the third step- eliciting
positive consumer responses toward the brand, the duality of brand associations results in the
rational and emotional responses (Keller, 2016). The rational responses judge the overall brand
quality, credibility, consideration, and superiority, while the emotional responses represent
warmth, fun, excitement, security, social approval, and self-respect (Keller, 2001). The last step-
maintaining the brand-consumer relationship can be achieved by enhancing sense of community,
attitudinal attachment, behavioral loyalty, and active engagement (Keller, 2001). Keller’s (2001)
model highlights the rational and emotional brand image and brand responses routes and
discusses the cross-over effects between the two routes. It has been widely used in the business
industries (e.g., Procter & Gamble’s global brand tracking system) (Keller, 2016).
23
Figure 3. Keller’s (2001) Brand Resonance Model (Graphic Source: Keller (2001))
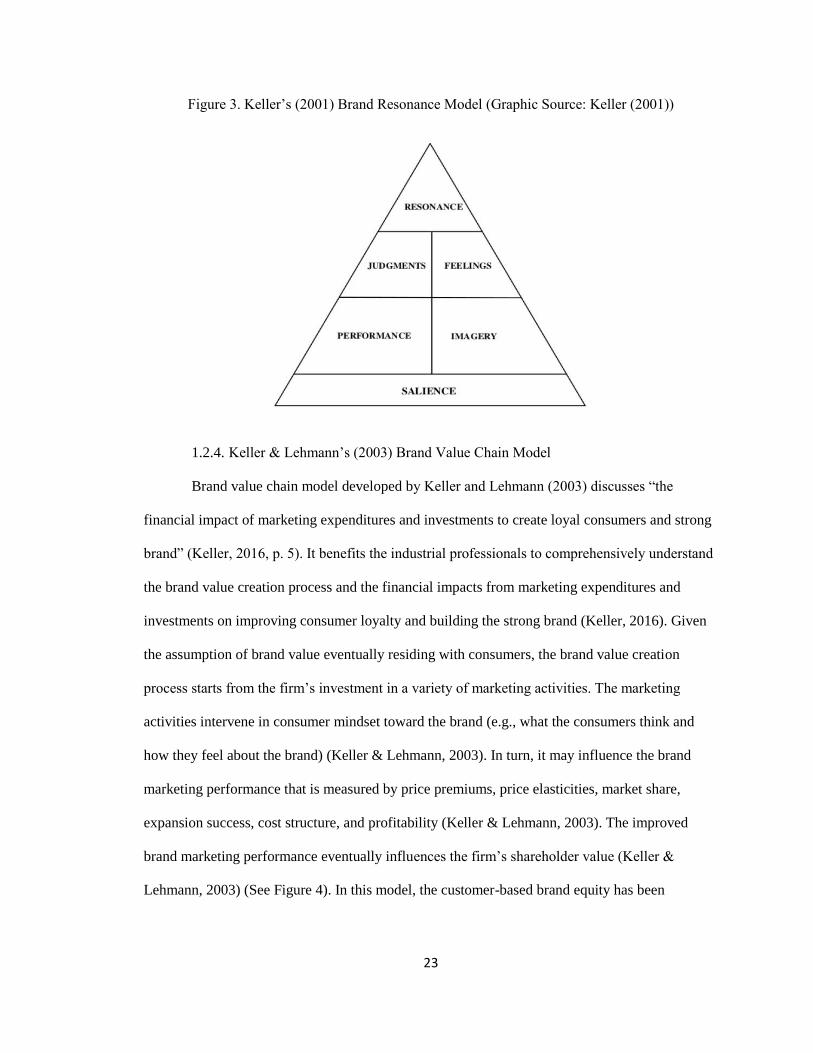
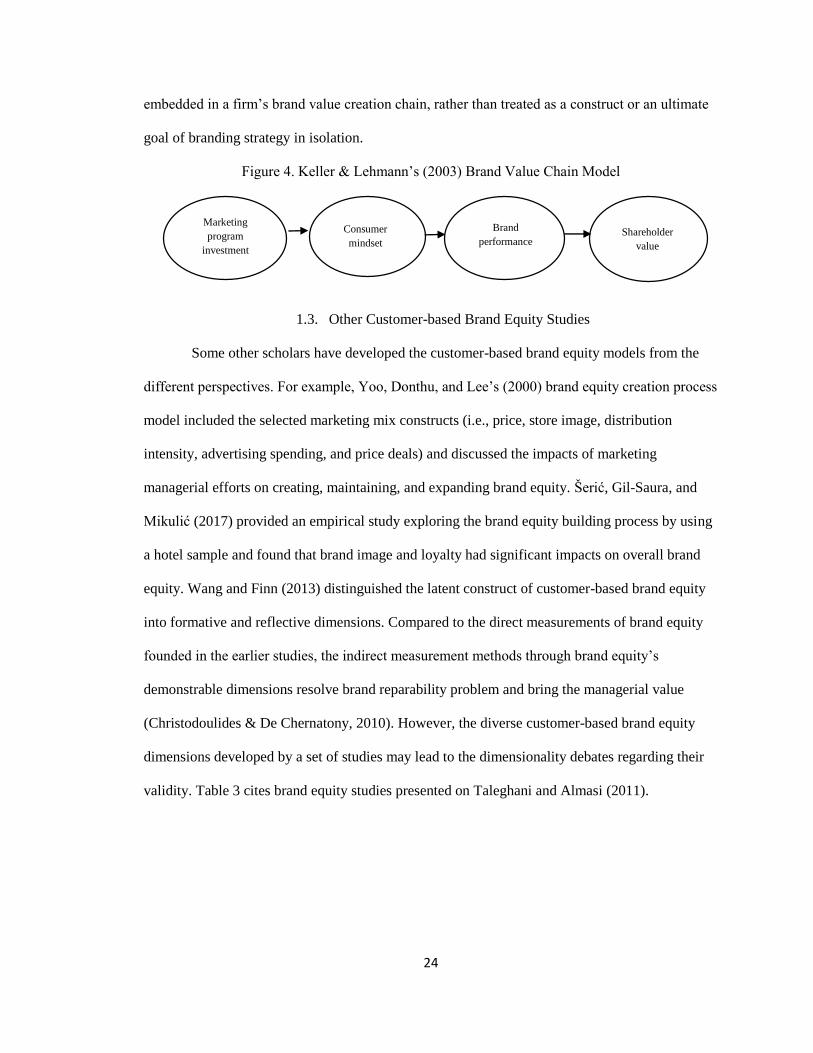
1.2.4. Keller & Lehmann’s (2003) Brand Value Chain Model
Brand value chain model developed by Keller and Lehmann (2003) discusses “the
financial impact of marketing expenditures and investments to create loyal consumers and strong
brand” (Keller, 2016, p. 5). It benefits the industrial professionals to comprehensively understand
the brand value creation process and the financial impacts from marketing expenditures and
investments on improving consumer loyalty and building the strong brand (Keller, 2016). Given
the assumption of brand value eventually residing with consumers, the brand value creation
process starts from the firm’s investment in a variety of marketing activities. The marketing
activities intervene in consumer mindset toward the brand (e.g., what the consumers think and
how they feel about the brand) (Keller & Lehmann, 2003). In turn, it may influence the brand
marketing performance that is measured by price premiums, price elasticities, market share,
expansion success, cost structure, and profitability (Keller & Lehmann, 2003). The improved
brand marketing performance eventually influences the firm’s shareholder value (Keller &
Lehmann, 2003) (See Figure 4). In this model, the customer-based brand equity has been
24
embedded in a firm’s brand value creation chain, rather than treated as a construct or an ultimate
goal of branding strategy in isolation.
Figure 4. Keller & Lehmann’s (2003) Brand Value Chain Model
1.3. Other Customer-based Brand Equity Studies
Some other scholars have developed the customer-based brand equity models from the
different perspectives. For example, Yoo, Donthu, and Lee’s (2000) brand equity creation process
model included the selected marketing mix constructs (i.e., price, store image, distribution
intensity, advertising spending, and price deals) and discussed the impacts of marketing
managerial efforts on creating, maintaining, and expanding brand equity. Šerić, Gil-Saura, and
Mikulić (2017) provided an empirical study exploring the brand equity building process by using
a hotel sample and found that brand image and loyalty had significant impacts on overall brand
equity. Wang and Finn (2013) distinguished the latent construct of customer-based brand equity
into formative and reflective dimensions. Compared to the direct measurements of brand equity
founded in the earlier studies, the indirect measurement methods through brand equity’s
demonstrable dimensions resolve brand reparability problem and bring the managerial value
(Christodoulides & De Chernatony, 2010). However, the diverse customer-based brand equity
dimensions developed by a set of studies may lead to the dimensionality debates regarding their
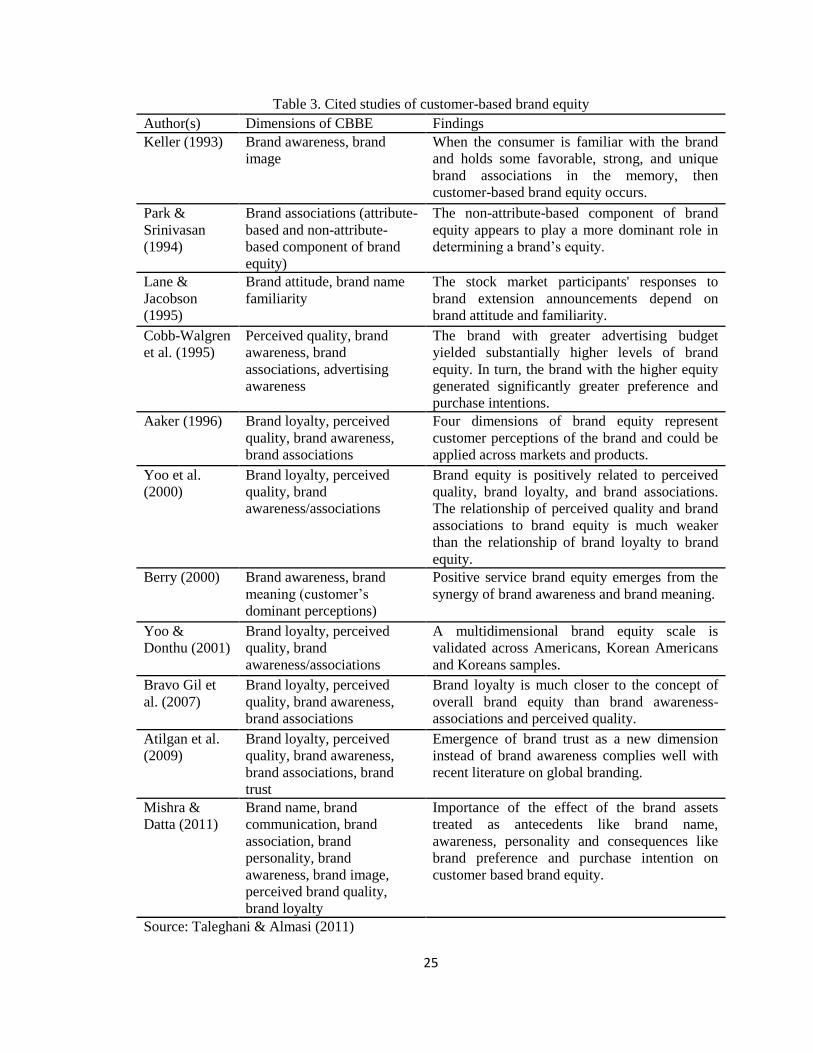
validity. Table 3 cites brand equity studies presented on Taleghani and Almasi (2011).
Marketing
program
investment
Consumer
mindset
Brand
performance Shareholder
value
25
Table 3. Cited studies of customer-based brand equity
Author(s) Dimensions of CBBE Findings
Keller (1993) Brand awareness, brand
image
When the consumer is familiar with the brand
and holds some favorable, strong, and unique
brand associations in the memory, then
customer-based brand equity occurs.
Park &
Srinivasan
(1994)
Brand associations (attribute-
based and non-attribute-
based component of brand
equity)
The non-attribute-based component of brand
equity appears to play a more dominant role in
determining a brand’s equity.
Lane &
Jacobson
(1995)
Brand attitude, brand name
familiarity
The stock market participants' responses to
brand extension announcements depend on
brand attitude and familiarity.
Cobb-Walgren
et al. (1995)
Perceived quality, brand
awareness, brand
associations, advertising
awareness
The brand with greater advertising budget
yielded substantially higher levels of brand
equity. In turn, the brand with the higher equity
generated significantly greater preference and
purchase intentions.
Aaker (1996) Brand loyalty, perceived
quality, brand awareness,
brand associations
Four dimensions of brand equity represent
customer perceptions of the brand and could be
applied across markets and products.
Yoo et al.
(2000)
Brand loyalty, perceived
quality, brand
awareness/associations
Brand equity is positively related to perceived
quality, brand loyalty, and brand associations.
The relationship of perceived quality and brand
associations to brand equity is much weaker
than the relationship of brand loyalty to brand
equity.
Berry (2000) Brand awareness, brand
meaning (customer’s
dominant perceptions)
Positive service brand equity emerges from the
synergy of brand awareness and brand meaning.
Yoo &
Donthu (2001)
Brand loyalty, perceived
quality, brand
awareness/associations
A multidimensional brand equity scale is
validated across Americans, Korean Americans
and Koreans samples.
Bravo Gil et
al. (2007)
Brand loyalty, perceived
quality, brand awareness,
brand associations
Brand loyalty is much closer to the concept of
overall brand equity than brand awareness-
associations and perceived quality.
Atilgan et al.
(2009)
Brand loyalty, perceived
quality, brand awareness,
brand associations, brand
trust
Emergence of brand trust as a new dimension
instead of brand awareness complies well with
recent literature on global branding.
Mishra &
Datta (2011)
Brand name, brand
communication, brand
association, brand
personality, brand
awareness, brand image,
perceived brand quality,
brand loyalty
Importance of the effect of the brand assets
treated as antecedents like brand name,
awareness, personality and consequences like
brand preference and purchase intention on
customer based brand equity.
Source: Taleghani & Almasi (2011)
26
2. Brand Extension Related Studies
The concept of brand extension refers to the “use of established brand names to launch
new products” (Völckner & Sattler, 2006, p. 18). When a firm launches a new product/service to
pursue market expansions and generate more revenue, it may choose to initiate the new
product/service either with an established brand name (a.k.a. brand extension) (e.g., Hilton
Garden Inn is a Hilton’s brand extension owned by Hilton Worldwide). As explained earlier,
Aaker’s (1991) and Keller’s (1993) models both emphasize the importance of brand associations
(Moisescu, 2005) and discuss the impacts of brand extension development. The brand extensions
efficiently use different types of brand associations leveraging the brand equity based on an
established brand and enhance marketing productivities by taking advantage of consumers’
existing brand knowledge (Aaker & Keller, 1990; Keller, 2002; Rangaswamy et al., 1993).
Because the brand is a firm’s valuable asset, it is better for the industrial professionals to
capitalize it on the new products/services to reach their multiple operational purposes, such as
improving advertising efficiency and market share (Smith & Park, 1992). Attaching the
established brand name with the new products/services, the brand extension may also produce
feedback effects that either enhance or dilute the parent brand equity (Aaker, 1991; Dacin &
Smith, 1994; Swaminathan, 2003).
2.1. Types of Brand Extensions
Co-branding and brand extension are two popular approaches to leverage the brand
equity (Aaker & Keller, 1990; Washburn, Till, & Priluck, 2000). Co-branding is a strategy that
pairs “two or more branded products (constituent brands) to form a separate and unique product
(composite brand)” (Washburn et al., 2000, p. 591), such as the McDonald’s Mcflurry with
M&M’s candies. Working as a brand alliance strategy, the co-branding partners become
beneficiary regardless of the low or high brand equity perceived by the consumers before brand
alliance (Washburn et al., 2000). Simonin and Ruth (1998) argued that consumers’ attitudes
27
toward the composite brand influenced their attitudes toward the constituent brands. On the other
hand, brand extension refers to “the use of established brand names to enter new product
categories or classes” (Keller & Aaker, 1992, p. 35), such as Energizer battery company extended
its brand to flashlights product. Some studies treat co-branding as a special case of brand
extension (Park, Jun, & Shocker, 1996). Some studies have classified the brand extension into
two types, named as category extension and line extension (Farquhar, 1989; Farquhar, Herr, &
Fazio, 1990). Compared with the category extension that applies the established brand name to
the new product category (Farquhar et al., 1990; Tauber, 1981), the line extension refers to “a
current brand name is used to enter a new market segment in its product class” (Aaker & Keller,
1990, p. 27). The consumers’ judgments toward the category extensions are raised from their
perceived fits between the parent brand category and the extension category (Aaker & Keller,
1990). Similarly, some studies divide the brand extension as the horizontal extension and the
vertical extension based on the product category (Pitta & Prevel Katsanis, 1995). The horizontal
extension refers to “either apply or extend an existing product’s name to a new product in the
same product class or to a product category new to the company” (Pitta & Prevel Katsanis, 1995,
p. 60). Accordingly, it includes line extension and franchise extension. The line extension
mentioned by Pitta and Prevel Katsanis (1995) has the same scope with Aaker and Keller’s
(1990). The vertical extension introduces “a related brand in the same product category but with a
different price and quality balance” (Pitta & Prevel Katsanis, 1995, p. 60). That is, the vertical
brand extension is introduced either above or below the parent brand price or quality levels
(Musante, 2007). The vertical brand extension is a popular marketing strategy in the lodging
industry, especially in the chain hotels (Lim, 2013). The sub-branding and nested branding are
two branding strategies that associate the extensions to the parent brand (Bhat et al., 1998). The
sub-branding refers to “a new brand name is used adjacent to an existing brand name,” and the
nested branding refers to “a new product is merely introduced by an existing brand” (Bhat et al.,
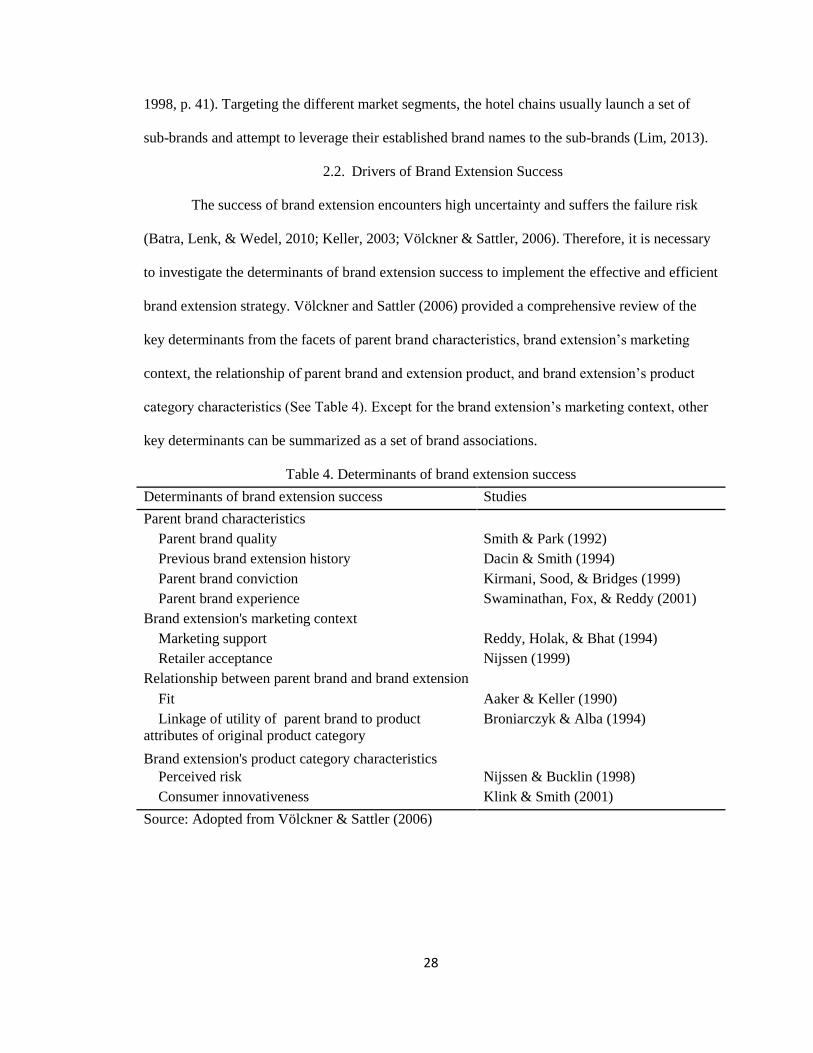
28
1998, p. 41). Targeting the different market segments, the hotel chains usually launch a set of
sub-brands and attempt to leverage their established brand names to the sub-brands (Lim, 2013).
2.2. Drivers of Brand Extension Success
The success of brand extension encounters high uncertainty and suffers the failure risk
(Batra, Lenk, & Wedel, 2010; Keller, 2003; Völckner & Sattler, 2006). Therefore, it is necessary
to investigate the determinants of brand extension success to implement the effective and efficient
brand extension strategy. Völckner and Sattler (2006) provided a comprehensive review of the
key determinants from the facets of parent brand characteristics, brand extension’s marketing
context, the relationship of parent brand and extension product, and brand extension’s product
category characteristics (See Table 4). Except for the brand extension’s marketing context, other
key determinants can be summarized as a set of brand associations.
Table 4. Determinants of brand extension success
Determinants of brand extension success Studies
Parent brand characteristics
Parent brand quality Smith & Park (1992)
Previous brand extension history Dacin & Smith (1994)
Parent brand conviction Kirmani, Sood, & Bridges (1999)
Parent brand experience Swaminathan, Fox, & Reddy (2001)
Brand extension's marketing context
Marketing support Reddy, Holak, & Bhat (1994)
Retailer acceptance Nijssen (1999)
Relationship between parent brand and brand extension
Fit Aaker & Keller (1990)
Linkage of utility of parent brand to product
attributes of original product category
Broniarczyk & Alba (1994)
Brand extension's product category characteristics
Perceived risk Nijssen & Bucklin (1998)
Consumer innovativeness Klink & Smith (2001)
Source: Adopted from Völckner & Sattler (2006)
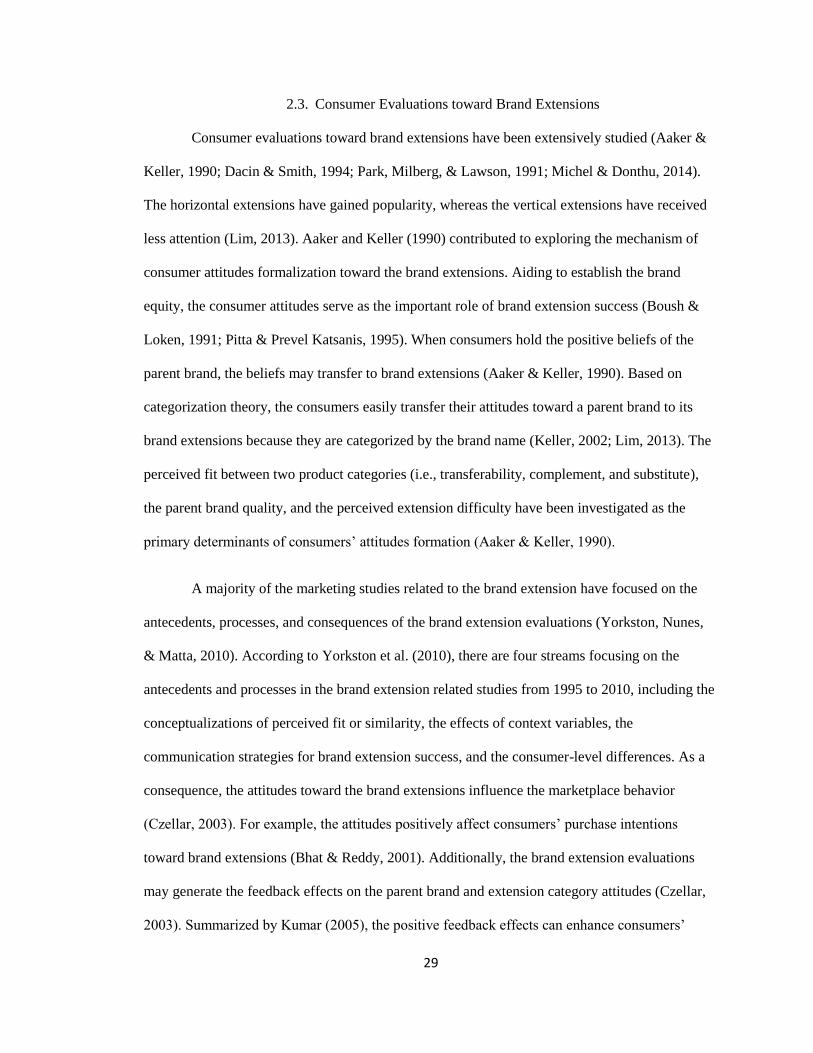
29
2.3. Consumer Evaluations toward Brand Extensions
Consumer evaluations toward brand extensions have been extensively studied (Aaker &
Keller, 1990; Dacin & Smith, 1994; Park, Milberg, & Lawson, 1991; Michel & Donthu, 2014).
The horizontal extensions have gained popularity, whereas the vertical extensions have received
less attention (Lim, 2013). Aaker and Keller (1990) contributed to exploring the mechanism of
consumer attitudes formalization toward the brand extensions. Aiding to establish the brand
equity, the consumer attitudes serve as the important role of brand extension success (Boush &
Loken, 1991; Pitta & Prevel Katsanis, 1995). When consumers hold the positive beliefs of the
parent brand, the beliefs may transfer to brand extensions (Aaker & Keller, 1990). Based on
categorization theory, the consumers easily transfer their attitudes toward a parent brand to its
brand extensions because they are categorized by the brand name (Keller, 2002; Lim, 2013). The
perceived fit between two product categories (i.e., transferability, complement, and substitute),
the parent brand quality, and the perceived extension difficulty have been investigated as the
primary determinants of consumers’ attitudes formation (Aaker & Keller, 1990).
A majority of the marketing studies related to the brand extension have focused on the
antecedents, processes, and consequences of the brand extension evaluations (Yorkston, Nunes,
& Matta, 2010). According to Yorkston et al. (2010), there are four streams focusing on the
antecedents and processes in the brand extension related studies from 1995 to 2010, including the
conceptualizations of perceived fit or similarity, the effects of context variables, the
communication strategies for brand extension success, and the consumer-level differences. As a
consequence, the attitudes toward the brand extensions influence the marketplace behavior
(Czellar, 2003). For example, the attitudes positively affect consumers’ purchase intentions
toward brand extensions (Bhat & Reddy, 2001). Additionally, the brand extension evaluations
may generate the feedback effects on the parent brand and extension category attitudes (Czellar,
2003). Summarized by Kumar (2005), the positive feedback effects can enhance consumers’
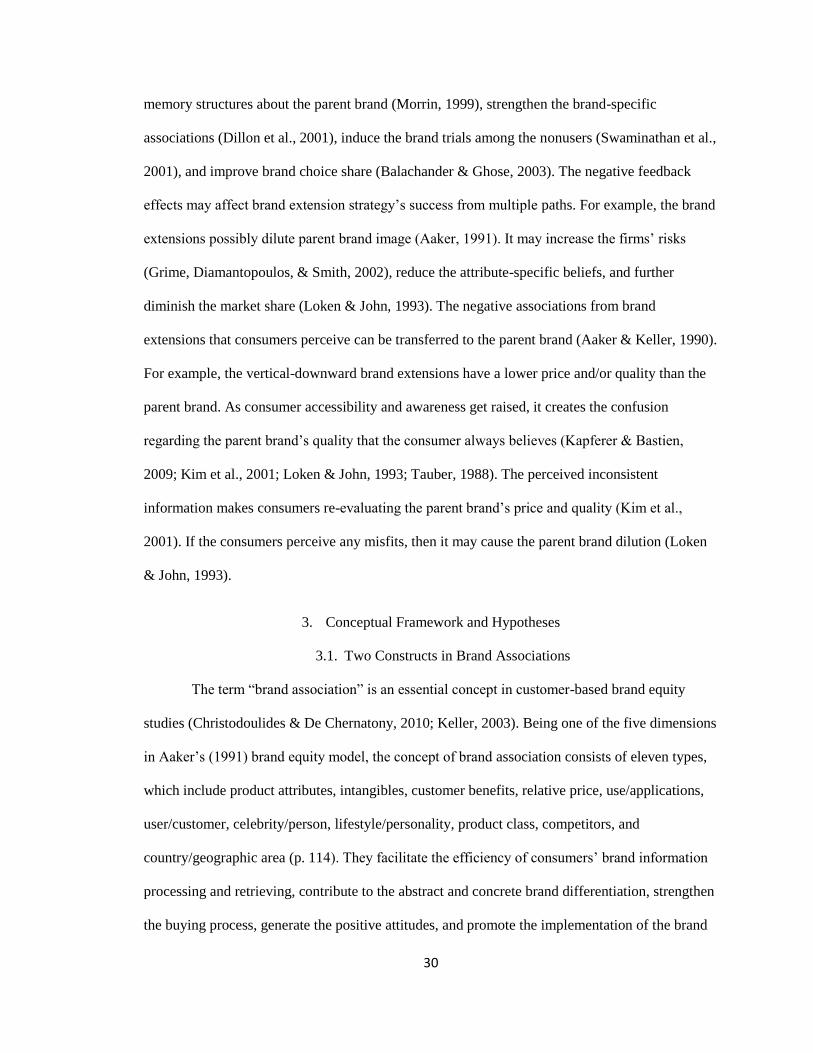
30
memory structures about the parent brand (Morrin, 1999), strengthen the brand-specific
associations (Dillon et al., 2001), induce the brand trials among the nonusers (Swaminathan et al.,
2001), and improve brand choice share (Balachander & Ghose, 2003). The negative feedback
effects may affect brand extension strategy’s success from multiple paths. For example, the brand
extensions possibly dilute parent brand image (Aaker, 1991). It may increase the firms’ risks
(Grime, Diamantopoulos, & Smith, 2002), reduce the attribute-specific beliefs, and further
diminish the market share (Loken & John, 1993). The negative associations from brand
extensions that consumers perceive can be transferred to the parent brand (Aaker & Keller, 1990).
For example, the vertical-downward brand extensions have a lower price and/or quality than the
parent brand. As consumer accessibility and awareness get raised, it creates the confusion
regarding the parent brand’s quality that the consumer always believes (Kapferer & Bastien,
2009; Kim et al., 2001; Loken & John, 1993; Tauber, 1988). The perceived inconsistent
information makes consumers re-evaluating the parent brand’s price and quality (Kim et al.,
2001). If the consumers perceive any misfits, then it may cause the parent brand dilution (Loken
& John, 1993).
3. Conceptual Framework and Hypotheses
3.1. Two Constructs in Brand Associations
The term “brand association” is an essential concept in customer-based brand equity
studies (Christodoulides & De Chernatony, 2010; Keller, 2003). Being one of the five dimensions
in Aaker’s (1991) brand equity model, the concept of brand association consists of eleven types,
which include product attributes, intangibles, customer benefits, relative price, use/applications,
user/customer, celebrity/person, lifestyle/personality, product class, competitors, and
country/geographic area (p. 114). They facilitate the efficiency of consumers’ brand information
processing and retrieving, contribute to the abstract and concrete brand differentiation, strengthen
the buying process, generate the positive attitudes, and promote the implementation of the brand
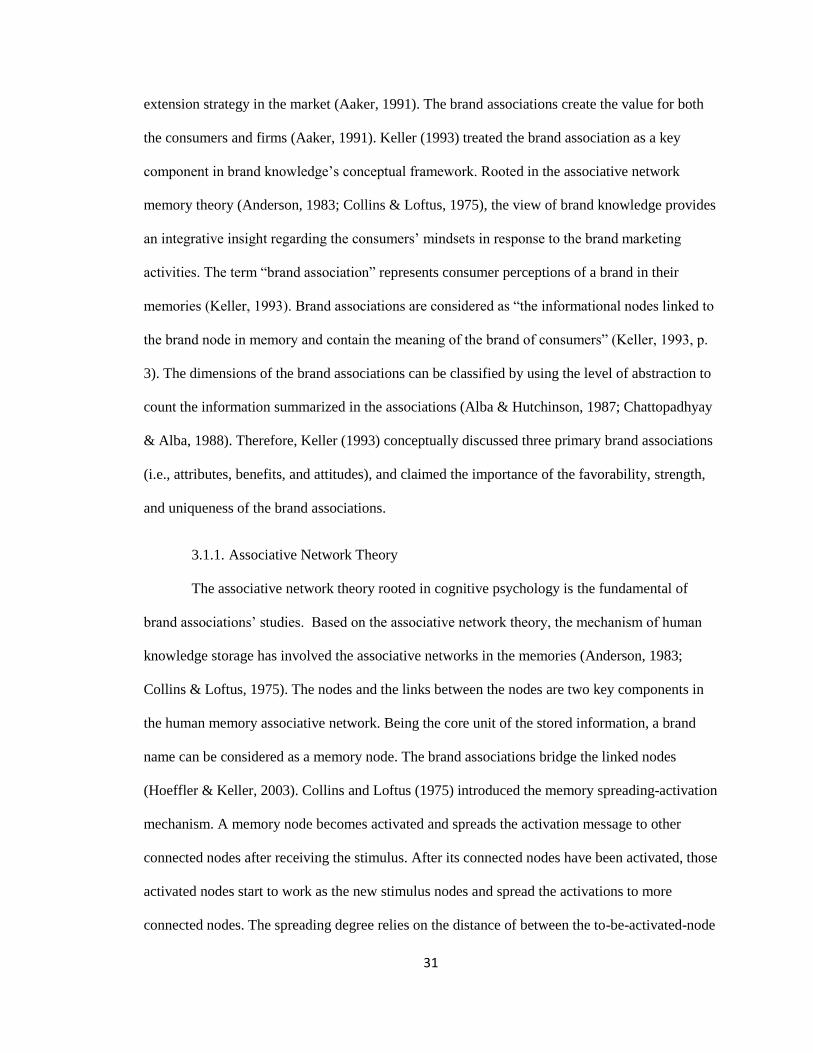
31
extension strategy in the market (Aaker, 1991). The brand associations create the value for both
the consumers and firms (Aaker, 1991). Keller (1993) treated the brand association as a key
component in brand knowledge’s conceptual framework. Rooted in the associative network
memory theory (Anderson, 1983; Collins & Loftus, 1975), the view of brand knowledge provides
an integrative insight regarding the consumers’ mindsets in response to the brand marketing
activities. The term “brand association” represents consumer perceptions of a brand in their
memories (Keller, 1993). Brand associations are considered as “the informational nodes linked to
the brand node in memory and contain the meaning of the brand of consumers” (Keller, 1993, p.
3). The dimensions of the brand associations can be classified by using the level of abstraction to
count the information summarized in the associations (Alba & Hutchinson, 1987; Chattopadhyay
& Alba, 1988). Therefore, Keller (1993) conceptually discussed three primary brand associations
(i.e., attributes, benefits, and attitudes), and claimed the importance of the favorability, strength,
and uniqueness of the brand associations.
3.1.1. Associative Network Theory
The associative network theory rooted in cognitive psychology is the fundamental of
brand associations’ studies. Based on the associative network theory, the mechanism of human
knowledge storage has involved the associative networks in the memories (Anderson, 1983;
Collins & Loftus, 1975). The nodes and the links between the nodes are two key components in
the human memory associative network. Being the core unit of the stored information, a brand
name can be considered as a memory node. The brand associations bridge the linked nodes
(Hoeffler & Keller, 2003). Collins and Loftus (1975) introduced the memory spreading-activation
mechanism. A memory node becomes activated and spreads the activation message to other
connected nodes after receiving the stimulus. After its connected nodes have been activated, those
activated nodes start to work as the new stimulus nodes and spread the activations to more
connected nodes. The spreading degree relies on the distance of between the to-be-activated-node
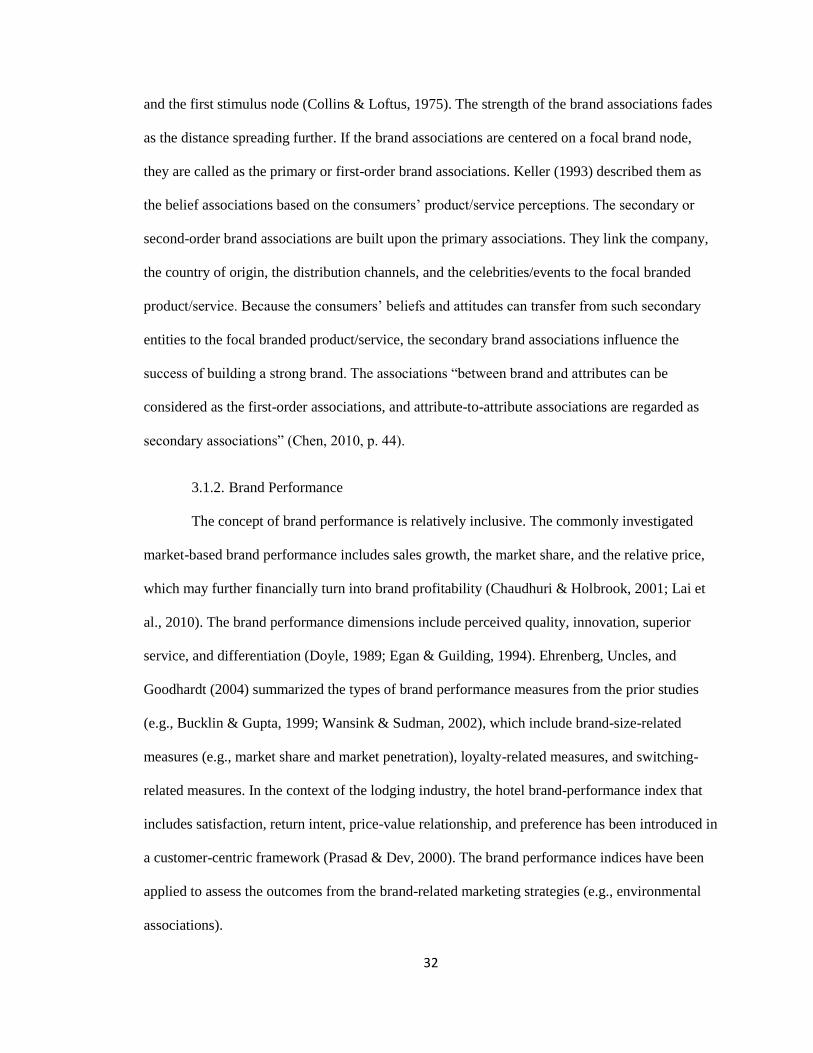
32
and the first stimulus node (Collins & Loftus, 1975). The strength of the brand associations fades
as the distance spreading further. If the brand associations are centered on a focal brand node,
they are called as the primary or first-order brand associations. Keller (1993) described them as
the belief associations based on the consumers’ product/service perceptions. The secondary or
second-order brand associations are built upon the primary associations. They link the company,
the country of origin, the distribution channels, and the celebrities/events to the focal branded
product/service. Because the consumers’ beliefs and attitudes can transfer from such secondary
entities to the focal branded product/service, the secondary brand associations influence the
success of building a strong brand. The associations “between brand and attributes can be
considered as the first-order associations, and attribute-to-attribute associations are regarded as
secondary associations” (Chen, 2010, p. 44).
3.1.2. Brand Performance
The concept of brand performance is relatively inclusive. The commonly investigated
market-based brand performance includes sales growth, the market share, and the relative price,
which may further financially turn into brand profitability (Chaudhuri & Holbrook, 2001; Lai et
al., 2010). The brand performance dimensions include perceived quality, innovation, superior
service, and differentiation (Doyle, 1989; Egan & Guilding, 1994). Ehrenberg, Uncles, and
Goodhardt (2004) summarized the types of brand performance measures from the prior studies
(e.g., Bucklin & Gupta, 1999; Wansink & Sudman, 2002), which include brand-size-related
measures (e.g., market share and market penetration), loyalty-related measures, and switching-
related measures. In the context of the lodging industry, the hotel brand-performance index that
includes satisfaction, return intent, price-value relationship, and preference has been introduced in
a customer-centric framework (Prasad & Dev, 2000). The brand performance indices have been
applied to assess the outcomes from the brand-related marketing strategies (e.g., environmental
associations).
33
Keller (2001) described the term “brand performance” more specifically that related to
“the ways in which the product or service attempts to meet customers’ more functional needs” (p.
10). Described in the previous section, the content of brand meaning has been discussed in the
Keller’s (2001) brand resonance model. Moving forward from the brand salience, the brand
meaning captures the brand associations in the consumers’ mindsets from two different routes,
the “functional, performance-related considerations” and the “abstract, imagery-related
considerations” (Keller, 2001, p. 9). Therefore, the brand performance focuses on the intrinsic
properties of the brand regard to the inherent product/service characteristics in this study. The
brand performance (i.e., primary characteristics and secondary features, product reliability,
durability, and serviceability, service effectiveness, efficiency, and empathy, style and design,
and price) creates the brand differentiation for the firms (Keller, 2001).
3.1.2.1. Brand Attribute-level Performance
According to Keller (1993)’s customer-based brand equity model, attributes, benefits,
and attitudes are three types of brand associations. The brand attribute-level performance has
been extensively studied in the field of consumer satisfaction. For example, Kano et al. (1984)
classified quality attributes into three groups, basic group, excitement group, and performance
group to assess their different impacts on the consumer satisfaction through the importance-
performance analysis (IPA). Mittal, Ross, and Baldasare (1998) gave the reasons of assessing
multi-attributes in the consumer satisfaction studies. First, the consumers more likely evaluate
their consumption experience at the attribute level rather than at the product level (Gardial et al.,
1994; Mittal et al., 1998). Second, the multi-attributes allow the scholars conceptualizing the
observable phenomena and distinguishing consumer’s mixed perceptions regard to a whole piece
of the product (Mittal et al., 1998). Third, using multi-attribute scale generates the higher level of
specificity and diagnostic usefulness rather than using the overall evaluations (LaTour & Peat,
1979; Mittal et al., 1998; Slevitch & Oh, 2010; Wittink & Bayer, 1994). Similarly, these reasons
34
may be applied to investigate how the multi-attribute performance influence a consumer overall
perceived brand quality.
The product-related attributes that represent product physical composition or service
requirement are defined as “the ingredients necessary for performing the product or service
function sought by consumers” (Keller, 1993, p. 4). Because the product-related attributes are
contingent by the product/service categories (Keller, 1993), they are unable to be identified
generically (Low & Lamb, 2000). For example, the consumer experience is composed of the
hotel tangible products and intangible services in the context of lodging industry (Slevitch & Oh,
2010). The hotel attributes can be classified as core and facilitating attributes (Slevitch & Oh,
2010). The core attributes are the baseline to meet consumers’ expectations (e.g., room
cleanliness and safety), while the facilitating attributes describe the service professionalism and
service recovery speed (Yen & Tang, 2015). The different attributes have been investigated
having different impacts on overall consumer satisfaction. Consumers perceive the quality based
on the key attributes they evaluate as the important (Yang, Jou, & Cheng, 2011).
3.1.2.2. Measuring Hotel Brand Attribute-level Performance
Table 5 presents the reviewed measurement items and scales of hotel brand attribute-level
performance. Qu, Ryan, and Chu (2000) developed 33 items to measure 402 international
travelers’ perceptions toward the Hong Kong hotel service and facility attributes. These items
were developed based on a large number of prior studies (e.g., Ananth et al., 1992; Parasuraman,
Zeithaml, & Berry, 1985; Wilensky & Buttle, 1988). They were factored into six dimensions
which include the quality of staff performance, quality of room facilities, variety and efficient
services, business-related services, value for money, and safety and security. A seven-point Likert
scale was used (1=strongly disagree; 7=strongly agree). Similarly, Choi and Chu (2001)
identified 29 Hong Kong hotel attributes and employed the factor analysis method to classify
these attributes into seven dimensions which are staff service quality, room quality, general
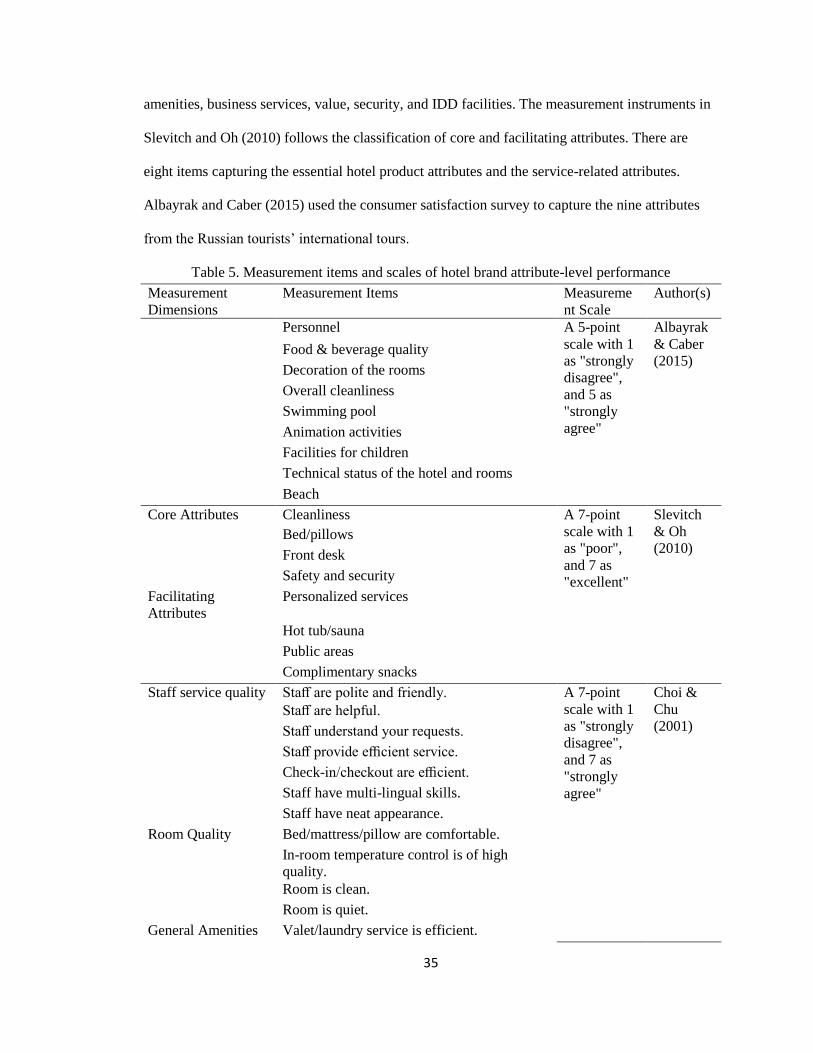
35
amenities, business services, value, security, and IDD facilities. The measurement instruments in
Slevitch and Oh (2010) follows the classification of core and facilitating attributes. There are
eight items capturing the essential hotel product attributes and the service-related attributes.
Albayrak and Caber (2015) used the consumer satisfaction survey to capture the nine attributes
from the Russian tourists’ international tours.
Table 5. Measurement items and scales of hotel brand attribute-level performance
Measurement
Dimensions
Measurement Items Measureme
nt Scale
Author(s)
Personnel A 5-point
scale with 1
as "strongly
disagree",
and 5 as
"strongly
agree"
Albayrak
& Caber
(2015) Food & beverage quality
Decoration of the rooms
Overall cleanliness
Swimming pool
Animation activities
Facilities for children
Technical status of the hotel and rooms
Beach
Core Attributes Cleanliness A 7-point
scale with 1
as "poor",
and 7 as
"excellent"
Slevitch
& Oh
(2010) Bed/pillows
Front desk
Safety and security
Facilitating
Attributes
Personalized services
Hot tub/sauna
Public areas
Complimentary snacks
Staff service quality Staff are polite and friendly. A 7-point
scale with 1
as "strongly
disagree",
and 7 as
"strongly
agree"
Choi &
Chu
(2001) Staff are helpful.
Staff understand your requests.
Staff provide efficient service.
Check-in/checkout are efficient.
Staff have multi-lingual skills.
Staff have neat appearance.
Room Quality Bed/mattress/pillow are comfortable.
In-room temperature control is of high
quality.
Room is clean.
Room is quiet.
General Amenities Valet/laundry service is efficient.
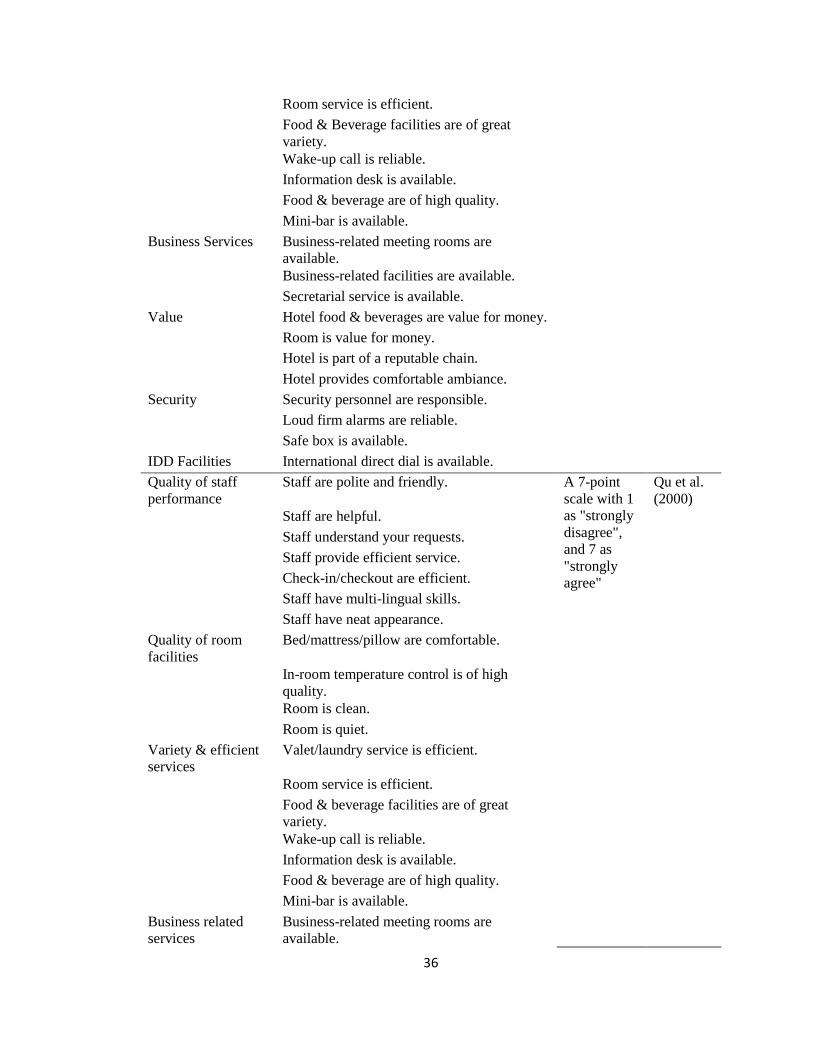
36
Room service is efficient.
Food & Beverage facilities are of great
variety.
Wake-up call is reliable.
Information desk is available.
Food & beverage are of high quality.
Mini-bar is available.
Business Services Business-related meeting rooms are
available.
Business-related facilities are available.
Secretarial service is available.
Value Hotel food & beverages are value for money.
Room is value for money.
Hotel is part of a reputable chain.
Hotel provides comfortable ambiance.
Security Security personnel are responsible.
Loud firm alarms are reliable.
Safe box is available.
IDD Facilities International direct dial is available.
Quality of staff
performance
Staff are polite and friendly. A 7-point
scale with 1
as "strongly
disagree",
and 7 as
"strongly
agree"
Qu et al.
(2000)
Staff are helpful.
Staff understand your requests.
Staff provide efficient service.
Check-in/checkout are efficient.
Staff have multi-lingual skills.
Staff have neat appearance.
Quality of room
facilities
Bed/mattress/pillow are comfortable.
In-room temperature control is of high
quality.
Room is clean.
Room is quiet.
Variety & efficient
services
Valet/laundry service is efficient.
Room service is efficient.
Food & beverage facilities are of great
variety.
Wake-up call is reliable.
Information desk is available.
Food & beverage are of high quality.
Mini-bar is available.
Business related
services
Business-related meeting rooms are
available.
37
Business-related facilities are available.
Secretarial service is available.
Value for money Hotel food & beverage are value for money.
Room is value for money.
Hotel is part of a reputable chain.
Hotel provides comfortable ambiance.
Safety & Security Security personnel are responsible.
Loud fire alarms are reliable.
Safe box is available.
3.1.3. Brand Imagery
The term “brand imagery” captures another facet of the brand meaning (Keller, 2003). It
“deals with the extrinsic properties of the product or service, including the ways in which the
brand attempts to meet customers’ psychological or social needs” (Keller, 2003, p. 11). Involving
the higher abstract level, brand imagery describes a brand’s intangible characteristics and
emphasizes how the consumers think about a brand (Keller, 2003). Keller (2003) classified the
concept of brand imagery into four categories which are user profiles, purchase and usage
situations, personality and values, and history, heritage and experience.
To access the insight of brand imagery, it is necessary to clarify the distinction between
two concepts, brand image, and brand imagery. Although the brand image has been investigated
for decades, it still lacks a universal definition (Dobni & Zinkhan,1990). Based on Keller (1993),
the brand image refers to “a set of perceptions about a brand as reflected by the brand
associations held in the consumer’s memory” from the consumer’s perspective (p. 3). Being an
encompassing concept, there are multiple possible elements in the set of brand image (e.g.,
symbols, brand-consumer relationship, emotional benefits, self-expressive benefits, user and
usage imagery, country-of-origin, organizational associations) (Aaker, 1996; Batra, Lehman, &
Singh, 1993). Even though brand image and brand personality are two interchangeable concepts
(Batra et al., 1993), brand personality has a relatively narrow range that focuses on the human
characteristics associated with a brand (e.g., consumers’ demographics, lifestyles, and human
38
personality traits) (Aaker, 1996; 1997). Brand personality discloses “the way in which a
consumer perceives the brand on dimensions that typically capture the personality extended to the
domain of brands” and humanizes the brand image (Batra et al., 1993, p. 84).
The concept of brand imagery consists of user and usage imagery that are used to evoke
the images and associations about the brand personality. The user imagery describes “the user of
the brand with personality traits and conveys the profile and characteristics of the typical
consumer of the product or service” (Keller, 1993, p. 4). This profile includes demographic and
psychographic information (Keller, 2003). The usage imagery describes the context of the brand
being used (Keller, 1993). The user imagery and usage imagery represent the non-product-related
attributes such as the brand personality attributes in the brand associations (Keller, 1993). The
brand personality is raised by the user and usage situation and can evoke the consumers’
emotions (Plummer, 1985).
3.1.3.1. Brand Personality
Brand personality refers to “the set of human characteristics associated with a brand”
(Aaker, 1997, p. 347). As a key concept in consumer behavior research, exploring the insight of
brand personality allows the scholars to find out the cognitive mechanisms how the consumers
express their self, the ideal self, and the specific dimensions of the self through using a brand
(Belk, 1988; Kleine, Kleine, & Kernan, 1993; Malhotra, 1988). These mechanisms associate the
consumers’ social stimuli perceptions to the marketing stimuli perceptions (Aaker, 1997; Caprara,
Barbaranelli, & Guido, 2001). The studies related to the brand personality have been inspirited by
human personality research. By using the psychological approach to developing thousands of
human personality attributes, a personality model with five traits (a.k.a. Big Five Factors) had
been established from factor analysis. The five personality traits consist of extroversion,
agreeableness, conscientiousness, emotional stability, and openness to experience (Goldberg,
1982; Hofstee, De Raad, & Goldberg, 1992). Similarly, the psychological approach had been
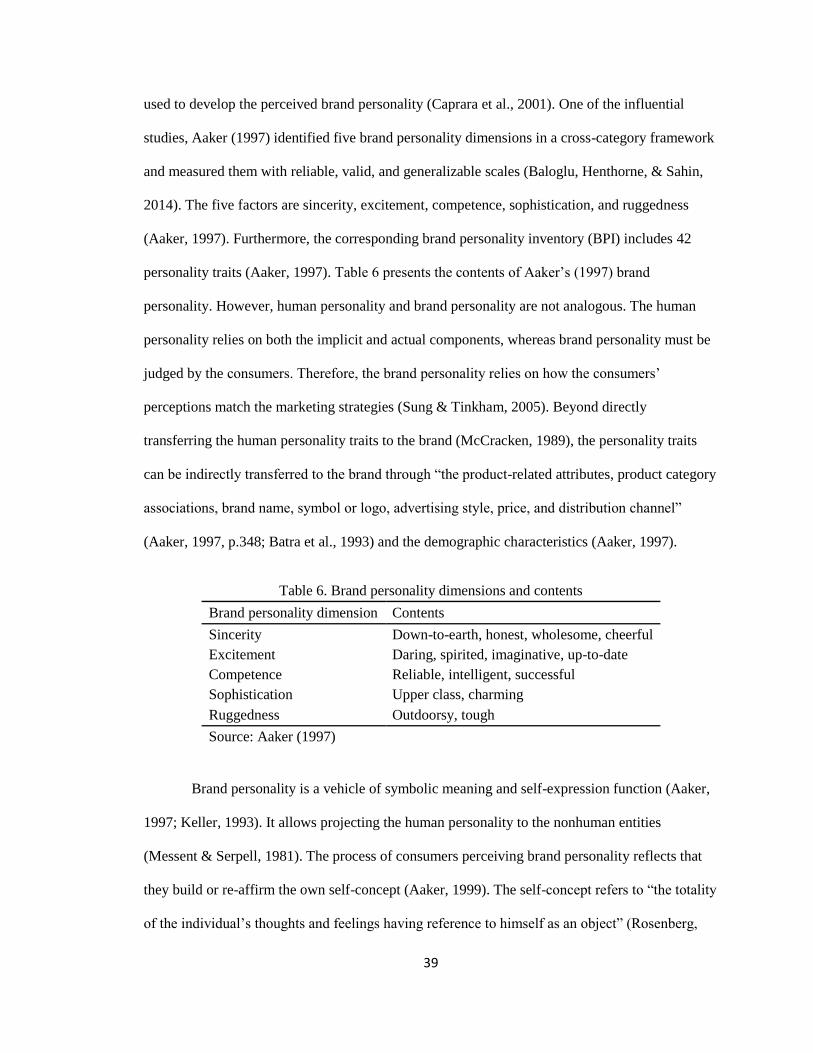
39
used to develop the perceived brand personality (Caprara et al., 2001). One of the influential
studies, Aaker (1997) identified five brand personality dimensions in a cross-category framework
and measured them with reliable, valid, and generalizable scales (Baloglu, Henthorne, & Sahin,
2014). The five factors are sincerity, excitement, competence, sophistication, and ruggedness
(Aaker, 1997). Furthermore, the corresponding brand personality inventory (BPI) includes 42
personality traits (Aaker, 1997). Table 6 presents the contents of Aaker’s (1997) brand
personality. However, human personality and brand personality are not analogous. The human
personality relies on both the implicit and actual components, whereas brand personality must be
judged by the consumers. Therefore, the brand personality relies on how the consumers’
perceptions match the marketing strategies (Sung & Tinkham, 2005). Beyond directly
transferring the human personality traits to the brand (McCracken, 1989), the personality traits
can be indirectly transferred to the brand through “the product-related attributes, product category
associations, brand name, symbol or logo, advertising style, price, and distribution channel”
(Aaker, 1997, p.348; Batra et al., 1993) and the demographic characteristics (Aaker, 1997).
Table 6. Brand personality dimensions and contents
Brand personality dimension Contents
Sincerity Down-to-earth, honest, wholesome, cheerful
Excitement Daring, spirited, imaginative, up-to-date
Competence Reliable, intelligent, successful
Sophistication Upper class, charming
Ruggedness Outdoorsy, tough
Source: Aaker (1997)
Brand personality is a vehicle of symbolic meaning and self-expression function (Aaker,
1997; Keller, 1993). It allows projecting the human personality to the nonhuman entities
(Messent & Serpell, 1981). The process of consumers perceiving brand personality reflects that
they build or re-affirm the own self-concept (Aaker, 1999). The self-concept refers to “the totality
of the individual’s thoughts and feelings having reference to himself as an object” (Rosenberg,
40
1986, p. 7). To keep the consistent relationship between the consumers’ self-images and the
behaviors, as well as to satisfy the needs of their self-expressions, the consumers usually accept
the brands with the images similar to their perceived self-concept (Sirgy, 1982; Su & Tong,
2015). The marketing strategies that associate personality traits with the brands can make the
enduring and distinct effects (Aaker, 1997). Therefore, brand personality is not only the key to
distinguish a brand within a product category, but also differs a brand from its competitors
(Maehle & Shneor, 2010). Additionally, brand personality is a key to building the brand-
consumer relationships (Aaker & Fournier, 1995). The brand personality associates with the
consumers and the brands in emotions, souls, and minds in the brand information processing
stage (Aaker & Fournier, 1995).
3.1.3.2. Measuring Brand Personality
Aaker (1997) pointed out two scales used to measure and examine the brand personality.
The ad hoc scales usually include a set of personality traits. They lack the reliability and validity.
Similarly, the scales based on human personality scales lack the validity as well (Aaker, 1997).
As the most cited study related to brand personality, Aaker (1997) used a variety of sources to
generate multiple descriptors that reduce brand personality traits to a manageable number (Avis,
2012). These items have been generalized in the measurement of a range of the U.S. brands from
different product categories. Aaker’s (1997) cross-category framework and scale reflect consumer
purchase preference for self-expression purpose. Although the critiques have been raised toward
Aaker (1997)’s brand personality measures and scales, they have been still widely used in the
brand personality-related studies (Freling, Crosno, & Henard, 2011; Lin, 2010). According to the
studies I have reviewed, some other scholars have developed alternative brand personality
dimensions (See Table 7). For example, Bosnjak, Bochmann, and Hufschmidt (2007) started from
the person-centric perspective, identified four brand personality dimensions (i.e., drive,
conscientiousness, emotion, and superficiality), and proposed a 20-item parsimonious
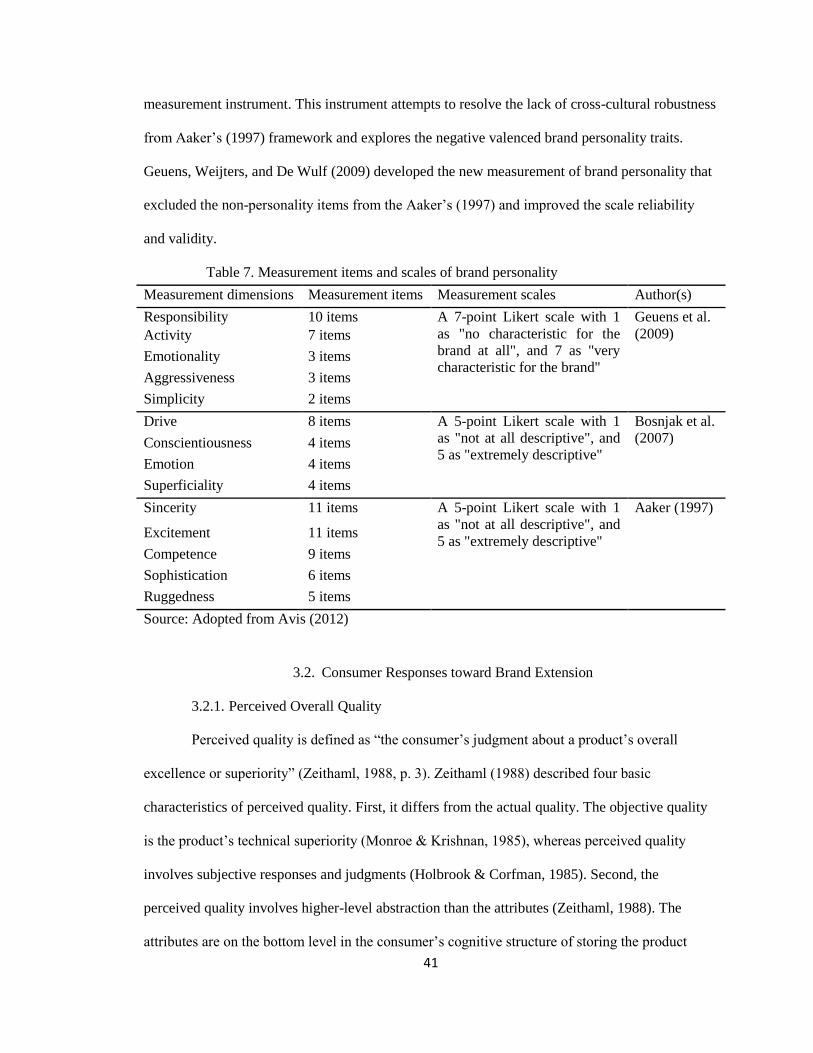
41
measurement instrument. This instrument attempts to resolve the lack of cross-cultural robustness
from Aaker’s (1997) framework and explores the negative valenced brand personality traits.
Geuens, Weijters, and De Wulf (2009) developed the new measurement of brand personality that
excluded the non-personality items from the Aaker’s (1997) and improved the scale reliability
and validity.
Table 7. Measurement items and scales of brand personality
Measurement dimensions Measurement items Measurement scales Author(s)
Responsibility 10 items A 7-point Likert scale with 1
as "no characteristic for the
brand at all", and 7 as "very
characteristic for the brand"
Geuens et al.
(2009) Activity 7 items
Emotionality 3 items
Aggressiveness 3 items
Simplicity 2 items
Drive 8 items A 5-point Likert scale with 1
as "not at all descriptive", and
5 as "extremely descriptive"
Bosnjak et al.
(2007) Conscientiousness 4 items
Emotion 4 items
Superficiality 4 items
Sincerity 11 items A 5-point Likert scale with 1
as "not at all descriptive", and
5 as "extremely descriptive"
Aaker (1997)
Excitement 11 items
Competence 9 items
Sophistication 6 items
Ruggedness 5 items
Source: Adopted from Avis (2012)
3.2. Consumer Responses toward Brand Extension
3.2.1. Perceived Overall Quality
Perceived quality is defined as “the consumer’s judgment about a product’s overall
excellence or superiority” (Zeithaml, 1988, p. 3). Zeithaml (1988) described four basic
characteristics of perceived quality. First, it differs from the actual quality. The objective quality
is the product’s technical superiority (Monroe & Krishnan, 1985), whereas perceived quality
involves subjective responses and judgments (Holbrook & Corfman, 1985). Second, the
perceived quality involves higher-level abstraction than the attributes (Zeithaml, 1988). The
attributes are on the bottom level in the consumer’s cognitive structure of storing the product
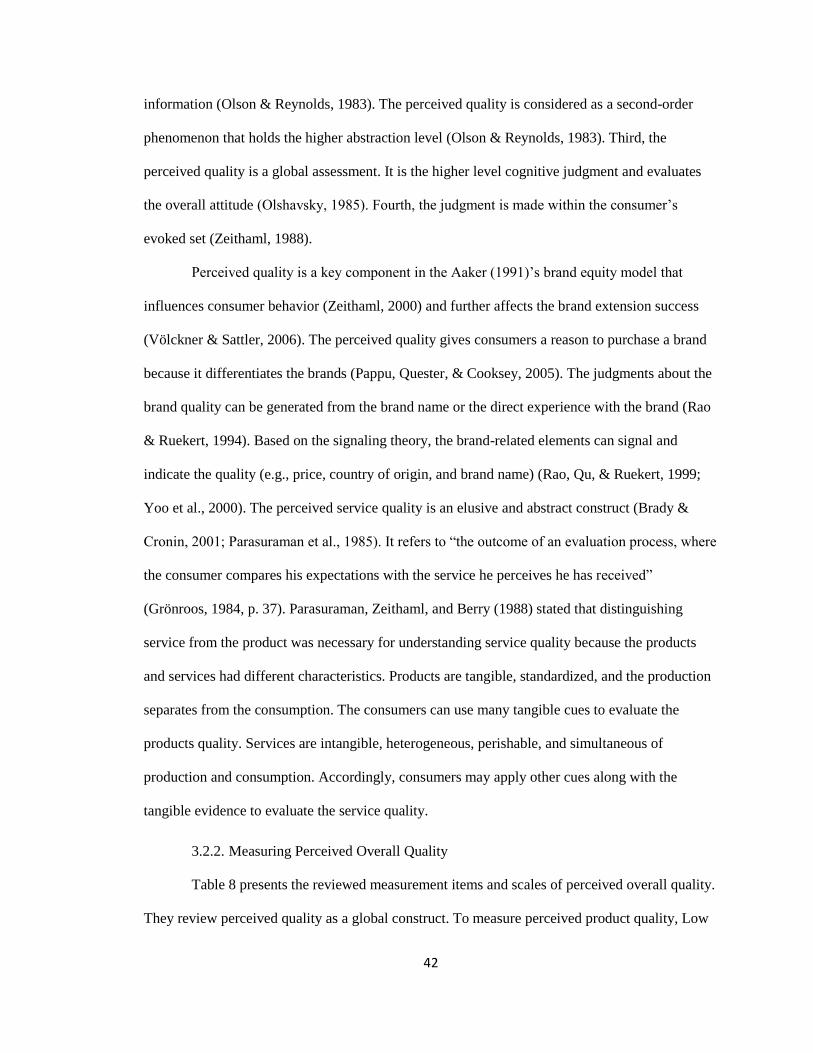
42
information (Olson & Reynolds, 1983). The perceived quality is considered as a second-order
phenomenon that holds the higher abstraction level (Olson & Reynolds, 1983). Third, the
perceived quality is a global assessment. It is the higher level cognitive judgment and evaluates
the overall attitude (Olshavsky, 1985). Fourth, the judgment is made within the consumer’s
evoked set (Zeithaml, 1988).
Perceived quality is a key component in the Aaker (1991)’s brand equity model that
influences consumer behavior (Zeithaml, 2000) and further affects the brand extension success
(Völckner & Sattler, 2006). The perceived quality gives consumers a reason to purchase a brand
because it differentiates the brands (Pappu, Quester, & Cooksey, 2005). The judgments about the
brand quality can be generated from the brand name or the direct experience with the brand (Rao
& Ruekert, 1994). Based on the signaling theory, the brand-related elements can signal and
indicate the quality (e.g., price, country of origin, and brand name) (Rao, Qu, & Ruekert, 1999;
Yoo et al., 2000). The perceived service quality is an elusive and abstract construct (Brady &
Cronin, 2001; Parasuraman et al., 1985). It refers to “the outcome of an evaluation process, where
the consumer compares his expectations with the service he perceives he has received”
(Grönroos, 1984, p. 37). Parasuraman, Zeithaml, and Berry (1988) stated that distinguishing
service from the product was necessary for understanding service quality because the products
and services had different characteristics. Products are tangible, standardized, and the production
separates from the consumption. The consumers can use many tangible cues to evaluate the
products quality. Services are intangible, heterogeneous, perishable, and simultaneous of
production and consumption. Accordingly, consumers may apply other cues along with the
tangible evidence to evaluate the service quality.
3.2.2. Measuring Perceived Overall Quality
Table 8 presents the reviewed measurement items and scales of perceived overall quality.
They review perceived quality as a global construct. To measure perceived product quality, Low
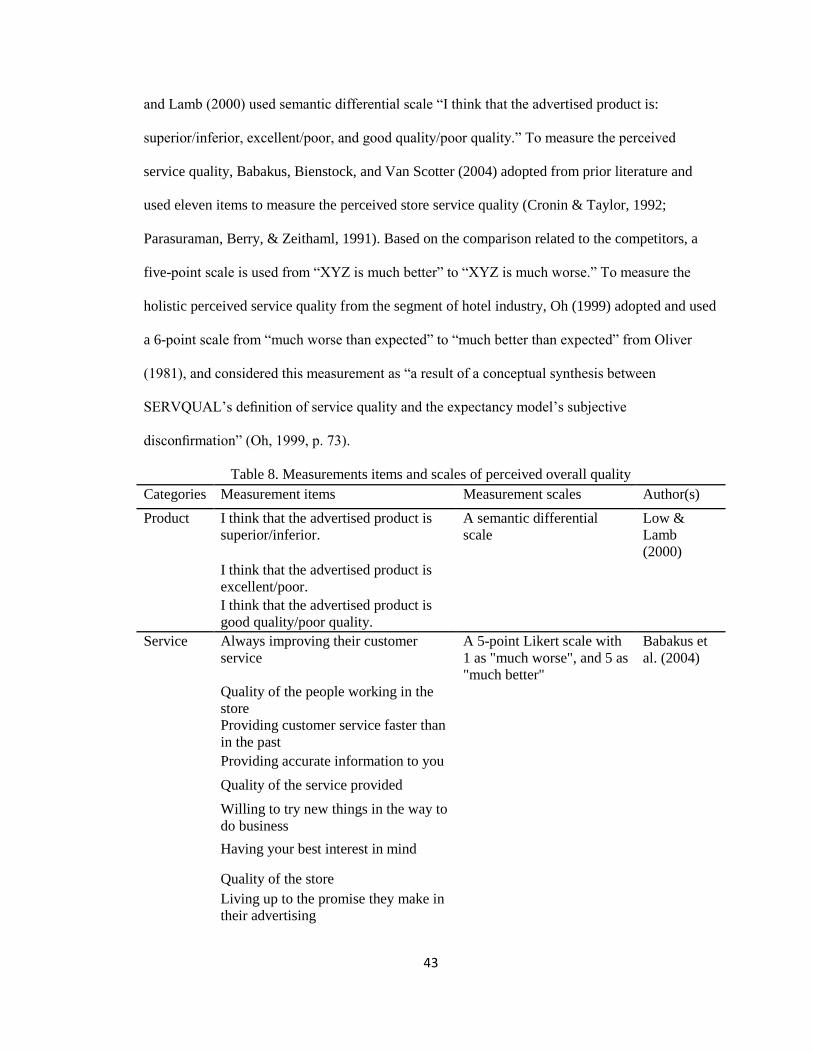
43
and Lamb (2000) used semantic differential scale “I think that the advertised product is:
superior/inferior, excellent/poor, and good quality/poor quality.” To measure the perceived
service quality, Babakus, Bienstock, and Van Scotter (2004) adopted from prior literature and
used eleven items to measure the perceived store service quality (Cronin & Taylor, 1992;
Parasuraman, Berry, & Zeithaml, 1991). Based on the comparison related to the competitors, a
five-point scale is used from “XYZ is much better” to “XYZ is much worse.” To measure the
holistic perceived service quality from the segment of hotel industry, Oh (1999) adopted and used
a 6-point scale from “much worse than expected” to “much better than expected” from Oliver
(1981), and considered this measurement as “a result of a conceptual synthesis between
SERVQUAL’s definition of service quality and the expectancy model’s subjective
disconfirmation” (Oh, 1999, p. 73).
Table 8. Measurements items and scales of perceived overall quality
Categories Measurement items Measurement scales Author(s)
Product I think that the advertised product is
superior/inferior.
A semantic differential
scale
Low &
Lamb
(2000)
I think that the advertised product is
excellent/poor.
I think that the advertised product is
good quality/poor quality.
Service Always improving their customer
service
A 5-point Likert scale with
1 as "much worse", and 5 as
"much better"
Babakus et
al. (2004)
Quality of the people working in the
store
Providing customer service faster than
in the past
Providing accurate information to you
Quality of the service provided
Willing to try new things in the way to
do business
Having your best interest in mind
Quality of the store
Living up to the promise they make in
their advertising
44
Informing you about new products and
services
Actively seeking your feedback about
the way they do business
Hotel This hotel was A 6-point Likert scale with
1 as "much worse than
expected", and 6 as "much
better than expected"
Oliver
(1981); Oh
(1999)
3.2.3. Relationship between Brand Extension’s Attribute-level Performance and
Perceived Overall Quality toward Brand Extension
Cue Utilization Theory. The cue utilization theory provided theoretical support of the
relationship between the brand extension’s attribute-level performance and perceived overall
quality toward brand extension. A cue refers to “any informational stimulus about or relating to
the product, service or purchase context” (Feng, 2011, p. 8). Cue utilization theory describes that
a set of cues from the product can become the indicators of consumers’ perceptions regard to the
stored brand quality (Cox, 1967; Richardson, Dick, & Jain, 1994; Olson & Jacoby, 1972). A
cue’s predictive value and confidence value provide the “degree to which consumers associate a
given cue with product quality,” and the “degree to which consumers have confidence in their
ability to use and judge that cue accurately” respectively (Richardson et al., 1994, p. 29). That
means a cue with high predictive and confidence value can be greatly weighted when the
consumers evaluate perceived product quality (Richardson et al., 1994).
There are two types of cues discussed in the prior literature, including extrinsic cues and
intrinsic cues (Olson & Jacoby, 1972, Richardson et al., 1994). The extrinsic cues refer to the
product-related attributes (e.g., price, brand name, store name, and packaging), whereas the
intrinsic cues represent the characteristics of the product (e.g., ingredients, taste, smell, and
texture) (Collins-Dodd & Lindley, 2003; Richardson et al., 1994). The extrinsic and intrinsic cues
influence consumers’ perceived quality assessments (Olson & Jacoby, 1972). The extrinsic cues
have been argued to explain more variance than the intrinsic cues in the product quality
45
perceptions (Collins-Dodd & Lindley, 2003; Richardson et al., 1994). However, the inherent cues
may play more important roles when the consumers have greater confidence in the product at the
purchase time and when they are highly involved in the judgment process (Maheswaran, Mackie,
& Chaiken, 1992; Sprott & Shimp, 2004; Zeithaml, 1988). Accordingly, if the consumers are
unable to assess the intrinsic cues or have the lower involvement in the judgment process, they
more reply on the extrinsic cues to evaluate the product quality (Maheswaran et al., 1992; Sprott
& Shimp, 2004). Based on my research purposes, this study focuses on the perceptions of the
consumers who have the consumption experience in the branded hotels. Their experience consists
of tangible products and intangible services (Slevitch & Oh, 2010) in the hotel brand extension
context. The multi-dimensional hotel attributes can serve as the extrinsic and intrinsic cues to
consumers. Therefore, Hypothesis 1 is proposed.
Hypothesis 1 (H1): Hotel brand extension’s attribute-level performance positively relates to
perceived overall quality toward brand extension.
3.2.4. Relationship between Brand Extension’s Brand Personality and Perceived Overall
Quality toward Brand Extension
Self-congruity Theory. Self-concept refers to “the totality of individual’s thoughts and
feelings having reference to himself as an object” (Rosenberg, 1986, p. 7). Sirgy (1982) proposed
four dimensions of the self-concept to explain consumer’s choice behavior, which are actual self-
concept, ideal self-concept, social self-concept, and ideal social self-concept. The consumers are
more likely willing to choose the brands similar to how they see or would like to see themselves
(Sirgy, 1982). Extending from self-concept theory, self-congruity theory suggests that “a
consumer tends to select products or brands that correspond to one’s self-concept” (Usakli &
Baloglu, 2011, p. 116). The self-congruity influences the consumers’ purchase preferences and
intensions (Erickson, 1996; Mehta, 1999). Consumers may prefer the brands or products that are
compatible with their self-perceptions (Erickson, 1996). Therefore, the self-congruity enhances
46
consumers’ positive attitudes and evaluations toward the brands and products (Erickson, 1996;
Graeff, 1996; Sirgy, 1982).
Brand personality describes how the consumers perceive the brand in their mindsets
(Sung & Kim, 2010). As one of the brand management objectives, it can be considered as a
powerful tool to strategically generate the differentiation from the marker competitors (Aaker,
1997; Siguaw, Mattila, & Austin, 1999). The brand personality contributes to the brand equity
(Aaker, 1996; Yoo & Donthu, 2001). Siguaw, Mattila, and Austin (1999) mentioned that the
well-established brand personality could increase the brand preference and usage, tightly tie the
emotions to the brand trust and loyalty (Ramaseshan & Tsao, 2007). Das (2014) investigated the
positive impact of retailer personality on the perceived quality. The consumers have the high
preference with the product’s personality matching their self-image (Govers & Schoormans,
2005). Moreover, brand personality’s congruity positively affects the consumers’ attitudes toward
the brands (De Chernatony & Dall’Olmo Riley, 1998; Harris & Fleming, 2005). As previously
stated, brand personality is measured by a list of five traits, including sincerity, excitement,
competence, sophistication, and ruggedness (Aaker, 1997). The consumer perceived quality can
be influenced by the product characteristics, such as price, appearance, components and features,
advertisements, and brand name (Dodds, Monroe, & Grewal, 1991; Ramaseshan & Tsao, 2007;
Rao & Monroe, 1989). Derived from the brand characteristics and marketing communications,
brand personality traits also serve as the cues of consumer perceived quality. Louis and Lombart
(2010) argued that brand personality influenced perceived brand quality and the attitude toward
the brand. Therefore, Hypothesis 2 is proposed.
Hypothesis 2 (H2): Hotel brand extensions’ brand personality positively relates to perceived
overall quality toward brand extension.
47
3.2.5. Consumer Emotional Responses
The concept of emotion has been well established in the fields of psychology and
marketing. Emotions are defined as “mental states of readiness that arise from cognitive
appraisals of events or one’s own thoughts” (Bagozzi, Gopinath, & Nyer, 1999, p. 194). Although
the terms “emotion”, “affect” and “mood” sometimes are interchangeably used in prior studies,
they have the different meanings and scopes. Emotion is an encompassing term that includes the
moods and affects, whereas affect is a general mental feeling category that includes emotions,
moods, and attitudes (Cohen & Areni, 1991). The moods describe “a phenomenological property
of an individual’s subjectively perceived affective state which will refer to the general, pervasive,
affective states that are transient and particularized to specific times and situations”
(Gardner,1985, p. 284). Bagozzi et al. (1999) pointed out the differences between the emotion
and mood. Compared with emotion, mood has a lower intensity, occurs without intention, and
does not associate with the action tendencies (Bagozzi et al., 1999). Besides consumers’ rational
judgments, the impacts of consumer emotional responses have gained popularity by marketing
scholars, especially in the area of consumers emotionally reacting to the advertising activities and
consumer satisfaction (Derbaix, 1995; Phillips & Baumgartner, 2002). The consumers’ emotional
states may affect their decision-making. The consumers with positive emotional states may
reduce the decision complexity and generate the shorter decision times (Isen et al., 1982).
3.2.6. Measuring Consumer Emotional Responses
Schoefer and Diamantopoulos (2009) summarized two approaches to the emotion
categorization in psychological studies. One approach is to treat the emotion as the stemming
from some discrete emotional categories (Izard, 1992). The emotion is described as the response
to the given situation (Richins, 1997). Another approach is using the continuous dimensions to
classify the emotion states (Russell & Mehrabian, 1977). Emotions can be captured either as the
general dimensions (e.g., positive and negative emotions), or as the sets of the specific emotions
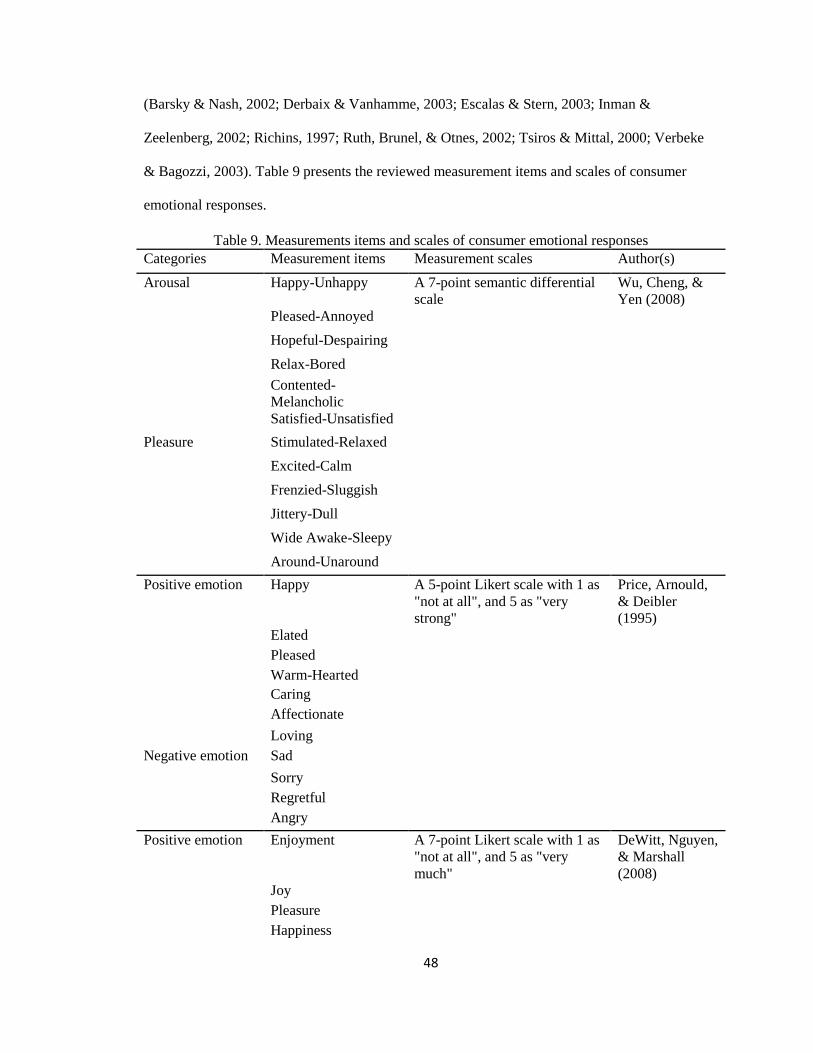
48
(Barsky & Nash, 2002; Derbaix & Vanhamme, 2003; Escalas & Stern, 2003; Inman &
Zeelenberg, 2002; Richins, 1997; Ruth, Brunel, & Otnes, 2002; Tsiros & Mittal, 2000; Verbeke
& Bagozzi, 2003). Table 9 presents the reviewed measurement items and scales of consumer
emotional responses.
Table 9. Measurements items and scales of consumer emotional responses
Categories Measurement items Measurement scales Author(s)
Arousal Happy-Unhappy A 7-point semantic differential
scale
Wu, Cheng, &
Yen (2008)
Pleased-Annoyed
Hopeful-Despairing
Relax-Bored
Contented-
Melancholic
Satisfied-Unsatisfied
Pleasure Stimulated-Relaxed
Excited-Calm
Frenzied-Sluggish
Jittery-Dull
Wide Awake-Sleepy
Around-Unaround
Positive emotion Happy A 5-point Likert scale with 1 as
"not at all", and 5 as "very
strong"
Price, Arnould,
& Deibler
(1995)
Elated
Pleased
Warm-Hearted
Caring
Affectionate
Loving
Negative emotion Sad
Sorry
Regretful
Angry
Positive emotion Enjoyment A 7-point Likert scale with 1 as
"not at all", and 5 as "very
much"
DeWitt, Nguyen,
& Marshall
(2008)
Joy
Pleasure
Happiness
49
Negative emotion Enraged
Incensed
Furious
Irate
Distressed
Comfortable
Barsky & Nash
(2002)
Content
Elegant
Entertained
Excited
Extravagant
Hip (or Cool)
Important
Inspired
Pampered
Practical
Relaxed
Respected
Secure
Sophisticated
Welcome
3.2.7. Relationship between Brand Extension’s Attribute-level Performance and
Consumer Emotional Responses toward Brand Extension
Mehrabian-Russell Model. Mehrabian and Russell (1974) proposed the Stimulus–
Organism–Response framework (a.k.a., M-R Model). The model describes the relationship
between the environmental stimuli and the behavioral responses mediated by the emotional
responses. The consumers’ emotional states may determine their further behavior (Donovan &
Rossiter, 1982; Mehrabian & Russell, 1974). When the individuals encounter an object or social
psychological stimulus, their internal cognitive and emotional states dictate their behavioral
responses (Mehrabian & Russell, 1974). The prior studies support the model’s validity in the
different contexts (Eroglu, Machleit, & Davis, 2001; Foxall & Greenley, 1999; Jang & Namkung,
2009; Mazaheri, Richard, & Laroche, 2010; Mummalaneni, 2005). For example, Lee, Ha, and
50
Widdows (2011) explored the relationship between the high-technology product attributes and the
consumer emotional responses. In their study, the perceptions of the product attributes (e.g.,
design and performance) serve as the stimuli and contribute to the consumer decision process.
The product attributes trigger consumers' internal emotional states. The M-R model has been used
to interpret the relationships between the physical environment and the consumer behavior in the
hospitality industry. In the context of the upscale restaurant, the perceived dining environment
significantly affects consumer emotional responses (Ryu & Jang, 2007). Extending from the
environmental stimuli, Jang and Namkung (2009) found that the perceived quality factors
positively affected the consumer emotional responses. Therefore, Hypothesis 3 is proposed.
Hypothesis 3 (H3): Hotel brand extension’s attribute-level performance positively relates to
consumer emotional responses toward brand extension.
3.2.8. Relationship between Brand Extension’s Brand Personality and Consumer
Emotional Responses toward Brand Extension
Compared with the personality traits that capture the enduring predispositions, the
emotions can capture the short-term consciously accessible feelings (Yik & Russell, 2001). There
are some studies that explore the relationship between the personality traits and emotion states
(Costa, McCrae, & Dye, 1991; Izard et al., 1993; Meyer & Shack, 1989). The personality traits
can be considered as the antecedents of the emotions (Costa et al., 1991; Yik & Russell, 2001).
Brand personality dimensions may lead to different types of the emotions. The brand personality
traits are “the unapprised affects which reflect a brand's affective assets that consumers will later
appraise and which will primarily influence the formation of their emotions” (Sung & Kim, 2010,
p. 646). For example, the consumers may be emotionally engaged with a brand that has a high
sophistication personality level. Additionally, the personality traits, such as agreeableness and
conscientiousness are positively related to the positive emotional states and negatively related to
51
the negative emotional states (Costa et al., 1991). Brand personality has been found to evoke the
consumers’ emotions in the marketing context (Restall & Gordon, 1993).
The mental representation of social episodes provides theoretical support for this
argument. It states that an individual’s mental representations can be mainly formed by “the
affective characteristics of episode stimuli, rather than by their actual descriptive features” (Sung
& Kim, 2010, p. 645). As an individual retrieving the information from memory, the first element
showed up is the affective quality of the original input (Zajonc, 1980). Hence, the consumer’s
mental brand representation may be influenced by the brand affective characteristic (Chaudhuri &
Holbrook, 2001). Therefore, Hypotheses 4 is proposed.
Hypothesis 4 (H4): Hotel brand extension’s brand personality positively relates to consumer
emotional responses toward brand extension.
3.2.9. Relationship between Perceived Overall Quality toward Brand Extension and
Consumer Emotional Responses toward Brand Extension
Mehrabian-Russell Model. The Mehrabian-Russell’s (1974) model can be used to explain
the relationship between the perceived quality and consumer emotional states. In this stimulus-
organism-response model, the stimuli are “external to the person and consist of various elements
of physical atmosphere” (Bagozzi, 1986; Jang & Namkung, 2009, p. 452). For example, Jang and
Namkung (2009) discussed the stimuli in the restaurant context include the tangible and
intangible restaurant features (e.g., product attributes, physical environments, and service aspects)
and investigated the relationship between the quality-specific stimuli and the consumer emotional
states. Because of the intensive interaction between the service providers and the customers, the
perceived quality may serve as the stimuli to affect consumer emotional responses (Jang &
Namkung, 2009). With the high perceived quality, the customers are willing to experience the
enhanced emotions (Kim & Moon, 2009). The customers holding a certain belief regarding the
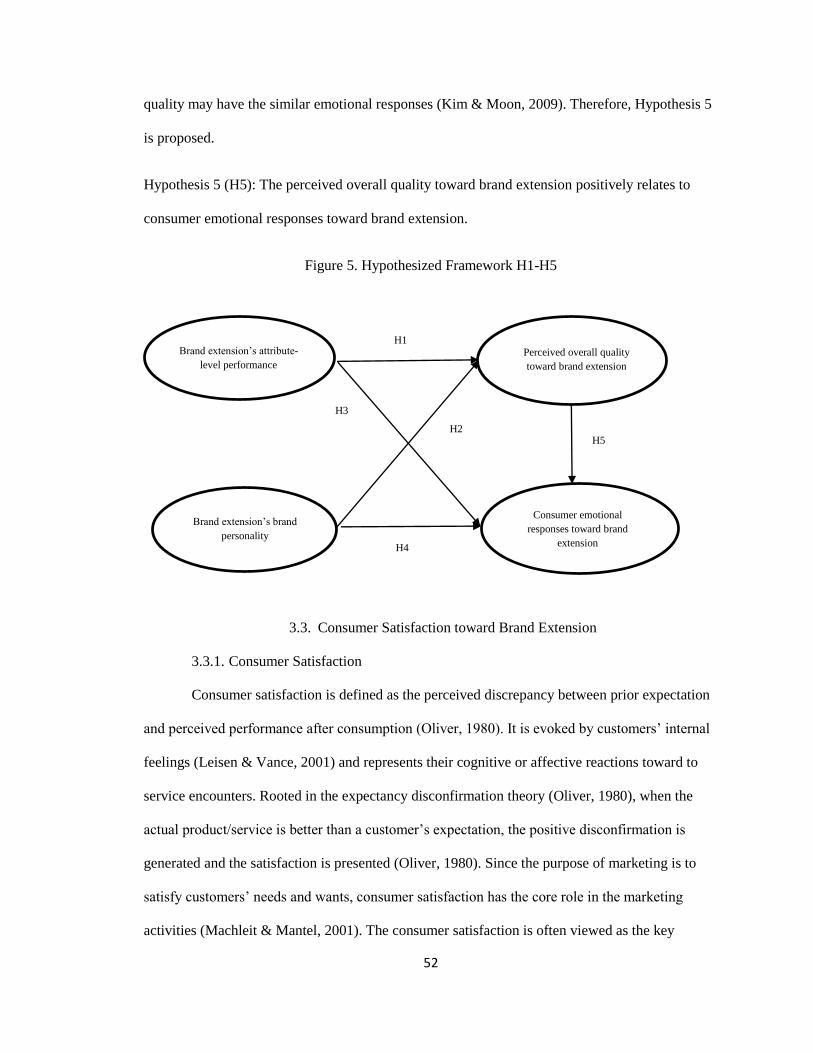
52
quality may have the similar emotional responses (Kim & Moon, 2009). Therefore, Hypothesis 5
is proposed.
Hypothesis 5 (H5): The perceived overall quality toward brand extension positively relates to
consumer emotional responses toward brand extension.
Figure 5. Hypothesized Framework H1-H5
3.3. Consumer Satisfaction toward Brand Extension
3.3.1. Consumer Satisfaction
Consumer satisfaction is defined as the perceived discrepancy between prior expectation
and perceived performance after consumption (Oliver, 1980). It is evoked by customers’ internal
feelings (Leisen & Vance, 2001) and represents their cognitive or affective reactions toward to
service encounters. Rooted in the expectancy disconfirmation theory (Oliver, 1980), when the
actual product/service is better than a customer’s expectation, the positive disconfirmation is
generated and the satisfaction is presented (Oliver, 1980). Since the purpose of marketing is to
satisfy customers’ needs and wants, consumer satisfaction has the core role in the marketing
activities (Machleit & Mantel, 2001). The consumer satisfaction is often viewed as the key
Brand extension’s attribute-
level performance
Perceived overall quality
toward brand extension
H3
H2
Brand extension’s brand
personality
Consumer emotional
responses toward brand
extension
H1
H4
H5
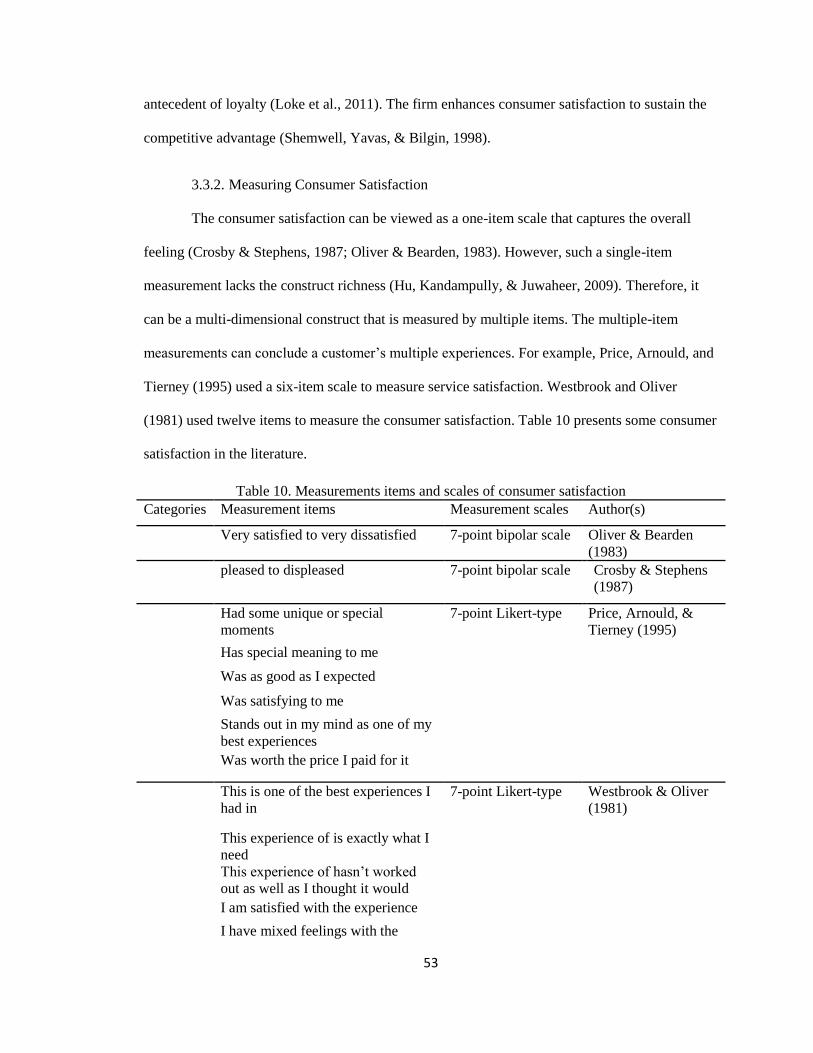
53
antecedent of loyalty (Loke et al., 2011). The firm enhances consumer satisfaction to sustain the
competitive advantage (Shemwell, Yavas, & Bilgin, 1998).
3.3.2. Measuring Consumer Satisfaction
The consumer satisfaction can be viewed as a one-item scale that captures the overall
feeling (Crosby & Stephens, 1987; Oliver & Bearden, 1983). However, such a single-item
measurement lacks the construct richness (Hu, Kandampully, & Juwaheer, 2009). Therefore, it
can be a multi-dimensional construct that is measured by multiple items. The multiple-item
measurements can conclude a customer’s multiple experiences. For example, Price, Arnould, and
Tierney (1995) used a six-item scale to measure service satisfaction. Westbrook and Oliver
(1981) used twelve items to measure the consumer satisfaction. Table 10 presents some consumer
satisfaction in the literature.
Table 10. Measurements items and scales of consumer satisfaction
Categories Measurement items Measurement scales Author(s)
Very satisfied to very dissatisfied 7-point bipolar scale Oliver & Bearden
(1983)
pleased to displeased 7-point bipolar scale Crosby & Stephens
(1987)
Had some unique or special
moments
7-point Likert-type Price, Arnould, &
Tierney (1995)
Has special meaning to me
Was as good as I expected
Was satisfying to me
Stands out in my mind as one of my
best experiences
Was worth the price I paid for it
This is one of the best experiences I
had in
7-point Likert-type Westbrook & Oliver
(1981)
This experience of is exactly what I
need
This experience of hasn’t worked
out as well as I thought it would
I am satisfied with the experience
I have mixed feelings with the
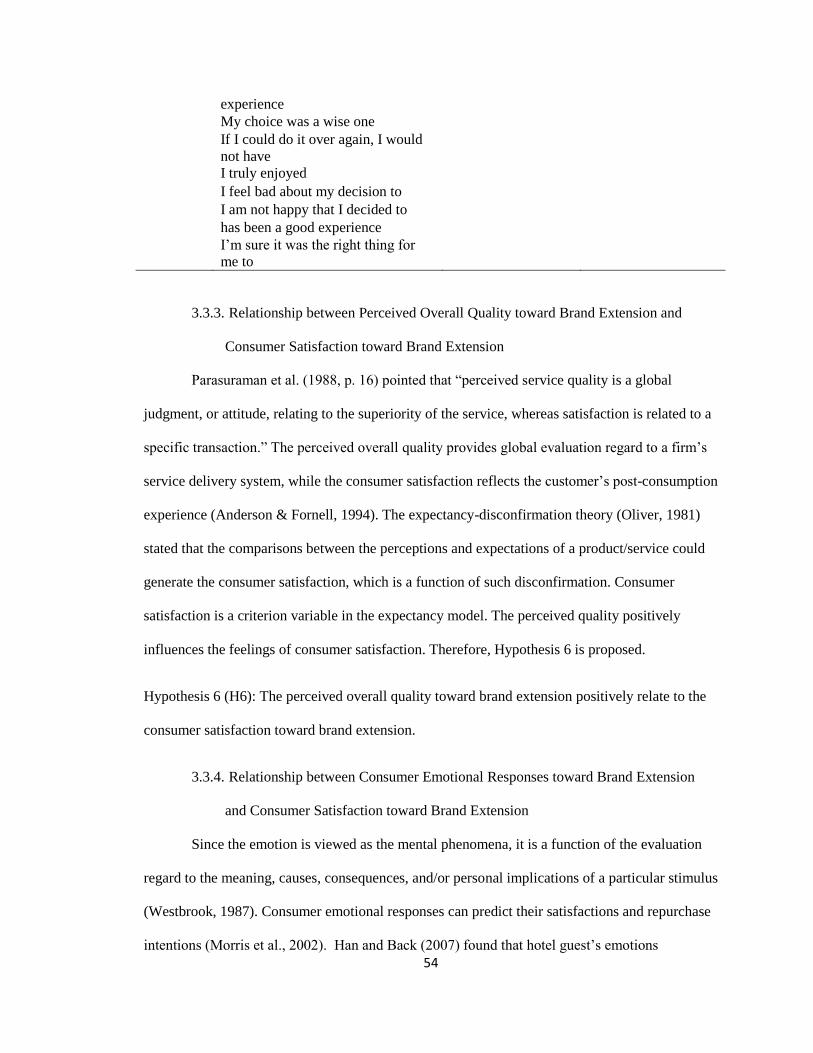
54
experience
My choice was a wise one
If I could do it over again, I would
not have
I truly enjoyed
I feel bad about my decision to
I am not happy that I decided to
has been a good experience
I’m sure it was the right thing for
me to
3.3.3. Relationship between Perceived Overall Quality toward Brand Extension and
Consumer Satisfaction toward Brand Extension
Parasuraman et al. (1988, p. 16) pointed that “perceived service quality is a global
judgment, or attitude, relating to the superiority of the service, whereas satisfaction is related to a
specific transaction.” The perceived overall quality provides global evaluation regard to a firm’s
service delivery system, while the consumer satisfaction reflects the customer’s post-consumption
experience (Anderson & Fornell, 1994). The expectancy-disconfirmation theory (Oliver, 1981)
stated that the comparisons between the perceptions and expectations of a product/service could
generate the consumer satisfaction, which is a function of such disconfirmation. Consumer
satisfaction is a criterion variable in the expectancy model. The perceived quality positively
influences the feelings of consumer satisfaction. Therefore, Hypothesis 6 is proposed.
Hypothesis 6 (H6): The perceived overall quality toward brand extension positively relate to the
consumer satisfaction toward brand extension.
3.3.4. Relationship between Consumer Emotional Responses toward Brand Extension
and Consumer Satisfaction toward Brand Extension
Since the emotion is viewed as the mental phenomena, it is a function of the evaluation
regard to the meaning, causes, consequences, and/or personal implications of a particular stimulus
(Westbrook, 1987). Consumer emotional responses can predict their satisfactions and repurchase
intentions (Morris et al., 2002). Han and Back (2007) found that hotel guest’s emotions
55
significantly relate to the repeat patronage. Similar results can be found (Laverie, Kleine, &
Kleine, 1993).
Consumer satisfaction not only has the transaction-specific nature but also has the
emotional nature (Machleit & Mantel, 2001; Westbrook, 1987). Based on cognitive appraisal
theory, customers experience the performance and appraise it. Emotions arise in response to
“appraisals one makes for something of relevance to one’s wellbeing” (Bagozzi et al., 1999,
p.185). When the perceived performance is better than the expectations, customers will react with
positive affect, which has a direct influence on consumer satisfaction. Therefore, consumer
emotional responses toward brand extension can form consumer satisfaction toward brand
extension. Therefore, Hypothesis 7 is proposed.
Hypothesis 7 (H7): The positive consumer emotional responses toward brand extension positively
relate to the consumer satisfaction toward brand extension.
3.4. Consumer Brand Loyalty toward Brand Extension
3.4.1. Consumer Brand Loyalty
Consumer brand loyalty is important to help the firms achieve long-term competitive
advantages. Consumer loyalty refers to “customer who repurchases from the same service
provider whenever possible and who continues to recommend or maintains a positive attitude
towards the service provider” (Kandampully & Suhartanto, 2000, p. 346). Consumer loyalty
includes attitudinal loyalty and behavioral loyalty. The behavioral loyalty is that the customers
intend to repurchase the brand or services over time (Bowen & Shoemaker, 1998). Attitudinal
loyalty refers to “a deeply held commitment to rebuy or patronize a preferred product or service
consistently in the future, despite situational influences and marketing efforts having the potential
to cause switching behavior” (Oliver, 1997, p. 392). It is the customer intention to repurchase and
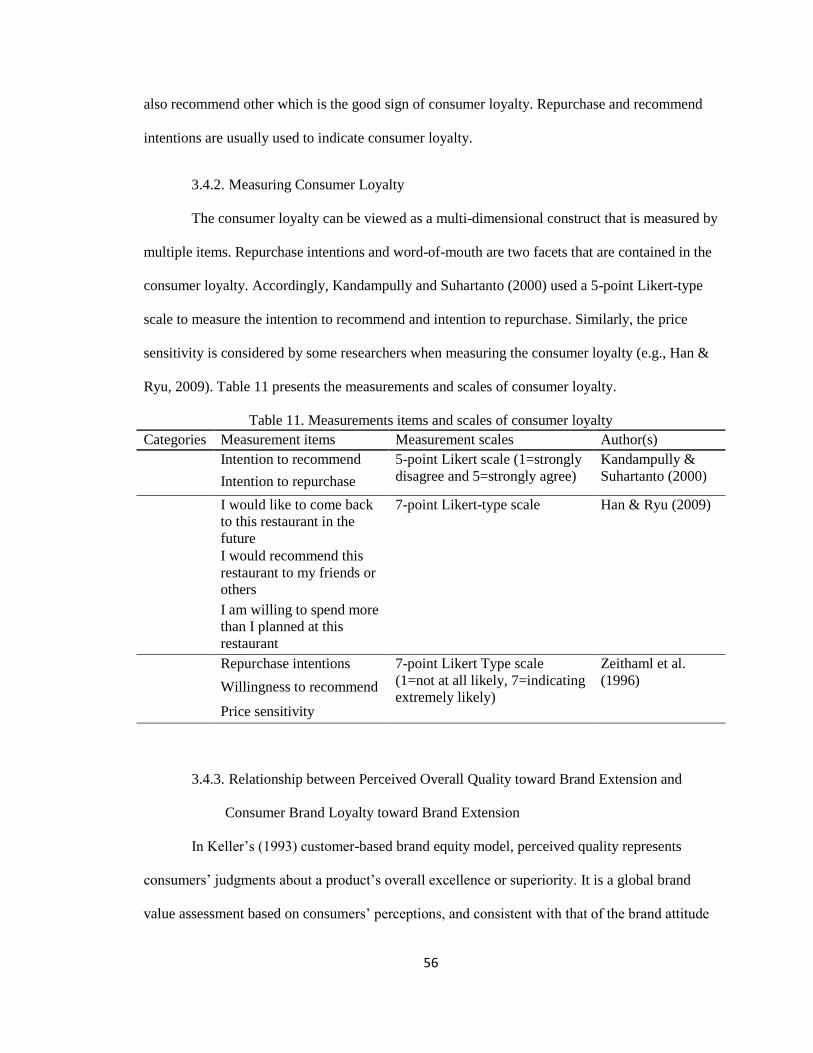
56
also recommend other which is the good sign of consumer loyalty. Repurchase and recommend
intentions are usually used to indicate consumer loyalty.
3.4.2. Measuring Consumer Loyalty
The consumer loyalty can be viewed as a multi-dimensional construct that is measured by
multiple items. Repurchase intentions and word-of-mouth are two facets that are contained in the
consumer loyalty. Accordingly, Kandampully and Suhartanto (2000) used a 5-point Likert-type
scale to measure the intention to recommend and intention to repurchase. Similarly, the price
sensitivity is considered by some researchers when measuring the consumer loyalty (e.g., Han &
Ryu, 2009). Table 11 presents the measurements and scales of consumer loyalty.
Table 11. Measurements items and scales of consumer loyalty
Categories Measurement items Measurement scales Author(s)
Intention to recommend 5-point Likert scale (1=strongly
disagree and 5=strongly agree)
Kandampully &
Suhartanto (2000) Intention to repurchase
I would like to come back
to this restaurant in the
future
7-point Likert-type scale Han & Ryu (2009)
I would recommend this
restaurant to my friends or
others
I am willing to spend more
than I planned at this
restaurant
Repurchase intentions 7-point Likert Type scale
(1=not at all likely, 7=indicating
extremely likely)
Zeithaml et al.
(1996)
Willingness to recommend
Price sensitivity
3.4.3. Relationship between Perceived Overall Quality toward Brand Extension and
Consumer Brand Loyalty toward Brand Extension
In Keller’s (1993) customer-based brand equity model, perceived quality represents
consumers’ judgments about a product’s overall excellence or superiority. It is a global brand
value assessment based on consumers’ perceptions, and consistent with that of the brand attitude
57
(Parasuraman et al., 1985). It serves as the antecedent of consumer brand loyalty. The perceived
quality has been found positively influencing the purchase intentions and willingness to
recommend (Boulding & Kirmani, 1993). In other words, the higher service quality leads to the
higher customer repurchase behavior (Brodie, Whittome, & Brush, 2009). The perceived high
quality drives to a high level of consumer brand loyalty. Therefore, Hypothesis 8 is proposed.
Hypothesis 8 (H8): The perceived overall quality toward brand extension positively relates to
consumer brand loyalty toward brand extension.
3.4.4. Relationship between Consumer Emotional Responses toward Brand Extension
and Consumer Brand Loyalty toward Brand Extension
De Ruyter and Bloemer (1999) found that the consumer loyalty can be enhanced if they
experience positive affect in a restaurant. Yu and Dean (2001) found a high correlation between
emotions and overall consumer loyalty. Emotional response is a powerful predictor of intentions
and brand attitude (Morris et al., 2002). Consumer emotions based on consumption play a
significant role in forming loyalty (Barsky & Nash, 2002; Han & Back, 2007). As we knew, the
emotion can be classified as positive emotion and negative emotion. These two types of emotion
have distinct roles on the consumer loyalty. That is, positive emotions positively affect loyalty,
whereas negative emotions negatively affect loyalty (Barsky & Nash, 2002). Therefore,
Hypothesis 9 is proposed.
Hypothesis 9 (H9): The positive consumer emotional responses toward brand extension positively
relate to consumer brand loyalty toward brand extension.
3.4.5. Relationship between Consumer Satisfaction toward Brand Extension and
Consumer Brand Loyalty toward Brand Extension
The relationship between the consumer satisfaction and consumer loyalty has been
investigated empirically (Zeithaml & Bitner, 1996). The consumer satisfaction can positively

58
affect attitudes toward the product/service (Oliver, 1980), enhance the belief (Albarracin & Wyer,
2000), reinforce positive affect (Oliver, 1993), and enhance repurchase intentions (Yi, 1990).
Consumer satisfaction has a significant effect on purchase intentions (Fornell et al., 1996) and
customers’ intentions to recommend (Getty & Thompson, 1994). Based on evaluative-cognitive
consistency theory (Eagly & Chaiken, 1995), the attitudes and the belief toward an object should
be consistent. In other words, a positive attitude may be consistent with the positive belief.
Therefore, Hypothesis 10 is proposed.
Hypothesis 10 (H10): The consumer satisfaction toward brand extension positively relates to
consumer brand loyalty toward brand extension.
Figure 6. Hypothesized Framework H6-H10
3.5. Parent Brand Resonance
Moving on now to consider the parent brand resonance, the term “brand resonance” can
broadly be defined as “the nature of the relationship that customers have with the brand and the
extent to which they feel that they are ‘in synch’ with the brand” (Keller, 2001, p. 15). It
emphasizes the relationships and identification levels that customers have with the brands and
captures the “intensity or the depth of the psychological bond that customers have with the brand
Consumer emotional
responses toward brand
extension
Consumer brand loyalty
toward brand extension
H9
Consumer emotional
responses toward brand
extension
Consumer brand loyalty
toward brand extension
Perceived overall quality
toward brand extension
Consumer satisfaction toward
brand extension
H8
H7
H6
H10
59
as well as the level of activity engendered by this loyalty” (Keller, 2001, p. 15). Keller (1993)
explained that resonating with a brand required customers to actively raise the psychological
attachment to the brand beyond frequently purchasing the branded products. With high brand
resonance, consumers may have a high degree of repurchase intention (Huang et al., 2014) and
loyalty through such brand relationships that allow them interacting with the brand and sharing
the experience with others (Keller, 2012). Accordingly, Keller (2012) suggested characterizing
brand resonance into two dimensions, intensity and activity. The intensity refers to “the strength
of the attitudinal attachment to the brand and sense of community with others,” while the activity
refers to “the behavioral changes engendered by this loyalty” (Keller, 2012, p. 188). Therefore,
the two mentioned categories (Keller, 2001), attitudinal attachment and sense of community are
classified into the dimension of intensity. The intensity-related constructs represent the brand
relationship quality and reflect the cognitive processes in shaping loyalty without the external
activity or behavior that makes it easier to be quantified with reliable and valid measurements
(Huang et al., 2014).
3.5.1. Consumer Attitudinal Attachment
Under the dimensions of brand resonance, the brand attachment is a psychological
construct that refers to “a long-lasting and inalterable affective reaction towards the brand,
expressing psychological proximity with this one” (Lacoeuilhe, 2000, p. 66, cited from Belaid &
Temessek Behi, 2011). It goes beyond consumers’ positive brand attitudes and describes
consumers’ favorite possession degrees towards the brand (Keller, 2001). Belaid and Temessek
Behi (2011, p.38) pointed out that “(1) the brand attachment expresses the consumer’s desire to
maintain, through brand consumption, a nostalgic connection; (2) self-brand connections lead to
strong brand connection-there are economic and psychic costs associated with buying and
consuming the brand; (3) consumer brand-bonds are strong when the brand enhances self-identity
but also when it is based on psychological similarity (the brand shares the same cultural or
60
personal values as the consumer); (4) as with possession attachment, brand attachment involves
psychological appropriation of specific brands, self-extension, a personal history between the
consumer and the brand; and (5) brand attachment develops in accordance with a person’s life
cycle.”
3.5.2. Consumer Sense of Community
The sense of community denotes “an important social phenomenon whereby customers
feel a kinship or affiliation with other people associated with the brand” (Keller, 2001, p. 15). It
engages the consumers having with the high brand commitment level (Muniz & O’Guinn, 2001).
Brand community is a relational community that is characterized by a psychological sense of
community among individuals (McMillan & Chavis, 1986) and it is a psychological sense of
brand community as “the degree to which an individual perceives relational bonds with other
brand users” (Carlson, Suter, & Brown, 2008, p. 286). The brand community can influence the
brand equity components through facilitating the brand information sharing and generating the
overall brand knowledge (Muniz & O’Guinn, 2001). Therefore, the consumers in a brand
community may get their brand information strengthened in their memories.
3.5.3. Brand Extension’s Feedback Effect on Parent Brand
The customer-based brand equity has been leveraged through the establishment of brand
extension. The consumer brand loyalty toward brand extension is assumed to be enhanced based
on the hypotheses. In the meantime, brand extension’s feedback effects on the parent brand have
been investigated (Cheng-Hsui Chen & Chen, 2000). On the one hand, possible dilution of parent
brand can be generated by the brand extensions (Cheng-Hsui Chen & Chen, 2000). When a firm
establishes a brand extension, the parent brand image may be changed because of the new brand
associations built in consumers’ minds (Ries & Trout, 1986). Therefore, consumers’ feelings and
beliefs toward parent brand may be diluted (Ries & Trout, 1986). Loken and John (1993) argued
that “a dilution effect occurs in the beliefs associated with the brand family when the attributes of
61
the extension are inconsistent with the prior beliefs about the brand family” (Martinez & De
Chernatony, 2004, p. 41). Völckner, Sattler, and Kaufmann (2008) argued that brand extension’s
negative feedback effect on parent brand’s image occurred in the short term, and diminished over
time with the increases of the perceived fit and perceived general extendibility. On the other
hand, the brand extension performance may change the consumers’ perceptions of the parent
brand (Keller, 1993). The favorably assessed brand extensions improve the consumers’
perceptions of the parent brand (Teas & Agarwal, 2000). As the proposed intentional
consequences of the positive brand extension’s evaluation, the high evaluation toward the brand
extension may lead to the positive parent brand resonance. The process is fulfilled by the
reciprocal transfer of associations and emotions (Czellar, 2003; Keller, 1993). Based on
associative network theory, the brand associations from parent brand can be updated or adapted
from its brand extension (Lei, Dawar, & Lemmink, 2008). Therefore, the exiting cognitive
structure from parent brand can be affected by the brand extension. The bookkeeping model
explains the association transfer between brand extension and parent brand by aggregating
updated or adapted brand associations from the brand extension into the parent brand (Loken &
John, 1993). Accordingly, the variations in brand extension attitudes drive the subsequent
accommodation of new associations within the parent brand image (Czellar, 2003; Lei et al.,
2008).
Based on attachment theory (Mikulincer & Shaver 2007), the customer attitudinal
attachment involves a rich and accessible memory network and the thoughts and feelings about
the brand and the brand's relationship to the self. As a dimension of brand resonance, attitudinal
attachment reflects a long-term relationship between the customer and the parent brand based on
their experience (Erdem & Swait, 1998). In a high resonance circumstance, the customer may feel
to be more in sync with the parent brand (Keller, 2001). The ways to reach out brand resonance
include frequently use products of the brand and actively be concerned about information relating
62
to the brand (Keller, 1993). The high consumer brand loyalty toward brand extension achieved
from the strong repurchase and recommend intentions reflects consumers’ consistent preference
toward brand extension. The positive attitude and briefs toward brand extension can be
strengthened and motivate customers updating the brand associations of the parent brand so that
to form a strong psychological attachment to the parent brand. Therefore, Hypothesis 11 is
proposed.
Hypothesis 11(H11): The consumer brand loyalty toward brand extension positively relates to the
consumer attitudinal attachment toward parent brand.
The sense of community can be generated by identifying consumers’ desirable brand
characteristics or the characteristics of other consumers who purchase the brand. It involves a
higher brand commitment level and a strengthened brand knowledge in consumers’ memories
(Muniz & O’Guinn, 2001). The factors that can drive the psychological sense of brand
community include the brand itself and the group of brand users (Carlson et al., 2008). Based on
the feedback effect, the high consumer brand loyalty toward brand extension strengthens
consumers’ desirable brand associations toward brand extension, and the positive parent brand
associations get updated. It leads to consumer’s high consumer sense of community toward parent
brand. Therefore, Hypothesis 12 is proposed.
Hypothesis 12 (H12): The consumer brand loyalty toward brand extension positively relates to
the consumer sense of community toward parent brand.
3.5.4. Relationship between Consumer Attitudinal Attachment toward parent brand and
Consumer Sense of Community toward Parent Brand
Argued by social identity theory, people may classify themselves and others into different
social categories based on different categorization schemas (Tajfel & Turner, 1985). It provides
people with a systematic means of defining others as well as allows people to define themselves
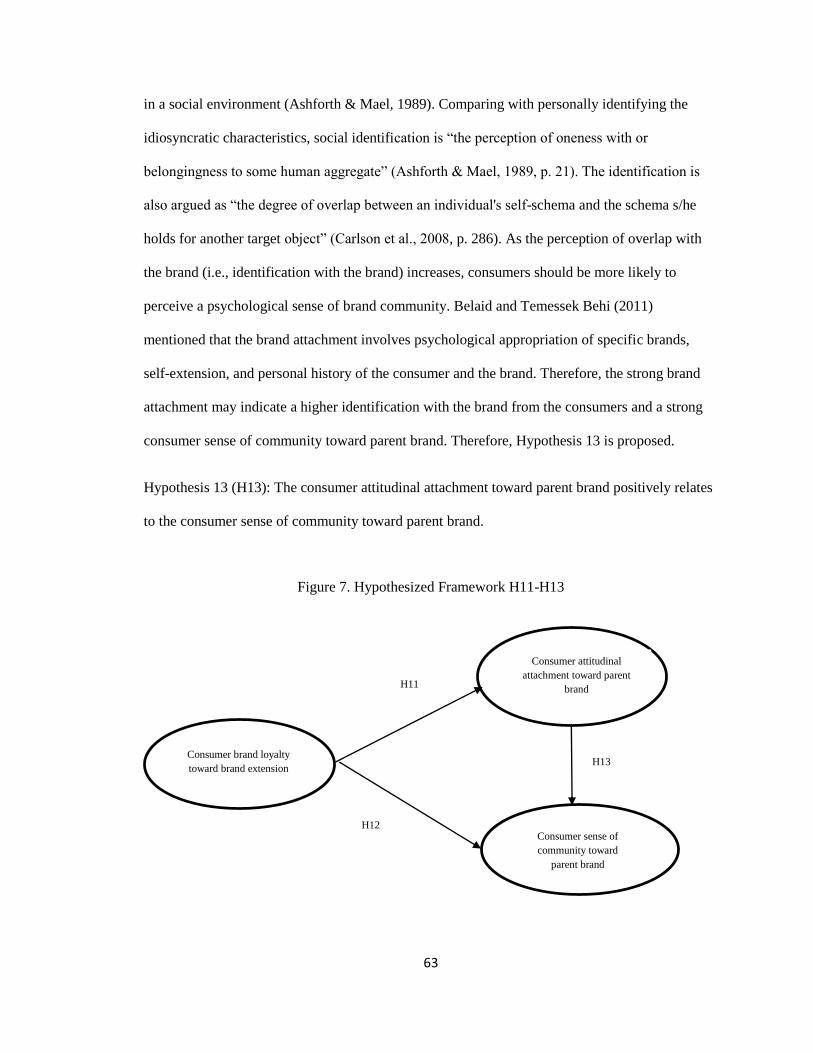
63
in a social environment (Ashforth & Mael, 1989). Comparing with personally identifying the
idiosyncratic characteristics, social identification is “the perception of oneness with or
belongingness to some human aggregate” (Ashforth & Mael, 1989, p. 21). The identification is
also argued as “the degree of overlap between an individual's self-schema and the schema s/he
holds for another target object” (Carlson et al., 2008, p. 286). As the perception of overlap with
the brand (i.e., identification with the brand) increases, consumers should be more likely to
perceive a psychological sense of brand community. Belaid and Temessek Behi (2011)
mentioned that the brand attachment involves psychological appropriation of specific brands,
self-extension, and personal history of the consumer and the brand. Therefore, the strong brand
attachment may indicate a higher identification with the brand from the consumers and a strong
consumer sense of community toward parent brand. Therefore, Hypothesis 13 is proposed.
Hypothesis 13 (H13): The consumer attitudinal attachment toward parent brand positively relates
to the consumer sense of community toward parent brand.
Figure 7. Hypothesized Framework H11-H13
Consumer sense of
community toward parent
brand
Consumer brand loyalty
toward brand extension
Consumer attitudinal
attachment toward parent
brand
H12
H11
H13
Consumer sense of
community toward
parent brand
64
3.6. Perceived Image Fit between Parent Brand and Brand Extension
The construct of perceived fit between the parent brand and brand extension has gained
popularity in brand extension literature since it captures the perceived associations between the
parent brand and its extension (Czellar, 2003). The perceived fit indicates the similarity between
brand extension and parent brand (Aaker & Keller, 1990). The high perceived fit commonly
occurs if the consumers perceive two entities logically match together (Speed & Thompson,
2000). Aaker and Keller (1990) pointed out the importance of perceived fit to brand extension
success. First, if two product categories match each other, it promotes the consumers transferring
their perceived quality from one brand to another one (Aaker & Keller, 1990). Aaker and Keller
(1990) used a set of theories to support this idea (e.g., cognitive consistency theory, stimulus
generalization theory, and categorization theory). Second, if the fit between two product
categories is low, it may not only diminish the transfer of the positive associations but also
stimulate undesirable beliefs and associations (Aaker & Keller, 1990).
Because the vertical brand extension is the commonly used strategy in the lodging
industry, the parent brand and the brand extension are usually in the same or very similar hotel
category. Thus, the product category fit is nearly perfect. This study focuses on the measurements
of perceived brand image fit between parent brand and brand extension (See Table 12). Based on
Bhat and Reddy (2001), a brand evaluation determination model was proposed to investigate the
impacts of the parent brand attribute associations on the brand extension evaluation. The brand
image fit is an important construct and assessed by a 2-item reliable measurement instrument in
the survey. Later on, this measurement instrument has been adopted by some studies related to
the brand extension (Lau & Phau, 2010). Salinas & Pérez (2009) developed a 3-item
measurement by Bhat and Reddy (2001). The reliability has been checked by the empirical
studies.
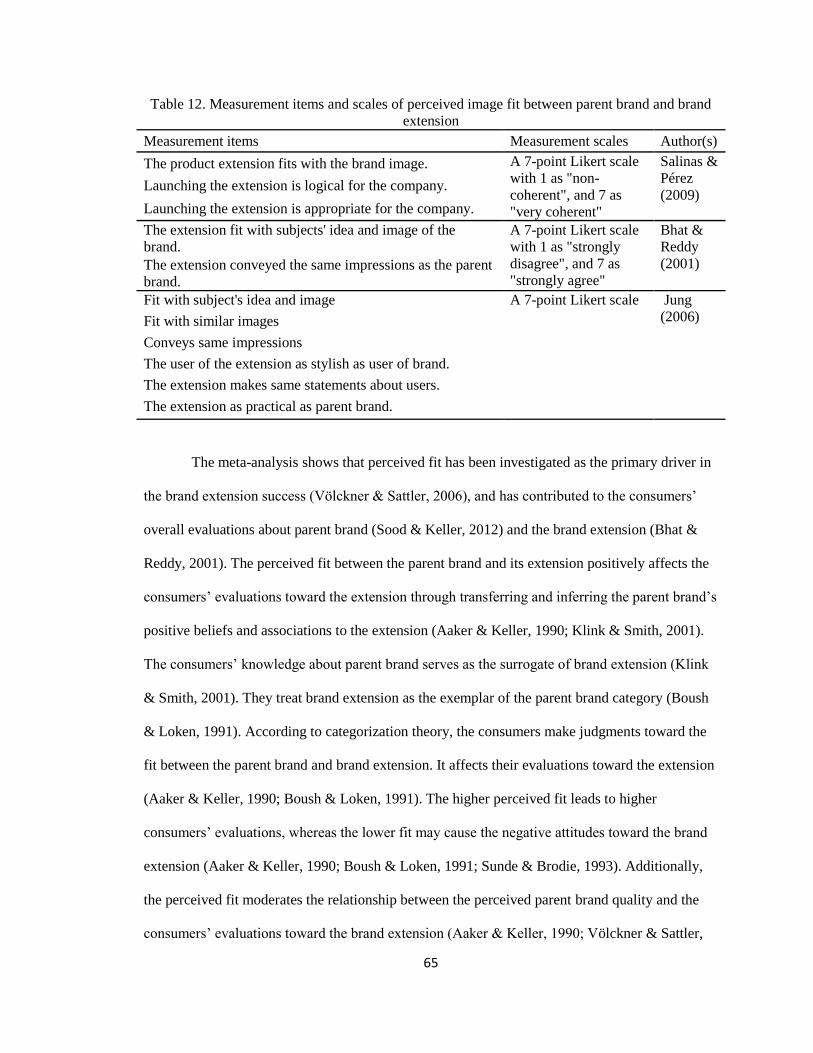
65
Table 12. Measurement items and scales of perceived image fit between parent brand and brand
extension
Measurement items Measurement scales Author(s)
The product extension fits with the brand image. A 7-point Likert scale
with 1 as "non-
coherent", and 7 as
"very coherent"
Salinas &
Pérez
(2009) Launching the extension is logical for the company.
Launching the extension is appropriate for the company.
The extension fit with subjects' idea and image of the
brand.
A 7-point Likert scale
with 1 as "strongly
disagree", and 7 as
"strongly agree"
Bhat &
Reddy
(2001) The extension conveyed the same impressions as the parent
brand.
Fit with subject's idea and image A 7-point Likert scale Jung
(2006) Fit with similar images
Conveys same impressions
The user of the extension as stylish as user of brand.
The extension makes same statements about users.
The extension as practical as parent brand.
The meta-analysis shows that perceived fit has been investigated as the primary driver in
the brand extension success (Völckner & Sattler, 2006), and has contributed to the consumers’
overall evaluations about parent brand (Sood & Keller, 2012) and the brand extension (Bhat &
Reddy, 2001). The perceived fit between the parent brand and its extension positively affects the
consumers’ evaluations toward the extension through transferring and inferring the parent brand’s
positive beliefs and associations to the extension (Aaker & Keller, 1990; Klink & Smith, 2001).
The consumers’ knowledge about parent brand serves as the surrogate of brand extension (Klink
& Smith, 2001). They treat brand extension as the exemplar of the parent brand category (Boush
& Loken, 1991). According to categorization theory, the consumers make judgments toward the
fit between the parent brand and brand extension. It affects their evaluations toward the extension
(Aaker & Keller, 1990; Boush & Loken, 1991). The higher perceived fit leads to higher
consumers’ evaluations, whereas the lower fit may cause the negative attitudes toward the brand
extension (Aaker & Keller, 1990; Boush & Loken, 1991; Sunde & Brodie, 1993). Additionally,
the perceived fit moderates the relationship between the perceived parent brand quality and the
consumers’ evaluations toward the brand extension (Aaker & Keller, 1990; Völckner & Sattler,
66
2006). That is, the degree of the brand associations’ transferring from the parent brand to the
extension relies on the level of the perceived fit between them (Aaker & Keller, 1990; Boush &
Loken, 1991). Furthermore, the perceived fit has the feedback effect on the parent brand (Smith
& Park, 1992; Morrin, 1999). It may improve or dilute the parent brand equity. The high
perceived fit or congruence allows the consumers evaluating the parent brand favorably and
positively (Keller & Aaker, 1992; Grime et al., 2002), and purchasing more branded products
(Swaminathan et al., 2001). It tends to promote the parent brand categorization and enhance the
parent brand awareness because the brand extension increases the brand visibility (Aaker, 1991;
Buil, De Chernatony, & Hem, 2009). The low perceived fit will reduce the differentiation, and
weaken the associations with the parent brand (Aaker, 1992; Buil et al., 2009; Keller & Aaker,
1992).
Aaker and Keller (1990) proposed three dimensions to measure the perceived fit between
two products (i.e., substitute, complement, and transfer). The substitutes are the products that can
replace one another in satisfying a need. The complements are products that contain the same
usage context. The transfer refers to a manufacturing skill that overlaps with what already exists.
The perceived fit can be classified as the brand image fit and the product category fit (Bhat &
Reddy, 2001). The brand image consists of the associations that differ the focal brand from the
competitors’ brands. Brand image fit counts the fit between the parent brand’s and brand
extension’s image. Because the brand image represents a set of brand associations stored in the
consumers’ memories, it may generate the favorable evaluations toward the brand extension
(Bhat & Reddy, 2001; Keller, 1993). Bhat and Reddy (2001) claimed that the perceived brand
image fit considered the “consumers’ perceptions of the similarity of the extension’s initial image
with that of the parent brand” (p. 114). It concerns “the similarity of the extension with the
specific attributes of the parent brand, including the brand’s quality” (Bhat & Reddy, 2001, p.
114). The product category fit describes the fit between the product categories (Keller & Aaker,
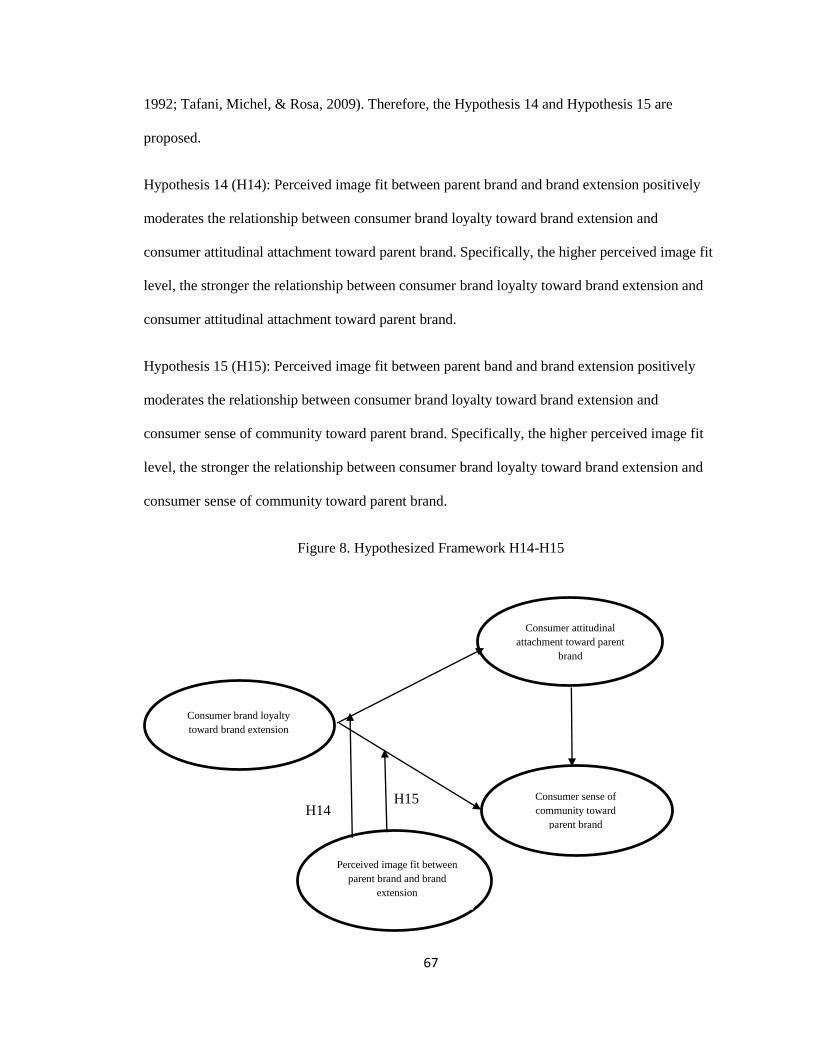
67
1992; Tafani, Michel, & Rosa, 2009). Therefore, the Hypothesis 14 and Hypothesis 15 are
proposed.
Hypothesis 14 (H14): Perceived image fit between parent brand and brand extension positively
moderates the relationship between consumer brand loyalty toward brand extension and
consumer attitudinal attachment toward parent brand. Specifically, the higher perceived image fit
level, the stronger the relationship between consumer brand loyalty toward brand extension and
consumer attitudinal attachment toward parent brand.
Hypothesis 15 (H15): Perceived image fit between parent band and brand extension positively
moderates the relationship between consumer brand loyalty toward brand extension and
consumer sense of community toward parent brand. Specifically, the higher perceived image fit
level, the stronger the relationship between consumer brand loyalty toward brand extension and
consumer sense of community toward parent brand.
Figure 8. Hypothesized Framework H14-H15
Perceived image fit between
parent brand and brand
extension
H15 Consumer sense of
community toward parent
brand
Consumer sense of
community toward
parent brand
H14
Consumer attitudinal
attachment toward parent
brand
Consumer brand loyalty
toward brand extension
Consumer sense of
community toward
parent brand
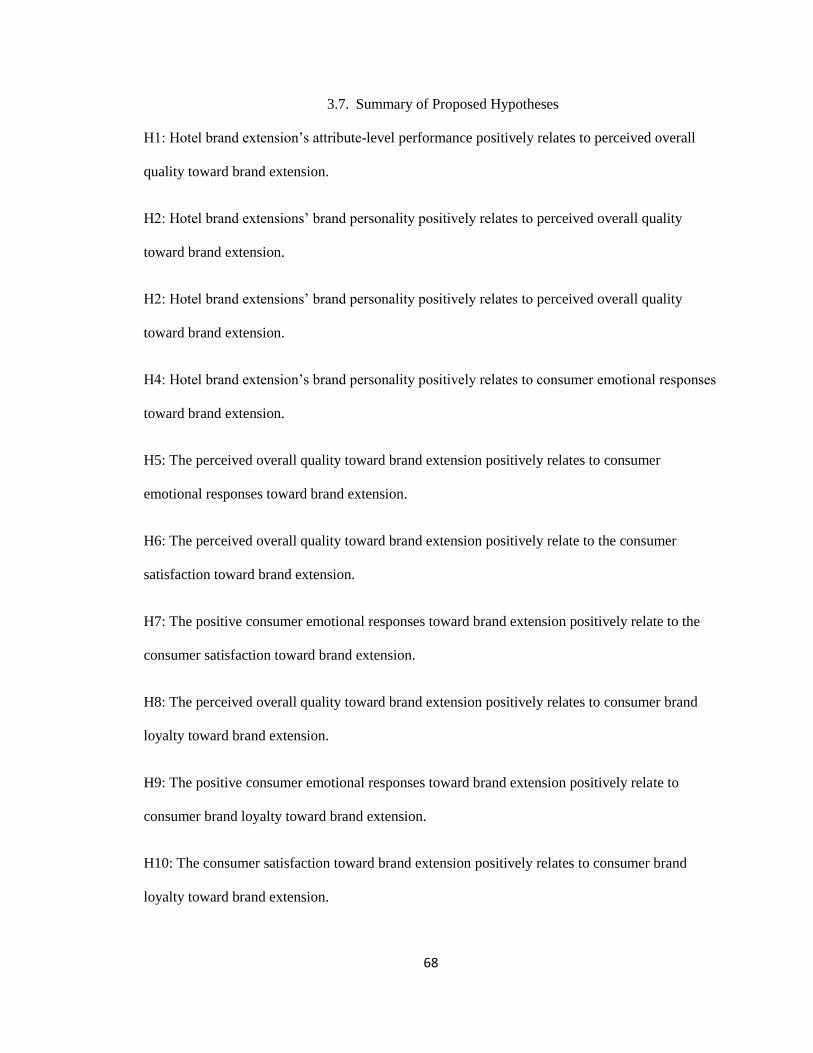
68
3.7. Summary of Proposed Hypotheses
H1: Hotel brand extension’s attribute-level performance positively relates to perceived overall
quality toward brand extension.
H2: Hotel brand extensions’ brand personality positively relates to perceived overall quality
toward brand extension.
H2: Hotel brand extensions’ brand personality positively relates to perceived overall quality
toward brand extension.
H4: Hotel brand extension’s brand personality positively relates to consumer emotional responses
toward brand extension.
H5: The perceived overall quality toward brand extension positively relates to consumer
emotional responses toward brand extension.
H6: The perceived overall quality toward brand extension positively relate to the consumer
satisfaction toward brand extension.
H7: The positive consumer emotional responses toward brand extension positively relate to the
consumer satisfaction toward brand extension.
H8: The perceived overall quality toward brand extension positively relates to consumer brand
loyalty toward brand extension.
H9: The positive consumer emotional responses toward brand extension positively relate to
consumer brand loyalty toward brand extension.
H10: The consumer satisfaction toward brand extension positively relates to consumer brand
loyalty toward brand extension.
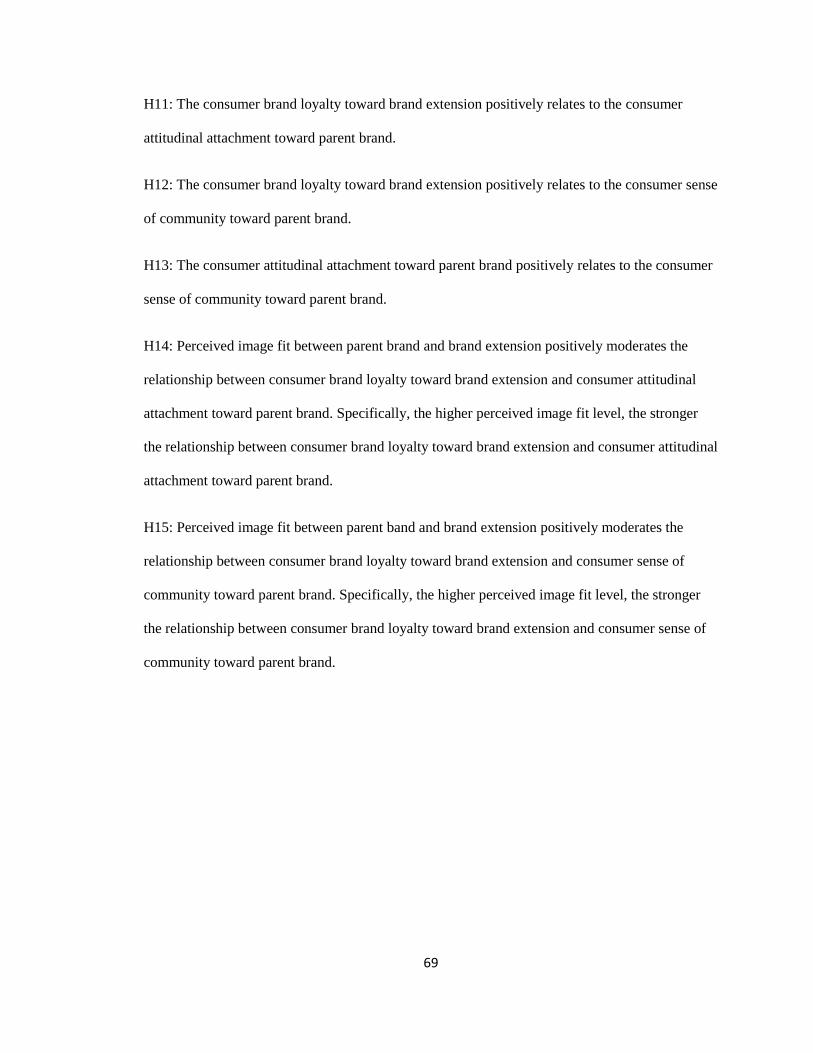
69
H11: The consumer brand loyalty toward brand extension positively relates to the consumer
attitudinal attachment toward parent brand.
H12: The consumer brand loyalty toward brand extension positively relates to the consumer sense
of community toward parent brand.
H13: The consumer attitudinal attachment toward parent brand positively relates to the consumer
sense of community toward parent brand.
H14: Perceived image fit between parent brand and brand extension positively moderates the
relationship between consumer brand loyalty toward brand extension and consumer attitudinal
attachment toward parent brand. Specifically, the higher perceived image fit level, the stronger
the relationship between consumer brand loyalty toward brand extension and consumer attitudinal
attachment toward parent brand.
H15: Perceived image fit between parent band and brand extension positively moderates the
relationship between consumer brand loyalty toward brand extension and consumer sense of
community toward parent brand. Specifically, the higher perceived image fit level, the stronger
the relationship between consumer brand loyalty toward brand extension and consumer sense of
community toward parent brand.
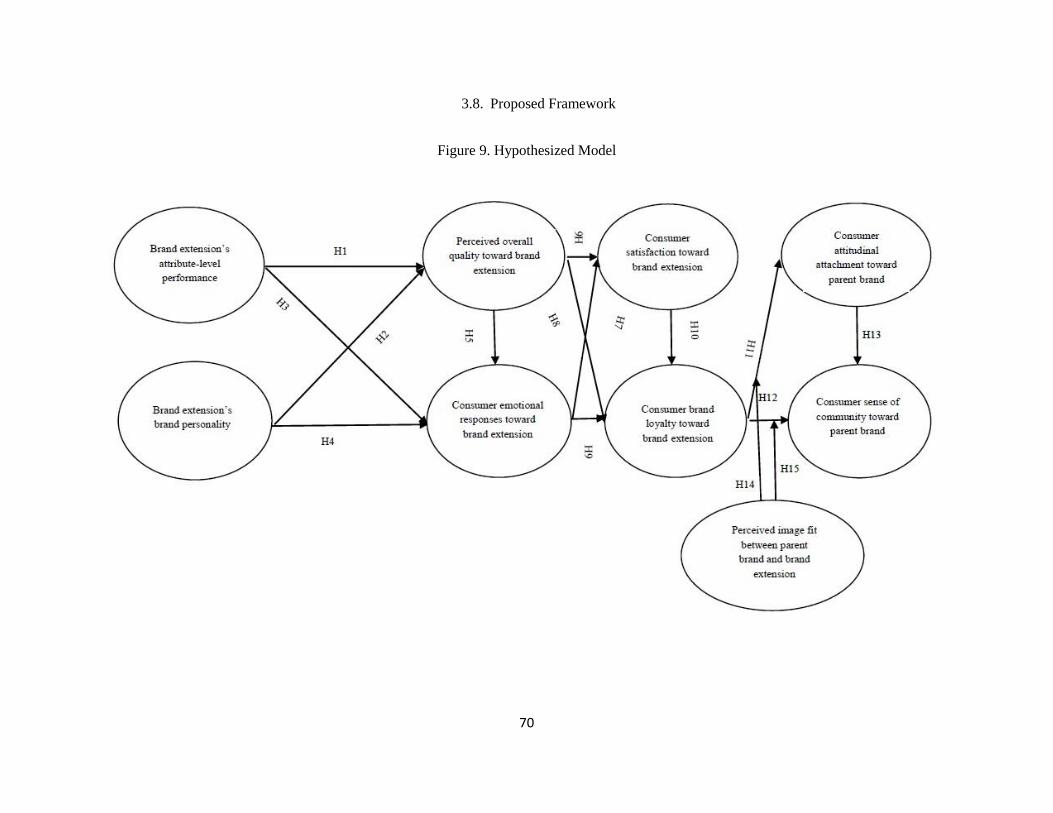
70
3.8. Proposed Framework
Figure 9. Hypothesized Model
71
CHAPTER III
METHODOLOGY
This chapter includes the sections of research design, survey instrument, pilot test,
sampling, data collection, and data analysis.
1. Research Design
This is quantitative research. This study combined descriptive research and causal
research to achieve the research objectives. The descriptive methods demonstrated demographic
information in the sample. The causal methods (e.g., Structural Equation Modeling method), were
used to examine the proposed Hypothesis 1-13. The hierarchical multiple regression method was
used to examine the moderating effects of perceived image fit between parent brand and brand
extension (Hypothesis 14 and Hypothesis 15). To test the research hypotheses and support
proposed conceptual framework, the cross-sectional online surveys with self-administrated
questionnaires were used to collect the data.
2. Survey Instrument
To collect data, this study focused on five parent brands from four leading U.S.-based
hotel companies, which were Hilton Worldwide, Hyatt Hotels, InterContinental Hotels Group,
and Marriott International. Accordingly, the five parent hotel brands were Hilton, Hyatt,
72
InterContinental, Marriott, and Starwood. A self-administrated questionnaire was adoptively
developed from the related literature. This study used five versions of questionnaires that targeted
each of the five parent brands respectively. There were seven sections of each questionnaire.
Section I presented screening questions that allowed the study accessing the leisure-
purposed hotel guests who had stay experience with the hotels extended from the selected parent
brands. A list of the hotel parent brand names was given, and the survey participants were asked
to select one they most recently stayed within the last six months. If the participant never stayed
with one of these parent brands, the survey was terminated. After the participants selected one
parent brand, a list of hotel brands extended from the selected parent brand shown up. The
participant had to identify the one he/she stayed with most recently. Using Hilton brand as an
example, a screening question was “Can you recall your experience at this selected brand of
Hilton hotel?” If the participant chose “No,” the survey was terminated. The participants who
chose “Yes” was asked the following question “Were you a member of Hilton Honors program
when you stayed at this selected brand of Hilton hotel?” Rather than using this question to screen
the participants, this study was also interested in looking at how the hotel loyalty program
influenced consumers’ evaluations. Additionally, the survey participants younger than 18 were
ruled out based on the minimum appropriate age range.
Section II had two parts which reach the brand association information (See Table 13).
The questions from the first part captured hotel guests’ perceived attribute-level performance
from the selected brand of hotels. This part consisted of seven questions. The 7-point Likert-type
scale was used to measure these items (1= Terrible; 7= Excellent). The items were adopted from
(Qu et al., 2000). The questions from the second part captured hotel guests’ perceived brand
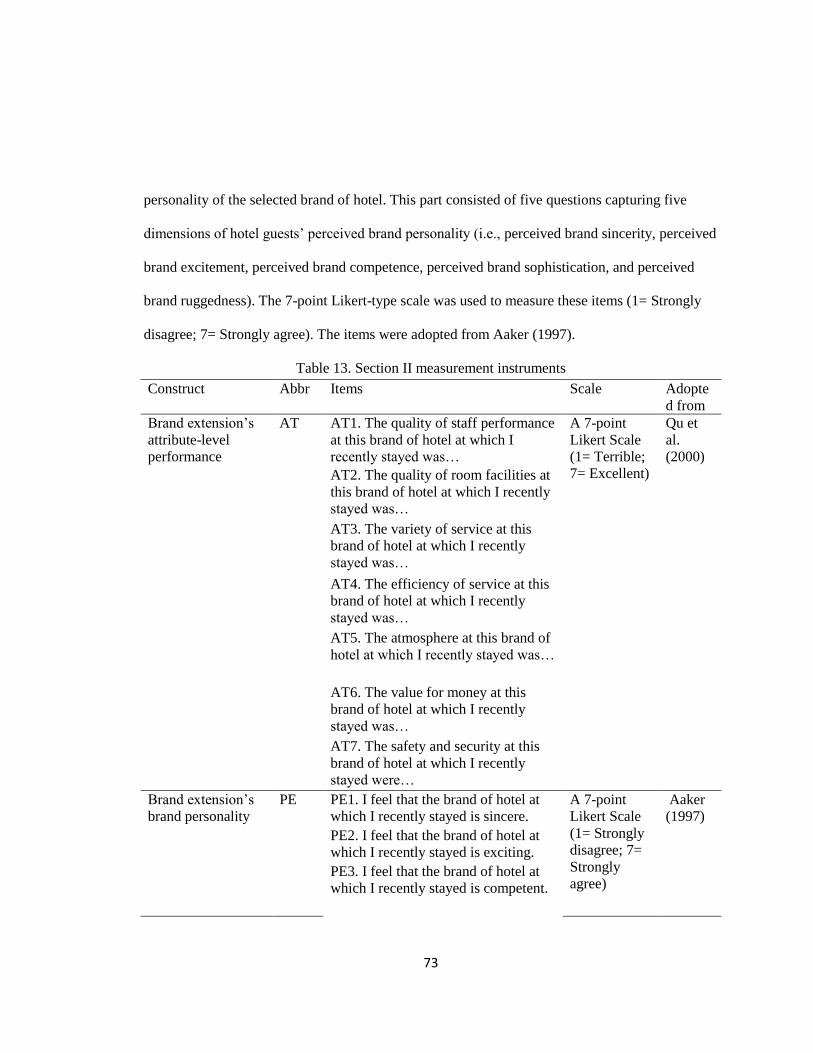
73
personality of the selected brand of hotel. This part consisted of five questions capturing five
dimensions of hotel guests’ perceived brand personality (i.e., perceived brand sincerity, perceived
brand excitement, perceived brand competence, perceived brand sophistication, and perceived
brand ruggedness). The 7-point Likert-type scale was used to measure these items (1= Strongly
disagree; 7= Strongly agree). The items were adopted from Aaker (1997).
Table 13. Section II measurement instruments
Construct Abbr Items Scale Adopte
d from
Brand extension’s
attribute-level
performance
AT AT1. The quality of staff performance
at this brand of hotel at which I
recently stayed was…
A 7-point
Likert Scale
(1= Terrible;
7= Excellent)
Qu et
al.
(2000)
AT2. The quality of room facilities at
this brand of hotel at which I recently
stayed was…
AT3. The variety of service at this
brand of hotel at which I recently
stayed was…
AT4. The efficiency of service at this
brand of hotel at which I recently
stayed was…
AT5. The atmosphere at this brand of
hotel at which I recently stayed was…
AT6. The value for money at this
brand of hotel at which I recently
stayed was…
AT7. The safety and security at this
brand of hotel at which I recently
stayed were…
Brand extension’s
brand personality
PE PE1. I feel that the brand of hotel at
which I recently stayed is sincere.
A 7-point
Likert Scale
(1= Strongly
disagree; 7=
Strongly
agree)
Aaker
(1997)
PE2. I feel that the brand of hotel at
which I recently stayed is exciting.
PE3. I feel that the brand of hotel at
which I recently stayed is competent.
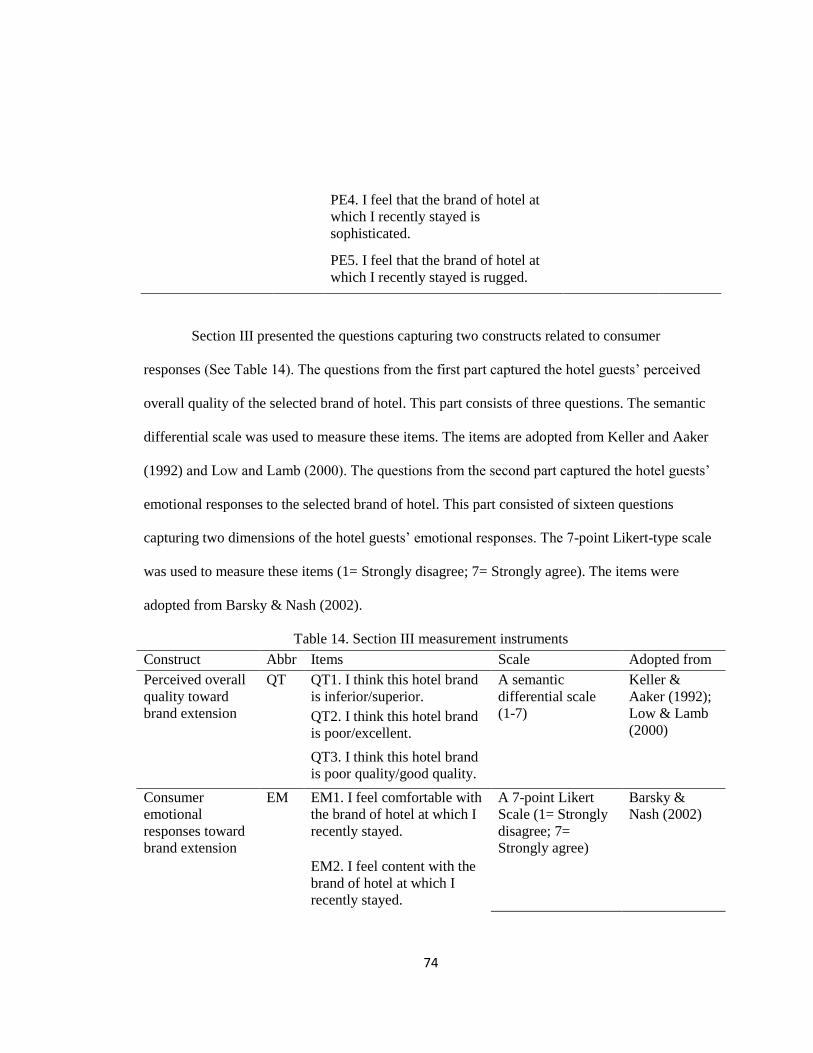
74
PE4. I feel that the brand of hotel at
which I recently stayed is
sophisticated.
PE5. I feel that the brand of hotel at
which I recently stayed is rugged.
Section III presented the questions capturing two constructs related to consumer
responses (See Table 14). The questions from the first part captured the hotel guests’ perceived
overall quality of the selected brand of hotel. This part consists of three questions. The semantic
differential scale was used to measure these items. The items are adopted from Keller and Aaker
(1992) and Low and Lamb (2000). The questions from the second part captured the hotel guests’
emotional responses to the selected brand of hotel. This part consisted of sixteen questions
capturing two dimensions of the hotel guests’ emotional responses. The 7-point Likert-type scale
was used to measure these items (1= Strongly disagree; 7= Strongly agree). The items were
adopted from Barsky & Nash (2002).
Table 14. Section III measurement instruments
Construct Abbr Items Scale Adopted from
Perceived overall
quality toward
brand extension
QT QT1. I think this hotel brand
is inferior/superior.
A semantic
differential scale
(1-7)
Keller &
Aaker (1992);
Low & Lamb
(2000) QT2. I think this hotel brand
is poor/excellent.
QT3. I think this hotel brand
is poor quality/good quality.
Consumer
emotional
responses toward
brand extension
EM EM1. I feel comfortable with
the brand of hotel at which I
recently stayed.
A 7-point Likert
Scale (1= Strongly
disagree; 7=
Strongly agree)
Barsky &
Nash (2002)
EM2. I feel content with the
brand of hotel at which I
recently stayed.
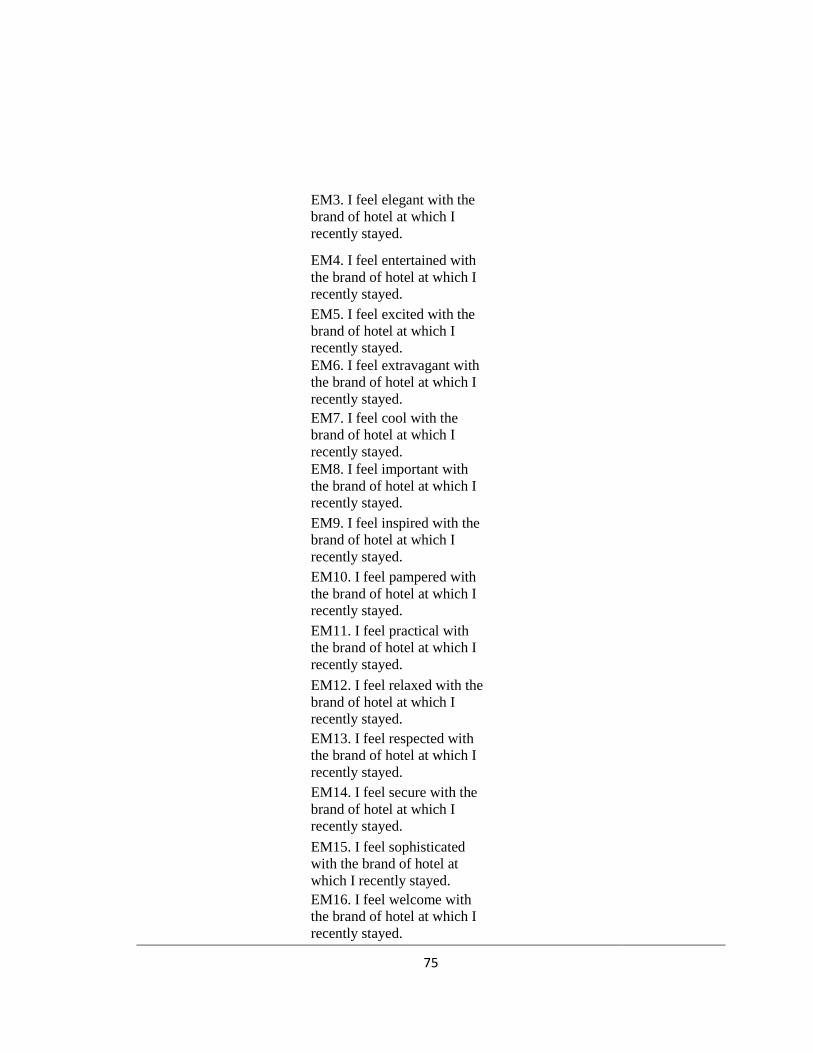
75
EM3. I feel elegant with the
brand of hotel at which I
recently stayed.
EM4. I feel entertained with
the brand of hotel at which I
recently stayed.
EM5. I feel excited with the
brand of hotel at which I
recently stayed.
EM6. I feel extravagant with
the brand of hotel at which I
recently stayed.
EM7. I feel cool with the
brand of hotel at which I
recently stayed.
EM8. I feel important with
the brand of hotel at which I
recently stayed.
EM9. I feel inspired with the
brand of hotel at which I
recently stayed.
EM10. I feel pampered with
the brand of hotel at which I
recently stayed.
EM11. I feel practical with
the brand of hotel at which I
recently stayed.
EM12. I feel relaxed with the
brand of hotel at which I
recently stayed.
EM13. I feel respected with
the brand of hotel at which I
recently stayed.
EM14. I feel secure with the
brand of hotel at which I
recently stayed.
EM15. I feel sophisticated
with the brand of hotel at
which I recently stayed.
EM16. I feel welcome with
the brand of hotel at which I
recently stayed.
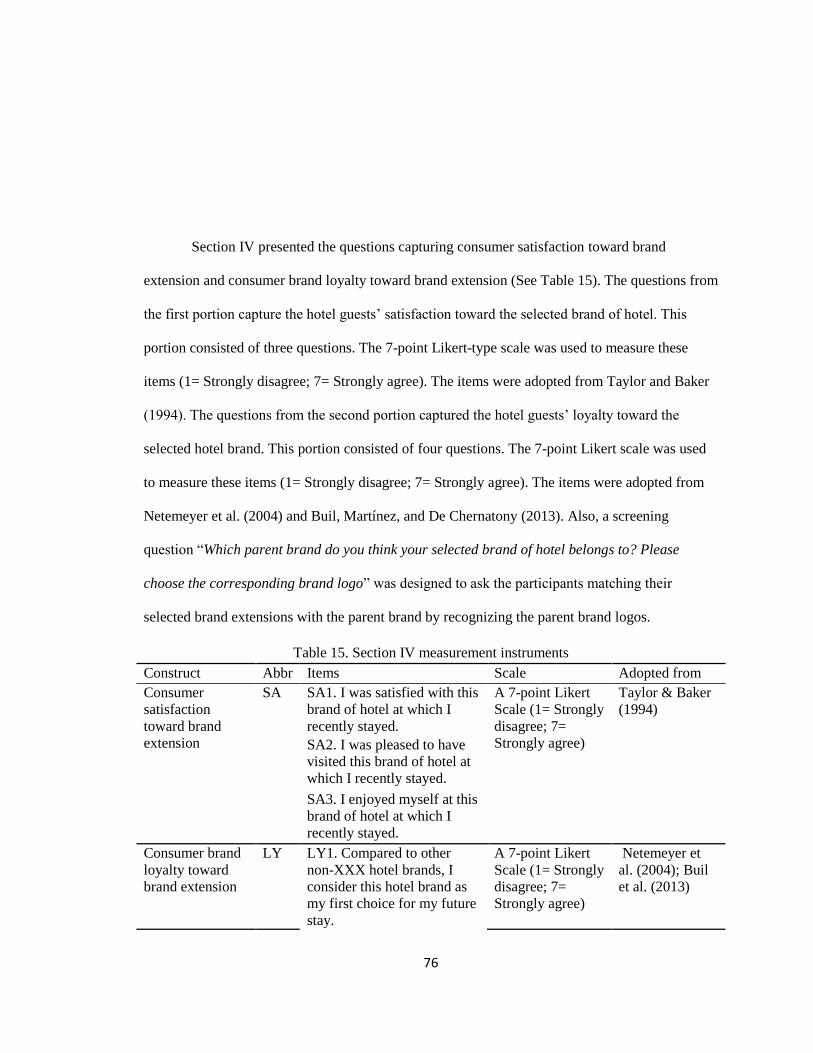
76
Section IV presented the questions capturing consumer satisfaction toward brand
extension and consumer brand loyalty toward brand extension (See Table 15). The questions from
the first portion capture the hotel guests’ satisfaction toward the selected brand of hotel. This
portion consisted of three questions. The 7-point Likert-type scale was used to measure these
items (1= Strongly disagree; 7= Strongly agree). The items were adopted from Taylor and Baker
(1994). The questions from the second portion captured the hotel guests’ loyalty toward the
selected hotel brand. This portion consisted of four questions. The 7-point Likert scale was used
to measure these items (1= Strongly disagree; 7= Strongly agree). The items were adopted from
Netemeyer et al. (2004) and Buil, Martínez, and De Chernatony (2013). Also, a screening
question “Which parent brand do you think your selected brand of hotel belongs to? Please
choose the corresponding brand logo” was designed to ask the participants matching their
selected brand extensions with the parent brand by recognizing the parent brand logos.
Table 15. Section IV measurement instruments
Construct Abbr Items Scale Adopted from
Consumer
satisfaction
toward brand
extension
SA SA1. I was satisfied with this
brand of hotel at which I
recently stayed.
A 7-point Likert
Scale (1= Strongly
disagree; 7=
Strongly agree)
Taylor & Baker
(1994)
SA2. I was pleased to have
visited this brand of hotel at
which I recently stayed.
SA3. I enjoyed myself at this
brand of hotel at which I
recently stayed.
Consumer brand
loyalty toward
brand extension
LY LY1. Compared to other
non-XXX hotel brands, I
consider this hotel brand as
my first choice for my future
stay.
A 7-point Likert
Scale (1= Strongly
disagree; 7=
Strongly agree)
Netemeyer et
al. (2004); Buil
et al. (2013)
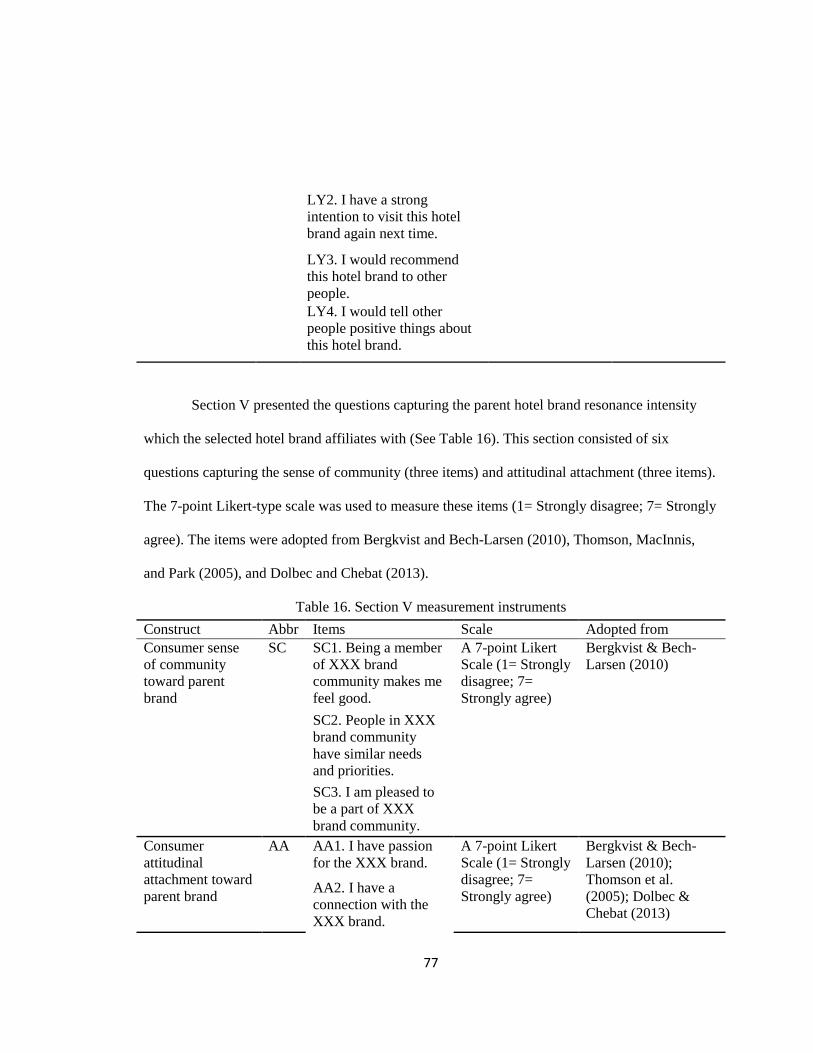
77
LY2. I have a strong
intention to visit this hotel
brand again next time.
LY3. I would recommend
this hotel brand to other
people.
LY4. I would tell other
people positive things about
this hotel brand.
Section V presented the questions capturing the parent hotel brand resonance intensity
which the selected hotel brand affiliates with (See Table 16). This section consisted of six
questions capturing the sense of community (three items) and attitudinal attachment (three items).
The 7-point Likert-type scale was used to measure these items (1= Strongly disagree; 7= Strongly
agree). The items were adopted from Bergkvist and Bech-Larsen (2010), Thomson, MacInnis,
and Park (2005), and Dolbec and Chebat (2013).
Table 16. Section V measurement instruments
Construct Abbr Items Scale Adopted from
Consumer sense
of community
toward parent
brand
SC SC1. Being a member
of XXX brand
community makes me
feel good.
A 7-point Likert
Scale (1= Strongly
disagree; 7=
Strongly agree)
Bergkvist & Bech-
Larsen (2010)
SC2. People in XXX
brand community
have similar needs
and priorities.
SC3. I am pleased to
be a part of XXX
brand community.
Consumer
attitudinal
attachment toward
parent brand
AA AA1. I have passion
for the XXX brand.
A 7-point Likert
Scale (1= Strongly
disagree; 7=
Strongly agree)
Bergkvist & Bech-
Larsen (2010);
Thomson et al.
(2005); Dolbec &
Chebat (2013)
AA2. I have a
connection with the
XXX brand.
78
AA3. I have affection
for the XXX brand.
Section VI presented the questions capturing the perceived image fit between parent
brand and brand extension (See Table 17). This section consists of three questions. The 7-point
Likert-type scale was used to measure these items (1= Strongly disagree; 7= Strongly agree). The
items were adopted from Salinas and Pérez (2009).
Table 17. Section VI measurement instruments
Construct Abbr Items Scale Adopted from
Perceived image fit
between parent
brand and brand
extension
FT FT1. The brand of hotel at
which I recently stayed fits
for the XXX brand's
image.
A 7-point Likert
Scale (1=
Strongly
disagree; 7=
Strongly agree)
Salinas & Pérez
(2009).
FT2. The brand of hotel at
which I recently stayed is
logical for the XXX brand.
FT3. The brand of hotel at
which I recently stayed is
appropriate for the XXX
brand.
Section VII presented the question asking the demographic information from the survey
participants, including gender, age range, ethnic background, marital status, annual household
income range, and educational level. For Section II to Section VI, I include “Don’t Know” option
to count the participants’ responses outside of the 7-point Likert-type scale. The responses with
“Don’t know” were removed in the data screening process later.
79
3. Pilot Test
There are two main reasons conducting a pilot test (Van Teijlingen et al., 2001). First, the
results from the pilot test provide the warning about the points where the main research project
could fail, where research protocols could not be followed, or where the instruments are
inappropriate or too complicated. Second, the pilot test may improve the questionnaire’s content
validity and reliability. Based on the pilot test results, the possible modifications towards the
survey instruments were made to get rid of any inappropriate contents that do not fit the research
context.
The survey questionnaire was reviewed by university faculty members and doctoral
students from dissertation writing workshop with diverse majors. The revision comments
provided by such a diverse group helped the survey instruments with better wording, sequence,
length, layout, and readability. The professional editing service was used to guarantee the survey
questionnaire content error free. It largely improved the content validity of the survey.
Using the convenient sample, the study assessed the pilot results from 56 usable
responses collected through Amazon Mechanical Turk. The pilot test mainly examined the survey
instrument’s reliability and internal consistency. Reliability assesses the degree to which scores
are free from the measurement errors. Cronbach’s Alpha is a common reliability measure (Hair et
al., 2006). It indicates how well the indicators of a construct are correlated with each other which
reflects the true score. The desired construct has the indicators highly correlated to each other.
The suggested acceptable lower bound of the Cronbach’s Alpha score is 0.70 (Hair et al., 2006).
If a construct with multiple items has a Cronbach’s alpha score equal to or greater than 0.70, the
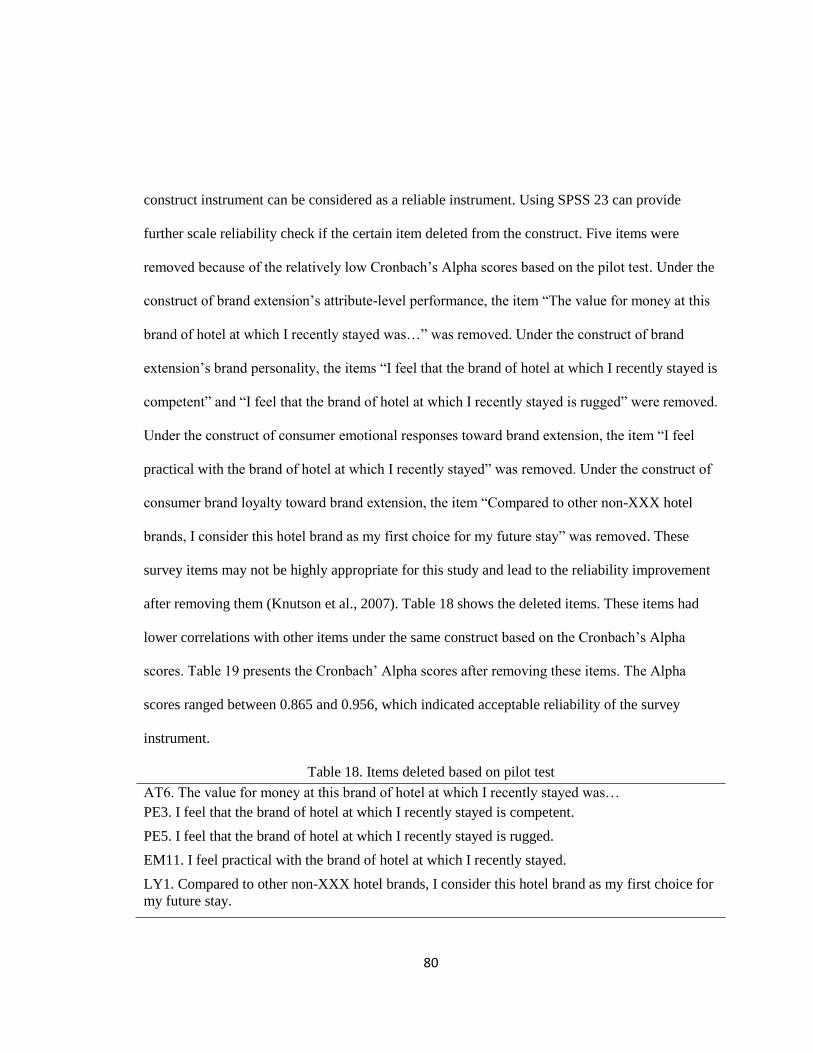
80
construct instrument can be considered as a reliable instrument. Using SPSS 23 can provide
further scale reliability check if the certain item deleted from the construct. Five items were
removed because of the relatively low Cronbach’s Alpha scores based on the pilot test. Under the
construct of brand extension’s attribute-level performance, the item “The value for money at this
brand of hotel at which I recently stayed was…” was removed. Under the construct of brand
extension’s brand personality, the items “I feel that the brand of hotel at which I recently stayed is
competent” and “I feel that the brand of hotel at which I recently stayed is rugged” were removed.
Under the construct of consumer emotional responses toward brand extension, the item “I feel
practical with the brand of hotel at which I recently stayed” was removed. Under the construct of
consumer brand loyalty toward brand extension, the item “Compared to other non-XXX hotel
brands, I consider this hotel brand as my first choice for my future stay” was removed. These
survey items may not be highly appropriate for this study and lead to the reliability improvement
after removing them (Knutson et al., 2007). Table 18 shows the deleted items. These items had
lower correlations with other items under the same construct based on the Cronbach’s Alpha
scores. Table 19 presents the Cronbach’ Alpha scores after removing these items. The Alpha
scores ranged between 0.865 and 0.956, which indicated acceptable reliability of the survey
instrument.
Table 18. Items deleted based on pilot test
AT6. The value for money at this brand of hotel at which I recently stayed was…
PE3. I feel that the brand of hotel at which I recently stayed is competent.
PE5. I feel that the brand of hotel at which I recently stayed is rugged.
EM11. I feel practical with the brand of hotel at which I recently stayed.
LY1. Compared to other non-XXX hotel brands, I consider this hotel brand as my first choice for
my future stay.
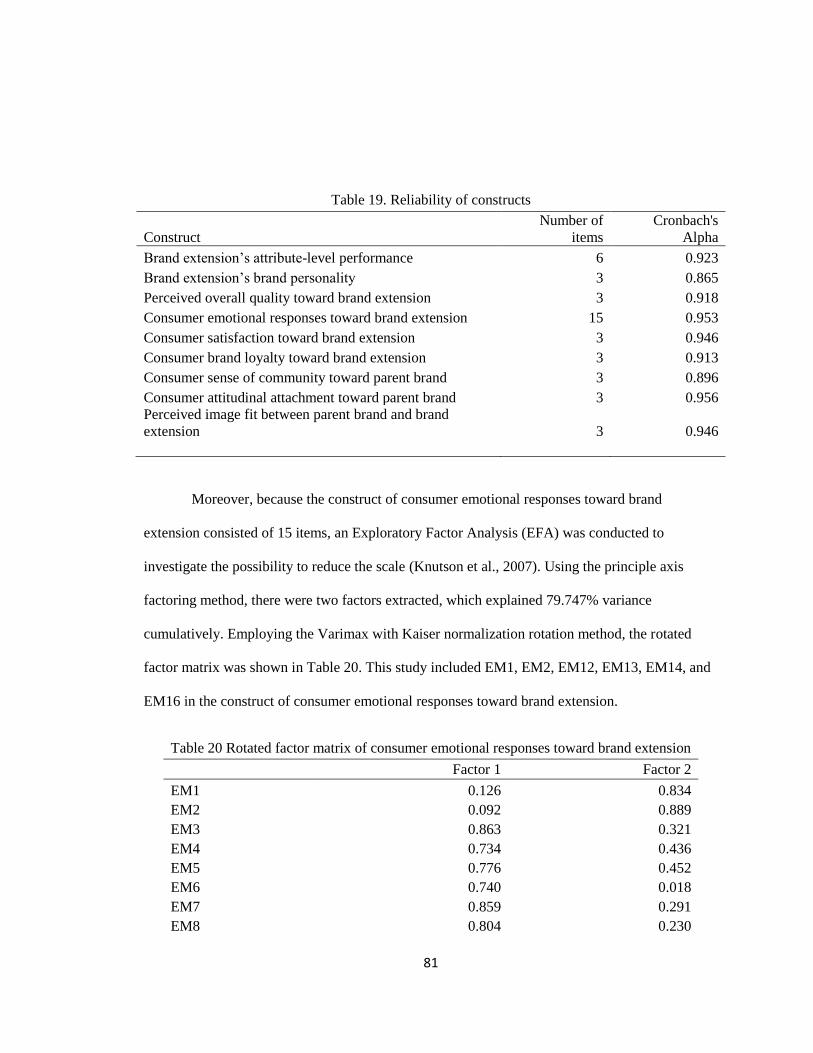
81
Table 19. Reliability of constructs
Construct
Number of
items
Cronbach's
Alpha
Brand extension’s attribute-level performance 6 0.923
Brand extension’s brand personality 3 0.865
Perceived overall quality toward brand extension 3 0.918
Consumer emotional responses toward brand extension 15 0.953
Consumer satisfaction toward brand extension 3 0.946
Consumer brand loyalty toward brand extension 3 0.913
Consumer sense of community toward parent brand 3 0.896
Consumer attitudinal attachment toward parent brand 3 0.956
Perceived image fit between parent brand and brand
extension 3 0.946
Moreover, because the construct of consumer emotional responses toward brand
extension consisted of 15 items, an Exploratory Factor Analysis (EFA) was conducted to
investigate the possibility to reduce the scale (Knutson et al., 2007). Using the principle axis
factoring method, there were two factors extracted, which explained 79.747% variance
cumulatively. Employing the Varimax with Kaiser normalization rotation method, the rotated
factor matrix was shown in Table 20. This study included EM1, EM2, EM12, EM13, EM14, and
EM16 in the construct of consumer emotional responses toward brand extension.
Table 20 Rotated factor matrix of consumer emotional responses toward brand extension
Factor 1 Factor 2
EM1 0.126 0.834
EM2 0.092 0.889
EM3 0.863 0.321
EM4 0.734 0.436
EM5 0.776 0.452
EM6 0.740 0.018
EM7 0.859 0.291
EM8 0.804 0.230
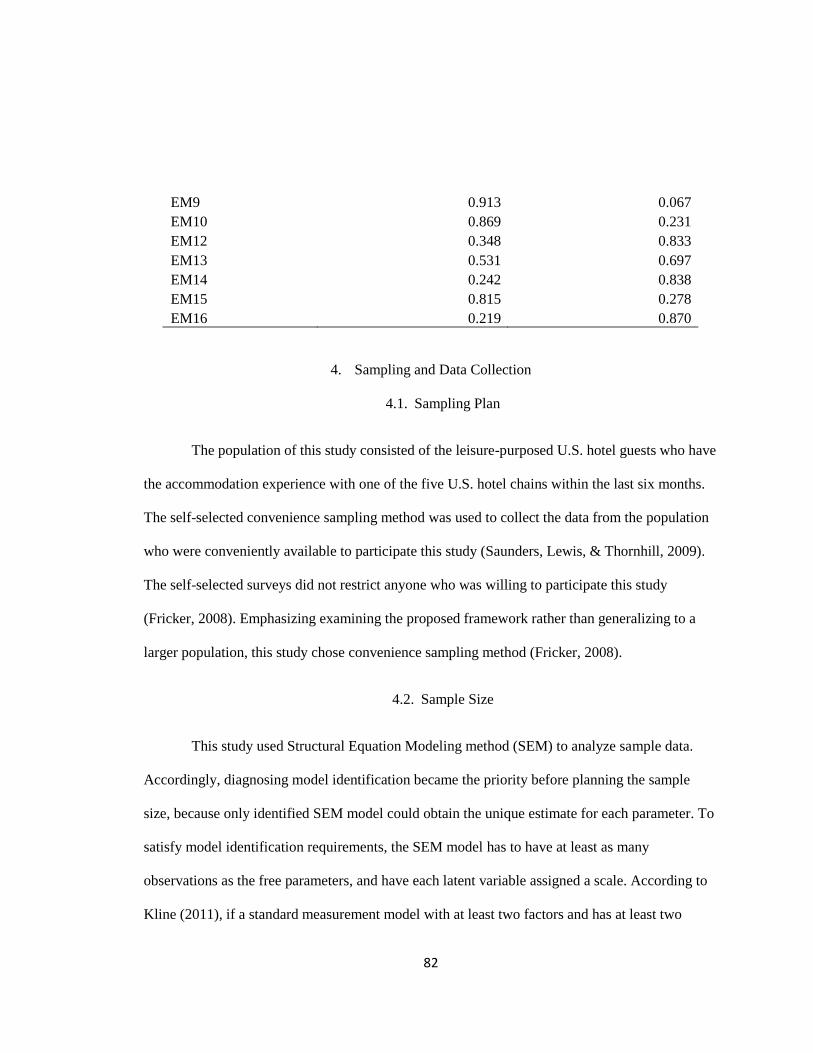
82
EM9 0.913 0.067
EM10 0.869 0.231
EM12 0.348 0.833
EM13 0.531 0.697
EM14 0.242 0.838
EM15 0.815 0.278
EM16 0.219 0.870
4. Sampling and Data Collection
4.1. Sampling Plan
The population of this study consisted of the leisure-purposed U.S. hotel guests who have
the accommodation experience with one of the five U.S. hotel chains within the last six months.
The self-selected convenience sampling method was used to collect the data from the population
who were conveniently available to participate this study (Saunders, Lewis, & Thornhill, 2009).
The self-selected surveys did not restrict anyone who was willing to participate this study
(Fricker, 2008). Emphasizing examining the proposed framework rather than generalizing to a
larger population, this study chose convenience sampling method (Fricker, 2008).
4.2. Sample Size
This study used Structural Equation Modeling method (SEM) to analyze sample data.
Accordingly, diagnosing model identification became the priority before planning the sample
size, because only identified SEM model could obtain the unique estimate for each parameter. To
satisfy model identification requirements, the SEM model has to have at least as many
observations as the free parameters, and have each latent variable assigned a scale. According to
Kline (2011), if a standard measurement model with at least two factors and has at least two
83
indicators per factor, the model is identified. Since the minimum number of the indicators
included under the factors in the proposed research model was three, the measurement model was
considered identified. Additionally, because the structural regression model is recursive, the SEM
model was identified (Kline, 2011).
Since the SEM uses Maximum likelihood estimations (MLE), Hair et al., (2006)
suggested that a sample size between 150 and 400 might ensure the estimation stability and the
larger sample size might increase the estimation stability. The number of free parameters plays
the important role on determining sample size to estimate the model. Bentler and Chou (1987)
suggested the ratio of cases to the number of free parameters is 5 to 1. The proposed SEM model
consisted of 8 constructs measured by 30 items. The model included 2 exogenous variables, 6
endogenous variables, and 13 direct paths. Therefore, the number of free parameters is 73 (2
exogenous variables+ 30 measurement errors+ 6 disturbances+ 22 factor loadings+ 13 direct
paths). If using the sample size determination criteria (Bentler & Chou, 1987), the minimum
acceptable sample size was 365 in this study (73 free parameters × 5 cases per parameter).
4.3. Data Collection Procedure
The online self-administrated survey was conducted to collect the sample data. There are
multiple reasons to use online questionnaire survey in this study (Wright, 2005). First, using
online survey questionnaire efficiently communicate with the target population by taking
advantage of the internet ability (Garton, Haythornthwaite, & Wellman, 1999). Second, the online
survey enhances the time efficiency during the data collection process (Bachmann & Elfrink,
1996). Third, the online survey reduces data collection costs by using electronic medium rather
84
than paper. The survey questionnaires were distributed through the Amazon Mechanical Turk
(MTurk). Mturk has been used by the behavioral research (Buhrmester, Kwang, & Gosling, 2011)
and other social sciences studies which need to recruit online participants. As an online platform,
Mturk allows the tasks launched instantaneously and data collected quickly (Litman, Robinson, &
Abberbock, 2017). It has been considered as a fast way to collect cheap and reliable data
(Buhrmester et al., 2011; Horton, Rand, & Zeckhauser, 2011). However, using Mturk to collect
data suffers from some weakness, for example, the participants cannot obtain assistance if they
get confused about the survey questions in the survey filing process (Davis, Bagozzi, &
Warshaw, 1992).
Before starting the recruitment process, the Institutional Review Board in conducting
Human Subjects Research (IRB)’s permission had been received. The original survey
questionnaire was designed on Qualtrics.com, which was an online survey platform. This study
used Mturk to recruit the participants. The participants (a.k.a., Mturk workers) could find the
posted survey information from their Mturk account dashboard. Only the participants whose
previously had completed at least 50 approved Mturk surveys and the previous survey approval
rate was no less than 75% could choose to work on the questionnaire for this study. These
qualification requirements could rule out the participants with less Mturk working credibility and
improved the response quality later. If the qualified participants would like to participate the
survey, the survey link I provided directed them to the Qualtrics survey webpage. The
participants could fill out the survey with questions.
To improve the collected data’s quality, this survey offered a $0.65 reward to the
participants who finished the last question and received a randomly generated verification code
85
by Qualtrics. If they entered the code into the Mturk webpage, a $0.65 was deposited to their
Mturk accounts after I approved it. This study removed any responses with missing data under
some questions in the data screening process.
A total of 869 complete responses were retained after deleting observations with missing
data and having the “Don’t know” answer to a particular question. More important, this initial
sample ruled out the participants without staying experience with one of the five parent brands in
the last six months. As I mentioned earlier, the survey included three screening questions to check
if the participants could match the extended hotel brand they stayed with the parent brand. Based
on the research objectives, if the participants mismatch the extended hotel brand they stayed with
the parent brand, the collected data were no reliable to the research model. Therefore, this study
excluded any responses with mismatched brands. After removing 104 such cases, a total of 765
responses were retained for further data screening process.
86
5. Data Analysis
This study used the statistical software packages SPSS 23, Amos, and SAS 9 to analyze
the collected data. The statistical methods used in this study include the descriptive statistics
analysis, Confirmatory Factor Analysis (CFA), Structural Equation Modeling (SEM), and
hierarchical multiple regression.
5.1. Data Preparation
The data screening was conducted. The data matrices submitted for analysis must be
positive definite. Therefore, the relevant data diagnosis was conducted before analyzed the data.
Based on Hair et al. (2006), there are four steps to deal with the missing data: (1) determining the
type of missing data; (2) determining the extent of missing data; (3) diagnosing the randomness
of the missing data processes; and (4) selecting the imputation method. Because the sample for
data screening had removed the cases with missing data except for the demographic information,
no further remedy made regard to the missing data.
The outliers are the big concern for the further statistical analysis. The univariate outlier
occurs when the extreme value exists on a single variable. This study used Z-scores to identify
the univariate outliers (Kline, 2011) and deleted 53 cases with the absolute value of Z-score
higher than 3.29. The multivariate outlier occurs when the extreme value exists on more than one
variable. Detecting multivariate outliers is more difficult. The multivariate outliers were
investigated by Mahalanobis distance statistics, which is “the distance in standard deviation units
between a set of scores for an individual case and the sample means for all variables” (Kline,
2011, p. 51). It distributes as the Pearson Chi-square statistics in a large sample and its null
hypothesis that the case from the sample population may be rejected with a low p value (Kline,
2011). Kline (2011) mentioned the conservative significant level is the 𝐷2 value with p< 0.001. A
87
total of 45 cases were removed because of the significant multivariate outliers. The sample size
retained as 667 cases.
The univariate normality and multivariate normality were tested. The skewness and
kurtosis are to indicators to check the univariate normality (Kline, 2011). If the absolute values of
skewness are greater than 3.0, the variables are considered as extremely skewed. If the absolute
values of kurtosis are greater than 10.0, the variables are considered as extremely kurtosis (i.e.,
leptokurtic and platykurtic) (Kline, 2011). The values of skewness ranged between -1.276 and -
0.225, and the values of kurtosis were between -0.769 and 2.23. The Mardia’s multivariate
kurtosis statistic (Mardia, 1970) was conducted to identify the cases with the large contribution to
the normalized multivariate kurtosis. A total of 10 cases were removed and the sample size
retained as 657 cases.
Multicollinearity violates the SEM assumption. It occurs when some variables’
correlations are high. The high correlations cause some mathematical operations meaningless
with the near zero denominators (Kline, 2011). If such correlation is greater than 0.90, one of the
variables is redundant from the model (Kline, 2011). The bivariate correlation was conducted and
there was no correlation between two variables significantly greater than 0.90. This study also
checked the tolerance value and the value of variance inflation factor (VIF) by regressing every
variable on the rest of variables. None of the tolerance value was less than 0.10. The VIF values
were all less than 10 (Kline, 2011). It indicates less likely to have severe multicollinearity
problem.
5.2. Descriptive Analysis
The descriptive analysis was conducted. The participants’ demographic information (i.e.,
gender, age, marital status, household income, educational level, stayed hotel brand, and hotel
brand membership) were analyzed through the frequencies. After the demographic profile
88
frequency analysis, the Confirmatory Factor Analysis (CFA), Structural Equation Modeling
(SEM), hierarchical multiple regression analysis, and Harman’s single-factor test were conducted
by SPSS 23 and AMOS. Conducting confirmatory analysis could investigate the overall fits and
validity from the measurement model. Based on the detected CFA result, the model re-
specification was possibly conducted. The structural equation modeling could find the overall fits
and validity from the structural model, and estimate the path coefficients. Hair et al. (2006)
summarized six steps to conduct a SEM analysis, which were “(1) defining individual constructs,
(2) developing the overall measurement model, (3) designing a study to produce empirical results,
(4) assessing the measurement model validity, (5) specifying the structural model, and (6)
assessing structural model validity (p.734).”
5.3. Confirmatory Factor Analysis
Based on proposed research objectives, this study included nine latent constructs, which
were brand extension’s attribute-level performance, brand extension’s brand personality,
perceived overall quality toward brand extension, consumer emotional responses toward brand
extension, consumer satisfaction toward brand extension, consumer brand loyalty toward brand
extension, consumer sense of community toward parent brand, consumer attitudinal attachment
toward parent brand, and perceived image fit between parent brand and brand extension.
Accordingly, 30 measurement items were used to measure the latent constructs based on the
literature and the results from the pilot test. To ensure the identification of the proposed model, at
least three measurable items were suggested under each latent construct (Hair et al., 2006). Each
construct in this study consists of at least three items. The sample size 657 is greater than 365
(Bentler & Chou, 1987).
The confirmatory factor analysis (CFA) model was conducted to assess the measurement
model’s validity. This study used goodness-of-fit (GOF) indices to evaluate the measurement
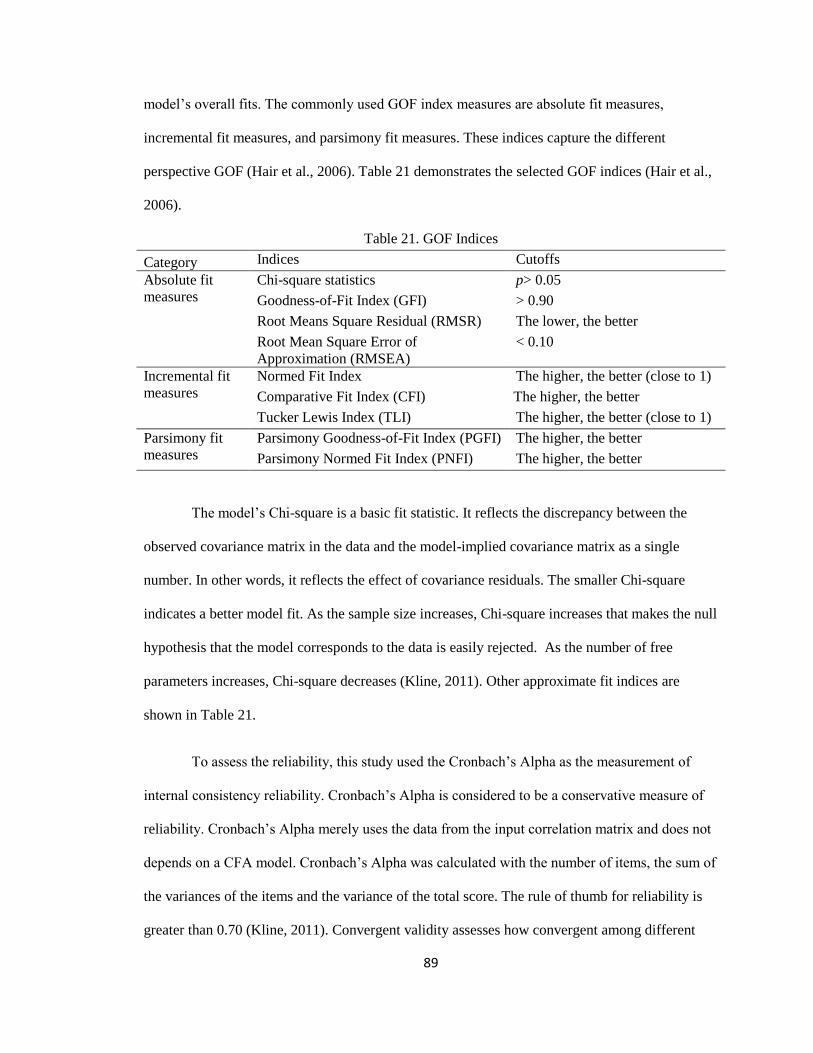
89
model’s overall fits. The commonly used GOF index measures are absolute fit measures,
incremental fit measures, and parsimony fit measures. These indices capture the different
perspective GOF (Hair et al., 2006). Table 21 demonstrates the selected GOF indices (Hair et al.,
2006).
Table 21. GOF Indices
Category Indices Cutoffs
Absolute fit
measures
Chi-square statistics p> 0.05
Goodness-of-Fit Index (GFI) > 0.90
Root Means Square Residual (RMSR) The lower, the better
Root Mean Square Error of
Approximation (RMSEA)
< 0.10
Incremental fit
measures
Normed Fit Index The higher, the better (close to 1)
Comparative Fit Index (CFI) The higher, the better
Tucker Lewis Index (TLI) The higher, the better (close to 1)
Parsimony fit
measures
Parsimony Goodness-of-Fit Index (PGFI) The higher, the better
Parsimony Normed Fit Index (PNFI) The higher, the better
The model’s Chi-square is a basic fit statistic. It reflects the discrepancy between the
observed covariance matrix in the data and the model-implied covariance matrix as a single
number. In other words, it reflects the effect of covariance residuals. The smaller Chi-square
indicates a better model fit. As the sample size increases, Chi-square increases that makes the null
hypothesis that the model corresponds to the data is easily rejected. As the number of free
parameters increases, Chi-square decreases (Kline, 2011). Other approximate fit indices are
shown in Table 21.
To assess the reliability, this study used the Cronbach’s Alpha as the measurement of
internal consistency reliability. Cronbach’s Alpha is considered to be a conservative measure of
reliability. Cronbach’s Alpha merely uses the data from the input correlation matrix and does not
depends on a CFA model. Cronbach’s Alpha was calculated with the number of items, the sum of
the variances of the items and the variance of the total score. The rule of thumb for reliability is
greater than 0.70 (Kline, 2011). Convergent validity assesses how convergent among different
90
methods to measure the same construct so that ensures the robustness of the construct definition.
Ideally, the high convergent validity means that the indicators share a high proportion of variance
in common (Kline, 2011). Convergent validity for each construct was evaluated by standardized
factor loadings, average variance extracted (AVE), and construct reliability (CR). The
standardized factor loadings are suggested to be 0.50 or higher, which means the factor could
explain the item by more than half (Hair et al., 2006). AVE measures proportion of the total
variance in all indicators of a construct accounted for by the construct (Fornell & Larcker, 1981).
The AVEs among a set of the items are calculated by dividing the sum of the total of all squared
standardized factor loadings with the number of items (Hair et al., 2006). The suggested cutoff
point of AVE is 0.50 or above to ensure reasonable convergent validity (Kline, 2011). Reliability
is also a useful indicator of convergent validity. Each construct’s construct reliability was
calculated based on the squared sum of factor loadings and the sum of the error variance terms for
the construct. Highly reliable construct indicates that all items consistently reflect the same latent
construct, and it suggests to be 0.70 or higher to be considered as good reliability (Hair et al.,
2006).
Discriminant validity is the distinctiveness of constructs, demonstrated by the divergence
of different methods designed to measure different constructs. It assesses whether all the
indicators of each construct load well on their theoretical constructs, but not on the constructs
they are not theoretically related to. It indicates that each construct is different from other
constructs by capturing unique phenomena that other constructs do not have (Hair et al., 2006). It
is examined by comparing the AVEs of any two constructs with squared inter-factor correlations
between the constructs. If the AVEs is greater than the squared inter-factor correlations, it
provides good evidence of discriminant validity (Hair et al., 2006). After validating the
measurement model, the structural model could be assessed.
91
5.4. Structural Model Analysis
The structural model analysis includes both measurement model analysis and the
structural model analysis (Hair et al., 2006). Using the measurement model with high reliability
and validity and good fit, the overall fit from the structural model should be checked. Beyond it,
the competing models that add or remove some paths from the original structural model based on
the theories and previous literature may be estimated (Hair et al., 2006). If such competing model
performs better than the original structural model, the proposed model should be re-specified
based on the competing model. Using AMOS, the study can estimate the unstandardized and
standardized path coefficient and assess their significance. The structural model is acceptable
with a reasonable model fit and predicted path coefficient’ signs (Hair et al., 2006).
5.5. Hierarchical Regression for Moderating Effects Testing
The moderator refers to “a qualitative (e.g., gender, race, class) or quantitative (e.g., level
of reward) variable that affects the direction and/or strength of the relation between an
independent or predictor variable and a dependent or criterion variable” (Baron & Kenny, 1986,
p. 1174). To testing the moderating effects of perceived image fit between parent brand and brand
extension, the hierarchical multiple regression was used. This study examined the interaction
effect in the regression models and found the significant changes of the 𝑅2 scores and the
significant effect from the interaction term. The moderating effect occurs when both conditions
get satisfied.
5.6. Common Method Variance and Bias
The method variance refers to “variance that is attributable to the measurement method
rather than to the construct of interest (Bagozzi, Yi, & Phillips, 1991). The term method refers to
“the form of measurement at different levels of abstraction, such as the content of specific items,
92
scale type, response format, and the general context” (Fiske, 1982, p. 81). The common method
variance may come from a common rater, item characteristic effects, item context effects, and
measurement context effects (Podsakoff et al., 2003). The common method variance may inflate
inter-measure correlations and has high convergent validity. Harman’s single factor test will be
performed to examine the significance of the common method variance (Podsakoff & Organ
1986). If common method variance exists, a single factor can be found from a factor analysis of
all questionnaire measurement items. A general factor accounted for most of the variance.
93
CHAPTER IV
FINDINGS
1. Descriptive Analysis of the Demographic Profile
The respondents’ demographic profile was illustrated in Table 22. Of 657 participants,
51.30% of the participants were male, and 48.40% were female. 39.00% of the participants were
aged between 30 to 39 years. 30.40% of the participants were aged between 21 to 29 years.
17.50% of the participants were aged between 40 to 49 years. The percentage of participants
below age 20 and above age 50 takes up 13.10%. The majority of participants were
White/Caucasian (72.50%). Other ethnical groups included Asian (13.70%), African American
(7.60%), and Hispanic (5.30%). Around half of the participants were married (49.00%) while
42.50% were single. A quarter of the participants had annual household income between $50,000
and $74,999. 20.20% of the participants earned in the range of $35,000 and $49,999. Following
income ranged $75,000 to $99,999 (17.40%), $20,000 to $34,999 (13.70%), and $100,000 to
$149,999 (12.20%). Around half of the respondents had Bachelor’s degree (50.10%). 17.00% had
some college education, and 13.20% had a graduate degree. In the sample, 36.40% of the
participants stayed in a Marriott brand within the last six months. 28.60% stayed in a Hilton
Brand, and 23.40% stayed in an InterContinental brand. 9.70% of the respondents stayed in a
Hyatt brand, and only 1.80% stayed in Starwood brand. 65.90% hold the membership with the
hotel loyalty program, and 34.10% does not have the membership.
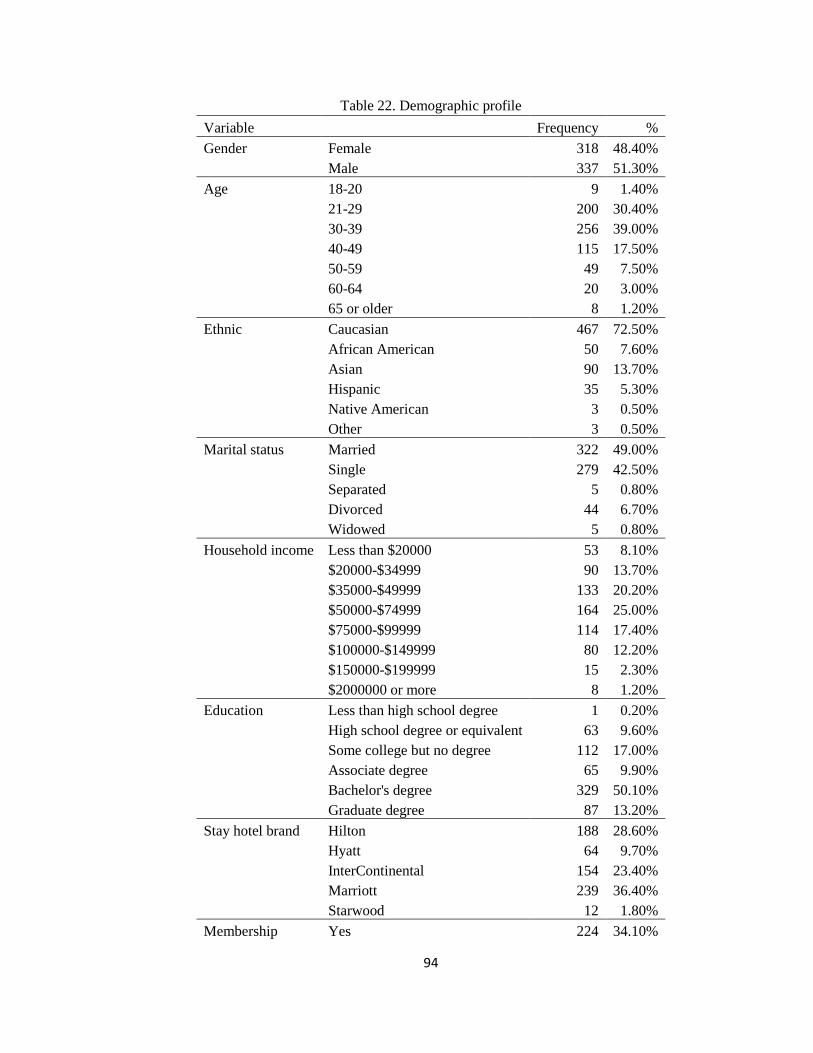
94
Table 22. Demographic profile
Variable Frequency %
Gender Female 318 48.40%
Male 337 51.30%
Age 18-20 9 1.40%
21-29 200 30.40%
30-39 256 39.00%
40-49 115 17.50%
50-59 49 7.50%
60-64 20 3.00%
65 or older 8 1.20%
Ethnic Caucasian 467 72.50%
African American 50 7.60%
Asian 90 13.70%
Hispanic 35 5.30%
Native American 3 0.50%
Other 3 0.50%
Marital status Married 322 49.00%
Single 279 42.50%
Separated 5 0.80%
Divorced 44 6.70%
Widowed 5 0.80%
Household income Less than $20000 53 8.10%
$20000-$34999 90 13.70%
$35000-$49999 133 20.20%
$50000-$74999 164 25.00%
$75000-$99999 114 17.40%
$100000-$149999 80 12.20%
$150000-$199999 15 2.30%
$2000000 or more 8 1.20%
Education Less than high school degree 1 0.20%
High school degree or equivalent 63 9.60%
Some college but no degree 112 17.00%
Associate degree 65 9.90%
Bachelor's degree 329 50.10%
Graduate degree 87 13.20%
Stay hotel brand Hilton 188 28.60%
Hyatt 64 9.70%
InterContinental 154 23.40%
Marriott 239 36.40%
Starwood 12 1.80%
Membership Yes 224 34.10%
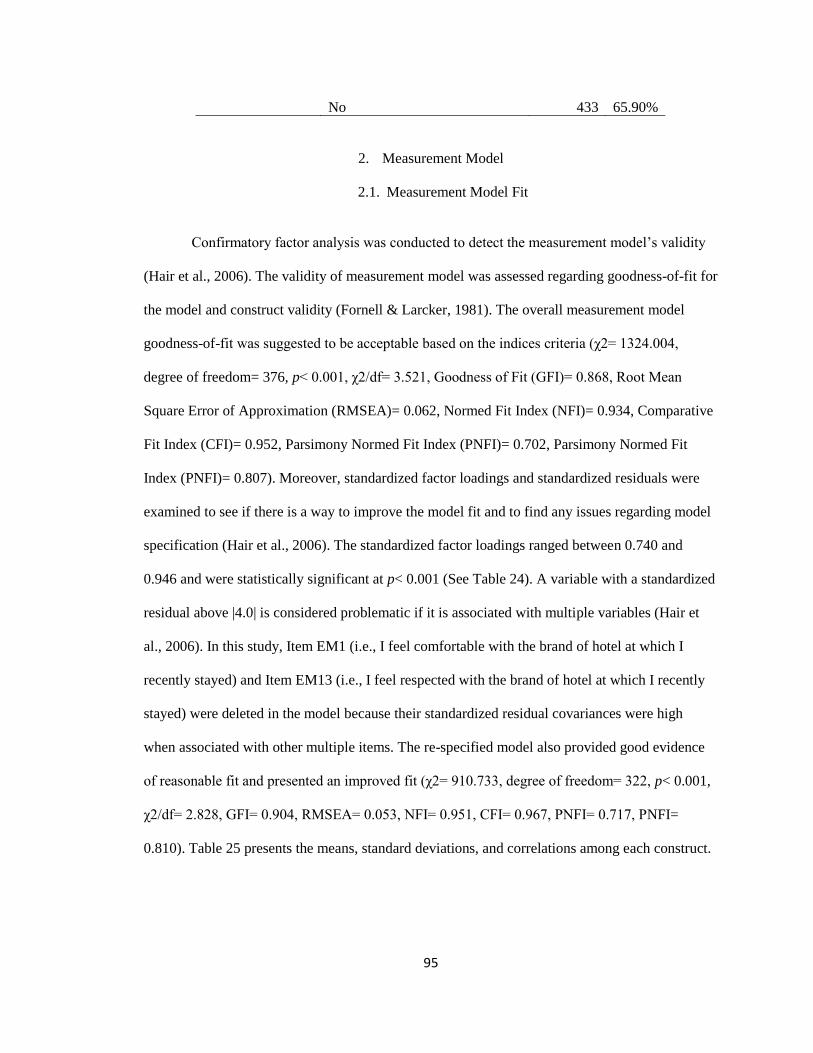
95
No 433 65.90%
2. Measurement Model
2.1. Measurement Model Fit
Confirmatory factor analysis was conducted to detect the measurement model’s validity
(Hair et al., 2006). The validity of measurement model was assessed regarding goodness-of-fit for
the model and construct validity (Fornell & Larcker, 1981). The overall measurement model
goodness-of-fit was suggested to be acceptable based on the indices criteria (χ2= 1324.004,
degree of freedom= 376, p< 0.001, χ2/df= 3.521, Goodness of Fit (GFI)= 0.868, Root Mean
Square Error of Approximation (RMSEA)= 0.062, Normed Fit Index (NFI)= 0.934, Comparative
Fit Index (CFI)= 0.952, Parsimony Normed Fit Index (PNFI)= 0.702, Parsimony Normed Fit
Index (PNFI)= 0.807). Moreover, standardized factor loadings and standardized residuals were
examined to see if there is a way to improve the model fit and to find any issues regarding model
specification (Hair et al., 2006). The standardized factor loadings ranged between 0.740 and
0.946 and were statistically significant at p< 0.001 (See Table 24). A variable with a standardized
residual above |4.0| is considered problematic if it is associated with multiple variables (Hair et
al., 2006). In this study, Item EM1 (i.e., I feel comfortable with the brand of hotel at which I
recently stayed) and Item EM13 (i.e., I feel respected with the brand of hotel at which I recently
stayed) were deleted in the model because their standardized residual covariances were high
when associated with other multiple items. The re-specified model also provided good evidence
of reasonable fit and presented an improved fit (χ2= 910.733, degree of freedom= 322, p< 0.001,
χ2/df= 2.828, GFI= 0.904, RMSEA= 0.053, NFI= 0.951, CFI= 0.967, PNFI= 0.717, PNFI=
0.810). Table 25 presents the means, standard deviations, and correlations among each construct.
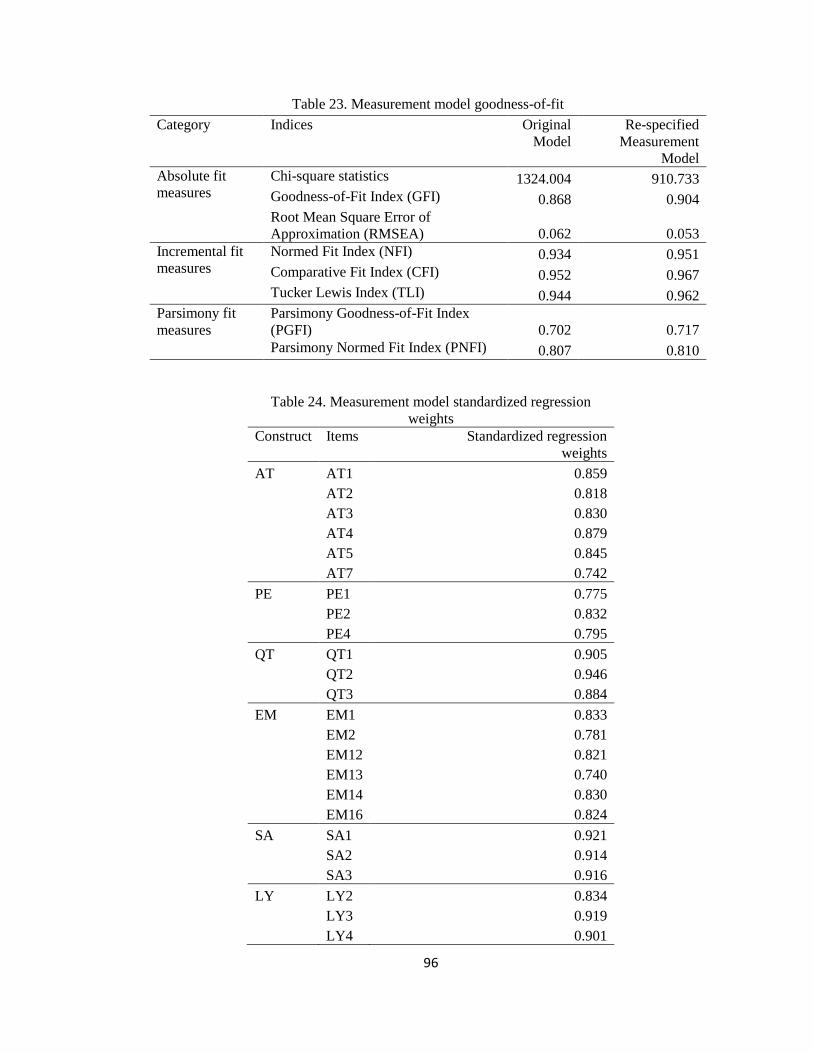
96
Table 23. Measurement model goodness-of-fit
Category Indices Original
Model
Re-specified
Measurement
Model
Absolute fit
measures
Chi-square statistics 1324.004 910.733
Goodness-of-Fit Index (GFI) 0.868 0.904
Root Mean Square Error of
Approximation (RMSEA) 0.062 0.053
Incremental fit
measures
Normed Fit Index (NFI) 0.934 0.951
Comparative Fit Index (CFI) 0.952 0.967
Tucker Lewis Index (TLI) 0.944 0.962
Parsimony fit
measures
Parsimony Goodness-of-Fit Index
(PGFI) 0.702 0.717
Parsimony Normed Fit Index (PNFI) 0.807 0.810
Table 24. Measurement model standardized regression
weights
Construct Items Standardized regression
weights
AT AT1 0.859
AT2 0.818
AT3 0.830
AT4 0.879
AT5 0.845
AT7 0.742
PE PE1 0.775
PE2 0.832
PE4 0.795
QT QT1 0.905
QT2 0.946
QT3 0.884
EM EM1 0.833
EM2 0.781
EM12 0.821
EM13 0.740
EM14 0.830
EM16 0.824
SA SA1 0.921
SA2 0.914
SA3 0.916
LY LY2 0.834
LY3 0.919
LY4 0.901
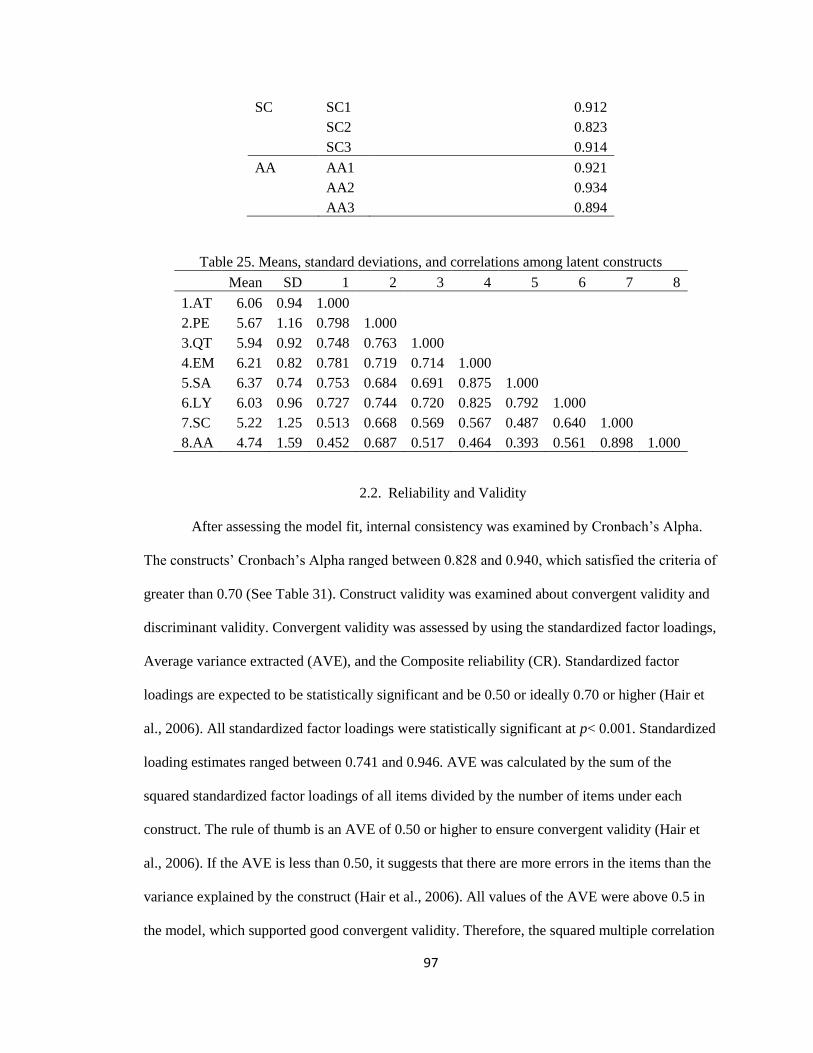
97
SC SC1 0.912
SC2 0.823
SC3 0.914
AA AA1 0.921
AA2 0.934
AA3 0.894
Table 25. Means, standard deviations, and correlations among latent constructs
Mean SD 1 2 3 4 5 6 7 8
1.AT 6.06 0.94 1.000
2.PE 5.67 1.16 0.798 1.000
3.QT 5.94 0.92 0.748 0.763 1.000
4.EM 6.21 0.82 0.781 0.719 0.714 1.000
5.SA 6.37 0.74 0.753 0.684 0.691 0.875 1.000
6.LY 6.03 0.96 0.727 0.744 0.720 0.825 0.792 1.000
7.SC 5.22 1.25 0.513 0.668 0.569 0.567 0.487 0.640 1.000
8.AA 4.74 1.59 0.452 0.687 0.517 0.464 0.393 0.561 0.898 1.000
2.2. Reliability and Validity
After assessing the model fit, internal consistency was examined by Cronbach’s Alpha.
The constructs’ Cronbach’s Alpha ranged between 0.828 and 0.940, which satisfied the criteria of
greater than 0.70 (See Table 31). Construct validity was examined about convergent validity and
discriminant validity. Convergent validity was assessed by using the standardized factor loadings,
Average variance extracted (AVE), and the Composite reliability (CR). Standardized factor
loadings are expected to be statistically significant and be 0.50 or ideally 0.70 or higher (Hair et
al., 2006). All standardized factor loadings were statistically significant at p< 0.001. Standardized
loading estimates ranged between 0.741 and 0.946. AVE was calculated by the sum of the
squared standardized factor loadings of all items divided by the number of items under each
construct. The rule of thumb is an AVE of 0.50 or higher to ensure convergent validity (Hair et
al., 2006). If the AVE is less than 0.50, it suggests that there are more errors in the items than the
variance explained by the construct (Hair et al., 2006). All values of the AVE were above 0.5 in
the model, which supported good convergent validity. Therefore, the squared multiple correlation
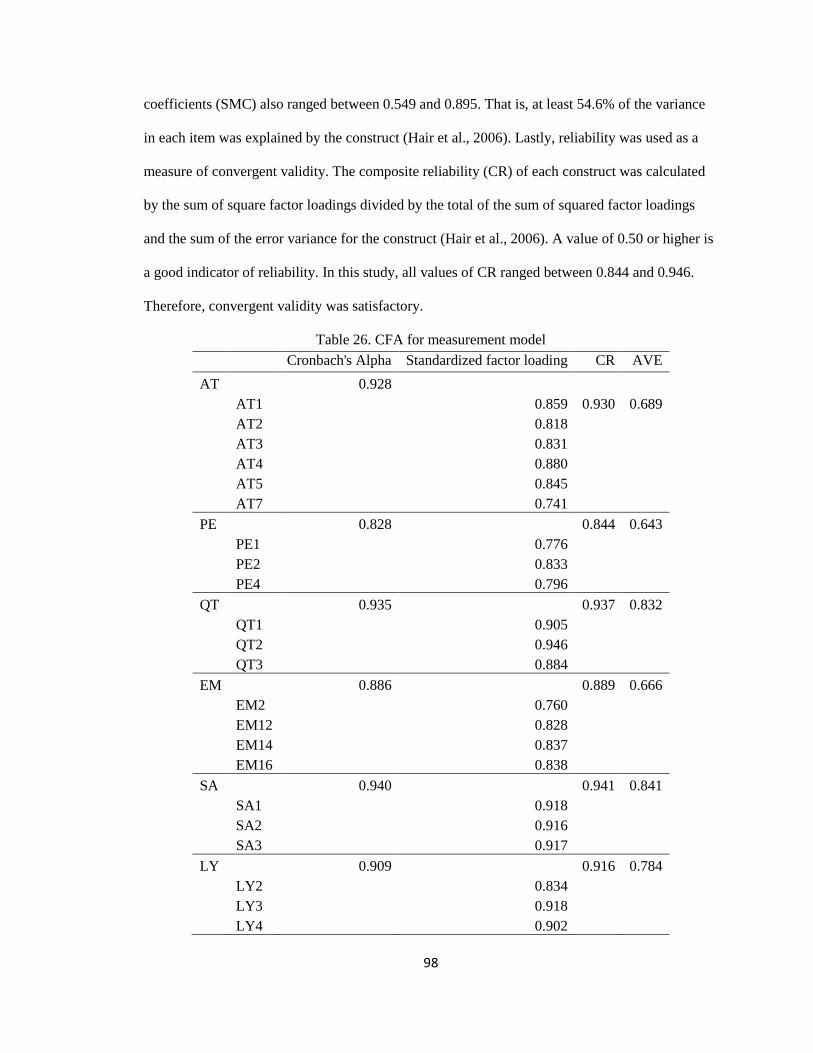
98
coefficients (SMC) also ranged between 0.549 and 0.895. That is, at least 54.6% of the variance
in each item was explained by the construct (Hair et al., 2006). Lastly, reliability was used as a
measure of convergent validity. The composite reliability (CR) of each construct was calculated
by the sum of square factor loadings divided by the total of the sum of squared factor loadings
and the sum of the error variance for the construct (Hair et al., 2006). A value of 0.50 or higher is
a good indicator of reliability. In this study, all values of CR ranged between 0.844 and 0.946.
Therefore, convergent validity was satisfactory.
Table 26. CFA for measurement model
Cronbach's Alpha Standardized factor loading CR AVE
AT
0.928
AT1
0.859 0.930 0.689
AT2
0.818
AT3
0.831
AT4
0.880
AT5
0.845
AT7 0.741
PE
0.828
0.844 0.643
PE1
0.776
PE2
0.833
PE4 0.796
QT
0.935
0.937 0.832
QT1
0.905
QT2
0.946
QT3 0.884
EM
0.886
0.889 0.666
EM2
0.760
EM12
0.828
EM14
0.837
EM16 0.838
SA
0.940
0.941 0.841
SA1
0.918
SA2
0.916
SA3 0.917
LY
0.909
0.916 0.784
LY2
0.834
LY3
0.918
LY4 0.902
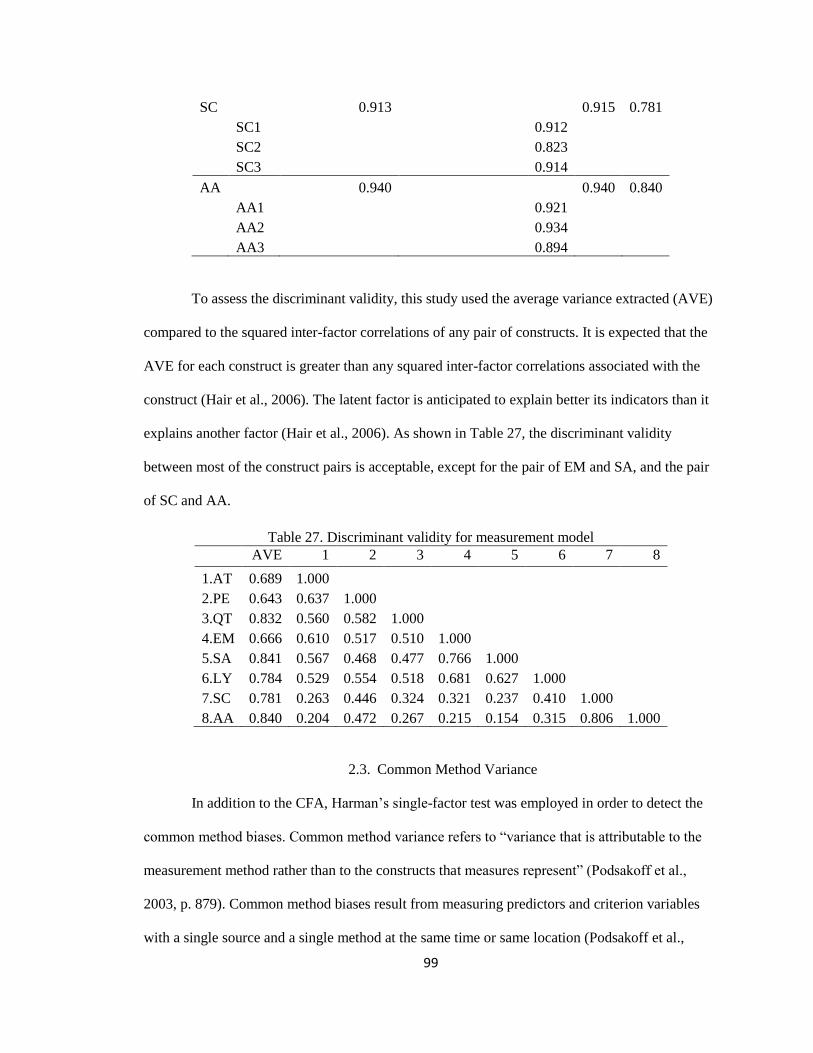
99
SC
0.913
0.915 0.781
SC1
0.912
SC2
0.823
SC3 0.914
AA
0.940
0.940 0.840
AA1
0.921
AA2
0.934
AA3 0.894
To assess the discriminant validity, this study used the average variance extracted (AVE)
compared to the squared inter-factor correlations of any pair of constructs. It is expected that the
AVE for each construct is greater than any squared inter-factor correlations associated with the
construct (Hair et al., 2006). The latent factor is anticipated to explain better its indicators than it
explains another factor (Hair et al., 2006). As shown in Table 27, the discriminant validity
between most of the construct pairs is acceptable, except for the pair of EM and SA, and the pair
of SC and AA.
Table 27. Discriminant validity for measurement model
AVE 1 2 3 4 5 6 7 8
1.AT 0.689 1.000
2.PE 0.643 0.637 1.000
3.QT 0.832 0.560 0.582 1.000
4.EM 0.666 0.610 0.517 0.510 1.000
5.SA 0.841 0.567 0.468 0.477 0.766 1.000
6.LY 0.784 0.529 0.554 0.518 0.681 0.627 1.000
7.SC 0.781 0.263 0.446 0.324 0.321 0.237 0.410 1.000
8.AA 0.840 0.204 0.472 0.267 0.215 0.154 0.315 0.806 1.000
2.3. Common Method Variance
In addition to the CFA, Harman’s single-factor test was employed in order to detect the
common method biases. Common method variance refers to “variance that is attributable to the
measurement method rather than to the constructs that measures represent” (Podsakoff et al.,
2003, p. 879). Common method biases result from measuring predictors and criterion variables
with a single source and a single method at the same time or same location (Podsakoff et al.,
100
2003). If a single factor generated from unrotated exploratory factor analysis explains the
majority of the covariance among measurement items, common method biases may occur
(Podsakoff et al., 2003). EFA result showed that a total of three factors were generated, and one
general factor explains 54.85% of the explained variance. Therefore, common method biases are
less likely a significant issue.
3. Structural Model
3.1. Proposed Structural Model
The proposed research model was examined using a structural equation modeling
regarding overall model fit and structural parameter estimates including their size, direction, and
statistical significance (Hair et al., 2006). The overall model fit of the completed proposed
research model was reasonable (χ2= 1086.837, degree of freedom= 336, p< 0.001, χ2/df= 3.235,
GFI= 0.886, RMSEA= 0.058, NFI= 0.941, CFI= 0.958, TLI= 0.953, PGFI= 0.733, PNFI= 0.836)
(See Table 28). The structural path estimates are shown in Table 29. Perceived overall quality
toward brand extension was predicted by brand extension’s attribute-level performance (β=
0.372, p< 0.001) and brand extension’s brand personality (β= 0.471, p< 0.001). H1 and H2 were
supported. This indicated that the consumers with a high evaluation of brand extension’s
attribute-level performance and high agreement of the brand personality were more likely to have
a high perceived overall quality toward brand extension. In particular, brand extension’s brand
personality was revealed to be the stronger predictor of perceived overall quality toward brand
extension. Customer emotional responses toward brand extension was predicted by brand
extension’s attribute-level performance (β= 0.492, p< 0.001), brand extension’s brand personality
(β= 0.197, p< 0.01), and perceived overall quality toward brand extension (β= 0.195, p< 0.01).
H3, H4, and H5 were supported. This indicated that the consumers with a high evaluation of
brand extension’s attribute-level performance and high agreement of the brand personality were
more likely to have the positive consumer emotional responses toward brand extension. In
101
addition, consumers with a high perceived overall quality toward brand extension were more
likely to have the positive consumer emotional responses toward brand extension.
Consumer satisfaction toward brand extension was predicted by perceived overall quality
toward brand extension (β= 0.125, p< 0.001) and consumer emotional responses toward brand
extension (β= 0.794, p< 0.001). H6 and H7 were supported. This indicated that the consumers
with a high perceived overall quality toward brand extension and more positive consumer
emotional responses toward brand extension were more likely to satisfy with the brand extension.
Consumer brand loyalty toward hotel brand extension was predicted by perceived overall quality
toward brand extension (β= 0.257, p< 0.001), consumer emotional responses toward brand
extension (β= 0.516, p< 0.001), and consumer satisfaction toward brand extension (β= 0.156, p<
0.001). H8, H9, and H10 were supported. This indicated that the consumers with a high perceived
overall quality toward brand extension and positive consumer emotional responses toward brand
extension were more likely to have a high consumer brand loyalty toward brand extension. In
addition, the high consumer satisfaction toward brand extension could lead to the high consumer
brand loyalty toward brand extension as well.
Moreover, the consumer brand loyalty toward hotel brand extension positively affected
consumer attitudinal attachment toward parent brand (β= 0.569, p< 0.001) and positively
influenced consumer sense of community toward parent brand (β= 0.209, p< 0.001). Consumer
attitudinal attachment positively affected the consumer sense of community toward parent brand
(β= 0.0.778, p< 0.001). As a result, H11, H12, H13 were supported. This indicated that the loyal
consumers toward brand extension were more likely to have a high attitudinal attachment and a
high sense of community toward the parent brand. In addition, a high attitudinal attachment
toward parent brand could lead to a high sense of community toward parent brand as well. Figure
10 illustrates the proposed model with standardized path estimates and significance.
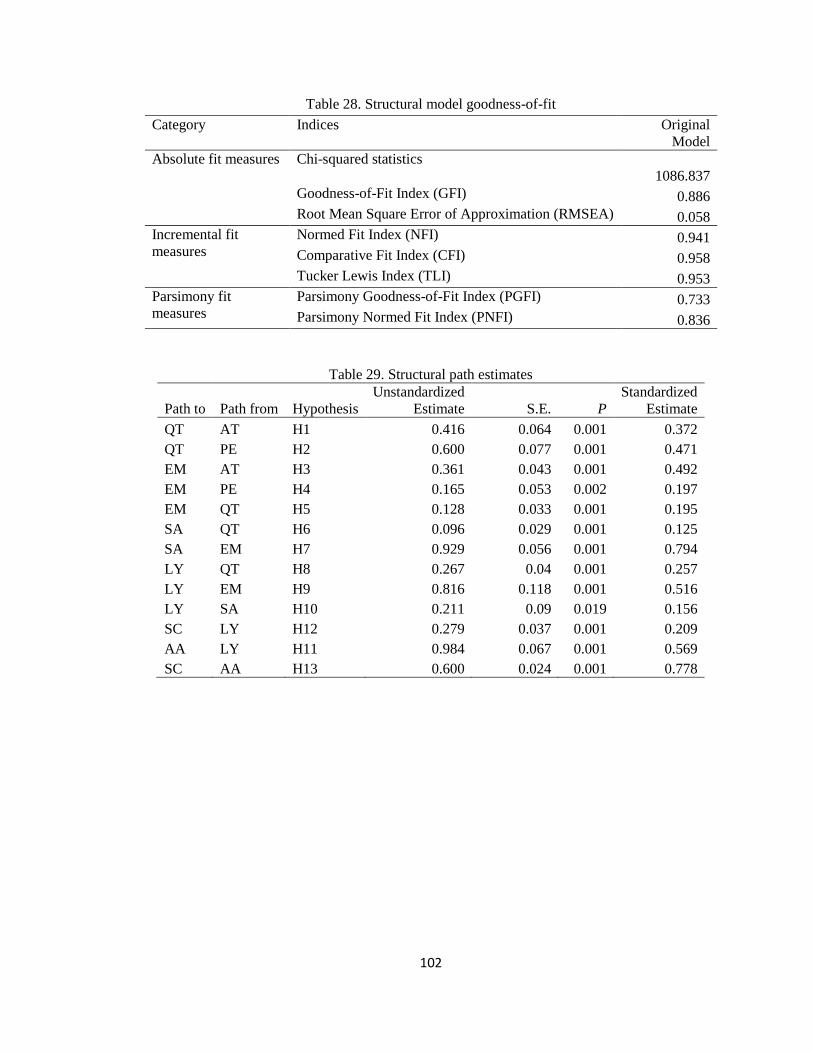
102
Table 28. Structural model goodness-of-fit
Category Indices Original
Model
Absolute fit measures Chi-squared statistics
1086.837
Goodness-of-Fit Index (GFI) 0.886
Root Mean Square Error of Approximation (RMSEA) 0.058
Incremental fit
measures
Normed Fit Index (NFI) 0.941
Comparative Fit Index (CFI) 0.958
Tucker Lewis Index (TLI) 0.953
Parsimony fit
measures
Parsimony Goodness-of-Fit Index (PGFI) 0.733
Parsimony Normed Fit Index (PNFI) 0.836
Table 29. Structural path estimates
Path to Path from Hypothesis
Unstandardized
Estimate S.E. P
Standardized
Estimate
QT AT H1 0.416 0.064 0.001 0.372
QT PE H2 0.600 0.077 0.001 0.471
EM AT H3 0.361 0.043 0.001 0.492
EM PE H4 0.165 0.053 0.002 0.197
EM QT H5 0.128 0.033 0.001 0.195
SA QT H6 0.096 0.029 0.001 0.125
SA EM H7 0.929 0.056 0.001 0.794
LY QT H8 0.267 0.04 0.001 0.257
LY EM H9 0.816 0.118 0.001 0.516
LY SA H10 0.211 0.09 0.019 0.156
SC LY H12 0.279 0.037 0.001 0.209
AA LY H11 0.984 0.067 0.001 0.569
SC AA H13 0.600 0.024 0.001 0.778
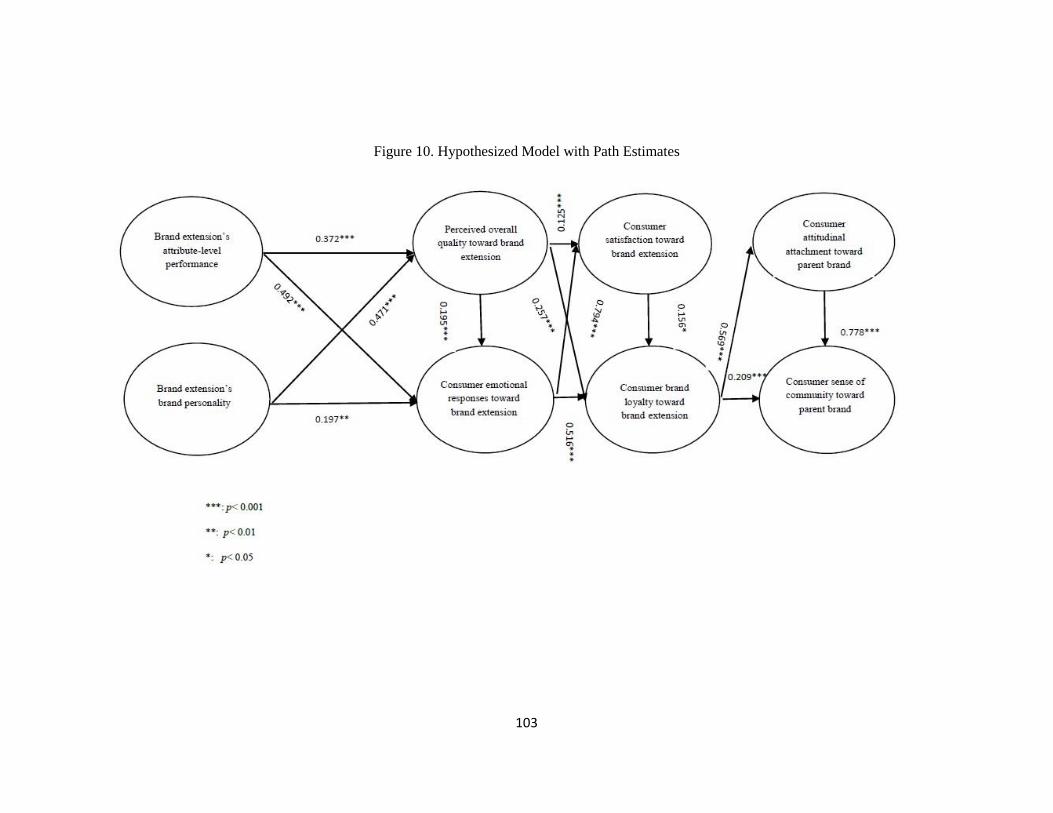
103
Figure 10. Hypothesized Model with Path Estimates
104
3.2. Competing Models
3.2.1. Competing Model 1
Competing Model 1 included two additional paths directly from brand extension’s
attribute-level performance to consumer satisfaction toward brand extension and from brand
extension’s brand personality to consumer satisfaction toward brand extension (See Figure 11).
The path between brand attribute-level performance and consumer satisfaction can be supported
by previous literature (e.g., Barsky, 1992; Choi & Chu, 2001). Oliver (1980) pointed out that the
consumer satisfaction was generated by comparing customer perceived performance and their
expectations based on the disconfirmation of expectation theory. Kano et al. (1984) proposed the
three-factor theory of consumer satisfaction and classified different types of quality attributes into
three factors, which were basic factors, excitement factors, and performance factors. The
relationship between attribute-level performance and overall consumer satisfaction can be found
from Oliver (1993), and Anderson and Mittal (2000). However, if using attribute-level
performance as the indicators of consumer satisfaction, more factors have to be considered, such
as the importance of the attributes on the customer satisfaction evaluation and the changes of the
attributes’ importance over time (Mittal, Katrichis, & Kumar, 2001). The path between brand
personality and consumer satisfaction can be supported by previous literature (e.g., Kim, Lee, &
Suh, 2015). Lee, Back, and Kim (2009) found the positive relationship between the restaurant
brand personality and consumer satisfaction.
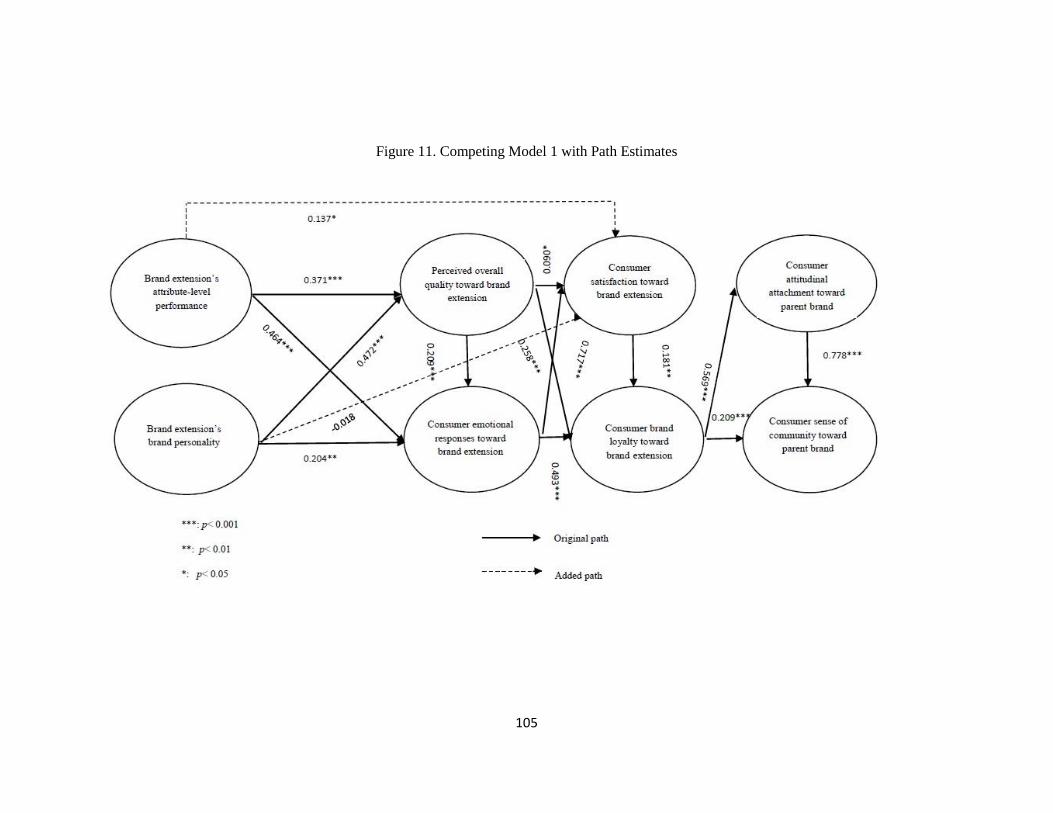
105
Figure 11. Competing Model 1 with Path Estimates
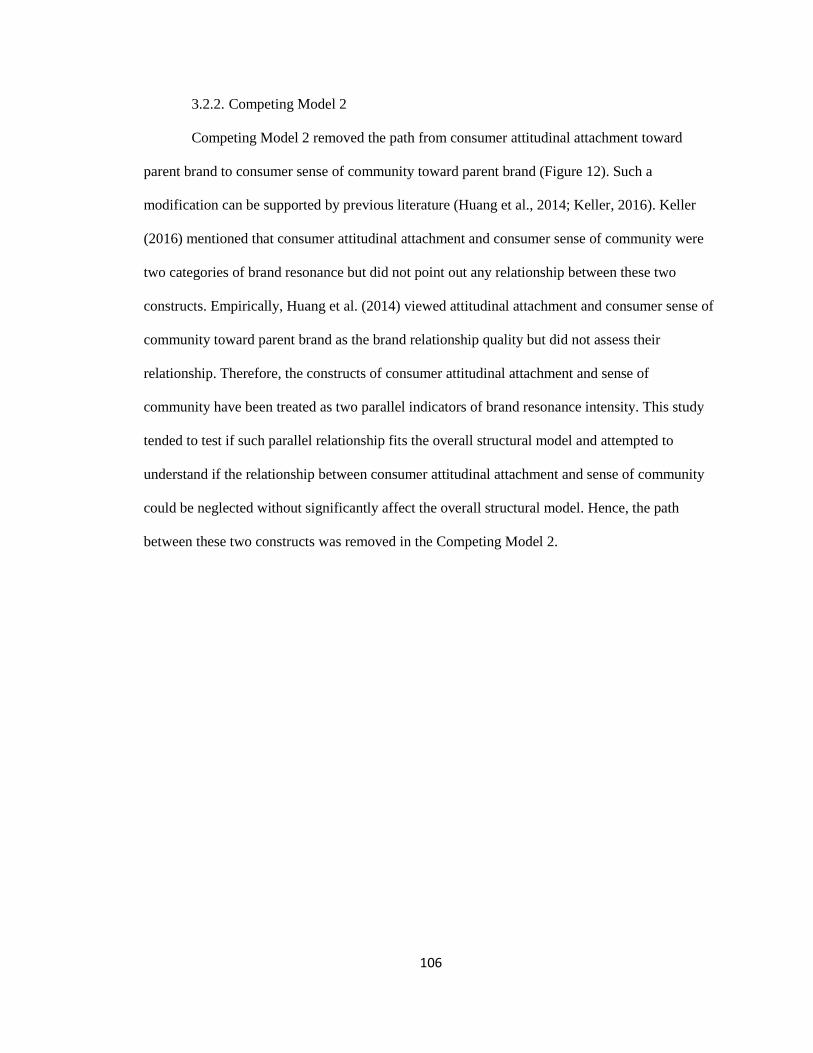
106
3.2.2. Competing Model 2
Competing Model 2 removed the path from consumer attitudinal attachment toward
parent brand to consumer sense of community toward parent brand (Figure 12). Such a
modification can be supported by previous literature (Huang et al., 2014; Keller, 2016). Keller
(2016) mentioned that consumer attitudinal attachment and consumer sense of community were
two categories of brand resonance but did not point out any relationship between these two
constructs. Empirically, Huang et al. (2014) viewed attitudinal attachment and consumer sense of
community toward parent brand as the brand relationship quality but did not assess their
relationship. Therefore, the constructs of consumer attitudinal attachment and sense of
community have been treated as two parallel indicators of brand resonance intensity. This study
tended to test if such parallel relationship fits the overall structural model and attempted to
understand if the relationship between consumer attitudinal attachment and sense of community
could be neglected without significantly affect the overall structural model. Hence, the path
between these two constructs was removed in the Competing Model 2.
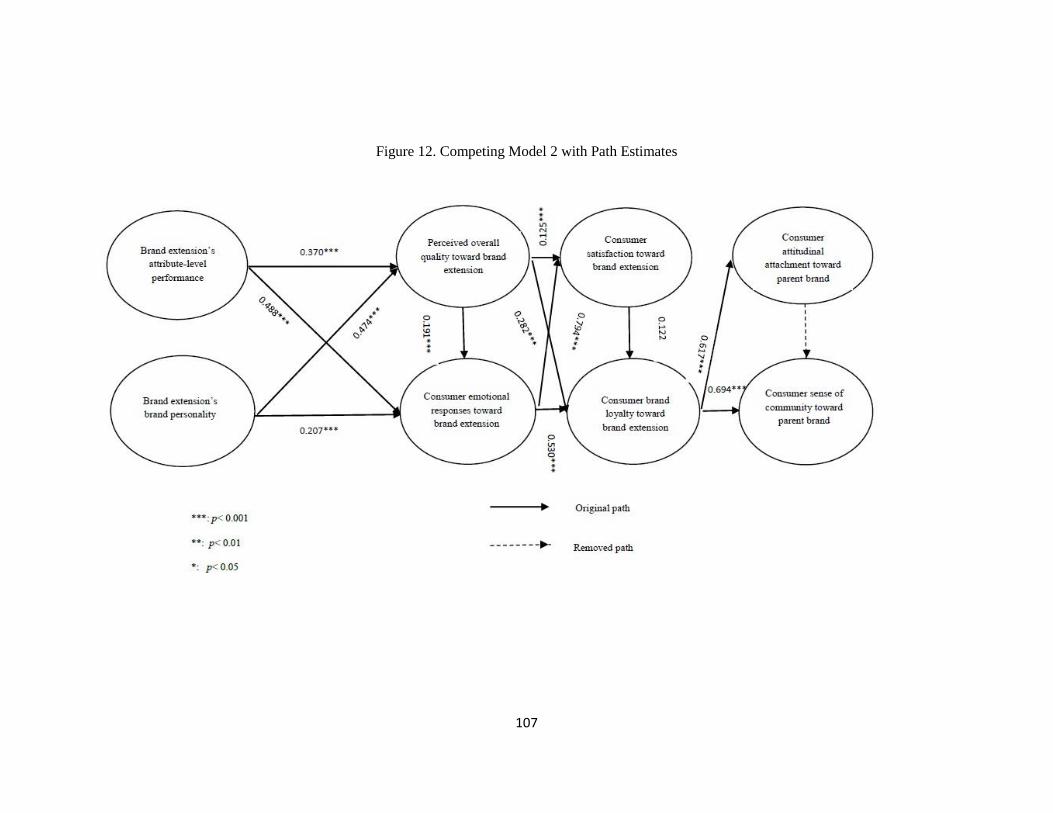
107
Figure 12. Competing Model 2 with Path Estimates
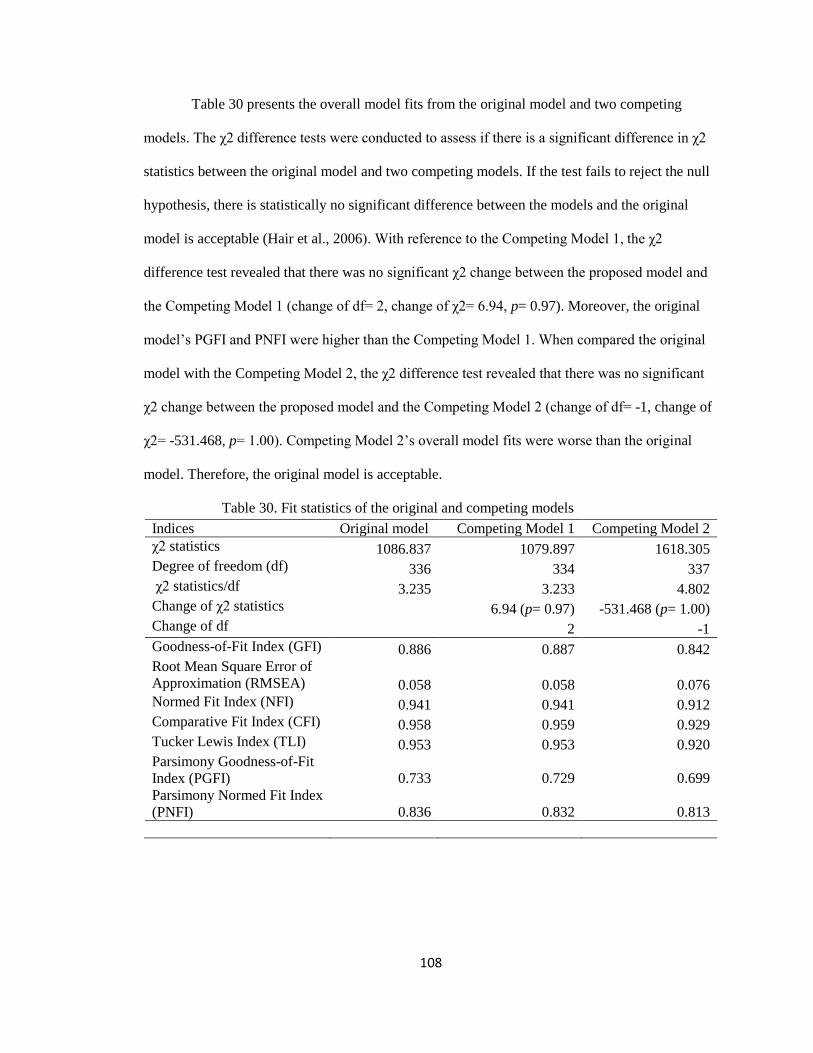
108
Table 30 presents the overall model fits from the original model and two competing
models. The χ2 difference tests were conducted to assess if there is a significant difference in χ2
statistics between the original model and two competing models. If the test fails to reject the null
hypothesis, there is statistically no significant difference between the models and the original
model is acceptable (Hair et al., 2006). With reference to the Competing Model 1, the χ2
difference test revealed that there was no significant χ2 change between the proposed model and
the Competing Model 1 (change of df= 2, change of χ2= 6.94, p= 0.97). Moreover, the original
model’s PGFI and PNFI were higher than the Competing Model 1. When compared the original
model with the Competing Model 2, the χ2 difference test revealed that there was no significant
χ2 change between the proposed model and the Competing Model 2 (change of df= -1, change of
χ2= -531.468, p= 1.00). Competing Model 2’s overall model fits were worse than the original
model. Therefore, the original model is acceptable.
Table 30. Fit statistics of the original and competing models
Indices Original model Competing Model 1 Competing Model 2
χ2 statistics 1086.837 1079.897 1618.305
Degree of freedom (df) 336 334 337
χ2 statistics/df 3.235 3.233 4.802
Change of χ2 statistics
6.94 (p= 0.97) -531.468 (p= 1.00)
Change of df 2 -1
Goodness-of-Fit Index (GFI) 0.886 0.887 0.842
Root Mean Square Error of
Approximation (RMSEA) 0.058 0.058 0.076
Normed Fit Index (NFI) 0.941 0.941 0.912
Comparative Fit Index (CFI) 0.958 0.959 0.929
Tucker Lewis Index (TLI) 0.953 0.953 0.920
Parsimony Goodness-of-Fit
Index (PGFI) 0.733 0.729 0.699
Parsimony Normed Fit Index
(PNFI) 0.836 0.832 0.813
109
3.3. Mediation Analysis
If the independent variable affects the dependent variable through at least one intervening
variable, there is the mediation effect, and the intervening variable is the mediator (Preacher &
Hayes, 2008). Figure 12 illustrates the mediating relationships. There are three types of
mediation. Full mediation refers to all of the correlation between X and Y is accounted for by the
product of the correlation between X and M and M and Y. In other words, the correlation
between X and Y, controlling for M, is zero. The path coefficient a and b must be significant, and
c is not significant. This means all of the variances in Y is fully accounted for by M, and that M
captures all the effect of X on Y. Partial mediation is that only some of the correlation between X
and Y is accounted for by the product of the correlation between X and M and M and Y. In other
words, the correlation between X and Y, controlling for M, is non-zero and positive. a and b must
be significant, and c is also significant. It means while M explains a significant portion of the
variance in Y, but X also explains some of the variances in Y. Suppression is that only some of
the correlation between X and Y is accounted for by the product of the correlation between X and
M and M and Y. In other words, the correlation between X and Y, controlling for M, is non-zero
and negative. In this study, the statistical significance of indirect effects was obtained by using
bias-corrected bootstrap confidence intervals (Arbuckle, 2010).
Figure 13. Mediator
c
M
X Y
b a
110
3.3.1. Mediating role of perceived overall quality toward brand extension on the
relationship between brand extension’s attribute-level performance and consumer
emotional responses toward brand extension
Brand extension’s attribute-level performance was positively related to perceived overall
quality toward brand extension (β= 0.372, p< 0.001) and consumer emotional responses toward
brand extension (β= 0.492, p< 0.001), respectively. Perceived overall quality toward brand
extension was positively related to consumer emotional responses toward brand extension (β=
0.195, p< 0.001). The indirect effect of brand extension’s attribute-level performance on
consumer emotional responses toward brand extension was 0.073. It generated a 0.565 total effect
(direct effect 0.492+ indirect effect 0.073). The indirect effect was weaker than the direct effect,
accounting for 12.92% of the total effect. This indicated the partial mediating effect of perceived
overall quality toward brand extension on the relationship between brand extensions’ attribute-
level performance and consumer emotional responses toward brand extension. The brand
extension’s attribute-level performance directly influenced consumer emotional responses toward
brand extension and indirectly influenced consumer emotional responses toward brand extension
by enhancing perceived overall quality toward brand extension.
3.3.2. Mediating role of perceived overall quality toward brand extension on the
relationship between Brand Extension’s Brand Personality and consumer emotional
responses toward brand extension
Brand extension’s brand personality was positively related to perceived overall quality
toward brand extension (β= 0.471, p< 0.001) and consumer emotional responses toward brand
extension (β= 0.197, p< 0.01), respectively. Perceived overall quality toward brand extension was
positively related to consumer emotional responses toward brand extension (β= 0.195, p< 0.001).
The indirect effect of brand extension’s brand personality on consumer emotional responses
111
toward brand extension was 0.092. It generated a 0.289 total effect (direct effect 0.197+ indirect
effect 0.092). The indirect effect was weaker than the direct effect, accounting for 31.83% of the
total effect. This indicated the partial mediating effect of perceived overall quality toward brand
extension on the relationship between brand extension’s brand personality and consumer
emotional responses toward brand extension. Brand extension’s brand personality directly
influenced the consumer emotional responses toward brand extension and indirectly influenced
consumer emotional responses toward brand extension by enhancing perceived overall quality
toward brand extension.
3.3.3. Mediating role of consumer emotional responses toward brand extension on the
relationship between perceived overall quality toward brand extension and
consumer satisfaction toward brand extension
Perceived overall quality toward brand extension was positively related to consumer
emotional responses toward brand extension (β= 0.195, p< 0.001) and consumer satisfaction
toward brand extension (β= 0.125, p< 0.001), respectively. Consumer emotional responses
toward brand extension were positively related to consumer satisfaction toward brand extension
(β= 0.794, p< 0.001). The indirect effect of perceived overall quality toward brand extension on
consumer satisfaction toward brand extension was 0.154. It generated a 0.279 total effect (direct
effect 0.125+ indirect effect 0.154). The indirect effect was stronger than the direct effect,
accounting for 55.20% of the total effect. This indicated the partial mediating effect of consumer
emotional responses toward brand extension on the relationship between perceived overall quality
toward brand extension and consumer satisfaction toward brand extension. The perceived overall
quality toward brand extension directly influenced consumer satisfaction toward brand extension
and indirectly influenced consumer satisfaction toward brand extension by enhancing consumer
emotional responses toward brand extension.
112
3.3.4. Mediating role of consumer satisfaction toward brand extension on the relationship
between perceived overall quality toward brand extension and consumer brand
loyalty toward brand extension
Perceived overall quality toward brand extension was positively related to consumer
brand loyalty toward brand extension (β= 0.257, p< 0.001) and consumer satisfaction toward
brand extension (β= 0.125, p< 0.001), respectively. Consumer satisfaction toward brand
extension is positively related to consumer brand loyalty toward brand extension (β= 0.156, p<
0.05). The indirect effect of perceived overall quality toward brand extension on consumer brand
loyalty toward brand extension was 0.020. It generated a 0.277 total effect (direct effect 0.257+
indirect effect 0.020). The indirect effect was weaker than the direct effect, accounting for 7.22%
of the total effect. This indicated the partial mediating effect of consumer satisfaction toward
brand extension on the relationship between perceived overall quality toward brand extension and
consumer brand loyalty toward brand extension. The perceived overall quality toward brand
extension directly influenced consumer brand loyalty toward brand extension and indirectly
influenced consumer brand loyalty toward brand extension by enhancing consumer satisfaction
toward brand extension.
3.3.5. Mediating role of consumer satisfaction toward brand extension on the relationship
between consumer emotional responses toward brand extension and consumer
brand loyalty toward brand extension
Consumer emotional responses toward brand extension were positively related to
consumer brand loyalty toward brand extension (β= 0.516, p< 0.001) and consumer satisfaction
toward brand extension (β= 0.794, p< 0.001), respectively. Consumer satisfaction toward brand
extension was positively related to consumer brand loyalty toward brand extension (β= 0.156, p<
0.001). The indirect effect of consumer emotional responses toward brand extension on consumer
brand loyalty toward brand extension was 0.124. It generated a 0.650 total effect (direct effect
113
0.516+ indirect effect 0.124). The indirect effect was weaker than the direct effect, accounting for
19.08% of the total effect. This indicated the partial mediating effect of consumer satisfaction
toward brand extension on the relationship between consumer emotional responses toward brand
extension and consumer brand loyalty toward brand extension. Consumer emotional responses
toward brand extension directly influenced consumer brand loyalty toward brand extension and
indirectly influenced consumer brand loyalty toward brand extension by enhancing consumer
satisfaction toward brand extension.
3.3.6. Mediating role of consumer attitudinal attachment toward parent brand on the
relationship between consumer brand loyalty toward brand extension and consumer
sense of community toward parent brand
Consumer brand loyalty toward brand extension was positively related to consumer
attitudinal attachment toward parent brand (β= 0.569, p< 0.001) and consumer sense of
community toward parent brand (β= 0.209, p< 0.001), respectively. Consumer attitudinal
attachment toward parent brand was positively related to consumer sense of community toward
parent brand (β= 0.778, p< 0.001). The indirect effect of consumer brand loyalty toward brand
extension on consumer sense of community toward parent brand was 0.443. It generated a 0.652
total effect (direct effect 0.209+ indirect effect 0.443). The indirect effect was stronger than the
direct effect, accounting for 67.94% of the total effect. This indicated the partial mediating effect
of consumer attitudinal attachment toward parent brand on the relationship between consumer
brand loyalty toward brand extension and consumer sense of community toward parent brand.
The consumer brand loyalty toward brand extension directly influenced the consumer sense of
community toward parent brand and indirectly influenced consumer sense of community toward
parent brand by enhancing consumer attitudinal attachment toward parent brand.
114
4. Moderating Effects of Perceived Image Fit
A moderator is the third variable that influences the zero-order correlation of two other
variables (Kline, 2011). Baron and Kenny (1986, p. 1174) defined a moderator as “a qualitative
(e.g., gender, race, class) or quantitative (e.g., level of reward) variable that affects the direction
and/or strength of the relation between an independent or predictor variable and a dependent or
criterion variable.” Hierarchical multiple regression is a common approach to test moderating
effects, especially for the moderators with continuous values. Using the hierarchical multiple
regression to test a moderating effect needs to compare the coefficient of determinants between
the model without interaction term and the model with interaction term.
4.1. Moderating Effect of Perceived Image Fit on the Relationship between Consumer Brand
Loyalty toward Brand Extension and Consumer Attitudinal Attachment toward Parent
Brand
With the dependent variable as consumer attitudinal attachment toward parent brand,
consumer brand loyalty toward brand extension and perceived image fit were two independent
variables in Model 1. The results from OLS regression showed 𝑅2 as 0.303, 𝑅2 adj as 0.301, 𝑅2
change as 0.303, F as 142.042 (p< 0.001), and F change as 142.042 (p< 0.001). The positive
relationship between consumer brand loyalty toward brand extension and consumer attitudinal
attachment toward parent brand was positively and significantly (β= 0.469, p< 0.001). It was
consistent with the result from H11. By adding the interaction term in to the model (Model 2), the
results showed 𝑅2 as 0.326, 𝑅2 adj as 0.323, 𝑅2 change as 0.326, F as 105.376 (p< 0.001), and F
change as 105.376 (p< 0.001). The positive relationship between consumer brand loyalty toward
brand extension and consumer attitudinal attachment toward parent brand was positively and
significantly (β= 0.528, p< 0.001). The positive relationship between perceived image fit and
consumer attitudinal attachment toward parent brand was positively and significantly (β= 0.141,
p< 0.001). The interaction term was positively and significantly related to consumer attitudinal
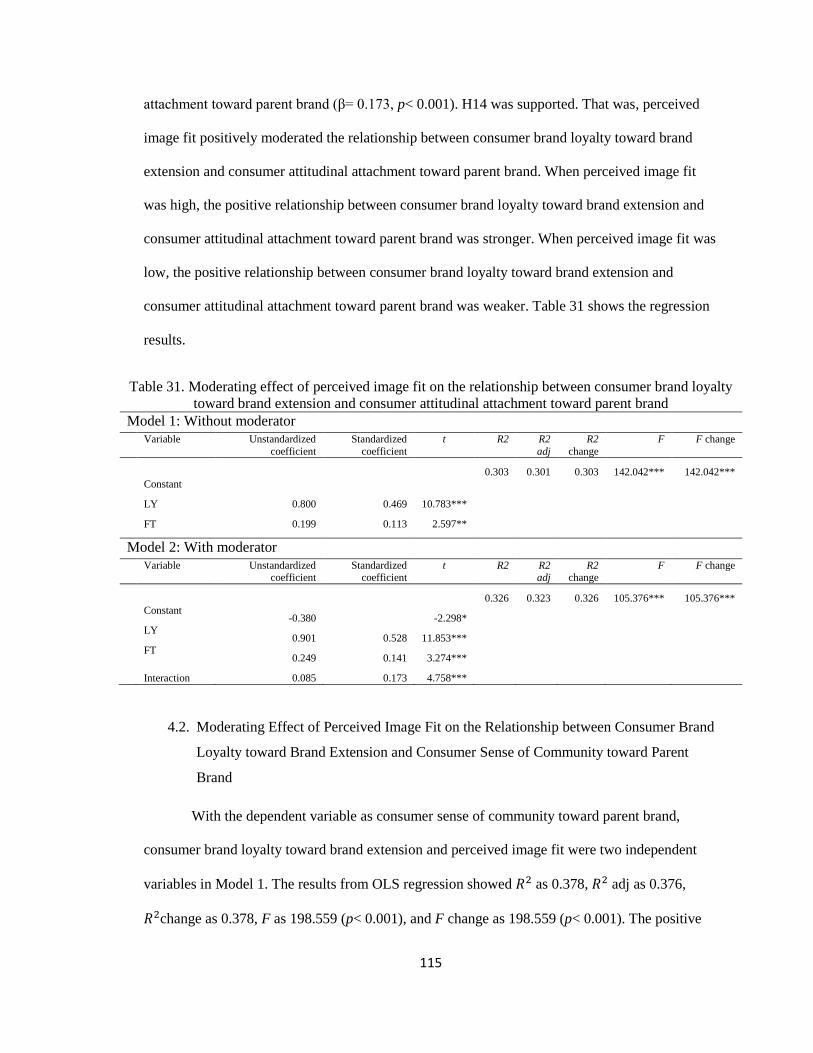
115
attachment toward parent brand (β= 0.173, p< 0.001). H14 was supported. That was, perceived
image fit positively moderated the relationship between consumer brand loyalty toward brand
extension and consumer attitudinal attachment toward parent brand. When perceived image fit
was high, the positive relationship between consumer brand loyalty toward brand extension and
consumer attitudinal attachment toward parent brand was stronger. When perceived image fit was
low, the positive relationship between consumer brand loyalty toward brand extension and
consumer attitudinal attachment toward parent brand was weaker. Table 31 shows the regression
results.
Table 31. Moderating effect of perceived image fit on the relationship between consumer brand loyalty
toward brand extension and consumer attitudinal attachment toward parent brand
Model 1: Without moderator
Variable Unstandardized
coefficient
Standardized
coefficient
t R2 R2
adj
R2
change
F F change
0.303 0.301 0.303 142.042*** 142.042***
Constant
LY 0.800 0.469 10.783***
FT 0.199 0.113 2.597**
Model 2: With moderator
Variable Unstandardized coefficient
Standardized coefficient
t R2 R2 adj
R2 change
F F change
0.326 0.323 0.326 105.376*** 105.376***
Constant -0.380
-2.298*
LY 0.901 0.528 11.853***
FT 0.249 0.141 3.274***
Interaction 0.085 0.173 4.758***
4.2. Moderating Effect of Perceived Image Fit on the Relationship between Consumer Brand
Loyalty toward Brand Extension and Consumer Sense of Community toward Parent
Brand
With the dependent variable as consumer sense of community toward parent brand,
consumer brand loyalty toward brand extension and perceived image fit were two independent
variables in Model 1. The results from OLS regression showed 𝑅2 as 0.378, 𝑅2 adj as 0.376,
𝑅2change as 0.378, F as 198.559 (p< 0.001), and F change as 198.559 (p< 0.001). The positive
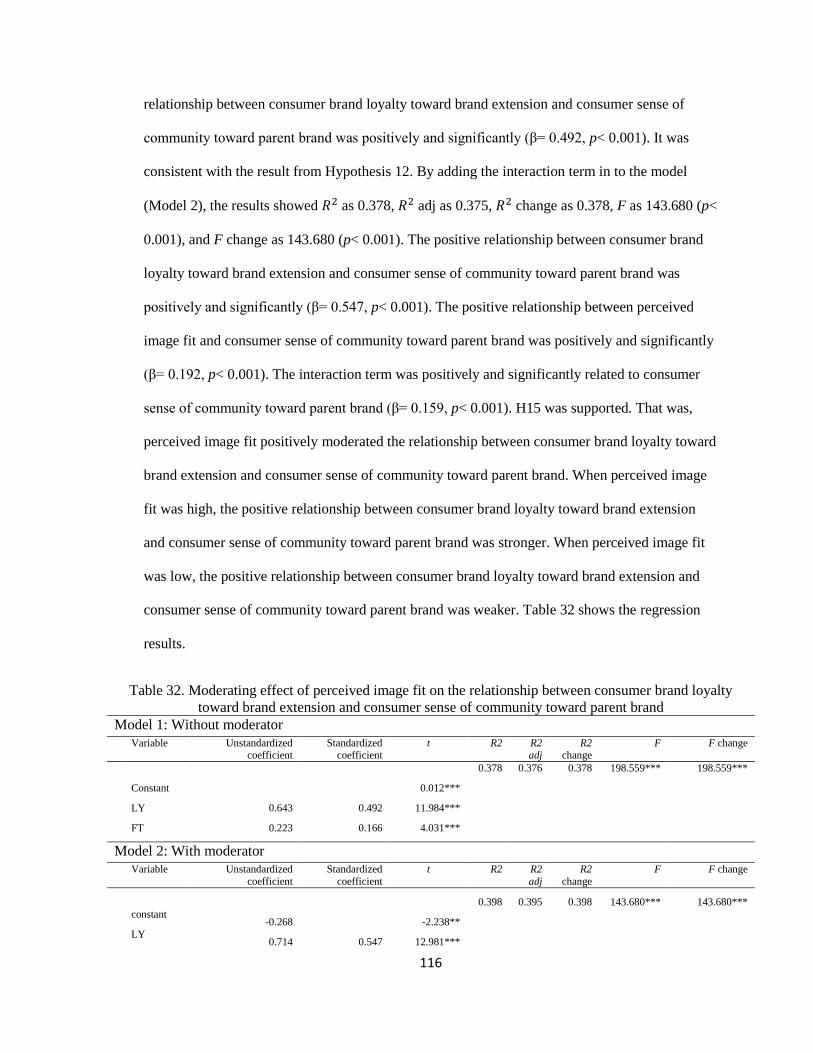
116
relationship between consumer brand loyalty toward brand extension and consumer sense of
community toward parent brand was positively and significantly (β= 0.492, p< 0.001). It was
consistent with the result from Hypothesis 12. By adding the interaction term in to the model
(Model 2), the results showed 𝑅2 as 0.378, 𝑅2 adj as 0.375, 𝑅2 change as 0.378, F as 143.680 (p<
0.001), and F change as 143.680 (p< 0.001). The positive relationship between consumer brand
loyalty toward brand extension and consumer sense of community toward parent brand was
positively and significantly (β= 0.547, p< 0.001). The positive relationship between perceived
image fit and consumer sense of community toward parent brand was positively and significantly
(β= 0.192, p< 0.001). The interaction term was positively and significantly related to consumer
sense of community toward parent brand (β= 0.159, p< 0.001). H15 was supported. That was,
perceived image fit positively moderated the relationship between consumer brand loyalty toward
brand extension and consumer sense of community toward parent brand. When perceived image
fit was high, the positive relationship between consumer brand loyalty toward brand extension
and consumer sense of community toward parent brand was stronger. When perceived image fit
was low, the positive relationship between consumer brand loyalty toward brand extension and
consumer sense of community toward parent brand was weaker. Table 32 shows the regression
results.
Table 32. Moderating effect of perceived image fit on the relationship between consumer brand loyalty
toward brand extension and consumer sense of community toward parent brand
Model 1: Without moderator
Variable Unstandardized coefficient
Standardized coefficient
t R2 R2 adj
R2 change
F F change
0.378 0.376 0.378 198.559*** 198.559***
Constant 0.012***
LY 0.643 0.492 11.984***
FT 0.223 0.166 4.031***
Model 2: With moderator
Variable Unstandardized
coefficient
Standardized
coefficient
t R2 R2
adj
R2
change
F F change
0.398 0.395 0.398 143.680*** 143.680***
constant -0.268
-2.238**
LY 0.714 0.547 12.981***
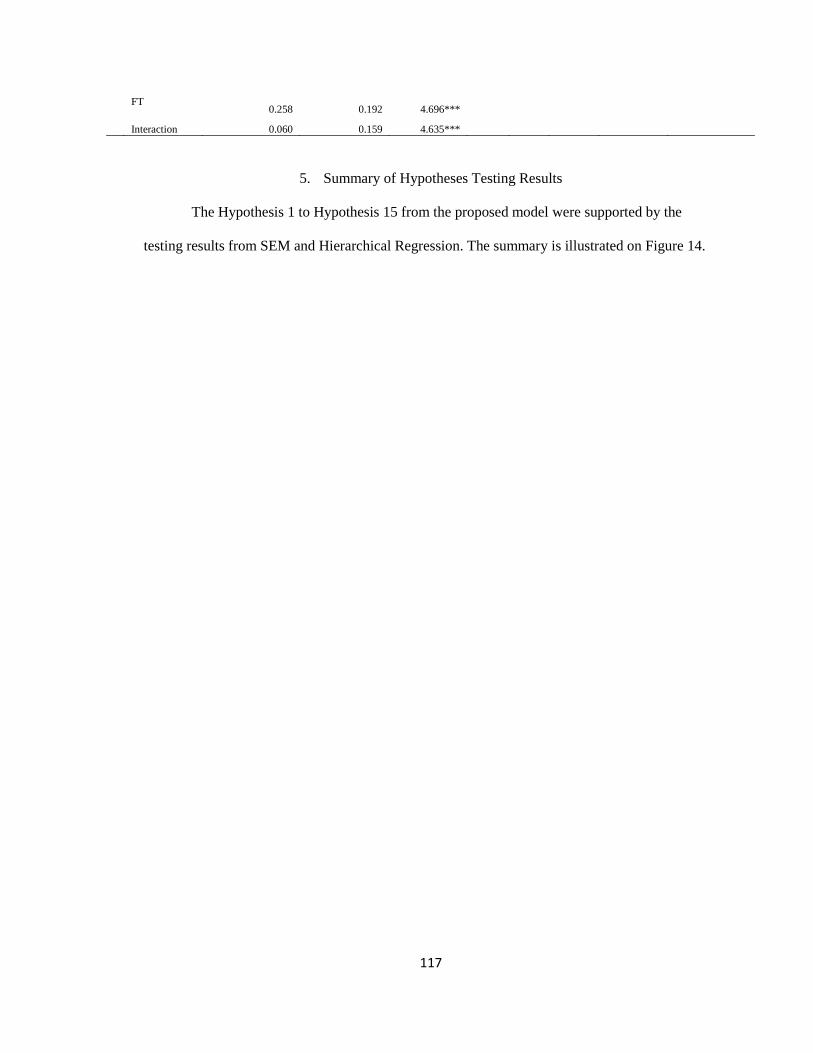
117
FT 0.258 0.192 4.696***
Interaction 0.060 0.159 4.635***
5. Summary of Hypotheses Testing Results
The Hypothesis 1 to Hypothesis 15 from the proposed model were supported by the
testing results from SEM and Hierarchical Regression. The summary is illustrated on Figure 14.
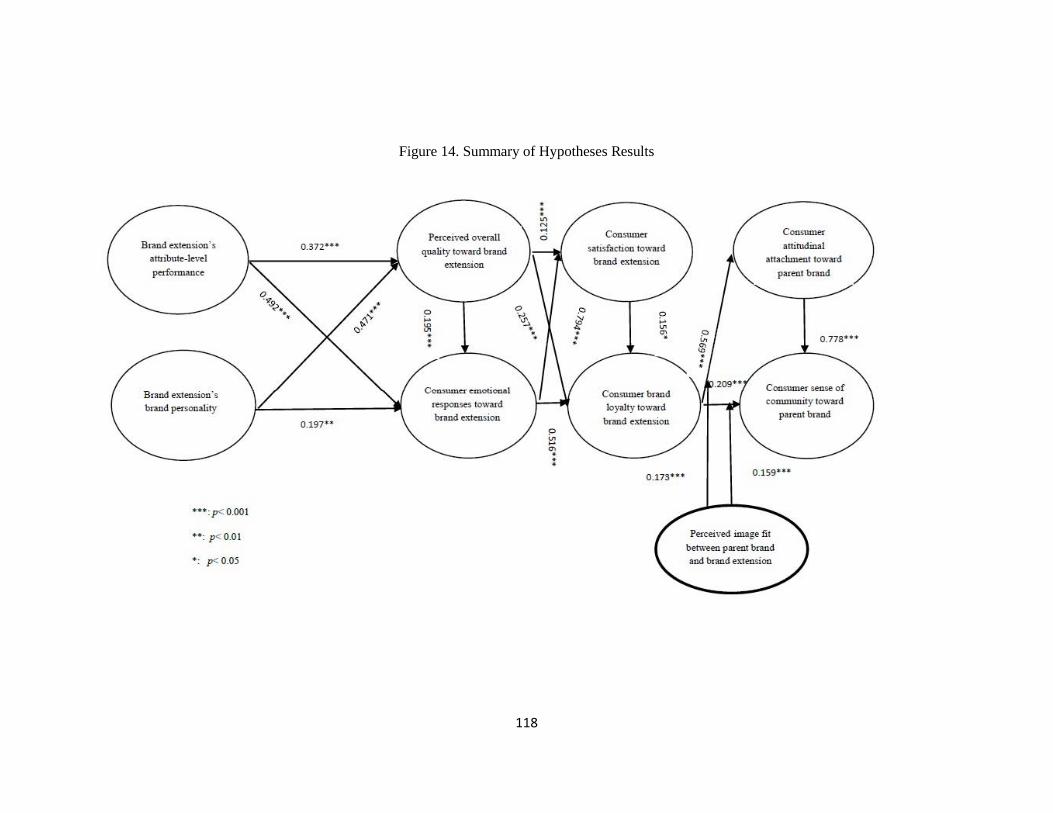
118
Figure 14. Summary of Hypotheses Results
119
CHAPTER V
CONCLUSION
1. Summary of Findings
The main purposes of this study were to (1) establish an integrated customer-based brand
extension equity resonance model in the U.S. lodging context, and (2) provide the practical
suggestions for the hotel practitioners to build the strong brands. In particular, I am interested in
investigating the roles of two brand associations, brand extension’s attribute-level performance,
and brand extension’s brand personality on determining consumer’s rational and emotional
judgment toward the hotel brand extension by applying associative network theory, cue
utilization theory, self-congruity theory, and Mehrabian-Russell Model. In addition, this study
found the relationship among the consumer judgment, satisfaction, and loyalty toward the hotel
brand extension. Moreover, this study considered the feedback effect and discussed the
mechanism how consumer brand loyalty toward brand extension could affect the consumer-brand
relationship of the parent brand, that is brand resonance. Beyond these discussions, this study also
investigated the moderating role of perceived image fit on the relationship between consumer
brand loyalty toward brand extension and parent brand resonance dimensions. This study tended
to indicate hotel developer and managers to pay attention to the critical brand extension
associations and focus on the consumer-brand relationships.
120
2. Discussions
2.1. The Effects of Brand Associations on Consumer Judgment toward Brand Extension
This study found that the hotel brand extension’s attribute-level performance and brand
extension’s brand personality positively affected consumer perceived overall quality toward
brand extension, which was supported by Hypothesis 1 and Hypothesis 2. That is to say, the
consumers with a high evaluation of brand extension’s attribute-level performance and high
agreement of the brand personality were more likely to have a high perceived overall quality
toward brand extension. In particular, brand extension’s brand personality was revealed to be the
stronger predictor of perceived overall quality toward brand extension.
This study also found that the hotel brand extension’s attribute-level performance and
brand extension’s brand personality positively affected consumer emotional responses toward
brand extension, which were supported by Hypothesis 3 and Hypothesis 4. That is to say, the
consumers with a high evaluation of brand extension’s attribute-level performance and high
agreement of the brand personality were more likely to have the positive consumer emotional
responses toward brand extension. In particular, hotel brand extension’s attribute-level
performance was revealed to be the stronger predictor of consumer emotional responses toward
brand extension.
Based on Keller (2001)’s brand resonance model, to generate consumers’ rational
judgment about the hotel brand extension (e.g., perceived overall quality toward brand extension)
and emotional responses (e.g., consumer emotional responses toward brand extension), reaching
the brand performance and imagery is the necessary step. The essential piece is to build the brand
associations based on the brand performance and imagery. The brand associations are the
fundamental component of the customer-based brand equity. Following the associative network
memory theory (Anderson, 1983; Collins & Loftus, 1975), the brand extension’s attribute-level
121
performance and brand extension’s brand personality raise brand meaning to the consumers.
Consumers experienced the attributes when they stayed in one of the selected brands. The
tangible hotel products and intangible services form the cues to customers and allow them to
make the evaluations regard to their perceived quality based on cue utilization theory. Brand
personality is essential on the customer-based brand equity because the well-established brand
personality may increase the brand preference and usage (Siguaw et al., 1999). The consumers
have the high preference for the product’s personality matching their self-image (Govers &
Schoormans, 2005). Brand personality’s congruity positively affects the consumers’ attitudes
toward the brands (De Chernatony & Dall’Olmo Riley, 1998; Harris & Fleming, 2005).
As the brand associations, the high hotel brand extension’s attribute-level performance
and brand personality can directly lead to consumers’ positive emotions based on the Mehrabian-
Russell Model (Mehrabian & Russell, 1974). Hotel brand extension’s attribute-level performance
can trigger consumers' internal emotional states, while the brand personality can be considered as
the antecedents of the emotions (Larsen & Ketelaar, 1991; Costa et al., 1991; Yik & Russell,
2001). In the meantime, the hotel brand extension’s attribute-level performance and personality
can indirectly affect consumers’ emotional responses through the mediating effect of their
perceived overall quality toward brand extension. This argument was supported by the
Hypothesis 5. Perceived overall quality toward brand extension mediates on the relationship
between brand extension’s attribute-level performance and consumer emotional responses toward
brand extension, and the relationship between brand extension’s brand personality and consumer
emotional responses toward brand extension.
2.2. The Effects of Consumer Judgment on Consumer Brand Loyalty toward Brand
Extension
This study found that the consumer perceived overall quality toward brand extension and
their emotional responses toward brand extension positively affected consumer satisfaction
122
toward brand extension, which were supported by Hypothesis 6 and Hypothesis 7. That is to say,
the consumers with a high perceived overall quality toward brand extension and more positive
consumer emotional responses toward brand extension were more likely to satisfy the brand
extension. In particular, consumer emotional responses toward brand extension were revealed to
be the stronger predictor of consumer satisfaction toward brand extension.
This study also found that the consumer perceived overall quality toward brand extension
and their emotional responses toward brand extension positively affected consumer brand loyalty
toward brand extension, which were supported by Hypothesis 8 and Hypothesis 9. That is to say,
the consumers with a high perceived overall quality toward brand extension and positive
consumer emotional responses toward brand extension were more likely to have a high consumer
brand loyalty toward brand extension. In particular, consumer emotional responses toward brand
extension were revealed to be the stronger predictor of consumer brand loyalty toward hotel
brand extension.
Based on the expectancy disconfirmation theory (Oliver, 1980), the positive
disconfirmation can be generated from the consumers’ international feelings (Leisen & Vance,
2001). Therefore, the consumers’ emotions can be an important predictor of their satisfaction
(Westbrook, 1987). Moreover, the perceived overall quality toward brand extension is
consumer’s global judgment toward the hotel brand extension. The high perceive quality may
generate customer’s satisfied feelings.
Parasuraman et al. (1988, p. 16) pointed that “perceived service quality is a global
judgment, or attitude, relating to the superiority of the service, whereas satisfaction is related to a
specific transaction.” The perceived overall quality toward brand extension provides global
evaluation regard to a firm’s service delivery system, while the consumer satisfaction reflects the
customer’s post-consumption experience (Anderson & Fornell, 1994). The expectancy-
123
disconfirmation theory (Oliver, 1981) stated that the comparisons between the perceptions and
expectations toward a product/service could generate the consumer satisfaction, which is a
function of such disconfirmation. Consumer satisfaction is a criterion variable in the expectancy
model (Oliver, 1997). The perceived quality positively influences the feelings of consumer
satisfaction. Moreover, consumer emotional responses toward brand extension mediate the
relationship between perceived overall quality toward brand extension and consumer satisfaction
toward brand extension. The perceived overall quality toward brand extension directly influenced
the consumer satisfaction toward brand extension and indirectly influenced consumer satisfaction
toward brand extension by enhancing consumer emotional responses toward brand extension.
This result is also an indication of Mehrabian-Russell Model.
Consumers’ perceived overall quality toward brand extension and their emotional
responses toward brand extension can directly cause consumer brand loyalty toward the hotel
brand extension. Perceived quality represents consumers’ judgments about a product’s overall
excellence or superiority. Consistently holding such superior brand attitude may be the antecedent
of generating brand loyalty, such as repurchase and recommend intentions (Parasuraman et al.,
1985). At the same time, consumer perceived overall quality toward brand extension and
consumer emotional responses toward brand extension can indirectly affect consumer brand
loyalty toward brand extension through the mediating effect of their satisfaction. This argument
was supported by the Hypothesis 10. Based on evaluative-cognitive consistency theory (Eagly &
Chaiken, 1995), a positive attitude may be consistent with the positive belief. The consumers who
highly satisfy the hotel brand extension may have the high consumer brand loyalty toward brand
extension as well. The consumer satisfaction toward brand extension mediates the relationship
between perceived overall quality toward brand extension and consumer brand loyalty toward
brand extension, and the relationship between consumer emotional responses toward brand
extension and consumer brand loyalty toward brand extension.
124
2.3. The Effects of Consumer Brand Loyalty toward Brand Extension on Parent Brand
Resonance
This study found that the consumer brand loyalty toward brand extension positively
affected their attitudinal attachment and consumer sense of community toward parent brand,
which was supported by Hypothesis 11 and Hypothesis 12. That is to say, the loyal consumers
toward hotel brand extension were more likely to resonate with the parent brand. Keller (1993)
argued that resonating with a brand required consumers to actively raise the psychological
attachment to the brand beyond frequently purchasing the branded products. Achieving brand
resonance is the ultimate step to build strong customer-based brand equity. Based on the
attachment theory (Mikulincer & Shaver 2007), social identity theory, and considering the hotel
brand extension’s feedback effect on the parent brand, consumer brand loyalty toward brand
extension with strong repurchase and recommend intentions may have the consistent preference
toward brand extension. The positive attitude and briefs toward brand extension can be
strengthened and motivate consumers updating the brand associations of the parent brand so that
to create a strong psychological attachment and the consumer sense of community to the parent
brand. Moreover, consumer attitudinal attachment toward parent brand positively affected the
consumer sense of community toward parent brand. It was supported by Hypothesis 13 testing
result. Since the brand attachment involves psychological appropriation of specific brands, self-
extension, and personal history between the consumer and the brand, it indicates a higher
identification with the brand from the consumers and a strong consumer sense of community
toward parent brand.
2.4. The Moderating Effect of Perceived Image Fit
This study found the perceived image fit positively moderated the relationship between
consumer brand loyalty toward brand extension and consumer attitudinal attachment toward
125
parent brand, as well as moderated the relationship between consumer brand loyalty toward brand
extension and consumer sense of community toward parent brand. That is to say, when perceived
image fit was high, the positive relationship between consumer brand loyalty toward brand
extension and consumer attitudinal attachment toward parent brand was stronger, and the positive
relationship between consumer brand loyalty toward brand extension and consumer sense of
community toward parent brand was stronger.
3. Contributions
3.1. Theoretical Contributions
This study proposed and examined an integrated customer-based brand extension equity
resonance model. As Kayaman and Arasli (2007) mentioned, the discussions regard to the service
brand equity were not as developed as the brand equity with tangible products. Services differ
from products in the unique characteristics including intangibility, inseparability of production
and consumption, heterogeneity of quality and perishability (De Chernatony & Segal-Horn,
2001). The lodging industry is one of them. Therefore, the lodging companies have been
challenged for capitalizing their guests’ intangible experience by maximizing their cognitive
processing abilities (Berry, 2000) and strengthening the brand. Based on Keller’s customer-based
brand equity model (1993), the strong brand equity may be generated if the consumer has
favorable, strong, and unique brand associations in the memory. This study used associative
network theory, cue utilization theory, self-congruity theory, and Mehrabian-Russell Model to
explore how hotel extension’s brand associations (i.e., brand extension’s attribute-level
performance and brand extension’s brand personality) influence consumers’ attitudes toward the
brands. In addition, this study found out the mediating effects of consumer emotional responses
toward brand extension on the relationship between brand associations and brand extension’s
marketing performance (e.g., consumer satisfaction and consumer brand loyalty). The consumer
emotional responses toward brand extension influenced by different types of brand associations
126
simultaneously as well as their rational judgments. The consumer satisfaction toward brand
extension and consumer brand loyalty toward brand extension are triggered by their cognitive
evaluations and affective feelings.
Based on the brand resonance model, this study considered the feedback effect and found
the mechanism how consumer brand loyalty toward hotel brand extension could affect the
consumer-brand relationship of the parent brand. The results indicate that the consumer brand
loyalty toward hotel brand extension generates, updates, and strengthen the brand knowledge of
the hotel parent brand and build new and persistent associations to the parent brand. The
consumer brand loyalty toward hotel brand extension has a stronger association with consumer
attitudinal attachment toward parent brand than the association with consumer sense of
community toward parent brand. Applying social identity theory and attachment theory, when
consumers feel more attached with the hotel parent brand, they have the strong perception of
overlap with the brand, and then consumers should be more likely to perceive a psychological
sense of brand community. Therefore, the strong consumer attitudinal attachment toward parent
brand leads to the strong consumer sense of community toward parent brand. Moreover, since the
consumer attitudinal attachment toward parent brand receives more attitude and brief updates
from the brand extension, it mediates consumer sense of community toward parent brand from
the consumer brand loyalty toward brand extension. Such a process helps lodging companies
build strong consumer-brand relationship and achieve the resonance.
3.2. Empirical Contributions
The lodging companies face the biggest challenge that is to capitalize the intangible
services and guest memories and experience. Since most of the U.S. chain hotel companies have
brand extensions, the customer-based brand equity model provides a guideline to formulate their
branding strategies. Aiming to build sound brands for the lodging firms, this study found how
127
brand associations influenced consumer responses throughout brand extension. It provided
lodging practitioners the insights that different brand associations have different effects on
consumer emotional feelings and rational judgments. The hotel managers may improve consumer
perceived overall quality toward brand extension by enhancing the brand extension’s attribute-
level performance as well as making a distinct brand extension’s brand personality through a
number of marketing strategies. In the meantime, the hotel managers may focus on monitoring
guest emotional responses regard to their hotel stay experience and making efforts on delighting
the guests. When consumers’ perceived overall quality is superior, the consumers may have
positive emotions, such as content, relaxed, secure, and welcome. It will lead to consumers’ high
satisfaction and loyalty toward the hotel brand extension.
Moreover, this study investigated how consumer brand loyalty toward brand extension
affected the consumer-brand relationship at the corporate level. As a highly competitive industry,
retaining consumers is an effective approach to increasing and preserving market share. The loyal
consumers can increase hotel’s competitive advantage. Enhancing consumer perceived quality
and positive emotions toward the hotel brand they experienced can increase the consumer brand
loyalty toward brand extension through improving consumer satisfaction toward brand extension.
Moreover, the hotel brand developers may increase consumer perceived image fit between the
brand extension and parent brand. It helps to increase consumer knowledge about the parent
brand, increase parent brand resonance intensity, and build the strong consumer-parent brand
relationship.
Employing brand extension strategy helps the lodging companies reduce the launching
costs and risks in the market (Chowdhury, 2007; Morrin, 1999). The results of this study indicate
that the consumer loyalty toward brand extension which is built upon consumers’ attitudes,
judgments, and evaluations positively promotes their loyalty toward parent brand. It inspirits
hotel developers to understand their brand equity from the customer-based perspective, not only
128
from the financial-based perspective. It suggests that consumers’ positive perceptions and
judgments toward hotel brand extension may help the lodging company strengthen the brand
equity by increasing consumers’ brand knowledge toward parent brand’s characteristics. By
contrast, if hotel brand extension’s attribute-level performance and brand personality are low, it
may lead to the consumers’ inferior perception of hotel’s service quality and negative emotion
states, further may cause the low consumer satisfaction and loyalty. According to the feedback
effect, the relationship between the consumers and hotel parent brand may be damaged in such a
way. Therefore, it is necessary for the hotel developers to evaluate the customer-based
performance of their existing brand extensions under the same parent brand. If the lodging
company has a sophisticated history of launching brand extensions and enjoys a good reputation
in the market, it may consider using brand extension strategy and leverage its parent brand on the
new hotels. However, if the lodging companies suffer from some negative service encounters
which result in the low consumer satisfaction or high consumers’ switching rate on their existing
brand extension, hotel developers need to be cautious about their new brand extension decisions.
Considering the important moderating role of perceived image fit between hotel brand
extension and parent brand revealed by this study, hotel developers may consider building strong
explanatory links to promote consumers’ positive perception of brand image fit. Such compelling
explanatory links can help consumers retrieve their brand information and knowledge from
memory. In the meantime, the effective communication strategies are also suggested to help the
lodging companies develop the strong brand image fit that can increase consumers’ brand
salience and make the consumers feel consistent between the parent brand and brand extension
(Bridges, Keller, & Sood, 2000).
4. Limitations and Future Studies
4.1. Limitations
129
There are several limitations in this study.
First, although the statistical methods provided efficient ways to detect and remedy the
common method variance, the multiple sources of the common method variance made it difficult
to eliminate. For example, the survey participants might have maintained consistency between
their cognition and attitudes, which, in turn, made their responses consistent and rational,
especially when they were asked to provide retrospective accounts of their attitudes, perceptions,
and/or behaviors (Podsakoff et al., 2003). Other potential causes of common method variance are
measurement rater effects, item context effects, item characteristics, and common rater effects
(Podsakoff et al., 2003), which may cause spurious relationships between the tested variables
(Podsakoff et al., 2003). Procedural remedies were suggested by MacKenzie and Podsakoff
(2012), such as the alignment between the survey respondents’ capabilities and survey task
difficulties, using more experienced respondents, clarifying concepts and language, and
emphasizing the motivations. Moreover, my future study may collect data from multiple sources,
such as hotel managers and employees. Using multiple sources may reduce the common method
variance (Podsakoff et al., 2003).
Second, the self-administered online survey took advantage of the Internet speed and cost
reduction. However, non-coverage and non-response are two critical issues of Internet-based
research. The non-coverage bias refers to “a function of the proportion of panel members with
access to the Internet and the differences between those with access and those without” (Couper
et al., 2007, p. 132). The non-response bias refers to “the willingness of those with Internet access
to participate in (additional) surveys using this mode” (Couper et al., 2007, p. 132). Using Mturk
to collect the sample data allowed me to access the respondents who had registered on the Mturk
platform and were motivated to accumulate the monetary and nonmonetary rewards. The sample
suffered from the nonprobability sampling bias, since individuals from the population who did
not have an Mturk account were excluded from this sample. Using such convenience sampling,
130
the sample was not generated randomly, therefore, some characteristics of the target population
might not have been reached by such as non-random sampling (Churchill & Brown, 2007). In the
future study, a random sampling method may be used to generate the sample from the target
population, and a paper-based survey may be distributed to the sampled mailing list to reduce the
non-coverage and nonresponse bias from the Internet-based survey tool.
Third, this study used a self-report questionnaire to collect the data from hotel guests with
staying experience at one of the well-known hotel brands. Although self-reported data is viewed
as a reliable source of assessing consumer information (Wang et al., 2006), some respondents
may lack the ability to understand the survey questions, feel uncomfortable evaluating negatively
(Huang, Liao, & Chang, 1998), or lack the relevant knowledge to answer the survey questions
(Van de Mortel, 2008). Moreover, the results may be influenced by the reputation of the hotel
brand. Hotels with lesser-known brand names were not included in our sample, which may lead
to different results. In the future study, the experimental design method may be used to reduce
these concerns. By controlling factors during the experiment, the results that I observe will have
less noise. For example, using scenarios with detailed explanations may help the respondents
better understand the survey questions. In addition, using pictures or video presentations may
enhance respondents’ knowledge and information, and control the brand reputation factor.
Fourth, this study removed the hotel consumers who mismatched the parent hotel brand
and the brand extension. And only retained the consumer responses that resulted in accurate
matches the parent hotel brand and the brand extension based on their knowledge and
experiences. However, some consumers’ responses that were removed from the sample may not
have been caused by unmindful behaviors. The sample data were collected soon after Marriott
International, Inc. had acquired Starwood Worldwide Holdings, Inc. Although the acquisition
information was provided to the survey respondents, some consumers may have mismatched the
brand extensions under the Marriott and Starwood brand because of ambiguous information in the
131
market. In the future study, the data may be re-collected after the consumers have attained better
awareness of the acquisition of the Marriott and Starwood brand.
4.2. Future Studies
In addition to the suggestions for the future study listed above, various other ideas are
also suggested for further research.
4.2.1. Exploring the Role of Interactive Marketing Factors
Interactive marketing factors will be further discussed as the moderators of the
relationship between consumer brand loyalty toward brand extension and parent brand resonance
in future studies. There are many important factors that possibly moderate the feedback effect of
hotel brand extension on the parent brand. This study explored the effects of perceived image fit,
which emphasized the brand itself. However, internal marketing factors may not be neglected. A
brand community, which provides “a specialized, non-geographically bound community, based
on a structured set of social relations among admirers of a brand” (Muniz & O’Guinn, 2001, p.
412), can be strengthened by the interaction of hotel employees with their consumers (e.g.,
sharing the wonderful experience) (McAlexander, Schouten, & Koening, 2002). Devasagayam et
al. (2010) argued that consumers might not automatically accept a brand and realize its
differentiation compared to other brands. Under such situations, hotel employees’ interacting
behaviors may socially negotiate the consumers regard for the significance of the hotel brand
(Devasagayam et al., 2010). Muniz (1997) mentioned more specific social negotiations, including
“recognizing the community aspect of the brand, sharing personal experiences with the brand,
emphasizing aspects of brand meaning, and rejecting aspects of brand meaning” (p. 308).
Therefore, investigating how the hotel employees’ interacting performance helps to strengthen the
relationship between consumer brand loyalty toward hotel brand extension and parent brand
132
resonance will be the theme of my future study. This tentative study may involve multilevel
models to analyze the data from consumers and the interacting hotel employees.
4.2.2. Exploring the Role of Hotel Membership
Hotel membership will be further discussed as the moderators of the relationship between
consumer brand loyalty toward brand extension and parent brand resonance in future studies.
Most hotel chains have developed membership programs to retain consumers. Such membership
reward programs have been found to positively influence the behavioral loyalty of hotel
consumers (Mattila, 2006). Compared to nonmembers, hotel consumers with reward
memberships generate a higher value and affective commitment (Tanford, Raab, & Kim, 2011).
Affective commitment is “an emotional attachment to the brand that creates a sense of belonging
and personal identification with a product or service” (Tanford et al., 2011, p. 280). Therefore,
membership reward programs may strengthen the brand extension’s feedback effect on parent
brand resonance and make hotel consumers feel more emotionally in synch with the parent brand
community.
4.2.3. Exploring the Role of Hotel Segments
This study did not include hotel segments as a construct in the research model. Hotel
segments will be further discussed as the moderators of the relationship between the consumer
satisfaction toward brand extension and consumer loyalty toward brand extension in future
studies. Hotels under different segments may position themselves differently with different
quality structures (Lee & Back, 2010). Back and Parks (2003) claimed that segments may affect
consumer satisfaction and consumer loyalty differently. Considering the segment factor in the
model may increase the external validity of the sampling (Back & Parks, 2003). Therefore, I am
interested in exploring the role of hotel segments in my future study.
133
REFERENCES
Aaker, D. A. (1991). Managing brand equity: Capitalizing on the value of a brand name. New
York: Free Press.
Aaker, D. A. (1992). The value of brand equity. Journal of Business Strategy, 13(4), 27-32.
Aaker, D. A. (1996). Measuring brand equity across products and markets. California
Management Review, 38(3), 102-120.
Aaker, D. A., & Keller, K. L. (1990). Consumer evaluations of brand extensions. Journal of
Marketing, 54(1), 27-41.
Aaker, J. (1999). The malleable self: The role of self-expression in persuasion. Retrieved from
https://ssrn.com/abstract=945453/
Aaker, J., & Fournier, S. (1995). A brand as a character, a partner and a person: Three
perspectives on the question of brand personality. NA-Advances in Consumer Research,
22. eds. Frank R. Kardes and Mita Sujan, Provo, UT: Association for Consumer
Research, 391-395.
Aaker, J. L. (1997). Dimensions of brand personality. Journal of Marketing Research, 34(3), 347-
356.
Abratt, R., & Bick, G. (2003). Valuing brands and brand equity: Methods and processes. Journal
of Applied Management and Entrepreneurship, 8(1), 21-39.
Ailawadi, K. L., Lehmann, D. R., & Neslin, S. A. (2003). Revenue premium as an outcome
measure of brand equity. Journal of Marketing, 67(4), 1-17.
Alba, J. W., & Hutchinson, J. W. (1987). Dimensions of consumer expertise. Journal of
Consumer Research, 13(4), 411-454.
134
Albarracin, D., & Wyer Jr, R. S. (2000). The cognitive impact of past behavior: influences on
beliefs, attitudes, and future behavioral decisions. Journal of Personality and Social
Psychology, 79(1), 5-22.
Albayrak, T., & Caber, M. (2015). Prioritisation of the hotel attributes according to their
influence on satisfaction: A comparison of two techniques. Tourism Management, 46, 43-
50.
American Marketing Association Dictionary. (1995). Retrieved from
https://www.ama.org/resources/pages/dictionary.aspx?dLetter=B/
Ananth, M., DeMicco, F. J., Moreo, P. J., & Howey, R. M. (1992). Marketplace lodging needs of
mature travelers. The Cornell Hotel and Restaurant Administration Quarterly, 33(4), 12-
24.
Anderson, J. R. (1983). A spreading activation theory of memory. Journal of Verbal Learning
and Verbal Behavior, 22(3), 261-295.
Anderson, E. W., Fornell, C., & Lehmann, D. R. (1994). Customer satisfaction, market share, and
profitability: Findings from Sweden. The Journal of Marketing, 58(3), 53-66.
Anderson, E. W., & Mittal, V. (2000). Strengthening the satisfaction-profit chain. Journal of
Service Research, 3(2), 107-120.
Arbuckle, J. L. (2010). IBM SPSS Amos 19 user’s guide. Crawfordville, FL: Amos Development
Corporation.
Ashforth, B. E., & Mael, F. (1989). Social identity theory and the organization. Academy of
Management Review, 14(1), 20-39.
Atilgan, E., Akinci, S., Aksoy, S., & Kaynak, E. (2009). Customer-based brand equity for global
brands: A multinational approach. Journal of Euromarketing, 18(2), 115-132.
Avis, M. (2012). Brand personality factor based models: A critical review. Australasian
Marketing Journal, 20(1), 89-96.
135
Babakus, E., Bienstock, C. C., & Van Scotter, J. R. (2004). Linking perceived quality and
customer satisfaction to store traffic and revenue growth. Decision Sciences, 35(4), 713-
737.
Bachmann, D., Elfrink, J., & Vazzana, G. (1996). Tracking the progress of e-mail vs. snail-
mail. Marketing Research, 8(2), 31-35.
Back, K. J., & Parks, S. C. (2003). A brand loyalty model involving cognitive, affective, and
conative brand loyalty and customer satisfaction. Journal of Hospitality & Tourism
Research, 27(4), 419-435.
Bagozzi, R. P., Gopinath, M., & Nyer, P. U. (1999). The role of emotions in marketing. Journal
of The Academy of Marketing Science, 27(2), 184-206.
Bagozzi, R. P., Yi, Y., & Phillips, L. W. (1991). Assessing construct validity in organizational
research. Administrative Science Quarterly, 36(3), 421-458.
Bagozzi, R. P. (1986). Principles of marketing management. Chicago, IL: Science Research
Associates.
Balachander, S., & Ghose, S. (2003). Reciprocal spillover effects: A strategic benefit of brand
extensions. Journal of Marketing, 67(1), 4-13.
Baloglu, S., Henthorne, T. L., & Sahin, S. (2014). Destination image and brand personality of
Jamaica: A model of tourist behavior. Journal of Travel & Tourism Marketing, 31(8),
1057-1070.
Barsky, J. D. (1992). Customer satisfaction in the hotel industry: meaning and
measurement. Hospitality Research Journal, 16(1), 51-73.
Barsky, J., & Nash, L. (2002). Evoking emotion: affective keys to hotel loyalty. Cornell Hotel
and Restaurant Administration Quarterly, 43(1), 39-46.
Baron, R. M., & Kenny, D. A. (1986). The moderator–mediator variable distinction in social
psychological research: Conceptual, strategic, and statistical considerations. Journal of
Personality and Social Psychology, 51(6), 1173.
136
Batra, R., Lehmann, D., & Singh, D. (1993). Brand equity and advertising. Hillsdale, NJ: Law-
rence Erlbaum Associates.
Batra, R., Lenk, P., & Wedel, M. (2010). Brand extension strategy planning: Empirical estimation
of brand–category personality fit and atypicality. Journal of Marketing Research, 47(2),
335-347.
Belaid, S., & Temessek Behi, A. (2011). The role of attachment in building consumer-brand
relationships: An empirical investigation in the utilitarian consumption context. Journal
of Product & Brand Management, 20(1), 37-47.
Belk, R. W. (1988). Possessions and the extended self. Journal of Consumer Research, 15(2),
139-168.
Bentler, P. M., & Chou, C. P. (1987). Practical issues in structural modeling. Sociological
Methods & Research, 16(1), 78-117.
Bergkvist, L., & Bech-Larsen, T. (2010). Two studies of consequences and actionable
antecedents of brand love. Journal of Brand Management, 17(7), 504-518.
Berry, L. L. (2000). Cultivating service brand equity. Journal of The Academy of Marketing
Science, 28(1), 128-137.
Bhat, S., Kelley, G. E., & O’Donnell, K. A. (1998). An investigation of consumer reactions to the
use of different brand names. Journal of Product & Brand Management, 7(1), 41-50.
Bhat, S., & Reddy, S. K. (2001). The impact of parent brand attribute associations and affect on
brand extension evaluation. Journal of Business Research, 53(3), 111-122.
Bosnjak, M., Bochmann, V., & Hufschmidt, T. (2007). Dimensions of brand personality
attributions: a person-centric approach in the German cultural context. Social Behavior
and Personality: An International Journal, 35(3), 303-316.
Boulding, W., & Kirmani, A. (1993). A consumer-side experimental examination of signaling
theory: Do consumers perceive warranties as signals of quality? Journal of Consumer
Research, 20(1), 111-123.
137
Boush, D. M., & Loken, B. (1991). A process-tracing study of brand extension evaluation.
Journal of Marketing Research, 28(1), 16-28.
Bowen, J., & Shoemaker, S. (1998). The antecedents and consequences of customer
loyalty. Cornell Hotel Restaurant and Administration Quarterly, 39(1), 12-25.
Brady, M. K., & Cronin Jr, J. J. (2001). Some new thoughts on conceptualizing perceived service
quality: A hierarchical approach. Journal of Marketing, 65(3), 34-49.
Bravo Gil, R., Fraj Andres, E., & Martinez Salinas, E. (2007). Family as a source of consumer-
based brand equity. Journal of Product & Brand Management, 16(3), 188-199.
Bridges, S., Keller, K. L., & Sood, S. (2000). Communication strategies for brand extensions:
Enhancing perceived fit by establishing explanatory links. Journal of Advertising, 29(4),
1-11.
Brodie, R. J., Whittome, J. R., & Brush, G. J. (2009). Investigating the service brand: A customer
value perspective. Journal of business Research, 62(3), 345-355.
Broniarczyk, S. M., & Alba, J. W. (1994). The importance of the brand in brand extension.
Journal of Marketing Research, 31(2), 214-228.
Bucklin, R. E., & Gupta, S. (1999). Commercial use of UPC scanner data: Industry and academic
perspectives. Marketing Science, 18(3), 247-273.
Buhrmester, M., Kwang, T., & Gosling, S. D. (2011). Amazon's Mechanical Turk: A new source
of inexpensive, yet high-quality, data?. Perspectives on Psychological Science, 6(1), 3-5.
Buil, I., De Chernatony, L., & Hem, L. E. (2009). Brand extension strategies: perceived fit, brand
type, and culture influences. European Journal of Marketing, 43(11/12), 1300-1324.
Buil, I., Martínez, E., & De Chernatony, L. (2013). The influence of brand equity on consumer
responses. Journal of Consumer Marketing, 30(1), 62-74.
Caprara, G. V., Barbaranelli, C., & Guido, G. (2001). Brand personality: How to make the
metaphor fit? Journal of Economic Psychology, 22(3), 377-395.
138
Carlson, B. D., Suter, T. A., & Brown, T. J. (2008). Social versus psychological brand
community: The role of psychological sense of brand community. Journal of Business
Research, 61(4), 284-291.
Chattopadhyay, A., & Alba, J. W. (1988). The situational importance of recall and inference in
consumer decision making. Journal of Consumer Research, 15(1), 1-12.
Chaudhuri, A., & Holbrook, M. B. (2001). The chain of effects from brand trust and brand affect
to brand performance: The role of brand loyalty. Journal of Marketing, 65(2), 81-93.
Chen, Y.-S. (2010). The drivers of green brand equity: Green brand image, green satisfaction, and
green trust. Journal of Business Ethics, 93(2), 307-319.
Cheng-Hsui Chen, A., & Chen, S. K. (2000). Brand dilution effect of extension failure–a Taiwan
study. Journal of Product & Brand Management, 9(4), 243-254.
Choi, T. Y., & Chu, R. (2001). Determinants of hotel guests’ satisfaction and repeat patronage in
the Hong Kong hotel industry. International Journal of Hospitality Management, 20(3),
277-297.
Chowdhry, N., Winterich, K. P., Mittal, V., & Morales, A. C. (2015). Not all negative emotions
lead to concrete construal. International Journal of Research in Marketing, 32(4), 428-
430.
Chowdhury, M., & Kabir, H. (2007). An investigation of consumer evaluation of brand
extensions. International Journal of Consumer Studies, 31(4), 377-384.
Christodoulides, G., & De Chernatony, L. (2010). Consumer-based brand equity
conceptualization and measurement: A literature review. International Journal of
Research in Marketing, 52(1), 43-66.
Cobb-Walgren, C. J., Ruble, C. A., & Donthu, N. (1995). Brand equity, brand preference, and
purchase intent. Journal of Advertising, 24(3), 25-40.
Cohen, J. B., & Areni, C. S. (1991). Affect and consumer behavior. Retrieved from
http://ro.uow.edu.au/gsbpapers/464/
139
Collins, A. M., & Loftus, E. F. (1975). A spreading-activation theory of semantic processing.
Psychological Review, 82(6), 407-428.
Collins-Dodd, C., & Lindley, T. (2003). Store brands and retail differentiation: The influence of
store image and store brand attitude on store own brand perceptions. Journal of Retailing
and Consumer Services, 10(6), 345-352.
Costa, P. T., McCrae, R. R., & Dye, D. A. (1991). Facet scales for agreeableness and
conscientiousness: A revision of the NEO Personality Inventory. Personality and
Individual Differences, 12(9), 887-898.
Couper, M. P., Kapteyn, A., Schonlau, M., & Winter, J. (2007). Noncoverage and nonresponse in
an Internet survey. Social Science Research, 36(1), 131-148.
Cox, D. F. (1967). Risk taking and information handling in consumer behavior. Retrieved from
http://agris.fao.org/agris-search/search.do?recordID=US201300599126/
Cronin Jr, J. J., & Taylor, S. A. (1992). Measuring service quality: A reexamination and
extension. Journal of Marketing, 56(3), 55-68.
Crosby, L. A., & Stephens, N. (1987). Effects of relationship marketing on satisfaction, retention,
and prices in the life insurance industry. Journal of Marketing Research, 24(4), 404-411.
Czellar, S. (2003). Consumer attitude toward brand extensions: An integrative model and
research propositions. International Journal of Research in Marketing, 20(1), 97-115.
Dacin, P. A., & Smith, D. C. (1994). The effect of brand portfolio characteristics on consumer
evaluations of brand extensions. Journal of Marketing Research, 31(2), 229-242.
Das, G. (2014). Impacts of retail brand personality and self-congruity on store loyalty: the
moderating role of gender. Journal of Retailing and Consumer Services, 21(2), 130-138.
Davis, F. D., Bagozzi, R. P., & Warshaw, P. R. (1992). Extrinsic and intrinsic motivation to use
computers in the workplace. Journal of Applied Social Psychology, 22(14), 1111-1132.
De Chernatony, L., & Dall'Olmo Riley, F. (1998). Defining a" brand": Beyond the literature with
experts' interpretations. Journal of Marketing Management, 14(5), 417-443.
140
Derbaix, C., & Vanhamme, J. (2003). Inducing word-of-mouth by eliciting surprise–a pilot
investigation. Journal of Economic Psychology, 24(1), 99-116.
Derbaix, C. M. (1995). The impact of affective reactions on attitudes toward the advertisement
and the brand: A step toward ecological validity. Journal of Marketing Research, 32(4),
470-479.
De Chernatony, L., & Segal-Horn, S. (2001). Building on services' characteristics to develop
successful services brands. Journal of Marketing Management, 17(7-8), 645-669.
De Ruyter, K., & Bloemer, J. (1999). Customer loyalty in extended service settings: The
interaction between satisfaction, value attainment and positive mood. International
Journal of Service Industry Management, 10(3), 320-336.
DeWitt, T., Nguyen, D. T., & Marshall, R. (2008). Exploring customer loyalty following service
recovery: The mediating effects of trust and emotions. Journal of Service
Research, 10(3), 269-281.
Dillon, W. R., Madden, T. J., Kirmani, A., & Mukherjee, S. (2001). Understanding what’s in a
brand rating: A model for assessing brand and attribute effects and their relationship to
brand equity. Journal of Marketing Research, 38(4), 415-429.
Dobni, D., & Zinkhan, G. M. (1990). In search of brand image: A foundation analysis. NA-
Advances in Consumer Research, 17. eds. Marvin E. Goldberg, Gerald Gorn, & Richard
W. Pollay, Provo, UT: Association for Consumer Research, 110-119.
Dodds, W. B., Monroe, K. B., & Grewal, D. (1991). Effects of price, brand, and store information
on buyers' product evaluations. Journal of Marketing Research, 28(3), 307-319.
Dolbec, P. Y., & Chebat, J. C. (2013). The impact of a flagship vs. a brand store on brand
attitude, brand attachment and brand equity. Journal of Retailing, 89(4), 460-466.
Donovan, R., & Rossiter, J. (1982). Store atmosphere: An environmental psychology approach.
Journal of Retailing, 58(1), 34–57.
141
Doyle, P. (1989). Building successful brands: the strategic options. Journal of Marketing
Management, 5(1), 77-95.
Eagly, A. H., & Chaiken, S. (1995). Attitude strength, attitude structure, and resistance to
change. Attitude Strength: Antecedents and Consequences, 4, 413-432.
Egan, C., & Guilding, C. (1994). Dimensions of brand performance: challenges for marketing
management and managerial accountancy. Journal of Marketing Management, 10(6),
449-472.
Ehrenberg, A. S., Uncles, M. D., & Goodhardt, G. J. (2004). Understanding brand performance
measures: using Dirichlet benchmarks. Journal of Business Research, 57(12), 1307-1325.
Erdem, T., & Swait, J. (1998). Brand equity as a signaling phenomenon. Journal of Consumer
Psychology, 7(2), 131-157.
Eroglu, S. A., Machleit, K. A., & Davis, L. M. (2001). Atmospheric qualities of online retailing:
A conceptual model and implications. Journal of Business Research, 54(2), 177-184.
Erickson, M.K. (1996) Using self-congruity and ideal congruity to predict purchase Intention: A
European perspective, Journal of Euromarketing, 6(1), 41-56.
Escalas, J. E., & Stern, B. B. (2003). Special Session Summary Antecedents and Consequences of
Emotional Responses to Advertising. NA-Advances in Consumer Research, 30. eds.
Punam Anand Keller and Dennis W. Rook, Valdosta, GA: Association for Consumer
Research, 85-90.
Farquhar, P. H. (1989). Managing brand equity. Marketing Research, 1(3), 22-33.
Farquhar, P. H., Herr, P. M., & Fazio, R. H. (1990). A relational model for category extensions of
brands. NA-Advances in Consumer Research, 17. eds. Goldberg, M. E., Gorn, G., &
Pollay, R. W., Provo, UT: Association for Consumer Research, 856-860.
Fayrene, C. Y., & Lee, G. C. (2011). Customer-based brand equity: A literature review.
Researchers World, 2(1), 33-42.
142
Feng, S. (2011). The effects of price context and prior product knowledge on consumers’ product
evaluations. Drexel University.
Fiske, D. W. (1982). Convergent-discriminant validation in measurements and research
strategies. New Directions for Methodology of Social & Behavioral Science, 12, 77-92.
Fornell, C., Johnson, M. D., Anderson, E. W., Cha, J., & Bryant, B. E. (1996). The American
customer satisfaction index: nature, purpose, and findings. The Journal of Marketing,
60(4), 7-18.
Fornell, C., & Larcker, D. F. (1981). Structural equation models with unobservable variables and
measurement error: Algebra and statistics. Journal of Marketing Research, 18(3), 382-
388.
Fournier, S. (1998). Consumers and their brands: Developing relationship theory in consumer
research. Journal of Consumer Research, 24(4), 343-373.
Foxall, G. R., & Greenley, G. E. (1999). Consumers' emotional responses to service
environments. Journal of Business Research, 46(2), 149-158.
Freling, T. H., Crosno, J. L., & Henard, D. H. (2011). Brand personality appeal: conceptualization
and empirical validation. Journal of The Academy of Marketing Science, 39(3), 392-406.
Fricker, R. D. (2008). Sampling methods for web and e-mail surveys. The SAGE Handbook of
Online Research Methods, 195-216.
Gardial, S. F., Clemons, D. S., Woodruff, R. B., Schumann, D. W., & Burns, M. J. (1994).
Comparing consumers' recall of prepurchase and postpurchase product evaluation
experiences. Journal of Consumer Research, 20(4), 548-560.
Gardner, M. P. (1985). Mood states and consumer behavior: A critical review. Journal of
Consumer Research, 12(3), 281-300.
Garton, L., Haythornthwaite, C., & Wellman, B. (1999). Studying on-line social networks.
In S.Jones (Ed.), Doing Internet Research: Critical Issues and Methods for Examining the
Net, Thousand Oaks , CA : Sage.
143
Getty, J. M., & Thompson, K. N. (1994). A procedure for scaling perceptions of lodging
quality. Hospitality Research Journal, 18(2), 75-75.
Geuens, M., Weijters, B., & De Wulf, K. (2009). A new measure of brand personality.
International Journal of Research in Marketing, 26(2), 97-107.
Goldberg, L. R. (1982). From Ace to Zombie: Some explorations in the language of personality.
Advances in Personality Assessment, 1, 203-234.
Govers, P. C., & Schoormans, J. P. (2005). Product personality and its influence on consumer
preference. Journal of Consumer Marketing, 22(4), 189-197.
Graeff, T. R. (1996). Image congruence effects on product evaluations: The role of self‐
monitoring and public/private consumption. Psychology & Marketing, 13(5), 481-499.
Grime, I., Diamantopoulos, A., & Smith, G. (2002). Consumer evaluations of extensions and their
effects on the core brand: Key issues and research propositions. European Journal of
Marketing, 36(11/12), 1415-1438.
Grönroos, C. (1984). A service quality model and its marketing implications. European Journal
of Marketing, 18(4), 36-44.
Hair, J. F., Black, W. C., Babin, B. J., Anderson, R. E., & Tatham, R. L. (2006). Multivariate
data analysis (6th ed.). NJ: Pearson Prentice Hall.
Harris, E. G., & Fleming, D. E. (2005). Assessing the human element in service personality
formation: Personality congruency and the Five Factor Model. Journal of Services
Marketing, 19(4), 187-198.
Han, H., & Back, K. J. (2007). Investigating the effects of consumption emotions on customer
satisfaction and repeat visit intentions in the lodging industry. Journal of Hospitality &
Leisure Marketing, 15(3), 5-30.
Han, H., & Ryu, K. (2009). The roles of the physical environment, price perception, and customer
satisfaction in determining customer loyalty in the restaurant industry. Journal of
Hospitality & Tourism Research, 33(4), 487-510.
144
Hoeffler, S., & Keller, K. L. (2003). The marketing advantages of strong brands. Journal of
Brand Management, 10(6), 421-445.
Hofstee, W. K., De Raad, B., & Goldberg, L. R. (1992). Integration of the big five and
circumplex approaches to trait structure. Journal of Personality and Social Psychology,
63(1), 146-163.
Holbrook, M. B., & Corfman, K. P. (1985). Quality and value in the consumption experience:
Phaedrus rides again. Perceived Quality, 31(2), 31-57.
Horton, J. J., Rand, D. G., & Zeckhauser, R. J. (2011). The online laboratory: Conducting
experiments in a real labor market. Experimental Economics, 14(3), 399-425.
Hu, H. H., Kandampully, J., & Juwaheer, T. D. (2009). Relationships and impacts of service
quality, perceived value, customer satisfaction, and image: an empirical study. The
Service Industries Journal, 29(2), 111-125.
Huang, C.-C., Fang, S.-C., Huang, S.-M., Chang, S.-C., & Fang, S.-R. (2014). The impact of
relational bonds on brand loyalty: the mediating effect of brand relationship quality.
Managing Service Quality, 24(2), 184-204.
Huang, C., Liao, H., & Chang, SH. (1998). Social desirability and the clinical self-report
inventory: Methodological reconsideration. Journal of Clinical Psychology, 54(4). 517-
528.
Huang, C.-C., Yen, S.-W., Liu, C.-Y., & Chang, T.-P. (2014). The relationship among brand
equity, customer satisfaction, and brand resonance to repurchase intention of cultural and
creative industries in Taiwan. International Journal of Organizational Innovation, 6(3),
106-120.
Huang, Z. J., & Cai, L. A. (2015). Modeling consumer-based brand equity for multinational hotel
brands–When hosts become guests. Tourism Management, 46, 431-443.
Inman, J. J., & Zeelenberg, M. (2002). Regret in repeat purchase versus switching decisions: The
attenuating role of decision justifiability. Journal of Consumer Research, 29(1), 116-128.
145
Ijiri, Y. (1988). Momentum accounting and managerial goals on impulses. Management
Science, 34(2), 160-166.
Isen, A. M., Means, B., Patrick, R., & Nowicki, G. (1982). Some factors influencing decision
making strategy and risk-taking. The 17th annual Carnegie Mellon symposium on
cognition. 243-261.
Izard, C. E. (1992). Basic emotions, relations among emotions, and emotion-cognition relations.
Psychological Review, 99(3), 561-565.
Izard, C. E., Libero, D. Z., Putnam, P., & Haynes, O. M. (1993). Stability of emotion experiences
and their relations to traits of personality. Journal of Personality and Social Psychology,
64(5), 847-860.
Jang, S. S., & Namkung, Y. (2009). Perceived quality, emotions, and behavioral intentions:
Application of an extended Mehrabian–Russell model to restaurants. Journal of Business
Research, 62(4), 451-460.
Jo, M. S. (2007). Should a quality sub-brand be located before or after the parent brand? An
application of composite concept theory. Journal of the Academy of Marketing
Science, 35(2), 184-196.
Jung, K. (2006). Cross-Gender Brand Extensions: Effects of Gender of Brand, Gender of
Consumer and Product Type on Evaluation of Cross-Gender Extensions. NA-Advances
in Consumer Research, 33.eds. Connie Pechmann and Linda Price, Duluth, MN:
Association for Consumer Research, 67-74.
Jiang, W., Dev, C. S., & Rao, V. R. (2002). Brand extension and customer loyalty: Evidence from
the lodging industry. The Cornell Hotel and Restaurant Administration Quarterly, 43(4),
5-16.
Kamakura, W. A., & Russell, G. J. (1993). Measuring brand value with scanner data.
International Journal of Research in Marketing, 10(1), 9-22.
146
Kandampully, J., & Suhartanto, D. (2000). Customer loyalty in the hotel industry: the role of
customer satisfaction and image. International Journal of Contemporary Hospitality
Management, 12(6), 346-351.
Kang, K. H., & Lee, S. (2014). The moderating role of brand diversification on the relationship
between geographic diversification and firm performance in the US lodging industry.
International Journal of Hospitality Management, 38, 106-117.
Kano, N., Seraku, N., Takahashi, F. and Tsuji, S. (1984). Attractive quality and must-be quality.
Hinshitsu, The Journal of the Japanese Society for Quality Control, April, 39-48.
Kapferer, J.-N., & Bastien, V. (2009). The specificity of luxury management: Turning marketing
upside down. Journal of Brand Management, 16(5-6), 311-322.
Kayaman, R., & Arasli, H. (2007). Customer based brand equity: evidence from the hotel
industry. Managing Service Quality: An International Journal, 17(1), 92-109.
Keller, K. L. (1993). Conceptualizing, measuring, and managing customer-based brand equity.
Journal of Marketing, 57(1), 1-22.
Keller, K. L. (2001). Building customer-based brand equity: A blueprint for creating strong
brands (Working Paper No. 01-107). Retrieved from Marketing Science Institute website
http://www.msi.org/reports/building-customer-based-brand-equity-a-blueprint-for-
creating-strong-brands/
Keller, K. L. (2002). Branding and brand equity. Handbook of Marketing, 151-177.
Keller, K. L. (2003). Brand synthesis: The multidimensionality of brand knowledge. Journal of
Consumer Research, 29(4), 595-600.
Keller, K. L. (2012). Understanding the richness of brand relationships: Research dialogue on
brands as intentional agents. Journal of Consumer Psychology, 22(2), 186-190.
Keller, K. L. (2016). Reflections on customer-based brand equity: Perspectives, progress, and
priorities. AMS review, 6(1-2), 1-16.
147
Keller, K. L., & Aaker, D. A. (1992). The effects of sequential introduction of brand extensions.
Journal of Marketing Research, 29(1), 35-50.
Keller, K. L., & Lehmann, D. R. (2001). The brand value chain: linking strategic and financial
performance. Working paper. Tuck School of Business, Dartmouth College.
Keller, K. L., & Lehmann, D. R. (2003). How do brands create value? Marketing Management,
12(3), 26-31.
Keller, K. L., & Sood, S. (2003). Brand equity dilution. MIT Sloan Management Review, 45(1),
12-15.
Kerin, R. A., Kalyanaram, G., & Howard, D. J. (1996). Product hierarchy and brand strategy
influences on the order of entry effect for consumer packaged goods. Journal of Product
Innovation Management, 13(1), 21-34.
Kim, C. K., & Lavack, A. M. (1996). Vertical brand extensions: Current research and managerial
implications. Journal of Product & Brand Management, 5(6), 24-37.
Kim, C. K., Lavack, A. M., & Smith, M. (2001). Consumer evaluation of vertical brand
extensions and core brands. Journal of Business Research, 52(3), 211-222.
Kim, J. W., Lee, F., & Suh, Y. G. (2015). Satisfaction and loyalty from shopping mall experience
and brand personality. Services Marketing Quarterly, 36(1), 62-76.
Kim, W. G., & Moon, Y. J. (2009). Customers’ cognitive, emotional, and actionable response to
the servicescape: A test of the moderating effect of the restaurant type. International
Journal of Hospitality Management, 28(1), 144-156.
Kirmani, A., Sood, S., & Bridges, S. (1999). The ownership effect in consumer responses to
brand line stretches. Journal of Marketing, 63(1), 88-101.
Kleine, R. E., Kleine, S. S., & Kernan, J. B. (1993). Mundane consumption and the self: A social-
identity perspective. Journal of Consumer Psychology, 2(3), 209-235.
Klink, R. R., & Smith, D. C. (2001). Threats to the external validity of brand extension research.
Journal of Marketing Research, 38(3), 326-335.
148
Kline, R. B. (2011). Principles and practice of structural equation modeling (3rd ed.). NY: The
Guilford Press.
Knutson, B. J., Beck, J. A., Kim, S. H., & Cha, J. (2007). Identifying the dimensions of the
experience construct. Journal of Hospitality & Leisure Marketing, 15(3), 31-47.
Kumar, P. (2005). The impact of cobranding on customer evaluation of brand counterextensions.
Journal of Marketing, 69(3), 1-18.
Labroo, A. A., & Patrick, V. M. (2009). Psychological distancing: Why happiness helps you see
the big picture. Journal of Consumer Research, 35(5), 800-809.
Lacoeuilhe, J. (2000). Attachment to the brand: proposal of a measurement scale. Research and
Applications in Marketing, 15(4), 61-77.
Lai, C.-S., Chiu, C.-J., Yang, C.-F., & Pai, D.-C. (2010). The effects of corporate social
responsibility on brand performance: The mediating effect of industrial brand equity and
corporate reputation. Journal of Business Ethics, 95(3), 457-469.
Lane, V., & Jacobson, R. (1995). Stock market reactions to brand extension announcements: The
effects of brand attitude and familiarity. Journal of Marketing, 59(1), 63-77.
Larsen, R. J., & Ketelaar, T. (1991). Personality and susceptibility to positive and negative
emotional states. Journal of Personality and Social Psychology, 61(1), 132-140.
Lassar, W., Mittal, B., & Sharma, A. (1995). Measuring customer-based brand equity. Journal of
Consumer Marketing, 12(4), 11-19.
LaTour, S. A., & Peat, N. C. (1979). Conceptual and methodological issues in consumer
satisfaction research. NA-Advances in Consumer Research, 6. eds. Wilkie, W. L., Ann
Abor, MI: Association for Consumer Research, 431-437.
Laverie, D. A., Robert III, E. K., & Kleine, S. S. (1993). Linking emotions and values in
consumption experiences: An exploratory study. ACR North American Advances. 70-75.
149
Lee, Y. K., Back, K. J., & Kim, J. Y. (2009). Family restaurant brand personality and its impact
on customer's emotion, satisfaction, and brand loyalty. Journal of Hospitality & Tourism
Research, 33(3), 305-328.
Lee, J. S., & Back, K. J. (2010). Examining antecedents and consequences of brand personality in
the upper-upscale business hotel segment. Journal of Travel & Tourism Marketing, 27(2),
132-145.
Lee, S., Ha, S., & Widdows, R. (2011). Consumer responses to high-technology products:
Product attributes, cognition, and emotions. Journal of Business Research, 64(11), 1195-
1200.
Lei, J., Dawar, N., & Lemmink, J. (2008). The impact of brand relatedness on negative spillover
effects in brand portfolios. ACR North American Advances. 1009-1009.
Leisen, B., & Vance, C. (2001). Cross-national assessment of service quality in the
telecommunication industry: evidence from the USA and Germany. Managing Service
Quality: An International Journal, 11(5), 307-317.
Leuthesser, L. (1988). Defining, measuring, and managing brand equity (Working Paper No. 88-
104). Retrieved from Marketing Science Institute website
http://www.msi.org/conferences/summaries/defining-measuring-and-managing-brand-
equity/
Lim, Y. M. (2013). Consumer Evaluation of a vertical brand extension in the lodging industry:
Relationship among brand trust, brand loyalty, brand distance, and brand extension.
Retrieved from https://vtechworks.lib.vt.edu/handle/10919/50574/
Lin, L.-Y. (2010). The relationship of consumer personality trait, brand personality and brand
loyalty: An empirical study of toys and video games buyers. Journal of Product & Brand
Management, 19(1), 4-17.
150
Litman, L., Robinson, J., & Abberbock, T. (2017). TurkPrime. com: A versatile crowdsourcing
data acquisition platform for the behavioral sciences. Behavior Research Methods, 49(2),
433-442.
Loke, S. P., Taiwo, A. A., Salim, H. M., Downe, A. G., & PETRONAS, U. T. (2011). Service
quality and customer satisfaction in a telecommunication service provider. International
Conference on Financial Management and Economics, 11, 24-29.
Loken, B., & John, D. R. (1993). Diluting brand beliefs: When do brand extensions have a
negative impact? Journal of Marketing, 57(3), 71-84.
Louis, D., & Lombart, C. (2010). Impact of brand personality on three major relational
consequences (trust, attachment, and commitment to the brand). Journal of Product &
Brand Management, 19(2), 114-130.
Low, G. S., & Lamb Jr, C. W. (2000). The measurement and dimensionality of brand
associations. Journal of Product & Brand Management, 9(6), 350-370.
Machleit, K. A., & Mantel, S. P. (2001). Emotional response and shopping satisfaction:
Moderating effects of shopper attributions. Journal of Business Research, 54(2), 97-106.
MacKenzie, S. B., & Podsakoff, P. M. (2012). Common method bias in marketing: causes,
mechanisms, and procedural remedies. Journal of Retailing, 88(4), 542-555.
Maehle, N., & Shneor, R. (2010). On congruence between brand and human personalities.
Journal of Product & Brand Management, 19(1), 44-53.
Maheswaran, D., Mackie, D. M., & Chaiken, S. (1992). Brand name as a heuristic cue: The
effects of task importance and expectancy confirmation on consumer judgments. Journal
of Consumer Psychology, 1(4), 317-336.
Malhotra, N. K. (1988). Self concept and product choice: An integrated perspective. Journal of
Economic Psychology, 9(1), 1-28.
Martinez, E., & De Chernatony, L. (2004). The effect of brand extension strategies upon brand
image. Journal of Consumer Marketing, 21(1), 39-50.
151
Mattila, A. S. (2006). How affective commitment boosts guest loyalty (and promotes frequent-
guest programs). Cornell Hotel and Restaurant Administration Quarterly, 47(2), 174-
181.
Mazaheri, E., Richard, M.-O., & Laroche, M. (2010). Investigating the moderating impact of
hedonism on online consumer behavior. Journal of Global Academy of Marketing
Science, 20(2), 123-134.
McAlexander, J. H., Schouten, J. W., & Koenig, H. F. (2002). Building brand
community. Journal of Marketing, 66(1), 38-54.
McCracken, G. (1989). Who is the celebrity endorser? Cultural foundations of the endorsement
process. Journal of Consumer Research, 16(3), 310-321.
Mardia, K. V. (1970). Measures of multivariate skewness and kurtosis with
applications. Biometrika, 57(3), 519-530.
McMillan, D. W., & Chavis, D. M. (1986). Sense of community: A definition and theory. Journal
of Community Psychology, 14(1), 6-23.
Messent, P.R., Serpell, J.A., 1981. An historical and biological view of the pet-owner bond. In:
Fogle, B. (Ed.), Interrelations between People and Pets. Charles C. Thomas, Springfield,
IL, 5-22.
Mehta, A. (1999). Using self-concept to assess advertising effectiveness. Journal of Advertising
Research, 39(1), 81-81.
Mehrabian, A., & Russell, J. A. (1974). An approach to environmental psychology. The MIT
Press.
Melewar, T., Lim, L. L., & Yan, R. (2010). Product brand differentiation and dual-channel store
performances of a multi-channel retailer. European Journal of Marketing, 44(5), 672-
692.
152
Meyer, G. J., & Shack, J. R. (1989). Structural convergence of mood and personality: Evidence
for old and new directions. Journal of Personality and Social Psychology, 57(4), 691-
706.
Michel, G., & Donthu, N. (2014). Why negative brand extension evaluations do not always
negatively affect the brand: The role of central and peripheral brand associations. Journal
of Business Research, 67(12), 2611-2619.
Mikulincer, M., & Shaver, P. R. (2007). Attachment in adulthood: Structure, dynamics, and
change. Guilford Press.
Mishra, P., & Datta, B. (2011). Perpetual asset management of customer-based brand equity-the
PAM evaluator. Current Research Journal of Social Sciences, 3(1), 34-43.
Mittal, V., Katrichis, J. M., & Kumar, P. (2001). Attribute performance and customer satisfaction
over time: evidence from two field studies. Journal of Services Marketing, 15(5), 343-
356.
Mittal, V., Ross, W. T., & Baldasare, P. M. (1998). The asymmetric impact of negative and
positive attribute-level performance on overall satisfaction and repurchase intentions.
Journal of Marketing, 62(1), 33-47.
Mohd Yasin, N., Nasser Noor, M., & Mohamad, O. (2007). Does image of country-of-origin
matter to brand equity? Journal of Product & Brand Management, 16(1), 38-48.
Moisescu, O. I. (2005). The concept of brand equity-A comparative approach. Proceedings from
The International Conference The Impact of European Integration on the National
Economy, 212-220.
Monroe, K. B., & Krishnan, R. (1985). The effect of price-comparison advertising on buyers’
perceptions of acquisition value, transaction value, and behavioral intentions. Journal of
Marketing, 62(2), 46-59.
Moor, L. (2007). The rise of brands. Oxford: Berg.
153
Morales, A. C., & Fitzsimons, G. J. (2007). Product contagion: Changing consumer evaluations
through physical contact with “disgusting” products. Journal of Marketing Research,
44(2), 272-283.
Morgan, N. A., & Rego, L. L. (2009). Brand portfolio strategy and firm performance. Journal of
Marketing, 73(1), 59-74.
Morrin, M. (1999). The impact of brand extensions on parent brand memory structures and
retrieval processes. Journal of Marketing Research, 36(4), 517-525.
Morris, J. D., Woo, C., Geason, J. A., & Kim, J. (2002). The power of affect: Predicting
intention. Journal of Advertising Research, 42(3), 7-17.
Müge Arslan, F., & Korkut Altuna, O. (2010). The effect of brand extensions on product brand
image. Journal of Product & Brand Management, 19(3), 170-180.
Mummalaneni, V. (2005). An empirical investigation of Web site characteristics, consumer
emotional states and on-line shopping behaviors. Journal of Business Research, 58(4),
526-532.
Muniz, A. M. (1997). Consumers and brand meaning: Brands, the self and others. Advances in
Consumer Research, 24(1), 308-309.
Muniz, A. M., & O'Guinn, T. C. (2001). Brand community. Journal of Consumer Research,
27(4), 412-432.
Musante, M. (2007). Brand portfolio influences on vertical brand extension evaluations.
Innovative Marketing, 3(4), 59-65.
Netemeyer, R. G., Krishnan, B., Pullig, C., Wang, G., Yagci, M., Dean, D., . . . Wirth, F. (2004).
Developing and validating measures of facets of customer-based brand equity. Journal of
Business Research, 57(2), 209-224.
Nijssen, E. J. (1999). Success factors of line extensions of fast-moving consumer goods.
European Journal of Marketing, 33(5/6), 450-474.
154
Nijssen & Bucklin, P. (1998). The effect of involvement upon brand extension. working paper,
Nijmegen School of Management, University of Nijmegen.
Oh, H. (1999). Service quality, customer satisfaction, and customer value: A holistic perspective.
International Journal of Hospitality Management, 18(1), 67-82.
Oliver, R. L. (1980). A cognitive model of the antecedents and consequences of satisfaction
decisions. Journal of Marketing Research, 17(4), 460-469.
Oliver, R. L. (1981). Measurement and evaluation of satisfaction processes in retail settings.
Journal of Retailing. 57(3), 25-48.
Oliver, R. L., & Bearden, W. O. (1983). The role of involvement in satisfaction processes. ACR
North American Advances. 250-255.
Oliver, R. L. (1993). Cognitive, affective, and attribute bases of the satisfaction response. Journal
of Consumer Research, 20(3), 418-430.
Oliver, R.L. (1997), Satisfaction: A Behavioral Perspective on the Customer, New York, NY.
Olshavsky, R. W. (1985). Perceived quality in consumer decision making: an integrated
theoretical perspective. Perceived Quality, 4, 3-29.
Olson, J. C., & Jacoby, J. (1972). Cue utilization in the quality perception process. SV-
proceedings of the third annual conference of the association for consumer research. eds.
M. Venkatesan, Chicago, IL: Association for Consumer Research, 167-179.
Olson, J. C., & Reynolds, T. J. (1983). Understanding consumers’ cognitive structures:
Implications for advertising strategy. Advertising and Consumer Psychology, 1, 77-90.
Panda, T. K., Panda, T. K., & Mishra, K. (2013). Does emotional appeal work in advertising? The
rationality behind using emotional appeal to create favorable brand attitude. IUP Journal
of Brand Management, 10(2), 7-23.
Pappu, R., Quester, P. G., & Cooksey, R. W. (2005). Consumer-based brand equity: Improving
the measurement–empirical evidence. Journal of Product & Brand Management, 14(3),
143-154.
155
Parasuraman, A., Berry, L. L., & Zeithaml, V. A. (1991). Refinement and reassessment of the
SERVQUAL scale. Journal of Retailing, 67(4), 420-450.
Parasuraman, A., Zeithaml, V. A., & Berry, L. L. (1985). A conceptual model of service quality
and its implications for future research. Journal of Marketing, 49(4), 41-50.
Parasuraman, A., Zeithaml, V. A., & Berry, L. L. (1988). Servqual: A multiple-item scale for
measuring consumer perc. Journal of Retailing, 64(1), 12-40.
Park, C. S., & Srinivasan, V. (1994). A survey-based method for measuring and understanding
brand equity and its extendibility. Journal of Marketing Research, 31(2), 271-288.
Park, C. W., Jaworski, B. J., & Maclnnis, D. J. (1986). Strategic brand concept-image
management. Journal of Marketing, 50(4), 135-145.
Park, C. W., Jun, S. Y., & Shocker, A. D. (1996). Composite branding alliances: An investigation
of extension and feedback effects. Journal of Marketing Research, 33(4), 453-466.
Park, C. W., Milberg, S., & Lawson, R. (1991). Evaluation of brand extensions: The role of
product feature similarity and brand concept consistency. Journal of Consumer Research,
18(2), 185-193.
Percy, L., & Elliot, R. (2007). Strategic brand management: Oxford University Press, New York,
NY.
Phillips, D. M., & Baumgartner, H. (2002). The role of consumption emotions in the satisfaction
response. Journal of Consumer Psychology, 12(3), 243-252.
Pitta, D. A., & Prevel Katsanis, L. (1995). Understanding brand equity for successful brand
extension. Journal of Consumer Marketing, 12(4), 51-64.
Plummer, J. T. (1985). Brand personality: A strategic concept for multinational advertising.
Marketing Educators' Conference. New York: Young & Rubicam.
Podsakoff, P. M., MacKenzie, S. B., Lee, J. Y., & Podsakoff, N. P. (2003). Common method
biases in behavioral research: A critical review of the literature and recommended
remedies. Journal of Applied Psychology, 88(5), 879.
156
Podsakoff, P. M., & Organ, D. W. (1986). Self-reports in organizational research: Problems and
prospects. Journal of Management, 12(4), 531-544.
Prasad, K., & Dev, C. S. (2000). Managing hotel brand equity: A customer-centric framework for
assessing performance. The Cornell Hotel and Restaurant Administration Quarterly,
41(3), 224-231.
Preacher, K. J., & Hayes, A. F. (2008). Asymptotic and resampling strategies for assessing and
comparing indirect effects in multiple mediator models. Behavior Research
Methods, 40(3), 879-891.
Price, L. L., Arnould, E. J., & Deibler, S. L. (1995). Consumers’ emotional responses to service
encounters: the influence of the service provider. International Journal of Service
Industry Management, 6(3), 34-63.
Price, L. L., Arnould, E. J., & Tierney, P. (1995). Going to extremes: Managing service
encounters and assessing provider performance. The Journal of Marketing, 59(2), 83-97.
Qu, H., Ryan, B., & Chu, R. (2000). The importance of hotel attributes in contributing to
travelers' satisfaction in the Hong Kong Hotel Industry. Journal of Quality Assurance in
Hospitality & Tourism, 1(3), 65-83.
Ramaseshan, B., & Tsao, H.-Y. (2007). Moderating effects of the brand concept on the
relationship between brand personality and perceived quality. Journal of Brand
Management, 14(6), 458-466.
Rangaswamy, A., Burke, R. R., & Oliva, T. A. (1993). Brand equity and the extendibility of
brand names. International Journal of Research in Marketing, 10(1), 61-75.
Rao, V. R., Mahajan, V., & Varaiya, N. P. (1991). A balance model for evaluating firms for
acquisition. Management Science, 37(3), 331-349.
Rao, A. R., & Monroe, K. B. (1989). The effect of price, brand name, and store name on buyers'
perceptions of product quality: An integrative review. Journal of Marketing Research,
26(3), 351-357.
157
Rao, A. R., Qu, L., & Ruekert, R. W. (1999). Signaling unobservable product quality through a
brand ally. Journal of Marketing Research, 36(2), 258-268.
Restall, A. & Gordon, W. (1993) Brands - the missing link; understanding the emotional
relationship. Marketing and Research Today, May, 59-67.
Richardson, P. S., Dick, A. S., & Jain, A. K. (1994). Extrinsic and intrinsic cue effects on
perceptions of store brand quality. Journal of Marketing, 58(4), 28-36.
Richins, M. L. (1997). Measuring emotions in the consumption experience. Journal of Consumer
Research, 24(2), 127-146.
Ries, A., & Trout, J. (1986). Marketing warfare. Journal of Consumer Marketing, 3(4), 77-82.
Rosenbaum-Elliott, R., Elliott, R. H., Percy, L., & Pervan, S. (2015). Strategic brand
management: Oxford University Press, USA.
Rosenberg, M. (1986). Self-concept from middle childhood through adolescence. Psychological
Perspectives on the Self, 3(1), 107-136.
Russell, J. A., & Mehrabian, A. (1977). Evidence for a three-factor theory of emotions. Journal of
Research in Personality, 11(3), 273-294.
Ruth, J. A. (2001). Promoting a brand's emotion benefits: the influence of emotion categorization
processes on consumer evaluations. Journal of Consumer Psychology, 11(2), 99-113.
Ruth, J. A., Brunel, F. F., & Otnes, C. C. (2002). Linking thoughts to feelings: Investigating
cognitive appraisals and consumption emotions in a mixed-emotions context. Journal of
The Academy of Marketing Science, 30(1), 44-58.
Ryu, K., & Jang, S. S. (2007). The effect of environmental perceptions on behavioral intentions
through emotions: The case of upscale restaurants. Journal of Hospitality & Tourism
Research, 31(1), 56-72.
Salinas, G. & Amber, T. (2009). A taxonomy of brand valuation practice: Methodologies and
purposes. Brand Management, 17(1), 39-61.
158
Salinas, E. M., & Pérez, J. M. P. (2009). Modeling the brand extensions' influence on brand
image. Journal of Business Research, 62(1), 50-60.
Salinas, G. (2009). The international brand valuation manual: A complete overview and analysis
of brand valuation techniques, methodologies and applications. New York: Wiley.
Salinas, G. (2016). Brand valuation. In Riley, F., Singh, J., & Blankson, C. Editor, The Routledge
Companion to Contemporary.
Saunders, M., Lewis P., & Thornhill, A. (2009). Research Methods for Business Students (5th
edition). New Jersey: Prentice Hall.
Schoefer, K., & Diamantopoulos, A. (2009). A typology of consumers' emotional response styles
during service recovery encounters. British Journal of Management, 20(3), 292-308.
Schuiling, I., & Moss, G. (2004). How different are branding strategies in the pharmaceutical
industry and the fast-moving consumer goods sector?. Journal of Brand
Management, 11(5), 366-380.
Šerić, M., Gil-Saura, I., & Mikulić, J. (2017). Customer-based brand equity building: Empirical
evidence from Croatian upscale hotels. Journal of Vacation Marketing, 23(2), 133-144.
Shemwell, D. J., Yavas, U., & Bilgin, Z. (1998). Customer-service provider relationships: an
empirical test of a model of service quality, satisfaction and relationship-oriented
outcomes. International Journal of Service Industry Management, 9(2), 155-168.
Siguaw, J. A., Mattila, A., & Austin, J. R. (1999). The brand-personality scale. The Cornell Hotel
and Restaurant Administration Quarterly, 40(3), 48-45.
Simon, C. J., & Sullivan, M. W. (1993). The measurement and determinants of brand equity: A
financial approach. Marketing Science, 12(1), 28-52.
Simonin, B. L., & Ruth, J. A. (1998). Is a company known by the company it keeps? Assessing
the spillover effects of brand alliances on consumer brand attitudes. Journal of Marketing
Research, 35(1), 30-42.
159
Sirgy, M. J. (1982). Self-concept in consumer behavior: A critical review. Journal of Consumer
Research, 9(3), 287-300.
Slevitch, L., & Oh, H. (2010). Asymmetric relationship between attribute performance and
customer satisfaction: A new perspective. International Journal of Hospitality
Management, 29(4), 559-569.
Smith, D. C., & Park, C. W. (1992). The effects of brand extensions on market share and
advertising efficiency. Journal of Marketing Research, 29(3), 296-313.
Sood, S., & Keller, K. L. (2012). The effects of brand name structure on brand extension
evaluations and parent brand dilution. Journal of Marketing Research, 49(3), 373-382.
Speed, R., & Thompson, P. (2000). Determinants of sports sponsorship response. Journal of The
Academy of Marketing Science, 28(2), 226-238.
Sprott, D. E., & Shimp, T. A. (2004). Using product sampling to augment the perceived quality of
store brands. Journal of Retailing, 80(4), 305-315.
Su, J., & Tong, X. (2015). Brand personality and brand equity: evidence from the sportswear
industry. Journal of Product & Brand Management, 24(2), 124-133.
Sunde, L., & Brodie, R. J. (1993). Consumer evaluations of brand extensions: Further empirical
results. International Journal of Research in Marketing, 10(1), 47-53.
Sung, Y., & Kim, J. (2010). Effects of brand personality on brand trust and brand affect.
Psychology & Marketing, 27(7), 639-661.
Sung, Y., & Tinkham, S. F. (2005). Brand personality structures in the United States and Korea:
Common and culture-specific factors. Journal of Consumer Psychology, 15(4), 334-350.
Swaminathan, V. (2003). Sequential brand extensions and brand choice behavior. Journal of
Business Research, 56(6), 431-442.
Swaminathan, V., Fox, R. J., & Reddy, S. K. (2001). The impact of brand extension introduction
on choice. Journal of Marketing, 65(4), 1-15.
160
Szőcs, A. (2012). The MIMIC model of the consumer-based brand equity. Testing the causal
specification of consumer-based brand equity. Retrieved from Corvinus Dissertations
University of Budapest.
Tafani, É., Michel, G., & Rosa, E. (2009). Vertical product line extension strategies: An
evaluation of brand halo effect according to range level. Recherche et Applications En
Marketing (English Edition), 24(2), 73-88.
Taleghani, M., & Almasi, M. (2011). Evaluate the factors affecting brand equity from the
perspective of customers using Aaker's model. Retrieved from
https://papers.ssrn.com/sol3/papers.cfm?abstract_id=1944550/
Tajfel, H., & Turner, J. C. (1985). The social identity theory of intergroup behavior. In: Worchel,
S., & Austin, W. G. (Eds) Psychology of Intergroup Relations, 2nd edn, Nelson-Hall, Chicago.
Tanford, S., Raab, C., & Kim, Y. S. (2011). The influence of reward program membership and
commitment on hotel loyalty. Journal of Hospitality & Tourism Research, 35(3), 279-
307.
Taylor, S. A., & Baker, T. L. (1994). An assessment of the relationship between service quality
and customer satisfaction in the formation of consumers' purchase intentions. Journal of
Retailing, 70(2), 163-178.
Tauber, E. M. (1981). Brand franchise extension: New product benefits from existing brand
names. Business Horizons, 24(2), 36-41.
Tauber, E. M. (1988). Brand leverage-strategy for growth in a cost-control world. Journal of
Advertising Research, 28(4), 26-30.
Teas, R. K., & Agarwal, S. (2000). The effects of extrinsic product cues on consumers’
perceptions of quality, sacrifice, and value. Journal of The Academy of Marketing
Science, 28(2), 278-290.
161
Thomson, M., MacInnis, D. J., & Park, C. W. (2005). The ties that bind: Measuring the strength
of consumers’ emotional attachments to brands. Journal of Consumer Psychology, 15(1),
77-91.
Tsiros, M., & Mittal, V. (2000). Regret: A model of its antecedents and consequences in
consumer decision making. Journal of Consumer Research, 26(4), 401-417.
Usakli, A., & Baloglu, S. (2011). Brand personality of tourist destinations: An application of self-
congruity theory. Tourism Management, 32(1), 114-127.
Van de Mortel, T. F. (2008). Faking it: social desirability response bias in self-report
research. Australian Journal of Advanced Nursing, 25(4), 40-48.
Van Teijlingen, E. R., Rennie, A. M., Hundley, V., & Graham, W. (2001). The importance of
conducting and reporting pilot studies: the example of the Scottish Births Survey. Journal
of Advanced Nursing, 34(3), 289-295.
Vázquez, R., Del Rio, A. B., & Iglesias, V. (2002). Consumer-based brand equity: Development
and validation of a measurement instrument. Journal of Marketing Management, 18(1-2),
27-48.
Verbeke, W., & Bagozzi, R. P. (2003). Exploring the role of self-and customer-provoked
embarrassment in personal selling. International Journal of Research in
Marketing, 20(3), 233-258.
Völckner, F., & Sattler, H. (2006). Drivers of brand extension success. Journal of Marketing,
70(2), 18-34.
Völckner, F., Sattler, H., & Kaufmann, G. (2008). Image feedback effects of brand extensions:
Evidence from a longitudinal field study. Marketing Letters, 19(2), 109-124.
Wang, L., & Finn, A. (2013). Heterogeneous sources of customer-based brand equity within a
product category. Marketing Intelligence & Planning, 31(6), 674-696.
162
Wang, N., Jome, L. M., Haase, R. F., & Bruch, M. A. (2006). The role of personality and career
decision-making self-efficacy in the career choice commitment of college
students. Journal of Career Assessment, 14(3), 312-332.
Wansink, B., & Sudman, S. (2002). Consumer panels. Chicago: AMA.
Washburn, J. H., Till, B. D., & Priluck, R. (2000). Co-branding: brand equity and trial effects.
Journal of Consumer Marketing, 17(7), 591-604.
Westbrook, R. A., & Oliver, R. L. (1981). Developing better measures of consumer satisfaction:
some preliminary results. ACR North American Advances. 94-99.
Westbrook, R. A. (1987). Product/consumption-based affective responses and postpurchase
processes. Journal of marketing research, 14(3), 258-270.
Wilensky, L., & Buttle, F. (1988). A multivariate analysis of hotel benefit bundles and choice
trade-offs. International Journal of Hospitality Management, 7(1), 29-41.
Wittink, D. R., & Bayer, L. R. (1994). The measurement imperative. Marketing Research, 6(4),
14.
Wood, L. (2000). Brands and brand equity: Definition and management. Management Decision,
38(9), 662-669.
Wright, K. B. (2005). Researching Internet‐based populations: Advantages and disadvantages of
online survey research, online questionnaire authoring software packages, and web
survey services. Journal of Computer‐Mediated Communication, 10(3).
Wu, C.-S., Cheng, F.-F., & Yen, D. C. (2008). The atmospheric factors of online storefront
environment design: An empirical experiment in Taiwan. Information & Management,
45(7), 493-498.
Yang, B., Kim, Y., & Yoo, C. (2013). The integrated mobile advertising model: The effects of
technology-and emotion-based evaluations. Journal of Business Research, 66(9), 1345-
1352.

163
Yang, C.-C., Jou, Y.-T., & Cheng, L.-Y. (2011). Using integrated quality assessment for hotel
service quality. Quality & Quantity, 45(2), 349-364.
Yen, C.-L. A., & Tang, C.-H. H. (2015). Hotel attribute performance, eWOM motivations, and
media choice. International Journal of Hospitality Management, 46, 79-88.
Yi, Y. (1990). A critical review of consumer satisfaction. Review of marketing, 4(1), 68-123.
Yik, M. S., & Russell, J. A. (2001). Predicting the Big Two of affect from the Big Five of
personality. Journal of Research in Personality, 35(3), 247-277.
Yoo, B., & Donthu, N. (2001). Developing and validating a multidimensional consumer-based
brand equity scale. Journal of Business Research, 52(1), 1-14.
Yoo, B., Donthu, N., & Lee, S. (2000). An examination of selected marketing mix elements and
brand equity. Journal of the Academy of Marketing Science, 28(2), 195-211.
Yorkston, E. A., Nunes, J. C., & Matta, S. (2010). The malleable brand: The role of implicit
theories in evaluating brand extensions. Journal of Marketing, 74(1), 80-93.
Yu, Y. T., & Dean, A. (2001). The contribution of emotional satisfaction to consumer
loyalty. International Journal of Service Industry Management, 12(3), 234-250.
Zajonc, R. B. (1980). Feeling and thinking: Preferences need no inferences. American
Psychologist, 35(2), 151-175.
Zeithaml, V. A. (1988). Consumer perceptions of price, quality, and value: a means-end model
and synthesis of evidence. The Journal of marketing, 52(3), 2-22.
Zeithaml, V. A. (2000). Service quality, profitability, and the economic worth of customers: What
we know and what we need to learn. Journal of The Academy of Marketing Science,
28(1), 67-85.
Zeithaml, V. A., Berry, L. L., & Parasuraman, A. (1996). The behavioral consequences of service
quality. The Journal of Marketing, 60(2), 31-46.
Zeithaml, V., & Bitner, M. (1996). Service marketing: Integrating customer focus across the firm.
USA: McGraw-Hill.

164
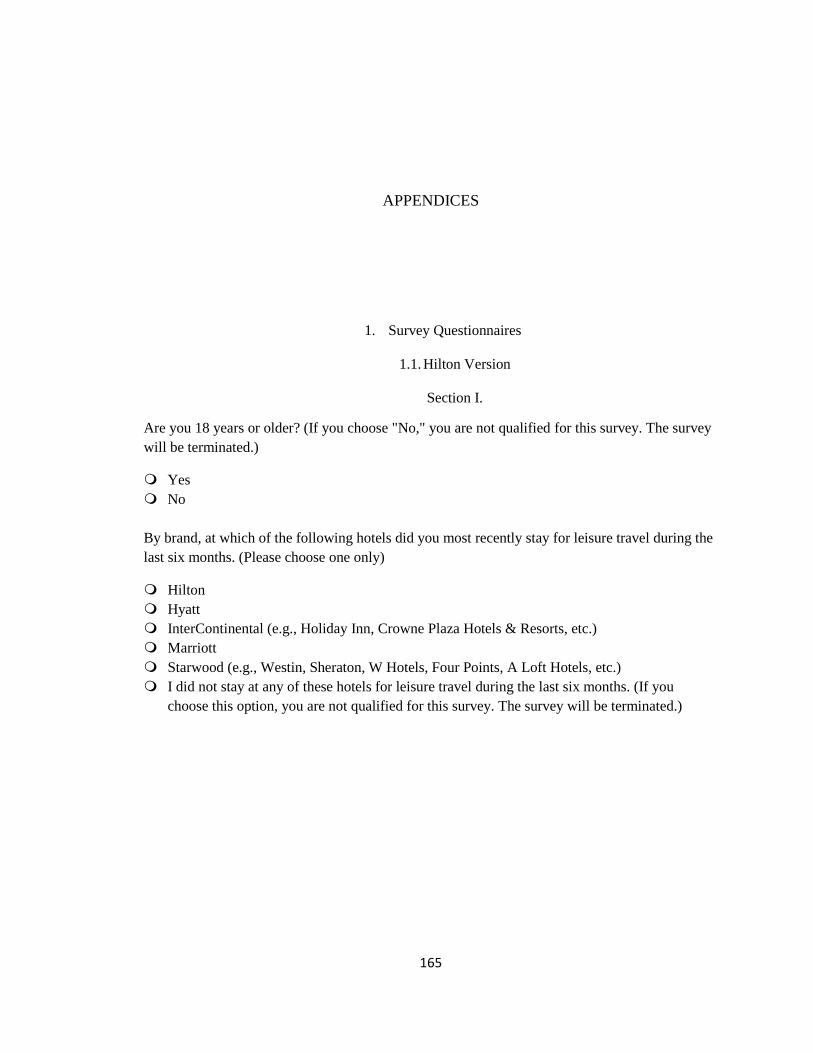
165
APPENDICES
1. Survey Questionnaires
1.1. Hilton Version
Section I.
Are you 18 years or older? (If you choose "No," you are not qualified for this survey. The survey
will be terminated.)
Yes
No
By brand, at which of the following hotels did you most recently stay for leisure travel during the
last six months. (Please choose one only)
Hilton
Hyatt
InterContinental (e.g., Holiday Inn, Crowne Plaza Hotels & Resorts, etc.)
Marriott
Starwood (e.g., Westin, Sheraton, W Hotels, Four Points, A Loft Hotels, etc.)
I did not stay at any of these hotels for leisure travel during the last six months. (If you
choose this option, you are not qualified for this survey. The survey will be terminated.)
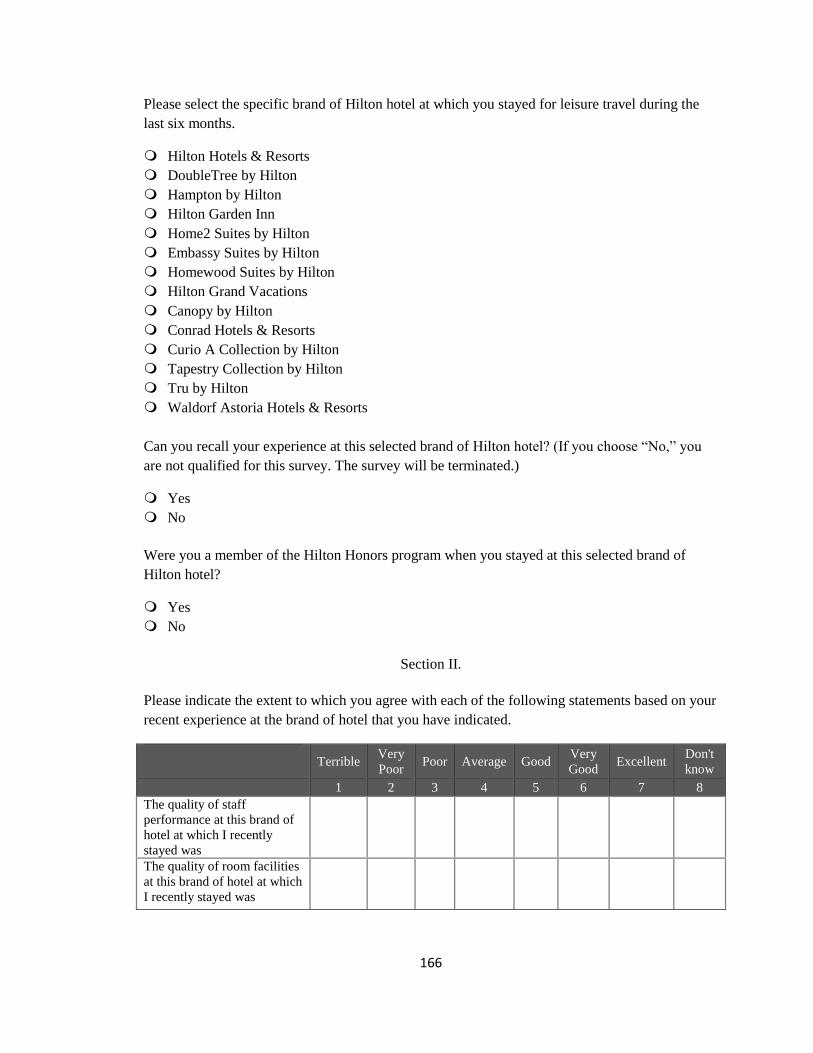
166
Please select the specific brand of Hilton hotel at which you stayed for leisure travel during the
last six months.
Hilton Hotels & Resorts
DoubleTree by Hilton
Hampton by Hilton
Hilton Garden Inn
Home2 Suites by Hilton
Embassy Suites by Hilton
Homewood Suites by Hilton
Hilton Grand Vacations
Canopy by Hilton
Conrad Hotels & Resorts
Curio A Collection by Hilton
Tapestry Collection by Hilton
Tru by Hilton
Waldorf Astoria Hotels & Resorts
Can you recall your experience at this selected brand of Hilton hotel? (If you choose “No,” you
are not qualified for this survey. The survey will be terminated.)
Yes
No
Were you a member of the Hilton Honors program when you stayed at this selected brand of
Hilton hotel?
Yes
No
Section II.
Please indicate the extent to which you agree with each of the following statements based on your
recent experience at the brand of hotel that you have indicated.
Terrible
Very
Poor Poor Average Good
Very
Good Excellent
Don't
know
1 2 3 4 5 6 7 8
The quality of staff
performance at this brand of
hotel at which I recently
stayed was
The quality of room facilities
at this brand of hotel at which
I recently stayed was
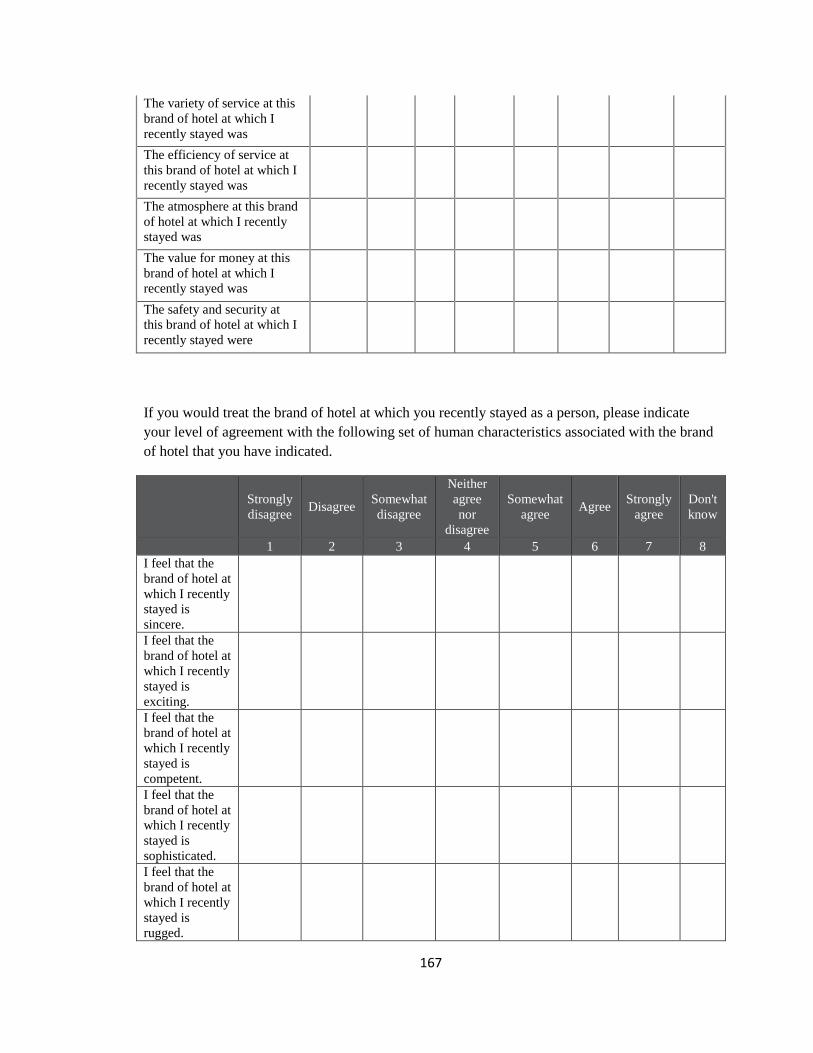
167
The variety of service at this
brand of hotel at which I
recently stayed was
The efficiency of service at
this brand of hotel at which I
recently stayed was
The atmosphere at this brand
of hotel at which I recently
stayed was
The value for money at this
brand of hotel at which I
recently stayed was
The safety and security at
this brand of hotel at which I
recently stayed were
If you would treat the brand of hotel at which you recently stayed as a person, please indicate
your level of agreement with the following set of human characteristics associated with the brand
of hotel that you have indicated.
Strongly
disagree Disagree
Somewhat
disagree
Neither
agree
nor
disagree
Somewhat
agree Agree
Strongly
agree
Don't
know
1 2 3 4 5 6 7 8
I feel that the
brand of hotel at
which I recently
stayed is
sincere.
I feel that the
brand of hotel at
which I recently
stayed is
exciting.
I feel that the
brand of hotel at
which I recently
stayed is
competent.
I feel that the
brand of hotel at
which I recently
stayed is
sophisticated.
I feel that the
brand of hotel at
which I recently
stayed is
rugged.
168
Which company do you think owns the brand of hotel that you have indicated?
Hilton Worldwide Holdings Inc.
Hyatt Hotels Corporation
InterContinental Hotels Group PLC
Marriott International Inc.
Starwood Hotels and Resorts Worldwide Inc. (A subsidiary of Marriott International Inc.
since September 23rd, 2016)
Section III.
Please indicate the extent to which you agree with each of the following statements based on your
recent experience at the brand of hotel that you have indicated.
I think this brand of hotel at which I recently stayed is:
1 2 3 4 5 6 7
Inferior: Superior
Poor: Excellent
Poor quality: Good quality
Please indicate the extent to which you agree with each of the following statements based on your
recent experience at the brand of hotel that you have indicated.
Strongly
disagree Disagree
Somewhat
disagree
Neither
agree
nor
disagree
Somewhat
agree Agree
Strongly
agree
Don't
know
1 2 3 4 5 6 7 8
I feel
comfortable
with the brand
of hotel at
which I
recently stayed.
I feel content
with the brand
of hotel at
which I
recently stayed.
I feel elegant
with the brand
of hotel at
which I
recently stayed.
I feel
entertained
with the brand
169
of hotel at
which I
recently stayed.
I feel excited
with the brand
of hotel at
which I
recently stayed.
I feel
extravagant
with the brand
of hotel at
which I
recently stayed.
I feel cool with
the brand of
hotel at which I
recently stayed.
I feel important
with the brand
of hotel at
which I
recently stayed.
I feel inspired
with the brand
of hotel at
which I
recently stayed.
I feel pampered
with the brand
of hotel at
which I
recently stayed.
I feel practical
with the brand
of hotel at
which I
recently stayed.
I feel relaxed
with the brand
of hotel at
which I
recently stayed.
I feel respected
with the brand
of hotel at
which I
recently stayed.
I feel secure
with the brand
of hotel at
which I
recently stayed.
170
I feel
sophisticated
with the brand
of hotel at
which I
recently stayed.
I feel welcome
with the brand
of hotel at
which I
recently stayed.
Section IV.
Please indicate the extent to which you agree with each of the following statements based on your recent
experience at the brand of hotel that you have indicated.
Strongly
disagree Disagree
Somewhat
disagree
Neither
agree nor
disagree
Somewhat
agree Agree
Strongly
agree
Don't
know
1 2 3 4 5 6 7 8
I was
satisfied with
this brand of
hotel at which
I recently
stayed.
I was pleased
to have
visited this
brand of hotel
at which I
recently
stayed.
I enjoyed
myself at this
brand of hotel
at which I
recently
stayed.
171
Which parent brand do you think your selected brand of hotel belongs to? Please choose the corresponding
brand logo.
Please indicate the extent to which you agree with each of the following statements based on your recent
experience at the brand of hotel that you have indicated.
Strongly
disagree Disagree
Somewhat
disagree
Neither
agree
nor
disagree
Somewhat
agree Agree
Strongly
agree
Don't
know
1 2 3 4 5 6 7 8
Compared to
other non-
Hilton hotel
brands, the hotel
brand that I
have indicated
is my first
choice for future
hotel stays.
I strongly intend
to stay at the
indicated brand
of hotel again.
I would
recommend the
indicated brand
of hotel to other
people.
I would tell
other people
positive things
about the
indicated hotel
brand.
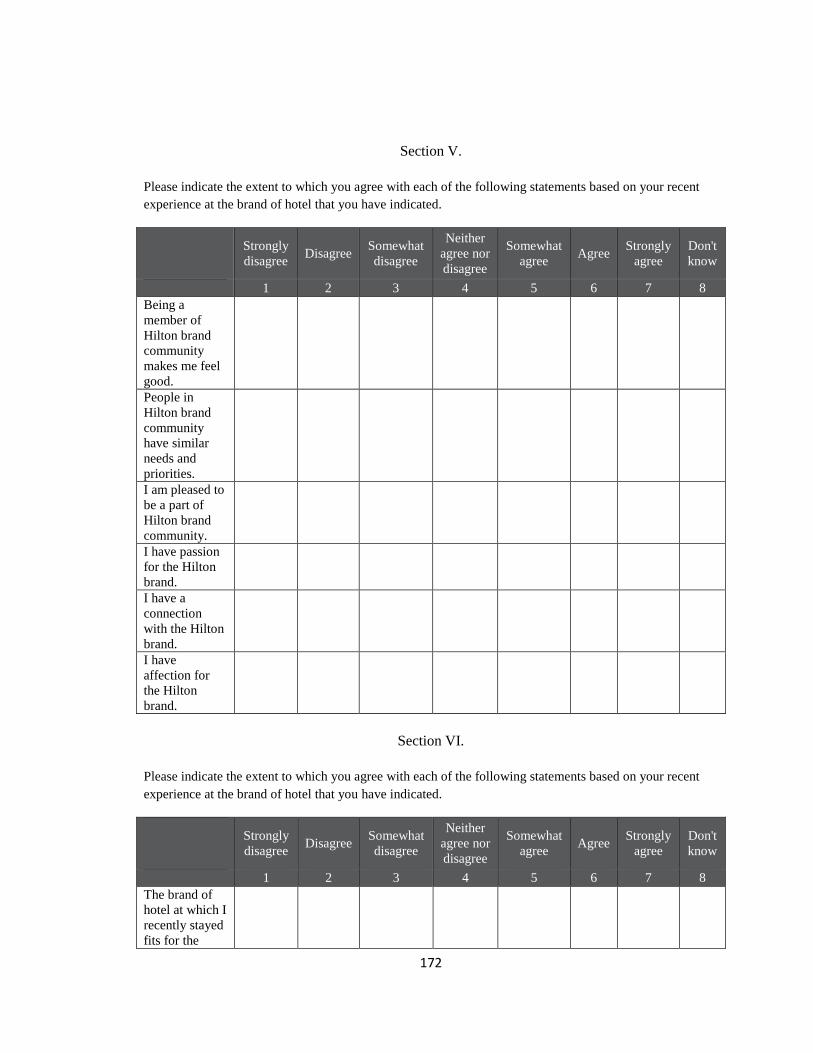
172
Section V.
Please indicate the extent to which you agree with each of the following statements based on your recent
experience at the brand of hotel that you have indicated.
Strongly
disagree Disagree
Somewhat
disagree
Neither
agree nor
disagree
Somewhat
agree Agree
Strongly
agree
Don't
know
1 2 3 4 5 6 7 8
Being a
member of
Hilton brand
community
makes me feel
good.
People in
Hilton brand
community
have similar
needs and
priorities.
I am pleased to
be a part of
Hilton brand
community.
I have passion
for the Hilton
brand.
I have a
connection
with the Hilton
brand.
I have
affection for
the Hilton
brand.
Section VI.
Please indicate the extent to which you agree with each of the following statements based on your recent
experience at the brand of hotel that you have indicated.
Strongly
disagree Disagree
Somewhat
disagree
Neither
agree nor
disagree
Somewhat
agree Agree
Strongly
agree
Don't
know
1 2 3 4 5 6 7 8
The brand of
hotel at which I
recently stayed
fits for the
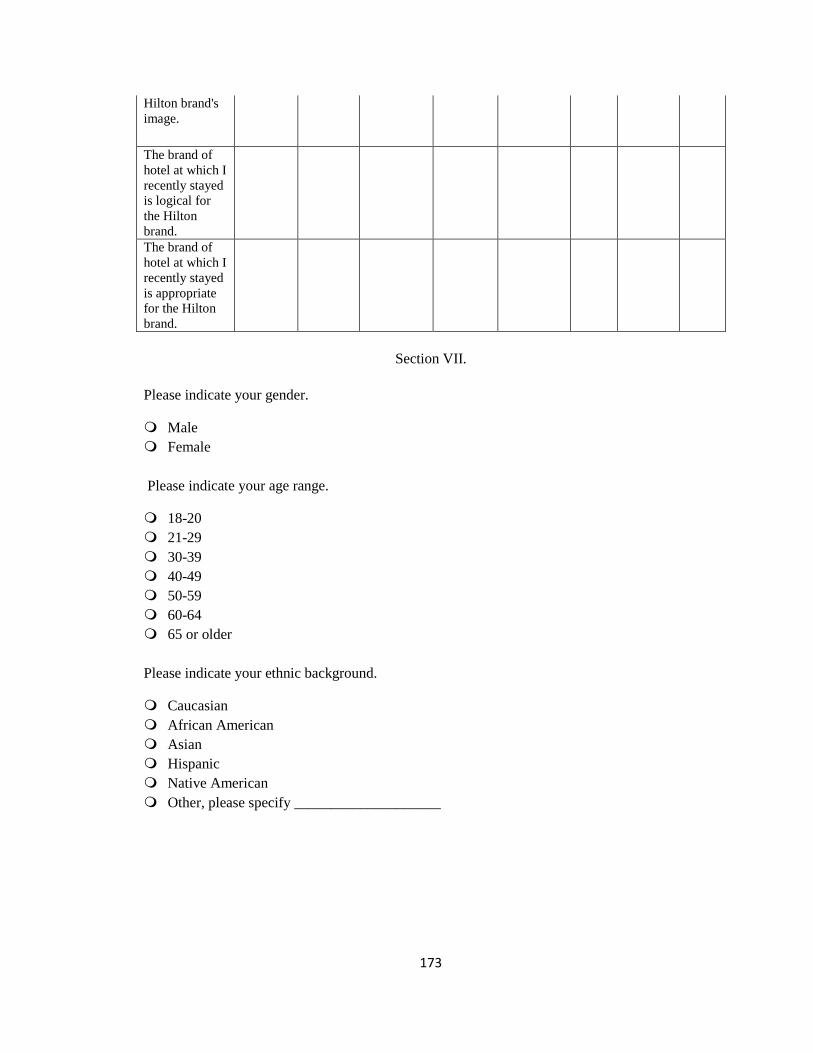
173
Hilton brand's
image.
The brand of
hotel at which I
recently stayed
is logical for
the Hilton
brand.
The brand of
hotel at which I
recently stayed
is appropriate
for the Hilton
brand.
Section VII.
Please indicate your gender.
Male
Female
Please indicate your age range.
18-20
21-29
30-39
40-49
50-59
60-64
65 or older
Please indicate your ethnic background.
Caucasian
African American
Asian
Hispanic
Native American
Other, please specify ____________________

174
Please indicate your marital status.
Married
Single
Separated
Divorced
Widowed
Please indicate your annual household income range.
Less than $20,000
$20,000 - $34,999
$35,000 - $49,999
$50,000 - $74,999
$75,000 - $99,999
$100,000 - $149,999
$150,000 - $199,999
$200,000 or more
What is the highest level of education you have completed?
Less than high school degree
High school degree or equivalent
Some college but no degree
Associate degree
Bachelor’s degree
Graduate degree
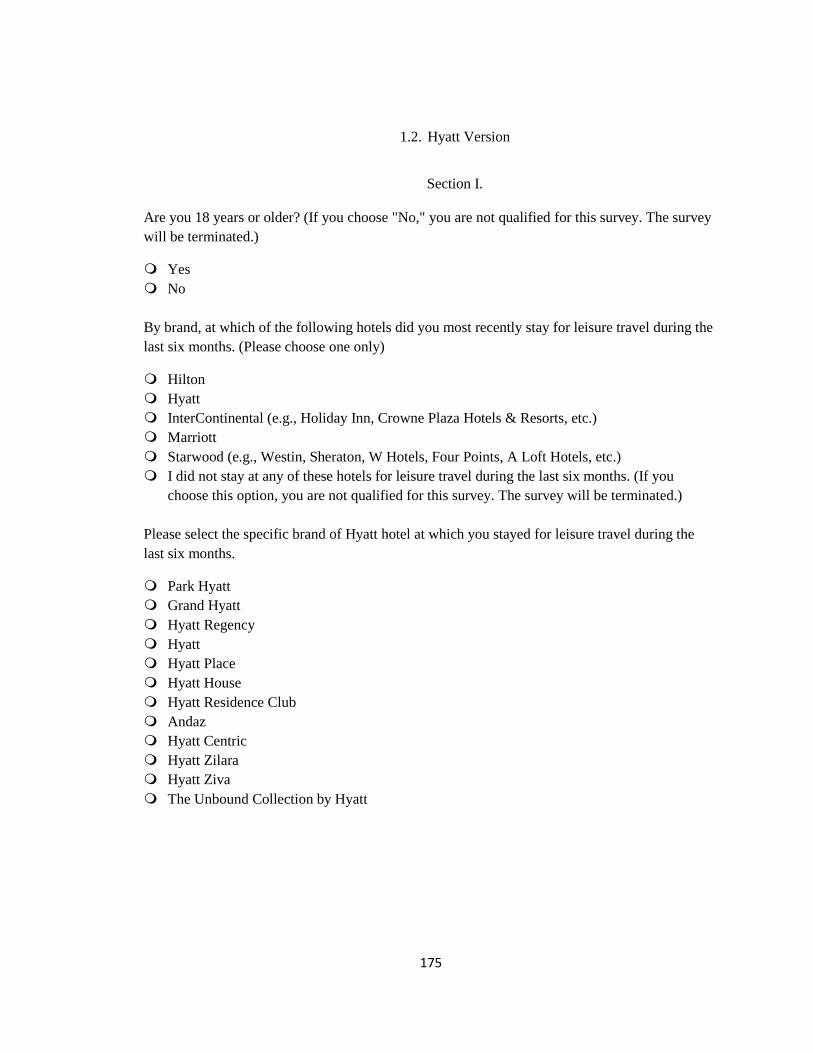
175
1.2. Hyatt Version
Section I.
Are you 18 years or older? (If you choose "No," you are not qualified for this survey. The survey
will be terminated.)
Yes
No
By brand, at which of the following hotels did you most recently stay for leisure travel during the
last six months. (Please choose one only)
Hilton
Hyatt
InterContinental (e.g., Holiday Inn, Crowne Plaza Hotels & Resorts, etc.)
Marriott
Starwood (e.g., Westin, Sheraton, W Hotels, Four Points, A Loft Hotels, etc.)
I did not stay at any of these hotels for leisure travel during the last six months. (If you
choose this option, you are not qualified for this survey. The survey will be terminated.)
Please select the specific brand of Hyatt hotel at which you stayed for leisure travel during the
last six months.
Park Hyatt
Grand Hyatt
Hyatt Regency
Hyatt
Hyatt Place
Hyatt House
Hyatt Residence Club
Andaz
Hyatt Centric
Hyatt Zilara
Hyatt Ziva
The Unbound Collection by Hyatt
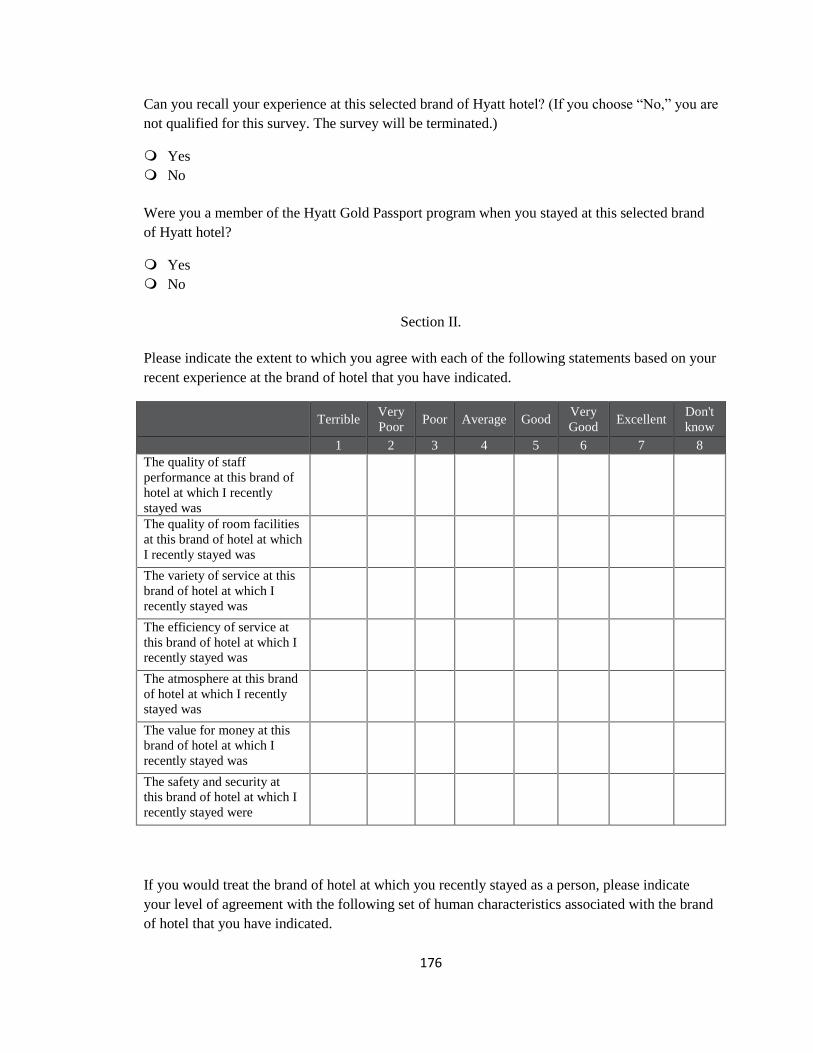
176
Can you recall your experience at this selected brand of Hyatt hotel? (If you choose “No,” you are
not qualified for this survey. The survey will be terminated.)
Yes
No
Were you a member of the Hyatt Gold Passport program when you stayed at this selected brand
of Hyatt hotel?
Yes
No
Section II.
Please indicate the extent to which you agree with each of the following statements based on your
recent experience at the brand of hotel that you have indicated.
Terrible
Very
Poor Poor Average Good
Very
Good Excellent
Don't
know
1 2 3 4 5 6 7 8
The quality of staff
performance at this brand of
hotel at which I recently
stayed was
The quality of room facilities
at this brand of hotel at which
I recently stayed was
The variety of service at this
brand of hotel at which I
recently stayed was
The efficiency of service at
this brand of hotel at which I
recently stayed was
The atmosphere at this brand
of hotel at which I recently
stayed was
The value for money at this
brand of hotel at which I
recently stayed was
The safety and security at
this brand of hotel at which I
recently stayed were
If you would treat the brand of hotel at which you recently stayed as a person, please indicate
your level of agreement with the following set of human characteristics associated with the brand
of hotel that you have indicated.
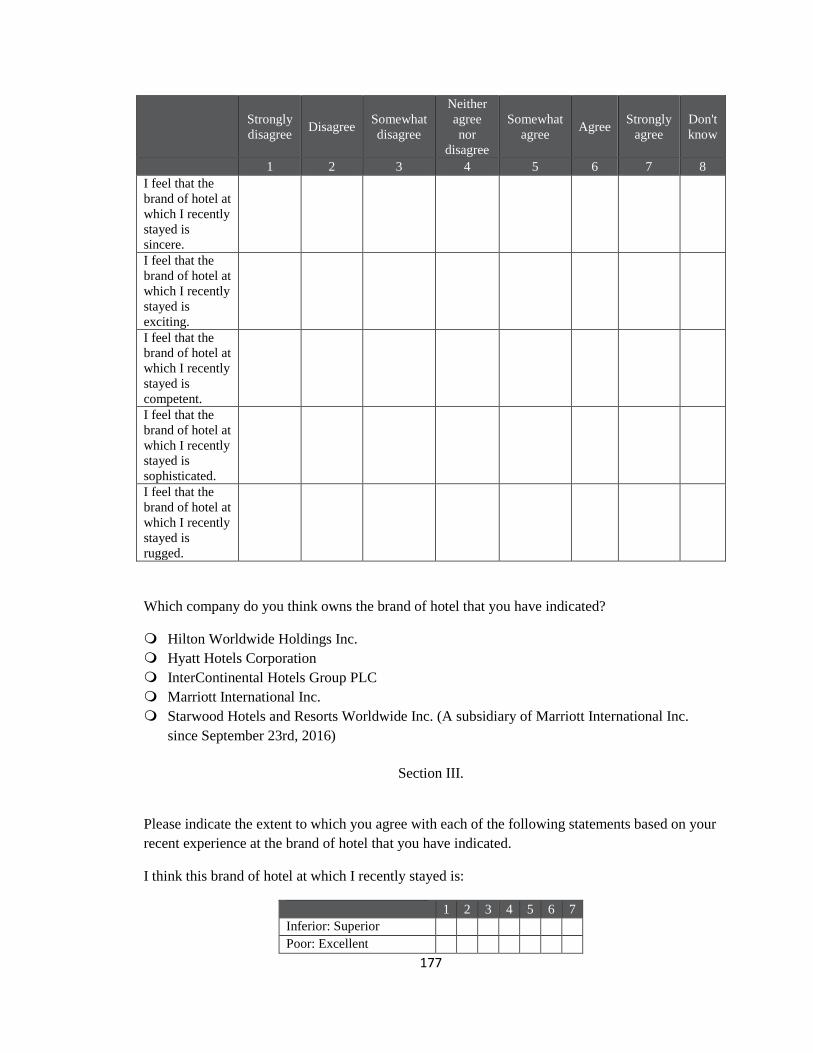
177
Strongly
disagree Disagree
Somewhat
disagree
Neither
agree
nor
disagree
Somewhat
agree Agree
Strongly
agree
Don't
know
1 2 3 4 5 6 7 8
I feel that the
brand of hotel at
which I recently
stayed is
sincere.
I feel that the
brand of hotel at
which I recently
stayed is
exciting.
I feel that the
brand of hotel at
which I recently
stayed is
competent.
I feel that the
brand of hotel at
which I recently
stayed is
sophisticated.
I feel that the
brand of hotel at
which I recently
stayed is
rugged.
Which company do you think owns the brand of hotel that you have indicated?
Hilton Worldwide Holdings Inc.
Hyatt Hotels Corporation
InterContinental Hotels Group PLC
Marriott International Inc.
Starwood Hotels and Resorts Worldwide Inc. (A subsidiary of Marriott International Inc.
since September 23rd, 2016)
Section III.
Please indicate the extent to which you agree with each of the following statements based on your
recent experience at the brand of hotel that you have indicated.
I think this brand of hotel at which I recently stayed is:
1 2 3 4 5 6 7
Inferior: Superior
Poor: Excellent
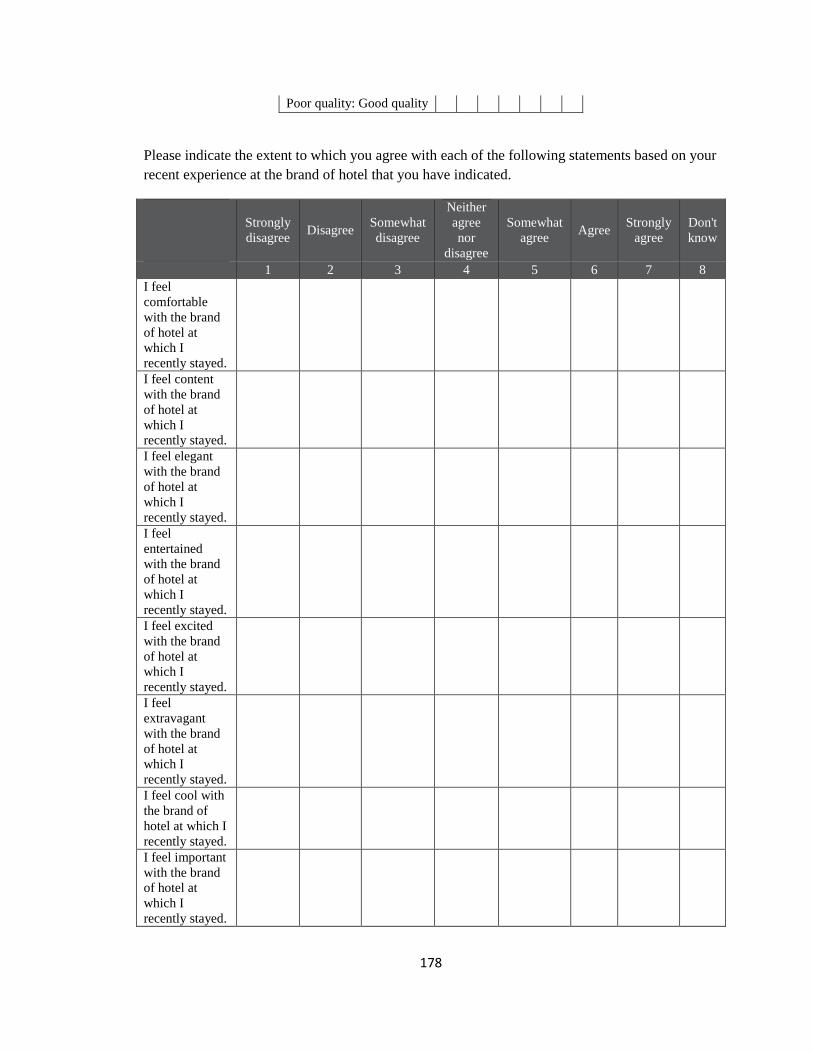
178
Poor quality: Good quality
Please indicate the extent to which you agree with each of the following statements based on your
recent experience at the brand of hotel that you have indicated.
Strongly
disagree Disagree
Somewhat
disagree
Neither
agree
nor
disagree
Somewhat
agree Agree
Strongly
agree
Don't
know
1 2 3 4 5 6 7 8
I feel
comfortable
with the brand
of hotel at
which I
recently stayed.
I feel content
with the brand
of hotel at
which I
recently stayed.
I feel elegant
with the brand
of hotel at
which I
recently stayed.
I feel
entertained
with the brand
of hotel at
which I
recently stayed.
I feel excited
with the brand
of hotel at
which I
recently stayed.
I feel
extravagant
with the brand
of hotel at
which I
recently stayed.
I feel cool with
the brand of
hotel at which I
recently stayed.
I feel important
with the brand
of hotel at
which I
recently stayed.
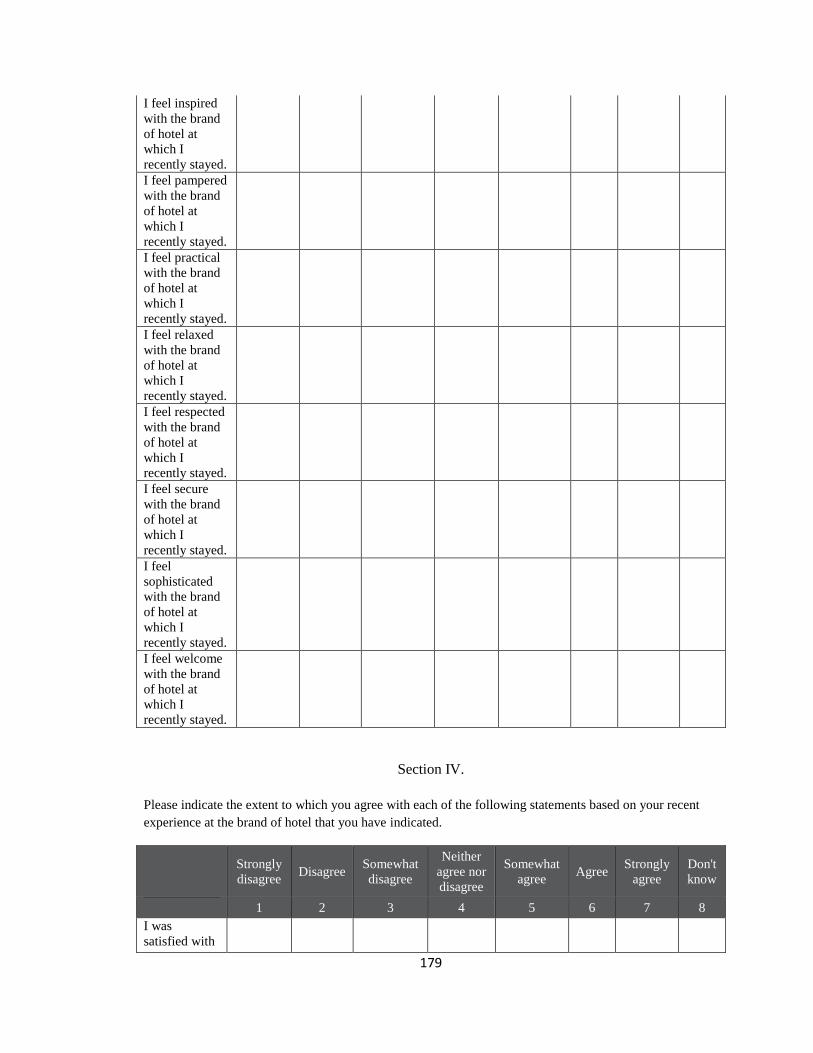
179
I feel inspired
with the brand
of hotel at
which I
recently stayed.
I feel pampered
with the brand
of hotel at
which I
recently stayed.
I feel practical
with the brand
of hotel at
which I
recently stayed.
I feel relaxed
with the brand
of hotel at
which I
recently stayed.
I feel respected
with the brand
of hotel at
which I
recently stayed.
I feel secure
with the brand
of hotel at
which I
recently stayed.
I feel
sophisticated
with the brand
of hotel at
which I
recently stayed.
I feel welcome
with the brand
of hotel at
which I
recently stayed.
Section IV.
Please indicate the extent to which you agree with each of the following statements based on your recent
experience at the brand of hotel that you have indicated.
Strongly
disagree Disagree
Somewhat
disagree
Neither
agree nor
disagree
Somewhat
agree Agree
Strongly
agree
Don't
know
1 2 3 4 5 6 7 8
I was
satisfied with
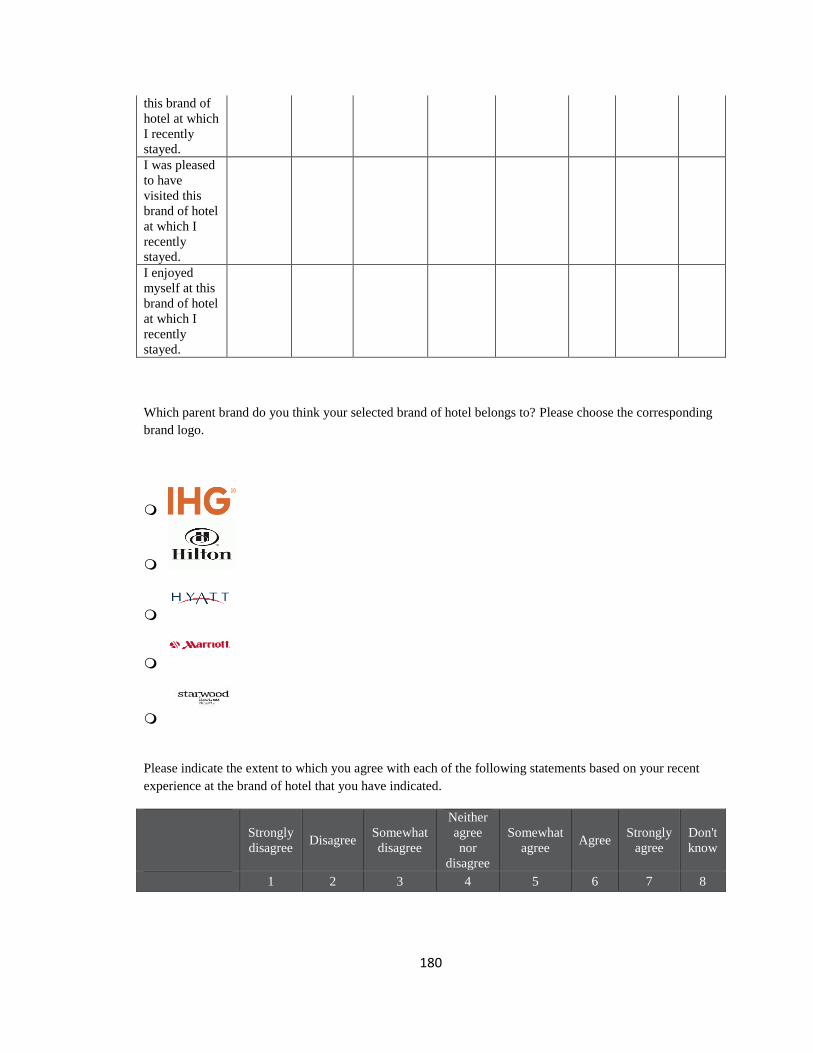
180
this brand of
hotel at which
I recently
stayed.
I was pleased
to have
visited this
brand of hotel
at which I
recently
stayed.
I enjoyed
myself at this
brand of hotel
at which I
recently
stayed.
Which parent brand do you think your selected brand of hotel belongs to? Please choose the corresponding
brand logo.
Please indicate the extent to which you agree with each of the following statements based on your recent
experience at the brand of hotel that you have indicated.
Strongly
disagree Disagree
Somewhat
disagree
Neither
agree
nor
disagree
Somewhat
agree Agree
Strongly
agree
Don't
know
1 2 3 4 5 6 7 8
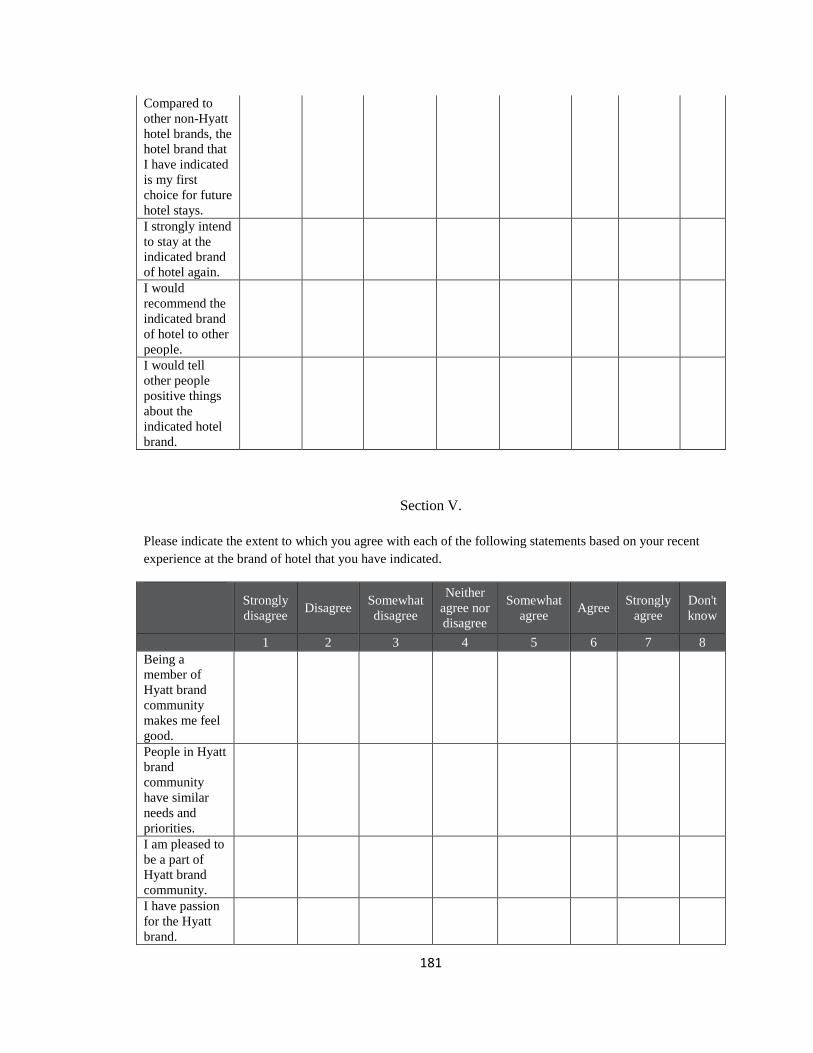
181
Compared to
other non-Hyatt
hotel brands, the
hotel brand that
I have indicated
is my first
choice for future
hotel stays.
I strongly intend
to stay at the
indicated brand
of hotel again.
I would
recommend the
indicated brand
of hotel to other
people.
I would tell
other people
positive things
about the
indicated hotel
brand.
Section V.
Please indicate the extent to which you agree with each of the following statements based on your recent
experience at the brand of hotel that you have indicated.
Strongly
disagree Disagree
Somewhat
disagree
Neither
agree nor
disagree
Somewhat
agree Agree
Strongly
agree
Don't
know
1 2 3 4 5 6 7 8
Being a
member of
Hyatt brand
community
makes me feel
good.
People in Hyatt
brand
community
have similar
needs and
priorities.
I am pleased to
be a part of
Hyatt brand
community.
I have passion
for the Hyatt
brand.
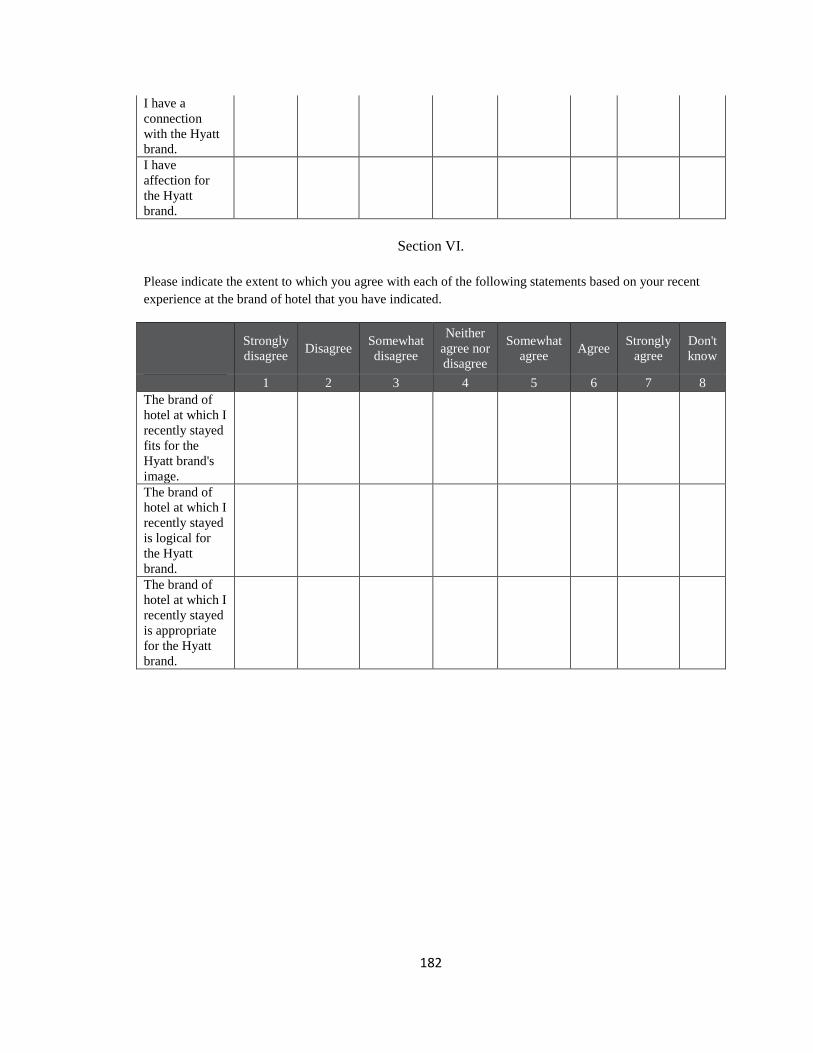
182
I have a
connection
with the Hyatt
brand.
I have
affection for
the Hyatt
brand.
Section VI.
Please indicate the extent to which you agree with each of the following statements based on your recent
experience at the brand of hotel that you have indicated.
Strongly
disagree Disagree
Somewhat
disagree
Neither
agree nor
disagree
Somewhat
agree Agree
Strongly
agree
Don't
know
1 2 3 4 5 6 7 8
The brand of
hotel at which I
recently stayed
fits for the
Hyatt brand's
image.
The brand of
hotel at which I
recently stayed
is logical for
the Hyatt
brand.
The brand of
hotel at which I
recently stayed
is appropriate
for the Hyatt
brand.
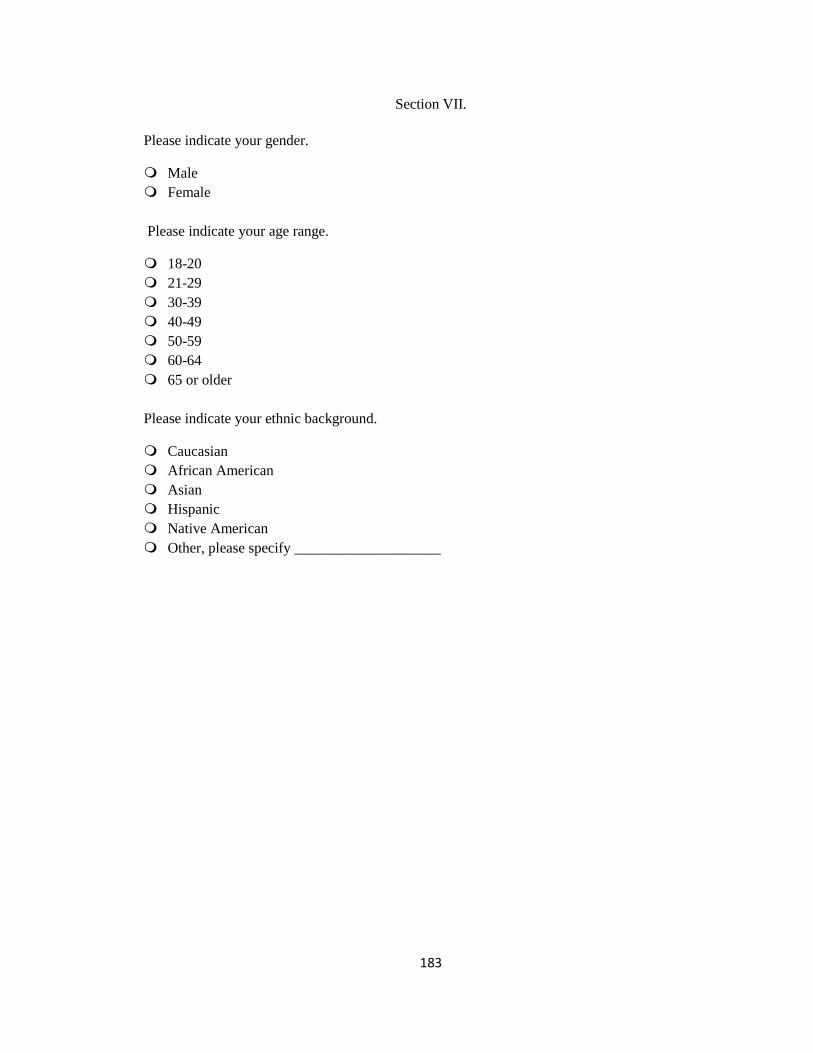
183
Section VII.
Please indicate your gender.
Male
Female
Please indicate your age range.
18-20
21-29
30-39
40-49
50-59
60-64
65 or older
Please indicate your ethnic background.
Caucasian
African American
Asian
Hispanic
Native American
Other, please specify ____________________

184
Please indicate your marital status.
Married
Single
Separated
Divorced
Widowed
Please indicate your annual household income range.
Less than $20,000
$20,000 - $34,999
$35,000 - $49,999
$50,000 - $74,999
$75,000 - $99,999
$100,000 - $149,999
$150,000 - $199,999
$200,000 or more
What is the highest level of education you have completed?
Less than high school degree
High school degree or equivalent
Some college but no degree
Associate degree
Bachelor’s degree
Graduate degree
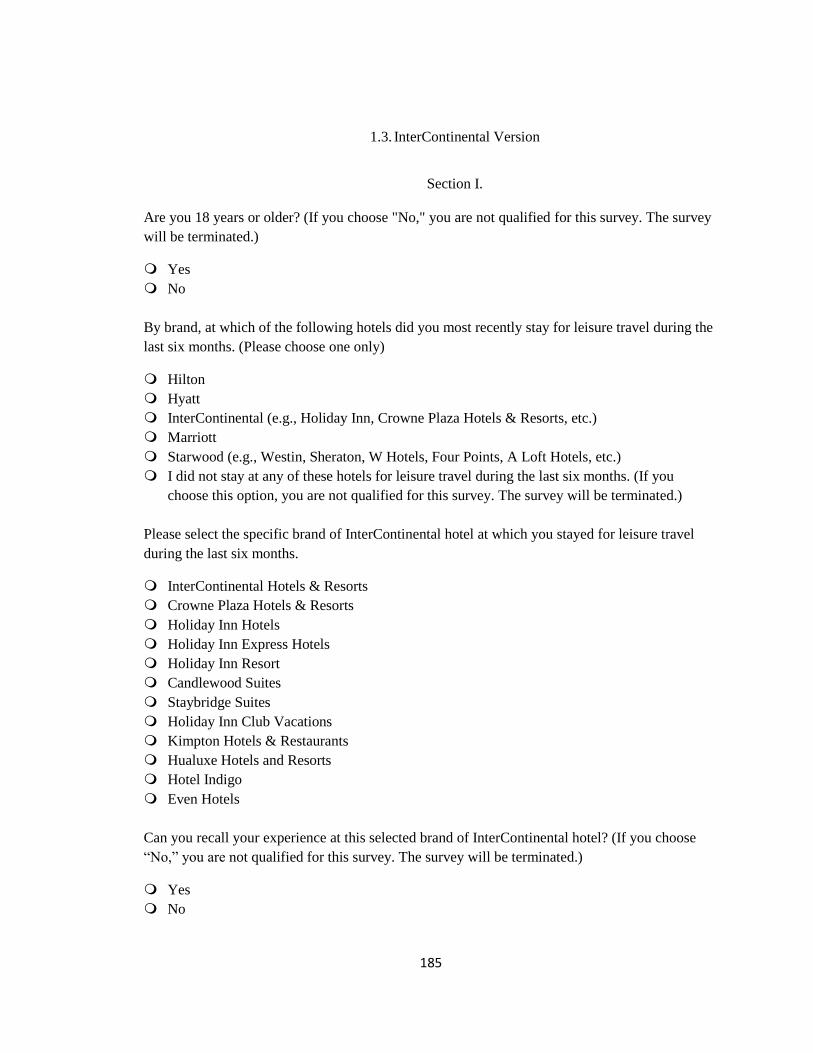
185
1.3. InterContinental Version
Section I.
Are you 18 years or older? (If you choose "No," you are not qualified for this survey. The survey
will be terminated.)
Yes
No
By brand, at which of the following hotels did you most recently stay for leisure travel during the
last six months. (Please choose one only)
Hilton
Hyatt
InterContinental (e.g., Holiday Inn, Crowne Plaza Hotels & Resorts, etc.)
Marriott
Starwood (e.g., Westin, Sheraton, W Hotels, Four Points, A Loft Hotels, etc.)
I did not stay at any of these hotels for leisure travel during the last six months. (If you
choose this option, you are not qualified for this survey. The survey will be terminated.)
Please select the specific brand of InterContinental hotel at which you stayed for leisure travel
during the last six months.
InterContinental Hotels & Resorts
Crowne Plaza Hotels & Resorts
Holiday Inn Hotels
Holiday Inn Express Hotels
Holiday Inn Resort
Candlewood Suites
Staybridge Suites
Holiday Inn Club Vacations
Kimpton Hotels & Restaurants
Hualuxe Hotels and Resorts
Hotel Indigo
Even Hotels
Can you recall your experience at this selected brand of InterContinental hotel? (If you choose
“No,” you are not qualified for this survey. The survey will be terminated.)
Yes
No

186
Were you a member of the IHG Rewards Club program when you stayed at this selected brand of
InterContinental hotel?
Yes
No
Section II.
Please indicate the extent to which you agree with each of the following statements based on your
recent experience at the brand of hotel that you have indicated.
Terrible
Very
Poor Poor Average Good
Very
Good Excellent
Don't
know
1 2 3 4 5 6 7 8
The quality of staff
performance at this brand of
hotel at which I recently
stayed was
The quality of room facilities
at this brand of hotel at which
I recently stayed was
The variety of service at this
brand of hotel at which I
recently stayed was
The efficiency of service at
this brand of hotel at which I
recently stayed was
The atmosphere at this brand
of hotel at which I recently
stayed was
The value for money at this
brand of hotel at which I
recently stayed was
The safety and security at
this brand of hotel at which I
recently stayed were
If you would treat the brand of hotel at which you recently stayed as a person, please indicate
your level of agreement with the following set of human characteristics associated with the brand
of hotel that you have indicated.
Strongly
disagree Disagree
Somewhat
disagree
Neither
agree
nor
disagree
Somewhat
agree Agree
Strongly
agree
Don't
know
1 2 3 4 5 6 7 8
I feel that the
brand of hotel at
187
which I recently
stayed is
sincere.
I feel that the
brand of hotel at
which I recently
stayed is
exciting.
I feel that the
brand of hotel at
which I recently
stayed is
competent.
I feel that the
brand of hotel at
which I recently
stayed is
sophisticated.
I feel that the
brand of hotel at
which I recently
stayed is
rugged.
Which company do you think owns the brand of hotel that you have indicated?
Hilton Worldwide Holdings Inc.
Hyatt Hotels Corporation
InterContinental Hotels Group PLC
Marriott International Inc.
Starwood Hotels and Resorts Worldwide Inc. (A subsidiary of Marriott International Inc.
since September 23rd, 2016)
Section III.
Please indicate the extent to which you agree with each of the following statements based on your
recent experience at the brand of hotel that you have indicated.
I think this brand of hotel at which I recently stayed is:
1 2 3 4 5 6 7
Inferior: Superior
Poor: Excellent
Poor quality: Good quality

188
Please indicate the extent to which you agree with each of the following statements based on your
recent experience at the brand of hotel that you have indicated.
Strongly
disagree Disagree
Somewhat
disagree
Neither
agree
nor
disagree
Somewhat
agree Agree
Strongly
agree
Don't
know
1 2 3 4 5 6 7 8
I feel
comfortable
with the brand
of hotel at
which I
recently stayed.
I feel content
with the brand
of hotel at
which I
recently stayed.
I feel elegant
with the brand
of hotel at
which I
recently stayed.
I feel
entertained
with the brand
of hotel at
which I
recently stayed.
I feel excited
with the brand
of hotel at
which I
recently stayed.
I feel
extravagant
with the brand
of hotel at
which I
recently stayed.
I feel cool with
the brand of
hotel at which I
recently stayed.
I feel important
with the brand
of hotel at
which I
recently stayed.
I feel inspired
with the brand
of hotel at
which I
recently stayed.

189
I feel pampered
with the brand
of hotel at
which I
recently stayed.
I feel practical
with the brand
of hotel at
which I
recently stayed.
I feel relaxed
with the brand
of hotel at
which I
recently stayed.
I feel respected
with the brand
of hotel at
which I
recently stayed.
I feel secure
with the brand
of hotel at
which I
recently stayed.
I feel
sophisticated
with the brand
of hotel at
which I
recently stayed.
I feel welcome
with the brand
of hotel at
which I
recently stayed.
Section IV.
Please indicate the extent to which you agree with each of the following statements based on your recent
experience at the brand of hotel that you have indicated.
Strongly
disagree Disagree
Somewhat
disagree
Neither
agree nor
disagree
Somewhat
agree Agree
Strongly
agree
Don't
know
1 2 3 4 5 6 7 8
I was
satisfied with
this brand of
hotel at which
I recently
stayed.
190
I was pleased
to have
visited this
brand of hotel
at which I
recently
stayed.
I enjoyed
myself at this
brand of hotel
at which I
recently
stayed.
Which parent brand do you think your selected brand of hotel belongs to? Please choose the corresponding
brand logo.
Please indicate the extent to which you agree with each of the following statements based on your recent
experience at the brand of hotel that you have indicated.
Strongly
disagree Disagree
Somewhat
disagree
Neither
agree
nor
disagree
Somewhat
agree Agree
Strongly
agree
Don't
know
1 2 3 4 5 6 7 8
Compared to
other non- InterContinental
hotel brands, the
hotel brand that I
have indicated is
my first choice
for future hotel
191
stays.
I strongly intend
to stay at the
indicated brand of
hotel again.
I would
recommend the
indicated brand of
hotel to other
people.
I would tell other
people positive
things about the
indicated hotel
brand.
Section V.
Please indicate the extent to which you agree with each of the following statements based on your recent
experience at the brand of hotel that you have indicated.
Strongly
disagree Disagree
Somewhat
disagree
Neither
agree
nor
disagree
Somewhat
agree Agree
Strongly
agree
Don't
know
1 2 3 4 5 6 7 8
Being a member
of
InterContinental
brand community
makes me feel
good.
People in
InterContinental
brand community
have similar
needs and
priorities.
I am pleased to
be a part of
InterContinental
brand
community.
I have passion for
the
InterContinental
brand.
I have a
connection with
the
InterContinental
brand.
192
I have affection
for the
InterContinental
brand.
Section VI.
Please indicate the extent to which you agree with each of the following statements based on your recent
experience at the brand of hotel that you have indicated.
Strongly
disagree Disagree
Somewhat
disagree
Neither
agree
nor
disagree
Somewhat
agree Agree
Strongly
agree
Don't
know
1 2 3 4 5 6 7 8
The brand of
hotel at which I
recently stayed
fits for the
InterContinental
brand's image.
The brand of
hotel at which I
recently stayed is
logical for the
InterContinental
brand.
The brand of
hotel at which I
recently stayed is
appropriate for
the
InterContinental
brand.

193
Section VII.
Please indicate your gender.
Male
Female
Please indicate your age range.
18-20
21-29
30-39
40-49
50-59
60-64
65 or older
Please indicate your ethnic background.
Caucasian
African American
Asian
Hispanic
Native American
Other, please specify ____________________

194
Please indicate your marital status.
Married
Single
Separated
Divorced
Widowed
Please indicate your annual household income range.
Less than $20,000
$20,000 - $34,999
$35,000 - $49,999
$50,000 - $74,999
$75,000 - $99,999
$100,000 - $149,999
$150,000 - $199,999
$200,000 or more
What is the highest level of education you have completed?
Less than high school degree
High school degree or equivalent
Some college but no degree
Associate degree
Bachelor’s degree
Graduate degree
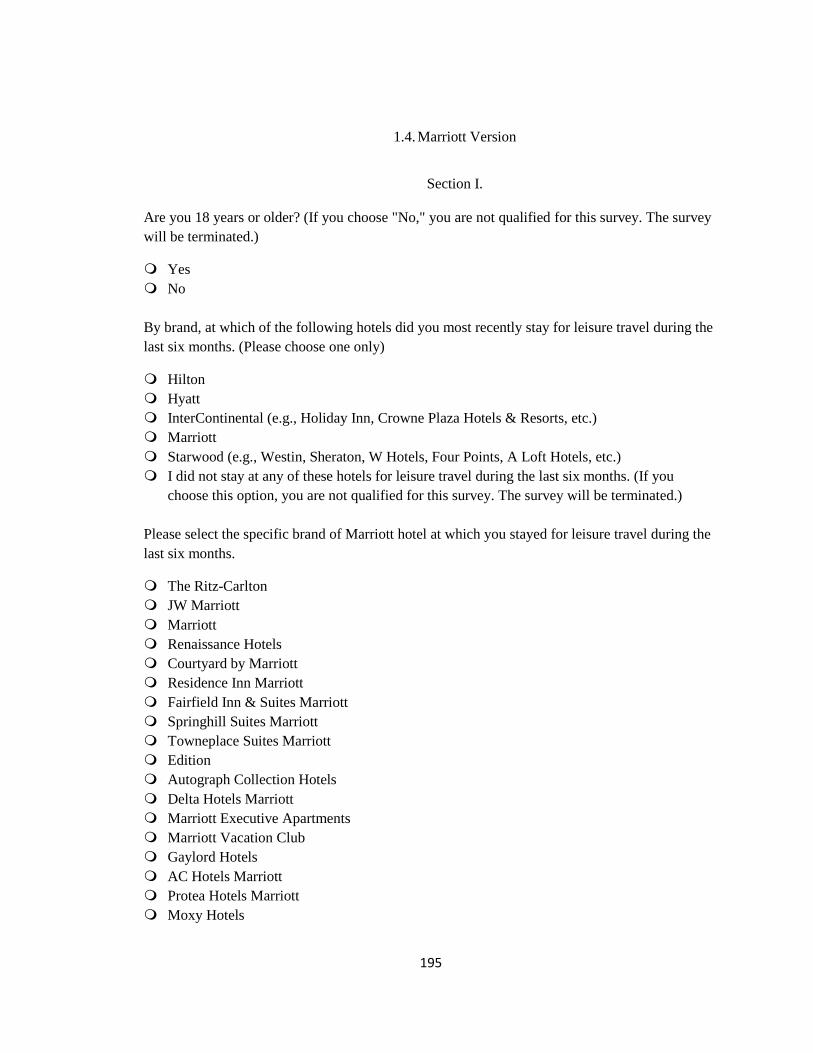
195
1.4. Marriott Version
Section I.
Are you 18 years or older? (If you choose "No," you are not qualified for this survey. The survey
will be terminated.)
Yes
No
By brand, at which of the following hotels did you most recently stay for leisure travel during the
last six months. (Please choose one only)
Hilton
Hyatt
InterContinental (e.g., Holiday Inn, Crowne Plaza Hotels & Resorts, etc.)
Marriott
Starwood (e.g., Westin, Sheraton, W Hotels, Four Points, A Loft Hotels, etc.)
I did not stay at any of these hotels for leisure travel during the last six months. (If you
choose this option, you are not qualified for this survey. The survey will be terminated.)
Please select the specific brand of Marriott hotel at which you stayed for leisure travel during the
last six months.
The Ritz-Carlton
JW Marriott
Marriott
Renaissance Hotels
Courtyard by Marriott
Residence Inn Marriott
Fairfield Inn & Suites Marriott
Springhill Suites Marriott
Towneplace Suites Marriott
Edition
Autograph Collection Hotels
Delta Hotels Marriott
Marriott Executive Apartments
Marriott Vacation Club
Gaylord Hotels
AC Hotels Marriott
Protea Hotels Marriott
Moxy Hotels
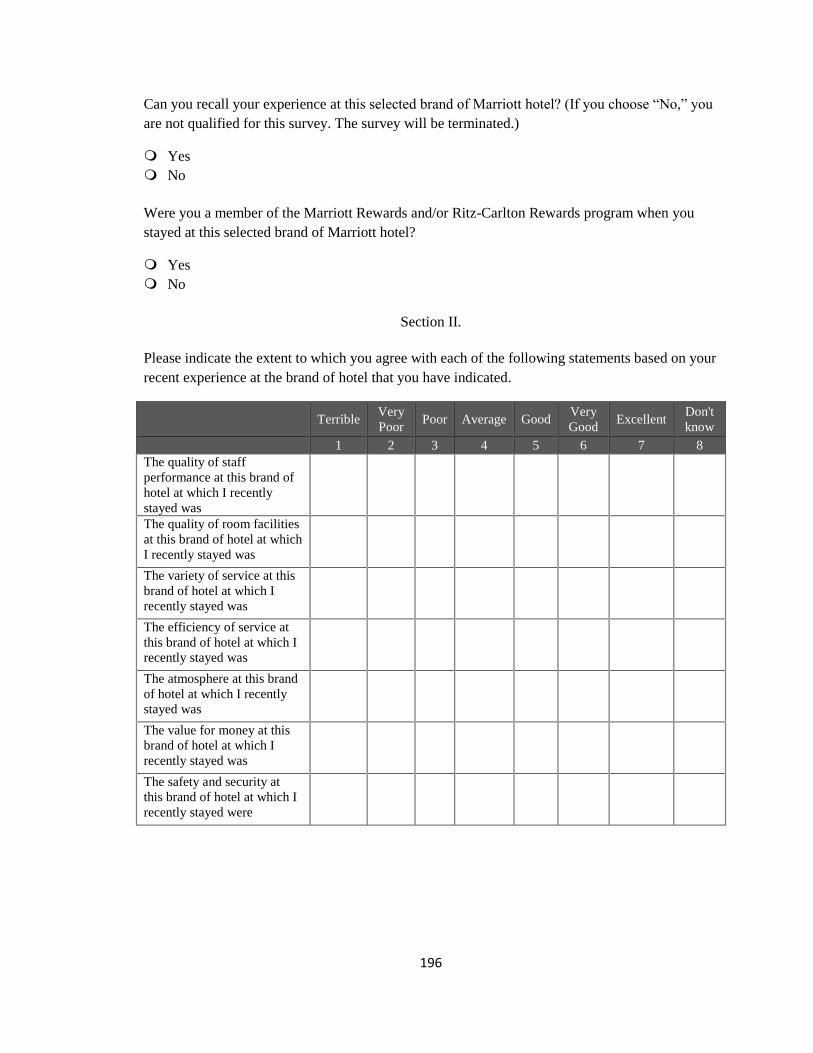
196
Can you recall your experience at this selected brand of Marriott hotel? (If you choose “No,” you
are not qualified for this survey. The survey will be terminated.)
Yes
No
Were you a member of the Marriott Rewards and/or Ritz-Carlton Rewards program when you
stayed at this selected brand of Marriott hotel?
Yes
No
Section II.
Please indicate the extent to which you agree with each of the following statements based on your
recent experience at the brand of hotel that you have indicated.
Terrible
Very
Poor Poor Average Good
Very
Good Excellent
Don't
know
1 2 3 4 5 6 7 8
The quality of staff
performance at this brand of
hotel at which I recently
stayed was
The quality of room facilities
at this brand of hotel at which
I recently stayed was
The variety of service at this
brand of hotel at which I
recently stayed was
The efficiency of service at
this brand of hotel at which I
recently stayed was
The atmosphere at this brand
of hotel at which I recently
stayed was
The value for money at this
brand of hotel at which I
recently stayed was
The safety and security at
this brand of hotel at which I
recently stayed were
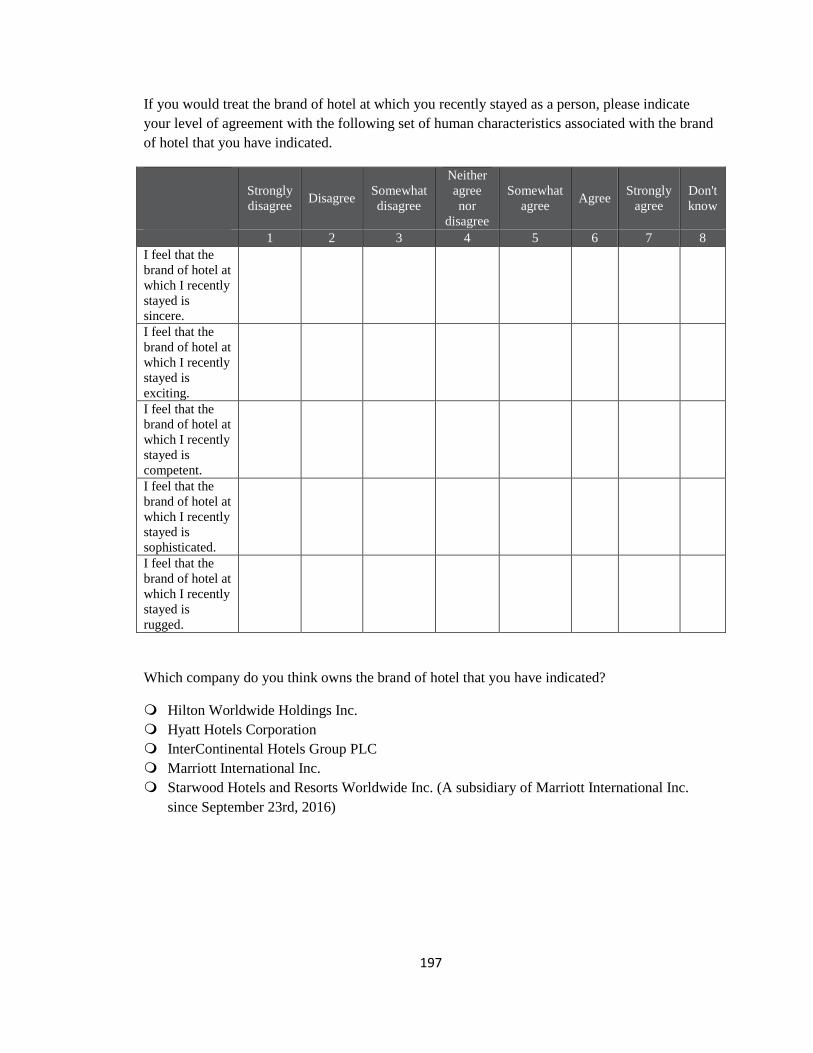
197
If you would treat the brand of hotel at which you recently stayed as a person, please indicate
your level of agreement with the following set of human characteristics associated with the brand
of hotel that you have indicated.
Strongly
disagree Disagree
Somewhat
disagree
Neither
agree
nor
disagree
Somewhat
agree Agree
Strongly
agree
Don't
know
1 2 3 4 5 6 7 8
I feel that the
brand of hotel at
which I recently
stayed is
sincere.
I feel that the
brand of hotel at
which I recently
stayed is
exciting.
I feel that the
brand of hotel at
which I recently
stayed is
competent.
I feel that the
brand of hotel at
which I recently
stayed is
sophisticated.
I feel that the
brand of hotel at
which I recently
stayed is
rugged.
Which company do you think owns the brand of hotel that you have indicated?
Hilton Worldwide Holdings Inc.
Hyatt Hotels Corporation
InterContinental Hotels Group PLC
Marriott International Inc.
Starwood Hotels and Resorts Worldwide Inc. (A subsidiary of Marriott International Inc.
since September 23rd, 2016)
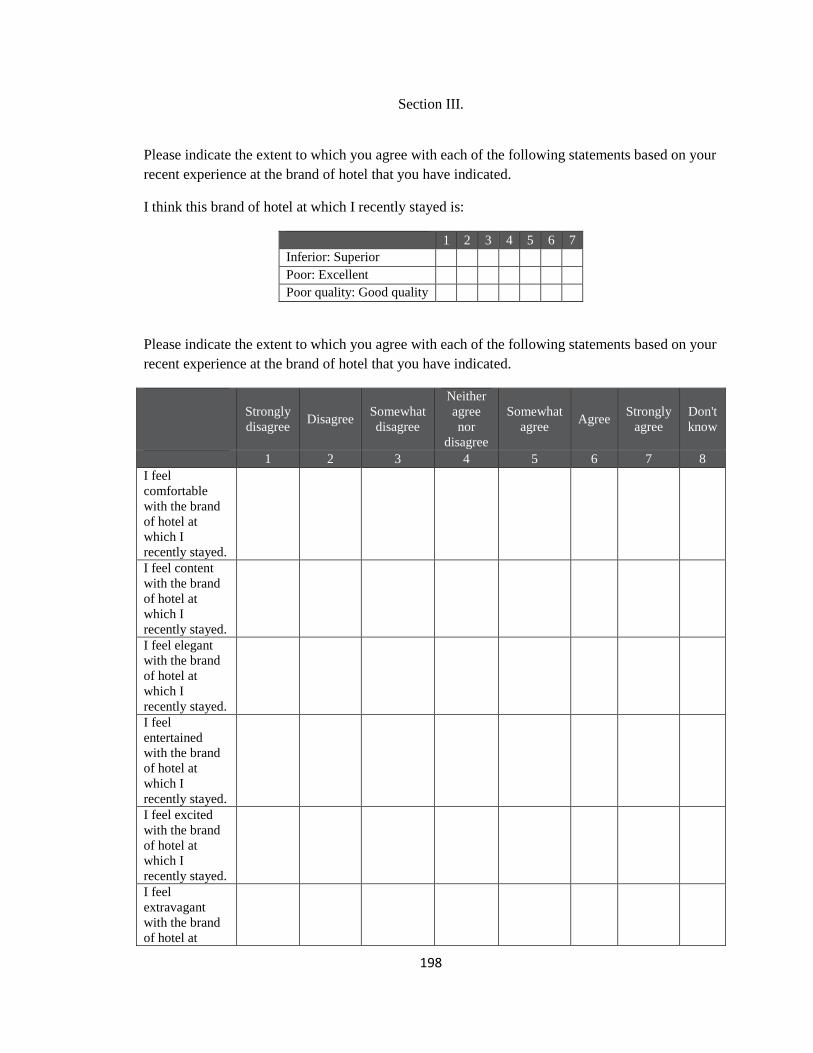
198
Section III.
Please indicate the extent to which you agree with each of the following statements based on your
recent experience at the brand of hotel that you have indicated.
I think this brand of hotel at which I recently stayed is:
1 2 3 4 5 6 7
Inferior: Superior
Poor: Excellent
Poor quality: Good quality
Please indicate the extent to which you agree with each of the following statements based on your
recent experience at the brand of hotel that you have indicated.
Strongly
disagree Disagree
Somewhat
disagree
Neither
agree
nor
disagree
Somewhat
agree Agree
Strongly
agree
Don't
know
1 2 3 4 5 6 7 8
I feel
comfortable
with the brand
of hotel at
which I
recently stayed.
I feel content
with the brand
of hotel at
which I
recently stayed.
I feel elegant
with the brand
of hotel at
which I
recently stayed.
I feel
entertained
with the brand
of hotel at
which I
recently stayed.
I feel excited
with the brand
of hotel at
which I
recently stayed.
I feel
extravagant
with the brand
of hotel at
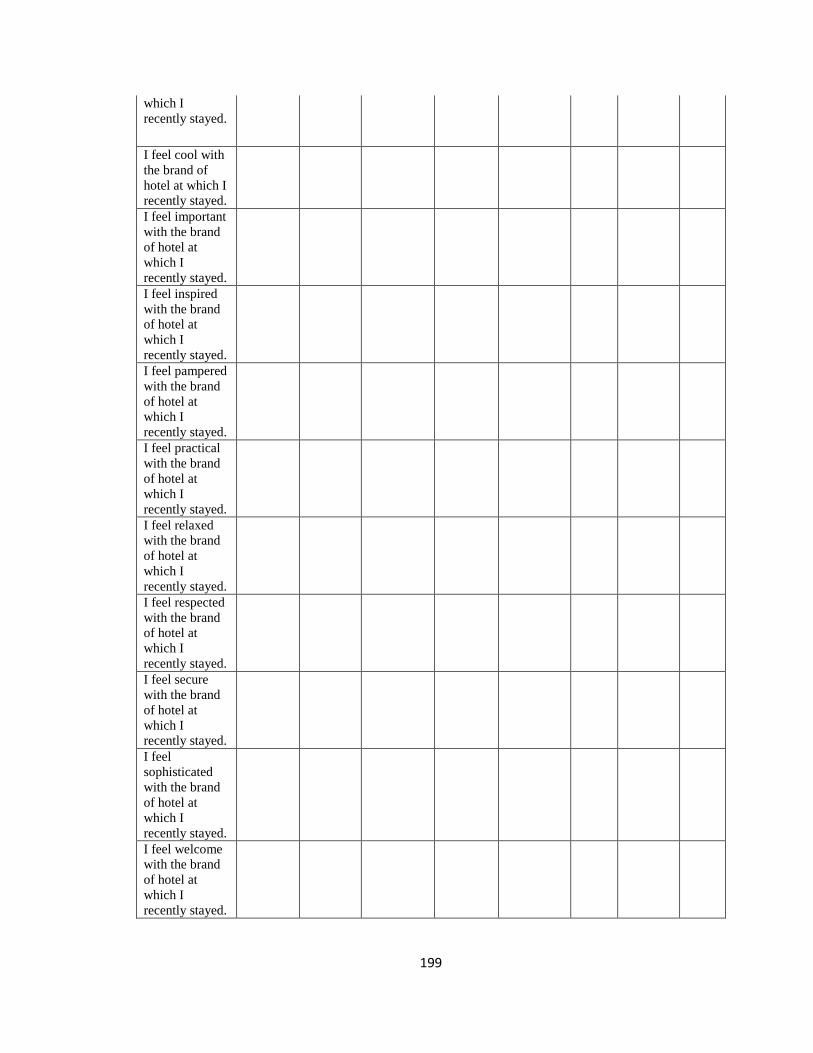
199
which I
recently stayed.
I feel cool with
the brand of
hotel at which I
recently stayed.
I feel important
with the brand
of hotel at
which I
recently stayed.
I feel inspired
with the brand
of hotel at
which I
recently stayed.
I feel pampered
with the brand
of hotel at
which I
recently stayed.
I feel practical
with the brand
of hotel at
which I
recently stayed.
I feel relaxed
with the brand
of hotel at
which I
recently stayed.
I feel respected
with the brand
of hotel at
which I
recently stayed.
I feel secure
with the brand
of hotel at
which I
recently stayed.
I feel
sophisticated
with the brand
of hotel at
which I
recently stayed.
I feel welcome
with the brand
of hotel at
which I
recently stayed.
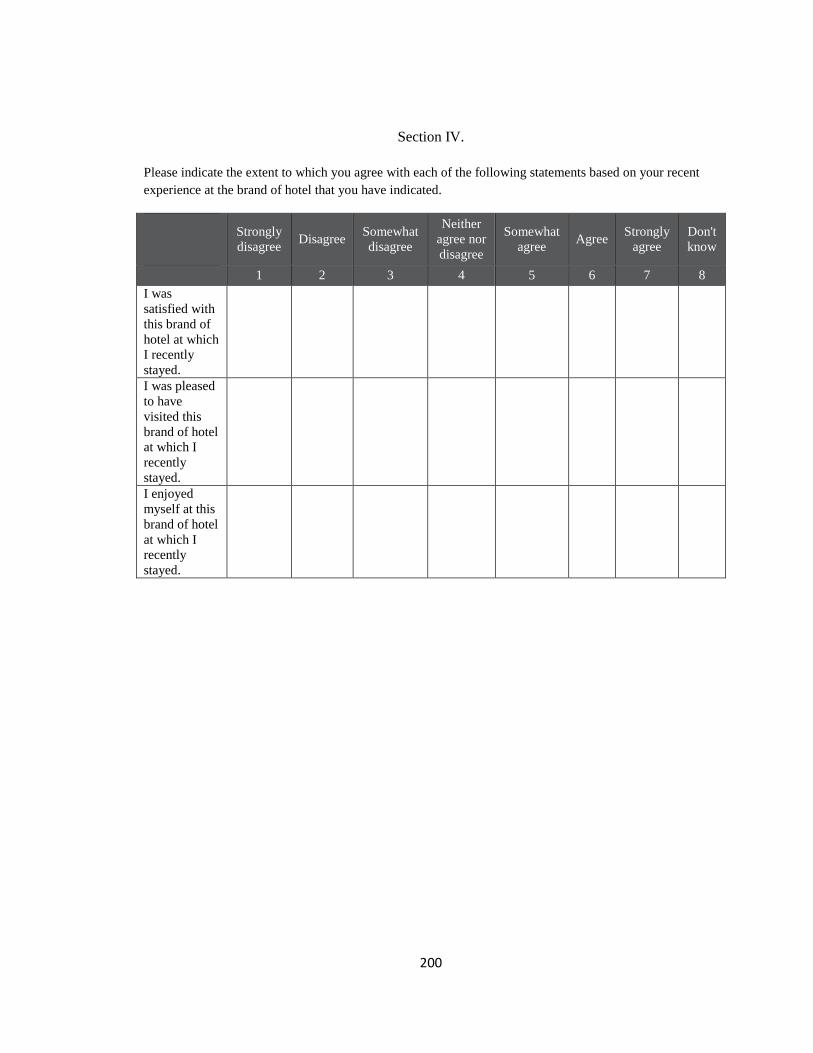
200
Section IV.
Please indicate the extent to which you agree with each of the following statements based on your recent
experience at the brand of hotel that you have indicated.
Strongly
disagree Disagree
Somewhat
disagree
Neither
agree nor
disagree
Somewhat
agree Agree
Strongly
agree
Don't
know
1 2 3 4 5 6 7 8
I was
satisfied with
this brand of
hotel at which
I recently
stayed.
I was pleased
to have
visited this
brand of hotel
at which I
recently
stayed.
I enjoyed
myself at this
brand of hotel
at which I
recently
stayed.

201
Which parent brand do you think your selected brand of hotel belongs to? Please choose the corresponding
brand logo.
Please indicate the extent to which you agree with each of the following statements based on your recent
experience at the brand of hotel that you have indicated.
Strongly
disagree Disagree
Somewhat
disagree
Neither
agree
nor
disagree
Somewhat
agree Agree
Strongly
agree
Don't
know
1 2 3 4 5 6 7 8
Compared to
other non- Marriott hotel
brands, the hotel
brand that I
have indicated
is my first
choice for future
hotel stays.
I strongly intend
to stay at the
indicated brand
of hotel again.
I would
recommend the
indicated brand
of hotel to other
people.
I would tell
other people
positive things
about the
indicated hotel
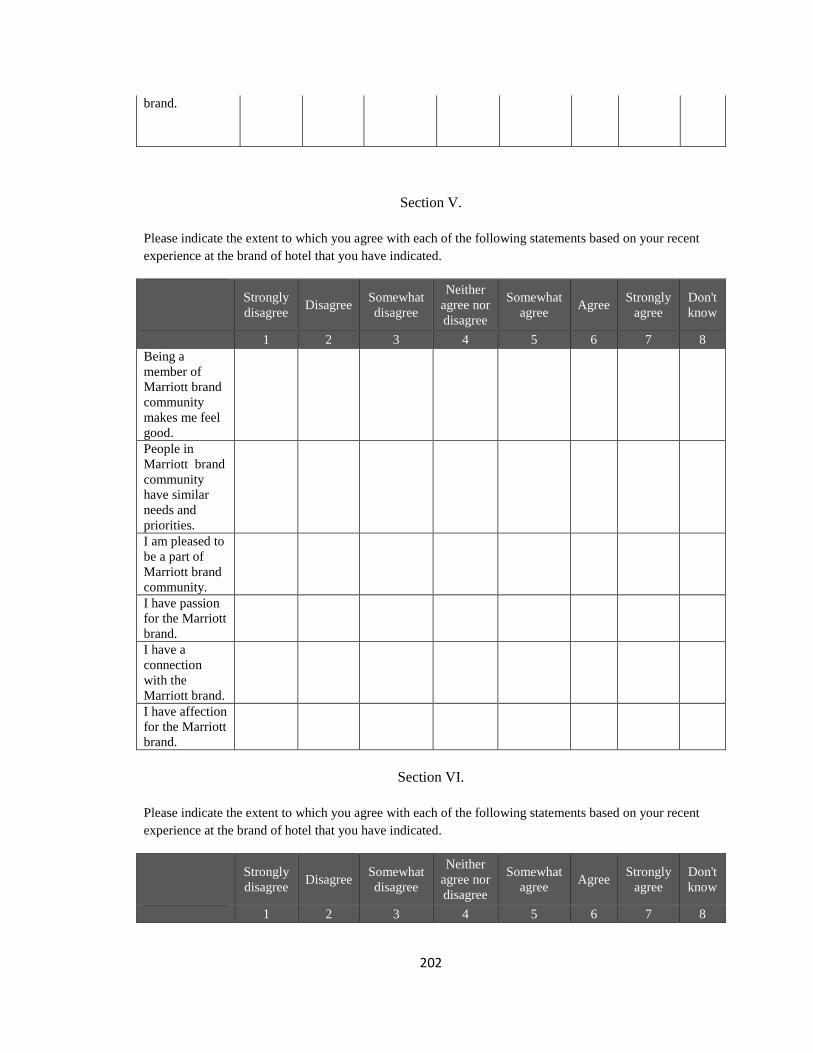
202
brand.
Section V.
Please indicate the extent to which you agree with each of the following statements based on your recent
experience at the brand of hotel that you have indicated.
Strongly
disagree Disagree
Somewhat
disagree
Neither
agree nor
disagree
Somewhat
agree Agree
Strongly
agree
Don't
know
1 2 3 4 5 6 7 8
Being a
member of
Marriott brand
community
makes me feel
good.
People in Marriott brand
community
have similar
needs and
priorities.
I am pleased to
be a part of
Marriott brand
community.
I have passion
for the Marriott
brand.
I have a
connection
with the
Marriott brand.
I have affection
for the Marriott
brand.
Section VI.
Please indicate the extent to which you agree with each of the following statements based on your recent
experience at the brand of hotel that you have indicated.
Strongly
disagree Disagree
Somewhat
disagree
Neither
agree nor
disagree
Somewhat
agree Agree
Strongly
agree
Don't
know
1 2 3 4 5 6 7 8
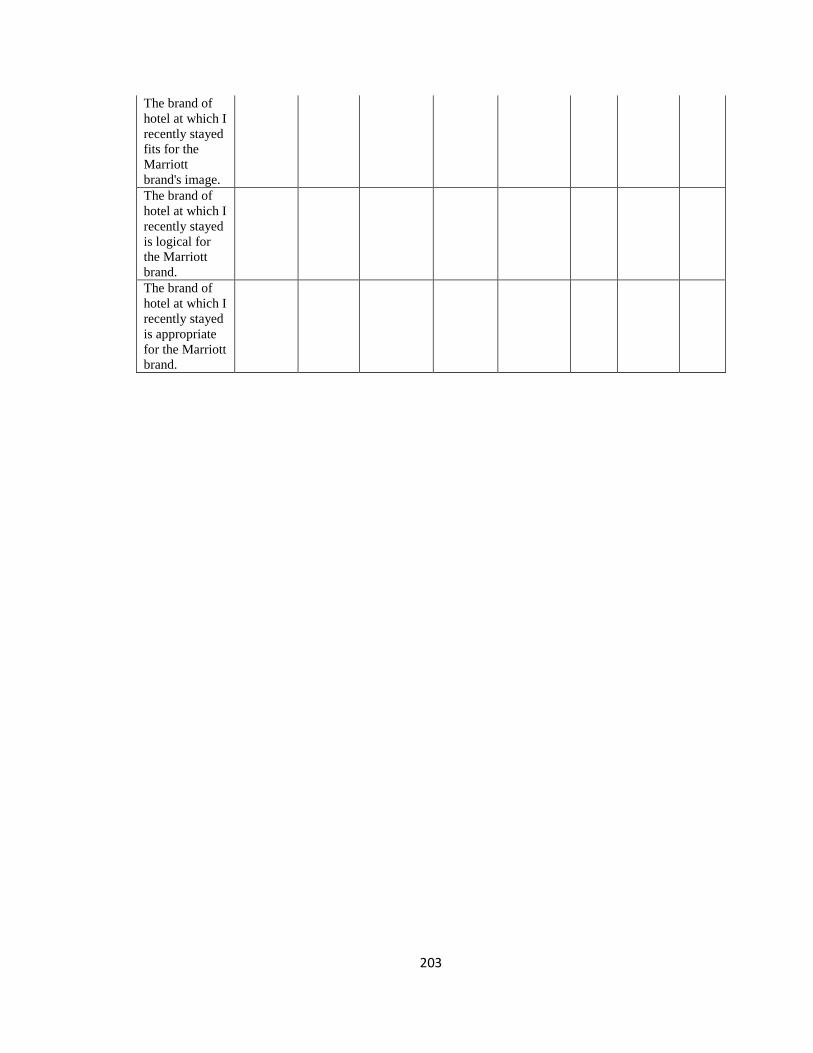
203
The brand of
hotel at which I
recently stayed
fits for the
Marriott
brand's image.
The brand of
hotel at which I
recently stayed
is logical for
the Marriott
brand.
The brand of
hotel at which I
recently stayed
is appropriate
for the Marriott
brand.

204
Section VII.
Please indicate your gender.
Male
Female
Please indicate your age range.
18-20
21-29
30-39
40-49
50-59
60-64
65 or older
Please indicate your ethnic background.
Caucasian
African American
Asian
Hispanic
Native American
Other, please specify ____________________
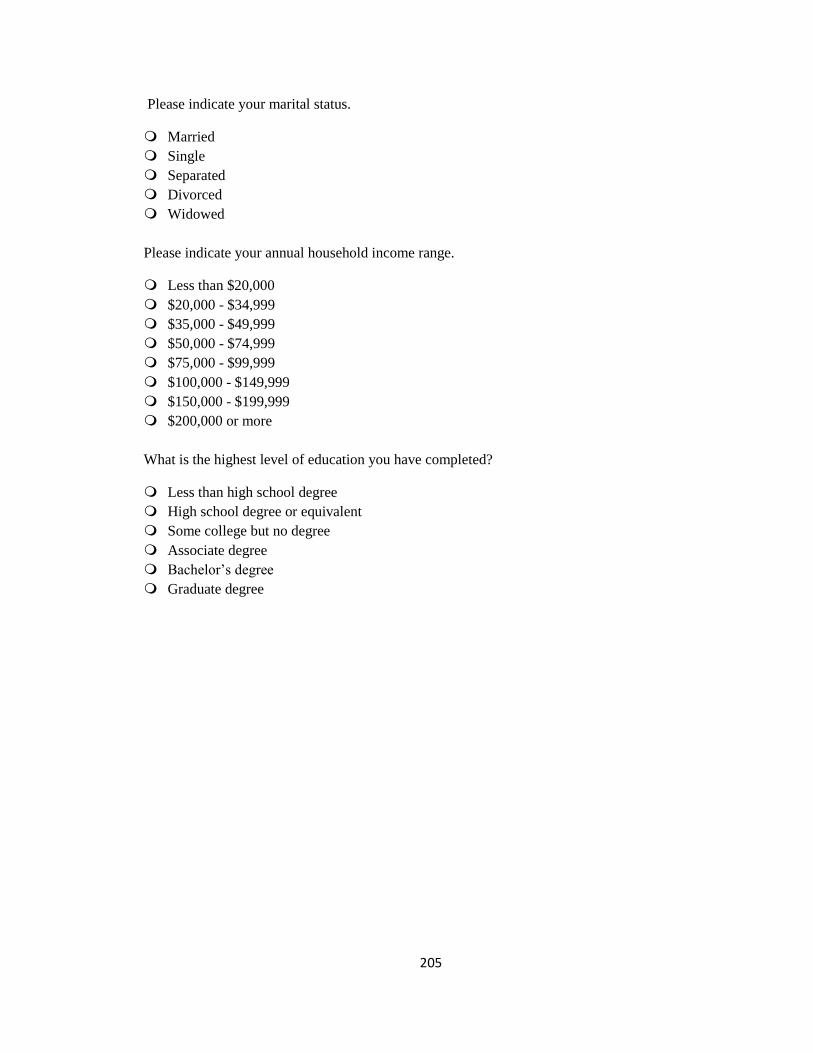
205
Please indicate your marital status.
Married
Single
Separated
Divorced
Widowed
Please indicate your annual household income range.
Less than $20,000
$20,000 - $34,999
$35,000 - $49,999
$50,000 - $74,999
$75,000 - $99,999
$100,000 - $149,999
$150,000 - $199,999
$200,000 or more
What is the highest level of education you have completed?
Less than high school degree
High school degree or equivalent
Some college but no degree
Associate degree
Bachelor’s degree
Graduate degree
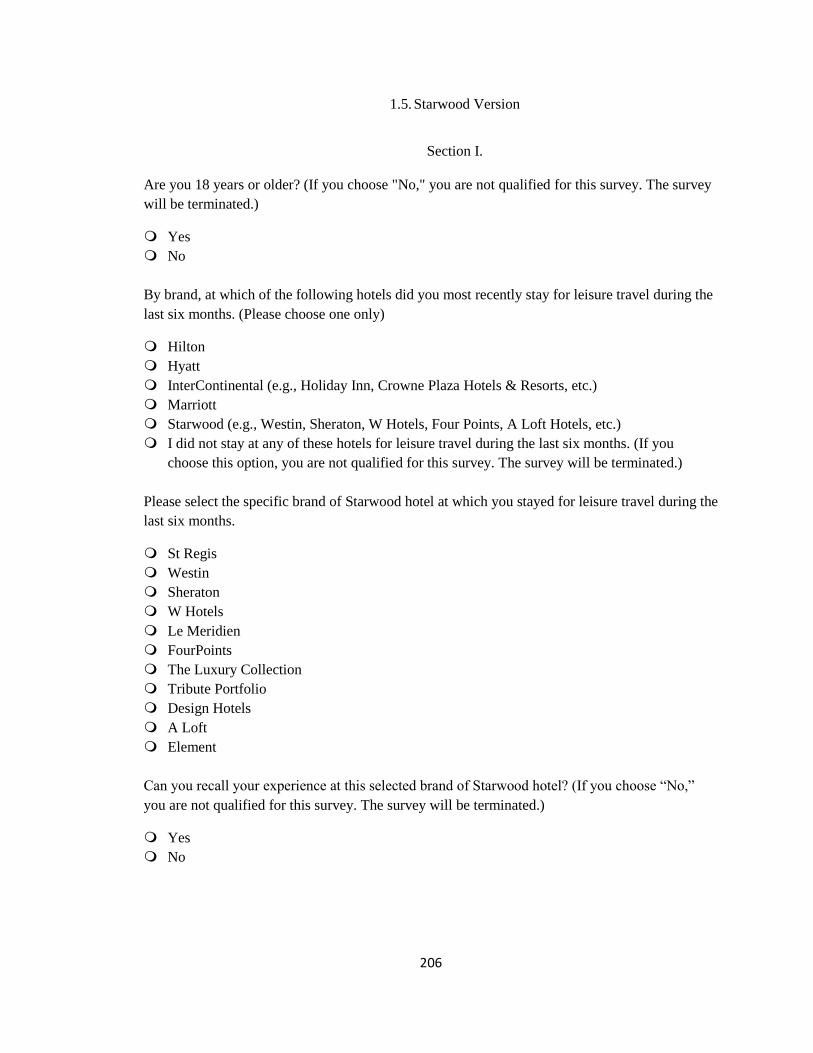
206
1.5. Starwood Version
Section I.
Are you 18 years or older? (If you choose "No," you are not qualified for this survey. The survey
will be terminated.)
Yes
No
By brand, at which of the following hotels did you most recently stay for leisure travel during the
last six months. (Please choose one only)
Hilton
Hyatt
InterContinental (e.g., Holiday Inn, Crowne Plaza Hotels & Resorts, etc.)
Marriott
Starwood (e.g., Westin, Sheraton, W Hotels, Four Points, A Loft Hotels, etc.)
I did not stay at any of these hotels for leisure travel during the last six months. (If you
choose this option, you are not qualified for this survey. The survey will be terminated.)
Please select the specific brand of Starwood hotel at which you stayed for leisure travel during the
last six months.
St Regis
Westin
Sheraton
W Hotels
Le Meridien
FourPoints
The Luxury Collection
Tribute Portfolio
Design Hotels
A Loft
Element
Can you recall your experience at this selected brand of Starwood hotel? (If you choose “No,”
you are not qualified for this survey. The survey will be terminated.)
Yes
No
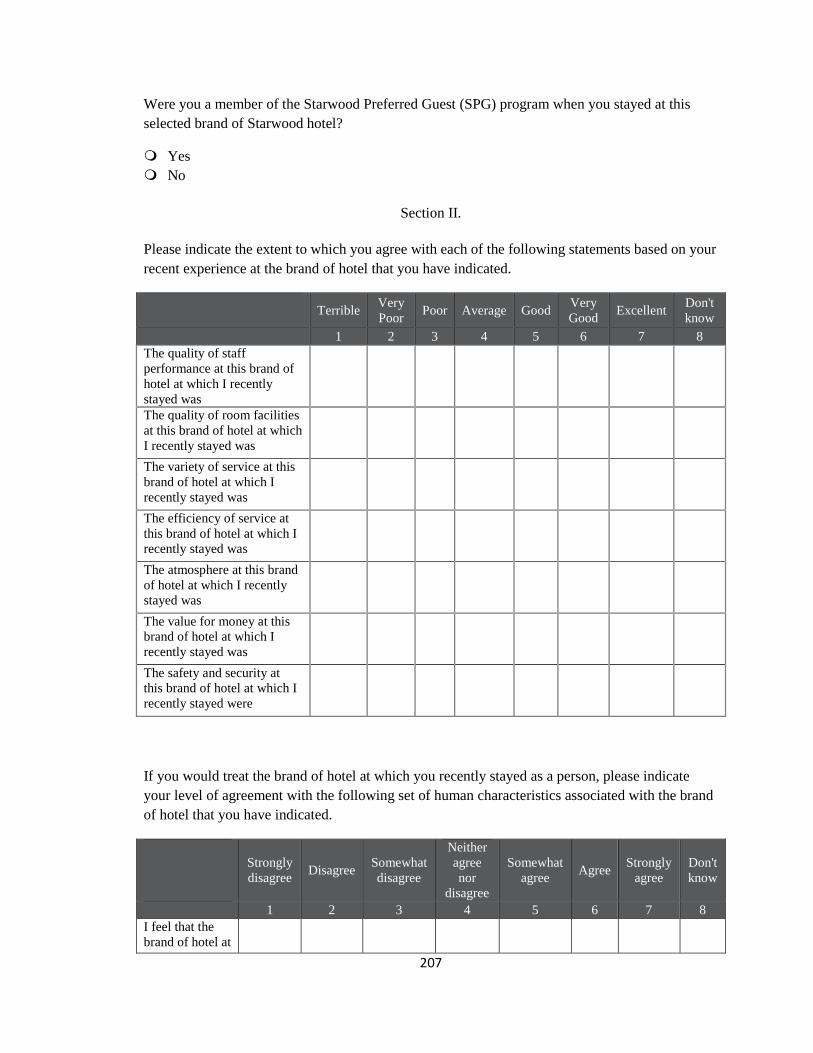
207
Were you a member of the Starwood Preferred Guest (SPG) program when you stayed at this
selected brand of Starwood hotel?
Yes
No
Section II.
Please indicate the extent to which you agree with each of the following statements based on your
recent experience at the brand of hotel that you have indicated.
Terrible
Very
Poor Poor Average Good
Very
Good Excellent
Don't
know
1 2 3 4 5 6 7 8
The quality of staff
performance at this brand of
hotel at which I recently
stayed was
The quality of room facilities
at this brand of hotel at which
I recently stayed was
The variety of service at this
brand of hotel at which I
recently stayed was
The efficiency of service at
this brand of hotel at which I
recently stayed was
The atmosphere at this brand
of hotel at which I recently
stayed was
The value for money at this
brand of hotel at which I
recently stayed was
The safety and security at
this brand of hotel at which I
recently stayed were
If you would treat the brand of hotel at which you recently stayed as a person, please indicate
your level of agreement with the following set of human characteristics associated with the brand
of hotel that you have indicated.
Strongly
disagree Disagree
Somewhat
disagree
Neither
agree
nor
disagree
Somewhat
agree Agree
Strongly
agree
Don't
know
1 2 3 4 5 6 7 8
I feel that the
brand of hotel at
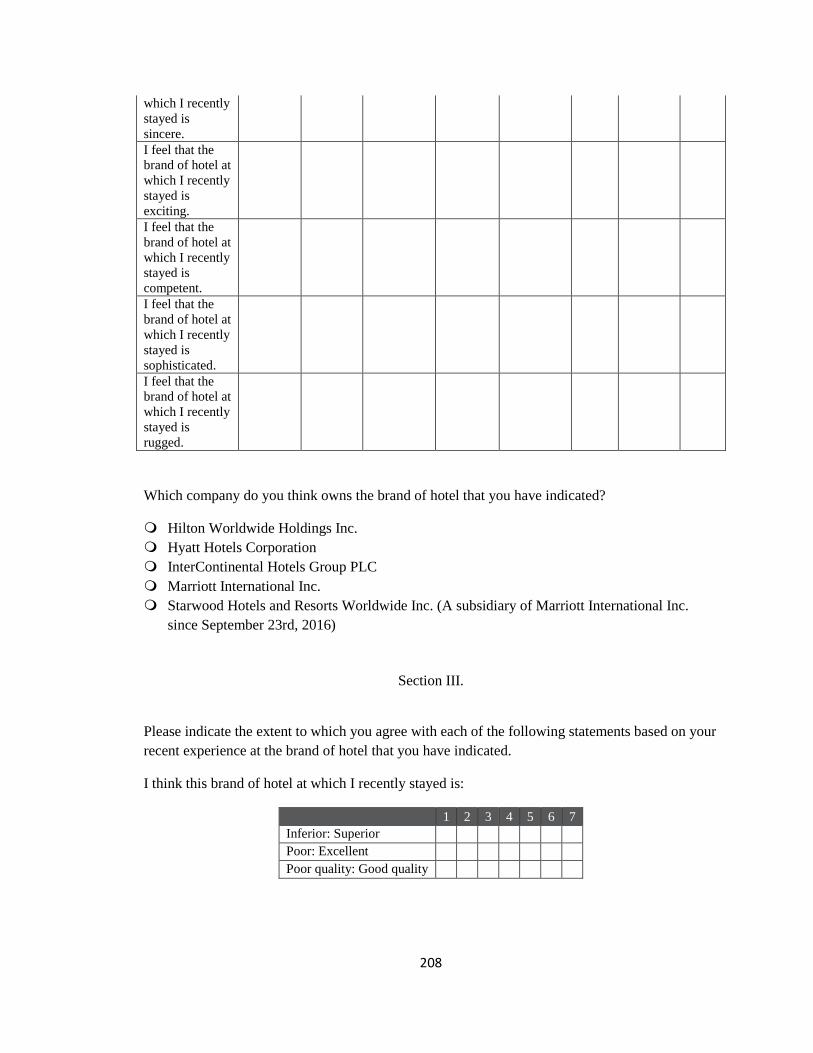
208
which I recently
stayed is
sincere.
I feel that the
brand of hotel at
which I recently
stayed is
exciting.
I feel that the
brand of hotel at
which I recently
stayed is
competent.
I feel that the
brand of hotel at
which I recently
stayed is
sophisticated.
I feel that the
brand of hotel at
which I recently
stayed is
rugged.
Which company do you think owns the brand of hotel that you have indicated?
Hilton Worldwide Holdings Inc.
Hyatt Hotels Corporation
InterContinental Hotels Group PLC
Marriott International Inc.
Starwood Hotels and Resorts Worldwide Inc. (A subsidiary of Marriott International Inc.
since September 23rd, 2016)
Section III.
Please indicate the extent to which you agree with each of the following statements based on your
recent experience at the brand of hotel that you have indicated.
I think this brand of hotel at which I recently stayed is:
1 2 3 4 5 6 7
Inferior: Superior
Poor: Excellent
Poor quality: Good quality
209
Please indicate the extent to which you agree with each of the following statements based on your
recent experience at the brand of hotel that you have indicated.
Strongly
disagree Disagree
Somewhat
disagree
Neither
agree
nor
disagree
Somewhat
agree Agree
Strongly
agree
Don't
know
1 2 3 4 5 6 7 8
I feel
comfortable
with the brand
of hotel at
which I
recently stayed.
I feel content
with the brand
of hotel at
which I
recently stayed.
I feel elegant
with the brand
of hotel at
which I
recently stayed.
I feel
entertained
with the brand
of hotel at
which I
recently stayed.
I feel excited
with the brand
of hotel at
which I
recently stayed.
I feel
extravagant
with the brand
of hotel at
which I
recently stayed.
I feel cool with
the brand of
hotel at which I
recently stayed.
I feel important
with the brand
of hotel at
which I
recently stayed.
I feel inspired
with the brand
of hotel at
which I
recently stayed.
210
I feel pampered
with the brand
of hotel at
which I
recently stayed.
I feel practical
with the brand
of hotel at
which I
recently stayed.
I feel relaxed
with the brand
of hotel at
which I
recently stayed.
I feel respected
with the brand
of hotel at
which I
recently stayed.
I feel secure
with the brand
of hotel at
which I
recently stayed.
I feel
sophisticated
with the brand
of hotel at
which I
recently stayed.
I feel welcome
with the brand
of hotel at
which I
recently stayed.
Section IV.
Please indicate the extent to which you agree with each of the following statements based on your recent
experience at the brand of hotel that you have indicated.
Strongly
disagree Disagree
Somewhat
disagree
Neither
agree nor
disagree
Somewhat
agree Agree
Strongly
agree
Don't
know
1 2 3 4 5 6 7 8
I was
satisfied with
this brand of
hotel at which
I recently
stayed.
211
I was pleased
to have
visited this
brand of hotel
at which I
recently
stayed.
I enjoyed
myself at this
brand of hotel
at which I
recently
stayed.
Which parent brand do you think your selected brand of hotel belongs to? Please choose the corresponding
brand logo.
Please indicate the extent to which you agree with each of the following statements based on your recent
experience at the brand of hotel that you have indicated.
Strongly
disagree Disagree
Somewhat
disagree
Neither
agree
nor
disagree
Somewhat
agree Agree
Strongly
agree
Don't
know
1 2 3 4 5 6 7 8
Compared to
other non-
Starwood hotel
brands, the hotel
brand that I
have indicated
is my first
choice for future
212
hotel stays.
I strongly intend
to stay at the
indicated brand
of hotel again.
I would
recommend the
indicated brand
of hotel to other
people.
I would tell
other people
positive things
about the
indicated hotel
brand.
Section V.
Please indicate the extent to which you agree with each of the following statements based on your recent
experience at the brand of hotel that you have indicated.
Strongly
disagree Disagree
Somewhat
disagree
Neither
agree nor
disagree
Somewhat
agree Agree
Strongly
agree
Don't
know
1 2 3 4 5 6 7 8
Being a
member of
Starwood
brand
community
makes me feel
good.
People in Starwood
brand
community
have similar
needs and
priorities.
I am pleased to
be a part of
Starwood
brand
community.
I have passion
for the
Starwood
brand.
213
I have a
connection
with the
Starwood
brand.
I have affection
for the
Starwood
brand.
Section VI.
Please indicate the extent to which you agree with each of the following statements based on your recent
experience at the brand of hotel that you have indicated.
Strongly
disagree Disagree
Somewhat
disagree
Neither
agree nor
disagree
Somewhat
agree Agree
Strongly
agree
Don't
know
1 2 3 4 5 6 7 8
The brand of
hotel at which I
recently stayed
fits for the
Starwood
brand's image.
The brand of
hotel at which I
recently stayed
is logical for
the Starwood
brand.
The brand of
hotel at which I
recently stayed
is appropriate
for the
Starwood
brand.

214
Section VII.
Please indicate your gender.
Male
Female
Please indicate your age range.
18-20
21-29
30-39
40-49
50-59
60-64
65 or older
Please indicate your ethnic background.
Caucasian
African American
Asian
Hispanic
Native American
Other, please specify ____________________

215
Please indicate your marital status.
Married
Single
Separated
Divorced
Widowed
Please indicate your annual household income range.
Less than $20,000
$20,000 - $34,999
$35,000 - $49,999
$50,000 - $74,999
$75,000 - $99,999
$100,000 - $149,999
$150,000 - $199,999
$200,000 or more
What is the highest level of education you have completed?
Less than high school degree
High school degree or equivalent
Some college but no degree
Associate degree
Bachelor’s degree
Graduate degree
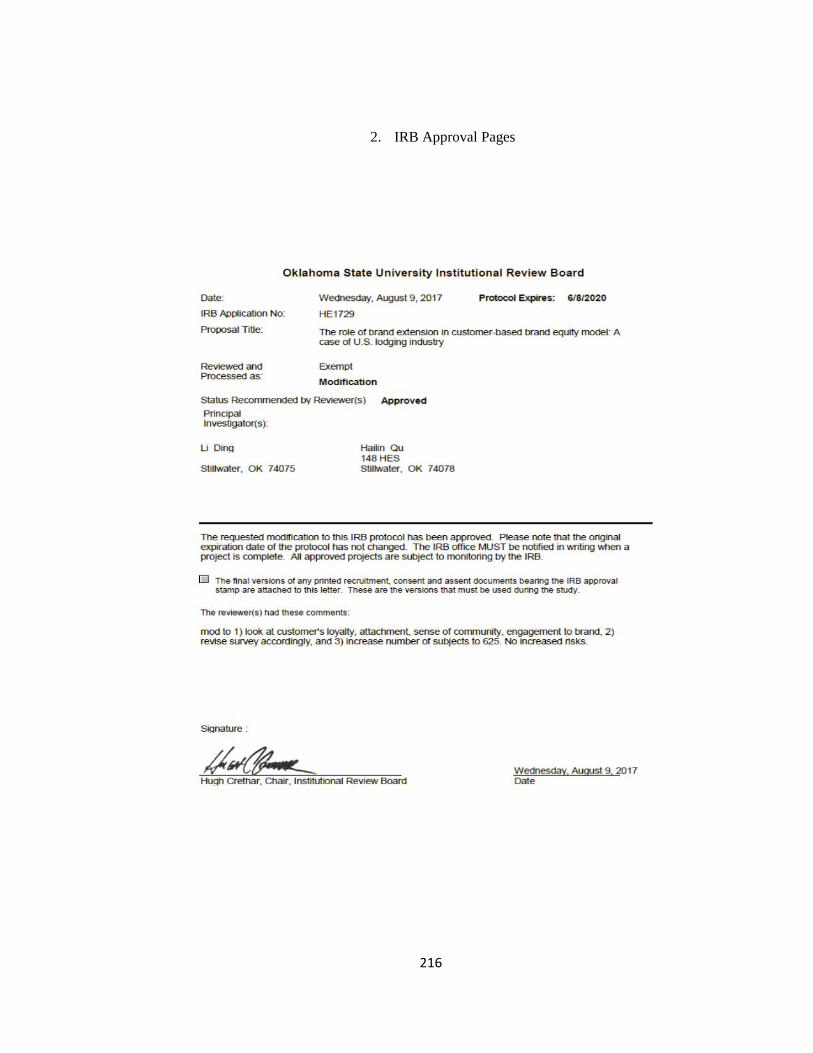
216
2. IRB Approval Pages
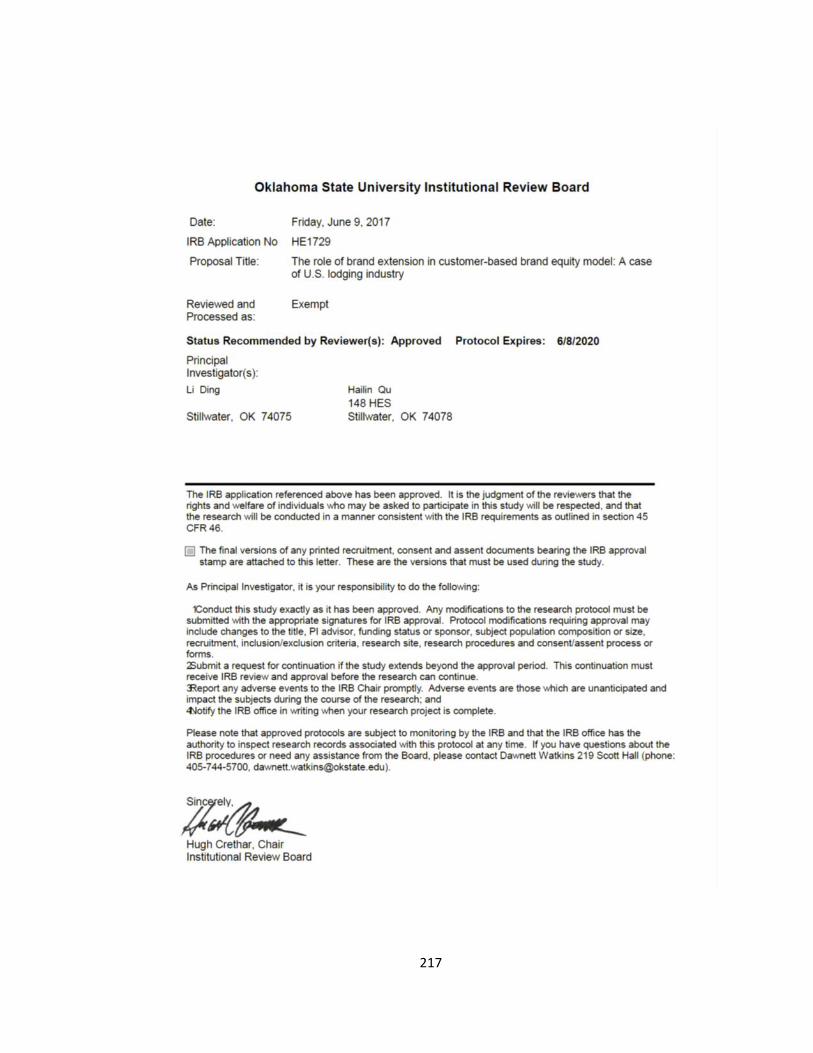
217
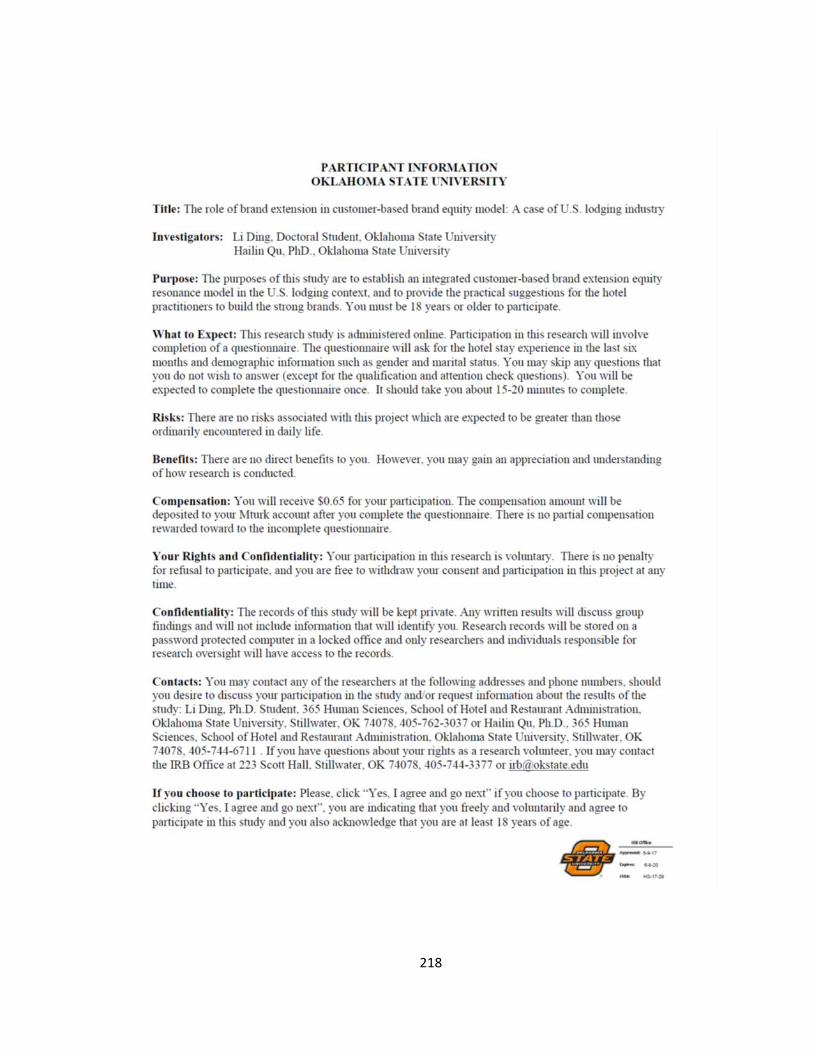
218
VITA
Li Ding
Candidate for the Degree of
Doctor of Philosophy
Thesis: BRAND EXTENSION IN CUSTOMER-BASED BRAND EQUITY MODEL:
A CASE OF U.S. LODGING INDUSTRY
Major Field: HUMAN SCIENCE
Biographical:
Education:
Completed the requirements for the Doctor of Philosophy in Human Science at
Oklahoma State University, Stillwater, Oklahoma in May, 2018.
Completed the requirements for the Master of Arts in Economics at Clemson
University, Clemson, South Carolina, U.S.A. in 2011.
Completed the requirements for the Master of Arts in Economics at University
of Missouri, Columbia, Missouri, U.S.A. in 2008.
Completed the requirements for the Bachelor in Economics at Tianjin
University of Finance and Economics, Tianjin, China in 2005.
Experience:
Instructor (2016-2017) at Oklahoma State University; Graduate Teaching and
Research Assistant (2013-2018) at Oklahoma State University; Graduate
Research Assistant (2009-2011) at Clemson University; 2014 TOSOK
International Tourism Conference.
Professional Memberships:
Level II Candidate of Chartered Financial Analyst Program (2018); Hospitality
Financial and Technology Professionals (2018-present); American
Economic Association (2015-present); American Finance Association
(2015-present); International Council on Hotel, Restaurant, and
Institutional Education (2014)


