Embed Size (px)
Citation preview
http://iaeme.com/Home/journal/IJM 548 [email protected]
International Journal of Management (IJM) Volume 11, Issue 10, October 2020, pp. 548-560, Article ID: IJM_11_10_052 Available online at http://iaeme.com/Home/issue/IJM?Volume=11&Issue=10 ISSN Print: 0976-6502 and ISSN Online: 0976-6510 DOI 10.34218/IJM.11.10.2020.052 :
© IAEME Publication Indexed Scopus
BRAND ATTITUDE MEASUREMENT USING THE TRI-PARTITE MODEL OF ATTITUDE AND
EVALUATING ITS RELATIONSHIP TO CUSTOMER SATISFACTION STUDY – OF A
HYPERMARKET BRAND IN UAE Saju Eapen Thomas
Ph.D., Department Chair Marketing, City University College Ajman (CUCA), UAE - United Arab Emirates
ABSTRACT Through this study, the author attempts to evaluate shoppers' brand attitudes
toward a permarket brand and establish the linkages between customer attitude sutowards a brand and customer satisfaction. This article is an exploratory work where the researcher uses the tripartite-model of attitude to measure brand attitudes. Here, brand attitude takes the role of the primary construct, with three additional constructs,
brand beliefs (the cognitive component), brand feelings (affective component), and brand purchase intention (the behavioral part) form the three parts. The study used a s questionnaire-based survey, and developing the questionnaire, which included a tri-component attitude scale, were the primary tasks. The Scale developed had 11 items in total comprising of the cognitive, affective, and behavioral components. The author carried out SEM path analysis on the data collected. The study could establish the
relationship between brand attitude and customer satisfaction reinforcing similar findings by other researchers. The study findings corroborate the tri-partite model's
diagnostic capabilities and how marketing professionals can use such results from measuring attitude to chalk out plans for improving the overall attitude.
Key words: Brand Attitude, Customer Satisfaction, Tri-Component Model of Attitude Cite this Article: Saju Eapen Thomas, Brand Attitude Measurement Using the Tri-Partite Model of Attitude and Evaluating its Relationship to Customer Satisfaction –Study of a Hypermarket Brand In UAE 11(10), , International Journal of Management, 2020, pp. 548-560. http://iaeme.com/Home/issue/IJM?Volume=11&Issue=10
1. INTRODUCTION Consumer attitude is a topic of great interest to psychologists and marketers, business
executives, and academicians (Bonfield, 1974; Bennet and Harrel, 1975; Day, 1970; Hansen,
Brand Attitude Measurement Using the Tri-Partite Model of Attitude and Evaluating its Relationship to Customer Satisfaction Study of a Hypermarket Brand In UAE–
http://iaeme.com/Home/journal/IJM 549 [email protected]
1969; Kraft et al., 1973). Attitude can involve in the evaluation of people, issues, objects, or events. Such evaluations are often positive or negative. They also can be uncertain or neutral at times. One will vote for the candidate about whom you have the most positive attitude in an election. If a person's attitude towards an object is neutral, uncertain, or hostile, there is very little chance of a positive outcome, as suggested in any of the above cases. Many people may support a candidate contesting in elections, representing a political party. A large portion of such supporters may not turn up for the election to vote. On deeper introspection, we can notice that those who voted had a higher level of attitude. Those with a lower level of attitude can be the ones who abstained from voting in elections (Chaiken, 2011). The above findings
lead us to two interesting aspects related to attitude: (i) attitude is relative, and hence the intensity attitude is essential, and (ii) attitude can change (it can move from negative to ofpositive and vice versa.)
Academicians and practitioners seriously look at factors that influence or change attitudes. The fact that marketing activities can control attitude indicates the need for measuring
attitude, as attitude to an object is a continuum with varying levels of intensities, from negative to positive. brand is indicative of consumer attitude. It An individual’s liking for a
will reflect on how his behavior will be towards a brand in purchasing and consuming it. As an example, a consumer will buy a BMW X7 SUV only if he firmly believes that X7 is the
right car, and only if he like it. A person's attitude toward the brand (or product) under consideration reflects his purchase behavior, referred to as Brand attitude. If you consider the brand to be a tourist place, a healthy positive attitude towards the site can lead to planning a trip and visiting the site.
As mentioned earlier, attitude is an essential topic of study in social psychology. In psychology, an attitude refers to a set of emotions, beliefs, and behaviors toward a particular object, person, thing, or event. Brand Attitudes in any person resulting from their early life experiences or upbringing and such factors can have a powerful impact on their behavior and
social norms (Kendra, 2016). Most academicians and practitioners agree that when individuals face any situation with multiple choices, they will opt for a behavior guided by their attitude. Social psychologists have also indicated that there are many occasions where attitude and related behavior may not match (Chaiken, 2011).
This study is exploratory and looks into the role played by the different factors that influence consumer attitudes. The author is attempting to evaluate the attitudes of shoppers toward a hypermarket brand. try to measure consumers' attitudes who shop from a Wesupermarket using the tripartite model of attitude. The author has selected the tripartite model to measure consumer attitudes, primarily because of its diagnostic capabilities. The tri-partite model indicates which attitude component lacks and demonstrates aspects of its improvement (Thomas, 2017). The researchers had to take up the challenge of developing a suitable scale
encompassing the three attitude components. This Scale helps compare the three parts prevalent among the respondents and develop a regression model to measure attitude.
2. MEASUREMENT OF BRAND ATTITUDE - LITERATURE REVIEW "Attitudes are learned predispositions." Hence, classical conditioning, instrumental
conditioning, modeling, and cognitive learning theories are relevant to attitude formation (Eagly & Chaiken, 1993). Therefore, consumers develop attitudes by experiential learning
and also by the observance of social roles. The primary causative factor of attitudes is the personal experiences gained during a person’s life journey is. There is enough evidence in the literature to prove that attitudes to many things evolve from early childhood. Attitudes formed
during early childhood can become enduring and remain part of any individual (Kendra 2016). While attitudes are enduring, they can also change. Attitude changes happen because
Saju Eapen Thomas
http://iaeme.com/Home/journal/IJM 550 [email protected]
of significant life events or changes in life stages. People do change attitudes to match behavior too. Persons may alter their behavior when they face cognitive dissonance.
The early works in measuring attitude looked at the attitude as a unified whole or a single object. They looked primarily at the linkages between attitudes and purchase intentions. In the
1960s, many researchers proposed the tri-partite (or tri-component) model of attitude (Rosenberg, Hovland, McGuire, Abelson, & Brehm, 1960, Kretch et al., 1962; Rosenberg and
Hovland, 1960). is model suggested that attitude to any object comprises of three Thcomponents. These are a cognitive or belief component about the object, affect or feelings
component, and a conative or behavioral intention component. Cognitive components are brand beliefs.
The traditional notions of attitude were object-specific. Under such notions, researchers assessed attitudes by asking questions or making inferences from their behavior, say trial, or
purchase of product under consideration (Schiffman and Kanuk, 2010). If consumers regularly buy the product and recommend the product to friends, it is likely to infer that they possess a positive attitude toward the product. The linkages between attitude and purchase behavior evoke a high curiosity among psychologists and marketing professionals (Bonfield, 1974; Bennet and Harrel, 1975; Day, 1970; Hansen, 1969; Kraft et al., 1973). Many models have evolved from these studies, and in several such formats, the tripartite model is similar to multi-attribute models used in this study to measure attitude.
The single object or single component model has failed to yield strong support from researchers as a predictive tool based on the assumption of attitude-behavior consistency
(Bagozzi et al. 1979). A large number of studies showed that the single component attitude model explained just a small but statistically significant portion of the variance in behavior
(Bonfield, 1974; Bennet and Harrel, 1975; Day, 1970; Hansen, 1969; Kraft et al., 1973). Proponents of the tripartite model believe that attitude is a multi-component construct
composed of cognitive, affective, and conative components (Kretch et al., 1962; Rosenberg and Hovland, 1960). The researchers consider all three components' evaluative responses
when looking at attitude using the tri-partite model as a predictive tool. Over time, the tripartite-model of attitude has become the most common framework for measuring attitudes (Eagly and Chicken, 1993; Edwards, 1992).
2.1. Tripartite Model of Brand Attitude Even though later researchers have expanded on the basic tri-partite model (Ajzen and
Fishbein 1980), the structures identified to us by the original model (Rosenberg et a , 1960) l.have provided a reliable foundation study of attitudes. Brand attitude is the primary construct. Three additional constructs, brand beliefs (the cognitive component), brand feelings (affective
component), and brand purchase intention (the behavioral component), form the primary components. The remaining constructs arise from the specific object whose attitude we focus on or any other antecedents or demographic variables contributing to the preceding construct.
Many studies that measured only one construct indicated the existence of shared variance among the three constructs (Edwards 1992; Kothandapani 1971). However, further studies
went on to substantiate that enough variance exists to proclaim that each component is an independent construct contributing to the claim that each component is a separate construct of attitude (Breckler 1983; Ostrom 1969).
Brand belief is often used interchangeably for the cognition or the tripartite model (Larsen 1997). It is a congregation of ideas, opinions, and knowledge that consumers hold about a brand (Edwards, 1992).
Researchers have defined brand belief as to the associations of thought that consumers have on their individual attributes (Ajzen and Fishbein 1980; Eagley and Chaiken, 1993). If
Brand Attitude Measurement Using the Tri-Partite Model of Attitude and Evaluating its Relationship to Customer Satisfaction Study of a Hypermarket Brand In UAE–
http://iaeme.com/Home/journal/IJM 551 [email protected]
you have a headache, you might take a Panadol (Paracetamol) tablet because you hold a firm conviction that Panadol will cure headaches. Consumer comments such as Toyota cars are
maintenance-free, or Volvo cars are very safe are indicative of customer beliefs. Such collective beliefs about each individual attribute will contribute to either a positive or negative
attitude toward the brand (Rinaca 2006). Attitude formation can directly affect knowledge gained through brand communications and personal experiences with the brand. We can
measure brand beliefs using verbal, evaluative statements (Breckler, 1983). Thes beliefs can e vary from extremely negative to extremely positive responses (Haddock et al., 1994; Trash, 1999; Eagly and Chaiken, 1993).
The brand effect is an index of the degree to which a person likes or dislikes a brand under consideration (Ajzen and Fishbein, 1980). Affect, and cognition are two terms used
interchangeably for attitude (Breckler, 1983; Edwards, 1992). Affect is related to the emotions, feelings, or a mood that a brand can trigger (Edwards, 1992; Larsen 1997). The
brand effect is the component that brings in energy or charge in the consumer when they hear or sees something about the brand, and hence the brand effect is also known as Brand
feelings. Such energy or charge is essential to developing a predisposition to action or formation of purchase intentions (Triandis, 1977). In consumers' effect, they are influenced by
what they know about the brand and their personal experience (Edwards, 1992). The literature defines brand effect as an emotional response similar to a gut reaction, one without a logical assessment of advantages and disadvantages (Breckler, 1983; Garimella, 1999). Such feelings can be measured using statements of emotional responses to the brand, and these can range from extremely negative to extremely positive values.
Brand purchase intention, the third component of the tripartite attitude model, refers to the possibility that consumers will purchase a specific brand. Research has proved that it is more accurate to predict brand purchasing behavior by purchase intention than purchase preference
(Edwards, 1992; Raynolds and Wells, 1977). Researchers surmised that brand attitude gradually takes shape by direct exposure to physical products or exposure to brand-related
communications (Eagly and Chaiken, 1993; Larsen, 1997). Consumers will generate an evaluation behavior once cognitive and affective components form, which are generally
enduring. Brand purchase intention is the result of such an evaluative response (Ajzen and Fishbein, 1980). Such reactions measure the consumer's overt actions or by his or her verbal responses or by overt acts that can include visits to the retailer or product trial. The verbal response consists of any expression of plans to buy the brand or not to purchase the brand;
such expressions from the consumer documented as good predictors of overt behavior by researchers. (Breckler, 1983; Kothandapani, 1971). Similar to Brand beliefs and Brand
feelings, statements related to purchasing intention is used as behavioral measures by locating on evaluative dimensions ranging from very negative to very positive (Eagly and Chaiken, 1993; Larsen, 1997).
Most academicians and researchers agree that attitudes get developed, and the consumers form attitudes related to buying behavior due to exposure to marketing communications or direct experience (Allen et al., 2005). Brand beliefs get formed by such exposures, and they
act as a cognitive part of the persuasive component. Classical conditioning enables the development of the attitudinal component, and conative or behavioral tendencies get
developed by instrumental conditioning (Greenweld, 1968).
2.2. Consumer Buying Behavior permarket in Su s Through his classic 1923 Harvard Business Review article, Melvyn Copeland was the first to discuss consumer goods' categorization as convenience goods, shopping goods, and specialty goods. According to Copeland, convenience goods are those goods that consumers buy at
Saju Eapen Thomas
http://iaeme.com/Home/journal/IJM 552 [email protected]
frequent intervals. The owners of convenience stores could manage reasonably small investments in stocks of merchandise items, as the consumers frequented these stores for
repeat purchases. The consumer generally purchases groceries and similar routinely bought items from stores located conveniently, either near his home, near his workplace, or a store
located at a point that can be visited easily considering his work routine. Consumers visit these stores regularly when they are out for purposes other than shopping trips. While
shopping goods are those for which consumers make stores goods intending to buy these items. In the case of shopping goods, the consumer will want to compare quality and style at the purchase time. Consumers will look forward to making comparisons in the offerings from several stores. A store location suitable for shopping goods may not be ideal for convenience
stores. The rental rates will be high in such areas, and the delivery intervals will be inconvenient for consumers are they will be away from residential areas (Copeland, 1923).
The consumer shopping behavior and the store formats from where they shop have changed drastically by this century's turn. A typical U.S. consumer purchases his convenience items and even many of his shopping goods from hypermarkets and uses multiple formats for
their grocery and convenience goods purchase. Other than supermarkets, they use mass merchandisers, drug stores, and, to some extent, from convenience stores (Luchs, Inman and Shankar, 2014). Marketing professionals will be interested in understanding the differences in
sensitivity to marketing mix variables across these formats as they strive for additional distribution penetration (Jindal et al., 2020). These formats operate providing different service
levels to their customers, and so also their sales margins do vary (Ailawadi et al. 2010). Manufacturing firms are also interested in knowing the kind of shopping trips made by
consumers to these different retail formats (Kahn and Schmittlein, 1992). The factor of interest to this study is the parameters that consumers consider while
deciding on supermarkets or hypermarkets. Today's consumers visit supermarkets more frequently, and they spend more during these trips than convenience stores (Jindal et al.,
2020). They end up buying more items from a larger number of product categories. Supermarkets generally offer reasonable prices, and many consumer trips are guided by consumer propensity to purchase during price specials (Walter and Jamil 2003). Consumers
consider locational convenience, prices, perceptions on quality of merchandise, and availability of a broad category of products crucial to customer satisfaction while shopping in
supermarkets or hypermarkets (Hunneman, Verhoef, and Sloot, 2017). Supermarkets and mass merchandisers maintain substantially large-sized stores with a greater spread of fast-
moving consumer goods and commodities. The larger size of the formats helps them in having more shelf display of their merchandise. Additionally, consumers consider factors
such as the store ambiance, service level, friendly staff, and other amenities such as proximity to cafes or entertainment sources while deciding on supermarkets for shopping.
3. METHODOLOGY This study focuses on evaluating brand attitude using the tripartite model as a measurement
tool, and the brand under consideration was a supermarket brand. The researcher also investigated the relationship between brand attitude and customer satisfaction derived from the brand. The estimation of consumer attitude towards a supermarket brand is derived as a sum of the cognitive, affective, and conative attitudes. It uses a single component measure of
customer satisfaction, comparing the tripartite attitude measure to evaluate the relationship between these two variables verifies attitude evaluations' validity.
The study used a questionnaire-based survey, and developing the questionnaire, which included a tri-component attitude scale, were the primary tasks. The Scale had 11 items in total. The firs seven items were to evaluate the brand beliefs or the cognitive component, t
Brand Attitude Measurement Using the Tri-Partite Model of Attitude and Evaluating its Relationship to Customer Satisfaction Study of a Hypermarket Brand In UAE–
http://iaeme.com/Home/journal/IJM 553 [email protected]
which the respondents have about the supermarket where they have shopped. There were two items, each representing the affective component and conative or behavioral component.
These items were identified from the literature survey and based on informal interviews and discussions with customers who are regular shoppers of Lulu, the supermarket under
consideration. Given below are the items of the Scale developed. Cognitive Scale used the following items
Lulu offers good quality goods Lulu’s employees are efficient and friendly Lulu hypermarket has a good and welcoming ambiance The prices of goods kept in Lulu stores are expensive* Lulu’s outlet location is ideal Lulu provides a safe and secure atmosphere I visit Lulu with my friends and family
Affective Scale includes the following items I dislike Lulu as a lot of products are out of stock when I shop* I feel happy when I visit Lulu as the service provided is good
Behavioral Scale included the following items I will recommend Lulu to my friends and relatives I will again visit Lulu to make my purchases
* are items which are reverse coded. The eligible sample comprised of eighty shoppers, randomly selected from the customers,
who had come to shop on four consecutive days at Lulu Hypermarket in Al Wahda Street, Sharjah, UAE. We distributed questionnaires to these shoppers, requesting the Respondents to
mark their answers and return the schedule. received back seventy-five questionnaires We with full responses. The attitude scale used a five-point scale labeled from fully disagree to "fully agree." Fully agree was assigned a score of five, while one was assigned to entirely disagree with the intermediate points carrying a score of four, three, and two. We checked the data collected for accuracy and tabulated and analyzed using SPSS 25 and SAS software.
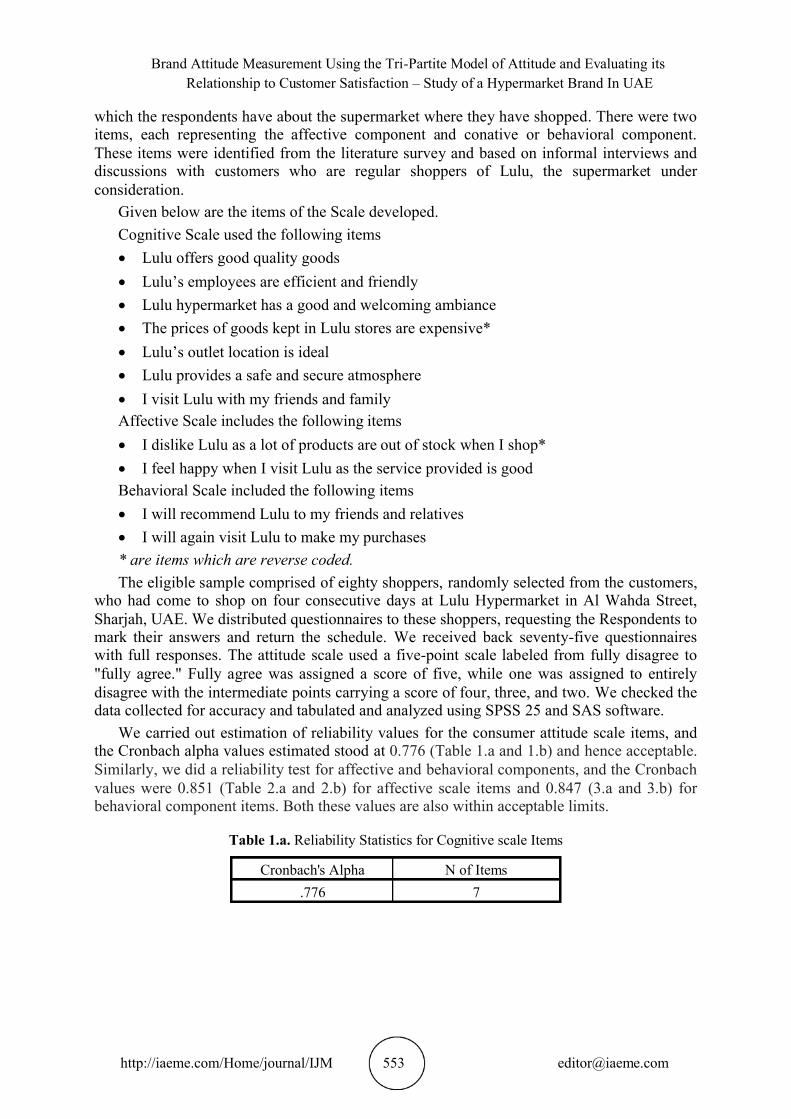
We carried out estimation of reliability values for the consumer attitude scale items, and the Cronbach alpha values estimated stood at 0.776 (Table 1.a and 1.b) and hence acceptable. Similarly, we did a reliability test for affective and behavioral components, and the Cronbach values were 0.851 (Table 2.a and 2.b) for affective scale items and 0.847 (3.a and 3.b) for behavioral component items. Both these values are also within acceptable limits.
Table 1.a. Reliability Statistics for Cognitive scale Items
Cronbach's Alpha N of Items .776 7
Saju Eapen Thomas
http://iaeme.com/Home/journal/IJM 554 [email protected]
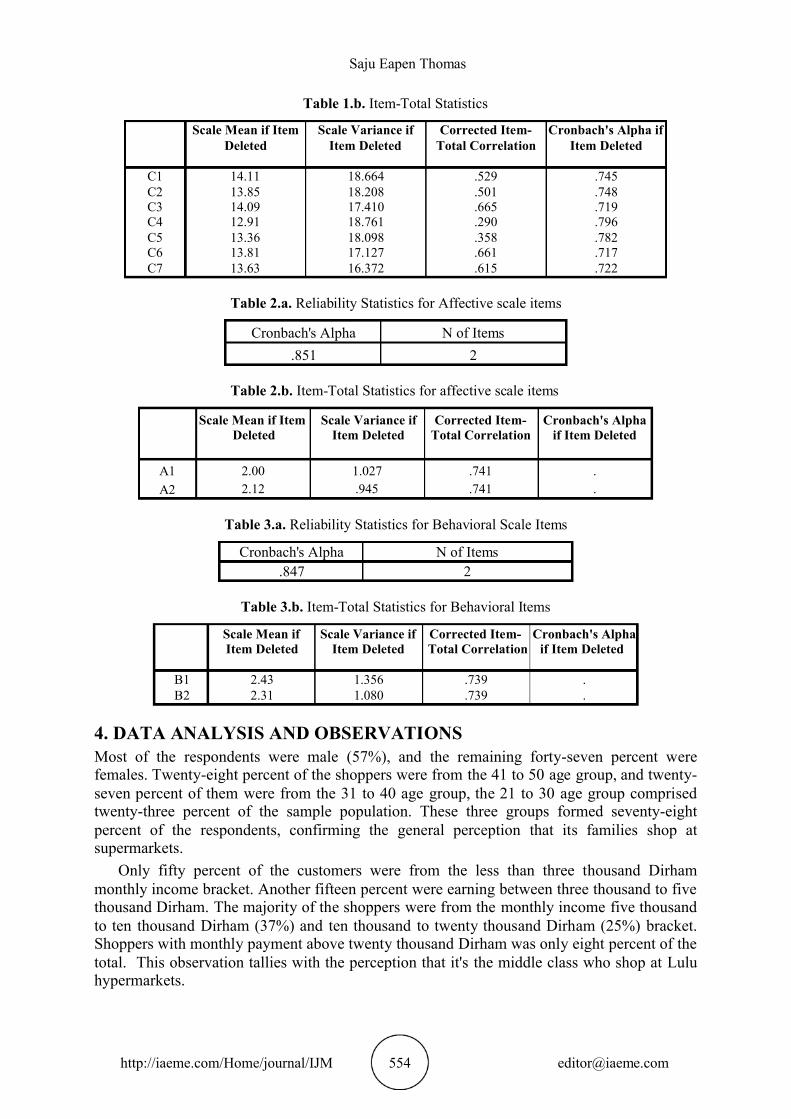
Table 1.b. Item-Total Statistics
Scale Mean if Item Deleted
Scale Variance if Item Deleted
Corrected Item-Total Correlation
Cronbach's Alpha if Item Deleted
C1 14.11 18.664 .529 .745 C2 13.85 18.208 .501 .748 C3 14.09 17.410 .665 .719 C4 12.91 18.761 .290 .796 C5 13.36 18.098 .358 .782 C6 13.81 17.127 .661 .717 C7 13.63 16.372 .615 .722
Table 2.a. Reliability Statistics for Affective scale items
Cronbach's Alpha N of Items .851 2
Table 2.b. Item-Total Statistics for affective scale items
Scale Mean if Item Deleted
Scale Variance if Item Deleted
Corrected Item-Total Correlation
Cronbach's Alpha if Item Deleted
A1 2.00 1.027 .741 . A2 2.12 .945 .741 .
Table 3.a. Reliability Statistics for Behavioral Scale Items
Cronbach's Alpha N of Items .847 2
Table 3.b. Item-Total Statistics for Behavioral Items
Scale Mean if Item Deleted
Scale Variance if Item Deleted
Corrected Item-Total Correlation
Cronbach's Alpha if Item Deleted
B1 2.43 1.356 .739 . B2 2.31 1.080 .739 .
4. DATA ANALYSIS AND OBSERVATIONS Most of the respondents were male (57%), and the remaining forty-seven percent were
females. Twenty-eight percent of the shoppers were from the 41 to 50 age group, and twenty-seven percent of them were from the 31 to 40 age group, the 21 to 30 age group comprised twenty-three percent of the sample population. These three groups form seventy-eight ed
percent of the respondents, confirming the general perception that its families shop at supermarkets.
Only fifty percent of the customers were from the less than three thousand Dirham monthly income bracket. Another fifteen percent were earning between three thousand to five thousand Dirham. The majority of the shoppers were from the monthly income five thousand to ten thousand Dirham (37%) and ten thousand to twenty thousand Dirham (25%) bracket. Shoppers with monthly payment above twenty thousand Dirham was only eight percent of the total. This observation tallies with the perception that it's the middle class who shop at Lulu hypermarkets.
Brand Attitude Measurement Using the Tri-Partite Model of Attitude and Evaluating its Relationship to Customer Satisfaction Study of a Hypermarket Brand In UAE–
http://iaeme.com/Home/journal/IJM 555 [email protected]
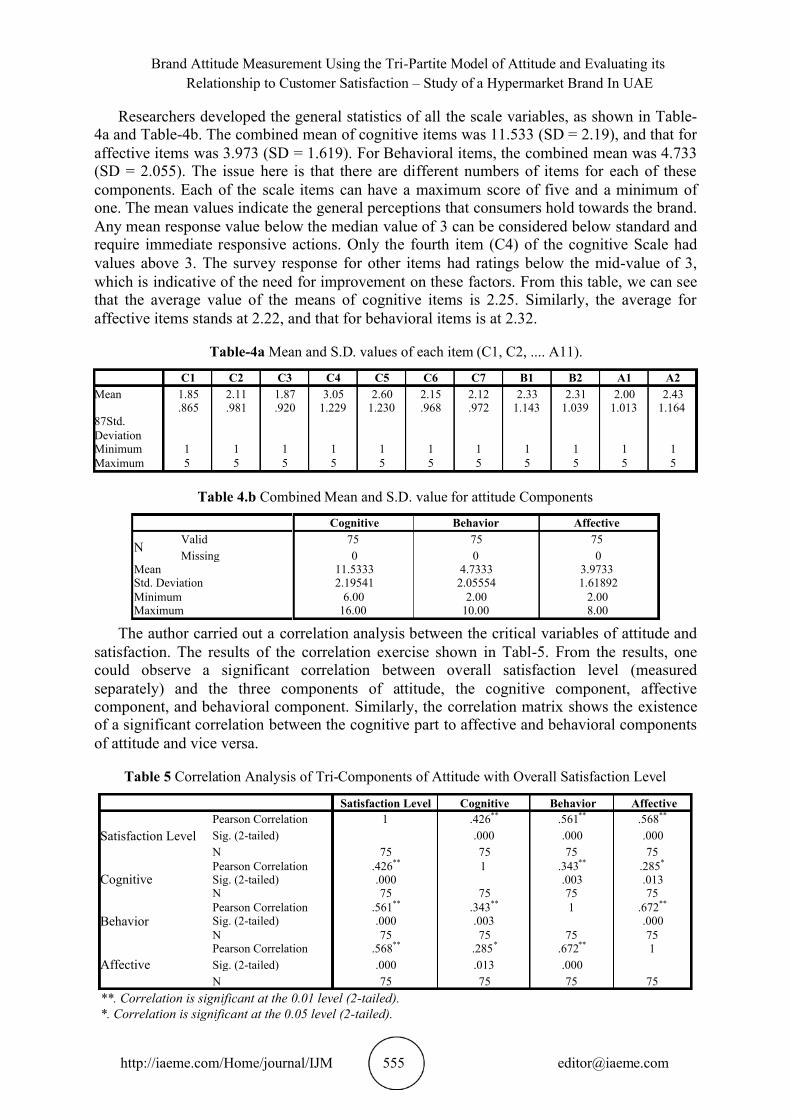
Researchers developed the general statistics of all the scale variables, as shown in Table-4a and Table-4b. The combined mean of cognitive items was 11.533 (SD = 2.19), and that for affective items was 3.973 (SD = 1.619). For Behavioral items, the combined mean was 4.733 (SD = 2.055). The issue here is that there are different numbers of items for each of these components. Each of the scale items can have a maximum score of five and a minimum of one. The mean values indicate the general perceptions that consumers hold towards the brand. Any mean response value below the median value of 3 can be considered below standard and require immediate responsive actions. Only the fourth item (C4) of the cognitive Scale had values above 3. The survey response for other items had ratings below the mid-value of 3, which is indicative of the need for improvement on these factors. From this table, we can see
that the average value of the means of cognitive items is 2.25. Similarly, the average for affective items stands at 2.22, and that for behavioral items is at 2.32.
Table-4a Mean and S.D. values of each item (C1, C2, .... A11).
C1 C2 C3 C4 C5 C6 C7 B1 B2 A1 A2 Mean 1.85 2.11 1.87 3.05 2.60 2.15 2.12 2.33 2.31 2.00 2.43 87Std. Deviation
.865 .981 .920 1.229 1.230 .968 .972 1.143 1.039 1.013 1.164
Minimum 1 1 1 1 1 1 1 1 1 1 1 Maximum 5 5 5 5 5 5 5 5 5 5 5
Table 4.b Combined Mean and S.D. value for attitude Components
Cognitive Behavior Affective
N Valid 75 75 75 Missing 0 0 0
Mean 11.5333 4.7333 3.9733 Std. Deviation 2.19541 2.05554 1.61892 Minimum 6.00 2.00 2.00 Maximum 16.00 10.00 8.00
The author carried out a correlation analysis between the critical variables of attitude and satisfaction. The results of the correlation exercise shown in Tabl-5. From the results, one
could observe a significant correlation between overall satisfaction level (measured separately) and the three components of attitude, the cognitive component, affective
component, and behavioral component. Similarly, the correlation matrix shows the existence of a significant correlation between the cognitive part to affective and behavioral components of attitude and vice versa.
Table 5 Correlation Analysis of Tri-Components of Attitude with Overall Satisfaction Level
Satisfaction Level Cognitive Behavior Affective
Satisfaction Level Pearson Correlation 1 .426** .561** .568** Sig. (2-tailed) .000 .000 .000 N 75 75 75 75
Cognitive Pearson Correlation .426** 1 .343** .285* Sig. (2-tailed) .000 .003 .013 N 75 75 75 75
Behavior Pearson Correlation .561** .343** 1 .672** Sig. (2-tailed) .000 .003 .000 N 75 75 75 75
Affective Pearson Correlation .568** .285* .672** 1 Sig. (2-tailed) .000 .013 .000 N 75 75 75 75
**. Correlation is significant at the 0.01 level (2-tailed). *. Correlation is significant at the 0.05 level (2-tailed).
Saju Eapen Thomas
http://iaeme.com/Home/journal/IJM 556 [email protected]
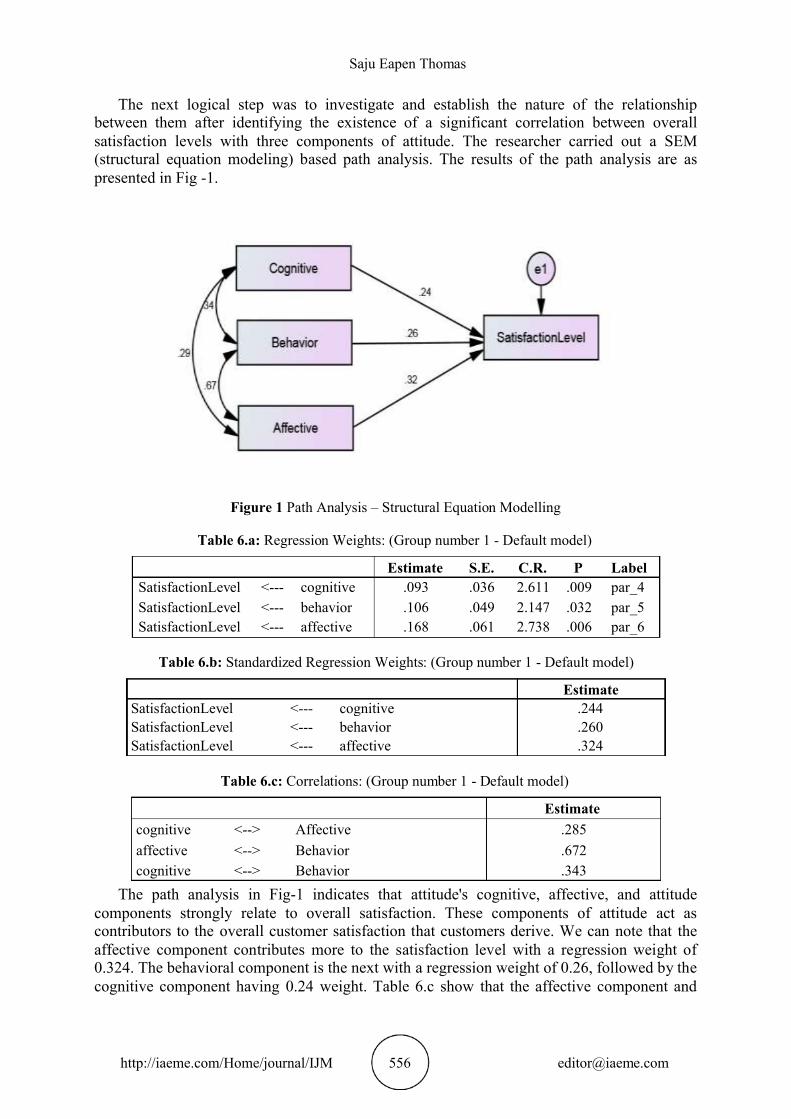
The next logical step was to investigate and establish the nature of the relationship between them after identifying the existence of a significant correlation between overall
satisfaction levels with three components of attitude. The researcher carried out a SEM (structural equation modeling) based path analysis. The results of the path analysis are as
presented in Fig -1.
Figure 1 Path Analysis Structural Equation Modelling –
Table 6.a: Regression Weights: (Group number 1 - Default model)
Estimate S.E. C.R. P Label SatisfactionLevel < --- cognitive .093 .036 2.611 .009 par_4 SatisfactionLevel < --- behavior .106 .049 2.147 .032 par_5 SatisfactionLevel < --- affective .168 .061 2.738 .006 par_6
Table 6.b: Standardized Regression Weights: (Group number 1 - Default model)
Estimate SatisfactionLevel < --- cognitive .244 SatisfactionLevel < --- behavior .260 SatisfactionLevel < --- affective .324
Table 6.c: Correlations: (Group number 1 - Default model)
Estimate cognitive < > -- Affective .285 affective < > -- Behavior .672 cognitive < > -- Behavior .343
The path analysis in Fig-1 indicates that attitude's cognitive, affective, and attitude components strongly relate to overall satisfaction. These components of attitude act as
contributors to the overall customer satisfaction that customers derive. We can note that the affective component contributes more to the satisfaction level with a regression weight of
0.324. The behavioral component is the next with a regression weight of 0.26, followed by the cognitive component having 0.24 weight. Table 6.c show that the affective component and
Brand Attitude Measurement Using the Tri-Partite Model of Attitude and Evaluating its Relationship to Customer Satisfaction Study of a Hypermarket Brand In UAE–
http://iaeme.com/Home/journal/IJM 557 [email protected]
behavior has a higher correlation (0.672), followed by the cognitive component and behavior component (0.343). Cognitive to affective components have the lowest correlation value.
5. FINDINGS FROM THIS STUDY This study's significant contribution is establishing the relationship between brand attitude
and customer satisfaction, reinforcing similar findings in the literature (Taylor and Hunter, 2014; Ko and Chiu, 2008). We used the tri-component model of attitude, and Fig-1 shows the role played by brand beliefs (the cognitive component), brand feelings (affective component),
and brand purchase intention (the behavioral component) in the formation of customer satisfaction. The inferences from above tell us that creating a healthy brand attitude will help in building customer satisfaction. The path analysis also shows that the affective component
(R = 0.324) plays a larger role in building a brand attitude. This prominent role of affect component is comprehensible as brand feelings can play a significant role in satisfaction as you have to like and love a product-brand to be satisfied with it. Brand Purchase Intention (R
= 0.26) is the second major contributor, followed by Brand beliefs (R = 0.24). Higher purchase intention is always good as it reflects on higher revenue generation and profits.
Equally notable is the lower brand beliefs, which can have a far-reaching effect of acting as a decelerator if not well attended. If consumers do not hold firm, favorable views about the
brand, then the brand is headed for trouble in the long-term. The author addresses the facet about the dangers that lower brand beliefs can bring-forth in the subsequent sections.
Brand feelings or the affective component ve a higher correlation with the behavior hacomponent (r = 0.672). Hence, we can deduce that the higher the brand feelings, the better
the chances of forming brand purchase intentions. The correlation index between the cognitive component and behavior component is lower (r = 0.343), suggesting the lower role of brand beliefs in forming purchase intentions, deciphering a negative factor, and calls for managerial intervention. The relationship between cognitive and affective components (r = 0.285) is lower and hints at the lower role of brand beliefs in triggering brand feelings and vice-versa.
A significant advantage of the tri-partite model over a simple component model is the tri- partite model's diagnostic capabilities (Thomas, 2017). We used the tri-partite model to
evaluate the supermarket's attitude by evaluating what consumers hold toward the different items that constituted the components. As the number of items in the three components was different, we avoided taking the combined means and standard deviation (S.D.). Instead, we focused on the average of the mean (M) and standard deviation (S.D.). The average index values are 2.25 for the cognitive component, 2.22 for the affective component, and 2.32 for
the behavioral component. We can infer from the Scale used, any mean value below 3 indicates poor to a neutral attitude. Thus, the customer attitude in all three components is
trending to poor customer ratings. Comparatively higher mean value for the behavioral content is a good sign, as it indicates more sales and customer visits. The lower mean values for the cognitive and affective components are equally problematic and shows lower brand beliefs and lower brand feelings. If the behavior happens even with lower brand beliefs and emotions, it can be because customers do not currently have other options. In turn, when such an opportunity opens up, customers may drift and switch to the new option.
The following brand beliefs from the cognitive component has mean values less than 2.5. They include , related to the quality of goods, C2 about efficient and friendly employees, C1C3, concerned with the store ambiance, C6, the safe and secure atmosphere, and C7 related to entertainment factors associated with shopping. Component C1 (M = 1.85; SD = 0.865) has
relatively lower mean values is about the quality of goods in the supermarket. This observation projects the need to build better quality perceptions about the supermarket's goods
Saju Eapen Thomas
http://iaeme.com/Home/journal/IJM 558 [email protected]
and merchandise. As the branded items are the same across all the supermarkets, the focus needs to be more on building quality perceptions of the firm's produces, bakery, butchery, and private label brands.
The brand belief C2 (M = 2.11; SD = 0.981) is related to efficient and friendly employees and C3 (M = 1.87; SD = 0.92) is concerned with good and welcoming and ambience. Such beliefs have to be built by training and motivating staff to provide better customer service. The supermarket management should understand the factors that consumers see lagging in the ambiance and improve them. C6 (M = 2.15; SD = 0.968) is concerned with creating of a safe and secure shopping atmosphere. observing that the item C7 (M = 2.12; SD = 0.972) about the hypermarket as a place to invest with family and friends in conjunction with the earlier
item . This item can be concerning the availability of entertainment avenues and cafes C6where the whole family can spend time and go shopping.
6. CONCLUSION This study reinforces the research findings that a robust favorable attitude plays a significant
role in the formation of customer satisfaction. This finding essential for marketing ispractitioners, as it indicates that beyond product performance aspects, giving importance todeveloping the right brand beliefs and brand feelings. These lead to the development of brand
purchase intention. One significant advantage of using the tri-partite model for measuring attitude is its diagnostic capabilities (Thomas, 2017). In this study, we can notice that
cognitive factors and affective factors are lagging; these lower ratings attributing to the items with lower mean values or low customer ratings. As mentioned in the earlier section, the
customer rating's mean value was low for the quality of goods merchandised, which is a severe threat, and this perception needs altering.
Management should give high priority to building quality perceptions on produces, bakery, butchery, and private label brands of the firm. Some efforts and investments in
marketing communications, mainly through social media, can be significant for achieving such results. The author strongly feels that the firm needs to train and motivate their
employees to perceive having a friendly and efficient staff. Equally important is to improve perceptions about the hypermarket as an exciting destination to visit with friends and relatives and as a safe and secure place for family. Another area where management should focus on is
the store ambiance. Investments need to create a welcoming and ambiance which the customers will appreciate.
The researcher feels that this study's limitations arise from the survey method used and the sampling process. Though we tried collecting data from a good number of customers who
visited the hypermarket, we could finally get only seventy-five responses, which were complete in all respects. Limitations exist with the Scale used in this study as it needs to be
fully validated. The author feels that even with these limitations, the study is exploratory work. It could prove that the consumer attitude towards a brand plays a significant role in consumer satisfaction. Further, it reinforces the diagnostic capabilities of the tri-partite model while measuring consumer attitude.
REFERENCES [1] Chaiken, H.; Attitudes, Behavior and Social Practice; The Journal of Sociology and Social
Welfare; V.38. Issue: 1, Article 38; 2011. [2] Vishal; International Journal of Advanced Research in Management and Social Sciences; 3D
Model of Attitude Introduction; https://www.academia.edu>3D_Model _of _Attitude _ Introduction.
Brand Attitude Measurement Using the Tri-Partite Model of Attitude and Evaluating its Relationship to Customer Satisfaction Study of a Hypermarket Brand In UAE–
http://iaeme.com/Home/journal/IJM 559 [email protected]
[3] Cherry, Kendra, Attitudes, and Behaviors in Psychology; verywellmind.com/attitudes_how_they_form_change_shape_behavior_2795897; downloaded
on January 14, 2016. [4] Ajzen, I (1991); “The Theory of Planned Behavior”; Organizational Behavior and Human
Decision Process; Vol. 50, No.2; P.179-211. [5] Eagly, S. and S. Chaiken (1993); The Psychology of Attitudes; Harcourt Brace Jovanovich
College Publishers; Fortworth; Texas. [6] Fishbein, M. And I. Ajzen (1975); "Belief, Attitude, Intention, and Behavior: An Introduction
to Theory and Research"; Reading, Addison Wesley; M.A. [7] Bennet, P. And G. Harrel (1975); “The Role of Confidence in Understanding and Predicting
Buyer’s Attitudes and Purchase Intentions”; Journal of Consumer Research; V.2 (1975);
P.110-179. [8] 10. Bonfield, E. (1974); “Attitude, Social Influence, Personal Norm and Intention Interactions
as Predictors of Brand Purchase Behavior”; Journal of Management Research; V.11 (Nov.
1974); P.379-389. [9] York; The Free Press, Day, G. (1970); “Buyer Attitudes and Brand Choice Behavior”; New
1970. [10] Hansen, F. (1969); “Consumer Choice Behavior: An Experimental Approach”; Journal of
Marketing Research; V.6 (Nov.1969); P.436-443. [11] Kraft, F., D. Granbois and J. Summers (1973); “Brand Evaluation and Brand Choice: A
Longitudinal Study”; Journal of Marketing Research; V.10 (Aug. 1973); P.235-241. [12] Krech, D., R. Crutchfield and E. Ballachey (1962); “Individuals in Society”; New York;
McGraw Hill Book Company. [13] Rosenberg, M. And C. Hovland (1960); “Cognitive, Affective and Behavioral Components of
Attitude”; in Rosenberg et al. Eds., “Attitude Organization and Change”; New Haven,
Connecticut: Yale University Press. [14] W. B. Dodds, K. B. Monroe, and D. Grewal, (1991); Effects of price, brand, and store
information on buyers’ product evaluations, Journal of Marketing Research, 28(3), 307-319. [15] F. D. Reynolds and W. D. Wells, Consumer Behavior, Mc Graw-Hill, New York, 1997. [16] P. Kotler, Marketing Management: Analysis Planning Implementation, and Control, tenth
edition, Prentice-Hall, Inc., New Jersey, 2000. [17] L. G. Schiffman and L. L. Kanuk, Consumer Behavior, Prentice-Hall Inc., New Jersey, 1994. [18] Garimella, R. N. (1999). A study of the knowledge and attitudes of physicians toward victims
of spouse abuse. Doctoral dissertation, Old Dominion University. [19] Ajzen, I., & Fishbein, M. (1980). Understanding attitudes and predicting social behavior.
Englewood Cliffs, NJ: Prentice-Hall, Inc. [20] Breckler, S. J. (1983). Validation of affect, behavior, and cognition as distinct components of
attitude. Doctoral dissertation, The Ohio State University. [21] Edwards, K. (1992). The primacy of affect in attitude formation and change: Restoring the
integrity of affect in the Tripartite model. Doctoral dissertation, University of Michigan. [22] Kothandapani, V. (1971). Validation of feeling, belief, and intention to act as three
components of attitude and their contribution to prediction of contraceptive behavior. Journal of Personality and Social Psychology, 19(3). 321-333.
[23] Larsen, J. A. (1997). Application of cognitive, affective, and behavioral theories to measure learning outcomes in management training. Doctoral Dissertation, University of South
Florida.
Saju Eapen Thomas
http://iaeme.com/Home/journal/IJM 560 [email protected]
[24] Ostrom, T. (1969). The relationship between the affective, behavioral, and cognitive components of attitude. Journal of Experimental Social Psychology. 5, 12-30.
[25] Rosenberg, M. J., Hovland, C. I., McGuire, W. J., Abelson, R. P., & Brehm, J. W. (1960). Attitude organization and change: An analysis of consistency among attitude components:
Yale University Press. [26] Rinaca, C., Elnitsky, C., & Brown, G. (1999). EMS agenda for the future: Virginia providers'
perspectives. Prehospital Emergency Care. 3(2), 150-156. [27] Trask, T. F. (1999). The role of affect and cognition in predicting attitudes toward the elderly.
Master thesis. Memorial University of Newfoundland. [28] Triandis, H. C. (1977). Interpersonal behavior. Monterey, California: Brooks/Cole Publishing
Company. [29] Copeland, Melvyn T.; Relation of Consumer’s Buying Habits to Marketing Methods; Harvard
Business Review; Harvard Business Publishing 1923. [30] Jindal, Pranav, Zhu, Ting, Chintaguata, Pradeep, and Dhar, Sanjay; Marketing Response
Across Retail Formats: The Role of Shopping Trip Types; Journal of Marketing (American Marketing Association 2020); vol. 84 (2); p.114-132.
[31] A Study of Luchs, Ryan J., Jeffrey Inman, and Venkatesh Shankar (2014), “Channel Blurring: Cross-Retail Format Shopping Among U.S. Households,” working paper,
https://mays.tamu.edu/center-for-retailing-studies/wp- content/uploads/sites/18/2015/04/Channel-Blurring-1-20-14-Final-Clean.pdf (accessed
December 18). [32] Ailawadi, Kusum L, S - cott A. Neslin, and Karen Gedenk (2001); “Pursuing the Value
Conscious Consumer: Store Brands Versus National Brand Promotions;” Journal of Marketing, 65 (1), 71 89. –
[33] Kahn, Barbara E. and David C. Schmittlein (1992); “The Relationship Between Purchases Made on Promotion and Shopping Trip Behavior;” Journal of Retailing; 68 (3), 294–315.
[34] Walters, Rockney G. and Maqbul Jamil (2003), “Exploring the Relationships Between Shopping Trip Type, Purchases of Products on Promotion, and Shopping Basket Profit,”
Journal of Business Research, 56 (1), 17 29. –
[35] Hunneman, Auke, Peter C. Verhoef, and Laurens M. Sloot (2017), “The Moderating Role of
Shopping Trip Type in Store Satisfaction Formation,” Journal of Business Research, V.78 (September), 133 42. –
[36] ll, David R., Teck-Hua Ho, and Christopher S. Tang (1998), Shop: Be “Determining Where to
Fixed and Variable Costs of Shopping,” Journal of Marketing Research, 35 (3), 352–69. [37] Thomas, S.E. (2017); Evaluating Consumer Attitudes Towards an Object Using Tri-Partite
Model of Attitude; ; Vol.3, No.2; August International Journal of Marketing Management2017; p. 31-40.
[38] Taylor, Stevan A., and Hunter, Gary (2014); An Exploratory Investigation Into The Antecedents of Satisfaction, Brand Attitude, And Loyalty Within The (B2B) ERM Industry; Journal of Consumer Satisfaction, Dissatisfaction, and Complaining Behavior; Vol. 27; June 2014; P. 24-42.
[39] Ko, Wen-Hwa and Chiu, Chihwei P. (2008); The Relationship Between Brand Attitude, Customer Satisfaction and Revisiting Intentions of The University Students A Case Study of –
Coffee Chain Stores in Taiwan: Journal of Food


![TRI-ANNUAL REPORT [7TH PROGRESS REPORT]](https://img.dokumen.tips/doc/110x75/6336c0900747ca5b85042fa4/tri-annual-report-7th-progress-report.jpg)


