Embed Size (px)
Citation preview
BLUE ECONOMY AND BLUE FINANCEToward Sustainable Development and Ocean Governance
Edited by Peter J. Morgan, Michael C. Huang, Michelle Voyer, Dominique Benzaken, and Atsushi Watanabe
ASIAN DEVELOPMENT BANK INSTITUTE
ASIAN DEVELOPMENT BANK INSTITUTE
Blue Economy and Blue Finance Toward Sustainable Development and Ocean Governance
Edited by
Peter J. Morgan, Michael C. Huang, Michelle Voyer, Dominique Benzaken, and Atsushi Watanabe

© 2022 Asian Development Bank Institute
All rights reserved.
ISBN 978-4-89974-251-7 (Print) ISBN 978-4-89974-252-4 (PDF)DOI: https://doi.org/10.56506/HDLZ1912
The views in this publication do not necessarily reflect the views and policies of the Asian Development Bank Institute (ADBI), its Advisory Council, ADB’s Board or Governors, or the governments of ADB members.
ADBI does not guarantee the accuracy of the data included in this publication and accepts no responsibility for any consequence of their use. ADBI uses proper ADB member names and abbreviations throughout and any variation or inaccuracy, including in citations and references, should be read as referring to the correct name.
By making any designation of or reference to a particular territory or geographic area, or by using the term “recognize,” “country,” or other geographical names in this publication, ADBI does not intend to make any judgments as to the legal or other status of any territory or area.
Users are restricted from reselling, redistributing, or creating derivative works without the express, written consent of ADBI.
ADB recognizes “China” as the People’s Republic of China; “Korea” and “South Korea” as the Republic of Korea; and “Britain” as the United Kingdom.
Note: In this publication, “$” refers to US dollars.
Asian Development Bank Institute Kasumigaseki Building 8F 3-2-5, Kasumigaseki, Chiyoda-ku Tokyo 100-6008, Japan www.adbi.org
iii
Contents
Tables and Figures vAbbreviations xContributors xiiiForeword 1 xviForeword 2 xviiiForeword 3 xx
1 Overview of the Blue Economy and Blue Finance 1 Michael Huang and Peter J. Morgan
PART I: Blue Finance
2 Approaches to Strengthening Fisheries Financing and Institutional Mechanisms: A Cross-Country Comparison of Cambodia, India, and Indonesia 11
Raghu Dharmapuri Tirumala and Piyush Tiwari
3 Tracking International Aid for Ocean Conservation and Climate Action 43
Nagisa Shiiba, Miko Maekawa, Tibor Vegh, and John Virdina
4 The Blueness Index, Investment Choice, and Portfolio Allocation 72
Muhammad Zubair Mumtaz and Zachary Alexander Smith
PART II: Blue Economy
5 Government Policy, Industrial Clusters, and the Blue Economy in the People’s Republic of China: A Case Study on the Shandong Peninsula Blue Economic Zone 93
Zhihai Xie
6 Developing the Philippine Blue Economy: Opportunities and Challenges in the Ocean Tourism Sector 115
Maria Angela G. Zafra
iv Contents
7 Capitalizing on Co-Benefits and Synergies to Promote the Blue Economy in Asia and the Pacific 150
Masanori Kobayashi, Atsushi Watanabe, Keita Furukawa, Keshia N. Tingson, Yimnang Golbuu, and Cielito F. Habito
8 Addressing Marine Litter through Sustainable Tourism: The Case of the Siargao Islands in the Southern Philippines 190
Kevin Roy B. Serrona, Jeongsoo Yu, and Mary Jean A. Camarin
PART III: Blue Economy-Related Industry
9 Offshore Wind Energy as an Emergent Ocean Infrastructure in India: Mapping the Social and Environmental Impacts 219
Gopal K. Sarangi
10 Sustainable Coastal and Maritime Tourism: A Potential Blue Economy Avenue for Bangladesh 248
Md Wasiul Islam and Tapan Sarker
PART IV: Interdisciplinary Methodology
11 Building Back Better in Small Island Developing States in the Pacific: Initial Insights from the Binary Constrained Disaster Model of Disaster Risk Management Policy Options in Fiji 291
Nepomuk Dunz, Hajime Tanaka, Nagisa Shiiba, Junko Mochizuki, and Asjad Naqvi
12 Are Coastal Protective Hard Structures Still Applicable with Respect to Shoreline Changes in Sri Lanka? 320
L.C.K. Abeykoon, E.P.D.N. Thilakarathne, A.P. Abeygunawardana, T.W.S. Warnasuriya, and K.P.U.T. Egodauyana

v
Tables and Figures
Tables2.1 Framework for the Comparative Analysis 192.2 Cambodia’s Fisheries Sector 212.3 India’s Fisheries Sector 242.4 Indonesia’s Fisheries Sector 252.5 Growth in Aquaculture Production 282.6 Growth of the Total Fisheries Capture 282.7 Fish and Fishery Product Exports in the Three Countries 292.8 Comparison of the Countries 323.1 Framework for Analysis of Public Financing of Ocean
Conservation and Climate Action 523.2 Search Terms 524.1 Terms of Blue Bonds 784.2 Descriptive Statistics 864.3 Results of the Panel Feasible Generalized
Least Square Estimator 875.1 Gross Domestic Product and Share of the
People’s Republic of China’s Marine Economy 985.2 Growth Rate of the People’s Republic of China’s
Marine Economy 995.3 Gross Domestic Product and Growth Rate of Major Marine
Industries in the People’s Republic of China, 2019 996.1 Estimated Ocean Resources of the Philippines 1236.2 Summary of Ocean Health Index Scores for
the Philippines in 2018 1246.3 Assessment of Ocean Tourism Products 1266.4 Inbound Arrivals in Number of Trips, 2014–2019 1276.5 Inbound Receipts by Type of Trip, 2014–2019 1286.6 Cruise Transport Sales, Value, 2014–2019 1296.7 Stakeholder Engagement for El Nido Resorts 1357.1 Major Policy Thematic Measures in Japan’s Ocean Policy 1568.1 Philippine Laws and Policies 1968.2 Tourist Arrivals in Siargao Islands, 2016–2020 2018.3 Tourist Arrivals vis-à-vis Solid Waste Generation
in the Siargao Islands, 2016–2020 2018.4 Number of Tourism-Related Facilities
on the Siargao Islands, 2020 2029.1 Cumulative Offshore Wind Installation
in Major Offshore Wind-Deploying Countries 224
vi Tables and Figures
9.2 Mapping of the Impacts and Gaps from the Key Policies and Regulations Governing Offshore Wind Energy in India 231
9.3 Major Marine National Parks and Sanctuaries in India 2369.4 Mapping of the Key Environmental Impacts 237A10.1 Related Supporting Institutions (National) to Develop
and Promote Coastal and Maritime Tourism in Bangladesh 28311.1 Basic Socioeconomic Characteristics of Fiji, 2019 29411.2 Past Hydrometeorological Disasters 29811.3 Cyclone Shock and Response Policy Simulation Scenarios 30712.1 Approximate Spatial Resolution of the High-Resolution
Satellite Images from the Google Earth Platform 32412.2 Coordinates of Ground Control Points Used
in Geometric Corrections 32712.3 Regions with the Largest and Smallest End Point Rate
Changes in Each District of the Study Area 33412.4 Comparison of the Data on Coastal Changes
(Average Values) in Each District by 2000 and 2019 33712.5 Erosion and Accretion Percentage Data Comparison
in the Years 2000 and 2019 33912.6 Summary of Shoreline Change Statistics 34112.7 Maximum and Minimum Shoreline Change Statistics
for Selected Areas 34112.8 Total Hard Structures in Kalutara, Colombo,
Gampaha, and Puttalam Districts 34512.9 Data Comparison of Applied Hard Structures
in 1996 and 2019 34612.10 Shoreline Changes in the Study Area with Respect
to Applied Hard Structures 348
Figures2.1 Aquaculture Production in the Three Countries 272.2 Exports of Fish and Fishery Products in the Three Countries 292.3 Institutional Frameworks 313.1 Cumulative Number of Projects for Ocean Conservation
and Climate Action 553.2 Distribution of Projects for Ocean Conservation
and Climate Action, 2013–2019 553.3 Funding Trend, 2013–2019 563.4 Finance by Category, 2013–2019 573.5 Finance by Sustainable Development Goal Target, 2013–2019 573.6 Distribution of Funding for Ocean Conservation
and Climate Action, 2013–2019 58
Tables and Figures vii
4.1 Portfolio Allocation Considering the Blueness Index 834.2 Emission Taxation and the Utility Function 855.1 Makeup of Major Marine Industries in the
People’s Republic of China in 2019 1006.1 International Tourism and Economic Development,
2000–2017 1176.2 Tourism’s Domestic Gross Value Added and
Gross Domestic Product at Current Prices, 2014–2018 1186.3 Inbound Tourism Expenditure and Exports
at Current Prices, 2014–2018 1196.4 Domestic Tourism Expenditure and Household Final
Consumption Expenditure at Current Prices, 2014–2018 1206.5 Employment in Tourism Industry versus
Total Employment, 2014–2018 1206.6 Blue Economy of the Philippines by Sector 1226.7 Conceptual Framework for Analyzing Tourism
in the Blue Economy 1326.8 Tourist Arrivals in El Nido 134A6.1 Institutional Relationships in
the National Ecotourism Strategy 146A6.2 Prioritization of Tourism Products in the Philippines 1487.1 Socio-Ecological System Framework 1547.2 Case Study Sites in Japan 1587.3 Number of Tourists Visiting Taketomi Town
and Iriomote Island, 1989–2019 1617.4 Oyster Production per Enterprise in Minamisanriku,
Miyagi, Japan, 2010 and 2017 1637.5 Changes in Seagrass Cover at its Peak in Areas of Hinase,
1950s‒2015 1657.6 Long-Term Fishery Production in Okayama Prefecture,
1956–2015 1667.7 Oyster Production in Okayama Prefecture, 2003–2018 1677.8 Prawn Aquaculture Production in Kumejima, Okinawa,
2008–2017 1707.9 Prawn Production in Okinawa, 2006–2017 1707.10 Revegetation/Reforestation and Fisheries Production
in Erimo, 1953–2008 1727.11 Kelp Production in Erimo, 1991–2018 1727.12 Trend of Seawater Temperature in Eastern Hokkaido,
2018–2020 1737.13 Fisheries and Aquaculture Production of the Philippines,
2000–2018 174
viii Tables and Figures
7.14 Fisheries and Aquaculture in Quezon Province, 2000–2019 1747.15 Changes in Mangrove Cover and Brackish Water Fishponds
in the Philippines, 1970–1992 1757.16 Changes in Mangrove Cover in the Philippines
and Quezon Province 1767.17 Trends in the Top Five Numbers of Tourists
Visiting Palau, 2008–2019 1787.18 Changes in Government Revenues, 2014–2019 1797.19 Multifaceted Interface of Enabling and Intervening
Factors for the Sustainable Blue Economy 1819.1 Compound Annual Growth Rate of Offshore Wind Energy 2249.2 Schematic of the Institutional Mechanisms Governing
Offshore Wind Energy in India 22810.1 Blue Economy Sectors of Bangladesh 25410.2 Proposed Sustainable Coastal and Maritime
Tourism Framework 26911.1 Exports and Imports, 2019 29511.2 Share of Trade by Destination, 2020 29611.3 BinD Model Flow Framework 30311.4 Real GDP Recovery Trends 30911.5 Private Consumption Recovery Trend 30911.6 Capital Stock Recovery Trend 31011.7 Foreign Debt Trajectory 31011.8 Budget Deficit to GDP Trend 31111.9 Public Spending Trajectory 31112.1 Selected Ground Control Points from Bentota River,
Kalutara, to Modaragam-aru River, Puttalam 32612.2 Generated Transect Lines from Baseline to Shoreline 32812.3 Flow Chart Showing the Overall Methodology
the Study Adopted 33012.4 End Point Rate of the Kalutara (A), Colombo (B),
Gampaha (C), and Puttalam (D) Districts, and the Wilpattu Region (E) 332
12.5 Graphical Representation of the End Point Rate of Each Selected Study Area 335
12.6 Average Rate of the Shoreline Changes in Each Selected Study Area 336
12.7 Percentage of Erosion and Accretion in Each Selected Area 338
12.8 Graphical Representation of the Shoreline Change Envelope of Kalutara, Colombo, Gampaha, and Puttalam Districts 340

Tables and Figures ix
12.9 Categorized Hard Structures in the Study Area 34412.10 Total Hard Structures in the Western
and North Western Provinces 34712.11 Coastal Development by Physical Alteration
of the Shoreline, 2000–2019 349

x
Abbreviations
ADB Asian Development BankAF Adaptation FundAfDB African Development BankASC Aquaculture Stewardship CouncilASEAN Association of Southeast Asian NationsBAU business as usualBIMSTEC Bay of Bengal Initiative for Multi-Sectoral Technical
and Economic CooperationBinD binary constrained disasterCBD Convention on Biological DiversityCC Coast ConservationCMEE China Marine Economy ExpoCMT coastal and maritime tourismCO2 carbon dioxideCODF China Oceanic Development FoundationCRMD Coastal Resource Management Department of Sri LankaDENR Department of Environment and Natural ResourcesDRM disaster risk management EAMCP East Asia Marine Cooperation PlatformEBRD European Bank for Reconstruction and DevelopmentEEZ exclusive economic zoneEIA environmental impact assessmentEPR end point rateFiA Fisheries AdministrationGCF Green Climate FundGCP ground control pointsGDP gross domestic productGEF Global Environment FacilityGHG greenhouse gasGIS geographic information systemGoI Government of IndiaGOP gross ocean productGPS global positioning systemGWEC Global Wind Energy CouncilIDB Inter-American Development BankIIED International Institute for Environment and
DevelopmentIPCC Intergovernmental Panel on Climate Change
Abbreviations xi
IPO initial public offeringITA international tourist arrivalIUCN International Union for Conservation of NatureKML Keyhole Markup LanguagekW kilowattLDCF Least Developed Countries FundLGU local government unitMAFF Ministry of Agriculture, Forestry, and FisheriesMFFI Marine and Fisheries Financing InstitutionMNRE Ministry of New and Renewable EnergyMoCAT Ministry of Civil Aviation and TourismMoEFCC Ministry of Environment, Forest and Climate ChangeMoFA Ministry of Foreign AffairsMOU memorandum of understandingMPA marine protected areaMRF materials recovery facilityNDC nationally determined contributionNELHA Natural Energy Laboratory of Hawaii AuthorityNGO nongovernment organizationNIWE National Institute of Wind EnergyNOx nitrogen oxide NSM net shoreline movement NSWMC National Solid Waste Management CommissionNTDP National Tourism Development PlanODA official development aidOECD Organisation for Economic Co-operation
and DevelopmentOTEC ocean thermal energy conversionPAMB Protected Area Management BoardPES payment for ecosystem servicesPPE personal protective equipmentPPP public–private partnershipPRC People’s Republic of ChinaPRISMA Preferred Reporting Items for Systematic Reviews
and MetaAnalysesSAARC South Asian Association for Regional CooperationSC scenarioSCCF Special Climate Change FundSCE shoreline change envelopeSD standard deviationSDG Sustainable Development GoalSIDS small island developing statesSIPLAS Siargao Islands Protected Landscape and Seascape

xii Abbreviations
SMEs small and medium-sized enterprisesSO2 sulfur dioxide SP-BEZ Shandong Peninsula Blue Economic Zone SWM solid waste managementTDGVA tourism’s domestic gross value addedUN United NationsUNFCCC United Nations Framework Convention
on Climate ChangeUNWTO United Nations World Tourism OrganizationUS United StatesWTTC World Travel and Tourism CouncilWWF World Wide Fund for Nature
xiii
Contributors
A.P. Abeygunawardana is a lecturer at the Faculty of Animal Science and Export Agriculture of Uva Wellassa University, Badulla, Sri Lanka.
L.C.K. Abeykoon is a researcher at the Faculty of Animal Science and Export Agriculture, Uva Wellassa University, Badulla, Sri Lanka.
Dominique Benzaken is a senior consultant with the Australian National Centre for Ocean Resources and Security, University of Wollongong, Australia.
Mary Jean A. Camarin is chief tourism operations officer at the Department of Tourism, Caraga Region, Butuan City, Philippines.
Nepomuk Dunz is a junior professional officer at the World Bank, Washington, DC, United States (US).
K.P.U.T. Egodauyana is a demonstrator at the Faculty of Animal Science and Export Agriculture of Uva Wellassa University, Badulla, Sri Lanka.
Keita Furukawa is president of the Association for Shore Environment Creation, Yokohama, Kanagawa, Japan.
Yimnang Golbuu is chief executive officer of the Palau International Coral Reef Center, Koror, Palau.
Cielito F. Habito is a professor emeritus at Ateneo de Manila University, Quezon City, Philippines.
Michael C. Huang is a research fellow at the Ocean Policy Research Institute, Sasakawa Peace Foundation, Japan.
Md Wasiul Islam is a professor at the Forestry and Wood Technology Discipline of Khulna University, Bangladesh.
Masanori Kobayashi is a senior research fellow at the Ocean Policy Research Institute of the Sasakawa Peace Foundation, Japan.
Miko Maekawa is a senior research fellow at the Ocean Policy Research Institute of the Sasakawa Peace Foundation, Japan.
xiv Contributors
Junko Mochizuki is a disaster risk management specialist at the World Bank, Washington, DC, US.
Peter Morgan is a senior consulting economist and advisor to the dean, Asian Development Bank Institute, Japan.
Muhammad Zubair Mumtaz is an associate professor of finance at the National University of Sciences and Technology, School of Social Sciences and Humanities, Islamabad, Pakistan, and an associate professor at the College of Business Administration, University of Bahrain, Sakhir, Bahrain.
Asjad Naqvi is a research scholar at the International Institute for Applied Systems Analysis, Austria.
Gopal K. Sarangi is an assistant professor at the TERI School of Advanced Studies in New Delhi, India.
Tapan Sarker is a professor at the School of Business of the University of Southern Queensland, Australia.
Kevin Roy B. Serrona is a solid waste planner at the Resource Recovery Division of the Department of the Environment, Prince George’s County, Largo, Maryland, US.
Nagisa Shiiba is a policy researcher at the Institute for Global Environmental Strategies, Japan.
Zachary Alexander Smith is an assistant professor of economics and finance at Saint Leo University, Tapia College of Business, Saint Leo, Florida, US.
Hajime Tanaka is a research fellow at the Ocean Policy Research Institute of the Sasakawa Peace Foundation, Japan.
E.P.D.N. Thilakarathne is a lecturer at the Faculty of Animal Science and Export Agriculture of Uva Wellassa University, Badulla, Sri Lanka.
Keshia N. Tingson is an assistant professor at the University of the Philippines Los Baños, Laguna, Philippines.
Contributors xv
Raghu Dharmapuri Tirumala is a senior lecturer at the Faculty of Architecture, Building, and Planning of the University of Melbourne, Australia.
Piyush Tiwari is a professor of property at the Faculty of Architecture, Building, and Planning of the University of Melbourne, Australia.
Tibor Vegh is a senior policy associate at the Ocean and Coastal Policy Program, Nicholas Institute for Environmental Policy Solutions, Duke University, US.
John Virdin is director of the Ocean and Coastal Policy Program, Nicholas Institute for Environmental Policy Solutions, Duke University, US.
Michelle Voyer is a senior research fellow with the Australian National Centre for Ocean Resources and Security at the University of Wollongong. Australia.
T.W.S. Warnasuriya is a lecturer at the Faculty of Fisheries and Ocean Sciences, Ocean University of Sri Lanka, Tangalle, Sri Lanka.
Atsushi Watanabe is a senior research fellow at the Ocean Policy Research Institute of the Sasakawa Peace Foundation, Japan.
Zhihai Xie is an associate professor at Kyoai Gakuen University, Japan.
Jeongsoo Yu is a professor at the Department of International Environment and Resources Policy of the Graduate School of International Cultural Studies, Tohoku University, Japan.
Maria Angela G. Zafra is executive director at the Strategia Development Research Institute, Inc., Mandaluyong, Philippines.
xvi
Foreword 1
Covering more than 70% of the planet’s surface, 95% of the biosphere, serving as home to many complex ecosystems, and producing half of the planet’s oxygen, the ocean and its well-being are crucial to our own well-being. Millions of people make their living from the ocean, be it as a source of income or food, or as a way of life. And yet, we have been mounting multiple threats to the ocean’s health through anthropogenically driven climate change, acidification, warming, overfishing, pollution, and the destruction of habitat and biodiversity. Meanwhile, the coronavirus disease pandemic has undermined global efforts to achieve sustainable development, including the implementation of Sustainable Development Goal 14 to conserve and sustainably use the ocean’s resources.
People increasingly view the sustainable blue economy as central to the future of human security, including new sources of food, medicines, and renewable energy. With the ocean providing powerful solutions to global challenges, the influential work of the High Level Panel for a Sustainable Ocean Economy has clearly demonstrated the need for urgent actions to safeguard the ocean’s capacity to deliver substantive economic, environmental, and social value.
The great region of Asia and the Pacific has a vital role to play in the development of the sustainable blue economy. The region is custodian to an immense ocean space and is home to rich and diverse marine life and ecosystems. Many people in the region depend on marine and coastal resources, and the sustainable use of marine and coastal resources is a centerpiece of the region’s healthy sustenance and prosperity. The Asian Development Bank is centrally placed in the region to support governments and stakeholders as they pursue shared policy goals of protecting the ocean’s health and achieving the resilient ocean economies.
This book, Blue Economy and Blue Finance, serves to consolidate regional expertise under the auspices of the Asian Development Bank Institute to provide useful insights and guidance for regional governments and stakeholders in the pursuit of sustainable ocean economies. I am sure it will also serve as useful input for regional preparations for and deliberations at global conferences regarding the ocean.

Foreword 1 xvii
I applaud the Asian Development Bank Institute and the Ocean Policy Research Institute of the Sasakawa Peace Foundation for the production of this timely publication. I recommend it to all readers who share an interest in the development of the sustainable blue economy.
Peter ThomsonUnited Nations Secretary-General’s Special Envoy for the Ocean
xviii
Foreword 2
The ocean is confronting unprecedented crises, such as overfishing, acidification, and marine debris, along with overwhelming human activities. Its health and capacity for sustaining the ecosystem are likely to decline if people do not become more aware of its misuse and take appropriate conservation measures. If we want to address the most defining issues of our time, such as climate change, food insecurity, diseases and pandemics, diminishing biodiversity, economic inequality, and even conflicts and strife, we must work toward a more resilient future where humanity and oceans thrive together. At present, most of the ocean remains unmapped, unexplored, and unknown. Our understanding of the ocean and its contribution to sustainability relies considerably on our commitment to conducting practical ocean science—through research and sustained observation, supported by plausible infrastructures and investments. The prosperity of our region depends on our endeavors to create healthy oceans and achieve sustainable development.
In 2019, the Ocean Policy Research Institute of the Sasakawa Peace Foundation kicked off a new research project, Blue Finance, with the aim of contributing quantitative and evidence-based research and policy dialogue for the blue economy—i.e., sustainable use of ocean resources for economic growth, improved livelihoods, and jobs while preserving the health of ocean ecosystems. Meanwhile, the Asian Development Bank (ADB) launched the Action Plan for Healthy Oceans and Sustainable Blue Economies for the Asia and Pacific region at the 52nd Annual Meeting of ADB’s Board of Governors in Fiji. The Asian Development Bank Institute, based in Tokyo, Japan, thus constructed a closer partnership to link academia with the public and private sectors for a broader scope.
Since 2020, despite the coronavirus disease global pandemic, and with the support of the Australian National Centre for Ocean Resources and Security of the University of Wollongong and the Ocean Affairs Council, we issued a call for papers on various issues of the blue economy and blue finance. We received a great number of submissions, indicating the tremendous amount of concern for ocean development that exists around the world. We invited authors of the selected papers to present at a virtual conference co-organized by four institutes. The vibrant deliberation among experts and practitioners provided constructive policy recommendations for better ocean governance and

Foreword 2 xix
implementation. We believe this book’s abundant content will motivate researchers and policy makers, fostering in-depth inspiration toward ocean governance and sustainable development.
With the ocean, we build back better and build back bluer!
Hide SakaguchiPresident, Ocean Policy Research InstituteSasakawa Peace Foundation
xx
Foreword 3
Working in the environmental financing sector for more than 20 years, I have witnessed a remarkable growth in the attention given to climate change issues and reinforcement of the global framework addressing them. In 2021, 197 countries adopted the Glasgow Climate Pact to turn the 2020s into a decade of climate action and support. This commitment is encouraging but far from enough because disparity in commitment and holistic participation still exists, especially from ocean-related sectors requiring substantial input of cutting-edge technology.
For all climate change issues, we believe the answers are to be found in the ocean. According to the report released by the Intergovernmental Panel on Climate Change of the United Nations in 2022, the ocean absorbs almost a third of emitted carbon dioxide and 90% of excess heat, and we may be nearing a tipping point with the world’s oceans. Moreover, the levels of ocean acidification, ocean warming, and deoxygenation threaten biodiversity and ecosystems so that the ocean and its biodiversity is coming to be seen as a critical facet of climate policy. These complex issues require greater collaboration from academia, research institutes, and government, and implementation must involve private sector stakeholders. While the 2021 United Nations Climate Change Conference (COP26) highlighted finance for climate adaptation, transparency, and reporting, to mobilize investment for environmental conservation and ocean-related industry will require evidence-based research to identify the risk and sustainability projections.
Undoubtedly, the development of the blue economy provides an opportunity for industry, community, and government in coastal and island states to consolidate their partnerships, as blue finance could accelerate the implementation more inclusively. Regarding blue finance, trackable process and assessment are the most critical considerations for multinational development banks and public and private financial institutions to set environmental, social, and governance investment criteria. The global environment funds are also ready to support these projects if they have quantifiable social and environmental impacts.
From the perspective of a financial strategist for sustainability, this book Blue Economy and Blue Finance covers an impressive scope because it includes emerging market countries and small island developing states. It provides an exceptional introduction to timely ocean issues such as fisheries, conservation, tourism, renewable energy, waste management, and financial schemes in Asia and the Pacific.
Foreword 3 xxi
The comprehensive discussion on these topics enables readers and policy makers to grasp the critical arguments and policy implications collectively. More importantly, the authors conducted the empirical studies and field investigations with sufficient academic rigor, making the research results robust, with applicable and replicable approaches for other regions.
I offer heartfelt praise for bringing this publication to fruition during this challenging time of the coronavirus disease global pandemic. I can state with confidence that the insights provided in this book will shed light on the sustainable development of the ocean and a resilient blue recovery.
Mari YoshitakaPrincipal Sustainability StrategistMitsubishi UFJ Research and Consulting

1
1
Overview of the Blue Economy and Blue Finance
Michael Huang and Peter J. Morgan
Billions of people in Asia and the Pacific depend on healthy oceans for their livelihoods, food security, health, and recreation. However, the impacts of climate change, marine pollution, unsustainable fishing, and rapid, unsustainable coastal development increasingly threaten these ecosystems, jeopardizing the region’s small island nations and other developing coastal economies.
At the same time, the blue economy has become increasingly common in public discourse and the popular imagination, along with better understanding of the nature of human relationships with the ocean. This is reflected in the increasing number of publications addressing this area. According to the World Bank (2017: vi), the blue economy is “the range of economic sectors and related policies that together determine whether the use of oceanic resources is sustainable.” Whisnant and Reyes (2015: 6) define the blue economy as “the set of environmentally and socially sustainable commercial activities, products, services and investments dependent on and impacting coastal and marine resources.” The Organisation for Economic Co-operation and Development (2019) focuses on assessing the crucial role of innovative approaches for a sustainable ocean economy and argues that science and technology will enable economic growth and preservation of ecosystems in the blue economy. The Economist Intelligence Unit (2015: 5) also emphasizes the “industrialization” effect in the blue economy and argues that “alongside established ocean industries, emerging and new activities—offshore renewable energy, aquaculture, deep seabed mining and marine biotechnology are often cited—will bring new opportunities, growth and greater diversity to the ocean economy.” Blue finance, as an offshoot of green finance, describes the frameworks to support the financing of sustainable ocean-related projects. See the Asian Development Bank (2021) for a very recent discussion of these issues.
The concepts of blue economy and blue finance are reflected in the 2030 Agenda for Sustainable Development (the 2030 Agenda), a set
2 Blue Economy and Blue Finance: Toward Sustainable Development and Ocean Governance
of international development goals from 2016 to 2030, adopted by the United Nations Sustainable Development Summit in 2015. The 2030 Agenda highlighted the Sustainable Development Goals (SDGs), which consist of 17 goals to eradicate poverty and realize a sustainable world. The SDGs are universal goals applicable to all countries. Goal 14—Life Below Water—calls for a healthy and sustainable manner of using marine resources which maintains the ecosystem while enabling economic development.
This book addresses crucial and timely issues related to promoting sustainable ocean and coastal development and management in Asia and the Pacific with evidence-based approaches. To tackle these ocean-related issues with intensive discussion among public and private stakeholders and academia, the Australian National Centre for Ocean Resources and Security of the University of Wollongong, the Ocean Policy Research Institute of the Sasakawa Peace Foundation, the Ocean Affairs Council, and the Asian Development Bank Institute cohosted an international conference in November 2020. The chapters of this book, first presented at the conference, include analyses of Bangladesh, Cambodia, the People’s Republic of China, Fiji, India, Indonesia, Japan, the Philippines, and Sri Lanka.
The book focuses on the blue economy and blue finance, including issues related to governance, planning, sectoral management, and risk management. Topics include innovative ocean financing schemes and strategies for mitigating the impacts of climate change and unsustainable practices on communities that rely on a healthy ocean and coastal ecosystems. The book is divided into four sections: blue finance (chapters 2–4), blue economy (chapters 5–8), blue economy–related industry (chapters 9–10), and interdisciplinary studies (chapters 11–12).
In Chapter 2: Approaches to Strengthening Fisheries Financing and Institutional Mechanisms: A Cross-Country Comparison of Cambodia, India, and Indonesia, Raghu Dharmapuri Tirumala and Piyush Tiwari conduct a comparative analysis to identify similarities, differences, and emerging patterns of financing frameworks across Cambodia, India, and Indonesia. Their analysis indicates that an institutional design with a specific focus on the fisheries sector that promotes constructive collaborations among diverse financing institutions and community organizations can support sustainable development of this sector of the blue economy.
To trace the flow of the public funding for the blue economy for ocean conservation and other climate change adaptation and mitigation measures, in Chapter 3: Tracking International Aid for Ocean Conservation and Climate Action, Nagisa Shiiba, Miko Maekawa, Tibor Vegh, and John Virdin produce a comprehensive
Overview of the Blue Economy and Blue Finance 3
baseline of international fund flows by identifying relevant global goals and targets. By building upon recent efforts that have established a baseline for international institutions operating at the global level, they estimate that cumulative public financing for ocean conservation and climate action has grown from $579 million to $3.5 billion between 2013 and 2019.
Since ocean-related firms will issue blue financial instruments to obtain funds and take necessary measures to make the ocean environment healthier, the measurement of the blueness of a firm or a blueness index has become desirable. In Chapter 4: The Blueness Index, Investment Choice, and Portfolio Allocation, Muhammad Zubair Mumtaz and Zachary Alexander Smith estimate the investor’s portfolio utility function by incorporating a blueness factor using greenhouse gas emissions as a percentage of sales. Their results suggest a positive relationship between the blueness proxy and optimal investment allocation. If firms have a low level of blueness, they are likely to face higher levels of environment-related taxation, which would reduce the portfolio allocation to them. The authors also examine factors that determine stock returns and find a positive association between the blueness of a firm and its stock returns. This suggests that firms that are relatively “bluer” may be more attractive to investors in light of the public’s preference for sustainable investments, thereby leading them to outperform other firms.
The blue economy has become increasingly important for countries to generate new growth sources while maintaining environmental stability. In Chapter 5: Government Policy, Industrial Clusters, and the Blue Economy in the People’s Republic of China: A Case Study on the Shandong Peninsula Blue Economic Zone, Zhihai Xie introduces the blue economy development program of the People’s Republic of China (PRC) and its transformative change over the last decade. He argues that government policy and industrial clusters are the two most important factors that contribute to the development of the PRC’s blue economy and uses the Shandong Peninsula Blue Economic Zone (SP-BEZ) as a case study. To promote the development of the blue economy in the SP-BEZ, the government has used the Shandong Peninsula’s industrial competitive advantages to redistribute and restructure industries in the region. The SP-BEZ has formed industrial clusters supported by its strengths in scientific and technological research and the development of the blue economy. These industrial clusters have integrated a wide range of industries and help promote domestic regional economic integration in the Shandong Peninsula.
Ocean tourism significantly contributes to the economy of the Philippines, an archipelagic nation with one of the longest coastlines
4 Blue Economy and Blue Finance: Toward Sustainable Development and Ocean Governance
in the world and one of the richest marine environments in terms of biodiversity. In Chapter 6: Developing the Philippine Blue Economy: Opportunities and Challenges in the Ocean Tourism Sector, Maria Angela G. Zafra explores how ocean tourism and economic development are intertwined in archipelagic nations, based on an analysis of statistical data on tourism and economic development in the Philippines over the last several years. The author describes in detail the policy landscape of enabling and disabling factors for the development of ocean tourism in the Philippines. She also describes how inclusive models can be a catalyst for sustainable tourism through a case analysis of El Nido Resorts, a tourism enterprise operating luxury resorts within the protected area of El Nido, Palawan.
The blue economy has become a pivotal policy objective to promote sustainable development through conservation and sustainable use of marine and coastal resources. Some lessons can be drawn from case studies of successful endeavors such as the need for a sound policy framework, multi-stakeholder and cross-sectoral collaboration, and innovation and science-based policy development and implementation. In Chapter 7: Capitalizing on Co-benefits and Synergies to Promote the Blue Economy in Asia and the Pacific, Masanori Kobayashi, Atsushi Watanabe, Keita Furukawa, Keshia N. Tingson, Yimnang Golbuu, and Cielito F. Habito recommend approaches that promote co-benefits and synergies that are useful in multiplying benefits for a wide range of stakeholders. In the analysis, market disruption, changes in the marine environment, and marine debris are some areas requiring a range of approaches to resolve challenges. Capacity development and international partnerships are indispensable to promote the blue economy and scale up such concepts. Research institutes can provide policy options and courses of action to assess the resources locally available and pursue co-benefits and synergies through conservation and sustainable use of marine and coastal resources toward achieving a sustainable blue economy.
Marine litter seriously affects the Philippines, partly due to the country’s strategic location on regional trade routes. In Chapter 8: Addressing Marine Litter through Sustainable Tourism: The Case of the Siargao Islands in the Southern Philippines, Kevin Roy B. Serrona, Jeongsoo Yu, and Mary Jean A. Camarin explore ways to reduce marine litter in tourism destinations like Siargao through circular economy interventions. Innovative legislation and policies, capacity building, deposit–refund systems, technology innovations, and community-based approaches to minimize, capture, and process marine litter are some of the critical areas that need to be tackled to contribute to global practices on sustainable tourism in island economies.
Overview of the Blue Economy and Blue Finance 5
Renewable energy from the ocean is expected to be one of the world’s major power supplies, and offshore wind energy has potential as an alternative energy source in India. In Chapter 9: Offshore Wind Energy as an Emergent Ocean Infrastructure in India: Mapping and Measuring Social and Environmental Challenges, Gopal K Sarangi conducts detailed assessments of policy and institutional mechanisms governing the development of offshore wind energy in the country and identifies the possible environmental and social impacts of such projects on India’s marine environment and livelihoods in the fisheries sector. He finds that significant gaps exist in policies and regulations. Moreover, impact mapping shows that India’s offshore wind projects could adversely impact the marine ecosystem and marine biodiversity, and he recommends that countries must take necessary preparatory measures before project implementation.
Coastal and maritime tourism could play a significant role in realizing the potential of the blue economy given the strategic location of Bangladesh on the Bay of Bengal. In Chapter 10: Sustainable Coastal and Maritime Tourism: A Potential Blue Economy Avenue for Bangladesh, Md. Wasiul Islam and Tapan Sarker investigate the coastal and marine zones of Bangladesh from sociocultural, economic, environmental, and institutional perspectives. This chapter examines the institutions supporting sustainable coastal and maritime tourism and gives recommendations for policy guidelines on how development could influence the blue economy, poverty reduction through new job creation, biodiversity conservation, environmental pollution control, and promotion of the sustainable use of coastal and marine natural resources.
Building resilience to disasters continues to pose challenges for developing countries. Historically, small island developing states (SIDS) in the Pacific Ocean have suffered from multiple hazards, such as earthquakes, tsunamis, coastal erosion, floods, and cyclones. Population increase, uneven progress in socioeconomic development, and environmental degradation, including climate change, have exacerbated their vulnerability to disasters. The outbreak of the coronavirus disease global pandemic in 2020 showed how the small, remote, and less-diversified economies of SIDS are particularly prone to additional external shocks. In Chapter 11: Building Back Better in Small Island Developing States in the Pacific: Initial Insights from the BinD Model of Disaster Risk Management Policy Options in Fiji, Nepomuk Dunz, Hajime Tanaka, Nagisa Shiiba, Junko Mochizuki, and Asjad Naqvi provide insights into the interaction of alternative disaster risk management policies in the presence of additional demand-side constraints evaluated through the recently developed binary
6 Blue Economy and Blue Finance: Toward Sustainable Development and Ocean Governance
constrained disaster (BinD) model. The modeling results show that a targeted increase of government spending in times of crisis could be beneficial for the economic recovery of Fiji. However, financing options have short-term trade-offs. Debt-financed recovery allows a faster and less painful recovery but requires quick and preferential access to foreign borrowing, while tax-financed recovery can substitute for short-term foreign borrowing needs but can have more detrimental impacts on gross domestic product and private sector consumption.
Monitoring the changes in coastlines has been the subject of great concern in recent years. In Sri Lanka, the western and northwestern coasts are economically significant but have highly dynamic natures. In Chapter 12: Are Coastal Protective Hard Structures Still Applicable with Respect to Shoreline Changes in Sri Lanka?, L.C.K. Abeykoon, E.P.D.N. Thilakarathne, A.P. Abeygunawardana, T.W.S. Warnasuriya, and K.P.U.T. Egodauyana use satellite images from the Google Earth platform to analyze the changes occurring in the coastal zone during the period 2005–2019 on the western and northwestern provincial coasts of Sri Lanka. The results reveal an increase over the past 15 years in the average coastal erosion rates, caused, paradoxically, by the construction of hard structures to mitigate the effects of coastal erosion. Due to mega-development projects, the western province has applied more hard structures at a higher rate than the northwestern province. Overall, anthropogenic activities are affecting coastal erosion in that area more than natural or global factors, and the constructed hard structures show little capability to control erosion.
The findings in these chapters provide comprehensive information and policy implications on various blue economy and blue finance issues, which can significantly contribute to the Asian Development Bank’s Action Plan for Healthy Oceans 2019–2024 (ADB 2019a) and the Oceans Financing Initiative (ADB 2019b) to support the blue economy.
The intent of these chapter topics is to find inclusive and effective policy measures to promote the blue economy for sustainable development while taking into account the perspective of climate change. The topics reemphasize the ocean agenda set by the United Nations Development Programme and advocate collaboration for creating financing instruments, as exemplified by the experience of establishing platforms among private sectors and nongovernment organizations for ocean plastic debris management. We trust that policy makers, academics, and think tank researchers will find this research useful.
Overview of the Blue Economy and Blue Finance 7
ReferencesADB (Asian Development Bank). 2019a. Action Plan for Healthy Oceans.
Manila: Asian Development Bank. https://www.adb.org/sites /default/files/am-content/484066/action-plan-flyer-20190430.pdf
____. 2019b. ADB Oceans Financing Initiative: Accelerating Blue Investments in Asia and the Pacific. Manila: Asian Development Bank. https://www.adb.org/sites/default/files/related/145041 /Oceans%20Financing%20Initiative.pdf
____. 2021. Financing the Ocean Back to Health in Southeast Asia: Approaches for Mainstreaming Blue Finance. Manila: Asian Development Bank. https://www.adb.org/sites/default/files /publication/756686/financing-ocean-health-southeast-asia.pdf
Economist Intelligence Unit. 2015. The Blue Economy: Growth, Opportunity and a Sustainable Ocean Economy. Briefing Paper for the World Ocean Summit. London: The Economist Intelligence Unit.
Organisation for Economic Co-operation and Development (OECD). 2019. Rethinking Innovation for a Sustainable Ocean Economy. Paris: OECD Publishing. https://doi.org/10.1787/9789264311053-en
Whisnant, R., and A. Reyes. 2015. Blue Economy for Business in East Asia: Towards an Integrated Understanding of Blue Economy. Quezon City, Philippines: Partnerships in Environmental Management for the Seas of East Asia (PEMSEA).
World Bank and United Nations Department of Economic and Social Affairs. 2017. The Potential of the Blue Economy: Increasing Long-term Benefits of the Sustainable Use of Marine Resources for Small Island Developing States and Coastal Least Developed Countries. Washington, DC: World Bank. https://openknowledge.worldbank.org/bitstream /handle/10986/26843/115545.pdf?sequence=1&isAllowed=y

PART I
Blue Finance

11
2
Approaches to Strengthening Fisheries Financing and
Institutional Mechanisms: A Cross-Country Comparison of Cambodia, India, and Indonesia
Raghu Dharmapuri Tirumala and Piyush Tiwari
2.1 IntroductionUsing marine resources in a healthy and sustainable manner is at the center of building a blue economy that will make Sustainable Development Goal 14, Life Below Water, achievable. Fisheries and related industries constitute an important component of the blue economy (World Bank 2017). Fisheries and other coastal, marine resources and industries have an estimated market value of $3 trillion to $5 trillion, approximately 5% of the global gross domestic product (FAO 2016). In 2018, the estimated global fish production was 179 million tons (FAO 2020b), its highest peak, representing a rise of over 120% since 1990. The global aquaculture production experienced even higher growth of 527% from 1990 to 2018. While the extent of aquaculture development differs across and within geographical regions, the People’s Republic of China (PRC) (47.6 million tons), India (7.1 million tons), and Indonesia (5.4 million tons) dominated the production between 2003 and 2018 (FAO 2020b). According to the estimates of the Food and Agriculture Organization (FAO), about 60 million people work in the fisheries sector globally, of whom more than 83% are in Asia (FAO 2020b). The FAO has stated that Asia will continue to dominate the aquaculture sector and expand its share to more than 89% of global production by 2030. There is increasing international recognition of developing blue economy
12 Blue Economy and Blue Finance: Toward Sustainable Development and Ocean Governance
principles through agencies such as the World Wide Fund for Nature, United Nations Development Programme, United Nations Environment Programme, Asian Development Bank (ADB), and World Bank. Agencies have developed several tools and guidance documents at the global level to help countries transition to blue economies. They based many of these tools on the FAO’s Code of Conduct for Responsible Fisheries, which more than 170 member countries drafted and adopted, and which focused on nutritional, economic, social, environmental, and cultural aspects. Worldwide, efforts are aiming to ensure positive outcomes for different blue economy–related projects. The blue economy can substantially improve people’s income and livelihood; the sector has the potential to create 100 million jobs by 2030 (PEMSEA n.d.), particularly in Asian countries such as Bangladesh (Hasan et al. 2018) and India (Pranathi and Gonchkar 2019). Projects like Mozambique’s Mais Peixe Sustentável aim to reduce rural poverty through investments in the fisheries sector. In contrast, India’s mapping of the “hazard line” of the coastline intends to improve the management of coastal spaces and minimize vulnerabilities through the protection of shorelines and land use plans.
Despite the importance of the ocean economy, ongoing human activities that pollute water bodies are negatively affecting the health of the oceans at an alarming pace. A combination of factors, including indiscriminate dumping of waste, plastics in the oceans, unsustainable fishing, unregulated coastal redevelopment, and climate change, are harming the quantity and quality of the fish produce. The discharging of untreated effluents from land into water bodies, fishing above the sustainable levels, and steady damage to the habitat have resulted in a noticeable reduction in the health of oceans (Halpern et al. 2008; Cohen et al. 2019), thereby affecting the livelihood and food security of communities that depend on fishing and exerting a negative impact on the world economy (Hertel 2016; FAO et al. 2018). The decline in the percentage of fish stocks within biologically sustainable levels—from 90% in 1974 to 65.8% in 2017—is a disturbing trend (World Bank 2020). There is an increasing global consensus that continued overfishing will significantly affect the food security and the livelihoods of vulnerable people in the future. The seafood industry, which provides nutrition and livelihoods to millions of people across the globe, is facing a serious threat from declining fish stocks and degrading ocean habitats. Failure to adopt adequate and timely measures regarding sustainable ocean resource mining and the protection of ocean biodiversity could threaten food security and livelihood opportunities.
According to the estimate of the International Institute for Environment and Development (IIED), restoring the depleting fisheries
Approaches to Strengthening Fisheries Financing and Institutional Mechanisms: A Cross-Country Comparison of Cambodia, India, and Indonesia 13
sector globally would require more than $200 billion (IIED 2020). Governments’ common fiscal policy tools, such as taxes, subsidies, and budgetary allocations, are unlikely to be adequate to meet the vast financing needs. These resources must be augmented by attracting private capital to bridge the financing gap and support the transition to blue economies. On the other hand, there is growing interest in the private sector in financing marine conservation and blue economy initiatives that need leveraging. The Meloy Fund and Althelia Sustainable Ocean Fund provide evidence of the role that private financing can play in supporting the growth of the blue economy and improving the livelihoods of local communities. Much of the success of these financing instruments will depend on the supporting frameworks that governments will create. The availability of appropriate institutional mechanisms and statutory support will incentivize the private sector to participate in fisheries and aquaculture sectors and other sustainable ocean-related economic activities (Yoshioka et al. 2020).
Recognizing this gap and enabling the transition to sustainable blue economies, many countries in the recent past have announced different institutional and financing mechanisms to promote private capital and commit public resources through budgetary allocations. Hence, the question arises: What should be the features of an institutional and financing mechanism that supports sustainable fisheries sector development? Achieving the goals that countries set for themselves would mean moving beyond the operational contours and adopting a comprehensive approach comprising institutional structures, governance, financing mechanisms, community engagement, and stakeholder buy-in (Tirrell 2017).
The research described in this chapter attempted to find an answer to the above question due to its relevance to many developing nations as they gear up to meet the targets that the sustainable development goals have set. The objective of this research was to study the different responses to the changing blue economy sectors, with particular reference to fisheries, and to investigate the features of an institutional and financing mechanism that promotes sustainable fisheries sector development. The research also investigated whether these financing structures enable private sector capital flows that can aid the transition to sustainable and inclusive blue economies.
About 25% of the world’s fish production comes from 10 countries in the Association of Southeast Asian Nations (ASEAN) region (Invest in ASEAN 2020). Indonesia is the largest producer of seafood in Southeast Asia and ranks second globally, after the PRC. In 2018, fisheries contributed 2.58% of Indonesia’s gross domestic product (GDP), approximately $26.9 billion (FAO 2020b). The Nature Conservancy
14 Blue Economy and Blue Finance: Toward Sustainable Development and Ocean Governance
(2020) estimates that the fisheries industry employs about 12 million people. Cambodia, also an ASEAN member country, is known for its rich biodiversity and fishery resources owing to the Mekong River. The country is also home to Tonle Sap, the largest freshwater lake in Southeast Asia and a rich fishing ground. The fisheries sector contributes about 17.08% of the country’s GDP, employing about 2 million people (RGC 2010; FAO 2020b). Globally, India ranks third in fish production and second in aquaculture. The fisheries sector, which employs over 145 million people in India, accounts for about 1.07% of the country’s GDP (GoI 2020). These countries vary in size and natural resources but are committed to improving their blue economy prospects. Though the approaches that the three countries have taken to build their blue economies are different, the overarching Sustainable Development Goals (SDGs) are at the very core of all their development efforts.
This chapter presents a comparative analysis of the institutional and funding mechanisms of three countries—Cambodia, India, and Indonesia—to gain a better understanding of how they are addressing the finance gap in the fisheries sector. We conducted a literature review to create a framework within which to undertake the country comparison. This identified various elements that provide a perspective on the institutional and financial mechanisms. Next, we collected information about fisheries and financing in the three countries from their governments and other published sources and then analyzed the information using the comparative framework to identify the countries’ similarities, differences, and uniqueness. They drew policy implications from the findings, providing pointers to shape a broader regional approach.
This chapter focuses on the institutional and financial strategies that the three countries are proposing to adopt rather than specific technical practices. Section 2.2 presents a review of the literature. Section 2.3 sets out the methodology for comparing the approaches that the countries have adopted. Section 2.4 outlines the backdrop of the fisheries sector with a focus on the financing and institutional structures of Cambodia, India, and Indonesia. Section 2.5 discusses the comparison of these structures. Section 2.6 presents the policy implications, and the chapter concludes in Section 2.7 by synthesizing the findings of this comparative analysis and lessons for their adoption for sustainable financing.
2.2 Review of the LiteratureThe discourse and research on the blue economy have ranged from determining what constitutes the blue economy (Keen, Schwarz, and Wini-Simeon 2018; World Bank 2017) to identifying the various
Approaches to Strengthening Fisheries Financing and Institutional Mechanisms: A Cross-Country Comparison of Cambodia, India, and Indonesia 15
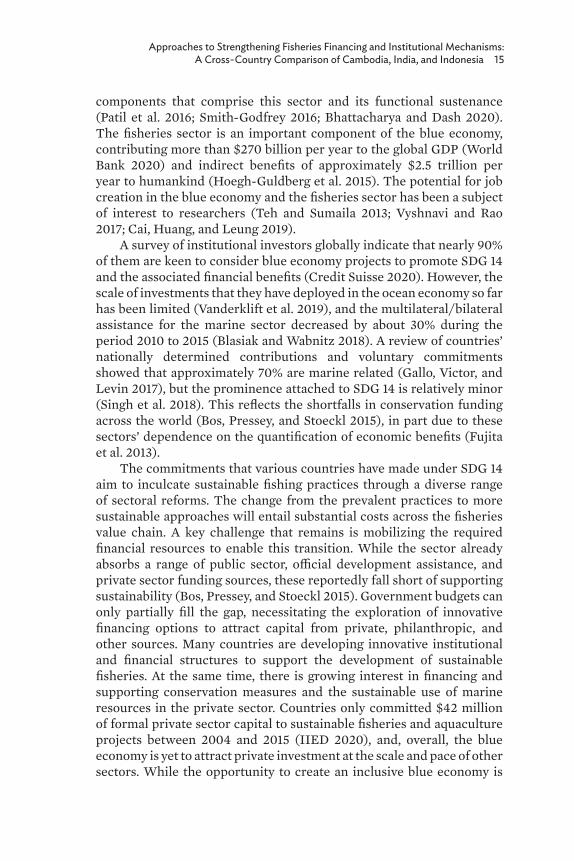
components that comprise this sector and its functional sustenance (Patil et al. 2016; Smith-Godfrey 2016; Bhattacharya and Dash 2020). The fisheries sector is an important component of the blue economy, contributing more than $270 billion per year to the global GDP (World Bank 2020) and indirect benefits of approximately $2.5 trillion per year to humankind (Hoegh-Guldberg et al. 2015). The potential for job creation in the blue economy and the fisheries sector has been a subject of interest to researchers (Teh and Sumaila 2013; Vyshnavi and Rao 2017; Cai, Huang, and Leung 2019).
A survey of institutional investors globally indicate that nearly 90% of them are keen to consider blue economy projects to promote SDG 14 and the associated financial benefits (Credit Suisse 2020). However, the scale of investments that they have deployed in the ocean economy so far has been limited (Vanderklift et al. 2019), and the multilateral/bilateral assistance for the marine sector decreased by about 30% during the period 2010 to 2015 (Blasiak and Wabnitz 2018). A review of countries’ nationally determined contributions and voluntary commitments showed that approximately 70% are marine related (Gallo, Victor, and Levin 2017), but the prominence attached to SDG 14 is relatively minor (Singh et al. 2018). This reflects the shortfalls in conservation funding across the world (Bos, Pressey, and Stoeckl 2015), in part due to these sectors’ dependence on the quantification of economic benefits (Fujita et al. 2013).
The commitments that various countries have made under SDG 14 aim to inculcate sustainable fishing practices through a diverse range of sectoral reforms. The change from the prevalent practices to more sustainable approaches will entail substantial costs across the fisheries value chain. A key challenge that remains is mobilizing the required financial resources to enable this transition. While the sector already absorbs a range of public sector, official development assistance, and private sector funding sources, these reportedly fall short of supporting sustainability (Bos, Pressey, and Stoeckl 2015). Government budgets can only partially fill the gap, necessitating the exploration of innovative financing options to attract capital from private, philanthropic, and other sources. Many countries are developing innovative institutional and financial structures to support the development of sustainable fisheries. At the same time, there is growing interest in financing and supporting conservation measures and the sustainable use of marine resources in the private sector. Countries only committed $42 million of formal private sector capital to sustainable fisheries and aquaculture projects between 2004 and 2015 (IIED 2020), and, overall, the blue economy is yet to attract private investment at the scale and pace of other sectors. While the opportunity to create an inclusive blue economy is
16 Blue Economy and Blue Finance: Toward Sustainable Development and Ocean Governance
promising, governments must reevaluate their strategies and strengthen their governance and financing frameworks. To achieve the SDGs and accelerate blue economy investments, it is imperative to use appropriate financing instruments and build institutional capacities (Tirumala and Tiwari 2020).
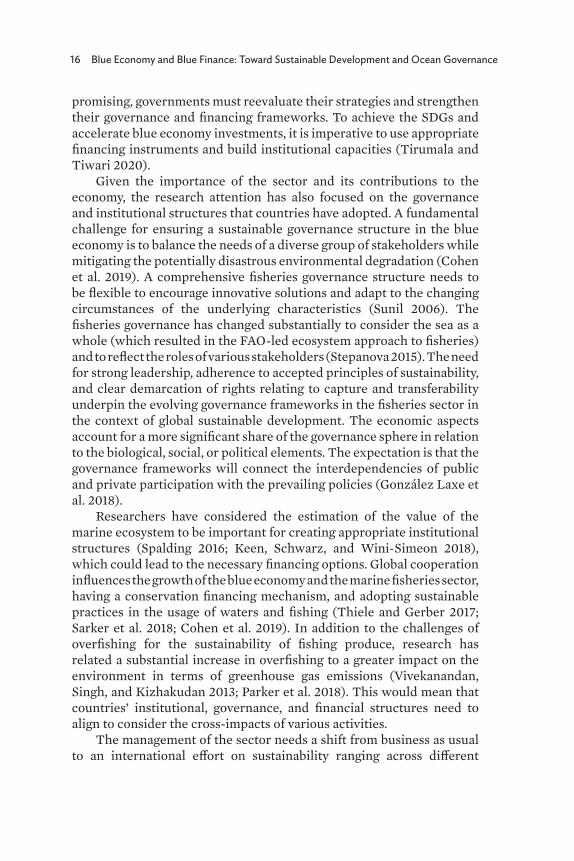
Given the importance of the sector and its contributions to the economy, the research attention has also focused on the governance and institutional structures that countries have adopted. A fundamental challenge for ensuring a sustainable governance structure in the blue economy is to balance the needs of a diverse group of stakeholders while mitigating the potentially disastrous environmental degradation (Cohen et al. 2019). A comprehensive fisheries governance structure needs to be flexible to encourage innovative solutions and adapt to the changing circumstances of the underlying characteristics (Sunil 2006). The fisheries governance has changed substantially to consider the sea as a whole (which resulted in the FAO-led ecosystem approach to fisheries) and to reflect the roles of various stakeholders (Stepanova 2015). The need for strong leadership, adherence to accepted principles of sustainability, and clear demarcation of rights relating to capture and transferability underpin the evolving governance frameworks in the fisheries sector in the context of global sustainable development. The economic aspects account for a more significant share of the governance sphere in relation to the biological, social, or political elements. The expectation is that the governance frameworks will connect the interdependencies of public and private participation with the prevailing policies (González Laxe et al. 2018).
Researchers have considered the estimation of the value of the marine ecosystem to be important for creating appropriate institutional structures (Spalding 2016; Keen, Schwarz, and Wini-Simeon 2018), which could lead to the necessary financing options. Global cooperation influences the growth of the blue economy and the marine fisheries sector, having a conservation financing mechanism, and adopting sustainable practices in the usage of waters and fishing (Thiele and Gerber 2017; Sarker et al. 2018; Cohen et al. 2019). In addition to the challenges of overfishing for the sustainability of fishing produce, research has related a substantial increase in overfishing to a greater impact on the environment in terms of greenhouse gas emissions (Vivekanandan, Singh, and Kizhakudan 2013; Parker et al. 2018). This would mean that countries’ institutional, governance, and financial structures need to align to consider the cross-impacts of various activities.
The management of the sector needs a shift from business as usual to an international effort on sustainability ranging across different

Approaches to Strengthening Fisheries Financing and Institutional Mechanisms: A Cross-Country Comparison of Cambodia, India, and Indonesia 17
subsectors and scales, which the active participation of the stakeholders concerned will support (Rudolph et al. 2020). The features of such an institutional mechanism comprise shared objectives across different entities, the development of frameworks that guide holistic oversight and require equitable distribution of market and government roles, and institutional structures (Rudolph et al. 2020). The existing systems need substantial alteration or redevelopment to effect a large-scale transformation while facing resistance from existing interests. The emerging systems need to balance the governance requirements of the top policy makers and on-the-ground communities and participants. A potential pathway to a more effective institutional and governance structure would be (i) to set out the underlying drivers of transformation; (ii) to demonstrate how the alteration of the drivers can result in the desired transformation; and (iii) to develop the contours of the desired new institutional and financing structures (Chaffin, Gosnell, and Cosens 2014).
Similar to the initial growth phase of green finance and sustainable finance, the blue economy does not have widely accepted principles or an investment framework. Frameworks provide the investing community with reassurance through definitions of eligible projects, information about the utilization of funds, and monitoring and reporting protocols (ICMA 2018). The European Commission, European Investment Bank, World Wide Fund, and the Prince of Wales’s International Sustainability Unit launched the world’s first framework for a sustainable blue economy (European Investment Bank 2018). The principles are broad, enabling them to address various subsectors and sustainability aspects, seven of them relating to investment and the other seven focusing on nurturing cooperation, research, data management, and innovation. The investment guidance regarding environmental, social, and corporate governance issues, a set of six voluntary principles that offer a wide variety of actions, is gaining popularity (PRI Association 2021). The World Ocean Summit 2018 launched a different set of principles, which aims to provide investors with certainty about their funds (Environmental Defense Fund, Rare/Meloy Fund, and Encourage Capital 2018). In October 2019, the United Nations Development Programme introduced its Blue Financial Instrument Framework, which grades various blue economy projects by their impact, sets out indicators to measure the impact of interventions, and lists different potential financial instruments (UNDP 2019).
ADB has committed $5 billion to the blue economy and is in the process of developing its blue finance framework (ADB 2019). The private sector, including financial institutions, community-based organizations,
18 Blue Economy and Blue Finance: Toward Sustainable Development and Ocean Governance
and development think tanks, has been active in promoting the transition toward the achievement of SDG 14. The existing gap in conservation funding is huge, an estimated $7 trillion, leading to the need to leverage private financing to bridge this gap (Tirumala and Tiwari 2020). The integration of ecological conservation into blue economy projects, increased access to funds for the stakeholders across the value chain, cross-functional linkages of maritime and land-based activities, creation of new markets, and opportunities for participation of a diverse range of stakeholders are important for the sustainable blue economy (IIED 2020).
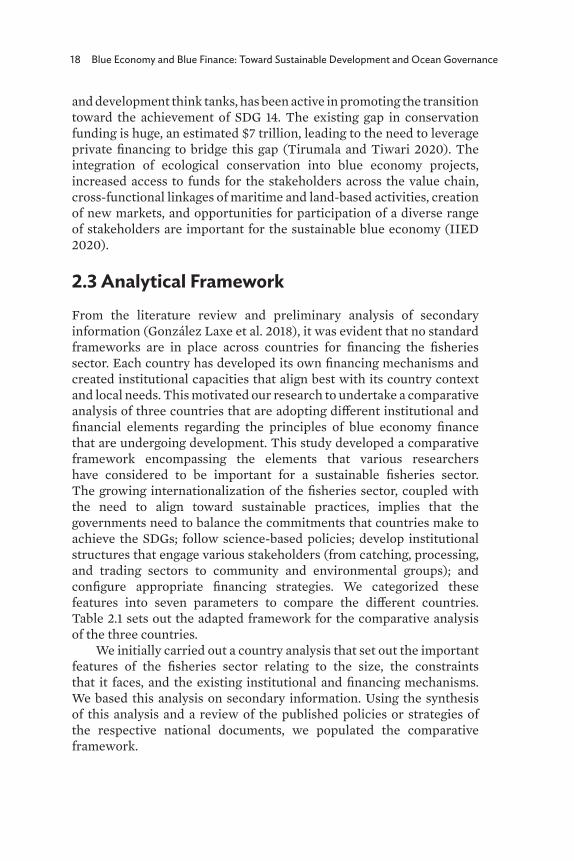
2.3 Analytical FrameworkFrom the literature review and preliminary analysis of secondary information (González Laxe et al. 2018), it was evident that no standard frameworks are in place across countries for financing the fisheries sector. Each country has developed its own financing mechanisms and created institutional capacities that align best with its country context and local needs. This motivated our research to undertake a comparative analysis of three countries that are adopting different institutional and financial elements regarding the principles of blue economy finance that are undergoing development. This study developed a comparative framework encompassing the elements that various researchers have considered to be important for a sustainable fisheries sector. The growing internationalization of the fisheries sector, coupled with the need to align toward sustainable practices, implies that the governments need to balance the commitments that countries make to achieve the SDGs; follow science-based policies; develop institutional structures that engage various stakeholders (from catching, processing, and trading sectors to community and environmental groups); and configure appropriate financing strategies. We categorized these features into seven parameters to compare the different countries. Table 2.1 sets out the adapted framework for the comparative analysis of the three countries.
We initially carried out a country analysis that set out the important features of the fisheries sector relating to the size, the constraints that it faces, and the existing institutional and financing mechanisms. We based this analysis on secondary information. Using the synthesis of this analysis and a review of the published policies or strategies of the respective national documents, we populated the comparative framework.
Approaches to Strengthening Fisheries Financing and Institutional Mechanisms: A Cross-Country Comparison of Cambodia, India, and Indonesia 19
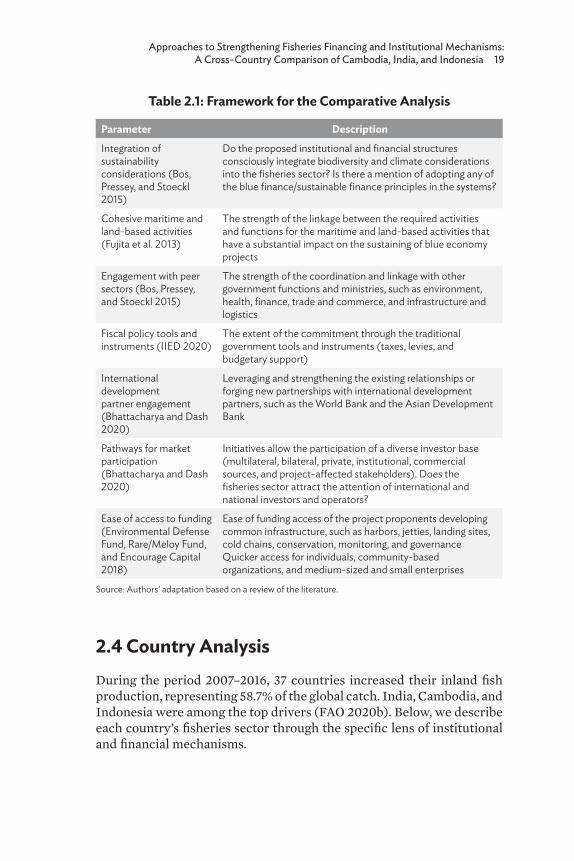
Table 2.1: Framework for the Comparative Analysis
Parameter Description
Integration of sustainability considerations (Bos, Pressey, and Stoeckl 2015)
Do the proposed institutional and financial structures consciously integrate biodiversity and climate considerations into the fisheries sector? Is there a mention of adopting any of the blue finance/sustainable finance principles in the systems?
Cohesive maritime and land-based activities (Fujita et al. 2013)
The strength of the linkage between the required activities and functions for the maritime and land-based activities that have a substantial impact on the sustaining of blue economy projects
Engagement with peer sectors (Bos, Pressey, and Stoeckl 2015)
The strength of the coordination and linkage with other government functions and ministries, such as environment, health, finance, trade and commerce, and infrastructure and logistics
Fiscal policy tools and instruments (IIED 2020)
The extent of the commitment through the traditional government tools and instruments (taxes, levies, and budgetary support)
International development partner engagement (Bhattacharya and Dash 2020)
Leveraging and strengthening the existing relationships or forging new partnerships with international development partners, such as the World Bank and the Asian Development Bank
Pathways for market participation (Bhattacharya and Dash 2020)
Initiatives allow the participation of a diverse investor base (multilateral, bilateral, private, institutional, commercial sources, and project-affected stakeholders). Does the fisheries sector attract the attention of international and national investors and operators?
Ease of access to funding (Environmental Defense Fund, Rare/Meloy Fund, and Encourage Capital 2018)
Ease of funding access of the project proponents developing common infrastructure, such as harbors, jetties, landing sites, cold chains, conservation, monitoring, and governanceQuicker access for individuals, community-based organizations, and medium-sized and small enterprises
Source: Authors’ adaptation based on a review of the literature.
2.4 Country Analysis During the period 2007–2016, 37 countries increased their inland fish production, representing 58.7% of the global catch. India, Cambodia, and Indonesia were among the top drivers (FAO 2020b). Below, we describe each country’s fisheries sector through the specific lens of institutional and financial mechanisms.
20 Blue Economy and Blue Finance: Toward Sustainable Development and Ocean Governance
2.4.1 Cambodia
Almost 61% of Cambodia’s animal protein consumption comes from fish, which contributes 6%–9% of the national GDP (RGC 2010; Lieng et al. 2018). Almost a third of the households in Cambodia engage in fishing activities. The fish capture in 2019 was an estimated 601,000 tons, of which the marine catch comprised a 20% share (FAO 2020b). Many rural poor people in Cambodia depend on fishing for their livelihoods. However, illegal fishing, rapid coastal development, and climate change are contributing to the decline of the fishing stock. Besides, the country suffers from unregulated and unsustainable exploitation practices, a lack of infrastructure, particularly for post-harvest activities, and limited access to finance for the fishing sector (small and medium-sized enterprises).
At the central level, the Ministry of Agriculture, Forestry, and Fisheries (MAFF) oversees the fisheries sector in Cambodia, and the Fisheries Administration (FiA) within MAFF is responsible for research and development, law, and policy making. At the local level, MAFF has entered into partnerships with various international agencies, like the World Wide Fund for Nature (WWF) and the International Union for Conservation of Nature (IUCN) to assist with sustainable fisheries development and management at the local/community levels. The Government of Cambodia has also produced the Strategic Planning Framework for Fisheries 2010–2019, which provides a road map for the government’s plan for the management, conservation, and development of sustainable fisheries. It aims to boost tourism, revive industrialization, significantly augment the post-harvest infrastructure, and improve the availability of finance for the various individual and small-scale fisheries operators. There is a substantial overlap between multiple ministries, including the Ministry of Economy and Finance, Ministry of Planning, Ministry of Environment, Ministry of Industry and Handicraft, and Ministry of Commerce, which manage different stakeholders and functional aspects of the fisheries sector (RGC 2010).
Table 2.2 summarizes the key institutional and financial aspects of Cambodia’s fishing sector.

Approaches to Strengthening Fisheries Financing and Institutional Mechanisms: A Cross-Country Comparison of Cambodia, India, and Indonesia 21
Table 2.2: Cambodia’s Fisheries Sector
Parameter Description
Marine capture production (million tons—2018)
0.12
Fisheries’ contribution to the GDP
6%–9%
Size of the fisheries sector
Provides more than 1.5 million full-time jobs and involves at least 6 million people in fishing activities
Broad sector issues • Long-term trend in declining fish sizes• Illegal fishing• Rapid coastal development• Climate change• Hydropower
Institutional structures Federal levelThe FiA of MAFF of Cambodia is the government agency responsible for managing, regulating, and promoting the national fisheries sector.Local/community level • Partnership with WorldFish, an international nonprofit research
organization, to strengthen livelihoods and improve food and nutrition security.
• WWF is working in partnership with the FiA and local governments to assist local communities in developing community fisheries.
• Partnership with IUCN to strengthen local-level initiatives.
Financing mechanisms • Funding from EU: Ambassador George Edgar confirmed a $98 million project to support the local fisheries sector from 2019 to 2023.
• IUCN and local NGO partner FACT implemented an EU-funded project from 2013 to 2016 to establish FCAs with legal recognition and management from elected fisheries committees.
• In 2018–2019, IUCN established a “mini” trust fund in three focal communes in Tonle Sap (and two more at the Stung Treng Ramsar site). Each trust fund received $5,000 in capital deposited with LOLC, a local bank, and generates 9% annual interest in local currency or about $35/month. This represents about half the cash necessary to pay for FCA patrols and other core management operations.
• The FA of MAFF signed an MoU with IUCN in December 2019 to strengthen collaboration on fisheries management and livelihoods.
• The Asian Development Bank is exploring the provision of official development assistance through a targeted sovereign loan, which also includes the development of a financing facility that could unite capital from various government, development partner, and private sources.
• UNIDO has been very active in promoting value chain investment opportunities, particularly among medium- and small-scale enterprises.
continued on next page
22 Blue Economy and Blue Finance: Toward Sustainable Development and Ocean Governance
Parameter Description
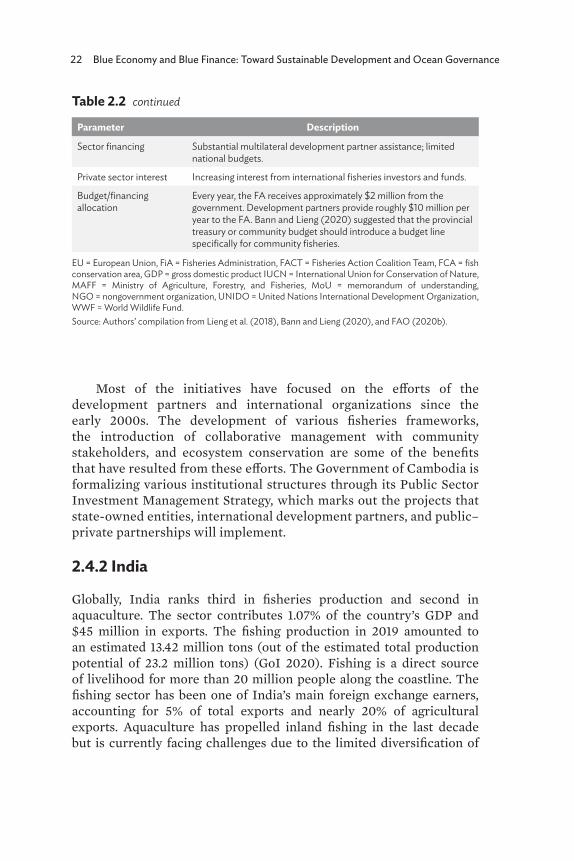
Sector financing Substantial multilateral development partner assistance; limited national budgets.
Private sector interest Increasing interest from international fisheries investors and funds.
Budget/financing allocation
Every year, the FA receives approximately $2 million from the government. Development partners provide roughly $10 million per year to the FA. Bann and Lieng (2020) suggested that the provincial treasury or community budget should introduce a budget line specifically for community fisheries.
EU = European Union, FiA = Fisheries Administration, FACT = Fisheries Action Coalition Team, FCA = fish conservation area, GDP = gross domestic product IUCN = International Union for Conservation of Nature, MAFF = Ministry of Agriculture, Forestry, and Fisheries, MoU = memorandum of understanding, NGO = nongovernment organization, UNIDO = United Nations International Development Organization, WWF = World Wildlife Fund.Source: Authors’ compilation from Lieng et al. (2018), Bann and Lieng (2020), and FAO (2020b).
Table 2.2 continued
Most of the initiatives have focused on the efforts of the development partners and international organizations since the early 2000s. The development of various fisheries frameworks, the introduction of collaborative management with community stakeholders, and ecosystem conservation are some of the benefits that have resulted from these efforts. The Government of Cambodia is formalizing various institutional structures through its Public Sector Investment Management Strategy, which marks out the projects that state-owned entities, international development partners, and public–private partnerships will implement.
2.4.2 India
Globally, India ranks third in fisheries production and second in aquaculture. The sector contributes 1.07% of the country’s GDP and $45 million in exports. The fishing production in 2019 amounted to an estimated 13.42 million tons (out of the estimated total production potential of 23.2 million tons) (GoI 2020). Fishing is a direct source of livelihood for more than 20 million people along the coastline. The fishing sector has been one of India’s main foreign exchange earners, accounting for 5% of total exports and nearly 20% of agricultural exports. Aquaculture has propelled inland fishing in the last decade but is currently facing challenges due to the limited diversification of
Approaches to Strengthening Fisheries Financing and Institutional Mechanisms: A Cross-Country Comparison of Cambodia, India, and Indonesia 23
species, the prevalence of diseases, and the high costs of inputs. Overall, the sector faces challenges due to inefficient management (wastage, traceability, and certification); limited improvements in the traditional fishing practices; inadequate infrastructure (landing jetties, harbors, and post-harvest cold chains); and insufficient skilled worker capacity. Currently, the sector depends extensively on budgetary funding for infrastructure and public projects (which, like grants, are limited to leverage and raising credit). There is also minimal credit funding available across the value chain, particularly for individuals and small-scale enterprises (GoI 2020).
The fisheries sector is a state subject in India, with the federal government (sharing the responsibility for marine fisheries) providing support for the provincial governments (which manage the inland fisheries). At the central level, the newly formed Ministry of Fisheries, Animal Husbandry, and Dairying manages the fisheries sector. At the state level, separate state fisheries departments govern the industry. In 2006, the government set up a separate body called the National Fisheries Development Board exclusively to develop fisheries across the country. The Coastal Aquaculture Authority is the agency responsible for the regulation of coastal aquaculture activities. There are numerous other fisheries institutions, including the Fishery Survey of India, National Institute of Fisheries Post Harvest Technology and Training, Central Institute of Coastal Engineering for Fishery, Central Institute of Fisheries Nautical and Engineering Training, and National Federation of Fishers Cooperatives Ltd.
The draft National Fisheries Policy proposes to continue the financial strategy of budgetary support along with the support of national financial institutions National Bank for Agriculture and Rural Development and National Cooperative Development Corporation and the assistance of development partners (including the World Bank, ADB, and Japan International Cooperation Agency). There is also a proposal to strengthen public–private partnerships and access to institutional credit.
Table 2.3 summarizes the key institutional and financial aspects of India’s fishing sector.
The government has created a separate fund, the Fisheries and Aquaculture Infrastructure Development Fund, to support marine and inland fisheries and aquaculture, the modernization of fishing boats, the construction of fishing harbors, and the creation of allied infrastructure.
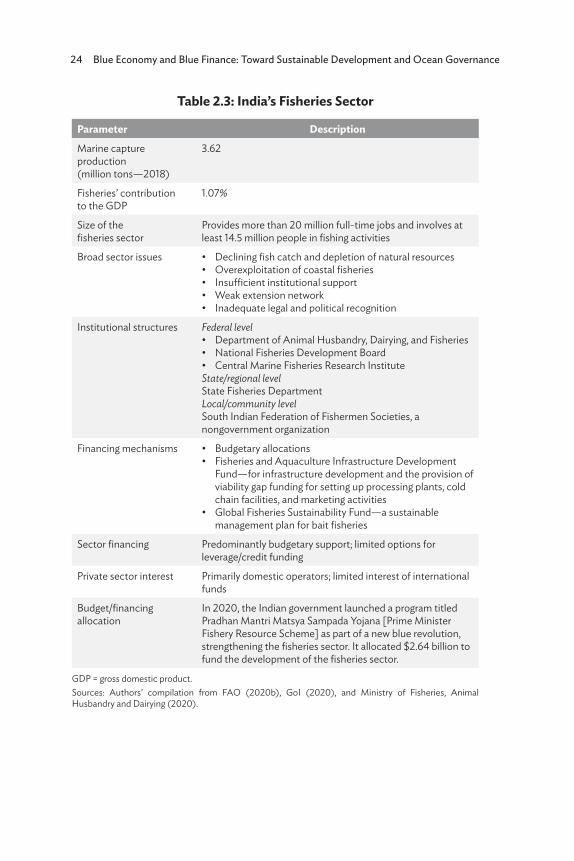
24 Blue Economy and Blue Finance: Toward Sustainable Development and Ocean Governance
Table 2.3: India’s Fisheries Sector
Parameter Description
Marine capture production (million tons—2018)
3.62
Fisheries’ contribution to the GDP
1.07%
Size of the fisheries sector
Provides more than 20 million full-time jobs and involves at least 14.5 million people in fishing activities
Broad sector issues • Declining fish catch and depletion of natural resources • Overexploitation of coastal fisheries• Insufficient institutional support• Weak extension network• Inadequate legal and political recognition
Institutional structures Federal level• Department of Animal Husbandry, Dairying, and Fisheries• National Fisheries Development Board• Central Marine Fisheries Research InstituteState/regional level State Fisheries DepartmentLocal/community levelSouth Indian Federation of Fishermen Societies, a nongovernment organization
Financing mechanisms • Budgetary allocations• Fisheries and Aquaculture Infrastructure Development
Fund—for infrastructure development and the provision of viability gap funding for setting up processing plants, cold chain facilities, and marketing activities
• Global Fisheries Sustainability Fund—a sustainable management plan for bait fisheries
Sector financing Predominantly budgetary support; limited options for leverage/credit funding
Private sector interest Primarily domestic operators; limited interest of international funds
Budget/financing allocation
In 2020, the Indian government launched a program titled Pradhan Mantri Matsya Sampada Yojana [Prime Minister Fishery Resource Scheme] as part of a new blue revolution, strengthening the fisheries sector. It allocated $2.64 billion to fund the development of the fisheries sector.
GDP = gross domestic product.Sources: Authors’ compilation from FAO (2020b), GoI (2020), and Ministry of Fisheries, Animal Husbandry and Dairying (2020).

Approaches to Strengthening Fisheries Financing and Institutional Mechanisms: A Cross-Country Comparison of Cambodia, India, and Indonesia 25
2.4.3 Indonesia
Indonesia is Southeast Asia’s largest economy and the second-largest fish producer in the world after the PRC. The fisheries sector contributed over $26.9 billion (around 2.6%) to Indonesia’s GDP in 2019, which makes it a leader among its regional peers, namely, the PRC, the Philippines, Malaysia, and Thailand (FAO 2020b). Over 12 million people in Indonesia work in fisheries, and 95% of fishery production there comes from small-scale fishers (Nature Conservancy 2020). Indonesia’s abundant marine life is facing many threats and challenges from human activities and natural stressors. Inefficient management of the fisheries sector costs the country nearly $7 billion per year (Nature Conservancy 2020). The seas of this region face major concerns in relation to illegal, unreported, and unregulated fishing; climate change; illegal wildlife trade; coastal development; and pollution.
At the federal government level, the Ministry of Marine Affairs and Fisheries is responsible for the fisheries sector in the country. The government has also created a separate institution for promoting sustainability and access to finance (the Marine and Fisheries Financing Institution) to enable private sector fund flows. In 2020, the Ministry proposed $69 million in stimulus for promoting fisheries and aquaculture. Indonesia aims to increase the contribution of the blue economy to its national GDP to 12.5% by 2045. The country is also a leader in attracting private capital flows to the fisheries sector. The Meloy Fund, the Global Fisheries Sustainability Fund, and the more recent fishery platform startup, Aruna, have closed a $5.5 million funding round with the country’s current investors.
Table 2.4 summarizes the key institutional and financial aspects of Indonesia’s fishing sector.
Table 2.4: Indonesia’s Fisheries Sector
Parameter Description
Marine capture production (million tons—2018)
6.71
Fisheries’ contribution to the GDP
2.6%
Size of the fisheries sector
Provides a livelihood for at least 12 million people in fishing activities
continued on next page
26 Blue Economy and Blue Finance: Toward Sustainable Development and Ocean Governance
Table 2.4 continued
Parameter Description
Broad sector issues • Depleting fish stock—illegal, unreported, and unregulated fishing combined with legal fishing and expansion of the domestic fishing fleet is affecting fish stocks
• Data deficiencies and a lack of coordination among agencies
• Lack of a fishery-specific plan• High wastage and losses
Institutional structures Federal level• Ministry of Marine Affairs and Fisheries • Planning agency (BAPPENAS)State/regional level Provincial governments Local/community level • Investments• MacArthur Foundation• Rare
Financing mechanisms • Institution for promoting sustainability and access to finance (Marine and Fisheries Financing Institution)
• Global Fisheries Sustainability Fund • Meloy Fund• Aruna• World Bank—Coastal Fisheries Initiative Challenge Fund
Sector financing A mix of domestic and development partner assistance
Private sector interest Increasing interest from international fisheries investors and funds
Budget/financing allocation
According to the press release that the Cabinet Secretariat of the Republic of Indonesia published, the Ministry of Marine Affairs and Fisheries proposed an additional budget of $69 million (Office of Assistant to Deputy Cabinet Secretary for State Documents and Translation 2020)
BAPPENAS = Ministry of National Development Planning of Indonesia, GDP = gross domestic product.Source: Authors’ compilation from FAO (2020b), Invest in ASEAN (2020), Nature Conservancy (2020), Office of Assistant to Deputy Cabinet Secretary for State Documents and Translation (2020).
The Ministry of National Development Planning of Indonesia (BAPPENAS) is developing an innovative blended finance vehicle: the Marine and Fisheries Financing Institution (MFFI). The MFFI aims to harness a blend of commercial capital, concessionary financing, and philanthropic contributions to deploy in participating provinces. ADB is assisting BAPPENAS in operationalizing this institution. This MFFI framework proposes to create contours for the financing of the fisheries
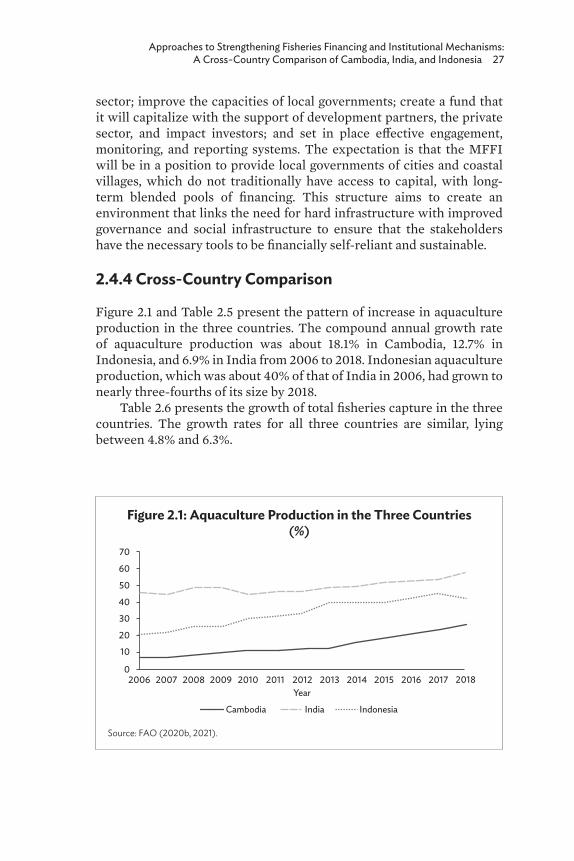
Approaches to Strengthening Fisheries Financing and Institutional Mechanisms: A Cross-Country Comparison of Cambodia, India, and Indonesia 27
sector; improve the capacities of local governments; create a fund that it will capitalize with the support of development partners, the private sector, and impact investors; and set in place effective engagement, monitoring, and reporting systems. The expectation is that the MFFI will be in a position to provide local governments of cities and coastal villages, which do not traditionally have access to capital, with long-term blended pools of financing. This structure aims to create an environment that links the need for hard infrastructure with improved governance and social infrastructure to ensure that the stakeholders have the necessary tools to be financially self-reliant and sustainable.
2.4.4 Cross-Country Comparison
Figure 2.1 and Table 2.5 present the pattern of increase in aquaculture production in the three countries. The compound annual growth rate of aquaculture production was about 18.1% in Cambodia, 12.7% in Indonesia, and 6.9% in India from 2006 to 2018. Indonesian aquaculture production, which was about 40% of that of India in 2006, had grown to nearly three-fourths of its size by 2018.
Table 2.6 presents the growth of total fisheries capture in the three countries. The growth rates for all three countries are similar, lying between 4.8% and 6.3%.
Figure 2.1: Aquaculture Production in the Three Countries (%)
Source: FAO (2020b, 2021).
2006 2007 2008 2009 2010 2011 2012Year
2013 2014 2015 2016 2017 20180
10
20
30
40
50
60
70
Cambodia India Indonesia
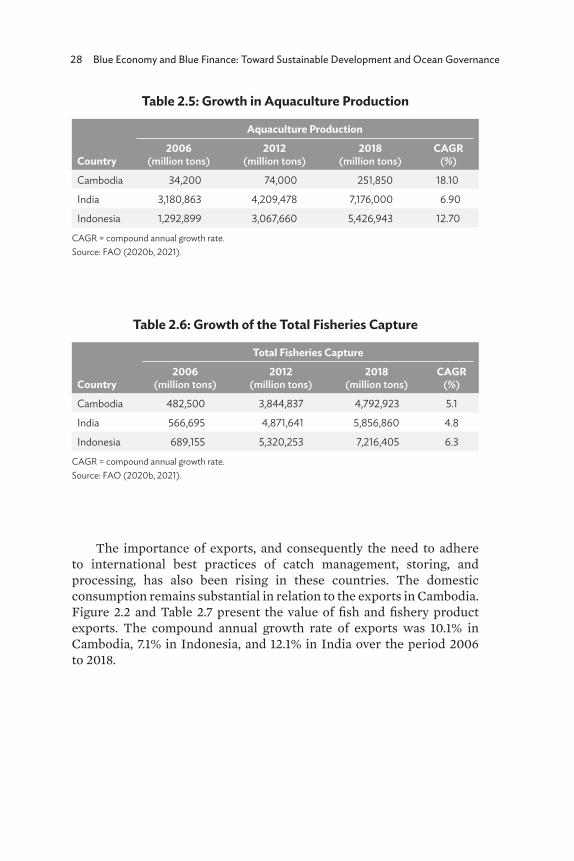
28 Blue Economy and Blue Finance: Toward Sustainable Development and Ocean Governance
Table 2.5: Growth in Aquaculture Production
Country
Aquaculture Production
2006(million tons)
2012 (million tons)
2018 (million tons)
CAGR(%)
Cambodia 34,200 74,000 251,850 18.10
India 3,180,863 4,209,478 7,176,000 6.90
Indonesia 1,292,899 3,067,660 5,426,943 12.70
CAGR = compound annual growth rate.Source: FAO (2020b, 2021).
Table 2.6: Growth of the Total Fisheries Capture
Country
Total Fisheries Capture
2006(million tons)
2012 (million tons)
2018 (million tons)
CAGR(%)
Cambodia 482,500 3,844,837 4,792,923 5.1
India 566,695 4,871,641 5,856,860 4.8
Indonesia 689,155 5,320,253 7,216,405 6.3
CAGR = compound annual growth rate.Source: FAO (2020b, 2021).
The importance of exports, and consequently the need to adhere to international best practices of catch management, storing, and processing, has also been rising in these countries. The domestic consumption remains substantial in relation to the exports in Cambodia. Figure 2.2 and Table 2.7 present the value of fish and fishery product exports. The compound annual growth rate of exports was 10.1% in Cambodia, 7.1% in Indonesia, and 12.1% in India over the period 2006 to 2018.
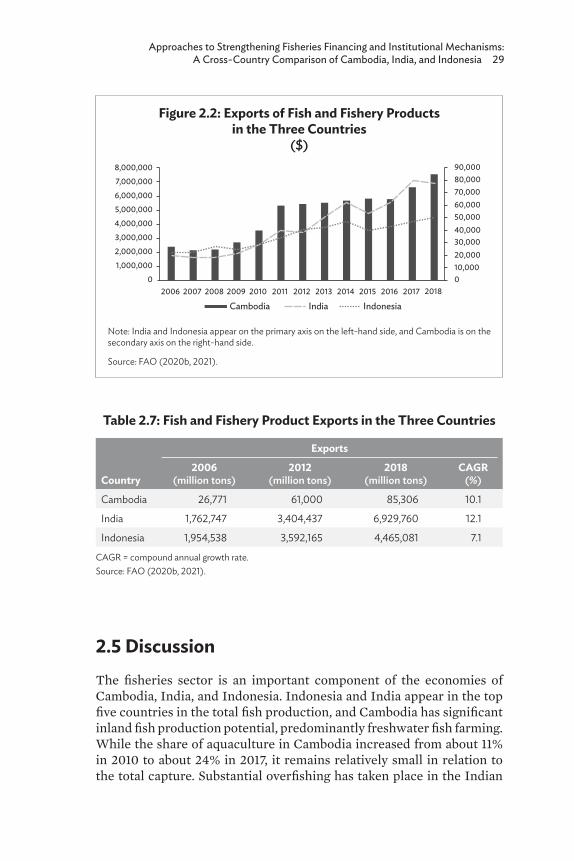
Approaches to Strengthening Fisheries Financing and Institutional Mechanisms: A Cross-Country Comparison of Cambodia, India, and Indonesia 29
Figure 2.2: Exports of Fish and Fishery Products in the Three Countries
($)
Note: India and Indonesia appear on the primary axis on the left-hand side, and Cambodia is on the secondary axis on the right-hand side.
Source: FAO (2020b, 2021).
2006 2007 2008 2009 2010 2011 2012 2013 2014 2015 2016 2017 20180 0
10,00020,00030,00040,00050,00060,00070,00080,00090,000
1,000,000
2,000,000
3,000,000
4,000,000
5,000,000
6,000,000
7,000,000
8,000,000
Cambodia India Indonesia
Table 2.7: Fish and Fishery Product Exports in the Three Countries
Country
Exports
2006(million tons)
2012 (million tons)
2018 (million tons)
CAGR(%)
Cambodia 26,771 61,000 85,306 10.1
India 1,762,747 3,404,437 6,929,760 12.1
Indonesia 1,954,538 3,592,165 4,465,081 7.1
CAGR = compound annual growth rate.Source: FAO (2020b, 2021).
2.5 DiscussionThe fisheries sector is an important component of the economies of Cambodia, India, and Indonesia. Indonesia and India appear in the top five countries in the total fish production, and Cambodia has significant inland fish production potential, predominantly freshwater fish farming. While the share of aquaculture in Cambodia increased from about 11% in 2010 to about 24% in 2017, it remains relatively small in relation to the total capture. Substantial overfishing has taken place in the Indian
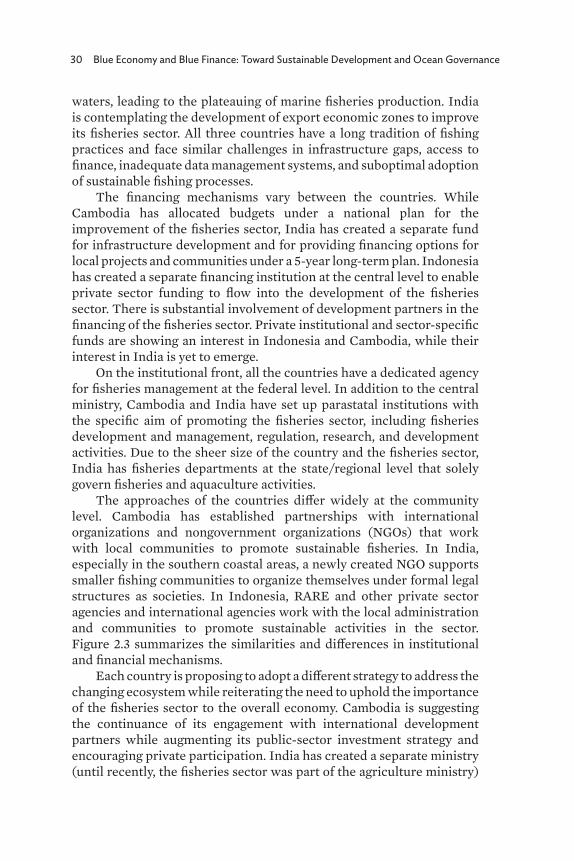
30 Blue Economy and Blue Finance: Toward Sustainable Development and Ocean Governance
waters, leading to the plateauing of marine fisheries production. India is contemplating the development of export economic zones to improve its fisheries sector. All three countries have a long tradition of fishing practices and face similar challenges in infrastructure gaps, access to finance, inadequate data management systems, and suboptimal adoption of sustainable fishing processes.
The financing mechanisms vary between the countries. While Cambodia has allocated budgets under a national plan for the improvement of the fisheries sector, India has created a separate fund for infrastructure development and for providing financing options for local projects and communities under a 5-year long-term plan. Indonesia has created a separate financing institution at the central level to enable private sector funding to flow into the development of the fisheries sector. There is substantial involvement of development partners in the financing of the fisheries sector. Private institutional and sector-specific funds are showing an interest in Indonesia and Cambodia, while their interest in India is yet to emerge.
On the institutional front, all the countries have a dedicated agency for fisheries management at the federal level. In addition to the central ministry, Cambodia and India have set up parastatal institutions with the specific aim of promoting the fisheries sector, including fisheries development and management, regulation, research, and development activities. Due to the sheer size of the country and the fisheries sector, India has fisheries departments at the state/regional level that solely govern fisheries and aquaculture activities.
The approaches of the countries differ widely at the community level. Cambodia has established partnerships with international organizations and nongovernment organizations (NGOs) that work with local communities to promote sustainable fisheries. In India, especially in the southern coastal areas, a newly created NGO supports smaller fishing communities to organize themselves under formal legal structures as societies. In Indonesia, RARE and other private sector agencies and international agencies work with the local administration and communities to promote sustainable activities in the sector. Figure 2.3 summarizes the similarities and differences in institutional and financial mechanisms.
Each country is proposing to adopt a different strategy to address the changing ecosystem while reiterating the need to uphold the importance of the fisheries sector to the overall economy. Cambodia is suggesting the continuance of its engagement with international development partners while augmenting its public-sector investment strategy and encouraging private participation. India has created a separate ministry (until recently, the fisheries sector was part of the agriculture ministry)
Approaches to Strengthening Fisheries Financing and Institutional Mechanisms: A Cross-Country Comparison of Cambodia, India, and Indonesia 31
Figure 2.3: Institutional Frameworks
MFFI = Marine and Fisheries Financing Institution, NGO = nongovernment organization.
Source: Authors’ compilation.
Central ministry that governs the fisheries sector.Budgetary allocations for financing the blue economy.Partnerships with international agencies and NGOs.
• Community- based approach supported by multilateral agencies.• No private-sector funding.• A national plan for fisheries development has been created.
• Creation of a separate institution for promoting sustainability and access to finance (MFFI).• Able to attract private sector cash flows.• A specific plan for fisheries sector is not well articulated.
• Central sponsored schemes including the Integrated Development and Management of Fisheries, and the Fisheries and Aquaculture Infrastucture Development Fund.• An overall vision and road map for the sector has been created.
SIM
ILA
RITI
ES
Cambodia India Indonesia
DIF
FERE
NCE
S
to pay more concerted attention to the sector. India has also formulated a scheme to promote the sector (through a “mission” mode that allows the allocation of administrative and budgetary resources) and announced the establishment of a dedicated fund. Indonesia has been contemplating setting up a separate financing facility that combines different sources of funding and provides flexibility to attract newer investor groups. Table 2.8 presents a comparison of these approaches.
Various policy documents have stated the intention to integrate different sustainability, biodiversity, and climate change practices and improved fishing practices into the governance structures and projects. This is generally in consonance with the respective commitments under various global accords and premises of engagement with international development organizations (Vanderklift et al. 2019). The translation of this intention into demonstrable projects is still underway in all three countries. The development and adoption of international blue finance

32 Blue Economy and Blue Finance: Toward Sustainable Development and Ocean Governance
frameworks could accelerate the transition to sustainable blue finance practices.
There is no perceptible discourse or statement of intent on approaching land-based and maritime activities cohesively in any of the three countries. They have paid considerable attention to improving the land-based infrastructure, particularly the landing sites and post-harvest infrastructure. However, the impact of land-based activities on marine productivity (pollution, runoff, waste disposal, and ecological damage due to human activities) are yet to receive adequate consideration. Indonesia has instituted a National Plastic Action Partnership that indirectly refers to the initiatives to minimize pollution in water bodies.
The existing ministerial organization structures mean that the sectors associated with fisheries (such as health, pollution, finance, and infrastructure) are under different line regimes. However, the appreciation of the need to coordinate with different ministries has increased, as the number of committees and the oversight from the heads of government indicate. Nevertheless, no country has a single window clearance system, and the nations rely on the conventional interministerial coordination setups.
Table 2.8: Comparison of the Countries
Parameter Cambodia India Indonesia
Future approach Reliant on development partner support; initiatives to diversify sources of funding
Separate ministry formulated; a sector-specific fund and a financing scheme announced
Proposal of a marine and fisheries financing institution; increased collaboration with international community organizations
Integration of sustainability considerations
Substantial discourse on incorporating the principles due to the involvement of international development and community organizations
The draft national policy acknowledges the need for and relevance of various sustainable practices
Has taken initiatives to achieve SDGs in collaboration with international development and community organizations
Cohesive maritime and land-based activities
Land-based and maritime activities are addressed independently
No stated principles on the integration of land and maritime-based activities. Different institutional setups are present for the same
A few macro steps are taken to integrate these areas (the National Plastic Action Partnership, etc.), which indirectly address the fisheries sector
continued on next page
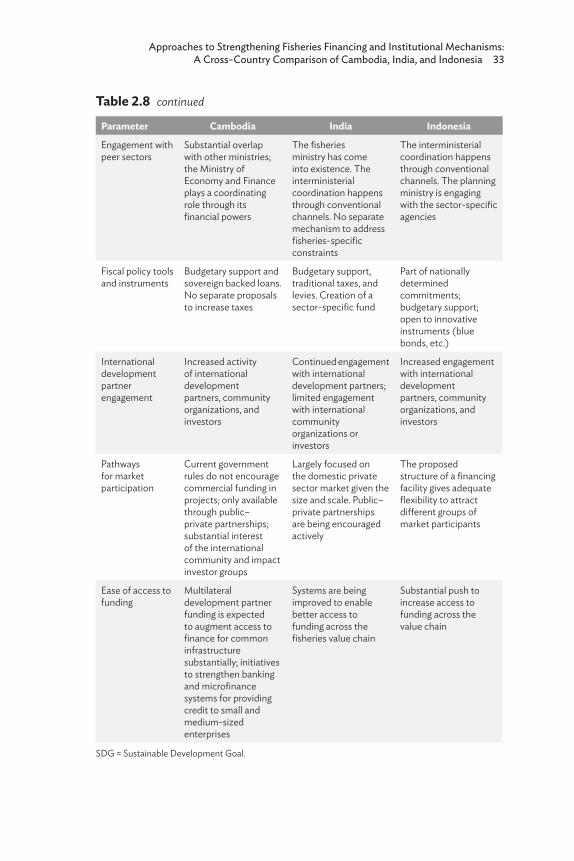
Approaches to Strengthening Fisheries Financing and Institutional Mechanisms: A Cross-Country Comparison of Cambodia, India, and Indonesia 33
Parameter Cambodia India Indonesia
Engagement with peer sectors
Substantial overlap with other ministries; the Ministry of Economy and Finance plays a coordinating role through its financial powers
The fisheries ministry has come into existence. The interministerial coordination happens through conventional channels. No separate mechanism to address fisheries-specific constraints
The interministerial coordination happens through conventional channels. The planning ministry is engaging with the sector-specific agencies
Fiscal policy tools and instruments
Budgetary support and sovereign backed loans. No separate proposals to increase taxes
Budgetary support, traditional taxes, and levies. Creation of a sector-specific fund
Part of nationally determined commitments; budgetary support; open to innovative instruments (blue bonds, etc.)
International development partner engagement
Increased activity of international development partners, community organizations, and investors
Continued engagement with international development partners; limited engagement with international community organizations or investors
Increased engagement with international development partners, community organizations, and investors
Pathways for market participation
Current government rules do not encourage commercial funding in projects; only available through public–private partnerships; substantial interest of the international community and impact investor groups
Largely focused on the domestic private sector market given the size and scale. Public–private partnerships are being encouraged actively
The proposed structure of a financing facility gives adequate flexibility to attract different groups of market participants
Ease of access to funding
Multilateral development partner funding is expected to augment access to finance for common infrastructure substantially; initiatives to strengthen banking and microfinance systems for providing credit to small and medium-sized enterprises
Systems are being improved to enable better access to funding across the fisheries value chain
Substantial push to increase access to funding across the value chain
SDG = Sustainable Development Goal.
Table 2.8 continued
34 Blue Economy and Blue Finance: Toward Sustainable Development and Ocean Governance
Through focused engagement with international development organizations, community groups, and the investing community, these countries are recognizing the role of partnerships. The investing community has slowly started to participate while also introducing the necessary frameworks to measure the impacts of the interventions. Each country is attempting to engage with the private sector to reflect its overall foreign investment philosophy.
The primary concern for all three countries has been the ease of access to funding, both at the public-sector level (which provides for common infrastructure and governance oversight) and among the market stakeholders, particularly individuals and small and medium-sized enterprises (SMEs). Cambodia is seeking international development partner support to increase the access to funds for the public sector, while India and Indonesia are more reliant on the budgetary mechanisms. However, both these countries intend to configure dedicated fund/facility structures to provide tangible means of raising and disbursing funds. The microfinance sector has been the most active in all three countries to access funds for individuals and SMEs. The microfinance institutions, do not, however, categorize fisheries separately. The dedicated routing through national institutions passes through “agriculture-based” financial enterprises, with fisheries representing a small portfolio. There has also been a considerable focus globally on blended finance, combining public and private sources of financing (Tirumala and Tiwari 2020). This could be a potential source of financing for these three countries.
South and Southeast Asia are attracting substantial interest from all the stakeholders concerned due to various geopolitical factors. The discourse and action in the blue economy, particularly in the fisheries sector, have a decisive focus on this region because of the large population, extensive availability and harvesting of marine catch, and presence of many polluted rivers. The growing influence of the PRC (which has substantial interests in Cambodia and Indonesia) through its Belt and Road Initiative, the expansion of the operations of the Asian Infrastructure Investment Bank, and ADB’s commitment to upscaling its investments mean that access to financing is likely to increase. Indonesia is poised to be the chair of the G20 from 2022, and, through its National Plastic Action Partnership, is taking a lead role in the ASEAN region. India, through its diplomacy, is increasingly becoming a favored partner of Organisation for Economic Co-operation and Development countries. The expectation is that all three countries, and the others in the region, will continue to attract investments from donors, which will also pave the way to greater participation from impact and philanthropic investors.
Approaches to Strengthening Fisheries Financing and Institutional Mechanisms: A Cross-Country Comparison of Cambodia, India, and Indonesia 35
2.6 Policy ImplicationsA cross-country comparison provides useful insights into the scaling, replication, and readaptation of successes to suit regional contexts. While different countries are adopting innovative financing mechanisms to meet the investment requirements for marine and fisheries sectors, this research contributes to the understanding of the context in which these mechanisms have evolved and how countries can strengthen them for the sustainable growth of fisheries. The transformation of the fisheries sector in the developing world is contingent on the adoption of accepted inclusive governance principles while maintaining the agreed path toward the achievement of SDG 14 (Cohen et al. 2019). The recent public health crisis that the coronavirus disease (COVID-19) caused has only exacerbated the need for transformative action from governments to ensure the protection of fish farmers’ livelihoods and food security for populations (FAO 2020a). The impact of the pandemic has resulted in income losses and increased the financial risks at every stage in the value chain, ranging from decreased cash flows to difficulty in meeting loan repayment obligations and the investment of additional capital to meet safety and hygiene standards. Therefore, lessons from this research could be useful in designing appropriate financial mechanisms that boost the growth of the sector in the long term and address immediate financial solutions in the short term.
The current approach of extending loans (and limited subsidies) through microfinance institutions has a limited ability to scale up and is restricted to a few value chain segments. Policy makers can consider augmenting the credit delivery mechanisms through interventions targeting these stakeholders. To strengthen microfinance institutions and improve their profitability, policy makers and fisheries administration can facilitate infrastructure development, research and technology, and improved access to markets and services through a structured intervention, which can pool various sources of funding (IDA 2020). This would entail creating the necessary financial infrastructure through appropriate legal and regulatory frameworks. The MFFI structure of Indonesia is a step in that direction. More recent developments include the emergence of impact investors that support sustainable fisheries management by seeking a return on the capital deployed. RARE’s work in the Southeast Asian region demonstrates the potential for transitioning to more sustainable fisheries while supporting livelihoods and sustaining critical ecosystems. An ability to earmark dedicated funds for the defined components of the value chain would also enhance the prospects of sustainable finance, which can

36 Blue Economy and Blue Finance: Toward Sustainable Development and Ocean Governance
invest in infrastructure, strengthened logistics supply chains, storage and transportation facilities, safety equipment, and so on.
The governance of fisheries is increasingly leaning toward modern management systems (González Laxe et al. 2018). The sustainability principles demand that the economic and social issues are part of the conceptualization and design of any governance framework. The structure of governance mechanisms can also benefit from the early adoption of blue economy principles (as applicable to the fisheries sector). An institutional design with a specific focus on the fisheries sector (either as a stand-alone entity or under the umbrella of a line ministry) with the support of a well-thought-out long-term vision and plan is crucial in building a more resilient fisheries sector. The design should act as an enabler to promote constructive collaborations with multilateral agencies, international organizations, NGOs, and other stakeholders that are interested in contributing to the sector’s growth. The presence of environmental community groups and the participation of impact investors give greater credence to a holistic ecosystem based on science, stakeholder engagement, and market dynamics and could result in a less politicized system. An awareness of these facets would help policy makers in configuring their region-specific responses to align with sustainable practices, community interests, and industry expectations.
This research focused on the institutional and financing landscape of three countries. As the blue finance sector gains pace, and when the outcomes of investments become available, research can investigate the efficacy of the approaches in greater detail, expanding the geographical footprint to the entire region.
2.7 ConclusionThe objective of this research was to study different responses to the changing blue economy sectors, with particular reference to fisheries, to understand the features of an institutional and financing mechanism that promotes sustainable fisheries sector development. A comparative analysis was undertaken to identify similarities, differences, and emerging financing frameworks across three countries: Cambodia, India, and Indonesia. Overall, this chapter presents the initiatives that the three countries are proposing to adopt in the changing fisheries ecosystem, providing guidance to shape a broader regional approach. The results from the analysis indicate that the countries have identified a need to alter their existing institutional structures and configure newer entities to attract more funding sources. None of the three countries has radically
Approaches to Strengthening Fisheries Financing and Institutional Mechanisms: A Cross-Country Comparison of Cambodia, India, and Indonesia 37
transformed its systems to address the cross-ministerial coordination points or elevate the sector approach to include a comprehensive land-based and maritime approach. Future research can use the findings to develop more generalizable frameworks for strengthening financing interventions in the fisheries sector.
While the trends for financing in the sustainable finance sector, and consequently the blue finance sector, appear to be ascending (Wabnitz and Blasiak 2019), it remains unclear whether there will be a tipping point, whether the changes are tectonic, or whether the adoption of the principles will occur gradually in accordance with each country’s bureaucratic pace (Cohen et al. 2019). The financing trends are also becoming more nuanced with the alignment toward sustainability and include multiple modalities, such as blended finance instruments and the attraction of investors from different groups. Nevertheless, the urgency to respond to the potentially critical damage to fisheries production is acute. Policy makers need to be aware of the opportunities, constraints, and bottlenecks involved in transitioning to more sustainable blue economy finance.
38 Blue Economy and Blue Finance: Toward Sustainable Development and Ocean Governance
ReferencesADB (Asian Development Bank). 2019. ADB Launches $5 Billion
Healthy Oceans Action Plan. Asian Development Bank (accessed 3 November 2020). https://www.adb.org/news/adb-launches-5 -billion-healthy-oceans-action-plan
Bann, C., and S. Lieng. 2020. FishCounts: Increasing the Visibility of Small-Scale Fisheries (SSFs) in Cambodia’s National Planning. IIED Working Paper. London: IIED. http://pubs.iied.org/16671IIED
Bhattacharya, P., and A. K. Dash. 2020. Drivers of Blue Economy in Asia and Pacific Island Countries: An Empirical Investigation of Tourism and Fisheries Sectors. ADBI Working Paper Series 1161. Tokyo: Asian Development Bank Institute. https://www.adb .org/publications/drivers-blue-economy-asia-pacific-island -countries
Blasiak, R., and C. Wabnitz. 2018. Aligning Fisheries Aid with International Development Targets and Goals. Marine Policy. https://doi.org/10.1016/j.marpol.2017.11.018
Bos, M., R. Pressey, and N. Stoeckl. 2015. Marine Conservation Finance: The Need for and Scope of an Emerging Field. Ocean and Coastal Management. https://doi.org/10.1016/j.ocecoaman.2015.06.021
Cai, J., H. Huang, and P.S. Leung. 2019. Understanding and Measuring the Contribution of Aquaculture and Fisheries to Gross Domestic Product (GDP). FAO Fisheries and Aquaculture Technical Paper. Rome, Italy: Food and Agriculture Organization.
Chaffin, B., H. Gosnell, and B. Cosens. 2014. A Decade of Adaptive Governance Scholarship: Synthesis and Future Directions. Ecology and Society. 19(3). https://doi.org/10.5751/ES-06824-190356
Cohen, P., E. H. Allison, N. L. Andrew, J. Cinner, L. S. Evans, M. Fabinyi, L. R. Garces, S. J. Hall, C. C. Hicks, T. P. Hughes, S. Jentoft, et al. 2019. Securing a Just Space for Small-Scale Fisheries in the Blue Economy. Frontiers in Marine Science. 6 (March): 171. https://doi .org/10.3389/fmars.2019.00171
Credit Suisse. 2020. Investors and the Blue Economy. 44. https://www .esg-data.com/blue-economy
Environmental Defense Fund, Rare/Meloy Fund, and Encourage Capital. 2018. Principles for Investment in Sustainable Wild-Caught Fisheries. http://www.fisheriesprinciples.org/ (accessed 3 November 2020).
European Investment Bank. 2018. Blue Finance Principles Unveiled to Support Ocean Health and Investment. https://www.eib.org/en /press/all/2018-060-blue-finance-principles-unveiled-to-support -ocean-health-and-investment (accessed 1 November 2021).
Approaches to Strengthening Fisheries Financing and Institutional Mechanisms: A Cross-Country Comparison of Cambodia, India, and Indonesia 39
FAO (Food and Agriculture Organization). 2016. Contribution of Fisheries to Food Security. Rome: Fisheries and Aquaculture Department, Food and Agriculture Organization of the United Nations.
____. 2020a. How Is COVID-19 Affecting the Fisheries and Aquaculture Food Systems. Rome: FAO. https://doi.org/10.4060/ca8637en
____. 2020b. The State of World Fisheries and Aquaculture 2020. Rome: FAO. http://www.fao.org/state-of-fisheries-aquaculture (accessed 3 November 2020).
____. 2021. Statistics—Introduction. Rome: Fisheries and Aquaculture Division, FAO. http://www.fao.org/fishery/statistics/en (accessed 8 October 2021).
FAO, IFAD, UNICEF, WFP, and WHO. 2018. The State of Food Security and Nutrition in the World. Building Climate Resilience for Food Security and Nutrition. Rome: FAO.
Fujita, R., J. Lynham, F. Micheli, P. Feinberg, L. Bourillón, A. Sáenz-Arroyo, and A. Markham. 2013. Ecomarkets for Conservation and Sustainable Development in the Coastal Zone. Biological Reviews. https://doi.org/10.1111/j.1469-185X.2012.00251.x
Gallo, N., D. Victor, and L. Levin. 2017. Ocean Commitments under the Paris Agreement. Nature Climate Change. https://doi.org/10.1038 /nclimate3422
GoI (Government of India). 2020. National Fisheries Policy, 2020. New Delhi: Government of India. http://nfdb.gov.in/PDF/National _Fisheries_Policy_2020.pdf (accessed 3 November 2020).
González Laxe, F., F. M. Bermúdez, F. M. Palmero, and I. Novo-Corti. 2018. Governance of the Fishery Industry: A New Global Context. Ocean and Coastal Management. https://doi.org/10.1016 /j.ocecoaman.2017.12.009
Halpern, B., S. Walbridge, K. A. Selkoe,* C. V. Kappel, F. Micheli, C. D’Agrosa, J. F. Bruno, K. S. Casey, C. Ebert, H. E. Fox, et al. 2008. A Global Map of Human Impact on Marine Ecosystems. Science. https://doi.org/10.1126/science.1149345
Hasan, M., B. M. S. Hossain, M. J. Alam, K. M. A. Chowdhury, A. Al Karim, and N. M. K. Chowdhury. 2018. The Prospects of Blue Economy to Promote Bangladesh into a Middle-Income Country. Open Journal of Marine Science. 8(3). https://doi.org/10.4236/ojms.2018.83019
Hertel, T. 2016. Food Security under Climate Change. Nature Climate Change. https://doi.org/10.1038/nclimate2834
Hoegh-Guldberg, O. et al. 2015. Reviving the Ocean Economy: The Case for Action—2015. Gland, Switzerland: WWF International.
ICMA (International Capital Market Association). 2018. The Green Bonds Principles—Voluntary Process Guidelines for Issuing Green Bonds. Paris: International Capital Market Association. https
40 Blue Economy and Blue Finance: Toward Sustainable Development and Ocean Governance
://www.icmagroup.org/green-social-and-sustainability-bonds /green-bond-principles-gbp/
IDA (International Development Association). 2020. Oceans, Fisheries and Coastal Economies, Understanding Poverty. Washington, DC: IDA.
IIED (International Institute for Environment and Development). 2020. Closing the Gap: Financing the Transition towards an Inclusive Blue Economy. Webinar. https://www.iied.org/closing-gap-financing -transition-towards-inclusive-blue-economy (accessed 3 November 2020).
Invest in ASEAN. 2020. Fisheries | ASEAN Investment, 2020. http ://investasean.asean.org/index.php/page/view/fisheries (accessed 3 November 2020).
Keen, M., A. M. Schwarz, and L. Wini-Simeon. 2018. Towards Defining the Blue Economy: Practical Lessons from Pacific Ocean Governance. Marine Policy. 88. https://doi.org/10.1016/j.marpol.2017.03.002
Lieng, S., N. Yagi, A. Mori, and J. Hastings. 2018. Savings-Group Improvements Contribute to Sustainable Community-Fisheries Management: A Case Study in Cambodia. Sustainability (Switzerland). 10(8). https://doi.org/10.3390/su10082905
Ministry of Fisheries, Animal Husbandry and Dairying. 2020. Department of Fisheries. https://dof.gov.in/ (accessed 2 November 2021).
Nature Conservancy. 2020. Indonesia Fisheries. https://www.nature .org/en-us/about-us/where-we-work/asia-pacific/indonesia /stories-in-indonesia/indonesia-fisheries/ (accessed 3 November 2020).
Office of Assistant to Deputy Cabinet Secretary for State Documents and Translation. 2020. Cabinet Secretariat of the Republic of Indonesia. https://setkab.go.id/en/author/naster/page/338/ (accessed 2 November 2021).
Parker, R., J. Blanchard, C. Gardner, B. Green, K. Hartmann, P. Tyedmers, and R. Watson. 2018. Fuel Use and Greenhouse Gas Emissions of World Fisheries. Nature Climate Change. 8(4). https://doi .org/10.1038/s41558-018-0117-x
Patil, P., J. Virdin, S. M. Diez, J. Roberts, and A. Singh. 2016. Toward a Blue Economy: A Promise for Sustainable Growth in the Caribbean. Washington, DC: World Bank.
PEMSEA. n.d. Blue Economy. http://pemsea.org/our-work/blue -economy (accessed 30 August 2019).
Pranathi, A., and P. Gonchkar. 2019. The Study of Blue Economy as an Emerging Sector for Employment Generation in India. Asia Pacific Journal of Research. I (XCVII): 89–90.
Approaches to Strengthening Fisheries Financing and Institutional Mechanisms: A Cross-Country Comparison of Cambodia, India, and Indonesia 41
PRI Association. 2021. What Are the Principles for Responsible Investment? https://www.unpri.org/pri/what-are-the-principles -for-responsible-investment (accessed 1 November 2021).
RGC (Royal Government of Cambodia). 2010. The Strategic Planning Framework for Fisheries: 2010–2019: Fishing for the Future. Unofficial Translation. Phnom Penh: Kingdom of Cambodia. http://extwprlegs1.fao.org/docs/pdf/cam143042.pdf (accessed 3 November 2020).
Rudolph, T. B., M. Ruckelshaus, M. Swilling, E. H. Allison, H. Österblom, S. Gelcich, and P. Mbatha. 2020. A Transition to Sustainable Ocean Governance. Nature Communications. 11(1). https://doi.org/10.1038 /s41467-020-17410-2
Sarker, S., M. A. H. Bhuyan, M. M. Rahman, M. A. Islam, M. S. Hossain, S. C. Basak, and M. M. Islam. 2018. From Science to Action: Exploring the Potentials of Blue Economy for Enhancing Economic Sustainability in Bangladesh. Ocean and Coastal Management. 157. https://doi.org/10.1016/j.ocecoaman.2018.03.001
Singh, G., A. M. Cisneros-Montemayor, W. Swartz, W. Cheung, J. A. Guy, T.-A. Kenny, C. J. McOwen, R. Asch, J. L. Geffert, C. C. C. Wabnitz, et al. 2018. A Rapid Assessment of Co-benefits and Trade-Offs among Sustainable Development Goals. Marine Policy. https://doi .org/10.1016/j.marpol.2017.05.030
Smith-Godfrey, S. 2016. Defining the Blue Economy. Maritime Affairs. 12(1). https://doi.org/10.1080/09733159.2016.1175131
Spalding, M. 2016. The New Blue Economy: The Future of Sustainability. Journal of Ocean and Coastal Economics. 2(2). https://doi.org /10.15351/2373-8456.1052
Stepanova, O. 2015. Conflict Resolution in Coastal Resource Management: Comparative Analysis of Case Studies from Four European Countries. Ocean and Coastal Management. 103. https://doi.org/10.1016/j.ocecoaman.2014.10.017
Sunil, D. S. 2006. Fish for Life: Interactive Governance for Fisheries edited by Jan Kooiman, Maarten Bavinck, Svein Jentoft and Roger Pullin. In J. Kooiman, M. Bavinck, S. Jentoft, and R. Pullin, eds. Development and Change. 37(5). https://doi.org/10.1111/j.1467 -7660.2006.00516_10.x
Teh, L., and U. R. Sumaila. 2013. Contribution of Marine Fisheries to Worldwide Employment. Fish and Fisheries. 14(1). https://doi .org/10.1111/j.1467-2979.2011.00450.x
Thiele, T., and L. Gerber. 2017. Innovative Financing for the High Seas. Aquatic Conservation: Marine and Freshwater Ecosystems. https://doi.org/10.1002/aqc.2794

42 Blue Economy and Blue Finance: Toward Sustainable Development and Ocean Governance
Tirrell, A. 2017. Sociocultural Institutions in Norwegian Fisheries Management. Marine Policy. 77. https://doi.org/10.1016/j.marpol .2016.12.002
Tirumala, R. D., and P. Tiwari. 2020. Innovative Financing Mechanism for Blue Economy Projects. Marine Policy. https://doi.org/10.1016 /j.marpol.2020.104194
UNDP (United Nations Development Programme). 2019. Indonesia and UNDP Ink Financing Mechanism to Support Archipelagic States on Climate Actions. Press release. UNDP in Indonesia. https://www.id.undp.org/content/indonesia/en/home/presscenter /pressreleases/2019/indonesia-and-undp-ink--financing -mechanism-to-support-archipela.html (accessed 3 November 2020).
Vanderklift, M. A., R. Marcos-Martinez, J. Butler, M. Coleman, A. Lawrence, H. Prislan, A. Steven, and S. Thomas. 2019. Constraints and Opportunities for Market-Based Finance for the Restoration and Protection of Blue Carbon Ecosystems. Marine Policy. https://doi.org/10.1016/j.marpol.2019.02.001
Vivekanandan, E., V. V. Singh, and J. Kizhakudan. 2013. Carbon Footprint by Marine Fishing Boats of India. Current Science. 105(3): 361–366.
Vyshnavi, P. V., and P. V. Rao. 2017. Importance of Marine Fisheries in Indian Economy. International Journal of Applied Science Engineering and Management. 2(10): 68–83.
Wabnitz, C., and R. Blasiak. 2019. The Rapidly Changing World of Ocean Finance. Marine Policy. https://doi.org/10.1016/j.marpol .2019.103526
World Bank. 2017. What is the Blue Economy? Infographic. https://www .worldbank.org/en/news/infographic/2017/06/06/blue-economy (accessed 31 October 2020).
____. 2020. Blue Economy. https://www.worldbank.org/en/topic /oceans-fisheries-and-coastal-economies#1 (accessed 2 November 2021).
Yoshioka, N., H. H. Wu, M. Huang, and H. Tanaka. 2020. Proposing Regulatory-Driven Blue Finance Mechanism for Blue Economy Development. ADBI Working Paper 1157. Tokyo: Asian Development Bank Institute.
43
3Tracking International Aid
for Ocean Conservation and Climate Action
Nagisa Shiiba, Miko Maekawa, Tibor Vegh, and John Virdin*
3.1 IntroductionEnsuring ocean conservation and sustainable ocean use has been an international priority since the United Nations Convention on the Law of the Sea was adopted in 1982. In particular, coastal developing states and the small island developing states (SIDS) depend heavily on ocean ecosystems and resources for economic development and people’s livelihoods. These states consequently emphasized ocean conservation and sustainable use goals in national policies (Ghina 2003). However, climate change has presented numerous challenges to ocean and coastal zones. In September 2019, the Intergovernmental Panel on Climate Change (IPCC) issued the Special Report on the Ocean and Cryosphere, which alerted the global community that “over the 21st century, the ocean is projected to transition to unprecedented conditions” (IPCC 2019: 18). Increased temperatures, further acidification, and an oxygen decline have been observed over the past 50 years, and this trend is predicted to continue (IPCC 2019). Climate change will reduce productivity and change the spatial distribution of marine species, and it is projected to cause the loss of coral reef cover and reduce tourism revenues, particularly in SIDS (Gaines et al. 2019). As such, global agendas, including the Paris Agreement and Sustainable Development Goals (SDGs), cannot be pursued or achieved without
* The authors are profoundly grateful for the financial support from the Nippon Foundation and the support provided by colleagues at the Ocean Policy Research Institute of the Sasakawa Peace Foundation. The authors express deep and sincere gratitude to Biliana Cicin-Sain for her guidance, advice, and encouragement. We are greatly indebted to her and dedicate this work to her memory.

44 Blue Economy and Blue Finance: Toward Sustainable Development and Ocean Governance
considering the effects of climate change on the ocean environment and coastal communities (Singh et al. 2019; Santos et al. 2020) and the role of the oceans in the global climate system.
On the other hand, there is a growing awareness of a sustainable ocean economy as part of the solution to climate change. In 2010, the Organisation for Economic Co-operation and Development (OECD) estimated that the global gross value added to ocean industries, including fishing, shipping, offshore wind, maritime and coastal tourism, and marine biotechnology, would increase from $1.5 trillion to $3.0 trillion by 2030 (OECD 2016). The trajectory of the ocean economy is upward in various parts of the world, although the global impact of the coronavirus disease (COVID-19) may slow the overall growth for a while (Sharma and Sharma 2020). Researchers also caution that the expansion of the ocean economy must be pursued in a sustainable manner, with consideration of environmental as well as social and equity aspects, which necessitate more sophisticated practice of a “blue economy” (Lee, Noh, and Khim 2020). Otherwise, ocean economy projects will end up as mere “ocean grabbing,” which refers to actions, policies, or initiatives that deprive small-scale fishers of the use of resources and access to areas of sea (Bennett, Govan, and Satterfield 2015). Although no universal definition exists for a sustainable ocean economy or blue economy, a large part of the literature tends to encompass multiple aspects of economic, ecological, and social dimensions, with a specific focus on climate change.
Ocean and coastal habitats can play a significant role in mitigating and adapting to climate change (Duarte et al. 2013; Cooley et al. 2019). For instance, the High Level Panel for a Sustainable Ocean Economy published The Ocean as a Solution to Climate Change: Five Opportunities for Action, indicating the significant potential of ocean-based solutions for addressing climate crises (Hoegh-Guldberg et al. 2019). This report estimates that ocean-based climate mitigation can reduce the emissions gap by up to 21% on a 1.5°C pathway and by approximately 25% on a 2.0°C pathway by 2050. One of the promising measures is ocean-based renewable energy, such as offshore wind, wave, and tidal power; the total mitigation potential is estimated to be equal to taking over 1 billion cars off the road per year (Hoegh-Guldberg et al. 2019). Another method with significant mitigation potential is coastal and marine ecosystem conservation. Coastal ecosystems, including mangroves, salt marshes, and seagrasses that store carbon, are commonly known as “blue carbon” and account for 46.9% of the total carbon burial in ocean sediments (Nellemann et al. 2009).
Interest has also been growing in ecosystem-based climate adaptation in coastal zones. Coastal habitats, for instance, serve as
Tracking International Aid for Ocean Conservation and Climate Action 45
restoration and conservation for protection from flooding and erosion (Arkema et al. 2013). Analyses of field measurements conducted by Narayan et al. (2016) indicated that coastal habitats—particularly coral reefs and salt marshes—have significant potential for reducing wave heights. Ruckelshaus et al. (2013) reported that ecosystem-based climate adaptation in fisheries and along coastlines can improve the resilience of species and habitats to future environmental challenges. Such restoration and preservation of coastal habitats provide combined services (coastal protection, nutrient cycling, food provision, etc.) at relatively low cost and thus constitute a cost-effective strategy (Duarte et al. 2013).
Against this backdrop, the importance of financing public goods for ocean conservation and sustainable use is increasing alongside calls for concrete actions by the international community as a whole. Ocean-related public goods are attracting interest from both the public and private sectors, and with the increase in environmental, social, and governance investments, investors are increasingly turning their attention to opportunities in ocean conservation and sustainability (Scott 2020). The Friends of Ocean Action—an informal multi-stakeholder coalition—was launched at the 2018 World Economic Forum Annual Meeting in Davos and released The Ocean Finance Handbook in 2019. The report attests to the growing interest of investors in the blue economy and the emerging trend of ocean financing for public goods. However, private funding is not plentiful, as is the case for many environmental projects (Friends of Ocean Action 2020). Therefore, the public sector still plays a major role in funding the public goods required for ocean conservation and climate action. Governments and multilateral aid agencies have recently committed programs and funds to provide financing for the sustainable management of public goods for ocean conservation and climate actions. The World Bank established a multi-donor trust fund called PROBLUE in 2018 as a part of its Blue Economy program, aiming to support fisheries and aquaculture, reduce the amount of plastic pollution, and resolve other ocean issues. In 2019, the Asian Development Bank (ADB) announced the launch of the Action Plan for Healthy Oceans and Sustainable Blue Economies for the Asia and Pacific region and launched the Oceans Financing Initiative, which aims to expand investment to $5 billion between 2019 and 2024 to promote a blue economy and create opportunities for the private sector to invest in bankable projects. The European Investment Bank launched the Blue Sustainable Ocean Strategy to enhance the sustainability of ocean-related activities, committing to more than double its lending to sustainable ocean projects (to €2.5 billion) between 2019 and 2023.
46 Blue Economy and Blue Finance: Toward Sustainable Development and Ocean Governance
As such, researchers have recently conducted studies on these types of financial flows as policy instruments to achieve international goals, including the ocean-related SDGs. For example, Guggisberg (2019) tracked marine fishery projects financed under the climate change adaptation funding regime and identified 25 projects. Piñeiro-Antelo, Villa, and Santos (2019) analyzed official development aid (ODA) in Galicia, Spain, focusing on the fishery sector. Blasiak and Wabnitz (2018) examined the global ODA trend from 2010 to 2015 and concluded that the grant for fisheries decreased by approximately 30%. Berger, Caruso, and Peterson (2019) analyzed the trends of total ocean-related grantmaking from philanthropic and ODA sources between 2015 and 2016. Despite the gradual emergence of such attempts, many questions regarding ocean funding remain unanswered. As indicated by the aforementioned examples of the World Bank and ADB, multilateral aid organizations are providing a growing pledge of global ocean funding, but a question remains of whether the funding reaches each sector in an unbiased manner and reaches people in need. Do the funds reach each ocean economy sector effectively, and are they fully utilizing the available resources? These points should be evaluated, and lessons should be considered in future projects. However, despite investments of an estimated $8 billion from philanthropy and $5 billion from ODA over the past 10 years (Sumaila et al. 2020), this level of investment is insufficient for the necessary change to a sustainable ocean economy in the first place, a point made in another Blue Paper commissioned by the High Level Panel. Despite many organizations having set up mechanisms to track both aid and climate finance (e.g., the OECD Development Assistance Committee), such trackers typically do not focus on financial flows related to ocean conservation and climate action or, particularly relevant, internationally agreed policy goals such as the Paris Agreement and SDG 14 for oceans. In the absence of such coordinated tracking and monitoring of aid projects, it is difficult for policy makers to assess the attention to, or prioritizing of, international funding mechanisms related to oceans and ocean-related climate issues. This results in disjuncture between regional ocean priorities and development assistance (Hills et al. 2019).
Thus, more detailed monitoring of international aid flows to ocean conservation and climate change projects should offer greater insights into the gaps between current efforts and what may be needed to achieve global goals. With this issue in mind, the objective of the present study was to track international aid projects for increasing resilience against environmental stressors by analyzing public financing of ocean conservation and climate action. This is a crucial step in identifying the current and future challenges and gaps for ultimately maximizing
Tracking International Aid for Ocean Conservation and Climate Action 47
the potential of ocean-based solutions to climate change. This study contributes to current efforts to track aid for ocean conservation and climate action. The existing ocean-specific trackers that we recognize include the OECD’s new database, the Sustainable Ocean Economy Database, which provides data sets of ocean-related funding from the OECD and partner organizations. FundingTheOcean.org is another example; it offers a fund map targeting philanthropic, United States federal, and bi- and multilateral aid grants from the OECD. These databases showcase efforts toward ocean conservation in general but do not track specific funding for climate action, and FundingTheOcean.org does not include the amount of loans provided, which also makes up a significant part of the overall funding structure. Therefore, our tracking study will build upon (but not duplicate) such existing tools by covering multilateral development banks and global climate funds and identifying a finance gap in ocean and climate actions. Section 3.2 details the methodology used, including the scope of the research and the analytical framework. Section 3.3 presents the collected baseline information, followed by an analysis of the progress and challenges in facilitating ocean conservation and climate action. In Section 3.4, we discuss the potential gaps between this aid baseline and existing estimates of the levels of financing for public goods that would be needed in lower- and lower-middle-income countries to achieve global ocean sustainability goals and targets. Policy recommendations follow in Section 3.5, and Section 3.6 gives the conclusion.
Snapshot of Ocean Financing and Multilateral Public FinanceUnderstanding the scale and impact of aid to developing countries for ocean conservation and climate action includes tracking financial flows from national sources (e.g., government aid agencies) as well as international sources. In this study, aid at the international level is defined as aid provided by global funds (e.g., the Global Environment Facility) and multilateral and regional development banks (e.g., the World Bank Group, the African Development Bank, ADB, and the Inter-American Development Bank). Additionally, climate funds, which are developed under the United Nations Framework Convention on Climate Change (e.g., the Adaptation Fund, Least Developed Countries Fund, Special Climate Change Fund, and Green Climate Fund) to fulfill global adaptation needs, play significant and growing roles in funding ocean conservation and sustainable fisheries in developing countries. Tracking aid for ocean conservation and climate action could include tracking grants and concessional investments from public institutions operating at the national or international level, i.e., public financing, as well as philanthropy and private capital for public goods (e.g., “impact
48 Blue Economy and Blue Finance: Toward Sustainable Development and Ocean Governance
investing”), but tracking these sources of funding is outside the scope of the present analysis. The following is a brief description of the multilateral financial institutions covered in this chapter and their activities related to ocean conservation.
The Green Climate Fund (GCF) administers the financing instruments under the United Nations Framework Convention on Climate Change (UNFCCC) to help developing countries reduce GHG emissions (mitigation) and cope with the impacts of climate change (adaptation). Although the GCF has not identified specific funds for the ocean, it plays a tremendous role in supporting small island developing countries, which are particularly vulnerable to climate change and degraded marine resources. For instance, it upgraded support for Pacific nations by strengthening its ties with the Pacific Community in 2019 (GCF 2019).
The Adaptation Fund (AF) is another global climate fund, established in 2001 under the Kyoto Protocol to finance projects that facilitate adaptation to climate change in developing countries. The financing for this fund is a share of proceeds from the Clean Development Mechanism (CDM), which amounts to 2% of certified emission reductions issued for a project under the CDM. The AF also serves the Paris Agreement, a new framework for global climate action adopted in 2015. The AF is active in many developing countries and has a wide range of investment themes, e.g., urban and rural development, agriculture, disaster risk reduction, and food security. Coastal zone management is one of the areas that the AF supports, and it has supported projects globally in various developing countries.
The Global Environment Facility (GEF) is another of the largest aid providers for ocean conservation and climate action. The GEF manages two global climate change funds established under the UNFCCC in 2001: the Least Developed Countries Fund (LDCF) and the Special Climate Change Fund (SCCF). The LDCF is mandated to address the needs of least developed countries, particularly the preparation and implementation of National Adaptation Programs of Action. The SCCF is designed to finance activities, programs, and measures in developing countries relating to adaptation, technology transfer and capacity building, energy, transport, industry, agriculture, forestry and waste management, and economic diversification (FCCC/CP/2001/13/Add.1).
The World Bank Group has been one of the largest international aid providers for ocean conservation and climate action projects since the early 2000s when it launched the Global Program on Fisheries with development partners and subsequently leveraged fishery investments. This program has merged with PROBLUE Umbrella 2.0, established
Tracking International Aid for Ocean Conservation and Climate Action 49
in 2018, to support sustainable development of ocean and coastal resources more broadly, beyond just fisheries (World Bank Group 2020). PROBLUE has four pillars: (i) improving fishery governance, (ii) strengthening management of marine litter and pollution, (iii) reducing the environmental footprint of oceanic sectors, and (iv) supporting integrated ocean management policies (“seascapes”). Its 2021 annual report indicates that the PROBLUE initiative had invested $60.3 million to support 85 activities across 71 countries as of 2021 (World Bank Group 2021).
ADB has traditionally focused on ocean conservation and sustainable use in the fishery sector. In 2019, ADB created an ocean financing initiative entitled The Action Plan for Healthy Oceans and Sustainable Blue Economies with targets from 2019 to 2024, covering a wide range of fields including sustainable tourism and fisheries, coastal and marine ecosystem conservation, reduction in land-based sources of marine pollution, and port and coastal infrastructure development. This initiative is expected to broaden the scope of ADB’s financing for ocean issues (ADB 2018).
Additionally, the African Development Bank (AfDB) has traditionally provided aid to African states for the fishery sector. The Blue Economy flagship program, which was established under AfDB’s strategy for agricultural transformation targeting the period 2016–2025, reported an increase in its investments in agriculture and fisheries of $1.0 billion per annum (FAO 2016). The AfDB also established a partnership with the Food and Agriculture Organization of the United Nations and the World Bank, which was called the African Package for Climate-Resilient Ocean Economies and planned to contribute $665.4 million for the period 2017–2020, supplemented by other funding through the GCF, the GEF, and other partners (AfDB 2018).
The Inter-American Development Bank (IDB) is the largest donor to the Caribbean island states, with numerous projects funding ocean conservation and sustainable use. In 2018, the IDB implemented the Blue Tech Challenge to facilitate, pilot, and scale up business models that are expected to provide technical solutions for the sustainable management of oceans, marine ecosystems, and coastal resources (IDB 2019).
The European Bank for Reconstruction and Development (EBRD) is relatively unique among multilateral development banks with regard to its mandate. Since the EBRD initially supported the system transformation in the former Eastern Bloc, its focus has been to facilitate the market economy in targeted regions, including Central Europe and Central Asia, by providing loans, equities, and credit. It has started to
50 Blue Economy and Blue Finance: Toward Sustainable Development and Ocean Governance
explore the potential of offshore wind and wave energy in countries such as Turkey, but there is not yet a substantial amount of ocean-related investments. Although the EBRD does not pay special attention to ocean and marine conservation, it has an explicit environmental mandate in its history and currently takes the Green Economy Transition approach to accelerate the development of eco-friendly, low-carbon, and resilient economies. Its main investment tools are not grants but loans, which is another reason why soft approaches to ocean conservation are outside of its scope. Of the 39 countries and territories where the EBRD operates, 21 are landlocked, which may be a reason for the few ocean-related investments made by the EBRD to date.
3.2 MethodologyIn this chapter, the international aid flows referred to were compiled annually by searching relevant databases for key terms related to ocean and climate goals and targets. The trends of the estimated annual disbursements provide a current snapshot of the aid provided by global multilateral financial institutions to governments and stakeholders in lower- and lower-middle-income coastal and SIDS countries.
We supplemented the analysis of the financial data with a series of semi-structured interviews with officers, including ocean conservation or blue economy experts, at four international financing institutions. We conducted four sessions with five interviewees in total whom we could contact (two from the AfDB, one from the EBRD, one from ADB, and one from the GEF) from October to December 2020. We used an online meeting platform to conduct all the sessions. The interview questions included the following topics: (i) the extent to which they see investment in ocean-related sectors as important, (ii) particular areas of focus in ocean investment for each bank, (iii) challenges of their current ocean financing initiatives, and (iv) expectations for future investments in ocean sectors.
3.2.1 Scope of Tracking
The study builds upon recent efforts that have established a baseline for international institutions operating at the global level, namely, the GEF and the World Bank, and at the regional level, i.e., ADB, the AfDB, the IDB, and the EBRD. We also cover the climate funds established under the UNFCCC regime: the AF and GCF. The other two climate funds, the LDCF and the SCCF, which are operated by the GEF, are not explicitly
Tracking International Aid for Ocean Conservation and Climate Action 51
listed to avoid double-counting. We do not include the European Investment Bank, as it provides loans to countries within the region, and our focus is the banks that mainly target developing states and emerging economies. However, we note the European Union’s high level of ambition, as shown in its commitments at the Our Ocean Conference.1 In total, we include eight multilateral funds in this study, tracked over the period from 2013 to 2019.
3.2.2 Analytical Framework
We searched the online project databases of selected multilateral finance providers using search terms tested according to relevance, erring on the side of inclusiveness. The coding process disaggregated the total project budgets into nine mutually exclusive project target categories: fisheries, pollution reduction, protected areas, ecosystem adaptation, GHG sinks, marine renewables, marine GHG emissions, population adaptation, and other ecosystem management and protection. For a detailed description of each category, see Table 3.1, where the project targets are matched to SDG targets. Table 3.2 presents the search terms used to extract the intended projects.
1 The European Union made 77 commitments (worth €10 billion) at the Our Ocean Conference in 2014 and has already achieved approximately 80% of the total. Additionally, the European Union announced 22 new commitments (worth €540 million) at the 2019 conference in Oslo. The European Investment Bank launched the Clean Oceans Initiative in 2018 to provide €2 billion by 2023 to reduce marine plastic pollution.
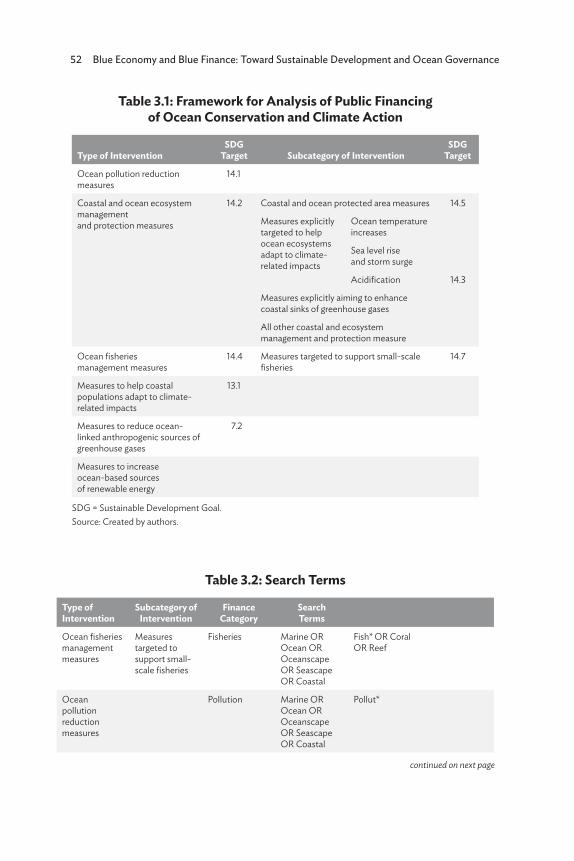
52 Blue Economy and Blue Finance: Toward Sustainable Development and Ocean Governance
Table 3.1: Framework for Analysis of Public Financing of Ocean Conservation and Climate Action
Type of InterventionSDG
Target Subcategory of InterventionSDG
Target
Ocean pollution reduction measures
14.1
Coastal and ocean ecosystem management and protection measures
14.2 Coastal and ocean protected area measures 14.5
Measures explicitly targeted to help ocean ecosystems adapt to climate-related impacts
Ocean temperature increases
Sea level rise and storm surge
Acidification 14.3
Measures explicitly aiming to enhance coastal sinks of greenhouse gases
All other coastal and ecosystem management and protection measure
Ocean fisheries management measures
14.4 Measures targeted to support small-scale fisheries
14.7
Measures to help coastal populations adapt to climate-related impacts
13.1
Measures to reduce ocean-linked anthropogenic sources of greenhouse gases
7.2
Measures to increase ocean-based sources of renewable energy
SDG = Sustainable Development Goal.Source: Created by authors.
Table 3.2: Search Terms
Type of Intervention
Subcategory of Intervention
Finance Category
Search Terms
Ocean fisheries management measures
Measures targeted to support small-scale fisheries
Fisheries Marine OR Ocean OR Oceanscape OR Seascape OR Coastal
Fish* OR Coral OR Reef
Ocean pollution reduction measures
Pollution Marine OR Ocean OR Oceanscape OR Seascape OR Coastal
Pollut*
continued on next page
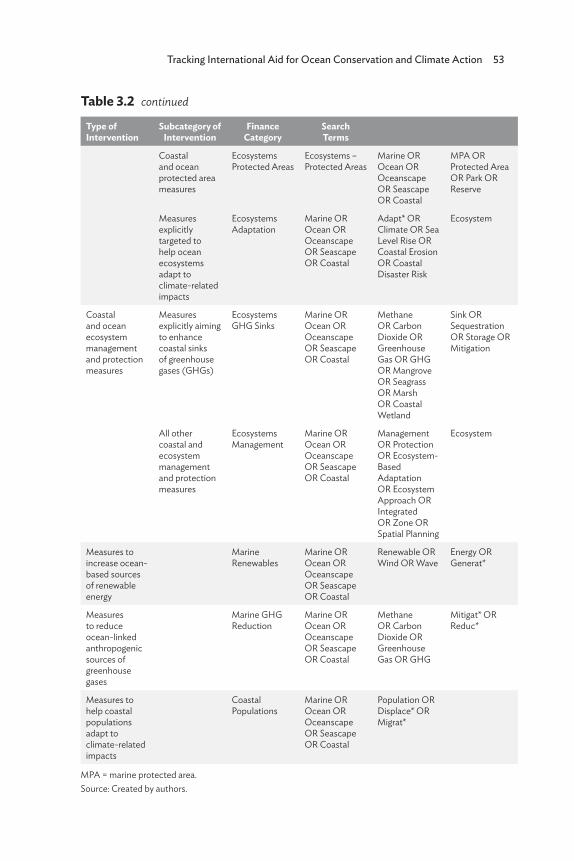
Tracking International Aid for Ocean Conservation and Climate Action 53
Type of Intervention
Subcategory of Intervention
Finance Category
Search Terms
Coastal and ocean protected area measures
Ecosystems Protected Areas
Ecosystems – Protected Areas
Marine OR Ocean OR Oceanscape OR Seascape OR Coastal
MPA OR Protected Area OR Park OR Reserve
Measures explicitly targeted to help ocean ecosystems adapt to climate-related impacts
Ecosystems Adaptation
Marine OR Ocean OR Oceanscape OR Seascape OR Coastal
Adapt* OR Climate OR Sea Level Rise OR Coastal Erosion OR Coastal Disaster Risk
Ecosystem
Coastal and ocean ecosystem management and protection measures
Measures explicitly aiming to enhance coastal sinks of greenhouse gases (GHGs)
Ecosystems GHG Sinks
Marine OR Ocean OR Oceanscape OR Seascape OR Coastal
Methane OR Carbon Dioxide OR Greenhouse Gas OR GHG OR Mangrove OR Seagrass OR Marsh OR Coastal Wetland
Sink OR Sequestration OR Storage OR Mitigation
All other coastal and ecosystem management and protection measures
Ecosystems Management
Marine OR Ocean OR Oceanscape OR Seascape OR Coastal
Management OR Protection OR Ecosystem-Based Adaptation OR Ecosystem Approach OR Integrated OR Zone OR Spatial Planning
Ecosystem
Measures to increase ocean-based sources of renewable energy
Marine Renewables
Marine OR Ocean OR Oceanscape OR Seascape OR Coastal
Renewable OR Wind OR Wave
Energy OR Generat*
Measures to reduce ocean-linked anthropogenic sources of greenhouse gases
Marine GHG Reduction
Marine OR Ocean OR Oceanscape OR Seascape OR Coastal
Methane OR Carbon Dioxide OR Greenhouse Gas OR GHG
Mitigat* OR Reduc*
Measures to help coastal populations adapt to climate-related impacts
Coastal Populations
Marine OR Ocean OR Oceanscape OR Seascape OR Coastal
Population OR Displace* OR Migrat*
MPA = marine protected area.Source: Created by authors.
Table 3.2 continued
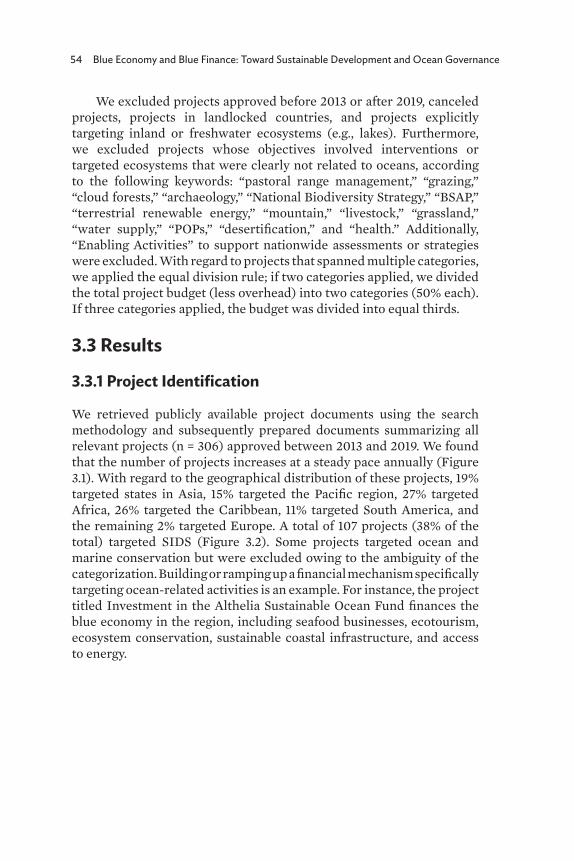
54 Blue Economy and Blue Finance: Toward Sustainable Development and Ocean Governance
We excluded projects approved before 2013 or after 2019, canceled projects, projects in landlocked countries, and projects explicitly targeting inland or freshwater ecosystems (e.g., lakes). Furthermore, we excluded projects whose objectives involved interventions or targeted ecosystems that were clearly not related to oceans, according to the following keywords: “pastoral range management,” “grazing,” “cloud forests,” “archaeology,” “National Biodiversity Strategy,” “BSAP,” “terrestrial renewable energy,” “mountain,” “livestock,” “grassland,” “water supply,” “POPs,” “desertification,” and “health.” Additionally, “Enabling Activities” to support nationwide assessments or strategies were excluded. With regard to projects that spanned multiple categories, we applied the equal division rule; if two categories applied, we divided the total project budget (less overhead) into two categories (50% each). If three categories applied, the budget was divided into equal thirds.
3.3 Results
3.3.1 Project Identification
We retrieved publicly available project documents using the search methodology and subsequently prepared documents summarizing all relevant projects (n = 306) approved between 2013 and 2019. We found that the number of projects increases at a steady pace annually (Figure 3.1). With regard to the geographical distribution of these projects, 19% targeted states in Asia, 15% targeted the Pacific region, 27% targeted Africa, 26% targeted the Caribbean, 11% targeted South America, and the remaining 2% targeted Europe. A total of 107 projects (38% of the total) targeted SIDS (Figure 3.2). Some projects targeted ocean and marine conservation but were excluded owing to the ambiguity of the categorization. Building or ramping up a financial mechanism specifically targeting ocean-related activities is an example. For instance, the project titled Investment in the Althelia Sustainable Ocean Fund finances the blue economy in the region, including seafood businesses, ecotourism, ecosystem conservation, sustainable coastal infrastructure, and access to energy.
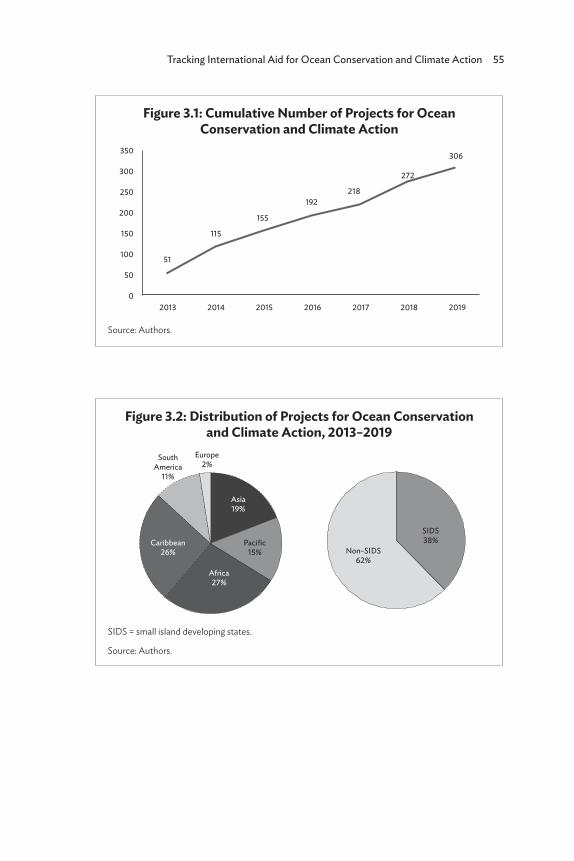
Tracking International Aid for Ocean Conservation and Climate Action 55
Figure 3.1: Cumulative Number of Projects for Ocean Conservation and Climate Action
Source: Authors.
350
300
250
200
150
100
50
51
115
155
192218
272
306
02013 2014 2015 2016 2017 2018 2019
Figure 3.2: Distribution of Projects for Ocean Conservation and Climate Action, 2013–2019
SIDS = small island developing states.
Source: Authors.
SouthAmerica
11%
Caribbean26%
Europe2%
SIDS38%
Asia19%
Pacific15%
Africa27%
Non-SIDS62%
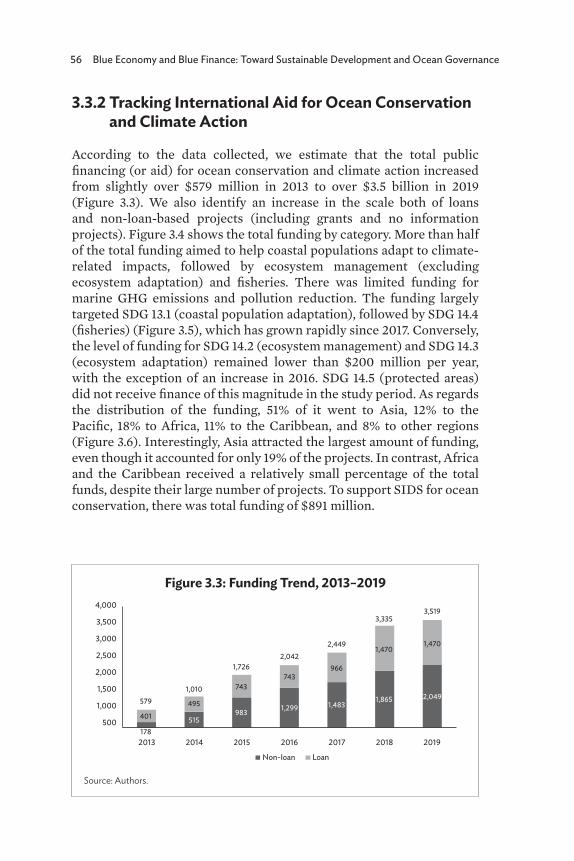
56 Blue Economy and Blue Finance: Toward Sustainable Development and Ocean Governance
3.3.2 Tracking International Aid for Ocean Conservation and Climate Action
According to the data collected, we estimate that the total public financing (or aid) for ocean conservation and climate action increased from slightly over $579 million in 2013 to over $3.5 billion in 2019 (Figure 3.3). We also identify an increase in the scale both of loans and non-loan-based projects (including grants and no information projects). Figure 3.4 shows the total funding by category. More than half of the total funding aimed to help coastal populations adapt to climate-related impacts, followed by ecosystem management (excluding ecosystem adaptation) and fisheries. There was limited funding for marine GHG emissions and pollution reduction. The funding largely targeted SDG 13.1 (coastal population adaptation), followed by SDG 14.4 (fisheries) (Figure 3.5), which has grown rapidly since 2017. Conversely, the level of funding for SDG 14.2 (ecosystem management) and SDG 14.3 (ecosystem adaptation) remained lower than $200 million per year, with the exception of an increase in 2016. SDG 14.5 (protected areas) did not receive finance of this magnitude in the study period. As regards the distribution of the funding, 51% of it went to Asia, 12% to the Pacific, 18% to Africa, 11% to the Caribbean, and 8% to other regions (Figure 3.6). Interestingly, Asia attracted the largest amount of funding, even though it accounted for only 19% of the projects. In contrast, Africa and the Caribbean received a relatively small percentage of the total funds, despite their large number of projects. To support SIDS for ocean conservation, there was total funding of $891 million.
Figure 3.3: Funding Trend, 2013–2019
Source: Authors.
2013
500178
401
579
515
495
1,010
983
743
1,726
1,299
743
2,042
1,483
966
2,449
1,865
1,470
3,335
2,049
1,470
3,519
1,000
1,500
2,000
2,500
3,000
3,500
4,000
2014 2015 2016
Non-loan Loan
2017 2018 2019

Tracking International Aid for Ocean Conservation and Climate Action 57
Figure 3.4: Finance by Category, 2013–2019
GHG = greenhouse gas.
Source: Authors.
Population adaptation54%
Fisheries15%
Pollution reduction2%
Protected areas5%
Ecosystem adaptation8%
GHG sink0%
Other ecosystem management16%
Marine renewables0%
Figure 3.5: Finance by Sustainable Development Goal Target, 2013–2019
SDG = Sustainable Development Goal.
Source: Authors.
SDG 13.1 - coastal population adaptationSDG 14.4 - fisheriesSDG 14.2 - ecosystem managementSDG 14.3 - ecosystem adaptationSDG 14.5 - protected areas
2013 2014 2015 2016 2017 2018 2019
600
500
300
200
100
$ m
illio
n 400
0
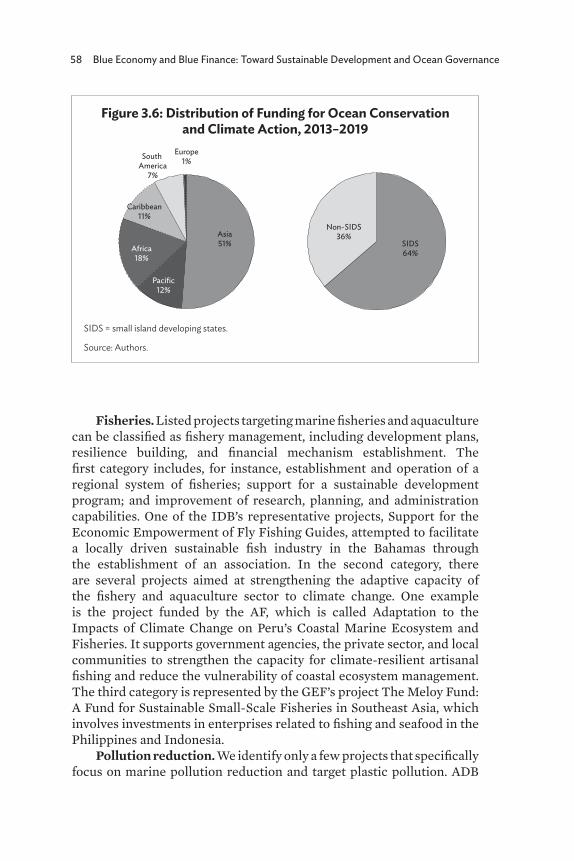
58 Blue Economy and Blue Finance: Toward Sustainable Development and Ocean Governance
Fisheries. Listed projects targeting marine fisheries and aquaculture can be classified as fishery management, including development plans, resilience building, and financial mechanism establishment. The first category includes, for instance, establishment and operation of a regional system of fisheries; support for a sustainable development program; and improvement of research, planning, and administration capabilities. One of the IDB’s representative projects, Support for the Economic Empowerment of Fly Fishing Guides, attempted to facilitate a locally driven sustainable fish industry in the Bahamas through the establishment of an association. In the second category, there are several projects aimed at strengthening the adaptive capacity of the fishery and aquaculture sector to climate change. One example is the project funded by the AF, which is called Adaptation to the Impacts of Climate Change on Peru’s Coastal Marine Ecosystem and Fisheries. It supports government agencies, the private sector, and local communities to strengthen the capacity for climate-resilient artisanal fishing and reduce the vulnerability of coastal ecosystem management. The third category is represented by the GEF’s project The Meloy Fund: A Fund for Sustainable Small-Scale Fisheries in Southeast Asia, which involves investments in enterprises related to fishing and seafood in the Philippines and Indonesia.
Pollution reduction. We identify only a few projects that specifically focus on marine pollution reduction and target plastic pollution. ADB
Figure 3.6: Distribution of Funding for Ocean Conservation and Climate Action, 2013–2019
SIDS = small island developing states.
Source: Authors.
South America
7%
Caribbean11%
Europe1%
Asia51%
Pacific12%
Africa18%
SIDS64%
Non-SIDS36%
Tracking International Aid for Ocean Conservation and Climate Action 59
has implemented “promoting action on plastic pollution from source to sea in Asia and the Pacific” projects, which helps prepare action plans, forms policy and regulations to encourage a circular economy, and provides investments in integrated solid-waste management and circular economy systems. Another example of a pollution reduction project is the GEF project, which supports the implementation of action programs for land-based pollution reduction to protect critical coastal ecosystems in the Western Indian Ocean, including improving river basin management.
Ecosystem management. We divide the projects related to ecosystem management into four subgroups: coastal and ocean protected area measures, measures explicitly targeted to help ocean ecosystems adapt to climate-related impacts, measures explicitly aimed at enhancing coastal sinks of GHGs, and all other coastal and ecosystem management and protection measures. With regard to marine protected areas (MPAs), the GEF has been the most active funding provider. Its activities range from the creation of an MPA to enhancing its governance and financial sustainability. In contrast, programs targeting ecosystem-based adaptation have been financed by a variety of funders, such as the GEF, GCF, and AF. This includes encouraging local action plans to integrate ecosystem-based adaptation approaches. The GCF undertakes a unique approach, i.e., the Blue Action Fund, where adaptation subprojects of nongovernmental organizations have been pooled to improve climate-resilient coastal management in the Western Indian Ocean. Programs focusing on the coastal sinks of GHGs involve updating local inventories for blue carbon ecosystems such as mangroves and managing production landscapes.
Marine renewable energy. The only identified project involving marine renewable energy is the Support of Marine Energy Pilot Projects in Southern Chile funded by the IDB. This project aims to support the market entry of marine renewables such as wave energy and tidal energy, which are mostly at the pre-commercial stage of development in targeted countries. Despite increasing interest in marine renewable energy, SIDS face challenges, including a lack of available data and human resources, the need for policy and regulatory frameworks, and the scarcity of funding (Lucas et al. 2017). Studies have been increasingly performed on the potential of offshore wind power generation in developing countries and emerging economies (Waewsak, Landry, and Gagnon 2015; Nagababu et al. 2017; Rusu and Onea 2017; Rueda-Bayona et al. 2019), providing insights and evidence to countries that aspire to develop projects in the future.
Population adaptation. This category lays out a variety of projects related to climate change adaptation in coastal zones such as coastal

60 Blue Economy and Blue Finance: Toward Sustainable Development and Ocean Governance
protection, disaster risk management, and resilience building in industries. It should be noted that investments in infrastructure (e.g., coastal roads, ports and shipping, evacuation shelters, or sea walls) aimed at resilience building are included in this category and are typically financed by loans. Meanwhile, grant-based approaches such as disaster information dissemination and coastal governance and support for policy making are also identified. The project in Timor-Leste funded by the United Nations Development Programme and the GEF focuses on reducing climate-induced disaster risks for small-scale rural infrastructure planning and management by supporting integration of climate risk into policies, regulations, and institutions. While these reactive measures are identified, we find no projects that deal with planned relocation or retreat, which are often cited as adaptation options (Dannenberg et al. 2019; McMichael, Katonivualiku, and Powell 2019).
Intersection. Some projects bring multiple benefits across categories. For example, the ecosystem approach to fishery management implemented by the GEF in Indonesia promotes ecosystem management for achieving sustainable fisheries. The ridge-to-reef project in Fiji is another example of approaches that are beneficial in multiple aspects; preservation of blue carbon ecosystems such as seagrass, mangroves, and coral reefs by addressing the problem of land-based pollution will also contribute to enhancing the adaptive capacities of island and coastal communities.
3.4 Discussion
3.4.1 Total Global Financing for Ocean Conservation and Climate Actions
In this study, we tracked the international aid/loan projects for ocean conservation and climate actions funded by multilateral and regional banks to provide an overview of the past and current trends of these projects, funding needs, and results to date. Our estimate of the total global financing for ocean conservation and climate action is $3.5 billion for the period 2013–2019. The question here is whether this amount is sufficient as compared to the global demand for ocean and coastal climate actions. Although there are few estimates of the funding required specifically for ocean conservation, existing assessments imply that our estimates of global ocean funding are far from sufficient. For instance, the OECD reports climate finance provided and mobilized by developed countries between 2013 and 2018 (OECD 2020). According to its estimate, total multilateral public climate finance attributable
Tracking International Aid for Ocean Conservation and Climate Action 61
to developed countries amounts to $128.1 billion for the given years. Assuming that our estimate covers nearly all outflows from multilateral institutions to developing countries, only a small amount of funding is provided for ocean conservation and climate action. The UNEP’s Adaptation Gap Report indicates that the cost of climate change adaptation will range from $140 billion to $300 billion per year by 2030 (UNEP 2018). Given that over 3 billion people depend on marine and coastal biodiversity for their livelihoods (UN 2017), further funding and efforts to implement it through concrete projects will be needed.
By comparing the current baseline and past investments in ocean conservation and climate action projects and the estimated future costs for ocean conservation and climate action, we should be able to evaluate the overall financing gap for lower- and lower-middle-income countries to help achieve international targets related to ocean conservation and climate action. Unfortunately, there are no existing plausible estimates of the total costs of ocean-based solutions to climate change. In future studies, the costs should be estimated through scientific and gray literature or submitted nationally determined contributions (NDCs) for the Paris Agreement that include cost estimates. Gallo, Victor, and Levin (2017) analyzed 112 of 161 NDCs (70%), including marine issues, although few of the contributions identified quantitative targets for financing and investment.
3.4.2 Geographic Distribution and Different Types of Financial Assistance
In regard to geographical distribution, we find that the Asia and Pacific region accommodates relatively large-scale projects compared with the rest of the world. These include projects that are fully or partly funded by loans. We identify 13 loan projects, of which 9 are implemented in Asia and the Pacific. All are funded either by ADB or the World Bank. Most loans have been directed to coastal disaster risk mitigation, including infrastructure construction and coastal fishery development, along with funded ecosystem preservation projects such as the World Bank’s Coral Reef Rehabilitation and Management Project in Indonesia. For grant projects, South Asia and South America receive the largest amounts of global ocean finance.
The identified predominance of grant projects should be noted. Comparisons between loans and grants have been made since 2000 (Bulow and Rogoff 2005; Cohen, Jacquet, and Reisen 2007). In numerous developing countries, small-scale grant-based projects may be ideal and feasible with regard to implementation and capacity building rather
62 Blue Economy and Blue Finance: Toward Sustainable Development and Ocean Governance
than large-scale loans at this stage. However, Cordella and Ulku (2007) argued that neither loan-dependent nor grant-dependent situations should be the most desirable outcome, albeit the optimal mix of grants and loans depends on the characteristics of the recipient country. There is a long-standing debate on which loans or grants are more effective in supporting the poorest countries. Cohen, Jacquet, and Reisen (2007) pointed out that loans or grants should not be taken in isolation, and that a more flexible mechanism that incorporates a mixture of those two mechanisms performs better than grants only or loans only, offering empirical evidence. They concluded that there is a rationale for loans as effective aid delivery mechanisms and that donors should build on a capacity to use a wide range of financial instruments, including loans. It is critical to explore other financial schemes for ocean-related projects rather than depending heavily on grant-based aid. Thus, ensuring the bankability of ocean and climate actions is a key issue. Interest is growing in the role of public finance in catalyzing private finance through a mix of private and public finance schemes such as public–private partnerships (PPPs). Researchers are increasingly investigating the potential of PPPs to resolve development issues, e.g., disaster risk reduction, solid-waste management, and carbon emission reduction (Stewart, Kolluru, and Smith 2009; Aliu, Adeyemi, and Adebayo 2014; Khan et al. 2020), whereas few studies have focused on ocean and coastal conservation. Golden et al. (2017) stated that private capital must play an active role in helping ocean industries be financed, while public finance is crucial for the introduction of sustainable policies. They proposed a PPP focused on the oceans under an international cooperation scheme, such as the United Nations Convention on the Law of the Sea, to facilitate international cooperation and support.
Blended finance, which is defined by the OECD as “the strategic use of development finance for the mobilisation of additional finance towards the SDGs in developing countries” (OECD 2018: 3), is another possible method for leveraging public finance to promote private investment (pump-priming). Recent literature focusing on water resource management highlighted the role of blended finance in mobilizing private financing to achieve the SDGs in developing countries (Kolker et al. 2016; Leigland, Trémolet, and Ikeda 2016; Winpenny et al. 2016). Additionally, the OECD Development Assistance Committee admits that blended finance will be crucial for unlocking commercial finance to satisfy the 2030 Agenda and the Paris Agreement and for developing a common policy framework and guidance to implement the principles developed in 2018 (OECD 2018).
To ensure private-sector involvement and achieve bankability, incorporating ocean conservation into national, regional, or local
Tracking International Aid for Ocean Conservation and Climate Action 63
economic systems offers stakeholders incentives to sustain investment in ocean and coastal natural resources. Kathijotes (2013) argued that introducing innovative technology to generate new cash flows, which creates jobs and builds social capital, is crucial. However, in reality, the major challenge in facilitating a sustainable blue economy is the lack of practical models that indicate how development aid drives regional and local economic cycles. Although emerging literature reviews the practices of a successful blue economy (Wenhai et al. 2019), developing sustainable models is challenging, particularly at the local level. Bennett et al. (2019) pointed out that assumptions of a “trickle-down” blue economy are problematic because unregulated economic growth can produce economic inequality and generate limited local benefits. Designing blue economy projects that ensure local benefits and private-sector participation would be a significant step toward maximizing and maintaining the effect of development aid from public funding and toward developing sustainable models of ocean conservation. We identified six projects that are labeled as “blue economy” from the AfDB and the IDB, and an increase in such projects is expected given the increasing attention being paid to this field.
3.4.3 Potential for Future Funding
Our findings also reveal that global ocean financing is likely to be directed toward specific categories such as coastal population adaptation, ecosystem management, and the fishery industry. A relatively small amount of finance flows to the MPAs and pollution reduction. In terms of the balance between climate change mitigation and adaptation, the current flows of ocean financing have concentrated on the adaptation side. The total financing scale of projects related to marine carbon sink, which is known as “blue carbon,” and marine renewable energy appears to be limited to less than $30 million for the given period. Additionally, we found few projects targeting GHG emission reduction in the ocean industry. These findings imply that ocean-based or ocean-related mitigation measures for climate change and their potential have not been sufficiently recognized by potential recipients. The aforementioned Blue Paper provided by the High Level Panel for a Sustainable Blue Economy indicates the global potential of the ocean for carbon neutrality, but it is also worthwhile to identify contributions on regional and local scales. Furthermore, there is a need for efforts to reduce the uncertainties and limitations of currently available ocean-based climate change mitigation measures. The carbon sink potentials of various coastal and marine ecosystems have been assessed with regard to long-term effectiveness (Howard et al. 2017; Gattuso et al. 2018), and
64 Blue Economy and Blue Finance: Toward Sustainable Development and Ocean Governance
the results can assist decision makers in designing effective projects. Marine renewable energy, such as offshore wind power, appears to take a long time to be expanded to developing countries owing to costs, legal barriers, and technological challenges, while international donors such as the World Bank are already seeking opportunities in emerging markets (World Bank Group 2019).
This study has several methodological limitations. Our estimate does not represent total outflows from multilateral institutions to ocean-related projects but only those from several major multilateral financial institutions with project data sets available online. However, this study is the first attempt to compile the data from eight regional development banks and climate funds and provides a rough picture of the global flows of public multilateral finance to ocean and climate actions, supplementing the existing ocean finance tracking data sets, which focus on bilateral finance.
3.5 Policy RecommendationsTracking multilateral aid flows to lower- and lower-middle-income coastal areas and SIDS for comparison against required funding to fully implement and build on NDCs and SDGs allows us to identify significant gaps and prospects for greater impact of aid for ocean conservation and climate action. The findings of this study suggest that adaptation and mitigation efforts in lower- and lower-middle-income coastal and SIDS countries/communities can receive increased funding through: (i) directing a significant portion of the current climate funds to coastal and SIDS issues and (ii) developing supplementary financing to support adaptation and mitigation methods through innovative approaches and partnerships. To achieve the first objective, enhancing access to available financial resources is crucial. Given the recent wave of commitment to ocean sustainability among political leaders (UNESCO 2020), without appropriate efforts, a significant gap will emerge between implementation and available resources. In addition to identifying the potential needs of ocean-related projects, capacity building helps countries develop proposals for financial institutions. To facilitate financing where it is needed and to support matchmaking between project needs and available financial resources, a practical guide would be helpful. Such a guide should include a list of available financial sources, procedures, and guidelines for project formulation and implementation, a menu of ocean and climate project models, and necessary environmental safeguarding and restoration measures.
Tracking International Aid for Ocean Conservation and Climate Action 65
3.6 ConclusionComprehending the scale and distribution of international aid is a critical first step in advancing ocean conservation and climate action on a global scale. In this study, baseline data were obtained by reviewing the online project databases of selected multilateral financial providers. In conclusion, the world has seen a steady increase in investment in ocean and climate actions. This quantitative analysis is expected to inform both donors and recipients of the emerging importance of the roles of multilateral aid in ocean-based solutions to climate change. We also identify future challenges, including the insufficient scale of funding, bias between regions and categories, the predominance of grant projects, and the lack of projects targeting climate change mitigation. These issues will be addressed by the international community through a discussion on relevant platforms such as the UNFCCC. To overcome the challenges and sufficiently leverage the increasing commitments to ocean financing, we will need tools and communications that bridge multilateral donors and potential recipients. We propose the development of a guide that helps lower- and lower-middle-income countries map out ocean-related projects and access available financial resources as well as informs climate finance providers. Furthermore, we propose global efforts to raise ambitions toward sustainable investment in ocean and coastal climate actions by creating ecosystems, including universal language for ocean financing, evidence-based bankable project models, and PPP platforms. This work contributes to enhancing global ocean financing and, in particular, the linkage between ocean and climate finance solutions for achieving international goals for ocean conservation and climate action.
66 Blue Economy and Blue Finance: Toward Sustainable Development and Ocean Governance
ReferencesAfrican Development Bank (AfDB). 2018. Blue Economy Flagship a
Briefing Note for Partnership: A Flagship under the Feed Africa Strategy 2016–2025. Abidjan. https://www.riob.org/sites/default /files/documents/AfDB%20Blue%20Economy%20Flagship%20_%20Briefing%20Note_November%202018.pdf (accessed 6 November 2021).
Asian Development Bank (ADB). 2018. The Action Plan for Healthy Oceans and Sustainable Blue Economies: Investing in Sustainable Marine Economies for Poverty Alleviation in Asia and the Pacific. Manila. https://www.adb.org/sites/default/files/related/145036 /Action%20Plan%20for%20Healthy%20Oceans%20and%20Sustainable%20Blue%20Economies.pdf (accessed 6 November 2021).
Aliu, I. R., O. E. Adeyemi, and A. Adebayo. 2014. Municipal Household Solid Waste Collection Strategies in an African Megacity: Analysis of Public Private Partnership Performance in Lagos. Waste Management and Research. 32(9) Supplement: 67–78.
Arkema, K. K., G. Guannel, G. Verutes, S. A. Wood, A. Guerry, M. Ruckelshaus, P. Kareiva, M. Lacayo, and J. M. Silver. 2013. Coastal Habitats Shield People and Property from Sea-Level Rise and Storms. Nature Climate Change. 3(10): 913–18.
Bennett, N. J., A. M. Cisneros-Montemayor, J. Blythe, J. J. Silver, G. Singh, N. Andrews, A. Calò, P. Christie, A. Di Franco, E. M. Finkbeiner, S. Gelcich, et al. 2019. Towards a Sustainable and Equitable Blue Economy. Nature Sustainability. 2(11): 991–93.
Bennett, N. J., H. Govan, and T. Satterfield. 2015. Ocean Grabbing. Marine Policy. 57: 61–68. https://doi.org/10.1016/j.marpol.2015.03.026 (accessed 6 November 2021).
Berger, M. F., V. Caruso, and E. Peterson. 2019. An Updated Orientation to Marine Conservation Funding Flows. Marine Policy. 107.
Blasiak, R., and C. C. C. Wabnitz. 2018. Aligning Fisheries Aid with International Development Targets and Goals. Marine Policy. 88: 86–92.
Bulow, J., and K. Rogoff. 2005. Grants Versus Loans for Development Banks. American Economic Review. 95(2): 393–97.
Cohen, D., P. Jacquet, and H. Reisen. 2007. Loans or Grants? Review of World Economics. 143(4): 764–82.
Cooley, S. R., B. Bello, D. Bodansky, A. Mansell, A. Merkl, N. Purvis, S. Ruffo, G. Taraska, A. Zivian, G. H. Leonard. 2019. Overlooked Ocean Strategies to Address Climate Change. Global Environmental Change. 59: 101968.
Cordella, T., and H. Ulku. 2007. Grants vs. Loans. IMF Staff Papers. 54(1): 139–62.
Tracking International Aid for Ocean Conservation and Climate Action 67
Dannenberg, A. L., H. Frumkin, J. J. Hess, and K. L. Ebi. 2019. Managed Retreat as a Strategy for Climate Change Adaptation in Small Communities: Public Health Implications. Climatic Change. 153(1–2): 1–14.
Duarte, C. M., I. J. Losada, I. E. Hendriks, I. Mazarrasa, and N. Marbà. 2013. The Role of Coastal Plant Communities for Climate Change Mitigation and Adaptation. Nature Climate Change. 3(11): 961–68.
Food and Agriculture Organization of the United Nations (FAO). 2016. African Package for Climate-Resilient Ocean Economies. Rome. https://www.tralac.org/images/docs/10857/african-package-for -climate-resilient-ocean-economies-afdb-fao-world-bank-2016.pdf (accessed 6 November 2021).
Friends of Ocean Action. 2020. The Ocean Finance Handbook: Increasing Finance for a Healthy Ocean. http://www3.weforum.org/docs / WEF_FOA_The_Ocean_Finance_Handbook_April_2020.pdf (accessed 6 November 2021).
Gaines, S., R. Cabral, C. M. Free, and Y. Golbuu. 2019. The Expected Impacts of Climate Change on the Ocean Economy. Washington, DC: World Resources Institute. https://www.oceanpanel.org/sites /default/files/2019-12/expected-impacts-climate-change-on-the -ocean-economy.pdf (accessed 6 November 2021).
Gallo, N. D., D. G. Victor, and L. A. Levin. 2017. Ocean Commitments under the Paris Agreement. Nature Climate Change. 7(11): 833–38.
Gattuso, J. P., A. K. Magnan, L. Bopp, W. W. L. Cheung, C. M. Duarte, J. Hinkel, E. Mcleod, F. Micheli, A. Oschlies, P. Williamson, et al. 2018. Ocean Solutions to Address Climate Change and Its Effects on Marine Ecosystems. Frontiers in Marine Science. 5: 337.
Green Climate Fund (GCF). 2019. GCF Upgrades Climate Support for Vulnerable Pacific Nations. Press release. Incheon. https://www.greenclimate.fund/news/gcf-upgrades-climate -support-vulnerable-pacific-nations (accessed 6 November 2021).
Ghina, F. 2003. Sustainable Development in Small Island Developing States. Environment, Development and Sustainability. 5(1–2): 139–65.
Golden, J. S., J. Virdin, D. Nowacek, P. Halpin, L. Bennear, and P. G. Patil. 2017. Making Sure the Blue Economy is Green. Nature Ecology and Evolution. 1(2): 17.
Guggisberg, S. 2018. Funding Coastal and Marine Fisheries Projects under the Climate Change Regime. Marine Policy. 107: 103352.
Hills, J., S. Bala, A. Solofa, P. Dunstan, M. Fischer, and D. Hayes. 2019. The Disjuncture between Regional Ocean Priorities and Development Assistance in the South Pacific. Marine Policy. 107: 103420.
Hoegh-Guldberg, O., K. Caldeira, T. Chopin, S. Gaines, P. Haugan, M. Hemer, J. Howard, M. Konar, D. Krause-Jensen, et al. 2019. The Ocean as a Solution to Climate Change: Five Opportunities for Action
68 Blue Economy and Blue Finance: Toward Sustainable Development and Ocean Governance
Report. Washington, DC: World Resources Institute. http://www.oceanpanel.org/climate (accessed 6 November 2021).
Howard, J., A. Sutton-Grier, D. Herr, J. Kleypas, E. Landis, E. Mcleod, E. Pidgeon, and S. Simpson. 2017. Clarifying the Role of Coastal and Marine Systems in Climate Mitigation. Frontiers in Ecology and the Environment. 15(1): 42–50.
Inter-American Development Bank (IDB). 2019. IDB Announces Selected Proposals of its Blue Tech Challenge in the Caribbean. News release. 4 March. https://www.iadb.org/en/news/idb -announces-selected-proposals-its-blue-tech-challenge-caribbean (accessed 6 November 2021).
Intergovernmental Panel on Climate Change (IPCC). 2019. Summary for Policymakers. In H. -O. Portner, D. C. Roberts, V. Masson-Delmotte, P. Zhai, M. Tignor, E. Poloczanska, K. Mintenbeck, A. Alegria, M. Nicolai, A. Okem, J. Petzold, B. Rama, and N. M. Weyer, eds. IPCC Special Report on the Ocean and Cryosphere in a Changing Climate. Cambridge, UK and New York, US: Cambridge University Press.
Kathijotes, N. 2013. Keynote: Blue Economy—Environmental and Behavioural Aspects Towards Sustainable Coastal Development. Procedia—Social and Behavioral Sciences. 101: 7–13.
Khan, Z., M. Ali, D. Kirikkaleli, S. Wahab, and Z. Jiao. 2020. The Impact of Technological Innovation and Public–Private Partnership Investment on Sustainable Environment in China: Consumption‐Based Carbon Emissions Analysis. Sustainable Development. 28(5): 1317–30.
Kolker, J. E., B. Kingdom, S. Trémolet, J. Winpenny, and R. Cardone. 2016. Financing Options for the 2030 Water Agenda. Water Global Practice Knowledge Brief, November 2016 Washington, DC: World Bank.
Lee, K. H., J. Noh, and J. S. Khim. 2020. The Blue Economy and the United Nations’ Sustainable Development Goals: Challenges and Opportunities. Environment International. 137: 105528.
Leigland, J., S. Trémolet, and J. Ikeda. 2016. Achieving Universal Access to Water and Sanitation by 2030: The Role of Blended Finance. Water Global Practice Discussion Paper. August 2016. Washington, DC: World Bank.
Lucas, H., S. Fifita, I. Talab, C. Marschel, and L. F. Cabeza. 2017. Critical Challenges and Capacity Building Needs for Renewable Energy Deployment in Pacific Small Island Developing States (Pacific SIDS). Renewable Energy. 107: 42–52.
McMichael, C., M. Katonivualiku, and T. Powell. 2019. Planned Relocation and Everyday Agency in Low-Lying Coastal Villages in Fiji. The Geographical Journal. 185(3): 325–37.
Tracking International Aid for Ocean Conservation and Climate Action 69
Nagababu, G., S. S. Kachhwaha, N. K. Naidu, and V. Savsani. 2017. Application of Reanalysis Data to Estimate Offshore Wind Potential in EEZ of India Based on Marine Ecosystem Considerations. Energy. 118: 622–31.
Narayan, S., M. W. Beck, B. G. Reguero, I. J. Losada, B. van Wesenbeeck, N. Pontee, J. N. Sanchirico, J. Carter Ingram, G.-M. Lange, and K. A. Burks-Copes. 2016. The Effectiveness, Costs and Coastal Protection Benefits of Natural and Nature-Based Defences. PLoS ONE. 11(5): e0154735.
Nellemann, C., E. Corcoran, C. M. Duarte, L. Valdés, C. De Young, L. Fonseca, and G. Grimsditch, eds. 2009. Blue Carbon: The Role of Healthy Oceans in Binding Carbon. A Rapid Response Assessment. Nairobi: United Nations Environment Programme. https://www .grida.no/publications/145 (accessed 6 November 2021).
Organisation for Economic Co-operation and Development (OECD). 2016. The Ocean Economy in 2030. Paris. https://doi .org/10.1787/9789264251724-en (6 November 2021).
____. 2018. Blended Finance Principles for Unlocking Commercial Finance for the Sustainable Development Goals. Paris. http://www .oecd.org/dac/financing-sustainable-development/development -finance-topics/OECD-Blended-Finance-Principles.pdf (accessed 6 November 2021).
____. 2020. Reframing Financing and Investment for a Sustainable Ocean Economy, Policy Perspectives OECD Environment Policy Paper No. 22. Paris. https://doi.org/10.1787/23097841 (accessed 6 November 2021).
Piñeiro-Antelo, M., F. R. D. Villa, and X. M. Santos. 2019. ODA in Galicia (Spain). The Importance of the Fisheries Sector and the Cultural Priority. Marine Policy. 107: 103455. https://doi.org/10.1016/j .marpol.2019.02.027
Ruckelshaus, M., S. C. Doney, H. M.Galindo, J. P.Barry, F. Chan, J. E. Duffy, C. A. English, S. D. Gaines, J. M. Grebmeier, et al. 2013. Securing Ocean Benefits for Society in the Face of Climate Change. Marine Policy. 40(1): 154–59.
Rueda-Bayona, J. G., A. Guzmán, J. J. C. Eras, R. Silva-Casarin, E. Bastidas-Arteaga, and J. Horrillo-Caraballo. 2019. Renewables Energies in Colombia and the Opportunity for the Offshore Wind Technology. Journal of Cleaner Production. 220: 529–43.
Rusu, E., and F. Onea. 2017. Joint Evaluation of the Wave and Offshore Wind Energy Resources in the Developing Countries. Energies. 10(11): 1866.
Santos, C. F., T. Agardy, F. Andrade, H. Calado, L. Crowder, C. Ehler, S. Garcia-Morales, E. Gissi, B. Halpern, H.-O. Portner, et al.
70 Blue Economy and Blue Finance: Toward Sustainable Development and Ocean Governance
2020. Integrating Climate Change in Ocean Planning. Nature Sustainability. 3(7): 505–16.
Scott, M. 2020. ESG Investors Slow to Make Waves in the $2.5tn Ocean Economy. Reuters Events. 30 August. https://www.reutersevents .com/sustainability/esg-investors-slow-make-waves-25tn-ocean -economy (accessed 6 November 2021).
Sharma, B., and B. Sharma. 2020. Blue Economy: Impact of Corona Pandemic. International Journal of Management. 11(9): 717–28. https://ssrn.com/abstract=3710696 (accessed 6 November 2021).
Singh, G. G., N. Hilmi, J. Bernhardt, A. M. Cisneros-Montemayor, M. Self Cashion, Y. Ota, S. Acar, R. Cottrell, S. Djoundourian, P. C. G. Espinosa, et al. 2019. Climate Impacts on the Ocean Are Making the Sustainable Development Goals a Moving Target Travelling Away from Us. People and Nature. 1(3): 317–30.
Stewart, G. T., R. Kolluru, and M. Smith. 2009. Leveraging Public–Private Partnerships to Improve Community Resilience in Times of Disaster. International Journal of Physical Distribution and Logistics Management. 39(5): 343–64.
Sumaila, U. R., M. Walsh, K. Hoareau, and A. Cox. 2020. Ocean Finance: Financing the Transition to a Sustainable Ocean Economy. Washington, DC: World Resources Institute. https://oceanpanel .org/sites/default/files/2020-10/Ocean%20Finance%20Full%20Paper.pdf (accessed 6 November 2021).
United Nations (UN). 2017. Factsheet: People and Oceans. The Ocean Conference. New York: United Nations, 5–9 June.
United Nations Environment Programme (UNEP). 2018. The Adaptation Gap Report 2018. Nairobi: UNEP. https://www.unenvironment.org /resources/adaptation-gap-report (accessed 6 November 2021).
United Nations Educational, Scientific and Cultural Organization (UNESCO). 2020. 14 World Leaders Commit to 100% Sustainable Ocean Management to Solve Global Challenges, and Call for More Countries to Join. 4 December. https://ioc.unesco.org/news/14 -world-leaders-commit-100-sustainable-ocean-management-solve -global-challenges-and-call-more (accessed 6 November 2021).
Waewsak, J., M. Landry, and Y. Gagnon. 2015. Offshore Wind Power Potential of the Gulf of Thailand. Renewable Energy. 81: 609–26.
Wenhai, L., C. Cusack, M. Baker, W. Tao, C. Mingbao, K. Paige, Z. Xiaofan, L. Levin, E. Escobar, D. Amon, et al. 2019. Successful Blue Economy Examples with an Emphasis on International Perspectives. Frontiers in Marine Science. 6: 261.
Approaches to Strengthening Fisheries Financing and Institutional Mechanisms: A Cross-Country Comparison of Cambodia, India, and Indonesia 71
Winpenny, J., S. Trémolet, R. Cardone, J. Kolker, B. Kingdom, and L. Mountsford. 2016. Aid Flows to the Water Sector: Overview and Recommendations. Water Global Practice Working Paper. November 2016. Washington, DC: World Bank. https://open knowledge.worldbank.org/ handle/10986/25528 (accessed 6 November 2021).
World Bank Group. 2019. Going Global: Expanding Offshore Wind to Emerging Markets. Washington, DC: World Bank Group.
____. 2020. Umbrella 2.0 Programs: A Flexible Instrument for Aligning and Managing Development Resources for Results at Scale. Trust Fund Reform Brief (February). https://thedocs.worldbank.org /en/doc/050140ca20f50c002b5e23cb13edd10d-0060052020 /original/TFReform-Umbrellas-Overview-Feb-2020.pdf (accessed 6 November 2021).
____. 2021. PROBLUE 2021 Annual Report. Washington, DC: World Bank Group. http://documents.worldbank.org/curated/en/412571635838 102176/PROBLUE-2021-Annual-Report (accessed 6 November 2021).
72
4
The Blueness Index, Investment Choice, and Portfolio Allocation
Muhammad Zubair Mumtaz and Zachary Alexander Smith
4.1 IntroductionThe ocean absorbs immense heat due to increased greenhouse gas (GHG) concentrations in the atmosphere, mainly from fossil fuel consumption. Vanderklift et al. (2019) claim that, due to the degradation of blue carbon ecosystems, which include mangroves, seagrass, and tidal marshes, 0.15 to 1.02 billion tons of carbon seeps into the atmosphere each year, which is one to six times the levels of carbon dioxide (CO2) that the deforestation of the Amazon releases. Increases in the release of carbon emissions into the atmosphere cause the temperature to rise, which leads to coral bleaching and causes a loss of breeding grounds for marine fish and mammals. The Paris Agreement on climate change envisages limiting the global average temperature rise to well below 2°C, which will avoid the massive, irreparable effects of ocean warming on marine ecosystems and services. The ocean emissions include CO2, sulfur dioxide (SO2), and nitrogen oxide (NOx). About 2% of sulfur oxide (SOx) emissions originate from the ocean across coastal regions, while atmospheric NOx contributes 25% of the total emissions. The proportion of CO2, SO2, and NOx in ocean emissions varies across regions, and ocean emissions assessment is too uncertain (Ciais and Sabine 2013).
Financial markets and institutions play a critical role in providing financing for firms that operate in ocean-related businesses, which we will call ocean firms, and achieving sustainability. Both the public and private sectors can contribute to achieving sustainability by providing blue financing to create a stable blue economy. The Sustainable Blue Economy Finance Principles are elastic in terms of their application throughout the whole ocean economy, identifying the necessary modalities to assess the different proposals and their implementation. The purpose of sustainable investment is to confirm that ocean-related
The Blueness Index, Investment Choice, and Portfolio Allocation 73
investment contributes long-term value without hurting marine ecosystems and reduces carbon emissions. The “blue finance” concept aims to obtain funds by issuing blue bonds, blue initial public offerings (IPOs), blue credit, or blue investments. The literature has not provided a specific definition of blue finance; however, researchers have defined it from their perspectives. Gulseven (2020) argues that blue finance’s goal is to promote the execution of projects and achieve the Sustainable Development Goals (SDGs) relating to marine resources. To achieve the objective of ocean sustainability, SDG 14 safeguards the interest of marine resources. We assume that when firms take necessary measures they will reduce the level of ocean emissions. To test this hypothesis, this chapter measures the blueness of ocean firms.
According to Tirumala and Tiwari (2020), there have been many investments in blue finance, ranging from investments in fisheries and aquaculture to investments in coastal and marine tourism, the water supply, environmental protection, shipbuilding, ecosystem conservation, chemicals and pharmaceuticals, ports and shipping, offshore oil and gas, and energy. The issuance of the first two blue bonds occurred in 2016 and 2019; these were the Seychelles Blue Bond and the Nordic–Baltic Blue Bond, which raised $15 million and $213 million. The purpose of blue bonds is to develop sustainable fisheries and water resource management and protection (Tirumala and Tiwari 2020). More recently, investments in blue finance have received more attention, and there are projections for an estimated $5.22 billion in pursuit of projects that focus on developing sustainable fisheries and protecting them from waste: Rare’s Meloy Fund, Encourage Capital, Althelia’s Sustainable Ocean Fund, and Circulate Capital (Tirumala and Tiwari 2020). Further, Tirumala and Tiwari (2020) state that the development of blue finance is in its infancy and looked to green finance initiatives as a reference point to begin to think about the future growth of the market for blue bonds; since 2007, green financing channels have raised over $521.
This study has several objectives. First, we estimate the blueness index, which determines how blue a firm is. To examine the blueness of a firm, we use the ocean emissions as a percentage of sales. A higher value of the blueness index for a firm means that it produces lower emissions. Second, we propose a theoretical model that measures the portfolio utility function, covering the return, risk, and blueness index. We assume that investors participate in blue bonds and that they base their preferences on the blueness of firms. Third, this study proposes that governments might impose taxes for ocean emissions in the absence of blueness factors, reducing bonds’ returns. We test this hypothesis empirically and report that when firms face taxes on emissions, the returns of non-blue firms are lower. Fourth, we identify the factors
74 Blue Economy and Blue Finance: Toward Sustainable Development and Ocean Governance
that affect stock returns and find a positive relationship between firms’ blueness and their returns. This study finds that relatively “bluer” firms may be more socially conscious, leading to them to outperform other firms.
The rest of this chapter is structured as follows. Section 4.2 explains the relationship between ocean emissions, financing, and the blue economy. Section 4.3 provides a brief overview of blue finance. Section 4.4 describes a theoretical model of investors’ utility function, including the blueness index and emission taxation, and examines the factors that cause stock returns. Section 4.5 describes the data and sample. Section 4.6 discusses the empirical results, and Section 4.7 concludes the chapter.
4.2 Ocean Emissions, Financing, and the Blue Economy
The blue economy has the potential to enable inclusive economic growth, generate employment opportunities, and attain sustainable development goals. The ocean provides an essential source of proteins for the global economy. Spalding (2016) suggests that half of the world’s inhabitants live within 100 kilometers of the coast and indicated that estimates place the global ocean economic activity between $3 trillion and $6 trillion. Hilborn and Costello (2018) suggest that capture fishery is the most important or significant human activity in the economy, playing a central role in the blue economy and blue growth. The general conclusion that Hilborn and Costello (2018) communicate is that the fishing yield is likely to increase and that blue growth is possible if fisheries engage in reforms focusing on enhancing efficiency. Ocean emissions affect the ecosystem, challenge goals associated with sustainable development, and affect people living on the world’s coasts (Steffen 2012).
Eikeset et al. (2018) indicate that the idea of blue growth (by way of “sustainable development”) stemmed from multiple academic meetings: (i) the first on sustainable development at a 1972 United Nations (UN) conference that took place in Stockholm; (ii) the second at a 1992 UN conference focused on the economic dimension of sustainable development in Rio; (iii) the third at a 2002 UN conference focused on the social dimensions of sustainable development in Johannesburg; finally, (iv) at a fourth meeting held in Rio, the idea of “blue growth” emerged to “secure or restore the potential of the oceans, lagoons, and inland waters by introducing responsible and sustainable approaches to reconcile economic growth and food security with the conservation of aquatic
The Blueness Index, Investment Choice, and Portfolio Allocation 75
resources” (Eikeset et al. 2018: 178). According to Niiranen et al. (2018: 321), the European Union sees blue growth as a framework for sustainable economic growth in our oceans and seas and along our coasts, whereas the UN Food and Agriculture Organization (FAO) views blue growth as an “opportunity to promote sustainable socioeconomic management of capture fisheries and aquaculture.” Niiranen et al. (2018: 321) describe blue growth as focusing on “using the oceans to create maximal income to society in a way that is ecologically, socially, and economically sustainable, i.e., preserving the functioning of all ecosystem services accrued from the oceans.” Goddard (2015) argues that the blue economy refers to a sustainable ocean economy in which countries explore marine resources by balancing ocean systems’ capacity and resilience. In another study, Smith-Godfrey (2016) contends that the blue economy aims to manage blue resources while considering societal development without affecting the ocean systems. Most countries have emphasized restrictions on ocean pollution, which are an essential component of the Paris Agreement and the Aichi targets (part of the Convention on Biological Diversity). In summary, people consider “blue investment” as the pursuit of growth in an ecological, social, and economically sustainable manner (Bennett 2018) in relation to marine resources.
It is possible to connect the blue economy’s components in terms of sustainability, human well-being, social equity, and multilateralism for international cooperation. The European Union has taken various initiatives to harness marine resources’ economic prospects for sustainable development and devise a proper utilization mechanism. The blue economy currently integrates traditional marine-based sectors, such as fishing, maritime transport, and tourism, and new marine activities, like aquaculture, biotechnology, offshore renewable energy, and bioprospecting. In an attempt to develop win-win-win strategies for aligning the concerns of coastal communities, the environment, and investors, Barbesgaard (2018) highlights four primary concerns: (i) the tragedy of the commons and “green grabbing"; (ii) blue growth as a counter to the destruction of marine and coastal ecosystems; (iii) incentivizing “sustainable fisheries "; and (iv) blue carbon initiatives. Overcoming these concerns and balancing the priorities associated with dealing with each of these issues require targeted efforts. Barbesgaard (2018) comments on creating a speculative frontier for financers and describes how blue initiatives can appeal to investors. Today, the primary sources that countries use to finance ocean activities are based on the commitments covering the official development assistance and public budgets (Wabnitz and Blasiak 2019), which are woefully inadequate. Other funding sources that have recently emerged include philanthropic grants (Guggisberg 2019).
76 Blue Economy and Blue Finance: Toward Sustainable Development and Ocean Governance
According to a survey by the World Ocean Initiative (2020), nine out of ten institutional investors have shown their intent to support the sustainable ocean economy. This survey evaluated the investors’ likelihood of financing the blue economy, enabling the utilization of ocean reserves to achieve economic growth and better livelihoods and to safeguard and reinstate the marine environment. Almost 81% of investors viewed blue finance as an attractive feature when investing. The respondents gave similar values to the environmental and social benefits as they did to obtaining financial returns. Roughly 75% of thematic investors attempted to invest in assets that would add value to their investments and ensure ocean sustainability. The respondents further claimed that a clear definition of blue finance to achieve a sustainable blue economy does not exist. Additionally, they argued that there is a lack of investment-grade projects in the blue economy. They proposed the introduction of innovative financial products covering a mix of finance and public–private partnerships to gauge and mitigate risk investments in the blue economy.
We can create a link between ocean emissions, financing, and the blue economy to explain their relationships. Like environmental pollution, ocean emissions create various problems for the ecosystem, which adversely affect the health of the ocean environment. An essential component of financing ocean firms is to create opportunities to invest in blue projects through incentives. As a comparison, we can refer to green finance, whereby firms have different options to raise funds and benefit the environment. In line with this proposal, ocean firms may issue blue bonds, blue IPOs, blue loans, and blue investment to gather funds that contribute to firms’ development and minimize the risk of ocean emissions, thereby achieving a blue economy. This study examines the blueness factor of firms and investigates how it helps to increase investment participation in blue bonds.
4.3 Blue Finance: An OverviewBlue finance is a recently introduced concept that covers (i) blue bonds, (ii) blue IPOs, and (iii) blue investment. The purpose of blue finance is to encourage the implementation of projects and attain the SDG that envisages the preservation and sustainable employment of the oceans, seas, and marine resources for sustainable development (Gulseven 2020). In the literature, no clear-cut definition of a “blue bond” or “blue project” is available. It is a financing instrument to gather funds for fulfilling the sustainable development goals associated with life under water by strengthening blue natural capital (BNCFF 2019). The good governance of the ocean and coastal habitats creates long-term value in
The Blueness Index, Investment Choice, and Portfolio Allocation 77
marine and coastal ecosystems, mitigates GHG emissions, and enhances livelihoods that rely on the ocean and resources in an erratic climate. According to the World Bank, a blue bond is “a debt instrument issued by governments, development banks, or others to raise capital from impact investors to finance marine and ocean-based projects that have positive environmental, economic, and climate benefits” (Bajpai 2021).
The financing principles of the sustainable blue economy developed in 2018 based on transparency to promote green and social bond markets to consider the environmental, social, and governance framework in identifying projects that increase the local community’s livelihoods. The BNCFF (2019: 7) refers to a blue bond as “a green/environmental, social or sustainable bond in the market.” This represents undertaking a project by issuing blue bonds to benefit the environmental condition of the ocean, seas, and marine resources. The financing of blue bonds emphasizes coastal ecosystems in alignment with the green bond principles to achieve environmentally sustainable management of living natural resources, terrestrial and aquatic biodiversity conservation, sustainable water and waste management, and climate change adaptation (International Capital Market Association 2018).
Initially, the Republic of Seychelles introduced the first blue bonds in October 2018 by raising proceeds of $15 million for a tenure of 10 years. It utilized the funds to extend the marine secured zones, invest in sustainable fisheries management, and ensure that the blue economy’s progress persists. Assistance has come from the World Bank with a finance package of $20 million, the Global Environment Facility (GEF) with loans of $5 million, and the International Bank for Reconstruction and Development (IBRD) with a grant of $5 million for financing blue bonds to preserve the marine ecosystem and enhance the possibilities for the value chain of the seafood industry. Furthermore, the IBRD extended a guarantee of €5 million and the GEF provided credit of $5 million as a non-grant instrument. These credit enhancement mechanisms aimed to mitigate risk on behalf of investors, thereby enhancing credit ratings and reducing interest rates to a level between 2% and 3%.
To safeguard and restore the Baltic Sea, the Nordic Investment Bank raised funds by issuing blue bonds in January 2019. It issued the blue bonds for 5 years and attracted an amount of $213 million with a coupon rate of 0.375%, which faced oversubscription by more than two times. The bank utilized the proceeds to finance projects relating to water pollution prevention, wastewater treatment, and water-related climate change adaptation. In short, we can argue that blue bonds aim to achieve social and sustainable goals to support the blue economy. Table 4.1 summarizes the details of blue bonds.
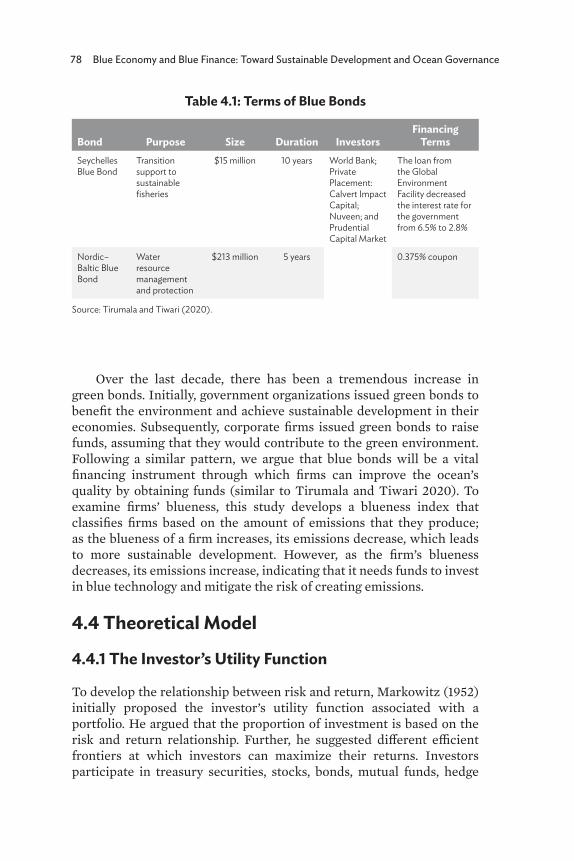
78 Blue Economy and Blue Finance: Toward Sustainable Development and Ocean Governance
Over the last decade, there has been a tremendous increase in green bonds. Initially, government organizations issued green bonds to benefit the environment and achieve sustainable development in their economies. Subsequently, corporate firms issued green bonds to raise funds, assuming that they would contribute to the green environment. Following a similar pattern, we argue that blue bonds will be a vital financing instrument through which firms can improve the ocean’s quality by obtaining funds (similar to Tirumala and Tiwari 2020). To examine firms’ blueness, this study develops a blueness index that classifies firms based on the amount of emissions that they produce; as the blueness of a firm increases, its emissions decrease, which leads to more sustainable development. However, as the firm’s blueness decreases, its emissions increase, indicating that it needs funds to invest in blue technology and mitigate the risk of creating emissions.
4.4 Theoretical Model
4.4.1 The Investor’s Utility Function
To develop the relationship between risk and return, Markowitz (1952) initially proposed the investor’s utility function associated with a portfolio. He argued that the proportion of investment is based on the risk and return relationship. Further, he suggested different efficient frontiers at which investors can maximize their returns. Investors participate in treasury securities, stocks, bonds, mutual funds, hedge
Table 4.1: Terms of Blue Bonds
Bond Purpose Size Duration InvestorsFinancing
TermsSeychelles Blue Bond
Transition support to sustainable fisheries
$15 million 10 years World Bank; Private Placement: Calvert Impact Capital; Nuveen; and Prudential Capital Market
The loan from the Global Environment Facility decreased the interest rate for the government from 6.5% to 2.8%
Nordic–Baltic Blue Bond
Water resource management and protection
$213 million 5 years 0.375% coupon
Source: Tirumala and Tiwari (2020).
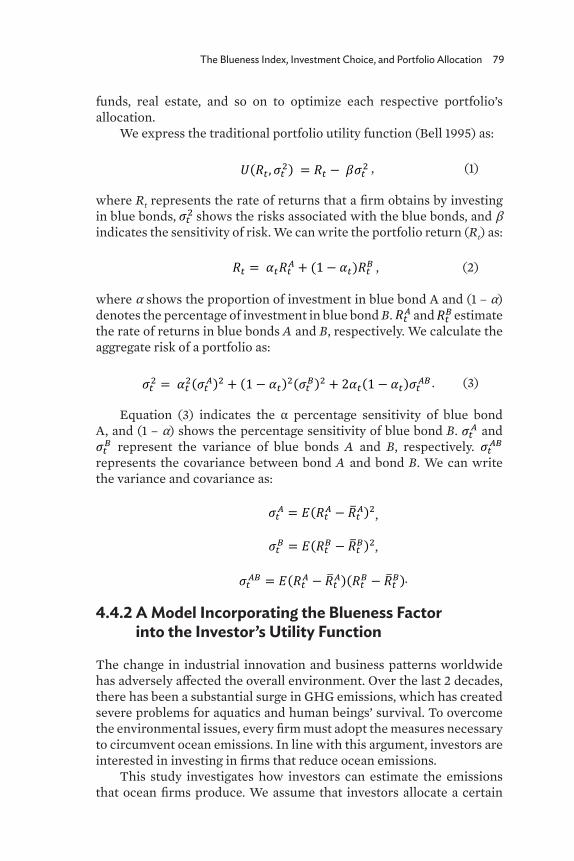
The Blueness Index, Investment Choice, and Portfolio Allocation 79
funds, real estate, and so on to optimize each respective portfolio’s allocation.
We express the traditional portfolio utility function (Bell 1995) as:
𝑈𝑈(𝑅𝑅𝑡𝑡 , 𝜎𝜎𝑡𝑡2) = 𝑅𝑅𝑡𝑡 − 𝛽𝛽𝜎𝜎𝑡𝑡
2
𝑅𝑅𝑡𝑡 = 𝛼𝛼𝑡𝑡𝑅𝑅𝑡𝑡𝐴𝐴 + (1 − 𝛼𝛼𝑡𝑡)𝑅𝑅𝑡𝑡
𝐵𝐵
(2)
𝑅𝑅𝑡𝑡𝐴𝐴 𝑅𝑅𝑡𝑡
𝐵𝐵
𝜎𝜎𝑡𝑡2 = 𝛼𝛼𝑡𝑡
2(𝜎𝜎𝑡𝑡𝐴𝐴)2 + (1 − 𝛼𝛼𝑡𝑡)2(𝜎𝜎𝑡𝑡
𝐵𝐵)2 + 2𝛼𝛼𝑡𝑡(1 − 𝛼𝛼𝑡𝑡)𝜎𝜎𝑡𝑡𝐴𝐴𝐵𝐵 (3)
𝜎𝜎𝑡𝑡𝐴𝐴 𝜎𝜎𝑡𝑡
𝐵𝐵 𝜎𝜎𝑡𝑡𝐴𝐴𝐵𝐵
𝜎𝜎𝑡𝑡𝐴𝐴 = 𝐸𝐸(𝑅𝑅𝑡𝑡
𝐴𝐴 − ��𝑅𝑡𝑡𝐴𝐴)2
𝜎𝜎𝑡𝑡𝐵𝐵 = 𝐸𝐸(𝑅𝑅𝑡𝑡
𝐵𝐵 − ��𝑅𝑡𝑡𝐵𝐵)2
𝜎𝜎𝑡𝑡𝐴𝐴𝐵𝐵 = 𝐸𝐸(𝑅𝑅𝑡𝑡
𝐴𝐴 − ��𝑅𝑡𝑡𝐴𝐴)(𝑅𝑅𝑡𝑡
𝐵𝐵 − ��𝑅𝑡𝑡𝐵𝐵)
𝑈𝑈(𝑅𝑅𝑡𝑡 , 𝜎𝜎𝑡𝑡2, 𝐵𝐵𝐵𝐵𝐵𝐵𝐵𝐵𝑡𝑡) = 𝑅𝑅𝑡𝑡 − 𝛽𝛽𝜎𝜎𝑡𝑡
2 + 𝛾𝛾(Blue𝑡𝑡). (4)
𝑅𝑅𝑡𝑡 = 𝛼𝛼𝑡𝑡𝑅𝑅𝑡𝑡𝐴𝐴 + (1 − 𝛼𝛼𝑡𝑡)𝑅𝑅𝑡𝑡
𝐵𝐵 𝜎𝜎𝑡𝑡
2 = 𝛼𝛼𝑡𝑡2(𝜎𝜎𝑡𝑡
𝐴𝐴)2 + (1 − 𝛼𝛼𝑡𝑡)2(𝜎𝜎𝑡𝑡𝐵𝐵)2 + 2𝛼𝛼𝑡𝑡(1 − 𝛼𝛼𝑡𝑡)𝜎𝜎𝑡𝑡
𝐴𝐴𝐵𝐵 𝜎𝜎𝑡𝑡
2
𝐵𝐵𝐵𝐵𝐵𝐵𝐵𝐵𝑡𝑡 = 𝛼𝛼𝐵𝐵𝐵𝐵𝐵𝐵𝐵𝐵𝑡𝑡𝐴𝐴 + (1 − 𝛼𝛼)𝐵𝐵𝐵𝐵𝐵𝐵𝐵𝐵𝑡𝑡
𝐵𝐵 (5)
𝐵𝐵𝐵𝐵𝐵𝐵𝐵𝐵𝑡𝑡𝐴𝐴 𝐵𝐵𝐵𝐵𝐵𝐵𝐵𝐵𝑡𝑡
𝐵𝐵
𝐵𝐵𝐵𝐵𝐵𝐵𝐵𝐵𝑡𝑡𝐴𝐴 = −𝑎𝑎1(𝐶𝐶𝐶𝐶2) − 𝑎𝑎2(𝑆𝑆𝐶𝐶2) − 𝑎𝑎3(𝑁𝑁𝐶𝐶𝑥𝑥)
𝑌𝑌𝑡𝑡𝐴𝐴 (6)
𝐵𝐵𝐵𝐵𝐵𝐵𝐵𝐵𝑡𝑡𝐵𝐵 = −𝑏𝑏1(𝐶𝐶𝐶𝐶2) − 𝑏𝑏2(𝑆𝑆𝐶𝐶2) − 𝑏𝑏3(𝑁𝑁𝐶𝐶𝑥𝑥)
𝑌𝑌𝑡𝑡𝐵𝐵 (7)
𝑌𝑌𝑡𝑡𝐴𝐴 𝑌𝑌𝑡𝑡
𝐵𝐵
𝛼𝛼𝑡𝑡 =1
2𝛽𝛽(𝑅𝑅𝑡𝑡𝐴𝐴−𝑅𝑅𝑡𝑡
𝐵𝐵)−(𝜎𝜎𝑡𝑡𝐵𝐵)2−𝜎𝜎𝑡𝑡
𝐴𝐴𝐵𝐵
(𝜎𝜎𝑡𝑡𝐴𝐴)2−(𝜎𝜎𝑡𝑡
𝐵𝐵)2−2𝜎𝜎𝑡𝑡𝐴𝐴𝐵𝐵
𝐵𝐵𝐵𝐵𝐵𝐵𝐵𝐵𝑡𝑡
𝐴𝐴 − 𝐵𝐵𝐵𝐵𝐵𝐵𝐵𝐵𝑡𝑡𝐵𝐵
𝐵𝐵𝐵𝐵𝐵𝐵𝐵𝐵𝑡𝑡𝐴𝐴 > 𝐵𝐵𝐵𝐵𝐵𝐵𝐵𝐵𝑡𝑡
𝐵𝐵
, (1)
where Rt represents the rate of returns that a firm obtains by investing in blue bonds,
𝑈𝑈(𝑅𝑅𝑡𝑡 , 𝜎𝜎𝑡𝑡2) = 𝑅𝑅𝑡𝑡 − 𝛽𝛽𝜎𝜎𝑡𝑡
2
𝑅𝑅𝑡𝑡 = 𝛼𝛼𝑡𝑡𝑅𝑅𝑡𝑡𝐴𝐴 + (1 − 𝛼𝛼𝑡𝑡)𝑅𝑅𝑡𝑡
𝐵𝐵
(2)
𝑅𝑅𝑡𝑡𝐴𝐴 𝑅𝑅𝑡𝑡
𝐵𝐵
𝜎𝜎𝑡𝑡2 = 𝛼𝛼𝑡𝑡
2(𝜎𝜎𝑡𝑡𝐴𝐴)2 + (1 − 𝛼𝛼𝑡𝑡)2(𝜎𝜎𝑡𝑡
𝐵𝐵)2 + 2𝛼𝛼𝑡𝑡(1 − 𝛼𝛼𝑡𝑡)𝜎𝜎𝑡𝑡𝐴𝐴𝐵𝐵 (3)
𝜎𝜎𝑡𝑡𝐴𝐴 𝜎𝜎𝑡𝑡
𝐵𝐵 𝜎𝜎𝑡𝑡𝐴𝐴𝐵𝐵
𝜎𝜎𝑡𝑡𝐴𝐴 = 𝐸𝐸(𝑅𝑅𝑡𝑡
𝐴𝐴 − ��𝑅𝑡𝑡𝐴𝐴)2
𝜎𝜎𝑡𝑡𝐵𝐵 = 𝐸𝐸(𝑅𝑅𝑡𝑡
𝐵𝐵 − ��𝑅𝑡𝑡𝐵𝐵)2
𝜎𝜎𝑡𝑡𝐴𝐴𝐵𝐵 = 𝐸𝐸(𝑅𝑅𝑡𝑡
𝐴𝐴 − ��𝑅𝑡𝑡𝐴𝐴)(𝑅𝑅𝑡𝑡
𝐵𝐵 − ��𝑅𝑡𝑡𝐵𝐵)
𝑈𝑈(𝑅𝑅𝑡𝑡 , 𝜎𝜎𝑡𝑡2, 𝐵𝐵𝐵𝐵𝐵𝐵𝐵𝐵𝑡𝑡) = 𝑅𝑅𝑡𝑡 − 𝛽𝛽𝜎𝜎𝑡𝑡
2 + 𝛾𝛾(Blue𝑡𝑡). (4)
𝑅𝑅𝑡𝑡 = 𝛼𝛼𝑡𝑡𝑅𝑅𝑡𝑡𝐴𝐴 + (1 − 𝛼𝛼𝑡𝑡)𝑅𝑅𝑡𝑡
𝐵𝐵 𝜎𝜎𝑡𝑡
2 = 𝛼𝛼𝑡𝑡2(𝜎𝜎𝑡𝑡
𝐴𝐴)2 + (1 − 𝛼𝛼𝑡𝑡)2(𝜎𝜎𝑡𝑡𝐵𝐵)2 + 2𝛼𝛼𝑡𝑡(1 − 𝛼𝛼𝑡𝑡)𝜎𝜎𝑡𝑡
𝐴𝐴𝐵𝐵 𝜎𝜎𝑡𝑡
2
𝐵𝐵𝐵𝐵𝐵𝐵𝐵𝐵𝑡𝑡 = 𝛼𝛼𝐵𝐵𝐵𝐵𝐵𝐵𝐵𝐵𝑡𝑡𝐴𝐴 + (1 − 𝛼𝛼)𝐵𝐵𝐵𝐵𝐵𝐵𝐵𝐵𝑡𝑡
𝐵𝐵 (5)
𝐵𝐵𝐵𝐵𝐵𝐵𝐵𝐵𝑡𝑡𝐴𝐴 𝐵𝐵𝐵𝐵𝐵𝐵𝐵𝐵𝑡𝑡
𝐵𝐵
𝐵𝐵𝐵𝐵𝐵𝐵𝐵𝐵𝑡𝑡𝐴𝐴 = −𝑎𝑎1(𝐶𝐶𝐶𝐶2) − 𝑎𝑎2(𝑆𝑆𝐶𝐶2) − 𝑎𝑎3(𝑁𝑁𝐶𝐶𝑥𝑥)
𝑌𝑌𝑡𝑡𝐴𝐴 (6)
𝐵𝐵𝐵𝐵𝐵𝐵𝐵𝐵𝑡𝑡𝐵𝐵 = −𝑏𝑏1(𝐶𝐶𝐶𝐶2) − 𝑏𝑏2(𝑆𝑆𝐶𝐶2) − 𝑏𝑏3(𝑁𝑁𝐶𝐶𝑥𝑥)
𝑌𝑌𝑡𝑡𝐵𝐵 (7)
𝑌𝑌𝑡𝑡𝐴𝐴 𝑌𝑌𝑡𝑡
𝐵𝐵
𝛼𝛼𝑡𝑡 =1
2𝛽𝛽(𝑅𝑅𝑡𝑡𝐴𝐴−𝑅𝑅𝑡𝑡
𝐵𝐵)−(𝜎𝜎𝑡𝑡𝐵𝐵)2−𝜎𝜎𝑡𝑡
𝐴𝐴𝐵𝐵
(𝜎𝜎𝑡𝑡𝐴𝐴)2−(𝜎𝜎𝑡𝑡
𝐵𝐵)2−2𝜎𝜎𝑡𝑡𝐴𝐴𝐵𝐵
𝐵𝐵𝐵𝐵𝐵𝐵𝐵𝐵𝑡𝑡
𝐴𝐴 − 𝐵𝐵𝐵𝐵𝐵𝐵𝐵𝐵𝑡𝑡𝐵𝐵
𝐵𝐵𝐵𝐵𝐵𝐵𝐵𝐵𝑡𝑡𝐴𝐴 > 𝐵𝐵𝐵𝐵𝐵𝐵𝐵𝐵𝑡𝑡
𝐵𝐵
shows the risks associated with the blue bonds, and β indicates the sensitivity of risk. We can write the portfolio return (Rt) as:
𝑈𝑈(𝑅𝑅𝑡𝑡 , 𝜎𝜎𝑡𝑡2) = 𝑅𝑅𝑡𝑡 − 𝛽𝛽𝜎𝜎𝑡𝑡
2
𝑅𝑅𝑡𝑡 = 𝛼𝛼𝑡𝑡𝑅𝑅𝑡𝑡𝐴𝐴 + (1 − 𝛼𝛼𝑡𝑡)𝑅𝑅𝑡𝑡
𝐵𝐵
(2)
𝑅𝑅𝑡𝑡𝐴𝐴 𝑅𝑅𝑡𝑡
𝐵𝐵
𝜎𝜎𝑡𝑡2 = 𝛼𝛼𝑡𝑡
2(𝜎𝜎𝑡𝑡𝐴𝐴)2 + (1 − 𝛼𝛼𝑡𝑡)2(𝜎𝜎𝑡𝑡
𝐵𝐵)2 + 2𝛼𝛼𝑡𝑡(1 − 𝛼𝛼𝑡𝑡)𝜎𝜎𝑡𝑡𝐴𝐴𝐵𝐵 (3)
𝜎𝜎𝑡𝑡𝐴𝐴 𝜎𝜎𝑡𝑡
𝐵𝐵 𝜎𝜎𝑡𝑡𝐴𝐴𝐵𝐵
𝜎𝜎𝑡𝑡𝐴𝐴 = 𝐸𝐸(𝑅𝑅𝑡𝑡
𝐴𝐴 − ��𝑅𝑡𝑡𝐴𝐴)2
𝜎𝜎𝑡𝑡𝐵𝐵 = 𝐸𝐸(𝑅𝑅𝑡𝑡
𝐵𝐵 − ��𝑅𝑡𝑡𝐵𝐵)2
𝜎𝜎𝑡𝑡𝐴𝐴𝐵𝐵 = 𝐸𝐸(𝑅𝑅𝑡𝑡
𝐴𝐴 − ��𝑅𝑡𝑡𝐴𝐴)(𝑅𝑅𝑡𝑡
𝐵𝐵 − ��𝑅𝑡𝑡𝐵𝐵)
𝑈𝑈(𝑅𝑅𝑡𝑡 , 𝜎𝜎𝑡𝑡2, 𝐵𝐵𝐵𝐵𝐵𝐵𝐵𝐵𝑡𝑡) = 𝑅𝑅𝑡𝑡 − 𝛽𝛽𝜎𝜎𝑡𝑡
2 + 𝛾𝛾(Blue𝑡𝑡). (4)
𝑅𝑅𝑡𝑡 = 𝛼𝛼𝑡𝑡𝑅𝑅𝑡𝑡𝐴𝐴 + (1 − 𝛼𝛼𝑡𝑡)𝑅𝑅𝑡𝑡
𝐵𝐵 𝜎𝜎𝑡𝑡
2 = 𝛼𝛼𝑡𝑡2(𝜎𝜎𝑡𝑡
𝐴𝐴)2 + (1 − 𝛼𝛼𝑡𝑡)2(𝜎𝜎𝑡𝑡𝐵𝐵)2 + 2𝛼𝛼𝑡𝑡(1 − 𝛼𝛼𝑡𝑡)𝜎𝜎𝑡𝑡
𝐴𝐴𝐵𝐵 𝜎𝜎𝑡𝑡
2
𝐵𝐵𝐵𝐵𝐵𝐵𝐵𝐵𝑡𝑡 = 𝛼𝛼𝐵𝐵𝐵𝐵𝐵𝐵𝐵𝐵𝑡𝑡𝐴𝐴 + (1 − 𝛼𝛼)𝐵𝐵𝐵𝐵𝐵𝐵𝐵𝐵𝑡𝑡
𝐵𝐵 (5)
𝐵𝐵𝐵𝐵𝐵𝐵𝐵𝐵𝑡𝑡𝐴𝐴 𝐵𝐵𝐵𝐵𝐵𝐵𝐵𝐵𝑡𝑡
𝐵𝐵
𝐵𝐵𝐵𝐵𝐵𝐵𝐵𝐵𝑡𝑡𝐴𝐴 = −𝑎𝑎1(𝐶𝐶𝐶𝐶2) − 𝑎𝑎2(𝑆𝑆𝐶𝐶2) − 𝑎𝑎3(𝑁𝑁𝐶𝐶𝑥𝑥)
𝑌𝑌𝑡𝑡𝐴𝐴 (6)
𝐵𝐵𝐵𝐵𝐵𝐵𝐵𝐵𝑡𝑡𝐵𝐵 = −𝑏𝑏1(𝐶𝐶𝐶𝐶2) − 𝑏𝑏2(𝑆𝑆𝐶𝐶2) − 𝑏𝑏3(𝑁𝑁𝐶𝐶𝑥𝑥)
𝑌𝑌𝑡𝑡𝐵𝐵 (7)
𝑌𝑌𝑡𝑡𝐴𝐴 𝑌𝑌𝑡𝑡
𝐵𝐵
𝛼𝛼𝑡𝑡 =1
2𝛽𝛽(𝑅𝑅𝑡𝑡𝐴𝐴−𝑅𝑅𝑡𝑡
𝐵𝐵)−(𝜎𝜎𝑡𝑡𝐵𝐵)2−𝜎𝜎𝑡𝑡
𝐴𝐴𝐵𝐵
(𝜎𝜎𝑡𝑡𝐴𝐴)2−(𝜎𝜎𝑡𝑡
𝐵𝐵)2−2𝜎𝜎𝑡𝑡𝐴𝐴𝐵𝐵
𝐵𝐵𝐵𝐵𝐵𝐵𝐵𝐵𝑡𝑡
𝐴𝐴 − 𝐵𝐵𝐵𝐵𝐵𝐵𝐵𝐵𝑡𝑡𝐵𝐵
𝐵𝐵𝐵𝐵𝐵𝐵𝐵𝐵𝑡𝑡𝐴𝐴 > 𝐵𝐵𝐵𝐵𝐵𝐵𝐵𝐵𝑡𝑡
𝐵𝐵
, (2)
where α shows the proportion of investment in blue bond A and (1 – α) denotes the percentage of investment in blue bond B.
𝑈𝑈(𝑅𝑅𝑡𝑡 , 𝜎𝜎𝑡𝑡2) = 𝑅𝑅𝑡𝑡 − 𝛽𝛽𝜎𝜎𝑡𝑡
2
𝑅𝑅𝑡𝑡 = 𝛼𝛼𝑡𝑡𝑅𝑅𝑡𝑡𝐴𝐴 + (1 − 𝛼𝛼𝑡𝑡)𝑅𝑅𝑡𝑡
𝐵𝐵
(2)
𝑅𝑅𝑡𝑡𝐴𝐴 𝑅𝑅𝑡𝑡
𝐵𝐵
𝜎𝜎𝑡𝑡2 = 𝛼𝛼𝑡𝑡
2(𝜎𝜎𝑡𝑡𝐴𝐴)2 + (1 − 𝛼𝛼𝑡𝑡)2(𝜎𝜎𝑡𝑡
𝐵𝐵)2 + 2𝛼𝛼𝑡𝑡(1 − 𝛼𝛼𝑡𝑡)𝜎𝜎𝑡𝑡𝐴𝐴𝐵𝐵 (3)
𝜎𝜎𝑡𝑡𝐴𝐴 𝜎𝜎𝑡𝑡
𝐵𝐵 𝜎𝜎𝑡𝑡𝐴𝐴𝐵𝐵
𝜎𝜎𝑡𝑡𝐴𝐴 = 𝐸𝐸(𝑅𝑅𝑡𝑡
𝐴𝐴 − ��𝑅𝑡𝑡𝐴𝐴)2
𝜎𝜎𝑡𝑡𝐵𝐵 = 𝐸𝐸(𝑅𝑅𝑡𝑡
𝐵𝐵 − ��𝑅𝑡𝑡𝐵𝐵)2
𝜎𝜎𝑡𝑡𝐴𝐴𝐵𝐵 = 𝐸𝐸(𝑅𝑅𝑡𝑡
𝐴𝐴 − ��𝑅𝑡𝑡𝐴𝐴)(𝑅𝑅𝑡𝑡
𝐵𝐵 − ��𝑅𝑡𝑡𝐵𝐵)
𝑈𝑈(𝑅𝑅𝑡𝑡 , 𝜎𝜎𝑡𝑡2, 𝐵𝐵𝐵𝐵𝐵𝐵𝐵𝐵𝑡𝑡) = 𝑅𝑅𝑡𝑡 − 𝛽𝛽𝜎𝜎𝑡𝑡
2 + 𝛾𝛾(Blue𝑡𝑡). (4)
𝑅𝑅𝑡𝑡 = 𝛼𝛼𝑡𝑡𝑅𝑅𝑡𝑡𝐴𝐴 + (1 − 𝛼𝛼𝑡𝑡)𝑅𝑅𝑡𝑡
𝐵𝐵 𝜎𝜎𝑡𝑡
2 = 𝛼𝛼𝑡𝑡2(𝜎𝜎𝑡𝑡
𝐴𝐴)2 + (1 − 𝛼𝛼𝑡𝑡)2(𝜎𝜎𝑡𝑡𝐵𝐵)2 + 2𝛼𝛼𝑡𝑡(1 − 𝛼𝛼𝑡𝑡)𝜎𝜎𝑡𝑡
𝐴𝐴𝐵𝐵 𝜎𝜎𝑡𝑡
2
𝐵𝐵𝐵𝐵𝐵𝐵𝐵𝐵𝑡𝑡 = 𝛼𝛼𝐵𝐵𝐵𝐵𝐵𝐵𝐵𝐵𝑡𝑡𝐴𝐴 + (1 − 𝛼𝛼)𝐵𝐵𝐵𝐵𝐵𝐵𝐵𝐵𝑡𝑡
𝐵𝐵 (5)
𝐵𝐵𝐵𝐵𝐵𝐵𝐵𝐵𝑡𝑡𝐴𝐴 𝐵𝐵𝐵𝐵𝐵𝐵𝐵𝐵𝑡𝑡
𝐵𝐵
𝐵𝐵𝐵𝐵𝐵𝐵𝐵𝐵𝑡𝑡𝐴𝐴 = −𝑎𝑎1(𝐶𝐶𝐶𝐶2) − 𝑎𝑎2(𝑆𝑆𝐶𝐶2) − 𝑎𝑎3(𝑁𝑁𝐶𝐶𝑥𝑥)
𝑌𝑌𝑡𝑡𝐴𝐴 (6)
𝐵𝐵𝐵𝐵𝐵𝐵𝐵𝐵𝑡𝑡𝐵𝐵 = −𝑏𝑏1(𝐶𝐶𝐶𝐶2) − 𝑏𝑏2(𝑆𝑆𝐶𝐶2) − 𝑏𝑏3(𝑁𝑁𝐶𝐶𝑥𝑥)
𝑌𝑌𝑡𝑡𝐵𝐵 (7)
𝑌𝑌𝑡𝑡𝐴𝐴 𝑌𝑌𝑡𝑡
𝐵𝐵
𝛼𝛼𝑡𝑡 =1
2𝛽𝛽(𝑅𝑅𝑡𝑡𝐴𝐴−𝑅𝑅𝑡𝑡
𝐵𝐵)−(𝜎𝜎𝑡𝑡𝐵𝐵)2−𝜎𝜎𝑡𝑡
𝐴𝐴𝐵𝐵
(𝜎𝜎𝑡𝑡𝐴𝐴)2−(𝜎𝜎𝑡𝑡
𝐵𝐵)2−2𝜎𝜎𝑡𝑡𝐴𝐴𝐵𝐵
𝐵𝐵𝐵𝐵𝐵𝐵𝐵𝐵𝑡𝑡
𝐴𝐴 − 𝐵𝐵𝐵𝐵𝐵𝐵𝐵𝐵𝑡𝑡𝐵𝐵
𝐵𝐵𝐵𝐵𝐵𝐵𝐵𝐵𝑡𝑡𝐴𝐴 > 𝐵𝐵𝐵𝐵𝐵𝐵𝐵𝐵𝑡𝑡
𝐵𝐵
and
𝑈𝑈(𝑅𝑅𝑡𝑡 , 𝜎𝜎𝑡𝑡2) = 𝑅𝑅𝑡𝑡 − 𝛽𝛽𝜎𝜎𝑡𝑡
2
𝑅𝑅𝑡𝑡 = 𝛼𝛼𝑡𝑡𝑅𝑅𝑡𝑡𝐴𝐴 + (1 − 𝛼𝛼𝑡𝑡)𝑅𝑅𝑡𝑡
𝐵𝐵
(2)
𝑅𝑅𝑡𝑡𝐴𝐴 𝑅𝑅𝑡𝑡
𝐵𝐵
𝜎𝜎𝑡𝑡2 = 𝛼𝛼𝑡𝑡
2(𝜎𝜎𝑡𝑡𝐴𝐴)2 + (1 − 𝛼𝛼𝑡𝑡)2(𝜎𝜎𝑡𝑡
𝐵𝐵)2 + 2𝛼𝛼𝑡𝑡(1 − 𝛼𝛼𝑡𝑡)𝜎𝜎𝑡𝑡𝐴𝐴𝐵𝐵 (3)
𝜎𝜎𝑡𝑡𝐴𝐴 𝜎𝜎𝑡𝑡
𝐵𝐵 𝜎𝜎𝑡𝑡𝐴𝐴𝐵𝐵
𝜎𝜎𝑡𝑡𝐴𝐴 = 𝐸𝐸(𝑅𝑅𝑡𝑡
𝐴𝐴 − ��𝑅𝑡𝑡𝐴𝐴)2
𝜎𝜎𝑡𝑡𝐵𝐵 = 𝐸𝐸(𝑅𝑅𝑡𝑡
𝐵𝐵 − ��𝑅𝑡𝑡𝐵𝐵)2
𝜎𝜎𝑡𝑡𝐴𝐴𝐵𝐵 = 𝐸𝐸(𝑅𝑅𝑡𝑡
𝐴𝐴 − ��𝑅𝑡𝑡𝐴𝐴)(𝑅𝑅𝑡𝑡
𝐵𝐵 − ��𝑅𝑡𝑡𝐵𝐵)
𝑈𝑈(𝑅𝑅𝑡𝑡 , 𝜎𝜎𝑡𝑡2, 𝐵𝐵𝐵𝐵𝐵𝐵𝐵𝐵𝑡𝑡) = 𝑅𝑅𝑡𝑡 − 𝛽𝛽𝜎𝜎𝑡𝑡
2 + 𝛾𝛾(Blue𝑡𝑡). (4)
𝑅𝑅𝑡𝑡 = 𝛼𝛼𝑡𝑡𝑅𝑅𝑡𝑡𝐴𝐴 + (1 − 𝛼𝛼𝑡𝑡)𝑅𝑅𝑡𝑡
𝐵𝐵 𝜎𝜎𝑡𝑡
2 = 𝛼𝛼𝑡𝑡2(𝜎𝜎𝑡𝑡
𝐴𝐴)2 + (1 − 𝛼𝛼𝑡𝑡)2(𝜎𝜎𝑡𝑡𝐵𝐵)2 + 2𝛼𝛼𝑡𝑡(1 − 𝛼𝛼𝑡𝑡)𝜎𝜎𝑡𝑡
𝐴𝐴𝐵𝐵 𝜎𝜎𝑡𝑡
2
𝐵𝐵𝐵𝐵𝐵𝐵𝐵𝐵𝑡𝑡 = 𝛼𝛼𝐵𝐵𝐵𝐵𝐵𝐵𝐵𝐵𝑡𝑡𝐴𝐴 + (1 − 𝛼𝛼)𝐵𝐵𝐵𝐵𝐵𝐵𝐵𝐵𝑡𝑡
𝐵𝐵 (5)
𝐵𝐵𝐵𝐵𝐵𝐵𝐵𝐵𝑡𝑡𝐴𝐴 𝐵𝐵𝐵𝐵𝐵𝐵𝐵𝐵𝑡𝑡
𝐵𝐵
𝐵𝐵𝐵𝐵𝐵𝐵𝐵𝐵𝑡𝑡𝐴𝐴 = −𝑎𝑎1(𝐶𝐶𝐶𝐶2) − 𝑎𝑎2(𝑆𝑆𝐶𝐶2) − 𝑎𝑎3(𝑁𝑁𝐶𝐶𝑥𝑥)
𝑌𝑌𝑡𝑡𝐴𝐴 (6)
𝐵𝐵𝐵𝐵𝐵𝐵𝐵𝐵𝑡𝑡𝐵𝐵 = −𝑏𝑏1(𝐶𝐶𝐶𝐶2) − 𝑏𝑏2(𝑆𝑆𝐶𝐶2) − 𝑏𝑏3(𝑁𝑁𝐶𝐶𝑥𝑥)
𝑌𝑌𝑡𝑡𝐵𝐵 (7)
𝑌𝑌𝑡𝑡𝐴𝐴 𝑌𝑌𝑡𝑡
𝐵𝐵
𝛼𝛼𝑡𝑡 =1
2𝛽𝛽(𝑅𝑅𝑡𝑡𝐴𝐴−𝑅𝑅𝑡𝑡
𝐵𝐵)−(𝜎𝜎𝑡𝑡𝐵𝐵)2−𝜎𝜎𝑡𝑡
𝐴𝐴𝐵𝐵
(𝜎𝜎𝑡𝑡𝐴𝐴)2−(𝜎𝜎𝑡𝑡
𝐵𝐵)2−2𝜎𝜎𝑡𝑡𝐴𝐴𝐵𝐵
𝐵𝐵𝐵𝐵𝐵𝐵𝐵𝐵𝑡𝑡
𝐴𝐴 − 𝐵𝐵𝐵𝐵𝐵𝐵𝐵𝐵𝑡𝑡𝐵𝐵
𝐵𝐵𝐵𝐵𝐵𝐵𝐵𝐵𝑡𝑡𝐴𝐴 > 𝐵𝐵𝐵𝐵𝐵𝐵𝐵𝐵𝑡𝑡
𝐵𝐵
estimate the rate of returns in blue bonds A and B, respectively. We calculate the aggregate risk of a portfolio as:
𝑈𝑈(𝑅𝑅𝑡𝑡 , 𝜎𝜎𝑡𝑡2) = 𝑅𝑅𝑡𝑡 − 𝛽𝛽𝜎𝜎𝑡𝑡
2
𝑅𝑅𝑡𝑡 = 𝛼𝛼𝑡𝑡𝑅𝑅𝑡𝑡𝐴𝐴 + (1 − 𝛼𝛼𝑡𝑡)𝑅𝑅𝑡𝑡
𝐵𝐵
(2)
𝑅𝑅𝑡𝑡𝐴𝐴 𝑅𝑅𝑡𝑡
𝐵𝐵
𝜎𝜎𝑡𝑡2 = 𝛼𝛼𝑡𝑡
2(𝜎𝜎𝑡𝑡𝐴𝐴)2 + (1 − 𝛼𝛼𝑡𝑡)2(𝜎𝜎𝑡𝑡
𝐵𝐵)2 + 2𝛼𝛼𝑡𝑡(1 − 𝛼𝛼𝑡𝑡)𝜎𝜎𝑡𝑡𝐴𝐴𝐵𝐵 (3)
𝜎𝜎𝑡𝑡𝐴𝐴 𝜎𝜎𝑡𝑡
𝐵𝐵 𝜎𝜎𝑡𝑡𝐴𝐴𝐵𝐵
𝜎𝜎𝑡𝑡𝐴𝐴 = 𝐸𝐸(𝑅𝑅𝑡𝑡
𝐴𝐴 − ��𝑅𝑡𝑡𝐴𝐴)2
𝜎𝜎𝑡𝑡𝐵𝐵 = 𝐸𝐸(𝑅𝑅𝑡𝑡
𝐵𝐵 − ��𝑅𝑡𝑡𝐵𝐵)2
𝜎𝜎𝑡𝑡𝐴𝐴𝐵𝐵 = 𝐸𝐸(𝑅𝑅𝑡𝑡
𝐴𝐴 − ��𝑅𝑡𝑡𝐴𝐴)(𝑅𝑅𝑡𝑡
𝐵𝐵 − ��𝑅𝑡𝑡𝐵𝐵)
𝑈𝑈(𝑅𝑅𝑡𝑡 , 𝜎𝜎𝑡𝑡2, 𝐵𝐵𝐵𝐵𝐵𝐵𝐵𝐵𝑡𝑡) = 𝑅𝑅𝑡𝑡 − 𝛽𝛽𝜎𝜎𝑡𝑡
2 + 𝛾𝛾(Blue𝑡𝑡). (4)
𝑅𝑅𝑡𝑡 = 𝛼𝛼𝑡𝑡𝑅𝑅𝑡𝑡𝐴𝐴 + (1 − 𝛼𝛼𝑡𝑡)𝑅𝑅𝑡𝑡
𝐵𝐵 𝜎𝜎𝑡𝑡
2 = 𝛼𝛼𝑡𝑡2(𝜎𝜎𝑡𝑡
𝐴𝐴)2 + (1 − 𝛼𝛼𝑡𝑡)2(𝜎𝜎𝑡𝑡𝐵𝐵)2 + 2𝛼𝛼𝑡𝑡(1 − 𝛼𝛼𝑡𝑡)𝜎𝜎𝑡𝑡
𝐴𝐴𝐵𝐵 𝜎𝜎𝑡𝑡
2
𝐵𝐵𝐵𝐵𝐵𝐵𝐵𝐵𝑡𝑡 = 𝛼𝛼𝐵𝐵𝐵𝐵𝐵𝐵𝐵𝐵𝑡𝑡𝐴𝐴 + (1 − 𝛼𝛼)𝐵𝐵𝐵𝐵𝐵𝐵𝐵𝐵𝑡𝑡
𝐵𝐵 (5)
𝐵𝐵𝐵𝐵𝐵𝐵𝐵𝐵𝑡𝑡𝐴𝐴 𝐵𝐵𝐵𝐵𝐵𝐵𝐵𝐵𝑡𝑡
𝐵𝐵
𝐵𝐵𝐵𝐵𝐵𝐵𝐵𝐵𝑡𝑡𝐴𝐴 = −𝑎𝑎1(𝐶𝐶𝐶𝐶2) − 𝑎𝑎2(𝑆𝑆𝐶𝐶2) − 𝑎𝑎3(𝑁𝑁𝐶𝐶𝑥𝑥)
𝑌𝑌𝑡𝑡𝐴𝐴 (6)
𝐵𝐵𝐵𝐵𝐵𝐵𝐵𝐵𝑡𝑡𝐵𝐵 = −𝑏𝑏1(𝐶𝐶𝐶𝐶2) − 𝑏𝑏2(𝑆𝑆𝐶𝐶2) − 𝑏𝑏3(𝑁𝑁𝐶𝐶𝑥𝑥)
𝑌𝑌𝑡𝑡𝐵𝐵 (7)
𝑌𝑌𝑡𝑡𝐴𝐴 𝑌𝑌𝑡𝑡
𝐵𝐵
𝛼𝛼𝑡𝑡 =1
2𝛽𝛽(𝑅𝑅𝑡𝑡𝐴𝐴−𝑅𝑅𝑡𝑡
𝐵𝐵)−(𝜎𝜎𝑡𝑡𝐵𝐵)2−𝜎𝜎𝑡𝑡
𝐴𝐴𝐵𝐵
(𝜎𝜎𝑡𝑡𝐴𝐴)2−(𝜎𝜎𝑡𝑡
𝐵𝐵)2−2𝜎𝜎𝑡𝑡𝐴𝐴𝐵𝐵
𝐵𝐵𝐵𝐵𝐵𝐵𝐵𝐵𝑡𝑡
𝐴𝐴 − 𝐵𝐵𝐵𝐵𝐵𝐵𝐵𝐵𝑡𝑡𝐵𝐵
𝐵𝐵𝐵𝐵𝐵𝐵𝐵𝐵𝑡𝑡𝐴𝐴 > 𝐵𝐵𝐵𝐵𝐵𝐵𝐵𝐵𝑡𝑡
𝐵𝐵
. (3)
Equation (3) indicates the α percentage sensitivity of blue bond A, and (1 – α) shows the percentage sensitivity of blue bond B.
𝑈𝑈(𝑅𝑅𝑡𝑡 , 𝜎𝜎𝑡𝑡2) = 𝑅𝑅𝑡𝑡 − 𝛽𝛽𝜎𝜎𝑡𝑡
2
𝑅𝑅𝑡𝑡 = 𝛼𝛼𝑡𝑡𝑅𝑅𝑡𝑡𝐴𝐴 + (1 − 𝛼𝛼𝑡𝑡)𝑅𝑅𝑡𝑡
𝐵𝐵
(2)
𝑅𝑅𝑡𝑡𝐴𝐴 𝑅𝑅𝑡𝑡
𝐵𝐵
𝜎𝜎𝑡𝑡2 = 𝛼𝛼𝑡𝑡
2(𝜎𝜎𝑡𝑡𝐴𝐴)2 + (1 − 𝛼𝛼𝑡𝑡)2(𝜎𝜎𝑡𝑡
𝐵𝐵)2 + 2𝛼𝛼𝑡𝑡(1 − 𝛼𝛼𝑡𝑡)𝜎𝜎𝑡𝑡𝐴𝐴𝐵𝐵 (3)
𝜎𝜎𝑡𝑡𝐴𝐴 𝜎𝜎𝑡𝑡
𝐵𝐵 𝜎𝜎𝑡𝑡𝐴𝐴𝐵𝐵
𝜎𝜎𝑡𝑡𝐴𝐴 = 𝐸𝐸(𝑅𝑅𝑡𝑡
𝐴𝐴 − ��𝑅𝑡𝑡𝐴𝐴)2
𝜎𝜎𝑡𝑡𝐵𝐵 = 𝐸𝐸(𝑅𝑅𝑡𝑡
𝐵𝐵 − ��𝑅𝑡𝑡𝐵𝐵)2
𝜎𝜎𝑡𝑡𝐴𝐴𝐵𝐵 = 𝐸𝐸(𝑅𝑅𝑡𝑡
𝐴𝐴 − ��𝑅𝑡𝑡𝐴𝐴)(𝑅𝑅𝑡𝑡
𝐵𝐵 − ��𝑅𝑡𝑡𝐵𝐵)
𝑈𝑈(𝑅𝑅𝑡𝑡 , 𝜎𝜎𝑡𝑡2, 𝐵𝐵𝐵𝐵𝐵𝐵𝐵𝐵𝑡𝑡) = 𝑅𝑅𝑡𝑡 − 𝛽𝛽𝜎𝜎𝑡𝑡
2 + 𝛾𝛾(Blue𝑡𝑡). (4)
𝑅𝑅𝑡𝑡 = 𝛼𝛼𝑡𝑡𝑅𝑅𝑡𝑡𝐴𝐴 + (1 − 𝛼𝛼𝑡𝑡)𝑅𝑅𝑡𝑡
𝐵𝐵 𝜎𝜎𝑡𝑡
2 = 𝛼𝛼𝑡𝑡2(𝜎𝜎𝑡𝑡
𝐴𝐴)2 + (1 − 𝛼𝛼𝑡𝑡)2(𝜎𝜎𝑡𝑡𝐵𝐵)2 + 2𝛼𝛼𝑡𝑡(1 − 𝛼𝛼𝑡𝑡)𝜎𝜎𝑡𝑡
𝐴𝐴𝐵𝐵 𝜎𝜎𝑡𝑡
2
𝐵𝐵𝐵𝐵𝐵𝐵𝐵𝐵𝑡𝑡 = 𝛼𝛼𝐵𝐵𝐵𝐵𝐵𝐵𝐵𝐵𝑡𝑡𝐴𝐴 + (1 − 𝛼𝛼)𝐵𝐵𝐵𝐵𝐵𝐵𝐵𝐵𝑡𝑡
𝐵𝐵 (5)
𝐵𝐵𝐵𝐵𝐵𝐵𝐵𝐵𝑡𝑡𝐴𝐴 𝐵𝐵𝐵𝐵𝐵𝐵𝐵𝐵𝑡𝑡
𝐵𝐵
𝐵𝐵𝐵𝐵𝐵𝐵𝐵𝐵𝑡𝑡𝐴𝐴 = −𝑎𝑎1(𝐶𝐶𝐶𝐶2) − 𝑎𝑎2(𝑆𝑆𝐶𝐶2) − 𝑎𝑎3(𝑁𝑁𝐶𝐶𝑥𝑥)
𝑌𝑌𝑡𝑡𝐴𝐴 (6)
𝐵𝐵𝐵𝐵𝐵𝐵𝐵𝐵𝑡𝑡𝐵𝐵 = −𝑏𝑏1(𝐶𝐶𝐶𝐶2) − 𝑏𝑏2(𝑆𝑆𝐶𝐶2) − 𝑏𝑏3(𝑁𝑁𝐶𝐶𝑥𝑥)
𝑌𝑌𝑡𝑡𝐵𝐵 (7)
𝑌𝑌𝑡𝑡𝐴𝐴 𝑌𝑌𝑡𝑡
𝐵𝐵
𝛼𝛼𝑡𝑡 =1
2𝛽𝛽(𝑅𝑅𝑡𝑡𝐴𝐴−𝑅𝑅𝑡𝑡
𝐵𝐵)−(𝜎𝜎𝑡𝑡𝐵𝐵)2−𝜎𝜎𝑡𝑡
𝐴𝐴𝐵𝐵
(𝜎𝜎𝑡𝑡𝐴𝐴)2−(𝜎𝜎𝑡𝑡
𝐵𝐵)2−2𝜎𝜎𝑡𝑡𝐴𝐴𝐵𝐵
𝐵𝐵𝐵𝐵𝐵𝐵𝐵𝐵𝑡𝑡
𝐴𝐴 − 𝐵𝐵𝐵𝐵𝐵𝐵𝐵𝐵𝑡𝑡𝐵𝐵
𝐵𝐵𝐵𝐵𝐵𝐵𝐵𝐵𝑡𝑡𝐴𝐴 > 𝐵𝐵𝐵𝐵𝐵𝐵𝐵𝐵𝑡𝑡
𝐵𝐵
and
𝑈𝑈(𝑅𝑅𝑡𝑡 , 𝜎𝜎𝑡𝑡2) = 𝑅𝑅𝑡𝑡 − 𝛽𝛽𝜎𝜎𝑡𝑡
2
𝑅𝑅𝑡𝑡 = 𝛼𝛼𝑡𝑡𝑅𝑅𝑡𝑡𝐴𝐴 + (1 − 𝛼𝛼𝑡𝑡)𝑅𝑅𝑡𝑡
𝐵𝐵
(2)
𝑅𝑅𝑡𝑡𝐴𝐴 𝑅𝑅𝑡𝑡
𝐵𝐵
𝜎𝜎𝑡𝑡2 = 𝛼𝛼𝑡𝑡
2(𝜎𝜎𝑡𝑡𝐴𝐴)2 + (1 − 𝛼𝛼𝑡𝑡)2(𝜎𝜎𝑡𝑡
𝐵𝐵)2 + 2𝛼𝛼𝑡𝑡(1 − 𝛼𝛼𝑡𝑡)𝜎𝜎𝑡𝑡𝐴𝐴𝐵𝐵 (3)
𝜎𝜎𝑡𝑡𝐴𝐴 𝜎𝜎𝑡𝑡
𝐵𝐵 𝜎𝜎𝑡𝑡𝐴𝐴𝐵𝐵
𝜎𝜎𝑡𝑡𝐴𝐴 = 𝐸𝐸(𝑅𝑅𝑡𝑡
𝐴𝐴 − ��𝑅𝑡𝑡𝐴𝐴)2
𝜎𝜎𝑡𝑡𝐵𝐵 = 𝐸𝐸(𝑅𝑅𝑡𝑡
𝐵𝐵 − ��𝑅𝑡𝑡𝐵𝐵)2
𝜎𝜎𝑡𝑡𝐴𝐴𝐵𝐵 = 𝐸𝐸(𝑅𝑅𝑡𝑡
𝐴𝐴 − ��𝑅𝑡𝑡𝐴𝐴)(𝑅𝑅𝑡𝑡
𝐵𝐵 − ��𝑅𝑡𝑡𝐵𝐵)
𝑈𝑈(𝑅𝑅𝑡𝑡 , 𝜎𝜎𝑡𝑡2, 𝐵𝐵𝐵𝐵𝐵𝐵𝐵𝐵𝑡𝑡) = 𝑅𝑅𝑡𝑡 − 𝛽𝛽𝜎𝜎𝑡𝑡
2 + 𝛾𝛾(Blue𝑡𝑡). (4)
𝑅𝑅𝑡𝑡 = 𝛼𝛼𝑡𝑡𝑅𝑅𝑡𝑡𝐴𝐴 + (1 − 𝛼𝛼𝑡𝑡)𝑅𝑅𝑡𝑡
𝐵𝐵 𝜎𝜎𝑡𝑡
2 = 𝛼𝛼𝑡𝑡2(𝜎𝜎𝑡𝑡
𝐴𝐴)2 + (1 − 𝛼𝛼𝑡𝑡)2(𝜎𝜎𝑡𝑡𝐵𝐵)2 + 2𝛼𝛼𝑡𝑡(1 − 𝛼𝛼𝑡𝑡)𝜎𝜎𝑡𝑡
𝐴𝐴𝐵𝐵 𝜎𝜎𝑡𝑡
2
𝐵𝐵𝐵𝐵𝐵𝐵𝐵𝐵𝑡𝑡 = 𝛼𝛼𝐵𝐵𝐵𝐵𝐵𝐵𝐵𝐵𝑡𝑡𝐴𝐴 + (1 − 𝛼𝛼)𝐵𝐵𝐵𝐵𝐵𝐵𝐵𝐵𝑡𝑡
𝐵𝐵 (5)
𝐵𝐵𝐵𝐵𝐵𝐵𝐵𝐵𝑡𝑡𝐴𝐴 𝐵𝐵𝐵𝐵𝐵𝐵𝐵𝐵𝑡𝑡
𝐵𝐵
𝐵𝐵𝐵𝐵𝐵𝐵𝐵𝐵𝑡𝑡𝐴𝐴 = −𝑎𝑎1(𝐶𝐶𝐶𝐶2) − 𝑎𝑎2(𝑆𝑆𝐶𝐶2) − 𝑎𝑎3(𝑁𝑁𝐶𝐶𝑥𝑥)
𝑌𝑌𝑡𝑡𝐴𝐴 (6)
𝐵𝐵𝐵𝐵𝐵𝐵𝐵𝐵𝑡𝑡𝐵𝐵 = −𝑏𝑏1(𝐶𝐶𝐶𝐶2) − 𝑏𝑏2(𝑆𝑆𝐶𝐶2) − 𝑏𝑏3(𝑁𝑁𝐶𝐶𝑥𝑥)
𝑌𝑌𝑡𝑡𝐵𝐵 (7)
𝑌𝑌𝑡𝑡𝐴𝐴 𝑌𝑌𝑡𝑡
𝐵𝐵
𝛼𝛼𝑡𝑡 =1
2𝛽𝛽(𝑅𝑅𝑡𝑡𝐴𝐴−𝑅𝑅𝑡𝑡
𝐵𝐵)−(𝜎𝜎𝑡𝑡𝐵𝐵)2−𝜎𝜎𝑡𝑡
𝐴𝐴𝐵𝐵
(𝜎𝜎𝑡𝑡𝐴𝐴)2−(𝜎𝜎𝑡𝑡
𝐵𝐵)2−2𝜎𝜎𝑡𝑡𝐴𝐴𝐵𝐵
𝐵𝐵𝐵𝐵𝐵𝐵𝐵𝐵𝑡𝑡
𝐴𝐴 − 𝐵𝐵𝐵𝐵𝐵𝐵𝐵𝐵𝑡𝑡𝐵𝐵
𝐵𝐵𝐵𝐵𝐵𝐵𝐵𝐵𝑡𝑡𝐴𝐴 > 𝐵𝐵𝐵𝐵𝐵𝐵𝐵𝐵𝑡𝑡
𝐵𝐵
represent the variance of blue bonds A and B, respectively.
𝑈𝑈(𝑅𝑅𝑡𝑡 , 𝜎𝜎𝑡𝑡2) = 𝑅𝑅𝑡𝑡 − 𝛽𝛽𝜎𝜎𝑡𝑡
2
𝑅𝑅𝑡𝑡 = 𝛼𝛼𝑡𝑡𝑅𝑅𝑡𝑡𝐴𝐴 + (1 − 𝛼𝛼𝑡𝑡)𝑅𝑅𝑡𝑡
𝐵𝐵
(2)
𝑅𝑅𝑡𝑡𝐴𝐴 𝑅𝑅𝑡𝑡
𝐵𝐵
𝜎𝜎𝑡𝑡2 = 𝛼𝛼𝑡𝑡
2(𝜎𝜎𝑡𝑡𝐴𝐴)2 + (1 − 𝛼𝛼𝑡𝑡)2(𝜎𝜎𝑡𝑡
𝐵𝐵)2 + 2𝛼𝛼𝑡𝑡(1 − 𝛼𝛼𝑡𝑡)𝜎𝜎𝑡𝑡𝐴𝐴𝐵𝐵 (3)
𝜎𝜎𝑡𝑡𝐴𝐴 𝜎𝜎𝑡𝑡
𝐵𝐵 𝜎𝜎𝑡𝑡𝐴𝐴𝐵𝐵
𝜎𝜎𝑡𝑡𝐴𝐴 = 𝐸𝐸(𝑅𝑅𝑡𝑡
𝐴𝐴 − ��𝑅𝑡𝑡𝐴𝐴)2
𝜎𝜎𝑡𝑡𝐵𝐵 = 𝐸𝐸(𝑅𝑅𝑡𝑡
𝐵𝐵 − ��𝑅𝑡𝑡𝐵𝐵)2
𝜎𝜎𝑡𝑡𝐴𝐴𝐵𝐵 = 𝐸𝐸(𝑅𝑅𝑡𝑡
𝐴𝐴 − ��𝑅𝑡𝑡𝐴𝐴)(𝑅𝑅𝑡𝑡
𝐵𝐵 − ��𝑅𝑡𝑡𝐵𝐵)
𝑈𝑈(𝑅𝑅𝑡𝑡 , 𝜎𝜎𝑡𝑡2, 𝐵𝐵𝐵𝐵𝐵𝐵𝐵𝐵𝑡𝑡) = 𝑅𝑅𝑡𝑡 − 𝛽𝛽𝜎𝜎𝑡𝑡
2 + 𝛾𝛾(Blue𝑡𝑡). (4)
𝑅𝑅𝑡𝑡 = 𝛼𝛼𝑡𝑡𝑅𝑅𝑡𝑡𝐴𝐴 + (1 − 𝛼𝛼𝑡𝑡)𝑅𝑅𝑡𝑡
𝐵𝐵 𝜎𝜎𝑡𝑡
2 = 𝛼𝛼𝑡𝑡2(𝜎𝜎𝑡𝑡
𝐴𝐴)2 + (1 − 𝛼𝛼𝑡𝑡)2(𝜎𝜎𝑡𝑡𝐵𝐵)2 + 2𝛼𝛼𝑡𝑡(1 − 𝛼𝛼𝑡𝑡)𝜎𝜎𝑡𝑡
𝐴𝐴𝐵𝐵 𝜎𝜎𝑡𝑡
2
𝐵𝐵𝐵𝐵𝐵𝐵𝐵𝐵𝑡𝑡 = 𝛼𝛼𝐵𝐵𝐵𝐵𝐵𝐵𝐵𝐵𝑡𝑡𝐴𝐴 + (1 − 𝛼𝛼)𝐵𝐵𝐵𝐵𝐵𝐵𝐵𝐵𝑡𝑡
𝐵𝐵 (5)
𝐵𝐵𝐵𝐵𝐵𝐵𝐵𝐵𝑡𝑡𝐴𝐴 𝐵𝐵𝐵𝐵𝐵𝐵𝐵𝐵𝑡𝑡
𝐵𝐵
𝐵𝐵𝐵𝐵𝐵𝐵𝐵𝐵𝑡𝑡𝐴𝐴 = −𝑎𝑎1(𝐶𝐶𝐶𝐶2) − 𝑎𝑎2(𝑆𝑆𝐶𝐶2) − 𝑎𝑎3(𝑁𝑁𝐶𝐶𝑥𝑥)
𝑌𝑌𝑡𝑡𝐴𝐴 (6)
𝐵𝐵𝐵𝐵𝐵𝐵𝐵𝐵𝑡𝑡𝐵𝐵 = −𝑏𝑏1(𝐶𝐶𝐶𝐶2) − 𝑏𝑏2(𝑆𝑆𝐶𝐶2) − 𝑏𝑏3(𝑁𝑁𝐶𝐶𝑥𝑥)
𝑌𝑌𝑡𝑡𝐵𝐵 (7)
𝑌𝑌𝑡𝑡𝐴𝐴 𝑌𝑌𝑡𝑡
𝐵𝐵
𝛼𝛼𝑡𝑡 =1
2𝛽𝛽(𝑅𝑅𝑡𝑡𝐴𝐴−𝑅𝑅𝑡𝑡
𝐵𝐵)−(𝜎𝜎𝑡𝑡𝐵𝐵)2−𝜎𝜎𝑡𝑡
𝐴𝐴𝐵𝐵
(𝜎𝜎𝑡𝑡𝐴𝐴)2−(𝜎𝜎𝑡𝑡
𝐵𝐵)2−2𝜎𝜎𝑡𝑡𝐴𝐴𝐵𝐵
𝐵𝐵𝐵𝐵𝐵𝐵𝐵𝐵𝑡𝑡
𝐴𝐴 − 𝐵𝐵𝐵𝐵𝐵𝐵𝐵𝐵𝑡𝑡𝐵𝐵
𝐵𝐵𝐵𝐵𝐵𝐵𝐵𝐵𝑡𝑡𝐴𝐴 > 𝐵𝐵𝐵𝐵𝐵𝐵𝐵𝐵𝑡𝑡
𝐵𝐵
represents the covariance between bond A and bond B. We can write the variance and covariance as:
𝑈𝑈(𝑅𝑅𝑡𝑡 , 𝜎𝜎𝑡𝑡2) = 𝑅𝑅𝑡𝑡 − 𝛽𝛽𝜎𝜎𝑡𝑡
2
𝑅𝑅𝑡𝑡 = 𝛼𝛼𝑡𝑡𝑅𝑅𝑡𝑡𝐴𝐴 + (1 − 𝛼𝛼𝑡𝑡)𝑅𝑅𝑡𝑡
𝐵𝐵
(2)
𝑅𝑅𝑡𝑡𝐴𝐴 𝑅𝑅𝑡𝑡
𝐵𝐵
𝜎𝜎𝑡𝑡2 = 𝛼𝛼𝑡𝑡
2(𝜎𝜎𝑡𝑡𝐴𝐴)2 + (1 − 𝛼𝛼𝑡𝑡)2(𝜎𝜎𝑡𝑡
𝐵𝐵)2 + 2𝛼𝛼𝑡𝑡(1 − 𝛼𝛼𝑡𝑡)𝜎𝜎𝑡𝑡𝐴𝐴𝐵𝐵 (3)
𝜎𝜎𝑡𝑡𝐴𝐴 𝜎𝜎𝑡𝑡
𝐵𝐵 𝜎𝜎𝑡𝑡𝐴𝐴𝐵𝐵
𝜎𝜎𝑡𝑡𝐴𝐴 = 𝐸𝐸(𝑅𝑅𝑡𝑡
𝐴𝐴 − ��𝑅𝑡𝑡𝐴𝐴)2
𝜎𝜎𝑡𝑡𝐵𝐵 = 𝐸𝐸(𝑅𝑅𝑡𝑡
𝐵𝐵 − ��𝑅𝑡𝑡𝐵𝐵)2
𝜎𝜎𝑡𝑡𝐴𝐴𝐵𝐵 = 𝐸𝐸(𝑅𝑅𝑡𝑡
𝐴𝐴 − ��𝑅𝑡𝑡𝐴𝐴)(𝑅𝑅𝑡𝑡
𝐵𝐵 − ��𝑅𝑡𝑡𝐵𝐵)
𝑈𝑈(𝑅𝑅𝑡𝑡 , 𝜎𝜎𝑡𝑡2, 𝐵𝐵𝐵𝐵𝐵𝐵𝐵𝐵𝑡𝑡) = 𝑅𝑅𝑡𝑡 − 𝛽𝛽𝜎𝜎𝑡𝑡
2 + 𝛾𝛾(Blue𝑡𝑡). (4)
𝑅𝑅𝑡𝑡 = 𝛼𝛼𝑡𝑡𝑅𝑅𝑡𝑡𝐴𝐴 + (1 − 𝛼𝛼𝑡𝑡)𝑅𝑅𝑡𝑡
𝐵𝐵 𝜎𝜎𝑡𝑡
2 = 𝛼𝛼𝑡𝑡2(𝜎𝜎𝑡𝑡
𝐴𝐴)2 + (1 − 𝛼𝛼𝑡𝑡)2(𝜎𝜎𝑡𝑡𝐵𝐵)2 + 2𝛼𝛼𝑡𝑡(1 − 𝛼𝛼𝑡𝑡)𝜎𝜎𝑡𝑡
𝐴𝐴𝐵𝐵 𝜎𝜎𝑡𝑡
2
𝐵𝐵𝐵𝐵𝐵𝐵𝐵𝐵𝑡𝑡 = 𝛼𝛼𝐵𝐵𝐵𝐵𝐵𝐵𝐵𝐵𝑡𝑡𝐴𝐴 + (1 − 𝛼𝛼)𝐵𝐵𝐵𝐵𝐵𝐵𝐵𝐵𝑡𝑡
𝐵𝐵 (5)
𝐵𝐵𝐵𝐵𝐵𝐵𝐵𝐵𝑡𝑡𝐴𝐴 𝐵𝐵𝐵𝐵𝐵𝐵𝐵𝐵𝑡𝑡
𝐵𝐵
𝐵𝐵𝐵𝐵𝐵𝐵𝐵𝐵𝑡𝑡𝐴𝐴 = −𝑎𝑎1(𝐶𝐶𝐶𝐶2) − 𝑎𝑎2(𝑆𝑆𝐶𝐶2) − 𝑎𝑎3(𝑁𝑁𝐶𝐶𝑥𝑥)
𝑌𝑌𝑡𝑡𝐴𝐴 (6)
𝐵𝐵𝐵𝐵𝐵𝐵𝐵𝐵𝑡𝑡𝐵𝐵 = −𝑏𝑏1(𝐶𝐶𝐶𝐶2) − 𝑏𝑏2(𝑆𝑆𝐶𝐶2) − 𝑏𝑏3(𝑁𝑁𝐶𝐶𝑥𝑥)
𝑌𝑌𝑡𝑡𝐵𝐵 (7)
𝑌𝑌𝑡𝑡𝐴𝐴 𝑌𝑌𝑡𝑡
𝐵𝐵
𝛼𝛼𝑡𝑡 =1
2𝛽𝛽(𝑅𝑅𝑡𝑡𝐴𝐴−𝑅𝑅𝑡𝑡
𝐵𝐵)−(𝜎𝜎𝑡𝑡𝐵𝐵)2−𝜎𝜎𝑡𝑡
𝐴𝐴𝐵𝐵
(𝜎𝜎𝑡𝑡𝐴𝐴)2−(𝜎𝜎𝑡𝑡
𝐵𝐵)2−2𝜎𝜎𝑡𝑡𝐴𝐴𝐵𝐵
𝐵𝐵𝐵𝐵𝐵𝐵𝐵𝐵𝑡𝑡
𝐴𝐴 − 𝐵𝐵𝐵𝐵𝐵𝐵𝐵𝐵𝑡𝑡𝐵𝐵
𝐵𝐵𝐵𝐵𝐵𝐵𝐵𝐵𝑡𝑡𝐴𝐴 > 𝐵𝐵𝐵𝐵𝐵𝐵𝐵𝐵𝑡𝑡
𝐵𝐵
,
𝑈𝑈(𝑅𝑅𝑡𝑡 , 𝜎𝜎𝑡𝑡2) = 𝑅𝑅𝑡𝑡 − 𝛽𝛽𝜎𝜎𝑡𝑡
2
𝑅𝑅𝑡𝑡 = 𝛼𝛼𝑡𝑡𝑅𝑅𝑡𝑡𝐴𝐴 + (1 − 𝛼𝛼𝑡𝑡)𝑅𝑅𝑡𝑡
𝐵𝐵
(2)
𝑅𝑅𝑡𝑡𝐴𝐴 𝑅𝑅𝑡𝑡
𝐵𝐵
𝜎𝜎𝑡𝑡2 = 𝛼𝛼𝑡𝑡
2(𝜎𝜎𝑡𝑡𝐴𝐴)2 + (1 − 𝛼𝛼𝑡𝑡)2(𝜎𝜎𝑡𝑡
𝐵𝐵)2 + 2𝛼𝛼𝑡𝑡(1 − 𝛼𝛼𝑡𝑡)𝜎𝜎𝑡𝑡𝐴𝐴𝐵𝐵 (3)
𝜎𝜎𝑡𝑡𝐴𝐴 𝜎𝜎𝑡𝑡
𝐵𝐵 𝜎𝜎𝑡𝑡𝐴𝐴𝐵𝐵
𝜎𝜎𝑡𝑡𝐴𝐴 = 𝐸𝐸(𝑅𝑅𝑡𝑡
𝐴𝐴 − ��𝑅𝑡𝑡𝐴𝐴)2
𝜎𝜎𝑡𝑡𝐵𝐵 = 𝐸𝐸(𝑅𝑅𝑡𝑡
𝐵𝐵 − ��𝑅𝑡𝑡𝐵𝐵)2
𝜎𝜎𝑡𝑡𝐴𝐴𝐵𝐵 = 𝐸𝐸(𝑅𝑅𝑡𝑡
𝐴𝐴 − ��𝑅𝑡𝑡𝐴𝐴)(𝑅𝑅𝑡𝑡
𝐵𝐵 − ��𝑅𝑡𝑡𝐵𝐵)
𝑈𝑈(𝑅𝑅𝑡𝑡 , 𝜎𝜎𝑡𝑡2, 𝐵𝐵𝐵𝐵𝐵𝐵𝐵𝐵𝑡𝑡) = 𝑅𝑅𝑡𝑡 − 𝛽𝛽𝜎𝜎𝑡𝑡
2 + 𝛾𝛾(Blue𝑡𝑡). (4)
𝑅𝑅𝑡𝑡 = 𝛼𝛼𝑡𝑡𝑅𝑅𝑡𝑡𝐴𝐴 + (1 − 𝛼𝛼𝑡𝑡)𝑅𝑅𝑡𝑡
𝐵𝐵 𝜎𝜎𝑡𝑡
2 = 𝛼𝛼𝑡𝑡2(𝜎𝜎𝑡𝑡
𝐴𝐴)2 + (1 − 𝛼𝛼𝑡𝑡)2(𝜎𝜎𝑡𝑡𝐵𝐵)2 + 2𝛼𝛼𝑡𝑡(1 − 𝛼𝛼𝑡𝑡)𝜎𝜎𝑡𝑡
𝐴𝐴𝐵𝐵 𝜎𝜎𝑡𝑡
2
𝐵𝐵𝐵𝐵𝐵𝐵𝐵𝐵𝑡𝑡 = 𝛼𝛼𝐵𝐵𝐵𝐵𝐵𝐵𝐵𝐵𝑡𝑡𝐴𝐴 + (1 − 𝛼𝛼)𝐵𝐵𝐵𝐵𝐵𝐵𝐵𝐵𝑡𝑡
𝐵𝐵 (5)
𝐵𝐵𝐵𝐵𝐵𝐵𝐵𝐵𝑡𝑡𝐴𝐴 𝐵𝐵𝐵𝐵𝐵𝐵𝐵𝐵𝑡𝑡
𝐵𝐵
𝐵𝐵𝐵𝐵𝐵𝐵𝐵𝐵𝑡𝑡𝐴𝐴 = −𝑎𝑎1(𝐶𝐶𝐶𝐶2) − 𝑎𝑎2(𝑆𝑆𝐶𝐶2) − 𝑎𝑎3(𝑁𝑁𝐶𝐶𝑥𝑥)
𝑌𝑌𝑡𝑡𝐴𝐴 (6)
𝐵𝐵𝐵𝐵𝐵𝐵𝐵𝐵𝑡𝑡𝐵𝐵 = −𝑏𝑏1(𝐶𝐶𝐶𝐶2) − 𝑏𝑏2(𝑆𝑆𝐶𝐶2) − 𝑏𝑏3(𝑁𝑁𝐶𝐶𝑥𝑥)
𝑌𝑌𝑡𝑡𝐵𝐵 (7)
𝑌𝑌𝑡𝑡𝐴𝐴 𝑌𝑌𝑡𝑡
𝐵𝐵
𝛼𝛼𝑡𝑡 =1
2𝛽𝛽(𝑅𝑅𝑡𝑡𝐴𝐴−𝑅𝑅𝑡𝑡
𝐵𝐵)−(𝜎𝜎𝑡𝑡𝐵𝐵)2−𝜎𝜎𝑡𝑡
𝐴𝐴𝐵𝐵
(𝜎𝜎𝑡𝑡𝐴𝐴)2−(𝜎𝜎𝑡𝑡
𝐵𝐵)2−2𝜎𝜎𝑡𝑡𝐴𝐴𝐵𝐵
𝐵𝐵𝐵𝐵𝐵𝐵𝐵𝐵𝑡𝑡
𝐴𝐴 − 𝐵𝐵𝐵𝐵𝐵𝐵𝐵𝐵𝑡𝑡𝐵𝐵
𝐵𝐵𝐵𝐵𝐵𝐵𝐵𝐵𝑡𝑡𝐴𝐴 > 𝐵𝐵𝐵𝐵𝐵𝐵𝐵𝐵𝑡𝑡
𝐵𝐵
.
4.4.2 A Model Incorporating the Blueness Factor into the Investor’s Utility Function
The change in industrial innovation and business patterns worldwide has adversely affected the overall environment. Over the last 2 decades, there has been a substantial surge in GHG emissions, which has created severe problems for aquatics and human beings’ survival. To overcome the environmental issues, every firm must adopt the measures necessary to circumvent ocean emissions. In line with this argument, investors are interested in investing in firms that reduce ocean emissions.
This study investigates how investors can estimate the emissions that ocean firms produce. We assume that investors allocate a certain

80 Blue Economy and Blue Finance: Toward Sustainable Development and Ocean Governance
proportion of their investments to blue bonds and that, as such, they have determined the optimal allocation among these investments. As investors are concerned about firms’ blueness, they prefer to invest in firms that reduce ocean emissions. In light of blue bonds, the portfolio utility function is based on the risk, the rate of return, and the blueness factor. We follow the methodology of Yoshino, Taghizadeh-Hesary, and Otsuka (2021) and Mumtaz and Yoshino (2021a) and assume that a firm issues bonds as a determinant of its blueness in terms of obtaining funds. We can express the utility function in this regard as:
𝑈𝑈(𝑅𝑅𝑡𝑡 , 𝜎𝜎𝑡𝑡2) = 𝑅𝑅𝑡𝑡 − 𝛽𝛽𝜎𝜎𝑡𝑡
2
𝑅𝑅𝑡𝑡 = 𝛼𝛼𝑡𝑡𝑅𝑅𝑡𝑡𝐴𝐴 + (1 − 𝛼𝛼𝑡𝑡)𝑅𝑅𝑡𝑡
𝐵𝐵
(2)
𝑅𝑅𝑡𝑡𝐴𝐴 𝑅𝑅𝑡𝑡
𝐵𝐵
𝜎𝜎𝑡𝑡2 = 𝛼𝛼𝑡𝑡
2(𝜎𝜎𝑡𝑡𝐴𝐴)2 + (1 − 𝛼𝛼𝑡𝑡)2(𝜎𝜎𝑡𝑡
𝐵𝐵)2 + 2𝛼𝛼𝑡𝑡(1 − 𝛼𝛼𝑡𝑡)𝜎𝜎𝑡𝑡𝐴𝐴𝐵𝐵 (3)
𝜎𝜎𝑡𝑡𝐴𝐴 𝜎𝜎𝑡𝑡
𝐵𝐵 𝜎𝜎𝑡𝑡𝐴𝐴𝐵𝐵
𝜎𝜎𝑡𝑡𝐴𝐴 = 𝐸𝐸(𝑅𝑅𝑡𝑡
𝐴𝐴 − ��𝑅𝑡𝑡𝐴𝐴)2
𝜎𝜎𝑡𝑡𝐵𝐵 = 𝐸𝐸(𝑅𝑅𝑡𝑡
𝐵𝐵 − ��𝑅𝑡𝑡𝐵𝐵)2
𝜎𝜎𝑡𝑡𝐴𝐴𝐵𝐵 = 𝐸𝐸(𝑅𝑅𝑡𝑡
𝐴𝐴 − ��𝑅𝑡𝑡𝐴𝐴)(𝑅𝑅𝑡𝑡
𝐵𝐵 − ��𝑅𝑡𝑡𝐵𝐵)
𝑈𝑈(𝑅𝑅𝑡𝑡 , 𝜎𝜎𝑡𝑡2, 𝐵𝐵𝐵𝐵𝐵𝐵𝐵𝐵𝑡𝑡) = 𝑅𝑅𝑡𝑡 − 𝛽𝛽𝜎𝜎𝑡𝑡
2 + 𝛾𝛾(Blue𝑡𝑡). (4)
𝑅𝑅𝑡𝑡 = 𝛼𝛼𝑡𝑡𝑅𝑅𝑡𝑡𝐴𝐴 + (1 − 𝛼𝛼𝑡𝑡)𝑅𝑅𝑡𝑡
𝐵𝐵 𝜎𝜎𝑡𝑡
2 = 𝛼𝛼𝑡𝑡2(𝜎𝜎𝑡𝑡
𝐴𝐴)2 + (1 − 𝛼𝛼𝑡𝑡)2(𝜎𝜎𝑡𝑡𝐵𝐵)2 + 2𝛼𝛼𝑡𝑡(1 − 𝛼𝛼𝑡𝑡)𝜎𝜎𝑡𝑡
𝐴𝐴𝐵𝐵 𝜎𝜎𝑡𝑡
2
𝐵𝐵𝐵𝐵𝐵𝐵𝐵𝐵𝑡𝑡 = 𝛼𝛼𝐵𝐵𝐵𝐵𝐵𝐵𝐵𝐵𝑡𝑡𝐴𝐴 + (1 − 𝛼𝛼)𝐵𝐵𝐵𝐵𝐵𝐵𝐵𝐵𝑡𝑡
𝐵𝐵 (5)
𝐵𝐵𝐵𝐵𝐵𝐵𝐵𝐵𝑡𝑡𝐴𝐴 𝐵𝐵𝐵𝐵𝐵𝐵𝐵𝐵𝑡𝑡
𝐵𝐵
𝐵𝐵𝐵𝐵𝐵𝐵𝐵𝐵𝑡𝑡𝐴𝐴 = −𝑎𝑎1(𝐶𝐶𝐶𝐶2) − 𝑎𝑎2(𝑆𝑆𝐶𝐶2) − 𝑎𝑎3(𝑁𝑁𝐶𝐶𝑥𝑥)
𝑌𝑌𝑡𝑡𝐴𝐴 (6)
𝐵𝐵𝐵𝐵𝐵𝐵𝐵𝐵𝑡𝑡𝐵𝐵 = −𝑏𝑏1(𝐶𝐶𝐶𝐶2) − 𝑏𝑏2(𝑆𝑆𝐶𝐶2) − 𝑏𝑏3(𝑁𝑁𝐶𝐶𝑥𝑥)
𝑌𝑌𝑡𝑡𝐵𝐵 (7)
𝑌𝑌𝑡𝑡𝐴𝐴 𝑌𝑌𝑡𝑡
𝐵𝐵
𝛼𝛼𝑡𝑡 =1
2𝛽𝛽(𝑅𝑅𝑡𝑡𝐴𝐴−𝑅𝑅𝑡𝑡
𝐵𝐵)−(𝜎𝜎𝑡𝑡𝐵𝐵)2−𝜎𝜎𝑡𝑡
𝐴𝐴𝐵𝐵
(𝜎𝜎𝑡𝑡𝐴𝐴)2−(𝜎𝜎𝑡𝑡
𝐵𝐵)2−2𝜎𝜎𝑡𝑡𝐴𝐴𝐵𝐵
𝐵𝐵𝐵𝐵𝐵𝐵𝐵𝐵𝑡𝑡
𝐴𝐴 − 𝐵𝐵𝐵𝐵𝐵𝐵𝐵𝐵𝑡𝑡𝐵𝐵
𝐵𝐵𝐵𝐵𝐵𝐵𝐵𝐵𝑡𝑡𝐴𝐴 > 𝐵𝐵𝐵𝐵𝐵𝐵𝐵𝐵𝑡𝑡
𝐵𝐵
(4)
Equation (4) is subject to
𝑈𝑈(𝑅𝑅𝑡𝑡 , 𝜎𝜎𝑡𝑡2) = 𝑅𝑅𝑡𝑡 − 𝛽𝛽𝜎𝜎𝑡𝑡
2
𝑅𝑅𝑡𝑡 = 𝛼𝛼𝑡𝑡𝑅𝑅𝑡𝑡𝐴𝐴 + (1 − 𝛼𝛼𝑡𝑡)𝑅𝑅𝑡𝑡
𝐵𝐵
(2)
𝑅𝑅𝑡𝑡𝐴𝐴 𝑅𝑅𝑡𝑡
𝐵𝐵
𝜎𝜎𝑡𝑡2 = 𝛼𝛼𝑡𝑡
2(𝜎𝜎𝑡𝑡𝐴𝐴)2 + (1 − 𝛼𝛼𝑡𝑡)2(𝜎𝜎𝑡𝑡
𝐵𝐵)2 + 2𝛼𝛼𝑡𝑡(1 − 𝛼𝛼𝑡𝑡)𝜎𝜎𝑡𝑡𝐴𝐴𝐵𝐵 (3)
𝜎𝜎𝑡𝑡𝐴𝐴 𝜎𝜎𝑡𝑡
𝐵𝐵 𝜎𝜎𝑡𝑡𝐴𝐴𝐵𝐵
𝜎𝜎𝑡𝑡𝐴𝐴 = 𝐸𝐸(𝑅𝑅𝑡𝑡
𝐴𝐴 − ��𝑅𝑡𝑡𝐴𝐴)2
𝜎𝜎𝑡𝑡𝐵𝐵 = 𝐸𝐸(𝑅𝑅𝑡𝑡
𝐵𝐵 − ��𝑅𝑡𝑡𝐵𝐵)2
𝜎𝜎𝑡𝑡𝐴𝐴𝐵𝐵 = 𝐸𝐸(𝑅𝑅𝑡𝑡
𝐴𝐴 − ��𝑅𝑡𝑡𝐴𝐴)(𝑅𝑅𝑡𝑡
𝐵𝐵 − ��𝑅𝑡𝑡𝐵𝐵)
𝑈𝑈(𝑅𝑅𝑡𝑡 , 𝜎𝜎𝑡𝑡2, 𝐵𝐵𝐵𝐵𝐵𝐵𝐵𝐵𝑡𝑡) = 𝑅𝑅𝑡𝑡 − 𝛽𝛽𝜎𝜎𝑡𝑡
2 + 𝛾𝛾(Blue𝑡𝑡). (4)
𝑅𝑅𝑡𝑡 = 𝛼𝛼𝑡𝑡𝑅𝑅𝑡𝑡𝐴𝐴 + (1 − 𝛼𝛼𝑡𝑡)𝑅𝑅𝑡𝑡
𝐵𝐵 𝜎𝜎𝑡𝑡
2 = 𝛼𝛼𝑡𝑡2(𝜎𝜎𝑡𝑡
𝐴𝐴)2 + (1 − 𝛼𝛼𝑡𝑡)2(𝜎𝜎𝑡𝑡𝐵𝐵)2 + 2𝛼𝛼𝑡𝑡(1 − 𝛼𝛼𝑡𝑡)𝜎𝜎𝑡𝑡
𝐴𝐴𝐵𝐵 𝜎𝜎𝑡𝑡
2
𝐵𝐵𝐵𝐵𝐵𝐵𝐵𝐵𝑡𝑡 = 𝛼𝛼𝐵𝐵𝐵𝐵𝐵𝐵𝐵𝐵𝑡𝑡𝐴𝐴 + (1 − 𝛼𝛼)𝐵𝐵𝐵𝐵𝐵𝐵𝐵𝐵𝑡𝑡
𝐵𝐵 (5)
𝐵𝐵𝐵𝐵𝐵𝐵𝐵𝐵𝑡𝑡𝐴𝐴 𝐵𝐵𝐵𝐵𝐵𝐵𝐵𝐵𝑡𝑡
𝐵𝐵
𝐵𝐵𝐵𝐵𝐵𝐵𝐵𝐵𝑡𝑡𝐴𝐴 = −𝑎𝑎1(𝐶𝐶𝐶𝐶2) − 𝑎𝑎2(𝑆𝑆𝐶𝐶2) − 𝑎𝑎3(𝑁𝑁𝐶𝐶𝑥𝑥)
𝑌𝑌𝑡𝑡𝐴𝐴 (6)
𝐵𝐵𝐵𝐵𝐵𝐵𝐵𝐵𝑡𝑡𝐵𝐵 = −𝑏𝑏1(𝐶𝐶𝐶𝐶2) − 𝑏𝑏2(𝑆𝑆𝐶𝐶2) − 𝑏𝑏3(𝑁𝑁𝐶𝐶𝑥𝑥)
𝑌𝑌𝑡𝑡𝐵𝐵 (7)
𝑌𝑌𝑡𝑡𝐴𝐴 𝑌𝑌𝑡𝑡
𝐵𝐵
𝛼𝛼𝑡𝑡 =1
2𝛽𝛽(𝑅𝑅𝑡𝑡𝐴𝐴−𝑅𝑅𝑡𝑡
𝐵𝐵)−(𝜎𝜎𝑡𝑡𝐵𝐵)2−𝜎𝜎𝑡𝑡
𝐴𝐴𝐵𝐵
(𝜎𝜎𝑡𝑡𝐴𝐴)2−(𝜎𝜎𝑡𝑡
𝐵𝐵)2−2𝜎𝜎𝑡𝑡𝐴𝐴𝐵𝐵
𝐵𝐵𝐵𝐵𝐵𝐵𝐵𝐵𝑡𝑡
𝐴𝐴 − 𝐵𝐵𝐵𝐵𝐵𝐵𝐵𝐵𝑡𝑡𝐵𝐵
𝐵𝐵𝐵𝐵𝐵𝐵𝐵𝐵𝑡𝑡𝐴𝐴 > 𝐵𝐵𝐵𝐵𝐵𝐵𝐵𝐵𝑡𝑡
𝐵𝐵
and
𝑈𝑈(𝑅𝑅𝑡𝑡 , 𝜎𝜎𝑡𝑡2) = 𝑅𝑅𝑡𝑡 − 𝛽𝛽𝜎𝜎𝑡𝑡
2
𝑅𝑅𝑡𝑡 = 𝛼𝛼𝑡𝑡𝑅𝑅𝑡𝑡𝐴𝐴 + (1 − 𝛼𝛼𝑡𝑡)𝑅𝑅𝑡𝑡
𝐵𝐵
(2)
𝑅𝑅𝑡𝑡𝐴𝐴 𝑅𝑅𝑡𝑡
𝐵𝐵
𝜎𝜎𝑡𝑡2 = 𝛼𝛼𝑡𝑡
2(𝜎𝜎𝑡𝑡𝐴𝐴)2 + (1 − 𝛼𝛼𝑡𝑡)2(𝜎𝜎𝑡𝑡
𝐵𝐵)2 + 2𝛼𝛼𝑡𝑡(1 − 𝛼𝛼𝑡𝑡)𝜎𝜎𝑡𝑡𝐴𝐴𝐵𝐵 (3)
𝜎𝜎𝑡𝑡𝐴𝐴 𝜎𝜎𝑡𝑡
𝐵𝐵 𝜎𝜎𝑡𝑡𝐴𝐴𝐵𝐵
𝜎𝜎𝑡𝑡𝐴𝐴 = 𝐸𝐸(𝑅𝑅𝑡𝑡
𝐴𝐴 − ��𝑅𝑡𝑡𝐴𝐴)2
𝜎𝜎𝑡𝑡𝐵𝐵 = 𝐸𝐸(𝑅𝑅𝑡𝑡
𝐵𝐵 − ��𝑅𝑡𝑡𝐵𝐵)2
𝜎𝜎𝑡𝑡𝐴𝐴𝐵𝐵 = 𝐸𝐸(𝑅𝑅𝑡𝑡
𝐴𝐴 − ��𝑅𝑡𝑡𝐴𝐴)(𝑅𝑅𝑡𝑡
𝐵𝐵 − ��𝑅𝑡𝑡𝐵𝐵)
𝑈𝑈(𝑅𝑅𝑡𝑡 , 𝜎𝜎𝑡𝑡2, 𝐵𝐵𝐵𝐵𝐵𝐵𝐵𝐵𝑡𝑡) = 𝑅𝑅𝑡𝑡 − 𝛽𝛽𝜎𝜎𝑡𝑡
2 + 𝛾𝛾(Blue𝑡𝑡). (4)
𝑅𝑅𝑡𝑡 = 𝛼𝛼𝑡𝑡𝑅𝑅𝑡𝑡𝐴𝐴 + (1 − 𝛼𝛼𝑡𝑡)𝑅𝑅𝑡𝑡
𝐵𝐵 𝜎𝜎𝑡𝑡
2 = 𝛼𝛼𝑡𝑡2(𝜎𝜎𝑡𝑡
𝐴𝐴)2 + (1 − 𝛼𝛼𝑡𝑡)2(𝜎𝜎𝑡𝑡𝐵𝐵)2 + 2𝛼𝛼𝑡𝑡(1 − 𝛼𝛼𝑡𝑡)𝜎𝜎𝑡𝑡
𝐴𝐴𝐵𝐵 𝜎𝜎𝑡𝑡
2
𝐵𝐵𝐵𝐵𝐵𝐵𝐵𝐵𝑡𝑡 = 𝛼𝛼𝐵𝐵𝐵𝐵𝐵𝐵𝐵𝐵𝑡𝑡𝐴𝐴 + (1 − 𝛼𝛼)𝐵𝐵𝐵𝐵𝐵𝐵𝐵𝐵𝑡𝑡
𝐵𝐵 (5)
𝐵𝐵𝐵𝐵𝐵𝐵𝐵𝐵𝑡𝑡𝐴𝐴 𝐵𝐵𝐵𝐵𝐵𝐵𝐵𝐵𝑡𝑡
𝐵𝐵
𝐵𝐵𝐵𝐵𝐵𝐵𝐵𝐵𝑡𝑡𝐴𝐴 = −𝑎𝑎1(𝐶𝐶𝐶𝐶2) − 𝑎𝑎2(𝑆𝑆𝐶𝐶2) − 𝑎𝑎3(𝑁𝑁𝐶𝐶𝑥𝑥)
𝑌𝑌𝑡𝑡𝐴𝐴 (6)
𝐵𝐵𝐵𝐵𝐵𝐵𝐵𝐵𝑡𝑡𝐵𝐵 = −𝑏𝑏1(𝐶𝐶𝐶𝐶2) − 𝑏𝑏2(𝑆𝑆𝐶𝐶2) − 𝑏𝑏3(𝑁𝑁𝐶𝐶𝑥𝑥)
𝑌𝑌𝑡𝑡𝐵𝐵 (7)
𝑌𝑌𝑡𝑡𝐴𝐴 𝑌𝑌𝑡𝑡
𝐵𝐵
𝛼𝛼𝑡𝑡 =1
2𝛽𝛽(𝑅𝑅𝑡𝑡𝐴𝐴−𝑅𝑅𝑡𝑡
𝐵𝐵)−(𝜎𝜎𝑡𝑡𝐵𝐵)2−𝜎𝜎𝑡𝑡
𝐴𝐴𝐵𝐵
(𝜎𝜎𝑡𝑡𝐴𝐴)2−(𝜎𝜎𝑡𝑡
𝐵𝐵)2−2𝜎𝜎𝑡𝑡𝐴𝐴𝐵𝐵
𝐵𝐵𝐵𝐵𝐵𝐵𝐵𝐵𝑡𝑡
𝐴𝐴 − 𝐵𝐵𝐵𝐵𝐵𝐵𝐵𝐵𝑡𝑡𝐵𝐵
𝐵𝐵𝐵𝐵𝐵𝐵𝐵𝐵𝑡𝑡𝐴𝐴 > 𝐵𝐵𝐵𝐵𝐵𝐵𝐵𝐵𝑡𝑡
𝐵𝐵
, where Rt indicates the return of the portfolio,
𝑈𝑈(𝑅𝑅𝑡𝑡 , 𝜎𝜎𝑡𝑡2) = 𝑅𝑅𝑡𝑡 − 𝛽𝛽𝜎𝜎𝑡𝑡
2
𝑅𝑅𝑡𝑡 = 𝛼𝛼𝑡𝑡𝑅𝑅𝑡𝑡𝐴𝐴 + (1 − 𝛼𝛼𝑡𝑡)𝑅𝑅𝑡𝑡
𝐵𝐵
(2)
𝑅𝑅𝑡𝑡𝐴𝐴 𝑅𝑅𝑡𝑡
𝐵𝐵
𝜎𝜎𝑡𝑡2 = 𝛼𝛼𝑡𝑡
2(𝜎𝜎𝑡𝑡𝐴𝐴)2 + (1 − 𝛼𝛼𝑡𝑡)2(𝜎𝜎𝑡𝑡
𝐵𝐵)2 + 2𝛼𝛼𝑡𝑡(1 − 𝛼𝛼𝑡𝑡)𝜎𝜎𝑡𝑡𝐴𝐴𝐵𝐵 (3)
𝜎𝜎𝑡𝑡𝐴𝐴 𝜎𝜎𝑡𝑡
𝐵𝐵 𝜎𝜎𝑡𝑡𝐴𝐴𝐵𝐵
𝜎𝜎𝑡𝑡𝐴𝐴 = 𝐸𝐸(𝑅𝑅𝑡𝑡
𝐴𝐴 − ��𝑅𝑡𝑡𝐴𝐴)2
𝜎𝜎𝑡𝑡𝐵𝐵 = 𝐸𝐸(𝑅𝑅𝑡𝑡
𝐵𝐵 − ��𝑅𝑡𝑡𝐵𝐵)2
𝜎𝜎𝑡𝑡𝐴𝐴𝐵𝐵 = 𝐸𝐸(𝑅𝑅𝑡𝑡
𝐴𝐴 − ��𝑅𝑡𝑡𝐴𝐴)(𝑅𝑅𝑡𝑡
𝐵𝐵 − ��𝑅𝑡𝑡𝐵𝐵)
𝑈𝑈(𝑅𝑅𝑡𝑡 , 𝜎𝜎𝑡𝑡2, 𝐵𝐵𝐵𝐵𝐵𝐵𝐵𝐵𝑡𝑡) = 𝑅𝑅𝑡𝑡 − 𝛽𝛽𝜎𝜎𝑡𝑡
2 + 𝛾𝛾(Blue𝑡𝑡). (4)
𝑅𝑅𝑡𝑡 = 𝛼𝛼𝑡𝑡𝑅𝑅𝑡𝑡𝐴𝐴 + (1 − 𝛼𝛼𝑡𝑡)𝑅𝑅𝑡𝑡
𝐵𝐵 𝜎𝜎𝑡𝑡
2 = 𝛼𝛼𝑡𝑡2(𝜎𝜎𝑡𝑡
𝐴𝐴)2 + (1 − 𝛼𝛼𝑡𝑡)2(𝜎𝜎𝑡𝑡𝐵𝐵)2 + 2𝛼𝛼𝑡𝑡(1 − 𝛼𝛼𝑡𝑡)𝜎𝜎𝑡𝑡
𝐴𝐴𝐵𝐵 𝜎𝜎𝑡𝑡
2
𝐵𝐵𝐵𝐵𝐵𝐵𝐵𝐵𝑡𝑡 = 𝛼𝛼𝐵𝐵𝐵𝐵𝐵𝐵𝐵𝐵𝑡𝑡𝐴𝐴 + (1 − 𝛼𝛼)𝐵𝐵𝐵𝐵𝐵𝐵𝐵𝐵𝑡𝑡
𝐵𝐵 (5)
𝐵𝐵𝐵𝐵𝐵𝐵𝐵𝐵𝑡𝑡𝐴𝐴 𝐵𝐵𝐵𝐵𝐵𝐵𝐵𝐵𝑡𝑡
𝐵𝐵
𝐵𝐵𝐵𝐵𝐵𝐵𝐵𝐵𝑡𝑡𝐴𝐴 = −𝑎𝑎1(𝐶𝐶𝐶𝐶2) − 𝑎𝑎2(𝑆𝑆𝐶𝐶2) − 𝑎𝑎3(𝑁𝑁𝐶𝐶𝑥𝑥)
𝑌𝑌𝑡𝑡𝐴𝐴 (6)
𝐵𝐵𝐵𝐵𝐵𝐵𝐵𝐵𝑡𝑡𝐵𝐵 = −𝑏𝑏1(𝐶𝐶𝐶𝐶2) − 𝑏𝑏2(𝑆𝑆𝐶𝐶2) − 𝑏𝑏3(𝑁𝑁𝐶𝐶𝑥𝑥)
𝑌𝑌𝑡𝑡𝐵𝐵 (7)
𝑌𝑌𝑡𝑡𝐴𝐴 𝑌𝑌𝑡𝑡
𝐵𝐵
𝛼𝛼𝑡𝑡 =1
2𝛽𝛽(𝑅𝑅𝑡𝑡𝐴𝐴−𝑅𝑅𝑡𝑡
𝐵𝐵)−(𝜎𝜎𝑡𝑡𝐵𝐵)2−𝜎𝜎𝑡𝑡
𝐴𝐴𝐵𝐵
(𝜎𝜎𝑡𝑡𝐴𝐴)2−(𝜎𝜎𝑡𝑡
𝐵𝐵)2−2𝜎𝜎𝑡𝑡𝐴𝐴𝐵𝐵
𝐵𝐵𝐵𝐵𝐵𝐵𝐵𝐵𝑡𝑡
𝐴𝐴 − 𝐵𝐵𝐵𝐵𝐵𝐵𝐵𝐵𝑡𝑡𝐵𝐵
𝐵𝐵𝐵𝐵𝐵𝐵𝐵𝐵𝑡𝑡𝐴𝐴 > 𝐵𝐵𝐵𝐵𝐵𝐵𝐵𝐵𝑡𝑡
𝐵𝐵
shows the riskiness of the bonds, and Bluet refers to the blueness of the bonds. β represents the sensitivity of risk, and γ suggests the weight of blueness related to bonds. This study examines the level of the blueness of bonds, which we can write as:
𝑈𝑈(𝑅𝑅𝑡𝑡 , 𝜎𝜎𝑡𝑡2) = 𝑅𝑅𝑡𝑡 − 𝛽𝛽𝜎𝜎𝑡𝑡
2
𝑅𝑅𝑡𝑡 = 𝛼𝛼𝑡𝑡𝑅𝑅𝑡𝑡𝐴𝐴 + (1 − 𝛼𝛼𝑡𝑡)𝑅𝑅𝑡𝑡
𝐵𝐵
(2)
𝑅𝑅𝑡𝑡𝐴𝐴 𝑅𝑅𝑡𝑡
𝐵𝐵
𝜎𝜎𝑡𝑡2 = 𝛼𝛼𝑡𝑡
2(𝜎𝜎𝑡𝑡𝐴𝐴)2 + (1 − 𝛼𝛼𝑡𝑡)2(𝜎𝜎𝑡𝑡
𝐵𝐵)2 + 2𝛼𝛼𝑡𝑡(1 − 𝛼𝛼𝑡𝑡)𝜎𝜎𝑡𝑡𝐴𝐴𝐵𝐵 (3)
𝜎𝜎𝑡𝑡𝐴𝐴 𝜎𝜎𝑡𝑡
𝐵𝐵 𝜎𝜎𝑡𝑡𝐴𝐴𝐵𝐵
𝜎𝜎𝑡𝑡𝐴𝐴 = 𝐸𝐸(𝑅𝑅𝑡𝑡
𝐴𝐴 − ��𝑅𝑡𝑡𝐴𝐴)2
𝜎𝜎𝑡𝑡𝐵𝐵 = 𝐸𝐸(𝑅𝑅𝑡𝑡
𝐵𝐵 − ��𝑅𝑡𝑡𝐵𝐵)2
𝜎𝜎𝑡𝑡𝐴𝐴𝐵𝐵 = 𝐸𝐸(𝑅𝑅𝑡𝑡
𝐴𝐴 − ��𝑅𝑡𝑡𝐴𝐴)(𝑅𝑅𝑡𝑡
𝐵𝐵 − ��𝑅𝑡𝑡𝐵𝐵)
𝑈𝑈(𝑅𝑅𝑡𝑡 , 𝜎𝜎𝑡𝑡2, 𝐵𝐵𝐵𝐵𝐵𝐵𝐵𝐵𝑡𝑡) = 𝑅𝑅𝑡𝑡 − 𝛽𝛽𝜎𝜎𝑡𝑡
2 + 𝛾𝛾(Blue𝑡𝑡). (4)
𝑅𝑅𝑡𝑡 = 𝛼𝛼𝑡𝑡𝑅𝑅𝑡𝑡𝐴𝐴 + (1 − 𝛼𝛼𝑡𝑡)𝑅𝑅𝑡𝑡
𝐵𝐵 𝜎𝜎𝑡𝑡
2 = 𝛼𝛼𝑡𝑡2(𝜎𝜎𝑡𝑡
𝐴𝐴)2 + (1 − 𝛼𝛼𝑡𝑡)2(𝜎𝜎𝑡𝑡𝐵𝐵)2 + 2𝛼𝛼𝑡𝑡(1 − 𝛼𝛼𝑡𝑡)𝜎𝜎𝑡𝑡
𝐴𝐴𝐵𝐵 𝜎𝜎𝑡𝑡
2
𝐵𝐵𝐵𝐵𝐵𝐵𝐵𝐵𝑡𝑡 = 𝛼𝛼𝐵𝐵𝐵𝐵𝐵𝐵𝐵𝐵𝑡𝑡𝐴𝐴 + (1 − 𝛼𝛼)𝐵𝐵𝐵𝐵𝐵𝐵𝐵𝐵𝑡𝑡
𝐵𝐵 (5)
𝐵𝐵𝐵𝐵𝐵𝐵𝐵𝐵𝑡𝑡𝐴𝐴 𝐵𝐵𝐵𝐵𝐵𝐵𝐵𝐵𝑡𝑡
𝐵𝐵
𝐵𝐵𝐵𝐵𝐵𝐵𝐵𝐵𝑡𝑡𝐴𝐴 = −𝑎𝑎1(𝐶𝐶𝐶𝐶2) − 𝑎𝑎2(𝑆𝑆𝐶𝐶2) − 𝑎𝑎3(𝑁𝑁𝐶𝐶𝑥𝑥)
𝑌𝑌𝑡𝑡𝐴𝐴 (6)
𝐵𝐵𝐵𝐵𝐵𝐵𝐵𝐵𝑡𝑡𝐵𝐵 = −𝑏𝑏1(𝐶𝐶𝐶𝐶2) − 𝑏𝑏2(𝑆𝑆𝐶𝐶2) − 𝑏𝑏3(𝑁𝑁𝐶𝐶𝑥𝑥)
𝑌𝑌𝑡𝑡𝐵𝐵 (7)
𝑌𝑌𝑡𝑡𝐴𝐴 𝑌𝑌𝑡𝑡
𝐵𝐵
𝛼𝛼𝑡𝑡 =1
2𝛽𝛽(𝑅𝑅𝑡𝑡𝐴𝐴−𝑅𝑅𝑡𝑡
𝐵𝐵)−(𝜎𝜎𝑡𝑡𝐵𝐵)2−𝜎𝜎𝑡𝑡
𝐴𝐴𝐵𝐵
(𝜎𝜎𝑡𝑡𝐴𝐴)2−(𝜎𝜎𝑡𝑡
𝐵𝐵)2−2𝜎𝜎𝑡𝑡𝐴𝐴𝐵𝐵
𝐵𝐵𝐵𝐵𝐵𝐵𝐵𝐵𝑡𝑡
𝐴𝐴 − 𝐵𝐵𝐵𝐵𝐵𝐵𝐵𝐵𝑡𝑡𝐵𝐵
𝐵𝐵𝐵𝐵𝐵𝐵𝐵𝐵𝑡𝑡𝐴𝐴 > 𝐵𝐵𝐵𝐵𝐵𝐵𝐵𝐵𝑡𝑡
𝐵𝐵
, (5)
where α and (1 – α) indicate the proportion of the blueness factor associated with bonds A and B, respectively.
𝑈𝑈(𝑅𝑅𝑡𝑡 , 𝜎𝜎𝑡𝑡2) = 𝑅𝑅𝑡𝑡 − 𝛽𝛽𝜎𝜎𝑡𝑡
2
𝑅𝑅𝑡𝑡 = 𝛼𝛼𝑡𝑡𝑅𝑅𝑡𝑡𝐴𝐴 + (1 − 𝛼𝛼𝑡𝑡)𝑅𝑅𝑡𝑡
𝐵𝐵
(2)
𝑅𝑅𝑡𝑡𝐴𝐴 𝑅𝑅𝑡𝑡
𝐵𝐵
𝜎𝜎𝑡𝑡2 = 𝛼𝛼𝑡𝑡
2(𝜎𝜎𝑡𝑡𝐴𝐴)2 + (1 − 𝛼𝛼𝑡𝑡)2(𝜎𝜎𝑡𝑡
𝐵𝐵)2 + 2𝛼𝛼𝑡𝑡(1 − 𝛼𝛼𝑡𝑡)𝜎𝜎𝑡𝑡𝐴𝐴𝐵𝐵 (3)
𝜎𝜎𝑡𝑡𝐴𝐴 𝜎𝜎𝑡𝑡
𝐵𝐵 𝜎𝜎𝑡𝑡𝐴𝐴𝐵𝐵
𝜎𝜎𝑡𝑡𝐴𝐴 = 𝐸𝐸(𝑅𝑅𝑡𝑡
𝐴𝐴 − ��𝑅𝑡𝑡𝐴𝐴)2
𝜎𝜎𝑡𝑡𝐵𝐵 = 𝐸𝐸(𝑅𝑅𝑡𝑡
𝐵𝐵 − ��𝑅𝑡𝑡𝐵𝐵)2
𝜎𝜎𝑡𝑡𝐴𝐴𝐵𝐵 = 𝐸𝐸(𝑅𝑅𝑡𝑡
𝐴𝐴 − ��𝑅𝑡𝑡𝐴𝐴)(𝑅𝑅𝑡𝑡
𝐵𝐵 − ��𝑅𝑡𝑡𝐵𝐵)
𝑈𝑈(𝑅𝑅𝑡𝑡 , 𝜎𝜎𝑡𝑡2, 𝐵𝐵𝐵𝐵𝐵𝐵𝐵𝐵𝑡𝑡) = 𝑅𝑅𝑡𝑡 − 𝛽𝛽𝜎𝜎𝑡𝑡
2 + 𝛾𝛾(Blue𝑡𝑡). (4)
𝑅𝑅𝑡𝑡 = 𝛼𝛼𝑡𝑡𝑅𝑅𝑡𝑡𝐴𝐴 + (1 − 𝛼𝛼𝑡𝑡)𝑅𝑅𝑡𝑡
𝐵𝐵 𝜎𝜎𝑡𝑡
2 = 𝛼𝛼𝑡𝑡2(𝜎𝜎𝑡𝑡
𝐴𝐴)2 + (1 − 𝛼𝛼𝑡𝑡)2(𝜎𝜎𝑡𝑡𝐵𝐵)2 + 2𝛼𝛼𝑡𝑡(1 − 𝛼𝛼𝑡𝑡)𝜎𝜎𝑡𝑡
𝐴𝐴𝐵𝐵 𝜎𝜎𝑡𝑡
2
𝐵𝐵𝐵𝐵𝐵𝐵𝐵𝐵𝑡𝑡 = 𝛼𝛼𝐵𝐵𝐵𝐵𝐵𝐵𝐵𝐵𝑡𝑡𝐴𝐴 + (1 − 𝛼𝛼)𝐵𝐵𝐵𝐵𝐵𝐵𝐵𝐵𝑡𝑡
𝐵𝐵 (5)
𝐵𝐵𝐵𝐵𝐵𝐵𝐵𝐵𝑡𝑡𝐴𝐴 𝐵𝐵𝐵𝐵𝐵𝐵𝐵𝐵𝑡𝑡
𝐵𝐵
𝐵𝐵𝐵𝐵𝐵𝐵𝐵𝐵𝑡𝑡𝐴𝐴 = −𝑎𝑎1(𝐶𝐶𝐶𝐶2) − 𝑎𝑎2(𝑆𝑆𝐶𝐶2) − 𝑎𝑎3(𝑁𝑁𝐶𝐶𝑥𝑥)
𝑌𝑌𝑡𝑡𝐴𝐴 (6)
𝐵𝐵𝐵𝐵𝐵𝐵𝐵𝐵𝑡𝑡𝐵𝐵 = −𝑏𝑏1(𝐶𝐶𝐶𝐶2) − 𝑏𝑏2(𝑆𝑆𝐶𝐶2) − 𝑏𝑏3(𝑁𝑁𝐶𝐶𝑥𝑥)
𝑌𝑌𝑡𝑡𝐵𝐵 (7)
𝑌𝑌𝑡𝑡𝐴𝐴 𝑌𝑌𝑡𝑡
𝐵𝐵
𝛼𝛼𝑡𝑡 =1
2𝛽𝛽(𝑅𝑅𝑡𝑡𝐴𝐴−𝑅𝑅𝑡𝑡
𝐵𝐵)−(𝜎𝜎𝑡𝑡𝐵𝐵)2−𝜎𝜎𝑡𝑡
𝐴𝐴𝐵𝐵
(𝜎𝜎𝑡𝑡𝐴𝐴)2−(𝜎𝜎𝑡𝑡
𝐵𝐵)2−2𝜎𝜎𝑡𝑡𝐴𝐴𝐵𝐵
𝐵𝐵𝐵𝐵𝐵𝐵𝐵𝐵𝑡𝑡
𝐴𝐴 − 𝐵𝐵𝐵𝐵𝐵𝐵𝐵𝐵𝑡𝑡𝐵𝐵
𝐵𝐵𝐵𝐵𝐵𝐵𝐵𝐵𝑡𝑡𝐴𝐴 > 𝐵𝐵𝐵𝐵𝐵𝐵𝐵𝐵𝑡𝑡
𝐵𝐵
and
𝑈𝑈(𝑅𝑅𝑡𝑡 , 𝜎𝜎𝑡𝑡2) = 𝑅𝑅𝑡𝑡 − 𝛽𝛽𝜎𝜎𝑡𝑡
2
𝑅𝑅𝑡𝑡 = 𝛼𝛼𝑡𝑡𝑅𝑅𝑡𝑡𝐴𝐴 + (1 − 𝛼𝛼𝑡𝑡)𝑅𝑅𝑡𝑡
𝐵𝐵
(2)
𝑅𝑅𝑡𝑡𝐴𝐴 𝑅𝑅𝑡𝑡
𝐵𝐵
𝜎𝜎𝑡𝑡2 = 𝛼𝛼𝑡𝑡
2(𝜎𝜎𝑡𝑡𝐴𝐴)2 + (1 − 𝛼𝛼𝑡𝑡)2(𝜎𝜎𝑡𝑡
𝐵𝐵)2 + 2𝛼𝛼𝑡𝑡(1 − 𝛼𝛼𝑡𝑡)𝜎𝜎𝑡𝑡𝐴𝐴𝐵𝐵 (3)
𝜎𝜎𝑡𝑡𝐴𝐴 𝜎𝜎𝑡𝑡
𝐵𝐵 𝜎𝜎𝑡𝑡𝐴𝐴𝐵𝐵
𝜎𝜎𝑡𝑡𝐴𝐴 = 𝐸𝐸(𝑅𝑅𝑡𝑡
𝐴𝐴 − ��𝑅𝑡𝑡𝐴𝐴)2
𝜎𝜎𝑡𝑡𝐵𝐵 = 𝐸𝐸(𝑅𝑅𝑡𝑡
𝐵𝐵 − ��𝑅𝑡𝑡𝐵𝐵)2
𝜎𝜎𝑡𝑡𝐴𝐴𝐵𝐵 = 𝐸𝐸(𝑅𝑅𝑡𝑡
𝐴𝐴 − ��𝑅𝑡𝑡𝐴𝐴)(𝑅𝑅𝑡𝑡
𝐵𝐵 − ��𝑅𝑡𝑡𝐵𝐵)
𝑈𝑈(𝑅𝑅𝑡𝑡 , 𝜎𝜎𝑡𝑡2, 𝐵𝐵𝐵𝐵𝐵𝐵𝐵𝐵𝑡𝑡) = 𝑅𝑅𝑡𝑡 − 𝛽𝛽𝜎𝜎𝑡𝑡
2 + 𝛾𝛾(Blue𝑡𝑡). (4)
𝑅𝑅𝑡𝑡 = 𝛼𝛼𝑡𝑡𝑅𝑅𝑡𝑡𝐴𝐴 + (1 − 𝛼𝛼𝑡𝑡)𝑅𝑅𝑡𝑡
𝐵𝐵 𝜎𝜎𝑡𝑡
2 = 𝛼𝛼𝑡𝑡2(𝜎𝜎𝑡𝑡
𝐴𝐴)2 + (1 − 𝛼𝛼𝑡𝑡)2(𝜎𝜎𝑡𝑡𝐵𝐵)2 + 2𝛼𝛼𝑡𝑡(1 − 𝛼𝛼𝑡𝑡)𝜎𝜎𝑡𝑡
𝐴𝐴𝐵𝐵 𝜎𝜎𝑡𝑡
2
𝐵𝐵𝐵𝐵𝐵𝐵𝐵𝐵𝑡𝑡 = 𝛼𝛼𝐵𝐵𝐵𝐵𝐵𝐵𝐵𝐵𝑡𝑡𝐴𝐴 + (1 − 𝛼𝛼)𝐵𝐵𝐵𝐵𝐵𝐵𝐵𝐵𝑡𝑡
𝐵𝐵 (5)
𝐵𝐵𝐵𝐵𝐵𝐵𝐵𝐵𝑡𝑡𝐴𝐴 𝐵𝐵𝐵𝐵𝐵𝐵𝐵𝐵𝑡𝑡
𝐵𝐵
𝐵𝐵𝐵𝐵𝐵𝐵𝐵𝐵𝑡𝑡𝐴𝐴 = −𝑎𝑎1(𝐶𝐶𝐶𝐶2) − 𝑎𝑎2(𝑆𝑆𝐶𝐶2) − 𝑎𝑎3(𝑁𝑁𝐶𝐶𝑥𝑥)
𝑌𝑌𝑡𝑡𝐴𝐴 (6)
𝐵𝐵𝐵𝐵𝐵𝐵𝐵𝐵𝑡𝑡𝐵𝐵 = −𝑏𝑏1(𝐶𝐶𝐶𝐶2) − 𝑏𝑏2(𝑆𝑆𝐶𝐶2) − 𝑏𝑏3(𝑁𝑁𝐶𝐶𝑥𝑥)
𝑌𝑌𝑡𝑡𝐵𝐵 (7)
𝑌𝑌𝑡𝑡𝐴𝐴 𝑌𝑌𝑡𝑡
𝐵𝐵
𝛼𝛼𝑡𝑡 =1
2𝛽𝛽(𝑅𝑅𝑡𝑡𝐴𝐴−𝑅𝑅𝑡𝑡
𝐵𝐵)−(𝜎𝜎𝑡𝑡𝐵𝐵)2−𝜎𝜎𝑡𝑡
𝐴𝐴𝐵𝐵
(𝜎𝜎𝑡𝑡𝐴𝐴)2−(𝜎𝜎𝑡𝑡
𝐵𝐵)2−2𝜎𝜎𝑡𝑡𝐴𝐴𝐵𝐵
𝐵𝐵𝐵𝐵𝐵𝐵𝐵𝐵𝑡𝑡
𝐴𝐴 − 𝐵𝐵𝐵𝐵𝐵𝐵𝐵𝐵𝑡𝑡𝐵𝐵
𝐵𝐵𝐵𝐵𝐵𝐵𝐵𝐵𝑡𝑡𝐴𝐴 > 𝐵𝐵𝐵𝐵𝐵𝐵𝐵𝐵𝑡𝑡
𝐵𝐵
show the blueness of bonds A and B, respectively.
In this study, we propose to estimate the blueness index, which is equal to the sum of ocean emissions scaled by the firm’s net sales. This measure indicates the percentage of ocean emissions that the net sales produce. To capture the effect of ocean emissions, we use the emissions of CO2, SO2, and NOx. A lower percentage of ocean emissions to sales represents lower emissions that a firm produces (Yoshino, Taghizadeh-Hesary, and Otsuka 2021). We compute the blueness of the bond as:
𝑈𝑈(𝑅𝑅𝑡𝑡 , 𝜎𝜎𝑡𝑡2) = 𝑅𝑅𝑡𝑡 − 𝛽𝛽𝜎𝜎𝑡𝑡
2
𝑅𝑅𝑡𝑡 = 𝛼𝛼𝑡𝑡𝑅𝑅𝑡𝑡𝐴𝐴 + (1 − 𝛼𝛼𝑡𝑡)𝑅𝑅𝑡𝑡
𝐵𝐵
(2)
𝑅𝑅𝑡𝑡𝐴𝐴 𝑅𝑅𝑡𝑡
𝐵𝐵
𝜎𝜎𝑡𝑡2 = 𝛼𝛼𝑡𝑡
2(𝜎𝜎𝑡𝑡𝐴𝐴)2 + (1 − 𝛼𝛼𝑡𝑡)2(𝜎𝜎𝑡𝑡
𝐵𝐵)2 + 2𝛼𝛼𝑡𝑡(1 − 𝛼𝛼𝑡𝑡)𝜎𝜎𝑡𝑡𝐴𝐴𝐵𝐵 (3)
𝜎𝜎𝑡𝑡𝐴𝐴 𝜎𝜎𝑡𝑡
𝐵𝐵 𝜎𝜎𝑡𝑡𝐴𝐴𝐵𝐵
𝜎𝜎𝑡𝑡𝐴𝐴 = 𝐸𝐸(𝑅𝑅𝑡𝑡
𝐴𝐴 − ��𝑅𝑡𝑡𝐴𝐴)2
𝜎𝜎𝑡𝑡𝐵𝐵 = 𝐸𝐸(𝑅𝑅𝑡𝑡
𝐵𝐵 − ��𝑅𝑡𝑡𝐵𝐵)2
𝜎𝜎𝑡𝑡𝐴𝐴𝐵𝐵 = 𝐸𝐸(𝑅𝑅𝑡𝑡
𝐴𝐴 − ��𝑅𝑡𝑡𝐴𝐴)(𝑅𝑅𝑡𝑡
𝐵𝐵 − ��𝑅𝑡𝑡𝐵𝐵)
𝑈𝑈(𝑅𝑅𝑡𝑡 , 𝜎𝜎𝑡𝑡2, 𝐵𝐵𝐵𝐵𝐵𝐵𝐵𝐵𝑡𝑡) = 𝑅𝑅𝑡𝑡 − 𝛽𝛽𝜎𝜎𝑡𝑡
2 + 𝛾𝛾(Blue𝑡𝑡). (4)
𝑅𝑅𝑡𝑡 = 𝛼𝛼𝑡𝑡𝑅𝑅𝑡𝑡𝐴𝐴 + (1 − 𝛼𝛼𝑡𝑡)𝑅𝑅𝑡𝑡
𝐵𝐵 𝜎𝜎𝑡𝑡
2 = 𝛼𝛼𝑡𝑡2(𝜎𝜎𝑡𝑡
𝐴𝐴)2 + (1 − 𝛼𝛼𝑡𝑡)2(𝜎𝜎𝑡𝑡𝐵𝐵)2 + 2𝛼𝛼𝑡𝑡(1 − 𝛼𝛼𝑡𝑡)𝜎𝜎𝑡𝑡
𝐴𝐴𝐵𝐵 𝜎𝜎𝑡𝑡
2
𝐵𝐵𝐵𝐵𝐵𝐵𝐵𝐵𝑡𝑡 = 𝛼𝛼𝐵𝐵𝐵𝐵𝐵𝐵𝐵𝐵𝑡𝑡𝐴𝐴 + (1 − 𝛼𝛼)𝐵𝐵𝐵𝐵𝐵𝐵𝐵𝐵𝑡𝑡
𝐵𝐵 (5)
𝐵𝐵𝐵𝐵𝐵𝐵𝐵𝐵𝑡𝑡𝐴𝐴 𝐵𝐵𝐵𝐵𝐵𝐵𝐵𝐵𝑡𝑡
𝐵𝐵
𝐵𝐵𝐵𝐵𝐵𝐵𝐵𝐵𝑡𝑡𝐴𝐴 = −𝑎𝑎1(𝐶𝐶𝐶𝐶2) − 𝑎𝑎2(𝑆𝑆𝐶𝐶2) − 𝑎𝑎3(𝑁𝑁𝐶𝐶𝑥𝑥)
𝑌𝑌𝑡𝑡𝐴𝐴 (6)
𝐵𝐵𝐵𝐵𝐵𝐵𝐵𝐵𝑡𝑡𝐵𝐵 = −𝑏𝑏1(𝐶𝐶𝐶𝐶2) − 𝑏𝑏2(𝑆𝑆𝐶𝐶2) − 𝑏𝑏3(𝑁𝑁𝐶𝐶𝑥𝑥)
𝑌𝑌𝑡𝑡𝐵𝐵 (7)
𝑌𝑌𝑡𝑡𝐴𝐴 𝑌𝑌𝑡𝑡
𝐵𝐵
𝛼𝛼𝑡𝑡 =1
2𝛽𝛽(𝑅𝑅𝑡𝑡𝐴𝐴−𝑅𝑅𝑡𝑡
𝐵𝐵)−(𝜎𝜎𝑡𝑡𝐵𝐵)2−𝜎𝜎𝑡𝑡
𝐴𝐴𝐵𝐵
(𝜎𝜎𝑡𝑡𝐴𝐴)2−(𝜎𝜎𝑡𝑡
𝐵𝐵)2−2𝜎𝜎𝑡𝑡𝐴𝐴𝐵𝐵
𝐵𝐵𝐵𝐵𝐵𝐵𝐵𝐵𝑡𝑡
𝐴𝐴 − 𝐵𝐵𝐵𝐵𝐵𝐵𝐵𝐵𝑡𝑡𝐵𝐵
𝐵𝐵𝐵𝐵𝐵𝐵𝐵𝐵𝑡𝑡𝐴𝐴 > 𝐵𝐵𝐵𝐵𝐵𝐵𝐵𝐵𝑡𝑡
𝐵𝐵
, (6)
𝑈𝑈(𝑅𝑅𝑡𝑡 , 𝜎𝜎𝑡𝑡2) = 𝑅𝑅𝑡𝑡 − 𝛽𝛽𝜎𝜎𝑡𝑡
2
𝑅𝑅𝑡𝑡 = 𝛼𝛼𝑡𝑡𝑅𝑅𝑡𝑡𝐴𝐴 + (1 − 𝛼𝛼𝑡𝑡)𝑅𝑅𝑡𝑡
𝐵𝐵
(2)
𝑅𝑅𝑡𝑡𝐴𝐴 𝑅𝑅𝑡𝑡
𝐵𝐵
𝜎𝜎𝑡𝑡2 = 𝛼𝛼𝑡𝑡
2(𝜎𝜎𝑡𝑡𝐴𝐴)2 + (1 − 𝛼𝛼𝑡𝑡)2(𝜎𝜎𝑡𝑡
𝐵𝐵)2 + 2𝛼𝛼𝑡𝑡(1 − 𝛼𝛼𝑡𝑡)𝜎𝜎𝑡𝑡𝐴𝐴𝐵𝐵 (3)
𝜎𝜎𝑡𝑡𝐴𝐴 𝜎𝜎𝑡𝑡
𝐵𝐵 𝜎𝜎𝑡𝑡𝐴𝐴𝐵𝐵
𝜎𝜎𝑡𝑡𝐴𝐴 = 𝐸𝐸(𝑅𝑅𝑡𝑡
𝐴𝐴 − ��𝑅𝑡𝑡𝐴𝐴)2
𝜎𝜎𝑡𝑡𝐵𝐵 = 𝐸𝐸(𝑅𝑅𝑡𝑡
𝐵𝐵 − ��𝑅𝑡𝑡𝐵𝐵)2
𝜎𝜎𝑡𝑡𝐴𝐴𝐵𝐵 = 𝐸𝐸(𝑅𝑅𝑡𝑡
𝐴𝐴 − ��𝑅𝑡𝑡𝐴𝐴)(𝑅𝑅𝑡𝑡
𝐵𝐵 − ��𝑅𝑡𝑡𝐵𝐵)
𝑈𝑈(𝑅𝑅𝑡𝑡 , 𝜎𝜎𝑡𝑡2, 𝐵𝐵𝐵𝐵𝐵𝐵𝐵𝐵𝑡𝑡) = 𝑅𝑅𝑡𝑡 − 𝛽𝛽𝜎𝜎𝑡𝑡
2 + 𝛾𝛾(Blue𝑡𝑡). (4)
𝑅𝑅𝑡𝑡 = 𝛼𝛼𝑡𝑡𝑅𝑅𝑡𝑡𝐴𝐴 + (1 − 𝛼𝛼𝑡𝑡)𝑅𝑅𝑡𝑡
𝐵𝐵 𝜎𝜎𝑡𝑡
2 = 𝛼𝛼𝑡𝑡2(𝜎𝜎𝑡𝑡
𝐴𝐴)2 + (1 − 𝛼𝛼𝑡𝑡)2(𝜎𝜎𝑡𝑡𝐵𝐵)2 + 2𝛼𝛼𝑡𝑡(1 − 𝛼𝛼𝑡𝑡)𝜎𝜎𝑡𝑡
𝐴𝐴𝐵𝐵 𝜎𝜎𝑡𝑡
2
𝐵𝐵𝐵𝐵𝐵𝐵𝐵𝐵𝑡𝑡 = 𝛼𝛼𝐵𝐵𝐵𝐵𝐵𝐵𝐵𝐵𝑡𝑡𝐴𝐴 + (1 − 𝛼𝛼)𝐵𝐵𝐵𝐵𝐵𝐵𝐵𝐵𝑡𝑡
𝐵𝐵 (5)
𝐵𝐵𝐵𝐵𝐵𝐵𝐵𝐵𝑡𝑡𝐴𝐴 𝐵𝐵𝐵𝐵𝐵𝐵𝐵𝐵𝑡𝑡
𝐵𝐵
𝐵𝐵𝐵𝐵𝐵𝐵𝐵𝐵𝑡𝑡𝐴𝐴 = −𝑎𝑎1(𝐶𝐶𝐶𝐶2) − 𝑎𝑎2(𝑆𝑆𝐶𝐶2) − 𝑎𝑎3(𝑁𝑁𝐶𝐶𝑥𝑥)
𝑌𝑌𝑡𝑡𝐴𝐴 (6)
𝐵𝐵𝐵𝐵𝐵𝐵𝐵𝐵𝑡𝑡𝐵𝐵 = −𝑏𝑏1(𝐶𝐶𝐶𝐶2) − 𝑏𝑏2(𝑆𝑆𝐶𝐶2) − 𝑏𝑏3(𝑁𝑁𝐶𝐶𝑥𝑥)
𝑌𝑌𝑡𝑡𝐵𝐵 (7)
𝑌𝑌𝑡𝑡𝐴𝐴 𝑌𝑌𝑡𝑡
𝐵𝐵
𝛼𝛼𝑡𝑡 =1
2𝛽𝛽(𝑅𝑅𝑡𝑡𝐴𝐴−𝑅𝑅𝑡𝑡
𝐵𝐵)−(𝜎𝜎𝑡𝑡𝐵𝐵)2−𝜎𝜎𝑡𝑡
𝐴𝐴𝐵𝐵
(𝜎𝜎𝑡𝑡𝐴𝐴)2−(𝜎𝜎𝑡𝑡
𝐵𝐵)2−2𝜎𝜎𝑡𝑡𝐴𝐴𝐵𝐵
𝐵𝐵𝐵𝐵𝐵𝐵𝐵𝐵𝑡𝑡
𝐴𝐴 − 𝐵𝐵𝐵𝐵𝐵𝐵𝐵𝐵𝑡𝑡𝐵𝐵
𝐵𝐵𝐵𝐵𝐵𝐵𝐵𝐵𝑡𝑡𝐴𝐴 > 𝐵𝐵𝐵𝐵𝐵𝐵𝐵𝐵𝑡𝑡
𝐵𝐵
, (7)
where CO2, SO2, and NOx refer to the ocean emissions that a firm produces. The coefficients (a1, a2, a3) and (b1, b2, b3) differ from one firm to another.
𝑈𝑈(𝑅𝑅𝑡𝑡 , 𝜎𝜎𝑡𝑡2) = 𝑅𝑅𝑡𝑡 − 𝛽𝛽𝜎𝜎𝑡𝑡
2
𝑅𝑅𝑡𝑡 = 𝛼𝛼𝑡𝑡𝑅𝑅𝑡𝑡𝐴𝐴 + (1 − 𝛼𝛼𝑡𝑡)𝑅𝑅𝑡𝑡
𝐵𝐵
(2)
𝑅𝑅𝑡𝑡𝐴𝐴 𝑅𝑅𝑡𝑡
𝐵𝐵
𝜎𝜎𝑡𝑡2 = 𝛼𝛼𝑡𝑡
2(𝜎𝜎𝑡𝑡𝐴𝐴)2 + (1 − 𝛼𝛼𝑡𝑡)2(𝜎𝜎𝑡𝑡
𝐵𝐵)2 + 2𝛼𝛼𝑡𝑡(1 − 𝛼𝛼𝑡𝑡)𝜎𝜎𝑡𝑡𝐴𝐴𝐵𝐵 (3)
𝜎𝜎𝑡𝑡𝐴𝐴 𝜎𝜎𝑡𝑡
𝐵𝐵 𝜎𝜎𝑡𝑡𝐴𝐴𝐵𝐵
𝜎𝜎𝑡𝑡𝐴𝐴 = 𝐸𝐸(𝑅𝑅𝑡𝑡
𝐴𝐴 − ��𝑅𝑡𝑡𝐴𝐴)2
𝜎𝜎𝑡𝑡𝐵𝐵 = 𝐸𝐸(𝑅𝑅𝑡𝑡
𝐵𝐵 − ��𝑅𝑡𝑡𝐵𝐵)2
𝜎𝜎𝑡𝑡𝐴𝐴𝐵𝐵 = 𝐸𝐸(𝑅𝑅𝑡𝑡
𝐴𝐴 − ��𝑅𝑡𝑡𝐴𝐴)(𝑅𝑅𝑡𝑡
𝐵𝐵 − ��𝑅𝑡𝑡𝐵𝐵)
𝑈𝑈(𝑅𝑅𝑡𝑡 , 𝜎𝜎𝑡𝑡2, 𝐵𝐵𝐵𝐵𝐵𝐵𝐵𝐵𝑡𝑡) = 𝑅𝑅𝑡𝑡 − 𝛽𝛽𝜎𝜎𝑡𝑡
2 + 𝛾𝛾(Blue𝑡𝑡). (4)
𝑅𝑅𝑡𝑡 = 𝛼𝛼𝑡𝑡𝑅𝑅𝑡𝑡𝐴𝐴 + (1 − 𝛼𝛼𝑡𝑡)𝑅𝑅𝑡𝑡
𝐵𝐵 𝜎𝜎𝑡𝑡
2 = 𝛼𝛼𝑡𝑡2(𝜎𝜎𝑡𝑡
𝐴𝐴)2 + (1 − 𝛼𝛼𝑡𝑡)2(𝜎𝜎𝑡𝑡𝐵𝐵)2 + 2𝛼𝛼𝑡𝑡(1 − 𝛼𝛼𝑡𝑡)𝜎𝜎𝑡𝑡
𝐴𝐴𝐵𝐵 𝜎𝜎𝑡𝑡
2
𝐵𝐵𝐵𝐵𝐵𝐵𝐵𝐵𝑡𝑡 = 𝛼𝛼𝐵𝐵𝐵𝐵𝐵𝐵𝐵𝐵𝑡𝑡𝐴𝐴 + (1 − 𝛼𝛼)𝐵𝐵𝐵𝐵𝐵𝐵𝐵𝐵𝑡𝑡
𝐵𝐵 (5)
𝐵𝐵𝐵𝐵𝐵𝐵𝐵𝐵𝑡𝑡𝐴𝐴 𝐵𝐵𝐵𝐵𝐵𝐵𝐵𝐵𝑡𝑡
𝐵𝐵
𝐵𝐵𝐵𝐵𝐵𝐵𝐵𝐵𝑡𝑡𝐴𝐴 = −𝑎𝑎1(𝐶𝐶𝐶𝐶2) − 𝑎𝑎2(𝑆𝑆𝐶𝐶2) − 𝑎𝑎3(𝑁𝑁𝐶𝐶𝑥𝑥)
𝑌𝑌𝑡𝑡𝐴𝐴 (6)
𝐵𝐵𝐵𝐵𝐵𝐵𝐵𝐵𝑡𝑡𝐵𝐵 = −𝑏𝑏1(𝐶𝐶𝐶𝐶2) − 𝑏𝑏2(𝑆𝑆𝐶𝐶2) − 𝑏𝑏3(𝑁𝑁𝐶𝐶𝑥𝑥)
𝑌𝑌𝑡𝑡𝐵𝐵 (7)
𝑌𝑌𝑡𝑡𝐴𝐴 𝑌𝑌𝑡𝑡
𝐵𝐵
𝛼𝛼𝑡𝑡 =1
2𝛽𝛽(𝑅𝑅𝑡𝑡𝐴𝐴−𝑅𝑅𝑡𝑡
𝐵𝐵)−(𝜎𝜎𝑡𝑡𝐵𝐵)2−𝜎𝜎𝑡𝑡
𝐴𝐴𝐵𝐵
(𝜎𝜎𝑡𝑡𝐴𝐴)2−(𝜎𝜎𝑡𝑡
𝐵𝐵)2−2𝜎𝜎𝑡𝑡𝐴𝐴𝐵𝐵
𝐵𝐵𝐵𝐵𝐵𝐵𝐵𝐵𝑡𝑡
𝐴𝐴 − 𝐵𝐵𝐵𝐵𝐵𝐵𝐵𝐵𝑡𝑡𝐵𝐵
𝐵𝐵𝐵𝐵𝐵𝐵𝐵𝐵𝑡𝑡𝐴𝐴 > 𝐵𝐵𝐵𝐵𝐵𝐵𝐵𝐵𝑡𝑡
𝐵𝐵
and
𝑈𝑈(𝑅𝑅𝑡𝑡 , 𝜎𝜎𝑡𝑡2) = 𝑅𝑅𝑡𝑡 − 𝛽𝛽𝜎𝜎𝑡𝑡
2
𝑅𝑅𝑡𝑡 = 𝛼𝛼𝑡𝑡𝑅𝑅𝑡𝑡𝐴𝐴 + (1 − 𝛼𝛼𝑡𝑡)𝑅𝑅𝑡𝑡
𝐵𝐵
(2)
𝑅𝑅𝑡𝑡𝐴𝐴 𝑅𝑅𝑡𝑡
𝐵𝐵
𝜎𝜎𝑡𝑡2 = 𝛼𝛼𝑡𝑡
2(𝜎𝜎𝑡𝑡𝐴𝐴)2 + (1 − 𝛼𝛼𝑡𝑡)2(𝜎𝜎𝑡𝑡
𝐵𝐵)2 + 2𝛼𝛼𝑡𝑡(1 − 𝛼𝛼𝑡𝑡)𝜎𝜎𝑡𝑡𝐴𝐴𝐵𝐵 (3)
𝜎𝜎𝑡𝑡𝐴𝐴 𝜎𝜎𝑡𝑡
𝐵𝐵 𝜎𝜎𝑡𝑡𝐴𝐴𝐵𝐵
𝜎𝜎𝑡𝑡𝐴𝐴 = 𝐸𝐸(𝑅𝑅𝑡𝑡
𝐴𝐴 − ��𝑅𝑡𝑡𝐴𝐴)2
𝜎𝜎𝑡𝑡𝐵𝐵 = 𝐸𝐸(𝑅𝑅𝑡𝑡
𝐵𝐵 − ��𝑅𝑡𝑡𝐵𝐵)2
𝜎𝜎𝑡𝑡𝐴𝐴𝐵𝐵 = 𝐸𝐸(𝑅𝑅𝑡𝑡
𝐴𝐴 − ��𝑅𝑡𝑡𝐴𝐴)(𝑅𝑅𝑡𝑡
𝐵𝐵 − ��𝑅𝑡𝑡𝐵𝐵)
𝑈𝑈(𝑅𝑅𝑡𝑡 , 𝜎𝜎𝑡𝑡2, 𝐵𝐵𝐵𝐵𝐵𝐵𝐵𝐵𝑡𝑡) = 𝑅𝑅𝑡𝑡 − 𝛽𝛽𝜎𝜎𝑡𝑡
2 + 𝛾𝛾(Blue𝑡𝑡). (4)
𝑅𝑅𝑡𝑡 = 𝛼𝛼𝑡𝑡𝑅𝑅𝑡𝑡𝐴𝐴 + (1 − 𝛼𝛼𝑡𝑡)𝑅𝑅𝑡𝑡
𝐵𝐵 𝜎𝜎𝑡𝑡
2 = 𝛼𝛼𝑡𝑡2(𝜎𝜎𝑡𝑡
𝐴𝐴)2 + (1 − 𝛼𝛼𝑡𝑡)2(𝜎𝜎𝑡𝑡𝐵𝐵)2 + 2𝛼𝛼𝑡𝑡(1 − 𝛼𝛼𝑡𝑡)𝜎𝜎𝑡𝑡
𝐴𝐴𝐵𝐵 𝜎𝜎𝑡𝑡
2
𝐵𝐵𝐵𝐵𝐵𝐵𝐵𝐵𝑡𝑡 = 𝛼𝛼𝐵𝐵𝐵𝐵𝐵𝐵𝐵𝐵𝑡𝑡𝐴𝐴 + (1 − 𝛼𝛼)𝐵𝐵𝐵𝐵𝐵𝐵𝐵𝐵𝑡𝑡
𝐵𝐵 (5)
𝐵𝐵𝐵𝐵𝐵𝐵𝐵𝐵𝑡𝑡𝐴𝐴 𝐵𝐵𝐵𝐵𝐵𝐵𝐵𝐵𝑡𝑡
𝐵𝐵
𝐵𝐵𝐵𝐵𝐵𝐵𝐵𝐵𝑡𝑡𝐴𝐴 = −𝑎𝑎1(𝐶𝐶𝐶𝐶2) − 𝑎𝑎2(𝑆𝑆𝐶𝐶2) − 𝑎𝑎3(𝑁𝑁𝐶𝐶𝑥𝑥)
𝑌𝑌𝑡𝑡𝐴𝐴 (6)
𝐵𝐵𝐵𝐵𝐵𝐵𝐵𝐵𝑡𝑡𝐵𝐵 = −𝑏𝑏1(𝐶𝐶𝐶𝐶2) − 𝑏𝑏2(𝑆𝑆𝐶𝐶2) − 𝑏𝑏3(𝑁𝑁𝐶𝐶𝑥𝑥)
𝑌𝑌𝑡𝑡𝐵𝐵 (7)
𝑌𝑌𝑡𝑡𝐴𝐴 𝑌𝑌𝑡𝑡
𝐵𝐵
𝛼𝛼𝑡𝑡 =1
2𝛽𝛽(𝑅𝑅𝑡𝑡𝐴𝐴−𝑅𝑅𝑡𝑡
𝐵𝐵)−(𝜎𝜎𝑡𝑡𝐵𝐵)2−𝜎𝜎𝑡𝑡
𝐴𝐴𝐵𝐵
(𝜎𝜎𝑡𝑡𝐴𝐴)2−(𝜎𝜎𝑡𝑡
𝐵𝐵)2−2𝜎𝜎𝑡𝑡𝐴𝐴𝐵𝐵
𝐵𝐵𝐵𝐵𝐵𝐵𝐵𝐵𝑡𝑡
𝐴𝐴 − 𝐵𝐵𝐵𝐵𝐵𝐵𝐵𝐵𝑡𝑡𝐵𝐵
𝐵𝐵𝐵𝐵𝐵𝐵𝐵𝐵𝑡𝑡𝐴𝐴 > 𝐵𝐵𝐵𝐵𝐵𝐵𝐵𝐵𝑡𝑡
𝐵𝐵
show the net sales of firms A and B.Equation (8) reveals the proportion of investment in bond A
(Yoshino, Taghizadeh-Hesary, and Otsuka 2020). If firms do not account for the necessary measures to reduce the ocean emissions, then the
share of bond A will be
𝑈𝑈(𝑅𝑅𝑡𝑡 , 𝜎𝜎𝑡𝑡2) = 𝑅𝑅𝑡𝑡 − 𝛽𝛽𝜎𝜎𝑡𝑡
2
𝑅𝑅𝑡𝑡 = 𝛼𝛼𝑡𝑡𝑅𝑅𝑡𝑡𝐴𝐴 + (1 − 𝛼𝛼𝑡𝑡)𝑅𝑅𝑡𝑡
𝐵𝐵
(2)
𝑅𝑅𝑡𝑡𝐴𝐴 𝑅𝑅𝑡𝑡
𝐵𝐵
𝜎𝜎𝑡𝑡2 = 𝛼𝛼𝑡𝑡
2(𝜎𝜎𝑡𝑡𝐴𝐴)2 + (1 − 𝛼𝛼𝑡𝑡)2(𝜎𝜎𝑡𝑡
𝐵𝐵)2 + 2𝛼𝛼𝑡𝑡(1 − 𝛼𝛼𝑡𝑡)𝜎𝜎𝑡𝑡𝐴𝐴𝐵𝐵 (3)
𝜎𝜎𝑡𝑡𝐴𝐴 𝜎𝜎𝑡𝑡
𝐵𝐵 𝜎𝜎𝑡𝑡𝐴𝐴𝐵𝐵
𝜎𝜎𝑡𝑡𝐴𝐴 = 𝐸𝐸(𝑅𝑅𝑡𝑡
𝐴𝐴 − ��𝑅𝑡𝑡𝐴𝐴)2
𝜎𝜎𝑡𝑡𝐵𝐵 = 𝐸𝐸(𝑅𝑅𝑡𝑡
𝐵𝐵 − ��𝑅𝑡𝑡𝐵𝐵)2
𝜎𝜎𝑡𝑡𝐴𝐴𝐵𝐵 = 𝐸𝐸(𝑅𝑅𝑡𝑡
𝐴𝐴 − ��𝑅𝑡𝑡𝐴𝐴)(𝑅𝑅𝑡𝑡
𝐵𝐵 − ��𝑅𝑡𝑡𝐵𝐵)
𝑈𝑈(𝑅𝑅𝑡𝑡 , 𝜎𝜎𝑡𝑡2, 𝐵𝐵𝐵𝐵𝐵𝐵𝐵𝐵𝑡𝑡) = 𝑅𝑅𝑡𝑡 − 𝛽𝛽𝜎𝜎𝑡𝑡
2 + 𝛾𝛾(Blue𝑡𝑡). (4)
𝑅𝑅𝑡𝑡 = 𝛼𝛼𝑡𝑡𝑅𝑅𝑡𝑡𝐴𝐴 + (1 − 𝛼𝛼𝑡𝑡)𝑅𝑅𝑡𝑡
𝐵𝐵 𝜎𝜎𝑡𝑡
2 = 𝛼𝛼𝑡𝑡2(𝜎𝜎𝑡𝑡
𝐴𝐴)2 + (1 − 𝛼𝛼𝑡𝑡)2(𝜎𝜎𝑡𝑡𝐵𝐵)2 + 2𝛼𝛼𝑡𝑡(1 − 𝛼𝛼𝑡𝑡)𝜎𝜎𝑡𝑡
𝐴𝐴𝐵𝐵 𝜎𝜎𝑡𝑡
2
𝐵𝐵𝐵𝐵𝐵𝐵𝐵𝐵𝑡𝑡 = 𝛼𝛼𝐵𝐵𝐵𝐵𝐵𝐵𝐵𝐵𝑡𝑡𝐴𝐴 + (1 − 𝛼𝛼)𝐵𝐵𝐵𝐵𝐵𝐵𝐵𝐵𝑡𝑡
𝐵𝐵 (5)
𝐵𝐵𝐵𝐵𝐵𝐵𝐵𝐵𝑡𝑡𝐴𝐴 𝐵𝐵𝐵𝐵𝐵𝐵𝐵𝐵𝑡𝑡
𝐵𝐵
𝐵𝐵𝐵𝐵𝐵𝐵𝐵𝐵𝑡𝑡𝐴𝐴 = −𝑎𝑎1(𝐶𝐶𝐶𝐶2) − 𝑎𝑎2(𝑆𝑆𝐶𝐶2) − 𝑎𝑎3(𝑁𝑁𝐶𝐶𝑥𝑥)
𝑌𝑌𝑡𝑡𝐴𝐴 (6)
𝐵𝐵𝐵𝐵𝐵𝐵𝐵𝐵𝑡𝑡𝐵𝐵 = −𝑏𝑏1(𝐶𝐶𝐶𝐶2) − 𝑏𝑏2(𝑆𝑆𝐶𝐶2) − 𝑏𝑏3(𝑁𝑁𝐶𝐶𝑥𝑥)
𝑌𝑌𝑡𝑡𝐵𝐵 (7)
𝑌𝑌𝑡𝑡𝐴𝐴 𝑌𝑌𝑡𝑡
𝐵𝐵
𝛼𝛼𝑡𝑡 =1
2𝛽𝛽(𝑅𝑅𝑡𝑡𝐴𝐴−𝑅𝑅𝑡𝑡
𝐵𝐵)−(𝜎𝜎𝑡𝑡𝐵𝐵)2−𝜎𝜎𝑡𝑡
𝐴𝐴𝐵𝐵
(𝜎𝜎𝑡𝑡𝐴𝐴)2−(𝜎𝜎𝑡𝑡
𝐵𝐵)2−2𝜎𝜎𝑡𝑡𝐴𝐴𝐵𝐵
𝐵𝐵𝐵𝐵𝐵𝐵𝐵𝐵𝑡𝑡
𝐴𝐴 − 𝐵𝐵𝐵𝐵𝐵𝐵𝐵𝐵𝑡𝑡𝐵𝐵
𝐵𝐵𝐵𝐵𝐵𝐵𝐵𝐵𝑡𝑡𝐴𝐴 > 𝐵𝐵𝐵𝐵𝐵𝐵𝐵𝐵𝑡𝑡
𝐵𝐵
.
The Blueness Index, Investment Choice, and Portfolio Allocation 81
𝑈𝑈(𝑅𝑅𝑡𝑡 , 𝜎𝜎𝑡𝑡2) = 𝑅𝑅𝑡𝑡 − 𝛽𝛽𝜎𝜎𝑡𝑡
2
𝑅𝑅𝑡𝑡 = 𝛼𝛼𝑡𝑡𝑅𝑅𝑡𝑡𝐴𝐴 + (1 − 𝛼𝛼𝑡𝑡)𝑅𝑅𝑡𝑡
𝐵𝐵
(2)
𝑅𝑅𝑡𝑡𝐴𝐴 𝑅𝑅𝑡𝑡
𝐵𝐵
𝜎𝜎𝑡𝑡2 = 𝛼𝛼𝑡𝑡
2(𝜎𝜎𝑡𝑡𝐴𝐴)2 + (1 − 𝛼𝛼𝑡𝑡)2(𝜎𝜎𝑡𝑡
𝐵𝐵)2 + 2𝛼𝛼𝑡𝑡(1 − 𝛼𝛼𝑡𝑡)𝜎𝜎𝑡𝑡𝐴𝐴𝐵𝐵 (3)
𝜎𝜎𝑡𝑡𝐴𝐴 𝜎𝜎𝑡𝑡
𝐵𝐵 𝜎𝜎𝑡𝑡𝐴𝐴𝐵𝐵
𝜎𝜎𝑡𝑡𝐴𝐴 = 𝐸𝐸(𝑅𝑅𝑡𝑡
𝐴𝐴 − ��𝑅𝑡𝑡𝐴𝐴)2
𝜎𝜎𝑡𝑡𝐵𝐵 = 𝐸𝐸(𝑅𝑅𝑡𝑡
𝐵𝐵 − ��𝑅𝑡𝑡𝐵𝐵)2
𝜎𝜎𝑡𝑡𝐴𝐴𝐵𝐵 = 𝐸𝐸(𝑅𝑅𝑡𝑡
𝐴𝐴 − ��𝑅𝑡𝑡𝐴𝐴)(𝑅𝑅𝑡𝑡
𝐵𝐵 − ��𝑅𝑡𝑡𝐵𝐵)
𝑈𝑈(𝑅𝑅𝑡𝑡 , 𝜎𝜎𝑡𝑡2, 𝐵𝐵𝐵𝐵𝐵𝐵𝐵𝐵𝑡𝑡) = 𝑅𝑅𝑡𝑡 − 𝛽𝛽𝜎𝜎𝑡𝑡
2 + 𝛾𝛾(Blue𝑡𝑡). (4)
𝑅𝑅𝑡𝑡 = 𝛼𝛼𝑡𝑡𝑅𝑅𝑡𝑡𝐴𝐴 + (1 − 𝛼𝛼𝑡𝑡)𝑅𝑅𝑡𝑡
𝐵𝐵 𝜎𝜎𝑡𝑡
2 = 𝛼𝛼𝑡𝑡2(𝜎𝜎𝑡𝑡
𝐴𝐴)2 + (1 − 𝛼𝛼𝑡𝑡)2(𝜎𝜎𝑡𝑡𝐵𝐵)2 + 2𝛼𝛼𝑡𝑡(1 − 𝛼𝛼𝑡𝑡)𝜎𝜎𝑡𝑡
𝐴𝐴𝐵𝐵 𝜎𝜎𝑡𝑡
2
𝐵𝐵𝐵𝐵𝐵𝐵𝐵𝐵𝑡𝑡 = 𝛼𝛼𝐵𝐵𝐵𝐵𝐵𝐵𝐵𝐵𝑡𝑡𝐴𝐴 + (1 − 𝛼𝛼)𝐵𝐵𝐵𝐵𝐵𝐵𝐵𝐵𝑡𝑡
𝐵𝐵 (5)
𝐵𝐵𝐵𝐵𝐵𝐵𝐵𝐵𝑡𝑡𝐴𝐴 𝐵𝐵𝐵𝐵𝐵𝐵𝐵𝐵𝑡𝑡
𝐵𝐵
𝐵𝐵𝐵𝐵𝐵𝐵𝐵𝐵𝑡𝑡𝐴𝐴 = −𝑎𝑎1(𝐶𝐶𝐶𝐶2) − 𝑎𝑎2(𝑆𝑆𝐶𝐶2) − 𝑎𝑎3(𝑁𝑁𝐶𝐶𝑥𝑥)
𝑌𝑌𝑡𝑡𝐴𝐴 (6)
𝐵𝐵𝐵𝐵𝐵𝐵𝐵𝐵𝑡𝑡𝐵𝐵 = −𝑏𝑏1(𝐶𝐶𝐶𝐶2) − 𝑏𝑏2(𝑆𝑆𝐶𝐶2) − 𝑏𝑏3(𝑁𝑁𝐶𝐶𝑥𝑥)
𝑌𝑌𝑡𝑡𝐵𝐵 (7)
𝑌𝑌𝑡𝑡𝐴𝐴 𝑌𝑌𝑡𝑡
𝐵𝐵
𝛼𝛼𝑡𝑡 =1
2𝛽𝛽(𝑅𝑅𝑡𝑡𝐴𝐴−𝑅𝑅𝑡𝑡
𝐵𝐵)−(𝜎𝜎𝑡𝑡𝐵𝐵)2−𝜎𝜎𝑡𝑡
𝐴𝐴𝐵𝐵
(𝜎𝜎𝑡𝑡𝐴𝐴)2−(𝜎𝜎𝑡𝑡
𝐵𝐵)2−2𝜎𝜎𝑡𝑡𝐴𝐴𝐵𝐵
𝐵𝐵𝐵𝐵𝐵𝐵𝐵𝐵𝑡𝑡
𝐴𝐴 − 𝐵𝐵𝐵𝐵𝐵𝐵𝐵𝐵𝑡𝑡𝐵𝐵
𝐵𝐵𝐵𝐵𝐵𝐵𝐵𝐵𝑡𝑡𝐴𝐴 > 𝐵𝐵𝐵𝐵𝐵𝐵𝐵𝐵𝑡𝑡
𝐵𝐵 distinguishes between the allocation of bond A and
the allocation of bond B. If
𝑈𝑈(𝑅𝑅𝑡𝑡 , 𝜎𝜎𝑡𝑡2) = 𝑅𝑅𝑡𝑡 − 𝛽𝛽𝜎𝜎𝑡𝑡
2
𝑅𝑅𝑡𝑡 = 𝛼𝛼𝑡𝑡𝑅𝑅𝑡𝑡𝐴𝐴 + (1 − 𝛼𝛼𝑡𝑡)𝑅𝑅𝑡𝑡
𝐵𝐵
(2)
𝑅𝑅𝑡𝑡𝐴𝐴 𝑅𝑅𝑡𝑡
𝐵𝐵
𝜎𝜎𝑡𝑡2 = 𝛼𝛼𝑡𝑡
2(𝜎𝜎𝑡𝑡𝐴𝐴)2 + (1 − 𝛼𝛼𝑡𝑡)2(𝜎𝜎𝑡𝑡
𝐵𝐵)2 + 2𝛼𝛼𝑡𝑡(1 − 𝛼𝛼𝑡𝑡)𝜎𝜎𝑡𝑡𝐴𝐴𝐵𝐵 (3)
𝜎𝜎𝑡𝑡𝐴𝐴 𝜎𝜎𝑡𝑡
𝐵𝐵 𝜎𝜎𝑡𝑡𝐴𝐴𝐵𝐵
𝜎𝜎𝑡𝑡𝐴𝐴 = 𝐸𝐸(𝑅𝑅𝑡𝑡
𝐴𝐴 − ��𝑅𝑡𝑡𝐴𝐴)2
𝜎𝜎𝑡𝑡𝐵𝐵 = 𝐸𝐸(𝑅𝑅𝑡𝑡
𝐵𝐵 − ��𝑅𝑡𝑡𝐵𝐵)2
𝜎𝜎𝑡𝑡𝐴𝐴𝐵𝐵 = 𝐸𝐸(𝑅𝑅𝑡𝑡
𝐴𝐴 − ��𝑅𝑡𝑡𝐴𝐴)(𝑅𝑅𝑡𝑡
𝐵𝐵 − ��𝑅𝑡𝑡𝐵𝐵)
𝑈𝑈(𝑅𝑅𝑡𝑡 , 𝜎𝜎𝑡𝑡2, 𝐵𝐵𝐵𝐵𝐵𝐵𝐵𝐵𝑡𝑡) = 𝑅𝑅𝑡𝑡 − 𝛽𝛽𝜎𝜎𝑡𝑡
2 + 𝛾𝛾(Blue𝑡𝑡). (4)
𝑅𝑅𝑡𝑡 = 𝛼𝛼𝑡𝑡𝑅𝑅𝑡𝑡𝐴𝐴 + (1 − 𝛼𝛼𝑡𝑡)𝑅𝑅𝑡𝑡
𝐵𝐵 𝜎𝜎𝑡𝑡
2 = 𝛼𝛼𝑡𝑡2(𝜎𝜎𝑡𝑡
𝐴𝐴)2 + (1 − 𝛼𝛼𝑡𝑡)2(𝜎𝜎𝑡𝑡𝐵𝐵)2 + 2𝛼𝛼𝑡𝑡(1 − 𝛼𝛼𝑡𝑡)𝜎𝜎𝑡𝑡
𝐴𝐴𝐵𝐵 𝜎𝜎𝑡𝑡
2
𝐵𝐵𝐵𝐵𝐵𝐵𝐵𝐵𝑡𝑡 = 𝛼𝛼𝐵𝐵𝐵𝐵𝐵𝐵𝐵𝐵𝑡𝑡𝐴𝐴 + (1 − 𝛼𝛼)𝐵𝐵𝐵𝐵𝐵𝐵𝐵𝐵𝑡𝑡
𝐵𝐵 (5)
𝐵𝐵𝐵𝐵𝐵𝐵𝐵𝐵𝑡𝑡𝐴𝐴 𝐵𝐵𝐵𝐵𝐵𝐵𝐵𝐵𝑡𝑡
𝐵𝐵
𝐵𝐵𝐵𝐵𝐵𝐵𝐵𝐵𝑡𝑡𝐴𝐴 = −𝑎𝑎1(𝐶𝐶𝐶𝐶2) − 𝑎𝑎2(𝑆𝑆𝐶𝐶2) − 𝑎𝑎3(𝑁𝑁𝐶𝐶𝑥𝑥)
𝑌𝑌𝑡𝑡𝐴𝐴 (6)
𝐵𝐵𝐵𝐵𝐵𝐵𝐵𝐵𝑡𝑡𝐵𝐵 = −𝑏𝑏1(𝐶𝐶𝐶𝐶2) − 𝑏𝑏2(𝑆𝑆𝐶𝐶2) − 𝑏𝑏3(𝑁𝑁𝐶𝐶𝑥𝑥)
𝑌𝑌𝑡𝑡𝐵𝐵 (7)
𝑌𝑌𝑡𝑡𝐴𝐴 𝑌𝑌𝑡𝑡
𝐵𝐵
𝛼𝛼𝑡𝑡 =1
2𝛽𝛽(𝑅𝑅𝑡𝑡𝐴𝐴−𝑅𝑅𝑡𝑡
𝐵𝐵)−(𝜎𝜎𝑡𝑡𝐵𝐵)2−𝜎𝜎𝑡𝑡
𝐴𝐴𝐵𝐵
(𝜎𝜎𝑡𝑡𝐴𝐴)2−(𝜎𝜎𝑡𝑡
𝐵𝐵)2−2𝜎𝜎𝑡𝑡𝐴𝐴𝐵𝐵
𝐵𝐵𝐵𝐵𝐵𝐵𝐵𝐵𝑡𝑡
𝐴𝐴 − 𝐵𝐵𝐵𝐵𝐵𝐵𝐵𝐵𝑡𝑡𝐵𝐵
𝐵𝐵𝐵𝐵𝐵𝐵𝐵𝐵𝑡𝑡𝐴𝐴 > 𝐵𝐵𝐵𝐵𝐵𝐵𝐵𝐵𝑡𝑡
𝐵𝐵 , then the portfolio allocation of bond A will be larger. However, the firm’s blueness index varies, and investors choose to allocate their portfolio based on the firm’s consideration of blueness measures.
𝛼𝛼𝑡𝑡 =1
2𝛽𝛽 (𝑅𝑅𝑡𝑡𝐴𝐴 − 𝑅𝑅𝑡𝑡
𝐵𝐵) − (𝜎𝜎𝑡𝑡𝐵𝐵)2 − 𝜎𝜎𝑡𝑡
𝐴𝐴𝐵𝐵 + 𝛾𝛾2𝛽𝛽 (𝐵𝐵𝐵𝐵𝐵𝐵𝐵𝐵𝑡𝑡
𝐴𝐴 − 𝐵𝐵𝐵𝐵𝐵𝐵𝐵𝐵𝑡𝑡𝐵𝐵)
(𝜎𝜎𝑡𝑡𝐴𝐴)2 − (𝜎𝜎𝑡𝑡
𝐵𝐵)2 − 2𝜎𝜎𝑡𝑡𝐴𝐴𝐵𝐵
(8)
𝑈𝑈𝑈��𝑅𝑡𝑡, 𝜎𝜎𝜎𝑡𝑡2) = ��𝑅𝑡𝑡 − 𝛽𝛽𝜎𝜎𝜎𝑡𝑡
2
𝑇𝑇𝐴𝐴 = 𝑡𝑡1𝑈𝐶𝐶𝐶𝐶2𝑡𝑡𝐴𝐴 ) + 𝑡𝑡2𝑈𝑆𝑆𝐶𝐶2𝑡𝑡
𝐴𝐴 ) + 𝑡𝑡3𝑈𝑁𝑁𝐶𝐶𝑥𝑥𝑡𝑡𝐴𝐴 )
𝑇𝑇𝐵𝐵 = 𝑡𝑡1𝑈𝐶𝐶𝐶𝐶2𝑡𝑡𝐵𝐵 ) + 𝑡𝑡2𝑈𝑆𝑆𝐶𝐶2𝑡𝑡
𝐵𝐵 ) + 𝑡𝑡3𝑈𝑁𝑁𝐶𝐶𝑥𝑥𝑡𝑡𝐵𝐵 )
��𝑅𝑡𝑡𝐴𝐴 = 𝑅𝑅𝑡𝑡
𝐴𝐴 − 𝑇𝑇𝐴𝐴 ��𝑅𝑡𝑡
𝐵𝐵 = 𝑅𝑅𝑡𝑡𝐵𝐵 − 𝑇𝑇𝐵𝐵
��𝑅𝑡𝑡 = 𝛼𝛼𝜎𝑡𝑡��𝑅𝑡𝑡𝐴𝐴 + (1 − 𝛼𝛼𝜎𝑡𝑡)��𝑅𝑡𝑡
𝐵𝐵
𝛼𝛼𝜎𝑡𝑡 =1
2𝛽𝛽𝑈��𝑅𝑡𝑡𝐴𝐴−��𝑅𝑡𝑡
𝐵𝐵)−𝑈��𝜎𝑡𝑡𝐵𝐵)2−��𝜎𝑡𝑡
𝐴𝐴𝐵𝐵
𝑈��𝜎𝑡𝑡𝐴𝐴)2−𝑈��𝜎𝑡𝑡
𝐵𝐵)2−2��𝜎𝑡𝑡𝐴𝐴𝐵𝐵 .
𝑆𝑆𝑆𝑆𝑅𝑅𝑖𝑖𝑡𝑡 = 𝛼𝛼𝑖𝑖𝑡𝑡 + 𝛽𝛽1𝑅𝑅𝐶𝐶𝐵𝐵𝑖𝑖𝑡𝑡 + 𝛽𝛽2𝐼𝐼𝐵𝐵𝑖𝑖𝑡𝑡 + 𝛽𝛽3𝐵𝐵𝐵𝐵𝐵𝐵𝐵𝐵𝐵𝐵𝐵𝐵𝐵𝐵𝐵𝐵𝑖𝑖𝑡𝑡 + 𝛽𝛽4𝑅𝑅𝑖𝑖𝐵𝐵𝑅𝑅𝑖𝑖𝑡𝑡 + 𝜀𝜀𝑖𝑖𝑡𝑡
(9)
𝐵𝐵𝐵𝐵𝐵𝐵𝐵𝐵𝑡𝑡 =−𝑎𝑎1(𝐶𝐶𝐶𝐶2) − 𝑎𝑎2(𝑆𝑆𝐶𝐶𝑥𝑥) − 𝑎𝑎3(𝑁𝑁2𝐶𝐶)
𝑌𝑌𝑡𝑡
𝛼𝛼𝑡𝑡 =1
2𝛽𝛽 (𝑅𝑅𝑡𝑡𝐴𝐴 − 𝑅𝑅𝑡𝑡
𝐵𝐵) − (𝜎𝜎𝑡𝑡𝐵𝐵)2 − 𝜎𝜎𝑡𝑡
𝐴𝐴𝐵𝐵
(𝜎𝜎𝑡𝑡𝐴𝐴)2 − (𝜎𝜎𝑡𝑡
𝐵𝐵)2 − 2𝜎𝜎𝑡𝑡𝐴𝐴𝐵𝐵
��𝛼𝑡𝑡 =1
2𝛽𝛽 (𝑅𝑅𝑡𝑡𝐴𝐴 − 𝑅𝑅𝑡𝑡
𝐵𝐵) − (𝜎𝜎𝑡𝑡𝐵𝐵)2 − 𝜎𝜎𝑡𝑡
𝐴𝐴𝐵𝐵 + 𝛾𝛾2𝛽𝛽 𝑈𝐵𝐵𝐵𝐵𝐵𝐵𝐵𝐵𝑡𝑡
𝐴𝐴 − 𝐵𝐵𝐵𝐵𝐵𝐵𝐵𝐵𝑡𝑡𝐵𝐵)
(𝜎𝜎𝑡𝑡𝐴𝐴)2 − (𝜎𝜎𝑡𝑡
𝐵𝐵)2 − 2𝜎𝜎𝑡𝑡𝐴𝐴𝐵𝐵
��𝛼 > 𝛼𝛼
(8)
4.4.3 Emission Taxation and Portfolio Allocation
This section argues that tax incentives exist for firms that behave in a socially responsible manner. In the presence of noncompliance, the government may impose emission (CO2, SO2, NOx) taxation, which emphasizes that firms need to invest in blue projects. Applying ocean emission taxation decreases the rate of returns on assets A and B (Yoshino, Taghizadeh-Hesary, and Otsuka 2021; Mumtaz
and Yoshino 2021b). We assume that
𝛼𝛼𝑡𝑡 =1
2𝛽𝛽 (𝑅𝑅𝑡𝑡𝐴𝐴 − 𝑅𝑅𝑡𝑡
𝐵𝐵) − (𝜎𝜎𝑡𝑡𝐵𝐵)2 − 𝜎𝜎𝑡𝑡
𝐴𝐴𝐵𝐵 + 𝛾𝛾2𝛽𝛽 (𝐵𝐵𝐵𝐵𝐵𝐵𝐵𝐵𝑡𝑡
𝐴𝐴 − 𝐵𝐵𝐵𝐵𝐵𝐵𝐵𝐵𝑡𝑡𝐵𝐵)
(𝜎𝜎𝑡𝑡𝐴𝐴)2 − (𝜎𝜎𝑡𝑡
𝐵𝐵)2 − 2𝜎𝜎𝑡𝑡𝐴𝐴𝐵𝐵
(8)
𝑈𝑈𝑈��𝑅𝑡𝑡, 𝜎𝜎𝜎𝑡𝑡2) = ��𝑅𝑡𝑡 − 𝛽𝛽𝜎𝜎𝜎𝑡𝑡
2
𝑇𝑇𝐴𝐴 = 𝑡𝑡1𝑈𝐶𝐶𝐶𝐶2𝑡𝑡𝐴𝐴 ) + 𝑡𝑡2𝑈𝑆𝑆𝐶𝐶2𝑡𝑡
𝐴𝐴 ) + 𝑡𝑡3𝑈𝑁𝑁𝐶𝐶𝑥𝑥𝑡𝑡𝐴𝐴 )
𝑇𝑇𝐵𝐵 = 𝑡𝑡1𝑈𝐶𝐶𝐶𝐶2𝑡𝑡𝐵𝐵 ) + 𝑡𝑡2𝑈𝑆𝑆𝐶𝐶2𝑡𝑡
𝐵𝐵 ) + 𝑡𝑡3𝑈𝑁𝑁𝐶𝐶𝑥𝑥𝑡𝑡𝐵𝐵 )
��𝑅𝑡𝑡𝐴𝐴 = 𝑅𝑅𝑡𝑡
𝐴𝐴 − 𝑇𝑇𝐴𝐴 ��𝑅𝑡𝑡
𝐵𝐵 = 𝑅𝑅𝑡𝑡𝐵𝐵 − 𝑇𝑇𝐵𝐵
��𝑅𝑡𝑡 = 𝛼𝛼𝜎𝑡𝑡��𝑅𝑡𝑡𝐴𝐴 + (1 − 𝛼𝛼𝜎𝑡𝑡)��𝑅𝑡𝑡
𝐵𝐵
𝛼𝛼𝜎𝑡𝑡 =1
2𝛽𝛽𝑈��𝑅𝑡𝑡𝐴𝐴−��𝑅𝑡𝑡
𝐵𝐵)−𝑈��𝜎𝑡𝑡𝐵𝐵)2−��𝜎𝑡𝑡
𝐴𝐴𝐵𝐵
𝑈��𝜎𝑡𝑡𝐴𝐴)2−𝑈��𝜎𝑡𝑡
𝐵𝐵)2−2��𝜎𝑡𝑡𝐴𝐴𝐵𝐵 .
𝑆𝑆𝑆𝑆𝑅𝑅𝑖𝑖𝑡𝑡 = 𝛼𝛼𝑖𝑖𝑡𝑡 + 𝛽𝛽1𝑅𝑅𝐶𝐶𝐵𝐵𝑖𝑖𝑡𝑡 + 𝛽𝛽2𝐼𝐼𝐵𝐵𝑖𝑖𝑡𝑡 + 𝛽𝛽3𝐵𝐵𝐵𝐵𝐵𝐵𝐵𝐵𝐵𝐵𝐵𝐵𝐵𝐵𝐵𝐵𝑖𝑖𝑡𝑡 + 𝛽𝛽4𝑅𝑅𝑖𝑖𝐵𝐵𝑅𝑅𝑖𝑖𝑡𝑡 + 𝜀𝜀𝑖𝑖𝑡𝑡
(9)
𝐵𝐵𝐵𝐵𝐵𝐵𝐵𝐵𝑡𝑡 =−𝑎𝑎1(𝐶𝐶𝐶𝐶2) − 𝑎𝑎2(𝑆𝑆𝐶𝐶𝑥𝑥) − 𝑎𝑎3(𝑁𝑁2𝐶𝐶)
𝑌𝑌𝑡𝑡
𝛼𝛼𝑡𝑡 =1
2𝛽𝛽 (𝑅𝑅𝑡𝑡𝐴𝐴 − 𝑅𝑅𝑡𝑡
𝐵𝐵) − (𝜎𝜎𝑡𝑡𝐵𝐵)2 − 𝜎𝜎𝑡𝑡
𝐴𝐴𝐵𝐵
(𝜎𝜎𝑡𝑡𝐴𝐴)2 − (𝜎𝜎𝑡𝑡
𝐵𝐵)2 − 2𝜎𝜎𝑡𝑡𝐴𝐴𝐵𝐵
��𝛼𝑡𝑡 =1
2𝛽𝛽 (𝑅𝑅𝑡𝑡𝐴𝐴 − 𝑅𝑅𝑡𝑡
𝐵𝐵) − (𝜎𝜎𝑡𝑡𝐵𝐵)2 − 𝜎𝜎𝑡𝑡
𝐴𝐴𝐵𝐵 + 𝛾𝛾2𝛽𝛽 𝑈𝐵𝐵𝐵𝐵𝐵𝐵𝐵𝐵𝑡𝑡
𝐴𝐴 − 𝐵𝐵𝐵𝐵𝐵𝐵𝐵𝐵𝑡𝑡𝐵𝐵)
(𝜎𝜎𝑡𝑡𝐴𝐴)2 − (𝜎𝜎𝑡𝑡
𝐵𝐵)2 − 2𝜎𝜎𝑡𝑡𝐴𝐴𝐵𝐵
��𝛼 > 𝛼𝛼
,
where
𝛼𝛼𝑡𝑡 =1
2𝛽𝛽 (𝑅𝑅𝑡𝑡𝐴𝐴 − 𝑅𝑅𝑡𝑡
𝐵𝐵) − (𝜎𝜎𝑡𝑡𝐵𝐵)2 − 𝜎𝜎𝑡𝑡
𝐴𝐴𝐵𝐵 + 𝛾𝛾2𝛽𝛽 (𝐵𝐵𝐵𝐵𝐵𝐵𝐵𝐵𝑡𝑡
𝐴𝐴 − 𝐵𝐵𝐵𝐵𝐵𝐵𝐵𝐵𝑡𝑡𝐵𝐵)
(𝜎𝜎𝑡𝑡𝐴𝐴)2 − (𝜎𝜎𝑡𝑡
𝐵𝐵)2 − 2𝜎𝜎𝑡𝑡𝐴𝐴𝐵𝐵
(8)
𝑈𝑈𝑈��𝑅𝑡𝑡, 𝜎𝜎𝜎𝑡𝑡2) = ��𝑅𝑡𝑡 − 𝛽𝛽𝜎𝜎𝜎𝑡𝑡
2
𝑇𝑇𝐴𝐴 = 𝑡𝑡1𝑈𝐶𝐶𝐶𝐶2𝑡𝑡𝐴𝐴 ) + 𝑡𝑡2𝑈𝑆𝑆𝐶𝐶2𝑡𝑡
𝐴𝐴 ) + 𝑡𝑡3𝑈𝑁𝑁𝐶𝐶𝑥𝑥𝑡𝑡𝐴𝐴 )
𝑇𝑇𝐵𝐵 = 𝑡𝑡1𝑈𝐶𝐶𝐶𝐶2𝑡𝑡𝐵𝐵 ) + 𝑡𝑡2𝑈𝑆𝑆𝐶𝐶2𝑡𝑡
𝐵𝐵 ) + 𝑡𝑡3𝑈𝑁𝑁𝐶𝐶𝑥𝑥𝑡𝑡𝐵𝐵 )
��𝑅𝑡𝑡𝐴𝐴 = 𝑅𝑅𝑡𝑡
𝐴𝐴 − 𝑇𝑇𝐴𝐴 ��𝑅𝑡𝑡
𝐵𝐵 = 𝑅𝑅𝑡𝑡𝐵𝐵 − 𝑇𝑇𝐵𝐵
��𝑅𝑡𝑡 = 𝛼𝛼𝜎𝑡𝑡��𝑅𝑡𝑡𝐴𝐴 + (1 − 𝛼𝛼𝜎𝑡𝑡)��𝑅𝑡𝑡
𝐵𝐵
𝛼𝛼𝜎𝑡𝑡 =1
2𝛽𝛽𝑈��𝑅𝑡𝑡𝐴𝐴−��𝑅𝑡𝑡
𝐵𝐵)−𝑈��𝜎𝑡𝑡𝐵𝐵)2−��𝜎𝑡𝑡
𝐴𝐴𝐵𝐵
𝑈��𝜎𝑡𝑡𝐴𝐴)2−𝑈��𝜎𝑡𝑡
𝐵𝐵)2−2��𝜎𝑡𝑡𝐴𝐴𝐵𝐵 .
𝑆𝑆𝑆𝑆𝑅𝑅𝑖𝑖𝑡𝑡 = 𝛼𝛼𝑖𝑖𝑡𝑡 + 𝛽𝛽1𝑅𝑅𝐶𝐶𝐵𝐵𝑖𝑖𝑡𝑡 + 𝛽𝛽2𝐼𝐼𝐵𝐵𝑖𝑖𝑡𝑡 + 𝛽𝛽3𝐵𝐵𝐵𝐵𝐵𝐵𝐵𝐵𝐵𝐵𝐵𝐵𝐵𝐵𝐵𝐵𝑖𝑖𝑡𝑡 + 𝛽𝛽4𝑅𝑅𝑖𝑖𝐵𝐵𝑅𝑅𝑖𝑖𝑡𝑡 + 𝜀𝜀𝑖𝑖𝑡𝑡
(9)
𝐵𝐵𝐵𝐵𝐵𝐵𝐵𝐵𝑡𝑡 =−𝑎𝑎1(𝐶𝐶𝐶𝐶2) − 𝑎𝑎2(𝑆𝑆𝐶𝐶𝑥𝑥) − 𝑎𝑎3(𝑁𝑁2𝐶𝐶)
𝑌𝑌𝑡𝑡
𝛼𝛼𝑡𝑡 =1
2𝛽𝛽 (𝑅𝑅𝑡𝑡𝐴𝐴 − 𝑅𝑅𝑡𝑡
𝐵𝐵) − (𝜎𝜎𝑡𝑡𝐵𝐵)2 − 𝜎𝜎𝑡𝑡
𝐴𝐴𝐵𝐵
(𝜎𝜎𝑡𝑡𝐴𝐴)2 − (𝜎𝜎𝑡𝑡
𝐵𝐵)2 − 2𝜎𝜎𝑡𝑡𝐴𝐴𝐵𝐵
��𝛼𝑡𝑡 =1
2𝛽𝛽 (𝑅𝑅𝑡𝑡𝐴𝐴 − 𝑅𝑅𝑡𝑡
𝐵𝐵) − (𝜎𝜎𝑡𝑡𝐵𝐵)2 − 𝜎𝜎𝑡𝑡
𝐴𝐴𝐵𝐵 + 𝛾𝛾2𝛽𝛽 𝑈𝐵𝐵𝐵𝐵𝐵𝐵𝐵𝐵𝑡𝑡
𝐴𝐴 − 𝐵𝐵𝐵𝐵𝐵𝐵𝐵𝐵𝑡𝑡𝐵𝐵)
(𝜎𝜎𝑡𝑡𝐴𝐴)2 − (𝜎𝜎𝑡𝑡
𝐵𝐵)2 − 2𝜎𝜎𝑡𝑡𝐴𝐴𝐵𝐵
��𝛼 > 𝛼𝛼
and
𝛼𝛼𝑡𝑡 =1
2𝛽𝛽 (𝑅𝑅𝑡𝑡𝐴𝐴 − 𝑅𝑅𝑡𝑡
𝐵𝐵) − (𝜎𝜎𝑡𝑡𝐵𝐵)2 − 𝜎𝜎𝑡𝑡
𝐴𝐴𝐵𝐵 + 𝛾𝛾2𝛽𝛽 (𝐵𝐵𝐵𝐵𝐵𝐵𝐵𝐵𝑡𝑡
𝐴𝐴 − 𝐵𝐵𝐵𝐵𝐵𝐵𝐵𝐵𝑡𝑡𝐵𝐵)
(𝜎𝜎𝑡𝑡𝐴𝐴)2 − (𝜎𝜎𝑡𝑡
𝐵𝐵)2 − 2𝜎𝜎𝑡𝑡𝐴𝐴𝐵𝐵
(8)
𝑈𝑈𝑈��𝑅𝑡𝑡, 𝜎𝜎𝜎𝑡𝑡2) = ��𝑅𝑡𝑡 − 𝛽𝛽𝜎𝜎𝜎𝑡𝑡
2
𝑇𝑇𝐴𝐴 = 𝑡𝑡1𝑈𝐶𝐶𝐶𝐶2𝑡𝑡𝐴𝐴 ) + 𝑡𝑡2𝑈𝑆𝑆𝐶𝐶2𝑡𝑡
𝐴𝐴 ) + 𝑡𝑡3𝑈𝑁𝑁𝐶𝐶𝑥𝑥𝑡𝑡𝐴𝐴 )
𝑇𝑇𝐵𝐵 = 𝑡𝑡1𝑈𝐶𝐶𝐶𝐶2𝑡𝑡𝐵𝐵 ) + 𝑡𝑡2𝑈𝑆𝑆𝐶𝐶2𝑡𝑡
𝐵𝐵 ) + 𝑡𝑡3𝑈𝑁𝑁𝐶𝐶𝑥𝑥𝑡𝑡𝐵𝐵 )
��𝑅𝑡𝑡𝐴𝐴 = 𝑅𝑅𝑡𝑡
𝐴𝐴 − 𝑇𝑇𝐴𝐴 ��𝑅𝑡𝑡
𝐵𝐵 = 𝑅𝑅𝑡𝑡𝐵𝐵 − 𝑇𝑇𝐵𝐵
��𝑅𝑡𝑡 = 𝛼𝛼𝜎𝑡𝑡��𝑅𝑡𝑡𝐴𝐴 + (1 − 𝛼𝛼𝜎𝑡𝑡)��𝑅𝑡𝑡
𝐵𝐵
𝛼𝛼𝜎𝑡𝑡 =1
2𝛽𝛽𝑈��𝑅𝑡𝑡𝐴𝐴−��𝑅𝑡𝑡
𝐵𝐵)−𝑈��𝜎𝑡𝑡𝐵𝐵)2−��𝜎𝑡𝑡
𝐴𝐴𝐵𝐵
𝑈��𝜎𝑡𝑡𝐴𝐴)2−𝑈��𝜎𝑡𝑡
𝐵𝐵)2−2��𝜎𝑡𝑡𝐴𝐴𝐵𝐵 .
𝑆𝑆𝑆𝑆𝑅𝑅𝑖𝑖𝑡𝑡 = 𝛼𝛼𝑖𝑖𝑡𝑡 + 𝛽𝛽1𝑅𝑅𝐶𝐶𝐵𝐵𝑖𝑖𝑡𝑡 + 𝛽𝛽2𝐼𝐼𝐵𝐵𝑖𝑖𝑡𝑡 + 𝛽𝛽3𝐵𝐵𝐵𝐵𝐵𝐵𝐵𝐵𝐵𝐵𝐵𝐵𝐵𝐵𝐵𝐵𝑖𝑖𝑡𝑡 + 𝛽𝛽4𝑅𝑅𝑖𝑖𝐵𝐵𝑅𝑅𝑖𝑖𝑡𝑡 + 𝜀𝜀𝑖𝑖𝑡𝑡
(9)
𝐵𝐵𝐵𝐵𝐵𝐵𝐵𝐵𝑡𝑡 =−𝑎𝑎1(𝐶𝐶𝐶𝐶2) − 𝑎𝑎2(𝑆𝑆𝐶𝐶𝑥𝑥) − 𝑎𝑎3(𝑁𝑁2𝐶𝐶)
𝑌𝑌𝑡𝑡
𝛼𝛼𝑡𝑡 =1
2𝛽𝛽 (𝑅𝑅𝑡𝑡𝐴𝐴 − 𝑅𝑅𝑡𝑡
𝐵𝐵) − (𝜎𝜎𝑡𝑡𝐵𝐵)2 − 𝜎𝜎𝑡𝑡
𝐴𝐴𝐵𝐵
(𝜎𝜎𝑡𝑡𝐴𝐴)2 − (𝜎𝜎𝑡𝑡
𝐵𝐵)2 − 2𝜎𝜎𝑡𝑡𝐴𝐴𝐵𝐵
��𝛼𝑡𝑡 =1
2𝛽𝛽 (𝑅𝑅𝑡𝑡𝐴𝐴 − 𝑅𝑅𝑡𝑡
𝐵𝐵) − (𝜎𝜎𝑡𝑡𝐵𝐵)2 − 𝜎𝜎𝑡𝑡
𝐴𝐴𝐵𝐵 + 𝛾𝛾2𝛽𝛽 𝑈𝐵𝐵𝐵𝐵𝐵𝐵𝐵𝐵𝑡𝑡
𝐴𝐴 − 𝐵𝐵𝐵𝐵𝐵𝐵𝐵𝐵𝑡𝑡𝐵𝐵)
(𝜎𝜎𝑡𝑡𝐴𝐴)2 − (𝜎𝜎𝑡𝑡
𝐵𝐵)2 − 2𝜎𝜎𝑡𝑡𝐴𝐴𝐵𝐵
��𝛼 > 𝛼𝛼
𝛼𝛼𝑡𝑡 =1
2𝛽𝛽 (𝑅𝑅𝑡𝑡𝐴𝐴 − 𝑅𝑅𝑡𝑡
𝐵𝐵) − (𝜎𝜎𝑡𝑡𝐵𝐵)2 − 𝜎𝜎𝑡𝑡
𝐴𝐴𝐵𝐵 + 𝛾𝛾2𝛽𝛽 (𝐵𝐵𝐵𝐵𝐵𝐵𝐵𝐵𝑡𝑡
𝐴𝐴 − 𝐵𝐵𝐵𝐵𝐵𝐵𝐵𝐵𝑡𝑡𝐵𝐵)
(𝜎𝜎𝑡𝑡𝐴𝐴)2 − (𝜎𝜎𝑡𝑡
𝐵𝐵)2 − 2𝜎𝜎𝑡𝑡𝐴𝐴𝐵𝐵
(8)
𝑈𝑈𝑈��𝑅𝑡𝑡, 𝜎𝜎𝜎𝑡𝑡2) = ��𝑅𝑡𝑡 − 𝛽𝛽𝜎𝜎𝜎𝑡𝑡
2
𝑇𝑇𝐴𝐴 = 𝑡𝑡1𝑈𝐶𝐶𝐶𝐶2𝑡𝑡𝐴𝐴 ) + 𝑡𝑡2𝑈𝑆𝑆𝐶𝐶2𝑡𝑡
𝐴𝐴 ) + 𝑡𝑡3𝑈𝑁𝑁𝐶𝐶𝑥𝑥𝑡𝑡𝐴𝐴 )
𝑇𝑇𝐵𝐵 = 𝑡𝑡1𝑈𝐶𝐶𝐶𝐶2𝑡𝑡𝐵𝐵 ) + 𝑡𝑡2𝑈𝑆𝑆𝐶𝐶2𝑡𝑡
𝐵𝐵 ) + 𝑡𝑡3𝑈𝑁𝑁𝐶𝐶𝑥𝑥𝑡𝑡𝐵𝐵 )
��𝑅𝑡𝑡𝐴𝐴 = 𝑅𝑅𝑡𝑡
𝐴𝐴 − 𝑇𝑇𝐴𝐴 ��𝑅𝑡𝑡
𝐵𝐵 = 𝑅𝑅𝑡𝑡𝐵𝐵 − 𝑇𝑇𝐵𝐵
��𝑅𝑡𝑡 = 𝛼𝛼𝜎𝑡𝑡��𝑅𝑡𝑡𝐴𝐴 + (1 − 𝛼𝛼𝜎𝑡𝑡)��𝑅𝑡𝑡
𝐵𝐵
𝛼𝛼𝜎𝑡𝑡 =1
2𝛽𝛽𝑈��𝑅𝑡𝑡𝐴𝐴−��𝑅𝑡𝑡
𝐵𝐵)−𝑈��𝜎𝑡𝑡𝐵𝐵)2−��𝜎𝑡𝑡
𝐴𝐴𝐵𝐵
𝑈��𝜎𝑡𝑡𝐴𝐴)2−𝑈��𝜎𝑡𝑡
𝐵𝐵)2−2��𝜎𝑡𝑡𝐴𝐴𝐵𝐵 .
𝑆𝑆𝑆𝑆𝑅𝑅𝑖𝑖𝑡𝑡 = 𝛼𝛼𝑖𝑖𝑡𝑡 + 𝛽𝛽1𝑅𝑅𝐶𝐶𝐵𝐵𝑖𝑖𝑡𝑡 + 𝛽𝛽2𝐼𝐼𝐵𝐵𝑖𝑖𝑡𝑡 + 𝛽𝛽3𝐵𝐵𝐵𝐵𝐵𝐵𝐵𝐵𝐵𝐵𝐵𝐵𝐵𝐵𝐵𝐵𝑖𝑖𝑡𝑡 + 𝛽𝛽4𝑅𝑅𝑖𝑖𝐵𝐵𝑅𝑅𝑖𝑖𝑡𝑡 + 𝜀𝜀𝑖𝑖𝑡𝑡
(9)
𝐵𝐵𝐵𝐵𝐵𝐵𝐵𝐵𝑡𝑡 =−𝑎𝑎1(𝐶𝐶𝐶𝐶2) − 𝑎𝑎2(𝑆𝑆𝐶𝐶𝑥𝑥) − 𝑎𝑎3(𝑁𝑁2𝐶𝐶)
𝑌𝑌𝑡𝑡
𝛼𝛼𝑡𝑡 =1
2𝛽𝛽 (𝑅𝑅𝑡𝑡𝐴𝐴 − 𝑅𝑅𝑡𝑡
𝐵𝐵) − (𝜎𝜎𝑡𝑡𝐵𝐵)2 − 𝜎𝜎𝑡𝑡
𝐴𝐴𝐵𝐵
(𝜎𝜎𝑡𝑡𝐴𝐴)2 − (𝜎𝜎𝑡𝑡
𝐵𝐵)2 − 2𝜎𝜎𝑡𝑡𝐴𝐴𝐵𝐵
��𝛼𝑡𝑡 =1
2𝛽𝛽 (𝑅𝑅𝑡𝑡𝐴𝐴 − 𝑅𝑅𝑡𝑡
𝐵𝐵) − (𝜎𝜎𝑡𝑡𝐵𝐵)2 − 𝜎𝜎𝑡𝑡
𝐴𝐴𝐵𝐵 + 𝛾𝛾2𝛽𝛽 𝑈𝐵𝐵𝐵𝐵𝐵𝐵𝐵𝐵𝑡𝑡
𝐴𝐴 − 𝐵𝐵𝐵𝐵𝐵𝐵𝐵𝐵𝑡𝑡𝐵𝐵)
(𝜎𝜎𝑡𝑡𝐴𝐴)2 − (𝜎𝜎𝑡𝑡
𝐵𝐵)2 − 2𝜎𝜎𝑡𝑡𝐴𝐴𝐵𝐵
��𝛼 > 𝛼𝛼
.By adjusting the ocean emissions, we obtain the new utility function
covering the after-tax rate of return and after-tax risk. The tax rates are the same for firms A and B. We can obtain an after-tax rate of return as
𝛼𝛼𝑡𝑡 =1
2𝛽𝛽 (𝑅𝑅𝑡𝑡𝐴𝐴 − 𝑅𝑅𝑡𝑡
𝐵𝐵) − (𝜎𝜎𝑡𝑡𝐵𝐵)2 − 𝜎𝜎𝑡𝑡
𝐴𝐴𝐵𝐵 + 𝛾𝛾2𝛽𝛽 (𝐵𝐵𝐵𝐵𝐵𝐵𝐵𝐵𝑡𝑡
𝐴𝐴 − 𝐵𝐵𝐵𝐵𝐵𝐵𝐵𝐵𝑡𝑡𝐵𝐵)
(𝜎𝜎𝑡𝑡𝐴𝐴)2 − (𝜎𝜎𝑡𝑡
𝐵𝐵)2 − 2𝜎𝜎𝑡𝑡𝐴𝐴𝐵𝐵
(8)
𝑈𝑈𝑈��𝑅𝑡𝑡, 𝜎𝜎𝜎𝑡𝑡2) = ��𝑅𝑡𝑡 − 𝛽𝛽𝜎𝜎𝜎𝑡𝑡
2
𝑇𝑇𝐴𝐴 = 𝑡𝑡1𝑈𝐶𝐶𝐶𝐶2𝑡𝑡𝐴𝐴 ) + 𝑡𝑡2𝑈𝑆𝑆𝐶𝐶2𝑡𝑡
𝐴𝐴 ) + 𝑡𝑡3𝑈𝑁𝑁𝐶𝐶𝑥𝑥𝑡𝑡𝐴𝐴 )
𝑇𝑇𝐵𝐵 = 𝑡𝑡1𝑈𝐶𝐶𝐶𝐶2𝑡𝑡𝐵𝐵 ) + 𝑡𝑡2𝑈𝑆𝑆𝐶𝐶2𝑡𝑡
𝐵𝐵 ) + 𝑡𝑡3𝑈𝑁𝑁𝐶𝐶𝑥𝑥𝑡𝑡𝐵𝐵 )
��𝑅𝑡𝑡𝐴𝐴 = 𝑅𝑅𝑡𝑡
𝐴𝐴 − 𝑇𝑇𝐴𝐴 ��𝑅𝑡𝑡
𝐵𝐵 = 𝑅𝑅𝑡𝑡𝐵𝐵 − 𝑇𝑇𝐵𝐵
��𝑅𝑡𝑡 = 𝛼𝛼𝜎𝑡𝑡��𝑅𝑡𝑡𝐴𝐴 + (1 − 𝛼𝛼𝜎𝑡𝑡)��𝑅𝑡𝑡
𝐵𝐵
𝛼𝛼𝜎𝑡𝑡 =1
2𝛽𝛽𝑈��𝑅𝑡𝑡𝐴𝐴−��𝑅𝑡𝑡
𝐵𝐵)−𝑈��𝜎𝑡𝑡𝐵𝐵)2−��𝜎𝑡𝑡
𝐴𝐴𝐵𝐵
𝑈��𝜎𝑡𝑡𝐴𝐴)2−𝑈��𝜎𝑡𝑡
𝐵𝐵)2−2��𝜎𝑡𝑡𝐴𝐴𝐵𝐵 .
𝑆𝑆𝑆𝑆𝑅𝑅𝑖𝑖𝑡𝑡 = 𝛼𝛼𝑖𝑖𝑡𝑡 + 𝛽𝛽1𝑅𝑅𝐶𝐶𝐵𝐵𝑖𝑖𝑡𝑡 + 𝛽𝛽2𝐼𝐼𝐵𝐵𝑖𝑖𝑡𝑡 + 𝛽𝛽3𝐵𝐵𝐵𝐵𝐵𝐵𝐵𝐵𝐵𝐵𝐵𝐵𝐵𝐵𝐵𝐵𝑖𝑖𝑡𝑡 + 𝛽𝛽4𝑅𝑅𝑖𝑖𝐵𝐵𝑅𝑅𝑖𝑖𝑡𝑡 + 𝜀𝜀𝑖𝑖𝑡𝑡
(9)
𝐵𝐵𝐵𝐵𝐵𝐵𝐵𝐵𝑡𝑡 =−𝑎𝑎1(𝐶𝐶𝐶𝐶2) − 𝑎𝑎2(𝑆𝑆𝐶𝐶𝑥𝑥) − 𝑎𝑎3(𝑁𝑁2𝐶𝐶)
𝑌𝑌𝑡𝑡
𝛼𝛼𝑡𝑡 =1
2𝛽𝛽 (𝑅𝑅𝑡𝑡𝐴𝐴 − 𝑅𝑅𝑡𝑡
𝐵𝐵) − (𝜎𝜎𝑡𝑡𝐵𝐵)2 − 𝜎𝜎𝑡𝑡
𝐴𝐴𝐵𝐵
(𝜎𝜎𝑡𝑡𝐴𝐴)2 − (𝜎𝜎𝑡𝑡
𝐵𝐵)2 − 2𝜎𝜎𝑡𝑡𝐴𝐴𝐵𝐵
��𝛼𝑡𝑡 =1
2𝛽𝛽 (𝑅𝑅𝑡𝑡𝐴𝐴 − 𝑅𝑅𝑡𝑡
𝐵𝐵) − (𝜎𝜎𝑡𝑡𝐵𝐵)2 − 𝜎𝜎𝑡𝑡
𝐴𝐴𝐵𝐵 + 𝛾𝛾2𝛽𝛽 𝑈𝐵𝐵𝐵𝐵𝐵𝐵𝐵𝐵𝑡𝑡
𝐴𝐴 − 𝐵𝐵𝐵𝐵𝐵𝐵𝐵𝐵𝑡𝑡𝐵𝐵)
(𝜎𝜎𝑡𝑡𝐴𝐴)2 − (𝜎𝜎𝑡𝑡
𝐵𝐵)2 − 2𝜎𝜎𝑡𝑡𝐴𝐴𝐵𝐵
��𝛼 > 𝛼𝛼
and
𝛼𝛼𝑡𝑡 =1
2𝛽𝛽 (𝑅𝑅𝑡𝑡𝐴𝐴 − 𝑅𝑅𝑡𝑡
𝐵𝐵) − (𝜎𝜎𝑡𝑡𝐵𝐵)2 − 𝜎𝜎𝑡𝑡
𝐴𝐴𝐵𝐵 + 𝛾𝛾2𝛽𝛽 (𝐵𝐵𝐵𝐵𝐵𝐵𝐵𝐵𝑡𝑡
𝐴𝐴 − 𝐵𝐵𝐵𝐵𝐵𝐵𝐵𝐵𝑡𝑡𝐵𝐵)
(𝜎𝜎𝑡𝑡𝐴𝐴)2 − (𝜎𝜎𝑡𝑡
𝐵𝐵)2 − 2𝜎𝜎𝑡𝑡𝐴𝐴𝐵𝐵
(8)
𝑈𝑈𝑈��𝑅𝑡𝑡, 𝜎𝜎𝜎𝑡𝑡2) = ��𝑅𝑡𝑡 − 𝛽𝛽𝜎𝜎𝜎𝑡𝑡
2
𝑇𝑇𝐴𝐴 = 𝑡𝑡1𝑈𝐶𝐶𝐶𝐶2𝑡𝑡𝐴𝐴 ) + 𝑡𝑡2𝑈𝑆𝑆𝐶𝐶2𝑡𝑡
𝐴𝐴 ) + 𝑡𝑡3𝑈𝑁𝑁𝐶𝐶𝑥𝑥𝑡𝑡𝐴𝐴 )
𝑇𝑇𝐵𝐵 = 𝑡𝑡1𝑈𝐶𝐶𝐶𝐶2𝑡𝑡𝐵𝐵 ) + 𝑡𝑡2𝑈𝑆𝑆𝐶𝐶2𝑡𝑡
𝐵𝐵 ) + 𝑡𝑡3𝑈𝑁𝑁𝐶𝐶𝑥𝑥𝑡𝑡𝐵𝐵 )
��𝑅𝑡𝑡𝐴𝐴 = 𝑅𝑅𝑡𝑡
𝐴𝐴 − 𝑇𝑇𝐴𝐴 ��𝑅𝑡𝑡
𝐵𝐵 = 𝑅𝑅𝑡𝑡𝐵𝐵 − 𝑇𝑇𝐵𝐵
��𝑅𝑡𝑡 = 𝛼𝛼𝜎𝑡𝑡��𝑅𝑡𝑡𝐴𝐴 + (1 − 𝛼𝛼𝜎𝑡𝑡)��𝑅𝑡𝑡
𝐵𝐵
𝛼𝛼𝜎𝑡𝑡 =1
2𝛽𝛽𝑈��𝑅𝑡𝑡𝐴𝐴−��𝑅𝑡𝑡
𝐵𝐵)−𝑈��𝜎𝑡𝑡𝐵𝐵)2−��𝜎𝑡𝑡
𝐴𝐴𝐵𝐵
𝑈��𝜎𝑡𝑡𝐴𝐴)2−𝑈��𝜎𝑡𝑡
𝐵𝐵)2−2��𝜎𝑡𝑡𝐴𝐴𝐵𝐵 .
𝑆𝑆𝑆𝑆𝑅𝑅𝑖𝑖𝑡𝑡 = 𝛼𝛼𝑖𝑖𝑡𝑡 + 𝛽𝛽1𝑅𝑅𝐶𝐶𝐵𝐵𝑖𝑖𝑡𝑡 + 𝛽𝛽2𝐼𝐼𝐵𝐵𝑖𝑖𝑡𝑡 + 𝛽𝛽3𝐵𝐵𝐵𝐵𝐵𝐵𝐵𝐵𝐵𝐵𝐵𝐵𝐵𝐵𝐵𝐵𝑖𝑖𝑡𝑡 + 𝛽𝛽4𝑅𝑅𝑖𝑖𝐵𝐵𝑅𝑅𝑖𝑖𝑡𝑡 + 𝜀𝜀𝑖𝑖𝑡𝑡
(9)
𝐵𝐵𝐵𝐵𝐵𝐵𝐵𝐵𝑡𝑡 =−𝑎𝑎1(𝐶𝐶𝐶𝐶2) − 𝑎𝑎2(𝑆𝑆𝐶𝐶𝑥𝑥) − 𝑎𝑎3(𝑁𝑁2𝐶𝐶)
𝑌𝑌𝑡𝑡
𝛼𝛼𝑡𝑡 =1
2𝛽𝛽 (𝑅𝑅𝑡𝑡𝐴𝐴 − 𝑅𝑅𝑡𝑡
𝐵𝐵) − (𝜎𝜎𝑡𝑡𝐵𝐵)2 − 𝜎𝜎𝑡𝑡
𝐴𝐴𝐵𝐵
(𝜎𝜎𝑡𝑡𝐴𝐴)2 − (𝜎𝜎𝑡𝑡
𝐵𝐵)2 − 2𝜎𝜎𝑡𝑡𝐴𝐴𝐵𝐵
��𝛼𝑡𝑡 =1
2𝛽𝛽 (𝑅𝑅𝑡𝑡𝐴𝐴 − 𝑅𝑅𝑡𝑡
𝐵𝐵) − (𝜎𝜎𝑡𝑡𝐵𝐵)2 − 𝜎𝜎𝑡𝑡
𝐴𝐴𝐵𝐵 + 𝛾𝛾2𝛽𝛽 𝑈𝐵𝐵𝐵𝐵𝐵𝐵𝐵𝐵𝑡𝑡
𝐴𝐴 − 𝐵𝐵𝐵𝐵𝐵𝐵𝐵𝐵𝑡𝑡𝐵𝐵)
(𝜎𝜎𝑡𝑡𝐴𝐴)2 − (𝜎𝜎𝑡𝑡
𝐵𝐵)2 − 2𝜎𝜎𝑡𝑡𝐴𝐴𝐵𝐵
��𝛼 > 𝛼𝛼
.Resultantly, we can determine the optimal allocation of assets
between A and B. We compute the optimal rate of return and risk as:
𝛼𝛼𝑡𝑡 =1
2𝛽𝛽 (𝑅𝑅𝑡𝑡𝐴𝐴 − 𝑅𝑅𝑡𝑡
𝐵𝐵) − (𝜎𝜎𝑡𝑡𝐵𝐵)2 − 𝜎𝜎𝑡𝑡
𝐴𝐴𝐵𝐵 + 𝛾𝛾2𝛽𝛽 (𝐵𝐵𝐵𝐵𝐵𝐵𝐵𝐵𝑡𝑡
𝐴𝐴 − 𝐵𝐵𝐵𝐵𝐵𝐵𝐵𝐵𝑡𝑡𝐵𝐵)
(𝜎𝜎𝑡𝑡𝐴𝐴)2 − (𝜎𝜎𝑡𝑡
𝐵𝐵)2 − 2𝜎𝜎𝑡𝑡𝐴𝐴𝐵𝐵
(8)
𝑈𝑈𝑈��𝑅𝑡𝑡, 𝜎𝜎𝜎𝑡𝑡2) = ��𝑅𝑡𝑡 − 𝛽𝛽𝜎𝜎𝜎𝑡𝑡
2
𝑇𝑇𝐴𝐴 = 𝑡𝑡1𝑈𝐶𝐶𝐶𝐶2𝑡𝑡𝐴𝐴 ) + 𝑡𝑡2𝑈𝑆𝑆𝐶𝐶2𝑡𝑡
𝐴𝐴 ) + 𝑡𝑡3𝑈𝑁𝑁𝐶𝐶𝑥𝑥𝑡𝑡𝐴𝐴 )
𝑇𝑇𝐵𝐵 = 𝑡𝑡1𝑈𝐶𝐶𝐶𝐶2𝑡𝑡𝐵𝐵 ) + 𝑡𝑡2𝑈𝑆𝑆𝐶𝐶2𝑡𝑡
𝐵𝐵 ) + 𝑡𝑡3𝑈𝑁𝑁𝐶𝐶𝑥𝑥𝑡𝑡𝐵𝐵 )
��𝑅𝑡𝑡𝐴𝐴 = 𝑅𝑅𝑡𝑡
𝐴𝐴 − 𝑇𝑇𝐴𝐴 ��𝑅𝑡𝑡
𝐵𝐵 = 𝑅𝑅𝑡𝑡𝐵𝐵 − 𝑇𝑇𝐵𝐵
��𝑅𝑡𝑡 = 𝛼𝛼𝜎𝑡𝑡��𝑅𝑡𝑡𝐴𝐴 + (1 − 𝛼𝛼𝜎𝑡𝑡)��𝑅𝑡𝑡
𝐵𝐵
𝛼𝛼𝜎𝑡𝑡 =1
2𝛽𝛽𝑈��𝑅𝑡𝑡𝐴𝐴−��𝑅𝑡𝑡
𝐵𝐵)−𝑈��𝜎𝑡𝑡𝐵𝐵)2−��𝜎𝑡𝑡
𝐴𝐴𝐵𝐵
𝑈��𝜎𝑡𝑡𝐴𝐴)2−𝑈��𝜎𝑡𝑡
𝐵𝐵)2−2��𝜎𝑡𝑡𝐴𝐴𝐵𝐵 .
𝑆𝑆𝑆𝑆𝑅𝑅𝑖𝑖𝑡𝑡 = 𝛼𝛼𝑖𝑖𝑡𝑡 + 𝛽𝛽1𝑅𝑅𝐶𝐶𝐵𝐵𝑖𝑖𝑡𝑡 + 𝛽𝛽2𝐼𝐼𝐵𝐵𝑖𝑖𝑡𝑡 + 𝛽𝛽3𝐵𝐵𝐵𝐵𝐵𝐵𝐵𝐵𝐵𝐵𝐵𝐵𝐵𝐵𝐵𝐵𝑖𝑖𝑡𝑡 + 𝛽𝛽4𝑅𝑅𝑖𝑖𝐵𝐵𝑅𝑅𝑖𝑖𝑡𝑡 + 𝜀𝜀𝑖𝑖𝑡𝑡
(9)
𝐵𝐵𝐵𝐵𝐵𝐵𝐵𝐵𝑡𝑡 =−𝑎𝑎1(𝐶𝐶𝐶𝐶2) − 𝑎𝑎2(𝑆𝑆𝐶𝐶𝑥𝑥) − 𝑎𝑎3(𝑁𝑁2𝐶𝐶)
𝑌𝑌𝑡𝑡
𝛼𝛼𝑡𝑡 =1
2𝛽𝛽 (𝑅𝑅𝑡𝑡𝐴𝐴 − 𝑅𝑅𝑡𝑡
𝐵𝐵) − (𝜎𝜎𝑡𝑡𝐵𝐵)2 − 𝜎𝜎𝑡𝑡
𝐴𝐴𝐵𝐵
(𝜎𝜎𝑡𝑡𝐴𝐴)2 − (𝜎𝜎𝑡𝑡
𝐵𝐵)2 − 2𝜎𝜎𝑡𝑡𝐴𝐴𝐵𝐵
��𝛼𝑡𝑡 =1
2𝛽𝛽 (𝑅𝑅𝑡𝑡𝐴𝐴 − 𝑅𝑅𝑡𝑡
𝐵𝐵) − (𝜎𝜎𝑡𝑡𝐵𝐵)2 − 𝜎𝜎𝑡𝑡
𝐴𝐴𝐵𝐵 + 𝛾𝛾2𝛽𝛽 𝑈𝐵𝐵𝐵𝐵𝐵𝐵𝐵𝐵𝑡𝑡
𝐴𝐴 − 𝐵𝐵𝐵𝐵𝐵𝐵𝐵𝐵𝑡𝑡𝐵𝐵)
(𝜎𝜎𝑡𝑡𝐴𝐴)2 − (𝜎𝜎𝑡𝑡
𝐵𝐵)2 − 2𝜎𝜎𝑡𝑡𝐴𝐴𝐵𝐵
��𝛼 > 𝛼𝛼
.By applying the first-order condition of the utility function, we find
the optimal allocation of the portfolio as follows:
𝛼𝛼𝑡𝑡 =1
2𝛽𝛽 (𝑅𝑅𝑡𝑡𝐴𝐴 − 𝑅𝑅𝑡𝑡
𝐵𝐵) − (𝜎𝜎𝑡𝑡𝐵𝐵)2 − 𝜎𝜎𝑡𝑡
𝐴𝐴𝐵𝐵 + 𝛾𝛾2𝛽𝛽 (𝐵𝐵𝐵𝐵𝐵𝐵𝐵𝐵𝑡𝑡
𝐴𝐴 − 𝐵𝐵𝐵𝐵𝐵𝐵𝐵𝐵𝑡𝑡𝐵𝐵)
(𝜎𝜎𝑡𝑡𝐴𝐴)2 − (𝜎𝜎𝑡𝑡
𝐵𝐵)2 − 2𝜎𝜎𝑡𝑡𝐴𝐴𝐵𝐵
(8)
𝑈𝑈𝑈��𝑅𝑡𝑡, 𝜎𝜎𝜎𝑡𝑡2) = ��𝑅𝑡𝑡 − 𝛽𝛽𝜎𝜎𝜎𝑡𝑡
2
𝑇𝑇𝐴𝐴 = 𝑡𝑡1𝑈𝐶𝐶𝐶𝐶2𝑡𝑡𝐴𝐴 ) + 𝑡𝑡2𝑈𝑆𝑆𝐶𝐶2𝑡𝑡
𝐴𝐴 ) + 𝑡𝑡3𝑈𝑁𝑁𝐶𝐶𝑥𝑥𝑡𝑡𝐴𝐴 )
𝑇𝑇𝐵𝐵 = 𝑡𝑡1𝑈𝐶𝐶𝐶𝐶2𝑡𝑡𝐵𝐵 ) + 𝑡𝑡2𝑈𝑆𝑆𝐶𝐶2𝑡𝑡
𝐵𝐵 ) + 𝑡𝑡3𝑈𝑁𝑁𝐶𝐶𝑥𝑥𝑡𝑡𝐵𝐵 )
��𝑅𝑡𝑡𝐴𝐴 = 𝑅𝑅𝑡𝑡
𝐴𝐴 − 𝑇𝑇𝐴𝐴 ��𝑅𝑡𝑡
𝐵𝐵 = 𝑅𝑅𝑡𝑡𝐵𝐵 − 𝑇𝑇𝐵𝐵
��𝑅𝑡𝑡 = 𝛼𝛼𝜎𝑡𝑡��𝑅𝑡𝑡𝐴𝐴 + (1 − 𝛼𝛼𝜎𝑡𝑡)��𝑅𝑡𝑡
𝐵𝐵
𝛼𝛼𝜎𝑡𝑡 =1
2𝛽𝛽𝑈��𝑅𝑡𝑡𝐴𝐴−��𝑅𝑡𝑡
𝐵𝐵)−𝑈��𝜎𝑡𝑡𝐵𝐵)2−��𝜎𝑡𝑡
𝐴𝐴𝐵𝐵
𝑈��𝜎𝑡𝑡𝐴𝐴)2−𝑈��𝜎𝑡𝑡
𝐵𝐵)2−2��𝜎𝑡𝑡𝐴𝐴𝐵𝐵 .
𝑆𝑆𝑆𝑆𝑅𝑅𝑖𝑖𝑡𝑡 = 𝛼𝛼𝑖𝑖𝑡𝑡 + 𝛽𝛽1𝑅𝑅𝐶𝐶𝐵𝐵𝑖𝑖𝑡𝑡 + 𝛽𝛽2𝐼𝐼𝐵𝐵𝑖𝑖𝑡𝑡 + 𝛽𝛽3𝐵𝐵𝐵𝐵𝐵𝐵𝐵𝐵𝐵𝐵𝐵𝐵𝐵𝐵𝐵𝐵𝑖𝑖𝑡𝑡 + 𝛽𝛽4𝑅𝑅𝑖𝑖𝐵𝐵𝑅𝑅𝑖𝑖𝑡𝑡 + 𝜀𝜀𝑖𝑖𝑡𝑡
(9)
𝐵𝐵𝐵𝐵𝐵𝐵𝐵𝐵𝑡𝑡 =−𝑎𝑎1(𝐶𝐶𝐶𝐶2) − 𝑎𝑎2(𝑆𝑆𝐶𝐶𝑥𝑥) − 𝑎𝑎3(𝑁𝑁2𝐶𝐶)
𝑌𝑌𝑡𝑡
𝛼𝛼𝑡𝑡 =1
2𝛽𝛽 (𝑅𝑅𝑡𝑡𝐴𝐴 − 𝑅𝑅𝑡𝑡
𝐵𝐵) − (𝜎𝜎𝑡𝑡𝐵𝐵)2 − 𝜎𝜎𝑡𝑡
𝐴𝐴𝐵𝐵
(𝜎𝜎𝑡𝑡𝐴𝐴)2 − (𝜎𝜎𝑡𝑡
𝐵𝐵)2 − 2𝜎𝜎𝑡𝑡𝐴𝐴𝐵𝐵
��𝛼𝑡𝑡 =1
2𝛽𝛽 (𝑅𝑅𝑡𝑡𝐴𝐴 − 𝑅𝑅𝑡𝑡
𝐵𝐵) − (𝜎𝜎𝑡𝑡𝐵𝐵)2 − 𝜎𝜎𝑡𝑡
𝐴𝐴𝐵𝐵 + 𝛾𝛾2𝛽𝛽 𝑈𝐵𝐵𝐵𝐵𝐵𝐵𝐵𝐵𝑡𝑡
𝐴𝐴 − 𝐵𝐵𝐵𝐵𝐵𝐵𝐵𝐵𝑡𝑡𝐵𝐵)
(𝜎𝜎𝑡𝑡𝐴𝐴)2 − (𝜎𝜎𝑡𝑡
𝐵𝐵)2 − 2𝜎𝜎𝑡𝑡𝐴𝐴𝐵𝐵
��𝛼 > 𝛼𝛼
. (9)
Equation (9) shows the proportion of investment after considering the ocean emission taxation. After imposing international emission taxation, we assume that the optimal allocation of a portfolio shifts downward. This implies that investment in blue bonds decreases if a firm does not account for the blueness factors and a regulator imposes emission taxation.
82 Blue Economy and Blue Finance: Toward Sustainable Development and Ocean Governance
4.4.4 Drivers of Stock Returns Including the Blueness Index
To determine how the blueness of a firm might affect its performance, we adopt the following empirical model (Yoshino, Taghizadeh-Hesary, and Otsuka 2021):
𝛼𝛼𝑡𝑡 =1
2𝛽𝛽 (𝑅𝑅𝑡𝑡𝐴𝐴 − 𝑅𝑅𝑡𝑡
𝐵𝐵) − (𝜎𝜎𝑡𝑡𝐵𝐵)2 − 𝜎𝜎𝑡𝑡
𝐴𝐴𝐵𝐵 + 𝛾𝛾2𝛽𝛽 (𝐵𝐵𝐵𝐵𝐵𝐵𝐵𝐵𝑡𝑡
𝐴𝐴 − 𝐵𝐵𝐵𝐵𝐵𝐵𝐵𝐵𝑡𝑡𝐵𝐵)
(𝜎𝜎𝑡𝑡𝐴𝐴)2 − (𝜎𝜎𝑡𝑡
𝐵𝐵)2 − 2𝜎𝜎𝑡𝑡𝐴𝐴𝐵𝐵
(8)
𝑈𝑈𝑈��𝑅𝑡𝑡, 𝜎𝜎𝜎𝑡𝑡2) = ��𝑅𝑡𝑡 − 𝛽𝛽𝜎𝜎𝜎𝑡𝑡
2
𝑇𝑇𝐴𝐴 = 𝑡𝑡1𝑈𝐶𝐶𝐶𝐶2𝑡𝑡𝐴𝐴 ) + 𝑡𝑡2𝑈𝑆𝑆𝐶𝐶2𝑡𝑡
𝐴𝐴 ) + 𝑡𝑡3𝑈𝑁𝑁𝐶𝐶𝑥𝑥𝑡𝑡𝐴𝐴 )
𝑇𝑇𝐵𝐵 = 𝑡𝑡1𝑈𝐶𝐶𝐶𝐶2𝑡𝑡𝐵𝐵 ) + 𝑡𝑡2𝑈𝑆𝑆𝐶𝐶2𝑡𝑡
𝐵𝐵 ) + 𝑡𝑡3𝑈𝑁𝑁𝐶𝐶𝑥𝑥𝑡𝑡𝐵𝐵 )
��𝑅𝑡𝑡𝐴𝐴 = 𝑅𝑅𝑡𝑡
𝐴𝐴 − 𝑇𝑇𝐴𝐴 ��𝑅𝑡𝑡
𝐵𝐵 = 𝑅𝑅𝑡𝑡𝐵𝐵 − 𝑇𝑇𝐵𝐵
��𝑅𝑡𝑡 = 𝛼𝛼𝜎𝑡𝑡��𝑅𝑡𝑡𝐴𝐴 + (1 − 𝛼𝛼𝜎𝑡𝑡)��𝑅𝑡𝑡
𝐵𝐵
𝛼𝛼𝜎𝑡𝑡 =1
2𝛽𝛽𝑈��𝑅𝑡𝑡𝐴𝐴−��𝑅𝑡𝑡
𝐵𝐵)−𝑈��𝜎𝑡𝑡𝐵𝐵)2−��𝜎𝑡𝑡
𝐴𝐴𝐵𝐵
𝑈��𝜎𝑡𝑡𝐴𝐴)2−𝑈��𝜎𝑡𝑡
𝐵𝐵)2−2��𝜎𝑡𝑡𝐴𝐴𝐵𝐵 .
𝑆𝑆𝑆𝑆𝑅𝑅𝑖𝑖𝑡𝑡 = 𝛼𝛼𝑖𝑖𝑡𝑡 + 𝛽𝛽1𝑅𝑅𝐶𝐶𝐵𝐵𝑖𝑖𝑡𝑡 + 𝛽𝛽2𝐼𝐼𝐵𝐵𝑖𝑖𝑡𝑡 + 𝛽𝛽3𝐵𝐵𝐵𝐵𝐵𝐵𝐵𝐵𝐵𝐵𝐵𝐵𝐵𝐵𝐵𝐵𝑖𝑖𝑡𝑡 + 𝛽𝛽4𝑅𝑅𝑖𝑖𝐵𝐵𝑅𝑅𝑖𝑖𝑡𝑡 + 𝜀𝜀𝑖𝑖𝑡𝑡
(9)
𝐵𝐵𝐵𝐵𝐵𝐵𝐵𝐵𝑡𝑡 =−𝑎𝑎1(𝐶𝐶𝐶𝐶2) − 𝑎𝑎2(𝑆𝑆𝐶𝐶𝑥𝑥) − 𝑎𝑎3(𝑁𝑁2𝐶𝐶)
𝑌𝑌𝑡𝑡
𝛼𝛼𝑡𝑡 =1
2𝛽𝛽 (𝑅𝑅𝑡𝑡𝐴𝐴 − 𝑅𝑅𝑡𝑡
𝐵𝐵) − (𝜎𝜎𝑡𝑡𝐵𝐵)2 − 𝜎𝜎𝑡𝑡
𝐴𝐴𝐵𝐵
(𝜎𝜎𝑡𝑡𝐴𝐴)2 − (𝜎𝜎𝑡𝑡
𝐵𝐵)2 − 2𝜎𝜎𝑡𝑡𝐴𝐴𝐵𝐵
��𝛼𝑡𝑡 =1
2𝛽𝛽 (𝑅𝑅𝑡𝑡𝐴𝐴 − 𝑅𝑅𝑡𝑡
𝐵𝐵) − (𝜎𝜎𝑡𝑡𝐵𝐵)2 − 𝜎𝜎𝑡𝑡
𝐴𝐴𝐵𝐵 + 𝛾𝛾2𝛽𝛽 𝑈𝐵𝐵𝐵𝐵𝐵𝐵𝐵𝐵𝑡𝑡
𝐴𝐴 − 𝐵𝐵𝐵𝐵𝐵𝐵𝐵𝐵𝑡𝑡𝐵𝐵)
(𝜎𝜎𝑡𝑡𝐴𝐴)2 − (𝜎𝜎𝑡𝑡
𝐵𝐵)2 − 2𝜎𝜎𝑡𝑡𝐴𝐴𝐵𝐵
��𝛼 > 𝛼𝛼
𝛼𝛼𝑡𝑡 =1
2𝛽𝛽 (𝑅𝑅𝑡𝑡𝐴𝐴 − 𝑅𝑅𝑡𝑡
𝐵𝐵) − (𝜎𝜎𝑡𝑡𝐵𝐵)2 − 𝜎𝜎𝑡𝑡
𝐴𝐴𝐵𝐵 + 𝛾𝛾2𝛽𝛽 (𝐵𝐵𝐵𝐵𝐵𝐵𝐵𝐵𝑡𝑡
𝐴𝐴 − 𝐵𝐵𝐵𝐵𝐵𝐵𝐵𝐵𝑡𝑡𝐵𝐵)
(𝜎𝜎𝑡𝑡𝐴𝐴)2 − (𝜎𝜎𝑡𝑡
𝐵𝐵)2 − 2𝜎𝜎𝑡𝑡𝐴𝐴𝐵𝐵
(8)
𝑈𝑈𝑈��𝑅𝑡𝑡, 𝜎𝜎𝜎𝑡𝑡2) = ��𝑅𝑡𝑡 − 𝛽𝛽𝜎𝜎𝜎𝑡𝑡
2
𝑇𝑇𝐴𝐴 = 𝑡𝑡1𝑈𝐶𝐶𝐶𝐶2𝑡𝑡𝐴𝐴 ) + 𝑡𝑡2𝑈𝑆𝑆𝐶𝐶2𝑡𝑡
𝐴𝐴 ) + 𝑡𝑡3𝑈𝑁𝑁𝐶𝐶𝑥𝑥𝑡𝑡𝐴𝐴 )
𝑇𝑇𝐵𝐵 = 𝑡𝑡1𝑈𝐶𝐶𝐶𝐶2𝑡𝑡𝐵𝐵 ) + 𝑡𝑡2𝑈𝑆𝑆𝐶𝐶2𝑡𝑡
𝐵𝐵 ) + 𝑡𝑡3𝑈𝑁𝑁𝐶𝐶𝑥𝑥𝑡𝑡𝐵𝐵 )
��𝑅𝑡𝑡𝐴𝐴 = 𝑅𝑅𝑡𝑡
𝐴𝐴 − 𝑇𝑇𝐴𝐴 ��𝑅𝑡𝑡
𝐵𝐵 = 𝑅𝑅𝑡𝑡𝐵𝐵 − 𝑇𝑇𝐵𝐵
��𝑅𝑡𝑡 = 𝛼𝛼𝜎𝑡𝑡��𝑅𝑡𝑡𝐴𝐴 + (1 − 𝛼𝛼𝜎𝑡𝑡)��𝑅𝑡𝑡
𝐵𝐵
𝛼𝛼𝜎𝑡𝑡 =1
2𝛽𝛽𝑈��𝑅𝑡𝑡𝐴𝐴−��𝑅𝑡𝑡
𝐵𝐵)−𝑈��𝜎𝑡𝑡𝐵𝐵)2−��𝜎𝑡𝑡
𝐴𝐴𝐵𝐵
𝑈��𝜎𝑡𝑡𝐴𝐴)2−𝑈��𝜎𝑡𝑡
𝐵𝐵)2−2��𝜎𝑡𝑡𝐴𝐴𝐵𝐵 .
𝑆𝑆𝑆𝑆𝑅𝑅𝑖𝑖𝑡𝑡 = 𝛼𝛼𝑖𝑖𝑡𝑡 + 𝛽𝛽1𝑅𝑅𝐶𝐶𝐵𝐵𝑖𝑖𝑡𝑡 + 𝛽𝛽2𝐼𝐼𝐵𝐵𝑖𝑖𝑡𝑡 + 𝛽𝛽3𝐵𝐵𝐵𝐵𝐵𝐵𝐵𝐵𝐵𝐵𝐵𝐵𝐵𝐵𝐵𝐵𝑖𝑖𝑡𝑡 + 𝛽𝛽4𝑅𝑅𝑖𝑖𝐵𝐵𝑅𝑅𝑖𝑖𝑡𝑡 + 𝜀𝜀𝑖𝑖𝑡𝑡
(9)
𝐵𝐵𝐵𝐵𝐵𝐵𝐵𝐵𝑡𝑡 =−𝑎𝑎1(𝐶𝐶𝐶𝐶2) − 𝑎𝑎2(𝑆𝑆𝐶𝐶𝑥𝑥) − 𝑎𝑎3(𝑁𝑁2𝐶𝐶)
𝑌𝑌𝑡𝑡
𝛼𝛼𝑡𝑡 =1
2𝛽𝛽 (𝑅𝑅𝑡𝑡𝐴𝐴 − 𝑅𝑅𝑡𝑡
𝐵𝐵) − (𝜎𝜎𝑡𝑡𝐵𝐵)2 − 𝜎𝜎𝑡𝑡
𝐴𝐴𝐵𝐵
(𝜎𝜎𝑡𝑡𝐴𝐴)2 − (𝜎𝜎𝑡𝑡
𝐵𝐵)2 − 2𝜎𝜎𝑡𝑡𝐴𝐴𝐵𝐵
��𝛼𝑡𝑡 =1
2𝛽𝛽 (𝑅𝑅𝑡𝑡𝐴𝐴 − 𝑅𝑅𝑡𝑡
𝐵𝐵) − (𝜎𝜎𝑡𝑡𝐵𝐵)2 − 𝜎𝜎𝑡𝑡
𝐴𝐴𝐵𝐵 + 𝛾𝛾2𝛽𝛽 𝑈𝐵𝐵𝐵𝐵𝐵𝐵𝐵𝐵𝑡𝑡
𝐴𝐴 − 𝐵𝐵𝐵𝐵𝐵𝐵𝐵𝐵𝑡𝑡𝐵𝐵)
(𝜎𝜎𝑡𝑡𝐴𝐴)2 − (𝜎𝜎𝑡𝑡
𝐵𝐵)2 − 2𝜎𝜎𝑡𝑡𝐴𝐴𝐵𝐵
��𝛼 > 𝛼𝛼
, (10)
where SPRit refers to the stock returns of ocean firms, ROBit denotes the rate of return on bonds, IBit stands for the number of issuance bonds, Bluenessit shows the blueness index of the firm, and Riskit is the credit rating of the bonds ranging from AA to BBB.
4.5 Data and SampleTo test our hypothesis by developing an investment portfolio, we selected seafood and shipping firms as proxies for blue firms. We obtained the data relating to the monthly prices of bonds from Yahoo! Finance between December 2018 and December 2019. Information about ocean emissions is difficult to obtain as different researchers have indicated only tentative percentages. However, we utilized the forecasted data of the global maritime emission inventory in 2019. This study determines the proportion of investment with and without the blueness index for developing the optimal portfolio. We propose that a firm’s blueness leads to increased participation of bonds as the firm takes steps to benefit the oceans. To examine the effect of the blueness index on the stock return, we select 31 Norwegian firms operating in the seafood and shipping sectors from 2017 to 2019.
4.6 Results
4.6.1 The Investor’s Utility Function and the Blueness Index
When participating in ocean firms, investors are concerned about firms’ preferences for making the environment blue. The blueness factor could help by taking advantage of the tax benefits associated with blue investment, and they may receive a halo effect as people consider them to be responsible stewards. Hence, we assume that bluer firms attract
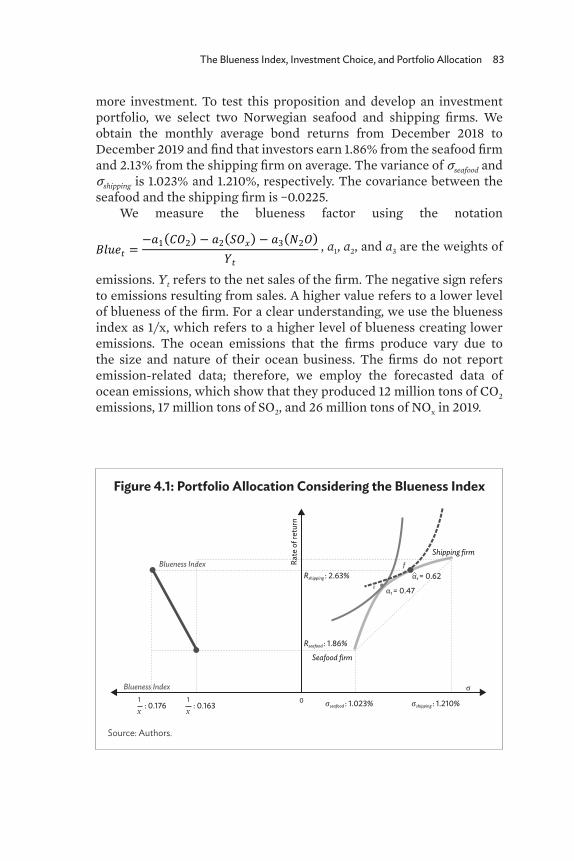
The Blueness Index, Investment Choice, and Portfolio Allocation 83
more investment. To test this proposition and develop an investment portfolio, we select two Norwegian seafood and shipping firms. We obtain the monthly average bond returns from December 2018 to December 2019 and find that investors earn 1.86% from the seafood firm and 2.13% from the shipping firm on average. The variance of σseafood and σshipping is 1.023% and 1.210%, respectively. The covariance between the seafood and the shipping firm is −0.0225.
We measure the blueness factor using the notation
𝛼𝛼𝑡𝑡 =1
2𝛽𝛽 (𝑅𝑅𝑡𝑡𝐴𝐴 − 𝑅𝑅𝑡𝑡
𝐵𝐵) − (𝜎𝜎𝑡𝑡𝐵𝐵)2 − 𝜎𝜎𝑡𝑡
𝐴𝐴𝐵𝐵 + 𝛾𝛾2𝛽𝛽 (𝐵𝐵𝐵𝐵𝐵𝐵𝐵𝐵𝑡𝑡
𝐴𝐴 − 𝐵𝐵𝐵𝐵𝐵𝐵𝐵𝐵𝑡𝑡𝐵𝐵)
(𝜎𝜎𝑡𝑡𝐴𝐴)2 − (𝜎𝜎𝑡𝑡
𝐵𝐵)2 − 2𝜎𝜎𝑡𝑡𝐴𝐴𝐵𝐵
(8)
𝑈𝑈𝑈��𝑅𝑡𝑡, 𝜎𝜎𝜎𝑡𝑡2) = ��𝑅𝑡𝑡 − 𝛽𝛽𝜎𝜎𝜎𝑡𝑡
2
𝑇𝑇𝐴𝐴 = 𝑡𝑡1𝑈𝐶𝐶𝐶𝐶2𝑡𝑡𝐴𝐴 ) + 𝑡𝑡2𝑈𝑆𝑆𝐶𝐶2𝑡𝑡
𝐴𝐴 ) + 𝑡𝑡3𝑈𝑁𝑁𝐶𝐶𝑥𝑥𝑡𝑡𝐴𝐴 )
𝑇𝑇𝐵𝐵 = 𝑡𝑡1𝑈𝐶𝐶𝐶𝐶2𝑡𝑡𝐵𝐵 ) + 𝑡𝑡2𝑈𝑆𝑆𝐶𝐶2𝑡𝑡
𝐵𝐵 ) + 𝑡𝑡3𝑈𝑁𝑁𝐶𝐶𝑥𝑥𝑡𝑡𝐵𝐵 )
��𝑅𝑡𝑡𝐴𝐴 = 𝑅𝑅𝑡𝑡
𝐴𝐴 − 𝑇𝑇𝐴𝐴 ��𝑅𝑡𝑡
𝐵𝐵 = 𝑅𝑅𝑡𝑡𝐵𝐵 − 𝑇𝑇𝐵𝐵
��𝑅𝑡𝑡 = 𝛼𝛼𝜎𝑡𝑡��𝑅𝑡𝑡𝐴𝐴 + (1 − 𝛼𝛼𝜎𝑡𝑡)��𝑅𝑡𝑡
𝐵𝐵
𝛼𝛼𝜎𝑡𝑡 =1
2𝛽𝛽𝑈��𝑅𝑡𝑡𝐴𝐴−��𝑅𝑡𝑡
𝐵𝐵)−𝑈��𝜎𝑡𝑡𝐵𝐵)2−��𝜎𝑡𝑡
𝐴𝐴𝐵𝐵
𝑈��𝜎𝑡𝑡𝐴𝐴)2−𝑈��𝜎𝑡𝑡
𝐵𝐵)2−2��𝜎𝑡𝑡𝐴𝐴𝐵𝐵 .
𝑆𝑆𝑆𝑆𝑅𝑅𝑖𝑖𝑡𝑡 = 𝛼𝛼𝑖𝑖𝑡𝑡 + 𝛽𝛽1𝑅𝑅𝐶𝐶𝐵𝐵𝑖𝑖𝑡𝑡 + 𝛽𝛽2𝐼𝐼𝐵𝐵𝑖𝑖𝑡𝑡 + 𝛽𝛽3𝐵𝐵𝐵𝐵𝐵𝐵𝐵𝐵𝐵𝐵𝐵𝐵𝐵𝐵𝐵𝐵𝑖𝑖𝑡𝑡 + 𝛽𝛽4𝑅𝑅𝑖𝑖𝐵𝐵𝑅𝑅𝑖𝑖𝑡𝑡 + 𝜀𝜀𝑖𝑖𝑡𝑡
(9)
𝐵𝐵𝐵𝐵𝐵𝐵𝐵𝐵𝑡𝑡 =−𝑎𝑎1(𝐶𝐶𝐶𝐶2) − 𝑎𝑎2(𝑆𝑆𝐶𝐶𝑥𝑥) − 𝑎𝑎3(𝑁𝑁2𝐶𝐶)
𝑌𝑌𝑡𝑡
𝛼𝛼𝑡𝑡 =1
2𝛽𝛽 (𝑅𝑅𝑡𝑡𝐴𝐴 − 𝑅𝑅𝑡𝑡
𝐵𝐵) − (𝜎𝜎𝑡𝑡𝐵𝐵)2 − 𝜎𝜎𝑡𝑡
𝐴𝐴𝐵𝐵
(𝜎𝜎𝑡𝑡𝐴𝐴)2 − (𝜎𝜎𝑡𝑡
𝐵𝐵)2 − 2𝜎𝜎𝑡𝑡𝐴𝐴𝐵𝐵
��𝛼𝑡𝑡 =1
2𝛽𝛽 (𝑅𝑅𝑡𝑡𝐴𝐴 − 𝑅𝑅𝑡𝑡
𝐵𝐵) − (𝜎𝜎𝑡𝑡𝐵𝐵)2 − 𝜎𝜎𝑡𝑡
𝐴𝐴𝐵𝐵 + 𝛾𝛾2𝛽𝛽 𝑈𝐵𝐵𝐵𝐵𝐵𝐵𝐵𝐵𝑡𝑡
𝐴𝐴 − 𝐵𝐵𝐵𝐵𝐵𝐵𝐵𝐵𝑡𝑡𝐵𝐵)
(𝜎𝜎𝑡𝑡𝐴𝐴)2 − (𝜎𝜎𝑡𝑡
𝐵𝐵)2 − 2𝜎𝜎𝑡𝑡𝐴𝐴𝐵𝐵
��𝛼 > 𝛼𝛼
, a1, a2, and a3 are the weights of
emissions. Yt refers to the net sales of the firm. The negative sign refers to emissions resulting from sales. A higher value refers to a lower level of blueness of the firm. For a clear understanding, we use the blueness index as 1/x, which refers to a higher level of blueness creating lower emissions. The ocean emissions that the firms produce vary due to the size and nature of their ocean business. The firms do not report emission-related data; therefore, we employ the forecasted data of ocean emissions, which show that they produced 12 million tons of CO2 emissions, 17 million tons of SO2, and 26 million tons of NOx in 2019.
Figure 4.1: Portfolio Allocation Considering the Blueness Index
Source: Authors.
Blueness Index
Seafood firm
σseafood : 1.023%
αt = 0.47
Rseafood : 1.86%
Rshipping : 2.63%
σshipping : 1.210%
Rate
of r
etur
n
Shipping firm
Blueness Index0
f
e
σ
αt = 0.62
: 0.1761
x: 0.163
1
x
84 Blue Economy and Blue Finance: Toward Sustainable Development and Ocean Governance
In the absence of the blueness factor, we measure the utility function
and the proportion of investment as
𝛼𝛼𝑡𝑡 =1
2𝛽𝛽 (𝑅𝑅𝑡𝑡𝐴𝐴 − 𝑅𝑅𝑡𝑡
𝐵𝐵) − (𝜎𝜎𝑡𝑡𝐵𝐵)2 − 𝜎𝜎𝑡𝑡
𝐴𝐴𝐵𝐵 + 𝛾𝛾2𝛽𝛽 (𝐵𝐵𝐵𝐵𝐵𝐵𝐵𝐵𝑡𝑡
𝐴𝐴 − 𝐵𝐵𝐵𝐵𝐵𝐵𝐵𝐵𝑡𝑡𝐵𝐵)
(𝜎𝜎𝑡𝑡𝐴𝐴)2 − (𝜎𝜎𝑡𝑡
𝐵𝐵)2 − 2𝜎𝜎𝑡𝑡𝐴𝐴𝐵𝐵
(8)
𝑈𝑈𝑈��𝑅𝑡𝑡, 𝜎𝜎𝜎𝑡𝑡2) = ��𝑅𝑡𝑡 − 𝛽𝛽𝜎𝜎𝜎𝑡𝑡
2
𝑇𝑇𝐴𝐴 = 𝑡𝑡1𝑈𝐶𝐶𝐶𝐶2𝑡𝑡𝐴𝐴 ) + 𝑡𝑡2𝑈𝑆𝑆𝐶𝐶2𝑡𝑡
𝐴𝐴 ) + 𝑡𝑡3𝑈𝑁𝑁𝐶𝐶𝑥𝑥𝑡𝑡𝐴𝐴 )
𝑇𝑇𝐵𝐵 = 𝑡𝑡1𝑈𝐶𝐶𝐶𝐶2𝑡𝑡𝐵𝐵 ) + 𝑡𝑡2𝑈𝑆𝑆𝐶𝐶2𝑡𝑡
𝐵𝐵 ) + 𝑡𝑡3𝑈𝑁𝑁𝐶𝐶𝑥𝑥𝑡𝑡𝐵𝐵 )
��𝑅𝑡𝑡𝐴𝐴 = 𝑅𝑅𝑡𝑡
𝐴𝐴 − 𝑇𝑇𝐴𝐴 ��𝑅𝑡𝑡
𝐵𝐵 = 𝑅𝑅𝑡𝑡𝐵𝐵 − 𝑇𝑇𝐵𝐵
��𝑅𝑡𝑡 = 𝛼𝛼𝜎𝑡𝑡��𝑅𝑡𝑡𝐴𝐴 + (1 − 𝛼𝛼𝜎𝑡𝑡)��𝑅𝑡𝑡
𝐵𝐵
𝛼𝛼𝜎𝑡𝑡 =1
2𝛽𝛽𝑈��𝑅𝑡𝑡𝐴𝐴−��𝑅𝑡𝑡
𝐵𝐵)−𝑈��𝜎𝑡𝑡𝐵𝐵)2−��𝜎𝑡𝑡
𝐴𝐴𝐵𝐵
𝑈��𝜎𝑡𝑡𝐴𝐴)2−𝑈��𝜎𝑡𝑡
𝐵𝐵)2−2��𝜎𝑡𝑡𝐴𝐴𝐵𝐵 .
𝑆𝑆𝑆𝑆𝑅𝑅𝑖𝑖𝑡𝑡 = 𝛼𝛼𝑖𝑖𝑡𝑡 + 𝛽𝛽1𝑅𝑅𝐶𝐶𝐵𝐵𝑖𝑖𝑡𝑡 + 𝛽𝛽2𝐼𝐼𝐵𝐵𝑖𝑖𝑡𝑡 + 𝛽𝛽3𝐵𝐵𝐵𝐵𝐵𝐵𝐵𝐵𝐵𝐵𝐵𝐵𝐵𝐵𝐵𝐵𝑖𝑖𝑡𝑡 + 𝛽𝛽4𝑅𝑅𝑖𝑖𝐵𝐵𝑅𝑅𝑖𝑖𝑡𝑡 + 𝜀𝜀𝑖𝑖𝑡𝑡
(9)
𝐵𝐵𝐵𝐵𝐵𝐵𝐵𝐵𝑡𝑡 =−𝑎𝑎1(𝐶𝐶𝐶𝐶2) − 𝑎𝑎2(𝑆𝑆𝐶𝐶𝑥𝑥) − 𝑎𝑎3(𝑁𝑁2𝐶𝐶)
𝑌𝑌𝑡𝑡
𝛼𝛼𝑡𝑡 =1
2𝛽𝛽 (𝑅𝑅𝑡𝑡𝐴𝐴 − 𝑅𝑅𝑡𝑡
𝐵𝐵) − (𝜎𝜎𝑡𝑡𝐵𝐵)2 − 𝜎𝜎𝑡𝑡
𝐴𝐴𝐵𝐵
(𝜎𝜎𝑡𝑡𝐴𝐴)2 − (𝜎𝜎𝑡𝑡
𝐵𝐵)2 − 2𝜎𝜎𝑡𝑡𝐴𝐴𝐵𝐵
��𝛼𝑡𝑡 =1
2𝛽𝛽 (𝑅𝑅𝑡𝑡𝐴𝐴 − 𝑅𝑅𝑡𝑡
𝐵𝐵) − (𝜎𝜎𝑡𝑡𝐵𝐵)2 − 𝜎𝜎𝑡𝑡
𝐴𝐴𝐵𝐵 + 𝛾𝛾2𝛽𝛽 𝑈𝐵𝐵𝐵𝐵𝐵𝐵𝐵𝐵𝑡𝑡
𝐴𝐴 − 𝐵𝐵𝐵𝐵𝐵𝐵𝐵𝐵𝑡𝑡𝐵𝐵)
(𝜎𝜎𝑡𝑡𝐴𝐴)2 − (𝜎𝜎𝑡𝑡
𝐵𝐵)2 − 2𝜎𝜎𝑡𝑡𝐴𝐴𝐵𝐵
��𝛼 > 𝛼𝛼
.
Figure 4.1 displays the relationship between the risk, the return, and the blueness index. On one side of the x-axis, we plot the riskiness of bonds; on the other side, we draw the blueness index. The y-axis represents the return on bonds. We find that the value of αt equals 0.47, which shows that investors purchase a 47% share in the seafood firm, as the red line on the utility function without the blueness index indicates. Next, we estimate the utility function by incorporating the blueness of the firms,
𝛼𝛼𝑡𝑡 =1
2𝛽𝛽 (𝑅𝑅𝑡𝑡𝐴𝐴 − 𝑅𝑅𝑡𝑡
𝐵𝐵) − (𝜎𝜎𝑡𝑡𝐵𝐵)2 − 𝜎𝜎𝑡𝑡
𝐴𝐴𝐵𝐵 + 𝛾𝛾2𝛽𝛽 (𝐵𝐵𝐵𝐵𝐵𝐵𝐵𝐵𝑡𝑡
𝐴𝐴 − 𝐵𝐵𝐵𝐵𝐵𝐵𝐵𝐵𝑡𝑡𝐵𝐵)
(𝜎𝜎𝑡𝑡𝐴𝐴)2 − (𝜎𝜎𝑡𝑡
𝐵𝐵)2 − 2𝜎𝜎𝑡𝑡𝐴𝐴𝐵𝐵
(8)
𝑈𝑈𝑈��𝑅𝑡𝑡, 𝜎𝜎𝜎𝑡𝑡2) = ��𝑅𝑡𝑡 − 𝛽𝛽𝜎𝜎𝜎𝑡𝑡
2
𝑇𝑇𝐴𝐴 = 𝑡𝑡1𝑈𝐶𝐶𝐶𝐶2𝑡𝑡𝐴𝐴 ) + 𝑡𝑡2𝑈𝑆𝑆𝐶𝐶2𝑡𝑡
𝐴𝐴 ) + 𝑡𝑡3𝑈𝑁𝑁𝐶𝐶𝑥𝑥𝑡𝑡𝐴𝐴 )
𝑇𝑇𝐵𝐵 = 𝑡𝑡1𝑈𝐶𝐶𝐶𝐶2𝑡𝑡𝐵𝐵 ) + 𝑡𝑡2𝑈𝑆𝑆𝐶𝐶2𝑡𝑡
𝐵𝐵 ) + 𝑡𝑡3𝑈𝑁𝑁𝐶𝐶𝑥𝑥𝑡𝑡𝐵𝐵 )
��𝑅𝑡𝑡𝐴𝐴 = 𝑅𝑅𝑡𝑡
𝐴𝐴 − 𝑇𝑇𝐴𝐴 ��𝑅𝑡𝑡
𝐵𝐵 = 𝑅𝑅𝑡𝑡𝐵𝐵 − 𝑇𝑇𝐵𝐵
��𝑅𝑡𝑡 = 𝛼𝛼𝜎𝑡𝑡��𝑅𝑡𝑡𝐴𝐴 + (1 − 𝛼𝛼𝜎𝑡𝑡)��𝑅𝑡𝑡
𝐵𝐵
𝛼𝛼𝜎𝑡𝑡 =1
2𝛽𝛽𝑈��𝑅𝑡𝑡𝐴𝐴−��𝑅𝑡𝑡
𝐵𝐵)−𝑈��𝜎𝑡𝑡𝐵𝐵)2−��𝜎𝑡𝑡
𝐴𝐴𝐵𝐵
𝑈��𝜎𝑡𝑡𝐴𝐴)2−𝑈��𝜎𝑡𝑡
𝐵𝐵)2−2��𝜎𝑡𝑡𝐴𝐴𝐵𝐵 .
𝑆𝑆𝑆𝑆𝑅𝑅𝑖𝑖𝑡𝑡 = 𝛼𝛼𝑖𝑖𝑡𝑡 + 𝛽𝛽1𝑅𝑅𝐶𝐶𝐵𝐵𝑖𝑖𝑡𝑡 + 𝛽𝛽2𝐼𝐼𝐵𝐵𝑖𝑖𝑡𝑡 + 𝛽𝛽3𝐵𝐵𝐵𝐵𝐵𝐵𝐵𝐵𝐵𝐵𝐵𝐵𝐵𝐵𝐵𝐵𝑖𝑖𝑡𝑡 + 𝛽𝛽4𝑅𝑅𝑖𝑖𝐵𝐵𝑅𝑅𝑖𝑖𝑡𝑡 + 𝜀𝜀𝑖𝑖𝑡𝑡
(9)
𝐵𝐵𝐵𝐵𝐵𝐵𝐵𝐵𝑡𝑡 =−𝑎𝑎1(𝐶𝐶𝐶𝐶2) − 𝑎𝑎2(𝑆𝑆𝐶𝐶𝑥𝑥) − 𝑎𝑎3(𝑁𝑁2𝐶𝐶)
𝑌𝑌𝑡𝑡
𝛼𝛼𝑡𝑡 =1
2𝛽𝛽 (𝑅𝑅𝑡𝑡𝐴𝐴 − 𝑅𝑅𝑡𝑡
𝐵𝐵) − (𝜎𝜎𝑡𝑡𝐵𝐵)2 − 𝜎𝜎𝑡𝑡
𝐴𝐴𝐵𝐵
(𝜎𝜎𝑡𝑡𝐴𝐴)2 − (𝜎𝜎𝑡𝑡
𝐵𝐵)2 − 2𝜎𝜎𝑡𝑡𝐴𝐴𝐵𝐵
��𝛼𝑡𝑡 =1
2𝛽𝛽 (𝑅𝑅𝑡𝑡𝐴𝐴 − 𝑅𝑅𝑡𝑡
𝐵𝐵) − (𝜎𝜎𝑡𝑡𝐵𝐵)2 − 𝜎𝜎𝑡𝑡
𝐴𝐴𝐵𝐵 + 𝛾𝛾2𝛽𝛽 𝑈𝐵𝐵𝐵𝐵𝐵𝐵𝐵𝐵𝑡𝑡
𝐴𝐴 − 𝐵𝐵𝐵𝐵𝐵𝐵𝐵𝐵𝑡𝑡𝐵𝐵)
(𝜎𝜎𝑡𝑡𝐴𝐴)2 − (𝜎𝜎𝑡𝑡
𝐵𝐵)2 − 2𝜎𝜎𝑡𝑡𝐴𝐴𝐵𝐵
��𝛼 > 𝛼𝛼
, and find that
participation in investment increases the share in the seafood firm to 62%. This implies that blueness is a vital predictor when deciding to invest in a portfolio because
𝛼𝛼𝑡𝑡 =1
2𝛽𝛽 (𝑅𝑅𝑡𝑡𝐴𝐴 − 𝑅𝑅𝑡𝑡
𝐵𝐵) − (𝜎𝜎𝑡𝑡𝐵𝐵)2 − 𝜎𝜎𝑡𝑡
𝐴𝐴𝐵𝐵 + 𝛾𝛾2𝛽𝛽 (𝐵𝐵𝐵𝐵𝐵𝐵𝐵𝐵𝑡𝑡
𝐴𝐴 − 𝐵𝐵𝐵𝐵𝐵𝐵𝐵𝐵𝑡𝑡𝐵𝐵)
(𝜎𝜎𝑡𝑡𝐴𝐴)2 − (𝜎𝜎𝑡𝑡
𝐵𝐵)2 − 2𝜎𝜎𝑡𝑡𝐴𝐴𝐵𝐵
(8)
𝑈𝑈𝑈��𝑅𝑡𝑡, 𝜎𝜎𝜎𝑡𝑡2) = ��𝑅𝑡𝑡 − 𝛽𝛽𝜎𝜎𝜎𝑡𝑡
2
𝑇𝑇𝐴𝐴 = 𝑡𝑡1𝑈𝐶𝐶𝐶𝐶2𝑡𝑡𝐴𝐴 ) + 𝑡𝑡2𝑈𝑆𝑆𝐶𝐶2𝑡𝑡
𝐴𝐴 ) + 𝑡𝑡3𝑈𝑁𝑁𝐶𝐶𝑥𝑥𝑡𝑡𝐴𝐴 )
𝑇𝑇𝐵𝐵 = 𝑡𝑡1𝑈𝐶𝐶𝐶𝐶2𝑡𝑡𝐵𝐵 ) + 𝑡𝑡2𝑈𝑆𝑆𝐶𝐶2𝑡𝑡
𝐵𝐵 ) + 𝑡𝑡3𝑈𝑁𝑁𝐶𝐶𝑥𝑥𝑡𝑡𝐵𝐵 )
��𝑅𝑡𝑡𝐴𝐴 = 𝑅𝑅𝑡𝑡
𝐴𝐴 − 𝑇𝑇𝐴𝐴 ��𝑅𝑡𝑡
𝐵𝐵 = 𝑅𝑅𝑡𝑡𝐵𝐵 − 𝑇𝑇𝐵𝐵
��𝑅𝑡𝑡 = 𝛼𝛼𝜎𝑡𝑡��𝑅𝑡𝑡𝐴𝐴 + (1 − 𝛼𝛼𝜎𝑡𝑡)��𝑅𝑡𝑡
𝐵𝐵
𝛼𝛼𝜎𝑡𝑡 =1
2𝛽𝛽𝑈��𝑅𝑡𝑡𝐴𝐴−��𝑅𝑡𝑡
𝐵𝐵)−𝑈��𝜎𝑡𝑡𝐵𝐵)2−��𝜎𝑡𝑡
𝐴𝐴𝐵𝐵
𝑈��𝜎𝑡𝑡𝐴𝐴)2−𝑈��𝜎𝑡𝑡
𝐵𝐵)2−2��𝜎𝑡𝑡𝐴𝐴𝐵𝐵 .
𝑆𝑆𝑆𝑆𝑅𝑅𝑖𝑖𝑡𝑡 = 𝛼𝛼𝑖𝑖𝑡𝑡 + 𝛽𝛽1𝑅𝑅𝐶𝐶𝐵𝐵𝑖𝑖𝑡𝑡 + 𝛽𝛽2𝐼𝐼𝐵𝐵𝑖𝑖𝑡𝑡 + 𝛽𝛽3𝐵𝐵𝐵𝐵𝐵𝐵𝐵𝐵𝐵𝐵𝐵𝐵𝐵𝐵𝐵𝐵𝑖𝑖𝑡𝑡 + 𝛽𝛽4𝑅𝑅𝑖𝑖𝐵𝐵𝑅𝑅𝑖𝑖𝑡𝑡 + 𝜀𝜀𝑖𝑖𝑡𝑡
(9)
𝐵𝐵𝐵𝐵𝐵𝐵𝐵𝐵𝑡𝑡 =−𝑎𝑎1(𝐶𝐶𝐶𝐶2) − 𝑎𝑎2(𝑆𝑆𝐶𝐶𝑥𝑥) − 𝑎𝑎3(𝑁𝑁2𝐶𝐶)
𝑌𝑌𝑡𝑡
𝛼𝛼𝑡𝑡 =1
2𝛽𝛽 (𝑅𝑅𝑡𝑡𝐴𝐴 − 𝑅𝑅𝑡𝑡
𝐵𝐵) − (𝜎𝜎𝑡𝑡𝐵𝐵)2 − 𝜎𝜎𝑡𝑡
𝐴𝐴𝐵𝐵
(𝜎𝜎𝑡𝑡𝐴𝐴)2 − (𝜎𝜎𝑡𝑡
𝐵𝐵)2 − 2𝜎𝜎𝑡𝑡𝐴𝐴𝐵𝐵
��𝛼𝑡𝑡 =1
2𝛽𝛽 (𝑅𝑅𝑡𝑡𝐴𝐴 − 𝑅𝑅𝑡𝑡
𝐵𝐵) − (𝜎𝜎𝑡𝑡𝐵𝐵)2 − 𝜎𝜎𝑡𝑡
𝐴𝐴𝐵𝐵 + 𝛾𝛾2𝛽𝛽 𝑈𝐵𝐵𝐵𝐵𝐵𝐵𝐵𝐵𝑡𝑡
𝐴𝐴 − 𝐵𝐵𝐵𝐵𝐵𝐵𝐵𝐵𝑡𝑡𝐵𝐵)
(𝜎𝜎𝑡𝑡𝐴𝐴)2 − (𝜎𝜎𝑡𝑡
𝐵𝐵)2 − 2𝜎𝜎𝑡𝑡𝐴𝐴𝐵𝐵
��𝛼 > 𝛼𝛼
. This finding suggests that investors allocate their funds by considering the rate of return, the riskiness of bonds, and the firm’s blueness. As a result, the utility function shifts upward from point “e” to point “f.” When we compare the utility functions of the seafood and the shipping firm and report that investors are willing to take on more risk, they prefer to invest in bluer firms.
It is important to note that, when the value of β increases, the participation in the respective bond decreases due to the rise in risk factors. In comparison, the value of γ shows the investors’ preference for bluer bonds. A higher value of γ increases the participation of investors in the respective bond.
In short, we can argue that “blueness” is an important indicator to attract investment on the one hand and to benefit the oceans on the other. Over the past few years, there has been a tremendous surge in the issuance of green bonds to benefit the environment. Following a similar pattern, ocean firms may issue bonds wherein investors prefer to participate in the firms that are taking the necessary measures to benefit the ocean.
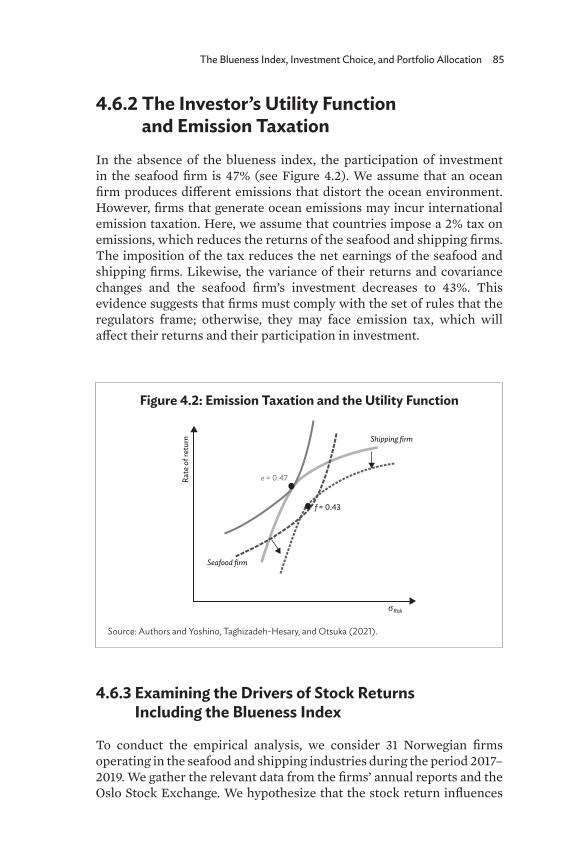
The Blueness Index, Investment Choice, and Portfolio Allocation 85
4.6.2 The Investor’s Utility Function and Emission Taxation
In the absence of the blueness index, the participation of investment in the seafood firm is 47% (see Figure 4.2). We assume that an ocean firm produces different emissions that distort the ocean environment. However, firms that generate ocean emissions may incur international emission taxation. Here, we assume that countries impose a 2% tax on emissions, which reduces the returns of the seafood and shipping firms. The imposition of the tax reduces the net earnings of the seafood and shipping firms. Likewise, the variance of their returns and covariance changes and the seafood firm’s investment decreases to 43%. This evidence suggests that firms must comply with the set of rules that the regulators frame; otherwise, they may face emission tax, which will affect their returns and their participation in investment.
Figure 4.2: Emission Taxation and the Utility Function
Source: Authors and Yoshino, Taghizadeh-Hesary, and Otsuka (2021).
Seafood firm
σRisk
Rate
of r
etur
n Shipping firm
f = 0.43
e = 0.47
4.6.3 Examining the Drivers of Stock Returns Including the Blueness Index
To conduct the empirical analysis, we consider 31 Norwegian firms operating in the seafood and shipping industries during the period 2017–2019. We gather the relevant data from the firms’ annual reports and the Oslo Stock Exchange. We hypothesize that the stock return influences

86 Blue Economy and Blue Finance: Toward Sustainable Development and Ocean Governance
the bonds’ return, the issuance number of bonds, the blueness index, and the bonds’ risk rating. Due to the lack of availability of data on blue bonds, we use the data on bond issuance and return on bonds. Table 4.2 presents the descriptive statistics of the variables that we use in this study.
Table 4.2: Descriptive Statistics
Variable Mean Std Dev. Min. Max.
SPR Share price returns (%) 5.03 0.15 –29.84 74.90
ROB Return on bonds (%) 0.52 0.84 0 4.70
IB Issuance of bonds (million Norwegian krone [NKr])
2,028.41 4,575.38 10.81 29,128.00
Blueness Emissions as a percentage of sales (1/x)
12.28 17.99 –6.23 75.18
Risk Credit ratings of the bonds (AA, A, and BBB)
– – – –
Source: Authors.
Table 4.3 presents the empirical results. This study employs the feasible generalized least square (FGLS) estimator to remove the problem of serial correlation and heteroskedasticity. We can report that the coefficient of the return of bonds is positive and significantly affects the stock returns. This evidence suggests that a firm’s required return is higher, which makes its beta or systemic risk higher, and we expect that, as a firm takes on more risk, it becomes inherently riskier. This study identifies a negative relationship between the number of issuances of bonds and the stock returns.
We express the blueness index as the ocean emissions produced as a percentage of the firm’s sales. A higher value of the blueness index of a firm refers to lower emissions produced. In this study, our variable of interest is the blueness index, which positively influences the stock returns. This evidence suggests that firms pursue blue strategies to maximize their share prices. In other words, environment-friendly firms satisfy the criteria to make the ocean blue and their probability of earning stock returns is higher. Lastly, the risk variable shows the credit rating of bonds, which does not have a statistical relationship with the stock returns. We can interpret this as indicating that the risk level associated with a firm’s bond issuance may not have a significant impact because we base the proxy for risk on investment-grade bonds.
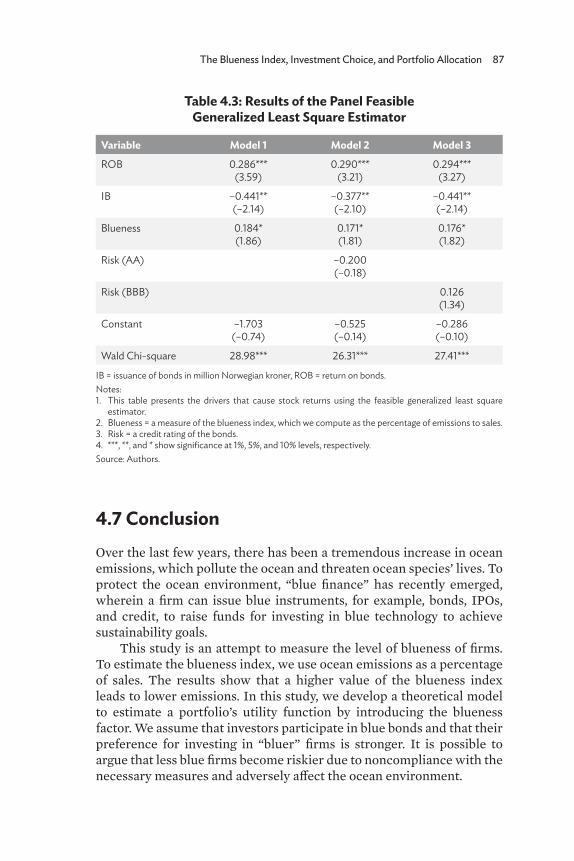
The Blueness Index, Investment Choice, and Portfolio Allocation 87
Table 4.3: Results of the Panel Feasible Generalized Least Square Estimator
Variable Model 1 Model 2 Model 3
ROB 0.286***(3.59)
0.290***(3.21)
0.294***(3.27)
IB –0.441**(–2.14)
–0.377**(–2.10)
–0.441**(–2.14)
Blueness 0.184*(1.86)
0.171*(1.81)
0.176*(1.82)
Risk (AA) –0.200(–0.18)
Risk (BBB) 0.126(1.34)
Constant –1.703(–0.74)
–0.525(–0.14)
–0.286(–0.10)
Wald Chi-square 28.98*** 26.31*** 27.41***
IB = issuance of bonds in million Norwegian kroner, ROB = return on bonds.Notes: 1. This table presents the drivers that cause stock returns using the feasible generalized least square
estimator. 2. Blueness = a measure of the blueness index, which we compute as the percentage of emissions to sales. 3. Risk = a credit rating of the bonds. 4. ***, **, and * show significance at 1%, 5%, and 10% levels, respectively.Source: Authors.
4.7 ConclusionOver the last few years, there has been a tremendous increase in ocean emissions, which pollute the ocean and threaten ocean species’ lives. To protect the ocean environment, “blue finance” has recently emerged, wherein a firm can issue blue instruments, for example, bonds, IPOs, and credit, to raise funds for investing in blue technology to achieve sustainability goals.
This study is an attempt to measure the level of blueness of firms. To estimate the blueness index, we use ocean emissions as a percentage of sales. The results show that a higher value of the blueness index leads to lower emissions. In this study, we develop a theoretical model to estimate a portfolio’s utility function by introducing the blueness factor. We assume that investors participate in blue bonds and that their preference for investing in “bluer” firms is stronger. It is possible to argue that less blue firms become riskier due to noncompliance with the necessary measures and adversely affect the ocean environment.
88 Blue Economy and Blue Finance: Toward Sustainable Development and Ocean Governance
Further, we report that if firms account for the blueness measures, their investment in blue bonds is higher. To achieve the objective of blueness, firms must do business in a way that benefits the ocean. For noncompliance with the blueness factors, governments should impose ocean emission taxation, which will affect the bond returns; thus, the participation in blue bonds decreases. Finally, we determine the drivers that cause stock returns and find that firms’ blueness positively influences their stock returns, indicating that firms that are relatively “bluer” may be socially responsible, leading them to outperform other firms.
This study is useful for policy makers, firms, investors, and regulators to account for firms’ blueness. In the absence of blue parameters, firms may face emission taxation, which eventually reduces their returns. We propose that financing regulators should develop different financing frameworks for providing funds so that firms can benefit from and invest in blue technology, thereby achieving the blueness parameters and benefiting the oceans. Future research could test the proposed theoretical model on a large data set of ocean firms and compare their returns, riskiness, and blueness index.

The Blueness Index, Investment Choice, and Portfolio Allocation 89
ReferencesBajpai, P. 2021. What Are Blue Bonds? Nasdaq. https://www.nasdaq
.com/articles/what-are-blue-bonds-2021-08-04Barbesgaard, M. 2018. Blue Growth: Savior or Ocean Grabbing? Journal
of Peasant Studies. 45(1): 130–49.Bell, D. E. 1995. Risk, Return, and Utility. Management Science. 41(1):
23–30.Bennett, N. 2018. Navigating a Just and Inclusive Path towards
Sustainable Oceans. Marine Policy. 97: 139–46.Blue Natural Capital Financing Facility (BNCFF). 2019. Blue Bonds:
Financing Resilience of Coastal Ecosystem, prepared by N. Roth, 4Climate; T. Thiele, Global Ocean Trust; and M. von Unger, Silvestrum. Luxembourg.
Ciais, P., and C. Sabine. 2013. Carbon and Other Biogeochemical Cycles (Chapter 6, 465–570). In T. F. Stocker D. Qin, G.-K. Plattner, M. Tignor, S.K. Allen, J. Boschung, A. Nauels, Y. Xia, V. Bex and P.M. Midgley, eds. Climate Change 2013: The Physical Science Basis. Contribution of Working Group I to the Fifth Assessment Report of the Intergovernmental Panel on Climate Change. Cambridge, UK: Cambridge University Press.
Eikeset, A., A. Mazzarella, B. Daviðsdóttir, D. Klinger, S. Levin, E. Rovenskaya, and N. Stenseth. 2018. What is Blue Growth? The Semantics of “Sustainable Development” of Marine Environments. Marine Policy. 87: 177–9.
Goddard, C. 2015. The Blue Economy: Growth, Opportunity and a Sustainable Ocean Economy. London: Economist Intelligence Unit.
Guggisberg, S. 2019. Funding Coastal and Marine Fisheries Projects under the Climate Change Regime. Marine Policy. 107, 103352.
Gulseven, O. 2020. Measuring Achievements towards SDG 14, Life below Water, in the United Arab Emirates. Marine Policy. 117, 103972.
Hilborn, R., and C. Costello. 2018. The Potential for Blue Growth in Marine Fish Yield, Profit and Abundance of Fish in the Ocean. Marine Policy. 87: 350–5.
International Capital Market Association. 2018. Green Bonds Principles—Voluntary Process Guidelines for Issuing Green Bonds. https://www.icmagroup.org/assets/documents/ Regulatory/Green-Bonds/Green-Bonds-Principles-June-2018-270520.pdf
Markowitz, H. 1952. Portfolio Selection. Journal of Finance. 7(1): 77–91.Mumtaz M. Z., and N. Yoshino. 2021a. Greenness Index: IPO Performance
and Portfolio Allocation. Research in International Business and Finance. 57(3): 101398.
____. 2021b. Greenness, Mood, and Portfolio Allocation: A Cross-Country Analysis. Environmental Challenges. 5: 100325.
90 Blue Economy and Blue Finance: Toward Sustainable Development and Ocean Governance
Niiranen, S., A. Ritcher, T. Blenckner, L. Stige, A. Valman, and A. Eikeset. 2018. Global Connectivity and Cross-Scale Interactions Create Uncertainty for Blue Growth of Arctic Fisheries. Marine Policy. 87: 321–30.
Smith-Godfrey, S. 2016. Defining the Blue Economy. Maritime Affairs: Journal of the National Maritime Foundation of India. 12(1): 58–64.
Spalding, M. 2016. The New Blue Economy: The Future of Sustainability. Journal of Ocean and Coastal Economics. 2(2): 1–21.
Steffen, J. 2012. Green to Blue Economy. International Union for Conservation of Nature. Presentation at 14th Annual Meeting of Pacific Islands Roundtable for Nature Conservation. https://www .iucn.org/sites/dev/files/import/downloads/iucn_green_to_blue _economy.pdf
Tirumala, R. D., and P. Tiwari. 2020. Innovating Financing Mechanism for Blue Economy Projects. Marine Policy. 104194.
Vanderklift, M., R. Marcos-Martinez, J. Butler, M. Coleman, A. Lawrence, H. Prislan, A. Steven, and S. Thomas. 2019. Constraints and Opportunities for Market-Based Finance for the Restoration and Protection of Blue Carbon Ecosystems. Marine Policy. 107. https://doi.org/10.1016/j.marpol.2019.02.001
Wabnitz, C., and R. Blasiak. 2019. The Rapidly Changing World of Ocean Finance. Marine Policy. 107.
World Ocean Initiative. 2020. Will Blue Finance Fulfill its Potential? https://ocean.economist.com/ blue-finance/articles/will-blue -finance-fulfil-its-potential (accessed 3 March 2022).
Yoshino, N., F. Taghizadeh-Hesary, and M. Otsuka. 2020. Optimal Portfolio Selection for Environment, Social, and Governance Investment. In N. Nemoto, and P. J. Morgan, eds. Environmental, Social, and Governance Investment: Opportunities and Risks for Asia. Tokyo: Asian Development Bank Institute.
____. 2021. Covid-19 and Optimal Portfolio Selection for Investment in Sustainable Development Goals. Finance Research Letters. 101695.
PART II
Blue Economy

93
5
Government Policy, Industrial Clusters, and the Blue Economy
in the People’s Republic of China: A Case Study on the Shandong Peninsula Blue Economic Zone
Zhihai Xie
5.1 IntroductionThe People’s Republic of China (PRC) has attached substantial importance to the blue economy in recent years. In the 12th Five-Year Plan for National Economic and Social Development (2011–2015), the PRC set the goal to expand the blue economy’s share of the gross domestic product (GDP) to 10% by 2015 (State Council 2011a). According to the China Blue Economy Development Report 2019, a joint release from the PRC’s National Development and Reform Commission and the Ministry of Natural Resources, the volume of the blue economy, or the gross ocean product (GOP), reached CNY8,341 billion in 2018, accounting for 9.3% of the country’s GDP. In the past decade, the PRC’s blue economy has continued to grow at a high rate of more than 6.5%. In the 13th Five-Year Plan (2016–2020), the PRC promoted the blue economy, or the marine economy, as a national strategy (State Council 2016). In delivering the State Council’s Government Work Report in 2019, Premier Li Keqiang confirmed the PRC’s commitment to “develop the blue economy, protect the marine environment, and build a maritime power.” The country has also updated its ambitious goal to expand the blue economy’s share of the GDP to 15% by 2035.
Under such circumstances, in 2011, the PRC’s State Council approved the plan to develop a blue economic zone on the Shandong Peninsula. The Shandong Peninsula BEZ (SP-BEZ) is the PRC’s first and
94 Blue Economy and Blue Finance: Toward Sustainable Development and Ocean Governance
only regional strategy centered on the blue economy. The SP-BEZ covers eight cities, specifically Jinan, Qingdao, Yantai, Zibo, Weifang, Weihai, Dongying, and Rizhao, with a sea area of 159,500 square kilometers and a land area of 64,000 square kilometers. Among the eight cities, Qingdao is not only the engine for the SP-BEZ’s development but also a pioneer of the entire country’s blue economy. It has 30% of the country’s marine education and research institutions, 50% of its marine research personnel, and 70% of its marine experts. According to the city’s Bureau of Statistics, Qingdao’s GOP reached CNY250 billion in 2016, accounting for more than one-fourth of its GDP.
The goal of the SP-BEZ is to develop a modern marine industrial cluster with relatively strong international competitiveness, a world-leading education center of marine science, a pilot zone for national marine economic reform and opening up, and a national key demonstration zone of marine ecological civilization (State Council 2011b). The strategy of the SP-BEZ is to redistribute the regional industries in the Shandong Peninsula and make full use of the region’s advantages to focus on the blue economy. Under such policy guidance, the GDP of Shandong Province and Qingdao City has increased greatly. The contribution of the blue economy to the GDP growth is also significant. For example, the blue economy alone helped the city’s GDP to grow by 3.9% in 2017 (Ministry of Natural Resources 2018).
What are the reasons for the rapid development of the PRC’s blue economy in the past decade? To what extent has the SP-BEZ contributed to the development of the blue economy in the PRC? What implications can the SP-BEZ provide for other countries if they are to promote their blue economy? To answer such questions, this chapter examines the role of both government policy and industrial clusters in the development of the blue economy through an empirical case study on the SP-BEZ in the PRC.
The research will combine both quantitative and qualitative studies. The study will collect and make use of the official data from the PRC’s State Council, National Development and Reform Commission, and China Oceanic Development Foundation as well as municipal governments, such as those of Shandong Province and Qingdao City.
5.2 Literature Review
5.2.1 The Blue Economy
“Blue economy” has become a buzzword in recent years. According to the World Bank (2017), the blue economy involves the sustainable use of ocean resources for economic growth, improved livelihoods and jobs,

Government Policy, Industrial Clusters, and the Blue Economy in the People’s Republic of China: A Case Study on the Shandong Peninsula Blue Economic Zone 95
and ocean ecosystem health. Since its activities are centered on the ocean, some literature has used the terms “ocean economy” or “marine economy,” which are synonyms for “blue economy.” Particularly in the PRC, for example, government documents and media reports have used “marine economy” more frequently. This chapter will use these terms interchangeably as it aims to include diverse perspectives and cite different sources.
There are already some comprehensive study reports on the blue economy. Some have tried to clarify the definition of the blue economy as “the set of environmentally and socially sustainable commercial activities, products, services and investments dependent on and impacting coastal and marine resources” (Whisnant and Reyes 2015). The OECD’s (2019) study report assessed the crucial role of innovative approaches in a sustainable ocean economy and argued that it is science and technology that enable economic growth and ecosystem preservation in the blue economy. The study report released by the Economist Intelligence Unit (2015) emphasized the “industrialization” effect in the blue economy and argued that “alongside established ocean industries, emerging and new activities—offshore renewable energy, aquaculture, deep seabed mining and marine biotechnology are often cited—will bring new opportunities, growth and greater diversity to the ocean economy.” In addition, recent academic research articles have stressed the important role of the government or policy in developing the blue economy. Some have argued that the blue economy is necessarily a complex governmental project that opens up new governable spaces and rationalizes particular ways of governing (Choi 2017). Others have analyzed the role of national macroeconomic strategies in the blue economy through empirical and comparative case studies of the European Union, Indonesia, and the PRC (Lu et al. 2019).
5.2.2 The Blue Economy in the People’s Republic of China
The rapid development of the blue economy in the PRC has also attracted academic research attention. The study report that the Center for American Progress released argued that the PRC model stresses an integrated, cross-sectoral approach to the development of coastal areas, offering lessons for other countries, such as the United States (US), after comparing the blue economy of the PRC with that of the US (Conathan and Moore 2015). The report also called for international cooperation in the blue economy between the PRC and the US. The study report that the David and Lucile Packard Foundation (2015) produced stressed the importance of four factors, specifically the government, academia, civil society, and philanthropy, in the PRC’s
96 Blue Economy and Blue Finance: Toward Sustainable Development and Ocean Governance
blue economy development strategy. Both studies recognized that the PRC’s approach to the blue economy has transformed from being development oriented to also being committed to marine ecological sustainability and marine resource preservation. Some academic research contributed to studies on the PRC’s blue economy from the perspective of methodology by establishing the industrial classification framework and sorting out the available statistical system in the ocean economy (J. Wang 2016). Some studies tried to define and quantify the value of major ocean industries in the PRC and examined the growth in the PRC’s major ocean industries during a given time period (Zhao, Hynes, and He 2014). Others examined the contribution of marine capital and marine labor to the PRC’s regional marine economic development (Jiang, Liu, and Su 2014).
5.3 Development of the Blue Economy in the People’s Republic of China
5.3.1 Government Policy on the Blue Economy’s Development in the People’s Republic of China
The PRC has attached importance to the marine economy since the 1990s. In the first decade of the 21st century, the average growth rate of the PRC’s marine economy, or the GOP, was 16.35%, much higher than the overall GDP growth rate during the same time period. From 2000 to 2011, the contribution of the PRC’s marine economy to the national economy rose from 6.46% to 13.83% (Jiang, Liu, and Su 2014). Particularly in coastal areas, marine industries have become the most important new source of economic growth. The PRC has not typically been at the top of the list of the countries that rely most heavily on their ocean resources (Conathan and Moore 2015). Since the land resources in the PRC, as well as in other countries around the world, are increasingly on the verge of economic and ecological exhaustion, the value of the oceans as a resource for economic development has become increasingly prominent (Zhao, Hynes, and He 2014).
In 2003, the State Council issued the first National Marine Economy Developing Plan Guideline. It raised the development goals to increase the marine economy’s share of the GDP to 4% by 2005 and over 5% by 2010 and gradually make the marine economy an important backbone for national development. Since this was the initial development stage of the PRC’s marine economy, the goals seemed to be rather conservative. As a matter of fact, the marine economy’s share of the GDP exceeded 9% in 2010. The document pointed out that there are 11 marine economic
Government Policy, Industrial Clusters, and the Blue Economy in the People’s Republic of China: A Case Study on the Shandong Peninsula Blue Economic Zone 97
zones in the PRC. In general, there are three large marine economy areas, the Bohai Sea area, the Yangtze River Delta, and the Pearl River Delta. These three areas include all 11 marine economic zones and account for more than 80% of the PRC’s marine economy GDP.
In 2008, the State Council issued the National Guideline for Marine Development Planning. This was the first overall plan for marine areas since the establishment of the PRC. It proclaimed that the marine industry must occupy a very important strategic position in the PRC’s socialist modernization (State Council 2008). In 2011, marine economic development first appeared in the PRC’s 12th Five-Year Plan (2011–2015) as a top-level strategy. Since then, the PRC’s government has released plans and documents to stress the sustainability of the marine economy (Zhang and Ravesteijn 2019). In addition, the 12th Five-Year Plan officially approved the establishment of the SP-BEZ.
At the 18th National Congress of the Chinese Communist Party in November 2012, then President Hu Jintao proclaimed that the country would develop itself into a maritime power, a statement that had both political and economic meaning. Politically, the PRC wanted to enhance its influence and protect its national interest in the sea. Economically, it identified the marine economy as an important sector of the PRC’s economy. In 2013, the State Council approved the Marine Career Development Plan for the 13th Five-Year Plan (2016–2020), which is a comprehensive plan to promote the sustainable and efficient development of the marine economy (Jiang, Liu, and Su 2014).
In July 2013, President Xi Jinping stressed that building a maritime power is one of the PRC’s most important development goals. After President Xi took office, the Maritime Silk Road, one of the two branches of the Belt and Road Initiative, was put forward in 2013. By starting the Maritime Silk Road, the PRC aimed not only to increase its geopolitical maritime influence but also to open up to the ocean and promote marine economic development through cooperation with other countries. In May 2017, the National Development and Reform Commission issued the 13th Five-Year Plan on National Marine Economy Development. Marine economic development continues to appear on the list of national strategies in the central government policy documents. At the 19th National Congress of the Chinese Communist Party in October 2017, President Xi reiterated the strategic goal to build a strong maritime country.
All these government policy documents and statements that the government has issued since 2003 have shown the PRC’s strong determination to develop an advanced marine economy. However, the PRC’s approach to the marine economy proved to focus too much on the development strategy in the first decade of the 21st century. The
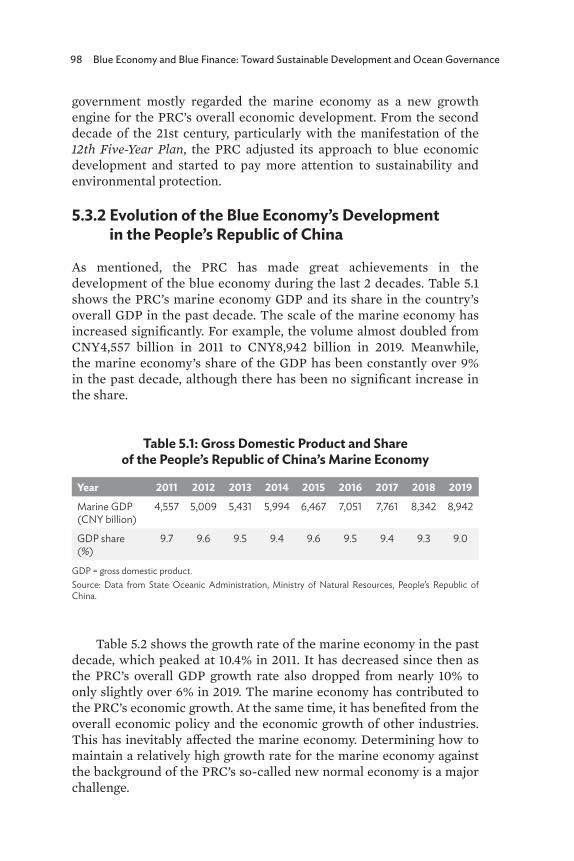
98 Blue Economy and Blue Finance: Toward Sustainable Development and Ocean Governance
government mostly regarded the marine economy as a new growth engine for the PRC’s overall economic development. From the second decade of the 21st century, particularly with the manifestation of the 12th Five-Year Plan, the PRC adjusted its approach to blue economic development and started to pay more attention to sustainability and environmental protection.
5.3.2 Evolution of the Blue Economy’s Development in the People’s Republic of China
As mentioned, the PRC has made great achievements in the development of the blue economy during the last 2 decades. Table 5.1 shows the PRC’s marine economy GDP and its share in the country’s overall GDP in the past decade. The scale of the marine economy has increased significantly. For example, the volume almost doubled from CNY4,557 billion in 2011 to CNY8,942 billion in 2019. Meanwhile, the marine economy’s share of the GDP has been constantly over 9% in the past decade, although there has been no significant increase in the share.
Table 5.1: Gross Domestic Product and Share of the People’s Republic of China’s Marine Economy
Year 2011 2012 2013 2014 2015 2016 2017 2018 2019
Marine GDP (CNY billion)
4,557 5,009 5,431 5,994 6,467 7,051 7,761 8,342 8,942
GDP share (%)
9.7 9.6 9.5 9.4 9.6 9.5 9.4 9.3 9.0
GDP = gross domestic product.Source: Data from State Oceanic Administration, Ministry of Natural Resources, People’s Republic of China.
Table 5.2 shows the growth rate of the marine economy in the past decade, which peaked at 10.4% in 2011. It has decreased since then as the PRC’s overall GDP growth rate also dropped from nearly 10% to only slightly over 6% in 2019. The marine economy has contributed to the PRC’s economic growth. At the same time, it has benefited from the overall economic policy and the economic growth of other industries. This has inevitably affected the marine economy. Determining how to maintain a relatively high growth rate for the marine economy against the background of the PRC’s so-called new normal economy is a major challenge.
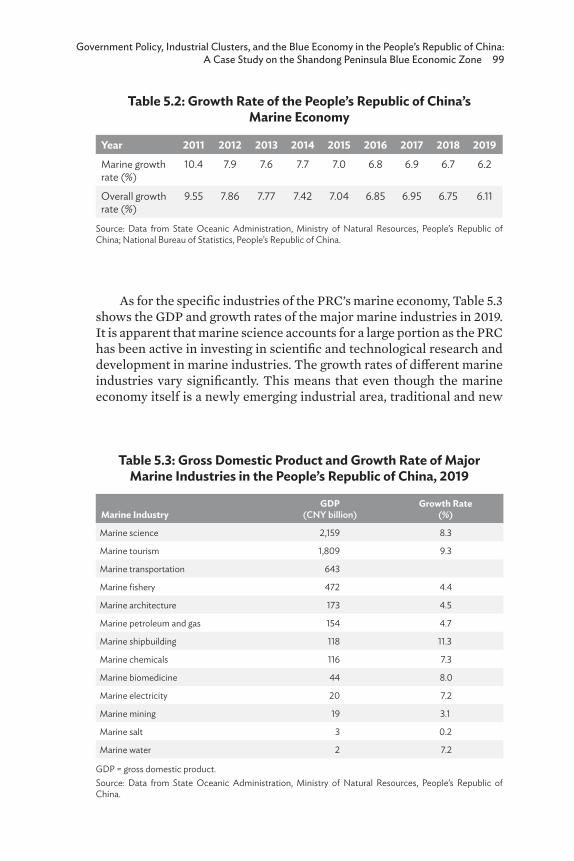
Government Policy, Industrial Clusters, and the Blue Economy in the People’s Republic of China: A Case Study on the Shandong Peninsula Blue Economic Zone 99
As for the specific industries of the PRC’s marine economy, Table 5.3 shows the GDP and growth rates of the major marine industries in 2019. It is apparent that marine science accounts for a large portion as the PRC has been active in investing in scientific and technological research and development in marine industries. The growth rates of different marine industries vary significantly. This means that even though the marine economy itself is a newly emerging industrial area, traditional and new
Table 5.2: Growth Rate of the People’s Republic of China’s Marine Economy
Year 2011 2012 2013 2014 2015 2016 2017 2018 2019
Marine growth rate (%)
10.4 7.9 7.6 7.7 7.0 6.8 6.9 6.7 6.2
Overall growth rate (%)
9.55 7.86 7.77 7.42 7.04 6.85 6.95 6.75 6.11
Source: Data from State Oceanic Administration, Ministry of Natural Resources, People’s Republic of China; National Bureau of Statistics, People’s Republic of China.
Table 5.3: Gross Domestic Product and Growth Rate of Major Marine Industries in the People’s Republic of China, 2019
Marine Industry GDP
(CNY billion)Growth Rate
(%)
Marine science 2,159 8.3
Marine tourism 1,809 9.3
Marine transportation 643
Marine fishery 472 4.4
Marine architecture 173 4.5
Marine petroleum and gas 154 4.7
Marine shipbuilding 118 11.3
Marine chemicals 116 7.3
Marine biomedicine 44 8.0
Marine electricity 20 7.2
Marine mining 19 3.1
Marine salt 3 0.2
Marine water 2 7.2
GDP = gross domestic product.Source: Data from State Oceanic Administration, Ministry of Natural Resources, People’s Republic of China.

100 Blue Economy and Blue Finance: Toward Sustainable Development and Ocean Governance
industries coexist in this area. The data shows that marine shipbuilding, marine tourism, marine science, and marine biomedicine are the four marine industries that grew the fastest in 2019. On the contrary, traditional marine industries, such as marine mining and marine salt, had relatively low growth rates.
Figure 5.1 shows the makeup of different marine industries and their share in the PRC in 2019. The largest three marine industries in the PRC are marine tourism, marine transportation, and marine fishery. Interestingly, marine tourism accounts for about half of the total marine GDP, meaning that the service industry already constitutes a significant share of the PRC’s marine economy. For example, the marine economy’s first industry, second industry, and third industry accounted for 4.2%, 35.8%, and 60.0%, respectively, in 2019 (Ministry of Natural Resources 2020). On the one hand, this shows the third industry’s high degree of participation in the PRC’s marine economy. On the other hand, it proves that the balance among the different marine industries needs improvement.
In addition to embarking on blue economic development domestically, the PRC has made efforts to increase its influence in the global discourse on the blue economy. For example, it organized and held the Asia-Pacific Economic Cooperation (APEC) Blue Economy Forum.
Figure 5.1: Makeup of Major Marine Industries in the People’s Republic of China in 2019
Source: Data from State Oceanic Administration, Ministry of Natural Resources, People’s Republic of China.
Marine tourism
Marine transportation
Marine fishery
Marine architecture
Marine petroleum and gas
Marine shipbuilding
Marine chemicals
Marine biomedicine
Marine electricity
Marine mining
Marine salt
Marine water
0% 10%
0.1%
0.1%
0.5%
0.6%
1.2%
3.2%
3.3%
4.3%
4.8%
13.2%
18.0%
50.6%
20% 30% 40% 50% 60%
Government Policy, Industrial Clusters, and the Blue Economy in the People’s Republic of China: A Case Study on the Shandong Peninsula Blue Economic Zone 101
The APEC Blue Economy Forum had taken place five times so far, in 2011, 2012, 2014, 2016, and 2018, all in the PRC. The theme of the fifth forum in Ningbo City of Zhejiang Province was “Local Blue Economy Practice: Policy and Approach.” The PRC aimed to promote blue economic cooperation and local best practice sharing in Asia and the Pacific region. Another example is the China Marine Economy Expo (CMEE). The CMEE, sponsored by the PRC’s Ministry of Natural Resources and Guangdong Provincial Government, has happened annually since 2014. The latest CMEE, with the theme “Open Cooperation, Win-Win and Sharing,” occurred in Shenzhen City of Guangdong Province in October 2020. The expo involved exhibitions in a wide range of areas, such as ships and port shipping, ocean resource development, high-end marine equipment, ocean electronic information, marine biomedicine, and marine ecology environment protection and safety. The CMEE is not only a window through which foreign countries can learn more about the PRC’s current situation and the developing trends of the blue economy but also an opportunity for foreign businesses to start cooperation with the PRC in the blue economy.
Meanwhile, there has been gradual bridging of the gap between the PRC’s concept of the “blue economy” and that of Western countries. In general, there are at least two points of difference when comparing the PRC’s blue economy with that of Western countries. First, the PRC’s blue economy tends to be more development oriented as the initial motive was to make use of ocean resources to provide new sources of economic growth. Second, the PRC started to recognize the issue of environmental protection for the ocean relatively later than Western countries. However, the situation has improved significantly in the past decades. For example, the concept of the blue economy in the PRC’s 2008 National Marine Industrial Development Plan signified the integrated development of coastal and marine resources as part of a strategic national economic development plan instead of referring to a new model of marine resource use that emphasizes environmental sustainability (Conathan and Moore 2015). However, the PRC’s latest concept of the blue economy is the sum of all kinds of activities associated with the development, utilization, and protection of the marine environment. For example, Wang Hong, the vice chair of the PRC’s delegation to the Rio+20 Summit in 2012, said, “The blue economy is a new thinking on development. It entails promoting marine economic development while protecting the environment and achieving sustainable resource use.” Currently, the PRC’s idea of the blue economy, though evolving late to include a new focus on “sustainable development and conservation,” prioritizes integrating coastal and ocean resources into a broader plan for national economic development and encouraging
102 Blue Economy and Blue Finance: Toward Sustainable Development and Ocean Governance
the marine industry to play a greater role in the economy (Economist Intelligence Unit 2015).
Why did the shift from a focus on development to an emphasis on sustainability and environmental protection take place in the PRC’s blue economy policy? There are three main reasons. First, the PRC’s economic development model has gradually changed since entering the 21st century. Second, the awareness of environmental protection has improved considerably on both the governmental and the civil level during the same time period. Third, the PRC has recognized the great value of ocean resources for long-term economic development. To ensure the sustainability of its blue economy, the PRC has enacted and enforced a range of laws and regulations to protect the marine environment. To provide some examples, on 1 August 2015, the State Council issued a notice on national marine functional area planning that called for shoreline protection of not less than 35% and an increase in marine protected areas’ coverage to 5% of the Exclusive Economic Zone (David and Lucile Packard Foundation 2019). Furthermore, in March 2016, the proposed outlines of the 13th Five-Year Plan that the National People’s Congress issued called for greater control of fishing efforts, the protection of coastal ecosystems, enhanced wetland restoration, and the implementation of marine ecosystem-based management (David and Lucile Packard Foundation 2019).
The PRC’s important approach to blue economic development is to designate marine economic zones in areas that are rich in ocean resources and nature. In these marine economic zones, the government aims not only to make use of ocean resources for industrial development but also to put the ocean under governmental governance and avoid environmental destruction. Since 2019, the PRC has been pushing forward scientific innovations in the marine industry and has established six national marine economic innovation and development demonstration areas and seven national industrial demonstration bases for rejuvenating the marine industry with science and technology (Lu et al. 2019). Among these are three strategic marine economic zones, specifically the SP-BEZ, the Guangdong Provincial Blue Economy Experimental Zone, which the government approved in July 2011, and the Zhejiang Provincial Blue Economy Experimental Zone, which it approved in 2012. As the names suggest, the SP-BEZ has gained complete approval as a national strategic marine economic zone, while the other two are still experimental. The government has applied the experiences of the SP-BEZ to the other marine economy areas to broaden and deepen the development of the blue economy nationwide. The next section will focus on studying the case of the SP-BEZ and examine the reasons for the PRC’s rapid development of the blue economy. Accordingly,
Government Policy, Industrial Clusters, and the Blue Economy in the People’s Republic of China: A Case Study on the Shandong Peninsula Blue Economic Zone 103
the section will focus on analyzing the role of government policy and industrial clusters in the development process of the SP-BEZ.
5.4 Case Study: The Shandong Peninsula Blue Economic Zone
5.4.1 Government Policy
Central Government Policy As Choi (2017) argued, the blue economy is necessarily a complex governmental project that opens up new governable spaces and rationalizes particular ways of governing. This is particularly the case for the PRC. Government policy has played the most important role in initiating and promoting the development of the blue economy in the PRC. The previous section has exemplified the PRC’s government policy documents and statements on blue economic development. There is no doubt that government policy is the most important driving force behind the development of the PRC’s blue economy.
First, the establishment of the blue economic zone is also the result of the interaction between the central and the municipal governments. In April and October 2009, then President Hu Jintao visited Shandong Province and pointed out that the province should speed up its development of the marine economy, make use of marine resources, nurture advantageous marine industries, and establish the SP-BEZ. The establishment of the SP-BEZ clearly took place under the guidance of the central government.
In 2011, the PRC’s State Council issued the Shandong Peninsula Blue Economy Zone Development Plan, which symbolized the establishment of the SP-BEZ. The plan is part of the national economic development plan, the 12th Five-Year Plan, which determined the medium-range national economic development goals from 2011 to 2015. This means that the establishment of the SP-BEZ took place within the framework of the PRC’s national development strategy. This plan also demonstrated the central government’s determination to promote the development of the blue economy. It set the goals of building a modern marine industrial system in the SP-BEZ, greatly enhancing the marine technological innovation ability, and improving the marine biodiversity and environmental condition by 2015 (State Council 2011b). The plan pointed out that by 2020, the SP-BEZ should be a zone with an advanced marine economy, an optimized industrial structure, and harmony between humans and nature (State Council 2011b). The goals show that the central government’s policy focuses not only on economic growth
104 Blue Economy and Blue Finance: Toward Sustainable Development and Ocean Governance
but also on the sustainability of development and, most importantly, the protection and conservation of the marine environment.
Second, the government provided full financial support for the establishment of the SP-BEZ and its industrial development. In June 2012, the PRC’s Ministry of Finance and State Oceanic Administration jointly issued the Notification on Promoting the Marine Economy of the Innovative Development Area. In this document, the Ministry of Finance clearly expressed its special financial support for the development of marine industries, particularly in areas such as marine biological pharmacy and seafood aquaculture. The purpose is to nurture a number of new companies and develop the fundamental technologies in the core marine industries. Under such circumstances, the SP-BEZ has gradually established a multifaceted investment mechanism in which the government encourages companies and other economic entities to join the investment with good examples of public–private partnerships (PPPs) (Zhang, Shi, and Han 2018). There is a global trend whereby new market-oriented programs and projects increasingly aim to tap the financial value of the ocean’s blue capital, ostensibly fostering income generation and sustainable solutions for conservation finance (Satizabal et al. 2020). In the PRC, blue finance, the finance invested in blue economy industries, is also gaining more and more attention. Globally, the success rate for PPPs in the blue economy is mixed due to the lack of a coordinated understanding between the investment needs of local governments and communities and the aspirations of companies (Whisnant and Reyes 2015). Therefore, it is important for the PRC government to rely more on the market to encourage blue finance investment.
The PRC has already established a Green Finance Professional Committee under the Chinese Finance Association and the People’s Bank of China. In November 2015, the State Council approved the establishment of the China Oceanic Development Foundation (CODF). The CODF is under the management and organization of the State Oceanic Administration. Its function is to collect public and private funding for the PRC’s marine development. The CODF has carried out its activities in areas such as marine spatial planning, blue economic development, marine publicity and education, marine conservation and restoration, and marine science and technology innovation. In May 2020, the China Banking and Insurance Regulatory Commission instructed financial institutions to develop a “blue bond” for the purpose of marine economic development (Gill and Pollard 2020). The Bank of Qingdao, located in the SP-BEZ, is reportedly the pioneering bank to engage in “blue bond” business.
Third, government policies have directed the PRC’s changed approach to blue economic development and thus helped update
Government Policy, Industrial Clusters, and the Blue Economy in the People’s Republic of China: A Case Study on the Shandong Peninsula Blue Economic Zone 105
the PRC’s concept of the blue economy. Awareness and more diligent incorporation of environmental, social, and governance considerations into investments in the ocean economy are evolving (Economist Intelligence Unit 2015). As mentioned earlier, the PRC government has realized that it should not apply the development model for its land economy to the blue economy. The blue economy is not only part of the national development strategy but also a way of developing. Therefore, it should give priority to the consideration of the marine ecology. The government’s policies pay attention to coordination between the protection of the ocean’s ecological resources and the development of the marine economy (Jiang, Liu, and Su 2014). Almost all the government documents have stressed sustainability. There is no doubt that, in reality, the PRC’s rapid marine development has also caused some environmental problems. According to the State Oceanic Administration’s Marine Environment Bulletin, large parts of the PRC’s coastal areas and territorial seas are heavily polluted (Conathan and Moore 2015). As the marine economy is a relatively newly emerging economic domain, the PRC government has been able to make use of the lessons that other industries have learned in the past as well as lessons from advanced countries with regard to environmental protection. Thanks to the changes in policy guidance, the new model of marine development in the PRC places a higher value on the management and conservation of marine resources and ecosystem functions and recognizes the importance of these resources to the newly emerging marine industries and to coastal tourism in particular (Zhao, Hynes, and He 2014).
Fourth, government policy has also tried to enhance international cooperation and bring in foreign investment for the development of the blue economy. Thanks to the government policy, the SP-BEZ has become not only a domestic strategic project for the blue economy but also an international engine and hub for global cooperation on the blue economy. One direct example is the East Asia Marine Cooperation Platform (EAMCP), whose headquarters is in Qingdao City. During the ASEAN+3 summit1 in 2013 to 2015, PRC Premier Li Keqiang called for the establishment of the EAMCP and pledged that the PRC would invest CNY30 million in helping build the platform. After negotiation with the other ASEAN+3 members, the PRC’s State Council and State Oceanic Administration decided to build the headquarters of the EAMCP in Qingdao, Shandong. The EAMCP started the Qingdao Forum, which it has held annually since 2018. The theme of the Qingdao Forum 2018 was
1 ASEAN+3 comprises the members of the Association of Southeast Asian Nations plus the PRC, Japan, and the Republic of Korea.

106 Blue Economy and Blue Finance: Toward Sustainable Development and Ocean Governance
“manage the ocean and reach out to the deep blue.” The Qingdao Forum has invited experts and professionals from other Asian countries to participate and has become a global platform for sharing knowledge and technologies on marine economy. This has helped improve the brand awareness of the SP-BEZ internationally.
The EAMCP has undoubtedly provided great opportunities for the development of the blue economy in the SP-BEZ. It not only exposes the region to the advanced industries and global market of the blue economy but also brings overseas investment into the region. The PRC’s central government sponsored the establishment of the EAMCP and chose Qingdao as the platform’s headquarters.
Municipal Government Policy The previous section addressed the blue economy policy of the PRC’s central government. There is no doubt that without the central government’s strong policy support, the SP-BEZ could not have achieved its aims. However, the policy of the municipal government is equally important. This section will focus on analyzing the policy of Shandong Province regarding the development of the blue economy.
As early as 1991, Shandong Province raised and started the Shandong on the Sea (Haishang Shandong) project. The concept of “Shandong on the Sea” originated from the first national convention on marine affairs, which took place in Beijing in late 1990. The representatives from Shandong expressed their ideas on how to “develop and protect the sea, build the Shandong on the sea.” This laid the foundation for the Shandong on the Sea project. Simply put, it is a development strategy to make full use of Shandong Province’s advantages in marine resources and focus on developing the marine economy.
In June 2006, Shandong Province issued the Shandong Provincial Marine Economy Development Plan under the 11th Five-Year Plan (2005–2010). In response to the National Marine Economy Developing Plan Guideline that the State Council issued in 2003, as well as the national 11th Five-Year Plan for economic development, Shandong Province made its own medium-range development plan exclusively for the marine economy. The plan highlighted the province’s strength in marine resources and called for the building of a marine economic zone, cultivating competitive marine industries and giving the province a strong marine economy. In June 2009, Shandong Province issued Suggestions on Building the SP-BEZ. At the same time, it published Suggestions on Enhancing the Building of the Shandong Peninsula High-Tech Industrial Cluster. These two documents formed the important bottom-up driving force for the establishment of the SP-BEZ. The frequent policy interaction between the central government and the

Government Policy, Industrial Clusters, and the Blue Economy in the People’s Republic of China: A Case Study on the Shandong Peninsula Blue Economic Zone 107
Shandong provincial government made clear the necessity of building the SP-BEZ. As a result, the State Council eventually gave its approval.
It is worth noting that not only Shandong Province but also the governments of municipal cities, such as Qingdao, actively updated their policy to enhance the development of the marine economy. In 2016, the central government chose Qingdao City, the central city of the SP-BEZ, as one of the pilot cities for the innovative development of the marine economy in the 13th development plan. In response to this, Qingdao City issued a series of policy directives to promote marine economic development. These included the Marine Plus Development Plan, the Action Plan for Building a Globally Advanced Marine Development Center, and the Action Plan for Developing the Marine Economy and Building a Globally Well-Known Marine City. In June 2019, Qingdao City released the so-called “Ocean Offensive” Development Plan, which aimed to invest CNY500 billion in 200 core marine projects during the period 2019–2022.
The government policy has brought considerable benefits to the marine economy in Shandong Province. In 2009, the GDP of Shandong Province’s marine economy was CNY300 billion, accounting for 10% of the province’s total GDP (Xu and Meng 2012). In 2019, the GDP of Shandong Province’s marine economy increased to CNY1,460 billion and accounted for 21% of the province’s total GDP. In just 1 decade, the marine GDP increased by almost five times and its share of the GDP doubled.
5.4.2 Industrial Clusters
Industrial Clusters in the Shandong Peninsula Blue Economic ZoneThe blue economy involves a wide range of industries. Depending on the method of categorization, the blue economy consists of nine key industries: fishery and aquaculture; ports, shipping, and marine transport; tourism, resorts, and coastal development; oil and gas; coastal manufacturing; seabed mining; renewable energy; marine biotechnology; marine technology; and environmental services. Their dependence and impact on coastal and marine areas make these nine primary industries the key to growing a blue economy (Whisnant and Reyes 2015). With such a diversity of industries, it is necessary to take advantage of industrial clusters to exert an agglomerative effect on the blue economy. In the PRC, it is possible to divide the ocean economy into ocean industries and ocean-related industries. Ocean industries are those that represent the core of the ocean economy and include industries involved in the production or supply of services for
108 Blue Economy and Blue Finance: Toward Sustainable Development and Ocean Governance
developing, utilizing, and/or protecting the ocean, while ocean-related industries refer to the enterprises that form a technical and economic link with major marine industries (X. Wang 2016).
According to the SP-BEZ Development Plan that the State Council issued in 2011, four aspects reflect the position of the SP-BEZ in the national strategy: advanced marine industrial clusters with international competitiveness; a core area for marine science, technology, and education; a pioneer zone for the reform and opening up of the national marine economy; and a model region of marine biodiversity civilization (State Council 2011b). Among these four aspects, the marine industrial cluster has both the functional means and the goal to develop the marine economy in the SP-BEZ. Again, the plan stressed the importance of sustainability and the environment as it also included the ambitious goal of building the marine biodiversity civilization. Since 2015, the SP-BEZ has issued documents such as the Guideline on Enhancing Innovative Industrial Clusters and the Guideline on Enhancing People’s Innovation and Entrepreneurship. Under the guidance of these documents, a number of coastal cities have built an innovation and entrepreneurial service center to encourage entrepreneurs in marine industries (Zhang, Shi, and Han 2018). People sometimes refer to these sectors collectively as the “new blue economy” or “blue tech,” and they are fundamental to a strategy of developing “blue clusters” (Conathan and Moore 2015). Shandong Province is promoting the development of emerging marine industries in the fields of biology, new energy, and new materials; and marine-related companies in coastal cities like Qingdao, Yantai, and Weihai are taking advantage of the plan to expand their business or upgrade their services (People’s Daily 2012).
Due to the rapid development of marine science and technology in recent years, all kinds of new marine industries are emerging and thereby expanding the scope of the marine economy (Zhao, Hynes, and He 2014). The SP-BEZ Development Plan involves the construction of four industrial areas and three industrial parks. The four industrial areas are Qingdao Western Coastal New Area, Weifang Coastal New Area, Weihai South Sea New Area, and Yantai Eastern New Area. The three industrial parks are the Qingdao PRC–Germany Industrial Park, Rizhao International Seashore City, and Weifang Coastal Industrial Park. To build the SP-BEZ, the region has started to forge six industrial bases, specifically a marine manufacturing industrial base, a shipbuilding and repairing industrial base, a port logistics industrial base, a seashore entertainment industrial base, a new energy industrial base, and a petroleum chemicals industrial base.
Instead of developing all the marine industries evenly at the same time, the government prefers to focus more on the advantageous
Government Policy, Industrial Clusters, and the Blue Economy in the People’s Republic of China: A Case Study on the Shandong Peninsula Blue Economic Zone 109
industries and try to achieve targets as soon as possible. For example, the SP-BEZ is traditionally strong in the biomedical industry. Therefore, it has concentrated more on the biomedical industry and thus made great achievements in this area. To accelerate the development of the bio-industry, at the very beginning of 2013, the State Council issued the 12th Five-Year Plan for Bio-industrial Development, which identified the marine biomedical industry as one of the key development areas (Zhao, Hynes, and He 2014). Under such policy guidance, new biomedical projects have commenced in the SP-BEZ. One example is the Blue Medical Tank Plan of the Marine Biomedical Research Institute of Qingdao. It is worth noting that Qingdao City’s marine biomedical GDP accounts for over 13% of the country’s total biomedical industry (Piao 2019).
Industrial Clusters in Qingdao City As the central city of the SP-BEZ, Qingdao’s development model focuses on the blue economy. In 2013, Qun Li, Party Chief of Qingdao City, said, “Blue economy will lead the city to adjust its development model and upgrade its industrial structure” (Xie 2013). Qingdao City’s marine economy GDP was CNY332.7 billion in 2018, which is 21% of Shandong Province’s marine economy GDP, 4% of the PRC’s marine economy GDP, and 28% of Qingdao City’s GDP in the same year (Piao 2019).
Compared with the land economy, the marine economic system itself has the characteristics of capital-heavy and technology-intensive production, and marine economic production activities require more technological development (Jiang, Liu, and Su 2014). Qingdao City’s strength lies in marine science and technology. Qingdao has marine scientific research institutions, such as the Ocean University of China; the Institute of Oceanology, Chinese Academy of Sciences; and the Yellow Sea Fisheries Research Institute, as well as new marine research facilities, for instance, the Pilot National Laboratory for Marine Science and Technology and the National Marine Equipment Quality Inspection Center (Gill and Pollard 2020). These entities are significant because science is crucial to achieving global sustainability and adequate stewardship of the ocean; it enables us to deepen our ability to understand and monitor the ocean’s resources and health as well as predict changes in its status (OECD 2019).
Taking Qingdao as an example, there are at least seven industrial clusters: the port, petroleum chemicals, shipbuilding, electrical products, biomedicine, tourism, and automobiles (Cheng, Zhang, and Yin 2015). In 2012, Qingdao City decided to build and integrate the blue industrial base called “One Valley and Two Areas,” which refers to the Blue Silicon Valley that it established in 2012, the West Coastal New
110 Blue Economy and Blue Finance: Toward Sustainable Development and Ocean Governance
Area that it started in 2014, and the Red Island High-Tech Area that it developed in 2002. It integrated the three into one blue industrial cluster concentrating on technological innovation and international cooperation in the marine industry. As a world-class research and development center for marine science and technology, the expectation is that the Blue Silicon Valley will be a driving force in the development of the city’s blue economy (China Briefing 2014). In 2018, the GDP of “One Valley and Two Areas” accounted for about 40% of Qingdao City’s GDP (Piao 2019). It is clear that the blue industrial base has become the most important engine for Qingdao City’s economic development.
On 6 August 2018, China Central Television reported on Qingdao’s marine development and praised its development model, which was to build a “high-tech blue silicon valley” based on its strength in marine industries. One example that the report gave was the Qingdao National Laboratory of Marine Science and Technology. The central government approved the laboratory, which began operating in 2015. In June 2018, President Xi visited the laboratory and stressed that the marine economy and marine technology constituted an important area the country was entering.
How can studies evaluate the effect of industrial clusters on the blue economy? The importance of measuring the economic performance of ocean-based industries is becoming increasingly apparent to public policymakers and private decision makers alike (OECD 2019). A new wave of “industrialization” of the ocean and coasts is underway, the scale of which is only now becoming apparent (Economist Intelligence Unit 2015). To grasp the opportunity of “blue industrialization,” countries need to rethink the industrial distribution and industrial strategy in their marine economy. The SP-BEZ has been successful largely because it has the clear goal of building industrial clusters and has always tried to optimize the industrial distribution.
The SP-BEZ has also enhanced the development of the regional economic integration within Shandong Province and the surrounding cities. In the PRC, in recent years, there has been a trend of domestic regional integration, meaning, economic integration at the domestic level. For example, there are economic blocs, such as the Yangtze River Delta, Pearl River Delta, and Beijing–Tianjin–Hebei region. Recently, the country has also developed the bay area along Guangdong; Hong Kong, China; and Macau, China. Such a trend is apparent in the Shandong Peninsula due to the industrial cooperation among different cities. This economic cooperation and integration will further strengthen the region’s brand of marine industries.
Government Policy, Industrial Clusters, and the Blue Economy in the People’s Republic of China: A Case Study on the Shandong Peninsula Blue Economic Zone 111
5.5 Conclusion and Policy Recommendations The blue economy or marine economy has become increasingly important for countries not only to generate a new source of growth but also to ensure the coexistence of humans and the environment. The PRC has attached great importance to the blue economy since the beginning of the 21st century. During the past 2 decades, the PRC’s development of the blue economy has made great achievements. The blue economy’s share in the GDP has increased substantially and remained large. The blue economy has become a national strategy, though traditionally the PRC has not relied heavily on marine resources. The PRC’s approach to the blue economy has also transformed during the past decade. In the policy directives and at the practical level, ecological sustainability and marine environmental protection have already become an important part of the blue economy in the PRC.
This chapter has argued that government policy and industrial clusters are the two most important factors contributing to the development of the PRC’s blue economy, as the case study of the SP-BEZ demonstrated. First, government policy was the basis for the establishment and development of the SP-BEZ. The PRC government has provided policy guidance and assistance for the development of the blue economy. Both the central and the municipal governments have sponsored the SP-BEZ project by providing substantial financial and technological support. The development of blue finance has occurred due to the public–private partnerships in the blue economy that the government has encouraged. For example, the sponsorship of the State Council and the Ministry of Natural Resources allowed the establishment of the China Oceanic Development Foundation in 2015. Its members consist of six giant state-owned companies.
Second, industrial clusters are both the means and the end for the SP-BEZ. To promote the development of the blue economy in the SP-BEZ, the government has made full use of Shandong Peninsula’s industrial advantages to redistribute and restructure the industries in the region. The SP-BEZ has formed industrial clusters with the structure of “one center, two poles, three belts, and three groups.” The industrial clusters have integrated a wide range of different industries, such as marine biological pharmaceuticals, marine energy, marine engineering, and marine logistics. In the process, the SP-BEZ has attached particular importance to the blue economy’s sustainable development, with projects that aim to preserve the marine resources
112 Blue Economy and Blue Finance: Toward Sustainable Development and Ocean Governance
in the region. Thanks to the industrial clusters, regional cooperation and integration have also developed rapidly on the Shandong Peninsula.
The expected policy implications from this study originate from both positive and negative lessons from the evolution of the PRC’s blue economy and the SP-BEZ case. The study has demonstrated the importance of government policy and industrial distribution in developing the blue economy. For example, the government should provide guidance and assistance in areas such as finance, facilities, personnel, and resources to promote the blue economy. Industrial redistribution and restructuring should help enhance the development of the blue economy. Meanwhile, the development of the blue economy should strike a balance between economic benefits and sustainable development.
Specifically speaking, the study leads to the following policy recommendations. First, the government, both the central government and the municipal governments, should produce robust policies that take into account the importance of the blue economy. Policies should also meet the local area’s development and ecological needs instead of considering only the factors at the national level. Second, industrial clusters are an effective way to strengthen the effects of different marine industries. The government should help to develop industrial clusters with the support of scientific and technological research and development in marine industries. Third, the government should encourage investments of blue finance, particularly private investment, in the blue economy’s industries. As mentioned previously, the government has initiated “blue bonds” in recent years. Countries should actively make policies that encourage banks to take bold action in this area. Fourth, the development model must be different from that of the land economy as the ocean is more vulnerable to pollution than the land. The blue economy should prioritize marine ecological sustainability and environmental protection rather than the development strategy.
Government Policy, Industrial Clusters, and the Blue Economy in the People’s Republic of China: A Case Study on the Shandong Peninsula Blue Economic Zone 113
ReferencesCheng, W., Y. Zhang, and B. Yin. 2015. On Coordinated Development of
Industrial Clusters in Maritime Economy. China Opening Journal. 2: 82–85.
China Briefing. 2014. Qingdao’s Blue Economy: Marine Investment on the Rise. https://www.china-briefing.com/news/qingdaos-blue -economy-marine-investment-rise/
Choi, Y. R. 2017. The Blue Economy as Governmentality and the Making of New Spatial Rationalities. Dialogues in Human Geography. 7(1): 37–41.
Conathan, M., and S. Moore. 2015. Developing a Blue Economy in China and the United States. Washington, DC: Center for American Progress. https://cdn.americanprogress.org/wp-content/uploads/2015/05 /ChinaBlueEcon-report-final.pdf
David and Lucile Packard Foundation. 2019. China Marine Strategy: Helping China Create an Ecological Civilization for Its Ocean and Coasts 2016–2020. https://www.packard.org/wp-content/uploads /2019/01/China-Marine-Strategy_English.pdf
Economist Intelligence Unit. 2015. The Blue Economy: Growth, Opportunity and a Sustainable Ocean Economy. Briefing Paper for the World Ocean Summit 2015. London.
Gill, C., and J. Pollard. 2020. China to Float New “Blue Bonds” for Better Oceans. Asia Times Financial. 12 May 2020.
Jiang, X.-Z., T.-Y. Liu, and C.-W. Su. 2014. China’s Marine Economy and Regional Development. Marine Policy. 50: 227–37.
Lu, W., C. Cusack, M. Baker, W. Tao, C. Mingbao, K. Paige, Z. Xiaofan, L. Levin, E. Escobar, D. Amon, Y. Yue, et al. 2019. Successful Blue Economy Examples with an Emphasis on International Perspectives. Frontiers in Marine Science. 6: 1–14.
Ministry of Natural Resources of the People’s Republic of China. 2018. Statistics Bulletin of the PRC’s Blue Economy in 2017. Beijing.
____. 2020. Statistics Bulletin of the PRC’s Blue Economy in 2019. Beijing.Organisation for Economic Co-operation and Development (OECD).
2019. Rethinking Innovation for a Sustainable Ocean Economy. Paris: OECD Publishing. https://doi.org/10.1787/9789264311053-en
People’s Daily. 2012. China’s “Blue Economy” Takes Off as Marine Industry Transforms, Upgrades. 8 January 2012.
Piao, W. 2019. Marine Economy Development Plan and Marine Industrial Park Construction Plan for Qingdao City. 18 September 2019. Qingdao: Joint Ocean Research Center in Qingdao.
Satizabal, P., W. H. Dressler, M. Fabinyi, and M. D. Pido. 2020. Blue Economy Discourses and Practices: Reconfiguring Ocean Spaces in the Philippines. Maritime Studies 19: 207–21.

114 Blue Economy and Blue Finance: Toward Sustainable Development and Ocean Governance
State Council. 2008. National Guideline for Marine Development Planning. Beijing.
____. 2011a. The 12th Five-Year Plan for National Economic and Social Development (2011–2015). Beijing.
____. 2011b. Shandong Peninsula Blue Economy Zone Development Plan. Beijing.
____. 2016. The 13th Five-Year Plan for National Economic and Social Development (2016–2020). Beijing.
Wang, J. 2016. Study on Transformation of China’s Marine Development Direction and Policy in the 13th Five-Year Plan. Ecological Economy. 32: 21–4.
Wang, X. 2016. The Ocean Economic Statistical System of China and Understanding of the Blue Economy. Journal of Ocean and Coastal Economics. 2(2): Article 10.
Whisnant, R., and A. Reyes. 2015. Blue Economy for Business in East Asia: Towards an Integrated Understanding of Blue Economy. Quezon City, Philippines: Partnerships in Environmental Management for the Seas of East Asia (PEMSEA).
World Bank. 2017. What Is the Blue Economy? Infographic. 6 June 2017. https://www.worldbank.org/en/news/infographic/2017/06/06 /blue-economy
Xie, C. 2013. “Blue Economy” Key to Qingdao’s Future. China Daily. 27 May 2013.
Xu, S., and Q. Meng. 2012. Analysis and Prospects of Marine Economy Development in Shandong Province. Marine Development and Management. 3: 114–119.
Zhang, L., L. Shi, and L. Han. 2018. A Study on the Innovation of System Mechanism in the Blue Economic Zone of Shandong Peninsula. Periodical of Ocean University of China. 4: 27–35.
Zhang, Y., and W. Ravesteijn. 2019. Sustainable Port Development Based on the Blue Economy Framework in China: The Example of Qingdao Port. Maritime Transport. 187: 121–131.
Zhao, R., S. Hynes, and G. S. He. 2014. Defining and Qualifying China’s Ocean Economy. Marine Policy. 43: 164–73.
115
6
Developing the Philippine Blue Economy:
Opportunities and Challenges in the Ocean Tourism Sector
Maria Angela G. Zafra
6.1 IntroductionOur oceans contain vast amounts of wealth, providing an estimated $1.5 trillion in global value added each year (Spalding, Brumbaugh, and Landis 2016). Research has acknowledged coastal and maritime activities as drivers supporting a nation’s economy (McKinley et al. 2019). With the spotlight on climate change, the current discourse is tackling the appropriate use and management of private sector activities in the ocean (Voyer and van Leeuwen 2019). The blue economy, “sustainable use of ocean resources for economic growth, improved livelihoods and jobs, and ocean ecosystem health,” covers a plethora of activities (World Bank 2017).
Ocean tourism constitutes a significant component of the economy for countries with marine resources. Sustainable ocean tourism can be part of the blue economy if the provision of livelihoods and economic growth occur simultaneously with the protection of marine resources. This requires countries to move away from business models that are purely extractive in nature and toward integrating conservation, protection, and rehabilitation into the equation. Proper management of tourism in marine environments can propel developing countries forward and help to achieve several of the Sustainable Development Goals.
This chapter aims to explore how ocean tourism and economic development intertwine in archipelagic nations by using the Philippines as a country case example. It will achieve this by examining national
116 Blue Economy and Blue Finance: Toward Sustainable Development and Ocean Governance
statistical data on tourism and economic development over the last several years. Furthermore, this chapter discusses the policy landscape that supports the development of ocean tourism in the country and seeks to understand how it is incorporating sustainability practices into ocean tourism by examining a tourism establishment in the Philippines.
With the importance of the blue economy in global sustainable development, understanding the different opportunities and challenges in ocean-related development is critical in making recommendations regarding existing tourism policies. The findings of the study have implications for policy makers, tourism planners, and other tourism stakeholders in developing island economies.
6.2 Tourism and Economic Development in the Philippines1
It is crucial to understand the importance of tourism to the Philippine economy since this sector is a key driver of the Philippine blue economy. In 2018, the country welcomed 7.1 million international visitors, while locals made 111 million domestic trips (Arnaldo 2019). Through the Build, Build, Build program of President Rodrigo Duterte, the country has built, renovated, or expanded tourism infrastructure, such as airports and seaports, to cope with the increasing tourist numbers. Data from the World Bank’s World Development Indicators show that international tourism has been increasing since the turn of the millennium in two separate cycles. The global financial crisis of 2008 led to a large slump in tourism, but the Philippines has long since recovered. In Figure 6.1, the bar graphs show that international tourism receipts, the gross domestic product (GDP) per capita, and the gross national income (GNI) per capita have all been on the rise since 2010, with tourism receipts showing the fastest increase. The line graphs in the same figure show that the annual GDP and GNI growth both hover between 6% and 7%, indicating economic growth for the country, as the dotted regression trend lines in the graph indicate.
1 The information in this section comes primarily from the Philippine Tourism Satellite Accounts, which the National Statistical Coordination Board (NSCB) compiled in coordination with the Department of Tourism and the NSCB Inter-Agency Committee on Tourism Statistics.
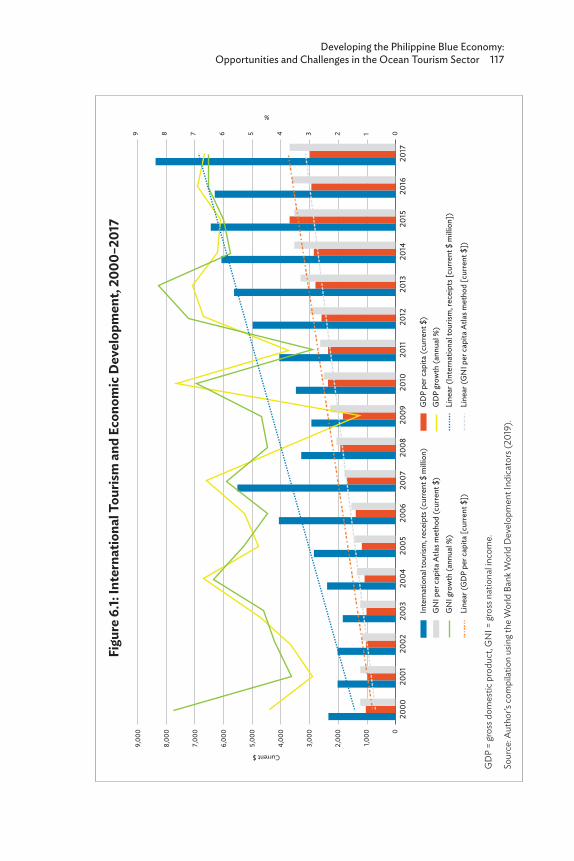
Developing the Philippine Blue Economy: Opportunities and Challenges in the Ocean Tourism Sector 117
Figu
re 6
.1: In
tern
atio
nal T
ouris
m a
nd E
cono
mic
Dev
elop
men
t, 20
00–2
017
GD
P =
gros
s dom
estic
pro
duct
, GN
I = gr
oss n
atio
nal in
com
e.
Sour
ce: A
utho
r’s c
ompi
latio
n us
ing t
he W
orld
Ban
k Wor
ld D
evel
opm
ent I
ndic
ator
s (20
19).
012345
%
Current $
6789
0
1,000
2,00
0
3,00
0
4,00
0
5,00
0
6,00
0
7,00
0
8,00
0
9,00
0
2000
2001
2002
2003
2004
2005
2006
2007
2008
2009
2010
2011
2012
2013
2014
2015
2016
2017
Inte
rnat
iona
l tou
rism
, rec
eipt
s (cu
rrent
$ m
illio
n)G
NI p
er c
apita
Atla
s met
hod
(cur
rent
$)
GD
P pe
r cap
ita (c
urre
nt $
)G
DP
grow
th (a
nnua
l %)
Line
ar (I
nter
natio
nal t
ouris
m, r
ecei
pts [
curre
nt $
mill
ion]
)
Line
ar (G
DP
per c
apita
[cur
rent
$])
GN
I gro
wth
(ann
ual %
)
Line
ar (G
NI p
er c
apita
Atla
s met
hod
[cur
rent
$])
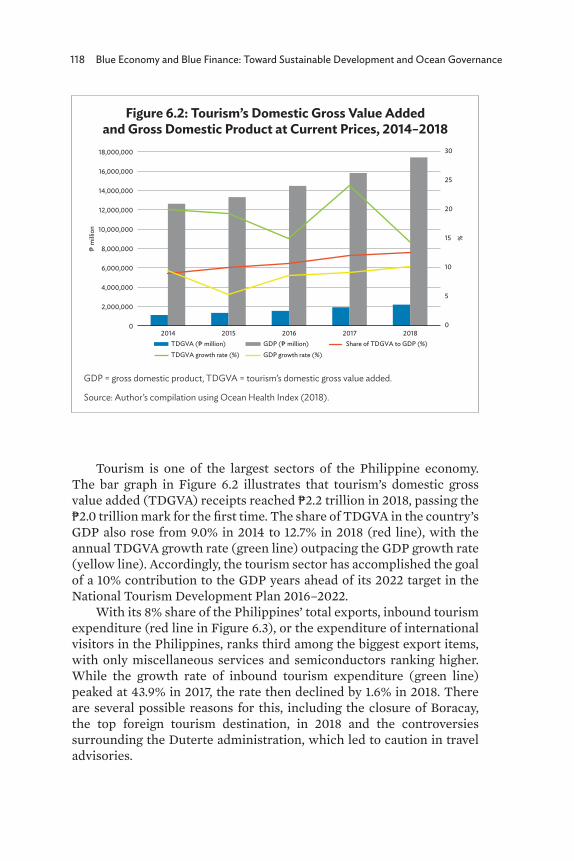
118 Blue Economy and Blue Finance: Toward Sustainable Development and Ocean Governance
Tourism is one of the largest sectors of the Philippine economy. The bar graph in Figure 6.2 illustrates that tourism’s domestic gross value added (TDGVA) receipts reached ₱2.2 trillion in 2018, passing the ₱2.0 trillion mark for the first time. The share of TDGVA in the country’s GDP also rose from 9.0% in 2014 to 12.7% in 2018 (red line), with the annual TDGVA growth rate (green line) outpacing the GDP growth rate (yellow line). Accordingly, the tourism sector has accomplished the goal of a 10% contribution to the GDP years ahead of its 2022 target in the National Tourism Development Plan 2016–2022.
With its 8% share of the Philippines’ total exports, inbound tourism expenditure (red line in Figure 6.3), or the expenditure of international visitors in the Philippines, ranks third among the biggest export items, with only miscellaneous services and semiconductors ranking higher. While the growth rate of inbound tourism expenditure (green line) peaked at 43.9% in 2017, the rate then declined by 1.6% in 2018. There are several possible reasons for this, including the closure of Boracay, the top foreign tourism destination, in 2018 and the controversies surrounding the Duterte administration, which led to caution in travel advisories.
Figure 6.2: Tourism’s Domestic Gross Value Added and Gross Domestic Product at Current Prices, 2014–2018
GDP = gross domestic product, TDGVA = tourism’s domestic gross value added.
Source: Author’s compilation using Ocean Health Index (2018).
0
5
10
15
20
25
30
0
2,000,000
4,000,000
6,000,000
8,000,000
10,000,000
12,000,000
14,000,000
16,000,000
18,000,000
2014 2015 2016 2017 2018
%
� m
illio
n
TDGVA (� million) GDP (� million) Share of TDGVA to GDP (%)TDGVA growth rate (%) GDP growth rate (%)

Developing the Philippine Blue Economy: Opportunities and Challenges in the Ocean Tourism Sector 119
Domestic tourism is also continuing to increase as Filipinos choose to travel to different regions of the country for holidays. The country reached the target numbers for domestic tourists in the National Tourism Development Plan 2016–2022 early, causing the Department of Tourism to consider revising the target (Talavera 2019a). The share of domestic tourism expenditure in household final consumption expenditure (red line) grew from 15.3% in 2014 to 24.9% in 2018, as Figure 6.4 shows. The increasing GDP per capita and the transitioning of the Philippine economy from the lower-middle-income to the upper-middle-income bracket over the next several years are encouraging more and more Filipinos to travel, starting with domestic travel and gradually including outbound international travel. The growth of domestic tourism expenditure (green line) is double the growth of household final consumption expenditure (yellow line).
Employment in the tourism industry grew from 4.8 million employed persons in 2014 to 5.3 million employed persons in 2018, as Figure 6.5 shows, with the industry employment growth rate (green line) a notch higher than the aggregate growth rate (yellow line). The share of employment in tourism in the total employment (red line) also increased modestly from 12.7% in 2014 to 13.0% in 2018.
Figure 6.3: Inbound Tourism Expenditure and Exports at Current Prices, 2014–2018
Source: Author’s compilation using Philippine Tourism Satellite Account data (2019).
–10
0
10
20
30
40
50
0
1,000,000
2,000,000
3,000,000
4,000,000
5,000,000
6,000,000
2014 2015 2016 2017 2018
%
� m
illio
n
Inbound tourism expenditure (� million) Exports (� million)Share of inbound tourism expenditure to exports (%) Inbound tourism expenditure growth rate (%)Exports growth rate (%)
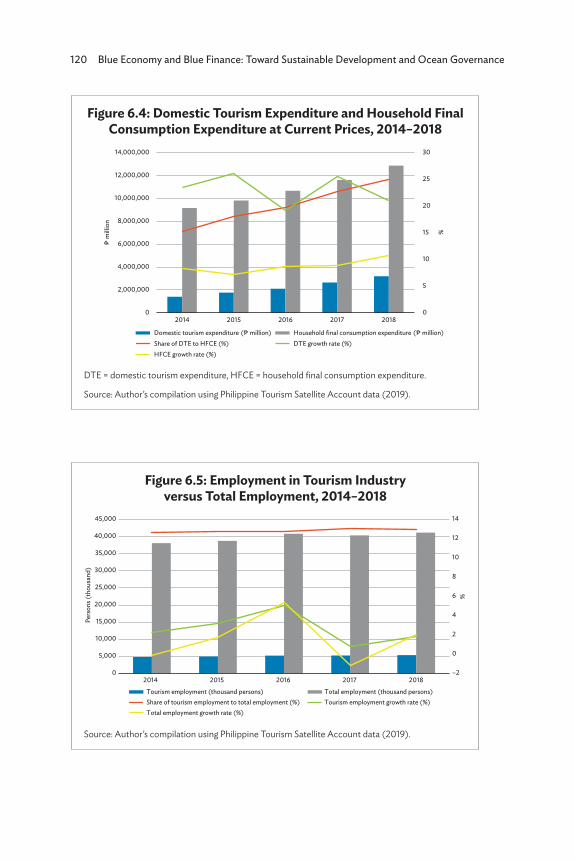
120 Blue Economy and Blue Finance: Toward Sustainable Development and Ocean Governance
Figure 6.4: Domestic Tourism Expenditure and Household Final Consumption Expenditure at Current Prices, 2014–2018
DTE = domestic tourism expenditure, HFCE = household final consumption expenditure.
Source: Author’s compilation using Philippine Tourism Satellite Account data (2019).
0
5
10
15
20
25
30
0
2,000,000
4,000,000
6,000,000
8,000,000
10,000,000
12,000,000
14,000,000
2014 2015 2016 2017 2018
%
� m
illio
n
Domestic tourism expenditure (� million) Household final consumption expenditure (� million)Share of DTE to HFCE (%) DTE growth rate (%)HFCE growth rate (%)
Figure 6.5: Employment in Tourism Industry versus Total Employment, 2014–2018
Source: Author’s compilation using Philippine Tourism Satellite Account data (2019).
–2
0
2
4
6
8
10
12
14
0
5,000
10,000
15,000
20,000
25,000
30,000
35,000
40,000
45,000
2014 2015 2016 2017 2018
%
Pers
ons (
thou
sand
)
Tourism employment (thousand persons) Total employment (thousand persons)Share of tourism employment to total employment (%) Tourism employment growth rate (%)Total employment growth rate (%)
Developing the Philippine Blue Economy: Opportunities and Challenges in the Ocean Tourism Sector 121
Just like in many developing countries, community participation in the tourism planning process is a way of implementing sustainable tourism in the Philippines (Okazaki 2008). In community-based tourism, local communities manage and organize most tourism activities. This is an effective way to manage tourism in the Philippines since it decentralizes the governance to the local government units, with the barangay as the smallest unit. Community-based tourism allows coordination among the different tourism stakeholders and active community involvement, making it a viable development strategy. This type of tourism is a mechanism for poverty alleviation as it provides greater economic benefits to the residents of the local community through the establishment of micro, small, or medium-sized enterprises and the generation of local employment (Teck-Weng, Hui-Bun, and Alim 2019). On the demand side, tourists can interact more with the local community and learn about the local culture and customs. This is important as the culture in the Philippines is as diverse as the number of islands. Taking this even further, many communities in the Philippines are developing strategies that incorporate sustainability components in the form of community-based ecotourism.
6.3 Ocean Wealth of the Philippines
6.3.1 The Philippine Blue Economy
The national State of Oceans and Coasts Report provides information on the status of seas and coasts of the Philippines, including the national ocean economy as well as the quantity and quality of resources in the coastal areas. The ocean economy of the Philippines covers 1,830 square kilometers of territorial sea, and its coastline of more than 7,000 islands spans a total 36,289 km, making it one of the longest coastlines in the world. Up to 62% of the country’s 105 million citizens reside and work in coastal areas, with 2.15 million Filipinos working in ocean economy industries. Estimations have indicated that the ocean economy contributes $11.9 billion in gross value added (2015, constant prices), accounting for 7% of the country’s GDP. As Figure 6.6 shows, coastal and marine tourism is the largest sector of the blue economy in the Philippines, contributing a quarter of the total value or an estimated $3 billion in value added, with around 900,000 employees. Fisheries and aquaculture (20%) and manufacturing (19%) follow. The value of the ecosystem services that the marine and coastal environment provides is an estimated $17 billion (PEMSEA 2018).
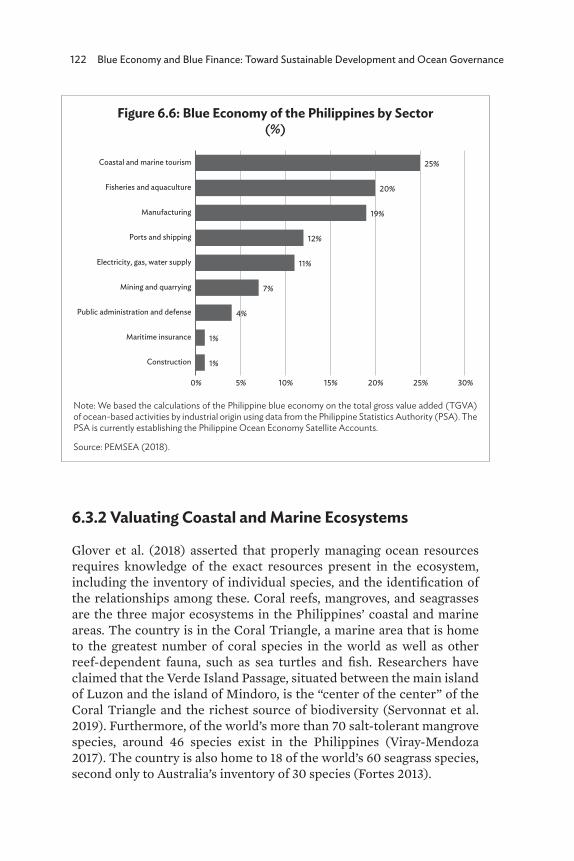
122 Blue Economy and Blue Finance: Toward Sustainable Development and Ocean Governance
6.3.2 Valuating Coastal and Marine Ecosystems
Glover et al. (2018) asserted that properly managing ocean resources requires knowledge of the exact resources present in the ecosystem, including the inventory of individual species, and the identification of the relationships among these. Coral reefs, mangroves, and seagrasses are the three major ecosystems in the Philippines’ coastal and marine areas. The country is in the Coral Triangle, a marine area that is home to the greatest number of coral species in the world as well as other reef-dependent fauna, such as sea turtles and fish. Researchers have claimed that the Verde Island Passage, situated between the main island of Luzon and the island of Mindoro, is the “center of the center” of the Coral Triangle and the richest source of biodiversity (Servonnat et al. 2019). Furthermore, of the world’s more than 70 salt-tolerant mangrove species, around 46 species exist in the Philippines (Viray-Mendoza 2017). The country is also home to 18 of the world’s 60 seagrass species, second only to Australia’s inventory of 30 species (Fortes 2013).
Figure 6.6: Blue Economy of the Philippines by Sector (%)
Note: We based the calculations of the Philippine blue economy on the total gross value added (TGVA) of ocean-based activities by industrial origin using data from the Philippine Statistics Authority (PSA). The PSA is currently establishing the Philippine Ocean Economy Satellite Accounts.
Source: PEMSEA (2018).
1%
1%
4%
7%
11%
12%
19%
20%
25%
0% 5% 10% 15% 20% 25% 30%
Construction
Maritime insurance
Public administration and defense
Mining and quarrying
Electricity, gas, water supply
Ports and shipping
Manufacturing
Fisheries and aquaculture
Coastal and marine tourism
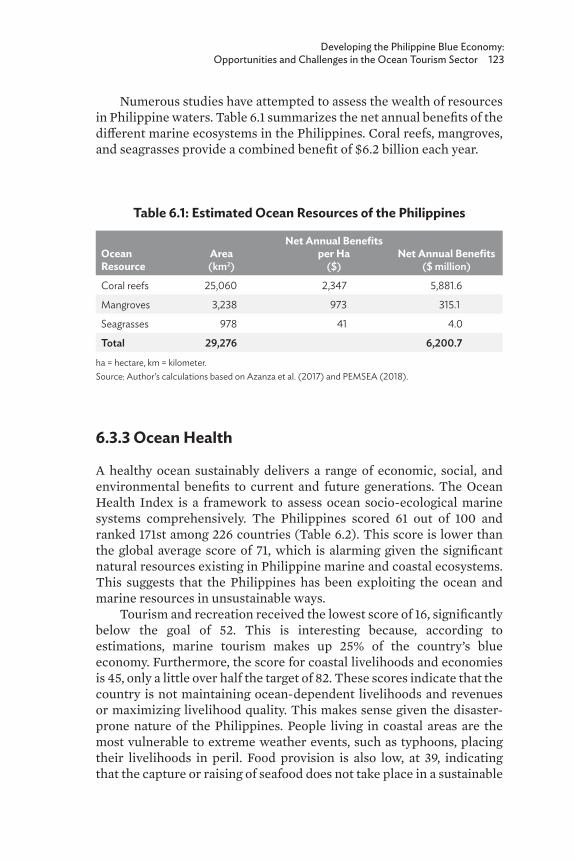
Developing the Philippine Blue Economy: Opportunities and Challenges in the Ocean Tourism Sector 123
Numerous studies have attempted to assess the wealth of resources in Philippine waters. Table 6.1 summarizes the net annual benefits of the different marine ecosystems in the Philippines. Coral reefs, mangroves, and seagrasses provide a combined benefit of $6.2 billion each year.
Table 6.1: Estimated Ocean Resources of the Philippines
Ocean Resource
Area(km2)
Net Annual Benefits per Ha
($)Net Annual Benefits
($ million)
Coral reefs 25,060 2,347 5,881.6
Mangroves 3,238 973 315.1
Seagrasses 978 41 4.0
Total 29,276 6,200.7
ha = hectare, km = kilometer.Source: Author’s calculations based on Azanza et al. (2017) and PEMSEA (2018).
6.3.3 Ocean Health
A healthy ocean sustainably delivers a range of economic, social, and environmental benefits to current and future generations. The Ocean Health Index is a framework to assess ocean socio-ecological marine systems comprehensively. The Philippines scored 61 out of 100 and ranked 171st among 226 countries (Table 6.2). This score is lower than the global average score of 71, which is alarming given the significant natural resources existing in Philippine marine and coastal ecosystems. This suggests that the Philippines has been exploiting the ocean and marine resources in unsustainable ways.
Tourism and recreation received the lowest score of 16, significantly below the goal of 52. This is interesting because, according to estimations, marine tourism makes up 25% of the country’s blue economy. Furthermore, the score for coastal livelihoods and economies is 45, only a little over half the target of 82. These scores indicate that the country is not maintaining ocean-dependent livelihoods and revenues or maximizing livelihood quality. This makes sense given the disaster-prone nature of the Philippines. People living in coastal areas are the most vulnerable to extreme weather events, such as typhoons, placing their livelihoods in peril. Food provision is also low, at 39, indicating that the capture or raising of seafood does not take place in a sustainable
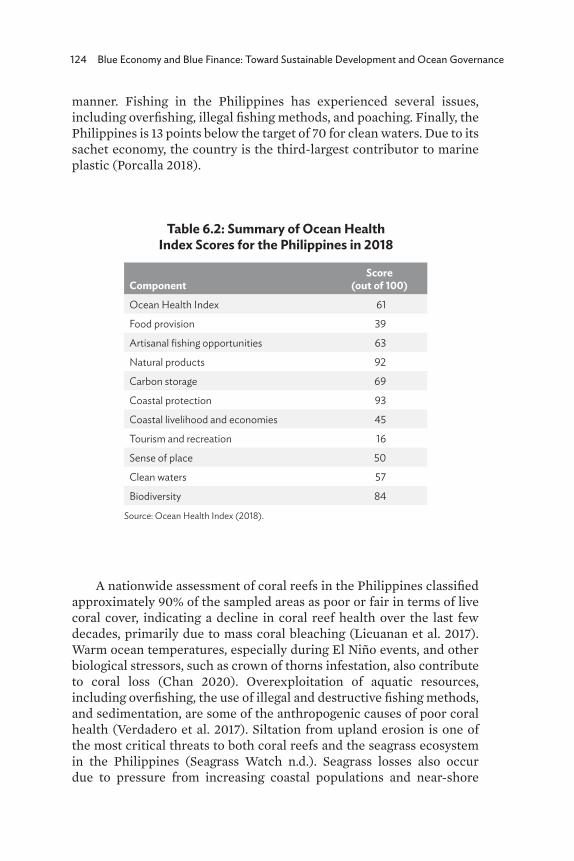
124 Blue Economy and Blue Finance: Toward Sustainable Development and Ocean Governance
manner. Fishing in the Philippines has experienced several issues, including overfishing, illegal fishing methods, and poaching. Finally, the Philippines is 13 points below the target of 70 for clean waters. Due to its sachet economy, the country is the third-largest contributor to marine plastic (Porcalla 2018).
Table 6.2: Summary of Ocean Health Index Scores for the Philippines in 2018
ComponentScore
(out of 100)
Ocean Health Index 61
Food provision 39
Artisanal fishing opportunities 63
Natural products 92
Carbon storage 69
Coastal protection 93
Coastal livelihood and economies 45
Tourism and recreation 16
Sense of place 50
Clean waters 57
Biodiversity 84
Source: Ocean Health Index (2018).
A nationwide assessment of coral reefs in the Philippines classified approximately 90% of the sampled areas as poor or fair in terms of live coral cover, indicating a decline in coral reef health over the last few decades, primarily due to mass coral bleaching (Licuanan et al. 2017). Warm ocean temperatures, especially during El Niño events, and other biological stressors, such as crown of thorns infestation, also contribute to coral loss (Chan 2020). Overexploitation of aquatic resources, including overfishing, the use of illegal and destructive fishing methods, and sedimentation, are some of the anthropogenic causes of poor coral health (Verdadero et al. 2017). Siltation from upland erosion is one of the most critical threats to both coral reefs and the seagrass ecosystem in the Philippines (Seagrass Watch n.d.). Seagrass losses also occur due to pressure from increasing coastal populations and near-shore
Developing the Philippine Blue Economy: Opportunities and Challenges in the Ocean Tourism Sector 125
developments (Fortes et al. 2018). Seagrass meadows remain the least-studied coastal habitats despite their importance, resulting in a lack of appreciation of them and their low priority in conservation programs (Cabico 2021).
Philippine mangrove areas have also declined by 50% since the 1970s, primarily due to both climate change and forest management practices. More frequent and intense tropical typhoons and the subsequent storm surges have destroyed significant mangrove cover. Anthropogenic sources, such as the expansion of aquaculture, with fishponds encroaching on mangrove forests, and the cutting of mangroves for fuel and home construction, have also contributed to mangrove loss (Buitre et al. 2019). Furthermore, the conversion of upland forests into agricultural land has increased the amount of pollution from agricultural compounds spreading through river systems. Deforestation has also contributed to erosion from upstream sources, and petroleum pollution from land-based activity can suffocate mangrove root systems (Viray-Mendoza 2017). While the Philippines has made significant investments in mangrove afforestation programs, these have been largely unsuccessful due to outplanting of the wrong species in areas with unsuitable hydrological characteristics (Sharma et al. 2017).
Tourism received one of the lowest scores because the Philippines often experiences overtourism or tourist pressure on local populations in many of its top destinations (Gossling, McCabe, and Chen 2020). Local chief executives are often at a loss in managing increasing tourist numbers and the multidimensional impact of tourism on their municipality (Varga 2019). The economic benefits of tourism to the local community resulted in their oblivion to environmental protection. Job generation and municipal development are the most positive impacts of tourism, which result in a trade-off against the carrying capacity of the ecosystem (Jalani 2012). Tourism-related environmental problems, such as overcrowding, the destruction of natural habitats, poor waste management, and pollution, have been reoccurring despite numerous national laws, local ordinances, and corresponding penalties for violations.
6.4 Ocean Tourism in the PhilippinesAs the previous section mentioned, estimations have indicated that ocean tourism contributes as much as 25% to the Philippines’ blue economy. Unfortunately, limited tourism-related statistics are available in the Philippines. The time series data that the Department of Tourism and the Philippine Statistical Authority publish only consider tourism’s contribution to the economy as an aggregate. They break down some of

126 Blue Economy and Blue Finance: Toward Sustainable Development and Ocean Governance
the data by type of travel (but this only applies to leisure and business travel) and by mode of travel, such as air, land, and water. No published official statistics relate to ocean, marine, or coastal tourism.2 Among ocean tourism pursuits, beach activities still provide the largest revenue stream, while diving is a growing segment. Mangrove ecotourism is the primary community-based form of ecotourism. Cruise tourism presents the largest potential for growth in the next 5 to 10 years. Surfing and sport fishing are present but constitute a niche market. Each type of tourism product has corresponding benefits, negative impacts, and challenges, which Table 6.3 summarizes.
2 The researcher has written to the Department of Tourism to request any disaggregated tourism statistics relating to ocean and marine tourism (e.g., cruises and diving). However, the Department of Tourism has yet to reply as of the writing and submission of this chapter.
Table 6.3: Assessment of Ocean Tourism Products
Type of Ocean Tourism Benefits Negative Impacts Challenges
Sun and beach tourism
Easy to develop across all market segments (budget to luxury)
Generates the most local employment
Many different mechanisms to integrate sustainability into tourism operations
Mismanagement and overcrowding can lead to unsustainable tourism
Solid waste and water pollution negatively affect the water quality and marine environments
Increased bacteria in the water can lead to illnesses
Preventing the overdevelopment of beaches and coastal ecosystems
Presenting the business case for investing in natural assets to mobilize the private sector
Dive tourism Can combine diving trips with marine educational and cleanup activities
Frequently dived sites may suffer damage or loss of coral cover due to close contact with divers stirring up sediment
Illegal removal of biodiversity or artifacts
Damage resulting from boat anchors
Making the economic benefits of diving more inclusive since it is a niche market
continued on next page
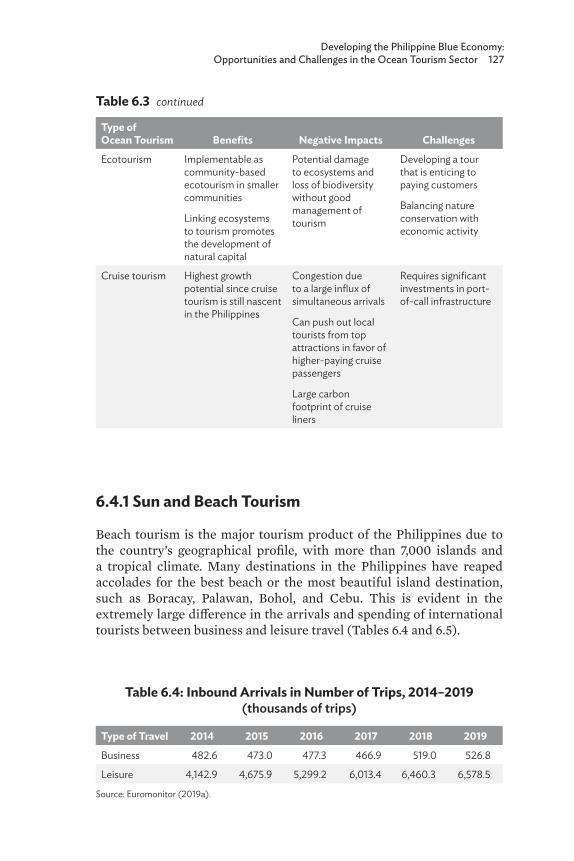
Developing the Philippine Blue Economy: Opportunities and Challenges in the Ocean Tourism Sector 127
Type of Ocean Tourism Benefits Negative Impacts Challenges
Ecotourism Implementable as community-based ecotourism in smaller communities
Linking ecosystems to tourism promotes the development of natural capital
Potential damage to ecosystems and loss of biodiversity without good management of tourism
Developing a tour that is enticing to paying customers
Balancing nature conservation with economic activity
Cruise tourism Highest growth potential since cruise tourism is still nascent in the Philippines
Congestion due to a large influx of simultaneous arrivals
Can push out local tourists from top attractions in favor of higher-paying cruise passengers
Large carbon footprint of cruise liners
Requires significant investments in port-of-call infrastructure
Table 6.3 continued
6.4.1 Sun and Beach Tourism
Beach tourism is the major tourism product of the Philippines due to the country’s geographical profile, with more than 7,000 islands and a tropical climate. Many destinations in the Philippines have reaped accolades for the best beach or the most beautiful island destination, such as Boracay, Palawan, Bohol, and Cebu. This is evident in the extremely large difference in the arrivals and spending of international tourists between business and leisure travel (Tables 6.4 and 6.5).
Table 6.4: Inbound Arrivals in Number of Trips, 2014–2019 (thousands of trips)
Type of Travel 2014 2015 2016 2017 2018 2019
Business 482.6 473.0 477.3 466.9 519.0 526.8
Leisure 4,142.9 4,675.9 5,299.2 6,013.4 6,460.3 6,578.5
Source: Euromonitor (2019a).
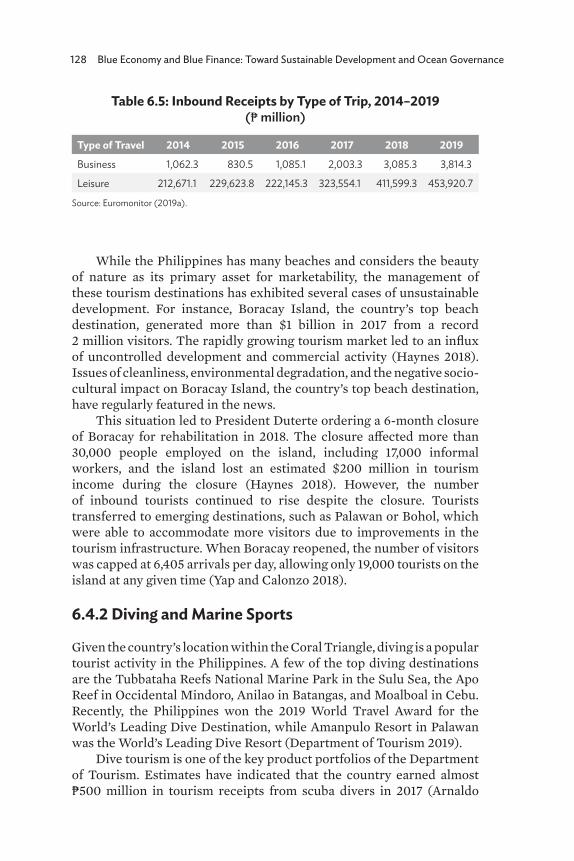
128 Blue Economy and Blue Finance: Toward Sustainable Development and Ocean Governance
While the Philippines has many beaches and considers the beauty of nature as its primary asset for marketability, the management of these tourism destinations has exhibited several cases of unsustainable development. For instance, Boracay Island, the country’s top beach destination, generated more than $1 billion in 2017 from a record 2 million visitors. The rapidly growing tourism market led to an influx of uncontrolled development and commercial activity (Haynes 2018). Issues of cleanliness, environmental degradation, and the negative socio-cultural impact on Boracay Island, the country’s top beach destination, have regularly featured in the news.
This situation led to President Duterte ordering a 6-month closure of Boracay for rehabilitation in 2018. The closure affected more than 30,000 people employed on the island, including 17,000 informal workers, and the island lost an estimated $200 million in tourism income during the closure (Haynes 2018). However, the number of inbound tourists continued to rise despite the closure. Tourists transferred to emerging destinations, such as Palawan or Bohol, which were able to accommodate more visitors due to improvements in the tourism infrastructure. When Boracay reopened, the number of visitors was capped at 6,405 arrivals per day, allowing only 19,000 tourists on the island at any given time (Yap and Calonzo 2018).
6.4.2 Diving and Marine Sports
Given the country’s location within the Coral Triangle, diving is a popular tourist activity in the Philippines. A few of the top diving destinations are the Tubbataha Reefs National Marine Park in the Sulu Sea, the Apo Reef in Occidental Mindoro, Anilao in Batangas, and Moalboal in Cebu. Recently, the Philippines won the 2019 World Travel Award for the World’s Leading Dive Destination, while Amanpulo Resort in Palawan was the World’s Leading Dive Resort (Department of Tourism 2019).
Dive tourism is one of the key product portfolios of the Department of Tourism. Estimates have indicated that the country earned almost ₱500 million in tourism receipts from scuba divers in 2017 (Arnaldo
Table 6.5: Inbound Receipts by Type of Trip, 2014–2019 (₱ million)
Type of Travel 2014 2015 2016 2017 2018 2019
Business 1,062.3 830.5 1,085.1 2,003.3 3,085.3 3,814.3
Leisure 212,671.1 229,623.8 222,145.3 323,554.1 411,599.3 453,920.7
Source: Euromonitor (2019a).
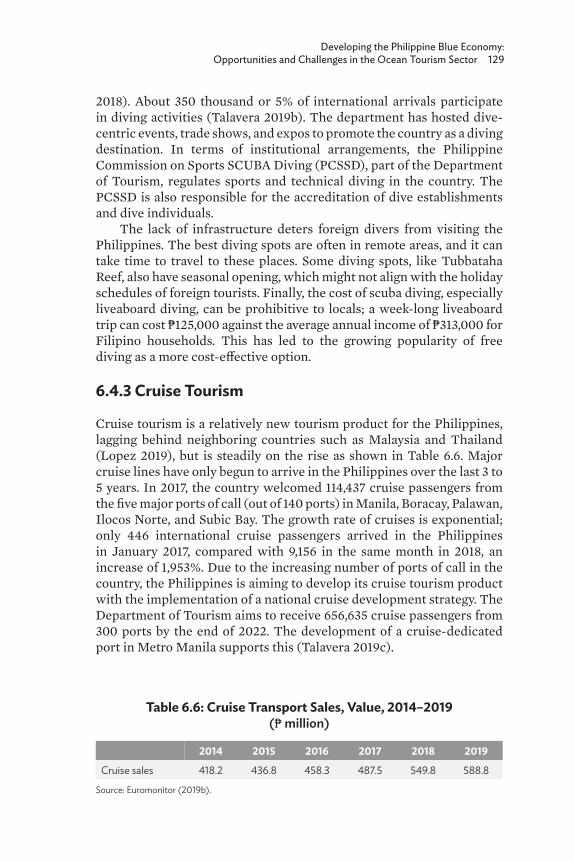
Developing the Philippine Blue Economy: Opportunities and Challenges in the Ocean Tourism Sector 129
2018). About 350 thousand or 5% of international arrivals participate in diving activities (Talavera 2019b). The department has hosted dive-centric events, trade shows, and expos to promote the country as a diving destination. In terms of institutional arrangements, the Philippine Commission on Sports SCUBA Diving (PCSSD), part of the Department of Tourism, regulates sports and technical diving in the country. The PCSSD is also responsible for the accreditation of dive establishments and dive individuals.
The lack of infrastructure deters foreign divers from visiting the Philippines. The best diving spots are often in remote areas, and it can take time to travel to these places. Some diving spots, like Tubbataha Reef, also have seasonal opening, which might not align with the holiday schedules of foreign tourists. Finally, the cost of scuba diving, especially liveaboard diving, can be prohibitive to locals; a week-long liveaboard trip can cost ₱125,000 against the average annual income of ₱313,000 for Filipino households. This has led to the growing popularity of free diving as a more cost-effective option.
6.4.3 Cruise Tourism
Cruise tourism is a relatively new tourism product for the Philippines, lagging behind neighboring countries such as Malaysia and Thailand (Lopez 2019), but is steadily on the rise as shown in Table 6.6. Major cruise lines have only begun to arrive in the Philippines over the last 3 to 5 years. In 2017, the country welcomed 114,437 cruise passengers from the five major ports of call (out of 140 ports) in Manila, Boracay, Palawan, Ilocos Norte, and Subic Bay. The growth rate of cruises is exponential; only 446 international cruise passengers arrived in the Philippines in January 2017, compared with 9,156 in the same month in 2018, an increase of 1,953%. Due to the increasing number of ports of call in the country, the Philippines is aiming to develop its cruise tourism product with the implementation of a national cruise development strategy. The Department of Tourism aims to receive 656,635 cruise passengers from 300 ports by the end of 2022. The development of a cruise-dedicated port in Metro Manila supports this (Talavera 2019c).
Table 6.6: Cruise Transport Sales, Value, 2014–2019 (₱ million)
2014 2015 2016 2017 2018 2019
Cruise sales 418.2 436.8 458.3 487.5 549.8 588.8
Source: Euromonitor (2019b).

130 Blue Economy and Blue Finance: Toward Sustainable Development and Ocean Governance
6.4.4 Ecotourism
Mangrove areas are the most common sites for community-based ecotourism in the Philippines. Many municipalities have mangrove rehabilitation programs to prevent the loss of mangrove habitats. Mangroves are an important part of the coastal ecosystem because of their ecological importance as a breeding ground for fish and other aquatic species, a habitat for birds, storage for carbon, and a means of preventing soil erosion. Developing mangrove ecotourism in coastal communities is relatively low cost compared with other tourism products in the Philippines and is easier to implement, making it an apt livelihood- and revenue-generating activity for residents and municipalities. Communities around the Philippines put up boardwalks along the mangrove forest and offer guided educational tours, boating and kayaking trips, and bird-watching sessions. In addition to the direct economic activities from mangrove ecotourism, the community benefits from increased mangrove cover, such as improvements in fishing.
6.5 Policy Landscape and GapsThe policy landscape for ocean tourism comprises a mix of tourism policies, environmental policies, and the integration of the two (see Appendix A6). As an archipelagic nation, the Philippines relies heavily on marine-related tourism activities. Thus, the policy framework for the blue economy is relatively well developed and robust. In fact, given the numerous regulations, it might be challenging for different actors to navigate the complex policy landscape.
Poor implementation and enforcement of laws are typical in the Philippines. Despite having a national ecotourism strategy and supposed coordination of different national agencies, many tourist destinations in the Philippines are experiencing uncontrolled development. The closure of Boracay, El Nido, and soon, other tourist destinations for necessary rehabilitation is evidence of the mismanagement of the growth of tourism. Given the economic impact of tourism, municipalities are now considering it as a way to alleviate poverty for the community. However, many municipalities are developing their tourism portfolios without proper planning and without putting the necessary infrastructure in place.
Successful management of protected areas in the Philippines is critical to both biodiversity preservation and inclusive development for the local communities. However, there are challenges in managing protected areas. Aside from the few that the National Integrated

Developing the Philippine Blue Economy: Opportunities and Challenges in the Ocean Tourism Sector 131
Protected Areas System (NIPAS) and the Expanded National Integrated Protected Areas System (E-NIPAS) cover, local government ordinances form the majority of marine protected areas (MPAs). Regulating fishing is the primary reason for designating MPAs. Tourism is usually an afterthought. There is often a need to build the capacity of locals to manage and govern their MPAs effectively. The MPAs often lack adequate funding because they rely primarily on income from permits and an allotment from the municipality’s coffers. Many of these biodiversity-rich areas are in low-income municipalities, implying that the proportion of funding will be smaller. The better-managed MPAs can augment their budget through grants, donations, and partnerships. However, this requires the local government and those managing the protected area to have the competencies and the resources to write grant applications.
There are instances in which policies have varying levels of applicability that lead to conflict among governing bodies. For instance, the Protected Area Management Office of a particular protected area will have jurisdiction over the seascape and landscape of that protected area. Thus, the local government can issue fishing permits only on waters that are not part of the protected area, which can conflict with the Philippine Fisheries Code, the scope of which covers all Philippine waters. The Department of Agriculture can also establish fish refuges and sanctuaries in fishing grounds. Too many governing laws and bureaucratic red tape can discourage potential tourism enterprise owners.
6.6 Case Study AnalysisThis chapter analyzes the case of El Nido Resorts as an example of a sustainable ocean tourism enterprise. The private sector is a key actor in the development of the Philippine blue economy. The majority of tourism establishments in the country are privately owned, and El Nido Resorts shows how a private tourism enterprise can contribute to the blue economy by providing local communities with economic benefits while ensuring ecosystem integrity through investments in natural capital. Engaging the private sector in shifting to more sustainable behavior is one of the key challenges for a lower-carbon economy.
6.6.1 Framework for the Case Study Analysis
The analysis of the succeeding case study utilizes a combined framework that espouses the principles of the blue economy (WWF 2015), sustainable tourism development (UNWTO 2018), and the inclusive
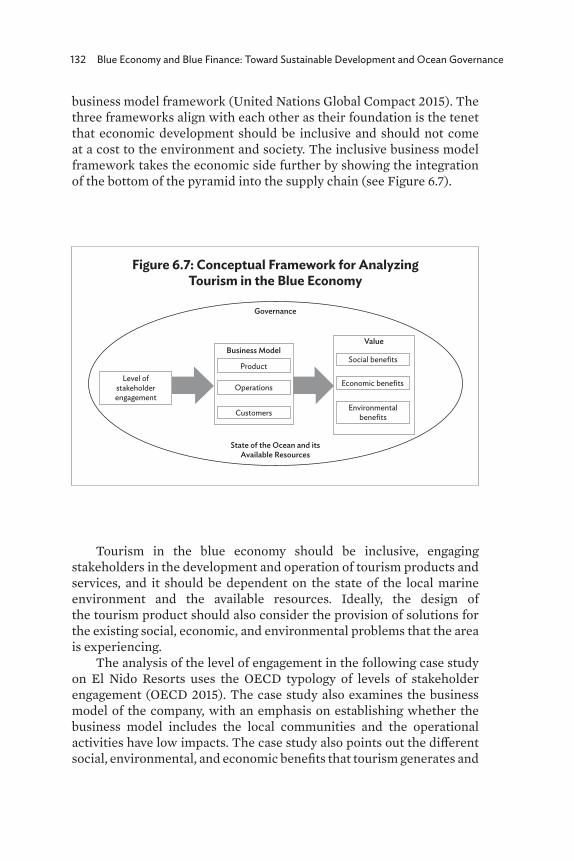
132 Blue Economy and Blue Finance: Toward Sustainable Development and Ocean Governance
business model framework (United Nations Global Compact 2015). The three frameworks align with each other as their foundation is the tenet that economic development should be inclusive and should not come at a cost to the environment and society. The inclusive business model framework takes the economic side further by showing the integration of the bottom of the pyramid into the supply chain (see Figure 6.7).
Figure 6.7: Conceptual Framework for Analyzing Tourism in the Blue Economy
Governance
Business ModelValue
Product
OperationsLevel of
stakeholderengagement
Customers
Social benefits
Economic benefits
Environmentalbenefits
State of the Ocean and itsAvailable Resources
Tourism in the blue economy should be inclusive, engaging stakeholders in the development and operation of tourism products and services, and it should be dependent on the state of the local marine environment and the available resources. Ideally, the design of the tourism product should also consider the provision of solutions for the existing social, economic, and environmental problems that the area is experiencing.
The analysis of the level of engagement in the following case study on El Nido Resorts uses the OECD typology of levels of stakeholder engagement (OECD 2015). The case study also examines the business model of the company, with an emphasis on establishing whether the business model includes the local communities and the operational activities have low impacts. The case study also points out the different social, environmental, and economic benefits that tourism generates and
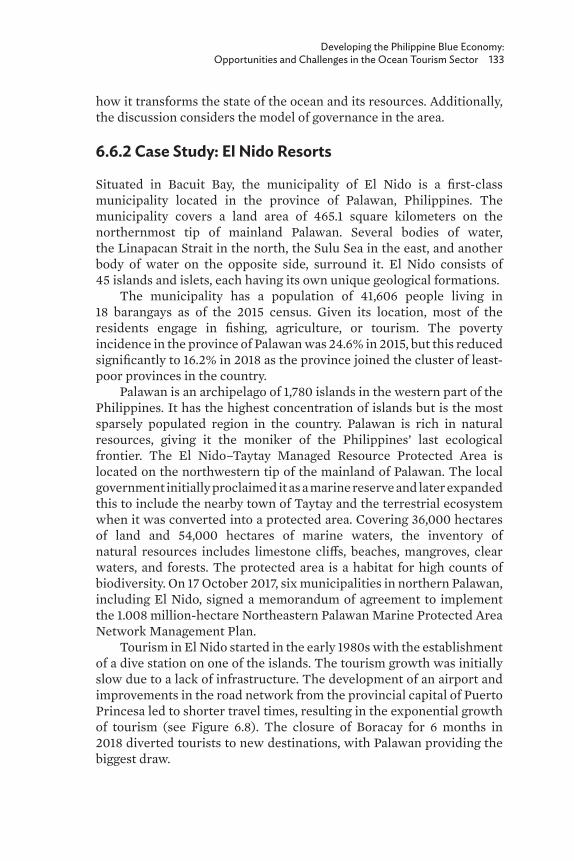
Developing the Philippine Blue Economy: Opportunities and Challenges in the Ocean Tourism Sector 133
how it transforms the state of the ocean and its resources. Additionally, the discussion considers the model of governance in the area.
6.6.2 Case Study: El Nido Resorts
Situated in Bacuit Bay, the municipality of El Nido is a first-class municipality located in the province of Palawan, Philippines. The municipality covers a land area of 465.1 square kilometers on the northernmost tip of mainland Palawan. Several bodies of water, the Linapacan Strait in the north, the Sulu Sea in the east, and another body of water on the opposite side, surround it. El Nido consists of 45 islands and islets, each having its own unique geological formations.
The municipality has a population of 41,606 people living in 18 barangays as of the 2015 census. Given its location, most of the residents engage in fishing, agriculture, or tourism. The poverty incidence in the province of Palawan was 24.6% in 2015, but this reduced significantly to 16.2% in 2018 as the province joined the cluster of least-poor provinces in the country.
Palawan is an archipelago of 1,780 islands in the western part of the Philippines. It has the highest concentration of islands but is the most sparsely populated region in the country. Palawan is rich in natural resources, giving it the moniker of the Philippines’ last ecological frontier. The El Nido–Taytay Managed Resource Protected Area is located on the northwestern tip of the mainland of Palawan. The local government initially proclaimed it as a marine reserve and later expanded this to include the nearby town of Taytay and the terrestrial ecosystem when it was converted into a protected area. Covering 36,000 hectares of land and 54,000 hectares of marine waters, the inventory of natural resources includes limestone cliffs, beaches, mangroves, clear waters, and forests. The protected area is a habitat for high counts of biodiversity. On 17 October 2017, six municipalities in northern Palawan, including El Nido, signed a memorandum of agreement to implement the 1.008 million-hectare Northeastern Palawan Marine Protected Area Network Management Plan.
Tourism in El Nido started in the early 1980s with the establishment of a dive station on one of the islands. The tourism growth was initially slow due to a lack of infrastructure. The development of an airport and improvements in the road network from the provincial capital of Puerto Princesa led to shorter travel times, resulting in the exponential growth of tourism (see Figure 6.8). The closure of Boracay for 6 months in 2018 diverted tourists to new destinations, with Palawan providing the biggest draw.
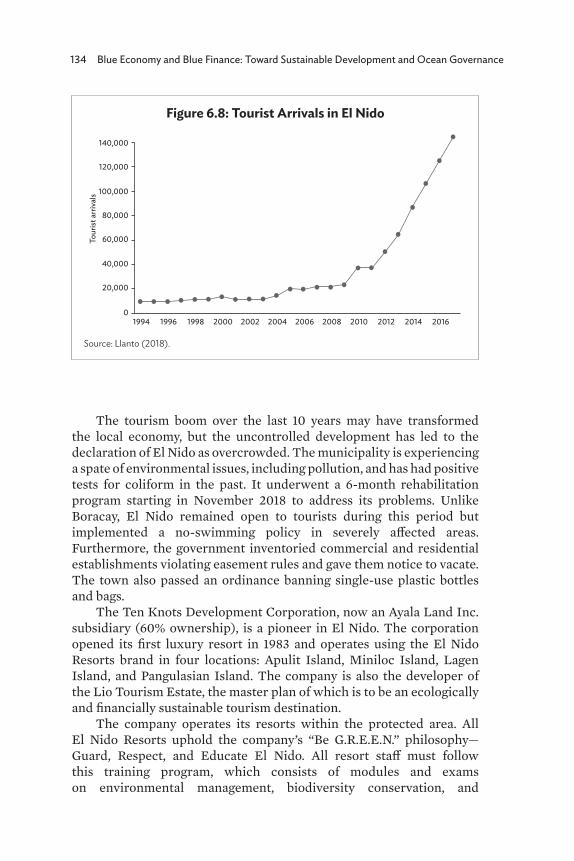
134 Blue Economy and Blue Finance: Toward Sustainable Development and Ocean Governance
The tourism boom over the last 10 years may have transformed the local economy, but the uncontrolled development has led to the declaration of El Nido as overcrowded. The municipality is experiencing a spate of environmental issues, including pollution, and has had positive tests for coliform in the past. It underwent a 6-month rehabilitation program starting in November 2018 to address its problems. Unlike Boracay, El Nido remained open to tourists during this period but implemented a no-swimming policy in severely affected areas. Furthermore, the government inventoried commercial and residential establishments violating easement rules and gave them notice to vacate. The town also passed an ordinance banning single-use plastic bottles and bags.
The Ten Knots Development Corporation, now an Ayala Land Inc. subsidiary (60% ownership), is a pioneer in El Nido. The corporation opened its first luxury resort in 1983 and operates using the El Nido Resorts brand in four locations: Apulit Island, Miniloc Island, Lagen Island, and Pangulasian Island. The company is also the developer of the Lio Tourism Estate, the master plan of which is to be an ecologically and financially sustainable tourism destination.
The company operates its resorts within the protected area. All El Nido Resorts uphold the company’s “Be G.R.E.E.N.” philosophy—Guard, Respect, and Educate El Nido. All resort staff must follow this training program, which consists of modules and exams on environmental management, biodiversity conservation, and
Figure 6.8: Tourist Arrivals in El Nido
Source: Llanto (2018).
01994 1996 1998 2000 2002 2004 2006 2008 2010 2012 2014 2016
20,000
40,000
60,000
80,000
Tour
ist a
rriva
ls 100,000
140,000
120,000
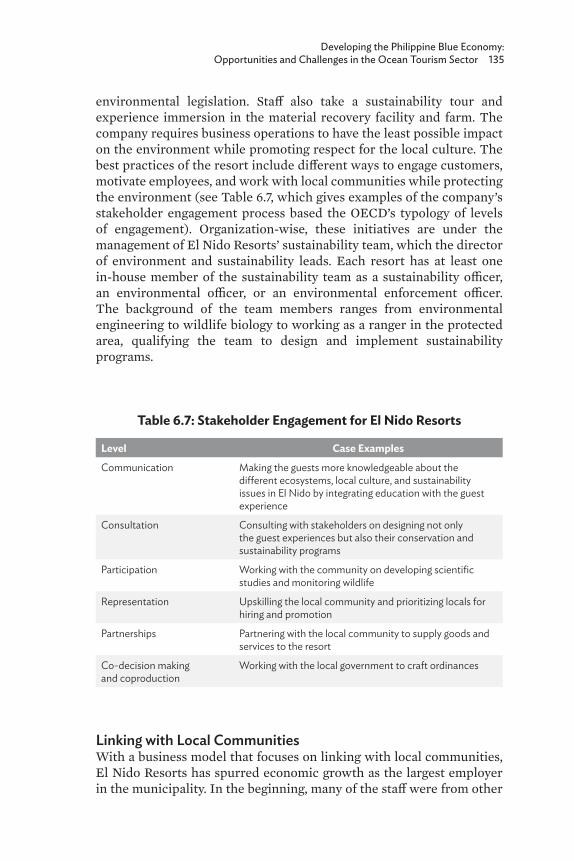
Developing the Philippine Blue Economy: Opportunities and Challenges in the Ocean Tourism Sector 135
environmental legislation. Staff also take a sustainability tour and experience immersion in the material recovery facility and farm. The company requires business operations to have the least possible impact on the environment while promoting respect for the local culture. The best practices of the resort include different ways to engage customers, motivate employees, and work with local communities while protecting the environment (see Table 6.7, which gives examples of the company’s stakeholder engagement process based the OECD’s typology of levels of engagement). Organization-wise, these initiatives are under the management of El Nido Resorts’ sustainability team, which the director of environment and sustainability leads. Each resort has at least one in-house member of the sustainability team as a sustainability officer, an environmental officer, or an environmental enforcement officer. The background of the team members ranges from environmental engineering to wildlife biology to working as a ranger in the protected area, qualifying the team to design and implement sustainability programs.
Table 6.7: Stakeholder Engagement for El Nido Resorts
Level Case Examples
Communication Making the guests more knowledgeable about the different ecosystems, local culture, and sustainability issues in El Nido by integrating education with the guest experience
Consultation Consulting with stakeholders on designing not only the guest experiences but also their conservation and sustainability programs
Participation Working with the community on developing scientific studies and monitoring wildlife
Representation Upskilling the local community and prioritizing locals for hiring and promotion
Partnerships Partnering with the local community to supply goods and services to the resort
Co-decision making and coproduction
Working with the local government to craft ordinances
Linking with Local Communities With a business model that focuses on linking with local communities, El Nido Resorts has spurred economic growth as the largest employer in the municipality. In the beginning, many of the staff were from other
136 Blue Economy and Blue Finance: Toward Sustainable Development and Ocean Governance
parts of the country due to the lack of hospitality skills among the locals. The resort began to build a capable workforce in the local community by offering training programs on the skills that the hospitality industry required. Local women received training to become licensed massage therapists. This allows the residents of El Nido to have a secure livelihood without migrating to other parts of the country. From a business standpoint, it guarantees a consistent supply of skilled workers for the El Nido Resorts and other establishments in the area.
As part of its business model, the resort also makes it a priority to use local products to provide a livelihood for the community and reduce the carbon footprint. Local farmers learn about sustainable agricultural techniques from the resort’s model farm, which they can then implement on their own farms. Locally and organically produced vegetables comprise 60% of the total kitchen purchases of vegetables, while locally reared livestock accounts for 90% of the total kitchen purchases of animal products. Sourcing locally allows the company to have more control over its supply chain while lowering the transportation costs. From a marketing standpoint, this can be a unique selling proposition due to the growing trend for consumers to prefer the “farm-to-table” approach to food.
Instead of investing in its own boats, El Nido Resorts works with local outrigger boat owners to fulfill the transportation requirements of the resort, including island-hopping tours and snorkeling trips. The resorts purchase native bags and slippers from local female weavers as complimentary room amenities for guests. Locals have a continuous livelihood because there will always be a demand from the resort. This also allows the preservation of the local culture and traditions through weaving. In addition, by paying competitive rates, the resorts will always have a supply of the products and services that they need.
Low-Impact OperationsEl Nido Resorts implements practices that reduce waste and save resources like energy and water. The initial investment in the required technology might be higher in terms of upfront costs, but it pays off in the long term in the form of savings due to operational efficiency. El Nido Resorts operates a sewage treatment plant in combination with native reed bed filters to prevent discharges of raw sewage and grey water into the sea. It utilizes treated water in flushing toilets, watering plants, and supplying fire hydrants. Solid wastes undergo strict segregation before reaching the resort’s full-cycle material recovery facility. This picks up recyclable waste for recycling while composting organic waste for use in the garden or on farms. Saying no to single-use plastics is common these days, but El Nido has had a refillable drinking water system for the last
Developing the Philippine Blue Economy: Opportunities and Challenges in the Ocean Tourism Sector 137
10 years. The kitchen also works with its suppliers to refill containers for some of their supplies, such as cooking oil.
The resorts also operate their own desalination plant to guarantee the supply of fresh water without competing with local communities for the limited supply on the island. A rainwater catchment system for flushing toilets augments it. Several resort cottages have solar panels. Instead of the once-a-year Earth Hour, the resorts turn off their lights for an hour every full moon during the summer months and use the savings to purchase seedlings for a carbon-offsetting program in the El Nido watershed.
Guest Satisfaction through Low-Impact TourismEl Nido is highly selective when it comes to its portfolio of guest activities; these should strongly engage guests but limit the disturbance to the natural environment. Only nonmotorized sports equipment, such as kayaks, snorkels, and paddleboards, are available for guest use. Investing in these amenities is less costly than investing in motorized equipment, and the potential for damaging the ecosystems is lower. Guided tours, such as fishing expeditions, educate guests on ecosystems and conservation. Guests learn how to catch fish sustainably using a line. The resort partners with a local fishing village to run these tours and demonstrate fishing techniques. With the ability to augment their income, local fishers are less prone to resort to illegal means of fishing in the protected area. Trends in consumer behavior indicate an increase in preferences for authentic experiences (Boss 2008). The combination of environmental education, engaging with locals, and learning traditional practices provides guests with a unique experience that captures their satisfaction and loyalty and gains a competitive advantage for the organization.
Governance, Conservation, and Education EffortsEl Nido Resorts works closely with the community and local government in the prevention of illegal fishing, coral and reef fish assessments, and environmental education campaigns. The organization launched El Nido Biodiversity Online, a database of El Nido’s flora and fauna, in 2000 so that guests can learn more about the biodiversity in the area. The resorts also support scientific studies by providing visiting researchers with logistical support.
The resort works with the government, mainly the Protected Area Office, to develop conservation programs, such as tagging and releasing sea turtles, protecting hatching grounds, and relocating giant clams to prevent poaching. A partnership with civil society organizations and the local community installed an artificial reef in part of Bacuit Bay that

138 Blue Economy and Blue Finance: Toward Sustainable Development and Ocean Governance
illegal fishing and coral bleaching had damaged. It also installed mooring buoys around the bay to prevent coral damage in high-traffic reefs.
El Nido Resorts sponsors Sea Scouts training for both resort staff and the local community to develop qualified personnel who can respond to marine incidents. Resort staff are also part of the joint Marine Monitoring Task Force, helping the Protected Area Management Board and the municipal government to patrol the area. Furthermore, the resort is highly engaged in the policy cycle as it participates in codesigning ordinances to improve the management of the protected area. El Nido Resorts was one of the stakeholders that lobbied for the creation of the marine reserve in 1991.
The Business Case for SustainabilityEl Nido Resorts has been operating in Palawan for almost 40 years and is an example of how to balance profit generation with social and environmental benefits. The various resorts within Ten Knot Development Corporation’s portfolio have been reaping rewards for the last 20 years. The company has built a very strong brand based on sustainability. Travel companies and prospective guests take note of these awards when they make their purchase decisions. For a tourism venture that generates revenues from guests experiencing nature, keeping the environment pristine can only enhance the product and experience. This has worked since all El Nido’s resorts currently enjoy a 4.5 or higher (out of 5) rating on Trip Advisor, the top online word-of-mouth rating website for travelers. El Nido Resorts’ good practices and key success factors in delivering tourism services within the context of a protected area can be a model for other ocean tourism enterprises.
6.7 Conclusion and Ways to Proceed As a component of the blue economy, ocean tourism is an important contributor to the growth and development of the Philippines. As an archipelagic nation, tourism activities in coastline areas, as well as in offshore zones, contribute to revenues for cities and municipalities, job generation and skills development for local residents, and business opportunities. These can lead to improvements in the quality of life of communities.
The Philippine government has been active in policy development given the significance of ocean tourism. Policies couple tourism development with environmental protection and poverty alleviation and require multi-agency collaboration. However, despite the numerous tourism and marine ecosystem protection policies in place, many tourism destinations, often beaches, are experiencing uncontrolled development.
Developing the Philippine Blue Economy: Opportunities and Challenges in the Ocean Tourism Sector 139
The analysis of the ocean tourism ecosystem of the Philippines and the corresponding case study of El Nido Resorts led to the identification of several policy recommendations:
(i) An analysis of ecosystems in a destination with significant natural resource assets is necessary to estimate the carrying capacity for tourism. This would allow tourism planners to manage tourist numbers and not exceed the carrying capacity when planning for tourism development. The collection of tourism statistics will be critical in monitoring the limits of tourism in the area. This requires harmonized standards and procedures on how to make inventories of natural capital.
(ii) Multiple stakeholders need to engage in the entire tourism development chain, from conceptualization and master planning to monitoring and evaluation. The co-creation of tourism development pathways is critical to innovation and to making the sector more inclusive. Stakeholders could include government agencies, local governments, the business sector, tourists, and the local community. The socioeconomic development of the area should also include minority groups to give them a voice. Stakeholder management will be critical in harnessing synergies that result in a mutually valued roadmap for tourism development.
(iii) There is also a need to assess infrastructure needs prior to creating a tourism development plan for a destination. Financing mechanisms and private–public partnerships could be the norm in tourism enterprise zones.
(iv) Embedding payment for ecosystem services (PES) in tourism products is a financing mechanism that ensures that those who work on preserving the environment also share in the economic benefits. Currently, national parks and other community-based tourist spots charge an environmental fee and/or entrance fees. PES can act as a value-added form of taxation through different modalities, commonly through a utilities charge. This mechanism can pass on the cost to the consumer in terms of a per bed per night fee. This defrays objections from the private sector on spending for sustainability. The charging of PES would need an estimate of the valuation of the natural resources and corresponding ecosystem services of the area.
(v) Limiting tourist numbers each day for each site or attraction based on assessments of the carrying capacity and infrastructure can help address the issue of capacity. The local government can restrict the capacity for public attractions by requiring prior reservations with the local
140 Blue Economy and Blue Finance: Toward Sustainable Development and Ocean Governance
tourism office, which tour operators or accommodation establishments can make on behalf of the guests. Booking time slots can also spread out visitors during the day, preventing overcrowding and making the experience much more pleasurable.
(vi) The private sector is responding to the changing regulations. Most tourism businesses will change their practices if government policies compel them to do so. Local governments and national agencies can explore policies mandating tourism establishments to incorporate sustainability into their business plans prior to the issuance or renewal of their business permit. Government incentives in the form of lower tax rates and other instruments can incentivize the private sector to incorporate environmental, social, and governance factors into their practices and key performance indicators. On the violation side, the imposition of stiffer penalties on violators can discourage businesses from choosing to pay the penalties rather than change their practices.
(vii) Local communities have a key role in citizen-led enforcement, which can address poor enforcement of laws and policies. Civil society organizations and community members can form volunteer groups to monitor violations of the existing tourism and environmental ordinances and legislation. Capacity building will be necessary to equip these groups with the ability to recognize and report illegal behavior to the relevant authorities through an established referral pathway.
(viii) Further research can develop the business case for sustainability in ocean tourism enterprises to understand the different modalities for success in terms of the financial sustainability of the business, environmental protection, and climate change mitigation or adaptation. The private sector will consider strategies if research can prove that investing in sustainability has a return and makes business sense.
Developing the Philippine Blue Economy: Opportunities and Challenges in the Ocean Tourism Sector 141
ReferencesArnaldo, M. S. 2018. DOT Takes Steps to Boost PHL Profile as Diving
Destination. Business Mirror. 10 September. https://businessmirror.com.ph/2018/09/10/dot-takes-steps-to-boost-phl-profile-as -diving-destination/
____. 2019. D.O.T. Retains Foreign Visitors Goal but Likely to Adjust Local Tourism Figures amid Upswing. Business Mirror. 12 February. https://businessmirror.com.ph/2019/02/12/d-o-t-retains-foreign -visitors-goal-but-likely-to-adjust-local-tourism-figures-amid -upswing/
Azanza, R., P. M. Aliño, R. B. Cabral, M. A. Juinio-Meñez, E. M. Pernia, R. U. Mendoza, and C. S. Siriban. 2017. Valuing and Managing the Philippines’ Marine Resources toward a Prosperous Ocean-Based Blue Economy. University of the Philippines Center for Integrative and Development Studies. https://cids.up.edu.ph/wp-content/uploads /ppj-18-azanza-2017.pdf
Boss, D. L. 2008. Providing Authentic Customer Experiences Yields Real Results. Nation’s Restaurant News. 42(8): 40.
Buitre, M. J., H. Zhang, and H. Lin. 2019. The Mangrove Forests Change and Impacts from Tropical Cyclones in the Philippines Using Time Series Satellite Imagery. Remote Sensing. 11(6): 688. https://doi .org/10.3390/rs11060688
Cabico, G. K. 2021. Lesser Known and Unappreciated Seagrass Struggles for Attention, Conservation. PhilStar Global. 1 July. https://www .philstar.com/headlines/2021/07/01/2109461/lesser-known-and -unappreciated-seagrass-struggles-attention-conservation
Chan, J. 2020. App Harnesses Citizen Power to Keep Tabs on Philippines’ Coral Reefs. Mongabay. 27 July. https://news.mongabay .com/2020/07/app-harnesses-citizen-power-to-keep-tabs-on -philippines-coral-reefs/
Department of Tourism. 2019. DOT Celebrates PHL’s Leading Dive Destination Citation. Department of Tourism News Features. 29 November. http://www.tourism.gov.ph/news_features/dot celebratesphlsleadingdivedestinationcitation.aspx
Euromonitor. 2019a. Passport: Travel in the Philippines. Euromonitor International.
____. 2019b. Passport: Tourism Flows in the Philippines. Euromonitor International.
Fortes, M. 2013. A Review: Biodiversity, Distribution, and Conservation of Philippine Seagrasses. Philippine Journal of Science. 142: 95–111.
Fortes, M., J. L. S. Ooi, Y. M. Tan, A. Prathep, J. S. Bujang, and S. M. Yaakub. 2018. Seagrass in Southeast Asia: A Review of Status and
142 Blue Economy and Blue Finance: Toward Sustainable Development and Ocean Governance
Knowledge Gaps, and a Road Map for Conservation. Botanica Marina. 61(3): 269–88. https://doi.org/10.1515/bot-2018-0008
Glover, A. G., H. Wiklund, C. Chen, and T. G. Dahlgren. 2018. Managing a Sustainable Deep-Sea “Blue Economy” Requires Knowledge of What Actually Lives There. eLife. 7. https://doi.org/10.7554 /eLife.41319
Gossling, S., S. McCabe, and N. C. Chen. 2020. A Socio-Psychological Conceptualisation of Overtourism. Annals of Tourism Research. 84: 102976. https://doi.org/10.1016/j.annals.2020.102976
Haynes, S. 2018. Boracay Islanders Feel the Pinch After the Philippines Shuts Down a Top Tourist Destination. 15 May. Time.com.
Jalani, J. 2012. Local People’s Perception on the Impacts and Importance of Ecotourism in Sabang, Palawan, Philippines. Procedia—Social and Behavioral Sciences. 57: 247–54.
Licuanan, A., M. Reyes, K. Luzon, M. A. Chan, and W. Licuanan. 2017. Initial Findings of the Nationwide Assessment of Philippine Coral Reefs. Philippine Journal of Science. 146(2): 177–85.
Llanto, J. 2018. El Nido: Tourism’s Boon and Bane. Rappler. 30 November. https://www.rappler.com/newsbreak/in-depth/217658-el-nido -palawan-tourism-boon-bane
Lopez, D. 2019. New Ports Lure Asia’s Biggest Cruise Ship to PH. Bloomberg. 8 October. https://business.mb.com.ph/2019/10/08 /new-ports-lure-asias-biggest-cruise-ship-to-ph/
McKinley, E., O. Aller-Rojas, C. Hattam, C. Germond-Duret, I. V. San Martin, C. R. Hopkins, H. Aponte, and T. Potts. 2019. Charting the Course for a Blue Economy in Peru: A Research Agenda. Environment, Development and Sustainability. 21(5): 2253–75. https://doi.org/10.1007/s10668-018-0133-z
Miclat, E., and J. Ingles. 2004. Standardized Terms and Definitions for Use in Marine Protected Area Management in the Philippines. In H. O. Arceo et al., eds. Proceedings of the Workshops towards the Formulation of the Philippine Marine Sanctuary Strategy (PhilMarSaSt). Quezon City, Philippines: Marine Science Institute, University of the Philippines.
Ocean Health Index. 2018. Philippine Scores. https://oceanhealthindex .org/global-scores/data-download/
Organisation for Co-operation and Development (OECD). 2015. Stakeholder Engagement for Inclusive Water Governance. Paris: OECD Publishing.
Okazaki, E. 2008. A Community-Based Tourism Model: Its Conception and Use. Journal of Sustainable Tourism. 16(5): 511–29. https://doi .org/10.2167/jost782.0
Developing the Philippine Blue Economy: Opportunities and Challenges in the Ocean Tourism Sector 143
PEMSEA. 2018. State of Oceans and Coasts—Philippines. Partnerships in Environmental Management for the Seas of East Asia (PEMSEA), Global Environment Facility (GEF), and United Nations Development Programme (UNDP).
Porcalla, D. 2018. Philippines 3rd Largest Contributor to Ocean Plastic. Philippine Star. 15 June. https://www.philstar.com / headlines/2018/06/15/1824813/philippines-3rd-largest -contributor-ocean-plastic
Republic of the Philippines. 1987. The 1987 Constitution of the Republic of the Philippines—Article XII. Official Gazette. https://www .officialgazette.gov.ph/constitutions/the-1987-constitution-of-the -republic-of-the-philippines/the-1987-constitution-of-the -republic-of-the-philippines-article-xii/
____. 1999. Executive Order No. 111, s. 1999. Official Gazette. https://www .officialgazette.gov.ph/1999/06/17/executive-order-no-111-s-1999/
____. 2009. Republic Act No. 9593. Official Gazette. https://www .officialgazette.gov.ph/2009/05/12/republic-act-no-9593-s-2009/
____. 2013. The Philippine National Ecotourism Strategy and Action Plan 2013–2022. Metro Manila, Philippines: Department of Tourism and Biodiversity Management Bureau, Department of Environment and Natural Resources.
____. 2016a. The Philippine National Development Plan 2016–2022. Pasig City, Philippines: National Economic and Development Authority.
____. 2016b. The Philippine Tourism Development Plan 2016–2022. Manila, Philippines: Department of Tourism.
Seagrass Watch. n.d. Seagrass in the Philippines. https://www .seagrasswatch.org/philippines/
Servonnat, M., R. Kaye, F. P. Siringan, J. Munar, and H. T. Yap. 2019. Imperatives for Conservation in a Threatened Center of Biodiversity. Coastal Management. 47(5): 453–72. https://doi.org/10.1080/08920753.2019.1641040
Sharma, S., K. Nadaoka, M. Nakaoka, W. H. Uy, R. A. MacKenzie, D. A. Friess, and M. D. Fortes. 2017. Growth Performance and Structure of a Mangrove Afforestation Project on a Former Seagrass Bed, Mindanao Island, Philippines. Hydrobiologia. 803: 359–71. https ://doi.org/10.1007/s10750-017-3252-x
Spalding, M.D., R. D. Brumbaugh, and E. Landis. 2016. Atlas of Ocean Wealth. Arlington, Virginia, US: The Nature Conservancy.
Talavera, C. 2019a. Philippines Travel, Tourism Sector Gets Recognition for Economic Growth. Philippine Star. 10 September. https://www .philstar.com/business/2019/09/10/1950482/philippines-travel -tourism-sector-gets-recognition-economic-growth
144 Blue Economy and Blue Finance: Toward Sustainable Development and Ocean Governance
____. 2019b. Philippines Named World’s Leading Dive Destination. Philippine Star. 1 December. https://www.philstar.com / headlines/2019/12/01/1973280/philippines-named-worlds -leading-diving-destination
____. 2019c. Cruise Tourism Needs Optimum Shipmix—Department of Tourism. Philippine Star. 26 February. https://www.philstar.com /business/2019/02/26/1896673/cruise-tourism-needs-optimum -shipmix-department-tourism
Teck-Weng, J., T. Hui-Bun, and M. A. Alim. 2019. Community Based Tourism Re-Visit Intention: Tourists’ Perspective. International Journal of Business and Society. 20(2): 585–604.
United Nations Global Compact. 2015. Implementing Inclusive Business Models: How Businesses Can Work with Low-Income Communities. https://www.unglobalcompact.org/library/3161
United Nations World Tourism Organization (UNWTO). 2018. Tourism and the Sustainable Development Goals. https://www.e-unwto.org /doi/book/10.18111/9789284419401
Varga, P. 2019. Overtourism: Lessons from Boracay Island, the Philippines. EHL Insights. Ecole hoteliere de Laussane. https :// hospitalityinsights.ehl.edu/overtourism-borocay-island -philippines
Verdadero, F. X., W. Licuanan, K. Escudero, E. Narida, A. C. Cristobal, and N. Espana. 2017. Status of Coral Communities and Reef-Associated Fish and Invertebrates in Batangas and Northern Palawan. Manila Journal of Science. 10: 101–14.
Viray-Mendoza, V. 2017. Mangrove Forests in the Philippines. The Maritime Review. https://maritimereview.ph/mangrove-forests-in -the-philippines/
Voyer, M., and J. van Leeuwen. 2019. “Social License to Operate” in the Blue Economy. Resources Policy. 62: 102–13. https://doi.org/10.1016/j .resourpol.2019.02.020.
World Bank. 2017. What Is the Blue Economy? Infographic. 6 June. https://www.worldbank.org/en/news/infographic/2017/06/06 /blue-economy
WWF. 2015. Principles for a Sustainable Blue Economy. WWF Baltic Ecoregion Programme.
Yap, C., and A. Calonzo. 2018. No More Beach Parties When Philippines’ Boracay Island Reopens. 24 October. Bloomberg.com.
Developing the Philippine Blue Economy: Opportunities and Challenges in the Ocean Tourism Sector 145
Appendix 6.1: Laws and Policies Regarding Blue Economy Development
A6.1 Overarching Policy
1987 Philippine ConstitutionOcean tourism’s foundation is Article XII of the 1987 Philippine Constitution—National Economy and Patrimony—which mandates that “The State shall protect the nation’s marine wealth in its archipelagic waters, territorial sea, and exclusive economic zone, and reserve its use and enjoyment exclusively to Filipino citizens” (Republic of the Philippines 1987).
A6.2 Tourism Policies
Executive Order 111, Series 1999EO 111, s. 1999 establishes the guidelines for ecotourism development in the Philippines, which foster sustainable tourism while enjoining the participation of the Filipino people in enhancing the growth and competitiveness of the Philippine economy. Provisions for the creation of the National Ecotourism Development Council and the formulation of a national ecotourism strategy are also part of the order (Republic of the Philippines 1999).
Republic Act 9593 or the Tourism Act of 2009RA 9593 (Republic of the Philippines 2009) declares tourism to be an indispensable element of the national economy and an industry of national interest and importance, which the country must harness as an engine of socioeconomic growth and cultural affirmation; to generate investment, foreign exchange, and employment; and to continue to mold an enhanced sense of national pride for all Filipinos. One of the specific objectives of this act is to promote a tourism industry that is ecologically sustainable, participative, and ethically and socially equitable for local communities. The act also paved the way for the creation of tourism enterprise zones through the reorganization of what is now called the Tourism Infrastructure and Enterprise Zone and the reorganization of the tourism promotion function of different organizations into the Tourism Promotions Board. A tourism enterprise zone is a master planned piece of land for development into an integrated tourism complex to host tourism enterprise facilities and services within the property.
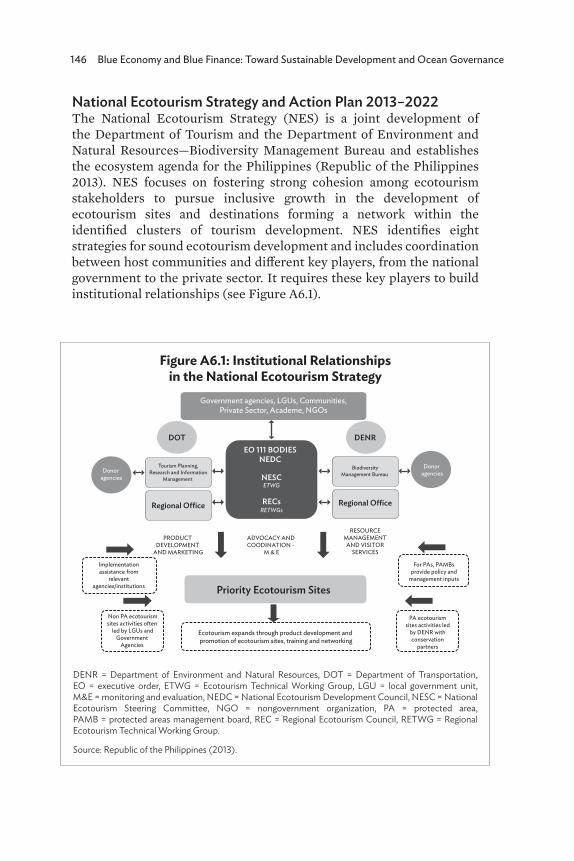
146 Blue Economy and Blue Finance: Toward Sustainable Development and Ocean Governance
National Ecotourism Strategy and Action Plan 2013–2022The National Ecotourism Strategy (NES) is a joint development of the Department of Tourism and the Department of Environment and Natural Resources—Biodiversity Management Bureau and establishes the ecosystem agenda for the Philippines (Republic of the Philippines 2013). NES focuses on fostering strong cohesion among ecotourism stakeholders to pursue inclusive growth in the development of ecotourism sites and destinations forming a network within the identified clusters of tourism development. NES identifies eight strategies for sound ecotourism development and includes coordination between host communities and different key players, from the national government to the private sector. It requires these key players to build institutional relationships (see Figure A6.1).
Figure A6.1: Institutional Relationships in the National Ecotourism Strategy
DENR = Department of Environment and Natural Resources, DOT = Department of Transportation, EO = executive order, ETWG = Ecotourism Technical Working Group, LGU = local government unit, M&E = monitoring and evaluation, NEDC = National Ecotourism Development Council, NESC = National Ecotourism Steering Committee, NGO = nongovernment organization, PA = protected area, PAMB = protected areas management board, REC = Regional Ecotourism Council, RETWG = Regional Ecotourism Technical Working Group.
Source: Republic of the Philippines (2013).
Government agencies, LGUs, Communities,Private Sector, Academe, NGOs
DOT
Regional O�ce
Priority Ecotourism Sites
Regional O�ce
DENR
NESC
EO 111 BODIESNEDC
ETWG
Donor agencies
Implementationassistance from
relevantagencies/institutions
For PAs, PAMBsprovide policy and
management inputs
PA ecotourismsites activities led
by DENR withconservation
partners
Ecotourism expands through product development and promotion of ecotourism sites, training and networking
Non PA ecotourismsites activities often
led by LGUs andGovernment
Agencies
Tourism Planning,Research and Information
Management
BiodiversityManagement Bureau
Donor agencies
RETWGsRECs
ADVOCACY AND COODINATION -
M & E
RESOURCEMANAGEMENT
AND VISITORSERVICES
PRODUCT DEVELOPMENT
AND MARKETING
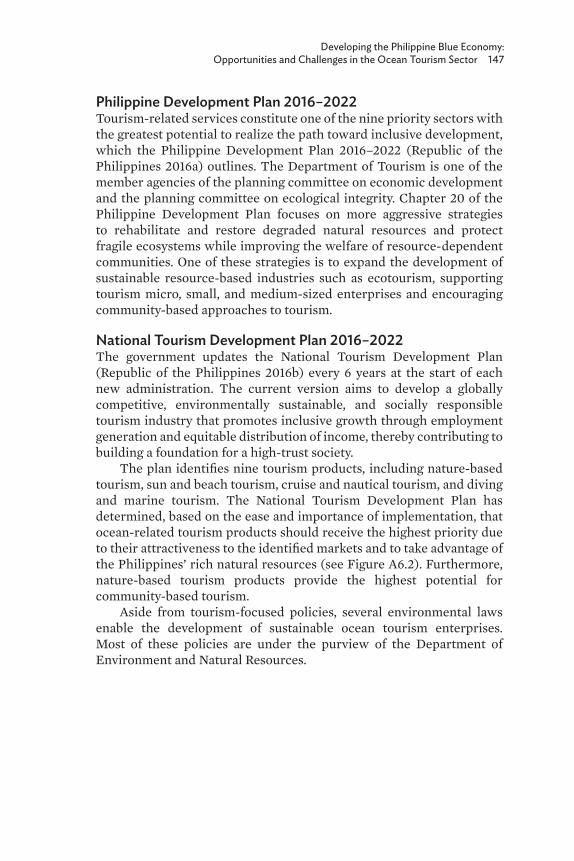
Developing the Philippine Blue Economy: Opportunities and Challenges in the Ocean Tourism Sector 147
Philippine Development Plan 2016–2022Tourism-related services constitute one of the nine priority sectors with the greatest potential to realize the path toward inclusive development, which the Philippine Development Plan 2016–2022 (Republic of the Philippines 2016a) outlines. The Department of Tourism is one of the member agencies of the planning committee on economic development and the planning committee on ecological integrity. Chapter 20 of the Philippine Development Plan focuses on more aggressive strategies to rehabilitate and restore degraded natural resources and protect fragile ecosystems while improving the welfare of resource-dependent communities. One of these strategies is to expand the development of sustainable resource-based industries such as ecotourism, supporting tourism micro, small, and medium-sized enterprises and encouraging community-based approaches to tourism.
National Tourism Development Plan 2016–2022The government updates the National Tourism Development Plan (Republic of the Philippines 2016b) every 6 years at the start of each new administration. The current version aims to develop a globally competitive, environmentally sustainable, and socially responsible tourism industry that promotes inclusive growth through employment generation and equitable distribution of income, thereby contributing to building a foundation for a high-trust society.
The plan identifies nine tourism products, including nature-based tourism, sun and beach tourism, cruise and nautical tourism, and diving and marine tourism. The National Tourism Development Plan has determined, based on the ease and importance of implementation, that ocean-related tourism products should receive the highest priority due to their attractiveness to the identified markets and to take advantage of the Philippines’ rich natural resources (see Figure A6.2). Furthermore, nature-based tourism products provide the highest potential for community-based tourism.
Aside from tourism-focused policies, several environmental laws enable the development of sustainable ocean tourism enterprises. Most of these policies are under the purview of the Department of Environment and Natural Resources.
148 Blue Economy and Blue Finance: Toward Sustainable Development and Ocean Governance
A6.3 Environmental Policies
Republic Act 7586 or the National Integrated Protected Areas System (NIPAS) Act of 1992 and the Republic Act 11038 or the Expanded NIPAS Act of 2018 (E-NIPAS)The NIPAS Act governs and supervises protected areas in the Philippines. The original NIPAS Act paved the way for the establishment of 13 national parks. In relation to ocean tourism, the NIPAS Act is critical because the establishment of marine protected areas (MPAs) took place through a combination of the NIPAS Act and local ordinances. The E-NIPAS Act broadens the scope by declaring an additional 94 protected areas as national parks. These national parks cover a variety of landscapes, from highlands to seascapes. The new law also requires the Department of Justice to appoint special prosecutors for violators of governing laws in protected areas.
Key aspects of the NIPAS Act are the identification of the Department of Tourism as a partner, the identification of areas with NIPAS coverage that have ecotourism potential and cultural heritage value, and the preparation of plans for their development or conversion into Tourism Enterprise Zones. For this reason, it is important to distinguish an MPA
Figure A6.2: Prioritization of Tourism Products in the Philippines
MICE = meetings, incentives, conventions, and exhibitions.
Source: Republic of the Philippines (2016b).
Low
Education Tourism
Health and Wellness,Medical, Retirement Shopping, Leisure
and Entertainment
MICECruise and Nautical
Tourism
Cultural
Nature-based
Sun and beach
Driving and Marine Sports
Low
Mid-AverageImportance of Implementation
Ease
of I
mpl
emen
tatio
n
Mid-Average
High
High
Developing the Philippine Blue Economy: Opportunities and Challenges in the Ocean Tourism Sector 149
from other modalities. Unlike marine reserves, sanctuaries, and parks, which prohibit or strictly control human access to the area, MPAs strive to strike a balance between economic activities and environmental protection through proper zoning with specific rules and guidelines (Miclat and Ingles 2004).
Executive Order 533, Series 2006EO 533 fleshes out the integrated coastal management strategy for the Philippines to ensure the sustainable development of the country’s coastal and marine environment and resources and to establish supporting mechanisms for its implementation. The intention is to implement integrated coastal management in all coastal and marine areas, addressing the interlinkages among associated watersheds, estuaries and wetlands, and coastal seas of all relevant national and local agencies. The mobilization of community stakeholders is a critical element of this approach.
Other Environmental LawsSeveral other environmental laws provide the foundation for the proper management of ocean resources. Different national government agencies and bureaus enforce and monitor most of this legislation. The Philippine Fisheries Code (Republic Act 8550) and its amendment (Republic Act 10654) provide for the development, management, and conservation of fisheries and aquatic resources. The Philippine Clean Water Act of 2004 (Republic Act 9275) aims to protect the country’s water bodies from pollution from land-based sources. This includes riverine, lake, and marine ecosystems. The Ecological Solid Waste Management Act (Republic Act 9003) is also important because it provides for a systematic, comprehensive, and ecological waste management program to ensure the protection of public health and the environment. Ideally, the act should prevent solid waste from entering aquatic environments. The Wildlife Resources Conservation and Protection Act (Republic Act 9147) establishes the guidelines for the conservation and protection of wildlife resources and their habitats.
150
7
Capitalizing on Co-Benefits and Synergies to Promote the Blue
Economy in Asia and the PacificMasanori Kobayashi, Atsushi Watanabe, Keita Furukawa, Keshia N. Tingson, Yimnang Golbuu, and Cielito F. Habito
7.1 IntroductionThe blue economy has grown in importance in policy discourse as a way to promote sustainable development. Research has often used the term “blue economy” interchangeably with the term “ocean-based economy.” Both cover a wide range of sectors related to the ocean and coasts, but the blue economy underlines the conservation and sustainability of marine and coastal ecosystems in the long term (Howard 2018; Economist Group 2020). There have been several attempts to valuate and measure blue economy sectors (McIlgorm 2016). Conservation and sustainable use of the ocean and marine resources are a pivotal principle of a sustainable blue economy, and the optimization of ocean use and the mitigation of conflicts remain vital (Jouffray et al. 2020). The policy discourse on sustainability and ecosystem services, particularly regarding the marine and coastal environment, underpins the sustainability dimension of the blue economy (Mulazzani and Malorgio 2017). In addition to the sustainability of the ocean environment and marine resources, the sustainable blue economy must improve human well-being and social equity (Pauly 2018; Nash et al. 2020). There is growing recognition that the sustainable blue economy can act as a vehicle to promote ocean resource-based development that is socially equitable, environmentally sustainable, and economically viable (Cisneros-Montemayor et al. 2019).
A sustainable blue economy is an important policy objective in Asia and the Pacific as there are many coastal, archipelagic, and island countries and economies, and they have sustained the robust global economic growth over the past decade. The development of the
Capitalizing on Co-Benefits and Synergies to Promote the Blue Economy in Asia and the Pacific 151
blue economy is an important driver of economic growth in Asia and the Pacific (Bhattacharya and Dash 2020). To support a sustainable blue economy, the Asian Development Bank launched a healthy ocean action plan, worth $5 billion, with four focus areas: (i) creating inclusive livelihoods and business opportunities in sustainable tourism and fisheries; (ii) protecting and restoring coastal and marine ecosystems and key rivers; (iii) reducing land-based sources of marine pollution, including plastics, wastewater, and agricultural runoff; and (iv) improving sustainability in port and coastal infrastructure development (Asian Development Bank 2019). The economies of Asia and the Pacific, however, have contracted as a result of the coronavirus disease (COVID-19). Despite the struggles in 2020, the prospect for recovery of economies in Asia and the Pacific turned out to be promising compared with that of other regions as the projected growth rate for 2021 is 7.4% for East Asia and the Pacific and 3.3% for South Asia (World Bank 2021). The spread of COVID-19 and its containment measures continue to be an important factor for the economic recovery in Asia and the Pacific. The expectation is that, as countries relax the containment measures, mobility and economic activities will resume, although subregional variations are possible (Asian Development Bank 2020). Countries in the Asia and Pacific region need to contain COVID-19 and reinforce their efforts to capitalize on the potential of the sustainable blue economy through conservation and sustainable use of the ocean and marine resources.
A sustainable blue economy relies on conservation and sustainable use of the ocean and marine resources, and these are concrete policy goals in the United Nations Sustainable Development Goals (SDGs), specifically Goal 14, entitled “Conserve and sustainably use the oceans, seas and marine resources for sustainable development” (SDG 14: Life below Water) (United Nations 2015). There are 17 SDGs that focus on sectoral issues. SDG 14 has 10 targets that specify concrete thematic policy goals. To achieve myriad policy targets across the SDGs, it is essential to build on the interlinkages and interactions among the SDGs and promote the implementation of policy measures through an integrated, coherent, and indivisible framework (Hegre, Petrova, and von Uexkull 2020). It is necessary to generate synergies while restraining or optimizing trade-offs by assessing the risks and benefits (Fader et al. 2018). The ocean involves multifaceted dimensions of the biosphere and human development, such as food, ecosystems, poverty, hunger, and gender equity. The development of strategies for generating synergies and optimizing trade-offs within SDG 14 is particularly important in the light of the inherent difficulties in comprehending the state of the marine and coastal environment and resources, the urgency of improving ocean health, the rapid growth of the blue economy, and
152 Blue Economy and Blue Finance: Toward Sustainable Development and Ocean Governance
the need for multi-stakeholder partnerships (Nash et al. 2020). The patterns of synergies and trade-offs demonstrate that they are not generic but rather heterogeneous, and it is important to understand them in the local and regional contexts (De Neve and Sachs 2020). To facilitate the development and implementation of policies and strategies for a sustainable blue economy in Asia and the Pacific, it is therefore important to undertake and draw lessons from empirical studies on the interactions between the SDGs and provide perspectives in this respect. This chapter assesses the enabling factors and their potential synergies and trade-offs in achieving a sustainable blue economy based on case studies in some of the countries in Asia and the Pacific and presents useful perspectives for devising and implementing strategies for a sustainable blue economy in Asia and the Pacific.
7.2 Development of International Policy Discourses on a Sustainable Blue Economy
The term “blue economy” arose in the process of the United Nations (UN) Conference on Sustainable Development in 2012. There was a strong call to boost the efforts to scale up ecosystem-based integrated coastal management and increase investment in the blue economy (Cicin-Sain et al. 2011). The outcome document of the 2012 conference, “The Future We Want,” did not include a direct reference to a blue or ocean economy. However, it did refer to the importance of the conservation and sustainable use of the oceans and seas and of their resources for sustainable development and the importance of building the capacity of developing countries to benefit from the conservation and sustainable use of the oceans and seas and their resources (United Nations 2012).
SDG 14 does not refer directly to the blue economy. However, it stipulates the key components of the blue economy with goals such as sustainably managing and protecting marine and coastal ecosystems (Target 14.2); effectively regulating harvesting and ending overfishing, illegal, unreported, and unregulated fishing, and destructive fishing practices (14.4); prohibiting certain forms of fisheries subsidies that contribute to overcapacity and overfishing (14.6); increasing the economic benefits for small island developing states and least-developed countries from the sustainable use of marine resources (14.7); and providing access to marine resources and markets for small-scale artisanal fishers (14.b). The direct reference to the blue economy appeared in the outcome document of the 2017 UN Ocean Conference entitled “Our Ocean, Our Future: Call for Action” (United Nations 2017). In the document, leaders recognized that the ocean contributes to sustainable development and sustainable ocean-based economies and called on all

Capitalizing on Co-Benefits and Synergies to Promote the Blue Economy in Asia and the Pacific 153
stakeholders to conserve and use the oceans, seas, and marine resources sustainably through actions including the promotion and strengthening of sustainable ocean-based economies, such as fisheries, tourism, aquaculture, maritime transportation, renewable energies, marine biotechnology, and seawater desalination, in paras. 3 and 13(q).
At the Global Sustainable Blue Economy Conference held in Nairobi, Kenya, in November 2018, the leaders adopted the Nairobi Statement of Intent on Advancing a Sustainable Blue Economy, which called for actions to promote blue economy strategies (Government of Kenya 2018). The High-Level Panel for a Sustainable Ocean Economy, which was an initiative of the Government of Norway and consisted of 14 heads of states and governments, launched a document on policy recommendations entitled “Transformations for a Sustainable Ocean Economy” in December 2020 (Stuchtey et al. 2020). The document presented 74 actions in five categories, namely, ocean wealth, ocean health, ocean equity, ocean knowledge, and ocean finance. In the document, the 14 leaders affirmed their commitment to the sustainable management of 100% of the ocean area by 2025 as a way to promote a sustainable blue economy. The document called for actions including, for instance, restoring and harvesting fish stocks at sustainable levels (sustainable ocean food); developing ocean-based renewable energy as a fast-growing industry and a leading source of energy (sustainable ocean energy); making coastal and ocean-based tourism sustainable and resilient (sustainable ocean-based tourism); and conserving marine and coastal ecosystems, enabling them to be healthy, resilient, and productive (protect and restore marine and coastal ecosystems).
To explore effective blue economy strategies, it is important to understand the interface of various sectors and factors, such as fisheries, renewable energies, tourism, and marine and coastal ecosystem conservation, as they interplay to create synergies in the implementation of sector-specific policies and actions while at the same time involving trade-offs. Other factors, such as climate change and the pandemic, can influence the activities aiming to achieve a sustainable blue economy. It is necessary to assess the socioeconomic and biophysical aspects of marine and coastal resource use in local and regional contexts as well to promote synergies and optimize trade-offs in the pursuit of a sustainable blue economy in Asia and the Pacific.
7.3 MethodTo examine the interface of marine ecosystems and various sectors in the efforts to promote a blue economy, we chose cases according to the degree of co-benefits and synergies in the promotion of a blue economy.
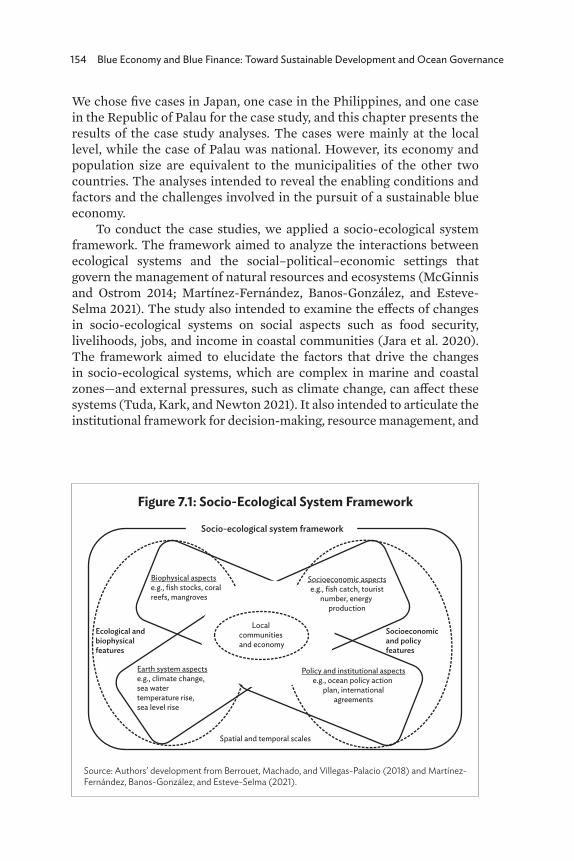
154 Blue Economy and Blue Finance: Toward Sustainable Development and Ocean Governance
We chose five cases in Japan, one case in the Philippines, and one case in the Republic of Palau for the case study, and this chapter presents the results of the case study analyses. The cases were mainly at the local level, while the case of Palau was national. However, its economy and population size are equivalent to the municipalities of the other two countries. The analyses intended to reveal the enabling conditions and factors and the challenges involved in the pursuit of a sustainable blue economy.
To conduct the case studies, we applied a socio-ecological system framework. The framework aimed to analyze the interactions between ecological systems and the social–political–economic settings that govern the management of natural resources and ecosystems (McGinnis and Ostrom 2014; Martinez-Fernández, Banos-González, and Esteve-Selma 2021). The study also intended to examine the effects of changes in socio-ecological systems on social aspects such as food security, livelihoods, jobs, and income in coastal communities (Jara et al. 2020). The framework aimed to elucidate the factors that drive the changes in socio-ecological systems, which are complex in marine and coastal zones—and external pressures, such as climate change, can affect these systems (Tuda, Kark, and Newton 2021). It also intended to articulate the institutional framework for decision-making, resource management, and
Figure 7.1: Socio-Ecological System Framework
Source: Authors’ development from Berrouet, Machado, and Villegas-Palacio (2018) and Martínez-Fernández, Banos-González, and Esteve-Selma (2021).
Local communities and economy
Spatial and temporal scales
Biophysical aspectse.g., fish stocks, coral reefs, mangroves
Earth system aspectse.g., climate change, sea water temperature rise, sea level rise
Socioeconomic aspectse.g., fish catch, tourist
number, energy production
Policy and institutional aspectse.g., ocean policy action
plan, internationalagreements
Socio-ecological system framework
Ecological and biophysical features
Socioeconomic and policy features
Capitalizing on Co-Benefits and Synergies to Promote the Blue Economy in Asia and the Pacific 155
stakeholder interactions that may enable or limit the adaptive governance of socio-ecological systems. When analyzing marine and coastal socio-ecological systems, it is important to consider the interconnectedness of land, coast, and marine systems (Lauerburg et al. 2020).
A full data set, which is necessary for thorough analysis under the socio-ecological system, is not available. Nonetheless, by applying the framework, the study intended to examine the synergies and trade-offs across socio-ecological systems in nonlinear and multidirectional processes that require analysis on the spatial and temporal scales (Berrouet, Machado, and Villegas-Palacio 2018; Núñez-Regueiro et al. 2020; Rosellon-Druker et al. 2021). Figure 7.1 illustrates the conceptual flow of the analysis method that this chapter adopted. It applied this concept to the subsequent case studies, and the analyses mainly concerned (i) policy and institutional aspects, (ii) socioeconomic aspects, (iii) biophysical aspects, and (iv) earth system aspects.
7.4 Opportunities and Challenges for a Sustainable Blue Economy in Asia and the Pacific
7.4.1 Japan
National Policies for Managing the OceanJapan is an archipelago country located in the Northwest Pacific. It consists of four main islands and over 6,800 large and small islands, of which 400 have inhabitants (Ministry of the Environment, Japan 2014). Japan has the world’s sixth-largest exclusive economic zone (EEZ). The areas that constitute Japan’s territorial waters and EEZ comprise about 44,470,000 square kilometers (km2). Japan has diverse ecosystems with long indented coastlines of about 35,000 km, a length equivalent to seven-eighths of the earth’s circumference. The protected coastal and marine areas, previously 8.3%, increased to 13.3% as of 1 January 2021 with the designation of four additional marine areas as protected areas in the ordinance that Japan’s Minister for the Environment released on 3 December 2020 (Ministry of the Environment, Japan 2020).
The Government of Japan enacted the Basic Act on Ocean Policy in 2007. The Act states that its intention is to stipulate the basic principles of Japan’s ocean policy and the responsibility of the national government, local governments, businesses, and citizens to promote the peaceful and proactive development and use of the ocean and the conservation of the marine environment in pursuance of the UN Convention on the
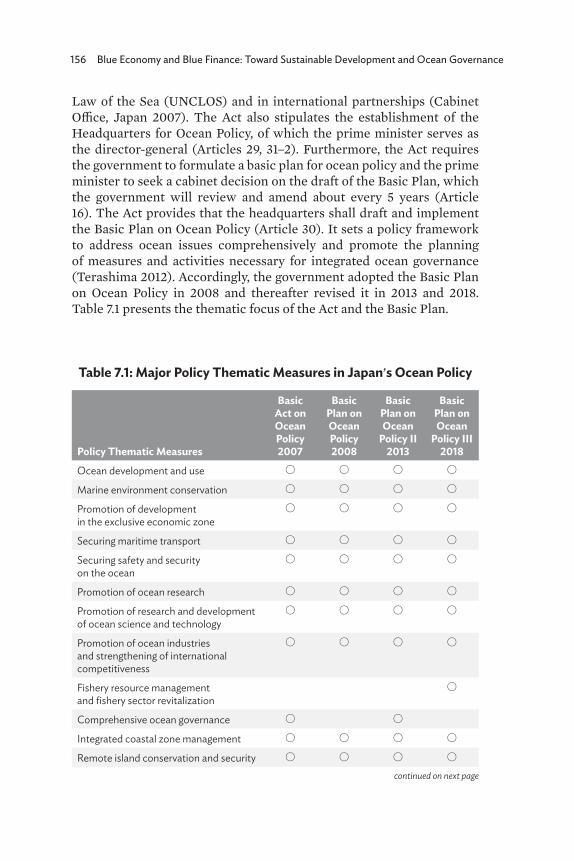
156 Blue Economy and Blue Finance: Toward Sustainable Development and Ocean Governance
Law of the Sea (UNCLOS) and in international partnerships (Cabinet Office, Japan 2007). The Act also stipulates the establishment of the Headquarters for Ocean Policy, of which the prime minister serves as the director-general (Articles 29, 31–2). Furthermore, the Act requires the government to formulate a basic plan for ocean policy and the prime minister to seek a cabinet decision on the draft of the Basic Plan, which the government will review and amend about every 5 years (Article 16). The Act provides that the headquarters shall draft and implement the Basic Plan on Ocean Policy (Article 30). It sets a policy framework to address ocean issues comprehensively and promote the planning of measures and activities necessary for integrated ocean governance (Terashima 2012). Accordingly, the government adopted the Basic Plan on Ocean Policy in 2008 and thereafter revised it in 2013 and 2018. Table 7.1 presents the thematic focus of the Act and the Basic Plan.
Table 7.1: Major Policy Thematic Measures in Japan’s Ocean Policy
Policy Thematic Measures
Basic Act on Ocean Policy2007
Basic Plan on Ocean Policy2008
Basic Plan on Ocean
Policy II2013
Basic Plan on Ocean
Policy III2018
Ocean development and use 〇 〇 〇 〇
Marine environment conservation 〇 〇 〇 〇
Promotion of development in the exclusive economic zone
〇 〇 〇 〇
Securing maritime transport 〇 〇 〇 〇
Securing safety and security on the ocean
〇 〇 〇 〇
Promotion of ocean research 〇 〇 〇 〇
Promotion of research and development of ocean science and technology
〇 〇 〇 〇
Promotion of ocean industries and strengthening of international competitiveness
〇 〇 〇 〇
Fishery resource management and fishery sector revitalization
〇
Comprehensive ocean governance 〇 〇
Integrated coastal zone management 〇 〇 〇 〇
Remote island conservation and security 〇 〇 〇 〇
continued on next page
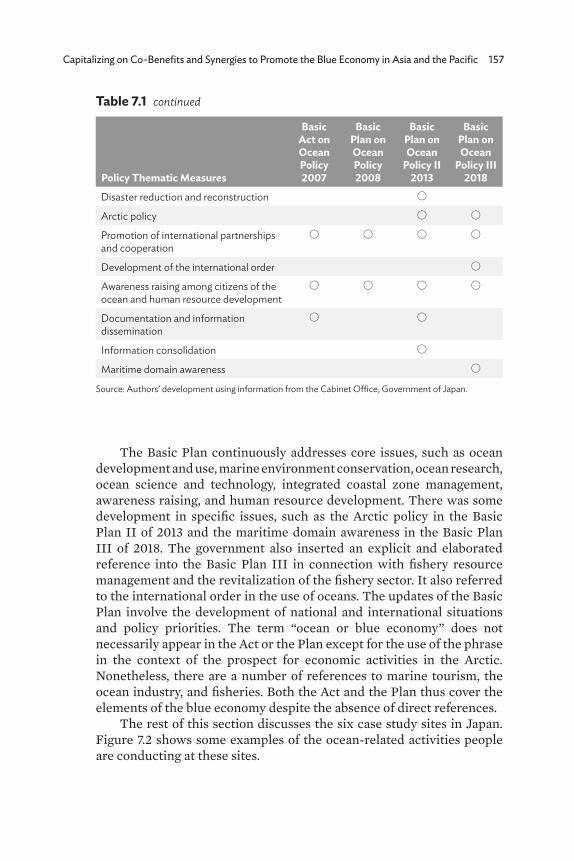
Capitalizing on Co-Benefits and Synergies to Promote the Blue Economy in Asia and the Pacific 157
Policy Thematic Measures
Basic Act on Ocean Policy2007
Basic Plan on Ocean Policy2008
Basic Plan on Ocean
Policy II2013
Basic Plan on Ocean
Policy III2018
Disaster reduction and reconstruction 〇
Arctic policy 〇 〇
Promotion of international partnerships and cooperation
〇 〇 〇 〇
Development of the international order 〇
Awareness raising among citizens of the ocean and human resource development
〇 〇 〇 〇
Documentation and information dissemination
〇 〇
Information consolidation 〇
Maritime domain awareness 〇
Source: Authors’ development using information from the Cabinet Office, Government of Japan.
Table 7.1 continued
The Basic Plan continuously addresses core issues, such as ocean development and use, marine environment conservation, ocean research, ocean science and technology, integrated coastal zone management, awareness raising, and human resource development. There was some development in specific issues, such as the Arctic policy in the Basic Plan II of 2013 and the maritime domain awareness in the Basic Plan III of 2018. The government also inserted an explicit and elaborated reference into the Basic Plan III in connection with fishery resource management and the revitalization of the fishery sector. It also referred to the international order in the use of oceans. The updates of the Basic Plan involve the development of national and international situations and policy priorities. The term “ocean or blue economy” does not necessarily appear in the Act or the Plan except for the use of the phrase in the context of the prospect for economic activities in the Arctic. Nonetheless, there are a number of references to marine tourism, the ocean industry, and fisheries. Both the Act and the Plan thus cover the elements of the blue economy despite the absence of direct references.
The rest of this section discusses the six case study sites in Japan. Figure 7.2 shows some examples of the ocean-related activities people are conducting at these sites.
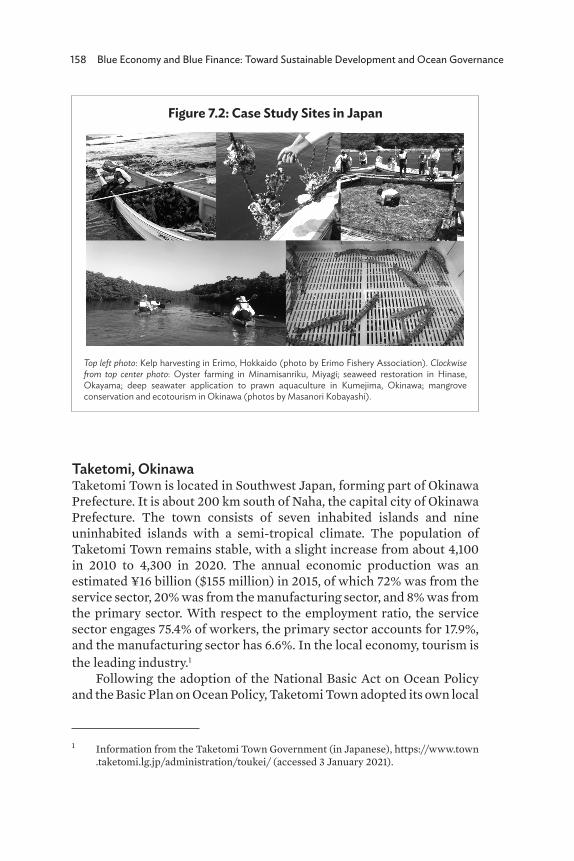
158 Blue Economy and Blue Finance: Toward Sustainable Development and Ocean Governance
Taketomi, OkinawaTaketomi Town is located in Southwest Japan, forming part of Okinawa Prefecture. It is about 200 km south of Naha, the capital city of Okinawa Prefecture. The town consists of seven inhabited islands and nine uninhabited islands with a semi-tropical climate. The population of Taketomi Town remains stable, with a slight increase from about 4,100 in 2010 to 4,300 in 2020. The annual economic production was an estimated ¥16 billion ($155 million) in 2015, of which 72% was from the service sector, 20% was from the manufacturing sector, and 8% was from the primary sector. With respect to the employment ratio, the service sector engages 75.4% of workers, the primary sector accounts for 17.9%, and the manufacturing sector has 6.6%. In the local economy, tourism is the leading industry.1
Following the adoption of the National Basic Act on Ocean Policy and the Basic Plan on Ocean Policy, Taketomi Town adopted its own local
1 Information from the Taketomi Town Government (in Japanese), https://www.town .taketomi.lg.jp/administration/toukei/ (accessed 3 January 2021).
Figure 7.2: Case Study Sites in Japan
Top left photo: Kelp harvesting in Erimo, Hokkaido (photo by Erimo Fishery Association). Clockwise from top center photo: Oyster farming in Minamisanriku, Miyagi; seaweed restoration in Hinase, Okayama; deep seawater application to prawn aquaculture in Kumejima, Okinawa; mangrove conservation and ecotourism in Okinawa (photos by Masanori Kobayashi).
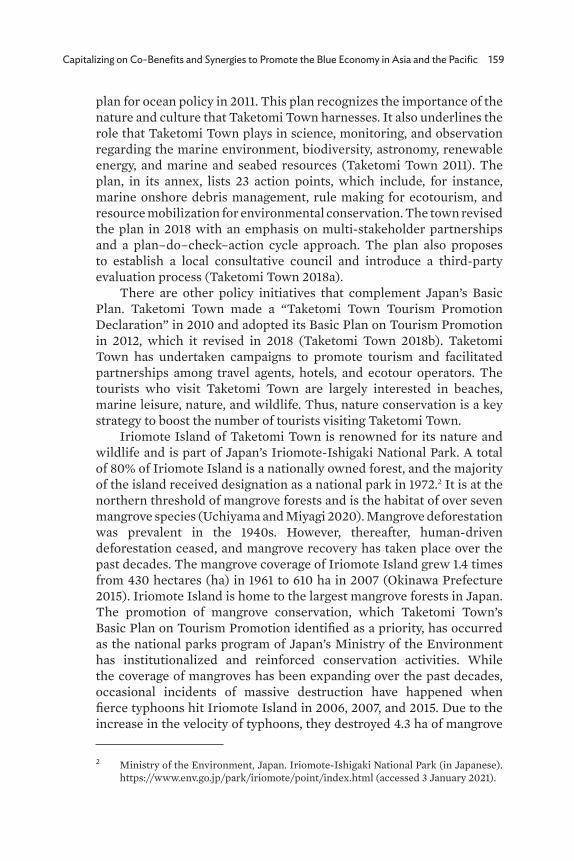
Capitalizing on Co-Benefits and Synergies to Promote the Blue Economy in Asia and the Pacific 159
plan for ocean policy in 2011. This plan recognizes the importance of the nature and culture that Taketomi Town harnesses. It also underlines the role that Taketomi Town plays in science, monitoring, and observation regarding the marine environment, biodiversity, astronomy, renewable energy, and marine and seabed resources (Taketomi Town 2011). The plan, in its annex, lists 23 action points, which include, for instance, marine onshore debris management, rule making for ecotourism, and resource mobilization for environmental conservation. The town revised the plan in 2018 with an emphasis on multi-stakeholder partnerships and a plan–do–check–action cycle approach. The plan also proposes to establish a local consultative council and introduce a third-party evaluation process (Taketomi Town 2018a).
There are other policy initiatives that complement Japan’s Basic Plan. Taketomi Town made a “Taketomi Town Tourism Promotion Declaration” in 2010 and adopted its Basic Plan on Tourism Promotion in 2012, which it revised in 2018 (Taketomi Town 2018b). Taketomi Town has undertaken campaigns to promote tourism and facilitated partnerships among travel agents, hotels, and ecotour operators. The tourists who visit Taketomi Town are largely interested in beaches, marine leisure, nature, and wildlife. Thus, nature conservation is a key strategy to boost the number of tourists visiting Taketomi Town.
Iriomote Island of Taketomi Town is renowned for its nature and wildlife and is part of Japan’s Iriomote-Ishigaki National Park. A total of 80% of Iriomote Island is a nationally owned forest, and the majority of the island received designation as a national park in 1972.2 It is at the northern threshold of mangrove forests and is the habitat of over seven mangrove species (Uchiyama and Miyagi 2020). Mangrove deforestation was prevalent in the 1940s. However, thereafter, human-driven deforestation ceased, and mangrove recovery has taken place over the past decades. The mangrove coverage of Iriomote Island grew 1.4 times from 430 hectares (ha) in 1961 to 610 ha in 2007 (Okinawa Prefecture 2015). Iriomote Island is home to the largest mangrove forests in Japan. The promotion of mangrove conservation, which Taketomi Town’s Basic Plan on Tourism Promotion identified as a priority, has occurred as the national parks program of Japan’s Ministry of the Environment has institutionalized and reinforced conservation activities. While the coverage of mangroves has been expanding over the past decades, occasional incidents of massive destruction have happened when fierce typhoons hit Iriomote Island in 2006, 2007, and 2015. Due to the increase in the velocity of typhoons, they destroyed 4.3 ha of mangrove
2 Ministry of the Environment, Japan. Iriomote-Ishigaki National Park (in Japanese). https://www.env.go.jp/park/iriomote/point/index.html (accessed 3 January 2021).
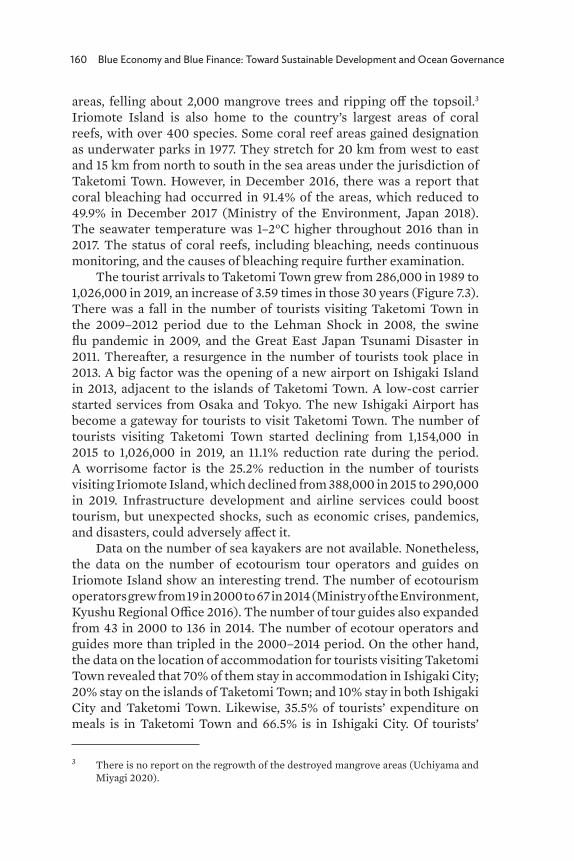
160 Blue Economy and Blue Finance: Toward Sustainable Development and Ocean Governance
areas, felling about 2,000 mangrove trees and ripping off the topsoil.3 Iriomote Island is also home to the country’s largest areas of coral reefs, with over 400 species. Some coral reef areas gained designation as underwater parks in 1977. They stretch for 20 km from west to east and 15 km from north to south in the sea areas under the jurisdiction of Taketomi Town. However, in December 2016, there was a report that coral bleaching had occurred in 91.4% of the areas, which reduced to 49.9% in December 2017 (Ministry of the Environment, Japan 2018). The seawater temperature was 1–2°C higher throughout 2016 than in 2017. The status of coral reefs, including bleaching, needs continuous monitoring, and the causes of bleaching require further examination.
The tourist arrivals to Taketomi Town grew from 286,000 in 1989 to 1,026,000 in 2019, an increase of 3.59 times in those 30 years (Figure 7.3). There was a fall in the number of tourists visiting Taketomi Town in the 2009–2012 period due to the Lehman Shock in 2008, the swine flu pandemic in 2009, and the Great East Japan Tsunami Disaster in 2011. Thereafter, a resurgence in the number of tourists took place in 2013. A big factor was the opening of a new airport on Ishigaki Island in 2013, adjacent to the islands of Taketomi Town. A low-cost carrier started services from Osaka and Tokyo. The new Ishigaki Airport has become a gateway for tourists to visit Taketomi Town. The number of tourists visiting Taketomi Town started declining from 1,154,000 in 2015 to 1,026,000 in 2019, an 11.1% reduction rate during the period. A worrisome factor is the 25.2% reduction in the number of tourists visiting Iriomote Island, which declined from 388,000 in 2015 to 290,000 in 2019. Infrastructure development and airline services could boost tourism, but unexpected shocks, such as economic crises, pandemics, and disasters, could adversely affect it.
Data on the number of sea kayakers are not available. Nonetheless, the data on the number of ecotourism tour operators and guides on Iriomote Island show an interesting trend. The number of ecotourism operators grew from 19 in 2000 to 67 in 2014 (Ministry of the Environment, Kyushu Regional Office 2016). The number of tour guides also expanded from 43 in 2000 to 136 in 2014. The number of ecotour operators and guides more than tripled in the 2000–2014 period. On the other hand, the data on the location of accommodation for tourists visiting Taketomi Town revealed that 70% of them stay in accommodation in Ishigaki City; 20% stay on the islands of Taketomi Town; and 10% stay in both Ishigaki City and Taketomi Town. Likewise, 35.5% of tourists’ expenditure on meals is in Taketomi Town and 66.5% is in Ishigaki City. Of tourists’
3 There is no report on the regrowth of the destroyed mangrove areas (Uchiyama and Miyagi 2020).

Capitalizing on Co-Benefits and Synergies to Promote the Blue Economy in Asia and the Pacific 161
expenditure on souvenir shopping, 28.6% is in Taketomi Town and 74.6% is in Ishigaki City. The increase in the number of tourists has not remained linear. The distribution of expenditure on accommodation, meals, and souvenirs does not favor the local economies in Taketomi Town.
It is worth noting that some distinctive developments have occurred in the implementation of the Basic Plan on Ocean Policy. With respect to the rule making to promote ecotourism in harmony with the conservation of nature, Taketomi Town released a tour guide ordinance on 20 September 2019 (Taketomi Town 2019a). The ordinance introduced a license system requiring those who want to operate tours in Taketomi Town to obtain a license from the mayor of Taketomi Town (Art. 8). The ordinance also provides the authority of the mayor to reject applications (Art. 8-5), the requirements for license renewal (Art. 12), the authority of the mayor to issue guidance and recommendations to tour operators (Art. 22), the authority of the mayor to request reports from tour operators and to inspect their offices (Art. 24), and the authority of the mayor to suspend the license of tour operators (Art. 25).
In connection with resource mobilization, Taketomi Town introduced a system to invite tourists to make financial contributions to support nature conservation in Taketomi Town in September 2019 (Taketomi Town 2019b). The payment is ¥300 ($2.89) per person and is voluntary, not obligatory. It introduced this system in accordance
Figure 7.3: Number of Tourists Visiting Taketomi Town and Iriomote Island, 1989–2019
Source: Authors’ development using the information in Japanese from Taketomi Town at https://www.town.taketomi.lg.jp/administration/toukei/kankonyuiki/1531308472/.
0
200
400
600
800
1,000
19891992
19951998
20012004
20072010
20132016
2019
1,200
1,400
Thou
sand
Iriomote Island Taketomi Town in total

162 Blue Economy and Blue Finance: Toward Sustainable Development and Ocean Governance
with the national Local Nature Asset Act of 2014, which allows local authorities to receive payments on the grounds of protecting nature in line with the nature conservation plan that a consultative council will develop. Local authorities can use the revenue to obtain land as a nature trust.4 The impacts of the ordinance and island entry payment system require further monitoring and examination.
Minamisanriku, MiyagiMinamisanriku Town is located in Miyagi Prefecture in Northeast Japan. It faces the Pacific Ocean with a deeply indented ria coastline. The population is about 12,800, and the economic production is worth ¥93.47 billion ($900 million). The manufacturing sector accounts for 71.0%, the service sector represents 23.8%, and the primary sector constitutes 5.2%. The economic production of the fishery and aquaculture sector is ¥4.17 billion ($40.3 million), which accounts for 4.5% of the total economic production. The fishery and aquaculture activities are mainly aquaculture of oysters, kelp, and coho salmon and gillnet fishing. As of 2019, Minamisanriku had registered 505 fishery enterprises (Minamisanriku Town 2020). The 2011 Great East Japan Tsunami Disaster devastated Minamisanriku, inundating 1,145 ha, about 7% of the total land area, where about 4,600 households with a population of 15,000 resided at the time of the disaster. The death toll rose to 444, with 349 missing. The total number of evacuees was 9,753, which accounted for 55.2% of the population at that time (Minamisanriku Town 2012).
Oyster farmers in Shizugawa Bay, Minamisanriku, also suffered enormous damage due to the 2011 tsunami. In Shizugawa Bay, the economic production of fisheries and aquaculture was worth ¥2.3 billion or $22.2 million. Estimations indicated that the 2011 disaster’s damage to fisheries and aquaculture facilities was ¥1.15 billion or $11.1 million (Miyagi Prefectural Fisheries Cooperative Association 2012).
The Shizugawa Bay division of the Fisheries Cooperative consists of two subdivisions, namely, Tokura District and Shizugawa District. In Tokura District, prior to the 2011 disaster, 88 fishers engaged in oyster farming and operated 3,000 units of oyster farming gear. This activity involves placing a wire rope below the sea surface, from which wire ropes about 5 meters long hang vertically with some scallop shells. The density of oyster farming was a concern prior to the disaster. With the destruction of all the oyster farming gear, some elderly farmers decided to abandon oyster farming. The remaining fishers started to
4 The government implemented the Act on 25 June 2014, and it came into effect on 1 April 2015 (Ministry of the Environment, Japan). http://www.env.go.jp/nature /national-trust/n-trust_law/index.html (in Japanese; accessed 3 January 2021).
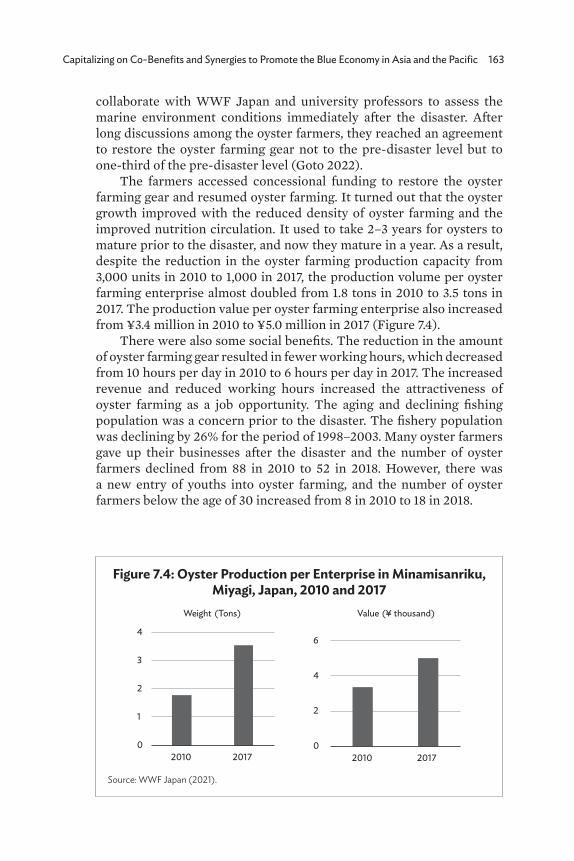
Capitalizing on Co-Benefits and Synergies to Promote the Blue Economy in Asia and the Pacific 163
collaborate with WWF Japan and university professors to assess the marine environment conditions immediately after the disaster. After long discussions among the oyster farmers, they reached an agreement to restore the oyster farming gear not to the pre-disaster level but to one-third of the pre-disaster level (Goto 2022).
The farmers accessed concessional funding to restore the oyster farming gear and resumed oyster farming. It turned out that the oyster growth improved with the reduced density of oyster farming and the improved nutrition circulation. It used to take 2–3 years for oysters to mature prior to the disaster, and now they mature in a year. As a result, despite the reduction in the oyster farming production capacity from 3,000 units in 2010 to 1,000 in 2017, the production volume per oyster farming enterprise almost doubled from 1.8 tons in 2010 to 3.5 tons in 2017. The production value per oyster farming enterprise also increased from ¥3.4 million in 2010 to ¥5.0 million in 2017 (Figure 7.4).
There were also some social benefits. The reduction in the amount of oyster farming gear resulted in fewer working hours, which decreased from 10 hours per day in 2010 to 6 hours per day in 2017. The increased revenue and reduced working hours increased the attractiveness of oyster farming as a job opportunity. The aging and declining fishing population was a concern prior to the disaster. The fishery population was declining by 26% for the period of 1998–2003. Many oyster farmers gave up their businesses after the disaster and the number of oyster farmers declined from 88 in 2010 to 52 in 2018. However, there was a new entry of youths into oyster farming, and the number of oyster farmers below the age of 30 increased from 8 in 2010 to 18 in 2018.
Figure 7.4: Oyster Production per Enterprise in Minamisanriku, Miyagi, Japan, 2010 and 2017
Source: WWF Japan (2021).
0
1
2
3
4
2010 2017
Weight (Tons)
0
2
4
6
2010 2017
Value (¥ thousand)

164 Blue Economy and Blue Finance: Toward Sustainable Development and Ocean Governance
Oyster farmers responded positively to WWF Japan’s suggestion of applying for Aquaculture Stewardship Council (ASC) certification in 2014. They had to prepare documents and meet the requirements of over 125 elements, such as legal compliance, environmental protection, and chemical management.
The Tokura District branch of the Fisheries Cooperative was the first in Japan to receive an ASC certificate in March 2018. After obtaining their ASC certificates, oyster farmers opened a marketing channel to a large food retailer. ASC-certified oysters do not necessarily receive a premium price. However, the price erosion that used to happen toward the end of the harvesting season no longer occurs. The stability of retail prices helps to sustain the revenue for oyster farmers.
The oyster farmers also supported the process of Shizugawa Bay for listing under the Ramsar Convention. Coastal and marine biodiversity assessment took place from 2017 to 2018 with the support of the Ministry of the Environment, Tohoku Regional Office. The survey confirmed the presence of 208 species of seaweeds and seagrasses. Shizugawa Bay achieved a listing under the Ramsar Convention in October 2018 (Ramsar Site Information Service 2018). Japan’s Ministry of the Environment opened a visitor center in Minamisanriku to exhibit local coastal and marine biodiversity to support the activities for experience-based nature learning. The oyster farmers feel proud of the international recognition of their oyster farming site and its use by schools and nonprofit organizations for nature learning.
Hinase, Bizen, OkayamaHinase is located in Bizen City, Okayama Prefecture. Hinase faces the Seto Inland Sea. It has hilly and mountainous areas in the north and 13 islands and islets in the south and is home to 6,900 people. Coastal fishers capture bream, squid, and crab and farm seaweed and oysters. The reduction of seagrass cover in the local sea area is likely to be among the reasons for the declining fishery productivity. The Hinase Fisheries Cooperative has spearheaded the activities to restore the seagrass cover over the past decade. The seagrass cover shrank from 590 ha in the 1950s to 12 ha in 1985 (Figure 7.5). With the restoration work, it increased to 250 ha in 2015 (Tanaka 2017). Likewise, the seagrass cover across the coastal areas of Okayama Prefecture, which was an estimated 4,300 ha in 1925, plummeted to 549 in 1989 and rose to 1,221 ha in 2007 (Goto et al. 2015).
Multi-stakeholder partnership is one of the unique features of the activities to restore the seagrass beds in Hinase. The Hinase Fisheries Cooperative collaborates with local junior high schools, and the students work with fishers to place the bags of seagrass seeds in the sea and collect floating leaves of the seagrass. At the same time, a nonprofit
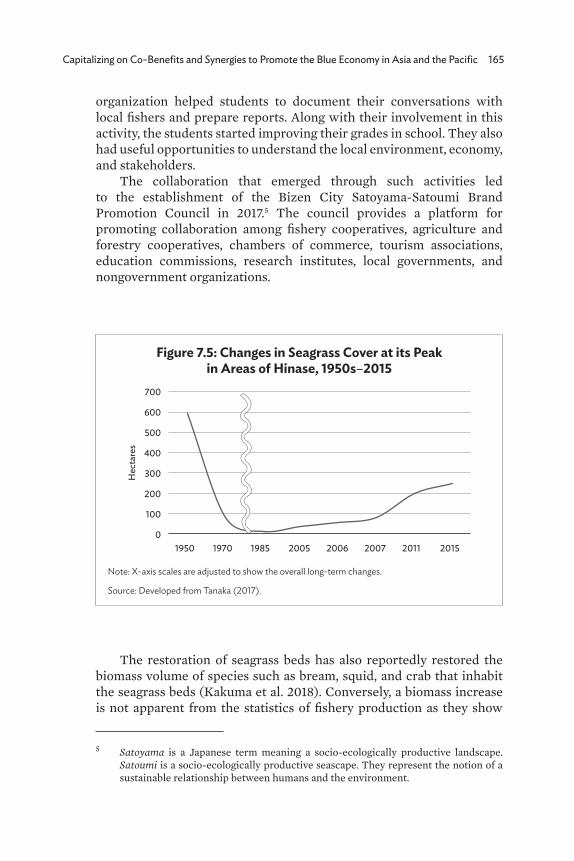
Capitalizing on Co-Benefits and Synergies to Promote the Blue Economy in Asia and the Pacific 165
organization helped students to document their conversations with local fishers and prepare reports. Along with their involvement in this activity, the students started improving their grades in school. They also had useful opportunities to understand the local environment, economy, and stakeholders.
The collaboration that emerged through such activities led to the establishment of the Bizen City Satoyama-Satoumi Brand Promotion Council in 2017.5 The council provides a platform for promoting collaboration among fishery cooperatives, agriculture and forestry cooperatives, chambers of commerce, tourism associations, education commissions, research institutes, local governments, and nongovernment organizations.
The restoration of seagrass beds has also reportedly restored the biomass volume of species such as bream, squid, and crab that inhabit the seagrass beds (Kakuma et al. 2018). Conversely, a biomass increase is not apparent from the statistics of fishery production as they show
5 Satoyama is a Japanese term meaning a socio-ecologically productive landscape. Satoumi is a socio-ecologically productive seascape. They represent the notion of a sustainable relationship between humans and the environment.
Figure 7.5: Changes in Seagrass Cover at its Peak in Areas of Hinase, 1950s‒2015
Note: X-axis scales are adjusted to show the overall long-term changes.
Source: Developed from Tanaka (2017).
0
100
200
300
400
500
600
700
1950
Hec
tare
s
1970 1985 2005 2006 2007 2011 2015
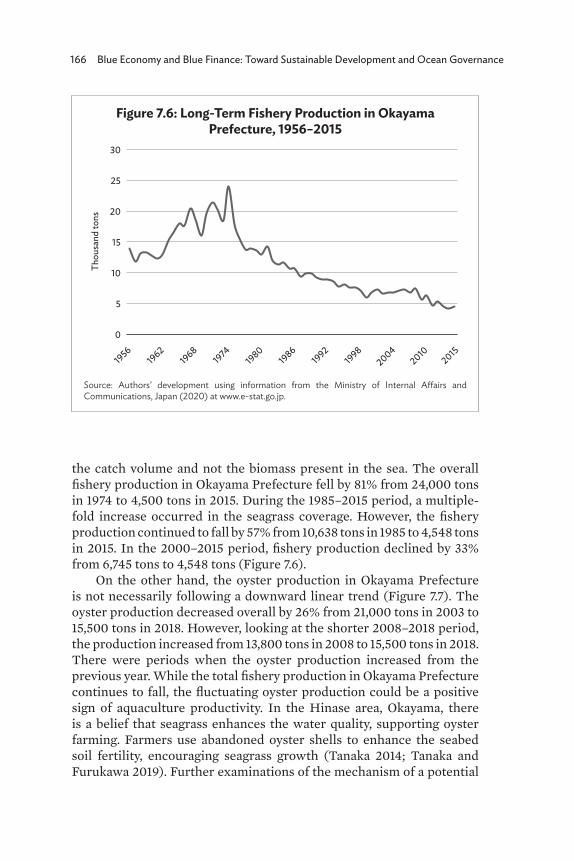
166 Blue Economy and Blue Finance: Toward Sustainable Development and Ocean Governance
the catch volume and not the biomass present in the sea. The overall fishery production in Okayama Prefecture fell by 81% from 24,000 tons in 1974 to 4,500 tons in 2015. During the 1985–2015 period, a multiple-fold increase occurred in the seagrass coverage. However, the fishery production continued to fall by 57% from 10,638 tons in 1985 to 4,548 tons in 2015. In the 2000–2015 period, fishery production declined by 33% from 6,745 tons to 4,548 tons (Figure 7.6).
On the other hand, the oyster production in Okayama Prefecture is not necessarily following a downward linear trend (Figure 7.7). The oyster production decreased overall by 26% from 21,000 tons in 2003 to 15,500 tons in 2018. However, looking at the shorter 2008–2018 period, the production increased from 13,800 tons in 2008 to 15,500 tons in 2018. There were periods when the oyster production increased from the previous year. While the total fishery production in Okayama Prefecture continues to fall, the fluctuating oyster production could be a positive sign of aquaculture productivity. In the Hinase area, Okayama, there is a belief that seagrass enhances the water quality, supporting oyster farming. Farmers use abandoned oyster shells to enhance the seabed soil fertility, encouraging seagrass growth (Tanaka 2014; Tanaka and Furukawa 2019). Further examinations of the mechanism of a potential
Figure 7.6: Long-Term Fishery Production in Okayama Prefecture, 1956–2015
Source: Authors’ development using information from the Ministry of Internal Affairs and Communications, Japan (2020) at www.e-stat.go.jp.
0
19561962
19681974
19801986
19921998
20042010
2015
5
10
15
20
25
30
Thou
sand
tons
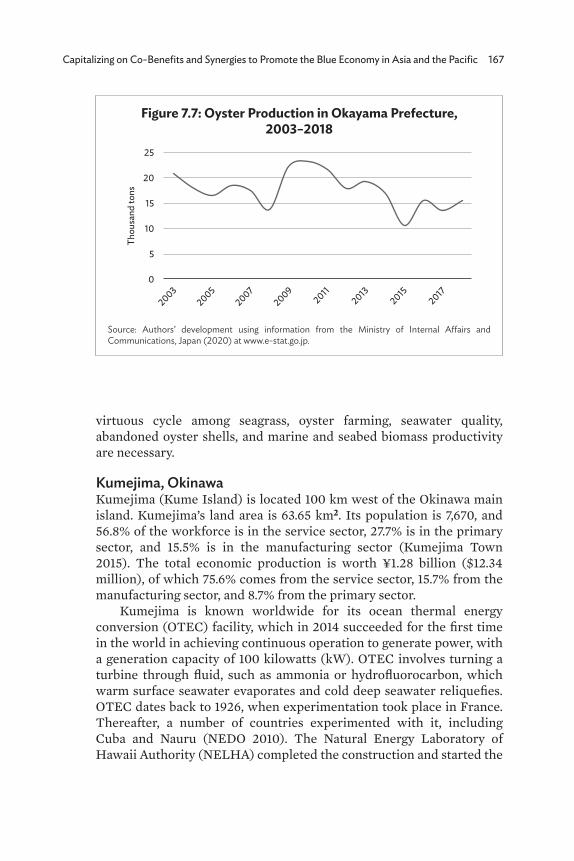
Capitalizing on Co-Benefits and Synergies to Promote the Blue Economy in Asia and the Pacific 167
virtuous cycle among seagrass, oyster farming, seawater quality, abandoned oyster shells, and marine and seabed biomass productivity are necessary.
Kumejima, OkinawaKumejima (Kume Island) is located 100 km west of the Okinawa main island. Kumejima’s land area is 63.65 km2. Its population is 7,670, and 56.8% of the workforce is in the service sector, 27.7% is in the primary sector, and 15.5% is in the manufacturing sector (Kumejima Town 2015). The total economic production is worth ¥1.28 billion ($12.34 million), of which 75.6% comes from the service sector, 15.7% from the manufacturing sector, and 8.7% from the primary sector.
Kumejima is known worldwide for its ocean thermal energy conversion (OTEC) facility, which in 2014 succeeded for the first time in the world in achieving continuous operation to generate power, with a generation capacity of 100 kilowatts (kW). OTEC involves turning a turbine through fluid, such as ammonia or hydrofluorocarbon, which warm surface seawater evaporates and cold deep seawater reliquefies. OTEC dates back to 1926, when experimentation took place in France. Thereafter, a number of countries experimented with it, including Cuba and Nauru (NEDO 2010). The Natural Energy Laboratory of Hawaii Authority (NELHA) completed the construction and started the
Figure 7.7: Oyster Production in Okayama Prefecture, 2003–2018
Source: Authors’ development using information from the Ministry of Internal Affairs and Communications, Japan (2020) at www.e-stat.go.jp.
2003
2005
2007
2009
2011
2013
2015
2017
0
5
10
15
20
25
Thou
sand
tons
168 Blue Economy and Blue Finance: Toward Sustainable Development and Ocean Governance
operation of an OTEC facility in 2015, with power generation capacity of 105 kW, the largest in the world. The OTEC facility in Kumejima has the capacity to draw 13,000 tons of deep seawater per day from a depth of 612 meters and is the second largest next to NELHA’s facility. The OTEC facility provides 100 kW of power, equivalent to the power that 250 households use.
The operation of OTEC has revealed its collateral socioeconomic benefits from the secondary or multiple use of deep seawater after power generation. Deep seawater has unique coolness, purity, and nourishment properties that are suitable for and beneficial to, for instance, shrimp/prawn and sea grape aquaculture, cosmetic and personal care production, and thalassotherapy, a therapy with the use of seawater. The value of production that uses deep seawater from OTEC in Kumejima was an estimated ¥2.48 billion ($22 million) in 2015, and it employed 140 people (Cabinet Office, Japan 2017). We can highlight a number of enabling factors.
Thorough preparation, including research and surveys, was necessary. The Okinawa Prefecture Ocean Science and Technology Basic Initiative incubated the concept of OTEC in 1986. It examined 25 potential sites for the location of the OTEC facility, which it narrowed down to three sites in 1994. The Okinawa Prefecture Deep Sea Water Research Center was established in 2000. The extensive preparations ensured the effectiveness of the OTEC facility’s operations.
The multi-stakeholder collaboration is also a key feature. The Kumejima Town Office spearheaded a multi-stakeholder and cross-sectoral partnership with the support of the Okinawa Prefecture government. The Kumejima Town Office established the Global Ocean Resource and Energy Association Institute as a consortium to promote OTEC in 2014.
The funding was also critical. The national government and the Okinawa Prefecture government created a mechanism whereby the users of deep seawater for aquaculture, manufacturing, and leisure purposes pay fees in exchange for receiving deep seawater. Though the operation ceased temporarily at the time of tourism closure due to COVID-19 in 2020, a spa that used deep seawater offered thalassotherapy for a half-price entry fee to local residents. Tours for the public also take place for awareness raising, learning, and education. These factors have helped increase the social acceptance of OTEC in Kumejima. People considered the secondary use of deep seawater as collateral at the initial stage. However, it has become a major driver of the expansion of OTEC’s capacity, particularly in terms of extracting deep seawater. The collaboration between OTEC in Kumejima and NELHA has flourished,
Capitalizing on Co-Benefits and Synergies to Promote the Blue Economy in Asia and the Pacific 169
and the institutionalization of a growing partnership resulted, for instance, in the establishment of the Ocean Thermal Energy Association in October 2020 as an international coalition of scientists and experts to promote OTEC around the world.6
Shrimp or kuruma prawn accounts for 47.7% of the total economic production based on the secondary use of deep seawater (Ikegami 2015). The volume of prawn aquaculture production was 248 tons in 2010 and fluctuated afterwards, falling to 122 tons in 2015 but rising to 186 tons in 2017 (Figure 7.8). The production volume did not necessarily show a linear upward trend. Data on the value of prawn production in Kumejima are not available. A possible explanation for the fall in the production is that it is a consequence of prawn disease, and a possible explanation for the stagnation of the production is that the producers sell juvenile prawns to the mainland in Okinawa before they mature. Data on the market value of prawns are available on the Okinawa prefectural level (Figure 7.9). The prawn production declined from 652 tons in 2006 to 545 tons in 2012. It fluctuated thereafter and was 523 tons in 2017, a decrease of 19.8% from the 2006 level. The production value fluctuated and was ¥2.67 billion ($23.6 million) in 2017, which was 17.8% less than the ¥3.24 billion ($28.7) in 2006. With respect to the value/weight, it was ¥5.1 million per ton in 2017, which was 2.5% more than the ¥5.0 million per ton in 2006. Despite the prawn production weight and value decreasing by 17.8%–19.8% in the 2006–2017 period, it is possible to interpret the increase in the value per production weight of 2.5% as an improvement in prawn productivity. A further analysis of the prawn productivity is necessary throughout the supply chain from production and retailing to consumption. The economic returns to the prawn growers also require assessment based on the dynamic market conditions.
6 The details of the Ocean Thermal Energy Association are available at http://www .ocean-thermal.org/about/ (accessed 5 January 2021).
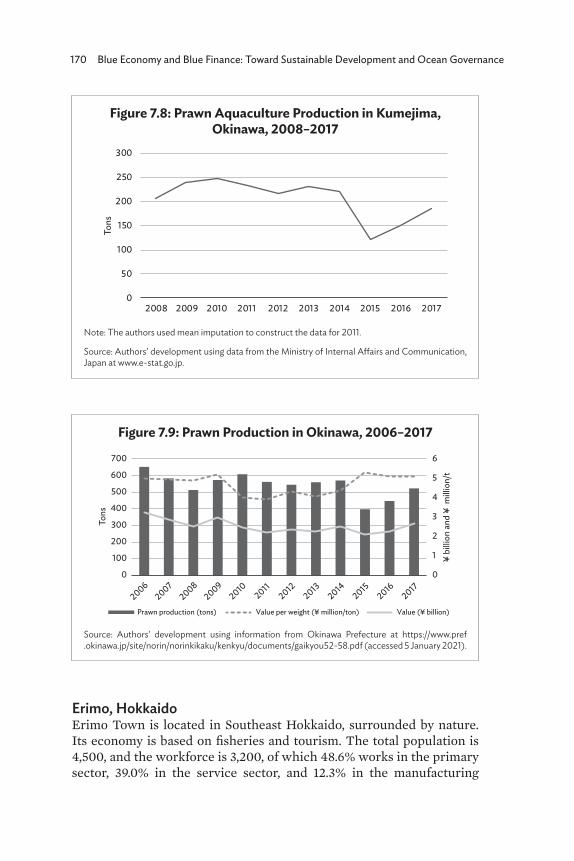
170 Blue Economy and Blue Finance: Toward Sustainable Development and Ocean Governance
Figure 7.8: Prawn Aquaculture Production in Kumejima, Okinawa, 2008–2017
Note: The authors used mean imputation to construct the data for 2011.
Source: Authors’ development using data from the Ministry of Internal Affairs and Communication, Japan at www.e-stat.go.jp.
0
50
100
150
200
250
300
2008
Tons
2009 2010 2011 2012 2013 2014 2015 2016 2017
Figure 7.9: Prawn Production in Okinawa, 2006–2017
Source: Authors’ development using information from Okinawa Prefecture at https://www.pref .okinawa.jp/site/norin/norinkikaku/kenkyu/documents/gaikyou52-58.pdf (accessed 5 January 2021).
20062007
20082009
20102011
20122013
20142015
20162017
0
1
2
3
4
5
6
0
100
200
300
400
500
600
700
Tons
¥ bi
llion
and
¥ m
illio
n/t
Prawn production (tons) Value per weight (¥ million/ton) Value (¥ billion)
Erimo, HokkaidoErimo Town is located in Southeast Hokkaido, surrounded by nature. Its economy is based on fisheries and tourism. The total population is 4,500, and the workforce is 3,200, of which 48.6% works in the primary sector, 39.0% in the service sector, and 12.3% in the manufacturing

Capitalizing on Co-Benefits and Synergies to Promote the Blue Economy in Asia and the Pacific 171
sector.7 The fisheries production in Erimo consists of mainly kelp and seaweed, cod, salmon and trout, and clams. Erimo faced stagnation of its fish production during the 1940s and 1950s. Local fishers considered deforestation and soil erosion to be a major cause of the slump in fishery production. Soil particles falling into the seawater accumulated as sediment and undermined the habitat of the kelp, seaweed, and fish stocks. The local fishers took the initiative to restore the land cover with vegetation and restoration in the 1950s. They reforested 3 ha of barren land in 1954. However, the survival rate of planted trees was not promising. In 1957, they introduced a system to use kelp and seaweed as organic fertilizer to enhance the soil nourishment. Thereafter, they started planting pine trees to arrest the soil erosion (Ministry of the Environment, Japan 2009). The Forestry Agency of Japan supported the reforestation activities and procured kelp and seagrass for use as soil nourishment. By 1970, it had reforested 192 ha in accordance with the reforestation plan.
There was a correlation between the increase in vegetation and reforested areas and the increase in fisheries production. Fisheries production started increasing in proportion with the revegetation and reforestation in Erimo (Figure 7.10). The revegetation with grass expanded faster than the reforestation. Soil erosion arrested in 1965, when the grass revegetation covered 80% of the targeted areas. Fishery production increased from 72 tons in 1952 to 2,264 tons in 2001. The case represents the virtuous correlation between the state of terrestrial ecosystems and the productivity in coastal and marine ecosystems.
Kelp production in Erimo peaked at 3,700 tons in 1993 and then declined to 1,400 in 2018, a 61.4% reduction (Figure 7.11). The production value decreased from ¥3.8 billion ($33.2 million) in 1993 to ¥2.2 billion ($20.0 million) in 2018, representing a 41.6% reduction. The reason for the reduction in kelp production is not the resurgence of soil erosion but presumably the increased seawater temperature. The Japan Meteorological Agency (2019) reported that the seawater temperature in the northern part of Hokkaido, where Erimo is located, has risen by 1.18°C over the past century. There was a 5°C difference between March 2019 and March 2020 (Figure 7.12). The difference may be due to the current change, but it needs further verification. A high seawater temperature, particularly in winter, has been a notable phenomenon around Japan in recent years. Further research is necessary on the correlation between a poor kelp harvest and the seawater temperature rise in Erimo. The presence of other predatory species also needs verification.
7 The information on Erimo Town is available at https://www.town.erimo.lg.jp/ (accessed 6 January 2021).
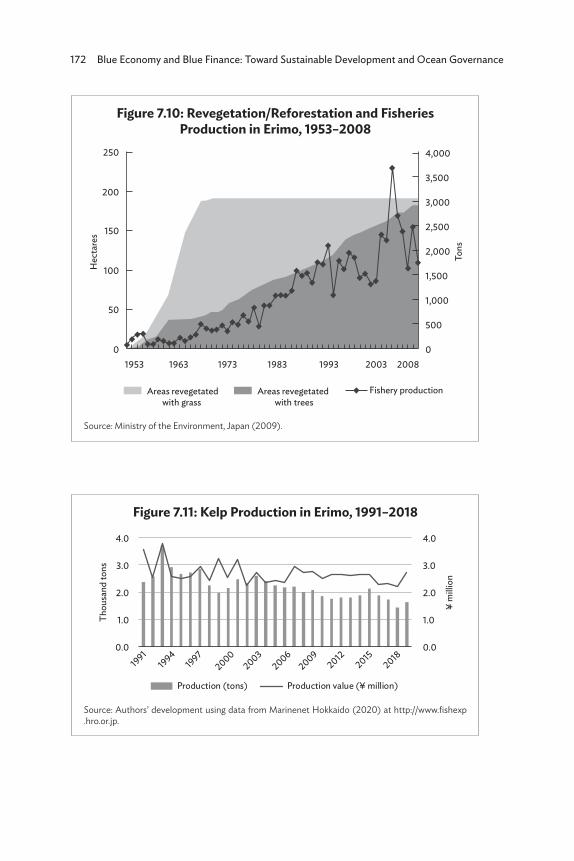
172 Blue Economy and Blue Finance: Toward Sustainable Development and Ocean Governance
Figure 7.11: Kelp Production in Erimo, 1991–2018
Source: Authors’ development using data from Marinenet Hokkaido (2020) at http://www.fishexp .hro.or.jp.
0.0
1.0
2.0
3.0
4.0
0.0
19911994
19972000
20032006
20092012
20152018
1.0
2.0
Thou
sand
tons
¥ m
illio
n
3.0
4.0
Production (tons) Production value (¥ million)
Figure 7.10: Revegetation/Reforestation and Fisheries Production in Erimo, 1953–2008
Source: Ministry of the Environment, Japan (2009).
250
Hec
tare
s
Tons
200
150
100
50
0 0
500
1,000
1,500
2,000
2,500
3,000
3,500
4,000
Areas revegetatedwith grass
Areas revegetated with trees
Fishery production
1953 1963 1973 1983 1993 2003 2008
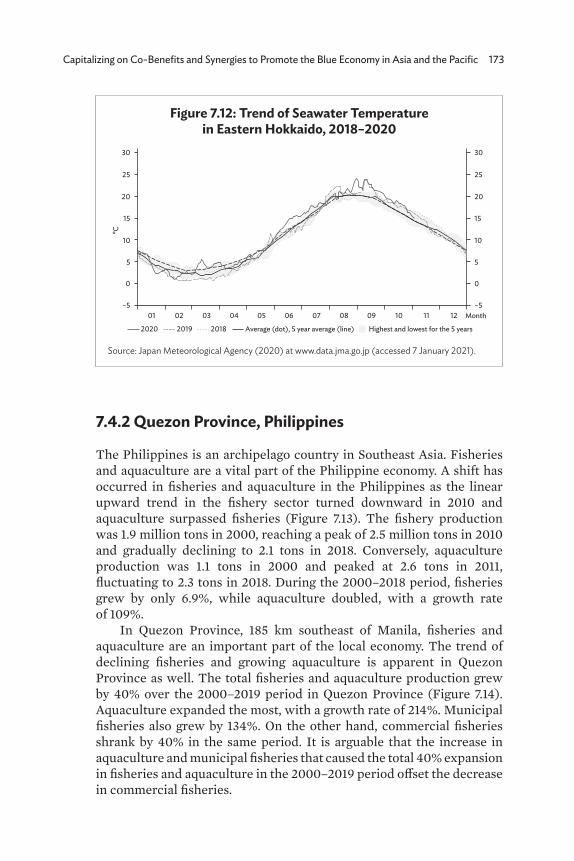
Capitalizing on Co-Benefits and Synergies to Promote the Blue Economy in Asia and the Pacific 173
7.4.2 Quezon Province, Philippines
The Philippines is an archipelago country in Southeast Asia. Fisheries and aquaculture are a vital part of the Philippine economy. A shift has occurred in fisheries and aquaculture in the Philippines as the linear upward trend in the fishery sector turned downward in 2010 and aquaculture surpassed fisheries (Figure 7.13). The fishery production was 1.9 million tons in 2000, reaching a peak of 2.5 million tons in 2010 and gradually declining to 2.1 tons in 2018. Conversely, aquaculture production was 1.1 tons in 2000 and peaked at 2.6 tons in 2011, fluctuating to 2.3 tons in 2018. During the 2000–2018 period, fisheries grew by only 6.9%, while aquaculture doubled, with a growth rate of 109%.
In Quezon Province, 185 km southeast of Manila, fisheries and aquaculture are an important part of the local economy. The trend of declining fisheries and growing aquaculture is apparent in Quezon Province as well. The total fisheries and aquaculture production grew by 40% over the 2000–2019 period in Quezon Province (Figure 7.14). Aquaculture expanded the most, with a growth rate of 214%. Municipal fisheries also grew by 134%. On the other hand, commercial fisheries shrank by 40% in the same period. It is arguable that the increase in aquaculture and municipal fisheries that caused the total 40% expansion in fisheries and aquaculture in the 2000–2019 period offset the decrease in commercial fisheries.
Figure 7.12: Trend of Seawater Temperature in Eastern Hokkaido, 2018–2020
Source: Japan Meteorological Agency (2020) at www.data.jma.go.jp (accessed 7 January 2021).
2020
0
01 02 03 04 05 06 07 08 09 10 11 12 Month–5
5
10
15
20
30
25
0
–5
5
10
15
20
30
25
ºC
2019 2018 Average (dot), 5 year average (line) Highest and lowest for the 5 years
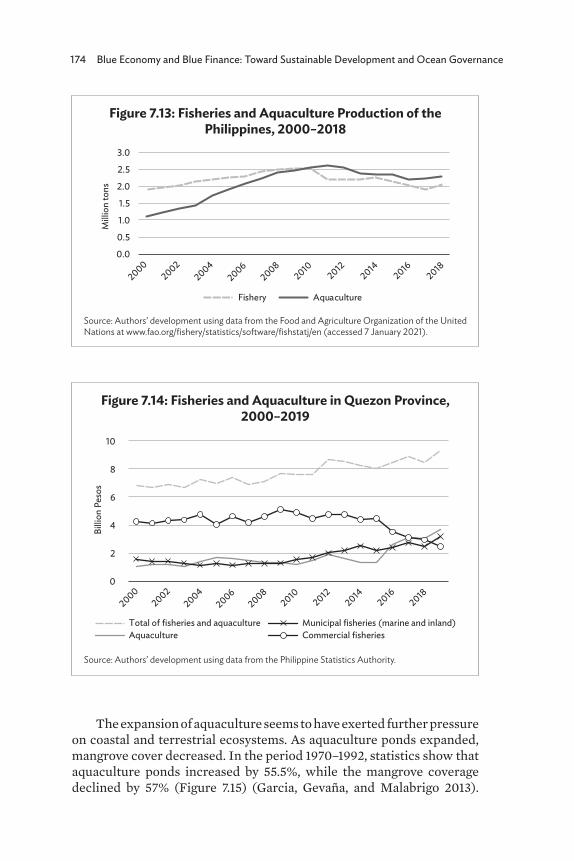
174 Blue Economy and Blue Finance: Toward Sustainable Development and Ocean Governance
Figure 7.13: Fisheries and Aquaculture Production of the Philippines, 2000–2018
Source: Authors’ development using data from the Food and Agriculture Organization of the United Nations at www.fao.org/fishery/statistics/software/fishstatj/en (accessed 7 January 2021).
0.0
0.5
1.0
1.5
2.0
2.5
3.0
Fishery Aquaculture
20002002
20042006
20082010
20122014
20162018
Mill
ion
tons
Figure 7.14: Fisheries and Aquaculture in Quezon Province, 2000–2019
Source: Authors’ development using data from the Philippine Statistics Authority.
Billi
on P
esos
0
2
4
6
8
10
Total of fisheries and aquacultureAquaculture
Municipal fisheries (marine and inland)Commercial fisheries
20002002
20042006
20082010
20122014
20162018
The expansion of aquaculture seems to have exerted further pressure on coastal and terrestrial ecosystems. As aquaculture ponds expanded, mangrove cover decreased. In the period 1970–1992, statistics show that aquaculture ponds increased by 55.5%, while the mangrove coverage declined by 57% (Figure 7.15) (Garcia, Gevaña, and Malabrigo 2013).
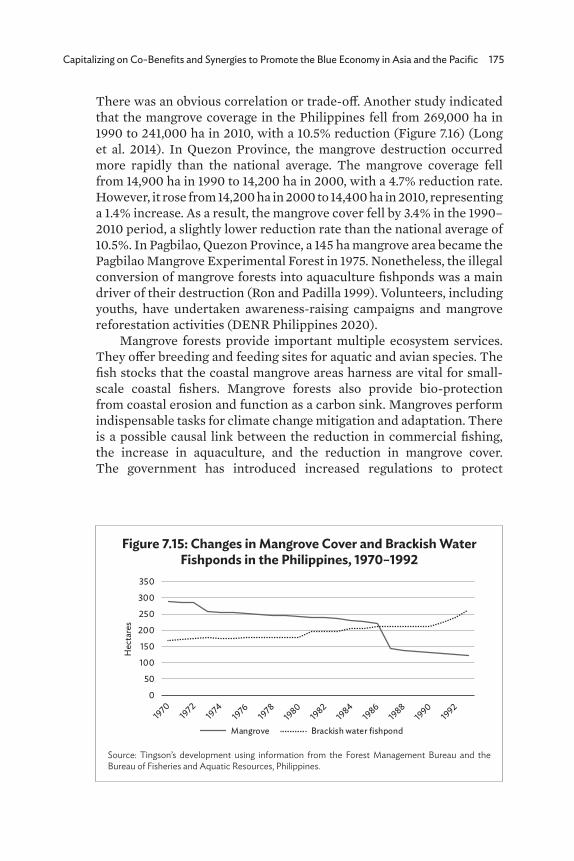
Capitalizing on Co-Benefits and Synergies to Promote the Blue Economy in Asia and the Pacific 175
There was an obvious correlation or trade-off. Another study indicated that the mangrove coverage in the Philippines fell from 269,000 ha in 1990 to 241,000 ha in 2010, with a 10.5% reduction (Figure 7.16) (Long et al. 2014). In Quezon Province, the mangrove destruction occurred more rapidly than the national average. The mangrove coverage fell from 14,900 ha in 1990 to 14,200 ha in 2000, with a 4.7% reduction rate. However, it rose from 14,200 ha in 2000 to 14,400 ha in 2010, representing a 1.4% increase. As a result, the mangrove cover fell by 3.4% in the 1990–2010 period, a slightly lower reduction rate than the national average of 10.5%. In Pagbilao, Quezon Province, a 145 ha mangrove area became the Pagbilao Mangrove Experimental Forest in 1975. Nonetheless, the illegal conversion of mangrove forests into aquaculture fishponds was a main driver of their destruction (Ron and Padilla 1999). Volunteers, including youths, have undertaken awareness-raising campaigns and mangrove reforestation activities (DENR Philippines 2020).
Mangrove forests provide important multiple ecosystem services. They offer breeding and feeding sites for aquatic and avian species. The fish stocks that the coastal mangrove areas harness are vital for small-scale coastal fishers. Mangrove forests also provide bio-protection from coastal erosion and function as a carbon sink. Mangroves perform indispensable tasks for climate change mitigation and adaptation. There is a possible causal link between the reduction in commercial fishing, the increase in aquaculture, and the reduction in mangrove cover. The government has introduced increased regulations to protect
Figure 7.15: Changes in Mangrove Cover and Brackish Water Fishponds in the Philippines, 1970–1992
Source: Tingson’s development using information from the Forest Management Bureau and the Bureau of Fisheries and Aquatic Resources, Philippines.
0
50
100
150
200
250
300
350
Hec
tare
s
Mangrove Brackish water fishpond1970
19721974
19761978
19801982
19841986
19881990
1992
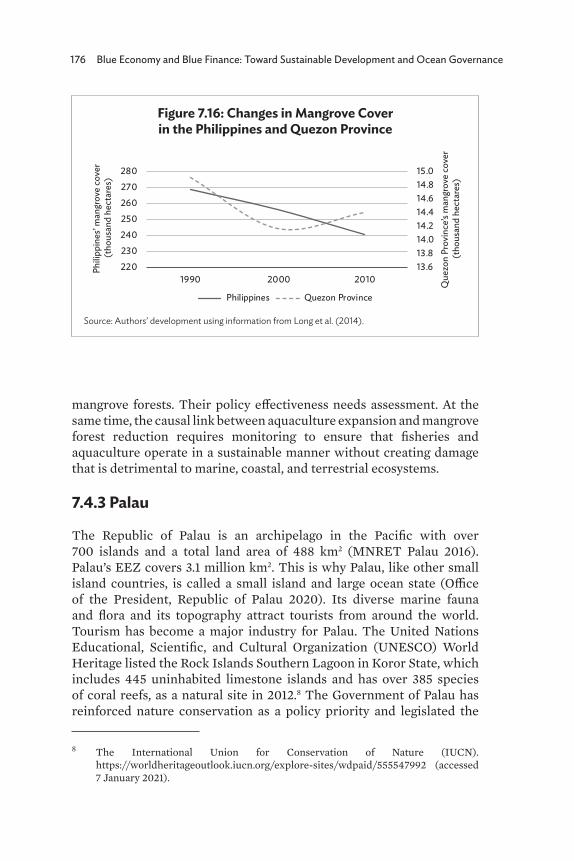
176 Blue Economy and Blue Finance: Toward Sustainable Development and Ocean Governance
mangrove forests. Their policy effectiveness needs assessment. At the same time, the causal link between aquaculture expansion and mangrove forest reduction requires monitoring to ensure that fisheries and aquaculture operate in a sustainable manner without creating damage that is detrimental to marine, coastal, and terrestrial ecosystems.
7.4.3 Palau
The Republic of Palau is an archipelago in the Pacific with over 700 islands and a total land area of 488 km2 (MNRET Palau 2016). Palau’s EEZ covers 3.1 million km2. This is why Palau, like other small island countries, is called a small island and large ocean state (Office of the President, Republic of Palau 2020). Its diverse marine fauna and flora and its topography attract tourists from around the world. Tourism has become a major industry for Palau. The United Nations Educational, Scientific, and Cultural Organization (UNESCO) World Heritage listed the Rock Islands Southern Lagoon in Koror State, which includes 445 uninhabited limestone islands and has over 385 species of coral reefs, as a natural site in 2012.8 The Government of Palau has reinforced nature conservation as a policy priority and legislated the
8 The International Union for Conservation of Nature (IUCN). https://worldheritageoutlook.iucn.org/explore-sites/wdpaid/555547992 (accessed 7 January 2021).
Figure 7.16: Changes in Mangrove Cover in the Philippines and Quezon Province
Source: Authors’ development using information from Long et al. (2014).
Phili
ppin
es’ m
angr
ove
cove
r (t
hous
and
hect
ares
)
Que
zon
Prov
ince
’s m
angr
ove
cove
r (t
hous
and
hect
ares
)
13.613.814.014.214.414.614.815.0
220
230
240
250
260
270
280
1990 2000 2010
Philippines Quezon Province

Capitalizing on Co-Benefits and Synergies to Promote the Blue Economy in Asia and the Pacific 177
Palau National Marine Sanctuary Act in 2015, which aims to protect 80% of its EEZ as a no-take marine protected area, with no permitted commercial fishing as of 1 January 2020 (Government of Palau 2015). The Act established domestic fishing zones around the main island of Babeldaob. The vessel days, a permit for operating fishing vessels under the Nauru Agreement, were to decrease each year from 2016 to 2019. In June 2019, with a view to enhancing the conservation efficiency and supporting the development of the fisheries and seafood sectors, the government revised the Act to relocate the fishing zone to the northwest of Palau and allow foreign fishing vessels to fish with permits from the Minister for Marine Resources, Environment, and Tourism (Office of the President, Republic of Palau 2019).
Palau has also introduced a green fee, which it raised to $100 per tourist and renamed the Palau Pristine Paradise Environmental Tax in January 2018. Koror State also collects a fee of $100 for the entry permit to Rock Islands and Jellyfish Lake, popular tourist destinations. The elimination of illegal fishing has become an important policy goal, and Palau has developed its cooperation with international partners, such as the Nippon Foundation and the Government of Australia, to strengthen its maritime surveillance capacity (Government of Palau 2018; Carreon 2020a). Palau has reinforced the progressive shift from fisheries to marine conservation and tourism. The total number of foreign tourists to Palau increased from 85,000 in 2010 to 164,000 in 2015, a 93% increase. The Rock Island inscription on the list of International Union for Conservation of Nature World Heritage natural sites in 2012 presumably boosted the increase. In terms of the nationality of foreign tourists, it is notable that the number of tourists from the People’s Republic of China (PRC) jumped from 1,000 in 2010 to 88,000 in 2015, an eightfold increase (Figure 7.17). Meanwhile, the number of tourists from Japan; Taipei,China; and the Republic of Korea declined from their peak in 2012. The number of tourists from the PRC plunged from 88,000 in 2015 to 30,000 in 2019. The total number of tourists in 2019 increased by 11.2% from 2010 but declined by 42.6% from 2015.
Multiple factors were involved in the declining tourist numbers. A severe drought hit Palau in 2016, and the government issued water use restrictions, though the measures that it took were to ensure the comfort of the tourists (Government of Palau 2016). The PRC’s authority banned group tours from the PRC in November 2017, presumably due to the absence of diplomatic relations between the Republic of Palau and the PRC (Cole 2017). Jellyfish Lake, one of the popular tourist destinations, continued to suffer the impacts of the drought. Jellyfish disappeared, and the tour operators suspended their visits. Jellyfish Lake was closed for 2 years to support the recovery of
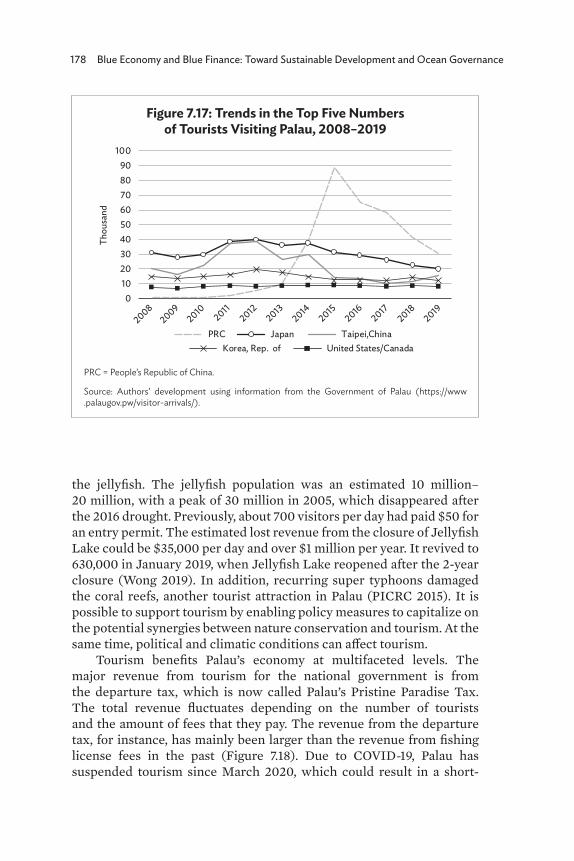
178 Blue Economy and Blue Finance: Toward Sustainable Development and Ocean Governance
the jellyfish. The jellyfish population was an estimated 10 million– 20 million, with a peak of 30 million in 2005, which disappeared after the 2016 drought. Previously, about 700 visitors per day had paid $50 for an entry permit. The estimated lost revenue from the closure of Jellyfish Lake could be $35,000 per day and over $1 million per year. It revived to 630,000 in January 2019, when Jellyfish Lake reopened after the 2-year closure (Wong 2019). In addition, recurring super typhoons damaged the coral reefs, another tourist attraction in Palau (PICRC 2015). It is possible to support tourism by enabling policy measures to capitalize on the potential synergies between nature conservation and tourism. At the same time, political and climatic conditions can affect tourism.
Tourism benefits Palau’s economy at multifaceted levels. The major revenue from tourism for the national government is from the departure tax, which is now called Palau’s Pristine Paradise Tax. The total revenue fluctuates depending on the number of tourists and the amount of fees that they pay. The revenue from the departure tax, for instance, has mainly been larger than the revenue from fishing license fees in the past (Figure 7.18). Due to COVID-19, Palau has suspended tourism since March 2020, which could result in a short-
Figure 7.17: Trends in the Top Five Numbers of Tourists Visiting Palau, 2008–2019
PRC = People’s Republic of China.
Source: Authors’ development using information from the Government of Palau (https://www .palaugov.pw/visitor-arrivals/).
0102030405060708090
100
PRC Japan Taipei,ChinaKorea, Rep. of United States/Canada
Thou
sand
20082009
20102011
20122013
20142015
20162017
20182019
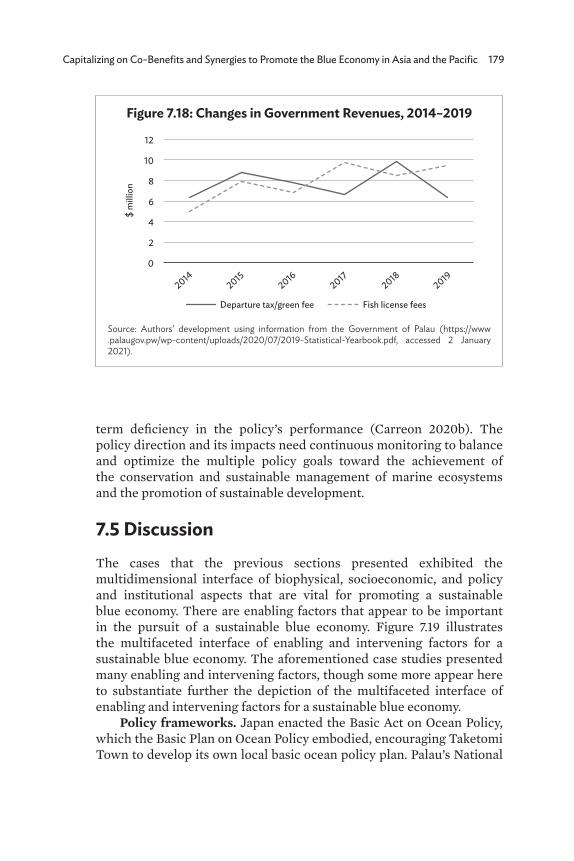
Capitalizing on Co-Benefits and Synergies to Promote the Blue Economy in Asia and the Pacific 179
term deficiency in the policy’s performance (Carreon 2020b). The policy direction and its impacts need continuous monitoring to balance and optimize the multiple policy goals toward the achievement of the conservation and sustainable management of marine ecosystems and the promotion of sustainable development.
7.5 DiscussionThe cases that the previous sections presented exhibited the multidimensional interface of biophysical, socioeconomic, and policy and institutional aspects that are vital for promoting a sustainable blue economy. There are enabling factors that appear to be important in the pursuit of a sustainable blue economy. Figure 7.19 illustrates the multifaceted interface of enabling and intervening factors for a sustainable blue economy. The aforementioned case studies presented many enabling and intervening factors, though some more appear here to substantiate further the depiction of the multifaceted interface of enabling and intervening factors for a sustainable blue economy.
Policy frameworks. Japan enacted the Basic Act on Ocean Policy, which the Basic Plan on Ocean Policy embodied, encouraging Taketomi Town to develop its own local basic ocean policy plan. Palau’s National
Figure 7.18: Changes in Government Revenues, 2014–2019
Source: Authors’ development using information from the Government of Palau (https://www .palaugov.pw/wp-content/uploads/2020/07/2019-Statistical-Yearbook.pdf, accessed 2 January 2021).
$ m
illio
n
20142015
20162017
20182019
0
2
4
6
8
10
12
Departure tax/green fee Fish license fees
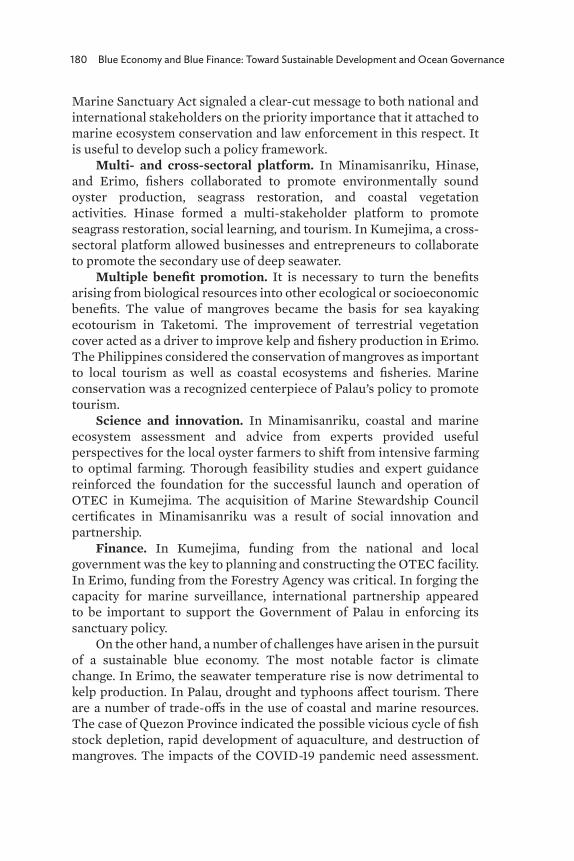
180 Blue Economy and Blue Finance: Toward Sustainable Development and Ocean Governance
Marine Sanctuary Act signaled a clear-cut message to both national and international stakeholders on the priority importance that it attached to marine ecosystem conservation and law enforcement in this respect. It is useful to develop such a policy framework.
Multi- and cross-sectoral platform. In Minamisanriku, Hinase, and Erimo, fishers collaborated to promote environmentally sound oyster production, seagrass restoration, and coastal vegetation activities. Hinase formed a multi-stakeholder platform to promote seagrass restoration, social learning, and tourism. In Kumejima, a cross-sectoral platform allowed businesses and entrepreneurs to collaborate to promote the secondary use of deep seawater.
Multiple benefit promotion. It is necessary to turn the benefits arising from biological resources into other ecological or socioeconomic benefits. The value of mangroves became the basis for sea kayaking ecotourism in Taketomi. The improvement of terrestrial vegetation cover acted as a driver to improve kelp and fishery production in Erimo. The Philippines considered the conservation of mangroves as important to local tourism as well as coastal ecosystems and fisheries. Marine conservation was a recognized centerpiece of Palau’s policy to promote tourism.
Science and innovation. In Minamisanriku, coastal and marine ecosystem assessment and advice from experts provided useful perspectives for the local oyster farmers to shift from intensive farming to optimal farming. Thorough feasibility studies and expert guidance reinforced the foundation for the successful launch and operation of OTEC in Kumejima. The acquisition of Marine Stewardship Council certificates in Minamisanriku was a result of social innovation and partnership.
Finance. In Kumejima, funding from the national and local government was the key to planning and constructing the OTEC facility. In Erimo, funding from the Forestry Agency was critical. In forging the capacity for marine surveillance, international partnership appeared to be important to support the Government of Palau in enforcing its sanctuary policy.
On the other hand, a number of challenges have arisen in the pursuit of a sustainable blue economy. The most notable factor is climate change. In Erimo, the seawater temperature rise is now detrimental to kelp production. In Palau, drought and typhoons affect tourism. There are a number of trade-offs in the use of coastal and marine resources. The case of Quezon Province indicated the possible vicious cycle of fish stock depletion, rapid development of aquaculture, and destruction of mangroves. The impacts of the COVID-19 pandemic need assessment.
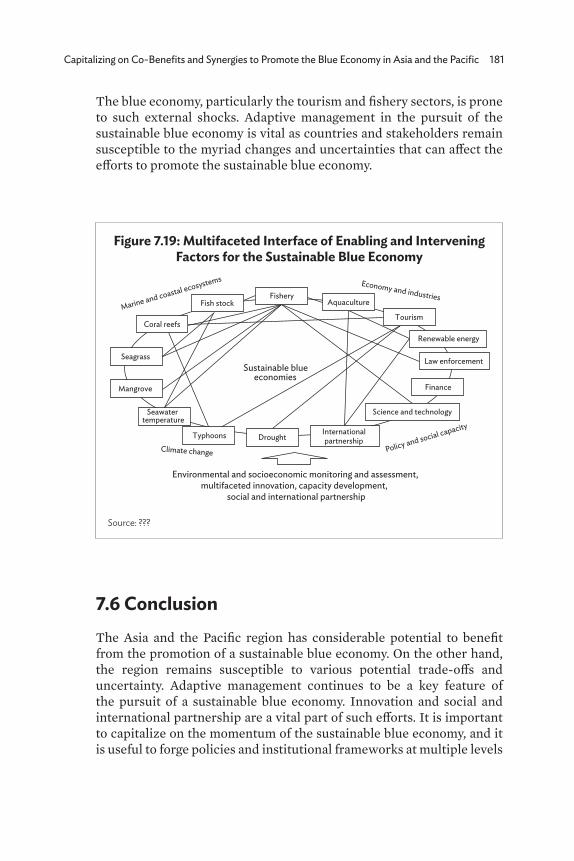
Capitalizing on Co-Benefits and Synergies to Promote the Blue Economy in Asia and the Pacific 181
The blue economy, particularly the tourism and fishery sectors, is prone to such external shocks. Adaptive management in the pursuit of the sustainable blue economy is vital as countries and stakeholders remain susceptible to the myriad changes and uncertainties that can affect the efforts to promote the sustainable blue economy.
7.6 ConclusionThe Asia and the Pacific region has considerable potential to benefit from the promotion of a sustainable blue economy. On the other hand, the region remains susceptible to various potential trade-offs and uncertainty. Adaptive management continues to be a key feature of the pursuit of a sustainable blue economy. Innovation and social and international partnership are a vital part of such efforts. It is important to capitalize on the momentum of the sustainable blue economy, and it is useful to forge policies and institutional frameworks at multiple levels
Figure 7.19: Multifaceted Interface of Enabling and Intervening Factors for the Sustainable Blue Economy
Source: ???
Sustainable blue economies
Fish stock
Coral reefs
Drought
Marine and coastal ecosystems Economy and industries
Policy and social capacity
Climate change
FisheryAquaculture
Mangrove
Law enforcement
International partnership
Science and technology
Finance
Seagrass
Renewable energy
Typhoons
Environmental and socioeconomic monitoring and assessment,multifaceted innovation, capacity development,
social and international partnership
Seawater temperature
Tourism
182 Blue Economy and Blue Finance: Toward Sustainable Development and Ocean Governance
in this respect. Policy and institutional transformations need support from inclusive policy dialogues based on science. It is vital for policy makers and stakeholders to reinforce their partnership and interaction to demonstrate success stories and achieve the common goals of promoting a sustainable blue economy and handing over healthy oceans to future generations.
Capitalizing on Co-Benefits and Synergies to Promote the Blue Economy in Asia and the Pacific 183
ReferencesAsian Development Bank. 2019. ADB Launches $5 Billion Healthy Oceans
Action Plan. News Release, 2 May. https://www.adb.org/news/adb -launches-5-billion-healthy-oceans-action-plan (accessed 2 January 2021).
____. 2020. Asian Development Outlook Supplement. December. https://www.adb.org/sites/default/files/publication/658721/ado -supplement-december-2020.pdf (accessed 2 January 2021).
Berrouet, L. M., J. Machado, and C. Villegas-Palacio. 2018. Vulnerability of Socio-ecological Systems: A Conceptual Framework. Ecological Indicators. 84: 632–47.
Bhattacharya, P., and A. K. Dash. 2020. Drivers of Blue Economy in Asia and Pacific Island Countries: An Empirical Investigation of Tourism and Fisheries Sectors. ADBI Working Paper 1161. Tokyo: Asian Development Bank Institute. https://www.adb.org/sites/default/files /publication/623236/adbi-wp1161.pdf (accessed 2 January 2021).
Cabinet Office, Japan. 2007. Basic Act on Ocean Policy. https://www8 .cao.go.jp/ocean/english/act/pdf/law_e.pdf (accessed 3 January 2021).
____. 2017. Report on the Feasibility of Local Promotion by the Use of Deep Sea Water in a Remote Island Region (in Japanese). http ://www.ogb.go.jp/-/media/Files/OGB/Keisan/move/OSHIRASE /oshirase/201710/171010houkokusho.pdf (accessed 5 January 2021).
Carreon, B. 2020a. Palau Receives New Australian Patrol Boat. Island Times. 22 September. https://islandtimes.org/palau-receives-new -australian-patrol-boat/ (accessed 7 January 2021).
____. 2020b. Palau’s Giant New Marine Sanctuary Draws Criticism. Maritime Executive. 11 October. https://www.maritime-executive .com/editorials/palau-s-giant-new-marine-sanctuary-draws -criticism (accessed 7 January 2021).
Cicin-Sain, B., M. Balgos, J. Appiott, K. Wowk, and G. Hamon. 2011. Ocean at Rio+20: How Well Are We Doing in Meeting the Commitments from the 1992 Earth Summit and the 2002 World Summit on Sustainable Development? Summary for Decision Makers. Global Ocean Forum. https://www.undp.org/content/dam/undp/library /Environment%20and%20Energy/Water%20and%20Ocean%20Governance/OceansatRio+20ReportSummaryforDecisionMakersOct102011.pdf (accessed 2 January 2021).
Cisneros-Montemayor, A., M. Moreno-Báez, M. Voyer, E. H. Allison, W. W. L. Cheung, M. Hessing-Lewis, M. A. Oyinlola, G. G. Singh, W. Swartz, and Y. Ota. 2019. Social Equity and Benefits as the Nexus of a Transformative Blue Economy: A Sectoral Review of Implications. Marine Policy. 109: 1–9.

184 Blue Economy and Blue Finance: Toward Sustainable Development and Ocean Governance
Cole, J. M. 2017. China Bans Tour Groups to the Vatican and Palau. 23 November. https://sentinel.tw/china-bans-tour-vatican-palau/ (accessed 7 January 2021).
De Neve, J. E., and J. D. Sachs. 2020. The SDGs and Human Well-Being: A Global Analysis of Synergies, Trade-Offs, and Regional Differences. Scientific Reports. 10: 15113.
Department of Environment and Natural Resources (DENR), Philippines. 2020. Stakeholders Plant in Pagbilao Mangrove Experimental Forest. 24 February. https://www.denr.gov.ph /index.php/news-events/photo-releases/1536-stakeholders -plant-in-pagbilao-mangrove-experimental-forest (accessed 7 January 2021).
Economist Group. 2020. A Sustainable Ocean Economy in 2030: Opportunities and Challenges. https://cdn.vev.design/private /Y00jvgKIBvZ1anyDSJNPOAQcI082/_jLT9hiqu_A_sustainable _ocean_economy_in_2030_%20copy.pdf.pdf (accessed 15 July 2021).
Fader, M., C. Cranmer, R. Lawford, and J. Engel-Cox. 2018. Toward an Understanding of Synergies and Trade-Offs Between Water, Energy, and Food SDG Targets. Frontiers in Environmental Science. 6: 1–11.
Garcia, K., D. Gevaña, and P. Malabrigo. 2013. Philippines’ Mangrove Ecosystem: Status, Threats, and Conservation. https://www.researchgate.net/publication/258925724_Philippines’ _Mangrove_Ecosystem_Status_Threats_and_Conservation /link/569129cd08aee91f69a4f3f9/download (accessed 13 January 2021).
Goto, K. 2022. Sustainable Farming of Oysters Achieved in the Reconstruction from the East Japan Great Disaster. https://www .projectdesign.jp/articles/6d9e50fe-1e2d-4ba9-a7f2-d7acc833d6f9 (accessed 15 March 2022).
Goto, M., et al. 2015. Activities To Develop Seagrass Beds in Okayama Prefecture (in Japanese). https://www.jstage.jst.go.jp/article /pamjsfe/2015/0/2015_33/_pdf (accessed 4 January 2021).
Government of Kenya. 2018. Report on the Global Sustainable Blue Economy Conference. http://www.blueeconomyconference.go.ke/wp-content/uploads/2018/11/Nairobi-Statement-of-Intent-Advancing-Global-Sustainable-Blue-Economy.pdf (accessed 3 January 2021).
Government of Palau. 2015. Palau National Marine Sanctuary Act. http ://extwprlegs1.fao.org/docs/pdf/pau152765.pdf (accessed 7 January 2021).
____. 2016. Drought Report Republic of Palau. June. http://palaugov.pw /wp-content/uploads/2017/06/2016-Drought-Report.pdf (accessed 7 January 2021).
Capitalizing on Co-Benefits and Synergies to Promote the Blue Economy in Asia and the Pacific 185
____. 2018. The Nippon Foundation to Handover Patrol Vessel, Marine Law Administrative Building, and Vessel Berth to the Republic of Palau. 13 February. https://www.palaugov.pw/the-nippon -foundation-to-handover-patrol-vessel-marine-law-administrative-building-and-vessel-berth-to-the-republic-of-palau/ (accessed 7 January 2020).
Hegre, H., K. Petrova, and N. von Uexkull. 2020. Synergies and Trade-Offs in Reaching the Sustainable Development Goals. Sustainability. 12(20): 8729.
Howard, B. C. 2018. Blue Growth: Stakeholder Perspectives. Marine Policy. 87: 375–7.
Ikegami, Y. 2015. The Advanced Technology and Future Prospect of OTEC for Island. https://iea.blob.core.windows.net/assets/imports /events/111/10Ikegami_SagaU.pdf (accessed 5 January 2021).
Japan Meteorological Agency. 2019. Long Term Trend of Sea Surface Temperature around the Sea of Japan. www.data.jma.go.jp (accessed 31 August 2021).
Jara, H. J., J. Tam, B. G. Reguero, F. Ganoza, G. Castillo, C. Y. Romero, M. Gévaudan, and A. A. Sánchez. 2020. Current and Future Socio-ecological Vulnerability and Adaptation of Artisanal Fisheries Communities in Peru: The Case of the Huaura Province. Marine Policy. 119: 104003.
Jouffray, J.-B., R. Blasiak, A. V. Norstrom, H. Österblom, and M. Nystrom. 2020. The Blue Acceleration: The Trajectory of Human Expansion into the Ocean. 24 January. One Earth. 2(1): 43–54.
Kakuma, S., et al. 2018. Recommendation of a Study on Satoumi (in Japanese). Tokyo: Bensei Publisher.
Kumejima Town. 2015. 2nd Kumejima Town Master Plan 2016–2025 (in Japanese). http://www.town.kumejima.okinawa.jp /docs/2jisougoukeikaku/file_contents/2kousou.pdf (accessed 5 January 2021).
Lauerburg, R. A. M., R. Diekmann, B. Blanz, K. Gee, H. Held, A. Kannen, C. Mollmann, W. N. Probst, H. Rambo, R. Cormier, et al. 2020. Socio-ecological Vulnerability to Tipping Points: A Review of Empirical Approaches and Their Use for Marine Management. Science of the Total Environment. 705: 135838.
Long, J., D. Napton, C. Giri, and J. Graesser. 2014. A Mapping and Monitoring Assessment of the Philippines’ Mangrove Forests from 1990 to 2010. Journal of Coastal Research. 30(2): 260–71.
Martinez-Fernández, J., I. Banos-González, and M. Á. Esteve-Selma. 2021. An Integral Approach to Address Socio-ecological Systems Sustainability and their Uncertainties. Science of the Total Environment. 762: 14457.
186 Blue Economy and Blue Finance: Toward Sustainable Development and Ocean Governance
McGinnis, M. D., and E. Ostrom. 2014. Social-Ecological System Framework: Initial Changes and Continuing Challenges. Ecology and Society. 19(2): 30.
McIlgorm, A. 2016. Ocean Economy Valuation Studies in the Asia-Pacific Region: Lessons for the Future International Use of National Accounts in the Blue Economy. Journal of Ocean and Coastal Economics. 2(2): 1–19.
Minamisanriku Town. 2012. Minamisanriku Town Reconstruction Plan (in Japanese). https://www.town.minamisanriku.miyagi.jp /index.cfm/6,303,c,html/303/fukkoukeikaku 120326.pdf (accessed 4 January 2021).
____. 2020. Minamisanriku Town Statistics Report. (in Japanese) https://www.town.minamisanriku.miyagi.jp/index.cfm/10,793,c,html/793/20200501-172530.pdf (accessed 4 January 2020).
Ministry of Internal Affairs and Communications, Japan. 2020. Long- Term Fishery Production in Okayama Prefecture (1956–2015) (in Japanese). www.e-stat.go.jp (accessed 12 January 2021).
Ministry of Natural Resources, Environment, and Tourism (MNRET), Palau. 2016. The Republic of Palau Revised National Biodiversity Strategy and Action Plan 2015–2025. https://www.cbd.int/doc /world/pw/pw-nbsap-v2-en.pdf (accessed 7 January 2021).
Ministry of the Environment, Japan. 2009. Black Pine Reforestation for Controlling Soil Erosion and Restoring Fishery Resources in Erimo-misaki, Hokkaido (in Japanese). https://www.env.go.jp/nature /satoyama/syuhourei/pdf/cjj_5.pdf (accessed 7 January 2021).
____. 2014. Fifth National Report of Japan to the Convention on Biological Diversity. https://www.cbd.int/doc/world/jp/jp-nr-05 -en.pdf (accessed 4 January 2021).
____. 2018. Outcome of Research on Coral Bleaching in Sekiseishoko, Iriomote-Ishigaki National Park (in Japanese). 19 January. https ://www.env.go.jp/press/105023.html (accessed 3 January 2021).
____. 2020. Designation of Offshore Seabed as Nature Conservation Areas (in Japanese). http://www.env.go.jp/press/108741.html (accessed 3 January 2021).
Ministry of the Environment, Kyushu Regional Office. 2016. Status and Challenges Regarding Tourism Use in Iriomote Island (in Japanese). http://kyushu.env.go.jp/okinawa/amami-okinawa /meeting/region/pdf/D2_e2_h28_2_iriomote/D.2.e2_H28-2_93.pdf (accessed 3 January 2021).
Miyagi Prefectural Fisheries Cooperative Association. 2012. Miyagi Prefecture Northern Regional Division Aquaculture Reconstruction Project Plan (in Japanese). http://www.fpo.jf-net.ne.jp/gyoumu /hojyojigyo/08hukkou/hukkou_yoshoku/fukkou_keikaku/tokura -fukugoubukai.pdf (accessed 4 January 2021).
Capitalizing on Co-Benefits and Synergies to Promote the Blue Economy in Asia and the Pacific 187
Mulazzani, L., and G. Malorgio. 2017. Blue Growth and Ecosystem Services. Marine Policy. 85: 17–24.
Nash, K. L., J. L. Blythe, C. Cvitanovic, E. A. Fulton, B. S. Halpern, E.J. Milner-Gulland, P. F.E.mAddison, G. T. Pecl, R. A.Watson, and J. L. Blanchard. 2020. To Achieve a Sustainable Blue Future, Progress Assessments Must Include Interdependencies between the Sustainable Development Goals. One Earth. 2(2): 161–73.
New Energy and Industrial Technology Development Organization (NEDO). 2010. NEDO Renewable Energy Technology White Paper (in Japanese). https://www.nedo.go.jp/content/100107275 .pdf (accessed 5 January 2021).
Núñez-Regueiro, M. M., L. C. Branch, E. Derlindati, I. Gasparri, S. Marinaro, S. Nanni, C. N. Godoy, M. Piquer-Rodriguez, J. R. Soto, and A. Tálamo. 2020. Open Standards for Conservation as a Tool for Linking Research and Conservation Agendas in Complex Socio-ecological Systems. Current Opinion in Environmental Sustainability. 44: 6–15.
Office of the President, Republic of Palau. 2019. Signing Statement for Senate Bill No. 10-157, SD1, HD1. https://www.palaugov.pw/wp -content/uploads/2019/07/RPPL-No.-10-35-re.-Amendment-to -the-PNMS.pdf (accessed 7 January 2021).
____. 2020. Address by H.E. Tommy E. Remengesau, Jr., President of the Republic of Palau at the United Nations General Assembly General Debate, 23 September. https://estatements.unmeetings.org/estatements/10.0010/20200923/ bVdkQECcmuDt/ k8T quxzpKKKr_en.pdf (accessed 7 January 2021).
Okinawa Prefecture. 2015. Synthesis Report on the Project for the Development of a Guideline Concerning Nature and Environment Restoration (in Japanese). https://www.pref.okinawa.jp/site /kankyo/saisei/documents/saisei05.pdf (accessed 3 January 2021).
Palau International Coral Reef Center (PICRC). 2015. Impact of Super Typhoons on Coral Reefs in Palau. 1 December. http://picrc.org /picrcpage/2015/12/01/impact-of-super-typhoons-on-coral-reefs -in-palau/ (accessed 7 January 2021).
Pauly, D. 2018. A Vision for Marine Fisheries in a Global Blue Economy. Marine Policy. 87: 371–74.
Ramsar Site Information Service. 2018. Japan Shizugawa-wan. https ://rsis.ramsar.org/RISapp/files/RISrep/JP2358RIS_1810_en.pdf (accessed 4 January 2021).
Ron, J., and J. Padilla. 1999. Preservation or Conversion? Valuation and Evaluation of a Mangrove Forest in the Philippines. Environmental and Resource Economics. 14: 297–331.
Rosellon-Druker, J., M. Szymkowiak, K. Y. Aydin, C.. J. Cunningham, E. A. Fergusson, S. Kasperski, G. H. Kruse, J. H. Moss, M. Rhodes-Reese,
188 Blue Economy and Blue Finance: Toward Sustainable Development and Ocean Governance
Kalei S.Shotwell, et al. 2021. Participatory Place-Based Integrated Ecosystem Assessment in Sitka, Alaska: Constructing and Operationalizing a Socio-ecological Conceptual Model for Sablefish (Anoplopoma fimbria). Deep-Sea Research Part II. 184–185: 104912.
Stuchtey, M., A. Vincent, A. Merkl, M. Bucher, P. M. Haugan, J. Lubchenco, and M. E. Pangestu. 2020. Ocean Solutions That Benefit People, Nature and the Economy. Washington, DC: World Resources Institute. https://www.oceanpanel.org/ocean-action /files/full-report-ocean-solutions-eng.pdf (accessed 3 January 2021).
Taketomi Town. 2011. Taketomi Town Basic Plan on Ocean Policy (in Japanese). https://www.town.taketomi.lg.jp/topics/1532674353/ (accessed 4 January 2020).
____. 2018a. Taketomi Town 2nd Basic Plan for Ocean Policy (in Japanese). https://www.town.taketomi.lg.jp/topics/1534306354/ (accessed 3 January 2021).
____. 2018b. Taketomi Town Basic Plan on Tourism Promotion (in Japanese). https://www.town.taketomi.lg.jp/sp/userfiles/files /topics/seisakusuishin/project/kankousinkoukihonkeikaku-all.pdf (accessed 3 January 2021).
____. 2019a. Taketomi Town Tour Operator Ordinance (in Japanese). 20 September. https://www.town.taketomi.lg.jp/sp/userfiles/files /kankoanjyourei.pdf (accessed 3 January 2020).
____. 2019b. Commencement of Receiving a Payment for Island Entry (in Japanese). 30 August. https://www.town.taketomi.lg.jp /topics/1567153227/ (accessed 3 January 2021).
Tanaka, T. 2014. Exploring a Sustainable and Circular Local Community (in Japanese). http://www.ecpr.or (accessed 4 January 2021).
Tanaka, T. 2017. Issues in Setonaikai—Challenges and Responding Measures (in Japanese). https://www.env.go.jp/press/files /jp/112391.pdf (accessed 5 January 2021).
Tanaka, T., and K. Furukawa. 2019. Prospects for Practical “Satoumi” Implementation for Sustainable Development Goals: Lessons Learnt from the Seto Inland Sea, Japan. Proceedings of Coast Bordeaux Symposium and of the 17th French–Japanese Oceanography Symposium 2017: 309–17.
Terashima, H. 2012. Japan’s Ocean Policymaking. Coastal Management. 40(2): 172–82.
Tuda, A. O., S. Kark, and A. Newton. 2021. Polycentricity and Adaptive Governance of Transboundary Marine Socio-ecological Systems. Ocean and Coastal Management. 200: 105412.
Capitalizing on Co-Benefits and Synergies to Promote the Blue Economy in Asia and the Pacific 189
Uchiyama, S., and T. Miyagi. 2020. Mangrove Forest Dynamics of the Nakama River Delta, Iriomote Island, Japan: Quantitative Estimations Based on the Image Archives during the Recent 70 Years (in Japanese). Mangrove Science. 11: 3–15.
United Nations. 2012. UN General Assembly Resolution 66/288. The Future We Want. https://www.un.org/en/development/desa /population/migration/generalassembly/docs/globalcompact/A _RES_66_288.pdf (accessed 3 January 2021).
____. 2015. Transforming Our World: The 2030 Agenda for Sustainable Development. A/RES/70/1. http://www.un.org/ga/search/view _doc.asp?symbol=A/RES/70/1&Lang=E (accessed 2 January 2021).
____. 2017. UN General Assembly Resolution 71/312. Our Ocean, Our Future: Call for Action. http://www.un.org/ga/search/view_doc .asp?symbol=A/RES/71/312&Lang=E (accessed 3 January 2021).
Wong, M. H. 2019. Palau’s Jellyfish Lake Reopens as Thousands of Jellyfish Return. CNN. 15 January. https://edition.cnn.com/travel /article/palau-jellyfish-lake-reopens/index.html (accessed 7 January 2021).
World Bank. 2021. Global Economic Prospects, January 2021. https ://www.worldbank.org/en/publication/global-economic-prospects (accessed 2 January 2021).
WWF Japan. 2021. Sustainable Aquaculture Achieved in the Reconstruction from the Disaster (in Japanese). https://www.wwf .or.jp/activities/lib/4574.html (accessed 15 March 2022).
190
8
Addressing Marine Litter through Sustainable Tourism:
The Case of the Siargao Islands in the Southern Philippines
Kevin Roy B. Serrona, Jeongsoo Yu, and Mary Jean A. Camarin
8.1 IntroductionThe Philippines has emerged among the most-favored tourist destinations in the world. Being an archipelagic country in Southeast Asia, its 7,641 islands offer a range of breathtaking tourism attractions. To the west of the country is the Western Exclusive Economic Zone and to the east is the Philippine Sea. The country has a total land area of 298,170 square kilometers and an extensive and rich coastline of 36,289 kilometers that serves as a major tourism asset. As of 2019, the country’s total population was over 108 million (World Bank 2020), of which the coastal population constitutes about 62%.
The ocean economy in the Philippines employs around 2.15 million people, which is 5.5% of the total employment. It accounts for 7% of the country’s gross domestic product, valued at $11.9 billion. The tourism sector contributes around $3 billion in value added (PEMSEA 2017). The tourist arrivals in the country have grown strongly and steadily in the last 10 years. They escalated to a growth rate of 6.07%, with more than 8 million arrivals, in 2019, generating 5.7 million jobs in the same year. This figure represents an increase of 6.5% in the employment rate compared with 2018 (DOT 2019).
The Philippines has enjoyed the benefits of the ocean economy primarily through tourism. However, the issue of marine litter has emerged as one of its major challenges. Marine litter from inland sources and marine debris coming from international waters have become a gargantuan problem. A study conducted by Ocean Conservancy (2017)
Addressing Marine Litter through Sustainable Tourism: The Case of the Siargao Islands in the Southern Philippines 191
revealed that the People’s Republic of China, Indonesia, the Philippines, Viet Nam, and Thailand are the top five countries that contribute more than half of the plastic waste in the ocean. The Philippines alone generates about 2.7 million tons of plastics annually (Lor 2019). Marine litter degrades the pristine coastal and marine assets and threatens tourism resources. If left unchecked, the tourism industry is likely to lose its vibrancy, and this will affect a huge population that is highly dependent on tourism for employment. Currently, many local governments units (LGUs) are betting on tourism as a major economic lifeline. The Government of the Philippines has exerted direct efforts to address the deterioration of nature-based tourism destinations through ecotourism.
The greater challenge, however, lies in the advent of the global health pandemic. Recent data from the Philippine Department of Tourism (DOT) revealed that tourist arrivals in the country had plummeted to a low of 82.05% (Rey 2021). Only 1,482,535 tourists visited in 2020 as opposed to 8,260,913 in 2019. Foreign tourists’ expenditure plunged to a low of 83.12% from ₱482.16 billion in 2019 to ₱81.4 billion in 2020. The pandemic has caused enormous economic distress in tourism, triggering leaders in the industry to rethink the industry. Marine litter is a major area that needs immediate interventions. As domestic tourism leads the recovery of the industry (DOT, ALTCFT, GTTP 2020), the government has issued health guidelines to ensure global health compliance in destinations. These require tourists and host communities to use personal protective equipment (PPE), face masks, and the like, which will further increase the generation of waste. A synergistic approach of cooperation at the local, national, and international levels will help considerably in achieving this end.
This chapter aims to discuss the existing and emerging measures to address marine litter in the Siargao Islands along with strategic and sustainable waste management solutions to maintain its ecological integrity and its position as a tourism destination. To arrest the linear thinking of consumption and disposal, it proposes juxtaposing circular economy—oriented measures with interventions like tourism branding, diversification, and enhanced partnerships.
8.2 Research Methodology8.2.1 Tourism in the Caraga Region and Siargao Islands
Caraga is one of the administrative regions of the Philippines. It is composed of five provinces: Agusan del Norte, Agusan del Sur, Dinagat Islands, Surigao del Norte, and Surigao del Sur. Located at the
192 Blue Economy and Blue Finance: Toward Sustainable Development and Ocean Governance
northeastern tip of Mindanao, Caraga Region is a tourist’s paradise. Its topography, consisting of mountainous areas, flat rolling lands, and long stretches of coastlines, is among its major tourism strengths. These natural endowments provide huge advantages to tourism and other industries, such as forestry, agriculture, and even mining. Caraga Region’s declaration as a separate administrative region on 23 February 1995 helped to gain momentum for the tourism industry, enabling it to flourish as one of the major economic drivers of the region.
Since surfing was introduced in the Siargao Islands in the 1980s, tourism development has experienced unprecedented growth. Surfing events attracted substantial attention from enthusiasts and eventually earned the island international recognition as the surfing capital of Asia. The wealth of the island’s marine resources made it even more popular through the International Game Fishing Tournament. Apart from the yearly water sports adventure events, the Siargao Islands’ diverse natural attractions, such as long stretches of white sand beaches, waterfalls, islands, lagoons, and caves, enticed more tourists to visit.
Tourism flourished almost effortlessly because of the island’s natural affluence. Its tourist arrival growth rate has swelled by 18.27% in the last 5 years. In 2018, there were 181,782 tourists, 42% more than the 257,900 who visited in 2019. While tourism has undoubtedly brought progress, the surge of tourists has become a growing concern in maintaining the integrity of the island as a protected area. Long before they became a popular tourism destination, the Siargao Islands were a protected area by virtue of Presidential Proclamation No. 902 in 1996, known as the Siargao Islands Protected Landscape and Seascape (SIPLAS). There are trade-offs with tourism development such that the tourism-carrying capacity has emerged as a major issue. An increase in tourist arrivals equates to increased waste generation. In 2020, tourists generated an estimated 125 tons of waste. The expectation is that this figure will rise in the advent of the global health pandemic. Domestic tourism is the Philippine Department of Tourism’s direction toward recovery with the enforcement of global standards of safety measures. The wearing of face masks, face shields, and PPE is mandatory and is likely to double the volume of waste on the islands.
The coronavirus disease 2019 (COVID-19) pandemic’s disruption of travel and tourism in Siargao decreased tourist arrivals by 3.57% in the first quarter of 2020, with 53,820 visitors compared to 55,814 in 2019. On the one hand, the pandemic caused heavy economic losses; on the other, it provided a break for many ecotourism sites. However, threat springs anew as destinations are slowly opening for domestic tourism. The threat of plastic pollution is foreseeable as health protocols require the wearing of face masks and the use of PPE.

Addressing Marine Litter through Sustainable Tourism: The Case of the Siargao Islands in the Southern Philippines 193
8.2.2 Literature Review
This research combined secondary data collection and a desk review of concepts, approaches, and methods of sustainable tourism and the circular economy. It analyzed sustainable tourism strategies and activities in island-based tourist destinations in Caraga Region, Siargao, in particular. It reviewed the policy and regulatory framework to identify the prevailing policies and regulations that affect tourism and waste management. The chapter presents a discussion of marine litter issues and interventions in Siargao using data from LGUs. The study analyzed the development patterns in the region and the existing and emerging sources of waste to gain an understanding of the waste pollution problem in the pilot area, including the approaches and technologies that are in operation in coastal marine litter management. The study selected Siargao as the featured area because it is one of the premiere tourist destination sites in the Philippines, with a steady growth rate of 20% in tourist arrivals in recent years. It also faces the Pacific, from which it receives trash and debris from the Great Pacific Garbage Patch during the northeast monsoon seasons.
In the 1950s to the 1970s, the tourism sector expanded almost on its own, without the support of proper planning and development policies. The absence of specific tourism planning controls, the inadequacy of legislation, and inadequate and ineffective tourism organizations were responsible for the failure of tourism planning (Dowling and Fennel 2003). According to Costa (2001), tourism was under the umbrella of town planning, which was dependent on urban growth. It lacked the planning instruments capable of coordinating and regulating the development of resorts, which resulted in failure to control tourism’s development. After the 1980s, tourism planning theory and practice started to emerge with the support of evidence and research through a unique body of knowledge (Buhalis and Costa 2006).
Getz’s (1986) integrative systems model emerged as an approach that introduced cohesive planning activity incorporating economic, social, and environmental components, spatial concerns, and temporal or evolutionary stage implications (Dowling and Fennel 2003). It is based on research and evaluation, in which planning and theory must interrelate and goal setting must complement the development plan. The model highlights the optimization of the potential contribution to human welfare and environmental quality. Getz stressed that a more comprehensive approach would be to incorporate salient issues, stakeholders, and unbiased information on regional impacts.
Related to Getz’s integrative systems model is Gunn’s (1988) interactive systems model, which contributed to the foundation of the
194 Blue Economy and Blue Finance: Toward Sustainable Development and Ocean Governance
sustainable development concept. He emphasized the need to integrate continuous tourism planning with all other planning for social and economic development. The model seeks to strike a balance between tourism and the protection of the cultural and natural resources on which tourism depends. It underscores the symbiotic relationship between a thriving tourism industry and a protected environment through the use of tourists’ satisfaction as the basis for tourism planning. It factors in tourism planning, tourism systems, and the supply versus demand relationship. The goal is to integrate tourism into the social and economic life of a community. Hence, the focus of planning is mainly on generating income and employment as well as ensuring resource conservation and traveler satisfaction.
Inskeep (1991) established approaches and guidelines for integrated and sustainable development. He was among those who opposed the market-driven approach of the tourism development model. He reasoned that the tourist market may demand attractions, facilities, and services that could result in environmental destruction and damage to the sociocultural integrity of the tourism area. In contrast, the supply-led approach implies that it is best to integrate those types of attractions, facilities, and services into tourism, resulting in the minimum impacts on the local development patterns and society. Marketing aims to attract only those tourists who find this product to be of interest (Andriotis 2015). Hall, Finsterwalder, and Ram (2015) advanced the idea that the achievement of tourism development occurs when tourists and the local community are satisfied. They said that, in the long run, the most sustainable tourist destination is not one that relies on tourism alone but one that lives, works, and interacts with diverse communities, allowing their distinctive identities to evolve over time. Its primary focus is on meeting the community’s needs (Hall, Finsterwalder, and Ram 2015).
8.3 Tourism in the Context of the Philippines
8.3.1 Definition and Classification
The United Nations World Tourism Organization (2011) defined tourism as comprising the activities of persons traveling to and staying in places outside their usual environment for not more than 1 consecutive year for leisure, business, and other purposes. The Philippines, like all other countries, aims to increase its number of tourist arrivals as a major economic indicator of tourism growth. According to the World Tourism Organization’s definition, a visitor is any person who travels to a country other than that in which the person has his or her usual residence but outside his or her usual environment for a period not exceeding
Addressing Marine Litter through Sustainable Tourism: The Case of the Siargao Islands in the Southern Philippines 195
12 months and whose main purpose of visiting is other than the exercise of an activity to receive remuneration from within the country visited. The person is a tourist if he or she stays for at least one night in collective or private accommodation in the country. However, a visitor who does not spend the night in collective or private accommodation in the country is a same-day visitor.
The Philippines offers rich and diverse tourism resources. The National Tourism Development Plan outlined a portfolio of 10 tourism products: nature based; cultural; agricultural (or agri-tourism); sun and beach; health, wellness, and retirement; cruise and nautical; education; meetings, incentives, conferences, and exhibits (or MICE); leisure and entertainment; and diving and marine sports. The 10 major tourism products emerged from the results of a market-product analysis recommending the prioritization of enriching the tourist experience and boosting the product diversification.
8.3.2 Approaches and Strategies
The Philippines Department of Tourism has adopted the tourism cluster approach for destination development among the guiding principles of the National Tourism Development Plan (NTDP). The strategy involves linking tourism development areas (TDAs) into logical groupings of transport networks, natural and cultural tourism sites, and urban service centers that provide facilities and amenities, all with at least a primary gateway providing services. There are 49 TDAs in the country, and the province of Surigao del Norte is part of the Southern Philippines Tourism Cluster.
The convergence approach is also an essential guiding principle of the NTDP’s implementation. It involves the creation of partnerships with public and private stakeholders, ensuring participatory governance and strengthening stakeholders’ capacity. The analysis of tourism’s current situation addressing the major challenges of the industry drew the strategic directions.
8.4 Policy and Regulatory FrameworkAs is apparent from the above discussion, all the policies are in place (Table 8.1). There are clearly defined areas for collaboration between and among government agencies, but an increase in their implementation and enforcement is necessary. LGUs, which are the frontline for addressing environmental issues such as marine litter, should have the available capacity and resources and at the same time the proper guidance from the national government to generate resources and navigate local solutions.
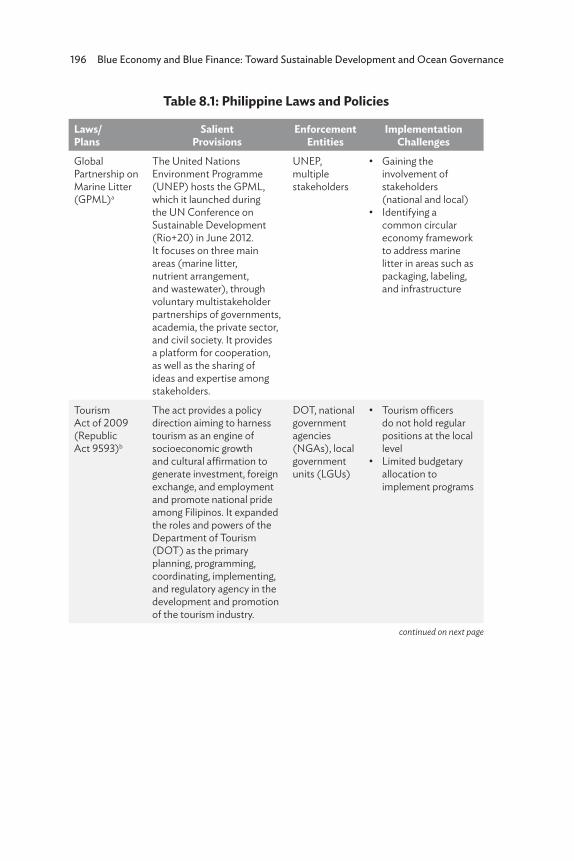
196 Blue Economy and Blue Finance: Toward Sustainable Development and Ocean Governance
Table 8.1: Philippine Laws and Policies
Laws/ Plans
Salient Provisions
Enforcement Entities
Implementation Challenges
Global Partnership on Marine Litter (GPML)a
The United Nations Environment Programme (UNEP) hosts the GPML, which it launched during the UN Conference on Sustainable Development (Rio+20) in June 2012. It focuses on three main areas (marine litter, nutrient arrangement, and wastewater), through voluntary multistakeholder partnerships of governments, academia, the private sector, and civil society. It provides a platform for cooperation, as well as the sharing of ideas and expertise among stakeholders.
UNEP, multiple stakeholders
• Gaining the involvement of stakeholders (national and local)
• Identifying a common circular economy framework to address marine litter in areas such as packaging, labeling, and infrastructure
Tourism Act of 2009 (Republic Act 9593)b
The act provides a policy direction aiming to harness tourism as an engine of socioeconomic growth and cultural affirmation to generate investment, foreign exchange, and employment and promote national pride among Filipinos. It expanded the roles and powers of the Department of Tourism (DOT) as the primary planning, programming, coordinating, implementing, and regulatory agency in the development and promotion of the tourism industry.
DOT, national government agencies (NGAs), local government units (LGUs)
• Tourism officers do not hold regular positions at the local level
• Limited budgetary allocation to implement programs
continued on next page
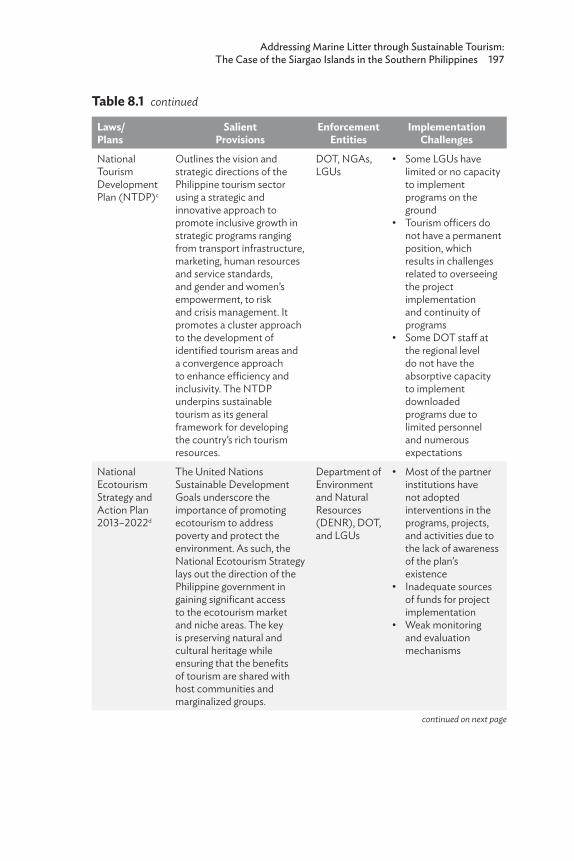
Addressing Marine Litter through Sustainable Tourism: The Case of the Siargao Islands in the Southern Philippines 197
Laws/ Plans
Salient Provisions
Enforcement Entities
Implementation Challenges
National Tourism Development Plan (NTDP)c
Outlines the vision and strategic directions of the Philippine tourism sector using a strategic and innovative approach to promote inclusive growth in strategic programs ranging from transport infrastructure, marketing, human resources and service standards, and gender and women’s empowerment, to risk and crisis management. It promotes a cluster approach to the development of identified tourism areas and a convergence approach to enhance efficiency and inclusivity. The NTDP underpins sustainable tourism as its general framework for developing the country’s rich tourism resources.
DOT, NGAs, LGUs
• Some LGUs have limited or no capacity to implement programs on the ground
• Tourism officers do not have a permanent position, which results in challenges related to overseeing the project implementation and continuity of programs
• Some DOT staff at the regional level do not have the absorptive capacity to implement downloaded programs due to limited personnel and numerous expectations
National Ecotourism Strategy and Action Plan 2013–2022d
The United Nations Sustainable Development Goals underscore the importance of promoting ecotourism to address poverty and protect the environment. As such, the National Ecotourism Strategy lays out the direction of the Philippine government in gaining significant access to the ecotourism market and niche areas. The key is preserving natural and cultural heritage while ensuring that the benefits of tourism are shared with host communities and marginalized groups.
Department of Environment and Natural Resources (DENR), DOT, and LGUs
• Most of the partner institutions have not adopted interventions in the programs, projects, and activities due to the lack of awareness of the plan’s existence
• Inadequate sources of funds for project implementation
• Weak monitoring and evaluation mechanisms
continued on next page
Table 8.1 continued
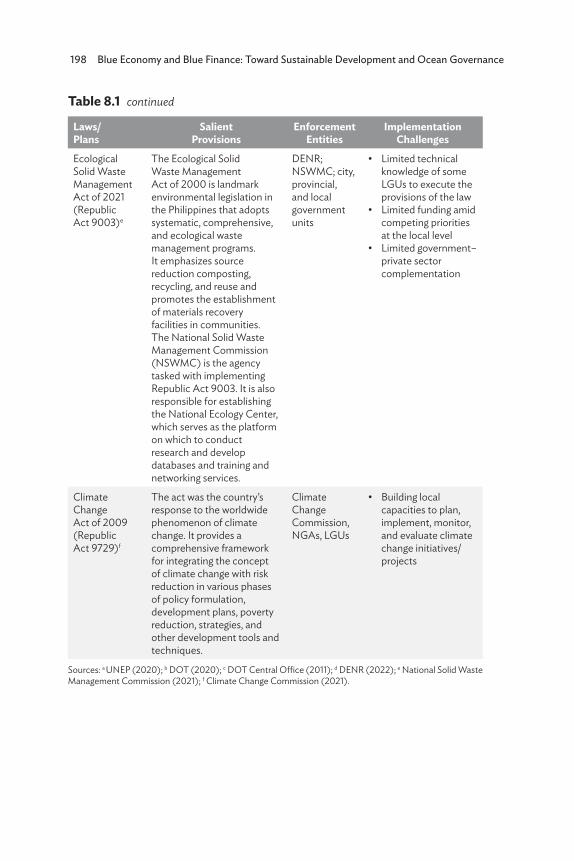
198 Blue Economy and Blue Finance: Toward Sustainable Development and Ocean Governance
Laws/ Plans
Salient Provisions
Enforcement Entities
Implementation Challenges
Ecological Solid Waste Management Act of 2021 (Republic Act 9003)e
The Ecological Solid Waste Management Act of 2000 is landmark environmental legislation in the Philippines that adopts systematic, comprehensive, and ecological waste management programs. It emphasizes source reduction composting, recycling, and reuse and promotes the establishment of materials recovery facilities in communities. The National Solid Waste Management Commission (NSWMC) is the agency tasked with implementing Republic Act 9003. It is also responsible for establishing the National Ecology Center, which serves as the platform on which to conduct research and develop databases and training and networking services.
DENR; NSWMC; city, provincial, and local government units
• Limited technical knowledge of some LGUs to execute the provisions of the law
• Limited funding amid competing priorities at the local level
• Limited government–private sector complementation
Climate Change Act of 2009 (Republic Act 9729)f
The act was the country’s response to the worldwide phenomenon of climate change. It provides a comprehensive framework for integrating the concept of climate change with risk reduction in various phases of policy formulation, development plans, poverty reduction, strategies, and other development tools and techniques.
Climate Change Commission, NGAs, LGUs
• Building local capacities to plan, implement, monitor, and evaluate climate change initiatives/projects
Sources: a UNEP (2020); b DOT (2020); c DOT Central Office (2011); d DENR (2022); e National Solid Waste Management Commission (2021); f Climate Change Commission (2021).
Table 8.1 continued
Addressing Marine Litter through Sustainable Tourism: The Case of the Siargao Islands in the Southern Philippines 199
Seamless coordination among these bodies is imperative to establish coherent programs to address identified issues. The Mandanas ruling, which the government intends to implement in 2022, aims to bridge the gaps along this line. It seeks to improve the capacity of the LGUs to implement plans by devolving some functions of the national government. These include concerns about the environment and tourism. Integral to the Mandanas ruling is the increase in the tax revenue shares of the LGUs. Executive Order 138 provides for the full devolution of certain functions of the executive branch to the local governments and the creation of a committee on devolution. The Mandanas ruling is the Philippine Supreme Court decision that clarified the method for calculating LGUs’ share in the national taxes (DILG 2021).
8.4.1 Institutional Arrangements
The National Integrated Protected Area System or Republic Act 7586 classifies the Siargao Islands as a wildlife sanctuary. Their management is under the tutelage of the Protected Area Management Board (PAMB) by virtue of Presidential Proclamation No. 902, Series of 1996, as the Siargao Island Protected Landscape and Seascape (SIPLAS). The PAMB serves as the deciding body for all major development interventions on the islands, with the aim of protecting its rich natural resources. It consists of the regional executive director of the Department of Environment and Natural Resources (DENR) Caraga, the provincial development officer, the local chief executive of each of the nine municipalities of the Siargao Islands, and three representatives from nongovernment or local community organizations. DOT’s role is to provide the provincial and municipal LGUs with technical support in the development and promotion of the Siargao Islands as a visitor destination. These include, among others, the formulation of a tourism development plan aiming to improve tourism products and linking them to other tourism hubs to expand the market niche (DENR 2015).
8.4.2 Implementation Gaps
Some implementation issues and gaps in the management of the Siargao Islands relate to political, technical, social, and economic factors. Political differences harm the continuity of initiatives and tend to become compartmentalized rather than being comprehensive because local leaders do not belong to the same political party. Regarding the aspect of waste management, the absence of an island-wide authority prevents
200 Blue Economy and Blue Finance: Toward Sustainable Development and Ocean Governance
LGUs from crafting island-wide resource recovery programs designed to reduce, recover, and recycle waste materials. The tendency is for each LGU to develop its own programs. There is also insufficient technical know-how on managing marine litter, which causes the abandonment of marine debris on coastal shores or its disposal at solid waste facilities without recovery efforts. Added to this is the lack of organized island-wide mechanisms to manage marine litter. At the community level, there is limited effort to heighten the awareness of proper waste disposal, which contributes to marine littering. The inability of LGUs to mobilize resources is due to their limited funds because of competing priorities like health, education, and sanitation.
The Siargao Islands Situational Report (Tourism Enterprise Zone Authority 2018) identified specific challenges in the island’s solid waste management (SWM). There is poor implementation of segregation at the source, particularly at the household level, as the mixed-waste collection practice of most municipalities evidences. An inefficient waste collection system due to the lack of resource allocation compounds the burden. Most of the municipalities have only one waste collection vehicle, which is vulnerable to breakdown. In most cases, when this happens, waste accumulates at the source. Residents look for alternatives for waste disposal, such as open pits in their backyards. The majority of the municipalities continue to operate illegal dumpsites. There is also a lack of waste diversion structures, such as materials recovery facilities (MRFs) and composting facilities. The islands do not have adequate final disposal facilities, such as an engineered sanitary landfill or waste-to-energy facility.
8.5 Marine Litter and Tourism in the Siargao Islands
8.5.1 Sources of Waste
The Siargao Islands generate waste from households, tourists, offices, shops, schools, and markets. Data from selected LGUs show that the average annual waste generation per municipality ranges from 300 to 2,000 tons, with average per capita waste generation of 0.30–0.65 kilograms per day. In terms of composition, Siargao’s waste consists primarily of biodegradable (47%), recyclable (36%), residual (11%), and special waste (8%). These figures are based on the initial average of data from four LGUs: Pilar, Santa Monica, Socorro, and San Benito. The increase in generation is attributable to the surge of tourist arrivals (Table 8.2).

Addressing Marine Litter through Sustainable Tourism: The Case of the Siargao Islands in the Southern Philippines 201
DOT Caraga has estimated that each tourist generates about 0.3 kilograms of waste per day and stays in Siargao for a minimum of 7 days (Table 8.3).
Table 8.2: Tourist Arrivals in Siargao Islands, 2016–2020
Year Foreign Local Total
2016 27,843 109,211 139,070
2017 34,166 95,564 131,747
2018 57,939 123,843 183,800
2019 74,858 183,042 259,919
2020 13,941 39,879 53,820
2021 22,456 97,810 120,266
2022 22,917 104,530 127,447
2023 23,386 111,713 135,099
2024 23,865 119,389 143,255
2025 29,930 143,329 173,259
Source: DOT Caraga.
Table 8.3: Tourist Arrivals vis-à-vis Solid Waste Generation in the Siargao Islands, 2016–2020
Year
Tourist Arrivals (Caraga Region)*
Tourist Arrivals(Siargao Islands)*
Waste Generation/Year
(kilogram)**
Waste Generation/Tourist/Year
(ton)
2016 1,464,124 139,070 292,047 322
2017 1,756,949 131,747 276,669 305
2018 2,108,339 183,800 385,980 425
2019 2,530,006 259,919 545,830 602
2020 194,498 53,820 113,022 125
* Domestic and foreign tourists combined.** Based on 0.3 kilograms per capita waste generation multiplied by 7 days’ minimum stay.Source: DOT Caraga.

202 Blue Economy and Blue Finance: Toward Sustainable Development and Ocean Governance
8.5.2 Development Patterns
Siargao has been undergoing infrastructural development for the past several years in response to the rising tourism market demand. The islands have become a popular tourist destination. Facing the Pacific Ocean, their tropical climate and exposure to strong winds, which generate large waves, make it a prime destination for local and international tourists who enjoy surfing and sports fishing. As such, resorts, hotels, and restaurants abound on the islands. A domestic airport provides a link from key cities, such as Metro Manila, Cebu, and Clark. Boats and ferries provide daily trips from and to Surigao City.
A number of tourist facilities exist in Siargao. Table 8.4 shows the number of tourism facilities on the islands.
Table 8.4: Number of Tourism-Related Facilities on the Siargao Islands, 2020
Facilities Number
Other tourism-related establishments 63
Accommodation establishments 502
Source: DOT Caraga.
The number of commercial establishments, likewise, is increasing to serve the needs of local residents and tourists. These are usually located in the central area of each LGU.
SIPLAS is divided into two zones: the strict protection zone (SPZ) and the multiple use zone (MUZ). The former covers both terrestrial and marine areas and constitutes only 3% while the latter occupies 97% of the protected area. The SPZ is closed to human activities except for scientific studies. In short, its designation is purely for protection and conservation, while the MUZ is for settlements, sustainable land use, extractive activities, and other revenue-generating activities (DENR 2015).
Some issues of the development patterns in Siargao include resorts along coastal areas violating the 20-meter easement rule, which prohibits establishments from erecting structures close to the shore. Another issue is noncompliance with the government’s required Environmental Compliance Certificate (ECC) to ensure that projects
Addressing Marine Litter through Sustainable Tourism: The Case of the Siargao Islands in the Southern Philippines 203
do not have negative impacts on the environment. Most of the tourism-related enterprises (TREs) and accommodation establishments do not have sewerage treatment plants to treat sewage before discharging it to the environment. Republic Act 9593 requires their accreditation with the DOT, but because of their noncompliance with the ECC requirements, very few establishments have registered with the DOT.
8.5.3 Plastic Pollution Epidemic
The Philippines produces 2.7 million metric tons of plastic annually, and estimations indicate that it has the third-highest rate of mismanaged plastic waste in the world (Cervantes 2020). Siargao, which consists of islands, faces the problem of high proliferation of single-use packaging materials for goods and products entering the islands. Tourists bring in bottled water and food items in single-use plastic bags. Currently, no LGU has legislation banning its use, so the problem lingers. Nongovernment organizations’ clean-up drives have resulted in the collection of a large number of plastic items, and they have ended up in open dumping sites because there is no sanitary landfill in Siargao. The DOT’s rapid assessment of solid waste facilities in 2017 revealed that plastics and paper are inundating disposal sites and that the disposal site in General Luna becomes submerged during the rainy season.
8.5.4 COVID-19 Impacts
The COVID-19 pandemic has had a tremendous impact on tourism in Siargao and in Caraga Region in general. The government-imposed lockdown in March 2020 shut down Siargao from tourists. Siargao airport was likewise closed, preventing commerce on the islands. Some businesses had to close because of the situation, leading to a loss of revenue and jobs for local residents. Those who had previously worked in the tourism industry returned to fishing and farming to survive. As of the writing of this study, Siargao remains closed to foreign tourists, according to DOT Caraga, with plans to reopen in November 2020. Conversely, the pandemic has given the islands a needed break from tourism activities and allowed the environment to heal and grow.
As an intervention, the Philippine Congress passed the proposed ₱165 billion Bayanihan to Recover as One Act in August 2020. One of its purposes is to provide soft loans for badly hit sectors, such as micro, small, and medium-sized enterprises, transport, tourism, and agriculture (Yap 2020). The assistance will provide the necessary relief for tourism-related enterprises and accommodation establishments in Siargao.
204 Blue Economy and Blue Finance: Toward Sustainable Development and Ocean Governance
8.6 Development Interventions8.6.1 The Circular Economy
The current global resource consumption model of take, make, and dispose has depleted natural resources enormously and led to environmental pollution. One of the main effects is the proliferation of single-use plastics and their indiscriminate disposal on streets and in waterways. In the Philippines, this causes the clogging of drains during flood events. The limited or lacking solid waste infrastructure to capture and recover this kind of material perpetuates the problem. One of the solutions is the concept of a circular economy, which aims to minimize or eliminate waste pollution, keep products and materials in use, and regenerate natural systems (Ellen MacArthur Foundation 2020). The idea of the circular economy is simple: to produce products that are reusable to avoid extraction in producing new products.
8.6.2 Practices to Reduce and Manage Waste in the Siargao Islands
The SIPLAS Management Plan articulates standards and guidelines. Regarding waste management, solid and liquid waste management programs require the approval of the PAMB and enforcement in all facilities and communities. Training is also part of the program to ensure sustainability. In compliance with Republic Act 9003, some LGUs practice segregated waste collection. Waste collection on the islands is the responsibility of LGUs. Generally, it is not performed regularly due to the limited number of collection vehicles, which, in some cases, departments share with each other. For example, in Del Carmen, the Engineering Department also uses the collection vehicle. In most cases, only the main barangays receive a service, leaving peripheral communities to manage waste on their own. In Del Carmen, the collection rate is only about 28%, covering only two urban barangays. Some LGUs, such as Pilar, have a separate collection schedule for non-biodegradable and biodegradable materials. The collection of health-care waste is separate from that of municipal waste. The form of treatment is the use of septic vaults.
The recovery of recyclable and biodegradable wastes is mandatory under Republic Act 9003 through the establishment of an MRF in each LGU or cluster of LGUs. Most of the municipalities in Siargao, including Del Carmen, Santa Monica, General Luna, and San Benito, have existing MRFs. In Dapa, the location of the main port, enterprising individuals
Addressing Marine Litter through Sustainable Tourism: The Case of the Siargao Islands in the Southern Philippines 205
have storage facilities for recyclable materials. However, the recovery of recyclable materials could still be low in Siargao due to its informality and the large deposits in disposal sites. The Municipal Environment and Resources Office reported that recycling has only reached 10% in San Benito.
The LGUs have enacted ordinances to reduce and manage waste. Pilar, Socorro, Del Carmen, Santa Monica, San Isidro, and General Luna are among those that have piloted an ordinance banning single-use plastics. Other local laws include mandatory backyard composting and proper waste segregation in Santa Monica. San Isidro and Del Carmen have adopted a SWM and environmental code. Socorro has legislated its Tourism Code, which defines the carrying capacity of its major tourism sites. Del Carmen practices annual closure of its major tourism sites for weeks to allow the areas’ rehabilitation and natural rejuvenation. The LGUs also regularly conduct clean-up drives in coastal areas to remove litter from the shores of Siargao.
Siargao Tourism Operators Association The Siargao Tourism Operators Association (STOA) serves as the united voice of tourism business operators in Siargao and aims to influence local policy making positively. Its mission is to synergize and strengthen business operators for the conservation and sustainable development of the islands as a tourist destination and a national asset. Its primary goal is to overcome the challenge of indiscriminate disposal of waste. Its main activities include awareness campaigns on integrated SWM, research and preparation of solid waste assessment reports, and active work with LGUs to improve local waste management (STOA 2017). Its clean-up drives include collecting trash along main roads and seashores. It also has drop-off points for recyclable items.
Siargao Environmental Awareness Movement The Siargao Environmental Awareness Movement (SEA Movement) is a volunteer organization that advocates for the preservation of the natural resources and beauty of Siargao. It is a platform to connect people with talents and skills to solve the island’s environmental problems (SEA Movement 2020). Its mission is to initiate and execute environmental awareness and protection projects in tandem with local stakeholders to institutionalize sustainable tourism on the islands. Its main projects include training women to become skilled in converting waste materials into fashionable items, workshops, video production on SWM, SEA Patrol clean-ups, and a plastic bottle campaign. The last project aims to convince business owners to provide water stations and reusable water bottles to reduce the dependence on single-use plastic bottles
206 Blue Economy and Blue Finance: Toward Sustainable Development and Ocean Governance
and eventually remove them from the waste stream. The clean-up drive takes place regularly and mobilizes communities and volunteers to remove marine litter from the seashores.
Caraga Departmental Initiatives In 2015, the DOT Caraga in partnership with the DENR initiated a region-wide solid waste planning program aimed at integrating waste management at tourism sites, activities, and local festivals. The program had two results: the SWM communication plan and the assessment of SWM in Siargao. The first output aimed to strengthen the education component by identifying key messages on solid waste. The second output was an assessment of the solid waste situation on the Siargao Islands and some key recommendations to reduce the use of plastics (DOT Caraga 2015). One key proposal was to implement a plastic beverage recycling program through a redemption program that will buy used plastic beverage containers from residents and tourists and sell them to processors in bulk. The program is a partnership between a private entity, the provincial government of Surigao del Norte, and the municipalities comprising Siargao. The private entity that will manage the program will receive a share of the income from selling recyclables through a profit-sharing arrangement. The DOT and DENR Caraga will provide technical assistance.
International DonorsThe DOT has partnered with the World Bank in a program called Transforming Communities Towards Resilient, Inclusive and Sustainable Tourism (TouRIST). It aims to improve access to priority infrastructures and to strengthen local economic development and disaster and crisis preparedness in select tourism destinations in the Philippines. The Siargao Islands are a recipient of an integrated SWM project with components focusing on priority infrastructure investments; information, education, and communication (IEC) campaigns and knowledge management; capacity building and enhancement; and project implementation and management support. The project costs ₱282.78 million.
The priority infrastructure investments cover the acquisition of four waste collection vehicles, 375 waste bins, sanitary landfill, an MRF, and composting equipment. The project also covers the construction of a sanitary landfill and a composting facility.
The technical components of the project include IEC and knowledge management, and capacity building and enhancement. The former involves conducting public awareness-raising campaigns and augmenting the present LGUs’ capability to disseminate information
Addressing Marine Litter through Sustainable Tourism: The Case of the Siargao Islands in the Southern Philippines 207
via digital media platforms to serve as a repository of SWM knowledge. The latter focuses on the improvement of the technical monitoring and evaluation capacity of LGU staff on environmental, physical, engineering, and technical standards and criteria, including training on SWM accounting, tariff setting, landfill operation, and collection.
The project implementation and management support component completes the SWM TouRIST initiative. It provides technical support in terms of data analysis, the identification and preparation of project proposals and detailed engineering design standards, financing schemes, and business plans for legal and institutional administrative structures and arrangements. The roll-out of the TouRIST program is expected to take place in the early part of 2021.
Technologies in Coastal Marine Litter ManagementThe collection of marine litter in Siargao remains highly manual, with groups and volunteers using jute sacks and debris-grabbing sticks. During the monsoon season, marine debris ends up on shorelines and LGUs mobilize employees to participate as well. They also provide the containment trucks and food for the volunteers.
8.6.3 Solving Marine Plastic Issues to Achieve the Sustainable Development Goals
Interventions to address marine litter relate to some key Sustainable Development Goals (SDGs). SDG 12 stresses sustainable production and consumption, redefining and broadening the scope of extended producer responsibility and ensuring the participation of key players, such as the chemical industry, plastic recycling companies, distributors, dealers, local governments, and consumers. Marine pollution cuts across boundaries and has regional and global impacts, so international cooperation and global partnerships, which SDG 17 embodies, are crucial. The Global Partnership on Marine Litter, which the United Nations Environment Programme hosts, aims to make an impact in terms of achieving SDG 14, specifically target 14.1, which aims to prevent and reduce marine pollution from land-based activities, including marine debris and nutrient pollution; and target 14.7, which aims to increase the economic benefits for least-developed countries from the sustainable use of marine resources through the sustainable management of fisheries, aquaculture, and tourism (UNEP 2020). Another relevant goal is SDG 14 on responsible consumption and production. Also, SDG target 12.5 aims to reduce waste generation through prevention, reduction, recycling, and reuse. It is possible to prevent marine litter by creating products with packaging materials that are reusable, biodegradable, and easy to recycle.
208 Blue Economy and Blue Finance: Toward Sustainable Development and Ocean Governance
8.7 Conclusions
The transition to a circular economy in the Philippines is a long process because of the sociocultural, political, and economic barriers. Republic Act 9003 institutionalized the reduce, reuse, and recycle (3Rs) approach at the regional, provincial, city, and barangay levels and placed the responsibility for waste management on LGUs. Through their SWM plans, they must articulate and implement soft and hard infrastructure. For example, some LGUs have enacted ordinances on banning single-use plastics in commercial establishments. However, some have faced difficulties passing similar legislation due to the abovementioned barriers. At the national government level, the National Solid Waste Management Commission (NSWMC) passed Resolution No. 1363, Series of 2020, directing the DENR to prepare and implement the banning and use of unnecessary single-use plastics in national government agencies, LGUs, offices, and all other government-controlled offices. The Lower House of the Philippine Congress has introduced a bill to prohibit the manufacture, importation, sale, and use of all single-use plastic products. However, there has been a counterproposal at the Philippine Senate to regulate instead of banning single-use plastics, requiring companies and manufacturers to recycle single-use plastics (Terrazola 2020).
One of the prerequisites for sustainable tourism in the Philippines is a legislative and policy backbone to address marine litter not just at the national level but in the Asian region. Siargao is vulnerable to external and internal marine litter, and addressing it involves instigating resource recovery systems that are sustainable, cost-effective, and participatory. Local residents remain dependent on the sea for their livelihood (fishing and tourism), so a blue economy on the islands must include a sound waste management system to ensure the health of marine life and assets.
8.8 Recommendations
8.8.1 Siargao Central Waste Authority
Siargao’s growing island-based tourism economy and the increasing requirements for coherent waste management call for the creation of a single solid waste authority. The goal is to strengthen waste management as a public service and enforce legislation consistently. An authority with a semi-corporate character would provide flexibility and efficiency in managing recycling programs and waste management facilities.
The nine municipalities of the Siargao Islands cannot separate themselves from each other in managing their common resources as an island-based tourism economy operating within a nationally declared
Addressing Marine Litter through Sustainable Tourism: The Case of the Siargao Islands in the Southern Philippines 209
protected area. The existing institutional mechanisms with which the LGUs operate separately only further the fragmentation of efforts toward a common goal, which at times become counterproductive. The authority can even expand its agenda from waste management to health-related concerns and other important island affairs.
8.8.2 Siargao Beverage Recycling Program
Recyclable materials, such as polyethylene terephthalate or PET bottles and bags, constitute about 35% of the waste stream of Siargao. Unmanaged, they end up in streets, drains, and water channels and pollute the environment heavily. They are part of marine litter, which kills aquatic life and ecosystems. A deposit–refund system would fit the geographical character of Siargao and would capture plastic beverage containers centrally, through a profit-sharing scheme, and sell them to processors. A private entity–led program would run as a business and be sustainable. A necessary ingredient of any deposit–refund system is the establishment of extended producer responsibility, which would elevate manufacturers’ participation in the recycling arena.
8.8.3 Sustainable Residual Waste Recovery
Most LGUs in Siargao engage in open dumping because of the unavailability of sanitary landfills. However, Republic Act 9003 allows a cluster approach to landfilling whereby LGUs can co-manage a landfill and share the costs of maintaining a disposal facility. Siargao does not need a landfill for each LGU but rather a centralized one with transfer stations to facilitate the shipment of waste to the central disposal facility. When the proposed centralized landfill starts to operate, the recovery of refuse-derived fuel can be undertaken along with landfill mining to prolong its life. It is also possible to establish a recovery center at the facility to recover more valuable waste materials, like metals, textile, and appliances, prior to their final disposal.
8.8.4 Zero-Carbon Resorts
The TREs in the Siargao Islands use a significant amount of electricity, water, and sewers. The push toward sustainable tourism requires a significant reduction in resource consumption and carbon dioxide emissions and decreased dependence on fossil fuel. To realize this, the DOT and DENR Caraga advocate the use of renewable energy to power resorts. The Most Environmentally Responsible Tourism-related Establishment initiative was launched in 2018, encouraging
210 Blue Economy and Blue Finance: Toward Sustainable Development and Ocean Governance
the reduction of carbon footprints in TREs. The criteria include best practices in TREs’ waste management, the use of renewable energy, support for community enterprises, corporate social responsibility, and compliance with government regulatory requirements. For a start, some establishments have started to use solar panels as the island enjoys year-round light and heat from the sun. Rainwater collection is another existing practice. Activities such as these can expand further to other tourism facilities and utilities, such as transportation units and restrooms, to produce more impactful results. In the near future, waterless toilets could save precious water. Tour boats could also use solar energy and electricity to reduce their reliance on petrol, which is expensive on the islands.
8.8.5 Tourism Branding
The DOT has branded the Siargao Islands as the ultimate surfing and game fishing destination in the world. More than a haven for surfers and anglers, this island paradise offers many learning experiences from its natural endowments, its people, and the unseen but strongly felt island vibe that make up the total of the Siargao Islands’ charm. Tourism branding needs to raise its pitch explicitly to carry key messages of responsible tourism to increase tourists’ consciousness of their behavior toward the environment and people. It is worth highlighting the islands’ notable practices in marine litter management through an innovative resource recovery program, multistakeholder partnership, and other efforts for environmental protection in tourism promotional campaigns. The introduction of mangrove- and tree-planting activities among tourists and community interactions in people’s everyday life can strengthen the image of the destination as a vibrant tourism destination that upholds its integrity as a declared protected area.
Other island destinations can learn great practical lessons that they may replicate in tourism island management. The Siargao Islands have the potential to become an island destination benchmark for other LGUs, especially with big-ticket project interventions from international donors.
8.8.6 Appropriate Technology to Manage Marine Litter
Land- and water-based technologies are emerging to tackle marine litter. Japan, for example, has developed plastic bottles made of 100% plant oil, which are biodegradable. It is also developing sorting technologies to improve the efficiency of plastic recycling using a combination of
Addressing Marine Litter through Sustainable Tourism: The Case of the Siargao Islands in the Southern Philippines 211
optical, gravity, and near-infrared technology. For example, Shibaura Institute of Technology, Tohoku University, and Shizuoka University in Japan are developing a new sorting machine using a terahertz device that greatly enhances plastic separation. The near-infrared sorter is the most popular technology in the recycling industry. However, it has difficulty sorting out colored plastic packaging and is expensive. In general, sorting machines remain costly for developing economies, and a partnership framework, of which the transfer of technology is a component, is necessary. Hence, the three mentioned universities are exploring avenues to introduce the technology into developing countries such as the Philippines. The terahertz-based technology has the potential to produce high-quality recycled plastic materials while creating employment.
Japan’s waste-to-energy technology captures single-use plastics effectively, thereby minimizing the leakage of plastic into the oceans. Over the years, sorting out plastic materials has become increasingly challenging in Japan due to the emergence of a multitude of plastics with complex properties. In the case of the Philippines, it is important for technological interventions to be appropriate, cost-effective, and locally accepted to ensure that they are sustainable. Regarding the sorting of plastics, a coastal community like Siargao can use a hybrid type of technology combining manual collection and handy sorting machines. The key is to be able to separate plastics based on their resin property, like polyethylene terephthalate (PET), polyethylene (PE), polystyrene (PS), and polypropylene (PP), because doing so would increase the value of plastic materials. The result is recycling efficiency and the creation of jobs for local communities. Beyond technology is the need to develop multidimensional solutions ranging from institutional reforms, capacity building, and innovation to knowledge sharing, which the Group of 20’s Osaka Blue Ocean Vision best encapsulates.
8.8.7 Sustainable Financing
The use of economic instruments could enable LGUs to have a constant source of revenue to manage local solid waste infrastructure. A user fee is one tool whereby households, tourists, and businesses pay for the management of waste. Residents and tourists may pay a fixed yearly amount, while the businesses’ fee depends on their size and nature. The government could impose tariffs on beverage containers arriving on the islands.
212 Blue Economy and Blue Finance: Toward Sustainable Development and Ocean Governance
8.8.8 Regional and International Cooperation to Deter Ocean Waste Pollution
Addressing marine litter entails a strong push from the national government in cooperation with regional and global communities. Limiting or eliminating the use of single-use plastics in one country will not solve the problem. There should be a coordinated effort among countries because a blue economy will prosper in shared waters.
Addressing Marine Litter through Sustainable Tourism: The Case of the Siargao Islands in the Southern Philippines 213
ReferencesAndriotis, K. 2015. Tourism Development. Angelfire. Chapter 2, pp.
11–60. https://www.angelfire.com/ks/andriotis/Chapter2.pdf (accessed 14 October 2020).
Buhalis, D., and C. Costa. 2006. Tourism Management Dynamics: Trends, Management and Tools. Burlington: Elsevier Ltd.
Cervantes, F.M. 2020. Passage of Bill on Single-Use Plastics Ban Pushed. Philippine News Agency. Republic of the Philippines, 26 February. https://www.pna.gov.ph/articles/1094875 (accessed 6 October 2020).
Climate Change Commission. 2021. Climate Change Act of 2009 (Republic Act 9729). https://climate.gov.ph/public/ckfinder/userfiles /files/Knowledge/RA%209729.pdf (accessed 12 October 2021).
Costa, C. M. M. 2001. An Emerging Tourism Planning Paradigm: A Comparative Analysis between Town and Tourism Planning. International Journal of Tourism Research. 3 (6). pp. 425–41.
Department of Environment and Natural Resources (DENR). 2015. Siargao Islands Protected Landscapes and Seascapes Management Plan. Orient Integrated Development Consultants, Inc and University of the Philippines Los Banos Foundation, Inc. http ://faspselib.denr.gov.ph/sites/default/files//Publication%20Files/C2.4%20SIPLAS%20Management%20Plan.pdf (accessed 2 October 2020).
____. 2022. National Ecotourism Strategy and Action Plan 2013–2022. Biodiversity Management Bureau. https://bmb.gov.ph/index.php /resources/downloadables/publications/action-plans (accessed 11 March 2022).
Department of the Interior and Local Government (DILG). 2021. Mandanas-Garcia SC Ruling, a “Preview” of Federalism in the Philippines—Governance Think Tank. 30 June. https://dilg.gov.ph /news/Mandanas-Garcia-SC-ruling-a-preview-of-federalism-in -the-Philippines-governance-think-tank/NC-2021-1137 (accessed 11 October 2021).
Department of Tourism (DOT). 2019. Philippine Tourism Statistics. Presentation slides. March 2020. Butuan City, Philippines. http://www.tourism.gov.ph/industry_performance/Dissemination _forum/2019_Tourism_Industry_Report.pdf
____. 2020. RA 9593 (Tourism Act of 2009) IRR. http://tourism.gov.ph /Downloadable%20Files/Updated_RA_9593_and_IRR_(as_of_01 _Nov_2020).pdf (accessed 12 October 2021).
Department of Tourism, Dr. Andrew L. Tan Center for Tourism, and Guide to the Philippines (DOT, ALTCFT, GTTP). 2020.
214 Blue Economy and Blue Finance: Toward Sustainable Development and Ocean Governance
The Philippine Travel Survey Report: Insights on Filipino Travelers’ Sentiments on the New Normal. Department of Tourism, Asian Institute of Management, Guide to the Philippines. June. https ://www.philippines.travel/data/PHTravelSurveyReport2020.pdf
Department of Tourism – Caraga (DOT Caraga). 2015. Solid Waste Communication Plan for the Tourism Sector in Caraga Region, Philippines. May. Butuan City, Philippines.
Department of Tourism (DOT) Central Office. 2011. The Philippine National Tourism Development Plan 2011–2016. Manila: Department of Tourism.
Dowling, R.K., and D.A. Fennell. 2003. The Context of Ecotourism Policy and Planning. In D.A. Fennell and R.K. Dowling, eds. Ecotourism Policy and Planning. Wallingford, Oxon and Cambridge, MA: CABI Publishing.
Ellen MacArthur Foundation. 2020. Circular Economy—Concept. https://www.ellenmacarthurfoundation.org/circular-economy /concept (accessed 4 October 2020).
Getz, D. 1986. Models in Tourism Planning towards Integration of Theory and Practice. Tourism Management. 7 (1). pp. 21–3.
Gunn, C.A. 1988. Tourism Planning, 2nd ed. New York, NY: Taylor and Francis.
Hall, M., J. Finsterwalder, and Y. Ram. 2015. Shaping, Experiencing, and Escaping the Tourist City. LA+ Pleasure. Fall. pp. 84–9.
Inskeep, E. 1991. Tourism Planning: An Integrated and Sustainable Approach. New York, NY: Van Norstrand Reinhold.
Lor, R. 2019. A Problem as Huge as the Ocean. UNDP Philippines. https://www.ph.undp.org/content/philippines/en/ home / blog/2019/a-problem-as-huge-as-the-ocean.html (accessed 21 October 2020).
National Solid Waste Management Commission. 2021. Republic Act 9003. https://nswmc.emb.gov.ph/wp-content/uploads/2016/07 /RA-IRR-2012-NEW-SEND-FILE-sept-10.pdf (accessed 12 October 2021).
Ocean Conservancy. 2017. Stemming the Tide: Land-Based Strategies for a Plastic-Free Ocean. https://oceanconservancy.org/wp-content /uploads/2017/04/full-report-stemming-the.pdf (accessed 22 October 2020).
PEMSEA. 2017. State of Oceans and Coasts—Philippines. PEMSEA Brief. http://pemsea.org/sites/default/files/NSOC_Philippines_0.pdf (accessed 14 October 2020).
Rey, A. 2021. Philippines’ Tourist Arrivals, Receipts Plunge by 83% in 2020. Rappler. 12 January. https://www.rappler.com/business/tourist -arrivals-receipts-philippines-2020/ (accessed 12 October 2021).
Addressing Marine Litter through Sustainable Tourism: The Case of the Siargao Islands in the Southern Philippines 215
Siargao Environmental Awareness Movement (SEA Movement). 2020. What Is SEA Movement? http://seamovement.ph (accessed 7 October 2020).
Siargao Tourism Operators Association (STOA). 2017. General Luna Solid Waste Management Report. Presentation slides. May 2017. Siargao, Philippines.
Terrazola, V.E. 2020. Senate Panel: Regulate, Don’t Ban, Single-Use Plastics. Manila Bulletin. 18 February. https://mb.com.ph/2020/02/18/senate -panel-regulate-dont-ban-single-use-plastics/ (accessed 6 October 2020).
Tourism Enterprise Zone Authority. 2018. Siargao Islands Situational Report. June 2018. Manila: Palafox Associate.
United Nations Environment Programme (UNEP). 2020. Global Partnership on Marine Litter—Who We Are. https://www.gpmarine litter.org/who-we-are (accessed 19 October 2020).
United Nations World Tourism Organization (UNWTO). 2011. Handbook on Tourism Product Development. Madrid.
World Bank. 2020. Philippine Population in 2019. https://data .worldbank.org/indicator/SP.POP.TOTL?locations=PH (accessed 14 October 2020).
Yap, D.J. 2020. Duterte Hit for Delay of “Bayanihan 2.” Philippine Daily Inquirer. 5 September. https://newsinfo.inquirer.net/1331449 /duterte-hit-for-delay-of-bayanihan-2 (accessed 4 October 2020).

PART III
Blue Economy– Related Industry

219
9
Offshore Wind Energy as an Emergent Ocean Infrastructure in India: Mapping the Social and Environmental Impacts
Gopal K. Sarangi
9.1 IntroductionIn the basket of renewables, offshore wind energy is emerging as a promising energy source worldwide, having far-reaching potential to meet the burgeoning energy demand. The International Energy Agency (IEA) (2018) has even recognized that “off-shore wind energy is a rising force.” Globally, offshore wind energy is gaining traction as an alternative source of energy, and the technology is fast achieving maturity and increasing its market penetration. Countries are also prioritizing offshore wind as a source of energy to mitigate climate-related challenges.
Given that offshore wind is carbon neutral and can meet the growing appetite for energy, coastal countries across the globe are considering it as a potential source. Though offshore wind assets constitute 5% of the total deployed wind assets globally, with cumulative global installations of 30 gigawatts (GW), projections have indicated that offshore wind energy will grow rapidly in the future to meet the renewable target of 2030. It has become an important part of the green and blue recovery of many countries impacted by the coronavirus disease 2019 (COVID-19) pandemic. Some countries, such as the United Kingdom, are even renewing their focus on offshore wind energy as a mechanism to realize the ambitious 2050 target of net zero emissions. The projections of the
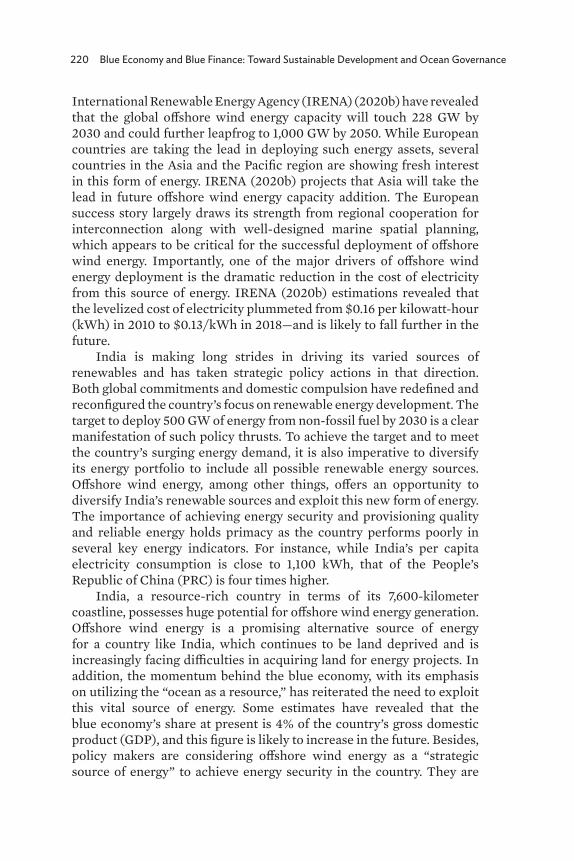
220 Blue Economy and Blue Finance: Toward Sustainable Development and Ocean Governance
International Renewable Energy Agency (IRENA) (2020b) have revealed that the global offshore wind energy capacity will touch 228 GW by 2030 and could further leapfrog to 1,000 GW by 2050. While European countries are taking the lead in deploying such energy assets, several countries in the Asia and the Pacific region are showing fresh interest in this form of energy. IRENA (2020b) projects that Asia will take the lead in future offshore wind energy capacity addition. The European success story largely draws its strength from regional cooperation for interconnection along with well-designed marine spatial planning, which appears to be critical for the successful deployment of offshore wind energy. Importantly, one of the major drivers of offshore wind energy deployment is the dramatic reduction in the cost of electricity from this source of energy. IRENA (2020b) estimations revealed that the levelized cost of electricity plummeted from $0.16 per kilowatt-hour (kWh) in 2010 to $0.13/kWh in 2018—and is likely to fall further in the future.
India is making long strides in driving its varied sources of renewables and has taken strategic policy actions in that direction. Both global commitments and domestic compulsion have redefined and reconfigured the country’s focus on renewable energy development. The target to deploy 500 GW of energy from non-fossil fuel by 2030 is a clear manifestation of such policy thrusts. To achieve the target and to meet the country’s surging energy demand, it is also imperative to diversify its energy portfolio to include all possible renewable energy sources. Offshore wind energy, among other things, offers an opportunity to diversify India’s renewable sources and exploit this new form of energy. The importance of achieving energy security and provisioning quality and reliable energy holds primacy as the country performs poorly in several key energy indicators. For instance, while India’s per capita electricity consumption is close to 1,100 kWh, that of the People’s Republic of China (PRC) is four times higher.
India, a resource-rich country in terms of its 7,600-kilometer coastline, possesses huge potential for offshore wind energy generation. Offshore wind energy is a promising alternative source of energy for a country like India, which continues to be land deprived and is increasingly facing difficulties in acquiring land for energy projects. In addition, the momentum behind the blue economy, with its emphasis on utilizing the “ocean as a resource,” has reiterated the need to exploit this vital source of energy. Some estimates have revealed that the blue economy’s share at present is 4% of the country’s gross domestic product (GDP), and this figure is likely to increase in the future. Besides, policy makers are considering offshore wind energy as a “strategic source of energy” to achieve energy security in the country. They are
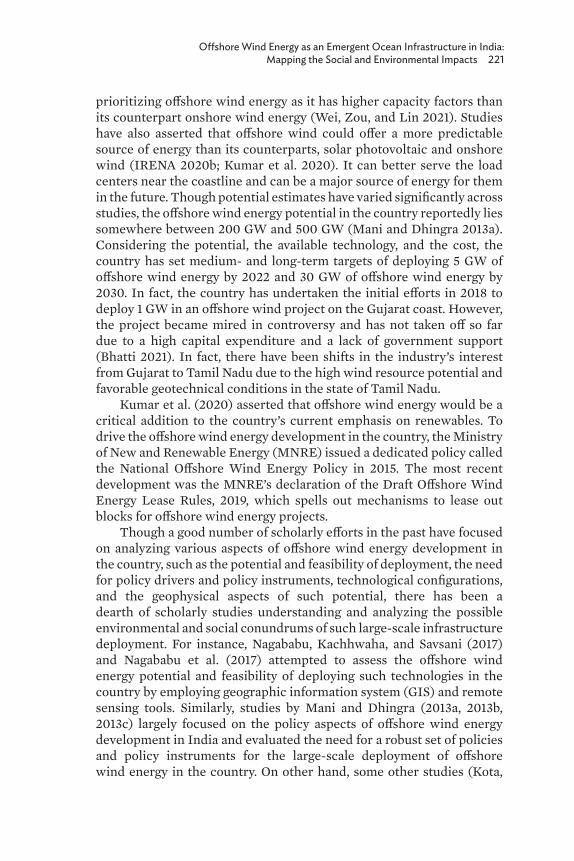
Offshore Wind Energy as an Emergent Ocean Infrastructure in India: Mapping the Social and Environmental Impacts 221
prioritizing offshore wind energy as it has higher capacity factors than its counterpart onshore wind energy (Wei, Zou, and Lin 2021). Studies have also asserted that offshore wind could offer a more predictable source of energy than its counterparts, solar photovoltaic and onshore wind (IRENA 2020b; Kumar et al. 2020). It can better serve the load centers near the coastline and can be a major source of energy for them in the future. Though potential estimates have varied significantly across studies, the offshore wind energy potential in the country reportedly lies somewhere between 200 GW and 500 GW (Mani and Dhingra 2013a). Considering the potential, the available technology, and the cost, the country has set medium- and long-term targets of deploying 5 GW of offshore wind energy by 2022 and 30 GW of offshore wind energy by 2030. In fact, the country has undertaken the initial efforts in 2018 to deploy 1 GW in an offshore wind project on the Gujarat coast. However, the project became mired in controversy and has not taken off so far due to a high capital expenditure and a lack of government support (Bhatti 2021). In fact, there have been shifts in the industry’s interest from Gujarat to Tamil Nadu due to the high wind resource potential and favorable geotechnical conditions in the state of Tamil Nadu.
Kumar et al. (2020) asserted that offshore wind energy would be a critical addition to the country’s current emphasis on renewables. To drive the offshore wind energy development in the country, the Ministry of New and Renewable Energy (MNRE) issued a dedicated policy called the National Offshore Wind Energy Policy in 2015. The most recent development was the MNRE’s declaration of the Draft Offshore Wind Energy Lease Rules, 2019, which spells out mechanisms to lease out blocks for offshore wind energy projects.
Though a good number of scholarly efforts in the past have focused on analyzing various aspects of offshore wind energy development in the country, such as the potential and feasibility of deployment, the need for policy drivers and policy instruments, technological configurations, and the geophysical aspects of such potential, there has been a dearth of scholarly studies understanding and analyzing the possible environmental and social conundrums of such large-scale infrastructure deployment. For instance, Nagababu, Kachhwaha, and Savsani (2017) and Nagababu et al. (2017) attempted to assess the offshore wind energy potential and feasibility of deploying such technologies in the country by employing geographic information system (GIS) and remote sensing tools. Similarly, studies by Mani and Dhingra (2013a, 2013b, 2013c) largely focused on the policy aspects of offshore wind energy development in India and evaluated the need for a robust set of policies and policy instruments for the large-scale deployment of offshore wind energy in the country. On other hand, some other studies (Kota,
222 Blue Economy and Blue Finance: Toward Sustainable Development and Ocean Governance
Bayne, and Nimmagada 2015) have attempted to compare the offshore wind energy development in India with that in the United Kingdom and the United States. These studies showed that there has been poor understanding of the possible environmental and social impacts of such infrastructure deployment. This is partly because of a lack of physical presence and implementation of such projects at present; however, such an understanding is of utmost importance at this juncture as the country is gearing up for the deployment of such assets in the near future (Aggarwal 2019). Several studies in other country contexts have pointed to the environmental and social challenges involved in offshore energy deployment (Bergstrom, Sundqvist, and Bergstrom 2013; Bailey, Brookes, and Thompson 2014; WWF 2014).
In this context, the present study aims to undertake the following tasks:
• To critically analyze and assess the policy and institutional framework governing offshore wind energy development in the country from the perspective of its environmental and social impacts.
• To carry out a detailed mapping of the possible environmental and social impacts of such projects on marine ecology and the livelihoods of fishing communities.
The study employs a qualitative research approach by using various types of secondary information and data. It carries out a detailed assessment of the existing laws and policies to understand and critically analyzes the legal and institutional framework governing such projects. It gathers various types of secondary data and information to map the possible impacts of these projects. The gathered information aligned with that of similar studies in other country contexts that have assessed such impacts. In addition, a select set of expert consultations was carried out to understand the contextual impacts of such infrastructure projects in the Indian policy setting. The findings of the study will help policy makers in their decision to deploy such projects and in taking the necessary policy actions at all layers of governance to minimize their environmental and social threats.
9.2 Offshore Wind Energy as an Emergent Ocean Infrastructure in India
India’s long coastline offers huge offshore wind energy potential. It also has 2.3 million square kilometers of exclusive economic zones (EEZs), which offer an enormous offshore area for the deployment of ocean infrastructure. The country has nine maritime states, of which Gujarat
Offshore Wind Energy as an Emergent Ocean Infrastructure in India: Mapping the Social and Environmental Impacts 223
has the longest coastline, followed by Tamil Nadu. The development of offshore energy infrastructure in India is not new; the offshore oil and gas industry has been thriving for quite some time. India’s Oil and Natural Gas Corporation has been operating offshore oil and gas fields in Mumbai, known as “Bombay High,” since 1976. Similarly, there have been offshore energy assets deployed in the Krishna–Godavari–Mahanadi basin on the eastern coast of the country. Studies have reported that the deep water basins of Mahanadi also hold good potential for hydrocarbons. The most recent development in this space was the subsea development project of Reliance and British Petroleum in the Krishna–Godavari basin. They installed ultra-deep infrastructures for the extraction of gas. Three recently developed deep-water gas projects have the potential to fulfill 15% of India’s gas demand by 2023. The most recent development in this space is the Government of India’s proposed “Deep Ocean Mission,” which emphasizes, among others, exploring minerals and energy. The Ministry of Earth Sciences of India has lauded it as a “futuristic and game changing” mission. The Union Budget of the Government of India 2021–22 placed special emphasis on the Deep Ocean Mission, with a budgetary allocation of ₹40.77 billion over a 5-year period. Although offshore wind energy received an explicit mention in the Deep Ocean Mission, its larger goal is to accelerate the blue economy, which can contribute to India’s development and help in meeting India’s future energy requirements.
Offshore wind energy is new to the country, and such technologies are evolving fast globally. Offshore wind energy technologies have been developing globally over the past 3 decades. They have received high prioritization due to their strength and steadiness and their greater efficiency and predictability (Kumar et al. 2020; Wei, Zou, and Lin 2021). The cost of generating electricity using these energy sources remains high, but the expectation is that it will fall in the near future with the large-scale deployment of such systems and technological advancements (IRENA 2020b).
There have been several efforts globally to develop offshore wind assets of varying forms and sizes. While Europe leads in terms of the deployment of offshore wind installations, the PRC is fast ramping up its new capacity and dominates in terms of new capacity additions, energy generation, and technological advancements, and other economies in Asia and the Pacific (e.g., Taipei,China; Viet Nam; Japan; and the Republic of Korea) are increasingly paying attention to offshore wind energy as an alternative and efficient source of energy. Though offshore wind assets constitute 5% of the total deployed wind assets globally, with cumulative global installations close to 30 GW, projections have indicated that they need to grow rapidly in the future to meet the renewable target of 2030. IRENA’s (2020a) projections revealed that the global offshore
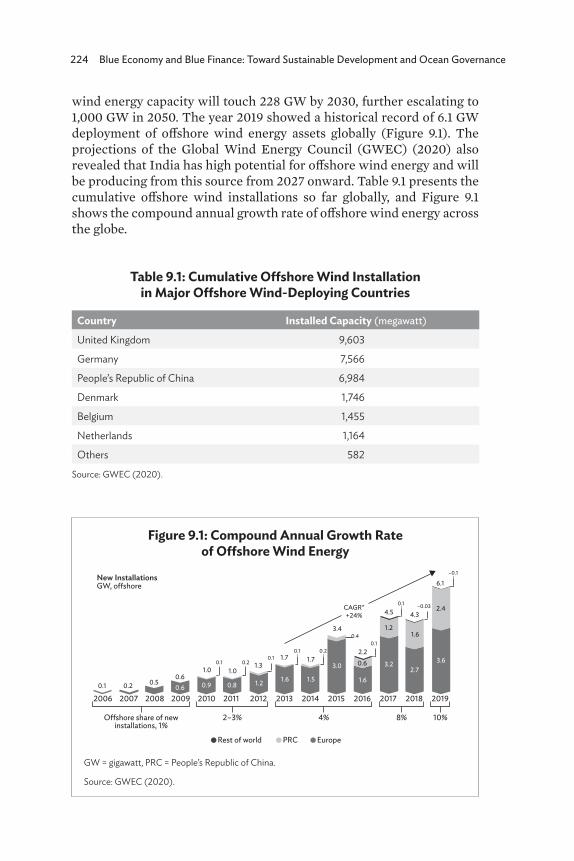
224 Blue Economy and Blue Finance: Toward Sustainable Development and Ocean Governance
wind energy capacity will touch 228 GW by 2030, further escalating to 1,000 GW in 2050. The year 2019 showed a historical record of 6.1 GW deployment of offshore wind energy assets globally (Figure 9.1). The projections of the Global Wind Energy Council (GWEC) (2020) also revealed that India has high potential for offshore wind energy and will be producing from this source from 2027 onward. Table 9.1 presents the cumulative offshore wind installations so far globally, and Figure 9.1 shows the compound annual growth rate of offshore wind energy across the globe.
Table 9.1: Cumulative Offshore Wind Installation in Major Offshore Wind-Deploying Countries
Country Installed Capacity (megawatt)
United Kingdom 9,603
Germany 7,566
People’s Republic of China 6,984
Denmark 1,746
Belgium 1,455
Netherlands 1,164
Others 582
Source: GWEC (2020).
Figure 9.1: Compound Annual Growth Rate of Offshore Wind Energy
GW = gigawatt, PRC = People’s Republic of China.
Source: GWEC (2020).
Rest of world EuropePRC
O�shore share of newinstallations, 1%
2–3%
20060.1 0.2 0.5
0.6 0.6
0.9 0.8 1.2
1.0 1.0 0.1 0.2
0.1 0.1
0.4 0.1
0.1 –0.03
–0.1
0.2
1.3
1.6 1.5
3.0 1.7 1.7
3.4
1.6
0.6 3.22.7
2.2
CAGR*+24%
1.2
4.5
1.6
4.3
3.6
2.4
6.1
2007 2008 2009 2010 2011 2012 2013 2014 2015 2016 2017 2018 2019
4% 8% 10%
New InstallationsGW, o�shore
Offshore Wind Energy as an Emergent Ocean Infrastructure in India: Mapping the Social and Environmental Impacts 225
In the Indian context, though some crucial developments have taken place in offshore wind energy, implementation is still in the nascent stage. Offshore wind energy is emerging as a crucial source of energy and a preferable alternative to onshore wind energy due to the inherent land acquisition problems combined with the increasing difficulty in obtaining windy sites. Given that India has a successful history of onshore wind energy and ranks as the fourth-largest wind energy producer globally, it is likely that it could capitalize on some of the experiences and learning from onshore wind deployment for its offshore wind energy deployment. It is an opportune time for the country to accelerate its offshore wind development given the favorable economic and climate-related commitments and compulsion.
Multiple agencies have estimated the offshore wind energy potential in the country. For instance, according to the estimates of the Lawrence Berkeley Laboratory, India has close to 214 GW of offshore wind energy potential (Phadke, Bharvirkar, and Khangura 2012). Mani and Dhingra (2013a), in one of their studies, estimated that the potential of offshore wind energy in India lies between 200 GW and 500 GW. However, most potential sites lie along the coasts of Gujarat and Tamil Nadu. Some of the Government of India’s preliminary estimates have revealed that Gujarat alone has the potential to generate around 106 GW of offshore wind energy, whereas Tamil Nadu has potential close to 60 GW (Aggarwal 2019), two high potential states in India, and the rest of the potential lies in other coastal states.
FOWIND (2017) carried out a detailed baseline mapping and supply chain assessment and investigated the feasibility of grid integration for these two Indian states: Gujarat and Tamil Nadu. The report identified five crucial factors for offshore wind development in the country: (i) drawing a long-term road map, (ii) developing a transparent consent and permission system, (iii) strengthening the regional and national grid, (iv) developing a well-structured financial support system, and (v) developing the necessary skill sets and competencies. According to the FOWIND (2017) study, the road map should involve identifying the policy drivers, setting the targets, and laying out a clear implementation plan. Given that the technology is nascent and quite complex, clear procedures are necessary in which consent and permission should be consistent, which would boost private investors’ spirit to venture into this risky sector. The third important aspect is grid integration. The problem of poor grid integration will have technical as well as financial implications for the sector’s development. This will become more pronounced due to the lack of a policy for offshore energy transmission. The fourth important factor is the creation of an ecosystem for the provisioning of the much-needed financing for the sector, given that these technologies are nascent and the cost of generating electricity is
226 Blue Economy and Blue Finance: Toward Sustainable Development and Ocean Governance
relatively high compared with the cost of other forms of energy. The government should extend the necessary financial support through the provision of smart subsidies along with easy access to credit for project developers. The final and most important factor is the development of the necessary skill set and competencies. A diverse set of skills is necessary during the life cycle of an offshore project. The most necessary skills are specialized and hence require building over time. Therefore, there is a need to develop an indigenous skill set through framework agreements with other countries for training and capacity building, through knowledge transfer, and through joint partnerships during project execution, implementation, and decommissioning (FOWIND 2017).
While there have been some efforts to install the first 1 GW of offshore wind energy in the country in the Gulf of Khambhat on the coast of Gujarat, the progress is slow and tardy. Toward that end, efforts have been undertaken to conduct the required geophysical study for an area of 365 square kilometers, as well as geotechnical and met-ocean studies, and to seek first stage clearance following the guidelines of the National Offshore Wind Energy Policy, 2015. The MNRE has also highlighted that the National Institute of Oceanography, Goa, has the responsibility for carrying out the environmental impact assessment (EIA) of the proposed project site. The next stage in the process is to select a developer through a competitive bidding procedure and then seek the second stage clearance for the project. Expecting the tariff to be high for this project, the MNRE has proposed to provide central financial assistance in the form of viability gap funding. However, the project has suffered considerable delays and has been unable to meet the targeted schedules. There are further proposals to deploy LiDAR or light detection and ranging off the coasts of Gujarat and Tamil Nadu to carry out a wind resource assessment along with geophysical, geotechnical, and oceanographic studies (Randall-Smith 2020).
9.3 Policy and Institutional Framework Governing the Offshore Wind Energy Development in India
It is necessary to highlight the larger policy and institutional framework governing the ocean infrastructure in general and offshore wind energy in particular. Both the Union Government and the provincial governments in India govern the marine resource management. This has led to often overlapping and conflicting jurisdiction of existing laws,
Offshore Wind Energy as an Emergent Ocean Infrastructure in India: Mapping the Social and Environmental Impacts 227
regulations, guidelines, and notifications among the different layers of institutions, resulting in ambiguities in ocean governance in India. In addition, climate change considerations have compounded the problems of marine resource governance and management in India (Jayaram 2016). However, the emphasis in this section is on assessing the major laws, regulations, and notifications that directly and indirectly affect the offshore wind energy development in the country.
Two sets of recently declared policies and guidelines—the National Offshore Wind Energy Policy, 2015 and the Draft Offshore Wind Energy Lease Rules, 2019—govern the policy environment of offshore wind energy in India. These two policy documents set the tone and lay down the governance setting for the offshore wind energy policy making in the country. This section presents a detailed and critical mapping and evaluation.
9.3.1 National Offshore Wind Energy Policy, 2015
Considering the importance of offshore wind energy in India, the Government of India produced the National Offshore Wind Energy Policy in 2015. The policy sets out the institutional mechanism for the offshore energy development in the country. The MNRE acts as the nodal ministry. As such, it is responsible for carrying out the overall monitoring of projects; coordinating with other ministries; offering guidelines and directives; providing support for the National Institute of Wind Energy (NIWE); promoting international cooperation; and conducting coordination in matters relating to tariff decisions and other such regulatory matters. The NIWE acts as a nodal agency for conducting the resource assessment and demarcating blocks for facilitating the development of offshore wind energy in the country. In addition to the nodal ministry and the nodal agency, the policy refers to the formation of an “Offshore Wind Energy Steering Committee” within the MNRE, with the Secretary as its chairperson, which would not only provide policy guidelines from time to time but would also oversee the execution and effective implementation of offshore wind project activities on a regular basis. In addition, the Ministry of Shipping, Central Transmission Utilities, and State Transmission Utilities will be part of the offshore wind energy development in the country. Besides, given that these technologies are new and complex, the policy requires clearance from a host of ministries, such as the Ministry of Defence and the Ministry of Environment, Forest and Climate Change (MoEFCC). Figure 9.2 presents a schematic of the institutional mapping.
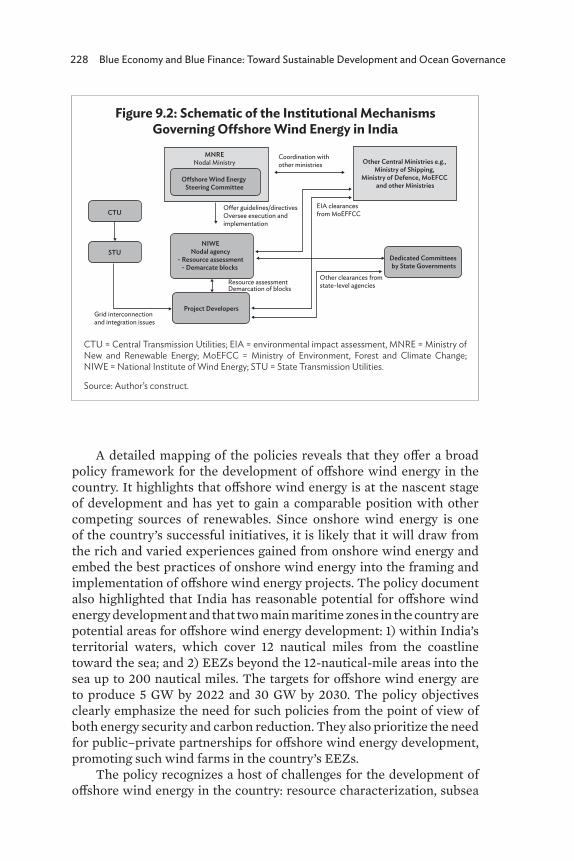
228 Blue Economy and Blue Finance: Toward Sustainable Development and Ocean Governance
A detailed mapping of the policies reveals that they offer a broad policy framework for the development of offshore wind energy in the country. It highlights that offshore wind energy is at the nascent stage of development and has yet to gain a comparable position with other competing sources of renewables. Since onshore wind energy is one of the country’s successful initiatives, it is likely that it will draw from the rich and varied experiences gained from onshore wind energy and embed the best practices of onshore wind energy into the framing and implementation of offshore wind energy projects. The policy document also highlighted that India has reasonable potential for offshore wind energy development and that two main maritime zones in the country are potential areas for offshore wind energy development: 1) within India’s territorial waters, which cover 12 nautical miles from the coastline toward the sea; and 2) EEZs beyond the 12-nautical-mile areas into the sea up to 200 nautical miles. The targets for offshore wind energy are to produce 5 GW by 2022 and 30 GW by 2030. The policy objectives clearly emphasize the need for such policies from the point of view of both energy security and carbon reduction. They also prioritize the need for public–private partnerships for offshore wind energy development, promoting such wind farms in the country’s EEZs.
The policy recognizes a host of challenges for the development of offshore wind energy in the country: resource characterization, subsea
Figure 9.2: Schematic of the Institutional Mechanisms Governing Offshore Wind Energy in India
CTU = Central Transmission Utilities; EIA = environmental impact assessment, MNRE = Ministry of New and Renewable Energy; MoEFCC = Ministry of Environment, Forest and Climate Change; NIWE = National Institute of Wind Energy; STU = State Transmission Utilities.
Source: Author’s construct.
MNRENodal Ministry
O�shore Wind Energy Steering Committee
NIWENodal agency
- Resource assessment- Demarcate blocks
CTU
STU
Project Developers
Dedicated Committees by State Governments
Other Central Ministries e.g., Ministry of Shipping,
Ministry of Defence, MoEFCC and other Ministries
Coordination with other ministries
EIA clearances from MoEFFCC
O�er guidelines/directivesOversee execution andimplementation
Resource assessmentDemarcation of blocks
Other clearances from state-level agencies
Grid interconnection and integration issues
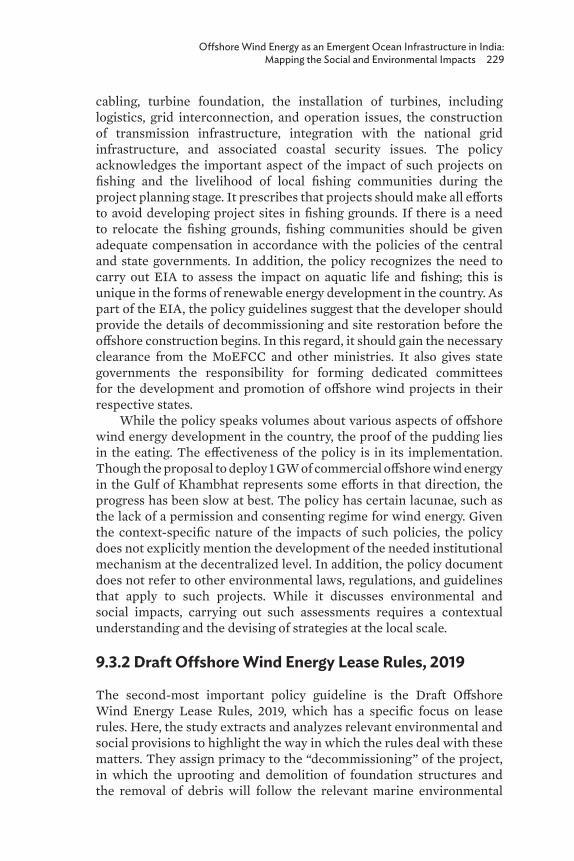
Offshore Wind Energy as an Emergent Ocean Infrastructure in India: Mapping the Social and Environmental Impacts 229
cabling, turbine foundation, the installation of turbines, including logistics, grid interconnection, and operation issues, the construction of transmission infrastructure, integration with the national grid infrastructure, and associated coastal security issues. The policy acknowledges the important aspect of the impact of such projects on fishing and the livelihood of local fishing communities during the project planning stage. It prescribes that projects should make all efforts to avoid developing project sites in fishing grounds. If there is a need to relocate the fishing grounds, fishing communities should be given adequate compensation in accordance with the policies of the central and state governments. In addition, the policy recognizes the need to carry out EIA to assess the impact on aquatic life and fishing; this is unique in the forms of renewable energy development in the country. As part of the EIA, the policy guidelines suggest that the developer should provide the details of decommissioning and site restoration before the offshore construction begins. In this regard, it should gain the necessary clearance from the MoEFCC and other ministries. It also gives state governments the responsibility for forming dedicated committees for the development and promotion of offshore wind projects in their respective states.
While the policy speaks volumes about various aspects of offshore wind energy development in the country, the proof of the pudding lies in the eating. The effectiveness of the policy is in its implementation. Though the proposal to deploy 1 GW of commercial offshore wind energy in the Gulf of Khambhat represents some efforts in that direction, the progress has been slow at best. The policy has certain lacunae, such as the lack of a permission and consenting regime for wind energy. Given the context-specific nature of the impacts of such policies, the policy does not explicitly mention the development of the needed institutional mechanism at the decentralized level. In addition, the policy document does not refer to other environmental laws, regulations, and guidelines that apply to such projects. While it discusses environmental and social impacts, carrying out such assessments requires a contextual understanding and the devising of strategies at the local scale.
9.3.2 Draft Offshore Wind Energy Lease Rules, 2019
The second-most important policy guideline is the Draft Offshore Wind Energy Lease Rules, 2019, which has a specific focus on lease rules. Here, the study extracts and analyzes relevant environmental and social provisions to highlight the way in which the rules deal with these matters. They assign primacy to the “decommissioning” of the project, in which the uprooting and demolition of foundation structures and the removal of debris will follow the relevant marine environmental
230 Blue Economy and Blue Finance: Toward Sustainable Development and Ocean Governance
norms. It also states that the lessee does not have the right to block or bar routine activities, including activities related to fishing. Another important clause concerns the cancellation of the lease agreement if the project causes environmental damage to flora and fauna lying under the sea and can pose threats to human life and property both while carrying out activities under water and while operating during the lease period. In addition, the rules state that the Union Government may take over the operation if the lessee misuses the operation of offshore wind zones and areas, including those under environmental protection. The central government can shut down the firm if it finds that it is causing damage to the environment or property and generating pollution.
9.3.3 Other Laws and Regulations Governing the Marine Environmental Systems
While the National Offshore Wind Energy Policy 2015 and the Draft Offshore Wind Energy Lease Rules 2019 refer to direct environmental and social considerations concerning offshore wind energy deployment in the country, there are other laws and regulations governing the marine environmental systems that have a bearing, albeit indirectly, on the offshore wind energy deployment in the country.
One such regulation is the Coastal Regulation Zone Notification 2019. Under such notification, while the central government specifies the coastal regulation zone norms, the state government should declare its coastal zone management plans and set up the Coastal Zone Management Authority. The framing of these notifications falls under the umbrella legislation of the Environmental Protection Act 1986; hence, their design is primarily intended to protect the marine ecosystem and marine environment. The government framed the first rule in 1991, further revising it in 2011 to allow some flexibility, and declared the latest one in 2018–2019. According to the latest rule, the thrust is on the management and conservation of marine ecosystems, the promotion of coastal areas, ecotourism, and livelihood options with specific reference to fishing communities and sustainable development at large. While different segments of zones exist, ecologically sensitive areas, such as mangroves, coral and coral reefs, sand dunes, biologically active mudflats, other parks, salt marshes, turtle nesting grounds, horseshoe crab habitats, sea grass beds, and nesting grounds of birds, require specific attention. It clearly identifies the coastal areas that require special focus and consideration, declaring as critical vulnerable coastal areas the Sundarban region of West Bengal, the Gulf of Khambat and Gulf of Kutchh in Gujarat, Malvan, Achra-Ratnagiri in Maharashtra, Karwar and Coondapur in Karnataka, Vembanad in Kerala, the Gulf of
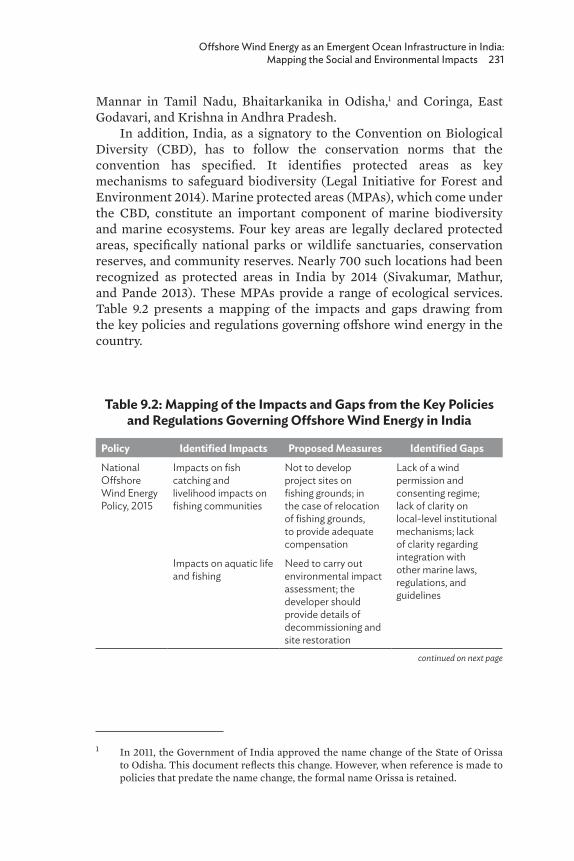
Offshore Wind Energy as an Emergent Ocean Infrastructure in India: Mapping the Social and Environmental Impacts 231
Mannar in Tamil Nadu, Bhaitarkanika in Odisha,1 and Coringa, East Godavari, and Krishna in Andhra Pradesh.
In addition, India, as a signatory to the Convention on Biological Diversity (CBD), has to follow the conservation norms that the convention has specified. It identifies protected areas as key mechanisms to safeguard biodiversity (Legal Initiative for Forest and Environment 2014). Marine protected areas (MPAs), which come under the CBD, constitute an important component of marine biodiversity and marine ecosystems. Four key areas are legally declared protected areas, specifically national parks or wildlife sanctuaries, conservation reserves, and community reserves. Nearly 700 such locations had been recognized as protected areas in India by 2014 (Sivakumar, Mathur, and Pande 2013). These MPAs provide a range of ecological services. Table 9.2 presents a mapping of the impacts and gaps drawing from the key policies and regulations governing offshore wind energy in the country.
1 In 2011, the Government of India approved the name change of the State of Orissa to Odisha. This document reflects this change. However, when reference is made to policies that predate the name change, the formal name Orissa is retained.
Table 9.2: Mapping of the Impacts and Gaps from the Key Policies and Regulations Governing Offshore Wind Energy in India
Policy Identified Impacts Proposed Measures Identified Gaps
National Offshore Wind Energy Policy, 2015
Impacts on fish catching and livelihood impacts on fishing communities
Not to develop project sites on fishing grounds; in the case of relocation of fishing grounds, to provide adequate compensation
Lack of a wind permission and consenting regime; lack of clarity on local-level institutional mechanisms; lack of clarity regarding integration with other marine laws, regulations, and guidelines
Impacts on aquatic life and fishing
Need to carry out environmental impact assessment; the developer should provide details of decommissioning and site restoration
continued on next page
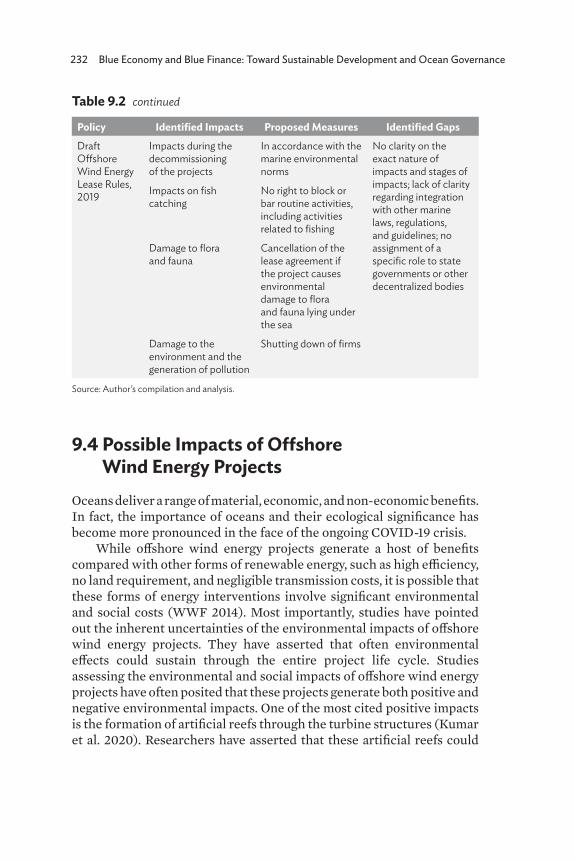
232 Blue Economy and Blue Finance: Toward Sustainable Development and Ocean Governance
9.4 Possible Impacts of Offshore Wind Energy Projects
Oceans deliver a range of material, economic, and non-economic benefits. In fact, the importance of oceans and their ecological significance has become more pronounced in the face of the ongoing COVID-19 crisis.
While offshore wind energy projects generate a host of benefits compared with other forms of renewable energy, such as high efficiency, no land requirement, and negligible transmission costs, it is possible that these forms of energy interventions involve significant environmental and social costs (WWF 2014). Most importantly, studies have pointed out the inherent uncertainties of the environmental impacts of offshore wind energy projects. They have asserted that often environmental effects could sustain through the entire project life cycle. Studies assessing the environmental and social impacts of offshore wind energy projects have often posited that these projects generate both positive and negative environmental impacts. One of the most cited positive impacts is the formation of artificial reefs through the turbine structures (Kumar et al. 2020). Researchers have asserted that these artificial reefs could
Policy Identified Impacts Proposed Measures Identified Gaps
Draft Offshore Wind Energy Lease Rules, 2019
Impacts during the decommissioning of the projects
In accordance with the marine environmental norms
No clarity on the exact nature of impacts and stages of impacts; lack of clarity regarding integration with other marine laws, regulations, and guidelines; no assignment of a specific role to state governments or other decentralized bodies
Impacts on fish catching
No right to block or bar routine activities, including activities related to fishing
Damage to flora and fauna
Cancellation of the lease agreement if the project causes environmental damage to flora and fauna lying under the sea
Damage to the environment and the generation of pollution
Shutting down of firms
Source: Author’s compilation and analysis.
Table 9.2 continued
Offshore Wind Energy as an Emergent Ocean Infrastructure in India: Mapping the Social and Environmental Impacts 233
enhance the species population and biomass types. Artificial habitat creation through reefs may increase the fish population, bird species, and marine mammals (Lindeboom et al. 2011).
However, some reports have denied such claims of increased diversity of ocean animals and fish populations following the deployment of offshore wind energy plants (Bergstrom, Sundqvist, and Bergstrom 2013). Negative impacts are also apparent in terms of the construction of offshore wind energy plants and consequent activities, such as transportation, deployment, and operational noise, and their impacts on marine life and marine ecosystems (Kumar et al. 2020). For instance, understanding the water depth and seabed characteristics is a crucial element of the deployment of such systems as this knowledge helps to identify the deployment sites. Similarly, the type of wind turbine generator and its positioning are two very important components of projects with significant environmental and ecological impacts. If not properly designed and contextualized, the generator may create possible environmental impacts, such as disturbing sea bird feeding areas, fish spawning areas, and protected species, along with negative visual impacts. For instance, the construction of wind plants within the sea impairs seabed habitats and generates negative consequences in the long run (Bailey, Brookes, and Thompson 2014). Offshore wind energy farms reportedly have negative impacts, decreasing the marine population, richness of species, biodiversity, functioning of marine species, their abundance, and their community structures—often affecting the behavior of marine lives. However, the cumulative environmental and ecological impacts are not clear and are often context based. Some studies have reported the visual impacts of offshore wind farms and pointed out that the nearer the installation of farms, the greater the visual impacts (Parsons et al. 2020). The noise that these projects emit might also have negative environmental consequences for marine species and their movements. The generated noise is harmful for mammals; loud sounds could also be detrimental to sea animals, causing hearing impairments and obstructing their communication, leading to their migration and relocation (Thompson et al. 2013; Bailey, Brookes, and Thompson 2014; Kumar et al. 2020).
Apart from the environmental impacts, such energy infrastructure generates a host of social impacts. Research has asserted that understanding the human dimension of such projects is vital for their successful implementation. Some studies have raised concerns about the impacts on the fishing industry (Ciara et al. 2020), and others have identified the negative impacts on ecotourism (Kumar et al. 2020). The
234 Blue Economy and Blue Finance: Toward Sustainable Development and Ocean Governance
local area and local people, terrestrial life and marine life, and the ocean ecosystem would experience significant impacts.
9.5 Mapping the Ecological and Social Impacts of Offshore Wind Energy Projects in India
While the full-scale impact of offshore wind projects in India will only be apparent after their implementation, drawing from the international experiences and expert interactions, this study has mapped, identified, and contextualized a host of possible impacts to understand their magnitude and their varying dimensions. Given that these projects involve large degrees of uncertainty regarding their environmental and social impacts (IRENA 2020b; Kumar et al. 2020), it is imperative to carry out full-scale mapping for offshore wind projects. Studies have contended that the extent and magnitude of the ecological disturbances that these projects may generate are still unexplored, underestimated, and at best poorly mapped (Kumar et al. 2020). This mapping exercise becomes more pertinent as most of the renewable energy in India does not fall under the ambit of the EIA Notification of 2006, and the pollution regulatory authorities at the subnational scale (i.e., state pollution control boards) tag renewable energy projects such as solar and wind as “green” (Thapar 2017).
Recent developments have also pointed to the need to perform this mapping exercise. For instance, some preliminary observations have revealed the looming dangers of extracting hydrocarbons from oceans in India and the possible ecological hazards of such extraction for ocean flora and fauna (Singh 2020). Notably, the recent focus on the blue economy, in which the private sector plays a dominant role in the exploitation of ocean resources, has brought the debated issue of social licensing to operate to the forefront (Roy 2019; Voyer and Leeuwen 2019). Traditionally, people have considered the ocean as a common pool resource that has deep social, cultural, and spiritual connections with the people of India (Roy 2019) and that is a major source of livelihood for a large chunk of the Indian population (Singh 2020). For instance, in India, close to 15 million people draw their livelihood from fishing and fishing-related activities alone, and fishing contributes nearly 5% of the GDP and 10% of foreign exchanges for the country. In addition, a range of climate-related challenges, such as ocean acidification, extreme weather events, and sea-level rise, have exacerbated the problems affecting the aquatic lives of ocean inhabitants, their distribution and movement patterns, and their behavior. Poor ocean literacy is arguably also causing problems in marine conservation and ecological restoration.
Offshore Wind Energy as an Emergent Ocean Infrastructure in India: Mapping the Social and Environmental Impacts 235
9.5.1 Environmental Impacts of Offshore Wind Projects
The Indian Ocean system is rich in ecosystems, such as beaches, mangroves, coral reefs, estuaries, islands, tidal mudflats, lagoons, marshes, and vegetated wetland coastal islands. Extensive stretches of mangroves, coral reefs, and sea grass beds form an ecosystem for many ocean animals and species. Not only do these coastlines and oceans have significant value in terms of giving shelter to wildlife, but they also provide cultural value, natural landscape benefits, and archaeological value. Studies have pointed out that the Indian Ocean is home to a host of marine ecosystems, offering habitats to various ocean animals and birds. Given the richness of the Indian Ocean’s ecosystem, the impacts could vary, with differing intensities depending on the context and ecosystem characteristics. Hence, before implementing any proposed offshore wind project, there should be careful scrutiny of its environmental and social impacts.
The proposed offshore wind projects could be distortionary in many ways. They could disturb the marine biodiversity, create noise pollution for marine habitats, pollute the ocean water at various stages of project development and implementation, such as construction, operation, maintenance, and decommissioning, and disturb marine habitats and their residents’ breeding and feeding seasons and grounds.
In both the Bay of Bengal and the Arabian Sea, there are a number of MPAs, which constitute important ecologically sensitive areas for any developmental projects (Singh 2020). Table 9.3 captures the major marine national parks and sanctuaries in India. Some of these areas are fragile in nature; hence, the protection of these areas should receive the utmost priority. Many of these MPAs are host to a number of mangrove species—for example, Bhitar Kanika Sanctuary and Gahirmatha Marine Sanctuary. Considering the importance of mangroves, the Government of India has identified 31 mangrove areas for intensive conservation (Singh 2003). There has been apprehension that offshore wind projects could adversely affect mangroves. For instance, the proposed project in the Gulf of Khambat will affect stretches of mangroves that have already faced degradation for the last couple of decades (Aggarwal 2018). In fact, the proposed project site of the Gulf of Khambhat is home to a variety of plants, animals, and birds. Developing such projects without adequate measures in hand could further accentuate the degradation of mangroves and exert an adverse impact on the marine biodiversity in the region. A report of the Gujarat Ecology Commission echoed this. It warned that, due to the strategic geographical location of the Gulf of Khambhat, it is becoming increasingly vulnerable to human-led activities, such as rapid
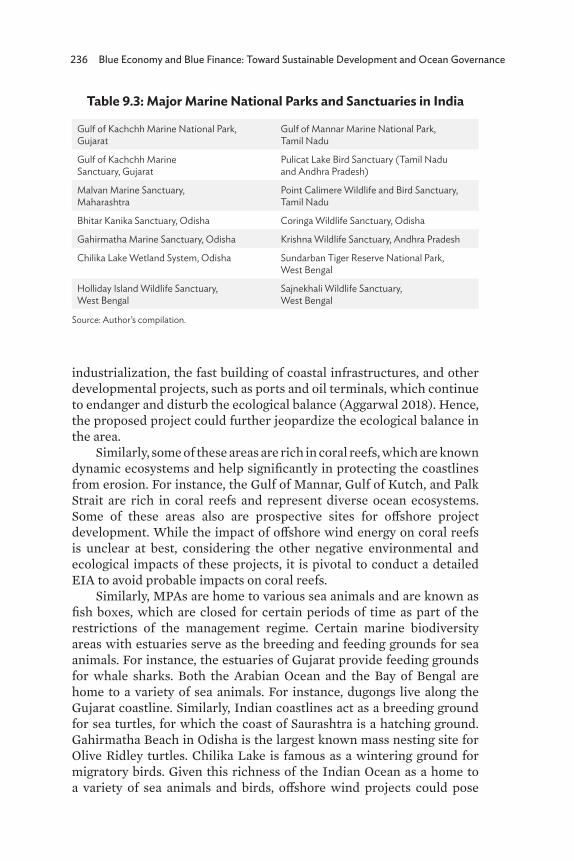
236 Blue Economy and Blue Finance: Toward Sustainable Development and Ocean Governance
industrialization, the fast building of coastal infrastructures, and other developmental projects, such as ports and oil terminals, which continue to endanger and disturb the ecological balance (Aggarwal 2018). Hence, the proposed project could further jeopardize the ecological balance in the area.
Similarly, some of these areas are rich in coral reefs, which are known dynamic ecosystems and help significantly in protecting the coastlines from erosion. For instance, the Gulf of Mannar, Gulf of Kutch, and Palk Strait are rich in coral reefs and represent diverse ocean ecosystems. Some of these areas also are prospective sites for offshore project development. While the impact of offshore wind energy on coral reefs is unclear at best, considering the other negative environmental and ecological impacts of these projects, it is pivotal to conduct a detailed EIA to avoid probable impacts on coral reefs.
Similarly, MPAs are home to various sea animals and are known as fish boxes, which are closed for certain periods of time as part of the restrictions of the management regime. Certain marine biodiversity areas with estuaries serve as the breeding and feeding grounds for sea animals. For instance, the estuaries of Gujarat provide feeding grounds for whale sharks. Both the Arabian Ocean and the Bay of Bengal are home to a variety of sea animals. For instance, dugongs live along the Gujarat coastline. Similarly, Indian coastlines act as a breeding ground for sea turtles, for which the coast of Saurashtra is a hatching ground. Gahirmatha Beach in Odisha is the largest known mass nesting site for Olive Ridley turtles. Chilika Lake is famous as a wintering ground for migratory birds. Given this richness of the Indian Ocean as a home to a variety of sea animals and birds, offshore wind projects could pose
Table 9.3: Major Marine National Parks and Sanctuaries in India
Gulf of Kachchh Marine National Park, Gujarat
Gulf of Mannar Marine National Park, Tamil Nadu
Gulf of Kachchh Marine Sanctuary, Gujarat
Pulicat Lake Bird Sanctuary (Tamil Nadu and Andhra Pradesh)
Malvan Marine Sanctuary, Maharashtra
Point Calimere Wildlife and Bird Sanctuary, Tamil Nadu
Bhitar Kanika Sanctuary, Odisha Coringa Wildlife Sanctuary, Odisha
Gahirmatha Marine Sanctuary, Odisha Krishna Wildlife Sanctuary, Andhra Pradesh
Chilika Lake Wetland System, Odisha Sundarban Tiger Reserve National Park, West Bengal
Holliday Island Wildlife Sanctuary, West Bengal
Sajnekhali Wildlife Sanctuary, West Bengal
Source: Author’s compilation.
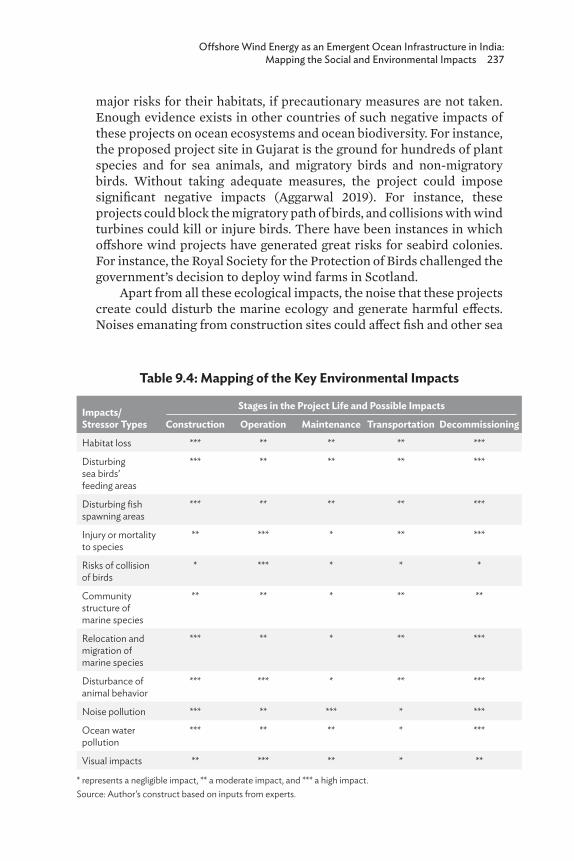
Offshore Wind Energy as an Emergent Ocean Infrastructure in India: Mapping the Social and Environmental Impacts 237
major risks for their habitats, if precautionary measures are not taken. Enough evidence exists in other countries of such negative impacts of these projects on ocean ecosystems and ocean biodiversity. For instance, the proposed project site in Gujarat is the ground for hundreds of plant species and for sea animals, and migratory birds and non-migratory birds. Without taking adequate measures, the project could impose significant negative impacts (Aggarwal 2019). For instance, these projects could block the migratory path of birds, and collisions with wind turbines could kill or injure birds. There have been instances in which offshore wind projects have generated great risks for seabird colonies. For instance, the Royal Society for the Protection of Birds challenged the government’s decision to deploy wind farms in Scotland.
Apart from all these ecological impacts, the noise that these projects create could disturb the marine ecology and generate harmful effects. Noises emanating from construction sites could affect fish and other sea
Table 9.4: Mapping of the Key Environmental Impacts
Impacts/ Stressor Types
Stages in the Project Life and Possible Impacts
Construction Operation Maintenance Transportation Decommissioning
Habitat loss *** ** ** ** ***
Disturbing sea birds’ feeding areas
*** ** ** ** ***
Disturbing fish spawning areas
*** ** ** ** ***
Injury or mortality to species
** *** * ** ***
Risks of collision of birds
* *** * * *
Community structure of marine species
** ** * ** **
Relocation and migration of marine species
*** ** * ** ***
Disturbance of animal behavior
*** *** * ** ***
Noise pollution *** ** *** * ***
Ocean water pollution
*** ** ** * ***
Visual impacts ** *** ** * **
* represents a negligible impact, ** a moderate impact, and *** a high impact. Source: Author’s construct based on inputs from experts.
238 Blue Economy and Blue Finance: Toward Sustainable Development and Ocean Governance
animals and change their behavior. Projects should employ advanced technologies to reduce the noise by using a soft-start or ramp-up procedure (OSPAR Commission 2008). Radiation from these plants, such as electromagnetic and heat radiation, could negatively affect marine animals. Table 9.4 captures the mapping of key environmental impacts based on the expert consultation.
9.5.2 Social Impacts of Offshore Wind Projects
The social impacts largely are concerned with the possibility that these projects will adversely affect the livelihood of fishing communities by reducing the fish catches. Even the National Offshore Wind Energy Policy of Government of India and the FOWIND (2017) study clearly recognized the importance of fishing as a major source of livelihood for Indian coastal communities. Studies have reported that there are short- and long-term effects of the development of offshore wind energy on the livelihood of fishing communities. However, the understanding of the complex linkage between wind energy development and its impacts on fish behavior and fishing communities’ livelihood is, at best, poor in India.
In India, nearly 15 million people draw their livelihood from fishing and fishing-related activities, and fishing contributes close to 5% of GDP and 10% of foreign exchange. Out of the total fishing production in the country, sea fishing constitutes 45%. Tamil Nadu, which is one of the designated states for offshore wind energy projects, is home to 600 marine fishing villages, and nearly 1.2 million people earn their livelihood directly from fishing. Both Tamil Nadu and Gujarat rank as the states with the largest amount of marine fish production in the country. While the livelihood of fishing communities is already under threat from ocean pollution and climate change considerations (Srinivasan 2019), the proposed offshore wind energy projects could further accentuate the problem.
Impacts on fishing could occur in multiple ways. Fishing through trawling could be damaging to the structure of offshore wind plants as trawling can cause damage to the seafloor and seabed. Often, in the case of floating turbines, trawling could damage the anchorage of moorings. Because of these effects, trawling is not permissible in offshore wind areas. This can create considerable hardship for fishing communities. If they lose their trawling ground, they lose their fish catches. In addition, these projects could disturb the fish habitat, and the noise that these wind farms create could be harmful to the fish population. Certain parts of the ocean, such as the Bay of Bengal, are already suffering from overfishing, aggravating the problem (Singh 2020).
Offshore Wind Energy as an Emergent Ocean Infrastructure in India: Mapping the Social and Environmental Impacts 239
It is also important to recognize that marine fishery resources have specific characteristics that make them difficult to monitor and manage, hence compounding the problem of mapping of wind farms’ impacts. For instance, they continue to migrate, largely dependent on the sea conditions, so it is challenging to monitor and assess them clearly. All these issues pose additional challenges to assessing offshore wind projects’ impact on fishing and devising appropriate strategies. While the National Wind Energy Policy prescribes the identification of fishing grounds and the relocation of such grounds, given the volatility in the migration character of sea fish, such relocation is difficult to execute.
Offshore wind projects could impair the visual and scenic beauty of the sea and have a negative impact on ocean-based tourism. The visual impacts depend on the location of the wind farms in relation to the coast. Studies in the context of other countries have pointed to the presence of such impacts (Ladenburg 2009; Maslov et al. 2017). While there has been considerable emphasis on coastal tourism, through schemes such as Sagarmala, the location of offshore wind energy projects may conflict with nature. The Indian coasts serve as a major source of tourism and constitute a major source of revenue in India.
It is evident from the mapping of impacts that they differ in their intensities across various stages of the project life and for different categories of environmental and social elements. Given the importance of ocean ecosystems and the ecological significance of marine biodiversity and species, development projects like offshore wind energy require detailed scrutiny and assessment. This becomes more pronounced as the policy envisages public–private partnerships, which often give less importance to such environmental and social considerations. Further, while the most substantial study, which FOWIND (2017) carried out, recognized the possible environmental and social impacts of such projects, it did not consider these impacts as crucial factors for offshore wind energy development in the country. The next section offers some possible pathways for the development of such energy assets.
9.6 Offshore Wind Energy Infrastructure in India: Mapping the Future Pathways
While the previous section mapped the possible environmental and social impacts of offshore wind energy projects, this section suggests some possible pathways.
240 Blue Economy and Blue Finance: Toward Sustainable Development and Ocean Governance
9.6.1 Need to Develop Robust Environmental and Social Impact Assessment
There is a need to develop robust and detailed guidelines for environmental and social impact assessment, which are crucial for understanding the possible environmental and social impacts and the management practices necessary to minimize such threats. While the National Wind Energy Policy 2015 refers to EIA and the possible impacts on fishing communities, detailed guidelines are lacking. Besides, the policy is silent regarding the institutional mechanism that it is necessary to develop to carry out such assessments, particularly at the subnational scale. The scale and timing of such impacts are also quite pertinent given that offshore wind energy technologies are new and the impacts are largely unknown. It is also important to identify localized impacts and undertake the required action plans. In many instances, the detailed environmental constraints have a strong link to the adopted technological approaches. Hence, efforts to carry out an EIA devoid of technological solutions will be suboptimal.
9.6.2 Detailed Marine Spatial Planning
Projects require a detailed marine spatial planning exercise to assess the possible environmental and social impacts. Most European countries carry out detailed marine spatial planning, which consists of developing a good understanding of the environmental constraints, conducting extensive stakeholder surveys, and so on. These are more pronounced in a country like India, where local community protests are very strong and importantly competing interests exist for the use of marine spaces exist. There is historical evidence that many power projects suffer delays or cancellation due to a poor understanding of their environmental and social impacts.
Spatial planning could also involve implementing the necessary action plans considering the contextual aspects. For instance, action plans are needed to identify birds’ migratory paths and avoid the construction of such projects in those paths, to produce technical designs for wind farms, such as grouping turbines to avoid flying paths, to increase the visibility of rotor blades with colors to reduce collisions, and so on. Similarly, the deployment of advanced technologies can reduce the noise by using the soft-start or ramp-up procedure (OSPAR Commission 2008). Necessary steps, such as the use of suitable cables, shielding of cables, and burial of cables at a safe depth, can reduce such negative impacts. While technological developments could help to
Offshore Wind Energy as an Emergent Ocean Infrastructure in India: Mapping the Social and Environmental Impacts 241
address some of the spatial issues of the development of offshore wind energy projects, it is important to carry out stakeholder consultations at every stage of project development to minimize frictions between different stakeholders in the use of marine areas and spaces.
9.6.3 Detailed Stakeholder Mapping
To assess the social impacts, it is pertinent to carry out detailed stakeholder surveys. For instance, fishing constitutes an important source of livelihoods in India. It is important for the proposed projects to start engaging with fishing communities from the very beginning of the project. Detailed engagement with various fishing communities and entities is crucial, such as with local fishing cooperatives; the National Coastal Zone Management Authority; the Department of Animal Husbandry, Dairying, and Fisheries; and the State Fisheries Department. This could build confidence and reduce the uncertainties.
Similarly, carrying out EIA involves engaging with the local stakeholders in both social and environmental matters and taking them into confidence in decision-making. Given that the thrust of these projects is on private development, poor and fragmented community engagement could generate adverse repercussions in the long run. While social issues, such as livelihoods, are more direct and immediate, the environmental issues will largely emerge over different phases of project operation. Inclusive, participatory, and well-informed stakeholder engagement is crucial for these projects.
These are a few action plans that could reduce the environmental and social impacts of offshore wind energy project development. For instance, the FOWIND (2017) study identified an extended list of stakeholders to consult when carrying out the EIA.
9.6.4 Transiting from Management to Governance
As it is likely that primarily private actors will develop and manage offshore wind energy infrastructures, it is necessary for sustainable ocean governance to move beyond the management structures to governance systems involving public, private, and other actors, such as cooperatives, informal groups, and civil society groups. A mix of management and a well-governed system could deliver the optimal outcomes. Governance is crucial as there are competing interests among varying stakeholders in extracting marine resources of different forms. On the one hand, maintaining the marine ecosystem and retaining its functionality are crucial; on the other, there has been increasing
242 Blue Economy and Blue Finance: Toward Sustainable Development and Ocean Governance
pressure on marine resources through various policy initiatives, such as deep ocean missions.
It is also important to focus on creating local jobs through these interventions. Studies have pointed out that offshore wind energy projects generate many sustainable jobs in various segments of the supply chain. For instance, the GWEC (2021) estimates suggested that offshore wind projects on average generate about 17 person-years per megawatt over the 25-year lifetime of the project. However, given the Indian context and the heavy reliance on the ocean for livelihoods, it is important to provide those who are losing their livelihoods with some alternative employment opportunities.
9.7 Concluding RemarksIn the basket of renewables, offshore wind energy is emerging as a promising energy infrastructure worldwide, with far-reaching potential to meet the burgeoning energy demand. Offshore wind energy is promising as an alternative source of energy for a country like India, which continues to be land deprived and increasingly faces difficulties in acquiring land for energy. Considering the potential, the available technology, and the cost, the country has set medium- and long-term targets of deploying 5 GW of offshore wind energy by 2022 and 30 GW by 2030. While some scholarly efforts in the Indian context have analyzed various aspects of offshore wind energy development, there is a dearth of studies understanding and analyzing the associated environmental and social challenges of such infrastructure deployment.
The development of the necessary policy and institutional framework governing offshore wind energy development has taken place and includes provisions to assess the environmental impact and the effects on livelihoods. However, the policy does not explicitly mention the institutional mechanisms that it is necessary to create at the subnational scale. The policy document also does not refer to other environmental laws, regulations, and guidelines that are applicable to such projects.
While the full-scale impact will be apparent after projects’ operationalization, drawing from the international experiences and expert consultation, this chapter identifies a host of possible environmental and social impacts. This mapping is more pertinent given that the EIA Notification of 2006 does not cover most of the renewable energy in India under its ambit and most of the state pollution control boards tag renewable energy projects such as solar and wind projects as “green.” There has been apprehension that offshore wind projects could adversely affect the MPAs and their ecosystems. It emerged from the
Offshore Wind Energy as an Emergent Ocean Infrastructure in India: Mapping the Social and Environmental Impacts 243
analysis that mangroves, for instance, could suffer adverse impacts, particularly from the proposed project in the Gulf of Khambhat, which has stretches of mangroves. Developing such projects without implementing adequate measures could accentuate the degradation of mangroves (Aggarwal 2018). Similarly, rich coral reef sites exist in the proposed offshore wind project states. For instance, the Gulf of Mannar, Gulf of Kutch, and Palk Strait are rich in coral reefs. Though the impacts on coral reefs are unclear, it is necessary to undertake precautionary measures to reduce the possible negative impacts. Offshore wind projects could pose major risks to the habitats of ocean animals and birds. For instance, the proposed project site in Gujarat is the ground for hundreds of plant species and a place for sea animals, and migratory and non-migratory birds (Aggarwal 2019). Without adequate measures, the project could exert strong negative impacts. For instance, the impact on migratory birds could be significant. It could be in the form of blocking their migratory paths or killing birds due to collision with wind turbines. Apart from all these impacts, the noise and radiation emanating from these plants, such as electromagnetic and heat radiation, could negatively affect marine animals. They could create harmful effects on fish and other sea animals and may change their behavior.
The social impacts are largely in the form of adverse impacts on the livelihood of fishing communities. The impacts on fishing could occur in multiple ways. Fishing through trawling could be damaging for the structure of the offshore wind plants; hence, offshore wind areas usually ban trawling. This can create substantial hardship for fishing communities. The noise that these wind farms create could also be harmful for the fish population. More importantly, marine fishery resources have specific characteristics that make them difficult to monitor and manage. For instance, fish continue to migrate frequently, largely affected by the sea conditions. While the National Wind Energy Policy prescribes the identification of fishing grounds and their relocation, given the fishing characteristics, it is difficult to execute such relocation. The overall mapping revealed that the impacts would be different at different stages of project development and operation. Hence, careful scrutiny and analysis are necessary before implementing such projects.
Our study offers some possible pathways to minimize these impacts. There is a need to develop robust and detailed environmental and social impact assessment guidelines. The assessments should consider localized effects. It is necessary to create adequate local-level capacities to deal with such impacts. The emphasis should be on detailed marine spatial planning exercises. Understanding environmental constraints is important. In the Indian context, it is crucial to conduct detailed
244 Blue Economy and Blue Finance: Toward Sustainable Development and Ocean Governance
stakeholder surveys, including all possible stakeholders. Finally, there is a need to make appropriate action plans. For instance, to reduce the impacts of offshore wind projects on migratory birds, it is important to identify birds’ migratory paths, increase the visibility of motor blades, and so on.
Though the assessment that this study carried out offers some direction for the offshore wind energy development in the country, it has limitations as it did not perform an in-depth survey to identify the localized impacts of such project development. Given the diversity and contextual heterogeneity, it is important to understand the possible impacts of such projects on the ground. Context-specific impact assessment that considers the heterogeneity of ocean ecology and ocean biodiversity would highlight the context-specific challenges. This opens up new areas of research and analysis for the future.
Offshore Wind Energy as an Emergent Ocean Infrastructure in India: Mapping the Social and Environmental Impacts 245
ReferencesAggarwal, M. 2018. Clean versus Green: Will India’s Offshore Wind
Energy Push Threaten Biodiversity? https://india.mongabay .com/2018/04/clean-vs-green-will-indias-offshore-wind-energy -push-threaten-biodiversity/
____. 2019. Environmental Damage Could Have Offshore Wind Farms Clearance Cancelled. The Wire. https://thewire.in/environment /environmental-damage-could-have-offshore-wind-farms -clearance-cancelled
Bailey, H., K. L. Brookes, and P. M. Thompson. 2014. Assessing Environmental Impacts of Offshore Wind Farms: Lessons Learned and Recommendations for the Future. Aquatic Biosystems. 10 (8). doi:10.1186/2046-9063-10-8.
Bergstrom, L., F. Sundqvist, and U. Bergstrom. 2013. Effects of an Offshore Wind Farm on Temporal and Spatial Patterns in the Demersal Fish Community. Marine Ecology Progress Series. 485. pp. 199–210. doi:10.3354/meps10344.
Bhatti, J. 2021. No Offshore Wind Project Has Commenced in India: Are We on Track for 30 GW by 2030? Down to Earth. https://www .downtoearth.org.in/blog/energy/no-offshore-wind-project-has -commenced-in-india-are-we-on-track-for-30-gw-by-2030--78982
Ciara, E., T. Garcia, C. Ortega, and L. Richmond. 2020. Social Impacts to Other Communities that Experienced Offshore Wind. In M. Severy, Z. Alva, G. Chapman, M. Cheli, T. Garcia, C. Ortega, N. Salas, A. Younes, J. Zoellick, and A. Jacobson, eds. California North Coast Offshore Wind Studies. Humboldt, CA: Schatz Energy Research Center. schatzcenter.org/pubs/2020-OSW-R20.pdf
FOWIND. 2017. From Zero to Five GW—Offshore Wind Outlook for Gujarat and Tamil Nadu (2018–2032). New Delhi.
Global Wind Energy Council (GWEC). 2020. Global Offshore Wind Report 2020. Belgium.
____. 2021. Wind Power and Green Recovery. Belgium. International Energy Agency (IEA). 2018. Off-shore Energy Outlook.
Paris.International Renewable Energy Agency (IRENA). 2020a. Countries
Raise the Sails on Offshore Renewable Sector. October 2020. Abu Dhabi, United Arab Emirates.
____. 2020b. Fostering a Blue Economy: Offshore Renewable Energy. December 2020. Abu Dhabi, United Arab Emirates.
Jayaram, D. 2016. Sustainable Marine Resource Governance in Indian Ocean Region. Climate Diplomacy. https://climate-diplomacy.org / m a g a z i n e /e nv i ro n m e n t / s u st a i n a b l e - m a r i n e - re s o u rc e -governance-indian-ocean-region (accessed on 18 February 2021).
246 Blue Economy and Blue Finance: Toward Sustainable Development and Ocean Governance
Kota, S., S. B. Bayne, and S. Nimmagada. 2015. Off-shore Wind Energy: A Comparative Analysis of UK, USA and India. Renewable and Sustainable Energy Reviews. 41. pp. 685–94.
Kumar, J C R., D.V. Kumar, D. Baskar, B.M. Arunsi, R. Jenova, and M.A. Maijid. 2020. Offshore Wind Energy Status, Challenges, Opportunities, Environmental Impacts, Occupational Health and Safety Management in India. Energy and Environment. 32 (4). pp. 565–603.
Ladenburg, J. 2009. Visual Impact Assessment of Offshore Wind Farms and Prior Experience. Applied Energy. 86. pp. 380–7.
Legal Initiative for Forest and Environment. 2014. Legal Framework for Conservation of Coastal and Marine Environment of India: A Review. CMPA Technical Series No. 02. Indo-German Biodiversity Programme. New Delhi: GIZ India.
Lindeboom, H. J., H. J. Kouwenhoven, M. J. N. Bergman, S. Bouma, S. Brasseur, R. Daan, et al. 2011. Short-Term Ecological Effects of an Offshore Wind Farm in the Dutch Coastal Zone: A Compilation. Environmental Research Letter. 6. 35101. doi:10.1088/1748-9326 /6/3/035101.
Mani, S., and T. Dhingra. 2013a. Critiques of Off Shore Wind Energy Policies of the UK and Germany—What Are the Lessons for India. Energy Policy. 63. pp. 900–9.
____. 2013b. Off Shore Wind Energy Policy in India—Key Factors to Be Considered. Energy Policy. 56. pp. 672–83.
____. 2013c. Policies to Accelerate Growth of Offshore Wind Energy in India. Renewable and Sustainable Energy Reviews. 24. pp. 473–82.
Maslov, N., C. Claramunt, T. Wang, and T. Tang. 2017. Evaluating the Visual Impact of an Off-shore Wind Farm. Energy Procedia. 105. pp. 3095–100.
Nagababu, G., S. S. Kachhwaha, N. K. Naidu, and V. Savsani. 2017. Application of Reanalysis Data to Estimate Offshore Wind Potential in EEZ of India Based on Marine Ecosystem Considerations. Energy. 118. pp. 622–31. doi:10.1016/j.energy.2016.10.097.
Nagababu, G., S. S. Kachhwaha, and V. Savsani. 2017. Estimation of Technical and Economic Potential of Offshore Wind along the Coast of India. Energy. doi:10.1016/ j.energy.2017.07.032.
OSPAR Commission. 2008. Assessment of Environmental Impacts of Offshore Wind Farms. https://qsr2010.ospar.org/media/assessments /p00385_Wind-farms_assessment_final.pdf
Parsons, G., J. Firestone, L. Yan, and J. Toussaint. 2020. The Effect of Offshore Wind Power Projects on Recreational Beach Use on the East Coast of the United States: Evidence from Contingent-Behavior Data. Energy Policy. 144. p. 11. doi:10.1016/j.enpol.2020.111659.
Offshore Wind Energy as an Emergent Ocean Infrastructure in India: Mapping the Social and Environmental Impacts 247
Phadke, A., R. Bharvirkar, and J. Khangura. 2012. Reassessing Wind Potential Estimates for India: Economic and Policy Implications. Lawrence Berkeley Labs, International Energy Studies, Environmental Energy, Technologies Division.
Randall-Smith, B. 2020. India Prepares to Tender 1 GW. https://www .4coffshore.com/news/india-prepares-to-tender-first-1-gw-nid 16998.html (accessed 30 October 2020).
Roy, A. 2019. Blue Economy in Indian Ocean: Governance Perspectives for Sustainable Development in the Region. Observer Research Foundation Occasional Paper. https://www.orfonline.org/research /blue-economy-in-the-indian-ocean-governance-perspectives-for -sustainable-development-in-the-region-47449/
Singh, H. 2003. Marine Protected Areas in India. Indian Journal of Marine Science. 32 (3). pp. 226–33.
Singh, A. 2020. Towards an Integrated “Blue Economy” Framework in the Bay of Bengal. ORF Issue Brief. October.
Sivakumar, K., V. B. Mathur, and A. Pande. 2013. Coastal and Marine Protected Areas in India: Challenges and Way Forward. In K. Sivakumar, ed. ENVIS Bulletin: Wildlife & Protected Areas. Vol. 15. pp. 292–8. Dehradun, India: Wildlife Institute of India.
Srinivasan, R. 2019. Trawling for a Sustainable Livelihood. Business Line. 17 April.
Thapar, S. 2017. Addressing Land Issues for Utility Scale Renewable Energy Deployment in India. New Delhi, India: TERI School of Advanced Studies.
Thompson, P. M., G. D. Hastie, J. Nedwell, R. Barham, K.L. Brookes, L.S. Cordes, et al. 2013. Framework for Assessing Impacts of Pile-Driving Noise from Offshore Wind Farm Construction on a Harbor Seal Population. Environmental Impact Assessment Review. 43. pp. 73–85.
Voyer, M., and J. V. Leeuwen. 2019. Social License to Operate in the Blue Economy. Resources Policy. 62. pp. 102–13.
Wei, Y., Q., Zou, and X. Lin. 2021. Evolution of Price Policy for Offshore Wind Energy in China: Trilemma of Capacity, Price and Subsidy. Renewable and Sustainable Energy Reviews. 136. pp. 1–13.
World Wide Fund for Nature (WWF). 2014. Environmental Impacts of Offshore Wind Power Production in North Sea. Oslo.

248
10
Sustainable Coastal and Maritime Tourism:
A Potential Blue Economy Avenue for Bangladesh
Md Wasiul Islam and Tapan Sarker
10.1 IntroductionCoastal and maritime tourism (CMT) is very popular in various corners of the world. It is arguably the largest component of the tourism industry as well as one of the largest wedges of the maritime economy sector (Tegar and Gurning 2018). Research has considered both coastal and maritime tourism to be among the oldest and largest segments of the tourism industry (Hall 2001; Ecorys 2013). Coastal tourism and marine tourism are interconnected as both rely on the marine environment (Vierros and De Fontaubert 2017; Tegar and Gurning 2018). These coastal and marine zones are well-known for providing specific habitats for diverse and unique biodiversity along with picturesque scenic beauty that attracts many tourists, offering the potential for CMT. This is part of blue tourism, along with some other types of sectoral development, including the exploration of offshore hydrocarbons and other natural resource extraction (Islam and Mostaque 2018; Alam 2019).
Coastal tourism takes place in a coastal environment, which refers to both beach-based and non-beach-focused land-based recreational and tourism activities depending on the vicinity of the sea and includes the suppliers and various manufacturing industries with connections to these activities. Examples of beach-based activities are swimming, sunbathing, surfing, and various other sports and activities. Conversely, examples of non-beach-focused activities are coastal walks, wildlife watching, accommodation, food and drink, and so on in that specific coastal environment. In contrast, marine or maritime tourism takes
Sustainable Coastal and Maritime Tourism: A Potential Blue Economy Avenue for Bangladesh 249
place at sea and consists of mainly water-based (rather than land-based) activities, such as cruising, sailing, boating, yachting, and various nautical sports. However, it includes the operation of land-based facilities and services and the manufacturing of the equipment necessary for such recreational and tourism activities (Ecorys 2013).
The blue economy is an economic development paradigm based on ecosystem principles that conceptualize oceans as “development spaces” where spatial planning integrates conservation, sustainable use, oil and mineral wealth extraction, bioprospecting, sustainable energy production, and marine transport (UNDP 2018). CMT comprises a crucial segment of the blue economy (Tegar and Gurning 2018), which represents 5% of the world gross domestic product (GDP). Being a human-resource-intensive subsector, CMT is increasingly involving local communities in its value chain, which can facilitate the development of the local economy and the reduction of poverty (UNDP 2018; Tonazzini et al. 2019).
CMT can claim to be even more important for many developing countries for boosting their domestic economy and significantly contributing to the tourism sector, enabling it to become the top export category. CMT is highly dependent on the quality of natural ecosystems to attract visitors but at the same time contributes strongly to their depletion and fragilization, hence putting its own sustainability at risk (Tonazzini et al. 2019). Consequently, research has identified CMT in many cases as a controversial issue, which strongly warrants consideration of the concept of sustainable development (Islam et al. 2013; Hossain et al. 2014; Islam and Shamsuddoha 2018; Hassan and Alam 2019; Hussain, Failler, and Sarker 2019; Patil, Failler, and Alam 2019). Therefore, the issues of developing and promoting CMT demand critical analysis to maximize the positive impacts and to reduce the negative impacts and ensure sustainable CMT. Consequently, sustainable CMT requires various institutional instruments and governance mechanisms to regulate its various functions and activities as well as to boost the blue economy sector.
Bangladesh, a South Asian country, is a floodplain delta, where thousands of rivers and canals spread all over the land. The country leans gently from the north to the south, meeting the Bay of Bengal at its southern end. The entire coast runs parallel to the Bay of Bengal, forming a coastline 710 kilometers long (Ministry of Water Resources 2005a). Considering the nature of these coastal areas, they are known as zones of both vulnerability and opportunities. According to the Bangladesh Maritime Zones Act 2019, the country will be able to exercise its sovereign rights on its sea territory, including the inland waters and water column suprajacent to the seabed; extend contiguous
250 Blue Economy and Blue Finance: Toward Sustainable Development and Ocean Governance
zones and exclusive economic zones up to 200 nautical miles and on the continental shelf beyond 200 nautical miles; and explore the sea resources on the continent for up to 354 nautical miles (Maritime Affairs 2019). These areas are crucial for the political, economic, and security interests of Bangladesh (Alam 2019; Iqbal 2019).
The discussions on the blue economy of Bangladesh received special momentum just after the settlement of the maritime boundary delimitation dispute with neighboring countries. This momentum started after the declaration of a verdict by the International Tribunal for the Law of the Sea in Germany on 14 March 2012. Similarly, the verdict with India declared on 7 July 2014 permitted the sovereignty rights of Bangladesh to all the living and mineral resources of the continental shelf of the Bay of Bengal. Consequently, Bangladesh has become an important maritime state with a long coastline and sea lanes of communication. Currently, it covers 118,813 square kilometers (km2) of the territorial sea due to these two historical verdicts. Therefore, Bangladesh has rights over a maritime zone that is almost the size of the country itself (147,570 km2). These two landmark verdicts have widened many existing and new opportunities, including CMT, in Bangladesh.
Due to the geographical situation and territorial resources, the islands are a top destination for CMT for millions of tourists every year. Islands constitute economic, social, cultural, and strategic heritage that supports 20% of the global biodiversity (IUCN 2020). Some policies and acts, along with other legal documents (see Table A10.1 in the Appendix), have created “windows of opportunity” for Bangladesh, allowing and recommending tourism development in the coastal and marine environment for the greater interest of the country on which it can base sociocultural, economic, environmental, and institutional development (Islam 2010; Islam, Iftekhar, and Islam 2011; Islam et al. 2013; Hossain et al. 2014; Islam and Shamsuddoha 2018; Hassan and Alam 2019; Hussain, Failler, and Sarker 2019; Patil, Failler, and Alam 2019).
Bangladesh is blessed with extraordinary natural beauty mixed with green slashes of forests, mountains, a variety of cultivation systems, and various water bodies, including ponds, haors, baors, canals, rivers, and the sea, along with diversified cultural wealth and a wide range of archaeological and historical attractions that can easily entice tourists to visit. Though nature-based tourism, particularly relating to forests, mountains, and rivers, has been popular in Bangladesh, CMT has not yet flourished significantly except for beach and mangrove tourism (mainly focusing on the Sundarbans) at some spots of the Bay of Bengal. The tourism facilities that the country has developed at these CMT destinations so far are very popular, particularly among domestic
Sustainable Coastal and Maritime Tourism: A Potential Blue Economy Avenue for Bangladesh 251
tourists. However, there is still huge untapped potential for CMT, especially considering maritime tourism resources. Judging by the existing and potential resources of CMT, especially after winning the two international cases against neighboring countries, environmental issues in these destinations have differentiated this subsector from others, particularly due to the excessive number of tourists at some beaches, the ongoing coronavirus disease 2019 (COVID-19) pandemic, recent priorities of the government for CMT development, and so on.
The Government of Bangladesh has identified CMT as one of the tools to develop the blue economy, and it is in the process of taking various initiatives in this regard (Alam 2019; Mukit 2019). Research has indicated that a marine tourism-based blue economy may attract both domestic and international tourists (domestic and inbound tourism), which may contribute significantly to the economy of Bangladesh. However, it has suggested sustainable marine tourism to ensure the balanced development of this untapped subsector of tourism. This therefore warrants a scientific study to explore how to develop sustainable CMT in Bangladesh. Against this backdrop, this chapter examines the institutional arrangements to study the prospects and challenges of developing sustainable CMT in Bangladesh. It investigates the existing institutions supporting CMT and suggests policy guidelines to develop sustainable CMT practices in Bangladesh.
10.2 MethodologyThis qualitative study performed a systematic literature review and meta-analysis to examine various existing policies, acts, rules, regulations, and other institutional and governance arrangements to assess their suitability for addressing and accommodating sustainable CMT development in the context of Bangladesh. The search for these national institutional instruments and governance mechanisms (national) used various keywords, such as tourism policy, acts, rules, regulations, strategies, and programs. Similarly, the authors searched for regional and international (global) institutional instruments and governance mechanisms using different keywords, such as international agreements, treaties, conventions, protocols, collaboration, associations, Sustainable Development Goals (SDGs), and memorandum of understanding (MOU) on tourism in the context of Bangladesh.
The keyword search used online search engines, including Google and Google Scholar, which led to various websites and archives relating to these institutional instruments and governance mechanisms. The authors visited websites from the list of links to judge whether they were

252 Blue Economy and Blue Finance: Toward Sustainable Development and Ocean Governance
relevant to the issues in focus. Furthermore, they deliberately visited the websites of different government ministries of Bangladesh and other organizations for the same purpose, as well as consulted various online books, journals, reports, blogs, and newspapers. After reading these sources, they sorted, organized, and analyzed relevant data to fulfill the objective of the study. They made special attempts to find specific information concerning CMT. The authors prepared a chart (see Table A10.1 in the Appendix) to list all these relevant institutional instruments and governance mechanisms (national) that could directly or indirectly regulate and influence CMT, categorizing them into different themes, like the constitution, acts and orders, rules, visions, plans, strategies and action plans, and programs or schemes. Moreover, they categorized relevant institutional instruments and governance mechanisms (regional and global) into treaties, conventions, agreements, protocols, frameworks, SDGs, MOUs, and so on.
The Preferred Reporting Items for Systematic Reviews and Meta-Analyses (PRISMA) aims to assist researchers in developing the reporting of systematic reviews and meta-analyses. Moreover, PRISMA may provide a framework for a critical assessment of published systematic reviews. However, this study did not treat PRISMA as an instrument to assess the quality of a systematic review (PRISMA 2015), following the PRISMA framework that Moher et al. (2009) prescribed.
10.3 Status of Coastal and Maritime Tourism in Bangladesh
Globally, CMT represents 5% of the world GDP. The expectation is that it will generate job opportunities for approximately 8.5 million people by 2030 (7 million employed in 2010) through CMT. The share of CMT in the total maritime industry value added is likely to reach 26% by 2030, making it the largest contributor to the blue economy (Tonazzini et al. 2019). The growth of the overall international tourist arrivals (ITAs) is overwhelming and likely to increase to 65% in 2030 compared to 2010, with an expected 1.8 billion tourists per year, and to be even higher in developing economies than in developed economies. Nevertheless, COVID-19 reduced ITAs by 84% between March and December 2020 (74% in 2020) compared with the previous year. However, such ITAs fell even more (80%–90% in 2020) in many developing economies. A similar trend emerged at the beginning of 2021, with an average global ITA decline of 88%. Estimates have indicated that the economic losses could be $1.7 trillion–$2.4 trillion, with the potential loss of 100 million–120 million direct tourism jobs in 2021 (UNCTAD 2021;
Sustainable Coastal and Maritime Tourism: A Potential Blue Economy Avenue for Bangladesh 253
UNWTO 2021) . There is an expectation that effective tourism recovery policies will help to recover the loss within a few years.
The current blue economy of Bangladesh focuses mainly on tourism and recreation (25%), followed by marine capture fisheries and aquaculture (22%), transportation (22%), offshore gas and oil extraction (19%), ship and boat building/breaking (9%), and minerals (3%) (Figure 10.1). Around 30 million people (including both employees and their household dependents) rely on the blue economy. Forecasts have indicated that the investment in the CMT sector will grow to more than 9% annually (Patil et al. 2018). Micro, small, and medium-sized enterprises, especially restaurants, region-based hotels, tour operators, and recreational activities, are strong drivers of Bangladesh’s tourism industry (Uddin 2019).
Bangladesh’s tourism sector generated revenue of $1,567.43 million from the blue economy in 2014–2015. The tourism satellite account for Bangladesh was not available in that period. Therefore, the researchers used aggregate data for the whole country and assumed that 16% of this gross value added came from CMT (Patil et al. 2018). The blue economy of Bangladesh contributes around $6.0 billion annually to the national GDP (4.3% of the GDP in 2016). The gross value added of the blue economy was $6.2 billion in 2015 (Business Standard 2020). The contributions of tourism and recreation to the national GDP amounted to over $10 billion in 2016, and they created more than 2 million direct and indirect jobs. This sector of Bangladesh bases its activity on domestic travel and tourism, which account for 98% of the total (WTTC 2017). The recent report on Voluntary National Reviews of Bangladesh 2020 (focusing on the achievement of SDG 2030) published the achievements of various sectors, including tourism (Government of Bangladesh 2020). According to the report, the tourism industry currently supports 1.3 million direct employees, while 2.4 million jobs are indirect.
Coastal tourism in Bangladesh mostly takes place on the world’s longest (120 kilometers) unbroken and natural sea beach, Cox’s Bazar, which is one of the most popular tourist destinations in Bangladesh. Gradually, the subsector has flourished due to the development of many other sea beaches, such as Patenga; Himchari, Inani, and its adjacent areas, representing a marine drive; Kuakata; Saint Martin; Char Kukri-Mukri; and several beaches at the Sundarbans, such as Jamtala, Kochikhali, Dublar Char, Trikona Char, Bangobondhu Char, and Mandarbaria. Nowadays, coastal tourism is one of the most popular forms of tourism in Bangladesh. However, maritime tourism is still popular. The government and the tourism-based private sector are
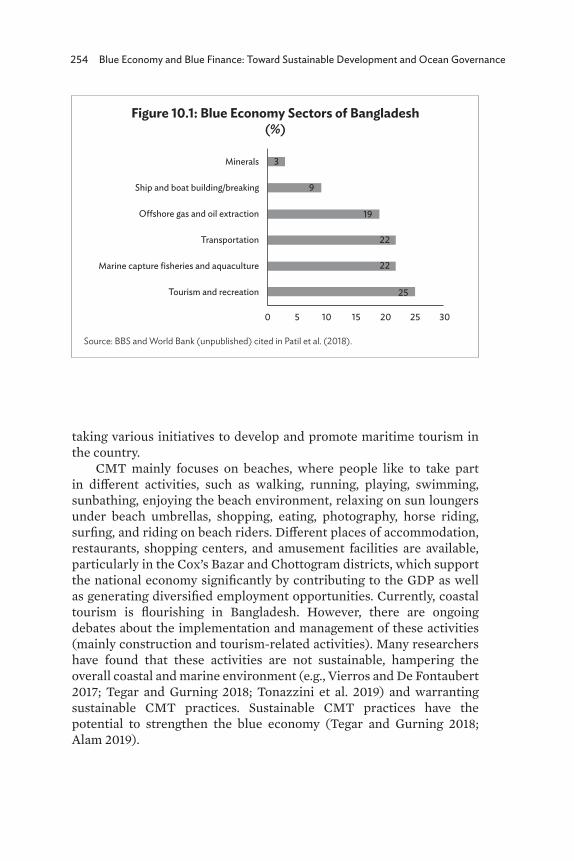
254 Blue Economy and Blue Finance: Toward Sustainable Development and Ocean Governance
taking various initiatives to develop and promote maritime tourism in the country.
CMT mainly focuses on beaches, where people like to take part in different activities, such as walking, running, playing, swimming, sunbathing, enjoying the beach environment, relaxing on sun loungers under beach umbrellas, shopping, eating, photography, horse riding, surfing, and riding on beach riders. Different places of accommodation, restaurants, shopping centers, and amusement facilities are available, particularly in the Cox’s Bazar and Chottogram districts, which support the national economy significantly by contributing to the GDP as well as generating diversified employment opportunities. Currently, coastal tourism is flourishing in Bangladesh. However, there are ongoing debates about the implementation and management of these activities (mainly construction and tourism-related activities). Many researchers have found that these activities are not sustainable, hampering the overall coastal and marine environment (e.g., Vierros and De Fontaubert 2017; Tegar and Gurning 2018; Tonazzini et al. 2019) and warranting sustainable CMT practices. Sustainable CMT practices have the potential to strengthen the blue economy (Tegar and Gurning 2018; Alam 2019).
Figure 10.1: Blue Economy Sectors of Bangladesh (%)
Source: BBS and World Bank (unpublished) cited in Patil et al. (2018).
Minerals 3
0 5 10 15 20 25 30
9
19
22
22
25
Ship and boat building/breaking
O�shore gas and oil extraction
Transportation
Marine capture fisheries and aquaculture
Tourism and recreation
Sustainable Coastal and Maritime Tourism: A Potential Blue Economy Avenue for Bangladesh 255
10.4 National Institutional Arrangements for Developing Coastal and Maritime Tourism
The Constitution of Bangladesh (Government of Bangladesh 1972b) established recreation and tourism-related basic necessities for citizens in section 15(c), which formed the foundation of tourism development of the country. This study provides a list of 41 institutional and governance arrangements (policies, acts, orders, rules, visions, plans, strategies, guidelines, etc.) which it identified through a systematic content analysis as being somehow linked to the development and flourishing of the overall tourism sector of Bangladesh (see Table A10.1 in the Appendix). However, very few such arrangements have focused specifically on CMT. Two policies—the National Tourism Policy 2010 and the National Industrial Policy 2016—specifically and directly recognized and recommended various forms of tourism, including CMT. Besides these, six policies, which various ministries formulated, have addressed tourism, which can also accommodate CMT. Moreover, various government ministries have formulated eleven acts and orders, three rules, three visions, four plans, seven strategies and action plans, and three programs or schemes as supporting institutional instruments and governance mechanisms to develop and promote tourism, which may also address CMT. The current Government of Bangladesh has tried (especially after resolving its conflicts with neighboring countries) to emphasize this specific subsector of tourism as a crucial part of the blue economy. As a result, it has attempted to formulate various legal institutional arrangements to promote CMT, especially during the last decade.
Several government ministries are involved in endeavors to promote CMT in Bangladesh. These include the Ministry of Civil Aviation and Tourism (Bangladesh Tourism Board and Bangladesh Parjatan Corporation); Ministry of Foreign Affairs; Ministry of Shipping; Ministry of Home Affairs; Ministry of Environment, Forests, and Climate Change; Ministry of Cultural Affairs; Ministry of Finance; Ministry of Local Government, Rural Development, and Co-operatives; Ministry of Law, Justice, and Parliamentary Affairs; Ministry of Chittagong Hill Tracts Affairs; and Ministry of Land. The Energy and Mineral Resources Division of the Ministry of Power, Energy, and Mineral Resources formed an administrative cell titled the “Blue Economy Cell” in 2017 to look after various issues of the blue economy. Moreover, some autonomous, private, and nongovernment organizations are cooperating with these ministries in their efforts to advance this tourism subsector. However, ensuring good collaborative relationships and functional
256 Blue Economy and Blue Finance: Toward Sustainable Development and Ocean Governance
networks among these ministries, departments, and other bodies is a major challenge. Therefore, Bangladesh needs to formulate integrated planning to develop and promote CMT.
Various higher education and research organizations focus on coastal and marine resources, such as the Bangabandhu Sheikh Mujibur Rahman Maritime University; some other universities with programs in oceanography, marine biology, and marine resources technology (Dhaka University, Chottogram University, Khulna University, etc.); National Maritime Institute; Marine Academy; Bangladesh Oceanographic Research Institute; Institute of Water Modelling; Center for Environmental and Geographic Information Services; and Bangladesh Institute of Maritime Research and Development (BIMRAD). Moreover, there are some training institutes, such as the Bangladesh Parjatan Corporation, as well as maritime and other private training institutes. The Bangladesh Forest Department, Coast Guard, Water Resources Planning Organization, Bangladesh Inland Water Transport Authority, different chambers of commerce, some nongovernment organizations, and private organizations are also playing a role in developing and facilitating CMT in Bangladesh.
Currently, the Bangladesh Tourism Board, under the Ministry of Civil Aviation and Tourism (MoCAT), is playing an important part in creating a competitive tourism industry, including ecotourism and CMT. It is attempting to improve the existing tourism facilities as well as create new tourism facilities in various tourism destinations in Bangladesh, including coastal and maritime tourist destinations. Moreover, they are promoting these destinations to domestic and international tourists. They have started to prepare a “Tourism Master Plan” for Bangladesh, which will also include CMT development and promotion.
Recently, the Ministry of Shipping has engaged in short-, medium-, and long-term strategic planning for the development of the blue economy, including CMT development and promotion issues, considering domestic, inbound, and outbound tourism. Some of the short-term initiatives (with an implementation period of not more than 2 years) include steps toward Bangladesh–India sea cruise/coastal tourism; a feasibility analysis to develop coastal tourism with Maldives and Sri Lanka; a project for designing and purchasing cruise ships and involving private entrepreneurs in introducing cruise tourism between Bangladesh, India, Maldives, and Sri Lanka; the establishment of river ports at Cox’s Bazar, Teknaf, Saint Martin’s Island, and Moju Chowdhury Hat (Laxmipur) to facilitate coastal tourism; the introduction of coastal passenger services for the Cox’s Bazar–Saint Martin’s and Cox’s Bazar–Moheshkhali routes; the introduction of passenger service through internal river routes for the Dhaka–Chottogram–Cox’s Bazar route;
Sustainable Coastal and Maritime Tourism: A Potential Blue Economy Avenue for Bangladesh 257
the introduction of a master’s course in maritime education; and the establishment of the National Maritime Institute, Madaripur branch project. Some of the medium-term initiatives (with an implementation period of 2–5 years) include the conservation of sea and sea resources and their sustainable use and postgraduate courses (master’s and doctorate) in coastal and maritime affairs.
Besides these endeavors, other ministries and departments have relevant initiatives to facilitate CMT development in Bangladesh. Examples include a notable initiative from the Bangladesh Economic Zones Authority (BEZA) (under the Prime Minister’s Office) to establish the Sabrang Tourism Park (an ongoing project with an area of 1,027 acres) as the first tourism-based special economic zone and the first exclusive tourism zone in Bangladesh. The park’s location is in amazing hill and sea beach territory with a multifaceted and diverse landscape and culture in Teknaf subdistrict in the Cox’s Bazar district. According to the master plan, this park will become a hub of tourism destinations around Cox’s Bazar and its neighboring areas. Moreover, the BEZA has prepared the master plan of the Sonadia Ecotourism Park (8,967 acres) and the Naf Tourism Park (271 acres) in the Cox’s Bazar district to attract domestic and international tourists.
10.5 Regional and International (Global) Institutional Arrangements
Bangladesh has signed and/or ratified various international treaties, conventions, and agreements. Some of these arrangements directly and indirectly concern different issues of CMT as well as the abovementioned national institutional arrangements. Among these international institutional arrangements are the Convention on Biological Diversity (CBD); Aichi Biodiversity Targets; 2030 Agenda for Sustainable Development (SDGs); Kyoto Protocol to the United Nations Framework Convention on Climate Change; Paris Agreement; World Conservation Strategy; International Convention for the Prevention of Pollution of the Sea by Oil; International Convention Relating to Intervention on the High Seas in Cases of Oil Pollution Casualties; Convention on Wetlands of International Importance Especially as Waterfowl Habitat (Ramsar Convention); Convention Concerning the Protection of the World Cultural and Natural Heritage (World Heritage Convention); Nagoya Protocol; Convention on International Trade in Endangered Species of Wild Fauna and Flora (CITES Convention); United Nations Convention on the Law of the Sea; Agreement on the Network of Aquaculture Centres in Asia and the Pacific; International
258 Blue Economy and Blue Finance: Toward Sustainable Development and Ocean Governance
Convention on Oil Pollution Preparedness, Response, and Cooperation; United Nations Framework Convention on Climate Change; Cartagena Protocol; and Convention on Persistent Organic Pollutants.
Moreover, the Government of Bangladesh and other countries and organizations have signed other institutional arrangements, such as bilateral or multilateral agreements and MOUs, to facilitate the development of CMT. Focusing on regional institutional arrangements, countries have recognized the significant role of tourism since the establishment of the South Asian Association for Regional Cooperation (SAARC) in 1985. Some initiatives were taken to strengthen tourism in the SAARC region when the leaders met during the Second Summit in Bangalore, India, in 1986, and successive summits reiterated the significance of various forms of tourism, including CMT (SAARC 2018). The second meeting of tourism ministers embraced the SAARC Action Plan on Promotion of Tourism, which included a joint proactive marketing campaign of the SAARC landmass as a composite destination in the international market. The plan incorporated the roles of private sectors in this region in promoting and developing tourism both intra-regionally and internationally.
The Bay of Bengal Initiative for Multi-Sectoral Technical and Economic Cooperation (BIMSTEC) (established in 1997) is another platform for intra-regional cooperation among seven South and Southeast Asian countries (Bangladesh, Bhutan, India, Myanmar, Nepal, Sri Lanka, and Thailand). It covers 3.7% of the global area and a market of around 1.7 billion people (i.e., 22.2% of the global population). Tourism has been one of the 14 sectors of cooperation since the inception of this platform. A seminar on “Tourism Connectivity in BIMSTEC Region” took place in Dhaka on 28 September 2019 in collaboration with the 8th Asian Tourism Fair 2019. The seminar took various steps to promote regional tourism in the Bay of Bengal and emphasized the necessity of more intense cooperation among government agencies and private sector tour operators as well as hospitality industry entrepreneurs. It also formulated the Plan of Action for Tourism Development and Promotion for the BIMSTEC Region (BIMSTEC 2019).
Five maritime countries (Bangladesh, India, Maldives, Pakistan, and Sri Lanka) established another maritime regional platform, the South Asian Seas Programme, under the Regional Seas Program and South Asian Seas Action Plan (adopted in 1995). It recognized recreation and tourism as a vital sector to contribute to the member states and the region considering its economic, social, and cultural importance. The Asian Development Bank (ADB) prepared the South Asia Subregional Economic Cooperation Tourism Development Plan (SASEC Tourism Plan), which represents the profiles of existing
Sustainable Coastal and Maritime Tourism: A Potential Blue Economy Avenue for Bangladesh 259
tourism status, patterns, and future tourism development agendas of Bangladesh, Bhutan, the eastern states of India, Nepal, and Sri Lanka. Moreover, it recommends core strategic directions for the Technical Working Group (ADB 2004). In addition, Bangladesh has an active association with various global organizations, including the United Nations World Tourism Organization (UNWTO), World Travel and Tourism Council (WTTC), and Pacific Asia Travel Association, which guide and facilitate the development and promotion of the tourism sector and CMT-related issues.
10.6 Challenges
10.6.1 Lack of a Dedicated Coastal and Maritime Tourism Policy and Coordination
Despite the increasing global interest, Bangladesh has not yet produced a well-coordinated blue economy policy or plan to strengthen the sector (Uddin 2019). It is clear that, though several legal institutional frameworks from different ministries have directly and indirectly touched on coastal and marine tourism (see the Appendix), there is still no integrated and dedicated policy, act, or plan focusing on this specific form of tourism. Moreover, there is a clear coordination gap among the concerned ministries regarding the implementation of the existing institutional instruments and governance mechanisms. Additionally, there is a low level of participation of local stakeholders in planning and implementing these institutional instruments and governance mechanisms. Currently, the tourism sector of Bangladesh enjoys no economic support, like cash incentives, tax holidays, and value-added tax exemption on imports, from the government (Uddin 2019).
10.6.2 Anthropogenic Pressure
The development and promotion of CMT face various challenges in Bangladesh, most of which are anthropogenic in nature. CMT is a complex phenomenon that has both positive and negative impacts on coastal and marine environments due to various tourism activities (Marafa 2008; Rahman et al. 2020). On the one hand, a healthy natural environment is a great asset for CMT. On the other hand, tourism exerts considerable pressure on the local environment and ecosystems, such as greater use of water, other resources, and energy; increased waste generation; and accumulated emissions from various sources, such as air, road, and sea transport, particularly in peak seasons.
260 Blue Economy and Blue Finance: Toward Sustainable Development and Ocean Governance
The rapid growth of the unplanned and uncontrolled domestic tourism industry has harmful impacts on the marine environment, particularly on Saint Martin’s Island and in Cox’s Bazar and the Sundarbans. These include harmful activities such as the collection of shells, corals, and eggs of various animals, as well as damage to coastal vegetation through trampling. Such an uncontrolled influx of tourists and their rampant abandonment of solid waste (e.g., plastic bags, cans, wrappers, water bottles, and other non-biodegradable substances) are becoming major threats to these sensitive ecosystems, causing various types of significant environmental pollution. Moreover, noise pollution from uncontrolled mechanized vehicles is triggering problems for the ecosystems, specifically the wildlife of coastal forests. Therefore, the Department of Environment (2006, 2010a, 2015) has identified coastal tourism as one of the 15 major sources of coastal and marine pollution. Moreover, conflict in coastal land use presents another challenge in addressing the sustainable development of the area (GED 2013). All these issues are responsible for the deteriorating coastal biodiversity of Bangladesh (TBS Report 2020).
10.6.3 Climate Change
The coastal area of Bangladesh is especially vulnerable to the effects of climate change. According to the influential Intergovernmental Panel on Climate Change, a 1-meter sea-level rise would flood 17% of the country and create 20 million refugees by 2050 (Sarwar 2005; Szczepanski, Sedlar, and Shalant 2018). Consequently, such a situation would adversely affect the entire coastal zone of Bangladesh and CMT.
10.6.4 Domestic Tourism and COVID-19
Domestic tourism is the main source (97%) of earnings in tourism, indicating that Bangladesh is not a popular destination among foreign tourists (WTTC 2020a). The COVID-19 pandemic situation will aggravate the situation for inbound tourism in Bangladesh. There will be more pressure on domestic tourists in the coastal and marine destinations, which will create more of the abovementioned anthropogenic challenges.
10.6.5 Other Challenges
Other challenges that warrant attention in developing and promoting CMT in Bangladesh include insufficiently trained and competent human resources, lacking innovative and creative thinking abilities; the
Sustainable Coastal and Maritime Tourism: A Potential Blue Economy Avenue for Bangladesh 261
knowledge gap; inadequate infrastructure for tourism facilities; the lack of CMT branding; insufficient coordination and partnerships among the concerned ministries, departments, and the private sector; poor promotional activities; the lack of certification guidelines for tourism products and services; the lack of a best practice-sharing culture; the poor tourism budget; and insufficient research and links between research and development, as well as policy formulation.
10.7 Prospects
10.7.1 Institutional Arrangements
Despite the absence of any specific and dedicated policy, act, or plan, the national, regional, and global institutional arrangements that relate directly and indirectly to CMT are somehow supportive of the development and promotion of this specific form of tourism in Bangladesh (see section 10.3 for the details). The current government has already made special considerations to promote the blue economy of Bangladesh, emphasizing CMT as one of the crucial subsectors. The Ministry of Foreign Affairs established a “Blue Economy Cell” in 2017 with the authorization to synchronize blue economy initiatives across different sectoral ministries. The Seventh Five Year Plan of Bangladesh declared a competitive tourism industry, including ecotourism and marine cruises, as one of the 12 activities to create and maintain a prosperous and sustainable blue economy. The ongoing Eighth Five Year Plan also emphasizes coastal tourism under the blue economy, which includes several activities aiming to develop the sector.
The CMT sector depends strongly on maintaining the marine ecosystems (Roy and Roy 2015). Considering the sensitivity of the ecosystems, the Government of Bangladesh has already declared Saint Martin’s Island (a coral island), Cox’s Bazar–Teknaf sea beach, and the Sundarbans as ecologically critical areas to protect their biodiversity. These ecologically critical areas, along with other coastal and marine areas, are also potential CMT destinations for the greater welfare of the local community as well as the environment. Scuba diving, recreational fishing, water skiing, windsurfing, cruise tourism, and tours to marine protected areas (MPAs) are some examples of potential activities under CMT. However, various tourism activities exert significant negative impacts, causing coastal and marine pollution, as different studies have reported (e.g., DoE 2006; Business Standard 2020).
The natural resources below sea level (particularly biodiversity) and the beauty of Bangladesh remain unexplored as a new horizon for maritime tourism. There are two MPAs in Bangladesh. The first such
262 Blue Economy and Blue Finance: Toward Sustainable Development and Ocean Governance
area is the Swatch of No Ground (consisting of an area of 1,738 km2) and Nijhum Dwip Marine Reserve/MPA (an area of 3,188 km2) in the South Bay of Bengal. There is an intention to propose another 1,743 km2 area adjacent to Saint Martin’s Island as an MPA to conserve its extraordinary biodiversity. All these MPAs offer substantial potential for maritime tourism. Tourists have the unique opportunity to enjoy endangered marine dolphins, whales, and sharks and facilitate their conservation through awareness creation and fund generation. Various actions are undergoing implementation there to foster the conservation of marine biodiversity, including dolphins and turtles.
10.7.2 Cruise Ships
Recently, the maritime tourism history of Bangladesh has reached some new milestones. International luxury cruise ships started to travel to Bangladesh in 2017, and the number increased in 2019. Moreover, the introduction of the first domestic luxury cruise ship (MV Bay-One) took place in December 2020, with the capacity to accommodate more than 2,000 guests. The ship started its operation on the Cox’s Bazar–Saint Martin’s–Cox’s Bazar route. It recently introduced a new route (Chattogram–Cox’s Bazar–Saint Martin), and other routes to adjacent islands are likely to commence in the near future to develop CMT further. Nonetheless, the ongoing COVID-19 pandemic has caused the cancellation or delay of many such endeavors. Therefore, CMT has good prospects for developing and promoting all types (domestic, inbound, and outbound) of tourism in Bangladesh.
10.7.3 Natural Attractions
The culture, tradition, and trades of Bangladesh are intimately concomitant with the Bay of Bengal—part of the Indian Ocean. The Bay of Bengal and the entire coastal zone (47,201 km2, i.e., 32% of the country under 19 coastal districts) of the country are rich in natural resources, which play crucial roles in the national economy; contribute profoundly to protecting against natural disasters through the natural green belt, particularly the Sundarbans; conserve important biodiversity of the coastal and marine environment; and protect the special culture of the region, among others. The potential for the development of CMT in Bangladesh is unique due to the presence of many glorious natural resources, including the world’s longest unbroken sandy sea beach (Cox’s Bazar), the largest single tract of mangrove forest
Sustainable Coastal and Maritime Tourism: A Potential Blue Economy Avenue for Bangladesh 263
(the Sundarbans), the magnificent Teknaf peninsula, the marvelous Saint Martin, and long coastal and maritime areas and their unique forest and aquatic biodiversity. Though Bangladesh is a small country, it contains some amazing and alluring islands. Most of these islands lie in the Bay of Bengal, although some of them are in the Padma River. Travel Mate (2019) identified the 15 most beautiful islands in Bangladesh and suggested that tourists visit these islands to experience their pristine nature, biodiversity, unique culture, and traditions. Since 2007, 29 new islands (with a total area of 507 km2) have emerged in the Bay of Bengal, and these are potential tourism destinations, particularly for adventure travel tourists (The Straits Times 2017). However, very few studies have been conducted on such tourism potential on these islands.
10.7.4 Contribution to the National Gross Domestic Product
Despite the small contributions of the tourism sector to the national GDP of Bangladesh, various studies have reported that Bangladesh is a prospective country for tourism development (Islam 2010; Islam, Iftekhar, and Islam 2011; Uddin 2019; Arif 2020), particularly for CMT (DoE 2015; Nobi and Majumder 2019; Business Standard 2020). The international visitor impact is still very low in Bangladesh (spent $333.5 million), accounting for only 0.7% of the total exports in 2019. International visitors contribute only 4% of the total spending on travel and tourism. However, this is likely to grow by 7.1% per year or 4.7% of the country’s GDP by 2027 (WTTC 2020b). The strong backward and forward linkages of ecotourism are its strength in supporting the local and national economy of Bangladesh through its significant contributions to the livelihood and well-being of the destinations (DoE 2015). Considering the current status of the territory that Bangladesh owns, it is possible to earn as much as $250 million every year from oil–gas exploration, fishing, and the expansion of seaport facilities and CMT (Rana 2019).
The contribution of the travel and tourism sector to Bangladesh’s GDP was 3% in 2019 (6.8% growth over 2018), and it generated 2.9% of the total employment. Moreover, the number of international visitors is expected to increase by 6.1% per year with growth in the total tourism GDP of 6.2% per year and employment growth of 1.8% per year (WTTC 2020b). All these statistics indicate that there are immense opportunities for inbound tourism growth in Bangladesh, which will increase the overall impacts of CMT in Bangladesh.
264 Blue Economy and Blue Finance: Toward Sustainable Development and Ocean Governance
10.7.5 Tourism Growth Potential
Bangladesh is among the top 25 countries in the world for tourism growth. Estimations have indicated that the overall tourism sector will grow at an annual rate of 6.1% from 2017 to 2027. Though not all the activities are part of the blue economy (WTTC 2017), CMT is likely to play an important role in such growth considering its current contributions and potential.
According to a World Bank study, the population growth rate of Bangladesh will approach zero after 2050. This population growth pattern will affect the future of the blue economy, including increased CMT tourism demands (Patil et al. 2018). The Organisation for Economic Co-operation and Development (2016) projected the global growth of CMT in the future, which also applies to Bangladesh, where the growth of investment in the tourism sector is likely to be 9.3% per year from 2018 to 2027. Additionally, urban areas will experience considerable growth during this period, which will ultimately lead to CMT development on various beaches, like Patenga, Cox’s Bazar, Himchori, Inani, Saint Martin, Moheshkhai, the Sundarbans, Kuakata, Bhola, and Monpura (Hussain et al. 2017).
10.7.6 Application of Different Forms of Tourism
Different forms of tourism may have potential in the context of the coastal environment of Bangladesh. Considering the abovementioned natural attractions and CMT, the principles of ecotourism (TIES 2019) and sustainable tourism (UNWTO 2020b) are crucial to consider when selecting a specific form of CMT. Consequently, community-based ecotourism, pro-poor tourism-based rural tourism, beach/sand tourism, cultural and heritage tourism, and tribal/ethnic tourism are some of the possible forms to adopt in such a coastal environment.
The Government of Bangladesh has prescribed controlled ecotourism as a protective form of tourism, especially for the key biodiversity areas and protected areas, including the coastal and maritime areas. Consequently, various formal documents have recognized controlled/managed ecotourism, including several legal documents (e.g., the National Tourism Policy 2010; Coastal Development Strategy 2006; Vision 2041; Seventh and Eighth Five Year Plans; National Forestry Policy 1994 and 2016 (draft); and National Biodiversity Strategy and Action Plan of Bangladesh 2016–2021). Ecotourism with a controlled entry of tourists is permissible anywhere that the government has declared as a protected area and restricted for general uses. It has suggested following

Sustainable Coastal and Maritime Tourism: A Potential Blue Economy Avenue for Bangladesh 265
successful sustainable models of ecotourism from countries in the Asia and Pacific region (MoEF 2012).
Tourism scholars posit that competent human resource development and good management of such forms of tourism to generate positive sociocultural, economic, environmental, and institutional impacts and control various negative impacts to facilitate sustainable CMT practice. Moreover, the feasibility analysis, demand, and supply of these forms of tourism will help to identify a specific form of CMT. The theme of “tourism and rural development” of World Tourism Day 2020 needs exploration in this regard to strengthen the selection of a specific form of tourism.
10.7.7 Sustainable Coastal and Maritime Tourism to Promote Sustainable Development
Sustainable CMT is one of the ways to foster sustainable development, which is still an unexplored sector in Bangladesh. Sustainable CMT has the potential to contribute to natural resource conservation and management and natural disaster risk reduction. It can also offer better living standards by improving people’s livelihoods (i.e., sustainable livelihoods) and is capable of earning millions in foreign exchanges and preserving the culture and traditions. Generally, there is a lack of environmental awareness and education among the people of Bangladesh. Sustainable CMT practice can improve this and control the various forms of environmental pollution, which constitutes one of the important challenges facing the country.
10.7.8 Sustainable Development Goals
As mentioned, the forecasted investment in the CMT sector will grow to more than 9% annually (Patil et al. 2018). Therefore, the expansion of various forms of the CMT industry is likely to facilitate the blue economy in achieving the 2030 Agenda for Sustainable Development by creating more opportunities, especially for women, including tribal and other minorities, reducing poverty through new livelihoods and job creation, enhancing environmental awareness and education, promoting biodiversity conservation both in water and on land, improving governance, and promoting the sustainable use of coastal and maritime natural resources as well as social and cultural sustainability. The expectation is that the implementation of the Tourism Master Plan (SDG 8) will create more than 6 million jobs by 2030 once ADB has financed the South Asia Tourism Infrastructure Development Project

266 Blue Economy and Blue Finance: Toward Sustainable Development and Ocean Governance
(Bangladesh Portion), aiming to improve culture-based tourism and to strengthen linkages between tourism and local people by building the capacity of communities to obtain greater benefits from the tourism sector (SDG 11).
Addressing sustainable consumption (SDG 12), the government has considered sustainable tourism. The Ministry of Civil Aviation and Tourism (MoCAT) is responsible for developing and implementing tools to monitor the impacts of tourism related to the sociocultural, economic, and environmental perspectives. MoCAT has prepared short-, medium-, and long-term action plans to achieve the objectives of sustainable tourism through which it will promote sustainable development. In 2013, the Government of Bangladesh established the Bangabandhu Sheikh Mujibur Rahman Maritime University, which is the third maritime university in South Asia and the twelfth maritime university in the world. This university focuses particularly on SDG 14 and plans to conduct both undergraduate and postgraduate academic and research courses in various coastal and maritime fields, including CMT. Currently, the Ministry of Foreign Affairs (MoFA) is formulating the legal framework according to the instruments of the United Nations Convention on the Law of the Sea to ensure the protection and conservation of the coastal and maritime environment and its biodiversity. Tourism development needs an integrated plan to conserve and preserve the life below the water of such sensitive coastal and marine ecosystems, which will also accelerate the blue economy.
The Bangladesh government is taking various initiatives to address the effects of climate change. It is also investing in clean energy sectors, which can contribute to reducing greenhouse gases (SDG 13). However, it has not yet included tourism extensively in such interventions. The recently formed Global Centre on Adaptation for South Asia established a regional office in Dhaka. The expectation is that this will function as a center of excellence for climate change adaptation measures in the region.
CMT can directly influence life below water (SDG 14) due to its operational nature. It can promote the conservation of coastal and marine biodiversity by controlling environmental pollution, which it will achieve by providing environmental education and awareness, creating new jobs and livelihoods, and improving governance and multi-stakeholder collaboration. According to Mojibul et al. (2018); Hussain, Failler, and Sarker (2019); and Bhuiyan, Darda, and Habib (2020), coastal and marine fishery activities, including recreational fishing, are one of the attractions of CMT that can generate considerable economic benefits, employment opportunities, and livelihoods for the local coastal communities of Bangladesh. Various stakeholders have perceived CMT
Sustainable Coastal and Maritime Tourism: A Potential Blue Economy Avenue for Bangladesh 267
as a facilitator of the coastal and marine fishery subsector. Furthermore, CMT has a strong impact on the generation of various livelihoods for coastal communities by introducing different service-oriented economic activities, such as providing diversified accommodation, restaurant facilities, handicraft manufacturing and marketing, transportation services, tour guiding, and amusement facilities. However, there is a specific research gap on the impacts of CMT on the fishery sector as well as other livelihood-generating sectors in Bangladesh. Moreover, terrestrial ecosystems and their biodiversity are important tourist attractions. Such attractions can generate sustainable revenue and create alternative livelihoods for the local people, which can eventually promote the conservation of life on land (SDG 15) as well as the cultural heritage of the destinations.
10.7.9 Upcoming Institutional Development
The Bangladesh Tourism Board is currently preparing a tourism master plan, and the Bangladesh Investment Development Authority has identified tourism as a potential sector for the overall development of Bangladesh. Moreover, the development of the Bangladesh Tour Operators and Tour Guides (Registration and Operation) Act 2021, the Community-Based Tourism Policy, and the Ecotourism Policy, the upgrading of the National Tourism Policy 2010, and the review of the master plan for airports are among the significant examples of ongoing activities to promote sustainable tourism in Bangladesh, which will also enhance the sustainability of CMT. MoCAT has also taken initiatives to construct a “Marine Aquarium” in Cox’s Bazar from 2017/18 to 2020/21. In a nutshell, considering the existing situation, there is a substantial opportunity for developing and promoting CMT in Bangladesh, which can facilitate the country’s achievement of developed country status by 2041.
10.7.10 Impacts of COVID-19
Tourism is one of the economic sectors that the COVID-19 pandemic has strongly affected, and it might face a decline of 58%–78% in international tourist arrivals during 2020, putting 100 million–120 million direct tourism jobs at risk (UNWTO 2020a). There are many additional impacts that are still difficult to quantify, such as threats to the conservation of species and biodiversity, all with a direct link to tourism. Moreover, the pandemic has hit coastal communities the hardest, with an estimated $7.4 billion fall in GDP across small island developing states due to the decline in tourism (Northrop et al. 2020).
268 Blue Economy and Blue Finance: Toward Sustainable Development and Ocean Governance
Considering the post-COVID-19 situation, people in Bangladesh are likely to visit its CMT destinations. A good number of people already started to visit these destinations just after the lifting of tourism restrictions in some CMT destinations after the first wave of the COVID-19 pandemic. The government has already decided to open tourism at the Sundarbans from 1 November 2020. However, currently, there are restrictions on visits to all these destinations due to the second wave of the pandemic (until July 2021). According to newspapers, social media, and personal communications, it is evident that the demand for these destinations will be high in the coming few months as people will require refreshment after the long and unprecedented lockdown. This tourism demand will create numerous benefits along with negative impacts.
10.8 Conclusions and Policy Recommendations The study clearly shows that CMT has immense potential in the blue economy, which may be one of the biggest sources of revenue (including foreign exchange) in Bangladesh’s tourism sector. Thus, it may contribute significantly to improving the sociocultural, economic, environmental, and institutional dimensions of the concerned areas.
Bangladesh ranked seventh in the top 10 best-value travel destinations for 2019 according to Lonely Planet, a global leader in publishing travel guidebooks (Uddin 2019). Therefore, the country is gradually gaining popularity among international tourists, for whom CMT occupies a significant position. Therefore, the development and promotion of CMT warrant a critical analysis to maximize its positive impacts and to reduce its negative impacts. This study aimed to focus on determining how sustainable CMT can influence the blue economy, reduce poverty through new job creation, conserve biodiversity, control environmental pollution, promote the sustainable use of coastal and marine natural resources, promote good governance, provide recreation facilities, and promote responsible (eco-friendly) tourism or ecotourism. It identified the challenges of CMT development in Bangladesh. It will be possible to resolve or at least reduce many of these challenges through the proper and judicious application of existing legal institutions, such as various national acts and rules, as well as international institutional arrangements (Figure 10.2) to turn those challenges into CMT potentials.
Tourism and recreation (25%) are the main activity of the current blue economy of Bangladesh (Patil et al. 2018). CMT can contribute positively to the sustainable blue economy through the sociocultural, economic, and environmental development of the country, with particular reference to sustainable CMT development. However,
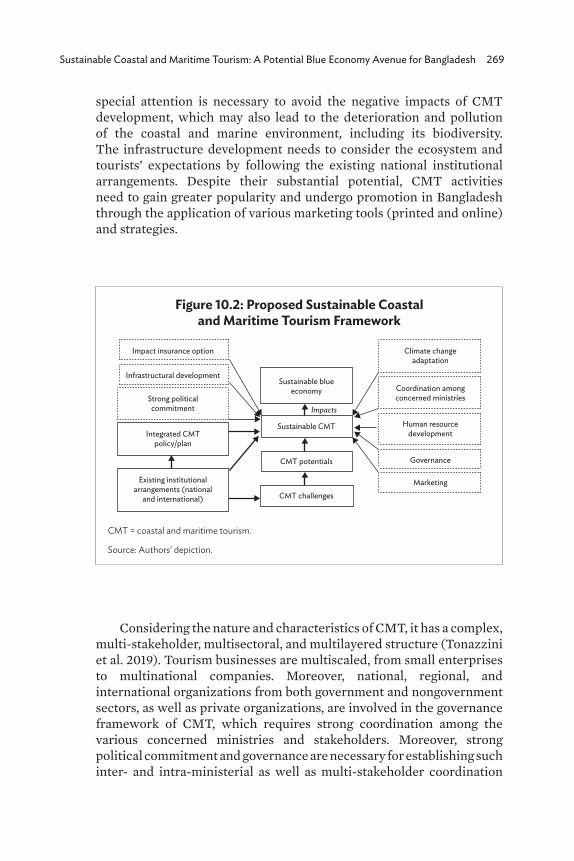
Sustainable Coastal and Maritime Tourism: A Potential Blue Economy Avenue for Bangladesh 269
special attention is necessary to avoid the negative impacts of CMT development, which may also lead to the deterioration and pollution of the coastal and marine environment, including its biodiversity. The infrastructure development needs to consider the ecosystem and tourists’ expectations by following the existing national institutional arrangements. Despite their substantial potential, CMT activities need to gain greater popularity and undergo promotion in Bangladesh through the application of various marketing tools (printed and online) and strategies.
Figure 10.2: Proposed Sustainable Coastal and Maritime Tourism Framework
CMT = coastal and maritime tourism.
Source: Authors’ depiction.
Impact insurance option
Sustainable blueeconomy
Infrastructural development
Sustainable CMT
CMT potentials
CMT challengesMarketing
Governance
ImpactsStrong political
commitment
Climate changeadaptation
Coordination amongconcerned ministries
Human resourcedevelopmentIntegrated CMT
policy/plan
Existing institutionalarrangements (national
and international)
Considering the nature and characteristics of CMT, it has a complex, multi-stakeholder, multisectoral, and multilayered structure (Tonazzini et al. 2019). Tourism businesses are multiscaled, from small enterprises to multinational companies. Moreover, national, regional, and international organizations from both government and nongovernment sectors, as well as private organizations, are involved in the governance framework of CMT, which requires strong coordination among the various concerned ministries and stakeholders. Moreover, strong political commitment and governance are necessary for establishing such inter- and intra-ministerial as well as multi-stakeholder coordination
270 Blue Economy and Blue Finance: Toward Sustainable Development and Ocean Governance
through their proactive leadership roles (Figure 10.2), which are also essential for compliance with the existing institutional arrangements (both national and international) related to CMT.
Sustainable CMT policies must acknowledge the impacts of tourism activities on the coastal territories, the vulnerability and complexity of the coastal and maritime ecosystems, and their interactions with the different subcomponents of CMT (Tonazzini et al. 2019). Therefore, this type of tourism should be consistent with the existing tourism-related institutional arrangements of Bangladesh to ensure its legal basis, as well as to develop and promote sustainable CMT.
The existing institutional instruments and governance mechanisms of Bangladesh might be enough to control most of the challenges that this chapter has mentioned. However, reality indicates that the enforcement of most of these legal bindings is insufficient to overcome these challenges, which require stronger political commitments, massive public participation, regular and integrated monitoring and performance assessment, and good governance to act inclusively. Otherwise, the mere formulation of new institutions will not produce any significant positive change in this regard. Addressing these challenges and their proper management will likely increase the untapped potential of CMT significantly and to make the coastal and marine areas more popular tourism destinations.
Research has analyzed the prospects of CMT in Bangladesh from various perspectives, including the relationships with the blue economy and its sustainable development. Moreover, several legal and policy documents of Bangladesh have recognized the existing contributions and potential of the tourism service sector. These documents have suggested that the contributions of tourism and recreation services, ecotourism, and community-based tourism support CMT. The potentially enormous impacts of these service industries on CMT are evident from the existing literature. These services can be good sources of solutions to many problems in CMT destinations and their surroundings by creating new job opportunities for local people, including youths, women, tribal, and other minorities; educational support; education and awareness-building facilities on the environment, pollution, and other local challenges; own cultural values and respect; empowerment; better networks; good governance; and so on. Considering these impacts, policy and decision makers should prepare an integrated and sustainable CMT policy or plan for Bangladesh to facilitate the sustainable development of coastal and marine areas that should address the prospects, challenges, and impacts of CMT activities on the overall coastal and maritime ecosystems. This CMT policy or plan should consider the local community and local government as key stakeholders of such sustainable development,
Sustainable Coastal and Maritime Tourism: A Potential Blue Economy Avenue for Bangladesh 271
as Tonazzini et al. (2019) and Bhuiyan, Darda, and Habib (2020) also indicated. The government should consider the implementation of such a CMT policy or plan as one of the avenues to promote the blue economy and facilitate the well-being of both the coastal communities and all these service industries within the blue economy framework.
The development of a multi-stakeholder participatory approach, like participatory planning, implementation, monitoring, and evaluation process and shared governance mechanisms for each of the CMT destinations, is advisable for their comprehensive management. The application of various participatory tools (such as citizen science) may be useful for data collection at a very low cost with the involvement of various stakeholders, including the local communities, to educate tourists and influence the value chain (following Tonazzini et al. 2019).
It is evident that climate change and the tourism sector can affect each other (Simpson et al. 2008; Kaján and Saarinen 2013). Therefore, climate change adaptation is an important factor for a sustainable CMT development framework. On the one hand, CMT should restrict greenhouse gas emissions from its transportation, accommodation, and recreational activities. On the other, the CMT development plan should contain climate change mitigation and adaptation strategies to address various climate change effects, including from disasters such as cyclones, floods, drought, and infectious diseases like COVID-19. Consequently, relevant policies, competent human resources, and other supportive instruments are warranted. Research has suggested a community-based climate change adaptation strategy through CMT (Hussain, Failler, and Sarker 2019; Bhuiyan, Darda, and Habib 2020). Therefore, an integrated and coordinated approach is necessary to integrate a coastal zone management plan that can attract tourists and consider the fragile ecosystem of the coastal and marine environment (Marafa 2008). Consequently, skilled and competent human resource development needs to be one of the key factors in developing sustainable CMT that can deal with all these sorts of policy and technical issues.
The Nature Conservancy, in a recent report, suggested that an impact insurance option could be useful for providing a cost-effective option to protect and restore mangrove habitat (Beck et al. 2020). In the context of the Caribbean, the report further highlighted the use of insurance as one of the best market-based mechanisms to safeguard assets and infrastructure in the mangroves and along the coastlines.
One recommendation is to follow success stories to improve practice. Bangladesh can learn lessons from Malaysia, as it is one of the 12 mega-biodiversity countries in the world that have significantly progressed in CMT development. There are various specific national policies, plans, and strategies (e.g., National Biological Diversity Policy
272 Blue Economy and Blue Finance: Toward Sustainable Development and Ocean Governance
2016–2025, National Ecotourism Plan 2015–2025, and National Physical Plan for Coastal Zones) to develop and promote CMT in Malaysia. It has established several marine parks, where the number of tourists and the amount of earned revenue are increasing. At the same time, Malaysia expanded its conservation efforts, which are contributing positively to conserving its marine biodiversity, including reef diversity. It has also created various recreational and educational services for tourists, considering safety and security measures (Department of Marine Park Malaysia 2017).
According to Vision 2041 (GED 2020b), it is possible to promote CMT through a number of actions, including effective and regular promotional campaigns for both domestic and international tourists; coordination for establishing joint CMT initiatives with neighboring countries (intercountry and interregional partnerships and networks); all-season tourism boat fleet development; the promotion of tour packages for watching dolphins, sea whales, and sharks; the provision of incentives for performance achievers to popularize CMT; the promotion of ecotourism principles as part of sustainable tourism to implement CMT to foster the sustainable development of the coastal areas; the development of capacity-building programs for professional tour guides and other required personnel, and so on.
The government provides practically no economic support, like cash incentives, tax holidays, and value-added tax (VAT) exemption on imports, for the tourism sector of Bangladesh (Uddin 2019). Therefore, considering the great potential of tourism services, the provision of more investment and tax incentives for tour operators and facilitators would help to establish and improve tourism services in Bangladesh (GED 2015, 2020a, 2020b). The tourism sector has received similar types of tax and fiscal incentives to create more job opportunities and develop the domestic tourism industry in several developing countries, including Brazil (Garsous, Corderi, and Velasco 2015), Thailand (Volodarsky 2021), India (IMRB International 2014), Nepal (Shrestha 2020), and Viet Nam (Falak 2020). Many developing countries (including Bangladesh) have also announced some economic incentives for the tourism sector as a recovery strategy from the ongoing COVID-19 pandemic. However, currently, more economic support from governments is warranted for the tourism sector to manage the post-pandemic crisis.
Moreover, undertaking the following tasks (also considered as future research directions) might promote CMT in Bangladesh: fixing environmental taxes (for entering and staying overnight in ecologically critical areas) to protect coastal biodiversity and generate revenues; emphasizing coastal and maritime tourism in various tourism initiatives of Bangladesh where appropriate, including promotional
Sustainable Coastal and Maritime Tourism: A Potential Blue Economy Avenue for Bangladesh 273
and communication campaigns; dialogue between Bangladesh and other governments (India, Maldives, Myanmar, Sri Lanka, Singapore, Malaysia, Indonesia, Thailand, etc.), international cruise operators, ports, and other CMT stakeholders to promote CMT; encouraging innovative management schemes through the application of information and communication technology and other technologies; developing preventive strategies to control various forms of environmental pollution to promote sustainable CMT; diversifying and integrating CMT and inland tourism attractions, such as natural, cultural, religious, and archaeological routes; establishing the required tourism and other coastal infrastructure considering the sensitive ecosystems and sea-level rise; learning various lessons from successful CMT in other countries; studying the behavior of tourists and host communities; and conducting various studies on CMT development and promotion, particularly focusing on new CMT products and service interventions to improve remote destinations’ connectivity and innovative designs for tourism strategies. To recover the seasonality of visits to coastal destinations, there should be innovative and attractive offers for potential tourists that may entice them to visit these destinations during the low season to make the business sustainable.
274 Blue Economy and Blue Finance: Toward Sustainable Development and Ocean Governance
ReferencesAlam, M. K. 2019. Maritime Safety and Security in the Bay of Bengal.
Bangladesh Maritime Journal. 3 (1). pp. 25–31. Arif, K. 2020. Tourism: A Possible New Driver for the Economy of
Bangladesh. https://databd.co/stories/tourism-a-possible-new -driver-for-the-economy-of-bangladesh-9357 (accessed 19 October 2020).
Asian Development Bank (ADB). 2004. South Asia Subregional Economic Cooperation Tourism Development Plan. Manila. https://www.adb .org/sites/default/files/publication/27954/tdp-final.pdf
Bangladesh Forest Department. 2016. National Forestry Policy, 2016 (Draft). Dhaka, Bangladesh. http://bforest.portal.gov.bd/sites/default /files/files/bforest.portal.gov.bd/page/238fc41d_700a_489d_9758 _e80b7efdb2ef/Forest%20Policy%20English%20version%20%28%20update%29.PDF
Bay of Bengal Initiative for Multi-Sectoral Technical and Economic Cooperation (BIMSTEC). 2019. Seminar on Tourism Connectivity in BIMSTEC Region. https://bimstec.org/?event=seminar-on -tourism-connectivity-in-bimstec-region (accessed 12 July 2020).
Beck, M. W., N. Heck, S. Narayan, P. Menéndez, S. Torres-Ortega, I. J. Losada, M. Way, M. Rogers, and L. McFarla-ne-Connelly. 2020. Reducing Caribbean Risk: Opportunities for Cost-Effective Mangrove Restoration and Insurance. Arlington, VA: The Nature Conservancy. https://www.nature.org/content/dam/tnc/nature/en/documents /TNC_MangroveInsurance_Final.pdf
Bhuiyan, A. H., A. Darda, and W. Habib. 2020. Marine Tourism for Sustainable Development in Cox’s Bazar, Bangladesh. ADBI Working Paper 1151. Tokyo: Asian Development Bank Institute. https://www.adb.org/sites/default/files/publication/616761/adbi -wp1151.pdf
Business Standard. 2020. Sea Tourism Can Help Bangladesh Beat Covid Blues: Experts. https://tbsnews.net/economy/sea-tourism -can-help-bangladesh-beat-covid-blues-experts-149350 (accessed 31 October 2020).
Department of Environment (DoE). 2006. Bangladesh National Programme of Action for Protection of the Coastal and Marine Environment from Land-Based Activities. http://www.doe.gov .bd/site/publications/9f8f37df-02ba-4096-af67-10479c6ee8e8 / bd-National-Programme-of-Action-for-Protection-of-the -Coastal-and-Marine-Environment-from-Land-Based-Activities
____. 2010a. Fourth National Report to the Convention on Biological Diversity (Biodiversity National Assessment and
Sustainable Coastal and Maritime Tourism: A Potential Blue Economy Avenue for Bangladesh 275
Programme of Action 2020). https://drive.google.com/file /d/0B6XjGVIRbmt0ZUFfOWVrWks4cG8/view
____. 2010b. National 3R Strategy for Waste Management, 2010. http ://www.doe.gov.bd/site/publications/322bf6c9-e23e-401f-864a -73efb078cd29/National-3R-Strategy-for-Waste-Management
____. 2015. Fifth National Report of Bangladesh to the Convention on Biological Diversity (Biodiversity National Assessment 2015). https://drive .google.com/file/d/0B6XjGVIRbmt0Zjl0ajVsNEQ3UmM/view
____. 2016. National Biodiversity Strategy and Action Plan of Bangladesh 2016–2021. http://document.bdfish.org/2017/09/national -biodiversity-strategy-and-action-plan-of-bangladesh-2016-2021 -nbsap-2016-2021/
Department of Marine Park Malaysia. 2017. Ecotourism in Coastal and Marine Areas in Malaysia. https://www.pemsea.org/sites/default /files/2b%20Ecotourism%20and%20marine%20Parks_Malaysia .pdf (accessed 22 December 2020).
Ecorys. 2013. Study in Support of Policy Measures for Maritime and Coastal Tourism at EU Level (Specific Contract under FWC MARE/2012/06—SC D1/2013/01-SI2.648530). https://ec.europa.eu /maritimeaffairs/sites/maritimeaffairs/files/docs/ body/study -maritime-and-coastal-tourism_en.pdf
EplerWood International. 2009. Teknaf Peninsula Community-Based Ecotourism Strategy. http://www.eplerwoodinternational.com/wp -content/uploads/2019/07/Teknaf_Peninsula_Community-based _Ecotourism_Strategy_2009.pdf
Falak, A. 2020. Vietnam Issues Incentives to Counter COVID-19 Impact. Vietnam Briefing, 15 April. https://www.vietnam-briefing.com /news/vietnam-issues-incentives-counter-covid-19-impact.html/ (accessed 29 July 2021).
The Straits Times. 2017. New Islands Spell Hope for Bangladesh. 15 November. https://www.straitstimes.com/asia/south-asia/new -islands-spell-hope-for-bangladesh
Garsous, G., N. D. Corderi, and M. Velasco. 2015. Tax Incentives and Job Creation in the Tourism Industry of Brazil. IDB Working Paper Series No. IDB-WP-644. Washington, DC: Inter-American Development Bank. https://publications.iadb.org/publications /english/document/Tax-Incentives-and-Job-Creation-in-the -Tourism-Industry-of-Brazil.pdf
General Economics Division (GED). 2012. Perspective Plan of Bangladesh 2010–2021: Making Vision 2021 a Reality. https ://bangladesh.gov.bd/sites/default/files/files/bangladesh.gov.bd /page/6dca6a2a_9857_4656_bce6_139584b7f160/Perspective-Plan -of-Bangladesh.pdf
276 Blue Economy and Blue Finance: Toward Sustainable Development and Ocean Governance
____. 2013. National Sustainable Development Strategy 2010–21 (NSDS). http://nda.erd.gov.bd/files/1/Publications/CC%20Policy%20Documents/National-Sustainable-Development-Strategy.pdf
____. 2015. Seventh Five Year Plan (FY2016–FY2020): Accelerating Growth, Empowering Citizens. Dhaka.
____. 2017. Bangladesh Delta Plan 2100. http://www.lged.gov.bd /UploadedDocument/UnitPublication/17/624/Bangladesh%20Delta%20Plan%202100%20Draft%20Report.pdf
____. 2020a. Eighth Five Year Plan (July 2020–June 2025): Promoting Prosperity and Fostering Inclusiveness. http://www.plancomm .gov.bd/sites/default/files/files/plancomm.portal.gov.bd /files/68e32f08_13b8_4192_ab9b_abd5a0a62a33/2021-02-03-17-04 -ec95e78e452a813808a483b3b22e14a1.pdf
____. 2020b. Making Vision 2041 a Reality: Perspective Plan of Bangladesh 2021–2041. Dhaka. http://oldweb.lged.gov.bd/UploadedDocument /UnitPublication/1/1049/vision%202021-2041.pdf
Government of Bangladesh. 1972a. The Bangladesh Parjatan Corporation Order, 1972. http://bdlaws.minlaw.gov.bd/act-print-421.html
____. 1972b. The Constitution of the People’s Republic of Bangladesh, 1972 (Act No. of 1972). Dhaka. http://bdlaws.minlaw.gov.bd/act-print-367 .html
____. 2009. Mobile Court Act (Amendment), 2009. http://www.doe .gov.bd/sites/default/files/files/doe.portal.gov.bd/notification _circular/2f7d8db5_a3e6_4fbc_b7bb_9d635b05f4c7/gadget.jpg
____. 2010a. Bangladesh Economic Zones Act, 2010. http://beza.gov.bd /wp-content/uploads/2015/06/BEZA-Act-Bangla-1.pdf
____. 2010b. The Bangladesh Environment Conservation (Amendment) Act, 2010 (Act No. 50). http://extwprlegs1.fao.org/docs/pdf /bgd167046.pdf
____. 2010c. The Environment Court Act, 2000. http://www.bwdb.gov .bd/archive/pdf/199.pdf
____. 2012. Wildlife (Conservation and Security) Act, 2012 (Act no. XXX of 2012). http://extwprlegs1.fao.org/docs/pdf/bgd165019.pdf
____. 2013. Bangladesh National Conservation Strategy, 2013. https ://www.iucn.org/asia/countries/bangladesh/national-conservation -strategy-ncs
____. 2016. Ecologically Critical Areas Management Rules, 2016. http://doe.portal.gov.bd/sites/default/files/files/doe.portal.gov.bd/page/260b2fa3_d26a_46fa_a0ce_52735287b9b9/ECA%20Rules_2016.pdf
____. 2017. Bangladesh Biodiversity Act, 2017. http://extwprlegs1.fao.org /docs/pdf/bgd165299.pdf

Sustainable Coastal and Maritime Tourism: A Potential Blue Economy Avenue for Bangladesh 277
____. 2018. National Environment Policy, 2018. Dhaka. https://moef.portal .gov.bd/sites/default/files/files/moef.portal.gov.bd/page/6ee9d54b _b349_4e85_b0da_6df1225285cb/%E0%A6%AA%E0%A6%B0%E0%A6%BF%E0%A6%AC%E0%A7%87%E0%A6%B6%20%E0%A6%A8%E0%A7%80%E0%A6%A4%E0%A6%BF%20%E0%A7%A8%E0%A7%A6%E0%A7%A7%E0%A7%AE.pdf
____. 2020. Bangladesh: Voluntary National Reviews (VNRs) 2020—Accelerated Action and Transformative Pathways: Realizing the Decade of Action and Delivery for Sustainable Development. https://sustainabledevelopment.un.org/content /documents/26303VNR_2020_Bangladesh_Report.pdf
____. 2021. Bangladesh Tour Operators and Tour Guides (Registration and Operation) Act, 2021. https://www.dhakatribune.com /business/2021/05/17/new-tourism-bill-proposed-in-parliament
Hall, C. 2001. Trends in Coastal and Marine Tourism: The End of the Last Frontier. Ocean and Coastal Management. 44 (9–10). pp. 601–18.
Hassan, D., and A. Alam. 2019. Institutional Arrangements for the Blue Economy: Marine Spatial Planning A Way Forward. Journal of Ocean and Coastal Economics. 6 (2). Article 10.
Hoque, M. 2020. Tourism Sector Awaits Big Boost under a Master Plan. United News of Bangladesh (UNB), 28 October. https://unb.com.bd /category/special/tourism-sector-awaits-big-boost-under-a -master-plan/44869
Hossain, M. S., S. Chowdhury, U. Navera, M. Hossain, B. Imam, and S. Sharifuzzaman. 2014. Opportunities and Strategies for Ocean and River Resources Management. Background Paper for Preparation of the 7th Five Year Plan. Dhaka: Planning Commission, Ministry of Planning, Bangladesh.
Hussain, M. G., P. Failler, A. A. Karim, and M. K. Alam. 2017. Review on Opportunities, Constraints and Challenges of Blue Economy Development in Bangladesh. Journal of Fisheries and Life Sciences. 2 (1). pp. 45–57.
Hussain, M. G., P. Failler, and S. Sarker. 2019. Future Importance of Maritime Activities in Bangladesh. Journal of Ocean and Coastal Economics. 6 (2). pp. 1–17. doi:10.15351/2373-8456.1104.
IMRB International. 2014. Study of Taxes Levied on Tourism Sector vis a vis Export Sector. https://tourism.gov.in/sites/default/files /2020-04/Fi%20nal%20Report-MOT-IMRB-Taxes%20on%20Tourism%20Sector-C6.pdf
International Union for Conservation of Nature (IUCN). 2020. Island Ecosystems. https://www.iucn.org/commissions/commission -ecosystem-management/our-work/cems-specialist-groups /island-ecosystems (accessed 28 October 2020).
278 Blue Economy and Blue Finance: Toward Sustainable Development and Ocean Governance
Iqbal, M. K. 2019. Ocean Policy for Bangladesh—A Comprehensive Roadmap. Bangladesh Maritime Journal. 3 (1). pp. 9–24.
Islam, M., and L.-Y. Mostaque. 2018. Blue Economy and Bangladesh: Lessons and Policy Implications. Bangladesh Institute of International and Strategic Studies. 39 (2). pp. 135–62.
Islam, M. M., and M. Shamsuddoha. 2018. Coastal and Marine Conservation Strategy for Bangladesh in the Context of Achieving Blue Growth and Sustainable Development Goals (SDGs). Environmental Science & Policy. 87. pp. 45–54.
Islam, M. R., M. S. Iftekhar, and M. W. Islam. 2011. Potential of Ecotourism Development in Bangladesh Coast: An Overview. Tourism Review International. 15 (4). pp. 325–36. doi:10.3727/154427212X13369577826780.
Islam, M. W. 2010. Community-Based Tourism and Ecotourism Are Potential Means to Facilitate the Conservation of Natural Resources of the Sundarbans—A Theoretical Perspective. Khulna University Studies. SESB 2010 (special issue). pp. 127–40.
Islam, M. W., M. M. Rahman, M. S. Iftekhar, and M. G. Rakkibu. 2013. Can Community-Based Tourism Facilitate Conservation of the Bangladesh Sundarbans? Journal of Ecotourism. 12 (2). pp. 119–29.
Kaján, E., and J. Saarinen. 2013. Tourism, Climate Change and Adaptation: A Review. Current Issues in Tourism. 16 (2). pp. 167–95.
Marafa, L. M. 2008. Integrating Sustainable Tourism Development in Coastal and Marine Zone Environment. Études caribéennes. 9–10.
Maritime Affairs. 2019. Bangladesh Maritime Zones Act, 2019. https://mofa.portal.gov.bd/sites/default/files/files/mofa .portal.gov.bd/page/6aac40c8_cdc3_4418_8755_db68f0ec9d5a /Bangladesh%20Maritime%20Zone%20Act%202018%20Draft.pdf (accessed 8 July 2020).
Ministry of Civil Aviation and Tourism (MoCAT). 2010a. Bangladesh Parjatan Board Act, 2010. http://www.tourismboard.gov.bd/sites /default/files/files/tourismboard.portal.gov.bd/law/ad5bfc22 _648b_4007_8c71_0804f87aa237/Bangladesh%20Parjatan%20Board%20Act%202010.pdf
____. 2010b. Bangladesh Tourist Reservation Area and Special Tourism Zone Act, 2010. https://www.ecolex.org/details/legislation / bangladesh-tourism-reserved-area-and-special-tourism-zone -act-2010-act-no-31-of-2010-lex-faoc179687/
____. 2010c. National Tourism Policy, 2010. Dhaka. http://www .tourismboard.gov.bd/sites/default/files/files/tourismboard .portal.gov.bd/policies/deab2a05_9fb8_496d_b291_76916590d1a3 /National%20Tourism%20Circular-2010.pdf
Ministry of Environment and Forests (MoEF). 1997. Environmental Conservation Rules, 1997.
Sustainable Coastal and Maritime Tourism: A Potential Blue Economy Avenue for Bangladesh 279
____. 2012. Rio+20: Bangladesh Report on Sustainable Development. https://sustainabledevelopment.un.org/content/documents /981bangladesh.pdf
____. 2017. Protected Area Management Rules, 2017. http://bforest .portal.gov.bd/sites/default/files/files/bforest.portal.gov.bd/page /a2f633e5_8b6c_4213_b78c_ec966bd2a942/PA%20Rule%202017 .pdf
Ministry of Foreign Affairs (MoFA). 2019. The Bangladesh Maritime Zones Act, 2019. Dhaka. https://mofa.portal.gov.bd/sites/default /files/files/mofa.portal.gov.bd/page/6aac40c8_cdc3_4418_8755 _db68f0ec9d5a/Bangladesh%20Maritime%20Zone%20Act%202018%20Draft.pdf
____. 2020. Blue Economy Development of Sea Resources for Bangladesh. https://mofa.gov.bd/site/page/8c5b2a3f-9873-4f27-8761-2737 db83c2ec/OCEAN/BLUE-ECONOMY--FOR-BANGLADESH (accessed 28 October 2020).
Ministry of Industry. 2016. National Industrial Policy, 2016. http://www .projectsprofile.com/info/Policy_Industry%202016%20Final.pdf
Ministry of Land. 2001. National Land Use Policy, 2001. http://nda .erd.gov.bd/files/1/Publications/Sectoral%20Policies%20and%20Plans/National%20Land%20Use%20Policy.pdf
Ministry of Shipping. 2000. National Shipping Policy, 2000. http://www .clcbd.org/document/112.html
____. n.d. Blue Economy Activities, Resource Extractions from the Sea and Concerned Short, Medium, and Long-Term Strategic Planning. https://mos.portal.gov.bd/sites/default/files/files/mos.portal .gov.bd/page/82f97324_3eb0_4408_acd3_4fd537c1dcf5/Blue%20economy.pdf (accessed 25 August 2020).
Ministry of Water Resources. 1999. National Water Policy, 1999. https://mowr.gov.bd/sites/default/files/files/mowr.portal.gov .bd/files/32e67290_f24e_4407_9381_166357695653/National%20Water%20Policy%20(English).pdf
____. 2005a. Coastal Zone Policy, 2005. http://lib.pmo.gov.bd/legalms /pdf/Costal-Zone-Policy-2005.pdf
____. 2005b. National Coastal Zone Policy, 2005. http://nda.erd.gov.bd/files/1/Publications/Sectoral%20Policies%20and%20Plans /Costal-Zone-Policy-2005.pdf
Moher, D., A. Liberati, J. Tetzlaff, D. G. Altman, and Prisma Group. 2009. Preferred Reporting Items for Systematic Reviews and Meta-Analyses: The PRISMA Statement. PLoS Med. 6 (7). e1000097.
Mojibul, M., M. M. Uddin, P. Schneider, M. Islam, and M. M. Shamsuzzaman. 2018. Fisheries-Based Ecotourism in Bangladesh: Potentials and Challenges. Resources 7. doi:10.3390/resources7040061.
280 Blue Economy and Blue Finance: Toward Sustainable Development and Ocean Governance
Morshed, M. M. R. 2004. Bangladesh Tourism Vision, 2020. Bangladesh Parjatan Corporation, Dhaka.
Mukit, M. H. 2019. Blue Economy: A New Economic Frontier of Bangladesh. Pressenza—International Press Agency, 5 November. https://www.pressenza.com/2019/11/ blue-economy-a-new -economic-frontier-of-bangladesh/
Nobi, M. N., and M. Majumder. 2019. Coastal and Marine Tourism in the Future. Journal of Ocean and Coastal Economics. 6 (2). p. 12.
Northrop, E., M. Konar, N. Frost, and L. Hollaway. 2020. Using the Ocean as a Tool for Global Economic Recovery. Washington, DC: World Resources Institute. https://www.wri.org/blog/2020/coronavirus -ocean-blue-recovery
Organisation for Economic Co-operation and Development (OECD). 2016. The Ocean Economy in 2030. Paris: OECD.
Patil, P. G., P. Failler, and K. Alam. 2019. Introduction to the Special Issue on the Blue Economy of Bangladesh. Journal of Ocean and Coastal Economics. 6 (2). Article 2. doi:10.15351/2373-8456.1119.
Patil, P. G., J. Virdin, C. S. Colgan, M. Hussain, P. Failler, and T. Vegh. 2018. Toward a Blue Economy: A Pathway for Sustainable Growth in Bangladesh. World Bank Group Open Knowledge Repository. https://openknowledge.worldbank.org/handle/10986/30014
PRISMA. 2015. PRISMA: Transparent Reporting of Systematic Reviews and Meta-Analyses. Ottawa Hospital and Research Institute, Oxford University. http://www.prisma-statement.org/ (accessed 20 December 2020).
Rahman, M. S., and F. Chowdhury. 2005. Investment and Financing Strategy for Coastal Zone Development in Bangladesh. http://warpo .portal.gov.bd/sites/default/files/files/warpo.portal.gov.bd/page /aa04373f_0ca3_49a5_b77e_5108186638dc/wp037.pdf
Rahman, S. M. A., G. S. Robin, M. Momotaj, J. Uddin, and M. A. M. Siddique. 2020. Occurrence and Spatial Distribution of Microplastics in Beach Sediments of Cox’s Bazar, Bangladesh. Marine Pollution Bulletin. 160. 111587.
Rana, S. 2019. Blue Economy: How Is Bangladesh Doing? Bangladesh Delays to Grab Ocean Opportunities. The Business Standard, 21 September. https://tbsnews.net/opinion/blue-economy-how-bangladesh-doing
Roy, S. C., and M. Roy. 2015. Tourism in Bangladesh: Present Status and Future Prospects. International Journal of Management Science and Business Administration. 1 (8). pp. 53–61.
Sarwar, M. G. M. 2005. Impacts of Sea Level Rise on the Coastal Zone of Bangladesh. http://static.weadapt.org/placemarks/files/225/golam _sarwar.pdf
Sustainable Coastal and Maritime Tourism: A Potential Blue Economy Avenue for Bangladesh 281
Shrestha, P. M. 2020. Budget Announces Significant Tax Exemptions of up to 75 Percent for Micro and Small Industries. Kathmandu Post, 29 May. https://kathmandupost.com/national/2020/05/29/budget -announces-significant-tax-exemptions-of-up-to-75-percent-for -micro-and-small-industries
Simpson, M. C., S. Gossling, D. Scott, C. M. Hall, and E. Gladin. 2008. Climate Change Adaptation and Mitigation in the Tourism Sector: Frameworks, Tools and Practices. United Nations Environment Programme. https://wedocs.unep.org/handle/20.500.11822/9681
South Asian Association for Regional Cooperation (SAARC). 2018. Human Resource Development and Tourism. http://saarc-sec.org /areas_of_cooperation/area_detail/human-resource-development -and-tourism/click-for-details_3 (accessed 12 July 2020).
Szczepanski, M., F. Sedlar, and J. Shalant. 2018. Bangladesh: A Country Underwater, a Culture on the Move. https://www.nrdc.org /onearth/bangladesh-country-underwater-culture-move (accessed 28 October 2020).
TBS Report. 2020. Potential of Community-Based, Maritime Tourism Remain Unexplored. The Business Standard, 27 September. https://tbsnews.net/ bangladesh/potential-community-based -maritime-tourism-remain-unexplored-138409 (accessed 28 October 2020).
Tegar, D., and R. O. S. Gurning. 2018. Development of Marine and Coastal Tourism Based on Blue Economy. International Journal of Marine Engineering Innovation and Research. 2. doi:10.12962/j25481479.v2i2.3650.
The International Ecotourism Society (TIES). 2019. What Is Ecotourism? https://ecotourism.org/what-is-ecotourism/ (accessed 28 October 2020).
Tonazzini, D., J. Fosse, E. Morales, A. González, S. Klarwein, K. Moukaddem, and O. Louveau. 2019. Blue Tourism: Towards a Sustainable Coastal and Maritime Tourism in World Marine Regions. http://www.ecounion.eu/wp-content/uploads/2019/06/TRIPA _Angles_2_p.pdf
Travel Mate. 2019. Top 15 Islands in Bangladesh You Shouldn’t Miss. https://www.travelmate.com.bd/top-15-islands-in-bangladesh/ (accessed 8 July 2020).
Uddin, S. 2019. Tapping Tourism Potential Crucial to BD Economy: USAID. The Financial Express, 23 November. https://www .thefinancialexpress.com.bd/economy/ bangladesh/tapping -tourism-potential-crucial-to-bd-economy-usaid-1574483512
United Nations Conference on Trade and Development (UNCTAD). 2021. COVID-19 and Tourism: An Update: Assessing the Economic
282 Blue Economy and Blue Finance: Toward Sustainable Development and Ocean Governance
Consequences. https://unctad.org/system/files/official-document /ditcinf2021d3_en_0.pdf
United Nations Development Programme (UNDP). 2018. Policy Brief on Leveraging the Blue Economy for Inclusive and Sustainable Growth. https://www.ke.undp.org/content/ kenya/en/ home/ library /strategic-policy-advisory-unit-/policy-brief--blue-economy-.html (accessed 28 October 2020).
United Nations World Tourism Organization (UNWTO). 2020a. International Tourist Numbers Could Fall 60–80% in 2020: UNWTO Reports. https://www.unwto.org/news/covid-19-international-tourist -numbers-could-fall-60-80-in-2020 (accessed 17 October 2020).
____. 2020b. Sustainable Development. https://www.unwto.org /sustainable-development (accessed 28 October 2020).
____. 2021. Secretary-General’s Policy Brief on Tourism and COVID-19: Tourism and COVID-19—Unprecedented Economic Impacts. https://www.unwto.org/tourism-and-covid-19-unprecedented -economic-impacts
Vierros, M., and C. De Fontaubert. 2017. The Potential of the Blue Economy: Increasing Long-Term Benefits of the Sustainable Use of Marine Resources for Small Island Developing States and Coastal Least Developed Countries. https://openknowledge.worldbank.org /bitstream/handle/10986/26843/115545.pdf
Volodarsky, P. 2021. Thai Government Considers Tax Incentives, Long Term Visas, Property Rights and More to Entice Wealthy Foreign Nationals to Thailand. DFDL, Thailand. https://www.dfdl .com/resources/legal-and-tax-updates/thailand-legal-tax/thai -government-considers-tax-incentives-long-term-visas-property -rights-and-more-to-entice-wealthy-foreign-nationals-to -thailand/ (accessed 28 July 2021).
Water Resources Planning Organization (WARPO). 2006. Coastal Development Strategy, 2006. http://extwprlegs1.fao.org/docs/pdf /bgd175355.pdf
World Travel and Tourism Council (WTTC). 2017. Travel & Tourism Economic Impact 2017: Bangladesh. https://www.wttc.org /-/media/files/reports/economic-impact-research/countries -2017/bangladesh2017.pdf
____. 2020a. Bangladesh 2020 Annual Research: Key Highlights. https ://wttc.org/Research/Economic-Impact
____. 2020b. Travel & Tourism: Global Economic Impact & Trends 2020: Bangladesh. https://wttc.org/Research/Economic-Impact
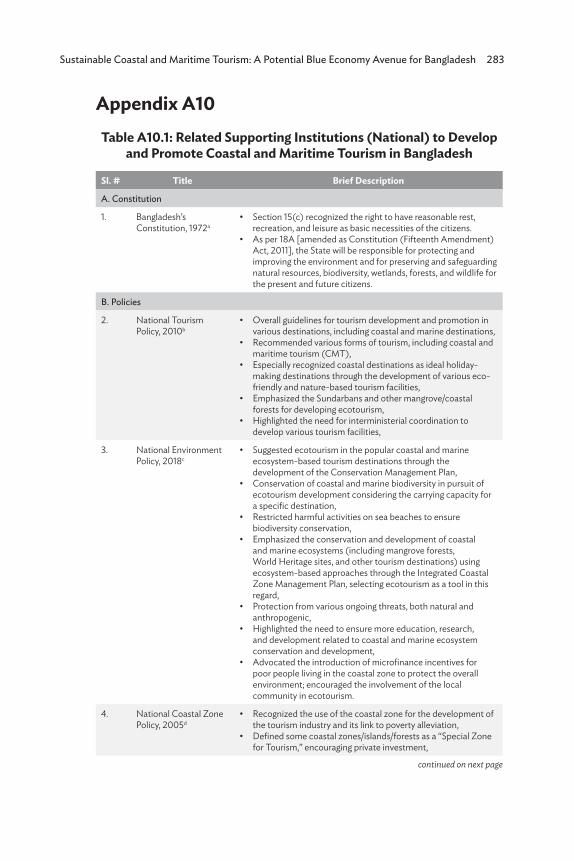
Sustainable Coastal and Maritime Tourism: A Potential Blue Economy Avenue for Bangladesh 283
Appendix A10Table A10.1: Related Supporting Institutions (National) to Develop
and Promote Coastal and Maritime Tourism in Bangladesh
Sl. # Title Brief Description
A. Constitution
1. Bangladesh’s Constitution, 1972a
• Section 15(c) recognized the right to have reasonable rest, recreation, and leisure as basic necessities of the citizens.
• As per 18A [amended as Constitution (Fifteenth Amendment) Act, 2011], the State will be responsible for protecting and improving the environment and for preserving and safeguarding natural resources, biodiversity, wetlands, forests, and wildlife for the present and future citizens.
B. Policies
2. National Tourism Policy, 2010b
• Overall guidelines for tourism development and promotion in various destinations, including coastal and marine destinations,
• Recommended various forms of tourism, including coastal and maritime tourism (CMT),
• Especially recognized coastal destinations as ideal holiday-making destinations through the development of various eco-friendly and nature-based tourism facilities,
• Emphasized the Sundarbans and other mangrove/coastal forests for developing ecotourism,
• Highlighted the need for interministerial coordination to develop various tourism facilities,
3. National Environment Policy, 2018c
• Suggested ecotourism in the popular coastal and marine ecosystem-based tourism destinations through the development of the Conservation Management Plan,
• Conservation of coastal and marine biodiversity in pursuit of ecotourism development considering the carrying capacity for a specific destination,
• Restricted harmful activities on sea beaches to ensure biodiversity conservation,
• Emphasized the conservation and development of coastal and marine ecosystems (including mangrove forests, World Heritage sites, and other tourism destinations) using ecosystem-based approaches through the Integrated Coastal Zone Management Plan, selecting ecotourism as a tool in this regard,
• Protection from various ongoing threats, both natural and anthropogenic,
• Highlighted the need to ensure more education, research, and development related to coastal and marine ecosystem conservation and development,
• Advocated the introduction of microfinance incentives for poor people living in the coastal zone to protect the overall environment; encouraged the involvement of the local community in ecotourism.
4. National Coastal Zone Policy, 2005d
• Recognized the use of the coastal zone for the development of the tourism industry and its link to poverty alleviation,
• Defined some coastal zones/islands/forests as a “Special Zone for Tourism,” encouraging private investment,
continued on next page
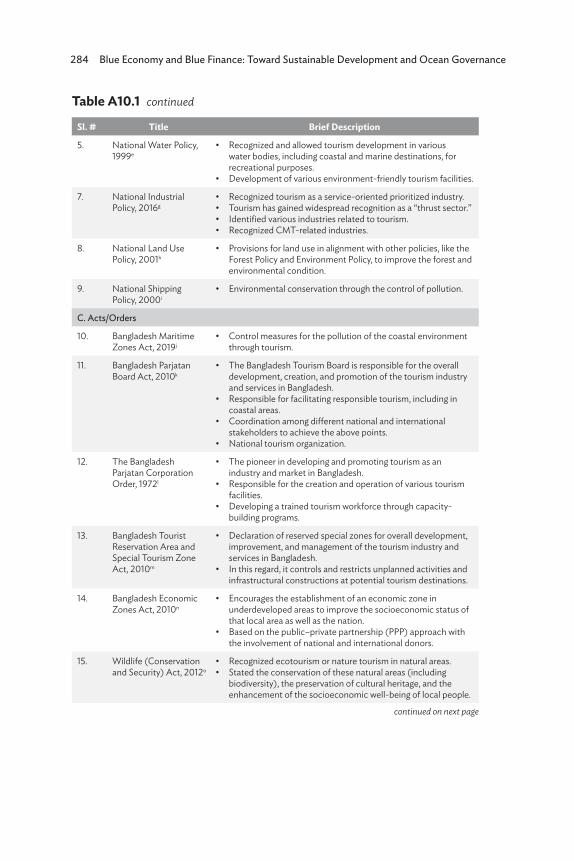
284 Blue Economy and Blue Finance: Toward Sustainable Development and Ocean Governance
Sl. # Title Brief Description
5. National Water Policy, 1999e
• Recognized and allowed tourism development in various water bodies, including coastal and marine destinations, for recreational purposes.
• Development of various environment-friendly tourism facilities.
7. National Industrial Policy, 2016g
• Recognized tourism as a service-oriented prioritized industry.• Tourism has gained widespread recognition as a “thrust sector.”• Identified various industries related to tourism.• Recognized CMT-related industries.
8. National Land Use Policy, 2001h
• Provisions for land use in alignment with other policies, like the Forest Policy and Environment Policy, to improve the forest and environmental condition.
9. National Shipping Policy, 2000i
• Environmental conservation through the control of pollution.
C. Acts/Orders
10. Bangladesh Maritime Zones Act, 2019j
• Control measures for the pollution of the coastal environment through tourism.
11. Bangladesh Parjatan Board Act, 2010k
• The Bangladesh Tourism Board is responsible for the overall development, creation, and promotion of the tourism industry and services in Bangladesh.
• Responsible for facilitating responsible tourism, including in coastal areas.
• Coordination among different national and international stakeholders to achieve the above points.
• National tourism organization.
12. The Bangladesh Parjatan Corporation Order, 1972l
• The pioneer in developing and promoting tourism as an industry and market in Bangladesh.
• Responsible for the creation and operation of various tourism facilities.
• Developing a trained tourism workforce through capacity-building programs.
13. Bangladesh Tourist Reservation Area and Special Tourism Zone Act, 2010m
• Declaration of reserved special zones for overall development, improvement, and management of the tourism industry and services in Bangladesh.
• In this regard, it controls and restricts unplanned activities and infrastructural constructions at potential tourism destinations.
14. Bangladesh Economic Zones Act, 2010n
• Encourages the establishment of an economic zone in underdeveloped areas to improve the socioeconomic status of that local area as well as the nation.
• Based on the public–private partnership (PPP) approach with the involvement of national and international donors.
15. Wildlife (Conservation and Security) Act, 2012o
• Recognized ecotourism or nature tourism in natural areas. • Stated the conservation of these natural areas (including
biodiversity), the preservation of cultural heritage, and the enhancement of the socioeconomic well-being of local people.
Table A10.1 continued
continued on next page
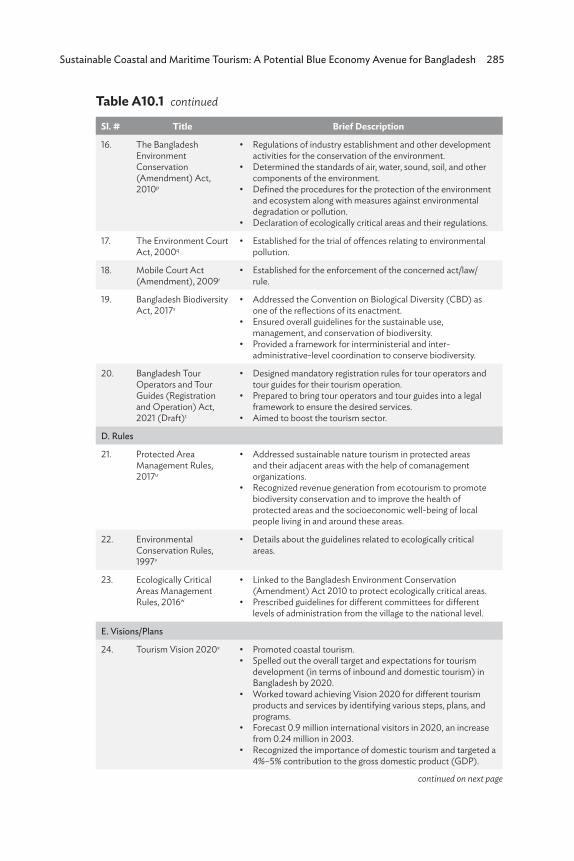
Sustainable Coastal and Maritime Tourism: A Potential Blue Economy Avenue for Bangladesh 285
Sl. # Title Brief Description
16. The Bangladesh Environment Conservation (Amendment) Act, 2010p
• Regulations of industry establishment and other development activities for the conservation of the environment.
• Determined the standards of air, water, sound, soil, and other components of the environment.
• Defined the procedures for the protection of the environment and ecosystem along with measures against environmental degradation or pollution.
• Declaration of ecologically critical areas and their regulations.
17. The Environment Court Act, 2000q
• Established for the trial of offences relating to environmental pollution.
18. Mobile Court Act (Amendment), 2009r
• Established for the enforcement of the concerned act/law/ rule.
19. Bangladesh Biodiversity Act, 2017s
• Addressed the Convention on Biological Diversity (CBD) as one of the reflections of its enactment.
• Ensured overall guidelines for the sustainable use, management, and conservation of biodiversity.
• Provided a framework for interministerial and inter-administrative-level coordination to conserve biodiversity.
20. Bangladesh Tour Operators and Tour Guides (Registration and Operation) Act, 2021 (Draft)t
• Designed mandatory registration rules for tour operators and tour guides for their tourism operation.
• Prepared to bring tour operators and tour guides into a legal framework to ensure the desired services.
• Aimed to boost the tourism sector.
D. Rules
21. Protected Area Management Rules, 2017u
• Addressed sustainable nature tourism in protected areas and their adjacent areas with the help of comanagement organizations.
• Recognized revenue generation from ecotourism to promote biodiversity conservation and to improve the health of protected areas and the socioeconomic well-being of local people living in and around these areas.
22. Environmental Conservation Rules, 1997v
• Details about the guidelines related to ecologically critical areas.
23. Ecologically Critical Areas Management Rules, 2016w
• Linked to the Bangladesh Environment Conservation (Amendment) Act 2010 to protect ecologically critical areas.
• Prescribed guidelines for different committees for different levels of administration from the village to the national level.
E. Visions/Plans
24. Tourism Vision 2020x • Promoted coastal tourism.• Spelled out the overall target and expectations for tourism
development (in terms of inbound and domestic tourism) in Bangladesh by 2020.
• Worked toward achieving Vision 2020 for different tourism products and services by identifying various steps, plans, and programs.
• Forecast 0.9 million international visitors in 2020, an increase from 0.24 million in 2003.
• Recognized the importance of domestic tourism and targeted a 4%–5% contribution to the gross domestic product (GDP).
Table A10.1 continued
continued on next page

286 Blue Economy and Blue Finance: Toward Sustainable Development and Ocean Governance
Sl. # Title Brief Description
25. Perspective Plan of Bangladesh 2010–2021 (Vision 2021)y
• Recognized tourism as a potential sector for developing the nation.
• Aimed to make Bangladesh an ecologically attractive exotic tourism destination in Asia.
• Promotion of environment-friendly tourism.• Planned to increase tourism’s contribution to the GDP to 5%
by 2021.
26. Perspective Plan of Bangladesh 2021–2041 (Vision 2041)z
• Increased service exports from the tourism sector.• Emphasized interregional river connectivity to facilitate
tourism.• Aimed to promote coastal tourism through a number of
actions.• Recognized the multiplier effects of tourism on GDP growth
and employment.• Recognized ecotourism as one of the main instruments for
boosting private financing for the environment.
F. Plans
27. Tourism Master Plan (2021–2041)aa
• The government’s plan for tourism development for the next 20 years.
• Targeted the travel and leisure sector as the third-largest economic engine of Bangladesh after garments and remittances.
• Targeted a distinctive brand image for Bangladesh as a popular tourist destination in the world to achieve the Vision 2041 of Bangladesh and to become a developed nation.
• The plan framed short-term (3 years), midterm (5 years), and long-term (15 years) initiatives.
28. Bangladesh Delta Plan 2100bb
• Exploring the blue economy through different forms of coastal tourism.
• Recommended forest-based, wetland-based, charland-based, and riverine ecotourism.
• Tourism as a tool for alternative income generation (livelihoods), biodiversity conservation, and ecosystem services.
• Use of multipurpose land and water bodies through tourism.
29. The Seventh Five Year Plan (7FYP)cc
• Chose the creation of competitive tourism industry, including ecotourism and marine cruises, as one of 12 activities to create and maintain a prosperous and sustainable blue economy.
• Selected tourism as one of the non-factor service export industries.
• Encouraged ecotourism and community-based tourism as a means of income generation for local people.
• PPP arrangements for tourism development.
Table A10.1 continued
continued on next page
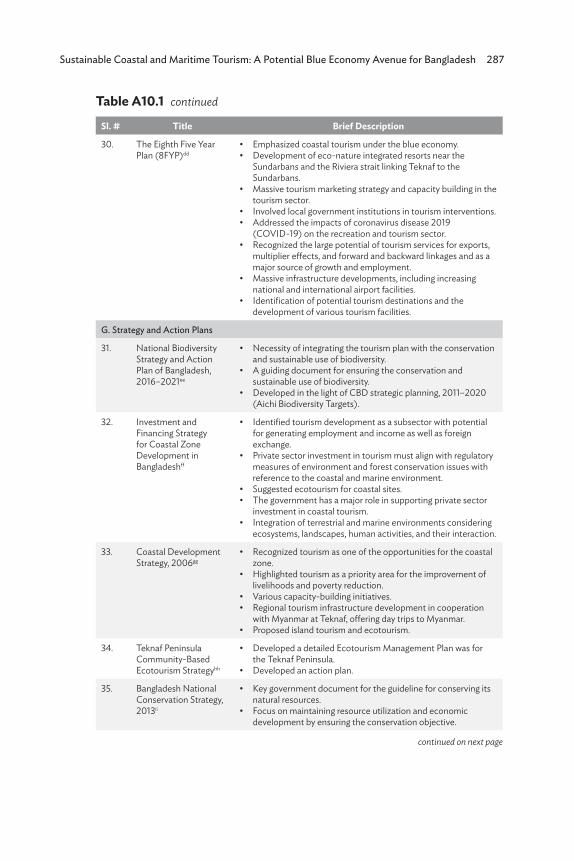
Sustainable Coastal and Maritime Tourism: A Potential Blue Economy Avenue for Bangladesh 287
Sl. # Title Brief Description
30. The Eighth Five Year Plan (8FYP)dd
• Emphasized coastal tourism under the blue economy. • Development of eco-nature integrated resorts near the
Sundarbans and the Riviera strait linking Teknaf to the Sundarbans.
• Massive tourism marketing strategy and capacity building in the tourism sector.
• Involved local government institutions in tourism interventions.• Addressed the impacts of coronavirus disease 2019
(COVID-19) on the recreation and tourism sector.• Recognized the large potential of tourism services for exports,
multiplier effects, and forward and backward linkages and as a major source of growth and employment.
• Massive infrastructure developments, including increasing national and international airport facilities.
• Identification of potential tourism destinations and the development of various tourism facilities.
G. Strategy and Action Plans
31. National Biodiversity Strategy and Action Plan of Bangladesh, 2016–2021ee
• Necessity of integrating the tourism plan with the conservation and sustainable use of biodiversity.
• A guiding document for ensuring the conservation and sustainable use of biodiversity.
• Developed in the light of CBD strategic planning, 2011–2020 (Aichi Biodiversity Targets).
32. Investment and Financing Strategy for Coastal Zone Development in Bangladeshff
• Identified tourism development as a subsector with potential for generating employment and income as well as foreign exchange.
• Private sector investment in tourism must align with regulatory measures of environment and forest conservation issues with reference to the coastal and marine environment.
• Suggested ecotourism for coastal sites.• The government has a major role in supporting private sector
investment in coastal tourism.• Integration of terrestrial and marine environments considering
ecosystems, landscapes, human activities, and their interaction.
33. Coastal Development Strategy, 2006gg
• Recognized tourism as one of the opportunities for the coastal zone.
• Highlighted tourism as a priority area for the improvement of livelihoods and poverty reduction.
• Various capacity-building initiatives.• Regional tourism infrastructure development in cooperation
with Myanmar at Teknaf, offering day trips to Myanmar.• Proposed island tourism and ecotourism.
34. Teknaf Peninsula Community-Based Ecotourism Strategyhh
• Developed a detailed Ecotourism Management Plan was for the Teknaf Peninsula.
• Developed an action plan.
35. Bangladesh National Conservation Strategy, 2013ii
• Key government document for the guideline for conserving its natural resources.
• Focus on maintaining resource utilization and economic development by ensuring the conservation objective.
Table A10.1 continued
continued on next page

288 Blue Economy and Blue Finance: Toward Sustainable Development and Ocean Governance
Sl. # Title Brief Description
36. National 3R Strategy for Waste Management, 2010jj
• Developed a national waste management strategy through reduce, reuse, and recycle (3R) to lessen the negative impacts of environmental pollution.
• Aimed to facilitate a clean and green environment.
37. Blue economy activities, resource extraction from the sea, and related short-, medium-, and long-term strategic planning (Ministry of Shipping)kk
• Economic development through coastal tourism.• Short- and medium-term strategies to develop and promote
CMT.• Distributed responsibilities among various concerned ministries
and departments.
H. Programs/Schemes
38. Blue economy development of sea resources for Bangladesh (Ministry of Foreign Affairs)ll
• Recognized CMT as a potential contributor to the blue economy.
39. Bangladesh National Programme of Action for Protection of the Coastal and Marine Environment from Land-Based Activitiesmm
• Recognized the great potentials of CMT in Bangladesh.• Recognized coastal tourism as one of the major sources of
coastal and marine pollution.
40. Voluntary National Reviewnn
• Recognized CMT, particularly ecotourism (an indication of Bangladesh’s intention to achieve the Sustainable Development Goals).
• Proposed CMT is one of the key issues to consider when formulating marine policy, laws, and regulations.
Notes: a Government of Bangladesh (1972b); b Ministry of Civil Aviation and Tourism (MoCAT) (2010c); c Government of Bangladesh (2018); d Ministry of Water Resources (2005b); e Ministry of Water Resources (1999); f Bangladesh Forest Department (2016); g Ministry of Industry (2016); h Ministry of Land (2001);
i Ministry of Shipping (2000); j Ministry of Foreign Affairs (MoFA) (2019); k MoCAT (2010a); l Government of Bangladesh (1972a); m MoCAT (2010b); n Government of Bangladesh (2010a); o Government of Bangladesh (2012); p Government of Bangladesh (2010b); q Government of Bangladesh (2010c); r Government of Bangladesh (2009); s Government of Bangladesh (2017); t Government of Bangladesh (2021); u Ministry of Environment and Forest (MoEF) (2017); v MoEF (1997); w Government of Bangladesh (2016); x Morshed (2004); y General Economics Division (GED) (2012); z GED (2020b); aa Hoque (2020); bb GED (2017); cc GED (2015); dd GED (2020a); ee Department of Environment (DoE) (2016); ff Rahman and Chowdhury (2005); gg Water Resources Planning Organization (2006); hh EplerWood International (2009); ii Government of Bangladesh (2013); jj DoE (2010b); kk Ministry of Shipping (n.d.); ll MoFA (2020); mm DoE (2006); nn Tonazzini et al. (2019).Source: Authors’ compilation.
Table A10.1 continued
PART IV
Interdisciplinary Methodology

291
11
Building Back Better in Small Island Developing States in the Pacific: Initial Insights
from the Binary Constrained Disaster Model of Disaster Risk
Management Policy Options in FijiNepomuk Dunz, Hajime Tanaka, Nagisa Shiiba,
Junko Mochizuki, and Asjad Naqvi*
11.1 IntroductionSmall island developing states (SIDS) in Asia and the Pacific face regular exposure to severe cyclones and flooding. The average annual disaster impact on gross domestic product (GDP) is around 8% for SIDS and around 0.1% globally, indicating the high vulnerability of SIDS to climate change and ocean risk (CRED 2020). As a small island country in the Asia and Pacific region, Fiji is prone to hazards, including cyclones, heavy rain, and flooding, which occur almost annually. Most of the population and infrastructure are located in the ocean’s proximity. Combined with socioeconomic vulnerability, these disasters result in severe damage to people in Fiji (UNDRR 2019). According to the World Bank (2016), Fiji’s coastal protection spending will account for about
* The following projects partially supported this study: Structuralist Macroeconomic Modeling of Disaster Risk and Sustainable Development Goals (Jubiläumsfondsprojekt Nr. 17390), and Distributional Implications of Climate-Related Disasters—A Macroeconomic Assessment (DIoD) (Jubiläumsfondsprojekt Nr. 18654).
292 Blue Economy and Blue Finance: Toward Sustainable Development and Ocean Governance
1%–3% of its projected GDP every year by 2040. Fiji is most likely to have severe difficulties in funding all its climate-related activities in the future. Tropical cyclone (TC) Harold, a category 4 cyclone (5 bring the most dangerous), hit Fiji on 8 and 9 April 2020, directly affecting more than 182,500 people (or around 20% of the population).
Due to the compound disaster of tropical cyclones and pandemics, 2020 was a catastrophic year for Fiji’s socioeconomic status. On 15 April 2020, the Prime Minister declared a “state of natural disaster” in response to the coronavirus disease 2019 (COVID-19) pandemic, which commenced only 3 days after the declaration of a separate state of natural disaster due to TC Harold on 12 April. The global pandemic and the disaster’s external shocks exposed the structural problems that Fiji’s economy is facing. Fiji recorded 63 positive cases of COVID-19 in total, 55 of which resulted in a full recovery (Ministry of Health and Medical Services, as of 5 March 2020). The United Nations report Socio-Economic Impact Assessment of COVID-19 in Fiji concluded that Fiji’s economic recession in 2019 was the largest in the last decade (UNDP 2020). Following the identification of the first confirmed case of COVID-19 in the country on 19 March 2020, the Government of Fiji took preventative measures, including lockdown, travel restrictions, border restrictions, and contact tracing. Although Fiji recorded a small number of cases of COVID-19 compared with other countries in the region, it has hit the country’s industries hard, especially tourism. The forecasted annual GDP growth rate from 2019 was around –20% in 2020 (ADB 2020).
COVID-19 and its interaction with disasters are the focus of recent scientific and policy discourse, with various studies evaluating, for example, how countries have adopted national disaster risk management (DRM) systems to cope with the emerging pandemic (GFDRR and World Bank 2020) or how they can effectively address pandemic risk in emergency response operations (Baidya, Maitra, and Bhattacharjee 2020; Ishiwatari et al. 2020). Other studies have examined further pathways to stronger inclusion of civil society during compound crises (Majumdar and DasGupta 2020). At the same time, extensive research on the macroeconomic impacts of COVID-19 and their countermeasures has taken place (Bashir, Benjiang, and Shahzad 2020; Brodeur et al. 2020; Nicola et al. 2020). There are also emergent strands of literature exploring the linkages between COVID-19 recovery stimulus policy and broader climate and sustainable development objectives (Engstrom et al. 2020; Fargher and Hallegatte 2020; Hepburn et al. 2020; Dunz et al. 2021; Mahul, Monasterolo, and Ranger 2021). However, research analyzing the performance of alternative DRM policy decisions intending to aid the recovery from disasters resulting from natural hazards in terms of their
Building Back Better in Small Island Developing States in the Pacific: Initial Insights from the Binary Constrained Disaster Model of Disaster Risk Management Policy Options in Fiji 293
macroeconomic outlook amid COVID-19 remains limited. For instance, Burns, Jooste, and Schwerhoff (2021) compared the performance of four alternative DRM strategies for hurricane damage in Jamaica, specifically adaptation investment, insurance, contingency funds, and debt reduction, assessing the accompanying trade-offs of each policy. Marto, Papageorgiou, and Klyuev (2018) applied a dynamic general equilibrium model to the case of Cyclone Pam in Vanuatu, comparing different financing channels and pre-disaster adaptation measures with post-disaster growth and debt trajectories. Their findings suggested that ex ante resilience policies can reduce debt distress and recovery costs in the aftermath of a disaster. The recent literature on the economics of disasters has increasingly emphasized the need to tailor DRM and adaptation policy options to the specific and timely contexts of each country while also evaluating key synergies and trade-offs (Hallegatte, Rentschler, and Rozenberg 2020; Yokomatsu et al. 2020).
To fill this important knowledge gap, we adopt and apply the binary constrained disaster (BinD) model, which the International Institute for Applied Systems Analysis developed, to an analysis of the combined impact of cyclones and COVID-19 in Fiji. The BinD model is a demand-driven macroeconomic model that aims to assess the fiscal and macroeconomic implications of disasters in financially constrained SIDS. Building on the three-gap models of Taylor (1991, 1994) and others, the BinD model describes public sector, private sector, and foreign sector saving constraints, which interact dynamically in an integrated modeling framework. Both aggregate demand and aggregate supply play a fundamental role in the BinD model, depending on which of the two is the constraining factor: limited private and public consumption not allowing profitable use of machinery or limited financial means to purchase machinery to satisfy the foreign and domestic demand (hence, as the name suggests, it indicates the “binary constraints” of supply and demand). The model extends the original gap approach through a dynamic macroeconomic model using parsimonious sets of adjustment mechanisms, and it allows for the combined evaluation of DRM policy and macroeconomic recovery trajectories under alternative demand and supply shock scenarios.
We adopted a simplified version of the BinD model for Fiji to highlight the initial insights into supply- and demand-side DRM policy responses under alternative macroeconomic conditions. Our results indicate that a targeted increase in government spending in times of crisis could be beneficial for the economic recovery of Fiji. However, short-term trade-offs emerged with respect to financing options. Debt-financed recovery allows faster and less painful recovery but requires quick and preferential access to foreign borrowing. Tax-financed
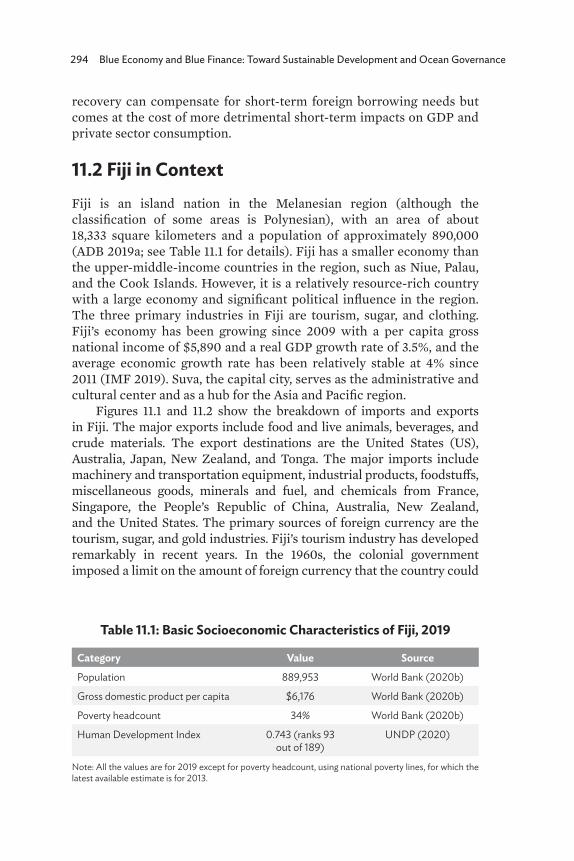
294 Blue Economy and Blue Finance: Toward Sustainable Development and Ocean Governance
recovery can compensate for short-term foreign borrowing needs but comes at the cost of more detrimental short-term impacts on GDP and private sector consumption.
11.2 Fiji in ContextFiji is an island nation in the Melanesian region (although the classification of some areas is Polynesian), with an area of about 18,333 square kilometers and a population of approximately 890,000 (ADB 2019a; see Table 11.1 for details). Fiji has a smaller economy than the upper-middle-income countries in the region, such as Niue, Palau, and the Cook Islands. However, it is a relatively resource-rich country with a large economy and significant political influence in the region. The three primary industries in Fiji are tourism, sugar, and clothing. Fiji’s economy has been growing since 2009 with a per capita gross national income of $5,890 and a real GDP growth rate of 3.5%, and the average economic growth rate has been relatively stable at 4% since 2011 (IMF 2019). Suva, the capital city, serves as the administrative and cultural center and as a hub for the Asia and Pacific region.
Figures 11.1 and 11.2 show the breakdown of imports and exports in Fiji. The major exports include food and live animals, beverages, and crude materials. The export destinations are the United States (US), Australia, Japan, New Zealand, and Tonga. The major imports include machinery and transportation equipment, industrial products, foodstuffs, miscellaneous goods, minerals and fuel, and chemicals from France, Singapore, the People’s Republic of China, Australia, New Zealand, and the United States. The primary sources of foreign currency are the tourism, sugar, and gold industries. Fiji’s tourism industry has developed remarkably in recent years. In the 1960s, the colonial government imposed a limit on the amount of foreign currency that the country could
Table 11.1: Basic Socioeconomic Characteristics of Fiji, 2019
Category Value Source
Population 889,953 World Bank (2020b)
Gross domestic product per capita $6,176 World Bank (2020b)
Poverty headcount 34% World Bank (2020b)
Human Development Index 0.743 (ranks 93 out of 189)
UNDP (2020)
Note: All the values are for 2019 except for poverty headcount, using national poverty lines, for which the latest available estimate is for 2013.
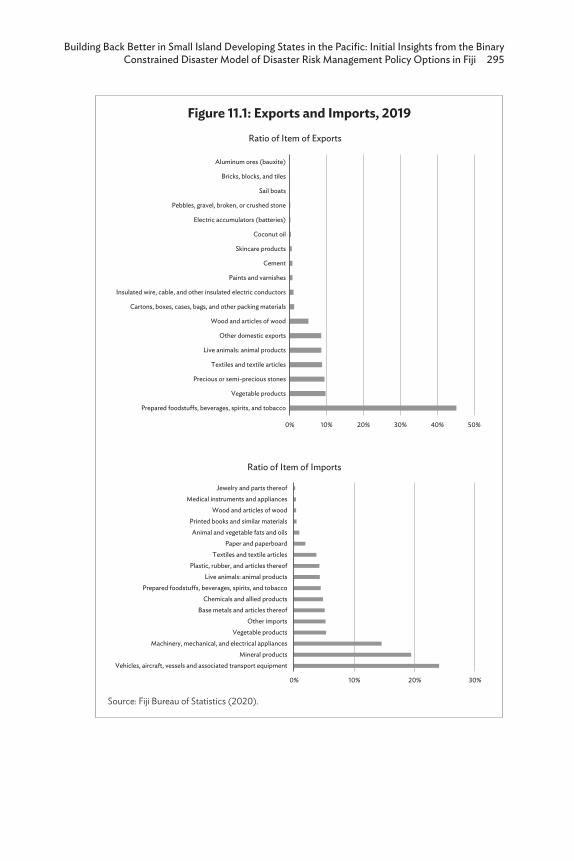
Building Back Better in Small Island Developing States in the Pacific: Initial Insights from the Binary Constrained Disaster Model of Disaster Risk Management Policy Options in Fiji 295
Figure 11.1: Exports and Imports, 2019
Source: Fiji Bureau of Statistics (2020).
0% 10% 20% 30% 40% 50%
Prepared foodstu�s, beverages, spirits, and tobacco
Vegetable products
Precious or semi-precious stones
Textiles and textile articles
Live animals: animal products
Other domestic exports
Wood and articles of wood
Cartons, boxes, cases, bags, and other packing materials
Insulated wire, cable, and other insulated electric conductors
Paints and varnishes
Cement
Skincare products
Coconut oil
Electric accumulators (batteries)
Pebbles, gravel, broken, or crushed stone
Sail boats
Bricks, blocks, and tiles
Aluminum ores (bauxite)
Ratio of Item of Exports
0% 10% 20% 30%
Vehicles, aircraft, vessels and associated transport equipmentMineral products
Machinery, mechanical, and electrical appliancesVegetable products
Other importsBase metals and articles thereof
Chemicals and allied productsPrepared foodstu�s, beverages, spirits, and tobacco
Live animals: animal productsPlastic, rubber, and articles thereof
Textiles and textile articlesPaper and paperboard
Animal and vegetable fats and oilsPrinted books and similar materials
Wood and articles of woodMedical instruments and appliances
Jewelry and parts thereof
Ratio of Item of Imports
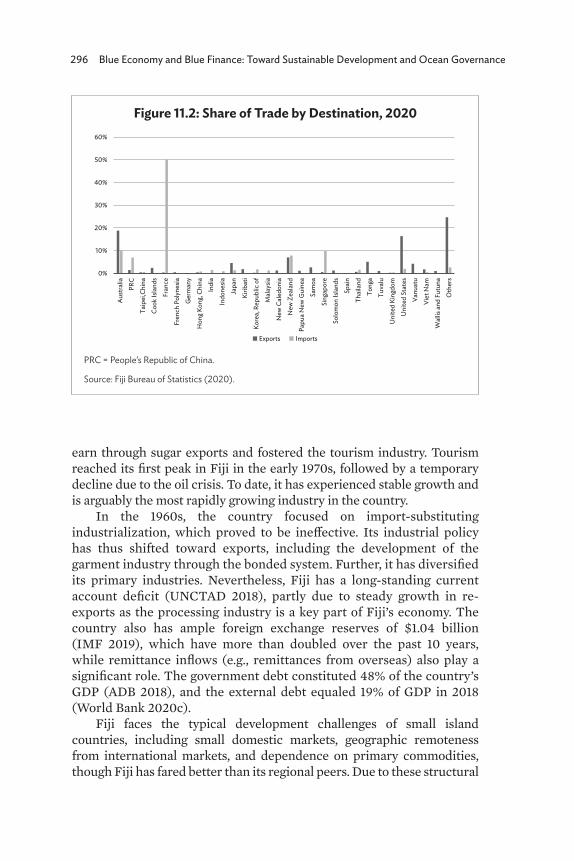
296 Blue Economy and Blue Finance: Toward Sustainable Development and Ocean Governance
earn through sugar exports and fostered the tourism industry. Tourism reached its first peak in Fiji in the early 1970s, followed by a temporary decline due to the oil crisis. To date, it has experienced stable growth and is arguably the most rapidly growing industry in the country.
In the 1960s, the country focused on import-substituting industrialization, which proved to be ineffective. Its industrial policy has thus shifted toward exports, including the development of the garment industry through the bonded system. Further, it has diversified its primary industries. Nevertheless, Fiji has a long-standing current account deficit (UNCTAD 2018), partly due to steady growth in re-exports as the processing industry is a key part of Fiji’s economy. The country also has ample foreign exchange reserves of $1.04 billion (IMF 2019), which have more than doubled over the past 10 years, while remittance inflows (e.g., remittances from overseas) also play a significant role. The government debt constituted 48% of the country’s GDP (ADB 2018), and the external debt equaled 19% of GDP in 2018 (World Bank 2020c).
Fiji faces the typical development challenges of small island countries, including small domestic markets, geographic remoteness from international markets, and dependence on primary commodities, though Fiji has fared better than its regional peers. Due to these structural
Figure 11.2: Share of Trade by Destination, 2020
PRC = People’s Republic of China.
Source: Fiji Bureau of Statistics (2020).
0%
10%
20%
30%
40%
50%
60%
Aus
tral
iaPR
CTa
ipei
,Chi
naCo
ok Is
land
sFr
ance
Fren
ch P
olyn
esia
Ger
man
yH
ong
Kong
, Chi
naIn
dia
Indo
nesia
Japa
nKi
ribat
iKo
rea,
Rep
ublic
of
Mal
aysia
New
Cal
edon
iaN
ew Z
eala
ndPa
pua
New
Gui
nea
Sam
oaSi
ngap
ore
Solo
mon
Isla
nds
Spai
nTh
aila
ndTo
nga
Tuva
luU
nite
d Ki
ngdo
mU
nite
d St
ates
Vanu
atu
Viet
Nam
Wal
lis a
nd F
utun
aO
ther
s
Exports Imports

Building Back Better in Small Island Developing States in the Pacific: Initial Insights from the Binary Constrained Disaster Model of Disaster Risk Management Policy Options in Fiji 297
challenges and underdeveloped domestic labor markets, many of the countries of Polynesia and Micronesia have a national economy—the so-called MIRAB economy—which relies on foreign aid for state finances and remittances from overseas migrants. In contrast, Fiji is less dependent on foreign aid than its regional peers (Dornan and Pryke 2017).1 The World Bank’s data show Fiji’s low dependence on net official development aid of gross national income (2.76%) and relatively high GDP per capita ($6,175) (World Bank 2020c). This could be partly due not only to Fiji’s predominant economic status in the region but also to its political situation. Traditional donors refrained from providing development assistance after the 2006 coup, but they have been likely to improve the relationship with Fiji since the 2014 election (Schmaljohann and Prizzon 2014). Nonetheless, Fiji’s aid dependence remains low. At the same time, there is considerable concern that climate change in the coming years could reverse the development gains that it has made in recent decades.
11.3 Fiji’s Climate and Disaster Risk Management Hydrometeorological hazards have frequently occurred in Fiji in recent years. According to the EM-DAT database, between 2000 and 2020, Fiji experienced 18 cyclones, with the total estimated economic damage being approximately $800 million (Table 11.2). The largest damage and losses often result from the destruction of the built environment, including residential, transport, and other infrastructural assets. While considerable uncertainly exists, the recent climate change assessment projected that the cyclone risk in Fiji is increasing due to climate change—estimations have indicated that losses associated with 1-in-50-year cyclones, for example, will increase by nearly 30% by the end of the century in the worst-case scenario (PCRAFI 2013).
At the same time, Fiji has made significant progress on climate change and DRM strategies in recent decades. Fiji has adopted its National Disaster Management Plan (1995) and National Disaster Management Act (1998) and is a signatory to the Hyogo Framework for Action (2005–2015) and the subsequent Sendai Framework for Disaster Risk Reduction (2015–2030). It has also adopted the National Climate Change Policy (2012) and conducted a climate vulnerability assessment in 2017, identifying priority investment areas. Currently, Fiji is implementing climate and DRM policies within its overall
1 The major donors are Australia, New Zealand, Japan, the Republic of Korea, Germany, and the United States. Due to pressure from Australia and New Zealand’s repeated interference in its internal affairs, Fiji’s government has strengthened its relationship with the People’s Republic of China in recent years.
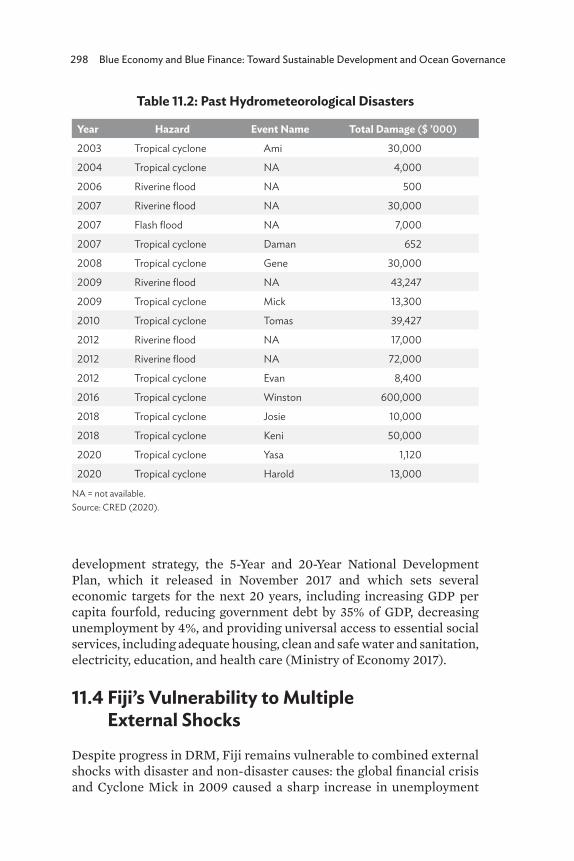
298 Blue Economy and Blue Finance: Toward Sustainable Development and Ocean Governance
Table 11.2: Past Hydrometeorological Disasters
Year Hazard Event Name Total Damage ($ ’000)
2003 Tropical cyclone Ami 30,000
2004 Tropical cyclone NA 4,000
2006 Riverine flood NA 500
2007 Riverine flood NA 30,000
2007 Flash flood NA 7,000
2007 Tropical cyclone Daman 652
2008 Tropical cyclone Gene 30,000
2009 Riverine flood NA 43,247
2009 Tropical cyclone Mick 13,300
2010 Tropical cyclone Tomas 39,427
2012 Riverine flood NA 17,000
2012 Riverine flood NA 72,000
2012 Tropical cyclone Evan 8,400
2016 Tropical cyclone Winston 600,000
2018 Tropical cyclone Josie 10,000
2018 Tropical cyclone Keni 50,000
2020 Tropical cyclone Yasa 1,120
2020 Tropical cyclone Harold 13,000
NA = not available. Source: CRED (2020).
development strategy, the 5-Year and 20-Year National Development Plan, which it released in November 2017 and which sets several economic targets for the next 20 years, including increasing GDP per capita fourfold, reducing government debt by 35% of GDP, decreasing unemployment by 4%, and providing universal access to essential social services, including adequate housing, clean and safe water and sanitation, electricity, education, and health care (Ministry of Economy 2017).
11.4 Fiji’s Vulnerability to Multiple External Shocks
Despite progress in DRM, Fiji remains vulnerable to combined external shocks with disaster and non-disaster causes: the global financial crisis and Cyclone Mick in 2009 caused a sharp increase in unemployment
Building Back Better in Small Island Developing States in the Pacific: Initial Insights from the Binary Constrained Disaster Model of Disaster Risk Management Policy Options in Fiji 299
(Reserve Bank of Fiji 2019), and the COVID-19 pandemic in early 2020 took a heavy toll on the economy. The Reserve Bank of Fiji predicted a contraction in tourism revenue of more than 20% in 2020, expecting it to spur unemployment. In addition, repeated incidents of political instability in the country have caused a rapid decline in foreign private investment, as in 2006.2 Such governance risks could amplify Fiji’s economic vulnerability in the face of disaster shocks.
Fiji’s efforts to build climate and disaster resilience over the next decades therefore hinge on both internal and external circumstances: internally, Fiji must evaluate carefully how alternative disaster and climate policy will fare under its structural rigidity—including the capital import dependence of its major industries, remoteness (i.e., the difficulty of access, especially in rural areas, which hampers poverty and inequity reduction), and less diversified export options, which render it susceptible to external shocks. The external factors that affect Fiji may include climate- and non-climate-related shocks, some of which are likely to worsen in the coming decades (World Economic Forum 2021).
The paragraphs below summarize Fiji’s structural challenges, which are especially notable in the light of increasing disaster risk.
11.4.1 Industrial Structure, Including Import and Export Rigidities
As with many small island states, Fiji’s less diversified and externally dependent industrial structure is vulnerable to numerous external shocks, with disaster and non-disaster causes. As mentioned, Fiji’s economy is highly dependent on capital goods imports (e.g., manufactured goods, machinery, and transport equipment) and petroleum products. These render the economy vulnerable in the case of extended supply and price shocks of these goods in the global market.
Regarding exports, Fiji is strongly dependent on tourism. Fiji’s tourism receipt as a share of its total exports reached approximately 50.9% in 2019 (World Tourism Organization 2019). However, the tourism
2 The prolonged political instability resulting from a series of coups has indeed led Fiji onto a lower growth path, and the accumulated effect is increasing (Fletcher and Morakabati 2008).
Alley (2001) analyzed the coup of 2000 and determined that it caused severe economic damage to Fiji compared with the coup of 1987. It produced not only economic shocks, such as a loss of existing trade concessions and disruptions to trade and services, but also political shocks, including the diplomatic isolation of Fiji. In addition, Fiji, as a hub of intergovernmental activity, risked the loss of generous sugar, tuna, and garment export subsidies and benefits in the European Union market. Exports of garment manufacturing, tourism, and aviation faced longer-term damage due to the coup of 2000.
300 Blue Economy and Blue Finance: Toward Sustainable Development and Ocean Governance
sector is prone to extensive volatility, as the COVID-19 pandemic has recently demonstrated. Further, its exports are predominantly unrefined commodities, such as sugar, gold, and timber, for which it loses ground in market shares.
For instance, Fiji’s traditional sugar industry’s performance has deteriorated for decades due to the challenges of economic, political, and disaster-related shocks. Fiji’s traditional sugar industry is lacking in modernization, which is gradually eroding its international competitiveness as problems such as aging machinery are beginning to emerge (Reddy 2003). The Fiji government has tried to rescue the Fijian Sugar Corporation, the biggest public sugar company in Fiji, by supporting the purchase of new farming machine; however, its performance has hardly recovered because of its vulnerability to domestic and external shocks (Sami 2020). Guaranteeing the sugar industry’s borrowing from domestic and foreign resources would be expensive and would face impediments. The installation of more modern machines to overcome such modernization issues would be more costly and impractical, especially when a disaster occurs, due to the limited foreign exchange and a lack of domestic demand. We explore these aspects in more detail in the following section.
11.4.2 The Lack of Redundancy in Critical Infrastructure, Financial Preparedness, and Technical Capacities
The lack of redundancy of critical infrastructure and facilities—most of which are, for convenience and strategic reasons, located along the coasts—renders SIDS especially vulnerable to the physical disruption of coastal hazards, and Fiji is no exception. The occurrence of hazards such as coastal storm surge, which climate change exacerbates, may destroy critical port and airport infrastructure and disrupt trade. At the same time, hazards may directly damage the local production of critical goods, hampering the country’s ability to substitute these goods domestically.
When one road is damaged, for example, the lack of redundancy means that taking an alternative route is not an option, leading to significant disruption of the transportation of goods and services and even reducing the productivity of other assets, such as factories (Hallegatte, Rentschler, and Rozenberg 2019). Fiji conducted a recent transport sector criticality analysis evaluating aspects such as road traffic, the level of redundancy, and hazard exposure, which identified, for instance, areas for priority investment. In Vanua Levu, the analysis indicated that the most critical roads are the Natewa west coast road and the Bucalevu, Nabouwalu Batiri Village, and Navolu roads. In Viti Levu, the report showed that King’s Road and Queen’s Road are critical.
Building Back Better in Small Island Developing States in the Pacific: Initial Insights from the Binary Constrained Disaster Model of Disaster Risk Management Policy Options in Fiji 301
Regarding bridges and culverts, important nodes include King’s Road (including the Vunato and Laqere bridges, the Thomson Nabukalou bridge, the Sawani bridge, the Draiba bridge, and the Laqere crossing) in Viti Levu and Savudrodro Road, Nayarabale Road, and Bucalevu Road in Vanua Levu (Government of Fiji 2017). The destruction of any of these choke points could have significant implications for the country’s economic activities and emergency response logistics.
The general lack of redundancy in small island economies applies not only to infrastructure but also to the necessary financial and technical capacities to manage complex reconstruction projects and to repair and maintain specialized facilities. According to the recent study that the International Bank for Reconstruction and Development conducted, $1.6 million of the national budget is available for disaster risk financing and insurance instruments in Fiji as of 2015 (World Bank 2015). However, probabilistic assessment of these financing resources vis-à-vis the reconstruction financing needs of major hazards shows that the response, recovery, and reconstruction needs are likely to exceed Fiji’s resource availability in any given year with a 60% probability (PCRAFI 2015).3 The planning and execution of reconstruction projects will involve complex handling of multi-currency grants and loans. Furthermore, the rebuilding of specialized facilities (port infrastructure, etc.) requires skills that may not be readily available. These additional operational bottlenecks are likely to delay the implementation of recovery and reconstruction projects, leading to increased adverse impacts on the economy.
11.4.3 Social Vulnerability, Including Poverty and Inequity
According to UNDP (2020), 24.2% of the population in Fiji still lived below the national poverty line of F$7.1 per day before COVID-19, of which more than 60% lived in rural areas. Relative to its regional peers, Fiji’s residential building stocks are relatively resilient to disasters, but some disparity remains: nationally, approximately 40% of houses are made of concrete or masonry, while 58% are timber framed with wood, tin, or cladding. Local bure housing is evident in areas such as the Northern Division (10%) and Eastern Division (7%). Among the areas of informal settlements, 10% of housing is made of concrete, the remainder consisting of timber, tin or iron, and other recycled materials
3 See, for example, Mochizuki, Hallwright, and Handmer (2019) for a discussion on implementation constraints in post-disaster operation.

302 Blue Economy and Blue Finance: Toward Sustainable Development and Ocean Governance
(Government of Fiji 2017). Providing safe housing and adequate preparedness, including access to warnings and evacuation shelters in these areas of heightened vulnerability, remains a policy priority for Fiji.
The recent microeconomic analysis showed that natural hazards place a significant burden on households: cyclones and floods on average push 25,700 people into poverty each year, while 100-year cyclone, fluvial, and pluvial flood events may force approximately 5.7%, 12.5%, and 7.8% of the total population into poverty, respectively. These figures are likely to increase (100-year cyclone: 5.7% in 2050, 5.7% in 2100; fluvial floods: 14.8% in 2050, 15.7% in 2100; and pluvial floods: 10.5% and 12.8%) (Government of Fiji 2017). To provide adequate social protection, especially for the vulnerable population, the Government of Fiji has been strengthening its social protection schemes: the social protection budget of the Ministry of Women, Children, and Poverty Alleviation has increased to $23 million, and it needs an estimated additional $1.96 million annually to scale up social protection under climate change (Government of Fiji 2017).
As we will describe below, Fiji faces a number of competing DRM policy needs, including the need for timely recovery of its critical infrastructure bottlenecks, the need to include resilience building (e.g., enhancing the structural safety of the built environment) in post-disaster reconstruction operations, and the provision of sufficient livelihood support for those susceptible to poverty, to name a few. All of these DRM policy options must receive financing within the structural rigidity of Fiji’s economy, as we will discuss. As observations in the past few years have indicated, the rebuilding of Fiji’s fiscal space remains a major policy priority as the country faces the deterioration of its current account deficit due to rising imports, appreciation of the real exchange rate, and expansionary spending following an election year (IMF 2020a).
11.5 MethodologyThis section investigates how these DRM policy options interact in the face of the acute demand-side constraints resulting from the additional external shock of COVID-19. To provide initial insights, we adopted the simplified version of the BinD model to conduct an analysis of Fiji’s disaster response scenario.4
4 While distributional aspects are important structural characteristics of Fiji’s economy, as section 11.4 reviewed, the simplified version of the BinD model primarily incorporates rigidities of import and export dependency, the lack of redundant production capacity, and general discussions of the trade-off between consumption and investment spending. The DIoD Project, with funding from the Austrian National Bank, is currently studying the incorporation of distributional aspects.
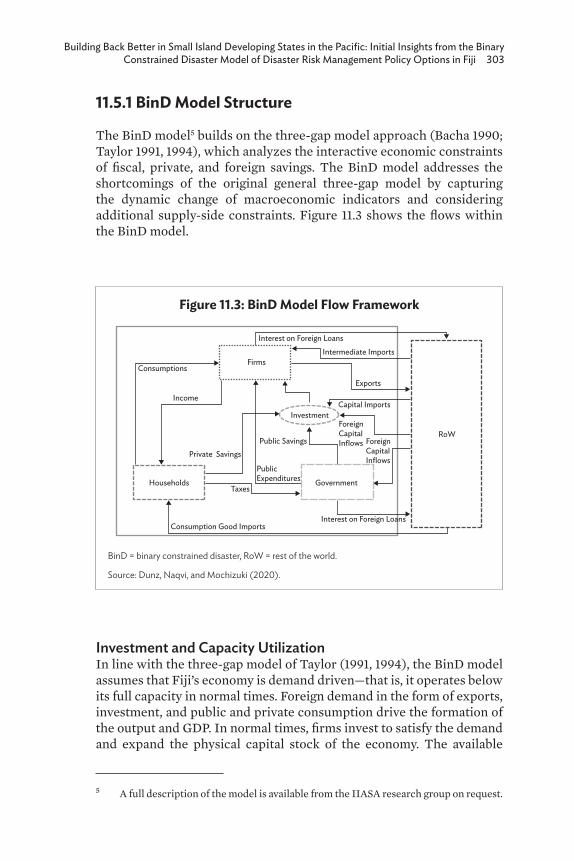
Building Back Better in Small Island Developing States in the Pacific: Initial Insights from the Binary Constrained Disaster Model of Disaster Risk Management Policy Options in Fiji 303
11.5.1 BinD Model Structure
The BinD model5 builds on the three-gap model approach (Bacha 1990; Taylor 1991, 1994), which analyzes the interactive economic constraints of fiscal, private, and foreign savings. The BinD model addresses the shortcomings of the original general three-gap model by capturing the dynamic change of macroeconomic indicators and considering additional supply-side constraints. Figure 11.3 shows the flows within the BinD model.
Investment and Capacity UtilizationIn line with the three-gap model of Taylor (1991, 1994), the BinD model assumes that Fiji’s economy is demand driven—that is, it operates below its full capacity in normal times. Foreign demand in the form of exports, investment, and public and private consumption drive the formation of the output and GDP. In normal times, firms invest to satisfy the demand and expand the physical capital stock of the economy. The available
5 A full description of the model is available from the IIASA research group on request.
Figure 11.3: BinD Model Flow Framework
BinD = binary constrained disaster, RoW = rest of the world.
Source: Dunz, Naqvi, and Mochizuki (2020).
Interest on Foreign Loans
Intermediate ImportsFirms
Capital Imports
ForeignCapitalInflows Foreign
CapitalInflows
Government
Interest on Foreign Loans
Investment
Private Savings
HouseholdsTaxes
Public Savings
Public Expenditures
Consumption Good Imports
Income
Exports
RoW
Consumptions
304 Blue Economy and Blue Finance: Toward Sustainable Development and Ocean Governance
financial means, however, constrain the capital formation since access of SIDS to capital markets is often limited. The BinD model hence assumes that it is possible to determine an economy’s actual output in one of two possible ways: (i) the aggregate demand (i.e., specified endogenously by simultaneously solving government, private consumption, investment, and import functions),6 representing a demand-side constraint; and (ii) the employed capacity (which the level of capital and the fixed capital to output ratio indicate), representing a supply-side constraint.
The economy’s production capacity (i.e., supply-side constraint) updates dynamically based on the level of actual investment (i.e., the level of realized investment in each time step)7 considering both the target investment and the available savings.8
Fiscal, Foreign, and Savings ConstraintsBuilding on the original three-gap model logic, the assumption is that an economy faces savings, foreign, and fiscal gaps (or constraints). First, we assumed that Fiji’s economy confronts a savings gap—i.e., the government, private, and foreign savings determine the economy’s available savings in each period. An excess (or shortfall) of private spending (i.e., private consumption and private investment) over private income (total real output plus foreign private transfer minus tax) establishes private (dis)savings.
Second, we assumed that an economy faces a foreign exchange gap—Fiji’s economy may not sustain a high level of balance of payment deficit. The current account balance in each period determines foreign (dis)savings. Based on the key structural features of Fiji’s economy, as the previous sections discussed, we assumed that capital imports are an important structural element of a productive economy. In normal times, for each additional unit of productive capital, a fixed share of capital imports (calibrated for the base year) is necessary. In disaster terms, a country needs additional capital imports to implement the reconstruction of built environments, such as houses, infrastructure, and production facilities. Given the constraints on foreign exchange, an economy faces a trade-off between consumption imports, which raise the effective demand, or capital imports, which raise the supply capacity.
Third, we assumed that an economy faces a fiscal gap—the Fiji government may not sustain a high level of fiscal deficit. It is possible
6 This version of the model assumes that exports are exogenous.7 This version of the model simulates the economy’s growth path monthly.8 Note that the model currently only captures human-made capital stock and respective
investment. Natural capital is, however, an important source of revenue and wealth in many small island states (Lange, Wodon, and Carey 2018), which future versions of the BinD model could include.
Building Back Better in Small Island Developing States in the Pacific: Initial Insights from the Binary Constrained Disaster Model of Disaster Risk Management Policy Options in Fiji 305
to calculate government (dis)savings as an excess (or shortfall) of government spending (e.g., government consumption and public investment) over government revenue (including direct taxes). We assumed that public investment crowds in private investment and hence plays a significant role in enhancing the production capacity. However, given the presence of a fiscal gap, public investment also competes with government consumption, having demand-side implications. In summary, these interrelated demand- and supply-side factors jointly determine the Fiji economy’s pre- and post-disaster growth trajectories.
The model consists of two kinds of path-dependent stocks, domestically produced and imported capital stock as well as foreign debt. Further, the model introduces supply-side constraints into a demand-driven model, a methodological and conceptual avenue that has been receiving increasing attention in the structuralist literature but is still relatively unexplored. The aggregate demand drives the output. Since there is restricted access to capital markets, however, the supply side can also constrain the output due to a lack of available savings for sufficient capital formation. Thereby, we incorporate the original three-gap features of necessary capital goods and intermediate goods imports for production capacity buildup and output formation, respectively, while public infrastructure investment is a necessary condition for mobilizing private investment. As such, the model highlights the trade-offs and the underlying allocative choice problem for constrained financial means that become prevalent in the case of an extreme weather shock. The dynamic setup with a private sector, government, and foreign account allows us to identify the interacting feedback effects of the distinct constraining factors in a post-disaster situation.
11.5.2 Calibration and Scenario Development
CalibrationWe calibrated the above conceptual model to Fiji’s macroeconomic data with a base year of 2017. We took the data from the Fiji Bureau of Statistics (2020), the Reserve Bank of Fiji (Reserve Bank of Fiji 2017), the IMF article VI consultation reports (IMF 2020b), the World Development Indicators and other databanks available from the World Bank (World Bank 2020d), and the Penn World Table (PWT 2020).
Simulating Disasters and Disaster Risk Management PoliciesDisasters may affect an economy through several channels, including the physical destruction of infrastructure, productive capital, and outputs; a reduction in sales revenue due to destruction, facility closure, temporary absence of labor or a decline in customer demands; and increased government spending on response, recovery, and reconstruction efforts.
306 Blue Economy and Blue Finance: Toward Sustainable Development and Ocean Governance
Those channels may also have implications for the country’s trade balances and so on. For example, the post-disaster needs assessment of Cyclone Winston in 2016 revealed strong macroeconomic and fiscal impacts (Government of Fiji 2016), such as:
• a reduction in economic growth to 1.3% in 2016 compared with the projected 3.8% in the pre-cyclone time;
• the inter-industry impacts noted include lower sugar production, affecting the manufacturing subsector, and water and electricity supply disruption, affecting manufacturing and commerce activities;
• a decline of 1.2% in the total exports in 2016 compared with the pre-cyclone projection of over 17% growth (primarily a decline in commodity outputs, with minimal effects on the tourism sector);
• higher imports (10% as opposed to the projected 7% pre-cyclone) with an inflow of capital for reconstruction (primarily in the housing, telecommunication, and transport sectors), and increased food imports to offset local production losses; and
• budget reallocation to finance disaster relief and early recovery activities, while projections indicate that collection of value-added tax is likely to decline by approximately $30.3 million.
Policy and Shock ScenariosTo prepare for these potential shocks, the Fiji government has invested in a DRM policy, as section 11.3 reviewed. Fiji’s current resource availability to respond to and recover from disasters includes (ADB 2019b):
• a contingency budget fund;• line agency budgets for the Ministry of Disaster Management
and Meteorology Services;• post-event budget reallocation; and• international external assistance, including official donor
assistance and remittances.
Fiji is also a member of the Pacific Catastrophe Risk Insurance Company, and discussions are currently taking place to increase the access to financing through instruments such as the World Bank Catastrophe Deferred Draw Down Option, or CATDDO.9
The BinD model could assess many of these disaster impact transmission channels and policy options, and this is the subject of
9 For details, see World Bank (2020a).
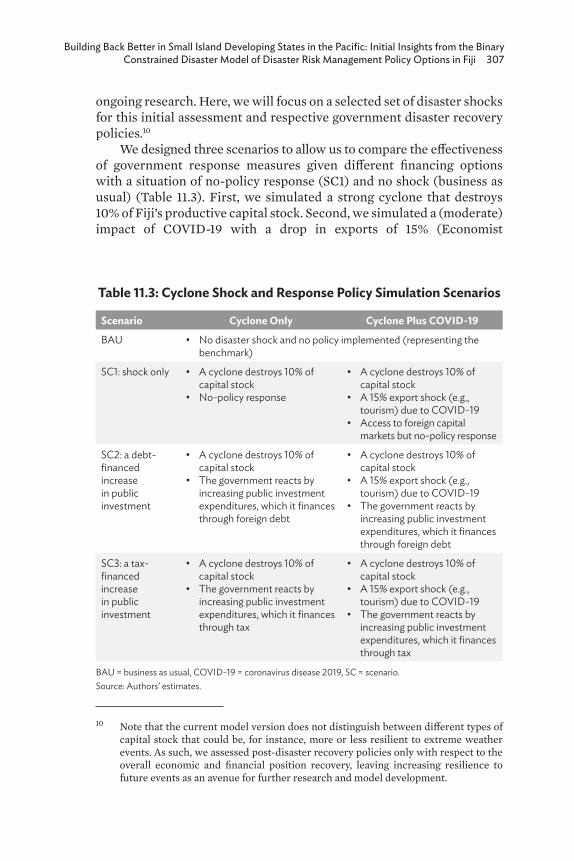
Building Back Better in Small Island Developing States in the Pacific: Initial Insights from the Binary Constrained Disaster Model of Disaster Risk Management Policy Options in Fiji 307
ongoing research. Here, we will focus on a selected set of disaster shocks for this initial assessment and respective government disaster recovery policies.10
We designed three scenarios to allow us to compare the effectiveness of government response measures given different financing options with a situation of no-policy response (SC1) and no shock (business as usual) (Table 11.3). First, we simulated a strong cyclone that destroys 10% of Fiji’s productive capital stock. Second, we simulated a (moderate) impact of COVID-19 with a drop in exports of 15% (Economist
10 Note that the current model version does not distinguish between different types of capital stock that could be, for instance, more or less resilient to extreme weather events. As such, we assessed post-disaster recovery policies only with respect to the overall economic and financial position recovery, leaving increasing resilience to future events as an avenue for further research and model development.
Table 11.3: Cyclone Shock and Response Policy Simulation Scenarios
Scenario Cyclone Only Cyclone Plus COVID-19
BAU • No disaster shock and no policy implemented (representing the benchmark)
SC1: shock only • A cyclone destroys 10% of capital stock
• No-policy response
• A cyclone destroys 10% of capital stock
• A 15% export shock (e.g., tourism) due to COVID-19
• Access to foreign capital markets but no-policy response
SC2: a debt-financed increase in public investment
• A cyclone destroys 10% of capital stock
• The government reacts by increasing public investment expenditures, which it finances through foreign debt
• A cyclone destroys 10% of capital stock
• A 15% export shock (e.g., tourism) due to COVID-19
• The government reacts by increasing public investment expenditures, which it finances through foreign debt
SC3: a tax-financed increase in public investment
• A cyclone destroys 10% of capital stock
• The government reacts by increasing public investment expenditures, which it finances through tax
• A cyclone destroys 10% of capital stock
• A 15% export shock (e.g., tourism) due to COVID-19
• The government reacts by increasing public investment expenditures, which it finances through tax
BAU = business as usual, COVID-19 = coronavirus disease 2019, SC = scenario. Source: Authors’ estimates.

308 Blue Economy and Blue Finance: Toward Sustainable Development and Ocean Governance
Intelligence Unit 2021). To stimulate the recovery, the government increases public investment by 20% in both policy scenarios (SC2 and SC3). In SC1 and SC2, we assumed fast access to international capital markets and multilateral lending to finance additional public investment expenditures. In SC3, we assumed that the government will increase income taxes by 4 percentage points to finance the additional public investment expenditures. We designed all the scenarios to be budget and debt neutral in the long run, when Fiji’s economy returns to its steady state.
11.6 ResultsFigure 11.4 presents the dynamics of Fiji’s real GDP under alternative simulation scenarios. The same cyclone shock hits all the scenarios, with or without an additional pandemic-related shock to exports. The destruction of capital stock leads to an initial drop in the real GDP of approximately 5.4% in the case of a cyclone shock only. The destroyed production capacity impedes firms’ ability to meet the aggregate demand in the immediate aftermath, reducing the output, private consumption, and GDP. The destruction of capital stock plus an export shock due to COVID-19 reduce the real GDP by approximately 10% initially. The shock in exports dampens the aggregate demand, delaying firms’ rebuilding efforts (Figure 11.5.b). For both scenarios, with and without an additional COVID-19 shock, the debt-financed increase in government investment reduces the immediate shocks in terms of GDP and achieves a faster recovery. The tax-financed increase in public investment leads to an initial worsening of the GDP trajectory, followed by a lagged increase in output that is apparent 2 years after the initial shock.
A reduction in private consumption due to higher tax payments may explain part of this time lag in the GDP recovery with a tax finance increase in government investment (Figure 11.5). Further, decreased public spending lowers the aggregate demand. While the government increases public investment by the same level as in the debt-financed scenario, it has to cut general public expenditures and reduce its budget deficit. The reasons are twofold. First, the government cannot access foreign borrowing, which would otherwise allow it to bridge financing gaps in the short run. Second, the negative impact on GDP further reduces the overall tax base, which a higher tax rate cannot fully compensate for in the immediate aftermath of a disaster shock. Reduced private consumption and public spending both dampen the aggregate demand and thus lead to a subsequent decline in demand-driven private capital investment (Figure 11.6) in SC3. The debt-financed increase in government investment, on the other hand, requires a temporary
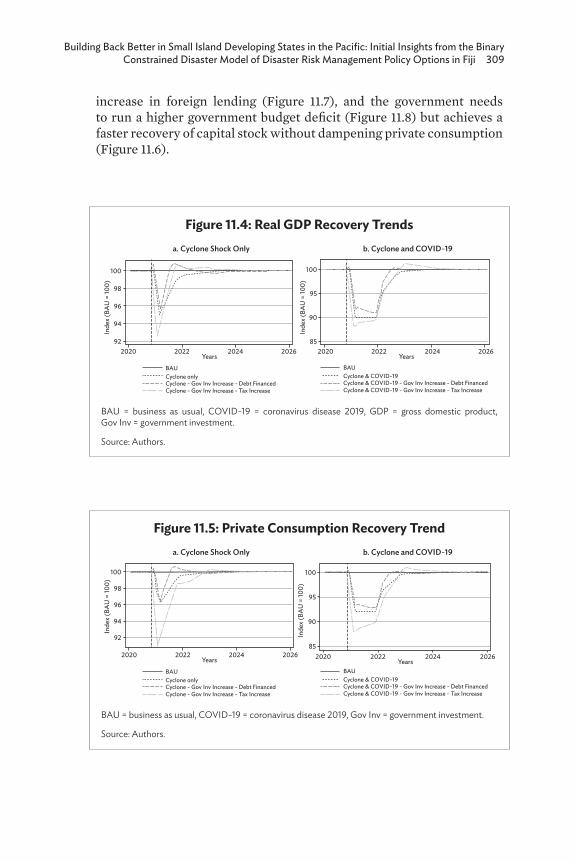
Building Back Better in Small Island Developing States in the Pacific: Initial Insights from the Binary Constrained Disaster Model of Disaster Risk Management Policy Options in Fiji 309
increase in foreign lending (Figure 11.7), and the government needs to run a higher government budget deficit (Figure 11.8) but achieves a faster recovery of capital stock without dampening private consumption (Figure 11.6).
Figure 11.4: Real GDP Recovery Trends
BAU = business as usual, COVID-19 = coronavirus disease 2019, GDP = gross domestic product, Gov Inv = government investment.
Source: Authors.
Inde
x (BA
U =
100)
2020 2022Years
2024 2026
BAUCyclone onlyCyclone - Gov Inv Increase - Debt FinancedCyclone - Gov Inv Increase - Tax Increase
100
98
96
94
92
Inde
x (BA
U =
100)
2020 2022Years
2024 2026
100
95
90
85
BAUCyclone & COVID-19Cyclone & COVID-19 - Gov Inv Increase - Debt FinancedCyclone & COVID-19 - Gov Inv Increase - Tax Increase
a. Cyclone Shock Only b. Cyclone and COVID-19
Figure 11.5: Private Consumption Recovery Trend
BAU = business as usual, COVID-19 = coronavirus disease 2019, Gov Inv = government investment.
Source: Authors.
Inde
x (BA
U =
100)
2020 2022Years
2024 2026
100
98
96
94
92 Inde
x (BA
U =
100)
BAUCyclone onlyCyclone - Gov Inv Increase - Debt FinancedCyclone - Gov Inv Increase - Tax Increase
BAUCyclone & COVID-19Cyclone & COVID-19 - Gov Inv Increase - Debt FinancedCyclone & COVID-19 - Gov Inv Increase - Tax Increase
a. Cyclone Shock Only b. Cyclone and COVID-19
2020 2022Years
2024 2026
100
95
90
85
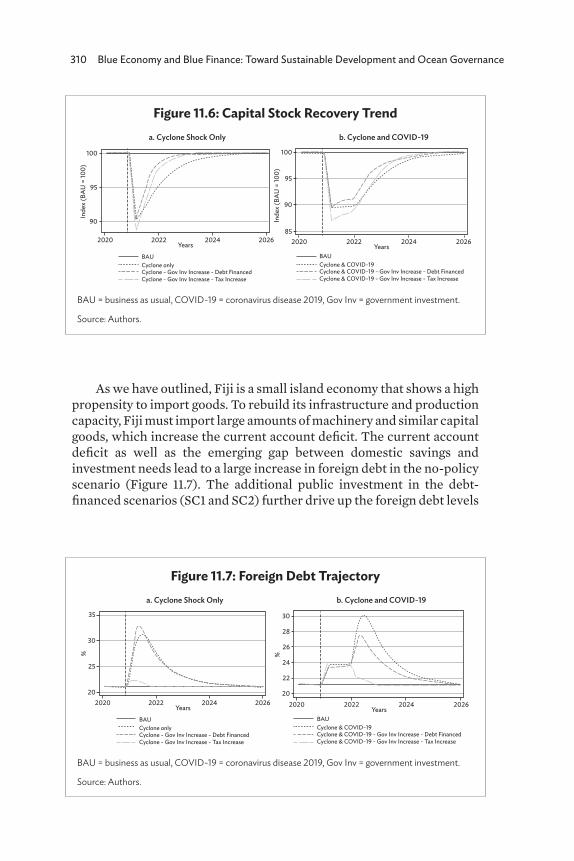
310 Blue Economy and Blue Finance: Toward Sustainable Development and Ocean Governance
As we have outlined, Fiji is a small island economy that shows a high propensity to import goods. To rebuild its infrastructure and production capacity, Fiji must import large amounts of machinery and similar capital goods, which increase the current account deficit. The current account deficit as well as the emerging gap between domestic savings and investment needs lead to a large increase in foreign debt in the no-policy scenario (Figure 11.7). The additional public investment in the debt-financed scenarios (SC1 and SC2) further drive up the foreign debt levels
Figure 11.6: Capital Stock Recovery Trend
BAU = business as usual, COVID-19 = coronavirus disease 2019, Gov Inv = government investment.
Source: Authors.
Inde
x (BA
U =
100)
2020 2022Years
2024 2026
100
95
90 Inde
x (BA
U =
100)
BAUCyclone onlyCyclone - Gov Inv Increase - Debt FinancedCyclone - Gov Inv Increase - Tax Increase
BAUCyclone & COVID-19Cyclone & COVID-19 - Gov Inv Increase - Debt FinancedCyclone & COVID-19 - Gov Inv Increase - Tax Increase
a. Cyclone Shock Only b. Cyclone and COVID-19
2020 2022Years
2024 2026
100
95
90
85
Figure 11.7: Foreign Debt Trajectory
BAU = business as usual, COVID-19 = coronavirus disease 2019, Gov Inv = government investment.
Source: Authors.
%
2020 2022Years
2024 2026
35
30
25
20
30
28
24
22
26
20
%
BAUCyclone onlyCyclone - Gov Inv Increase - Debt FinancedCyclone - Gov Inv Increase - Tax Increase
BAUCyclone & COVID-19Cyclone & COVID-19 - Gov Inv Increase - Debt FinancedCyclone & COVID-19 - Gov Inv Increase - Tax Increase
a. Cyclone Shock Only b. Cyclone and COVID-19
2020 2022Years
2024 2026
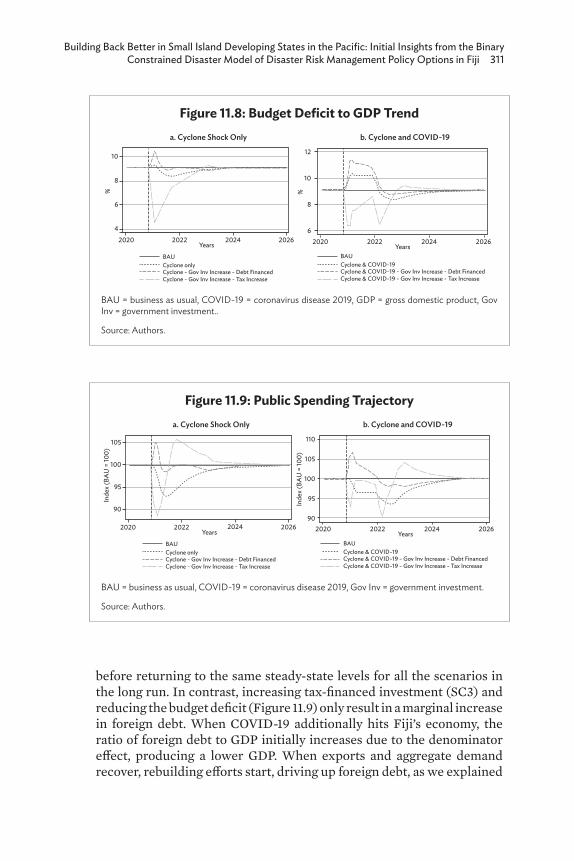
Building Back Better in Small Island Developing States in the Pacific: Initial Insights from the Binary Constrained Disaster Model of Disaster Risk Management Policy Options in Fiji 311
Figure 11.8: Budget Deficit to GDP Trend
BAU = business as usual, COVID-19 = coronavirus disease 2019, GDP = gross domestic product, Gov Inv = government investment..
Source: Authors.
%
2020 2022Years
2024 2026
10
8
6
4
12
10
8
6
%
BAUCyclone onlyCyclone - Gov Inv Increase - Debt FinancedCyclone - Gov Inv Increase - Tax Increase
BAUCyclone & COVID-19Cyclone & COVID-19 - Gov Inv Increase - Debt FinancedCyclone & COVID-19 - Gov Inv Increase - Tax Increase
a. Cyclone Shock Only b. Cyclone and COVID-19
2020 2022Years
2024 2026
Figure 11.9: Public Spending Trajectory
BAU = business as usual, COVID-19 = coronavirus disease 2019, Gov Inv = government investment.
Source: Authors.
Inde
x (BA
U =
100)
2020 2022Years
2024 2026
105
100
95
90
110
105
100
95
90
Inde
x (BA
U =
100)
BAUCyclone onlyCyclone - Gov Inv Increase - Debt FinancedCyclone - Gov Inv Increase - Tax Increase
BAUCyclone & COVID-19Cyclone & COVID-19 - Gov Inv Increase - Debt FinancedCyclone & COVID-19 - Gov Inv Increase - Tax Increase
a. Cyclone Shock Only b. Cyclone and COVID-19
2020 2022Years
2024 2026
before returning to the same steady-state levels for all the scenarios in the long run. In contrast, increasing tax-financed investment (SC3) and reducing the budget deficit (Figure 11.9) only result in a marginal increase in foreign debt. When COVID-19 additionally hits Fiji’s economy, the ratio of foreign debt to GDP initially increases due to the denominator effect, producing a lower GDP. When exports and aggregate demand recover, rebuilding efforts start, driving up foreign debt, as we explained
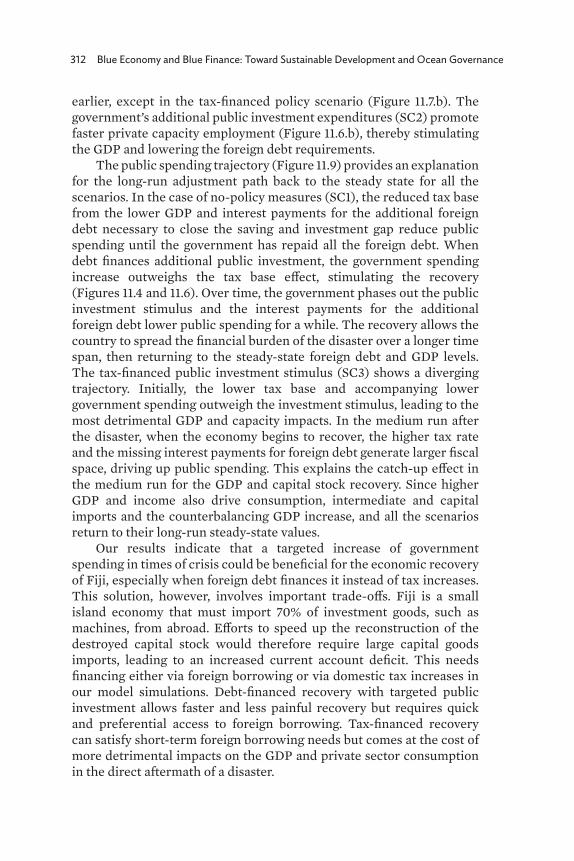
312 Blue Economy and Blue Finance: Toward Sustainable Development and Ocean Governance
earlier, except in the tax-financed policy scenario (Figure 11.7.b). The government’s additional public investment expenditures (SC2) promote faster private capacity employment (Figure 11.6.b), thereby stimulating the GDP and lowering the foreign debt requirements.
The public spending trajectory (Figure 11.9) provides an explanation for the long-run adjustment path back to the steady state for all the scenarios. In the case of no-policy measures (SC1), the reduced tax base from the lower GDP and interest payments for the additional foreign debt necessary to close the saving and investment gap reduce public spending until the government has repaid all the foreign debt. When debt finances additional public investment, the government spending increase outweighs the tax base effect, stimulating the recovery (Figures 11.4 and 11.6). Over time, the government phases out the public investment stimulus and the interest payments for the additional foreign debt lower public spending for a while. The recovery allows the country to spread the financial burden of the disaster over a longer time span, then returning to the steady-state foreign debt and GDP levels. The tax-financed public investment stimulus (SC3) shows a diverging trajectory. Initially, the lower tax base and accompanying lower government spending outweigh the investment stimulus, leading to the most detrimental GDP and capacity impacts. In the medium run after the disaster, when the economy begins to recover, the higher tax rate and the missing interest payments for foreign debt generate larger fiscal space, driving up public spending. This explains the catch-up effect in the medium run for the GDP and capital stock recovery. Since higher GDP and income also drive consumption, intermediate and capital imports and the counterbalancing GDP increase, and all the scenarios return to their long-run steady-state values.
Our results indicate that a targeted increase of government spending in times of crisis could be beneficial for the economic recovery of Fiji, especially when foreign debt finances it instead of tax increases. This solution, however, involves important trade-offs. Fiji is a small island economy that must import 70% of investment goods, such as machines, from abroad. Efforts to speed up the reconstruction of the destroyed capital stock would therefore require large capital goods imports, leading to an increased current account deficit. This needs financing either via foreign borrowing or via domestic tax increases in our model simulations. Debt-financed recovery with targeted public investment allows faster and less painful recovery but requires quick and preferential access to foreign borrowing. Tax-financed recovery can satisfy short-term foreign borrowing needs but comes at the cost of more detrimental impacts on the GDP and private sector consumption in the direct aftermath of a disaster.
Building Back Better in Small Island Developing States in the Pacific: Initial Insights from the Binary Constrained Disaster Model of Disaster Risk Management Policy Options in Fiji 313
11.7 ConclusionTo build economic resilience against disasters, one must address appropriately the trade-offs associated with alternative recovery policy options for a small island economy such as Fiji. Reviewing the hazard profile, climate, and DRM policy frameworks and the structural vulnerabilities associated with Fiji’s economy, such as trade dependency and access to foreign borrowing, we developed and calibrated a BinD model, incorporating the three gaps of fiscal, foreign, and savings constraints. The BinD model assessed post-disaster response and recovery options against cyclone and COVID-19 impacts under alternative financing options of debt- and tax-financed increases in government investment.
As our analysis has demonstrated, efforts to restore disaster-affected infrastructure, buildings, and livelihoods as swiftly as possible may in fact compete with other development objectives, such as quickly restoring an adequate level of consumption, especially for the most vulnerable population. The simulation results indicated that a cyclone-only shock (resulting in 10% destruction of capital stock) leads to an initial drop in the real GDP of approximately 5.4%, while the same magnitude of destruction of capital stock under an additional export shock of COVID-19 reduces the real GDP by approximately 10%. A debt-financed increase in government investment requires a temporary higher foreign lending and government budget deficit while achieving a faster recovery of capital stock without dampening private consumption. A tax-financed increase in government investment, conversely, will hamper the aggregate demand. Thus, capital investment and the overall macroeconomic recovery, as the GDP trajectory indicated, will perform poorly compared with the no-policy and debt-financed scenarios. This highlights the crucial role that domestic demand plays in facilitating a swift economic recovery, especially with significant curtailment of foreign demand, such as in the case of COVID-19.
Our initial assessment indicated the importance of quick and preferential access to foreign borrowing in line with the Fiji government’s current engagement to access donor financing, for instance, through a contingent credit arrangement. At the same time, the government must design credible recovery and debt repayment plans to allow for long-run sustainability of debt in the country. While our analysis provided initial insights into the potential trade-offs associated with post-disaster recovery policies under demand-side constraints, additional knowledge gaps remain. They have the impact of alternative recovery-financing options and their distributional implications and the performance of debt- and tax-financed recovery options in comparison with other
314 Blue Economy and Blue Finance: Toward Sustainable Development and Ocean Governance
financing options, such as sovereign insurance and reserve funds. Further, it is necessary to explore an evaluation of ex post versus ex ante policy options, including adaptation policy. Finally, the analysis of long-run impacts of disasters, that is, how persistent changes in economic and financing conditions may drive long-run growth trajectories, is highly relevant, especially with the increased frequency and intensity of disaster occurrence due to climate change.

Building Back Better in Small Island Developing States in the Pacific: Initial Insights from the Binary Constrained Disaster Model of Disaster Risk Management Policy Options in Fiji 315
ReferencesAlley, R. 2001. Fiji’s Coups of 1987 and 2000: A Comparison. Revue
Juridique Polynésienne. 1. pp. 217–39.Asian Development Bank (ADB). 2018. Basic Statistics, Asia and the
Pacific. ADB Data Library. https://data.adb.org/dataset/basic -statistics-asia-and-pacific
____. 2019a. Fiji, Key Indicators. https://data.adb.org/dataset/fiji-key -indicators
____. 2019b. The Enabling Environment for Disaster Risk Financing in Fiji: Country Diagnostics Assessment. https://www.adb.org /publications/fiji-environment-disaster-risk-financing
____. 2020. Economic Indicators for Fiji. https://www.adb.org /countries/fiji/economy
Bacha, E.L. 1990. A Three-Gap Model of Foreign Transfers and the GDP Growth Rate in Developing Countries. Journal of Development Economics. 32. pp. 279–96.
Baidya, D.K., S. Maitra, and S. Bhattacharjee. 2020. Facing Post-Cyclone Disaster in Times of COVID-19 Pandemic in India: Possible Testing Strategy to Reduce Further Spread of Disease. Asia Pacific Journal of Public Health. 32 (6–7). p. 376.
Bashir, M.F., M.A. Benjiang, and L. Shahzad. 2020. A Brief Review of Socio-economic and Environmental Impact of Covid-19. Air Quality, Atmosphere & Health. 13 (12). pp. 1403–9.
Brodeur, A., D.M. Gray, A. Islam, and S. Bhuiyan. 2020. A Literature Review of the Economics of COVID-19. https://www.iza.org /publications/dp/13411/a-literature-review-of-the-economics-of -covid-19
Burns, A., C. Jooste, and G. Schwerhoff. 2021. Macroeconomic Modeling of Managing Hurricane Damage in the Caribbean: The Case of Jamaica. https://elibrary.worldbank.org/doi/abs/10.1596/1813-9450 -9505
Centre for Research on the Epidemiology of Disasters (CRED). 2020. EM-DAT: The International Disaster Database. https://www .emdat.be/database
Dornan, M., and J. Pryke. 2017. Foreign Aid to the Pacific: Trends and Developments in the Twenty‐First Century. Asia & the Pacific Policy Studies. 4 (3). pp. 386–404.
Dunz, N., A. Mazzocchetti, I. Monasterolo, A.H. Essenfelder, and M. Raberto. 2021. Macroeconomic and Financial Impacts of Compounding Pandemics and Climate Risks. SSRN Working Paper. https://doi.org/https://dx.doi.org/10.2139/ssrn.382785
316 Blue Economy and Blue Finance: Toward Sustainable Development and Ocean Governance
Dunz, N., A. Naqvi, and J. Mochizuki. 2020. Developing a New Generation Dynamic Disaster-Macroeconomic Modeling Framework (BinD): The Role of Saving and Demand Constraints for Developing Countries. Manuscript under preparation for submission.
Economist Intelligence Unit. 2021. Country Economic Database - Fiji. London. http://country.eiu.com/fiji
Engstrom, G., J. Gars, N. Jaakkola, T. Lindahl, D. Spiro, and A. Benthem. 2020. What Policies Address Both the Coronavirus Crisis and the Climate Crisis? Environmental and Resource Economics. 76 (4). pp. 789–810.
Fargher, S., and S. Hallegatte. 2020. Best Investments for an Economic Recovery from Coronavirus. https://elibrary.worldbank.org/doi/pdf /10.1596/34405
Fiji Bureau of Statistics. 2020. Economic Statistics. https://www.statsfiji .gov.fj/
Fletcher, J., and Y. Morakabati. 2008. Tourism Activity, Terrorism and Political Instability within the Commonwealth: The Cases of Fiji and Kenya. International Journal of Tourism Research. 10. pp. 537–56.
Global Facility for Disaster Reduction and Recovery (GFDRR) and the World Bank. 2020. Adapting Disaster Risk Management Systems for Health-Related Emergencies: Early Lessons from the Asia-Pacific Region. http://documents1.worldbank.org /curated/en/866721604561114600/pdf/Adapting-Disaster-Risk -Management-Systems-for-Health-Related-Emergencies-Early -Lessons-from-the-Asia-Pacific-Region.pdf
Government of Fiji. 2016. Post-Disaster Needs Assessment: Tropical Cyclone Winston, 2016. https://www.gfdrr.org/sites/default/files /publication/Post%20Disaster%20Needs%20Assessments%20CYCLONE%20WINSTON%20Fiji%202016%20(Online%20Version).pdf
____. 2017. Climate Vulnerability Assessment. http://documents1 .worldbank.org/curated/en/163081509454340771/pdf/Climate -vulnerability-assessment-making-Fiji-climate-resilient.pdf
Hallegatte, S., J. Rentschler, and J. Rozenberg. 2019. Lifelines: The Resilient Infrastructure Opportunity. https://openknowledge .worldbank.org/handle/10986/31805
____. 2020. Adaptation Principles: A Guide for Designing Strategies for Climate Change Adaptation and Resilience. https://openknowledge .worldbank.org/handle/10986/34780
Hepburn, C., B. O’Callaghan, N. Stern, J. Stiglitz, and D. Zenghelis. 2020. Will COVID-19 Fiscal Recovery Packages Accelerate or Retard Progress on Climate Change? Oxford Review of Economic Policy. 36. pp. 359–81.
Building Back Better in Small Island Developing States in the Pacific: Initial Insights from the Binary Constrained Disaster Model of Disaster Risk Management Policy Options in Fiji 317
International Monetary Fund (IMF). 2019. Country Data Profile. Fiji: IMF Datamapper. https://www.imf.org/external/datamapper /profile/FJI
____. 2020a. Currency Composition of Official Foreign Exchange Reserves. IMF DATA Access to Macroeconomic & Financial Data. https://data.imf.org/?sk=E6A5F467-C14B-4AA8-9F6D -5A09EC4E62A4&sId=1408243036575
____. 2020b. Republic of Fiji: 2019 Article IV Consultation – Ress Release; Staff Report; and Statement by the Executive Director for the Republic of Fiji. https://www.imf.org/en/Publications/CR /Issues/2020/03/19/Republic-of-Fiji-2019-Article-IV-Consultation -Press-Release-Staff-Report-and-Statement-by-49279
Ishiwatari, M., T. Koike, K. Hiroki, T. Toda, and T. Katsube. 2020. Managing Disasters Amid COVID-19 Pandemic: Approaches of Response to Flood Disasters. Progress in Disaster Science. 6. pp. 1–4.
Lange, G.-M., Q. Wodon, and K. Carey, eds.. 2018. The Changing Wealth of Nations 2018: Building a Sustainable Future. Washington, DC: World Bank. doi:10.1596/978-1-4648-1046-6.
Mahul, O., I. Monasterolo, and N. A. Ranger. 2021. Learning from COVID-19 and Climate Change: Managing the Financial Risks of Compound Shocks. World Bank Blogs. https://blogs.worldbank.org /climatechange/learning-covid-19-and-climate-change-managing -financial-risks-compound-shocks
Majumdar, B., and S. DasGupta. 2020. Let Bengal Be Heard: Dealing with Covid and Cyclone Amphan Together. South Asian History and Culture. 11 (3). pp. 317–22.
Marto, R., C. Papageorgiou, and V. Klyuev. 2018. Building Resilience to Natural Disasters: An Application to Small Developing States. Journal of Development Economics. 135. pp. 574–86. doi:10.1016/j .jdeveco.2018.08.008.
Ministry of Economy, Fiji. 2017. 5-Year & 20-Year National Development Plan. https://www.greengrowthknowledge.org/sites/default/files /downloads/policy-database/Fiji%20National%20Development %20Plan.pdf
Mochizuki, J., J. Hallwright, and J. Handmer. 2019. Enabling Factors for Financing and Implementing Postdisaster Operations. Asian Development Bank Economics Working Paper Series, 594. Manila: ADB.
Nicola, M., Z. Alsafi, C., Sohrabi, A. Kerwan, A. Al-Jabir, C. Iosifidis, M. Agha, and R. Agha. 2020. The Socio-economic Implications of the Coronavirus and COVID-19 Pandemic: A Review. International Journal of Surgery. 78. pp. 185–93.
318 Blue Economy and Blue Finance: Toward Sustainable Development and Ocean Governance
Pacific Risk Information System (PCRAFI). 2013. Current and Future Tropical Cyclone Risk in the South Pacific. https://www.terranova .org.au/repository/paccsap-collection/current-and-future -tropical-cyclone-risk-in-the-south-pacific-south-pacific-regional -risk-assessment
____. 2015. Country Note: Fiji—Disaster Risk Financing and Insurance. https://reliefweb.int/sites/reliefweb.int/files/resources/Country -Note-Fiji.pdf
Penn World Table (PWT). 2020. PWT 10.0. https://www.rug.nl/ggdc /productivity/pwt/?lang=en
Reserve Bank of Fiji. 2017. Statistics. https://www.rbf.gov.fj/____. 2019. Unemployment in Fiji. https://www.rbf.gov.fj/wp-content
/uploads/2019/06/Unemployment-in-Fiji-230416.pdfReddy, N. 2003. Survival Strategies for the Fiji Sugar Industry. Fijian
Studies: A Journal of Contemporary Fiji. 1 (2). pp. 265–85.Sami, J. 2020. Time Series Dynamics of Sugar Export Earnings in Fiji
with Multiple Endogenous Structural Breaks: Implications for EU Sugar and Industry Reforms. Journal of Quantitative Economics. 18. pp. 169–89.
Schmaljohann, M., and A. Prizzon. 2014. The Age of Choice: Fiji and Vanuatu in the New Aid Landscape. ODI Report. London: Overseas Development Institute.
Taylor, L. 1991. WIDER Research for Action—Foreign Resource Flows and Developing Country Growth. Research for Action 1991/008. Helsinki: UNU-WIDER.
____. 1994. GAP Models. Journal of Development Economics. 45. pp. 17–34.United Nations Conference on Trade and Development (UNCTAD).
2018. Country Profiles: Fiji. UNCTAD STAT. http://unctadstat .unctad.org/CountryProfile/GeneralProfile/en-GB/242/index.html
United Nations Development Programme (UNDP). 2020. Human Development Report 2020 The Next Frontier: Human Development and the Anthropocene. Briefing Note for Countries on the 2020 Human Development Report Fiji. http://hdr.undp.org/sites/all /themes/hdr_theme/country-notes/FJI.pdf
United Nations Office for Disaster Risk Reduction (UNDRR). 2019. Disaster Risk Reduction in the Republic of Fiji. https://www .preventionweb.net/files/68251_682302fijirevised16oct2019.pdf
World Bank. 2015. Fiji: Disaster Risk Financing and Insurance. https ://openknowledge.worldbank.org/handle/10986/21696
____. 2016. Pacific Possible: Climate and Disaster Resilience. https ://reliefweb.int/sites/reliefweb.int/files/resources/PACIFIC -POSSIBLE-Climate.pdf
Building Back Better in Small Island Developing States in the Pacific: Initial Insights from the Binary Constrained Disaster Model of Disaster Risk Management Policy Options in Fiji 319
____. 2020a. Fiji First Recovery and Resilience Development Policy Operation with a Catastrophe-Deferred Drawdown Option. http ://documents1.worldbank.org/curated/en/913071603238067503 /text/Concept-Program-Information-Document-PID-Fiji-First -Recovery-and-Resilience-Development-Policy-Operation-with-a -Cat-DDO-P173558.txt
____. 2020b. World Bank Open Data. https://data.worldbank.org/____. 2020c. World Development Indicators. https://data.worldbank
.org/indicator/DT.DOD.DECT.GN.ZS?locations=FJ____. 2020d. World Development Indicators. https://data.worldbank
.org/indicator/NY.GDP.PCAP.CD?locations=FJWorld Economic Forum. 2021. The Global Risk Report 2021. Davos:
World Economic Forum. http://www3.weforum.org/docs/WEF _The_Global_Risks_Report_2021.pdf
World Tourism Organization. 2019. Tourism Data Dashboard. https ://www.unwto.org/country-profile-inbound-tourism
Yokomatsu, M., J. Mochizuki, P. Burek, and T. Kahil. 2020. Measuring Multiple Benefits of Disaster Risk Reduction Investment and Growth of Developing Countries. Proceedings of Infrastructure Planning 62.
320
12
Are Coastal Protective Hard Structures Still Applicable with Respect to Shoreline
Changes in Sri Lanka?L.C.K. Abeykoon, E.P.D.N. Thilakarathne,
A.P. Abeygunawardana, T.W.S. Warnasuriya, and K.P.U.T. Egodauyana
12.1 IntroductionSorenson and McCreary (cited in Clark 1995) defined a coastal zone, or a coastal area, as the transition or interface region where “part of the land is affected by its proximity to the sea and where part of the ocean is affected by its proximity to the land.” The Coast Conservation Act of 1981 defined the coastal zone of Sri Lanka as follows:
… the area lying within a limit of 300m landward of the mean high-water level and a limit of 2 km seaward of the mean low water level. In the case of rivers, streams, lagoons, or any other body of water connected to the sea either permanently or periodically the landward boundary extends to a limit of 2 km measured perpendicular to the straight base line drawn between the natural entrance points thereof and shall include the waters of such rivers, streams, and lagoons or any other body of water so connected to the sea.
It is a complex series of interlinked physical systems that involve both offshore and onshore processes (Prasad and Kumar 2014).
In fact, coastal zones are very important due to their abundant natural resources and wide variety of interconnected ecosystems, such as coral
Are Coastal Protective Hard Structures Still Applicable with Respect to Shoreline Changes in Sri Lanka? 321
reefs, seagrass beds, mangroves, sand dunes, coastal vegetation, lagoons, estuaries, and coastal wetlands (Clark 1995; Alesheikh, Ghorbanali, and Nouri 2007). As Sri Lanka is a small island, the coastal zone is a remarkable landscape that plays a vital role in the country’s economy. The development activities covering the fisheries sector, tourism and transport, and logistic development provide unlimited benefits to the coastal dwellers over a wide area. Therefore, most countries distinguish their coastal zone as a key element of their economy and culture (Clark 1995; Beatley, Brower, and Schwab 2002).
Research has identified coastal erosion and temporal shoreline changes as a major national-level problem in this developing country since the early 1980s (Perera 1990; Godage 1992). The temporal shoreline changes resulting from natural phenomena like coastal floods, storm surges, hurricanes, tsunamis, sea-level rises, and tidal variations could cause coastal erosion (Zhang, Douglas, and Leatherman 2004; Prasetya 2007; Nayak 2017). Research has found that coastal longshore currents, coastal rip currents, waves, and wind activities, transporting sand from the shore and depositing it somewhere else, are influential factors for coastal erosion (Senevirathna et al. 2018). In addition, amplified anthropogenic activities, such as disturbing coral reefs, sand mining, deforesting coastal vegetation, and artificial alteration through dredging, filling, and construction, are leading issues that produce coastal erosion (Clark 1995; Van Rijn 2011; Prasad and Kumar 2014). Coastal erosion directly and indirectly creates environmental issues, reduces economic growth, and generates social conflicts (Hanson and Lindh 1993; Ndour et al. 2018; Williams et al. 2018).
Researchers identified coastal erosion as a major problem a long time ago. The mechanisms of coastal erosion are not fully understood, and researchers have not fully investigated the effect of coastal protective structures. As a developing country, Sri Lanka has implemented various types of coastal protective methods. The major techniques that it has used to protect its coastal areas are soft coastal protection techniques (beach nourishment and dune construction) and hard coastal protection techniques (revetments, groynes, offshore breakwaters, gabion walls, coves, and immediate rock beddings), which allow the shore to behave naturally without any constructive protection method (declared as a restricted area) (Dias et al. 2003; Iskander 2010; Borsje et al. 2011). However, a new inclination toward eco-friendly, soft, and state-of-the-art methods rather than hard constructions is observable (Hegde 2010). Due to the prevailing economic state, the country has implemented low-cost coastal protective structures, and research has not yet fully studied their effectiveness and their negative impacts on the coastal zone of Sri Lanka.
322 Blue Economy and Blue Finance: Toward Sustainable Development and Ocean Governance
On the other hand, the monitoring of coastal zones is a significant task in sustainable development and environmental protection due to their highly dynamic nature; they are continually changing due to the interaction between the oceans and the land (Harley et al. 2011; Łabuz 2015) and various anthropogenic impacts (Dias et al. 2013; Pessoa and Lidon 2013). Therefore, conducting regular monitoring of the coastal environment is very important to ascertain the environmental, social, and economic vulnerabilities in the coastal regions.
Furthermore, several major economic activities take place in the coastal zone, like tourism, fisheries, fishery harbors, commercial harbors, and development projects, such as for power generation, and approximately 70% of tourist hotels and nearly 62% of industrial units contribute to the national gross domestic product, according to the Revised Coastal Zone Management Plan (Coast Conservation Department 2004). Furthermore, infrastructure has developed rapidly with the high densification of inhabitants along the coastal zone in the past decades (Senevirathna et al. 2018).
Geographic information system (GIS) and remote sensing technologies are among the dominant tools for quantifying the coastal zone changes such as shoreline change as they provide information in digital form (Zuzek, Nairn, and Thieme 2003). In addition, researchers have identified GIS and remote sensing techniques using high-resolution satellite images as one of the best solutions to investigate shoreline changes over a long period as they are efficient and effective and provide access to temporal data (Warnasuriya, Gunaalan, and Gunasekara 2018). The high-resolution satellite images from the Google Earth platform are freely available, so they are cost-effective and can enable the mapping of changes in a coastal zone after the appropriate corrections. The major advantages of using such satellite images are the availability of both medium- and high-resolution images and the availability of time series data (Malarvizhi, Kumar, and Porchelvan 2016).
Recent studies have revealed that the erosion of the coastal zone of Sri Lanka is a long-standing problem (Lakmali et al. 2017; Ratnayake et al. 2018, 2019) but has poor monitoring and documentation. Other than that, studies on shoreline changes have been very limited in the Western and North Western provinces.
The Western coastal area (Kalutara, Colombo, and Gampaha districts) of Sri Lanka, including the capital city of Colombo, has a highly concentrated population, development activities, and infrastructure and industries with mass development projects that will increase the coastal erosion of their particular area. The North Western Province’s coastal zone includes only Puttalam district, which covers the Wilpattu
Are Coastal Protective Hard Structures Still Applicable with Respect to Shoreline Changes in Sri Lanka? 323
National Park. Its status as a restricted area that belongs to the national park fully inhibits anthropogenic interventions.
The current study selected the Western coastal area (Kalutara, Colombo, and Gampaha districts)—Zone A—and the North Western coastal area (Puttalam)—Zone B—to study the temporal shoreline changes over a 15-year (2005–2019) period. To determine the effectiveness of the applied coastal protective structures and the effect of the physical alteration due to anthropogenic interventions and natural phenomena, it investigated the shoreline changes over the 15-year period by utilizing GIS and remote sensing techniques.
12.2 Materials and Methods
12.2.1 Study Area
The coastlines of three administrative districts, specifically Kalutara (42.3 kilometers [km]), Colombo (24.3 km), and Gampaha (34.7 km), belong to the Western Province (Zone A), while only the coastline of Puttalam district (159 km) belongs to the North Western Province (Zone B). The study area extends approximately 260 km in the coastal zone from the Bentota River (Western Province), Kalutara, to the Modaragam-aru River, Puttalam (North Western Province). This area lies between the Benthota River, at the southern end of Kalutara (6.5854° N, 79.9607° E), and the Modaragam-aru River, at the northern end of Puttalam (8.0408° N, 79.8394° E).
The study area experiences a typical maritime climate with an average temperature of 27°C on the western and northwestern coasts. The mean annual rainfall varies from less than 900 millimeters (mm) in the driest parts (North Western Province) to over 5,000 mm in the wettest parts (Western Province) (Schott and McCreary 2001; Tomczak and Godfrey 2013; Department of Meteorology, Sri Lanka 2019). The rainfall pattern varies seasonally with the monsoon system. The prevailing changes in the weather are due to the southwestern monsoon (May to September) (Ranathunge, Steudle, and Lafitte 2003). The changes in the sediment transport flux, river discharge, and wave climate are totally dependent on the monsoon pattern, and this directly influences the temporal coastal changes. The area faces numerous natural hazards, such as coastal erosion, stream flooding, storm and tidal surges, and active surface faulting. The anthropogenic interventions include sand mining, coral mining, coastal development, inappropriate removal of coastal vegetation, and direct pollution as well as temporal coastal changes. The Wilpattu National Park, a protected area, completely covers Zone B, which represents the Wilpattu region (from Dutch Bay
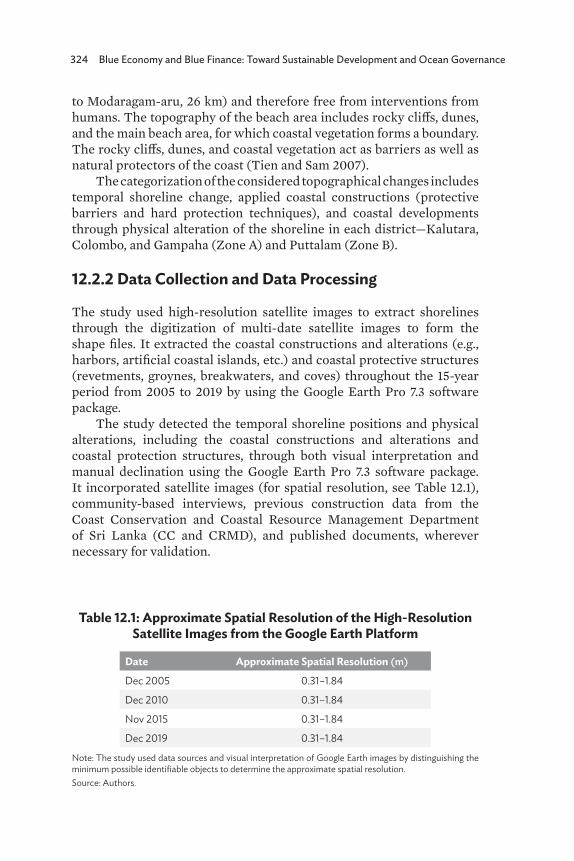
324 Blue Economy and Blue Finance: Toward Sustainable Development and Ocean Governance
to Modaragam-aru, 26 km) and therefore free from interventions from humans. The topography of the beach area includes rocky cliffs, dunes, and the main beach area, for which coastal vegetation forms a boundary. The rocky cliffs, dunes, and coastal vegetation act as barriers as well as natural protectors of the coast (Tien and Sam 2007).
The categorization of the considered topographical changes includes temporal shoreline change, applied coastal constructions (protective barriers and hard protection techniques), and coastal developments through physical alteration of the shoreline in each district—Kalutara, Colombo, and Gampaha (Zone A) and Puttalam (Zone B).
12.2.2 Data Collection and Data Processing
The study used high-resolution satellite images to extract shorelines through the digitization of multi-date satellite images to form the shape files. It extracted the coastal constructions and alterations (e.g., harbors, artificial coastal islands, etc.) and coastal protective structures (revetments, groynes, breakwaters, and coves) throughout the 15-year period from 2005 to 2019 by using the Google Earth Pro 7.3 software package.
The study detected the temporal shoreline positions and physical alterations, including the coastal constructions and alterations and coastal protection structures, through both visual interpretation and manual declination using the Google Earth Pro 7.3 software package. It incorporated satellite images (for spatial resolution, see Table 12.1), community-based interviews, previous construction data from the Coast Conservation and Coastal Resource Management Department of Sri Lanka (CC and CRMD), and published documents, wherever necessary for validation.
Table 12.1: Approximate Spatial Resolution of the High-Resolution Satellite Images from the Google Earth Platform
Date Approximate Spatial Resolution (m)
Dec 2005 0.31–1.84
Dec 2010 0.31–1.84
Nov 2015 0.31–1.84
Dec 2019 0.31–1.84
Note: The study used data sources and visual interpretation of Google Earth images by distinguishing the minimum possible identifiable objects to determine the approximate spatial resolution. Source: Authors.
Are Coastal Protective Hard Structures Still Applicable with Respect to Shoreline Changes in Sri Lanka? 325
Extraction of the ShorelineThe study considered the borderline between land and water as the shoreline, referencing the blue margin that splits the land from the water in satellite images via visual interpretation (Warnasuriya, Gunaalan, and Gunasekara 2018; Warnasuriya et al. 2020). The wave action within the selected season of the years (October, November, December) was comparatively low because there was no direct influence of the inter-monsoon (October–November) and northeastern monsoon (December–February) on the study area (Schott and McCreary 2001; Gunaratna et al. 2011; Tomczak and Godfrey 2013; Thevasiyani and Perera 2014; Bamunawala et al. 2015).
Ground truth investigation obtained ground control points (GCPs) in places; physical shoreline alteration with protective structures affected shoreline positions and permanent structures (harbors and buildings) and adjusted ecosystems (sand dunes and vegetation). The ground survey obtained GCP locations using the Garmin GPSMAP 64s Global Positioning System (GPS).
In the shoreline extraction, the tilt of the images of the study area, the scale, and the eye altitude (300 m) remained similar for each image throughout the process to remove the errors arising during digitization due to the zoom level (Warnasuriya et al. 2020). We saved the digitized shorelines in Keyhole Markup Language (KML) file format and converted the KML files into “layer files” using the ArcGIS 10.6 software. They projected all the digitized shorelines to the WGS 1984 UTM 44N projection system.
Shoreline RectificationWe checked the accuracy of the satellite images using 15 GCPs and applied geometric corrections to each shoreline before conducting the analysis process (Figure 12.1). We estimated slight shifts of Google Earth satellite images due to geo-referencing errors and platform-oriented errors with reference to the GCPs in the satellite image of 2011, which was closely related to the ground truth data (Warnasuriya, Gunaalan, and Gunasekara 2018). We considered permanent structures, such as the roof tips of square-shaped buildings, as GCPs in all the satellite images of different years.
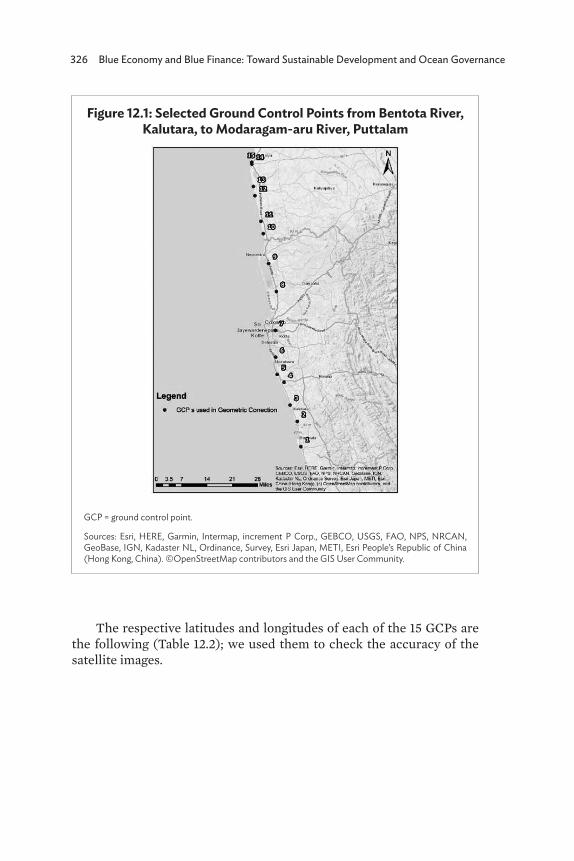
326 Blue Economy and Blue Finance: Toward Sustainable Development and Ocean Governance
Figure 12.1: Selected Ground Control Points from Bentota River, Kalutara, to Modaragam-aru River, Puttalam
GCP = ground control point.
Sources: Esri, HERE, Garmin, Intermap, increment P Corp., GEBCO, USGS, FAO, NPS, NRCAN, GeoBase, IGN, Kadaster NL, Ordinance, Survey, Esri Japan, METI, Esri People’s Republic of China (Hong Kong, China). ©OpenStreetMap contributors and the GIS User Community.
The respective latitudes and longitudes of each of the 15 GCPs are the following (Table 12.2); we used them to check the accuracy of the satellite images.
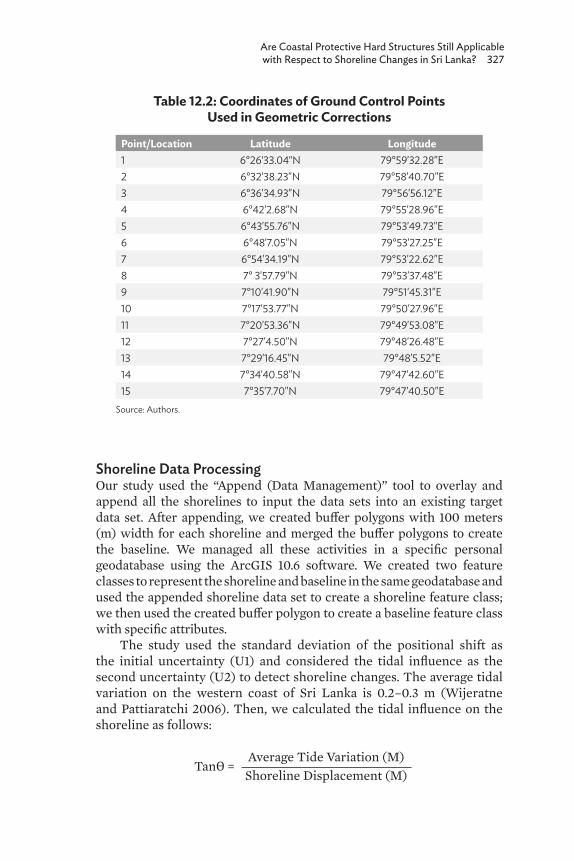
Are Coastal Protective Hard Structures Still Applicable with Respect to Shoreline Changes in Sri Lanka? 327
Shoreline Data ProcessingOur study used the “Append (Data Management)” tool to overlay and append all the shorelines to input the data sets into an existing target data set. After appending, we created buffer polygons with 100 meters (m) width for each shoreline and merged the buffer polygons to create the baseline. We managed all these activities in a specific personal geodatabase using the ArcGIS 10.6 software. We created two feature classes to represent the shoreline and baseline in the same geodatabase and used the appended shoreline data set to create a shoreline feature class; we then used the created buffer polygon to create a baseline feature class with specific attributes.
The study used the standard deviation of the positional shift as the initial uncertainty (U1) and considered the tidal influence as the second uncertainty (U2) to detect shoreline changes. The average tidal variation on the western coast of Sri Lanka is 0.2–0.3 m (Wijeratne and Pattiaratchi 2006). Then, we calculated the tidal influence on the shoreline as follows:
Table 12.2: Coordinates of Ground Control Points Used in Geometric Corrections
Point/Location Latitude Longitude1 6°26'33.04"N 79°59'32.28"E2 6°32'38.23"N 79°58'40.70"E3 6°36'34.93"N 79°56'56.12"E4 6°42'2.68"N 79°55'28.96"E5 6°43'55.76"N 79°53'49.73"E6 6°48'7.05"N 79°53'27.25"E7 6°54'34.19"N 79°53'22.62"E8 7° 3'57.79"N 79°53'37.48"E9 7°10'41.90"N 79°51'45.31"E10 7°17'53.77"N 79°50'27.96"E11 7°20'53.36"N 79°49'53.08"E12 7°27'4.50"N 79°48'26.48"E13 7°29'16.45"N 79°48'5.52"E14 7°34'40.58"N 79°47'42.60"E15 7°35'7.70"N 79°47'40.50"E
Source: Authors.
TanƟ = Average Tide Variation (M)Shoreline Displacement (M)
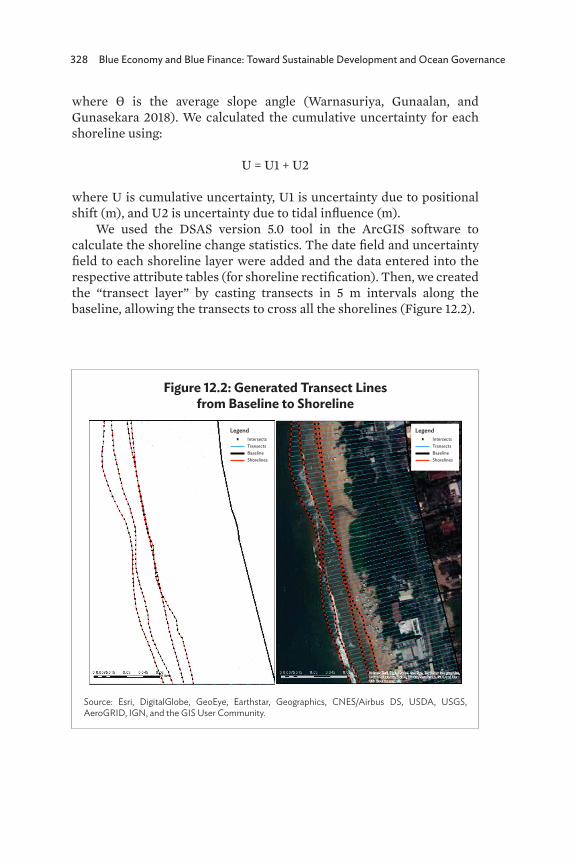
328 Blue Economy and Blue Finance: Toward Sustainable Development and Ocean Governance
where Ɵ is the average slope angle (Warnasuriya, Gunaalan, and Gunasekara 2018). We calculated the cumulative uncertainty for each shoreline using:
U = U1 + U2
where U is cumulative uncertainty, U1 is uncertainty due to positional shift (m), and U2 is uncertainty due to tidal influence (m).
We used the DSAS version 5.0 tool in the ArcGIS software to calculate the shoreline change statistics. The date field and uncertainty field to each shoreline layer were added and the data entered into the respective attribute tables (for shoreline rectification). Then, we created the “transect layer” by casting transects in 5 m intervals along the baseline, allowing the transects to cross all the shorelines (Figure 12.2).
Figure 12.2: Generated Transect Lines from Baseline to Shoreline
Source: Esri, DigitalGlobe, GeoEye, Earthstar, Geographics, CNES/Airbus DS, USDA, USGS, AeroGRID, IGN, and the GIS User Community.
Legend Intersects Transects Baseline Shorelines
Legend Intersects Transects Baseline Shorelines
Are Coastal Protective Hard Structures Still Applicable with Respect to Shoreline Changes in Sri Lanka? 329
Extraction of Coastal Protective StructuresFirst, we adjusted the tilt of the images of the study area using the Google Earth Pro software to minimize the geometric errors and kept the scale similar for each image throughout the digitization process. Then, we delineated the coastal protective structures for the time period from 2005 to 2019 based on the satellite images from the Google Earth platform with the same eye altitude of 300 m. We adjusted these for all the satellite images to avoid errors arising during the digitization process due to the zoom level in the software itself.
These digitized coastal protective structures were saved in the KML file format year by year. We measured and recorded the length of each coastal protective structure separately according to the following categories:
• breakwaters;• groynes (fishtail, roundhead, L-shaped, T-shaped);• revetments (artificial walls); and• coves.
Extraction of Coastal Developments We delineated all the coastal developments (harbors and land fillings and coastal protective structures), making physical alterations to the shoreline by digitizing the total area of development within the study area.
12.2.3 Data Analysis
The net shoreline movement (NSM) explained the distance between the oldest (2005) and the youngest (2019) shoreline (Oyedotun 2014). The NSM revealed the overall shoreline change based on the shoreline position during the 15-year period.
We derived the end point rate (EPR) by dividing the distance of the shoreline movement by the time elapsed between the oldest and the youngest shoreline position (Oyedotun 2014). They divided the distance between the oldest (2005) and the youngest (2019) shoreline by the time of the study. The shoreline change envelope (SCE) is the measurement of the total change of the shoreline positions with their distance without specifying the study dates (Oyedotun 2014; Himmelstoss et al. 2018).
The DSAS v5.0 tool (extension) in the ArcGIS 10.6 software calculated the shoreline change statistics for NSM, EPR, and SCE to estimate the shoreline changes. MS Excel and the Minitab 17 software
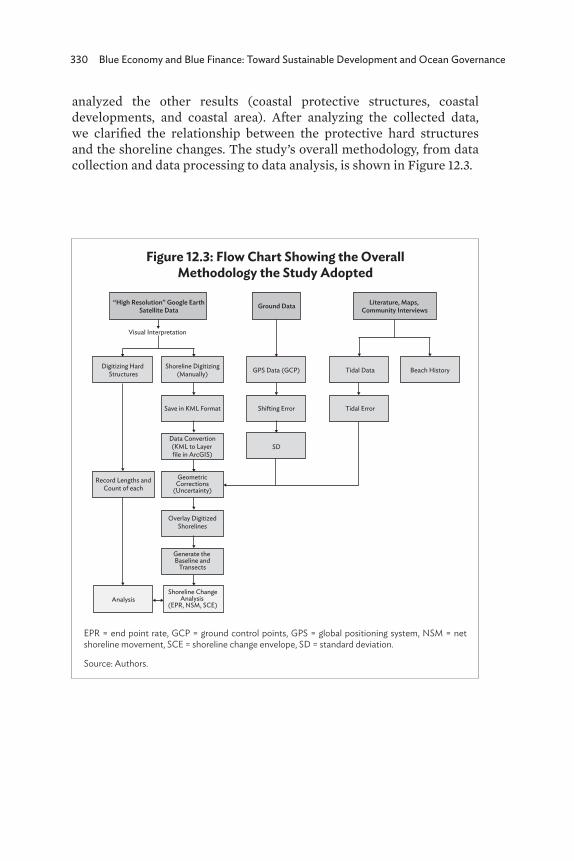
330 Blue Economy and Blue Finance: Toward Sustainable Development and Ocean Governance
analyzed the other results (coastal protective structures, coastal developments, and coastal area). After analyzing the collected data, we clarified the relationship between the protective hard structures and the shoreline changes. The study’s overall methodology, from data collection and data processing to data analysis, is shown in Figure 12.3.
Figure 12.3: Flow Chart Showing the Overall Methodology the Study Adopted
EPR = end point rate, GCP = ground control points, GPS = global positioning system, NSM = net shoreline movement, SCE = shoreline change envelope, SD = standard deviation.
Source: Authors.
“High Resolution” Google EarthSatellite Data
Visual Interpretation
GPS Data (GCP)Shoreline Digitizing(Manually)
Digitizing Hard Structures
Overlay DigitizedShorelines
Data Convertion(KML to Layer file in ArcGIS)
Record Lengths andCount of each
Analysis
Ground Data Literature, Maps, Community Interviews
SD
Shifting ErrorSave in KML Format
Tidal Data
Tidal Error
Beach History
GeometricCorrections
(Uncertainty)
Generate the Baseline and
Transects
Shoreline ChangeAnalysis
(EPR, NSM, SCE)
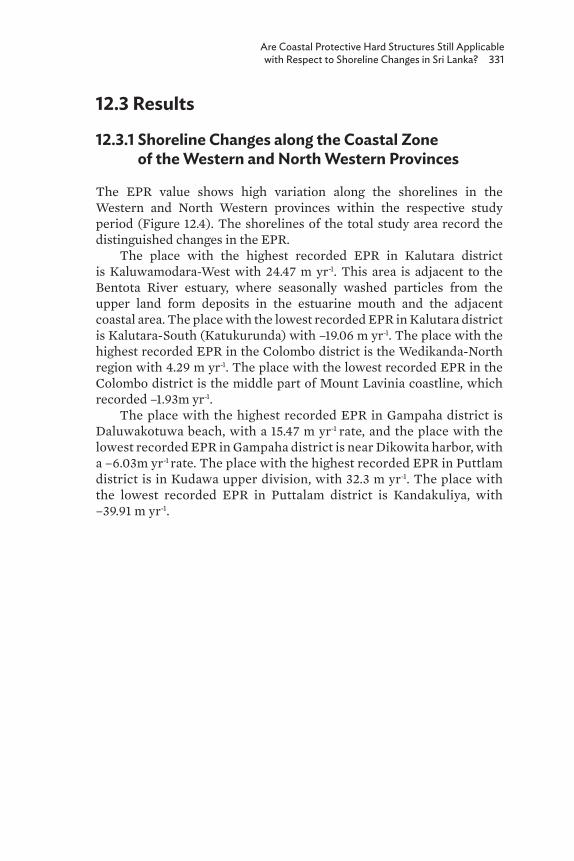
Are Coastal Protective Hard Structures Still Applicable with Respect to Shoreline Changes in Sri Lanka? 331
12.3 Results
12.3.1 Shoreline Changes along the Coastal Zone of the Western and North Western Provinces
The EPR value shows high variation along the shorelines in the Western and North Western provinces within the respective study period (Figure 12.4). The shorelines of the total study area record the distinguished changes in the EPR.
The place with the highest recorded EPR in Kalutara district is Kaluwamodara-West with 24.47 m yr-1. This area is adjacent to the Bentota River estuary, where seasonally washed particles from the upper land form deposits in the estuarine mouth and the adjacent coastal area. The place with the lowest recorded EPR in Kalutara district is Kalutara-South (Katukurunda) with –19.06 m yr-1. The place with the highest recorded EPR in the Colombo district is the Wedikanda-North region with 4.29 m yr-1. The place with the lowest recorded EPR in the Colombo district is the middle part of Mount Lavinia coastline, which recorded –1.93m yr-1.
The place with the highest recorded EPR in Gampaha district is Daluwakotuwa beach, with a 15.47 m yr-1 rate, and the place with the lowest recorded EPR in Gampaha district is near Dikowita harbor, with a –6.03m yr-1 rate. The place with the highest recorded EPR in Puttlam district is in Kudawa upper division, with 32.3 m yr-1. The place with the lowest recorded EPR in Puttalam district is Kandakuliya, with –39.91 m yr-1.
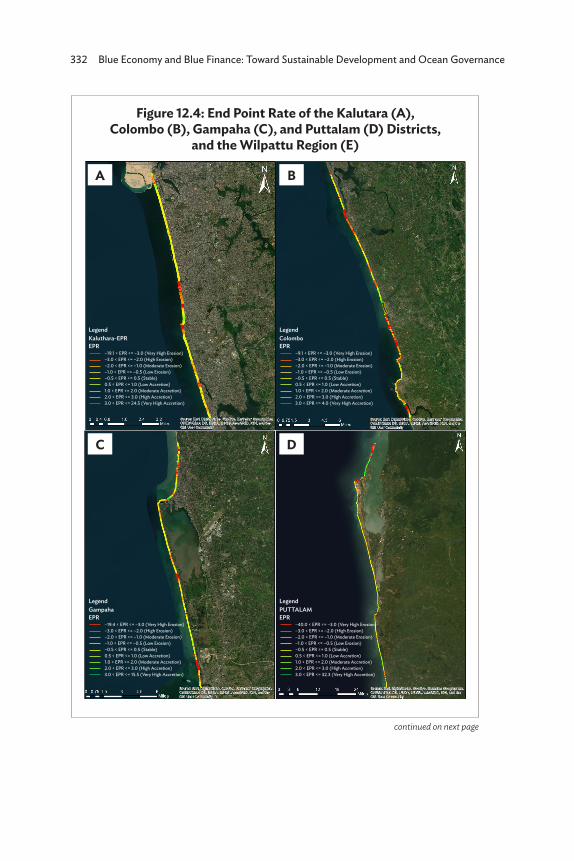
332 Blue Economy and Blue Finance: Toward Sustainable Development and Ocean Governance
Figure 12.4: End Point Rate of the Kalutara (A), Colombo (B), Gampaha (C), and Puttalam (D) Districts,
and the Wilpattu Region (E)
LegendKaluthara-EPREPR –19.1 < EPR <= –3.0 (Very High Erosion) –3.0 < EPR <= –2.0 (High Erosion) –2.0 < EPR <= –1.0 (Moderate Erosion) –1.0 < EPR <= –0.5 (Low Erosion) –0.5 < EPR <= 0.5 (Stable) 0.5 < EPR <= 1.0 (Low Accretion) 1.0 < EPR <= 2.0 (Moderate Accretion) 2.0 < EPR <= 3.0 (High Accretion) 3.0 < EPR <= 24.5 (Very High Accretion)
LegendGampahaEPR –19.4 < EPR <= –3.0 (Very High Erosion) –3.0 < EPR <= –2.0 (High Erosion) –2.0 < EPR <= –1.0 (Moderate Erosion) –1.0 < EPR <= –0.5 (Low Erosion) –0.5 < EPR <= 0.5 (Stable) 0.5 < EPR <= 1.0 (Low Accretion) 1.0 < EPR <= 2.0 (Moderate Accretion) 2.0 < EPR <= 3.0 (High Accretion) 3.0 < EPR <= 15.5 (Very High Accretion)
LegendColomboEPR –9.1 < EPR <= –3.0 (Very High Erosion) –3.0 < EPR <= –2.0 (High Erosion) –2.0 < EPR <= –1.0 (Moderate Erosion) –1.0 < EPR <= –0.5 (Low Erosion) –0.5 < EPR <= 0.5 (Stable) 0.5 < EPR <= 1.0 (Low Accretion) 1.0 < EPR <= 2.0 (Moderate Accretion) 2.0 < EPR <= 3.0 (High Accretion) 3.0 < EPR <= 4.0 (Very High Accretion)
LegendPUTTALAMEPR –40.0 < EPR <= –3.0 (Very High Erosion) –3.0 < EPR <= –2.0 (High Erosion) –2.0 < EPR <= –1.0 (Moderate Erosion) –1.0 < EPR <= –0.5 (Low Erosion) –0.5 < EPR <= 0.5 (Stable) 0.5 < EPR <= 1.0 (Low Accretion) 1.0 < EPR <= 2.0 (Moderate Accretion) 2.0 < EPR <= 3.0 (High Accretion) 3.0 < EPR <= 32.3 (Very High Accretion)
A
C
B
D
continued on next page
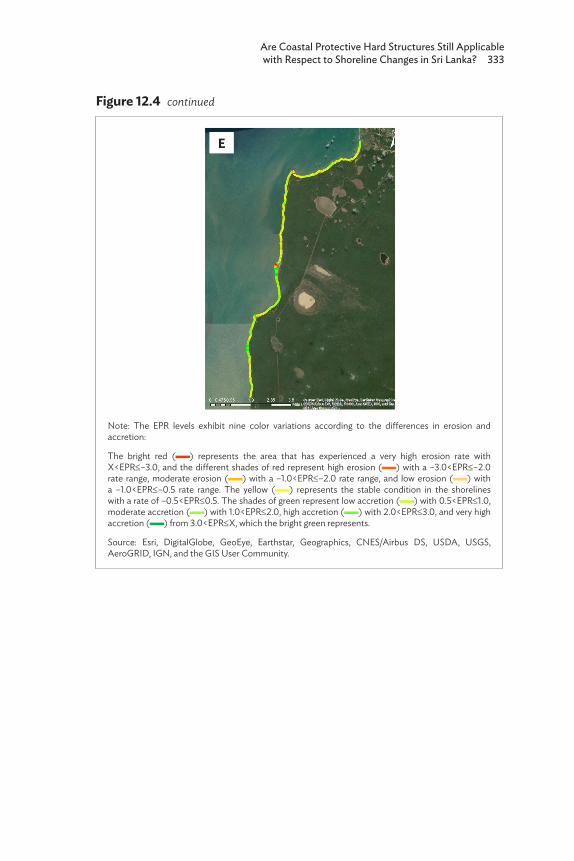
Are Coastal Protective Hard Structures Still Applicable with Respect to Shoreline Changes in Sri Lanka? 333
Note: The EPR levels exhibit nine color variations according to the differences in erosion and accretion:
The bright red ( ) represents the area that has experienced a very high erosion rate with X<EPR≤–3.0, and the different shades of red represent high erosion ( ) with a –3.0<EPR≤–2.0 rate range, moderate erosion ( ) with a –1.0<EPR≤–2.0 rate range, and low erosion ( ) with a –1.0<EPR≤–0.5 rate range. The yellow ( ) represents the stable condition in the shorelines with a rate of –0.5<EPR≤0.5. The shades of green represent low accretion ( ) with 0.5<EPR≤1.0, moderate accretion ( ) with 1.0<EPR≤2.0, high accretion ( ) with 2.0<EPR≤3.0, and very high accretion ( ) from 3.0<EPR≤X, which the bright green represents.
Source: Esri, DigitalGlobe, GeoEye, Earthstar, Geographics, CNES/Airbus DS, USDA, USGS, AeroGRID, IGN, and the GIS User Community.
E
Figure 12.4 continued
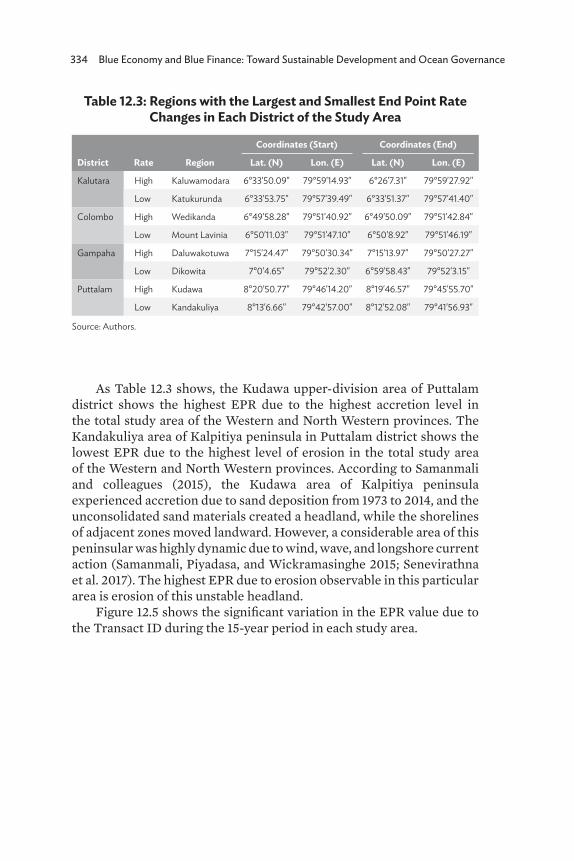
334 Blue Economy and Blue Finance: Toward Sustainable Development and Ocean Governance
Table 12.3: Regions with the Largest and Smallest End Point Rate Changes in Each District of the Study Area
District Rate Region
Coordinates (Start) Coordinates (End)
Lat. (N) Lon. (E) Lat. (N) Lon. (E)
Kalutara High Kaluwamodara 6°33'50.09" 79°59'14.93" 6°26'7.31" 79°59'27.92"
Low Katukurunda 6°33'53.75" 79°57'39.49" 6°33'51.37" 79°57'41.40"
Colombo High Wedikanda 6°49'58.28" 79°51'40.92" 6°49'50.09" 79°51'42.84"
Low Mount Lavinia 6°50'11.03" 79°51'47.10" 6°50'8.92" 79°51'46.19"
Gampaha High Daluwakotuwa 7°15'24.47" 79°50'30.34" 7°15'13.97" 79°50'27.27"
Low Dikowita 7°0'4.65" 79°52'2.30" 6°59'58.43" 79°52'3.15"
Puttalam High Kudawa 8°20'50.77" 79°46'14.20" 8°19'46.57" 79°45'55.70"
Low Kandakuliya 8°13'6.66" 79°42'57.00" 8°12'52.08" 79°41'56.93"
Source: Authors.
As Table 12.3 shows, the Kudawa upper-division area of Puttalam district shows the highest EPR due to the highest accretion level in the total study area of the Western and North Western provinces. The Kandakuliya area of Kalpitiya peninsula in Puttalam district shows the lowest EPR due to the highest level of erosion in the total study area of the Western and North Western provinces. According to Samanmali and colleagues (2015), the Kudawa area of Kalpitiya peninsula experienced accretion due to sand deposition from 1973 to 2014, and the unconsolidated sand materials created a headland, while the shorelines of adjacent zones moved landward. However, a considerable area of this peninsular was highly dynamic due to wind, wave, and longshore current action (Samanmali, Piyadasa, and Wickramasinghe 2015; Senevirathna et al. 2017). The highest EPR due to erosion observable in this particular area is erosion of this unstable headland.
Figure 12.5 shows the significant variation in the EPR value due to the Transact ID during the 15-year period in each study area.
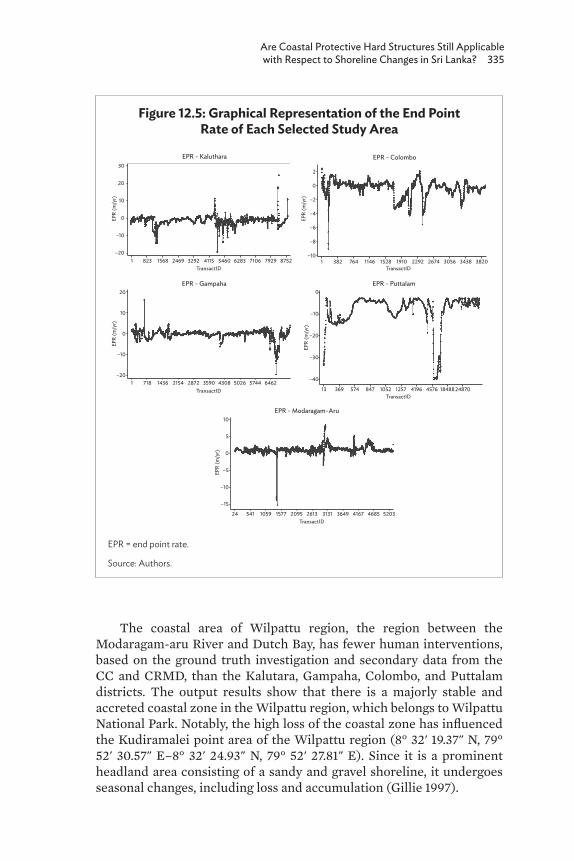
Are Coastal Protective Hard Structures Still Applicable with Respect to Shoreline Changes in Sri Lanka? 335
Figure 12.5: Graphical Representation of the End Point Rate of Each Selected Study Area
EPR = end point rate.
Source: Authors.
EPR - Kaluthara EPR - Colombo
EPR - Gampaha
EPR - Modaragam-Aru
EPR - Puttalam
EPR
(m/y
r)
TransactID
30
20
10
0
–10
–201 823 1568 2469 3292 4115 5460 6283 7106 7929 8752
EPR
(m/y
r)
TransactID
–8
–6
–4
–2
0
2
–101 382 764 1146 1528 1910 2292 2674 3056 3438 3820
EPR
(m/y
r)
TransactID
20
10
0
–10
–201 718 1436 2154 2872 3590 4308 5026 5744 6462
EPR
(m/y
r)
TransactID
0
–10
–20
–40
–30
13 369 574 847 1052 1257 4196 4576 18488 24870
EPR
(m/y
r)
TransactID
10
5
0
–5
–10
–15
24 541 1059 1577 2095 2613 3131 3649 4167 4685 5203
The coastal area of Wilpattu region, the region between the Modaragam-aru River and Dutch Bay, has fewer human interventions, based on the ground truth investigation and secondary data from the CC and CRMD, than the Kalutara, Gampaha, Colombo, and Puttalam districts. The output results show that there is a majorly stable and accreted coastal zone in the Wilpattu region, which belongs to Wilpattu National Park. Notably, the high loss of the coastal zone has influenced the Kudiramalei point area of the Wilpattu region (8° 32' 19.37" N, 79° 52' 30.57" E–8° 32' 24.93" N, 79° 52' 27.81" E). Since it is a prominent headland area consisting of a sandy and gravel shoreline, it undergoes seasonal changes, including loss and accumulation (Gillie 1997).
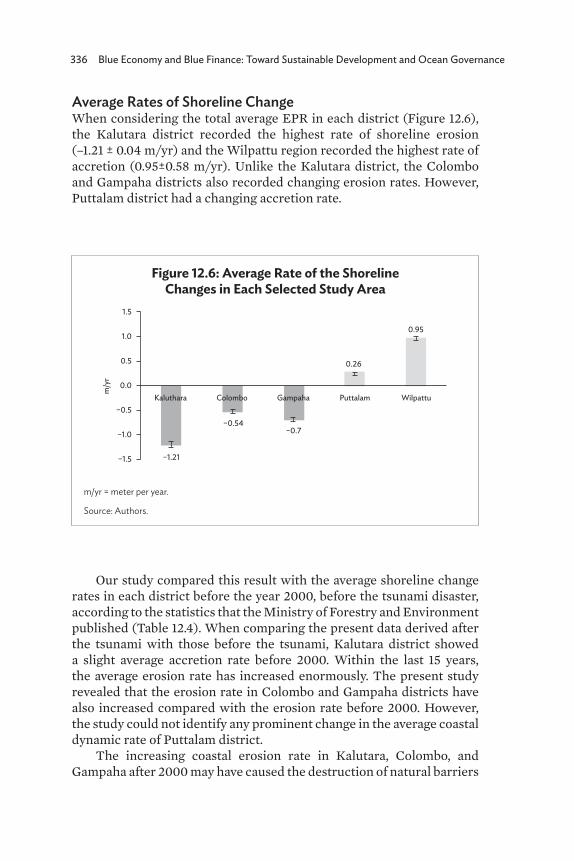
336 Blue Economy and Blue Finance: Toward Sustainable Development and Ocean Governance
Average Rates of Shoreline Change When considering the total average EPR in each district (Figure 12.6), the Kalutara district recorded the highest rate of shoreline erosion (–1.21 ± 0.04 m/yr) and the Wilpattu region recorded the highest rate of accretion (0.95±0.58 m/yr). Unlike the Kalutara district, the Colombo and Gampaha districts also recorded changing erosion rates. However, Puttalam district had a changing accretion rate.
Figure 12.6: Average Rate of the Shoreline Changes in Each Selected Study Area
m/yr = meter per year.
Source: Authors.
1.5
1.0
0.5
–0.5
–1.0
–1.5 –1.21
–0.54–0.7
0.26
0.95
0.0Kaluthara Colombo Gampaha Puttalam Wilpattu
m/y
r
Our study compared this result with the average shoreline change rates in each district before the year 2000, before the tsunami disaster, according to the statistics that the Ministry of Forestry and Environment published (Table 12.4). When comparing the present data derived after the tsunami with those before the tsunami, Kalutara district showed a slight average accretion rate before 2000. Within the last 15 years, the average erosion rate has increased enormously. The present study revealed that the erosion rate in Colombo and Gampaha districts have also increased compared with the erosion rate before 2000. However, the study could not identify any prominent change in the average coastal dynamic rate of Puttalam district.
The increasing coastal erosion rate in Kalutara, Colombo, and Gampaha after 2000 may have caused the destruction of natural barriers
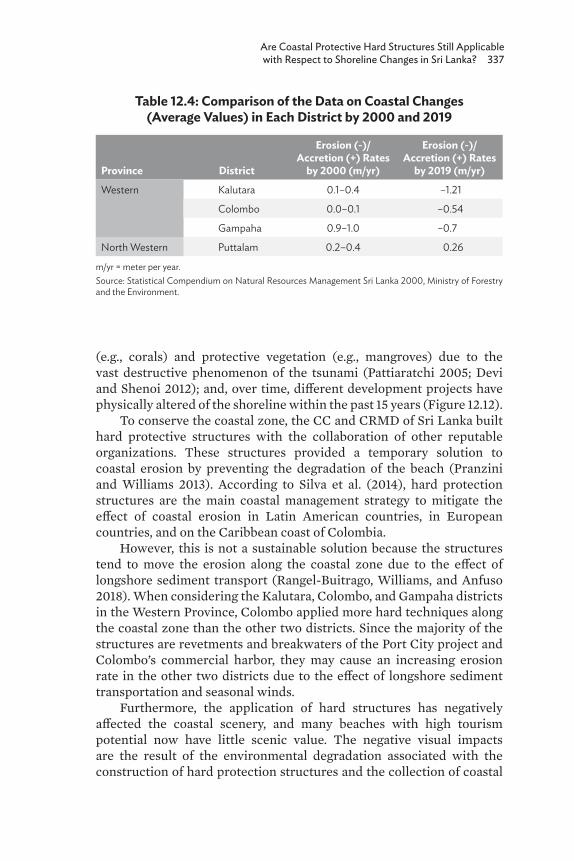
Are Coastal Protective Hard Structures Still Applicable with Respect to Shoreline Changes in Sri Lanka? 337
(e.g., corals) and protective vegetation (e.g., mangroves) due to the vast destructive phenomenon of the tsunami (Pattiaratchi 2005; Devi and Shenoi 2012); and, over time, different development projects have physically altered of the shoreline within the past 15 years (Figure 12.12).
To conserve the coastal zone, the CC and CRMD of Sri Lanka built hard protective structures with the collaboration of other reputable organizations. These structures provided a temporary solution to coastal erosion by preventing the degradation of the beach (Pranzini and Williams 2013). According to Silva et al. (2014), hard protection structures are the main coastal management strategy to mitigate the effect of coastal erosion in Latin American countries, in European countries, and on the Caribbean coast of Colombia.
However, this is not a sustainable solution because the structures tend to move the erosion along the coastal zone due to the effect of longshore sediment transport (Rangel-Buitrago, Williams, and Anfuso 2018). When considering the Kalutara, Colombo, and Gampaha districts in the Western Province, Colombo applied more hard techniques along the coastal zone than the other two districts. Since the majority of the structures are revetments and breakwaters of the Port City project and Colombo’s commercial harbor, they may cause an increasing erosion rate in the other two districts due to the effect of longshore sediment transportation and seasonal winds.
Furthermore, the application of hard structures has negatively affected the coastal scenery, and many beaches with high tourism potential now have little scenic value. The negative visual impacts are the result of the environmental degradation associated with the construction of hard protection structures and the collection of coastal
Table 12.4: Comparison of the Data on Coastal Changes (Average Values) in Each District by 2000 and 2019
Province District
Erosion (-)/Accretion (+) Rates
by 2000 (m/yr)
Erosion (-)/Accretion (+) Rates
by 2019 (m/yr)
Western Kalutara 0.1–0.4 –1.21
Colombo 0.0–0.1 –0.54
Gampaha 0.9–1.0 –0.7
North Western Puttalam 0.2–0.4 0.26
m/yr = meter per year. Source: Statistical Compendium on Natural Resources Management Sri Lanka 2000, Ministry of Forestry and the Environment.
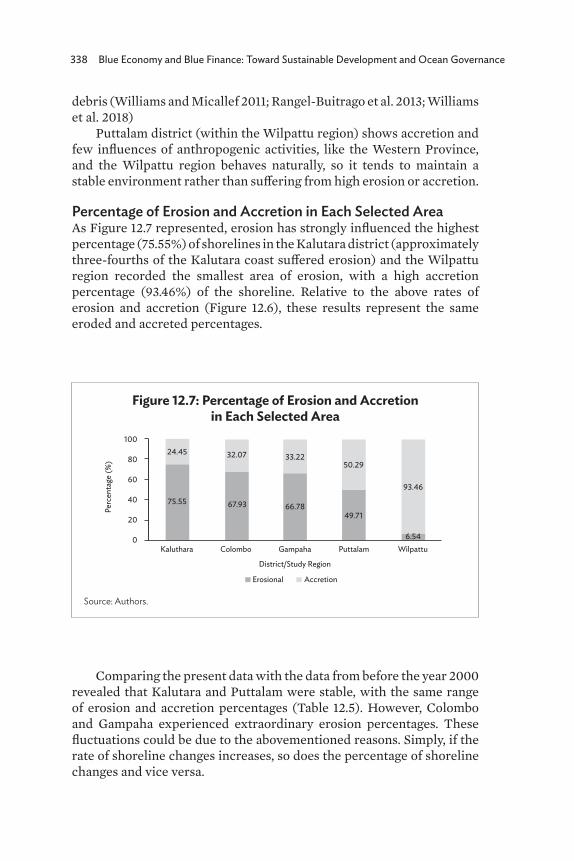
338 Blue Economy and Blue Finance: Toward Sustainable Development and Ocean Governance
debris (Williams and Micallef 2011; Rangel-Buitrago et al. 2013; Williams et al. 2018)
Puttalam district (within the Wilpattu region) shows accretion and few influences of anthropogenic activities, like the Western Province, and the Wilpattu region behaves naturally, so it tends to maintain a stable environment rather than suffering from high erosion or accretion.
Percentage of Erosion and Accretion in Each Selected Area As Figure 12.7 represented, erosion has strongly influenced the highest percentage (75.55%) of shorelines in the Kalutara district (approximately three-fourths of the Kalutara coast suffered erosion) and the Wilpattu region recorded the smallest area of erosion, with a high accretion percentage (93.46%) of the shoreline. Relative to the above rates of erosion and accretion (Figure 12.6), these results represent the same eroded and accreted percentages.
Figure 12.7: Percentage of Erosion and Accretion in Each Selected Area
Source: Authors.
24.45
75.55
32.07
67.93
33.22
66.78
50.29
49.71
93.46
6.540
20
40
60
80
100
Kaluthara Colombo Gampaha
District/Study Region
Erosional Accretion
Puttalam Wilpattu
Perc
enta
ge (%
)
Comparing the present data with the data from before the year 2000 revealed that Kalutara and Puttalam were stable, with the same range of erosion and accretion percentages (Table 12.5). However, Colombo and Gampaha experienced extraordinary erosion percentages. These fluctuations could be due to the abovementioned reasons. Simply, if the rate of shoreline changes increases, so does the percentage of shoreline changes and vice versa.
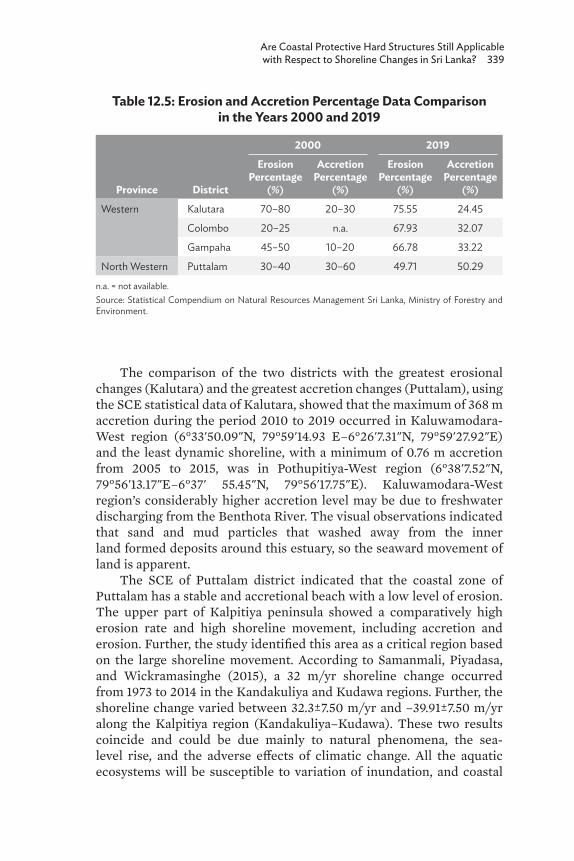
Are Coastal Protective Hard Structures Still Applicable with Respect to Shoreline Changes in Sri Lanka? 339
The comparison of the two districts with the greatest erosional changes (Kalutara) and the greatest accretion changes (Puttalam), using the SCE statistical data of Kalutara, showed that the maximum of 368 m accretion during the period 2010 to 2019 occurred in Kaluwamodara-West region (6°33'50.09"N, 79°59'14.93 E–6°26'7.31"N, 79°59'27.92"E) and the least dynamic shoreline, with a minimum of 0.76 m accretion from 2005 to 2015, was in Pothupitiya-West region (6°38'7.52"N, 79°56'13.17"E–6°37' 55.45"N, 79°56'17.75"E). Kaluwamodara-West region’s considerably higher accretion level may be due to freshwater discharging from the Benthota River. The visual observations indicated that sand and mud particles that washed away from the inner land formed deposits around this estuary, so the seaward movement of land is apparent.
The SCE of Puttalam district indicated that the coastal zone of Puttalam has a stable and accretional beach with a low level of erosion. The upper part of Kalpitiya peninsula showed a comparatively high erosion rate and high shoreline movement, including accretion and erosion. Further, the study identified this area as a critical region based on the large shoreline movement. According to Samanmali, Piyadasa, and Wickramasinghe (2015), a 32 m/yr shoreline change occurred from 1973 to 2014 in the Kandakuliya and Kudawa regions. Further, the shoreline change varied between 32.3±7.50 m/yr and –39.91±7.50 m/yr along the Kalpitiya region (Kandakuliya–Kudawa). These two results coincide and could be due mainly to natural phenomena, the sea-level rise, and the adverse effects of climatic change. All the aquatic ecosystems will be susceptible to variation of inundation, and coastal
Table 12.5: Erosion and Accretion Percentage Data Comparison in the Years 2000 and 2019
Province District
2000 2019
Erosion Percentage
(%)
Accretion Percentage
(%)
Erosion Percentage
(%)
Accretion Percentage
(%)
Western Kalutara 70–80 20–30 75.55 24.45
Colombo 20–25 n.a. 67.93 32.07
Gampaha 45–50 10–20 66.78 33.22
North Western Puttalam 30–40 30–60 49.71 50.29
n.a. = not available.Source: Statistical Compendium on Natural Resources Management Sri Lanka, Ministry of Forestry and Environment.
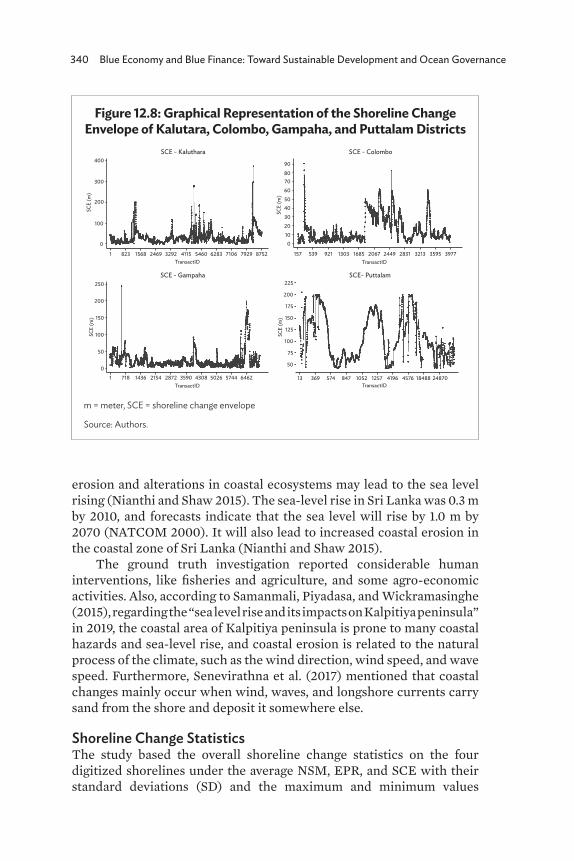
340 Blue Economy and Blue Finance: Toward Sustainable Development and Ocean Governance
Figure 12.8: Graphical Representation of the Shoreline Change Envelope of Kalutara, Colombo, Gampaha, and Puttalam Districts
m = meter, SCE = shoreline change envelope
Source: Authors.
SCE - Colombo
SCE - Gampaha SCE- Puttalam
SCE - Kaluthara
SCE
(m)
TransactID
0
100
200
300
400
1 823 1568 2469 3292 4115 5460 6283 7106 7929 8752
SCE
(m)
TransactID
01020304050607080
90
157 539 921 1303 1685 2067 2449 2831 3213 3595 3977
SCE
(m)
TransactID
250
200
150
100
50
0
1 718 1436 2154 2872 3590 4308 5026 5744 6462
SCE
(m)
TransactID
100
125
150
175
200
225
50
75
13 369 574 847 1052 1257 4196 4576 18488 24870
erosion and alterations in coastal ecosystems may lead to the sea level rising (Nianthi and Shaw 2015). The sea-level rise in Sri Lanka was 0.3 m by 2010, and forecasts indicate that the sea level will rise by 1.0 m by 2070 (NATCOM 2000). It will also lead to increased coastal erosion in the coastal zone of Sri Lanka (Nianthi and Shaw 2015).
The ground truth investigation reported considerable human interventions, like fisheries and agriculture, and some agro-economic activities. Also, according to Samanmali, Piyadasa, and Wickramasinghe (2015), regarding the “sea level rise and its impacts on Kalpitiya peninsula” in 2019, the coastal area of Kalpitiya peninsula is prone to many coastal hazards and sea-level rise, and coastal erosion is related to the natural process of the climate, such as the wind direction, wind speed, and wave speed. Furthermore, Senevirathna et al. (2017) mentioned that coastal changes mainly occur when wind, waves, and longshore currents carry sand from the shore and deposit it somewhere else.
Shoreline Change StatisticsThe study based the overall shoreline change statistics on the four digitized shorelines under the average NSM, EPR, and SCE with their standard deviations (SD) and the maximum and minimum values
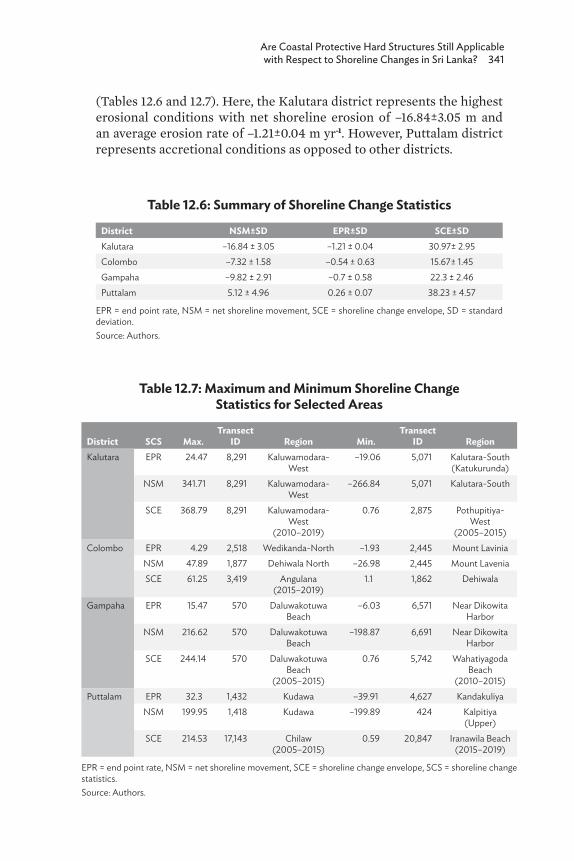
Are Coastal Protective Hard Structures Still Applicable with Respect to Shoreline Changes in Sri Lanka? 341
(Tables 12.6 and 12.7). Here, the Kalutara district represents the highest erosional conditions with net shoreline erosion of –16.84±3.05 m and an average erosion rate of –1.21±0.04 m yr-1. However, Puttalam district represents accretional conditions as opposed to other districts.
Table 12.6: Summary of Shoreline Change Statistics
District NSM±SD EPR±SD SCE±SDKalutara –16.84 ± 3.05 –1.21 ± 0.04 30.97± 2.95Colombo –7.32 ± 1.58 –0.54 ± 0.63 15.67± 1.45Gampaha –9.82 ± 2.91 –0.7 ± 0.58 22.3 ± 2.46Puttalam 5.12 ± 4.96 0.26 ± 0.07 38.23 ± 4.57
EPR = end point rate, NSM = net shoreline movement, SCE = shoreline change envelope, SD = standard deviation.Source: Authors.
Table 12.7: Maximum and Minimum Shoreline Change Statistics for Selected Areas
District SCS Max.Transect
ID Region Min.Transect
ID RegionKalutara EPR 24.47 8,291 Kaluwamodara-
West–19.06 5,071 Kalutara-South
(Katukurunda)NSM 341.71 8,291 Kaluwamodara-
West–266.84 5,071 Kalutara-South
SCE 368.79 8,291 Kaluwamodara-West
(2010–2019)
0.76 2,875 Pothupitiya-West
(2005–2015)Colombo EPR 4.29 2,518 Wedikanda-North –1.93 2,445 Mount Lavinia
NSM 47.89 1,877 Dehiwala North –26.98 2,445 Mount LaveniaSCE 61.25 3,419 Angulana
(2015–2019)1.1 1,862 Dehiwala
Gampaha EPR 15.47 570 Daluwakotuwa Beach
–6.03 6,571 Near Dikowita Harbor
NSM 216.62 570 Daluwakotuwa Beach
–198.87 6,691 Near Dikowita Harbor
SCE 244.14 570 Daluwakotuwa Beach
(2005–2015)
0.76 5,742 Wahatiyagoda Beach
(2010–2015)Puttalam EPR 32.3 1,432 Kudawa –39.91 4,627 Kandakuliya
NSM 199.95 1,418 Kudawa –199.89 424 Kalpitiya (Upper)
SCE 214.53 17,143 Chilaw (2005–2015)
0.59 20,847 Iranawila Beach(2015–2019)
EPR = end point rate, NSM = net shoreline movement, SCE = shoreline change envelope, SCS = shoreline change statistics.Source: Authors.
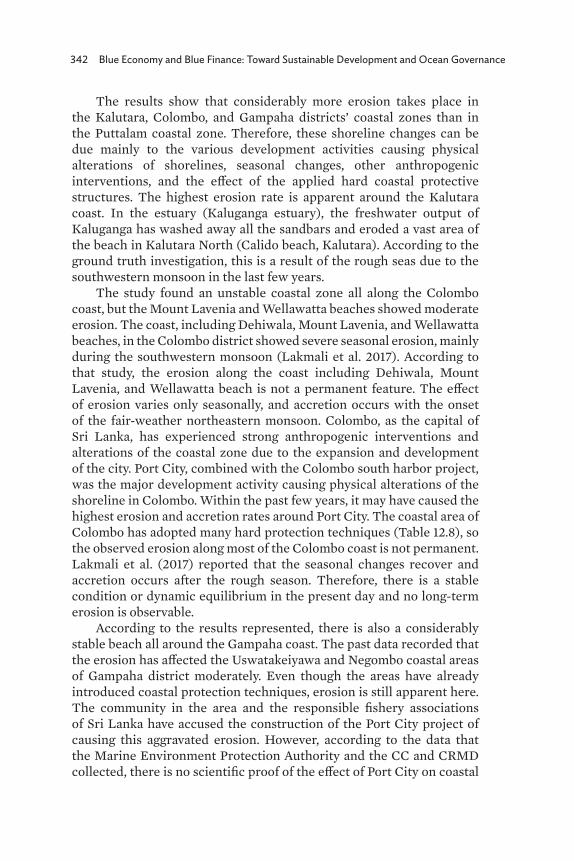
342 Blue Economy and Blue Finance: Toward Sustainable Development and Ocean Governance
The results show that considerably more erosion takes place in the Kalutara, Colombo, and Gampaha districts’ coastal zones than in the Puttalam coastal zone. Therefore, these shoreline changes can be due mainly to the various development activities causing physical alterations of shorelines, seasonal changes, other anthropogenic interventions, and the effect of the applied hard coastal protective structures. The highest erosion rate is apparent around the Kalutara coast. In the estuary (Kaluganga estuary), the freshwater output of Kaluganga has washed away all the sandbars and eroded a vast area of the beach in Kalutara North (Calido beach, Kalutara). According to the ground truth investigation, this is a result of the rough seas due to the southwestern monsoon in the last few years.
The study found an unstable coastal zone all along the Colombo coast, but the Mount Lavenia and Wellawatta beaches showed moderate erosion. The coast, including Dehiwala, Mount Lavenia, and Wellawatta beaches, in the Colombo district showed severe seasonal erosion, mainly during the southwestern monsoon (Lakmali et al. 2017). According to that study, the erosion along the coast including Dehiwala, Mount Lavenia, and Wellawatta beach is not a permanent feature. The effect of erosion varies only seasonally, and accretion occurs with the onset of the fair-weather northeastern monsoon. Colombo, as the capital of Sri Lanka, has experienced strong anthropogenic interventions and alterations of the coastal zone due to the expansion and development of the city. Port City, combined with the Colombo south harbor project, was the major development activity causing physical alterations of the shoreline in Colombo. Within the past few years, it may have caused the highest erosion and accretion rates around Port City. The coastal area of Colombo has adopted many hard protection techniques (Table 12.8), so the observed erosion along most of the Colombo coast is not permanent. Lakmali et al. (2017) reported that the seasonal changes recover and accretion occurs after the rough season. Therefore, there is a stable condition or dynamic equilibrium in the present day and no long-term erosion is observable.
According to the results represented, there is also a considerably stable beach all around the Gampaha coast. The past data recorded that the erosion has affected the Uswatakeiyawa and Negombo coastal areas of Gampaha district moderately. Even though the areas have already introduced coastal protection techniques, erosion is still apparent here. The community in the area and the responsible fishery associations of Sri Lanka have accused the construction of the Port City project of causing this aggravated erosion. However, according to the data that the Marine Environment Protection Authority and the CC and CRMD collected, there is no scientific proof of the effect of Port City on coastal
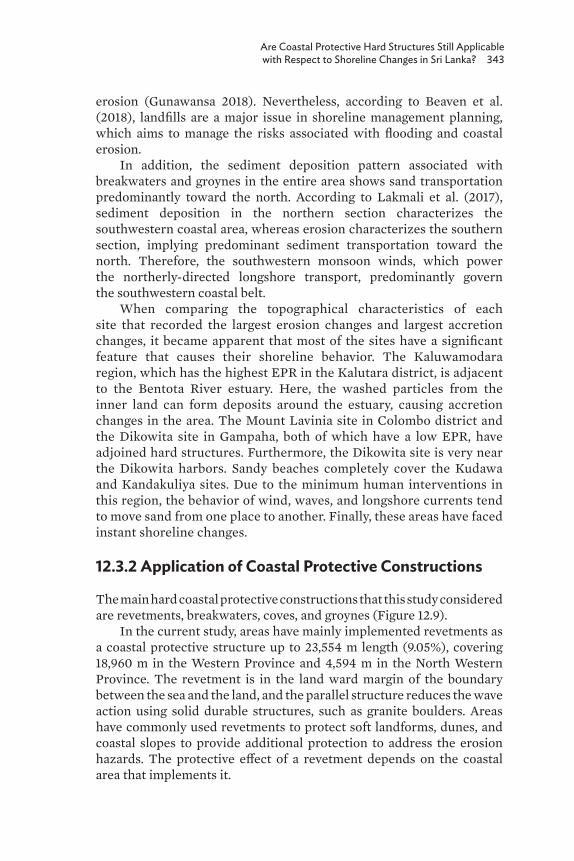
Are Coastal Protective Hard Structures Still Applicable with Respect to Shoreline Changes in Sri Lanka? 343
erosion (Gunawansa 2018). Nevertheless, according to Beaven et al. (2018), landfills are a major issue in shoreline management planning, which aims to manage the risks associated with flooding and coastal erosion.
In addition, the sediment deposition pattern associated with breakwaters and groynes in the entire area shows sand transportation predominantly toward the north. According to Lakmali et al. (2017), sediment deposition in the northern section characterizes the southwestern coastal area, whereas erosion characterizes the southern section, implying predominant sediment transportation toward the north. Therefore, the southwestern monsoon winds, which power the northerly-directed longshore transport, predominantly govern the southwestern coastal belt.
When comparing the topographical characteristics of each site that recorded the largest erosion changes and largest accretion changes, it became apparent that most of the sites have a significant feature that causes their shoreline behavior. The Kaluwamodara region, which has the highest EPR in the Kalutara district, is adjacent to the Bentota River estuary. Here, the washed particles from the inner land can form deposits around the estuary, causing accretion changes in the area. The Mount Lavinia site in Colombo district and the Dikowita site in Gampaha, both of which have a low EPR, have adjoined hard structures. Furthermore, the Dikowita site is very near the Dikowita harbors. Sandy beaches completely cover the Kudawa and Kandakuliya sites. Due to the minimum human interventions in this region, the behavior of wind, waves, and longshore currents tend to move sand from one place to another. Finally, these areas have faced instant shoreline changes.
12.3.2 Application of Coastal Protective Constructions
The main hard coastal protective constructions that this study considered are revetments, breakwaters, coves, and groynes (Figure 12.9).
In the current study, areas have mainly implemented revetments as a coastal protective structure up to 23,554 m length (9.05%), covering 18,960 m in the Western Province and 4,594 m in the North Western Province. The revetment is in the land ward margin of the boundary between the sea and the land, and the parallel structure reduces the wave action using solid durable structures, such as granite boulders. Areas have commonly used revetments to protect soft landforms, dunes, and coastal slopes to provide additional protection to address the erosion hazards. The protective effect of a revetment depends on the coastal area that implements it.

344 Blue Economy and Blue Finance: Toward Sustainable Development and Ocean Governance
The extents of the coastal revetment in Kalutara, Colombo, Gampaha, and Puttalam districts were approximately 7,133 m, 9,432 m, 2,395 m, and 4,594 m, and their coverage percentages of the total coastal length were 16.85%, 38.81%, 6.90%, and 2.88%, respectively. The high net erosion rate that the Kalutara district recorded caused the implementation of a considerable extent of coastal revetments.
The total constructed lengths of breakwaters in the above districts, respectively, were 1,903 m, 702 m, 2,175 m, and 4,141 m. The total numbers of groynes in those districts were 19, 2, 29, and 91, respectively. According to the results, there were three coves in Kalutara, none in Colombo and Gampaha, and two in Puttalam at the end of 2019 (Table 12.8).
At the end of 2019, Puttalam district, specifically on Kalpitiya peninsula, applied a vast amount of different hard structures: revetments
Figure 12.9: Categorized Hard Structures in the Study Area
Source: Breakwaters and cove images from Google Earth imagery; revetment and groyne images by authors.
A. Revetments
C. Coves
B. Breakwaters
D. Groynes
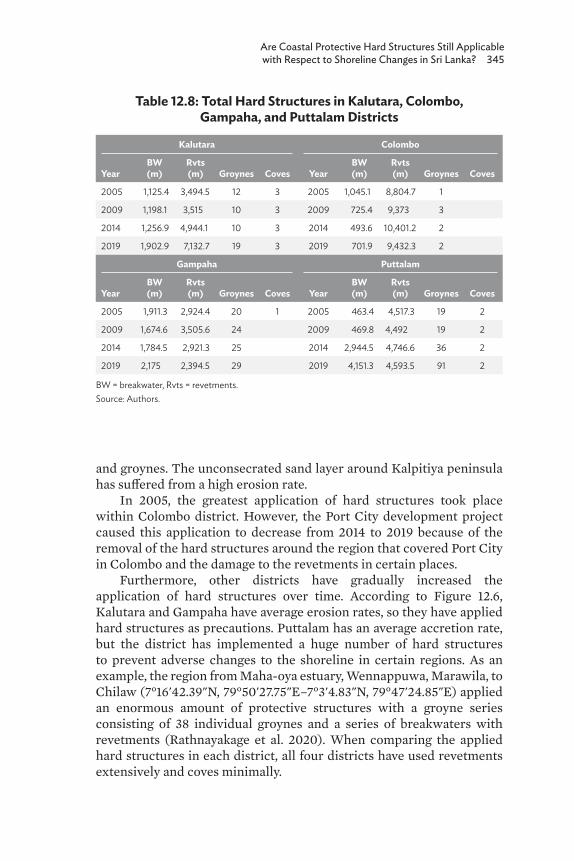
Are Coastal Protective Hard Structures Still Applicable with Respect to Shoreline Changes in Sri Lanka? 345
and groynes. The unconsecrated sand layer around Kalpitiya peninsula has suffered from a high erosion rate.
In 2005, the greatest application of hard structures took place within Colombo district. However, the Port City development project caused this application to decrease from 2014 to 2019 because of the removal of the hard structures around the region that covered Port City in Colombo and the damage to the revetments in certain places.
Furthermore, other districts have gradually increased the application of hard structures over time. According to Figure 12.6, Kalutara and Gampaha have average erosion rates, so they have applied hard structures as precautions. Puttalam has an average accretion rate, but the district has implemented a huge number of hard structures to prevent adverse changes to the shoreline in certain regions. As an example, the region from Maha-oya estuary, Wennappuwa, Marawila, to Chilaw (7°16'42.39"N, 79°50'27.75"E–7°3'4.83"N, 79°47'24.85"E) applied an enormous amount of protective structures with a groyne series consisting of 38 individual groynes and a series of breakwaters with revetments (Rathnayakage et al. 2020). When comparing the applied hard structures in each district, all four districts have used revetments extensively and coves minimally.
Table 12.8: Total Hard Structures in Kalutara, Colombo, Gampaha, and Puttalam Districts
Kalutara Colombo
YearBW (m)
Rvts (m) Groynes Coves Year
BW (m)
Rvts (m) Groynes Coves
2005 1,125.4 3,494.5 12 3 2005 1,045.1 8,804.7 1
2009 1,198.1 3,515 10 3 2009 725.4 9,373 3
2014 1,256.9 4,944.1 10 3 2014 493.6 10,401.2 2
2019 1,902.9 7,132.7 19 3 2019 701.9 9,432.3 2
Gampaha Puttalam
YearBW (m)
Rvts (m) Groynes Coves Year
BW (m)
Rvts (m) Groynes Coves
2005 1,911.3 2,924.4 20 1 2005 463.4 4,517.3 19 2
2009 1,674.6 3,505.6 24 2009 469.8 4,492 19 2
2014 1,784.5 2,921.3 25 2014 2,944.5 4,746.6 36 2
2019 2,175 2,394.5 29 2019 4,151.3 4,593.5 91 2
BW = breakwater, Rvts = revetments. Source: Authors.
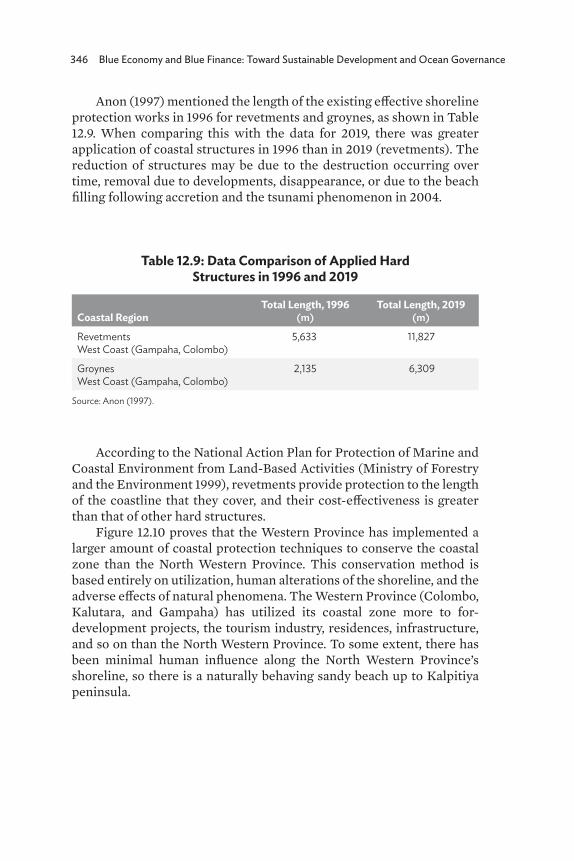
346 Blue Economy and Blue Finance: Toward Sustainable Development and Ocean Governance
Anon (1997) mentioned the length of the existing effective shoreline protection works in 1996 for revetments and groynes, as shown in Table 12.9. When comparing this with the data for 2019, there was greater application of coastal structures in 1996 than in 2019 (revetments). The reduction of structures may be due to the destruction occurring over time, removal due to developments, disappearance, or due to the beach filling following accretion and the tsunami phenomenon in 2004.
Table 12.9: Data Comparison of Applied Hard Structures in 1996 and 2019
Coastal RegionTotal Length, 1996
(m)Total Length, 2019
(m)
RevetmentsWest Coast (Gampaha, Colombo)
5,633 11,827
GroynesWest Coast (Gampaha, Colombo)
2,135 6,309
Source: Anon (1997).
According to the National Action Plan for Protection of Marine and Coastal Environment from Land-Based Activities (Ministry of Forestry and the Environment 1999), revetments provide protection to the length of the coastline that they cover, and their cost-effectiveness is greater than that of other hard structures.
Figure 12.10 proves that the Western Province has implemented a larger amount of coastal protection techniques to conserve the coastal zone than the North Western Province. This conservation method is based entirely on utilization, human alterations of the shoreline, and the adverse effects of natural phenomena. The Western Province (Colombo, Kalutara, and Gampaha) has utilized its coastal zone more to for- development projects, the tourism industry, residences, infrastructure, and so on than the North Western Province. To some extent, there has been minimal human influence along the North Western Province’s shoreline, so there is a naturally behaving sandy beach up to Kalpitiya peninsula.
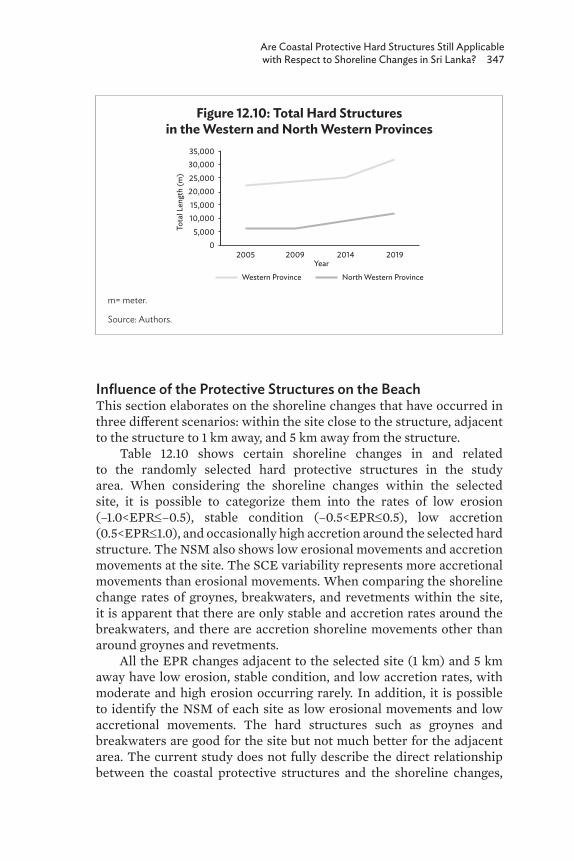
Are Coastal Protective Hard Structures Still Applicable with Respect to Shoreline Changes in Sri Lanka? 347
Influence of the Protective Structures on the BeachThis section elaborates on the shoreline changes that have occurred in three different scenarios: within the site close to the structure, adjacent to the structure to 1 km away, and 5 km away from the structure.
Table 12.10 shows certain shoreline changes in and related to the randomly selected hard protective structures in the study area. When considering the shoreline changes within the selected site, it is possible to categorize them into the rates of low erosion (–1.0<EPR≤–0.5), stable condition (–0.5<EPR≤0.5), low accretion (0.5<EPR≤1.0), and occasionally high accretion around the selected hard structure. The NSM also shows low erosional movements and accretion movements at the site. The SCE variability represents more accretional movements than erosional movements. When comparing the shoreline change rates of groynes, breakwaters, and revetments within the site, it is apparent that there are only stable and accretion rates around the breakwaters, and there are accretion shoreline movements other than around groynes and revetments.
All the EPR changes adjacent to the selected site (1 km) and 5 km away have low erosion, stable condition, and low accretion rates, with moderate and high erosion occurring rarely. In addition, it is possible to identify the NSM of each site as low erosional movements and low accretional movements. The hard structures such as groynes and breakwaters are good for the site but not much better for the adjacent area. The current study does not fully describe the direct relationship between the coastal protective structures and the shoreline changes,
Figure 12.10: Total Hard Structures in the Western and North Western Provinces
m= meter.
Source: Authors.
05,000
10,00015,000
20,00025,000
30,00035,000
2005 2009 2014 2019Year
North Western ProvinceWestern Province
Tota
l Len
gth
(m)
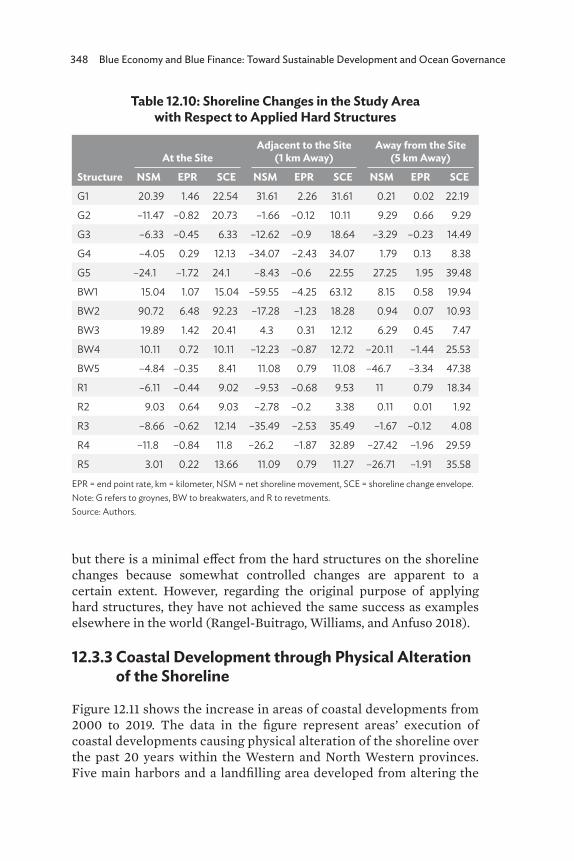
348 Blue Economy and Blue Finance: Toward Sustainable Development and Ocean Governance
Table 12.10: Shoreline Changes in the Study Area with Respect to Applied Hard Structures
Structure
At the SiteAdjacent to the Site
(1 km Away)Away from the Site
(5 km Away)
NSM EPR SCE NSM EPR SCE NSM EPR SCE
G1 20.39 1.46 22.54 31.61 2.26 31.61 0.21 0.02 22.19
G2 –11.47 –0.82 20.73 –1.66 –0.12 10.11 9.29 0.66 9.29
G3 –6.33 –0.45 6.33 –12.62 –0.9 18.64 –3.29 –0.23 14.49
G4 –4.05 0.29 12.13 –34.07 –2.43 34.07 1.79 0.13 8.38
G5 –24.1 –1.72 24.1 –8.43 –0.6 22.55 27.25 1.95 39.48
BW1 15.04 1.07 15.04 –59.55 –4.25 63.12 8.15 0.58 19.94
BW2 90.72 6.48 92.23 –17.28 –1.23 18.28 0.94 0.07 10.93
BW3 19.89 1.42 20.41 4.3 0.31 12.12 6.29 0.45 7.47
BW4 10.11 0.72 10.11 –12.23 –0.87 12.72 –20.11 –1.44 25.53
BW5 –4.84 –0.35 8.41 11.08 0.79 11.08 –46.7 –3.34 47.38
R1 –6.11 –0.44 9.02 –9.53 –0.68 9.53 11 0.79 18.34
R2 9.03 0.64 9.03 –2.78 –0.2 3.38 0.11 0.01 1.92
R3 –8.66 –0.62 12.14 –35.49 –2.53 35.49 –1.67 –0.12 4.08
R4 –11.8 –0.84 11.8 –26.2 –1.87 32.89 –27.42 –1.96 29.59
R5 3.01 0.22 13.66 11.09 0.79 11.27 –26.71 –1.91 35.58
EPR = end point rate, km = kilometer, NSM = net shoreline movement, SCE = shoreline change envelope.Note: G refers to groynes, BW to breakwaters, and R to revetments.Source: Authors.
but there is a minimal effect from the hard structures on the shoreline changes because somewhat controlled changes are apparent to a certain extent. However, regarding the original purpose of applying hard structures, they have not achieved the same success as examples elsewhere in the world (Rangel-Buitrago, Williams, and Anfuso 2018).
12.3.3 Coastal Development through Physical Alteration of the Shoreline
Figure 12.11 shows the increase in areas of coastal developments from 2000 to 2019. The data in the figure represent areas’ execution of coastal developments causing physical alteration of the shoreline over the past 20 years within the Western and North Western provinces. Five main harbors and a landfilling area developed from altering the

Are Coastal Protective Hard Structures Still Applicable with Respect to Shoreline Changes in Sri Lanka? 349
shoreline in the study area. The Colombo harbor, the fishery harbor in Colombo, and the Beruwala fishery harbors have existed from the early 2000s up to the present in the Western Province. From 2009 to 2011, a small harbor was located in Pothupitiya, Kalutara. The governing body selected this area as a suitable coastal stretch, extending over an area of 72,000 square meters, for siting the temporary quarry rock loadout point for the transshipment of rock to Colombo. It has finished the construction of a temporary breakwater extending over 500 m and a seafront wall and has been undertaking the dredging of the basin since October 2008 (Lee et al. 2010). It established the Dikowita fishery harbor and Colombo south harbor in 2010 and a huge area incrementation in Colombo south harbor by 2019 by expanding the wave breaks to protect the harbor. Furthermore, the mass artificial landfilling Port City project commenced in 2015 and has now expanded over 269 hectares as an additional part of Sri Lanka in Colombo district.
Figure 12.11: Coastal Development by Physical Alteration of the Shoreline, 2000–2019
km2 = square kilometer.
Source: Authors.
0
2
4
6
8
10
12
20192015201020052000
7.4051398.703161
11.393161
Years
Are
a (k
m2 )
3.251171 3.251171
Finally, this study has helped to prove that all these human influences or anthropogenic interventions have caused shoreline changes directly or indirectly in this study area. In addition, there is an effect of natural phenomena such as tidal variations, sea-level rises, storm surges, and so on. These two causes are interconnected. If highly adverse activities occur around the coastal zone, they cause adverse behaviors of the sea, and the aggravated behaviors of the sea
350 Blue Economy and Blue Finance: Toward Sustainable Development and Ocean Governance
tend to increase the human influence on the coastal zone. Therefore, it is important to study the dynamic nature of the shoreline with respect to wind patterns, current patterns, sea-level rises, and natural barriers, which help to protect the coastal zone.
12.4 Conclusions
The findings highlighted that the part of the study area experiencing coastal erosion due to anthropogenic activities may face more drastic changes in its shoreline and environment than other areas in the Western and North Western provinces of Sri Lanka. Therefore, anthropogenic activities are the leading factor in coastal erosion in the respective study area rather than natural scenarios such as a sea-level rise, climatic changes, and natural hazards. The application of hard structures is the solution that is least able to control coastal erosion in a large area because applying hard structure is good for the site but not very helpful for other adjacent areas. Therefore, as long as humans introduce no alterations, the environment will remain under its natural conditions. If the shoreline is changing naturally, as humans, we have to adjust rather than alter it. Furthermore, it is important to have proper identification of the dynamic nature of the shoreline that is occurring due to the behavior of wave patterns and coastal currents, obligatory subsidies for the conservation and management of the coastal zone, buffering capacity from natural coastal ecosystems, and coastal-based industries. This study may provide information regarding where and when ad hoc coastal zone development projects and ad hoc soft and hard coastal conservation programs will work effectively within the coastal zone.
12.4.1 Limitations of the Study
This study is based on the analysis of GIS and remote sensing data. The digitization relied on visual interpretations and errors can occur in the final results if the remote sensing data do not undergo correct preprocessing. Insufficient previous data and studies regarding shoreline changes in this area were available to carry out a comparative study.
Are Coastal Protective Hard Structures Still Applicable with Respect to Shoreline Changes in Sri Lanka? 351
12.4.2 Recommendations for Future Research
This research mainly focused on the shoreline changes and the effect of human influences and natural phenomena on the coasts of the Western and North Western provinces. Further study could identify the changes along the whole coastline of Sri Lanka and establish a proper mechanism to define the predictability and the dynamic nature of the shoreline, as well as the effect of sea-level rise, current patterns, and wind patterns on the shoreline. The findings of further studies can assist in revising the coastal management plan to ensure effective management approaches.
352 Blue Economy and Blue Finance: Toward Sustainable Development and Ocean Governance
ReferencesAlesheikh, A.A., A. Ghorbanali, and N. Nouri. 2007. Coastline Change
Detection Using Remote Sensing. International Journal of Environmental Science & Technology. 4 (1). pp. 61–6.
Anon. 1997. Essex Shoreline Management Plan. April. Surrey, UK: Mouchel and Partners Ltd.
Bamunawala, R.M.J., S.S.L. Hettiarachchi, S.P. Samarawickrama, P.N. Wickramanayakkara, and R. Ranasinghe. 2015. Climate Change Impacts on Seasonal Wave Climate of the Western Coast of Sri Lanka. ACEPS 2015. p. 126.
Beatley, T., D. Brower, and A.K. Schwab. 2002. An Introduction to Coastal Zone Management. Washington, DC: Island Press.
Beaven, R.P., R. Nicholls, I. Haigh, A.S. Kebede, J. Watts, and A. Stringfellow. 2018. Coastal Landfill and Shoreline Management: Implications for Coastal Adaptation Infrastructure. Case Study: Lyme Regis. University of Southampton Institutional Repository.
Borsje, B.W., B.K. van Wesenbeeck, F. Dekker, P. Paalvast, T.J. Bouma, M.M. van Katwijk, and M.B. de Vries. 2011. How Ecological Engineering Can Serve in Coastal Protection. Ecological Engineering. 37 (2). pp. 113–22. doi:10.1016/j.ecoleng.2010.11.027.
Clark, J.R., ed. 1995. Coastal Zone Management Handbook. Boca Raton, FL: CRC Press.
Coast Conservation Department. 2004. Revised Coastal Zone Management Plan (CZMP), Sri Lanka. Colombo.
Department of Meteorology, Sri Lanka. 2019. Climate of Sri Lanka. http://www.meteo.gov.lk/index.php?option=com_content&view=article&id=94&Itemid=310&lang=en&lang=en (accessed 26 February 2020).
Devi, E.U., and S.S.C. Shenoi. 2012. Tsunami and the Effects on Coastal Morphology and Ecosystems: A Report. Proceedings of the Indian National Science Academy. 78 (3). pp. 513–21.
Dias, J.A., A. Cearreta, F.I. Isla, and M.M. de Mahiques. 2013. Anthropogenic Impacts on Iberoamerican Coastal Areas: Historical Processes, Present Challenges, and Consequences for Coastal Zone Management. Ocean & Coastal Management. 77. pp. 80–8. doi:10.1016/j.ocecoaman.2012.07.025.
Dias, J.A., Ó. Ferreira, A. Matias, A. Vila-Concejo, and C. Sá-Pires. 2003. Evaluation of Soft Protection Techniques in Barrier Islands by Monitoring Programs: Case Studies from Ria Formosa (Algarve—Portugal). Journal of Coastal Research. Special Issue No. 35. pp. 117–31.
Gillie, R.D. 1997. Causes of Coastal Erosion in Pacific Island Nations. Journal of Coastal Research. Special Issue No. 24. pp. 173–204.
Are Coastal Protective Hard Structures Still Applicable with Respect to Shoreline Changes in Sri Lanka? 353
Godage, D. 1992. Coast Erosion Management Plan and Its Implementation. In Seminar on Causes of Coastal Erosion in Sri Lanka. CCD/GTZ Coast Conservation Project, Colombo, Sri Lanka. pp. 323–30.
Gunaratna, P.P., D.P.L. Ranasinghe, and T.A.N. Sugandika. 2011. Assessment of Nearshore Wave Climate Off the Southern Coast of Sri Lanka. Engineer. 44 (2). pp. 33–42.
Gunawansa, A. 2018. Creation of New Urban Land by Reclaiming the Sea in Colombo Port City, Sri Lanka. 24th International Sustainable Development Research Society Conference. pp. 98–119.
Hanson, H., and G. Lindh. 1993. Coastal Erosion: An Escalating Environmental Threat. Ambio. 22 (4). pp. 188–95.
Harley, M.D., I.L. Turner, A.D. Short, and R. Ranasinghe. 2011. A Reevaluation of Coastal Embayment Rotation: The Dominance of Cross‐Shore versus Alongshore Sediment Transport Processes, Collaroy‐Narrabeen Beach, Southeast Australia. Journal of Geophysical Research: Earth Surface. 116 (F4).
Hegde, A.V. 2010. Coastal Erosion and Mitigation Methods – Global State of Art. Indian Journal of Geo-Marine Sciences. 39(4). pp. 521–30. National Institute of Technology Karnataka, India.
Himmelstoss, E.A., R.E. Henderson, M.G. Kratzmann, and A.S. Farris. 2018. Digital Shoreline Analysis System (DSAS) Version 5.0 User Guide. No. 2018-1179. Reston, VA: US Geological Survey.
Iskander, M.M. 2010. Environmental Friendly Methods for the Egyptian Coastal Protection. In First International Conference on Coastal Zone Management of River Deltas and Low Land Coastlines, Alexandria, Egypt/ 1 (32). pp. 625–42.
Łabuz, T.A. 2015. Environmental Impacts—Coastal Erosion and Coastline Changes. In The BACC II Author Team (eds.), Second Assessment of Climate Change for the Baltic Sea Basin. pp. 381–96. Cham: Springer.
Lakmali, E.N., W.G.A. Deshapriya, K.G.A. Ishara Jayawardene, R.M.P. Raviranga, N.P. Ratnayake, H.M.R. Premasiri, and I.P. Senanayake. 2017. Long Term Coastal Erosion and Shoreline Positions of Sri Lanka. Journal of Survey in Fisheries Sciences. 3 (2). pp. 1–6. doi:10.18331/sfs2017.3.2.1.
Lee, S.W., Y.Y. Chung, G.Y. Lee, and K.H. Park. 2010. Case Studies on Construction and Design in Colombo Port, Sri Lanka. In Proceedings of the Korean Geotechical Society Conference. pp. 44–57. Korean Geotechnical Society.
Malarvizhi, K., S. Vasantha Kumar, and P. Porchelvan. 2016. Use of High Resolution Google Earth Satellite Imagery in Landuse Map Preparation for Urban Related Applications. Procedia Technology. 24. pp. 1835–42. doi:10.1016/j.protcy.2016.05.231.
354 Blue Economy and Blue Finance: Toward Sustainable Development and Ocean Governance
Ministry of Forestry and the Environment. 1999. National Action Plan for Protection of Marine and Coastal Environment from Land-Based Activities. Colombo.
NATCOM, Democratic Socialist Republic of Sri Lanka. 2000. Initial National Communication under the United Nations Framework Convention on Climate Change. Padukka: State Printing Corporation.
Nayak, S. 2017. Coastal Zone Management in India—Present Status and Future Needs. Geo-Spatial Information Science. 20 (2). pp. 174–83. doi:10.1080/10095020.2017.1333715.
Ndour, A., R.A. Laïbi, M. Sadio, C.G.E. Degbe, A.T. Diaw, L.M. Oyédé, E.J. Anthony, P. Dussouillez, H. Sambou, and E.H.B. Dièye. 2018. Management Strategies for Coastal Erosion Problems in West Africa: Analysis, Issues, and Constraints Drawn from the Examples of Senegal and Benin. Ocean and Coastal Management. 156. pp. 92–106. doi:10.1016/j.ocecoaman.2017.09.001.
Nianthi, K.W.G.R., and R. Shaw. 2015. Climate Change and Its Impact on Coastal Economy of Sri Lanka. In R. Krishnamurthy et al., eds. The Global Challenge. Weinheim, Germany: Research Publishing.
Oyedotun, T.D.T. 2014. Shoreline Geometry: DSAS as a Tool for Historical Trend Analysis. Geomorphological Techniques. 3 (2.2). pp. 1–12.
Pattiaratchi, C. 2005. Tsunami Impacts on Sri Lanka—Lessons for Disaster Reduction on Coasts. In International Symposium: Disaster Reduction on Coasts. Monash University, Australia. pp. 1–10.
Perera, H.N. 1990. Need for Review and Upgrading of Master Plan for Coast Erosion Management. In H.J. Sheffer, ed. Seminar on Causes of Coastal Erosion in Sri Lanka. Colombo: CCD/GTZ Coast Conservation Project. pp. 331–48.
Pessoa, M.F., and F.C. Lidon. 2013. Impact of Human Activities on Coastal Vegetation—A Review. Emirates Journal of Food and Agriculture. pp. 926–44.
Pranzini, E., and A.T. Williams, eds. 2013. Coastal Erosion and Protection in Europe. Routledge.
Prasad, D.H., and N.D. Kumar. 2014. Coastal Erosion Studies—A Review. International Journal of Geosciences. 5 (3). pp. 341–5. doi:10.4236 /ijg.2014.53033.
Prasetya, G. 2007. In S. Braatz S. Fortuna, J. Broadhead, R. Leslie, and Forestry Group, eds. Coastal Protection in the Aftermath of the Indian Ocean Tsunami: What Role for Forests and Trees? Proceedings of the Regional Technical Workshop. 28–31 August 2006. Khao Lak, Thailand. Bangkok: Food and Agriculture Organization of the United Nations Regional Office for Asia and the Pacific.
Are Coastal Protective Hard Structures Still Applicable with Respect to Shoreline Changes in Sri Lanka? 355
Ranathunge, K., E. Steudle, and R. Lafitte. 2003. Control of Water Uptake by Rice (Oryza sativa L.): Role of the Outer Part of the Root. Planta. 217 (2). pp. 193–205.
Rangel-Buitrago, N., I.D. Correa, G. Anfuso, A.Y.Ş.E.N. Ergin, and A.T. Williams. 2013. Assessing and Managing Scenery of the Caribbean Coast of Colombia. Tourism Management. 35. pp. 41–58.
Rangel-Buitrago, N., A.T. Williams, and G. Anfuso. 2018. Hard Protection Structures as a Principal Coastal Erosion Management Strategy along the Caribbean Coast of Colombia. A Chronicle of Pitfalls. Ocean and Coastal Management. 156. pp. 58–75. doi:10.1016/j .ocecoaman.2017.04.006.
Ratnayake, N.P., A.S. Ratnayake, R.M. Azoor, S.M. Weththasinghe, I.D.J. Seneviratne, N. Senarathne, R. Premasiri, and N. Dushyantha. 2018. Erosion Processes Driven by Monsoon Events after a Beach Nourishment and Breakwater Construction at Uswetakeiyawa Beach, Sri Lanka. SN Applied Sciences. 1 (1). doi:10.1007/s424 na52-018-0050-7.
Ratnayake, N.P., A.S. Ratnayake, P.V. Keegle, M.A.K.M. Mallawa Arachchi, and H.M.R. Premasiri. 2019. An Analysis of Beach Profile Changes Subsequent to the Colombo Harbor Expansion Project, Sri Lanka. Environmental Earth Sciences. 77 (1). doi:10.1007/s12665-018-7234-8.
Rathnayake, D.K., D. Kularatne, S. Abeysinghe, I. Shehara, T. Fonseka, S.D.J. Edirisinghe Mudiyanselage, W.G.C.T. Kamalrathne, C. Siriwardana, C.S.B. Alagiyawanna Mohotti Appuhamilage, and R. Dissanayake. 2020. Barriers and Enablers of Coastal Disaster Resilience – Lessons Learned from Tsunami in Sri Lanka. International Journal of Disaster Resilience in the Built Environment. 11 (2). pp. 275–88. doi:10.1108/IJDRBE-07-2019-0050.
Samanmali, M.A.D., R.U.K. Piyadasa, and D.D. Wickramasinghe. 2015. In H. Schaeben, R.T. Delgado, K.G. van den Boogaart, R. van den Boogaart, eds. Shoreline Changes Investigation during the last 50 Years in Kalpitiya Peninsula, Sri Lanka. Proceedings of IAMG 2015 Freiberg, Germany.
Schott, F.A., and J.P. McCreary. 2001. The Monsoon Circulation of the Indian Ocean. Progress in Oceanography. 51 (1). pp. 1–123. doi:10.1016 /s0079-6611(01)00083-0.
Senevirathna, E.M.T.K., K.V.D. Edirisooriya, S.P. Uluwaduge, and K.B.C.A. Wijerathna. 2018. Analysis of Causes and Effects of Coastal Erosion and Environmental Degradation in Southern Coastal Belt of Sri Lanka Special Reference to Unawatuna Coastal Area. Procedia Engineering. 212. pp. 1010–7. doi:10.1016/j.proeng.2018.01.130.
356 Blue Economy and Blue Finance: Toward Sustainable Development and Ocean Governance
Silva, R., M.L. Martinez, P.A. Hesp, P. Catalan, A.F. Osorio, R. Martell, M. Fossati, G. Miot da Silva, I. Mariño-Tapia, P. Pereira, R. Cienfuegos, A. Klein, and G. Govaere. 2014. Present and Future Challenges of Coastal Erosion in Latin America. Journal of Coastal Research. 71 (sp1). pp. 1–16.
Thevasiyani, T., and K. Perera. 2014. Statistical Analysis of Extreme Ocean Waves in Galle, Sri Lanka. Weather and Climate Extremes. 5. pp. 40–7.
Tien, P.H., and D. Sam. 2007. Chapter 4 Protection from Coastal Erosion: Thematic Paper: The Role of Coastal Forests and Trees in Protecting against Coastal Erosion. Environmental Science.
Tomczak, M., and J.S. Godfrey. 2013. Regional Oceanography: An Introduction. Delhi: Daya Publishing House, Elsevier.
Van Rijn, L.C. 2011. Coastal Erosion and Control. Ocean & Coastal Management. 54 (12). pp. 867–87. doi:10.1016/j .ocecoaman.2011.05.004.
Warnasuriya, T.W.S., K. Gunaalan, and S.S. Gunasekara. 2018. Google Earth: A New Resource for Shoreline Change Estimation—Case Study from Jaffna Peninsula, Sri Lanka. Marine Geodesy. 41 (6). pp. 546–80. doi:10.1080/01490419.2018.1509160.
Warnasuriya, T.W.S., M.P. Kumara, S.S. Gunasekara, K. Gunaalan, and R.M.R.M. Jayathilaka. 2020. An Improved Method to Detect Shoreline Changes in Small-Scale Beaches Using Google Earth Pro. Marine Geodesy. 43 (6). pp. 1–32. doi:10.1080/01490419.2020.1822478.
Wijeratne, E.M.S., and C.B. Pattiaratchi. 2006. Sea Level Variability in Sri Lanka Waters. National Aquatic Resources Research and Development Agency, Colombo. Understanding Sea-Level Rise and Variability: Report of UNESCO Workshop. Paris, June. p. 8.
Williams, A., and A. Micallef. 2011. Beach Management: Principles and Practice. New York, NY: Earthscan, Routledge.
Williams, A.T., N. Rangel-Buitrago, E. Pranzini, and G. Anfuso. 2018. The Management of Coastal Erosion. Ocean & Coastal Management. 156. pp. 4–20. doi:10.1016/j.ocecoaman.2017.03.022.
Zhang, K., B.C. Douglas, and S.P. Leatherman. 2004. Global Warming and Coastal Erosion. Climatic Change. 64 (1/2). pp. 41–58. doi:10.1023 /b:clim.0000024690.32682.48.
Zuzek, P.J., R.B. Nairn, and S.J. Thieme. 2003. Spatial and Temporal Considerations for Calculating Shoreline Change Rates in the Great Lakes Basin. Journal of Coastal Research. Special Issue No. 38. pp. 125–46.