Embed Size (px)
Citation preview

Benchmarking educational web portals: An application of the Kano method
C A MacDonald
©© UUnniivveerrssiittyy ooff PPrreettoorriiaa

Benchmarking educational web portals: An application of the Kano method
by
C A MacDonald
Submitted in partial fulfilment of the requirements for the degree Magister Educationis: Computer Integrated Education
in the Department of Curriculum Studies Faculty of Education University of Pretoria
Supervisor: Prof. Dr. J G Knoetze
August 2008


Declaration I declare that...
Benchmarking educational web portals: An application of the Kano method
... is my own work, and that the sources that I have used or quoted have been included and acknowledged by means of complete references.
Catherine Ann MacDonald 29th August 2008

Acknowledgements I would like to take this opportunity to acknowledge and thank all the people who have contributed in different ways to the compilation of this report.
• All of the research participants • Prof. Dr. Johan Knoetze • Neil MacDonald • Chris Ellis • Judith Ellis • Neil Butcher
i
Table of Contents
Terminology List ............... ........................................................................................................ iii
Abstract............... ...................................................................................................................... iv
Chapter 1: Introduction
1.1 Introduction ............................................................................................................. 2
1.2 Aim and purpose of the research ............................................................................ 2
1.3 Rationale .................................................................................................................. 2
1.4 Methodology ........................................................................................................... 3
1.5 Limitations of the research ...................................................................................... 3
1.6 Report structure ...................................................................................................... 4
Chapter 2: Literature Review
2.1 Introduction ............................................................................................................. 6
2.2 Information management ....................................................................................... 6
2.3 Web portals ............................................................................................................. 7
2.4 Web portal types ................................................................................................... 11
2.5 Web portal design ................................................................................................. 15
2.6 Summary ................................................................................................................ 19
Chapter 3: Research Methodology
3.1 Introduction ........................................................................................................... 22
3.2 Research ................................................................................................................ 22
3.3 The research paradigm of this study ..................................................................... 26
3.4 The research aim and process ............................................................................... 26
3.5 Summary ................................................................................................................ 34
ii
Chapter 4: Data Collection and Analysis
4.1 Introduction ........................................................................................................... 36
4.2 Data collection ....................................................................................................... 36
4.3 Data processing ..................................................................................................... 39
4.4 Data analysis .......................................................................................................... 44
4.5 Summary ................................................................................................................ 46
Chapter 5: Summary, Conclusions and Recommendations
5.1 Summary ................................................................................................................ 48
5.2 Conclusion ............................................................................................................. 49
5.3 Recommendations ................................................................................................. 53
Reference List
Reference List ........................................................................................................ 55
List of Addenda
(Addenda are available on the CD‐Rom Attached)
Addendum A ‐ Research Process Email
Addendum B ‐ Consent Form
Addendum C ‐ Kano Questionnaire
Addendum D ‐ Data Collected
iii
Terminology List Action Research: “...an on‐the‐spot procedure designed to deal with a concrete
problem located in an immediate situation” (Cohen & Manion, 1994 in Bless & Higson‐Smith, 2004).
Benchmark: “a standard or point of reference” (Allen, 1991). Benchmarking: The process of testing or determining whether or not a
product meets a benchmark or “a particular point of reference” (Allen, 1991).
Benchmark specifications: “... what the system, process, or product/ service must do in order
to fulfil the business requirements” (Allen, 1991). Design research: “Knowledge is generated and accumulated through action. Doing
something and judging the results is the general model... the process is shown as a cycle in which knowledge is used to create works, and works are evaluated to build knowledge” (AIS, 2007).
Educational web portal: “A portal acts as a gateway which provides entry to...”
educational materials or sites “...on the World Wide Web (WWW)” (Yang et al, 2005).
Kano method: Noriaki Kano, a professor from the University of Tokyo,
developed a model to understand users’ perception of quality (Berger et al, 1999).
Portals: “A portal acts as a gateway which provides entry to specific sites on the World Wide Web (WWW) (Yang et al, 2005).
iv
Abstract Candidate: Catherine Ann MacDonald Student Number: 24326586 Supervisor: Prof. Dr. J G Knoetze Department: Curriculum Studies Faculty: Faculty of Education University: University of Pretoria Degree: MEd Computer Integrated Education Title: Benchmarking educational web portals: An application of the Kano
method The Kano method1 was used in order to determine the benchmark requirements of an
educational web portal. A comprehensive list of possible specifications for an educational
portal was constructed by examining the characteristics of educational portals globally. This
information was used to develop a questionnaire in accordance with the Kano method. A
number of hand‐picked expert users were asked to answer the questionnaire. The results
obtained from these questionnaires were used to categorize the importance of each
component of a web portal as a “one‐dimensional”2, “must‐be”3 or “attractive”4
requirement. The components categorized as “must‐be” requirements were used to
generate the benchmark of the minimum specifications of an educational web portal.
Keywords: 1. Educational web portals 2. Portals 3. Kano method 4. Noriaki Kano 5. Customer requirements 6. One‐dimensional requirements 7. Must‐be requirements 8. Attractive requirements 9. Perception of quality 10. Benchmark specifications
1 Noriaki Kano, a professor at the University of Tokyo, developed a model to understand users’ perception of quality. See Chapter 3: Research Methodology, Page 21. 2 See Chapter 3: Research Methodology, Page 21. 3 See Chapter 3: Research Methodology, Page 21. 4 See Chapter 3: Research Methodology, Page 21.

1 Chapter 1: Introduction
Chapter 1: Introduction
Contents
1.1 Introduction ............................................................................................................. 2
1.2 Aim and purpose of the research ............................................................................ 2
1.3 Rationale .................................................................................................................. 2
1.4 Methodology ........................................................................................................... 3
1.5 Limitations of the research ...................................................................................... 3
1.6 Report structure ...................................................................................................... 4
2 Chapter 1: Introduction
1.1 Introduction
Chapter 1 is an introduction to the research study and gives a short description of the aim
and purpose of the research. It contains, as well, a rationale for the research, and a
summary of the methodology used. The limitations experienced during the research process
are set out, and, finally, an overview of the research report structure is given.
1.2 Aim and purpose of the research
The aim of the research was to determine the benchmark specifications5 of an educational
web portal. Points investigated included the following:
• What are the benchmark specifications of an educational web portal that affect
specialist users’ perception of quality?
• What minimum benchmark specifications do specialist users expect of an educational
web portal?6
The research findings are essential to creating a benchmark for the minimum specifications
of an educational web portal expected by specialist users.
1.3 Rationale
The importance of this research is highlighted by drawing attention to the fact that the data
for benchmark specifications of educational portals was previously not available. The
results of the research have provided a set of guidelines which can be utilized by portal
developers, in order to ensure that new portals meet all of the requirements of specialist
users. The results of the research also provide the basis for further research in order to
ascertain the quality of web portals, including Thutong,7 and to establish whether or not the
portals are addressing the needs and system requirements of their target audiences.
5 See Chapter 3: Research Methodology, Page 21. 6 See Chapter 3: Research Methodology, Page 21. 7 The South African National Education Portal.
3 Chapter 1: Introduction
1.4 Methodology
The following is a brief synopsis of the research methodology used in this study. A
comprehensive description may be found in Chapter 3: Research Methodology.
The Kano method8 was used in order to determine the benchmark requirements of an
educational web portal. A comprehensive list of possible specifications for an educational
portal was constructed by examining the characteristics of educational portals globally. This
information was used to develop a questionnaire in accordance with the Kano method. A
number of hand‐picked expert users were asked to answer the questionnaire. The results
obtained from these questionnaires were used to categorize the importance of each
component of a web portal as a “one‐dimensional”9, “must‐be”10 or “attractive”11
requirement. The components categorized as “must‐be” requirements were used to
generate the benchmark of the minimum specifications of an educational web portal.
As the Kano method is a quantitative research process, the following research techniques
were used:
• Quantitative questionnaires. The questions were formulated so as to address the
research questions outlined above.
• Quantitative analysis of the data collected.
1.5 Limitations of the research
A limitation of the research was the small number of individuals who participated in the
study. In order to raise the level of participation it is recommended that an incentive be
offered to research participants. The number of individuals approached to participate in the
research could also be increased.
8 Noriaki Kano, a professor at the University of Tokyo, developed a model to understand users’ perception of quality. See Chapter 3: Research Methodology, Page 21. 9 See Chapter 3: Research Methodology, Page 21. 10 See Chapter 3: Research Methodology, Page 21. 11 See Chapter 3: Research Methodology, Page 21.
4 Chapter 1: Introduction
Participants became frustrated when answering the online questionnaire. The online
questionnaire did not save the participants responses periodically, if connectivity was
disrupted or lost, which caused the participants to lose all the answers captured before the
disruption occurred. The inclusion of a mechanism which saves participants’ answers
periodically, perhaps every minute, would overcome this problem.
One participant became irritated by the tedious nature (having to answer the functional and
dysfunctional form of each question for 128 questions) of the questionnaire, and decided
not to complete it. Perhaps this problem could be eliminated by reducing the number of
questions.
1.6 Report structure
An overview of the structure of the report is provided in Table 1.1. Table 1.1: Report structure Chapter Title Description
1 Introduction Chapter 1 gives a brief synopsis of the research
study.
2 Literature review Chapter 2 provides a review of literature
pertaining to portals.
3 Research methodology Chapter 3 gives an overview of research and
documents the process followed in order to
ensure that this study complied with the highest
standards.
4 Data collection and analysis Chapter 4 describes the data collection, data
processing and data analysis processes.
5 Summary, conclusions and
recommendations
Chapter 5 sets out the overall conclusions drawn
from the research study as well as
recommendations for both researchers and web
portal designers.

Chapter 2: Literature Review 5
Chapter 2: Literature Review
Contents
2.1 Introduction ............................................................................................................. 6
2.2 Information management ....................................................................................... 6
2.3 Web portals ............................................................................................................. 7
2.4 Web portal types ................................................................................................... 11
2.5 Web portal design ................................................................................................. 15
2.6 Summary ................................................................................................................ 19

Chapter 2: Literature Review 6
2.1 Introduction
This chapter gives a review of the literature pertaining to portals, with particular emphasis
on the process of information management. The various definitions of a portal, offered in
the literature, are included.
The literature review provides an indication of the way in which portal functionality has
developed over the years and covers information about the various types of portals, namely
information portals, and business, corporate and enterprise information portals. The nature
of public portals compared to other portals is explored and the content accessibility
guidelines developed by Yang, Cai, Zhou and Zhou (2005) are reviewed. The
recommendations for web portal design created by Yang, Cai, Zhou and Zhou (2005) are
compared to the recommendations for mobile portal design devised by the Nokia
Corporation (2005).
2.2 Information management
Dias (2001 citing Horton, 1986) highlights the fact that information management has
undergone a number of changes and evolved through various stages of development and
that, “until the 1980s, information management has passed seven different stages”. He
notes that the initial stages (one and two) of information management involved the
management of structures which contained information. According to him, primary
attempts to handle the numerous structures which contained information were only made
in the early 1900s:
In the first period, the concern was the physical control of information containers that,
after the turn of the century, tended to mechanization, simplification, and replication of
these containers, originating the first efforts to control the proliferation of information
containers, essentially on paper (Dias, 2001).
Dias (2001) believes that the third stage of information management involved handling the
structures which contained information in a more ordered manner, pointing out that “[i]n
Chapter 2: Literature Review 7
the 1920s and 1930s, the third stage came with records management, focusing on
information containers management in a more organized and wider perspective”. The
fourth stage began “with the advent of the computer … represented by the management of
automated information technologies”.
Dias (2001) goes on to explain that stage five of information management was introduced as
a result of the dissemination of information and the widespread use of information
technology This phase, he says, “was characterized by information explosion and use of
computers and other technologies such as microfilms, microfiches, and optical devices”.
The sixth stage of information management started at the end of the 1960s (Dias,
2001) with the development of information management systems. With regard to the
seventh stage, Dias (2001) cites Chen (1998), as follows:
In the 1970’s, information management started to be called information resources
management, a new strategy for managing all necessary information in an enterprise.
Most of the modern companies are experiencing this seventh stage of information
management, although a new concept has already appeared recently, knowledge
management, the eighth stage of information management.
Information management has clearly undergone a number of changes and has evolved
through various stages of development. The most significant of these changes relates
to the dissemination of information through the use of computers and information
technology.
2.3 Web portals
2.3.1 Definition of a web portal
According to Katz (2002), the 2002 edition of the Winston Dictionary defines a portal
as a “gate, door, or entrance; especially one that is stately and imposing, as of a
cathedral”.
Chapter 2: Literature Review 8
In his analysis of this definition, Katz (2002) notes that a portal in the context of the web is
more than a gateway: “the portal is an ‘organizing principle’ or metaphor for how
institutions will organize themselves and their services in cyberspace”.
A definition similar to that offered by the Winston Dictionary is proposed by Clarke
and Flaherty (2003), who point out that the word “portal” is “derived from the Latin
porta, or gate, through which something will pass in an effort to get to another place”.
Clarke and Flaherty go on to define web portals as “[a]ny site that serves as an entry
point to other content on the Internet” and “the gateways through which business
clients enter the web to connect to desired Internet locations”.
Likewise, Gappa and Nordbrock (2004) associate the term “portal” with a gateway and an
entry or starting point to visiting specific locations on the worldwide web (WWW) when
they say: “Internet portals are gateways to the World Wide Web utilized by users as a
starting point in their browsing activities or as an anchor site.”
Yang et al (2005) offer the following description of the characteristics of portals:
An information presenting Web portal (IP Web portal) is a site that provides users with
online information and information‐related services, such as search functions,
community building features, commerce offerings, personal productivity applications,
and a channel of communication with the site owner and peer users.
It is clear from the definitions of a portal offered above that the descriptions can be
classified into two categories – those that focus on the metaphor of a portal as a gate
or gateway and those that focus on the purpose of the portal. The majority of the
definitions listed focus on the metaphor of the portal as gate or gateway. Ideally, the
definition of a portal should reflect both elements of the two categories, as in the
following definition given by Yang et al (2005): “A portal acts as a gateway which
provides entry to specific sites on the WWW” and facilitates access to “online
information and information‐related services.”
Chapter 2: Literature Review 9
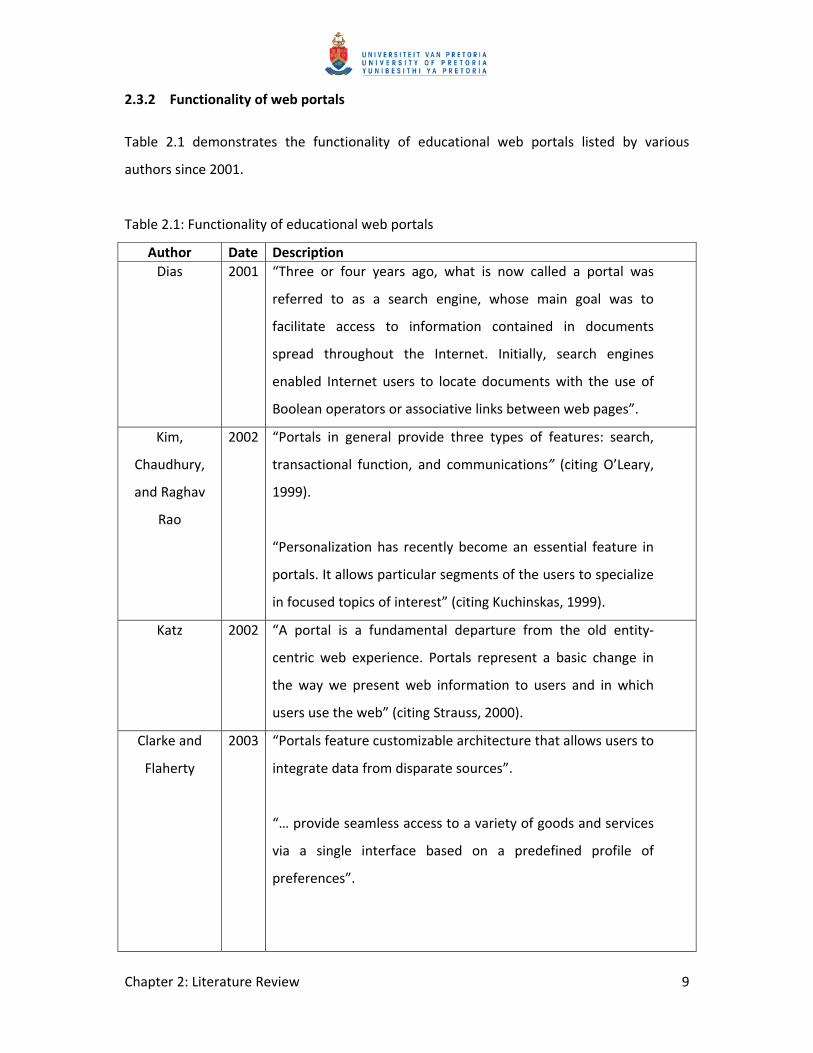
2.3.2 Functionality of web portals
Table 2.1 demonstrates the functionality of educational web portals listed by various
authors since 2001.
Table 2.1: Functionality of educational web portals
Author Date Description Dias 2001 “Three or four years ago, what is now called a portal was
referred to as a search engine, whose main goal was to
facilitate access to information contained in documents
spread throughout the Internet. Initially, search engines
enabled Internet users to locate documents with the use of
Boolean operators or associative links between web pages”.
Kim,
Chaudhury,
and Raghav
Rao
2002
“Portals in general provide three types of features: search,
transactional function, and communications” (citing O’Leary,
1999).
“Personalization has recently become an essential feature in
portals. It allows particular segments of the users to specialize
in focused topics of interest” (citing Kuchinskas, 1999).
Katz 2002 “A portal is a fundamental departure from the old entity‐
centric web experience. Portals represent a basic change in
the way we present web information to users and in which
users use the web” (citing Strauss, 2000).
Clarke and
Flaherty
2003 “Portals feature customizable architecture that allows users to
integrate data from disparate sources”.
“… provide seamless access to a variety of goods and services
via a single interface based on a predefined profile of
preferences”.
Chapter 2: Literature Review 10
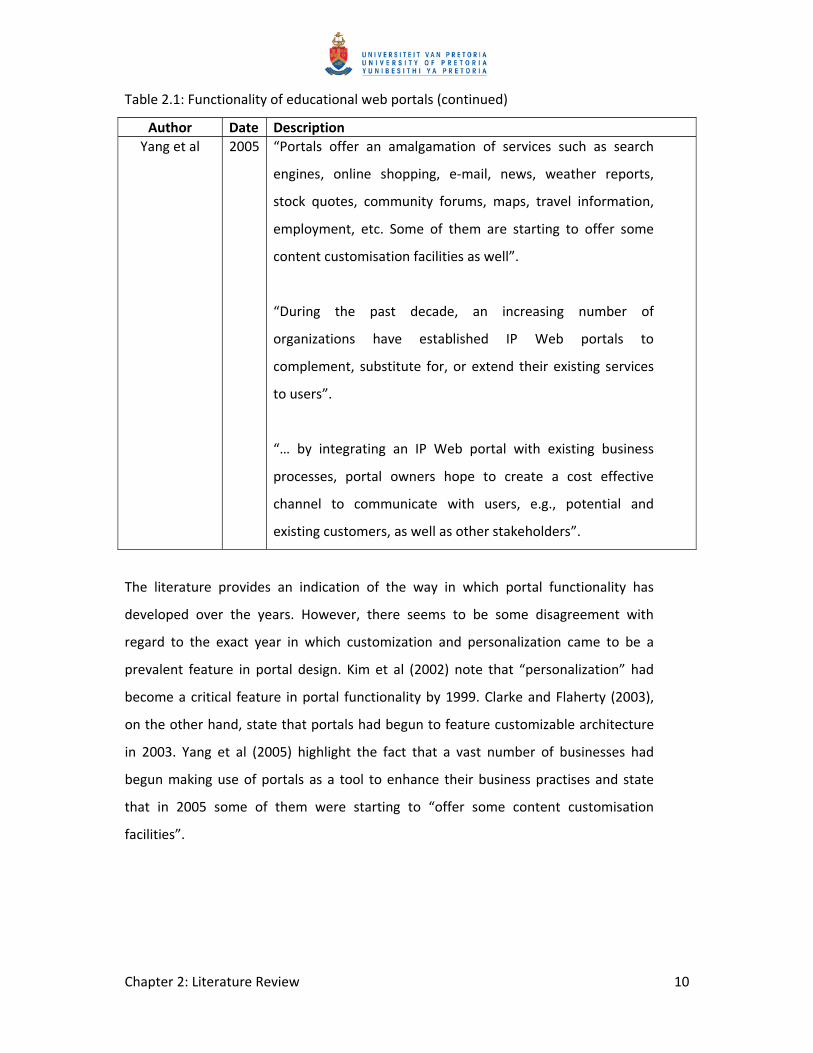
Table 2.1: Functionality of educational web portals (continued)
Author Date DescriptionYang et al 2005 “Portals offer an amalgamation of services such as search
engines, online shopping, e‐mail, news, weather reports,
stock quotes, community forums, maps, travel information,
employment, etc. Some of them are starting to offer some
content customisation facilities as well”.
“During the past decade, an increasing number of
organizations have established IP Web portals to
complement, substitute for, or extend their existing services
to users”.
“… by integrating an IP Web portal with existing business
processes, portal owners hope to create a cost effective
channel to communicate with users, e.g., potential and
existing customers, as well as other stakeholders”.
The literature provides an indication of the way in which portal functionality has
developed over the years. However, there seems to be some disagreement with
regard to the exact year in which customization and personalization came to be a
prevalent feature in portal design. Kim et al (2002) note that “personalization” had
become a critical feature in portal functionality by 1999. Clarke and Flaherty (2003),
on the other hand, state that portals had begun to feature customizable architecture
in 2003. Yang et al (2005) highlight the fact that a vast number of businesses had
begun making use of portals as a tool to enhance their business practises and state
that in 2005 some of them were starting to “offer some content customisation
facilities”.
Chapter 2: Literature Review 11
2.4 Web portal types
2.4.1 Information portals
Dias (2001) refers to the following observations by Murray (1999, in Dias 2001) and White
(1999, in Dias 2001) as providing a basis for a definition of an information or content portal:
Murray (1999 in Dias, 2001) states that the information portal is the one able just to
organize large collections of content based on the subjects they contain, connecting
people with information.
White (1999 in Dias, 2001) calls this basic form of portal an “Intranet portal”, which
includes links to information and web sites within and outside the company.
If these observations are combined, a good definition of an information portal might
be as follows:
An information portal is a portal which can “organize large collections of content
based on the subjects they contain” (Murray, 1999 in Dias, 2001) and which provides
“links to information and websites within and outside the company” (White, 1999 in
Dias, 2001) in order to facilitate access to information required.
2.4.2 Corporate, business and enterprise information portals
The terms “corporate portal”, “business portal” and “enterprise information portal”
(EIP) seem to be used interchangeably to describe a portal which is used to share
information, content and tools within an organization, corporate or business
environment.
Dias (2001) carried out a review of various definitions of corporate portals, business
portals and EIPs, and highlights the following:
Reynolds and Koulopoulos (1999 in Dias, 2001) view the corporate portal as a user‐
Chapter 2: Literature Review 12
centric information system, able to integrate and deliver knowledge and experiences of
individuals and teams, in order to achieve the ‘‘knowledge‐centric’’ patterns of today’s
work world (Reynolds & Koulopoulos, 1999 in Dias, 2001).
Eckerson (1999, in Dias, 2001), on the other hand, uses another term ‘‘business portal”
and defines it as an application able to provide business users with one‐stop shopping
for any information they need inside or outside the enterprise (Eckerson, 1999 in Dias,
2001).
Murray (1999, in Dias, 2001) states that portals that focus only on content are
inadequate for the corporate market and that ‘‘corporate portals must connect us not
only with everything we need, but with everyone we need, and provide all the tools we
need to work (Murray, 1999 in Dias, 2001).
Plumtree Software (2000, in Dias 2001), from another standpoint, defines its corporate
portal as a system which is able to bring together in one simple, personalized web page,
all the information and productivity tools relevant to corporate users, hosting dynamic
applications, such as online reports, e‐mail, schedules, calendars, and business services
(Plumtree Software, 2000 in Dias, 2001).
Enterprise information portals are applications that enable companies to unlock
internally and externally stored information, and provide users a single gateway to
personalized information needed to make informed business decisions (Shilakes &
Tylman, 1998 in Dias, 2001).
White (1999, in Dias, 2001) views the EIP as a tool that provides business users with a
single web interface to corporate information scattered throughout the enterprise
(White, 1999 in Dias, 2001).
Applications that enable companies to provide access to internally and externally stored
information, and offer users within and external to the enterprise a single window to
personalized information needed to make informed business decisions (Viador, 1999, in
Dias, 2001).
Chapter 2: Literature Review 13
Enterprise Information Portals (EIP) are gateways that streamline access to information,
thereby easing the task of transforming data into knowledge and helping in efficient
knowledge management (Millman, 1999, in Dias, 2001).
It is apparent from the above definitions of corporate portals, business portals and
EIPs that there are some minor disparities. The definitions provided by Shilakes and
Tylman (1998, in Dias, 2001), Reynolds and Koulopoulos (1999, in Dias, 2001),
Eckerson (1999, in Dias, 2001), White (1999, in Dias, 2001) and Millman (1999, in Dias,
2001) are all centred on the provision of access to all the information and knowledge
needed in the world of work. By contrast, Murray (1999, in Dias, 2001) considers the
corporate portal to be more than a point of access to commercial information and
notes how important it is that such portals should be able to provide the essential
tools required to work effectively. The definition offered by Viador (1999, in Dias,
2001) appears to place greater emphasis on the personalization of the information in
order to aid the decision‐making process within the business environment. Plumtree
Software (2000, in Dias, 2001) seems to merge many of the characteristics mentioned
in the other definitions, stating that a corporate portal must be able to not only
provide necessary information and tools but also support collaborative decision
processing.
2.4.2.1 Types of corporate, business and enterprise information portals
Research carried out by Dias (2001) revealed two types of corporate, business and
enterprise information portals, which he classifies as “decision processing” and
“collaborative processing” portals. (For ease of reading, these portals are collectively
referred to as EIPs from here onwards in this text.)
According to Dias (2001) the main focus of a collaborative EIP is to facilitate access to
“groupware tools and workflow systems” in order to make available relevant
information, created by groups of individuals. In this regard, he states:
This type of portal uses collaborative groupware tools and workflow systems to provide
access to information produced by individuals or workgroups. The information managed
Chapter 2: Literature Review 14
by this type of portal is generally unstructured, customized and displayed as texts,
memos, graphs, e‐mail messages, news bulletins, web pages, and multimedia files (Dias,
2001).
The main focus of the decision processing EIP is to facilitate access to specific
information essential for constructing decisions pertaining to business issues:
[T]he decision processing EIP helps executives, managers and analysts access the
necessary information for making business‐oriented decisions, while the collaborative
processing EIP organizes and shares workgroup information, such as e‐mail, reports, and
memos (Dias, 2001).
Roberts‐Witt (1999, in Kim et al, 2002), however, believes that there are three types
of EIPs, namely data, information and collaborative portals.
Clearly, therefore, there are different types of EIP. Both Dias (2001) and Roberts‐Witt (1999,
in Kim et al, 2002) believe that one type of EIP is the collaborative. Combining the
classifications of these authors, it may be concluded that there are four types of EIP:
collaborative, decision processing, data and information. The existence of these different
types of EIP could be the reason for the slight disparities between the definitions offered
earlier.
2.4.3 Public portals
The purpose of a public portal, according to Dias (2001) is to draw as many visitors as
possible from throughout the WWW. He elaborates on this as follows:
The public portal, also called Internet portal, web portal or consumer portal, provides a
single interface to the immense network of Internet servers. Its purpose is to attract the
Internet community. The larger the number of visitors, the greater the probability of
establishing virtual consumer groups that will potentially buy what portal advertisers
want to sell (Dias, 2001).
Similarly, Clarke and Flaherty (2003) believe a public portal should be accessible to
Chapter 2: Literature Review 15
everyone navigating the WWW and state that there are no limitations of use: “A
public portal is available to anyone on the Internet and there are no restrictions for
access”.
It seems, therefore that public portals are accessible to all Internet users whereas EIPs are
only accessible to specific individuals who work within a particular business or corporate
environment.
2.5 Web portal design
Davenport and Prusack (1998, in Kim et al, 2002) emphasize the importance of
considering “behavioural, cultural and organizational issues” in knowledge
management and thus web portal design. They maintain that “[t]echnology alone
cannot bring effective knowledge management without taking into account extensive
behavioural, cultural, and organizational issues” (Davenport & Prusak, 1998, in Kim et
al, 2002).
2.5.1 Web content accessibility guidelines
The ease of access to web content is raised as a pertinent issue by Yang et al (2005),
who were responsible for developing a number of web content accessibility
guidelines. The first of these guidelines focuses on the way in which information or
content has been presented on the portal:
Guideline 1: Perceivable. The perception of information presented as text is problematic
for the studied user groups. In particular, small font sizes and cluttered layouts pose big
problems (Yang et al, 2005).
The next guideline notes the importance of the way in which users operate or make
use of the portal:
Guideline 2: Operable. Users participating in the study expressed strong opinions against
blinking and flickering ads, which they found annoying and distracting. We must also
Chapter 2: Literature Review 16
highlight the fact that older persons and people with physical disabilities often prefer to
use the mouse or a mouse emulation system, even if it is more difficult for them to
access active elements than via the key board (Yang et al, 2005).
Navigation is highlighted as one of the most significant components of accessible
portal design. The importance of including both a sitemap and a search function in
order to help users find their way through the portal is also acknowledged:
Guideline 3: Navigable. This is probably the most critical issue in regard to Internet
portals. Users have difficulties in finding information more than two layers deep. Our
study has shown that the alternative method most used by test participants is the
search function. In our opinion, the minimum default alternative navigation method
(success criteria at the minimum level) should include both the search function and the
sitemap (Yang et al, 2005).
Yang et al’s (2005) fourth content accessibility guideline emphasizes the value of
including a glossary as well as a list of frequently asked questions (FAQs) as
mechanisms to increase users’ understanding:
Guideline 4: Understandable. This is also a critical issue for the test participants … In our
opinion, the minimum success criteria shall be linked to the existence of a glossary and a
set of frequently asked questions (FAQs). It is important to highlight also that users
explicitly quantified the length of paragraphs that can bring up understandability
problems (Yang et al, 2005).
According to Yang et al (2005) the accessibility of content contained in a web portal depends
on how “perceivable”, “operable”, “navigable” and “understandable” it is.
2.5.2 Recommendations for portal design
Clarke and Flaherty (2003) construct the following approach to devise an effectual
portal strategy: “The ‘Five D’s’ of portal strategy are proposed: (1) define, (2) design,
(3) develop, (4) deliver, and (5) defend. The ‘Five D’s’ offer a general blueprint for the
creation of an effective portal strategy”.
Chapter 2: Literature Review 17
A review of the recommendations provided for portal design reveal the approach
suggested by Clarke and Flaherty (2003) to be very different to the recommendations
made by Yang et al (2005). Yang et al focus more closely on the design of the structure
of the portal rather than is the case with the strategy for developing the portal put
forward by Clarke and Flaherty.
Yang et al (2005) make a number of suggestions pertaining to the design of portals.
The first of these relates to layout, and in this regard they point out that “Internet
portals offer a vast amount of information. There is a need to limit the amount of
information on a Web page”. They note, further, that “[w]hen designing the layout of
an Internet portal, it needs to be initially considered that visitors have certain
questions in mind, to which they are seeking an answer”.
With regard to navigation, Yang et al (2005) believe that links to other websites should
be obviously recognizable:
When linking to another Web site, as it happens frequently in Internet portals, designers
often decide to highlight this fact by opening a new window in the browser. This is
rather confusing for users. Therefore, external links must be clearly identified as such via
some visual cues (e.g., a small icon) and contain an adequate title attribute.
According to Yang et al (2005) there are clear guidelines which should be taken into
consideration when creating a search facility of a portal:
[O]ffering always a very visible in‐site search facility, with the input field at the top of
the page, near the navigation bar.
The search engine should carefully reflect the content and functionality of the portal. It
shall also accommodate weak writing skills, neglect typing and spelling mistakes, and
recognize conjugated verbs and declined nouns.
Chapter 2: Literature Review 18
The search engine must be able to suggest alternative keywords according to the users’
histories of search queries.
Yang et al (2005) also put forward a number of suggestions about the content
contained on the portal:
Emphasize keywords (with visual or oral cues); otherwise the user will quickly leave the
portal and become a lost customer.
To enable the scanning of a Web page, it is very important to provide headers and
summaries, so the user can decide quickly whether it is worth to read further.
Also sentences formulated in active rather than passive voice are easier to understand.
In order to accommodate all the recommendations provided by Yang et al (2005) a
portal designer should be conscious of the layout, navigation, search facility and
content contained on the portal.
2.5.3 Recommendations for mobile portal design
The recommendations for mobile portal design offered by the Nokia Corporation
(2005) are very different to those provided by Yang et al (2005) regarding the design
of web portals. The Nokia Corporation believes that the use of different page names
throughout a mobile portal may help users locate their whereabouts and aid
navigability:
Very often the page title is same throughout the portal. Sometimes the main page has
portal name and the rest of the pages have subsection names. This does not help user to
navigate and to know where he is in the portal (Nokia Corporation, 2005).
Each time content is downloaded from a mobile portal, the procedure followed should
be identical. The Nokia Corporation (2005) maintains that “[p]roviding same steps and
Chapter 2: Literature Review 19
structure in all download processes would help user to learn the process and know
beforehand what to expect”. They also highlight the importance of making more
detailed information about a particular product available on a mobile portal: “Typically
the information is only a small icon of the game, the name and one word genre
description. User should also be provided with sufficient information to make the
purchase decision”.
Finally, the Nokia Corporation (2005) emphasizes that mobile portals should be
suitable for use by all phones and browsers: “If the portal is designed to be used well
with all phones and browsers, user should always be able to navigate forward with
hyperlinks”.
The literature reviewed indicates that, like web portal designers, mobile portal
designers should consider the layout, navigation and content contained on the portal.
However, rather than focusing on the search facility, mobile portal designers should
be aware of the technical aspects of the site and ensure that these are compatible
with all phones, and that the site can be used by all browsers.
2.6 Summary
The literature reviewed demonstrated that information management has undergone a
number of changes and has evolved through various stages of development. The most
significant of these changes relates to the dissemination of information through the
use of computers and information technology. An examination of the definitions of a
portal offered in the literature showed that a portal acts as a gateway which provides
entry to specific sites on the WWW and facilitates access to “online information and
information‐related services” (Yang et al 2005). The literature indicates how portal
functionality has developed over the years and discusses the various types of portals,
namely information portals, and business, corporate and enterprise information
portals. The chapter also gives an account of the nature of public portals compared to
other portals, as explored in the literature.
Chapter 2: Literature Review 20
A review of the content accessibility guidelines developed by Yang et al (2005) is
provided, and the recommendations for web portal design made by Yang et al (2005)
are compared to the recommendations for mobile portal design devised by the Nokia
Corporation (2005). The literature reviewed indicates that mobile portal designers,
like web portal designers, should consider the layout, navigation and content
contained on the portal. However, rather than focusing on the search facility mobile
portal designers should be aware of the technical aspects of the site and should
ensure that it is compatible with all phones and can be used by all browsers.
Chapter 3: Research Methodology 21
Chapter 3: Research Methodology
Contents
3.1 Introduction ........................................................................................................... 22
3.2 Research ................................................................................................................ 22
3.3 The research paradigm of this study ..................................................................... 26
3.4 The research aim and process ............................................................................... 26
3.5 Summary ................................................................................................................ 34
List of Addenda
(Addenda are available on the CD‐Rom Attached)
Addendum A ‐ Research Process Email
Addendum B ‐ Consent Form
Addendum C ‐ Kano Questionnaire
Addendum D ‐ Data Collected

Chapter 3: Research Methodology 22
3.1 Introduction
In order to identify the context for this research study, Chapter 3 provides an overview of
research by defining what is meant by the term “research”. The position of design research
is explained by means of a graphical representation which demonstrates how design
research fits into research as a whole. In order to further clarify what is meant by design
research, a concrete example of a potential outcome is included. The research paradigm of
the study is indicated by explaining the characteristics of the research study. The chapter
concludes by documenting the process which was followed in order to ensure that the
research was carried out to the highest standards.
3.2 Research
According to the Concise Oxford Dictionary, “research” can be defined as an “endeavour to
discover new or collate old facts by the scientific study of a subject or by a course of critical
investigation” (Allen, 1991). The same source defines “research and development” as
“[w]ork directed towards the innovation, introduction and improvement of products and
processes”.
The Association for Information Systems (AIS, 2007) provides this definition of research,
which is based on the theories of Kuhn (1962, in AIS, 2007) and Lakatos (1978, in AIS, 2007):
“Research can be very generally defined as an activity that contributes to the understanding
of a phenomenon. In the case of design research, all or part of the phenomenon may be
created as opposed to naturally occurring” (AIS, 2007). According to Bereiter (2002), design
research is “research that produces innovations and sustains their development”.
Taking these definitions into consideration, design research can be defined as an endeavour
that contributes to the understanding of a created phenomenon, developed by a designer,
with the aim of achieving sustainable development.
Chapter 3: Research Methodology 23
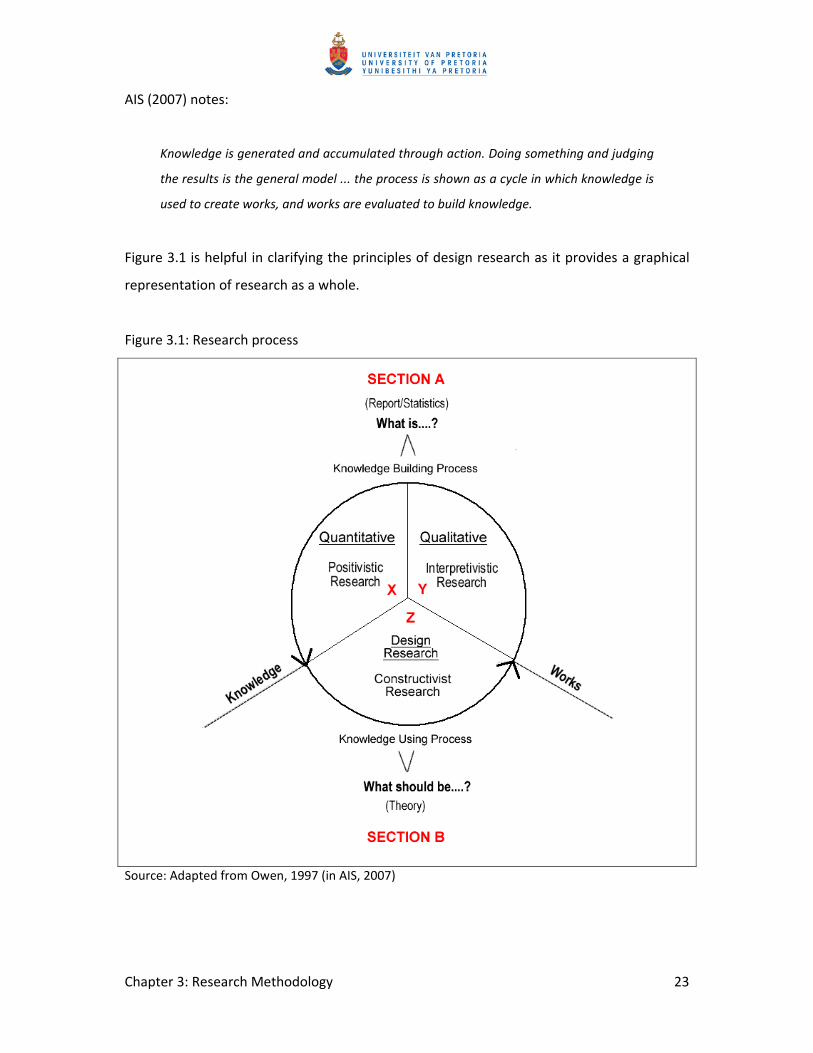
AIS (2007) notes:
Knowledge is generated and accumulated through action. Doing something and judging
the results is the general model ... the process is shown as a cycle in which knowledge is
used to create works, and works are evaluated to build knowledge.
Figure 3.1 is helpful in clarifying the principles of design research as it provides a graphical
representation of research as a whole.
Figure 3.1: Research process
Source: Adapted from Owen, 1997 (in AIS, 2007)

Chapter 3: Research Methodology 24
Section A of Figure 3.1 demonstrates how research can be used to build knowledge. This
type of research process is often used to answer the question, “What is?”. The process
involves the examination of a naturally occurring phenomenon in order to develop
knowledge. An example of an output for this type of research would be a report containing
detailed statistics. Both qualitative and quantitative research processes can take place
through this type of knowledge building process.
Section A, point Y demonstrates the fact that interpretive research processes make use of
works in order to create knowledge. In the world of social sciences, interpretive research
methods focus on providing an interpretation of events and phenomena in terms of how
the individuals involved perceive and understand their own experience (AIS, 2007). An
example would be an enquiry into individuals’ perception of the quality of a specific
product.
Section A, point X demonstrates that positivistic research processes also make use of works
to create knowledge. The philosophy of positivism states that actual knowledge or truth is
based only on real experience. Positivists believe that truth can only be arrived at through
proving theories by means of strict scientific methods (AIS, 2007). An example of this would
be an experiment carried out to prove the mathematical expression E=mc².
Section B of Figure 3.1 is a graphical representation of design research, illustrating the way
in which an individual can evaluate knowledge in order to devise a theory on the design
research process. An example of output for this type of research would be a theory or a
model. Constructivists maintain that scientific knowledge is constructed and not discovered
(AIS, 2007). The design research process often attempts to answer the question, “What
should be?”.
Blignaut (1997) conducted an investigation with the purpose of designing an instructional
model for a Home Economics lecturer. A brief description of this investigation is given here
to illustrate the approach and outcomes of the design research process. It was intended that
the instructional model would enable the lecturer to design activities for his or her students
to develop their competency in the use of computers and research. According to Blignaut,

Chapter 3: Research Methodology 25
competencies in the use of computers and research “underlie appropriate career related
and marketable abilities to benefit a changing socio‐technological culture within the
framework of a changing democratising South Africa”. She elaborates further as follows:
By means of action research procedure, these ideas were refined during a preliminary
study into a prospective instructional model in which it is suggested that computer and
contextual skills should be developed in an integrated way in order to empower the
individual with career related marketable abilities (Blignaut, 1997).
In an attempt to develop and make improvements to the instructional practice, the
proposed model was implemented by means of an action research process and tested on a
group of students. The outcomes of the research project were evaluated and finally an
instructional model was constructed. Such an instructional model is a typical outcome of a
design research process as it can be replicated and used in a multitude of subject areas. The
framework could, for example, be followed by a music teacher who wishes to develop her
or his students’ competency in the use of computers as well as their ability to conduct
research. Figure 3.2 gives a graphical representation of the instructional model developed.
Figure 3.2: Example of an outcome of the design research process
Chapter 3: Research Methodology 26
Source: Blignaut, 1997
3.3 The research paradigm of this study
The research paradigm of this study fits into section A, point X and Y of Figure 3.1, for the
following reasons:
• The Kano method12 is used in order to determine the minimum benchmark
specifications13 of an educational web portal expected14 by specialist users.
• The Kano method makes use of both qualitative and quantitative research
techniques, for example:
− Quantitative questionnaires
− Qualitative analysis of the data collected
• This research provides an interpretation of events and phenomena in terms of how
individuals perceive and understand their own experience.
Therefore it can be said that the study makes use of works in order to create knowledge.
3.4 The research aim and process
3.4.1 Research aim
The aim of the research was to determine the benchmark specifications of an educational
web portal. Points investigated included the following:
• What are the benchmark specifications of an educational web portal that affect
specialist users’ perception of quality?
• What are the minimum benchmark specifications of an educational web portal
expected by specialist users?
3.4.2 Research process
The Kano method was used in order to determine the benchmark requirements of an
educational web portal. A comprehensive description of the Kano method detailing all
components of the research process was used in order to ensure that the research was
12 Noriaki Kano, a professor from the University of Tokyo, developed a model to understand users’ perception
of quality (Berger et al, 1993). 13 System specifications describe what the system, process, or product/service must do in order to fulfill the
business requirement/s (Allen, 1991). 14 In accordance with Kano’s “must-be” requirements (Berger et al, 1993).

Chapter 3: Research Methodology 27
carried out to the highest standards. Figure 3.3 provides a visual representation of the
research process.
Figure 3.3: Research process

Chapter 3: Research Methodology 28
3.4.2.1 Training in the Kano method
As the researcher did not have any previous experience in conducting this type of research,
it was necessary for her to receive training in the Kano method. It is noted that the
supervisor of the research process has extensive experience with this type of research and
was therefore able to provide the researcher with training in the application of the Kano
method.
3.4.2.2 Selection of participants
A group of 20 expert users (from schools, higher education institutions, private
organizations, government organizations and non‐government organizations) were
specifically targeted to participate in the research. Table 3.1 summarizes the number of
individuals approached to participate in the research from each type of
organization/institution.
Table 3.1: Targeted individuals
Organization/Institution type Number of
individuals
School 3
Higher education institution 3
Private organization 5
Government organization 6
Non‐government organization 3
The participants were selected according to their experience and understanding of
educational web portals. Each participant was competent in reading and writing English.
Participants’ race, sex, age and/or institutional affiliation were not used as criteria for the
selection.
Chapter 3: Research Methodology 29
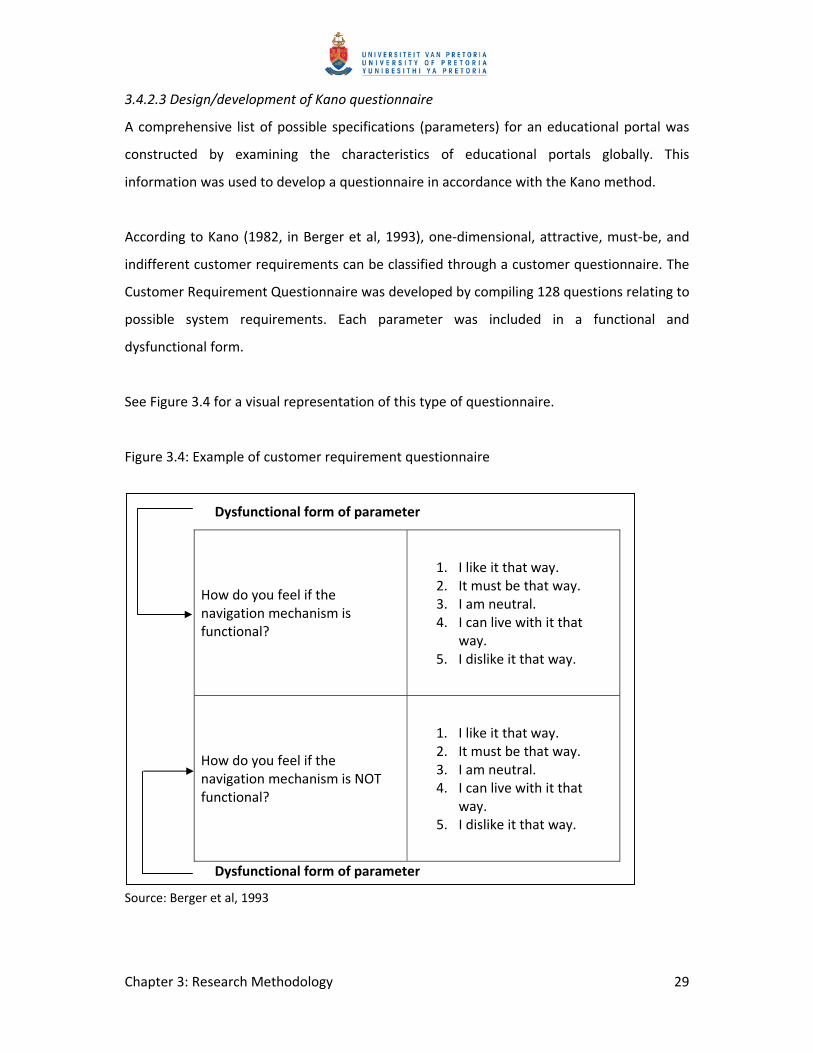
3.4.2.3 Design/development of Kano questionnaire
A comprehensive list of possible specifications (parameters) for an educational portal was
constructed by examining the characteristics of educational portals globally. This
information was used to develop a questionnaire in accordance with the Kano method.
According to Kano (1982, in Berger et al, 1993), one‐dimensional, attractive, must‐be, and
indifferent customer requirements can be classified through a customer questionnaire. The
Customer Requirement Questionnaire was developed by compiling 128 questions relating to
possible system requirements. Each parameter was included in a functional and
dysfunctional form.
See Figure 3.4 for a visual representation of this type of questionnaire.
Figure 3.4: Example of customer requirement questionnaire
Dysfunctional form of parameter
How do you feel if the navigation mechanism is functional?
1. I like it that way. 2. It must be that way. 3. I am neutral. 4. I can live with it that
way. 5. I dislike it that way.
How do you feel if the navigation mechanism is NOT functional?
1. I like it that way. 2. It must be that way. 3. I am neutral. 4. I can live with it that
way. 5. I dislike it that way.
Dysfunctional form of parameter
Source: Berger et al, 1993
Chapter 3: Research Methodology 30
3.4.2.4 Pilot Kano questionnaire
The Kano questionnaire was tested on a group of three users who were familiar with the use
and development of educational web portals. Enhancements were made to the Kano
questionnaire based on feedback from these users.
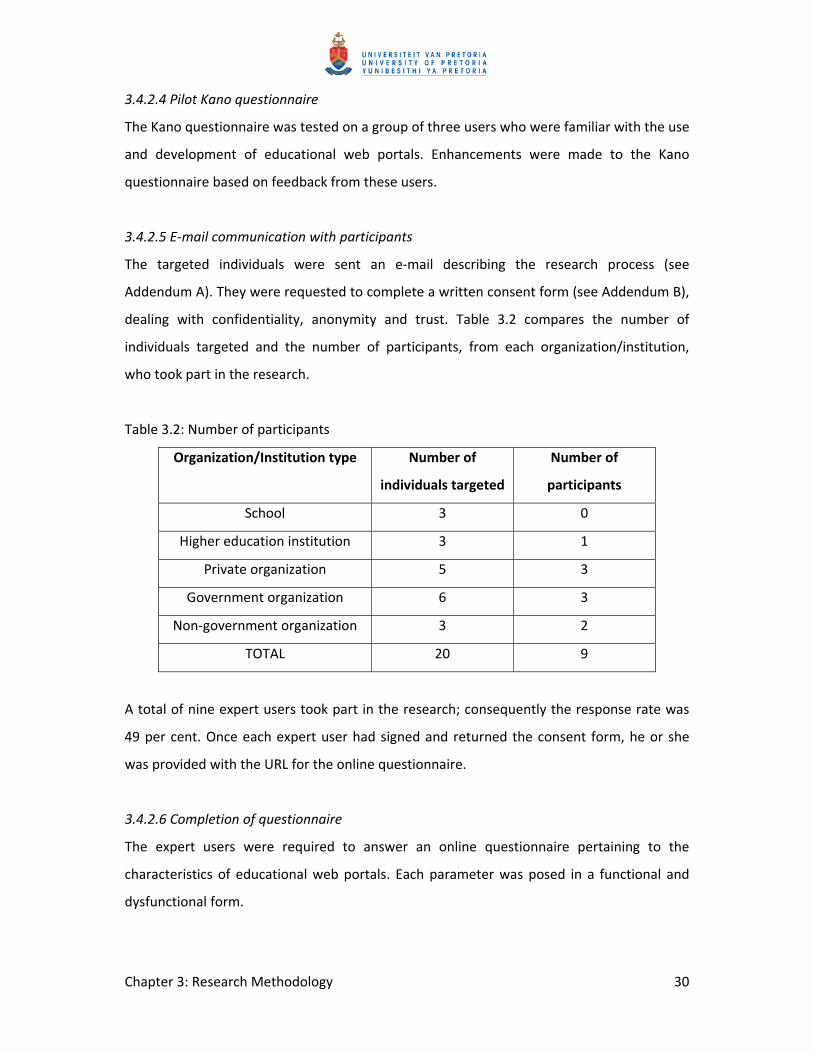
3.4.2.5 E‐mail communication with participants
The targeted individuals were sent an e‐mail describing the research process (see
Addendum A). They were requested to complete a written consent form (see Addendum B),
dealing with confidentiality, anonymity and trust. Table 3.2 compares the number of
individuals targeted and the number of participants, from each organization/institution,
who took part in the research.
Table 3.2: Number of participants
Organization/Institution type Number of
individuals targeted
Number of
participants
School 3 0
Higher education institution 3 1
Private organization 5 3
Government organization 6 3
Non‐government organization 3 2
TOTAL 20 9
A total of nine expert users took part in the research; consequently the response rate was
49 per cent. Once each expert user had signed and returned the consent form, he or she
was provided with the URL for the online questionnaire.
3.4.2.6 Completion of questionnaire
The expert users were required to answer an online questionnaire pertaining to the
characteristics of educational web portals. Each parameter was posed in a functional and
dysfunctional form.
Chapter 3: Research Methodology 31
3.4.2.7 Submission of responses
Once the participants had answered the questionnaire, they were requested to select a
submit button at the bottom of the screen. The selection of the submit button activated an
automated process whereby participants’ responses were e‐mailed directly to the
researcher.
3.4.2.8 Data analysis
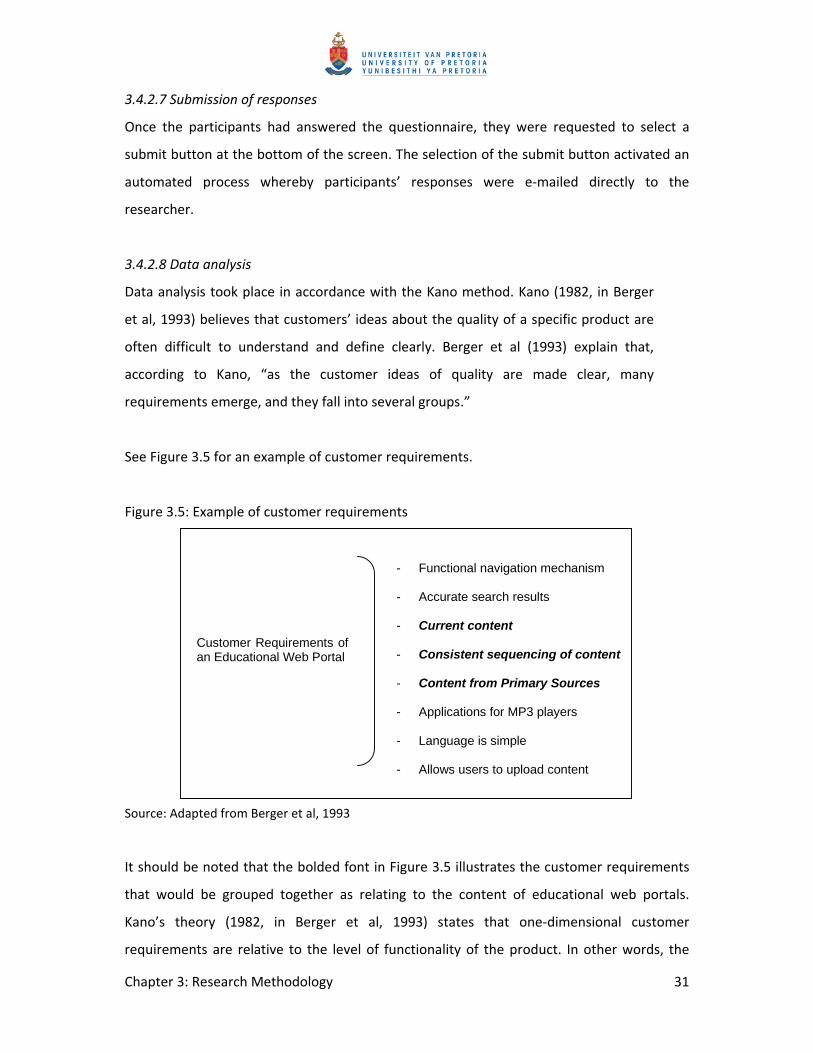
Data analysis took place in accordance with the Kano method. Kano (1982, in Berger
et al, 1993) believes that customers’ ideas about the quality of a specific product are
often difficult to understand and define clearly. Berger et al (1993) explain that,
according to Kano, “as the customer ideas of quality are made clear, many
requirements emerge, and they fall into several groups.”
See Figure 3.5 for an example of customer requirements.
Figure 3.5: Example of customer requirements
Source: Adapted from Berger et al, 1993
It should be noted that the bolded font in Figure 3.5 illustrates the customer requirements
that would be grouped together as relating to the content of educational web portals.
Kano’s theory (1982, in Berger et al, 1993) states that one‐dimensional customer
requirements are relative to the level of functionality of the product. In other words, the
Customer Requirements of an Educational Web Portal
- Functional navigation mechanism
- Accurate search results
- Current content
- Consistent sequencing of content
- Content from Primary Sources
- Applications for MP3 players
- Language is simple
- Allows users to upload content

Chapter 3: Research Methodology 32
customers’ level of satisfaction increases as the functionality of the product increases.
Likewise, the customer’s level of satisfaction decreases as the functionality of the product
decreases.
See Figure 3.6 for a visual representation of Kano’s one‐dimensional requirements.
Figure 3.6: Kano’s one‐dimensional requirements
Source: Adapted from Berger et al, 1993
The horizontal axis of the Kano diagram in Figure 3.6 indicates how functional the
parameters of the product are, and the vertical axis indicates the customer’s level of
satisfaction. According to Berger et al (1993), one‐dimensional customer satisfaction
“is proportional to the full functionality of the product.”
An excellent example of Kano’s must‐be requirement would be the brakes on a car. Poor
brakes or brakes that do not work properly would cause dissatisfaction among customers,
but effective brakes would not raise customers’ level of satisfaction since properly
functioning brakes are regarded as a prerequisite. In order words, customers would be
dissatisfied if the parameter was not effective or did not work properly.
See Figure 3.7 for a visual representation of Kano’s must‐be requirements.
One-dimensional
Customer Satisfied
Customer Dissatisfied
Product Dysfunctional
Product Fully Functional

Chapter 3: Research Methodology 33
Figure 3.7: Must‐be customer requirements
Source: Adapted from Berger et al, 1993
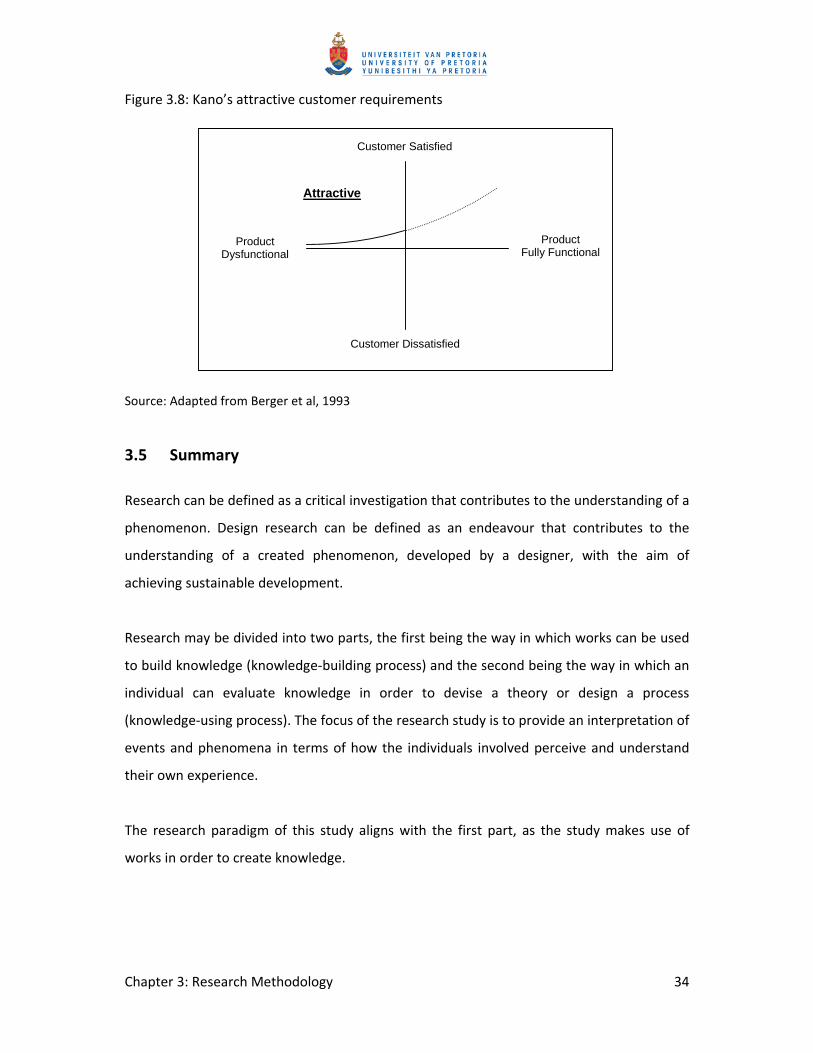
Kano’s theory (Berger et al, 1993) states that the attractive curve illustrates the area where
the customers’ level of satisfaction is increased by the functionality of the product or service
but is not affected by the elimination of the functionality. Berger et al (1993) explain this as
follows:
An example of this would be the addition of specialized features such as a radio antenna
that automatically lowers itself when the radio is turned off. The customer would not
necessarily be dissatisfied if the feature wasn’t available.
See Figure 3.8 for a visual representation of Kano’s attractive requirements.
Must-be
Customer Satisfied
Customer Dissatisfied
Product Dysfunctional
Product Fully Functional
Chapter 3: Research Methodology 34
Figure 3.8: Kano’s attractive customer requirements
Source: Adapted from Berger et al, 1993
3.5 Summary
Research can be defined as a critical investigation that contributes to the understanding of a
phenomenon. Design research can be defined as an endeavour that contributes to the
understanding of a created phenomenon, developed by a designer, with the aim of
achieving sustainable development.
Research may be divided into two parts, the first being the way in which works can be used
to build knowledge (knowledge‐building process) and the second being the way in which an
individual can evaluate knowledge in order to devise a theory or design a process
(knowledge‐using process). The focus of the research study is to provide an interpretation of
events and phenomena in terms of how the individuals involved perceive and understand
their own experience.
The research paradigm of this study aligns with the first part, as the study makes use of
works in order to create knowledge.
Attractive
Customer Satisfied
Customer Dissatisfied
Product Dysfunctional
Product Fully Functional
Chapter 4: Data Collection and Analysis 35
Chapter 4: Data Collection and Analysis
Contents
4.1 Introduction ........................................................................................................... 36
4.2 Data collection ....................................................................................................... 36
4.3 Data processing ..................................................................................................... 39
4.4 Data analysis .......................................................................................................... 44
4.5 Summary ................................................................................................................ 46
List of Addenda
(Addenda are available on the CD‐Rom attached)
Addendum A ‐ Research process e‐mail
Addendum B ‐ Consent form
Addendum C ‐ Kano questionnaire
Addendum D ‐ Data collected
Chapter 4: Data Collection and Analysis 36
4.1 Introduction
This chapter describes the data collection process. A graphical representation of the process
has been included in order to demonstrate the linear procedure that was followed.
In an attempt to increase the level of participation and responses received, the data
collection process consisted of intensive communication and follow‐up with the targeted
individuals and research participants. Processing the data involved following the five‐stage
process developed by Kano (Berger et al, 1993). The final stage in the process was to
construct a Kano graph in order to provide a visual representation of the overall
classification of each customer requirement (parameter) in relation to its position on the
graph. The graph was analysed in order to compile a list of parameters that were classified
as “must‐be” customer requirements in accordance with Kano’s method (see Chapter 3:
Research methodology).
4.2 Data collection
The data collection process involved e‐mail and telephone communication with the research
participants. Participants were contacted on a number of occasions in an attempt to
increase the level of participation and responses received. Figure 4.1 gives a visual
representation of the data collection process.
Chapter 4: Data Collection and Analysis 37
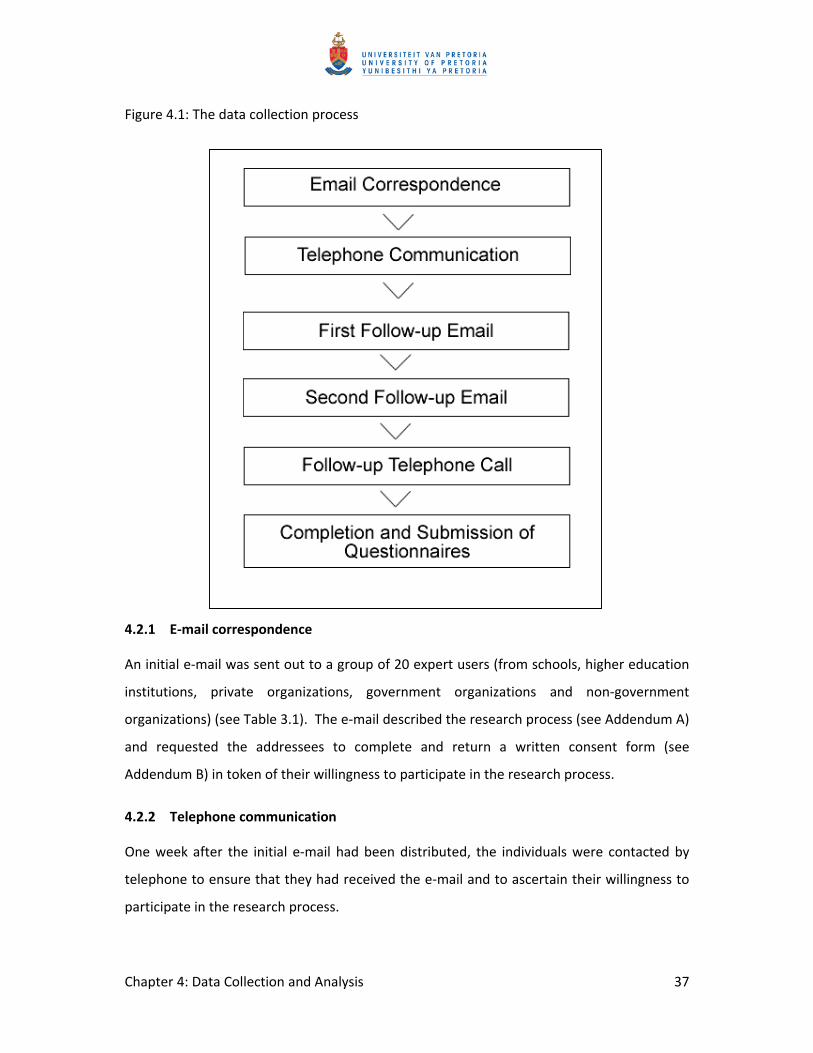
Figure 4.1: The data collection process
4.2.1 E‐mail correspondence
An initial e‐mail was sent out to a group of 20 expert users (from schools, higher education
institutions, private organizations, government organizations and non‐government
organizations) (see Table 3.1). The e‐mail described the research process (see Addendum A)
and requested the addressees to complete and return a written consent form (see
Addendum B) in token of their willingness to participate in the research process.
4.2.2 Telephone communication
One week after the initial e‐mail had been distributed, the individuals were contacted by
telephone to ensure that they had received the e‐mail and to ascertain their willingness to
participate in the research process.
Chapter 4: Data Collection and Analysis 38
4.2.3 First follow‐up e‐mail
During the telephone conversation a number of expert users indicated that they had failed
to receive the e‐mail (or rather notice the e‐mail in their inbox) and requested that the e‐
mail be resent. This second e‐mail contained the same information as the first and was sent
out approximately two days after the telephone call took place.
4.2.4 Second follow‐up e‐mail
Approximately two weeks later, two types of follow‐up e‐mails were sent out. The first of
these was addressed to the individuals who had failed to submit the consent form. It
reminded them about the study and urged them to participate in the research process. The
second e‐mail was addressed to the participants who had signed and returned the consent
forms but had failed to answer the online questionnaire. This e‐mail reminded them of the
deadline and urged them to send their responses through as soon as possible.
4.2.5 Follow‐up telephone call
A final follow‐up telephone call was made, one week later, to participants who had
submitted consent forms but had failed to answer the online questionnaire, once again
reminding them of the deadline and urging them to send their responses through as soon as
possible.
A total of nine expert users took part in the research process (see Table 3.2).
4.2.6 Completion and submission of questionnaires
The expert users were required to answer an online questionnaire about the characteristics
of educational web portals. Each parameter was posed in a functional and dysfunctional
form.
Participants were requested to select a submit button at the bottom of the screen once they
had answered the questionnaire. The selection of the submit button activated an
automated process whereby the participant’s responses were e‐mailed directly to the
researcher.
Chapter 4: Data Collection and Analysis 39
4.3 Data processing
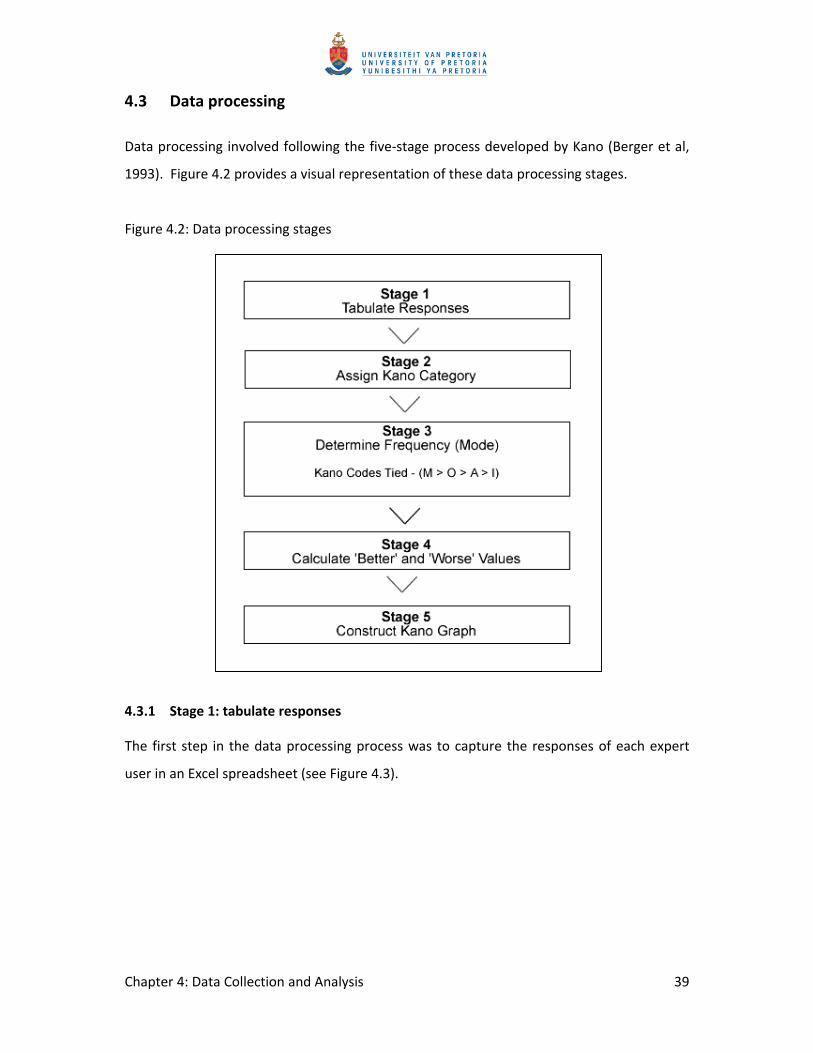
Data processing involved following the five‐stage process developed by Kano (Berger et al,
1993). Figure 4.2 provides a visual representation of these data processing stages.
Figure 4.2: Data processing stages
4.3.1 Stage 1: tabulate responses
The first step in the data processing process was to capture the responses of each expert
user in an Excel spreadsheet (see Figure 4.3).

Chapter 4: Data Collection and Analysis 40
Figure 4.3: Tabulation of responses
4.3.2 Stage 2: assign Kano category
The Kano method (Berger et al, 1993) states that each customer requirement (parameter)
should be assigned a Kano category. The Kano Evaluation Table was used in order to assign
the appropriate Kano category to each customer requirement (parameter). See Figure 4.4
for a visual representation.
The expert users’ responses to each question, in both functional and dysfunctional forms,
were reviewed and the appropriate Kano category was then assigned to each customer
requirement (parameter) using the Kano Evaluation Table.
In other words, if a research participant’s response to the functional form of the question,
“How do you feel if the colour contrast contributes to the readability of the text?” was “I
can live with it that way”, and their response to the dysfunctional form of the question,
“How do you feel if the colour contrast does NOT contribute to the readability of the text?”
was “I dislike it that way”, then the overall customer requirement (parameter) for that
specific respondent was classified as “M” (“must‐be”). (See circled “M” in Figure 4.4.) It
should be noted that every customer requirement (parameter) was classified in accordance
with this method.
Chapter 4: Data Collection and Analysis 41
Figure 4.4: Kano Evaluation Table
Customer
requirement
(parameter)
Dysfunctional
Functional 1. Like 2. Must be 3. Neutral 4. Live with 5. Dislike
1. Like Q A A A O
2. Must be R I I I M
3. Neutral R I I I M
4. Live with R I I I M
5. Dislike R R R R Q
Customer Requirement is:
A: Attractive O: One‐dimensional
M: Must‐be Q: Questionable results
R: Reverse I: indifferent
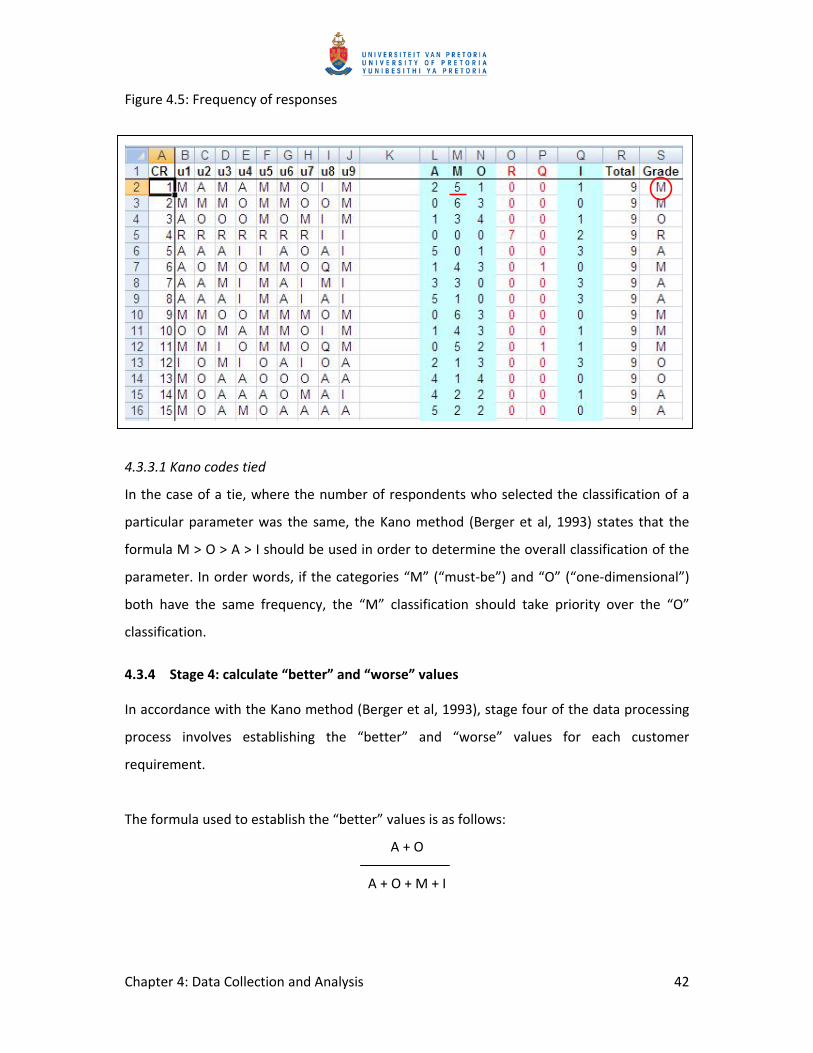
4.3.3 Stage 3: determine frequency (mode)
The next stage of the data processing process involved determining the frequency (mode) of
respondents who had classified their customer requirements (parameters) in the same
category. In other words, how many respondents classified a particular customer
requirement as “M” (“must‐be”)? This was done by adding up the total number of each
category using a formula in the Microsoft Excel program. The overall classification was
awarded to the customer requirement (parameter) with the highest frequency (mode). In
other words, if the majority of respondents (5 out of 9) had selected “M” (“must‐be”) as the
classification of a particular parameter, the overall classification of the parameter was “M”
(“must‐be”). See Figure 4.5 for a visual representation.
Chapter 4: Data Collection and Analysis 42
Figure 4.5: Frequency of responses
4.3.3.1 Kano codes tied
In the case of a tie, where the number of respondents who selected the classification of a
particular parameter was the same, the Kano method (Berger et al, 1993) states that the
formula M > O > A > I should be used in order to determine the overall classification of the
parameter. In order words, if the categories “M” (“must‐be”) and “O” (“one‐dimensional”)
both have the same frequency, the “M” classification should take priority over the “O”
classification.
4.3.4 Stage 4: calculate “better” and “worse” values
In accordance with the Kano method (Berger et al, 1993), stage four of the data processing
process involves establishing the “better” and “worse” values for each customer
requirement.
The formula used to establish the “better” values is as follows:
A + O
A + O + M + I

Chapter 4: Data Collection and Analysis 43
The formula used to establish the “worse” values is as follows:
O + M
A + O + M + I
Figure 4.6 provides a graphical representation of the “better” and “worse” values that were
created using Kano formulas.
Figure 4.6: “Better” and “worse” values
4.3.5 Stage 5: construct Kano graph
Once each customer requirement (parameter) had been changed into digital values
(“better” and “worse” values), a graph was created using Microsoft Excel. This graph is
reproduced in Figure 4.7.
Chapter 4: Data Collection and Analysis 44
Figure 4.7: Kano graph
0
0.5
1
0 0.5 1
Be
tte
r
Worse
4.4 Data analysis
The Kano graph demonstrates the location of each point, and thus the position of each
customer requirement (parameter). Figure 4.8 gives a visual representation of the overall
classification of each customer requirement (parameter) in relation to its position on the
graph.
Figure 4.8: Classification of parameters
0
0.5
1
0 0.5 1
Be
tte
r
Worse
The parameters positioned in the “A” quadrant illustrate the “attractive” requirements. The
“O” quadrant illustrates the “one‐dimensional” requirements, the “I” quadrant the
OA
M I

Chapter 4: Data Collection and Analysis 45
“indifferent” requirements and “M”, the “must‐be” requirements. The values in the “M”
quadrant were analysed in order create a list of “must‐be” requirements for educational
web portals. The list of parameters classified as “must‐be” requirements is given in Table
4.1.
Table 4.1: Must‐be requirements for educational web portals Layout − The layout is intuitive to follow. − The information is readable. − The information is organized. Navigation − The navigation mechanism is functional. − The navigation mechanism is intuitive to use. − The navigation mechanism is effective (i.e. serves its purpose) Search − The search facility is easy to use. − The search facility provides accurate (correct) results. Content Relevance − The content is accurate. − The content is current (up to date). − The abstract of each resource is accurate. Organization − The sequencing of content is consistent. Sources − The credibility of the source of the content is clear.− The content comes from a credible source. − The usage rights (copyright conditions/terms of use) of the content are clear. Language − The language is simple. − The language is coherent. − The information contained on the web portal is spelt correctly. Uploading content − The upload facility is easy to use. − The resource must be moderated before it can be found in the web portal. − You must receive notification once your resource has been uploaded and can be found
on the web portal. − You must be able to modify a resource that you have uploaded. Technical − The web portal works in all browsers.

Chapter 4: Data Collection and Analysis 46
4.5 Summary
The step‐by‐step data collection process consisted of intensive e‐mail and telephone
communication with the targeted individuals and research participants. Kano’s (Berger et al,
1993) five stages of data processing were followed in order to turn the data into a suitable
format for data analysis. The first step in processing the data was to capture the responses
of each expert user into an Excel spreadsheet. The next step was to use the Kano Evaluation
Table in order to assign the appropriate Kano category to each customer requirement
(parameter). Stage three involved determining the frequency (mode) of respondents who
had classified the customer requirements (parameters) in the same category. In accordance
with the Kano method, stage four of the data processing process involved establishing the
“better” and “worse” values for each customer requirement. The “better” and “worse”
values were used in the final stage of processing the data, to create a graph. The purpose of
the graph was to provide a visual representation of the overall classification of each
customer requirement (parameter) in relation to its position on the graph. The graph was
analysed in order to compile a list of parameters that were classified as “must‐be” customer
requirements. According to the expert users who took part in the study, there are 23
“must‐be” requirements for educational web portals. The “must‐be” requirements
identified concern the following key areas pertaining to educational web portals: layout,
navigation, search, content and technical.

Chapter 5: Summary, Conclusion and Recommendations 47
Chapter 5: Summary, Conclusions and Recommendations
Contents
5.1 Summary ................................................................................................................ 48
5.2 Conclusion ............................................................................................................. 49
5.3 Recommendations ................................................................................................. 53
Chapter 5: Summary, Conclusion and Recommendations 48
5.1 Summary
Research can be defined as a critical investigation that contributes to the understanding of a
phenomenon. Design research can be defined as an endeavour that contributes to the
understanding of a created phenomenon, developed by a designer, with the aim of
achieving sustainable development.
Research can be divided into two parts, the first being the way in which works can be used
to build knowledge (knowledge‐building process) and the second being the way in which an
individual can evaluate knowledge in order to devise a theory or design a process
(knowledge‐using process). The focus of this research study is to interpret events and
phenomena in terms of how the individuals involved perceive and understand their own
experience. The research paradigm of this study fits into the first part, as the study makes
use of works in order to create knowledge.
The aim of this research was to determine the benchmark specifications of an educational
web portal. Points investigated included the following:
• What are the benchmark specifications of an educational web portal that affect
specialist users’ perception of quality?
• What are the minimum benchmark specifications of an educational web portal
expected by specialist users?
The Kano method (Berger et al, 1993) was used in order to determine the benchmark
requirements of an educational web portal.
The research process involved the training of the researcher in the Kano method; the
selection of participants; the design/development of the Kano questionnaire; piloting the
Kano questionnaire; e‐mail communication with participants; administering the
questionnaire; the submission of responses; and, finally, the analysis.

Chapter 5: Summary, Conclusion and Recommendations 49
5.2 Conclusion
As noted above, the Kano method (Berger et al, 1993) was used in order to determine the
benchmark requirements of an educational web portal. Kano’s theory is based on the
assumption that a customer’s level of satisfaction can be classified into different categories,
the first of these categories being Kano’s one‐dimensional customer requirement.
Kano’s theory (Berger et al, 1993) states, further, that one‐dimensional customer
requirements are relative to the level of functionality of the product. In other words, the
customer's level of satisfaction increases as the functionality of the product increases.
Likewise, the customer’s level of satisfaction decreases as the functionality of the product
decreases. See Figure 5.1 for a visual representation of Kano’s one‐dimensional
requirements.
Figure 5.1: Kano’s one‐dimensional customer requirements.
Source: Berger et al, 1993
An excellent example of Kano’s (Berger et al, 1993) must‐be requirement is the brakes on a
car. Poor brakes or brakes that do not work properly would cause dissatisfaction among
customers, but effective brakes would not raise customers’ level of satisfaction since
properly functioning brakes are regarded as a prerequisite. In other words, customers would
be dissatisfied if the parameter (the brakes on the car) was not effective or working
properly. See Figure 5.2 for a visual representation of Kano’s must‐be requirements.
One-dimensional
Customer Satisfied
Customer Dissatisfied
Product Dysfunctional
Product Fully Functional
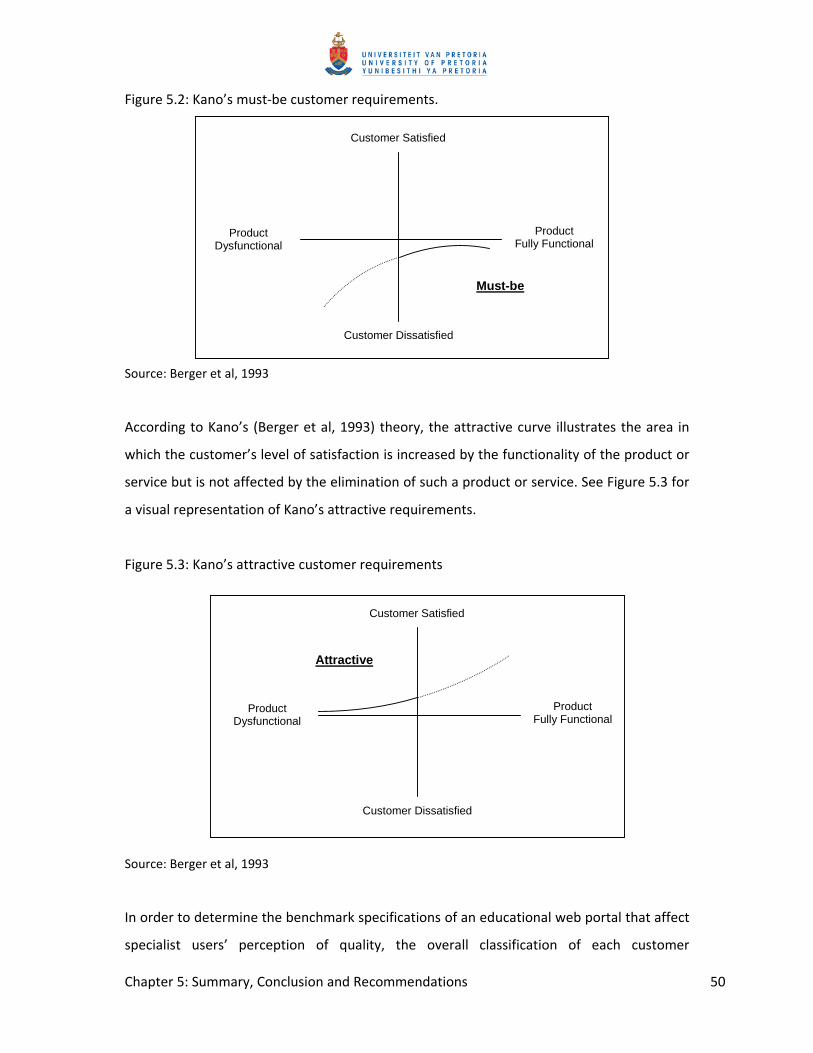
Chapter 5: Summary, Conclusion and Recommendations 50
Figure 5.2: Kano’s must‐be customer requirements.
Source: Berger et al, 1993
According to Kano’s (Berger et al, 1993) theory, the attractive curve illustrates the area in
which the customer’s level of satisfaction is increased by the functionality of the product or
service but is not affected by the elimination of such a product or service. See Figure 5.3 for
a visual representation of Kano’s attractive requirements.
Figure 5.3: Kano’s attractive customer requirements
Source: Berger et al, 1993
In order to determine the benchmark specifications of an educational web portal that affect
specialist users’ perception of quality, the overall classification of each customer
Attractive
Customer Satisfied
Customer Dissatisfied
Product Dysfunctional
Product Fully Functional
Must-be
Customer Satisfied
Customer Dissatisfied
Product Dysfunctional
Product Fully Functional

Chapter 5: Summary, Conclusion and Recommendations 51
requirement in relation to its position on the graph was analysed. Figure 5.4 provides a
visual representation of the overall classification of each customer requirement (parameter)
in relation to its position on the graph.
0
0.5
1
0 0.5 1
Be
tte
r
Worse
Figure 5.4: Classification of parameters
The parameters positioned in the “A” quadrant illustrate the “attractive” requirements,
those in the “O” quadrant illustrate the “one‐dimensional” requirements, those in the “I”
quadrant illustrate the “indifferent” requirements and those in “M”, the “must‐be”
requirements.
In order to determine the minimum benchmark specifications of an educational web portal
expected by specialist users, the values in the “M” quadrant were analysed and a list of
must‐be requirements for educational web portals was developed. Table 5.1 lists the
parameters that were classified as must‐be requirements.
OA
M I
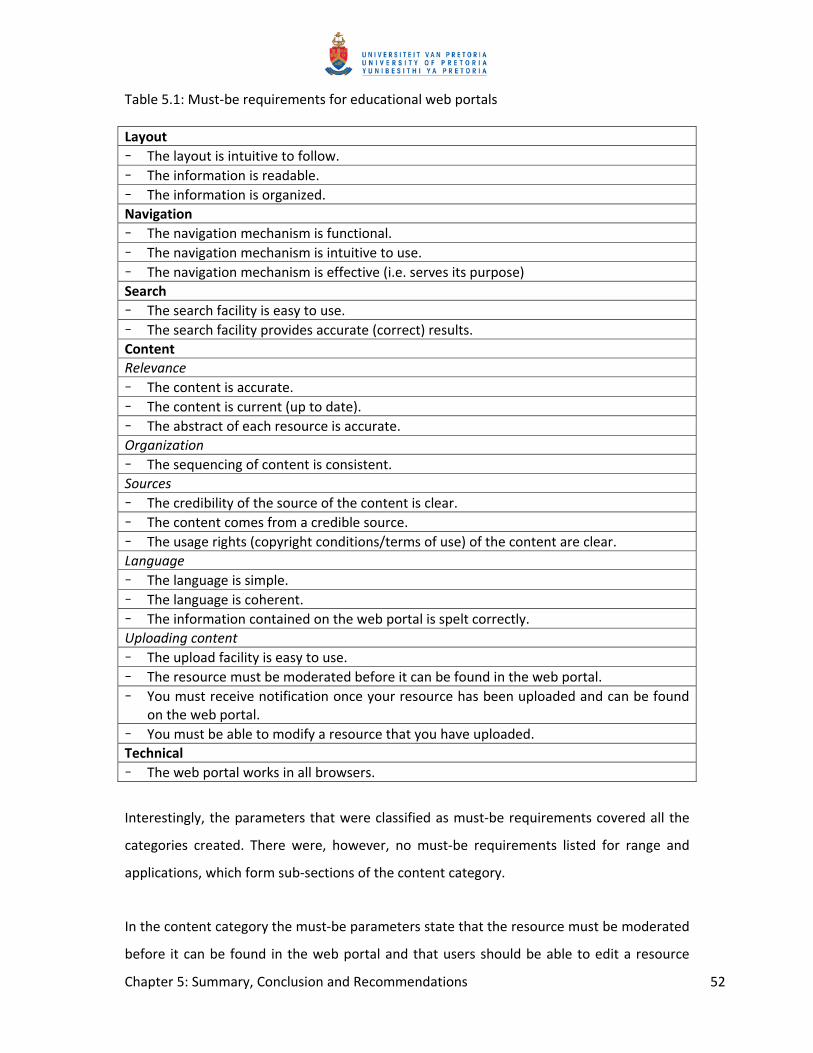
Chapter 5: Summary, Conclusion and Recommendations 52
Table 5.1: Must‐be requirements for educational web portals Layout − The layout is intuitive to follow. − The information is readable. − The information is organized. Navigation − The navigation mechanism is functional. − The navigation mechanism is intuitive to use. − The navigation mechanism is effective (i.e. serves its purpose)Search − The search facility is easy to use. − The search facility provides accurate (correct) results. Content Relevance − The content is accurate. − The content is current (up to date). − The abstract of each resource is accurate. Organization − The sequencing of content is consistent. Sources − The credibility of the source of the content is clear.− The content comes from a credible source. − The usage rights (copyright conditions/terms of use) of the content are clear. Language − The language is simple. − The language is coherent. − The information contained on the web portal is spelt correctly. Uploading content − The upload facility is easy to use. − The resource must be moderated before it can be found in the web portal. − You must receive notification once your resource has been uploaded and can be found
on the web portal. − You must be able to modify a resource that you have uploaded. Technical − The web portal works in all browsers.
Interestingly, the parameters that were classified as must‐be requirements covered all the
categories created. There were, however, no must‐be requirements listed for range and
applications, which form sub‐sections of the content category.
In the content category the must‐be parameters state that the resource must be moderated
before it can be found in the web portal and that users should be able to edit a resource

Chapter 5: Summary, Conclusion and Recommendations 53
that they have uploaded. In order to fulfil both requirements it would be necessary to
include a mechanism to alert the portal moderator whenever the original holder of the
resource modifies the resource and resubmits it.
5.3 Recommendations
The following recommendations are relevant to those individuals who wish to replicate the
research process:
• Increase response rate. A limitation of the research was the small number of individuals
who participated in the study. It is recommended that, in order to raise the level of
participation, an incentive be offered to research participants. The number of targeted
individuals approached to participate in the research could also be increased.
• Add auto save function to the online questionnaire. Two participants became frustrated
when answering the online questionnaire. The online questionnaire did not save
participants’ responses periodically, thus if connectivity was disrupted or lost, all the
answers captured before the disruption occurred were lost. The inclusion of a
mechanism that saved participants’ answers periodically, perhaps every minute, would
prevent this problem from occurring.
• Reduce the number of questions posed. One of the participants became irritated by the
tedious nature of the questionnaire (having to answer the functional and dysfunctional
form of each question for 128 questions), and decided not to complete it. Reducing the
number of questions posed could perhaps eliminate this problem.
The following recommendations are offered to the designers of web portals:
• Portals should contain the minimum specifications expected by expert users, as
identified in this study. In other words, the web portal should be carefully scrutinised to
ensure that it meets all of the must‐be requirements noted in Table 5.1.
• A mechanism should be included to alert the portal moderator whenever the original
holder of the resource modifies and resubmits it.
• Small font sizes should be avoided.
• Cluttered layouts should be avoided by limiting the amount of information provided on
each page.
Chapter 5: Summary, Conclusion and Recommendations 54
• Flashing and flickering advertisements should not be included on web portals.
• A glossary and a list of frequently asked questions (FAQs) are essential elements and
should be included on web portals.
• Links to external websites should be clearly distinguishable by means of visual cues
(icons).
• All portals should include a clearly visible search facility, which should be positioned at
the top of the page near the navigation menu.
• The search facilities included on the portal should accommodate weak writing skills, and
should overlook typing and spelling mistakes.
• The search engine should be capable of analysing users’ histories of search queries and
offering alternative keywords, as recommended by Yang et al, 2005.
• Sentences should be posed in the active rather than the passive voice.
Reference List 55
Reference List
Allen, R (Ed) (1991). Concise Oxford dictionary of current English. London: Oxford University
Press.
Association for Information Systems (AIS) (2007). Design research in information systems.
Retrieved April 21, 2008, from AISNet web site:
http://www.isworld.org/researchdesign/drisISworld.htm
Bereiter, C (2002). Design research for sustained innovation. Cognitive Studies. Bulletin of
the Japanese Cognitive Science Society, 9(3), 321‐327.
Berger, C, Blauth, R, Bolser, C, Burchill, G, du Mouchel, W, Pouliot, F, Richter, R, Ribinoff, A,
Shen, D, Timko M, & Walden, D (1993). Kano's methods for understanding customer‐
defined quality. Centre for Quality of Management Journal, 2(4), 37.
Bless, C, & Higson‐Smith, C (2004). Fundamental of Social Research Methods: An African
Perspective. Lusaka: Juta.
Blignaut, A (1997). An instructional model for the integration of computer and research skills
on the higher educational level. Unpublished PhD Thesis. Pretoria: University of Pretoria.
Clarke, I, & Flaherty, T (2003). Web‐based B2B portals. Industrial Marketing Management
Journal, 32, 15‐23.
Dias, C (2001). Corporate portals: a literature review of a new concept in Information
Management. International Journal of Information Management, 21, 269‐287.
Gappa, H & Nordbrock, E (2004). Applying web accessibility to Internet portals. Springer‐
Verlag Journal, 3, 80‐87.

Reference List 56
Katz, R (2002). Web portals and higher education to make IT personal. Indianapolis: Jossey‐
Bass.
Kim, Y, Chaudhury, A, & Raghav Rao, H (2002). A knowledge management perspective to
evaluation of enterprise information portals. Knowledge and Process Management Journal,
9, 57‐71.
Nokia Corporation. (2005) Usability problems in today's mobile Internet portals [Corporate
Publication]. Finland: Anne Kaikkonen.
Yang, Z, Cai, S, Zhou, Z, & Zhou, N (2005). Development and validation of an instrument to
measure user perceived service quality of information presenting web portals. Information
and Management Journal, 42, 575‐589.